base - annual report 2021 - cern document server
TRANSCRIPT
CER
N-S
PSC
-202
2-00
7/
SPSC
-SR
-304
17/0
1/20
22
BASE - Annual Report 2021
Stefan Ulmer1, Christian Smorra1,2, Jack A. Devlin1,3, Barbara M. Latacz1,4, Peter Micke1,3, EliseWursten1,4, Matthias J. Borchert1,5,6, Stefan Erlewein1,4, Markus Fleck1,7, Philip Geissler 1, Julia I.Jäger1,3,4, Phil Nuschke 1,6, Gilbertas Umbrazunas1,8, Frederik Völksen1,9, Fatma. Abbass2, MatthewA. Bohman1,4, Daniel. Popper2, Markus Wiesinger4, Christian Will4, Amado Bautista-Salvador5,6,Julia-Aileen Coenders 6, Juan Manuel Cornejo5,6, Teresa Meiners5,6, Johannes Mielke5,6, JulianPick4,5, Klaus Blaum4, Yasuyuki Matsuda7, Andreas H. Mooser4, Christian Ospelkaus5,6, WolfgangQuint9, Anna Soter8, Jochen Walz2, Yasunori Yamazaki11RIKEN, Ulmer Fundamental Symmetries Laboratory, 2-1 Hirosawa, Wako, Saitama, 351-0198, Japan2Institut für Physik, Johannes Gutenberg-Universität, Staudinger Weg 7, D-55128 Mainz, Germany3CERN, Esplanade des Particules 1, CH-1211 Geneva 23, Switzerland4Max-Planck-Institut für Kernphysik, Saupfercheckweg 1, D-69117 Heidelberg, Germany5Physikalisch-Technische Bundesanstalt, Bundesallee 100, D-38116 Braunschweig, Germany6Institut für Quantenoptik, Leibniz Universität Hannover, Welfengarten 1, D-30167 Hannover, Germany7Graduate School of Arts and Sciences, University of Tokyo, 3-8-1 Komaba, Tokyo 153-8902, Japan8Eidgenössisch Technische Hochschule Zürich, Rämistrasse 101, 8092 Zürich, Switzerland9GSI-Helmholtzzentrum für Schwerionenforschung GmbH, Planckstraße 1, D-64291 Darmstadt,Germany
AbstractThis report summarizes the progress made by the BASE collaboration in2021. It contains short summaries of the main output produced, which arethree manuscripts published, one in Physical Review Letters [1] and two inNature [2, 3]. One of these manuscripts sets constraints on the coupling ofaxions and axion-like particles to photons using the highly sensitive singleparticle detection systems in the strong magnetic field of the superconductingmagnet of the experiment [4, 5]. As a consequence of the successful demon-stration of this LC-resonator-based haloscope technique we started construct-ing the new experiment BASE-CDM. The second manuscript reports on thefirst demonstration of sympathetic cooling of a single trapped proton by coup-ling the particle to a cloud of laser-cooled 9Be+ ions using a common-endcapPenning trap method and a superconducting tuned circuit that mediates thecooling [2]. This work was selected by "Physics World" as one of the top tenphysics breakthroughs made in 2021. The third manuscript reports on a 16-parts-per-trillion comparison of the proton-to-antiproton charge-to-mass ratio.This measurement improves the previous best limit [6] by a factor of 4.3, andcontains the first-ever performed clock-based differential test of the weak equi-valence principle with protons and antiprotons. In addition, the group focusedon the development and implementation of the new ELENA/BASE interface,and the setup of an experiment dedicated to measure the antiproton magneticmoment with a fractional precision at a level of ≈ 100 parts in a trillion. Thisincludes the setup of a new trap stack, the development of revised cryogenicexperiment electronics and superconducting single particle detectors, as wellas the implementation of a new magnet shimming system and the develop-ment of a cooling trap for sub-thermal cooling cycles at drastically reducedthermalization times.

Contents
1 BASE - Overview . . . . . . . . . . . . . . . . . . . . . . . . . . . . . . . . . . . . . . . 4
2 About this Report . . . . . . . . . . . . . . . . . . . . . . . . . . . . . . . . . . . . . . . 6
3 Final Data Evaluation of the Charge-to-Mass Ratio Measurement Campaign Acquired inthe Antiproton Runs of 2017 to 2019 . . . . . . . . . . . . . . . . . . . . . . . . . . . 7
3.1 Summary . . . . . . . . . . . . . . . . . . . . . . . . . . . . . . . . . . . . . . . . . . 7
3.2 Statistical Data Analysis and Result . . . . . . . . . . . . . . . . . . . . . . . . . . . . 8
3.3 Systematic Frequency Shifts of the Different Measurement Campaigns . . . . . . . . . . 9
3.4 Final Result . . . . . . . . . . . . . . . . . . . . . . . . . . . . . . . . . . . . . . . . . 9
3.5 Discussion of the Result . . . . . . . . . . . . . . . . . . . . . . . . . . . . . . . . . . . 11
3.6 Coefficients of the Standard Model Extension . . . . . . . . . . . . . . . . . . . . . . . 13
3.7 Outlook - Phase-Sensitive Frequency Measurements and Future Improvements in q/mRatio Measurements . . . . . . . . . . . . . . . . . . . . . . . . . . . . . . . . 13
3.8 Outlook - Superconducting Shimming System . . . . . . . . . . . . . . . . . . . . . . . 14
4 Status and Implementation of a Transportable Antiproton Trap BASE-STEP . . . . . . . . 15
5 BASE-CDM . . . . . . . . . . . . . . . . . . . . . . . . . . . . . . . . . . . . . . . . . . 16
5.1 Developments for BASE-CDM during 2021 - Tuneable Detector . . . . . . . . . . . . . 16
5.2 Developments for BASE-CDM during 2021 - Experiment Integration . . . . . . . . . . . 18
6 Towards an Improved Measurement of the Antiproton Magnetic Moment . . . . . . . . . . 19
6.1 Revised Electronics Setup . . . . . . . . . . . . . . . . . . . . . . . . . . . . . . . . . . 21
6.2 Development of a New Degrader System to Interface BASE to ELENA . . . . . . . . . . 22
6.3 Setup for the Antiproton Run - Timeline 2021 . . . . . . . . . . . . . . . . . . . . . . . 26
6.4 Development and Characterization of the New Cyclotron Detection Electronics for thePrecision Trap . . . . . . . . . . . . . . . . . . . . . . . . . . . . . . . . . . 27
6.5 Axial Detection System of the Precision Trap . . . . . . . . . . . . . . . . . . . . . . . 27
6.6 Trap Stack - Magnetic Gradients in the Precision Trap . . . . . . . . . . . . . . . . . . . 29
6.7 Persistent Coil System . . . . . . . . . . . . . . . . . . . . . . . . . . . . . . . . . . . 29
6.8 Axial Detection Systems of the Analysis Trap and the Cooling Trap . . . . . . . . . . . 32
6.9 Particle Transport and Detection of Particles in the Analysis Trap and the Cooling Trap . 32
2

7 Parallel Developments . . . . . . . . . . . . . . . . . . . . . . . . . . . . . . . . . . . . . 33
7.1 Development of a New 7-Electrode Trap . . . . . . . . . . . . . . . . . . . . . . . . . . 33
7.2 Development of New Magnetometry . . . . . . . . . . . . . . . . . . . . . . . . . . . . 35
7.3 Magnet Logger System . . . . . . . . . . . . . . . . . . . . . . . . . . . . . . . . . . . 36
7.4 New Electron Gun . . . . . . . . . . . . . . . . . . . . . . . . . . . . . . . . . . . . . . 38
8 BASE-Mainz and BASE-Hannover Experiments . . . . . . . . . . . . . . . . . . . . . . . 39
8.1 Sympathetic Cooling of Protons at the BASE-Mainz Experiment . . . . . . . . . . . . . 39
8.2 Summary BASE Hannover 2020 . . . . . . . . . . . . . . . . . . . . . . . . . . . . . . 41
9 Summary on Experimental Progress . . . . . . . . . . . . . . . . . . . . . . . . . . . . . 41
10 Projects for the 2022 run . . . . . . . . . . . . . . . . . . . . . . . . . . . . . . . . . . . . 42
11 Funding . . . . . . . . . . . . . . . . . . . . . . . . . . . . . . . . . . . . . . . . . . . . 42
12 Collaboration and Manpower . . . . . . . . . . . . . . . . . . . . . . . . . . . . . . . . . 42
13 Explicit Requests . . . . . . . . . . . . . . . . . . . . . . . . . . . . . . . . . . . . . . . 42
14 Acknowledgments . . . . . . . . . . . . . . . . . . . . . . . . . . . . . . . . . . . . . . . 43
3
1 BASE - Overview
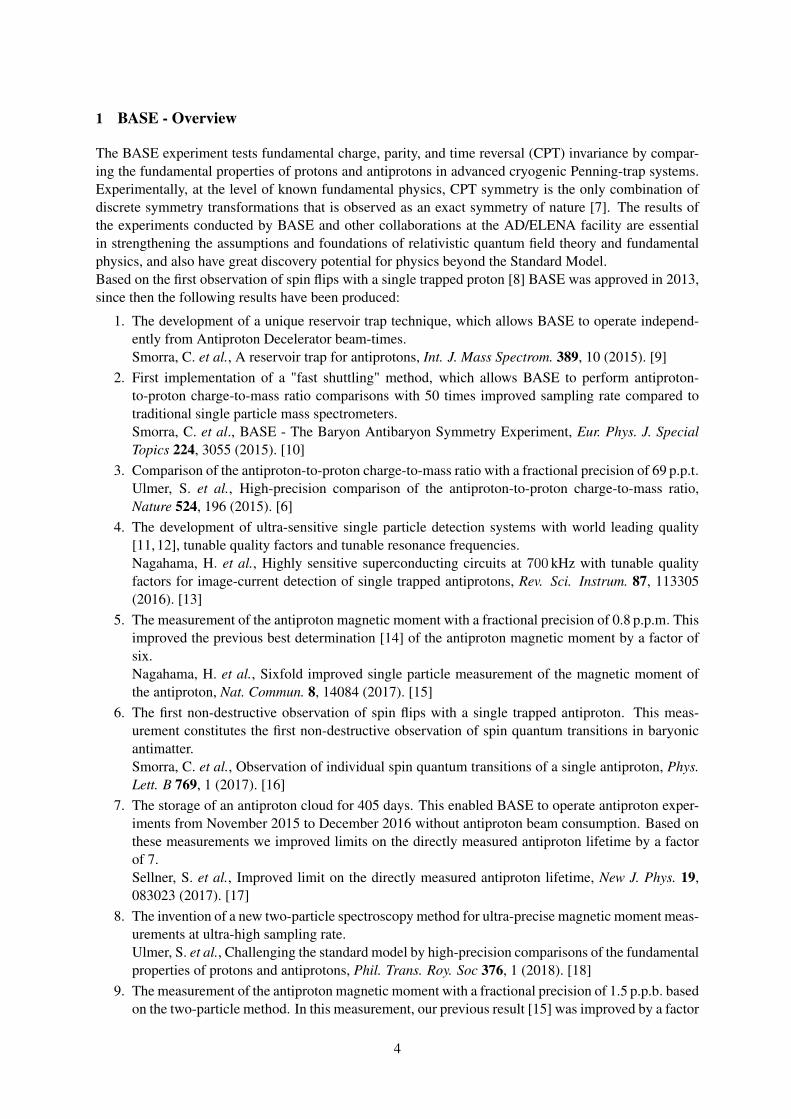
The BASE experiment tests fundamental charge, parity, and time reversal (CPT) invariance by compar-ing the fundamental properties of protons and antiprotons in advanced cryogenic Penning-trap systems.Experimentally, at the level of known fundamental physics, CPT symmetry is the only combination ofdiscrete symmetry transformations that is observed as an exact symmetry of nature [7]. The results ofthe experiments conducted by BASE and other collaborations at the AD/ELENA facility are essentialin strengthening the assumptions and foundations of relativistic quantum field theory and fundamentalphysics, and also have great discovery potential for physics beyond the Standard Model.Based on the first observation of spin flips with a single trapped proton [8] BASE was approved in 2013,since then the following results have been produced:
1. The development of a unique reservoir trap technique, which allows BASE to operate independ-ently from Antiproton Decelerator beam-times.Smorra, C. et al., A reservoir trap for antiprotons, Int. J. Mass Spectrom. 389, 10 (2015). [9]
2. First implementation of a "fast shuttling" method, which allows BASE to perform antiproton-to-proton charge-to-mass ratio comparisons with 50 times improved sampling rate compared totraditional single particle mass spectrometers.Smorra, C. et al., BASE - The Baryon Antibaryon Symmetry Experiment, Eur. Phys. J. SpecialTopics 224, 3055 (2015). [10]
3. Comparison of the antiproton-to-proton charge-to-mass ratio with a fractional precision of 69 p.p.t.Ulmer, S. et al., High-precision comparison of the antiproton-to-proton charge-to-mass ratio,Nature 524, 196 (2015). [6]
4. The development of ultra-sensitive single particle detection systems with world leading quality[11, 12], tunable quality factors and tunable resonance frequencies.Nagahama, H. et al., Highly sensitive superconducting circuits at 700 kHz with tunable qualityfactors for image-current detection of single trapped antiprotons, Rev. Sci. Instrum. 87, 113305(2016). [13]
5. The measurement of the antiproton magnetic moment with a fractional precision of 0.8 p.p.m. Thisimproved the previous best determination [14] of the antiproton magnetic moment by a factor ofsix.Nagahama, H. et al., Sixfold improved single particle measurement of the magnetic moment ofthe antiproton, Nat. Commun. 8, 14084 (2017). [15]
6. The first non-destructive observation of spin flips with a single trapped antiproton. This meas-urement constitutes the first non-destructive observation of spin quantum transitions in baryonicantimatter.Smorra, C. et al., Observation of individual spin quantum transitions of a single antiproton, Phys.Lett. B 769, 1 (2017). [16]
7. The storage of an antiproton cloud for 405 days. This enabled BASE to operate antiproton exper-iments from November 2015 to December 2016 without antiproton beam consumption. Based onthese measurements we improved limits on the directly measured antiproton lifetime by a factorof 7.Sellner, S. et al., Improved limit on the directly measured antiproton lifetime, New J. Phys. 19,083023 (2017). [17]
8. The invention of a new two-particle spectroscopy method for ultra-precise magnetic moment meas-urements at ultra-high sampling rate.Ulmer, S. et al., Challenging the standard model by high-precision comparisons of the fundamentalproperties of protons and antiprotons, Phil. Trans. Roy. Soc 376, 1 (2018). [18]
9. The measurement of the antiproton magnetic moment with a fractional precision of 1.5 p.p.b. basedon the two-particle method. In this measurement, our previous result [15] was improved by a factor
4
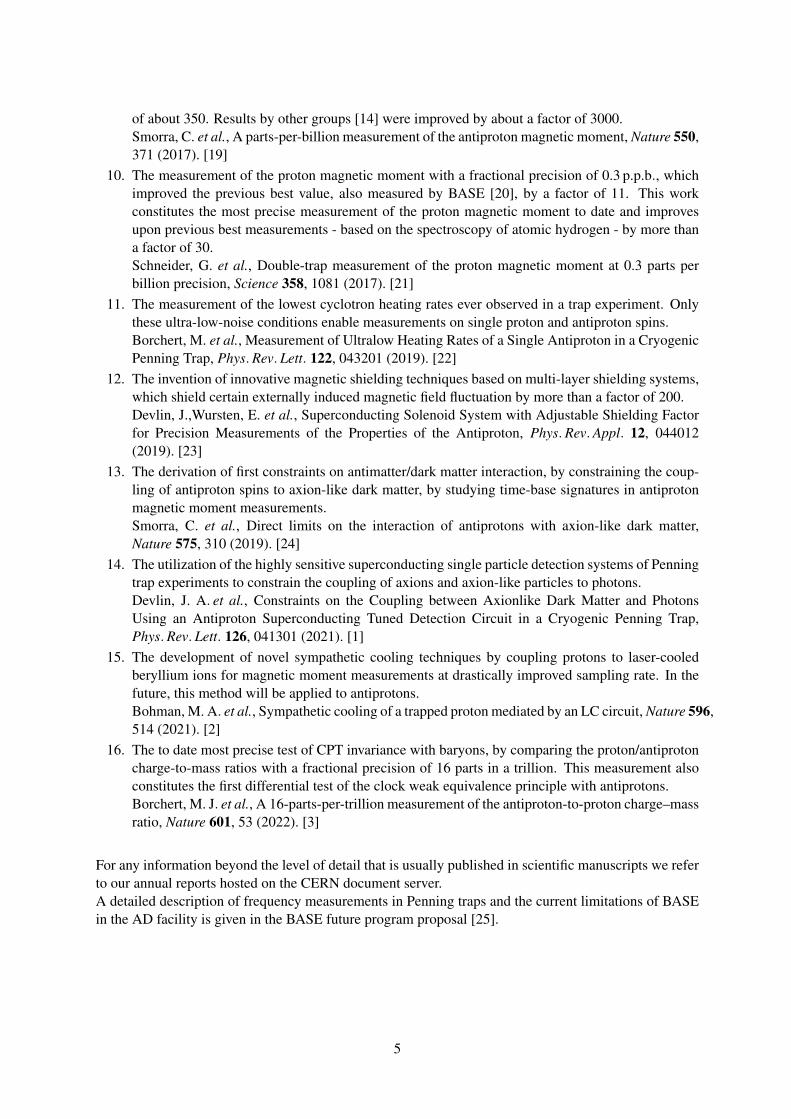
of about 350. Results by other groups [14] were improved by about a factor of 3000.Smorra, C. et al., A parts-per-billion measurement of the antiproton magnetic moment, Nature 550,371 (2017). [19]
10. The measurement of the proton magnetic moment with a fractional precision of 0.3 p.p.b., whichimproved the previous best value, also measured by BASE [20], by a factor of 11. This workconstitutes the most precise measurement of the proton magnetic moment to date and improvesupon previous best measurements - based on the spectroscopy of atomic hydrogen - by more thana factor of 30.Schneider, G. et al., Double-trap measurement of the proton magnetic moment at 0.3 parts perbillion precision, Science 358, 1081 (2017). [21]
11. The measurement of the lowest cyclotron heating rates ever observed in a trap experiment. Onlythese ultra-low-noise conditions enable measurements on single proton and antiproton spins.Borchert, M. et al., Measurement of Ultralow Heating Rates of a Single Antiproton in a CryogenicPenning Trap, Phys.Rev.Lett. 122, 043201 (2019). [22]
12. The invention of innovative magnetic shielding techniques based on multi-layer shielding systems,which shield certain externally induced magnetic field fluctuation by more than a factor of 200.Devlin, J.,Wursten, E. et al., Superconducting Solenoid System with Adjustable Shielding Factorfor Precision Measurements of the Properties of the Antiproton, Phys.Rev.Appl. 12, 044012(2019). [23]
13. The derivation of first constraints on antimatter/dark matter interaction, by constraining the coup-ling of antiproton spins to axion-like dark matter, by studying time-base signatures in antiprotonmagnetic moment measurements.Smorra, C. et al., Direct limits on the interaction of antiprotons with axion-like dark matter,Nature 575, 310 (2019). [24]
14. The utilization of the highly sensitive superconducting single particle detection systems of Penningtrap experiments to constrain the coupling of axions and axion-like particles to photons.Devlin, J. A. et al., Constraints on the Coupling between Axionlike Dark Matter and PhotonsUsing an Antiproton Superconducting Tuned Detection Circuit in a Cryogenic Penning Trap,Phys.Rev.Lett. 126, 041301 (2021). [1]
15. The development of novel sympathetic cooling techniques by coupling protons to laser-cooledberyllium ions for magnetic moment measurements at drastically improved sampling rate. In thefuture, this method will be applied to antiprotons.Bohman, M. A. et al., Sympathetic cooling of a trapped proton mediated by an LC circuit, Nature 596,514 (2021). [2]
16. The to date most precise test of CPT invariance with baryons, by comparing the proton/antiprotoncharge-to-mass ratios with a fractional precision of 16 parts in a trillion. This measurement alsoconstitutes the first differential test of the clock weak equivalence principle with antiprotons.Borchert, M. J. et al., A 16-parts-per-trillion measurement of the antiproton-to-proton charge–massratio, Nature 601, 53 (2022). [3]
For any information beyond the level of detail that is usually published in scientific manuscripts we referto our annual reports hosted on the CERN document server.A detailed description of frequency measurements in Penning traps and the current limitations of BASEin the AD facility is given in the BASE future program proposal [25].
5
2 About this Report
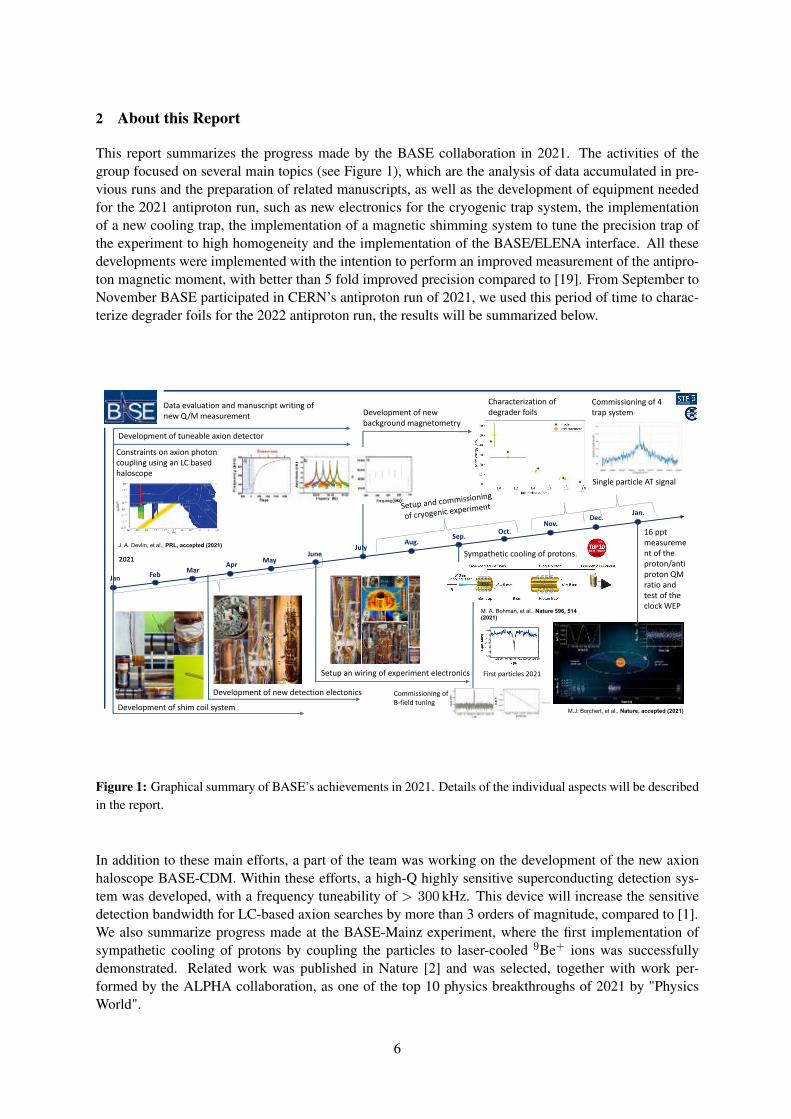
This report summarizes the progress made by the BASE collaboration in 2021. The activities of thegroup focused on several main topics (see Figure 1), which are the analysis of data accumulated in pre-vious runs and the preparation of related manuscripts, as well as the development of equipment neededfor the 2021 antiproton run, such as new electronics for the cryogenic trap system, the implementationof a new cooling trap, the implementation of a magnetic shimming system to tune the precision trap ofthe experiment to high homogeneity and the implementation of the BASE/ELENA interface. All thesedevelopments were implemented with the intention to perform an improved measurement of the antipro-ton magnetic moment, with better than 5 fold improved precision compared to [19]. From September toNovember BASE participated in CERN’s antiproton run of 2021, we used this period of time to charac-terize degrader foils for the 2022 antiproton run, the results will be summarized below.
Jan Feb Mar
June
Oct.
2021
M.J. Borchert, et al., Nature, accepted (2021)
J. A. Devlin, et al., PRL, accepted (2021)
M. A. Bohman, et al., Nature 596, 514 (2021)
Apr May
JulyAug.
Sep.
Dec.Nov.
Jan.
Characterization of degrader foils
Constraints on axion photon coupling using an LC based haloscope
16 pptmeasurement of the proton/antiproton QM ratio and test of the clock WEP
Sympathetic cooling of protons.
Setup an wiring of experiment electronics
Development of shim coil system
Development of new detection electonics
Commissioning of 4 trap system
Development of tuneable axion detector
Single particle AT signal
Development of new background magnetometry
Commissioning of B‐field tuning
First particles 2021
Data evaluation and manuscript writing of new Q/M measurement
Figure 1: Graphical summary of BASE’s achievements in 2021. Details of the individual aspects will be describedin the report.
In addition to these main efforts, a part of the team was working on the development of the new axionhaloscope BASE-CDM. Within these efforts, a high-Q highly sensitive superconducting detection sys-tem was developed, with a frequency tuneability of > 300 kHz. This device will increase the sensitivedetection bandwidth for LC-based axion searches by more than 3 orders of magnitude, compared to [1].We also summarize progress made at the BASE-Mainz experiment, where the first implementation ofsympathetic cooling of protons by coupling the particles to laser-cooled 9Be+ ions was successfullydemonstrated. Related work was published in Nature [2] and was selected, together with work per-formed by the ALPHA collaboration, as one of the top 10 physics breakthroughs of 2021 by "PhysicsWorld".
6
We start this report with summarizing comments on the recently published 16-parts-per-trillion measure-ment of the proton-to-antiproton charge-to-mass ratio [3], which also includes a stringent test of the clockweak equivalence principle. We continue with a progress update on the development of the transportabletrap BASE-STEP, and thereafter describe our efforts to develop the axion haloscope BASE-CDM. Next,we describe experimental upgrades implemented for the 2021 antiproton run and detail their character-ization. We conclude with summaries on the sympathetic cooling efforts carried out at BASE-Mainz andBASE-Hannover.
3 Final Data Evaluation of the Charge-to-Mass Ratio Measurement Campaign Acquiredin the Antiproton Runs of 2017 to 2019
3.1 Summary
The implementation of the experiment scheme to measure the proton/antiproton charge-to-mass ratio,and the applied data analysis methods were described in detail in the last annual report. This includesa description of the experimental implementation of the measurement scheme, a description of the fre-quency evaluation and the used data cleaning filters, the description of weighted frequency ratio analysisand polynomial frequency ratio analysis, and a detailed analysis of systematic frequency shifts in themeasurements. The contributions are discussed for both peak-based frequency measurements where theparticle’s modified cyclotron motion is excited, as well as dip-based frequency measurements, whichtake place with the particle in thermal equilibrium with the axial detection system. A condensed formof this analysis, together with updated numbers is summarized in the supplementary material of the pub-lished manuscript [3], which is also attached to this summary report. Compared to the measurementcarried out in 2014 [6], the experiment stability for the recent measurement was considerably improvedby implementing the following upgrades:
– A multi-layer self-shielding coil system for efficient shielding of background magnetic field fluctu-ations. The system, carefully described and characterized in [23], builds upon an idea introducedby Gabrielse [26]. This multi-layer shielding system suppresses certain external magnetic fielddisturbances by up to a factor of S ≈ 225(15). The self-shielding factor used in the previousBASE charge-to-mass ratio run was S ≈ 10.
– Temperature shielding was installed, this includes shielding of the sensitive tops of the experimentcryostats, covering the previously open experiment zone by a tent, and insulating the boil-off linesconnected to the helium recovery manifold of CERN with several layers of insulating foam. Com-pared to the 2014 charge-to-mass ratio run the temperature fluctuation of the system per frequencymeasurement were suppressed by up to a factor of 11.
– A very important upgrade that has been developed is a frequency-tuneable axial frequency de-tection system, inspired by the work described in [27]. The frequency tuneability of the systemcovers the antiproton-to-H− axial frequency difference of ≈ 348.5Hz. This system enables us tooperate the trap at constant trapping voltage, which eliminates the dominant systematic error ofthe previous BASE charge-to-mass ratio measurement [6].
– A new voltage supply UM1-14-LN-25 which has been developed according to the specificationsof BASE has been implemented. Compared to the previously used devices, the new version has afive-fold reduced output relaxation time constant (4 s).
– For the axial frequency measurement system, a single sideband downconverter (SSB) has been im-plemented. This improves the dip signal-to-noise ratio (SNR) by 3 dB, and enables measurementsat improved frequency resolution.
– The internal reference clock of the FFT analyzer has been replaced by an external 10 MHz rubid-ium reference oscillator.
7
-1.×10-8 -5.×10-9 0 5.×10-9 1.×10-80
2×10⁸
4×10⁸
6×10⁸
8×10⁸
1×10⁹
Ratio-scatter
σ(R2019)= 1.6(2) p.p.b.
σ(R2014)= 5.8(3) p.p.b.
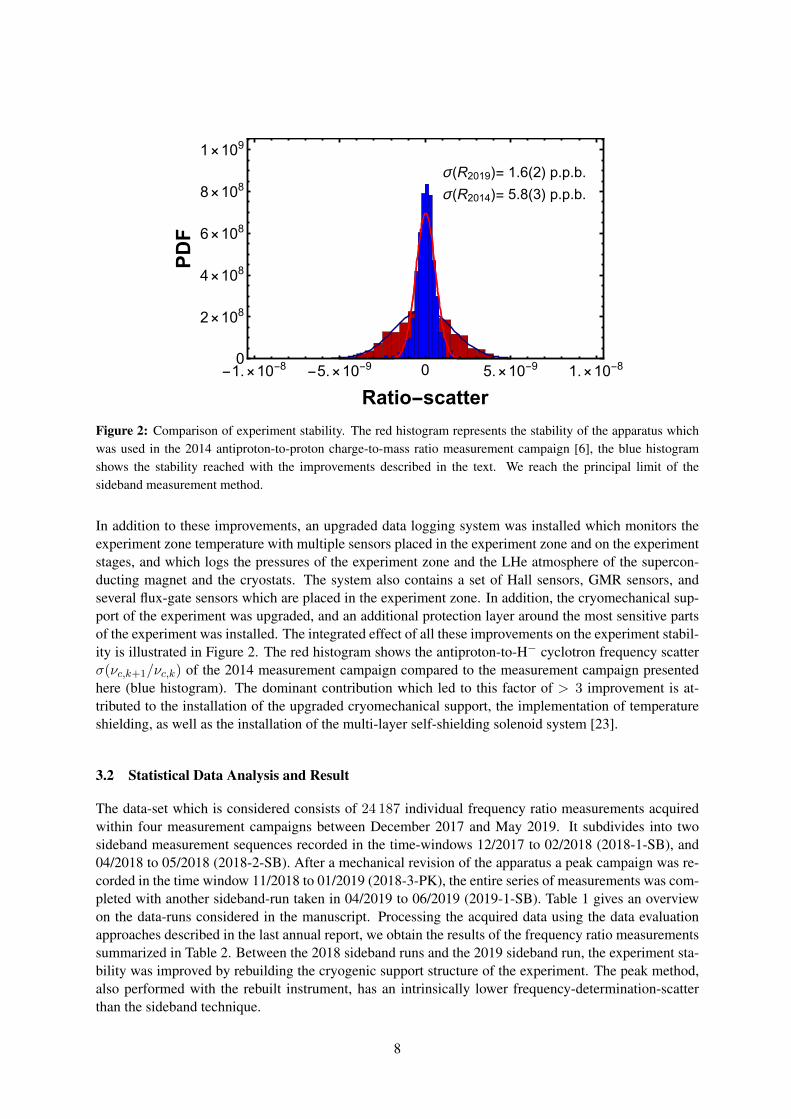
Figure 2: Comparison of experiment stability. The red histogram represents the stability of the apparatus whichwas used in the 2014 antiproton-to-proton charge-to-mass ratio measurement campaign [6], the blue histogramshows the stability reached with the improvements described in the text. We reach the principal limit of thesideband measurement method.
In addition to these improvements, an upgraded data logging system was installed which monitors theexperiment zone temperature with multiple sensors placed in the experiment zone and on the experimentstages, and which logs the pressures of the experiment zone and the LHe atmosphere of the supercon-ducting magnet and the cryostats. The system also contains a set of Hall sensors, GMR sensors, andseveral flux-gate sensors which are placed in the experiment zone. In addition, the cryomechanical sup-port of the experiment was upgraded, and an additional protection layer around the most sensitive partsof the experiment was installed. The integrated effect of all these improvements on the experiment stabil-ity is illustrated in Figure 2. The red histogram shows the antiproton-to-H− cyclotron frequency scatterσ(νc,k+1/νc,k) of the 2014 measurement campaign compared to the measurement campaign presentedhere (blue histogram). The dominant contribution which led to this factor of > 3 improvement is at-tributed to the installation of the upgraded cryomechanical support, the implementation of temperatureshielding, as well as the installation of the multi-layer self-shielding solenoid system [23].
3.2 Statistical Data Analysis and Result
The data-set which is considered consists of 24 187 individual frequency ratio measurements acquiredwithin four measurement campaigns between December 2017 and May 2019. It subdivides into twosideband measurement sequences recorded in the time-windows 12/2017 to 02/2018 (2018-1-SB), and04/2018 to 05/2018 (2018-2-SB). After a mechanical revision of the apparatus a peak campaign was re-corded in the time window 11/2018 to 01/2019 (2018-3-PK), the entire series of measurements was com-pleted with another sideband-run taken in 04/2019 to 06/2019 (2019-1-SB). Table 1 gives an overviewon the data-runs considered in the manuscript. Processing the acquired data using the data evaluationapproaches described in the last annual report, we obtain the results of the frequency ratio measurementssummarized in Table 2. Between the 2018 sideband runs and the 2019 sideband run, the experiment sta-bility was improved by rebuilding the cryogenic support structure of the experiment. The peak method,also performed with the rebuilt instrument, has an intrinsically lower frequency-determination-scatterthan the sideband technique.
8
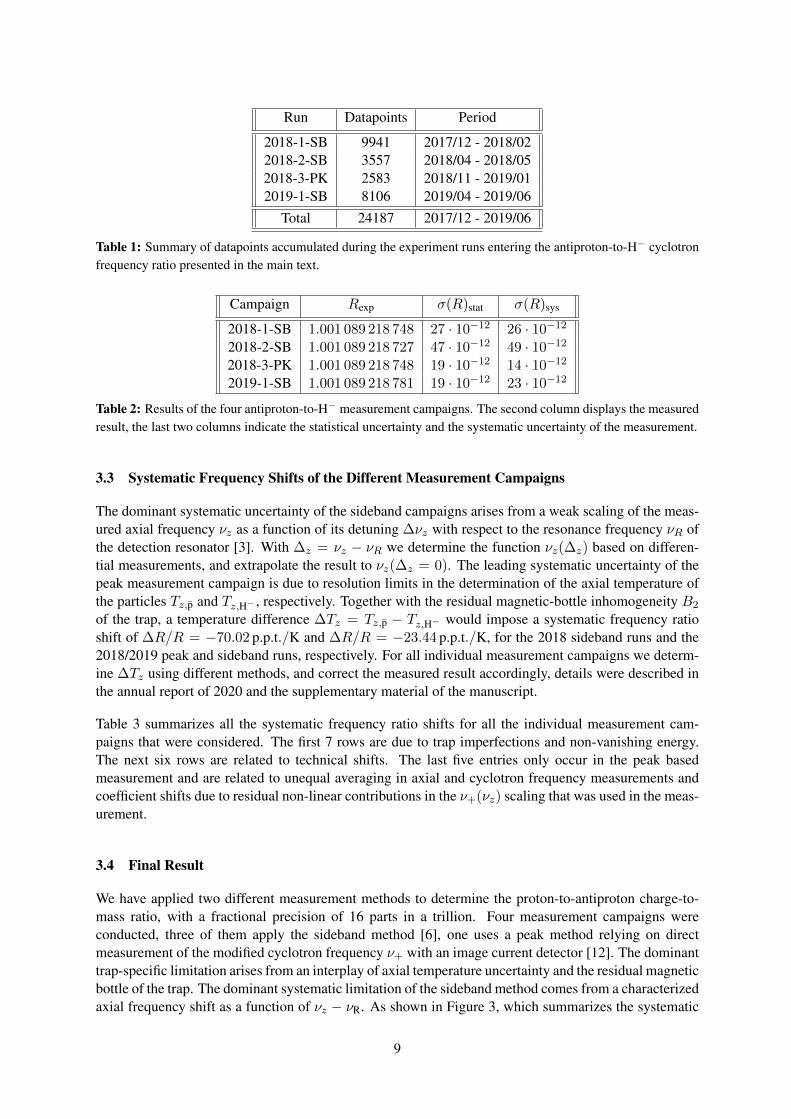
Run Datapoints Period
2018-1-SB 9941 2017/12 - 2018/022018-2-SB 3557 2018/04 - 2018/052018-3-PK 2583 2018/11 - 2019/012019-1-SB 8106 2019/04 - 2019/06
Total 24187 2017/12 - 2019/06
Table 1: Summary of datapoints accumulated during the experiment runs entering the antiproton-to-H− cyclotronfrequency ratio presented in the main text.
Campaign Rexp σ(R)stat σ(R)sys
2018-1-SB 1.001 089 218 748 27 · 10−12 26 · 10−12
2018-2-SB 1.001 089 218 727 47 · 10−12 49 · 10−12
2018-3-PK 1.001 089 218 748 19 · 10−12 14 · 10−12
2019-1-SB 1.001 089 218 781 19 · 10−12 23 · 10−12
Table 2: Results of the four antiproton-to-H− measurement campaigns. The second column displays the measuredresult, the last two columns indicate the statistical uncertainty and the systematic uncertainty of the measurement.
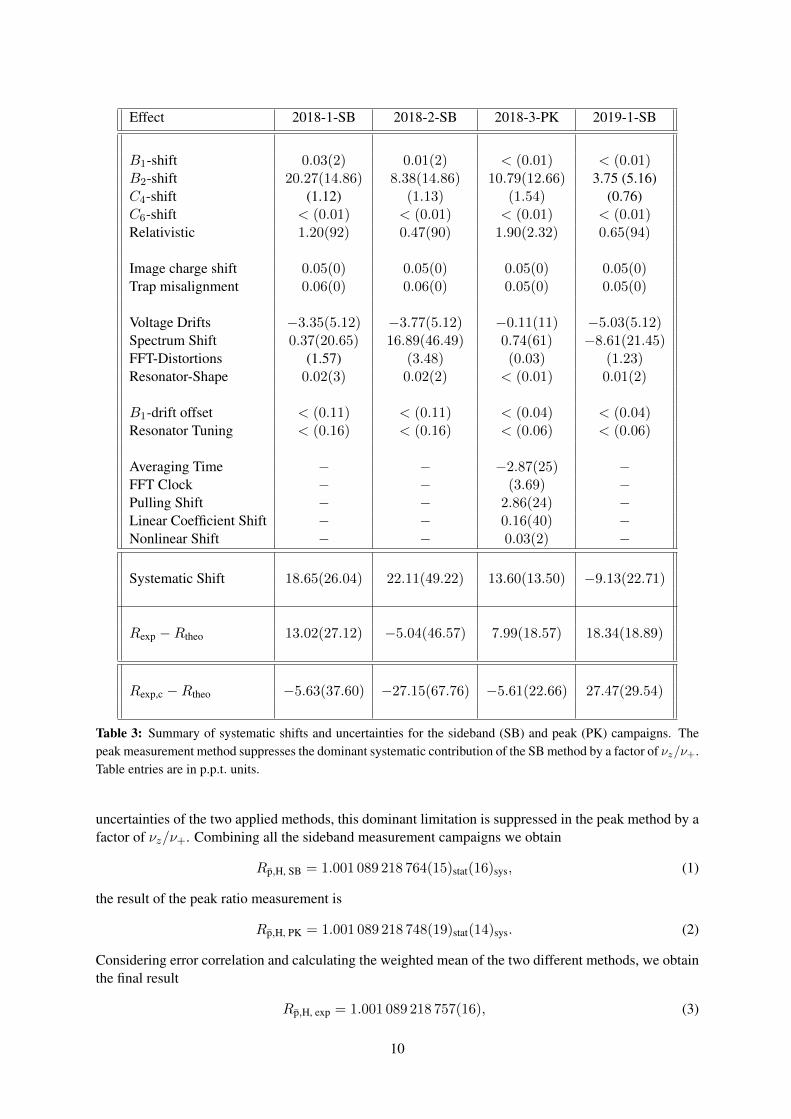
3.3 Systematic Frequency Shifts of the Different Measurement Campaigns
The dominant systematic uncertainty of the sideband campaigns arises from a weak scaling of the meas-ured axial frequency νz as a function of its detuning ∆νz with respect to the resonance frequency νR ofthe detection resonator [3]. With ∆z = νz − νR we determine the function νz(∆z) based on differen-tial measurements, and extrapolate the result to νz(∆z = 0). The leading systematic uncertainty of thepeak measurement campaign is due to resolution limits in the determination of the axial temperature ofthe particles Tz,p and Tz,H− , respectively. Together with the residual magnetic-bottle inhomogeneity B2
of the trap, a temperature difference ∆Tz = Tz,p − Tz,H− would impose a systematic frequency ratioshift of ∆R/R = −70.02 p.p.t./K and ∆R/R = −23.44 p.p.t./K, for the 2018 sideband runs and the2018/2019 peak and sideband runs, respectively. For all individual measurement campaigns we determ-ine ∆Tz using different methods, and correct the measured result accordingly, details were described inthe annual report of 2020 and the supplementary material of the manuscript.
Table 3 summarizes all the systematic frequency ratio shifts for all the individual measurement cam-paigns that were considered. The first 7 rows are due to trap imperfections and non-vanishing energy.The next six rows are related to technical shifts. The last five entries only occur in the peak basedmeasurement and are related to unequal averaging in axial and cyclotron frequency measurements andcoefficient shifts due to residual non-linear contributions in the ν+(νz) scaling that was used in the meas-urement.
3.4 Final Result
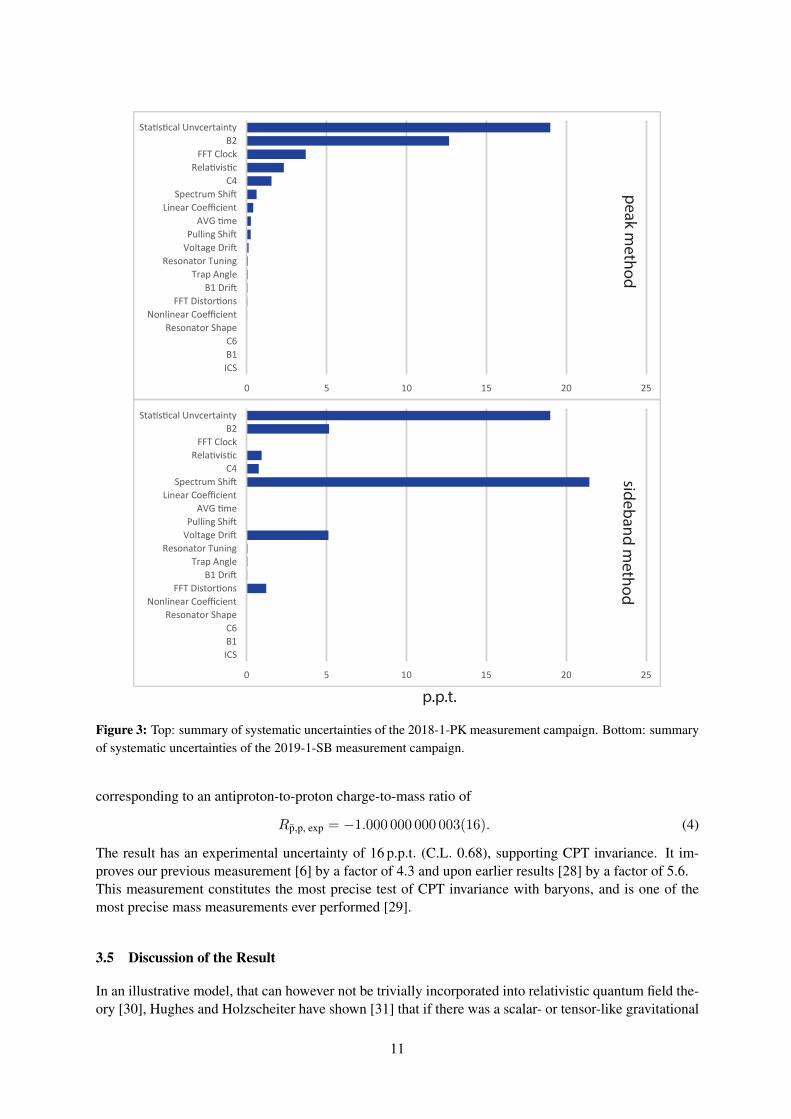
We have applied two different measurement methods to determine the proton-to-antiproton charge-to-mass ratio, with a fractional precision of 16 parts in a trillion. Four measurement campaigns wereconducted, three of them apply the sideband method [6], one uses a peak method relying on directmeasurement of the modified cyclotron frequency ν+ with an image current detector [12]. The dominanttrap-specific limitation arises from an interplay of axial temperature uncertainty and the residual magneticbottle of the trap. The dominant systematic limitation of the sideband method comes from a characterizedaxial frequency shift as a function of νz − νR. As shown in Figure 3, which summarizes the systematic
9
Effect 2018-1-SB 2018-2-SB 2018-3-PK 2019-1-SB
B1-shift 0.03(2) 0.01(2) < (0.01) < (0.01)B2-shift 20.27(14.86) 8.38(14.86) 10.79(12.66) 3.75 (5.16)C4-shift (1.12) (1.13) (1.54) (0.76)C6-shift < (0.01) < (0.01) < (0.01) < (0.01)Relativistic 1.20(92) 0.47(90) 1.90(2.32) 0.65(94)
Image charge shift 0.05(0) 0.05(0) 0.05(0) 0.05(0)Trap misalignment 0.06(0) 0.06(0) 0.05(0) 0.05(0)
Voltage Drifts −3.35(5.12) −3.77(5.12) −0.11(11) −5.03(5.12)Spectrum Shift 0.37(20.65) 16.89(46.49) 0.74(61) −8.61(21.45)FFT-Distortions (1.57) (3.48) (0.03) (1.23)Resonator-Shape 0.02(3) 0.02(2) < (0.01) 0.01(2)
B1-drift offset < (0.11) < (0.11) < (0.04) < (0.04)Resonator Tuning < (0.16) < (0.16) < (0.06) < (0.06)
Averaging Time − − −2.87(25) −FFT Clock − − (3.69) −Pulling Shift − − 2.86(24) −Linear Coefficient Shift − − 0.16(40) −Nonlinear Shift − − 0.03(2) −
Systematic Shift 18.65(26.04) 22.11(49.22) 13.60(13.50) −9.13(22.71)
Rexp −Rtheo 13.02(27.12) −5.04(46.57) 7.99(18.57) 18.34(18.89)
Rexp,c −Rtheo −5.63(37.60) −27.15(67.76) −5.61(22.66) 27.47(29.54)
Table 3: Summary of systematic shifts and uncertainties for the sideband (SB) and peak (PK) campaigns. Thepeak measurement method suppresses the dominant systematic contribution of the SB method by a factor of νz/ν+.Table entries are in p.p.t. units.
uncertainties of the two applied methods, this dominant limitation is suppressed in the peak method by afactor of νz/ν+. Combining all the sideband measurement campaigns we obtain
Rp,H, SB = 1.001 089 218 764(15)stat(16)sys, (1)
the result of the peak ratio measurement is
Rp,H, PK = 1.001 089 218 748(19)stat(14)sys. (2)
Considering error correlation and calculating the weighted mean of the two different methods, we obtainthe final result
Rp,H, exp = 1.001 089 218 757(16), (3)
10
0 5 10 15 20 25
ICSB1C6
Resonator ShapeNonlinear Coefficient
FFT DistoronsB1 Dri
Trap AngleResonator Tuning
Voltage DriPulling Shi
AVG meLinear Coefficient
Spectrum ShiC4
RelaviscFFT Clock
B2Stascal Unvcertainty
0 5 10 15 20 25
ICSB1C6
Resonator ShapeNonlinear Coefficient
FFT DistoronsB1 Dri
Trap AngleResonator Tuning
Voltage DriPulling Shi
AVG meLinear Coefficient
Spectrum ShiC4
RelaviscFFT Clock
B2Stascal Unvcertainty
p.p.t.
peak method
sideband method
Figure 3: Top: summary of systematic uncertainties of the 2018-1-PK measurement campaign. Bottom: summaryof systematic uncertainties of the 2019-1-SB measurement campaign.
corresponding to an antiproton-to-proton charge-to-mass ratio of
Rp,p, exp = −1.000 000 000 003(16). (4)
The result has an experimental uncertainty of 16 p.p.t. (C.L. 0.68), supporting CPT invariance. It im-proves our previous measurement [6] by a factor of 4.3 and upon earlier results [28] by a factor of 5.6.This measurement constitutes the most precise test of CPT invariance with baryons, and is one of themost precise mass measurements ever performed [29].
3.5 Discussion of the Result
In an illustrative model, that can however not be trivially incorporated into relativistic quantum field the-ory [30], Hughes and Holzscheiter have shown [31] that if there was a scalar- or tensor-like gravitational
11
coupling to the energy of antimatter that violates the Weak Equivalence Principle (or more specificallythe universality of clocks, referred to as WEPc) [32], there will be, at the same height in a gravitationalfield, a frequency difference
νc,p − νc,pνc,avg
=3Φ
c2(αg − 1) (5)
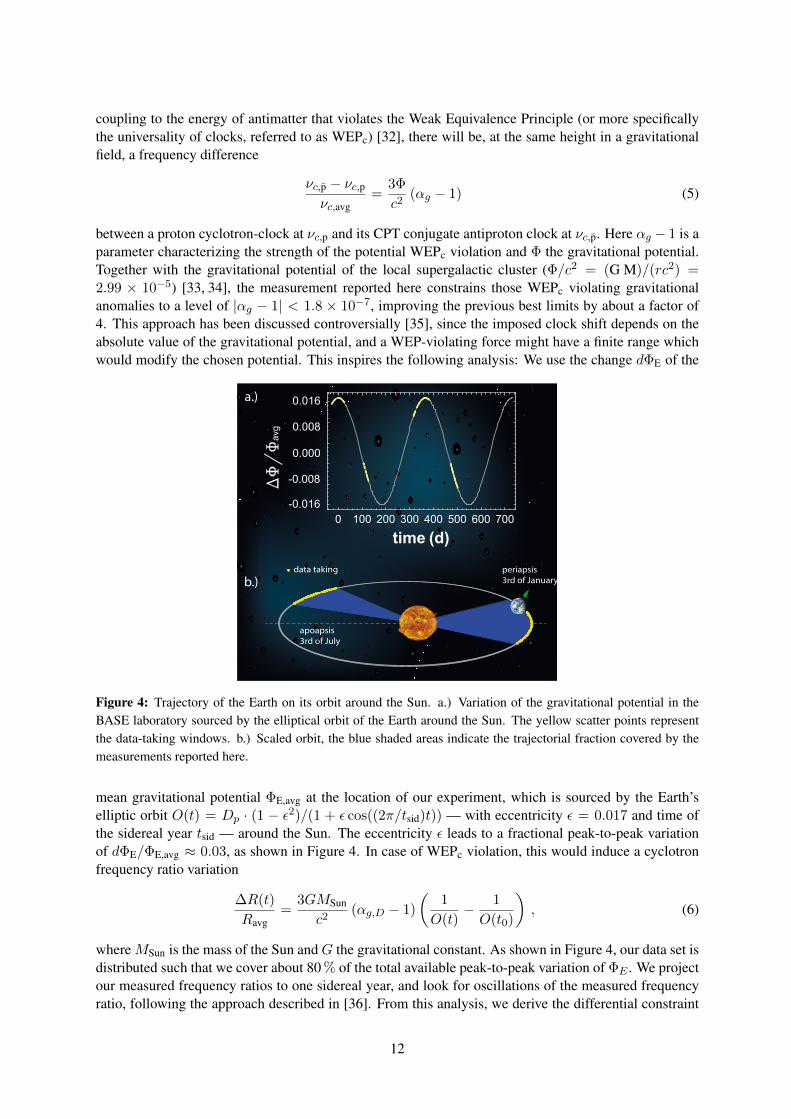
between a proton cyclotron-clock at νc,p and its CPT conjugate antiproton clock at νc,p. Here αg − 1 is aparameter characterizing the strength of the potential WEPc violation and Φ the gravitational potential.Together with the gravitational potential of the local supergalactic cluster (Φ/c2 = (G M)/(rc2) =2.99 × 10⁻⁵) [33, 34], the measurement reported here constrains those WEPc violating gravitationalanomalies to a level of |αg − 1| < 1.8 × 10⁻⁷, improving the previous best limits by about a factor of4. This approach has been discussed controversially [35], since the imposed clock shift depends on theabsolute value of the gravitational potential, and a WEP-violating force might have a finite range whichwould modify the chosen potential. This inspires the following analysis: We use the change dΦE of the
L
periapsis3rd of January
apoapsis3rd of July
a.)
b.)
0 100 200 300 400 500 600 700-0.016
0.016
time (d)
DF/F
avg
0.000
0.008
-0.008
data taking
Figure 4: Trajectory of the Earth on its orbit around the Sun. a.) Variation of the gravitational potential in theBASE laboratory sourced by the elliptical orbit of the Earth around the Sun. The yellow scatter points representthe data-taking windows. b.) Scaled orbit, the blue shaded areas indicate the trajectorial fraction covered by themeasurements reported here.
mean gravitational potential ΦE,avg at the location of our experiment, which is sourced by the Earth’selliptic orbit O(t) = Dp · (1 − ϵ2)/(1 + ϵ cos((2π/tsid)t)) — with eccentricity ϵ = 0.017 and time ofthe sidereal year tsid — around the Sun. The eccentricity ϵ leads to a fractional peak-to-peak variationof dΦE/ΦE,avg ≈ 0.03, as shown in Figure 4. In case of WEPc violation, this would induce a cyclotronfrequency ratio variation
∆R(t)
Ravg=
3GMSun
c2(αg,D − 1)
(1
O(t)− 1
O(t0)
), (6)
where MSun is the mass of the Sun and G the gravitational constant. As shown in Figure 4, our data set isdistributed such that we cover about 80% of the total available peak-to-peak variation of ΦE . We projectour measured frequency ratios to one sidereal year, and look for oscillations of the measured frequencyratio, following the approach described in [36]. From this analysis, we derive the differential constraint
12
|αg,D − 1| < 0.030 (C.L. 0.68), setting limits similar to the initial goals of model-independent experi-ments testing the Weak Equivalence Principle (or more specifically the universality of free-fall, referredto as WEPff) by dropping antihydrogen in the gravitational field of the earth [37–39].
3.6 Coefficients of the Standard Model Extension
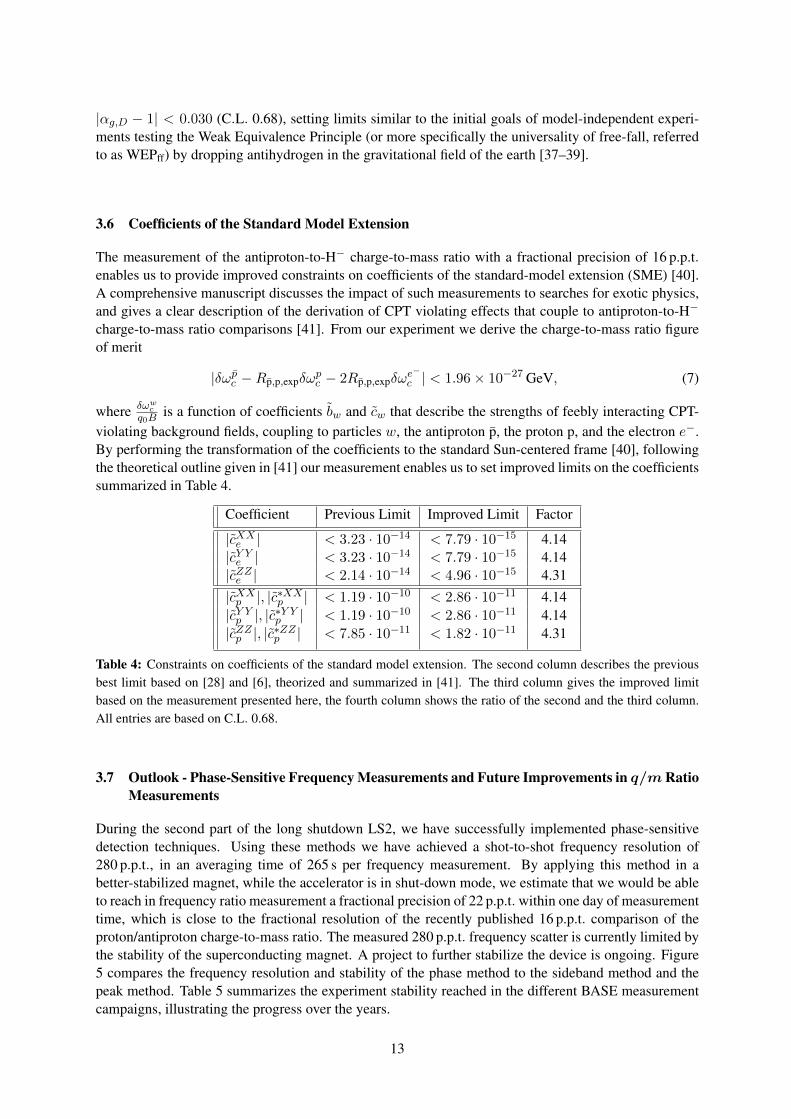
The measurement of the antiproton-to-H− charge-to-mass ratio with a fractional precision of 16 p.p.t.enables us to provide improved constraints on coefficients of the standard-model extension (SME) [40].A comprehensive manuscript discusses the impact of such measurements to searches for exotic physics,and gives a clear description of the derivation of CPT violating effects that couple to antiproton-to-H−
charge-to-mass ratio comparisons [41]. From our experiment we derive the charge-to-mass ratio figureof merit
|δωpc −Rp,p,expδω
pc − 2Rp,p,expδω
e−c | < 1.96× 10⁻²⁷ GeV, (7)
where δωwc
q0Bis a function of coefficients bw and cw that describe the strengths of feebly interacting CPT-
violating background fields, coupling to particles w, the antiproton p, the proton p, and the electron e−.By performing the transformation of the coefficients to the standard Sun-centered frame [40], followingthe theoretical outline given in [41] our measurement enables us to set improved limits on the coefficientssummarized in Table 4.
Coefficient Previous Limit Improved Limit Factor
|cXXe | < 3.23 · 10−14 < 7.79 · 10−15 4.14
|cY Ye | < 3.23 · 10−14 < 7.79 · 10−15 4.14
|cZZe | < 2.14 · 10−14 < 4.96 · 10−15 4.31
|cXXp |, |c∗XX
p | < 1.19 · 10−10 < 2.86 · 10−11 4.14|cY Yp |, |c∗Y Y
p | < 1.19 · 10−10 < 2.86 · 10−11 4.14|cZZp |, |c∗ZZ
p | < 7.85 · 10−11 < 1.82 · 10−11 4.31
Table 4: Constraints on coefficients of the standard model extension. The second column describes the previousbest limit based on [28] and [6], theorized and summarized in [41]. The third column gives the improved limitbased on the measurement presented here, the fourth column shows the ratio of the second and the third column.All entries are based on C.L. 0.68.
3.7 Outlook - Phase-Sensitive Frequency Measurements and Future Improvements in q/m RatioMeasurements
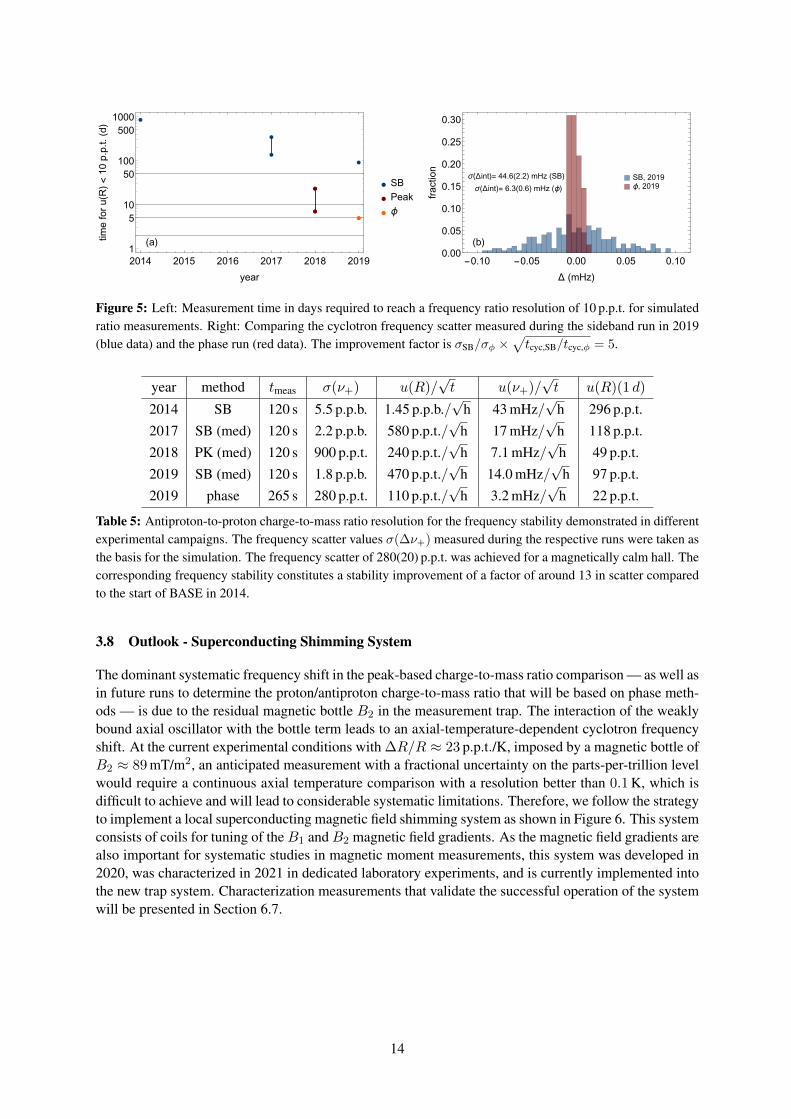
During the second part of the long shutdown LS2, we have successfully implemented phase-sensitivedetection techniques. Using these methods we have achieved a shot-to-shot frequency resolution of280 p.p.t., in an averaging time of 265 s per frequency measurement. By applying this method in abetter-stabilized magnet, while the accelerator is in shut-down mode, we estimate that we would be ableto reach in frequency ratio measurement a fractional precision of 22 p.p.t. within one day of measurementtime, which is close to the fractional resolution of the recently published 16 p.p.t. comparison of theproton/antiproton charge-to-mass ratio. The measured 280 p.p.t. frequency scatter is currently limited bythe stability of the superconducting magnet. A project to further stabilize the device is ongoing. Figure5 compares the frequency resolution and stability of the phase method to the sideband method and thepeak method. Table 5 summarizes the experiment stability reached in the different BASE measurementcampaigns, illustrating the progress over the years.
13
2014 2015 2016 2017 2018 20191
510
50100
5001000
year
timeforu(R)<10p.p.t.(d)
(a)
SB
Peak
ϕ
SB, 2019ϕ, 2019
-0.10 -0.05 0.00 0.05 0.100.00
0.05
0.10
0.15
0.20
0.25
0.30
Δ (mHz)
fraction
(b)
σ(Δint)= 44.6(2.2) mHz (SB)
σ(Δint)= 6.3(0.6) mHz (ϕ)
Figure 5: Left: Measurement time in days required to reach a frequency ratio resolution of 10 p.p.t. for simulatedratio measurements. Right: Comparing the cyclotron frequency scatter measured during the sideband run in 2019(blue data) and the phase run (red data). The improvement factor is σSB/σϕ ×
√tcyc,SB/tcyc,ϕ = 5.
year method tmeas σ(ν+) u(R)/√t u(ν+)/
√t u(R)(1 d)
2014 SB 120 s 5.5 p.p.b. 1.45 p.p.b./√
h 43 mHz/√
h 296 p.p.t.2017 SB (med) 120 s 2.2 p.p.b. 580 p.p.t./
√h 17 mHz/
√h 118 p.p.t.
2018 PK (med) 120 s 900 p.p.t. 240 p.p.t./√
h 7.1 mHz/√
h 49 p.p.t.2019 SB (med) 120 s 1.8 p.p.b. 470 p.p.t./
√h 14.0 mHz/
√h 97 p.p.t.
2019 phase 265 s 280 p.p.t. 110 p.p.t./√
h 3.2 mHz/√
h 22 p.p.t.
Table 5: Antiproton-to-proton charge-to-mass ratio resolution for the frequency stability demonstrated in differentexperimental campaigns. The frequency scatter values σ(∆ν+) measured during the respective runs were taken asthe basis for the simulation. The frequency scatter of 280(20) p.p.t. was achieved for a magnetically calm hall. Thecorresponding frequency stability constitutes a stability improvement of a factor of around 13 in scatter comparedto the start of BASE in 2014.
3.8 Outlook - Superconducting Shimming System
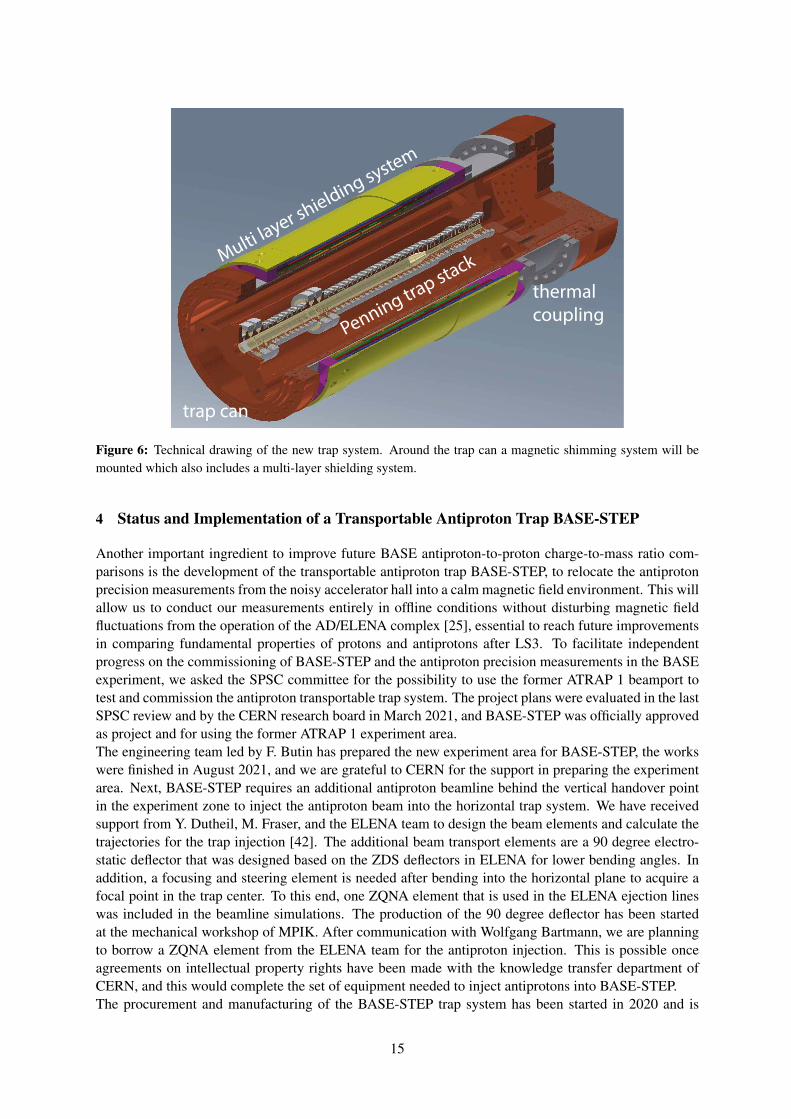
The dominant systematic frequency shift in the peak-based charge-to-mass ratio comparison — as well asin future runs to determine the proton/antiproton charge-to-mass ratio that will be based on phase meth-ods — is due to the residual magnetic bottle B2 in the measurement trap. The interaction of the weaklybound axial oscillator with the bottle term leads to an axial-temperature-dependent cyclotron frequencyshift. At the current experimental conditions with ∆R/R ≈ 23 p.p.t./K, imposed by a magnetic bottle ofB2 ≈ 89mT/m2, an anticipated measurement with a fractional uncertainty on the parts-per-trillion levelwould require a continuous axial temperature comparison with a resolution better than 0.1K, which isdifficult to achieve and will lead to considerable systematic limitations. Therefore, we follow the strategyto implement a local superconducting magnetic field shimming system as shown in Figure 6. This systemconsists of coils for tuning of the B1 and B2 magnetic field gradients. As the magnetic field gradients arealso important for systematic studies in magnetic moment measurements, this system was developed in2020, was characterized in 2021 in dedicated laboratory experiments, and is currently implemented intothe new trap system. Characterization measurements that validate the successful operation of the systemwill be presented in Section 6.7.
14
trap can
Penning trap stackMulti la
yer shielding system
thermal coupling
Figure 6: Technical drawing of the new trap system. Around the trap can a magnetic shimming system will bemounted which also includes a multi-layer shielding system.
4 Status and Implementation of a Transportable Antiproton Trap BASE-STEP
Another important ingredient to improve future BASE antiproton-to-proton charge-to-mass ratio com-parisons is the development of the transportable antiproton trap BASE-STEP, to relocate the antiprotonprecision measurements from the noisy accelerator hall into a calm magnetic field environment. This willallow us to conduct our measurements entirely in offline conditions without disturbing magnetic fieldfluctuations from the operation of the AD/ELENA complex [25], essential to reach future improvementsin comparing fundamental properties of protons and antiprotons after LS3. To facilitate independentprogress on the commissioning of BASE-STEP and the antiproton precision measurements in the BASEexperiment, we asked the SPSC committee for the possibility to use the former ATRAP 1 beamport totest and commission the antiproton transportable trap system. The project plans were evaluated in the lastSPSC review and by the CERN research board in March 2021, and BASE-STEP was officially approvedas project and for using the former ATRAP 1 experiment area.The engineering team led by F. Butin has prepared the new experiment area for BASE-STEP, the workswere finished in August 2021, and we are grateful to CERN for the support in preparing the experimentarea. Next, BASE-STEP requires an additional antiproton beamline behind the vertical handover pointin the experiment zone to inject the antiproton beam into the horizontal trap system. We have receivedsupport from Y. Dutheil, M. Fraser, and the ELENA team to design the beam elements and calculate thetrajectories for the trap injection [42]. The additional beam transport elements are a 90 degree electro-static deflector that was designed based on the ZDS deflectors in ELENA for lower bending angles. Inaddition, a focusing and steering element is needed after bending into the horizontal plane to acquire afocal point in the trap center. To this end, one ZQNA element that is used in the ELENA ejection lineswas included in the beamline simulations. The production of the 90 degree deflector has been startedat the mechanical workshop of MPIK. After communication with Wolfgang Bartmann, we are planningto borrow a ZQNA element from the ELENA team for the antiproton injection. This is possible onceagreements on intellectual property rights have been made with the knowledge transfer department ofCERN, and this would complete the set of equipment needed to inject antiprotons into BASE-STEP.The procurement and manufacturing of the BASE-STEP trap system has been started in 2020 and is
15
close to being completed. The contract for the transportable superconducting magnet for BASE-STEPwas signed in September 2020, and the magnet delivery is presently expected for May 2022. Accordingto the progress report from the supplier, all hardware for the magnet is available except for the vacuumvessel and the liquid helium tank that are delayed by third-party suppliers which require up to 20 weeksof working time for such projects under the present circumstances. The experiment equipment for theBASE-STEP trap system is prepared at the University of Mainz with additional support from the MaxPlanck Institute for Nuclear Physics. The design of the cryogenic trap system was revised during last yearand new valves were designed to reduce the residual gas flow into the antiproton storage traps and avoidthe direct exposure of the antiprotons to residual gas from the injection/ejection channel. These includenow commercial cryogenic piezomotor-driven rotation stages to operate the rotating electrodes. The trapsystem has been assembled and the wiring is almost completed. The hardware is complete except for afew components, such as a position readout for the rotating electrodes and an optimised field-emissiontip for electron loading. The trap system will be equipped with four image-current detection systems, twoaxial detectors and two cyclotron detectors, one of each for the two traps. These four detection systemswere constructed, tested and characterized in 2021 and are ready for operation.The objectives set for 2022 are to start up the BASE-STEP trap system in the experiment area at CERNand demonstrate the transport of charged particles, ideally with antiprotons. We expect to start the in-stallation work of experiment equipment in the BASE-STEP area as soon as travelling to CERN will notinvolve quarantine measures for the BASE-STEP team. With the magnet delivery scheduled for May2022, we anticipate that we need to work two months with the magnet as preparation time before thetrap system can potentially be ready for antiproton operation. In addition, we will need to install andpump the beam transport elements between the handover point and the trap system in this time window.Therefore, we expect that we can start to participate in the upcoming antiproton physics run from August2022 , at the earliest .
5 BASE-CDM
5.1 Developments for BASE-CDM during 2021 - Tuneable Detector
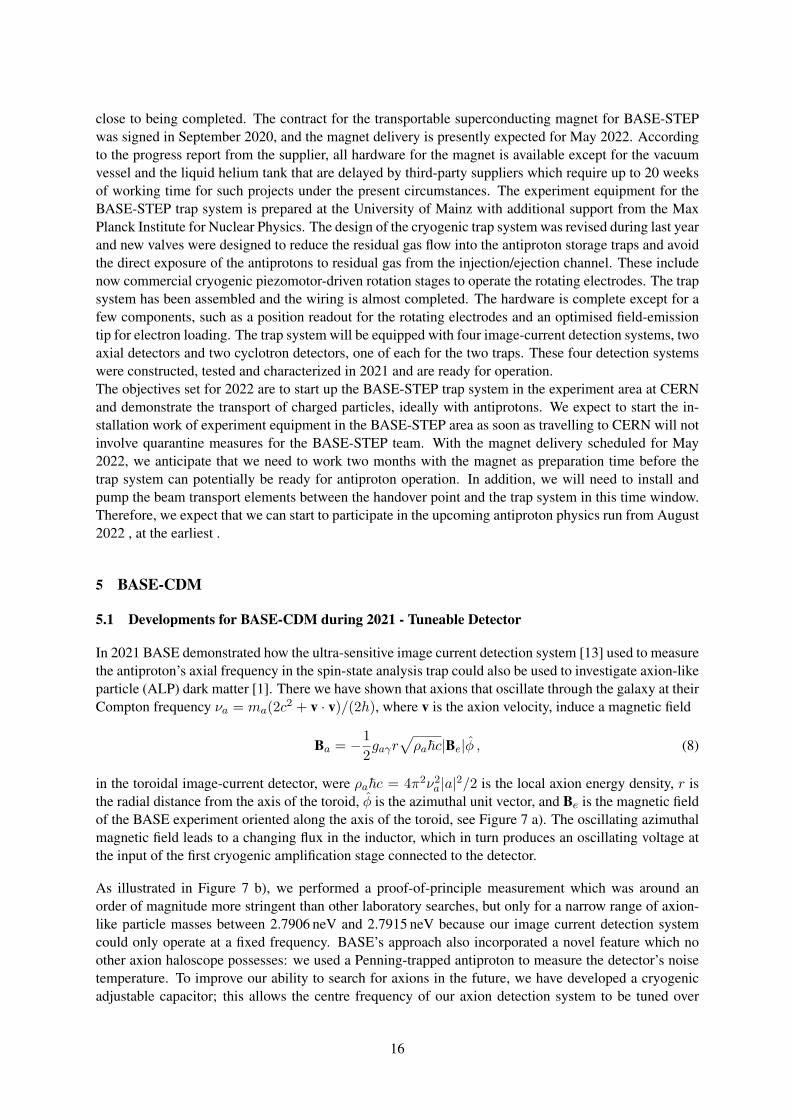
In 2021 BASE demonstrated how the ultra-sensitive image current detection system [13] used to measurethe antiproton’s axial frequency in the spin-state analysis trap could also be used to investigate axion-likeparticle (ALP) dark matter [1]. There we have shown that axions that oscillate through the galaxy at theirCompton frequency νa = ma(2c
2 + v · v)/(2h), where v is the axion velocity, induce a magnetic field
Ba = −1
2gaγr
√ρaℏc|Be|ϕ , (8)
in the toroidal image-current detector, were ρaℏc = 4π2ν2a |a|2/2 is the local axion energy density, r isthe radial distance from the axis of the toroid, ϕ is the azimuthal unit vector, and Be is the magnetic fieldof the BASE experiment oriented along the axis of the toroid, see Figure 7 a). The oscillating azimuthalmagnetic field leads to a changing flux in the inductor, which in turn produces an oscillating voltage atthe input of the first cryogenic amplification stage connected to the detector.
As illustrated in Figure 7 b), we performed a proof-of-principle measurement which was around anorder of magnitude more stringent than other laboratory searches, but only for a narrow range of axion-like particle masses between 2.7906 neV and 2.7915 neV because our image current detection systemcould only operate at a fixed frequency. BASE’s approach also incorporated a novel feature which noother axion haloscope possesses: we used a Penning-trapped antiproton to measure the detector’s noisetemperature. To improve our ability to search for axions in the future, we have developed a cryogenicadjustable capacitor; this allows the centre frequency of our axion detection system to be tuned over
16
10-11 10-9 10-7 10-5 10-3 10-1 10 103 105 107 109
10-4
10-6
10-8
10-10
10-12
10-14
10-16
10-18
g ag
(GeV
-1)
ma(eV)
Laboratory
Helioscopes (CAST)
Sun
HB
EBL
CMB
BBN
SN
SN
Dump
g
X
IONTAD
MX
a.) b.)
Figure 7: a.) An illustration of the main elements of the cryogenic detection system together with the externalmagnetic field Be and the azimuthal ALP magnetic field Ba. The NbTi end cap is not shown for clarity. b.)95% confidence exclusion region for the axion-photon interaction parameter as a function of the axion mass.The parameter space excluded by our analysis is shown in red, in blue the parameter space excluded by otherexperiments. The green region indicates the parameter space that will become accessible with the new BASE-CDM experiment dedicated to the search for axions.
one complete octave without loss of sensitivity. We constructed a small test device and validated itsperformance. We are also developing larger resonators which will increase our sensitivity to ALPs.
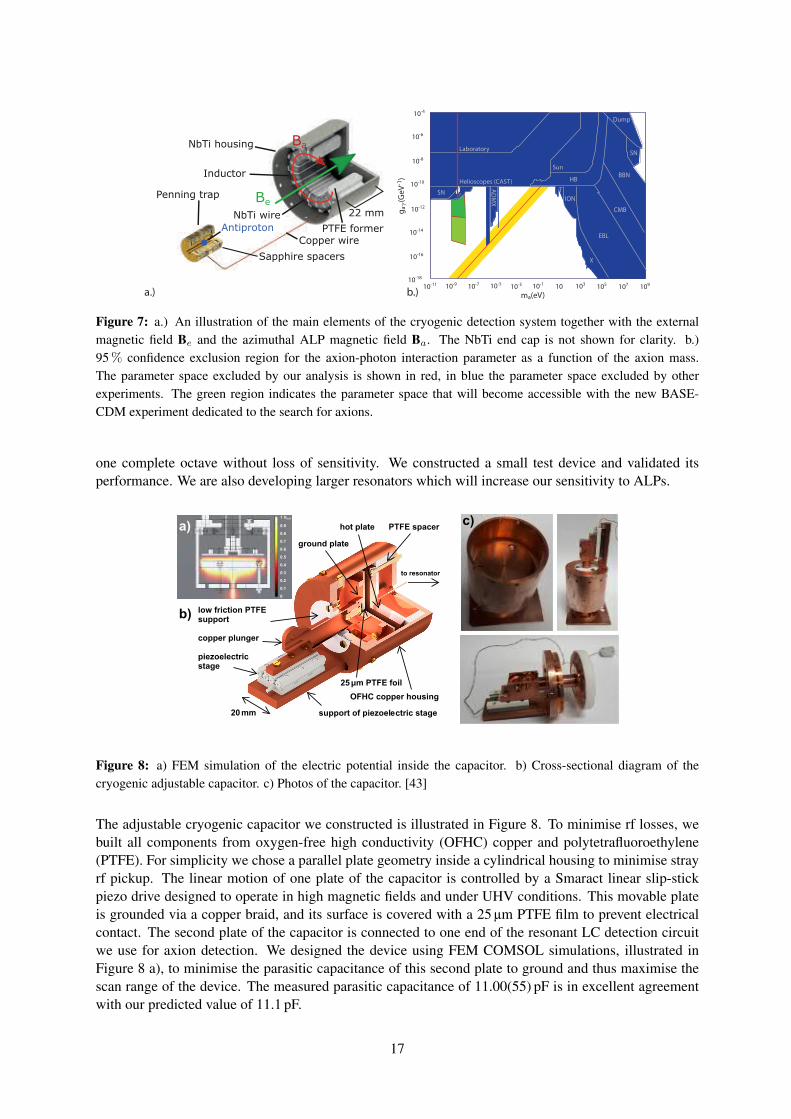
Figure 8: a) FEM simulation of the electric potential inside the capacitor. b) Cross-sectional diagram of thecryogenic adjustable capacitor. c) Photos of the capacitor. [43]
The adjustable cryogenic capacitor we constructed is illustrated in Figure 8. To minimise rf losses, webuilt all components from oxygen-free high conductivity (OFHC) copper and polytetrafluoroethylene(PTFE). For simplicity we chose a parallel plate geometry inside a cylindrical housing to minimise strayrf pickup. The linear motion of one plate of the capacitor is controlled by a Smaract linear slip-stickpiezo drive designed to operate in high magnetic fields and under UHV conditions. This movable plateis grounded via a copper braid, and its surface is covered with a 25 µm PTFE film to prevent electricalcontact. The second plate of the capacitor is connected to one end of the resonant LC detection circuitwe use for axion detection. We designed the device using FEM COMSOL simulations, illustrated inFigure 8 a), to minimise the parasitic capacitance of this second plate to ground and thus maximise thescan range of the device. The measured parasitic capacitance of 11.00(55) pF is in excellent agreementwith our predicted value of 11.1 pF.
17
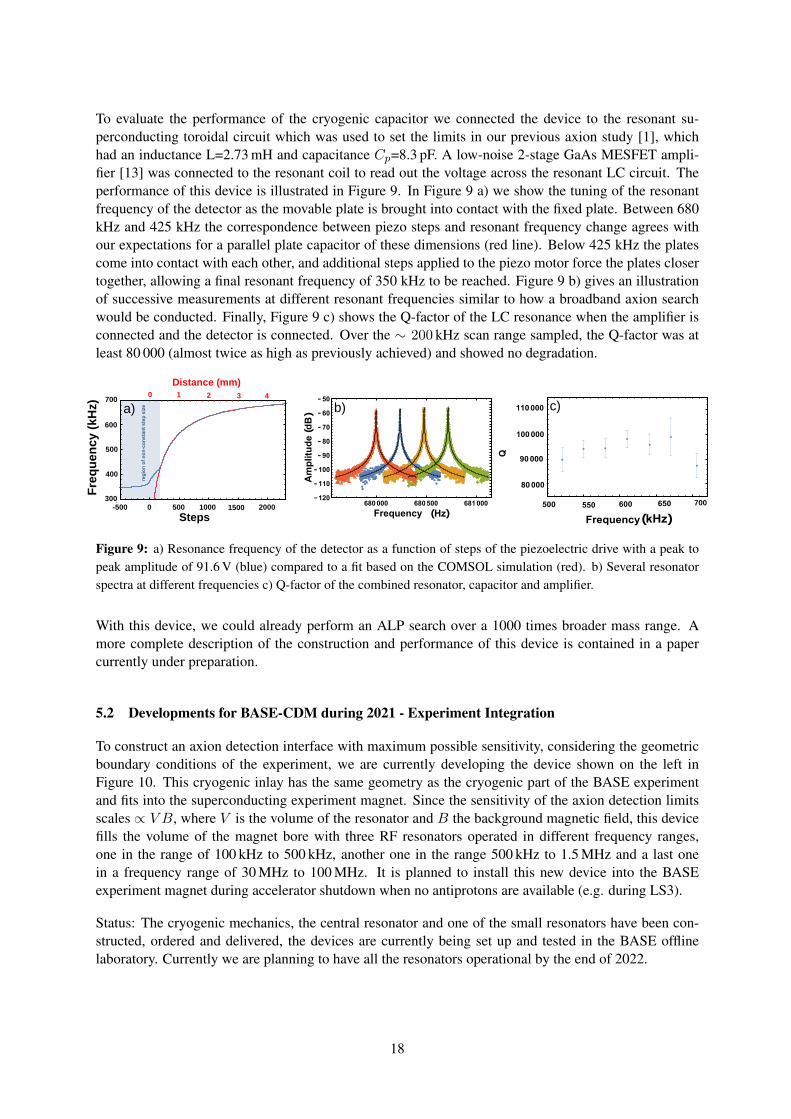
To evaluate the performance of the cryogenic capacitor we connected the device to the resonant su-perconducting toroidal circuit which was used to set the limits in our previous axion study [1], whichhad an inductance L=2.73 mH and capacitance Cp=8.3 pF. A low-noise 2-stage GaAs MESFET ampli-fier [13] was connected to the resonant coil to read out the voltage across the resonant LC circuit. Theperformance of this device is illustrated in Figure 9. In Figure 9 a) we show the tuning of the resonantfrequency of the detector as the movable plate is brought into contact with the fixed plate. Between 680kHz and 425 kHz the correspondence between piezo steps and resonant frequency change agrees withour expectations for a parallel plate capacitor of these dimensions (red line). Below 425 kHz the platescome into contact with each other, and additional steps applied to the piezo motor force the plates closertogether, allowing a final resonant frequency of 350 kHz to be reached. Figure 9 b) gives an illustrationof successive measurements at different resonant frequencies similar to how a broadband axion searchwould be conducted. Finally, Figure 9 c) shows the Q-factor of the LC resonance when the amplifier isconnected and the detector is connected. Over the ∼ 200 kHz scan range sampled, the Q-factor was atleast 80 000 (almost twice as high as previously achieved) and showed no degradation.
-
-
reg
ion
of
no
n-c
on
stan
t st
ep s
ize
500 550 600 650
80 000
90 000
100 000
110 000
Frequency(kHz)
Q680 000 680 500 681 000
- 120
- 110
- 100
- 90
- 80
- 70
- 60
- 50
Frequency (Hz)
Am
plit
ud
e(d
B)
700
600
500
400
300
Freq
uenc
y (k
Hz)
700-500 0 500 1000 1500 2000
0 1 2 3 4Distance (mm)
a) b) c)
Steps
Figure 9: a) Resonance frequency of the detector as a function of steps of the piezoelectric drive with a peak topeak amplitude of 91.6 V (blue) compared to a fit based on the COMSOL simulation (red). b) Several resonatorspectra at different frequencies c) Q-factor of the combined resonator, capacitor and amplifier.
With this device, we could already perform an ALP search over a 1000 times broader mass range. Amore complete description of the construction and performance of this device is contained in a papercurrently under preparation.
5.2 Developments for BASE-CDM during 2021 - Experiment Integration
To construct an axion detection interface with maximum possible sensitivity, considering the geometricboundary conditions of the experiment, we are currently developing the device shown on the left inFigure 10. This cryogenic inlay has the same geometry as the cryogenic part of the BASE experimentand fits into the superconducting experiment magnet. Since the sensitivity of the axion detection limitsscales ∝ V B, where V is the volume of the resonator and B the background magnetic field, this devicefills the volume of the magnet bore with three RF resonators operated in different frequency ranges,one in the range of 100 kHz to 500 kHz, another one in the range 500 kHz to 1.5 MHz and a last onein a frequency range of 30 MHz to 100 MHz. It is planned to install this new device into the BASEexperiment magnet during accelerator shutdown when no antiprotons are available (e.g. during LS3).
Status: The cryogenic mechanics, the central resonator and one of the small resonators have been con-structed, ordered and delivered, the devices are currently being set up and tested in the BASE offlinelaboratory. Currently we are planning to have all the resonators operational by the end of 2022.
18
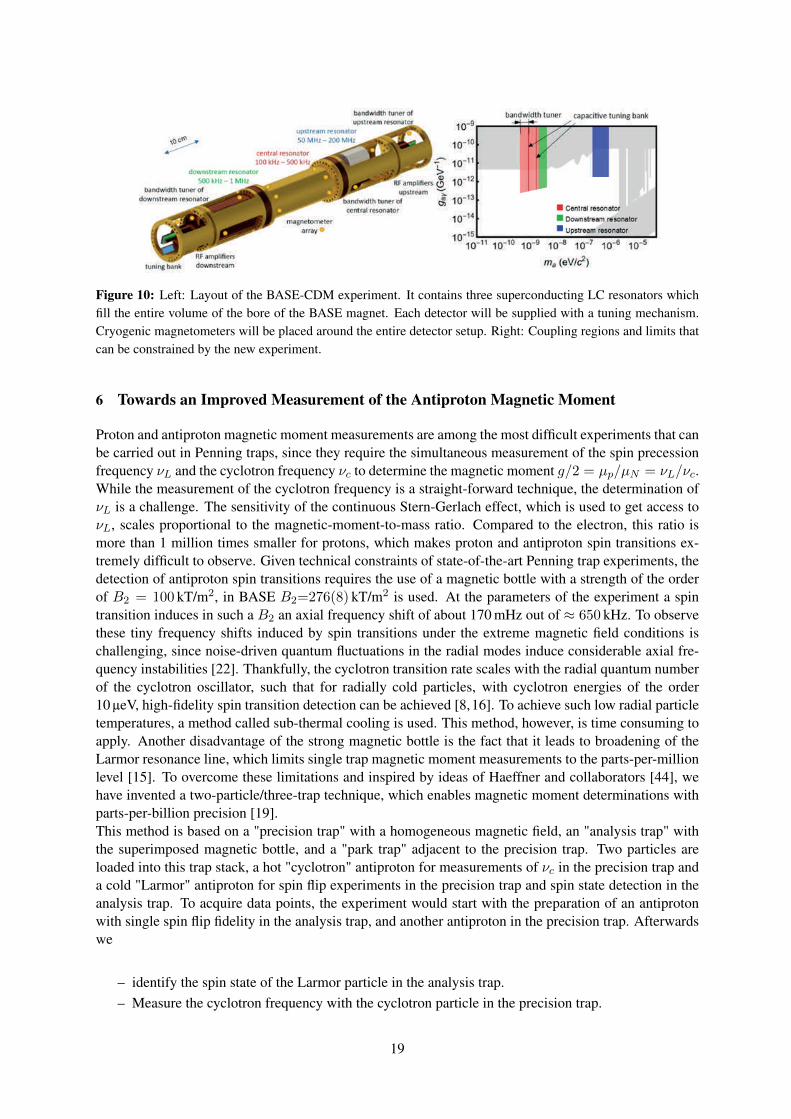
Figure 10: Left: Layout of the BASE-CDM experiment. It contains three superconducting LC resonators whichfill the entire volume of the bore of the BASE magnet. Each detector will be supplied with a tuning mechanism.Cryogenic magnetometers will be placed around the entire detector setup. Right: Coupling regions and limits thatcan be constrained by the new experiment.
6 Towards an Improved Measurement of the Antiproton Magnetic Moment
Proton and antiproton magnetic moment measurements are among the most difficult experiments that canbe carried out in Penning traps, since they require the simultaneous measurement of the spin precessionfrequency νL and the cyclotron frequency νc to determine the magnetic moment g/2 = µp/µN = νL/νc.While the measurement of the cyclotron frequency is a straight-forward technique, the determination ofνL is a challenge. The sensitivity of the continuous Stern-Gerlach effect, which is used to get access toνL, scales proportional to the magnetic-moment-to-mass ratio. Compared to the electron, this ratio ismore than 1 million times smaller for protons, which makes proton and antiproton spin transitions ex-tremely difficult to observe. Given technical constraints of state-of-the-art Penning trap experiments, thedetection of antiproton spin transitions requires the use of a magnetic bottle with a strength of the orderof B2 = 100 kT/m2, in BASE B2=276(8) kT/m2 is used. At the parameters of the experiment a spintransition induces in such a B2 an axial frequency shift of about 170 mHz out of ≈ 650 kHz. To observethese tiny frequency shifts induced by spin transitions under the extreme magnetic field conditions ischallenging, since noise-driven quantum fluctuations in the radial modes induce considerable axial fre-quency instabilities [22]. Thankfully, the cyclotron transition rate scales with the radial quantum numberof the cyclotron oscillator, such that for radially cold particles, with cyclotron energies of the order10 µeV, high-fidelity spin transition detection can be achieved [8,16]. To achieve such low radial particletemperatures, a method called sub-thermal cooling is used. This method, however, is time consuming toapply. Another disadvantage of the strong magnetic bottle is the fact that it leads to broadening of theLarmor resonance line, which limits single trap magnetic moment measurements to the parts-per-millionlevel [15]. To overcome these limitations and inspired by ideas of Haeffner and collaborators [44], wehave invented a two-particle/three-trap technique, which enables magnetic moment determinations withparts-per-billion precision [19].This method is based on a "precision trap" with a homogeneous magnetic field, an "analysis trap" withthe superimposed magnetic bottle, and a "park trap" adjacent to the precision trap. Two particles areloaded into this trap stack, a hot "cyclotron" antiproton for measurements of νc in the precision trap anda cold "Larmor" antiproton for spin flip experiments in the precision trap and spin state detection in theanalysis trap. To acquire data points, the experiment would start with the preparation of an antiprotonwith single spin flip fidelity in the analysis trap, and another antiproton in the precision trap. Afterwardswe
– identify the spin state of the Larmor particle in the analysis trap.– Measure the cyclotron frequency with the cyclotron particle in the precision trap.
19
-0.003 0.000 0.003 0.006 0.009 0.012-0.1
0.0
0.1
0.2
0.3
0.4
0.5
0.6
spin
ip
pro
babi
lity
νL/νc
-0.002 0.000 0.002 0.004 0.006 0.008 0.010 0.012-0.1
0.0
0.1
0.2
0.3
0.4
0.5
0.6
spin
ip
pro
babi
lity
νL/νc
a.)
b.) c.)
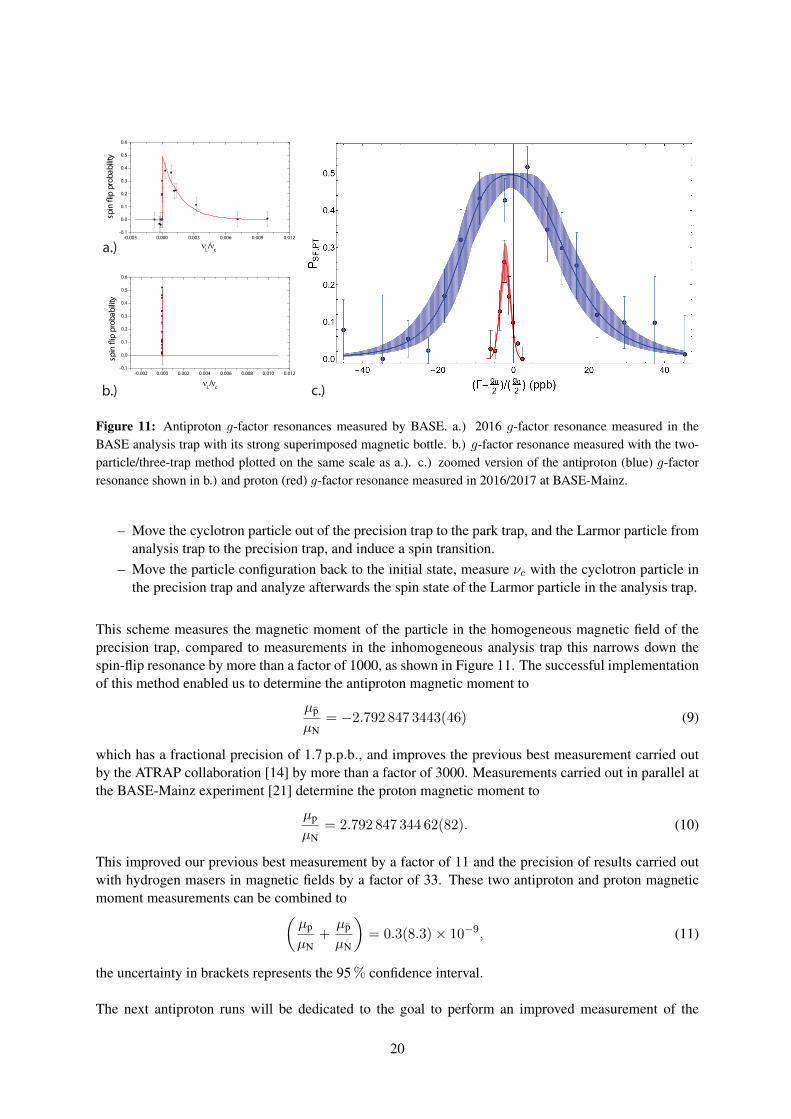
Figure 11: Antiproton g-factor resonances measured by BASE. a.) 2016 g-factor resonance measured in theBASE analysis trap with its strong superimposed magnetic bottle. b.) g-factor resonance measured with the two-particle/three-trap method plotted on the same scale as a.). c.) zoomed version of the antiproton (blue) g-factorresonance shown in b.) and proton (red) g-factor resonance measured in 2016/2017 at BASE-Mainz.
– Move the cyclotron particle out of the precision trap to the park trap, and the Larmor particle fromanalysis trap to the precision trap, and induce a spin transition.
– Move the particle configuration back to the initial state, measure νc with the cyclotron particle inthe precision trap and analyze afterwards the spin state of the Larmor particle in the analysis trap.
This scheme measures the magnetic moment of the particle in the homogeneous magnetic field of theprecision trap, compared to measurements in the inhomogeneous analysis trap this narrows down thespin-flip resonance by more than a factor of 1000, as shown in Figure 11. The successful implementationof this method enabled us to determine the antiproton magnetic moment to
µp
µN= −2.792 847 3443(46) (9)
which has a fractional precision of 1.7 p.p.b., and improves the previous best measurement carried outby the ATRAP collaboration [14] by more than a factor of 3000. Measurements carried out in parallel atthe BASE-Mainz experiment [21] determine the proton magnetic moment to
µp
µN= 2.792 847 344 62(82). (10)
This improved our previous best measurement by a factor of 11 and the precision of results carried outwith hydrogen masers in magnetic fields by a factor of 33. These two antiproton and proton magneticmoment measurements can be combined to(
µp
µN+
µp
µN
)= 0.3(8.3)× 10−9, (11)
the uncertainty in brackets represents the 95% confidence interval.
The next antiproton runs will be dedicated to the goal to perform an improved measurement of the
20
antiproton magnetic moment, compared to [19] with at least 5-fold improved fractional precision. Thenew experiment includes
– new detection systems for cyclotron frequency measurements,– new filter electronics to further suppress heating rates in the analysis trap,– the superconducting coil system already mentioned above,– a cooling trap for efficient sub-thermal cooling cycles to prepare antiprotons with high spin state
detection fidelity.
In addition CERN has upgraded the AD antiproton physics program from the previously used antiprotondecelerator, which provided antiprotons at an energy of 5.3MeV, to the ELENA synchrotron, whichdelivers antiprotons at 100 keV. This required a considerable experiment upgrade to replace thepreviously used 25 µm stainless steel degrader foil to a degrader with a thickness matched to the100 keV ELENA antiproton energies, while maintaining the challenging vacuum requirements ofBASE. In addition to these major upgrades, the superconducting detection systems for all four traps,reservoir trap, precision trap, analysis trap and cooling trap were upgraded and improved.
6.1 Revised Electronics Setup
Penning trap measurements rely on measurements of the motional frequencies that are defined not onlyby the strong, homogeneous magnetic field, but likewise by the DC voltages which are applied to thecylindrical trap electrodes. As a direct consequence, highly stable trap conditions with highly stablemotional frequencies and low heating rates require sufficiently stable voltage sources and heavy filteringto suppress residual voltage noise. We employ commercial power supplies with sub-p.p.m. stability onthe time scale of a day in combination with up to four RC-filter stages for each trap electrode for thispurpose. Endcap and transport electrodes are switched to ground potential during precision measure-ments. RF lines for particle excitation are shielded and connected to their electrodes through capacitiveattenuators. For the 2021 run we redesigned most parts of the electronics setup at both cryogenic androom temperature stages.
6.1.1 DC biasing
The DC bias voltages are provided by commercial power supplies (Stahl Electronics – UM-1-14) andfiltered at room temperature, 77K, and twice at 4K. Based on experiences from our earlier runs, thisfiltering concept has been completely revised, refined, and rebuilt. All filters use two parallel resistorsof 1MΩ combined with a 10 nF capacitor yielding a cutoff frequency of about 30Hz. This is suffi-ciently high to allow for adiabatic particle transport with slow voltage ramps on the 100ms time scale.An exemption is made for the two high-voltage lines which are directly connected to two capture elec-trodes and allow for fast switching and thereby the capture of antiprotons from the ELENA beamline.However, these capture electrodes are sufficiently far away from the relevant Penning traps for precisionmeasurements.
6.1.2 RF lines
The wiring concept has to deal with two different RF lines: excitation lines to manipulate the motionalamplitudes of the trapped particles and signal lines which connect image-current pick-up electrodes to
21
particle detectors, namely cyclotron detectors which operate at about 30MHz and axial detectors operat-ing between 600 and 800 kHz. These signal lines are bare 1mm OFHC copper wires without any coaxialshield to avoid any additional parasitic capacitance. The cyclotron detectors are operated inside the trapcan to keep the signal lines as short as possible and to avoid the usage of vacuum feedthroughs, whichagain would affect the detection performance significantly owing to their compromising RF properties.The axial detectors are placed outside the trap can, inside a dedicated electronics segment and connectedto their respective pick-up electrodes via special Sapphire isolated feedthroughs which have better RFproperties than the PTFE isolated feedthroughs used in pure bias lines. The excitation lines, by contrast,are coaxial lines with capacitive attenuators and high impedance RF-blocks on the 4K stage that protectthe DC voltage sources.Additionally, we implemented cryogenic filters for all excitation lines related to the analysis trap, asany noise can potentially disturb the spin flip measurement. Two of them are also switched to physicalground using cryogenic switches.
LegendR: reservoir trapP: precision trap
C: cooling trapA: analysis trap
T: transport electrodeHV: high voltageG: electron gunSF: spin ip
4K Bulkhead
View from 77K to 4K
RTEA
RTER
PTER
CTE
PTEA
ATEA
1
3
2
4
5
6
RF lines1: RTEA - R012: RTER - R023: PTEA - P01
4: PTER - P025: CTER - C056: ATEA - A02
4K Trap Stack
Upstream
Downstream
Elec
tron
Gun
Cool
ing
Trap
Tran
spor
t An
alys
is Tr
apPr
ecisi
on Tr
apRe
serv
oir T
rap
HV
TH
VT
TT
G01 (e-gun
G02 (e-gun HV)
G03
C06
C05C04C03C02C01
A06A07
A05
A04
A03A02A01
T10
T11
T09
T08
T07
T06
T05
P04
P05
P03
P02
P01
T04
T03
HVS (static)
T02
HVP (pulse)
T01 (target)
R04
R06
R03
R02
R01Ez
ER
Ez
ER
Ez
νz
νz
ν+
ν+
νz
νz
Ez
ER
R05
PTSF
ATSF
AT ER
G04 (repeller)G
cathode)
4K Pin Base
StandardSapphireBroken
A06G01
G02
C05
C04
C03C02
C01
CTDC
CV
CDCG
A07
A05
A04
A03
A02
A01
T11 T10
T09
T08 T07
T06T05T04
T03 T02 T01
P05
P04P03
P02
P01
PDPV
PG
PTDC
HVS
HVP
R06
R05
R04
R03
R02
R01
PTSF
ATSF
ATER
View into trapcan
G04
4K Electronics Segment
out
B2 - CT and RT
inR04
R03R02
C01C02
C03C04
C05
x x
xx
B3 - AT and Transport
in
out
A03A04
A05A01
A02A06
A07T09
T10T11
B4 - PT and Transport
in
out
P04P03
P02T04
P01P05
T05T06
T07T08
Connectorlabel
G1G2
GSFD
DSF
ConnectorAmplier
Convention
Axial
VARG
D
ConnectorAmplier
Convention
Cyclotron
T03R06
R05R01
T02
B1 - RT, e-gun repeller and Transport
in
out
G04
300K UM BoardTop view
UM26UM11
UM25 UM12
ASACUSA
ELENA
DSUS
A05A04
A03
A07A06
A02A01
1 2 3 4
C' B' A'
5 6 7 8
C B A
9 10 1 2 3 4 5 6 7 8 9 10
C' B' A' C B A
T04P01
P05T11
T10T09
T08T07
T06T05
P04P03
P02
C01C02
C03C04
C05
12345678910
C'B'A'CBA
R02R03
R04
T03T02 R05R06R01
128910
C'B'A'CBA
37 6 5 4
VARG
D
ConnectorAmplier
Convention
Cyclotron
G1G2
GSFD
DSF
ConnectorAmplier
Convention
Axial
300K Amplier Biasing, Signal Pickup and SSCsView inside the box
looking atthe ange
PTDC PTDA
ATDA
G1G2
GSFD
DSFVAR
GD
G1G2
GSFD
DSFG01T01
PTVAG04
ATDAPTDAPTDC
ATDAPTDA
PTDC
ZFLsupplies
G1
G2
GSF
D
DSF
GSF
D
DSF
G2G1
VAR
D
GPTVA
T01G01
G04
cathode
target
repeller
e-gun
ELENAASACUSAUSange CTDC RTDA
CTDA
G1G2
GSFD
DSFVAR
GD
G1G2
GSFD
DSFB2LSR2
SR1SA2
RTDACTDACTDC
SA1
B1L B0L
B2Q
B1Q SSCQB0Q
B2L
B1L
B0L
B2Q
B1Q
B0Q
SSCQ
GND+5V
CTDCCTDA
RTDA
ZFLsupplies
G1
G2
GSF
D
DSF
D
DSF
G2G1
VAR
D
GSR1
SA2SA1
SR2
GSF
ATSW
ELENA ASACUSA
DSange
300K RF Box
ATER PTEA
PTFB PTER CTE
CTFB RTEA
RTERATFB
ATEA
PTSFATSF
DSUS
CTFB PTER
CTE
RTEA RTER
PTEA
PTFB
ATEAATER
ATFB
ATSF PTSFlabe
l
ELENA
ASACUSA
US DS
Top view ofRF ange
Front view of RF box
BASExperiment Layout
US
4K 1. Trap Stack 2. Pin Base 3. Electronics Segment 4. Bulkhead
77K 5. Filters
300K 6. UM Board 7. UM Filter Box 8. Amplier Biasing Boxes 9. RF Box
5
1
2
3
4
DS7
8
6
8
9
DS
Q&L: SSC system
ASACUSA anges
View from ASACUSA to ELENA
US
Beammonitor
pressuregauge
cryogenicthermometers
S5-S6-S7-BM
DScryogenicthermometers
S1-S2-S3-S4pressure
gauge
HV static &HV pulse
G02e-gun HV
S1: X85565S2: X127257S3: X127284S4: X108359S5: X85558S6: X109418S7: X127303BM: X85556
lowimpedance
lowimpedance
highimpedance
300K UM Filter Box
T03T02 R05R06R01
C01C02
T04P01
P05T07
T06T05T11
T10T09
T08A07
A06A02
A01
P04P03
P02
R04R03
R02
C05C04
C03
A05A04
A03
123
ASACUSA
US DS
ASACUSA
ELENA
View from the top, looking into the box
RT CT PT AT
AT&P
T
RT&C
TTest
pin
s RelaysTop
Bottom
Top Bo
ttom
GND GN
D
GND+
5V
Relay Relay
RelayRelayCT RT
PTAT
Spares
Spares
77K FiltersView from 300K to 77K
PTDCATDA
CTDA CTDC PTDA
RTDAG1G2GSFDDSF
VGD
VGD
Amplier Biasing Board
G01T01
PTVASA1SA2SR1SR2
B2LB1LB0LB2QB1QB0Q
SSCQ
e-gun
Coil
Quenchheaters
varactor
loading
T04P01P05T05T06T07T08T09T10A01A02A06A07
P04P03P02
T11A03A04A05
T03R06R05R01T02
Spare1 - GNDSpare2 - GNDSpare3 - GND
C01C02
R04R03R02
C03C04C05
UM
ATER ATEA PTEA
PTFB PTER CTE
CTFB RTEA
RTERATFB
RF lines
electrodebiasing
switchesAT
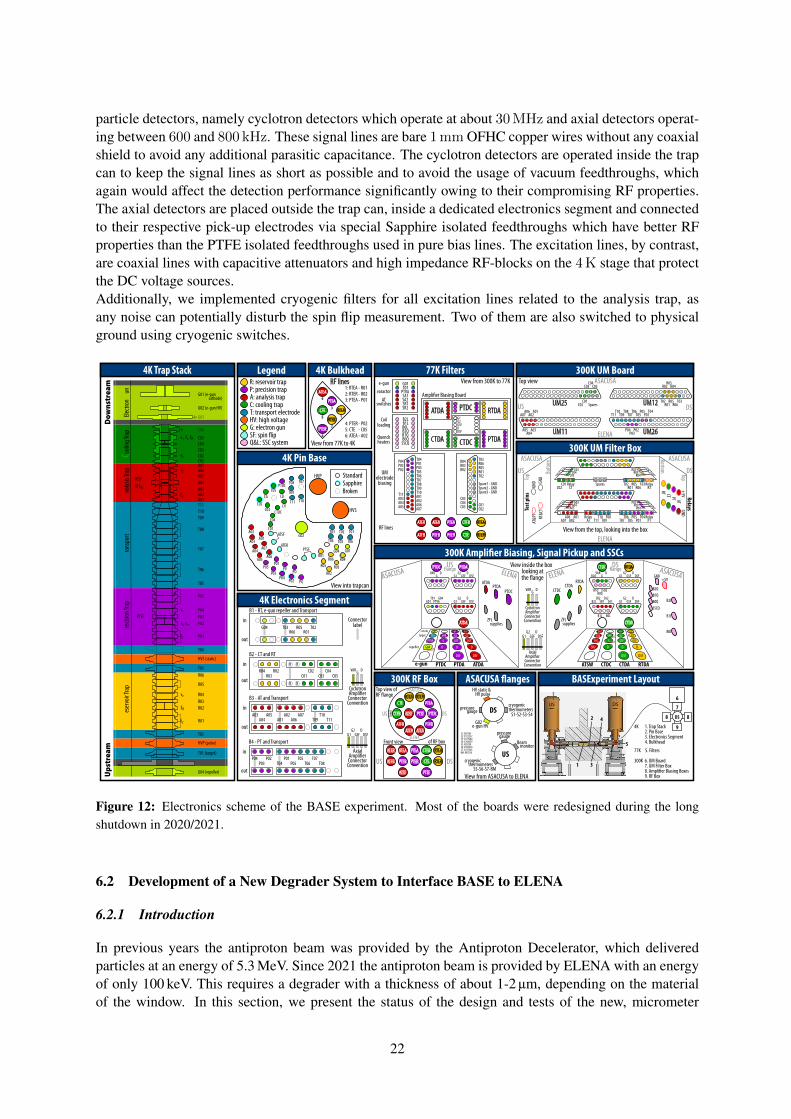
Figure 12: Electronics scheme of the BASE experiment. Most of the boards were redesigned during the longshutdown in 2020/2021.
6.2 Development of a New Degrader System to Interface BASE to ELENA
6.2.1 Introduction
In previous years the antiproton beam was provided by the Antiproton Decelerator, which deliveredparticles at an energy of 5.3 MeV. Since 2021 the antiproton beam is provided by ELENA with an energyof only 100 keV. This requires a degrader with a thickness of about 1-2 µm, depending on the materialof the window. In this section, we present the status of the design and tests of the new, micrometer
22
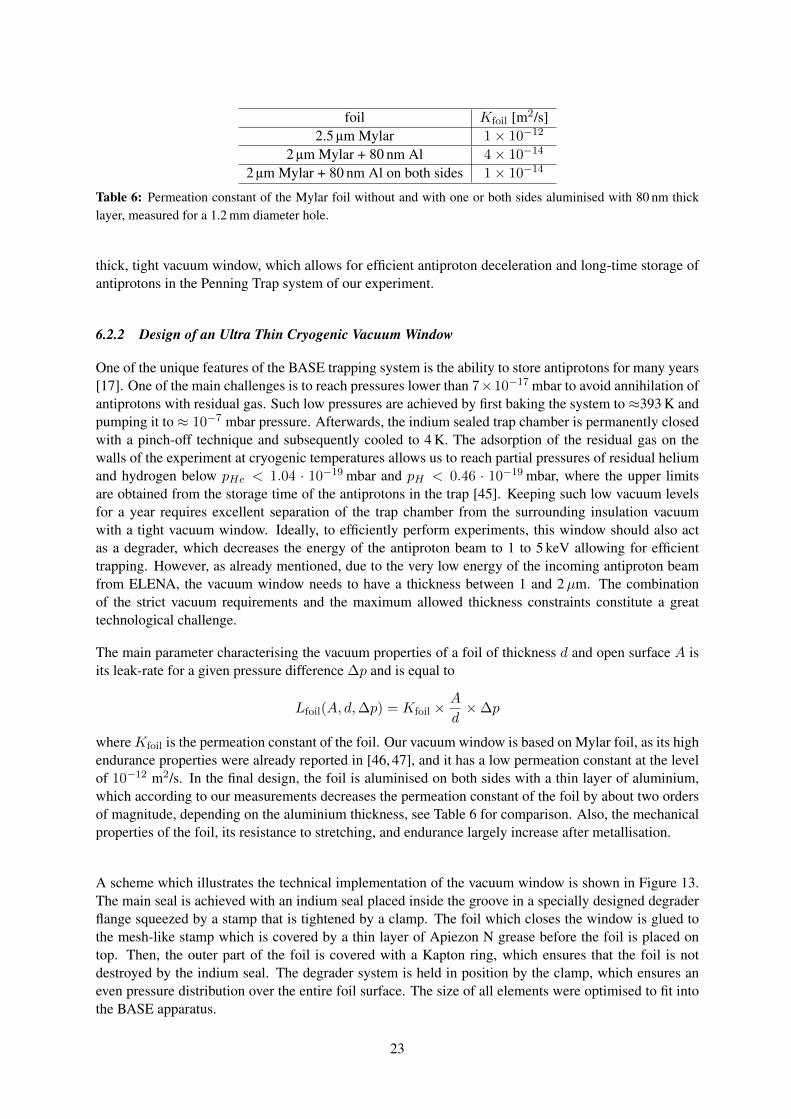
foil Kfoil [m2/s]2.5 µm Mylar 1× 10⁻¹²
2 µm Mylar + 80 nm Al 4× 10⁻¹⁴
2 µm Mylar + 80 nm Al on both sides 1× 10⁻¹⁴
Table 6: Permeation constant of the Mylar foil without and with one or both sides aluminised with 80 nm thicklayer, measured for a 1.2 mm diameter hole.
thick, tight vacuum window, which allows for efficient antiproton deceleration and long-time storage ofantiprotons in the Penning Trap system of our experiment.
6.2.2 Design of an Ultra Thin Cryogenic Vacuum Window
One of the unique features of the BASE trapping system is the ability to store antiprotons for many years[17]. One of the main challenges is to reach pressures lower than 7×10⁻¹⁷ mbar to avoid annihilation ofantiprotons with residual gas. Such low pressures are achieved by first baking the system to ≈393 K andpumping it to ≈ 10−7 mbar pressure. Afterwards, the indium sealed trap chamber is permanently closedwith a pinch-off technique and subsequently cooled to 4 K. The adsorption of the residual gas on thewalls of the experiment at cryogenic temperatures allows us to reach partial pressures of residual heliumand hydrogen below pHe < 1.04 · 10−19 mbar and pH < 0.46 · 10−19 mbar, where the upper limitsare obtained from the storage time of the antiprotons in the trap [45]. Keeping such low vacuum levelsfor a year requires excellent separation of the trap chamber from the surrounding insulation vacuumwith a tight vacuum window. Ideally, to efficiently perform experiments, this window should also actas a degrader, which decreases the energy of the antiproton beam to 1 to 5 keV allowing for efficienttrapping. However, as already mentioned, due to the very low energy of the incoming antiproton beamfrom ELENA, the vacuum window needs to have a thickness between 1 and 2µm. The combinationof the strict vacuum requirements and the maximum allowed thickness constraints constitute a greattechnological challenge.
The main parameter characterising the vacuum properties of a foil of thickness d and open surface A isits leak-rate for a given pressure difference ∆p and is equal to
Lfoil(A, d,∆p) = Kfoil ×A
d×∆p
where Kfoil is the permeation constant of the foil. Our vacuum window is based on Mylar foil, as its highendurance properties were already reported in [46, 47], and it has a low permeation constant at the levelof 10−12 m2/s. In the final design, the foil is aluminised on both sides with a thin layer of aluminium,which according to our measurements decreases the permeation constant of the foil by about two ordersof magnitude, depending on the aluminium thickness, see Table 6 for comparison. Also, the mechanicalproperties of the foil, its resistance to stretching, and endurance largely increase after metallisation.
A scheme which illustrates the technical implementation of the vacuum window is shown in Figure 13.The main seal is achieved with an indium seal placed inside the groove in a specially designed degraderflange squeezed by a stamp that is tightened by a clamp. The foil which closes the window is glued tothe mesh-like stamp which is covered by a thin layer of Apiezon N grease before the foil is placed ontop. Then, the outer part of the foil is covered with a Kapton ring, which ensures that the foil is notdestroyed by the indium seal. The degrader system is held in position by the clamp, which ensures aneven pressure distribution over the entire foil surface. The size of all elements were optimised to fit intothe BASE apparatus.
23
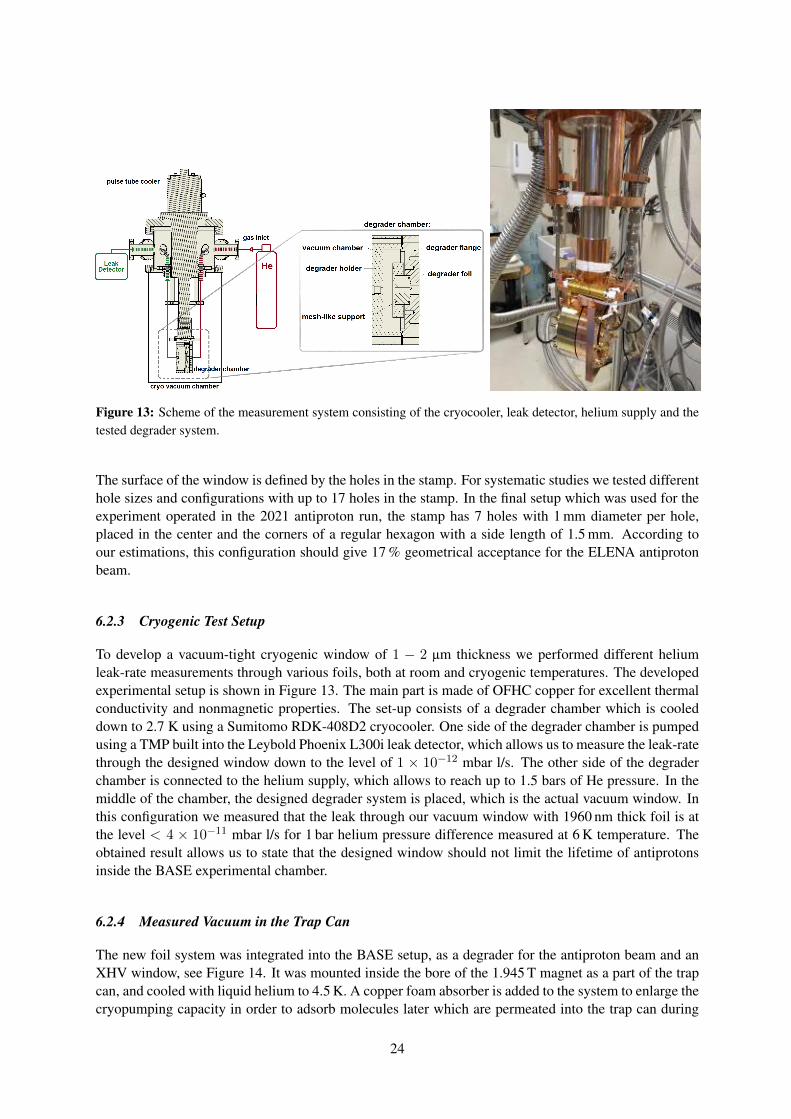
Figure 13: Scheme of the measurement system consisting of the cryocooler, leak detector, helium supply and thetested degrader system.
The surface of the window is defined by the holes in the stamp. For systematic studies we tested differenthole sizes and configurations with up to 17 holes in the stamp. In the final setup which was used for theexperiment operated in the 2021 antiproton run, the stamp has 7 holes with 1 mm diameter per hole,placed in the center and the corners of a regular hexagon with a side length of 1.5 mm. According toour estimations, this configuration should give 17 % geometrical acceptance for the ELENA antiprotonbeam.
6.2.3 Cryogenic Test Setup
To develop a vacuum-tight cryogenic window of 1 − 2 µm thickness we performed different heliumleak-rate measurements through various foils, both at room and cryogenic temperatures. The developedexperimental setup is shown in Figure 13. The main part is made of OFHC copper for excellent thermalconductivity and nonmagnetic properties. The set-up consists of a degrader chamber which is cooleddown to 2.7 K using a Sumitomo RDK-408D2 cryocooler. One side of the degrader chamber is pumpedusing a TMP built into the Leybold Phoenix L300i leak detector, which allows us to measure the leak-ratethrough the designed window down to the level of 1 × 10⁻¹² mbar l/s. The other side of the degraderchamber is connected to the helium supply, which allows to reach up to 1.5 bars of He pressure. In themiddle of the chamber, the designed degrader system is placed, which is the actual vacuum window. Inthis configuration we measured that the leak through our vacuum window with 1960 nm thick foil is atthe level < 4 × 10⁻¹¹ mbar l/s for 1 bar helium pressure difference measured at 6 K temperature. Theobtained result allows us to state that the designed window should not limit the lifetime of antiprotonsinside the BASE experimental chamber.
6.2.4 Measured Vacuum in the Trap Can
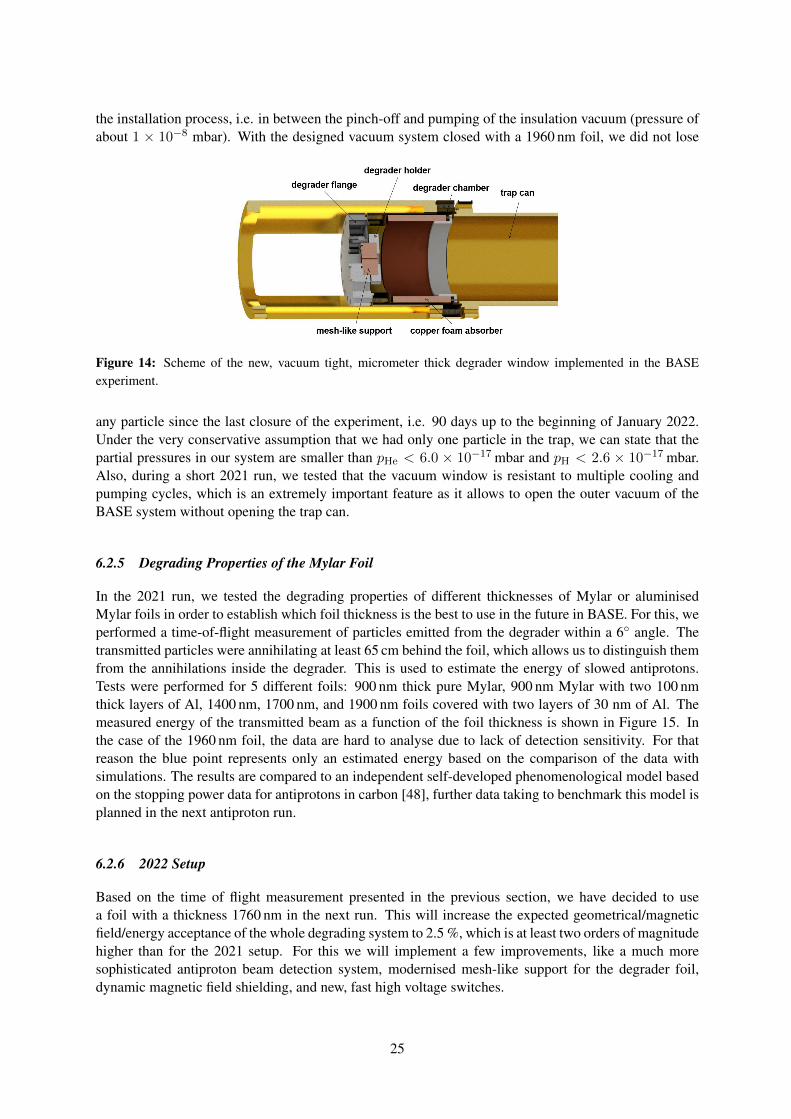
The new foil system was integrated into the BASE setup, as a degrader for the antiproton beam and anXHV window, see Figure 14. It was mounted inside the bore of the 1.945 T magnet as a part of the trapcan, and cooled with liquid helium to 4.5 K. A copper foam absorber is added to the system to enlarge thecryopumping capacity in order to adsorb molecules later which are permeated into the trap can during
24
the installation process, i.e. in between the pinch-off and pumping of the insulation vacuum (pressure ofabout 1 × 10⁻⁸ mbar). With the designed vacuum system closed with a 1960 nm foil, we did not lose
Figure 14: Scheme of the new, vacuum tight, micrometer thick degrader window implemented in the BASEexperiment.
any particle since the last closure of the experiment, i.e. 90 days up to the beginning of January 2022.Under the very conservative assumption that we had only one particle in the trap, we can state that thepartial pressures in our system are smaller than pHe < 6.0 × 10⁻¹⁷ mbar and pH < 2.6 × 10⁻¹⁷ mbar.Also, during a short 2021 run, we tested that the vacuum window is resistant to multiple cooling andpumping cycles, which is an extremely important feature as it allows to open the outer vacuum of theBASE system without opening the trap can.
6.2.5 Degrading Properties of the Mylar Foil
In the 2021 run, we tested the degrading properties of different thicknesses of Mylar or aluminisedMylar foils in order to establish which foil thickness is the best to use in the future in BASE. For this, weperformed a time-of-flight measurement of particles emitted from the degrader within a 6 angle. Thetransmitted particles were annihilating at least 65 cm behind the foil, which allows us to distinguish themfrom the annihilations inside the degrader. This is used to estimate the energy of slowed antiprotons.Tests were performed for 5 different foils: 900 nm thick pure Mylar, 900 nm Mylar with two 100 nmthick layers of Al, 1400 nm, 1700 nm, and 1900 nm foils covered with two layers of 30 nm of Al. Themeasured energy of the transmitted beam as a function of the foil thickness is shown in Figure 15. Inthe case of the 1960 nm foil, the data are hard to analyse due to lack of detection sensitivity. For thatreason the blue point represents only an estimated energy based on the comparison of the data withsimulations. The results are compared to an independent self-developed phenomenological model basedon the stopping power data for antiprotons in carbon [48], further data taking to benchmark this model isplanned in the next antiproton run.
6.2.6 2022 Setup
Based on the time of flight measurement presented in the previous section, we have decided to usea foil with a thickness 1760 nm in the next run. This will increase the expected geometrical/magneticfield/energy acceptance of the whole degrading system to 2.5 %, which is at least two orders of magnitudehigher than for the 2021 setup. For this we will implement a few improvements, like a much moresophisticated antiproton beam detection system, modernised mesh-like support for the degrader foil,dynamic magnetic field shielding, and new, fast high voltage switches.
25
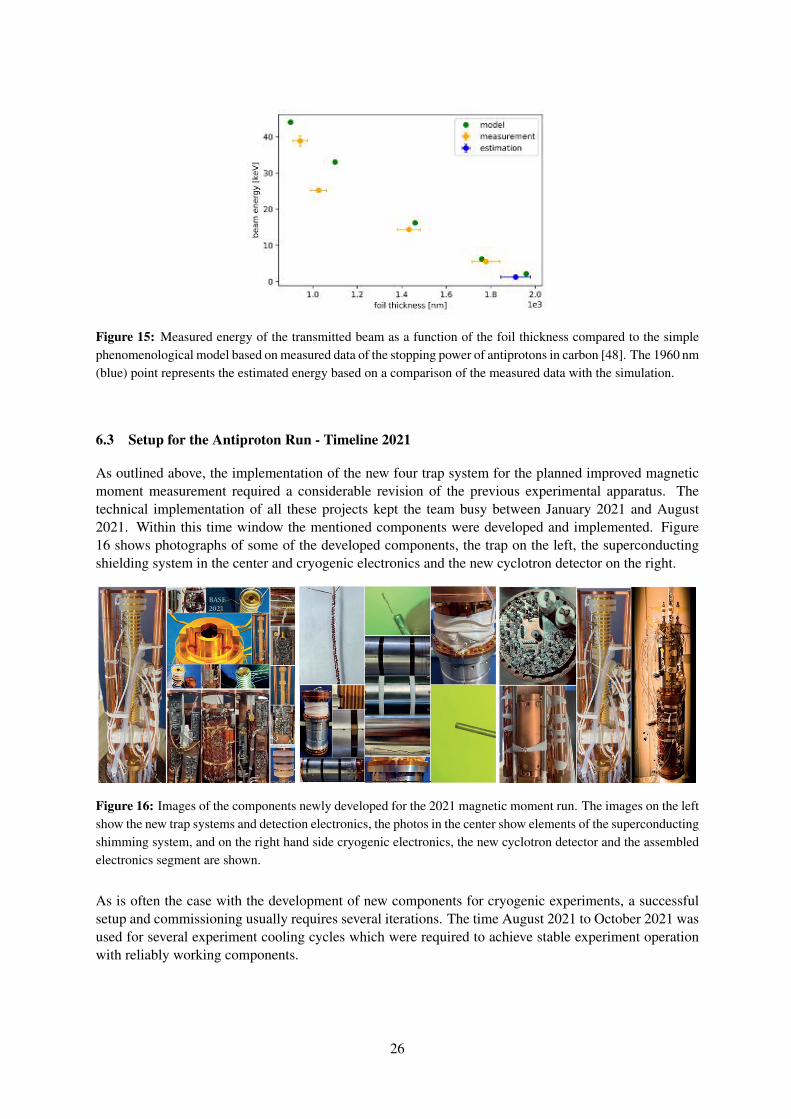
Figure 15: Measured energy of the transmitted beam as a function of the foil thickness compared to the simplephenomenological model based on measured data of the stopping power of antiprotons in carbon [48]. The 1960 nm(blue) point represents the estimated energy based on a comparison of the measured data with the simulation.
6.3 Setup for the Antiproton Run - Timeline 2021
As outlined above, the implementation of the new four trap system for the planned improved magneticmoment measurement required a considerable revision of the previous experimental apparatus. Thetechnical implementation of all these projects kept the team busy between January 2021 and August2021. Within this time window the mentioned components were developed and implemented. Figure16 shows photographs of some of the developed components, the trap on the left, the superconductingshielding system in the center and cryogenic electronics and the new cyclotron detector on the right.
Figure 16: Images of the components newly developed for the 2021 magnetic moment run. The images on the leftshow the new trap systems and detection electronics, the photos in the center show elements of the superconductingshimming system, and on the right hand side cryogenic electronics, the new cyclotron detector and the assembledelectronics segment are shown.
As is often the case with the development of new components for cryogenic experiments, a successfulsetup and commissioning usually requires several iterations. The time August 2021 to October 2021 wasused for several experiment cooling cycles which were required to achieve stable experiment operationwith reliably working components.
26
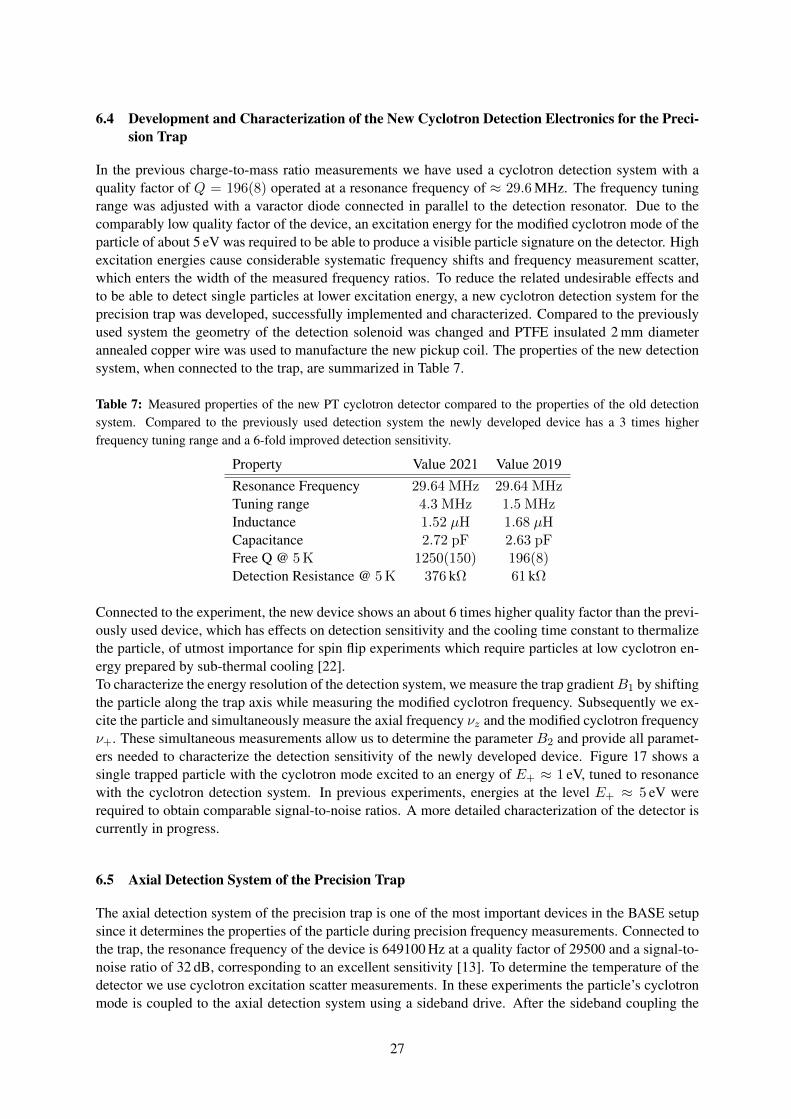
6.4 Development and Characterization of the New Cyclotron Detection Electronics for the Preci-sion Trap
In the previous charge-to-mass ratio measurements we have used a cyclotron detection system with aquality factor of Q = 196(8) operated at a resonance frequency of ≈ 29.6MHz. The frequency tuningrange was adjusted with a varactor diode connected in parallel to the detection resonator. Due to thecomparably low quality factor of the device, an excitation energy for the modified cyclotron mode of theparticle of about 5 eV was required to be able to produce a visible particle signature on the detector. Highexcitation energies cause considerable systematic frequency shifts and frequency measurement scatter,which enters the width of the measured frequency ratios. To reduce the related undesirable effects andto be able to detect single particles at lower excitation energy, a new cyclotron detection system for theprecision trap was developed, successfully implemented and characterized. Compared to the previouslyused system the geometry of the detection solenoid was changed and PTFE insulated 2 mm diameterannealed copper wire was used to manufacture the new pickup coil. The properties of the new detectionsystem, when connected to the trap, are summarized in Table 7.
Table 7: Measured properties of the new PT cyclotron detector compared to the properties of the old detectionsystem. Compared to the previously used detection system the newly developed device has a 3 times higherfrequency tuning range and a 6-fold improved detection sensitivity.
Property Value 2021 Value 2019Resonance Frequency 29.64 MHz 29.64 MHzTuning range 4.3 MHz 1.5 MHzInductance 1.52 µH 1.68 µHCapacitance 2.72 pF 2.63 pFFree Q @ 5K 1250(150) 196(8)Detection Resistance @ 5K 376 kΩ 61 kΩ
Connected to the experiment, the new device shows an about 6 times higher quality factor than the previ-ously used device, which has effects on detection sensitivity and the cooling time constant to thermalizethe particle, of utmost importance for spin flip experiments which require particles at low cyclotron en-ergy prepared by sub-thermal cooling [22].To characterize the energy resolution of the detection system, we measure the trap gradient B1 by shiftingthe particle along the trap axis while measuring the modified cyclotron frequency. Subsequently we ex-cite the particle and simultaneously measure the axial frequency νz and the modified cyclotron frequencyν+. These simultaneous measurements allow us to determine the parameter B2 and provide all paramet-ers needed to characterize the detection sensitivity of the newly developed device. Figure 17 shows asingle trapped particle with the cyclotron mode excited to an energy of E+ ≈ 1 eV, tuned to resonancewith the cyclotron detection system. In previous experiments, energies at the level E+ ≈ 5 eV wererequired to obtain comparable signal-to-noise ratios. A more detailed characterization of the detector iscurrently in progress.
6.5 Axial Detection System of the Precision Trap
The axial detection system of the precision trap is one of the most important devices in the BASE setupsince it determines the properties of the particle during precision frequency measurements. Connected tothe trap, the resonance frequency of the device is 649100 Hz at a quality factor of 29500 and a signal-to-noise ratio of 32 dB, corresponding to an excellent sensitivity [13]. To determine the temperature of thedetector we use cyclotron excitation scatter measurements. In these experiments the particle’s cyclotronmode is coupled to the axial detection system using a sideband drive. After the sideband coupling the
27
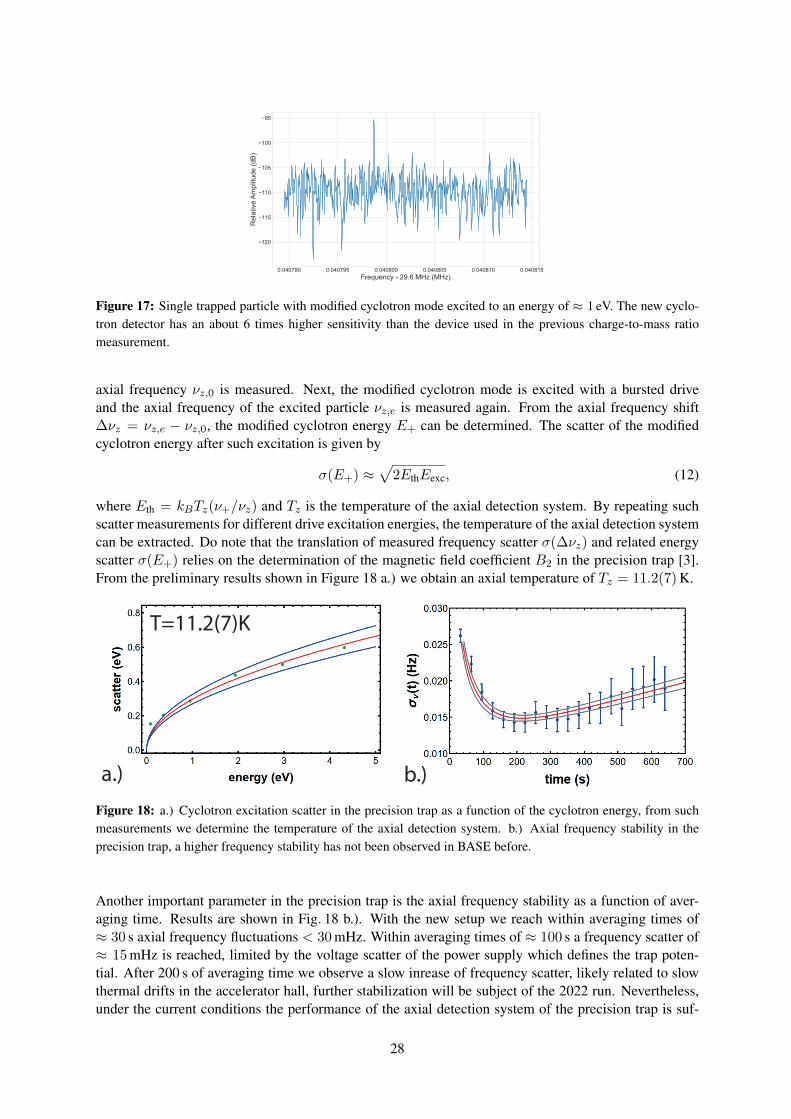
0.040790 0.040795 0.040800 0.040805 0.040810 0.040815Frequency - 29.6 MHz (MHz)
120
115
110
105
100
95
Rel
ativ
e Am
plitu
de (d
B)
Figure 17: Single trapped particle with modified cyclotron mode excited to an energy of ≈ 1 eV. The new cyclo-tron detector has an about 6 times higher sensitivity than the device used in the previous charge-to-mass ratiomeasurement.
axial frequency νz,0 is measured. Next, the modified cyclotron mode is excited with a bursted driveand the axial frequency of the excited particle νz,e is measured again. From the axial frequency shift∆νz = νz,e − νz,0, the modified cyclotron energy E+ can be determined. The scatter of the modifiedcyclotron energy after such excitation is given by
σ(E+) ≈√2EthEexc, (12)
where Eth = kBTz(ν+/νz) and Tz is the temperature of the axial detection system. By repeating suchscatter measurements for different drive excitation energies, the temperature of the axial detection systemcan be extracted. Do note that the translation of measured frequency scatter σ(∆νz) and related energyscatter σ(E+) relies on the determination of the magnetic field coefficient B2 in the precision trap [3].From the preliminary results shown in Figure 18 a.) we obtain an axial temperature of Tz = 11.2(7)K.
a.)
T=11.2(7)K
b.)Figure 18: a.) Cyclotron excitation scatter in the precision trap as a function of the cyclotron energy, from suchmeasurements we determine the temperature of the axial detection system. b.) Axial frequency stability in theprecision trap, a higher frequency stability has not been observed in BASE before.
Another important parameter in the precision trap is the axial frequency stability as a function of aver-aging time. Results are shown in Fig. 18 b.). With the new setup we reach within averaging times of≈ 30 s axial frequency fluctuations < 30mHz. Within averaging times of ≈ 100 s a frequency scatter of≈ 15mHz is reached, limited by the voltage scatter of the power supply which defines the trap poten-tial. After 200 s of averaging time we observe a slow inrease of frequency scatter, likely related to slowthermal drifts in the accelerator hall, further stabilization will be subject of the 2022 run. Nevertheless,under the current conditions the performance of the axial detection system of the precision trap is suf-
28
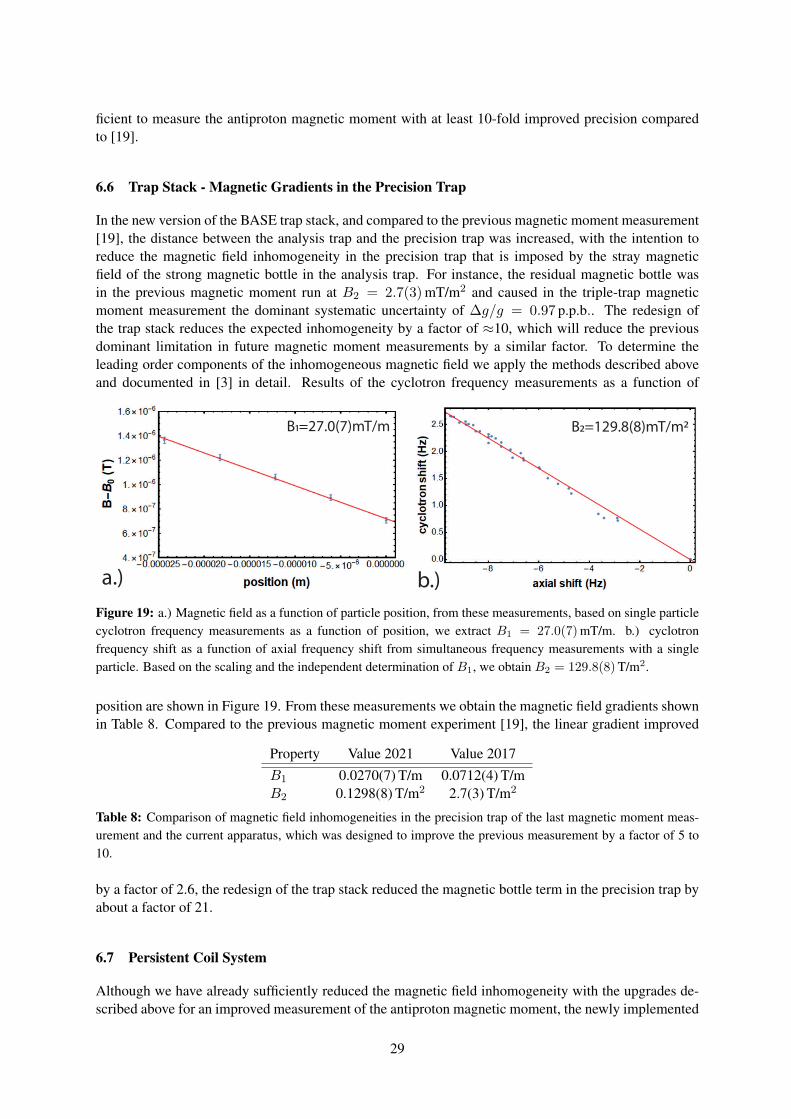
ficient to measure the antiproton magnetic moment with at least 10-fold improved precision comparedto [19].
6.6 Trap Stack - Magnetic Gradients in the Precision Trap
In the new version of the BASE trap stack, and compared to the previous magnetic moment measurement[19], the distance between the analysis trap and the precision trap was increased, with the intention toreduce the magnetic field inhomogeneity in the precision trap that is imposed by the stray magneticfield of the strong magnetic bottle in the analysis trap. For instance, the residual magnetic bottle wasin the previous magnetic moment run at B2 = 2.7(3)mT/m2 and caused in the triple-trap magneticmoment measurement the dominant systematic uncertainty of ∆g/g = 0.97 p.p.b.. The redesign ofthe trap stack reduces the expected inhomogeneity by a factor of ≈10, which will reduce the previousdominant limitation in future magnetic moment measurements by a similar factor. To determine theleading order components of the inhomogeneous magnetic field we apply the methods described aboveand documented in [3] in detail. Results of the cyclotron frequency measurements as a function of
a.) b.)
B1=27.0(7)mT/m B2=129.8(8)mT/m2
Figure 19: a.) Magnetic field as a function of particle position, from these measurements, based on single particlecyclotron frequency measurements as a function of position, we extract B1 = 27.0(7)mT/m. b.) cyclotronfrequency shift as a function of axial frequency shift from simultaneous frequency measurements with a singleparticle. Based on the scaling and the independent determination of B1, we obtain B2 = 129.8(8)T/m2.
position are shown in Figure 19. From these measurements we obtain the magnetic field gradients shownin Table 8. Compared to the previous magnetic moment experiment [19], the linear gradient improved
Property Value 2021 Value 2017B1 0.0270(7) T/m 0.0712(4) T/mB2 0.1298(8) T/m2 2.7(3) T/m2
Table 8: Comparison of magnetic field inhomogeneities in the precision trap of the last magnetic moment meas-urement and the current apparatus, which was designed to improve the previous measurement by a factor of 5 to10.
by a factor of 2.6, the redesign of the trap stack reduced the magnetic bottle term in the precision trap byabout a factor of 21.
6.7 Persistent Coil System
Although we have already sufficiently reduced the magnetic field inhomogeneity with the upgrades de-scribed above for an improved measurement of the antiproton magnetic moment, the newly implemented
29
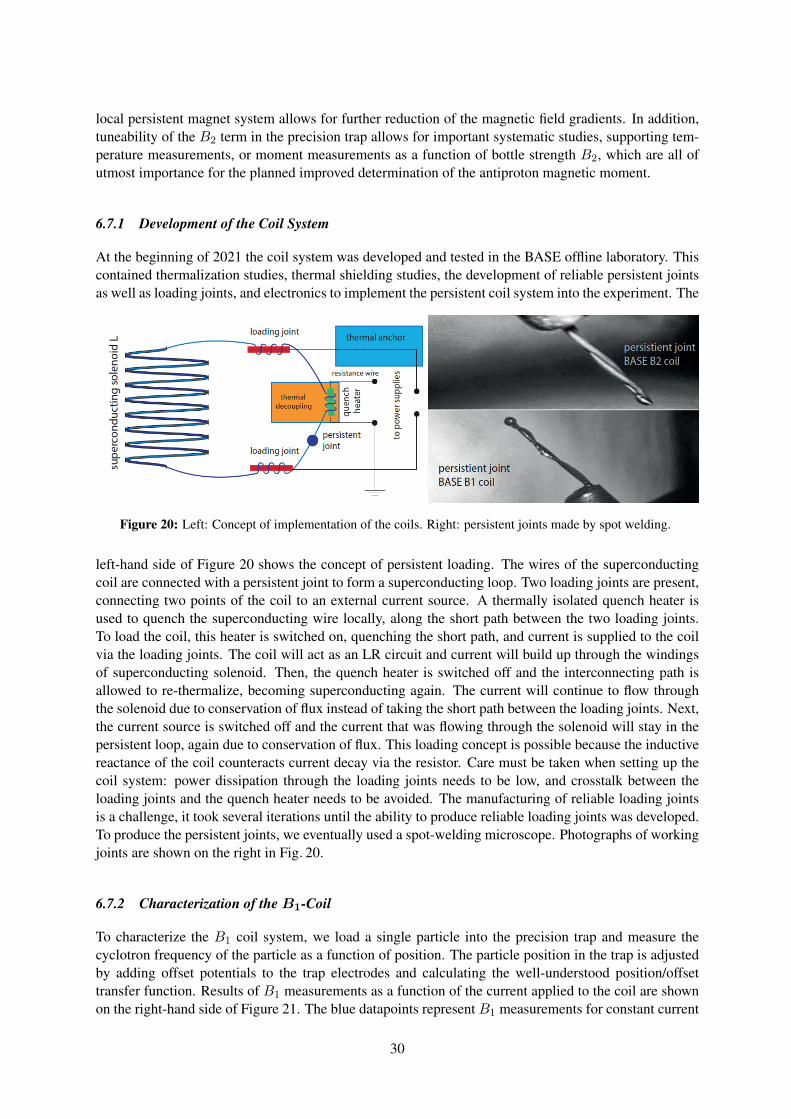
local persistent magnet system allows for further reduction of the magnetic field gradients. In addition,tuneability of the B2 term in the precision trap allows for important systematic studies, supporting tem-perature measurements, or moment measurements as a function of bottle strength B2, which are all ofutmost importance for the planned improved determination of the antiproton magnetic moment.
6.7.1 Development of the Coil System
At the beginning of 2021 the coil system was developed and tested in the BASE offline laboratory. Thiscontained thermalization studies, thermal shielding studies, the development of reliable persistent jointsas well as loading joints, and electronics to implement the persistent coil system into the experiment. The
Figure 20: Left: Concept of implementation of the coils. Right: persistent joints made by spot welding.
left-hand side of Figure 20 shows the concept of persistent loading. The wires of the superconductingcoil are connected with a persistent joint to form a superconducting loop. Two loading joints are present,connecting two points of the coil to an external current source. A thermally isolated quench heater isused to quench the superconducting wire locally, along the short path between the two loading joints.To load the coil, this heater is switched on, quenching the short path, and current is supplied to the coilvia the loading joints. The coil will act as an LR circuit and current will build up through the windingsof superconducting solenoid. Then, the quench heater is switched off and the interconnecting path isallowed to re-thermalize, becoming superconducting again. The current will continue to flow throughthe solenoid due to conservation of flux instead of taking the short path between the loading joints. Next,the current source is switched off and the current that was flowing through the solenoid will stay in thepersistent loop, again due to conservation of flux. This loading concept is possible because the inductivereactance of the coil counteracts current decay via the resistor. Care must be taken when setting up thecoil system: power dissipation through the loading joints needs to be low, and crosstalk between theloading joints and the quench heater needs to be avoided. The manufacturing of reliable loading jointsis a challenge, it took several iterations until the ability to produce reliable loading joints was developed.To produce the persistent joints, we eventually used a spot-welding microscope. Photographs of workingjoints are shown on the right in Fig. 20.
6.7.2 Characterization of the B1-Coil
To characterize the B1 coil system, we load a single particle into the precision trap and measure thecyclotron frequency of the particle as a function of position. The particle position in the trap is adjustedby adding offset potentials to the trap electrodes and calculating the well-understood position/offsettransfer function. Results of B1 measurements as a function of the current applied to the coil are shownon the right-hand side of Figure 21. The blue datapoints represent B1 measurements for constant current
30
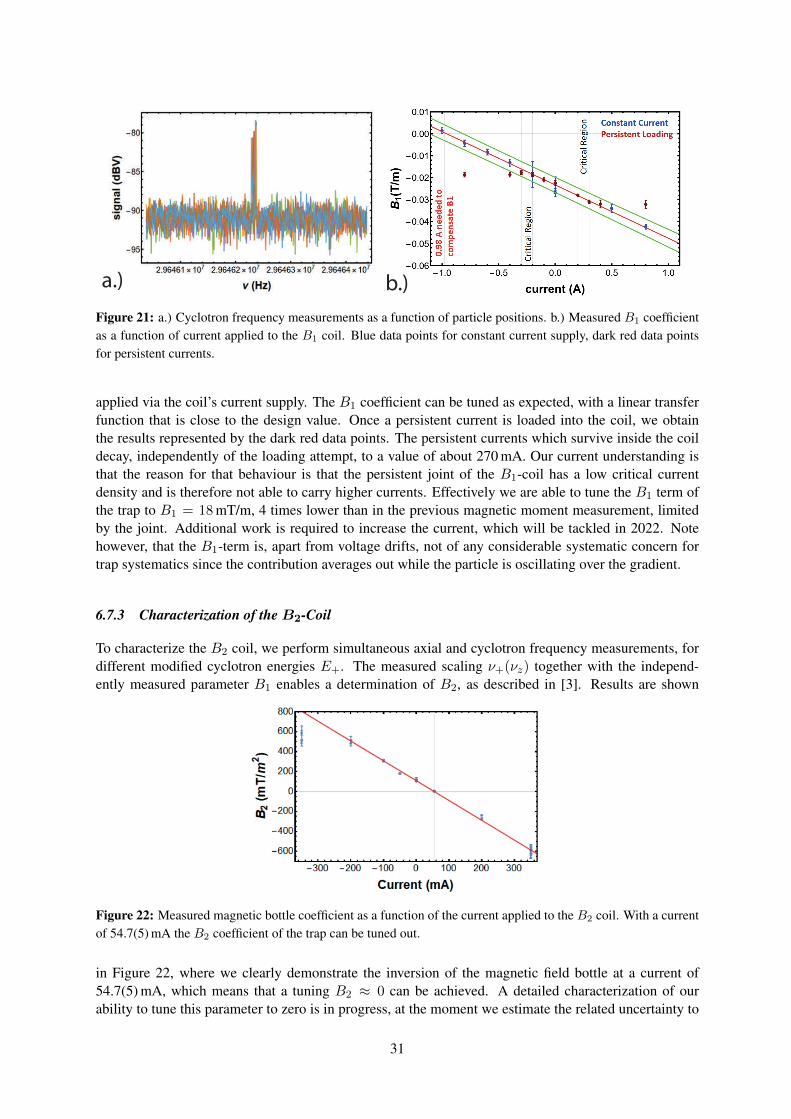
a.) b.)Figure 21: a.) Cyclotron frequency measurements as a function of particle positions. b.) Measured B1 coefficientas a function of current applied to the B1 coil. Blue data points for constant current supply, dark red data pointsfor persistent currents.
applied via the coil’s current supply. The B1 coefficient can be tuned as expected, with a linear transferfunction that is close to the design value. Once a persistent current is loaded into the coil, we obtainthe results represented by the dark red data points. The persistent currents which survive inside the coildecay, independently of the loading attempt, to a value of about 270 mA. Our current understanding isthat the reason for that behaviour is that the persistent joint of the B1-coil has a low critical currentdensity and is therefore not able to carry higher currents. Effectively we are able to tune the B1 term ofthe trap to B1 = 18mT/m, 4 times lower than in the previous magnetic moment measurement, limitedby the joint. Additional work is required to increase the current, which will be tackled in 2022. Notehowever, that the B1-term is, apart from voltage drifts, not of any considerable systematic concern fortrap systematics since the contribution averages out while the particle is oscillating over the gradient.
6.7.3 Characterization of the B2-Coil
To characterize the B2 coil, we perform simultaneous axial and cyclotron frequency measurements, fordifferent modified cyclotron energies E+. The measured scaling ν+(νz) together with the independ-ently measured parameter B1 enables a determination of B2, as described in [3]. Results are shown
Figure 22: Measured magnetic bottle coefficient as a function of the current applied to the B2 coil. With a currentof 54.7(5) mA the B2 coefficient of the trap can be tuned out.
in Figure 22, where we clearly demonstrate the inversion of the magnetic field bottle at a current of54.7(5) mA, which means that a tuning B2 ≈ 0 can be achieved. A detailed characterization of ourability to tune this parameter to zero is in progress, at the moment we estimate the related uncertainty to
31
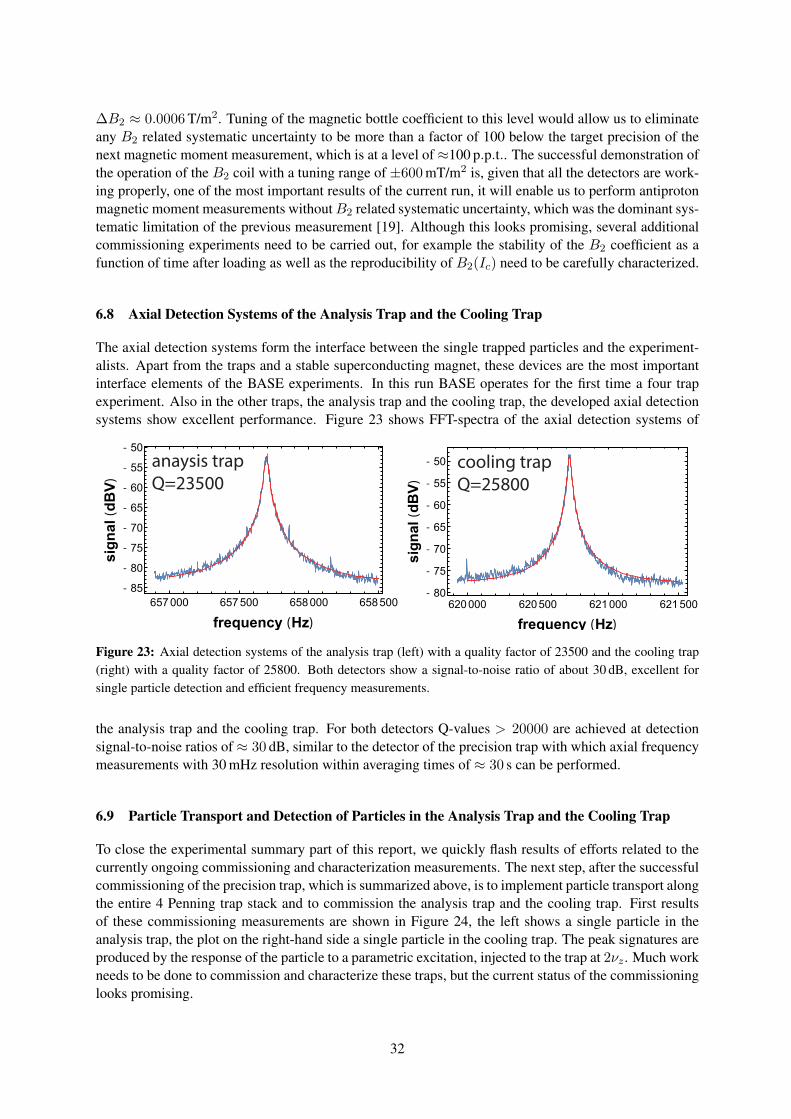
∆B2 ≈ 0.0006T/m2. Tuning of the magnetic bottle coefficient to this level would allow us to eliminateany B2 related systematic uncertainty to be more than a factor of 100 below the target precision of thenext magnetic moment measurement, which is at a level of ≈100 p.p.t.. The successful demonstration ofthe operation of the B2 coil with a tuning range of ±600mT/m2 is, given that all the detectors are work-ing properly, one of the most important results of the current run, it will enable us to perform antiprotonmagnetic moment measurements without B2 related systematic uncertainty, which was the dominant sys-tematic limitation of the previous measurement [19]. Although this looks promising, several additionalcommissioning experiments need to be carried out, for example the stability of the B2 coefficient as afunction of time after loading as well as the reproducibility of B2(Ic) need to be carefully characterized.
6.8 Axial Detection Systems of the Analysis Trap and the Cooling Trap
The axial detection systems form the interface between the single trapped particles and the experiment-alists. Apart from the traps and a stable superconducting magnet, these devices are the most importantinterface elements of the BASE experiments. In this run BASE operates for the first time a four trapexperiment. Also in the other traps, the analysis trap and the cooling trap, the developed axial detectionsystems show excellent performance. Figure 23 shows FFT-spectra of the axial detection systems of
620000 620500 621000 621500- 80
- 75
- 70
- 65
- 60
- 55
- 50
frequency (Hz)
sign
al(d
BV)
657000 657500 658000 658500- 85
- 80
- 75
- 70
- 65
- 60
- 55
- 50
frequency (Hz)
sign
al(d
BV)
anaysis trapQ=23500
cooling trapQ=25800
Figure 23: Axial detection systems of the analysis trap (left) with a quality factor of 23500 and the cooling trap(right) with a quality factor of 25800. Both detectors show a signal-to-noise ratio of about 30 dB, excellent forsingle particle detection and efficient frequency measurements.
the analysis trap and the cooling trap. For both detectors Q-values > 20000 are achieved at detectionsignal-to-noise ratios of ≈ 30 dB, similar to the detector of the precision trap with which axial frequencymeasurements with 30 mHz resolution within averaging times of ≈ 30 s can be performed.
6.9 Particle Transport and Detection of Particles in the Analysis Trap and the Cooling Trap
To close the experimental summary part of this report, we quickly flash results of efforts related to thecurrently ongoing commissioning and characterization measurements. The next step, after the successfulcommissioning of the precision trap, which is summarized above, is to implement particle transport alongthe entire 4 Penning trap stack and to commission the analysis trap and the cooling trap. First resultsof these commissioning measurements are shown in Figure 24, the left shows a single particle in theanalysis trap, the plot on the right-hand side a single particle in the cooling trap. The peak signatures areproduced by the response of the particle to a parametric excitation, injected to the trap at 2νz . Much workneeds to be done to commission and characterize these traps, but the current status of the commissioninglooks promising.
32
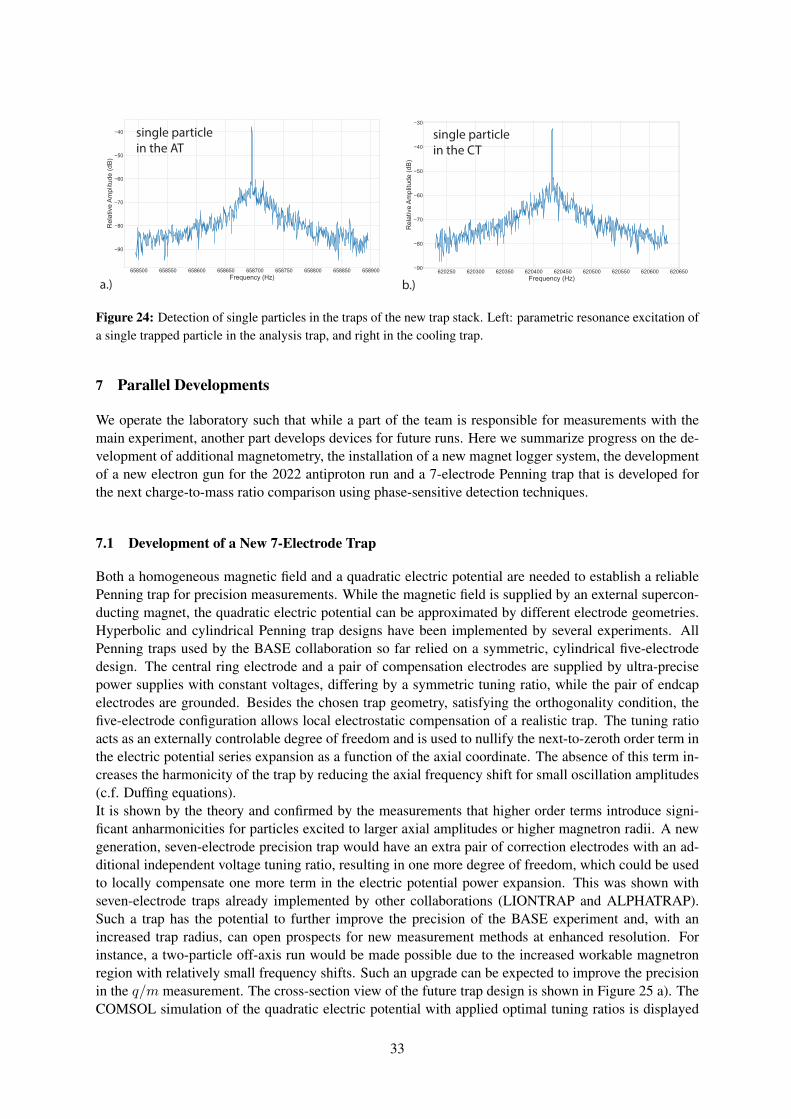
single particle in the AT
single particle in the CT
a.) b.)
Figure 24: Detection of single particles in the traps of the new trap stack. Left: parametric resonance excitation ofa single trapped particle in the analysis trap, and right in the cooling trap.
7 Parallel Developments
We operate the laboratory such that while a part of the team is responsible for measurements with themain experiment, another part develops devices for future runs. Here we summarize progress on the de-velopment of additional magnetometry, the installation of a new magnet logger system, the developmentof a new electron gun for the 2022 antiproton run and a 7-electrode Penning trap that is developed forthe next charge-to-mass ratio comparison using phase-sensitive detection techniques.
7.1 Development of a New 7-Electrode Trap
Both a homogeneous magnetic field and a quadratic electric potential are needed to establish a reliablePenning trap for precision measurements. While the magnetic field is supplied by an external supercon-ducting magnet, the quadratic electric potential can be approximated by different electrode geometries.Hyperbolic and cylindrical Penning trap designs have been implemented by several experiments. AllPenning traps used by the BASE collaboration so far relied on a symmetric, cylindrical five-electrodedesign. The central ring electrode and a pair of compensation electrodes are supplied by ultra-precisepower supplies with constant voltages, differing by a symmetric tuning ratio, while the pair of endcapelectrodes are grounded. Besides the chosen trap geometry, satisfying the orthogonality condition, thefive-electrode configuration allows local electrostatic compensation of a realistic trap. The tuning ratioacts as an externally controlable degree of freedom and is used to nullify the next-to-zeroth order term inthe electric potential series expansion as a function of the axial coordinate. The absence of this term in-creases the harmonicity of the trap by reducing the axial frequency shift for small oscillation amplitudes(c.f. Duffing equations).It is shown by the theory and confirmed by the measurements that higher order terms introduce signi-ficant anharmonicities for particles excited to larger axial amplitudes or higher magnetron radii. A newgeneration, seven-electrode precision trap would have an extra pair of correction electrodes with an ad-ditional independent voltage tuning ratio, resulting in one more degree of freedom, which could be usedto locally compensate one more term in the electric potential power expansion. This was shown withseven-electrode traps already implemented by other collaborations (LIONTRAP and ALPHATRAP).Such a trap has the potential to further improve the precision of the BASE experiment and, with anincreased trap radius, can open prospects for new measurement methods at enhanced resolution. Forinstance, a two-particle off-axis run would be made possible due to the increased workable magnetronregion with relatively small frequency shifts. Such an upgrade can be expected to improve the precisionin the q/m measurement. The cross-section view of the future trap design is shown in Figure 25 a). TheCOMSOL simulation of the quadratic electric potential with applied optimal tuning ratios is displayed
33
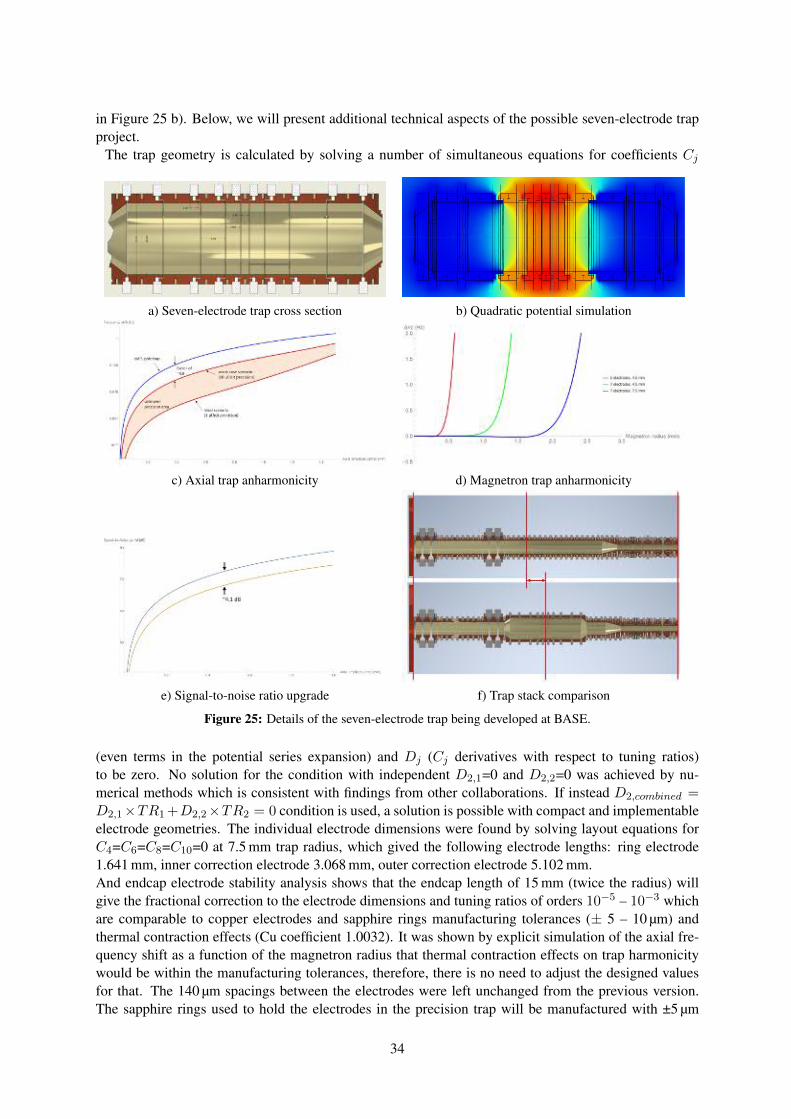
in Figure 25 b). Below, we will present additional technical aspects of the possible seven-electrode trapproject.
The trap geometry is calculated by solving a number of simultaneous equations for coefficients Cj
a) Seven-electrode trap cross section b) Quadratic potential simulation
c) Axial trap anharmonicity d) Magnetron trap anharmonicity
e) Signal-to-noise ratio upgrade f) Trap stack comparison
Figure 25: Details of the seven-electrode trap being developed at BASE.
(even terms in the potential series expansion) and Dj (Cj derivatives with respect to tuning ratios)to be zero. No solution for the condition with independent D2,1=0 and D2,2=0 was achieved by nu-merical methods which is consistent with findings from other collaborations. If instead D2,combined =D2,1×TR1+D2,2×TR2 = 0 condition is used, a solution is possible with compact and implementableelectrode geometries. The individual electrode dimensions were found by solving layout equations forC4=C6=C8=C10=0 at 7.5 mm trap radius, which gived the following electrode lengths: ring electrode1.641 mm, inner correction electrode 3.068 mm, outer correction electrode 5.102 mm.And endcap electrode stability analysis shows that the endcap length of 15 mm (twice the radius) willgive the fractional correction to the electrode dimensions and tuning ratios of orders 10−5 – 10−3 whichare comparable to copper electrodes and sapphire rings manufacturing tolerances (± 5 – 10 µm) andthermal contraction effects (Cu coefficient 1.0032). It was shown by explicit simulation of the axial fre-quency shift as a function of the magnetron radius that thermal contraction effects on trap harmonicitywould be within the manufacturing tolerances, therefore, there is no need to adjust the designed valuesfor that. The 140 µm spacings between the electrodes were left unchanged from the previous version.The sapphire rings used to hold the electrodes in the precision trap will be manufactured with ±5 µm
34
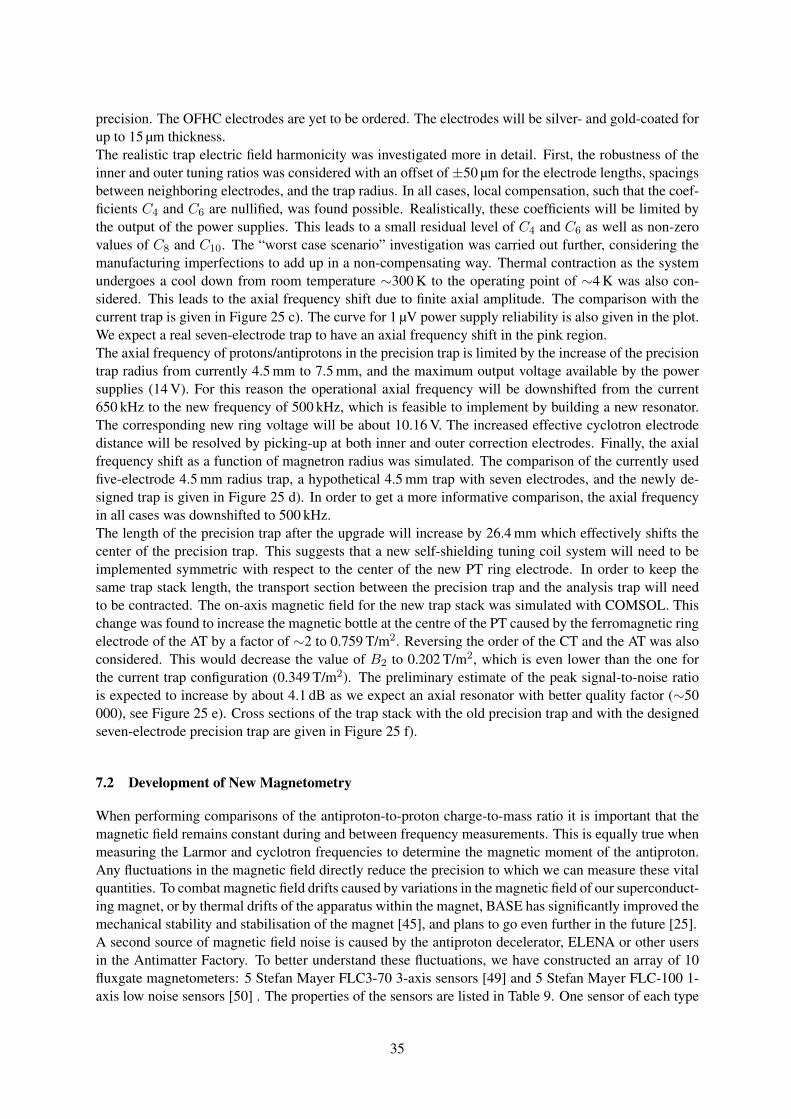
precision. The OFHC electrodes are yet to be ordered. The electrodes will be silver- and gold-coated forup to 15 µm thickness.The realistic trap electric field harmonicity was investigated more in detail. First, the robustness of theinner and outer tuning ratios was considered with an offset of ±50 µm for the electrode lengths, spacingsbetween neighboring electrodes, and the trap radius. In all cases, local compensation, such that the coef-ficients C4 and C6 are nullified, was found possible. Realistically, these coefficients will be limited bythe output of the power supplies. This leads to a small residual level of C4 and C6 as well as non-zerovalues of C8 and C10. The “worst case scenario” investigation was carried out further, considering themanufacturing imperfections to add up in a non-compensating way. Thermal contraction as the systemundergoes a cool down from room temperature ∼300 K to the operating point of ∼4 K was also con-sidered. This leads to the axial frequency shift due to finite axial amplitude. The comparison with thecurrent trap is given in Figure 25 c). The curve for 1 µV power supply reliability is also given in the plot.We expect a real seven-electrode trap to have an axial frequency shift in the pink region.The axial frequency of protons/antiprotons in the precision trap is limited by the increase of the precisiontrap radius from currently 4.5 mm to 7.5 mm, and the maximum output voltage available by the powersupplies (14 V). For this reason the operational axial frequency will be downshifted from the current650 kHz to the new frequency of 500 kHz, which is feasible to implement by building a new resonator.The corresponding new ring voltage will be about 10.16 V. The increased effective cyclotron electrodedistance will be resolved by picking-up at both inner and outer correction electrodes. Finally, the axialfrequency shift as a function of magnetron radius was simulated. The comparison of the currently usedfive-electrode 4.5 mm radius trap, a hypothetical 4.5 mm trap with seven electrodes, and the newly de-signed trap is given in Figure 25 d). In order to get a more informative comparison, the axial frequencyin all cases was downshifted to 500 kHz.The length of the precision trap after the upgrade will increase by 26.4 mm which effectively shifts thecenter of the precision trap. This suggests that a new self-shielding tuning coil system will need to beimplemented symmetric with respect to the center of the new PT ring electrode. In order to keep thesame trap stack length, the transport section between the precision trap and the analysis trap will needto be contracted. The on-axis magnetic field for the new trap stack was simulated with COMSOL. Thischange was found to increase the magnetic bottle at the centre of the PT caused by the ferromagnetic ringelectrode of the AT by a factor of ∼2 to 0.759 T/m2. Reversing the order of the CT and the AT was alsoconsidered. This would decrease the value of B2 to 0.202 T/m2, which is even lower than the one forthe current trap configuration (0.349 T/m2). The preliminary estimate of the peak signal-to-noise ratiois expected to increase by about 4.1 dB as we expect an axial resonator with better quality factor (∼50000), see Figure 25 e). Cross sections of the trap stack with the old precision trap and with the designedseven-electrode precision trap are given in Figure 25 f).
7.2 Development of New Magnetometry
When performing comparisons of the antiproton-to-proton charge-to-mass ratio it is important that themagnetic field remains constant during and between frequency measurements. This is equally true whenmeasuring the Larmor and cyclotron frequencies to determine the magnetic moment of the antiproton.Any fluctuations in the magnetic field directly reduce the precision to which we can measure these vitalquantities. To combat magnetic field drifts caused by variations in the magnetic field of our superconduct-ing magnet, or by thermal drifts of the apparatus within the magnet, BASE has significantly improved themechanical stability and stabilisation of the magnet [45], and plans to go even further in the future [25].A second source of magnetic field noise is caused by the antiproton decelerator, ELENA or other usersin the Antimatter Factory. To better understand these fluctuations, we have constructed an array of 10fluxgate magnetometers: 5 Stefan Mayer FLC3-70 3-axis sensors [49] and 5 Stefan Mayer FLC-100 1-axis low noise sensors [50] . The properties of the sensors are listed in Table 9. One sensor of each type
35
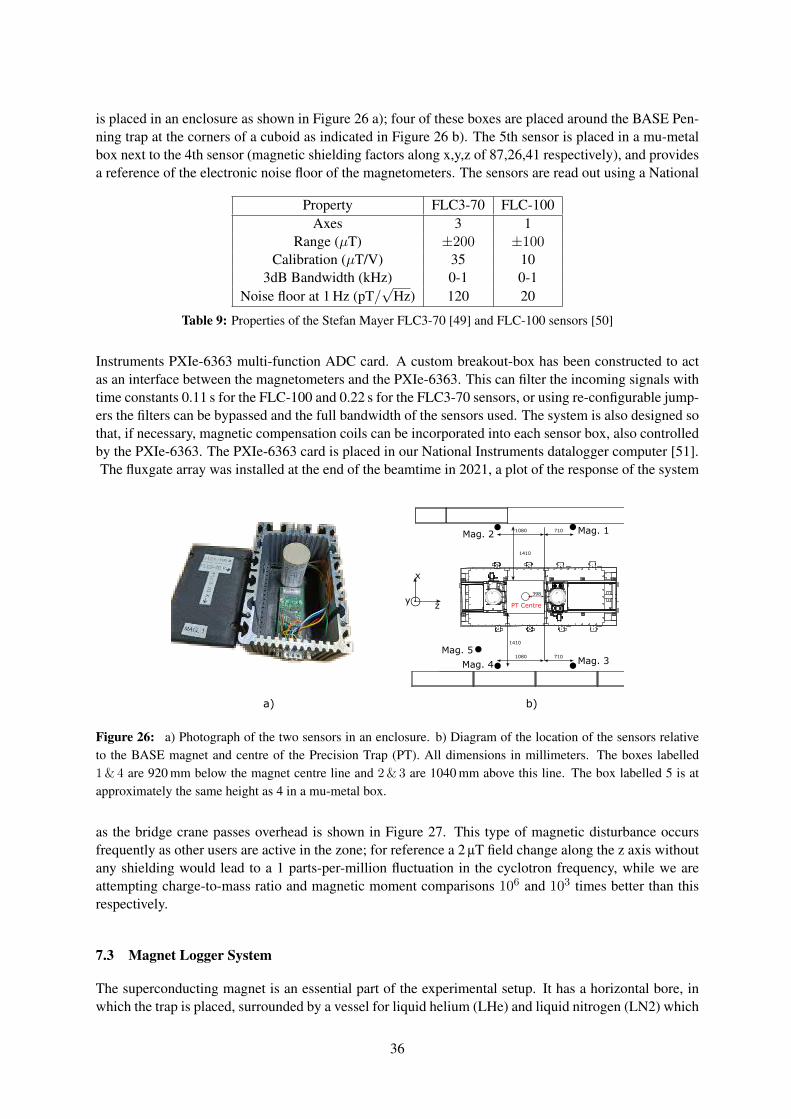
is placed in an enclosure as shown in Figure 26 a); four of these boxes are placed around the BASE Pen-ning trap at the corners of a cuboid as indicated in Figure 26 b). The 5th sensor is placed in a mu-metalbox next to the 4th sensor (magnetic shielding factors along x,y,z of 87,26,41 respectively), and providesa reference of the electronic noise floor of the magnetometers. The sensors are read out using a National
Property FLC3-70 FLC-100Axes 3 1
Range (µT) ±200 ±100Calibration (µT/V) 35 10
3dB Bandwidth (kHz) 0-1 0-1Noise floor at 1 Hz (pT/
√Hz) 120 20
Table 9: Properties of the Stefan Mayer FLC3-70 [49] and FLC-100 sensors [50]
Instruments PXIe-6363 multi-function ADC card. A custom breakout-box has been constructed to actas an interface between the magnetometers and the PXIe-6363. This can filter the incoming signals withtime constants 0.11 s for the FLC-100 and 0.22 s for the FLC3-70 sensors, or using re-configurable jump-ers the filters can be bypassed and the full bandwidth of the sensors used. The system is also designed sothat, if necessary, magnetic compensation coils can be incorporated into each sensor box, also controlledby the PXIe-6363. The PXIe-6363 card is placed in our National Instruments datalogger computer [51].The fluxgate array was installed at the end of the beamtime in 2021, a plot of the response of the system
a) b)
7101080
7101080
1410
1410
Mag. 1Mag. 2
Mag. 3Mag. 4
Mag. 5
398
PT Centrez
x
y
Figure 26: a) Photograph of the two sensors in an enclosure. b) Diagram of the location of the sensors relativeto the BASE magnet and centre of the Precision Trap (PT). All dimensions in millimeters. The boxes labelled1&4 are 920 mm below the magnet centre line and 2&3 are 1040 mm above this line. The box labelled 5 is atapproximately the same height as 4 in a mu-metal box.
as the bridge crane passes overhead is shown in Figure 27. This type of magnetic disturbance occursfrequently as other users are active in the zone; for reference a 2 µT field change along the z axis withoutany shielding would lead to a 1 parts-per-million fluctuation in the cyclotron frequency, while we areattempting charge-to-mass ratio and magnetic moment comparisons 106 and 103 times better than thisrespectively.
7.3 Magnet Logger System
The superconducting magnet is an essential part of the experimental setup. It has a horizontal bore, inwhich the trap is placed, surrounded by a vessel for liquid helium (LHe) and liquid nitrogen (LN2) which
36
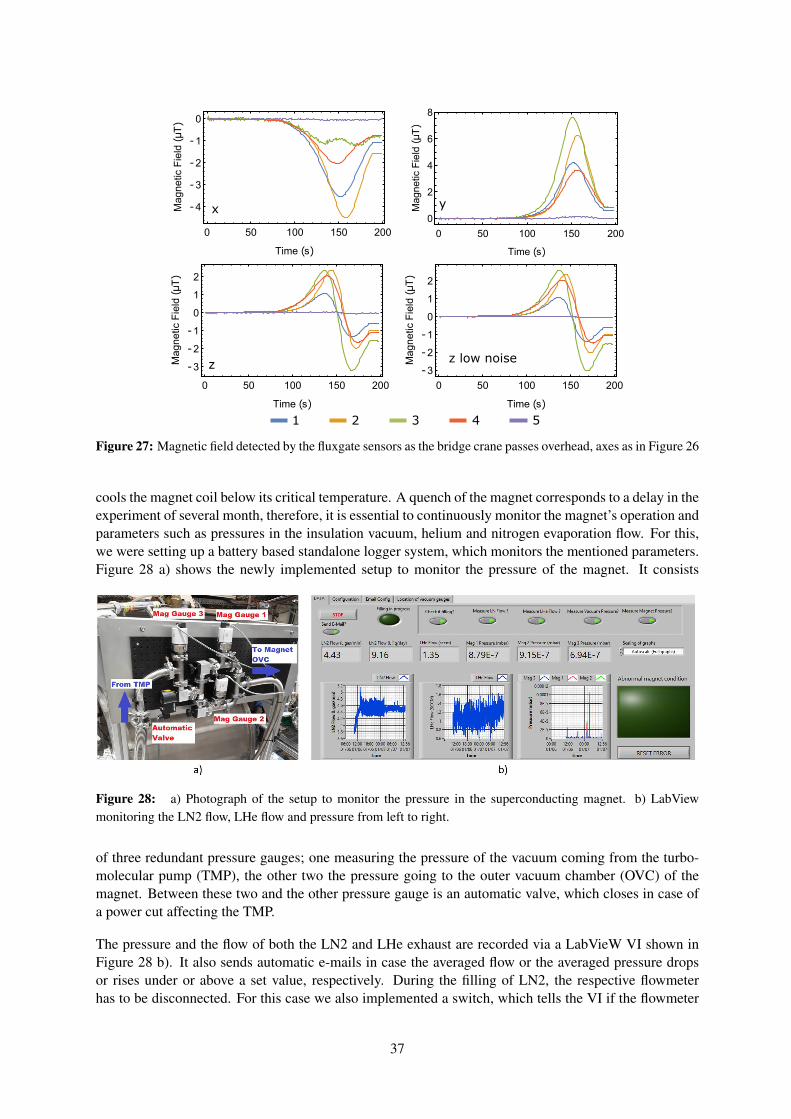
0 50 100 150 200
-3
-2
-1
0
1
2
Time (s)MagneticField
(μT)
0 50 100 150 200
-3
-2
-1
0
1
2
Time (s)
MagneticField
(μT)
0 50 100 150 200
-4
-3
-2
-1
0
Time (s)
MagneticField
(μT)
0 50 100 150 200
0
2
4
6
8
Time (s)
MagneticField
(μT)
x y
z z low noise
1 2 3 4 5
Figure 27: Magnetic field detected by the fluxgate sensors as the bridge crane passes overhead, axes as in Figure 26
cools the magnet coil below its critical temperature. A quench of the magnet corresponds to a delay in theexperiment of several month, therefore, it is essential to continuously monitor the magnet’s operation andparameters such as pressures in the insulation vacuum, helium and nitrogen evaporation flow. For this,we were setting up a battery based standalone logger system, which monitors the mentioned parameters.Figure 28 a) shows the newly implemented setup to monitor the pressure of the magnet. It consists
Figure 28: a) Photograph of the setup to monitor the pressure in the superconducting magnet. b) LabViewmonitoring the LN2 flow, LHe flow and pressure from left to right.
of three redundant pressure gauges; one measuring the pressure of the vacuum coming from the turbo-molecular pump (TMP), the other two the pressure going to the outer vacuum chamber (OVC) of themagnet. Between these two and the other pressure gauge is an automatic valve, which closes in case ofa power cut affecting the TMP.
The pressure and the flow of both the LN2 and LHe exhaust are recorded via a LabVieW VI shown inFigure 28 b). It also sends automatic e-mails in case the averaged flow or the averaged pressure dropsor rises under or above a set value, respectively. During the filling of LN2, the respective flowmeterhas to be disconnected. For this case we also implemented a switch, which tells the VI if the flowmeter
37
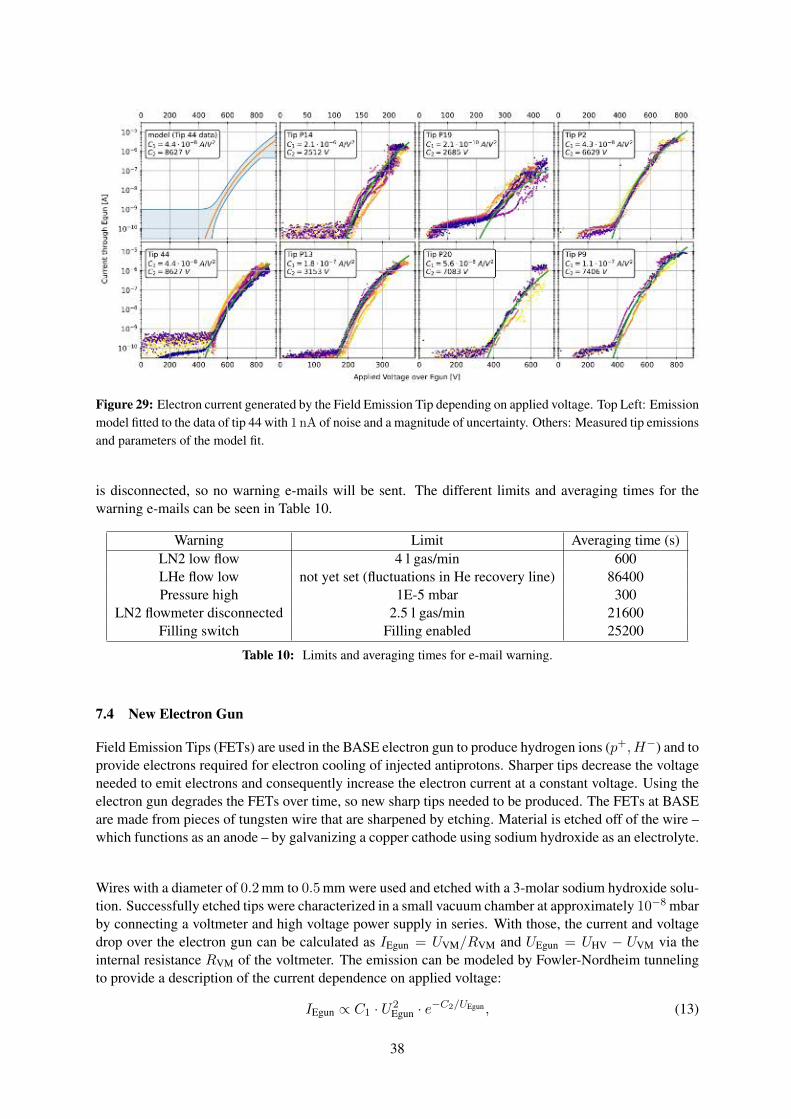
Figure 29: Electron current generated by the Field Emission Tip depending on applied voltage. Top Left: Emissionmodel fitted to the data of tip 44 with 1 nA of noise and a magnitude of uncertainty. Others: Measured tip emissionsand parameters of the model fit.
is disconnected, so no warning e-mails will be sent. The different limits and averaging times for thewarning e-mails can be seen in Table 10.
Warning Limit Averaging time (s)LN2 low flow 4 l gas/min 600LHe flow low not yet set (fluctuations in He recovery line) 86400Pressure high 1E-5 mbar 300
LN2 flowmeter disconnected 2.5 l gas/min 21600Filling switch Filling enabled 25200
Table 10: Limits and averaging times for e-mail warning.
7.4 New Electron Gun
Field Emission Tips (FETs) are used in the BASE electron gun to produce hydrogen ions (p+, H−) and toprovide electrons required for electron cooling of injected antiprotons. Sharper tips decrease the voltageneeded to emit electrons and consequently increase the electron current at a constant voltage. Using theelectron gun degrades the FETs over time, so new sharp tips needed to be produced. The FETs at BASEare made from pieces of tungsten wire that are sharpened by etching. Material is etched off of the wire –which functions as an anode – by galvanizing a copper cathode using sodium hydroxide as an electrolyte.
Wires with a diameter of 0.2mm to 0.5mm were used and etched with a 3-molar sodium hydroxide solu-tion. Successfully etched tips were characterized in a small vacuum chamber at approximately 10−8 mbarby connecting a voltmeter and high voltage power supply in series. With those, the current and voltagedrop over the electron gun can be calculated as IEgun = UVM/RVM and UEgun = UHV − UVM via theinternal resistance RVM of the voltmeter. The emission can be modeled by Fowler-Nordheim tunnelingto provide a description of the current dependence on applied voltage:
IEgun ∝ C1 · U2Egun · e−C2/UEgun , (13)
38
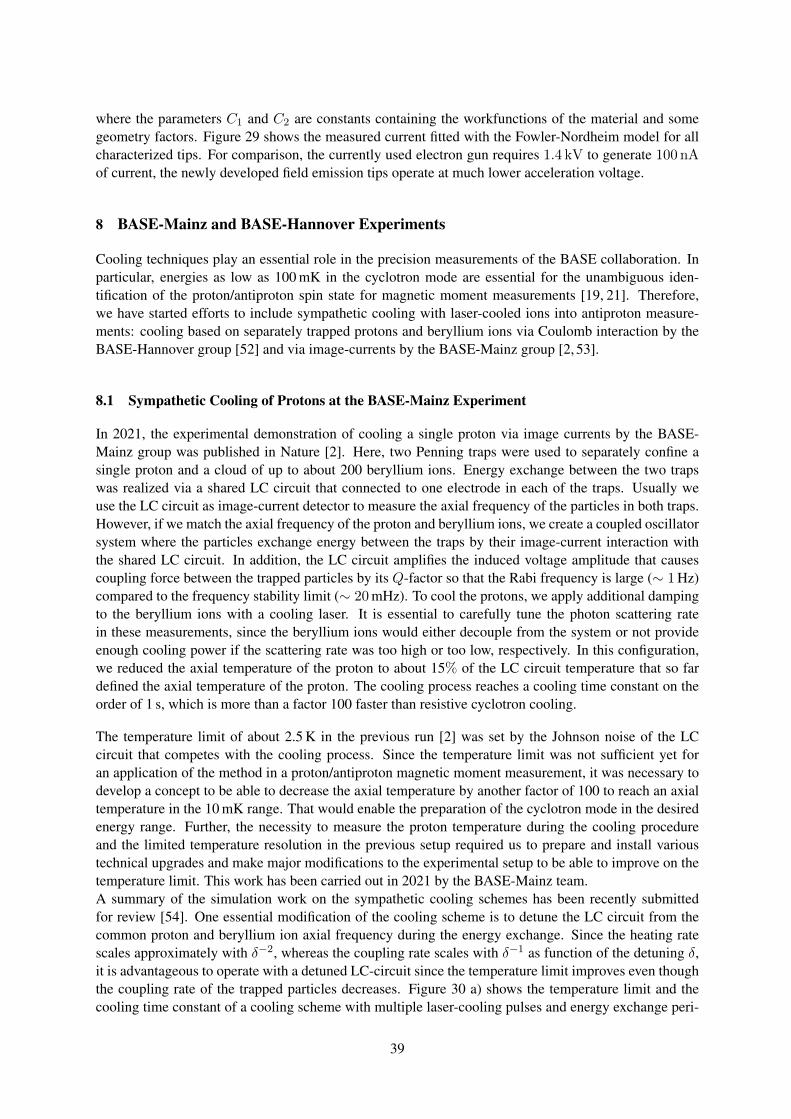
where the parameters C1 and C2 are constants containing the workfunctions of the material and somegeometry factors. Figure 29 shows the measured current fitted with the Fowler-Nordheim model for allcharacterized tips. For comparison, the currently used electron gun requires 1.4 kV to generate 100 nAof current, the newly developed field emission tips operate at much lower acceleration voltage.
8 BASE-Mainz and BASE-Hannover Experiments
Cooling techniques play an essential role in the precision measurements of the BASE collaboration. Inparticular, energies as low as 100 mK in the cyclotron mode are essential for the unambiguous iden-tification of the proton/antiproton spin state for magnetic moment measurements [19, 21]. Therefore,we have started efforts to include sympathetic cooling with laser-cooled ions into antiproton measure-ments: cooling based on separately trapped protons and beryllium ions via Coulomb interaction by theBASE-Hannover group [52] and via image-currents by the BASE-Mainz group [2, 53].
8.1 Sympathetic Cooling of Protons at the BASE-Mainz Experiment
In 2021, the experimental demonstration of cooling a single proton via image currents by the BASE-Mainz group was published in Nature [2]. Here, two Penning traps were used to separately confine asingle proton and a cloud of up to about 200 beryllium ions. Energy exchange between the two trapswas realized via a shared LC circuit that connected to one electrode in each of the traps. Usually weuse the LC circuit as image-current detector to measure the axial frequency of the particles in both traps.However, if we match the axial frequency of the proton and beryllium ions, we create a coupled oscillatorsystem where the particles exchange energy between the traps by their image-current interaction withthe shared LC circuit. In addition, the LC circuit amplifies the induced voltage amplitude that causescoupling force between the trapped particles by its Q-factor so that the Rabi frequency is large (∼ 1Hz)compared to the frequency stability limit (∼ 20mHz). To cool the protons, we apply additional dampingto the beryllium ions with a cooling laser. It is essential to carefully tune the photon scattering ratein these measurements, since the beryllium ions would either decouple from the system or not provideenough cooling power if the scattering rate was too high or too low, respectively. In this configuration,we reduced the axial temperature of the proton to about 15% of the LC circuit temperature that so fardefined the axial temperature of the proton. The cooling process reaches a cooling time constant on theorder of 1 s, which is more than a factor 100 faster than resistive cyclotron cooling.
The temperature limit of about 2.5 K in the previous run [2] was set by the Johnson noise of the LCcircuit that competes with the cooling process. Since the temperature limit was not sufficient yet foran application of the method in a proton/antiproton magnetic moment measurement, it was necessary todevelop a concept to be able to decrease the axial temperature by another factor of 100 to reach an axialtemperature in the 10 mK range. That would enable the preparation of the cyclotron mode in the desiredenergy range. Further, the necessity to measure the proton temperature during the cooling procedureand the limited temperature resolution in the previous setup required us to prepare and install varioustechnical upgrades and make major modifications to the experimental setup to be able to improve on thetemperature limit. This work has been carried out in 2021 by the BASE-Mainz team.A summary of the simulation work on the sympathetic cooling schemes has been recently submittedfor review [54]. One essential modification of the cooling scheme is to detune the LC circuit from thecommon proton and beryllium ion axial frequency during the energy exchange. Since the heating ratescales approximately with δ−2, whereas the coupling rate scales with δ−1 as function of the detuning δ,it is advantageous to operate with a detuned LC-circuit since the temperature limit improves even thoughthe coupling rate of the trapped particles decreases. Figure 30 a) shows the temperature limit and thecooling time constant of a cooling scheme with multiple laser-cooling pulses and energy exchange peri-
39
a)
0.0
2.5
5.0
7.5
10.0
0
10
20
30
40
8 10 12 14 16 18 20
Resonator detuning δνres(kHz)
τ (s
)
Tp,m
in (mK
)
Cooling time constantLower limit
b)
441600 442000 442400 442800
frequency (Hz)
-95
-90
-85
-80
-75
ampl
itude
(dB
m)
BT CT resonator
datafit
Figure 30: a) Simulation results of cooling a single proton with beryllium ions via a detuned LC-circuit. Thecooling time and the temperature limit are shown as function of the detuning from the LC circuit frequency.Details are found in ref. [54]. b) FFT spectrum of the improved image-current detection system of the berylliumtrap and the coupling trap, illustrating the improved Q-factor necessary to explore the 10 mK range in proton axialtemperature.
ods between the coupled trapped particles as function of the frequency detuning of the common particlefrequency from the one of the LC circuit. It is possible to reach 10 mK using a detuning of about 300 to600 LC circuit linewidths.The installation of the technical upgrades has been completed and the experiment was cooled down atthe end of the year with the goal to demonstrate cooling in the 10 mK range in 2022. To this end, anew trap stack consisting of six Penning traps was assembled. Compared to the previous trap system,a dedicated temperature measurement trap was added that includes an about 10-fold weaker magneticbottle compared to the spin-flip analysis trap. This provides faster temperature measurements with about10 mK resolution and requires less time in commissioning. Further, a new loading trap for proton andberyllium ions was installed that enables the production of protons and beryllium ions from two separatelaser ablation targets. Thereby, the two particle species are produced with a lower amount of contamin-ation which reduces the trap reloading time. Of particular importance here is that the trap geometry hasno direct line of sight between the targets and the neighbouring traps, so that loading ions does not causepotential shifts in the other traps by material deposition on the trap surfaces. These upgrades will avoidmany technical difficulties encountered in the operation of the previous trap system. Another essentialupgrade was the improvement of the image-current detection systems to higher Q-factors. In particu-lar, the Q-factor of the coupling trap needed to be improved to reduce the temperature limit in the newcoupling procedure. To this end, the detectors and the trap system were tested in a cold head installationwithout magnetic field, where all components that potentially affect the Q-factor of the LC circuit wereimproved until a Q value of 20 000 was reached. The operation in the magnetic field reduces the Q-factorto 12 000, see Figure 30 b), which is a factor 6 improvement compared to the previous run and will sufficeto explore the 10 mK range. The optimization work includes also the installation of a loss-free tunablecapacity that shifts the LC circuit frequency by up to 20 kHz using a commercial cryogenic piezo-motor,which was not available in the last run and is essential to reach a lower temperature.We expect to observe coherent energy exchange between the proton and beryllium axial amplitudes, andexplore the temperature range down to the 10 mK range in the year 2022. If successful, we expect thatthe technique will be sufficiently developed to be applied in the next proton magnetic moment measure-ment in the BASE-Mainz trap system, and with a revised trap system with laser access, also in futureantiproton measurements of the BASE collaboration at CERN.
40
8.2 Summary BASE Hannover 2020
At the BASE Hannover experiment, we are working on an experimental method inspired by quantumlogic techniques that could improve particle localization and readout speed. The method allows for sym-pathetic cooling of the (anti-)proton to its quantum-mechanical ground state as well as the readout of itsspin alignment. Both of these features are achieved through coupling to a laser-cooled ‘logic’ ion whichis co-trapped in a double-well potential. This technique is similar to the BASE-Mainz experiment insome aspects but will provide much higher coupling rates and enables more sensitive particle manipula-tion schemes due to the used double-well potential. This will boost the measurement sampling rate byorders of magnitude and will thus provide results with a lower statistical error and could contribute to astringent search for sidereal variations in the data. Such measurements ultimately yield extremely highsensitivities to many baryonic coefficients in the Standard-Model Extension [40] and allow the explora-tion of previously unmeasured types of symmetry violations. In 2021, we have published a full proposalon the implementation and implications of sympathetic laser cooling and quantum logic spectroscopyfor precision spectroscopy on single (anti-)protons [55]. We have used the novel 140 GHz Raman lasersystem to observe spin-flip transitions in a cloud of trapped 9Be+ ions. By implementing a wave vectordifference of both phase-coherent 140 GHz split UV laser beams along the axial direction of the trap,we have been able to perform thermometry on the cloud and obtain an axial temperature of 1.77 mK asa result of Doppler cooling [56]. We have significantly improved the control over single ions and havebeen able to observe spin-motional sideband transitions that add or substract one quantum of axial mo-tion while flipping the spin of the ion. In combination with spin-resetting resonant repumping transitions,this has allowed the realization of sideband cooling to the absolute motional ground state of the axial mo-tion. To our knowledge, we are only the third group worldwide achieving optical sideband cooling to themotional ground state in a Penning trap. Furthermore, we have been able to use both Doppler-recoolingand Raman spectroscopy to characterize motional excitation during ion transport and have, at the levelof sensititivity, not found any transport-induced motional heating yet.
9 Summary on Experimental Progress
We have summarized the progress made by the BASE collaboration in 2021. While several manuscriptsin visible scientific journals were produced, which were summarized in this report, the team producedconsiderable progress with:
– The development of a broad band high-Q superconducting detector which will increase the band-width of future BASE efforts to search for axions by more than a factor of 1000 in bandwidth andat improved detection sensitivity.
– The successful setup of an interface which connects BASE to ELENA. We have demonstrated thatthe interface allows sufficient transmission in a foil range with a width thickness of about 1760 nm.The currently used foil is able to hold the vacuum to provide conditions sufficient to store singleantiprotons for > 3months. With the reservoir trap which usually stores up to 1000 particlescontinuous experiment operation during accelerator shutdown periods will be possible.
– The newly developed 4 trap system is performing very well. The superconducting particle detect-ors were commissioned successfully, all the devices have sufficient detection sensitivity to conductefficient single particle experiments. Transport through the entire trap stack was demonstrated andsingle particle signals were observed in all traps that are required for the planned magnetic momentmeasurements. The newly implemented superconducting shim coil system was commissionedsuccessfully. While the less important B1 coil requires one additional more iteration, the B2 coiltuning range is sufficient to tune B2 ≈ 0, which will eliminate the dominant systematic uncer-tainty of the previous magnetic moment measurement and will allow for a new class of systematic
41
studies.
10 Projects for the 2022 run
Continued commissioning of an experiment to measure the antiproton magnetic moment with a fractionalprecision of ≈ 100 p.p.t.
11 Funding
BASE is supported by the RIKEN chief scientist program (Ulmer), the RIKEN pioneering project pro-gram (Ulmer/Yamazaki), the RIKEN SPDR (Wursten, Latacz) and JRA (Fleck) programs, an ERC start-ing grant for the implementation of quantum logic methods (Ospelkaus), and an ERC starting grant forthe implementation of the transportable trap (Smorra). In addition, several of the BASE co-workers aresupported by fellowships. The collaborating institutes (MPI-K, Univ. Hannover/PTB, ETH Zuerich, andUniv. Mainz) contribute funding for and supervision of the BASE PhD-students (Blaum / Walz / Os-pelkaus / Quint / Soter).Currently the collaboration funding is secured, further details on available research funds can be presen-ted on request.
12 Collaboration and Manpower
We are happy to welcome ETH Zuerich as a new collaborating institute (Prof. Dr. Anna Soter). With thisnew collaboration member BASE consists now of 10 collaborating institutes and universities which sendstudents and post docs to operate the CERN experiment. The CERN experiment is typically operated by
– RIKEN: 1 P.I., two post docs, students which are usually supported by RIKEN’s junior scientistprograms (JRA, SPDR, FPR) and students from international joined programs. Due to the restrict-ive COVID policy of the Japanese government manpower-supply from Japan is currently reduced.In addition some BASE post-docs are expected to spend in 2022 extended time periods in Japan,which will potentially affect the operation of the 2022 antiproton run.
– MPIK: two PhD students or one post doc, one PhD student.– LU-Hannover / PTB: one PhD student / MA and BA students (typically 2).– University of Tokyo: under discussion (see COVID policy of Japan).– JG-Mainz / HIM Mainz: 1 PhD or MA student.– GSI: 1 MA student.– CERN: Currently CERN supports BASE via one PhD student (Gentner Program, Jaeger), one
fellow (Micke), and one LD position (Devlin).The current manpower-availability is sufficient to secure the operation of the BASE-CERN experimentin the AD hall.The BASE collaboration partners will secure continued operation of the BASE experiments under com-parable conditions as described above.
13 Explicit Requests
In 2022 BASE will be expanded by the second experiment BASE-STEP. The STEP team will send upto three persons permanently to CERN, office space for these three persons is required. Although in
42
the office building 545 two offices are practically not in use and we were asking to allocate one ofthese offices to BASE, no communication was possible with the responsible group at CERN. We askour referees to support our request to get one of the available offices in building 545 with considerablemomentum.
14 Acknowledgments
We would like to thank the committee and our reviewers for the invaluable time invested to evaluate thisreport. We acknowledge technical support of the Antiproton Decelerator group, CERN’s cryolab team,and all other CERN groups which provide support to Antiproton Decelerator experiments.We would like to thank the other AD collaborations for many fruitful discussions, continuous support,friendship and the inspiring coexistence at CERN’s antiproton decelerator facility.We would like to explicitly express our empathic gratitude to CERN for promoting the BASE technicalcoordinator Jack A. Devlin to one of the highly competitve LD positions!We acknowledge financial support by RIKEN’s Chief Scientist Program, RIKEN Pioneering ProjectFunding (EEE), the RIKEN-JRA Program, the RIKEN-FPR Program, the Max-Planck Society, CERN’sfellowship program, CERN’s Gentner Program, the Helmholtz-Gemeinschaft, the DFG through SFB1227 ‘DQ-mat’ (grant ID 274200144), the European Research Council (ERC) (Grant agreement No. 852818,No. 337154 and No. 832848 ), and the Max-Planck–RIKEN–PTB Center for Time, Constants and Fun-damental Symmetries,
Bibliography
[1] J. A. Devlin et al., Physical Review Letters 126, 041301 (2021).[2] M. Bohman et al., Nature 596, 514 (2021).[3] M. J. Borchert et al., Nature 601, 53 (2022).[4] S. Depanfilis et al., Physical Review Letters 59, 839 (1987).[5] S. Ulmer, First observations of spin flips with a single trapped proton, PhD thesis, Univ. Heidelberg,
2011.[6] S. Ulmer et al., Nature 524, 196 (2015).[7] R. Lehnert, Symmetry 8, 114 (2016).[8] S. Ulmer et al., Physical Review Letters 106, 253001 (2011).[9] C. Smorra et al., International Journal of Mass Spectrometry 389, 10 (2015).
[10] C. Smorra et al., The European Physical Journal Special Topics 224, 3055 (2015).[11] S. Ulmer et al., Review of Scientific Instruments 80, 123302 (2009).[12] S. Ulmer et al., Nuclear Instruments and Methods in Physics Research Section A 705, 55 (2013).[13] H. Nagahama et al., Review of Scientific Instruments 87, 113305 (2016).[14] J. DiSciacca et al., Physical Review Letters 110, 130801 (2013).[15] H. Nagahama et al., Nature communications 8, 1 (2017).[16] C. Smorra et al., Physics Letters B 769, 1 (2017).[17] S. Sellner et al., New Journal of Physics 19, 083023 (2017).[18] S. Ulmer, A. Mooser, H. Nagahama, S. Sellner, and C. Smorra, Philosophical Transactions of the
Royal Society A: Mathematical, Physical and Engineering Sciences 376, 20170275 (2018).[19] C. Smorra et al., Nature 550, 371 (2017).[20] A. Mooser et al., Nature 509, 596 (2014).[21] G. Schneider et al., Science 358, 1081 (2017).
43
[22] M. Borchert et al., Physical Review Letters 122, 043201 (2019).[23] J. A. Devlin et al., Physical Review Applied 12, 044012 (2019).[24] C. Smorra et al., Nature 575, 310 (2019).[25] S. Ulmer et al., Future Program of the BASE Experiment at the Antiproton Decelerator of CERN,
Technical report, CERN, Geneva, 2019.[26] G. Gabrielse and J. Tan, Journal of Applied Physics 63, 5143 (1988).[27] F. Heiße et al., Physical Review Letters 119, 033001 (2017).[28] G. Gabrielse et al., Physical Review Letters 82, 3198 (1999).[29] E. G. Myers, International Journal of Mass Spectrometry 349, 107 (2013).[30] M. Charlton, S. Eriksson, and G. Shore, Testing fundamental physics in antihydrogen experiments,
Preprint at https://arxiv.org/abs/2002.09348, 2020.[31] R. J. Hughes and M. H. Holzscheiter, Physical Review Letters 66, 854 (1991).[32] R. J. Hughes, Physical Review D 41, 2367 (1990).[33] I. Kenyon, Physics Letters B 237, 274 (1990).[34] C. Tchernin, E. T. Lau, S. Stapelberg, D. Hug, and M. Bartelmann, Astronomy and Astrophysics
644, A126 (2020).[35] G. Chardin and G. Manfredi, Hyperfine Interactions 239, 1 (2018).[36] K. Abe et al., Physical Review D 95, 012004 (2017).[37] P. Perez and Y. Sacquin, Classical and Quantum Gravity 29, 184008 (2012).[38] W. A. Bertsche, Philosophical Transactions of the Royal Society A: Mathematical, Physical and
Engineering Sciences 376, 20170265 (2018).[39] P. Scampoli and J. Storey, Modern Physics Letters A 29, 1430017 (2014).[40] V. A. Kostelecky and N. Russell, Reviews of Modern Physics 83, 11 (2011).[41] Y. Ding and M. F. Rawnak, Physical Review D 102, 056009 (2020).[42] C. Smorra et al., Technical Design Report of BASE-STEP, Technical report, CERN, Geneva, 2021.[43] F. Volksen, Bachelor Thesis, PhD thesis, 2021.[44] H. Häffner et al., The European Physical Journal D-Atomic, Molecular, Optical and Plasma Physics
22, 163 (2003).[45] M. Borchert, Challenging the standard model by high-precision comparisons of the fundamental
properties of protons and antiprotons, PhD thesis, Leibniz University of Hannover, 2020.[46] W. Hassenzahl and W. Gray, Cryogenics 15, 627 (1975).[47] J. Engel et al., AIP Advances 10, 025224 (2020).[48] S. P. Møller et al., Physical Review Letters 88, 193201 (2002).[49] Stefan Mayer Instruments, Magnetic Field Sensor FLC3-70.[50] Stefan Mayer Instruments, Fluxgate Sensor FL1-100.[51] A. L. Ponten, BASE Data Logger, Technical report, 2019.[52] M. Niemann et al., Measurement Science and Technology 31, 035003 (2019).[53] M. Bohman et al., Journal of Modern Optics 65, 568 (2018).[54] C. Will et al., Sympathetic cooling schemes for separately trapped ions coupled via image currents,
2021, arXiv/2112.04818.[55] J. M. Cornejo et al., New Journal of Physics 23, 073045 (2021), Publisher: IOP Publishing.[56] J. Mielke et al., Journal of Physics B 54, 195402 (2021), Publisher: IOP Publishing.
44