audited financial statements for the year
TRANSCRIPT
AUDITED FINANCIAL STATEMENTS FOR THE YEAR ENDED 31 DECEMBER 2021
A75/33 SEVENTY-FIFTH WORLD HEALTH ASSEMBLY
Provisional agenda item 22.1 13 May 2022


Table of contents
Financial statements at a glance 2
Director-General’s summary 4
2021 Statement of Internal Control 18
Certification of financial statements for the year ended 31 December 2021 22
Opinion of the External Auditor 23
Independent Auditor’s report 25
Financial statements 28
Statement I. Statement of Financial Position 28
Statement II. Statement of Financial Performance 29
Statement III. Statement of Changes in Net Assets/Equity 30
Statement IV. Statement of Cash Flow 31
Statement V. Statement of Comparison of Budget and Actual Amounts 32
1. Notes to the financial statements 33
2. Significant accounting policies 34
3. Note on the restatement/reclassification of balances 44
4. Supporting information to the Statement of Financial Position 45
5. Supporting information to the Statement of Financial Performance 68
6. Supporting information to the Statement of Changes in Net Assets/Equity 73
7. Supporting information to the Statement of Comparison of Budget and Actual Amounts 79
8. Segment reporting 81
9. Amounts written-off and ex-gratia payments 83
10. Related party and other senior management disclosures 83
11. Events after the reporting date 84
12. Contingent liabilities, commitments and contingent assets 84
Schedule I. Statement of Financial Performance by major funds 85
Schedule II. Expenses by major office - General Fund only 86
Schedule III. Financial overview – all funds, 2020–2021, 2018–2019 and 2016–2017 87
A75/33
1

Financial Statements 2021 at a Glance
Revenue
2021: US$ 4066 m 2020: US$ 4299 m
Assets
2021: US$ 7214 m 2020: US$ 7137m
Expenses
2021: US$ 3718 m 2020: US$ 3561 m
Liabilities
2021: US$ 3807 m 2020: US$ 4547 m
Surplus / (deficit)1
2021: US$ 351 m 2020: US$ 824 m
1 Includes Finance Revenue (2021: US$ 3m, 2020: US$ 86m)
Net assets/equity
2021: US$ 3407 m 2020: $2590 m
351
2590
466
Staff related Opening Net Assets
Inter-entity Surplus/(deficit)
Other Other adjustments
BorrowingFinancial Assets
Fixed assets
Receivables
Other Deferred and advance contributions
5015
235
1671
293
798
1480
973
383173
184 5
3333 353
549
1330 497
1185410
186
7819 13
(7)
Non-Programme budget / other revenue
Voluntary contributions (PB)
Contractual services Medical supplies and materials
Staff costs Transfers and grants
Travel General operating expenses
Equipment, vehicles and furniture Depreciation and amortization
General fund
Member States - other
Fiduciary Fund
US$ 3718 million
US$ 3807 million
US$ 7214 million
Assessed contributions (PB)
2
A75/33
Financial Statements 2021 at a Glance
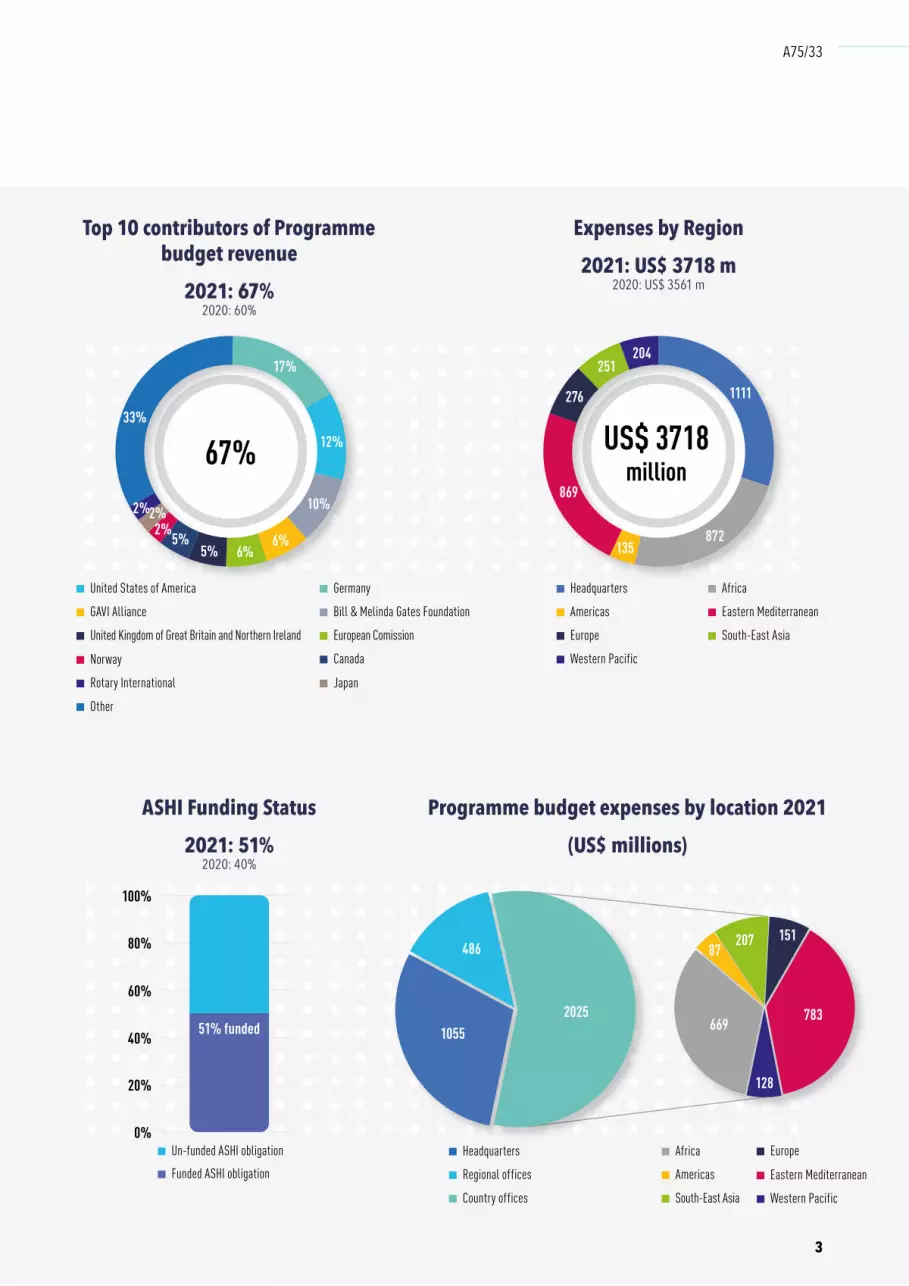
Programme budget expenses by location 2021
(US$ millions)
ASHI Funding Status
2021: 51% 2020: 40%
Top 10 contributors of Programme budget revenue
2021: 67% 2020: 60%
Expenses by Region
2021: US$ 3718 m 2020: US$ 3561 m
51% funded
Headquarters Africa
Americas Eastern Mediterranean
Europe South-East Asia
Western Pacific
Un-funded ASHI obligation
Funded ASHI obligation
GermanyUnited States of America
Bill & Melinda Gates FoundationGAVI Alliance
Norway
European Comission
Japan
United Kingdom of Great Britain and Northern Ireland
Rotary International
Canada
Headquarters Africa
Regional offices Americas
Country offices South-East Asia
Eastern Mediterranean
Western Pacific
Europe
33%
17%
1111
872
869
276
251204
135
12%
10%
6%6%5%
5%
2%2%2%
67% US$ 3718 million
0%
20%
40%
60%
80%
100%
1055
486
2025669
128
783
15120787
Other
3
A75/33
Director-General’s summary
The past year was not one that we, or anyone, could have predicted. For many it has been a time of great hardship and loss. Since declaring a public health emergency of international concern over the spread of Coronavirus disease (COVID-19), WHO has worked tirelessly with Member States and the wider community to overcome the ongoing challenges of responding to COVID-19, addressing inequities, and plotting a course out of the pandemic.
In addition, WHO responded to 75 other health emergencies in 2021, from acute crises in Afghanistan, the Democratic Republic of the Congo, Ethiopia and Guinea, as well as outbreaks of Ebola virus disease, yellow fever, Marburg virus disease, and meningitis, and continued to provide support in the protracted emergencies in South Sudan, Syrian Arab Republic, and Yemen.
Current estimates suggest that we will get close to our “triple billion” target to see one billion more people better protected from health emergencies. But the pandemic has shown that we need to be much more ambitious, be better prepared, and improve the way we measure protection against health emergencies.
The pandemic has caused severe disruption to health systems, economies and societies the world over, and has hampered our shared work in achieving the goals of the Thirteenth General Programme of Work (GPW13). For that reason, the two-year extension of the GPW13 to 2025 recommended by the Executive Board, provides us all a chance to get back on track, apply the lessons learned from the pandemic, intensify investments and accelerate progress.
Below you will find an outline of the major financial highlights while details of the achievements in terms of results are set out in the WHO Results Report (document A75/32) which is data driven, results-oriented and country-focused, and firmly grounded in the Sustainable Development Goals.
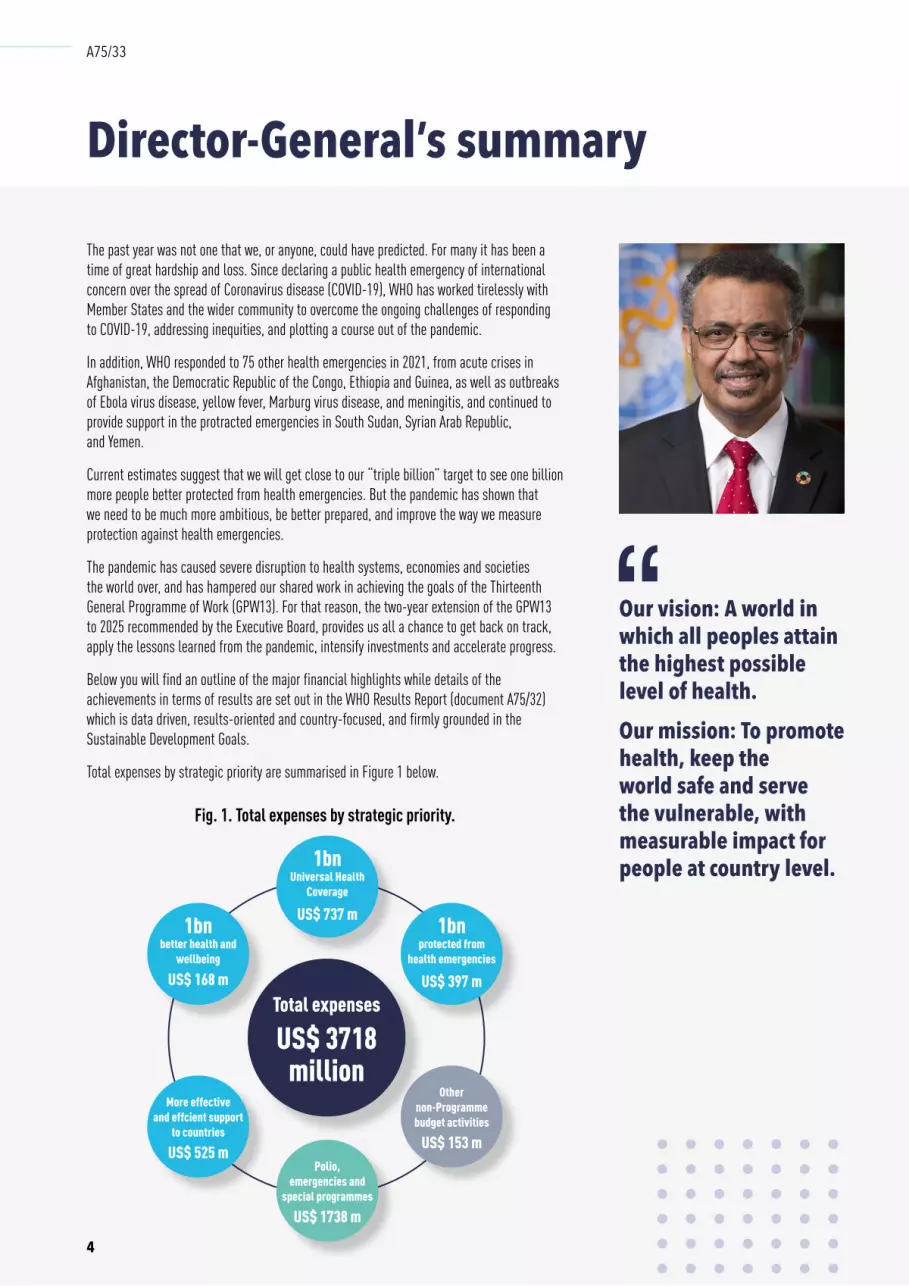
Total expenses by strategic priority are summarised in Figure 1 below.
Fig. 1. Total expenses by strategic priority.
1bn Universal Health
Coverage
US$ 737 m
More effective and effcient support
to countries
US$ 525 m
1bn better health and
wellbeing
US$ 168 m
1bn protected from
health emergencies
US$ 397 m
Other non-Programme budget activities
US$ 153 mPolio,
emergencies and special programmes
US$ 1738 m
Total expenses
US$ 3718 million
Our vision: A world in which all peoples attain the highest possible level of health.
Our mission: To promote health, keep the world safe and serve the vulnerable, with measurable impact for people at country level.
4
A75/33

Increasing our presence on the front line
WHO operates globally, and an increasing proportion of costs are incurred in country offices, at the front line of WHO service delivery. In 2021, US$ 2039 million (55%) of total expenses were incurred in country operations (Fig. 2), an increase of US$ 203 million (11%) over 2020, mainly in delivering the base segment of the Programme budget.
Total expenses for declared emergencies stood at US$ 1214 million, of which an amount of US$ 814 million was related to COVID-19 work.
Maintaining control
In its role as the custodian of Member States’ and donors’ contributions, WHO maintains an effective internal control environment across the Organization. A detailed statement of internal control is included in this report.
Fig. 2. 2020 and 2021 total expenses by location in US$ millions.
Our staff have risen to the challenge of providing practical assistance, innovating at speed across all levels of the Organization.
Headquarters 1172
Headquarters 1111
Regional offices 553
Regional offices 568
Country offices 1836
Country offices 2039
2020 2021
5
A75/33

In 2021, total revenue was US$ 4066 million, and expenses were US$ 3718 million, a reduction of US$ 233 million and an increase of US$ 157 million respectively compared to 2020. This resulted in a net surplus of US$ 351 million, which was US$ 484 million lower than in 2020 (Fig. 3).
This includes US$ 970 million of revenue and US$ 814 million of expenses in respect of the COVID-19 pandemic response work, representing over one fifth of the total figures.
FINANCIAL PERFORMANCE
Revenue
Continued support from Member States and donors
During this difficult time, Member States and donors rallied to provide their generous support and trust. Total revenue reached US$ 4066 million; the second-highest level ever after 2020. This funding made it possible to deliver WHO’s highest programme implementation ever.
Of the total revenue of US$ 4066 million, US$ 3365 (83%) came from voluntary contributions with US$ 3333 million funding the Programme budget.
Total Programme budget voluntary contribution revenue has increased by 58% from 2017 to 2021, to help finance WHO’s growing programme of work. Of the US$ 3333 million voluntary contributions in 2021, US$ 464 million (14%) was fully flexible or thematic (designated to
Fig. 3. Summarized financial performance 2017-2021 (US$ millions).
1000
2000
3000
4000
5000
2017 2018 2019 2020 2021Total revenue Total expenditure
47% increase2017-2021
39% increase2017-2021
In the 2020-21 biennium, WHO received its highest ever levels of contributions at US$ 8365 million, and delivered the highest ever levels of programme implementation of US$ 7279 million.
Total revenue in 2021
Reduction of US$ 233 million as compared to 2020
US$ 4066 million
26812500
3088
35613718
40664299
31162901
2775
6
A75/33
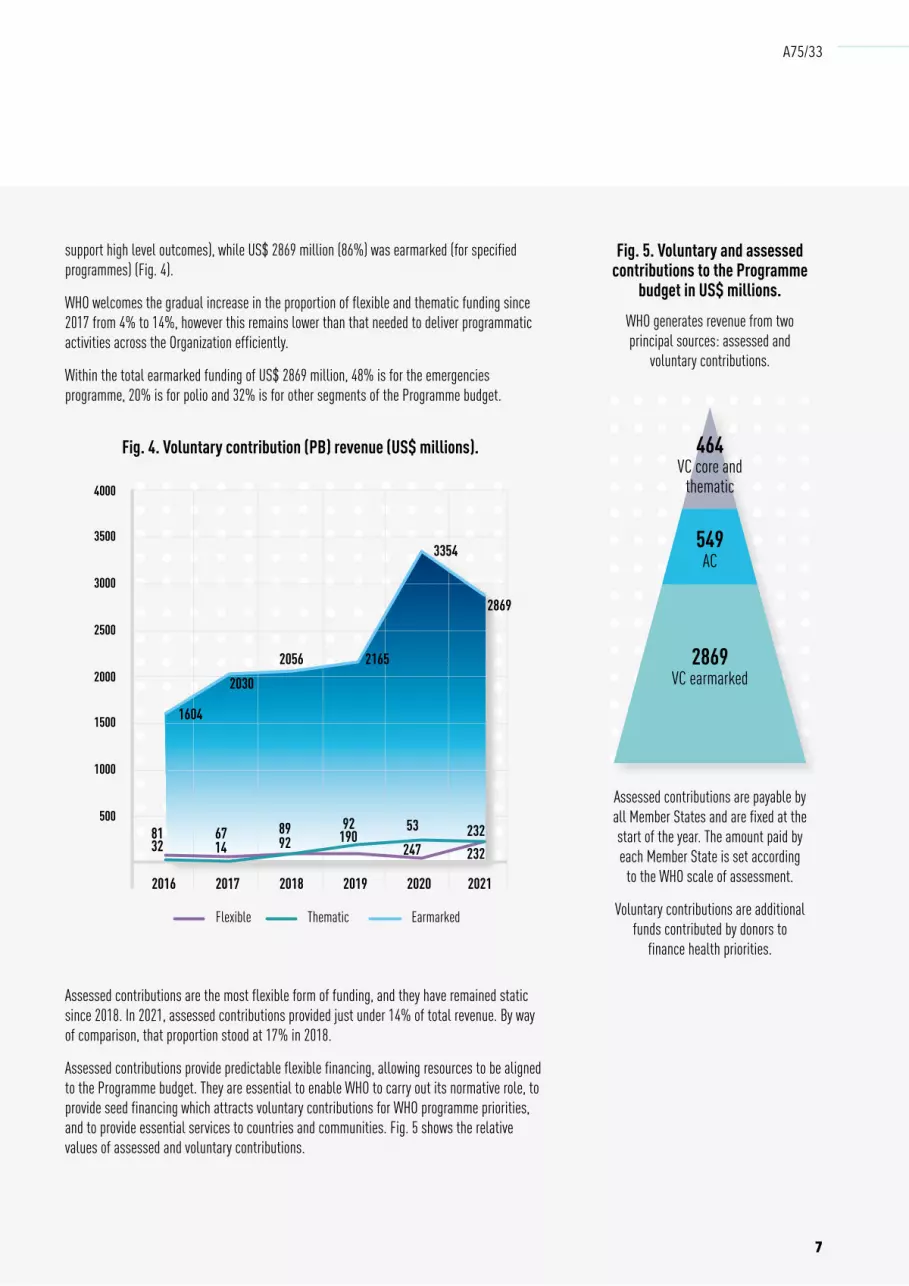
support high level outcomes), while US$ 2869 million (86%) was earmarked (for specified programmes) (Fig. 4).
WHO welcomes the gradual increase in the proportion of flexible and thematic funding since 2017 from 4% to 14%, however this remains lower than that needed to deliver programmatic activities across the Organization efficiently.
Within the total earmarked funding of US$ 2869 million, 48% is for the emergencies programme, 20% is for polio and 32% is for other segments of the Programme budget.
Assessed contributions are the most flexible form of funding, and they have remained static since 2018. In 2021, assessed contributions provided just under 14% of total revenue. By way of comparison, that proportion stood at 17% in 2018.
Assessed contributions provide predictable flexible financing, allowing resources to be aligned to the Programme budget. They are essential to enable WHO to carry out its normative role, to provide seed financing which attracts voluntary contributions for WHO programme priorities, and to provide essential services to countries and communities. Fig. 5 shows the relative values of assessed and voluntary contributions.
Fig. 4. Voluntary contribution (PB) revenue (US$ millions).
81 67 89 92 53 23232 14 92 190
247 232
1604
20302056 2165
3354
2869
500
1000
1500
2000
2500
3000
3500
4000
2016 2017 2018 2019 2020 2021
Flexible Thematic Earmarked
WHO generates revenue from two principal sources: assessed and
voluntary contributions.
Assessed contributions are payable by all Member States and are fixed at the start of the year. The amount paid by each Member State is set according
to the WHO scale of assessment.
Voluntary contributions are additional funds contributed by donors to
finance health priorities.
Fig. 5. Voluntary and assessed contributions to the Programme
budget in US$ millions.
464 VC core and
thematic
549 AC
2869 VC earmarked
7
A75/33
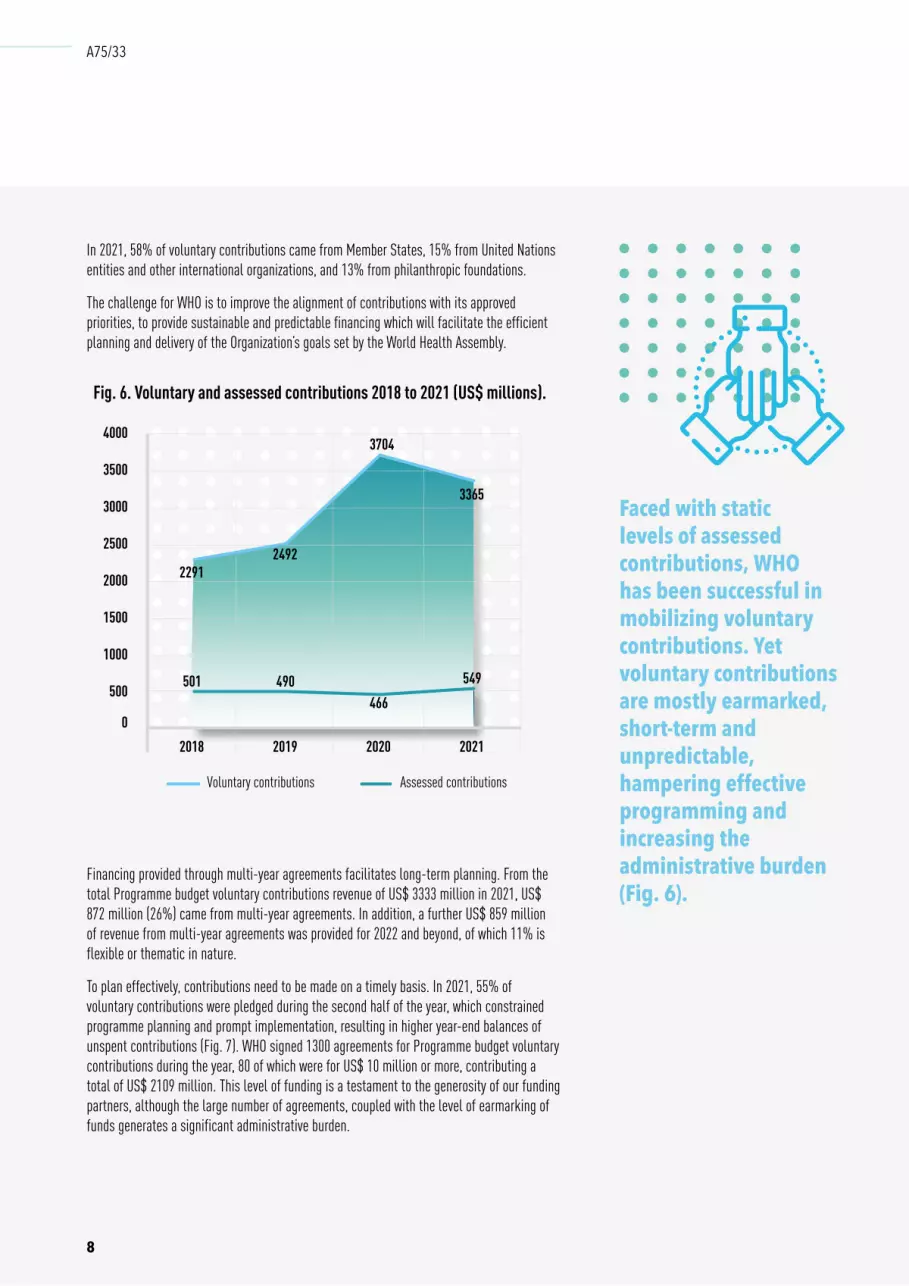
In 2021, 58% of voluntary contributions came from Member States, 15% from United Nations entities and other international organizations, and 13% from philanthropic foundations.
The challenge for WHO is to improve the alignment of contributions with its approved priorities, to provide sustainable and predictable financing which will facilitate the efficient planning and delivery of the Organization’s goals set by the World Health Assembly.
Financing provided through multi-year agreements facilitates long-term planning. From the total Programme budget voluntary contributions revenue of US$ 3333 million in 2021, US$ 872 million (26%) came from multi-year agreements. In addition, a further US$ 859 million of revenue from multi-year agreements was provided for 2022 and beyond, of which 11% is flexible or thematic in nature.
To plan effectively, contributions need to be made on a timely basis. In 2021, 55% of voluntary contributions were pledged during the second half of the year, which constrained programme planning and prompt implementation, resulting in higher year-end balances of unspent contributions (Fig. 7). WHO signed 1300 agreements for Programme budget voluntary contributions during the year, 80 of which were for US$ 10 million or more, contributing a total of US$ 2109 million. This level of funding is a testament to the generosity of our funding partners, although the large number of agreements, coupled with the level of earmarking of funds generates a significant administrative burden.
Fig. 6. Voluntary and assessed contributions 2018 to 2021 (US$ millions).
22912492
3704
3365
501 490466
549 500
0
1000
1500
2000
2500
3000
3500
4000
2018 2019 2020 2021
Voluntary contributions Assessed contributions
Faced with static levels of assessed contributions, WHO has been successful in mobilizing voluntary contributions. Yet voluntary contributions are mostly earmarked, short-term and unpredictable, hampering effective programming and increasing the administrative burden (Fig. 6).
8
A75/33

A broad donor base is key to sustainable financing, as it reduces the dependency on a small group of donors. In 2021 the top ten donors (Fig. 8) contributed US$ 2383 million (72%) of voluntary contributions (2020: 61%). Of this total US$ 268 million (11%) was for flexible or thematic funding, 45% was for emergencies and the remainder was earmarked for projects and partnerships.
There was also a concentration in the number of donors from countries where there are WHO programmes during 2021. US$ 83.6 million was received directly from 19 programme countries (2020: 23), and a further US$ 93.8 million came from 29 programme countries (2020: 40) funded through development banks loans and other financing partners.
Fig. 7. 2021 voluntary contribution revenue (PB) (US$ millions).
Fig. 8. Top 10 voluntary contributions (US$ millions).
636
886 921
893
600
650
700
750
800
850
900
950
Quarter 1 Quarter 2 Quarter 3 Quarter 4
Revenue
605 375
352245
222 181
161 85 82 75
Germany
Bill & Melinda Gates Foundation
United States of America
GAVI Alliance
European CommissionUnited Kingdom of Great Britain
and Northern IrelandCanada
Rotary International
NorwayUnited Nations Central Emergency
Response Fund (CERF)
9
A75/33
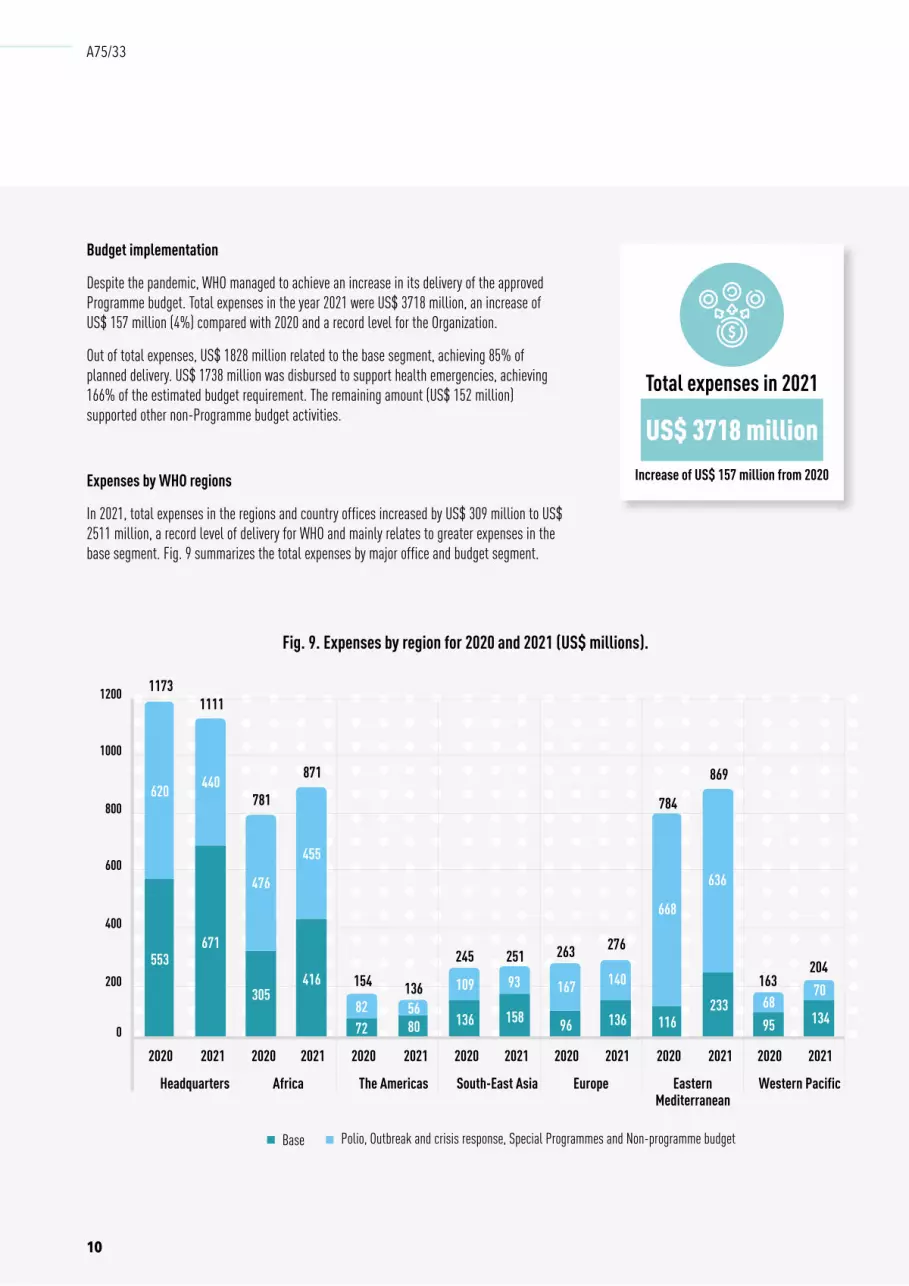
Budget implementation
Despite the pandemic, WHO managed to achieve an increase in its delivery of the approved Programme budget. Total expenses in the year 2021 were US$ 3718 million, an increase of US$ 157 million (4%) compared with 2020 and a record level for the Organization.
Out of total expenses, US$ 1828 million related to the base segment, achieving 85% of planned delivery. US$ 1738 million was disbursed to support health emergencies, achieving 166% of the estimated budget requirement. The remaining amount (US$ 152 million) supported other non-Programme budget activities.
Expenses by WHO regions
In 2021, total expenses in the regions and country offices increased by US$ 309 million to US$ 2511 million, a record level of delivery for WHO and mainly relates to greater expenses in the base segment. Fig. 9 summarizes the total expenses by major office and budget segment.
Fig. 9. Expenses by region for 2020 and 2021 (US$ millions).
553671
305416
72 80 136 158 96 136 116233
95
620 440
476
455
82 56109 93 167 140
668
636
6870
0
200
400
600
800
1000
1200
2020 2021 2020 2021 2020 2021 2020 2021 2020 2021 2020 2021 2020 2021
Headquarters Africa The Americas South-East Asia Europe EasternMediterranean
Western Pacific
US$ M
illion
s
Polio, Outbreak and crisis response, Special Programmes and Non-programme budgetBase
871
1111
136
251276
869
204
1173
781
154245 263
784
163
134
Total expenses in 2021
Increase of US$ 157 million from 2020
US$ 3718 million
10
A75/33
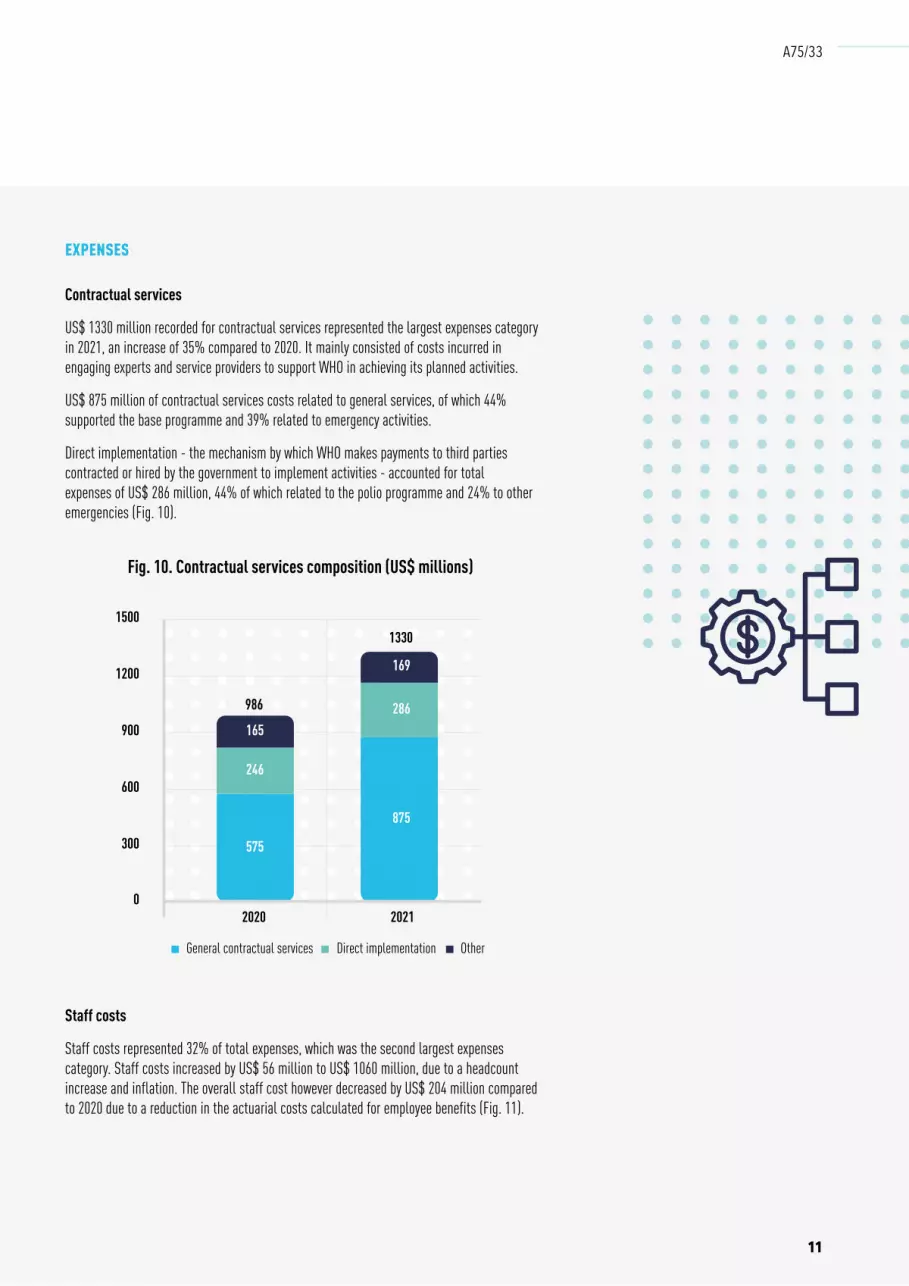
EXPENSES
Contractual services
US$ 1330 million recorded for contractual services represented the largest expenses category in 2021, an increase of 35% compared to 2020. It mainly consisted of costs incurred in engaging experts and service providers to support WHO in achieving its planned activities.
US$ 875 million of contractual services costs related to general services, of which 44% supported the base programme and 39% related to emergency activities.
Direct implementation - the mechanism by which WHO makes payments to third parties contracted or hired by the government to implement activities - accounted for total expenses of US$ 286 million, 44% of which related to the polio programme and 24% to other emergencies (Fig. 10).
Fig. 10. Contractual services composition (US$ millions)
575
875
246
286165
169
986
1330
300
0
600
900
1200
1500
2020 2021
General contractual services Direct implementation Other
Staff costs
Staff costs represented 32% of total expenses, which was the second largest expenses category. Staff costs increased by US$ 56 million to US$ 1060 million, due to a headcount increase and inflation. The overall staff cost however decreased by US$ 204 million compared to 2020 due to a reduction in the actuarial costs calculated for employee benefits (Fig. 11).
11
A75/33

Procurement of medical supplies
Expenditure on medical supplies of US$ 497 million in 2021 was broadly in line with the figure for 2020 (US$ 524 million). The COVID-19 supply chain programme continued to be the largest component, as supplies in relation to emergencies represented 58% of the total, with a further 24% in respect of the polio programme. Over 40% was spent in the Eastern Mediterranean Region on the COVID-19 response work and the Yemen crisis response, and a further 20% was disbursed in headquarters to support the emergency and humanitarian crises responses.
Transfers and Grants
Transfers and grants to counterparts of US$ 410 million represented 11% of total expenses in 2021, an increase of 5% compared to 2020 (US$ 389 million). Of that total, 60% was disbursed in the African and Eastern Mediterranean regions, 62% of which related to the emergencies programmes.
The procurement of emergency supplies and equipment for third parties was the largest component of transfers and grants (44%) due to the impact of the COVID-19 pandemic. Grants to national counterparts under direct financial cooperation (DFC) agreements represented 33% of the total.
Fig. 11. Staff cost composition (US$ millions).
1004 1060
285
1001389
1185
0
500
1000
1500
2020 2021
3590
Salary cost Actuarial cost Other personnel costs
Travel costs totalled US$ 78 million in 2021, a further decrease of 7% from 2020 due to the travel restrictions caused by the COVID-19 pandemic. The continued use of teleworking arrangements and virtual meetings freed up funds for programmatic activities.
12
A75/33

Net assets increased by US$ 817 million to US$ 3407 million, mainly driven by a decrease in staff-related liabilities (such as after-service health insurance and terminal benefit payments) as valued by independent external actuaries.
The liability reduced mainly due to favorable discount rates and claims experience, and cost-containment measures.
Table 1: Summarized financial position at 31 December 2021.
FINANCIAL POSITION
The financial position of the Organization is summarized in Table 1.
US$ m 2021 2020 Change
Assets 7214 7137 77
Financial assets and cash 5015 4932 83
Fixed assets 235 211 24
Receivables 1671 1738 (67)
Other assets 293 256 37
Liabilities 3807 4547 (740)
Borrowing 173 156 17
Deferred and advance contributions
973 1112 (139)
Staff related 1480 1946 (466)
Inter-entity liabilities 798 946 (148)
Other liabilities 383 387 (4)
Net assets 3407 2590 817
13
A75/33
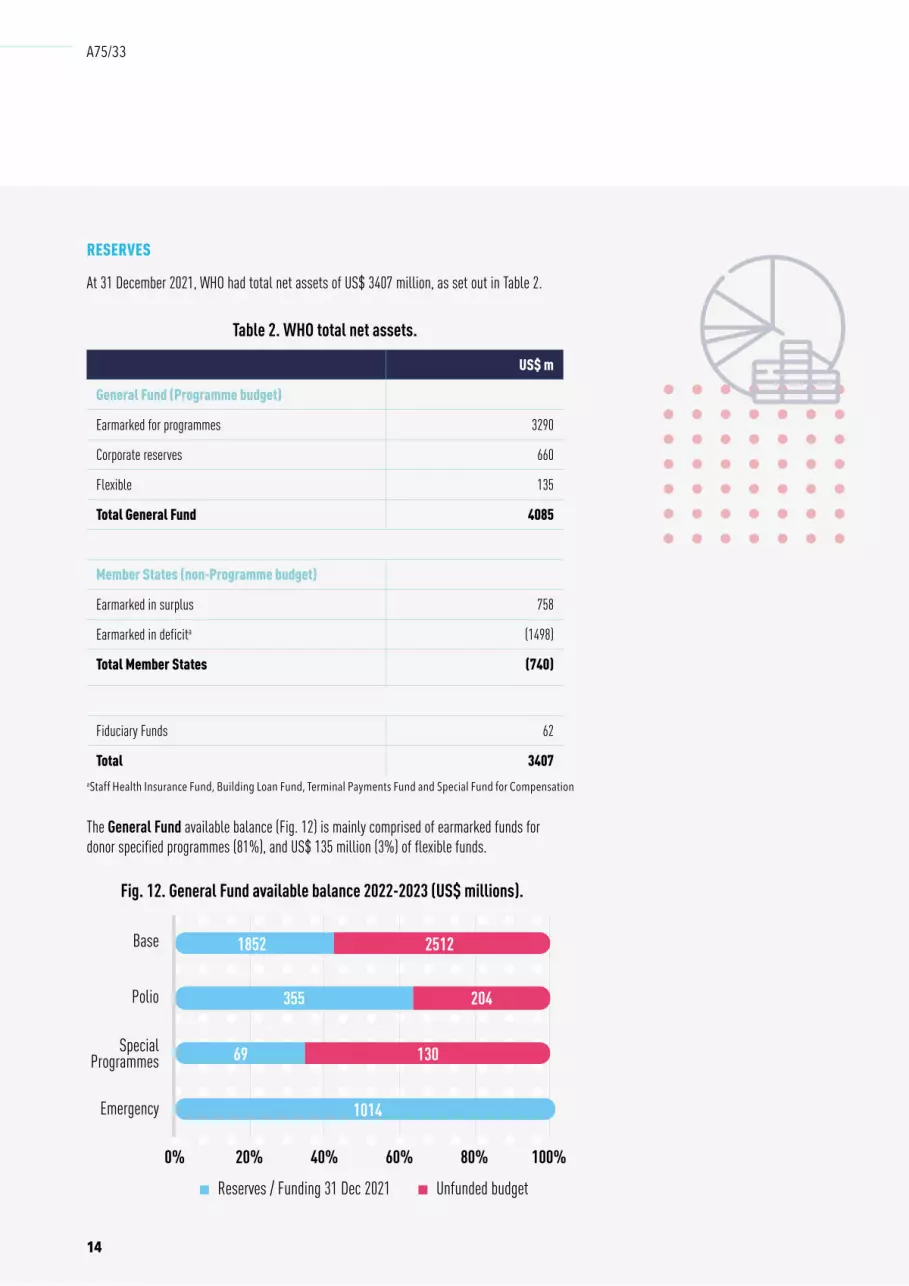
RESERVES
At 31 December 2021, WHO had total net assets of US$ 3407 million, as set out in Table 2.
The General Fund available balance (Fig. 12) is mainly comprised of earmarked funds for donor specified programmes (81%), and US$ 135 million (3%) of flexible funds.
aStaff Health Insurance Fund, Building Loan Fund, Terminal Payments Fund and Special Fund for Compensation
US$ m
General Fund (Programme budget)
Earmarked for programmes 3290
Corporate reserves 660
Flexible 135
Total General Fund 4085
Member States (non-Programme budget)
Earmarked in surplus 758
Earmarked in deficita (1498)
Total Member States (740)
Fiduciary Funds 62
Total 3407
Fig. 12. General Fund available balance 2022-2023 (US$ millions).
1852
355
69
1014
2512
204
130
0% 20% 40% 60% 80% 100%
Base
Polio
SpecialProgrammes
Emergency
Reserves / Funding 31 Dec 2021 Unfunded budget
Table 2. WHO total net assets.
14
A75/33

Within the earmarked reserves of US$ 3290, the level of funding for the Programme budget varies by budget segment: the emergency segment is fully funded, with 42% of the base segment, 64% of polio, and 35% of special programmes budgets funded for 2022-2023.
The deficit on the Member States Fund is caused by the balances of unfunded employee benefit liabilities. WHO has funding and investment strategies in place to finance these liabilities in the medium to long term.
The Fiduciary Funds are managed by WHO in a trustee capacity, and cannot be applied in respect of the Organization’s own programmes.
ASSETS
WHO funds are co-mingled with those of the Staff Health Insurance (SHI) fund, UNAIDS, Unitaid and UNICC, and are managed in accordance with the Organization’s investment policy. WHO Treasury works with international investment managers to ensure that the credit quality, security and liquidity of the WHO investments are maintained to the highest standards so that the funds are available to finance the Organization’s objectives.
Investment income in 2021 was low due to the low interest rate environment globally. Yields on short term bonds were extremely low during the first 9 months of 2021, with the 1-year United States Treasury bill rate around 0.1%. In the fourth quarter, yields rose due to rising inflation following the lifting of pandemic lockdowns, and this yield increase caused a short-term decrease in the valuation of the bond portfolios. The benefit of the increase in yields will be reflected in the 2022 investment income, with the 1-year United States Treasury bill rate now around 1.0%.
Foreign exchange risk management
WHO manages foreign exchange hedging programmes to minimise the risk of exchange rate movements, to provide exchange rate stability over an extended period, and delay the impact of significant exchange rate movements. In 2021 the receivables hedging programme generated gains of US$ 33 million, which offset the foreign exchange losses recorded on the non-US$ receivables, and the expenses hedging programme generated gains of US$ 8 million to offset the increased US$ cost of the non-US$ expenses.
Investments
Total investments and cash at 31 December 2021
US$ 5015 million
15
A75/33
25%
35%
45%
55%
65%
0
500
1000
1500
2000
2500
3000
Dec-17 Dec-18 Dec-19 Dec-20 Dec-21
Funded ASHI obligation Un-funded ASHI obligation Percentage funding
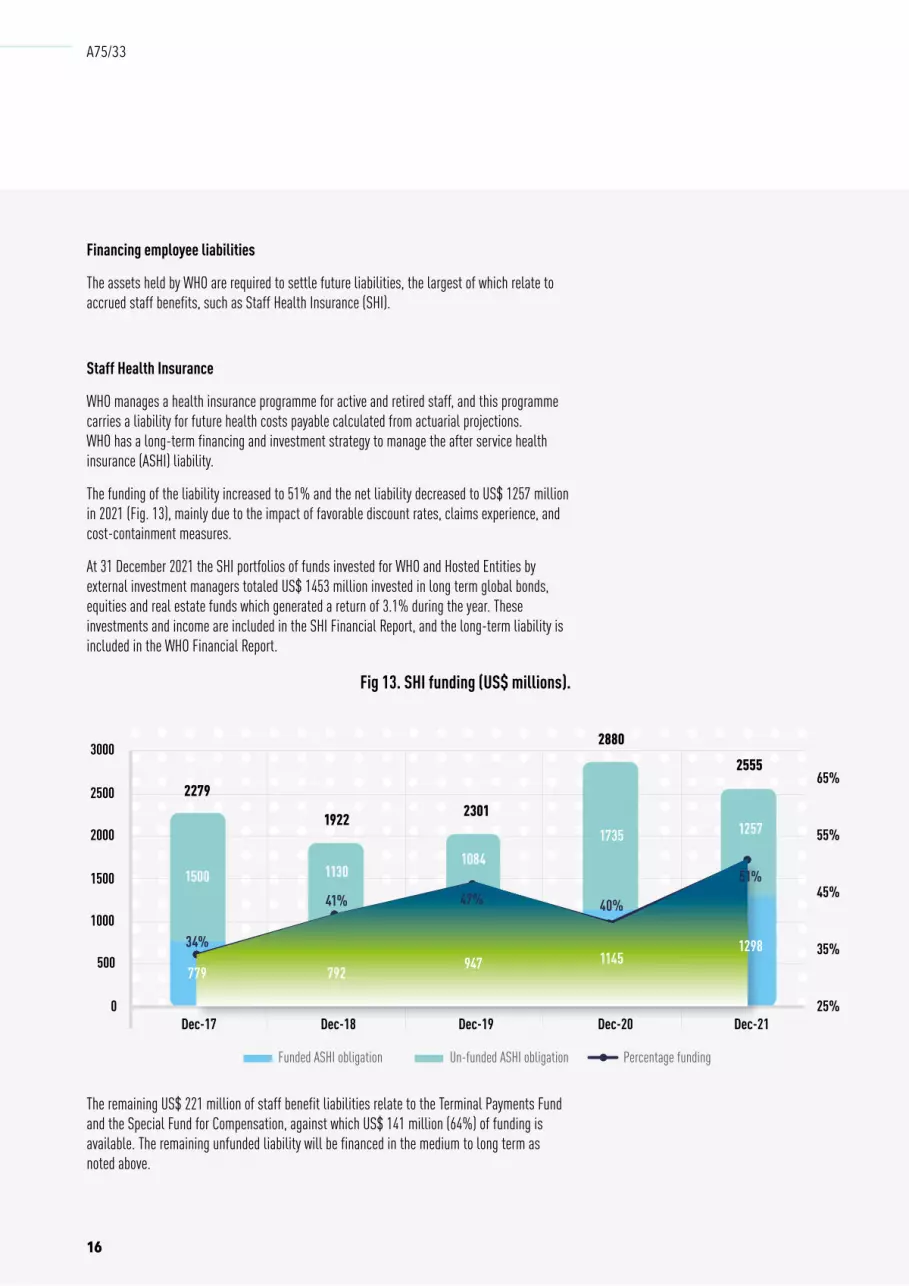
Financing employee liabilities
The assets held by WHO are required to settle future liabilities, the largest of which relate to accrued staff benefits, such as Staff Health Insurance (SHI).
Staff Health Insurance
WHO manages a health insurance programme for active and retired staff, and this programme carries a liability for future health costs payable calculated from actuarial projections. WHO has a long-term financing and investment strategy to manage the after service health insurance (ASHI) liability.
The funding of the liability increased to 51% and the net liability decreased to US$ 1257 million in 2021 (Fig. 13), mainly due to the impact of favorable discount rates, claims experience, and cost-containment measures.
At 31 December 2021 the SHI portfolios of funds invested for WHO and Hosted Entities by external investment managers totaled US$ 1453 million invested in long term global bonds, equities and real estate funds which generated a return of 3.1% during the year. These investments and income are included in the SHI Financial Report, and the long-term liability is included in the WHO Financial Report.
The remaining US$ 221 million of staff benefit liabilities relate to the Terminal Payments Fund and the Special Fund for Compensation, against which US$ 141 million (64%) of funding is available. The remaining unfunded liability will be financed in the medium to long term as noted above.
Fig 13. SHI funding (US$ millions).
1500
2279
1922 2301
28802555
779
1130
792
1084
947
1735
1145
1257
129834%
41% 47% 40%
51%
16
A75/33
Property plant and equipment and inventory
The value of property, plant and equipment in 2021 increased by US$ 23 million to US$ 230 million due to work on the new headquarters building and other asset purchases. Inventory balances increased in 2021 by US$ 45 million to US$ 190 million representing medical and vaccine supplies in respect of the COVID-19 pandemic response work.
CONCLUSIONThe past biennium has been the most testing in our Organization’s history. Yet even in the face of immense challenges, by working together, we have made important progress in implementing the GPW13.
2021 marked the highest ever levels of expenditure recorded by WHO, demonstrating the Organization’s capacity to deliver results in extremely difficult circumstances. While maintaining the focus on COVID-19, emergencies and other priorities, WHO was able to increase support to Member States by intensifying delivery of the base segment of the Programme budget in countries.
WHO is grateful for the generous support it has received from Member States and other funding partners, the second-highest contributions ever, at a time when there are many competing priorities for scarce resources. Concerted efforts by these funding partners to accelerate the switch to more flexible financing will enable us to focus better on the priorities set for WHO, and improve our ability to deliver results efficiently and effectively.
The achievements reached together demonstrate why the world needs a sustainable and effective WHO more than ever. We are committed to further strengthening our ability to deliver results in countries - and in doing so, continue our transformation journey to make WHO more effective, efficient, transparent and accountable.
Dr Tedros Adhanom Ghebreyesus Director-General
Geneva, 25 March 2022
17
A75/33
A75/33
18
2021 Statement of Internal Control
Scope of responsibility
As Director-General of the World Health Organization, I am accountable to the World Health Assembly for the administration of the Organization and the implementation of its programmes. Under Financial Regulations I and XII, I am accountable for maintaining a sound system of internal control, including internal audit and investigation, to ensure the effective and efficient use of the Organization's resources and the safeguarding of its assets. Pursuant to Financial Regulation I, I have delegated authority and accountability to Regional Directors, Deputy Directors-General, Assistant Directors-General, Executive Directors, Directors, WHO Heads of Country Offices and other relevant staff members. Every individual in the Organization has, to varying degrees of responsibility, a role to play in internal control.
Purpose of internal control
The system of internal control is designed to manage risks to an acceptable level rather than to eliminate them. It can therefore provide reasonable but not absolute assurance of the achievement of results and objectives. The system of internal control is based on a process designed to identify, evaluate, prioritize and manage the risks to the Organization’s objectives efficiently, effectively and economically.
Internal control is a key role of management and an integral part of the overall process of managing WHO`s activities. As such WHO management at all levels has the responsibility to:
• establish an environment and culture that promotes effective internal control;
• identify and assess risks that may affect the achievement of objectives;
• specify and implement policies, plans, operating standards, procedures, systems and other control activities to manage the risks associated with any exposure identified;
• ensure an effective flow of information and communication so that all WHO personnel have the information they need to fulfil their responsibilities; and
• monitor the effectiveness of internal control.
From an operational perspective, WHO’s internal control system operates continually at all levels of the Organization through internal control processes to ensure the above objectives.
This is WHO’s sixth statement of internal control and applies for the year ended 31 December 2021, up to the date of the approval of the Organization's 2021 financial statements.
WHO’s operating environment
WHO operates in more than 150 countries and sometimes in very challenging environments. The expectations and context in which WHO operates have shifted in recent years, since the GPW13 included addressing health emergencies as one of the Organization’s strategic priorities. Consequently, WHO is increasingly involved in emergency operations in conflicted and fragile environments. Standards of internal control vary significantly amongst countries, exposing WHO to situations with a high level of inherent risk. It is therefore necessary to define differentiated risk profiles and approaches. All risks identified in WHO country offices, departments, divisions and regions are captured in a risk register, which is subject to regular review by managers and escalated to senior levels for attention, as required.

A75/33
19
The Internal Control Framework and risk management
The WHO corporate risk management policy embeds risk management in WHO’s strategic and operational planning and budgeting cycles, as well as in the accountability and internal control frameworks. The key objective is to ensure that all of the risks inherent to the Organization’s activities are fully understood, and that appropriate strategy is chosen to manage them. Well-grounded risk management and internal control policies, systems and processes help to better understand the risks that the Organization is exposed to, ensure that appropriate accountabilities and controls are in place to address those risks, and effectively pursue the Organization's activities.
WHO country offices and departments have continued to use WHO’s risk management tool to identify and evaluate risks, and to develop response plans to deal with them. At the global level, the risks that WHO faces in achieving its strategy and mission are reflected in a corporate-level risk register (the “WHO Principal Risks”). An annual report on the state of risk management, compliance and ethics is subsequently presented to Member States through the Executive Board.
As the Director-General of the Organization, I have the ultimate responsibility for assessing the risks associated with the implementation of the GPW13 and WHO`s overall activities. I am assisted in this task by the Regional Directors, senior management and the WHO Global Risk Management Committee. The Committee plays a key role in ensuring that the most critical risks are identified and addressed in an efficient manner. Furthermore, I am supported by the Office of Compliance, Risk Management and Ethics, which facilitates and guides the Organization-wide risk management process. Finally, as highlighted in the WHO corporate risk management policy, every WHO staff member has the responsibility to identify risks at his or her own level of work.
Review of the effectiveness of internal controls
My review of the effectiveness of WHO’s system of internal control is based on the following.
(a) An annual “letter of representation”. This is reviewed and approved by all Regional Directors, Deputy Directors-General and Assistant Directors-General, and confirms the importance of ensuring that adequate internal controls are in place, along with other assurances. All issues raised in the letter of representation feed into the annual audit and financial statements.
(b) The internal control self-assessment checklist, which is completed and submitted by all WHO country offices and departments. The checklist is used by each office manager (country office and departments) to review all key controls and rate compliance. The consolidated results 2021 show that overall, throughout WHO, internal controls have been self-assessed as robust despite the COVID-19 pandemic, which has continued to impact the Organization’s operations. This challenging context has revealed the central importance of operationalizing risk management at all levels and the need to develop operational tools for staff to guide everyday decision-making. This was widely recognized in the results of the self-assessment, which call for continued efforts to improve the integration of risk management into planning activities. The results of the self-assessment also show that further improvement is needed in the area of monitoring, mainly due to COVID-19 restrictions causing limitations in undertaking oversight activities such as country compliance reviews, onsite verifications and other assurance mechanisms. The Organization is in the process of developing corporate-wide actions to address these points and advance its overall risk maturity.
(c) Reports issued by the Office of Internal Oversight. The internal audit reports, conducted under the audit workplan for 2021 and preceding years, provide objective information on compliance and control effectiveness, together with recommendations for improvement. Critical findings from these reports are summarized in the Annual Report of the Internal Auditor to the Health Assembly. Individual audit reports are available for review by Member States on request.
(d) Reports issued by the WHO External Auditor. The external audit provides independent oversight and reporting on WHO’s compliance with financial rules and regulations. The external auditors present

A75/33
20
their key findings, observations and recommendations to the governing bodies. In addition, they also have completed audits at the Regional Office for the Western Pacific, the Cambodia Country Office and the Global Transformation programme in 2021. For further information, please refer to the report of the External Auditor to the Seventy-fifth World Health Assembly (document A75/35).
(e) The work of the Independent Expert Oversight Advisory Committee. The Committee reviews all audit reports, risk reports, and financial reports, as well as other information relevant to the overall control framework. The Committee's reports are presented to the Executive Board, through the Board’s Programme, Budget and Administration Committee, which identifies areas for potential improvement and advises how to address weaknesses with regard to risk management, and financial and internal control matters.
Most critical risk issues noted
The Office of Compliance, Risk Management and Ethics reviewed and consolidated findings based on WHO country office or department risk register updates in 2021, and presented the emerging risks to the WHO Risk Committee. Some of the key risks currently facing the Organization are summarized in the table below.
Risk Examples of ongoing and planned risk response actions
Failure to adequately manage multiple, simultaneous or consecutive Grade 3 emergencies
1. Review of the Emergency Response Framework (ERF). 2. Request for Programme Budget increase for 2022-23 to enable expansion of 3-
levels capacity and implementation of critical activities. 3. Negotiation of a legal instrument for emergency preparedness and response.
Unsustainable financing 1. Update of the WHO investment case. 2. Continued engagement with the Member States’ Working Group on Sustainable
financing. 3. Implementation of the WHO Global Resource Mobilization Strategy with
improved efficiency through the New Contributor Engagement Management (CEM) system.
Sexual exploitation, abuse and harassment (SEAH)
1. Publication and implementation of a management response to the report of the Independent Commission on Allegations of Sexual Exploitation and Abuse during the tenth outbreak of Ebola virus disease in North Kivu and Ituri provinces of the Democratic Republic of the Congo.
2. Implementation of a new Policy Directive on protection from sexual exploitation and sexual abuse and update of related WHO policies and processes.
3. Development and rollout of an agency-specific risk assessment tool for SEAH. Failure to interrupt transmission of WPV1 and cVDPV2 by end of 2023
1. Strengthen the alignment of programme priorities with epidemiology, resources available and capacity to implement, while cost-sharing outbreak response with affected countries in line with decision EB146(11) (2020).
2. Strengthen vaccine management, including more accurate forecasting of long-term demand and supply (manufacturer capacity) while maintaining funding to ensure adequate stockpiles for WPV and cVDPV response.
3. Mobilize resources with an investment case to fully deliver the 2022-26 GPEI Strategy: Delivering on a Promise, and bolster donor confidence towards higher un-earmarked contributions through more cost-effective programming and greater financial transparency.
4. Mainstream performance and risk management through balanced scorecard approaches with all GPEI activities and structures to ensure informed decision making by the Polio Oversight Board (POB).

A75/33
21
Risk Examples of ongoing and planned risk response actions
Cybersecurity threats and failures 1. Establishment of cybersecurity governance at the three levels of WHO. 2. Monitoring of cybersecurity strategy and roadmap. 3. Integration and automation with threat intelligence and vulnerability
management. Business services disruptions 1. Development of a security strategic plan.
2. Strengthened business continuity plans for headquarters, regional offices and country offices with simulation exercises.
3. Monitoring of security threat information and update of the Security Risk Management (SRM) process through the UN Security Management System (UNSMS), UN Department of Safety and Security (UNDSS) and the UN Inter-Agency Security Management Network (IASMN).
Threats to workforce well-being and mental health
1. Staff across the three levels provided with greater access to good-quality counselling and mental health services.
2. Implementation of the United Nations Workplace Mental Health and Well-being Strategy.
3. Implementation of the policy on preventing and addressing abusive conduct. Fraud and corruption 1. Approval of a revised Anti-Fraud/Anti- Corruption policy.
2. Definition of an implementation plan at the three levels of WHO. 3. Development and launch of a communication campaign and training programme.
To ensure that appropriate action is taken to address them, each of the above risks has been discussed by the WHO Risk Committee, as well as with the relevant risk owners.
Statement
Internal control, while operating effectively, has inherent limitations, including the possibility of circumvention, no matter how well designed. It can therefore provide only reasonable assurance. Furthermore, because of changes of conditions, the effectiveness of internal control may vary over time.
I am committed to addressing any weaknesses in internal controls that may be noted during the year and brought to my attention.
Based on the above, I conclude that, to the best of my knowledge and information, there are no material weaknesses that would prevent the external auditor from providing an unqualified opinion on the Organization’s financial statements, nor are there other significant matters arising that would need to be raised in the present document for the year ended 31 December 2021 and up to the date of approval of the financial statements.
Dr Tedros Adhanom Ghebreyesus Director-General Geneva, 25 March 2022

A75/33
22
Certification of financial statements for the year ended 31 December 2021
According to Financial Regulation XIII – Accounts and Financial Statements, the Financial Report for the World Health Organization for 31 December 2021 has been prepared in compliance with the International Public Sector Accounting Standards (IPSAS) and the Financial Regulations of the World Health Organization and its Financial Rules. The financial statements for the year ended 31 December 2021, together with the notes to the statements and supporting schedules, have been reviewed and are approved.
George Kyriacou Dr Tedros Adhanom Ghebreyesus Comptroller and Director Finance Director-General
Geneva, 25 March 2022
A75/33
23
Opinion of the External Auditor
1 April 2022
Opinion of the External Auditor on the Financial Statements of the World Health Organization for the financial year ended 31 December 2021
Dear Dr. Ghebreyesus,
Thank you for the Representation Letter in connection with our audit of the financial statements of the World Health Organization for the financial year ended 31 December 2021.
I have the honour to present to you the Audit Opinion, on the financial statements of the World Health Organization for the financial year ended 31 December 2021, which may kindly be transmitted to the Seventy Fifth World Health Assembly.
I express my appreciation for the cooperation and assistance that I have received in the performance of my audit mandate.
Yours sincerely,
Girish Chandra Murmu
Dr. Tedros Adhanom Ghebreyesus Director-General World Health Organization 20, Avenue Appia CH -1211 Geneva 27, Switzerland
9, Deen Dayal Upadhyaya Marg, New Delhi – 110124 Tel. No. : ++91 11 23235797 • Fax : ++91 11 23233618 • e-mail : [email protected]
A75/33
24
1 April 2022
Opinion of the External Auditor on the Financial Statements of the World Health Organization for the financial year ended 31 December 2021
Your Excellency,
I have the honor to present to the Seventy Fifth World Health Assembly, the External Auditor’s Opinion on the financial statements of the World Health Organization for the financial year ended 31 December 2021.
I record my appreciation to the World Health Assembly for the honor and privilege to serve as External Auditor of WHO.
Yours sincerely,
Girish Chandra Murmu
The President of the Seventy Fifth World Health Assembly World Health Organization Geneva, Switzerland
9, Deen Dayal Upadhyaya Marg, New Delhi – 110124 Tel. No. : ++91 11 23235797 • Fax : ++91 11 23233618 • e-mail : [email protected]

A75/33
25

A75/33
26
A75/33
27
A75/33
28
Financial statements
World Health Organization
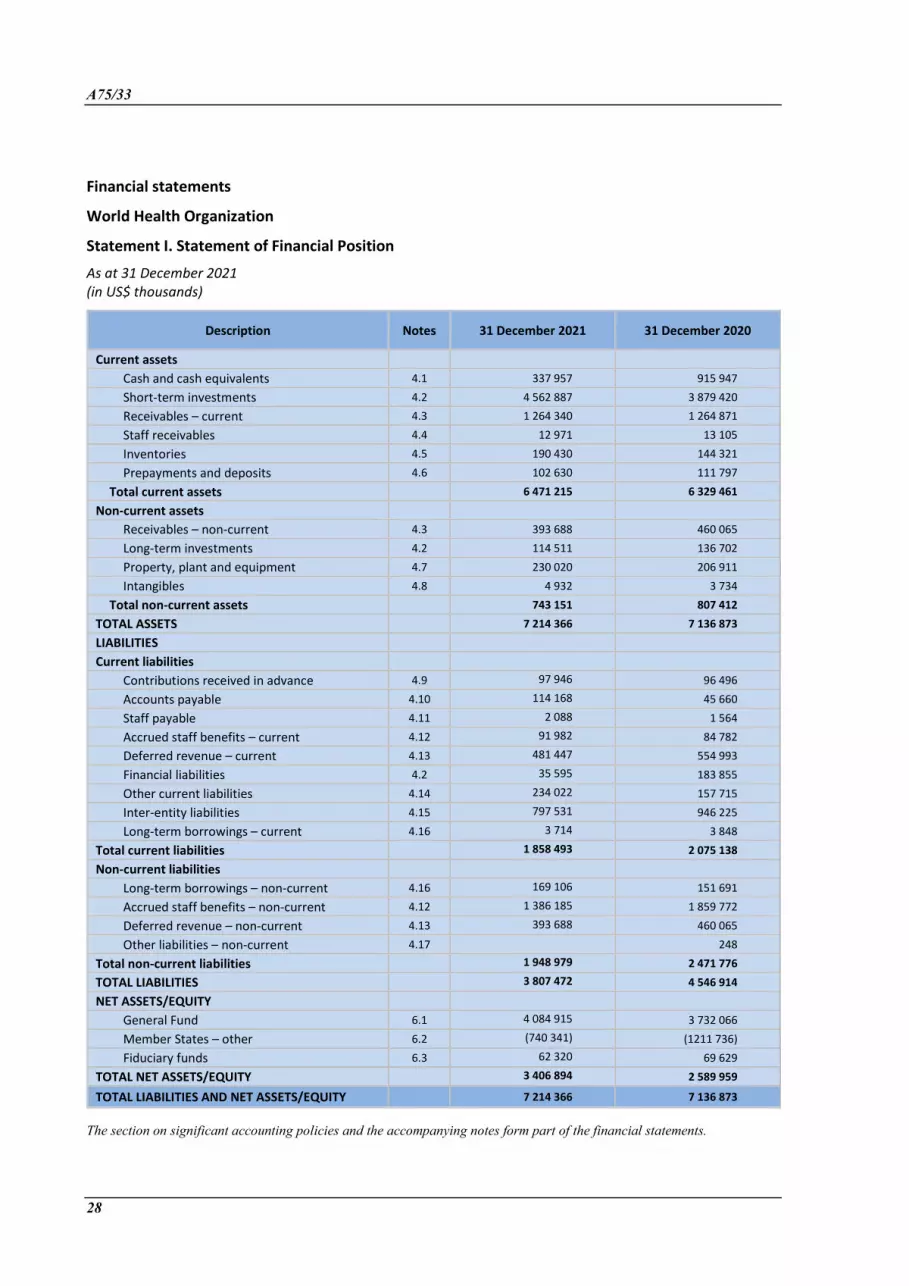
Statement I. Statement of Financial Position
As at 31 December 2021 (in US$ thousands)
Description Notes 31 December 2021 31 December 2020
Current assets
Cash and cash equivalents 4.1 337 957 915 947 Short-term investments 4.2 4 562 887 3 879 420 Receivables – current 4.3 1 264 340 1 264 871 Staff receivables 4.4 12 971 13 105 Inventories 4.5 190 430 144 321 Prepayments and deposits 4.6 102 630 111 797
Total current assets 6 471 215 6 329 461 Non-current assets
Receivables – non-current 4.3 393 688 460 065 Long-term investments 4.2 114 511 136 702 Property, plant and equipment 4.7 230 020 206 911 Intangibles 4.8 4 932 3 734
Total non-current assets 743 151 807 412 TOTAL ASSETS 7 214 366 7 136 873 LIABILITIES
Current liabilities
Contributions received in advance 4.9 97 946 96 496 Accounts payable 4.10 114 168 45 660 Staff payable 4.11 2 088 1 564 Accrued staff benefits – current 4.12 91 982 84 782 Deferred revenue – current 4.13 481 447 554 993 Financial liabilities 4.2 35 595 183 855 Other current liabilities 4.14 234 022 157 715 Inter-entity liabilities 4.15 797 531 946 225 Long-term borrowings – current 4.16 3 714 3 848
Total current liabilities 1 858 493 2 075 138 Non-current liabilities
Long-term borrowings – non-current 4.16 169 106 151 691 Accrued staff benefits – non-current 4.12 1 386 185 1 859 772 Deferred revenue – non-current 4.13 393 688 460 065 Other liabilities – non-current 4.17
248
Total non-current liabilities 1 948 979 2 471 776 TOTAL LIABILITIES 3 807 472 4 546 914 NET ASSETS/EQUITY
General Fund 6.1 4 084 915 3 732 066 Member States – other 6.2 (740 341) (1211 736) Fiduciary funds 6.3 62 320 69 629
TOTAL NET ASSETS/EQUITY 3 406 894 2 589 959 TOTAL LIABILITIES AND NET ASSETS/EQUITY 7 214 366 7 136 873
The section on significant accounting policies and the accompanying notes form part of the financial statements.
A75/33
29
World Health Organization
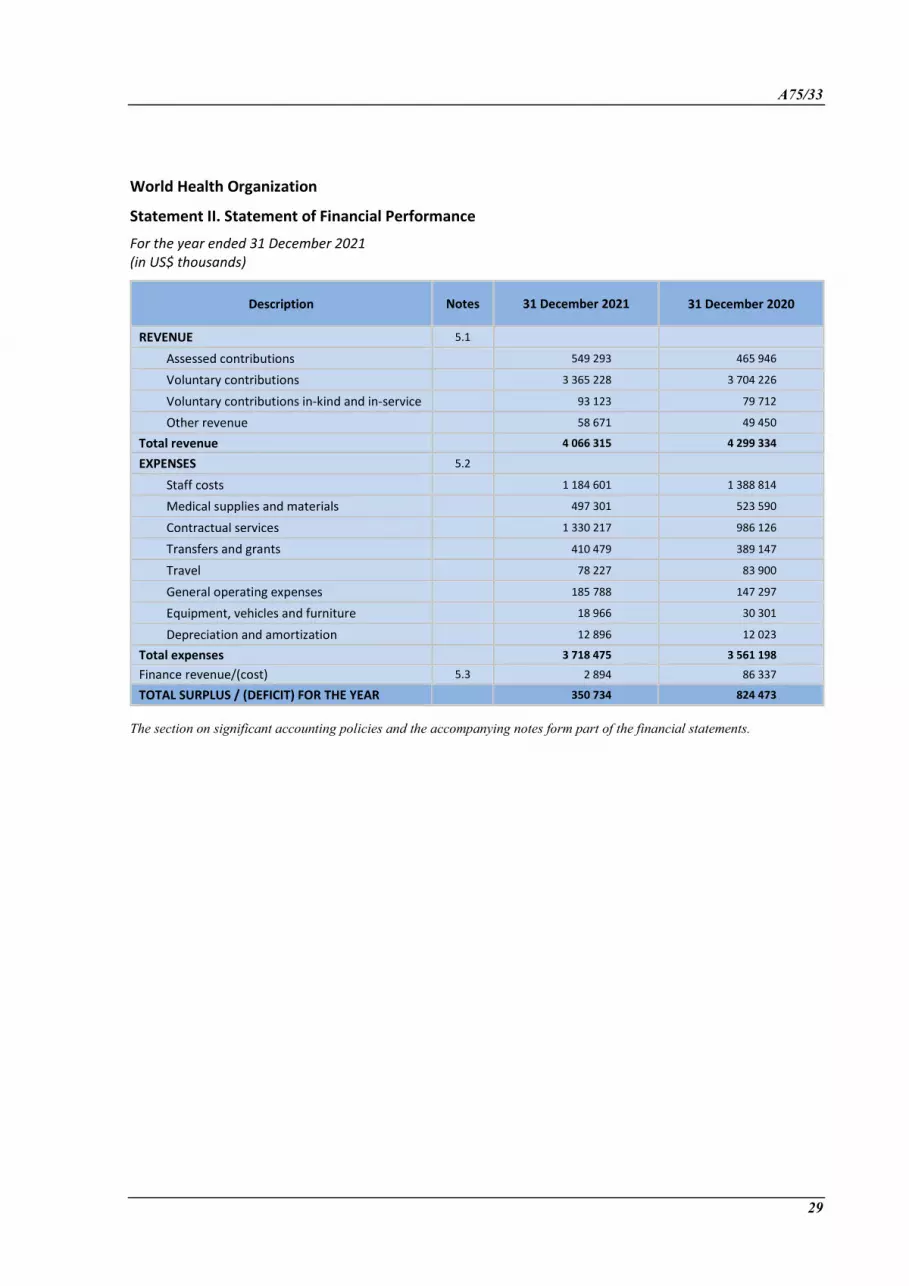
Statement II. Statement of Financial Performance
For the year ended 31 December 2021 (in US$ thousands)
Description Notes 31 December 2021 31 December 2020
REVENUE 5.1 Assessed contributions 549 293 465 946
Voluntary contributions 3 365 228 3 704 226
Voluntary contributions in-kind and in-service 93 123 79 712
Other revenue 58 671 49 450 Total revenue 4 066 315 4 299 334 EXPENSES 5.2
Staff costs 1 184 601 1 388 814
Medical supplies and materials 497 301 523 590
Contractual services 1 330 217 986 126
Transfers and grants 410 479 389 147
Travel 78 227 83 900
General operating expenses 185 788 147 297
Equipment, vehicles and furniture 18 966 30 301
Depreciation and amortization 12 896 12 023 Total expenses 3 718 475 3 561 198 Finance revenue/(cost) 5.3 2 894 86 337 TOTAL SURPLUS / (DEFICIT) FOR THE YEAR 350 734 824 473
The section on significant accounting policies and the accompanying notes form part of the financial statements.

A75/33
30
World Health Organization
Statement III. Statement of Changes in Net Assets/Equity
For the year ended 31 December 2021 (in US$ thousands)
Description Notes 31 December 2021 Other adjustments (refer to Note 4.12) Surplus/(deficit) 31 December 2020
General Fund 6.1 4 084 915 352 849 3 732 066
Member States – other 6.2 (740 341) 466 201 5 194 (1 211 736)
Fiduciary Fund 6.3 62 320 (7 309) 69 629
TOTAL NET ASSETS/EQUITY 3 406 894 466 201 350 734 2 589 959
The section on significant accounting policies and the accompanying notes form part of the financial statements.

A75/33
31
World Health Organization
Statement IV. Statement of Cash Flow
For the year ended 31 December 2021 (in US$ thousands)
Description 31 December 2021 31 December 2020
CASH FLOWS FROM OPERATING ACTIVITIES
TOTAL DEFICIT/SURPLUS FOR THE YEAR 350 734 824 473
Depreciation and amortization 12 896 12 023
Investment revenue presented as investing activities 6 226 (44 039)
Unrealized (gains)/losses on revaluation of long-term borrowings 8 075 2 364
(Increase)/Decrease in receivables – current 531 (104 117)
(Increase)/Decrease in staff receivables 134 (271)
(Increase)/Decrease in inventories (46 109) (85 136)
(Increase)/Decrease in prepayments and deposits 9 167 (55 923)
(Increase)/Decrease in receivables – non-current 66 377 (74 958)
Increase/(Decrease) in contributions received in advance 1 450 25 222
Increase/(Decrease) in accounts payable 68 508 (16 666)
Increase/(Decrease) in staff payable 524 432
Increase/(Decrease) in accrued staff benefits – current 7 200 29 583
Increase/(Decrease) in deferred revenue – current (73 546) 186 507
Increase/(Decrease) in other current liabilities 76 307 56 969
Increase/(Decrease) in inter-entity liabilities (148 694) 57 033
Increase/(Decrease) in accrued staff benefits – non-current (7 386) 294 344
Increase/(Decrease) in deferred revenue – non-current (66 377) 74 958
Increase/(Decrease) in other liabilities – non-current (248) (4 558)
Net cash flows from operating activities 265 769 1 178 240
CASH FLOWS FROM INVESTING ACTIVITIES
Investment revenue presented as investing activities (6 226) 44 039
(Increase)/Decrease in short-term investments (683 467) (619 969)
(Increase)/Decrease in long-term investments 22 191 (6 146)
Increase/(Decrease) in financial liabilities (148 260) 4 018
(Increase)/Decrease in property, plant and equipment (34 851) (37 747)
(Increase)/Decrease in intangibles (2 352) (2 615)
Net cash flows from investing activities (852 965) (618 420)
CASH FLOWS FROM FINANCING ACTIVITIES
Increase/(Decrease) in long-term borrowings – current ( 134) 3 235
Increase/(Decrease) in long-term borrowings – non-current 9 340 24 196
Net cash flows from financing activities 9 206 27 431
Net increase/(decrease) in cash and cash equivalents (577 990) 587 251
Cash and cash equivalents at beginning of the year 915 947 328 696
Cash and cash equivalents at end of the year 337 957 915 947
The section on significant accounting policies and the accompanying notes form part of the financial statements.
A75/33
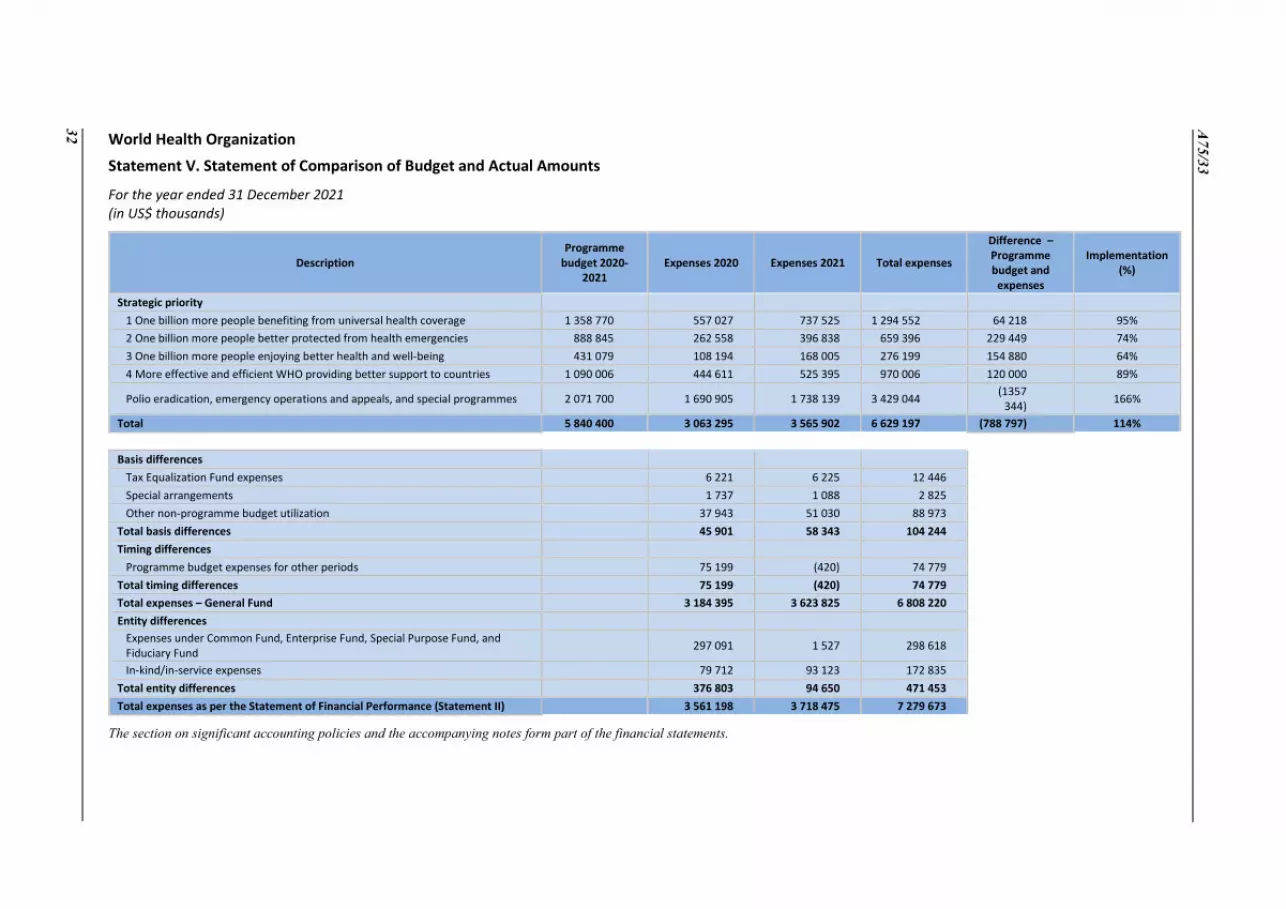
32 World Health Organization Statement V. Statement of Comparison of Budget and Actual Amounts
For the year ended 31 December 2021 (in US$ thousands)
Description Programme
budget 2020-2021
Expenses 2020 Expenses 2021 Total expenses
Difference – Programme budget and expenses
Implementation (%)
Strategic priority 1 One billion more people benefiting from universal health coverage 1 358 770 557 027 737 525 1 294 552 64 218 95% 2 One billion more people better protected from health emergencies 888 845 262 558 396 838 659 396 229 449 74% 3 One billion more people enjoying better health and well-being 431 079 108 194 168 005 276 199 154 880 64% 4 More effective and efficient WHO providing better support to countries 1 090 006 444 611 525 395 970 006 120 000 89%
Polio eradication, emergency operations and appeals, and special programmes 2 071 700 1 690 905 1 738 139 3 429 044 (1357 344) 166%
Total 5 840 400 3 063 295 3 565 902 6 629 197 (788 797) 114%
Basis differences
Tax Equalization Fund expenses 6 221 6 225 12 446 Special arrangements 1 737 1 088 2 825 Other non-programme budget utilization 37 943 51 030 88 973
Total basis differences 45 901 58 343 104 244 Timing differences
Programme budget expenses for other periods 75 199 (420) 74 779 Total timing differences 75 199 (420) 74 779 Total expenses – General Fund 3 184 395 3 623 825 6 808 220 Entity differences
Expenses under Common Fund, Enterprise Fund, Special Purpose Fund, and Fiduciary Fund 297 091 1 527 298 618 In-kind/in-service expenses 79 712 93 123 172 835
Total entity differences 376 803 94 650 471 453 Total expenses as per the Statement of Financial Performance (Statement II) 3 561 198 3 718 475 7 279 673
The section on significant accounting policies and the accompanying notes form part of the financial statements.

A75/33
33
1. Notes to the financial statements
Reporting Entity
The World Health Organization is an intergovernmental organization and a specialized agency of the United Nations. WHO is politically neutral and its work is impartial. It seeks to conduct its work in a transparent manner and is accountable to all its stakeholders. In accordance with its Constitution (which came into force on 7 April 1948), WHO acts as the directing and coordinating authority on international health work. The Organization’s headquarters are located in Geneva, Switzerland. WHO also has six regional offices and more than 150 country offices.
The Financial Regulations and Financial Rules of the World Health Organization1 govern the financial management of WHO. The financial statements include only the operations of WHO, which has no subsidiaries or interests in associates or jointly controlled entities.
Non-consolidated entities
WHO provides administrative services to the following non-consolidated entities:
– Trust Fund for the Joint United Nations Programme on HIV/AIDS (UNAIDS)
– Unitaid
– International Agency for Research on Cancer (IARC)
– International Computing Centre (ICC)
– Staff Health Insurance (SHI)
These entities are governed by their own constitutions, bylaws and governance structures. They prepare their own financial statements and undergo separate external audit and certification. WHO has the same voting rights (except in Unitaid) as any other member or partner and transactions with these organizations are at arm’s length. Assets and liabilities are owned by the respective organization; in the event of dissolution, the division of all assets and liabilities amongst members and partner organizations shall be agreed by constitution, bylaws and governance structure on the basis of a formula to be defined at that time.
Basis of preparation and presentation
The financial statements of the World Health Organization have been prepared on an accrual basis of accounting in accordance with International Public Sector Accounting Standards (IPSAS) and the Financial Regulations and Financial Rules of WHO. They have been prepared using the historical cost convention. Investments and loans, however, are recorded at fair value or amortized cost. Where a specific matter is not covered by IPSAS, the appropriate International Financial Reporting Standards (IFRS) have been applied.
These financial statements have been prepared on the basis that WHO is a going concern and will meet its mandate for the foreseeable future (IPSAS 1 – Presentation of Financial Statements).
These financial statements and notes are presented in United States dollars and all values are rounded to the nearest thousand, also denoted as US$ thousands (US$ 000s) unless otherwise stated.
1 See document WHA66/2013/REC/1, resolution WHA66.3.

A75/33
34
Functional currency and translation of foreign currencies
Foreign currency transactions are translated into United States dollars at the prevailing United Nations Operational Rates of Exchange, which approximates to the exchange rates at the date of the transactions. The United Nations Operational Rates of Exchange are set once a month, and revised mid-month if there are significant exchange rate fluctuations relating to individual currencies.
Assets and liabilities in currencies other than United States dollars are translated into United States dollars at the prevailing United Nations Operational Rates of Exchange year-end closing rate. The resulting gains or losses are accounted for in the Statement of Financial Performance.
The non-United States dollar denominated assets and liabilities in the investment portfolios are translated into United States dollars at the month-end closing rate used by the custodian.
Materiality and the use of judgments and estimates
Materiality1 is central to WHO’s financial statements. The Organization’s process for reviewing accounting materiality provides a systematic approach to the identification, analysis, evaluation, endorsement and periodic review of decisions taken involving the materiality of information, spanning a number of accounting areas. The financial statements include amounts based on judgments, estimates and assumptions by management. Changes in estimates are reflected in the period in which they become known.
Financial statements
In accordance with IPSAS 1 (Presentation of Financial Statements), a complete set of financial statements has been prepared as follows:
• Statement of Financial Position;
• Statement of Financial Performance;
• Statement of Changes in Net Assets/Equity;
• Statement of Cash Flow;
• Statement of Comparison of Budget and Actual Amounts; and
• Notes to the financial statements, comprising a description of the basis of preparation and presentation of the statements, a summary of significant accounting policies, and other relevant information.
2. Significant accounting policies
2.1 Cash and cash equivalents
Cash and cash equivalents are held at nominal value and comprise cash on hand, cash at banks, collateral deposits, commercial paper, money market funds and short-term bills and notes. All investments that have a maturity of three months or less from the date of acquisition are included as cash and cash equivalents. This includes cash and cash equivalents held in the portfolios managed by external investment managers.
2.2 Investments and financial instruments
Financial instruments are recognized from the date when WHO becomes a party to the contractual provisions of the instrument until the rights to receive cash flows from those assets have expired or have been transferred
1 Omissions or misstatements of items are material if they could, individually or collectively, influence the decisions or assessments of users made on the basis of the financial statements.
A75/33
35
and the Organization has transferred substantially all the risks and rewards of ownership. Investments are classified as being: (i) financial assets or financial liabilities at fair value through surplus or deficit; (ii) held-to-maturity; or (iii) bank deposits and other receivables. All purchases and sales of investments are recognized on the basis of their trade date.
Financial assets or financial liabilities at fair value through surplus or deficit are financial instruments that meet either of the following conditions: (i) they are held-for-trading or (ii) they are designated by the entity upon initial recognition at fair value through surplus or deficit.
Financial instruments in this category are measured at fair value and any gains or losses arising from changes in the fair value are accounted for through surplus or deficit and included within the Statement of Financial Performance in the period in which they arise. All derivative instruments, such as swaps, currency forward contracts or options are classified as held-for-trading except for designated and effective hedging instruments as defined under IPSAS 29 (Financial Instruments: Recognition and Measurement). Financial assets in the externally managed portfolios designated upon initial recognition as at fair value through surplus or deficit are classified as current assets or non-current assets according to the time horizon of the investment objectives of each portfolio. If the time horizon is less than or equal to one year, they are classified as current assets, and if it is more than one year, they are classified as non-current assets. Due to the large number of individual securities within each portfolio, at any given time there may be a minority of securities with a maturity profile that is different from the time horizon of the objectives of that portfolio.
Held-to-maturity investments are non-derivative financial assets with fixed or determinable payments and fixed maturity dates which WHO has both the intention and the ability to hold to maturity. Held-to-maturity investments are stated at amortized cost using the effective interest rate method, with interest revenue being recognized on an effective yield basis in the Statement of Financial Performance. As at 31 December 2021, no held-to maturity investments were held by the Organization.
Bank deposits and other receivables are non-derivative financial assets with fixed or determinable payments that are not quoted in an active market. Accrued revenue related to interest, dividends and pending cash to be received from investments are included herein. Bank deposits and other receivables are stated at amortized cost calculated using the effective interest rate method, less any impairments. Interest revenue is recognized on the effective interest rate basis, with the exception of short-term receivables for which the recognition of interest would be immaterial.
Other financial liabilities include payables and accruals relating to investments and are recognized initially at fair value and subsequently measured at amortized cost using the effective interest rate method, with the exception of short-term liabilities for which the recognition of interest would be immaterial.
2.3 Receivables
Receivables are non-derivative financial assets with fixed or determinable payments that are not traded in an active market. Current receivables are for amounts due within 12 months of the reporting date, while non-current receivables are those that are due more than 12 months from the reporting date of the financial statements.
Voluntary contributions receivables are recognized based on the payment terms specified in a binding agreement between WHO and the contributor. Where no payment terms are specified, the full amount receivable is recognized as currently due. Assessed contributions receivable are recognized annually, at the beginning of the year as per the assessments approved by the Health Assembly. Receivables are recorded at their estimated net realizable value and not discounted as the effect of discounting is considered immaterial.
An allowance for doubtful accounts is recognized when there is a risk that the receivables may be impaired. Changes in the allowance for doubtful accounts are recognized in the Statement of Financial Performance (Statement II).

A75/33
36
2.4 Inventories
WHO recognizes medicines, vaccines, humanitarian supplies, and publications as part of its inventory. Inventories are valued taking the lower amount of (i) cost or (ii) net realizable value, using a weighted average basis. A stock count is conducted once every year. Packaging, freight and insurance charges are allocated based on the total value of inventory purchases and added to the inventory value.
Where inventories have been acquired through a non-exchange transaction (i.e. inventories were donated as an in-kind contribution), the value of inventory is determined by reference to the donated goods’ fair value at the date of acquisition.
When inventories are sold, exchanged or distributed, their carrying amount is recognized as an expense.
2.5 Prepayments and deposits
Prepayments relate to amounts paid to suppliers for goods or services not yet received. Deposits relate to amounts paid as security for the leasing of office space. Deposits and prepayments are recorded at cost.
2.6 Property, plant and equipment
Property, plant and equipment with a value greater than US$ 5000 are recognized as non-current assets in the Statement of Financial Position. Property, plant and equipment are stated at historical cost, less accumulated depreciation and any impairment losses. Property, plant and equipment acquired through a non-exchange transaction are recognized at fair value at the date of acquisition. WHO considers all assets of this type to be non-cash generating.
Depreciation is calculated on a straight-line basis over the asset’s useful life except for land, which is not subject to depreciation. Property, plant and equipment are reviewed annually for impairment. The estimated useful lives of the asset classes that make up property, plant and equipment are provided in the table below.
Asset class Estimated useful life (in years)
Land N/A
Buildings – permanent 60
Buildings – temporary 5
Furniture, fixtures and fittings 5
Vehicles and transport 5
Office equipment 3
Communications equipment 3
Audio visual equipment 3
Computer equipment 3
Network equipment 3
Security equipment 3
Other equipment 3
Improvements are capitalized when the improvement results in an increase in the useful life of the asset or adds usable space. The residual value of the asset and the cost of the improvement will be amortized over the adjusted useful life (remaining life). Normal repair and maintenance costs are expensed in the year when the costs are incurred.

A75/33
37
2.7 Intangibles
Intangible assets that are above the pre-established capitalisation threshold of US$ 100 000 are stated at historical cost less accumulated amortization and any impairment losses. Intangible assets acquired through a non-exchange transaction are recognized at fair value at the date of acquisition. Amortization is determined over the estimated useful life of the assets using the straight-line method of amortization. The estimated useful life of software acquired externally is between two and six years.
WHO’s intangible assets are assumed to have a residual value of zero as intangible assets are not sold or transferred at the end of their useful life. Intangible assets are reviewed annually for impairment. Some intangible assets may have a shorter useful life.
2.8 Leases
A lease is an agreement whereby the lessor conveys to the lessee (the Organization), in return for a payment or series of payments, the right to use an asset for an agreed period of time. Every lease is reviewed to determine whether it constitutes a financial or operating lease. Necessary accounting entries are done accordingly and disclosures are made for the leases above the recognition threshold of US$ 50 000 per year.
Where WHO is the lessor, lease revenue from operating leases is recognized as revenue on a straight-line basis over the lease term. All costs associated with the asset incurred in earning the lease revenue, including depreciation, are recognized as an expense.
2.9 Contributions received in advance
Contributions received in advance arise from legally binding agreements between WHO and its contributors ‒ including governments, international organizations and private and public institutions ‒ whereby contributions are received in advance of the amounts concerned falling due to the Organization.
2.10 Accounts payable and accrued liabilities
Accounts payable are financial liabilities for goods or services that have been received by WHO and invoiced but not yet paid for.
Accrued liabilities are financial liabilities for goods or services that have been received by WHO and which have neither been paid for nor invoiced to WHO.
Accounts payable and accrued liabilities are recognized at cost, as the effect of discounting is considered immaterial.
2.11 Employee benefits
WHO recognizes the following categories of employee benefits:
• short-term employee benefits that fall due wholly within 12 months following the end of the accounting period in which employees render the related service;
• post-employment benefits;
• other long-term employee benefits; and
• termination benefits.
WHO is a member organization participating in the United Nations Joint Staff Pension Fund (the Fund), which was established by the United Nations General Assembly to provide retirement, death, disability and related

A75/33
38
benefits to employees. The Fund is a funded, multi-employer defined benefit plan. As specified by Article 3(b) of the Regulations of the Fund, membership in the Fund shall be open to the specialized agencies and to any other international, intergovernmental organization that participates in the common system of salaries, allowances and other conditions of service of the United Nations and the specialized agencies.
The plan exposes participating organizations to actuarial risks associated with participation of current and former employees of other organizations in the Fund, with the result that there is no consistent and reliable basis for allocating the obligation, plan assets, and costs to individual organizations participating in the plan. WHO and the Fund, in line with the other participating organizations in the Fund, are not in a position to identify WHO’s proportionate share of the defined benefit obligation, the plan assets and the costs associated with the plan with sufficient reliability for accounting purposes. WHO has therefore treated it as a defined contribution plan in line with the requirements of IPSAS 39 (Employee Benefits). WHO’s contributions to the Fund during the financial period are recognized as expenses in the Statement of Financial Performance (Statement II).
2.12 Inter-entity liabilities
Inter-entity liabilities are cash balance held by WHO on behalf of hosted entities (refer to Notes 4.2 and 4.15).
2.13 Provisions and contingent liabilities
Provisions are recognized for future liabilities and charges where WHO has a present legal or constructive obligation as a result of past events, and it is probable that the Organization will be required to settle the obligation.
Other commitments, which do not meet the recognition criteria for liabilities, are disclosed in the notes to the financial statements as contingent liabilities when their existence will be confirmed only by the occurrence or non-occurrence of one or more uncertain future events that are not wholly within the control of WHO.
2.14 Contingent assets
Contingent assets will be disclosed when an event gives rise to a probable inflow of economic benefits or service potential and there is sufficient information to assess the probability of the inflow of economic benefits or service potential.
2.15 Deferred revenue
Deferred revenue derives from legally binding agreements between WHO and its contributors, including governments, international organizations and private and public institutions. Deferred revenue is recognized when:
• a contractual agreement is confirmed in writing by both the Organization and the contributor; and
• the funds are earmarked and due in a future period.
Deferred revenue also includes advances from exchange transactions.
Deferred revenue is presented as current if the revenue is due within one year and non-current if the revenue is due one year or more after the reporting date.
2.16 Revenue
Revenue comprises gross inflows of economic benefits or service potential received and receivable by WHO during the year and represents an increase in net assets/equity. The Organization recognizes revenue following
A75/33
39
the established criteria of IPSAS 1 (Presentation of Financial Statements), IPSAS 9 (Revenue from Exchange Transactions) and IPSAS 23 (Revenue from Non Exchange Transactions).
The main sources of revenue for WHO include but are not limited to:
Non-exchange revenue
– Assessed contributions. Revenue from contributions from Member States and Associate Members is recorded annually at the beginning of the year as per the assessments approved by the Health Assembly.
– Voluntary contributions. Revenue from voluntary contributions is recorded when a binding agreement is signed by WHO and the contributor. Where there are so-called subject to clauses in an agreement, WHO does not control the resource and does not record the revenue and amount receivable until the cash is received. Where there are no payment terms specified by the contributor or payment terms are in the current accounting year, revenue is recognized in the current period. Where payment terms specify payment after the year end, the amount is reported as deferred revenue. Where start date of the contract is after 31 December, revenue is recognized in the future accounting year.
– Contributions in-kind and in-service. Contributions in-kind and in-service are recorded at an amount equal to their fair market value as determined at the time of acquisition, based on an agreement between WHO and the contributor and upon confirmation from the receiving budget centre of the receipt of the goods or services. An entry corresponding to the expense is recorded in the same period that the contributions in-kind and in-service are recorded as revenue.
Exchange revenue
– Reimbursable procurement, concessions, revolving sales and other exchange revenue. Revenue from reimbursable procurement on behalf of Member States, revenue from the sale of goods or services and fees charged to manufacturer for pre-qualification services is recorded on an accrual basis at the fair value of the consideration received or receivable when it is probable that the future economic benefits and/or service potential will flow to WHO and those benefits can be measured reliably. The corresponding expense is recognized in the same year as the revenue.
2.17 Expenses
Expenses are defined as decreases in economic benefits or service potential during the reporting period in the form of outflows, consumption of assets, or incurrences of liabilities that result in decreases in net assets/equity. WHO recognizes expenses at the point where goods have been received or services rendered (delivery principle) and not when cash or its equivalent is paid.
2.18 Fund accounting
Fund accounting is a method of segregating resources into categories (i.e. funds) to identify both the source and the use of the funds. Establishing such funds helps to ensure better reporting of revenue and expenses. The General Fund, the Special Purpose Fund, the Enterprise Fund and the Fiduciary Fund serve to ensure the proper segregation of revenue and expenses. Any transfers between funds that would result in duplication of revenue and/or expenses are eliminated during consolidation. Intra-fund transfers such as programme support costs within the General Fund are also eliminated.
General Fund
The accounts contained under this fund support the implementation of the programme budget. The General Fund contains the following:

A75/33
40
– Assessed Contributions Fund. This fund consolidates revenues and expenses arising from assessed contributions from Member States and other miscellaneous income.
– Tax Equalization Fund. In accordance with resolution WHA21.10 (1968), in which the Health Assembly decided to establish the Tax Equalization Fund, the assessed contributions of all Member States are reduced by the revenue generated by the staff assessment plan. In determining the reduction of assessed contributions to be applied to the Member States concerned, the Tax Equalization Fund is credited with the revenue from the staff assessment plan, the credits being recorded in the name of individual Member States, in proportion to their assessments for the biennium. For those Member States that levy income tax on emoluments received from the Organization by their nationals or others liable to such taxes, the credit from the staff assessment plan is charged with the estimated amount to be levied by those Member States. Those amounts which have been charged are, in turn, used by the Organization to reimburse income tax paid by the staff concerned, as per resolution WHA21.10.
– Working Capital Fund. The Fund was established to implement the programme budget pending receipt of assessed contributions in arrears. In accordance with Financial Regulation VII, implementation of that part of the budget financed from assessed contributions may be financed from the Working Capital Fund and thereafter by internal borrowing against available cash reserves of WHO, excluding trust funds. Amounts borrowed are repaid from the collection of arrears of assessed contributions and are credited first against any internal borrowing and then against any borrowing from the Working Capital Fund.
– Voluntary funds. This fund consolidates revenue and expenses arising from the following funds:
‒ Core voluntary contributions account
‒ Voluntary Contributions Core Fund
‒ Voluntary Contributions Specified Fund
‒ Contingency Fund for Emergencies. This fund was established by the Health Assembly through decision WHA68(10) (2015). The purpose of the fund is to provide temporary financing for emergency field operations.
‒ Special Programme for Research and Training in Tropical Diseases (TDR Trust Fund)
‒ Special Programme of Research, Development and Research Training in Human Reproduction (HRP Trust Fund)
‒ Special Programmes and Collaborative Arrangements Fund
‒ Special Account for Servicing Costs Fund
‒ Outbreak and Crisis Response Fund and Contingency Fund for Emergencies.
‒ Fee for Services Fund. This fund was established to record, and report fees charged to manufacturers for pre-qualification services to assess the quality, safety and efficacy of medical produces (vaccines, medicines or diagnostics).
‒ Supply Chain Fund. This fund was established to manage the supply chain operation initiative as a part of the COVID-19 pandemic response. It is used to record and report stockpile sales to external parties.
Member States – other
The following accounts are contained in Member States – other:
– Common Fund. This fund reflects the movement in the asset and liability accounts of the Organization resulting from changes in items such as inventory, fixed assets adjustment, construction-in-progress adjustment, depreciation, investment gain and losses and exchange gains and losses.

A75/33
41
– Enterprise Fund. This fund contains accounts that generate self-sustaining revenue. The revenue and expenses under this fund are not included in the reporting of the programme budget. The Enterprise Fund contains the following:
‒ Accident and Illness Insurance Fund. This fund was established as a self-insurance mechanism to provide coverage for staff members in case of accident and illness.
‒ Concessions Fund. This fund was established to manage activities for concessionaries. It is financed from amounts paid by the concessionaires for space, equipment utilities and use of facilities made available by the Organization.
‒ Garage Rental Fund. This fund was established mainly to record and report activities for the maintenance of a garage facility in Geneva. It is financed by way of a charge towards usage of the garage facility by applicable staff members.
‒ Global Conference and Training Centre – Tunis Fund. This fund was established in 2018 to manage the operations of the Global Conference and Training Centre in Tunis. The Fund receives revenue and incurs expenses for hosting meetings and conferences.
‒ Insurance Policies Fund. This fund was established to manage activities for commercial insurance policies. It is financed from benefits received from the applicable commercial insurance policies.
‒ In-kind Contributions Fund.1 This fund was established to record and report in-kind contributions.
‒ Revolving Sales Fund.2 This fund was established to record and report activities for publications.
‒ Reimbursable Procurement Fund.3 This fund was established to record, and report procurement activities undertaken on behalf of Member States or other United Nations organizations.
‒ Shared Services Fund. This fund was established in 2018 to record and report revenue and expenses for services shared facilities with other United Nations agencies which are managed by WHO.
‒ Global Assurance Hub Fund. This fund was established in 2021 to record and report contributions and expenses to cover assurance activities for transfers and grants by the Organization.
‒ Special Purpose Fund. The accounts contained under this fund represent transfers from the General Fund or appropriations by the Health Assembly. The revenue and expenses under this fund are not included in the reporting of the programme budget. The Special Purpose Fund contains the following:
‒ Building Loan Fund. This fund was established to record and report on a loan from the Swiss Government in support of expenses towards the construction of new building in Geneva. It is funded by the Swiss Government loan.
‒ Internal Service Cost Recovery Fund. This fund was established to record, and report services provided between departments within the Organization.
‒ Infrastructure Fund. This fund was established by the Seventieth World Health Assembly through decision WHA70(16) (2017) to consolidate reporting for Real Estate Fund and Information Technology Fund.
1 Transactions under the In-kind Contributions Fund are from non-exchange transactions. Total revenue equals total expenses; hence there is no fund balance at year-end (refer to Note 2.16).
2 In accordance with Health Assembly resolution WHA22.8 (1969) and resolution WHA55.9 (2002), the Revolving Sales Fund is credited with proceeds from the sale of publications, international certificates of vaccination, films, videos, DVDs and other information material. The related costs of production and printing are charged to the Fund.
3 Transactions under the Reimbursable Procurement Fund are from exchange transactions. Total revenue equals total expenses; hence, there is no fund balance at year-end (refer to Note 2.16).
A75/33
42
‒ Information Technology Fund. This fund was established to meet current and future information technology requirements of the Organization. It may be financed by way of appropriation from the regular budget and from voluntary contributions including the Special Account for Servicing Costs.
‒ Intern Fund. This fund was established to record and report operational costs under the intern programme. It is financed by way of a charge to the hiring department.
‒ Real Estate Fund. This fund was established by the Twenty-third World Health Assembly through resolution WHA23.14 (1970). It is funded mainly by appropriation from the regular budget. The Real Estate Fund is also credited with receipts from rentals relating to real estate operations (other than garage rentals and income from the operation of concessions at headquarters), by way of a charge on salary cost of staff members and interest earned.
The fund was established to meet the costs of the construction of new buildings or extensions to existing buildings, the acquisition of land that may be required and major maintenance and repairs of real estate assets owned by the Organization. Specific Health Assembly authorization is required for acquisition of land and construction of buildings or building extensions.
‒ Maternity Fund. This fund was established in 2018 as a new facility to support temporary backfilling of staff members on maternity leave. It is financed by way of a charge on salary cost of staff members.
‒ Mobility Fund. This fund was established to provide financing towards staff mobility entitlements such as assignment grant and reassignment grant. It is financed by way of a charge on salary cost of staff members.
‒ Non-Payroll Staff Entitlements Fund. This fund was established to provide financing towards staff entitlements such as home leave, education grant etc. It is financed by way of a charge on salary cost of staff members.
‒ Post Occupancy Charge Fund. This fund was established to finance corporate and administrative expenses of the Organization. It is financed by way of a charge on salary cost of staff members.
‒ Polio Staff Fund. This fund was established to manage staff liabilities due to the closure of the polio programme.
‒ Staff Health Insurance Fund. This fund was established to record and report net liability of the Organization. It is financed by way of a charge on salary cost of staff members and contributions from retirees.
‒ Security Fund. This fund was established to record and report security expenses. It may be financed by way of appropriation from the regular budget and from voluntary contributions including the Special Account for Servicing Costs.
‒ Special Fund for Compensation. This fund was established by the Director-General for the payment of periodic benefits awarded to staff members under WHO compensation rules for service-incurred accidents and illnesses. It may be financed by funds allocated to cover the cost of employing the staff member, and by way of any interest earned.
‒ Stockpiles Replenishment Fund. This fund was established to support emergency procurement needs, mainly for the Eastern Mediterranean Region.
‒ Terminal Payments Fund. This fund was established to finance the terminal emoluments of staff members, including repatriation grant, accrued annual leave, repatriation travel and removal on repatriation. It is financed by way of a charge on salary cost of staff members and any interest earned.
A75/33
43
Fiduciary Fund
This fund accounts for assets that are held by WHO in a trustee or agent capacity for others and that cannot be used to support the Organization’s own programmes. The Fund includes the assets of the partnerships that are administered by the Organization and whose budgets are not approved by the Health Assembly. The Fund did not contribute to the Programme budget 2020–2021, and at 31 December 2021 contained the following:
‒ Alliance for Health Policy and System Research Fund
‒ European Observatory on Health Systems and Policies
‒ Expanded Special Project for Elimination of Neglected Tropical Diseases (ESPEN) Fund
‒ Partnership for Maternal, Newborn and Child Health Fund
‒ Staff Association Fund
‒ WHO Framework Convention on Tobacco Control (FCTC)
2.19 Segment reporting
As required under IPSAS, WHO reports on segments based on its regional structure. Revenue, expenses, assets and liabilities are reported for each major office (region). The use of major offices is in line with the decision making practices of the Member States and the Secretariat, with respect to the allocation of resources. WHO’s programme budget is presented by major office, which supports using major offices as the segments. Furthermore, the accountability for results and management of assets and liabilities lies with the heads of each regional office.
2.20 Statement of Cash Flow
The Statement of Cash Flow (Statement IV) is prepared using the indirect method.
2.21 Budget comparison
WHO’s budget and accounting basis differ. Budgets within the Organization are approved on a modified cash basis rather than the full accrual basis of IPSAS. In addition, budgets are prepared on a biennial basis.
Although WHO’s financial statements cover all the activities of the Organization, budgets are approved by the World Health Assembly only for the General Fund. There are no approved budgets for other funds. All funds are administered in accordance with the Financial Regulations and Financial Rules.
As required under IPSAS 24 (Presentation of Budget Information in Financial Statements), the actual amounts presented on a comparable basis to the budget shall, where the financial statements and the budget are not prepared on a comparable basis, be reconciled to the actual amounts presented in the financial statements, identifying separately any basis, timing, presentation and entity differences. There may also be differences in formats and classification schemes adopted for the presentation of financial statements and the budget.
Through the adoption of resolution WHA72.1 (2019), the Seventy-second World Health Assembly approved the Programme budget 2020‒2021. The Statement of Comparison of Budget and Actual Amounts (Statement V) compares the final budget to actual amounts calculated on the same basis as the corresponding budgetary amounts. As the basis used to prepare the budget and financial statements differ, Note 7 reconciles the actual amounts presented in Statement V to the actual amounts presented in the Statement of Cash Flow (Statement IV).

A75/33
44
3. Note on the restatement/reclassification of balances
On this occasion, there is no information to provide under this note.

A75/33
45
4. Supporting information to the Statement of Financial Position
4.1 Cash and cash equivalents
Cash and cash equivalents comprise cash on hand, cash at banks, investments in money market funds, collateral deposits, bank deposits, and short-term highly liquid investments with original maturity dates of three months or less from the date of acquisition.
Cash and cash equivalents are held for the purpose of meeting the short-term cash requirements of the Organization, rather than for longer-term investment purposes. They are held on behalf of the Organization, including the General Fund, the Special Purpose Fund, the Enterprise Fund, the Fiduciary Fund and non-WHO entities administered by the Organization. The figures include cash and cash equivalents held in the portfolios managed by external investment managers. The table below shows cash and cash equivalents by major office.
Description 31 December 2021 31 December 2020 US$ thousands Major office
Headquarters 87 298 146 563 Regional Office for Africa 14 615 26 364 Regional Office for the Eastern Mediterranean 10 048 19 520 Regional Office for Europe 1 796 743 Regional Office for South-East Asia 4 079 1 545 Regional Office for the Western Pacific 3 436 3 453
Cash at banks, investment accounts, in transit and on hand 121 272 198 188 Headquarters 216 685 717 759
Cash and cash equivalents held by investment portfolios 216 685 717 759 Total cash and cash equivalents 337 957 915 947
4.2 Investments and financial instruments
Details of the accounting policies for investments and financial instruments are provided in Note 2.2.
WHO’s funds are invested with the following objectives:
‒ Preservation of capital. The goal of capital preservation is of paramount importance and is the principal objective of the investment policy;
‒ Maintenance of sufficient liquidity to meet all payments of liabilities on time; and
‒ Optimization of income return, commensurate with the above requirements on preservation of capital and liquidity.
The quality, security and liquidity of the investments are always given priority over the rate of return on the investments.
WHO has integrated high standards of environmental, social and governance (ESG) investment principles in its investment mandates. Companies which derive more than 5% of their income from the following sectors were excluded from investment:
‒ tobacco production
‒ armaments production
‒ fossil fuel reserves and extraction
WHO’s funds are co-mingled with those of the Staff Health Insurance (SHI) fund, UNAIDS, Unitaid and UNICC (refer to Note 4.15). These short-term funds are invested by WHO Treasury directly, and also by high-quality

A75/33
46
approved international investment managers. The total amounts invested on behalf of other entities are as follows:
Description 31 December 2021 31 December 2020 US$ thousands Staff Health Insurance 113 537 215 435 International Computing Centre 42 313 33 359 Unitaid 465 565 499 452 Trust Fund for the Joint United Nations Programme on HIV/AIDS (UNAIDS) 176 116 197 979 Total inter-entity liabilities 797 531 946 225
Applying the relative proportions of cash and cash equivalents, short-term investments and financial liabilities of the total figures to the inter entity balances for the hosted entities, the investments figures for each hosted entity can be presented as follows:
Description WHO SHI ICC UNITAID UNAIDS Total
US$ thousands Cash and cash equivalents 282 558 7 887 2 939 32 340 12 234 337 957 Short term investments 3 814 920 106 481 39 683 436 631 165 171 4 562 887 Financial liabilities (29 760) (831) (310) (3 406) (1 288) (35 595) Total 4 067 718 113 537 42 313 465 565 176 116 4 865 249
An analysis of the Organization’s investments is provided in the following table.

A75/33
47
Investments and financial instruments (in US$ thousands)
Description
Internally managed funds Externally managed funds Foreign
exchange hedging
contracts
Grand total as of
31 December 2021
Grand total as of
31 December 2020
Time deposits and cash
Short-term portfolio A
Short-term portfolio B
Short-term portfolio C
Short-term portfolio D
Long-term portfolio Total
Investments under current Assets
Cash and cash equivalent held by investment portfolio
95 418 34 009 9 286 54 059 23 912 1 121 267 216 685 717 759
Short-term investments
Financial assets at fair value through surplus or deficit – held for trading
15 025 11 590 187 3 021 14 798 3 433 33 256 23 804
Financial assets at fair value through surplus or deficit – upon initial recognition 998 615 168 494 697 739 1 013 711 2 878 559 2 878 559 2 528 101
Bank deposits & other receivables 1 636 335 2 825 7 317 1 280 3 315 14 737 1 651 072 1 327 515
Total short-term investments 1 651 360 1 013 030 175 998 699 019 1 020 047 2 908 094 3 433 4 562 887 3 879 420
Total investments under current assets 1 746 778 1 047 039 185 284 753 078 1 043 959 1 3 029 361 3 433 4 779 572 4 597 179
Investments under non-current assets
Long-term investments
Financial assets at fair value through surplus or deficit – upon initial recognition 114 511 114 511 114 511 136 702
Total long-term assets 114 511 136 702
Total investments under non-current assets 114 511 136 702
Financial liabilities under current liabilities
Financial liabilities at fair value through surplus or deficit for trading
(837) (1 857) ( 669) (2 526) (9 185) (12 548) (63 720)
Payables and accruals (8 870) (14 175) (1) (1) (23 047) (23 047) (120 135)
Total financial liabilities (837) (10 727) (14 175) (1) (670) (25 573) (9 185) (35 595) (183 855)
Total financial liabilities under current liabilities (837) (10 727) (14 175) (1) (670) (25 573) (9 185) (35 595) (183 855)
Total investment – net 1 745 941 1 036 312 171 109 753 077 1 043 289 114 512 3 118 299 (5 752) 4 858 488 4 550 026
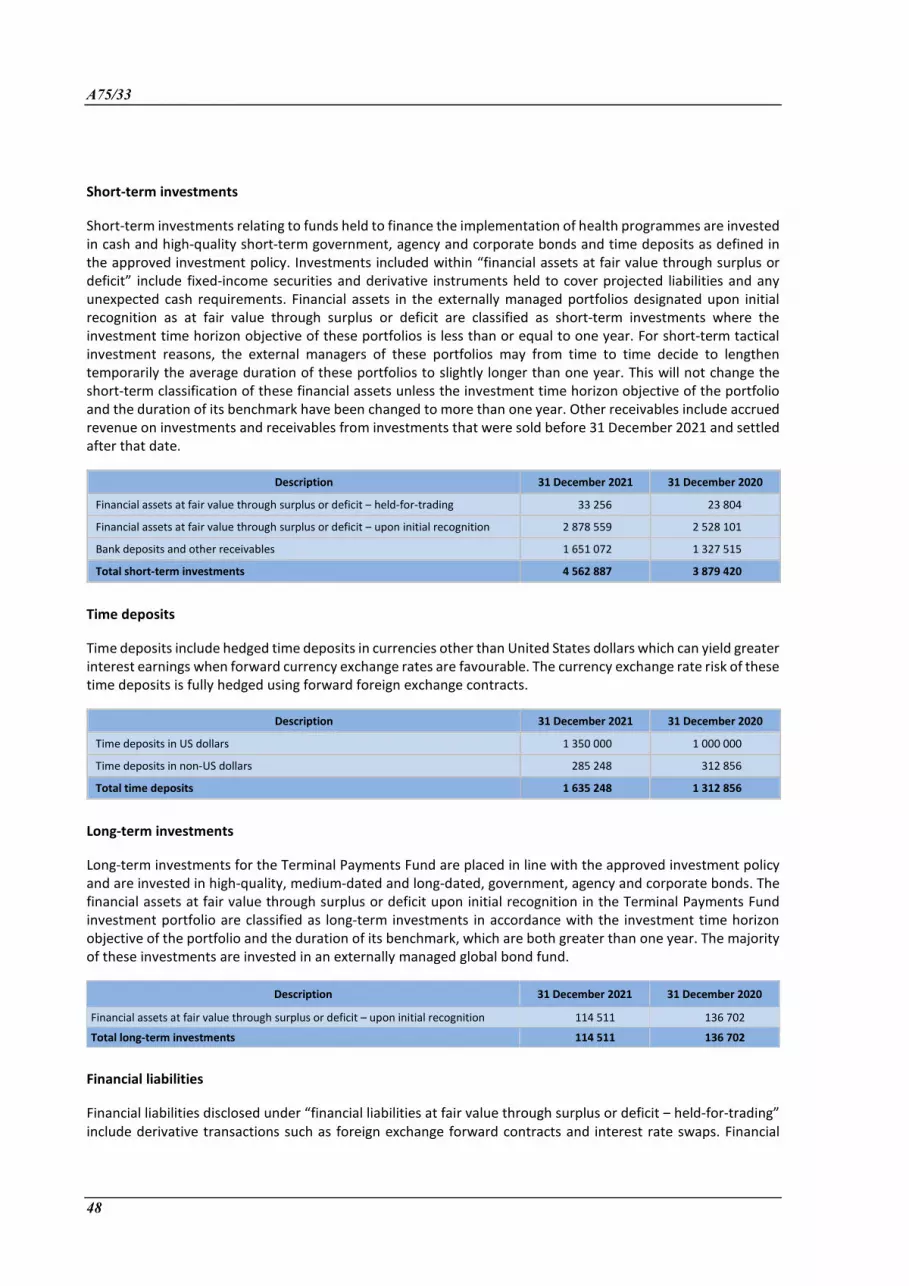
A75/33
48
Short-term investments
Short-term investments relating to funds held to finance the implementation of health programmes are invested in cash and high-quality short-term government, agency and corporate bonds and time deposits as defined in the approved investment policy. Investments included within “financial assets at fair value through surplus or deficit” include fixed-income securities and derivative instruments held to cover projected liabilities and any unexpected cash requirements. Financial assets in the externally managed portfolios designated upon initial recognition as at fair value through surplus or deficit are classified as short-term investments where the investment time horizon objective of these portfolios is less than or equal to one year. For short-term tactical investment reasons, the external managers of these portfolios may from time to time decide to lengthen temporarily the average duration of these portfolios to slightly longer than one year. This will not change the short-term classification of these financial assets unless the investment time horizon objective of the portfolio and the duration of its benchmark have been changed to more than one year. Other receivables include accrued revenue on investments and receivables from investments that were sold before 31 December 2021 and settled after that date.
Description 31 December 2021 31 December 2020
Financial assets at fair value through surplus or deficit ‒ held-for-trading 33 256 23 804
Financial assets at fair value through surplus or deficit ‒ upon initial recognition 2 878 559 2 528 101
Bank deposits and other receivables 1 651 072 1 327 515
Total short-term investments 4 562 887 3 879 420
Time deposits
Time deposits include hedged time deposits in currencies other than United States dollars which can yield greater interest earnings when forward currency exchange rates are favourable. The currency exchange rate risk of these time deposits is fully hedged using forward foreign exchange contracts.
Description 31 December 2021 31 December 2020
Time deposits in US dollars 1 350 000 1 000 000
Time deposits in non-US dollars 285 248 312 856
Total time deposits 1 635 248 1 312 856
Long-term investments
Long-term investments for the Terminal Payments Fund are placed in line with the approved investment policy and are invested in high-quality, medium-dated and long-dated, government, agency and corporate bonds. The financial assets at fair value through surplus or deficit upon initial recognition in the Terminal Payments Fund investment portfolio are classified as long-term investments in accordance with the investment time horizon objective of the portfolio and the duration of its benchmark, which are both greater than one year. The majority of these investments are invested in an externally managed global bond fund.
Description 31 December 2021 31 December 2020
Financial assets at fair value through surplus or deficit – upon initial recognition 114 511 136 702
Total long-term investments 114 511 136 702
Financial liabilities
Financial liabilities disclosed under “financial liabilities at fair value through surplus or deficit ‒ held-for-trading” include derivative transactions such as foreign exchange forward contracts and interest rate swaps. Financial
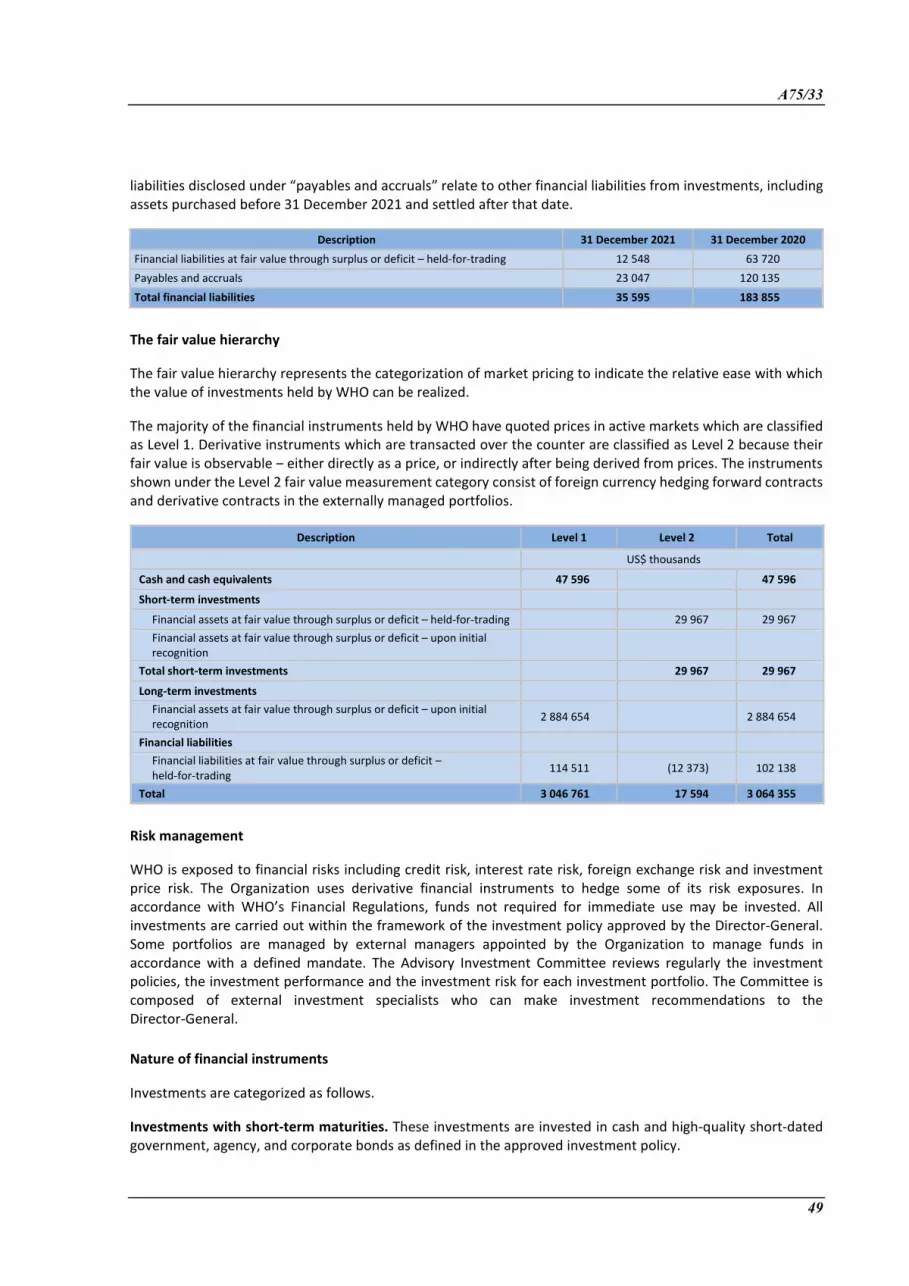
A75/33
49
liabilities disclosed under “payables and accruals” relate to other financial liabilities from investments, including assets purchased before 31 December 2021 and settled after that date.
Description 31 December 2021 31 December 2020 Financial liabilities at fair value through surplus or deficit – held-for-trading 12 548 63 720 Payables and accruals 23 047 120 135 Total financial liabilities 35 595 183 855
The fair value hierarchy
The fair value hierarchy represents the categorization of market pricing to indicate the relative ease with which the value of investments held by WHO can be realized.
The majority of the financial instruments held by WHO have quoted prices in active markets which are classified as Level 1. Derivative instruments which are transacted over the counter are classified as Level 2 because their fair value is observable ‒ either directly as a price, or indirectly after being derived from prices. The instruments shown under the Level 2 fair value measurement category consist of foreign currency hedging forward contracts and derivative contracts in the externally managed portfolios.
Description Level 1 Level 2 Total US$ thousands
Cash and cash equivalents 47 596 47 596
Short-term investments
Financial assets at fair value through surplus or deficit – held-for-trading 29 967 29 967 Financial assets at fair value through surplus or deficit – upon initial recognition
Total short-term investments 29 967 29 967
Long-term investments Financial assets at fair value through surplus or deficit – upon initial recognition 2 884 654 2 884 654
Financial liabilities Financial liabilities at fair value through surplus or deficit – held-for-trading 114 511 (12 373) 102 138
Total 3 046 761 17 594 3 064 355
Risk management
WHO is exposed to financial risks including credit risk, interest rate risk, foreign exchange risk and investment price risk. The Organization uses derivative financial instruments to hedge some of its risk exposures. In accordance with WHO’s Financial Regulations, funds not required for immediate use may be invested. All investments are carried out within the framework of the investment policy approved by the Director-General. Some portfolios are managed by external managers appointed by the Organization to manage funds in accordance with a defined mandate. The Advisory Investment Committee reviews regularly the investment policies, the investment performance and the investment risk for each investment portfolio. The Committee is composed of external investment specialists who can make investment recommendations to the Director-General.
Nature of financial instruments
Investments are categorized as follows.
Investments with short-term maturities. These investments are invested in cash and high-quality short-dated government, agency, and corporate bonds as defined in the approved investment policy.
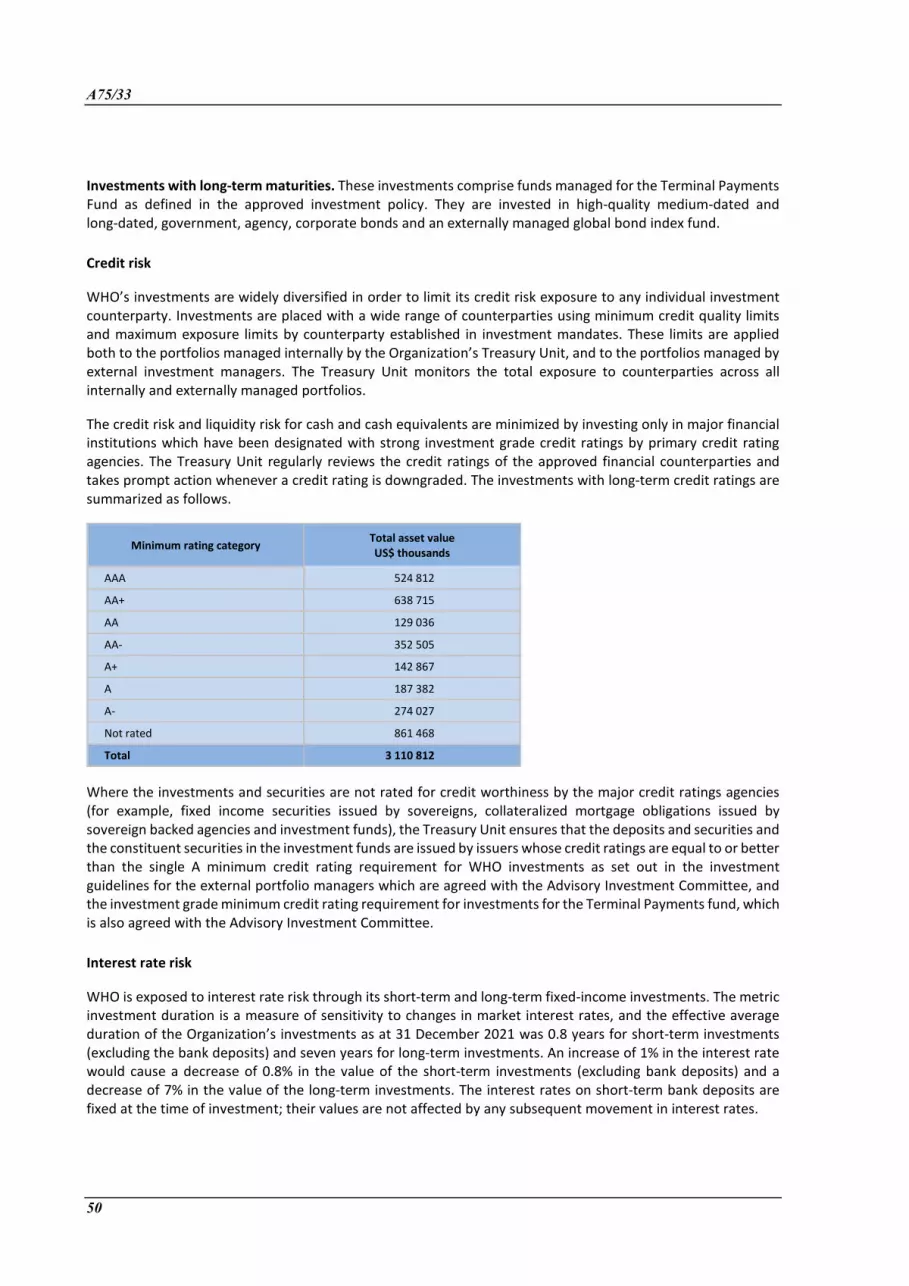
A75/33
50
Investments with long-term maturities. These investments comprise funds managed for the Terminal Payments Fund as defined in the approved investment policy. They are invested in high-quality medium-dated and long-dated, government, agency, corporate bonds and an externally managed global bond index fund.
Credit risk
WHO’s investments are widely diversified in order to limit its credit risk exposure to any individual investment counterparty. Investments are placed with a wide range of counterparties using minimum credit quality limits and maximum exposure limits by counterparty established in investment mandates. These limits are applied both to the portfolios managed internally by the Organization’s Treasury Unit, and to the portfolios managed by external investment managers. The Treasury Unit monitors the total exposure to counterparties across all internally and externally managed portfolios.
The credit risk and liquidity risk for cash and cash equivalents are minimized by investing only in major financial institutions which have been designated with strong investment grade credit ratings by primary credit rating agencies. The Treasury Unit regularly reviews the credit ratings of the approved financial counterparties and takes prompt action whenever a credit rating is downgraded. The investments with long-term credit ratings are summarized as follows.
Minimum rating category Total asset value US$ thousands
AAA 524 812
AA+ 638 715
AA 129 036
AA- 352 505
A+ 142 867
A 187 382
A- 274 027
Not rated 861 468
Total 3 110 812
Where the investments and securities are not rated for credit worthiness by the major credit ratings agencies (for example, fixed income securities issued by sovereigns, collateralized mortgage obligations issued by sovereign backed agencies and investment funds), the Treasury Unit ensures that the deposits and securities and the constituent securities in the investment funds are issued by issuers whose credit ratings are equal to or better than the single A minimum credit rating requirement for WHO investments as set out in the investment guidelines for the external portfolio managers which are agreed with the Advisory Investment Committee, and the investment grade minimum credit rating requirement for investments for the Terminal Payments fund, which is also agreed with the Advisory Investment Committee.
Interest rate risk
WHO is exposed to interest rate risk through its short-term and long-term fixed-income investments. The metric investment duration is a measure of sensitivity to changes in market interest rates, and the effective average duration of the Organization’s investments as at 31 December 2021 was 0.8 years for short-term investments (excluding the bank deposits) and seven years for long-term investments. An increase of 1% in the interest rate would cause a decrease of 0.8% in the value of the short-term investments (excluding bank deposits) and a decrease of 7% in the value of the long-term investments. The interest rates on short-term bank deposits are fixed at the time of investment; their values are not affected by any subsequent movement in interest rates.
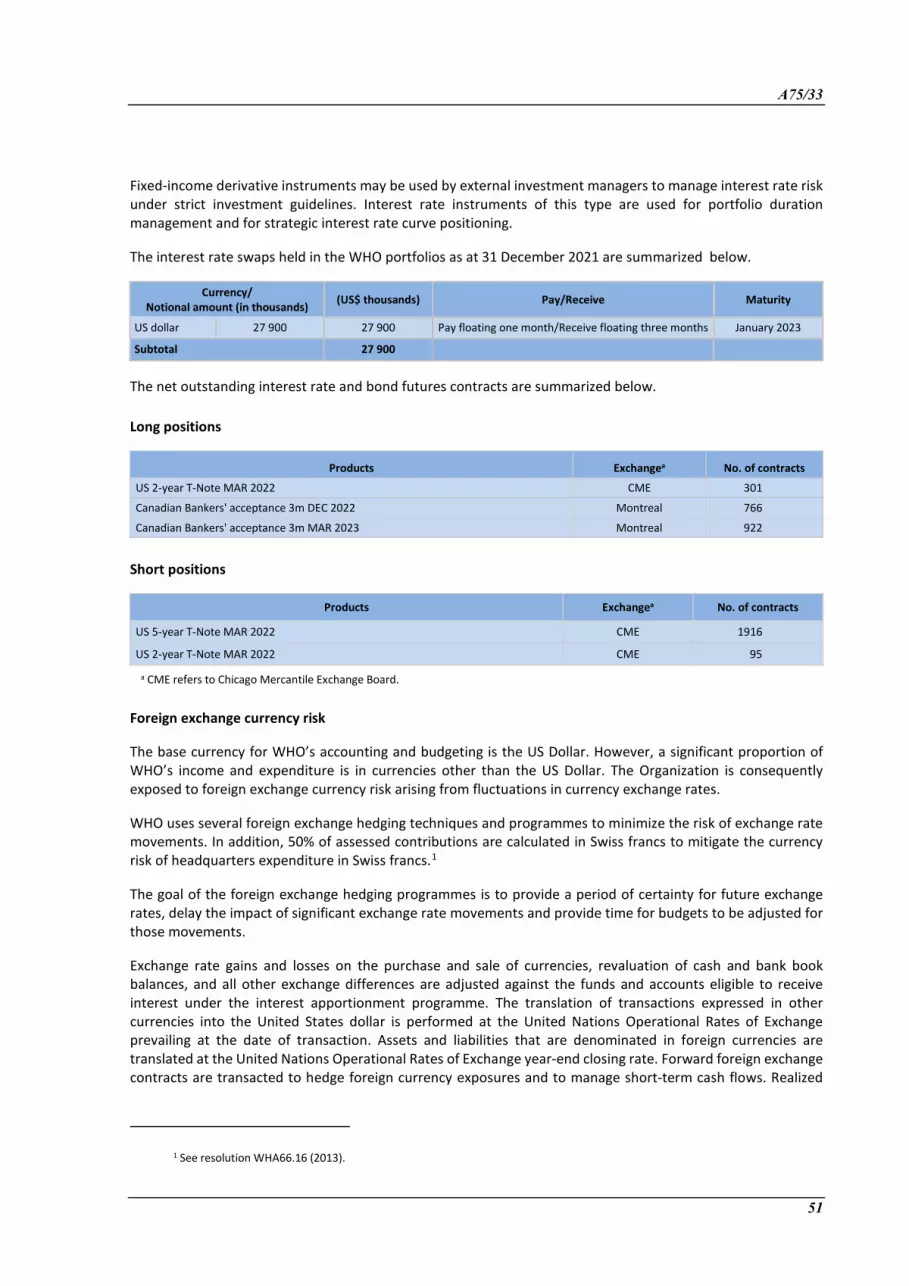
A75/33
51
Fixed-income derivative instruments may be used by external investment managers to manage interest rate risk under strict investment guidelines. Interest rate instruments of this type are used for portfolio duration management and for strategic interest rate curve positioning.
The interest rate swaps held in the WHO portfolios as at 31 December 2021 are summarized below.
Currency/ Notional amount (in thousands) (US$ thousands) Pay/Receive Maturity
US dollar 27 900 27 900 Pay floating one month/Receive floating three months January 2023
Subtotal 27 900
The net outstanding interest rate and bond futures contracts are summarized below.
Long positions
Products Exchangea No. of contracts
US 2-year T-Note MAR 2022 CME 301
Canadian Bankers' acceptance 3m DEC 2022 Montreal 766
Canadian Bankers' acceptance 3m MAR 2023 Montreal 922
Short positions
Products Exchangea No. of contracts
US 5-year T-Note MAR 2022 CME 1916
US 2-year T-Note MAR 2022 CME 95
a CME refers to Chicago Mercantile Exchange Board.
Foreign exchange currency risk
The base currency for WHO’s accounting and budgeting is the US Dollar. However, a significant proportion of WHO’s income and expenditure is in currencies other than the US Dollar. The Organization is consequently exposed to foreign exchange currency risk arising from fluctuations in currency exchange rates.
WHO uses several foreign exchange hedging techniques and programmes to minimize the risk of exchange rate movements. In addition, 50% of assessed contributions are calculated in Swiss francs to mitigate the currency risk of headquarters expenditure in Swiss francs.1
The goal of the foreign exchange hedging programmes is to provide a period of certainty for future exchange rates, delay the impact of significant exchange rate movements and provide time for budgets to be adjusted for those movements.
Exchange rate gains and losses on the purchase and sale of currencies, revaluation of cash and bank book balances, and all other exchange differences are adjusted against the funds and accounts eligible to receive interest under the interest apportionment programme. The translation of transactions expressed in other currencies into the United States dollar is performed at the United Nations Operational Rates of Exchange prevailing at the date of transaction. Assets and liabilities that are denominated in foreign currencies are translated at the United Nations Operational Rates of Exchange year-end closing rate. Forward foreign exchange contracts are transacted to hedge foreign currency exposures and to manage short-term cash flows. Realized
1 See resolution WHA66.16 (2013).

A75/33
52
and unrealized gains and losses resulting from the settlement and revaluation of foreign currency transactions are recognized in the Statement of Financial Performance (Statement II).
Hedging foreign exchange exposures on future payroll costs: The United States dollar value of non-US dollar expenditure in 2022 has been protected from the impact of movements in foreign exchange rates through the transaction of forward currency contracts during 2021. As at 31 December 2021 these forward foreign currency exchange hedging contracts by currency are summarized as follows.
Currency forward bought (in thousands) Net amount sold (US$ thousands)
Net unrealized gain/(loss) (US$ thousands)
Swiss franc 183 400 202 275 238
Euro 124 800 148 305 (5 858)
Egyptian pound 265 200 15 325 699
Indian rupee 1 682 400 21 712 374
Malaysian ringgit 42 600 10 159 23
Philippine peso 816 000 16 086 (420)
Total 413 862 (4 944)
There was a net unrealized loss on these contracts of US$ 4.9 million as at 31 December 2021 (unrealized gain of US$ 18.9 million as at 31 December 2020). Realized gains or losses on these contracts will be recorded on maturity of the contracts and applied during 2022.
Hedging foreign exchange exposures on receivables and payables: Currency exchange risk arises as a result of differences in the exchange rates at which foreign currency receivables or payables are recorded, and the exchange rates at which the cash receipt or payment is subsequently recorded. A monthly programme of currency hedging is in place to protect against this foreign currency risk. On a monthly basis, the exposures in respect of receivables and accounts payable are netted by currency and each significant net foreign currency exposure is bought or sold forward using a forward foreign exchange contract equal and opposite to the net currency exposure.
These exposures are re-balanced at each month-end to coincide with the setting of the monthly United Nations Operational Rates of Exchange. Through this process the exchange gains or losses realized on the forward foreign currency contracts match the corresponding unrealized exchange losses and gains on the movements in net receivables and accounts payable. As at 31 December 2021, the total forward foreign currency exchange hedging contracts by currency were as follows.
Currency forward sold (in thousands) Currency forward bought (US$ thousands)
Net unrealized gain/(loss) (US$ thousands)
Australian dollar 17 000 12 309 (43)
Canadian dollar 99 900 77 977 (1 048)
Swiss franc 5 950 6 505 (28)
Euro 326 500 370 432 508
Pound sterling 15 130 20 376 (116)
Norwegian kroner 103 527 11 741 4
Swedish kroner 101 000 11 170 (85)
Total 510 510 (808)
There was a net unrealized loss on these contracts of US$ 0.8 million as at 31 December 2021 (unrealized net loss of US$ 31.1 million as at 31 December 2020). Realized gains or losses on these contracts will be recorded on the maturity of the contracts and applied during 2022.
The above table does not include data for hedging contracts that are transacted by WHO on behalf of other entities, which are reported in separate financial statements.
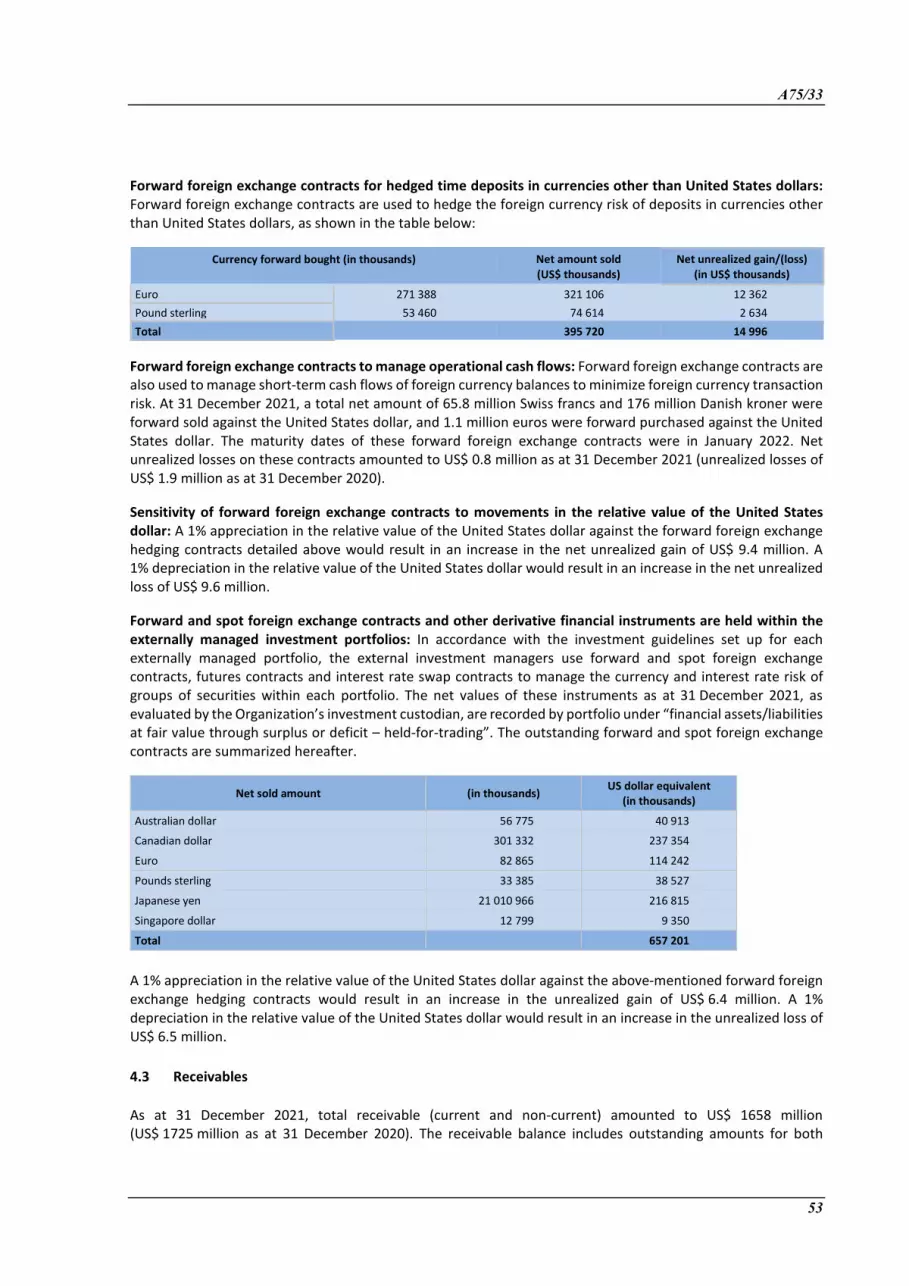
A75/33
53
Forward foreign exchange contracts for hedged time deposits in currencies other than United States dollars: Forward foreign exchange contracts are used to hedge the foreign currency risk of deposits in currencies other than United States dollars, as shown in the table below:
Currency forward bought (in thousands) Net amount sold (US$ thousands)
Net unrealized gain/(loss) (in US$ thousands)
Euro 271 388 321 106 12 362 Pound sterling 53 460 74 614 2 634 Total 395 720 14 996
Forward foreign exchange contracts to manage operational cash flows: Forward foreign exchange contracts are also used to manage short-term cash flows of foreign currency balances to minimize foreign currency transaction risk. At 31 December 2021, a total net amount of 65.8 million Swiss francs and 176 million Danish kroner were forward sold against the United States dollar, and 1.1 million euros were forward purchased against the United States dollar. The maturity dates of these forward foreign exchange contracts were in January 2022. Net unrealized losses on these contracts amounted to US$ 0.8 million as at 31 December 2021 (unrealized losses of US$ 1.9 million as at 31 December 2020).
Sensitivity of forward foreign exchange contracts to movements in the relative value of the United States dollar: A 1% appreciation in the relative value of the United States dollar against the forward foreign exchange hedging contracts detailed above would result in an increase in the net unrealized gain of US$ 9.4 million. A 1% depreciation in the relative value of the United States dollar would result in an increase in the net unrealized loss of US$ 9.6 million.
Forward and spot foreign exchange contracts and other derivative financial instruments are held within the externally managed investment portfolios: In accordance with the investment guidelines set up for each externally managed portfolio, the external investment managers use forward and spot foreign exchange contracts, futures contracts and interest rate swap contracts to manage the currency and interest rate risk of groups of securities within each portfolio. The net values of these instruments as at 31 December 2021, as evaluated by the Organization’s investment custodian, are recorded by portfolio under “financial assets/liabilities at fair value through surplus or deficit – held-for-trading”. The outstanding forward and spot foreign exchange contracts are summarized hereafter.
Net sold amount (in thousands) US dollar equivalent (in thousands)
Australian dollar 56 775 40 913
Canadian dollar 301 332 237 354
Euro 82 865 114 242
Pounds sterling 33 385 38 527
Japanese yen 21 010 966 216 815
Singapore dollar 12 799 9 350
Total 657 201
A 1% appreciation in the relative value of the United States dollar against the above-mentioned forward foreign exchange hedging contracts would result in an increase in the unrealized gain of US$ 6.4 million. A 1% depreciation in the relative value of the United States dollar would result in an increase in the unrealized loss of US$ 6.5 million.
4.3 Receivables
As at 31 December 2021, total receivable (current and non-current) amounted to US$ 1658 million (US$ 1725 million as at 31 December 2020). The receivable balance includes outstanding amounts for both
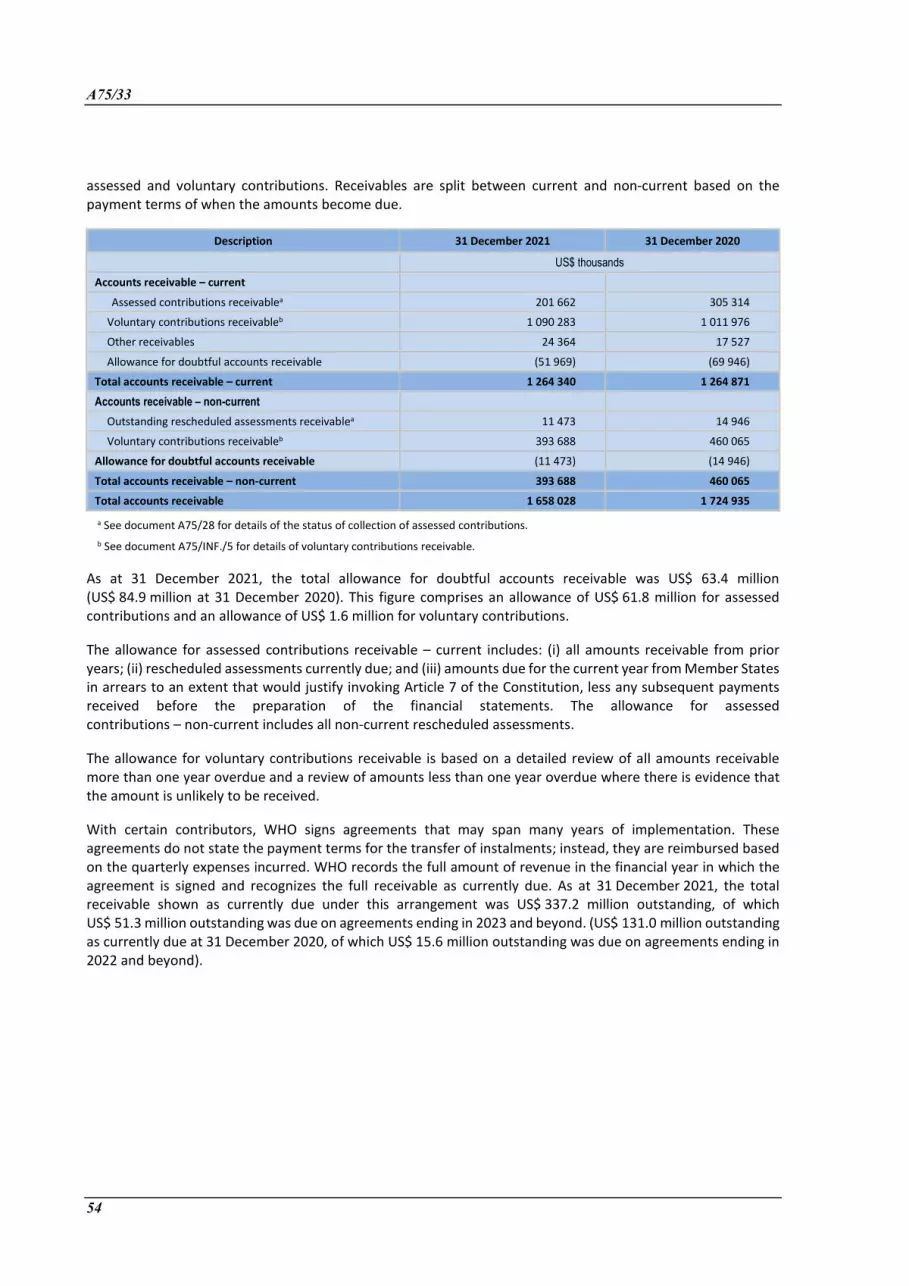
A75/33
54
assessed and voluntary contributions. Receivables are split between current and non-current based on the payment terms of when the amounts become due.
Description 31 December 2021 31 December 2020 US$ thousands Accounts receivable – current
Assessed contributions receivablea 201 662 305 314
Voluntary contributions receivableb 1 090 283 1 011 976
Other receivables 24 364 17 527
Allowance for doubtful accounts receivable (51 969) (69 946)
Total accounts receivable – current 1 264 340 1 264 871
Accounts receivable – non-current
Outstanding rescheduled assessments receivablea 11 473 14 946
Voluntary contributions receivableb 393 688 460 065
Allowance for doubtful accounts receivable (11 473) (14 946)
Total accounts receivable – non-current 393 688 460 065
Total accounts receivable 1 658 028 1 724 935
a See document A75/28 for details of the status of collection of assessed contributions. b See document A75/INF./5 for details of voluntary contributions receivable.
As at 31 December 2021, the total allowance for doubtful accounts receivable was US$ 63.4 million (US$ 84.9 million at 31 December 2020). This figure comprises an allowance of US$ 61.8 million for assessed contributions and an allowance of US$ 1.6 million for voluntary contributions.
The allowance for assessed contributions receivable – current includes: (i) all amounts receivable from prior years; (ii) rescheduled assessments currently due; and (iii) amounts due for the current year from Member States in arrears to an extent that would justify invoking Article 7 of the Constitution, less any subsequent payments received before the preparation of the financial statements. The allowance for assessed contributions – non-current includes all non-current rescheduled assessments.
The allowance for voluntary contributions receivable is based on a detailed review of all amounts receivable more than one year overdue and a review of amounts less than one year overdue where there is evidence that the amount is unlikely to be received.
With certain contributors, WHO signs agreements that may span many years of implementation. These agreements do not state the payment terms for the transfer of instalments; instead, they are reimbursed based on the quarterly expenses incurred. WHO records the full amount of revenue in the financial year in which the agreement is signed and recognizes the full receivable as currently due. As at 31 December 2021, the total receivable shown as currently due under this arrangement was US$ 337.2 million outstanding, of which US$ 51.3 million outstanding was due on agreements ending in 2023 and beyond. (US$ 131.0 million outstanding as currently due at 31 December 2020, of which US$ 15.6 million outstanding was due on agreements ending in 2022 and beyond).

A75/33
55
The movement in the allowance for doubtful debts is as follows.
Description 31 December 2021 31 December 2020
US$ thousands
Opening balance – assessed contributions 83 569 49 537
Increase/(decrease) in allowance for doubtful accounts receivable (21 761) 34 032
Ending balance – assessed contributions 61 808 83 569
Opening balance – voluntary contributions 1 323 7 023
Write-off of accounts receivable previously provided - (6 537) (Decrease)/increase in allowance for doubtful accounts receivable (refer to Note 5.1) 311 837
Ending balance – voluntary contributions 1 634 1 323
Total allowance for doubtful accounts receivable 63 442 84 892
Allowance for doubtful accounts receivable
Allowance – current 51 969 69 946
Allowance – non-current 11 473 14 946
Total allowance for doubtful accounts receivable 63 442 84 892
The total allowance for doubtful accounts on voluntary contributions was US$ 1.6 million (US$ 1.3 million at 31 December 2020). During 2021, no amounts receivable were approved for write-off (US$ 6.5 million for 2020).
4.4 Staff receivables
In accordance with WHO’s Staff Regulations and Staff Rules, staff members are entitled to certain advances including those for salary, education, rent and travel.
The total balance of staff receivables amounted to US$ 13.0 million as at 31 December 2021 (US$ 13.1 million as at December 2020). The largest balance relates to education grant which represents advances made to staff for the 2021 portion of the 2021–2022 school year.
Description 31 December 2021 31 December 2020 US$ thousands
Salary advances 637 394
Education grant advances 12 380 11 406
Rental advances 1 097 1 038
Travel receivables (1 137) 271
Other staff receivables (6) (4)
Total staff receivables 12 971 13 105
4.5 Inventories
The total value of inventory as at 31 December 2021 was US$ 190.4 million (US$ 144.3 million as at 31 December 2020). The movement of inventory items during the year is shown in the table below:
Description 31 December 2020 Net additions Net shipments Net disposals and
expired items Net inventory
in-transit 31 December
2021 US$ thousands
Medicines, vaccines and humanitarian supplies 138 100 304 778 (272 716) (3 394) 17 492 184 260
Publications 6 221 1 631 (1 561) (121) 0 6 170 Total inventory 144 321 306 409 (274 277) (3 515) 17 492 190 430

A75/33
56
Total expenses relating to inventories during the period (net shipments, net disposals and expired items) amounted to US$ 277.8 million (US$ 302 million as at 31 December 2020. The expenses relating to inventories are reported in the Statement of Financial Performance (Statement II) under “Medical supplies and materials”. The year-end inventory balance includes shipping cost of 10%.
4.6 Prepayments and deposits
The total value of prepayments as at 31 December 2021 was US$ 102.6 million (US$ 111.8 million in 2020). These represent payments to suppliers in advance of the receipt of goods or services. The largest component of prepayment (US$ 94 million) relates to procurement of polio vaccine through the United Nations Children’s Fund. It is common practice for technical service contractors to request payments in advance to support project work. When goods or services are delivered, prepayments are applied to the appropriate expense account.
Prepayments include US$ 3.7 million of deposits (US$ 3.7 million as at 31 December 2020). Deposits represent amounts given to landlords as a security to rent office space.
4.7 Property, plant and equipment
As at 31 December 2021, the total value of recognized property, plant and equipment (net of accumulated depreciation) was US$ 230 million (US$ 206.9 million as at 31 December 2020).
Details of the total property, plant and equipment are as follows:
Property
The total value of property (net of accumulated depreciation) was US$ 212.4 million (US$ 190 million as at 31 December 2020). The addition of US$ 22.4 million was mainly for the headquarters construction project. The details of property are as follows.
Major office 31 December 2020 Additions Disposals/
Transfers Impairments Depreciation 31 December 2021
US$ thousands Headquarters
Land 1 000 1 000 Buildings 30 909 151 469 (2 524) (2 279) 177 575 CIP 135 611 23 504 (146 860) 12 255 Total property – headquarters 167 520 174 973 (149 384) (2 279) 190 830 Regional Office for Africa Land 103 103 Buildings 3 850 16 (373) 3 493 CIP 184 184 Total property – Regional Office
for Africa 4 137 16 (373) 3 780
Regional Office for the Eastern Mediterranean
Buildings 17 888 (403) 17 485 CIP Total property – Regional Office
for the Eastern Mediterranean 17 888 (403) 17 485
Regional Office for the Western Pacific
Buildings 444 (51) 393 CIP Total property – Regional Office
for the Western Pacific 444 (51) 393
Total WHO Land 1 103 1 103 Buildings 53 091 151 485 (2 524) (3 106) 198 946

A75/33
57
Major office 31 December 2020 Additions Disposals/
Transfers Impairments Depreciation 31 December 2021
CIP 135 795 23 504 (146 860) 12 439 Total property – WHO 189 989 174 989 (149 384) (3 106) 212 488
Equipment
The total value of equipment (net of accumulated depreciation) was US$ 17.5 million (US$ 16.9 million as at 31 December 2020). The details of equipment are as follows.
Asset category 31 December 2020 Additions Depreciation Disposals/
Transfers Impairments 31 December 2021
US$ thousands Vehicles and transport equipment 12 267 6 143 (5 650) (83) 12 677 Computer and communications equipment 3 094 2 367 (2 091) (5) 3 365 Machinery and specialized equipment 1 487 547 (836) (33) 1 165 Furniture 74 310 (59) 325
Total equipment – WHO 16 922 9 367 (8 636) (121) 17 532
The total depreciation for 2021 was US$ 11.7 million (refer to Note 5.2) – US$ 3.1 million for property and US$ 8.6 million for equipment.
In locations where WHO does not own the land, surface rights were granted at no cost. No value for land has been recognized as the Organization does not have the ability to dispose of these rights in a commercial transaction. In addition, the Organization continues to use the fully depreciated assets; the total purchase cost was US$ 71 million.
Details of fully depreciated assets in use are as follows.
Asset category Fully depreciated equipment in service as at 31 December 2021
units Vehicles and transport equipment 1 151 Computer and communications equipment 1 716 Machinery and specialized equipment 448 Furniture 41 Total equipment – WHO 3 356
4.8 Intangibles
Intangible assets held as at 31 December 2021 amounted to US$ 4.9 million (US$ 3.7 million as at 31 December 2020). All intangibles relate to the implementation of purchased software.
Asset category 31 December 2020 Additions Disposals/
transfers Impairments Amortization 31 December 2021
US$ thousands Software acquired 2 581 305 (1 153) 1 733 Software under development 1 153 2 175 (129) 3 199
Total intangible assets 3 734 2 480 (129) (1 153) 4 932
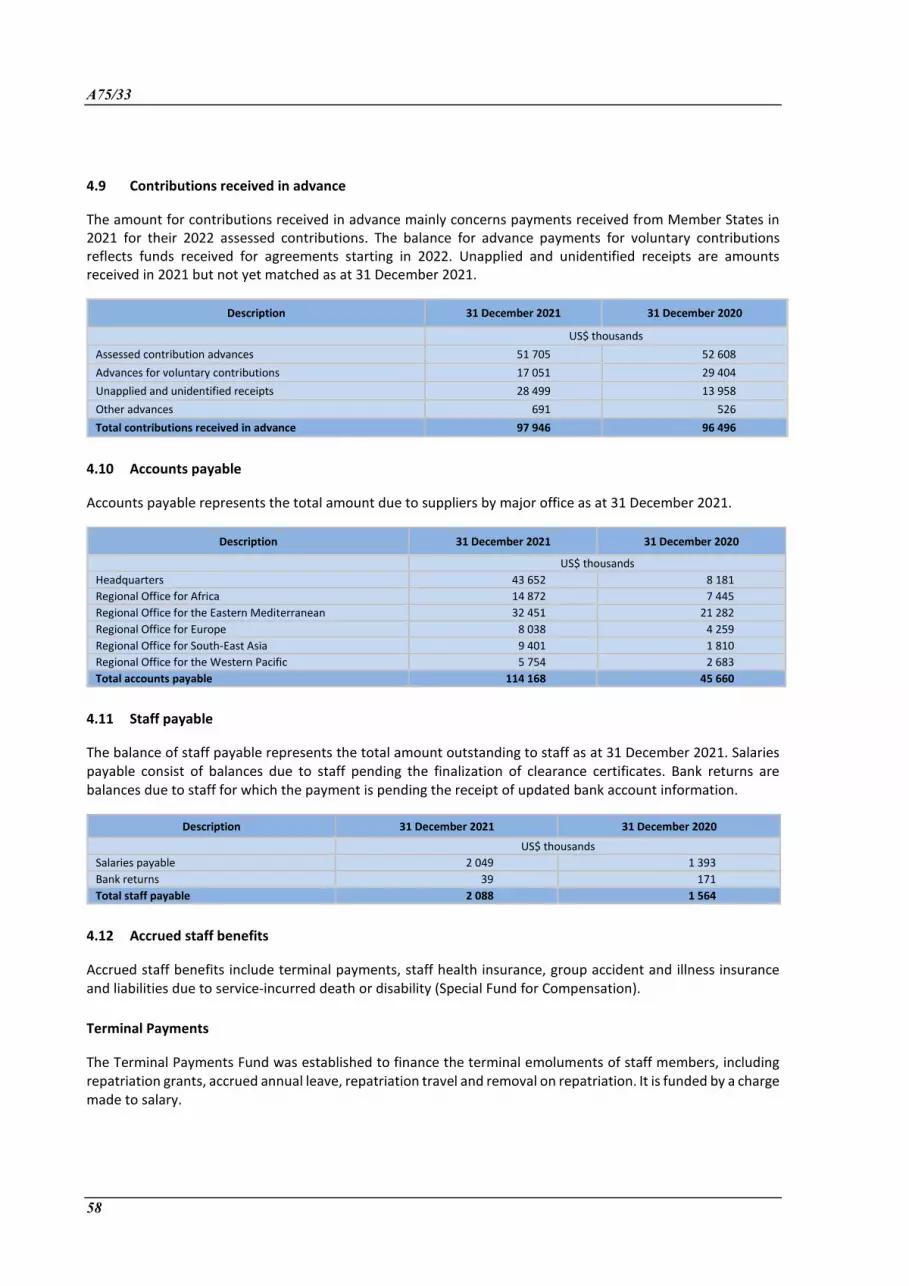
A75/33
58
4.9 Contributions received in advance
The amount for contributions received in advance mainly concerns payments received from Member States in 2021 for their 2022 assessed contributions. The balance for advance payments for voluntary contributions reflects funds received for agreements starting in 2022. Unapplied and unidentified receipts are amounts received in 2021 but not yet matched as at 31 December 2021.
Description 31 December 2021 31 December 2020 US$ thousands Assessed contribution advances 51 705 52 608 Advances for voluntary contributions 17 051 29 404 Unapplied and unidentified receipts 28 499 13 958 Other advances 691 526 Total contributions received in advance 97 946 96 496
4.10 Accounts payable
Accounts payable represents the total amount due to suppliers by major office as at 31 December 2021.
Description 31 December 2021 31 December 2020 US$ thousands Headquarters 43 652 8 181 Regional Office for Africa 14 872 7 445 Regional Office for the Eastern Mediterranean 32 451 21 282 Regional Office for Europe 8 038 4 259 Regional Office for South-East Asia 9 401 1 810 Regional Office for the Western Pacific 5 754 2 683 Total accounts payable 114 168 45 660
4.11 Staff payable
The balance of staff payable represents the total amount outstanding to staff as at 31 December 2021. Salaries payable consist of balances due to staff pending the finalization of clearance certificates. Bank returns are balances due to staff for which the payment is pending the receipt of updated bank account information.
Description 31 December 2021 31 December 2020 US$ thousands Salaries payable 2 049 1 393 Bank returns 39 171 Total staff payable 2 088 1 564
4.12 Accrued staff benefits
Accrued staff benefits include terminal payments, staff health insurance, group accident and illness insurance and liabilities due to service-incurred death or disability (Special Fund for Compensation).
Terminal Payments
The Terminal Payments Fund was established to finance the terminal emoluments of staff members, including repatriation grants, accrued annual leave, repatriation travel and removal on repatriation. It is funded by a charge made to salary.
A75/33
59
Liabilities arising from repatriation benefits and annual leave are determined by independent consulting actuaries. However, the accrued leave is calculated on a walk-away basis ‒ that is, as if all staff separated immediately ‒ and, therefore, is not discounted.
The latest actuarial study (as at 31 December 2021) estimated the full terminal payment liability to be US$ 161.3 million (short-term liability, US$ 86.6 million; long-term liability, US$ 74.7 million) compared to US$ 151.3 million as at 31 December 2020, a net increase of US$ 10 million, which is recognized by nature of expense, in the Statement of Financial Performance (Statement II). The main reason for the increase in the accrued annual leave is due to the temporary extension of COVID-19 measures. This calculation does not include costs for the end-of-service grant, separation by agreement or abolishment of posts. The defined benefit obligation amounted to US$ 84.8 million (US$ 79.7 million as at 31 December 2020) for terminal entitlements, and US$ 76.5 million (US$ 71.6 million as at 31 December 2020) for annual leave which is included in the terminal payments current balance.
Special Fund for Compensation
In the event of a death or disablement attributable to the performance of official duties of an eligible staff member, the Special Fund for Compensation covers all reasonable medical, hospital, and other directly related costs, as well as funeral expenses. In addition, the Fund provides compensation to disabled staff members (for the duration of the disability) or to the surviving family members.
WHO accounts for the Special Fund for Compensation as a post-employment benefit. Actuarial gains and losses are recognized in the net assets/equity (Statement III), in accordance with IPSAS 39 (Employee Benefits).
As per the actuarial study, the total liability was US$ 53 million at 31 December 2021 (US$ 53.2 million as at 31 December 2020). The liability decreased mainly due to the change in discount rate and expected annual growth. In accordance with IPSAS 39 (Employee Benefits), the actuarial gain of US$ 3.2 million (loss of US$ 4.6 million in 2020) was credited directly to net assets/equity (Statement III) in 2021, and US$ 4.2 million (US$ 3.2 million in 2020) was charged by nature of expense in the Statement of Financial Performance (Statement II).
Accident and Illness Insurance
The Accident and Illness Insurance Fund was established to cover benefit payments in the event of death, permanent disability, loss of function and sick leave to staff members of WHO, PAHO, IARC, the International Computing Centre, Unitaid and UNAIDS. It is funded by contributions from staff and their organizations.
Liabilities for these benefits are determined by professional consulting actuaries and recorded as other long-term benefits. In accordance with IPSAS 39 (Employee Benefits), a net increase of US$ 1.3 million was recognized by nature of expense, in the Statement of Financial Performance (Statement II).
As per the actuarial study, the total liability was US$ 6.4 million at 31 December 2021 (US$ 5.1 million at 31 December 2020).
Staff Health Insurance
The Secretariat manages its own health insurance scheme as a separate entity. The Staff Health Insurance has its own governance structure and provides for the reimbursement of a major portion of expenses for medically recognized health care incurred by staff members, retired staff members and their eligible family members. The Staff Health Insurance is financed by the contributions made by the participants (one third) and the Organization (two thirds) and from investment income.
The Organization accounts for after-service staff health insurance as a post-employment benefit. Actuarial gains and losses are recognized in the net assets/equity in accordance with IPSAS 39 (Employee Benefits).
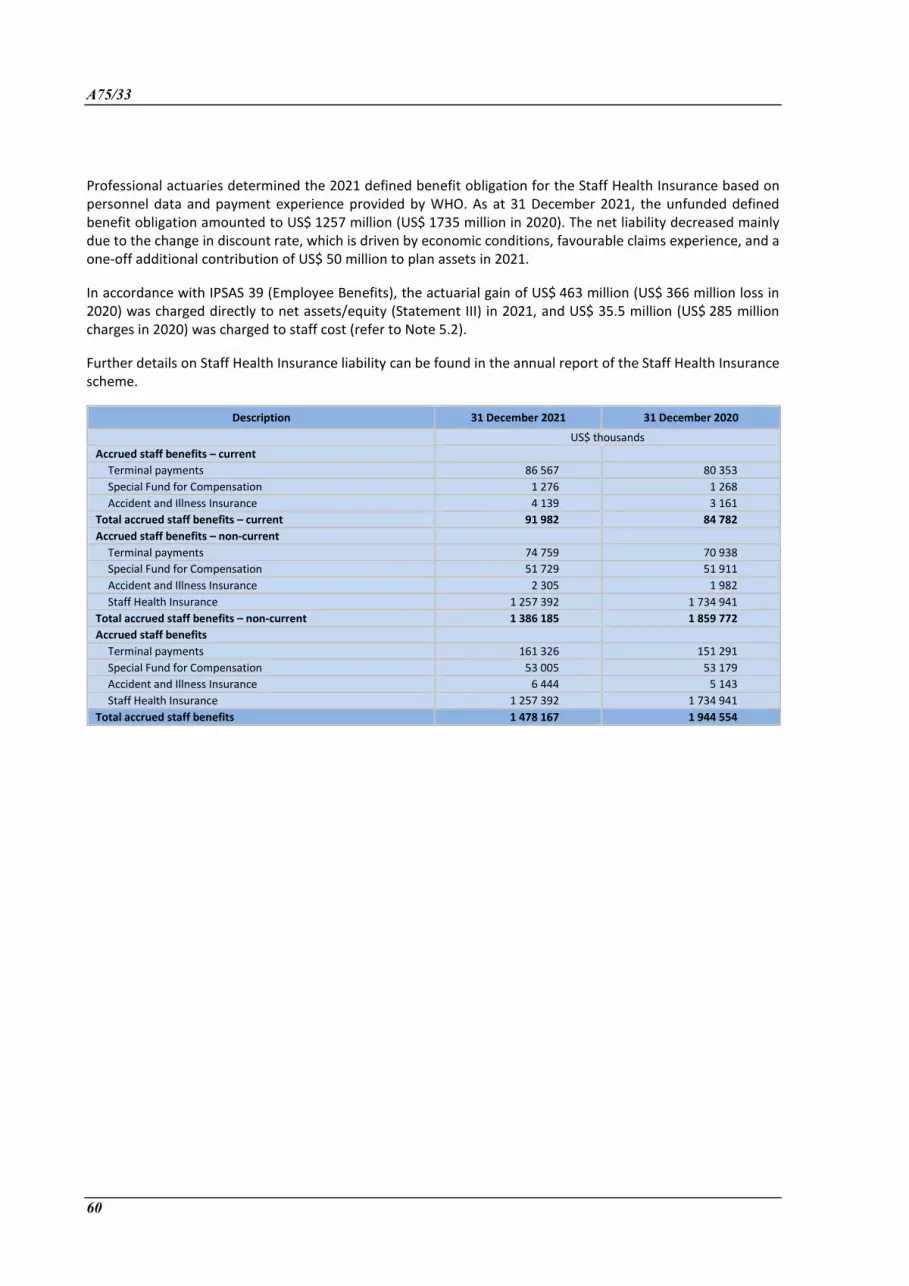
A75/33
60
Professional actuaries determined the 2021 defined benefit obligation for the Staff Health Insurance based on personnel data and payment experience provided by WHO. As at 31 December 2021, the unfunded defined benefit obligation amounted to US$ 1257 million (US$ 1735 million in 2020). The net liability decreased mainly due to the change in discount rate, which is driven by economic conditions, favourable claims experience, and a one-off additional contribution of US$ 50 million to plan assets in 2021.
In accordance with IPSAS 39 (Employee Benefits), the actuarial gain of US$ 463 million (US$ 366 million loss in 2020) was charged directly to net assets/equity (Statement III) in 2021, and US$ 35.5 million (US$ 285 million charges in 2020) was charged to staff cost (refer to Note 5.2).
Further details on Staff Health Insurance liability can be found in the annual report of the Staff Health Insurance scheme.
Description 31 December 2021 31 December 2020 US$ thousands Accrued staff benefits – current
Terminal payments 86 567 80 353 Special Fund for Compensation 1 276 1 268 Accident and Illness Insurance 4 139 3 161
Total accrued staff benefits – current 91 982 84 782 Accrued staff benefits – non-current
Terminal payments 74 759 70 938 Special Fund for Compensation 51 729 51 911 Accident and Illness Insurance 2 305 1 982 Staff Health Insurance 1 257 392 1 734 941
Total accrued staff benefits – non-current 1 386 185 1 859 772 Accrued staff benefits
Terminal payments 161 326 151 291 Special Fund for Compensation 53 005 53 179 Accident and Illness Insurance 6 444 5 143 Staff Health Insurance 1 257 392 1 734 941
Total accrued staff benefits 1 478 167 1 944 554

A75/33
61
Actuarial summary of terminal payments, the Staff Health Insurance and the Special Fund for Compensation (in US$ thousands)
Description Terminal payments (other than accrued
leave)
Special Fund for Compensation
Accident and Illness Insurance
Staff Health Insurance
Reconciliation of defined benefit obligation
Defined benefit obligation as at 31 December 2020 79 712 53 179 5 143 2 859 045 Service cost 7 708 3 609 4 659 118 430 Interest on defined benefit obligation 1 581 578 28 864 Actual gross benefit payments (6 813) (668) (3 090) (38 220) Actual administrative expenses (511) (734) (3 053) Actual contributions by participants 12 802 Plan amendments (Gain)/Loss on defined benefit obligation due to financial assumption changes 216 941 ( 34) (123 367)
(Gain)/Loss on defined benefit obligation due to other assumption changes 2 386 (4 123) 500 (324 422)
Defined benefit obligation as at 31 December 2021 84 790 53 005 6 444 2 530 079 Reconciliation of incurred but not paid reserve
Incurred but not paid reserve as at 31 December 2020 21 356 Interest on incurred but not paid reserve for 2021 209 (Gain)/Loss on incurred but not paid reserve 3 256
Incurred but not paid reserve as at 31 December 2021 24 821 Reconciliation of assets
Assets as at 31 December 2020 1 145 460 Actual gross benefit payments for 2021 (6 813) (668) (3 090) (68 896) Actual administrative expenses (511) ( 734) (5 568) Organization contributions during 2021 – regular 6 813 1 179 3 824 94 447
Organization contributions during 2021 – additional a 50 000
Participant contributions during 2021 46 325 Interest on Staff Health Insurance assets for 2021 17 256 Gain/(Loss) on plan assets 18 484
Assets as at 31 December 2021 1 297 508 Reconciliation of unfunded status
Defined benefit obligation
Active 84 790 16 807 1 408 774 Inactive 36 198 6 444 1 121 305 Incurred but not paid reserve 24 821
Total defined benefit obligation 84 790 53 005 6 444 2 554 900 Plan assets
Gross plan assets (1297 508) Total plan assets (1297 508) Net liability (asset) recognized in Statement of
Financial Position 84 790 53 005 6 444 1 257 392
(Gain)/Loss on defined benefit obligation 2 602 (3 182) 466 (463 017) Current 10 032 1 276 4 139 Non-current 74 758 51 729 2 305 1 257 392
Net liability (asset) recognized in Statement of Financial Position 84 790 53 005 6 444 1 257 392
Annual expense for 2021
Service cost 7 708 3 609 4 659 118 430 Interest on (surplus)/deficit 1 581 578 11 817 Past service (credit)/cost
Remeasurements 2 602 Not Applicable 466 Not
Applicable Total expense recognized in Statement of Financial
Performance 11 891 4 187 5 125 130 247
Actuarial (gain)/loss recognized in net assets/equity Not Applicable (3 182) Not Applicable (463 017)
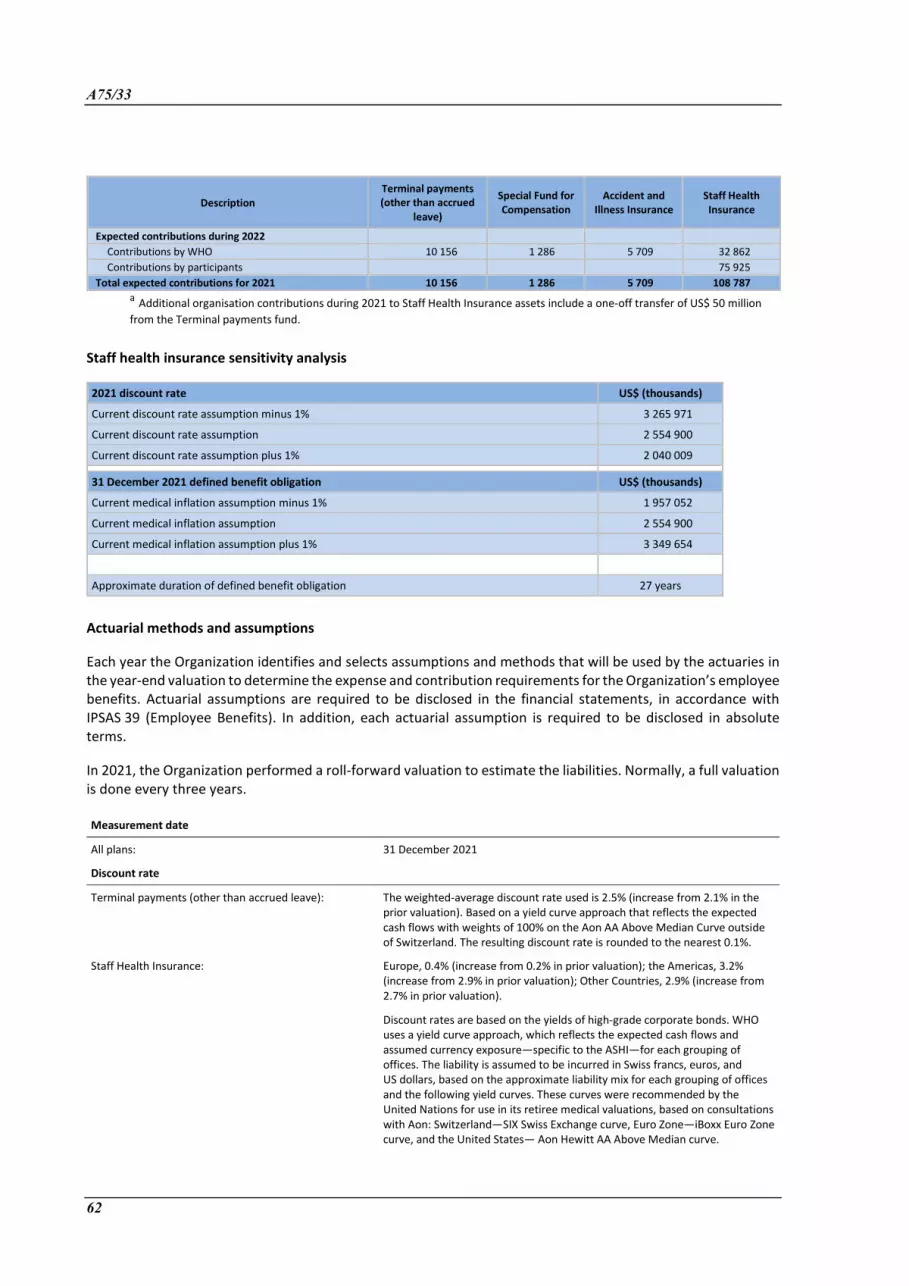
A75/33
62
Description Terminal payments (other than accrued
leave)
Special Fund for Compensation
Accident and Illness Insurance
Staff Health Insurance
Expected contributions during 2022 Contributions by WHO 10 156 1 286 5 709 32 862 Contributions by participants 75 925
Total expected contributions for 2021 10 156 1 286 5 709 108 787 a Additional organisation contributions during 2021 to Staff Health Insurance assets include a one-off transfer of US$ 50 million from the Terminal payments fund.
Staff health insurance sensitivity analysis
2021 discount rate US$ (thousands)
Current discount rate assumption minus 1% 3 265 971
Current discount rate assumption 2 554 900
Current discount rate assumption plus 1% 2 040 009 31 December 2021 defined benefit obligation US$ (thousands)
Current medical inflation assumption minus 1% 1 957 052
Current medical inflation assumption 2 554 900
Current medical inflation assumption plus 1% 3 349 654
Approximate duration of defined benefit obligation 27 years
Actuarial methods and assumptions
Each year the Organization identifies and selects assumptions and methods that will be used by the actuaries in the year-end valuation to determine the expense and contribution requirements for the Organization’s employee benefits. Actuarial assumptions are required to be disclosed in the financial statements, in accordance with IPSAS 39 (Employee Benefits). In addition, each actuarial assumption is required to be disclosed in absolute terms.
In 2021, the Organization performed a roll-forward valuation to estimate the liabilities. Normally, a full valuation is done every three years.
Measurement date
All plans: 31 December 2021
Discount rate
Terminal payments (other than accrued leave): The weighted-average discount rate used is 2.5% (increase from 2.1% in the prior valuation). Based on a yield curve approach that reflects the expected cash flows with weights of 100% on the Aon AA Above Median Curve outside of Switzerland. The resulting discount rate is rounded to the nearest 0.1%.
Staff Health Insurance: Europe, 0.4% (increase from 0.2% in prior valuation); the Americas, 3.2% (increase from 2.9% in prior valuation); Other Countries, 2.9% (increase from 2.7% in prior valuation).
Discount rates are based on the yields of high-grade corporate bonds. WHO uses a yield curve approach, which reflects the expected cash flows and assumed currency exposure—specific to the ASHI—for each grouping of offices. The liability is assumed to be incurred in Swiss francs, euros, and US dollars, based on the approximate liability mix for each grouping of offices and the following yield curves. These curves were recommended by the United Nations for use in its retiree medical valuations, based on consultations with Aon: Switzerland—SIX Swiss Exchange curve, Euro Zone—iBoxx Euro Zone curve, and the United States— Aon Hewitt AA Above Median curve.

A75/33
63
The discount rates for the 31 December 2021 valuation are based on the geographic locations of the offices, as described in the section below entitled Regional groupings for all purposes except claims costs. The resulting rate is rounded to the nearest 0.1%.
Special Fund for Compensation: The weighted-average discount rate used is 1.6% (increase from 1.1% in the prior valuation). Based on a yield curve approach that reflects the expected cash flows with weights of 25% on the Aon AA Above Median Curve outside of Switzerland and 15% on the SIX Swiss Exchange yield curve for Switzerland and 60% on the iBoxx Euro Zone curve. The resulting discount rate is rounded to the nearest 0.1%.
Accident and Illness Insurance: The weighted-average discount rate used is 0.3% (decrease from 0.0% in the prior valuation). Based on a yield curve approach that reflects the expected cash flows with weights of 30% on the Aon AA Above Median Curve outside of Switzerland and 70% on the SIX Swiss Exchange yield curve for Switzerland. The resulting discount rate is rounded to the nearest 0.1%.
Annual general inflation
Terminal payments (other than accrued leave): The weighted-average inflation rate used is 2.5%. The regional weightings used are 100% on United States rate. Rounding of the resulting weighted-average inflation rates for each plan to the nearest 0.1%.
Staff Health Insurance: Europe 1.2%, the Americas 2.5%, and Other Countries 2.4%. The rates are based on the United Nations common assumptions (for long-duration plans) as directed by the United Nations System Task Force on Accounting Standards. Specifically, the rate for Europe is a weighted average of the rates for Switzerland (0.9%) and the Euro Zone (2.2%), and 2.5% for the United States with the result rounded to the nearest 0.1%. The currency weightings for each claims region are assumed to be the same currency weightings for offices located in those regions. The currency weightings used are as follows: for Europe, 80% Swiss francs and 20% euros; for the Americas, 100% US dollars; and for Other Countries, 80% US dollars and 20% euros.
Special Fund for Compensation: The weighted-average inflation rate used is 2.1%. The regional weightings used are 15% on Swiss, 60% Euro Zone and 25% on United States rate. Rounding of the resulting weighted-average inflation rates for each plan to the nearest 0.1%.
Accident and Illness Insurance: The weighted-average inflation rate used is 1.4%. The regional weightings used are 70% on Swiss and 30% on United States rate. Rounding of the resulting weighted-average inflation rates for each plan to the nearest 0.1%.
Annual salary scale
All plans: General inflation, plus 0.5% for productivity growth, plus merit/promotion increases.
Regional groupings for all purposes except claims costs
Terminal payments (other than accrued leave): Not applicable
Staff Health Insurance: Based on: the Regional Office for Europe and headquarters, which are grouped as Europe; the Regional Office for the Americas, which constitutes the Americas; and the African Region, the Eastern Mediterranean Region, the South-East Asia Region, and the Western Pacific Region, which are grouped as Other Countries.
Special Fund for Compensation: Not applicable
Accident and Illness Insurance: Not applicable
Repatriation travel and removal on repatriation
Terminal payments (other than accrued leave): Calculated using the projected unit credit method with service prorated, and an attribution period from the entry on duty date to separation. A 2% increase is applied for incurred but not paid benefits.
Staff Health Insurance: Not applicable

A75/33
64
Special Fund for Compensation: Not applicable
Accident and Illness Insurance: Not applicable
Repatriation grant, termination indemnity, and grant in case of death
Terminal payments (other than accrued leave): Using the projected unit credit method with accrual rate proration. A 2% increase is applied for incurred but not paid benefits.
Staff Health Insurance: Not applicable
Special Fund for Compensation: Not applicable
Accident and Illness Insurance: Not applicable
Accrued leave
Terminal payments (other than accrued leave): The liability is set equal to the walk-away liability ‒ that is, as if all staff separated immediately. Plus 2% increase is applied for incurred but not paid benefits.
Staff Health Insurance: Not applicable
Special Fund for Compensation: Not applicable
Accident and Illness Insurance: Not applicable
Abolition of post, end-of-service grant, and separation by mutual agreement
Terminal payments (other than accrued leave): These benefits are considered termination benefits under IPSAS 39 (Employee Benefits) and, therefore, are excluded from the valuation.
Staff Health Insurance: Not applicable
Special Fund for Compensation: Not applicable
Accident and Illness Insurance: Not applicable
United Nations Joint Staff Pension Fund
WHO is a member organization participating in the United Nations Joint Staff Pension Fund (the Fund), which was established by the United Nations General Assembly to provide retirement, death, disability and related benefits to employees. The Fund is a funded, multi-employer defined benefit plan. As specified in Article 3(b) of the Regulations of the Fund, membership in the Fund shall be open to the specialized agencies and to any other international, intergovernmental organization which participates in the common system of salaries, allowances and other conditions of service of the United Nations and the specialized agencies.
The Fund exposes participating organizations to actuarial risks associated with the current and former employees of other organizations participating in the Fund, with the result that there is no consistent and reliable basis for allocating the obligation, plan assets and costs to individual organizations participating in the Fund. WHO and the Fund, in line with the other participating organizations in the Fund, are not in a position to identify WHO’s proportionate share of the defined benefit obligation, the plan assets and the costs associated with the plan with sufficient reliability for accounting purposes. Hence, WHO has treated this plan as if it were a defined contribution plan in line with the requirements of IPSAS 39 (Employee Benefits). WHO’s contributions to the Fund during the financial period are recognized as expenses in the Statement of Financial Performance.
The Fund’s Regulations state that the Pension Board shall have an actuarial valuation made of the Fund at least once every three years by the Consulting Actuary. The practice of the Pension Board has been to carry out an actuarial valuation every two years using the Open Group Aggregate Method. The primary purpose of the actuarial valuation is to determine whether the current and estimated future assets of the Fund will be sufficient to meet its liabilities.
WHO’s financial obligation to the Fund consists of its mandated contribution, at the rate established by the United Nations General Assembly (currently at 7.9% for participants and 15.8% for member organizations) together with any share of any actuarial deficiency payments under Article 26 of the Regulations of the Pension
A75/33
65
Fund. Such deficiency payments are only payable if and when the United Nations General Assembly has invoked the provision of Article 26, following determination that there is a requirement for deficiency payments based on an assessment of the actuarial sufficiency of the Fund as of the valuation date. Each member organization shall contribute to this deficiency an amount proportionate to the total contributions which each paid during the three years preceding the valuation date.
The latest actuarial valuation for the Fund was completed as of 31 December 2019, and the valuation as of 31 December 2021 is currently being performed. A roll forward of the participation data as of 31 December 2019 to 31 December 2020 was used by the Fund for its 2020 financial statements.
The actuarial valuation as of 31 December 2019 resulted in a funded ratio of actuarial assets to actuarial liabilities, assuming no future pension adjustments, of 144.2%. The funded ratio was 107.1 when the current system of pension adjustments was taken into account.
After assessing the actuarial sufficiency of the Fund, the Consulting Actuary concluded that there was no requirement, as of 31 December 2019, for deficiency payments under Article 26 of the Regulations of the Fund as the actuarial value of assets exceeded the actuarial value of all accrued liabilities under the plan. In addition, the market value of assets also exceeded the actuarial value of all accrued liabilities as of the valuation date. At the time of this report, the General Assembly has not invoked the provision of Article 26.
Should Article 26 be invoked due to an actuarial deficiency, either during the ongoing operation or due to the termination of the Fund, deficiency payments required from each member organization would be based upon the proportion of that member organization’s contributions to the total contributions paid to the Fund during the three years preceding the valuation date. Total contributions paid to the Fund during the preceding three years (2018, 2019 and 2020) amounted to US$ 7 993.15 million, of which 6.9% was contributed by WHO.
During 2021, contributions paid to the Fund amounted to US$ 211 million (2020 US$ 199.2 million). Expected contributions due in 2022 are approximately US$ 219 million.
Membership of the Fund may be terminated by decision of the United Nations General Assembly, upon the affirmative recommendation of the Pension Board. A proportionate share of the total assets of the Fund at the date of termination shall be paid to the former member organization for the exclusive benefit of its staff who were participants in the Fund at that date, pursuant to an arrangement mutually agreed between the organization and the Fund. The amount is determined by the United Nations Joint Staff Pension Board based on an actuarial valuation of the assets and liabilities of the Fund on the date of termination; no part of the assets which are in excess of the liabilities are included in the amount.
The United Nations Board of Auditors carries out an annual audit of the Fund and reports to the Pension Board and to the United Nations General Assembly on the audit every year. The Fund publishes quarterly reports on its investments and these can be viewed by visiting the Fund at www.unjspf.org.
4.13 Deferred revenue
Deferred revenue on voluntary contributions represents multi-year agreements signed in 2021 or prior years but for which the revenue recognition has been deferred to future financial periods. The balance on voluntary contributions is split into current and non-current deferred revenue, depending on when the funds are available to the Organization to spend. Further details of voluntary contributions by fund and by contributor are available on the WHO Programme budget web portal and the WHO website.1
1 WHO Programme budget web portal (https://open.who.int/2020-21/home); details of voluntary contributions by fund and by contributor, 2021 (document A75/INF./5, https://apps.who.int/gb/e/e_wha75.html) both accessed 29 April, 2022.

A75/33
66
Deferred revenue on reimbursable procurement relates to revenue recognized where supplies or services have not been delivered to requesting parties at year end. As reimbursable procurement is an exchange transaction, revenue is recorded on an accrual basis. The entire amount of deferred revenue for reimbursable procurement is current.
Description 31 December 2021 31 December 2020
US$ thousands
Voluntary contributions 474 455 551 117
Reimbursable procurement 6 992 3 876
Total deferred revenue – current 481 447 554 993
Voluntary contributions 393 688 460 065
Total deferred revenue – non-current 393 688 460 065
Total deferred revenue 875 135 1 015 058
Of the total non-current deferred revenue, US$ 384.3 million is earmarked both for high-level outcomes and tightly earmarked, and US$ 9.3 million is fully flexible. Non-current deferred revenue is summarized by year below:
Year Amount (US$ thousands)
2023 284 576 2024 75 186 2025 21 826 2026+ 12 100 Total deferred revenue – non-current 393 688
4.14 Other current liabilities
The total balance for other current liabilities as at 31 December 2021 was US$ 234 million (US$ 157.7 million as at 31 December 2020). The largest component is various year-end accruals amounting to US$ 150 million. Insurance payable includes amounts payable to the COVAX NFC fund (US$ 47 million). The main element under other liabilities relates to balances collected to settle the shipping and freight component for goods procurement (US$ 13 million), and retention fees payable (US$ 8 million).
Description 31 December 2021 31 December 2020
US$ thousands
Accrual for uninvoiced goods and services 127 527 96 961
Accrual for restructuring cost 1 057 500
Accrued staff liability 18 064 19 569
Accrual for refunds payable 2 856 2 845
Pension payable 973 1 450
Insurance payable 48 255 1 983
Foundations 3 242 3 258
Other liabilities 32 048 31 149
Total other current liabilities 234 022 157 715
The balance for foundations concerns funds that WHO holds in trust and for whose financial and administrative management the Organization is responsible. As at 31 December 2021, the foundations with funds in trust were as follows.
• Down Syndrome Research Prize Foundation in the Eastern Mediterranean Region
A75/33
67
• Dr A.T. Shousha Foundation
• Dr Comlan A.A. Quenum Prize for Public Health
• Ihsan Doğramacı Family Health Foundation
• Léon Bernard Foundation
• Francesco Pocchiari Fellowship
• Foundation for the State of Kuwait Prize for the Control of Cancer, Cardiovascular Diseases and Diabetes in the Eastern Mediterranean Region
• State of Kuwait Health Promotion Foundation
• United Arab Emirates Health Foundation
• Dr Lee Jong-Wook Memorial Prize for Public Health
4.15 Inter-entity liabilities
WHO hosts a number of entities through administrative service agreements. As cash for all entities is managed by the Organization, liabilities exist with these entities for funds held on their behalf. The total amounts due per entity are as follows (refer to Note 4.2).
Description 31 December 2021 31 December 2020 US$ thousands Staff Health Insurance 113 537 215 435 International Computing Centre 42 313 33 359 Unitaid 465 565 499 452 Trust Fund for the Joint United Nations Programme on HIV/AIDS (UNAIDS) 176 116 197 979 Total inter-entity liabilities 797 531 946 225
4.16 Long-term borrowings
Resolution WHA55.8 (2002) and resolution WHA56.13 (2003), authorized construction of a new building at headquarters for WHO and UNAIDS at an estimated cost of 66 million Swiss francs, of which WHO’s share was estimated at 33 million Swiss francs. The Swiss Confederation agreed to provide an interest-free loan to WHO and UNAIDS of 59.8 million Swiss francs, of which WHO’s share is 29.9 million Swiss francs. In the resolutions mentioned above, the World Health Assembly also approved the use of the Real Estate Fund for the repayment over a 50-year period of the Organization’s share of the interest-free loan provided by the Swiss Confederation with effect from the first year of the completion of the building.
The Swiss Confederation 30-year bonds rate was -0.095% at Dec 2021 (-0.356% for 2020).In line with prudent accounting principles, the non-current outstanding amount of US$ 22.2 million for the UNAIDS building loan was not discounted.
In 2015, following decision WHA67(12) (2014), the Organization signed a new interest-free loan agreement of 140 million Swiss francs for the planning and construction of a new WHO building in Geneva which was fully received in 2021.
The outstanding balance of the two loans as at 31 December 2021 was US$ 172.8 million (US$ 155.6 million at 31 December 2020) and is made up as follows.

A75/33
68
Description 31 December 2021 31 December 2020 US$ thousands Current liabilities
WHO/UNAIDS building 654 677 WHO headquarters building (new) 3 060 3 171 Total current liabilities 3 714 3 848 Non-current liabilities WHO/UNAIDS building 22 221 23 703 WHO headquarters building (new) 146 885 127 988 Total non-current liabilities 169 106 151 691 Total long-term borrowings 172 820 155 539
4.17 Other liabilities – non-current
The total balance for other liabilities non-current as at 31 December 2021 was NIL (US$ 0.2 million as at 31 December 2020).
5. Supporting information to the Statement of Financial Performance
5.1 Revenue
Assessed contributions
Assessed contributions for 2021 were US$ 549.3 million1 (US$ 465.9 million for 2020).
Description 31 December 2021 31 December 2020 US$ thousands Assessed contributions 526 796 500 373 (Increase)/Decrease in allowance for doubtful accounts 21 761 (34 031) Assessed contributions net of allowance 548 557 466 342 Tax equalization fund – adjustments 736 (396) Total Assessed contributions 549 293 465 946
In May 2019, the Seventy-second World Health Assembly adopted the resolution for the financial period 2020‒2021,2 in which it approved a total effective budget of US$ 5840.4 million (including US$ 1000 million for emergency operations and appeals). In resolution WHA72.1, the Health Assembly further resolved that the total assessment on Member States in respect of the financial period 2020–2021 would be US$ 956.9 million.
Following resolution WHA66.16 (2013), where the total annual assessed contribution for a Member State is US$ 200 000 or more, the contribution is assessed half in United States dollars and half in Swiss francs. Where the annual assessed contribution for a Member State is less than US$ 200 000, the contribution is assessed in United States dollars only.
The annual assessment for 2021 amounted to US$ 488.9 million or US$ 246.7 million and 247.2 million Swiss francs per year using the May 2019 exchange rate. Contributions are due from 1 January, so the Swiss franc portion of the assessment was recorded at the January 2021 exchange rate, which resulted in an exchange gain on recording of US$ 37.8 million.
In December 2018, through an exchange of letters between WHO and the Government of France, residents working in the IARC were granted tax exemption on the salaries and emoluments paid by IARC. The excess tax
1 See document A75/28 for details of the status of collection of assessed contributions.
2 Resolution WHA72.1

A75/33
69
equalization contribution from France has been transferred to fund voluntary contributions. A balance of US$ 0.3 million remains in the Tax equalization fund.
Voluntary contributions
Voluntary contributions for 2021 were US$ 3365 million (US$ 3704 million for 2020).
Description 31 December 2021 31 December 2020 US$ thousands Voluntary contributions 3 365 539 3 705 063 (Increase)/Decrease in allowance for doubtful debts (311) (837) Voluntary contributions net of allowance 3 365 228 3 704 226
These contributions represent revenue recognized from governments, intergovernmental organizations, institutions, other United Nations organizations as well as nongovernmental organizations. A portion of the revenue reported in 2021 relates to agreements that continue in future years. Further details of voluntary contributions by fund and by contributor are contained in the Annex to the Financial Report.1
The figure for total voluntary contributions reported of US$ 3365 million is after the deduction of (i) refunds to contributors ‒ these amounted to US$ 11.2 million (US$ 6.2 million for 2020); (ii) reductions in revenue recognized in prior years due to evidence arising in the current year that amounts will no longer be collected ‒ these amounted to US$ 12.2 million (US$ 12.4 million for 2020); and (iii) the adjustment of payment terms with the effect of increasing deferred revenue and decreasing current revenue for revenue recognized in previous years – these amounted to US$ 4.3 million (US$ 1.4 million for 2020).
In line with the accounting policy, agreements signed in one financial year stating a start date of the agreement in the following financial year will be recorded and revenue recognized in the following financial period based on the start date. At the time of financial statements preparation, US$ 322 million of revenue or deferred revenue was recorded in January 2022 based on agreements signed in 2021. Where cash was received for these agreements before 31 December 2021, funds have been recorded as advances and disclosed under Note 4.9.
Voluntary contributions in-kind and in-service
WHO receives non-cash contributions from Member States and other contributors. In 2021, the Organization received in-kind and in-service contributions amounting to US$ 93.1 million (US$ 79.7 million as at 31 December 2020).2
Description 31 December 2021 31 December 2020 US$ thousands In-kind – medical supplies and materials 53 133 35 592 In-kind – office space and field supplies 16 379 12 170 In-kind – contractual services 11 421 20 919 In-service 12 190 11 031 Total voluntary contributions in-kind and in-service 93 123 79 712
In addition, WHO also benefits from land made available from the host governments either at no cost or at a token rent. As the title to the land remains with the government, the value of land is not recognized in the
1 Document A75/INF./5, the Annex to the Financial Report, is also available at: http://www.who.int/about/finances-
accountability/funding/voluntary-contributions/en/. 2 Further details of in-kind and in-service contributions are available on the WHO Programme budget web portal available at:
http://open.who.int/2020-21/home (accessed 9 April 2021) and on the WHO website: http://www.who.int/about/finances-accountability/funding/voluntary-contributions/en/ (accessed 30 April 2021).
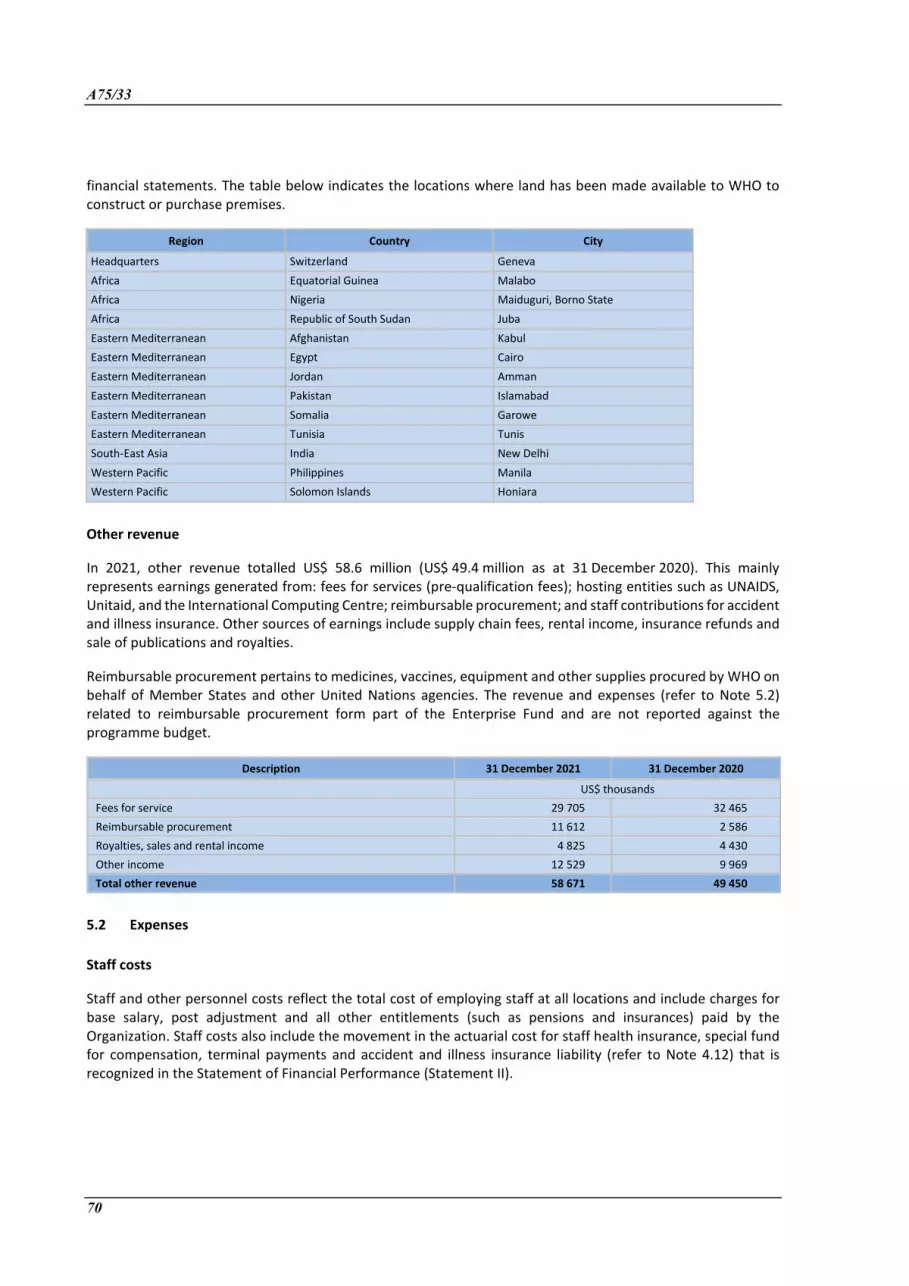
A75/33
70
financial statements. The table below indicates the locations where land has been made available to WHO to construct or purchase premises.
Region Country City
Headquarters Switzerland Geneva Africa Equatorial Guinea Malabo Africa Nigeria Maiduguri, Borno State Africa Republic of South Sudan Juba Eastern Mediterranean Afghanistan Kabul Eastern Mediterranean Egypt Cairo Eastern Mediterranean Jordan Amman Eastern Mediterranean Pakistan Islamabad Eastern Mediterranean Somalia Garowe Eastern Mediterranean Tunisia Tunis South-East Asia India New Delhi Western Pacific Philippines Manila Western Pacific Solomon Islands Honiara
Other revenue
In 2021, other revenue totalled US$ 58.6 million (US$ 49.4 million as at 31 December 2020). This mainly represents earnings generated from: fees for services (pre-qualification fees); hosting entities such as UNAIDS, Unitaid, and the International Computing Centre; reimbursable procurement; and staff contributions for accident and illness insurance. Other sources of earnings include supply chain fees, rental income, insurance refunds and sale of publications and royalties.
Reimbursable procurement pertains to medicines, vaccines, equipment and other supplies procured by WHO on behalf of Member States and other United Nations agencies. The revenue and expenses (refer to Note 5.2) related to reimbursable procurement form part of the Enterprise Fund and are not reported against the programme budget.
Description 31 December 2021 31 December 2020 US$ thousands Fees for service 29 705 32 465 Reimbursable procurement 11 612 2 586 Royalties, sales and rental income 4 825 4 430 Other income 12 529 9 969 Total other revenue 58 671 49 450
5.2 Expenses
Staff costs
Staff and other personnel costs reflect the total cost of employing staff at all locations and include charges for base salary, post adjustment and all other entitlements (such as pensions and insurances) paid by the Organization. Staff costs also include the movement in the actuarial cost for staff health insurance, special fund for compensation, terminal payments and accident and illness insurance liability (refer to Note 4.12) that is recognized in the Statement of Financial Performance (Statement II).
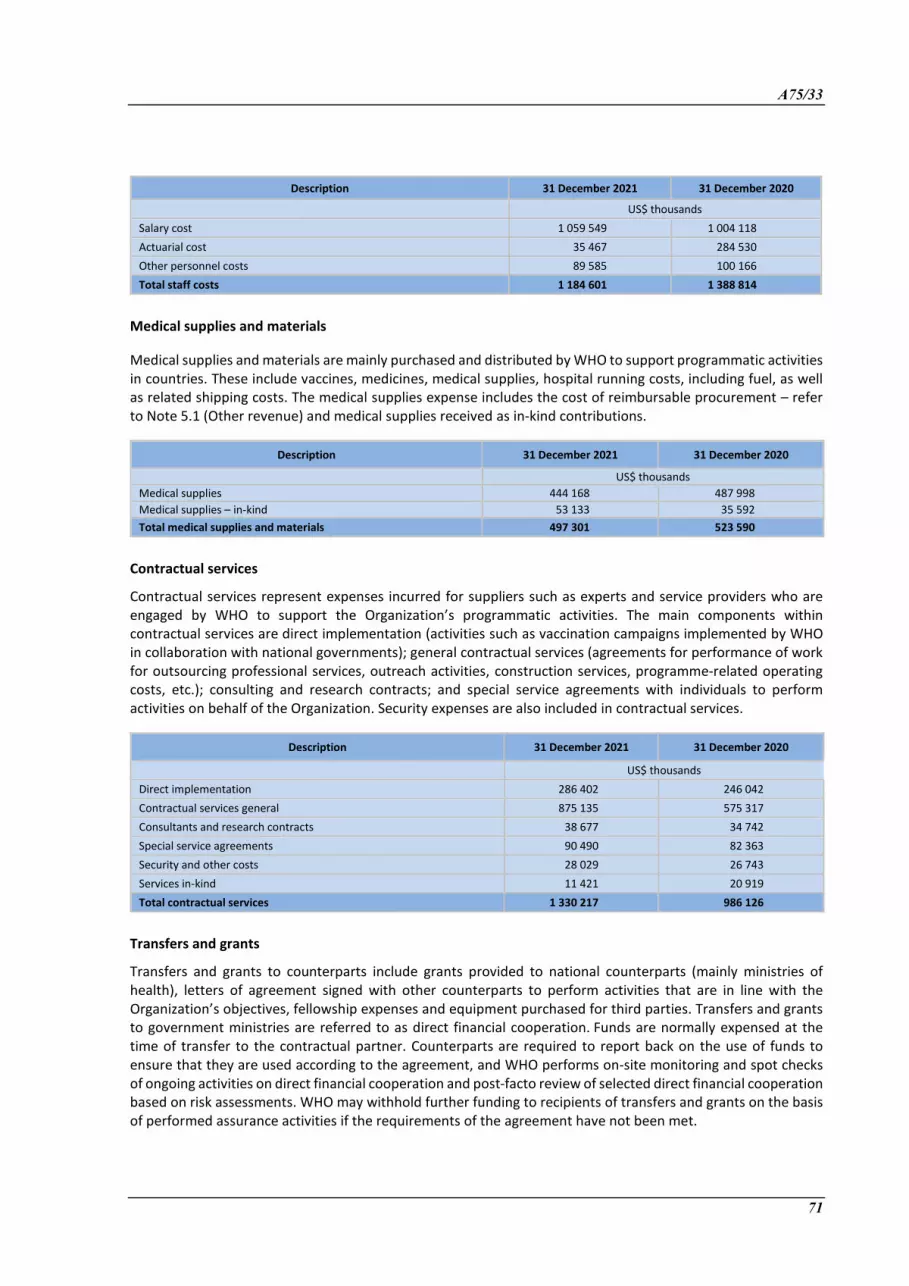
A75/33
71
Description 31 December 2021 31 December 2020 US$ thousands Salary cost 1 059 549 1 004 118 Actuarial cost 35 467 284 530 Other personnel costs 89 585 100 166 Total staff costs 1 184 601 1 388 814
Medical supplies and materials
Medical supplies and materials are mainly purchased and distributed by WHO to support programmatic activities in countries. These include vaccines, medicines, medical supplies, hospital running costs, including fuel, as well as related shipping costs. The medical supplies expense includes the cost of reimbursable procurement – refer to Note 5.1 (Other revenue) and medical supplies received as in-kind contributions.
Description 31 December 2021 31 December 2020 US$ thousands Medical supplies 444 168 487 998 Medical supplies – in-kind 53 133 35 592 Total medical supplies and materials 497 301 523 590
Contractual services
Contractual services represent expenses incurred for suppliers such as experts and service providers who are engaged by WHO to support the Organization’s programmatic activities. The main components within contractual services are direct implementation (activities such as vaccination campaigns implemented by WHO in collaboration with national governments); general contractual services (agreements for performance of work for outsourcing professional services, outreach activities, construction services, programme-related operating costs, etc.); consulting and research contracts; and special service agreements with individuals to perform activities on behalf of the Organization. Security expenses are also included in contractual services.
Description 31 December 2021 31 December 2020 US$ thousands Direct implementation 286 402 246 042 Contractual services general 875 135 575 317 Consultants and research contracts 38 677 34 742 Special service agreements 90 490 82 363 Security and other costs 28 029 26 743 Services in-kind 11 421 20 919 Total contractual services 1 330 217 986 126
Transfers and grants
Transfers and grants to counterparts include grants provided to national counterparts (mainly ministries of health), letters of agreement signed with other counterparts to perform activities that are in line with the Organization’s objectives, fellowship expenses and equipment purchased for third parties. Transfers and grants to government ministries are referred to as direct financial cooperation. Funds are normally expensed at the time of transfer to the contractual partner. Counterparts are required to report back on the use of funds to ensure that they are used according to the agreement, and WHO performs on-site monitoring and spot checks of ongoing activities on direct financial cooperation and post-facto review of selected direct financial cooperation based on risk assessments. WHO may withhold further funding to recipients of transfers and grants on the basis of performed assurance activities if the requirements of the agreement have not been met.
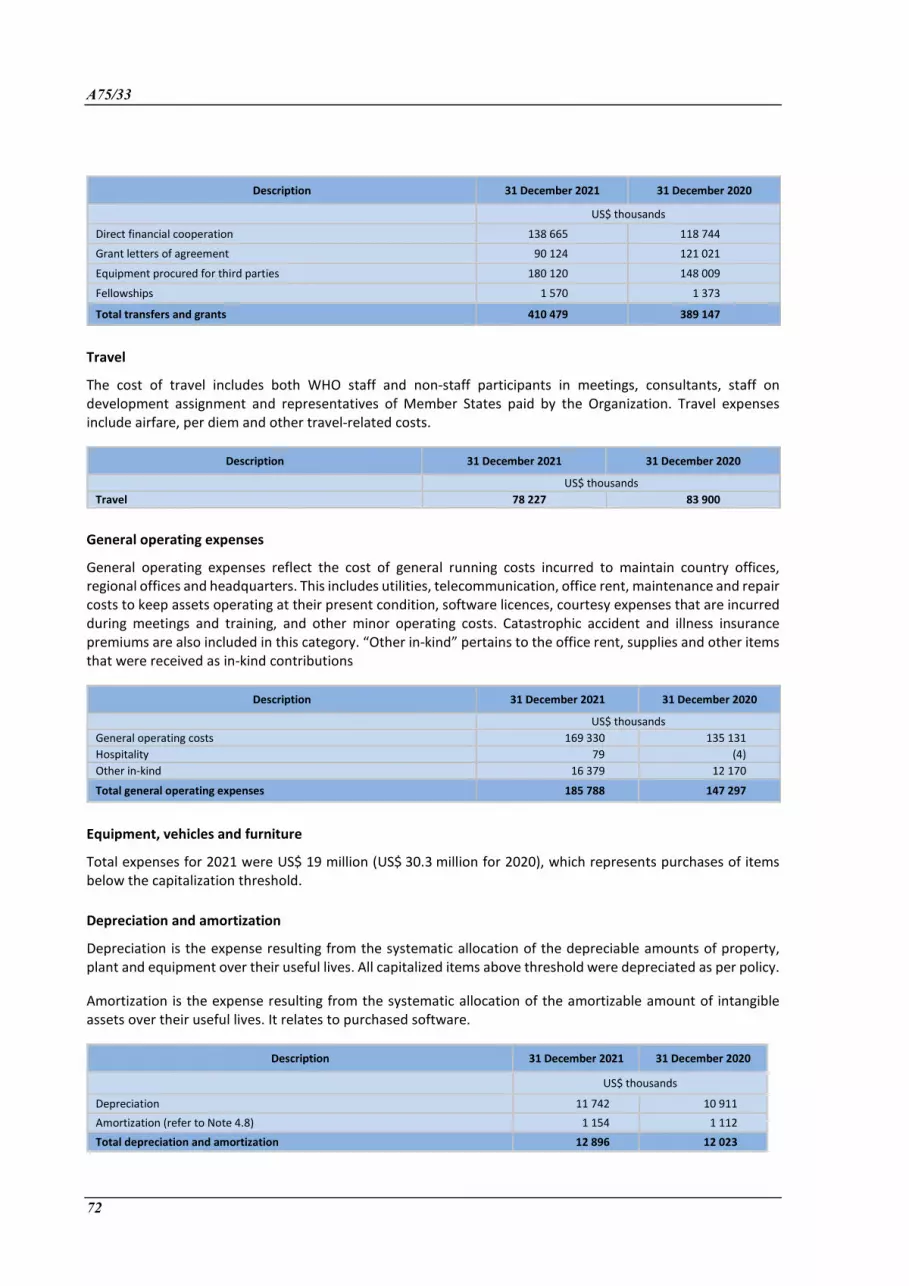
A75/33
72
Description 31 December 2021 31 December 2020
US$ thousands
Direct financial cooperation 138 665 118 744
Grant letters of agreement 90 124 121 021
Equipment procured for third parties 180 120 148 009
Fellowships 1 570 1 373
Total transfers and grants 410 479 389 147
Travel
The cost of travel includes both WHO staff and non-staff participants in meetings, consultants, staff on development assignment and representatives of Member States paid by the Organization. Travel expenses include airfare, per diem and other travel-related costs.
Description 31 December 2021 31 December 2020 US$ thousands Travel 78 227 83 900
General operating expenses
General operating expenses reflect the cost of general running costs incurred to maintain country offices, regional offices and headquarters. This includes utilities, telecommunication, office rent, maintenance and repair costs to keep assets operating at their present condition, software licences, courtesy expenses that are incurred during meetings and training, and other minor operating costs. Catastrophic accident and illness insurance premiums are also included in this category. “Other in-kind” pertains to the office rent, supplies and other items that were received as in-kind contributions
Description 31 December 2021 31 December 2020 US$ thousands General operating costs 169 330 135 131 Hospitality 79 (4) Other in-kind 16 379 12 170
Total general operating expenses 185 788 147 297
Equipment, vehicles and furniture
Total expenses for 2021 were US$ 19 million (US$ 30.3 million for 2020), which represents purchases of items below the capitalization threshold.
Depreciation and amortization
Depreciation is the expense resulting from the systematic allocation of the depreciable amounts of property, plant and equipment over their useful lives. All capitalized items above threshold were depreciated as per policy.
Amortization is the expense resulting from the systematic allocation of the amortizable amount of intangible assets over their useful lives. It relates to purchased software.
Description 31 December 2021 31 December 2020
US$ thousands
Depreciation 11 742 10 911 Amortization (refer to Note 4.8) 1 154 1 112 Total depreciation and amortization 12 896 12 023
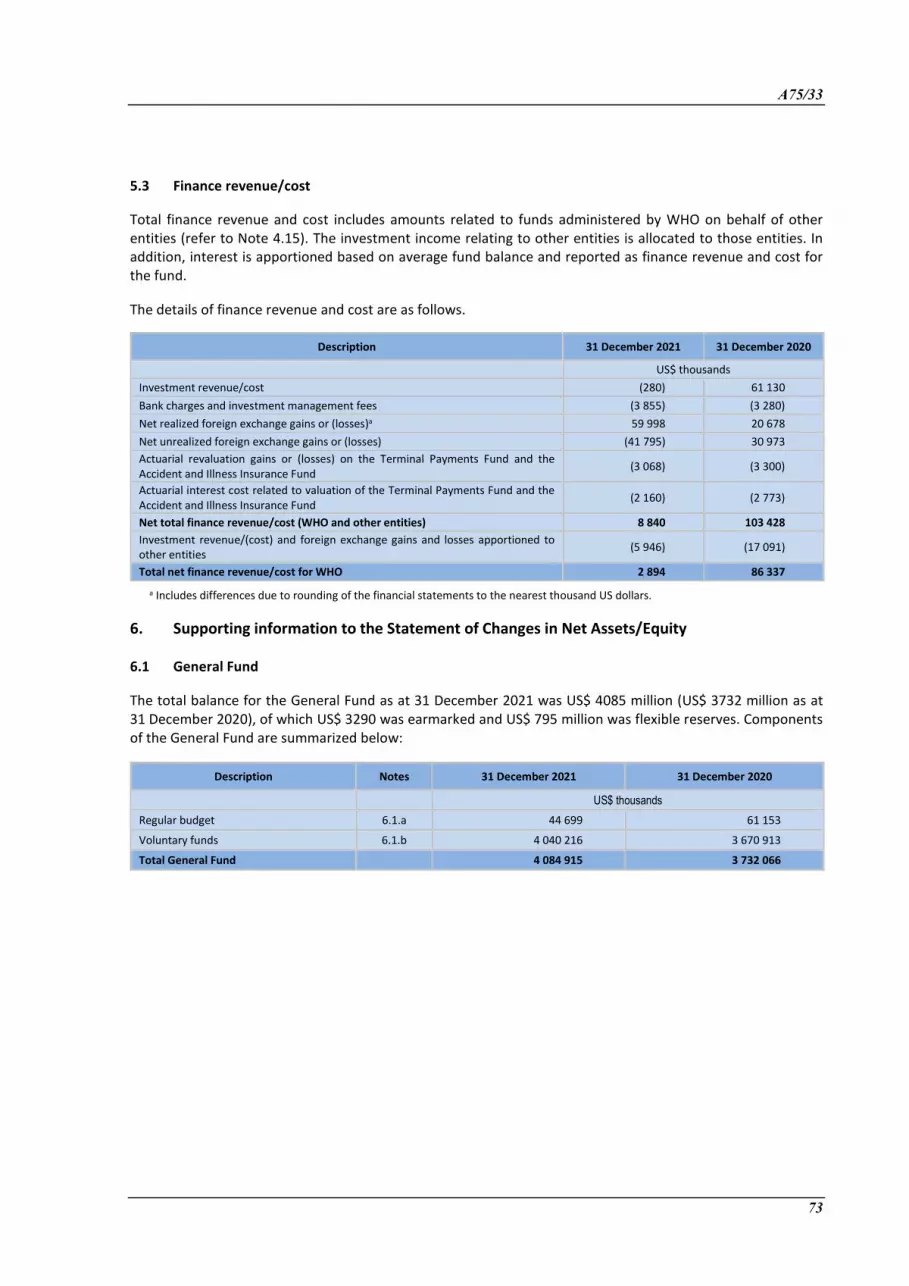
A75/33
73
5.3 Finance revenue/cost
Total finance revenue and cost includes amounts related to funds administered by WHO on behalf of other entities (refer to Note 4.15). The investment income relating to other entities is allocated to those entities. In addition, interest is apportioned based on average fund balance and reported as finance revenue and cost for the fund.
The details of finance revenue and cost are as follows.
Description 31 December 2021 31 December 2020
US$ thousands Investment revenue/cost (280) 61 130 Bank charges and investment management fees (3 855) (3 280) Net realized foreign exchange gains or (losses)a 59 998 20 678 Net unrealized foreign exchange gains or (losses) (41 795) 30 973 Actuarial revaluation gains or (losses) on the Terminal Payments Fund and the Accident and Illness Insurance Fund (3 068) (3 300)
Actuarial interest cost related to valuation of the Terminal Payments Fund and the Accident and Illness Insurance Fund (2 160) (2 773)
Net total finance revenue/cost (WHO and other entities) 8 840 103 428 Investment revenue/(cost) and foreign exchange gains and losses apportioned to other entities (5 946) (17 091)
Total net finance revenue/cost for WHO 2 894 86 337
a Includes differences due to rounding of the financial statements to the nearest thousand US dollars.
6. Supporting information to the Statement of Changes in Net Assets/Equity
6.1 General Fund
The total balance for the General Fund as at 31 December 2021 was US$ 4085 million (US$ 3732 million as at 31 December 2020), of which US$ 3290 was earmarked and US$ 795 million was flexible reserves. Components of the General Fund are summarized below:
Description Notes 31 December 2021 31 December 2020
US$ thousands Regular budget 6.1.a 44 699 61 153
Voluntary funds 6.1.b 4 040 216 3 670 913
Total General Fund 4 084 915 3 732 066
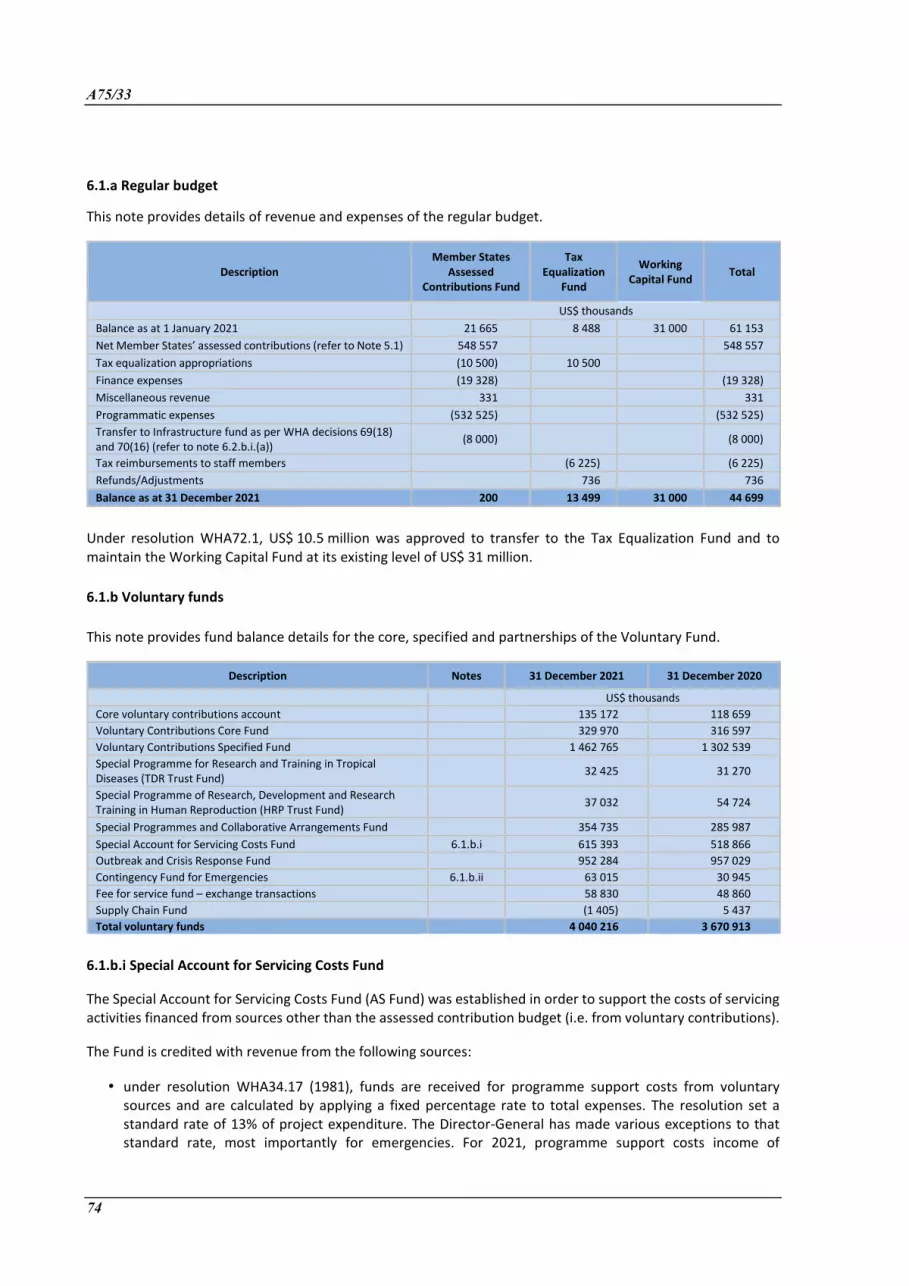
A75/33
74
6.1.a Regular budget
This note provides details of revenue and expenses of the regular budget.
Description Member States
Assessed Contributions Fund
Tax Equalization
Fund
Working Capital Fund Total
US$ thousands Balance as at 1 January 2021 21 665 8 488 31 000 61 153 Net Member States’ assessed contributions (refer to Note 5.1) 548 557 548 557 Tax equalization appropriations (10 500) 10 500 Finance expenses (19 328) (19 328) Miscellaneous revenue 331 331 Programmatic expenses (532 525) (532 525) Transfer to Infrastructure fund as per WHA decisions 69(18) and 70(16) (refer to note 6.2.b.i.(a)) (8 000) (8 000)
Tax reimbursements to staff members (6 225) (6 225) Refunds/Adjustments 736 736 Balance as at 31 December 2021 200 13 499 31 000 44 699
Under resolution WHA72.1, US$ 10.5 million was approved to transfer to the Tax Equalization Fund and to maintain the Working Capital Fund at its existing level of US$ 31 million.
6.1.b Voluntary funds
This note provides fund balance details for the core, specified and partnerships of the Voluntary Fund.
Description Notes 31 December 2021 31 December 2020 US$ thousands Core voluntary contributions account 135 172 118 659 Voluntary Contributions Core Fund 329 970 316 597 Voluntary Contributions Specified Fund 1 462 765 1 302 539 Special Programme for Research and Training in Tropical Diseases (TDR Trust Fund)
32 425 31 270
Special Programme of Research, Development and Research Training in Human Reproduction (HRP Trust Fund)
37 032 54 724
Special Programmes and Collaborative Arrangements Fund 354 735 285 987 Special Account for Servicing Costs Fund 6.1.b.i 615 393 518 866 Outbreak and Crisis Response Fund 952 284 957 029 Contingency Fund for Emergencies 6.1.b.ii 63 015 30 945 Fee for service fund – exchange transactions 58 830 48 860 Supply Chain Fund (1 405) 5 437 Total voluntary funds 4 040 216 3 670 913
6.1.b.i Special Account for Servicing Costs Fund
The Special Account for Servicing Costs Fund (AS Fund) was established in order to support the costs of servicing activities financed from sources other than the assessed contribution budget (i.e. from voluntary contributions).
The Fund is credited with revenue from the following sources:
• under resolution WHA34.17 (1981), funds are received for programme support costs from voluntary sources and are calculated by applying a fixed percentage rate to total expenses. The resolution set a standard rate of 13% of project expenditure. The Director-General has made various exceptions to that standard rate, most importantly for emergencies. For 2021, programme support costs income of

A75/33
75
US$ 245.2 million was earned on project expenditure, resulting in a computed average programme support cost rate of 8%.
• administrative service agreements with other entities.
• interest earned on voluntary funds is described in document EB122/3.
A summary of the Fund is provided below.
Description 31 December 2021 31 December 2020 US$ thousands Balance as at 1 January 518 866 421 924 Revenue
Programme support costs 245 184 185 196 Finance revenue 30 307 64 065 Administrative service agreements with other entities 3 574 3 706 Transfer for special projectsa 40 000 0 Other revenue 255 86
Total revenue 319 320 253 053 Expenses
Staff and other personnel costs 146 803 94 459 Medical supplies and materials 690 605 Contractual services 29 574 20 948 Transfers and grants to counterparts 1 006 89 Travel 680 548 General operating expenses 31 444 36 746 Equipment, vehicles and furniture 3 285 1 879
Total expenses 213 482 155 274 Less:
Transfer to Special Purpose Fundsb 9 000 0 Increase in allowance for doubtful accounts receivables – voluntary contributions (refer to note 4.3 and 5.1) 311 837
Balance as at 31 December 615 393 518 866 a In 2021, transfers were made to the Special Account for Servicing Costs Fund from the Mobility Fund and Maternity Fund in the amounts of US $36 million and US$ 4 million respectively.
b In 2021, a transfer was made from the Special Account for Servicing Costs Fund to the Information Technology Fund in the amount of US$ 9 million.
Expenses under the Fund by major office are as follows.
Expenses by major office 31 December 2021 31 December 2020 US$ thousands Global and interregional activities 116 313 84 427 Regional Office for Africa 21 812 22 162 Regional Office for the Americas 4 022 3 574 Regional Office for the Eastern Mediterranean 23 442 14 408 Regional Office for Europe 15 113 7 101 Regional Office for South-East Asia 16 663 15 660 Regional Office for the Western Pacific 16 117 7 942 Total expenses by major office 213 482 155 274

A75/33
76
6.1.b.ii Contingency Fund for Emergencies
This Fund was established by the Sixty-eighth World Health Assembly in decision WHA68(10) (2015). The purpose of the Fund is to provide temporary financing for the emergency field operations with a target capitalization of US$ 100 million. A summary of the Fund is as follows.
Description 31 December 2021 31 December 2020 US$ thousands Balance as at 1 January 30 945 32 326 Revenue
Contributions 46 299 22 849 Total revenue 46 299 22 849 Expenses
Staff costs 313 636 Medical supplies and materials 2 315 2 661 Contractual services 7 106 16 607 Transfers and grants 635 647 Travel 1 383 853 General operating expenses 1 962 2 440 Equipment, vehicles and furniture 515 386
Total expenses 14 229 24 230 Balance as at 31 December 63 015 30 945
6.2 Member States – other
This note provides fund balance details for the Member States – other.
Description Notes 31 December 2021 31 December 2020 US$ thousands
Common Fund 405 011 306 342 Enterprise Fund 6.2.a 35 551 35 513 Special Purpose Fund 6.2.b (1 180 903) (1 553 591)
Total Member States – other (740 341) (1 211 736)
6.2.a Enterprise Fund
This note provides fund balance details for the Enterprise Fund.
Description 31 December 2021 31 December 2020 US$ thousands Enterprise Fund
Accident and Illness Insurance Fund 13 466 12 796 Concessions Fund 3 252 5 137 Garage Rental Fund 6 357 5 695 Global Conference and Training Centre - Tunis Fund 1 996 1 898 Insurance Policies Fund 5 475 4 633 Revolving Sales Fund 4 394 4 357 Shared Services Fund 611 997
Total Enterprise Fund 35 551 35 513
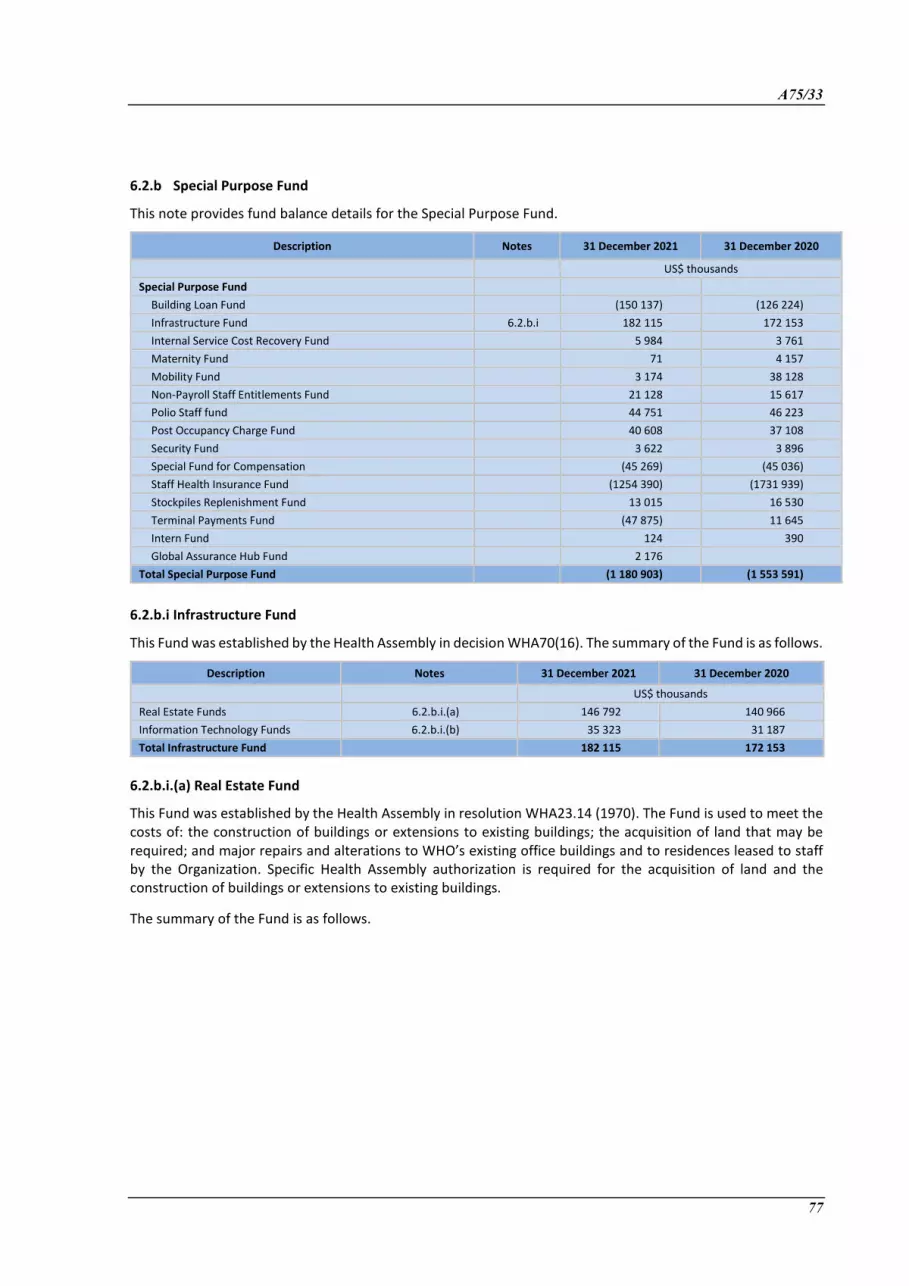
A75/33
77
6.2.b Special Purpose Fund
This note provides fund balance details for the Special Purpose Fund.
Description Notes 31 December 2021 31 December 2020 US$ thousands Special Purpose Fund
Building Loan Fund (150 137) (126 224) Infrastructure Fund 6.2.b.i 182 115 172 153 Internal Service Cost Recovery Fund 5 984 3 761 Maternity Fund 71 4 157 Mobility Fund 3 174 38 128 Non-Payroll Staff Entitlements Fund 21 128 15 617 Polio Staff fund 44 751 46 223 Post Occupancy Charge Fund 40 608 37 108 Security Fund 3 622 3 896 Special Fund for Compensation (45 269) (45 036) Staff Health Insurance Fund (1254 390) (1731 939) Stockpiles Replenishment Fund 13 015 16 530 Terminal Payments Fund (47 875) 11 645 Intern Fund 124 390 Global Assurance Hub Fund 2 176
Total Special Purpose Fund (1 180 903) (1 553 591)
6.2.b.i Infrastructure Fund
This Fund was established by the Health Assembly in decision WHA70(16). The summary of the Fund is as follows.
Description Notes 31 December 2021 31 December 2020 US$ thousands Real Estate Funds 6.2.b.i.(a) 146 792 140 966 Information Technology Funds 6.2.b.i.(b) 35 323 31 187 Total Infrastructure Fund 182 115 172 153
6.2.b.i.(a) Real Estate Fund
This Fund was established by the Health Assembly in resolution WHA23.14 (1970). The Fund is used to meet the costs of: the construction of buildings or extensions to existing buildings; the acquisition of land that may be required; and major repairs and alterations to WHO’s existing office buildings and to residences leased to staff by the Organization. Specific Health Assembly authorization is required for the acquisition of land and the construction of buildings or extensions to existing buildings.
The summary of the Fund is as follows.
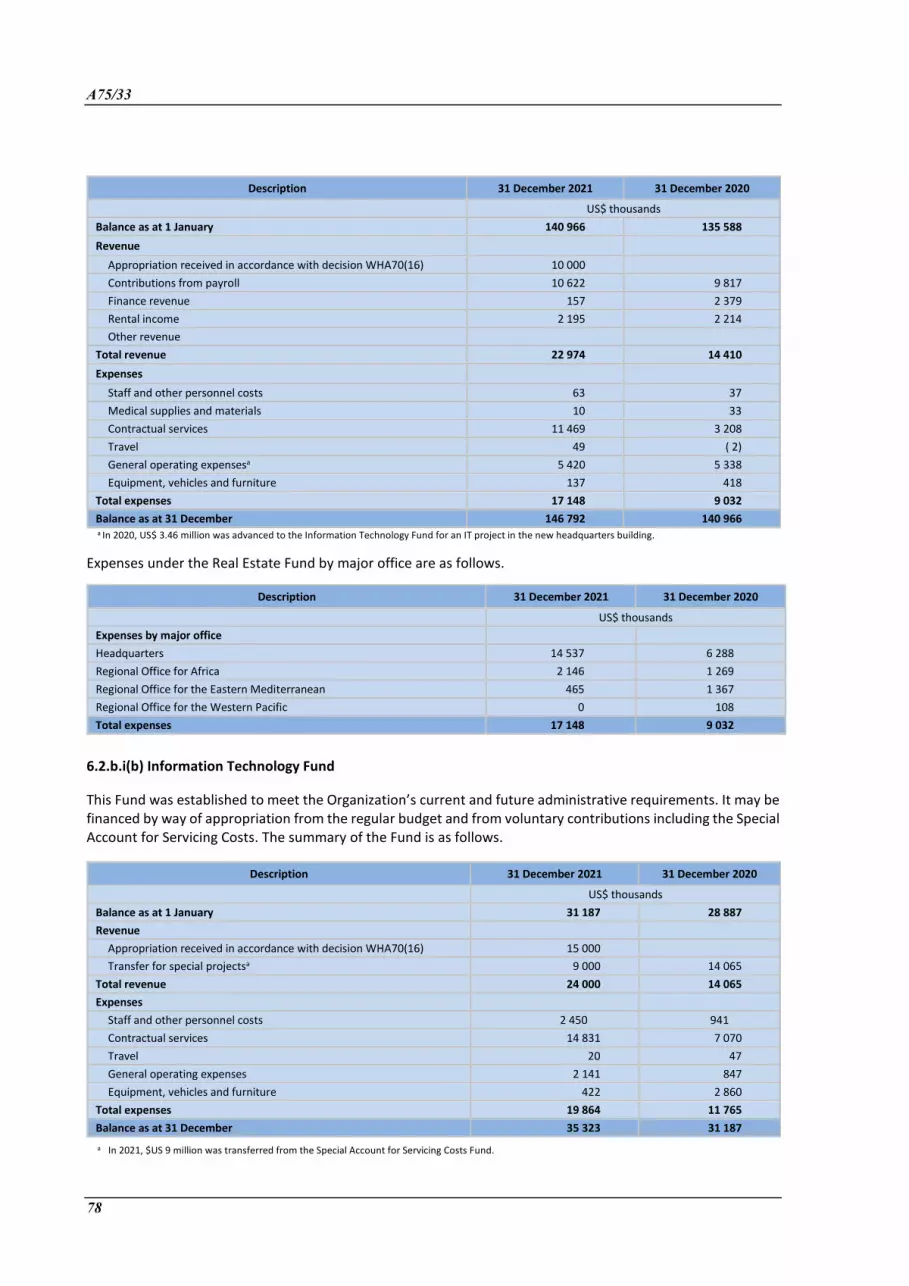
A75/33
78
Description 31 December 2021 31 December 2020 US$ thousands Balance as at 1 January 140 966 135 588 Revenue
Appropriation received in accordance with decision WHA70(16) 10 000 Contributions from payroll 10 622 9 817 Finance revenue 157 2 379 Rental income 2 195 2 214 Other revenue
Total revenue 22 974 14 410 Expenses
Staff and other personnel costs 63 37 Medical supplies and materials 10 33 Contractual services 11 469 3 208 Travel 49 ( 2) General operating expensesa 5 420 5 338 Equipment, vehicles and furniture 137 418
Total expenses 17 148 9 032 Balance as at 31 December 146 792 140 966 a In 2020, US$ 3.46 million was advanced to the Information Technology Fund for an IT project in the new headquarters building.
Expenses under the Real Estate Fund by major office are as follows.
Description 31 December 2021 31 December 2020 US$ thousands Expenses by major office
Headquarters 14 537 6 288 Regional Office for Africa 2 146 1 269 Regional Office for the Eastern Mediterranean 465 1 367 Regional Office for the Western Pacific 0 108 Total expenses 17 148 9 032
6.2.b.i(b) Information Technology Fund
This Fund was established to meet the Organization’s current and future administrative requirements. It may be financed by way of appropriation from the regular budget and from voluntary contributions including the Special Account for Servicing Costs. The summary of the Fund is as follows.
Description 31 December 2021 31 December 2020 US$ thousands
Balance as at 1 January 31 187 28 887 Revenue
Appropriation received in accordance with decision WHA70(16) 15 000 Transfer for special projectsa 9 000 14 065
Total revenue 24 000 14 065 Expenses
Staff and other personnel costs 2 450 941 Contractual services 14 831 7 070 Travel 20 47 General operating expenses 2 141 847 Equipment, vehicles and furniture 422 2 860
Total expenses 19 864 11 765 Balance as at 31 December 35 323 31 187 a In 2021, $US 9 million was transferred from the Special Account for Servicing Costs Fund.
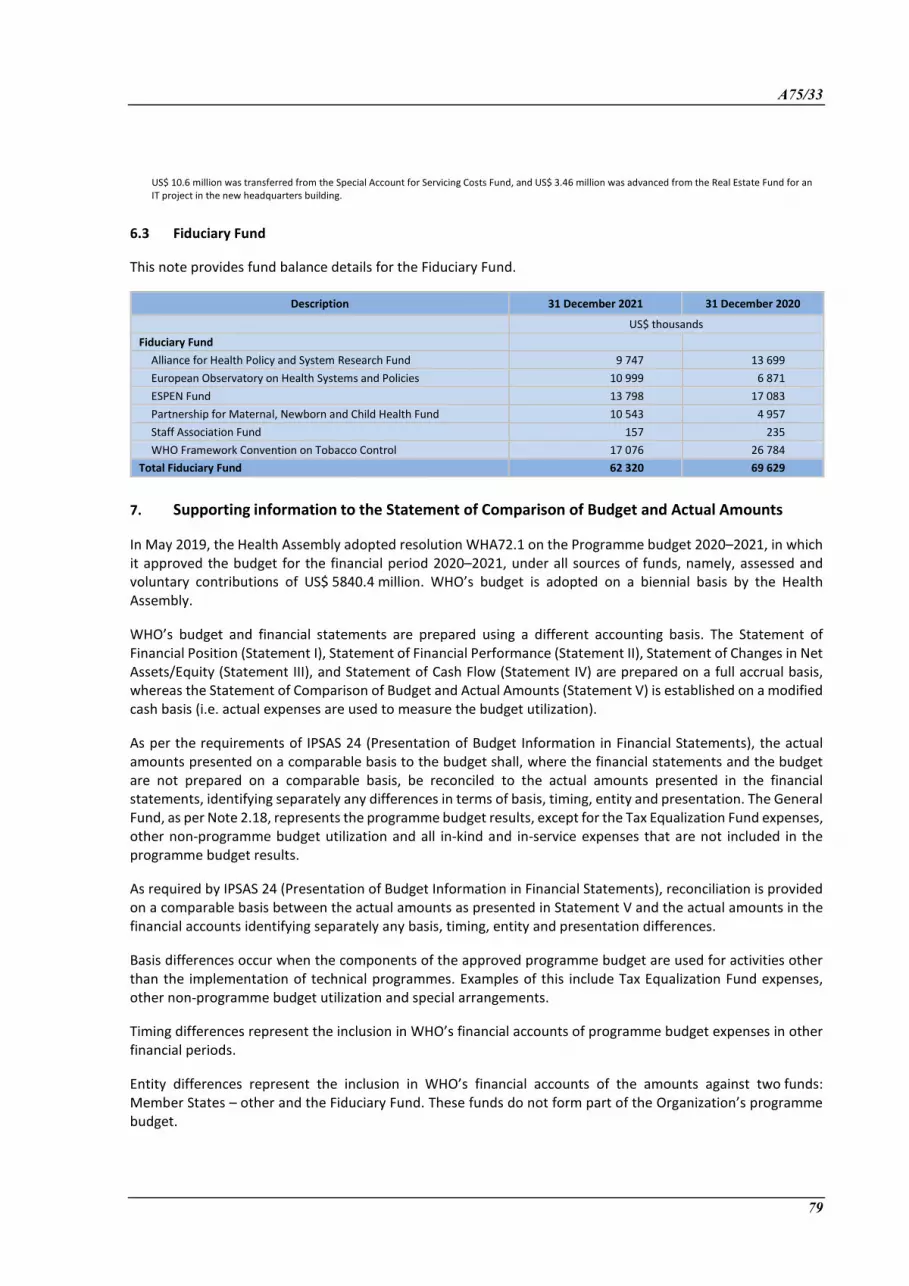
A75/33
79
US$ 10.6 million was transferred from the Special Account for Servicing Costs Fund, and US$ 3.46 million was advanced from the Real Estate Fund for an IT project in the new headquarters building.
6.3 Fiduciary Fund
This note provides fund balance details for the Fiduciary Fund.
Description 31 December 2021 31 December 2020 US$ thousands
Fiduciary Fund
Alliance for Health Policy and System Research Fund 9 747 13 699 European Observatory on Health Systems and Policies 10 999 6 871 ESPEN Fund 13 798 17 083 Partnership for Maternal, Newborn and Child Health Fund 10 543 4 957 Staff Association Fund 157 235 WHO Framework Convention on Tobacco Control 17 076 26 784
Total Fiduciary Fund 62 320 69 629
7. Supporting information to the Statement of Comparison of Budget and Actual Amounts
In May 2019, the Health Assembly adopted resolution WHA72.1 on the Programme budget 2020–2021, in which it approved the budget for the financial period 2020–2021, under all sources of funds, namely, assessed and voluntary contributions of US$ 5840.4 million. WHO’s budget is adopted on a biennial basis by the Health Assembly.
WHO’s budget and financial statements are prepared using a different accounting basis. The Statement of Financial Position (Statement I), Statement of Financial Performance (Statement II), Statement of Changes in Net Assets/Equity (Statement III), and Statement of Cash Flow (Statement IV) are prepared on a full accrual basis, whereas the Statement of Comparison of Budget and Actual Amounts (Statement V) is established on a modified cash basis (i.e. actual expenses are used to measure the budget utilization).
As per the requirements of IPSAS 24 (Presentation of Budget Information in Financial Statements), the actual amounts presented on a comparable basis to the budget shall, where the financial statements and the budget are not prepared on a comparable basis, be reconciled to the actual amounts presented in the financial statements, identifying separately any differences in terms of basis, timing, entity and presentation. The General Fund, as per Note 2.18, represents the programme budget results, except for the Tax Equalization Fund expenses, other non-programme budget utilization and all in-kind and in-service expenses that are not included in the programme budget results.
As required by IPSAS 24 (Presentation of Budget Information in Financial Statements), reconciliation is provided on a comparable basis between the actual amounts as presented in Statement V and the actual amounts in the financial accounts identifying separately any basis, timing, entity and presentation differences.
Basis differences occur when the components of the approved programme budget are used for activities other than the implementation of technical programmes. Examples of this include Tax Equalization Fund expenses, other non-programme budget utilization and special arrangements.
Timing differences represent the inclusion in WHO’s financial accounts of programme budget expenses in other financial periods.
Entity differences represent the inclusion in WHO’s financial accounts of the amounts against two funds: Member States – other and the Fiduciary Fund. These funds do not form part of the Organization’s programme budget.

A75/33
80
Presentation differences concern differences in the format and classification schemes in the Statement of Cash Flow (Statement IV) and the Statement of Comparison of Budget and Actual Amounts (Statement V).
A reconciliation between the actual amounts on a comparable basis in Statement V and the actual amounts in Statement IV for December 2021 is presented below.
Description 2021
Operating Investing Financing Total US$ thousands Actual amount on a comparable basis (Statement V) (3 565 902) (3 565 902)
Basis differences 58 343 (831 727) 9 206 (764 178) Timing differences (420) (420) Entity differences 94 650 22 191 116 841 Presentation differences 3 679 098 (43 429) 3 635 669
Actual amount in the Statement of Cash Flow (Statement IV) 265 769 (852 965) 9 206 (577 990)

A75/33
81
8. Segment reporting 8.1 Statement of Financial Position by segments As at 31 December 2021 (in US$ thousands)
Description Headquarters Regional Office for Africa
Regional Office for the Americas
Regional Office for the Eastern Mediterranean
Regional Office for Europe
Regional Office for South-East Asia
Regional Office for the Western Pacific Total
ASSETS Current assets
Cash and cash equivalents 303 983 14 615 0 10 048 1 796 4 079 3 436 337 957 Short-term investments 4 562 887 0 0 0 0 0 0 4 562 887 Receivables – current 2 266 013 6 504 (1 019 735) 2 059 1 028 7 472 999 1 264 340 Staff receivables 6 882 2 188 0 910 960 618 1 413 12 971 Inventories 125 197 7 977 0 48 016 224 5 269 3 747 190 430 Prepayments and deposits 94 457 292 0 1 489 958 3 712 1 722 102 630
Total current assets 7 359 419 31 576 (1 019 735) 62 522 4 966 21 150 11 317 6 471 215 Non-current assets
Receivables – non-current 393 688 0 0 0 0 0 0 393 688 Long-term investments 114 511 0 0 0 0 0 0 114 511 Property, plant and equipment 192 719 11 390 0 21 641 588 2 471 1 211 230 020 Intangibles 4 932 0 0 0 0 0 0 4 932
Total non-current assets 705 850 11 390 0 21 641 588 2 471 1 211 743 151 TOTAL ASSETS 8 065 269 42 966 (1 019 735) 84 163 5 554 23 621 12 528 7 214 366 LIABILITIES Current liabilities
Contributions received in advance 97 583 122 0 0 0 241 0 97 946 Accounts payable 43 652 14 872 0 32 451 8 038 9 401 5 754 114 168 Staff payable 536 864 0 284 91 157 156 2 088 Accrued staff benefits – current 45 971 19 595 0 9 292 6 490 5 484 5 150 91 982 Deferred revenue – current 481 447 0 0 0 0 0 0 481 447 Financial liabilities 35 595 0 0 0 0 0 0 35 595 Other current liabilities (22 286 908) 9 332 610 142 351 6 524 799 1 946 626 2 654 763 1 919 781 234 022 Inter-entity liabilities 797 531 0 0 0 0 0 0 797 531 Long-term borrowings – current 3 714 0 0 0 0 0 0 3 714
Total current liabilities (20 780 879) 9 368 063 142 351 6 566 826 1 961 245 2 670 046 1 930 841 1 858 493 Non-current liabilities
Long-term borrowings – non-current 169 106 0 0 0 0 0 0 169 106 Accrued staff benefits – non-current 1 118 127 46 952 0 21 094 154 417 24 512 21 083 1 386 185 Deferred revenue – non-current 393 688 0 0 0 0 0 0 393 688 Other liabilities – non-current 0 0 0 0 0 0 0 0
Total non-current liabilities 1 680 921 46 952 0 21 094 154 417 24 512 21 083 1 948 979 TOTAL LIABILITIES (19 099 958) 9 415 015 142 351 6 587 920 2 115 662 2 694 558 1 951 924 3 807 472 NET ASSETS/EQUITY
General Fund 26 934 990 (9 094 142) (1 146 153) (6 349 551) (1 857 307) (2 556 339) (1 846 583) 4 084 915 Member States – other 74 513 (232 129) (14 466) (150 127) (213 150) (113 357) (91 625) (740 341) Fiduciary funds 155 724 (45 778) (1 467) (4 079) (39 651) (1 241) (1 188) 62 320
TOTAL NET ASSETS/EQUITY 27 165 227 (9 372 049) (1 162 086) (6 503 757) (2 110 108) (2 670 937) (1 939 396) 3 406 894 TOTAL LIABILITIES AND NET ASSETS/EQUITY 8 065 269 42 966 (1 019 735) 84 163 5 554 23 621 12 528 7 214 366
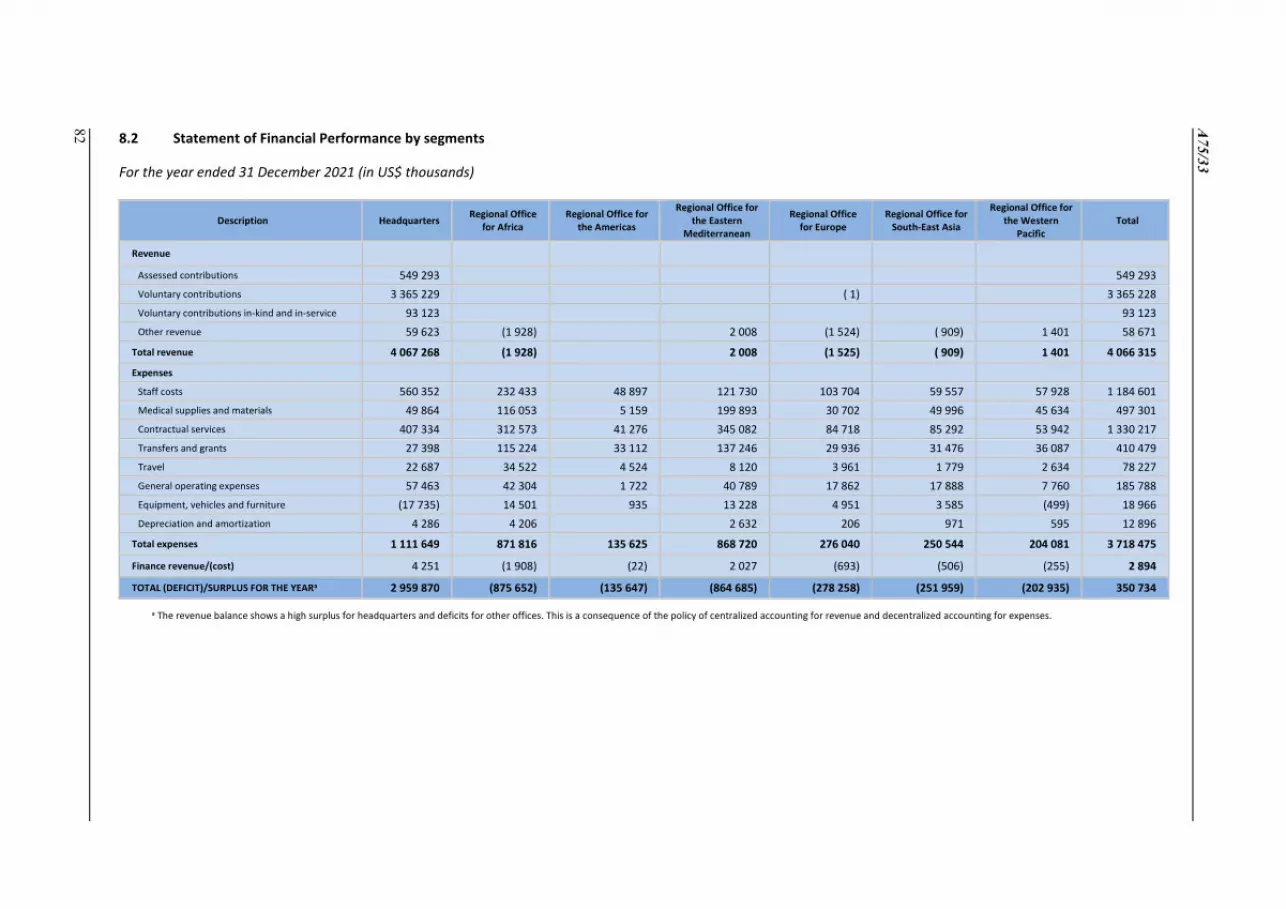
A75/33
82 8.2 Statement of Financial Performance by segments
For the year ended 31 December 2021 (in US$ thousands)
Description Headquarters Regional Office for Africa
Regional Office for the Americas
Regional Office for the Eastern
Mediterranean
Regional Office for Europe
Regional Office for South-East Asia
Regional Office for the Western
Pacific Total
Revenue
Assessed contributions 549 293 549 293
Voluntary contributions 3 365 229 ( 1) 3 365 228
Voluntary contributions in-kind and in-service 93 123 93 123
Other revenue 59 623 (1 928) 2 008 (1 524) ( 909) 1 401 58 671
Total revenue 4 067 268 (1 928) 2 008 (1 525) ( 909) 1 401 4 066 315
Expenses Staff costs 560 352 232 433 48 897 121 730 103 704 59 557 57 928 1 184 601
Medical supplies and materials 49 864 116 053 5 159 199 893 30 702 49 996 45 634 497 301
Contractual services 407 334 312 573 41 276 345 082 84 718 85 292 53 942 1 330 217
Transfers and grants 27 398 115 224 33 112 137 246 29 936 31 476 36 087 410 479
Travel 22 687 34 522 4 524 8 120 3 961 1 779 2 634 78 227
General operating expenses 57 463 42 304 1 722 40 789 17 862 17 888 7 760 185 788
Equipment, vehicles and furniture (17 735) 14 501 935 13 228 4 951 3 585 (499) 18 966
Depreciation and amortization 4 286 4 206 2 632 206 971 595 12 896
Total expenses 1 111 649 871 816 135 625 868 720 276 040 250 544 204 081 3 718 475
Finance revenue/(cost) 4 251 (1 908) (22) 2 027 (693) (506) (255) 2 894
TOTAL (DEFICIT)/SURPLUS FOR THE YEARa 2 959 870 (875 652) (135 647) (864 685) (278 258) (251 959) (202 935) 350 734
a The revenue balance shows a high surplus for headquarters and deficits for other offices. This is a consequence of the policy of centralized accounting for revenue and decentralized accounting for expenses.
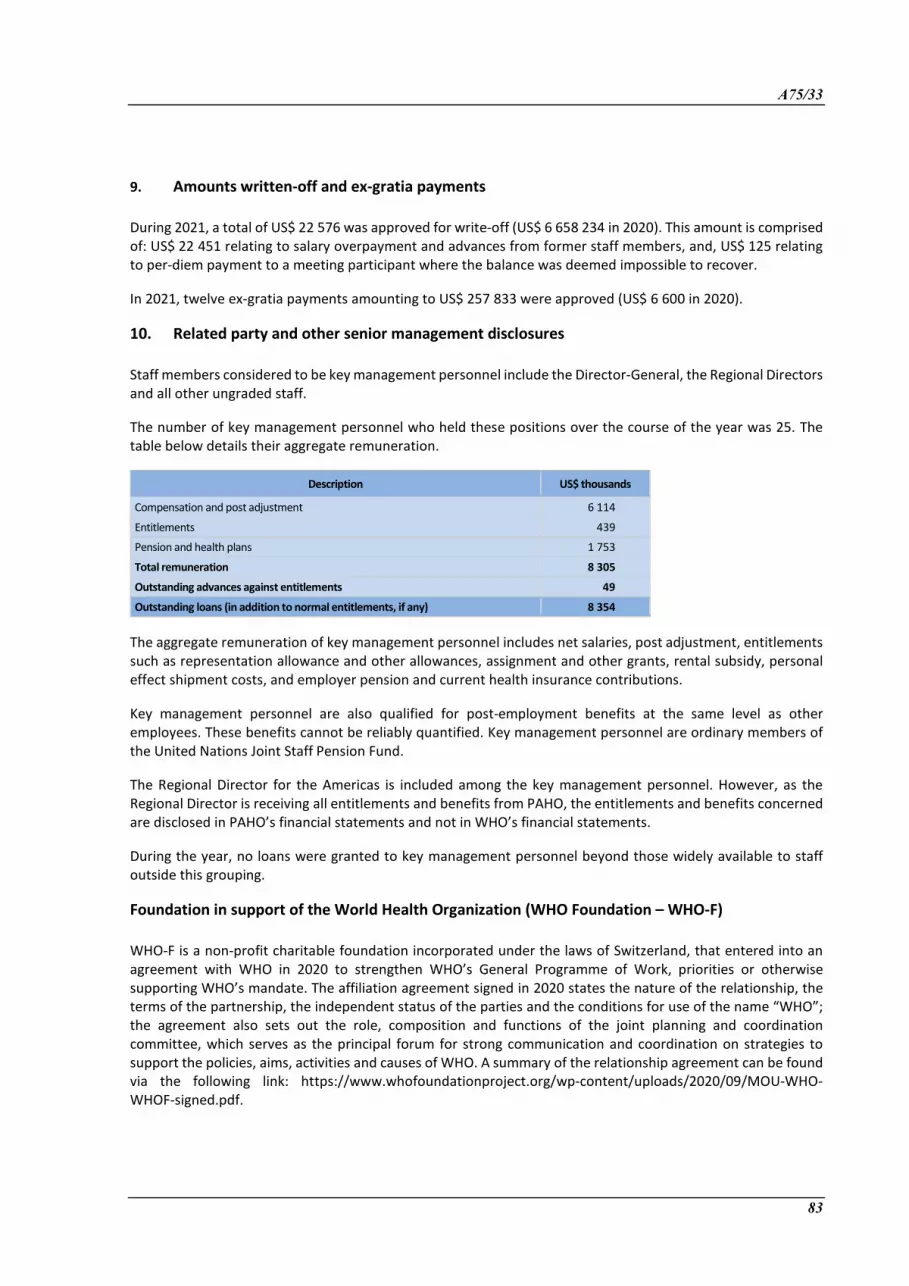
A75/33
83
9. Amounts written-off and ex-gratia payments
During 2021, a total of US$ 22 576 was approved for write-off (US$ 6 658 234 in 2020). This amount is comprised of: US$ 22 451 relating to salary overpayment and advances from former staff members, and, US$ 125 relating to per-diem payment to a meeting participant where the balance was deemed impossible to recover.
In 2021, twelve ex-gratia payments amounting to US$ 257 833 were approved (US$ 6 600 in 2020).
10. Related party and other senior management disclosures
Staff members considered to be key management personnel include the Director-General, the Regional Directors and all other ungraded staff.
The number of key management personnel who held these positions over the course of the year was 25. The table below details their aggregate remuneration.
Description US$ thousands
Compensation and post adjustment 6 114
Entitlements 439
Pension and health plans 1 753
Total remuneration 8 305
Outstanding advances against entitlements 49
Outstanding loans (in addition to normal entitlements, if any) 8 354
The aggregate remuneration of key management personnel includes net salaries, post adjustment, entitlements such as representation allowance and other allowances, assignment and other grants, rental subsidy, personal effect shipment costs, and employer pension and current health insurance contributions.
Key management personnel are also qualified for post-employment benefits at the same level as other employees. These benefits cannot be reliably quantified. Key management personnel are ordinary members of the United Nations Joint Staff Pension Fund.
The Regional Director for the Americas is included among the key management personnel. However, as the Regional Director is receiving all entitlements and benefits from PAHO, the entitlements and benefits concerned are disclosed in PAHO’s financial statements and not in WHO’s financial statements.
During the year, no loans were granted to key management personnel beyond those widely available to staff outside this grouping.
Foundation in support of the World Health Organization (WHO Foundation – WHO-F)
WHO-F is a non-profit charitable foundation incorporated under the laws of Switzerland, that entered into an agreement with WHO in 2020 to strengthen WHO’s General Programme of Work, priorities or otherwise supporting WHO’s mandate. The affiliation agreement signed in 2020 states the nature of the relationship, the terms of the partnership, the independent status of the parties and the conditions for use of the name “WHO”; the agreement also sets out the role, composition and functions of the joint planning and coordination committee, which serves as the principal forum for strong communication and coordination on strategies to support the policies, aims, activities and causes of WHO. A summary of the relationship agreement can be found via the following link: https://www.whofoundationproject.org/wp-content/uploads/2020/09/MOU-WHO-WHOF-signed.pdf.

A75/33
84
11. Events after the reporting date
WHO’s reporting date is 31 December 2021. The financial statements were authorized for issue on 25 March 2022, the date at which they were submitted to the External Auditor by the Director-General. On the date of the signing of these accounts, no material events, favourable or unfavourable, had arisen between the balance sheet date and the date when the financial statements were authorized for issue that would have had an impact on the financial statements.
12. Contingent liabilities, commitments and contingent assets
Contingent liabilities
As at 31 December 2021, WHO had a number of legal cases pending. Most involve disputes that are not recorded because the likelihood of repayment has been determined to be remote. However, there is one case involving contractual disputes that is to be considered a contingent liability. The total potential cost to the Organization is estimated at US$ 319 122 (US$ 318 066 as at 31 December 2020).
Operating lease commitments
WHO enters into operating lease arrangements for renting office space in various country offices. In 2021, WHO incurred US$ 16.1 million in rental expenses for office space. Future minimum lease rental payments for premises above the threshold of US$ 50 000 per annum for the following periods are as follows.
Description Total
US$ thousands
Year 2021 Year 2020
Under one year 16 098 13 967
One to five years 23 282 20 271
Five years + 2 747 4 532
Total operating lease commitments 42 127 38 770
The Organization has no outstanding leases qualifying as finance leases at the reporting date.
As at 31 December 2021, total revenue from the leasing office space was US$ 0.5 million (US$ 0.6 million as at 31 December 2020). There is no minimum payment commitment for 2022 and beyond.
Contingent assets
In accordance with IPSAS 19 (Provisions, Contingent Liabilities and Contingent Assets), contingent assets will be disclosed for cases where an event will give rise to a probable inflow of economic benefits. As at 31 December 2021, there are no material contingent assets to disclose

A75/33
85
Schedule I. Statement of Financial Performance by major funds
For the year ended 31 December 2021 (in US$ thousands)
Description
General Fund Member States – other Fiduciary
Fund Subtotal Eliminationsa Total Percentage Regular budget Voluntary
funds Eliminations Subtotal Common Fund
Enterprise Fund
Special Purpose Fund
Revenue
Assessed contributions 549 293 549 293 549 293 14%
Voluntary contributions 3 333 070 3 333 070 75 38 062 38 137 (5 979) 3 365 228 83% Voluntary contributions in-kind and in-service 93 123 93 123 93 123 2%
Other revenue 331 321 976 (239 050) 83 257 (2 648) 23 352 295 658 316 362 (340 948) 58 671 1%
Total operating revenue 549 624 3 655 046 (239 050) 3 965 620 (2 648) 116 475 295 733 38 062 447 622 (346 927) 4 066 315 100% Expenses
Staff costs 379 707 796 263 1 175 970 19 031 168 278 20 027 207 336 (198 705) 1 184 601 32%
Medical supplies and materials 20 761 476 540 497 301 (66 516) 62 656 7 332 100 3 572 (3 572) 497 301 13%
Contractual services 78 374 1 182 272 1 260 646 (13 937) 14 169 70 626 13 961 84 819 (15 248) 1 330 217 36%
Transfers and grants 24 785 384 809 409 594 ( 453) 1 198 85 6 890 7 720 (6 835) 410 479 11%
Travel 6 472 70 974 77 446 371 410 781 78 227 2%
General operating expenses 30 658 365 386 (239 050) 156 994 18 652 128 163 3 920 150 735 (121 941) 185 788 5% Equipment, vehicles and furniture 5 993 39 881 45 874 (25 630) 285 (1 000) 63 (26 282) (626) 18 966 1%
Depreciation and amortization 12 896 12 896 12 896 0%
Total expenses 546 750 3 316 125 (239 050) 3 623 825 (93 640) 115 991 373 855 45 371 441 577 (346 927) 3 718 475 100%
Finance revenue (cost) (19 328) 30 382 11 054 7 677 (446) (15 391) (8 160) 2 894 TOTAL SURPLUS/(DEFICIT) FOR THE YEAR (16 454) 369 303 352 849 98 669 38 (93 513) (7 309) (2 115) 350 734
Fund balance – 1 January 2020 61 153 3 670 913 3 732 066 306 342 35 513 (1553 591) 69 629 (1142 107) 2 589 959 Direct adjustments to net assets/equity 466 201 466 201 466 201
Fund balance – 31 December 2021 44 699 4 040 216 4 084 915 405 011 35 551 (1180 903) 62 320 (1144 222) 3 406 894
a Eliminations as reported in the Statement of Financial Performance by major fund (Schedule I) are accounting adjustments made to remove the effect of inter-fund transfers that would otherwise overstate revenue and expenses of the Organization. These accounting adjustments are done through a separate elimination fund established for this purpose.

A75/33
86 Schedule II. Expenses by major office ‒ General Fund only
For the year ended 31 December 2021 (in US$ thousands)
Description Headquarters Regional Office for Africa
Regional Office for the Americas
Regional Office for the Eastern Mediterranean
Regional Office for Europe
Regional Office for South-East Asia
Regional Office for the Western
Pacific Total
Expenses
Staff costs 556 145 239 629 48 897 123 207 87 164 62 473 58 455 1 175 970 Medical supplies and materials 100 509 73 202 5 159 198 023 31 462 50 661 38 285 497 301 Contractual services 354 155 308 871 40 876 334 956 82 808 86 348 52 632 1 260 646 Transfers and grants 32 220 111 278 33 054 136 939 29 936 31 444 34 723 409 594 Travel 22 583 34 059 4 523 7 970 3 906 1 771 2 634 77 446 General operating expenses 47 036 38 267 1 722 36 684 9 954 17 122 6 209 156 994 Equipment, vehicles and furniture 1 940 18 559 930 15 638 5 247 3 958 ( 398) 45 874
Total expenses 1 114 588 823 865 135 161 853 417 250 477 253 777 192 540 3 623 825 Percentage of expenses by expense
type across major office
Staff and other personnel costs 47% 20% 4% 10% 7% 5% 5% 100% Medical supplies and materials 20% 15% 1% 40% 6% 10% 8% 100% Contractual services 28% 25% 3% 27% 7% 7% 4% 100% Transfers and grants to
counterparts 8% 27% 8% 33% 7% 8% 8% 100%
Travel 29% 44% 6% 10% 5% 2% 3% 100% General operating expenses 30% 24% 1% 23% 6% 11% 4% 100% Equipment, vehicles and furniture 4% 40% 2% 34% 11% 9% -1% 100%
Total percentage 31% 23% 4% 24% 7% 7% 5% 100% Percentage of expenses by expense
type within each major office
Staff and other personnel costs 50% 29% 36% 14% 35% 25% 30% 32% Medical supplies and materials 9% 9% 4% 23% 13% 20% 20% 14% Contractual services 32% 37% 30% 39% 33% 34% 27% 35% Transfers and grants to
counterparts 3% 14% 24% 16% 12% 12% 18% 11%
Travel 2% 4% 3% 1% 2% 1% 1% 2% General operating expenses 4% 5% 1% 4% 4% 7% 3% 4% Equipment, vehicles and furniture 0% 2% 1% 2% 2% 2% 0% 1%
Total percentage 100% 100% 100% 100% 100% 100% 100% 100%

A75/33
87
Schedule III. Financial overview – all funds, 2020–2021, 2018–2019 and 2016–2017 For the year ended 31 December 2021 (in US$ millions)
Description Total 2020–2021 Total 2018–2019 Total 2016–2017
Assessed contributions 1 015 991 927
Voluntary contributions – programme budget 6 988 4 690 3 828
Total contributions – programme budget 8 003 5 681 4 755
Other revenue – programme budget 122 63 37
Non-programme budget revenue 67 121 122
Voluntary contributions in-kind and in-service 173 152 225
Total revenue (all sources) 8 365 6 017 5 139
Expenses – programme budget 6 629 5 314 4 572
Expenses – non-programme budget and other 477 123 354
Expenses – in-kind and in-service 173 151 225
Total expenses (all sources) 7 279 5 588 5 151
Finance revenue 89 102 140
Total surplus/(deficit) 1 175 531 128
= = =