annual report and audited financial statements blackrock
TRANSCRIPT
Annual report and
audited financial statements
BlackRock Index Selection Fund For the financial year ended 31 May 2019
BLACKROCK INDEX SELECTION FUND
CONTENTS Page
Overview General information 1 Background 2 Performance Investment manager’s report 5 Governance Statement of the manager’s responsibilities Trustee’s report to the unitholders
23 24
Independent auditor’s report 25 Financial statements Income statement 28 Statement of changes in net assets attributable to redeemable participating unitholders 32 Balance sheet 36 Notes to the financial statements 40 Schedules of investments 103 Additional information and regulatory disclosures (unaudited) Schedules of material purchases and sales 295 Calendar year performance 312 Total expense ratios 314 Transactions with connected persons 317 Transaction costs 317 Soft commissions 317 Cross investments 318 Global exposure 318 Leverage 318 Report on remuneration 320 Efficient portfolio management and securities financing transactions 325 Disclaimers 344 This annual report and audited financial statements (the “Report and Accounts”) may be translated into other languages. Any such translation shall only contain the same information and have the same meaning as the English language Report and Accounts. To the extent that there is any inconsistency between the English language Report and Accounts and the Report and Accounts in another language, the English language Report and Accounts will prevail, except to the extent (and only to the extent) that it is required by law of any jurisdiction where the shares are sold, that in an action based upon disclosure in a Report and Accounts in a language other than English, the language of the Report and Accounts on which such action is based shall prevail. Any disputes as to the terms of the Report and Accounts, regardless of the language of the Report and Accounts, shall be governed by and construed in accordance with the laws of Ireland.
BLACKROCK INDEX SELECTION FUND
OVERVIEW
GENERAL INFORMATION
Directors of the Manager1 Investment Manager, Promoter, Distributor and Securities Lending Agent
William Roberts (Chairman) (British but Irish resident) BlackRock Advisors (UK) Limited Patrick Boylan (Irish) 12 Throgmorton Avenue Paul Freeman (British) London EC2N 2DL Justin Mealy (Irish) United Kingdom Barry O’Dwyer (Irish) Adele Spillane (Irish) Sub-Investment Manager Catherine Woods (Irish) In respect to the BlackRock Market Advantage Strategy Fund BlackRock Institutional Trust Company, N.A. 1All Directors are non-executive 400 Howard Street San Francisco Manager California 94105 BlackRock Asset Management Ireland Limited United States 1st Floor 2 Ballsbridge Park Independent Auditor Ballsbridge Deloitte Ireland LLP Dublin 4, D04 YW83 Chartered Accountants and Statutory Audit Firm Ireland Deloitte & Touche House Earlsfort Terrace Currency Hedging Manager2 Dublin 2, D02 AY28 State Street Global Markets Ireland One Lincoln Street, 3rd Floor Boston Irish Legal Advisers MA 02111-2900 William Fry 2 Grand Canal Square Administrator, Registrar and Transfer Agent Dublin 2, D02 A342 J.P. Morgan Administration Services (Ireland) Limited Ireland 200 Capital Dock 79 Sir John Rogerson’s Quay Paying Agent in Switzerland Dublin 2, D02 RK57 State Street Bank International GmbH Ireland Munich, Zürich Branch Beethovenstrasse 19 Trustee CH-8027 Zürich J.P. Morgan Bank (Ireland) plc Switzerland 200 Capital Dock 79 Sir John Rogerson’s Quay Information Agent in Germany Dublin 2, D02 RK57 Commerzbank AG Ireland Theodor-Heuss-Allee 50 60486 Frankfurt am Main Secretary of the Manager Germany Sanne Corporate Administration Services (Ireland) Limited Fourth Floor Representative in Switzerland 76 Baggot Street Lower BlackRock Asset Management Switzerland Limited Dublin 2, D02 EK81 Bahnhofstrasse 39 Ireland 8001 Zürich Switzerland 2In respect of the currency hedged share classes of certain Funds only.
For Swiss investors: The prospectus of the Entity, Trust Deed, the Key Investor Information Documents (“KIID”), the latest annual report and audited financial statements and interim report and unaudited financial statements, as applicable and a detailed list of investments purchased and sold for each Fund during the financial year may be obtained on request and free of charge from the representative in Switzerland.
For German investors: The prospectus and KIID are available, free of charge, from the Information Agent in Germany.
The Fund is duly registered with the Comisión Nacional de Mercado de Valores in Spain under number 1504.
1
BLACKROCK INDEX SELECTION FUND
OVERVIEW (continued)
BACKGROUND
BlackRock Index Selection Fund (the “Entity”) is an open-ended unit trust established on 27 February 1996 as an umbrella fund under the laws of Ireland. The Entity was constituted by the Trust Deed dated 27 February 1996 between BlackRock Asset Management Ireland Limited (the “Manager”) and J.P. Morgan Bank (Ireland) plc (the “Trustee”) and is governed by an amended and restated Trust Deed dated 4 December 2009 and any deeds supplemental thereto. The Entity is authorised as a unit trust with segregated liability between the funds pursuant to the Unit Trusts Act, 1990 (the “Act”). The Entity is authorised and supervised by the Central Bank of Ireland (“CBI”) pursuant to the provisions of the European Communities (Undertaking for Collective Investment in Transferable Securities) Regulations, 2011 (as amended) (the “UCITS Regulations”). The Entity is constituted as an umbrella fund and comprises separate funds (“Fund”) of the Entity. The units of each Fund may be grouped into different classes of units (each a “unit class”). Each Fund will represent a separate portfolio of assets and may consist of one or more unit classes. Each unit class may apply different subscription and redemption provisions, charges, fees or brokerage arrangements. The creation of an additional class of units will be notified to the CBI in advance. The portfolio of assets maintained for each Fund will be invested in accordance with the investment objectives and policies applicable to each Fund as set out in the prospectus and supplement. The assets of each Fund shall belong exclusively to that Fund, shall be segregated from the assets of other Funds, shall not be used to discharge directly or indirectly the liabilities of or claims against any other Fund and shall not be available for any such purpose. The term “Fund” shall be deemed to mean either a Fund or Funds of the Entity, or if the context so requires, the Manager or its delegate acting for the accounts of the relevant Fund. The term “BlackRock” and “Investment Manager” are used to represent BlackRock Advisors (UK) Limited as appropriate. All references to “redeemable units” shall be deemed to mean redeemable participating units when Fund units are classified as financial liabilities. The term “Directors” means the directors of the Manager. Further details, including the investment objectives and minimum subscription requirements, are set out in the Fund’s prospectus and supplements. Changes to the Entity during the financial year
On 6 June 2018, the JPY Flexible Accumulating Class was launched for the iShares Japan Index Fund (IE).
The Manager declared a special distribution from iShares Europe ex-UK Index Fund (IE) for ex-date 7 June 2018. The pay date for the distribution occurred on 29 June 2018 for Euro Institutional Distributing Class and on 31 July 2018 for Euro Flexible Distributing Class and Euro D Distributing Class. The distribution amount for the Fund was EUR 12,507,000.
On 8 June 2018, the US Dollar Institutional Distributing Class was launched for the iShares Developed Real Estate Index Fund (IE).
On 13 June 2018, the US Dollar (Hedged) Institutional Accumulating Class was launched for the iShares Emerging Markets Index Fund (IE).
On 26 June 2018, the Sterling (Hedged) Flexible Accumulating Class was launched for the iShares Developed World Index Fund (IE).
On 3 July 2018, the Sterling Flexible Accumulating Class was launched for the iShares North America Index Fund (IE).
On 5 August 2018, Catherine Woods was appointed as a non-executive Director.
On 22 August 2018, Linda Silcock resigned as a non-executive Director.
On 22 October 2018, the Euro (Hedged) Flexible Accumulating Class was launched for the iShares Developed World Index Fund (IE).
On 31 October 2018, Desmond Murray resigned as a non-executive Director.
On 21 November 2018, Deloitte Ireland LLP were appointed as statutory auditors of the Fund and PricewaterhouseCoopers resigned.
2
BLACKROCK INDEX SELECTION FUND
OVERVIEW (continued)
BACKGROUND (continued)
Changes to the Entity during the financial year (continued)
On 23 November 2018, the Sterling (Hedged) D Distributing Class was launched for the iShares Developed World Index Fund (IE).
Effective 10 December 2018, the registered address of the Manager was updated to 1st Floor, 2 Ballsbridge Park, Ballsbridge, Dublin 4, D04 YW83, Ireland. Effective 10 December 2018, the registered address of the Trustee, Administrator, Registrar and Transfer Agent was updated to 200 Capital Dock, 79 Sir John Rogerson’s Quay, Dublin 2, D02 RK57, Ireland. On 21 December 2018, the prospectus and supplement were updated to incorporate the change of address of the Manager and of the Trustee, Administrator, Registrar and Transfer Agent.
On 14 January 2019, the Euro Institutional Distributing Class was re-launched for the iShares Edge EM Fundamental Weighted Index Fund (IE).
On 4 March 2019, the Sterling Institutional Accumulating Class was launched for the iShares Pacific Index Fund (IE).
On 29 March 2019, an updated prospectus and supplement was issued for the Entity to facilitate the following changes: • Inclusion of share classes; • Inclusion of Deloitte Ireland LLP as auditor. On 17 April 2019, the Euro (Hedged) Flexible Accumulating Class was launched for the iShares Europe ex-UK Index Fund (IE), iShares North America Index Fund (IE) and iShares UK Index Fund (IE).
On 15 May 2019, the Sterling Flexible Accumulating Class was launched for the iShares Europe ex-UK Index Fund (IE).
Potential implications of Brexit
In the referendum held on 23 June 2016 the United Kingdom ("UK") voted to leave the European Union ("EU"). This has been followed by a continued period of political and economic uncertainty, culminating in the resignation of Prime Minister Theresa May, and the election of Boris Johnson as Conservative Party leader and Prime Minister. BlackRock is implementing a number of steps to prepare for various outcomes, including effecting organisational, governance and operational changes, applying for and receiving licenses and permissions in the EU, and engaging in client communications. Depending on the terms of the UK’s exit from the EU, BlackRock may experience organisational and operational challenges, incur additional costs or face other execution risks in connection with its European operations post-Brexit. Following the Emergency EU Summit held on 10 April 2019, an agreement was reached to provide an extension for the UK to leave the EU. This extension will only be as long as necessary and no longer than 31 October 2019 unless another extension is agreed. If the withdrawal agreement is ratified before this date, the withdrawal will take place on the first day of the following month. BlackRock will evaluate the regulatory and political developments as we continue our preparations to ensure we remain well placed to serve our clients regardless of the outcome of Brexit.
Fund details
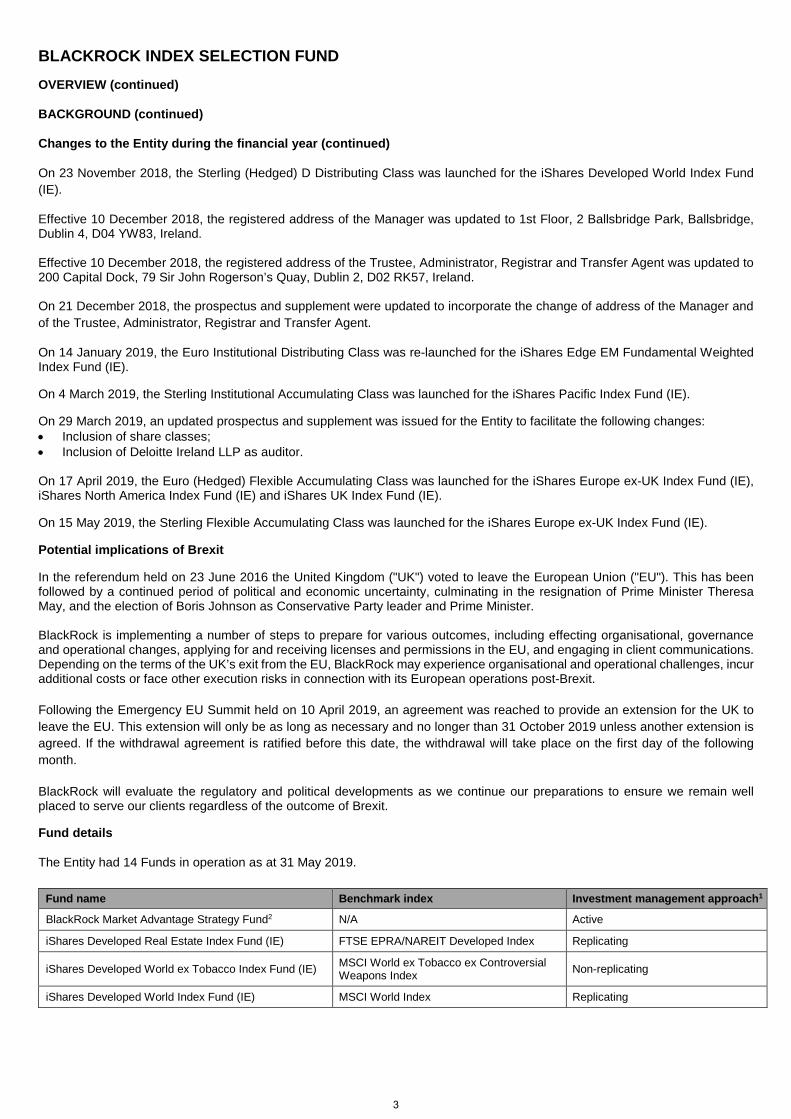
The Entity had 14 Funds in operation as at 31 May 2019. Fund name Benchmark index Investment management approach1
BlackRock Market Advantage Strategy Fund2 N/A Active
iShares Developed Real Estate Index Fund (IE) FTSE EPRA/NAREIT Developed Index Replicating
iShares Developed World ex Tobacco Index Fund (IE) MSCI World ex Tobacco ex Controversial Weapons Index Non-replicating
iShares Developed World Index Fund (IE) MSCI World Index Replicating
3
BLACKROCK INDEX SELECTION FUND
OVERVIEW (continued)
BACKGROUND (continued)
Fund details (continued)
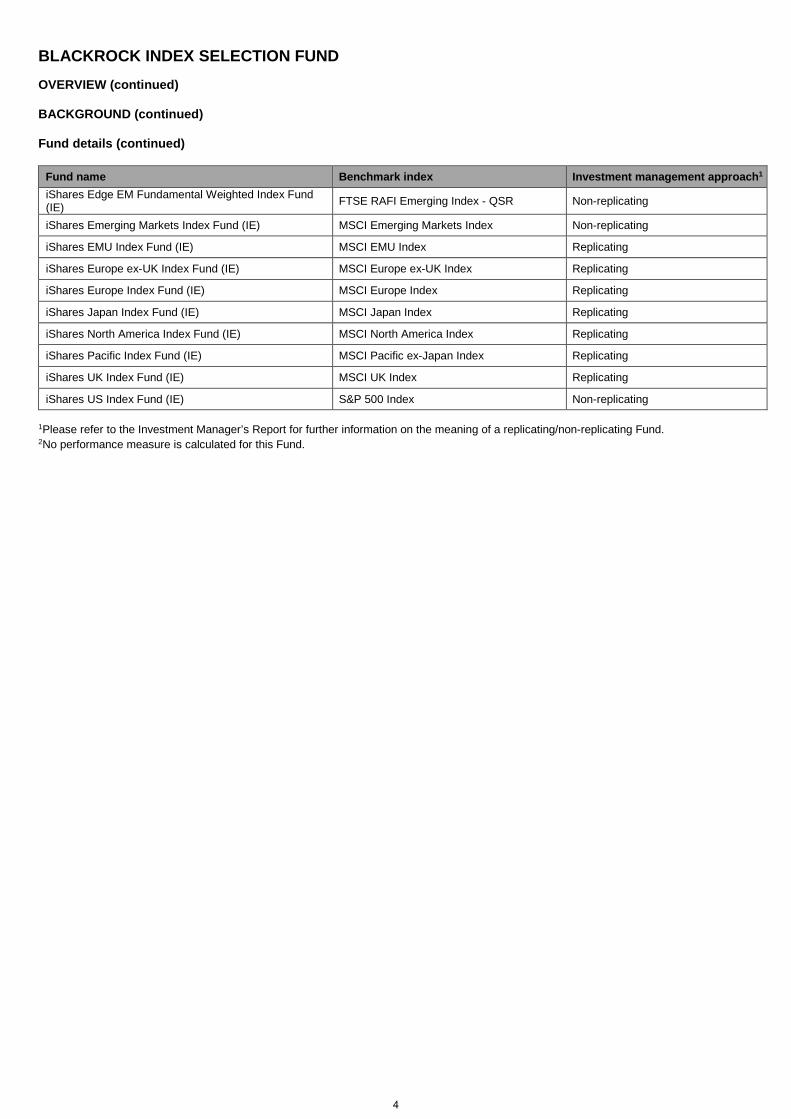
Fund name Benchmark index Investment management approach1 iShares Edge EM Fundamental Weighted Index Fund (IE) FTSE RAFI Emerging Index - QSR Non-replicating
iShares Emerging Markets Index Fund (IE) MSCI Emerging Markets Index Non-replicating
iShares EMU Index Fund (IE) MSCI EMU Index Replicating
iShares Europe ex-UK Index Fund (IE) MSCI Europe ex-UK Index Replicating
iShares Europe Index Fund (IE) MSCI Europe Index Replicating
iShares Japan Index Fund (IE) MSCI Japan Index Replicating
iShares North America Index Fund (IE) MSCI North America Index Replicating
iShares Pacific Index Fund (IE) MSCI Pacific ex-Japan Index Replicating
iShares UK Index Fund (IE) MSCI UK Index Replicating
iShares US Index Fund (IE) S&P 500 Index Non-replicating
1Please refer to the Investment Manager’s Report for further information on the meaning of a replicating/non-replicating Fund. 2No performance measure is calculated for this Fund.
4
BLACKROCK INDEX SELECTION FUND
PERFORMANCE
INVESTMENT MANAGER’S REPORT
Investment objective
BlackRock Market Advantage Strategy Fund
The investment objective of the BlackRock Market Advantage Strategy Fund is to seek to provide a total return, taking into account both capital and income returns over the long-term. This objective will be effected through strategic exposure to multiple asset classes which, through diversification, is expected to generate growth with comparatively lower risk than exposure to worldwide equities alone.
iShares Developed Real Estate Index Fund (IE)
The investment objective of the iShares Developed Real Estate Index Fund (IE) is to provide unitholders with a total return, taking into account both capital and income returns, which reflects the total return of the FTSE EPRA/NAREIT Developed Index, the Fund’s Benchmark Index.
iShares Developed World ex Tobacco Index Fund (IE)
The investment objective of the iShares Developed World ex Tobacco Index Fund (IE) is to provide a total return, taking into account both capital and income returns, which reflects the total return of the developed world equity markets excluding companies that generate a majority of their revenue and income from tobacco, and those companies that are involved in the production of controversial weapons.
iShares Developed World Index Fund (IE)
The investment objective of the iShares Developed World Index Fund (IE) is to provide a total return, taking into account both capital and income returns, which reflects the total return of the developed world equity markets.
iShares Edge EM Fundamental Weighted Index Fund (IE)
The investment objective of the iShares Edge EM Fundamental Weighted Index Fund (IE) is to provide a total return, taking into account both capital and income returns, which reflects the total return of the global emerging equity market.
iShares Emerging Markets Index Fund (IE)
The investment objective of the iShares Emerging Markets Index Fund (IE) is to provide a total return, taking into account both capital and income returns, which reflects the total return of the global emerging equity market.
iShares EMU Index Fund (IE)
The investment objective of the iShares EMU Index Fund (IE) is to provide a total return, taking into account both capital and income returns, which reflects the total return of the equity market in the European Economic and Monetary Union (the "EMU").
iShares Europe ex-UK Index Fund (IE)
The investment objective of the iShares Europe ex-UK Index Fund (IE) is to provide a total return, taking into account both capital and income returns, which reflects the total return of the equity market in Europe apart from the UK.
iShares Europe Index Fund (IE)
The investment objective of the iShares Europe Index Fund (IE) is to provide a total return, taking into account both capital and income returns, which reflects the total return of the European equity market.
iShares Japan Index Fund (IE)
The investment objective of the iShares Japan Index Fund (IE) is to provide a total return, taking into account both capital and income returns, which reflects the total return of the equity market in Japan.
5

BLACKROCK INDEX SELECTION FUND
PERFORMANCE (continued)
INVESTMENT MANAGER’S REPORT (continued)
Investment objective (continued)
iShares North America Index Fund (IE)
The investment objective of the iShares North America Index Fund (IE) is to provide a total return, taking into account both capital and income returns, which reflects the total return of the equity market in the United States and Canada.
iShares Pacific Index Fund (IE)
The investment objective of the iShares Pacific Index Fund (IE) is to provide a total return, taking into account both capital and income returns, which reflects the total return of the equity market in the Pacific Rim, excluding Japan.
iShares UK Index Fund (IE)
The investment objective of the iShares UK Index Fund (IE) is to provide a total return, taking into account both capital and income returns, which reflects the total return of the equity market in the UK.
iShares US Index Fund (IE)
The investment objective of the iShares US Index Fund (IE) is to provide a total return, taking into account both capital and income returns, which reflects the total return of the equity market in the United States.
Fund performance, tracking difference and tracking error
The Fund performance figures are based on the Net Asset Value ("NAV") calculated in accordance with the prospectus for the financial year under review with any dividends reinvested. Due to FRS 102 requirements which apply to the financial statements, there may be differences between the NAV per unit as recorded in the financial statements and the NAV per unit calculated in accordance with the prospectus. Tracking difference is defined as the difference in returns between a Fund and its benchmark index. Realised tracking error is the annualised standard deviation of the difference in monthly returns between a Fund and its benchmark index. Tracking error shows the consistency of the returns relative to the benchmark index over a defined period of time. Anticipated tracking error is based on the expected volatility of differences between the returns of a Fund and the returns of its benchmark index. For physically replicating Fund, the investment management approach is to buy a portfolio of securities that as far as practicable consist of the securities that make up the benchmark index, in similar proportion to the weights represented in the benchmark index over a defined period of time. For non-replicating Fund, the investment management approach aims to match the main risk characteristics of the benchmark index by investing in a portfolio that is primarily made up of securities that represent the benchmark index. The objective is to generate a return which is as close as practicable to the total return of the index net of transaction costs and gross of fees and other costs. Cash management, efficient portfolio management techniques including securities lending, transaction costs from rebalancing and currency hedging can have an impact on tracking difference. Importantly, these impacts can be either positive or negative depending on the underlying circumstances. Each Fund’s total expense ratio (“TER”) is accrued on a daily basis throughout the financial year, which can impact the measurement of a tracking error in a positive or negative manner depending on the performance in the market and the TER rate applied. The extent and magnitude of this effect on performance measurement is subject to the timing of the market performance relative to the performance period and can be greater than the headline TER in a positive market and lower than the TER in a negative market.
6
BLACKROCK INDEX SELECTION FUND
PERFORMANCE (continued)
INVESTMENT MANAGER’S REPORT (continued)
Fund performance, tracking difference and tracking error (continued)
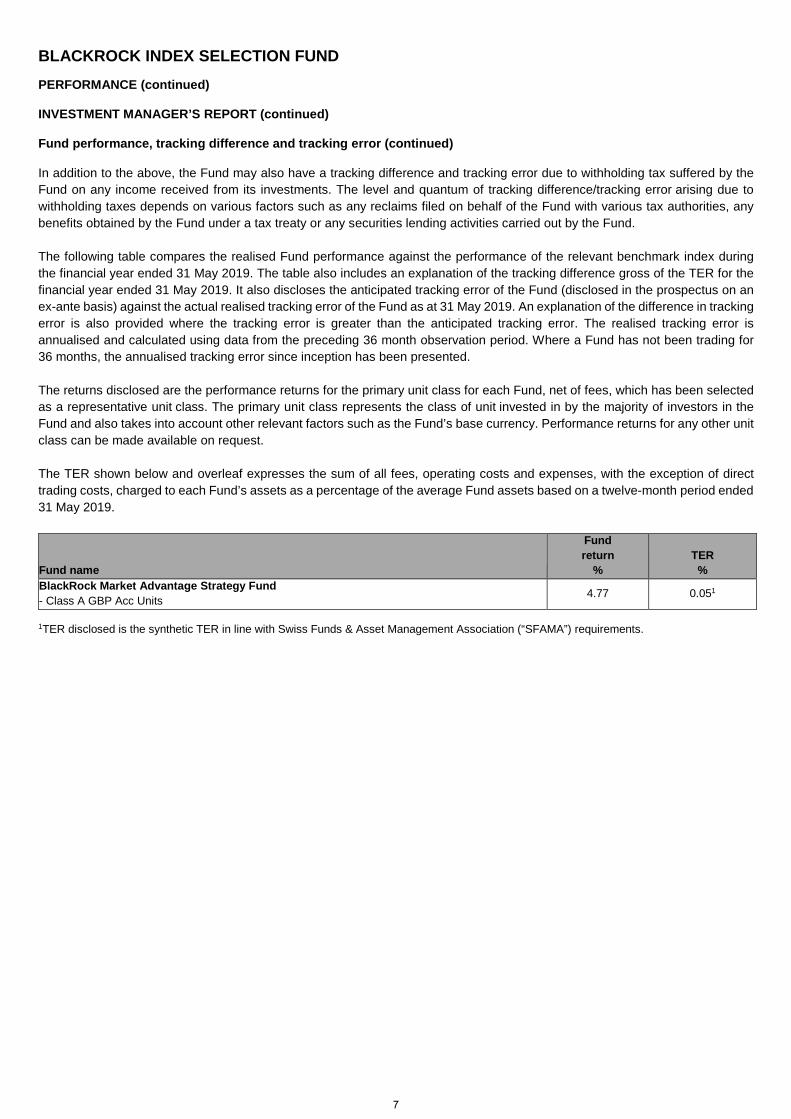
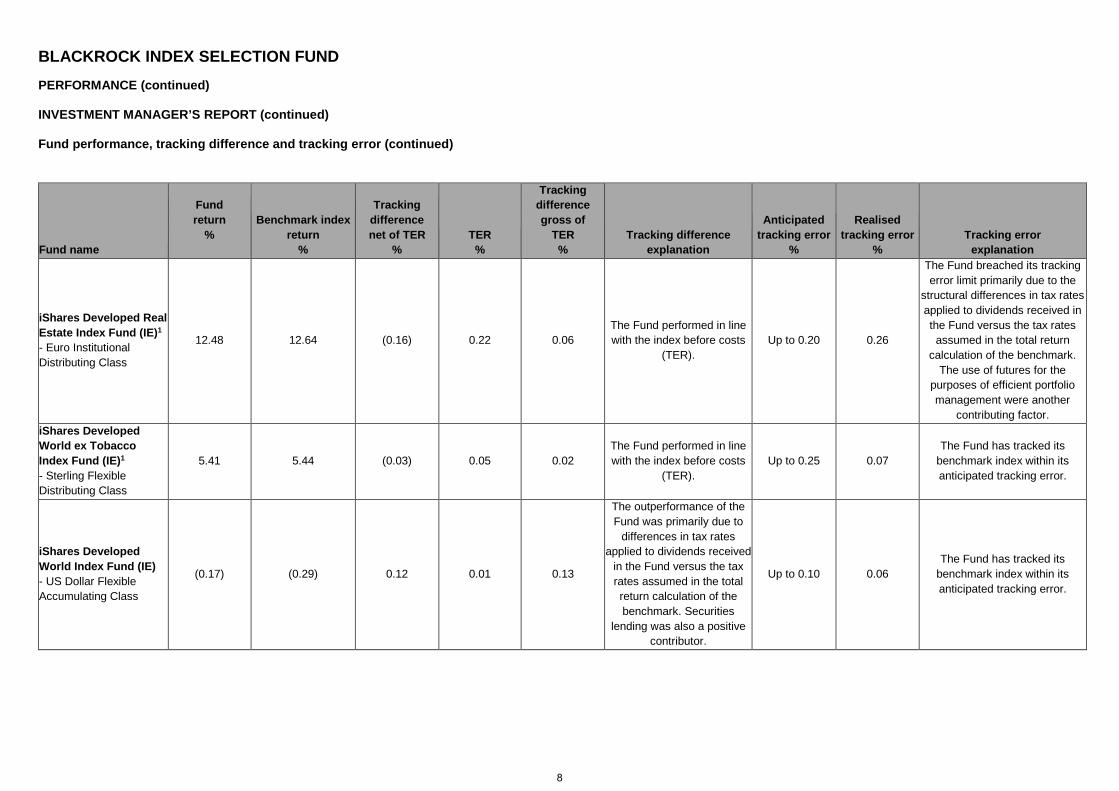
In addition to the above, the Fund may also have a tracking difference and tracking error due to withholding tax suffered by the Fund on any income received from its investments. The level and quantum of tracking difference/tracking error arising due to withholding taxes depends on various factors such as any reclaims filed on behalf of the Fund with various tax authorities, any benefits obtained by the Fund under a tax treaty or any securities lending activities carried out by the Fund. The following table compares the realised Fund performance against the performance of the relevant benchmark index during the financial year ended 31 May 2019. The table also includes an explanation of the tracking difference gross of the TER for the financial year ended 31 May 2019. It also discloses the anticipated tracking error of the Fund (disclosed in the prospectus on an ex-ante basis) against the actual realised tracking error of the Fund as at 31 May 2019. An explanation of the difference in tracking error is also provided where the tracking error is greater than the anticipated tracking error. The realised tracking error is annualised and calculated using data from the preceding 36 month observation period. Where a Fund has not been trading for 36 months, the annualised tracking error since inception has been presented. The returns disclosed are the performance returns for the primary unit class for each Fund, net of fees, which has been selected as a representative unit class. The primary unit class represents the class of unit invested in by the majority of investors in the Fund and also takes into account other relevant factors such as the Fund’s base currency. Performance returns for any other unit class can be made available on request.
The TER shown below and overleaf expresses the sum of all fees, operating costs and expenses, with the exception of direct trading costs, charged to each Fund’s assets as a percentage of the average Fund assets based on a twelve-month period ended 31 May 2019.
Fund name
Fund return
% TER
% BlackRock Market Advantage Strategy Fund
- Class A GBP Acc Units 4.77 0.051
1TER disclosed is the synthetic TER in line with Swiss Funds & Asset Management Association (“SFAMA”) requirements.
7
BLACKROCK INDEX SELECTION FUND
PERFORMANCE (continued)
INVESTMENT MANAGER’S REPORT (continued)
Fund performance, tracking difference and tracking error (continued)
Fund name
Fund return
%
Benchmark index return
%
Tracking difference net of TER
% TER
%
Tracking difference gross of
TER %
Tracking difference explanation
Anticipated tracking error
%
Realised tracking error
% Tracking error
explanation
iShares Developed Real Estate Index Fund (IE)1 - Euro Institutional Distributing Class
12.48 12.64 (0.16) 0.22 0.06 The Fund performed in line with the index before costs
(TER). Up to 0.20 0.26
The Fund breached its tracking error limit primarily due to the
structural differences in tax rates applied to dividends received in the Fund versus the tax rates assumed in the total return
calculation of the benchmark. The use of futures for the
purposes of efficient portfolio management were another
contributing factor. iShares Developed World ex Tobacco Index Fund (IE)1 - Sterling Flexible Distributing Class
5.41 5.44 (0.03) 0.05 0.02 The Fund performed in line with the index before costs
(TER). Up to 0.25 0.07
The Fund has tracked its benchmark index within its anticipated tracking error.
iShares Developed World Index Fund (IE) - US Dollar Flexible Accumulating Class
(0.17) (0.29) 0.12 0.01 0.13
The outperformance of the Fund was primarily due to
differences in tax rates applied to dividends received
in the Fund versus the tax rates assumed in the total return calculation of the benchmark. Securities
lending was also a positive contributor.
Up to 0.10 0.06 The Fund has tracked its
benchmark index within its anticipated tracking error.
8
BLACKROCK INDEX SELECTION FUND
PERFORMANCE (continued)
INVESTMENT MANAGER’S REPORT (continued)
Fund performance, tracking difference and tracking error (continued)
Fund name
Fund return
%
Benchmark index return
%
Tracking difference net of TER
% TER
%
Tracking difference gross of
TER %
Tracking difference explanation
Anticipated tracking error
%
Realised tracking error
% Tracking error
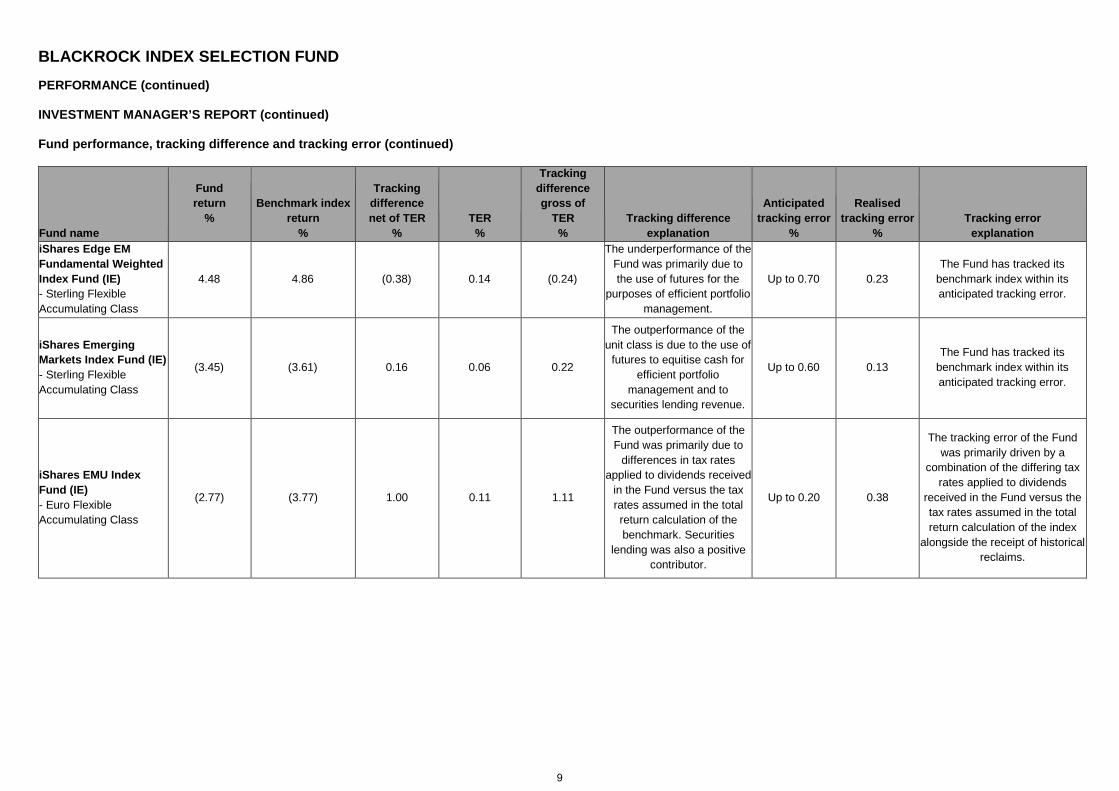
explanation iShares Edge EM Fundamental Weighted Index Fund (IE) - Sterling Flexible Accumulating Class
4.48 4.86 (0.38) 0.14 (0.24)
The underperformance of the Fund was primarily due to the use of futures for the
purposes of efficient portfolio management.
Up to 0.70 0.23 The Fund has tracked its
benchmark index within its anticipated tracking error.
iShares Emerging Markets Index Fund (IE) - Sterling Flexible Accumulating Class
(3.45) (3.61) 0.16 0.06 0.22
The outperformance of the unit class is due to the use of
futures to equitise cash for efficient portfolio
management and to securities lending revenue.
Up to 0.60 0.13 The Fund has tracked its
benchmark index within its anticipated tracking error.
iShares EMU Index Fund (IE) - Euro Flexible Accumulating Class
(2.77) (3.77) 1.00 0.11 1.11
The outperformance of the Fund was primarily due to
differences in tax rates applied to dividends received
in the Fund versus the tax rates assumed in the total return calculation of the benchmark. Securities
lending was also a positive contributor.
Up to 0.20 0.38
The tracking error of the Fund was primarily driven by a
combination of the differing tax rates applied to dividends
received in the Fund versus the tax rates assumed in the total return calculation of the index
alongside the receipt of historical reclaims.
9
BLACKROCK INDEX SELECTION FUND
PERFORMANCE (continued)
INVESTMENT MANAGER’S REPORT (continued)
Fund performance, tracking difference and tracking error (continued)
Fund name
Fund return
%
Benchmark index return
%
Tracking difference net of TER
% TER
%
Tracking difference gross of
TER %
Tracking difference explanation
Anticipated tracking error
%
Realised tracking error
% Tracking error
explanation
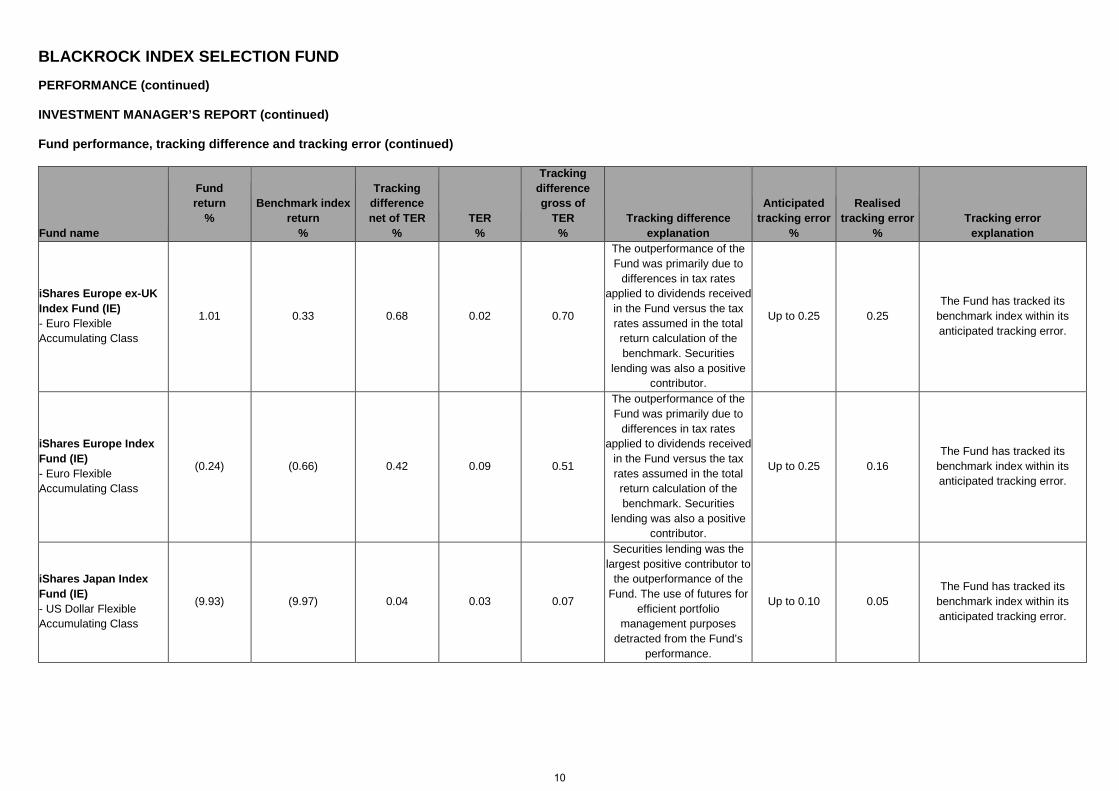
iShares Europe ex-UK Index Fund (IE) - Euro Flexible Accumulating Class
1.01 0.33 0.68 0.02 0.70
The outperformance of the Fund was primarily due to
differences in tax rates applied to dividends received
in the Fund versus the tax rates assumed in the total return calculation of the benchmark. Securities
lending was also a positive contributor.
Up to 0.25 0.25 The Fund has tracked its
benchmark index within its anticipated tracking error.
iShares Europe Index Fund (IE) - Euro Flexible Accumulating Class
(0.24) (0.66) 0.42 0.09 0.51
The outperformance of the Fund was primarily due to
differences in tax rates applied to dividends received
in the Fund versus the tax rates assumed in the total return calculation of the benchmark. Securities
lending was also a positive contributor.
Up to 0.25 0.16 The Fund has tracked its
benchmark index within its anticipated tracking error.
iShares Japan Index Fund (IE) - US Dollar Flexible Accumulating Class
(9.93) (9.97) 0.04 0.03 0.07
Securities lending was the largest positive contributor to
the outperformance of the Fund. The use of futures for
efficient portfolio management purposes
detracted from the Fund’s performance.
Up to 0.10 0.05 The Fund has tracked its
benchmark index within its anticipated tracking error.
10
BLACKROCK INDEX SELECTION FUND
PERFORMANCE (continued)
INVESTMENT MANAGER’S REPORT (continued)
Fund performance, tracking difference and tracking error (continued)
Fund name
Fund return
%
Benchmark index return
%
Tracking difference net of TER
% TER
%
Tracking difference gross of
TER %
Tracking difference explanation
Anticipated tracking error
%
Realised tracking error
% Tracking error
explanation
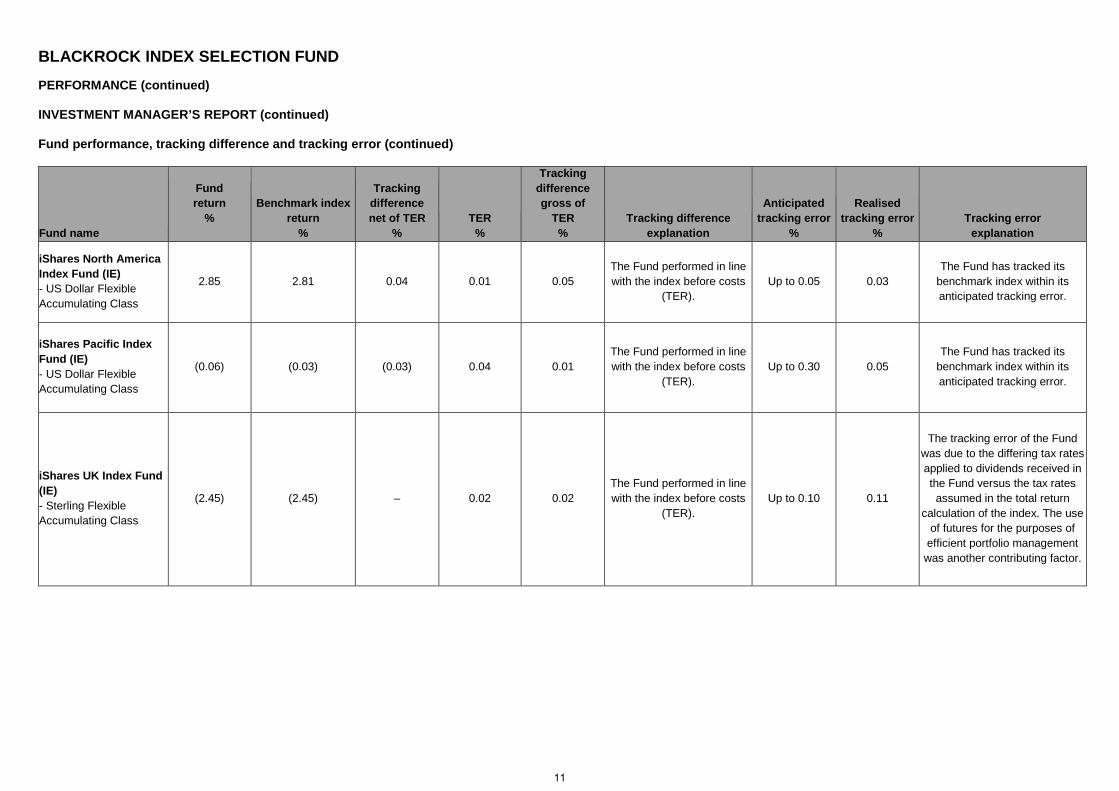
iShares North America Index Fund (IE) - US Dollar Flexible Accumulating Class
2.85 2.81 0.04 0.01 0.05 The Fund performed in line with the index before costs
(TER). Up to 0.05 0.03
The Fund has tracked its benchmark index within its anticipated tracking error.
iShares Pacific Index Fund (IE) - US Dollar Flexible Accumulating Class
(0.06) (0.03) (0.03) 0.04 0.01 The Fund performed in line with the index before costs
(TER). Up to 0.30 0.05
The Fund has tracked its benchmark index within its anticipated tracking error.
iShares UK Index Fund (IE) - Sterling Flexible Accumulating Class
(2.45) (2.45) – 0.02 0.02
The Fund performed in line with the index before costs
(TER).
Up to 0.10 0.11
The tracking error of the Fund was due to the differing tax rates applied to dividends received in the Fund versus the tax rates assumed in the total return
calculation of the index. The use of futures for the purposes of
efficient portfolio management was another contributing factor.
11
BLACKROCK INDEX SELECTION FUND
PERFORMANCE (continued)
INVESTMENT MANAGER’S REPORT (continued)
Fund performance, tracking difference and tracking error (continued)
Fund name
Fund return
%
Benchmark index return
%
Tracking difference net of TER
% TER
%
Tracking difference gross of
TER %
Tracking difference explanation
Anticipated tracking error
%
Realised tracking error
% Tracking error
explanation
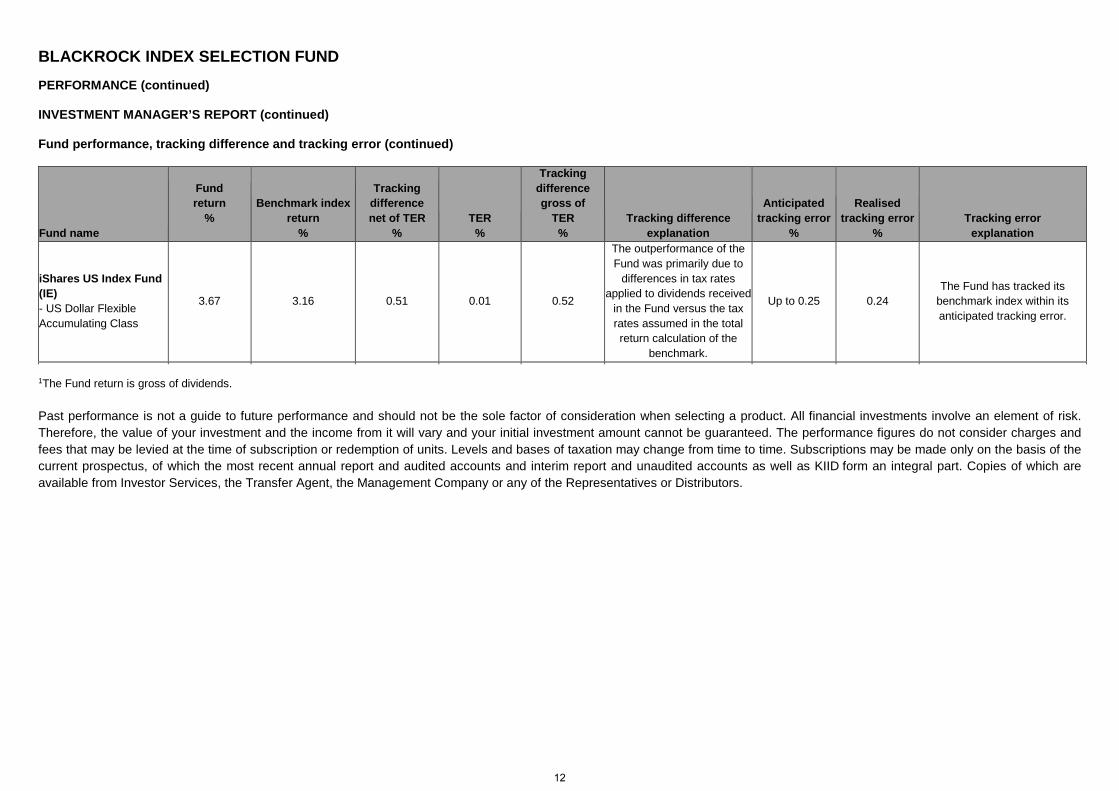
iShares US Index Fund (IE) - US Dollar Flexible Accumulating Class
3.67 3.16 0.51 0.01 0.52
The outperformance of the Fund was primarily due to
differences in tax rates applied to dividends received
in the Fund versus the tax rates assumed in the total return calculation of the
benchmark.
Up to 0.25 0.24 The Fund has tracked its
benchmark index within its anticipated tracking error.
1The Fund return is gross of dividends. Past performance is not a guide to future performance and should not be the sole factor of consideration when selecting a product. All financial investments involve an element of risk. Therefore, the value of your investment and the income from it will vary and your initial investment amount cannot be guaranteed. The performance figures do not consider charges and fees that may be levied at the time of subscription or redemption of units. Levels and bases of taxation may change from time to time. Subscriptions may be made only on the basis of the current prospectus, of which the most recent annual report and audited accounts and interim report and unaudited accounts as well as KIID form an integral part. Copies of which are available from Investor Services, the Transfer Agent, the Management Company or any of the Representatives or Distributors.
12
BLACKROCK INDEX SELECTION FUND
PERFORMANCE (continued)
INVESTMENT MANAGER’S REPORT (continued)
PERFORMANCE AND ACTIVITY
BlackRock Market Advantage Strategy Fund The Fund posted strong positive returns during the year ended 31 May 2019. This was driven by the defensive factors and fixed income exposures, mitigating flat to negative returns from pro-cyclical factors which are more sensitive to market moves. The period can be split into two halves; in 2018 the fourth quarter dominated with broad underperformance across the asset class spectrum on the back of heightened geopolitical risk and global growth concerns. The Fund’s deliberate diversification across macroeconomic factors held up well, with the more defensive factors – real rates and inflation – providing effective ballast against the underperformance of more pro-cyclical factors such as economic growth, credit, and liquidity. The portfolio widely outperformed equities, as designed during periods of market stress. In contrast, 2019 saw a significant uptick in investor sentiment and a return to a risk-on environment which benefitted all drivers of return, up until May as investor sentiment retracted. The real rates and inflation factors were the primary drivers of positive returns for the strategy during the period. Inflation benefitted from the ‘flight to quality’ as risk-off sentiment took hold, whereby nominal bonds outperformed their inflation-linked counterparts. As markets became increasingly sensitive to a potential economic slowdown, investors shifted to traditional safe-haven assets such as government bonds for balance against risk assets. A dovish shift by central banks across developed markets benefitted the real rates factor as yields moved downwards. Credit was another positive contributor over the period; performance was up across investment grade and high yield instruments. Although worries around a cooling global economy began to climb towards the end of the period, risk appetite remained healthy and investors shifted to higher quality names with attractive yields. The emerging market factor finished the period flat as positive returns from emerging market debt exposures were offset by underperformance in equities, which struggled on the back of persistent trade tensions. Strong returns from the defensive factors were partly offset by negative returns from economic growth and liquidity. Developed market equities had somewhat of a rollercoaster ride through the 12 months, selling off sharply in the fourth quarter of 2018; with the S&P 500 index posting its worst calendar year return in a decade, despite being positive for the first three quarters, and the Stoxx Europe 600 index falling to its lowest level in December in more than two years. Equity markets recovered through the first part of the year, before moving sharply downward in late May. Commodities also detracted as record output from Saudi Arabia, Russia, and the US led to a global supply glut, driving down oil and oil derivative prices. Liquidity was the worst performing factor as small cap equities underperformed their large cap counterparts and volatility strategies detracted as realised volatility rose beyond implied levels across markets. The proprietary indicators used to measure the factor valuations, benefits of a diversified portfolio and investor sentiment were broadly stable, except for sentiment. Factor valuations remained within normal ranges through the period and the benefit of a diversified portfolio remained above its long-term average, with the diversification ratio finishing the period at 2.7 versus a long-term average of 2.4. The risk tolerance indicator, which measures investor sentiment, oscillated through the period; starting at +58% and finishing at -4%, with an intra-period low of -82% on 9 January 2019. MARKET REVIEW
The past year saw large swings in the macro environment, with geopolitical evolutions having a significant impact on market prices and investor sentiment. Market turbulence in the fourth quarter was the primary catalyst for performance in 2018; disappointing economic data sparked global growth slowdown fears and concerns around trade frictions and European politics remained elevated. The equity market sell-off was led by the US; political turmoil in Washington, D.C. including a partial government shutdown, and a hawkish Federal Reserve (the “Fed”) dented investor sentiment, driving down pro-cyclical assets and boosting demand for traditional safe-havens such as government bonds. European assets were also challenged amidst Brexit uncertainties and the risk of fragmentation in Europe.
13
BLACKROCK INDEX SELECTION FUND
PERFORMANCE (continued)
INVESTMENT MANAGER’S REPORT (continued)
MARKET REVIEW (continued)
Financial markets rebounded in 2019, with global equities posting their best quarter in the past five years through the first quarter. A recovery in commodity prices, developments in US-China trade disputes and a significant shift in policy expectations across the globe acted as key market drivers. The Fed went to great lengths to emphasise flexibility both around future interest rate hikes and balance sheet reductions. The Reserve Bank of Australia (“RBA”) also shifted from a tightening bias towards a more neutral/supportive monetary policy stance, while China signalled a move to easier credit and fiscal conditions. The European Central Bank (“ECB”) lowered its 2019 growth forecast and announced it would keep interest rates on hold until at least the end of this year, stating it would provide a new wave of cheap funding for European banks to spur lending. In addition, several European governments signalled an increase in fiscal stimulus to boost their economies.
As a result of the synchronised efforts by various governments and central banks around the globe, concerns of a weakening global economy eased and risk appetite increased, up until mid-May. The latter part of the month saw a significant reversal as geopolitical risks and trade tensions escalated. The VIX index, a gauge of US stock market volatility, jumped to its highest level since late January and on the trade front, US-China trade negotiations collapsed, sparking a trade war that is threatening to escalate into a broader struggle for technological supremacy. Further weighing on risk sentiment in May, Middle Eastern tensions heightened after the US mobilised military resources to the region and re-imposed sanctions on Iran that it had previously lifted under a 2015 nuclear accord, whilst in Europe, Brexit returned to centre stage as the UK Prime Minister Theresa May resigned, unable to break the parliamentary deadlock on Britain’s withdrawal from the European Union (“EU”).
OUTLOOK
We remain underweight in real rates relative to economic growth risk as our central scenario remains that the real rates factor will experience low returns and higher volatility going forward.
MARKET REVIEW
GLOBAL MARKET REVIEW
iShares Developed Real Estate Index Fund (IE), the iShares Developed World ex Tobacco Index Fund (IE) and the iShares Developed World Index Fund (IE).
In global equity markets, June was a muted month. In the US, equities gained - the dominant issues were the beginning of the end for monetary easing and President Trump’s efforts to restrict global trade in order to protect the US domestic economy, firstly with Asia, and later on in the month, with the EU. In a widely anticipated move, the Fed raised interest rates by 25 basis points: the US dollar strengthened on this news, and the 10-year treasury yield moved briefly back above 3%. Elsewhere, the ECB stated that, based on the improved health of the European economy, the bank’s bond-buying programme would taper in September from €30 billion per month to €15 billion, and would be discontinued at the close of 2018.
The third quarter of 2018 was strongly positive for global equity markets led by US equities which were powered by bullish company earnings and strong economic data. Over the quarter, the trade war initiated by the Trump administration had not dampened markets in the US. Tariffs were imposed by the US on Chinese, Mexican, EU and Canadian imports in a bid to make domestic products more attractive. Every region responded to these tariffs with retaliation in kind but, nevertheless, in September a further round of tariffs was introduced by the US on Chinese goods. Elsewhere during the third quarter, emerging markets lagged, China being particularly weak. Further, the Turkish lira crisis escalated, causing other emerging currencies to weaken. Some stability was restored when the Turkish central bank hiked rates to 24% in September. Europe also trailed the global average.
Developed world equities fell in the fourth quarter of 2018. In Asia-Pacific (“APAC”), a jump in the Japanese yen against the US dollar weighed on the export-oriented Japanese equity market broadly. Elsewhere, Australian equities also fell as the slowdown in China weighed on the country’s domestic growth prospects. Similarly, the western European region fell due to slowing economic activity, broad market risk-off behaviour, and political uncertainty marring the region. Within Europe, the United Kingdom tumbled, as continued Brexit turbulence weighed on both consumer and investor sentiment. In France, the “Yellow Vest” political movement raised domestic uncertainty, thus also leading to a drop in French equities. German manufacturing orders declined throughout the quarter, catalysing a significant drop in German stocks. In the US, concerns over Fed policy, Sino-American trade tensions, and a potential slowdown in growth contributed to investor anxiety throughout the quarter. Despite the fact US and China were able to broker a 90-day trade war “truce” on 1 December 2018, volatility abounded in December, in the wake of the Federal Open Market Committee (“FOMC”) announcement. Though the Fed’s December rate hike and lowering of interest rate projections was largely expected, the Fed’s relatively hawkish tone and Powell’s affirmation that the balance sheet run-off was to run on autopilot was punished by the market.
14
BLACKROCK INDEX SELECTION FUND
PERFORMANCE (continued)
INVESTMENT MANAGER’S REPORT (continued)
MARKET REVIEW (continued)
GLOBAL MARKET REVIEW (continued)
US markets were especially strong in January 2019, after the Fed confirmed it would adjust planned interest rate returns as a result of a slowing global economy. Eurozone equities were also supported by central bank policy as the ECB said it would keep interest rates on hold until 2020, not until Summer 2019 as previously planned. UK equities perceived to offer superior and defensible earnings growth outperformed, while Asia ex-Japan equities rebounded from a sell off in the fourth quarter. All regional markets closed higher helped in part by progress in the US-China trade negotiations and moves from central banks globally. Trade tensions between the US and China, the US government shutdown, uncertainty around Brexit, and geopolitical tension between India and Pakistan were key risks to the market over the period. Most markets continued to climb in April, including the US, UK, Europe and Japan. However, the International Monetary Fund (“IMF”) revised down its global economic growth forecast from 3.5% to 3.2% and said most countries can expect slower growth. This was attributed to escalating US and Chinese trade tensions, credit tightening in China, macroeconomic stress in Turkey and Argentina, and issues in the German automotive sector. In a reversal to previous months, in May most markets posted losses for the first time in 2019. The US market tumbled 6.6% as the US-China truce ended, and this, alongside Brexit woe resulted in a loss for UK equities. Japanese stocks posted the sharpest loss at 7.45%, while geopolitics both near and far left the European market down as well. JAPAN MARKET REVIEW
iShares Japan Index Fund (IE) Japanese equities moved downwards over June, in both local and sterling terms. Mid-month, when President Trump announced his intention to bring in further tariffs against foreign imports, there were steep falls on Asian markets, including Japan’s, which were led by a sell-off in Chinese stocks. Consequently, a survey of business confidence, the Bank of Japan’s tankan report, indicated a drop in confidence among the leading manufacturers. The central bank’s inflation assessment for the current fiscal year was brought down to 0.5–1%, from 1% previously. There was also a drop in the jobless rate, which had not been anticipated. The third quarter of 2018 was generally a positive one for Japanese equities with the MSCI Japan index moving up 6.46% in Japanese yen terms and 5.10% in sterling terms. Markets were boosted by a weaker Japanese yen and the anticipation of Prime Minister Shinzo Abe’s re-election as leader of the ruling Liberal Democratic party. This sets him up to be Japan’s longest-ever serving prime minister, as he is now due to hold office for a further three years. Throughout the period, the Bank of Japan affirmed its commitment to accommodative monetary policy and intervened in bond markets several times to lower the yield on the 10-year government bond, which it continued to maintain at a target of around 0%. In August, inflation increased to 1.3% year-on-year. This was up from the figure of 0.9% recorded in July and ahead of the 1.1% rate that had been anticipated. Increased costs for food and transport were among the main contributors to the rise. However, as this was still well short of the target 2% rate, interest rates look set to remain low for the foreseeable future. Gross domestic product (“GDP”) for the second quarter was revised upwards in September, as growth advanced by 0.7% on the quarter, ahead of the initial estimate of 0.5%. This was a marked improvement on the (0.2)% contraction experienced in the opening quarter of the year. The final quarter of 2018 continued to be marred by persistent trade-related concerns, rising rates and slowing economic growth. Increased market volatility drove demand for safe assets, leading to an appreciation of the Japanese yen against the US dollar and a decline in the US long term bond yield to 2.7%. Economic indicators were mixed. The economy contracted by 0.6% in the third quarter, which still reflected the impact of natural disasters. The unemployment rate of 2.4% was at the time Japan’s lowest since 1993. However, consumer price index (“CPI”) inflation refused to move up to the central bank’s 2% target and fell to 0.8% in November from 1.4% in October. Monthly retail sales slumped 1.0% in November, dampening hopes that consumer spending might help the economy recover from a weak third quarter that was heavily impacted by natural disasters. The first print of November’s industrial production also disappointed (-1.1%), in part reflecting the strong rebound across the board seen in October. The central bank’s fourth-quarter Tankan index showed companies viewed current business conditions positively – consistent with improvements seen in exports and capex data.
15
BLACKROCK INDEX SELECTION FUND
PERFORMANCE (continued)
INVESTMENT MANAGER’S REPORT (continued)
MARKET REVIEW (continued)
JAPAN MARKET REVIEW (continued)
Japanese equity markets rallied over January, after falling towards the end of 2018. The MSCI Japan index gained 2.73% in local terms and 5.25% in sterling terms during the month. Momentum continued into February on prospects of improved trading relations between the US and China, but returns flatlined in March. Economic data was mixed over the quarter. Japan was shown to have posted a trade deficit of ¥1.2 trillion in 2018, its first annual deficit since 2015, in January. But GDP in the fourth quarter was shown to have advanced by 0.3% quarter-on-quarter. This was an improvement on the negative growth in the third quarter, which was attributed to a succession of natural disasters. In March, the Bank of Japan’s quarterly assessment of business sentiment among large manufacturers showed the biggest decline since December 2012. This reflected concerns over the outlook for Chinese and other Asian markets on the back of slowing demand. A continuing labour shortage impacted sentiment among large nonmanufacturers but, despite being lower year-on-year, plans for capital spending were slightly stronger than anticipated. Japan’s machinery, semi-conductors and auto-related sectors, which have been impacted by the downturn in China, were given a boost at the end of the quarter as signs emerged that China’s government stimulus policies were taking effect. Factory output fell unexpectedly in March; in total, production was down 2.6% quarter-on-quarter, the largest quarterly decline in almost five years. Elsewhere, retail sales grew 0.2% month-on-month in March, data released in April showed, while the jobless rate tracked higher, to 2.5%. Core inflation in Tokyo, an early indicator of nationwide prices, grew to a four-year high of 1.3% in April. The data prompted speculation Prime Minister Shinzo Abe may postpone a proposed tax rise from 8% to 10%, currently penned for October. Abe and US President Donald Trump met at the White House at the end of April, the aim being to deepen the two countries’ partnership, to discuss the $60 billion US trade deficit with Japan. May’s purchasing manager’s index (“PMI”) figures showed the Japanese service industry grew at a slower pace month-on-month, falling 0.1 to 51.7. The manufacturing sector fell into contraction, while employment in the services sector also declined compared with a month earlier. The overall composite PMI tumbled 0.1 to finish May at 50.7. Re-escalated trade tensions between China and the US added to existing concerns for manufacturers, while US President Donald Trump threatened to put tariffs on Japanese auto imports unless he and the country’s Prime Minister reach a trade deal. The White House wants more access to the Japanese market for American farmers and ranchers, and for Japanese auto makers to build more US factories so cars can be assembled by American workers.
US MARKET REVIEW
iShares North America Index Fund (IE) and the iShares US Index Fund (IE) June 2018 was another encouraging month for US equities. At the start of the month, technology and consumer shares helped lift the NASDAQ to new highs, with headline performances from Amazon, Apple and Netflix. In a move that had been widely expected, the Fed raised rates by 25 basis points, which strengthened the US dollar and increased treasuries rates. A strengthened US economy, highlighted by a jump in the services PMI and a drop in the unemployment level, alongside an upward creep in US inflation, were cited as factors behind the tightening decision. President Trump’s announcement of new sanctions on Iran helped to boost oil prices, which consequently was good for US energy stocks. The third quarter was a highly positive one for equity markets in the US. Despite the trade tensions that were generated by the Trump administration’s imposition of import taxes on goods from most of its major trading partners, strong company earnings and the benefits of significant corporation tax cuts were beneficial for stock markets. In September, GDP in the US was confirmed to have expanded over the second quarter at an annual rate of 4.2%; although this was a significant jump on the 2.2% rate of the previous quarter, it matched expectations. With clear positive signals of health from the US economy, plus inflation sitting well above the 2% target (2.7% in August), the Fed raised interest rates in September. As had been widely anticipated, the target range for the federal funds rate was increased by 25 basis points. Over the quarter, the yield on the benchmark 10-year treasury yield rose by around 20 basis points and stood above 3% at quarter-end. Both the number of new jobs and wages increased over August. After a slowdown in July, the US services sector accelerated again in August, at the same time clocking its 103rd consecutive growth (according to the Institute of Supply Management). In the same month, however, retail sales were muted, and the budget deficit increased by more than had been anticipated.
16
BLACKROCK INDEX SELECTION FUND
PERFORMANCE (continued)
INVESTMENT MANAGER’S REPORT (continued)
MARKET REVIEW (continued)
US MARKET REVIEW (continued)
US equities decreased in the fourth quarter of 2018, the worst quarterly return since 2011. Ten out of the eleven Global Industry Classification Standard (“GICS”) equity sectors moved lower. The utilities sector was the only sector to advance, as lower interest rates and a flight to safety throughout the quarter benefited the traditionally defensive sector. Conversely, the energy sector trailed the market, as a decline in crude oil provided a headwind. However, it was the information technology sector that deducted the most from the index’s overall total return, as lowered corporate earnings guidance weighed on investor sentiment. More broadly, concerns over Fed policy, Sino-American trade tensions, and a potential slowdown in growth contributed to investor anxiety throughout the quarter. This was accompanied by a broad based risk-off in December – which was the worst December performance on record since 1931 – and the 10 year US treasury yield ended the quarter 57 basis points lower than intra-quarter highs to +2.68%. Even though the US and China were able to broker a 90-day trade war “truce” on 1 December 2018, volatility abounded in December, in the wake of the FOMC announcement. Though the Fed’s December rate hike and lowering of interest rate projections was largely expected, the Fed’s relatively hawkish tone and Powell’s affirmation that the balance sheet run-off was to run on autopilot was punished by the market. The downward spiral rebounded in the first quarter, with US equities having the best first quarter return since 1998. The rebound was attributed to an oversold bounce, improved expectations for a trade deal with China, and a dovish pivot from the Fed. The FOMC took a dovish turn in January, stating it was considering winding down the balance sheet reduction and would be “patient” in rising rates. In March, the FOMC said two projected rate hikes had been knocked down to zero and balance sheet reduction would end in September. While US-China talks were ongoing in February, the US administration pressed pause on the tariff rises that had been due to be introduced to $200 billion-worth of Chinese imports. By the end of the quarter there was increased hope both sides were ready to do a deal. February’s State of the Union address focused on trade with China and a programme of spending on infrastructure and made a renewed call for a border wall with Mexico. Economic data released during the quarter was mixed. February brought news that retail sales in December suffered the hardest falls since September 2009. The manufacturing PMI for the US fell to 53 in February from 54.9 in January, but rebounded in March. US equities continued to climb 3.93% in April, following strong GDP growth over the first quarter. This growth was supported by trade as exports rose and imports fell, and companies built up inventories of goods at the fastest rate since the quarter two of 2015. The data also showed that disposable personal income was up 3%, while prices – excluding food and energy – rose 1.3% during quarter one of 2019. But consumer spending, which accounts for around two-thirds of economic activity in the US, grew by only 1.2% in quarter one, a 1.3 percentage point decline compared with the three months to 31 December 2018. Claiming rising rates had slowed down economic growth, President Donald Trump called on the Fed to cut interest rates, which stand between 2.25% and 2.5%. The US stock market tumbled 6.6% in May as the China-US truce ended, while the 10-year US treasury yield saw its largest monthly decline since January 2015. The escalating trade war between the US and China is perceived to be the biggest threat to future economic growth, and the US Agriculture Secretary unveiled a $16 billion aid package to help farmers caught in the cross-fire of the US-China trade war in mid-May. Other signs of weakness persisted during the month. Earnings tumbled $65.4 billion quarter-on-quarter to their lowest level since the end of 2015. The US manufacturing PMI fell two points month-on-month to 50.6, a 116-month low, prompting calls for an emergency rate cut to avert a spiral into recession. In Canada, their central bank said trade restrictions introduced by China are having direct effects on Canadian exports, but in contrast, the removal of steel and aluminium tariffs, coupled with the increasing prospects for the ratification of the Canada-US-Mexico Agreement will have positive implications for Canadian exports and investments. EUROPE MARKET REVIEW
iShares EMU Index Fund (IE), the iShares Europe ex-UK Index Fund (IE) and the iShares Europe Index Fund (IE) Markets in Europe made a negative return in June. The ECB announced the end of its bond-buying programme. According to the ECB’s policymakers, the health of the European economy was resilient enough to withdraw the financial stimulus. In March 2018, they had forecast a rate of 2.4%, but this was lowered to 2.1% due to increased uncertainty, weaker trade impetus and a ‘temporary supply-side shock’. Figures released in June showed that growth slowed in the eurozone over the first quarter of the year. Output increased by 0.4%, down from the 0.7% during the previous quarter. EU leaders made it clear that there would be retaliation in kind for any protectionist measures introduced by President Trump, when he took aim at US imports of European cars.
17
BLACKROCK INDEX SELECTION FUND
PERFORMANCE (continued)
INVESTMENT MANAGER’S REPORT (continued)
MARKET REVIEW (continued)
EUROPE MARKET REVIEW (continued)
Global trade tensions, the ongoing stalemate in Brexit negotiations and concern over the Italian government’s budget deficit all served to dampen sentiment around Europe over the third quarter of 2018. In Italy, the coalition government declared that it would increase government spending over the year ahead, as its electoral promises included lowered taxes and a universal income for those on lower incomes. However, Italy was already under a substantial debt burden, and both the EU and investors would like to see the deficit reduced. Italian bonds had rallied when economy Minister Giovanni Tria assured markets that the new budget would be sustainable, but then tumbled when the government set next year’s deficit target at 2.4% of GDP. For the eurozone overall, in August the annual inflation rate was recorded at 2%, a slight drop on July’s 2.1%. As had been anticipated, the ECB held its refinancing rate at 0% and confirmed that asset purchasing will drop to €15 billion per month from September to December, before halting altogether. The eurozone economy expanded by 0.4% on quarter in the second quarter of the year. This pace of growth matched the rate seen in the first quarter. However, consumer confidence in the region dropped in September to a level not seen since May 2017. European equities decreased in the fourth quarter of 2018. The western European region fell the most over the quarter and contributed to 63% of the index’s quarterly decline. Slowing economic activity, broad-market risk-off behaviour, and political uncertainty marred the region. The euro and sterling both moved lower against the US dollar, down -4.8% and -5.9% on the year, respectively. Within Europe, the United Kingdom fell as continued Brexit turbulence weighed on both consumer and investor sentiment. Elsewhere, French equities dropped as the “Yellow Vest” political movement raised domestic uncertainty. German manufacturing orders declined throughout the quarter, catalysing a significant drop in German stock prices. All major sectors declined in the MSCI Europe index, except the utility sector, which returned +0.19%. Information technology shares saw the most negative return (-16.85%), followed by consumer discretionary (-16.79%), industrials (-16.32%), materials (-16.17%), and energy (-16.14%). European equities climbed over the quarter, following a strong January and further upticks in February and March. Mid-quarter data showed growth in the eurozone amounted to just 0.2% during quarter four of 2018, while the ECB, did a U-turn on ending a loans policy that enables commercial banks to borrow money at zero interest rates on the agreement it lends the money to businesses or consumers. It also said that it did not anticipate an interest rate rise until 2020. This reflected concern over the global slowdown. Further negative data emerged in mid-March, as the European PMI fell 0.6 to 51.3 month-on-month. Consumer price rises also slowed across the zone, pointing to a weakening economy. Inflation data for the month was below expectations, with the core rate hitting 0.8% year-on-year. German industrial orders plummeted in 4.2% month-on-month in February, the biggest drop for two years. This followed a 2.1% decline in January. Year-on-year, factory orders were down 8.4%. Foreign orders declined significantly more than domestic, the country’s economic ministry said. The European stock market continued to climb in April, spurred by quarter one GDP growth data. Spain lead the way with 0.7% growth, France maintained its 0.3% level, while Italy posted growth of 0.2%, signalling it may have moved out of recessionary territory. Growth was attributed to job creation, as unemployment across Europe fell to its lowest level since at least 2000. Inflation picked up to 1.7% in April, and an underlying measure that excludes components such as energy rose by the highest amount for almost a year. Financial results were buoyant, as sales were stronger than expected, particularly among consumer goods companies. About half of the companies that had reported quarter one results by 3 May had beaten expectations, with a weighted average increase in sales of 5.8%. But other data points were less convincing. PMIs improved, particularly in Italy and France, but still amounted to an overall contraction. French President Emmanuel Macron promised tax cuts, higher pensions and a reform of the civil service in response to the yellow vest protests which began in November. The positive run reversed in May, as European indexes ended down over the month. The US-China trade war added to patchy economic data and political issues, including Brexit and Italy’s challenge of European fiscal rules, weighing on markets. Earnings expectations for European companies had briefly turned positive last month, but in May profit downgrades outweighed upward revisions, according to the Citigroup index. The Eurozone service sector PMI was above expectations following outperformance at a state level and came in at 52.9. The composite was also revised upwards, at 51.8. Retail sales slipped by 0.4% across the zone in April, however, according to data released the same day.
18
BLACKROCK INDEX SELECTION FUND
PERFORMANCE (continued)
INVESTMENT MANAGER’S REPORT (continued)
MARKET REVIEW (continued)
PACIFIC-RIM MARKET REVIEW
iShares Pacific Index Fund (IE)
Stocks in Asia outside Japan were down over June. South Korean stocks fell in June, but recovered slightly after China announced that it would allow foreign investors greater access to its markets. In Australia, equities made strong gains for the month, spurred on by strong performance from financials. In Singapore, equities finished close to nine-month lows. However, economic news was uplifting, as unemployment in the first quarter decreased to a two-year low and industrial output in May surged past estimates. Stock markets in Asia Pacific ex Japan were little changed over the third quarter in sterling terms. South Korea’s Kospi index retreated to a 15-month low in August, after an emerging-market currency sell-off, but still managed to post slight gains for the third quarter. The market rallied as US indices reached all time highs and as fears over the effects of global trade tariffs subsided somewhat. In the economy, GDP growth in the second quarter came in a little below expectations and manufacturing activity contracted in August. Australian equities had a rather volatile third quarter: the S&P/ASX 200 index surged to an over 10-year high in August before weakness in the Australian dollar and concerns over the local financial sector and world trade dented performance in September. The first quarter of 2019 saw Asian Pacific stocks perform very strongly. Despite slowing economic growth, Australia’s S&P/ASX 200 index rallied almost 10% in the first quarter, marking its best ever performance. This was attributed to strong commodity prices and promises of an easy monetary policy from central banks. Singaporean stocks surged to six month highs in February, but fell by month end, posting slight month-on-month gains in Singaporean dollar terms. Returns were flat in March. Growth expectations were revised down by 0.1% to 2.5% mid-month amid concerns over trade protectionism, a further slowdown in China and the potential for higher interest rates. However, Korean stocks faired slightly worse. An abrupt end to US-North Korea negotiations took its toll on Korean stocks. The country’s bank also held interest rates in its February meeting. Foreign direct investments in South Korea plummeted 35.7% year-on-year during the quarter, as a result of global economic slowdown. The performance of Asian-Pacific stocks began to turn negative in April. South Korea’s GDP declined by the largest amount for a decade, signalling that the worst of the global economic slowdown may not have passed, and reflecting the ongoing technology slowdown. The country’s exports also fell for a fifth straight month in April, albeit by a smaller amount than expected. Around two-fifths of the 50 mostly large-cap Kospi index firms that announced quarter one earnings missed analysts estimates. Asian-Pacific equities tumbled in May, marking its second consecutive month in the red. South Korea’s exports fell for a sixth consecutive month in May due to slowing global growth and a downturn in the semi-conductor industry. Shipments tumbled 9.4% year-on-year, far more than the 6.6% decline that was forecast. Core inflation slowed to a near 20-year low, adding to the case for the central bank to cut interest rates. GDP shrank 0.4% during quarter one compared with the final three months of 2018, data released during May showed. This was the worst performance since the global financial crisis. Speculation mounted that the Reserve Bank of Australia will cut the interest rate three times during the remainder of 2019, and that rates could reach an historic 0.75%. It came as the country deals with anaemic GDP growth, falling house prices and rising unemployment. GDP grew 0.4% quarter-on-quarter, and just 1.8% year-on-year in the three months to 31 March 2019 - the weakest reading since the global financial crisis. In Singapore, May proved to be the worst performing month for over three years. EMERGING MARKETS MARKET REVIEW
iShares Edge EM Fundamental Weighted Index Fund (IE) and the iShares Emerging Markets Index Fund (IE)
Equities in emerging markets suffered over June, with the MSCI Emerging Markets index down over the period, as a stronger US dollar and continuing trade problems between the US and China had a negative impact. However, some losses were clawed back when the index posted its biggest daily gain in over a year on the final day of trading. In China, stocks fell over the month, after the Beijing government threatened to counteract any additional US tariffs on Chinese imports. Some key economic figures were lacklustre, with industrial output, retail sales and investment growth in May below expectations, and the official PMI in June down on the previous month. In Brazil, stocks were down to yearly lows at one point, as concerns over upcoming presidential elections and fiscal management by the government weighed on markets. In Mexico, bourses had a strong month, reaching the highest levels in eight weeks at the end of the month. In emerging Europe, Russian stocks markets were up, aided by rising oil prices. Greek stocks posted gains over the month, helped by the debt relief deal that was reached with the EU.
19
BLACKROCK INDEX SELECTION FUND
PERFORMANCE (continued)
INVESTMENT MANAGER’S REPORT (continued)
MARKET REVIEW (continued)
EMERGING MARKETS MARKET REVIEW (continued)
Emerging market equities were slightly up over the third quarter of 2018, shaking off the negative impact of the Turkish and Argentine currency crises, as well as the Fed’s hiking of rates in September. Brazilian stocks were a notable outperformer. The market surged towards quarter end after concerns over the upcoming election in October abated somewhat as business friendly Jair Bolsonaro moved ahead in opinion polls. Mexican stocks performed well, buoyed towards quarter end by the announcement of a revamped trade deal with the US. Economic news, however, was downbeat, with GDP growth in the second quarter suffering a contraction. South African markets were dragged down over the quarter by general emerging-market uncertainty and negative economic data releases. Indian bourses had a mixed quarter, surpassing all-time highs in August, but then falling in September over concerns of higher oil prices and liquidity in the local non-banking financial sector. Emerging Europe saw varied performance over the third quarter. Russia surged in September after an oil rally helped the country’s commodity-heavy indices. Economic figures were also encouraging, with second quarter GDP growth beating estimates and unemployment in August at a record low. By contrast, Greece performed poorly, with equities kept down by trepidation over the Italian budget at the end of the period.
Emerging markets, as represented by the MSCI Emerging Markets $ index, decreased by (-7.39%) in the fourth quarter of 2018. An economic growth slowdown, tighter financial conditions, and rising geopolitical uncertainties created difficulties for emerging economies and weighed on investor sentiment. While emerging markets suffered another (-7.5%) drawdown in the final quarter, they outperformed the US and developed markets by more than 5%. In Latin America, Brazil outperformed as the country surged more than +13%. The election of Jair Bolsonaro raised investor hope that the country could rein in spending and institute fiscally conservative reforms. Elsewhere, Mexico tumbled (-18.9%) in quarter four after President Andres Manuel Lopez Obrador’s cancellation of the Mexico City airport project raised policy concerns. In Asia, even though the US and China were able to broker a 90-day trade war “truce” on 1 December 2018, Chinese equities (-12%) fell amid slowing growth indicators. Lingering trade concerns also negatively impacted sensitive industries in Taiwan (-13.7%) and South Korea (-14.2%). Indonesia (+9.7%), Philippines (+5.4%) and India (+2.5%) were the only Asian countries in green.
The first quarter of 2019 was positive for emerging market equities. The Shaghai Composite index rose nearly one-quarter in quarter one of 2019, its best performance since 2014. This coincided with an unexpected growth in manufacturing activity, the first expansion in employment for more than five years, and positive progress in Sino-US talks.
All eleven GICS 1 sectors advanced in the quarter as improved Sino-American trade relations and a relief from tightening financial conditions helped improve sentiment. Consumer discretionary (+19.4%) and real estate (+15.6%) led the market. Energy (+12.2%) was also well bid amid a +27% increase in Brent crude prices in the quarter. From a country standpoint, the China component rose +19% in the first quarter, a welcome reprieve from the bear market the country sustained in 2018. An extended pause in tariff hikes between the US and China and the country’s pivot toward stimulus after 2018’s aggressive deleveraging campaign to clamp down on the country’s excessive credit expansion helped increase investor sentiment. Elsewhere in Asia, Taiwan (+8.3%) and South Korea (+4%) underperformed emerging market equities as exports in both countries declined year-on-year. Indian equities (+7%) recovered from early quarter losses as Prime Minister Narendra Modi’s ruling Bharatiya Janata Party (BJP) advanced in the polls ahead of April elections. In Latin America, Colombian equities outperformed and gained +25% in the quarter. Though the country led emerging market country performance in quarter one, the MSCI Colombia index remains -40% below 2012 highs. Elsewhere in Latin America, Brazilian equities gained +8.4% in the quarter as President Jair Bolsonaro assumed office at the start of the year.
20
BLACKROCK INDEX SELECTION FUND
PERFORMANCE (continued)
INVESTMENT MANAGER’S REPORT (continued)
MARKET REVIEW (continued)
EMERGING MARKETS MARKET REVIEW (continued)
The MSCI benchmark emerging market equity index reached a nine-month high on 17 April 2019, but tumbled as the US dollar surprised markets and gained strength. China’s manufacturing sector grew slower than expected in April, posting 50.2. This was 0.6 below the March figure, and missed the projected 51. The unexpected loss of momentum – March had proved to be a positive month for the country - triggered a stock price fall across Asia, while the Chinese yuan tumbled. Brazil’s iBovespa returned 1.63%, following a negative result in March, as the country’s trade surplus reached $6.06 billion in April, up 2.3% year-on-year. In India, the BSE Sensex 30 index returned 0.93%, considerably lower than the 7.82% seen in March, with creeping unemployment and a dropping services PMI figure beginning to hit. The MSCI Emerging Markets index posted the biggest loss of the major indices in May, tumbling 7.3% as trade-related fears weighed on sentiment. This was its first negative return for the year, and the deepest loss since October 2018. South Africa’s economy shrank by 3.2% in quarter one of 2019, data released in May showed, prompting forecasts that the country could experience a technical recession in 2019. The slump was the largest quarterly drop for 10 years, and driven mainly by declines in the agriculture, manufacturing and mining sectors. Further electricity rationing – or load shedding – also weighed on growth. Russia’s RTS index was up 20% year-on-year as of 20 May, shaking off the emerging markets sell-off triggered by the escalating trade war between the US and China. Analysts expect stock indices to peak within a few months, before retreating below current levels towards mid-2020. Russia’s economic ministry forecast 1.3% growth in 2019, lower year-on-year, with both domestic and external factors weighing on growth. The Greek economy grew 1.3% in the first quarter of 2019, missing the target by one percentage point and indicating that weak growth in the eurozone has filtered through to Greece. This raised concerns that fiscal targets could be at risk. Greek prime minister Alexis Tsipras announced snap elections at the end of the month, four months ahead of schedule.
UK MARKET REVIEW
iShares UK Index Fund (IE) After hitting record highs in May 2018, UK stocks were marginally down over June, as a further escalation in tensions between the US and its global trading partners occurred, leading to a sell-off in markets. In the geopolitical sphere, EU leaders called into doubt the UK’s ability to maintain access to the single market for goods unless contentious issues, such as the Irish border, are resolved. In economic news, GDP figures for the first quarter showed that although the year-on-year figure was the lowest since 2012 – and lagged the eurozone significantly – the upwardly revised quarterly figure outmatched expectations, at 0.2%. Moreover, unemployment in the three months to April continued at the over 42-year low of 4.2%, buoyed by a positive job creation figure. Stock markets in the UK were down marginally over the third quarter of 2018, dragged on a downward trend by uncertainty around Brexit, US-China trade tensions and concerns over the Turkish currency crisis. A rally in the second half of September helped the index to recover some losses. Brexit developments continued over the quarter: Prime Minister Theresa May gained cabinet approval for her Brexit withdrawal plan at the Chequers summit in July, but several high-profile ministers quit in response. Moreover, in August, EU leaders deemed that the plan was not viable, heightening fears of a ‘no deal’ outcome. Figures released over the quarter suggested that the UK economy was witnessing a slight pickup in activity. In news for August, growth in the manufacturing sector was at a 25-month low, although growth in retail sales and services sector activity both surpassed expectations. As widely predicted, the Bank of England raised interest rates at its August meeting to 0.75%, owing to improving economic fundamentals and as inflation remained consistently above the 2% target; consumer prices rose by 2.5% (annualised) in July. UK equities performed strongly over the first quarter of 2019, supported by annual results season and dividend announcements and despite Brexit uncertainty. Earlier in the quarter, data indicated that Brexit uncertainty was having a damaging effect on the economy. Productivity growth in the third quarter and services sector growth in the fourth quarter were both at close to two year lows, while industrial production in the three months to November fell by 0.8 percentage points. Retail sales in December were below expectations, down 0.9% month-on-month. Since then, data from the Office of National Statistics released in April show the UK economy grew 0.2% in February, putting the country on track for its best quarter since quarter two of 2015. The initial estimate of GDP was stronger than expected. The UK manufacturing PMI rose to its highest level for over a year in March as stockpiling for Brexit rose to a record level. This also fed into economic growth which was on track to be 0.4% quarter-on-quarter. Sterling had one of its most volatile months since the EU referendum in 2016 in March as uncertainty over Brexit continued. By the end of the month, its value compared with the US dollar was around 12% lower than it was pre-referendum.
21
BLACKROCK INDEX SELECTION FUND
PERFORMANCE (continued)
INVESTMENT MANAGER’S REPORT (continued)
MARKET REVIEW (continued)
UK MARKET REVIEW (continued)
UK stocks ended slightly up in April, with small cap stocks doing particularly well. Sterling dropped 2% against the US dollar and 1.5% against the euro, but this helped some of the UK’s biggest companies which make profits abroad in foreign currencies. The CPI measure of inflation unexpectedly remained at 1.9% in March, data released in April showed, while trade deficit figures for February, published in April, showed a record monthly goods trade deficit for the second consecutive month. Industry performance was mixed. Britain’s construction sector returned to growth as housebuilding picked up, and the construction PMI rose to a three -month high of 50.5. This compares with a 49.7 reading in March. But commercial activity and civil engineering continued to decline in the month to 30 April. UK manufacturers’ exports also fell - at the second fastest rate for four and a half years - as demand from the US, Europe and China dropped. The rush to stockpile raw materials in time for Brexit, now delayed until 31 October, also began to fade. The headline PMI fell to 53.1, from a 13-month high of 55.1 in March. In May, Prime Minister Theresa May announced she would step down on 7 June. This amplified uncertainty around Brexit and increased the likelihood of the UK leaving the bloc without a deal, or a further delay to the departure. Most Conservative MPs are believed to be opposed to a no-deal Brexit, but grassroots members are perceived to be most likely to support leaving without a deal. The Sterling to Euro exchange rate fell 3.66% in May, while the Sterling to US dollar rate tumbled 4.25% over the same period. Sterling is expected to remain vulnerable in the near-term, given the ongoing Brexit uncertainties. Taking a broader view, the Bank of England warned the value of shares and other assets could fall sharply if financial markets are underestimating the risk of a fresh crisis. Dave Ramsden, the Bank’s deputy governor responsible for banks and markets, said the policy environment could prove challenging, and that a disruptive no-deal Brexit was “unarguably” the biggest risk for the UK economy.
BlackRock Advisors (UK) Limited June 2019
22
BLACKROCK INDEX SELECTION FUND
GOVERNANCE
STATEMENT OF THE MANAGER’S RESPONSIBILITIES
BlackRock Asset Management Ireland Limited (the “Manager”), is responsible for preparing the annual report and the audited financial statements in accordance with applicable Irish law and Financial Reporting Standard 102 (“FRS 102”), the Financial Reporting Standard applicable in the United Kingdom and the Republic of Ireland issued by the Financial Reporting Council. In preparing these financial statements, the Manager is required to:
• select suitable accounting policies and then apply them consistently; • make judgements and estimates that are reasonable and prudent; • state whether the financial statements have been prepared in accordance with applicable accounting standards and identify
the standards in question, subject to any material departures from those standards being disclosed and explained in the notes to the financial statements; and
• prepare the financial statements on the going concern basis, unless it is inappropriate to presume that the Entity will continue in business.
The Manager is responsible for keeping proper accounting records which disclose with reasonable accuracy at any time, the financial position of the Entity and to enable them to ensure that the financial statements are prepared in accordance with FRS 102 and comply with the provisions of the Unit Trusts Act, 1990. In this regard, the Manager has appointed J.P. Morgan Administration Services (Ireland) Limited for the purpose of maintaining proper accounting records and for preparing the financial statements. Accordingly, the accounting records are kept at the following address: 200 Capital Dock 79 Sir John Rogerson’s Quay Dublin 2, D02 RK57 Ireland
The Manager is also responsible for taking reasonable steps for the prevention and detection of fraud and other irregularities. The assets of the Fund have been entrusted to the Trustee for safekeeping. The Trustee is J.P. Morgan Bank (Ireland) plc. The address at which this business is conducted is as follows:
200 Capital Dock 79 Sir John Rogerson’s Quay Dublin 2, D02 RK57 Ireland
The financial statements for the Entity, and the accompanying notes and unaudited information, are approved by the Directors.
On behalf of the Manager
Director Director 24 September 2019 24 September 2019
23
BLACKROCK INDEX SELECTION FUND
GOVERNANCE (continued)
TRUSTEE’S REPORT TO THE UNITHOLDERS
We have enquired into the conduct of BlackRock Asset Management Ireland Limited (“the Manager”) in respect of the BlackRock Index Selection Fund (“the Entity”) for the year ended 31 May 2019 (“the Accounting Period”) in our capacity as Trustee to the Entity.
We provide this report solely in favour of the unitholders in the Entity as a body in accordance with the UCITS Regulations – European Communities (Undertakings for Collective Investment in Transferable Securities) Regulations 2011 (SI No 352 of 2011) as amended, (“the UCITS Regulations”). We do not, in the provision of this report, accept nor assume responsibility for any other purpose or person to whom this report is shown. In accordance with our Trustee obligation as provided for under the UCITS Regulations, we have enquired into the conduct of the Manager of the Entity for the Accounting Period and we hereby report thereon to the unitholders of the Entity. We are of the opinion that the Entity has been managed during the Accounting Period, in all material respects: (i) In accordance with the limitations imposed on the investment and borrowing powers of the Manager and the Trustee by the
Trust Deed and the UCITS Regulations; and
(ii) Otherwise in accordance with the provisions of the Trust Deed and the UCITS Regulations.
For and on behalf of
J.P. Morgan Bank (Ireland) plc 200 Capital Dock 79 Sir John Rogerson’s Quay Dublin 2, D02 RK57 Ireland 24 September 2019
24
INDEPENDENT AUDITOR’S REPORT TO THE UNITHOLDERS OF BLACKROCK INDEX SELECTION FUND
Report on the audit of the financial statements Opinion on the financial statements of Blackrock Index Selection Fund (the ‘Fund’) In our opinion the Fund’s financial statements:
• give a true and fair view of the assets, liabilities and financial position of the Fund as at 31 May 2019 and of the profit/loss for the financial year then ended; and
• have been properly prepared in accordance with the relevant financial reporting framework, the applicable Regulations and the provisions of the Trust Deed
The financial statements we have audited comprise:
• the Income Statement; • the Statement of Changes in Net Assets attributable to Redeemable Participating Unitholders; • the Balance Sheet; and • the related notes 1 to 18, including a summary of significant accounting policies as set out in note 2.
The relevant financial reporting framework that has been applied in their preparation is FRS 102 “The Financial Reporting Standard applicable in the UK and Republic of Ireland” issued by the Financial Reporting Council (“the relevant financial reporting framework”). The applicable regulations that have been applied in their preparation is the European Communities (Undertakings for Collective Investment in Transferable Securities) Regulations, 2011 and Central Bank (Supervision and Enforcement) Act 2013 (Section 48(1)) (Undertakings for Collective Investment in Transferable Securities) Regulations, 2019 (“the applicable Regulations”). Basis for opinion We conducted our audit in accordance with International Standards on Auditing (Ireland) (ISAs (Ireland)) and applicable law. Our responsibilities under those standards are described below in the “Auditor's responsibilities for the audit of the financial statements” section of our report. We are independent of the Fund in accordance with the ethical requirements that are relevant to our audit of the financial statements in Ireland, including the Ethical Standard issued by the Irish Auditing and Accounting Supervisory Authority, and we have fulfilled our other ethical responsibilities in accordance with these requirements. We believe that the audit evidence we have obtained is sufficient and appropriate to provide a basis for our opinion. Conclusions relating to going concern We have nothing to report in respect of the following matters in relation to which ISAs (Ireland) require us to report to you where:
• the Manager’s use of the going concern basis of accounting in preparation of the financial statements is not appropriate; or
• the Manager has not disclosed in the financial statements any identified material uncertainties that may cast significant doubt about the Fund’s ability to continue to adopt the going concern basis of accounting for a period of at least twelve months from the date when the financial statements are authorised for issue.
Other information The Manager is responsible for the other information. The other information comprises the information included in the describe the annual report, other than the financial statements and our auditor’s report thereon. Our opinion on the financial statements does not cover the other information and, except to the extent otherwise explicitly stated in our report, we do not express any form of assurance conclusion thereon. In connection with our audit of the financial statements, our responsibility is to read the other information and, in doing so, consider whether the other information is materially inconsistent with the financial statements or our knowledge obtained in the audit or otherwise appears to be materially misstated. If we identify such material inconsistencies or apparent material misstatements, we are required to determine whether there is a material misstatement in the financial statements or a material misstatement of the other information. If, based on the work we have performed, we conclude that there is a material misstatement of this other information, we are required to report that fact. We have nothing to report in this regard.
/Continued on next page
25
/Continued from previous page
INDEPENDENT AUDITOR’S REPORT TO THE UNITHOLDERS OF BLACKROCK INDEX SELECTION FUND Responsibilities of the Manager for the financial statements The Manager is responsible for the preparation and fair presentation of the financial statements in accordance with the relevant financial reporting framework, and for such internal control as the Manager determines is necessary to enable the preparation of financial statements that are free from material misstatement, whether due to fraud or error. In preparing the financial statements, the Manager is responsible for assessing the Fund’s ability to continue as a going concern, disclosing, as applicable, matters related to going concern and using the going concern basis of accounting unless the Manager either intend to liquidate the Fund or to cease operations, or have no realistic alternative but to do so Auditor’s responsibilities for the audit of the financial statements Our objectives are to obtain reasonable assurance about whether the financial statements as a whole are free from material misstatement, whether due to fraud or error, and to issue an auditor's report that includes our opinion. Reasonable assurance is a high level of assurance, but is not a guarantee that an audit conducted in accordance with ISAs (Ireland) will always detect a material misstatement when it exists. Misstatements can arise from fraud or error and are considered material if, individually or in the aggregate, they could reasonably be expected to influence the economic decisions of users taken on the basis of these financial statements. As part of an audit in accordance with ISAs (Ireland), we exercise professional judgment and maintain professional scepticism throughout the audit. We also: • Identify and assess the risks of material misstatement of the financial statements, whether due to fraud or error,
design and perform audit procedures responsive to those risks, and obtain audit evidence that is sufficient and appropriate to provide a basis for our opinion. The risk of not detecting a material misstatement resulting from fraud is higher than for one resulting from error, as fraud may involve collusion, forgery, intentional omissions, misrepresentations, or the override of internal control.
• Obtain an understanding of internal control relevant to the audit in order to design audit procedures that are appropriate in the circumstances, but not for the purpose of expressing an opinion on the effectiveness of the Fund’s internal control.
• Evaluate the appropriateness of accounting policies used and the reasonableness of accounting estimates and
related disclosures made by the Manager.
• Conclude on the appropriateness of the Manager’s use of the going concern basis of accounting and, based on the audit evidence obtained, whether a material uncertainty exists related to events or conditions that may cast significant doubt on the Fund’s ability to continue as a going concern. If we conclude that a material uncertainty exists, we are required to draw attention in our auditor’s report to the related disclosures in the financial statements or, if such disclosures are inadequate, to modify our opinion. Our conclusions are based on the audit evidence obtained up to the date of the auditor’s report. However, future events or conditions may cause the entity (or where relevant, the group) to cease to continue as a going concern.
• Evaluate the overall presentation, structure and content of the financial statements, including the disclosures, and
whether the financial statements represent the underlying transactions and events in a manner that achieves fair presentation.
/Continued on next page
26
/Continued from previous page
INDEPENDENT AUDITOR’S REPORT TO THE UNITHOLDERS OF BLACKROCK INDEX SELECTION FUND We communicate with those charged with governance regarding, among other matters, the planned scope and timing of the audit and significant audit findings, including any significant deficiencies in internal control that the auditor identifies during the audit. This report is made solely to the Fund’s unitholders, as a body, in accordance with the applicable Regulations and the provisions of the Trust Deed. Our audit work has been undertaken so that we might state to the Fund’s unitholders those matters we are required to state to them in an auditor’s report and for no other purpose. To the fullest extent permitted by law, we do not accept or assume responsibility to anyone other than the Fund and the Fund’s unitholders as a body, for our audit work, for this report, or for the opinions we have formed. Report on other legal and regulatory requirements Opinion on other matters prescribed by the applicable Regulations Based solely on the work undertaken in the course of the audit, we report that: • We have obtained all the information and explanations which we consider necessary for the purposes of our audit. • In our opinion the accounting records of the Fund were sufficient to permit the financial statements to be readily
and properly audited. • The financial statements are in agreement with the accounting records. Niamh Geraghty For and on behalf of Deloitte Ireland LLP Chartered Accountants and Statutory Audit Firm Deloitte & Touche House, Earlsfort Terrace, Dublin 2 Date: 24 September 2019
27
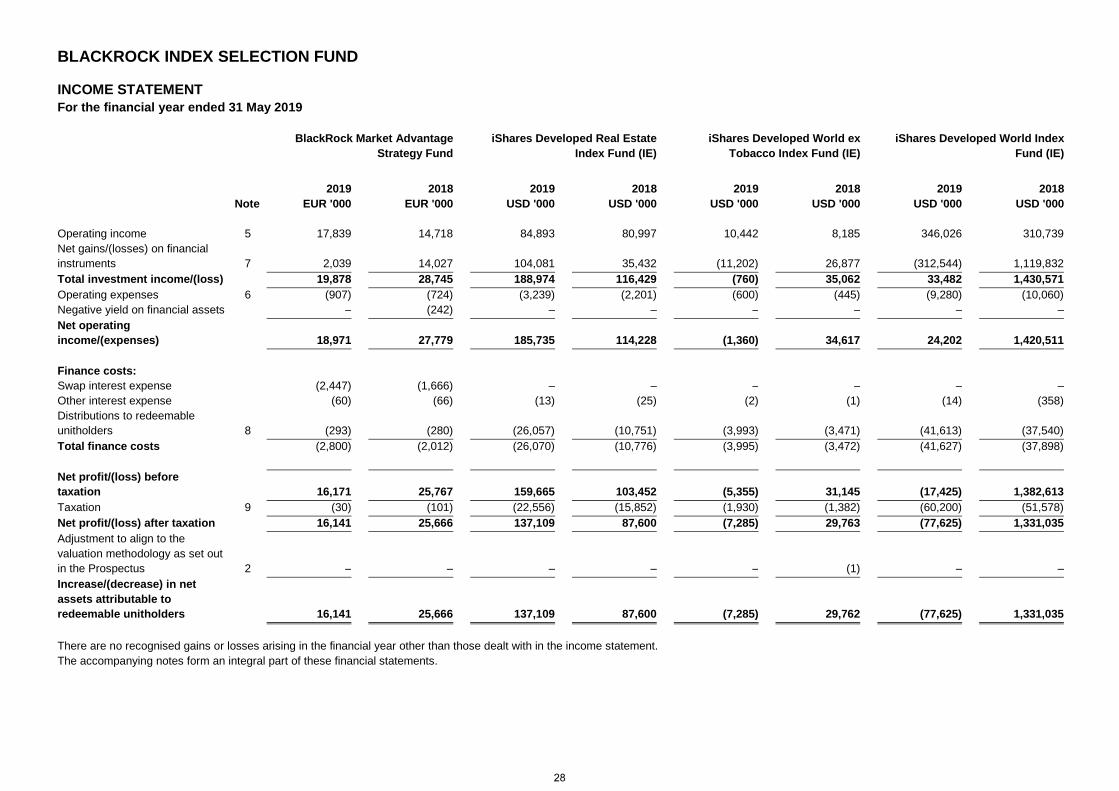
BLACKROCK INDEX SELECTION FUND
INCOME STATEMENT For the financial year ended 31 May 2019
BlackRock Market Advantage
Strategy Fund iShares Developed Real Estate
Index Fund (IE) iShares Developed World ex
Tobacco Index Fund (IE) iShares Developed World Index
Fund (IE)
Note 2019
EUR '000 2018
EUR '000 2019
USD '000 2018
USD '000 2019
USD '000 2018
USD '000 2019
USD '000 2018
USD '000
Operating income 5 17,839 14,718 84,893 80,997 10,442 8,185 346,026 310,739 Net gains/(losses) on financial instruments 7 2,039 14,027 104,081 35,432 (11,202) 26,877 (312,544) 1,119,832 Total investment income/(loss) 19,878 28,745 188,974 116,429 (760) 35,062 33,482 1,430,571 Operating expenses 6 (907) (724) (3,239) (2,201) (600) (445) (9,280) (10,060) Negative yield on financial assets – (242) – – – – – – Net operating income/(expenses) 18,971 27,779 185,735 114,228 (1,360) 34,617 24,202 1,420,511 Finance costs: Swap interest expense (2,447) (1,666) – – – – – – Other interest expense (60) (66) (13) (25) (2) (1) (14) (358) Distributions to redeemable unitholders 8 (293) (280) (26,057) (10,751) (3,993) (3,471) (41,613) (37,540) Total finance costs (2,800) (2,012) (26,070) (10,776) (3,995) (3,472) (41,627) (37,898) Net profit/(loss) before taxation 16,171 25,767 159,665 103,452 (5,355) 31,145 (17,425) 1,382,613 Taxation 9 (30) (101) (22,556) (15,852) (1,930) (1,382) (60,200) (51,578) Net profit/(loss) after taxation 16,141 25,666 137,109 87,600 (7,285) 29,763 (77,625) 1,331,035 Adjustment to align to the valuation methodology as set out in the Prospectus 2 – – – – – (1) – – Increase/(decrease) in net assets attributable to redeemable unitholders 16,141 25,666 137,109 87,600 (7,285) 29,762 (77,625) 1,331,035 There are no recognised gains or losses arising in the financial year other than those dealt with in the income statement. The accompanying notes form an integral part of these financial statements.
28
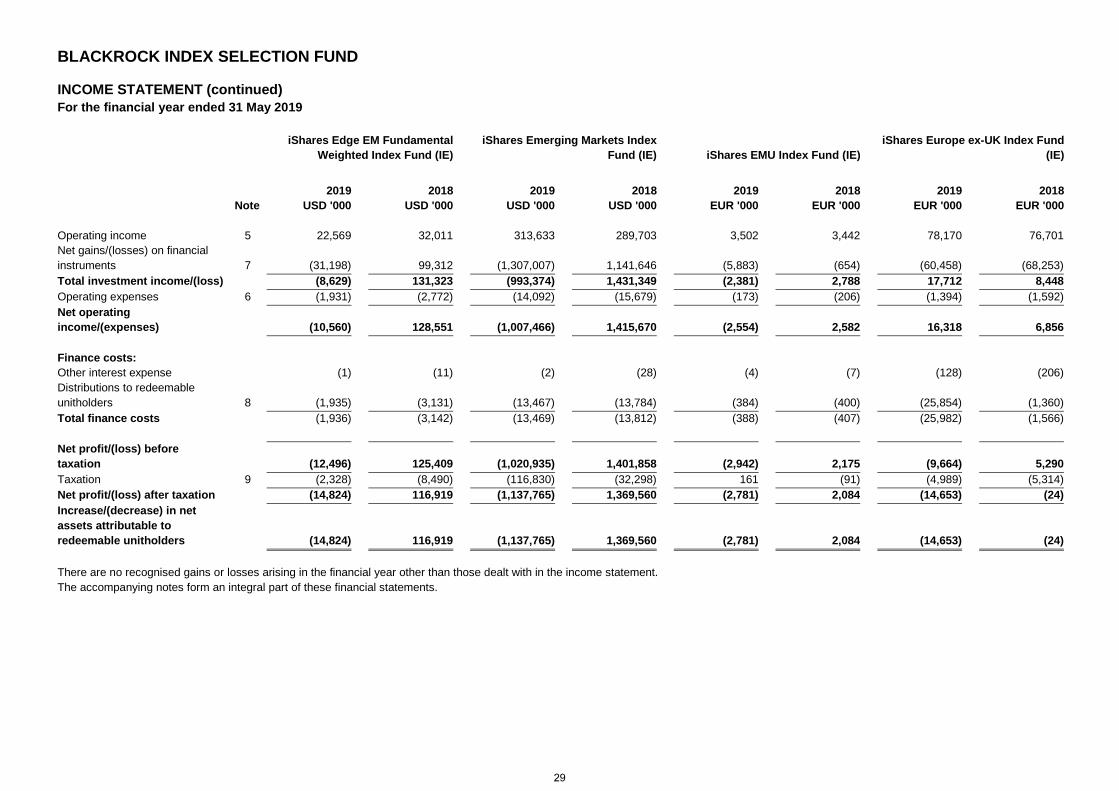
BLACKROCK INDEX SELECTION FUND
INCOME STATEMENT (continued) For the financial year ended 31 May 2019
iShares Edge EM Fundamental
Weighted Index Fund (IE) iShares Emerging Markets Index
Fund (IE) iShares EMU Index Fund (IE) iShares Europe ex-UK Index Fund
(IE)
Note 2019
USD '000 2018
USD '000 2019
USD '000 2018
USD '000 2019
EUR '000 2018
EUR '000 2019
EUR '000 2018
EUR '000
Operating income 5 22,569 32,011 313,633 289,703 3,502 3,442 78,170 76,701 Net gains/(losses) on financial instruments 7 (31,198) 99,312 (1,307,007) 1,141,646 (5,883) (654) (60,458) (68,253) Total investment income/(loss) (8,629) 131,323 (993,374) 1,431,349 (2,381) 2,788 17,712 8,448 Operating expenses 6 (1,931) (2,772) (14,092) (15,679) (173) (206) (1,394) (1,592) Net operating income/(expenses) (10,560) 128,551 (1,007,466) 1,415,670 (2,554) 2,582 16,318 6,856 Finance costs: Other interest expense (1) (11) (2) (28) (4) (7) (128) (206) Distributions to redeemable unitholders 8 (1,935) (3,131) (13,467) (13,784) (384) (400) (25,854) (1,360) Total finance costs (1,936) (3,142) (13,469) (13,812) (388) (407) (25,982) (1,566) Net profit/(loss) before taxation (12,496) 125,409 (1,020,935) 1,401,858 (2,942) 2,175 (9,664) 5,290 Taxation 9 (2,328) (8,490) (116,830) (32,298) 161 (91) (4,989) (5,314) Net profit/(loss) after taxation (14,824) 116,919 (1,137,765) 1,369,560 (2,781) 2,084 (14,653) (24) Increase/(decrease) in net assets attributable to redeemable unitholders (14,824) 116,919 (1,137,765) 1,369,560 (2,781) 2,084 (14,653) (24) There are no recognised gains or losses arising in the financial year other than those dealt with in the income statement. The accompanying notes form an integral part of these financial statements.
29
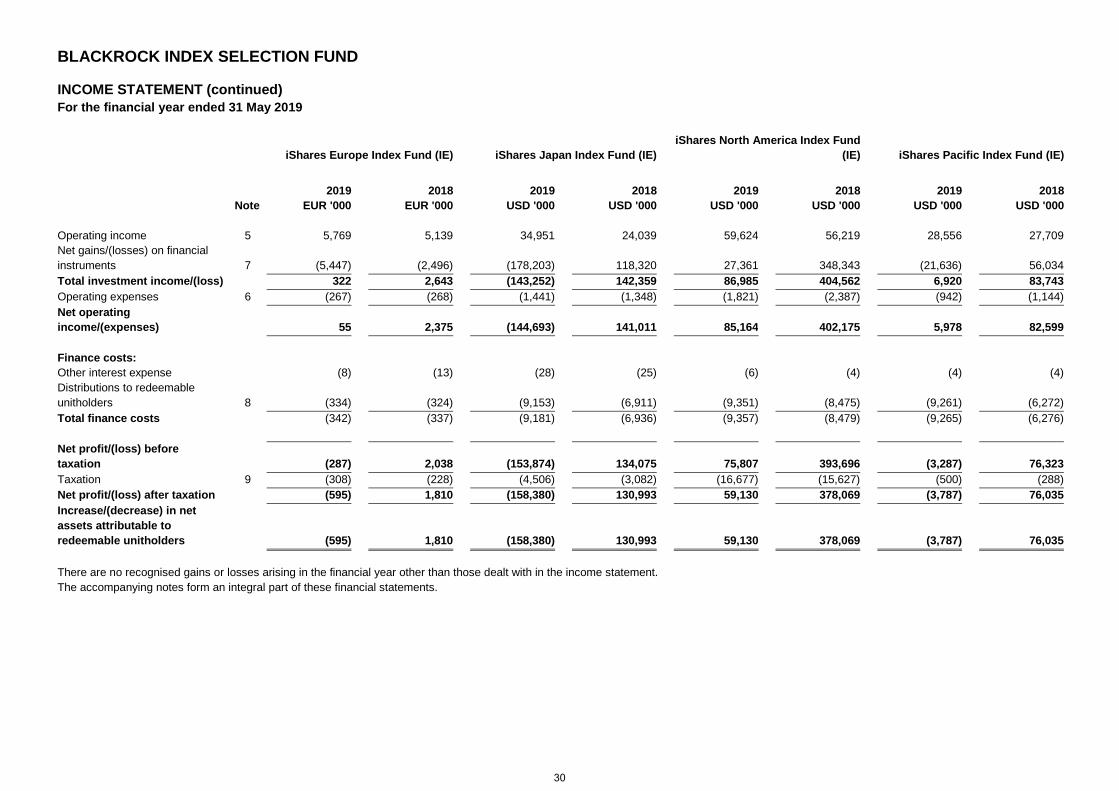
BLACKROCK INDEX SELECTION FUND
INCOME STATEMENT (continued) For the financial year ended 31 May 2019
iShares Europe Index Fund (IE) iShares Japan Index Fund (IE) iShares North America Index Fund
(IE) iShares Pacific Index Fund (IE)
Note 2019
EUR '000 2018
EUR '000 2019
USD '000 2018
USD '000 2019
USD '000 2018
USD '000 2019
USD '000 2018
USD '000
Operating income 5 5,769 5,139 34,951 24,039 59,624 56,219 28,556 27,709 Net gains/(losses) on financial instruments 7 (5,447) (2,496) (178,203) 118,320 27,361 348,343 (21,636) 56,034 Total investment income/(loss) 322 2,643 (143,252) 142,359 86,985 404,562 6,920 83,743 Operating expenses 6 (267) (268) (1,441) (1,348) (1,821) (2,387) (942) (1,144) Net operating income/(expenses) 55 2,375 (144,693) 141,011 85,164 402,175 5,978 82,599 Finance costs: Other interest expense (8) (13) (28) (25) (6) (4) (4) (4) Distributions to redeemable unitholders 8 (334) (324) (9,153) (6,911) (9,351) (8,475) (9,261) (6,272) Total finance costs (342) (337) (9,181) (6,936) (9,357) (8,479) (9,265) (6,276) Net profit/(loss) before taxation (287) 2,038 (153,874) 134,075 75,807 393,696 (3,287) 76,323 Taxation 9 (308) (228) (4,506) (3,082) (16,677) (15,627) (500) (288) Net profit/(loss) after taxation (595) 1,810 (158,380) 130,993 59,130 378,069 (3,787) 76,035 Increase/(decrease) in net assets attributable to redeemable unitholders (595) 1,810 (158,380) 130,993 59,130 378,069 (3,787) 76,035 There are no recognised gains or losses arising in the financial year other than those dealt with in the income statement. The accompanying notes form an integral part of these financial statements.
30
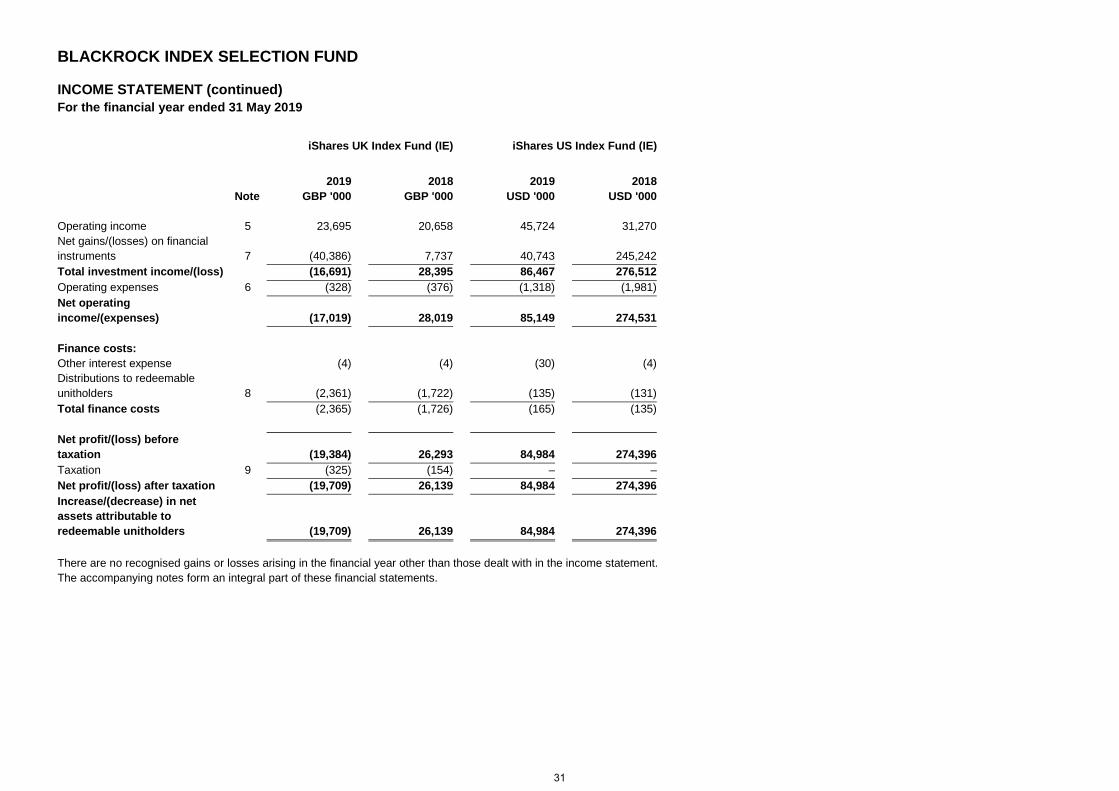
BLACKROCK INDEX SELECTION FUND
INCOME STATEMENT (continued) For the financial year ended 31 May 2019
iShares UK Index Fund (IE) iShares US Index Fund (IE)
Note 2019
GBP '000 2018
GBP '000 2019
USD '000 2018
USD '000
Operating income 5 23,695 20,658 45,724 31,270 Net gains/(losses) on financial instruments 7 (40,386) 7,737 40,743 245,242 Total investment income/(loss) (16,691) 28,395 86,467 276,512 Operating expenses 6 (328) (376) (1,318) (1,981) Net operating income/(expenses) (17,019) 28,019 85,149 274,531 Finance costs: Other interest expense (4) (4) (30) (4) Distributions to redeemable unitholders 8 (2,361) (1,722) (135) (131) Total finance costs (2,365) (1,726) (165) (135) Net profit/(loss) before taxation (19,384) 26,293 84,984 274,396 Taxation 9 (325) (154) – – Net profit/(loss) after taxation (19,709) 26,139 84,984 274,396 Increase/(decrease) in net assets attributable to redeemable unitholders (19,709) 26,139 84,984 274,396 There are no recognised gains or losses arising in the financial year other than those dealt with in the income statement. The accompanying notes form an integral part of these financial statements.
31
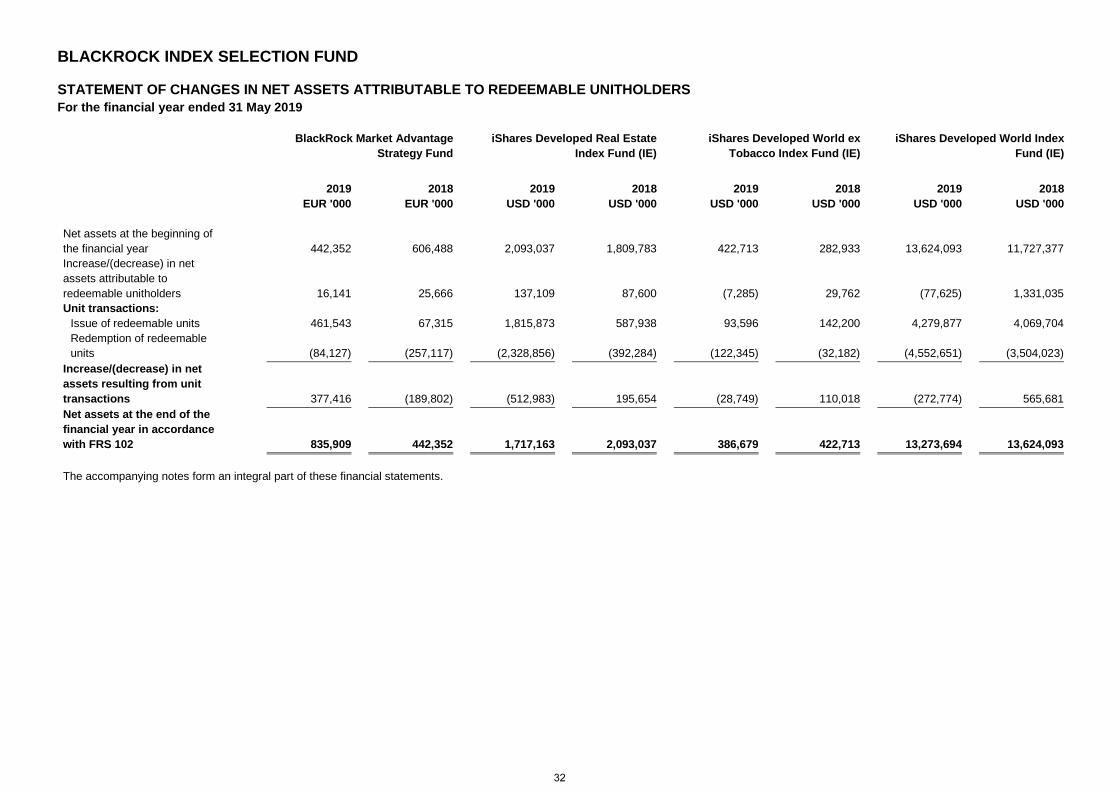
BLACKROCK INDEX SELECTION FUND
STATEMENT OF CHANGES IN NET ASSETS ATTRIBUTABLE TO REDEEMABLE UNITHOLDERS For the financial year ended 31 May 2019
BlackRock Market Advantage
Strategy Fund iShares Developed Real Estate
Index Fund (IE) iShares Developed World ex
Tobacco Index Fund (IE) iShares Developed World Index
Fund (IE)
2019
EUR '000 2018
EUR '000 2019
USD '000 2018
USD '000 2019
USD '000 2018
USD '000 2019
USD '000 2018
USD '000 Net assets at the beginning of the financial year 442,352 606,488 2,093,037 1,809,783 422,713 282,933 13,624,093 11,727,377 Increase/(decrease) in net assets attributable to redeemable unitholders 16,141 25,666 137,109 87,600 (7,285) 29,762 (77,625) 1,331,035 Unit transactions:
Issue of redeemable units 461,543 67,315 1,815,873 587,938 93,596 142,200 4,279,877 4,069,704 Redemption of redeemable units (84,127) (257,117) (2,328,856) (392,284) (122,345) (32,182) (4,552,651) (3,504,023)
Increase/(decrease) in net assets resulting from unit transactions 377,416 (189,802) (512,983) 195,654 (28,749) 110,018 (272,774) 565,681 Net assets at the end of the financial year in accordance with FRS 102 835,909 442,352 1,717,163 2,093,037 386,679 422,713 13,273,694 13,624,093 The accompanying notes form an integral part of these financial statements.
32
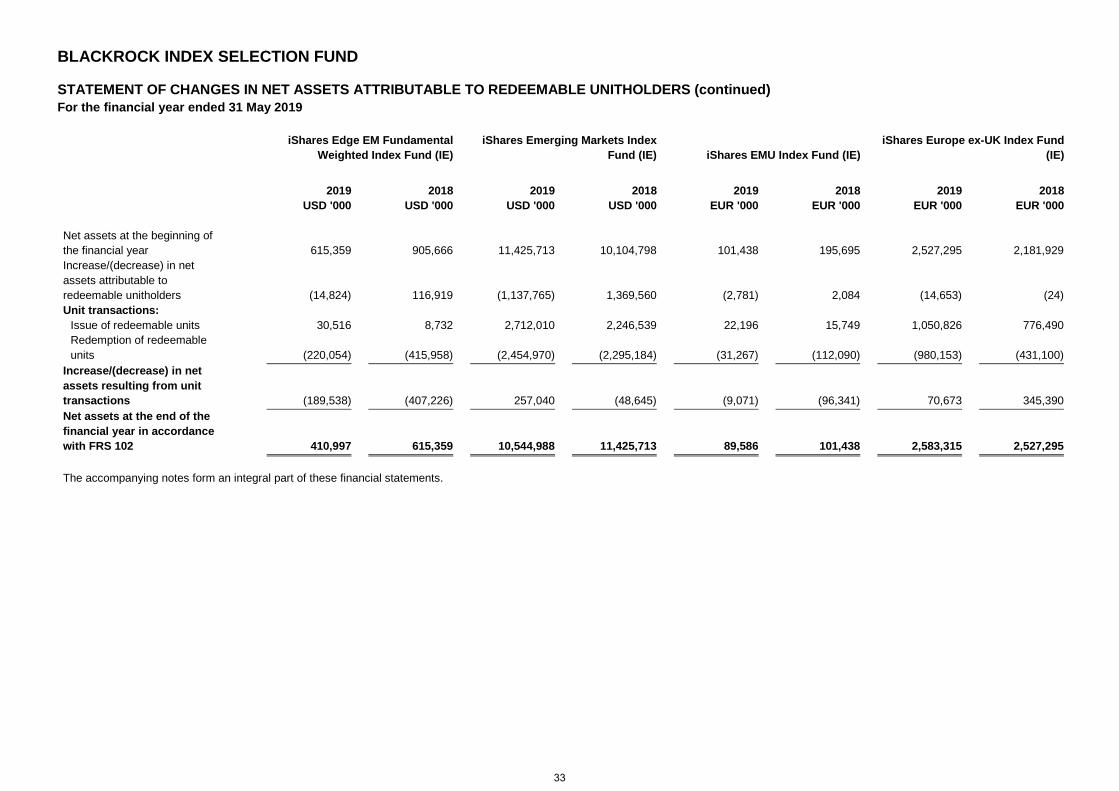
BLACKROCK INDEX SELECTION FUND
STATEMENT OF CHANGES IN NET ASSETS ATTRIBUTABLE TO REDEEMABLE UNITHOLDERS (continued) For the financial year ended 31 May 2019
iShares Edge EM Fundamental
Weighted Index Fund (IE) iShares Emerging Markets Index
Fund (IE) iShares EMU Index Fund (IE) iShares Europe ex-UK Index Fund
(IE)
2019
USD '000 2018
USD '000 2019
USD '000 2018
USD '000 2019
EUR '000 2018
EUR '000 2019
EUR '000 2018
EUR '000 Net assets at the beginning of the financial year 615,359 905,666 11,425,713 10,104,798 101,438 195,695 2,527,295 2,181,929 Increase/(decrease) in net assets attributable to redeemable unitholders (14,824) 116,919 (1,137,765) 1,369,560 (2,781) 2,084 (14,653) (24) Unit transactions:
Issue of redeemable units 30,516 8,732 2,712,010 2,246,539 22,196 15,749 1,050,826 776,490 Redemption of redeemable units (220,054) (415,958) (2,454,970) (2,295,184) (31,267) (112,090) (980,153) (431,100)
Increase/(decrease) in net assets resulting from unit transactions (189,538) (407,226) 257,040 (48,645) (9,071) (96,341) 70,673 345,390 Net assets at the end of the financial year in accordance with FRS 102 410,997 615,359 10,544,988 11,425,713 89,586 101,438 2,583,315 2,527,295 The accompanying notes form an integral part of these financial statements.
33
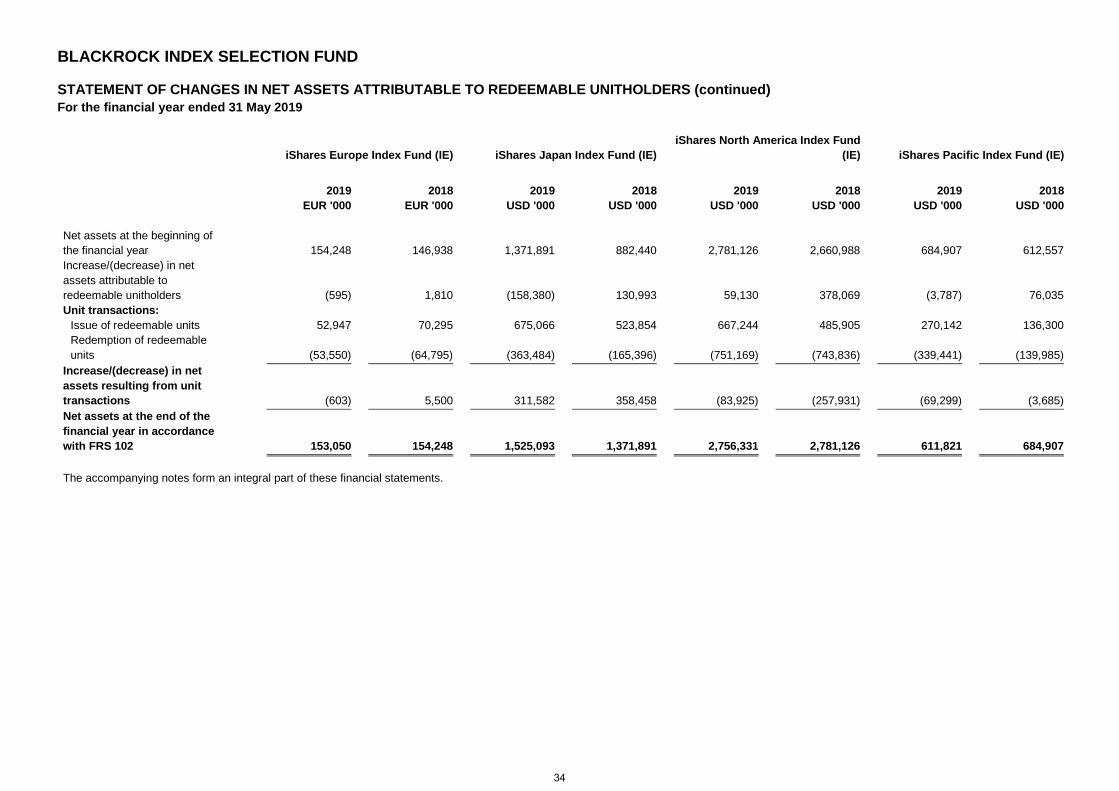
BLACKROCK INDEX SELECTION FUND
STATEMENT OF CHANGES IN NET ASSETS ATTRIBUTABLE TO REDEEMABLE UNITHOLDERS (continued) For the financial year ended 31 May 2019
iShares Europe Index Fund (IE) iShares Japan Index Fund (IE) iShares North America Index Fund
(IE) iShares Pacific Index Fund (IE)
2019
EUR '000 2018
EUR '000 2019
USD '000 2018
USD '000 2019
USD '000 2018
USD '000 2019
USD '000 2018
USD '000 Net assets at the beginning of the financial year 154,248 146,938 1,371,891 882,440 2,781,126 2,660,988 684,907 612,557 Increase/(decrease) in net assets attributable to redeemable unitholders (595) 1,810 (158,380) 130,993 59,130 378,069 (3,787) 76,035 Unit transactions:
Issue of redeemable units 52,947 70,295 675,066 523,854 667,244 485,905 270,142 136,300 Redemption of redeemable units (53,550) (64,795) (363,484) (165,396) (751,169) (743,836) (339,441) (139,985)
Increase/(decrease) in net assets resulting from unit transactions (603) 5,500 311,582 358,458 (83,925) (257,931) (69,299) (3,685) Net assets at the end of the financial year in accordance with FRS 102 153,050 154,248 1,525,093 1,371,891 2,756,331 2,781,126 611,821 684,907 The accompanying notes form an integral part of these financial statements.
34
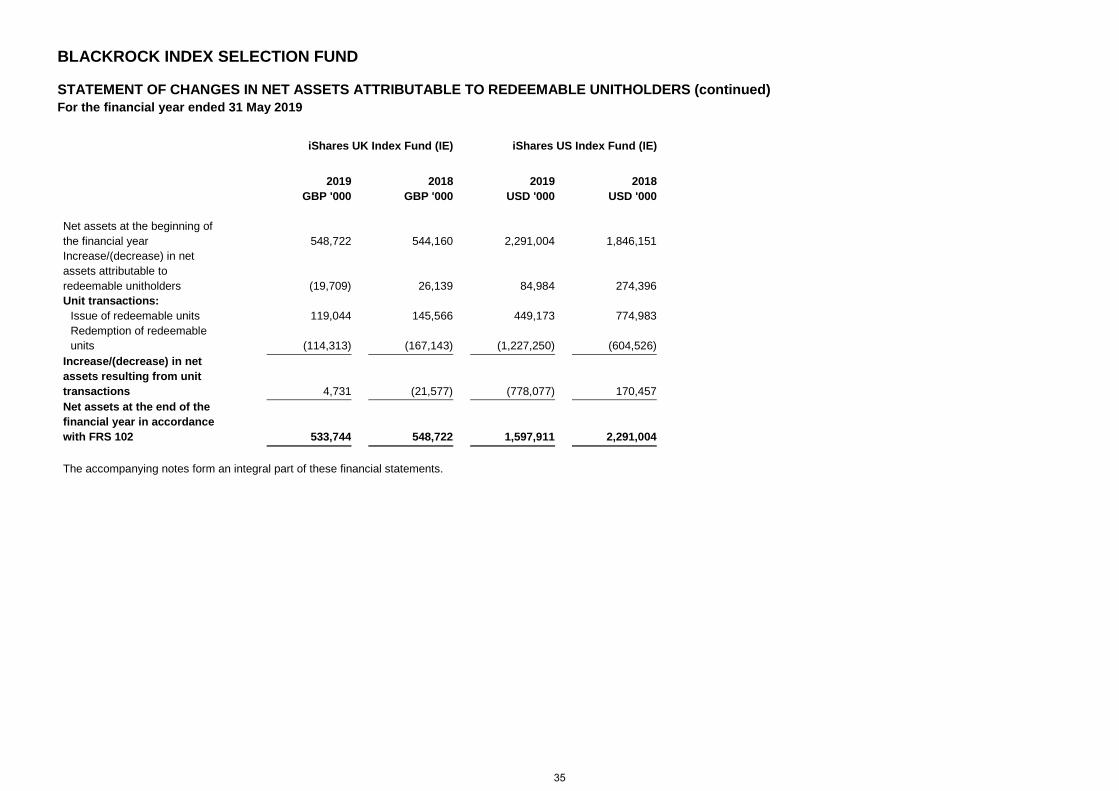
BLACKROCK INDEX SELECTION FUND
STATEMENT OF CHANGES IN NET ASSETS ATTRIBUTABLE TO REDEEMABLE UNITHOLDERS (continued) For the financial year ended 31 May 2019
iShares UK Index Fund (IE) iShares US Index Fund (IE)
2019
GBP '000 2018
GBP '000 2019
USD '000 2018
USD '000 Net assets at the beginning of the financial year 548,722 544,160 2,291,004 1,846,151 Increase/(decrease) in net assets attributable to redeemable unitholders (19,709) 26,139 84,984 274,396 Unit transactions:
Issue of redeemable units 119,044 145,566 449,173 774,983 Redemption of redeemable units (114,313) (167,143) (1,227,250) (604,526)
Increase/(decrease) in net assets resulting from unit transactions 4,731 (21,577) (778,077) 170,457 Net assets at the end of the financial year in accordance with FRS 102 533,744 548,722 1,597,911 2,291,004 The accompanying notes form an integral part of these financial statements.
35
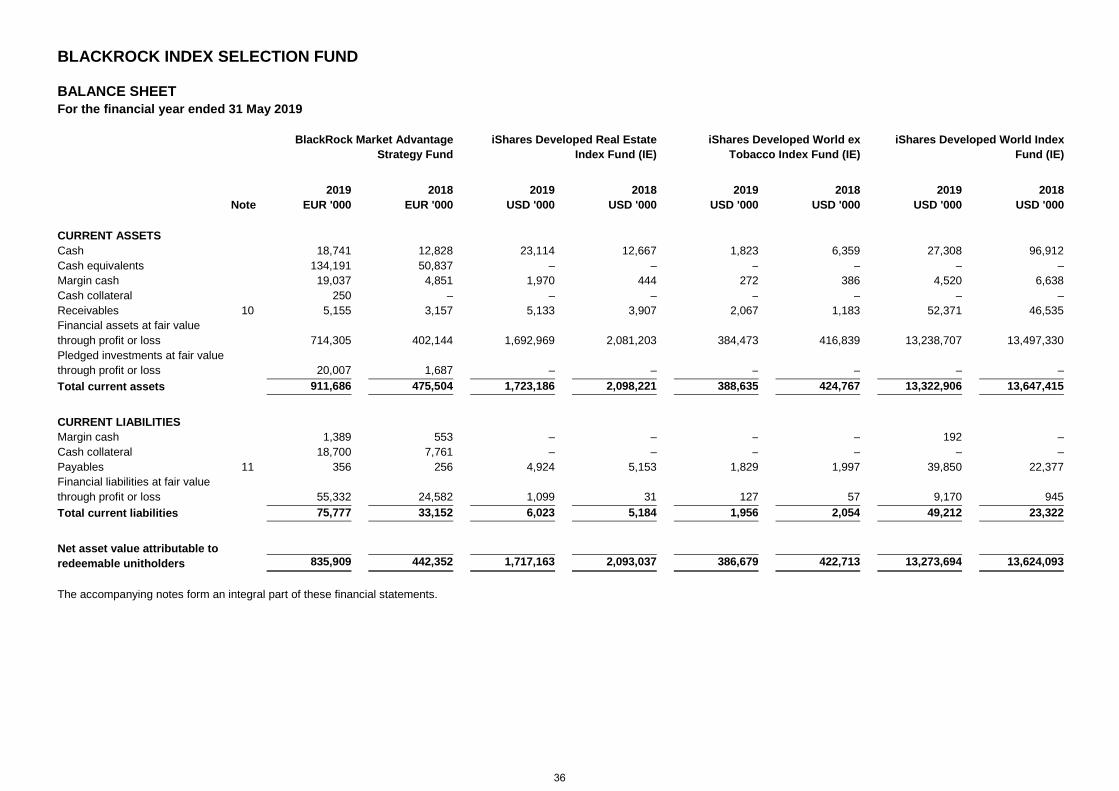
BLACKROCK INDEX SELECTION FUND
BALANCE SHEET For the financial year ended 31 May 2019
BlackRock Market Advantage
Strategy Fund iShares Developed Real Estate
Index Fund (IE) iShares Developed World ex
Tobacco Index Fund (IE) iShares Developed World Index
Fund (IE)
Note 2019
EUR '000 2018
EUR '000 2019
USD '000 2018
USD '000 2019
USD '000 2018
USD '000 2019
USD '000 2018
USD '000
CURRENT ASSETS Cash 18,741 12,828 23,114 12,667 1,823 6,359 27,308 96,912 Cash equivalents 134,191 50,837 – – – – – – Margin cash 19,037 4,851 1,970 444 272 386 4,520 6,638 Cash collateral 250 – – – – – – – Receivables 10 5,155 3,157 5,133 3,907 2,067 1,183 52,371 46,535 Financial assets at fair value through profit or loss 714,305 402,144 1,692,969 2,081,203 384,473 416,839 13,238,707 13,497,330 Pledged investments at fair value through profit or loss 20,007 1,687 – – – – – – Total current assets 911,686 475,504 1,723,186 2,098,221 388,635 424,767 13,322,906 13,647,415 CURRENT LIABILITIES Margin cash 1,389 553 – – – – 192 – Cash collateral 18,700 7,761 – – – – – – Payables 11 356 256 4,924 5,153 1,829 1,997 39,850 22,377 Financial liabilities at fair value through profit or loss 55,332 24,582 1,099 31 127 57 9,170 945 Total current liabilities 75,777 33,152 6,023 5,184 1,956 2,054 49,212 23,322 Net asset value attributable to redeemable unitholders 835,909 442,352 1,717,163 2,093,037 386,679 422,713 13,273,694 13,624,093 The accompanying notes form an integral part of these financial statements.
36
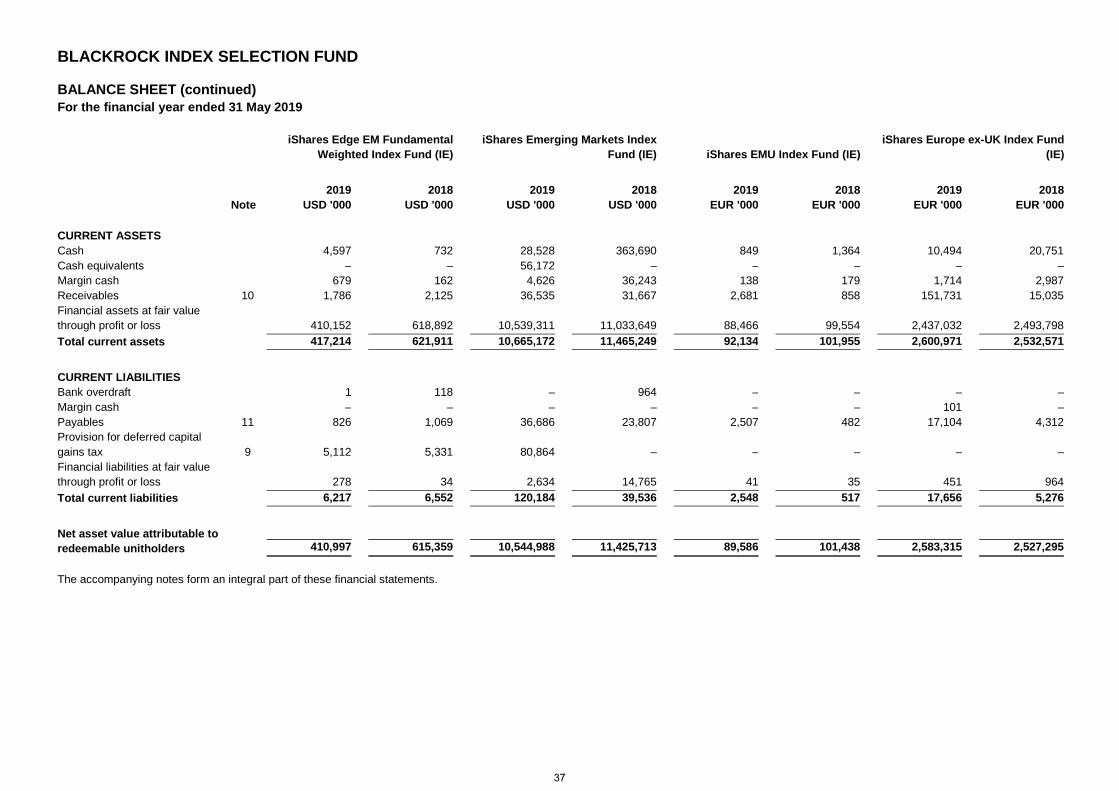
BLACKROCK INDEX SELECTION FUND
BALANCE SHEET (continued) For the financial year ended 31 May 2019
iShares Edge EM Fundamental
Weighted Index Fund (IE) iShares Emerging Markets Index
Fund (IE) iShares EMU Index Fund (IE) iShares Europe ex-UK Index Fund
(IE)
Note 2019
USD '000 2018
USD '000 2019
USD '000 2018
USD '000 2019
EUR '000 2018
EUR '000 2019
EUR '000 2018
EUR '000
CURRENT ASSETS Cash 4,597 732 28,528 363,690 849 1,364 10,494 20,751 Cash equivalents – – 56,172 – – – – – Margin cash 679 162 4,626 36,243 138 179 1,714 2,987 Receivables 10 1,786 2,125 36,535 31,667 2,681 858 151,731 15,035 Financial assets at fair value through profit or loss 410,152 618,892 10,539,311 11,033,649 88,466 99,554 2,437,032 2,493,798 Total current assets 417,214 621,911 10,665,172 11,465,249 92,134 101,955 2,600,971 2,532,571 CURRENT LIABILITIES Bank overdraft 1 118 – 964 – – – – Margin cash – – – – – – 101 – Payables 11 826 1,069 36,686 23,807 2,507 482 17,104 4,312 Provision for deferred capital gains tax 9 5,112 5,331 80,864 – – – – – Financial liabilities at fair value through profit or loss 278 34 2,634 14,765 41 35 451 964 Total current liabilities 6,217 6,552 120,184 39,536 2,548 517 17,656 5,276 Net asset value attributable to redeemable unitholders 410,997 615,359 10,544,988 11,425,713 89,586 101,438 2,583,315 2,527,295 The accompanying notes form an integral part of these financial statements.
37
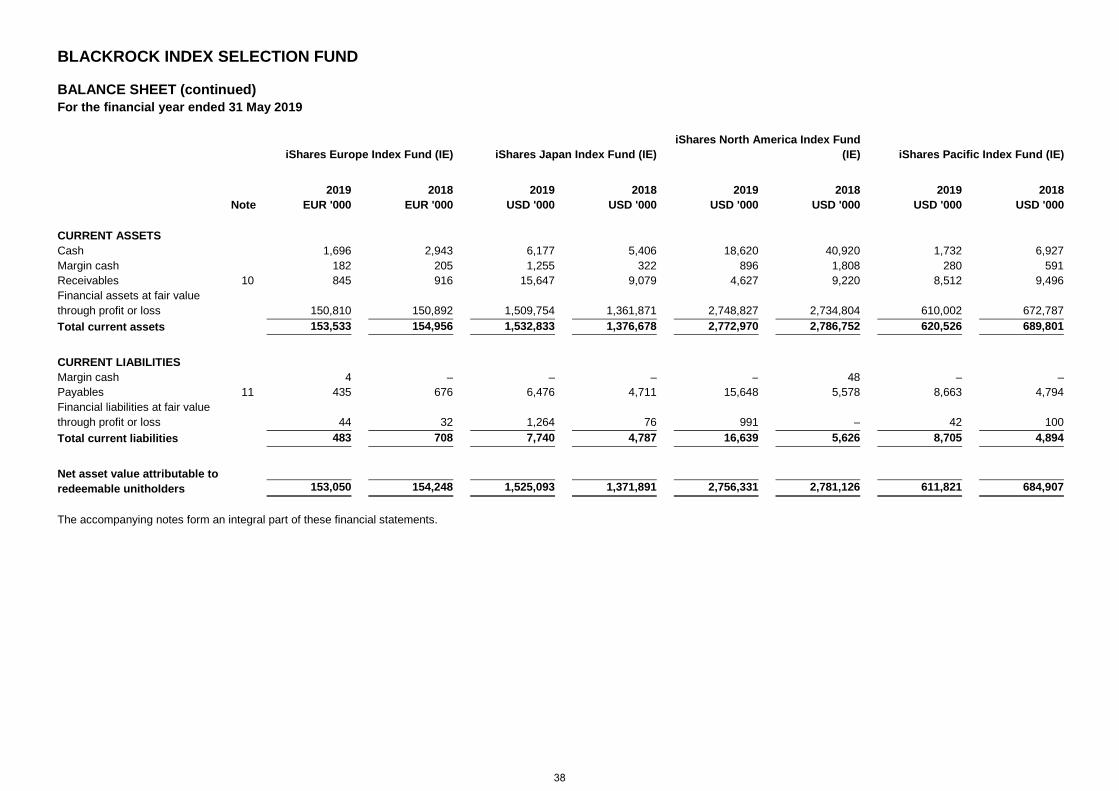
BLACKROCK INDEX SELECTION FUND
BALANCE SHEET (continued) For the financial year ended 31 May 2019
iShares Europe Index Fund (IE) iShares Japan Index Fund (IE) iShares North America Index Fund
(IE) iShares Pacific Index Fund (IE)
Note 2019
EUR '000 2018
EUR '000 2019
USD '000 2018
USD '000 2019
USD '000 2018
USD '000 2019
USD '000 2018
USD '000
CURRENT ASSETS Cash 1,696 2,943 6,177 5,406 18,620 40,920 1,732 6,927 Margin cash 182 205 1,255 322 896 1,808 280 591 Receivables 10 845 916 15,647 9,079 4,627 9,220 8,512 9,496 Financial assets at fair value through profit or loss 150,810 150,892 1,509,754 1,361,871 2,748,827 2,734,804 610,002 672,787 Total current assets 153,533 154,956 1,532,833 1,376,678 2,772,970 2,786,752 620,526 689,801 CURRENT LIABILITIES Margin cash 4 – – – – 48 – – Payables 11 435 676 6,476 4,711 15,648 5,578 8,663 4,794 Financial liabilities at fair value through profit or loss 44 32 1,264 76 991 – 42 100 Total current liabilities 483 708 7,740 4,787 16,639 5,626 8,705 4,894 Net asset value attributable to redeemable unitholders 153,050 154,248 1,525,093 1,371,891 2,756,331 2,781,126 611,821 684,907 The accompanying notes form an integral part of these financial statements.
38
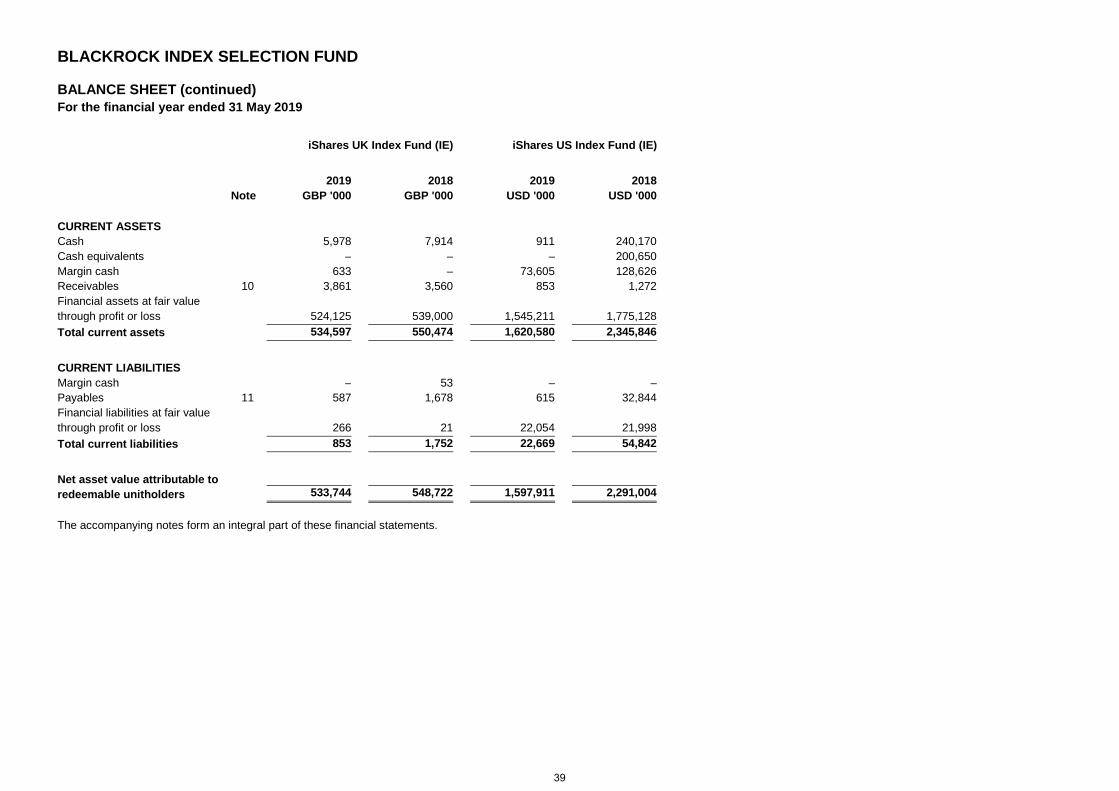
BLACKROCK INDEX SELECTION FUND
BALANCE SHEET (continued) For the financial year ended 31 May 2019
iShares UK Index Fund (IE) iShares US Index Fund (IE)
Note 2019
GBP '000 2018
GBP '000 2019
USD '000 2018
USD '000
CURRENT ASSETS Cash 5,978 7,914 911 240,170 Cash equivalents – – – 200,650 Margin cash 633 – 73,605 128,626 Receivables 10 3,861 3,560 853 1,272 Financial assets at fair value through profit or loss 524,125 539,000 1,545,211 1,775,128 Total current assets 534,597 550,474 1,620,580 2,345,846 CURRENT LIABILITIES Margin cash – 53 – – Payables 11 587 1,678 615 32,844 Financial liabilities at fair value through profit or loss 266 21 22,054 21,998 Total current liabilities 853 1,752 22,669 54,842 Net asset value attributable to redeemable unitholders 533,744 548,722 1,597,911 2,291,004 The accompanying notes form an integral part of these financial statements.
39
BLACKROCK INDEX SELECTION FUND
NOTES TO THE FINANCIAL STATEMENTS
1. General information
The Entity is an open-ended unit trust domiciled and incorporated under the laws of Ireland as a unit trust. The Entity is authorised by the CBI and is governed by the provisions of the UCITS Regulations. 2. Significant accounting policies
2.1 Basis of preparation The financial statements are prepared in accordance with Financial Reporting Standard 102 (“FRS 102”) “The Financial Reporting Standard applicable in the United Kingdom and Republic of Ireland” issued by the Financial Reporting Council. The financial statements are prepared on a going concern basis under the historical cost convention as modified by the revaluation of financial assets and financial liabilities held at fair value through profit or loss. The Entity has availed of the exemption available to open-ended investment funds that hold a substantial proportion of highly liquid and fair valued investments under Section 7 of FRS 102 and is not presenting a cash flow statement. The format and certain wordings of the financial statements have been adapted from those contained in Section 3 of FRS 102, so that, in the opinion of the Directors, they more appropriately reflect the nature of the Entity’s business as an investment fund. All amounts have been rounded to the nearest thousand, unless otherwise indicated. 2.2 Financial instruments The Entity has chosen to implement the recognition and measurement provisions of IAS 39 and only the disclosure requirements of Sections 11 and 12 of FRS 102 as they relate to financial instruments. 2.2.1 Classification The Entity classifies its investments in debt, equity, liquidity instruments and derivatives as financial assets or financial liabilities at fair value through profit or loss. These financial assets and financial liabilities are classified as held for trading or designated by the Directors at fair value through profit or loss at inception. All the derivative investments are held for trading purposes. All other financial assets and financial liabilities including cash, cash equivalents, receivables and payables are classified at amortised cost using the effective interest method. 2.2.2 Recognition and derecognition The Entity recognises a financial asset or a financial liability when it becomes a party to the contractual provisions of the instrument. Purchases and sales of investments are recognised on the day the trade takes place. Realised gains and losses on disposals of financial instruments are calculated using the average cost method. For instruments held long, they represent the difference between the initial carrying amount and disposal amount. For instruments held short, they represent the difference between the proceeds received and the opening value. For derivative contracts, they represent the cash payments or receipts made on derivative contracts (excluding those on collateral or margin accounts for such instruments). Financial assets are derecognised when the rights to receive cash flows from the asset have expired or the risks and rewards of ownership have all been substantially transferred. Financial liabilities are derecognised when the obligation under the liability is discharged, cancelled or expired. 2.2.3 Measurement All financial instruments are initially recognised at fair value. Financial assets and financial liabilities at fair value through profit or loss are subsequently measured at fair value. Transaction costs on purchases or sales of investments and gains and losses arising from changes in the fair value of financial assets or financial liabilities at fair value through profit or loss are presented in the income statement within ‘Net gains/(losses) on financial instruments’, in the period in which they arise. Financial assets and financial liabilities, other than those classified as at fair value through profit or loss, are subsequently measured at amortised cost.
40
BLACKROCK INDEX SELECTION FUND
NOTES TO THE FINANCIAL STATEMENTS (continued)
2. Significant accounting policies (continued)
2.2 Financial instruments (continued) 2.2.4 Fair value estimation Fair value is the amount for which an asset could be exchanged, a liability settled or an equity instrument granted could be exchanged, between knowledgeable, willing parties in an arm's length transaction. The estimation of fair value, after initial recognition, is determined as follows:
• Investments in debt and equity instruments, exchange traded funds ("ETFs"), and exchange traded derivatives which are quoted, listed, traded or dealt on a market or exchange are valued based on quoted market prices which, for the purposes of the financial statements is in line with the valuation methodology prescribed in the Entity’s prospectus. Depending on the nature of the underlying investment, the value taken could be either at the closing price, closing mid-market price or bid price on the relevant market.
• Investments which are a unit of participation in an investee collective investment schemes ("CIS") are valued at the unaudited NAV, and where available the independently audited NAV, on the valuation date of such unit of participation as calculated by the administrator of the investee CIS and in accordance with the requirements of the scheme of which the relevant investment is a unit of participation. The unaudited NAV of the underlying investee CIS is reflected gross of any redemption costs which may potentially arise upon redemption from the underlying CIS.
• Investments in over-the-counter (“OTC”) derivatives are valued using valuation techniques.
• Investments in liquidity instruments are valued at amortised cost, this method is deemed equivalent to the fair value,
given the short-term nature of such investments.
In the case of an investment which is not quoted, listed or dealt on a recognised market, or in respect of which a listed, traded or dealt price or quotation is not available at the time of valuation, the fair value of such investment shall be estimated with care and in good faith by a competent professional person, body, firm or corporation (appointed for such purpose by the Directors in consultation with the Investment Manager and approved for the purpose by the Trustee), and such fair value shall be determined using valuation techniques. The Fund uses a variety of methods and makes assumptions that are based on market conditions existing at each reporting date. Valuation techniques used for non-standardised financial instruments such as OTC derivatives include those detailed in the fair value hierarchy note, and those used by market participants making the maximum use of market inputs and relying as little as possible on entity-specific inputs. 2.2.5 Financial derivative and other specific instruments
2.2.5.1 Futures contracts A futures contract is a contract, traded on an exchange, to buy or sell a certain underlying instrument at a certain date in the future, at a specified price. Initial margin deposits are made to relevant brokers upon entering into futures contracts and are included in margin cash. 2.2.5.2 Forward currency contracts A forward currency contract is an agreement, in the OTC market, between two parties to buy or sell a certain underlying currency at a certain date in the future, at a specified price. 2.2.5.3 Swaps A swap is an individually negotiated agreement, in the OTC market, between two parties to swap one stream of payments for another. They may be entered into as a bilateral contract (“OTC swaps”) or centrally cleared (“centrally cleared swaps”). Upon entering into a centrally cleared swap, the Fund is required to deposit initial margin with the broker in the form of cash of an amount that varies depending on the size and risk profile of the underlying swap contract.
41
BLACKROCK INDEX SELECTION FUND
NOTES TO THE FINANCIAL STATEMENTS (continued)
2. Significant accounting policies (continued)
2.2 Financial instruments (continued) 2.2.6 Cash and cash equivalents Cash in the balance sheet includes cash deposits held on call with banks. Cash equivalents include short-term liquid investments that are readily convertible to known amounts of cash and which are subject to an insignificant risk of changes in value. Bank overdrafts are classified as liabilities in the balance sheet. 2.2.7 Collateral and margin cash Cash collateral provided by the Fund is identified on the balance sheet as ‘Cash collateral’ and is not included as a component of cash and cash equivalents. For collateral other than cash provided by the Fund, if the party to whom the collateral is provided has the right by contract to sell or re-pledge the collateral, the Fund classifies that asset on its balance sheet separately from other assets and identifies the asset as a pledged investment. Where the party to whom the collateral is provided does not have the right to sell or re-pledge, a disclosure of the collateral provided is made in the notes to the financial statements. Cash balances held as margin with relevant brokers relating to investments in derivatives at the reporting date are identified on the balance sheet as margin cash. Cash collateral provided to the Fund by counterparties is identified on the balance sheet as ‘Cash collateral payable’. The Fund may reinvest this cash collateral and the assets purchased are included as ‘Cash equivalents’ on the balance sheet. 2.2.8 Redeemable units The Fund classifies redeemable units issued as financial liabilities or equity in accordance with the substance of the contractual terms of the instruments. Redeemable units are measured at the present value of redemption amounts. The redeemable units are redeemable at the option of the holders and do not meet the conditions set out in Section 22.4 of FRS 102, to be classified as equity and as a result are classified as financial liabilities. The redeemable units are accounted for on the day the trade takes place. Where duties and charges are applied in the context of a subscription or redemption, they will have an impact on the value of an investment of a subscribing or redeeming investor and as a result are reflected as part of the issue of redeemable units or the redemption of redeemable units in the statement of changes in net assets attributable to redeemable unitholders. Any potential duties and charges are at the discretion of the Directors. 2.3 Foreign currency
2.3.1 Functional and presentation currency Foreign currency items included in the financial statements are measured in the Fund’s functional currency which is shown in the table overleaf:
42
BLACKROCK INDEX SELECTION FUND
NOTES TO THE FINANCIAL STATEMENTS (continued)
2. Significant accounting policies (continued)
2.3 Foreign currency (continued)
2.3.1 Functional and presentation currency (continued)
Fund name Currency BlackRock Market Advantage Strategy Fund EUR iShares Developed Real Estate Index Fund (IE) USD iShares Developed World ex Tobacco Index Fund (IE) USD iShares Developed World Index Fund (IE) USD iShares Edge EM Fundamental Weighted Index Fund (IE) USD iShares Emerging Markets Index Fund (IE) USD iShares EMU Index Fund (IE) EUR iShares Europe ex-UK Index Fund (IE) EUR iShares Europe Index Fund (IE) EUR iShares Japan Index Fund (IE) USD iShares North America Index Fund (IE) USD iShares Pacific Index Fund (IE) USD iShares UK Index Fund (IE) GBP iShares US Index Fund (IE) USD
The Directors consider that these currencies most accurately represent the economic effects of the underlying transactions, events and conditions of each Fund. The Fund’s presentation currency is the same as the functional currency. 2.3.2 Transactions and balances Transactions in foreign currencies are translated into the functional currency of each Fund at the foreign currency exchange rate in effect at the date of the transaction. Foreign currency assets and liabilities, including investments, are translated at the exchange rate prevailing at the reporting date. The foreign exchange gain or loss based on the translation of the investments, as well as the gain or loss arising on the translation of other assets and liabilities, is included in the income statement. 2.4 Critical accounting estimates and judgements The preparation of the financial statements in conformity with FRS 102 requires the use of certain critical accounting estimates. It also requires the Directors to exercise its judgement in the process of applying the Entity’s accounting policies. Changes in assumptions may have a significant impact on the financial statements in the period the assumptions changed. The Directors believe that the underlying assumptions are appropriate and that the Entity’s financial statements, therefore, present the Entity’s financial position and its results fairly. The estimates and underlying assumptions are reviewed on an ongoing basis. Revisions to accounting estimates are recognised in the period in which the estimate is revised if the revision affects only that period or in the period of the revision and future years if the revision affects both current and future years. The areas involving a higher degree of judgement or complexity, or areas where assumptions and estimates are significant to the financial statements, are disclosed below. 2.4.1 Fair value of OTC derivative financial instruments OTC financial derivative instruments are valued using valuation techniques, as detailed in the fair value hierarchy note to the financial statements. Where valuation techniques (for example, models) are used to determine fair values, they are validated and periodically reviewed and compared to the price provided by an independent pricing service provider, where available. 2.4.2 Fair value of financial instruments not quoted in an active market The fair value of such instruments not quoted in an active market may be determined by the Fund using reputable pricing sources or indicative prices from bond/debt market makers. The Fund would exercise judgement and estimates on the quantity and quality of pricing sources used. Broker quotes as obtained from the pricing sources may be indicative and not executable or binding.
43
BLACKROCK INDEX SELECTION FUND
NOTES TO THE FINANCIAL STATEMENTS (continued)
2. Significant accounting policies (continued)
2.4 Critical accounting estimates and judgements (continued) 2.4.3 Fair value of financial instruments with significant unobservable inputs The fair value of such instruments is determined using valuation techniques including inputs not based on market data and where significant entity determined adjustments or assumptions are applied, as detailed in the fair value hierarchy note to the financial statements. 2.5 Dividend income Dividend income is recognised in the income statement when the Fund’s right to receive the payment is established. For quoted equity securities, this is usually the ex-dividend date. For unquoted equity securities, this is usually the date on which the unitholders approve the payment of a dividend. Dividend income is shown gross of any nonrecoverable withholding taxes, which are presented separately in the income statement. CIS and ETF income is recognised when the distributions are declared by the underlying CIS/ETF. 2.6 Interest income and expense Interest income and expense for all interest-bearing financial instruments are recognised in the income statement using the effective interest method. 2.7 Securities lending income Securities lending income is earned from lending securities owned by the Fund to third party borrowers. Securities lending income is recognised in the income statement on an accruals method basis. 2.8 Fees and expenses Expenses are recognised in the income statement on an accruals basis except for transaction charges relating to the acquisition and realisation of investments which are charged for as incurred. Expenses directly attributable to a specific class of units are borne directly by such class solely. 2.9 Negative yield on financial assets Negative yield on financial assets relating to interest from a negative effective interest rate on a financial asset is accreted daily and is recognised in the income statement over the life of the underlying instrument. 2.10 Distributions Distributions are recognised in the income statement as finance costs where units in Fund do not meet the conditions to be classified as equity and as a result are classified as financial liabilities. All remaining distributions are recognised in the statement of changes in equity. The Directors may declare distributions on the units of the class in respect of each financial period. Distributions may be paid out of the Fund’s net income. The Directors have implemented income equalisation arrangements to ensure that the level of income derived from investments is not affected by the issue, conversion or redemption of units during the financial period. As part of the distribution payment, the average amount of this equalisation is returned to unitholders who subscribed to or redeemed from the Fund during the year. The equalisation element of the distribution is treated as a repayment of capital. Distributions will not be made to the unitholders of the accumulating unit classes. The income and other profits will be accumulated and reinvested in the Fund on behalf of these unitholders. 2.11 Adjustment to align to the valuation methodology as set out in the prospectus Establishment costs are amortised over a period of 5 years for the purpose of calculating the dealing NAV as detailed in the prospectus. However, FRS 102 requires such costs to be expensed when incurred therefore, for the purposes of the financial statements, any unamortised establishment costs have been recognised in full in the income statement in the period in which they were incurred.
44
BLACKROCK INDEX SELECTION FUND
NOTES TO THE FINANCIAL STATEMENTS (continued)
2. Significant accounting policies (continued)
2.11 Adjustment to align to the valuation methodology as set out in the prospectus (continued) Consequently, the differences described above adjust the carrying amount of the net assets attributable to unitholders and the cumulative differences are included in ’Adjustment to align to the valuation methodology as set out in the prospectus on the balance sheet. 2.12 Taxation
2.12.1 Current tax Current tax is recognised for the amount of income tax payable in respect of the overseas taxable profit for the current or past reporting periods using the tax rates and laws that that have been enacted or substantively enacted by the reporting date. 2.12.2 Deferred tax A provision for deferred tax payable is recognised in respect of material timing differences that have originated but not reversed at the balance sheet date. A deferred tax asset is not recognised to the extent that the transfer of economic benefits in the future is uncertain. Timing differences are differences between the Fund’s overseas taxable profits and its results as stated in the financial statements that arise from the inclusion of income and expenses in tax assessments in periods different from those in which they are recognised in the financial statements. 2.13 Comparatives Certain prior year figures have been reclassified to correspond to current year presentation. 3. Financial risks
Each Fund’s investment activities expose them to the various types of risk which are associated with the financial instruments and markets in which it invests. The following information is not intended to be a comprehensive summary of all risks and investors should refer to the prospectus for a more detailed discussion of the risks inherent in investing in each Fund. 3.1 Risk management framework The Directors review quarterly investment performance reports and receive semi-annual presentations from the Investment Manager covering the Entity’s performance and risk profile during the financial year. The Directors have delegated the day-to-day administration of the investment programme to the Investment Manager. The Investment Manager is also responsible for ensuring that the Entity is managed within the terms of its investment guidelines and limits set out in the prospectus. The Directors reserve to themselves the investment performance, product risk monitoring and oversight and the responsibility for the monitoring and oversight of regulatory and operational risk for the Entity. The Directors have appointed a risk manager who has responsibility for the daily risk management process with assistance from key risk management personnel of the Investment Manager, including members of the BlackRock Risk and Quantitative Analysis Group (“RQA Group”) which is a centralised group which performs an independent risk management function. The RQA Group independently identifies, measures and monitors investment risk. The RQA Group tracks the actual risk management practices being deployed across each different Fund. By breaking down the components of the process, the RQA Group has the ability to determine if the appropriate risk management processes are in place across each Fund. This captures the risk management tools employed, how the levels of risk are controlled, ensuring risk/return is considered in portfolio construction and reviewing outcomes. 3.2 Market risk Market risk arises mainly from uncertainty about future values of financial instruments influenced by currency, interest rate and price movements. It represents the potential loss each Fund may suffer through holding market positions in the face of market movements. A key metric used by the RQA Group to measure market risk is Value-at-Risk (“VaR”) which encompasses currency, interest rate and price risk. VaR is a statistical risk measure that estimates the potential portfolio loss from adverse market movements in an ordinary market environment. VaR analysis reflects the interdependencies between risk variables, unlike a traditional sensitivity analysis. There are two preferred methods of using VaR to measure and manage market risk volatility, the relative and the absolute. Under relative VaR, each Fund’s portfolio will not exceed twice the VaR of the reference portfolio. Under absolute VaR, the VaR will not exceed 20% of each Fund’s NAV.
45
BLACKROCK INDEX SELECTION FUND
NOTES TO THE FINANCIAL STATEMENTS (continued)
3. Financial risks (continued)
3.2 Market risk (continued) The VaR calculations are based on an adjusted historical simulation model with a confidence level of 99%, a holding period of one day and a historical observation period of not less than one year (250 days). A VaR number is defined at a specified probability and a specified time horizon. A 99% one day VaR means that the expectation is that 99% of the time over a one-day period each Fund will lose no more than this number in percentage terms. Therefore, higher VaR numbers indicate higher risk. It is noted that the use of VaR methodology has limitations, namely that the use of historical market data as a basis for estimating future events does not encompass all possible scenarios, particularly those that are of an extreme nature and that the use of a specified confidence level (e.g. 99%) does not take into account losses that occur beyond this level. There is some probability that the loss could be greater than the VaR amounts. These limitations and the nature of the VaR measure mean that each Fund can neither guarantee that losses will not exceed the VaR amounts indicated, nor that losses in excess of the VaR amounts will not occur more frequently. The one-day VaR based on 99% confidence level is outlined in the table below:
Fund name Methodology 2019 %
2018 %
BlackRock Market Advantage Strategy Fund Absolute 0.98 1.13 iShares Developed Real Estate Index Fund (IE) Absolute 1.75 1.70 iShares Developed World ex Tobacco Index Fund (IE) Absolute 2.05 2.02 iShares Developed World Index Fund (IE) Absolute 2.03 2.03 iShares Edge EM Fundamental Weighted Index Fund (IE) Absolute 1.93 2.11 iShares Emerging Markets Index Fund (IE) Absolute 2.17 2.25 iShares EMU Index Fund (IE) Absolute 2.16 1.90 iShares Europe ex-UK Index Fund (IE) Absolute 2.05 1.89 iShares Europe Index Fund (IE) Absolute 2.00 1.90 iShares Japan Index Fund (IE) Absolute 2.60 2.22 iShares North America Index Fund (IE) Absolute 2.69 2.94 iShares Pacific Index Fund (IE) Absolute 1.83 1.73 iShares UK Index Fund (IE) Absolute 2.02 1.94 iShares US Index Fund (IE) Absolute 2.79 3.09
3.2.1 Market risk arising from foreign currency risk Foreign currency risk is the risk that the fair value or future cash flows of a financial instrument will fluctuate because of changes in foreign exchange rates. Exposure to foreign currency risk Each Fund may invest in financial instruments denominated in currencies other than its functional currency. Consequently, each Fund is exposed, directly and/or indirectly, to risks that the exchange rate of its functional currency relative to other currencies may change in a manner which has an adverse effect on the value of the portion of each Fund's assets which are denominated in currencies other than its own currency. The details of the open forward currency contracts in place to hedge foreign currency risk at the financial year end date are disclosed in the schedules of investments. In addition, each Fund issued unit classes denominated in currencies other than the functional currency of each Fund. Management of foreign currency risk Each Fund engages in foreign currency hedging to minimise the effect of currency movements between the currencies of the investments held by the Fund and the Fund’s currency hedged unit classes. The Investment Manager monitors foreign currency risk exposure against pre-determined tolerances and determines when a currency hedge should be reset and the gain or loss arising from such hedge reinvested or settled, while taking into consideration the frequency and associated transaction and reinvestment costs of resetting the currency hedge.
46
BLACKROCK INDEX SELECTION FUND
NOTES TO THE FINANCIAL STATEMENTS (continued)
3. Financial risks (continued)
3.2 Market risk (continued) 3.2.2 Market risk arising from interest rate risk Interest rate risk is the risk that the fair value or future cash flows of a financial instrument will fluctuate because of changes in market interest rates. Exposure to interest rate risk Each Fund is exposed to interest rate risk through its cash and cash equivalent holdings including margin cash held with brokers and through its investments in interest bearing financial instruments which are disclosed in the schedules of investments. Each Fund also has indirect exposure to interest rate risk through its investments into CIS, ETF and interest rate financial derivative instruments (“FDIs”), whereby the value of an underlying asset may fluctuate as a result of a change in interest rates. Management of interest rate risk Interest rate risk exposure is managed by constantly monitoring the position for deviations outside of a pre-determined tolerance level and, when necessary, rebalancing back to the original desired parameters. Cash and cash collateral is invested into money market funds to generate a return to protect the Fund against unfavourable movements in interest rates. 3.2.3 Market risk arising from price risk Price risk is the risk that the fair value of future cash flows of a financial instrument will fluctuate because of changes in market prices (other than those arising from interest rate risk or currency risk), whether those changes are caused by factors specific to the individual financial instrument or its issuer, or factors affecting similar financial instruments traded in the market. Exposure to price risk Each Fund is exposed to price risk arising from its investments in financial instruments. The exposure of each Fund to price risk is the fair value of the investments held as shown in the schedules of investments of each Fund. Management of price risk By diversifying the portfolio, where this is appropriate and consistent with each Fund's objectives, the risk that a price change of a particular investment will have a material impact on the NAV of each Fund is minimised. There is a risk that the valuation of each Fund may not fairly reflect the value of the investments held at a specific time due to events outside the control of the Directors, which could result in significant losses or inaccurate pricing for each Fund. To mitigate this risk the Directors may temporarily suspend the determination of the NAV of any Fund until a fair or reasonable valuation of the investments held can be determined. The price risk inherent in the CIS holdings is monitored by the Investment Manager by understanding the investment objectives of the underlying funds as well as their internal control policies and regular risk and performance reporting. The investments into other CIS are all investments into related party funds. Such CIS are subject to the same control procedures the Investment Manager employs for each Fund. 3.3 Liquidity risk Liquidity risk is the risk that each Fund will encounter difficulties in meeting obligations associated with financial liabilities. Exposure to liquidity risk Each Fund’s principal liquidity risks arise from the ability of investors to effect redemption requests and the liquidity of the underlying investments each Fund has invested in.
47
BLACKROCK INDEX SELECTION FUND
NOTES TO THE FINANCIAL STATEMENTS (continued)
3. Financial risks (continued)
3.3 Liquidity risk (continued) Exposure to liquidity risk (continued) Each Fund's unitholders may redeem their units on the close of any daily dealing deadline for cash equal to a proportionate share of each Fund's NAV, excluding any duties and charges where applicable. Each Fund is therefore potentially exposed to the liquidity risk of meeting the unitholders’ redemptions and may need to sell assets at prevailing market prices to meet liquidity demands. Each Fund may invest in CIS which can impose notice periods or other restrictions on redemptions and this may increase the liquidity risk of each Fund. Each Fund is also exposed to liquidity risk associated with daily margin calls on FDIs. The majority of each Fund's financial liabilities, based on contractual maturities, fall due within three months with the exception of FDI liabilities. The expected settlement dates for FDI liabilities can be more than three months based on the analysis of the remaining period at the reporting date to the maturity date and are outlined in the schedules of investments. Management of liquidity risk Liquidity risk is minimised by holding sufficient liquid investments which can be readily realised to meet liquidity demands. Asset disposals may also be required to meet redemption requests. However, timely sale of trading positions can be impaired by many factors including trading volume and increased price volatility. As a result, each Fund may experience difficulties in disposing of assets to satisfy liquidity demands. Each Fund's liquidity risk is managed by the Investment Manager in accordance with established policies and procedures in place. The portfolio managers review daily forward-looking cash reports which project cash obligations. These reports allow them to manage their cash obligations. If redemption requests from all holders of units in a Fund exceed more than 10% of the NAV of each Fund on any particular dealing day, the Directors shall be entitled, at their discretion, to refuse to redeem such excess numbers of units in issue from each Fund. The units which are not redeemed at any given dealing day shall be redeemed on each subsequent dealing day on a pro-rata basis in priority to any requests received thereafter. None of the assets of each Fund is subject to special liquidity arrangements. 3.4 Counterparty credit risk Counterparty credit risk is the risk that one party to a financial instrument will cause a financial loss for the other party by failing to discharge an obligation. Exposure to counterparty credit risk Each Fund is exposed to counterparty credit risk from the parties with which it trades and will bear the risk of settlement default. Each Fund's exposure is limited to the contracts in which it currently has a financial asset position reduced by any collateral received from the counterparty, or to counterparties who have received collateral from each Fund. The carrying value of financial assets together with cash held with counterparties best represents each Fund's gross maximum exposure to counterparty credit risk at the reporting date, before including the effect of any International Swaps and Derivatives Associations, Inc. Master Agreement (“ISDA Master Agreement”) or similar agreement, and netting, which would reduce the overall counterparty credit risk exposure. Each Fund only transacts with counterparties that are regulated entities subject to prudential supervision, or with high credit-ratings assigned by international credit-rating agencies. Cash held as security by the counterparty to FDI contracts is subject to the credit risk of the counterparty. All transactions in listed securities are settled/paid for upon delivery of securities, using approved brokers. Risk relating to unsettled transactions is considered low due to the short settlement period involved and the high credit quality of the brokers used.
48
BLACKROCK INDEX SELECTION FUND
NOTES TO THE FINANCIAL STATEMENTS (continued)
3. Financial risks (continued)
3.4 Counterparty credit risk (continued) Management of counterparty credit risk Counterparty credit risk is monitored and managed by BlackRock’s RQA Counterparty & Concentration Risk Team. The team is headed by BlackRock’s Chief Counterparty Credit Officer who reports to the Global Head of RQA. Credit authority resides with the Chief Counterparty Credit Officer and selected team members to whom specific credit authority has been delegated. As such, counterparty approvals may be granted by the Chief Counterparty Credit Officer, or by identified RQA Credit Risk Officers who have been formally delegated authority by the Chief Counterparty Credit Officer. The BlackRock RQA Counterparty & Concentration Risk Team completes a formal review of each new counterparty, monitors and reviews all approved counterparties on an ongoing basis and maintains an active oversight of counterparty exposures and the collateral management process. There were no past due or impaired balances in relation to transactions with counterparties as at 31 May 2019 or 31 May 2018. 3.4.1 FDIs Each Fund's holdings in exchange traded and OTC FDIs expose each Fund to counterparty credit risk. 3.4.1.1 Exchange traded FDIs The exposure is limited by trading contracts through a clearing house. Each Fund's exposure to credit risk on contracts in which it currently has a gain position is reduced by such gains received in cash from the counterparty under the daily mark-to-market mechanism on exchange traded contracts (variation margin). Each Fund's exposure to credit risk on contracts in which it currently has a loss position is equal to the amount of margin posted to the counterparty which has not been transferred to the exchange under the daily mark-to market mechanism. 3.4.1.2 OTC FDIs The risk in relation to OTC FDIs arises from the failure of the counterparty to perform according to the terms of the contract as these FDI transactions are traded bilaterally and not through a central clearing counterparty. All OTC FDI transactions are entered into by each Fund under an ISDA Master Agreement or similar agreement. An ISDA Master Agreement is a bilateral agreement between each Fund and a counterparty that governs OTC FDI transactions entered into by the parties. The parties’ exposures under the ISDA Master Agreement are netted and collateralised together, therefore, any collateral disclosures provided are in respect of all OTC FDI transactions entered into by each Fund under the ISDA Master Agreement. All cash collateral received/posted by each Fund under the ISDA Master Agreement is transferred bilaterally under a title transfer arrangement. Each Fund is the legal owner of inbound collateral and can sell the assets and withhold the cash in the case of default. If the counterparty fulfils its obligations in relation to the investment, each Fund will return an equal amount of cash to the counterparty on maturity or sale of the investment. When each Fund returns securities collateral to the counterparty, it must be of the same type, nominal value, description and amount as the securities that were transferred to each Fund. Trading in OTC FDIs which have not been collateralised give rise to counterparty exposure. Each Fund's maximum exposure to counterparty credit risk from holding forward currency contracts will be equal to the notional amount of the currency contract and any net unrealised gains as disclosed in the relevant Fund’s schedule of investments. Forward currency contracts do not require variation margins and the counterparty credit risk is monitored through the BlackRock RQA Counterparty & Concentration Risk Team who monitor the creditworthiness of the counterparty. Each Fund has the right to reinvest cash collateral received. Securities pledged as collateral have been annotated on the schedules of investments and separately disclosed on the balance sheets. Collateral received in the form of securities is not reflected on the balance sheets but is reflected in the notes to the financial statements.
49
BLACKROCK INDEX SELECTION FUND
NOTES TO THE FINANCIAL STATEMENTS (continued)
3. Financial risks (continued)
3.4 Counterparty credit risk (continued) 3.4.1 FDIs (continued) 3.4.1.2 OTC FDIs (continued) Cash collateral pledged by the Fund is separately identified on the balance sheets as cash collateral and is not included as a component of cash and cash equivalents. Inbound cash collateral received by each Fund is reflected on the balance sheets as cash collateral payable. Each Fund is also exposed to counterparty risk of rehypothecation of pledged collateral. The value of inbound cash collateral is reflected on the balance sheets of each Fund. The fair value of securities collateral pledged is reflected in the table below:
As at 31 May 2019 Currency Pledged collateral 2019 2018 BlackRock Market Advantage Strategy Fund EUR’000 20,007 1,687 The following tables detail the total number of OTC FDI counterparties each Fund is exposed to, the maximum exposure to any one counterparty which is calculated on a net basis and the lowest long-term credit rating of any one counterparty (or its ultimate parent, if it is unrated):
As at 31 May 2019 Currency
Total number of
counterparties
Maximum exposure to any one counterparty
'000
Collateral received
'000
Lowest credit rating of any
one counterparty
BlackRock Market Advantage Strategy Fund EUR 13 2,060 2,370 BBB+ iShares Developed World Index Fund (IE) USD 1 – – A iShares Emerging Markets Index Fund (IE) USD 2 – – A iShares Europe ex-UK Index Fund (IE) EUR 1 – – A iShares North America Index Fund (IE) USD 1 – – A iShares UK Index Fund (IE) GBP 2 82 – BBB+
As at 31 May 2018 Currency
Total number of
counterparties
Maximum exposure to any
one counterparty ‘000
Collateral received
‘000
Lowest credit rating of any
one counterparty
BlackRock Market Advantage Strategy Fund EUR 9 5,184 – BBB+ iShares Emerging Markets Index Fund (IE) USD 2 2 – A+ iShares Pacific Index Fund (IE) USD 1 – – A iShares UK Index Fund (IE) GBP 2 – – BBB+
3.4.2 Trustee The majority of the investments are held by the Trustee at the financial year end. Investments are segregated from the assets of the Trustee, with ownership rights remaining with each Fund. Bankruptcy or insolvency of the Trustee may cause the Fund's rights with respect to its investments held by the Trustee to be delayed or limited. The maximum exposure to this risk is the amount of long investments disclosed in the schedule of investments, plus any unsettled trades. To mitigate each Fund's exposure to the Trustee, the Investment Manager employs specific procedures to ensure that the Trustee is a reputable institution and that the counterparty credit risk is acceptable to each Fund. Each Fund only transacts with Trustee's that are regulated entities subject to prudential supervision, or with "high credit ratings" assigned by international credit rating agencies. The long-term credit rating of the parent company of the Trustee as at 31 May 2019 is A+ (31 May 2018: A+) (Standard & Poor’s rating). 3.4.3 Securities lending Each Fund that engage in securities lending activities expose such Funds to counterparty credit risk. The maximum exposure of each Fund is equal to the value of the securities loaned.
50
BLACKROCK INDEX SELECTION FUND
NOTES TO THE FINANCIAL STATEMENTS (continued)
3. Financial risks (continued)
3.4 Counterparty credit risk (continued) 3.4.3 Securities lending (continued) All securities lending transactions entered into by each Fund are subject to a written legal agreement between each Fund and the securities lending agent, BlackRock Advisors (UK) Limited, a related party to the Entity, and separately between the securities lending agent and the approved borrowing counterparty. Collateral received in exchange for securities lent is transferred under a title transfer arrangement and is delivered to and held in an account with a tri-party collateral manager in the name of the Trustee on behalf of each Fund. Collateral received is segregated from the assets belonging to each Fund’s Trustee or the securities lending agent. The collateral is registered and held in the name of Trustee on behalf of each Fund in any or all of the following central securities depositories; J.P. Morgan Chase, Euroclear or Bank of New York Mellon, depending on the type of collateral the counterparty has to give in order to cover the required value of exposure. The collateral provided by these counterparties consists of shares admitted to dealing on a regulated market. The Funds outlined below engaged in securities lending activities during the year. The value of securities on loan and collateral held at the financial year end are shown below:
31 May 2019 31 May 2018
Value of securities on
loan
Value of collateral received
Value of securities on
loan
Value of collateral received
Fund name Currency ‘000 ‘000 ‘000 ‘000 BlackRock Market Advantage Strategy Fund EUR 13,935 15,384 3,446 3,808
iShares Developed Real Estate Index Fund (IE) USD 227,414 250,841 182,646 200,938
iShares Developed World ex Tobacco Index Fund (IE) USD 87,881 96,891 12,731 14,014
iShares Developed World Index Fund (IE) USD 1,916,019 2,111,655 2,019,812 2,211,247
iShares Edge EM Fundamental Weighted Index Fund (IE) USD 35,197 39,296 60,808 67,592
iShares Emerging Markets Index Fund (IE) USD 1,266,248 1,407,797 1,518,919 1,677,229
iShares EMU Index Fund (IE) EUR 10,696 11,680 20,531 22,588
iShares Europe ex-UK Index Fund (IE) EUR 390,157 435,972 421,027 463,854
iShares Europe Index Fund (IE) EUR 43,819 49,038 22,843 24,929
iShares Japan Index Fund (IE) USD 381,248 430,672 381,688 418,631
iShares North America Index Fund (IE) USD 368,515 407,168 385,679 417,752
iShares Pacific Index Fund (IE) USD 119,954 135,773 144,382 159,606
iShares UK Index Fund (IE) GBP 20,857 24,173 36,658 40,516 To mitigate this risk, each Fund receives either cash or securities as collateral equal to a certain percentage in excess of the fair value of the securities loaned. The Investment Manager monitors the fair value of the securities loaned and additional collateral is obtained, if necessary. As at 31 May 2019 and 31 May 2018, all collateral received consists of securities admitted to or dealt on a regulated market. Each Fund also benefits from a borrower default indemnity provided by BlackRock, Inc. The indemnity allows for full replacement of securities lent. BlackRock, Inc. bears the cost of indemnification against borrower default. 3.4.5 Issuer credit risk relating to debt instruments Issuer credit risk is the default risk of one of the issuers of any debt instruments held by each Fund. Debt instruments involve credit risk to the issuer which may be evidenced by the issuer’s credit rating. Securities which are subordinated and/or have a lower credit rating are generally considered to have a higher credit risk and a greater possibility of default than more highly rated. A number of each Fund invest into sovereign debt which expose them to the default risk of the issuer with regards to interest or principal payments.
51

BLACKROCK INDEX SELECTION FUND
NOTES TO THE FINANCIAL STATEMENTS (continued)
3. Financial risks (continued)
3.4 Counterparty credit risk (continued) 3.4.5 Issuer credit risk relating to debt instruments (continued) The following tables detail the credit rating profile of the debt instruments held by each Fund:
As at 31 May 2019 Currency
Investment grade % of debt
instruments
Non-investment grade % of debt
instruments
Not rated % of debt
instruments Total % of debt
instruments BlackRock Market Advantage Strategy Fund EUR 100.00 – – 100.00 iShares US Index Fund (IE) USD 100.00 – – 100.00
As at 31 May 2018 Currency
Investment grade % of debt
instruments
Non-investment grade % of debt
instruments
Not rated % of debt
instruments Total % of debt
instruments BlackRock Market Advantage Strategy Fund EUR 100.00 – – 100.00 iShares US Index Fund (IE) USD 100.00 – – 100.00
To manage this risk, the Investment Manager, where appropriate and consistent with each Fund's objectives, invests in a wide range of debt instruments. The ratings of debt instruments are continually monitored by the BlackRock Portfolio Management Group (“PMG”) and for non-rated or securities with subordinated or lower credit ratings, additional specific procedures are employed to ensure the associated credit risk is acceptable to each Fund. 4. Fair value hierarchy
Each Fund classifies financial instruments measured at fair value using a fair value hierarchy. The fair value hierarchy has the following categories: Level 1: The unadjusted quoted price in an active market for identical assets or liabilities that the entity can access at the measurement date. Level 2: Inputs other than quoted prices included within Level 1 that are observable (i.e. developed using market data) for the asset or liability, either directly or indirectly. This category includes instruments valued using: quoted prices in active markets for similar instruments; quoted prices for similar instruments in markets that are considered less than active; or other valuation techniques where all significant inputs are directly or indirectly observable from market data. Level 3: Inputs are unobservable (i.e. for which market data is unavailable) for the asset or liability. This category includes all instruments where the valuation techniques used include inputs not based on market data and these inputs could have a significant impact on the instrument’s valuation. This category also includes instruments that are valued based on quoted prices for similar instruments where significant entity determined adjustments or assumptions are required to reflect differences between the instruments and instruments for which there is no active market. Valuation techniques include net present value and discounted cash flow models, comparison with similar instruments for which observable market prices exist and other valuation models. Assumptions and inputs used in valuation techniques include risk-free and benchmark interest rates, credit spreads and other premiums used in estimating discount rates, bond and equity prices, foreign currency exchange rates, equity indices, and expected price volatilities and correlations.
52
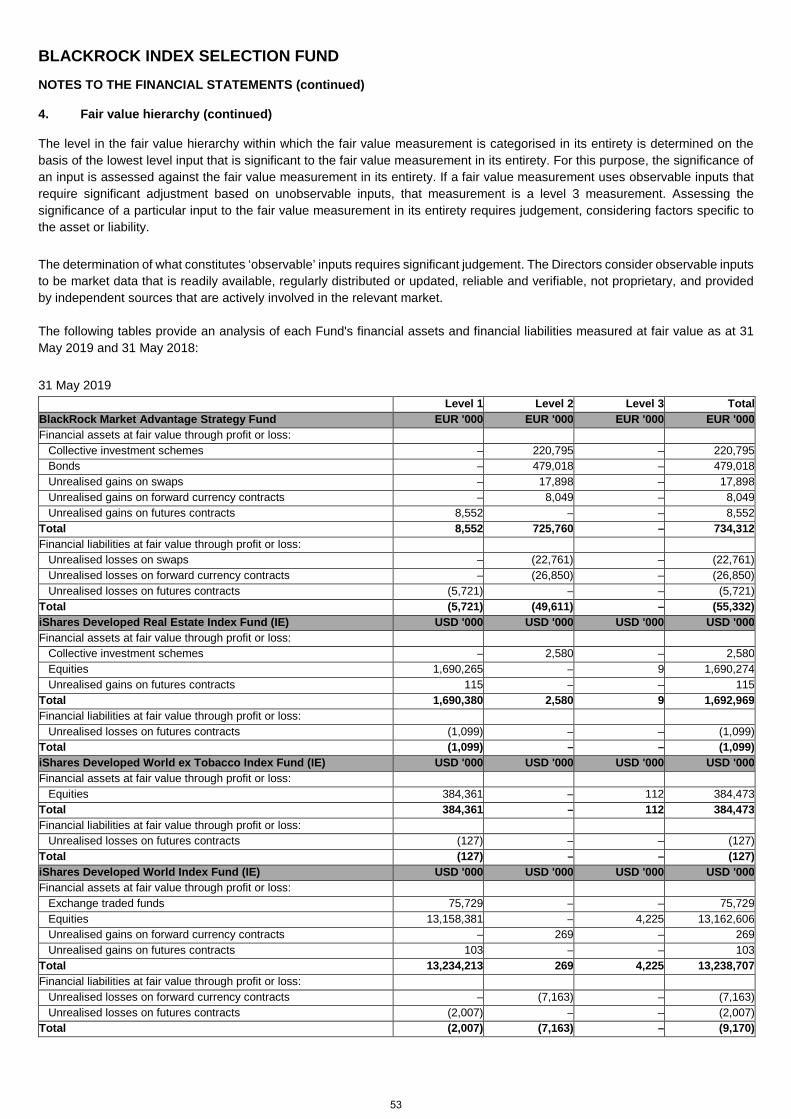
BLACKROCK INDEX SELECTION FUND
NOTES TO THE FINANCIAL STATEMENTS (continued)
4. Fair value hierarchy (continued)
The level in the fair value hierarchy within which the fair value measurement is categorised in its entirety is determined on the basis of the lowest level input that is significant to the fair value measurement in its entirety. For this purpose, the significance of an input is assessed against the fair value measurement in its entirety. If a fair value measurement uses observable inputs that require significant adjustment based on unobservable inputs, that measurement is a level 3 measurement. Assessing the significance of a particular input to the fair value measurement in its entirety requires judgement, considering factors specific to the asset or liability. The determination of what constitutes ‘observable’ inputs requires significant judgement. The Directors consider observable inputs to be market data that is readily available, regularly distributed or updated, reliable and verifiable, not proprietary, and provided by independent sources that are actively involved in the relevant market. The following tables provide an analysis of each Fund's financial assets and financial liabilities measured at fair value as at 31 May 2019 and 31 May 2018: 31 May 2019
Level 1 Level 2 Level 3 Total BlackRock Market Advantage Strategy Fund EUR '000 EUR '000 EUR '000 EUR '000 Financial assets at fair value through profit or loss:
Collective investment schemes – 220,795 – 220,795 Bonds – 479,018 – 479,018 Unrealised gains on swaps – 17,898 – 17,898 Unrealised gains on forward currency contracts – 8,049 – 8,049 Unrealised gains on futures contracts 8,552 – – 8,552
Total 8,552 725,760 – 734,312 Financial liabilities at fair value through profit or loss:
Unrealised losses on swaps – (22,761) – (22,761) Unrealised losses on forward currency contracts – (26,850) – (26,850) Unrealised losses on futures contracts (5,721) – – (5,721)
Total (5,721) (49,611) – (55,332) iShares Developed Real Estate Index Fund (IE) USD '000 USD '000 USD '000 USD '000 Financial assets at fair value through profit or loss:
Collective investment schemes – 2,580 – 2,580 Equities 1,690,265 – 9 1,690,274 Unrealised gains on futures contracts 115 – – 115
Total 1,690,380 2,580 9 1,692,969 Financial liabilities at fair value through profit or loss:
Unrealised losses on futures contracts (1,099) – – (1,099) Total (1,099) – – (1,099) iShares Developed World ex Tobacco Index Fund (IE) USD '000 USD '000 USD '000 USD '000 Financial assets at fair value through profit or loss:
Equities 384,361 – 112 384,473 Total 384,361 – 112 384,473 Financial liabilities at fair value through profit or loss:
Unrealised losses on futures contracts (127) – – (127) Total (127) – – (127) iShares Developed World Index Fund (IE) USD '000 USD '000 USD '000 USD '000 Financial assets at fair value through profit or loss:
Exchange traded funds 75,729 – – 75,729 Equities 13,158,381 – 4,225 13,162,606 Unrealised gains on forward currency contracts – 269 – 269 Unrealised gains on futures contracts 103 – – 103
Total 13,234,213 269 4,225 13,238,707 Financial liabilities at fair value through profit or loss:
Unrealised losses on forward currency contracts – (7,163) – (7,163) Unrealised losses on futures contracts (2,007) – – (2,007)
Total (2,007) (7,163) – (9,170)
53
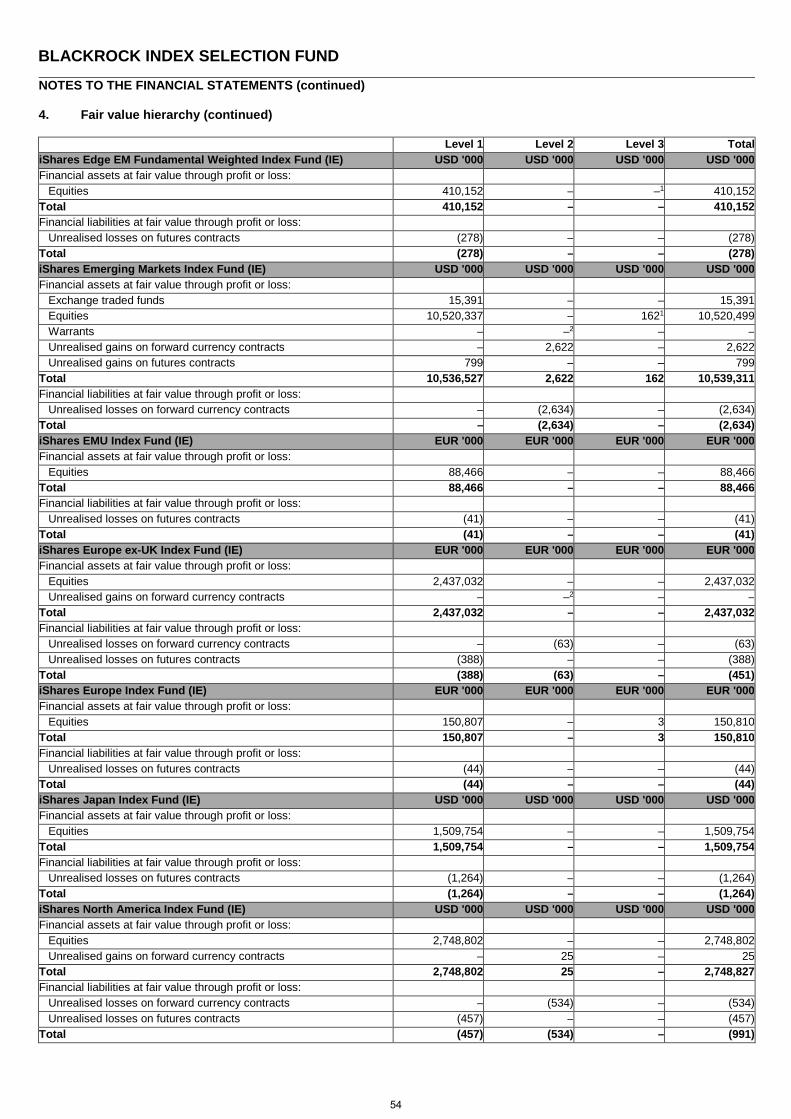
BLACKROCK INDEX SELECTION FUND
NOTES TO THE FINANCIAL STATEMENTS (continued)
4. Fair value hierarchy (continued)
Level 1 Level 2 Level 3 Total iShares Edge EM Fundamental Weighted Index Fund (IE) USD '000 USD '000 USD '000 USD '000 Financial assets at fair value through profit or loss:
Equities 410,152 – –1 410,152 Total 410,152 – – 410,152 Financial liabilities at fair value through profit or loss:
Unrealised losses on futures contracts (278) – – (278) Total (278) – – (278) iShares Emerging Markets Index Fund (IE) USD '000 USD '000 USD '000 USD '000 Financial assets at fair value through profit or loss:
Exchange traded funds 15,391 – – 15,391 Equities 10,520,337 – 1621 10,520,499 Warrants – –2 – – Unrealised gains on forward currency contracts – 2,622 – 2,622 Unrealised gains on futures contracts 799 – – 799
Total 10,536,527 2,622 162 10,539,311 Financial liabilities at fair value through profit or loss:
Unrealised losses on forward currency contracts – (2,634) – (2,634) Total – (2,634) – (2,634) iShares EMU Index Fund (IE) EUR '000 EUR '000 EUR '000 EUR '000 Financial assets at fair value through profit or loss:
Equities 88,466 – – 88,466 Total 88,466 – – 88,466 Financial liabilities at fair value through profit or loss:
Unrealised losses on futures contracts (41) – – (41) Total (41) – – (41) iShares Europe ex-UK Index Fund (IE) EUR '000 EUR '000 EUR '000 EUR '000 Financial assets at fair value through profit or loss:
Equities 2,437,032 – – 2,437,032 Unrealised gains on forward currency contracts – –2 – –
Total 2,437,032 – – 2,437,032 Financial liabilities at fair value through profit or loss:
Unrealised losses on forward currency contracts – (63) – (63) Unrealised losses on futures contracts (388) – – (388)
Total (388) (63) – (451) iShares Europe Index Fund (IE) EUR '000 EUR '000 EUR '000 EUR '000 Financial assets at fair value through profit or loss:
Equities 150,807 – 3 150,810 Total 150,807 – 3 150,810 Financial liabilities at fair value through profit or loss:
Unrealised losses on futures contracts (44) – – (44) Total (44) – – (44) iShares Japan Index Fund (IE) USD '000 USD '000 USD '000 USD '000 Financial assets at fair value through profit or loss:
Equities 1,509,754 – – 1,509,754 Total 1,509,754 – – 1,509,754 Financial liabilities at fair value through profit or loss:
Unrealised losses on futures contracts (1,264) – – (1,264) Total (1,264) – – (1,264) iShares North America Index Fund (IE) USD '000 USD '000 USD '000 USD '000 Financial assets at fair value through profit or loss:
Equities 2,748,802 – – 2,748,802 Unrealised gains on forward currency contracts – 25 – 25
Total 2,748,802 25 – 2,748,827 Financial liabilities at fair value through profit or loss:
Unrealised losses on forward currency contracts – (534) – (534) Unrealised losses on futures contracts (457) – – (457)
Total (457) (534) – (991)
54

BLACKROCK INDEX SELECTION FUND
NOTES TO THE FINANCIAL STATEMENTS (continued)
4. Fair value hierarchy (continued)
Level 1 Level 2 Level 3 Total iShares Pacific Index Fund (IE) USD '000 USD '000 USD '000 USD '000 Financial assets at fair value through profit or loss:
Equities 609,950 – –1 609,950 Unrealised gains on futures contracts 52 – – 52
Total 610,002 – – 610,002 Financial liabilities at fair value through profit or loss:
Unrealised losses on futures contracts (42) – – (42) Total (42) – – (42) iShares UK Index Fund (IE) GBP '000 GBP '000 GBP '000 GBP '000 Financial assets at fair value through profit or loss:
Equities 524,008 – 35 524,043 Unrealised gains on forward currency contracts – 82 – 82
Total 524,008 82 35 524,125 Financial liabilities at fair value through profit or loss:
Unrealised losses on forward currency contracts – (35) – (35) Unrealised losses on futures contracts (231) – – (231)
Total (231) (35) – (266) iShares US Index Fund (IE) USD '000 USD '000 USD '000 USD '000 Financial assets at fair value through profit or loss:
Liquidity instruments – 1,545,211 – 1,545,211 Total – 1,545,211 – 1,545,211 Financial liabilities at fair value through profit or loss:
Unrealised losses on futures contracts (22,054) – – (22,054) Total (22,054) – – (22,054)
1Level 3 securities which are less than 500 are rounded to zero. 2Level 2 securities which are less than 500 are rounded to zero. 31 May 2018
Level 1 Level 2 Level 3 Total BlackRock Market Advantage Strategy Fund EUR '000 EUR '000 EUR '000 EUR '000 Financial assets at fair value through profit or loss:
Collective investment schemes – 144,937 – 144,937 Bonds – 228,078 – 228,078 Unrealised gains on swaps – 10,326 – 10,326 Unrealised gains on swaptions – 639 – 639 Unrealised gains on forward currency contracts – 13,469 – 13,469 Unrealised gains on futures contracts 6,382 – – 6,382
Total 6,382 397,449 – 403,831 Financial liabilities at fair value through profit or loss:
Unrealised losses on swaps – (5,407) – (5,407) Unrealised losses on forward currency contracts – (18,482) – (18,482) Unrealised losses on futures contracts (693) – – (693)
Total (693) (23,889) – (24,582) iShares Developed Real Estate Index Fund (IE) USD '000 USD '000 USD '000 USD '000 Financial assets at fair value through profit or loss:
Collective investment schemes – 4,026 – 4,026 Equities 2,058,620 – 18,369 2,076,989 Unrealised gains on futures contracts 188 – – 188
Total 2,058,808 4,026 18,369 2,081,203 Financial liabilities at fair value through profit or loss:
Unrealised losses on futures contracts (31) – – (31) Total (31) – – (31)
55
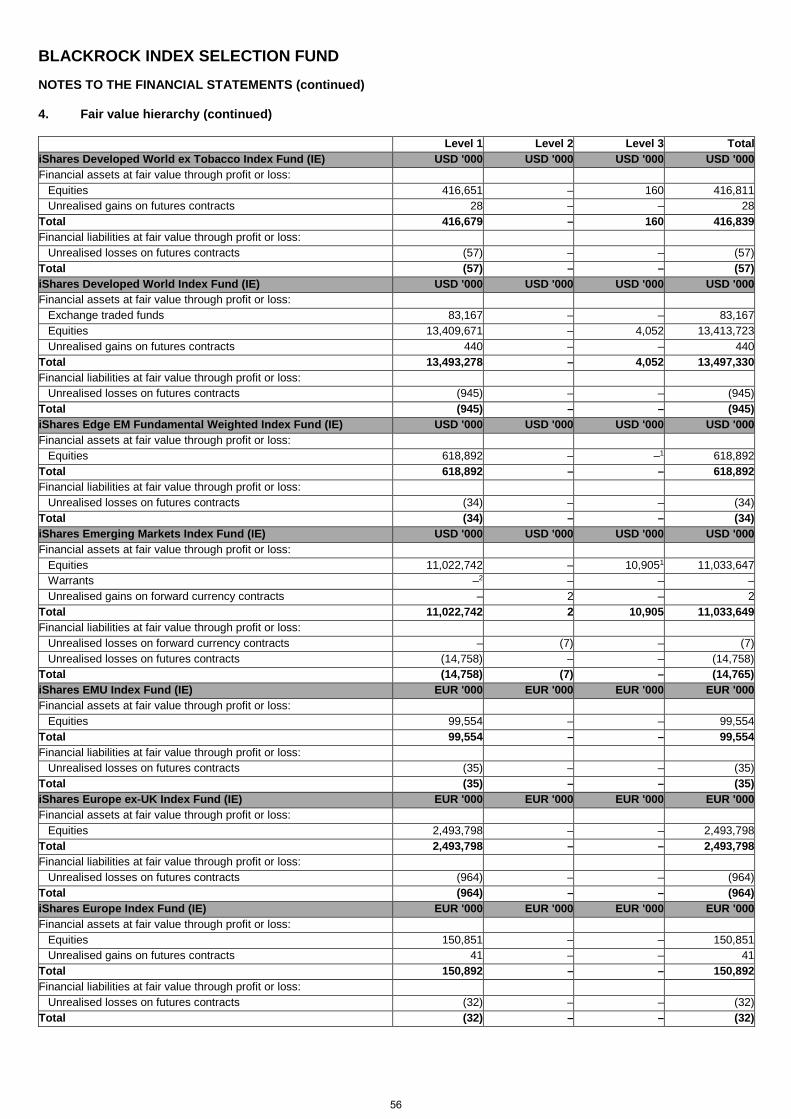
BLACKROCK INDEX SELECTION FUND
NOTES TO THE FINANCIAL STATEMENTS (continued)
4. Fair value hierarchy (continued)
Level 1 Level 2 Level 3 Total iShares Developed World ex Tobacco Index Fund (IE) USD '000 USD '000 USD '000 USD '000 Financial assets at fair value through profit or loss:
Equities 416,651 – 160 416,811 Unrealised gains on futures contracts 28 – – 28
Total 416,679 – 160 416,839 Financial liabilities at fair value through profit or loss:
Unrealised losses on futures contracts (57) – – (57) Total (57) – – (57) iShares Developed World Index Fund (IE) USD '000 USD '000 USD '000 USD '000 Financial assets at fair value through profit or loss:
Exchange traded funds 83,167 – – 83,167 Equities 13,409,671 – 4,052 13,413,723 Unrealised gains on futures contracts 440 – – 440
Total 13,493,278 – 4,052 13,497,330 Financial liabilities at fair value through profit or loss:
Unrealised losses on futures contracts (945) – – (945) Total (945) – – (945) iShares Edge EM Fundamental Weighted Index Fund (IE) USD '000 USD '000 USD '000 USD '000 Financial assets at fair value through profit or loss:
Equities 618,892 – –1 618,892 Total 618,892 – – 618,892 Financial liabilities at fair value through profit or loss:
Unrealised losses on futures contracts (34) – – (34) Total (34) – – (34) iShares Emerging Markets Index Fund (IE) USD '000 USD '000 USD '000 USD '000 Financial assets at fair value through profit or loss:
Equities 11,022,742 – 10,9051 11,033,647 Warrants –2 – – – Unrealised gains on forward currency contracts – 2 – 2
Total 11,022,742 2 10,905 11,033,649 Financial liabilities at fair value through profit or loss:
Unrealised losses on forward currency contracts – (7) – (7) Unrealised losses on futures contracts (14,758) – – (14,758)
Total (14,758) (7) – (14,765) iShares EMU Index Fund (IE) EUR '000 EUR '000 EUR '000 EUR '000 Financial assets at fair value through profit or loss:
Equities 99,554 – – 99,554 Total 99,554 – – 99,554 Financial liabilities at fair value through profit or loss:
Unrealised losses on futures contracts (35) – – (35) Total (35) – – (35) iShares Europe ex-UK Index Fund (IE) EUR '000 EUR '000 EUR '000 EUR '000 Financial assets at fair value through profit or loss:
Equities 2,493,798 – – 2,493,798 Total 2,493,798 – – 2,493,798 Financial liabilities at fair value through profit or loss:
Unrealised losses on futures contracts (964) – – (964) Total (964) – – (964) iShares Europe Index Fund (IE) EUR '000 EUR '000 EUR '000 EUR '000 Financial assets at fair value through profit or loss:
Equities 150,851 – – 150,851 Unrealised gains on futures contracts 41 – – 41
Total 150,892 – – 150,892 Financial liabilities at fair value through profit or loss:
Unrealised losses on futures contracts (32) – – (32) Total (32) – – (32)
56
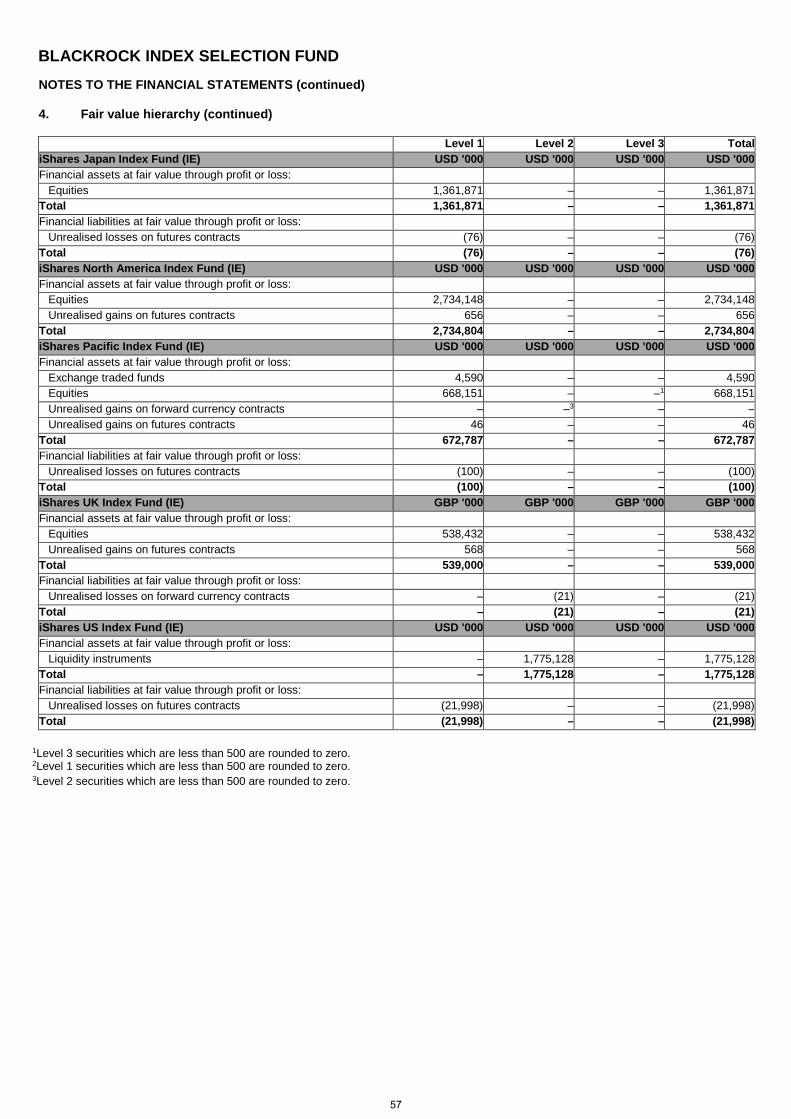
BLACKROCK INDEX SELECTION FUND
NOTES TO THE FINANCIAL STATEMENTS (continued)
4. Fair value hierarchy (continued)
Level 1 Level 2 Level 3 Total iShares Japan Index Fund (IE) USD '000 USD '000 USD '000 USD '000 Financial assets at fair value through profit or loss:
Equities 1,361,871 – – 1,361,871 Total 1,361,871 – – 1,361,871 Financial liabilities at fair value through profit or loss:
Unrealised losses on futures contracts (76) – – (76) Total (76) – – (76) iShares North America Index Fund (IE) USD '000 USD '000 USD '000 USD '000 Financial assets at fair value through profit or loss:
Equities 2,734,148 – – 2,734,148 Unrealised gains on futures contracts 656 – – 656
Total 2,734,804 – – 2,734,804 iShares Pacific Index Fund (IE) USD '000 USD '000 USD '000 USD '000 Financial assets at fair value through profit or loss:
Exchange traded funds 4,590 – – 4,590 Equities 668,151 – –1 668,151 Unrealised gains on forward currency contracts – –3 – – Unrealised gains on futures contracts 46 – – 46
Total 672,787 – – 672,787 Financial liabilities at fair value through profit or loss:
Unrealised losses on futures contracts (100) – – (100) Total (100) – – (100) iShares UK Index Fund (IE) GBP '000 GBP '000 GBP '000 GBP '000 Financial assets at fair value through profit or loss:
Equities 538,432 – – 538,432 Unrealised gains on futures contracts 568 – – 568
Total 539,000 – – 539,000 Financial liabilities at fair value through profit or loss:
Unrealised losses on forward currency contracts – (21) – (21) Total – (21) – (21) iShares US Index Fund (IE) USD '000 USD '000 USD '000 USD '000 Financial assets at fair value through profit or loss:
Liquidity instruments – 1,775,128 – 1,775,128 Total – 1,775,128 – 1,775,128 Financial liabilities at fair value through profit or loss:
Unrealised losses on futures contracts (21,998) – – (21,998) Total (21,998) – – (21,998)
1Level 3 securities which are less than 500 are rounded to zero. 2Level 1 securities which are less than 500 are rounded to zero. 3Level 2 securities which are less than 500 are rounded to zero.
57
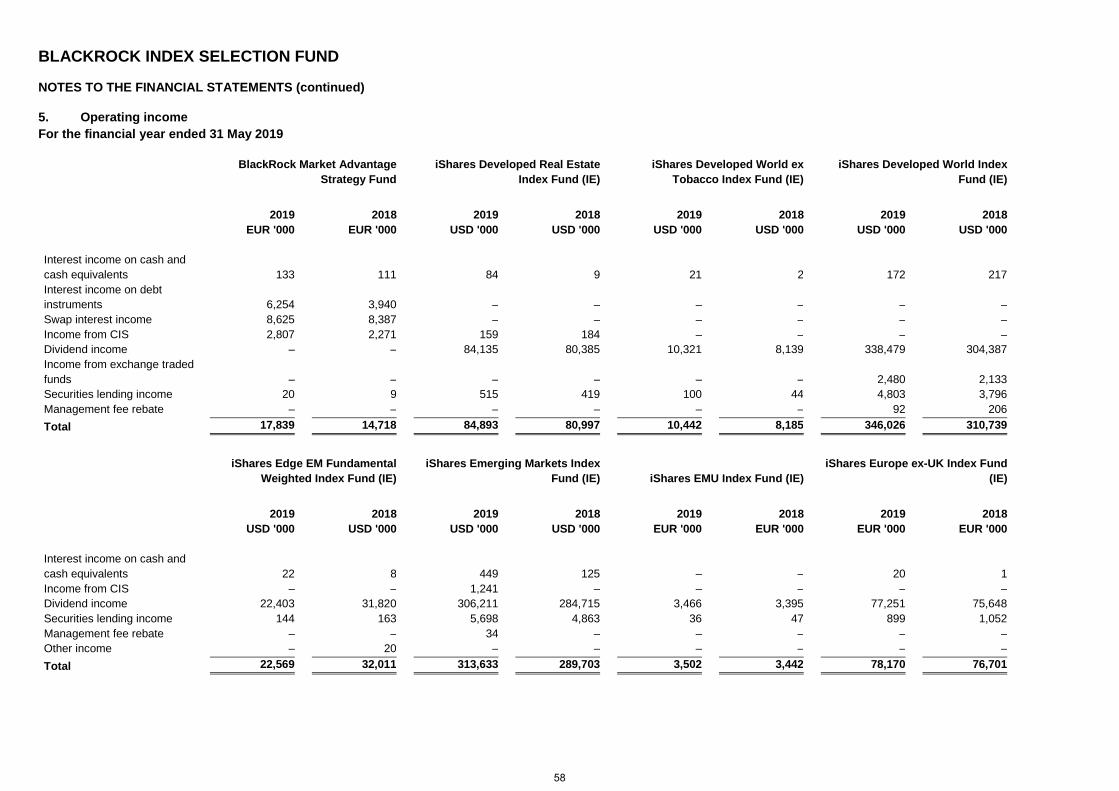
BLACKROCK INDEX SELECTION FUND NOTES TO THE FINANCIAL STATEMENTS (continued)
5. Operating income For the financial year ended 31 May 2019
BlackRock Market Advantage
Strategy Fund iShares Developed Real Estate
Index Fund (IE) iShares Developed World ex
Tobacco Index Fund (IE) iShares Developed World Index
Fund (IE)
2019
EUR '000 2018
EUR '000 2019
USD '000 2018
USD '000 2019
USD '000 2018
USD '000 2019
USD '000 2018
USD '000 Interest income on cash and cash equivalents 133 111 84 9 21 2 172 217 Interest income on debt instruments 6,254 3,940 – – – – – – Swap interest income 8,625 8,387 – – – – – – Income from CIS 2,807 2,271 159 184 – – – – Dividend income – – 84,135 80,385 10,321 8,139 338,479 304,387 Income from exchange traded funds – – – – – – 2,480 2,133 Securities lending income 20 9 515 419 100 44 4,803 3,796 Management fee rebate – – – – – – 92 206 Total 17,839 14,718 84,893 80,997 10,442 8,185 346,026 310,739
iShares Edge EM Fundamental
Weighted Index Fund (IE) iShares Emerging Markets Index
Fund (IE) iShares EMU Index Fund (IE) iShares Europe ex-UK Index Fund
(IE)
2019
USD '000 2018
USD '000 2019
USD '000 2018
USD '000 2019
EUR '000 2018
EUR '000 2019
EUR '000 2018
EUR '000 Interest income on cash and cash equivalents 22 8 449 125 – – 20 1 Income from CIS – – 1,241 – – – – – Dividend income 22,403 31,820 306,211 284,715 3,466 3,395 77,251 75,648 Securities lending income 144 163 5,698 4,863 36 47 899 1,052 Management fee rebate – – 34 – – – – – Other income – 20 – – – – – – Total 22,569 32,011 313,633 289,703 3,502 3,442 78,170 76,701
58
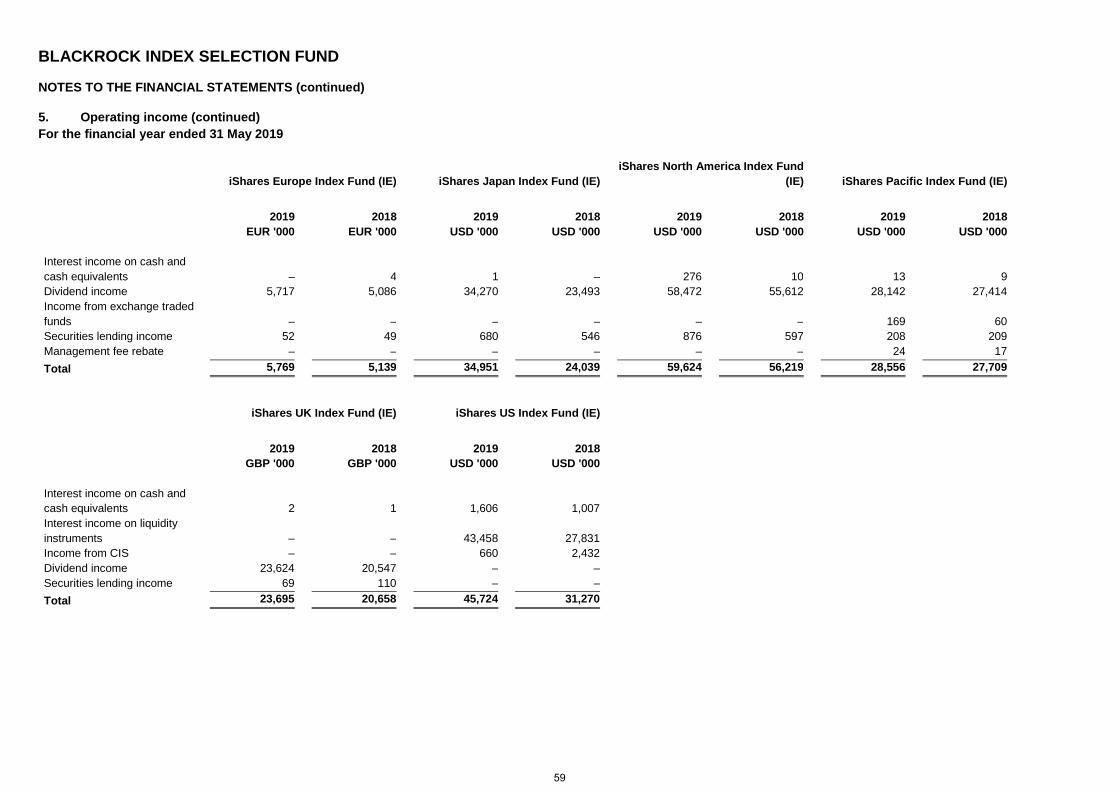
BLACKROCK INDEX SELECTION FUND NOTES TO THE FINANCIAL STATEMENTS (continued)
5. Operating income (continued) For the financial year ended 31 May 2019
iShares Europe Index Fund (IE) iShares Japan Index Fund (IE) iShares North America Index Fund
(IE) iShares Pacific Index Fund (IE)
2019
EUR '000 2018
EUR '000 2019
USD '000 2018
USD '000 2019
USD '000 2018
USD '000 2019
USD '000 2018
USD '000 Interest income on cash and cash equivalents – 4 1 – 276 10 13 9 Dividend income 5,717 5,086 34,270 23,493 58,472 55,612 28,142 27,414 Income from exchange traded funds – – – – – – 169 60 Securities lending income 52 49 680 546 876 597 208 209 Management fee rebate – – – – – – 24 17 Total 5,769 5,139 34,951 24,039 59,624 56,219 28,556 27,709
iShares UK Index Fund (IE) iShares US Index Fund (IE)
2019
GBP '000 2018
GBP '000 2019
USD '000 2018
USD '000 Interest income on cash and cash equivalents 2 1 1,606 1,007 Interest income on liquidity instruments – – 43,458 27,831 Income from CIS – – 660 2,432 Dividend income 23,624 20,547 – – Securities lending income 69 110 – – Total 23,695 20,658 45,724 31,270
59
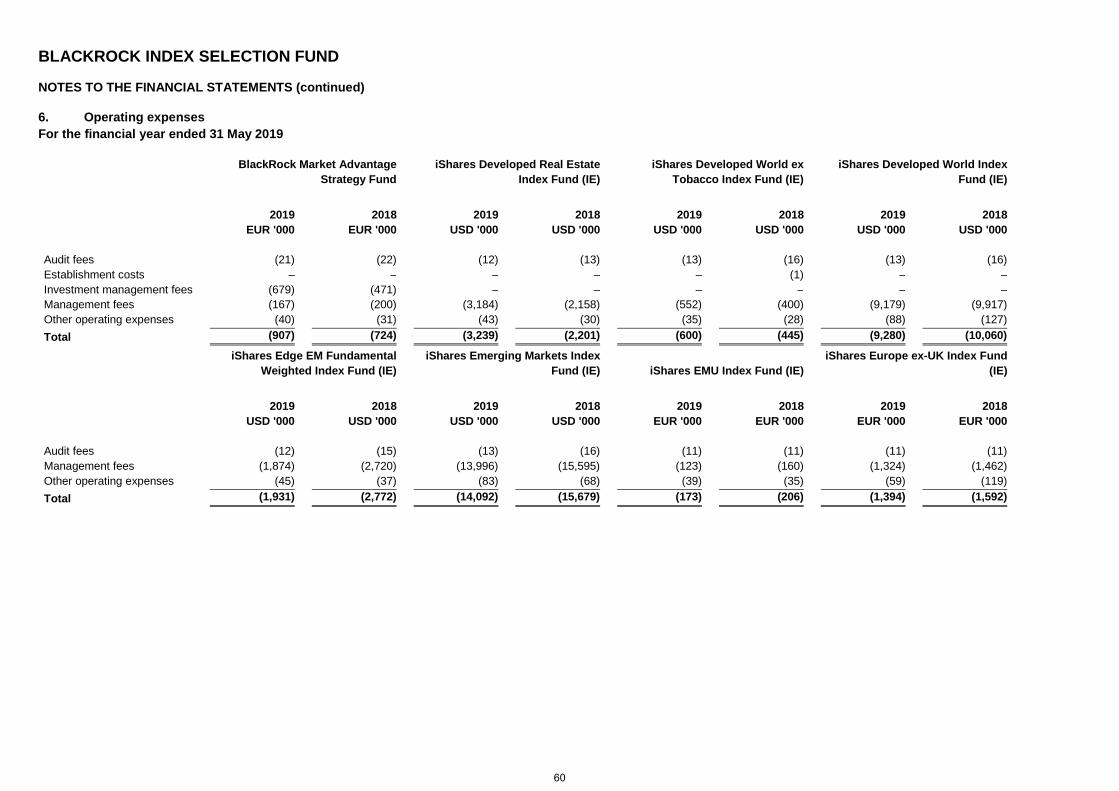
BLACKROCK INDEX SELECTION FUND NOTES TO THE FINANCIAL STATEMENTS (continued)
6. Operating expenses For the financial year ended 31 May 2019
BlackRock Market Advantage
Strategy Fund iShares Developed Real Estate
Index Fund (IE) iShares Developed World ex
Tobacco Index Fund (IE) iShares Developed World Index
Fund (IE)
2019
EUR '000 2018
EUR '000 2019
USD '000 2018
USD '000 2019
USD '000 2018
USD '000 2019
USD '000 2018
USD '000 Audit fees (21) (22) (12) (13) (13) (16) (13) (16) Establishment costs – – – – – (1) – – Investment management fees (679) (471) – – – – – – Management fees (167) (200) (3,184) (2,158) (552) (400) (9,179) (9,917) Other operating expenses (40) (31) (43) (30) (35) (28) (88) (127) Total (907) (724) (3,239) (2,201) (600) (445) (9,280) (10,060)
iShares Edge EM Fundamental
Weighted Index Fund (IE) iShares Emerging Markets Index
Fund (IE) iShares EMU Index Fund (IE) iShares Europe ex-UK Index Fund
(IE)
2019
USD '000 2018
USD '000 2019
USD '000 2018
USD '000 2019
EUR '000 2018
EUR '000 2019
EUR '000 2018
EUR '000 Audit fees (12) (15) (13) (16) (11) (11) (11) (11) Management fees (1,874) (2,720) (13,996) (15,595) (123) (160) (1,324) (1,462) Other operating expenses (45) (37) (83) (68) (39) (35) (59) (119) Total (1,931) (2,772) (14,092) (15,679) (173) (206) (1,394) (1,592)
60
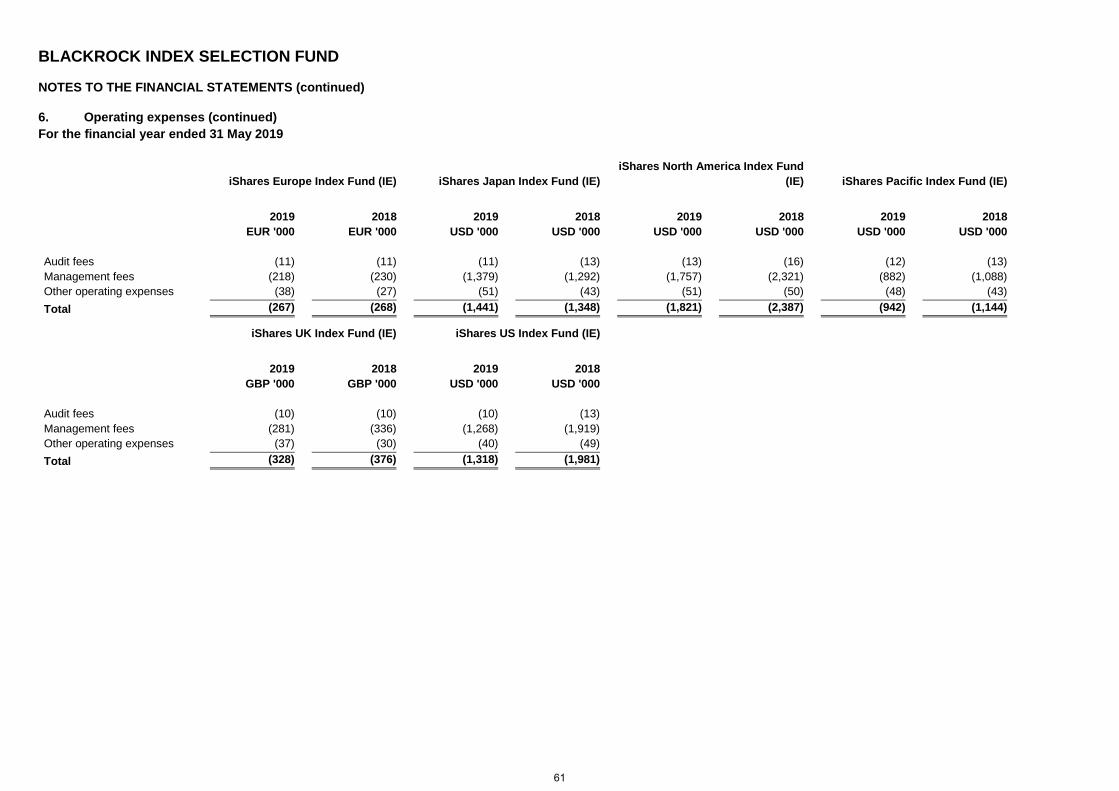
BLACKROCK INDEX SELECTION FUND NOTES TO THE FINANCIAL STATEMENTS (continued)
6. Operating expenses (continued) For the financial year ended 31 May 2019
iShares Europe Index Fund (IE) iShares Japan Index Fund (IE) iShares North America Index Fund
(IE) iShares Pacific Index Fund (IE)
2019
EUR '000 2018
EUR '000 2019
USD '000 2018
USD '000 2019
USD '000 2018
USD '000 2019
USD '000 2018
USD '000 Audit fees (11) (11) (11) (13) (13) (16) (12) (13) Management fees (218) (230) (1,379) (1,292) (1,757) (2,321) (882) (1,088) Other operating expenses (38) (27) (51) (43) (51) (50) (48) (43) Total (267) (268) (1,441) (1,348) (1,821) (2,387) (942) (1,144)
iShares UK Index Fund (IE) iShares US Index Fund (IE)
2019
GBP '000 2018
GBP '000 2019
USD '000 2018
USD '000 Audit fees (10) (10) (10) (13) Management fees (281) (336) (1,268) (1,919) Other operating expenses (37) (30) (40) (49) Total (328) (376) (1,318) (1,981)
61
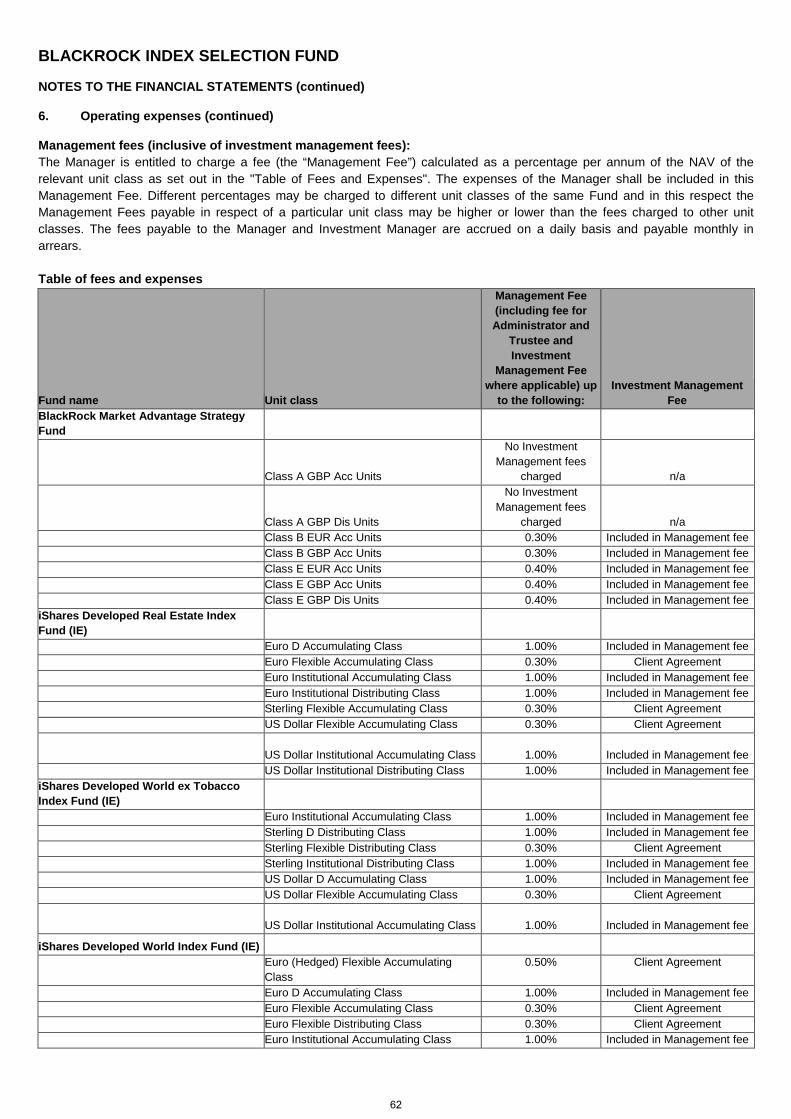
BLACKROCK INDEX SELECTION FUND NOTES TO THE FINANCIAL STATEMENTS (continued)
6. Operating expenses (continued)
Management fees (inclusive of investment management fees): The Manager is entitled to charge a fee (the “Management Fee”) calculated as a percentage per annum of the NAV of the relevant unit class as set out in the "Table of Fees and Expenses". The expenses of the Manager shall be included in this Management Fee. Different percentages may be charged to different unit classes of the same Fund and in this respect the Management Fees payable in respect of a particular unit class may be higher or lower than the fees charged to other unit classes. The fees payable to the Manager and Investment Manager are accrued on a daily basis and payable monthly in arrears. Table of fees and expenses
Fund name Unit class
Management Fee (including fee for Administrator and
Trustee and Investment
Management Fee where applicable) up
to the following: Investment Management
Fee BlackRock Market Advantage Strategy Fund
Class A GBP Acc Units Class A GBP Acc Units
No Investment Management fees
charged n/a
Class A GBP Dis Units Class A GBP Dis Units
No Investment Management fees
charged n/a Class B EUR Acc Units Class B EUR Acc Units 0.30% Included in Management fee Class B GBP Acc Units Class B GBP Acc Units 0.30% Included in Management fee Class E EUR Acc Units Class E EUR Acc Units 0.40% Included in Management fee Class E GBP Acc Units Class E GBP Acc Units 0.40% Included in Management fee Class E GBP Dis Units Class E GBP Dis Units 0.40% Included in Management fee iShares Developed Real Estate Index Fund (IE) Euro D Accumulating Class Euro D Accumulating Class 1.00% Included in Management fee Euro Flexible Accumulating Class Euro Flexible Accumulating Class 0.30% Client Agreement Euro Institutional Accumulating Class Euro Institutional Accumulating Class 1.00% Included in Management fee Euro Institutional Distributing Class Euro Institutional Distributing Class 1.00% Included in Management fee Sterling Flexible Accumulating Class Sterling Flexible Accumulating Class 0.30% Client Agreement US Dollar Flexible Accumulating Class US Dollar Flexible Accumulating Class 0.30% Client Agreement US Dollar Institutional Accumulating Class US Dollar Institutional Accumulating Class 1.00% Included in Management fee US Dollar Institutional Distributing Class US Dollar Institutional Distributing Class 1.00% Included in Management fee iShares Developed World ex Tobacco Index Fund (IE) Euro Institutional Accumulating Class Euro Institutional Accumulating Class 1.00% Included in Management fee Sterling D Distributing Class Sterling D Distributing Class 1.00% Included in Management fee Sterling Flexible Distributing Class Sterling Flexible Distributing Class 0.30% Client Agreement Sterling Institutional Distributing Class Sterling Institutional Distributing Class 1.00% Included in Management fee US Dollar D Accumulating Class US Dollar D Accumulating Class 1.00% Included in Management fee US Dollar Flexible Accumulating Class US Dollar Flexible Accumulating Class 0.30% Client Agreement US Dollar Institutional Accumulating Class US Dollar Institutional Accumulating Class 1.00% Included in Management fee
iShares Developed World Index Fund (IE) Euro (Hedged) Flexible Accumulating Class
Euro (Hedged) Flexible Accumulating Class
0.50% Client Agreement
Euro D Accumulating Class Euro D Accumulating Class 1.00% Included in Management fee Euro Flexible Accumulating Class Euro Flexible Accumulating Class 0.30% Client Agreement Euro Flexible Distributing Class Euro Flexible Distributing Class 0.30% Client Agreement Euro Institutional Accumulating Class Euro Institutional Accumulating Class 1.00% Included in Management fee
62
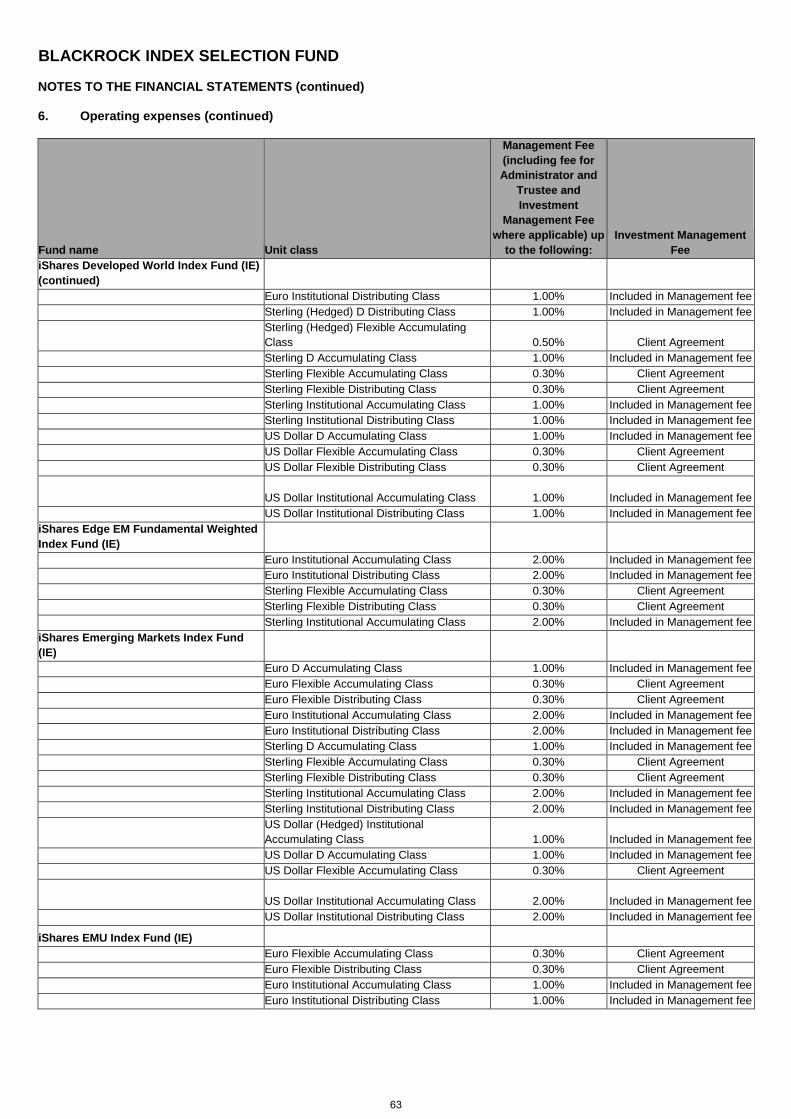
BLACKROCK INDEX SELECTION FUND NOTES TO THE FINANCIAL STATEMENTS (continued)
6. Operating expenses (continued)
Fund name Unit class
Management Fee (including fee for Administrator and
Trustee and Investment
Management Fee where applicable) up
to the following: Investment Management
Fee iShares Developed World Index Fund (IE) (continued) Euro Institutional Distributing Class 1.00% Included in Management fee Sterling (Hedged) D Distributing Class 1.00% Included in Management fee
Sterling (Hedged) Flexible Accumulating Class 0.50% Client Agreement
Sterling D Accumulating Class 1.00% Included in Management fee Sterling Flexible Accumulating Class 0.30% Client Agreement Sterling Flexible Distributing Class Sterling Flexible Distributing Class 0.30% Client Agreement Sterling Institutional Accumulating Class Sterling Institutional Accumulating Class 1.00% Included in Management fee Sterling Institutional Distributing Class Sterling Institutional Distributing Class 1.00% Included in Management fee US Dollar D Accumulating Class US Dollar D Accumulating Class 1.00% Included in Management fee US Dollar Flexible Accumulating Class US Dollar Flexible Accumulating Class 0.30% Client Agreement US Dollar Flexible Distributing Class US Dollar Flexible Distributing Class 0.30% Client Agreement US Dollar Institutional Accumulating Class US Dollar Institutional Accumulating Class 1.00% Included in Management fee US Dollar Institutional Distributing Class US Dollar Institutional Distributing Class 1.00% Included in Management fee iShares Edge EM Fundamental Weighted Index Fund (IE) Euro Institutional Accumulating Class Euro Institutional Accumulating Class 2.00% Included in Management fee Euro Institutional Distributing Class Euro Institutional Distributing Class 2.00% Included in Management fee Sterling Flexible Accumulating Class Sterling Flexible Accumulating Class 0.30% Client Agreement Sterling Flexible Distributing Class Sterling Flexible Distributing Class 0.30% Client Agreement Sterling Institutional Accumulating Class Sterling Institutional Accumulating Class 2.00% Included in Management fee iShares Emerging Markets Index Fund (IE) Euro D Accumulating Class Euro D Accumulating Class 1.00% Included in Management fee Euro Flexible Accumulating Class Euro Flexible Accumulating Class 0.30% Client Agreement Euro Flexible Distributing Class Euro Flexible Distributing Class 0.30% Client Agreement Euro Institutional Accumulating Class Euro Institutional Accumulating Class 2.00% Included in Management fee Euro Institutional Distributing Class Euro Institutional Distributing Class 2.00% Included in Management fee Sterling D Accumulating Class Sterling D Accumulating Class 1.00% Included in Management fee Sterling Flexible Accumulating Class Sterling Flexible Accumulating Class 0.30% Client Agreement Sterling Flexible Distributing Class Sterling Flexible Distributing Class 0.30% Client Agreement Sterling Institutional Accumulating Class Sterling Institutional Accumulating Class 2.00% Included in Management fee Sterling Institutional Distributing Class Sterling Institutional Distributing Class 2.00% Included in Management fee US Dollar (Hedged) Institutional Accumulating Class
US Dollar (Hedged) Institutional Accumulating Class 1.00% Included in Management fee
US Dollar D Accumulating Class US Dollar D Accumulating Class 1.00% Included in Management fee US Dollar Flexible Accumulating Class US Dollar Flexible Accumulating Class 0.30% Client Agreement US Dollar Institutional Accumulating Class US Dollar Institutional Accumulating Class 2.00% Included in Management fee US Dollar Institutional Distributing Class US Dollar Institutional Distributing Class 2.00% Included in Management fee
iShares EMU Index Fund (IE) Euro Flexible Accumulating Class Euro Flexible Accumulating Class 0.30% Client Agreement Euro Flexible Distributing Class Euro Flexible Distributing Class 0.30% Client Agreement Euro Institutional Accumulating Class Euro Institutional Accumulating Class 1.00% Included in Management fee Euro Institutional Distributing Class Euro Institutional Distributing Class 1.00% Included in Management fee
63
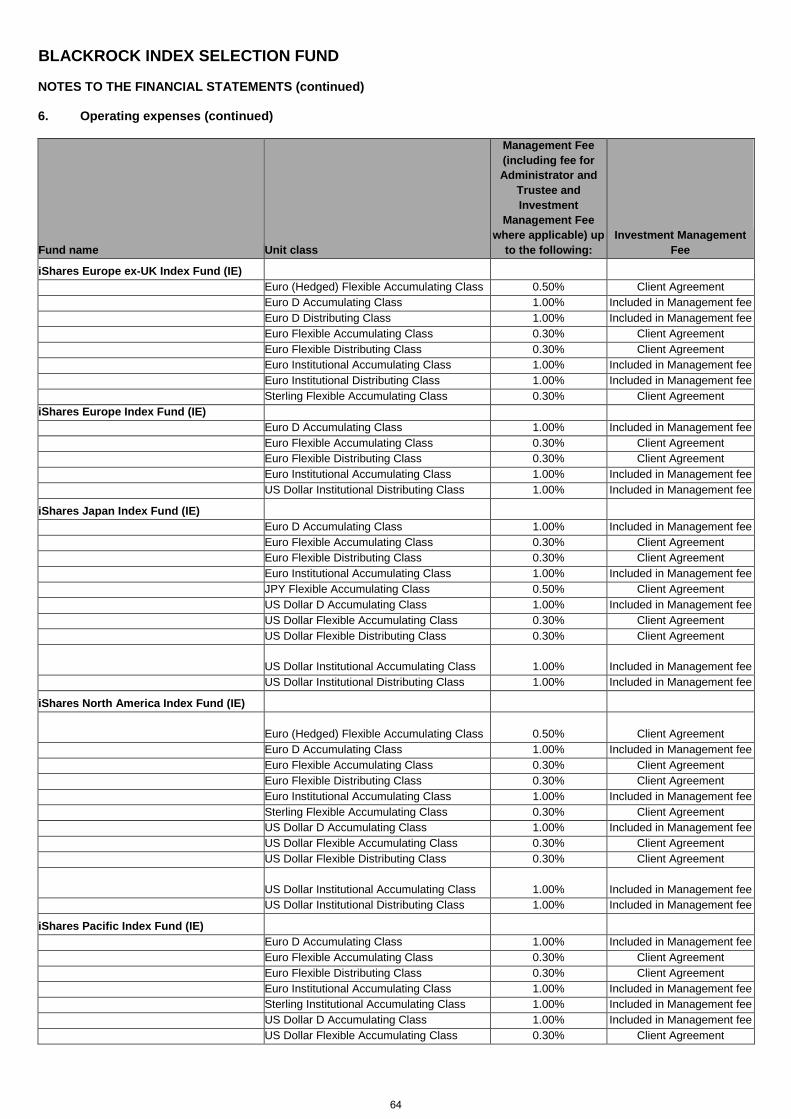
BLACKROCK INDEX SELECTION FUND NOTES TO THE FINANCIAL STATEMENTS (continued)
6. Operating expenses (continued)
Fund name Unit class
Management Fee (including fee for Administrator and
Trustee and Investment
Management Fee where applicable) up
to the following: Investment Management
Fee
iShares Europe ex-UK Index Fund (IE) Euro (Hedged) Flexible Accumulating Class 0.50% Client Agreement Euro D Accumulating Class 1.00% Included in Management fee Euro D Distributing Class 1.00% Included in Management fee Euro Flexible Accumulating Class 0.30% Client Agreement Euro Flexible Distributing Class 0.30% Client Agreement Euro Institutional Accumulating Class 1.00% Included in Management fee Euro Institutional Distributing Class 1.00% Included in Management fee Sterling Flexible Accumulating Class 0.30% Client Agreement iShares Europe Index Fund (IE) Euro D Accumulating Class Euro D Accumulating Class 1.00% Included in Management fee Euro Flexible Accumulating Class Euro Flexible Accumulating Class 0.30% Client Agreement Euro Flexible Distributing Class Euro Flexible Distributing Class 0.30% Client Agreement Euro Institutional Accumulating Class Euro Institutional Accumulating Class 1.00% Included in Management fee US Dollar Institutional Distributing Class US Dollar Institutional Distributing Class 1.00% Included in Management fee
iShares Japan Index Fund (IE) Euro D Accumulating Class Euro D Accumulating Class 1.00% Included in Management fee Euro Flexible Accumulating Class Euro Flexible Accumulating Class 0.30% Client Agreement Euro Flexible Distributing Class Euro Flexible Distributing Class 0.30% Client Agreement Euro Institutional Accumulating Class Euro Institutional Accumulating Class 1.00% Included in Management fee JPY Flexible Accumulating Class JPY Flexible Accumulating Class 0.50% Client Agreement US Dollar D Accumulating Class US Dollar D Accumulating Class 1.00% Included in Management fee US Dollar Flexible Accumulating Class US Dollar Flexible Accumulating Class 0.30% Client Agreement US Dollar Flexible Distributing Class US Dollar Flexible Distributing Class 0.30% Client Agreement US Dollar Institutional Accumulating Class US Dollar Institutional Accumulating Class 1.00% Included in Management fee US Dollar Institutional Distributing Class US Dollar Institutional Distributing Class 1.00% Included in Management fee
iShares North America Index Fund (IE) Euro (Hedged) Flexible Accumulating Class Euro (Hedged) Flexible Accumulating Class 0.50% Client Agreement Euro D Accumulating Class Euro D Accumulating Class 1.00% Included in Management fee Euro Flexible Accumulating Class Euro Flexible Accumulating Class 0.30% Client Agreement Euro Flexible Distributing Class Euro Flexible Distributing Class 0.30% Client Agreement Euro Institutional Accumulating Class Euro Institutional Accumulating Class 1.00% Included in Management fee Sterling Flexible Accumulating Class Sterling Flexible Accumulating Class 0.30% Client Agreement US Dollar D Accumulating Class US Dollar D Accumulating Class 1.00% Included in Management fee US Dollar Flexible Accumulating Class US Dollar Flexible Accumulating Class 0.30% Client Agreement US Dollar Flexible Distributing Class US Dollar Flexible Distributing Class 0.30% Client Agreement US Dollar Institutional Accumulating Class US Dollar Institutional Accumulating Class 1.00% Included in Management fee US Dollar Institutional Distributing Class US Dollar Institutional Distributing Class 1.00% Included in Management fee
iShares Pacific Index Fund (IE) Euro D Accumulating Class Euro D Accumulating Class 1.00% Included in Management fee Euro Flexible Accumulating Class Euro Flexible Accumulating Class 0.30% Client Agreement Euro Flexible Distributing Class Euro Flexible Distributing Class 0.30% Client Agreement Euro Institutional Accumulating Class Euro Institutional Accumulating Class 1.00% Included in Management fee Sterling Institutional Accumulating Class Sterling Institutional Accumulating Class 1.00% Included in Management fee US Dollar D Accumulating Class US Dollar D Accumulating Class 1.00% Included in Management fee US Dollar Flexible Accumulating Class US Dollar Flexible Accumulating Class 0.30% Client Agreement
64
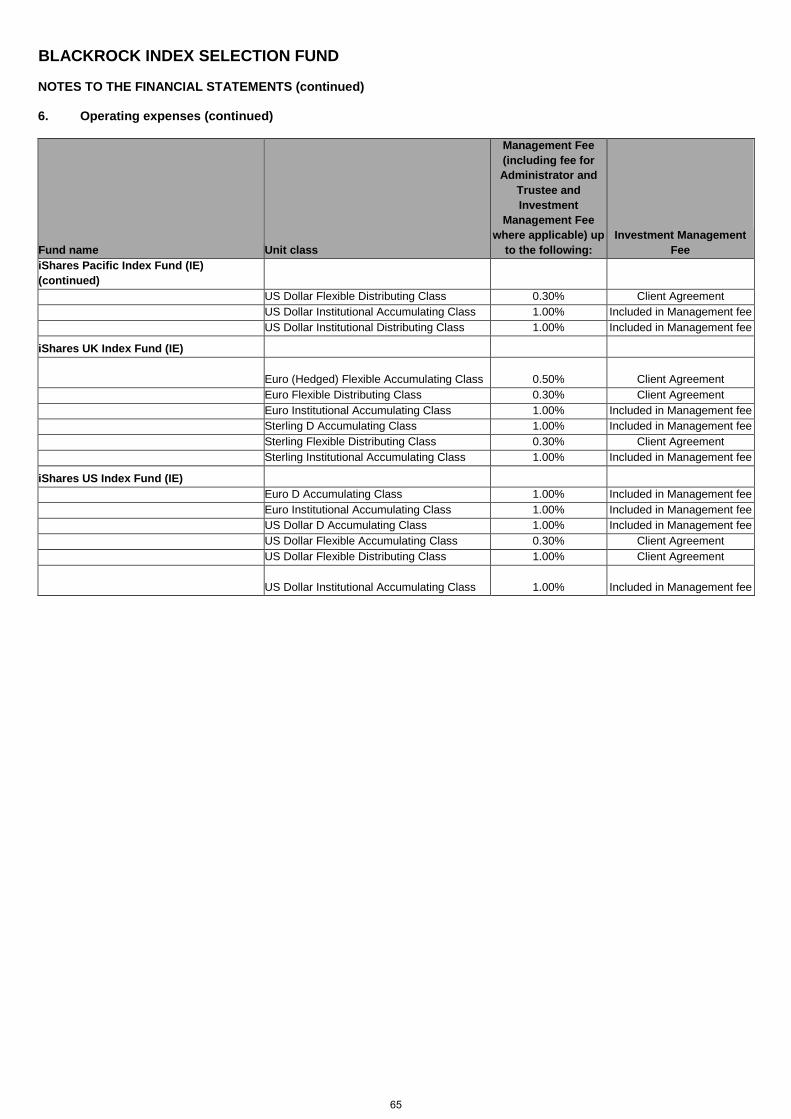
BLACKROCK INDEX SELECTION FUND NOTES TO THE FINANCIAL STATEMENTS (continued)
6. Operating expenses (continued)
Fund name Unit class
Management Fee (including fee for Administrator and
Trustee and Investment
Management Fee where applicable) up
to the following: Investment Management
Fee iShares Pacific Index Fund (IE) (continued) US Dollar Flexible Distributing Class 0.30% Client Agreement US Dollar Institutional Accumulating Class 1.00% Included in Management fee US Dollar Institutional Distributing Class US Dollar Institutional Distributing Class 1.00% Included in Management fee
iShares UK Index Fund (IE) Euro (Hedged) Flexible Accumulating Class Euro (Hedged) Flexible Accumulating Class 0.50% Client Agreement Euro Flexible Distributing Class Euro Flexible Distributing Class 0.30% Client Agreement Euro Institutional Accumulating Class Euro Institutional Accumulating Class 1.00% Included in Management fee Sterling D Accumulating Class Sterling D Accumulating Class 1.00% Included in Management fee Sterling Flexible Distributing Class Sterling Flexible Distributing Class 0.30% Client Agreement Sterling Institutional Accumulating Class Sterling Institutional Accumulating Class 1.00% Included in Management fee
iShares US Index Fund (IE) Euro D Accumulating Class Euro D Accumulating Class 1.00% Included in Management fee Euro Institutional Accumulating Class Euro Institutional Accumulating Class 1.00% Included in Management fee US Dollar D Accumulating Class US Dollar D Accumulating Class 1.00% Included in Management fee US Dollar Flexible Accumulating Class US Dollar Flexible Accumulating Class 0.30% Client Agreement US Dollar Flexible Distributing Class US Dollar Flexible Distributing Class 1.00% Client Agreement US Dollar Institutional Accumulating Class US Dollar Institutional Accumulating Class 1.00% Included in Management fee
65
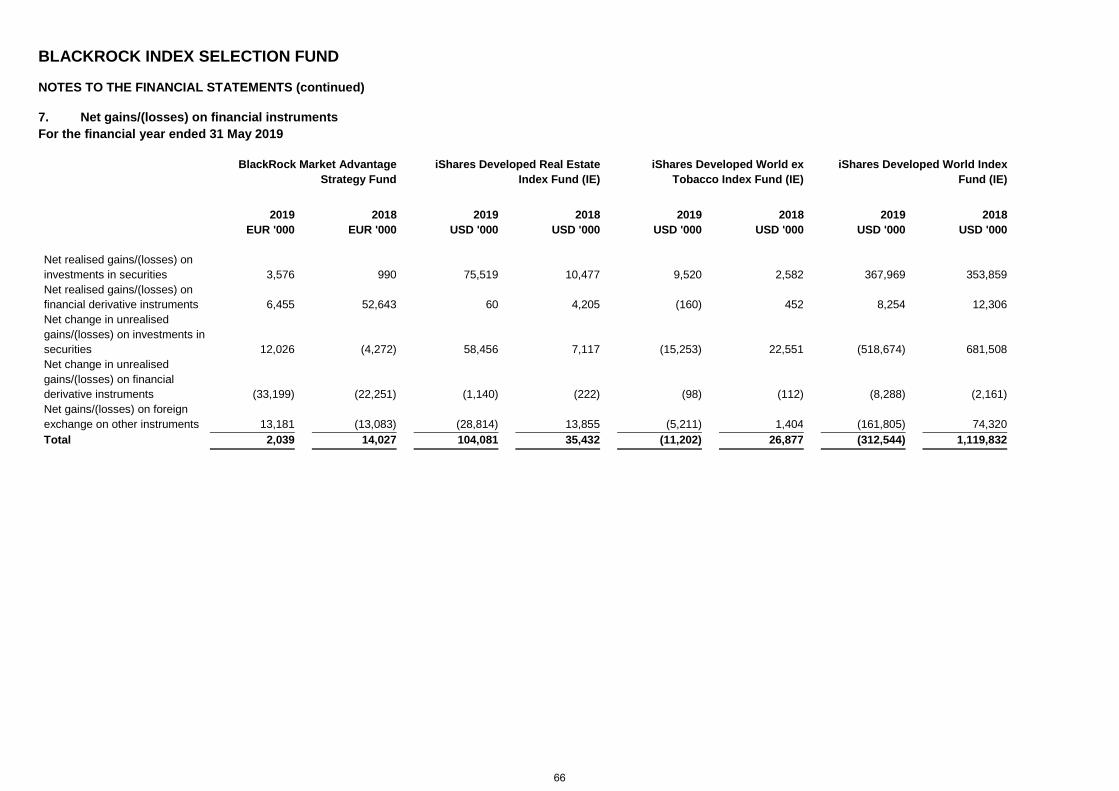
BLACKROCK INDEX SELECTION FUND NOTES TO THE FINANCIAL STATEMENTS (continued)
7. Net gains/(losses) on financial instruments For the financial year ended 31 May 2019
BlackRock Market Advantage
Strategy Fund iShares Developed Real Estate
Index Fund (IE) iShares Developed World ex
Tobacco Index Fund (IE) iShares Developed World Index
Fund (IE)
2019
EUR '000 2018
EUR '000 2019
USD '000 2018
USD '000 2019
USD '000 2018
USD '000 2019
USD '000 2018
USD '000 Net realised gains/(losses) on investments in securities 3,576 990 75,519 10,477 9,520 2,582 367,969 353,859 Net realised gains/(losses) on financial derivative instruments 6,455 52,643 60 4,205 (160) 452 8,254 12,306 Net change in unrealised gains/(losses) on investments in securities 12,026 (4,272) 58,456 7,117 (15,253) 22,551 (518,674) 681,508 Net change in unrealised gains/(losses) on financial derivative instruments (33,199) (22,251) (1,140) (222) (98) (112) (8,288) (2,161) Net gains/(losses) on foreign exchange on other instruments 13,181 (13,083) (28,814) 13,855 (5,211) 1,404 (161,805) 74,320 Total 2,039 14,027 104,081 35,432 (11,202) 26,877 (312,544) 1,119,832
66
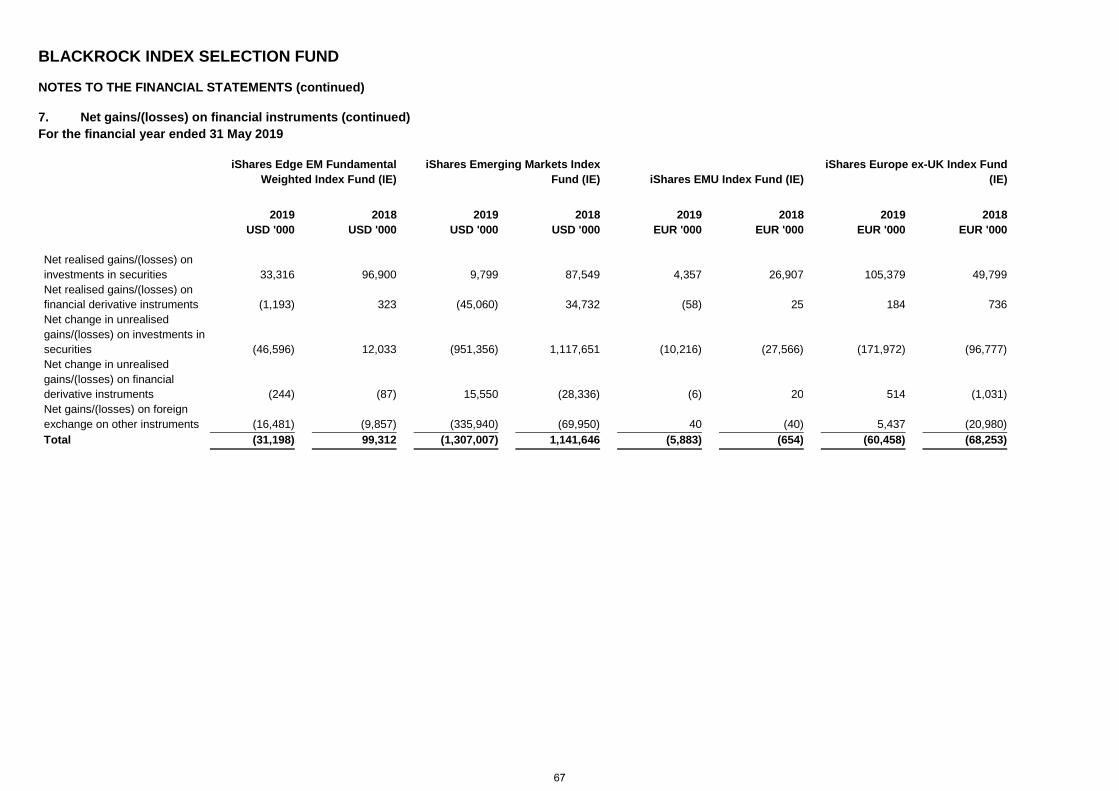
BLACKROCK INDEX SELECTION FUND NOTES TO THE FINANCIAL STATEMENTS (continued)
7. Net gains/(losses) on financial instruments (continued) For the financial year ended 31 May 2019
iShares Edge EM Fundamental
Weighted Index Fund (IE) iShares Emerging Markets Index
Fund (IE) iShares EMU Index Fund (IE) iShares Europe ex-UK Index Fund
(IE)
2019
USD '000 2018
USD '000 2019
USD '000 2018
USD '000 2019
EUR '000 2018
EUR '000 2019
EUR '000 2018
EUR '000 Net realised gains/(losses) on investments in securities 33,316 96,900 9,799 87,549 4,357 26,907 105,379 49,799 Net realised gains/(losses) on financial derivative instruments (1,193) 323 (45,060) 34,732 (58) 25 184 736 Net change in unrealised gains/(losses) on investments in securities (46,596) 12,033 (951,356) 1,117,651 (10,216) (27,566) (171,972) (96,777) Net change in unrealised gains/(losses) on financial derivative instruments (244) (87) 15,550 (28,336) (6) 20 514 (1,031) Net gains/(losses) on foreign exchange on other instruments (16,481) (9,857) (335,940) (69,950) 40 (40) 5,437 (20,980) Total (31,198) 99,312 (1,307,007) 1,141,646 (5,883) (654) (60,458) (68,253)
67
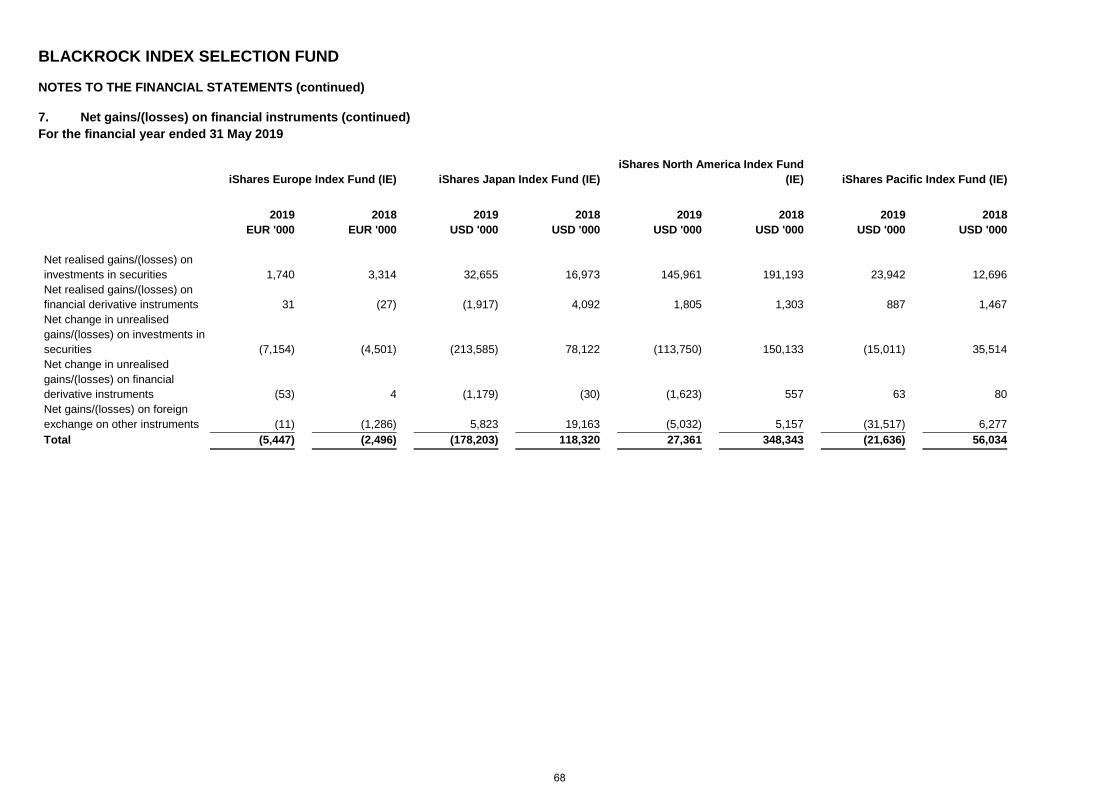
BLACKROCK INDEX SELECTION FUND NOTES TO THE FINANCIAL STATEMENTS (continued)
7. Net gains/(losses) on financial instruments (continued) For the financial year ended 31 May 2019
iShares Europe Index Fund (IE) iShares Japan Index Fund (IE) iShares North America Index Fund
(IE) iShares Pacific Index Fund (IE)
2019
EUR '000 2018
EUR '000 2019
USD '000 2018
USD '000 2019
USD '000 2018
USD '000 2019
USD '000 2018
USD '000 Net realised gains/(losses) on investments in securities 1,740 3,314 32,655 16,973 145,961 191,193 23,942 12,696 Net realised gains/(losses) on financial derivative instruments 31 (27) (1,917) 4,092 1,805 1,303 887 1,467 Net change in unrealised gains/(losses) on investments in securities (7,154) (4,501) (213,585) 78,122 (113,750) 150,133 (15,011) 35,514 Net change in unrealised gains/(losses) on financial derivative instruments (53) 4 (1,179) (30) (1,623) 557 63 80 Net gains/(losses) on foreign exchange on other instruments (11) (1,286) 5,823 19,163 (5,032) 5,157 (31,517) 6,277 Total (5,447) (2,496) (178,203) 118,320 27,361 348,343 (21,636) 56,034
68
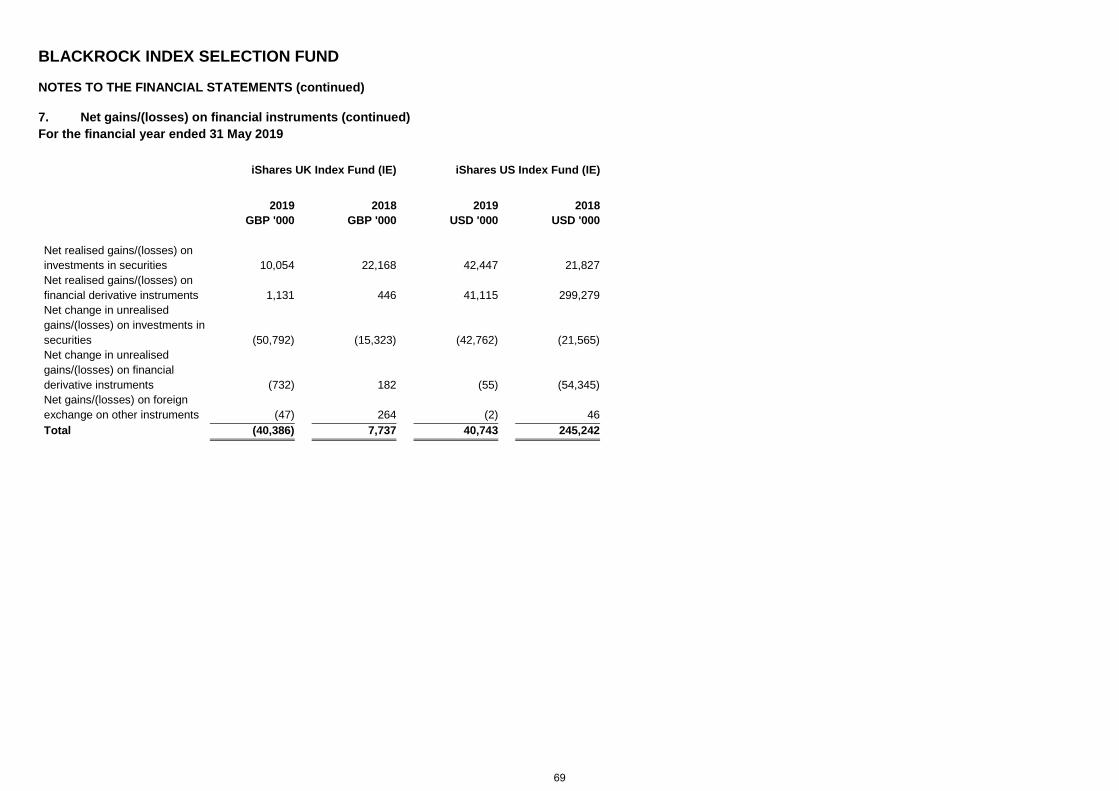
BLACKROCK INDEX SELECTION FUND NOTES TO THE FINANCIAL STATEMENTS (continued)
7. Net gains/(losses) on financial instruments (continued) For the financial year ended 31 May 2019
iShares UK Index Fund (IE) iShares US Index Fund (IE)
2019
GBP '000 2018
GBP '000 2019
USD '000 2018
USD '000 Net realised gains/(losses) on investments in securities 10,054 22,168 42,447 21,827 Net realised gains/(losses) on financial derivative instruments 1,131 446 41,115 299,279 Net change in unrealised gains/(losses) on investments in securities (50,792) (15,323) (42,762) (21,565) Net change in unrealised gains/(losses) on financial derivative instruments (732) 182 (55) (54,345) Net gains/(losses) on foreign exchange on other instruments (47) 264 (2) 46 Total (40,386) 7,737 40,743 245,242
69
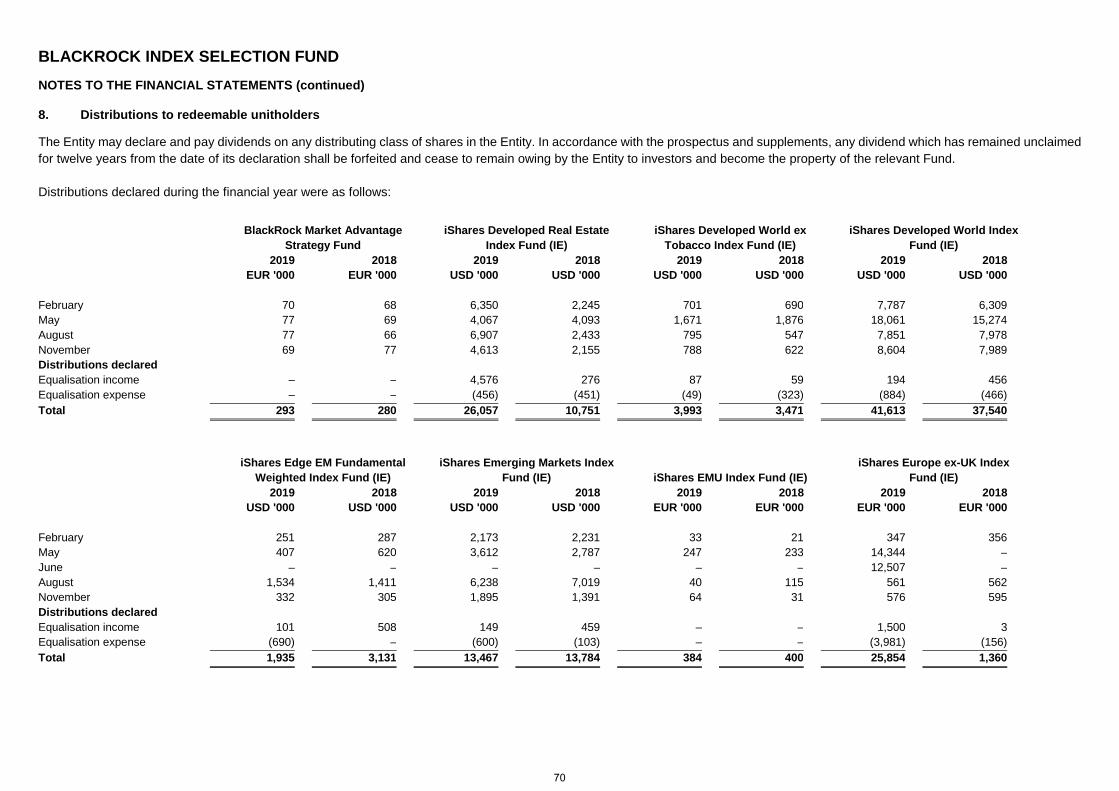
BLACKROCK INDEX SELECTION FUND
NOTES TO THE FINANCIAL STATEMENTS (continued)
8. Distributions to redeemable unitholders
The Entity may declare and pay dividends on any distributing class of shares in the Entity. In accordance with the prospectus and supplements, any dividend which has remained unclaimed for twelve years from the date of its declaration shall be forfeited and cease to remain owing by the Entity to investors and become the property of the relevant Fund. Distributions declared during the financial year were as follows:
BlackRock Market Advantage
Strategy Fund iShares Developed Real Estate
Index Fund (IE) iShares Developed World ex
Tobacco Index Fund (IE) iShares Developed World Index
Fund (IE)
2019
EUR '000 2018
EUR '000 2019
USD '000 2018
USD '000 2019
USD '000 2018
USD '000 2019
USD '000 2018
USD '000
February 70 68 6,350 2,245 701 690 7,787 6,309 May 77 69 4,067 4,093 1,671 1,876 18,061 15,274 August 77 66 6,907 2,433 795 547 7,851 7,978 November 69 77 4,613 2,155 788 622 8,604 7,989 Distributions declared Equalisation income – – 4,576 276 87 59 194 456 Equalisation expense – – (456) (451) (49) (323) (884) (466) Total 293 280 26,057 10,751 3,993 3,471 41,613 37,540
iShares Edge EM Fundamental
Weighted Index Fund (IE) iShares Emerging Markets Index
Fund (IE) iShares EMU Index Fund (IE) iShares Europe ex-UK Index
Fund (IE)
2019
USD '000 2018
USD '000 2019
USD '000 2018
USD '000 2019
EUR '000 2018
EUR '000 2019
EUR '000 2018
EUR '000
February 251 287 2,173 2,231 33 21 347 356 May 407 620 3,612 2,787 247 233 14,344 – June – – – – – – 12,507 – August 1,534 1,411 6,238 7,019 40 115 561 562 November 332 305 1,895 1,391 64 31 576 595 Distributions declared Equalisation income 101 508 149 459 – – 1,500 3 Equalisation expense (690) – (600) (103) – – (3,981) (156) Total 1,935 3,131 13,467 13,784 384 400 25,854 1,360
70
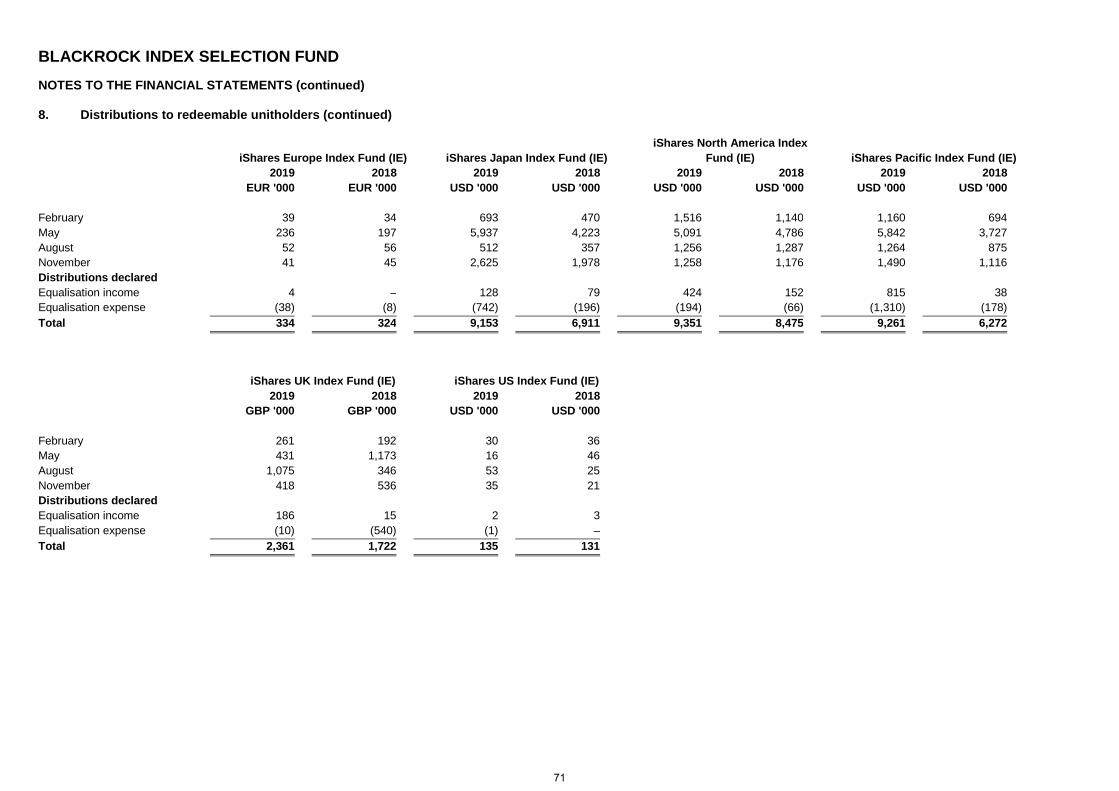
BLACKROCK INDEX SELECTION FUND
NOTES TO THE FINANCIAL STATEMENTS (continued)
8. Distributions to redeemable unitholders (continued)
iShares Europe Index Fund (IE) iShares Japan Index Fund (IE) iShares North America Index
Fund (IE) iShares Pacific Index Fund (IE)
2019
EUR '000 2018
EUR '000 2019
USD '000 2018
USD '000 2019
USD '000 2018
USD '000 2019
USD '000 2018
USD '000
February 39 34 693 470 1,516 1,140 1,160 694 May 236 197 5,937 4,223 5,091 4,786 5,842 3,727 August 52 56 512 357 1,256 1,287 1,264 875 November 41 45 2,625 1,978 1,258 1,176 1,490 1,116 Distributions declared Equalisation income 4 – 128 79 424 152 815 38 Equalisation expense (38) (8) (742) (196) (194) (66) (1,310) (178) Total 334 324 9,153 6,911 9,351 8,475 9,261 6,272
iShares UK Index Fund (IE) iShares US Index Fund (IE)
2019
GBP '000 2018
GBP '000 2019
USD '000 2018
USD '000
February 261 192 30 36 May 431 1,173 16 46 August 1,075 346 53 25 November 418 536 35 21 Distributions declared Equalisation income 186 15 2 3 Equalisation expense (10) (540) (1) – Total 2,361 1,722 135 131
71
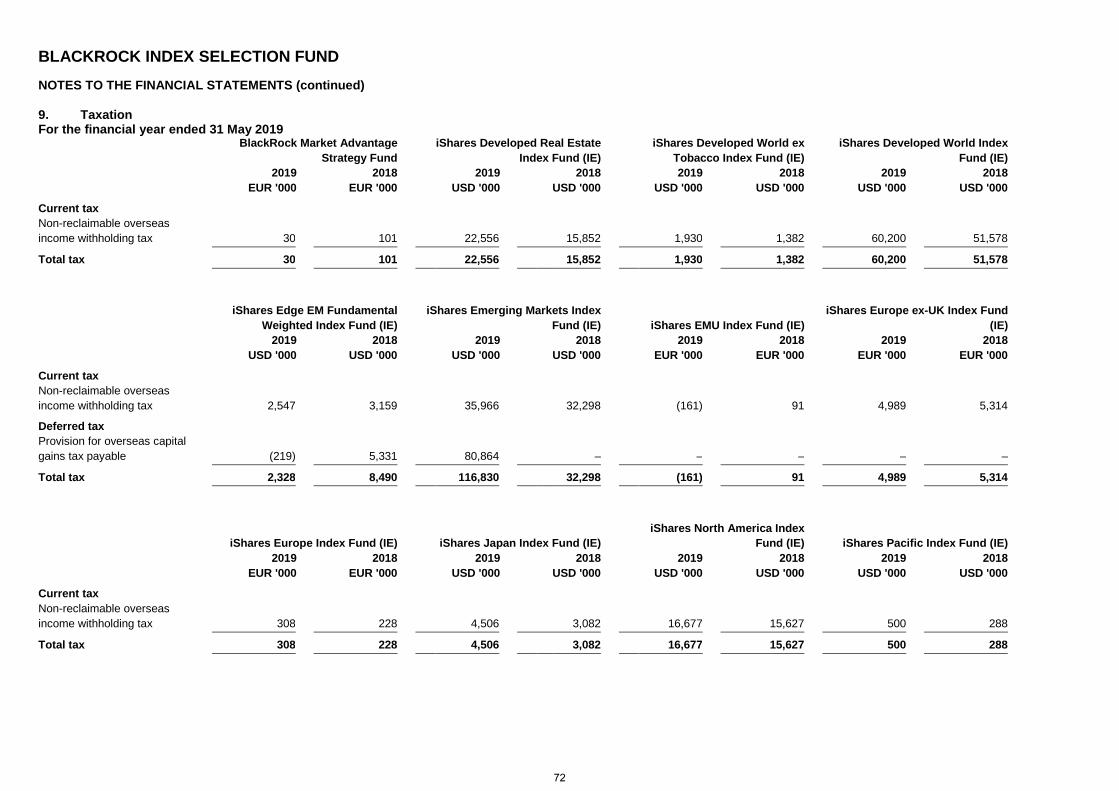
BLACKROCK INDEX SELECTION FUND
NOTES TO THE FINANCIAL STATEMENTS (continued)
9. Taxation For the financial year ended 31 May 2019
BlackRock Market Advantage
Strategy Fund iShares Developed Real Estate
Index Fund (IE) iShares Developed World ex
Tobacco Index Fund (IE) iShares Developed World Index
Fund (IE)
2019
EUR '000 2018
EUR '000 2019
USD '000 2018
USD '000 2019
USD '000 2018
USD '000 2019
USD '000 2018
USD '000
Current tax Non-reclaimable overseas income withholding tax 30 101 22,556 15,852 1,930 1,382 60,200 51,578
Total tax 30 101 22,556 15,852 1,930 1,382 60,200 51,578
iShares Edge EM Fundamental
Weighted Index Fund (IE) iShares Emerging Markets Index
Fund (IE) iShares EMU Index Fund (IE) iShares Europe ex-UK Index Fund
(IE)
2019
USD '000 2018
USD '000 2019
USD '000 2018
USD '000 2019
EUR '000 2018
EUR '000 2019
EUR '000 2018
EUR '000
Current tax Non-reclaimable overseas income withholding tax 2,547 3,159 35,966 32,298 (161) 91 4,989 5,314
Deferred tax Provision for overseas capital gains tax payable (219) 5,331 80,864 – – – – –
Total tax 2,328 8,490 116,830 32,298 (161) 91 4,989 5,314
iShares Europe Index Fund (IE) iShares Japan Index Fund (IE) iShares North America Index
Fund (IE) iShares Pacific Index Fund (IE)
2019
EUR '000 2018
EUR '000 2019
USD '000 2018
USD '000 2019
USD '000 2018
USD '000 2019
USD '000 2018
USD '000
Current tax Non-reclaimable overseas income withholding tax 308 228 4,506 3,082 16,677 15,627 500 288
Total tax 308 228 4,506 3,082 16,677 15,627 500 288
72
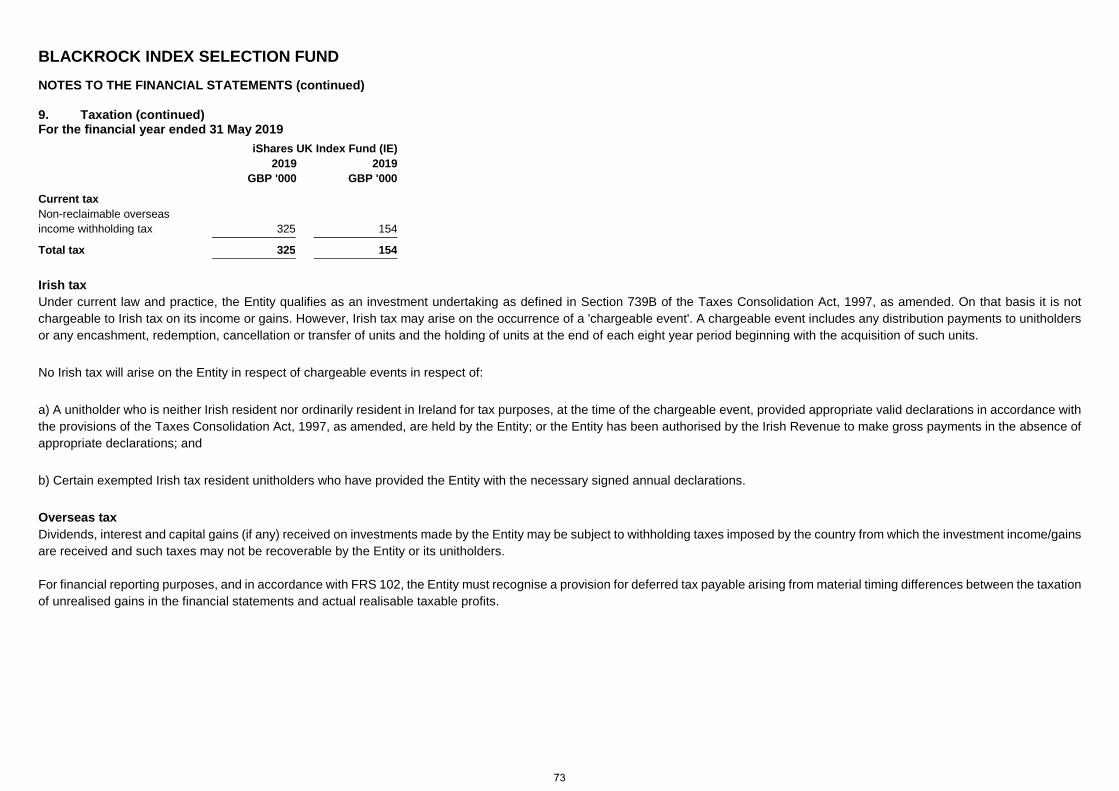
BLACKROCK INDEX SELECTION FUND
NOTES TO THE FINANCIAL STATEMENTS (continued)
9. Taxation (continued) For the financial year ended 31 May 2019 iShares UK Index Fund (IE)
2019
GBP '000 2019
GBP '000 Current tax Non-reclaimable overseas income withholding tax 325 154
Total tax 325 154
Irish tax Under current law and practice, the Entity qualifies as an investment undertaking as defined in Section 739B of the Taxes Consolidation Act, 1997, as amended. On that basis it is not chargeable to Irish tax on its income or gains. However, Irish tax may arise on the occurrence of a 'chargeable event'. A chargeable event includes any distribution payments to unitholders or any encashment, redemption, cancellation or transfer of units and the holding of units at the end of each eight year period beginning with the acquisition of such units. No Irish tax will arise on the Entity in respect of chargeable events in respect of: a) A unitholder who is neither Irish resident nor ordinarily resident in Ireland for tax purposes, at the time of the chargeable event, provided appropriate valid declarations in accordance with the provisions of the Taxes Consolidation Act, 1997, as amended, are held by the Entity; or the Entity has been authorised by the Irish Revenue to make gross payments in the absence of appropriate declarations; and b) Certain exempted Irish tax resident unitholders who have provided the Entity with the necessary signed annual declarations. Overseas tax Dividends, interest and capital gains (if any) received on investments made by the Entity may be subject to withholding taxes imposed by the country from which the investment income/gains are received and such taxes may not be recoverable by the Entity or its unitholders. For financial reporting purposes, and in accordance with FRS 102, the Entity must recognise a provision for deferred tax payable arising from material timing differences between the taxation of unrealised gains in the financial statements and actual realisable taxable profits.
73
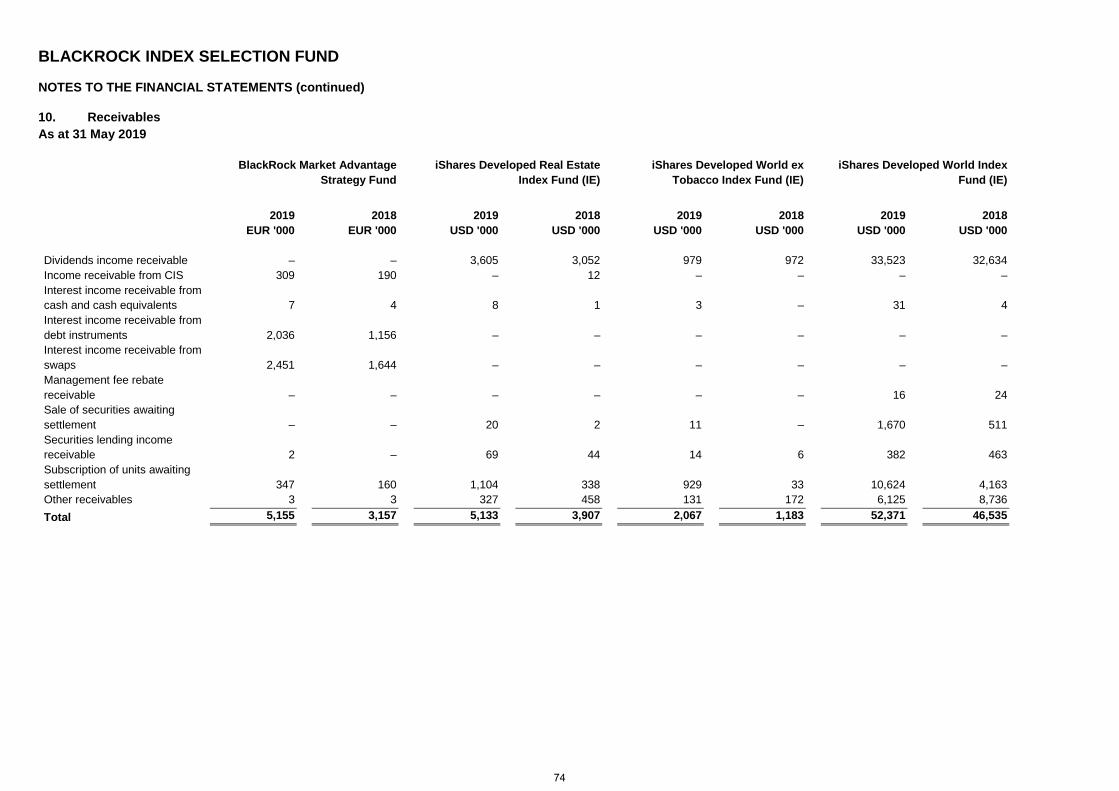
BLACKROCK INDEX SELECTION FUND NOTES TO THE FINANCIAL STATEMENTS (continued)
10. Receivables As at 31 May 2019
BlackRock Market Advantage
Strategy Fund iShares Developed Real Estate
Index Fund (IE) iShares Developed World ex
Tobacco Index Fund (IE) iShares Developed World Index
Fund (IE)
2019
EUR '000 2018
EUR '000 2019
USD '000 2018
USD '000 2019
USD '000 2018
USD '000 2019
USD '000 2018
USD '000 Dividends income receivable – – 3,605 3,052 979 972 33,523 32,634 Income receivable from CIS 309 190 – 12 – – – – Interest income receivable from cash and cash equivalents 7 4 8 1 3 – 31 4 Interest income receivable from debt instruments 2,036 1,156 – – – – – – Interest income receivable from swaps 2,451 1,644 – – – – – – Management fee rebate receivable – – – – – – 16 24 Sale of securities awaiting settlement – – 20 2 11 – 1,670 511 Securities lending income receivable 2 – 69 44 14 6 382 463 Subscription of units awaiting settlement 347 160 1,104 338 929 33 10,624 4,163 Other receivables 3 3 327 458 131 172 6,125 8,736 Total 5,155 3,157 5,133 3,907 2,067 1,183 52,371 46,535
74
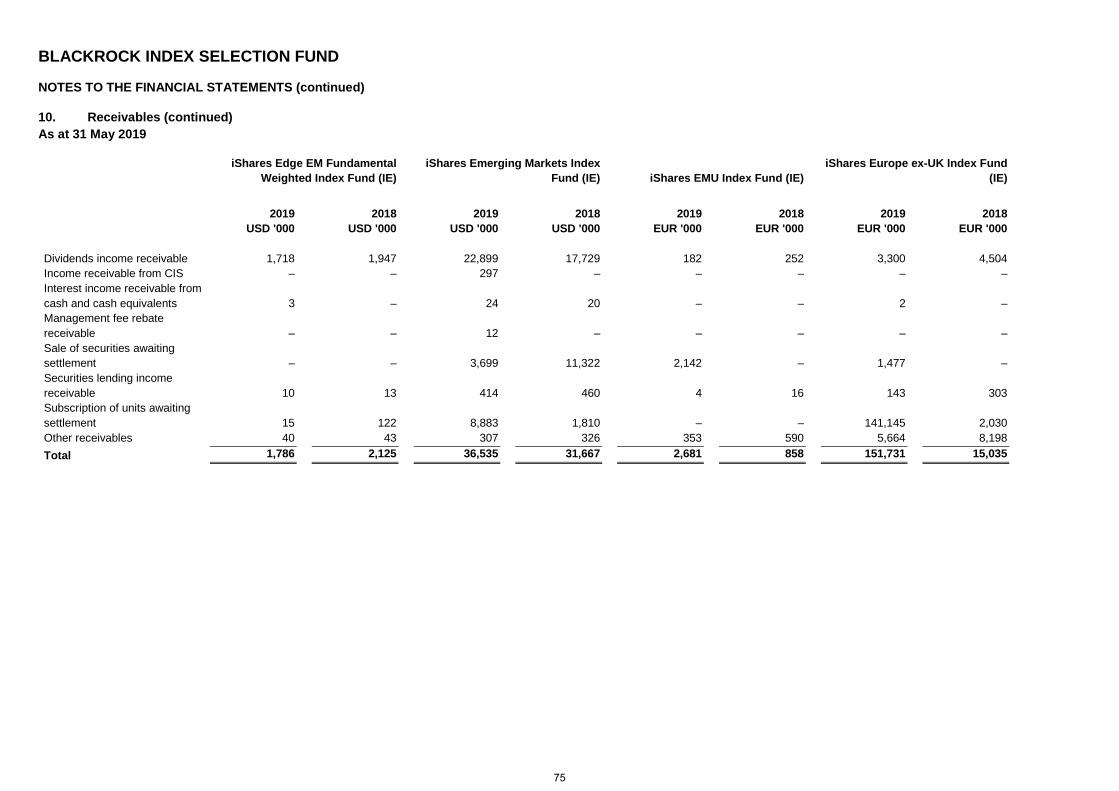
BLACKROCK INDEX SELECTION FUND NOTES TO THE FINANCIAL STATEMENTS (continued)
10. Receivables (continued) As at 31 May 2019
iShares Edge EM Fundamental
Weighted Index Fund (IE) iShares Emerging Markets Index
Fund (IE) iShares EMU Index Fund (IE) iShares Europe ex-UK Index Fund
(IE)
2019
USD '000 2018
USD '000 2019
USD '000 2018
USD '000 2019
EUR '000 2018
EUR '000 2019
EUR '000 2018
EUR '000 Dividends income receivable 1,718 1,947 22,899 17,729 182 252 3,300 4,504 Income receivable from CIS – – 297 – – – – – Interest income receivable from cash and cash equivalents 3 – 24 20 – – 2 – Management fee rebate receivable – – 12 – – – – – Sale of securities awaiting settlement – – 3,699 11,322 2,142 – 1,477 – Securities lending income receivable 10 13 414 460 4 16 143 303 Subscription of units awaiting settlement 15 122 8,883 1,810 – – 141,145 2,030 Other receivables 40 43 307 326 353 590 5,664 8,198 Total 1,786 2,125 36,535 31,667 2,681 858 151,731 15,035
75
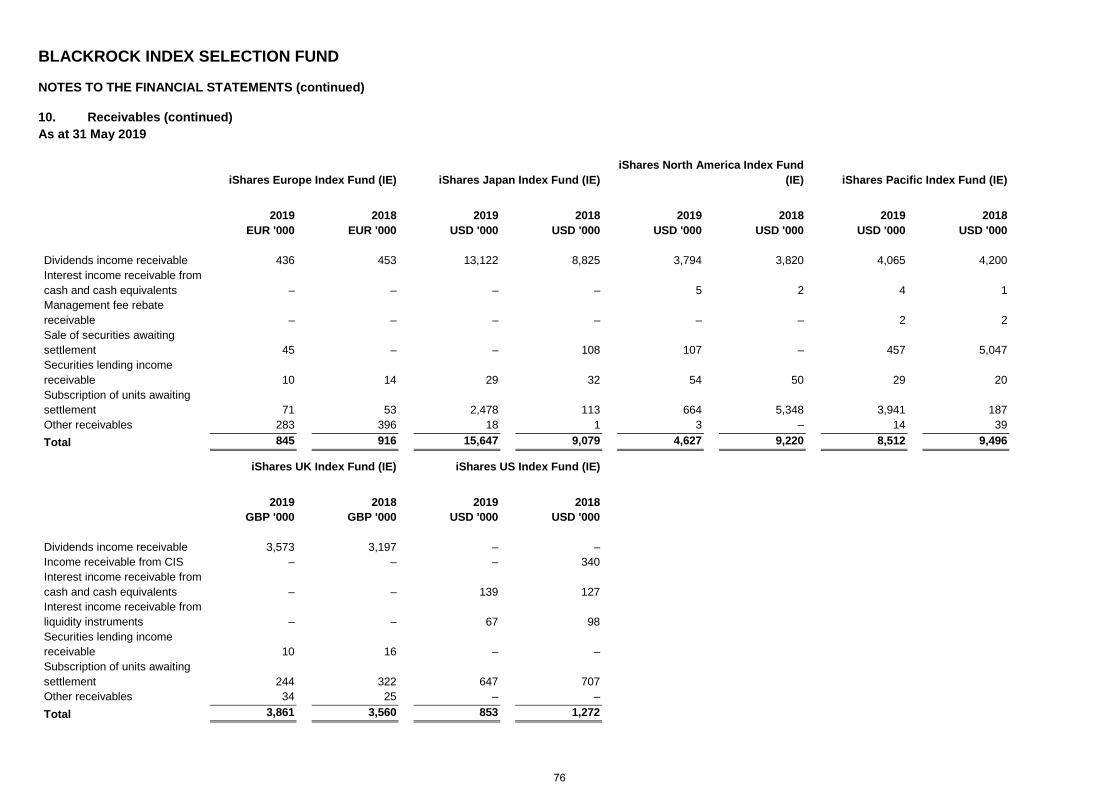
BLACKROCK INDEX SELECTION FUND NOTES TO THE FINANCIAL STATEMENTS (continued)
10. Receivables (continued) As at 31 May 2019
iShares Europe Index Fund (IE) iShares Japan Index Fund (IE) iShares North America Index Fund
(IE) iShares Pacific Index Fund (IE)
2019
EUR '000 2018
EUR '000 2019
USD '000 2018
USD '000 2019
USD '000 2018
USD '000 2019
USD '000 2018
USD '000 Dividends income receivable 436 453 13,122 8,825 3,794 3,820 4,065 4,200 Interest income receivable from cash and cash equivalents – – – – 5 2 4 1 Management fee rebate receivable – – – – – – 2 2 Sale of securities awaiting settlement 45 – – 108 107 – 457 5,047 Securities lending income receivable 10 14 29 32 54 50 29 20 Subscription of units awaiting settlement 71 53 2,478 113 664 5,348 3,941 187 Other receivables 283 396 18 1 3 – 14 39 Total 845 916 15,647 9,079 4,627 9,220 8,512 9,496
iShares UK Index Fund (IE) iShares US Index Fund (IE)
2019
GBP '000 2018
GBP '000 2019
USD '000 2018
USD '000 Dividends income receivable 3,573 3,197 – – Income receivable from CIS – – – 340 Interest income receivable from cash and cash equivalents – – 139 127 Interest income receivable from liquidity instruments – – 67 98 Securities lending income receivable 10 16 – – Subscription of units awaiting settlement 244 322 647 707 Other receivables 34 25 – – Total 3,861 3,560 853 1,272
76
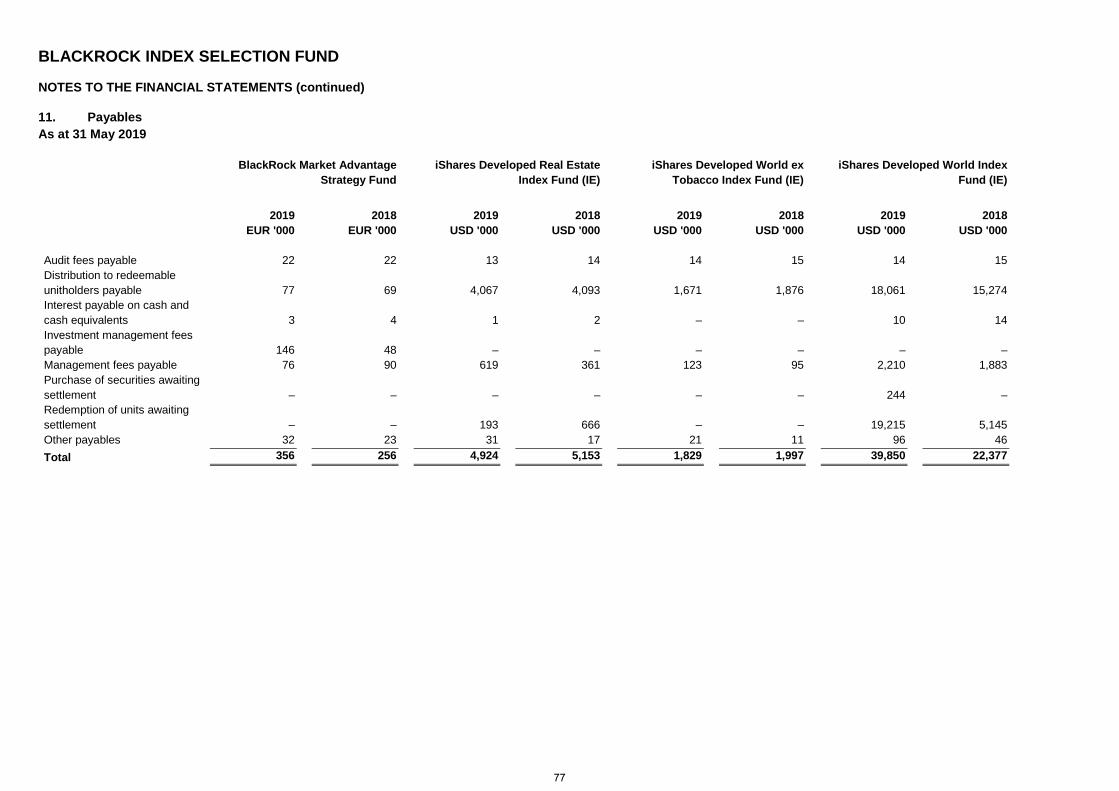
BLACKROCK INDEX SELECTION FUND NOTES TO THE FINANCIAL STATEMENTS (continued)
11. Payables As at 31 May 2019
BlackRock Market Advantage
Strategy Fund iShares Developed Real Estate
Index Fund (IE) iShares Developed World ex
Tobacco Index Fund (IE) iShares Developed World Index
Fund (IE)
2019
EUR '000 2018
EUR '000 2019
USD '000 2018
USD '000 2019
USD '000 2018
USD '000 2019
USD '000 2018
USD '000 Audit fees payable 22 22 13 14 14 15 14 15 Distribution to redeemable unitholders payable 77 69 4,067 4,093 1,671 1,876 18,061 15,274 Interest payable on cash and cash equivalents 3 4 1 2 – – 10 14 Investment management fees payable 146 48 – – – – – – Management fees payable 76 90 619 361 123 95 2,210 1,883 Purchase of securities awaiting settlement – – – – – – 244 – Redemption of units awaiting settlement – – 193 666 – – 19,215 5,145 Other payables 32 23 31 17 21 11 96 46 Total 356 256 4,924 5,153 1,829 1,997 39,850 22,377
77
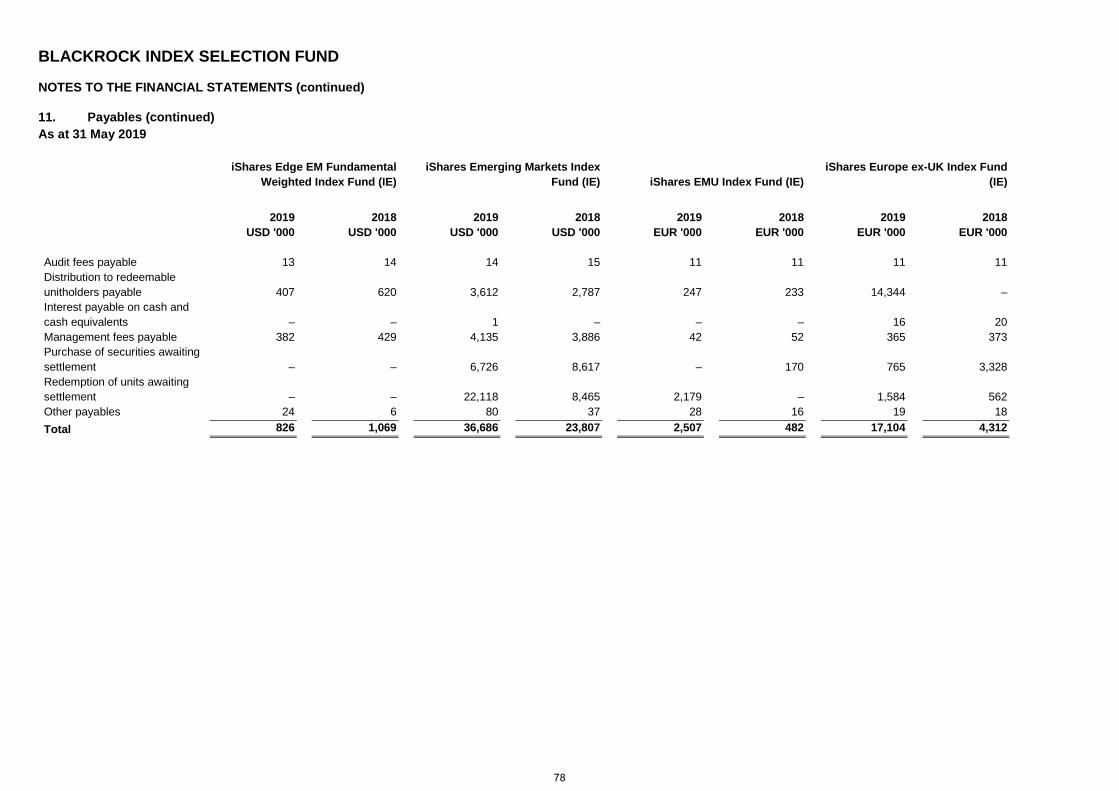
BLACKROCK INDEX SELECTION FUND NOTES TO THE FINANCIAL STATEMENTS (continued)
11. Payables (continued) As at 31 May 2019
iShares Edge EM Fundamental
Weighted Index Fund (IE) iShares Emerging Markets Index
Fund (IE) iShares EMU Index Fund (IE) iShares Europe ex-UK Index Fund
(IE)
2019
USD '000 2018
USD '000 2019
USD '000 2018
USD '000 2019
EUR '000 2018
EUR '000 2019
EUR '000 2018
EUR '000 Audit fees payable 13 14 14 15 11 11 11 11 Distribution to redeemable unitholders payable 407 620 3,612 2,787 247 233 14,344 – Interest payable on cash and cash equivalents – – 1 – – – 16 20 Management fees payable 382 429 4,135 3,886 42 52 365 373 Purchase of securities awaiting settlement – – 6,726 8,617 – 170 765 3,328 Redemption of units awaiting settlement – – 22,118 8,465 2,179 – 1,584 562 Other payables 24 6 80 37 28 16 19 18 Total 826 1,069 36,686 23,807 2,507 482 17,104 4,312
78
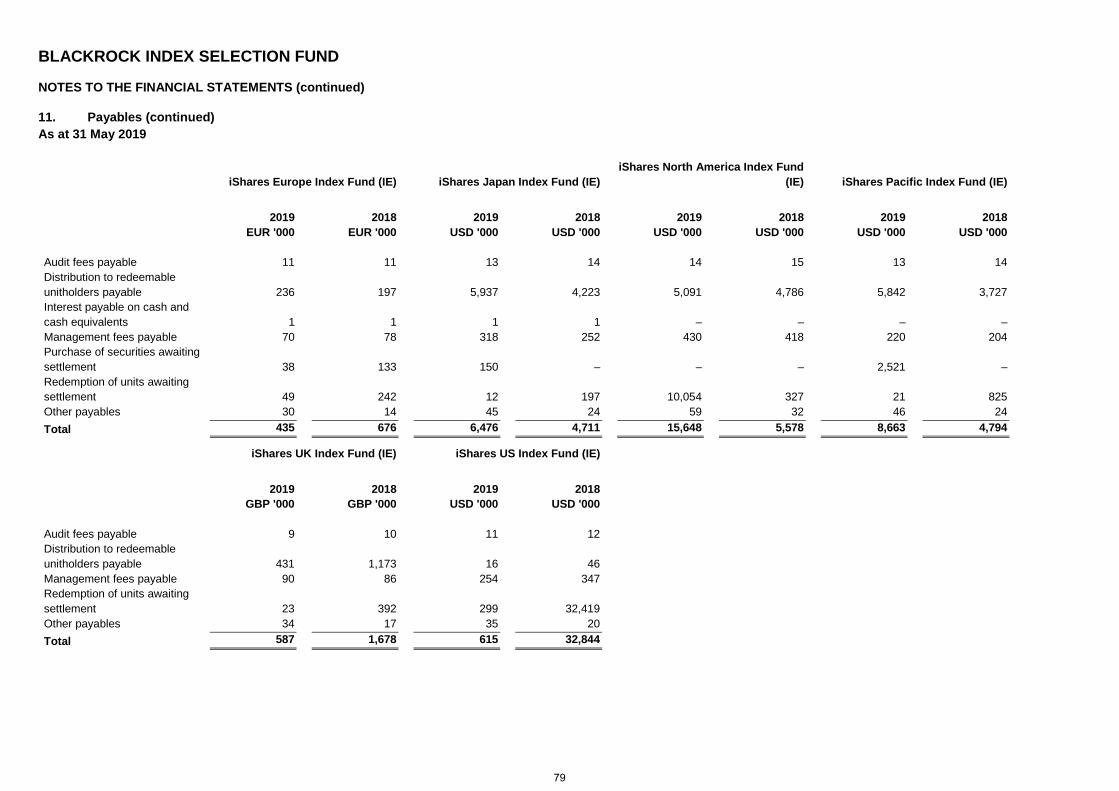
BLACKROCK INDEX SELECTION FUND NOTES TO THE FINANCIAL STATEMENTS (continued)
11. Payables (continued) As at 31 May 2019
iShares Europe Index Fund (IE) iShares Japan Index Fund (IE) iShares North America Index Fund
(IE) iShares Pacific Index Fund (IE)
2019
EUR '000 2018
EUR '000 2019
USD '000 2018
USD '000 2019
USD '000 2018
USD '000 2019
USD '000 2018
USD '000 Audit fees payable 11 11 13 14 14 15 13 14 Distribution to redeemable unitholders payable 236 197 5,937 4,223 5,091 4,786 5,842 3,727 Interest payable on cash and cash equivalents 1 1 1 1 – – – – Management fees payable 70 78 318 252 430 418 220 204 Purchase of securities awaiting settlement 38 133 150 – – – 2,521 – Redemption of units awaiting settlement 49 242 12 197 10,054 327 21 825 Other payables 30 14 45 24 59 32 46 24 Total 435 676 6,476 4,711 15,648 5,578 8,663 4,794
iShares UK Index Fund (IE) iShares US Index Fund (IE)
2019
GBP '000 2018
GBP '000 2019
USD '000 2018
USD '000 Audit fees payable 9 10 11 12 Distribution to redeemable unitholders payable 431 1,173 16 46 Management fees payable 90 86 254 347 Redemption of units awaiting settlement 23 392 299 32,419 Other payables 34 17 35 20 Total 587 1,678 615 32,844
79
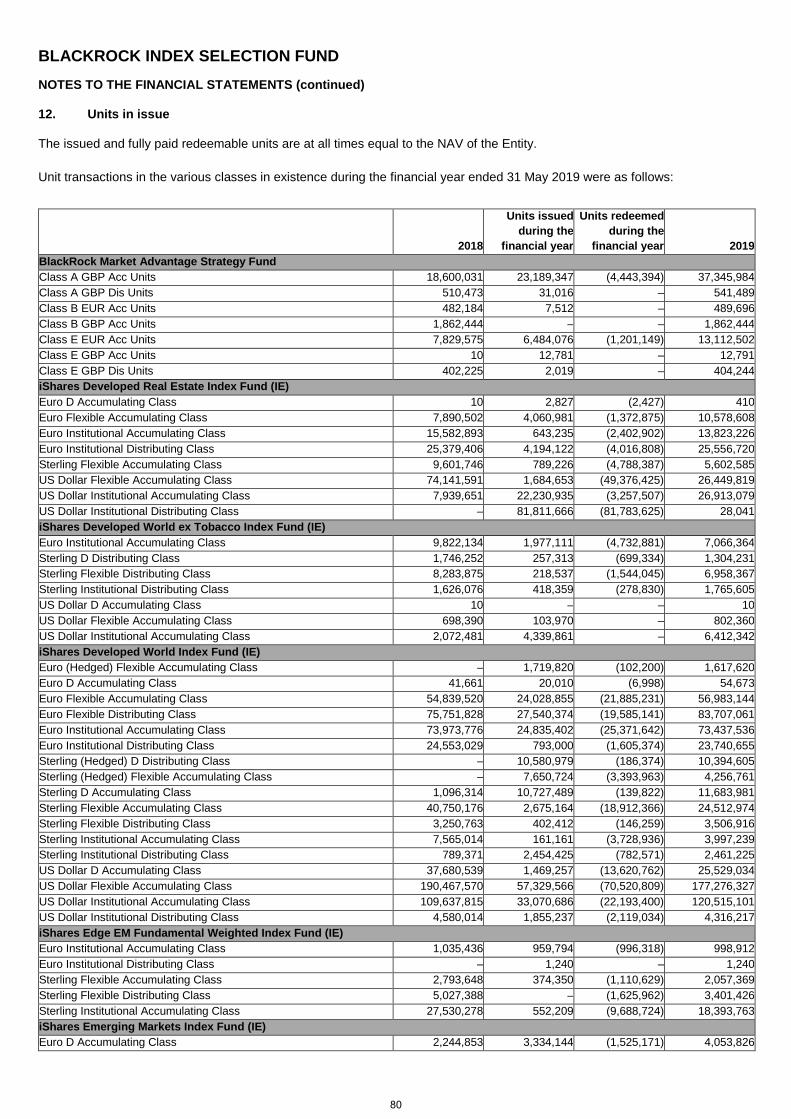
BLACKROCK INDEX SELECTION FUND
NOTES TO THE FINANCIAL STATEMENTS (continued)
12. Units in issue
The issued and fully paid redeemable units are at all times equal to the NAV of the Entity. Unit transactions in the various classes in existence during the financial year ended 31 May 2019 were as follows:
2018
Units issued during the
financial year
Units redeemed during the
financial year 2019 BlackRock Market Advantage Strategy Fund Class A GBP Acc Units 18,600,031 23,189,347 (4,443,394) 37,345,984 Class A GBP Dis Units 510,473 31,016 – 541,489 Class B EUR Acc Units 482,184 7,512 – 489,696 Class B GBP Acc Units 1,862,444 – – 1,862,444 Class E EUR Acc Units 7,829,575 6,484,076 (1,201,149) 13,112,502 Class E GBP Acc Units 10 12,781 – 12,791 Class E GBP Dis Units 402,225 2,019 – 404,244 iShares Developed Real Estate Index Fund (IE) Euro D Accumulating Class 10 2,827 (2,427) 410 Euro Flexible Accumulating Class 7,890,502 4,060,981 (1,372,875) 10,578,608 Euro Institutional Accumulating Class 15,582,893 643,235 (2,402,902) 13,823,226 Euro Institutional Distributing Class 25,379,406 4,194,122 (4,016,808) 25,556,720 Sterling Flexible Accumulating Class 9,601,746 789,226 (4,788,387) 5,602,585 US Dollar Flexible Accumulating Class 74,141,591 1,684,653 (49,376,425) 26,449,819 US Dollar Institutional Accumulating Class 7,939,651 22,230,935 (3,257,507) 26,913,079 US Dollar Institutional Distributing Class – 81,811,666 (81,783,625) 28,041 iShares Developed World ex Tobacco Index Fund (IE) Euro Institutional Accumulating Class 9,822,134 1,977,111 (4,732,881) 7,066,364 Sterling D Distributing Class 1,746,252 257,313 (699,334) 1,304,231 Sterling Flexible Distributing Class 8,283,875 218,537 (1,544,045) 6,958,367 Sterling Institutional Distributing Class 1,626,076 418,359 (278,830) 1,765,605 US Dollar D Accumulating Class 10 – – 10 US Dollar Flexible Accumulating Class 698,390 103,970 – 802,360 US Dollar Institutional Accumulating Class 2,072,481 4,339,861 – 6,412,342 iShares Developed World Index Fund (IE) Euro (Hedged) Flexible Accumulating Class – 1,719,820 (102,200) 1,617,620 Euro D Accumulating Class 41,661 20,010 (6,998) 54,673 Euro Flexible Accumulating Class 54,839,520 24,028,855 (21,885,231) 56,983,144 Euro Flexible Distributing Class 75,751,828 27,540,374 (19,585,141) 83,707,061 Euro Institutional Accumulating Class 73,973,776 24,835,402 (25,371,642) 73,437,536 Euro Institutional Distributing Class 24,553,029 793,000 (1,605,374) 23,740,655 Sterling (Hedged) D Distributing Class – 10,580,979 (186,374) 10,394,605 Sterling (Hedged) Flexible Accumulating Class – 7,650,724 (3,393,963) 4,256,761 Sterling D Accumulating Class 1,096,314 10,727,489 (139,822) 11,683,981 Sterling Flexible Accumulating Class 40,750,176 2,675,164 (18,912,366) 24,512,974 Sterling Flexible Distributing Class 3,250,763 402,412 (146,259) 3,506,916 Sterling Institutional Accumulating Class 7,565,014 161,161 (3,728,936) 3,997,239 Sterling Institutional Distributing Class 789,371 2,454,425 (782,571) 2,461,225 US Dollar D Accumulating Class 37,680,539 1,469,257 (13,620,762) 25,529,034 US Dollar Flexible Accumulating Class 190,467,570 57,329,566 (70,520,809) 177,276,327 US Dollar Institutional Accumulating Class 109,637,815 33,070,686 (22,193,400) 120,515,101 US Dollar Institutional Distributing Class 4,580,014 1,855,237 (2,119,034) 4,316,217 iShares Edge EM Fundamental Weighted Index Fund (IE) Euro Institutional Accumulating Class 1,035,436 959,794 (996,318) 998,912 Euro Institutional Distributing Class – 1,240 – 1,240 Sterling Flexible Accumulating Class 2,793,648 374,350 (1,110,629) 2,057,369 Sterling Flexible Distributing Class 5,027,388 – (1,625,962) 3,401,426 Sterling Institutional Accumulating Class 27,530,278 552,209 (9,688,724) 18,393,763 iShares Emerging Markets Index Fund (IE) Euro D Accumulating Class 2,244,853 3,334,144 (1,525,171) 4,053,826
80
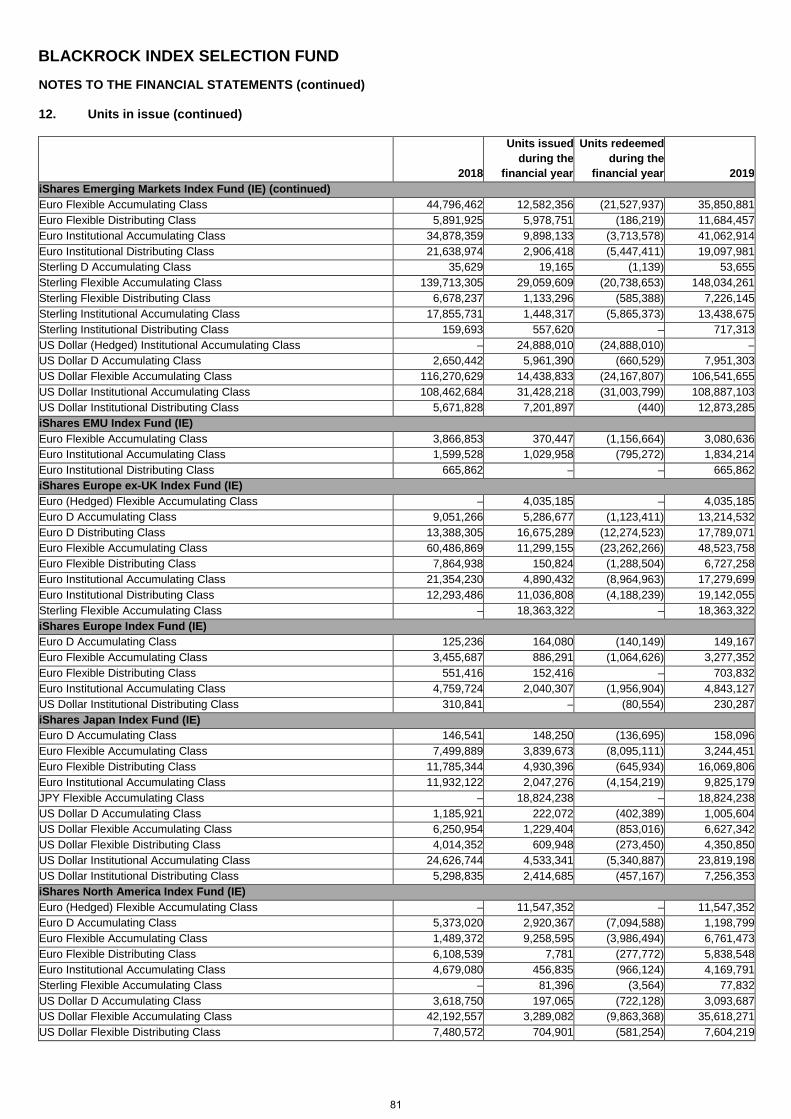
BLACKROCK INDEX SELECTION FUND
NOTES TO THE FINANCIAL STATEMENTS (continued)
12. Units in issue (continued)
2018
Units issued during the
financial year
Units redeemed during the
financial year 2019 iShares Emerging Markets Index Fund (IE) (continued) Euro Flexible Accumulating Class 44,796,462 12,582,356 (21,527,937) 35,850,881 Euro Flexible Distributing Class 5,891,925 5,978,751 (186,219) 11,684,457 Euro Institutional Accumulating Class 34,878,359 9,898,133 (3,713,578) 41,062,914 Euro Institutional Distributing Class 21,638,974 2,906,418 (5,447,411) 19,097,981 Sterling D Accumulating Class 35,629 19,165 (1,139) 53,655 Sterling Flexible Accumulating Class 139,713,305 29,059,609 (20,738,653) 148,034,261 Sterling Flexible Distributing Class 6,678,237 1,133,296 (585,388) 7,226,145 Sterling Institutional Accumulating Class 17,855,731 1,448,317 (5,865,373) 13,438,675 Sterling Institutional Distributing Class 159,693 557,620 – 717,313 US Dollar (Hedged) Institutional Accumulating Class – 24,888,010 (24,888,010) – US Dollar D Accumulating Class 2,650,442 5,961,390 (660,529) 7,951,303 US Dollar Flexible Accumulating Class 116,270,629 14,438,833 (24,167,807) 106,541,655 US Dollar Institutional Accumulating Class 108,462,684 31,428,218 (31,003,799) 108,887,103 US Dollar Institutional Distributing Class 5,671,828 7,201,897 (440) 12,873,285 iShares EMU Index Fund (IE) Euro Flexible Accumulating Class 3,866,853 370,447 (1,156,664) 3,080,636 Euro Institutional Accumulating Class 1,599,528 1,029,958 (795,272) 1,834,214 Euro Institutional Distributing Class 665,862 – – 665,862 iShares Europe ex-UK Index Fund (IE) Euro (Hedged) Flexible Accumulating Class – 4,035,185 – 4,035,185 Euro D Accumulating Class 9,051,266 5,286,677 (1,123,411) 13,214,532 Euro D Distributing Class 13,388,305 16,675,289 (12,274,523) 17,789,071 Euro Flexible Accumulating Class 60,486,869 11,299,155 (23,262,266) 48,523,758 Euro Flexible Distributing Class 7,864,938 150,824 (1,288,504) 6,727,258 Euro Institutional Accumulating Class 21,354,230 4,890,432 (8,964,963) 17,279,699 Euro Institutional Distributing Class 12,293,486 11,036,808 (4,188,239) 19,142,055 Sterling Flexible Accumulating Class – 18,363,322 – 18,363,322 iShares Europe Index Fund (IE) Euro D Accumulating Class 125,236 164,080 (140,149) 149,167 Euro Flexible Accumulating Class 3,455,687 886,291 (1,064,626) 3,277,352 Euro Flexible Distributing Class 551,416 152,416 – 703,832 Euro Institutional Accumulating Class 4,759,724 2,040,307 (1,956,904) 4,843,127 US Dollar Institutional Distributing Class 310,841 – (80,554) 230,287 iShares Japan Index Fund (IE) Euro D Accumulating Class 146,541 148,250 (136,695) 158,096 Euro Flexible Accumulating Class 7,499,889 3,839,673 (8,095,111) 3,244,451 Euro Flexible Distributing Class 11,785,344 4,930,396 (645,934) 16,069,806 Euro Institutional Accumulating Class 11,932,122 2,047,276 (4,154,219) 9,825,179 JPY Flexible Accumulating Class – 18,824,238 – 18,824,238 US Dollar D Accumulating Class 1,185,921 222,072 (402,389) 1,005,604 US Dollar Flexible Accumulating Class 6,250,954 1,229,404 (853,016) 6,627,342 US Dollar Flexible Distributing Class 4,014,352 609,948 (273,450) 4,350,850 US Dollar Institutional Accumulating Class 24,626,744 4,533,341 (5,340,887) 23,819,198 US Dollar Institutional Distributing Class 5,298,835 2,414,685 (457,167) 7,256,353 iShares North America Index Fund (IE) Euro (Hedged) Flexible Accumulating Class – 11,547,352 – 11,547,352 Euro D Accumulating Class 5,373,020 2,920,367 (7,094,588) 1,198,799 Euro Flexible Accumulating Class 1,489,372 9,258,595 (3,986,494) 6,761,473 Euro Flexible Distributing Class 6,108,539 7,781 (277,772) 5,838,548 Euro Institutional Accumulating Class 4,679,080 456,835 (966,124) 4,169,791 Sterling Flexible Accumulating Class – 81,396 (3,564) 77,832 US Dollar D Accumulating Class 3,618,750 197,065 (722,128) 3,093,687 US Dollar Flexible Accumulating Class 42,192,557 3,289,082 (9,863,368) 35,618,271 US Dollar Flexible Distributing Class 7,480,572 704,901 (581,254) 7,604,219
81
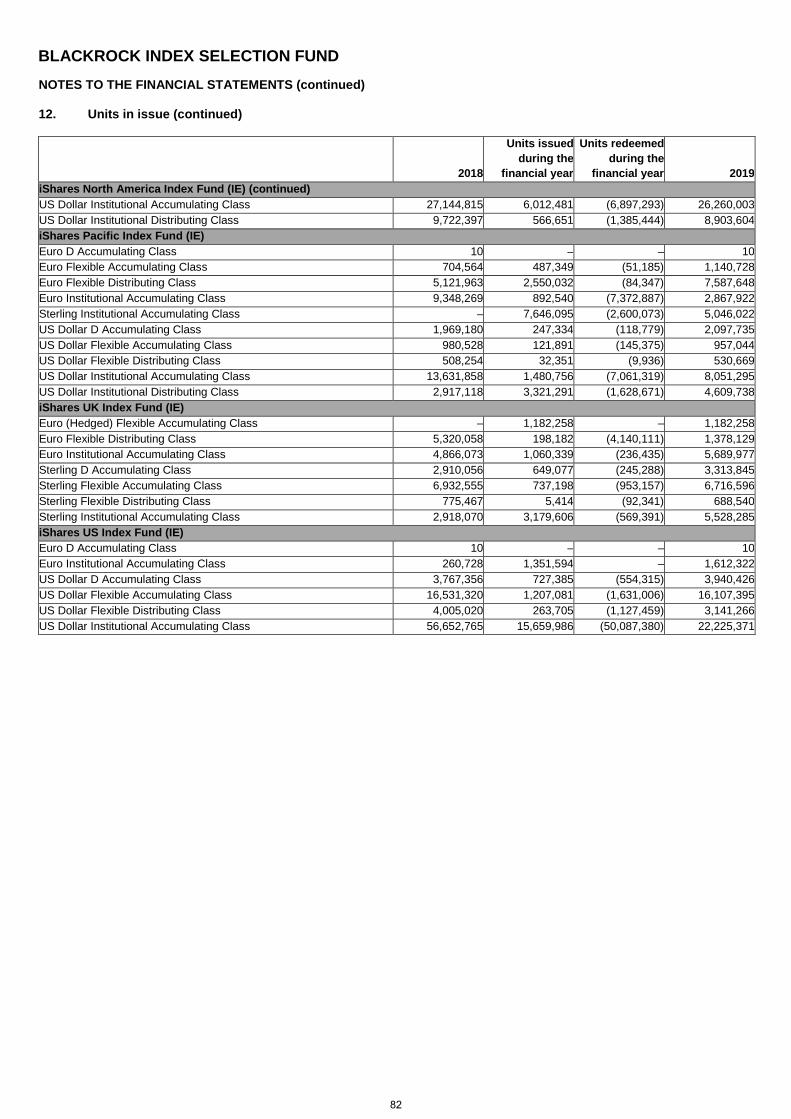
BLACKROCK INDEX SELECTION FUND
NOTES TO THE FINANCIAL STATEMENTS (continued)
12. Units in issue (continued)
2018
Units issued during the
financial year
Units redeemed during the
financial year 2019 iShares North America Index Fund (IE) (continued) US Dollar Institutional Accumulating Class 27,144,815 6,012,481 (6,897,293) 26,260,003 US Dollar Institutional Distributing Class 9,722,397 566,651 (1,385,444) 8,903,604 iShares Pacific Index Fund (IE) Euro D Accumulating Class 10 – – 10 Euro Flexible Accumulating Class 704,564 487,349 (51,185) 1,140,728 Euro Flexible Distributing Class 5,121,963 2,550,032 (84,347) 7,587,648 Euro Institutional Accumulating Class 9,348,269 892,540 (7,372,887) 2,867,922 Sterling Institutional Accumulating Class – 7,646,095 (2,600,073) 5,046,022 US Dollar D Accumulating Class 1,969,180 247,334 (118,779) 2,097,735 US Dollar Flexible Accumulating Class 980,528 121,891 (145,375) 957,044 US Dollar Flexible Distributing Class 508,254 32,351 (9,936) 530,669 US Dollar Institutional Accumulating Class 13,631,858 1,480,756 (7,061,319) 8,051,295 US Dollar Institutional Distributing Class 2,917,118 3,321,291 (1,628,671) 4,609,738 iShares UK Index Fund (IE) Euro (Hedged) Flexible Accumulating Class – 1,182,258 – 1,182,258 Euro Flexible Distributing Class 5,320,058 198,182 (4,140,111) 1,378,129 Euro Institutional Accumulating Class 4,866,073 1,060,339 (236,435) 5,689,977 Sterling D Accumulating Class 2,910,056 649,077 (245,288) 3,313,845 Sterling Flexible Accumulating Class 6,932,555 737,198 (953,157) 6,716,596 Sterling Flexible Distributing Class 775,467 5,414 (92,341) 688,540 Sterling Institutional Accumulating Class 2,918,070 3,179,606 (569,391) 5,528,285 iShares US Index Fund (IE) Euro D Accumulating Class 10 – – 10 Euro Institutional Accumulating Class 260,728 1,351,594 – 1,612,322 US Dollar D Accumulating Class 3,767,356 727,385 (554,315) 3,940,426 US Dollar Flexible Accumulating Class 16,531,320 1,207,081 (1,631,006) 16,107,395 US Dollar Flexible Distributing Class 4,005,020 263,705 (1,127,459) 3,141,266 US Dollar Institutional Accumulating Class 56,652,765 15,659,986 (50,087,380) 22,225,371
82
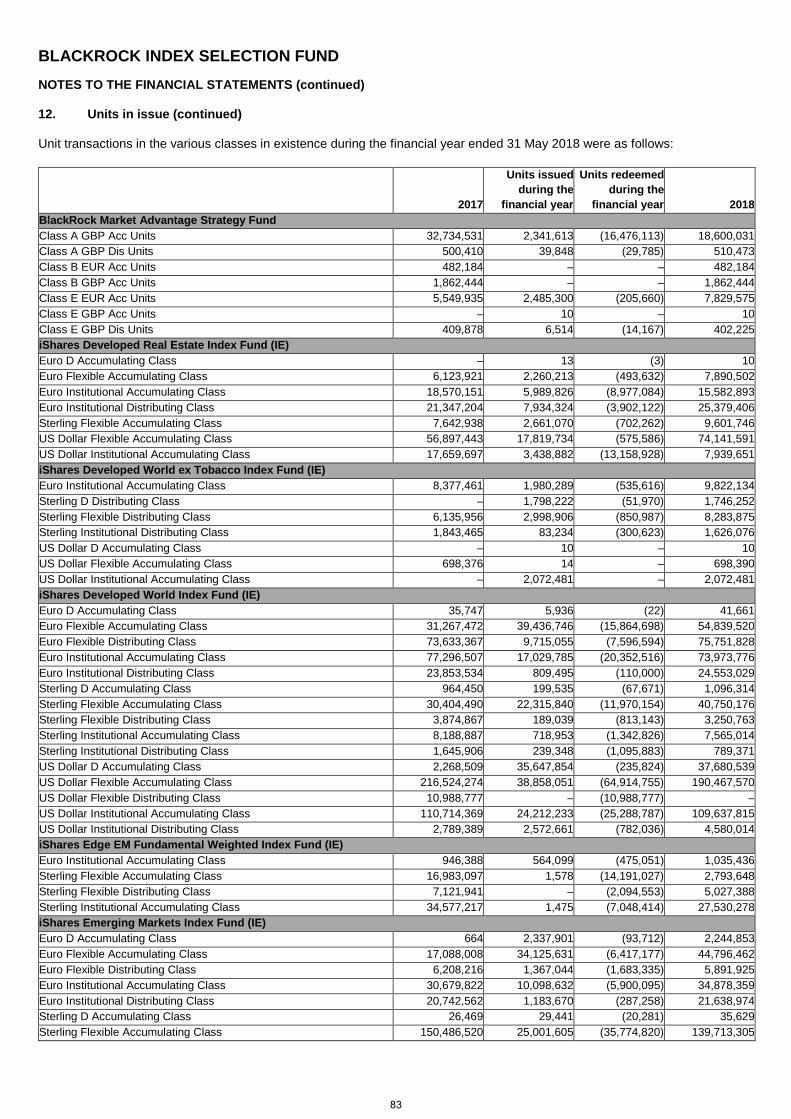
BLACKROCK INDEX SELECTION FUND
NOTES TO THE FINANCIAL STATEMENTS (continued)
12. Units in issue (continued)
Unit transactions in the various classes in existence during the financial year ended 31 May 2018 were as follows:
2017
Units issued during the
financial year
Units redeemed during the
financial year 2018 BlackRock Market Advantage Strategy Fund Class A GBP Acc Units 32,734,531 2,341,613 (16,476,113) 18,600,031 Class A GBP Dis Units 500,410 39,848 (29,785) 510,473 Class B EUR Acc Units 482,184 – – 482,184 Class B GBP Acc Units 1,862,444 – – 1,862,444 Class E EUR Acc Units 5,549,935 2,485,300 (205,660) 7,829,575 Class E GBP Acc Units – 10 – 10 Class E GBP Dis Units 409,878 6,514 (14,167) 402,225 iShares Developed Real Estate Index Fund (IE) Euro D Accumulating Class – 13 (3) 10 Euro Flexible Accumulating Class 6,123,921 2,260,213 (493,632) 7,890,502 Euro Institutional Accumulating Class 18,570,151 5,989,826 (8,977,084) 15,582,893 Euro Institutional Distributing Class 21,347,204 7,934,324 (3,902,122) 25,379,406 Sterling Flexible Accumulating Class 7,642,938 2,661,070 (702,262) 9,601,746 US Dollar Flexible Accumulating Class 56,897,443 17,819,734 (575,586) 74,141,591 US Dollar Institutional Accumulating Class 17,659,697 3,438,882 (13,158,928) 7,939,651 iShares Developed World ex Tobacco Index Fund (IE) Euro Institutional Accumulating Class 8,377,461 1,980,289 (535,616) 9,822,134 Sterling D Distributing Class – 1,798,222 (51,970) 1,746,252 Sterling Flexible Distributing Class 6,135,956 2,998,906 (850,987) 8,283,875 Sterling Institutional Distributing Class 1,843,465 83,234 (300,623) 1,626,076 US Dollar D Accumulating Class – 10 – 10 US Dollar Flexible Accumulating Class 698,376 14 – 698,390 US Dollar Institutional Accumulating Class – 2,072,481 – 2,072,481 iShares Developed World Index Fund (IE) Euro D Accumulating Class 35,747 5,936 (22) 41,661 Euro Flexible Accumulating Class 31,267,472 39,436,746 (15,864,698) 54,839,520 Euro Flexible Distributing Class 73,633,367 9,715,055 (7,596,594) 75,751,828 Euro Institutional Accumulating Class 77,296,507 17,029,785 (20,352,516) 73,973,776 Euro Institutional Distributing Class 23,853,534 809,495 (110,000) 24,553,029 Sterling D Accumulating Class 964,450 199,535 (67,671) 1,096,314 Sterling Flexible Accumulating Class 30,404,490 22,315,840 (11,970,154) 40,750,176 Sterling Flexible Distributing Class 3,874,867 189,039 (813,143) 3,250,763 Sterling Institutional Accumulating Class 8,188,887 718,953 (1,342,826) 7,565,014 Sterling Institutional Distributing Class 1,645,906 239,348 (1,095,883) 789,371 US Dollar D Accumulating Class 2,268,509 35,647,854 (235,824) 37,680,539 US Dollar Flexible Accumulating Class 216,524,274 38,858,051 (64,914,755) 190,467,570 US Dollar Flexible Distributing Class 10,988,777 – (10,988,777) – US Dollar Institutional Accumulating Class 110,714,369 24,212,233 (25,288,787) 109,637,815 US Dollar Institutional Distributing Class 2,789,389 2,572,661 (782,036) 4,580,014 iShares Edge EM Fundamental Weighted Index Fund (IE) Euro Institutional Accumulating Class 946,388 564,099 (475,051) 1,035,436 Sterling Flexible Accumulating Class 16,983,097 1,578 (14,191,027) 2,793,648 Sterling Flexible Distributing Class 7,121,941 – (2,094,553) 5,027,388 Sterling Institutional Accumulating Class 34,577,217 1,475 (7,048,414) 27,530,278 iShares Emerging Markets Index Fund (IE) Euro D Accumulating Class 664 2,337,901 (93,712) 2,244,853 Euro Flexible Accumulating Class 17,088,008 34,125,631 (6,417,177) 44,796,462 Euro Flexible Distributing Class 6,208,216 1,367,044 (1,683,335) 5,891,925 Euro Institutional Accumulating Class 30,679,822 10,098,632 (5,900,095) 34,878,359 Euro Institutional Distributing Class 20,742,562 1,183,670 (287,258) 21,638,974 Sterling D Accumulating Class 26,469 29,441 (20,281) 35,629 Sterling Flexible Accumulating Class 150,486,520 25,001,605 (35,774,820) 139,713,305
83
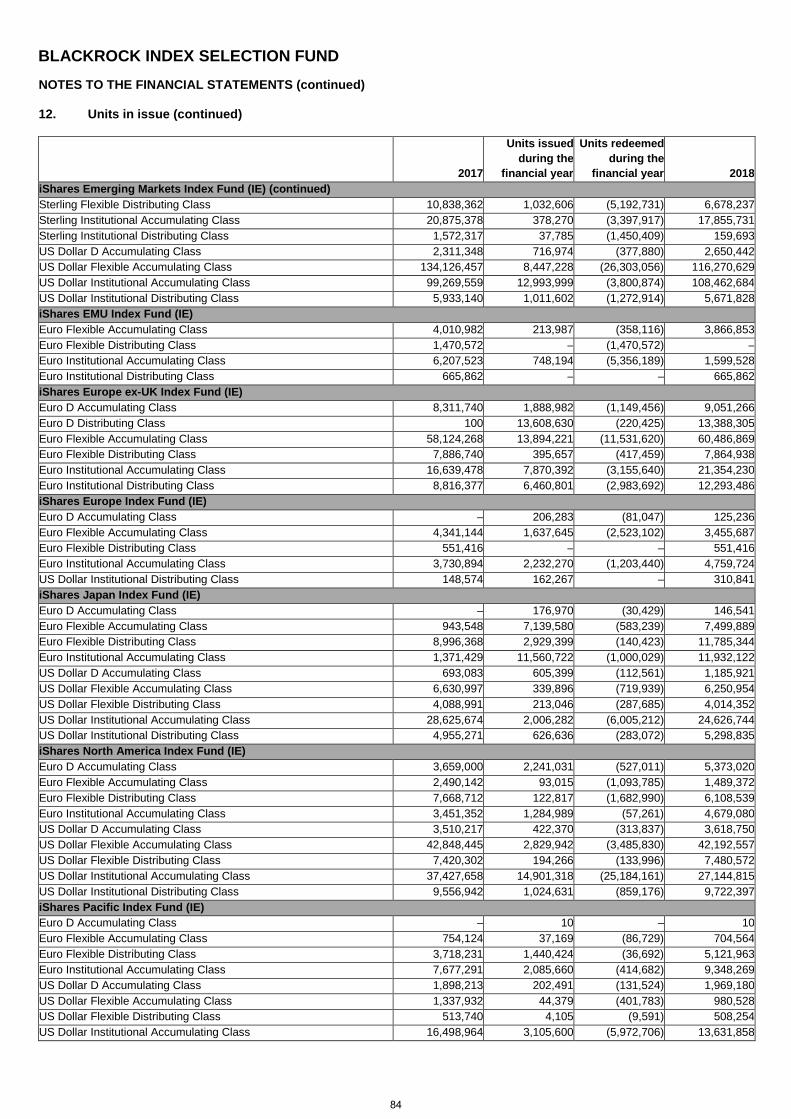
BLACKROCK INDEX SELECTION FUND
NOTES TO THE FINANCIAL STATEMENTS (continued)
12. Units in issue (continued)
2017
Units issued during the
financial year
Units redeemed during the
financial year 2018 iShares Emerging Markets Index Fund (IE) (continued) Sterling Flexible Distributing Class 10,838,362 1,032,606 (5,192,731) 6,678,237 Sterling Institutional Accumulating Class 20,875,378 378,270 (3,397,917) 17,855,731 Sterling Institutional Distributing Class 1,572,317 37,785 (1,450,409) 159,693 US Dollar D Accumulating Class 2,311,348 716,974 (377,880) 2,650,442 US Dollar Flexible Accumulating Class 134,126,457 8,447,228 (26,303,056) 116,270,629 US Dollar Institutional Accumulating Class 99,269,559 12,993,999 (3,800,874) 108,462,684 US Dollar Institutional Distributing Class 5,933,140 1,011,602 (1,272,914) 5,671,828 iShares EMU Index Fund (IE) Euro Flexible Accumulating Class 4,010,982 213,987 (358,116) 3,866,853 Euro Flexible Distributing Class 1,470,572 – (1,470,572) – Euro Institutional Accumulating Class 6,207,523 748,194 (5,356,189) 1,599,528 Euro Institutional Distributing Class 665,862 – – 665,862 iShares Europe ex-UK Index Fund (IE) Euro D Accumulating Class 8,311,740 1,888,982 (1,149,456) 9,051,266 Euro D Distributing Class 100 13,608,630 (220,425) 13,388,305 Euro Flexible Accumulating Class 58,124,268 13,894,221 (11,531,620) 60,486,869 Euro Flexible Distributing Class 7,886,740 395,657 (417,459) 7,864,938 Euro Institutional Accumulating Class 16,639,478 7,870,392 (3,155,640) 21,354,230 Euro Institutional Distributing Class 8,816,377 6,460,801 (2,983,692) 12,293,486 iShares Europe Index Fund (IE) Euro D Accumulating Class – 206,283 (81,047) 125,236 Euro Flexible Accumulating Class 4,341,144 1,637,645 (2,523,102) 3,455,687 Euro Flexible Distributing Class 551,416 – – 551,416 Euro Institutional Accumulating Class 3,730,894 2,232,270 (1,203,440) 4,759,724 US Dollar Institutional Distributing Class 148,574 162,267 – 310,841 iShares Japan Index Fund (IE) Euro D Accumulating Class – 176,970 (30,429) 146,541 Euro Flexible Accumulating Class 943,548 7,139,580 (583,239) 7,499,889 Euro Flexible Distributing Class 8,996,368 2,929,399 (140,423) 11,785,344 Euro Institutional Accumulating Class 1,371,429 11,560,722 (1,000,029) 11,932,122 US Dollar D Accumulating Class 693,083 605,399 (112,561) 1,185,921 US Dollar Flexible Accumulating Class 6,630,997 339,896 (719,939) 6,250,954 US Dollar Flexible Distributing Class 4,088,991 213,046 (287,685) 4,014,352 US Dollar Institutional Accumulating Class 28,625,674 2,006,282 (6,005,212) 24,626,744 US Dollar Institutional Distributing Class 4,955,271 626,636 (283,072) 5,298,835 iShares North America Index Fund (IE) Euro D Accumulating Class 3,659,000 2,241,031 (527,011) 5,373,020 Euro Flexible Accumulating Class 2,490,142 93,015 (1,093,785) 1,489,372 Euro Flexible Distributing Class 7,668,712 122,817 (1,682,990) 6,108,539 Euro Institutional Accumulating Class 3,451,352 1,284,989 (57,261) 4,679,080 US Dollar D Accumulating Class 3,510,217 422,370 (313,837) 3,618,750 US Dollar Flexible Accumulating Class 42,848,445 2,829,942 (3,485,830) 42,192,557 US Dollar Flexible Distributing Class 7,420,302 194,266 (133,996) 7,480,572 US Dollar Institutional Accumulating Class 37,427,658 14,901,318 (25,184,161) 27,144,815 US Dollar Institutional Distributing Class 9,556,942 1,024,631 (859,176) 9,722,397 iShares Pacific Index Fund (IE) Euro D Accumulating Class – 10 – 10 Euro Flexible Accumulating Class 754,124 37,169 (86,729) 704,564 Euro Flexible Distributing Class 3,718,231 1,440,424 (36,692) 5,121,963 Euro Institutional Accumulating Class 7,677,291 2,085,660 (414,682) 9,348,269 US Dollar D Accumulating Class 1,898,213 202,491 (131,524) 1,969,180 US Dollar Flexible Accumulating Class 1,337,932 44,379 (401,783) 980,528 US Dollar Flexible Distributing Class 513,740 4,105 (9,591) 508,254 US Dollar Institutional Accumulating Class 16,498,964 3,105,600 (5,972,706) 13,631,858
84
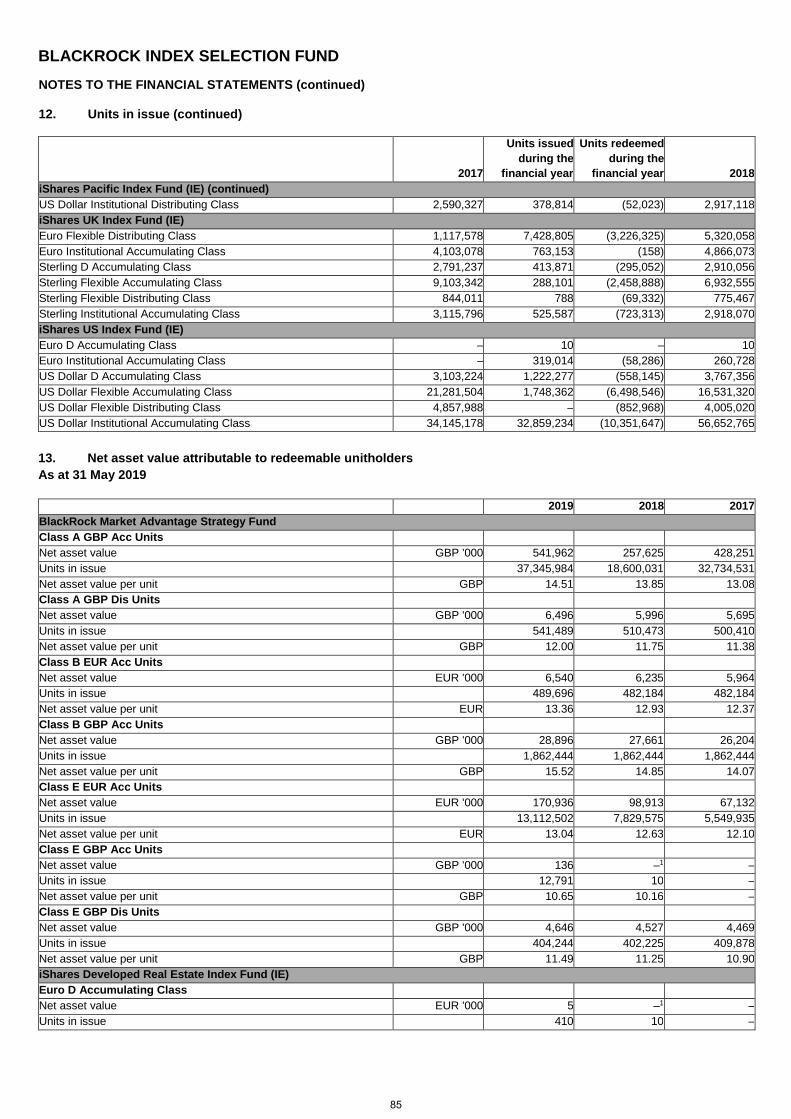
BLACKROCK INDEX SELECTION FUND
NOTES TO THE FINANCIAL STATEMENTS (continued)
12. Units in issue (continued)
2017
Units issued during the
financial year
Units redeemed during the
financial year 2018 iShares Pacific Index Fund (IE) (continued) US Dollar Institutional Distributing Class 2,590,327 378,814 (52,023) 2,917,118 iShares UK Index Fund (IE) Euro Flexible Distributing Class 1,117,578 7,428,805 (3,226,325) 5,320,058 Euro Institutional Accumulating Class 4,103,078 763,153 (158) 4,866,073 Sterling D Accumulating Class 2,791,237 413,871 (295,052) 2,910,056 Sterling Flexible Accumulating Class 9,103,342 288,101 (2,458,888) 6,932,555 Sterling Flexible Distributing Class 844,011 788 (69,332) 775,467 Sterling Institutional Accumulating Class 3,115,796 525,587 (723,313) 2,918,070 iShares US Index Fund (IE) Euro D Accumulating Class – 10 – 10 Euro Institutional Accumulating Class – 319,014 (58,286) 260,728 US Dollar D Accumulating Class 3,103,224 1,222,277 (558,145) 3,767,356 US Dollar Flexible Accumulating Class 21,281,504 1,748,362 (6,498,546) 16,531,320 US Dollar Flexible Distributing Class 4,857,988 – (852,968) 4,005,020 US Dollar Institutional Accumulating Class 34,145,178 32,859,234 (10,351,647) 56,652,765
13. Net asset value attributable to redeemable unitholders As at 31 May 2019
2019 2018 2017 BlackRock Market Advantage Strategy Fund Class A GBP Acc Units Net asset value GBP '000 541,962 257,625 428,251 Units in issue 37,345,984 18,600,031 32,734,531 Net asset value per unit GBP 14.51 13.85 13.08 Class A GBP Dis Units Net asset value GBP '000 6,496 5,996 5,695 Units in issue 541,489 510,473 500,410 Net asset value per unit GBP 12.00 11.75 11.38 Class B EUR Acc Units Net asset value EUR '000 6,540 6,235 5,964 Units in issue 489,696 482,184 482,184 Net asset value per unit EUR 13.36 12.93 12.37 Class B GBP Acc Units Net asset value GBP '000 28,896 27,661 26,204 Units in issue 1,862,444 1,862,444 1,862,444 Net asset value per unit GBP 15.52 14.85 14.07 Class E EUR Acc Units Net asset value EUR '000 170,936 98,913 67,132 Units in issue 13,112,502 7,829,575 5,549,935 Net asset value per unit EUR 13.04 12.63 12.10 Class E GBP Acc Units Net asset value GBP '000 136 –1 – Units in issue 12,791 10 – Net asset value per unit GBP 10.65 10.16 – Class E GBP Dis Units Net asset value GBP '000 4,646 4,527 4,469 Units in issue 404,244 402,225 409,878 Net asset value per unit GBP 11.49 11.25 10.90 iShares Developed Real Estate Index Fund (IE) Euro D Accumulating Class Net asset value EUR '000 5 –1 – Units in issue 410 10 –
85
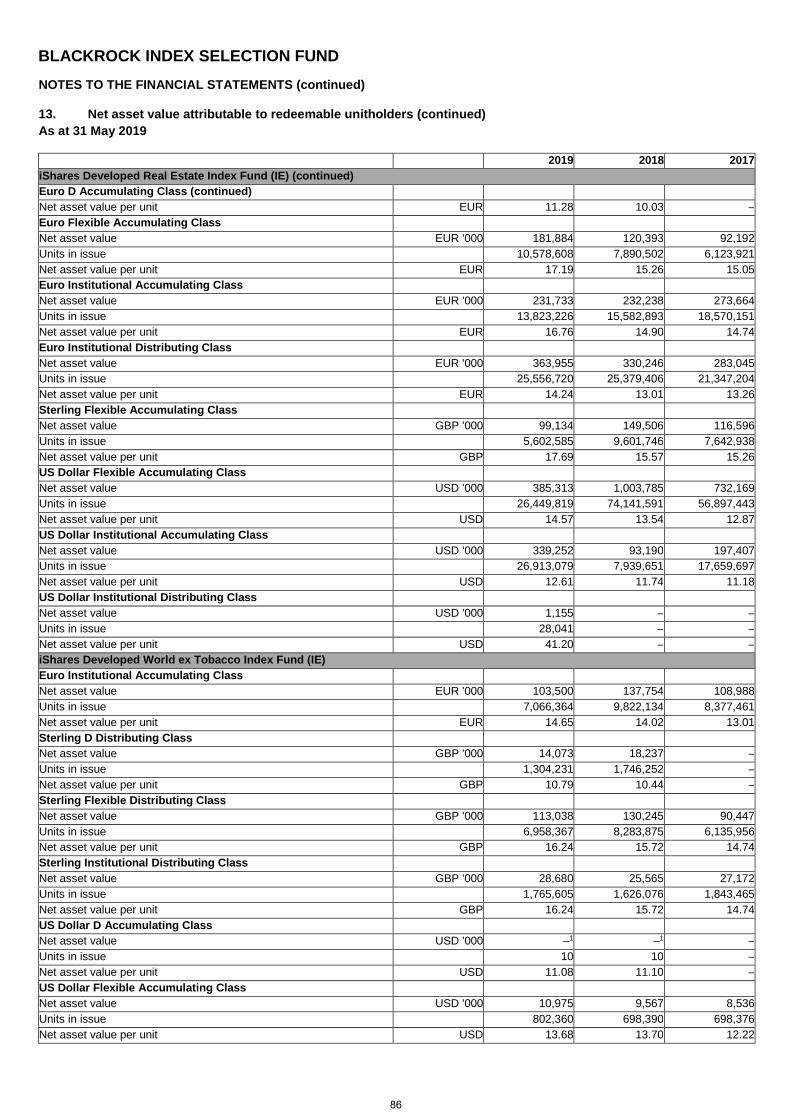
BLACKROCK INDEX SELECTION FUND
NOTES TO THE FINANCIAL STATEMENTS (continued)
13. Net asset value attributable to redeemable unitholders (continued) As at 31 May 2019
2019 2018 2017 iShares Developed Real Estate Index Fund (IE) (continued) Euro D Accumulating Class (continued) Net asset value per unit EUR 11.28 10.03 – Euro Flexible Accumulating Class Net asset value EUR '000 181,884 120,393 92,192 Units in issue 10,578,608 7,890,502 6,123,921 Net asset value per unit EUR 17.19 15.26 15.05 Euro Institutional Accumulating Class Net asset value EUR '000 231,733 232,238 273,664 Units in issue 13,823,226 15,582,893 18,570,151 Net asset value per unit EUR 16.76 14.90 14.74 Euro Institutional Distributing Class Net asset value EUR '000 363,955 330,246 283,045 Units in issue 25,556,720 25,379,406 21,347,204 Net asset value per unit EUR 14.24 13.01 13.26 Sterling Flexible Accumulating Class Net asset value GBP '000 99,134 149,506 116,596 Units in issue 5,602,585 9,601,746 7,642,938 Net asset value per unit GBP 17.69 15.57 15.26 US Dollar Flexible Accumulating Class Net asset value USD '000 385,313 1,003,785 732,169 Units in issue 26,449,819 74,141,591 56,897,443 Net asset value per unit USD 14.57 13.54 12.87 US Dollar Institutional Accumulating Class Net asset value USD '000 339,252 93,190 197,407 Units in issue 26,913,079 7,939,651 17,659,697 Net asset value per unit USD 12.61 11.74 11.18 US Dollar Institutional Distributing Class Net asset value USD '000 1,155 – – Units in issue 28,041 – – Net asset value per unit USD 41.20 – – iShares Developed World ex Tobacco Index Fund (IE) Euro Institutional Accumulating Class Net asset value EUR '000 103,500 137,754 108,988 Units in issue 7,066,364 9,822,134 8,377,461 Net asset value per unit EUR 14.65 14.02 13.01 Sterling D Distributing Class Net asset value GBP '000 14,073 18,237 – Units in issue 1,304,231 1,746,252 – Net asset value per unit GBP 10.79 10.44 – Sterling Flexible Distributing Class Net asset value GBP '000 113,038 130,245 90,447 Units in issue 6,958,367 8,283,875 6,135,956 Net asset value per unit GBP 16.24 15.72 14.74 Sterling Institutional Distributing Class Net asset value GBP '000 28,680 25,565 27,172 Units in issue 1,765,605 1,626,076 1,843,465 Net asset value per unit GBP 16.24 15.72 14.74 US Dollar D Accumulating Class Net asset value USD '000 –1 –1 – Units in issue 10 10 – Net asset value per unit USD 11.08 11.10 – US Dollar Flexible Accumulating Class Net asset value USD '000 10,975 9,567 8,536 Units in issue 802,360 698,390 698,376 Net asset value per unit USD 13.68 13.70 12.22
86
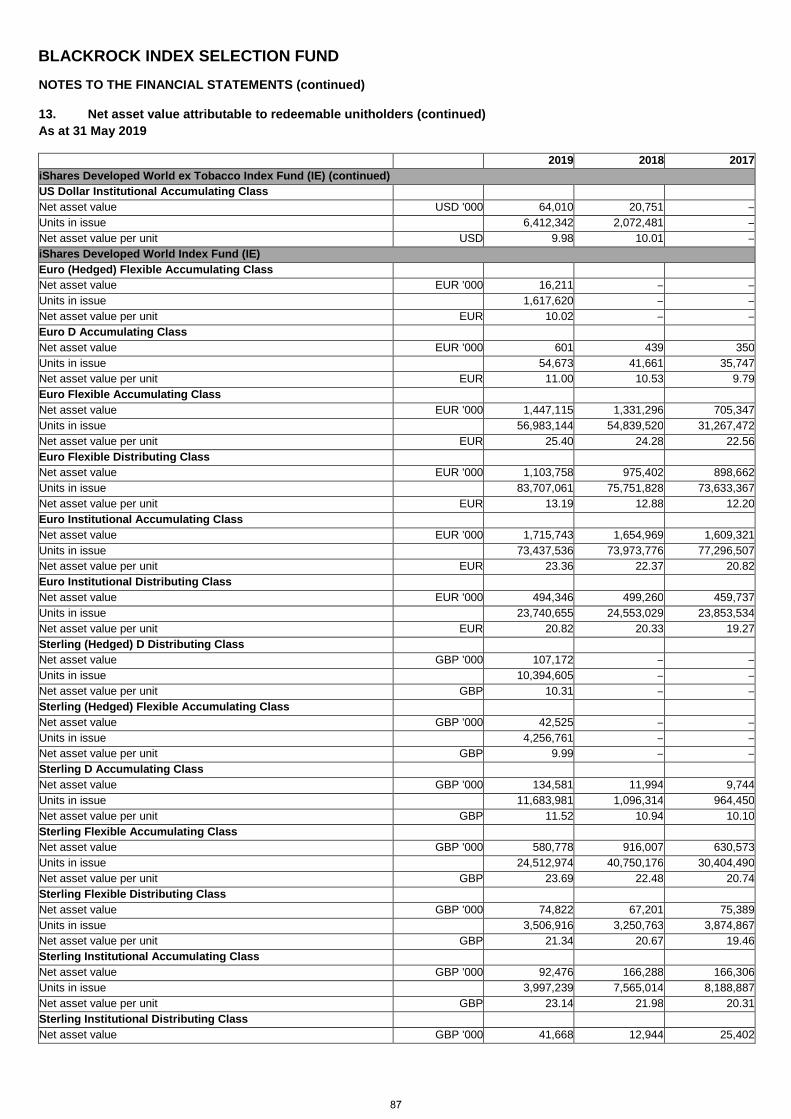
BLACKROCK INDEX SELECTION FUND
NOTES TO THE FINANCIAL STATEMENTS (continued)
13. Net asset value attributable to redeemable unitholders (continued) As at 31 May 2019
2019 2018 2017 iShares Developed World ex Tobacco Index Fund (IE) (continued) US Dollar Institutional Accumulating Class Net asset value USD '000 64,010 20,751 – Units in issue 6,412,342 2,072,481 – Net asset value per unit USD 9.98 10.01 – iShares Developed World Index Fund (IE) Euro (Hedged) Flexible Accumulating Class Net asset value EUR '000 16,211 – – Units in issue 1,617,620 – – Net asset value per unit EUR 10.02 – – Euro D Accumulating Class Net asset value EUR '000 601 439 350 Units in issue 54,673 41,661 35,747 Net asset value per unit EUR 11.00 10.53 9.79 Euro Flexible Accumulating Class Net asset value EUR '000 1,447,115 1,331,296 705,347 Units in issue 56,983,144 54,839,520 31,267,472 Net asset value per unit EUR 25.40 24.28 22.56 Euro Flexible Distributing Class Net asset value EUR '000 1,103,758 975,402 898,662 Units in issue 83,707,061 75,751,828 73,633,367 Net asset value per unit EUR 13.19 12.88 12.20 Euro Institutional Accumulating Class Net asset value EUR '000 1,715,743 1,654,969 1,609,321 Units in issue 73,437,536 73,973,776 77,296,507 Net asset value per unit EUR 23.36 22.37 20.82 Euro Institutional Distributing Class Net asset value EUR '000 494,346 499,260 459,737 Units in issue 23,740,655 24,553,029 23,853,534 Net asset value per unit EUR 20.82 20.33 19.27 Sterling (Hedged) D Distributing Class Net asset value GBP '000 107,172 – – Units in issue 10,394,605 – – Net asset value per unit GBP 10.31 – – Sterling (Hedged) Flexible Accumulating Class Net asset value GBP '000 42,525 – – Units in issue 4,256,761 – – Net asset value per unit GBP 9.99 – – Sterling D Accumulating Class Net asset value GBP '000 134,581 11,994 9,744 Units in issue 11,683,981 1,096,314 964,450 Net asset value per unit GBP 11.52 10.94 10.10 Sterling Flexible Accumulating Class Net asset value GBP '000 580,778 916,007 630,573 Units in issue 24,512,974 40,750,176 30,404,490 Net asset value per unit GBP 23.69 22.48 20.74 Sterling Flexible Distributing Class Net asset value GBP '000 74,822 67,201 75,389 Units in issue 3,506,916 3,250,763 3,874,867 Net asset value per unit GBP 21.34 20.67 19.46 Sterling Institutional Accumulating Class Net asset value GBP '000 92,476 166,288 166,306 Units in issue 3,997,239 7,565,014 8,188,887 Net asset value per unit GBP 23.14 21.98 20.31 Sterling Institutional Distributing Class Net asset value GBP '000 41,668 12,944 25,402
87
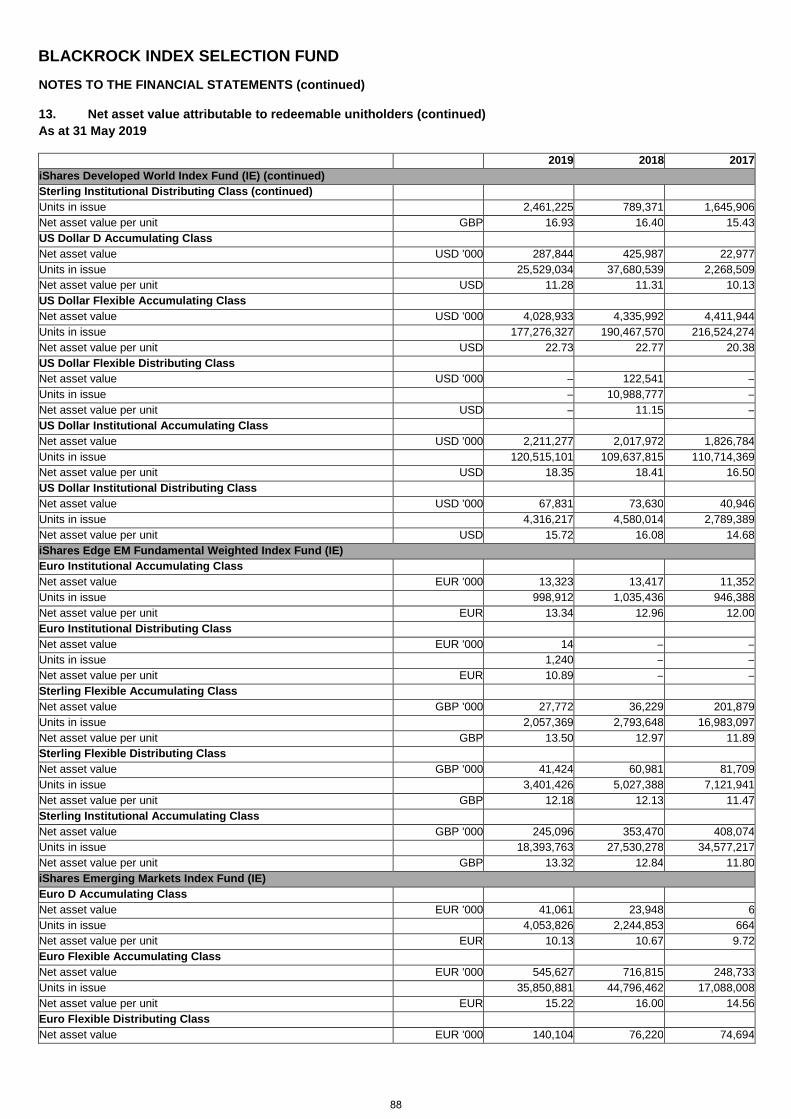
BLACKROCK INDEX SELECTION FUND
NOTES TO THE FINANCIAL STATEMENTS (continued)
13. Net asset value attributable to redeemable unitholders (continued) As at 31 May 2019
2019 2018 2017 iShares Developed World Index Fund (IE) (continued) Sterling Institutional Distributing Class (continued) Units in issue 2,461,225 789,371 1,645,906 Net asset value per unit GBP 16.93 16.40 15.43 US Dollar D Accumulating Class Net asset value USD '000 287,844 425,987 22,977 Units in issue 25,529,034 37,680,539 2,268,509 Net asset value per unit USD 11.28 11.31 10.13 US Dollar Flexible Accumulating Class Net asset value USD '000 4,028,933 4,335,992 4,411,944 Units in issue 177,276,327 190,467,570 216,524,274 Net asset value per unit USD 22.73 22.77 20.38 US Dollar Flexible Distributing Class Net asset value USD '000 – 122,541 – Units in issue – 10,988,777 – Net asset value per unit USD – 11.15 – US Dollar Institutional Accumulating Class Net asset value USD '000 2,211,277 2,017,972 1,826,784 Units in issue 120,515,101 109,637,815 110,714,369 Net asset value per unit USD 18.35 18.41 16.50 US Dollar Institutional Distributing Class Net asset value USD '000 67,831 73,630 40,946 Units in issue 4,316,217 4,580,014 2,789,389 Net asset value per unit USD 15.72 16.08 14.68 iShares Edge EM Fundamental Weighted Index Fund (IE) Euro Institutional Accumulating Class Net asset value EUR '000 13,323 13,417 11,352 Units in issue 998,912 1,035,436 946,388 Net asset value per unit EUR 13.34 12.96 12.00 Euro Institutional Distributing Class Net asset value EUR '000 14 – – Units in issue 1,240 – – Net asset value per unit EUR 10.89 – – Sterling Flexible Accumulating Class Net asset value GBP '000 27,772 36,229 201,879 Units in issue 2,057,369 2,793,648 16,983,097 Net asset value per unit GBP 13.50 12.97 11.89 Sterling Flexible Distributing Class Net asset value GBP '000 41,424 60,981 81,709 Units in issue 3,401,426 5,027,388 7,121,941 Net asset value per unit GBP 12.18 12.13 11.47 Sterling Institutional Accumulating Class Net asset value GBP '000 245,096 353,470 408,074 Units in issue 18,393,763 27,530,278 34,577,217 Net asset value per unit GBP 13.32 12.84 11.80 iShares Emerging Markets Index Fund (IE) Euro D Accumulating Class Net asset value EUR '000 41,061 23,948 6 Units in issue 4,053,826 2,244,853 664 Net asset value per unit EUR 10.13 10.67 9.72 Euro Flexible Accumulating Class Net asset value EUR '000 545,627 716,815 248,733 Units in issue 35,850,881 44,796,462 17,088,008 Net asset value per unit EUR 15.22 16.00 14.56 Euro Flexible Distributing Class Net asset value EUR '000 140,104 76,220 74,694
88
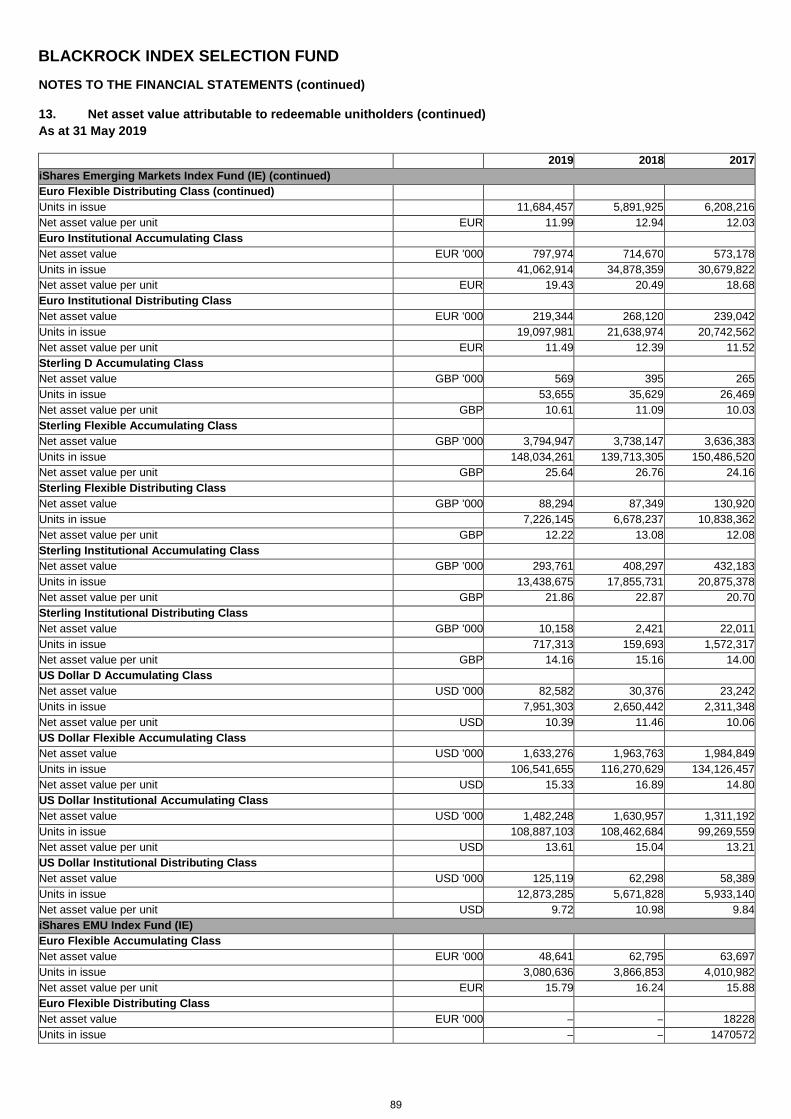
BLACKROCK INDEX SELECTION FUND
NOTES TO THE FINANCIAL STATEMENTS (continued)
13. Net asset value attributable to redeemable unitholders (continued) As at 31 May 2019
2019 2018 2017 iShares Emerging Markets Index Fund (IE) (continued) Euro Flexible Distributing Class (continued) Units in issue 11,684,457 5,891,925 6,208,216 Net asset value per unit EUR 11.99 12.94 12.03 Euro Institutional Accumulating Class Net asset value EUR '000 797,974 714,670 573,178 Units in issue 41,062,914 34,878,359 30,679,822 Net asset value per unit EUR 19.43 20.49 18.68 Euro Institutional Distributing Class Net asset value EUR '000 219,344 268,120 239,042 Units in issue 19,097,981 21,638,974 20,742,562 Net asset value per unit EUR 11.49 12.39 11.52 Sterling D Accumulating Class Net asset value GBP '000 569 395 265 Units in issue 53,655 35,629 26,469 Net asset value per unit GBP 10.61 11.09 10.03 Sterling Flexible Accumulating Class Net asset value GBP '000 3,794,947 3,738,147 3,636,383 Units in issue 148,034,261 139,713,305 150,486,520 Net asset value per unit GBP 25.64 26.76 24.16 Sterling Flexible Distributing Class Net asset value GBP '000 88,294 87,349 130,920 Units in issue 7,226,145 6,678,237 10,838,362 Net asset value per unit GBP 12.22 13.08 12.08 Sterling Institutional Accumulating Class Net asset value GBP '000 293,761 408,297 432,183 Units in issue 13,438,675 17,855,731 20,875,378 Net asset value per unit GBP 21.86 22.87 20.70 Sterling Institutional Distributing Class Net asset value GBP '000 10,158 2,421 22,011 Units in issue 717,313 159,693 1,572,317 Net asset value per unit GBP 14.16 15.16 14.00 US Dollar D Accumulating Class Net asset value USD '000 82,582 30,376 23,242 Units in issue 7,951,303 2,650,442 2,311,348 Net asset value per unit USD 10.39 11.46 10.06 US Dollar Flexible Accumulating Class Net asset value USD '000 1,633,276 1,963,763 1,984,849 Units in issue 106,541,655 116,270,629 134,126,457 Net asset value per unit USD 15.33 16.89 14.80 US Dollar Institutional Accumulating Class Net asset value USD '000 1,482,248 1,630,957 1,311,192 Units in issue 108,887,103 108,462,684 99,269,559 Net asset value per unit USD 13.61 15.04 13.21 US Dollar Institutional Distributing Class Net asset value USD '000 125,119 62,298 58,389 Units in issue 12,873,285 5,671,828 5,933,140 Net asset value per unit USD 9.72 10.98 9.84 iShares EMU Index Fund (IE) Euro Flexible Accumulating Class Net asset value EUR '000 48,641 62,795 63,697 Units in issue 3,080,636 3,866,853 4,010,982 Net asset value per unit EUR 15.79 16.24 15.88 Euro Flexible Distributing Class Net asset value EUR '000 – – 18228 Units in issue – – 1470572
89
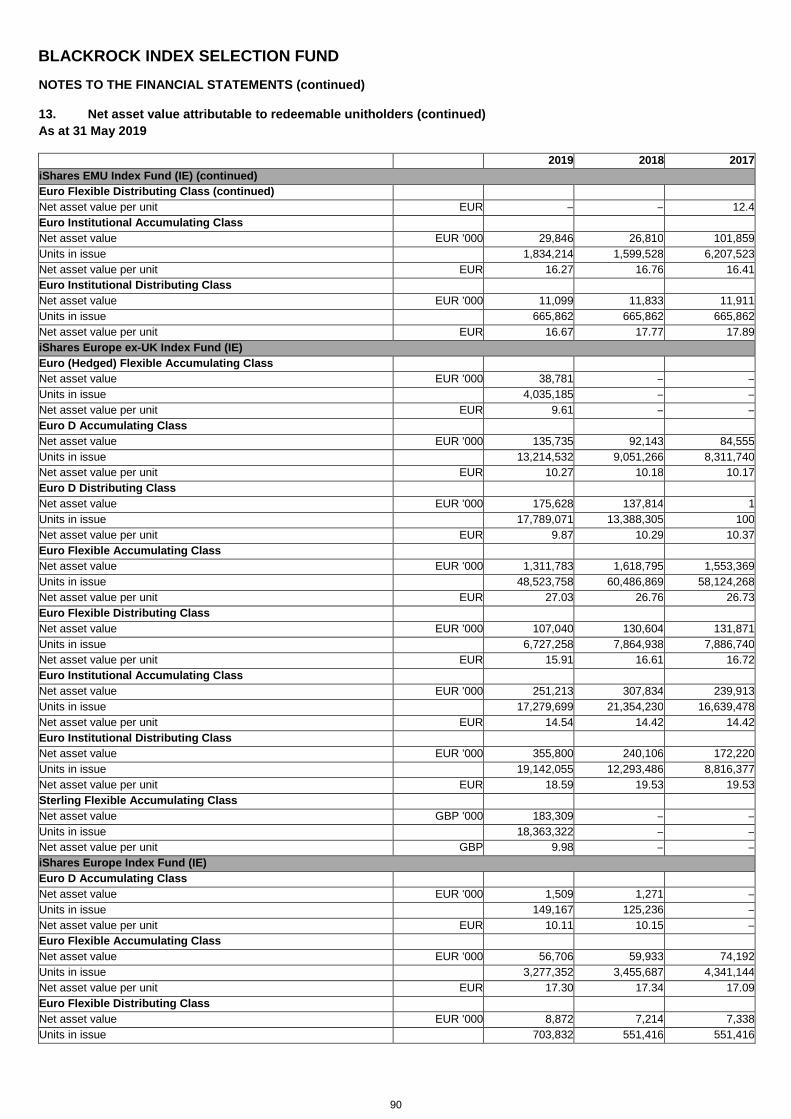
BLACKROCK INDEX SELECTION FUND
NOTES TO THE FINANCIAL STATEMENTS (continued)
13. Net asset value attributable to redeemable unitholders (continued) As at 31 May 2019
2019 2018 2017 iShares EMU Index Fund (IE) (continued) Euro Flexible Distributing Class (continued) Net asset value per unit EUR – – 12.4 Euro Institutional Accumulating Class Net asset value EUR '000 29,846 26,810 101,859 Units in issue 1,834,214 1,599,528 6,207,523 Net asset value per unit EUR 16.27 16.76 16.41 Euro Institutional Distributing Class Net asset value EUR '000 11,099 11,833 11,911 Units in issue 665,862 665,862 665,862 Net asset value per unit EUR 16.67 17.77 17.89 iShares Europe ex-UK Index Fund (IE) Euro (Hedged) Flexible Accumulating Class Net asset value EUR '000 38,781 – – Units in issue 4,035,185 – – Net asset value per unit EUR 9.61 – – Euro D Accumulating Class Net asset value EUR '000 135,735 92,143 84,555 Units in issue 13,214,532 9,051,266 8,311,740 Net asset value per unit EUR 10.27 10.18 10.17 Euro D Distributing Class Net asset value EUR '000 175,628 137,814 1 Units in issue 17,789,071 13,388,305 100 Net asset value per unit EUR 9.87 10.29 10.37 Euro Flexible Accumulating Class Net asset value EUR '000 1,311,783 1,618,795 1,553,369 Units in issue 48,523,758 60,486,869 58,124,268 Net asset value per unit EUR 27.03 26.76 26.73 Euro Flexible Distributing Class Net asset value EUR '000 107,040 130,604 131,871 Units in issue 6,727,258 7,864,938 7,886,740 Net asset value per unit EUR 15.91 16.61 16.72 Euro Institutional Accumulating Class Net asset value EUR '000 251,213 307,834 239,913 Units in issue 17,279,699 21,354,230 16,639,478 Net asset value per unit EUR 14.54 14.42 14.42 Euro Institutional Distributing Class Net asset value EUR '000 355,800 240,106 172,220 Units in issue 19,142,055 12,293,486 8,816,377 Net asset value per unit EUR 18.59 19.53 19.53 Sterling Flexible Accumulating Class Net asset value GBP '000 183,309 – – Units in issue 18,363,322 – – Net asset value per unit GBP 9.98 – – iShares Europe Index Fund (IE) Euro D Accumulating Class Net asset value EUR '000 1,509 1,271 – Units in issue 149,167 125,236 – Net asset value per unit EUR 10.11 10.15 – Euro Flexible Accumulating Class Net asset value EUR '000 56,706 59,933 74,192 Units in issue 3,277,352 3,455,687 4,341,144 Net asset value per unit EUR 17.30 17.34 17.09 Euro Flexible Distributing Class Net asset value EUR '000 8,872 7,214 7,338 Units in issue 703,832 551,416 551,416
90
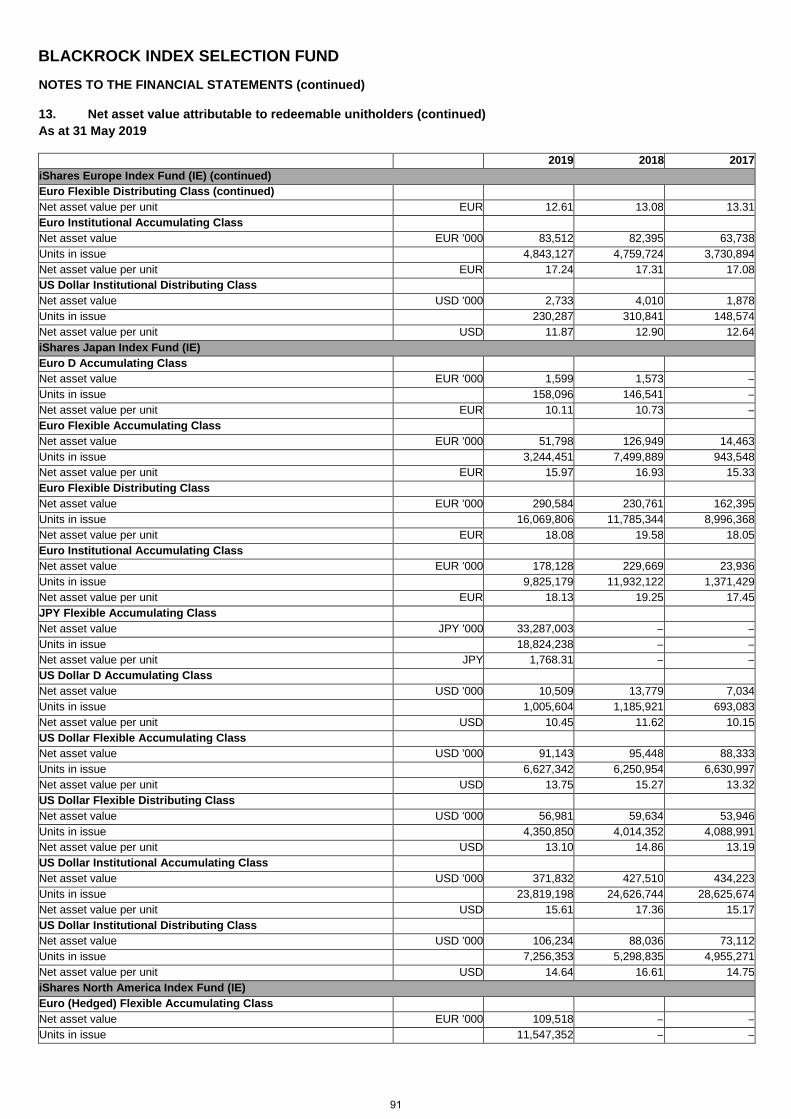
BLACKROCK INDEX SELECTION FUND
NOTES TO THE FINANCIAL STATEMENTS (continued)
13. Net asset value attributable to redeemable unitholders (continued) As at 31 May 2019
2019 2018 2017 iShares Europe Index Fund (IE) (continued) Euro Flexible Distributing Class (continued) Net asset value per unit EUR 12.61 13.08 13.31 Euro Institutional Accumulating Class Net asset value EUR '000 83,512 82,395 63,738 Units in issue 4,843,127 4,759,724 3,730,894 Net asset value per unit EUR 17.24 17.31 17.08 US Dollar Institutional Distributing Class Net asset value USD '000 2,733 4,010 1,878 Units in issue 230,287 310,841 148,574 Net asset value per unit USD 11.87 12.90 12.64 iShares Japan Index Fund (IE) Euro D Accumulating Class Net asset value EUR '000 1,599 1,573 – Units in issue 158,096 146,541 – Net asset value per unit EUR 10.11 10.73 – Euro Flexible Accumulating Class Net asset value EUR '000 51,798 126,949 14,463 Units in issue 3,244,451 7,499,889 943,548 Net asset value per unit EUR 15.97 16.93 15.33 Euro Flexible Distributing Class Net asset value EUR '000 290,584 230,761 162,395 Units in issue 16,069,806 11,785,344 8,996,368 Net asset value per unit EUR 18.08 19.58 18.05 Euro Institutional Accumulating Class Net asset value EUR '000 178,128 229,669 23,936 Units in issue 9,825,179 11,932,122 1,371,429 Net asset value per unit EUR 18.13 19.25 17.45 JPY Flexible Accumulating Class Net asset value JPY '000 33,287,003 – – Units in issue 18,824,238 – – Net asset value per unit JPY 1,768.31 – – US Dollar D Accumulating Class Net asset value USD '000 10,509 13,779 7,034 Units in issue 1,005,604 1,185,921 693,083 Net asset value per unit USD 10.45 11.62 10.15 US Dollar Flexible Accumulating Class Net asset value USD '000 91,143 95,448 88,333 Units in issue 6,627,342 6,250,954 6,630,997 Net asset value per unit USD 13.75 15.27 13.32 US Dollar Flexible Distributing Class Net asset value USD '000 56,981 59,634 53,946 Units in issue 4,350,850 4,014,352 4,088,991 Net asset value per unit USD 13.10 14.86 13.19 US Dollar Institutional Accumulating Class Net asset value USD '000 371,832 427,510 434,223 Units in issue 23,819,198 24,626,744 28,625,674 Net asset value per unit USD 15.61 17.36 15.17 US Dollar Institutional Distributing Class Net asset value USD '000 106,234 88,036 73,112 Units in issue 7,256,353 5,298,835 4,955,271 Net asset value per unit USD 14.64 16.61 14.75 iShares North America Index Fund (IE) Euro (Hedged) Flexible Accumulating Class Net asset value EUR '000 109,518 – – Units in issue 11,547,352 – –
91
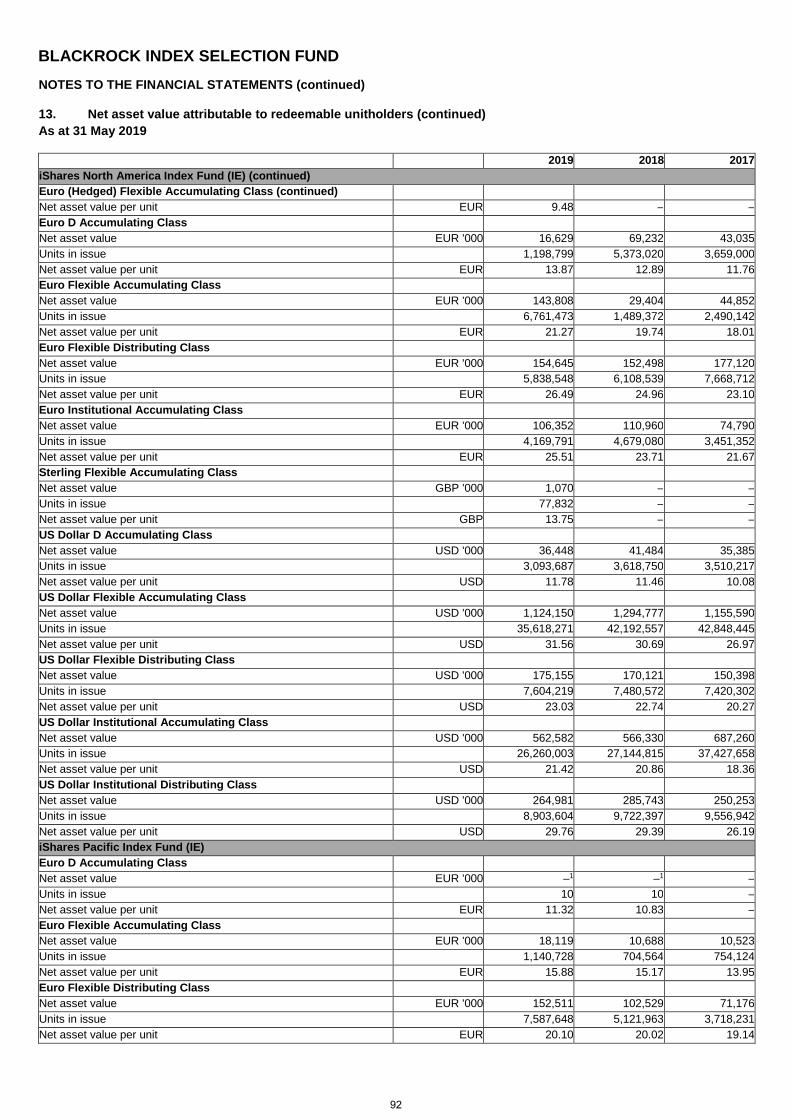
BLACKROCK INDEX SELECTION FUND
NOTES TO THE FINANCIAL STATEMENTS (continued)
13. Net asset value attributable to redeemable unitholders (continued) As at 31 May 2019
2019 2018 2017 iShares North America Index Fund (IE) (continued) Euro (Hedged) Flexible Accumulating Class (continued) Net asset value per unit EUR 9.48 – – Euro D Accumulating Class Net asset value EUR '000 16,629 69,232 43,035 Units in issue 1,198,799 5,373,020 3,659,000 Net asset value per unit EUR 13.87 12.89 11.76 Euro Flexible Accumulating Class Net asset value EUR '000 143,808 29,404 44,852 Units in issue 6,761,473 1,489,372 2,490,142 Net asset value per unit EUR 21.27 19.74 18.01 Euro Flexible Distributing Class Net asset value EUR '000 154,645 152,498 177,120 Units in issue 5,838,548 6,108,539 7,668,712 Net asset value per unit EUR 26.49 24.96 23.10 Euro Institutional Accumulating Class Net asset value EUR '000 106,352 110,960 74,790 Units in issue 4,169,791 4,679,080 3,451,352 Net asset value per unit EUR 25.51 23.71 21.67 Sterling Flexible Accumulating Class Net asset value GBP '000 1,070 – – Units in issue 77,832 – – Net asset value per unit GBP 13.75 – – US Dollar D Accumulating Class Net asset value USD '000 36,448 41,484 35,385 Units in issue 3,093,687 3,618,750 3,510,217 Net asset value per unit USD 11.78 11.46 10.08 US Dollar Flexible Accumulating Class Net asset value USD '000 1,124,150 1,294,777 1,155,590 Units in issue 35,618,271 42,192,557 42,848,445 Net asset value per unit USD 31.56 30.69 26.97 US Dollar Flexible Distributing Class Net asset value USD '000 175,155 170,121 150,398 Units in issue 7,604,219 7,480,572 7,420,302 Net asset value per unit USD 23.03 22.74 20.27 US Dollar Institutional Accumulating Class Net asset value USD '000 562,582 566,330 687,260 Units in issue 26,260,003 27,144,815 37,427,658 Net asset value per unit USD 21.42 20.86 18.36 US Dollar Institutional Distributing Class Net asset value USD '000 264,981 285,743 250,253 Units in issue 8,903,604 9,722,397 9,556,942 Net asset value per unit USD 29.76 29.39 26.19 iShares Pacific Index Fund (IE) Euro D Accumulating Class Net asset value EUR '000 –1 –1 – Units in issue 10 10 – Net asset value per unit EUR 11.32 10.83 – Euro Flexible Accumulating Class Net asset value EUR '000 18,119 10,688 10,523 Units in issue 1,140,728 704,564 754,124 Net asset value per unit EUR 15.88 15.17 13.95 Euro Flexible Distributing Class Net asset value EUR '000 152,511 102,529 71,176 Units in issue 7,587,648 5,121,963 3,718,231 Net asset value per unit EUR 20.10 20.02 19.14
92
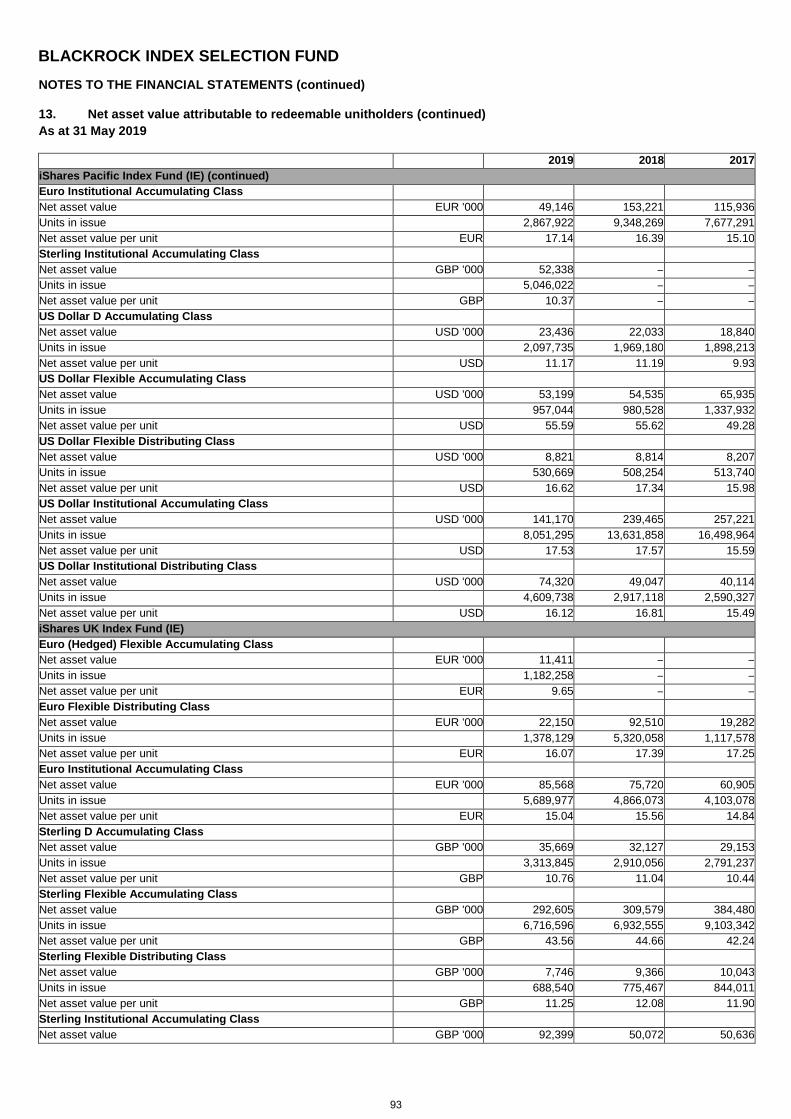
BLACKROCK INDEX SELECTION FUND
NOTES TO THE FINANCIAL STATEMENTS (continued)
13. Net asset value attributable to redeemable unitholders (continued) As at 31 May 2019
2019 2018 2017 iShares Pacific Index Fund (IE) (continued) Euro Institutional Accumulating Class Net asset value EUR '000 49,146 153,221 115,936 Units in issue 2,867,922 9,348,269 7,677,291 Net asset value per unit EUR 17.14 16.39 15.10 Sterling Institutional Accumulating Class Net asset value GBP '000 52,338 – – Units in issue 5,046,022 – – Net asset value per unit GBP 10.37 – – US Dollar D Accumulating Class Net asset value USD '000 23,436 22,033 18,840 Units in issue 2,097,735 1,969,180 1,898,213 Net asset value per unit USD 11.17 11.19 9.93 US Dollar Flexible Accumulating Class Net asset value USD '000 53,199 54,535 65,935 Units in issue 957,044 980,528 1,337,932 Net asset value per unit USD 55.59 55.62 49.28 US Dollar Flexible Distributing Class Net asset value USD '000 8,821 8,814 8,207 Units in issue 530,669 508,254 513,740 Net asset value per unit USD 16.62 17.34 15.98 US Dollar Institutional Accumulating Class Net asset value USD '000 141,170 239,465 257,221 Units in issue 8,051,295 13,631,858 16,498,964 Net asset value per unit USD 17.53 17.57 15.59 US Dollar Institutional Distributing Class Net asset value USD '000 74,320 49,047 40,114 Units in issue 4,609,738 2,917,118 2,590,327 Net asset value per unit USD 16.12 16.81 15.49 iShares UK Index Fund (IE) Euro (Hedged) Flexible Accumulating Class Net asset value EUR '000 11,411 – – Units in issue 1,182,258 – – Net asset value per unit EUR 9.65 – – Euro Flexible Distributing Class Net asset value EUR '000 22,150 92,510 19,282 Units in issue 1,378,129 5,320,058 1,117,578 Net asset value per unit EUR 16.07 17.39 17.25 Euro Institutional Accumulating Class Net asset value EUR '000 85,568 75,720 60,905 Units in issue 5,689,977 4,866,073 4,103,078 Net asset value per unit EUR 15.04 15.56 14.84 Sterling D Accumulating Class Net asset value GBP '000 35,669 32,127 29,153 Units in issue 3,313,845 2,910,056 2,791,237 Net asset value per unit GBP 10.76 11.04 10.44 Sterling Flexible Accumulating Class Net asset value GBP '000 292,605 309,579 384,480 Units in issue 6,716,596 6,932,555 9,103,342 Net asset value per unit GBP 43.56 44.66 42.24 Sterling Flexible Distributing Class Net asset value GBP '000 7,746 9,366 10,043 Units in issue 688,540 775,467 844,011 Net asset value per unit GBP 11.25 12.08 11.90 Sterling Institutional Accumulating Class Net asset value GBP '000 92,399 50,072 50,636
93
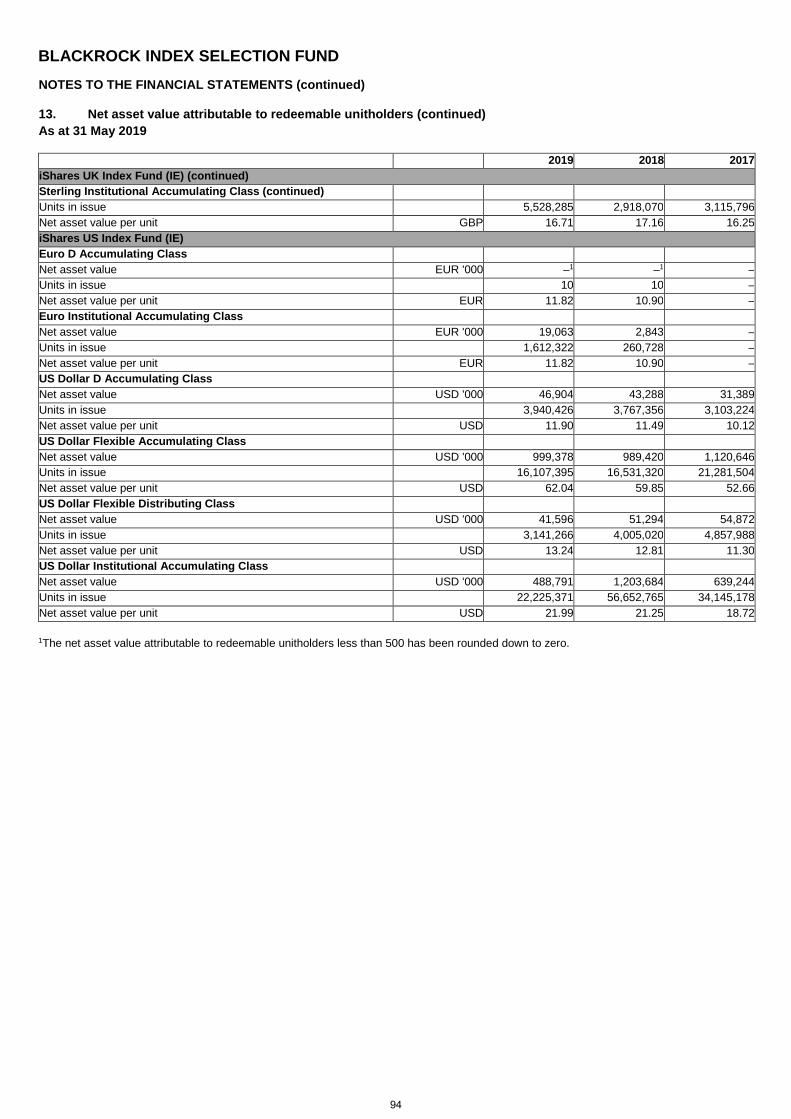
BLACKROCK INDEX SELECTION FUND
NOTES TO THE FINANCIAL STATEMENTS (continued)
13. Net asset value attributable to redeemable unitholders (continued) As at 31 May 2019
2019 2018 2017 iShares UK Index Fund (IE) (continued) Sterling Institutional Accumulating Class (continued) Units in issue 5,528,285 2,918,070 3,115,796 Net asset value per unit GBP 16.71 17.16 16.25 iShares US Index Fund (IE) Euro D Accumulating Class Net asset value EUR '000 –1 –1 – Units in issue 10 10 – Net asset value per unit EUR 11.82 10.90 – Euro Institutional Accumulating Class Net asset value EUR '000 19,063 2,843 – Units in issue 1,612,322 260,728 – Net asset value per unit EUR 11.82 10.90 – US Dollar D Accumulating Class Net asset value USD '000 46,904 43,288 31,389 Units in issue 3,940,426 3,767,356 3,103,224 Net asset value per unit USD 11.90 11.49 10.12 US Dollar Flexible Accumulating Class Net asset value USD '000 999,378 989,420 1,120,646 Units in issue 16,107,395 16,531,320 21,281,504 Net asset value per unit USD 62.04 59.85 52.66 US Dollar Flexible Distributing Class Net asset value USD '000 41,596 51,294 54,872 Units in issue 3,141,266 4,005,020 4,857,988 Net asset value per unit USD 13.24 12.81 11.30 US Dollar Institutional Accumulating Class Net asset value USD '000 488,791 1,203,684 639,244 Units in issue 22,225,371 56,652,765 34,145,178 Net asset value per unit USD 21.99 21.25 18.72
1The net asset value attributable to redeemable unitholders less than 500 has been rounded down to zero.
94
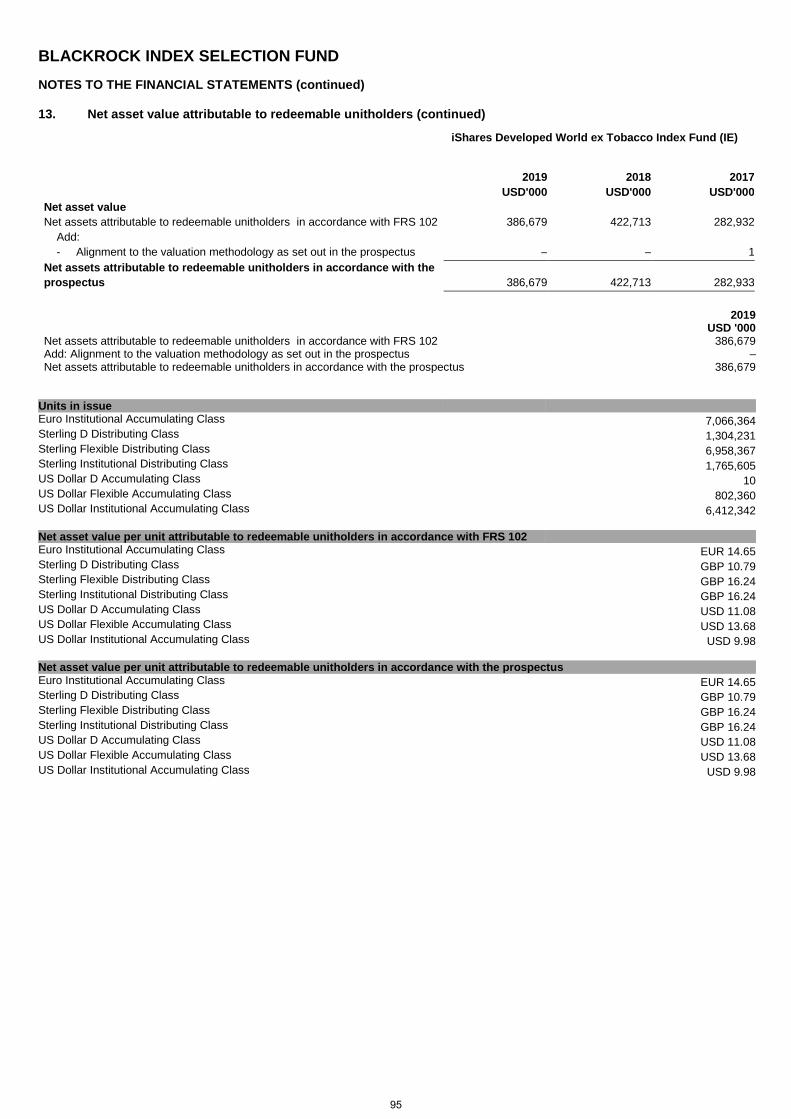
BLACKROCK INDEX SELECTION FUND
NOTES TO THE FINANCIAL STATEMENTS (continued)
13. Net asset value attributable to redeemable unitholders (continued)
iShares Developed World ex Tobacco Index Fund (IE)
2019 2018 2017 USD'000 USD'000 USD'000 Net asset value Net assets attributable to redeemable unitholders in accordance with FRS 102 386,679 422,713 282,932 Add: - Alignment to the valuation methodology as set out in the prospectus – – 1 Net assets attributable to redeemable unitholders in accordance with the prospectus 386,679 422,713 282,933
2019 USD '000 Net assets attributable to redeemable unitholders in accordance with FRS 102 386,679 Add: Alignment to the valuation methodology as set out in the prospectus – Net assets attributable to redeemable unitholders in accordance with the prospectus 386,679
Units in issue Euro Institutional Accumulating Class 7,066,364 Sterling D Distributing Class 1,304,231 Sterling Flexible Distributing Class 6,958,367 Sterling Institutional Distributing Class 1,765,605 US Dollar D Accumulating Class 10 US Dollar Flexible Accumulating Class 802,360 US Dollar Institutional Accumulating Class 6,412,342 Net asset value per unit attributable to redeemable unitholders in accordance with FRS 102 Euro Institutional Accumulating Class EUR 14.65 Sterling D Distributing Class GBP 10.79 Sterling Flexible Distributing Class GBP 16.24 Sterling Institutional Distributing Class GBP 16.24 US Dollar D Accumulating Class USD 11.08 US Dollar Flexible Accumulating Class USD 13.68 US Dollar Institutional Accumulating Class USD 9.98 Net asset value per unit attributable to redeemable unitholders in accordance with the prospectus Euro Institutional Accumulating Class EUR 14.65 Sterling D Distributing Class GBP 10.79 Sterling Flexible Distributing Class GBP 16.24 Sterling Institutional Distributing Class GBP 16.24 US Dollar D Accumulating Class USD 11.08 US Dollar Flexible Accumulating Class USD 13.68 US Dollar Institutional Accumulating Class USD 9.98
95
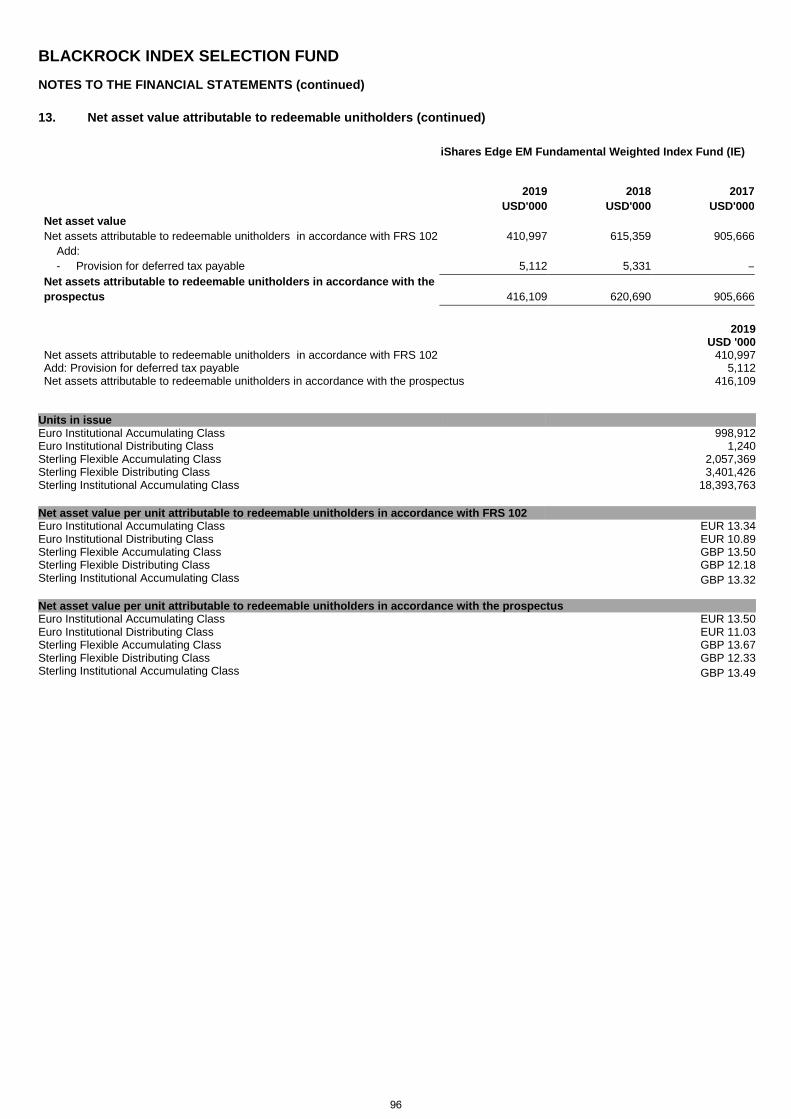
BLACKROCK INDEX SELECTION FUND
NOTES TO THE FINANCIAL STATEMENTS (continued)
13. Net asset value attributable to redeemable unitholders (continued)
iShares Edge EM Fundamental Weighted Index Fund (IE)
2019 2018 2017 USD'000 USD'000 USD'000 Net asset value Net assets attributable to redeemable unitholders in accordance with FRS 102 410,997 615,359 905,666 Add: - Provision for deferred tax payable 5,112 5,331 – Net assets attributable to redeemable unitholders in accordance with the prospectus 416,109 620,690 905,666
2019 USD '000 Net assets attributable to redeemable unitholders in accordance with FRS 102 410,997 Add: Provision for deferred tax payable 5,112 Net assets attributable to redeemable unitholders in accordance with the prospectus 416,109
Units in issue Euro Institutional Accumulating Class 998,912 Euro Institutional Distributing Class 1,240 Sterling Flexible Accumulating Class 2,057,369 Sterling Flexible Distributing Class 3,401,426 Sterling Institutional Accumulating Class 18,393,763 Net asset value per unit attributable to redeemable unitholders in accordance with FRS 102 Euro Institutional Accumulating Class EUR 13.34 Euro Institutional Distributing Class EUR 10.89 Sterling Flexible Accumulating Class GBP 13.50 Sterling Flexible Distributing Class GBP 12.18 Sterling Institutional Accumulating Class GBP 13.32 Net asset value per unit attributable to redeemable unitholders in accordance with the prospectus Euro Institutional Accumulating Class EUR 13.50 Euro Institutional Distributing Class EUR 11.03 Sterling Flexible Accumulating Class GBP 13.67 Sterling Flexible Distributing Class GBP 12.33 Sterling Institutional Accumulating Class GBP 13.49
96
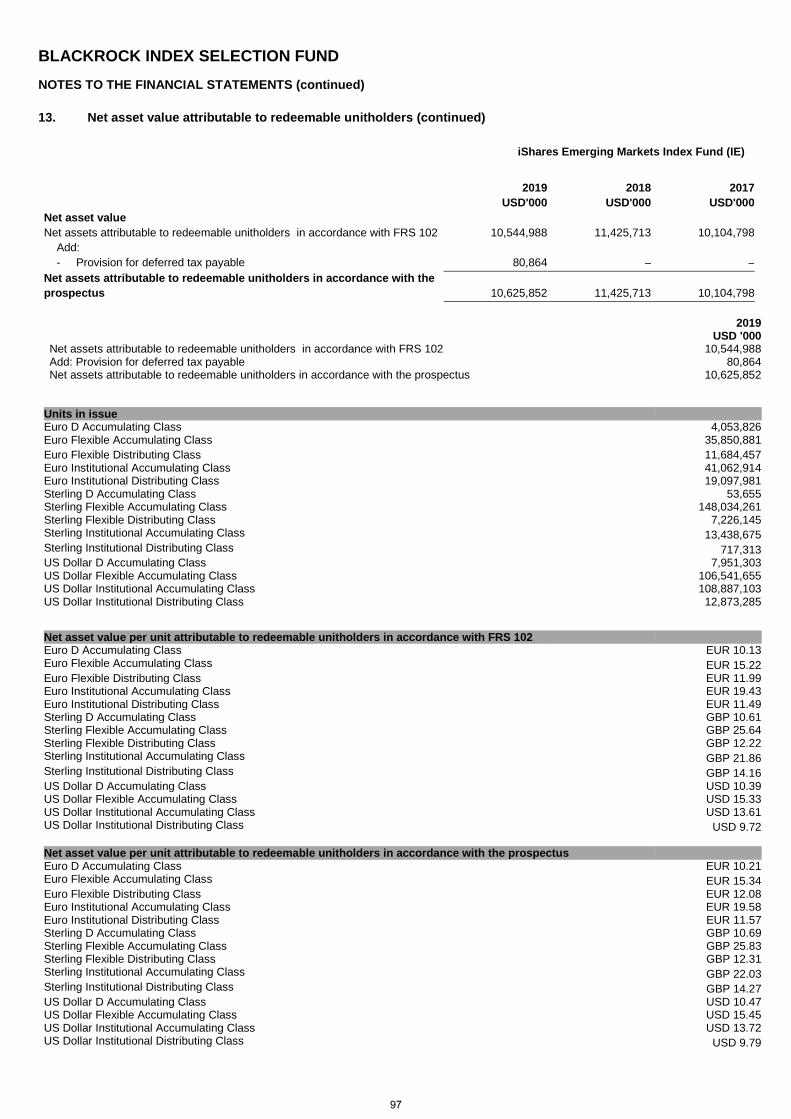
BLACKROCK INDEX SELECTION FUND
NOTES TO THE FINANCIAL STATEMENTS (continued)
13. Net asset value attributable to redeemable unitholders (continued)
iShares Emerging Markets Index Fund (IE)
2019 2018 2017 USD'000 USD'000 USD'000 Net asset value Net assets attributable to redeemable unitholders in accordance with FRS 102 10,544,988 11,425,713 10,104,798 Add: - Provision for deferred tax payable 80,864 – – Net assets attributable to redeemable unitholders in accordance with the prospectus 10,625,852 11,425,713 10,104,798
2019 USD '000 Net assets attributable to redeemable unitholders in accordance with FRS 102 10,544,988 Add: Provision for deferred tax payable 80,864 Net assets attributable to redeemable unitholders in accordance with the prospectus 10,625,852
Units in issue Euro D Accumulating Class 4,053,826 Euro Flexible Accumulating Class 35,850,881 Euro Flexible Distributing Class 11,684,457 Euro Institutional Accumulating Class 41,062,914 Euro Institutional Distributing Class 19,097,981 Sterling D Accumulating Class 53,655 Sterling Flexible Accumulating Class 148,034,261 Sterling Flexible Distributing Class 7,226,145 Sterling Institutional Accumulating Class 13,438,675 Sterling Institutional Distributing Class 717,313 US Dollar D Accumulating Class 7,951,303 US Dollar Flexible Accumulating Class 106,541,655 US Dollar Institutional Accumulating Class 108,887,103 US Dollar Institutional Distributing Class 12,873,285 Net asset value per unit attributable to redeemable unitholders in accordance with FRS 102 Euro D Accumulating Class EUR 10.13 Euro Flexible Accumulating Class EUR 15.22 Euro Flexible Distributing Class EUR 11.99 Euro Institutional Accumulating Class EUR 19.43 Euro Institutional Distributing Class EUR 11.49 Sterling D Accumulating Class GBP 10.61 Sterling Flexible Accumulating Class GBP 25.64 Sterling Flexible Distributing Class GBP 12.22 Sterling Institutional Accumulating Class GBP 21.86 Sterling Institutional Distributing Class GBP 14.16 US Dollar D Accumulating Class USD 10.39 US Dollar Flexible Accumulating Class USD 15.33 US Dollar Institutional Accumulating Class USD 13.61 US Dollar Institutional Distributing Class USD 9.72 Net asset value per unit attributable to redeemable unitholders in accordance with the prospectus Euro D Accumulating Class EUR 10.21 Euro Flexible Accumulating Class EUR 15.34 Euro Flexible Distributing Class EUR 12.08 Euro Institutional Accumulating Class EUR 19.58 Euro Institutional Distributing Class EUR 11.57 Sterling D Accumulating Class GBP 10.69 Sterling Flexible Accumulating Class GBP 25.83 Sterling Flexible Distributing Class GBP 12.31 Sterling Institutional Accumulating Class GBP 22.03 Sterling Institutional Distributing Class GBP 14.27 US Dollar D Accumulating Class USD 10.47 US Dollar Flexible Accumulating Class USD 15.45 US Dollar Institutional Accumulating Class USD 13.72 US Dollar Institutional Distributing Class USD 9.79
97
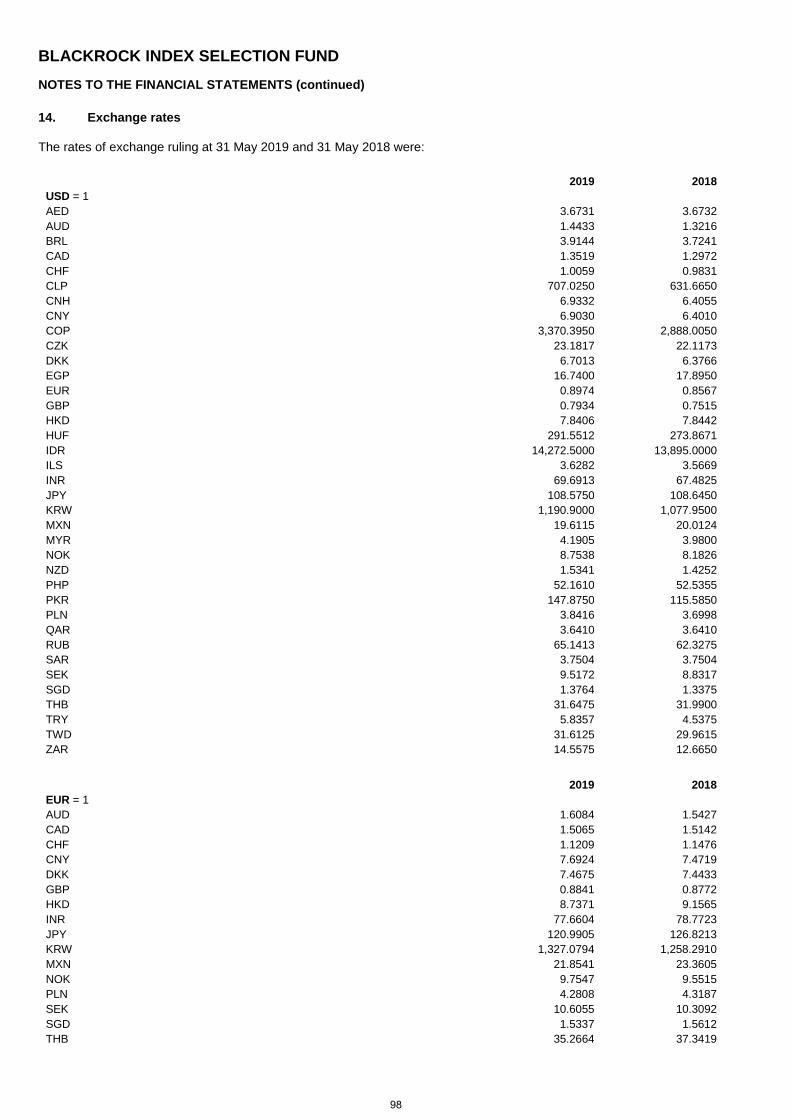
BLACKROCK INDEX SELECTION FUND
NOTES TO THE FINANCIAL STATEMENTS (continued)
14. Exchange rates
The rates of exchange ruling at 31 May 2019 and 31 May 2018 were:
2019 2018 USD = 1 AED 3.6731 3.6732 AUD 1.4433 1.3216 BRL 3.9144 3.7241 CAD 1.3519 1.2972 CHF 1.0059 0.9831 CLP 707.0250 631.6650 CNH 6.9332 6.4055 CNY 6.9030 6.4010 COP 3,370.3950 2,888.0050 CZK 23.1817 22.1173 DKK 6.7013 6.3766 EGP 16.7400 17.8950 EUR 0.8974 0.8567 GBP 0.7934 0.7515 HKD 7.8406 7.8442 HUF 291.5512 273.8671 IDR 14,272.5000 13,895.0000 ILS 3.6282 3.5669 INR 69.6913 67.4825 JPY 108.5750 108.6450 KRW 1,190.9000 1,077.9500 MXN 19.6115 20.0124 MYR 4.1905 3.9800 NOK 8.7538 8.1826 NZD 1.5341 1.4252 PHP 52.1610 52.5355 PKR 147.8750 115.5850 PLN 3.8416 3.6998 QAR 3.6410 3.6410 RUB 65.1413 62.3275 SAR 3.7504 3.7504 SEK 9.5172 8.8317 SGD 1.3764 1.3375 THB 31.6475 31.9900 TRY 5.8357 4.5375 TWD 31.6125 29.9615 ZAR 14.5575 12.6650
2019 2018 EUR = 1 AUD 1.6084 1.5427 CAD 1.5065 1.5142 CHF 1.1209 1.1476 CNY 7.6924 7.4719 DKK 7.4675 7.4433 GBP 0.8841 0.8772 HKD 8.7371 9.1565 INR 77.6604 78.7723 JPY 120.9905 126.8213 KRW 1,327.0794 1,258.2910 MXN 21.8541 23.3605 NOK 9.7547 9.5515 PLN 4.2808 4.3187 SEK 10.6055 10.3092 SGD 1.5337 1.5612 THB 35.2664 37.3419
98
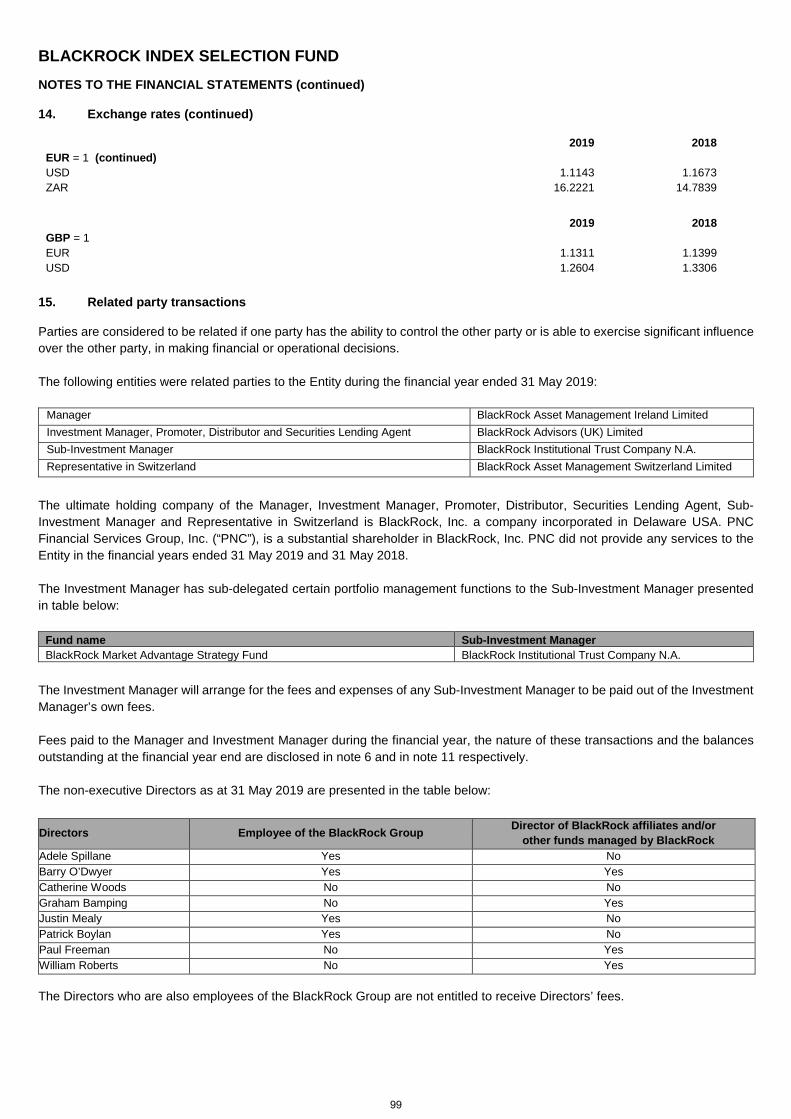
BLACKROCK INDEX SELECTION FUND
NOTES TO THE FINANCIAL STATEMENTS (continued)
14. Exchange rates (continued)
2019 2018 EUR = 1 (continued) USD 1.1143 1.1673 ZAR 16.2221 14.7839
2019 2018 GBP = 1 EUR 1.1311 1.1399 USD 1.2604 1.3306
15. Related party transactions
Parties are considered to be related if one party has the ability to control the other party or is able to exercise significant influence over the other party, in making financial or operational decisions. The following entities were related parties to the Entity during the financial year ended 31 May 2019:
Manager BlackRock Asset Management Ireland Limited Investment Manager, Promoter, Distributor and Securities Lending Agent BlackRock Advisors (UK) Limited Sub-Investment Manager BlackRock Institutional Trust Company N.A. Representative in Switzerland BlackRock Asset Management Switzerland Limited
The ultimate holding company of the Manager, Investment Manager, Promoter, Distributor, Securities Lending Agent, Sub-Investment Manager and Representative in Switzerland is BlackRock, Inc. a company incorporated in Delaware USA. PNC Financial Services Group, Inc. (“PNC”), is a substantial shareholder in BlackRock, Inc. PNC did not provide any services to the Entity in the financial years ended 31 May 2019 and 31 May 2018. The Investment Manager has sub-delegated certain portfolio management functions to the Sub-Investment Manager presented in table below:
Fund name Sub-Investment Manager BlackRock Market Advantage Strategy Fund BlackRock Institutional Trust Company N.A.
The Investment Manager will arrange for the fees and expenses of any Sub-Investment Manager to be paid out of the Investment Manager’s own fees. Fees paid to the Manager and Investment Manager during the financial year, the nature of these transactions and the balances outstanding at the financial year end are disclosed in note 6 and in note 11 respectively. The non-executive Directors as at 31 May 2019 are presented in the table below:
Directors Employee of the BlackRock Group Director of BlackRock affiliates and/or other funds managed by BlackRock
Adele Spillane Yes No Barry O’Dwyer Yes Yes Catherine Woods No No Graham Bamping No Yes Justin Mealy Yes No Patrick Boylan Yes No Paul Freeman No Yes William Roberts No Yes
The Directors who are also employees of the BlackRock Group are not entitled to receive Directors’ fees.
99
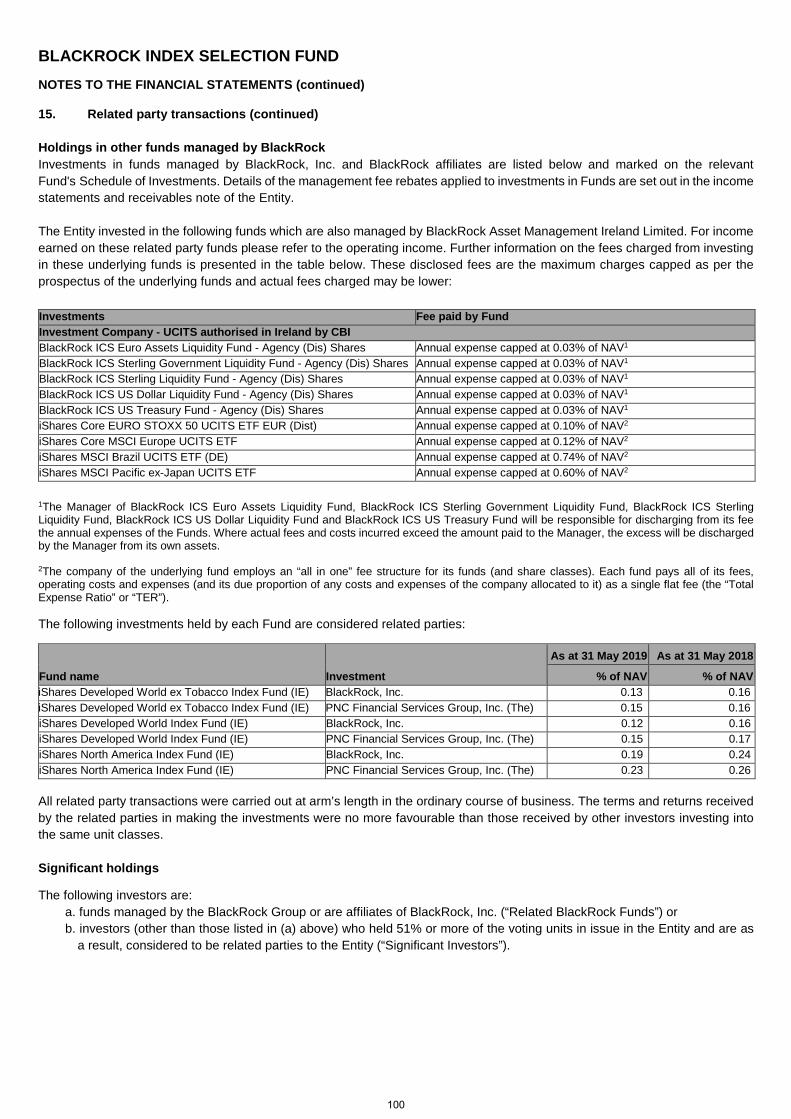
BLACKROCK INDEX SELECTION FUND
NOTES TO THE FINANCIAL STATEMENTS (continued)
15. Related party transactions (continued) Holdings in other funds managed by BlackRock Investments in funds managed by BlackRock, Inc. and BlackRock affiliates are listed below and marked on the relevant Fund's Schedule of Investments. Details of the management fee rebates applied to investments in Funds are set out in the income statements and receivables note of the Entity. The Entity invested in the following funds which are also managed by BlackRock Asset Management Ireland Limited. For income earned on these related party funds please refer to the operating income. Further information on the fees charged from investing in these underlying funds is presented in the table below. These disclosed fees are the maximum charges capped as per the prospectus of the underlying funds and actual fees charged may be lower:
Investments Fee paid by Fund Investment Company - UCITS authorised in Ireland by CBI BlackRock ICS Euro Assets Liquidity Fund - Agency (Dis) Shares Annual expense capped at 0.03% of NAV1 BlackRock ICS Sterling Government Liquidity Fund - Agency (Dis) Shares Annual expense capped at 0.03% of NAV1 BlackRock ICS Sterling Liquidity Fund - Agency (Dis) Shares Annual expense capped at 0.03% of NAV1 BlackRock ICS US Dollar Liquidity Fund - Agency (Dis) Shares Annual expense capped at 0.03% of NAV1 BlackRock ICS US Treasury Fund - Agency (Dis) Shares Annual expense capped at 0.03% of NAV1 iShares Core EURO STOXX 50 UCITS ETF EUR (Dist) Annual expense capped at 0.10% of NAV2 iShares Core MSCI Europe UCITS ETF Annual expense capped at 0.12% of NAV2 iShares MSCI Brazil UCITS ETF (DE) Annual expense capped at 0.74% of NAV2 iShares MSCI Pacific ex-Japan UCITS ETF Annual expense capped at 0.60% of NAV2
1The Manager of BlackRock ICS Euro Assets Liquidity Fund, BlackRock ICS Sterling Government Liquidity Fund, BlackRock ICS Sterling Liquidity Fund, BlackRock ICS US Dollar Liquidity Fund and BlackRock ICS US Treasury Fund will be responsible for discharging from its fee the annual expenses of the Funds. Where actual fees and costs incurred exceed the amount paid to the Manager, the excess will be discharged by the Manager from its own assets.
2The company of the underlying fund employs an “all in one” fee structure for its funds (and share classes). Each fund pays all of its fees, operating costs and expenses (and its due proportion of any costs and expenses of the company allocated to it) as a single flat fee (the “Total Expense Ratio” or “TER”).
The following investments held by each Fund are considered related parties:
Fund name Investment
As at 31 May 2019 As at 31 May 2018
% of NAV % of NAV iShares Developed World ex Tobacco Index Fund (IE) BlackRock, Inc. 0.13 0.16 iShares Developed World ex Tobacco Index Fund (IE) PNC Financial Services Group, Inc. (The) 0.15 0.16 iShares Developed World Index Fund (IE) BlackRock, Inc. 0.12 0.16 iShares Developed World Index Fund (IE) PNC Financial Services Group, Inc. (The) 0.15 0.17 iShares North America Index Fund (IE) BlackRock, Inc. 0.19 0.24 iShares North America Index Fund (IE) PNC Financial Services Group, Inc. (The) 0.23 0.26 All related party transactions were carried out at arm’s length in the ordinary course of business. The terms and returns received by the related parties in making the investments were no more favourable than those received by other investors investing into the same unit classes. Significant holdings
The following investors are: a. funds managed by the BlackRock Group or are affiliates of BlackRock, Inc. (“Related BlackRock Funds”) or b. investors (other than those listed in (a) above) who held 51% or more of the voting units in issue in the Entity and are as
a result, considered to be related parties to the Entity (“Significant Investors”).
100
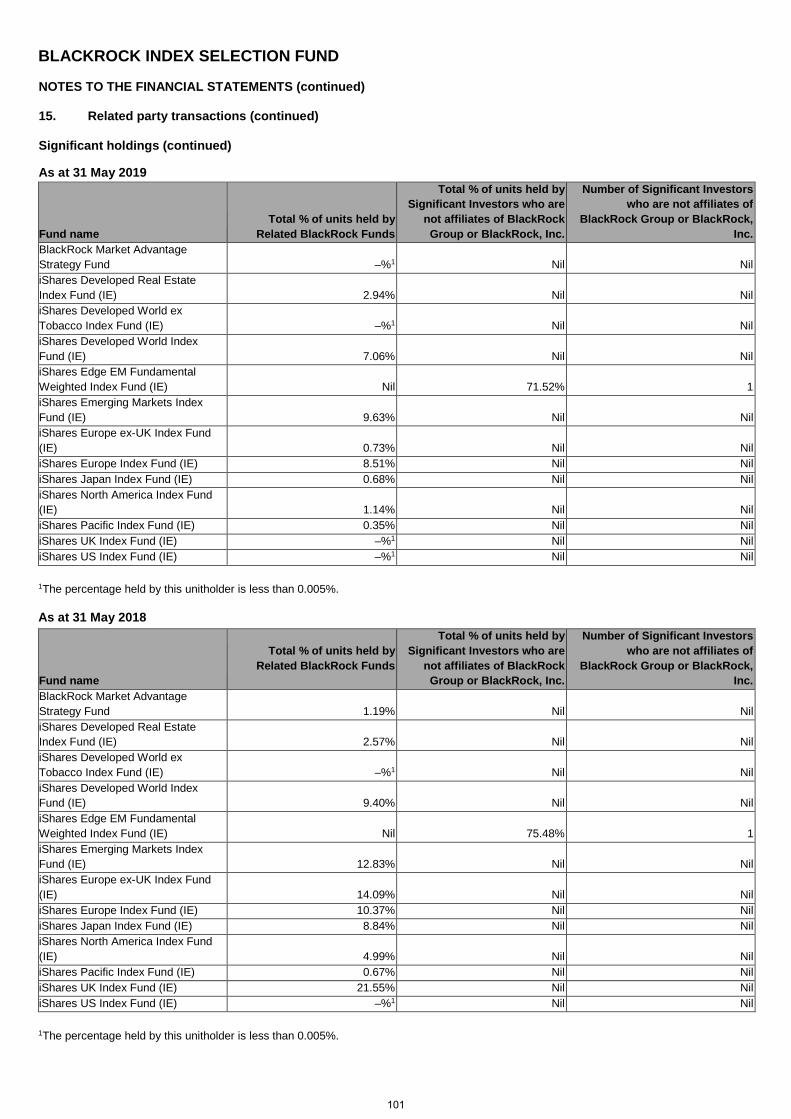
BLACKROCK INDEX SELECTION FUND
NOTES TO THE FINANCIAL STATEMENTS (continued)
15. Related party transactions (continued)
Significant holdings (continued)
As at 31 May 2019
Fund name Total % of units held by
Related BlackRock Funds
Total % of units held by Significant Investors who are
not affiliates of BlackRock Group or BlackRock, Inc.
Number of Significant Investors who are not affiliates of
BlackRock Group or BlackRock, Inc.
BlackRock Market Advantage Strategy Fund –%1 Nil Nil iShares Developed Real Estate Index Fund (IE) 2.94% Nil Nil iShares Developed World ex Tobacco Index Fund (IE) –%1 Nil Nil iShares Developed World Index Fund (IE) 7.06% Nil Nil iShares Edge EM Fundamental Weighted Index Fund (IE) Nil 71.52% 1 iShares Emerging Markets Index Fund (IE) 9.63% Nil Nil iShares Europe ex-UK Index Fund (IE) 0.73% Nil Nil iShares Europe Index Fund (IE) 8.51% Nil Nil iShares Japan Index Fund (IE) 0.68% Nil Nil iShares North America Index Fund (IE) 1.14% Nil Nil iShares Pacific Index Fund (IE) 0.35% Nil Nil iShares UK Index Fund (IE) –%1 Nil Nil iShares US Index Fund (IE) –%1 Nil Nil
1The percentage held by this unitholder is less than 0.005%.
As at 31 May 2018
Fund name
Total % of units held by Related BlackRock Funds
Total % of units held by Significant Investors who are
not affiliates of BlackRock Group or BlackRock, Inc.
Number of Significant Investors who are not affiliates of
BlackRock Group or BlackRock, Inc.
BlackRock Market Advantage Strategy Fund 1.19% Nil Nil iShares Developed Real Estate Index Fund (IE) 2.57% Nil Nil iShares Developed World ex Tobacco Index Fund (IE) –%1 Nil Nil iShares Developed World Index Fund (IE) 9.40% Nil Nil iShares Edge EM Fundamental Weighted Index Fund (IE) Nil 75.48% 1 iShares Emerging Markets Index Fund (IE) 12.83% Nil Nil iShares Europe ex-UK Index Fund (IE) 14.09% Nil Nil iShares Europe Index Fund (IE) 10.37% Nil Nil iShares Japan Index Fund (IE) 8.84% Nil Nil iShares North America Index Fund (IE) 4.99% Nil Nil iShares Pacific Index Fund (IE) 0.67% Nil Nil iShares UK Index Fund (IE) 21.55% Nil Nil iShares US Index Fund (IE) –%1 Nil Nil
1The percentage held by this unitholder is less than 0.005%.
101
BLACKROCK INDEX SELECTION FUND
NOTES TO THE FINANCIAL STATEMENTS (continued) 15. Related party transactions (continued) No provisions have been recognised by the Funds against amounts due from related parties at the financial year end date (31 May 2018: Nil). No amounts have been written off during the financial year in respect of amounts due to or from related parties (31 May 2018: Nil). No commitments secured or unsecured or guarantees have been entered into with related parties during the financial year (31 May 2018: Nil). Securities Lending
The total income earned from securities lending transactions is split between the relevant Fund and the Securities Lending Agent. The Funds which undertake securities lending transactions receive at least 62.5%, while the Securities Lending Agent receives up to 37.5% of such income, with all operational costs borne out of the Securities Lending Agent’s share. Income earned during the financial year by the Funds from securities lending transactions is disclosed in the income statement. 16. Commitments and contingent liabilities
There were no significant commitments or contingent liabilities at the financial years ended 31 May 2019 and 31 May 2018. 17. Subsequent events
On 19 June 2019, Graham Bamping resigned as a non-executive Director.
Other than the above, there have been no events subsequent to the financial year end, which, in the opinion of the Directors, may have had an impact on the financial statements for the financial year ended 31 May 2019. 18. Approval date
The financial statements were approved by the Directors on 24 September 2019.
102
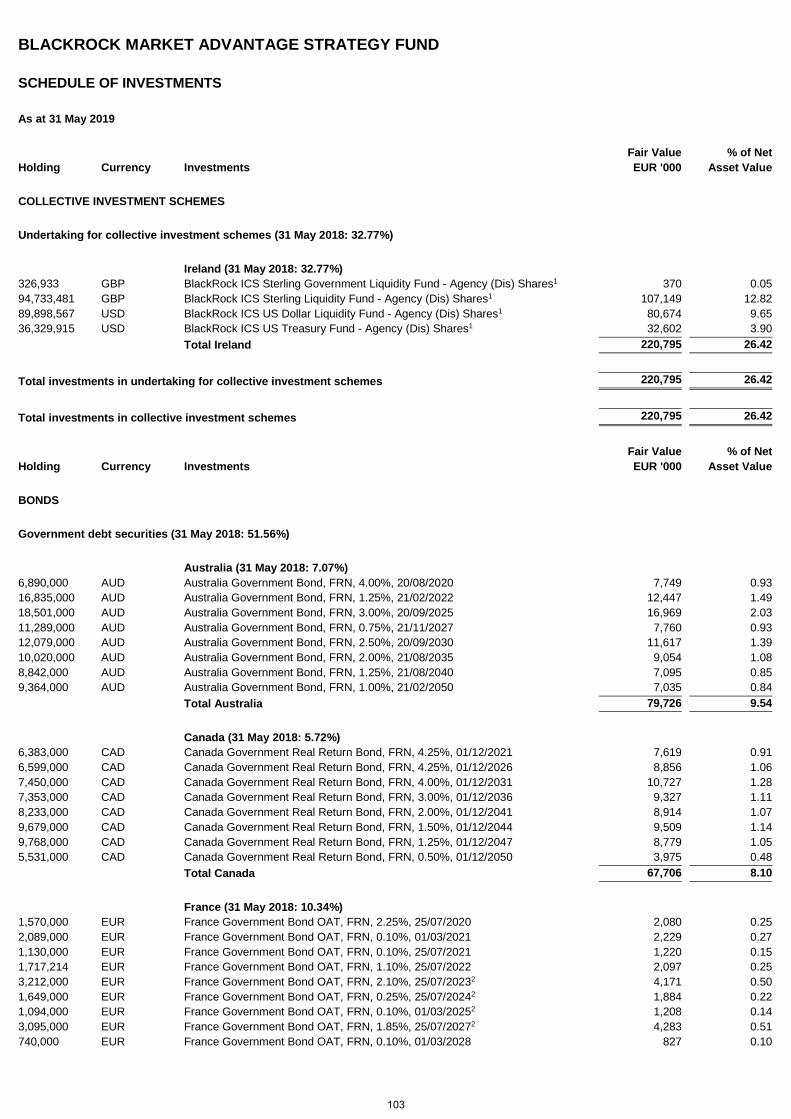
BLACKROCK MARKET ADVANTAGE STRATEGY FUND
SCHEDULE OF INVESTMENTS
As at 31 May 2019
Holding Currency Investments Fair Value EUR '000
% of Net Asset Value
COLLECTIVE INVESTMENT SCHEMES
Undertaking for collective investment schemes (31 May 2018: 32.77%)
Ireland (31 May 2018: 32.77%) 326,933 GBP BlackRock ICS Sterling Government Liquidity Fund - Agency (Dis) Shares1 370 0.05 94,733,481 GBP BlackRock ICS Sterling Liquidity Fund - Agency (Dis) Shares1 107,149 12.82 89,898,567 USD BlackRock ICS US Dollar Liquidity Fund - Agency (Dis) Shares1 80,674 9.65 36,329,915 USD BlackRock ICS US Treasury Fund - Agency (Dis) Shares1 32,602 3.90 Total Ireland 220,795 26.42
Total investments in undertaking for collective investment schemes 220,795 26.42
Total investments in collective investment schemes 220,795 26.42
Holding Currency Investments Fair Value EUR '000
% of Net Asset Value
BONDS
Government debt securities (31 May 2018: 51.56%)
Australia (31 May 2018: 7.07%) 6,890,000 AUD Australia Government Bond, FRN, 4.00%, 20/08/2020 7,749 0.93 16,835,000 AUD Australia Government Bond, FRN, 1.25%, 21/02/2022 12,447 1.49 18,501,000 AUD Australia Government Bond, FRN, 3.00%, 20/09/2025 16,969 2.03 11,289,000 AUD Australia Government Bond, FRN, 0.75%, 21/11/2027 7,760 0.93 12,079,000 AUD Australia Government Bond, FRN, 2.50%, 20/09/2030 11,617 1.39 10,020,000 AUD Australia Government Bond, FRN, 2.00%, 21/08/2035 9,054 1.08 8,842,000 AUD Australia Government Bond, FRN, 1.25%, 21/08/2040 7,095 0.85 9,364,000 AUD Australia Government Bond, FRN, 1.00%, 21/02/2050 7,035 0.84 Total Australia 79,726 9.54
Canada (31 May 2018: 5.72%) 6,383,000 CAD Canada Government Real Return Bond, FRN, 4.25%, 01/12/2021 7,619 0.91 6,599,000 CAD Canada Government Real Return Bond, FRN, 4.25%, 01/12/2026 8,856 1.06 7,450,000 CAD Canada Government Real Return Bond, FRN, 4.00%, 01/12/2031 10,727 1.28 7,353,000 CAD Canada Government Real Return Bond, FRN, 3.00%, 01/12/2036 9,327 1.11 8,233,000 CAD Canada Government Real Return Bond, FRN, 2.00%, 01/12/2041 8,914 1.07 9,679,000 CAD Canada Government Real Return Bond, FRN, 1.50%, 01/12/2044 9,509 1.14 9,768,000 CAD Canada Government Real Return Bond, FRN, 1.25%, 01/12/2047 8,779 1.05 5,531,000 CAD Canada Government Real Return Bond, FRN, 0.50%, 01/12/2050 3,975 0.48 Total Canada 67,706 8.10
France (31 May 2018: 10.34%) 1,570,000 EUR France Government Bond OAT, FRN, 2.25%, 25/07/2020 2,080 0.25 2,089,000 EUR France Government Bond OAT, FRN, 0.10%, 01/03/2021 2,229 0.27 1,130,000 EUR France Government Bond OAT, FRN, 0.10%, 25/07/2021 1,220 0.15 1,717,214 EUR France Government Bond OAT, FRN, 1.10%, 25/07/2022 2,097 0.25 3,212,000 EUR France Government Bond OAT, FRN, 2.10%, 25/07/20232 4,171 0.50 1,649,000 EUR France Government Bond OAT, FRN, 0.25%, 25/07/20242 1,884 0.22 1,094,000 EUR France Government Bond OAT, FRN, 0.10%, 01/03/20252 1,208 0.14 3,095,000 EUR France Government Bond OAT, FRN, 1.85%, 25/07/20272 4,283 0.51 740,000 EUR France Government Bond OAT, FRN, 0.10%, 01/03/2028 827 0.10
103
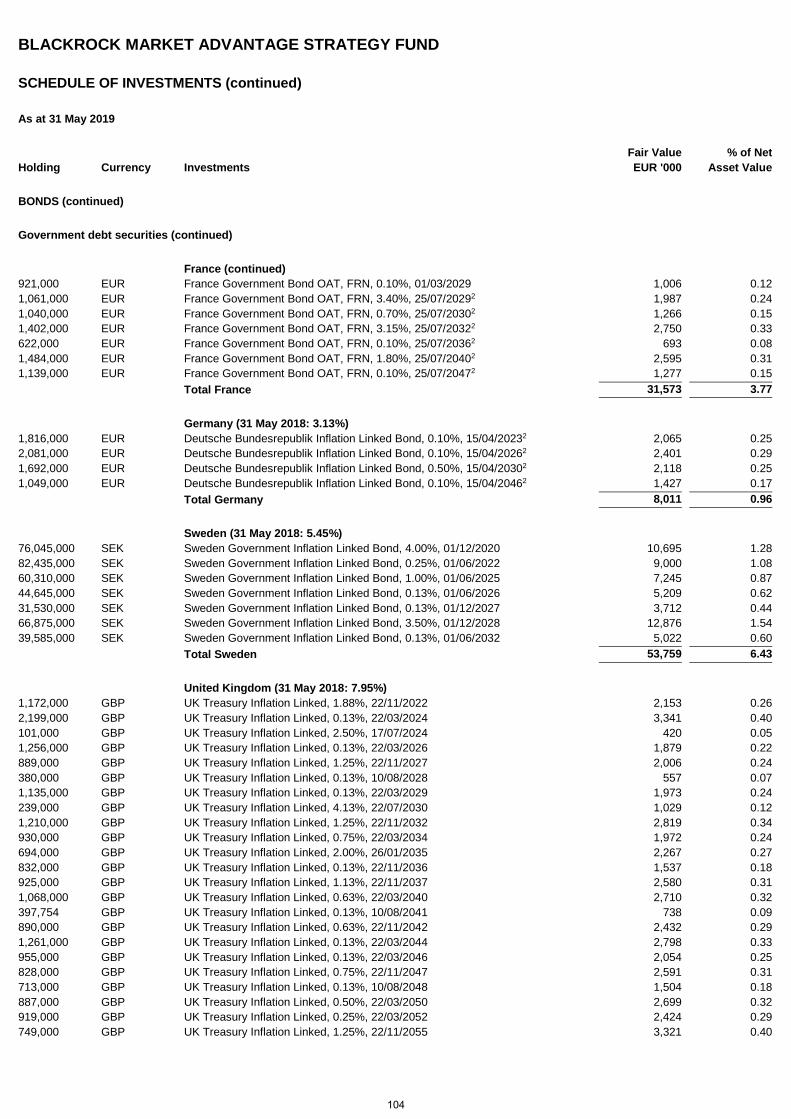
BLACKROCK MARKET ADVANTAGE STRATEGY FUND
SCHEDULE OF INVESTMENTS (continued)
As at 31 May 2019
Holding Currency Investments Fair Value EUR '000
% of Net Asset Value
BONDS (continued)
Government debt securities (continued)
France (continued) 921,000 EUR France Government Bond OAT, FRN, 0.10%, 01/03/2029 1,006 0.12 1,061,000 EUR France Government Bond OAT, FRN, 3.40%, 25/07/20292 1,987 0.24 1,040,000 EUR France Government Bond OAT, FRN, 0.70%, 25/07/20302 1,266 0.15 1,402,000 EUR France Government Bond OAT, FRN, 3.15%, 25/07/20322 2,750 0.33 622,000 EUR France Government Bond OAT, FRN, 0.10%, 25/07/20362 693 0.08 1,484,000 EUR France Government Bond OAT, FRN, 1.80%, 25/07/20402 2,595 0.31 1,139,000 EUR France Government Bond OAT, FRN, 0.10%, 25/07/20472 1,277 0.15 Total France 31,573 3.77
Germany (31 May 2018: 3.13%) 1,816,000 EUR Deutsche Bundesrepublik Inflation Linked Bond, 0.10%, 15/04/20232 2,065 0.25 2,081,000 EUR Deutsche Bundesrepublik Inflation Linked Bond, 0.10%, 15/04/20262 2,401 0.29 1,692,000 EUR Deutsche Bundesrepublik Inflation Linked Bond, 0.50%, 15/04/20302 2,118 0.25 1,049,000 EUR Deutsche Bundesrepublik Inflation Linked Bond, 0.10%, 15/04/20462 1,427 0.17 Total Germany 8,011 0.96
Sweden (31 May 2018: 5.45%) 76,045,000 SEK Sweden Government Inflation Linked Bond, 4.00%, 01/12/2020 10,695 1.28 82,435,000 SEK Sweden Government Inflation Linked Bond, 0.25%, 01/06/2022 9,000 1.08 60,310,000 SEK Sweden Government Inflation Linked Bond, 1.00%, 01/06/2025 7,245 0.87 44,645,000 SEK Sweden Government Inflation Linked Bond, 0.13%, 01/06/2026 5,209 0.62 31,530,000 SEK Sweden Government Inflation Linked Bond, 0.13%, 01/12/2027 3,712 0.44 66,875,000 SEK Sweden Government Inflation Linked Bond, 3.50%, 01/12/2028 12,876 1.54 39,585,000 SEK Sweden Government Inflation Linked Bond, 0.13%, 01/06/2032 5,022 0.60 Total Sweden 53,759 6.43
United Kingdom (31 May 2018: 7.95%) 1,172,000 GBP UK Treasury Inflation Linked, 1.88%, 22/11/2022 2,153 0.26 2,199,000 GBP UK Treasury Inflation Linked, 0.13%, 22/03/2024 3,341 0.40 101,000 GBP UK Treasury Inflation Linked, 2.50%, 17/07/2024 420 0.05 1,256,000 GBP UK Treasury Inflation Linked, 0.13%, 22/03/2026 1,879 0.22 889,000 GBP UK Treasury Inflation Linked, 1.25%, 22/11/2027 2,006 0.24 380,000 GBP UK Treasury Inflation Linked, 0.13%, 10/08/2028 557 0.07 1,135,000 GBP UK Treasury Inflation Linked, 0.13%, 22/03/2029 1,973 0.24 239,000 GBP UK Treasury Inflation Linked, 4.13%, 22/07/2030 1,029 0.12 1,210,000 GBP UK Treasury Inflation Linked, 1.25%, 22/11/2032 2,819 0.34 930,000 GBP UK Treasury Inflation Linked, 0.75%, 22/03/2034 1,972 0.24 694,000 GBP UK Treasury Inflation Linked, 2.00%, 26/01/2035 2,267 0.27 832,000 GBP UK Treasury Inflation Linked, 0.13%, 22/11/2036 1,537 0.18 925,000 GBP UK Treasury Inflation Linked, 1.13%, 22/11/2037 2,580 0.31 1,068,000 GBP UK Treasury Inflation Linked, 0.63%, 22/03/2040 2,710 0.32 397,754 GBP UK Treasury Inflation Linked, 0.13%, 10/08/2041 738 0.09 890,000 GBP UK Treasury Inflation Linked, 0.63%, 22/11/2042 2,432 0.29 1,261,000 GBP UK Treasury Inflation Linked, 0.13%, 22/03/2044 2,798 0.33 955,000 GBP UK Treasury Inflation Linked, 0.13%, 22/03/2046 2,054 0.25 828,000 GBP UK Treasury Inflation Linked, 0.75%, 22/11/2047 2,591 0.31 713,000 GBP UK Treasury Inflation Linked, 0.13%, 10/08/2048 1,504 0.18 887,000 GBP UK Treasury Inflation Linked, 0.50%, 22/03/2050 2,699 0.32 919,000 GBP UK Treasury Inflation Linked, 0.25%, 22/03/2052 2,424 0.29 749,000 GBP UK Treasury Inflation Linked, 1.25%, 22/11/2055 3,321 0.40
104
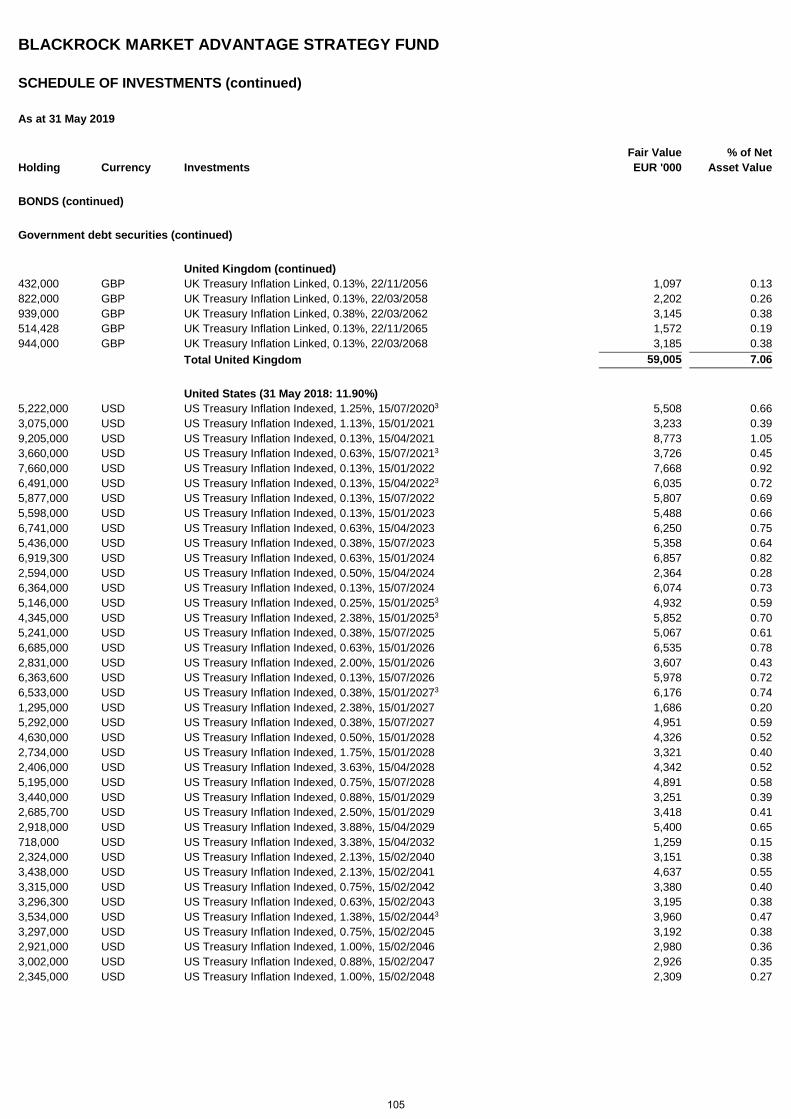
BLACKROCK MARKET ADVANTAGE STRATEGY FUND
SCHEDULE OF INVESTMENTS (continued)
As at 31 May 2019
Holding Currency Investments Fair Value EUR '000
% of Net Asset Value
BONDS (continued)
Government debt securities (continued)
United Kingdom (continued) 432,000 GBP UK Treasury Inflation Linked, 0.13%, 22/11/2056 1,097 0.13 822,000 GBP UK Treasury Inflation Linked, 0.13%, 22/03/2058 2,202 0.26 939,000 GBP UK Treasury Inflation Linked, 0.38%, 22/03/2062 3,145 0.38 514,428 GBP UK Treasury Inflation Linked, 0.13%, 22/11/2065 1,572 0.19 944,000 GBP UK Treasury Inflation Linked, 0.13%, 22/03/2068 3,185 0.38 Total United Kingdom 59,005 7.06
United States (31 May 2018: 11.90%) 5,222,000 USD US Treasury Inflation Indexed, 1.25%, 15/07/20203 5,508 0.66 3,075,000 USD US Treasury Inflation Indexed, 1.13%, 15/01/2021 3,233 0.39 9,205,000 USD US Treasury Inflation Indexed, 0.13%, 15/04/2021 8,773 1.05 3,660,000 USD US Treasury Inflation Indexed, 0.63%, 15/07/20213 3,726 0.45 7,660,000 USD US Treasury Inflation Indexed, 0.13%, 15/01/2022 7,668 0.92 6,491,000 USD US Treasury Inflation Indexed, 0.13%, 15/04/20223 6,035 0.72 5,877,000 USD US Treasury Inflation Indexed, 0.13%, 15/07/2022 5,807 0.69 5,598,000 USD US Treasury Inflation Indexed, 0.13%, 15/01/2023 5,488 0.66 6,741,000 USD US Treasury Inflation Indexed, 0.63%, 15/04/2023 6,250 0.75 5,436,000 USD US Treasury Inflation Indexed, 0.38%, 15/07/2023 5,358 0.64 6,919,300 USD US Treasury Inflation Indexed, 0.63%, 15/01/2024 6,857 0.82 2,594,000 USD US Treasury Inflation Indexed, 0.50%, 15/04/2024 2,364 0.28 6,364,000 USD US Treasury Inflation Indexed, 0.13%, 15/07/2024 6,074 0.73 5,146,000 USD US Treasury Inflation Indexed, 0.25%, 15/01/20253 4,932 0.59 4,345,000 USD US Treasury Inflation Indexed, 2.38%, 15/01/20253 5,852 0.70 5,241,000 USD US Treasury Inflation Indexed, 0.38%, 15/07/2025 5,067 0.61 6,685,000 USD US Treasury Inflation Indexed, 0.63%, 15/01/2026 6,535 0.78 2,831,000 USD US Treasury Inflation Indexed, 2.00%, 15/01/2026 3,607 0.43 6,363,600 USD US Treasury Inflation Indexed, 0.13%, 15/07/2026 5,978 0.72 6,533,000 USD US Treasury Inflation Indexed, 0.38%, 15/01/20273 6,176 0.74 1,295,000 USD US Treasury Inflation Indexed, 2.38%, 15/01/2027 1,686 0.20 5,292,000 USD US Treasury Inflation Indexed, 0.38%, 15/07/2027 4,951 0.59 4,630,000 USD US Treasury Inflation Indexed, 0.50%, 15/01/2028 4,326 0.52 2,734,000 USD US Treasury Inflation Indexed, 1.75%, 15/01/2028 3,321 0.40 2,406,000 USD US Treasury Inflation Indexed, 3.63%, 15/04/2028 4,342 0.52 5,195,000 USD US Treasury Inflation Indexed, 0.75%, 15/07/2028 4,891 0.58 3,440,000 USD US Treasury Inflation Indexed, 0.88%, 15/01/2029 3,251 0.39 2,685,700 USD US Treasury Inflation Indexed, 2.50%, 15/01/2029 3,418 0.41 2,918,000 USD US Treasury Inflation Indexed, 3.88%, 15/04/2029 5,400 0.65 718,000 USD US Treasury Inflation Indexed, 3.38%, 15/04/2032 1,259 0.15 2,324,000 USD US Treasury Inflation Indexed, 2.13%, 15/02/2040 3,151 0.38 3,438,000 USD US Treasury Inflation Indexed, 2.13%, 15/02/2041 4,637 0.55 3,315,000 USD US Treasury Inflation Indexed, 0.75%, 15/02/2042 3,380 0.40 3,296,300 USD US Treasury Inflation Indexed, 0.63%, 15/02/2043 3,195 0.38 3,534,000 USD US Treasury Inflation Indexed, 1.38%, 15/02/20443 3,960 0.47 3,297,000 USD US Treasury Inflation Indexed, 0.75%, 15/02/2045 3,192 0.38 2,921,000 USD US Treasury Inflation Indexed, 1.00%, 15/02/2046 2,980 0.36 3,002,000 USD US Treasury Inflation Indexed, 0.88%, 15/02/2047 2,926 0.35 2,345,000 USD US Treasury Inflation Indexed, 1.00%, 15/02/2048 2,309 0.27
105
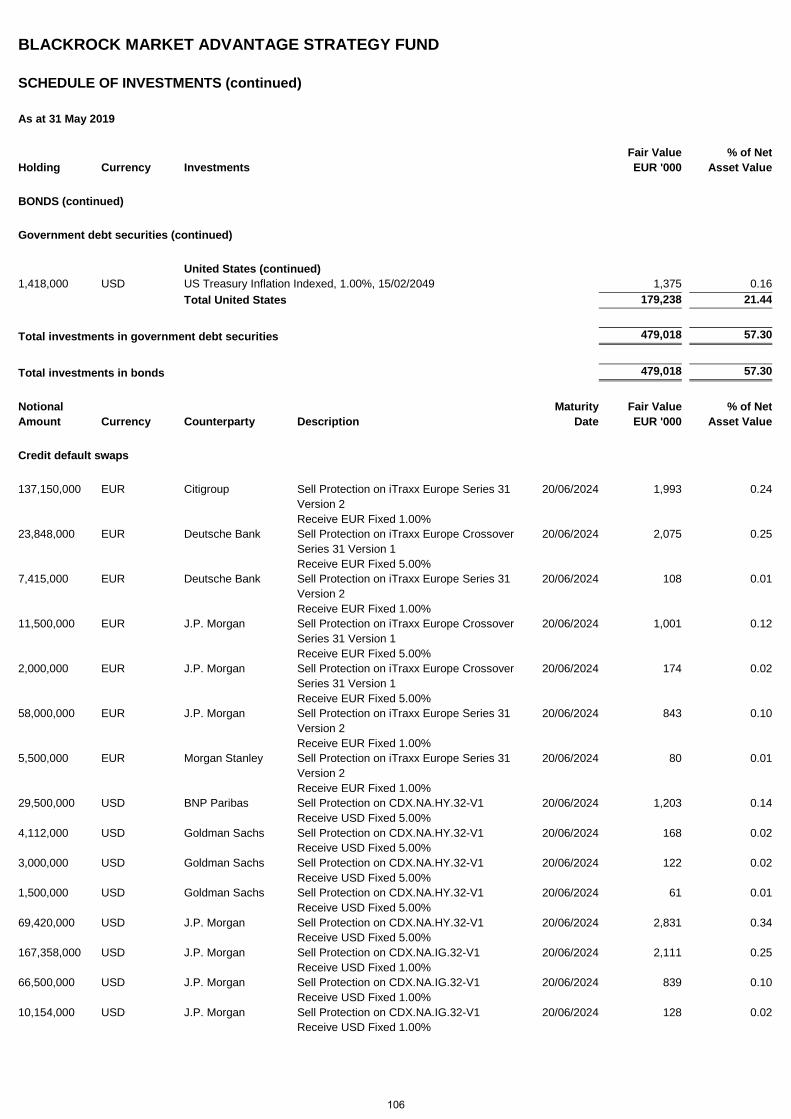
BLACKROCK MARKET ADVANTAGE STRATEGY FUND
SCHEDULE OF INVESTMENTS (continued)
As at 31 May 2019
Holding Currency Investments Fair Value EUR '000
% of Net Asset Value
BONDS (continued)
Government debt securities (continued)
United States (continued) 1,418,000 USD US Treasury Inflation Indexed, 1.00%, 15/02/2049 1,375 0.16 Total United States 179,238 21.44
Total investments in government debt securities 479,018 57.30
Total investments in bonds 479,018 57.30
Notional Maturity Fair Value % of Net Amount Currency Counterparty Description Date EUR '000 Asset Value
Credit default swaps
137,150,000 EUR Citigroup Sell Protection on iTraxx Europe Series 31 Version 2 Receive EUR Fixed 1.00%
20/06/2024 1,993
0.24
23,848,000 EUR Deutsche Bank Sell Protection on iTraxx Europe Crossover Series 31 Version 1 Receive EUR Fixed 5.00%
20/06/2024 2,075
0.25
7,415,000 EUR Deutsche Bank Sell Protection on iTraxx Europe Series 31 Version 2 Receive EUR Fixed 1.00%
20/06/2024 108
0.01
11,500,000 EUR J.P. Morgan Sell Protection on iTraxx Europe Crossover Series 31 Version 1 Receive EUR Fixed 5.00%
20/06/2024 1,001
0.12
2,000,000 EUR J.P. Morgan Sell Protection on iTraxx Europe Crossover Series 31 Version 1 Receive EUR Fixed 5.00%
20/06/2024 174
0.02
58,000,000 EUR J.P. Morgan Sell Protection on iTraxx Europe Series 31 Version 2 Receive EUR Fixed 1.00%
20/06/2024 843
0.10
5,500,000 EUR Morgan Stanley Sell Protection on iTraxx Europe Series 31 Version 2 Receive EUR Fixed 1.00%
20/06/2024 80
0.01
29,500,000 USD BNP Paribas Sell Protection on CDX.NA.HY.32-V1 Receive USD Fixed 5.00%
20/06/2024 1,203
0.14
4,112,000 USD Goldman Sachs Sell Protection on CDX.NA.HY.32-V1 Receive USD Fixed 5.00%
20/06/2024 168
0.02
3,000,000 USD Goldman Sachs Sell Protection on CDX.NA.HY.32-V1 Receive USD Fixed 5.00%
20/06/2024 122
0.02
1,500,000 USD Goldman Sachs Sell Protection on CDX.NA.HY.32-V1 Receive USD Fixed 5.00%
20/06/2024 61
0.01
69,420,000 USD J.P. Morgan Sell Protection on CDX.NA.HY.32-V1 Receive USD Fixed 5.00%
20/06/2024 2,831
0.34
167,358,000 USD J.P. Morgan Sell Protection on CDX.NA.IG.32-V1 Receive USD Fixed 1.00%
20/06/2024 2,111
0.25
66,500,000 USD J.P. Morgan Sell Protection on CDX.NA.IG.32-V1 Receive USD Fixed 1.00%
20/06/2024 839
0.10
10,154,000 USD J.P. Morgan Sell Protection on CDX.NA.IG.32-V1 Receive USD Fixed 1.00%
20/06/2024 128
0.02
106
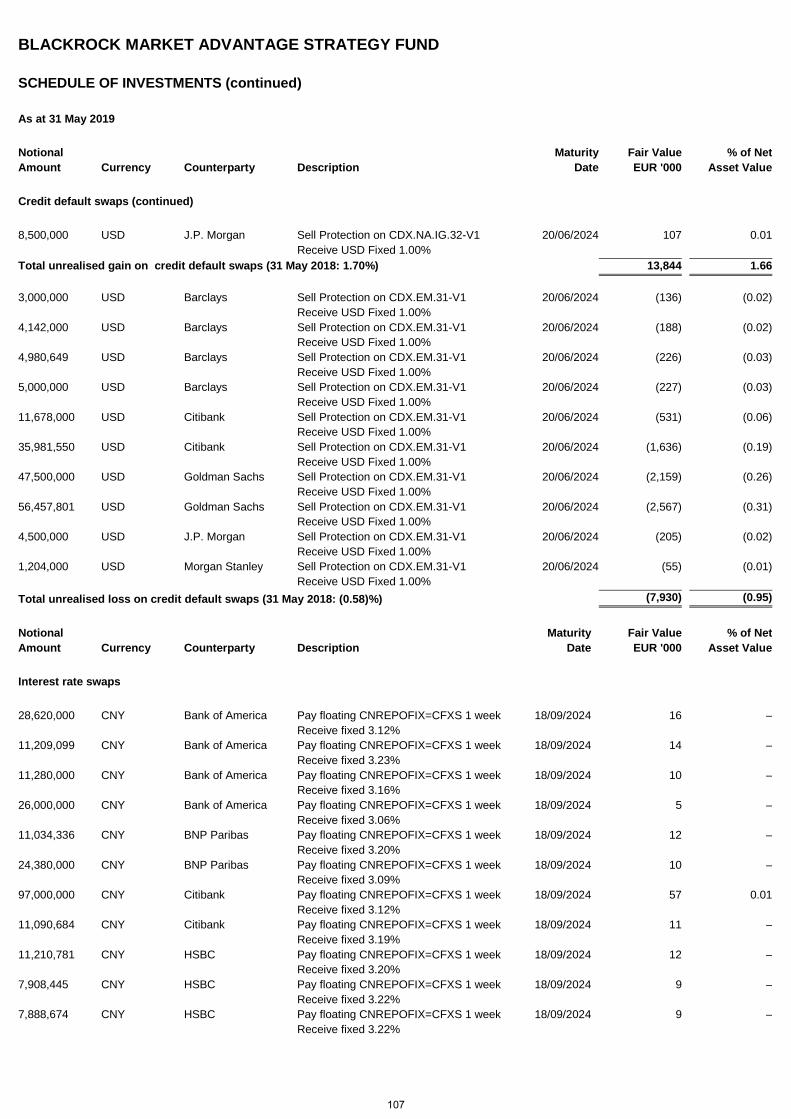
BLACKROCK MARKET ADVANTAGE STRATEGY FUND
SCHEDULE OF INVESTMENTS (continued)
As at 31 May 2019
Notional Maturity Fair Value % of Net Amount Currency Counterparty Description Date EUR '000 Asset Value
Credit default swaps (continued)
8,500,000 USD J.P. Morgan Sell Protection on CDX.NA.IG.32-V1 Receive USD Fixed 1.00%
20/06/2024 107
0.01
Total unrealised gain on credit default swaps (31 May 2018: 1.70%) 13,844 1.66 3,000,000 USD Barclays Sell Protection on CDX.EM.31-V1
Receive USD Fixed 1.00% 20/06/2024 (136)
(0.02)
4,142,000 USD Barclays Sell Protection on CDX.EM.31-V1 Receive USD Fixed 1.00%
20/06/2024 (188)
(0.02)
4,980,649 USD Barclays Sell Protection on CDX.EM.31-V1 Receive USD Fixed 1.00%
20/06/2024 (226)
(0.03)
5,000,000 USD Barclays Sell Protection on CDX.EM.31-V1 Receive USD Fixed 1.00%
20/06/2024 (227)
(0.03)
11,678,000 USD Citibank Sell Protection on CDX.EM.31-V1 Receive USD Fixed 1.00%
20/06/2024 (531)
(0.06)
35,981,550 USD Citibank Sell Protection on CDX.EM.31-V1 Receive USD Fixed 1.00%
20/06/2024 (1,636)
(0.19)
47,500,000 USD Goldman Sachs Sell Protection on CDX.EM.31-V1 Receive USD Fixed 1.00%
20/06/2024 (2,159)
(0.26)
56,457,801 USD Goldman Sachs Sell Protection on CDX.EM.31-V1 Receive USD Fixed 1.00%
20/06/2024 (2,567)
(0.31)
4,500,000 USD J.P. Morgan Sell Protection on CDX.EM.31-V1 Receive USD Fixed 1.00%
20/06/2024 (205)
(0.02)
1,204,000 USD Morgan Stanley Sell Protection on CDX.EM.31-V1 Receive USD Fixed 1.00%
20/06/2024 (55)
(0.01)
Total unrealised loss on credit default swaps (31 May 2018: (0.58)%) (7,930) (0.95)
Notional Maturity Fair Value % of Net Amount Currency Counterparty Description Date EUR '000 Asset Value
Interest rate swaps
28,620,000 CNY Bank of America Pay floating CNREPOFIX=CFXS 1 week Receive fixed 3.12%
18/09/2024 16
–
11,209,099 CNY Bank of America Pay floating CNREPOFIX=CFXS 1 week Receive fixed 3.23%
18/09/2024 14
–
11,280,000 CNY Bank of America Pay floating CNREPOFIX=CFXS 1 week Receive fixed 3.16%
18/09/2024 10
–
26,000,000 CNY Bank of America Pay floating CNREPOFIX=CFXS 1 week Receive fixed 3.06%
18/09/2024 5
–
11,034,336 CNY BNP Paribas Pay floating CNREPOFIX=CFXS 1 week Receive fixed 3.20%
18/09/2024 12
–
24,380,000 CNY BNP Paribas Pay floating CNREPOFIX=CFXS 1 week Receive fixed 3.09%
18/09/2024 10
–
97,000,000 CNY Citibank Pay floating CNREPOFIX=CFXS 1 week Receive fixed 3.12%
18/09/2024 57
0.01
11,090,684 CNY Citibank Pay floating CNREPOFIX=CFXS 1 week Receive fixed 3.19%
18/09/2024 11
–
11,210,781 CNY HSBC Pay floating CNREPOFIX=CFXS 1 week Receive fixed 3.20%
18/09/2024 12
–
7,908,445 CNY HSBC Pay floating CNREPOFIX=CFXS 1 week Receive fixed 3.22%
18/09/2024 9
–
7,888,674 CNY HSBC Pay floating CNREPOFIX=CFXS 1 week Receive fixed 3.22%
18/09/2024 9
–
107
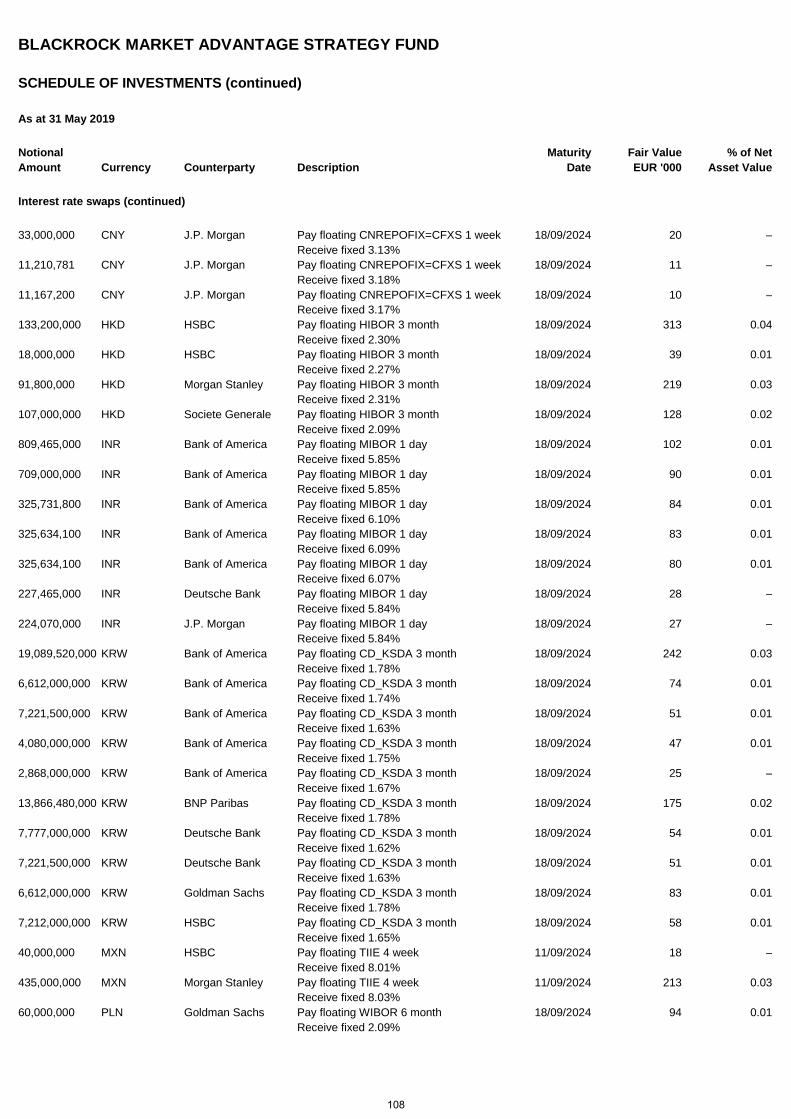
BLACKROCK MARKET ADVANTAGE STRATEGY FUND
SCHEDULE OF INVESTMENTS (continued)
As at 31 May 2019
Notional Maturity Fair Value % of Net Amount Currency Counterparty Description Date EUR '000 Asset Value
Interest rate swaps (continued)
33,000,000 CNY J.P. Morgan Pay floating CNREPOFIX=CFXS 1 week Receive fixed 3.13%
18/09/2024 20
–
11,210,781 CNY J.P. Morgan Pay floating CNREPOFIX=CFXS 1 week Receive fixed 3.18%
18/09/2024 11
–
11,167,200 CNY J.P. Morgan Pay floating CNREPOFIX=CFXS 1 week Receive fixed 3.17%
18/09/2024 10
–
133,200,000 HKD HSBC Pay floating HIBOR 3 month Receive fixed 2.30%
18/09/2024 313
0.04
18,000,000 HKD HSBC Pay floating HIBOR 3 month Receive fixed 2.27%
18/09/2024 39
0.01
91,800,000 HKD Morgan Stanley Pay floating HIBOR 3 month Receive fixed 2.31%
18/09/2024 219
0.03
107,000,000 HKD Societe Generale Pay floating HIBOR 3 month Receive fixed 2.09%
18/09/2024 128
0.02
809,465,000 INR Bank of America Pay floating MIBOR 1 day Receive fixed 5.85%
18/09/2024 102
0.01
709,000,000 INR Bank of America Pay floating MIBOR 1 day Receive fixed 5.85%
18/09/2024 90
0.01
325,731,800 INR Bank of America Pay floating MIBOR 1 day Receive fixed 6.10%
18/09/2024 84
0.01
325,634,100 INR Bank of America Pay floating MIBOR 1 day Receive fixed 6.09%
18/09/2024 83
0.01
325,634,100 INR Bank of America Pay floating MIBOR 1 day Receive fixed 6.07%
18/09/2024 80
0.01
227,465,000 INR Deutsche Bank Pay floating MIBOR 1 day Receive fixed 5.84%
18/09/2024 28
–
224,070,000 INR J.P. Morgan Pay floating MIBOR 1 day Receive fixed 5.84%
18/09/2024 27
–
19,089,520,000 KRW Bank of America Pay floating CD_KSDA 3 month Receive fixed 1.78%
18/09/2024 242
0.03
6,612,000,000 KRW Bank of America Pay floating CD_KSDA 3 month Receive fixed 1.74%
18/09/2024 74
0.01
7,221,500,000 KRW Bank of America Pay floating CD_KSDA 3 month Receive fixed 1.63%
18/09/2024 51
0.01
4,080,000,000 KRW Bank of America Pay floating CD_KSDA 3 month Receive fixed 1.75%
18/09/2024 47
0.01
2,868,000,000 KRW Bank of America Pay floating CD_KSDA 3 month Receive fixed 1.67%
18/09/2024 25
–
13,866,480,000 KRW BNP Paribas Pay floating CD_KSDA 3 month Receive fixed 1.78%
18/09/2024 175
0.02
7,777,000,000 KRW Deutsche Bank Pay floating CD_KSDA 3 month Receive fixed 1.62%
18/09/2024 54
0.01
7,221,500,000 KRW Deutsche Bank Pay floating CD_KSDA 3 month Receive fixed 1.63%
18/09/2024 51
0.01
6,612,000,000 KRW Goldman Sachs Pay floating CD_KSDA 3 month Receive fixed 1.78%
18/09/2024 83
0.01
7,212,000,000 KRW HSBC Pay floating CD_KSDA 3 month Receive fixed 1.65%
18/09/2024 58
0.01
40,000,000 MXN HSBC Pay floating TIIE 4 week Receive fixed 8.01%
11/09/2024 18
–
435,000,000 MXN Morgan Stanley Pay floating TIIE 4 week Receive fixed 8.03%
11/09/2024 213
0.03
60,000,000 PLN Goldman Sachs Pay floating WIBOR 6 month Receive fixed 2.09%
18/09/2024 94
0.01
108
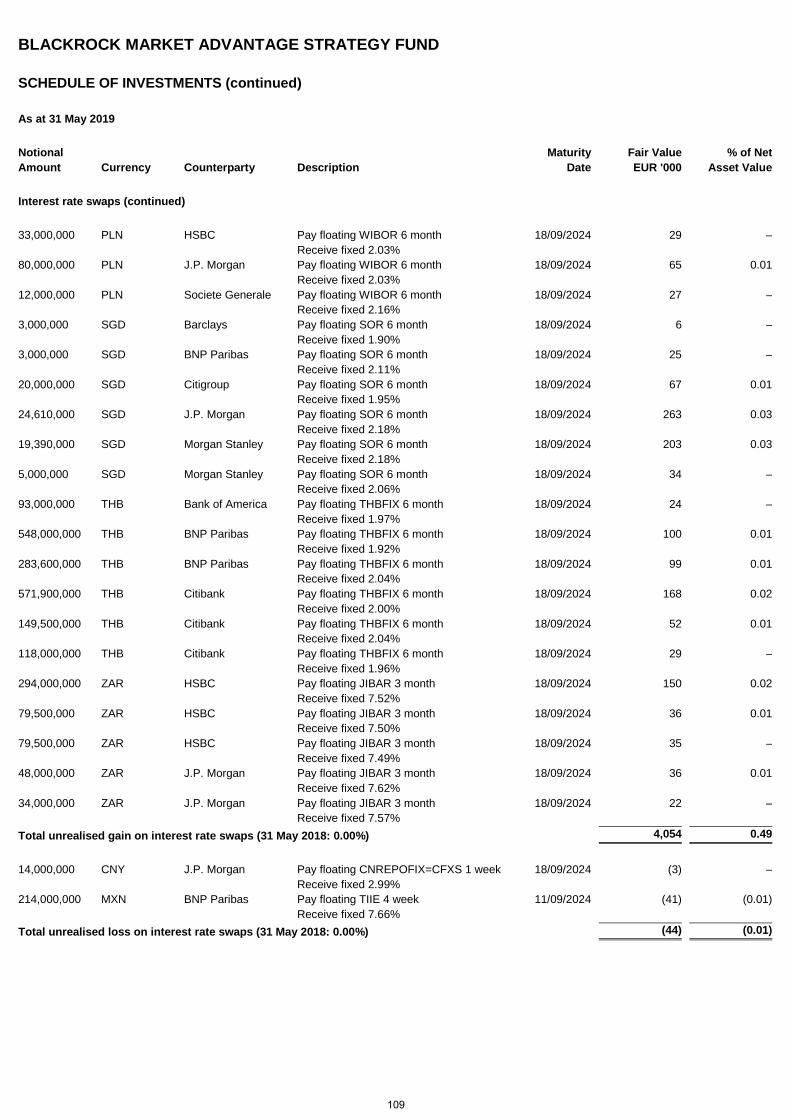
BLACKROCK MARKET ADVANTAGE STRATEGY FUND
SCHEDULE OF INVESTMENTS (continued)
As at 31 May 2019
Notional Maturity Fair Value % of Net Amount Currency Counterparty Description Date EUR '000 Asset Value
Interest rate swaps (continued)
33,000,000 PLN HSBC Pay floating WIBOR 6 month Receive fixed 2.03%
18/09/2024 29
–
80,000,000 PLN J.P. Morgan Pay floating WIBOR 6 month Receive fixed 2.03%
18/09/2024 65
0.01
12,000,000 PLN Societe Generale Pay floating WIBOR 6 month Receive fixed 2.16%
18/09/2024 27
–
3,000,000 SGD Barclays Pay floating SOR 6 month Receive fixed 1.90%
18/09/2024 6
–
3,000,000 SGD BNP Paribas Pay floating SOR 6 month Receive fixed 2.11%
18/09/2024 25
–
20,000,000 SGD Citigroup Pay floating SOR 6 month Receive fixed 1.95%
18/09/2024 67
0.01
24,610,000 SGD J.P. Morgan Pay floating SOR 6 month Receive fixed 2.18%
18/09/2024 263
0.03
19,390,000 SGD Morgan Stanley Pay floating SOR 6 month Receive fixed 2.18%
18/09/2024 203
0.03
5,000,000 SGD Morgan Stanley Pay floating SOR 6 month Receive fixed 2.06%
18/09/2024 34
–
93,000,000 THB Bank of America Pay floating THBFIX 6 month Receive fixed 1.97%
18/09/2024 24
–
548,000,000 THB BNP Paribas Pay floating THBFIX 6 month Receive fixed 1.92%
18/09/2024 100
0.01
283,600,000 THB BNP Paribas Pay floating THBFIX 6 month Receive fixed 2.04%
18/09/2024 99
0.01
571,900,000 THB Citibank Pay floating THBFIX 6 month Receive fixed 2.00%
18/09/2024 168
0.02
149,500,000 THB Citibank Pay floating THBFIX 6 month Receive fixed 2.04%
18/09/2024 52
0.01
118,000,000 THB Citibank Pay floating THBFIX 6 month Receive fixed 1.96%
18/09/2024 29
–
294,000,000 ZAR HSBC Pay floating JIBAR 3 month Receive fixed 7.52%
18/09/2024 150
0.02
79,500,000 ZAR HSBC Pay floating JIBAR 3 month Receive fixed 7.50%
18/09/2024 36
0.01
79,500,000 ZAR HSBC Pay floating JIBAR 3 month Receive fixed 7.49%
18/09/2024 35
–
48,000,000 ZAR J.P. Morgan Pay floating JIBAR 3 month Receive fixed 7.62%
18/09/2024 36
0.01
34,000,000 ZAR J.P. Morgan Pay floating JIBAR 3 month Receive fixed 7.57%
18/09/2024 22
–
Total unrealised gain on interest rate swaps (31 May 2018: 0.00%) 4,054 0.49
14,000,000 CNY J.P. Morgan Pay floating CNREPOFIX=CFXS 1 week Receive fixed 2.99%
18/09/2024 (3)
–
214,000,000 MXN BNP Paribas Pay floating TIIE 4 week Receive fixed 7.66%
11/09/2024 (41)
(0.01)
Total unrealised loss on interest rate swaps (31 May 2018: 0.00%) (44) (0.01)
109
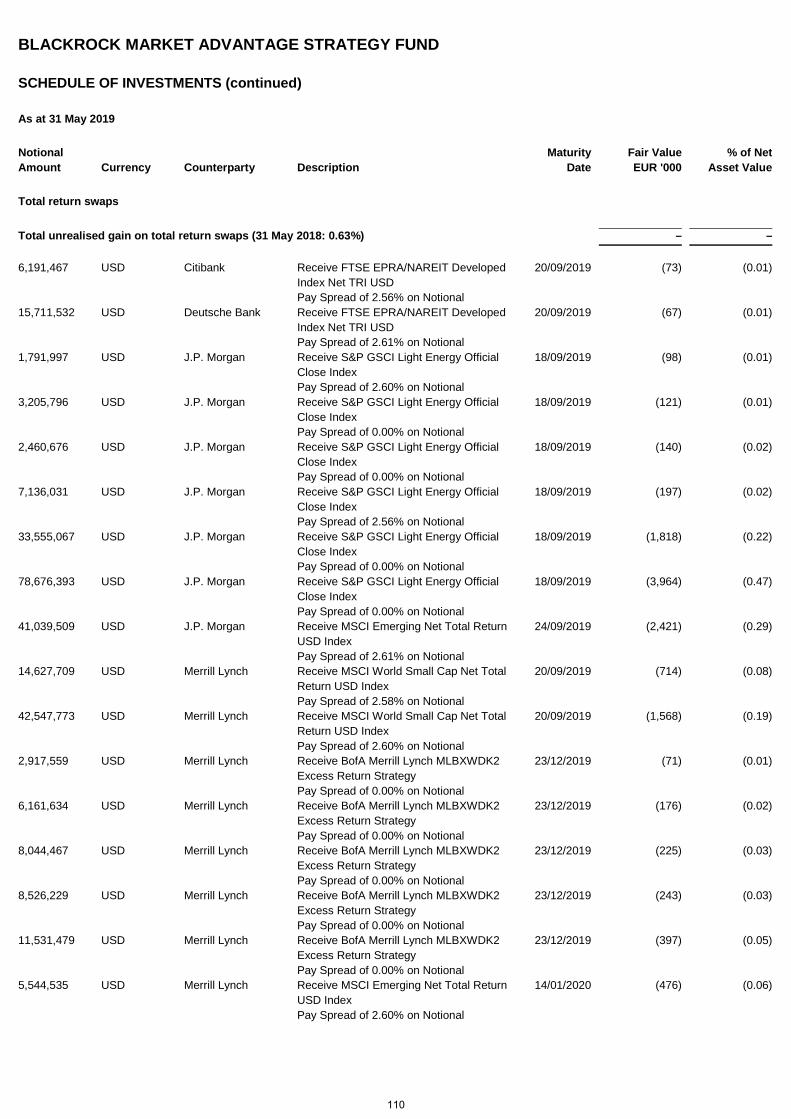
BLACKROCK MARKET ADVANTAGE STRATEGY FUND
SCHEDULE OF INVESTMENTS (continued)
As at 31 May 2019
Notional Maturity Fair Value % of Net Amount Currency Counterparty Description Date EUR '000 Asset Value
Total return swaps
Total unrealised gain on total return swaps (31 May 2018: 0.63%) – – 6,191,467 USD Citibank Receive FTSE EPRA/NAREIT Developed
Index Net TRI USD Pay Spread of 2.56% on Notional
20/09/2019 (73)
(0.01)
15,711,532 USD Deutsche Bank Receive FTSE EPRA/NAREIT Developed Index Net TRI USD Pay Spread of 2.61% on Notional
20/09/2019 (67)
(0.01)
1,791,997 USD J.P. Morgan Receive S&P GSCI Light Energy Official Close Index Pay Spread of 2.60% on Notional
18/09/2019 (98)
(0.01)
3,205,796 USD J.P. Morgan Receive S&P GSCI Light Energy Official Close Index Pay Spread of 0.00% on Notional
18/09/2019 (121)
(0.01)
2,460,676 USD J.P. Morgan Receive S&P GSCI Light Energy Official Close Index Pay Spread of 0.00% on Notional
18/09/2019 (140)
(0.02)
7,136,031 USD J.P. Morgan Receive S&P GSCI Light Energy Official Close Index Pay Spread of 2.56% on Notional
18/09/2019 (197)
(0.02)
33,555,067 USD J.P. Morgan Receive S&P GSCI Light Energy Official Close Index Pay Spread of 0.00% on Notional
18/09/2019 (1,818)
(0.22)
78,676,393 USD J.P. Morgan Receive S&P GSCI Light Energy Official Close Index Pay Spread of 0.00% on Notional
18/09/2019 (3,964)
(0.47)
41,039,509 USD J.P. Morgan Receive MSCI Emerging Net Total Return USD Index Pay Spread of 2.61% on Notional
24/09/2019 (2,421)
(0.29)
14,627,709 USD Merrill Lynch Receive MSCI World Small Cap Net Total Return USD Index Pay Spread of 2.58% on Notional
20/09/2019 (714)
(0.08)
42,547,773 USD Merrill Lynch Receive MSCI World Small Cap Net Total Return USD Index Pay Spread of 2.60% on Notional
20/09/2019 (1,568)
(0.19)
2,917,559 USD Merrill Lynch Receive BofA Merrill Lynch MLBXWDK2 Excess Return Strategy Pay Spread of 0.00% on Notional
23/12/2019 (71)
(0.01)
6,161,634 USD Merrill Lynch Receive BofA Merrill Lynch MLBXWDK2 Excess Return Strategy Pay Spread of 0.00% on Notional
23/12/2019 (176)
(0.02)
8,044,467 USD Merrill Lynch Receive BofA Merrill Lynch MLBXWDK2 Excess Return Strategy Pay Spread of 0.00% on Notional
23/12/2019 (225)
(0.03)
8,526,229 USD Merrill Lynch Receive BofA Merrill Lynch MLBXWDK2 Excess Return Strategy Pay Spread of 0.00% on Notional
23/12/2019 (243)
(0.03)
11,531,479 USD Merrill Lynch Receive BofA Merrill Lynch MLBXWDK2 Excess Return Strategy Pay Spread of 0.00% on Notional
23/12/2019 (397)
(0.05)
5,544,535 USD Merrill Lynch Receive MSCI Emerging Net Total Return USD Index Pay Spread of 2.60% on Notional
14/01/2020 (476)
(0.06)
110
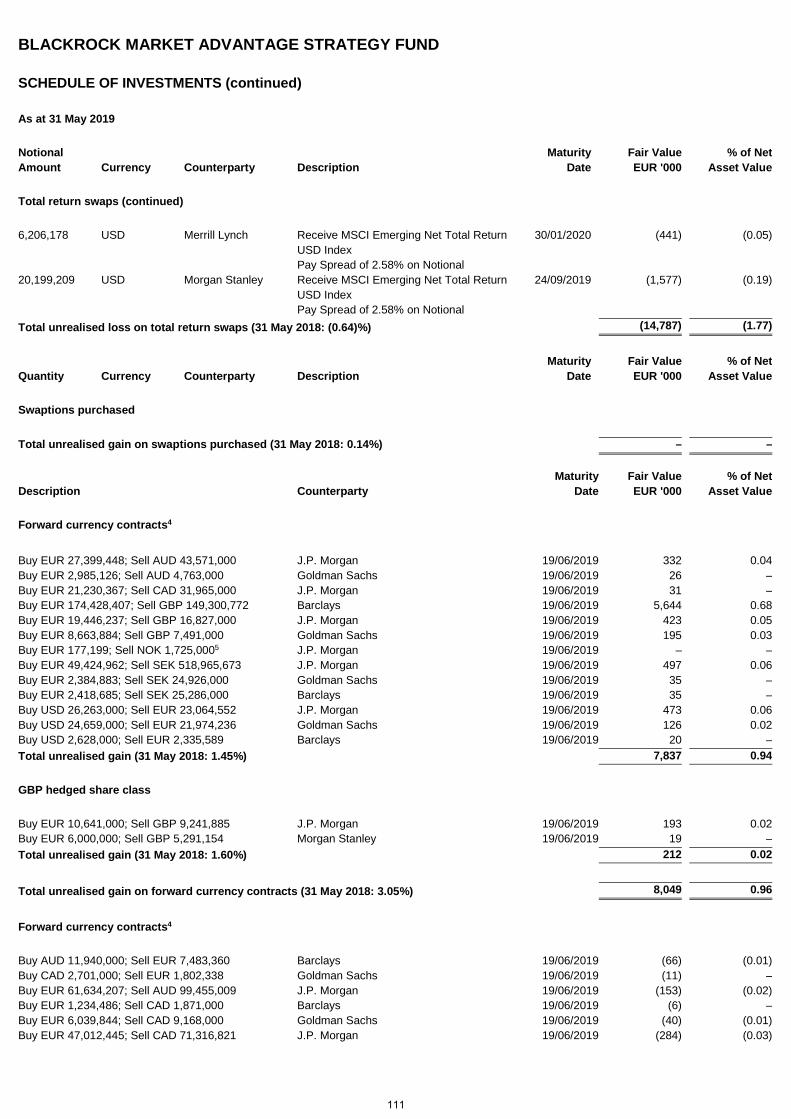
BLACKROCK MARKET ADVANTAGE STRATEGY FUND
SCHEDULE OF INVESTMENTS (continued)
As at 31 May 2019
Notional Maturity Fair Value % of Net Amount Currency Counterparty Description Date EUR '000 Asset Value
Total return swaps (continued)
6,206,178 USD Merrill Lynch Receive MSCI Emerging Net Total Return USD Index Pay Spread of 2.58% on Notional
30/01/2020 (441)
(0.05)
20,199,209 USD Morgan Stanley Receive MSCI Emerging Net Total Return USD Index Pay Spread of 2.58% on Notional
24/09/2019 (1,577)
(0.19)
Total unrealised loss on total return swaps (31 May 2018: (0.64)%) (14,787) (1.77)
Maturity Fair Value % of Net Quantity Currency Counterparty Description Date EUR '000 Asset Value
Swaptions purchased
Total unrealised gain on swaptions purchased (31 May 2018: 0.14%) – – Maturity Fair Value % of Net Description Counterparty Date EUR '000 Asset Value
Forward currency contracts4
Buy EUR 27,399,448; Sell AUD 43,571,000 J.P. Morgan 19/06/2019 332 0.04 Buy EUR 2,985,126; Sell AUD 4,763,000 Goldman Sachs 19/06/2019 26 – Buy EUR 21,230,367; Sell CAD 31,965,000 J.P. Morgan 19/06/2019 31 – Buy EUR 174,428,407; Sell GBP 149,300,772 Barclays 19/06/2019 5,644 0.68 Buy EUR 19,446,237; Sell GBP 16,827,000 J.P. Morgan 19/06/2019 423 0.05 Buy EUR 8,663,884; Sell GBP 7,491,000 Goldman Sachs 19/06/2019 195 0.03 Buy EUR 177,199; Sell NOK 1,725,0005 J.P. Morgan 19/06/2019 – – Buy EUR 49,424,962; Sell SEK 518,965,673 J.P. Morgan 19/06/2019 497 0.06 Buy EUR 2,384,883; Sell SEK 24,926,000 Goldman Sachs 19/06/2019 35 – Buy EUR 2,418,685; Sell SEK 25,286,000 Barclays 19/06/2019 35 – Buy USD 26,263,000; Sell EUR 23,064,552 J.P. Morgan 19/06/2019 473 0.06 Buy USD 24,659,000; Sell EUR 21,974,236 Goldman Sachs 19/06/2019 126 0.02 Buy USD 2,628,000; Sell EUR 2,335,589 Barclays 19/06/2019 20 – Total unrealised gain (31 May 2018: 1.45%) 7,837 0.94
GBP hedged share class
Buy EUR 10,641,000; Sell GBP 9,241,885 J.P. Morgan 19/06/2019 193 0.02 Buy EUR 6,000,000; Sell GBP 5,291,154 Morgan Stanley 19/06/2019 19 – Total unrealised gain (31 May 2018: 1.60%) 212 0.02
Total unrealised gain on forward currency contracts (31 May 2018: 3.05%) 8,049 0.96
Forward currency contracts4
Buy AUD 11,940,000; Sell EUR 7,483,360 Barclays 19/06/2019 (66) (0.01) Buy CAD 2,701,000; Sell EUR 1,802,338 Goldman Sachs 19/06/2019 (11) – Buy EUR 61,634,207; Sell AUD 99,455,009 J.P. Morgan 19/06/2019 (153) (0.02) Buy EUR 1,234,486; Sell CAD 1,871,000 Barclays 19/06/2019 (6) – Buy EUR 6,039,844; Sell CAD 9,168,000 Goldman Sachs 19/06/2019 (40) (0.01) Buy EUR 47,012,445; Sell CAD 71,316,821 J.P. Morgan 19/06/2019 (284) (0.03)
111
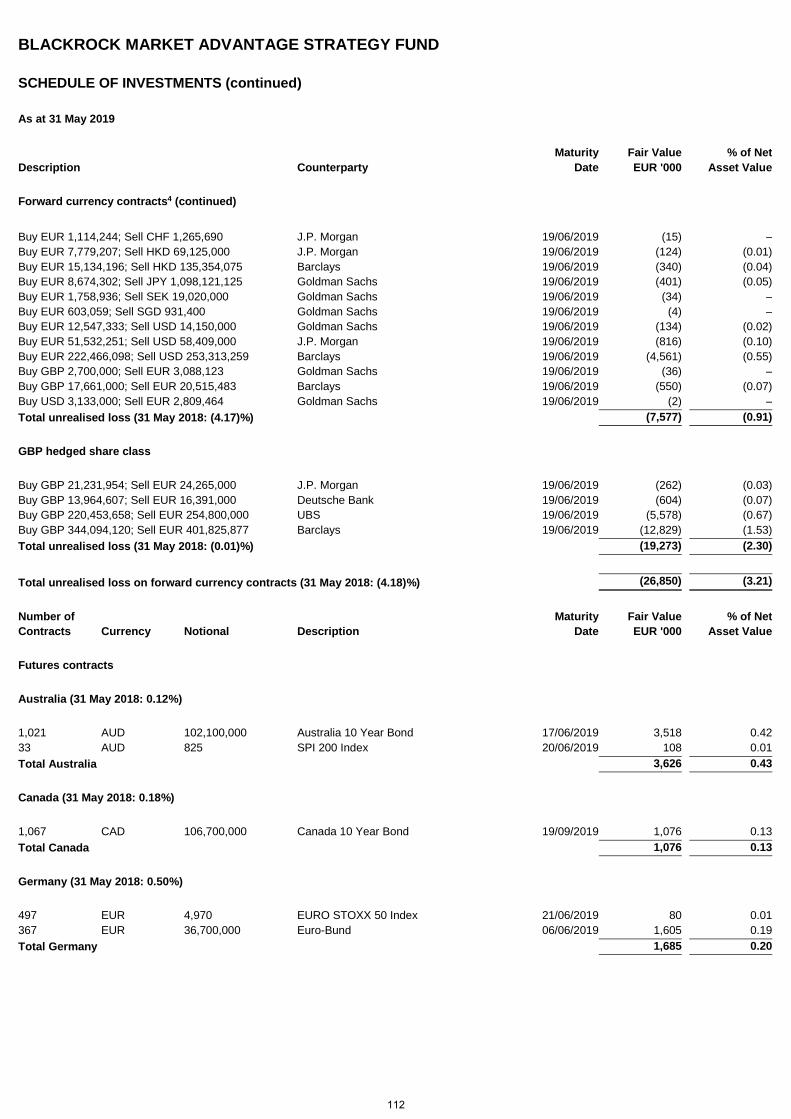
BLACKROCK MARKET ADVANTAGE STRATEGY FUND
SCHEDULE OF INVESTMENTS (continued)
As at 31 May 2019
Maturity Fair Value % of Net Description Counterparty Date EUR '000 Asset Value
Forward currency contracts4 (continued)
Buy EUR 1,114,244; Sell CHF 1,265,690 J.P. Morgan 19/06/2019 (15) – Buy EUR 7,779,207; Sell HKD 69,125,000 J.P. Morgan 19/06/2019 (124) (0.01) Buy EUR 15,134,196; Sell HKD 135,354,075 Barclays 19/06/2019 (340) (0.04) Buy EUR 8,674,302; Sell JPY 1,098,121,125 Goldman Sachs 19/06/2019 (401) (0.05) Buy EUR 1,758,936; Sell SEK 19,020,000 Goldman Sachs 19/06/2019 (34) – Buy EUR 603,059; Sell SGD 931,400 Goldman Sachs 19/06/2019 (4) – Buy EUR 12,547,333; Sell USD 14,150,000 Goldman Sachs 19/06/2019 (134) (0.02) Buy EUR 51,532,251; Sell USD 58,409,000 J.P. Morgan 19/06/2019 (816) (0.10) Buy EUR 222,466,098; Sell USD 253,313,259 Barclays 19/06/2019 (4,561) (0.55) Buy GBP 2,700,000; Sell EUR 3,088,123 Goldman Sachs 19/06/2019 (36) – Buy GBP 17,661,000; Sell EUR 20,515,483 Barclays 19/06/2019 (550) (0.07) Buy USD 3,133,000; Sell EUR 2,809,464 Goldman Sachs 19/06/2019 (2) – Total unrealised loss (31 May 2018: (4.17)%) (7,577) (0.91)
GBP hedged share class
Buy GBP 21,231,954; Sell EUR 24,265,000 J.P. Morgan 19/06/2019 (262) (0.03) Buy GBP 13,964,607; Sell EUR 16,391,000 Deutsche Bank 19/06/2019 (604) (0.07) Buy GBP 220,453,658; Sell EUR 254,800,000 UBS 19/06/2019 (5,578) (0.67) Buy GBP 344,094,120; Sell EUR 401,825,877 Barclays 19/06/2019 (12,829) (1.53) Total unrealised loss (31 May 2018: (0.01)%) (19,273) (2.30)
Total unrealised loss on forward currency contracts (31 May 2018: (4.18)%) (26,850) (3.21)
Number of Maturity Fair Value % of Net Contracts Currency Notional Description Date EUR '000 Asset Value
Futures contracts
Australia (31 May 2018: 0.12%)
1,021 AUD 102,100,000 Australia 10 Year Bond 17/06/2019 3,518 0.42 33 AUD 825 SPI 200 Index 20/06/2019 108 0.01 Total Australia 3,626 0.43
Canada (31 May 2018: 0.18%)
1,067 CAD 106,700,000 Canada 10 Year Bond 19/09/2019 1,076 0.13 Total Canada 1,076 0.13
Germany (31 May 2018: 0.50%)
497 EUR 4,970 EURO STOXX 50 Index 21/06/2019 80 0.01 367 EUR 36,700,000 Euro-Bund 06/06/2019 1,605 0.19 Total Germany 1,685 0.20
112
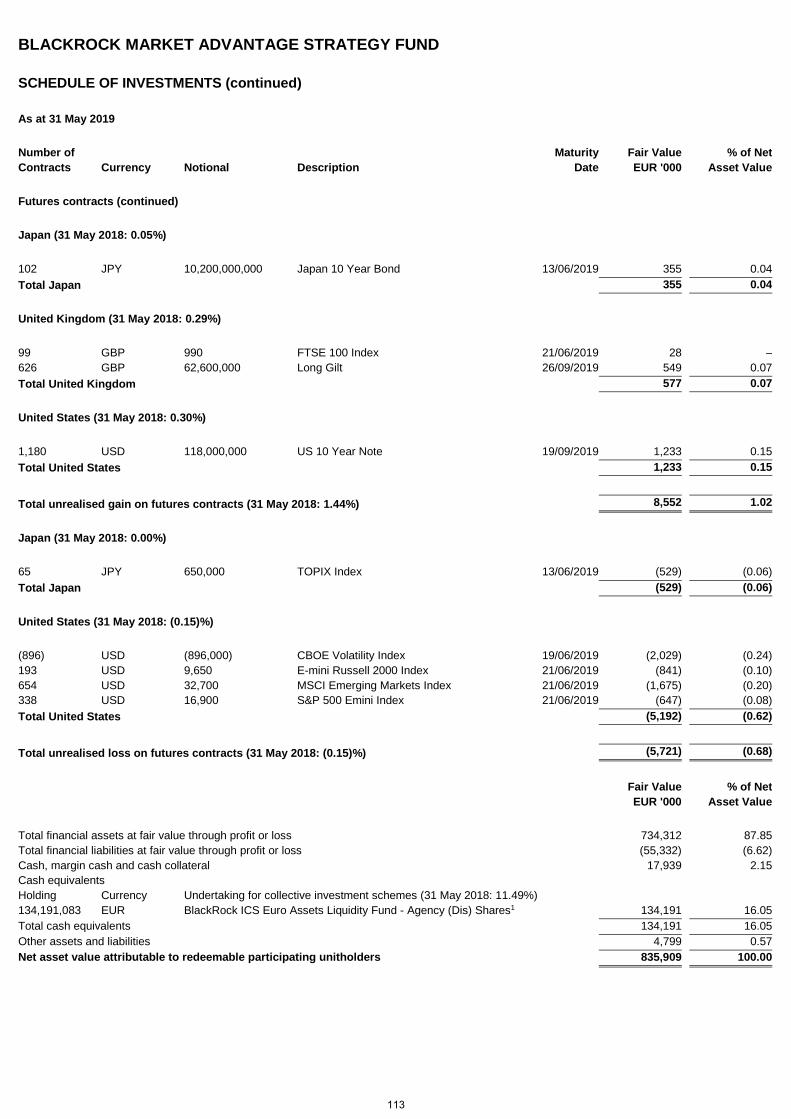
BLACKROCK MARKET ADVANTAGE STRATEGY FUND
SCHEDULE OF INVESTMENTS (continued)
As at 31 May 2019
Number of Maturity Fair Value % of Net Contracts Currency Notional Description Date EUR '000 Asset Value
Futures contracts (continued)
Japan (31 May 2018: 0.05%)
102 JPY 10,200,000,000 Japan 10 Year Bond 13/06/2019 355 0.04 Total Japan 355 0.04
United Kingdom (31 May 2018: 0.29%)
99 GBP 990 FTSE 100 Index 21/06/2019 28 – 626 GBP 62,600,000 Long Gilt 26/09/2019 549 0.07 Total United Kingdom 577 0.07
United States (31 May 2018: 0.30%)
1,180 USD 118,000,000 US 10 Year Note 19/09/2019 1,233 0.15 Total United States 1,233 0.15
Total unrealised gain on futures contracts (31 May 2018: 1.44%) 8,552 1.02
Japan (31 May 2018: 0.00%)
65 JPY 650,000 TOPIX Index 13/06/2019 (529) (0.06) Total Japan (529) (0.06)
United States (31 May 2018: (0.15)%)
(896) USD (896,000) CBOE Volatility Index 19/06/2019 (2,029) (0.24) 193 USD 9,650 E-mini Russell 2000 Index 21/06/2019 (841) (0.10) 654 USD 32,700 MSCI Emerging Markets Index 21/06/2019 (1,675) (0.20) 338 USD 16,900 S&P 500 Emini Index 21/06/2019 (647) (0.08) Total United States (5,192) (0.62)
Total unrealised loss on futures contracts (31 May 2018: (0.15)%) (5,721) (0.68)
Fair Value EUR '000
% of Net Asset Value
Total financial assets at fair value through profit or loss 734,312 87.85 Total financial liabilities at fair value through profit or loss (55,332) (6.62) Cash, margin cash and cash collateral 17,939 2.15 Cash equivalents Holding Currency Undertaking for collective investment schemes (31 May 2018: 11.49%) 134,191,083 EUR BlackRock ICS Euro Assets Liquidity Fund - Agency (Dis) Shares1 134,191 16.05 Total cash equivalents 134,191 16.05 Other assets and liabilities 4,799 0.57 Net asset value attributable to redeemable participating unitholders 835,909 100.00
113
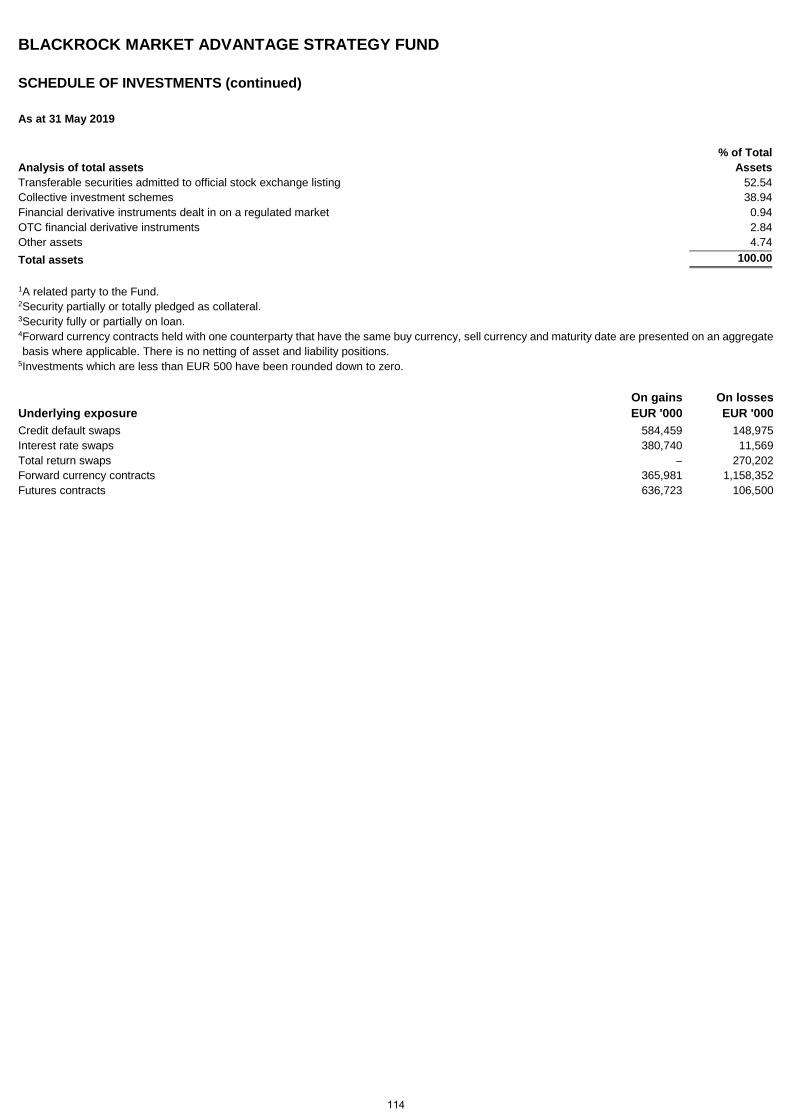
BLACKROCK MARKET ADVANTAGE STRATEGY FUND
SCHEDULE OF INVESTMENTS (continued)
As at 31 May 2019
Analysis of total assets % of Total
Assets Transferable securities admitted to official stock exchange listing 52.54 Collective investment schemes 38.94 Financial derivative instruments dealt in on a regulated market 0.94 OTC financial derivative instruments 2.84 Other assets 4.74 Total assets 100.00
1 A related party to the Fund. 2 Security partially or totally pledged as collateral. 3 Security fully or partially on loan. 4 Forward currency contracts held with one counterparty that have the same buy currency, sell currency and maturity date are presented on an aggregate basis where applicable. There is no netting of asset and liability positions.
5 Investments which are less than EUR 500 have been rounded down to zero.
Underlying exposure On gains EUR '000
On losses EUR '000
Credit default swaps 584,459 148,975 Interest rate swaps 380,740 11,569 Total return swaps – 270,202 Forward currency contracts 365,981 1,158,352 Futures contracts 636,723 106,500
114
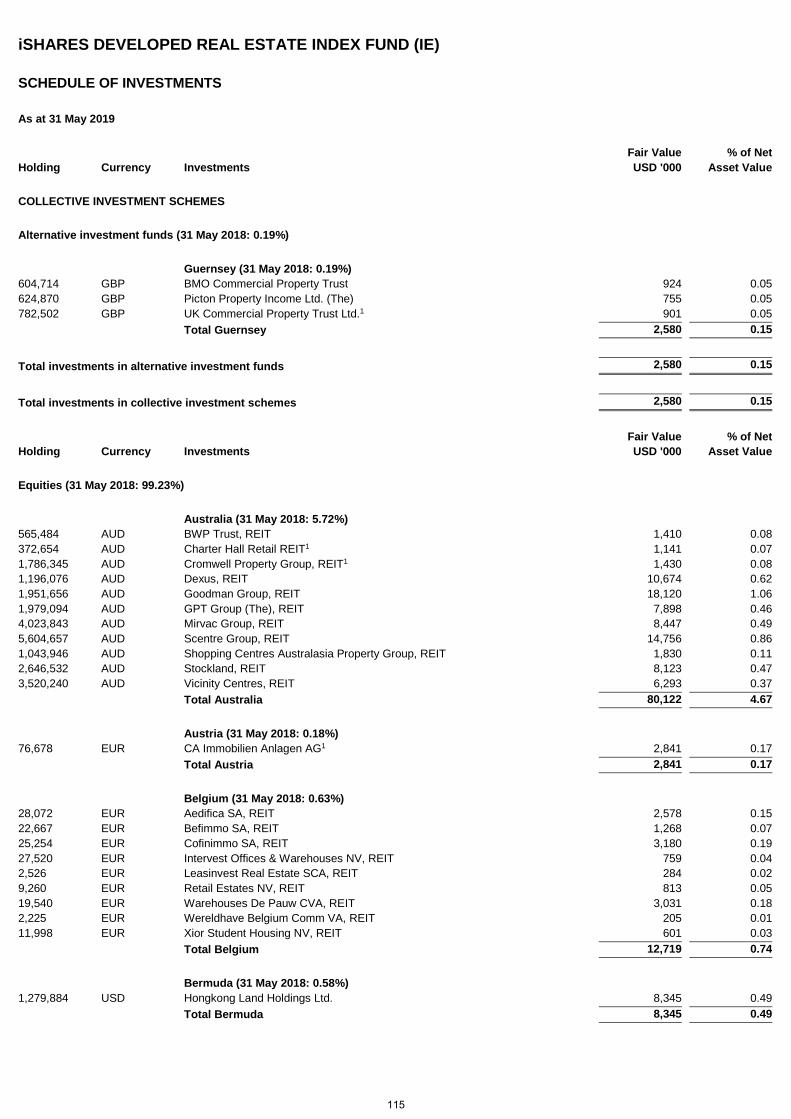
iSHARES DEVELOPED REAL ESTATE INDEX FUND (IE)
SCHEDULE OF INVESTMENTS
As at 31 May 2019
Holding Currency Investments Fair Value USD '000
% of Net Asset Value
COLLECTIVE INVESTMENT SCHEMES
Alternative investment funds (31 May 2018: 0.19%)
Guernsey (31 May 2018: 0.19%) 604,714 GBP BMO Commercial Property Trust 924 0.05 624,870 GBP Picton Property Income Ltd. (The) 755 0.05 782,502 GBP UK Commercial Property Trust Ltd.1 901 0.05 Total Guernsey 2,580 0.15
Total investments in alternative investment funds 2,580 0.15
Total investments in collective investment schemes 2,580 0.15
Holding Currency Investments Fair Value USD '000
% of Net Asset Value
Equities (31 May 2018: 99.23%)
Australia (31 May 2018: 5.72%) 565,484 AUD BWP Trust, REIT 1,410 0.08 372,654 AUD Charter Hall Retail REIT1 1,141 0.07 1,786,345 AUD Cromwell Property Group, REIT1 1,430 0.08 1,196,076 AUD Dexus, REIT 10,674 0.62 1,951,656 AUD Goodman Group, REIT 18,120 1.06 1,979,094 AUD GPT Group (The), REIT 7,898 0.46 4,023,843 AUD Mirvac Group, REIT 8,447 0.49 5,604,657 AUD Scentre Group, REIT 14,756 0.86 1,043,946 AUD Shopping Centres Australasia Property Group, REIT 1,830 0.11 2,646,532 AUD Stockland, REIT 8,123 0.47 3,520,240 AUD Vicinity Centres, REIT 6,293 0.37 Total Australia 80,122 4.67
Austria (31 May 2018: 0.18%) 76,678 EUR CA Immobilien Anlagen AG1 2,841 0.17 Total Austria 2,841 0.17
Belgium (31 May 2018: 0.63%) 28,072 EUR Aedifica SA, REIT 2,578 0.15 22,667 EUR Befimmo SA, REIT 1,268 0.07 25,254 EUR Cofinimmo SA, REIT 3,180 0.19 27,520 EUR Intervest Offices & Warehouses NV, REIT 759 0.04 2,526 EUR Leasinvest Real Estate SCA, REIT 284 0.02 9,260 EUR Retail Estates NV, REIT 813 0.05 19,540 EUR Warehouses De Pauw CVA, REIT 3,031 0.18 2,225 EUR Wereldhave Belgium Comm VA, REIT 205 0.01 11,998 EUR Xior Student Housing NV, REIT 601 0.03 Total Belgium 12,719 0.74
Bermuda (31 May 2018: 0.58%) 1,279,884 USD Hongkong Land Holdings Ltd. 8,345 0.49 Total Bermuda 8,345 0.49
115
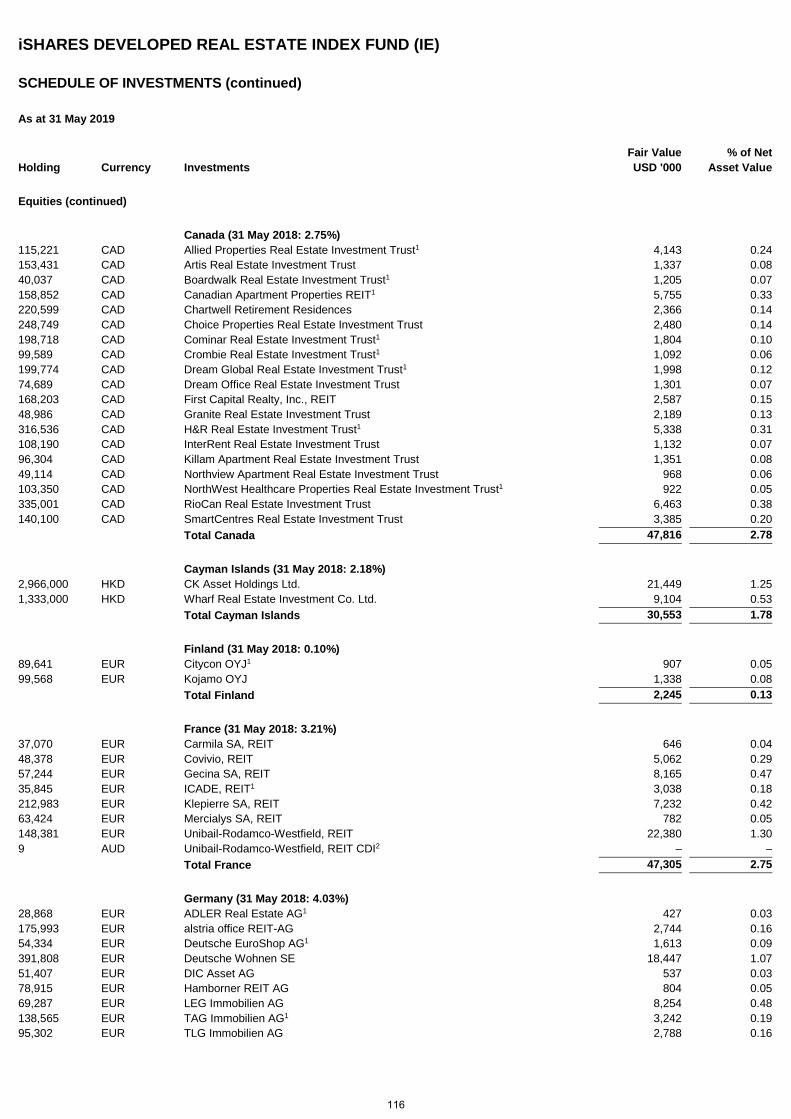
iSHARES DEVELOPED REAL ESTATE INDEX FUND (IE)
SCHEDULE OF INVESTMENTS (continued)
As at 31 May 2019
Holding Currency Investments Fair Value USD '000
% of Net Asset Value
Equities (continued)
Canada (31 May 2018: 2.75%) 115,221 CAD Allied Properties Real Estate Investment Trust1 4,143 0.24 153,431 CAD Artis Real Estate Investment Trust 1,337 0.08 40,037 CAD Boardwalk Real Estate Investment Trust1 1,205 0.07 158,852 CAD Canadian Apartment Properties REIT1 5,755 0.33 220,599 CAD Chartwell Retirement Residences 2,366 0.14 248,749 CAD Choice Properties Real Estate Investment Trust 2,480 0.14 198,718 CAD Cominar Real Estate Investment Trust1 1,804 0.10 99,589 CAD Crombie Real Estate Investment Trust1 1,092 0.06 199,774 CAD Dream Global Real Estate Investment Trust1 1,998 0.12 74,689 CAD Dream Office Real Estate Investment Trust 1,301 0.07 168,203 CAD First Capital Realty, Inc., REIT 2,587 0.15 48,986 CAD Granite Real Estate Investment Trust 2,189 0.13 316,536 CAD H&R Real Estate Investment Trust1 5,338 0.31 108,190 CAD InterRent Real Estate Investment Trust 1,132 0.07 96,304 CAD Killam Apartment Real Estate Investment Trust 1,351 0.08 49,114 CAD Northview Apartment Real Estate Investment Trust 968 0.06 103,350 CAD NorthWest Healthcare Properties Real Estate Investment Trust1 922 0.05 335,001 CAD RioCan Real Estate Investment Trust 6,463 0.38 140,100 CAD SmartCentres Real Estate Investment Trust 3,385 0.20 Total Canada 47,816 2.78
Cayman Islands (31 May 2018: 2.18%) 2,966,000 HKD CK Asset Holdings Ltd. 21,449 1.25 1,333,000 HKD Wharf Real Estate Investment Co. Ltd. 9,104 0.53 Total Cayman Islands 30,553 1.78
Finland (31 May 2018: 0.10%) 89,641 EUR Citycon OYJ1 907 0.05 99,568 EUR Kojamo OYJ 1,338 0.08 Total Finland 2,245 0.13
France (31 May 2018: 3.21%) 37,070 EUR Carmila SA, REIT 646 0.04 48,378 EUR Covivio, REIT 5,062 0.29 57,244 EUR Gecina SA, REIT 8,165 0.47 35,845 EUR ICADE, REIT1 3,038 0.18 212,983 EUR Klepierre SA, REIT 7,232 0.42 63,424 EUR Mercialys SA, REIT 782 0.05 148,381 EUR Unibail-Rodamco-Westfield, REIT 22,380 1.30 9 AUD Unibail-Rodamco-Westfield, REIT CDI2 – – Total France 47,305 2.75
Germany (31 May 2018: 4.03%) 28,868 EUR ADLER Real Estate AG1 427 0.03 175,993 EUR alstria office REIT-AG 2,744 0.16 54,334 EUR Deutsche EuroShop AG1 1,613 0.09 391,808 EUR Deutsche Wohnen SE 18,447 1.07 51,407 EUR DIC Asset AG 537 0.03 78,915 EUR Hamborner REIT AG 804 0.05 69,287 EUR LEG Immobilien AG 8,254 0.48 138,565 EUR TAG Immobilien AG1 3,242 0.19 95,302 EUR TLG Immobilien AG 2,788 0.16
116
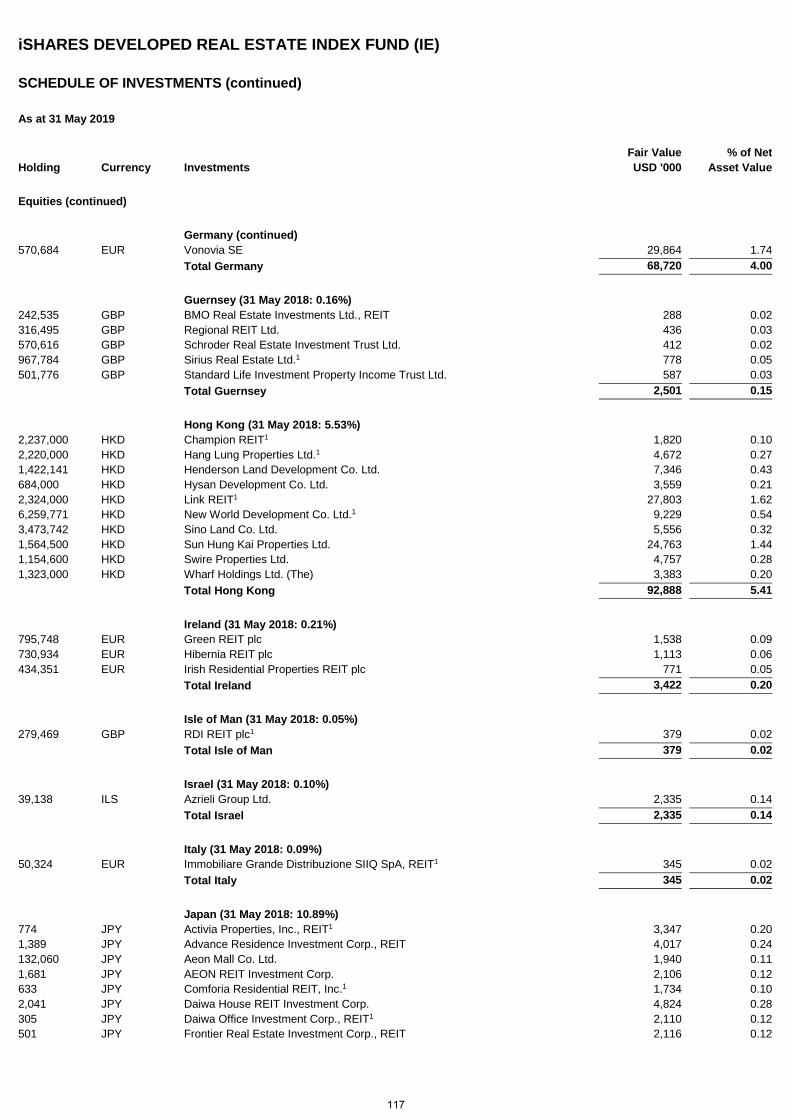
iSHARES DEVELOPED REAL ESTATE INDEX FUND (IE)
SCHEDULE OF INVESTMENTS (continued)
As at 31 May 2019
Holding Currency Investments Fair Value USD '000
% of Net Asset Value
Equities (continued)
Germany (continued) 570,684 EUR Vonovia SE 29,864 1.74 Total Germany 68,720 4.00
Guernsey (31 May 2018: 0.16%) 242,535 GBP BMO Real Estate Investments Ltd., REIT 288 0.02 316,495 GBP Regional REIT Ltd. 436 0.03 570,616 GBP Schroder Real Estate Investment Trust Ltd. 412 0.02 967,784 GBP Sirius Real Estate Ltd.1 778 0.05 501,776 GBP Standard Life Investment Property Income Trust Ltd. 587 0.03 Total Guernsey 2,501 0.15
Hong Kong (31 May 2018: 5.53%) 2,237,000 HKD Champion REIT1 1,820 0.10 2,220,000 HKD Hang Lung Properties Ltd.1 4,672 0.27 1,422,141 HKD Henderson Land Development Co. Ltd. 7,346 0.43 684,000 HKD Hysan Development Co. Ltd. 3,559 0.21 2,324,000 HKD Link REIT1 27,803 1.62 6,259,771 HKD New World Development Co. Ltd.1 9,229 0.54 3,473,742 HKD Sino Land Co. Ltd. 5,556 0.32 1,564,500 HKD Sun Hung Kai Properties Ltd. 24,763 1.44 1,154,600 HKD Swire Properties Ltd. 4,757 0.28 1,323,000 HKD Wharf Holdings Ltd. (The) 3,383 0.20 Total Hong Kong 92,888 5.41
Ireland (31 May 2018: 0.21%) 795,748 EUR Green REIT plc 1,538 0.09 730,934 EUR Hibernia REIT plc 1,113 0.06 434,351 EUR Irish Residential Properties REIT plc 771 0.05 Total Ireland 3,422 0.20
Isle of Man (31 May 2018: 0.05%) 279,469 GBP RDI REIT plc1 379 0.02 Total Isle of Man 379 0.02
Israel (31 May 2018: 0.10%) 39,138 ILS Azrieli Group Ltd. 2,335 0.14 Total Israel 2,335 0.14
Italy (31 May 2018: 0.09%) 50,324 EUR Immobiliare Grande Distribuzione SIIQ SpA, REIT1 345 0.02 Total Italy 345 0.02
Japan (31 May 2018: 10.89%) 774 JPY Activia Properties, Inc., REIT1 3,347 0.20 1,389 JPY Advance Residence Investment Corp., REIT 4,017 0.24 132,060 JPY Aeon Mall Co. Ltd. 1,940 0.11 1,681 JPY AEON REIT Investment Corp. 2,106 0.12 633 JPY Comforia Residential REIT, Inc.1 1,734 0.10 2,041 JPY Daiwa House REIT Investment Corp. 4,824 0.28 305 JPY Daiwa Office Investment Corp., REIT1 2,110 0.12 501 JPY Frontier Real Estate Investment Corp., REIT 2,116 0.12
117
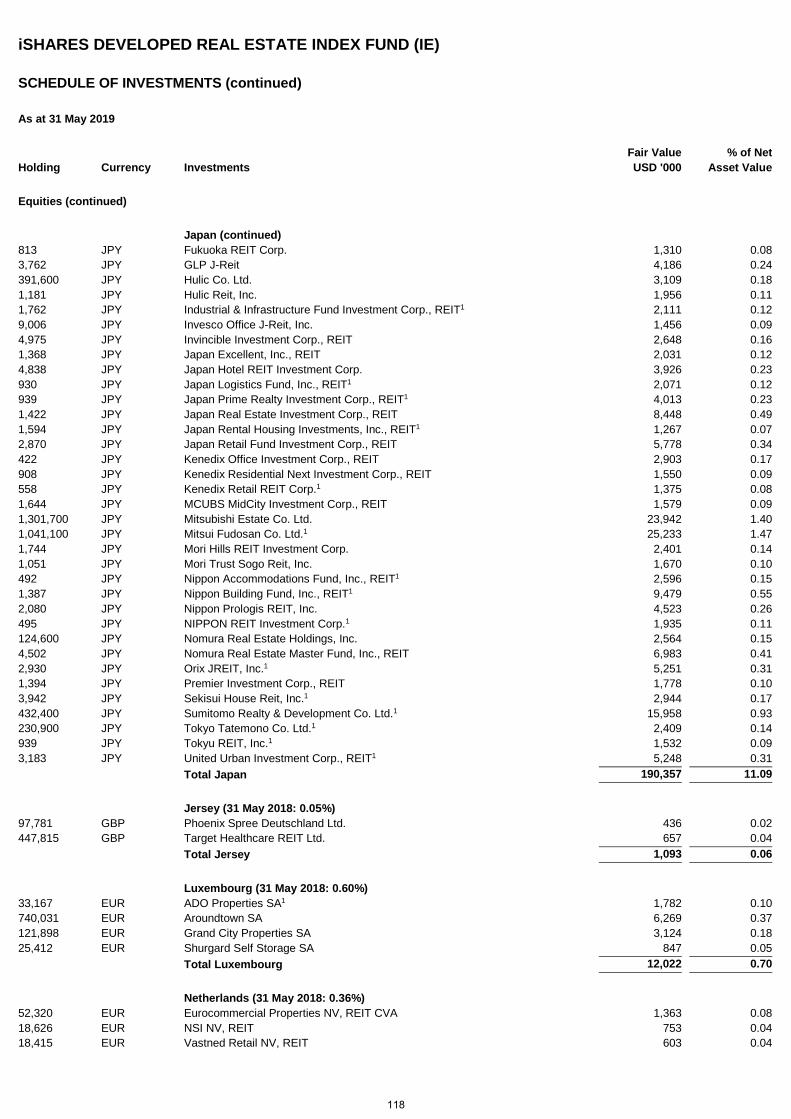
iSHARES DEVELOPED REAL ESTATE INDEX FUND (IE)
SCHEDULE OF INVESTMENTS (continued)
As at 31 May 2019
Holding Currency Investments Fair Value USD '000
% of Net Asset Value
Equities (continued)
Japan (continued) 813 JPY Fukuoka REIT Corp. 1,310 0.08 3,762 JPY GLP J-Reit 4,186 0.24 391,600 JPY Hulic Co. Ltd. 3,109 0.18 1,181 JPY Hulic Reit, Inc. 1,956 0.11 1,762 JPY Industrial & Infrastructure Fund Investment Corp., REIT1 2,111 0.12 9,006 JPY Invesco Office J-Reit, Inc. 1,456 0.09 4,975 JPY Invincible Investment Corp., REIT 2,648 0.16 1,368 JPY Japan Excellent, Inc., REIT 2,031 0.12 4,838 JPY Japan Hotel REIT Investment Corp. 3,926 0.23 930 JPY Japan Logistics Fund, Inc., REIT1 2,071 0.12 939 JPY Japan Prime Realty Investment Corp., REIT1 4,013 0.23 1,422 JPY Japan Real Estate Investment Corp., REIT 8,448 0.49 1,594 JPY Japan Rental Housing Investments, Inc., REIT1 1,267 0.07 2,870 JPY Japan Retail Fund Investment Corp., REIT 5,778 0.34 422 JPY Kenedix Office Investment Corp., REIT 2,903 0.17 908 JPY Kenedix Residential Next Investment Corp., REIT 1,550 0.09 558 JPY Kenedix Retail REIT Corp.1 1,375 0.08 1,644 JPY MCUBS MidCity Investment Corp., REIT 1,579 0.09 1,301,700 JPY Mitsubishi Estate Co. Ltd. 23,942 1.40 1,041,100 JPY Mitsui Fudosan Co. Ltd.1 25,233 1.47 1,744 JPY Mori Hills REIT Investment Corp. 2,401 0.14 1,051 JPY Mori Trust Sogo Reit, Inc. 1,670 0.10 492 JPY Nippon Accommodations Fund, Inc., REIT1 2,596 0.15 1,387 JPY Nippon Building Fund, Inc., REIT1 9,479 0.55 2,080 JPY Nippon Prologis REIT, Inc. 4,523 0.26 495 JPY NIPPON REIT Investment Corp.1 1,935 0.11 124,600 JPY Nomura Real Estate Holdings, Inc. 2,564 0.15 4,502 JPY Nomura Real Estate Master Fund, Inc., REIT 6,983 0.41 2,930 JPY Orix JREIT, Inc.1 5,251 0.31 1,394 JPY Premier Investment Corp., REIT 1,778 0.10 3,942 JPY Sekisui House Reit, Inc.1 2,944 0.17 432,400 JPY Sumitomo Realty & Development Co. Ltd.1 15,958 0.93 230,900 JPY Tokyo Tatemono Co. Ltd.1 2,409 0.14 939 JPY Tokyu REIT, Inc.1 1,532 0.09 3,183 JPY United Urban Investment Corp., REIT1 5,248 0.31 Total Japan 190,357 11.09
Jersey (31 May 2018: 0.05%) 97,781 GBP Phoenix Spree Deutschland Ltd. 436 0.02 447,815 GBP Target Healthcare REIT Ltd. 657 0.04 Total Jersey 1,093 0.06
Luxembourg (31 May 2018: 0.60%) 33,167 EUR ADO Properties SA1 1,782 0.10 740,031 EUR Aroundtown SA 6,269 0.37 121,898 EUR Grand City Properties SA 3,124 0.18 25,412 EUR Shurgard Self Storage SA 847 0.05 Total Luxembourg 12,022 0.70
Netherlands (31 May 2018: 0.36%) 52,320 EUR Eurocommercial Properties NV, REIT CVA 1,363 0.08 18,626 EUR NSI NV, REIT 753 0.04 18,415 EUR Vastned Retail NV, REIT 603 0.04
118
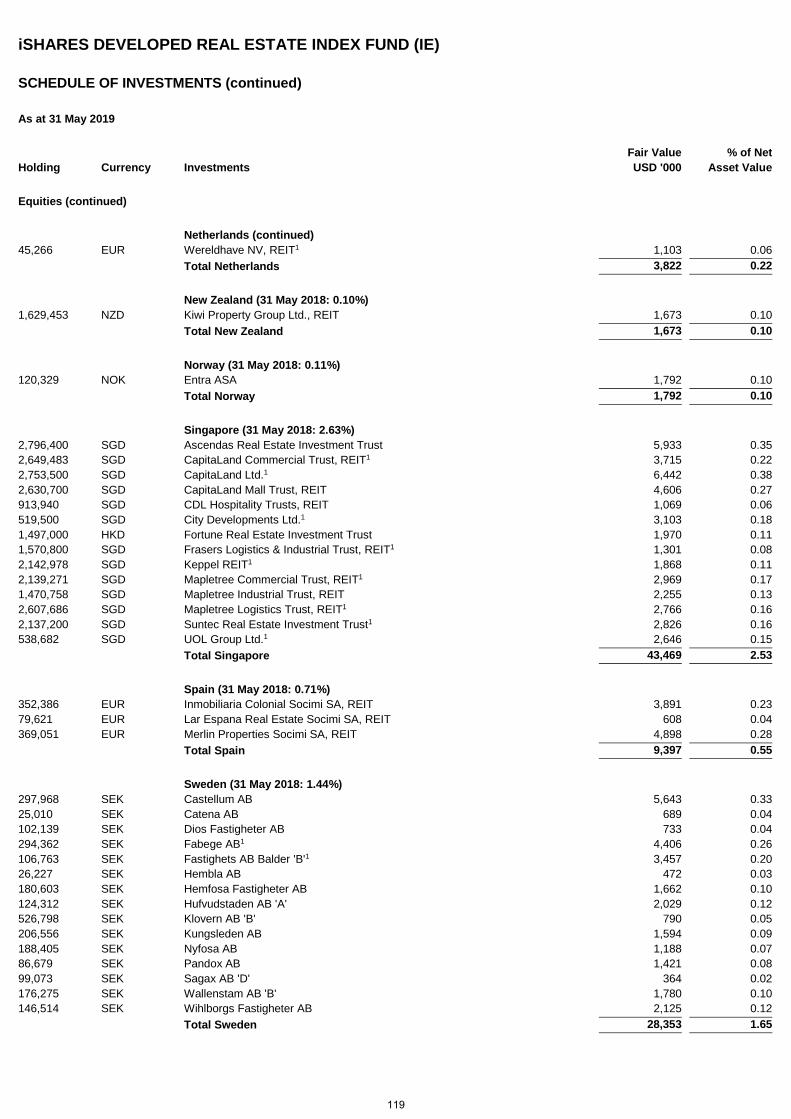
iSHARES DEVELOPED REAL ESTATE INDEX FUND (IE)
SCHEDULE OF INVESTMENTS (continued)
As at 31 May 2019
Holding Currency Investments Fair Value USD '000
% of Net Asset Value
Equities (continued)
Netherlands (continued) 45,266 EUR Wereldhave NV, REIT1 1,103 0.06 Total Netherlands 3,822 0.22
New Zealand (31 May 2018: 0.10%) 1,629,453 NZD Kiwi Property Group Ltd., REIT 1,673 0.10 Total New Zealand 1,673 0.10
Norway (31 May 2018: 0.11%) 120,329 NOK Entra ASA 1,792 0.10 Total Norway 1,792 0.10
Singapore (31 May 2018: 2.63%) 2,796,400 SGD Ascendas Real Estate Investment Trust 5,933 0.35 2,649,483 SGD CapitaLand Commercial Trust, REIT1 3,715 0.22 2,753,500 SGD CapitaLand Ltd.1 6,442 0.38 2,630,700 SGD CapitaLand Mall Trust, REIT 4,606 0.27 913,940 SGD CDL Hospitality Trusts, REIT 1,069 0.06 519,500 SGD City Developments Ltd.1 3,103 0.18 1,497,000 HKD Fortune Real Estate Investment Trust 1,970 0.11 1,570,800 SGD Frasers Logistics & Industrial Trust, REIT1 1,301 0.08 2,142,978 SGD Keppel REIT1 1,868 0.11 2,139,271 SGD Mapletree Commercial Trust, REIT1 2,969 0.17 1,470,758 SGD Mapletree Industrial Trust, REIT 2,255 0.13 2,607,686 SGD Mapletree Logistics Trust, REIT1 2,766 0.16 2,137,200 SGD Suntec Real Estate Investment Trust1 2,826 0.16 538,682 SGD UOL Group Ltd.1 2,646 0.15 Total Singapore 43,469 2.53
Spain (31 May 2018: 0.71%) 352,386 EUR Inmobiliaria Colonial Socimi SA, REIT 3,891 0.23 79,621 EUR Lar Espana Real Estate Socimi SA, REIT 608 0.04 369,051 EUR Merlin Properties Socimi SA, REIT 4,898 0.28 Total Spain 9,397 0.55
Sweden (31 May 2018: 1.44%) 297,968 SEK Castellum AB 5,643 0.33 25,010 SEK Catena AB 689 0.04 102,139 SEK Dios Fastigheter AB 733 0.04 294,362 SEK Fabege AB1 4,406 0.26 106,763 SEK Fastighets AB Balder 'B'1 3,457 0.20 26,227 SEK Hembla AB 472 0.03 180,603 SEK Hemfosa Fastigheter AB 1,662 0.10 124,312 SEK Hufvudstaden AB 'A' 2,029 0.12 526,798 SEK Klovern AB 'B' 790 0.05 206,556 SEK Kungsleden AB 1,594 0.09 188,405 SEK Nyfosa AB 1,188 0.07 86,679 SEK Pandox AB 1,421 0.08 99,073 SEK Sagax AB 'D' 364 0.02 176,275 SEK Wallenstam AB 'B' 1,780 0.10 146,514 SEK Wihlborgs Fastigheter AB 2,125 0.12 Total Sweden 28,353 1.65
119
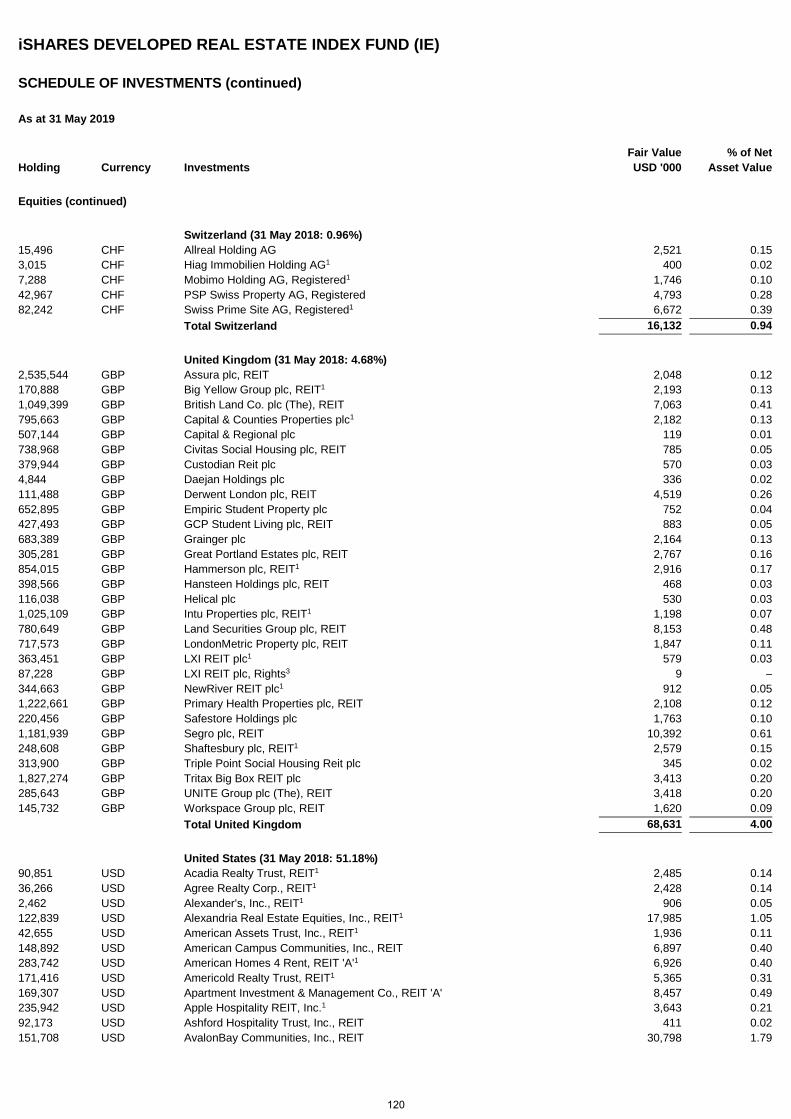
iSHARES DEVELOPED REAL ESTATE INDEX FUND (IE)
SCHEDULE OF INVESTMENTS (continued)
As at 31 May 2019
Holding Currency Investments Fair Value USD '000
% of Net Asset Value
Equities (continued)
Switzerland (31 May 2018: 0.96%) 15,496 CHF Allreal Holding AG 2,521 0.15 3,015 CHF Hiag Immobilien Holding AG1 400 0.02 7,288 CHF Mobimo Holding AG, Registered1 1,746 0.10 42,967 CHF PSP Swiss Property AG, Registered 4,793 0.28 82,242 CHF Swiss Prime Site AG, Registered1 6,672 0.39 Total Switzerland 16,132 0.94
United Kingdom (31 May 2018: 4.68%) 2,535,544 GBP Assura plc, REIT 2,048 0.12 170,888 GBP Big Yellow Group plc, REIT1 2,193 0.13 1,049,399 GBP British Land Co. plc (The), REIT 7,063 0.41 795,663 GBP Capital & Counties Properties plc1 2,182 0.13 507,144 GBP Capital & Regional plc 119 0.01 738,968 GBP Civitas Social Housing plc, REIT 785 0.05 379,944 GBP Custodian Reit plc 570 0.03 4,844 GBP Daejan Holdings plc 336 0.02 111,488 GBP Derwent London plc, REIT 4,519 0.26 652,895 GBP Empiric Student Property plc 752 0.04 427,493 GBP GCP Student Living plc, REIT 883 0.05 683,389 GBP Grainger plc 2,164 0.13 305,281 GBP Great Portland Estates plc, REIT 2,767 0.16 854,015 GBP Hammerson plc, REIT1 2,916 0.17 398,566 GBP Hansteen Holdings plc, REIT 468 0.03 116,038 GBP Helical plc 530 0.03 1,025,109 GBP Intu Properties plc, REIT1 1,198 0.07 780,649 GBP Land Securities Group plc, REIT 8,153 0.48 717,573 GBP LondonMetric Property plc, REIT 1,847 0.11 363,451 GBP LXI REIT plc1 579 0.03 87,228 GBP LXI REIT plc, Rights3 9 – 344,663 GBP NewRiver REIT plc1 912 0.05 1,222,661 GBP Primary Health Properties plc, REIT 2,108 0.12 220,456 GBP Safestore Holdings plc 1,763 0.10 1,181,939 GBP Segro plc, REIT 10,392 0.61 248,608 GBP Shaftesbury plc, REIT1 2,579 0.15 313,900 GBP Triple Point Social Housing Reit plc 345 0.02 1,827,274 GBP Tritax Big Box REIT plc 3,413 0.20 285,643 GBP UNITE Group plc (The), REIT 3,418 0.20 145,732 GBP Workspace Group plc, REIT 1,620 0.09 Total United Kingdom 68,631 4.00
United States (31 May 2018: 51.18%) 90,851 USD Acadia Realty Trust, REIT1 2,485 0.14 36,266 USD Agree Realty Corp., REIT1 2,428 0.14 2,462 USD Alexander's, Inc., REIT1 906 0.05 122,839 USD Alexandria Real Estate Equities, Inc., REIT1 17,985 1.05 42,655 USD American Assets Trust, Inc., REIT1 1,936 0.11 148,892 USD American Campus Communities, Inc., REIT 6,897 0.40 283,742 USD American Homes 4 Rent, REIT 'A'1 6,926 0.40 171,416 USD Americold Realty Trust, REIT1 5,365 0.31 169,307 USD Apartment Investment & Management Co., REIT 'A' 8,457 0.49 235,942 USD Apple Hospitality REIT, Inc.1 3,643 0.21 92,173 USD Ashford Hospitality Trust, Inc., REIT 411 0.02 151,708 USD AvalonBay Communities, Inc., REIT 30,798 1.79
120
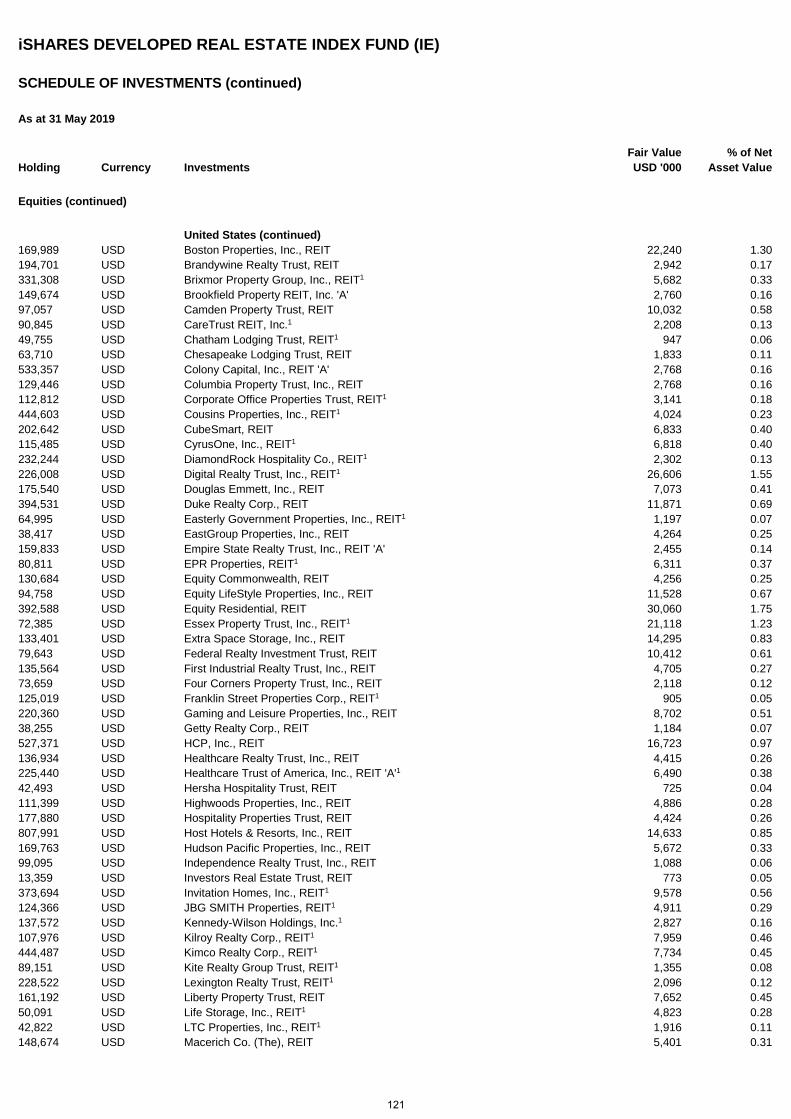
iSHARES DEVELOPED REAL ESTATE INDEX FUND (IE)
SCHEDULE OF INVESTMENTS (continued)
As at 31 May 2019
Holding Currency Investments Fair Value USD '000
% of Net Asset Value
Equities (continued)
United States (continued) 169,989 USD Boston Properties, Inc., REIT 22,240 1.30 194,701 USD Brandywine Realty Trust, REIT 2,942 0.17 331,308 USD Brixmor Property Group, Inc., REIT1 5,682 0.33 149,674 USD Brookfield Property REIT, Inc. 'A' 2,760 0.16 97,057 USD Camden Property Trust, REIT 10,032 0.58 90,845 USD CareTrust REIT, Inc.1 2,208 0.13 49,755 USD Chatham Lodging Trust, REIT1 947 0.06 63,710 USD Chesapeake Lodging Trust, REIT 1,833 0.11 533,357 USD Colony Capital, Inc., REIT 'A' 2,768 0.16 129,446 USD Columbia Property Trust, Inc., REIT 2,768 0.16 112,812 USD Corporate Office Properties Trust, REIT1 3,141 0.18 444,603 USD Cousins Properties, Inc., REIT1 4,024 0.23 202,642 USD CubeSmart, REIT 6,833 0.40 115,485 USD CyrusOne, Inc., REIT1 6,818 0.40 232,244 USD DiamondRock Hospitality Co., REIT1 2,302 0.13 226,008 USD Digital Realty Trust, Inc., REIT1 26,606 1.55 175,540 USD Douglas Emmett, Inc., REIT 7,073 0.41 394,531 USD Duke Realty Corp., REIT 11,871 0.69 64,995 USD Easterly Government Properties, Inc., REIT1 1,197 0.07 38,417 USD EastGroup Properties, Inc., REIT 4,264 0.25 159,833 USD Empire State Realty Trust, Inc., REIT 'A' 2,455 0.14 80,811 USD EPR Properties, REIT1 6,311 0.37 130,684 USD Equity Commonwealth, REIT 4,256 0.25 94,758 USD Equity LifeStyle Properties, Inc., REIT 11,528 0.67 392,588 USD Equity Residential, REIT 30,060 1.75 72,385 USD Essex Property Trust, Inc., REIT1 21,118 1.23 133,401 USD Extra Space Storage, Inc., REIT 14,295 0.83 79,643 USD Federal Realty Investment Trust, REIT 10,412 0.61 135,564 USD First Industrial Realty Trust, Inc., REIT 4,705 0.27 73,659 USD Four Corners Property Trust, Inc., REIT 2,118 0.12 125,019 USD Franklin Street Properties Corp., REIT1 905 0.05 220,360 USD Gaming and Leisure Properties, Inc., REIT 8,702 0.51 38,255 USD Getty Realty Corp., REIT 1,184 0.07 527,371 USD HCP, Inc., REIT 16,723 0.97 136,934 USD Healthcare Realty Trust, Inc., REIT 4,415 0.26 225,440 USD Healthcare Trust of America, Inc., REIT 'A'1 6,490 0.38 42,493 USD Hersha Hospitality Trust, REIT 725 0.04 111,399 USD Highwoods Properties, Inc., REIT 4,886 0.28 177,880 USD Hospitality Properties Trust, REIT 4,424 0.26 807,991 USD Host Hotels & Resorts, Inc., REIT 14,633 0.85 169,763 USD Hudson Pacific Properties, Inc., REIT 5,672 0.33 99,095 USD Independence Realty Trust, Inc., REIT 1,088 0.06 13,359 USD Investors Real Estate Trust, REIT 773 0.05 373,694 USD Invitation Homes, Inc., REIT1 9,578 0.56 124,366 USD JBG SMITH Properties, REIT1 4,911 0.29 137,572 USD Kennedy-Wilson Holdings, Inc.1 2,827 0.16 107,976 USD Kilroy Realty Corp., REIT1 7,959 0.46 444,487 USD Kimco Realty Corp., REIT1 7,734 0.45 89,151 USD Kite Realty Group Trust, REIT1 1,355 0.08 228,522 USD Lexington Realty Trust, REIT1 2,096 0.12 161,192 USD Liberty Property Trust, REIT 7,652 0.45 50,091 USD Life Storage, Inc., REIT1 4,823 0.28 42,822 USD LTC Properties, Inc., REIT1 1,916 0.11 148,674 USD Macerich Co. (The), REIT 5,401 0.31
121
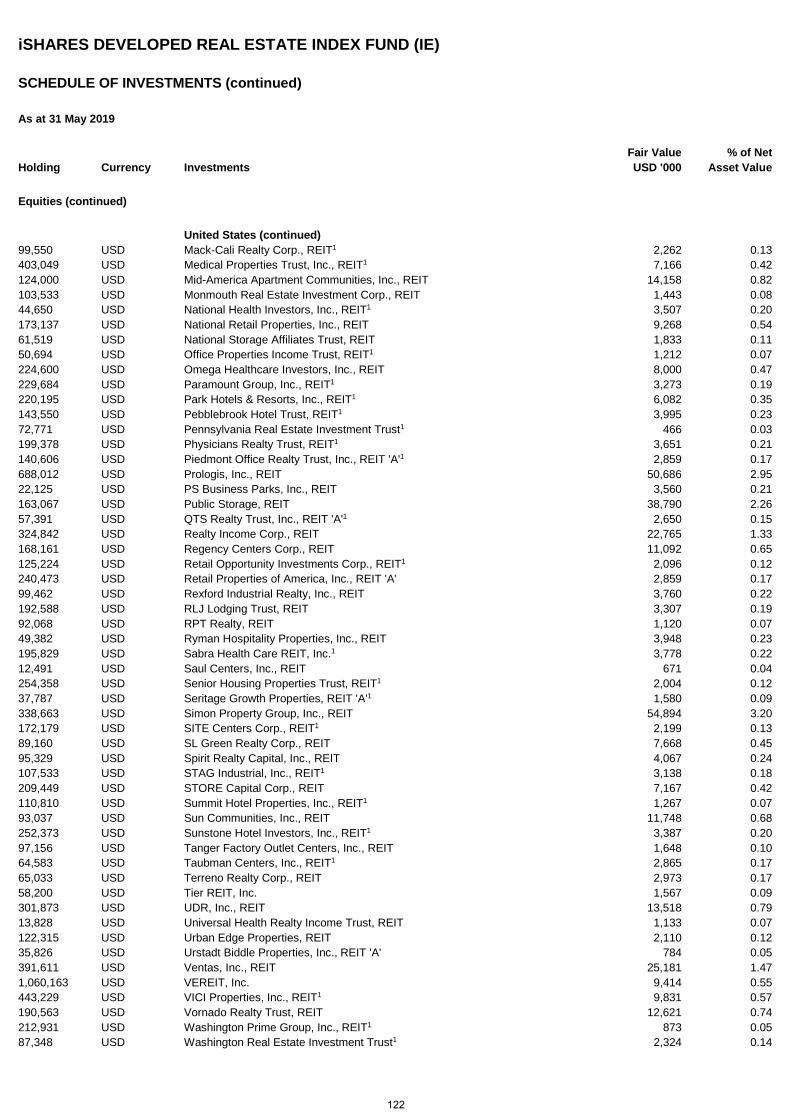
iSHARES DEVELOPED REAL ESTATE INDEX FUND (IE)
SCHEDULE OF INVESTMENTS (continued)
As at 31 May 2019
Holding Currency Investments Fair Value USD '000
% of Net Asset Value
Equities (continued)
United States (continued) 99,550 USD Mack-Cali Realty Corp., REIT1 2,262 0.13 403,049 USD Medical Properties Trust, Inc., REIT1 7,166 0.42 124,000 USD Mid-America Apartment Communities, Inc., REIT 14,158 0.82 103,533 USD Monmouth Real Estate Investment Corp., REIT 1,443 0.08 44,650 USD National Health Investors, Inc., REIT1 3,507 0.20 173,137 USD National Retail Properties, Inc., REIT 9,268 0.54 61,519 USD National Storage Affiliates Trust, REIT 1,833 0.11 50,694 USD Office Properties Income Trust, REIT1 1,212 0.07 224,600 USD Omega Healthcare Investors, Inc., REIT 8,000 0.47 229,684 USD Paramount Group, Inc., REIT1 3,273 0.19 220,195 USD Park Hotels & Resorts, Inc., REIT1 6,082 0.35 143,550 USD Pebblebrook Hotel Trust, REIT1 3,995 0.23 72,771 USD Pennsylvania Real Estate Investment Trust1 466 0.03 199,378 USD Physicians Realty Trust, REIT1 3,651 0.21 140,606 USD Piedmont Office Realty Trust, Inc., REIT 'A'1 2,859 0.17 688,012 USD Prologis, Inc., REIT 50,686 2.95 22,125 USD PS Business Parks, Inc., REIT 3,560 0.21 163,067 USD Public Storage, REIT 38,790 2.26 57,391 USD QTS Realty Trust, Inc., REIT 'A'1 2,650 0.15 324,842 USD Realty Income Corp., REIT 22,765 1.33 168,161 USD Regency Centers Corp., REIT 11,092 0.65 125,224 USD Retail Opportunity Investments Corp., REIT1 2,096 0.12 240,473 USD Retail Properties of America, Inc., REIT 'A' 2,859 0.17 99,462 USD Rexford Industrial Realty, Inc., REIT 3,760 0.22 192,588 USD RLJ Lodging Trust, REIT 3,307 0.19 92,068 USD RPT Realty, REIT 1,120 0.07 49,382 USD Ryman Hospitality Properties, Inc., REIT 3,948 0.23 195,829 USD Sabra Health Care REIT, Inc.1 3,778 0.22 12,491 USD Saul Centers, Inc., REIT 671 0.04 254,358 USD Senior Housing Properties Trust, REIT1 2,004 0.12 37,787 USD Seritage Growth Properties, REIT 'A'1 1,580 0.09 338,663 USD Simon Property Group, Inc., REIT 54,894 3.20 172,179 USD SITE Centers Corp., REIT1 2,199 0.13 89,160 USD SL Green Realty Corp., REIT 7,668 0.45 95,329 USD Spirit Realty Capital, Inc., REIT 4,067 0.24 107,533 USD STAG Industrial, Inc., REIT1 3,138 0.18 209,449 USD STORE Capital Corp., REIT 7,167 0.42 110,810 USD Summit Hotel Properties, Inc., REIT1 1,267 0.07 93,037 USD Sun Communities, Inc., REIT 11,748 0.68 252,373 USD Sunstone Hotel Investors, Inc., REIT1 3,387 0.20 97,156 USD Tanger Factory Outlet Centers, Inc., REIT 1,648 0.10 64,583 USD Taubman Centers, Inc., REIT1 2,865 0.17 65,033 USD Terreno Realty Corp., REIT 2,973 0.17 58,200 USD Tier REIT, Inc. 1,567 0.09 301,873 USD UDR, Inc., REIT 13,518 0.79 13,828 USD Universal Health Realty Income Trust, REIT 1,133 0.07 122,315 USD Urban Edge Properties, REIT 2,110 0.12 35,826 USD Urstadt Biddle Properties, Inc., REIT 'A' 784 0.05 391,611 USD Ventas, Inc., REIT 25,181 1.47 1,060,163 USD VEREIT, Inc. 9,414 0.55 443,229 USD VICI Properties, Inc., REIT1 9,831 0.57 190,563 USD Vornado Realty Trust, REIT 12,621 0.74 212,931 USD Washington Prime Group, Inc., REIT1 873 0.05 87,348 USD Washington Real Estate Investment Trust1 2,324 0.14
122
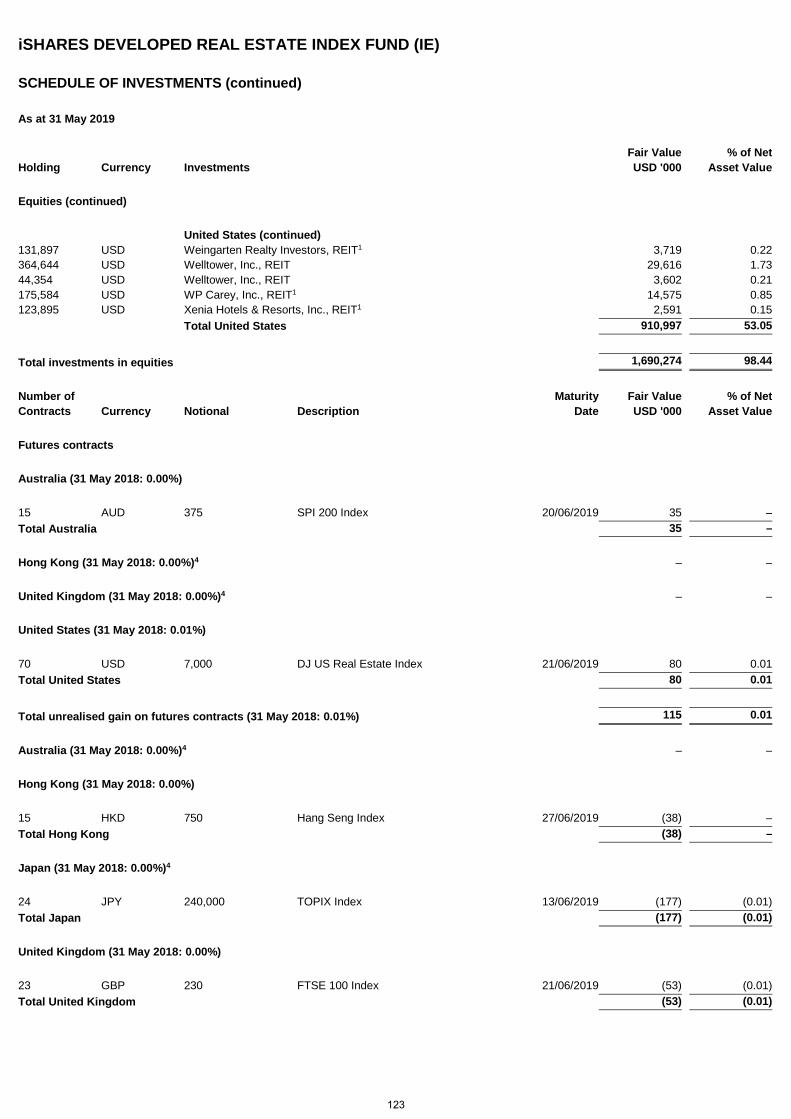
iSHARES DEVELOPED REAL ESTATE INDEX FUND (IE)
SCHEDULE OF INVESTMENTS (continued)
As at 31 May 2019
Holding Currency Investments Fair Value USD '000
% of Net Asset Value
Equities (continued)
United States (continued) 131,897 USD Weingarten Realty Investors, REIT1 3,719 0.22 364,644 USD Welltower, Inc., REIT 29,616 1.73 44,354 USD Welltower, Inc., REIT 3,602 0.21 175,584 USD WP Carey, Inc., REIT1 14,575 0.85 123,895 USD Xenia Hotels & Resorts, Inc., REIT1 2,591 0.15 Total United States 910,997 53.05
Total investments in equities 1,690,274 98.44
Number of Maturity Fair Value % of Net Contracts Currency Notional Description Date USD '000 Asset Value
Futures contracts
Australia (31 May 2018: 0.00%)
15 AUD 375 SPI 200 Index 20/06/2019 35 – Total Australia 35 –
Hong Kong (31 May 2018: 0.00%)4 – –
United Kingdom (31 May 2018: 0.00%)4 – –
United States (31 May 2018: 0.01%)
70 USD 7,000 DJ US Real Estate Index 21/06/2019 80 0.01 Total United States 80 0.01
Total unrealised gain on futures contracts (31 May 2018: 0.01%) 115 0.01
Australia (31 May 2018: 0.00%)4 – –
Hong Kong (31 May 2018: 0.00%)
15 HKD 750 Hang Seng Index 27/06/2019 (38) – Total Hong Kong (38) –
Japan (31 May 2018: 0.00%)4
24 JPY 240,000 TOPIX Index 13/06/2019 (177) (0.01) Total Japan (177) (0.01)
United Kingdom (31 May 2018: 0.00%)
23 GBP 230 FTSE 100 Index 21/06/2019 (53) (0.01) Total United Kingdom (53) (0.01)
123
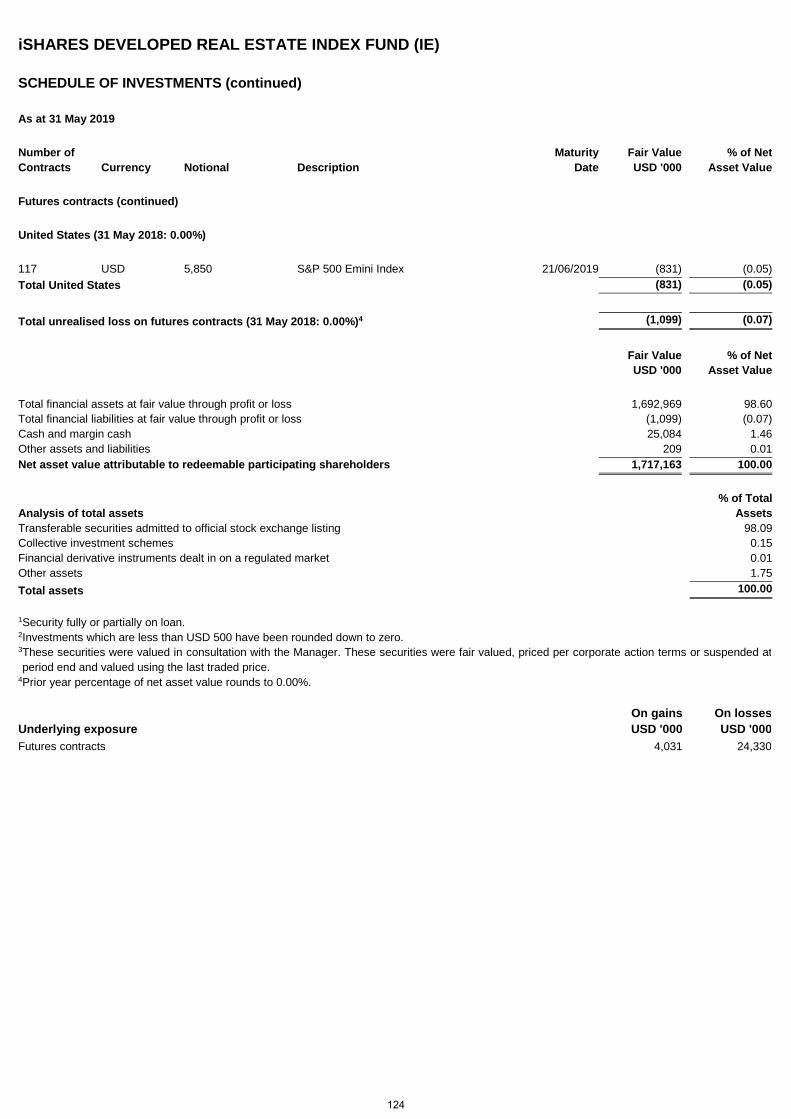
iSHARES DEVELOPED REAL ESTATE INDEX FUND (IE)
SCHEDULE OF INVESTMENTS (continued)
As at 31 May 2019
Number of Maturity Fair Value % of Net Contracts Currency Notional Description Date USD '000 Asset Value
Futures contracts (continued)
United States (31 May 2018: 0.00%)
117 USD 5,850 S&P 500 Emini Index 21/06/2019 (831) (0.05) Total United States (831) (0.05)
Total unrealised loss on futures contracts (31 May 2018: 0.00%)4 (1,099) (0.07)
Fair Value USD '000
% of Net Asset Value
Total financial assets at fair value through profit or loss 1,692,969 98.60 Total financial liabilities at fair value through profit or loss (1,099) (0.07) Cash and margin cash 25,084 1.46 Other assets and liabilities 209 0.01 Net asset value attributable to redeemable participating shareholders 1,717,163 100.00
Analysis of total assets % of Total
Assets Transferable securities admitted to official stock exchange listing 98.09 Collective investment schemes 0.15 Financial derivative instruments dealt in on a regulated market 0.01 Other assets 1.75 Total assets 100.00
1 Security fully or partially on loan. 2 Investments which are less than USD 500 have been rounded down to zero. 3 These securities were valued in consultation with the Manager. These securities were fair valued, priced per corporate action terms or suspended at period end and valued using the last traded price.
4 Prior year percentage of net asset value rounds to 0.00%.
Underlying exposure On gains USD '000
On losses USD '000
Futures contracts 4,031 24,330
124
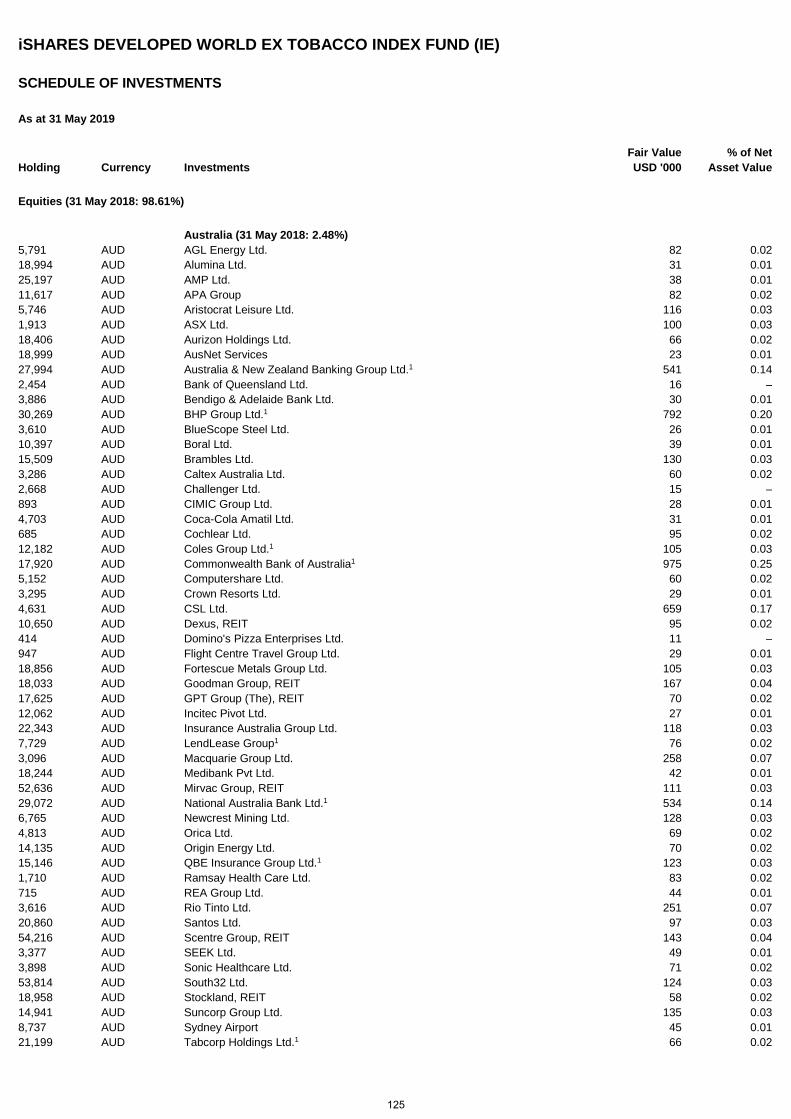
iSHARES DEVELOPED WORLD EX TOBACCO INDEX FUND (IE)
SCHEDULE OF INVESTMENTS
As at 31 May 2019
Holding Currency Investments Fair Value USD '000
% of Net Asset Value
Equities (31 May 2018: 98.61%)
Australia (31 May 2018: 2.48%) 5,791 AUD AGL Energy Ltd. 82 0.02 18,994 AUD Alumina Ltd. 31 0.01 25,197 AUD AMP Ltd. 38 0.01 11,617 AUD APA Group 82 0.02 5,746 AUD Aristocrat Leisure Ltd. 116 0.03 1,913 AUD ASX Ltd. 100 0.03 18,406 AUD Aurizon Holdings Ltd. 66 0.02 18,999 AUD AusNet Services 23 0.01 27,994 AUD Australia & New Zealand Banking Group Ltd.1 541 0.14 2,454 AUD Bank of Queensland Ltd. 16 – 3,886 AUD Bendigo & Adelaide Bank Ltd. 30 0.01 30,269 AUD BHP Group Ltd.1 792 0.20 3,610 AUD BlueScope Steel Ltd. 26 0.01 10,397 AUD Boral Ltd. 39 0.01 15,509 AUD Brambles Ltd. 130 0.03 3,286 AUD Caltex Australia Ltd. 60 0.02 2,668 AUD Challenger Ltd. 15 – 893 AUD CIMIC Group Ltd. 28 0.01 4,703 AUD Coca-Cola Amatil Ltd. 31 0.01 685 AUD Cochlear Ltd. 95 0.02 12,182 AUD Coles Group Ltd.1 105 0.03 17,920 AUD Commonwealth Bank of Australia1 975 0.25 5,152 AUD Computershare Ltd. 60 0.02 3,295 AUD Crown Resorts Ltd. 29 0.01 4,631 AUD CSL Ltd. 659 0.17 10,650 AUD Dexus, REIT 95 0.02 414 AUD Domino's Pizza Enterprises Ltd. 11 – 947 AUD Flight Centre Travel Group Ltd. 29 0.01 18,856 AUD Fortescue Metals Group Ltd. 105 0.03 18,033 AUD Goodman Group, REIT 167 0.04 17,625 AUD GPT Group (The), REIT 70 0.02 12,062 AUD Incitec Pivot Ltd. 27 0.01 22,343 AUD Insurance Australia Group Ltd. 118 0.03 7,729 AUD LendLease Group1 76 0.02 3,096 AUD Macquarie Group Ltd. 258 0.07 18,244 AUD Medibank Pvt Ltd. 42 0.01 52,636 AUD Mirvac Group, REIT 111 0.03 29,072 AUD National Australia Bank Ltd.1 534 0.14 6,765 AUD Newcrest Mining Ltd. 128 0.03 4,813 AUD Orica Ltd. 69 0.02 14,135 AUD Origin Energy Ltd. 70 0.02 15,146 AUD QBE Insurance Group Ltd.1 123 0.03 1,710 AUD Ramsay Health Care Ltd. 83 0.02 715 AUD REA Group Ltd. 44 0.01 3,616 AUD Rio Tinto Ltd. 251 0.07 20,860 AUD Santos Ltd. 97 0.03 54,216 AUD Scentre Group, REIT 143 0.04 3,377 AUD SEEK Ltd. 49 0.01 3,898 AUD Sonic Healthcare Ltd. 71 0.02 53,814 AUD South32 Ltd. 124 0.03 18,958 AUD Stockland, REIT 58 0.02 14,941 AUD Suncorp Group Ltd. 135 0.03 8,737 AUD Sydney Airport 45 0.01 21,199 AUD Tabcorp Holdings Ltd.1 66 0.02
125
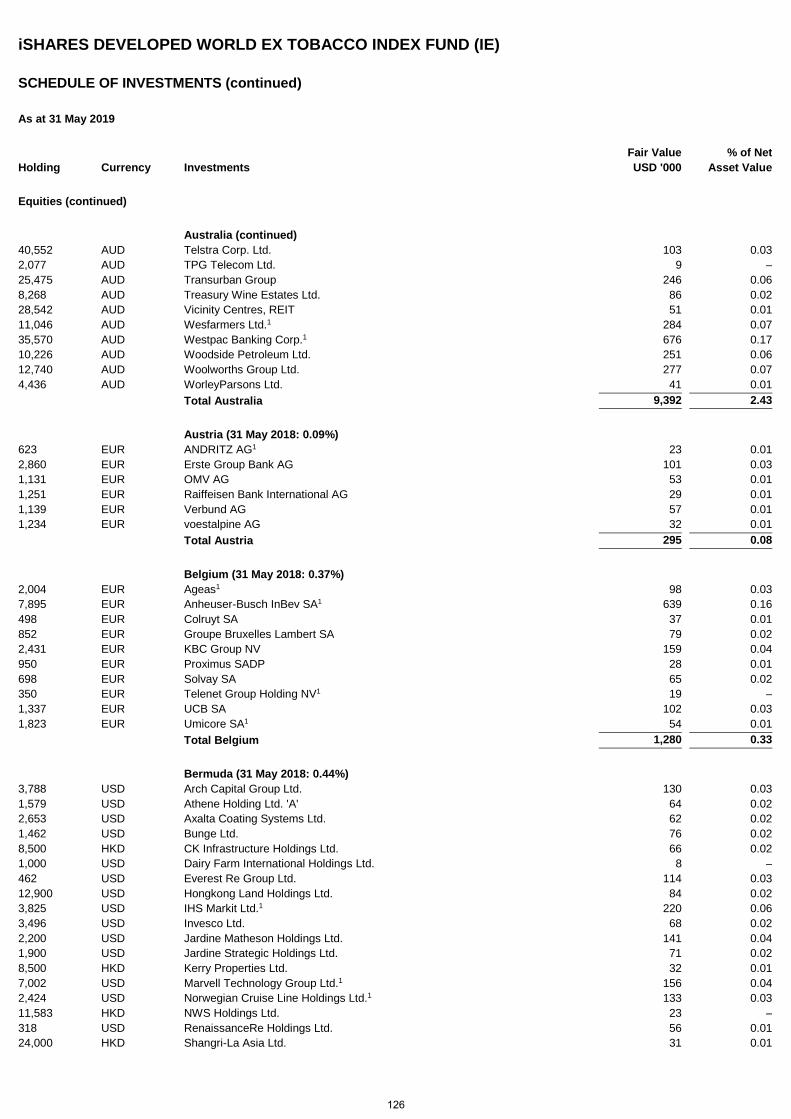
iSHARES DEVELOPED WORLD EX TOBACCO INDEX FUND (IE)
SCHEDULE OF INVESTMENTS (continued)
As at 31 May 2019
Holding Currency Investments Fair Value USD '000
% of Net Asset Value
Equities (continued)
Australia (continued) 40,552 AUD Telstra Corp. Ltd. 103 0.03 2,077 AUD TPG Telecom Ltd. 9 – 25,475 AUD Transurban Group 246 0.06 8,268 AUD Treasury Wine Estates Ltd. 86 0.02 28,542 AUD Vicinity Centres, REIT 51 0.01 11,046 AUD Wesfarmers Ltd.1 284 0.07 35,570 AUD Westpac Banking Corp.1 676 0.17 10,226 AUD Woodside Petroleum Ltd. 251 0.06 12,740 AUD Woolworths Group Ltd. 277 0.07 4,436 AUD WorleyParsons Ltd. 41 0.01 Total Australia 9,392 2.43
Austria (31 May 2018: 0.09%) 623 EUR ANDRITZ AG1 23 0.01 2,860 EUR Erste Group Bank AG 101 0.03 1,131 EUR OMV AG 53 0.01 1,251 EUR Raiffeisen Bank International AG 29 0.01 1,139 EUR Verbund AG 57 0.01 1,234 EUR voestalpine AG 32 0.01 Total Austria 295 0.08
Belgium (31 May 2018: 0.37%) 2,004 EUR Ageas1 98 0.03 7,895 EUR Anheuser-Busch InBev SA1 639 0.16 498 EUR Colruyt SA 37 0.01 852 EUR Groupe Bruxelles Lambert SA 79 0.02 2,431 EUR KBC Group NV 159 0.04 950 EUR Proximus SADP 28 0.01 698 EUR Solvay SA 65 0.02 350 EUR Telenet Group Holding NV1 19 – 1,337 EUR UCB SA 102 0.03 1,823 EUR Umicore SA1 54 0.01 Total Belgium 1,280 0.33
Bermuda (31 May 2018: 0.44%) 3,788 USD Arch Capital Group Ltd. 130 0.03 1,579 USD Athene Holding Ltd. 'A' 64 0.02 2,653 USD Axalta Coating Systems Ltd. 62 0.02 1,462 USD Bunge Ltd. 76 0.02 8,500 HKD CK Infrastructure Holdings Ltd. 66 0.02 1,000 USD Dairy Farm International Holdings Ltd. 8 – 462 USD Everest Re Group Ltd. 114 0.03 12,900 USD Hongkong Land Holdings Ltd. 84 0.02 3,825 USD IHS Markit Ltd.1 220 0.06 3,496 USD Invesco Ltd. 68 0.02 2,200 USD Jardine Matheson Holdings Ltd. 141 0.04 1,900 USD Jardine Strategic Holdings Ltd. 71 0.02 8,500 HKD Kerry Properties Ltd. 32 0.01 7,002 USD Marvell Technology Group Ltd.1 156 0.04 2,424 USD Norwegian Cruise Line Holdings Ltd.1 133 0.03 11,583 HKD NWS Holdings Ltd. 23 – 318 USD RenaissanceRe Holdings Ltd. 56 0.01 24,000 HKD Shangri-La Asia Ltd. 31 0.01
126
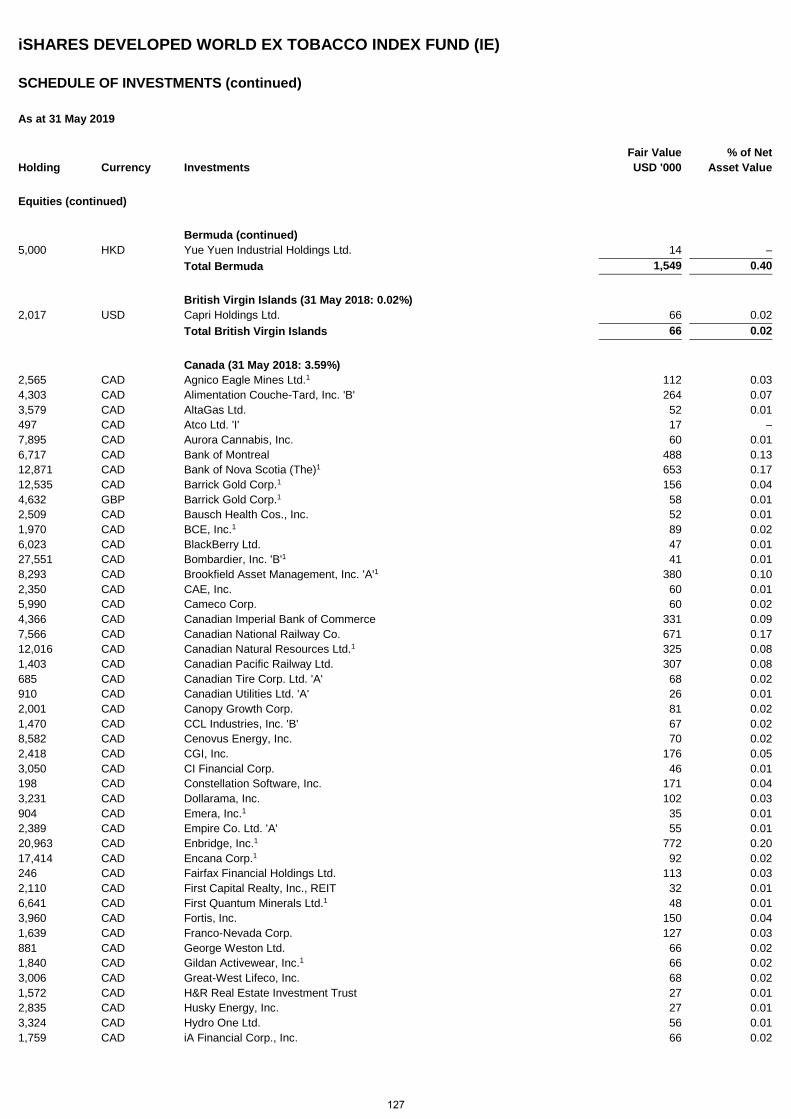
iSHARES DEVELOPED WORLD EX TOBACCO INDEX FUND (IE)
SCHEDULE OF INVESTMENTS (continued)
As at 31 May 2019
Holding Currency Investments Fair Value USD '000
% of Net Asset Value
Equities (continued)
Bermuda (continued) 5,000 HKD Yue Yuen Industrial Holdings Ltd. 14 – Total Bermuda 1,549 0.40
British Virgin Islands (31 May 2018: 0.02%) 2,017 USD Capri Holdings Ltd. 66 0.02 Total British Virgin Islands 66 0.02
Canada (31 May 2018: 3.59%) 2,565 CAD Agnico Eagle Mines Ltd.1 112 0.03 4,303 CAD Alimentation Couche-Tard, Inc. 'B' 264 0.07 3,579 CAD AltaGas Ltd. 52 0.01 497 CAD Atco Ltd. 'I' 17 – 7,895 CAD Aurora Cannabis, Inc. 60 0.01 6,717 CAD Bank of Montreal 488 0.13 12,871 CAD Bank of Nova Scotia (The)1 653 0.17 12,535 CAD Barrick Gold Corp.1 156 0.04 4,632 GBP Barrick Gold Corp.1 58 0.01 2,509 CAD Bausch Health Cos., Inc. 52 0.01 1,970 CAD BCE, Inc.1 89 0.02 6,023 CAD BlackBerry Ltd. 47 0.01 27,551 CAD Bombardier, Inc. 'B'1 41 0.01 8,293 CAD Brookfield Asset Management, Inc. 'A'1 380 0.10 2,350 CAD CAE, Inc. 60 0.01 5,990 CAD Cameco Corp. 60 0.02 4,366 CAD Canadian Imperial Bank of Commerce 331 0.09 7,566 CAD Canadian National Railway Co. 671 0.17 12,016 CAD Canadian Natural Resources Ltd.1 325 0.08 1,403 CAD Canadian Pacific Railway Ltd. 307 0.08 685 CAD Canadian Tire Corp. Ltd. 'A' 68 0.02 910 CAD Canadian Utilities Ltd. 'A' 26 0.01 2,001 CAD Canopy Growth Corp. 81 0.02 1,470 CAD CCL Industries, Inc. 'B' 67 0.02 8,582 CAD Cenovus Energy, Inc. 70 0.02 2,418 CAD CGI, Inc. 176 0.05 3,050 CAD CI Financial Corp. 46 0.01 198 CAD Constellation Software, Inc. 171 0.04 3,231 CAD Dollarama, Inc. 102 0.03 904 CAD Emera, Inc.1 35 0.01 2,389 CAD Empire Co. Ltd. 'A' 55 0.01 20,963 CAD Enbridge, Inc.1 772 0.20 17,414 CAD Encana Corp.1 92 0.02 246 CAD Fairfax Financial Holdings Ltd. 113 0.03 2,110 CAD First Capital Realty, Inc., REIT 32 0.01 6,641 CAD First Quantum Minerals Ltd.1 48 0.01 3,960 CAD Fortis, Inc. 150 0.04 1,639 CAD Franco-Nevada Corp. 127 0.03 881 CAD George Weston Ltd. 66 0.02 1,840 CAD Gildan Activewear, Inc.1 66 0.02 3,006 CAD Great-West Lifeco, Inc. 68 0.02 1,572 CAD H&R Real Estate Investment Trust 27 0.01 2,835 CAD Husky Energy, Inc. 27 0.01 3,324 CAD Hydro One Ltd. 56 0.01 1,759 CAD iA Financial Corp., Inc. 66 0.02
127
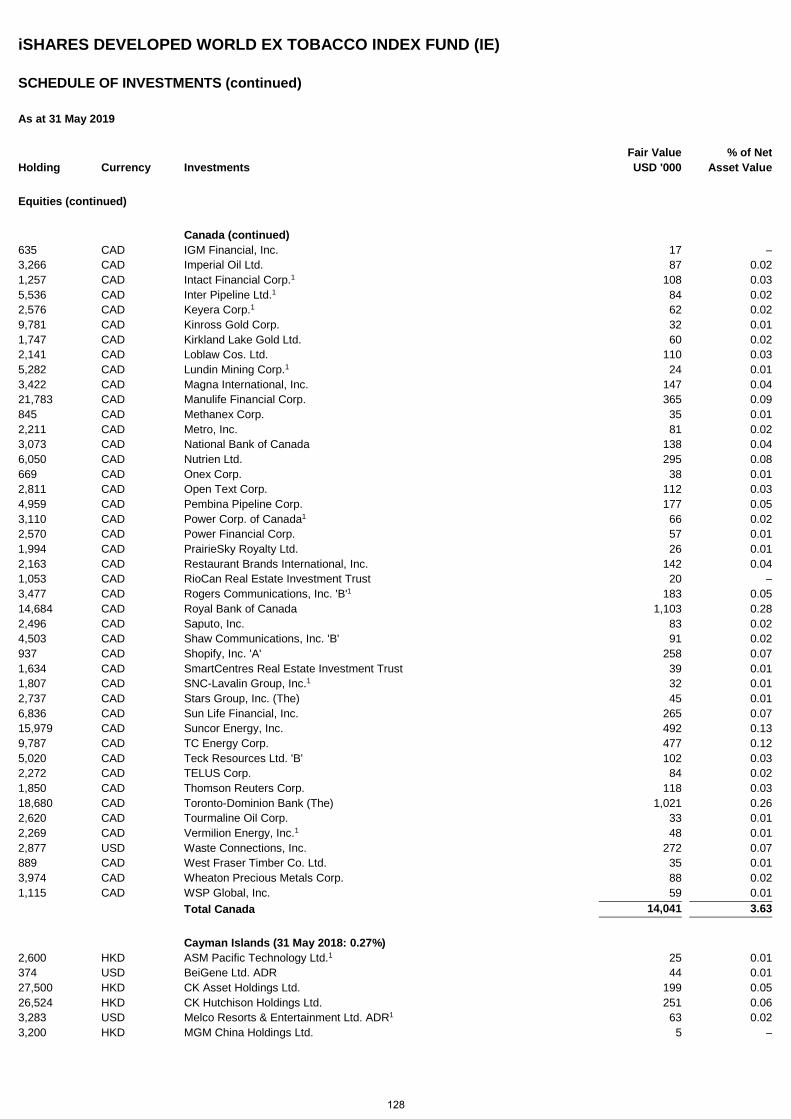
iSHARES DEVELOPED WORLD EX TOBACCO INDEX FUND (IE)
SCHEDULE OF INVESTMENTS (continued)
As at 31 May 2019
Holding Currency Investments Fair Value USD '000
% of Net Asset Value
Equities (continued)
Canada (continued) 635 CAD IGM Financial, Inc. 17 – 3,266 CAD Imperial Oil Ltd. 87 0.02 1,257 CAD Intact Financial Corp.1 108 0.03 5,536 CAD Inter Pipeline Ltd.1 84 0.02 2,576 CAD Keyera Corp.1 62 0.02 9,781 CAD Kinross Gold Corp. 32 0.01 1,747 CAD Kirkland Lake Gold Ltd. 60 0.02 2,141 CAD Loblaw Cos. Ltd. 110 0.03 5,282 CAD Lundin Mining Corp.1 24 0.01 3,422 CAD Magna International, Inc. 147 0.04 21,783 CAD Manulife Financial Corp. 365 0.09 845 CAD Methanex Corp. 35 0.01 2,211 CAD Metro, Inc. 81 0.02 3,073 CAD National Bank of Canada 138 0.04 6,050 CAD Nutrien Ltd. 295 0.08 669 CAD Onex Corp. 38 0.01 2,811 CAD Open Text Corp. 112 0.03 4,959 CAD Pembina Pipeline Corp. 177 0.05 3,110 CAD Power Corp. of Canada1 66 0.02 2,570 CAD Power Financial Corp. 57 0.01 1,994 CAD PrairieSky Royalty Ltd. 26 0.01 2,163 CAD Restaurant Brands International, Inc. 142 0.04 1,053 CAD RioCan Real Estate Investment Trust 20 – 3,477 CAD Rogers Communications, Inc. 'B'1 183 0.05 14,684 CAD Royal Bank of Canada 1,103 0.28 2,496 CAD Saputo, Inc. 83 0.02 4,503 CAD Shaw Communications, Inc. 'B' 91 0.02 937 CAD Shopify, Inc. 'A' 258 0.07 1,634 CAD SmartCentres Real Estate Investment Trust 39 0.01 1,807 CAD SNC-Lavalin Group, Inc.1 32 0.01 2,737 CAD Stars Group, Inc. (The) 45 0.01 6,836 CAD Sun Life Financial, Inc. 265 0.07 15,979 CAD Suncor Energy, Inc. 492 0.13 9,787 CAD TC Energy Corp. 477 0.12 5,020 CAD Teck Resources Ltd. 'B' 102 0.03 2,272 CAD TELUS Corp. 84 0.02 1,850 CAD Thomson Reuters Corp. 118 0.03 18,680 CAD Toronto-Dominion Bank (The) 1,021 0.26 2,620 CAD Tourmaline Oil Corp. 33 0.01 2,269 CAD Vermilion Energy, Inc.1 48 0.01 2,877 USD Waste Connections, Inc. 272 0.07 889 CAD West Fraser Timber Co. Ltd. 35 0.01 3,974 CAD Wheaton Precious Metals Corp. 88 0.02 1,115 CAD WSP Global, Inc. 59 0.01 Total Canada 14,041 3.63
Cayman Islands (31 May 2018: 0.27%) 2,600 HKD ASM Pacific Technology Ltd.1 25 0.01 374 USD BeiGene Ltd. ADR 44 0.01 27,500 HKD CK Asset Holdings Ltd. 199 0.05 26,524 HKD CK Hutchison Holdings Ltd. 251 0.06 3,283 USD Melco Resorts & Entertainment Ltd. ADR1 63 0.02 3,200 HKD MGM China Holdings Ltd. 5 –
128
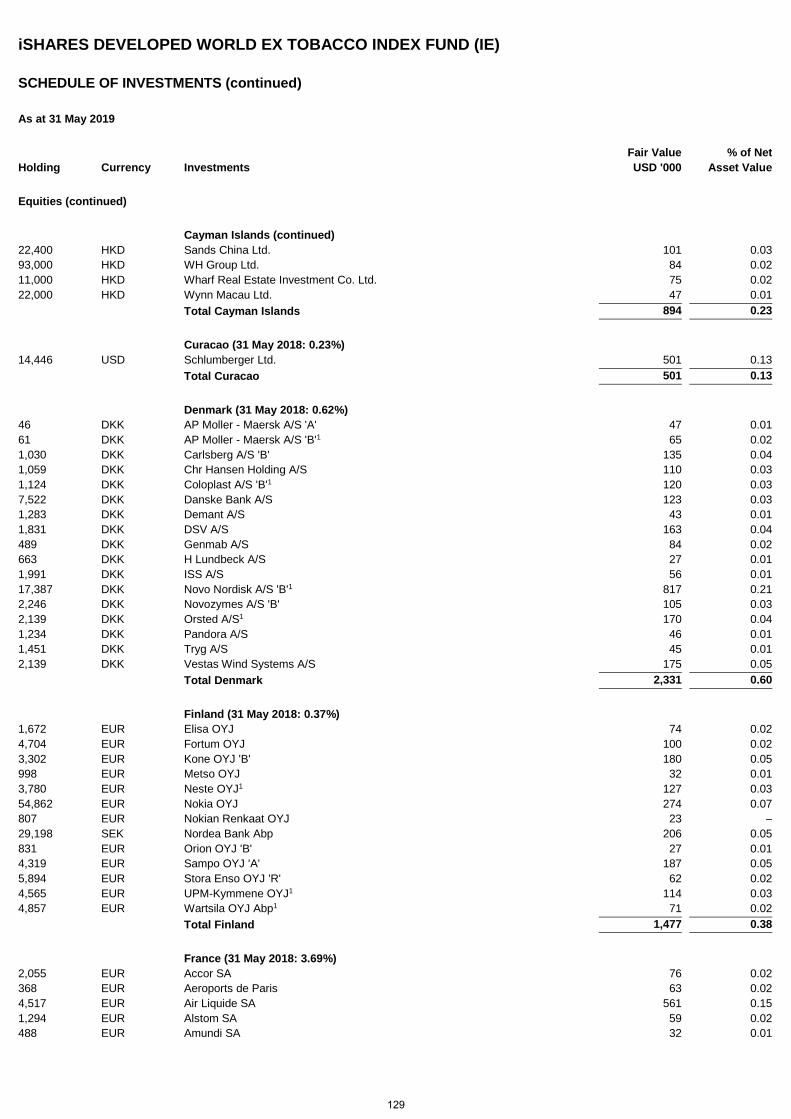
iSHARES DEVELOPED WORLD EX TOBACCO INDEX FUND (IE)
SCHEDULE OF INVESTMENTS (continued)
As at 31 May 2019
Holding Currency Investments Fair Value USD '000
% of Net Asset Value
Equities (continued)
Cayman Islands (continued) 22,400 HKD Sands China Ltd. 101 0.03 93,000 HKD WH Group Ltd. 84 0.02 11,000 HKD Wharf Real Estate Investment Co. Ltd. 75 0.02 22,000 HKD Wynn Macau Ltd. 47 0.01 Total Cayman Islands 894 0.23
Curacao (31 May 2018: 0.23%) 14,446 USD Schlumberger Ltd. 501 0.13 Total Curacao 501 0.13
Denmark (31 May 2018: 0.62%) 46 DKK AP Moller - Maersk A/S 'A' 47 0.01 61 DKK AP Moller - Maersk A/S 'B'1 65 0.02 1,030 DKK Carlsberg A/S 'B' 135 0.04 1,059 DKK Chr Hansen Holding A/S 110 0.03 1,124 DKK Coloplast A/S 'B'1 120 0.03 7,522 DKK Danske Bank A/S 123 0.03 1,283 DKK Demant A/S 43 0.01 1,831 DKK DSV A/S 163 0.04 489 DKK Genmab A/S 84 0.02 663 DKK H Lundbeck A/S 27 0.01 1,991 DKK ISS A/S 56 0.01 17,387 DKK Novo Nordisk A/S 'B'1 817 0.21 2,246 DKK Novozymes A/S 'B' 105 0.03 2,139 DKK Orsted A/S1 170 0.04 1,234 DKK Pandora A/S 46 0.01 1,451 DKK Tryg A/S 45 0.01 2,139 DKK Vestas Wind Systems A/S 175 0.05 Total Denmark 2,331 0.60
Finland (31 May 2018: 0.37%) 1,672 EUR Elisa OYJ 74 0.02 4,704 EUR Fortum OYJ 100 0.02 3,302 EUR Kone OYJ 'B' 180 0.05 998 EUR Metso OYJ 32 0.01 3,780 EUR Neste OYJ1 127 0.03 54,862 EUR Nokia OYJ 274 0.07 807 EUR Nokian Renkaat OYJ 23 – 29,198 SEK Nordea Bank Abp 206 0.05 831 EUR Orion OYJ 'B' 27 0.01 4,319 EUR Sampo OYJ 'A' 187 0.05 5,894 EUR Stora Enso OYJ 'R' 62 0.02 4,565 EUR UPM-Kymmene OYJ1 114 0.03 4,857 EUR Wartsila OYJ Abp1 71 0.02 Total Finland 1,477 0.38
France (31 May 2018: 3.69%) 2,055 EUR Accor SA 76 0.02 368 EUR Aeroports de Paris 63 0.02 4,517 EUR Air Liquide SA 561 0.15 1,294 EUR Alstom SA 59 0.02 488 EUR Amundi SA 32 0.01
129
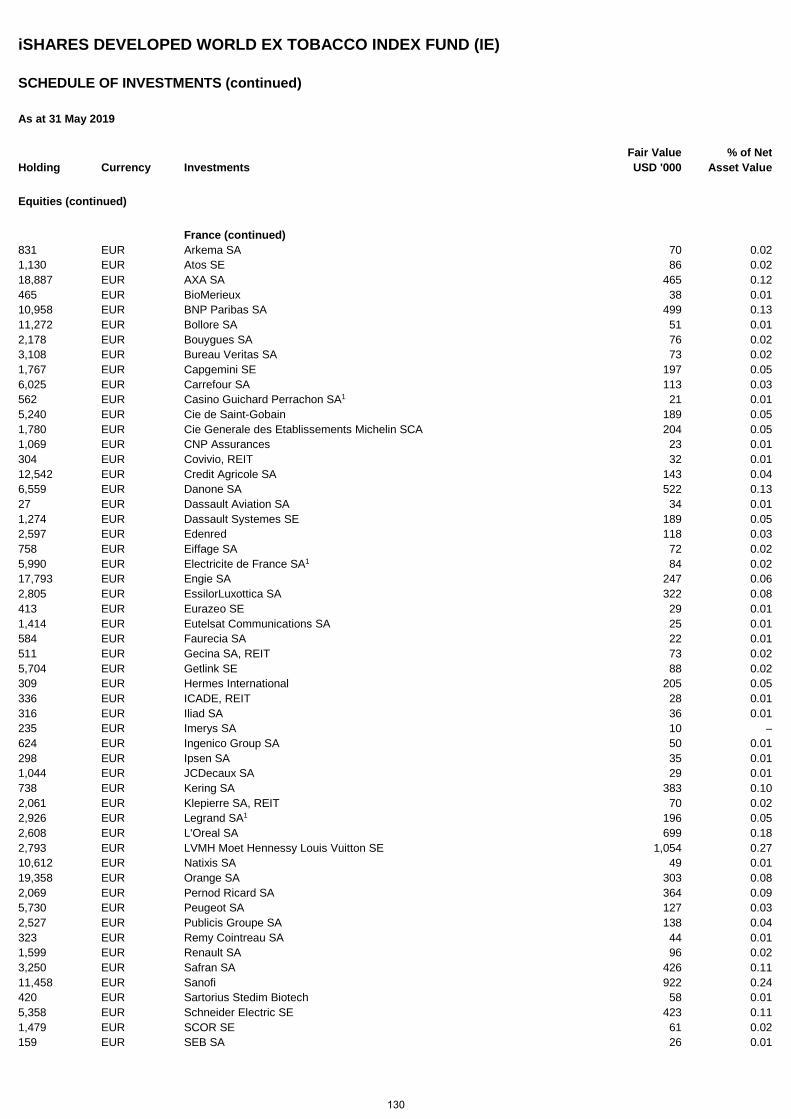
iSHARES DEVELOPED WORLD EX TOBACCO INDEX FUND (IE)
SCHEDULE OF INVESTMENTS (continued)
As at 31 May 2019
Holding Currency Investments Fair Value USD '000
% of Net Asset Value
Equities (continued)
France (continued) 831 EUR Arkema SA 70 0.02 1,130 EUR Atos SE 86 0.02 18,887 EUR AXA SA 465 0.12 465 EUR BioMerieux 38 0.01 10,958 EUR BNP Paribas SA 499 0.13 11,272 EUR Bollore SA 51 0.01 2,178 EUR Bouygues SA 76 0.02 3,108 EUR Bureau Veritas SA 73 0.02 1,767 EUR Capgemini SE 197 0.05 6,025 EUR Carrefour SA 113 0.03 562 EUR Casino Guichard Perrachon SA1 21 0.01 5,240 EUR Cie de Saint-Gobain 189 0.05 1,780 EUR Cie Generale des Etablissements Michelin SCA 204 0.05 1,069 EUR CNP Assurances 23 0.01 304 EUR Covivio, REIT 32 0.01 12,542 EUR Credit Agricole SA 143 0.04 6,559 EUR Danone SA 522 0.13 27 EUR Dassault Aviation SA 34 0.01 1,274 EUR Dassault Systemes SE 189 0.05 2,597 EUR Edenred 118 0.03 758 EUR Eiffage SA 72 0.02 5,990 EUR Electricite de France SA1 84 0.02 17,793 EUR Engie SA 247 0.06 2,805 EUR EssilorLuxottica SA 322 0.08 413 EUR Eurazeo SE 29 0.01 1,414 EUR Eutelsat Communications SA 25 0.01 584 EUR Faurecia SA 22 0.01 511 EUR Gecina SA, REIT 73 0.02 5,704 EUR Getlink SE 88 0.02 309 EUR Hermes International 205 0.05 336 EUR ICADE, REIT 28 0.01 316 EUR Iliad SA 36 0.01 235 EUR Imerys SA 10 – 624 EUR Ingenico Group SA 50 0.01 298 EUR Ipsen SA 35 0.01 1,044 EUR JCDecaux SA 29 0.01 738 EUR Kering SA 383 0.10 2,061 EUR Klepierre SA, REIT 70 0.02 2,926 EUR Legrand SA1 196 0.05 2,608 EUR L'Oreal SA 699 0.18 2,793 EUR LVMH Moet Hennessy Louis Vuitton SE 1,054 0.27 10,612 EUR Natixis SA 49 0.01 19,358 EUR Orange SA 303 0.08 2,069 EUR Pernod Ricard SA 364 0.09 5,730 EUR Peugeot SA 127 0.03 2,527 EUR Publicis Groupe SA 138 0.04 323 EUR Remy Cointreau SA 44 0.01 1,599 EUR Renault SA 96 0.02 3,250 EUR Safran SA 426 0.11 11,458 EUR Sanofi 922 0.24 420 EUR Sartorius Stedim Biotech 58 0.01 5,358 EUR Schneider Electric SE 423 0.11 1,479 EUR SCOR SE 61 0.02 159 EUR SEB SA 26 0.01
130
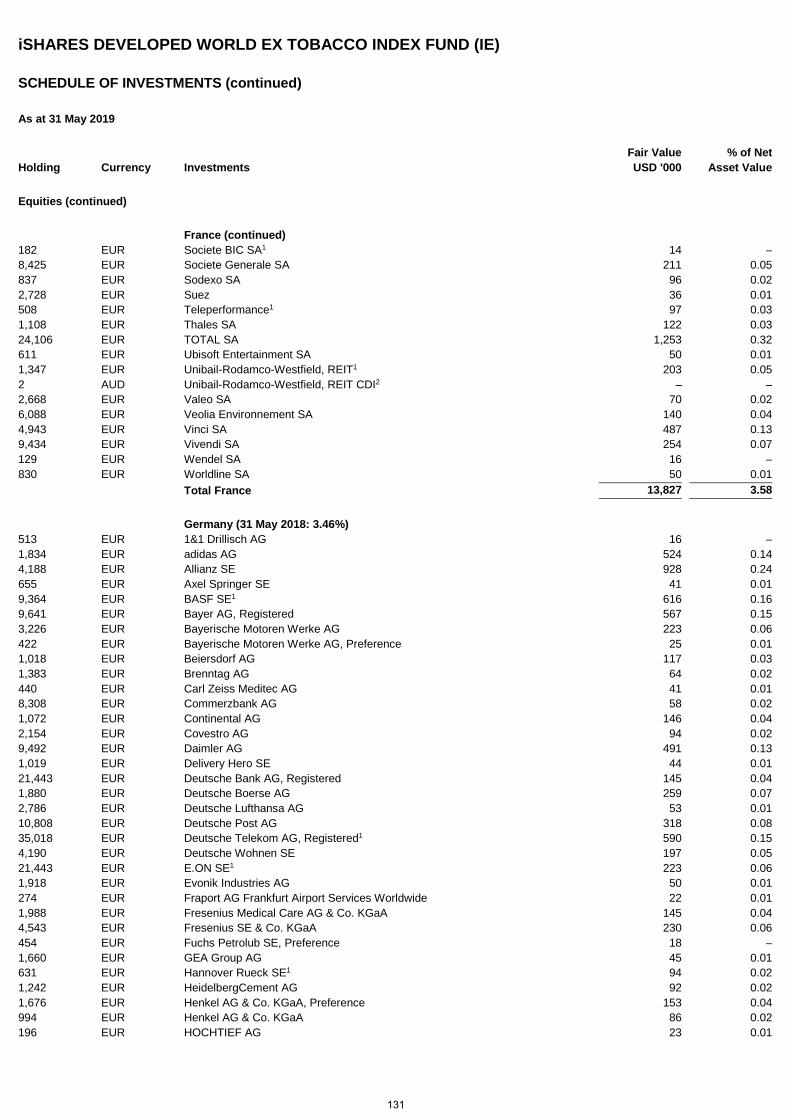
iSHARES DEVELOPED WORLD EX TOBACCO INDEX FUND (IE)
SCHEDULE OF INVESTMENTS (continued)
As at 31 May 2019
Holding Currency Investments Fair Value USD '000
% of Net Asset Value
Equities (continued)
France (continued) 182 EUR Societe BIC SA1 14 – 8,425 EUR Societe Generale SA 211 0.05 837 EUR Sodexo SA 96 0.02 2,728 EUR Suez 36 0.01 508 EUR Teleperformance1 97 0.03 1,108 EUR Thales SA 122 0.03 24,106 EUR TOTAL SA 1,253 0.32 611 EUR Ubisoft Entertainment SA 50 0.01 1,347 EUR Unibail-Rodamco-Westfield, REIT1 203 0.05 2 AUD Unibail-Rodamco-Westfield, REIT CDI2 – – 2,668 EUR Valeo SA 70 0.02 6,088 EUR Veolia Environnement SA 140 0.04 4,943 EUR Vinci SA 487 0.13 9,434 EUR Vivendi SA 254 0.07 129 EUR Wendel SA 16 – 830 EUR Worldline SA 50 0.01 Total France 13,827 3.58
Germany (31 May 2018: 3.46%) 513 EUR 1&1 Drillisch AG 16 – 1,834 EUR adidas AG 524 0.14 4,188 EUR Allianz SE 928 0.24 655 EUR Axel Springer SE 41 0.01 9,364 EUR BASF SE1 616 0.16 9,641 EUR Bayer AG, Registered 567 0.15 3,226 EUR Bayerische Motoren Werke AG 223 0.06 422 EUR Bayerische Motoren Werke AG, Preference 25 0.01 1,018 EUR Beiersdorf AG 117 0.03 1,383 EUR Brenntag AG 64 0.02 440 EUR Carl Zeiss Meditec AG 41 0.01 8,308 EUR Commerzbank AG 58 0.02 1,072 EUR Continental AG 146 0.04 2,154 EUR Covestro AG 94 0.02 9,492 EUR Daimler AG 491 0.13 1,019 EUR Delivery Hero SE 44 0.01 21,443 EUR Deutsche Bank AG, Registered 145 0.04 1,880 EUR Deutsche Boerse AG 259 0.07 2,786 EUR Deutsche Lufthansa AG 53 0.01 10,808 EUR Deutsche Post AG 318 0.08 35,018 EUR Deutsche Telekom AG, Registered1 590 0.15 4,190 EUR Deutsche Wohnen SE 197 0.05 21,443 EUR E.ON SE1 223 0.06 1,918 EUR Evonik Industries AG 50 0.01 274 EUR Fraport AG Frankfurt Airport Services Worldwide 22 0.01 1,988 EUR Fresenius Medical Care AG & Co. KGaA 145 0.04 4,543 EUR Fresenius SE & Co. KGaA 230 0.06 454 EUR Fuchs Petrolub SE, Preference 18 – 1,660 EUR GEA Group AG 45 0.01 631 EUR Hannover Rueck SE1 94 0.02 1,242 EUR HeidelbergCement AG 92 0.02 1,676 EUR Henkel AG & Co. KGaA, Preference 153 0.04 994 EUR Henkel AG & Co. KGaA 86 0.02 196 EUR HOCHTIEF AG 23 0.01
131
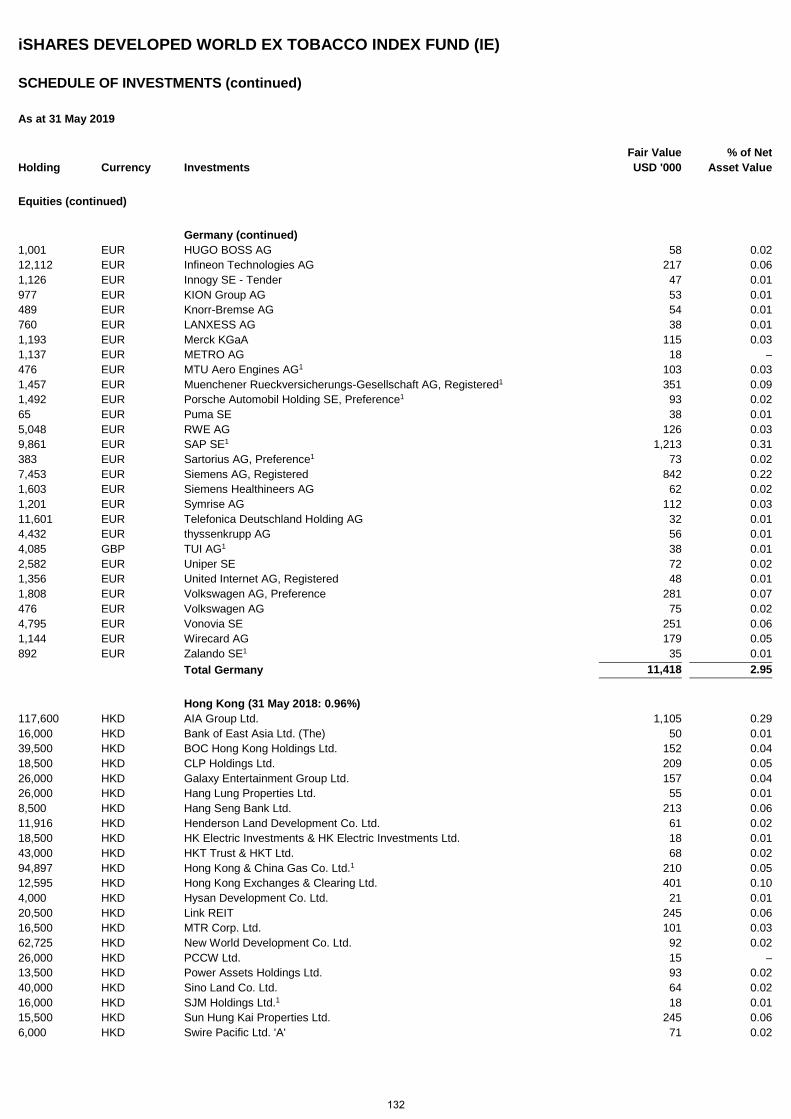
iSHARES DEVELOPED WORLD EX TOBACCO INDEX FUND (IE)
SCHEDULE OF INVESTMENTS (continued)
As at 31 May 2019
Holding Currency Investments Fair Value USD '000
% of Net Asset Value
Equities (continued)
Germany (continued) 1,001 EUR HUGO BOSS AG 58 0.02 12,112 EUR Infineon Technologies AG 217 0.06 1,126 EUR Innogy SE - Tender 47 0.01 977 EUR KION Group AG 53 0.01 489 EUR Knorr-Bremse AG 54 0.01 760 EUR LANXESS AG 38 0.01 1,193 EUR Merck KGaA 115 0.03 1,137 EUR METRO AG 18 – 476 EUR MTU Aero Engines AG1 103 0.03 1,457 EUR Muenchener Rueckversicherungs-Gesellschaft AG, Registered1 351 0.09 1,492 EUR Porsche Automobil Holding SE, Preference1 93 0.02 65 EUR Puma SE 38 0.01 5,048 EUR RWE AG 126 0.03 9,861 EUR SAP SE1 1,213 0.31 383 EUR Sartorius AG, Preference1 73 0.02 7,453 EUR Siemens AG, Registered 842 0.22 1,603 EUR Siemens Healthineers AG 62 0.02 1,201 EUR Symrise AG 112 0.03 11,601 EUR Telefonica Deutschland Holding AG 32 0.01 4,432 EUR thyssenkrupp AG 56 0.01 4,085 GBP TUI AG1 38 0.01 2,582 EUR Uniper SE 72 0.02 1,356 EUR United Internet AG, Registered 48 0.01 1,808 EUR Volkswagen AG, Preference 281 0.07 476 EUR Volkswagen AG 75 0.02 4,795 EUR Vonovia SE 251 0.06 1,144 EUR Wirecard AG 179 0.05 892 EUR Zalando SE1 35 0.01 Total Germany 11,418 2.95
Hong Kong (31 May 2018: 0.96%) 117,600 HKD AIA Group Ltd. 1,105 0.29 16,000 HKD Bank of East Asia Ltd. (The) 50 0.01 39,500 HKD BOC Hong Kong Holdings Ltd. 152 0.04 18,500 HKD CLP Holdings Ltd. 209 0.05 26,000 HKD Galaxy Entertainment Group Ltd. 157 0.04 26,000 HKD Hang Lung Properties Ltd. 55 0.01 8,500 HKD Hang Seng Bank Ltd. 213 0.06 11,916 HKD Henderson Land Development Co. Ltd. 61 0.02 18,500 HKD HK Electric Investments & HK Electric Investments Ltd. 18 0.01 43,000 HKD HKT Trust & HKT Ltd. 68 0.02 94,897 HKD Hong Kong & China Gas Co. Ltd.1 210 0.05 12,595 HKD Hong Kong Exchanges & Clearing Ltd. 401 0.10 4,000 HKD Hysan Development Co. Ltd. 21 0.01 20,500 HKD Link REIT 245 0.06 16,500 HKD MTR Corp. Ltd. 101 0.03 62,725 HKD New World Development Co. Ltd. 92 0.02 26,000 HKD PCCW Ltd. 15 – 13,500 HKD Power Assets Holdings Ltd. 93 0.02 40,000 HKD Sino Land Co. Ltd. 64 0.02 16,000 HKD SJM Holdings Ltd.1 18 0.01 15,500 HKD Sun Hung Kai Properties Ltd. 245 0.06 6,000 HKD Swire Pacific Ltd. 'A' 71 0.02
132
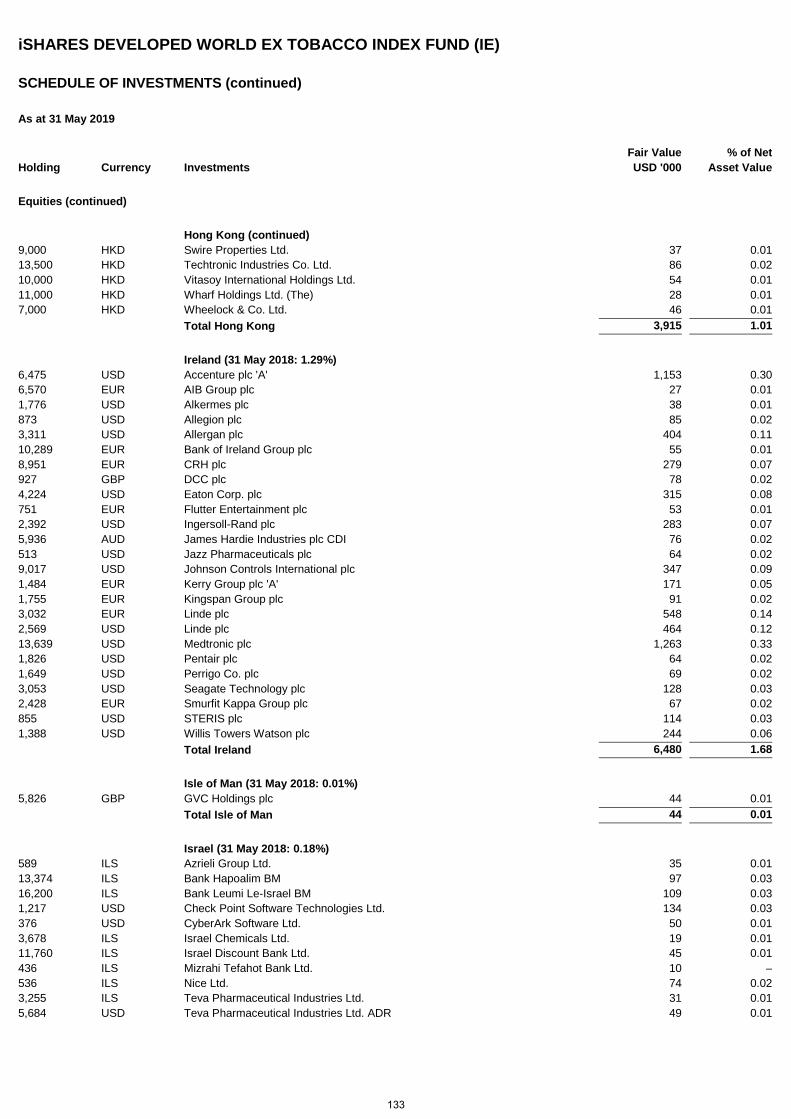
iSHARES DEVELOPED WORLD EX TOBACCO INDEX FUND (IE)
SCHEDULE OF INVESTMENTS (continued)
As at 31 May 2019
Holding Currency Investments Fair Value USD '000
% of Net Asset Value
Equities (continued)
Hong Kong (continued) 9,000 HKD Swire Properties Ltd. 37 0.01 13,500 HKD Techtronic Industries Co. Ltd. 86 0.02 10,000 HKD Vitasoy International Holdings Ltd. 54 0.01 11,000 HKD Wharf Holdings Ltd. (The) 28 0.01 7,000 HKD Wheelock & Co. Ltd. 46 0.01 Total Hong Kong 3,915 1.01
Ireland (31 May 2018: 1.29%) 6,475 USD Accenture plc 'A' 1,153 0.30 6,570 EUR AIB Group plc 27 0.01 1,776 USD Alkermes plc 38 0.01 873 USD Allegion plc 85 0.02 3,311 USD Allergan plc 404 0.11 10,289 EUR Bank of Ireland Group plc 55 0.01 8,951 EUR CRH plc 279 0.07 927 GBP DCC plc 78 0.02 4,224 USD Eaton Corp. plc 315 0.08 751 EUR Flutter Entertainment plc 53 0.01 2,392 USD Ingersoll-Rand plc 283 0.07 5,936 AUD James Hardie Industries plc CDI 76 0.02 513 USD Jazz Pharmaceuticals plc 64 0.02 9,017 USD Johnson Controls International plc 347 0.09 1,484 EUR Kerry Group plc 'A' 171 0.05 1,755 EUR Kingspan Group plc 91 0.02 3,032 EUR Linde plc 548 0.14 2,569 USD Linde plc 464 0.12 13,639 USD Medtronic plc 1,263 0.33 1,826 USD Pentair plc 64 0.02 1,649 USD Perrigo Co. plc 69 0.02 3,053 USD Seagate Technology plc 128 0.03 2,428 EUR Smurfit Kappa Group plc 67 0.02 855 USD STERIS plc 114 0.03 1,388 USD Willis Towers Watson plc 244 0.06 Total Ireland 6,480 1.68
Isle of Man (31 May 2018: 0.01%) 5,826 GBP GVC Holdings plc 44 0.01 Total Isle of Man 44 0.01
Israel (31 May 2018: 0.18%) 589 ILS Azrieli Group Ltd. 35 0.01 13,374 ILS Bank Hapoalim BM 97 0.03 16,200 ILS Bank Leumi Le-Israel BM 109 0.03 1,217 USD Check Point Software Technologies Ltd. 134 0.03 376 USD CyberArk Software Ltd. 50 0.01 3,678 ILS Israel Chemicals Ltd. 19 0.01 11,760 ILS Israel Discount Bank Ltd. 45 0.01 436 ILS Mizrahi Tefahot Bank Ltd. 10 – 536 ILS Nice Ltd. 74 0.02 3,255 ILS Teva Pharmaceutical Industries Ltd. 31 0.01 5,684 USD Teva Pharmaceutical Industries Ltd. ADR 49 0.01
133
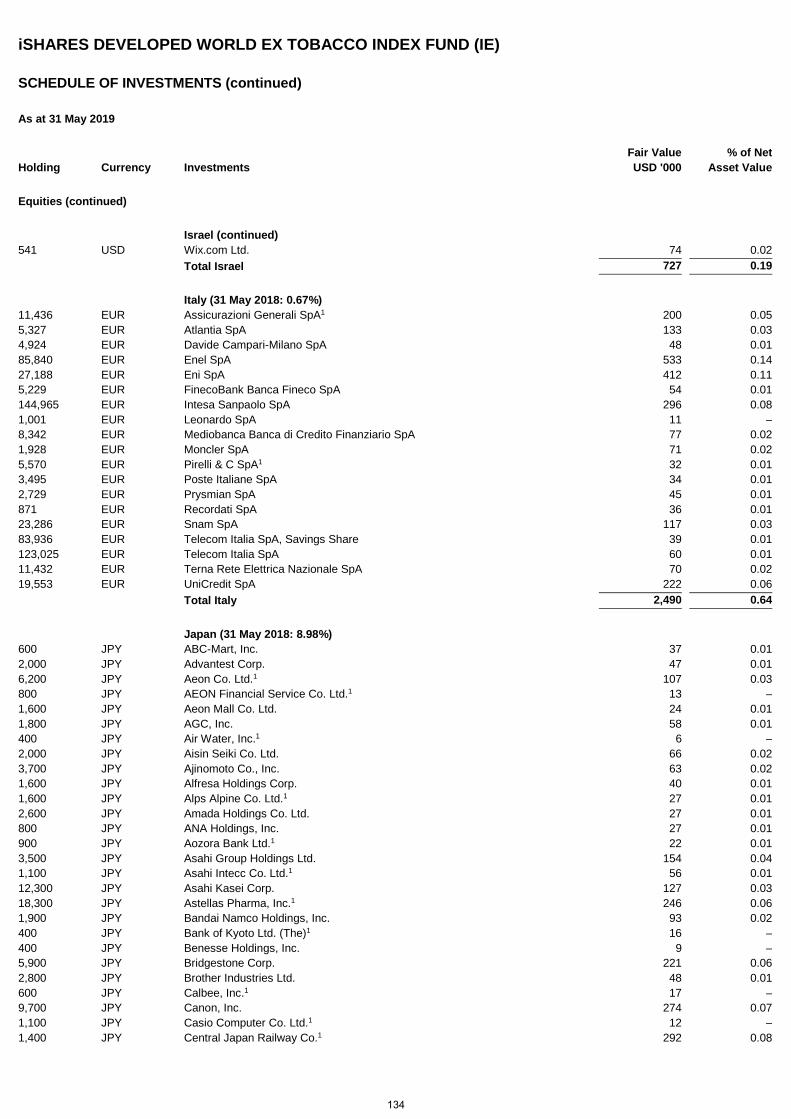
iSHARES DEVELOPED WORLD EX TOBACCO INDEX FUND (IE)
SCHEDULE OF INVESTMENTS (continued)
As at 31 May 2019
Holding Currency Investments Fair Value USD '000
% of Net Asset Value
Equities (continued)
Israel (continued) 541 USD Wix.com Ltd. 74 0.02 Total Israel 727 0.19
Italy (31 May 2018: 0.67%) 11,436 EUR Assicurazioni Generali SpA1 200 0.05 5,327 EUR Atlantia SpA 133 0.03 4,924 EUR Davide Campari-Milano SpA 48 0.01 85,840 EUR Enel SpA 533 0.14 27,188 EUR Eni SpA 412 0.11 5,229 EUR FinecoBank Banca Fineco SpA 54 0.01 144,965 EUR Intesa Sanpaolo SpA 296 0.08 1,001 EUR Leonardo SpA 11 – 8,342 EUR Mediobanca Banca di Credito Finanziario SpA 77 0.02 1,928 EUR Moncler SpA 71 0.02 5,570 EUR Pirelli & C SpA1 32 0.01 3,495 EUR Poste Italiane SpA 34 0.01 2,729 EUR Prysmian SpA 45 0.01 871 EUR Recordati SpA 36 0.01 23,286 EUR Snam SpA 117 0.03 83,936 EUR Telecom Italia SpA, Savings Share 39 0.01 123,025 EUR Telecom Italia SpA 60 0.01 11,432 EUR Terna Rete Elettrica Nazionale SpA 70 0.02 19,553 EUR UniCredit SpA 222 0.06 Total Italy 2,490 0.64
Japan (31 May 2018: 8.98%) 600 JPY ABC-Mart, Inc. 37 0.01 2,000 JPY Advantest Corp. 47 0.01 6,200 JPY Aeon Co. Ltd.1 107 0.03 800 JPY AEON Financial Service Co. Ltd.1 13 – 1,600 JPY Aeon Mall Co. Ltd. 24 0.01 1,800 JPY AGC, Inc. 58 0.01 400 JPY Air Water, Inc.1 6 – 2,000 JPY Aisin Seiki Co. Ltd. 66 0.02 3,700 JPY Ajinomoto Co., Inc. 63 0.02 1,600 JPY Alfresa Holdings Corp. 40 0.01 1,600 JPY Alps Alpine Co. Ltd.1 27 0.01 2,600 JPY Amada Holdings Co. Ltd. 27 0.01 800 JPY ANA Holdings, Inc. 27 0.01 900 JPY Aozora Bank Ltd.1 22 0.01 3,500 JPY Asahi Group Holdings Ltd. 154 0.04 1,100 JPY Asahi Intecc Co. Ltd.1 56 0.01 12,300 JPY Asahi Kasei Corp. 127 0.03 18,300 JPY Astellas Pharma, Inc.1 246 0.06 1,900 JPY Bandai Namco Holdings, Inc. 93 0.02 400 JPY Bank of Kyoto Ltd. (The)1 16 – 400 JPY Benesse Holdings, Inc. 9 – 5,900 JPY Bridgestone Corp. 221 0.06 2,800 JPY Brother Industries Ltd. 48 0.01 600 JPY Calbee, Inc.1 17 – 9,700 JPY Canon, Inc. 274 0.07 1,100 JPY Casio Computer Co. Ltd.1 12 – 1,400 JPY Central Japan Railway Co.1 292 0.08
134
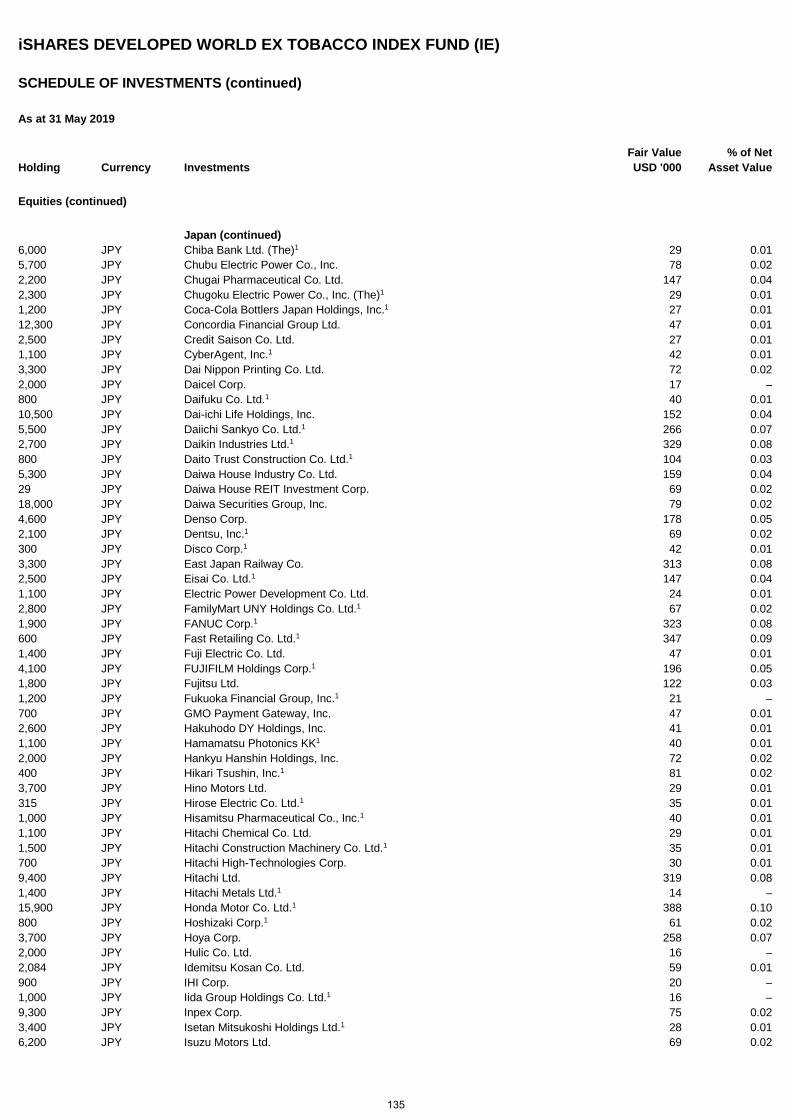
iSHARES DEVELOPED WORLD EX TOBACCO INDEX FUND (IE)
SCHEDULE OF INVESTMENTS (continued)
As at 31 May 2019
Holding Currency Investments Fair Value USD '000
% of Net Asset Value
Equities (continued)
Japan (continued) 6,000 JPY Chiba Bank Ltd. (The)1 29 0.01 5,700 JPY Chubu Electric Power Co., Inc. 78 0.02 2,200 JPY Chugai Pharmaceutical Co. Ltd. 147 0.04 2,300 JPY Chugoku Electric Power Co., Inc. (The)1 29 0.01 1,200 JPY Coca-Cola Bottlers Japan Holdings, Inc.1 27 0.01 12,300 JPY Concordia Financial Group Ltd. 47 0.01 2,500 JPY Credit Saison Co. Ltd. 27 0.01 1,100 JPY CyberAgent, Inc.1 42 0.01 3,300 JPY Dai Nippon Printing Co. Ltd. 72 0.02 2,000 JPY Daicel Corp. 17 – 800 JPY Daifuku Co. Ltd.1 40 0.01 10,500 JPY Dai-ichi Life Holdings, Inc. 152 0.04 5,500 JPY Daiichi Sankyo Co. Ltd.1 266 0.07 2,700 JPY Daikin Industries Ltd.1 329 0.08 800 JPY Daito Trust Construction Co. Ltd.1 104 0.03 5,300 JPY Daiwa House Industry Co. Ltd. 159 0.04 29 JPY Daiwa House REIT Investment Corp. 69 0.02 18,000 JPY Daiwa Securities Group, Inc. 79 0.02 4,600 JPY Denso Corp. 178 0.05 2,100 JPY Dentsu, Inc.1 69 0.02 300 JPY Disco Corp.1 42 0.01 3,300 JPY East Japan Railway Co. 313 0.08 2,500 JPY Eisai Co. Ltd.1 147 0.04 1,100 JPY Electric Power Development Co. Ltd. 24 0.01 2,800 JPY FamilyMart UNY Holdings Co. Ltd.1 67 0.02 1,900 JPY FANUC Corp.1 323 0.08 600 JPY Fast Retailing Co. Ltd.1 347 0.09 1,400 JPY Fuji Electric Co. Ltd. 47 0.01 4,100 JPY FUJIFILM Holdings Corp.1 196 0.05 1,800 JPY Fujitsu Ltd. 122 0.03 1,200 JPY Fukuoka Financial Group, Inc.1 21 – 700 JPY GMO Payment Gateway, Inc. 47 0.01 2,600 JPY Hakuhodo DY Holdings, Inc. 41 0.01 1,100 JPY Hamamatsu Photonics KK1 40 0.01 2,000 JPY Hankyu Hanshin Holdings, Inc. 72 0.02 400 JPY Hikari Tsushin, Inc.1 81 0.02 3,700 JPY Hino Motors Ltd. 29 0.01 315 JPY Hirose Electric Co. Ltd.1 35 0.01 1,000 JPY Hisamitsu Pharmaceutical Co., Inc.1 40 0.01 1,100 JPY Hitachi Chemical Co. Ltd. 29 0.01 1,500 JPY Hitachi Construction Machinery Co. Ltd.1 35 0.01 700 JPY Hitachi High-Technologies Corp. 30 0.01 9,400 JPY Hitachi Ltd. 319 0.08 1,400 JPY Hitachi Metals Ltd.1 14 – 15,900 JPY Honda Motor Co. Ltd.1 388 0.10 800 JPY Hoshizaki Corp.1 61 0.02 3,700 JPY Hoya Corp. 258 0.07 2,000 JPY Hulic Co. Ltd. 16 – 2,084 JPY Idemitsu Kosan Co. Ltd. 59 0.01 900 JPY IHI Corp. 20 – 1,000 JPY Iida Group Holdings Co. Ltd.1 16 – 9,300 JPY Inpex Corp. 75 0.02 3,400 JPY Isetan Mitsukoshi Holdings Ltd.1 28 0.01 6,200 JPY Isuzu Motors Ltd. 69 0.02
135
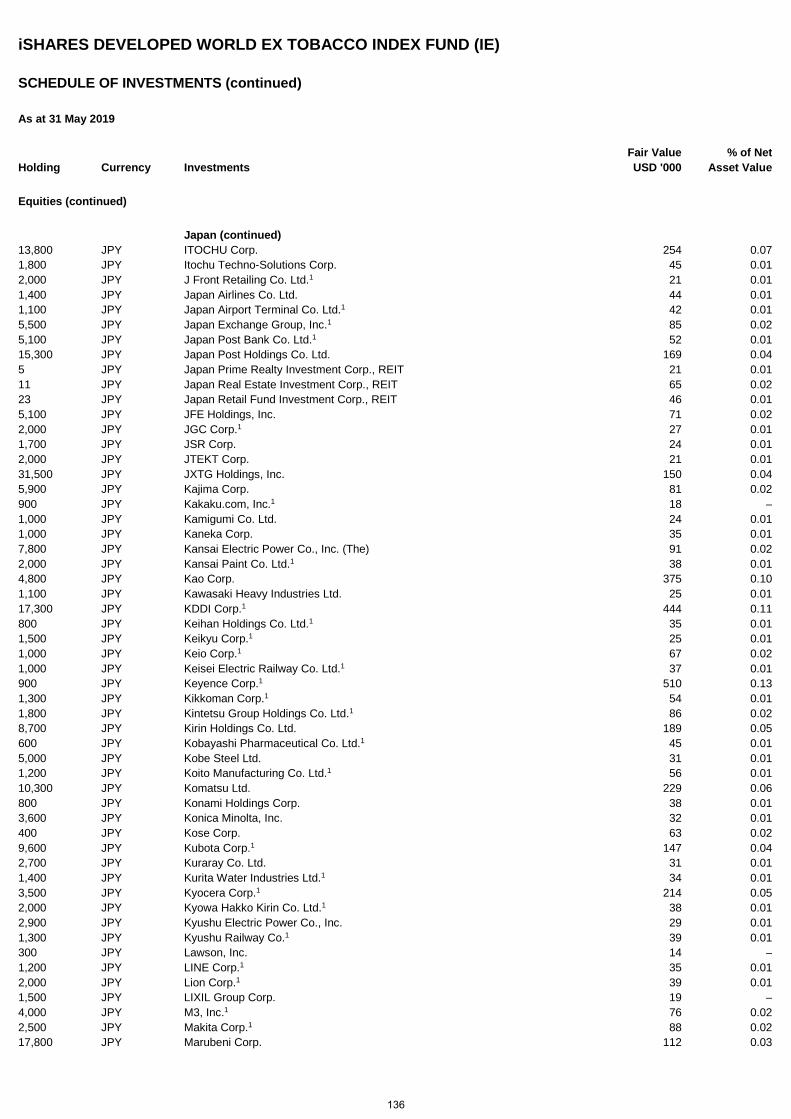
iSHARES DEVELOPED WORLD EX TOBACCO INDEX FUND (IE)
SCHEDULE OF INVESTMENTS (continued)
As at 31 May 2019
Holding Currency Investments Fair Value USD '000
% of Net Asset Value
Equities (continued)
Japan (continued) 13,800 JPY ITOCHU Corp. 254 0.07 1,800 JPY Itochu Techno-Solutions Corp. 45 0.01 2,000 JPY J Front Retailing Co. Ltd.1 21 0.01 1,400 JPY Japan Airlines Co. Ltd. 44 0.01 1,100 JPY Japan Airport Terminal Co. Ltd.1 42 0.01 5,500 JPY Japan Exchange Group, Inc.1 85 0.02 5,100 JPY Japan Post Bank Co. Ltd.1 52 0.01 15,300 JPY Japan Post Holdings Co. Ltd. 169 0.04 5 JPY Japan Prime Realty Investment Corp., REIT 21 0.01 11 JPY Japan Real Estate Investment Corp., REIT 65 0.02 23 JPY Japan Retail Fund Investment Corp., REIT 46 0.01 5,100 JPY JFE Holdings, Inc. 71 0.02 2,000 JPY JGC Corp.1 27 0.01 1,700 JPY JSR Corp. 24 0.01 2,000 JPY JTEKT Corp. 21 0.01 31,500 JPY JXTG Holdings, Inc. 150 0.04 5,900 JPY Kajima Corp. 81 0.02 900 JPY Kakaku.com, Inc.1 18 – 1,000 JPY Kamigumi Co. Ltd. 24 0.01 1,000 JPY Kaneka Corp. 35 0.01 7,800 JPY Kansai Electric Power Co., Inc. (The) 91 0.02 2,000 JPY Kansai Paint Co. Ltd.1 38 0.01 4,800 JPY Kao Corp. 375 0.10 1,100 JPY Kawasaki Heavy Industries Ltd. 25 0.01 17,300 JPY KDDI Corp.1 444 0.11 800 JPY Keihan Holdings Co. Ltd.1 35 0.01 1,500 JPY Keikyu Corp.1 25 0.01 1,000 JPY Keio Corp.1 67 0.02 1,000 JPY Keisei Electric Railway Co. Ltd.1 37 0.01 900 JPY Keyence Corp.1 510 0.13 1,300 JPY Kikkoman Corp.1 54 0.01 1,800 JPY Kintetsu Group Holdings Co. Ltd.1 86 0.02 8,700 JPY Kirin Holdings Co. Ltd. 189 0.05 600 JPY Kobayashi Pharmaceutical Co. Ltd.1 45 0.01 5,000 JPY Kobe Steel Ltd. 31 0.01 1,200 JPY Koito Manufacturing Co. Ltd.1 56 0.01 10,300 JPY Komatsu Ltd. 229 0.06 800 JPY Konami Holdings Corp. 38 0.01 3,600 JPY Konica Minolta, Inc. 32 0.01 400 JPY Kose Corp. 63 0.02 9,600 JPY Kubota Corp.1 147 0.04 2,700 JPY Kuraray Co. Ltd. 31 0.01 1,400 JPY Kurita Water Industries Ltd.1 34 0.01 3,500 JPY Kyocera Corp.1 214 0.05 2,000 JPY Kyowa Hakko Kirin Co. Ltd.1 38 0.01 2,900 JPY Kyushu Electric Power Co., Inc. 29 0.01 1,300 JPY Kyushu Railway Co.1 39 0.01 300 JPY Lawson, Inc. 14 – 1,200 JPY LINE Corp.1 35 0.01 2,000 JPY Lion Corp.1 39 0.01 1,500 JPY LIXIL Group Corp. 19 – 4,000 JPY M3, Inc.1 76 0.02 2,500 JPY Makita Corp.1 88 0.02 17,800 JPY Marubeni Corp. 112 0.03
136
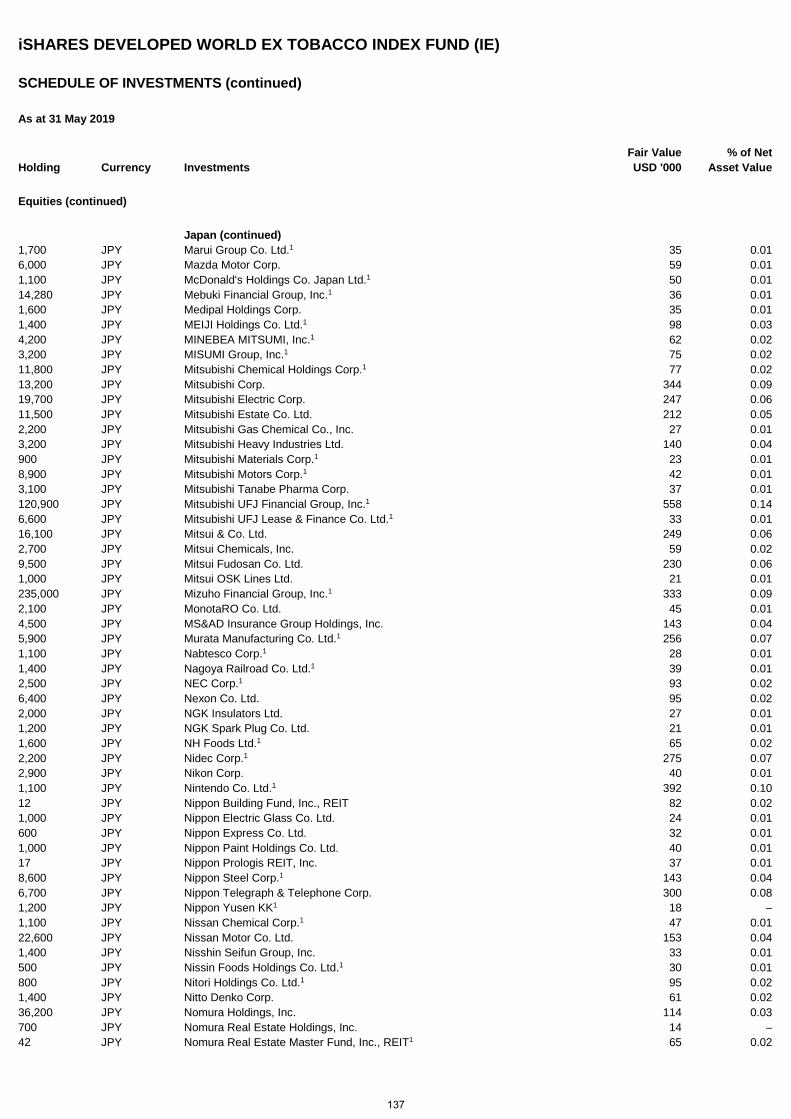
iSHARES DEVELOPED WORLD EX TOBACCO INDEX FUND (IE)
SCHEDULE OF INVESTMENTS (continued)
As at 31 May 2019
Holding Currency Investments Fair Value USD '000
% of Net Asset Value
Equities (continued)
Japan (continued) 1,700 JPY Marui Group Co. Ltd.1 35 0.01 6,000 JPY Mazda Motor Corp. 59 0.01 1,100 JPY McDonald's Holdings Co. Japan Ltd.1 50 0.01 14,280 JPY Mebuki Financial Group, Inc.1 36 0.01 1,600 JPY Medipal Holdings Corp. 35 0.01 1,400 JPY MEIJI Holdings Co. Ltd.1 98 0.03 4,200 JPY MINEBEA MITSUMI, Inc.1 62 0.02 3,200 JPY MISUMI Group, Inc.1 75 0.02 11,800 JPY Mitsubishi Chemical Holdings Corp.1 77 0.02 13,200 JPY Mitsubishi Corp. 344 0.09 19,700 JPY Mitsubishi Electric Corp. 247 0.06 11,500 JPY Mitsubishi Estate Co. Ltd. 212 0.05 2,200 JPY Mitsubishi Gas Chemical Co., Inc. 27 0.01 3,200 JPY Mitsubishi Heavy Industries Ltd. 140 0.04 900 JPY Mitsubishi Materials Corp.1 23 0.01 8,900 JPY Mitsubishi Motors Corp.1 42 0.01 3,100 JPY Mitsubishi Tanabe Pharma Corp. 37 0.01 120,900 JPY Mitsubishi UFJ Financial Group, Inc.1 558 0.14 6,600 JPY Mitsubishi UFJ Lease & Finance Co. Ltd.1 33 0.01 16,100 JPY Mitsui & Co. Ltd. 249 0.06 2,700 JPY Mitsui Chemicals, Inc. 59 0.02 9,500 JPY Mitsui Fudosan Co. Ltd. 230 0.06 1,000 JPY Mitsui OSK Lines Ltd. 21 0.01 235,000 JPY Mizuho Financial Group, Inc.1 333 0.09 2,100 JPY MonotaRO Co. Ltd. 45 0.01 4,500 JPY MS&AD Insurance Group Holdings, Inc. 143 0.04 5,900 JPY Murata Manufacturing Co. Ltd.1 256 0.07 1,100 JPY Nabtesco Corp.1 28 0.01 1,400 JPY Nagoya Railroad Co. Ltd.1 39 0.01 2,500 JPY NEC Corp.1 93 0.02 6,400 JPY Nexon Co. Ltd. 95 0.02 2,000 JPY NGK Insulators Ltd. 27 0.01 1,200 JPY NGK Spark Plug Co. Ltd. 21 0.01 1,600 JPY NH Foods Ltd.1 65 0.02 2,200 JPY Nidec Corp.1 275 0.07 2,900 JPY Nikon Corp. 40 0.01 1,100 JPY Nintendo Co. Ltd.1 392 0.10 12 JPY Nippon Building Fund, Inc., REIT 82 0.02 1,000 JPY Nippon Electric Glass Co. Ltd. 24 0.01 600 JPY Nippon Express Co. Ltd. 32 0.01 1,000 JPY Nippon Paint Holdings Co. Ltd. 40 0.01 17 JPY Nippon Prologis REIT, Inc. 37 0.01 8,600 JPY Nippon Steel Corp.1 143 0.04 6,700 JPY Nippon Telegraph & Telephone Corp. 300 0.08 1,200 JPY Nippon Yusen KK1 18 – 1,100 JPY Nissan Chemical Corp.1 47 0.01 22,600 JPY Nissan Motor Co. Ltd. 153 0.04 1,400 JPY Nisshin Seifun Group, Inc. 33 0.01 500 JPY Nissin Foods Holdings Co. Ltd.1 30 0.01 800 JPY Nitori Holdings Co. Ltd.1 95 0.02 1,400 JPY Nitto Denko Corp. 61 0.02 36,200 JPY Nomura Holdings, Inc. 114 0.03 700 JPY Nomura Real Estate Holdings, Inc. 14 – 42 JPY Nomura Real Estate Master Fund, Inc., REIT1 65 0.02
137
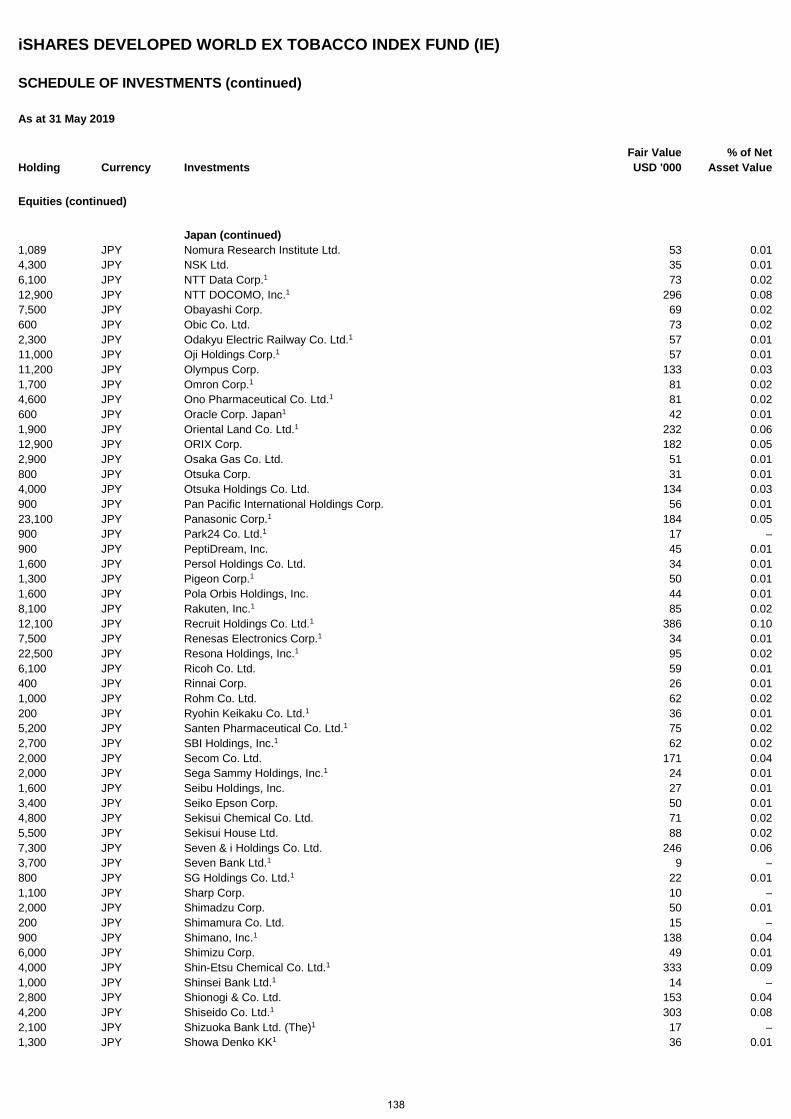
iSHARES DEVELOPED WORLD EX TOBACCO INDEX FUND (IE)
SCHEDULE OF INVESTMENTS (continued)
As at 31 May 2019
Holding Currency Investments Fair Value USD '000
% of Net Asset Value
Equities (continued)
Japan (continued) 1,089 JPY Nomura Research Institute Ltd. 53 0.01 4,300 JPY NSK Ltd. 35 0.01 6,100 JPY NTT Data Corp.1 73 0.02 12,900 JPY NTT DOCOMO, Inc.1 296 0.08 7,500 JPY Obayashi Corp. 69 0.02 600 JPY Obic Co. Ltd. 73 0.02 2,300 JPY Odakyu Electric Railway Co. Ltd.1 57 0.01 11,000 JPY Oji Holdings Corp.1 57 0.01 11,200 JPY Olympus Corp. 133 0.03 1,700 JPY Omron Corp.1 81 0.02 4,600 JPY Ono Pharmaceutical Co. Ltd.1 81 0.02 600 JPY Oracle Corp. Japan1 42 0.01 1,900 JPY Oriental Land Co. Ltd.1 232 0.06 12,900 JPY ORIX Corp. 182 0.05 2,900 JPY Osaka Gas Co. Ltd. 51 0.01 800 JPY Otsuka Corp. 31 0.01 4,000 JPY Otsuka Holdings Co. Ltd. 134 0.03 900 JPY Pan Pacific International Holdings Corp. 56 0.01 23,100 JPY Panasonic Corp.1 184 0.05 900 JPY Park24 Co. Ltd.1 17 – 900 JPY PeptiDream, Inc. 45 0.01 1,600 JPY Persol Holdings Co. Ltd. 34 0.01 1,300 JPY Pigeon Corp.1 50 0.01 1,600 JPY Pola Orbis Holdings, Inc. 44 0.01 8,100 JPY Rakuten, Inc.1 85 0.02 12,100 JPY Recruit Holdings Co. Ltd.1 386 0.10 7,500 JPY Renesas Electronics Corp.1 34 0.01 22,500 JPY Resona Holdings, Inc.1 95 0.02 6,100 JPY Ricoh Co. Ltd. 59 0.01 400 JPY Rinnai Corp. 26 0.01 1,000 JPY Rohm Co. Ltd. 62 0.02 200 JPY Ryohin Keikaku Co. Ltd.1 36 0.01 5,200 JPY Santen Pharmaceutical Co. Ltd.1 75 0.02 2,700 JPY SBI Holdings, Inc.1 62 0.02 2,000 JPY Secom Co. Ltd. 171 0.04 2,000 JPY Sega Sammy Holdings, Inc.1 24 0.01 1,600 JPY Seibu Holdings, Inc. 27 0.01 3,400 JPY Seiko Epson Corp. 50 0.01 4,800 JPY Sekisui Chemical Co. Ltd. 71 0.02 5,500 JPY Sekisui House Ltd. 88 0.02 7,300 JPY Seven & i Holdings Co. Ltd. 246 0.06 3,700 JPY Seven Bank Ltd.1 9 – 800 JPY SG Holdings Co. Ltd.1 22 0.01 1,100 JPY Sharp Corp. 10 – 2,000 JPY Shimadzu Corp. 50 0.01 200 JPY Shimamura Co. Ltd. 15 – 900 JPY Shimano, Inc.1 138 0.04 6,000 JPY Shimizu Corp. 49 0.01 4,000 JPY Shin-Etsu Chemical Co. Ltd.1 333 0.09 1,000 JPY Shinsei Bank Ltd.1 14 – 2,800 JPY Shionogi & Co. Ltd. 153 0.04 4,200 JPY Shiseido Co. Ltd.1 303 0.08 2,100 JPY Shizuoka Bank Ltd. (The)1 17 – 1,300 JPY Showa Denko KK1 36 0.01
138
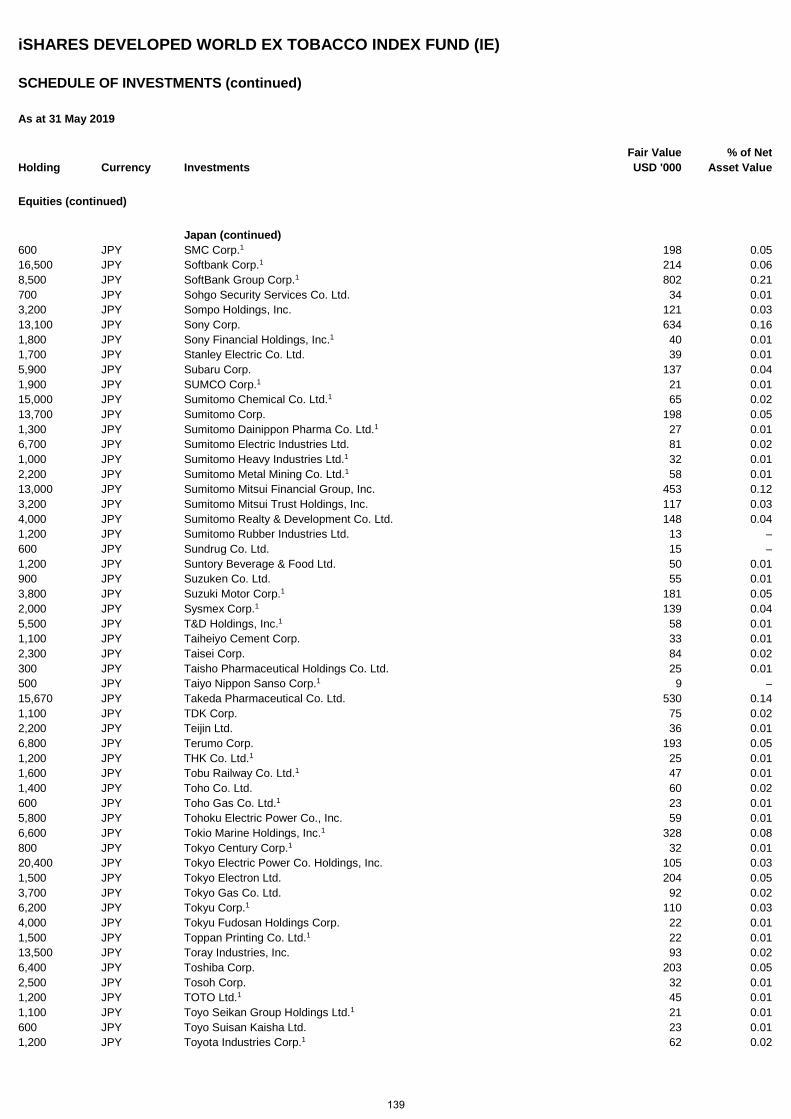
iSHARES DEVELOPED WORLD EX TOBACCO INDEX FUND (IE)
SCHEDULE OF INVESTMENTS (continued)
As at 31 May 2019
Holding Currency Investments Fair Value USD '000
% of Net Asset Value
Equities (continued)
Japan (continued) 600 JPY SMC Corp.1 198 0.05 16,500 JPY Softbank Corp.1 214 0.06 8,500 JPY SoftBank Group Corp.1 802 0.21 700 JPY Sohgo Security Services Co. Ltd. 34 0.01 3,200 JPY Sompo Holdings, Inc. 121 0.03 13,100 JPY Sony Corp. 634 0.16 1,800 JPY Sony Financial Holdings, Inc.1 40 0.01 1,700 JPY Stanley Electric Co. Ltd. 39 0.01 5,900 JPY Subaru Corp. 137 0.04 1,900 JPY SUMCO Corp.1 21 0.01 15,000 JPY Sumitomo Chemical Co. Ltd.1 65 0.02 13,700 JPY Sumitomo Corp. 198 0.05 1,300 JPY Sumitomo Dainippon Pharma Co. Ltd.1 27 0.01 6,700 JPY Sumitomo Electric Industries Ltd. 81 0.02 1,000 JPY Sumitomo Heavy Industries Ltd.1 32 0.01 2,200 JPY Sumitomo Metal Mining Co. Ltd.1 58 0.01 13,000 JPY Sumitomo Mitsui Financial Group, Inc. 453 0.12 3,200 JPY Sumitomo Mitsui Trust Holdings, Inc. 117 0.03 4,000 JPY Sumitomo Realty & Development Co. Ltd. 148 0.04 1,200 JPY Sumitomo Rubber Industries Ltd. 13 – 600 JPY Sundrug Co. Ltd. 15 – 1,200 JPY Suntory Beverage & Food Ltd. 50 0.01 900 JPY Suzuken Co. Ltd. 55 0.01 3,800 JPY Suzuki Motor Corp.1 181 0.05 2,000 JPY Sysmex Corp.1 139 0.04 5,500 JPY T&D Holdings, Inc.1 58 0.01 1,100 JPY Taiheiyo Cement Corp. 33 0.01 2,300 JPY Taisei Corp. 84 0.02 300 JPY Taisho Pharmaceutical Holdings Co. Ltd. 25 0.01 500 JPY Taiyo Nippon Sanso Corp.1 9 – 15,670 JPY Takeda Pharmaceutical Co. Ltd. 530 0.14 1,100 JPY TDK Corp. 75 0.02 2,200 JPY Teijin Ltd. 36 0.01 6,800 JPY Terumo Corp. 193 0.05 1,200 JPY THK Co. Ltd.1 25 0.01 1,600 JPY Tobu Railway Co. Ltd.1 47 0.01 1,400 JPY Toho Co. Ltd. 60 0.02 600 JPY Toho Gas Co. Ltd.1 23 0.01 5,800 JPY Tohoku Electric Power Co., Inc. 59 0.01 6,600 JPY Tokio Marine Holdings, Inc.1 328 0.08 800 JPY Tokyo Century Corp.1 32 0.01 20,400 JPY Tokyo Electric Power Co. Holdings, Inc. 105 0.03 1,500 JPY Tokyo Electron Ltd. 204 0.05 3,700 JPY Tokyo Gas Co. Ltd. 92 0.02 6,200 JPY Tokyu Corp.1 110 0.03 4,000 JPY Tokyu Fudosan Holdings Corp. 22 0.01 1,500 JPY Toppan Printing Co. Ltd.1 22 0.01 13,500 JPY Toray Industries, Inc. 93 0.02 6,400 JPY Toshiba Corp. 203 0.05 2,500 JPY Tosoh Corp. 32 0.01 1,200 JPY TOTO Ltd.1 45 0.01 1,100 JPY Toyo Seikan Group Holdings Ltd.1 21 0.01 600 JPY Toyo Suisan Kaisha Ltd. 23 0.01 1,200 JPY Toyota Industries Corp.1 62 0.02
139
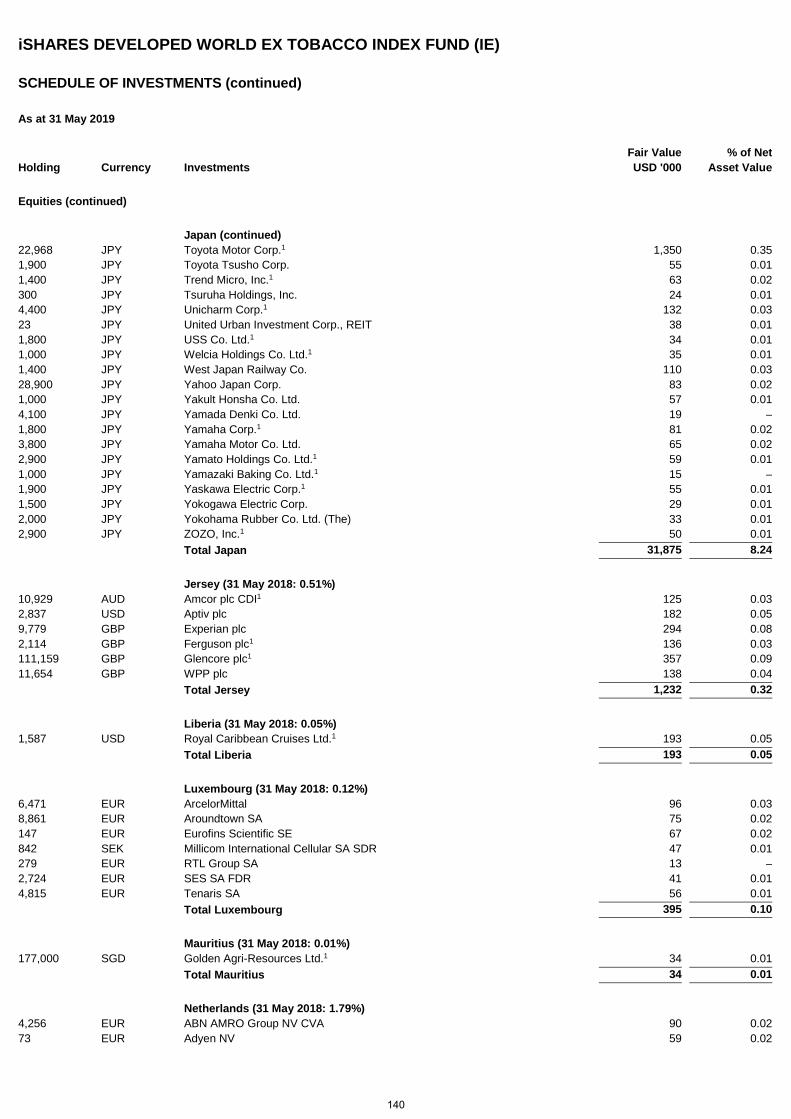
iSHARES DEVELOPED WORLD EX TOBACCO INDEX FUND (IE)
SCHEDULE OF INVESTMENTS (continued)
As at 31 May 2019
Holding Currency Investments Fair Value USD '000
% of Net Asset Value
Equities (continued)
Japan (continued) 22,968 JPY Toyota Motor Corp.1 1,350 0.35 1,900 JPY Toyota Tsusho Corp. 55 0.01 1,400 JPY Trend Micro, Inc.1 63 0.02 300 JPY Tsuruha Holdings, Inc. 24 0.01 4,400 JPY Unicharm Corp.1 132 0.03 23 JPY United Urban Investment Corp., REIT 38 0.01 1,800 JPY USS Co. Ltd.1 34 0.01 1,000 JPY Welcia Holdings Co. Ltd.1 35 0.01 1,400 JPY West Japan Railway Co. 110 0.03 28,900 JPY Yahoo Japan Corp. 83 0.02 1,000 JPY Yakult Honsha Co. Ltd. 57 0.01 4,100 JPY Yamada Denki Co. Ltd. 19 – 1,800 JPY Yamaha Corp.1 81 0.02 3,800 JPY Yamaha Motor Co. Ltd. 65 0.02 2,900 JPY Yamato Holdings Co. Ltd.1 59 0.01 1,000 JPY Yamazaki Baking Co. Ltd.1 15 – 1,900 JPY Yaskawa Electric Corp.1 55 0.01 1,500 JPY Yokogawa Electric Corp. 29 0.01 2,000 JPY Yokohama Rubber Co. Ltd. (The) 33 0.01 2,900 JPY ZOZO, Inc.1 50 0.01 Total Japan 31,875 8.24
Jersey (31 May 2018: 0.51%) 10,929 AUD Amcor plc CDI1 125 0.03 2,837 USD Aptiv plc 182 0.05 9,779 GBP Experian plc 294 0.08 2,114 GBP Ferguson plc1 136 0.03 111,159 GBP Glencore plc1 357 0.09 11,654 GBP WPP plc 138 0.04 Total Jersey 1,232 0.32
Liberia (31 May 2018: 0.05%) 1,587 USD Royal Caribbean Cruises Ltd.1 193 0.05 Total Liberia 193 0.05
Luxembourg (31 May 2018: 0.12%) 6,471 EUR ArcelorMittal 96 0.03 8,861 EUR Aroundtown SA 75 0.02 147 EUR Eurofins Scientific SE 67 0.02 842 SEK Millicom International Cellular SA SDR 47 0.01 279 EUR RTL Group SA 13 – 2,724 EUR SES SA FDR 41 0.01 4,815 EUR Tenaris SA 56 0.01 Total Luxembourg 395 0.10
Mauritius (31 May 2018: 0.01%) 177,000 SGD Golden Agri-Resources Ltd.1 34 0.01 Total Mauritius 34 0.01
Netherlands (31 May 2018: 1.79%) 4,256 EUR ABN AMRO Group NV CVA 90 0.02 73 EUR Adyen NV 59 0.02
140
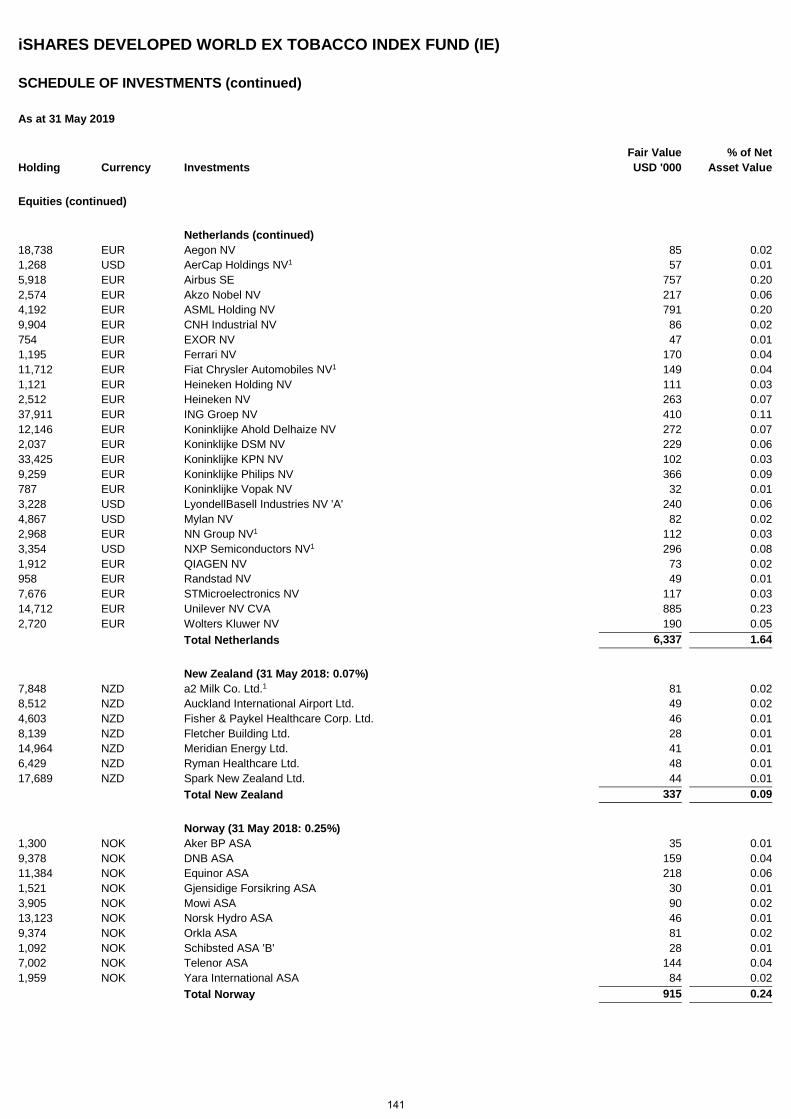
iSHARES DEVELOPED WORLD EX TOBACCO INDEX FUND (IE)
SCHEDULE OF INVESTMENTS (continued)
As at 31 May 2019
Holding Currency Investments Fair Value USD '000
% of Net Asset Value
Equities (continued)
Netherlands (continued) 18,738 EUR Aegon NV 85 0.02 1,268 USD AerCap Holdings NV1 57 0.01 5,918 EUR Airbus SE 757 0.20 2,574 EUR Akzo Nobel NV 217 0.06 4,192 EUR ASML Holding NV 791 0.20 9,904 EUR CNH Industrial NV 86 0.02 754 EUR EXOR NV 47 0.01 1,195 EUR Ferrari NV 170 0.04 11,712 EUR Fiat Chrysler Automobiles NV1 149 0.04 1,121 EUR Heineken Holding NV 111 0.03 2,512 EUR Heineken NV 263 0.07 37,911 EUR ING Groep NV 410 0.11 12,146 EUR Koninklijke Ahold Delhaize NV 272 0.07 2,037 EUR Koninklijke DSM NV 229 0.06 33,425 EUR Koninklijke KPN NV 102 0.03 9,259 EUR Koninklijke Philips NV 366 0.09 787 EUR Koninklijke Vopak NV 32 0.01 3,228 USD LyondellBasell Industries NV 'A' 240 0.06 4,867 USD Mylan NV 82 0.02 2,968 EUR NN Group NV1 112 0.03 3,354 USD NXP Semiconductors NV1 296 0.08 1,912 EUR QIAGEN NV 73 0.02 958 EUR Randstad NV 49 0.01 7,676 EUR STMicroelectronics NV 117 0.03 14,712 EUR Unilever NV CVA 885 0.23 2,720 EUR Wolters Kluwer NV 190 0.05 Total Netherlands 6,337 1.64
New Zealand (31 May 2018: 0.07%) 7,848 NZD a2 Milk Co. Ltd.1 81 0.02 8,512 NZD Auckland International Airport Ltd. 49 0.02 4,603 NZD Fisher & Paykel Healthcare Corp. Ltd. 46 0.01 8,139 NZD Fletcher Building Ltd. 28 0.01 14,964 NZD Meridian Energy Ltd. 41 0.01 6,429 NZD Ryman Healthcare Ltd. 48 0.01 17,689 NZD Spark New Zealand Ltd. 44 0.01 Total New Zealand 337 0.09
Norway (31 May 2018: 0.25%) 1,300 NOK Aker BP ASA 35 0.01 9,378 NOK DNB ASA 159 0.04 11,384 NOK Equinor ASA 218 0.06 1,521 NOK Gjensidige Forsikring ASA 30 0.01 3,905 NOK Mowi ASA 90 0.02 13,123 NOK Norsk Hydro ASA 46 0.01 9,374 NOK Orkla ASA 81 0.02 1,092 NOK Schibsted ASA 'B' 28 0.01 7,002 NOK Telenor ASA 144 0.04 1,959 NOK Yara International ASA 84 0.02 Total Norway 915 0.24
141
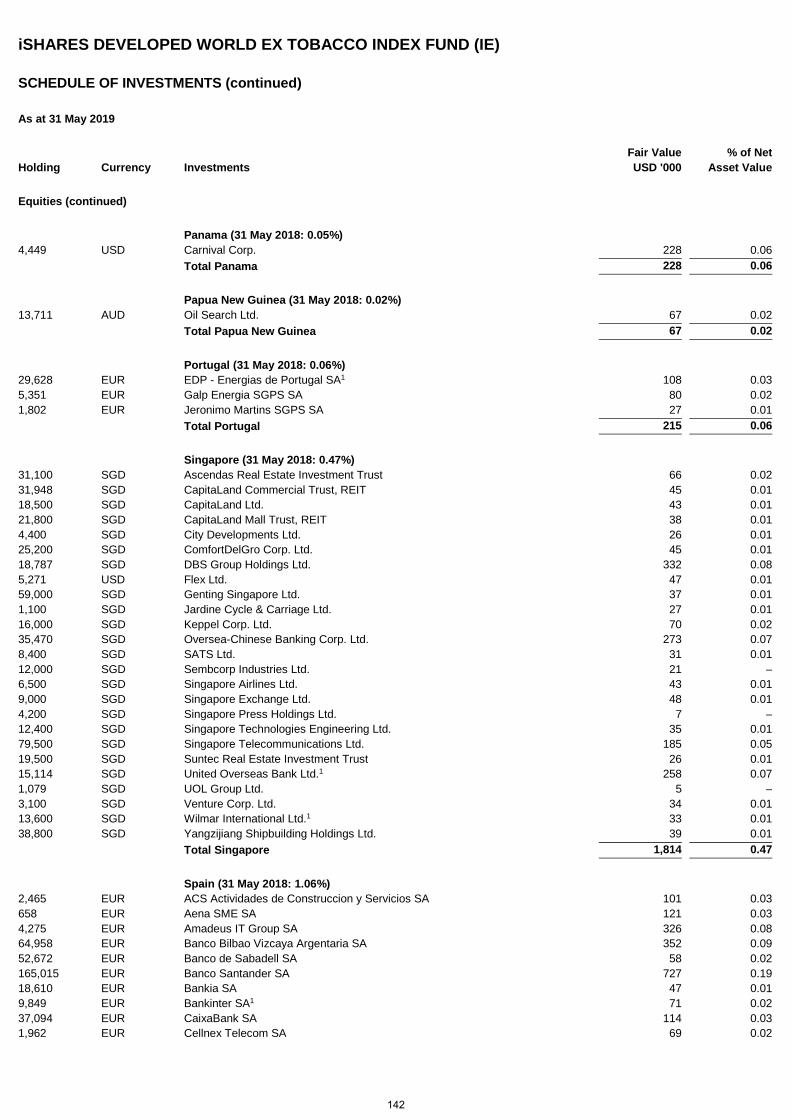
iSHARES DEVELOPED WORLD EX TOBACCO INDEX FUND (IE)
SCHEDULE OF INVESTMENTS (continued)
As at 31 May 2019
Holding Currency Investments Fair Value USD '000
% of Net Asset Value
Equities (continued)
Panama (31 May 2018: 0.05%) 4,449 USD Carnival Corp. 228 0.06 Total Panama 228 0.06
Papua New Guinea (31 May 2018: 0.02%) 13,711 AUD Oil Search Ltd. 67 0.02 Total Papua New Guinea 67 0.02
Portugal (31 May 2018: 0.06%) 29,628 EUR EDP - Energias de Portugal SA1 108 0.03 5,351 EUR Galp Energia SGPS SA 80 0.02 1,802 EUR Jeronimo Martins SGPS SA 27 0.01 Total Portugal 215 0.06
Singapore (31 May 2018: 0.47%) 31,100 SGD Ascendas Real Estate Investment Trust 66 0.02 31,948 SGD CapitaLand Commercial Trust, REIT 45 0.01 18,500 SGD CapitaLand Ltd. 43 0.01 21,800 SGD CapitaLand Mall Trust, REIT 38 0.01 4,400 SGD City Developments Ltd. 26 0.01 25,200 SGD ComfortDelGro Corp. Ltd. 45 0.01 18,787 SGD DBS Group Holdings Ltd. 332 0.08 5,271 USD Flex Ltd. 47 0.01 59,000 SGD Genting Singapore Ltd. 37 0.01 1,100 SGD Jardine Cycle & Carriage Ltd. 27 0.01 16,000 SGD Keppel Corp. Ltd. 70 0.02 35,470 SGD Oversea-Chinese Banking Corp. Ltd. 273 0.07 8,400 SGD SATS Ltd. 31 0.01 12,000 SGD Sembcorp Industries Ltd. 21 – 6,500 SGD Singapore Airlines Ltd. 43 0.01 9,000 SGD Singapore Exchange Ltd. 48 0.01 4,200 SGD Singapore Press Holdings Ltd. 7 – 12,400 SGD Singapore Technologies Engineering Ltd. 35 0.01 79,500 SGD Singapore Telecommunications Ltd. 185 0.05 19,500 SGD Suntec Real Estate Investment Trust 26 0.01 15,114 SGD United Overseas Bank Ltd.1 258 0.07 1,079 SGD UOL Group Ltd. 5 – 3,100 SGD Venture Corp. Ltd. 34 0.01 13,600 SGD Wilmar International Ltd.1 33 0.01 38,800 SGD Yangzijiang Shipbuilding Holdings Ltd. 39 0.01 Total Singapore 1,814 0.47
Spain (31 May 2018: 1.06%) 2,465 EUR ACS Actividades de Construccion y Servicios SA 101 0.03 658 EUR Aena SME SA 121 0.03 4,275 EUR Amadeus IT Group SA 326 0.08 64,958 EUR Banco Bilbao Vizcaya Argentaria SA 352 0.09 52,672 EUR Banco de Sabadell SA 58 0.02 165,015 EUR Banco Santander SA 727 0.19 18,610 EUR Bankia SA 47 0.01 9,849 EUR Bankinter SA1 71 0.02 37,094 EUR CaixaBank SA 114 0.03 1,962 EUR Cellnex Telecom SA 69 0.02
142
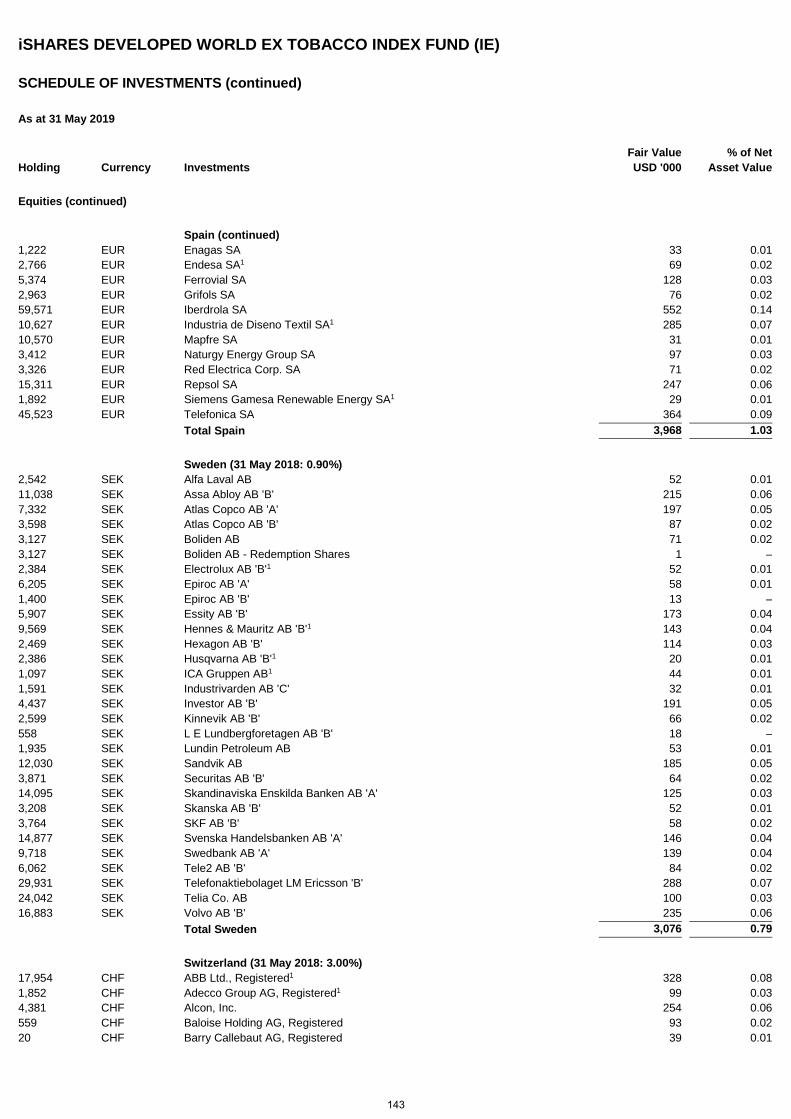
iSHARES DEVELOPED WORLD EX TOBACCO INDEX FUND (IE)
SCHEDULE OF INVESTMENTS (continued)
As at 31 May 2019
Holding Currency Investments Fair Value USD '000
% of Net Asset Value
Equities (continued)
Spain (continued) 1,222 EUR Enagas SA 33 0.01 2,766 EUR Endesa SA1 69 0.02 5,374 EUR Ferrovial SA 128 0.03 2,963 EUR Grifols SA 76 0.02 59,571 EUR Iberdrola SA 552 0.14 10,627 EUR Industria de Diseno Textil SA1 285 0.07 10,570 EUR Mapfre SA 31 0.01 3,412 EUR Naturgy Energy Group SA 97 0.03 3,326 EUR Red Electrica Corp. SA 71 0.02 15,311 EUR Repsol SA 247 0.06 1,892 EUR Siemens Gamesa Renewable Energy SA1 29 0.01 45,523 EUR Telefonica SA 364 0.09 Total Spain 3,968 1.03
Sweden (31 May 2018: 0.90%) 2,542 SEK Alfa Laval AB 52 0.01 11,038 SEK Assa Abloy AB 'B' 215 0.06 7,332 SEK Atlas Copco AB 'A' 197 0.05 3,598 SEK Atlas Copco AB 'B' 87 0.02 3,127 SEK Boliden AB 71 0.02 3,127 SEK Boliden AB - Redemption Shares 1 – 2,384 SEK Electrolux AB 'B'1 52 0.01 6,205 SEK Epiroc AB 'A' 58 0.01 1,400 SEK Epiroc AB 'B' 13 – 5,907 SEK Essity AB 'B' 173 0.04 9,569 SEK Hennes & Mauritz AB 'B'1 143 0.04 2,469 SEK Hexagon AB 'B' 114 0.03 2,386 SEK Husqvarna AB 'B'1 20 0.01 1,097 SEK ICA Gruppen AB1 44 0.01 1,591 SEK Industrivarden AB 'C' 32 0.01 4,437 SEK Investor AB 'B' 191 0.05 2,599 SEK Kinnevik AB 'B' 66 0.02 558 SEK L E Lundbergforetagen AB 'B' 18 – 1,935 SEK Lundin Petroleum AB 53 0.01 12,030 SEK Sandvik AB 185 0.05 3,871 SEK Securitas AB 'B' 64 0.02 14,095 SEK Skandinaviska Enskilda Banken AB 'A' 125 0.03 3,208 SEK Skanska AB 'B' 52 0.01 3,764 SEK SKF AB 'B' 58 0.02 14,877 SEK Svenska Handelsbanken AB 'A' 146 0.04 9,718 SEK Swedbank AB 'A' 139 0.04 6,062 SEK Tele2 AB 'B' 84 0.02 29,931 SEK Telefonaktiebolaget LM Ericsson 'B' 288 0.07 24,042 SEK Telia Co. AB 100 0.03 16,883 SEK Volvo AB 'B' 235 0.06 Total Sweden 3,076 0.79
Switzerland (31 May 2018: 3.00%) 17,954 CHF ABB Ltd., Registered1 328 0.08 1,852 CHF Adecco Group AG, Registered1 99 0.03 4,381 CHF Alcon, Inc. 254 0.06 559 CHF Baloise Holding AG, Registered 93 0.02 20 CHF Barry Callebaut AG, Registered 39 0.01
143
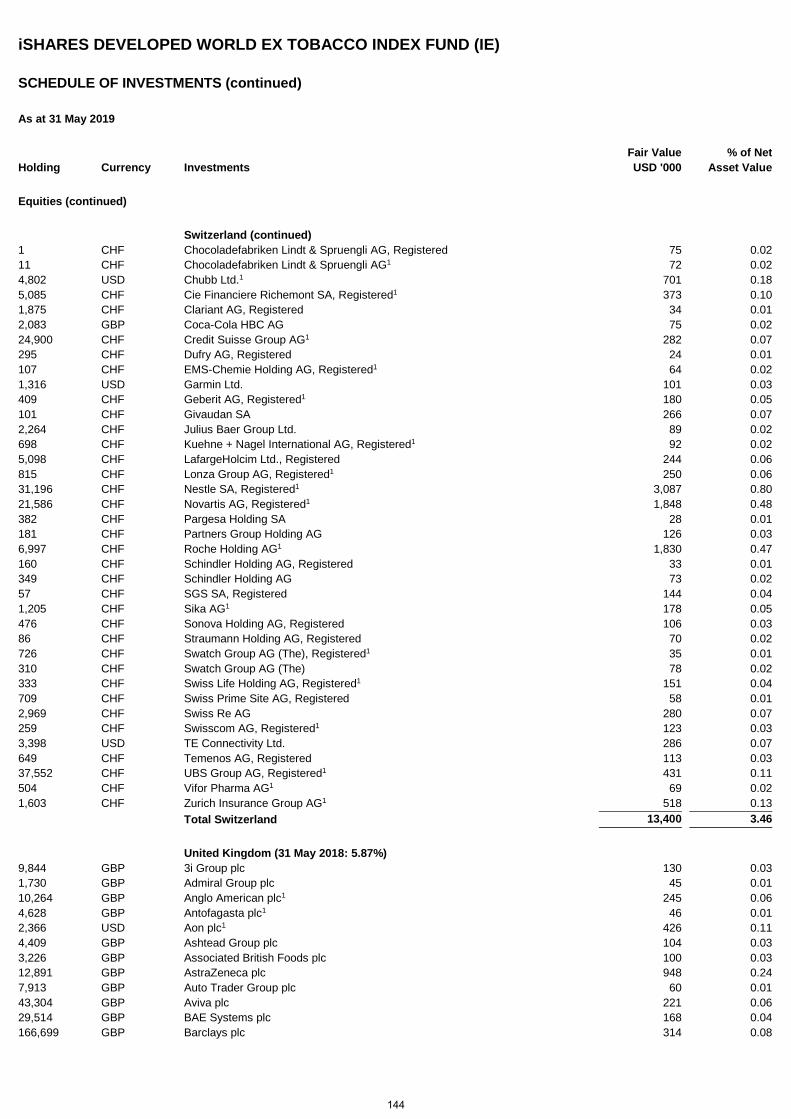
iSHARES DEVELOPED WORLD EX TOBACCO INDEX FUND (IE)
SCHEDULE OF INVESTMENTS (continued)
As at 31 May 2019
Holding Currency Investments Fair Value USD '000
% of Net Asset Value
Equities (continued)
Switzerland (continued) 1 CHF Chocoladefabriken Lindt & Spruengli AG, Registered 75 0.02 11 CHF Chocoladefabriken Lindt & Spruengli AG1 72 0.02 4,802 USD Chubb Ltd.1 701 0.18 5,085 CHF Cie Financiere Richemont SA, Registered1 373 0.10 1,875 CHF Clariant AG, Registered 34 0.01 2,083 GBP Coca-Cola HBC AG 75 0.02 24,900 CHF Credit Suisse Group AG1 282 0.07 295 CHF Dufry AG, Registered 24 0.01 107 CHF EMS-Chemie Holding AG, Registered1 64 0.02 1,316 USD Garmin Ltd. 101 0.03 409 CHF Geberit AG, Registered1 180 0.05 101 CHF Givaudan SA 266 0.07 2,264 CHF Julius Baer Group Ltd. 89 0.02 698 CHF Kuehne + Nagel International AG, Registered1 92 0.02 5,098 CHF LafargeHolcim Ltd., Registered 244 0.06 815 CHF Lonza Group AG, Registered1 250 0.06 31,196 CHF Nestle SA, Registered1 3,087 0.80 21,586 CHF Novartis AG, Registered1 1,848 0.48 382 CHF Pargesa Holding SA 28 0.01 181 CHF Partners Group Holding AG 126 0.03 6,997 CHF Roche Holding AG1 1,830 0.47 160 CHF Schindler Holding AG, Registered 33 0.01 349 CHF Schindler Holding AG 73 0.02 57 CHF SGS SA, Registered 144 0.04 1,205 CHF Sika AG1 178 0.05 476 CHF Sonova Holding AG, Registered 106 0.03 86 CHF Straumann Holding AG, Registered 70 0.02 726 CHF Swatch Group AG (The), Registered1 35 0.01 310 CHF Swatch Group AG (The) 78 0.02 333 CHF Swiss Life Holding AG, Registered1 151 0.04 709 CHF Swiss Prime Site AG, Registered 58 0.01 2,969 CHF Swiss Re AG 280 0.07 259 CHF Swisscom AG, Registered1 123 0.03 3,398 USD TE Connectivity Ltd. 286 0.07 649 CHF Temenos AG, Registered 113 0.03 37,552 CHF UBS Group AG, Registered1 431 0.11 504 CHF Vifor Pharma AG1 69 0.02 1,603 CHF Zurich Insurance Group AG1 518 0.13 Total Switzerland 13,400 3.46
United Kingdom (31 May 2018: 5.87%) 9,844 GBP 3i Group plc 130 0.03 1,730 GBP Admiral Group plc 45 0.01 10,264 GBP Anglo American plc1 245 0.06 4,628 GBP Antofagasta plc1 46 0.01 2,366 USD Aon plc1 426 0.11 4,409 GBP Ashtead Group plc 104 0.03 3,226 GBP Associated British Foods plc 100 0.03 12,891 GBP AstraZeneca plc 948 0.24 7,913 GBP Auto Trader Group plc 60 0.01 43,304 GBP Aviva plc 221 0.06 29,514 GBP BAE Systems plc 168 0.04 166,699 GBP Barclays plc 314 0.08
144
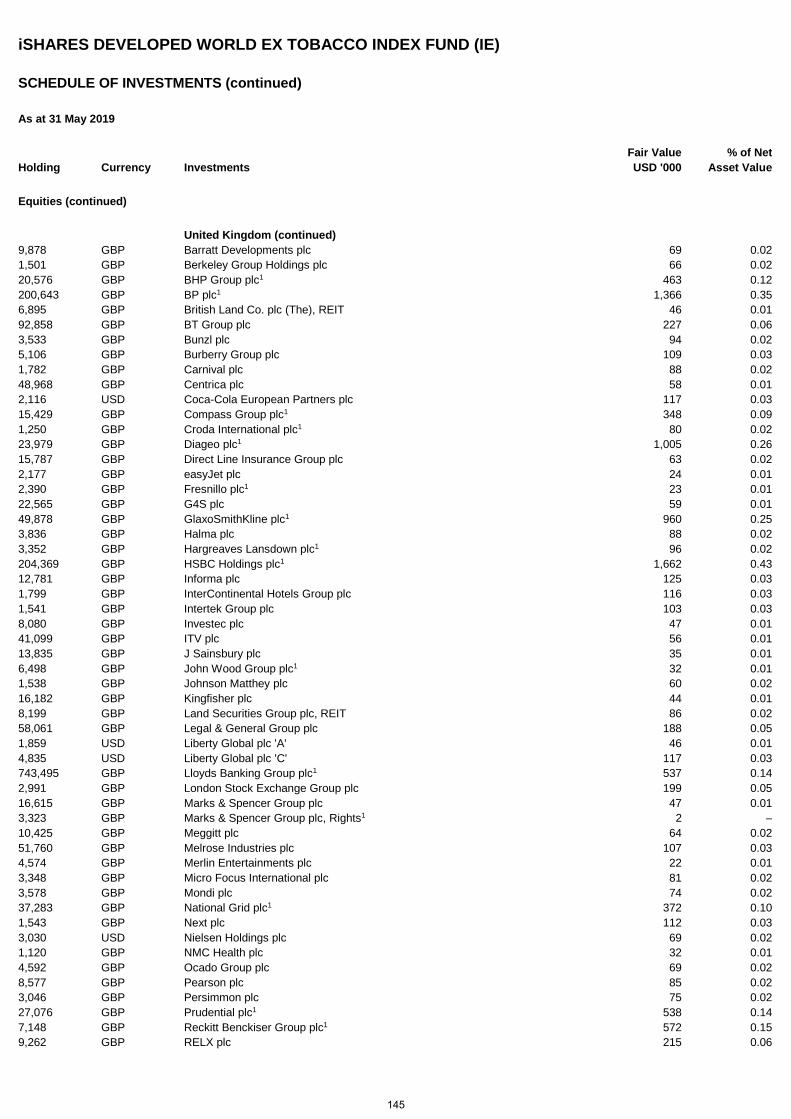
iSHARES DEVELOPED WORLD EX TOBACCO INDEX FUND (IE)
SCHEDULE OF INVESTMENTS (continued)
As at 31 May 2019
Holding Currency Investments Fair Value USD '000
% of Net Asset Value
Equities (continued)
United Kingdom (continued) 9,878 GBP Barratt Developments plc 69 0.02 1,501 GBP Berkeley Group Holdings plc 66 0.02 20,576 GBP BHP Group plc1 463 0.12 200,643 GBP BP plc1 1,366 0.35 6,895 GBP British Land Co. plc (The), REIT 46 0.01 92,858 GBP BT Group plc 227 0.06 3,533 GBP Bunzl plc 94 0.02 5,106 GBP Burberry Group plc 109 0.03 1,782 GBP Carnival plc 88 0.02 48,968 GBP Centrica plc 58 0.01 2,116 USD Coca-Cola European Partners plc 117 0.03 15,429 GBP Compass Group plc1 348 0.09 1,250 GBP Croda International plc1 80 0.02 23,979 GBP Diageo plc1 1,005 0.26 15,787 GBP Direct Line Insurance Group plc 63 0.02 2,177 GBP easyJet plc 24 0.01 2,390 GBP Fresnillo plc1 23 0.01 22,565 GBP G4S plc 59 0.01 49,878 GBP GlaxoSmithKline plc1 960 0.25 3,836 GBP Halma plc 88 0.02 3,352 GBP Hargreaves Lansdown plc1 96 0.02 204,369 GBP HSBC Holdings plc1 1,662 0.43 12,781 GBP Informa plc 125 0.03 1,799 GBP InterContinental Hotels Group plc 116 0.03 1,541 GBP Intertek Group plc 103 0.03 8,080 GBP Investec plc 47 0.01 41,099 GBP ITV plc 56 0.01 13,835 GBP J Sainsbury plc 35 0.01 6,498 GBP John Wood Group plc1 32 0.01 1,538 GBP Johnson Matthey plc 60 0.02 16,182 GBP Kingfisher plc 44 0.01 8,199 GBP Land Securities Group plc, REIT 86 0.02 58,061 GBP Legal & General Group plc 188 0.05 1,859 USD Liberty Global plc 'A' 46 0.01 4,835 USD Liberty Global plc 'C' 117 0.03 743,495 GBP Lloyds Banking Group plc1 537 0.14 2,991 GBP London Stock Exchange Group plc 199 0.05 16,615 GBP Marks & Spencer Group plc 47 0.01 3,323 GBP Marks & Spencer Group plc, Rights1 2 – 10,425 GBP Meggitt plc 64 0.02 51,760 GBP Melrose Industries plc 107 0.03 4,574 GBP Merlin Entertainments plc 22 0.01 3,348 GBP Micro Focus International plc 81 0.02 3,578 GBP Mondi plc 74 0.02 37,283 GBP National Grid plc1 372 0.10 1,543 GBP Next plc 112 0.03 3,030 USD Nielsen Holdings plc 69 0.02 1,120 GBP NMC Health plc 32 0.01 4,592 GBP Ocado Group plc 69 0.02 8,577 GBP Pearson plc 85 0.02 3,046 GBP Persimmon plc 75 0.02 27,076 GBP Prudential plc1 538 0.14 7,148 GBP Reckitt Benckiser Group plc1 572 0.15 9,262 GBP RELX plc 215 0.06
145
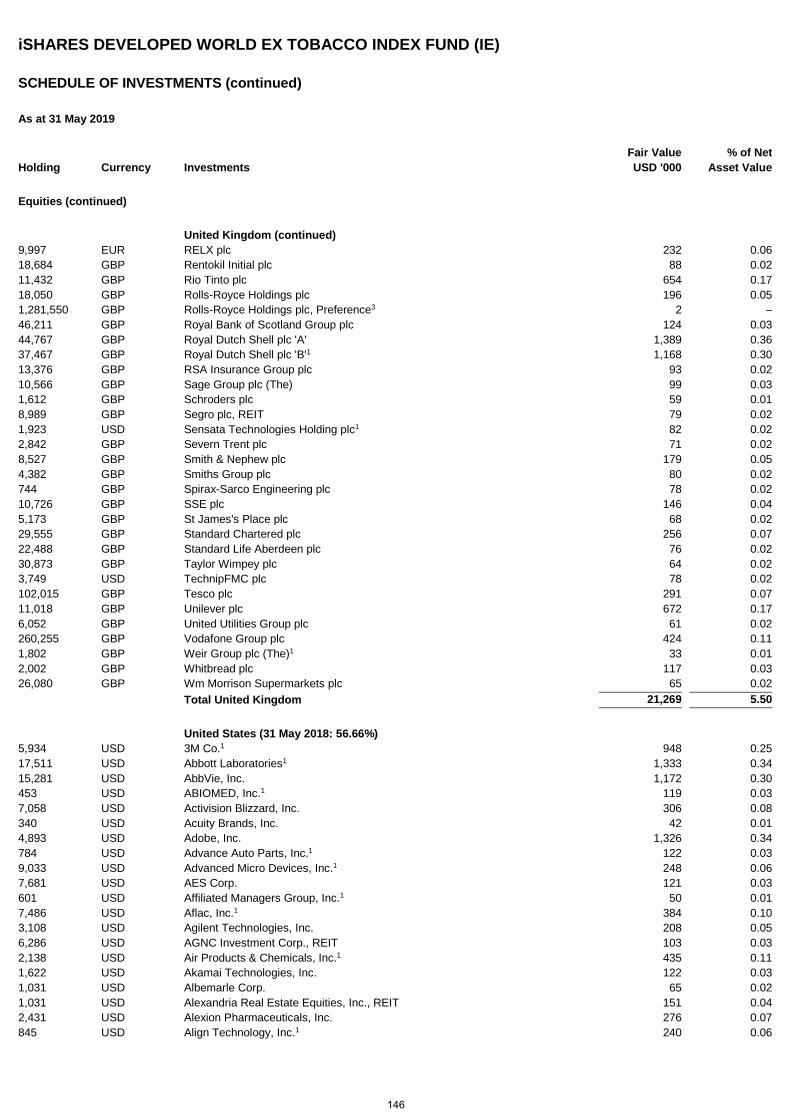
iSHARES DEVELOPED WORLD EX TOBACCO INDEX FUND (IE)
SCHEDULE OF INVESTMENTS (continued)
As at 31 May 2019
Holding Currency Investments Fair Value USD '000
% of Net Asset Value
Equities (continued)
United Kingdom (continued) 9,997 EUR RELX plc 232 0.06 18,684 GBP Rentokil Initial plc 88 0.02 11,432 GBP Rio Tinto plc 654 0.17 18,050 GBP Rolls-Royce Holdings plc 196 0.05 1,281,550 GBP Rolls-Royce Holdings plc, Preference3 2 – 46,211 GBP Royal Bank of Scotland Group plc 124 0.03 44,767 GBP Royal Dutch Shell plc 'A' 1,389 0.36 37,467 GBP Royal Dutch Shell plc 'B'1 1,168 0.30 13,376 GBP RSA Insurance Group plc 93 0.02 10,566 GBP Sage Group plc (The) 99 0.03 1,612 GBP Schroders plc 59 0.01 8,989 GBP Segro plc, REIT 79 0.02 1,923 USD Sensata Technologies Holding plc1 82 0.02 2,842 GBP Severn Trent plc 71 0.02 8,527 GBP Smith & Nephew plc 179 0.05 4,382 GBP Smiths Group plc 80 0.02 744 GBP Spirax-Sarco Engineering plc 78 0.02 10,726 GBP SSE plc 146 0.04 5,173 GBP St James's Place plc 68 0.02 29,555 GBP Standard Chartered plc 256 0.07 22,488 GBP Standard Life Aberdeen plc 76 0.02 30,873 GBP Taylor Wimpey plc 64 0.02 3,749 USD TechnipFMC plc 78 0.02 102,015 GBP Tesco plc 291 0.07 11,018 GBP Unilever plc 672 0.17 6,052 GBP United Utilities Group plc 61 0.02 260,255 GBP Vodafone Group plc 424 0.11 1,802 GBP Weir Group plc (The)1 33 0.01 2,002 GBP Whitbread plc 117 0.03 26,080 GBP Wm Morrison Supermarkets plc 65 0.02 Total United Kingdom 21,269 5.50
United States (31 May 2018: 56.66%) 5,934 USD 3M Co.1 948 0.25 17,511 USD Abbott Laboratories1 1,333 0.34 15,281 USD AbbVie, Inc. 1,172 0.30 453 USD ABIOMED, Inc.1 119 0.03 7,058 USD Activision Blizzard, Inc. 306 0.08 340 USD Acuity Brands, Inc. 42 0.01 4,893 USD Adobe, Inc. 1,326 0.34 784 USD Advance Auto Parts, Inc.1 122 0.03 9,033 USD Advanced Micro Devices, Inc.1 248 0.06 7,681 USD AES Corp. 121 0.03 601 USD Affiliated Managers Group, Inc.1 50 0.01 7,486 USD Aflac, Inc.1 384 0.10 3,108 USD Agilent Technologies, Inc. 208 0.05 6,286 USD AGNC Investment Corp., REIT 103 0.03 2,138 USD Air Products & Chemicals, Inc.1 435 0.11 1,622 USD Akamai Technologies, Inc. 122 0.03 1,031 USD Albemarle Corp. 65 0.02 1,031 USD Alexandria Real Estate Equities, Inc., REIT 151 0.04 2,431 USD Alexion Pharmaceuticals, Inc. 276 0.07 845 USD Align Technology, Inc.1 240 0.06
146
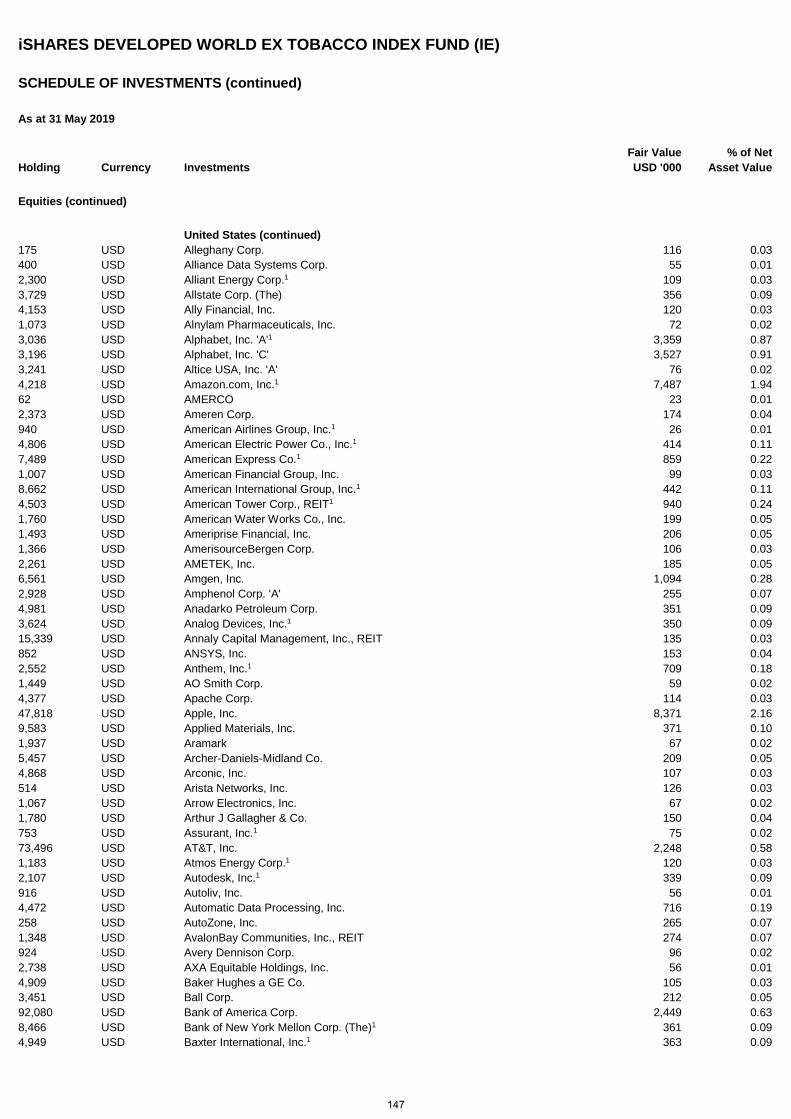
iSHARES DEVELOPED WORLD EX TOBACCO INDEX FUND (IE)
SCHEDULE OF INVESTMENTS (continued)
As at 31 May 2019
Holding Currency Investments Fair Value USD '000
% of Net Asset Value
Equities (continued)
United States (continued) 175 USD Alleghany Corp. 116 0.03 400 USD Alliance Data Systems Corp. 55 0.01 2,300 USD Alliant Energy Corp.1 109 0.03 3,729 USD Allstate Corp. (The) 356 0.09 4,153 USD Ally Financial, Inc. 120 0.03 1,073 USD Alnylam Pharmaceuticals, Inc. 72 0.02 3,036 USD Alphabet, Inc. 'A'1 3,359 0.87 3,196 USD Alphabet, Inc. 'C' 3,527 0.91 3,241 USD Altice USA, Inc. 'A' 76 0.02 4,218 USD Amazon.com, Inc.1 7,487 1.94 62 USD AMERCO 23 0.01 2,373 USD Ameren Corp. 174 0.04 940 USD American Airlines Group, Inc.1 26 0.01 4,806 USD American Electric Power Co., Inc.1 414 0.11 7,489 USD American Express Co.1 859 0.22 1,007 USD American Financial Group, Inc. 99 0.03 8,662 USD American International Group, Inc.1 442 0.11 4,503 USD American Tower Corp., REIT1 940 0.24 1,760 USD American Water Works Co., Inc. 199 0.05 1,493 USD Ameriprise Financial, Inc. 206 0.05 1,366 USD AmerisourceBergen Corp. 106 0.03 2,261 USD AMETEK, Inc. 185 0.05 6,561 USD Amgen, Inc. 1,094 0.28 2,928 USD Amphenol Corp. 'A' 255 0.07 4,981 USD Anadarko Petroleum Corp. 351 0.09 3,624 USD Analog Devices, Inc.1 350 0.09 15,339 USD Annaly Capital Management, Inc., REIT 135 0.03 852 USD ANSYS, Inc. 153 0.04 2,552 USD Anthem, Inc.1 709 0.18 1,449 USD AO Smith Corp. 59 0.02 4,377 USD Apache Corp. 114 0.03 47,818 USD Apple, Inc. 8,371 2.16 9,583 USD Applied Materials, Inc. 371 0.10 1,937 USD Aramark 67 0.02 5,457 USD Archer-Daniels-Midland Co. 209 0.05 4,868 USD Arconic, Inc. 107 0.03 514 USD Arista Networks, Inc. 126 0.03 1,067 USD Arrow Electronics, Inc. 67 0.02 1,780 USD Arthur J Gallagher & Co. 150 0.04 753 USD Assurant, Inc.1 75 0.02 73,496 USD AT&T, Inc. 2,248 0.58 1,183 USD Atmos Energy Corp.1 120 0.03 2,107 USD Autodesk, Inc.1 339 0.09 916 USD Autoliv, Inc. 56 0.01 4,472 USD Automatic Data Processing, Inc. 716 0.19 258 USD AutoZone, Inc. 265 0.07 1,348 USD AvalonBay Communities, Inc., REIT 274 0.07 924 USD Avery Dennison Corp. 96 0.02 2,738 USD AXA Equitable Holdings, Inc. 56 0.01 4,909 USD Baker Hughes a GE Co. 105 0.03 3,451 USD Ball Corp. 212 0.05 92,080 USD Bank of America Corp. 2,449 0.63 8,466 USD Bank of New York Mellon Corp. (The)1 361 0.09 4,949 USD Baxter International, Inc.1 363 0.09
147
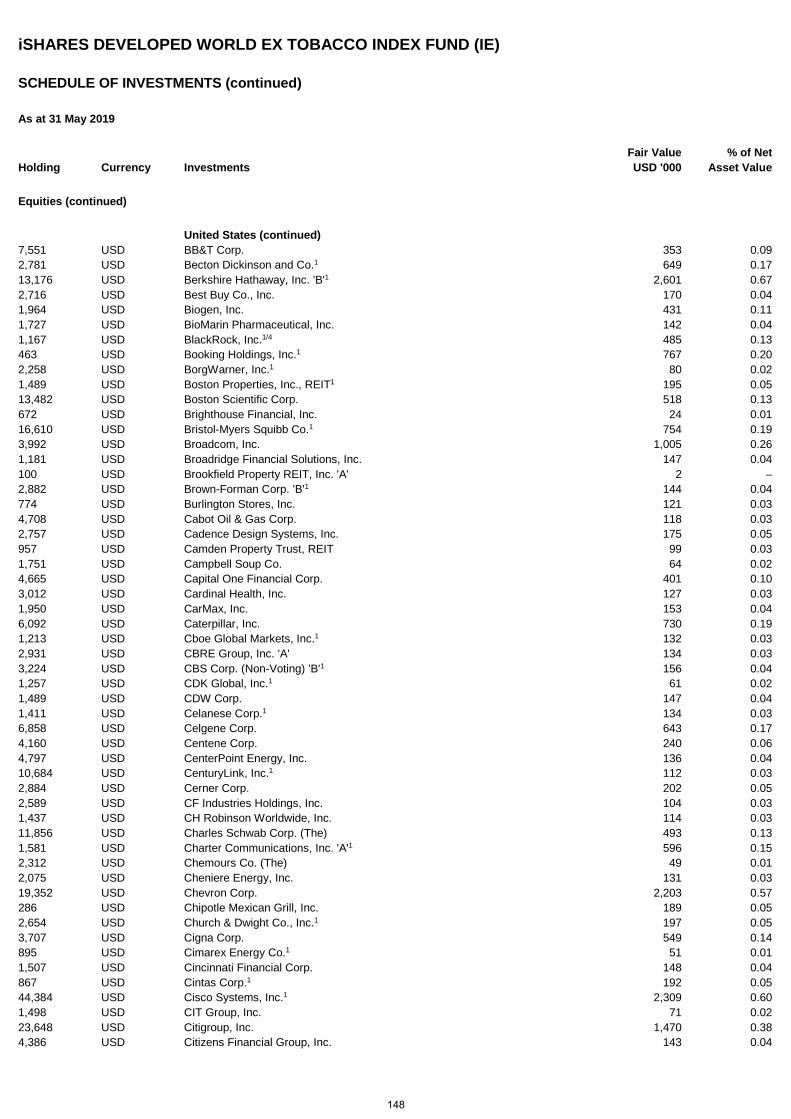
iSHARES DEVELOPED WORLD EX TOBACCO INDEX FUND (IE)
SCHEDULE OF INVESTMENTS (continued)
As at 31 May 2019
Holding Currency Investments Fair Value USD '000
% of Net Asset Value
Equities (continued)
United States (continued) 7,551 USD BB&T Corp. 353 0.09 2,781 USD Becton Dickinson and Co.1 649 0.17 13,176 USD Berkshire Hathaway, Inc. 'B'1 2,601 0.67 2,716 USD Best Buy Co., Inc. 170 0.04 1,964 USD Biogen, Inc. 431 0.11 1,727 USD BioMarin Pharmaceutical, Inc. 142 0.04 1,167 USD BlackRock, Inc.1/4 485 0.13 463 USD Booking Holdings, Inc.1 767 0.20 2,258 USD BorgWarner, Inc.1 80 0.02 1,489 USD Boston Properties, Inc., REIT1 195 0.05 13,482 USD Boston Scientific Corp. 518 0.13 672 USD Brighthouse Financial, Inc. 24 0.01 16,610 USD Bristol-Myers Squibb Co.1 754 0.19 3,992 USD Broadcom, Inc. 1,005 0.26 1,181 USD Broadridge Financial Solutions, Inc. 147 0.04 100 USD Brookfield Property REIT, Inc. 'A' 2 – 2,882 USD Brown-Forman Corp. 'B'1 144 0.04 774 USD Burlington Stores, Inc. 121 0.03 4,708 USD Cabot Oil & Gas Corp. 118 0.03 2,757 USD Cadence Design Systems, Inc. 175 0.05 957 USD Camden Property Trust, REIT 99 0.03 1,751 USD Campbell Soup Co. 64 0.02 4,665 USD Capital One Financial Corp. 401 0.10 3,012 USD Cardinal Health, Inc. 127 0.03 1,950 USD CarMax, Inc. 153 0.04 6,092 USD Caterpillar, Inc. 730 0.19 1,213 USD Cboe Global Markets, Inc.1 132 0.03 2,931 USD CBRE Group, Inc. 'A' 134 0.03 3,224 USD CBS Corp. (Non-Voting) 'B'1 156 0.04 1,257 USD CDK Global, Inc.1 61 0.02 1,489 USD CDW Corp. 147 0.04 1,411 USD Celanese Corp.1 134 0.03 6,858 USD Celgene Corp. 643 0.17 4,160 USD Centene Corp. 240 0.06 4,797 USD CenterPoint Energy, Inc. 136 0.04 10,684 USD CenturyLink, Inc.1 112 0.03 2,884 USD Cerner Corp. 202 0.05 2,589 USD CF Industries Holdings, Inc. 104 0.03 1,437 USD CH Robinson Worldwide, Inc. 114 0.03 11,856 USD Charles Schwab Corp. (The) 493 0.13 1,581 USD Charter Communications, Inc. 'A'1 596 0.15 2,312 USD Chemours Co. (The) 49 0.01 2,075 USD Cheniere Energy, Inc. 131 0.03 19,352 USD Chevron Corp. 2,203 0.57 286 USD Chipotle Mexican Grill, Inc. 189 0.05 2,654 USD Church & Dwight Co., Inc.1 197 0.05 3,707 USD Cigna Corp. 549 0.14 895 USD Cimarex Energy Co.1 51 0.01 1,507 USD Cincinnati Financial Corp. 148 0.04 867 USD Cintas Corp.1 192 0.05 44,384 USD Cisco Systems, Inc.1 2,309 0.60 1,498 USD CIT Group, Inc. 71 0.02 23,648 USD Citigroup, Inc. 1,470 0.38 4,386 USD Citizens Financial Group, Inc. 143 0.04
148
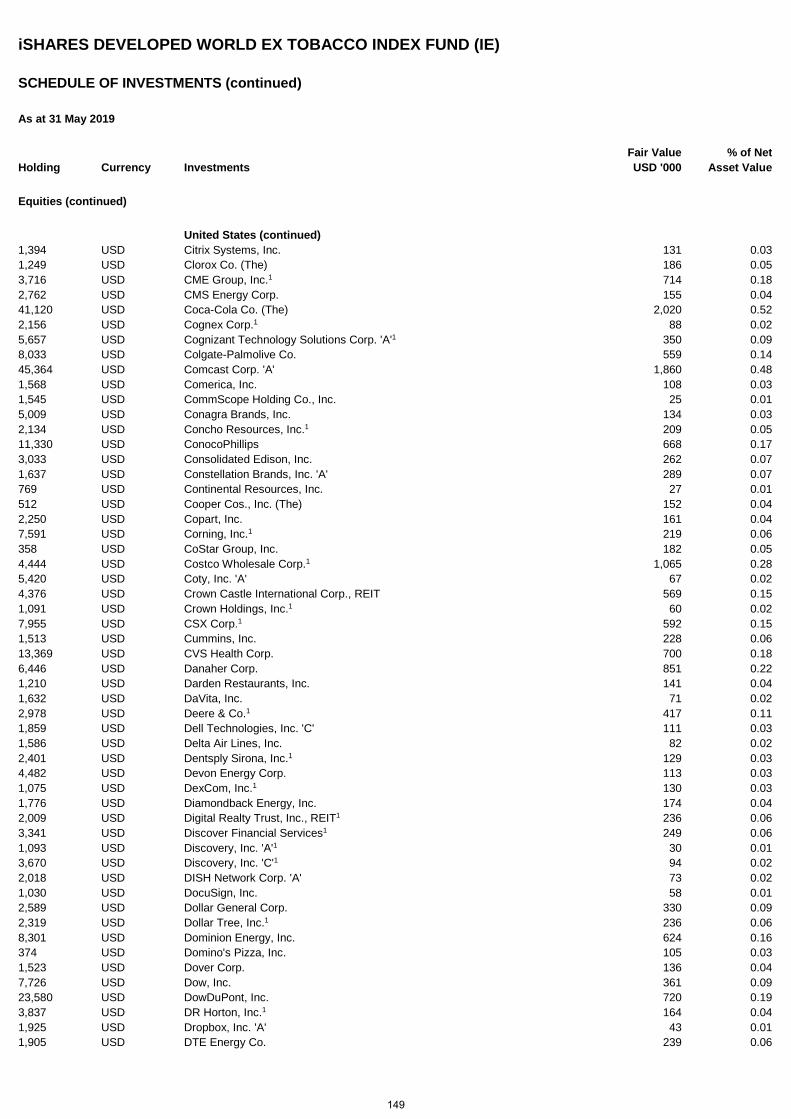
iSHARES DEVELOPED WORLD EX TOBACCO INDEX FUND (IE)
SCHEDULE OF INVESTMENTS (continued)
As at 31 May 2019
Holding Currency Investments Fair Value USD '000
% of Net Asset Value
Equities (continued)
United States (continued) 1,394 USD Citrix Systems, Inc. 131 0.03 1,249 USD Clorox Co. (The) 186 0.05 3,716 USD CME Group, Inc.1 714 0.18 2,762 USD CMS Energy Corp. 155 0.04 41,120 USD Coca-Cola Co. (The) 2,020 0.52 2,156 USD Cognex Corp.1 88 0.02 5,657 USD Cognizant Technology Solutions Corp. 'A'1 350 0.09 8,033 USD Colgate-Palmolive Co. 559 0.14 45,364 USD Comcast Corp. 'A' 1,860 0.48 1,568 USD Comerica, Inc. 108 0.03 1,545 USD CommScope Holding Co., Inc. 25 0.01 5,009 USD Conagra Brands, Inc. 134 0.03 2,134 USD Concho Resources, Inc.1 209 0.05 11,330 USD ConocoPhillips 668 0.17 3,033 USD Consolidated Edison, Inc. 262 0.07 1,637 USD Constellation Brands, Inc. 'A' 289 0.07 769 USD Continental Resources, Inc. 27 0.01 512 USD Cooper Cos., Inc. (The) 152 0.04 2,250 USD Copart, Inc. 161 0.04 7,591 USD Corning, Inc.1 219 0.06 358 USD CoStar Group, Inc. 182 0.05 4,444 USD Costco Wholesale Corp.1 1,065 0.28 5,420 USD Coty, Inc. 'A' 67 0.02 4,376 USD Crown Castle International Corp., REIT 569 0.15 1,091 USD Crown Holdings, Inc.1 60 0.02 7,955 USD CSX Corp.1 592 0.15 1,513 USD Cummins, Inc. 228 0.06 13,369 USD CVS Health Corp. 700 0.18 6,446 USD Danaher Corp. 851 0.22 1,210 USD Darden Restaurants, Inc. 141 0.04 1,632 USD DaVita, Inc. 71 0.02 2,978 USD Deere & Co.1 417 0.11 1,859 USD Dell Technologies, Inc. 'C' 111 0.03 1,586 USD Delta Air Lines, Inc. 82 0.02 2,401 USD Dentsply Sirona, Inc.1 129 0.03 4,482 USD Devon Energy Corp. 113 0.03 1,075 USD DexCom, Inc.1 130 0.03 1,776 USD Diamondback Energy, Inc. 174 0.04 2,009 USD Digital Realty Trust, Inc., REIT1 236 0.06 3,341 USD Discover Financial Services1 249 0.06 1,093 USD Discovery, Inc. 'A'1 30 0.01 3,670 USD Discovery, Inc. 'C'1 94 0.02 2,018 USD DISH Network Corp. 'A' 73 0.02 1,030 USD DocuSign, Inc. 58 0.01 2,589 USD Dollar General Corp. 330 0.09 2,319 USD Dollar Tree, Inc.1 236 0.06 8,301 USD Dominion Energy, Inc. 624 0.16 374 USD Domino's Pizza, Inc. 105 0.03 1,523 USD Dover Corp. 136 0.04 7,726 USD Dow, Inc. 361 0.09 23,580 USD DowDuPont, Inc. 720 0.19 3,837 USD DR Horton, Inc.1 164 0.04 1,925 USD Dropbox, Inc. 'A' 43 0.01 1,905 USD DTE Energy Co. 239 0.06
149
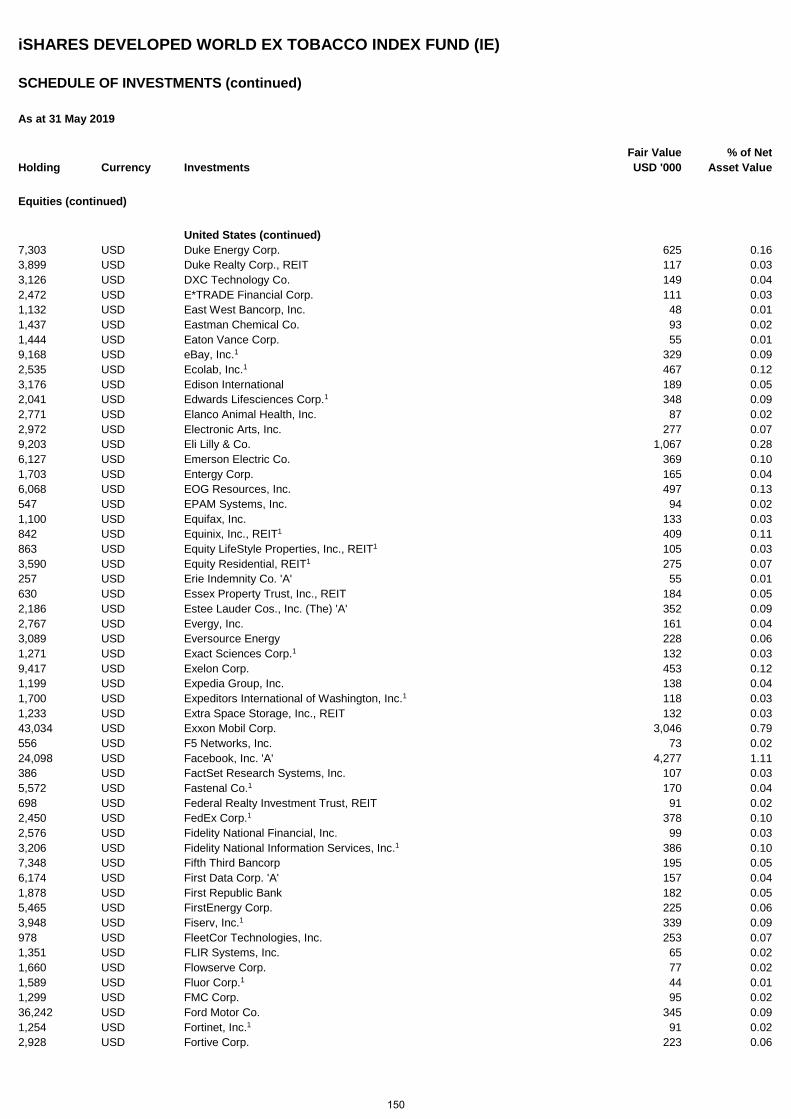
iSHARES DEVELOPED WORLD EX TOBACCO INDEX FUND (IE)
SCHEDULE OF INVESTMENTS (continued)
As at 31 May 2019
Holding Currency Investments Fair Value USD '000
% of Net Asset Value
Equities (continued)
United States (continued) 7,303 USD Duke Energy Corp. 625 0.16 3,899 USD Duke Realty Corp., REIT 117 0.03 3,126 USD DXC Technology Co. 149 0.04 2,472 USD E*TRADE Financial Corp. 111 0.03 1,132 USD East West Bancorp, Inc. 48 0.01 1,437 USD Eastman Chemical Co. 93 0.02 1,444 USD Eaton Vance Corp. 55 0.01 9,168 USD eBay, Inc.1 329 0.09 2,535 USD Ecolab, Inc.1 467 0.12 3,176 USD Edison International 189 0.05 2,041 USD Edwards Lifesciences Corp.1 348 0.09 2,771 USD Elanco Animal Health, Inc. 87 0.02 2,972 USD Electronic Arts, Inc. 277 0.07 9,203 USD Eli Lilly & Co. 1,067 0.28 6,127 USD Emerson Electric Co. 369 0.10 1,703 USD Entergy Corp. 165 0.04 6,068 USD EOG Resources, Inc. 497 0.13 547 USD EPAM Systems, Inc. 94 0.02 1,100 USD Equifax, Inc. 133 0.03 842 USD Equinix, Inc., REIT1 409 0.11 863 USD Equity LifeStyle Properties, Inc., REIT1 105 0.03 3,590 USD Equity Residential, REIT1 275 0.07 257 USD Erie Indemnity Co. 'A' 55 0.01 630 USD Essex Property Trust, Inc., REIT 184 0.05 2,186 USD Estee Lauder Cos., Inc. (The) 'A' 352 0.09 2,767 USD Evergy, Inc. 161 0.04 3,089 USD Eversource Energy 228 0.06 1,271 USD Exact Sciences Corp.1 132 0.03 9,417 USD Exelon Corp. 453 0.12 1,199 USD Expedia Group, Inc. 138 0.04 1,700 USD Expeditors International of Washington, Inc.1 118 0.03 1,233 USD Extra Space Storage, Inc., REIT 132 0.03 43,034 USD Exxon Mobil Corp. 3,046 0.79 556 USD F5 Networks, Inc. 73 0.02 24,098 USD Facebook, Inc. 'A' 4,277 1.11 386 USD FactSet Research Systems, Inc. 107 0.03 5,572 USD Fastenal Co.1 170 0.04 698 USD Federal Realty Investment Trust, REIT 91 0.02 2,450 USD FedEx Corp.1 378 0.10 2,576 USD Fidelity National Financial, Inc. 99 0.03 3,206 USD Fidelity National Information Services, Inc.1 386 0.10 7,348 USD Fifth Third Bancorp 195 0.05 6,174 USD First Data Corp. 'A' 157 0.04 1,878 USD First Republic Bank 182 0.05 5,465 USD FirstEnergy Corp. 225 0.06 3,948 USD Fiserv, Inc.1 339 0.09 978 USD FleetCor Technologies, Inc. 253 0.07 1,351 USD FLIR Systems, Inc. 65 0.02 1,660 USD Flowserve Corp. 77 0.02 1,589 USD Fluor Corp.1 44 0.01 1,299 USD FMC Corp. 95 0.02 36,242 USD Ford Motor Co. 345 0.09 1,254 USD Fortinet, Inc.1 91 0.02 2,928 USD Fortive Corp. 223 0.06
150
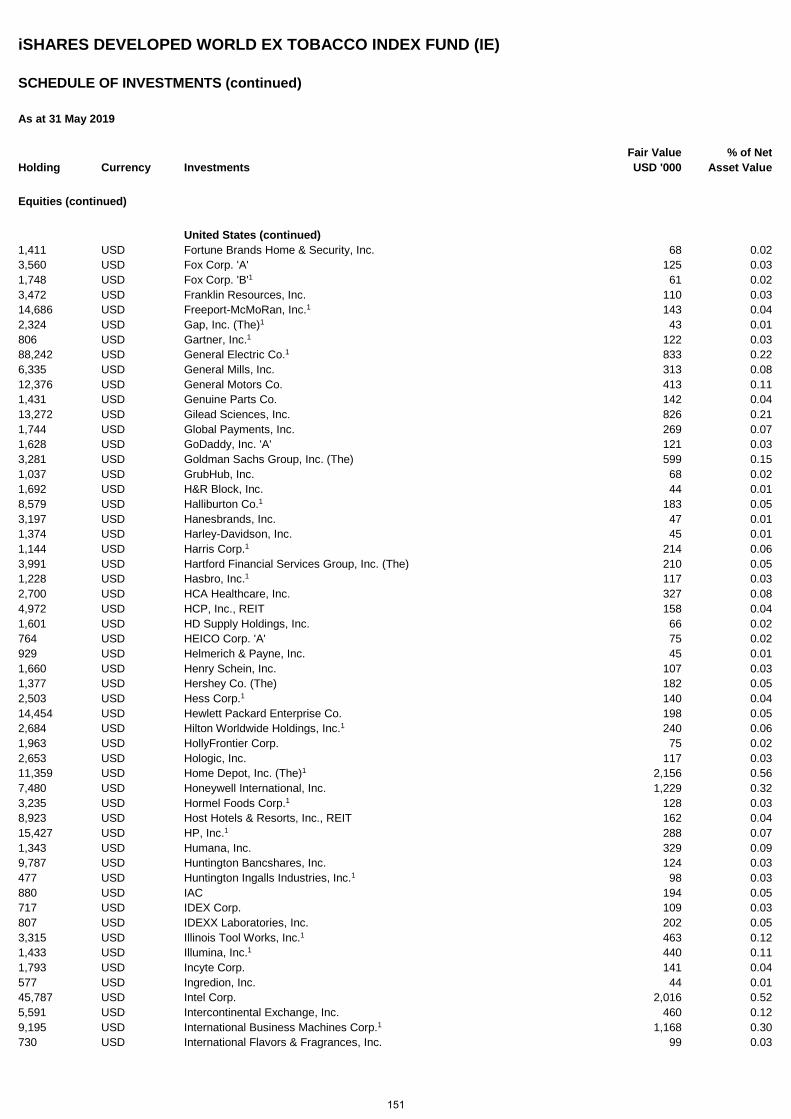
iSHARES DEVELOPED WORLD EX TOBACCO INDEX FUND (IE)
SCHEDULE OF INVESTMENTS (continued)
As at 31 May 2019
Holding Currency Investments Fair Value USD '000
% of Net Asset Value
Equities (continued)
United States (continued) 1,411 USD Fortune Brands Home & Security, Inc. 68 0.02 3,560 USD Fox Corp. 'A' 125 0.03 1,748 USD Fox Corp. 'B'1 61 0.02 3,472 USD Franklin Resources, Inc. 110 0.03 14,686 USD Freeport-McMoRan, Inc.1 143 0.04 2,324 USD Gap, Inc. (The)1 43 0.01 806 USD Gartner, Inc.1 122 0.03 88,242 USD General Electric Co.1 833 0.22 6,335 USD General Mills, Inc. 313 0.08 12,376 USD General Motors Co. 413 0.11 1,431 USD Genuine Parts Co. 142 0.04 13,272 USD Gilead Sciences, Inc. 826 0.21 1,744 USD Global Payments, Inc. 269 0.07 1,628 USD GoDaddy, Inc. 'A' 121 0.03 3,281 USD Goldman Sachs Group, Inc. (The) 599 0.15 1,037 USD GrubHub, Inc. 68 0.02 1,692 USD H&R Block, Inc. 44 0.01 8,579 USD Halliburton Co.1 183 0.05 3,197 USD Hanesbrands, Inc. 47 0.01 1,374 USD Harley-Davidson, Inc. 45 0.01 1,144 USD Harris Corp.1 214 0.06 3,991 USD Hartford Financial Services Group, Inc. (The) 210 0.05 1,228 USD Hasbro, Inc.1 117 0.03 2,700 USD HCA Healthcare, Inc. 327 0.08 4,972 USD HCP, Inc., REIT 158 0.04 1,601 USD HD Supply Holdings, Inc. 66 0.02 764 USD HEICO Corp. 'A' 75 0.02 929 USD Helmerich & Payne, Inc. 45 0.01 1,660 USD Henry Schein, Inc. 107 0.03 1,377 USD Hershey Co. (The) 182 0.05 2,503 USD Hess Corp.1 140 0.04 14,454 USD Hewlett Packard Enterprise Co. 198 0.05 2,684 USD Hilton Worldwide Holdings, Inc.1 240 0.06 1,963 USD HollyFrontier Corp. 75 0.02 2,653 USD Hologic, Inc. 117 0.03 11,359 USD Home Depot, Inc. (The)1 2,156 0.56 7,480 USD Honeywell International, Inc. 1,229 0.32 3,235 USD Hormel Foods Corp.1 128 0.03 8,923 USD Host Hotels & Resorts, Inc., REIT 162 0.04 15,427 USD HP, Inc.1 288 0.07 1,343 USD Humana, Inc. 329 0.09 9,787 USD Huntington Bancshares, Inc. 124 0.03 477 USD Huntington Ingalls Industries, Inc.1 98 0.03 880 USD IAC 194 0.05 717 USD IDEX Corp. 109 0.03 807 USD IDEXX Laboratories, Inc. 202 0.05 3,315 USD Illinois Tool Works, Inc.1 463 0.12 1,433 USD Illumina, Inc.1 440 0.11 1,793 USD Incyte Corp. 141 0.04 577 USD Ingredion, Inc. 44 0.01 45,787 USD Intel Corp. 2,016 0.52 5,591 USD Intercontinental Exchange, Inc. 460 0.12 9,195 USD International Business Machines Corp.1 1,168 0.30 730 USD International Flavors & Fragrances, Inc. 99 0.03
151
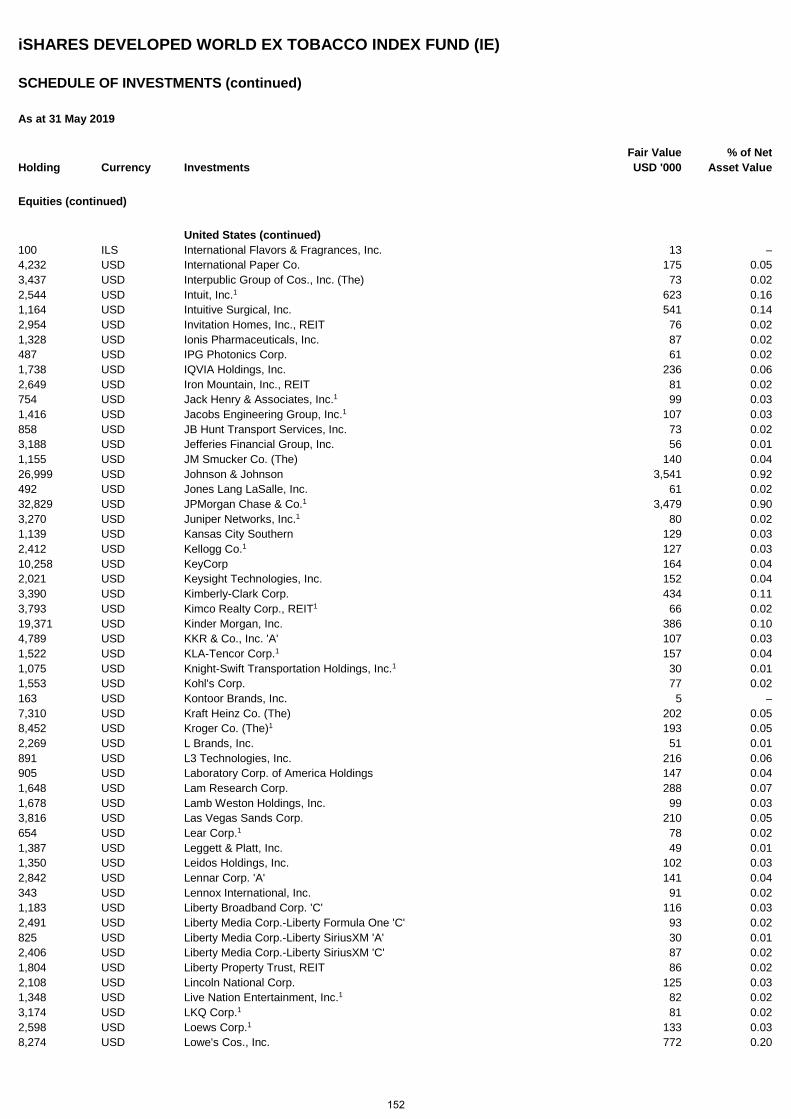
iSHARES DEVELOPED WORLD EX TOBACCO INDEX FUND (IE)
SCHEDULE OF INVESTMENTS (continued)
As at 31 May 2019
Holding Currency Investments Fair Value USD '000
% of Net Asset Value
Equities (continued)
United States (continued) 100 ILS International Flavors & Fragrances, Inc. 13 – 4,232 USD International Paper Co. 175 0.05 3,437 USD Interpublic Group of Cos., Inc. (The) 73 0.02 2,544 USD Intuit, Inc.1 623 0.16 1,164 USD Intuitive Surgical, Inc. 541 0.14 2,954 USD Invitation Homes, Inc., REIT 76 0.02 1,328 USD Ionis Pharmaceuticals, Inc. 87 0.02 487 USD IPG Photonics Corp. 61 0.02 1,738 USD IQVIA Holdings, Inc. 236 0.06 2,649 USD Iron Mountain, Inc., REIT 81 0.02 754 USD Jack Henry & Associates, Inc.1 99 0.03 1,416 USD Jacobs Engineering Group, Inc.1 107 0.03 858 USD JB Hunt Transport Services, Inc. 73 0.02 3,188 USD Jefferies Financial Group, Inc. 56 0.01 1,155 USD JM Smucker Co. (The) 140 0.04 26,999 USD Johnson & Johnson 3,541 0.92 492 USD Jones Lang LaSalle, Inc. 61 0.02 32,829 USD JPMorgan Chase & Co.1 3,479 0.90 3,270 USD Juniper Networks, Inc.1 80 0.02 1,139 USD Kansas City Southern 129 0.03 2,412 USD Kellogg Co.1 127 0.03 10,258 USD KeyCorp 164 0.04 2,021 USD Keysight Technologies, Inc. 152 0.04 3,390 USD Kimberly-Clark Corp. 434 0.11 3,793 USD Kimco Realty Corp., REIT1 66 0.02 19,371 USD Kinder Morgan, Inc. 386 0.10 4,789 USD KKR & Co., Inc. 'A' 107 0.03 1,522 USD KLA-Tencor Corp.1 157 0.04 1,075 USD Knight-Swift Transportation Holdings, Inc.1 30 0.01 1,553 USD Kohl's Corp. 77 0.02 163 USD Kontoor Brands, Inc. 5 – 7,310 USD Kraft Heinz Co. (The) 202 0.05 8,452 USD Kroger Co. (The)1 193 0.05 2,269 USD L Brands, Inc. 51 0.01 891 USD L3 Technologies, Inc. 216 0.06 905 USD Laboratory Corp. of America Holdings 147 0.04 1,648 USD Lam Research Corp. 288 0.07 1,678 USD Lamb Weston Holdings, Inc. 99 0.03 3,816 USD Las Vegas Sands Corp. 210 0.05 654 USD Lear Corp.1 78 0.02 1,387 USD Leggett & Platt, Inc. 49 0.01 1,350 USD Leidos Holdings, Inc. 102 0.03 2,842 USD Lennar Corp. 'A' 141 0.04 343 USD Lennox International, Inc. 91 0.02 1,183 USD Liberty Broadband Corp. 'C' 116 0.03 2,491 USD Liberty Media Corp.-Liberty Formula One 'C' 93 0.02 825 USD Liberty Media Corp.-Liberty SiriusXM 'A' 30 0.01 2,406 USD Liberty Media Corp.-Liberty SiriusXM 'C' 87 0.02 1,804 USD Liberty Property Trust, REIT 86 0.02 2,108 USD Lincoln National Corp. 125 0.03 1,348 USD Live Nation Entertainment, Inc.1 82 0.02 3,174 USD LKQ Corp.1 81 0.02 2,598 USD Loews Corp.1 133 0.03 8,274 USD Lowe's Cos., Inc. 772 0.20
152
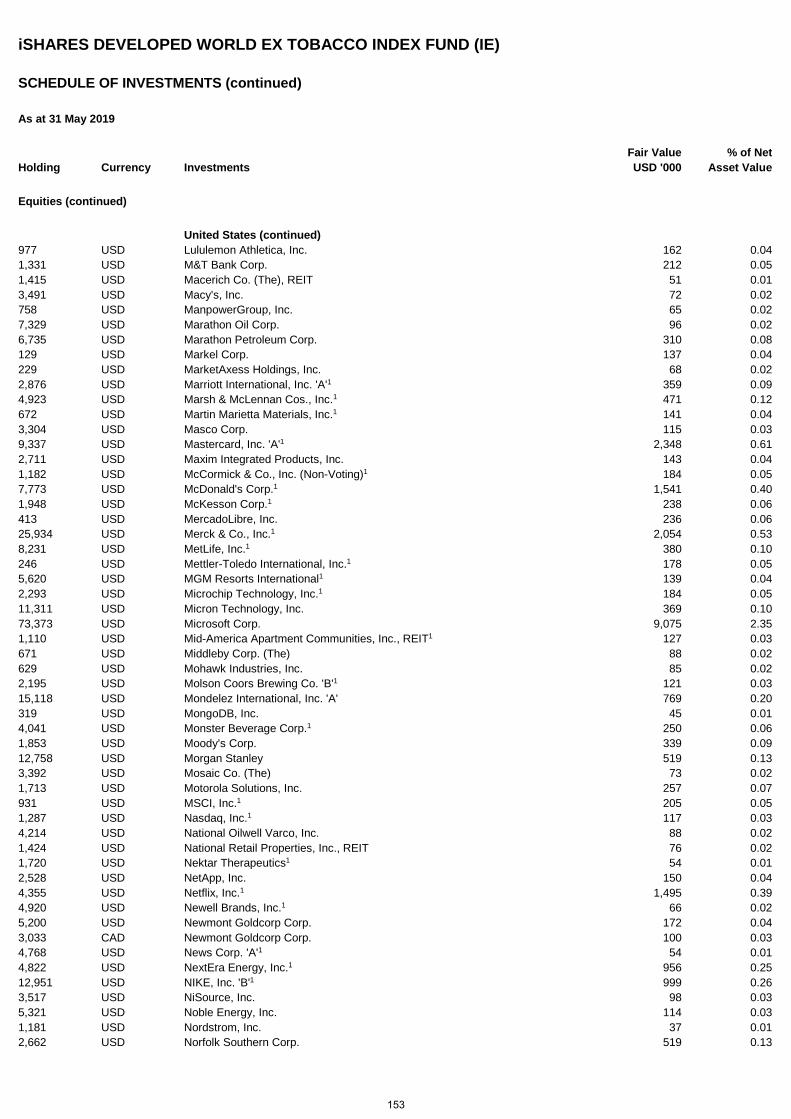
iSHARES DEVELOPED WORLD EX TOBACCO INDEX FUND (IE)
SCHEDULE OF INVESTMENTS (continued)
As at 31 May 2019
Holding Currency Investments Fair Value USD '000
% of Net Asset Value
Equities (continued)
United States (continued) 977 USD Lululemon Athletica, Inc. 162 0.04 1,331 USD M&T Bank Corp. 212 0.05 1,415 USD Macerich Co. (The), REIT 51 0.01 3,491 USD Macy's, Inc. 72 0.02 758 USD ManpowerGroup, Inc. 65 0.02 7,329 USD Marathon Oil Corp. 96 0.02 6,735 USD Marathon Petroleum Corp. 310 0.08 129 USD Markel Corp. 137 0.04 229 USD MarketAxess Holdings, Inc. 68 0.02 2,876 USD Marriott International, Inc. 'A'1 359 0.09 4,923 USD Marsh & McLennan Cos., Inc.1 471 0.12 672 USD Martin Marietta Materials, Inc.1 141 0.04 3,304 USD Masco Corp. 115 0.03 9,337 USD Mastercard, Inc. 'A'1 2,348 0.61 2,711 USD Maxim Integrated Products, Inc. 143 0.04 1,182 USD McCormick & Co., Inc. (Non-Voting)1 184 0.05 7,773 USD McDonald's Corp.1 1,541 0.40 1,948 USD McKesson Corp.1 238 0.06 413 USD MercadoLibre, Inc. 236 0.06 25,934 USD Merck & Co., Inc.1 2,054 0.53 8,231 USD MetLife, Inc.1 380 0.10 246 USD Mettler-Toledo International, Inc.1 178 0.05 5,620 USD MGM Resorts International1 139 0.04 2,293 USD Microchip Technology, Inc.1 184 0.05 11,311 USD Micron Technology, Inc. 369 0.10 73,373 USD Microsoft Corp. 9,075 2.35 1,110 USD Mid-America Apartment Communities, Inc., REIT1 127 0.03 671 USD Middleby Corp. (The) 88 0.02 629 USD Mohawk Industries, Inc. 85 0.02 2,195 USD Molson Coors Brewing Co. 'B'1 121 0.03 15,118 USD Mondelez International, Inc. 'A' 769 0.20 319 USD MongoDB, Inc. 45 0.01 4,041 USD Monster Beverage Corp.1 250 0.06 1,853 USD Moody's Corp. 339 0.09 12,758 USD Morgan Stanley 519 0.13 3,392 USD Mosaic Co. (The) 73 0.02 1,713 USD Motorola Solutions, Inc. 257 0.07 931 USD MSCI, Inc.1 205 0.05 1,287 USD Nasdaq, Inc.1 117 0.03 4,214 USD National Oilwell Varco, Inc. 88 0.02 1,424 USD National Retail Properties, Inc., REIT 76 0.02 1,720 USD Nektar Therapeutics1 54 0.01 2,528 USD NetApp, Inc. 150 0.04 4,355 USD Netflix, Inc.1 1,495 0.39 4,920 USD Newell Brands, Inc.1 66 0.02 5,200 USD Newmont Goldcorp Corp. 172 0.04 3,033 CAD Newmont Goldcorp Corp. 100 0.03 4,768 USD News Corp. 'A'1 54 0.01 4,822 USD NextEra Energy, Inc.1 956 0.25 12,951 USD NIKE, Inc. 'B'1 999 0.26 3,517 USD NiSource, Inc. 98 0.03 5,321 USD Noble Energy, Inc. 114 0.03 1,181 USD Nordstrom, Inc. 37 0.01 2,662 USD Norfolk Southern Corp. 519 0.13
153
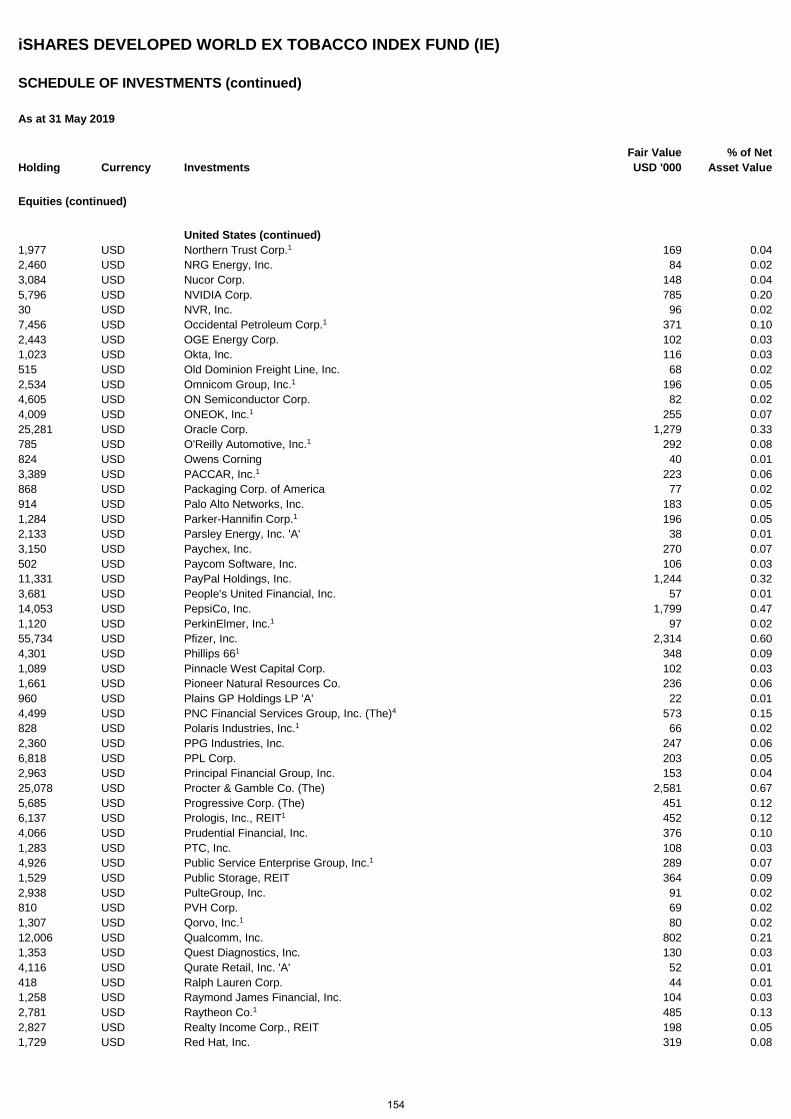
iSHARES DEVELOPED WORLD EX TOBACCO INDEX FUND (IE)
SCHEDULE OF INVESTMENTS (continued)
As at 31 May 2019
Holding Currency Investments Fair Value USD '000
% of Net Asset Value
Equities (continued)
United States (continued) 1,977 USD Northern Trust Corp.1 169 0.04 2,460 USD NRG Energy, Inc. 84 0.02 3,084 USD Nucor Corp. 148 0.04 5,796 USD NVIDIA Corp. 785 0.20 30 USD NVR, Inc. 96 0.02 7,456 USD Occidental Petroleum Corp.1 371 0.10 2,443 USD OGE Energy Corp. 102 0.03 1,023 USD Okta, Inc. 116 0.03 515 USD Old Dominion Freight Line, Inc. 68 0.02 2,534 USD Omnicom Group, Inc.1 196 0.05 4,605 USD ON Semiconductor Corp. 82 0.02 4,009 USD ONEOK, Inc.1 255 0.07 25,281 USD Oracle Corp. 1,279 0.33 785 USD O'Reilly Automotive, Inc.1 292 0.08 824 USD Owens Corning 40 0.01 3,389 USD PACCAR, Inc.1 223 0.06 868 USD Packaging Corp. of America 77 0.02 914 USD Palo Alto Networks, Inc. 183 0.05 1,284 USD Parker-Hannifin Corp.1 196 0.05 2,133 USD Parsley Energy, Inc. 'A' 38 0.01 3,150 USD Paychex, Inc. 270 0.07 502 USD Paycom Software, Inc. 106 0.03 11,331 USD PayPal Holdings, Inc. 1,244 0.32 3,681 USD People's United Financial, Inc. 57 0.01 14,053 USD PepsiCo, Inc. 1,799 0.47 1,120 USD PerkinElmer, Inc.1 97 0.02 55,734 USD Pfizer, Inc. 2,314 0.60 4,301 USD Phillips 661 348 0.09 1,089 USD Pinnacle West Capital Corp. 102 0.03 1,661 USD Pioneer Natural Resources Co. 236 0.06 960 USD Plains GP Holdings LP 'A' 22 0.01 4,499 USD PNC Financial Services Group, Inc. (The)4 573 0.15 828 USD Polaris Industries, Inc.1 66 0.02 2,360 USD PPG Industries, Inc. 247 0.06 6,818 USD PPL Corp. 203 0.05 2,963 USD Principal Financial Group, Inc. 153 0.04 25,078 USD Procter & Gamble Co. (The) 2,581 0.67 5,685 USD Progressive Corp. (The) 451 0.12 6,137 USD Prologis, Inc., REIT1 452 0.12 4,066 USD Prudential Financial, Inc. 376 0.10 1,283 USD PTC, Inc. 108 0.03 4,926 USD Public Service Enterprise Group, Inc.1 289 0.07 1,529 USD Public Storage, REIT 364 0.09 2,938 USD PulteGroup, Inc. 91 0.02 810 USD PVH Corp. 69 0.02 1,307 USD Qorvo, Inc.1 80 0.02 12,006 USD Qualcomm, Inc. 802 0.21 1,353 USD Quest Diagnostics, Inc. 130 0.03 4,116 USD Qurate Retail, Inc. 'A' 52 0.01 418 USD Ralph Lauren Corp. 44 0.01 1,258 USD Raymond James Financial, Inc. 104 0.03 2,781 USD Raytheon Co.1 485 0.13 2,827 USD Realty Income Corp., REIT 198 0.05 1,729 USD Red Hat, Inc. 319 0.08
154
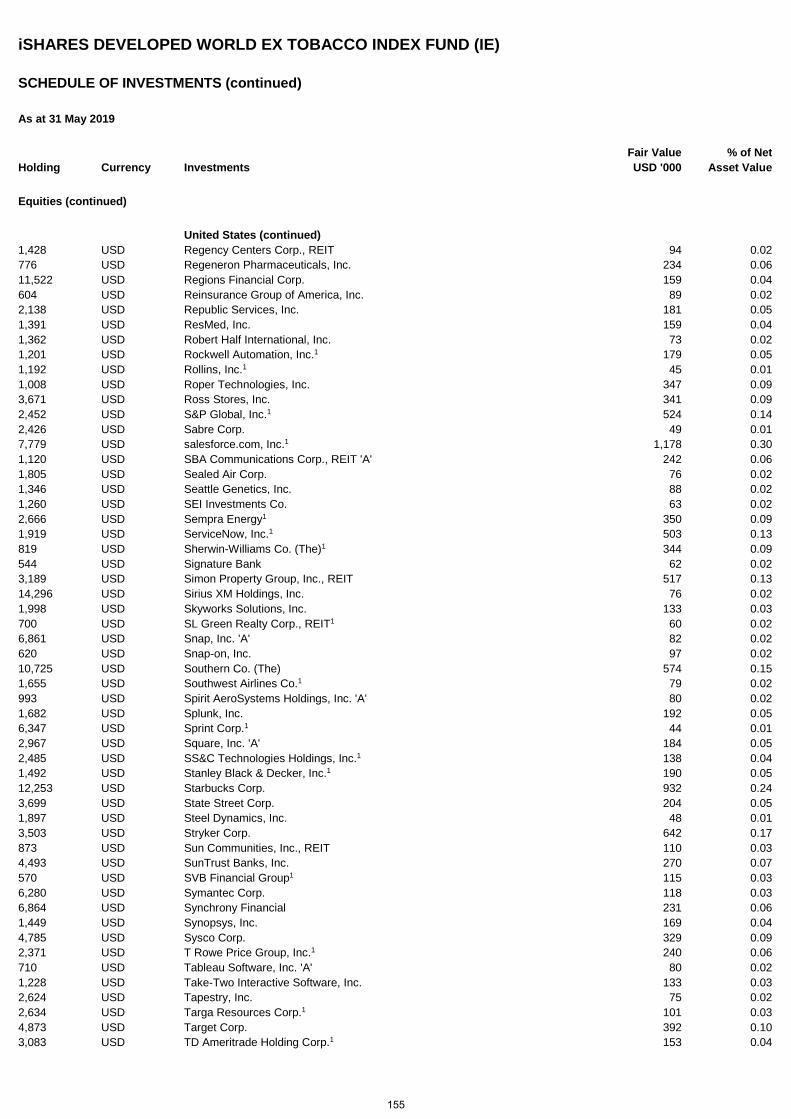
iSHARES DEVELOPED WORLD EX TOBACCO INDEX FUND (IE)
SCHEDULE OF INVESTMENTS (continued)
As at 31 May 2019
Holding Currency Investments Fair Value USD '000
% of Net Asset Value
Equities (continued)
United States (continued) 1,428 USD Regency Centers Corp., REIT 94 0.02 776 USD Regeneron Pharmaceuticals, Inc. 234 0.06 11,522 USD Regions Financial Corp. 159 0.04 604 USD Reinsurance Group of America, Inc. 89 0.02 2,138 USD Republic Services, Inc. 181 0.05 1,391 USD ResMed, Inc. 159 0.04 1,362 USD Robert Half International, Inc. 73 0.02 1,201 USD Rockwell Automation, Inc.1 179 0.05 1,192 USD Rollins, Inc.1 45 0.01 1,008 USD Roper Technologies, Inc. 347 0.09 3,671 USD Ross Stores, Inc. 341 0.09 2,452 USD S&P Global, Inc.1 524 0.14 2,426 USD Sabre Corp. 49 0.01 7,779 USD salesforce.com, Inc.1 1,178 0.30 1,120 USD SBA Communications Corp., REIT 'A' 242 0.06 1,805 USD Sealed Air Corp. 76 0.02 1,346 USD Seattle Genetics, Inc. 88 0.02 1,260 USD SEI Investments Co. 63 0.02 2,666 USD Sempra Energy1 350 0.09 1,919 USD ServiceNow, Inc.1 503 0.13 819 USD Sherwin-Williams Co. (The)1 344 0.09 544 USD Signature Bank 62 0.02 3,189 USD Simon Property Group, Inc., REIT 517 0.13 14,296 USD Sirius XM Holdings, Inc. 76 0.02 1,998 USD Skyworks Solutions, Inc. 133 0.03 700 USD SL Green Realty Corp., REIT1 60 0.02 6,861 USD Snap, Inc. 'A' 82 0.02 620 USD Snap-on, Inc. 97 0.02 10,725 USD Southern Co. (The) 574 0.15 1,655 USD Southwest Airlines Co.1 79 0.02 993 USD Spirit AeroSystems Holdings, Inc. 'A' 80 0.02 1,682 USD Splunk, Inc. 192 0.05 6,347 USD Sprint Corp.1 44 0.01 2,967 USD Square, Inc. 'A' 184 0.05 2,485 USD SS&C Technologies Holdings, Inc.1 138 0.04 1,492 USD Stanley Black & Decker, Inc.1 190 0.05 12,253 USD Starbucks Corp. 932 0.24 3,699 USD State Street Corp. 204 0.05 1,897 USD Steel Dynamics, Inc. 48 0.01 3,503 USD Stryker Corp. 642 0.17 873 USD Sun Communities, Inc., REIT 110 0.03 4,493 USD SunTrust Banks, Inc. 270 0.07 570 USD SVB Financial Group1 115 0.03 6,280 USD Symantec Corp. 118 0.03 6,864 USD Synchrony Financial 231 0.06 1,449 USD Synopsys, Inc. 169 0.04 4,785 USD Sysco Corp. 329 0.09 2,371 USD T Rowe Price Group, Inc.1 240 0.06 710 USD Tableau Software, Inc. 'A' 80 0.02 1,228 USD Take-Two Interactive Software, Inc. 133 0.03 2,624 USD Tapestry, Inc. 75 0.02 2,634 USD Targa Resources Corp.1 101 0.03 4,873 USD Target Corp. 392 0.10 3,083 USD TD Ameritrade Holding Corp.1 153 0.04
155
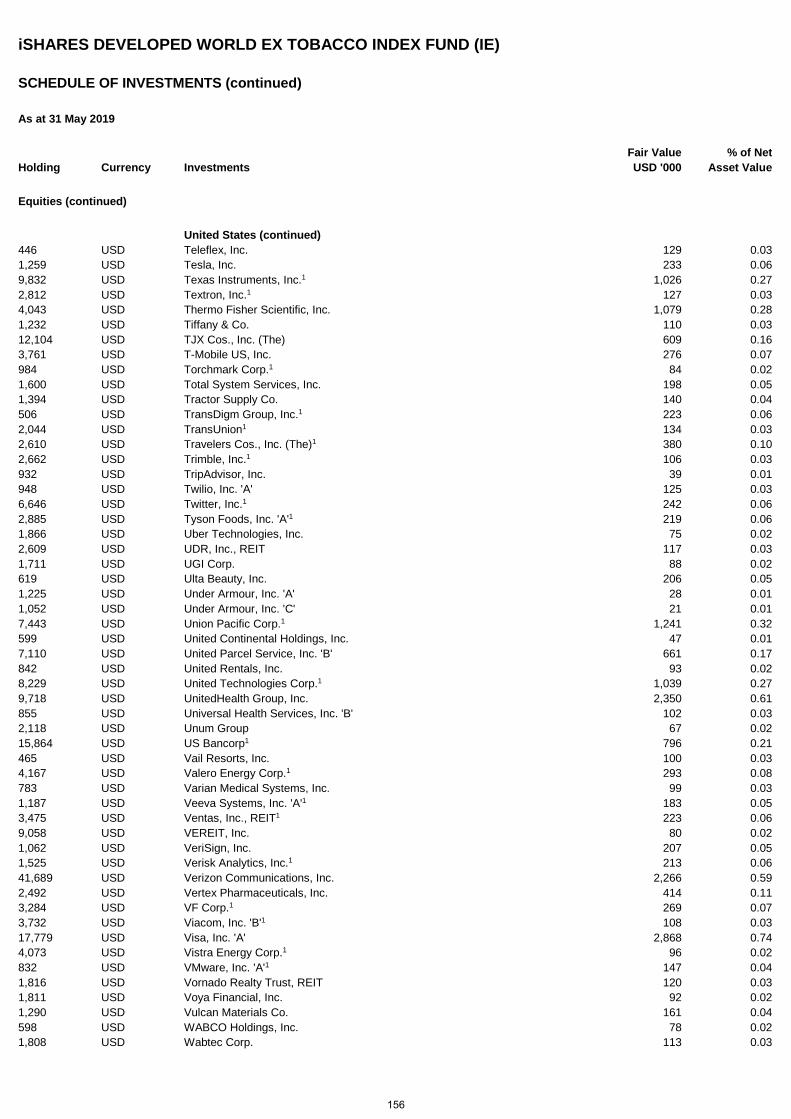
iSHARES DEVELOPED WORLD EX TOBACCO INDEX FUND (IE)
SCHEDULE OF INVESTMENTS (continued)
As at 31 May 2019
Holding Currency Investments Fair Value USD '000
% of Net Asset Value
Equities (continued)
United States (continued) 446 USD Teleflex, Inc. 129 0.03 1,259 USD Tesla, Inc. 233 0.06 9,832 USD Texas Instruments, Inc.1 1,026 0.27 2,812 USD Textron, Inc.1 127 0.03 4,043 USD Thermo Fisher Scientific, Inc. 1,079 0.28 1,232 USD Tiffany & Co. 110 0.03 12,104 USD TJX Cos., Inc. (The) 609 0.16 3,761 USD T-Mobile US, Inc. 276 0.07 984 USD Torchmark Corp.1 84 0.02 1,600 USD Total System Services, Inc. 198 0.05 1,394 USD Tractor Supply Co. 140 0.04 506 USD TransDigm Group, Inc.1 223 0.06 2,044 USD TransUnion1 134 0.03 2,610 USD Travelers Cos., Inc. (The)1 380 0.10 2,662 USD Trimble, Inc.1 106 0.03 932 USD TripAdvisor, Inc. 39 0.01 948 USD Twilio, Inc. 'A' 125 0.03 6,646 USD Twitter, Inc.1 242 0.06 2,885 USD Tyson Foods, Inc. 'A'1 219 0.06 1,866 USD Uber Technologies, Inc. 75 0.02 2,609 USD UDR, Inc., REIT 117 0.03 1,711 USD UGI Corp. 88 0.02 619 USD Ulta Beauty, Inc. 206 0.05 1,225 USD Under Armour, Inc. 'A' 28 0.01 1,052 USD Under Armour, Inc. 'C' 21 0.01 7,443 USD Union Pacific Corp.1 1,241 0.32 599 USD United Continental Holdings, Inc. 47 0.01 7,110 USD United Parcel Service, Inc. 'B' 661 0.17 842 USD United Rentals, Inc. 93 0.02 8,229 USD United Technologies Corp.1 1,039 0.27 9,718 USD UnitedHealth Group, Inc. 2,350 0.61 855 USD Universal Health Services, Inc. 'B' 102 0.03 2,118 USD Unum Group 67 0.02 15,864 USD US Bancorp1 796 0.21 465 USD Vail Resorts, Inc. 100 0.03 4,167 USD Valero Energy Corp.1 293 0.08 783 USD Varian Medical Systems, Inc. 99 0.03 1,187 USD Veeva Systems, Inc. 'A'1 183 0.05 3,475 USD Ventas, Inc., REIT1 223 0.06 9,058 USD VEREIT, Inc. 80 0.02 1,062 USD VeriSign, Inc. 207 0.05 1,525 USD Verisk Analytics, Inc.1 213 0.06 41,689 USD Verizon Communications, Inc. 2,266 0.59 2,492 USD Vertex Pharmaceuticals, Inc. 414 0.11 3,284 USD VF Corp.1 269 0.07 3,732 USD Viacom, Inc. 'B'1 108 0.03 17,779 USD Visa, Inc. 'A' 2,868 0.74 4,073 USD Vistra Energy Corp.1 96 0.02 832 USD VMware, Inc. 'A'1 147 0.04 1,816 USD Vornado Realty Trust, REIT 120 0.03 1,811 USD Voya Financial, Inc. 92 0.02 1,290 USD Vulcan Materials Co. 161 0.04 598 USD WABCO Holdings, Inc. 78 0.02 1,808 USD Wabtec Corp. 113 0.03
156
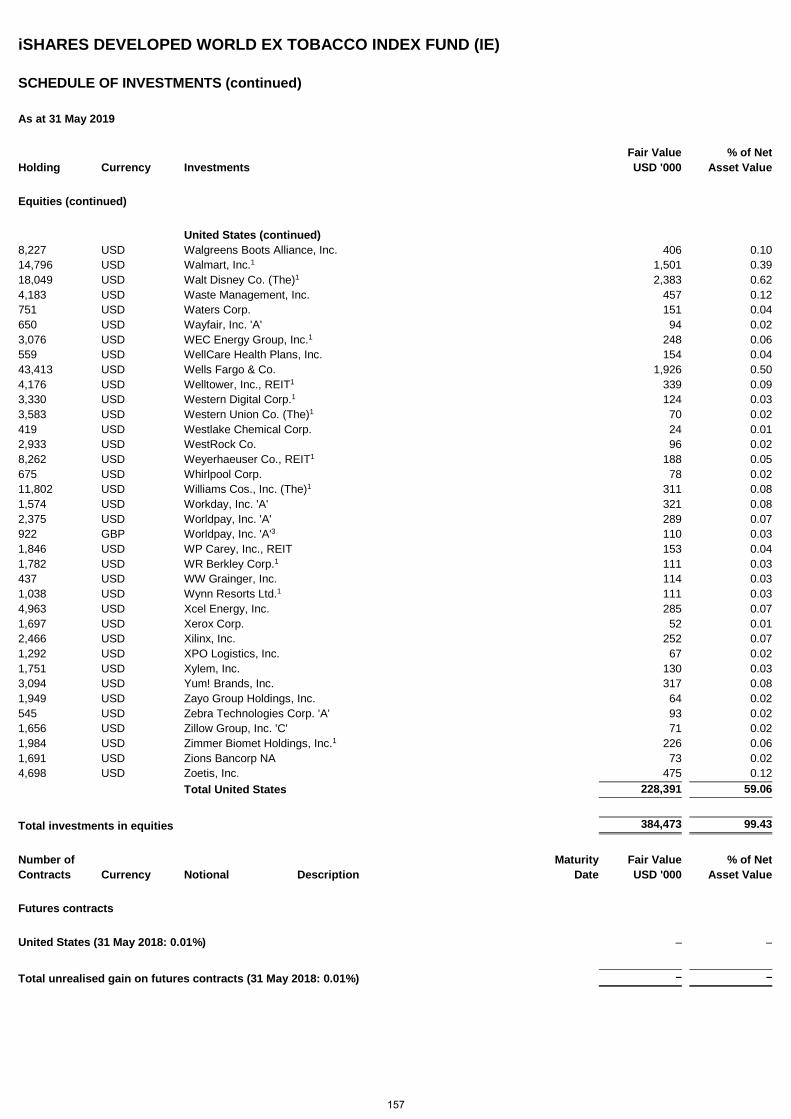
iSHARES DEVELOPED WORLD EX TOBACCO INDEX FUND (IE)
SCHEDULE OF INVESTMENTS (continued)
As at 31 May 2019
Holding Currency Investments Fair Value USD '000
% of Net Asset Value
Equities (continued)
United States (continued) 8,227 USD Walgreens Boots Alliance, Inc. 406 0.10 14,796 USD Walmart, Inc.1 1,501 0.39 18,049 USD Walt Disney Co. (The)1 2,383 0.62 4,183 USD Waste Management, Inc. 457 0.12 751 USD Waters Corp. 151 0.04 650 USD Wayfair, Inc. 'A' 94 0.02 3,076 USD WEC Energy Group, Inc.1 248 0.06 559 USD WellCare Health Plans, Inc. 154 0.04 43,413 USD Wells Fargo & Co. 1,926 0.50 4,176 USD Welltower, Inc., REIT1 339 0.09 3,330 USD Western Digital Corp.1 124 0.03 3,583 USD Western Union Co. (The)1 70 0.02 419 USD Westlake Chemical Corp. 24 0.01 2,933 USD WestRock Co. 96 0.02 8,262 USD Weyerhaeuser Co., REIT1 188 0.05 675 USD Whirlpool Corp. 78 0.02 11,802 USD Williams Cos., Inc. (The)1 311 0.08 1,574 USD Workday, Inc. 'A' 321 0.08 2,375 USD Worldpay, Inc. 'A' 289 0.07 922 GBP Worldpay, Inc. 'A'3 110 0.03 1,846 USD WP Carey, Inc., REIT 153 0.04 1,782 USD WR Berkley Corp.1 111 0.03 437 USD WW Grainger, Inc. 114 0.03 1,038 USD Wynn Resorts Ltd.1 111 0.03 4,963 USD Xcel Energy, Inc. 285 0.07 1,697 USD Xerox Corp. 52 0.01 2,466 USD Xilinx, Inc. 252 0.07 1,292 USD XPO Logistics, Inc. 67 0.02 1,751 USD Xylem, Inc. 130 0.03 3,094 USD Yum! Brands, Inc. 317 0.08 1,949 USD Zayo Group Holdings, Inc. 64 0.02 545 USD Zebra Technologies Corp. 'A' 93 0.02 1,656 USD Zillow Group, Inc. 'C' 71 0.02 1,984 USD Zimmer Biomet Holdings, Inc.1 226 0.06 1,691 USD Zions Bancorp NA 73 0.02 4,698 USD Zoetis, Inc. 475 0.12 Total United States 228,391 59.06
Total investments in equities 384,473 99.43
Number of Maturity Fair Value % of Net Contracts Currency Notional Description Date USD '000 Asset Value
Futures contracts
United States (31 May 2018: 0.01%) – –
Total unrealised gain on futures contracts (31 May 2018: 0.01%) – –
157
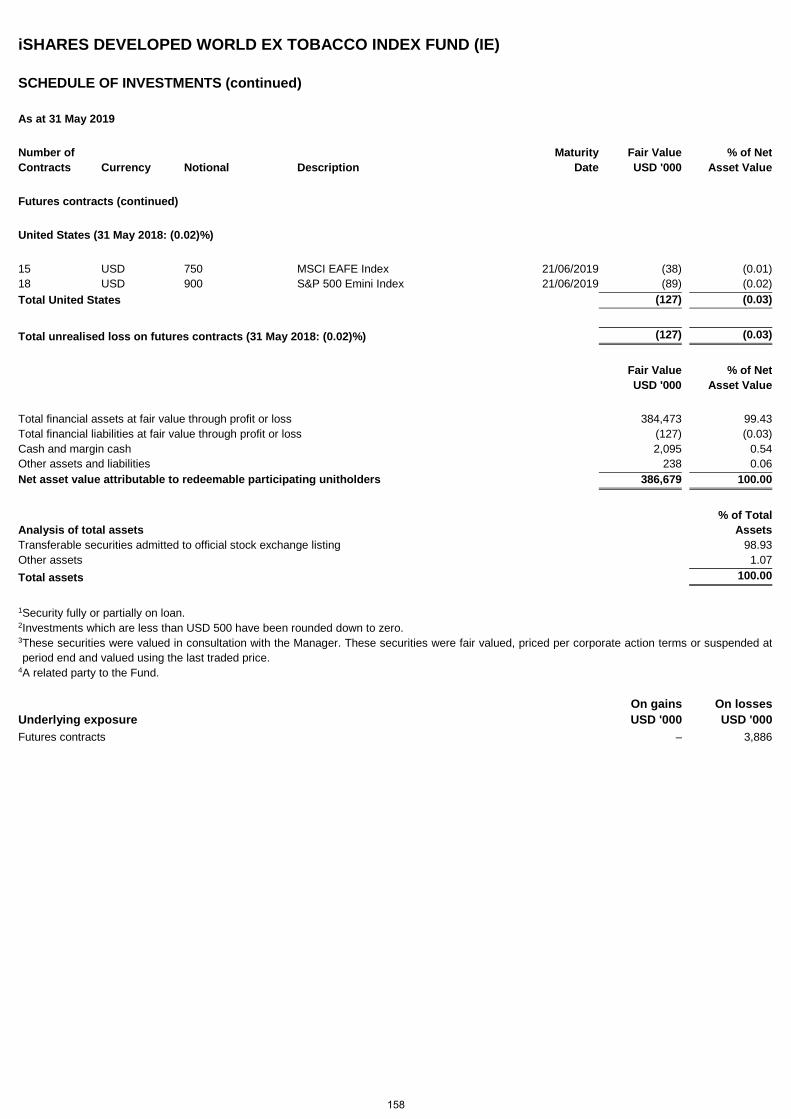
iSHARES DEVELOPED WORLD EX TOBACCO INDEX FUND (IE)
SCHEDULE OF INVESTMENTS (continued)
As at 31 May 2019
Number of Maturity Fair Value % of Net Contracts Currency Notional Description Date USD '000 Asset Value
Futures contracts (continued)
United States (31 May 2018: (0.02)%)
15 USD 750 MSCI EAFE Index 21/06/2019 (38) (0.01) 18 USD 900 S&P 500 Emini Index 21/06/2019 (89) (0.02) Total United States (127) (0.03)
Total unrealised loss on futures contracts (31 May 2018: (0.02)%) (127) (0.03)
Fair Value USD '000
% of Net Asset Value
Total financial assets at fair value through profit or loss 384,473 99.43 Total financial liabilities at fair value through profit or loss (127) (0.03) Cash and margin cash 2,095 0.54 Other assets and liabilities 238 0.06 Net asset value attributable to redeemable participating unitholders 386,679 100.00
Analysis of total assets % of Total
Assets Transferable securities admitted to official stock exchange listing 98.93 Other assets 1.07 Total assets 100.00
1 Security fully or partially on loan. 2 Investments which are less than USD 500 have been rounded down to zero. 3 These securities were valued in consultation with the Manager. These securities were fair valued, priced per corporate action terms or suspended at period end and valued using the last traded price.
4 A related party to the Fund.
Underlying exposure On gains USD '000
On losses USD '000
Futures contracts – 3,886
158
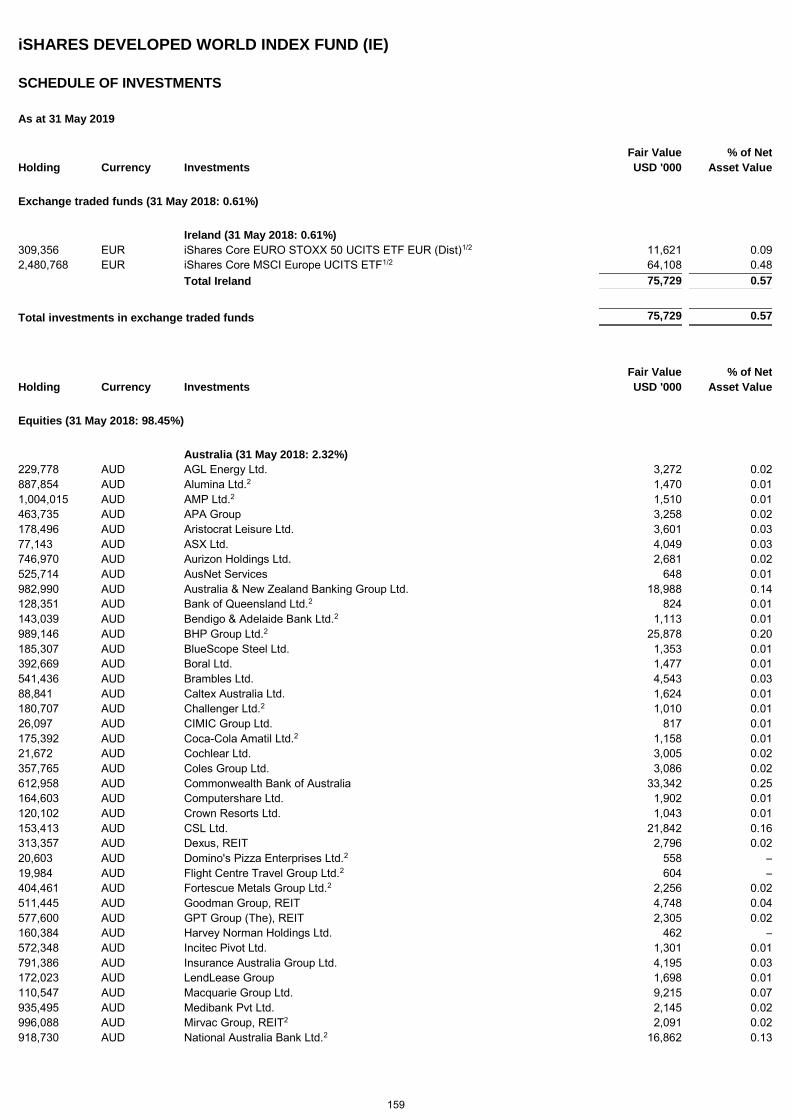
iSHARES DEVELOPED WORLD INDEX FUND (IE)
SCHEDULE OF INVESTMENTS
As at 31 May 2019
Holding Currency Investments Fair Value
USD '000 % of Net
Asset Value
Exchange traded funds (31 May 2018: 0.61%)
Ireland (31 May 2018: 0.61%) 309,356 EUR iShares Core EURO STOXX 50 UCITS ETF EUR (Dist)1/2 11,621 0.09 2,480,768 EUR iShares Core MSCI Europe UCITS ETF1/2 64,108 0.48 Total Ireland 75,729 0.57
Total investments in exchange traded funds 75,729 0.57
Holding Currency Investments Fair Value
USD '000 % of Net
Asset Value
Equities (31 May 2018: 98.45%)
Australia (31 May 2018: 2.32%) 229,778 AUD AGL Energy Ltd. 3,272 0.02 887,854 AUD Alumina Ltd.2 1,470 0.01 1,004,015 AUD AMP Ltd.2 1,510 0.01 463,735 AUD APA Group 3,258 0.02 178,496 AUD Aristocrat Leisure Ltd. 3,601 0.03 77,143 AUD ASX Ltd. 4,049 0.03 746,970 AUD Aurizon Holdings Ltd. 2,681 0.02 525,714 AUD AusNet Services 648 0.01 982,990 AUD Australia & New Zealand Banking Group Ltd. 18,988 0.14 128,351 AUD Bank of Queensland Ltd.2 824 0.01 143,039 AUD Bendigo & Adelaide Bank Ltd.2 1,113 0.01 989,146 AUD BHP Group Ltd.2 25,878 0.20 185,307 AUD BlueScope Steel Ltd. 1,353 0.01 392,669 AUD Boral Ltd. 1,477 0.01 541,436 AUD Brambles Ltd. 4,543 0.03 88,841 AUD Caltex Australia Ltd. 1,624 0.01 180,707 AUD Challenger Ltd.2 1,010 0.01 26,097 AUD CIMIC Group Ltd. 817 0.01 175,392 AUD Coca-Cola Amatil Ltd.2 1,158 0.01 21,672 AUD Cochlear Ltd. 3,005 0.02 357,765 AUD Coles Group Ltd. 3,086 0.02 612,958 AUD Commonwealth Bank of Australia 33,342 0.25 164,603 AUD Computershare Ltd. 1,902 0.01 120,102 AUD Crown Resorts Ltd. 1,043 0.01 153,413 AUD CSL Ltd. 21,842 0.16 313,357 AUD Dexus, REIT 2,796 0.02 20,603 AUD Domino's Pizza Enterprises Ltd.2 558 – 19,984 AUD Flight Centre Travel Group Ltd.2 604 – 404,461 AUD Fortescue Metals Group Ltd.2 2,256 0.02 511,445 AUD Goodman Group, REIT 4,748 0.04 577,600 AUD GPT Group (The), REIT 2,305 0.02 160,384 AUD Harvey Norman Holdings Ltd. 462 – 572,348 AUD Incitec Pivot Ltd. 1,301 0.01 791,386 AUD Insurance Australia Group Ltd. 4,195 0.03 172,023 AUD LendLease Group 1,698 0.01 110,547 AUD Macquarie Group Ltd. 9,215 0.07 935,495 AUD Medibank Pvt Ltd. 2,145 0.02 996,088 AUD Mirvac Group, REIT2 2,091 0.02 918,730 AUD National Australia Bank Ltd.2 16,862 0.13
159
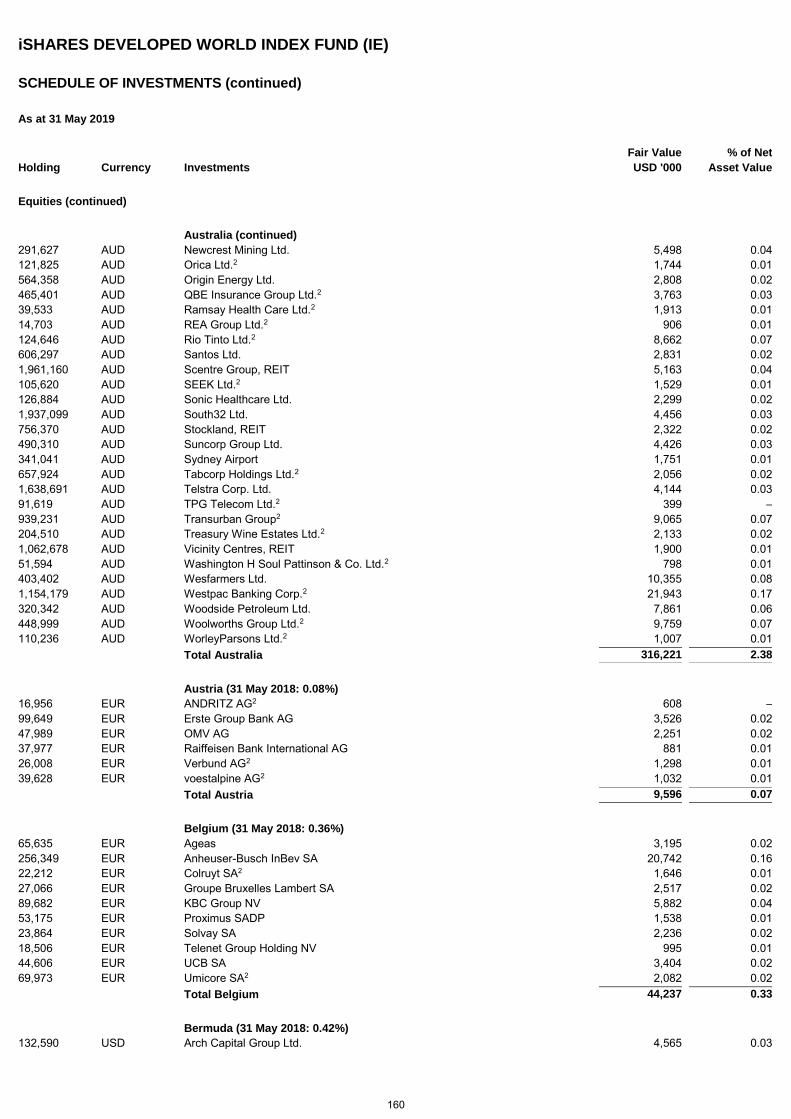
iSHARES DEVELOPED WORLD INDEX FUND (IE)
SCHEDULE OF INVESTMENTS (continued)
As at 31 May 2019
Holding Currency Investments Fair Value
USD '000 % of Net
Asset Value
Equities (continued)
Australia (continued) 291,627 AUD Newcrest Mining Ltd. 5,498 0.04 121,825 AUD Orica Ltd.2 1,744 0.01 564,358 AUD Origin Energy Ltd. 2,808 0.02 465,401 AUD QBE Insurance Group Ltd.2 3,763 0.03 39,533 AUD Ramsay Health Care Ltd.2 1,913 0.01 14,703 AUD REA Group Ltd.2 906 0.01 124,646 AUD Rio Tinto Ltd.2 8,662 0.07 606,297 AUD Santos Ltd. 2,831 0.02 1,961,160 AUD Scentre Group, REIT 5,163 0.04 105,620 AUD SEEK Ltd.2 1,529 0.01 126,884 AUD Sonic Healthcare Ltd. 2,299 0.02 1,937,099 AUD South32 Ltd. 4,456 0.03 756,370 AUD Stockland, REIT 2,322 0.02 490,310 AUD Suncorp Group Ltd. 4,426 0.03 341,041 AUD Sydney Airport 1,751 0.01 657,924 AUD Tabcorp Holdings Ltd.2 2,056 0.02 1,638,691 AUD Telstra Corp. Ltd. 4,144 0.03 91,619 AUD TPG Telecom Ltd.2 399 – 939,231 AUD Transurban Group2 9,065 0.07 204,510 AUD Treasury Wine Estates Ltd.2 2,133 0.02 1,062,678 AUD Vicinity Centres, REIT 1,900 0.01 51,594 AUD Washington H Soul Pattinson & Co. Ltd.2 798 0.01 403,402 AUD Wesfarmers Ltd. 10,355 0.08 1,154,179 AUD Westpac Banking Corp.2 21,943 0.17 320,342 AUD Woodside Petroleum Ltd. 7,861 0.06 448,999 AUD Woolworths Group Ltd.2 9,759 0.07 110,236 AUD WorleyParsons Ltd.2 1,007 0.01 Total Australia 316,221 2.38
Austria (31 May 2018: 0.08%) 16,956 EUR ANDRITZ AG2 608 – 99,649 EUR Erste Group Bank AG 3,526 0.02 47,989 EUR OMV AG 2,251 0.02 37,977 EUR Raiffeisen Bank International AG 881 0.01 26,008 EUR Verbund AG2 1,298 0.01 39,628 EUR voestalpine AG2 1,032 0.01 Total Austria 9,596 0.07
Belgium (31 May 2018: 0.36%) 65,635 EUR Ageas 3,195 0.02 256,349 EUR Anheuser-Busch InBev SA 20,742 0.16 22,212 EUR Colruyt SA2 1,646 0.01 27,066 EUR Groupe Bruxelles Lambert SA 2,517 0.02 89,682 EUR KBC Group NV 5,882 0.04 53,175 EUR Proximus SADP 1,538 0.01 23,864 EUR Solvay SA 2,236 0.02 18,506 EUR Telenet Group Holding NV 995 0.01 44,606 EUR UCB SA 3,404 0.02 69,973 EUR Umicore SA2 2,082 0.02 Total Belgium 44,237 0.33
Bermuda (31 May 2018: 0.42%) 132,590 USD Arch Capital Group Ltd. 4,565 0.03
160
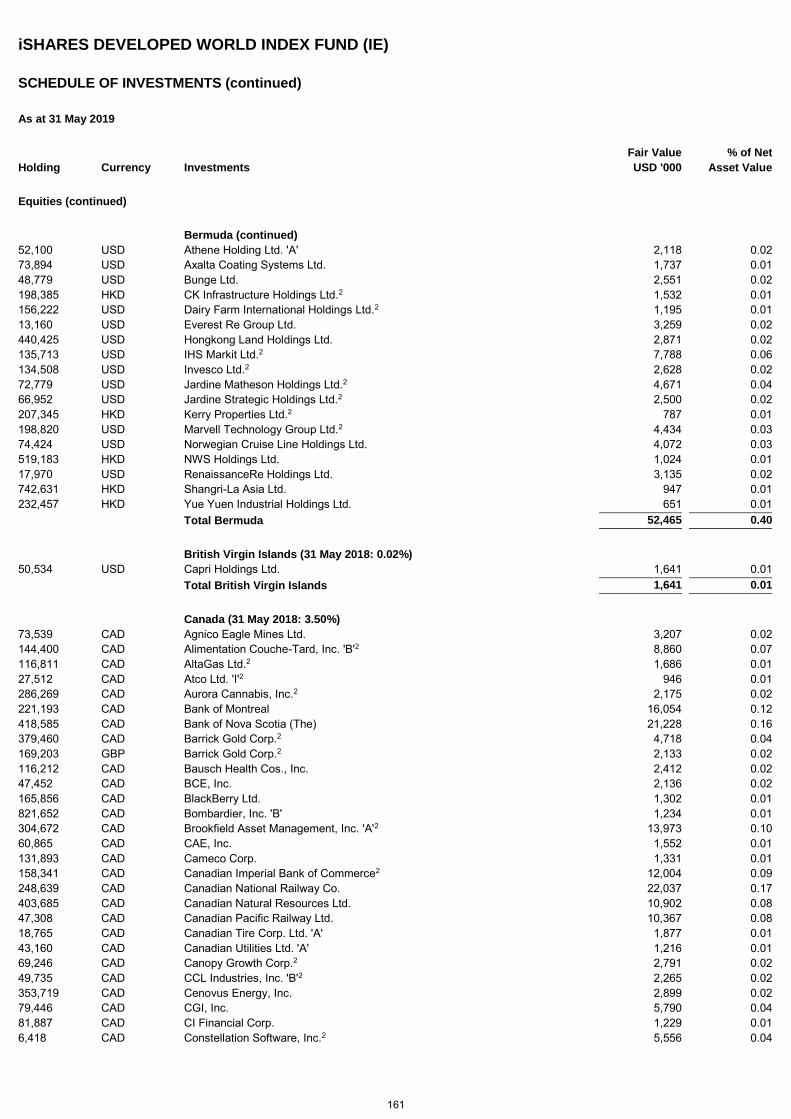
iSHARES DEVELOPED WORLD INDEX FUND (IE)
SCHEDULE OF INVESTMENTS (continued)
As at 31 May 2019
Holding Currency Investments Fair Value
USD '000 % of Net
Asset Value
Equities (continued)
Bermuda (continued) 52,100 USD Athene Holding Ltd. 'A' 2,118 0.02 73,894 USD Axalta Coating Systems Ltd. 1,737 0.01 48,779 USD Bunge Ltd. 2,551 0.02 198,385 HKD CK Infrastructure Holdings Ltd.2 1,532 0.01 156,222 USD Dairy Farm International Holdings Ltd.2 1,195 0.01 13,160 USD Everest Re Group Ltd. 3,259 0.02 440,425 USD Hongkong Land Holdings Ltd. 2,871 0.02 135,713 USD IHS Markit Ltd.2 7,788 0.06 134,508 USD Invesco Ltd.2 2,628 0.02 72,779 USD Jardine Matheson Holdings Ltd.2 4,671 0.04 66,952 USD Jardine Strategic Holdings Ltd.2 2,500 0.02 207,345 HKD Kerry Properties Ltd.2 787 0.01 198,820 USD Marvell Technology Group Ltd.2 4,434 0.03 74,424 USD Norwegian Cruise Line Holdings Ltd. 4,072 0.03 519,183 HKD NWS Holdings Ltd. 1,024 0.01 17,970 USD RenaissanceRe Holdings Ltd. 3,135 0.02 742,631 HKD Shangri-La Asia Ltd. 947 0.01 232,457 HKD Yue Yuen Industrial Holdings Ltd. 651 0.01 Total Bermuda 52,465 0.40
British Virgin Islands (31 May 2018: 0.02%) 50,534 USD Capri Holdings Ltd. 1,641 0.01 Total British Virgin Islands 1,641 0.01
Canada (31 May 2018: 3.50%) 73,539 CAD Agnico Eagle Mines Ltd. 3,207 0.02 144,400 CAD Alimentation Couche-Tard, Inc. 'B'2 8,860 0.07 116,811 CAD AltaGas Ltd.2 1,686 0.01 27,512 CAD Atco Ltd. 'I'2 946 0.01 286,269 CAD Aurora Cannabis, Inc.2 2,175 0.02 221,193 CAD Bank of Montreal 16,054 0.12 418,585 CAD Bank of Nova Scotia (The) 21,228 0.16 379,460 CAD Barrick Gold Corp.2 4,718 0.04 169,203 GBP Barrick Gold Corp.2 2,133 0.02 116,212 CAD Bausch Health Cos., Inc. 2,412 0.02 47,452 CAD BCE, Inc. 2,136 0.02 165,856 CAD BlackBerry Ltd. 1,302 0.01 821,652 CAD Bombardier, Inc. 'B' 1,234 0.01 304,672 CAD Brookfield Asset Management, Inc. 'A'2 13,973 0.10 60,865 CAD CAE, Inc. 1,552 0.01 131,893 CAD Cameco Corp. 1,331 0.01 158,341 CAD Canadian Imperial Bank of Commerce2 12,004 0.09 248,639 CAD Canadian National Railway Co. 22,037 0.17 403,685 CAD Canadian Natural Resources Ltd. 10,902 0.08 47,308 CAD Canadian Pacific Railway Ltd. 10,367 0.08 18,765 CAD Canadian Tire Corp. Ltd. 'A' 1,877 0.01 43,160 CAD Canadian Utilities Ltd. 'A' 1,216 0.01 69,246 CAD Canopy Growth Corp.2 2,791 0.02 49,735 CAD CCL Industries, Inc. 'B'2 2,265 0.02 353,719 CAD Cenovus Energy, Inc. 2,899 0.02 79,446 CAD CGI, Inc. 5,790 0.04 81,887 CAD CI Financial Corp. 1,229 0.01 6,418 CAD Constellation Software, Inc.2 5,556 0.04
161
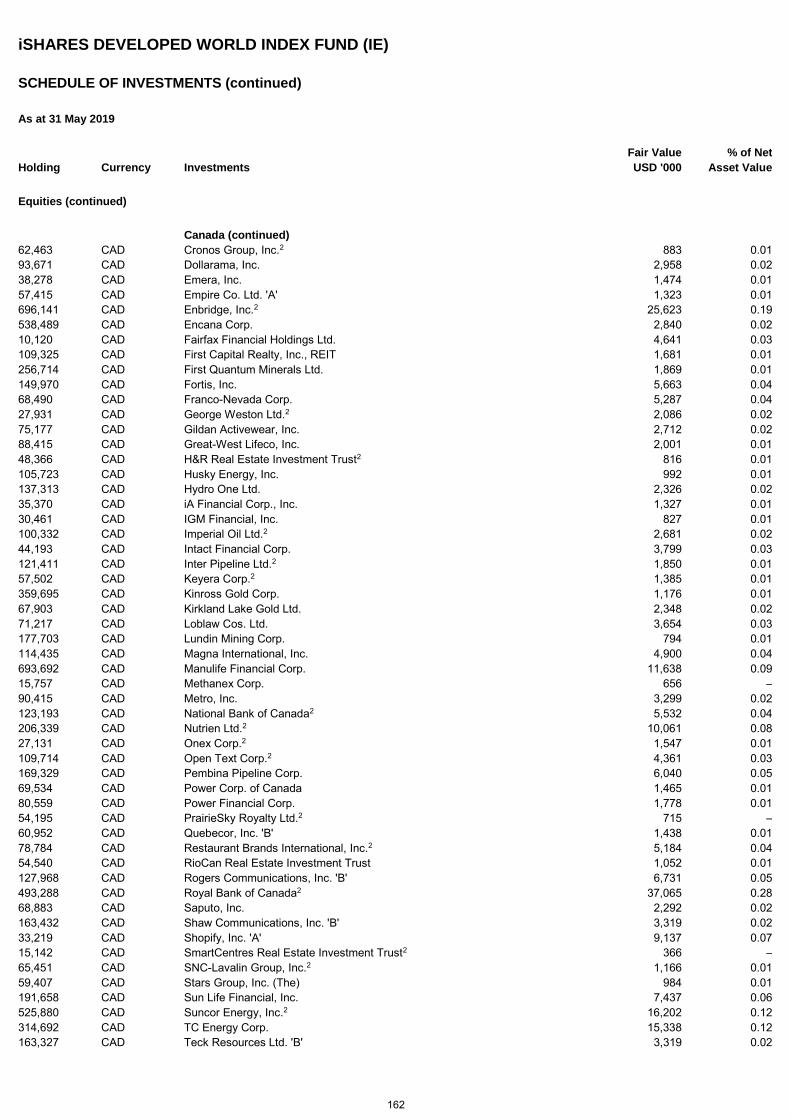
iSHARES DEVELOPED WORLD INDEX FUND (IE)
SCHEDULE OF INVESTMENTS (continued)
As at 31 May 2019
Holding Currency Investments Fair Value
USD '000 % of Net
Asset Value
Equities (continued)
Canada (continued) 62,463 CAD Cronos Group, Inc.2 883 0.01 93,671 CAD Dollarama, Inc. 2,958 0.02 38,278 CAD Emera, Inc. 1,474 0.01 57,415 CAD Empire Co. Ltd. 'A' 1,323 0.01 696,141 CAD Enbridge, Inc.2 25,623 0.19 538,489 CAD Encana Corp. 2,840 0.02 10,120 CAD Fairfax Financial Holdings Ltd. 4,641 0.03 109,325 CAD First Capital Realty, Inc., REIT 1,681 0.01 256,714 CAD First Quantum Minerals Ltd. 1,869 0.01 149,970 CAD Fortis, Inc. 5,663 0.04 68,490 CAD Franco-Nevada Corp. 5,287 0.04 27,931 CAD George Weston Ltd.2 2,086 0.02 75,177 CAD Gildan Activewear, Inc. 2,712 0.02 88,415 CAD Great-West Lifeco, Inc. 2,001 0.01 48,366 CAD H&R Real Estate Investment Trust2 816 0.01 105,723 CAD Husky Energy, Inc. 992 0.01 137,313 CAD Hydro One Ltd. 2,326 0.02 35,370 CAD iA Financial Corp., Inc. 1,327 0.01 30,461 CAD IGM Financial, Inc. 827 0.01 100,332 CAD Imperial Oil Ltd.2 2,681 0.02 44,193 CAD Intact Financial Corp. 3,799 0.03 121,411 CAD Inter Pipeline Ltd.2 1,850 0.01 57,502 CAD Keyera Corp.2 1,385 0.01 359,695 CAD Kinross Gold Corp. 1,176 0.01 67,903 CAD Kirkland Lake Gold Ltd. 2,348 0.02 71,217 CAD Loblaw Cos. Ltd. 3,654 0.03 177,703 CAD Lundin Mining Corp. 794 0.01 114,435 CAD Magna International, Inc. 4,900 0.04 693,692 CAD Manulife Financial Corp. 11,638 0.09 15,757 CAD Methanex Corp. 656 – 90,415 CAD Metro, Inc. 3,299 0.02 123,193 CAD National Bank of Canada2 5,532 0.04 206,339 CAD Nutrien Ltd.2 10,061 0.08 27,131 CAD Onex Corp.2 1,547 0.01 109,714 CAD Open Text Corp.2 4,361 0.03 169,329 CAD Pembina Pipeline Corp. 6,040 0.05 69,534 CAD Power Corp. of Canada 1,465 0.01 80,559 CAD Power Financial Corp. 1,778 0.01 54,195 CAD PrairieSky Royalty Ltd.2 715 – 60,952 CAD Quebecor, Inc. 'B' 1,438 0.01 78,784 CAD Restaurant Brands International, Inc.2 5,184 0.04 54,540 CAD RioCan Real Estate Investment Trust 1,052 0.01 127,968 CAD Rogers Communications, Inc. 'B' 6,731 0.05 493,288 CAD Royal Bank of Canada2 37,065 0.28 68,883 CAD Saputo, Inc. 2,292 0.02 163,432 CAD Shaw Communications, Inc. 'B' 3,319 0.02 33,219 CAD Shopify, Inc. 'A' 9,137 0.07 15,142 CAD SmartCentres Real Estate Investment Trust2 366 – 65,451 CAD SNC-Lavalin Group, Inc.2 1,166 0.01 59,407 CAD Stars Group, Inc. (The) 984 0.01 191,658 CAD Sun Life Financial, Inc. 7,437 0.06 525,880 CAD Suncor Energy, Inc.2 16,202 0.12 314,692 CAD TC Energy Corp. 15,338 0.12 163,327 CAD Teck Resources Ltd. 'B' 3,319 0.02
162
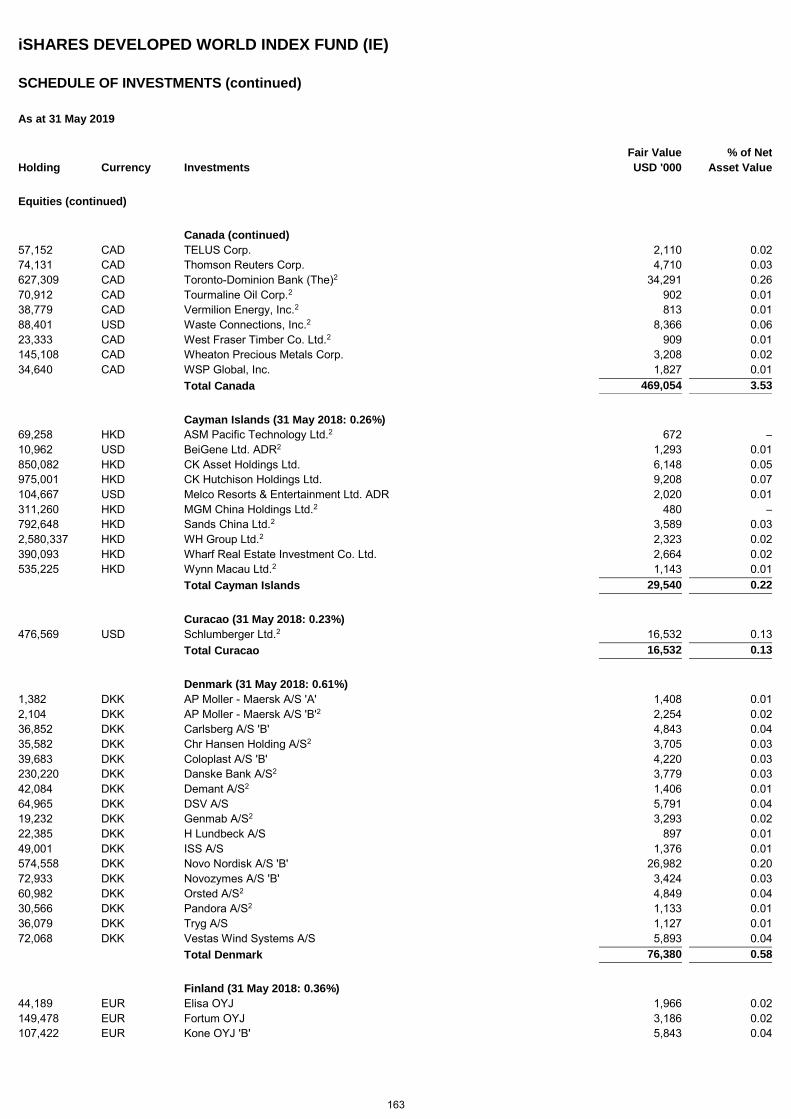
iSHARES DEVELOPED WORLD INDEX FUND (IE)
SCHEDULE OF INVESTMENTS (continued)
As at 31 May 2019
Holding Currency Investments Fair Value
USD '000 % of Net
Asset Value
Equities (continued)
Canada (continued) 57,152 CAD TELUS Corp. 2,110 0.02 74,131 CAD Thomson Reuters Corp. 4,710 0.03 627,309 CAD Toronto-Dominion Bank (The)2 34,291 0.26 70,912 CAD Tourmaline Oil Corp.2 902 0.01 38,779 CAD Vermilion Energy, Inc.2 813 0.01 88,401 USD Waste Connections, Inc.2 8,366 0.06 23,333 CAD West Fraser Timber Co. Ltd.2 909 0.01 145,108 CAD Wheaton Precious Metals Corp. 3,208 0.02 34,640 CAD WSP Global, Inc. 1,827 0.01 Total Canada 469,054 3.53
Cayman Islands (31 May 2018: 0.26%) 69,258 HKD ASM Pacific Technology Ltd.2 672 – 10,962 USD BeiGene Ltd. ADR2 1,293 0.01 850,082 HKD CK Asset Holdings Ltd. 6,148 0.05 975,001 HKD CK Hutchison Holdings Ltd. 9,208 0.07 104,667 USD Melco Resorts & Entertainment Ltd. ADR 2,020 0.01 311,260 HKD MGM China Holdings Ltd.2 480 – 792,648 HKD Sands China Ltd.2 3,589 0.03 2,580,337 HKD WH Group Ltd.2 2,323 0.02 390,093 HKD Wharf Real Estate Investment Co. Ltd. 2,664 0.02 535,225 HKD Wynn Macau Ltd.2 1,143 0.01 Total Cayman Islands 29,540 0.22
Curacao (31 May 2018: 0.23%) 476,569 USD Schlumberger Ltd.2 16,532 0.13 Total Curacao 16,532 0.13
Denmark (31 May 2018: 0.61%) 1,382 DKK AP Moller - Maersk A/S 'A' 1,408 0.01 2,104 DKK AP Moller - Maersk A/S 'B'2 2,254 0.02 36,852 DKK Carlsberg A/S 'B' 4,843 0.04 35,582 DKK Chr Hansen Holding A/S2 3,705 0.03 39,683 DKK Coloplast A/S 'B' 4,220 0.03 230,220 DKK Danske Bank A/S2 3,779 0.03 42,084 DKK Demant A/S2 1,406 0.01 64,965 DKK DSV A/S 5,791 0.04 19,232 DKK Genmab A/S2 3,293 0.02 22,385 DKK H Lundbeck A/S 897 0.01 49,001 DKK ISS A/S 1,376 0.01 574,558 DKK Novo Nordisk A/S 'B' 26,982 0.20 72,933 DKK Novozymes A/S 'B' 3,424 0.03 60,982 DKK Orsted A/S2 4,849 0.04 30,566 DKK Pandora A/S2 1,133 0.01 36,079 DKK Tryg A/S 1,127 0.01 72,068 DKK Vestas Wind Systems A/S 5,893 0.04 Total Denmark 76,380 0.58
Finland (31 May 2018: 0.36%) 44,189 EUR Elisa OYJ 1,966 0.02 149,478 EUR Fortum OYJ 3,186 0.02 107,422 EUR Kone OYJ 'B' 5,843 0.04
163
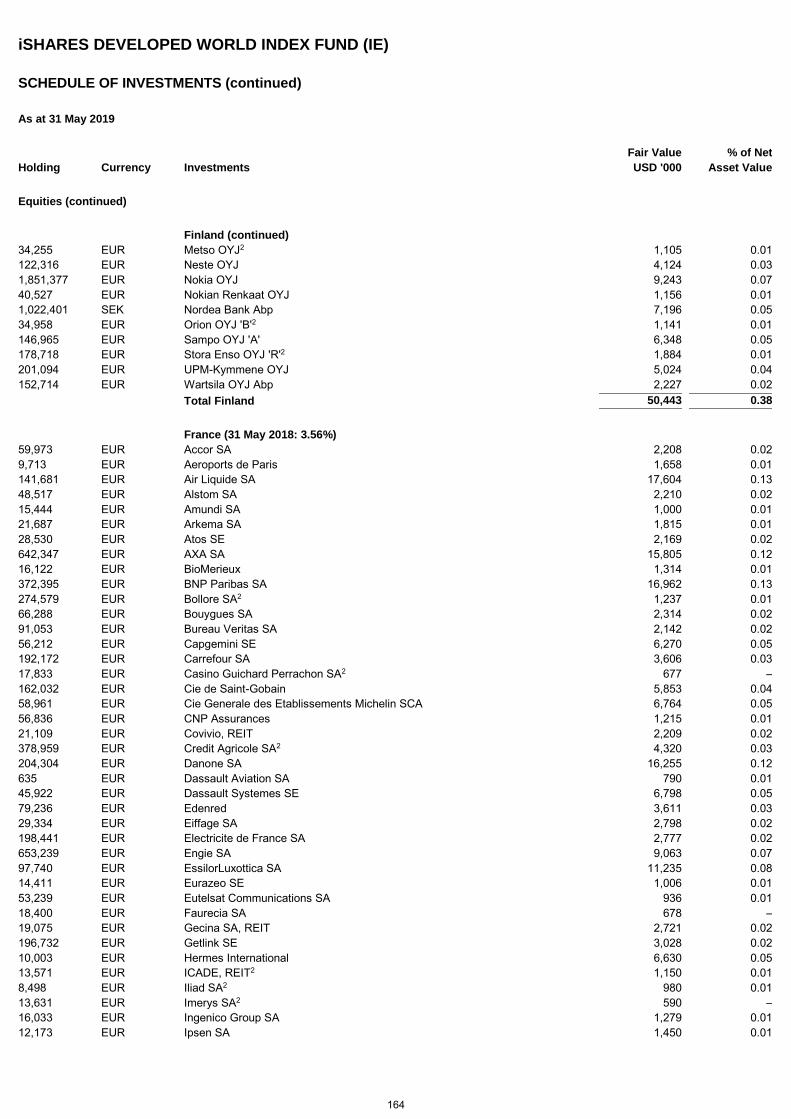
iSHARES DEVELOPED WORLD INDEX FUND (IE)
SCHEDULE OF INVESTMENTS (continued)
As at 31 May 2019
Holding Currency Investments Fair Value
USD '000 % of Net
Asset Value
Equities (continued)
Finland (continued) 34,255 EUR Metso OYJ2 1,105 0.01 122,316 EUR Neste OYJ 4,124 0.03 1,851,377 EUR Nokia OYJ 9,243 0.07 40,527 EUR Nokian Renkaat OYJ 1,156 0.01 1,022,401 SEK Nordea Bank Abp 7,196 0.05 34,958 EUR Orion OYJ 'B'2 1,141 0.01 146,965 EUR Sampo OYJ 'A' 6,348 0.05 178,718 EUR Stora Enso OYJ 'R'2 1,884 0.01 201,094 EUR UPM-Kymmene OYJ 5,024 0.04 152,714 EUR Wartsila OYJ Abp 2,227 0.02 Total Finland 50,443 0.38
France (31 May 2018: 3.56%) 59,973 EUR Accor SA 2,208 0.02 9,713 EUR Aeroports de Paris 1,658 0.01 141,681 EUR Air Liquide SA 17,604 0.13 48,517 EUR Alstom SA 2,210 0.02 15,444 EUR Amundi SA 1,000 0.01 21,687 EUR Arkema SA 1,815 0.01 28,530 EUR Atos SE 2,169 0.02 642,347 EUR AXA SA 15,805 0.12 16,122 EUR BioMerieux 1,314 0.01 372,395 EUR BNP Paribas SA 16,962 0.13 274,579 EUR Bollore SA2 1,237 0.01 66,288 EUR Bouygues SA 2,314 0.02 91,053 EUR Bureau Veritas SA 2,142 0.02 56,212 EUR Capgemini SE 6,270 0.05 192,172 EUR Carrefour SA 3,606 0.03 17,833 EUR Casino Guichard Perrachon SA2 677 – 162,032 EUR Cie de Saint-Gobain 5,853 0.04 58,961 EUR Cie Generale des Etablissements Michelin SCA 6,764 0.05 56,836 EUR CNP Assurances 1,215 0.01 21,109 EUR Covivio, REIT 2,209 0.02 378,959 EUR Credit Agricole SA2 4,320 0.03 204,304 EUR Danone SA 16,255 0.12 635 EUR Dassault Aviation SA 790 0.01 45,922 EUR Dassault Systemes SE 6,798 0.05 79,236 EUR Edenred 3,611 0.03 29,334 EUR Eiffage SA 2,798 0.02 198,441 EUR Electricite de France SA 2,777 0.02 653,239 EUR Engie SA 9,063 0.07 97,740 EUR EssilorLuxottica SA 11,235 0.08 14,411 EUR Eurazeo SE 1,006 0.01 53,239 EUR Eutelsat Communications SA 936 0.01 18,400 EUR Faurecia SA 678 – 19,075 EUR Gecina SA, REIT 2,721 0.02 196,732 EUR Getlink SE 3,028 0.02 10,003 EUR Hermes International 6,630 0.05 13,571 EUR ICADE, REIT2 1,150 0.01 8,498 EUR Iliad SA2 980 0.01 13,631 EUR Imerys SA2 590 – 16,033 EUR Ingenico Group SA 1,279 0.01 12,173 EUR Ipsen SA 1,450 0.01
164
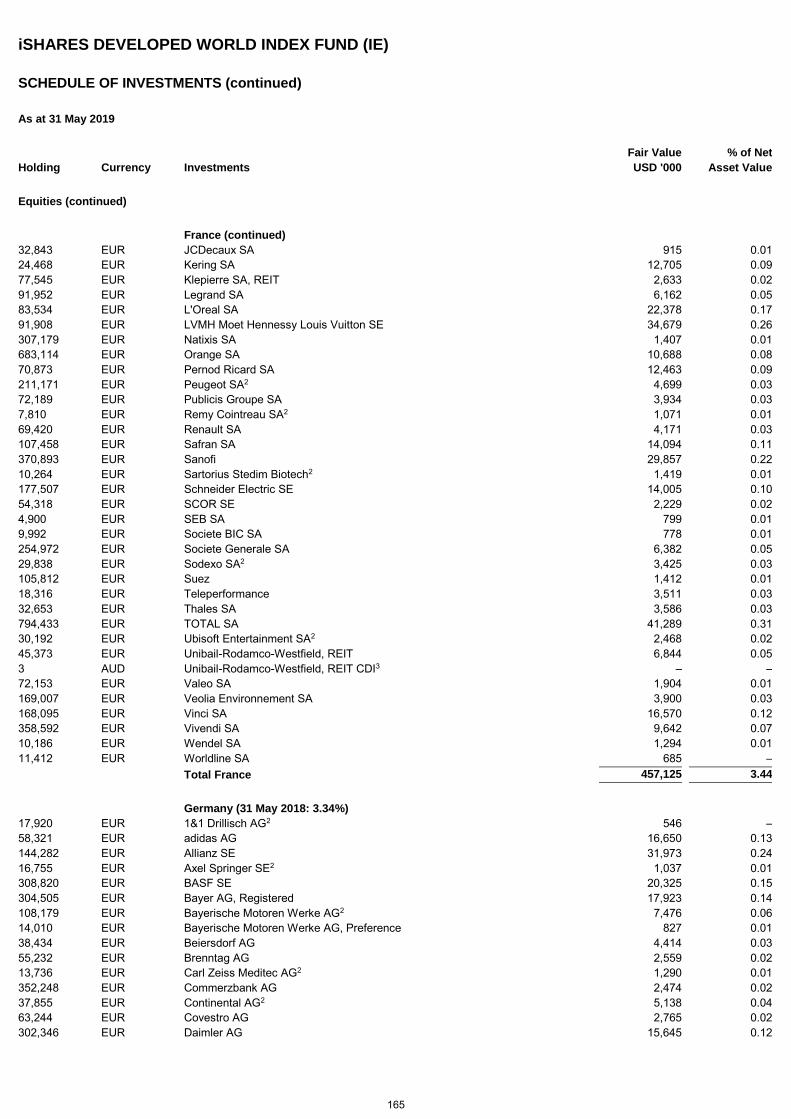
iSHARES DEVELOPED WORLD INDEX FUND (IE)
SCHEDULE OF INVESTMENTS (continued)
As at 31 May 2019
Holding Currency Investments Fair Value
USD '000 % of Net
Asset Value
Equities (continued)
France (continued) 32,843 EUR JCDecaux SA 915 0.01 24,468 EUR Kering SA 12,705 0.09 77,545 EUR Klepierre SA, REIT 2,633 0.02 91,952 EUR Legrand SA 6,162 0.05 83,534 EUR L'Oreal SA 22,378 0.17 91,908 EUR LVMH Moet Hennessy Louis Vuitton SE 34,679 0.26 307,179 EUR Natixis SA 1,407 0.01 683,114 EUR Orange SA 10,688 0.08 70,873 EUR Pernod Ricard SA 12,463 0.09 211,171 EUR Peugeot SA2 4,699 0.03 72,189 EUR Publicis Groupe SA 3,934 0.03 7,810 EUR Remy Cointreau SA2 1,071 0.01 69,420 EUR Renault SA 4,171 0.03 107,458 EUR Safran SA 14,094 0.11 370,893 EUR Sanofi 29,857 0.22 10,264 EUR Sartorius Stedim Biotech2 1,419 0.01 177,507 EUR Schneider Electric SE 14,005 0.10 54,318 EUR SCOR SE 2,229 0.02 4,900 EUR SEB SA 799 0.01 9,992 EUR Societe BIC SA 778 0.01 254,972 EUR Societe Generale SA 6,382 0.05 29,838 EUR Sodexo SA2 3,425 0.03 105,812 EUR Suez 1,412 0.01 18,316 EUR Teleperformance 3,511 0.03 32,653 EUR Thales SA 3,586 0.03 794,433 EUR TOTAL SA 41,289 0.31 30,192 EUR Ubisoft Entertainment SA2 2,468 0.02 45,373 EUR Unibail-Rodamco-Westfield, REIT 6,844 0.05 3 AUD Unibail-Rodamco-Westfield, REIT CDI3 – – 72,153 EUR Valeo SA 1,904 0.01 169,007 EUR Veolia Environnement SA 3,900 0.03 168,095 EUR Vinci SA 16,570 0.12 358,592 EUR Vivendi SA 9,642 0.07 10,186 EUR Wendel SA 1,294 0.01 11,412 EUR Worldline SA 685 – Total France 457,125 3.44
Germany (31 May 2018: 3.34%) 17,920 EUR 1&1 Drillisch AG2 546 – 58,321 EUR adidas AG 16,650 0.13 144,282 EUR Allianz SE 31,973 0.24 16,755 EUR Axel Springer SE2 1,037 0.01 308,820 EUR BASF SE 20,325 0.15 304,505 EUR Bayer AG, Registered 17,923 0.14 108,179 EUR Bayerische Motoren Werke AG2 7,476 0.06 14,010 EUR Bayerische Motoren Werke AG, Preference 827 0.01 38,434 EUR Beiersdorf AG 4,414 0.03 55,232 EUR Brenntag AG 2,559 0.02 13,736 EUR Carl Zeiss Meditec AG2 1,290 0.01 352,248 EUR Commerzbank AG 2,474 0.02 37,855 EUR Continental AG2 5,138 0.04 63,244 EUR Covestro AG 2,765 0.02 302,346 EUR Daimler AG 15,645 0.12
165
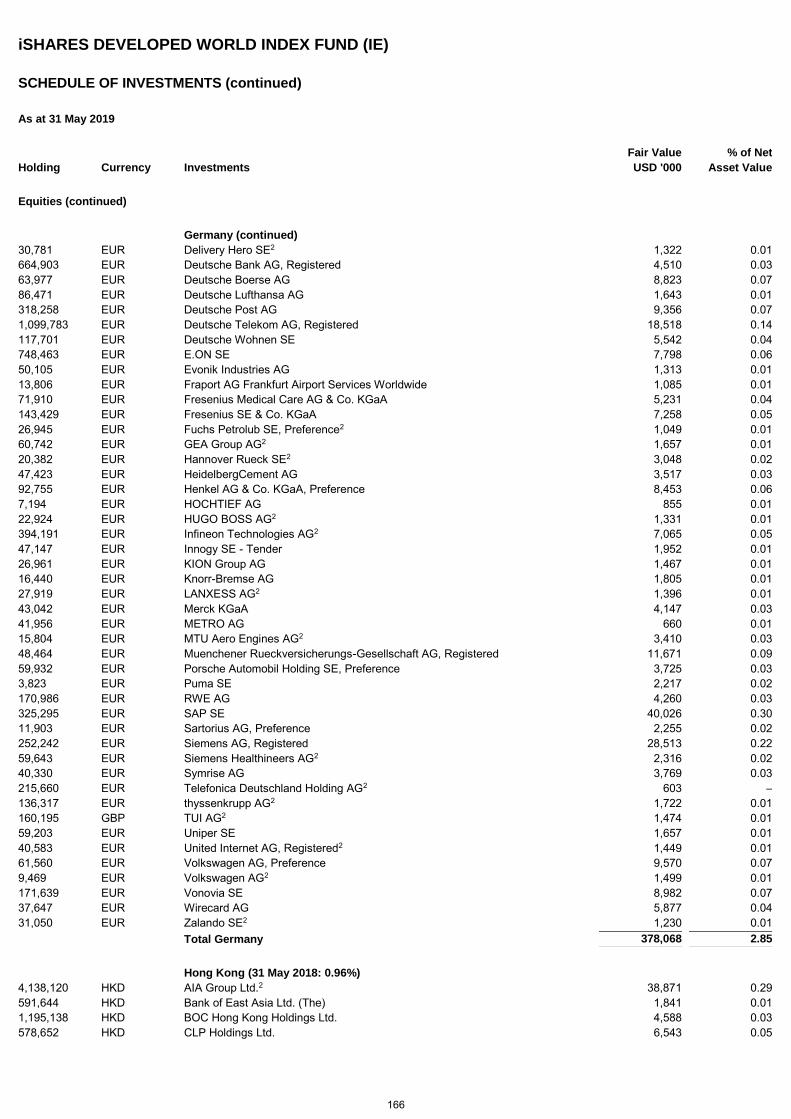
iSHARES DEVELOPED WORLD INDEX FUND (IE)
SCHEDULE OF INVESTMENTS (continued)
As at 31 May 2019
Holding Currency Investments Fair Value
USD '000 % of Net
Asset Value
Equities (continued)
Germany (continued) 30,781 EUR Delivery Hero SE2 1,322 0.01 664,903 EUR Deutsche Bank AG, Registered 4,510 0.03 63,977 EUR Deutsche Boerse AG 8,823 0.07 86,471 EUR Deutsche Lufthansa AG 1,643 0.01 318,258 EUR Deutsche Post AG 9,356 0.07 1,099,783 EUR Deutsche Telekom AG, Registered 18,518 0.14 117,701 EUR Deutsche Wohnen SE 5,542 0.04 748,463 EUR E.ON SE 7,798 0.06 50,105 EUR Evonik Industries AG 1,313 0.01 13,806 EUR Fraport AG Frankfurt Airport Services Worldwide 1,085 0.01 71,910 EUR Fresenius Medical Care AG & Co. KGaA 5,231 0.04 143,429 EUR Fresenius SE & Co. KGaA 7,258 0.05 26,945 EUR Fuchs Petrolub SE, Preference2 1,049 0.01 60,742 EUR GEA Group AG2 1,657 0.01 20,382 EUR Hannover Rueck SE2 3,048 0.02 47,423 EUR HeidelbergCement AG 3,517 0.03 92,755 EUR Henkel AG & Co. KGaA, Preference 8,453 0.06 7,194 EUR HOCHTIEF AG 855 0.01 22,924 EUR HUGO BOSS AG2 1,331 0.01 394,191 EUR Infineon Technologies AG2 7,065 0.05 47,147 EUR Innogy SE - Tender 1,952 0.01 26,961 EUR KION Group AG 1,467 0.01 16,440 EUR Knorr-Bremse AG 1,805 0.01 27,919 EUR LANXESS AG2 1,396 0.01 43,042 EUR Merck KGaA 4,147 0.03 41,956 EUR METRO AG 660 0.01 15,804 EUR MTU Aero Engines AG2 3,410 0.03 48,464 EUR Muenchener Rueckversicherungs-Gesellschaft AG, Registered 11,671 0.09 59,932 EUR Porsche Automobil Holding SE, Preference 3,725 0.03 3,823 EUR Puma SE 2,217 0.02 170,986 EUR RWE AG 4,260 0.03 325,295 EUR SAP SE 40,026 0.30 11,903 EUR Sartorius AG, Preference 2,255 0.02 252,242 EUR Siemens AG, Registered 28,513 0.22 59,643 EUR Siemens Healthineers AG2 2,316 0.02 40,330 EUR Symrise AG 3,769 0.03 215,660 EUR Telefonica Deutschland Holding AG2 603 – 136,317 EUR thyssenkrupp AG2 1,722 0.01 160,195 GBP TUI AG2 1,474 0.01 59,203 EUR Uniper SE 1,657 0.01 40,583 EUR United Internet AG, Registered2 1,449 0.01 61,560 EUR Volkswagen AG, Preference 9,570 0.07 9,469 EUR Volkswagen AG2 1,499 0.01 171,639 EUR Vonovia SE 8,982 0.07 37,647 EUR Wirecard AG 5,877 0.04 31,050 EUR Zalando SE2 1,230 0.01 Total Germany 378,068 2.85
Hong Kong (31 May 2018: 0.96%) 4,138,120 HKD AIA Group Ltd.2 38,871 0.29 591,644 HKD Bank of East Asia Ltd. (The) 1,841 0.01 1,195,138 HKD BOC Hong Kong Holdings Ltd. 4,588 0.03 578,652 HKD CLP Holdings Ltd. 6,543 0.05
166
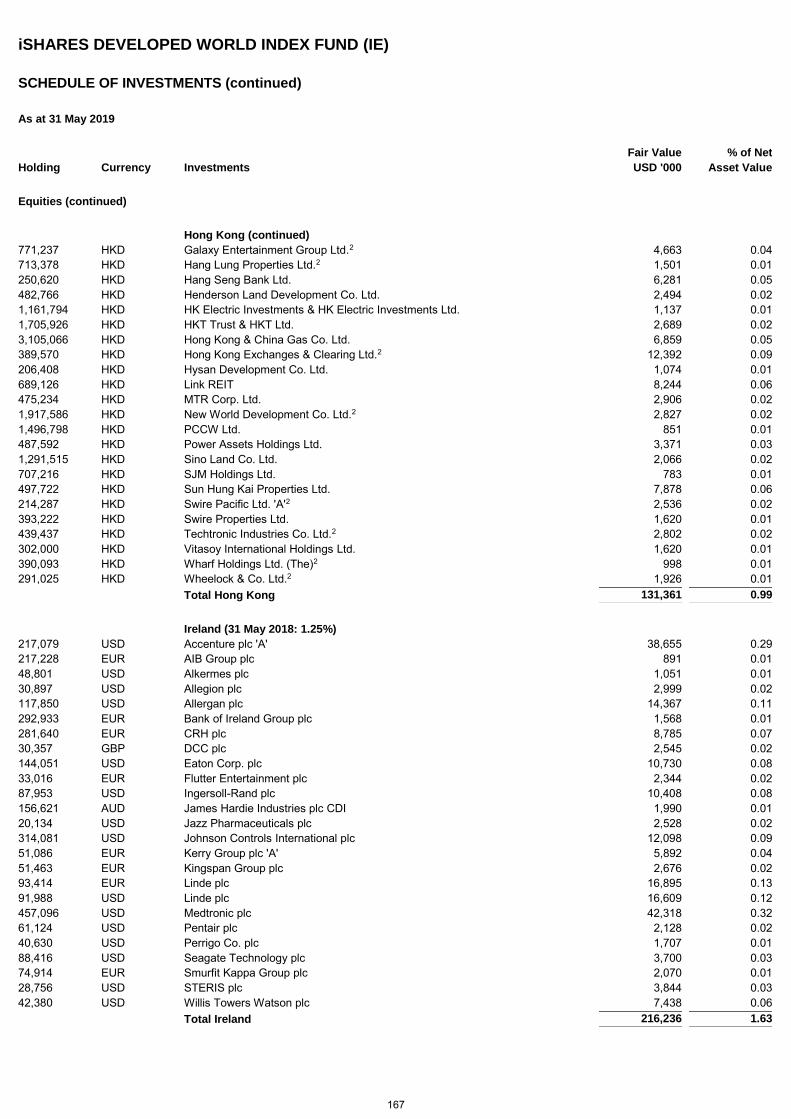
iSHARES DEVELOPED WORLD INDEX FUND (IE)
SCHEDULE OF INVESTMENTS (continued)
As at 31 May 2019
Holding Currency Investments Fair Value
USD '000 % of Net
Asset Value
Equities (continued)
Hong Kong (continued) 771,237 HKD Galaxy Entertainment Group Ltd.2 4,663 0.04 713,378 HKD Hang Lung Properties Ltd.2 1,501 0.01 250,620 HKD Hang Seng Bank Ltd. 6,281 0.05 482,766 HKD Henderson Land Development Co. Ltd. 2,494 0.02 1,161,794 HKD HK Electric Investments & HK Electric Investments Ltd. 1,137 0.01 1,705,926 HKD HKT Trust & HKT Ltd. 2,689 0.02 3,105,066 HKD Hong Kong & China Gas Co. Ltd. 6,859 0.05 389,570 HKD Hong Kong Exchanges & Clearing Ltd.2 12,392 0.09 206,408 HKD Hysan Development Co. Ltd. 1,074 0.01 689,126 HKD Link REIT 8,244 0.06 475,234 HKD MTR Corp. Ltd. 2,906 0.02 1,917,586 HKD New World Development Co. Ltd.2 2,827 0.02 1,496,798 HKD PCCW Ltd. 851 0.01 487,592 HKD Power Assets Holdings Ltd. 3,371 0.03 1,291,515 HKD Sino Land Co. Ltd. 2,066 0.02 707,216 HKD SJM Holdings Ltd. 783 0.01 497,722 HKD Sun Hung Kai Properties Ltd. 7,878 0.06 214,287 HKD Swire Pacific Ltd. 'A'2 2,536 0.02 393,222 HKD Swire Properties Ltd. 1,620 0.01 439,437 HKD Techtronic Industries Co. Ltd.2 2,802 0.02 302,000 HKD Vitasoy International Holdings Ltd. 1,620 0.01 390,093 HKD Wharf Holdings Ltd. (The)2 998 0.01 291,025 HKD Wheelock & Co. Ltd.2 1,926 0.01 Total Hong Kong 131,361 0.99
Ireland (31 May 2018: 1.25%) 217,079 USD Accenture plc 'A' 38,655 0.29 217,228 EUR AIB Group plc 891 0.01 48,801 USD Alkermes plc 1,051 0.01 30,897 USD Allegion plc 2,999 0.02 117,850 USD Allergan plc 14,367 0.11 292,933 EUR Bank of Ireland Group plc 1,568 0.01 281,640 EUR CRH plc 8,785 0.07 30,357 GBP DCC plc 2,545 0.02 144,051 USD Eaton Corp. plc 10,730 0.08 33,016 EUR Flutter Entertainment plc 2,344 0.02 87,953 USD Ingersoll-Rand plc 10,408 0.08 156,621 AUD James Hardie Industries plc CDI 1,990 0.01 20,134 USD Jazz Pharmaceuticals plc 2,528 0.02 314,081 USD Johnson Controls International plc 12,098 0.09 51,086 EUR Kerry Group plc 'A' 5,892 0.04 51,463 EUR Kingspan Group plc 2,676 0.02 93,414 EUR Linde plc 16,895 0.13 91,988 USD Linde plc 16,609 0.12 457,096 USD Medtronic plc 42,318 0.32 61,124 USD Pentair plc 2,128 0.02 40,630 USD Perrigo Co. plc 1,707 0.01 88,416 USD Seagate Technology plc 3,700 0.03 74,914 EUR Smurfit Kappa Group plc 2,070 0.01 28,756 USD STERIS plc 3,844 0.03 42,380 USD Willis Towers Watson plc 7,438 0.06 Total Ireland 216,236 1.63
167
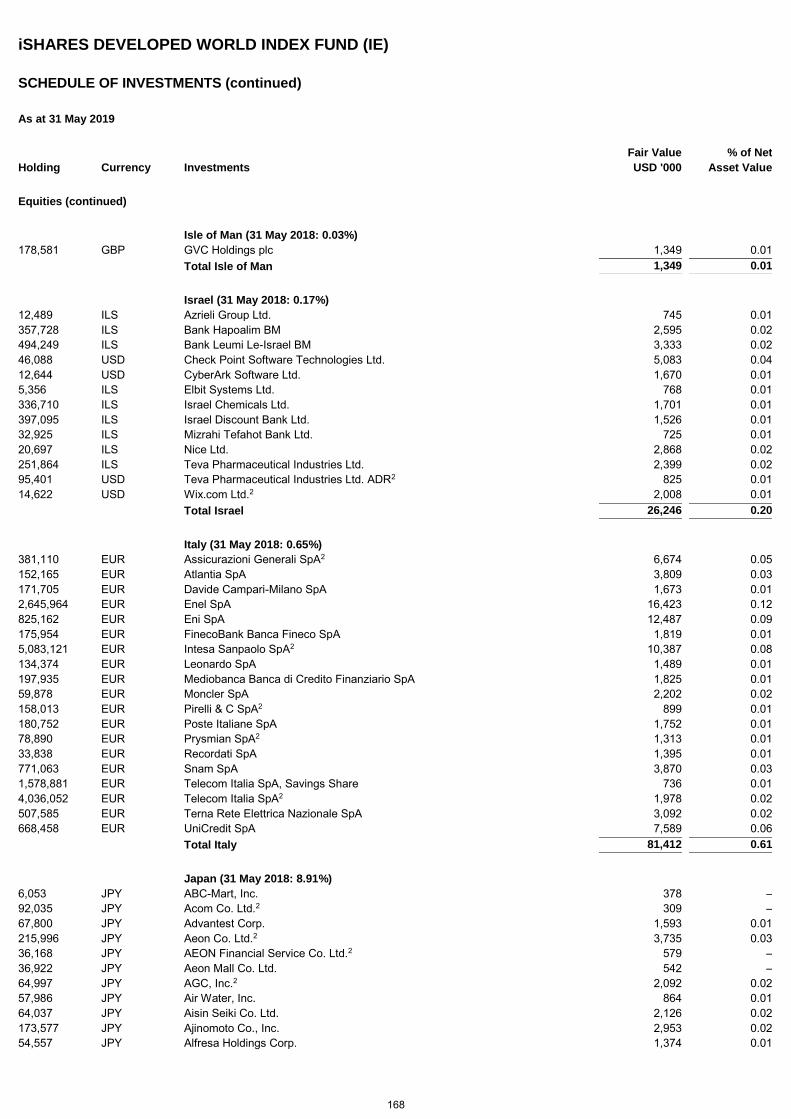
iSHARES DEVELOPED WORLD INDEX FUND (IE)
SCHEDULE OF INVESTMENTS (continued)
As at 31 May 2019
Holding Currency Investments Fair Value
USD '000 % of Net
Asset Value
Equities (continued)
Isle of Man (31 May 2018: 0.03%) 178,581 GBP GVC Holdings plc 1,349 0.01 Total Isle of Man 1,349 0.01
Israel (31 May 2018: 0.17%) 12,489 ILS Azrieli Group Ltd. 745 0.01 357,728 ILS Bank Hapoalim BM 2,595 0.02 494,249 ILS Bank Leumi Le-Israel BM 3,333 0.02 46,088 USD Check Point Software Technologies Ltd. 5,083 0.04 12,644 USD CyberArk Software Ltd. 1,670 0.01 5,356 ILS Elbit Systems Ltd. 768 0.01 336,710 ILS Israel Chemicals Ltd. 1,701 0.01 397,095 ILS Israel Discount Bank Ltd. 1,526 0.01 32,925 ILS Mizrahi Tefahot Bank Ltd. 725 0.01 20,697 ILS Nice Ltd. 2,868 0.02 251,864 ILS Teva Pharmaceutical Industries Ltd. 2,399 0.02 95,401 USD Teva Pharmaceutical Industries Ltd. ADR2 825 0.01 14,622 USD Wix.com Ltd.2 2,008 0.01 Total Israel 26,246 0.20
Italy (31 May 2018: 0.65%) 381,110 EUR Assicurazioni Generali SpA2 6,674 0.05 152,165 EUR Atlantia SpA 3,809 0.03 171,705 EUR Davide Campari-Milano SpA 1,673 0.01 2,645,964 EUR Enel SpA 16,423 0.12 825,162 EUR Eni SpA 12,487 0.09 175,954 EUR FinecoBank Banca Fineco SpA 1,819 0.01 5,083,121 EUR Intesa Sanpaolo SpA2 10,387 0.08 134,374 EUR Leonardo SpA 1,489 0.01 197,935 EUR Mediobanca Banca di Credito Finanziario SpA 1,825 0.01 59,878 EUR Moncler SpA 2,202 0.02 158,013 EUR Pirelli & C SpA2 899 0.01 180,752 EUR Poste Italiane SpA 1,752 0.01 78,890 EUR Prysmian SpA2 1,313 0.01 33,838 EUR Recordati SpA 1,395 0.01 771,063 EUR Snam SpA 3,870 0.03 1,578,881 EUR Telecom Italia SpA, Savings Share 736 0.01 4,036,052 EUR Telecom Italia SpA2 1,978 0.02 507,585 EUR Terna Rete Elettrica Nazionale SpA 3,092 0.02 668,458 EUR UniCredit SpA 7,589 0.06 Total Italy 81,412 0.61
Japan (31 May 2018: 8.91%) 6,053 JPY ABC-Mart, Inc. 378 – 92,035 JPY Acom Co. Ltd.2 309 – 67,800 JPY Advantest Corp. 1,593 0.01 215,996 JPY Aeon Co. Ltd.2 3,735 0.03 36,168 JPY AEON Financial Service Co. Ltd.2 579 – 36,922 JPY Aeon Mall Co. Ltd. 542 – 64,997 JPY AGC, Inc.2 2,092 0.02 57,986 JPY Air Water, Inc. 864 0.01 64,037 JPY Aisin Seiki Co. Ltd. 2,126 0.02 173,577 JPY Ajinomoto Co., Inc. 2,953 0.02 54,557 JPY Alfresa Holdings Corp. 1,374 0.01
168
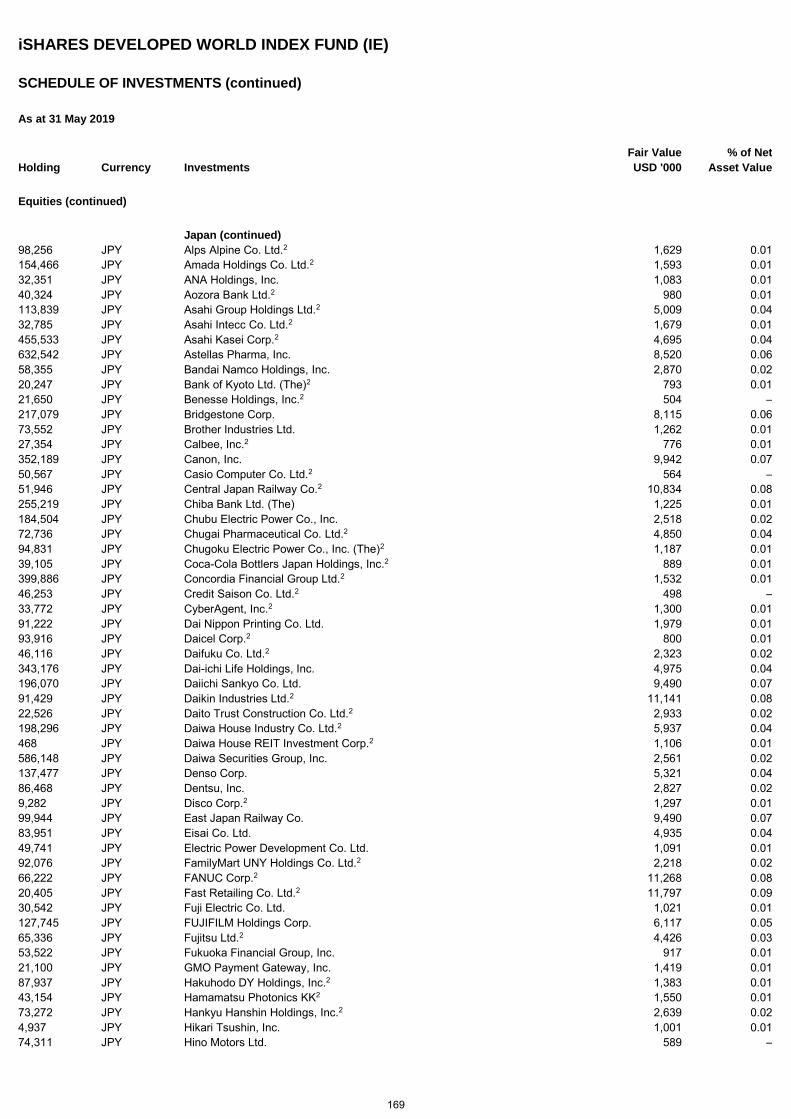
iSHARES DEVELOPED WORLD INDEX FUND (IE)
SCHEDULE OF INVESTMENTS (continued)
As at 31 May 2019
Holding Currency Investments Fair Value
USD '000 % of Net
Asset Value
Equities (continued)
Japan (continued) 98,256 JPY Alps Alpine Co. Ltd.2 1,629 0.01 154,466 JPY Amada Holdings Co. Ltd.2 1,593 0.01 32,351 JPY ANA Holdings, Inc. 1,083 0.01 40,324 JPY Aozora Bank Ltd.2 980 0.01 113,839 JPY Asahi Group Holdings Ltd.2 5,009 0.04 32,785 JPY Asahi Intecc Co. Ltd.2 1,679 0.01 455,533 JPY Asahi Kasei Corp.2 4,695 0.04 632,542 JPY Astellas Pharma, Inc. 8,520 0.06 58,355 JPY Bandai Namco Holdings, Inc. 2,870 0.02 20,247 JPY Bank of Kyoto Ltd. (The)2 793 0.01 21,650 JPY Benesse Holdings, Inc.2 504 – 217,079 JPY Bridgestone Corp. 8,115 0.06 73,552 JPY Brother Industries Ltd. 1,262 0.01 27,354 JPY Calbee, Inc.2 776 0.01 352,189 JPY Canon, Inc. 9,942 0.07 50,567 JPY Casio Computer Co. Ltd.2 564 – 51,946 JPY Central Japan Railway Co.2 10,834 0.08 255,219 JPY Chiba Bank Ltd. (The) 1,225 0.01 184,504 JPY Chubu Electric Power Co., Inc. 2,518 0.02 72,736 JPY Chugai Pharmaceutical Co. Ltd.2 4,850 0.04 94,831 JPY Chugoku Electric Power Co., Inc. (The)2 1,187 0.01 39,105 JPY Coca-Cola Bottlers Japan Holdings, Inc.2 889 0.01 399,886 JPY Concordia Financial Group Ltd.2 1,532 0.01 46,253 JPY Credit Saison Co. Ltd.2 498 – 33,772 JPY CyberAgent, Inc.2 1,300 0.01 91,222 JPY Dai Nippon Printing Co. Ltd. 1,979 0.01 93,916 JPY Daicel Corp.2 800 0.01 46,116 JPY Daifuku Co. Ltd.2 2,323 0.02 343,176 JPY Dai-ichi Life Holdings, Inc. 4,975 0.04 196,070 JPY Daiichi Sankyo Co. Ltd. 9,490 0.07 91,429 JPY Daikin Industries Ltd.2 11,141 0.08 22,526 JPY Daito Trust Construction Co. Ltd.2 2,933 0.02 198,296 JPY Daiwa House Industry Co. Ltd.2 5,937 0.04 468 JPY Daiwa House REIT Investment Corp.2 1,106 0.01 586,148 JPY Daiwa Securities Group, Inc. 2,561 0.02 137,477 JPY Denso Corp. 5,321 0.04 86,468 JPY Dentsu, Inc. 2,827 0.02 9,282 JPY Disco Corp.2 1,297 0.01 99,944 JPY East Japan Railway Co. 9,490 0.07 83,951 JPY Eisai Co. Ltd. 4,935 0.04 49,741 JPY Electric Power Development Co. Ltd. 1,091 0.01 92,076 JPY FamilyMart UNY Holdings Co. Ltd.2 2,218 0.02 66,222 JPY FANUC Corp.2 11,268 0.08 20,405 JPY Fast Retailing Co. Ltd.2 11,797 0.09 30,542 JPY Fuji Electric Co. Ltd. 1,021 0.01 127,745 JPY FUJIFILM Holdings Corp. 6,117 0.05 65,336 JPY Fujitsu Ltd.2 4,426 0.03 53,522 JPY Fukuoka Financial Group, Inc. 917 0.01 21,100 JPY GMO Payment Gateway, Inc. 1,419 0.01 87,937 JPY Hakuhodo DY Holdings, Inc.2 1,383 0.01 43,154 JPY Hamamatsu Photonics KK2 1,550 0.01 73,272 JPY Hankyu Hanshin Holdings, Inc.2 2,639 0.02 4,937 JPY Hikari Tsushin, Inc. 1,001 0.01 74,311 JPY Hino Motors Ltd. 589 –
169
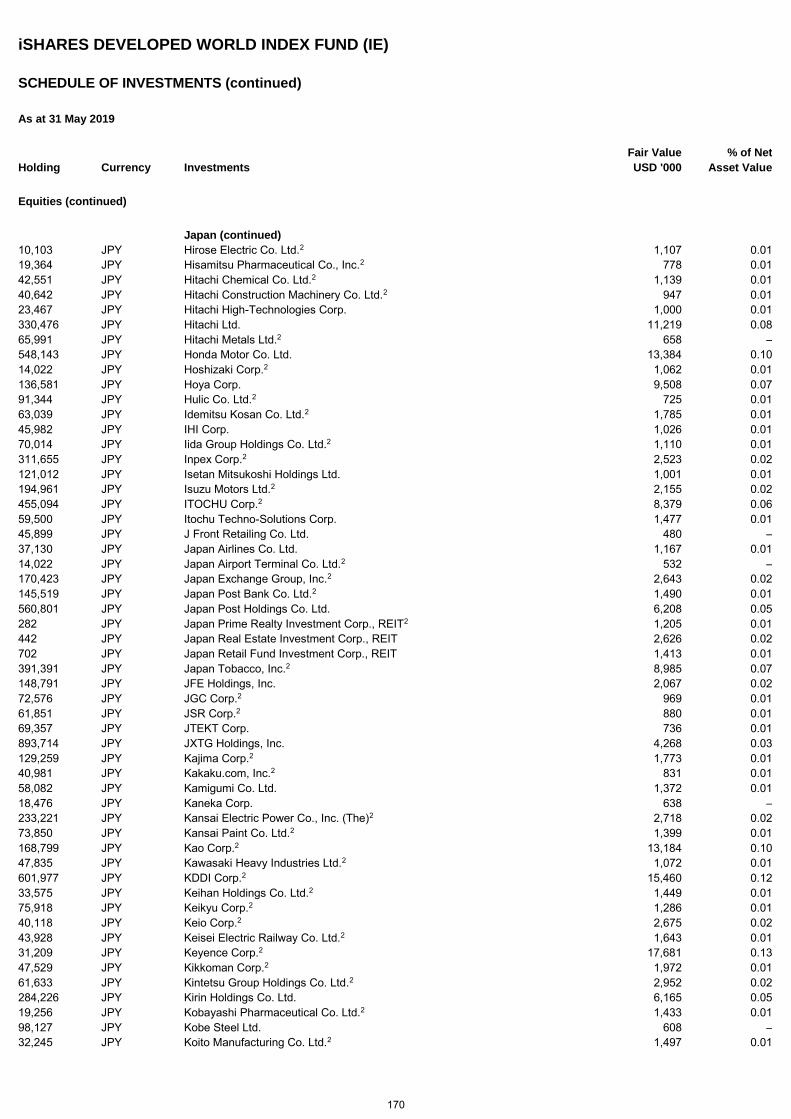
iSHARES DEVELOPED WORLD INDEX FUND (IE)
SCHEDULE OF INVESTMENTS (continued)
As at 31 May 2019
Holding Currency Investments Fair Value
USD '000 % of Net
Asset Value
Equities (continued)
Japan (continued) 10,103 JPY Hirose Electric Co. Ltd.2 1,107 0.01 19,364 JPY Hisamitsu Pharmaceutical Co., Inc.2 778 0.01 42,551 JPY Hitachi Chemical Co. Ltd.2 1,139 0.01 40,642 JPY Hitachi Construction Machinery Co. Ltd.2 947 0.01 23,467 JPY Hitachi High-Technologies Corp. 1,000 0.01 330,476 JPY Hitachi Ltd. 11,219 0.08 65,991 JPY Hitachi Metals Ltd.2 658 – 548,143 JPY Honda Motor Co. Ltd. 13,384 0.10 14,022 JPY Hoshizaki Corp.2 1,062 0.01 136,581 JPY Hoya Corp. 9,508 0.07 91,344 JPY Hulic Co. Ltd.2 725 0.01 63,039 JPY Idemitsu Kosan Co. Ltd.2 1,785 0.01 45,982 JPY IHI Corp. 1,026 0.01 70,014 JPY Iida Group Holdings Co. Ltd.2 1,110 0.01 311,655 JPY Inpex Corp.2 2,523 0.02 121,012 JPY Isetan Mitsukoshi Holdings Ltd. 1,001 0.01 194,961 JPY Isuzu Motors Ltd.2 2,155 0.02 455,094 JPY ITOCHU Corp.2 8,379 0.06 59,500 JPY Itochu Techno-Solutions Corp. 1,477 0.01 45,899 JPY J Front Retailing Co. Ltd. 480 – 37,130 JPY Japan Airlines Co. Ltd. 1,167 0.01 14,022 JPY Japan Airport Terminal Co. Ltd.2 532 – 170,423 JPY Japan Exchange Group, Inc.2 2,643 0.02 145,519 JPY Japan Post Bank Co. Ltd.2 1,490 0.01 560,801 JPY Japan Post Holdings Co. Ltd. 6,208 0.05 282 JPY Japan Prime Realty Investment Corp., REIT2 1,205 0.01 442 JPY Japan Real Estate Investment Corp., REIT 2,626 0.02 702 JPY Japan Retail Fund Investment Corp., REIT 1,413 0.01 391,391 JPY Japan Tobacco, Inc.2 8,985 0.07 148,791 JPY JFE Holdings, Inc. 2,067 0.02 72,576 JPY JGC Corp.2 969 0.01 61,851 JPY JSR Corp.2 880 0.01 69,357 JPY JTEKT Corp. 736 0.01 893,714 JPY JXTG Holdings, Inc. 4,268 0.03 129,259 JPY Kajima Corp.2 1,773 0.01 40,981 JPY Kakaku.com, Inc.2 831 0.01 58,082 JPY Kamigumi Co. Ltd. 1,372 0.01 18,476 JPY Kaneka Corp. 638 – 233,221 JPY Kansai Electric Power Co., Inc. (The)2 2,718 0.02 73,850 JPY Kansai Paint Co. Ltd.2 1,399 0.01 168,799 JPY Kao Corp.2 13,184 0.10 47,835 JPY Kawasaki Heavy Industries Ltd.2 1,072 0.01 601,977 JPY KDDI Corp.2 15,460 0.12 33,575 JPY Keihan Holdings Co. Ltd.2 1,449 0.01 75,918 JPY Keikyu Corp.2 1,286 0.01 40,118 JPY Keio Corp.2 2,675 0.02 43,928 JPY Keisei Electric Railway Co. Ltd.2 1,643 0.01 31,209 JPY Keyence Corp.2 17,681 0.13 47,529 JPY Kikkoman Corp.2 1,972 0.01 61,633 JPY Kintetsu Group Holdings Co. Ltd.2 2,952 0.02 284,226 JPY Kirin Holdings Co. Ltd. 6,165 0.05 19,256 JPY Kobayashi Pharmaceutical Co. Ltd.2 1,433 0.01 98,127 JPY Kobe Steel Ltd. 608 – 32,245 JPY Koito Manufacturing Co. Ltd.2 1,497 0.01
170
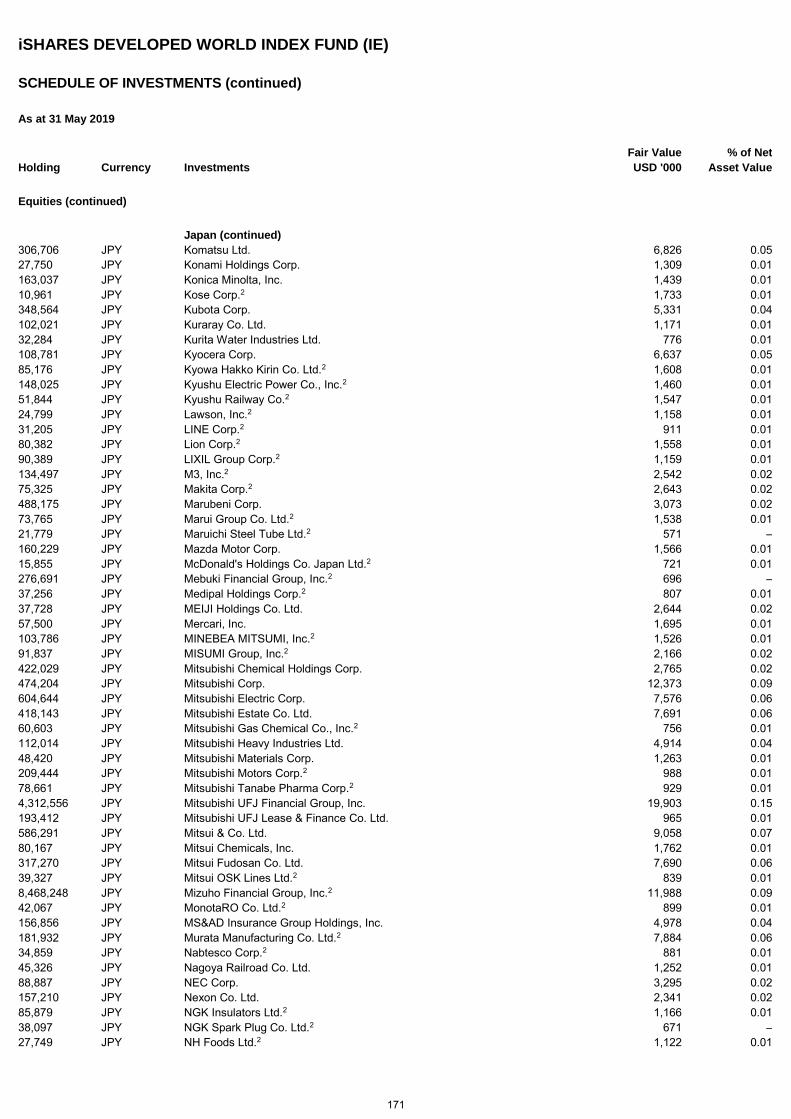
iSHARES DEVELOPED WORLD INDEX FUND (IE)
SCHEDULE OF INVESTMENTS (continued)
As at 31 May 2019
Holding Currency Investments Fair Value
USD '000 % of Net
Asset Value
Equities (continued)
Japan (continued) 306,706 JPY Komatsu Ltd. 6,826 0.05 27,750 JPY Konami Holdings Corp. 1,309 0.01 163,037 JPY Konica Minolta, Inc. 1,439 0.01 10,961 JPY Kose Corp.2 1,733 0.01 348,564 JPY Kubota Corp. 5,331 0.04 102,021 JPY Kuraray Co. Ltd. 1,171 0.01 32,284 JPY Kurita Water Industries Ltd. 776 0.01 108,781 JPY Kyocera Corp. 6,637 0.05 85,176 JPY Kyowa Hakko Kirin Co. Ltd.2 1,608 0.01 148,025 JPY Kyushu Electric Power Co., Inc.2 1,460 0.01 51,844 JPY Kyushu Railway Co.2 1,547 0.01 24,799 JPY Lawson, Inc.2 1,158 0.01 31,205 JPY LINE Corp.2 911 0.01 80,382 JPY Lion Corp.2 1,558 0.01 90,389 JPY LIXIL Group Corp.2 1,159 0.01 134,497 JPY M3, Inc.2 2,542 0.02 75,325 JPY Makita Corp.2 2,643 0.02 488,175 JPY Marubeni Corp. 3,073 0.02 73,765 JPY Marui Group Co. Ltd.2 1,538 0.01 21,779 JPY Maruichi Steel Tube Ltd.2 571 – 160,229 JPY Mazda Motor Corp. 1,566 0.01 15,855 JPY McDonald's Holdings Co. Japan Ltd.2 721 0.01 276,691 JPY Mebuki Financial Group, Inc.2 696 – 37,256 JPY Medipal Holdings Corp.2 807 0.01 37,728 JPY MEIJI Holdings Co. Ltd. 2,644 0.02 57,500 JPY Mercari, Inc. 1,695 0.01 103,786 JPY MINEBEA MITSUMI, Inc.2 1,526 0.01 91,837 JPY MISUMI Group, Inc.2 2,166 0.02 422,029 JPY Mitsubishi Chemical Holdings Corp. 2,765 0.02 474,204 JPY Mitsubishi Corp. 12,373 0.09 604,644 JPY Mitsubishi Electric Corp. 7,576 0.06 418,143 JPY Mitsubishi Estate Co. Ltd. 7,691 0.06 60,603 JPY Mitsubishi Gas Chemical Co., Inc.2 756 0.01 112,014 JPY Mitsubishi Heavy Industries Ltd. 4,914 0.04 48,420 JPY Mitsubishi Materials Corp. 1,263 0.01 209,444 JPY Mitsubishi Motors Corp.2 988 0.01 78,661 JPY Mitsubishi Tanabe Pharma Corp.2 929 0.01 4,312,556 JPY Mitsubishi UFJ Financial Group, Inc. 19,903 0.15 193,412 JPY Mitsubishi UFJ Lease & Finance Co. Ltd. 965 0.01 586,291 JPY Mitsui & Co. Ltd. 9,058 0.07 80,167 JPY Mitsui Chemicals, Inc. 1,762 0.01 317,270 JPY Mitsui Fudosan Co. Ltd. 7,690 0.06 39,327 JPY Mitsui OSK Lines Ltd.2 839 0.01 8,468,248 JPY Mizuho Financial Group, Inc.2 11,988 0.09 42,067 JPY MonotaRO Co. Ltd.2 899 0.01 156,856 JPY MS&AD Insurance Group Holdings, Inc. 4,978 0.04 181,932 JPY Murata Manufacturing Co. Ltd.2 7,884 0.06 34,859 JPY Nabtesco Corp.2 881 0.01 45,326 JPY Nagoya Railroad Co. Ltd. 1,252 0.01 88,887 JPY NEC Corp. 3,295 0.02 157,210 JPY Nexon Co. Ltd. 2,341 0.02 85,879 JPY NGK Insulators Ltd.2 1,166 0.01 38,097 JPY NGK Spark Plug Co. Ltd.2 671 – 27,749 JPY NH Foods Ltd.2 1,122 0.01
171
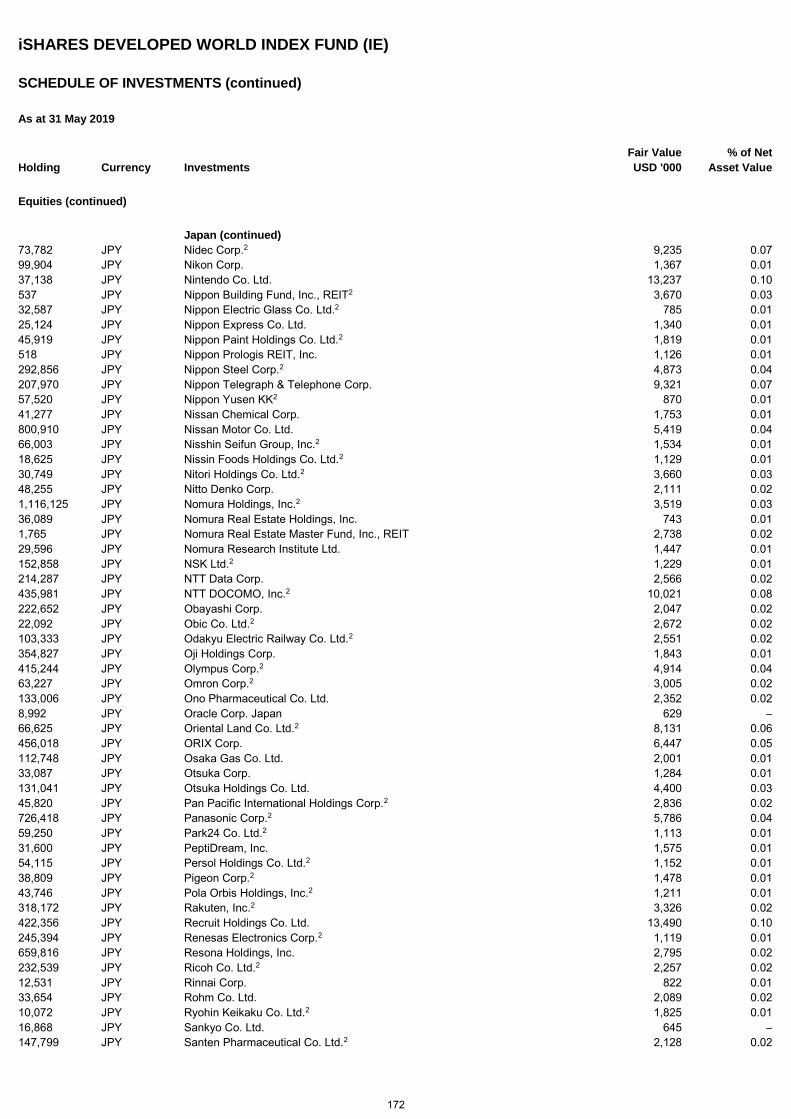
iSHARES DEVELOPED WORLD INDEX FUND (IE)
SCHEDULE OF INVESTMENTS (continued)
As at 31 May 2019
Holding Currency Investments Fair Value
USD '000 % of Net
Asset Value
Equities (continued)
Japan (continued) 73,782 JPY Nidec Corp.2 9,235 0.07 99,904 JPY Nikon Corp. 1,367 0.01 37,138 JPY Nintendo Co. Ltd. 13,237 0.10 537 JPY Nippon Building Fund, Inc., REIT2 3,670 0.03 32,587 JPY Nippon Electric Glass Co. Ltd.2 785 0.01 25,124 JPY Nippon Express Co. Ltd. 1,340 0.01 45,919 JPY Nippon Paint Holdings Co. Ltd.2 1,819 0.01 518 JPY Nippon Prologis REIT, Inc. 1,126 0.01 292,856 JPY Nippon Steel Corp.2 4,873 0.04 207,970 JPY Nippon Telegraph & Telephone Corp. 9,321 0.07 57,520 JPY Nippon Yusen KK2 870 0.01 41,277 JPY Nissan Chemical Corp. 1,753 0.01 800,910 JPY Nissan Motor Co. Ltd. 5,419 0.04 66,003 JPY Nisshin Seifun Group, Inc.2 1,534 0.01 18,625 JPY Nissin Foods Holdings Co. Ltd.2 1,129 0.01 30,749 JPY Nitori Holdings Co. Ltd.2 3,660 0.03 48,255 JPY Nitto Denko Corp. 2,111 0.02 1,116,125 JPY Nomura Holdings, Inc.2 3,519 0.03 36,089 JPY Nomura Real Estate Holdings, Inc. 743 0.01 1,765 JPY Nomura Real Estate Master Fund, Inc., REIT 2,738 0.02 29,596 JPY Nomura Research Institute Ltd. 1,447 0.01 152,858 JPY NSK Ltd.2 1,229 0.01 214,287 JPY NTT Data Corp. 2,566 0.02 435,981 JPY NTT DOCOMO, Inc.2 10,021 0.08 222,652 JPY Obayashi Corp. 2,047 0.02 22,092 JPY Obic Co. Ltd.2 2,672 0.02 103,333 JPY Odakyu Electric Railway Co. Ltd.2 2,551 0.02 354,827 JPY Oji Holdings Corp. 1,843 0.01 415,244 JPY Olympus Corp.2 4,914 0.04 63,227 JPY Omron Corp.2 3,005 0.02 133,006 JPY Ono Pharmaceutical Co. Ltd. 2,352 0.02 8,992 JPY Oracle Corp. Japan 629 – 66,625 JPY Oriental Land Co. Ltd.2 8,131 0.06 456,018 JPY ORIX Corp. 6,447 0.05 112,748 JPY Osaka Gas Co. Ltd. 2,001 0.01 33,087 JPY Otsuka Corp. 1,284 0.01 131,041 JPY Otsuka Holdings Co. Ltd. 4,400 0.03 45,820 JPY Pan Pacific International Holdings Corp.2 2,836 0.02 726,418 JPY Panasonic Corp.2 5,786 0.04 59,250 JPY Park24 Co. Ltd.2 1,113 0.01 31,600 JPY PeptiDream, Inc. 1,575 0.01 54,115 JPY Persol Holdings Co. Ltd.2 1,152 0.01 38,809 JPY Pigeon Corp.2 1,478 0.01 43,746 JPY Pola Orbis Holdings, Inc.2 1,211 0.01 318,172 JPY Rakuten, Inc.2 3,326 0.02 422,356 JPY Recruit Holdings Co. Ltd. 13,490 0.10 245,394 JPY Renesas Electronics Corp.2 1,119 0.01 659,816 JPY Resona Holdings, Inc. 2,795 0.02 232,539 JPY Ricoh Co. Ltd.2 2,257 0.02 12,531 JPY Rinnai Corp. 822 0.01 33,654 JPY Rohm Co. Ltd. 2,089 0.02 10,072 JPY Ryohin Keikaku Co. Ltd.2 1,825 0.01 16,868 JPY Sankyo Co. Ltd. 645 – 147,799 JPY Santen Pharmaceutical Co. Ltd.2 2,128 0.02
172
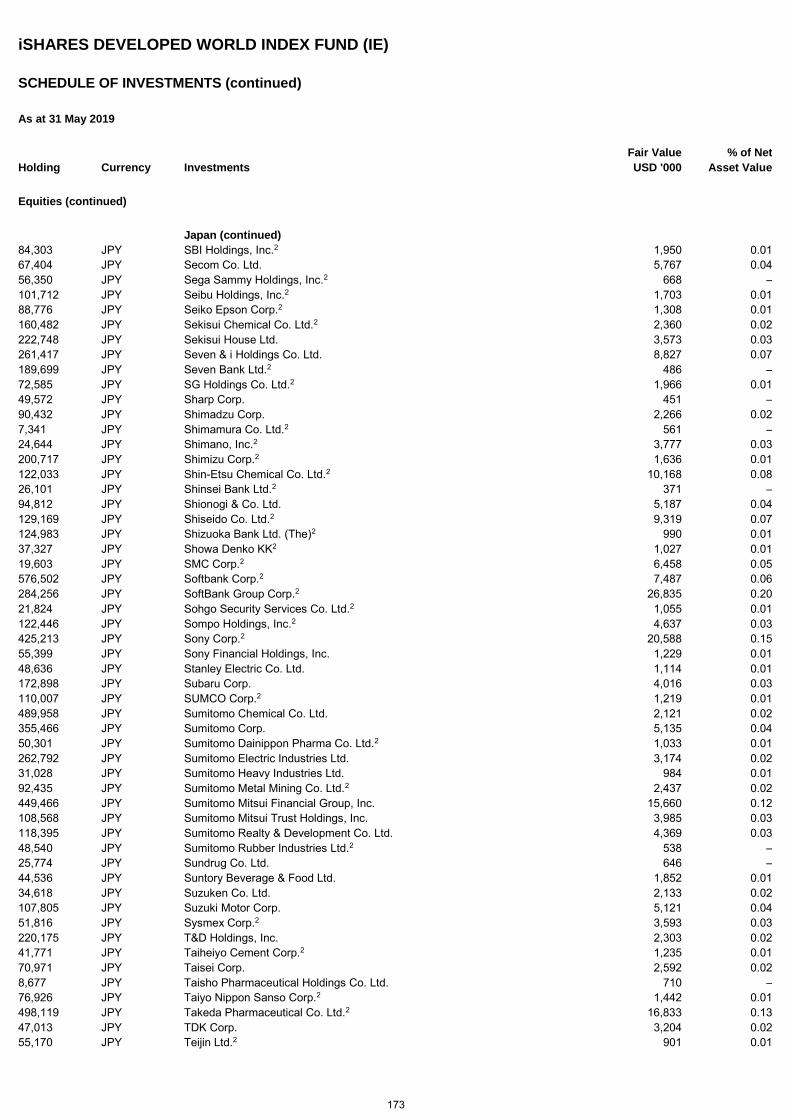
iSHARES DEVELOPED WORLD INDEX FUND (IE)
SCHEDULE OF INVESTMENTS (continued)
As at 31 May 2019
Holding Currency Investments Fair Value
USD '000 % of Net
Asset Value
Equities (continued)
Japan (continued) 84,303 JPY SBI Holdings, Inc.2 1,950 0.01 67,404 JPY Secom Co. Ltd. 5,767 0.04 56,350 JPY Sega Sammy Holdings, Inc.2 668 – 101,712 JPY Seibu Holdings, Inc.2 1,703 0.01 88,776 JPY Seiko Epson Corp.2 1,308 0.01 160,482 JPY Sekisui Chemical Co. Ltd.2 2,360 0.02 222,748 JPY Sekisui House Ltd. 3,573 0.03 261,417 JPY Seven & i Holdings Co. Ltd. 8,827 0.07 189,699 JPY Seven Bank Ltd.2 486 – 72,585 JPY SG Holdings Co. Ltd.2 1,966 0.01 49,572 JPY Sharp Corp. 451 – 90,432 JPY Shimadzu Corp. 2,266 0.02 7,341 JPY Shimamura Co. Ltd.2 561 – 24,644 JPY Shimano, Inc.2 3,777 0.03 200,717 JPY Shimizu Corp.2 1,636 0.01 122,033 JPY Shin-Etsu Chemical Co. Ltd.2 10,168 0.08 26,101 JPY Shinsei Bank Ltd.2 371 – 94,812 JPY Shionogi & Co. Ltd. 5,187 0.04 129,169 JPY Shiseido Co. Ltd.2 9,319 0.07 124,983 JPY Shizuoka Bank Ltd. (The)2 990 0.01 37,327 JPY Showa Denko KK2 1,027 0.01 19,603 JPY SMC Corp.2 6,458 0.05 576,502 JPY Softbank Corp.2 7,487 0.06 284,256 JPY SoftBank Group Corp.2 26,835 0.20 21,824 JPY Sohgo Security Services Co. Ltd.2 1,055 0.01 122,446 JPY Sompo Holdings, Inc.2 4,637 0.03 425,213 JPY Sony Corp.2 20,588 0.15 55,399 JPY Sony Financial Holdings, Inc. 1,229 0.01 48,636 JPY Stanley Electric Co. Ltd. 1,114 0.01 172,898 JPY Subaru Corp. 4,016 0.03 110,007 JPY SUMCO Corp.2 1,219 0.01 489,958 JPY Sumitomo Chemical Co. Ltd. 2,121 0.02 355,466 JPY Sumitomo Corp. 5,135 0.04 50,301 JPY Sumitomo Dainippon Pharma Co. Ltd.2 1,033 0.01 262,792 JPY Sumitomo Electric Industries Ltd. 3,174 0.02 31,028 JPY Sumitomo Heavy Industries Ltd. 984 0.01 92,435 JPY Sumitomo Metal Mining Co. Ltd.2 2,437 0.02 449,466 JPY Sumitomo Mitsui Financial Group, Inc. 15,660 0.12 108,568 JPY Sumitomo Mitsui Trust Holdings, Inc. 3,985 0.03 118,395 JPY Sumitomo Realty & Development Co. Ltd. 4,369 0.03 48,540 JPY Sumitomo Rubber Industries Ltd.2 538 – 25,774 JPY Sundrug Co. Ltd. 646 – 44,536 JPY Suntory Beverage & Food Ltd. 1,852 0.01 34,618 JPY Suzuken Co. Ltd. 2,133 0.02 107,805 JPY Suzuki Motor Corp. 5,121 0.04 51,816 JPY Sysmex Corp.2 3,593 0.03 220,175 JPY T&D Holdings, Inc. 2,303 0.02 41,771 JPY Taiheiyo Cement Corp.2 1,235 0.01 70,971 JPY Taisei Corp. 2,592 0.02 8,677 JPY Taisho Pharmaceutical Holdings Co. Ltd. 710 – 76,926 JPY Taiyo Nippon Sanso Corp.2 1,442 0.01 498,119 JPY Takeda Pharmaceutical Co. Ltd.2 16,833 0.13 47,013 JPY TDK Corp. 3,204 0.02 55,170 JPY Teijin Ltd.2 901 0.01
173
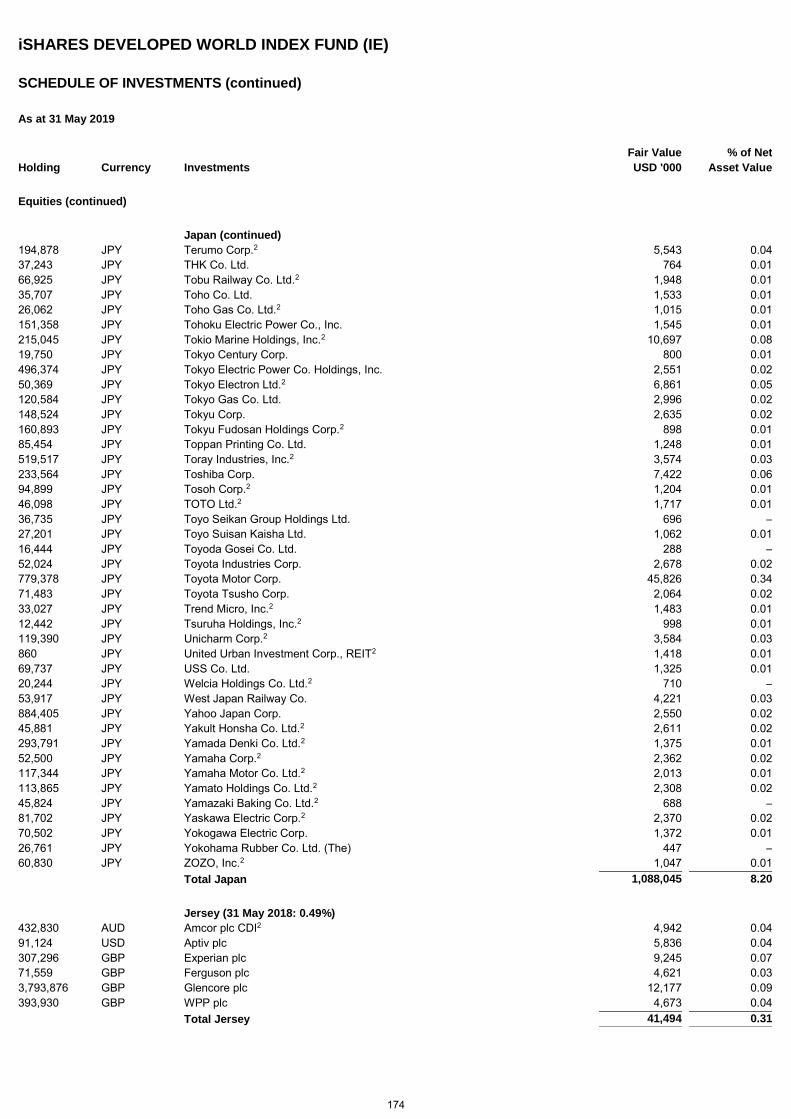
iSHARES DEVELOPED WORLD INDEX FUND (IE)
SCHEDULE OF INVESTMENTS (continued)
As at 31 May 2019
Holding Currency Investments Fair Value
USD '000 % of Net
Asset Value
Equities (continued)
Japan (continued) 194,878 JPY Terumo Corp.2 5,543 0.04 37,243 JPY THK Co. Ltd. 764 0.01 66,925 JPY Tobu Railway Co. Ltd.2 1,948 0.01 35,707 JPY Toho Co. Ltd. 1,533 0.01 26,062 JPY Toho Gas Co. Ltd.2 1,015 0.01 151,358 JPY Tohoku Electric Power Co., Inc. 1,545 0.01 215,045 JPY Tokio Marine Holdings, Inc.2 10,697 0.08 19,750 JPY Tokyo Century Corp. 800 0.01 496,374 JPY Tokyo Electric Power Co. Holdings, Inc. 2,551 0.02 50,369 JPY Tokyo Electron Ltd.2 6,861 0.05 120,584 JPY Tokyo Gas Co. Ltd. 2,996 0.02 148,524 JPY Tokyu Corp. 2,635 0.02 160,893 JPY Tokyu Fudosan Holdings Corp.2 898 0.01 85,454 JPY Toppan Printing Co. Ltd. 1,248 0.01 519,517 JPY Toray Industries, Inc.2 3,574 0.03 233,564 JPY Toshiba Corp. 7,422 0.06 94,899 JPY Tosoh Corp.2 1,204 0.01 46,098 JPY TOTO Ltd.2 1,717 0.01 36,735 JPY Toyo Seikan Group Holdings Ltd. 696 – 27,201 JPY Toyo Suisan Kaisha Ltd. 1,062 0.01 16,444 JPY Toyoda Gosei Co. Ltd. 288 – 52,024 JPY Toyota Industries Corp. 2,678 0.02 779,378 JPY Toyota Motor Corp. 45,826 0.34 71,483 JPY Toyota Tsusho Corp. 2,064 0.02 33,027 JPY Trend Micro, Inc.2 1,483 0.01 12,442 JPY Tsuruha Holdings, Inc.2 998 0.01 119,390 JPY Unicharm Corp.2 3,584 0.03 860 JPY United Urban Investment Corp., REIT2 1,418 0.01 69,737 JPY USS Co. Ltd. 1,325 0.01 20,244 JPY Welcia Holdings Co. Ltd.2 710 – 53,917 JPY West Japan Railway Co. 4,221 0.03 884,405 JPY Yahoo Japan Corp. 2,550 0.02 45,881 JPY Yakult Honsha Co. Ltd.2 2,611 0.02 293,791 JPY Yamada Denki Co. Ltd.2 1,375 0.01 52,500 JPY Yamaha Corp.2 2,362 0.02 117,344 JPY Yamaha Motor Co. Ltd.2 2,013 0.01 113,865 JPY Yamato Holdings Co. Ltd.2 2,308 0.02 45,824 JPY Yamazaki Baking Co. Ltd.2 688 – 81,702 JPY Yaskawa Electric Corp.2 2,370 0.02 70,502 JPY Yokogawa Electric Corp. 1,372 0.01 26,761 JPY Yokohama Rubber Co. Ltd. (The) 447 – 60,830 JPY ZOZO, Inc.2 1,047 0.01 Total Japan 1,088,045 8.20
Jersey (31 May 2018: 0.49%) 432,830 AUD Amcor plc CDI2 4,942 0.04 91,124 USD Aptiv plc 5,836 0.04 307,296 GBP Experian plc 9,245 0.07 71,559 GBP Ferguson plc 4,621 0.03 3,793,876 GBP Glencore plc 12,177 0.09 393,930 GBP WPP plc 4,673 0.04 Total Jersey 41,494 0.31
174
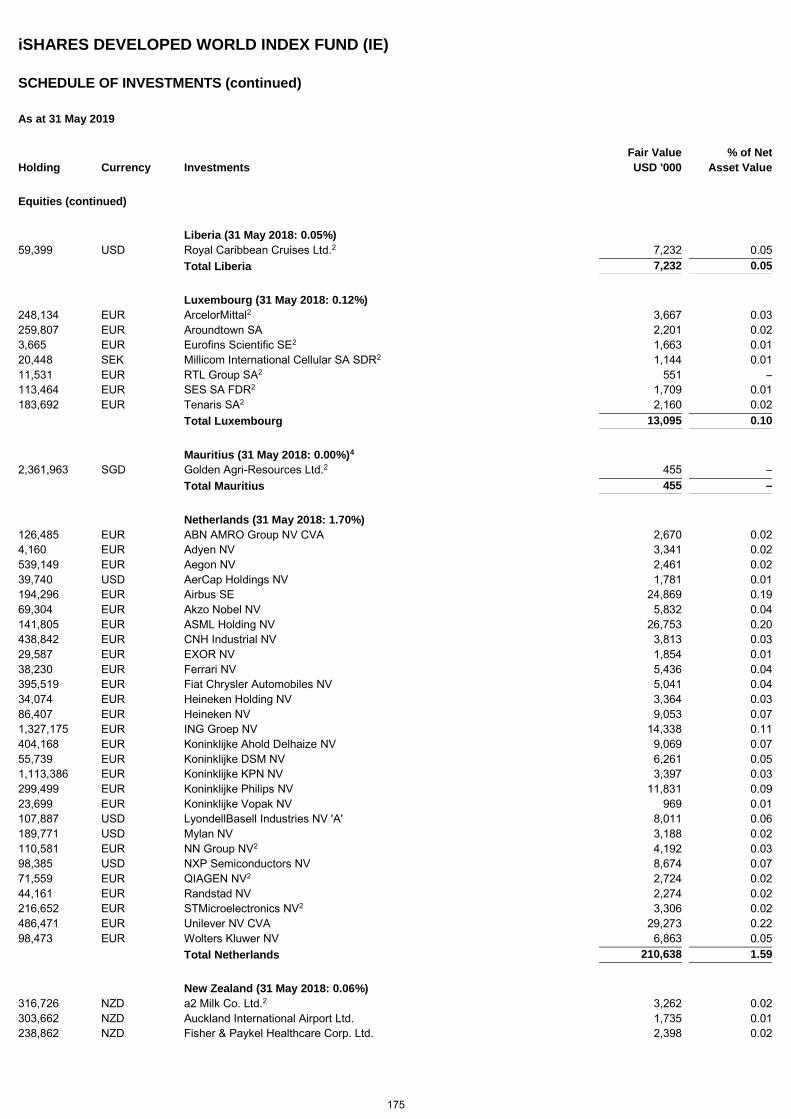
iSHARES DEVELOPED WORLD INDEX FUND (IE)
SCHEDULE OF INVESTMENTS (continued)
As at 31 May 2019
Holding Currency Investments Fair Value
USD '000 % of Net
Asset Value
Equities (continued)
Liberia (31 May 2018: 0.05%) 59,399 USD Royal Caribbean Cruises Ltd.2 7,232 0.05 Total Liberia 7,232 0.05
Luxembourg (31 May 2018: 0.12%) 248,134 EUR ArcelorMittal2 3,667 0.03 259,807 EUR Aroundtown SA 2,201 0.02 3,665 EUR Eurofins Scientific SE2 1,663 0.01 20,448 SEK Millicom International Cellular SA SDR2 1,144 0.01 11,531 EUR RTL Group SA2 551 – 113,464 EUR SES SA FDR2 1,709 0.01 183,692 EUR Tenaris SA2 2,160 0.02 Total Luxembourg 13,095 0.10
Mauritius (31 May 2018: 0.00%)4 2,361,963 SGD Golden Agri-Resources Ltd.2 455 – Total Mauritius 455 –
Netherlands (31 May 2018: 1.70%) 126,485 EUR ABN AMRO Group NV CVA 2,670 0.02 4,160 EUR Adyen NV 3,341 0.02 539,149 EUR Aegon NV 2,461 0.02 39,740 USD AerCap Holdings NV 1,781 0.01 194,296 EUR Airbus SE 24,869 0.19 69,304 EUR Akzo Nobel NV 5,832 0.04 141,805 EUR ASML Holding NV 26,753 0.20 438,842 EUR CNH Industrial NV 3,813 0.03 29,587 EUR EXOR NV 1,854 0.01 38,230 EUR Ferrari NV 5,436 0.04 395,519 EUR Fiat Chrysler Automobiles NV 5,041 0.04 34,074 EUR Heineken Holding NV 3,364 0.03 86,407 EUR Heineken NV 9,053 0.07 1,327,175 EUR ING Groep NV 14,338 0.11 404,168 EUR Koninklijke Ahold Delhaize NV 9,069 0.07 55,739 EUR Koninklijke DSM NV 6,261 0.05 1,113,386 EUR Koninklijke KPN NV 3,397 0.03 299,499 EUR Koninklijke Philips NV 11,831 0.09 23,699 EUR Koninklijke Vopak NV 969 0.01 107,887 USD LyondellBasell Industries NV 'A' 8,011 0.06 189,771 USD Mylan NV 3,188 0.02 110,581 EUR NN Group NV2 4,192 0.03 98,385 USD NXP Semiconductors NV 8,674 0.07 71,559 EUR QIAGEN NV2 2,724 0.02 44,161 EUR Randstad NV 2,274 0.02 216,652 EUR STMicroelectronics NV2 3,306 0.02 486,471 EUR Unilever NV CVA 29,273 0.22 98,473 EUR Wolters Kluwer NV 6,863 0.05 Total Netherlands 210,638 1.59
New Zealand (31 May 2018: 0.06%) 316,726 NZD a2 Milk Co. Ltd.2 3,262 0.02 303,662 NZD Auckland International Airport Ltd. 1,735 0.01 238,862 NZD Fisher & Paykel Healthcare Corp. Ltd. 2,398 0.02
175
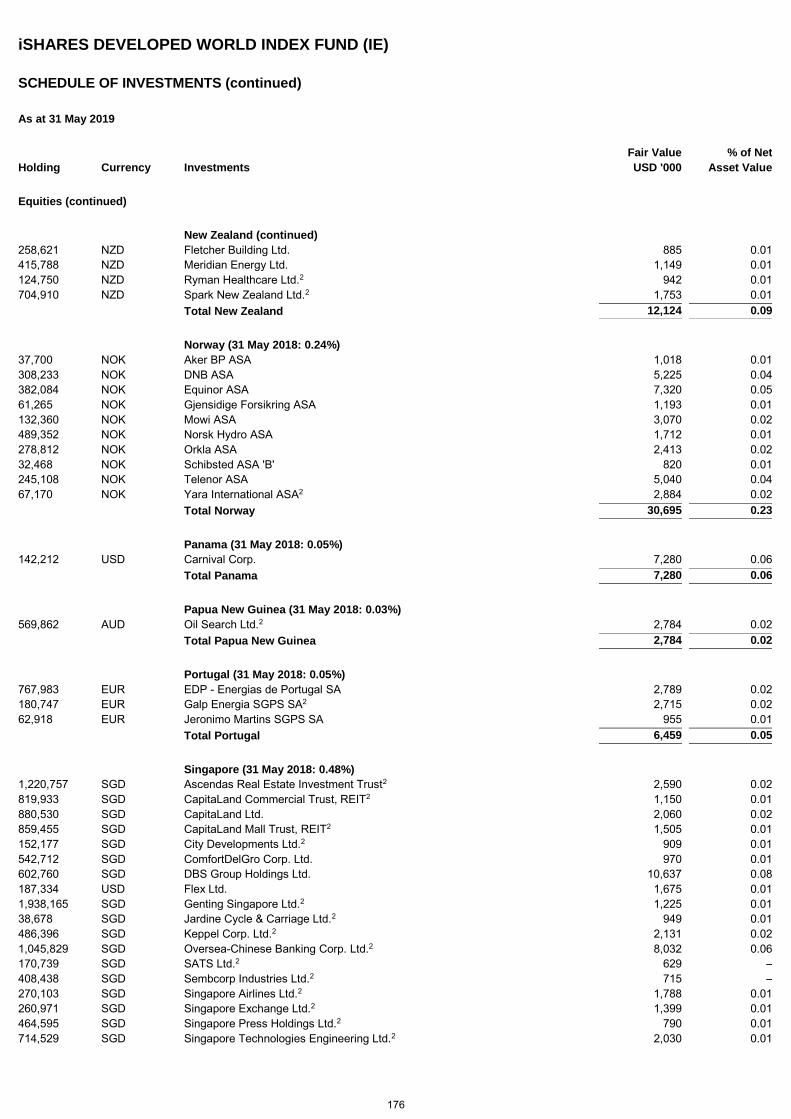
iSHARES DEVELOPED WORLD INDEX FUND (IE)
SCHEDULE OF INVESTMENTS (continued)
As at 31 May 2019
Holding Currency Investments Fair Value
USD '000 % of Net
Asset Value
Equities (continued)
New Zealand (continued) 258,621 NZD Fletcher Building Ltd. 885 0.01 415,788 NZD Meridian Energy Ltd. 1,149 0.01 124,750 NZD Ryman Healthcare Ltd.2 942 0.01 704,910 NZD Spark New Zealand Ltd.2 1,753 0.01 Total New Zealand 12,124 0.09
Norway (31 May 2018: 0.24%) 37,700 NOK Aker BP ASA 1,018 0.01 308,233 NOK DNB ASA 5,225 0.04 382,084 NOK Equinor ASA 7,320 0.05 61,265 NOK Gjensidige Forsikring ASA 1,193 0.01 132,360 NOK Mowi ASA 3,070 0.02 489,352 NOK Norsk Hydro ASA 1,712 0.01 278,812 NOK Orkla ASA 2,413 0.02 32,468 NOK Schibsted ASA 'B' 820 0.01 245,108 NOK Telenor ASA 5,040 0.04 67,170 NOK Yara International ASA2 2,884 0.02 Total Norway 30,695 0.23
Panama (31 May 2018: 0.05%) 142,212 USD Carnival Corp. 7,280 0.06 Total Panama 7,280 0.06
Papua New Guinea (31 May 2018: 0.03%) 569,862 AUD Oil Search Ltd.2 2,784 0.02 Total Papua New Guinea 2,784 0.02
Portugal (31 May 2018: 0.05%) 767,983 EUR EDP - Energias de Portugal SA 2,789 0.02 180,747 EUR Galp Energia SGPS SA2 2,715 0.02 62,918 EUR Jeronimo Martins SGPS SA 955 0.01 Total Portugal 6,459 0.05
Singapore (31 May 2018: 0.48%) 1,220,757 SGD Ascendas Real Estate Investment Trust2 2,590 0.02 819,933 SGD CapitaLand Commercial Trust, REIT2 1,150 0.01 880,530 SGD CapitaLand Ltd. 2,060 0.02 859,455 SGD CapitaLand Mall Trust, REIT2 1,505 0.01 152,177 SGD City Developments Ltd.2 909 0.01 542,712 SGD ComfortDelGro Corp. Ltd. 970 0.01 602,760 SGD DBS Group Holdings Ltd. 10,637 0.08 187,334 USD Flex Ltd. 1,675 0.01 1,938,165 SGD Genting Singapore Ltd.2 1,225 0.01 38,678 SGD Jardine Cycle & Carriage Ltd.2 949 0.01 486,396 SGD Keppel Corp. Ltd.2 2,131 0.02 1,045,829 SGD Oversea-Chinese Banking Corp. Ltd.2 8,032 0.06 170,739 SGD SATS Ltd.2 629 – 408,438 SGD Sembcorp Industries Ltd.2 715 – 270,103 SGD Singapore Airlines Ltd.2 1,788 0.01 260,971 SGD Singapore Exchange Ltd.2 1,399 0.01 464,595 SGD Singapore Press Holdings Ltd.2 790 0.01 714,529 SGD Singapore Technologies Engineering Ltd.2 2,030 0.01
176
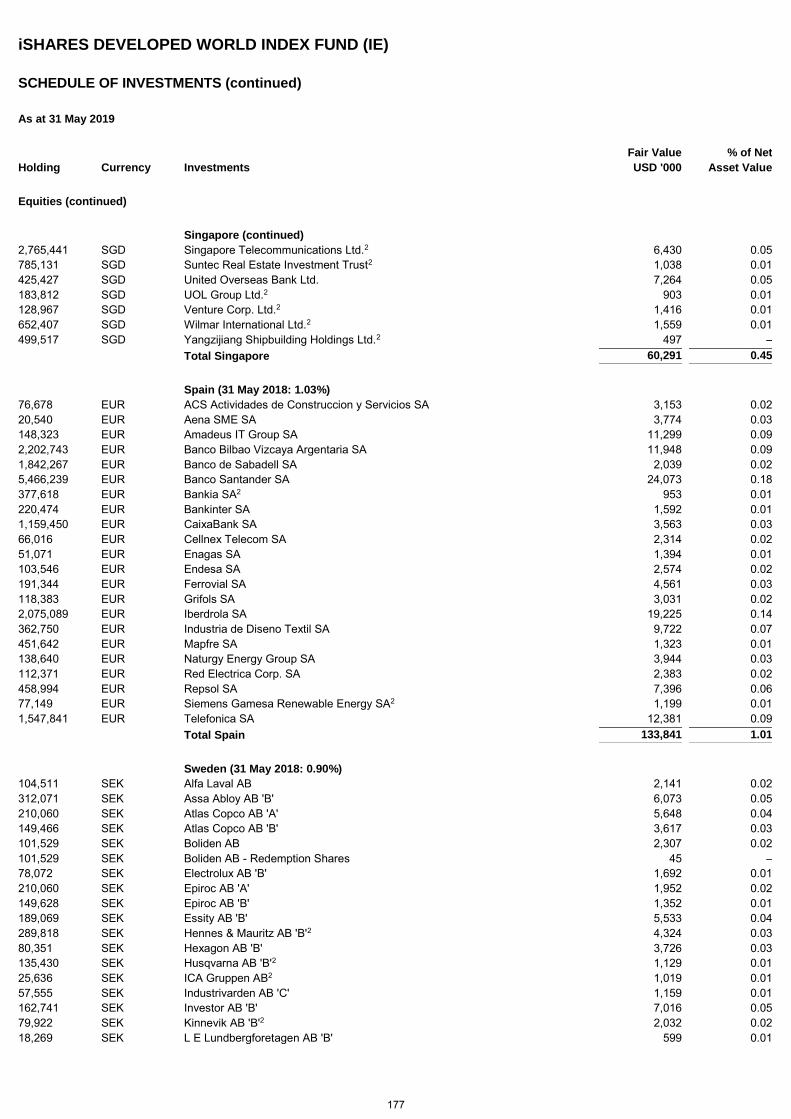
iSHARES DEVELOPED WORLD INDEX FUND (IE)
SCHEDULE OF INVESTMENTS (continued)
As at 31 May 2019
Holding Currency Investments Fair Value
USD '000 % of Net
Asset Value
Equities (continued)
Singapore (continued) 2,765,441 SGD Singapore Telecommunications Ltd.2 6,430 0.05 785,131 SGD Suntec Real Estate Investment Trust2 1,038 0.01 425,427 SGD United Overseas Bank Ltd. 7,264 0.05 183,812 SGD UOL Group Ltd.2 903 0.01 128,967 SGD Venture Corp. Ltd.2 1,416 0.01 652,407 SGD Wilmar International Ltd.2 1,559 0.01 499,517 SGD Yangzijiang Shipbuilding Holdings Ltd.2 497 – Total Singapore 60,291 0.45
Spain (31 May 2018: 1.03%) 76,678 EUR ACS Actividades de Construccion y Servicios SA 3,153 0.02 20,540 EUR Aena SME SA 3,774 0.03 148,323 EUR Amadeus IT Group SA 11,299 0.09 2,202,743 EUR Banco Bilbao Vizcaya Argentaria SA 11,948 0.09 1,842,267 EUR Banco de Sabadell SA 2,039 0.02 5,466,239 EUR Banco Santander SA 24,073 0.18 377,618 EUR Bankia SA2 953 0.01 220,474 EUR Bankinter SA 1,592 0.01 1,159,450 EUR CaixaBank SA 3,563 0.03 66,016 EUR Cellnex Telecom SA 2,314 0.02 51,071 EUR Enagas SA 1,394 0.01 103,546 EUR Endesa SA 2,574 0.02 191,344 EUR Ferrovial SA 4,561 0.03 118,383 EUR Grifols SA 3,031 0.02 2,075,089 EUR Iberdrola SA 19,225 0.14 362,750 EUR Industria de Diseno Textil SA 9,722 0.07 451,642 EUR Mapfre SA 1,323 0.01 138,640 EUR Naturgy Energy Group SA 3,944 0.03 112,371 EUR Red Electrica Corp. SA 2,383 0.02 458,994 EUR Repsol SA 7,396 0.06 77,149 EUR Siemens Gamesa Renewable Energy SA2 1,199 0.01 1,547,841 EUR Telefonica SA 12,381 0.09 Total Spain 133,841 1.01
Sweden (31 May 2018: 0.90%) 104,511 SEK Alfa Laval AB 2,141 0.02 312,071 SEK Assa Abloy AB 'B' 6,073 0.05 210,060 SEK Atlas Copco AB 'A' 5,648 0.04 149,466 SEK Atlas Copco AB 'B' 3,617 0.03 101,529 SEK Boliden AB 2,307 0.02 101,529 SEK Boliden AB - Redemption Shares 45 – 78,072 SEK Electrolux AB 'B' 1,692 0.01 210,060 SEK Epiroc AB 'A' 1,952 0.02 149,628 SEK Epiroc AB 'B' 1,352 0.01 189,069 SEK Essity AB 'B' 5,533 0.04 289,818 SEK Hennes & Mauritz AB 'B'2 4,324 0.03 80,351 SEK Hexagon AB 'B' 3,726 0.03 135,430 SEK Husqvarna AB 'B'2 1,129 0.01 25,636 SEK ICA Gruppen AB2 1,019 0.01 57,555 SEK Industrivarden AB 'C' 1,159 0.01 162,741 SEK Investor AB 'B' 7,016 0.05 79,922 SEK Kinnevik AB 'B'2 2,032 0.02 18,269 SEK L E Lundbergforetagen AB 'B' 599 0.01
177
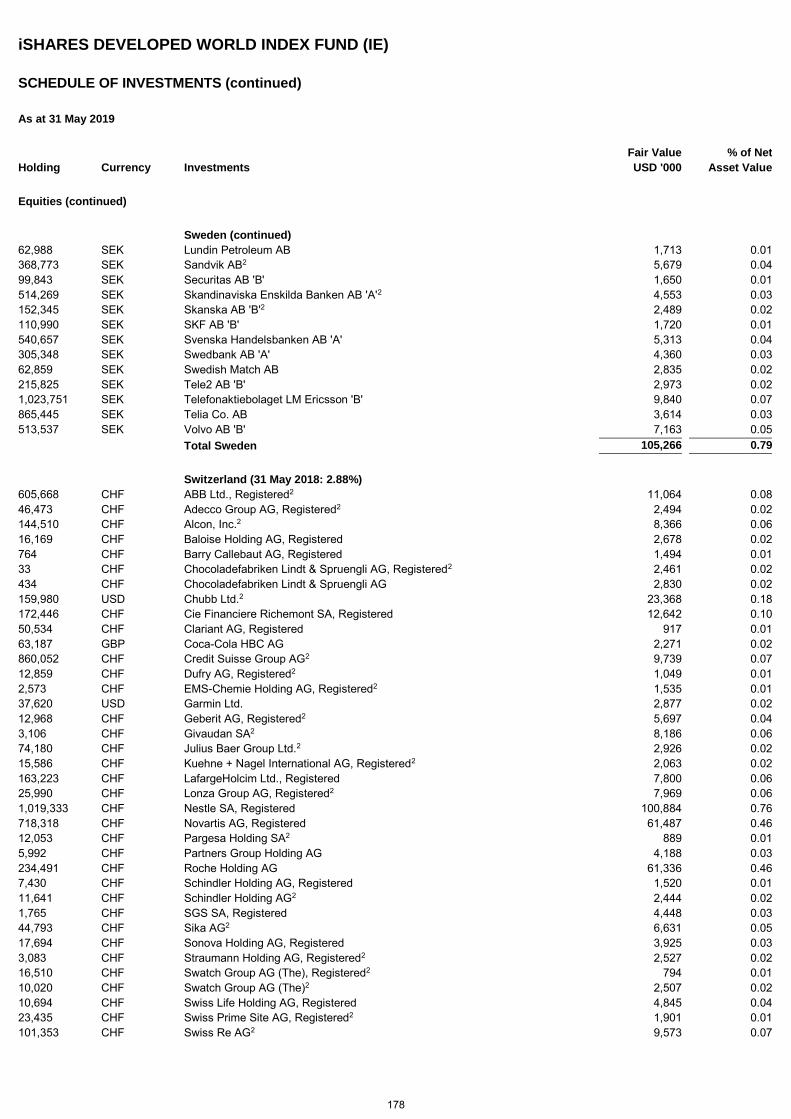
iSHARES DEVELOPED WORLD INDEX FUND (IE)
SCHEDULE OF INVESTMENTS (continued)
As at 31 May 2019
Holding Currency Investments Fair Value
USD '000 % of Net
Asset Value
Equities (continued)
Sweden (continued) 62,988 SEK Lundin Petroleum AB 1,713 0.01 368,773 SEK Sandvik AB2 5,679 0.04 99,843 SEK Securitas AB 'B' 1,650 0.01 514,269 SEK Skandinaviska Enskilda Banken AB 'A'2 4,553 0.03 152,345 SEK Skanska AB 'B'2 2,489 0.02 110,990 SEK SKF AB 'B' 1,720 0.01 540,657 SEK Svenska Handelsbanken AB 'A' 5,313 0.04 305,348 SEK Swedbank AB 'A' 4,360 0.03 62,859 SEK Swedish Match AB 2,835 0.02 215,825 SEK Tele2 AB 'B' 2,973 0.02 1,023,751 SEK Telefonaktiebolaget LM Ericsson 'B' 9,840 0.07 865,445 SEK Telia Co. AB 3,614 0.03 513,537 SEK Volvo AB 'B' 7,163 0.05 Total Sweden 105,266 0.79
Switzerland (31 May 2018: 2.88%) 605,668 CHF ABB Ltd., Registered2 11,064 0.08 46,473 CHF Adecco Group AG, Registered2 2,494 0.02 144,510 CHF Alcon, Inc.2 8,366 0.06 16,169 CHF Baloise Holding AG, Registered 2,678 0.02 764 CHF Barry Callebaut AG, Registered 1,494 0.01 33 CHF Chocoladefabriken Lindt & Spruengli AG, Registered2 2,461 0.02 434 CHF Chocoladefabriken Lindt & Spruengli AG 2,830 0.02 159,980 USD Chubb Ltd.2 23,368 0.18 172,446 CHF Cie Financiere Richemont SA, Registered 12,642 0.10 50,534 CHF Clariant AG, Registered 917 0.01 63,187 GBP Coca-Cola HBC AG 2,271 0.02 860,052 CHF Credit Suisse Group AG2 9,739 0.07 12,859 CHF Dufry AG, Registered2 1,049 0.01 2,573 CHF EMS-Chemie Holding AG, Registered2 1,535 0.01 37,620 USD Garmin Ltd. 2,877 0.02 12,968 CHF Geberit AG, Registered2 5,697 0.04 3,106 CHF Givaudan SA2 8,186 0.06 74,180 CHF Julius Baer Group Ltd.2 2,926 0.02 15,586 CHF Kuehne + Nagel International AG, Registered2 2,063 0.02 163,223 CHF LafargeHolcim Ltd., Registered 7,800 0.06 25,990 CHF Lonza Group AG, Registered2 7,969 0.06 1,019,333 CHF Nestle SA, Registered 100,884 0.76 718,318 CHF Novartis AG, Registered 61,487 0.46 12,053 CHF Pargesa Holding SA2 889 0.01 5,992 CHF Partners Group Holding AG 4,188 0.03 234,491 CHF Roche Holding AG 61,336 0.46 7,430 CHF Schindler Holding AG, Registered 1,520 0.01 11,641 CHF Schindler Holding AG2 2,444 0.02 1,765 CHF SGS SA, Registered 4,448 0.03 44,793 CHF Sika AG2 6,631 0.05 17,694 CHF Sonova Holding AG, Registered 3,925 0.03 3,083 CHF Straumann Holding AG, Registered2 2,527 0.02 16,510 CHF Swatch Group AG (The), Registered2 794 0.01 10,020 CHF Swatch Group AG (The)2 2,507 0.02 10,694 CHF Swiss Life Holding AG, Registered 4,845 0.04 23,435 CHF Swiss Prime Site AG, Registered2 1,901 0.01 101,353 CHF Swiss Re AG2 9,573 0.07
178
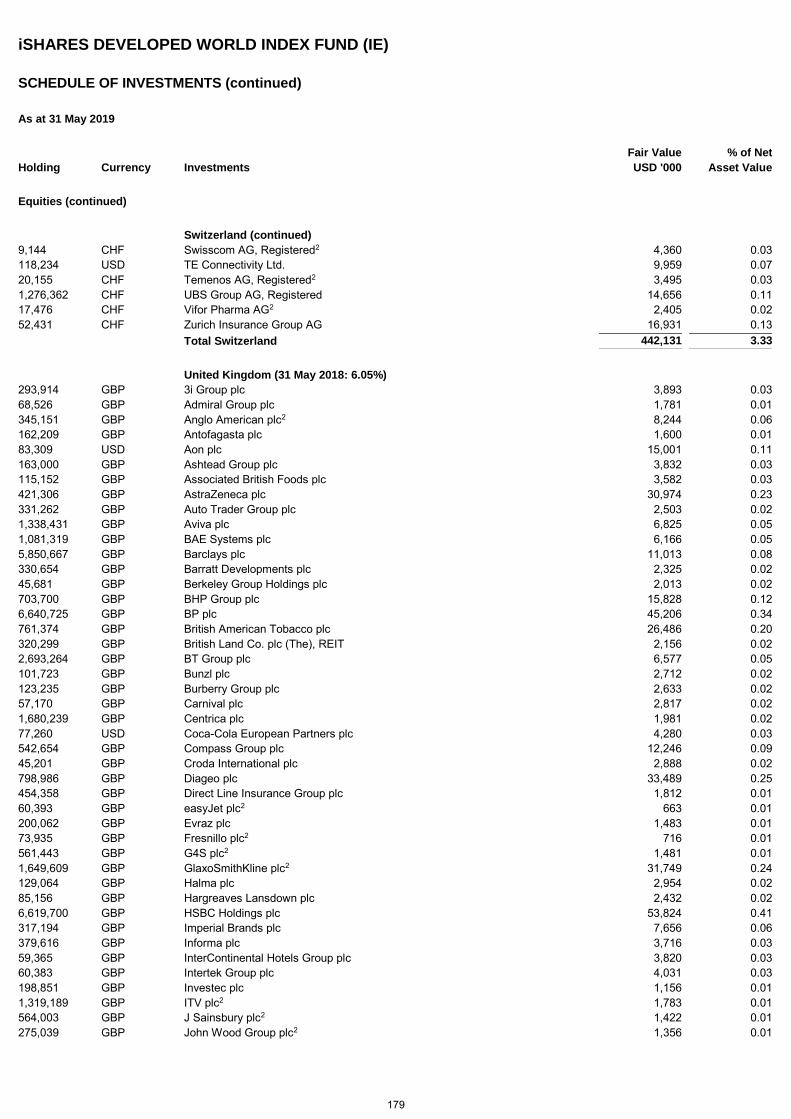
iSHARES DEVELOPED WORLD INDEX FUND (IE)
SCHEDULE OF INVESTMENTS (continued)
As at 31 May 2019
Holding Currency Investments Fair Value
USD '000 % of Net
Asset Value
Equities (continued)
Switzerland (continued) 9,144 CHF Swisscom AG, Registered2 4,360 0.03 118,234 USD TE Connectivity Ltd. 9,959 0.07 20,155 CHF Temenos AG, Registered2 3,495 0.03 1,276,362 CHF UBS Group AG, Registered 14,656 0.11 17,476 CHF Vifor Pharma AG2 2,405 0.02 52,431 CHF Zurich Insurance Group AG 16,931 0.13 Total Switzerland 442,131 3.33
United Kingdom (31 May 2018: 6.05%) 293,914 GBP 3i Group plc 3,893 0.03 68,526 GBP Admiral Group plc 1,781 0.01 345,151 GBP Anglo American plc2 8,244 0.06 162,209 GBP Antofagasta plc 1,600 0.01 83,309 USD Aon plc 15,001 0.11 163,000 GBP Ashtead Group plc 3,832 0.03 115,152 GBP Associated British Foods plc 3,582 0.03 421,306 GBP AstraZeneca plc 30,974 0.23 331,262 GBP Auto Trader Group plc 2,503 0.02 1,338,431 GBP Aviva plc 6,825 0.05 1,081,319 GBP BAE Systems plc 6,166 0.05 5,850,667 GBP Barclays plc 11,013 0.08 330,654 GBP Barratt Developments plc 2,325 0.02 45,681 GBP Berkeley Group Holdings plc 2,013 0.02 703,700 GBP BHP Group plc 15,828 0.12 6,640,725 GBP BP plc 45,206 0.34 761,374 GBP British American Tobacco plc 26,486 0.20 320,299 GBP British Land Co. plc (The), REIT 2,156 0.02 2,693,264 GBP BT Group plc 6,577 0.05 101,723 GBP Bunzl plc 2,712 0.02 123,235 GBP Burberry Group plc 2,633 0.02 57,170 GBP Carnival plc 2,817 0.02 1,680,239 GBP Centrica plc 1,981 0.02 77,260 USD Coca-Cola European Partners plc 4,280 0.03 542,654 GBP Compass Group plc 12,246 0.09 45,201 GBP Croda International plc 2,888 0.02 798,986 GBP Diageo plc 33,489 0.25 454,358 GBP Direct Line Insurance Group plc 1,812 0.01 60,393 GBP easyJet plc2 663 0.01 200,062 GBP Evraz plc 1,483 0.01 73,935 GBP Fresnillo plc2 716 0.01 561,443 GBP G4S plc2 1,481 0.01 1,649,609 GBP GlaxoSmithKline plc2 31,749 0.24 129,064 GBP Halma plc 2,954 0.02 85,156 GBP Hargreaves Lansdown plc 2,432 0.02 6,619,700 GBP HSBC Holdings plc 53,824 0.41 317,194 GBP Imperial Brands plc 7,656 0.06 379,616 GBP Informa plc 3,716 0.03 59,365 GBP InterContinental Hotels Group plc 3,820 0.03 60,383 GBP Intertek Group plc 4,031 0.03 198,851 GBP Investec plc 1,156 0.01 1,319,189 GBP ITV plc2 1,783 0.01 564,003 GBP J Sainsbury plc2 1,422 0.01 275,039 GBP John Wood Group plc2 1,356 0.01
179
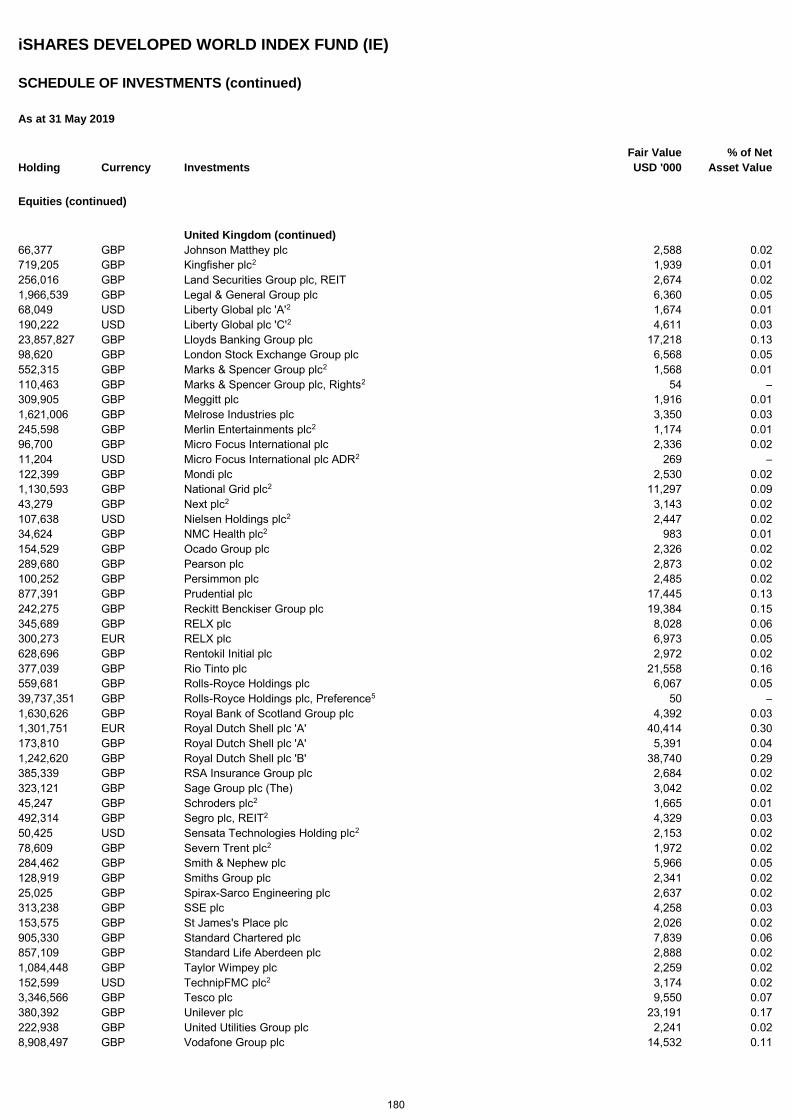
iSHARES DEVELOPED WORLD INDEX FUND (IE)
SCHEDULE OF INVESTMENTS (continued)
As at 31 May 2019
Holding Currency Investments Fair Value
USD '000 % of Net
Asset Value
Equities (continued)
United Kingdom (continued) 66,377 GBP Johnson Matthey plc 2,588 0.02 719,205 GBP Kingfisher plc2 1,939 0.01 256,016 GBP Land Securities Group plc, REIT 2,674 0.02 1,966,539 GBP Legal & General Group plc 6,360 0.05 68,049 USD Liberty Global plc 'A'2 1,674 0.01 190,222 USD Liberty Global plc 'C'2 4,611 0.03 23,857,827 GBP Lloyds Banking Group plc 17,218 0.13 98,620 GBP London Stock Exchange Group plc 6,568 0.05 552,315 GBP Marks & Spencer Group plc2 1,568 0.01 110,463 GBP Marks & Spencer Group plc, Rights2 54 – 309,905 GBP Meggitt plc 1,916 0.01 1,621,006 GBP Melrose Industries plc 3,350 0.03 245,598 GBP Merlin Entertainments plc2 1,174 0.01 96,700 GBP Micro Focus International plc 2,336 0.02 11,204 USD Micro Focus International plc ADR2 269 – 122,399 GBP Mondi plc 2,530 0.02 1,130,593 GBP National Grid plc2 11,297 0.09 43,279 GBP Next plc2 3,143 0.02 107,638 USD Nielsen Holdings plc2 2,447 0.02 34,624 GBP NMC Health plc2 983 0.01 154,529 GBP Ocado Group plc 2,326 0.02 289,680 GBP Pearson plc 2,873 0.02 100,252 GBP Persimmon plc 2,485 0.02 877,391 GBP Prudential plc 17,445 0.13 242,275 GBP Reckitt Benckiser Group plc 19,384 0.15 345,689 GBP RELX plc 8,028 0.06 300,273 EUR RELX plc 6,973 0.05 628,696 GBP Rentokil Initial plc 2,972 0.02 377,039 GBP Rio Tinto plc 21,558 0.16 559,681 GBP Rolls-Royce Holdings plc 6,067 0.05 39,737,351 GBP Rolls-Royce Holdings plc, Preference5 50 – 1,630,626 GBP Royal Bank of Scotland Group plc 4,392 0.03 1,301,751 EUR Royal Dutch Shell plc 'A' 40,414 0.30 173,810 GBP Royal Dutch Shell plc 'A' 5,391 0.04 1,242,620 GBP Royal Dutch Shell plc 'B' 38,740 0.29 385,339 GBP RSA Insurance Group plc 2,684 0.02 323,121 GBP Sage Group plc (The) 3,042 0.02 45,247 GBP Schroders plc2 1,665 0.01 492,314 GBP Segro plc, REIT2 4,329 0.03 50,425 USD Sensata Technologies Holding plc2 2,153 0.02 78,609 GBP Severn Trent plc2 1,972 0.02 284,462 GBP Smith & Nephew plc 5,966 0.05 128,919 GBP Smiths Group plc 2,341 0.02 25,025 GBP Spirax-Sarco Engineering plc 2,637 0.02 313,238 GBP SSE plc 4,258 0.03 153,575 GBP St James's Place plc 2,026 0.02 905,330 GBP Standard Chartered plc 7,839 0.06 857,109 GBP Standard Life Aberdeen plc 2,888 0.02 1,084,448 GBP Taylor Wimpey plc 2,259 0.02 152,599 USD TechnipFMC plc2 3,174 0.02 3,346,566 GBP Tesco plc 9,550 0.07 380,392 GBP Unilever plc 23,191 0.17 222,938 GBP United Utilities Group plc 2,241 0.02 8,908,497 GBP Vodafone Group plc 14,532 0.11
180
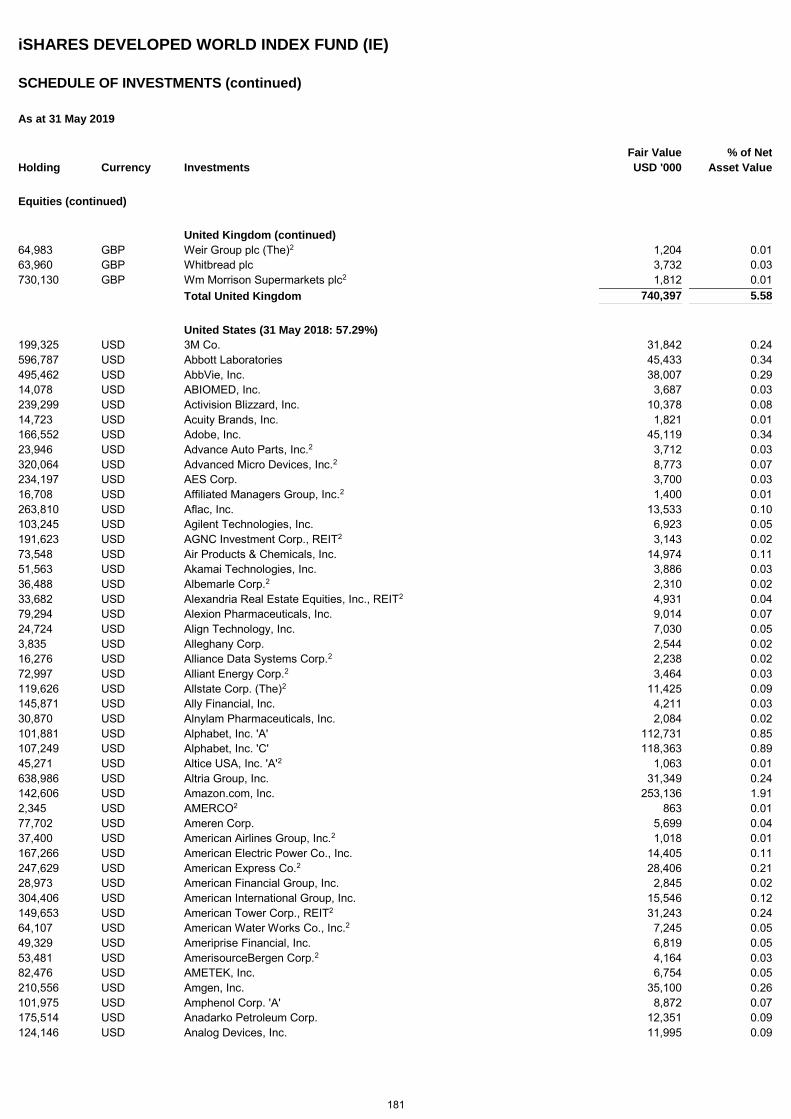
iSHARES DEVELOPED WORLD INDEX FUND (IE)
SCHEDULE OF INVESTMENTS (continued)
As at 31 May 2019
Holding Currency Investments Fair Value
USD '000 % of Net
Asset Value
Equities (continued)
United Kingdom (continued) 64,983 GBP Weir Group plc (The)2 1,204 0.01 63,960 GBP Whitbread plc 3,732 0.03 730,130 GBP Wm Morrison Supermarkets plc2 1,812 0.01 Total United Kingdom 740,397 5.58
United States (31 May 2018: 57.29%) 199,325 USD 3M Co. 31,842 0.24 596,787 USD Abbott Laboratories 45,433 0.34 495,462 USD AbbVie, Inc. 38,007 0.29 14,078 USD ABIOMED, Inc. 3,687 0.03 239,299 USD Activision Blizzard, Inc. 10,378 0.08 14,723 USD Acuity Brands, Inc. 1,821 0.01 166,552 USD Adobe, Inc. 45,119 0.34 23,946 USD Advance Auto Parts, Inc.2 3,712 0.03 320,064 USD Advanced Micro Devices, Inc.2 8,773 0.07 234,197 USD AES Corp. 3,700 0.03 16,708 USD Affiliated Managers Group, Inc.2 1,400 0.01 263,810 USD Aflac, Inc. 13,533 0.10 103,245 USD Agilent Technologies, Inc. 6,923 0.05 191,623 USD AGNC Investment Corp., REIT2 3,143 0.02 73,548 USD Air Products & Chemicals, Inc. 14,974 0.11 51,563 USD Akamai Technologies, Inc. 3,886 0.03 36,488 USD Albemarle Corp.2 2,310 0.02 33,682 USD Alexandria Real Estate Equities, Inc., REIT2 4,931 0.04 79,294 USD Alexion Pharmaceuticals, Inc. 9,014 0.07 24,724 USD Align Technology, Inc. 7,030 0.05 3,835 USD Alleghany Corp. 2,544 0.02 16,276 USD Alliance Data Systems Corp.2 2,238 0.02 72,997 USD Alliant Energy Corp.2 3,464 0.03 119,626 USD Allstate Corp. (The)2 11,425 0.09 145,871 USD Ally Financial, Inc. 4,211 0.03 30,870 USD Alnylam Pharmaceuticals, Inc. 2,084 0.02 101,881 USD Alphabet, Inc. 'A' 112,731 0.85 107,249 USD Alphabet, Inc. 'C' 118,363 0.89 45,271 USD Altice USA, Inc. 'A'2 1,063 0.01 638,986 USD Altria Group, Inc. 31,349 0.24 142,606 USD Amazon.com, Inc. 253,136 1.91 2,345 USD AMERCO2 863 0.01 77,702 USD Ameren Corp. 5,699 0.04 37,400 USD American Airlines Group, Inc.2 1,018 0.01 167,266 USD American Electric Power Co., Inc. 14,405 0.11 247,629 USD American Express Co.2 28,406 0.21 28,973 USD American Financial Group, Inc. 2,845 0.02 304,406 USD American International Group, Inc. 15,546 0.12 149,653 USD American Tower Corp., REIT2 31,243 0.24 64,107 USD American Water Works Co., Inc.2 7,245 0.05 49,329 USD Ameriprise Financial, Inc. 6,819 0.05 53,481 USD AmerisourceBergen Corp.2 4,164 0.03 82,476 USD AMETEK, Inc. 6,754 0.05 210,556 USD Amgen, Inc. 35,100 0.26 101,975 USD Amphenol Corp. 'A' 8,872 0.07 175,514 USD Anadarko Petroleum Corp. 12,351 0.09 124,146 USD Analog Devices, Inc. 11,995 0.09
181
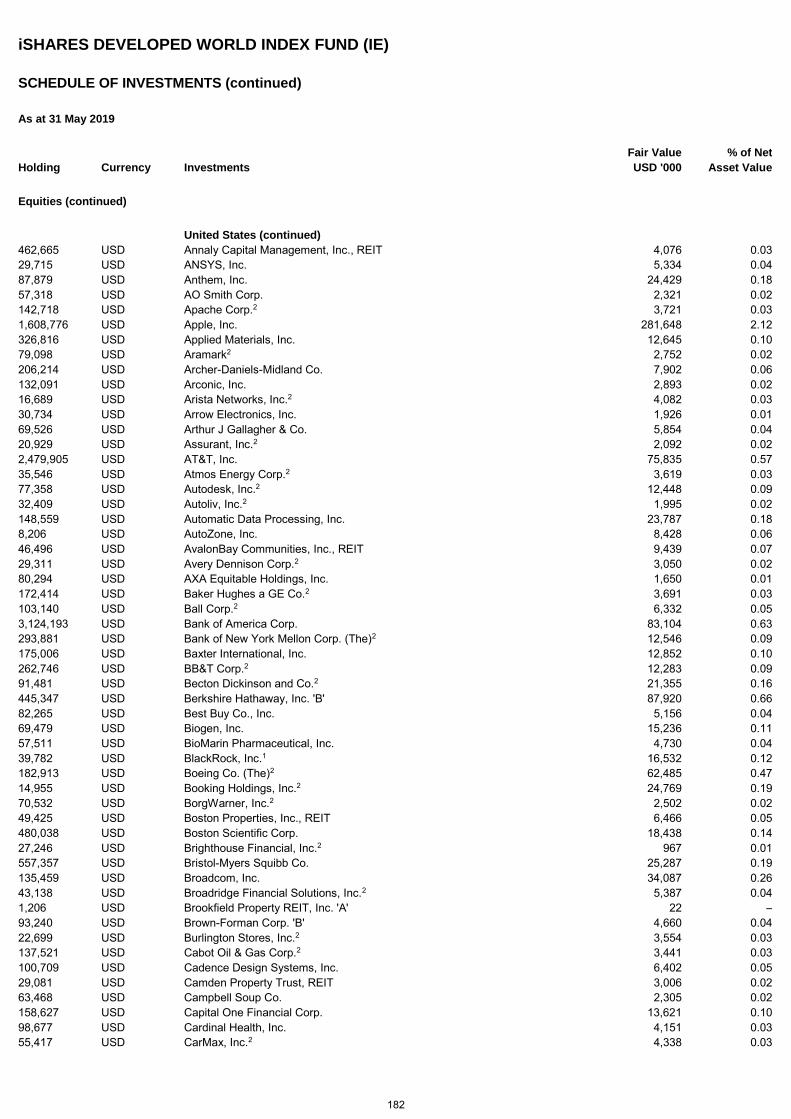
iSHARES DEVELOPED WORLD INDEX FUND (IE)
SCHEDULE OF INVESTMENTS (continued)
As at 31 May 2019
Holding Currency Investments Fair Value
USD '000 % of Net
Asset Value
Equities (continued)
United States (continued) 462,665 USD Annaly Capital Management, Inc., REIT 4,076 0.03 29,715 USD ANSYS, Inc. 5,334 0.04 87,879 USD Anthem, Inc. 24,429 0.18 57,318 USD AO Smith Corp. 2,321 0.02 142,718 USD Apache Corp.2 3,721 0.03 1,608,776 USD Apple, Inc. 281,648 2.12 326,816 USD Applied Materials, Inc. 12,645 0.10 79,098 USD Aramark2 2,752 0.02 206,214 USD Archer-Daniels-Midland Co. 7,902 0.06 132,091 USD Arconic, Inc. 2,893 0.02 16,689 USD Arista Networks, Inc.2 4,082 0.03 30,734 USD Arrow Electronics, Inc. 1,926 0.01 69,526 USD Arthur J Gallagher & Co. 5,854 0.04 20,929 USD Assurant, Inc.2 2,092 0.02 2,479,905 USD AT&T, Inc. 75,835 0.57 35,546 USD Atmos Energy Corp.2 3,619 0.03 77,358 USD Autodesk, Inc.2 12,448 0.09 32,409 USD Autoliv, Inc.2 1,995 0.02 148,559 USD Automatic Data Processing, Inc. 23,787 0.18 8,206 USD AutoZone, Inc. 8,428 0.06 46,496 USD AvalonBay Communities, Inc., REIT 9,439 0.07 29,311 USD Avery Dennison Corp.2 3,050 0.02 80,294 USD AXA Equitable Holdings, Inc. 1,650 0.01 172,414 USD Baker Hughes a GE Co.2 3,691 0.03 103,140 USD Ball Corp.2 6,332 0.05 3,124,193 USD Bank of America Corp. 83,104 0.63 293,881 USD Bank of New York Mellon Corp. (The)2 12,546 0.09 175,006 USD Baxter International, Inc. 12,852 0.10 262,746 USD BB&T Corp.2 12,283 0.09 91,481 USD Becton Dickinson and Co.2 21,355 0.16 445,347 USD Berkshire Hathaway, Inc. 'B' 87,920 0.66 82,265 USD Best Buy Co., Inc. 5,156 0.04 69,479 USD Biogen, Inc. 15,236 0.11 57,511 USD BioMarin Pharmaceutical, Inc. 4,730 0.04 39,782 USD BlackRock, Inc.1 16,532 0.12 182,913 USD Boeing Co. (The)2 62,485 0.47 14,955 USD Booking Holdings, Inc.2 24,769 0.19 70,532 USD BorgWarner, Inc.2 2,502 0.02 49,425 USD Boston Properties, Inc., REIT 6,466 0.05 480,038 USD Boston Scientific Corp. 18,438 0.14 27,246 USD Brighthouse Financial, Inc.2 967 0.01 557,357 USD Bristol-Myers Squibb Co. 25,287 0.19 135,459 USD Broadcom, Inc. 34,087 0.26 43,138 USD Broadridge Financial Solutions, Inc.2 5,387 0.04 1,206 USD Brookfield Property REIT, Inc. 'A' 22 – 93,240 USD Brown-Forman Corp. 'B' 4,660 0.04 22,699 USD Burlington Stores, Inc.2 3,554 0.03 137,521 USD Cabot Oil & Gas Corp.2 3,441 0.03 100,709 USD Cadence Design Systems, Inc. 6,402 0.05 29,081 USD Camden Property Trust, REIT 3,006 0.02 63,468 USD Campbell Soup Co. 2,305 0.02 158,627 USD Capital One Financial Corp. 13,621 0.10 98,677 USD Cardinal Health, Inc. 4,151 0.03 55,417 USD CarMax, Inc.2 4,338 0.03
182
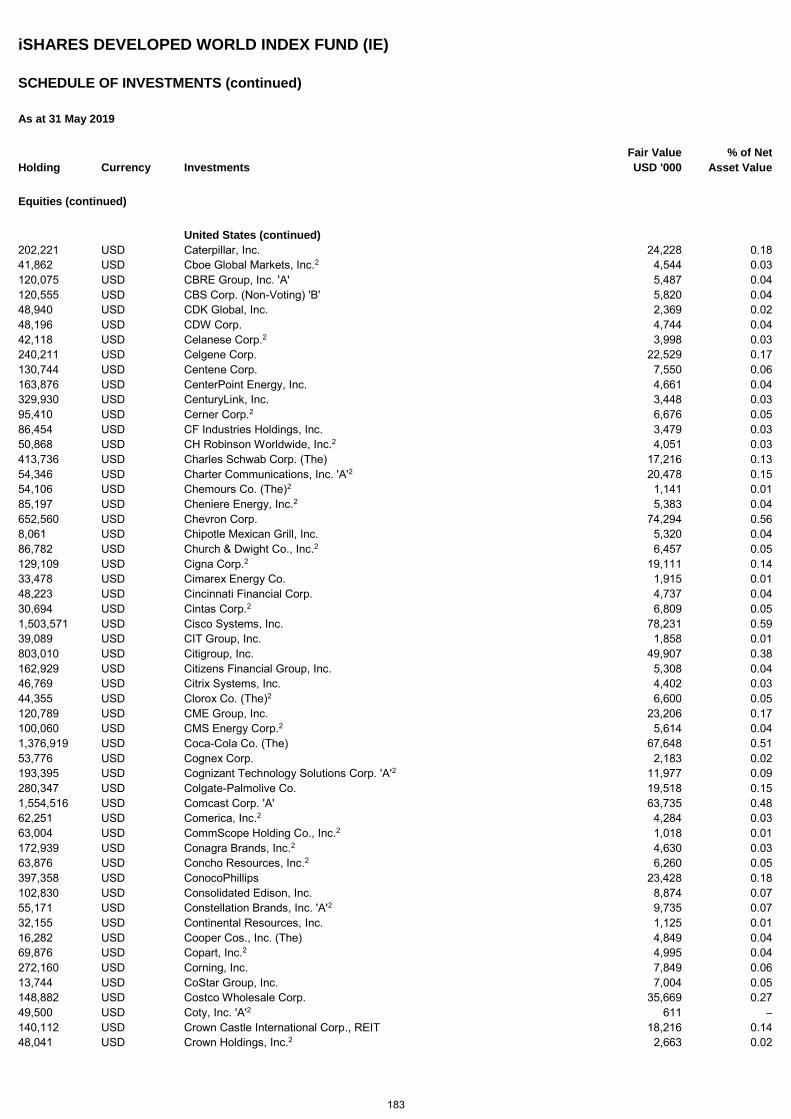
iSHARES DEVELOPED WORLD INDEX FUND (IE)
SCHEDULE OF INVESTMENTS (continued)
As at 31 May 2019
Holding Currency Investments Fair Value
USD '000 % of Net
Asset Value
Equities (continued)
United States (continued) 202,221 USD Caterpillar, Inc. 24,228 0.18 41,862 USD Cboe Global Markets, Inc.2 4,544 0.03 120,075 USD CBRE Group, Inc. 'A' 5,487 0.04 120,555 USD CBS Corp. (Non-Voting) 'B' 5,820 0.04 48,940 USD CDK Global, Inc. 2,369 0.02 48,196 USD CDW Corp. 4,744 0.04 42,118 USD Celanese Corp.2 3,998 0.03 240,211 USD Celgene Corp. 22,529 0.17 130,744 USD Centene Corp. 7,550 0.06 163,876 USD CenterPoint Energy, Inc. 4,661 0.04 329,930 USD CenturyLink, Inc. 3,448 0.03 95,410 USD Cerner Corp.2 6,676 0.05 86,454 USD CF Industries Holdings, Inc. 3,479 0.03 50,868 USD CH Robinson Worldwide, Inc.2 4,051 0.03 413,736 USD Charles Schwab Corp. (The) 17,216 0.13 54,346 USD Charter Communications, Inc. 'A'2 20,478 0.15 54,106 USD Chemours Co. (The)2 1,141 0.01 85,197 USD Cheniere Energy, Inc.2 5,383 0.04 652,560 USD Chevron Corp. 74,294 0.56 8,061 USD Chipotle Mexican Grill, Inc. 5,320 0.04 86,782 USD Church & Dwight Co., Inc.2 6,457 0.05 129,109 USD Cigna Corp.2 19,111 0.14 33,478 USD Cimarex Energy Co. 1,915 0.01 48,223 USD Cincinnati Financial Corp. 4,737 0.04 30,694 USD Cintas Corp.2 6,809 0.05 1,503,571 USD Cisco Systems, Inc. 78,231 0.59 39,089 USD CIT Group, Inc. 1,858 0.01 803,010 USD Citigroup, Inc. 49,907 0.38 162,929 USD Citizens Financial Group, Inc. 5,308 0.04 46,769 USD Citrix Systems, Inc. 4,402 0.03 44,355 USD Clorox Co. (The)2 6,600 0.05 120,789 USD CME Group, Inc. 23,206 0.17 100,060 USD CMS Energy Corp.2 5,614 0.04 1,376,919 USD Coca-Cola Co. (The) 67,648 0.51 53,776 USD Cognex Corp. 2,183 0.02 193,395 USD Cognizant Technology Solutions Corp. 'A'2 11,977 0.09 280,347 USD Colgate-Palmolive Co. 19,518 0.15 1,554,516 USD Comcast Corp. 'A' 63,735 0.48 62,251 USD Comerica, Inc.2 4,284 0.03 63,004 USD CommScope Holding Co., Inc.2 1,018 0.01 172,939 USD Conagra Brands, Inc.2 4,630 0.03 63,876 USD Concho Resources, Inc.2 6,260 0.05 397,358 USD ConocoPhillips 23,428 0.18 102,830 USD Consolidated Edison, Inc. 8,874 0.07 55,171 USD Constellation Brands, Inc. 'A'2 9,735 0.07 32,155 USD Continental Resources, Inc. 1,125 0.01 16,282 USD Cooper Cos., Inc. (The) 4,849 0.04 69,876 USD Copart, Inc.2 4,995 0.04 272,160 USD Corning, Inc. 7,849 0.06 13,744 USD CoStar Group, Inc. 7,004 0.05 148,882 USD Costco Wholesale Corp. 35,669 0.27 49,500 USD Coty, Inc. 'A'2 611 – 140,112 USD Crown Castle International Corp., REIT 18,216 0.14 48,041 USD Crown Holdings, Inc.2 2,663 0.02
183
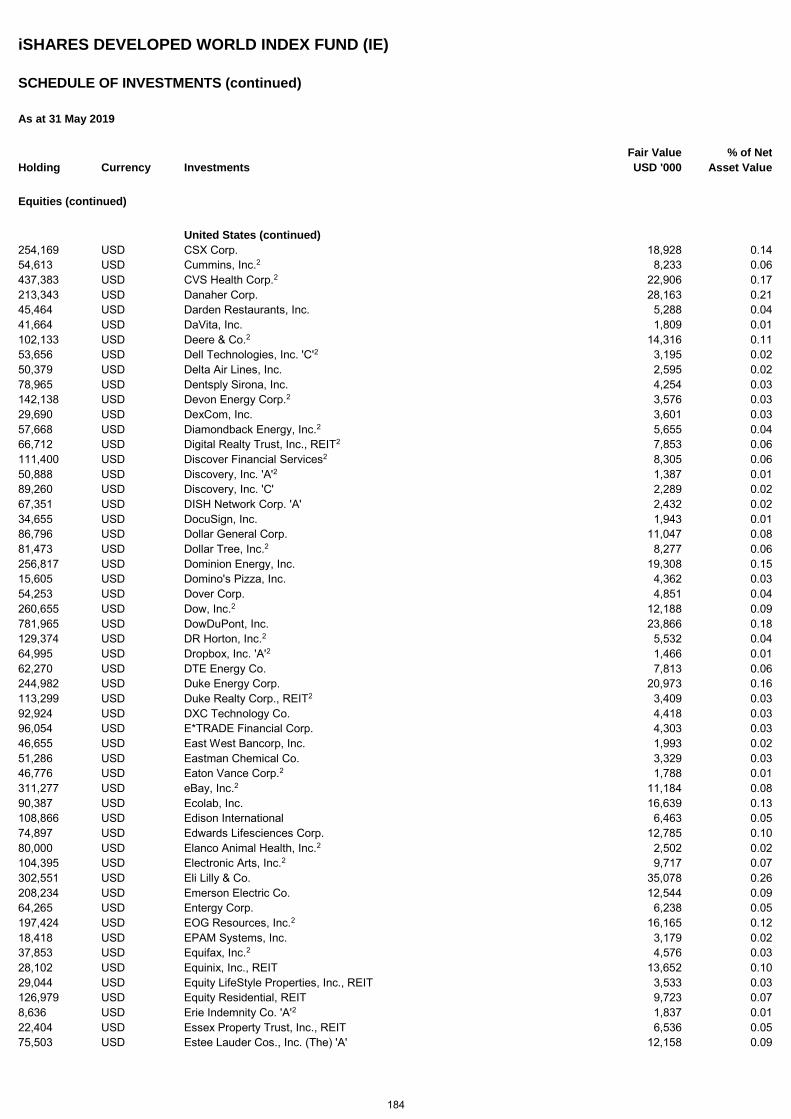
iSHARES DEVELOPED WORLD INDEX FUND (IE)
SCHEDULE OF INVESTMENTS (continued)
As at 31 May 2019
Holding Currency Investments Fair Value
USD '000 % of Net
Asset Value
Equities (continued)
United States (continued) 254,169 USD CSX Corp. 18,928 0.14 54,613 USD Cummins, Inc.2 8,233 0.06 437,383 USD CVS Health Corp.2 22,906 0.17 213,343 USD Danaher Corp. 28,163 0.21 45,464 USD Darden Restaurants, Inc. 5,288 0.04 41,664 USD DaVita, Inc. 1,809 0.01 102,133 USD Deere & Co.2 14,316 0.11 53,656 USD Dell Technologies, Inc. 'C'2 3,195 0.02 50,379 USD Delta Air Lines, Inc. 2,595 0.02 78,965 USD Dentsply Sirona, Inc. 4,254 0.03 142,138 USD Devon Energy Corp.2 3,576 0.03 29,690 USD DexCom, Inc. 3,601 0.03 57,668 USD Diamondback Energy, Inc.2 5,655 0.04 66,712 USD Digital Realty Trust, Inc., REIT2 7,853 0.06 111,400 USD Discover Financial Services2 8,305 0.06 50,888 USD Discovery, Inc. 'A'2 1,387 0.01 89,260 USD Discovery, Inc. 'C' 2,289 0.02 67,351 USD DISH Network Corp. 'A' 2,432 0.02 34,655 USD DocuSign, Inc. 1,943 0.01 86,796 USD Dollar General Corp. 11,047 0.08 81,473 USD Dollar Tree, Inc.2 8,277 0.06 256,817 USD Dominion Energy, Inc. 19,308 0.15 15,605 USD Domino's Pizza, Inc. 4,362 0.03 54,253 USD Dover Corp. 4,851 0.04 260,655 USD Dow, Inc.2 12,188 0.09 781,965 USD DowDuPont, Inc. 23,866 0.18 129,374 USD DR Horton, Inc.2 5,532 0.04 64,995 USD Dropbox, Inc. 'A'2 1,466 0.01 62,270 USD DTE Energy Co. 7,813 0.06 244,982 USD Duke Energy Corp. 20,973 0.16 113,299 USD Duke Realty Corp., REIT2 3,409 0.03 92,924 USD DXC Technology Co. 4,418 0.03 96,054 USD E*TRADE Financial Corp. 4,303 0.03 46,655 USD East West Bancorp, Inc. 1,993 0.02 51,286 USD Eastman Chemical Co. 3,329 0.03 46,776 USD Eaton Vance Corp.2 1,788 0.01 311,277 USD eBay, Inc.2 11,184 0.08 90,387 USD Ecolab, Inc. 16,639 0.13 108,866 USD Edison International 6,463 0.05 74,897 USD Edwards Lifesciences Corp. 12,785 0.10 80,000 USD Elanco Animal Health, Inc.2 2,502 0.02 104,395 USD Electronic Arts, Inc.2 9,717 0.07 302,551 USD Eli Lilly & Co. 35,078 0.26 208,234 USD Emerson Electric Co. 12,544 0.09 64,265 USD Entergy Corp. 6,238 0.05 197,424 USD EOG Resources, Inc.2 16,165 0.12 18,418 USD EPAM Systems, Inc. 3,179 0.02 37,853 USD Equifax, Inc.2 4,576 0.03 28,102 USD Equinix, Inc., REIT 13,652 0.10 29,044 USD Equity LifeStyle Properties, Inc., REIT 3,533 0.03 126,979 USD Equity Residential, REIT 9,723 0.07 8,636 USD Erie Indemnity Co. 'A'2 1,837 0.01 22,404 USD Essex Property Trust, Inc., REIT 6,536 0.05 75,503 USD Estee Lauder Cos., Inc. (The) 'A' 12,158 0.09
184
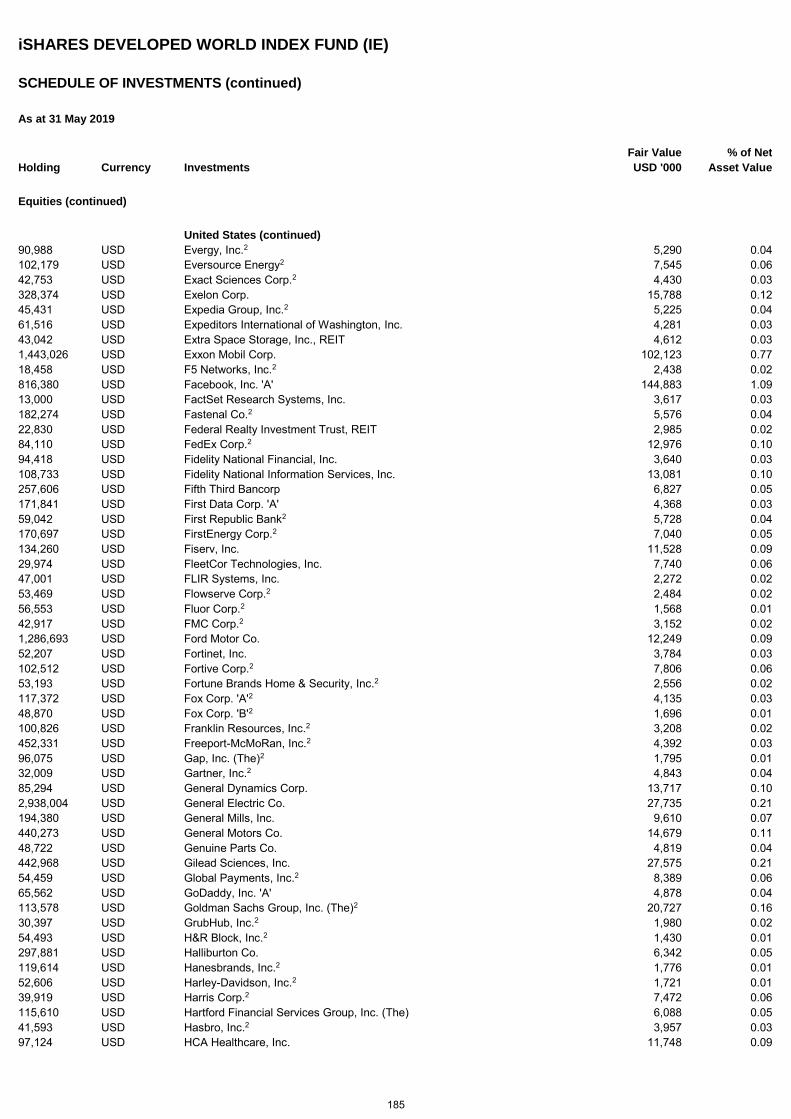
iSHARES DEVELOPED WORLD INDEX FUND (IE)
SCHEDULE OF INVESTMENTS (continued)
As at 31 May 2019
Holding Currency Investments Fair Value
USD '000 % of Net
Asset Value
Equities (continued)
United States (continued) 90,988 USD Evergy, Inc.2 5,290 0.04 102,179 USD Eversource Energy2 7,545 0.06 42,753 USD Exact Sciences Corp.2 4,430 0.03 328,374 USD Exelon Corp. 15,788 0.12 45,431 USD Expedia Group, Inc.2 5,225 0.04 61,516 USD Expeditors International of Washington, Inc. 4,281 0.03 43,042 USD Extra Space Storage, Inc., REIT 4,612 0.03 1,443,026 USD Exxon Mobil Corp. 102,123 0.77 18,458 USD F5 Networks, Inc.2 2,438 0.02 816,380 USD Facebook, Inc. 'A' 144,883 1.09 13,000 USD FactSet Research Systems, Inc. 3,617 0.03 182,274 USD Fastenal Co.2 5,576 0.04 22,830 USD Federal Realty Investment Trust, REIT 2,985 0.02 84,110 USD FedEx Corp.2 12,976 0.10 94,418 USD Fidelity National Financial, Inc. 3,640 0.03 108,733 USD Fidelity National Information Services, Inc. 13,081 0.10 257,606 USD Fifth Third Bancorp 6,827 0.05 171,841 USD First Data Corp. 'A' 4,368 0.03 59,042 USD First Republic Bank2 5,728 0.04 170,697 USD FirstEnergy Corp.2 7,040 0.05 134,260 USD Fiserv, Inc. 11,528 0.09 29,974 USD FleetCor Technologies, Inc. 7,740 0.06 47,001 USD FLIR Systems, Inc. 2,272 0.02 53,469 USD Flowserve Corp.2 2,484 0.02 56,553 USD Fluor Corp.2 1,568 0.01 42,917 USD FMC Corp.2 3,152 0.02 1,286,693 USD Ford Motor Co. 12,249 0.09 52,207 USD Fortinet, Inc. 3,784 0.03 102,512 USD Fortive Corp.2 7,806 0.06 53,193 USD Fortune Brands Home & Security, Inc.2 2,556 0.02 117,372 USD Fox Corp. 'A'2 4,135 0.03 48,870 USD Fox Corp. 'B'2 1,696 0.01 100,826 USD Franklin Resources, Inc.2 3,208 0.02 452,331 USD Freeport-McMoRan, Inc.2 4,392 0.03 96,075 USD Gap, Inc. (The)2 1,795 0.01 32,009 USD Gartner, Inc.2 4,843 0.04 85,294 USD General Dynamics Corp. 13,717 0.10 2,938,004 USD General Electric Co. 27,735 0.21 194,380 USD General Mills, Inc. 9,610 0.07 440,273 USD General Motors Co. 14,679 0.11 48,722 USD Genuine Parts Co. 4,819 0.04 442,968 USD Gilead Sciences, Inc. 27,575 0.21 54,459 USD Global Payments, Inc.2 8,389 0.06 65,562 USD GoDaddy, Inc. 'A' 4,878 0.04 113,578 USD Goldman Sachs Group, Inc. (The)2 20,727 0.16 30,397 USD GrubHub, Inc.2 1,980 0.02 54,493 USD H&R Block, Inc.2 1,430 0.01 297,881 USD Halliburton Co. 6,342 0.05 119,614 USD Hanesbrands, Inc.2 1,776 0.01 52,606 USD Harley-Davidson, Inc.2 1,721 0.01 39,919 USD Harris Corp.2 7,472 0.06 115,610 USD Hartford Financial Services Group, Inc. (The) 6,088 0.05 41,593 USD Hasbro, Inc.2 3,957 0.03 97,124 USD HCA Healthcare, Inc. 11,748 0.09
185
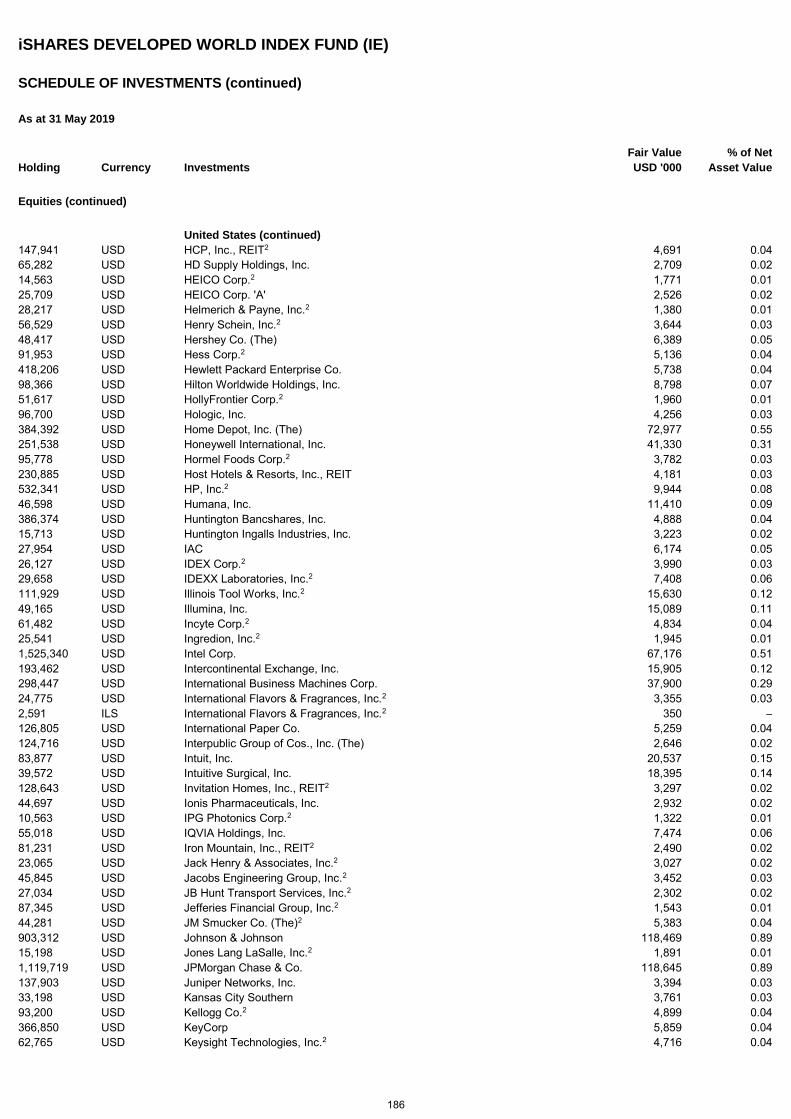
iSHARES DEVELOPED WORLD INDEX FUND (IE)
SCHEDULE OF INVESTMENTS (continued)
As at 31 May 2019
Holding Currency Investments Fair Value
USD '000 % of Net
Asset Value
Equities (continued)
United States (continued) 147,941 USD HCP, Inc., REIT2 4,691 0.04 65,282 USD HD Supply Holdings, Inc. 2,709 0.02 14,563 USD HEICO Corp.2 1,771 0.01 25,709 USD HEICO Corp. 'A' 2,526 0.02 28,217 USD Helmerich & Payne, Inc.2 1,380 0.01 56,529 USD Henry Schein, Inc.2 3,644 0.03 48,417 USD Hershey Co. (The) 6,389 0.05 91,953 USD Hess Corp.2 5,136 0.04 418,206 USD Hewlett Packard Enterprise Co. 5,738 0.04 98,366 USD Hilton Worldwide Holdings, Inc. 8,798 0.07 51,617 USD HollyFrontier Corp.2 1,960 0.01 96,700 USD Hologic, Inc. 4,256 0.03 384,392 USD Home Depot, Inc. (The) 72,977 0.55 251,538 USD Honeywell International, Inc. 41,330 0.31 95,778 USD Hormel Foods Corp.2 3,782 0.03 230,885 USD Host Hotels & Resorts, Inc., REIT 4,181 0.03 532,341 USD HP, Inc.2 9,944 0.08 46,598 USD Humana, Inc. 11,410 0.09 386,374 USD Huntington Bancshares, Inc. 4,888 0.04 15,713 USD Huntington Ingalls Industries, Inc. 3,223 0.02 27,954 USD IAC 6,174 0.05 26,127 USD IDEX Corp.2 3,990 0.03 29,658 USD IDEXX Laboratories, Inc.2 7,408 0.06 111,929 USD Illinois Tool Works, Inc.2 15,630 0.12 49,165 USD Illumina, Inc. 15,089 0.11 61,482 USD Incyte Corp.2 4,834 0.04 25,541 USD Ingredion, Inc.2 1,945 0.01 1,525,340 USD Intel Corp. 67,176 0.51 193,462 USD Intercontinental Exchange, Inc. 15,905 0.12 298,447 USD International Business Machines Corp. 37,900 0.29 24,775 USD International Flavors & Fragrances, Inc.2 3,355 0.03 2,591 ILS International Flavors & Fragrances, Inc.2 350 – 126,805 USD International Paper Co. 5,259 0.04 124,716 USD Interpublic Group of Cos., Inc. (The) 2,646 0.02 83,877 USD Intuit, Inc. 20,537 0.15 39,572 USD Intuitive Surgical, Inc. 18,395 0.14 128,643 USD Invitation Homes, Inc., REIT2 3,297 0.02 44,697 USD Ionis Pharmaceuticals, Inc. 2,932 0.02 10,563 USD IPG Photonics Corp.2 1,322 0.01 55,018 USD IQVIA Holdings, Inc. 7,474 0.06 81,231 USD Iron Mountain, Inc., REIT2 2,490 0.02 23,065 USD Jack Henry & Associates, Inc.2 3,027 0.02 45,845 USD Jacobs Engineering Group, Inc.2 3,452 0.03 27,034 USD JB Hunt Transport Services, Inc.2 2,302 0.02 87,345 USD Jefferies Financial Group, Inc.2 1,543 0.01 44,281 USD JM Smucker Co. (The)2 5,383 0.04 903,312 USD Johnson & Johnson 118,469 0.89 15,198 USD Jones Lang LaSalle, Inc.2 1,891 0.01 1,119,719 USD JPMorgan Chase & Co. 118,645 0.89 137,903 USD Juniper Networks, Inc. 3,394 0.03 33,198 USD Kansas City Southern 3,761 0.03 93,200 USD Kellogg Co.2 4,899 0.04 366,850 USD KeyCorp 5,859 0.04 62,765 USD Keysight Technologies, Inc.2 4,716 0.04
186
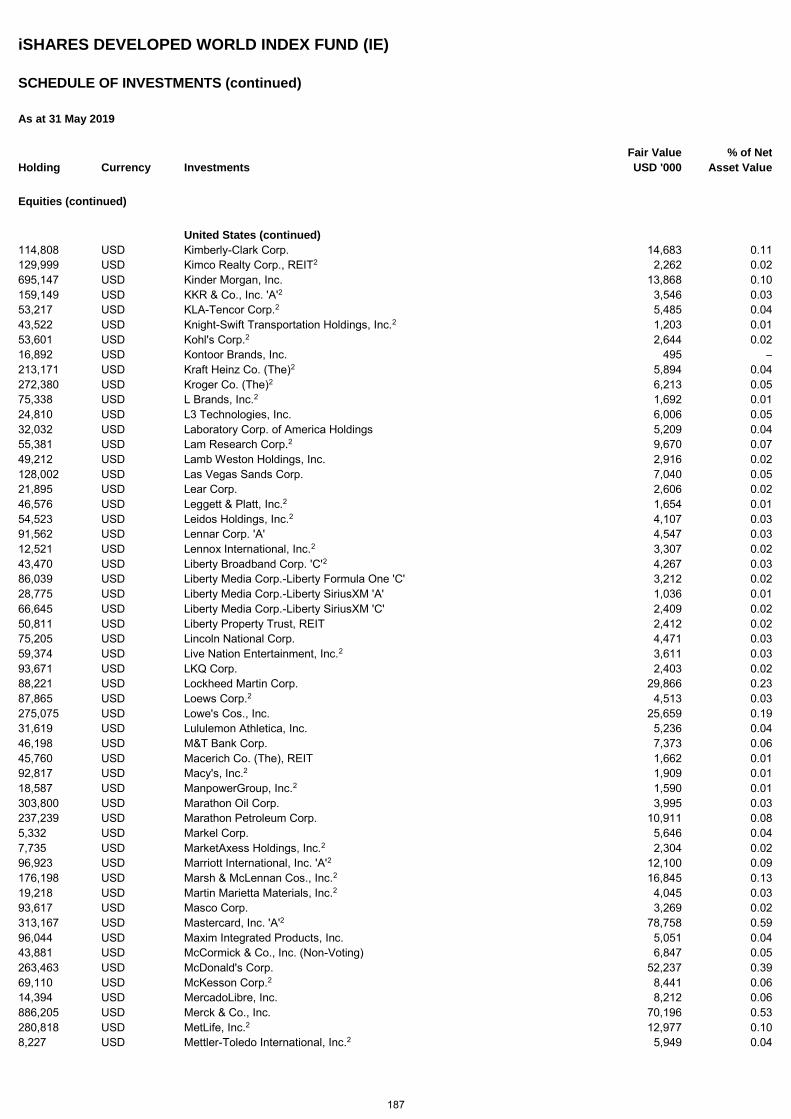
iSHARES DEVELOPED WORLD INDEX FUND (IE)
SCHEDULE OF INVESTMENTS (continued)
As at 31 May 2019
Holding Currency Investments Fair Value
USD '000 % of Net
Asset Value
Equities (continued)
United States (continued) 114,808 USD Kimberly-Clark Corp. 14,683 0.11 129,999 USD Kimco Realty Corp., REIT2 2,262 0.02 695,147 USD Kinder Morgan, Inc. 13,868 0.10 159,149 USD KKR & Co., Inc. 'A'2 3,546 0.03 53,217 USD KLA-Tencor Corp.2 5,485 0.04 43,522 USD Knight-Swift Transportation Holdings, Inc.2 1,203 0.01 53,601 USD Kohl's Corp.2 2,644 0.02 16,892 USD Kontoor Brands, Inc. 495 – 213,171 USD Kraft Heinz Co. (The)2 5,894 0.04 272,380 USD Kroger Co. (The)2 6,213 0.05 75,338 USD L Brands, Inc.2 1,692 0.01 24,810 USD L3 Technologies, Inc. 6,006 0.05 32,032 USD Laboratory Corp. of America Holdings 5,209 0.04 55,381 USD Lam Research Corp.2 9,670 0.07 49,212 USD Lamb Weston Holdings, Inc. 2,916 0.02 128,002 USD Las Vegas Sands Corp. 7,040 0.05 21,895 USD Lear Corp. 2,606 0.02 46,576 USD Leggett & Platt, Inc.2 1,654 0.01 54,523 USD Leidos Holdings, Inc.2 4,107 0.03 91,562 USD Lennar Corp. 'A' 4,547 0.03 12,521 USD Lennox International, Inc.2 3,307 0.02 43,470 USD Liberty Broadband Corp. 'C'2 4,267 0.03 86,039 USD Liberty Media Corp.-Liberty Formula One 'C' 3,212 0.02 28,775 USD Liberty Media Corp.-Liberty SiriusXM 'A' 1,036 0.01 66,645 USD Liberty Media Corp.-Liberty SiriusXM 'C' 2,409 0.02 50,811 USD Liberty Property Trust, REIT 2,412 0.02 75,205 USD Lincoln National Corp. 4,471 0.03 59,374 USD Live Nation Entertainment, Inc.2 3,611 0.03 93,671 USD LKQ Corp. 2,403 0.02 88,221 USD Lockheed Martin Corp. 29,866 0.23 87,865 USD Loews Corp.2 4,513 0.03 275,075 USD Lowe's Cos., Inc. 25,659 0.19 31,619 USD Lululemon Athletica, Inc. 5,236 0.04 46,198 USD M&T Bank Corp. 7,373 0.06 45,760 USD Macerich Co. (The), REIT 1,662 0.01 92,817 USD Macy's, Inc.2 1,909 0.01 18,587 USD ManpowerGroup, Inc.2 1,590 0.01 303,800 USD Marathon Oil Corp. 3,995 0.03 237,239 USD Marathon Petroleum Corp. 10,911 0.08 5,332 USD Markel Corp. 5,646 0.04 7,735 USD MarketAxess Holdings, Inc.2 2,304 0.02 96,923 USD Marriott International, Inc. 'A'2 12,100 0.09 176,198 USD Marsh & McLennan Cos., Inc.2 16,845 0.13 19,218 USD Martin Marietta Materials, Inc.2 4,045 0.03 93,617 USD Masco Corp. 3,269 0.02 313,167 USD Mastercard, Inc. 'A'2 78,758 0.59 96,044 USD Maxim Integrated Products, Inc. 5,051 0.04 43,881 USD McCormick & Co., Inc. (Non-Voting) 6,847 0.05 263,463 USD McDonald's Corp. 52,237 0.39 69,110 USD McKesson Corp.2 8,441 0.06 14,394 USD MercadoLibre, Inc. 8,212 0.06 886,205 USD Merck & Co., Inc. 70,196 0.53 280,818 USD MetLife, Inc.2 12,977 0.10 8,227 USD Mettler-Toledo International, Inc.2 5,949 0.04
187
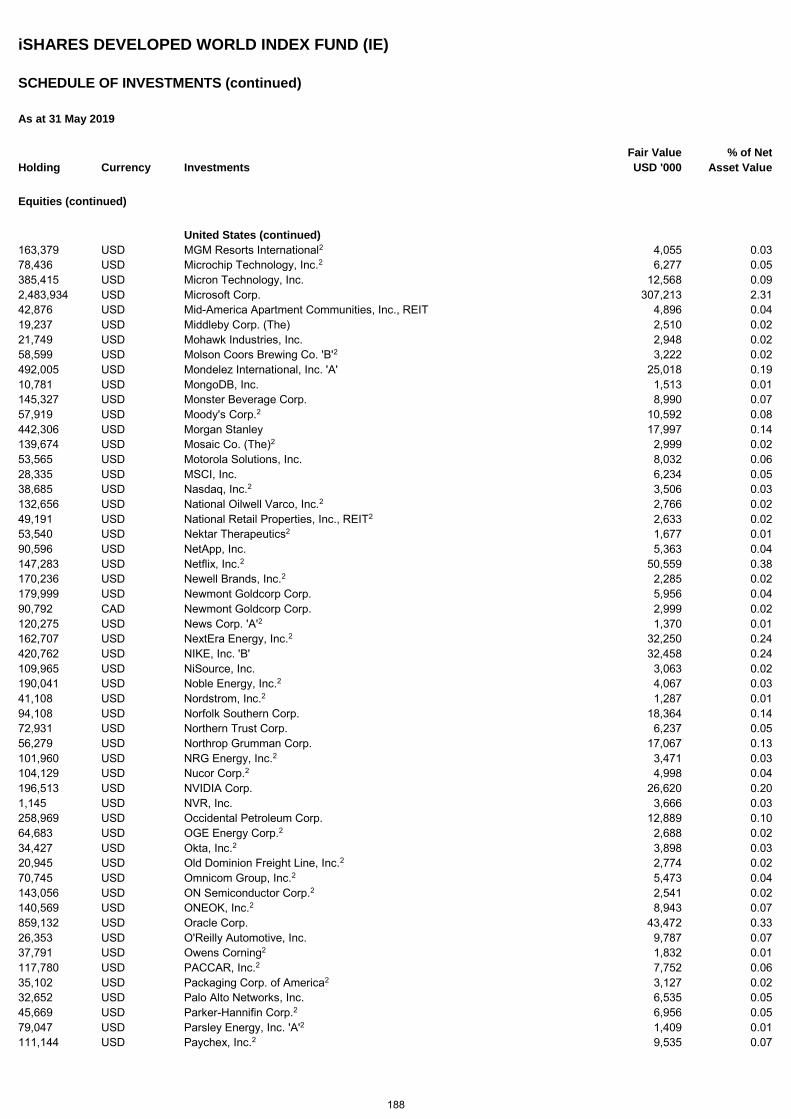
iSHARES DEVELOPED WORLD INDEX FUND (IE)
SCHEDULE OF INVESTMENTS (continued)
As at 31 May 2019
Holding Currency Investments Fair Value
USD '000 % of Net
Asset Value
Equities (continued)
United States (continued) 163,379 USD MGM Resorts International2 4,055 0.03 78,436 USD Microchip Technology, Inc.2 6,277 0.05 385,415 USD Micron Technology, Inc. 12,568 0.09 2,483,934 USD Microsoft Corp. 307,213 2.31 42,876 USD Mid-America Apartment Communities, Inc., REIT 4,896 0.04 19,237 USD Middleby Corp. (The) 2,510 0.02 21,749 USD Mohawk Industries, Inc. 2,948 0.02 58,599 USD Molson Coors Brewing Co. 'B'2 3,222 0.02 492,005 USD Mondelez International, Inc. 'A' 25,018 0.19 10,781 USD MongoDB, Inc. 1,513 0.01 145,327 USD Monster Beverage Corp. 8,990 0.07 57,919 USD Moody's Corp.2 10,592 0.08 442,306 USD Morgan Stanley 17,997 0.14 139,674 USD Mosaic Co. (The)2 2,999 0.02 53,565 USD Motorola Solutions, Inc. 8,032 0.06 28,335 USD MSCI, Inc. 6,234 0.05 38,685 USD Nasdaq, Inc.2 3,506 0.03 132,656 USD National Oilwell Varco, Inc.2 2,766 0.02 49,191 USD National Retail Properties, Inc., REIT2 2,633 0.02 53,540 USD Nektar Therapeutics2 1,677 0.01 90,596 USD NetApp, Inc. 5,363 0.04 147,283 USD Netflix, Inc.2 50,559 0.38 170,236 USD Newell Brands, Inc.2 2,285 0.02 179,999 USD Newmont Goldcorp Corp. 5,956 0.04 90,792 CAD Newmont Goldcorp Corp. 2,999 0.02 120,275 USD News Corp. 'A'2 1,370 0.01 162,707 USD NextEra Energy, Inc.2 32,250 0.24 420,762 USD NIKE, Inc. 'B' 32,458 0.24 109,965 USD NiSource, Inc. 3,063 0.02 190,041 USD Noble Energy, Inc.2 4,067 0.03 41,108 USD Nordstrom, Inc.2 1,287 0.01 94,108 USD Norfolk Southern Corp. 18,364 0.14 72,931 USD Northern Trust Corp. 6,237 0.05 56,279 USD Northrop Grumman Corp. 17,067 0.13 101,960 USD NRG Energy, Inc.2 3,471 0.03 104,129 USD Nucor Corp.2 4,998 0.04 196,513 USD NVIDIA Corp. 26,620 0.20 1,145 USD NVR, Inc. 3,666 0.03 258,969 USD Occidental Petroleum Corp. 12,889 0.10 64,683 USD OGE Energy Corp.2 2,688 0.02 34,427 USD Okta, Inc.2 3,898 0.03 20,945 USD Old Dominion Freight Line, Inc.2 2,774 0.02 70,745 USD Omnicom Group, Inc.2 5,473 0.04 143,056 USD ON Semiconductor Corp.2 2,541 0.02 140,569 USD ONEOK, Inc.2 8,943 0.07 859,132 USD Oracle Corp. 43,472 0.33 26,353 USD O'Reilly Automotive, Inc. 9,787 0.07 37,791 USD Owens Corning2 1,832 0.01 117,780 USD PACCAR, Inc.2 7,752 0.06 35,102 USD Packaging Corp. of America2 3,127 0.02 32,652 USD Palo Alto Networks, Inc. 6,535 0.05 45,669 USD Parker-Hannifin Corp.2 6,956 0.05 79,047 USD Parsley Energy, Inc. 'A'2 1,409 0.01 111,144 USD Paychex, Inc.2 9,535 0.07
188
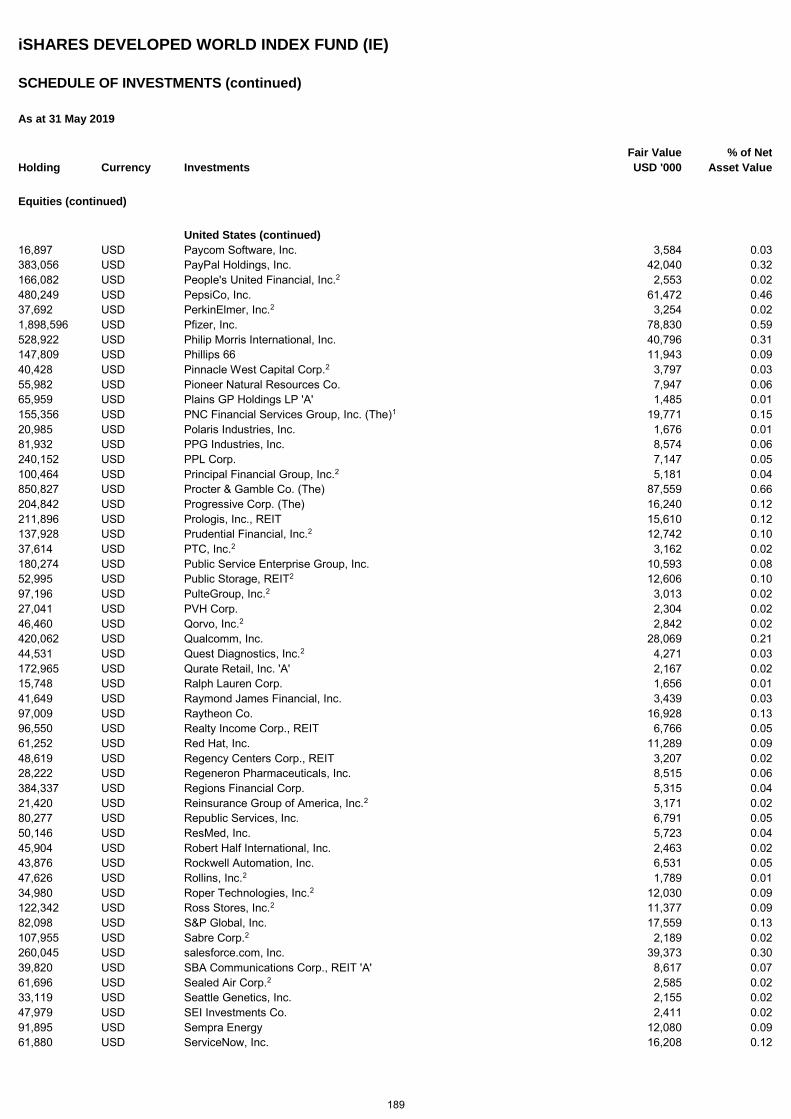
iSHARES DEVELOPED WORLD INDEX FUND (IE)
SCHEDULE OF INVESTMENTS (continued)
As at 31 May 2019
Holding Currency Investments Fair Value
USD '000 % of Net
Asset Value
Equities (continued)
United States (continued) 16,897 USD Paycom Software, Inc. 3,584 0.03 383,056 USD PayPal Holdings, Inc. 42,040 0.32 166,082 USD People's United Financial, Inc.2 2,553 0.02 480,249 USD PepsiCo, Inc. 61,472 0.46 37,692 USD PerkinElmer, Inc.2 3,254 0.02 1,898,596 USD Pfizer, Inc. 78,830 0.59 528,922 USD Philip Morris International, Inc. 40,796 0.31 147,809 USD Phillips 66 11,943 0.09 40,428 USD Pinnacle West Capital Corp.2 3,797 0.03 55,982 USD Pioneer Natural Resources Co. 7,947 0.06 65,959 USD Plains GP Holdings LP 'A' 1,485 0.01 155,356 USD PNC Financial Services Group, Inc. (The)1 19,771 0.15 20,985 USD Polaris Industries, Inc. 1,676 0.01 81,932 USD PPG Industries, Inc. 8,574 0.06 240,152 USD PPL Corp. 7,147 0.05 100,464 USD Principal Financial Group, Inc.2 5,181 0.04 850,827 USD Procter & Gamble Co. (The) 87,559 0.66 204,842 USD Progressive Corp. (The) 16,240 0.12 211,896 USD Prologis, Inc., REIT 15,610 0.12 137,928 USD Prudential Financial, Inc.2 12,742 0.10 37,614 USD PTC, Inc.2 3,162 0.02 180,274 USD Public Service Enterprise Group, Inc. 10,593 0.08 52,995 USD Public Storage, REIT2 12,606 0.10 97,196 USD PulteGroup, Inc.2 3,013 0.02 27,041 USD PVH Corp. 2,304 0.02 46,460 USD Qorvo, Inc.2 2,842 0.02 420,062 USD Qualcomm, Inc. 28,069 0.21 44,531 USD Quest Diagnostics, Inc.2 4,271 0.03 172,965 USD Qurate Retail, Inc. 'A' 2,167 0.02 15,748 USD Ralph Lauren Corp. 1,656 0.01 41,649 USD Raymond James Financial, Inc. 3,439 0.03 97,009 USD Raytheon Co. 16,928 0.13 96,550 USD Realty Income Corp., REIT 6,766 0.05 61,252 USD Red Hat, Inc. 11,289 0.09 48,619 USD Regency Centers Corp., REIT 3,207 0.02 28,222 USD Regeneron Pharmaceuticals, Inc. 8,515 0.06 384,337 USD Regions Financial Corp. 5,315 0.04 21,420 USD Reinsurance Group of America, Inc.2 3,171 0.02 80,277 USD Republic Services, Inc. 6,791 0.05 50,146 USD ResMed, Inc. 5,723 0.04 45,904 USD Robert Half International, Inc. 2,463 0.02 43,876 USD Rockwell Automation, Inc. 6,531 0.05 47,626 USD Rollins, Inc.2 1,789 0.01 34,980 USD Roper Technologies, Inc.2 12,030 0.09 122,342 USD Ross Stores, Inc.2 11,377 0.09 82,098 USD S&P Global, Inc. 17,559 0.13 107,955 USD Sabre Corp.2 2,189 0.02 260,045 USD salesforce.com, Inc. 39,373 0.30 39,820 USD SBA Communications Corp., REIT 'A' 8,617 0.07 61,696 USD Sealed Air Corp.2 2,585 0.02 33,119 USD Seattle Genetics, Inc. 2,155 0.02 47,979 USD SEI Investments Co. 2,411 0.02 91,895 USD Sempra Energy 12,080 0.09 61,880 USD ServiceNow, Inc. 16,208 0.12
189
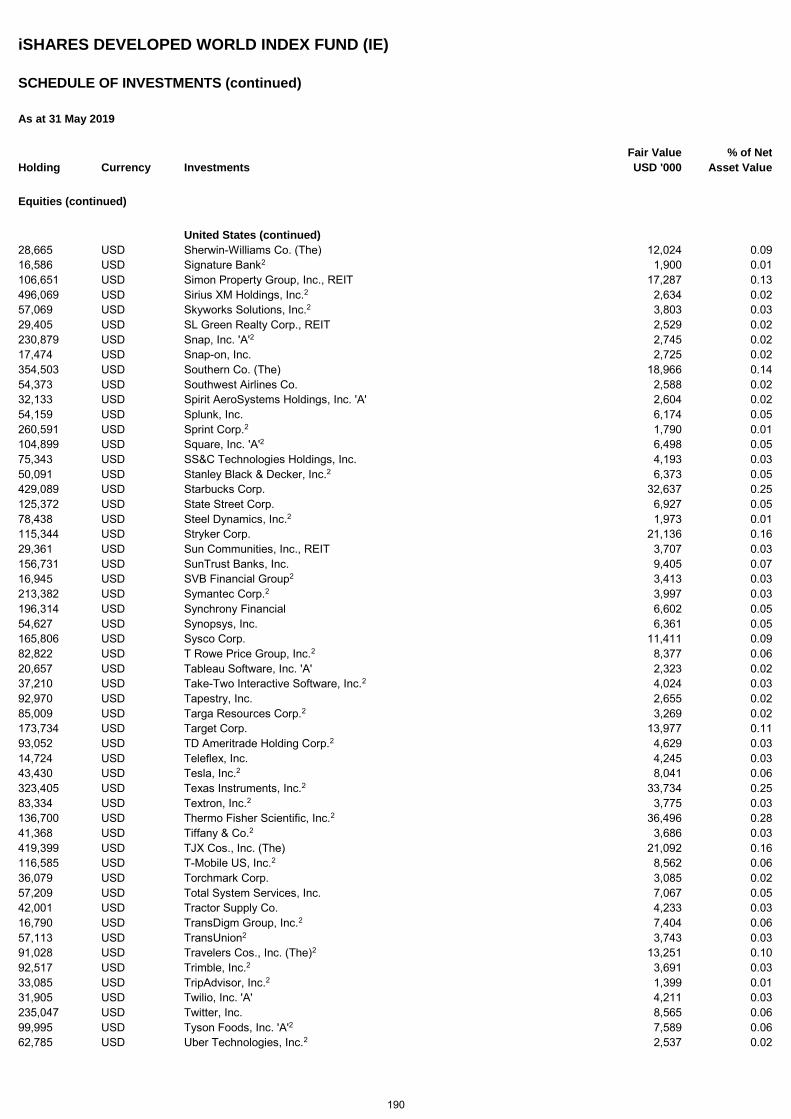
iSHARES DEVELOPED WORLD INDEX FUND (IE)
SCHEDULE OF INVESTMENTS (continued)
As at 31 May 2019
Holding Currency Investments Fair Value
USD '000 % of Net
Asset Value
Equities (continued)
United States (continued) 28,665 USD Sherwin-Williams Co. (The) 12,024 0.09 16,586 USD Signature Bank2 1,900 0.01 106,651 USD Simon Property Group, Inc., REIT 17,287 0.13 496,069 USD Sirius XM Holdings, Inc.2 2,634 0.02 57,069 USD Skyworks Solutions, Inc.2 3,803 0.03 29,405 USD SL Green Realty Corp., REIT 2,529 0.02 230,879 USD Snap, Inc. 'A'2 2,745 0.02 17,474 USD Snap-on, Inc. 2,725 0.02 354,503 USD Southern Co. (The) 18,966 0.14 54,373 USD Southwest Airlines Co. 2,588 0.02 32,133 USD Spirit AeroSystems Holdings, Inc. 'A' 2,604 0.02 54,159 USD Splunk, Inc. 6,174 0.05 260,591 USD Sprint Corp.2 1,790 0.01 104,899 USD Square, Inc. 'A'2 6,498 0.05 75,343 USD SS&C Technologies Holdings, Inc. 4,193 0.03 50,091 USD Stanley Black & Decker, Inc.2 6,373 0.05 429,089 USD Starbucks Corp. 32,637 0.25 125,372 USD State Street Corp. 6,927 0.05 78,438 USD Steel Dynamics, Inc.2 1,973 0.01 115,344 USD Stryker Corp. 21,136 0.16 29,361 USD Sun Communities, Inc., REIT 3,707 0.03 156,731 USD SunTrust Banks, Inc. 9,405 0.07 16,945 USD SVB Financial Group2 3,413 0.03 213,382 USD Symantec Corp.2 3,997 0.03 196,314 USD Synchrony Financial 6,602 0.05 54,627 USD Synopsys, Inc. 6,361 0.05 165,806 USD Sysco Corp. 11,411 0.09 82,822 USD T Rowe Price Group, Inc.2 8,377 0.06 20,657 USD Tableau Software, Inc. 'A' 2,323 0.02 37,210 USD Take-Two Interactive Software, Inc.2 4,024 0.03 92,970 USD Tapestry, Inc. 2,655 0.02 85,009 USD Targa Resources Corp.2 3,269 0.02 173,734 USD Target Corp. 13,977 0.11 93,052 USD TD Ameritrade Holding Corp.2 4,629 0.03 14,724 USD Teleflex, Inc. 4,245 0.03 43,430 USD Tesla, Inc.2 8,041 0.06 323,405 USD Texas Instruments, Inc.2 33,734 0.25 83,334 USD Textron, Inc.2 3,775 0.03 136,700 USD Thermo Fisher Scientific, Inc.2 36,496 0.28 41,368 USD Tiffany & Co.2 3,686 0.03 419,399 USD TJX Cos., Inc. (The) 21,092 0.16 116,585 USD T-Mobile US, Inc.2 8,562 0.06 36,079 USD Torchmark Corp. 3,085 0.02 57,209 USD Total System Services, Inc. 7,067 0.05 42,001 USD Tractor Supply Co. 4,233 0.03 16,790 USD TransDigm Group, Inc.2 7,404 0.06 57,113 USD TransUnion2 3,743 0.03 91,028 USD Travelers Cos., Inc. (The)2 13,251 0.10 92,517 USD Trimble, Inc.2 3,691 0.03 33,085 USD TripAdvisor, Inc.2 1,399 0.01 31,905 USD Twilio, Inc. 'A' 4,211 0.03 235,047 USD Twitter, Inc. 8,565 0.06 99,995 USD Tyson Foods, Inc. 'A'2 7,589 0.06 62,785 USD Uber Technologies, Inc.2 2,537 0.02
190
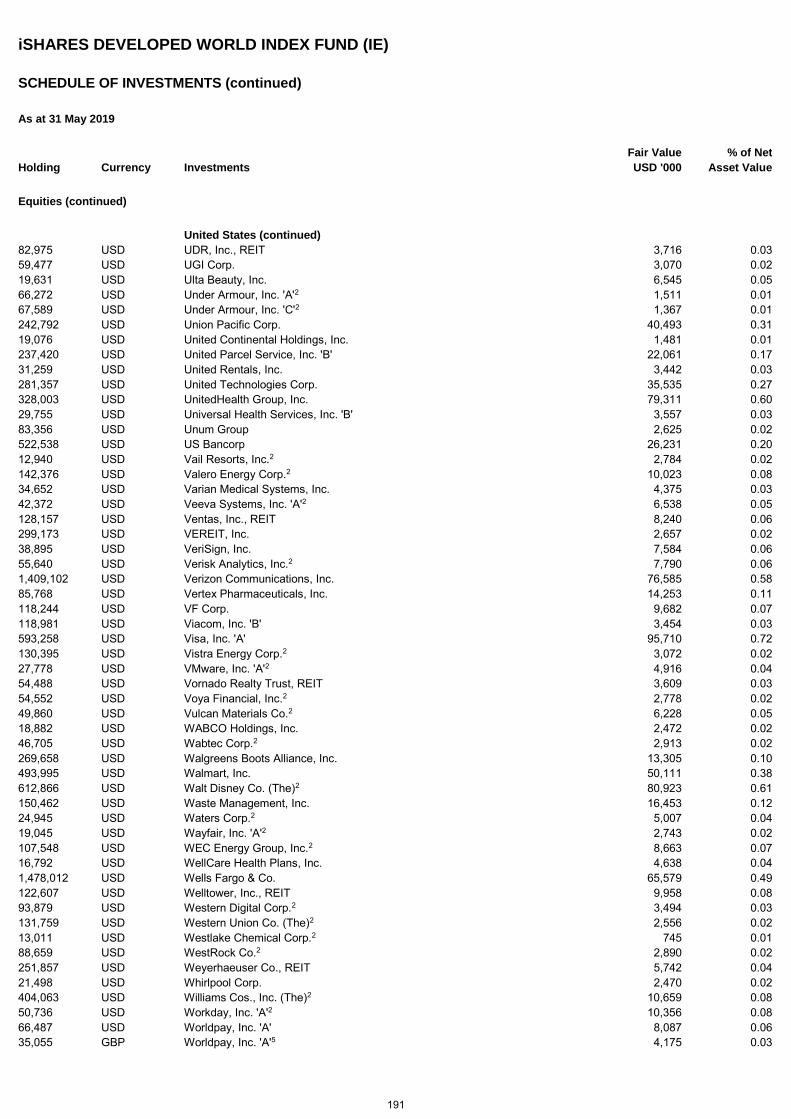
iSHARES DEVELOPED WORLD INDEX FUND (IE)
SCHEDULE OF INVESTMENTS (continued)
As at 31 May 2019
Holding Currency Investments Fair Value
USD '000 % of Net
Asset Value
Equities (continued)
United States (continued) 82,975 USD UDR, Inc., REIT 3,716 0.03 59,477 USD UGI Corp. 3,070 0.02 19,631 USD Ulta Beauty, Inc. 6,545 0.05 66,272 USD Under Armour, Inc. 'A'2 1,511 0.01 67,589 USD Under Armour, Inc. 'C'2 1,367 0.01 242,792 USD Union Pacific Corp. 40,493 0.31 19,076 USD United Continental Holdings, Inc. 1,481 0.01 237,420 USD United Parcel Service, Inc. 'B' 22,061 0.17 31,259 USD United Rentals, Inc. 3,442 0.03 281,357 USD United Technologies Corp. 35,535 0.27 328,003 USD UnitedHealth Group, Inc. 79,311 0.60 29,755 USD Universal Health Services, Inc. 'B' 3,557 0.03 83,356 USD Unum Group 2,625 0.02 522,538 USD US Bancorp 26,231 0.20 12,940 USD Vail Resorts, Inc.2 2,784 0.02 142,376 USD Valero Energy Corp.2 10,023 0.08 34,652 USD Varian Medical Systems, Inc. 4,375 0.03 42,372 USD Veeva Systems, Inc. 'A'2 6,538 0.05 128,157 USD Ventas, Inc., REIT 8,240 0.06 299,173 USD VEREIT, Inc. 2,657 0.02 38,895 USD VeriSign, Inc. 7,584 0.06 55,640 USD Verisk Analytics, Inc.2 7,790 0.06 1,409,102 USD Verizon Communications, Inc. 76,585 0.58 85,768 USD Vertex Pharmaceuticals, Inc. 14,253 0.11 118,244 USD VF Corp. 9,682 0.07 118,981 USD Viacom, Inc. 'B' 3,454 0.03 593,258 USD Visa, Inc. 'A' 95,710 0.72 130,395 USD Vistra Energy Corp.2 3,072 0.02 27,778 USD VMware, Inc. 'A'2 4,916 0.04 54,488 USD Vornado Realty Trust, REIT 3,609 0.03 54,552 USD Voya Financial, Inc.2 2,778 0.02 49,860 USD Vulcan Materials Co.2 6,228 0.05 18,882 USD WABCO Holdings, Inc. 2,472 0.02 46,705 USD Wabtec Corp.2 2,913 0.02 269,658 USD Walgreens Boots Alliance, Inc. 13,305 0.10 493,995 USD Walmart, Inc. 50,111 0.38 612,866 USD Walt Disney Co. (The)2 80,923 0.61 150,462 USD Waste Management, Inc. 16,453 0.12 24,945 USD Waters Corp.2 5,007 0.04 19,045 USD Wayfair, Inc. 'A'2 2,743 0.02 107,548 USD WEC Energy Group, Inc.2 8,663 0.07 16,792 USD WellCare Health Plans, Inc. 4,638 0.04 1,478,012 USD Wells Fargo & Co. 65,579 0.49 122,607 USD Welltower, Inc., REIT 9,958 0.08 93,879 USD Western Digital Corp.2 3,494 0.03 131,759 USD Western Union Co. (The)2 2,556 0.02 13,011 USD Westlake Chemical Corp.2 745 0.01 88,659 USD WestRock Co.2 2,890 0.02 251,857 USD Weyerhaeuser Co., REIT 5,742 0.04 21,498 USD Whirlpool Corp. 2,470 0.02 404,063 USD Williams Cos., Inc. (The)2 10,659 0.08 50,736 USD Workday, Inc. 'A'2 10,356 0.08 66,487 USD Worldpay, Inc. 'A' 8,087 0.06 35,055 GBP Worldpay, Inc. 'A'5 4,175 0.03
191
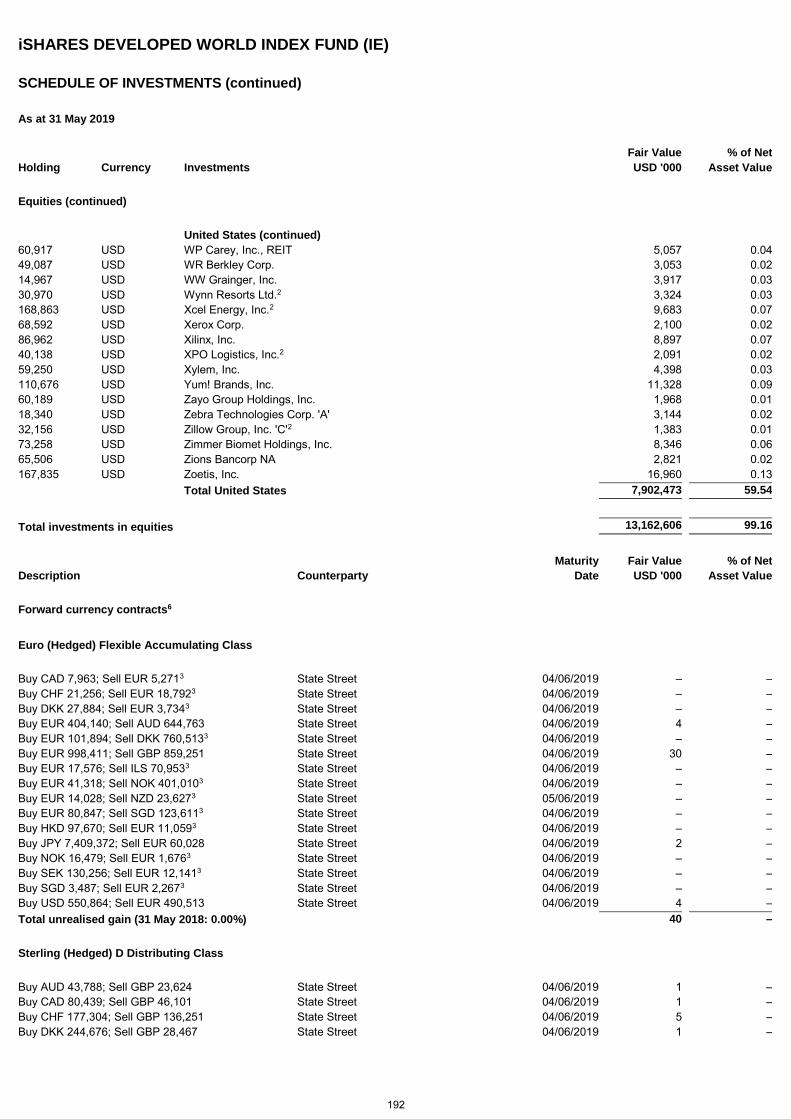
iSHARES DEVELOPED WORLD INDEX FUND (IE)
SCHEDULE OF INVESTMENTS (continued)
As at 31 May 2019
Holding Currency Investments Fair Value
USD '000 % of Net
Asset Value
Equities (continued)
United States (continued) 60,917 USD WP Carey, Inc., REIT 5,057 0.04 49,087 USD WR Berkley Corp. 3,053 0.02 14,967 USD WW Grainger, Inc. 3,917 0.03 30,970 USD Wynn Resorts Ltd.2 3,324 0.03 168,863 USD Xcel Energy, Inc.2 9,683 0.07 68,592 USD Xerox Corp. 2,100 0.02 86,962 USD Xilinx, Inc. 8,897 0.07 40,138 USD XPO Logistics, Inc.2 2,091 0.02 59,250 USD Xylem, Inc. 4,398 0.03 110,676 USD Yum! Brands, Inc. 11,328 0.09 60,189 USD Zayo Group Holdings, Inc. 1,968 0.01 18,340 USD Zebra Technologies Corp. 'A' 3,144 0.02 32,156 USD Zillow Group, Inc. 'C'2 1,383 0.01 73,258 USD Zimmer Biomet Holdings, Inc. 8,346 0.06 65,506 USD Zions Bancorp NA 2,821 0.02 167,835 USD Zoetis, Inc. 16,960 0.13 Total United States 7,902,473 59.54
Total investments in equities 13,162,606 99.16
Maturity Fair Value % of Net
Description Counterparty Date USD '000 Asset Value
Forward currency contracts6
Euro (Hedged) Flexible Accumulating Class
Buy CAD 7,963; Sell EUR 5,2713 State Street 04/06/2019 – – Buy CHF 21,256; Sell EUR 18,7923 State Street 04/06/2019 – – Buy DKK 27,884; Sell EUR 3,7343 State Street 04/06/2019 – – Buy EUR 404,140; Sell AUD 644,763 State Street 04/06/2019 4 – Buy EUR 101,894; Sell DKK 760,5133 State Street 04/06/2019 – – Buy EUR 998,411; Sell GBP 859,251 State Street 04/06/2019 30 – Buy EUR 17,576; Sell ILS 70,9533 State Street 04/06/2019 – – Buy EUR 41,318; Sell NOK 401,0103 State Street 04/06/2019 – – Buy EUR 14,028; Sell NZD 23,6273 State Street 05/06/2019 – – Buy EUR 80,847; Sell SGD 123,6113 State Street 04/06/2019 – – Buy HKD 97,670; Sell EUR 11,0593 State Street 04/06/2019 – – Buy JPY 7,409,372; Sell EUR 60,028 State Street 04/06/2019 2 – Buy NOK 16,479; Sell EUR 1,6763 State Street 04/06/2019 – – Buy SEK 130,256; Sell EUR 12,1413 State Street 04/06/2019 – – Buy SGD 3,487; Sell EUR 2,2673 State Street 04/06/2019 – – Buy USD 550,864; Sell EUR 490,513 State Street 04/06/2019 4 – Total unrealised gain (31 May 2018: 0.00%) 40 –
Sterling (Hedged) D Distributing Class
Buy AUD 43,788; Sell GBP 23,624 State Street 04/06/2019 1 – Buy CAD 80,439; Sell GBP 46,101 State Street 04/06/2019 1 – Buy CHF 177,304; Sell GBP 136,251 State Street 04/06/2019 5 – Buy DKK 244,676; Sell GBP 28,467 State Street 04/06/2019 1 –
192
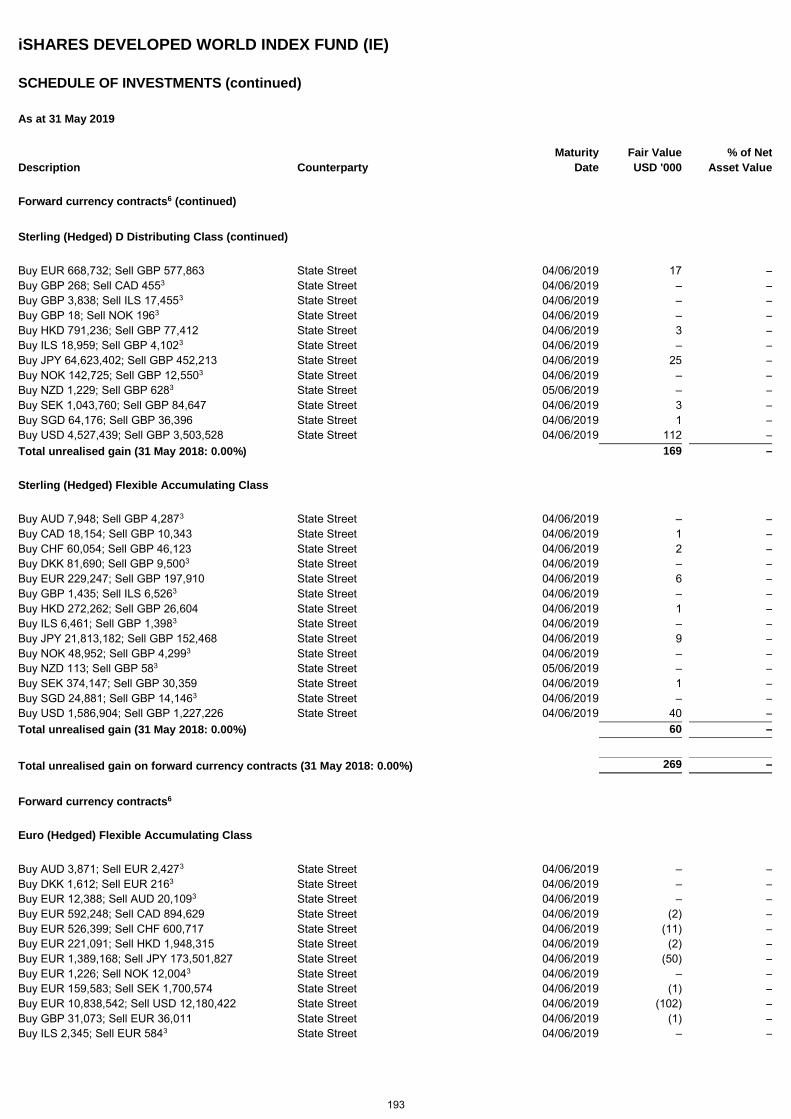
iSHARES DEVELOPED WORLD INDEX FUND (IE)
SCHEDULE OF INVESTMENTS (continued)
As at 31 May 2019
Maturity Fair Value % of Net
Description Counterparty Date USD '000 Asset Value
Forward currency contracts6 (continued)
Sterling (Hedged) D Distributing Class (continued)
Buy EUR 668,732; Sell GBP 577,863 State Street 04/06/2019 17 – Buy GBP 268; Sell CAD 4553 State Street 04/06/2019 – – Buy GBP 3,838; Sell ILS 17,4553 State Street 04/06/2019 – – Buy GBP 18; Sell NOK 1963 State Street 04/06/2019 – – Buy HKD 791,236; Sell GBP 77,412 State Street 04/06/2019 3 – Buy ILS 18,959; Sell GBP 4,1023 State Street 04/06/2019 – – Buy JPY 64,623,402; Sell GBP 452,213 State Street 04/06/2019 25 – Buy NOK 142,725; Sell GBP 12,5503 State Street 04/06/2019 – – Buy NZD 1,229; Sell GBP 6283 State Street 05/06/2019 – – Buy SEK 1,043,760; Sell GBP 84,647 State Street 04/06/2019 3 – Buy SGD 64,176; Sell GBP 36,396 State Street 04/06/2019 1 – Buy USD 4,527,439; Sell GBP 3,503,528 State Street 04/06/2019 112 – Total unrealised gain (31 May 2018: 0.00%) 169 –
Sterling (Hedged) Flexible Accumulating Class
Buy AUD 7,948; Sell GBP 4,2873 State Street 04/06/2019 – – Buy CAD 18,154; Sell GBP 10,343 State Street 04/06/2019 1 – Buy CHF 60,054; Sell GBP 46,123 State Street 04/06/2019 2 – Buy DKK 81,690; Sell GBP 9,5003 State Street 04/06/2019 – – Buy EUR 229,247; Sell GBP 197,910 State Street 04/06/2019 6 – Buy GBP 1,435; Sell ILS 6,5263 State Street 04/06/2019 – – Buy HKD 272,262; Sell GBP 26,604 State Street 04/06/2019 1 – Buy ILS 6,461; Sell GBP 1,3983 State Street 04/06/2019 – – Buy JPY 21,813,182; Sell GBP 152,468 State Street 04/06/2019 9 – Buy NOK 48,952; Sell GBP 4,2993 State Street 04/06/2019 – – Buy NZD 113; Sell GBP 583 State Street 05/06/2019 – – Buy SEK 374,147; Sell GBP 30,359 State Street 04/06/2019 1 – Buy SGD 24,881; Sell GBP 14,1463 State Street 04/06/2019 – – Buy USD 1,586,904; Sell GBP 1,227,226 State Street 04/06/2019 40 – Total unrealised gain (31 May 2018: 0.00%) 60 –
Total unrealised gain on forward currency contracts (31 May 2018: 0.00%) 269 –
Forward currency contracts6
Euro (Hedged) Flexible Accumulating Class
Buy AUD 3,871; Sell EUR 2,4273 State Street 04/06/2019 – – Buy DKK 1,612; Sell EUR 2163 State Street 04/06/2019 – – Buy EUR 12,388; Sell AUD 20,1093 State Street 04/06/2019 – – Buy EUR 592,248; Sell CAD 894,629 State Street 04/06/2019 (2) – Buy EUR 526,399; Sell CHF 600,717 State Street 04/06/2019 (11) – Buy EUR 221,091; Sell HKD 1,948,315 State Street 04/06/2019 (2) – Buy EUR 1,389,168; Sell JPY 173,501,827 State Street 04/06/2019 (50) – Buy EUR 1,226; Sell NOK 12,0043 State Street 04/06/2019 – – Buy EUR 159,583; Sell SEK 1,700,574 State Street 04/06/2019 (1) – Buy EUR 10,838,542; Sell USD 12,180,422 State Street 04/06/2019 (102) – Buy GBP 31,073; Sell EUR 36,011 State Street 04/06/2019 (1) – Buy ILS 2,345; Sell EUR 5843 State Street 04/06/2019 – –
193
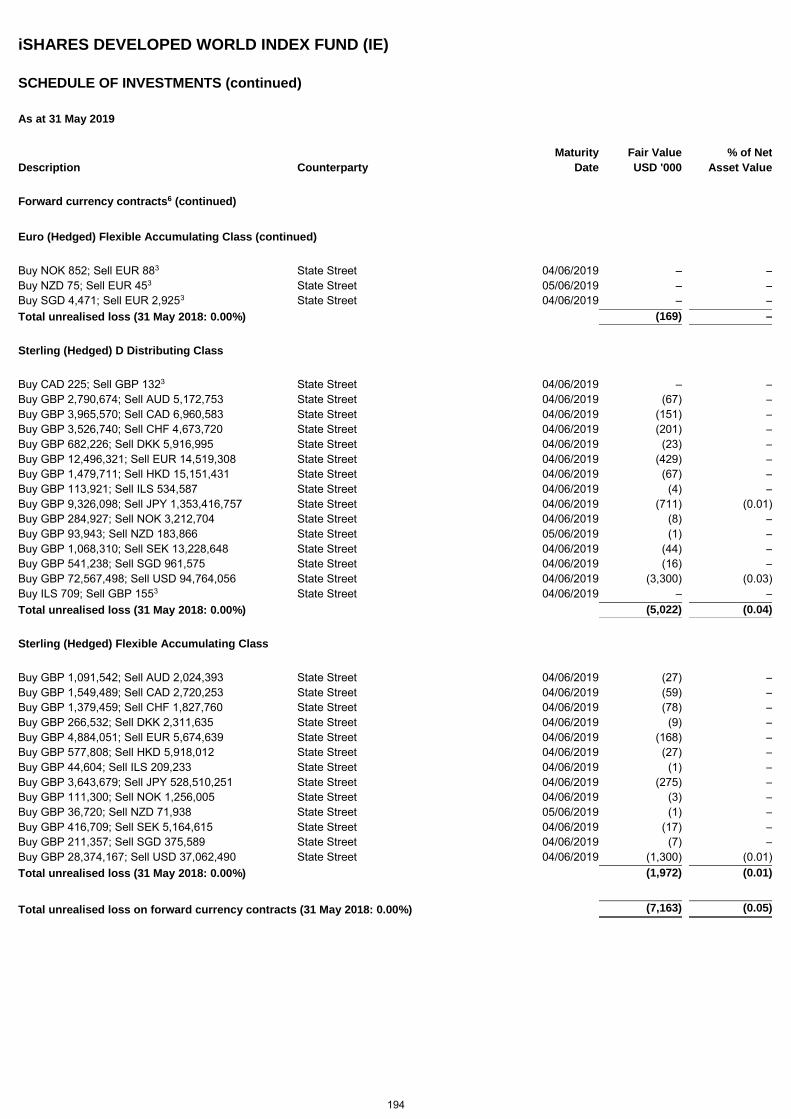
iSHARES DEVELOPED WORLD INDEX FUND (IE)
SCHEDULE OF INVESTMENTS (continued)
As at 31 May 2019
Maturity Fair Value % of Net
Description Counterparty Date USD '000 Asset Value
Forward currency contracts6 (continued)
Euro (Hedged) Flexible Accumulating Class (continued)
Buy NOK 852; Sell EUR 883 State Street 04/06/2019 – – Buy NZD 75; Sell EUR 453 State Street 05/06/2019 – – Buy SGD 4,471; Sell EUR 2,9253 State Street 04/06/2019 – – Total unrealised loss (31 May 2018: 0.00%) (169) –
Sterling (Hedged) D Distributing Class
Buy CAD 225; Sell GBP 1323 State Street 04/06/2019 – – Buy GBP 2,790,674; Sell AUD 5,172,753 State Street 04/06/2019 (67) – Buy GBP 3,965,570; Sell CAD 6,960,583 State Street 04/06/2019 (151) – Buy GBP 3,526,740; Sell CHF 4,673,720 State Street 04/06/2019 (201) – Buy GBP 682,226; Sell DKK 5,916,995 State Street 04/06/2019 (23) – Buy GBP 12,496,321; Sell EUR 14,519,308 State Street 04/06/2019 (429) – Buy GBP 1,479,711; Sell HKD 15,151,431 State Street 04/06/2019 (67) – Buy GBP 113,921; Sell ILS 534,587 State Street 04/06/2019 (4) – Buy GBP 9,326,098; Sell JPY 1,353,416,757 State Street 04/06/2019 (711) (0.01) Buy GBP 284,927; Sell NOK 3,212,704 State Street 04/06/2019 (8) – Buy GBP 93,943; Sell NZD 183,866 State Street 05/06/2019 (1) – Buy GBP 1,068,310; Sell SEK 13,228,648 State Street 04/06/2019 (44) – Buy GBP 541,238; Sell SGD 961,575 State Street 04/06/2019 (16) – Buy GBP 72,567,498; Sell USD 94,764,056 State Street 04/06/2019 (3,300) (0.03) Buy ILS 709; Sell GBP 1553 State Street 04/06/2019 – – Total unrealised loss (31 May 2018: 0.00%) (5,022) (0.04)
Sterling (Hedged) Flexible Accumulating Class
Buy GBP 1,091,542; Sell AUD 2,024,393 State Street 04/06/2019 (27) – Buy GBP 1,549,489; Sell CAD 2,720,253 State Street 04/06/2019 (59) – Buy GBP 1,379,459; Sell CHF 1,827,760 State Street 04/06/2019 (78) – Buy GBP 266,532; Sell DKK 2,311,635 State Street 04/06/2019 (9) – Buy GBP 4,884,051; Sell EUR 5,674,639 State Street 04/06/2019 (168) – Buy GBP 577,808; Sell HKD 5,918,012 State Street 04/06/2019 (27) – Buy GBP 44,604; Sell ILS 209,233 State Street 04/06/2019 (1) – Buy GBP 3,643,679; Sell JPY 528,510,251 State Street 04/06/2019 (275) – Buy GBP 111,300; Sell NOK 1,256,005 State Street 04/06/2019 (3) – Buy GBP 36,720; Sell NZD 71,938 State Street 05/06/2019 (1) – Buy GBP 416,709; Sell SEK 5,164,615 State Street 04/06/2019 (17) – Buy GBP 211,357; Sell SGD 375,589 State Street 04/06/2019 (7) – Buy GBP 28,374,167; Sell USD 37,062,490 State Street 04/06/2019 (1,300) (0.01) Total unrealised loss (31 May 2018: 0.00%) (1,972) (0.01)
Total unrealised loss on forward currency contracts (31 May 2018: 0.00%) (7,163) (0.05)
194
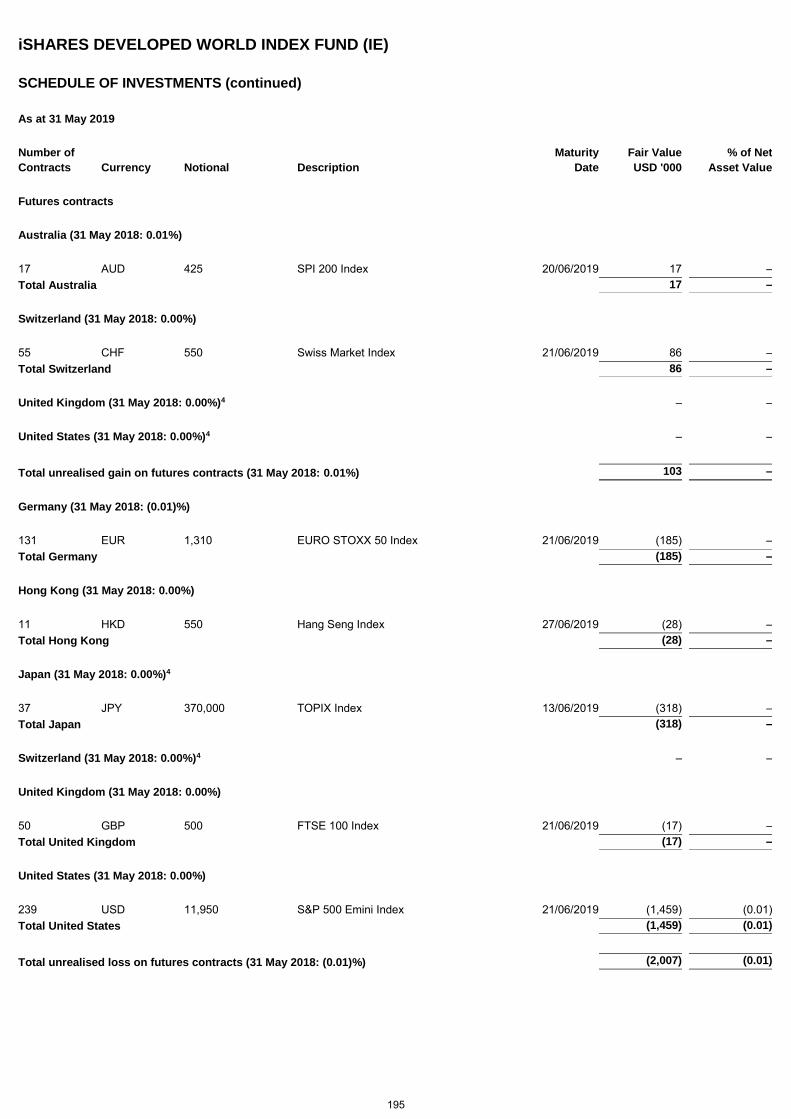
iSHARES DEVELOPED WORLD INDEX FUND (IE)
SCHEDULE OF INVESTMENTS (continued)
As at 31 May 2019
Number of Maturity Fair Value % of Net
Contracts Currency Notional Description Date USD '000 Asset Value
Futures contracts
Australia (31 May 2018: 0.01%)
17 AUD 425 SPI 200 Index 20/06/2019 17 – Total Australia 17 –
Switzerland (31 May 2018: 0.00%)
55 CHF 550 Swiss Market Index 21/06/2019 86 – Total Switzerland 86 –
United Kingdom (31 May 2018: 0.00%)4 – –
United States (31 May 2018: 0.00%)4 – –
Total unrealised gain on futures contracts (31 May 2018: 0.01%) 103 –
Germany (31 May 2018: (0.01)%)
131 EUR 1,310 EURO STOXX 50 Index 21/06/2019 (185) – Total Germany (185) –
Hong Kong (31 May 2018: 0.00%)
11 HKD 550 Hang Seng Index 27/06/2019 (28) – Total Hong Kong (28) –
Japan (31 May 2018: 0.00%)4
37 JPY 370,000 TOPIX Index 13/06/2019 (318) – Total Japan (318) –
Switzerland (31 May 2018: 0.00%)4 – –
United Kingdom (31 May 2018: 0.00%)
50 GBP 500 FTSE 100 Index 21/06/2019 (17) – Total United Kingdom (17) –
United States (31 May 2018: 0.00%)
239 USD 11,950 S&P 500 Emini Index 21/06/2019 (1,459) (0.01) Total United States (1,459) (0.01)
Total unrealised loss on futures contracts (31 May 2018: (0.01)%) (2,007) (0.01)
195
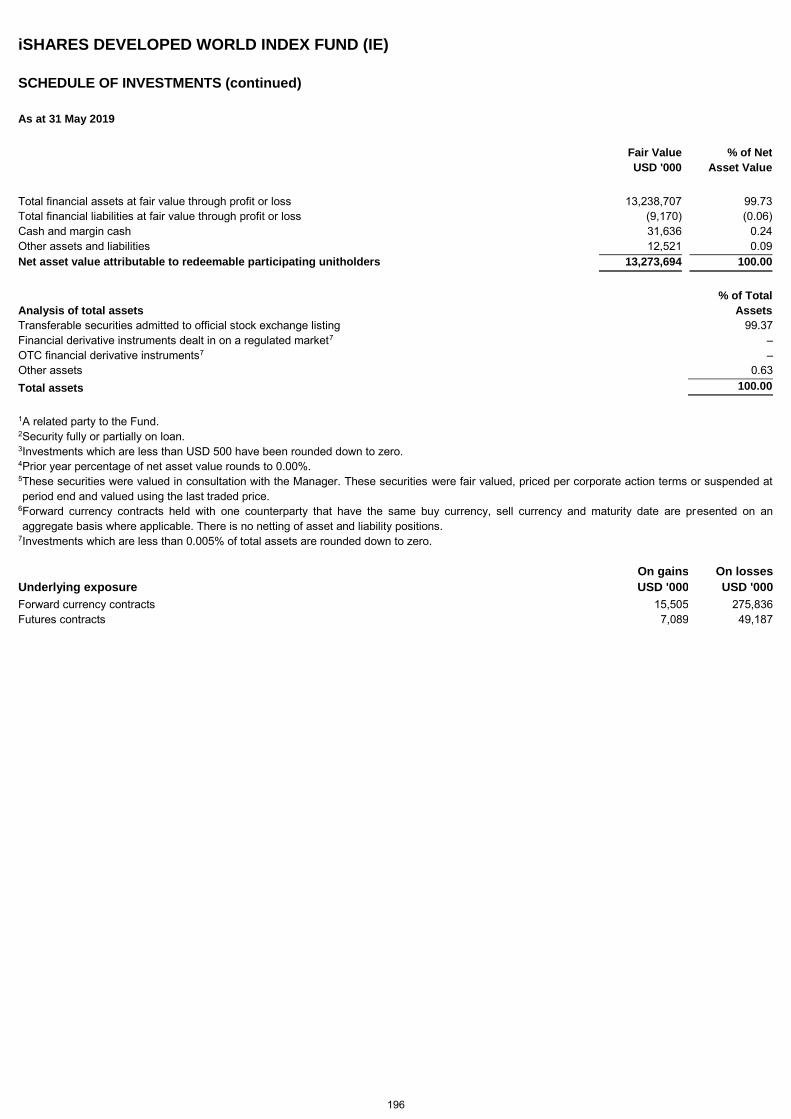
iSHARES DEVELOPED WORLD INDEX FUND (IE)
SCHEDULE OF INVESTMENTS (continued)
As at 31 May 2019
Fair Value
USD '000 % of Net
Asset Value
Total financial assets at fair value through profit or loss 13,238,707 99.73 Total financial liabilities at fair value through profit or loss (9,170) (0.06) Cash and margin cash 31,636 0.24 Other assets and liabilities 12,521 0.09 Net asset value attributable to redeemable participating unitholders 13,273,694 100.00
Analysis of total assets
% of Total
Assets
Transferable securities admitted to official stock exchange listing 99.37 Financial derivative instruments dealt in on a regulated market7 – OTC financial derivative instruments7 – Other assets 0.63 Total assets 100.00
1 A related party to the Fund. 2 Security fully or partially on loan. 3 Investments which are less than USD 500 have been rounded down to zero. 4 Prior year percentage of net asset value rounds to 0.00%. 5 These securities were valued in consultation with the Manager. These securities were fair valued, priced per corporate action terms or suspended at period end and valued using the last traded price.
6 Forward currency contracts held with one counterparty that have the same buy currency, sell currency and maturity date are presented on an aggregate basis where applicable. There is no netting of asset and liability positions.
7 Investments which are less than 0.005% of total assets are rounded down to zero.
Underlying exposure
On gains
USD '000
On losses
USD '000
Forward currency contracts 15,505 275,836 Futures contracts 7,089 49,187
196
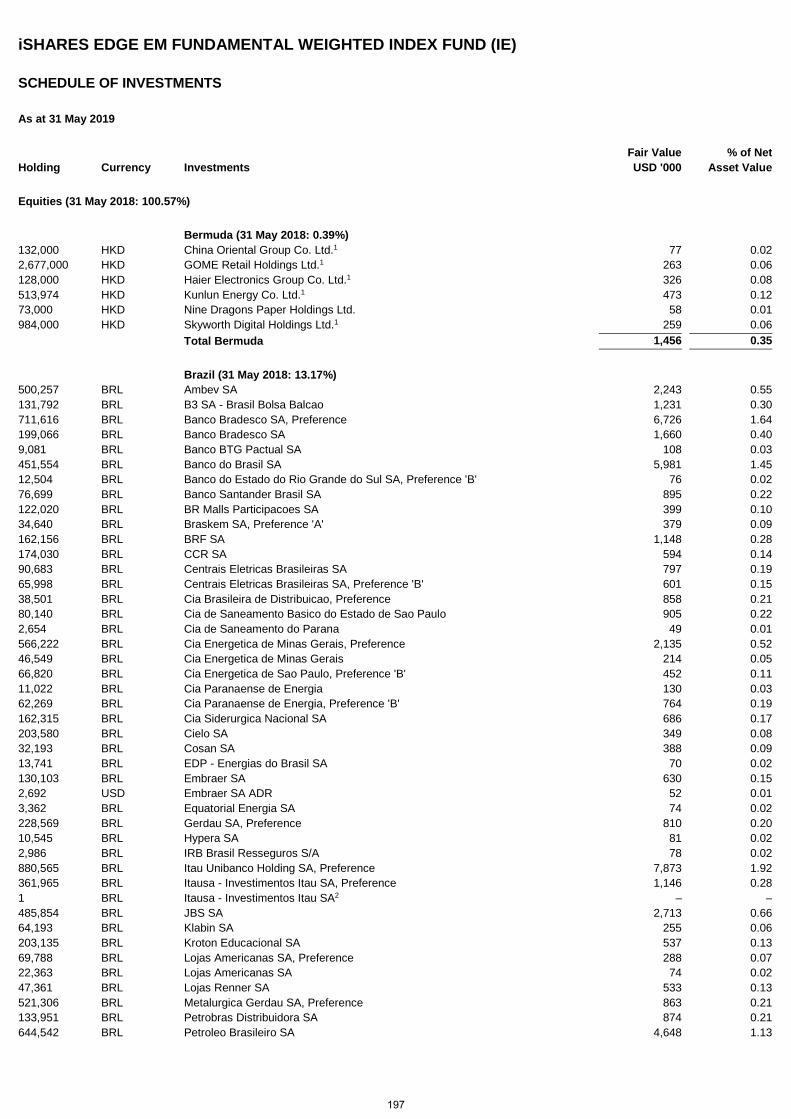
iSHARES EDGE EM FUNDAMENTAL WEIGHTED INDEX FUND (IE)
SCHEDULE OF INVESTMENTS
As at 31 May 2019
Holding Currency Investments Fair Value USD '000
% of Net Asset Value
Equities (31 May 2018: 100.57%)
Bermuda (31 May 2018: 0.39%) 132,000 HKD China Oriental Group Co. Ltd.1 77 0.02 2,677,000 HKD GOME Retail Holdings Ltd.1 263 0.06 128,000 HKD Haier Electronics Group Co. Ltd.1 326 0.08 513,974 HKD Kunlun Energy Co. Ltd.1 473 0.12 73,000 HKD Nine Dragons Paper Holdings Ltd. 58 0.01 984,000 HKD Skyworth Digital Holdings Ltd.1 259 0.06 Total Bermuda 1,456 0.35
Brazil (31 May 2018: 13.17%) 500,257 BRL Ambev SA 2,243 0.55 131,792 BRL B3 SA - Brasil Bolsa Balcao 1,231 0.30 711,616 BRL Banco Bradesco SA, Preference 6,726 1.64 199,066 BRL Banco Bradesco SA 1,660 0.40 9,081 BRL Banco BTG Pactual SA 108 0.03 451,554 BRL Banco do Brasil SA 5,981 1.45 12,504 BRL Banco do Estado do Rio Grande do Sul SA, Preference 'B' 76 0.02 76,699 BRL Banco Santander Brasil SA 895 0.22 122,020 BRL BR Malls Participacoes SA 399 0.10 34,640 BRL Braskem SA, Preference 'A' 379 0.09 162,156 BRL BRF SA 1,148 0.28 174,030 BRL CCR SA 594 0.14 90,683 BRL Centrais Eletricas Brasileiras SA 797 0.19 65,998 BRL Centrais Eletricas Brasileiras SA, Preference 'B' 601 0.15 38,501 BRL Cia Brasileira de Distribuicao, Preference 858 0.21 80,140 BRL Cia de Saneamento Basico do Estado de Sao Paulo 905 0.22 2,654 BRL Cia de Saneamento do Parana 49 0.01 566,222 BRL Cia Energetica de Minas Gerais, Preference 2,135 0.52 46,549 BRL Cia Energetica de Minas Gerais 214 0.05 66,820 BRL Cia Energetica de Sao Paulo, Preference 'B' 452 0.11 11,022 BRL Cia Paranaense de Energia 130 0.03 62,269 BRL Cia Paranaense de Energia, Preference 'B' 764 0.19 162,315 BRL Cia Siderurgica Nacional SA 686 0.17 203,580 BRL Cielo SA 349 0.08 32,193 BRL Cosan SA 388 0.09 13,741 BRL EDP - Energias do Brasil SA 70 0.02 130,103 BRL Embraer SA 630 0.15 2,692 USD Embraer SA ADR 52 0.01 3,362 BRL Equatorial Energia SA 74 0.02 228,569 BRL Gerdau SA, Preference 810 0.20 10,545 BRL Hypera SA 81 0.02 2,986 BRL IRB Brasil Resseguros S/A 78 0.02 880,565 BRL Itau Unibanco Holding SA, Preference 7,873 1.92 361,965 BRL Itausa - Investimentos Itau SA, Preference 1,146 0.28 1 BRL Itausa - Investimentos Itau SA2 – – 485,854 BRL JBS SA 2,713 0.66 64,193 BRL Klabin SA 255 0.06 203,135 BRL Kroton Educacional SA 537 0.13 69,788 BRL Lojas Americanas SA, Preference 288 0.07 22,363 BRL Lojas Americanas SA 74 0.02 47,361 BRL Lojas Renner SA 533 0.13 521,306 BRL Metalurgica Gerdau SA, Preference 863 0.21 133,951 BRL Petrobras Distribuidora SA 874 0.21 644,542 BRL Petroleo Brasileiro SA 4,648 1.13
197
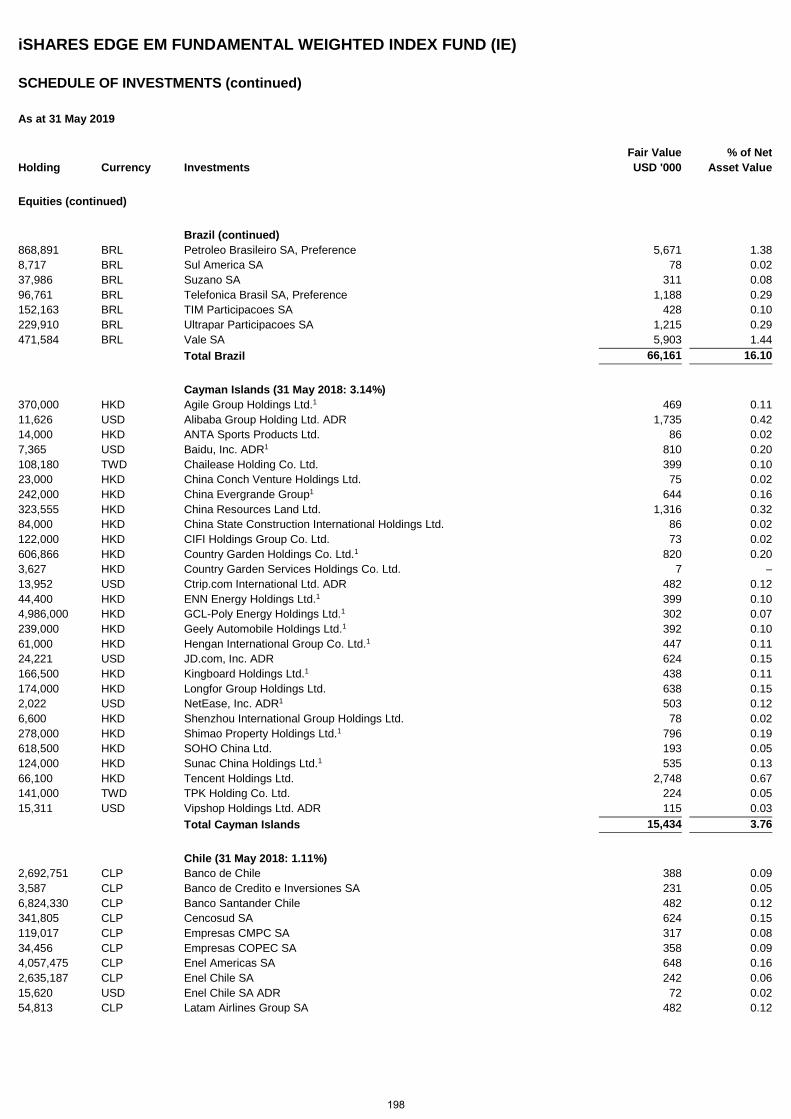
iSHARES EDGE EM FUNDAMENTAL WEIGHTED INDEX FUND (IE)
SCHEDULE OF INVESTMENTS (continued)
As at 31 May 2019
Holding Currency Investments Fair Value USD '000
% of Net Asset Value
Equities (continued)
Brazil (continued) 868,891 BRL Petroleo Brasileiro SA, Preference 5,671 1.38 8,717 BRL Sul America SA 78 0.02 37,986 BRL Suzano SA 311 0.08 96,761 BRL Telefonica Brasil SA, Preference 1,188 0.29 152,163 BRL TIM Participacoes SA 428 0.10 229,910 BRL Ultrapar Participacoes SA 1,215 0.29 471,584 BRL Vale SA 5,903 1.44 Total Brazil 66,161 16.10
Cayman Islands (31 May 2018: 3.14%) 370,000 HKD Agile Group Holdings Ltd.1 469 0.11 11,626 USD Alibaba Group Holding Ltd. ADR 1,735 0.42 14,000 HKD ANTA Sports Products Ltd. 86 0.02 7,365 USD Baidu, Inc. ADR1 810 0.20 108,180 TWD Chailease Holding Co. Ltd. 399 0.10 23,000 HKD China Conch Venture Holdings Ltd. 75 0.02 242,000 HKD China Evergrande Group1 644 0.16 323,555 HKD China Resources Land Ltd. 1,316 0.32 84,000 HKD China State Construction International Holdings Ltd. 86 0.02 122,000 HKD CIFI Holdings Group Co. Ltd. 73 0.02 606,866 HKD Country Garden Holdings Co. Ltd.1 820 0.20 3,627 HKD Country Garden Services Holdings Co. Ltd. 7 – 13,952 USD Ctrip.com International Ltd. ADR 482 0.12 44,400 HKD ENN Energy Holdings Ltd.1 399 0.10 4,986,000 HKD GCL-Poly Energy Holdings Ltd.1 302 0.07 239,000 HKD Geely Automobile Holdings Ltd.1 392 0.10 61,000 HKD Hengan International Group Co. Ltd.1 447 0.11 24,221 USD JD.com, Inc. ADR 624 0.15 166,500 HKD Kingboard Holdings Ltd.1 438 0.11 174,000 HKD Longfor Group Holdings Ltd. 638 0.15 2,022 USD NetEase, Inc. ADR1 503 0.12 6,600 HKD Shenzhou International Group Holdings Ltd. 78 0.02 278,000 HKD Shimao Property Holdings Ltd.1 796 0.19 618,500 HKD SOHO China Ltd. 193 0.05 124,000 HKD Sunac China Holdings Ltd.1 535 0.13 66,100 HKD Tencent Holdings Ltd. 2,748 0.67 141,000 TWD TPK Holding Co. Ltd. 224 0.05 15,311 USD Vipshop Holdings Ltd. ADR 115 0.03 Total Cayman Islands 15,434 3.76
Chile (31 May 2018: 1.11%) 2,692,751 CLP Banco de Chile 388 0.09 3,587 CLP Banco de Credito e Inversiones SA 231 0.05 6,824,330 CLP Banco Santander Chile 482 0.12 341,805 CLP Cencosud SA 624 0.15 119,017 CLP Empresas CMPC SA 317 0.08 34,456 CLP Empresas COPEC SA 358 0.09 4,057,475 CLP Enel Americas SA 648 0.16 2,635,187 CLP Enel Chile SA 242 0.06 15,620 USD Enel Chile SA ADR 72 0.02 54,813 CLP Latam Airlines Group SA 482 0.12
198
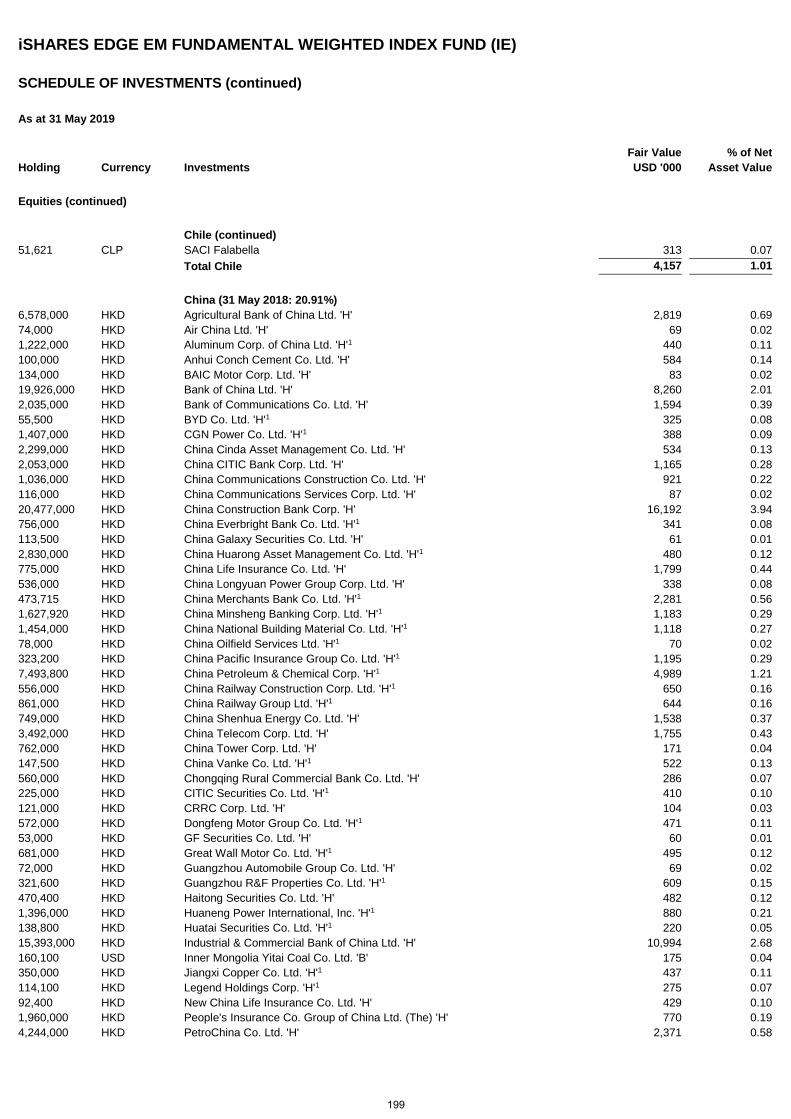
iSHARES EDGE EM FUNDAMENTAL WEIGHTED INDEX FUND (IE)
SCHEDULE OF INVESTMENTS (continued)
As at 31 May 2019
Holding Currency Investments Fair Value USD '000
% of Net Asset Value
Equities (continued)
Chile (continued) 51,621 CLP SACI Falabella 313 0.07 Total Chile 4,157 1.01
China (31 May 2018: 20.91%) 6,578,000 HKD Agricultural Bank of China Ltd. 'H' 2,819 0.69 74,000 HKD Air China Ltd. 'H' 69 0.02 1,222,000 HKD Aluminum Corp. of China Ltd. 'H'1 440 0.11 100,000 HKD Anhui Conch Cement Co. Ltd. 'H' 584 0.14 134,000 HKD BAIC Motor Corp. Ltd. 'H' 83 0.02 19,926,000 HKD Bank of China Ltd. 'H' 8,260 2.01 2,035,000 HKD Bank of Communications Co. Ltd. 'H' 1,594 0.39 55,500 HKD BYD Co. Ltd. 'H'1 325 0.08 1,407,000 HKD CGN Power Co. Ltd. 'H'1 388 0.09 2,299,000 HKD China Cinda Asset Management Co. Ltd. 'H' 534 0.13 2,053,000 HKD China CITIC Bank Corp. Ltd. 'H' 1,165 0.28 1,036,000 HKD China Communications Construction Co. Ltd. 'H' 921 0.22 116,000 HKD China Communications Services Corp. Ltd. 'H' 87 0.02 20,477,000 HKD China Construction Bank Corp. 'H' 16,192 3.94 756,000 HKD China Everbright Bank Co. Ltd. 'H'1 341 0.08 113,500 HKD China Galaxy Securities Co. Ltd. 'H' 61 0.01 2,830,000 HKD China Huarong Asset Management Co. Ltd. 'H'1 480 0.12 775,000 HKD China Life Insurance Co. Ltd. 'H' 1,799 0.44 536,000 HKD China Longyuan Power Group Corp. Ltd. 'H' 338 0.08 473,715 HKD China Merchants Bank Co. Ltd. 'H'1 2,281 0.56 1,627,920 HKD China Minsheng Banking Corp. Ltd. 'H'1 1,183 0.29 1,454,000 HKD China National Building Material Co. Ltd. 'H'1 1,118 0.27 78,000 HKD China Oilfield Services Ltd. 'H'1 70 0.02 323,200 HKD China Pacific Insurance Group Co. Ltd. 'H'1 1,195 0.29 7,493,800 HKD China Petroleum & Chemical Corp. 'H'1 4,989 1.21 556,000 HKD China Railway Construction Corp. Ltd. 'H'1 650 0.16 861,000 HKD China Railway Group Ltd. 'H'1 644 0.16 749,000 HKD China Shenhua Energy Co. Ltd. 'H' 1,538 0.37 3,492,000 HKD China Telecom Corp. Ltd. 'H' 1,755 0.43 762,000 HKD China Tower Corp. Ltd. 'H' 171 0.04 147,500 HKD China Vanke Co. Ltd. 'H'1 522 0.13 560,000 HKD Chongqing Rural Commercial Bank Co. Ltd. 'H' 286 0.07 225,000 HKD CITIC Securities Co. Ltd. 'H'1 410 0.10 121,000 HKD CRRC Corp. Ltd. 'H' 104 0.03 572,000 HKD Dongfeng Motor Group Co. Ltd. 'H'1 471 0.11 53,000 HKD GF Securities Co. Ltd. 'H' 60 0.01 681,000 HKD Great Wall Motor Co. Ltd. 'H'1 495 0.12 72,000 HKD Guangzhou Automobile Group Co. Ltd. 'H' 69 0.02 321,600 HKD Guangzhou R&F Properties Co. Ltd. 'H'1 609 0.15 470,400 HKD Haitong Securities Co. Ltd. 'H' 482 0.12 1,396,000 HKD Huaneng Power International, Inc. 'H'1 880 0.21 138,800 HKD Huatai Securities Co. Ltd. 'H'1 220 0.05 15,393,000 HKD Industrial & Commercial Bank of China Ltd. 'H' 10,994 2.68 160,100 USD Inner Mongolia Yitai Coal Co. Ltd. 'B' 175 0.04 350,000 HKD Jiangxi Copper Co. Ltd. 'H'1 437 0.11 114,100 HKD Legend Holdings Corp. 'H'1 275 0.07 92,400 HKD New China Life Insurance Co. Ltd. 'H' 429 0.10 1,960,000 HKD People's Insurance Co. Group of China Ltd. (The) 'H' 770 0.19 4,244,000 HKD PetroChina Co. Ltd. 'H' 2,371 0.58
199
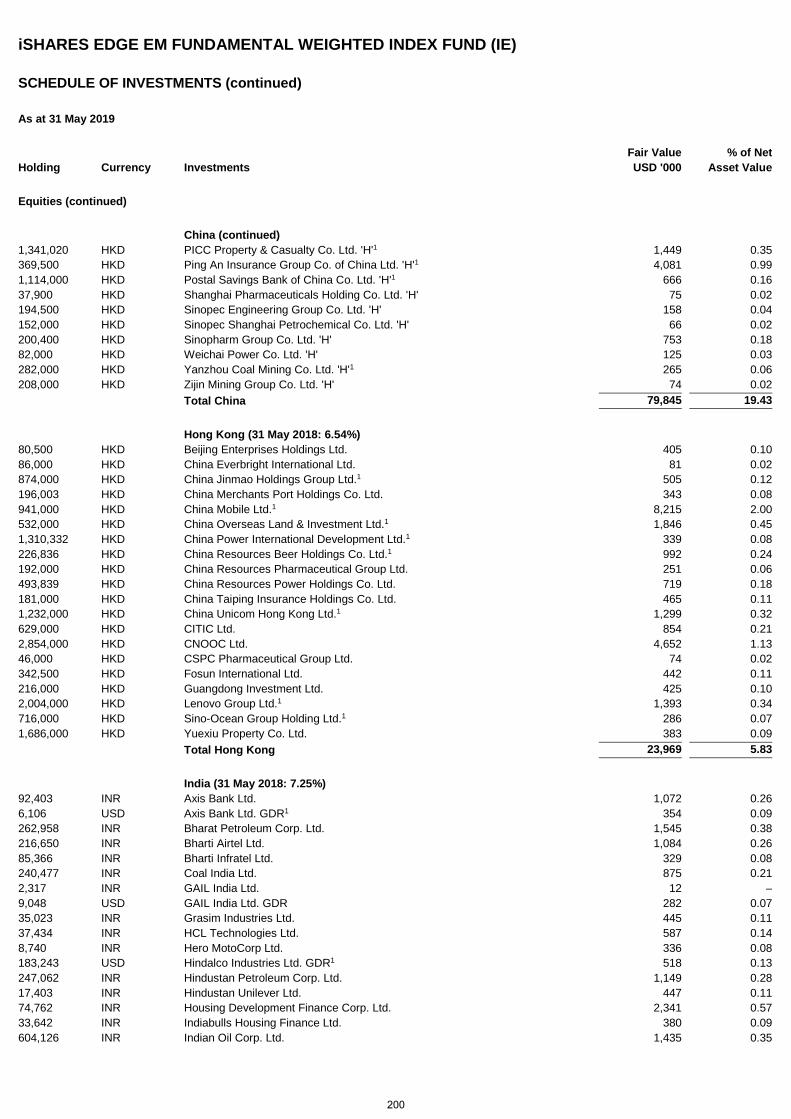
iSHARES EDGE EM FUNDAMENTAL WEIGHTED INDEX FUND (IE)
SCHEDULE OF INVESTMENTS (continued)
As at 31 May 2019
Holding Currency Investments Fair Value USD '000
% of Net Asset Value
Equities (continued)
China (continued) 1,341,020 HKD PICC Property & Casualty Co. Ltd. 'H'1 1,449 0.35 369,500 HKD Ping An Insurance Group Co. of China Ltd. 'H'1 4,081 0.99 1,114,000 HKD Postal Savings Bank of China Co. Ltd. 'H'1 666 0.16 37,900 HKD Shanghai Pharmaceuticals Holding Co. Ltd. 'H' 75 0.02 194,500 HKD Sinopec Engineering Group Co. Ltd. 'H' 158 0.04 152,000 HKD Sinopec Shanghai Petrochemical Co. Ltd. 'H' 66 0.02 200,400 HKD Sinopharm Group Co. Ltd. 'H' 753 0.18 82,000 HKD Weichai Power Co. Ltd. 'H' 125 0.03 282,000 HKD Yanzhou Coal Mining Co. Ltd. 'H'1 265 0.06 208,000 HKD Zijin Mining Group Co. Ltd. 'H' 74 0.02 Total China 79,845 19.43
Hong Kong (31 May 2018: 6.54%) 80,500 HKD Beijing Enterprises Holdings Ltd. 405 0.10 86,000 HKD China Everbright International Ltd. 81 0.02 874,000 HKD China Jinmao Holdings Group Ltd.1 505 0.12 196,003 HKD China Merchants Port Holdings Co. Ltd. 343 0.08 941,000 HKD China Mobile Ltd.1 8,215 2.00 532,000 HKD China Overseas Land & Investment Ltd.1 1,846 0.45 1,310,332 HKD China Power International Development Ltd.1 339 0.08 226,836 HKD China Resources Beer Holdings Co. Ltd.1 992 0.24 192,000 HKD China Resources Pharmaceutical Group Ltd. 251 0.06 493,839 HKD China Resources Power Holdings Co. Ltd. 719 0.18 181,000 HKD China Taiping Insurance Holdings Co. Ltd. 465 0.11 1,232,000 HKD China Unicom Hong Kong Ltd.1 1,299 0.32 629,000 HKD CITIC Ltd. 854 0.21 2,854,000 HKD CNOOC Ltd. 4,652 1.13 46,000 HKD CSPC Pharmaceutical Group Ltd. 74 0.02 342,500 HKD Fosun International Ltd. 442 0.11 216,000 HKD Guangdong Investment Ltd. 425 0.10 2,004,000 HKD Lenovo Group Ltd.1 1,393 0.34 716,000 HKD Sino-Ocean Group Holding Ltd.1 286 0.07 1,686,000 HKD Yuexiu Property Co. Ltd. 383 0.09 Total Hong Kong 23,969 5.83
India (31 May 2018: 7.25%) 92,403 INR Axis Bank Ltd. 1,072 0.26 6,106 USD Axis Bank Ltd. GDR1 354 0.09 262,958 INR Bharat Petroleum Corp. Ltd. 1,545 0.38 216,650 INR Bharti Airtel Ltd. 1,084 0.26 85,366 INR Bharti Infratel Ltd. 329 0.08 240,477 INR Coal India Ltd. 875 0.21 2,317 INR GAIL India Ltd. 12 – 9,048 USD GAIL India Ltd. GDR 282 0.07 35,023 INR Grasim Industries Ltd. 445 0.11 37,434 INR HCL Technologies Ltd. 587 0.14 8,740 INR Hero MotoCorp Ltd. 336 0.08 183,243 USD Hindalco Industries Ltd. GDR1 518 0.13 247,062 INR Hindustan Petroleum Corp. Ltd. 1,149 0.28 17,403 INR Hindustan Unilever Ltd. 447 0.11 74,762 INR Housing Development Finance Corp. Ltd. 2,341 0.57 33,642 INR Indiabulls Housing Finance Ltd. 380 0.09 604,126 INR Indian Oil Corp. Ltd. 1,435 0.35
200
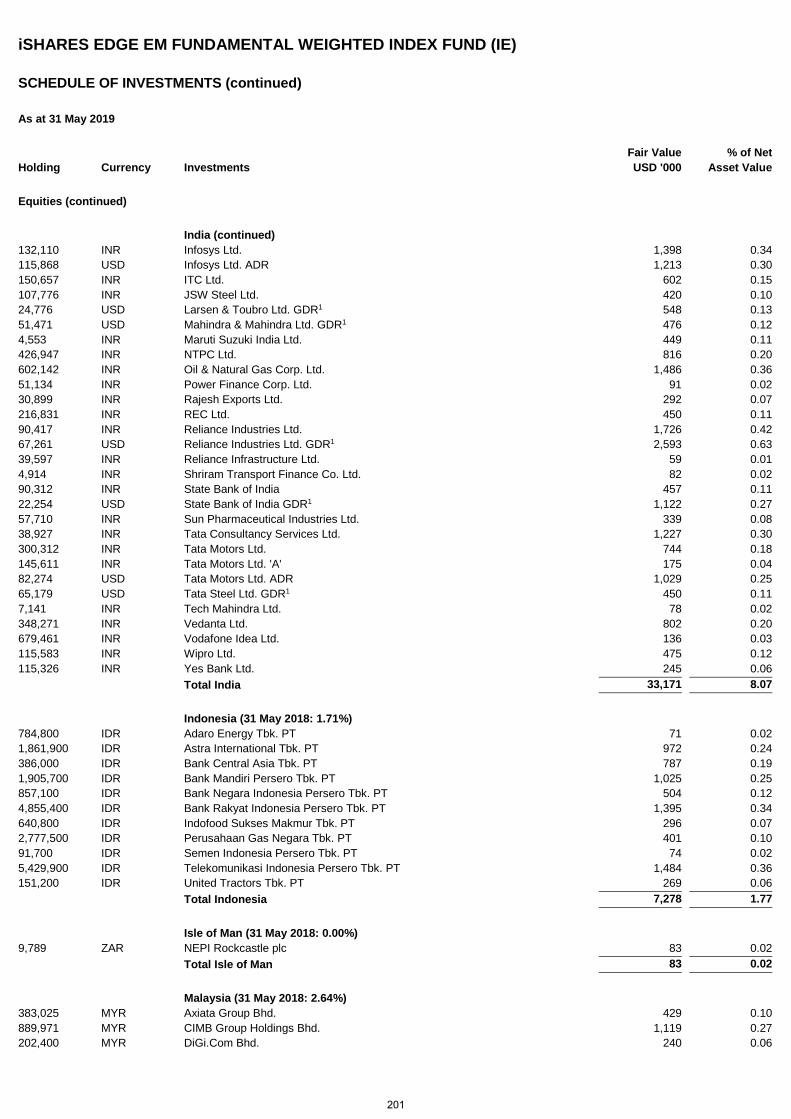
iSHARES EDGE EM FUNDAMENTAL WEIGHTED INDEX FUND (IE)
SCHEDULE OF INVESTMENTS (continued)
As at 31 May 2019
Holding Currency Investments Fair Value USD '000
% of Net Asset Value
Equities (continued)
India (continued) 132,110 INR Infosys Ltd. 1,398 0.34 115,868 USD Infosys Ltd. ADR 1,213 0.30 150,657 INR ITC Ltd. 602 0.15 107,776 INR JSW Steel Ltd. 420 0.10 24,776 USD Larsen & Toubro Ltd. GDR1 548 0.13 51,471 USD Mahindra & Mahindra Ltd. GDR1 476 0.12 4,553 INR Maruti Suzuki India Ltd. 449 0.11 426,947 INR NTPC Ltd. 816 0.20 602,142 INR Oil & Natural Gas Corp. Ltd. 1,486 0.36 51,134 INR Power Finance Corp. Ltd. 91 0.02 30,899 INR Rajesh Exports Ltd. 292 0.07 216,831 INR REC Ltd. 450 0.11 90,417 INR Reliance Industries Ltd. 1,726 0.42 67,261 USD Reliance Industries Ltd. GDR1 2,593 0.63 39,597 INR Reliance Infrastructure Ltd. 59 0.01 4,914 INR Shriram Transport Finance Co. Ltd. 82 0.02 90,312 INR State Bank of India 457 0.11 22,254 USD State Bank of India GDR1 1,122 0.27 57,710 INR Sun Pharmaceutical Industries Ltd. 339 0.08 38,927 INR Tata Consultancy Services Ltd. 1,227 0.30 300,312 INR Tata Motors Ltd. 744 0.18 145,611 INR Tata Motors Ltd. 'A' 175 0.04 82,274 USD Tata Motors Ltd. ADR 1,029 0.25 65,179 USD Tata Steel Ltd. GDR1 450 0.11 7,141 INR Tech Mahindra Ltd. 78 0.02 348,271 INR Vedanta Ltd. 802 0.20 679,461 INR Vodafone Idea Ltd. 136 0.03 115,583 INR Wipro Ltd. 475 0.12 115,326 INR Yes Bank Ltd. 245 0.06 Total India 33,171 8.07
Indonesia (31 May 2018: 1.71%) 784,800 IDR Adaro Energy Tbk. PT 71 0.02 1,861,900 IDR Astra International Tbk. PT 972 0.24 386,000 IDR Bank Central Asia Tbk. PT 787 0.19 1,905,700 IDR Bank Mandiri Persero Tbk. PT 1,025 0.25 857,100 IDR Bank Negara Indonesia Persero Tbk. PT 504 0.12 4,855,400 IDR Bank Rakyat Indonesia Persero Tbk. PT 1,395 0.34 640,800 IDR Indofood Sukses Makmur Tbk. PT 296 0.07 2,777,500 IDR Perusahaan Gas Negara Tbk. PT 401 0.10 91,700 IDR Semen Indonesia Persero Tbk. PT 74 0.02 5,429,900 IDR Telekomunikasi Indonesia Persero Tbk. PT 1,484 0.36 151,200 IDR United Tractors Tbk. PT 269 0.06 Total Indonesia 7,278 1.77
Isle of Man (31 May 2018: 0.00%) 9,789 ZAR NEPI Rockcastle plc 83 0.02 Total Isle of Man 83 0.02
Malaysia (31 May 2018: 2.64%) 383,025 MYR Axiata Group Bhd. 429 0.10 889,971 MYR CIMB Group Holdings Bhd. 1,119 0.27 202,400 MYR DiGi.Com Bhd. 240 0.06
201
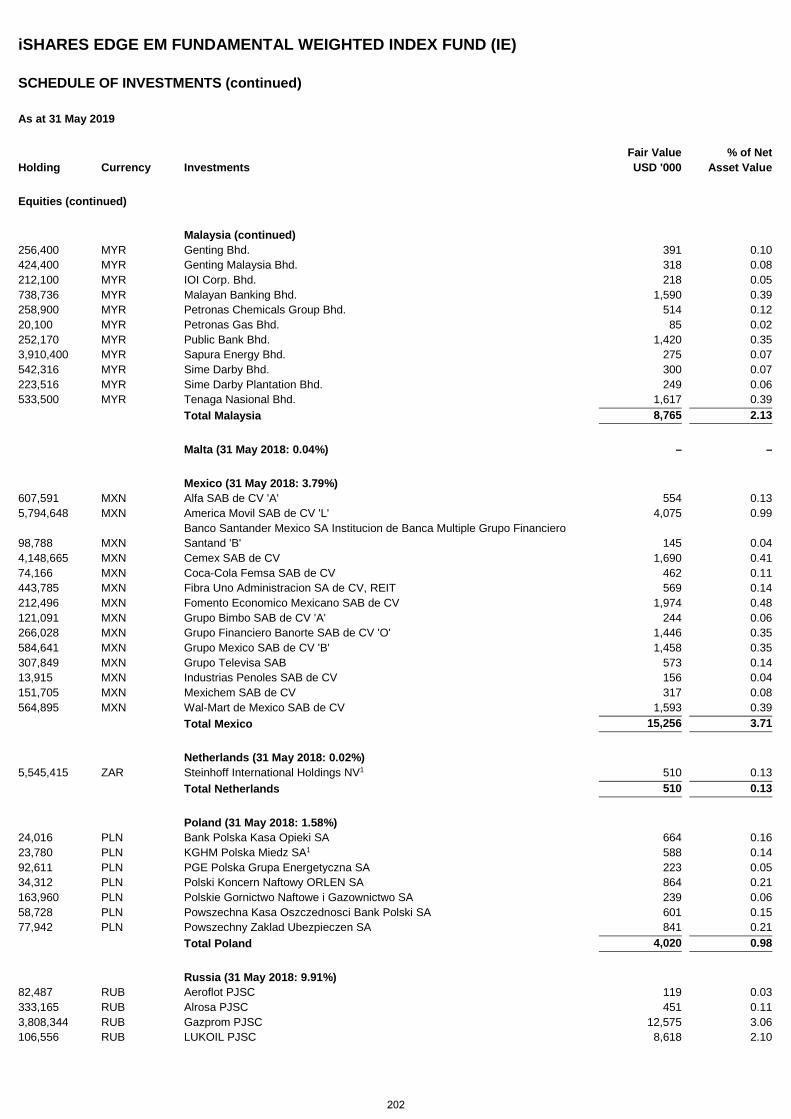
iSHARES EDGE EM FUNDAMENTAL WEIGHTED INDEX FUND (IE)
SCHEDULE OF INVESTMENTS (continued)
As at 31 May 2019
Holding Currency Investments Fair Value USD '000
% of Net Asset Value
Equities (continued)
Malaysia (continued) 256,400 MYR Genting Bhd. 391 0.10 424,400 MYR Genting Malaysia Bhd. 318 0.08 212,100 MYR IOI Corp. Bhd. 218 0.05 738,736 MYR Malayan Banking Bhd. 1,590 0.39 258,900 MYR Petronas Chemicals Group Bhd. 514 0.12 20,100 MYR Petronas Gas Bhd. 85 0.02 252,170 MYR Public Bank Bhd. 1,420 0.35 3,910,400 MYR Sapura Energy Bhd. 275 0.07 542,316 MYR Sime Darby Bhd. 300 0.07 223,516 MYR Sime Darby Plantation Bhd. 249 0.06 533,500 MYR Tenaga Nasional Bhd. 1,617 0.39 Total Malaysia 8,765 2.13
Malta (31 May 2018: 0.04%) – –
Mexico (31 May 2018: 3.79%) 607,591 MXN Alfa SAB de CV 'A' 554 0.13 5,794,648 MXN America Movil SAB de CV 'L' 4,075 0.99
98,788 MXN Banco Santander Mexico SA Institucion de Banca Multiple Grupo Financiero Santand 'B' 145 0.04
4,148,665 MXN Cemex SAB de CV 1,690 0.41 74,166 MXN Coca-Cola Femsa SAB de CV 462 0.11 443,785 MXN Fibra Uno Administracion SA de CV, REIT 569 0.14 212,496 MXN Fomento Economico Mexicano SAB de CV 1,974 0.48 121,091 MXN Grupo Bimbo SAB de CV 'A' 244 0.06 266,028 MXN Grupo Financiero Banorte SAB de CV 'O' 1,446 0.35 584,641 MXN Grupo Mexico SAB de CV 'B' 1,458 0.35 307,849 MXN Grupo Televisa SAB 573 0.14 13,915 MXN Industrias Penoles SAB de CV 156 0.04 151,705 MXN Mexichem SAB de CV 317 0.08 564,895 MXN Wal-Mart de Mexico SAB de CV 1,593 0.39 Total Mexico 15,256 3.71
Netherlands (31 May 2018: 0.02%) 5,545,415 ZAR Steinhoff International Holdings NV1 510 0.13 Total Netherlands 510 0.13
Poland (31 May 2018: 1.58%) 24,016 PLN Bank Polska Kasa Opieki SA 664 0.16 23,780 PLN KGHM Polska Miedz SA1 588 0.14 92,611 PLN PGE Polska Grupa Energetyczna SA 223 0.05 34,312 PLN Polski Koncern Naftowy ORLEN SA 864 0.21 163,960 PLN Polskie Gornictwo Naftowe i Gazownictwo SA 239 0.06 58,728 PLN Powszechna Kasa Oszczednosci Bank Polski SA 601 0.15 77,942 PLN Powszechny Zaklad Ubezpieczen SA 841 0.21 Total Poland 4,020 0.98
Russia (31 May 2018: 9.91%) 82,487 RUB Aeroflot PJSC 119 0.03 333,165 RUB Alrosa PJSC 451 0.11 3,808,344 RUB Gazprom PJSC 12,575 3.06 106,556 RUB LUKOIL PJSC 8,618 2.10
202
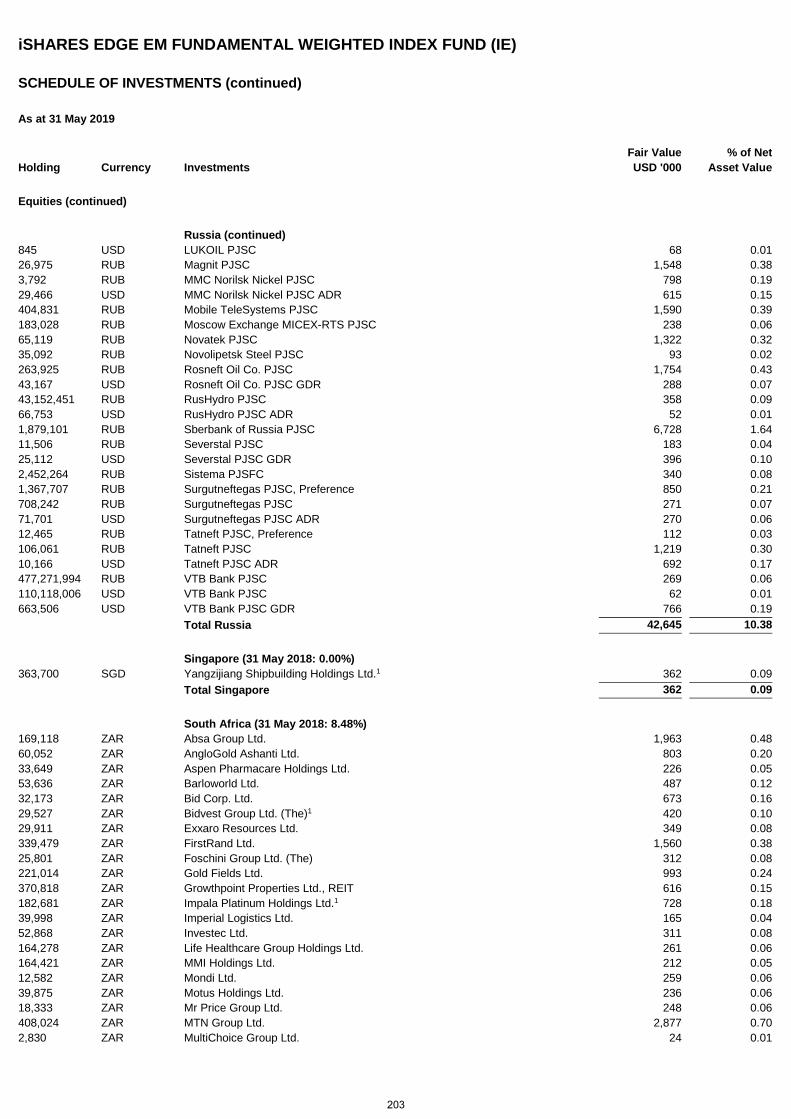
iSHARES EDGE EM FUNDAMENTAL WEIGHTED INDEX FUND (IE)
SCHEDULE OF INVESTMENTS (continued)
As at 31 May 2019
Holding Currency Investments Fair Value USD '000
% of Net Asset Value
Equities (continued)
Russia (continued) 845 USD LUKOIL PJSC 68 0.01 26,975 RUB Magnit PJSC 1,548 0.38 3,792 RUB MMC Norilsk Nickel PJSC 798 0.19 29,466 USD MMC Norilsk Nickel PJSC ADR 615 0.15 404,831 RUB Mobile TeleSystems PJSC 1,590 0.39 183,028 RUB Moscow Exchange MICEX-RTS PJSC 238 0.06 65,119 RUB Novatek PJSC 1,322 0.32 35,092 RUB Novolipetsk Steel PJSC 93 0.02 263,925 RUB Rosneft Oil Co. PJSC 1,754 0.43 43,167 USD Rosneft Oil Co. PJSC GDR 288 0.07 43,152,451 RUB RusHydro PJSC 358 0.09 66,753 USD RusHydro PJSC ADR 52 0.01 1,879,101 RUB Sberbank of Russia PJSC 6,728 1.64 11,506 RUB Severstal PJSC 183 0.04 25,112 USD Severstal PJSC GDR 396 0.10 2,452,264 RUB Sistema PJSFC 340 0.08 1,367,707 RUB Surgutneftegas PJSC, Preference 850 0.21 708,242 RUB Surgutneftegas PJSC 271 0.07 71,701 USD Surgutneftegas PJSC ADR 270 0.06 12,465 RUB Tatneft PJSC, Preference 112 0.03 106,061 RUB Tatneft PJSC 1,219 0.30 10,166 USD Tatneft PJSC ADR 692 0.17 477,271,994 RUB VTB Bank PJSC 269 0.06 110,118,006 USD VTB Bank PJSC 62 0.01 663,506 USD VTB Bank PJSC GDR 766 0.19 Total Russia 42,645 10.38
Singapore (31 May 2018: 0.00%) 363,700 SGD Yangzijiang Shipbuilding Holdings Ltd.1 362 0.09 Total Singapore 362 0.09
South Africa (31 May 2018: 8.48%) 169,118 ZAR Absa Group Ltd. 1,963 0.48 60,052 ZAR AngloGold Ashanti Ltd. 803 0.20 33,649 ZAR Aspen Pharmacare Holdings Ltd. 226 0.05 53,636 ZAR Barloworld Ltd. 487 0.12 32,173 ZAR Bid Corp. Ltd. 673 0.16 29,527 ZAR Bidvest Group Ltd. (The)1 420 0.10 29,911 ZAR Exxaro Resources Ltd. 349 0.08 339,479 ZAR FirstRand Ltd. 1,560 0.38 25,801 ZAR Foschini Group Ltd. (The) 312 0.08 221,014 ZAR Gold Fields Ltd. 993 0.24 370,818 ZAR Growthpoint Properties Ltd., REIT 616 0.15 182,681 ZAR Impala Platinum Holdings Ltd.1 728 0.18 39,998 ZAR Imperial Logistics Ltd. 165 0.04 52,868 ZAR Investec Ltd. 311 0.08 164,278 ZAR Life Healthcare Group Holdings Ltd. 261 0.06 164,421 ZAR MMI Holdings Ltd. 212 0.05 12,582 ZAR Mondi Ltd. 259 0.06 39,875 ZAR Motus Holdings Ltd. 236 0.06 18,333 ZAR Mr Price Group Ltd. 248 0.06 408,024 ZAR MTN Group Ltd. 2,877 0.70 2,830 ZAR MultiChoice Group Ltd. 24 0.01
203
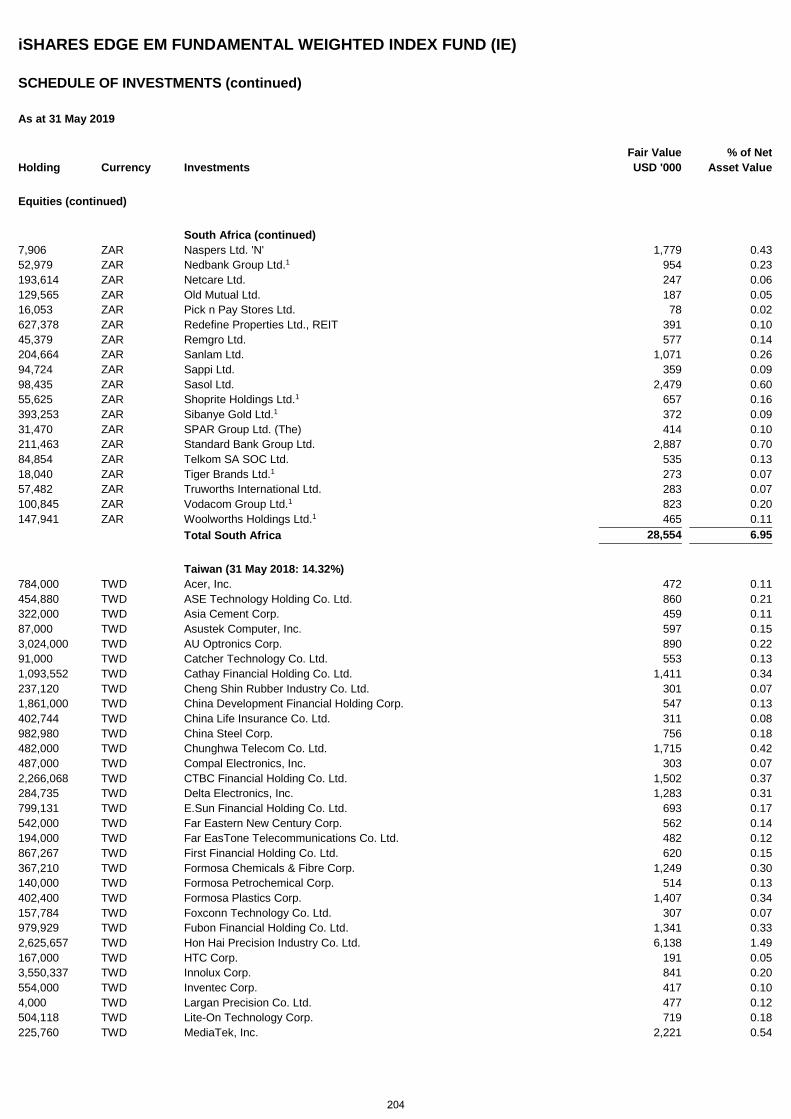
iSHARES EDGE EM FUNDAMENTAL WEIGHTED INDEX FUND (IE)
SCHEDULE OF INVESTMENTS (continued)
As at 31 May 2019
Holding Currency Investments Fair Value USD '000
% of Net Asset Value
Equities (continued)
South Africa (continued) 7,906 ZAR Naspers Ltd. 'N' 1,779 0.43 52,979 ZAR Nedbank Group Ltd.1 954 0.23 193,614 ZAR Netcare Ltd. 247 0.06 129,565 ZAR Old Mutual Ltd. 187 0.05 16,053 ZAR Pick n Pay Stores Ltd. 78 0.02 627,378 ZAR Redefine Properties Ltd., REIT 391 0.10 45,379 ZAR Remgro Ltd. 577 0.14 204,664 ZAR Sanlam Ltd. 1,071 0.26 94,724 ZAR Sappi Ltd. 359 0.09 98,435 ZAR Sasol Ltd. 2,479 0.60 55,625 ZAR Shoprite Holdings Ltd.1 657 0.16 393,253 ZAR Sibanye Gold Ltd.1 372 0.09 31,470 ZAR SPAR Group Ltd. (The) 414 0.10 211,463 ZAR Standard Bank Group Ltd. 2,887 0.70 84,854 ZAR Telkom SA SOC Ltd. 535 0.13 18,040 ZAR Tiger Brands Ltd.1 273 0.07 57,482 ZAR Truworths International Ltd. 283 0.07 100,845 ZAR Vodacom Group Ltd.1 823 0.20 147,941 ZAR Woolworths Holdings Ltd.1 465 0.11 Total South Africa 28,554 6.95
Taiwan (31 May 2018: 14.32%) 784,000 TWD Acer, Inc. 472 0.11 454,880 TWD ASE Technology Holding Co. Ltd. 860 0.21 322,000 TWD Asia Cement Corp. 459 0.11 87,000 TWD Asustek Computer, Inc. 597 0.15 3,024,000 TWD AU Optronics Corp. 890 0.22 91,000 TWD Catcher Technology Co. Ltd. 553 0.13 1,093,552 TWD Cathay Financial Holding Co. Ltd. 1,411 0.34 237,120 TWD Cheng Shin Rubber Industry Co. Ltd. 301 0.07 1,861,000 TWD China Development Financial Holding Corp. 547 0.13 402,744 TWD China Life Insurance Co. Ltd. 311 0.08 982,980 TWD China Steel Corp. 756 0.18 482,000 TWD Chunghwa Telecom Co. Ltd. 1,715 0.42 487,000 TWD Compal Electronics, Inc. 303 0.07 2,266,068 TWD CTBC Financial Holding Co. Ltd. 1,502 0.37 284,735 TWD Delta Electronics, Inc. 1,283 0.31 799,131 TWD E.Sun Financial Holding Co. Ltd. 693 0.17 542,000 TWD Far Eastern New Century Corp. 562 0.14 194,000 TWD Far EasTone Telecommunications Co. Ltd. 482 0.12 867,267 TWD First Financial Holding Co. Ltd. 620 0.15 367,210 TWD Formosa Chemicals & Fibre Corp. 1,249 0.30 140,000 TWD Formosa Petrochemical Corp. 514 0.13 402,400 TWD Formosa Plastics Corp. 1,407 0.34 157,784 TWD Foxconn Technology Co. Ltd. 307 0.07 979,929 TWD Fubon Financial Holding Co. Ltd. 1,341 0.33 2,625,657 TWD Hon Hai Precision Industry Co. Ltd. 6,138 1.49 167,000 TWD HTC Corp. 191 0.05 3,550,337 TWD Innolux Corp. 841 0.20 554,000 TWD Inventec Corp. 417 0.10 4,000 TWD Largan Precision Co. Ltd. 477 0.12 504,118 TWD Lite-On Technology Corp. 719 0.18 225,760 TWD MediaTek, Inc. 2,221 0.54
204
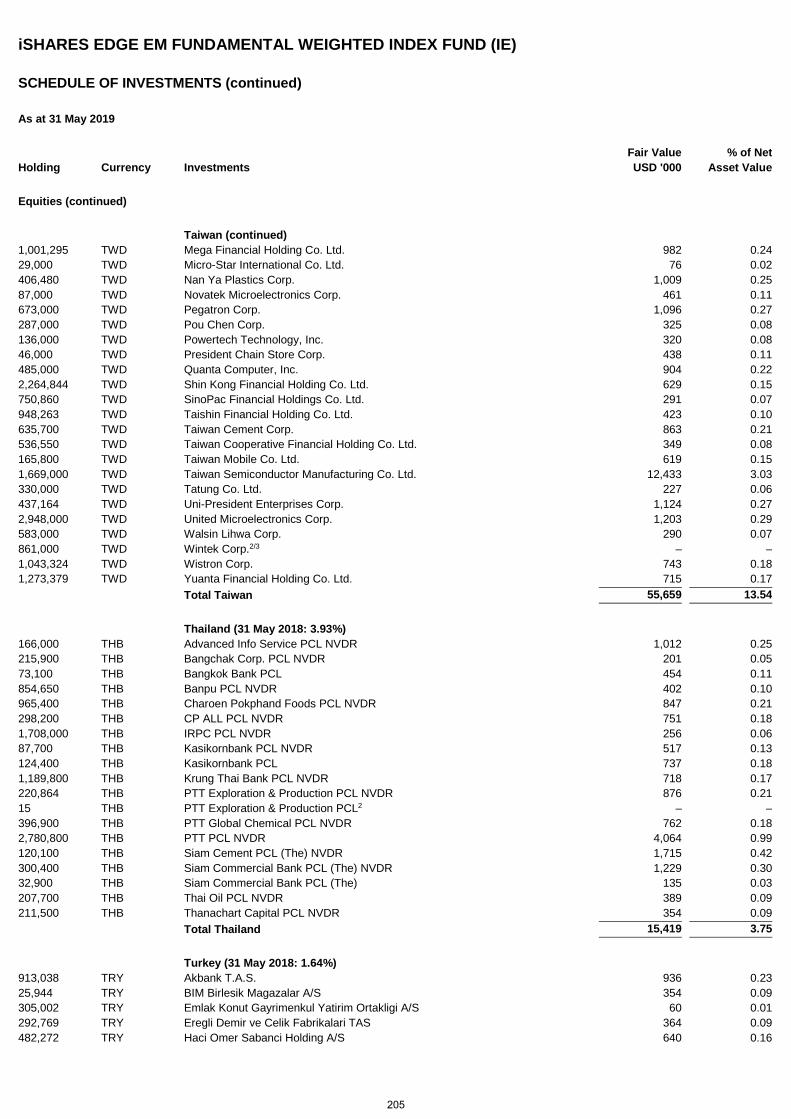
iSHARES EDGE EM FUNDAMENTAL WEIGHTED INDEX FUND (IE)
SCHEDULE OF INVESTMENTS (continued)
As at 31 May 2019
Holding Currency Investments Fair Value USD '000
% of Net Asset Value
Equities (continued)
Taiwan (continued) 1,001,295 TWD Mega Financial Holding Co. Ltd. 982 0.24 29,000 TWD Micro-Star International Co. Ltd. 76 0.02 406,480 TWD Nan Ya Plastics Corp. 1,009 0.25 87,000 TWD Novatek Microelectronics Corp. 461 0.11 673,000 TWD Pegatron Corp. 1,096 0.27 287,000 TWD Pou Chen Corp. 325 0.08 136,000 TWD Powertech Technology, Inc. 320 0.08 46,000 TWD President Chain Store Corp. 438 0.11 485,000 TWD Quanta Computer, Inc. 904 0.22 2,264,844 TWD Shin Kong Financial Holding Co. Ltd. 629 0.15 750,860 TWD SinoPac Financial Holdings Co. Ltd. 291 0.07 948,263 TWD Taishin Financial Holding Co. Ltd. 423 0.10 635,700 TWD Taiwan Cement Corp. 863 0.21 536,550 TWD Taiwan Cooperative Financial Holding Co. Ltd. 349 0.08 165,800 TWD Taiwan Mobile Co. Ltd. 619 0.15 1,669,000 TWD Taiwan Semiconductor Manufacturing Co. Ltd. 12,433 3.03 330,000 TWD Tatung Co. Ltd. 227 0.06 437,164 TWD Uni-President Enterprises Corp. 1,124 0.27 2,948,000 TWD United Microelectronics Corp. 1,203 0.29 583,000 TWD Walsin Lihwa Corp. 290 0.07 861,000 TWD Wintek Corp.2/3 – – 1,043,324 TWD Wistron Corp. 743 0.18 1,273,379 TWD Yuanta Financial Holding Co. Ltd. 715 0.17 Total Taiwan 55,659 13.54
Thailand (31 May 2018: 3.93%) 166,000 THB Advanced Info Service PCL NVDR 1,012 0.25 215,900 THB Bangchak Corp. PCL NVDR 201 0.05 73,100 THB Bangkok Bank PCL 454 0.11 854,650 THB Banpu PCL NVDR 402 0.10 965,400 THB Charoen Pokphand Foods PCL NVDR 847 0.21 298,200 THB CP ALL PCL NVDR 751 0.18 1,708,000 THB IRPC PCL NVDR 256 0.06 87,700 THB Kasikornbank PCL NVDR 517 0.13 124,400 THB Kasikornbank PCL 737 0.18 1,189,800 THB Krung Thai Bank PCL NVDR 718 0.17 220,864 THB PTT Exploration & Production PCL NVDR 876 0.21 15 THB PTT Exploration & Production PCL2 – – 396,900 THB PTT Global Chemical PCL NVDR 762 0.18 2,780,800 THB PTT PCL NVDR 4,064 0.99 120,100 THB Siam Cement PCL (The) NVDR 1,715 0.42 300,400 THB Siam Commercial Bank PCL (The) NVDR 1,229 0.30 32,900 THB Siam Commercial Bank PCL (The) 135 0.03 207,700 THB Thai Oil PCL NVDR 389 0.09 211,500 THB Thanachart Capital PCL NVDR 354 0.09 Total Thailand 15,419 3.75
Turkey (31 May 2018: 1.64%) 913,038 TRY Akbank T.A.S. 936 0.23 25,944 TRY BIM Birlesik Magazalar A/S 354 0.09 305,002 TRY Emlak Konut Gayrimenkul Yatirim Ortakligi A/S 60 0.01 292,769 TRY Eregli Demir ve Celik Fabrikalari TAS 364 0.09 482,272 TRY Haci Omer Sabanci Holding A/S 640 0.16
205
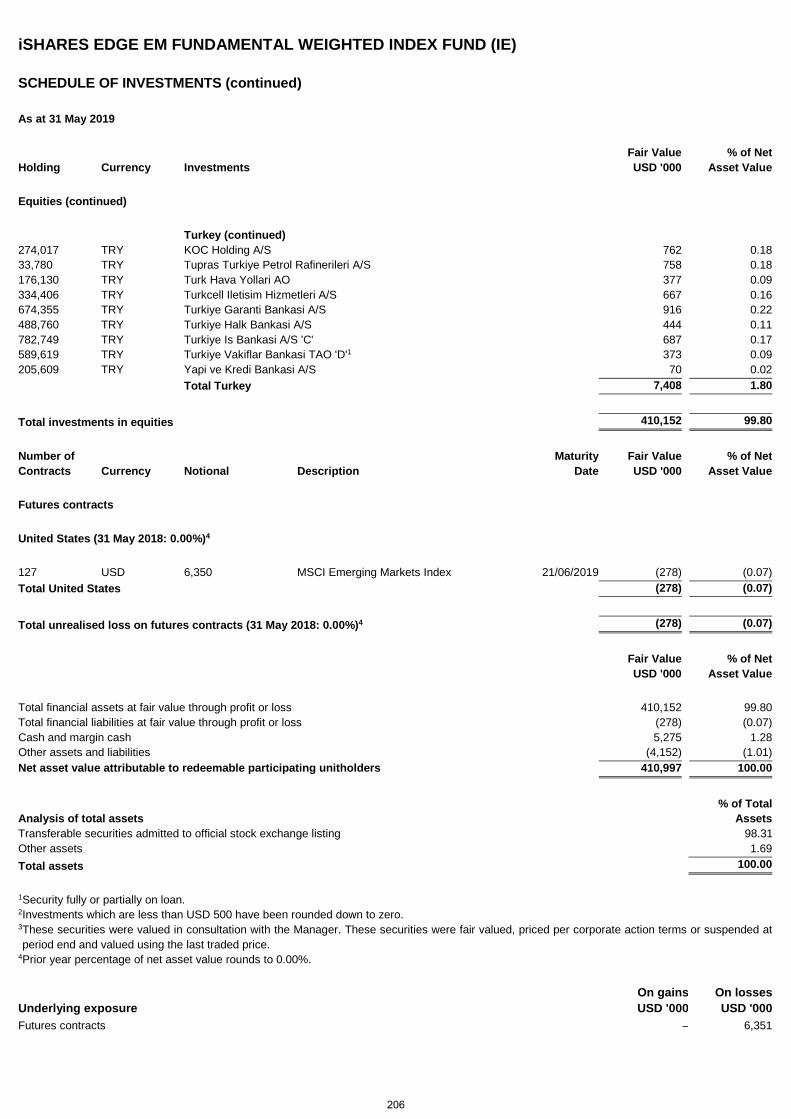
iSHARES EDGE EM FUNDAMENTAL WEIGHTED INDEX FUND (IE)
SCHEDULE OF INVESTMENTS (continued)
As at 31 May 2019
Holding Currency Investments Fair Value USD '000
% of Net Asset Value
Equities (continued)
Turkey (continued) 274,017 TRY KOC Holding A/S 762 0.18 33,780 TRY Tupras Turkiye Petrol Rafinerileri A/S 758 0.18 176,130 TRY Turk Hava Yollari AO 377 0.09 334,406 TRY Turkcell Iletisim Hizmetleri A/S 667 0.16 674,355 TRY Turkiye Garanti Bankasi A/S 916 0.22 488,760 TRY Turkiye Halk Bankasi A/S 444 0.11 782,749 TRY Turkiye Is Bankasi A/S 'C' 687 0.17 589,619 TRY Turkiye Vakiflar Bankasi TAO 'D'1 373 0.09 205,609 TRY Yapi ve Kredi Bankasi A/S 70 0.02 Total Turkey 7,408 1.80
Total investments in equities 410,152 99.80
Number of Maturity Fair Value % of Net Contracts Currency Notional Description Date USD '000 Asset Value
Futures contracts
United States (31 May 2018: 0.00%)4
127 USD 6,350 MSCI Emerging Markets Index 21/06/2019 (278) (0.07) Total United States (278) (0.07)
Total unrealised loss on futures contracts (31 May 2018: 0.00%)4 (278) (0.07)
Fair Value USD '000
% of Net Asset Value
Total financial assets at fair value through profit or loss 410,152 99.80 Total financial liabilities at fair value through profit or loss (278) (0.07) Cash and margin cash 5,275 1.28 Other assets and liabilities (4,152) (1.01) Net asset value attributable to redeemable participating unitholders 410,997 100.00
Analysis of total assets % of Total
Assets Transferable securities admitted to official stock exchange listing 98.31 Other assets 1.69 Total assets 100.00
1 Security fully or partially on loan. 2 Investments which are less than USD 500 have been rounded down to zero. 3 These securities were valued in consultation with the Manager. These securities were fair valued, priced per corporate action terms or suspended at period end and valued using the last traded price.
4 Prior year percentage of net asset value rounds to 0.00%.
Underlying exposure On gains USD '000
On losses USD '000
Futures contracts – 6,351
206
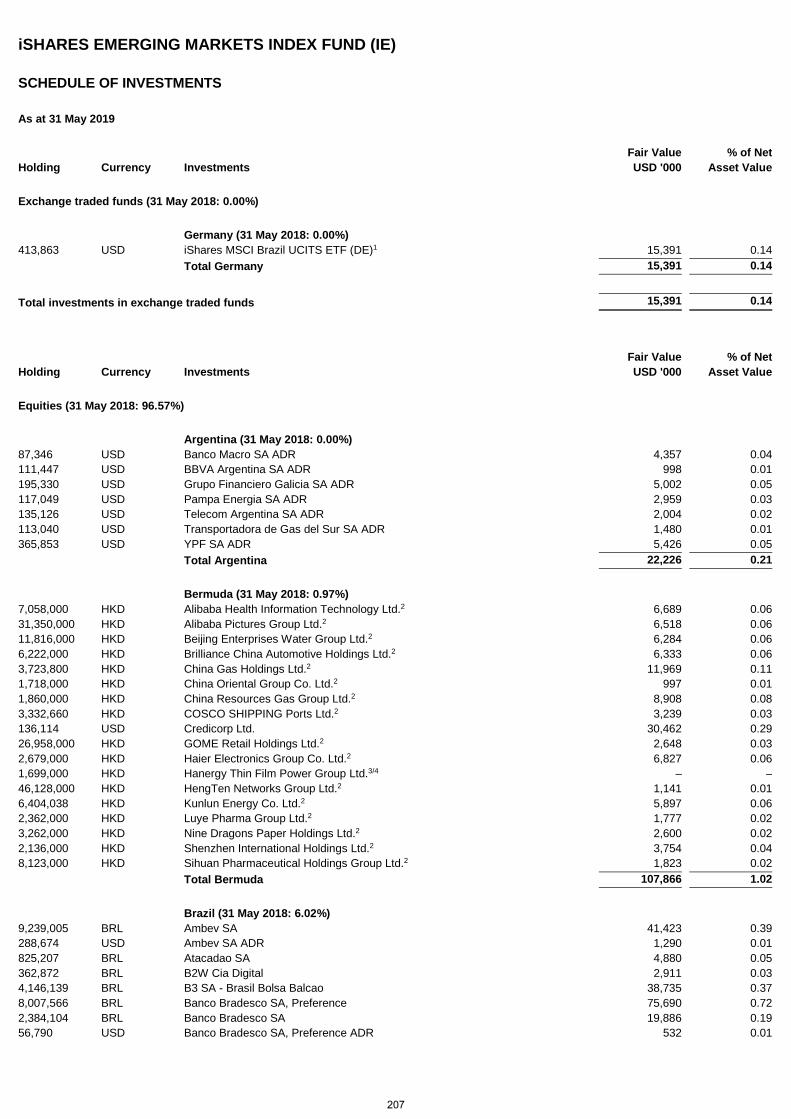
iSHARES EMERGING MARKETS INDEX FUND (IE)
SCHEDULE OF INVESTMENTS
As at 31 May 2019
Holding Currency Investments Fair Value USD '000
% of Net Asset Value
Exchange traded funds (31 May 2018: 0.00%)
Germany (31 May 2018: 0.00%) 413,863 USD iShares MSCI Brazil UCITS ETF (DE)1 15,391 0.14 Total Germany 15,391 0.14
Total investments in exchange traded funds 15,391 0.14
Holding Currency Investments Fair Value USD '000
% of Net Asset Value
Equities (31 May 2018: 96.57%)
Argentina (31 May 2018: 0.00%) 87,346 USD Banco Macro SA ADR 4,357 0.04 111,447 USD BBVA Argentina SA ADR 998 0.01 195,330 USD Grupo Financiero Galicia SA ADR 5,002 0.05 117,049 USD Pampa Energia SA ADR 2,959 0.03 135,126 USD Telecom Argentina SA ADR 2,004 0.02 113,040 USD Transportadora de Gas del Sur SA ADR 1,480 0.01 365,853 USD YPF SA ADR 5,426 0.05 Total Argentina 22,226 0.21
Bermuda (31 May 2018: 0.97%) 7,058,000 HKD Alibaba Health Information Technology Ltd.2 6,689 0.06 31,350,000 HKD Alibaba Pictures Group Ltd.2 6,518 0.06 11,816,000 HKD Beijing Enterprises Water Group Ltd.2 6,284 0.06 6,222,000 HKD Brilliance China Automotive Holdings Ltd.2 6,333 0.06 3,723,800 HKD China Gas Holdings Ltd.2 11,969 0.11 1,718,000 HKD China Oriental Group Co. Ltd.2 997 0.01 1,860,000 HKD China Resources Gas Group Ltd.2 8,908 0.08 3,332,660 HKD COSCO SHIPPING Ports Ltd.2 3,239 0.03 136,114 USD Credicorp Ltd. 30,462 0.29 26,958,000 HKD GOME Retail Holdings Ltd.2 2,648 0.03 2,679,000 HKD Haier Electronics Group Co. Ltd.2 6,827 0.06 1,699,000 HKD Hanergy Thin Film Power Group Ltd.3/4 – – 46,128,000 HKD HengTen Networks Group Ltd.2 1,141 0.01 6,404,038 HKD Kunlun Energy Co. Ltd.2 5,897 0.06 2,362,000 HKD Luye Pharma Group Ltd.2 1,777 0.02 3,262,000 HKD Nine Dragons Paper Holdings Ltd.2 2,600 0.02 2,136,000 HKD Shenzhen International Holdings Ltd.2 3,754 0.04 8,123,000 HKD Sihuan Pharmaceutical Holdings Group Ltd.2 1,823 0.02 Total Bermuda 107,866 1.02
Brazil (31 May 2018: 6.02%) 9,239,005 BRL Ambev SA 41,423 0.39 288,674 USD Ambev SA ADR 1,290 0.01 825,207 BRL Atacadao SA 4,880 0.05 362,872 BRL B2W Cia Digital 2,911 0.03 4,146,139 BRL B3 SA - Brasil Bolsa Balcao 38,735 0.37 8,007,566 BRL Banco Bradesco SA, Preference 75,690 0.72 2,384,104 BRL Banco Bradesco SA 19,886 0.19 56,790 USD Banco Bradesco SA, Preference ADR 532 0.01
207
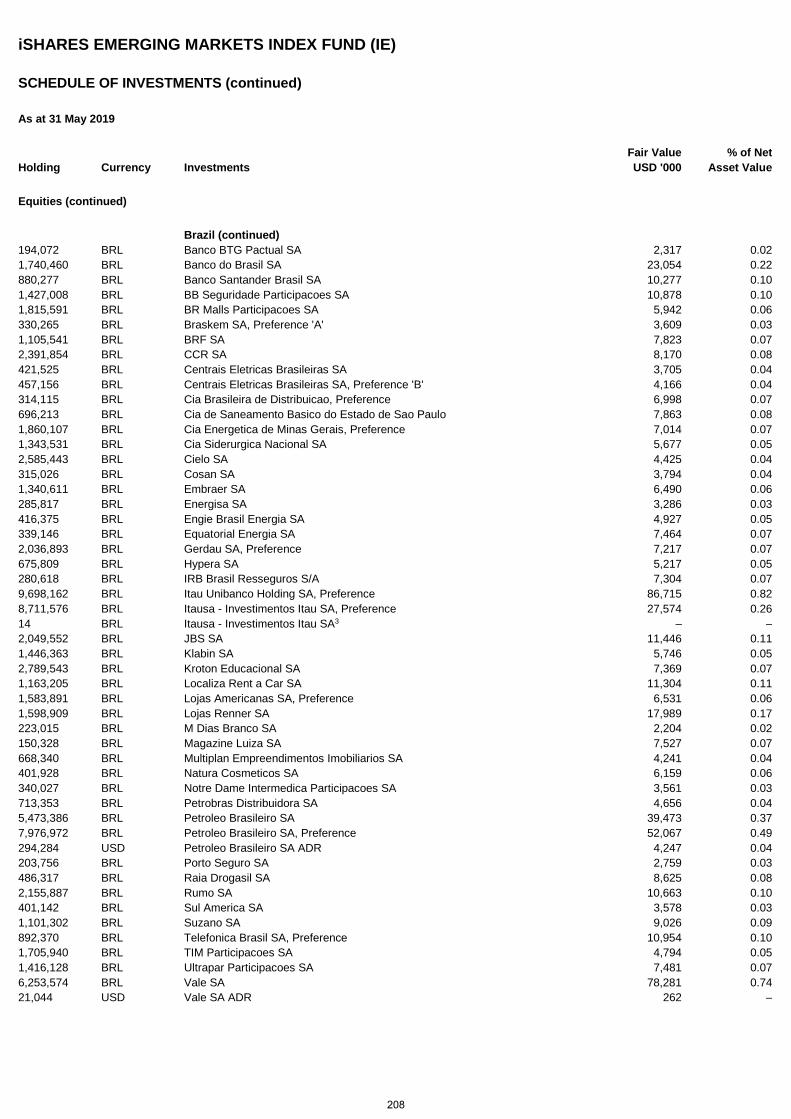
iSHARES EMERGING MARKETS INDEX FUND (IE)
SCHEDULE OF INVESTMENTS (continued)
As at 31 May 2019
Holding Currency Investments Fair Value USD '000
% of Net Asset Value
Equities (continued)
Brazil (continued) 194,072 BRL Banco BTG Pactual SA 2,317 0.02 1,740,460 BRL Banco do Brasil SA 23,054 0.22 880,277 BRL Banco Santander Brasil SA 10,277 0.10 1,427,008 BRL BB Seguridade Participacoes SA 10,878 0.10 1,815,591 BRL BR Malls Participacoes SA 5,942 0.06 330,265 BRL Braskem SA, Preference 'A' 3,609 0.03 1,105,541 BRL BRF SA 7,823 0.07 2,391,854 BRL CCR SA 8,170 0.08 421,525 BRL Centrais Eletricas Brasileiras SA 3,705 0.04 457,156 BRL Centrais Eletricas Brasileiras SA, Preference 'B' 4,166 0.04 314,115 BRL Cia Brasileira de Distribuicao, Preference 6,998 0.07 696,213 BRL Cia de Saneamento Basico do Estado de Sao Paulo 7,863 0.08 1,860,107 BRL Cia Energetica de Minas Gerais, Preference 7,014 0.07 1,343,531 BRL Cia Siderurgica Nacional SA 5,677 0.05 2,585,443 BRL Cielo SA 4,425 0.04 315,026 BRL Cosan SA 3,794 0.04 1,340,611 BRL Embraer SA 6,490 0.06 285,817 BRL Energisa SA 3,286 0.03 416,375 BRL Engie Brasil Energia SA 4,927 0.05 339,146 BRL Equatorial Energia SA 7,464 0.07 2,036,893 BRL Gerdau SA, Preference 7,217 0.07 675,809 BRL Hypera SA 5,217 0.05 280,618 BRL IRB Brasil Resseguros S/A 7,304 0.07 9,698,162 BRL Itau Unibanco Holding SA, Preference 86,715 0.82 8,711,576 BRL Itausa - Investimentos Itau SA, Preference 27,574 0.26 14 BRL Itausa - Investimentos Itau SA3 – – 2,049,552 BRL JBS SA 11,446 0.11 1,446,363 BRL Klabin SA 5,746 0.05 2,789,543 BRL Kroton Educacional SA 7,369 0.07 1,163,205 BRL Localiza Rent a Car SA 11,304 0.11 1,583,891 BRL Lojas Americanas SA, Preference 6,531 0.06 1,598,909 BRL Lojas Renner SA 17,989 0.17 223,015 BRL M Dias Branco SA 2,204 0.02 150,328 BRL Magazine Luiza SA 7,527 0.07 668,340 BRL Multiplan Empreendimentos Imobiliarios SA 4,241 0.04 401,928 BRL Natura Cosmeticos SA 6,159 0.06 340,027 BRL Notre Dame Intermedica Participacoes SA 3,561 0.03 713,353 BRL Petrobras Distribuidora SA 4,656 0.04 5,473,386 BRL Petroleo Brasileiro SA 39,473 0.37 7,976,972 BRL Petroleo Brasileiro SA, Preference 52,067 0.49 294,284 USD Petroleo Brasileiro SA ADR 4,247 0.04 203,756 BRL Porto Seguro SA 2,759 0.03 486,317 BRL Raia Drogasil SA 8,625 0.08 2,155,887 BRL Rumo SA 10,663 0.10 401,142 BRL Sul America SA 3,578 0.03 1,101,302 BRL Suzano SA 9,026 0.09 892,370 BRL Telefonica Brasil SA, Preference 10,954 0.10 1,705,940 BRL TIM Participacoes SA 4,794 0.05 1,416,128 BRL Ultrapar Participacoes SA 7,481 0.07 6,253,574 BRL Vale SA 78,281 0.74 21,044 USD Vale SA ADR 262 –
208
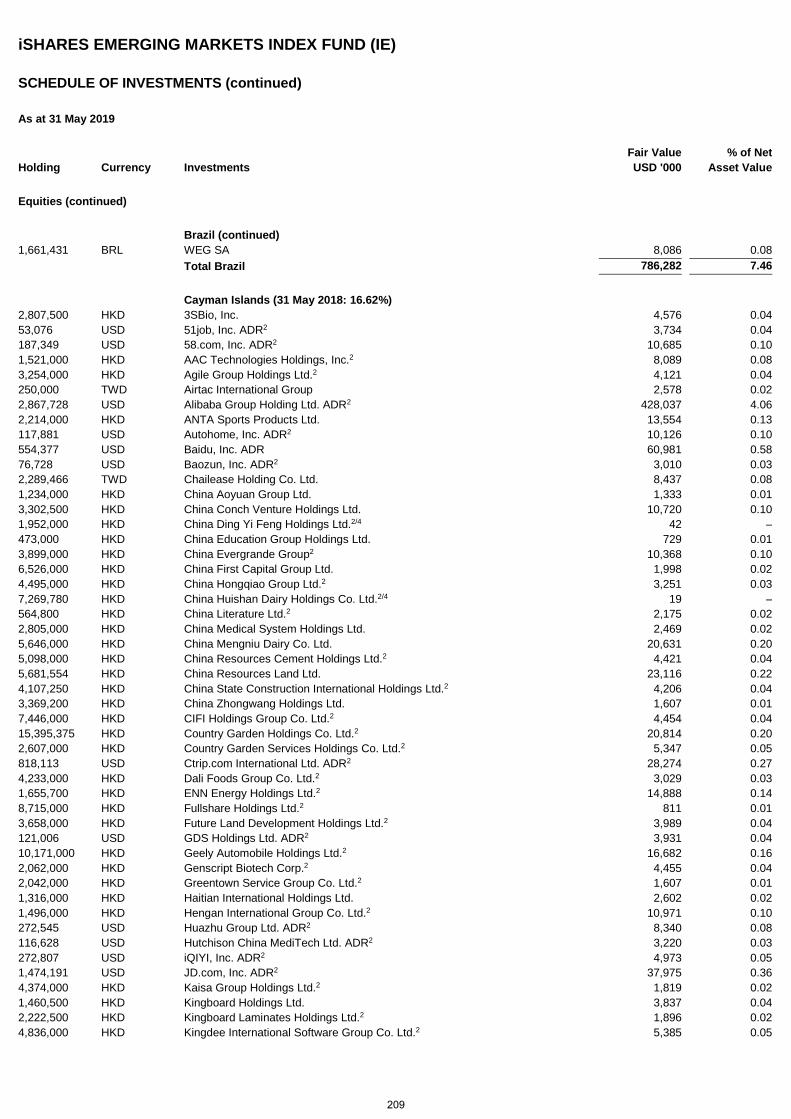
iSHARES EMERGING MARKETS INDEX FUND (IE)
SCHEDULE OF INVESTMENTS (continued)
As at 31 May 2019
Holding Currency Investments Fair Value USD '000
% of Net Asset Value
Equities (continued)
Brazil (continued) 1,661,431 BRL WEG SA 8,086 0.08 Total Brazil 786,282 7.46
Cayman Islands (31 May 2018: 16.62%) 2,807,500 HKD 3SBio, Inc. 4,576 0.04 53,076 USD 51job, Inc. ADR2 3,734 0.04 187,349 USD 58.com, Inc. ADR2 10,685 0.10 1,521,000 HKD AAC Technologies Holdings, Inc.2 8,089 0.08 3,254,000 HKD Agile Group Holdings Ltd.2 4,121 0.04 250,000 TWD Airtac International Group 2,578 0.02 2,867,728 USD Alibaba Group Holding Ltd. ADR2 428,037 4.06 2,214,000 HKD ANTA Sports Products Ltd. 13,554 0.13 117,881 USD Autohome, Inc. ADR2 10,126 0.10 554,377 USD Baidu, Inc. ADR 60,981 0.58 76,728 USD Baozun, Inc. ADR2 3,010 0.03 2,289,466 TWD Chailease Holding Co. Ltd. 8,437 0.08 1,234,000 HKD China Aoyuan Group Ltd. 1,333 0.01 3,302,500 HKD China Conch Venture Holdings Ltd. 10,720 0.10 1,952,000 HKD China Ding Yi Feng Holdings Ltd.2/4 42 – 473,000 HKD China Education Group Holdings Ltd. 729 0.01 3,899,000 HKD China Evergrande Group2 10,368 0.10 6,526,000 HKD China First Capital Group Ltd. 1,998 0.02 4,495,000 HKD China Hongqiao Group Ltd.2 3,251 0.03 7,269,780 HKD China Huishan Dairy Holdings Co. Ltd.2/4 19 – 564,800 HKD China Literature Ltd.2 2,175 0.02 2,805,000 HKD China Medical System Holdings Ltd. 2,469 0.02 5,646,000 HKD China Mengniu Dairy Co. Ltd. 20,631 0.20 5,098,000 HKD China Resources Cement Holdings Ltd.2 4,421 0.04 5,681,554 HKD China Resources Land Ltd. 23,116 0.22 4,107,250 HKD China State Construction International Holdings Ltd.2 4,206 0.04 3,369,200 HKD China Zhongwang Holdings Ltd. 1,607 0.01 7,446,000 HKD CIFI Holdings Group Co. Ltd.2 4,454 0.04 15,395,375 HKD Country Garden Holdings Co. Ltd.2 20,814 0.20 2,607,000 HKD Country Garden Services Holdings Co. Ltd.2 5,347 0.05 818,113 USD Ctrip.com International Ltd. ADR2 28,274 0.27 4,233,000 HKD Dali Foods Group Co. Ltd.2 3,029 0.03 1,655,700 HKD ENN Energy Holdings Ltd.2 14,888 0.14 8,715,000 HKD Fullshare Holdings Ltd.2 811 0.01 3,658,000 HKD Future Land Development Holdings Ltd.2 3,989 0.04 121,006 USD GDS Holdings Ltd. ADR2 3,931 0.04 10,171,000 HKD Geely Automobile Holdings Ltd.2 16,682 0.16 2,062,000 HKD Genscript Biotech Corp.2 4,455 0.04 2,042,000 HKD Greentown Service Group Co. Ltd.2 1,607 0.01 1,316,000 HKD Haitian International Holdings Ltd. 2,602 0.02 1,496,000 HKD Hengan International Group Co. Ltd.2 10,971 0.10 272,545 USD Huazhu Group Ltd. ADR2 8,340 0.08 116,628 USD Hutchison China MediTech Ltd. ADR2 3,220 0.03 272,807 USD iQIYI, Inc. ADR2 4,973 0.05 1,474,191 USD JD.com, Inc. ADR2 37,975 0.36 4,374,000 HKD Kaisa Group Holdings Ltd.2 1,819 0.02 1,460,500 HKD Kingboard Holdings Ltd. 3,837 0.04 2,222,500 HKD Kingboard Laminates Holdings Ltd.2 1,896 0.02 4,836,000 HKD Kingdee International Software Group Co. Ltd.2 5,385 0.05
209
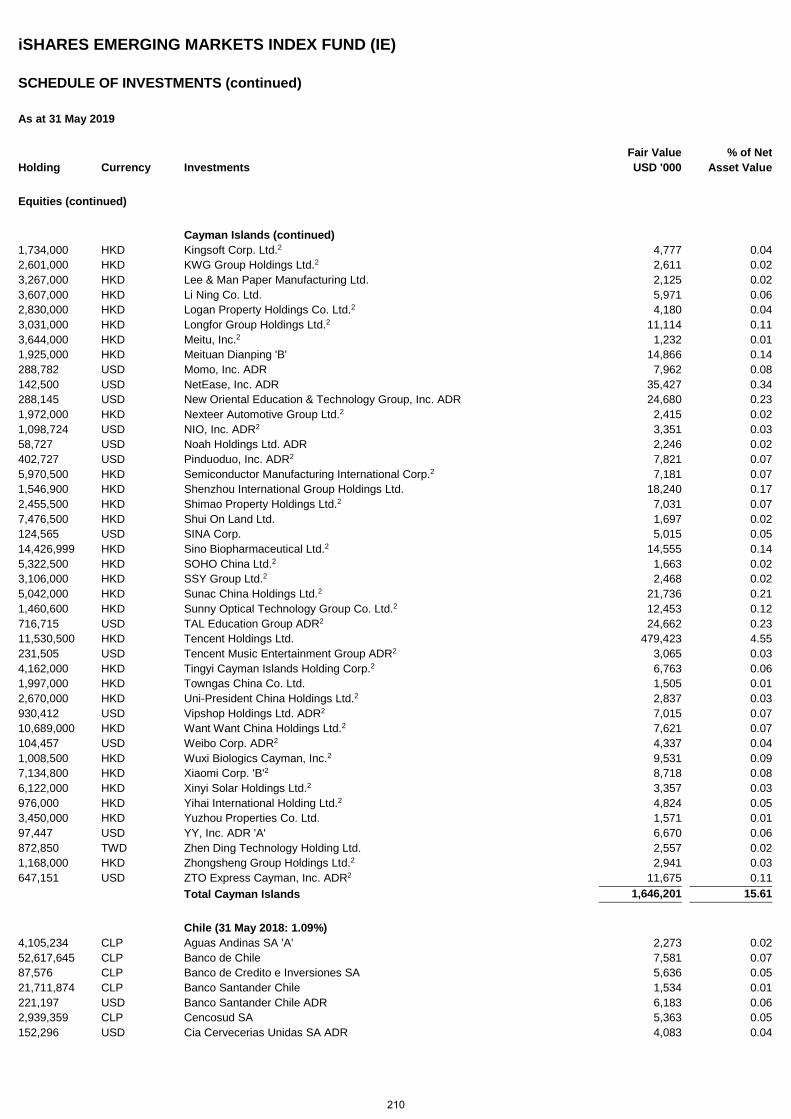
iSHARES EMERGING MARKETS INDEX FUND (IE)
SCHEDULE OF INVESTMENTS (continued)
As at 31 May 2019
Holding Currency Investments Fair Value USD '000
% of Net Asset Value
Equities (continued)
Cayman Islands (continued) 1,734,000 HKD Kingsoft Corp. Ltd.2 4,777 0.04 2,601,000 HKD KWG Group Holdings Ltd.2 2,611 0.02 3,267,000 HKD Lee & Man Paper Manufacturing Ltd. 2,125 0.02 3,607,000 HKD Li Ning Co. Ltd. 5,971 0.06 2,830,000 HKD Logan Property Holdings Co. Ltd.2 4,180 0.04 3,031,000 HKD Longfor Group Holdings Ltd.2 11,114 0.11 3,644,000 HKD Meitu, Inc.2 1,232 0.01 1,925,000 HKD Meituan Dianping 'B' 14,866 0.14 288,782 USD Momo, Inc. ADR 7,962 0.08 142,500 USD NetEase, Inc. ADR 35,427 0.34 288,145 USD New Oriental Education & Technology Group, Inc. ADR 24,680 0.23 1,972,000 HKD Nexteer Automotive Group Ltd.2 2,415 0.02 1,098,724 USD NIO, Inc. ADR2 3,351 0.03 58,727 USD Noah Holdings Ltd. ADR 2,246 0.02 402,727 USD Pinduoduo, Inc. ADR2 7,821 0.07 5,970,500 HKD Semiconductor Manufacturing International Corp.2 7,181 0.07 1,546,900 HKD Shenzhou International Group Holdings Ltd. 18,240 0.17 2,455,500 HKD Shimao Property Holdings Ltd.2 7,031 0.07 7,476,500 HKD Shui On Land Ltd. 1,697 0.02 124,565 USD SINA Corp. 5,015 0.05 14,426,999 HKD Sino Biopharmaceutical Ltd.2 14,555 0.14 5,322,500 HKD SOHO China Ltd.2 1,663 0.02 3,106,000 HKD SSY Group Ltd.2 2,468 0.02 5,042,000 HKD Sunac China Holdings Ltd.2 21,736 0.21 1,460,600 HKD Sunny Optical Technology Group Co. Ltd.2 12,453 0.12 716,715 USD TAL Education Group ADR2 24,662 0.23 11,530,500 HKD Tencent Holdings Ltd. 479,423 4.55 231,505 USD Tencent Music Entertainment Group ADR2 3,065 0.03 4,162,000 HKD Tingyi Cayman Islands Holding Corp.2 6,763 0.06 1,997,000 HKD Towngas China Co. Ltd. 1,505 0.01 2,670,000 HKD Uni-President China Holdings Ltd.2 2,837 0.03 930,412 USD Vipshop Holdings Ltd. ADR2 7,015 0.07 10,689,000 HKD Want Want China Holdings Ltd.2 7,621 0.07 104,457 USD Weibo Corp. ADR2 4,337 0.04 1,008,500 HKD Wuxi Biologics Cayman, Inc.2 9,531 0.09 7,134,800 HKD Xiaomi Corp. 'B'2 8,718 0.08 6,122,000 HKD Xinyi Solar Holdings Ltd.2 3,357 0.03 976,000 HKD Yihai International Holding Ltd.2 4,824 0.05 3,450,000 HKD Yuzhou Properties Co. Ltd. 1,571 0.01 97,447 USD YY, Inc. ADR 'A' 6,670 0.06 872,850 TWD Zhen Ding Technology Holding Ltd. 2,557 0.02 1,168,000 HKD Zhongsheng Group Holdings Ltd.2 2,941 0.03 647,151 USD ZTO Express Cayman, Inc. ADR2 11,675 0.11 Total Cayman Islands 1,646,201 15.61
Chile (31 May 2018: 1.09%) 4,105,234 CLP Aguas Andinas SA 'A' 2,273 0.02 52,617,645 CLP Banco de Chile 7,581 0.07 87,576 CLP Banco de Credito e Inversiones SA 5,636 0.05 21,711,874 CLP Banco Santander Chile 1,534 0.01 221,197 USD Banco Santander Chile ADR 6,183 0.06 2,939,359 CLP Cencosud SA 5,363 0.05 152,296 USD Cia Cervecerias Unidas SA ADR 4,083 0.04
210
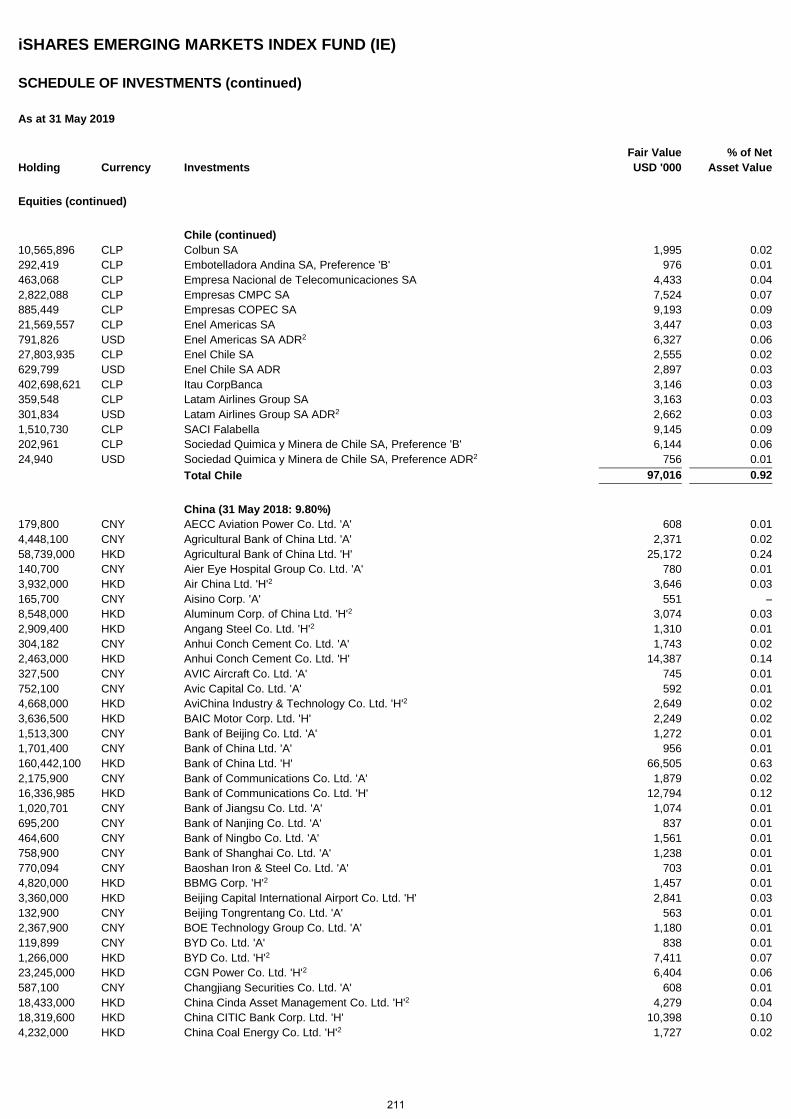
iSHARES EMERGING MARKETS INDEX FUND (IE)
SCHEDULE OF INVESTMENTS (continued)
As at 31 May 2019
Holding Currency Investments Fair Value USD '000
% of Net Asset Value
Equities (continued)
Chile (continued) 10,565,896 CLP Colbun SA 1,995 0.02 292,419 CLP Embotelladora Andina SA, Preference 'B' 976 0.01 463,068 CLP Empresa Nacional de Telecomunicaciones SA 4,433 0.04 2,822,088 CLP Empresas CMPC SA 7,524 0.07 885,449 CLP Empresas COPEC SA 9,193 0.09 21,569,557 CLP Enel Americas SA 3,447 0.03 791,826 USD Enel Americas SA ADR2 6,327 0.06 27,803,935 CLP Enel Chile SA 2,555 0.02 629,799 USD Enel Chile SA ADR 2,897 0.03 402,698,621 CLP Itau CorpBanca 3,146 0.03 359,548 CLP Latam Airlines Group SA 3,163 0.03 301,834 USD Latam Airlines Group SA ADR2 2,662 0.03 1,510,730 CLP SACI Falabella 9,145 0.09 202,961 CLP Sociedad Quimica y Minera de Chile SA, Preference 'B' 6,144 0.06 24,940 USD Sociedad Quimica y Minera de Chile SA, Preference ADR2 756 0.01 Total Chile 97,016 0.92
China (31 May 2018: 9.80%) 179,800 CNY AECC Aviation Power Co. Ltd. 'A' 608 0.01 4,448,100 CNY Agricultural Bank of China Ltd. 'A' 2,371 0.02 58,739,000 HKD Agricultural Bank of China Ltd. 'H' 25,172 0.24 140,700 CNY Aier Eye Hospital Group Co. Ltd. 'A' 780 0.01 3,932,000 HKD Air China Ltd. 'H'2 3,646 0.03 165,700 CNY Aisino Corp. 'A' 551 – 8,548,000 HKD Aluminum Corp. of China Ltd. 'H'2 3,074 0.03 2,909,400 HKD Angang Steel Co. Ltd. 'H'2 1,310 0.01 304,182 CNY Anhui Conch Cement Co. Ltd. 'A' 1,743 0.02 2,463,000 HKD Anhui Conch Cement Co. Ltd. 'H' 14,387 0.14 327,500 CNY AVIC Aircraft Co. Ltd. 'A' 745 0.01 752,100 CNY Avic Capital Co. Ltd. 'A' 592 0.01 4,668,000 HKD AviChina Industry & Technology Co. Ltd. 'H'2 2,649 0.02 3,636,500 HKD BAIC Motor Corp. Ltd. 'H' 2,249 0.02 1,513,300 CNY Bank of Beijing Co. Ltd. 'A' 1,272 0.01 1,701,400 CNY Bank of China Ltd. 'A' 956 0.01 160,442,100 HKD Bank of China Ltd. 'H' 66,505 0.63 2,175,900 CNY Bank of Communications Co. Ltd. 'A' 1,879 0.02 16,336,985 HKD Bank of Communications Co. Ltd. 'H' 12,794 0.12 1,020,701 CNY Bank of Jiangsu Co. Ltd. 'A' 1,074 0.01 695,200 CNY Bank of Nanjing Co. Ltd. 'A' 837 0.01 464,600 CNY Bank of Ningbo Co. Ltd. 'A' 1,561 0.01 758,900 CNY Bank of Shanghai Co. Ltd. 'A' 1,238 0.01 770,094 CNY Baoshan Iron & Steel Co. Ltd. 'A' 703 0.01 4,820,000 HKD BBMG Corp. 'H'2 1,457 0.01 3,360,000 HKD Beijing Capital International Airport Co. Ltd. 'H' 2,841 0.03 132,900 CNY Beijing Tongrentang Co. Ltd. 'A' 563 0.01 2,367,900 CNY BOE Technology Group Co. Ltd. 'A' 1,180 0.01 119,899 CNY BYD Co. Ltd. 'A' 838 0.01 1,266,000 HKD BYD Co. Ltd. 'H'2 7,411 0.07 23,245,000 HKD CGN Power Co. Ltd. 'H'2 6,404 0.06 587,100 CNY Changjiang Securities Co. Ltd. 'A' 608 0.01 18,433,000 HKD China Cinda Asset Management Co. Ltd. 'H'2 4,279 0.04 18,319,600 HKD China CITIC Bank Corp. Ltd. 'H' 10,398 0.10 4,232,000 HKD China Coal Energy Co. Ltd. 'H'2 1,727 0.02
211
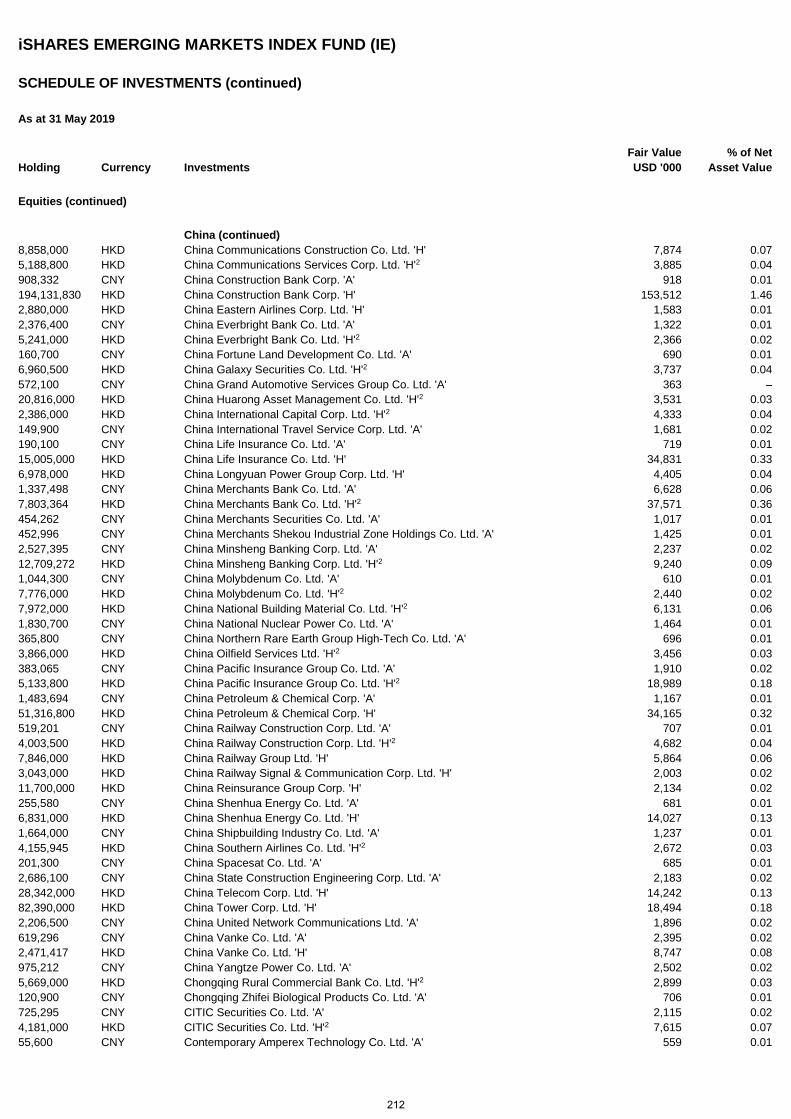
iSHARES EMERGING MARKETS INDEX FUND (IE)
SCHEDULE OF INVESTMENTS (continued)
As at 31 May 2019
Holding Currency Investments Fair Value USD '000
% of Net Asset Value
Equities (continued)
China (continued) 8,858,000 HKD China Communications Construction Co. Ltd. 'H' 7,874 0.07 5,188,800 HKD China Communications Services Corp. Ltd. 'H'2 3,885 0.04 908,332 CNY China Construction Bank Corp. 'A' 918 0.01 194,131,830 HKD China Construction Bank Corp. 'H' 153,512 1.46 2,880,000 HKD China Eastern Airlines Corp. Ltd. 'H' 1,583 0.01 2,376,400 CNY China Everbright Bank Co. Ltd. 'A' 1,322 0.01 5,241,000 HKD China Everbright Bank Co. Ltd. 'H'2 2,366 0.02 160,700 CNY China Fortune Land Development Co. Ltd. 'A' 690 0.01 6,960,500 HKD China Galaxy Securities Co. Ltd. 'H'2 3,737 0.04 572,100 CNY China Grand Automotive Services Group Co. Ltd. 'A' 363 – 20,816,000 HKD China Huarong Asset Management Co. Ltd. 'H'2 3,531 0.03 2,386,000 HKD China International Capital Corp. Ltd. 'H'2 4,333 0.04 149,900 CNY China International Travel Service Corp. Ltd. 'A' 1,681 0.02 190,100 CNY China Life Insurance Co. Ltd. 'A' 719 0.01 15,005,000 HKD China Life Insurance Co. Ltd. 'H' 34,831 0.33 6,978,000 HKD China Longyuan Power Group Corp. Ltd. 'H' 4,405 0.04 1,337,498 CNY China Merchants Bank Co. Ltd. 'A' 6,628 0.06 7,803,364 HKD China Merchants Bank Co. Ltd. 'H'2 37,571 0.36 454,262 CNY China Merchants Securities Co. Ltd. 'A' 1,017 0.01 452,996 CNY China Merchants Shekou Industrial Zone Holdings Co. Ltd. 'A' 1,425 0.01 2,527,395 CNY China Minsheng Banking Corp. Ltd. 'A' 2,237 0.02 12,709,272 HKD China Minsheng Banking Corp. Ltd. 'H'2 9,240 0.09 1,044,300 CNY China Molybdenum Co. Ltd. 'A' 610 0.01 7,776,000 HKD China Molybdenum Co. Ltd. 'H'2 2,440 0.02 7,972,000 HKD China National Building Material Co. Ltd. 'H'2 6,131 0.06 1,830,700 CNY China National Nuclear Power Co. Ltd. 'A' 1,464 0.01 365,800 CNY China Northern Rare Earth Group High-Tech Co. Ltd. 'A' 696 0.01 3,866,000 HKD China Oilfield Services Ltd. 'H'2 3,456 0.03 383,065 CNY China Pacific Insurance Group Co. Ltd. 'A' 1,910 0.02 5,133,800 HKD China Pacific Insurance Group Co. Ltd. 'H'2 18,989 0.18 1,483,694 CNY China Petroleum & Chemical Corp. 'A' 1,167 0.01 51,316,800 HKD China Petroleum & Chemical Corp. 'H' 34,165 0.32 519,201 CNY China Railway Construction Corp. Ltd. 'A' 707 0.01 4,003,500 HKD China Railway Construction Corp. Ltd. 'H'2 4,682 0.04 7,846,000 HKD China Railway Group Ltd. 'H' 5,864 0.06 3,043,000 HKD China Railway Signal & Communication Corp. Ltd. 'H' 2,003 0.02 11,700,000 HKD China Reinsurance Group Corp. 'H' 2,134 0.02 255,580 CNY China Shenhua Energy Co. Ltd. 'A' 681 0.01 6,831,000 HKD China Shenhua Energy Co. Ltd. 'H' 14,027 0.13 1,664,000 CNY China Shipbuilding Industry Co. Ltd. 'A' 1,237 0.01 4,155,945 HKD China Southern Airlines Co. Ltd. 'H'2 2,672 0.03 201,300 CNY China Spacesat Co. Ltd. 'A' 685 0.01 2,686,100 CNY China State Construction Engineering Corp. Ltd. 'A' 2,183 0.02 28,342,000 HKD China Telecom Corp. Ltd. 'H' 14,242 0.13 82,390,000 HKD China Tower Corp. Ltd. 'H' 18,494 0.18 2,206,500 CNY China United Network Communications Ltd. 'A' 1,896 0.02 619,296 CNY China Vanke Co. Ltd. 'A' 2,395 0.02 2,471,417 HKD China Vanke Co. Ltd. 'H' 8,747 0.08 975,212 CNY China Yangtze Power Co. Ltd. 'A' 2,502 0.02 5,669,000 HKD Chongqing Rural Commercial Bank Co. Ltd. 'H'2 2,899 0.03 120,900 CNY Chongqing Zhifei Biological Products Co. Ltd. 'A' 706 0.01 725,295 CNY CITIC Securities Co. Ltd. 'A' 2,115 0.02 4,181,000 HKD CITIC Securities Co. Ltd. 'H'2 7,615 0.07 55,600 CNY Contemporary Amperex Technology Co. Ltd. 'A' 559 0.01
212
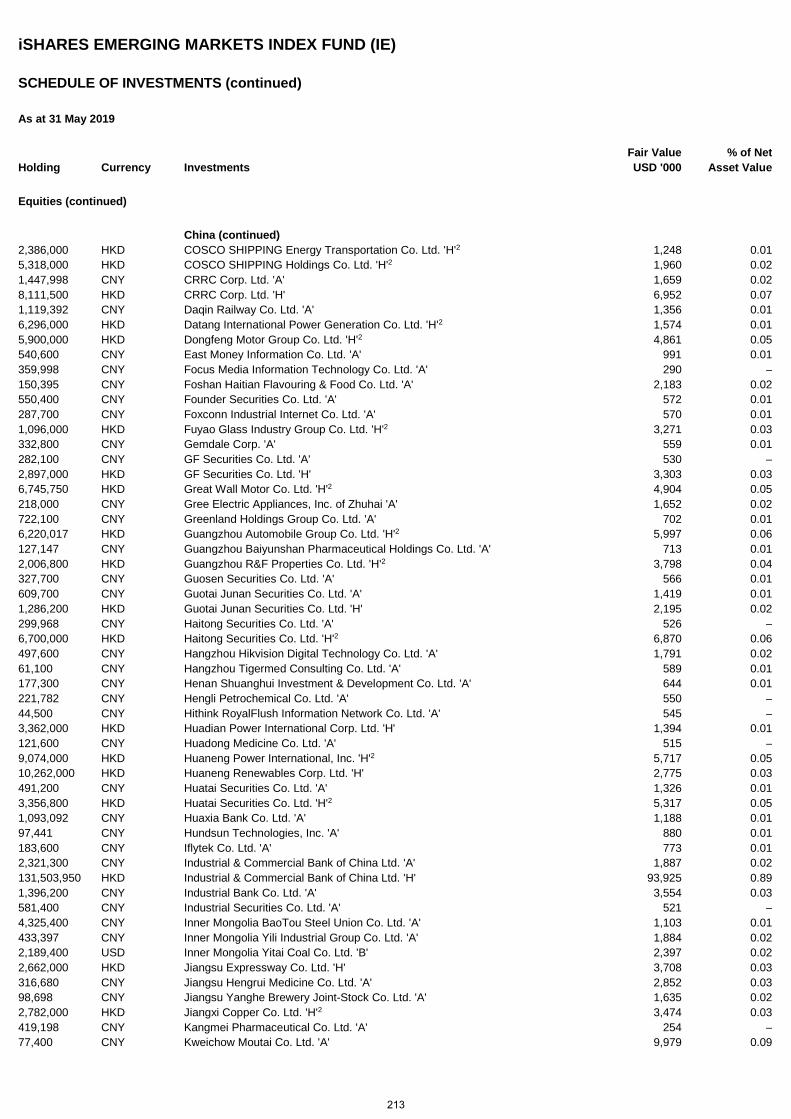
iSHARES EMERGING MARKETS INDEX FUND (IE)
SCHEDULE OF INVESTMENTS (continued)
As at 31 May 2019
Holding Currency Investments Fair Value USD '000
% of Net Asset Value
Equities (continued)
China (continued) 2,386,000 HKD COSCO SHIPPING Energy Transportation Co. Ltd. 'H'2 1,248 0.01 5,318,000 HKD COSCO SHIPPING Holdings Co. Ltd. 'H'2 1,960 0.02 1,447,998 CNY CRRC Corp. Ltd. 'A' 1,659 0.02 8,111,500 HKD CRRC Corp. Ltd. 'H' 6,952 0.07 1,119,392 CNY Daqin Railway Co. Ltd. 'A' 1,356 0.01 6,296,000 HKD Datang International Power Generation Co. Ltd. 'H'2 1,574 0.01 5,900,000 HKD Dongfeng Motor Group Co. Ltd. 'H'2 4,861 0.05 540,600 CNY East Money Information Co. Ltd. 'A' 991 0.01 359,998 CNY Focus Media Information Technology Co. Ltd. 'A' 290 – 150,395 CNY Foshan Haitian Flavouring & Food Co. Ltd. 'A' 2,183 0.02 550,400 CNY Founder Securities Co. Ltd. 'A' 572 0.01 287,700 CNY Foxconn Industrial Internet Co. Ltd. 'A' 570 0.01 1,096,000 HKD Fuyao Glass Industry Group Co. Ltd. 'H'2 3,271 0.03 332,800 CNY Gemdale Corp. 'A' 559 0.01 282,100 CNY GF Securities Co. Ltd. 'A' 530 – 2,897,000 HKD GF Securities Co. Ltd. 'H' 3,303 0.03 6,745,750 HKD Great Wall Motor Co. Ltd. 'H'2 4,904 0.05 218,000 CNY Gree Electric Appliances, Inc. of Zhuhai 'A' 1,652 0.02 722,100 CNY Greenland Holdings Group Co. Ltd. 'A' 702 0.01 6,220,017 HKD Guangzhou Automobile Group Co. Ltd. 'H'2 5,997 0.06 127,147 CNY Guangzhou Baiyunshan Pharmaceutical Holdings Co. Ltd. 'A' 713 0.01 2,006,800 HKD Guangzhou R&F Properties Co. Ltd. 'H'2 3,798 0.04 327,700 CNY Guosen Securities Co. Ltd. 'A' 566 0.01 609,700 CNY Guotai Junan Securities Co. Ltd. 'A' 1,419 0.01 1,286,200 HKD Guotai Junan Securities Co. Ltd. 'H' 2,195 0.02 299,968 CNY Haitong Securities Co. Ltd. 'A' 526 – 6,700,000 HKD Haitong Securities Co. Ltd. 'H'2 6,870 0.06 497,600 CNY Hangzhou Hikvision Digital Technology Co. Ltd. 'A' 1,791 0.02 61,100 CNY Hangzhou Tigermed Consulting Co. Ltd. 'A' 589 0.01 177,300 CNY Henan Shuanghui Investment & Development Co. Ltd. 'A' 644 0.01 221,782 CNY Hengli Petrochemical Co. Ltd. 'A' 550 – 44,500 CNY Hithink RoyalFlush Information Network Co. Ltd. 'A' 545 – 3,362,000 HKD Huadian Power International Corp. Ltd. 'H' 1,394 0.01 121,600 CNY Huadong Medicine Co. Ltd. 'A' 515 – 9,074,000 HKD Huaneng Power International, Inc. 'H'2 5,717 0.05 10,262,000 HKD Huaneng Renewables Corp. Ltd. 'H' 2,775 0.03 491,200 CNY Huatai Securities Co. Ltd. 'A' 1,326 0.01 3,356,800 HKD Huatai Securities Co. Ltd. 'H'2 5,317 0.05 1,093,092 CNY Huaxia Bank Co. Ltd. 'A' 1,188 0.01 97,441 CNY Hundsun Technologies, Inc. 'A' 880 0.01 183,600 CNY Iflytek Co. Ltd. 'A' 773 0.01 2,321,300 CNY Industrial & Commercial Bank of China Ltd. 'A' 1,887 0.02 131,503,950 HKD Industrial & Commercial Bank of China Ltd. 'H' 93,925 0.89 1,396,200 CNY Industrial Bank Co. Ltd. 'A' 3,554 0.03 581,400 CNY Industrial Securities Co. Ltd. 'A' 521 – 4,325,400 CNY Inner Mongolia BaoTou Steel Union Co. Ltd. 'A' 1,103 0.01 433,397 CNY Inner Mongolia Yili Industrial Group Co. Ltd. 'A' 1,884 0.02 2,189,400 USD Inner Mongolia Yitai Coal Co. Ltd. 'B' 2,397 0.02 2,662,000 HKD Jiangsu Expressway Co. Ltd. 'H' 3,708 0.03 316,680 CNY Jiangsu Hengrui Medicine Co. Ltd. 'A' 2,852 0.03 98,698 CNY Jiangsu Yanghe Brewery Joint-Stock Co. Ltd. 'A' 1,635 0.02 2,782,000 HKD Jiangxi Copper Co. Ltd. 'H'2 3,474 0.03 419,198 CNY Kangmei Pharmaceutical Co. Ltd. 'A' 254 – 77,400 CNY Kweichow Moutai Co. Ltd. 'A' 9,979 0.09
213
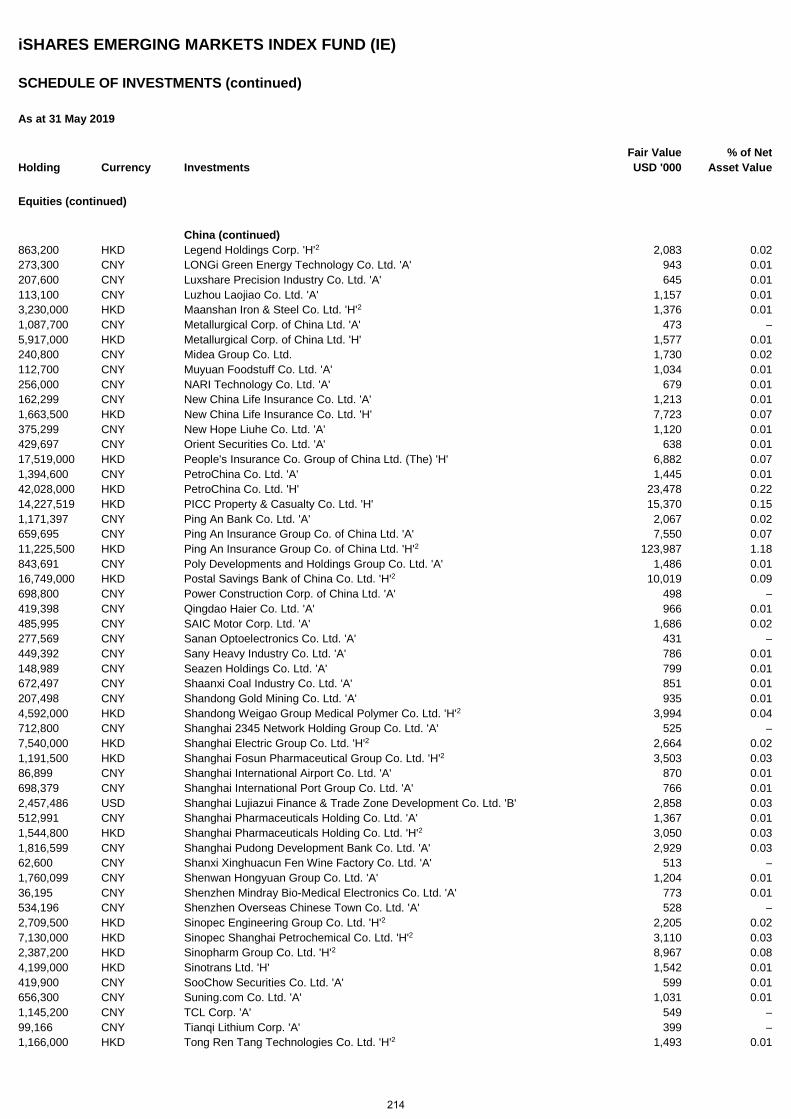
iSHARES EMERGING MARKETS INDEX FUND (IE)
SCHEDULE OF INVESTMENTS (continued)
As at 31 May 2019
Holding Currency Investments Fair Value USD '000
% of Net Asset Value
Equities (continued)
China (continued) 863,200 HKD Legend Holdings Corp. 'H'2 2,083 0.02 273,300 CNY LONGi Green Energy Technology Co. Ltd. 'A' 943 0.01 207,600 CNY Luxshare Precision Industry Co. Ltd. 'A' 645 0.01 113,100 CNY Luzhou Laojiao Co. Ltd. 'A' 1,157 0.01 3,230,000 HKD Maanshan Iron & Steel Co. Ltd. 'H'2 1,376 0.01 1,087,700 CNY Metallurgical Corp. of China Ltd. 'A' 473 – 5,917,000 HKD Metallurgical Corp. of China Ltd. 'H' 1,577 0.01 240,800 CNY Midea Group Co. Ltd. 1,730 0.02 112,700 CNY Muyuan Foodstuff Co. Ltd. 'A' 1,034 0.01 256,000 CNY NARI Technology Co. Ltd. 'A' 679 0.01 162,299 CNY New China Life Insurance Co. Ltd. 'A' 1,213 0.01 1,663,500 HKD New China Life Insurance Co. Ltd. 'H' 7,723 0.07 375,299 CNY New Hope Liuhe Co. Ltd. 'A' 1,120 0.01 429,697 CNY Orient Securities Co. Ltd. 'A' 638 0.01 17,519,000 HKD People's Insurance Co. Group of China Ltd. (The) 'H' 6,882 0.07 1,394,600 CNY PetroChina Co. Ltd. 'A' 1,445 0.01 42,028,000 HKD PetroChina Co. Ltd. 'H' 23,478 0.22 14,227,519 HKD PICC Property & Casualty Co. Ltd. 'H' 15,370 0.15 1,171,397 CNY Ping An Bank Co. Ltd. 'A' 2,067 0.02 659,695 CNY Ping An Insurance Group Co. of China Ltd. 'A' 7,550 0.07 11,225,500 HKD Ping An Insurance Group Co. of China Ltd. 'H'2 123,987 1.18 843,691 CNY Poly Developments and Holdings Group Co. Ltd. 'A' 1,486 0.01 16,749,000 HKD Postal Savings Bank of China Co. Ltd. 'H'2 10,019 0.09 698,800 CNY Power Construction Corp. of China Ltd. 'A' 498 – 419,398 CNY Qingdao Haier Co. Ltd. 'A' 966 0.01 485,995 CNY SAIC Motor Corp. Ltd. 'A' 1,686 0.02 277,569 CNY Sanan Optoelectronics Co. Ltd. 'A' 431 – 449,392 CNY Sany Heavy Industry Co. Ltd. 'A' 786 0.01 148,989 CNY Seazen Holdings Co. Ltd. 'A' 799 0.01 672,497 CNY Shaanxi Coal Industry Co. Ltd. 'A' 851 0.01 207,498 CNY Shandong Gold Mining Co. Ltd. 'A' 935 0.01 4,592,000 HKD Shandong Weigao Group Medical Polymer Co. Ltd. 'H'2 3,994 0.04 712,800 CNY Shanghai 2345 Network Holding Group Co. Ltd. 'A' 525 – 7,540,000 HKD Shanghai Electric Group Co. Ltd. 'H'2 2,664 0.02 1,191,500 HKD Shanghai Fosun Pharmaceutical Group Co. Ltd. 'H'2 3,503 0.03 86,899 CNY Shanghai International Airport Co. Ltd. 'A' 870 0.01 698,379 CNY Shanghai International Port Group Co. Ltd. 'A' 766 0.01 2,457,486 USD Shanghai Lujiazui Finance & Trade Zone Development Co. Ltd. 'B' 2,858 0.03 512,991 CNY Shanghai Pharmaceuticals Holding Co. Ltd. 'A' 1,367 0.01 1,544,800 HKD Shanghai Pharmaceuticals Holding Co. Ltd. 'H'2 3,050 0.03 1,816,599 CNY Shanghai Pudong Development Bank Co. Ltd. 'A' 2,929 0.03 62,600 CNY Shanxi Xinghuacun Fen Wine Factory Co. Ltd. 'A' 513 – 1,760,099 CNY Shenwan Hongyuan Group Co. Ltd. 'A' 1,204 0.01 36,195 CNY Shenzhen Mindray Bio-Medical Electronics Co. Ltd. 'A' 773 0.01 534,196 CNY Shenzhen Overseas Chinese Town Co. Ltd. 'A' 528 – 2,709,500 HKD Sinopec Engineering Group Co. Ltd. 'H'2 2,205 0.02 7,130,000 HKD Sinopec Shanghai Petrochemical Co. Ltd. 'H'2 3,110 0.03 2,387,200 HKD Sinopharm Group Co. Ltd. 'H'2 8,967 0.08 4,199,000 HKD Sinotrans Ltd. 'H' 1,542 0.01 419,900 CNY SooChow Securities Co. Ltd. 'A' 599 0.01 656,300 CNY Suning.com Co. Ltd. 'A' 1,031 0.01 1,145,200 CNY TCL Corp. 'A' 549 – 99,166 CNY Tianqi Lithium Corp. 'A' 399 – 1,166,000 HKD Tong Ren Tang Technologies Co. Ltd. 'H'2 1,493 0.01
214
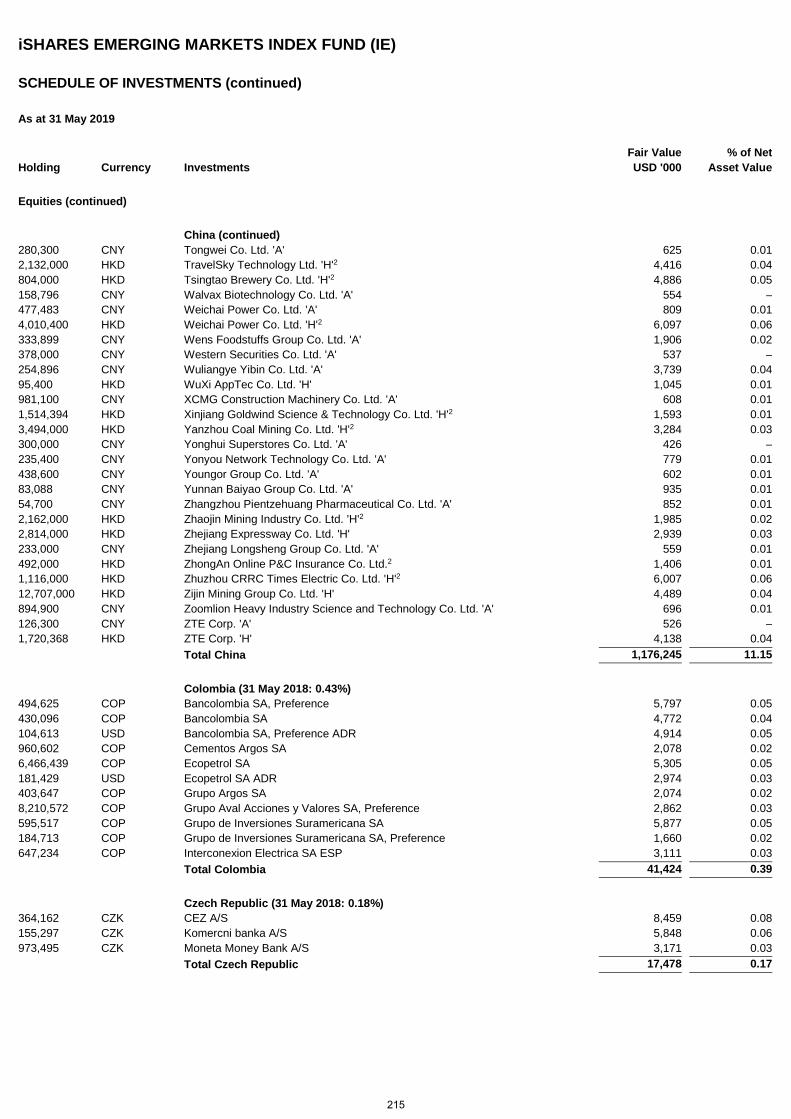
iSHARES EMERGING MARKETS INDEX FUND (IE)
SCHEDULE OF INVESTMENTS (continued)
As at 31 May 2019
Holding Currency Investments Fair Value USD '000
% of Net Asset Value
Equities (continued)
China (continued) 280,300 CNY Tongwei Co. Ltd. 'A' 625 0.01 2,132,000 HKD TravelSky Technology Ltd. 'H'2 4,416 0.04 804,000 HKD Tsingtao Brewery Co. Ltd. 'H'2 4,886 0.05 158,796 CNY Walvax Biotechnology Co. Ltd. 'A' 554 – 477,483 CNY Weichai Power Co. Ltd. 'A' 809 0.01 4,010,400 HKD Weichai Power Co. Ltd. 'H'2 6,097 0.06 333,899 CNY Wens Foodstuffs Group Co. Ltd. 'A' 1,906 0.02 378,000 CNY Western Securities Co. Ltd. 'A' 537 – 254,896 CNY Wuliangye Yibin Co. Ltd. 'A' 3,739 0.04 95,400 HKD WuXi AppTec Co. Ltd. 'H' 1,045 0.01 981,100 CNY XCMG Construction Machinery Co. Ltd. 'A' 608 0.01 1,514,394 HKD Xinjiang Goldwind Science & Technology Co. Ltd. 'H'2 1,593 0.01 3,494,000 HKD Yanzhou Coal Mining Co. Ltd. 'H'2 3,284 0.03 300,000 CNY Yonghui Superstores Co. Ltd. 'A' 426 – 235,400 CNY Yonyou Network Technology Co. Ltd. 'A' 779 0.01 438,600 CNY Youngor Group Co. Ltd. 'A' 602 0.01 83,088 CNY Yunnan Baiyao Group Co. Ltd. 'A' 935 0.01 54,700 CNY Zhangzhou Pientzehuang Pharmaceutical Co. Ltd. 'A' 852 0.01 2,162,000 HKD Zhaojin Mining Industry Co. Ltd. 'H'2 1,985 0.02 2,814,000 HKD Zhejiang Expressway Co. Ltd. 'H' 2,939 0.03 233,000 CNY Zhejiang Longsheng Group Co. Ltd. 'A' 559 0.01 492,000 HKD ZhongAn Online P&C Insurance Co. Ltd.2 1,406 0.01 1,116,000 HKD Zhuzhou CRRC Times Electric Co. Ltd. 'H'2 6,007 0.06 12,707,000 HKD Zijin Mining Group Co. Ltd. 'H' 4,489 0.04 894,900 CNY Zoomlion Heavy Industry Science and Technology Co. Ltd. 'A' 696 0.01 126,300 CNY ZTE Corp. 'A' 526 – 1,720,368 HKD ZTE Corp. 'H' 4,138 0.04 Total China 1,176,245 11.15
Colombia (31 May 2018: 0.43%) 494,625 COP Bancolombia SA, Preference 5,797 0.05 430,096 COP Bancolombia SA 4,772 0.04 104,613 USD Bancolombia SA, Preference ADR 4,914 0.05 960,602 COP Cementos Argos SA 2,078 0.02 6,466,439 COP Ecopetrol SA 5,305 0.05 181,429 USD Ecopetrol SA ADR 2,974 0.03 403,647 COP Grupo Argos SA 2,074 0.02 8,210,572 COP Grupo Aval Acciones y Valores SA, Preference 2,862 0.03 595,517 COP Grupo de Inversiones Suramericana SA 5,877 0.05 184,713 COP Grupo de Inversiones Suramericana SA, Preference 1,660 0.02 647,234 COP Interconexion Electrica SA ESP 3,111 0.03 Total Colombia 41,424 0.39
Czech Republic (31 May 2018: 0.18%) 364,162 CZK CEZ A/S 8,459 0.08 155,297 CZK Komercni banka A/S 5,848 0.06 973,495 CZK Moneta Money Bank A/S 3,171 0.03 Total Czech Republic 17,478 0.17
215
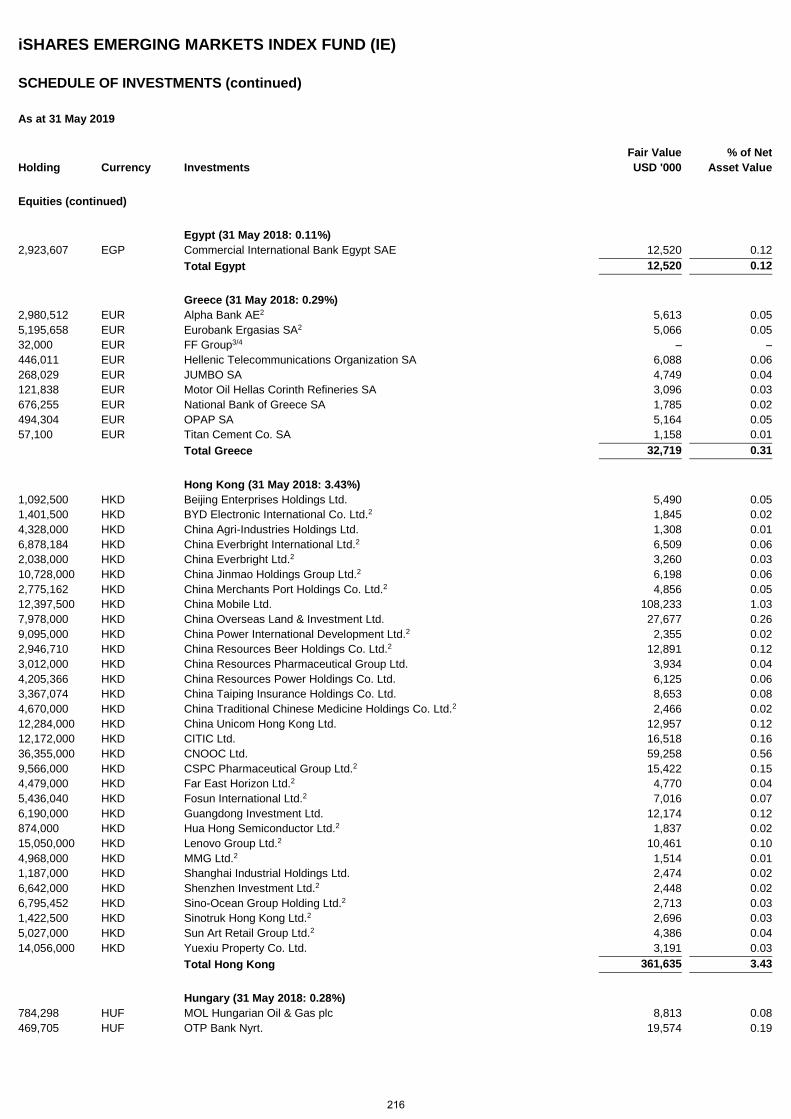
iSHARES EMERGING MARKETS INDEX FUND (IE)
SCHEDULE OF INVESTMENTS (continued)
As at 31 May 2019
Holding Currency Investments Fair Value USD '000
% of Net Asset Value
Equities (continued)
Egypt (31 May 2018: 0.11%) 2,923,607 EGP Commercial International Bank Egypt SAE 12,520 0.12 Total Egypt 12,520 0.12
Greece (31 May 2018: 0.29%) 2,980,512 EUR Alpha Bank AE2 5,613 0.05 5,195,658 EUR Eurobank Ergasias SA2 5,066 0.05 32,000 EUR FF Group3/4 – – 446,011 EUR Hellenic Telecommunications Organization SA 6,088 0.06 268,029 EUR JUMBO SA 4,749 0.04 121,838 EUR Motor Oil Hellas Corinth Refineries SA 3,096 0.03 676,255 EUR National Bank of Greece SA 1,785 0.02 494,304 EUR OPAP SA 5,164 0.05 57,100 EUR Titan Cement Co. SA 1,158 0.01 Total Greece 32,719 0.31
Hong Kong (31 May 2018: 3.43%) 1,092,500 HKD Beijing Enterprises Holdings Ltd. 5,490 0.05 1,401,500 HKD BYD Electronic International Co. Ltd.2 1,845 0.02 4,328,000 HKD China Agri-Industries Holdings Ltd. 1,308 0.01 6,878,184 HKD China Everbright International Ltd.2 6,509 0.06 2,038,000 HKD China Everbright Ltd.2 3,260 0.03 10,728,000 HKD China Jinmao Holdings Group Ltd.2 6,198 0.06 2,775,162 HKD China Merchants Port Holdings Co. Ltd.2 4,856 0.05 12,397,500 HKD China Mobile Ltd. 108,233 1.03 7,978,000 HKD China Overseas Land & Investment Ltd. 27,677 0.26 9,095,000 HKD China Power International Development Ltd.2 2,355 0.02 2,946,710 HKD China Resources Beer Holdings Co. Ltd.2 12,891 0.12 3,012,000 HKD China Resources Pharmaceutical Group Ltd. 3,934 0.04 4,205,366 HKD China Resources Power Holdings Co. Ltd. 6,125 0.06 3,367,074 HKD China Taiping Insurance Holdings Co. Ltd. 8,653 0.08 4,670,000 HKD China Traditional Chinese Medicine Holdings Co. Ltd.2 2,466 0.02 12,284,000 HKD China Unicom Hong Kong Ltd. 12,957 0.12 12,172,000 HKD CITIC Ltd. 16,518 0.16 36,355,000 HKD CNOOC Ltd. 59,258 0.56 9,566,000 HKD CSPC Pharmaceutical Group Ltd.2 15,422 0.15 4,479,000 HKD Far East Horizon Ltd.2 4,770 0.04 5,436,040 HKD Fosun International Ltd.2 7,016 0.07 6,190,000 HKD Guangdong Investment Ltd. 12,174 0.12 874,000 HKD Hua Hong Semiconductor Ltd.2 1,837 0.02 15,050,000 HKD Lenovo Group Ltd.2 10,461 0.10 4,968,000 HKD MMG Ltd.2 1,514 0.01 1,187,000 HKD Shanghai Industrial Holdings Ltd. 2,474 0.02 6,642,000 HKD Shenzhen Investment Ltd.2 2,448 0.02 6,795,452 HKD Sino-Ocean Group Holding Ltd.2 2,713 0.03 1,422,500 HKD Sinotruk Hong Kong Ltd.2 2,696 0.03 5,027,000 HKD Sun Art Retail Group Ltd.2 4,386 0.04 14,056,000 HKD Yuexiu Property Co. Ltd. 3,191 0.03 Total Hong Kong 361,635 3.43
Hungary (31 May 2018: 0.28%) 784,298 HUF MOL Hungarian Oil & Gas plc 8,813 0.08 469,705 HUF OTP Bank Nyrt. 19,574 0.19
216
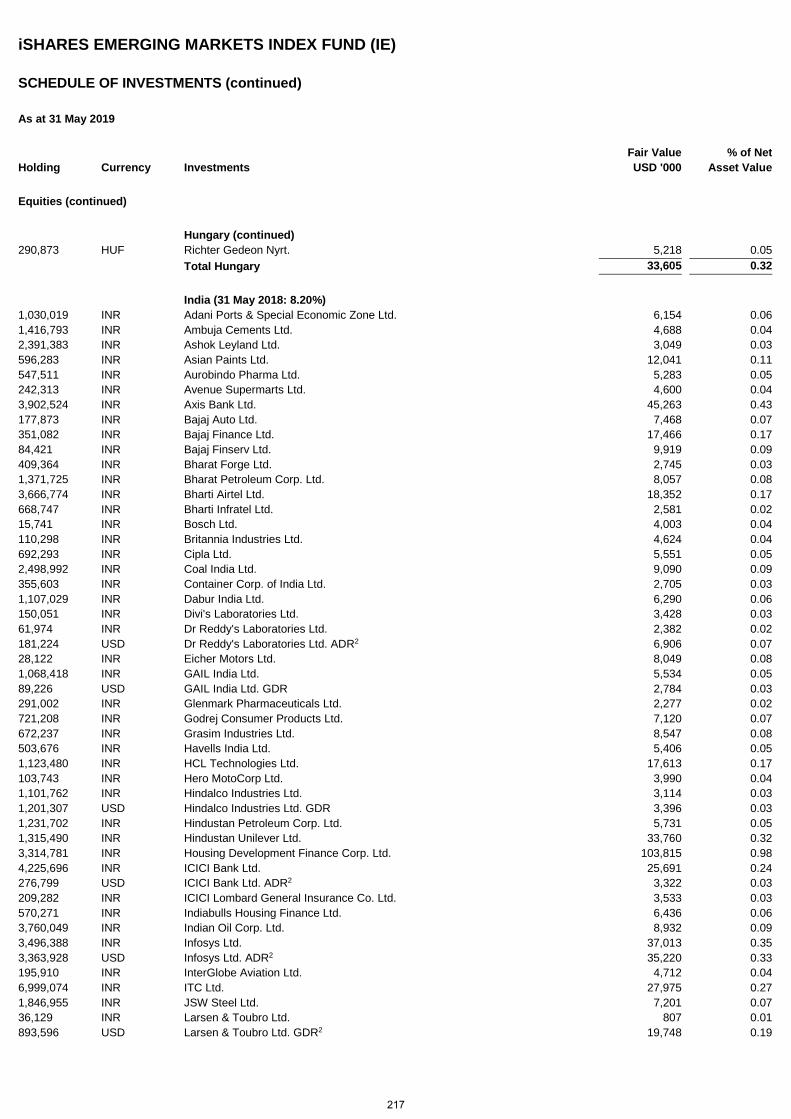
iSHARES EMERGING MARKETS INDEX FUND (IE)
SCHEDULE OF INVESTMENTS (continued)
As at 31 May 2019
Holding Currency Investments Fair Value USD '000
% of Net Asset Value
Equities (continued)
Hungary (continued) 290,873 HUF Richter Gedeon Nyrt. 5,218 0.05 Total Hungary 33,605 0.32
India (31 May 2018: 8.20%) 1,030,019 INR Adani Ports & Special Economic Zone Ltd. 6,154 0.06 1,416,793 INR Ambuja Cements Ltd. 4,688 0.04 2,391,383 INR Ashok Leyland Ltd. 3,049 0.03 596,283 INR Asian Paints Ltd. 12,041 0.11 547,511 INR Aurobindo Pharma Ltd. 5,283 0.05 242,313 INR Avenue Supermarts Ltd. 4,600 0.04 3,902,524 INR Axis Bank Ltd. 45,263 0.43 177,873 INR Bajaj Auto Ltd. 7,468 0.07 351,082 INR Bajaj Finance Ltd. 17,466 0.17 84,421 INR Bajaj Finserv Ltd. 9,919 0.09 409,364 INR Bharat Forge Ltd. 2,745 0.03 1,371,725 INR Bharat Petroleum Corp. Ltd. 8,057 0.08 3,666,774 INR Bharti Airtel Ltd. 18,352 0.17 668,747 INR Bharti Infratel Ltd. 2,581 0.02 15,741 INR Bosch Ltd. 4,003 0.04 110,298 INR Britannia Industries Ltd. 4,624 0.04 692,293 INR Cipla Ltd. 5,551 0.05 2,498,992 INR Coal India Ltd. 9,090 0.09 355,603 INR Container Corp. of India Ltd. 2,705 0.03 1,107,029 INR Dabur India Ltd. 6,290 0.06 150,051 INR Divi's Laboratories Ltd. 3,428 0.03 61,974 INR Dr Reddy's Laboratories Ltd. 2,382 0.02 181,224 USD Dr Reddy's Laboratories Ltd. ADR2 6,906 0.07 28,122 INR Eicher Motors Ltd. 8,049 0.08 1,068,418 INR GAIL India Ltd. 5,534 0.05 89,226 USD GAIL India Ltd. GDR 2,784 0.03 291,002 INR Glenmark Pharmaceuticals Ltd. 2,277 0.02 721,208 INR Godrej Consumer Products Ltd. 7,120 0.07 672,237 INR Grasim Industries Ltd. 8,547 0.08 503,676 INR Havells India Ltd. 5,406 0.05 1,123,480 INR HCL Technologies Ltd. 17,613 0.17 103,743 INR Hero MotoCorp Ltd. 3,990 0.04 1,101,762 INR Hindalco Industries Ltd. 3,114 0.03 1,201,307 USD Hindalco Industries Ltd. GDR 3,396 0.03 1,231,702 INR Hindustan Petroleum Corp. Ltd. 5,731 0.05 1,315,490 INR Hindustan Unilever Ltd. 33,760 0.32 3,314,781 INR Housing Development Finance Corp. Ltd. 103,815 0.98 4,225,696 INR ICICI Bank Ltd. 25,691 0.24 276,799 USD ICICI Bank Ltd. ADR2 3,322 0.03 209,282 INR ICICI Lombard General Insurance Co. Ltd. 3,533 0.03 570,271 INR Indiabulls Housing Finance Ltd. 6,436 0.06 3,760,049 INR Indian Oil Corp. Ltd. 8,932 0.09 3,496,388 INR Infosys Ltd. 37,013 0.35 3,363,928 USD Infosys Ltd. ADR2 35,220 0.33 195,910 INR InterGlobe Aviation Ltd. 4,712 0.04 6,999,074 INR ITC Ltd. 27,975 0.27 1,846,955 INR JSW Steel Ltd. 7,201 0.07 36,129 INR Larsen & Toubro Ltd. 807 0.01 893,596 USD Larsen & Toubro Ltd. GDR2 19,748 0.19
217
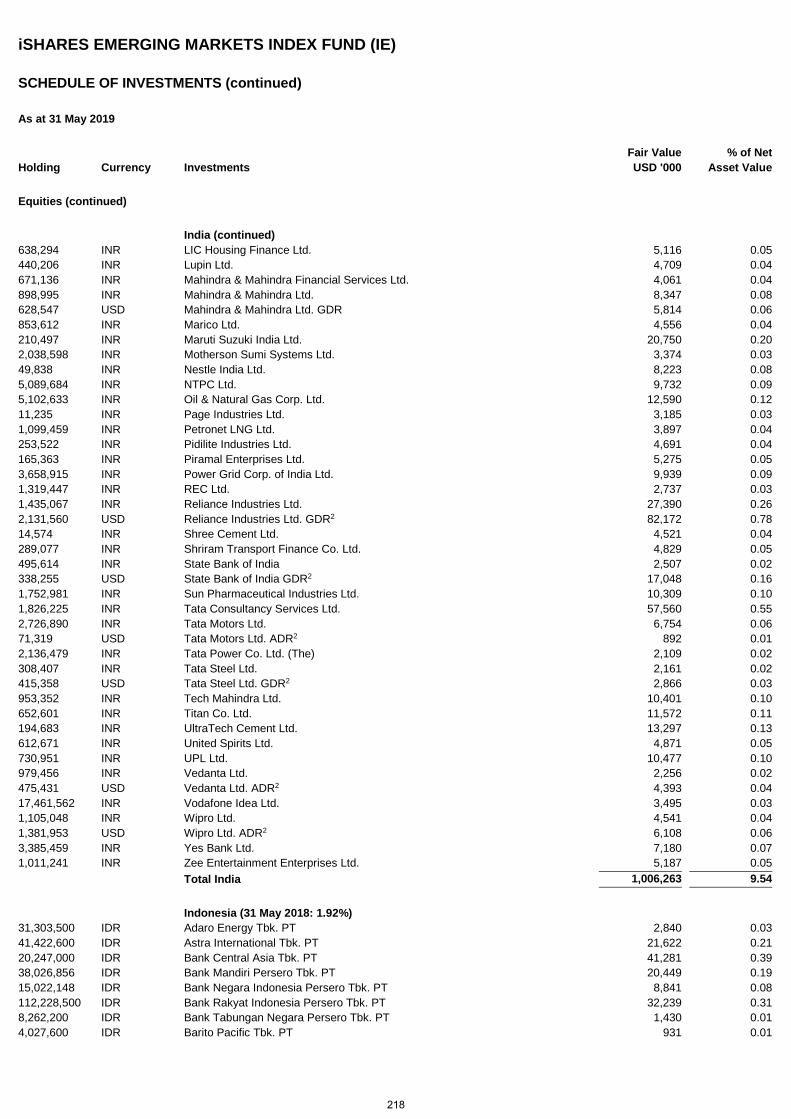
iSHARES EMERGING MARKETS INDEX FUND (IE)
SCHEDULE OF INVESTMENTS (continued)
As at 31 May 2019
Holding Currency Investments Fair Value USD '000
% of Net Asset Value
Equities (continued)
India (continued) 638,294 INR LIC Housing Finance Ltd. 5,116 0.05 440,206 INR Lupin Ltd. 4,709 0.04 671,136 INR Mahindra & Mahindra Financial Services Ltd. 4,061 0.04 898,995 INR Mahindra & Mahindra Ltd. 8,347 0.08 628,547 USD Mahindra & Mahindra Ltd. GDR 5,814 0.06 853,612 INR Marico Ltd. 4,556 0.04 210,497 INR Maruti Suzuki India Ltd. 20,750 0.20 2,038,598 INR Motherson Sumi Systems Ltd. 3,374 0.03 49,838 INR Nestle India Ltd. 8,223 0.08 5,089,684 INR NTPC Ltd. 9,732 0.09 5,102,633 INR Oil & Natural Gas Corp. Ltd. 12,590 0.12 11,235 INR Page Industries Ltd. 3,185 0.03 1,099,459 INR Petronet LNG Ltd. 3,897 0.04 253,522 INR Pidilite Industries Ltd. 4,691 0.04 165,363 INR Piramal Enterprises Ltd. 5,275 0.05 3,658,915 INR Power Grid Corp. of India Ltd. 9,939 0.09 1,319,447 INR REC Ltd. 2,737 0.03 1,435,067 INR Reliance Industries Ltd. 27,390 0.26 2,131,560 USD Reliance Industries Ltd. GDR2 82,172 0.78 14,574 INR Shree Cement Ltd. 4,521 0.04 289,077 INR Shriram Transport Finance Co. Ltd. 4,829 0.05 495,614 INR State Bank of India 2,507 0.02 338,255 USD State Bank of India GDR2 17,048 0.16 1,752,981 INR Sun Pharmaceutical Industries Ltd. 10,309 0.10 1,826,225 INR Tata Consultancy Services Ltd. 57,560 0.55 2,726,890 INR Tata Motors Ltd. 6,754 0.06 71,319 USD Tata Motors Ltd. ADR2 892 0.01 2,136,479 INR Tata Power Co. Ltd. (The) 2,109 0.02 308,407 INR Tata Steel Ltd. 2,161 0.02 415,358 USD Tata Steel Ltd. GDR2 2,866 0.03 953,352 INR Tech Mahindra Ltd. 10,401 0.10 652,601 INR Titan Co. Ltd. 11,572 0.11 194,683 INR UltraTech Cement Ltd. 13,297 0.13 612,671 INR United Spirits Ltd. 4,871 0.05 730,951 INR UPL Ltd. 10,477 0.10 979,456 INR Vedanta Ltd. 2,256 0.02 475,431 USD Vedanta Ltd. ADR2 4,393 0.04 17,461,562 INR Vodafone Idea Ltd. 3,495 0.03 1,105,048 INR Wipro Ltd. 4,541 0.04 1,381,953 USD Wipro Ltd. ADR2 6,108 0.06 3,385,459 INR Yes Bank Ltd. 7,180 0.07 1,011,241 INR Zee Entertainment Enterprises Ltd. 5,187 0.05 Total India 1,006,263 9.54
Indonesia (31 May 2018: 1.92%) 31,303,500 IDR Adaro Energy Tbk. PT 2,840 0.03 41,422,600 IDR Astra International Tbk. PT 21,622 0.21 20,247,000 IDR Bank Central Asia Tbk. PT 41,281 0.39 38,026,856 IDR Bank Mandiri Persero Tbk. PT 20,449 0.19 15,022,148 IDR Bank Negara Indonesia Persero Tbk. PT 8,841 0.08 112,228,500 IDR Bank Rakyat Indonesia Persero Tbk. PT 32,239 0.31 8,262,200 IDR Bank Tabungan Negara Persero Tbk. PT 1,430 0.01 4,027,600 IDR Barito Pacific Tbk. PT 931 0.01
218
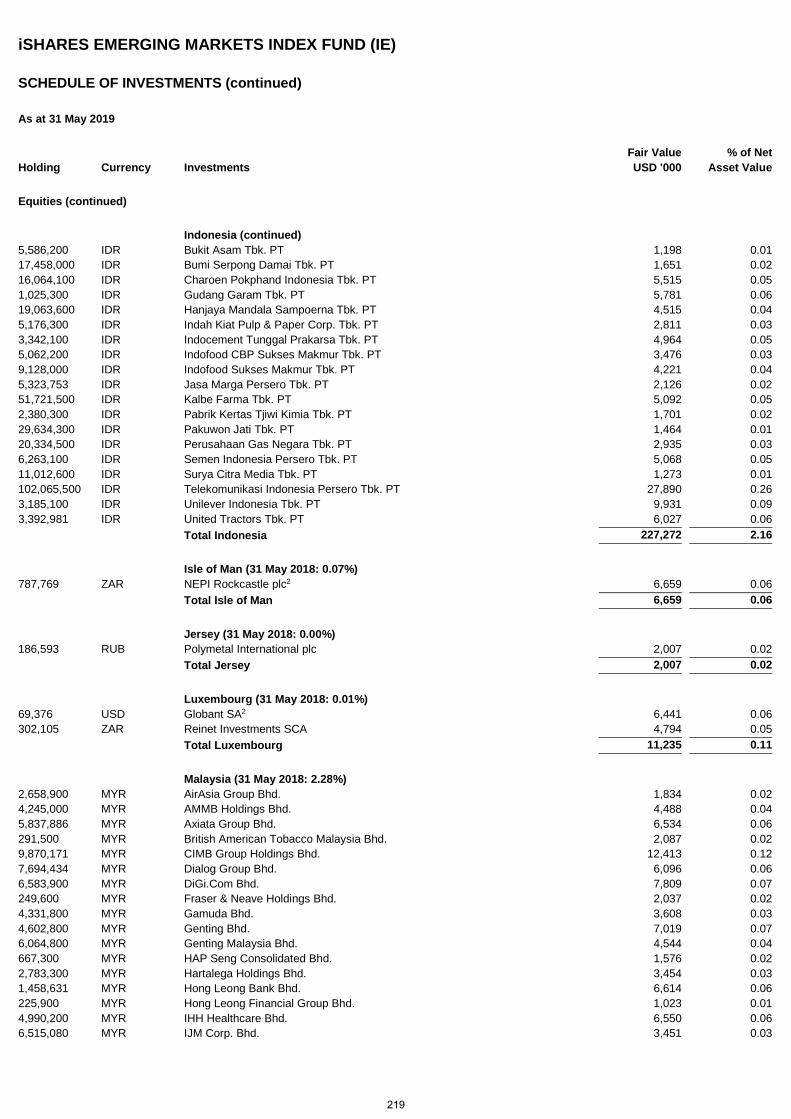
iSHARES EMERGING MARKETS INDEX FUND (IE)
SCHEDULE OF INVESTMENTS (continued)
As at 31 May 2019
Holding Currency Investments Fair Value USD '000
% of Net Asset Value
Equities (continued)
Indonesia (continued) 5,586,200 IDR Bukit Asam Tbk. PT 1,198 0.01 17,458,000 IDR Bumi Serpong Damai Tbk. PT 1,651 0.02 16,064,100 IDR Charoen Pokphand Indonesia Tbk. PT 5,515 0.05 1,025,300 IDR Gudang Garam Tbk. PT 5,781 0.06 19,063,600 IDR Hanjaya Mandala Sampoerna Tbk. PT 4,515 0.04 5,176,300 IDR Indah Kiat Pulp & Paper Corp. Tbk. PT 2,811 0.03 3,342,100 IDR Indocement Tunggal Prakarsa Tbk. PT 4,964 0.05 5,062,200 IDR Indofood CBP Sukses Makmur Tbk. PT 3,476 0.03 9,128,000 IDR Indofood Sukses Makmur Tbk. PT 4,221 0.04 5,323,753 IDR Jasa Marga Persero Tbk. PT 2,126 0.02 51,721,500 IDR Kalbe Farma Tbk. PT 5,092 0.05 2,380,300 IDR Pabrik Kertas Tjiwi Kimia Tbk. PT 1,701 0.02 29,634,300 IDR Pakuwon Jati Tbk. PT 1,464 0.01 20,334,500 IDR Perusahaan Gas Negara Tbk. PT 2,935 0.03 6,263,100 IDR Semen Indonesia Persero Tbk. PT 5,068 0.05 11,012,600 IDR Surya Citra Media Tbk. PT 1,273 0.01 102,065,500 IDR Telekomunikasi Indonesia Persero Tbk. PT 27,890 0.26 3,185,100 IDR Unilever Indonesia Tbk. PT 9,931 0.09 3,392,981 IDR United Tractors Tbk. PT 6,027 0.06 Total Indonesia 227,272 2.16
Isle of Man (31 May 2018: 0.07%) 787,769 ZAR NEPI Rockcastle plc2 6,659 0.06 Total Isle of Man 6,659 0.06
Jersey (31 May 2018: 0.00%) 186,593 RUB Polymetal International plc 2,007 0.02 Total Jersey 2,007 0.02
Luxembourg (31 May 2018: 0.01%) 69,376 USD Globant SA2 6,441 0.06 302,105 ZAR Reinet Investments SCA 4,794 0.05 Total Luxembourg 11,235 0.11
Malaysia (31 May 2018: 2.28%) 2,658,900 MYR AirAsia Group Bhd. 1,834 0.02 4,245,000 MYR AMMB Holdings Bhd. 4,488 0.04 5,837,886 MYR Axiata Group Bhd. 6,534 0.06 291,500 MYR British American Tobacco Malaysia Bhd. 2,087 0.02 9,870,171 MYR CIMB Group Holdings Bhd. 12,413 0.12 7,694,434 MYR Dialog Group Bhd. 6,096 0.06 6,583,900 MYR DiGi.Com Bhd. 7,809 0.07 249,600 MYR Fraser & Neave Holdings Bhd. 2,037 0.02 4,331,800 MYR Gamuda Bhd. 3,608 0.03 4,602,800 MYR Genting Bhd. 7,019 0.07 6,064,800 MYR Genting Malaysia Bhd. 4,544 0.04 667,300 MYR HAP Seng Consolidated Bhd. 1,576 0.02 2,783,300 MYR Hartalega Holdings Bhd. 3,454 0.03 1,458,631 MYR Hong Leong Bank Bhd. 6,614 0.06 225,900 MYR Hong Leong Financial Group Bhd. 1,023 0.01 4,990,200 MYR IHH Healthcare Bhd. 6,550 0.06 6,515,080 MYR IJM Corp. Bhd. 3,451 0.03
219
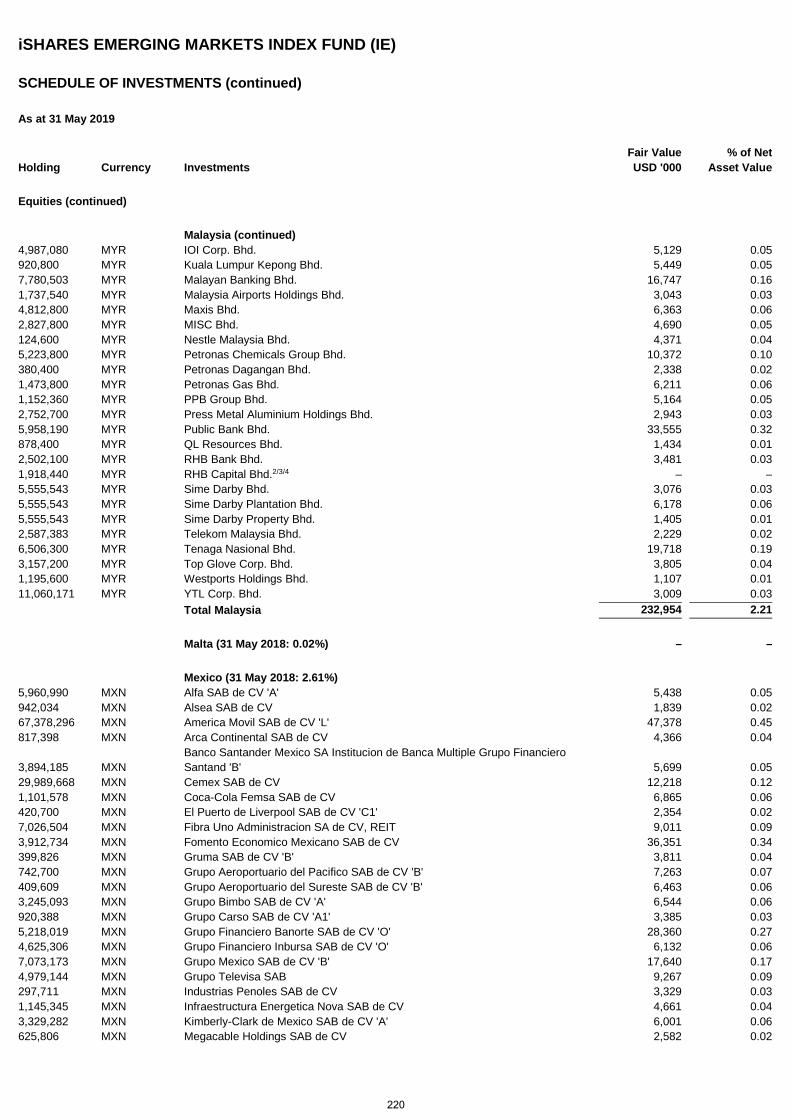
iSHARES EMERGING MARKETS INDEX FUND (IE)
SCHEDULE OF INVESTMENTS (continued)
As at 31 May 2019
Holding Currency Investments Fair Value USD '000
% of Net Asset Value
Equities (continued)
Malaysia (continued) 4,987,080 MYR IOI Corp. Bhd. 5,129 0.05 920,800 MYR Kuala Lumpur Kepong Bhd. 5,449 0.05 7,780,503 MYR Malayan Banking Bhd. 16,747 0.16 1,737,540 MYR Malaysia Airports Holdings Bhd. 3,043 0.03 4,812,800 MYR Maxis Bhd. 6,363 0.06 2,827,800 MYR MISC Bhd. 4,690 0.05 124,600 MYR Nestle Malaysia Bhd. 4,371 0.04 5,223,800 MYR Petronas Chemicals Group Bhd. 10,372 0.10 380,400 MYR Petronas Dagangan Bhd. 2,338 0.02 1,473,800 MYR Petronas Gas Bhd. 6,211 0.06 1,152,360 MYR PPB Group Bhd. 5,164 0.05 2,752,700 MYR Press Metal Aluminium Holdings Bhd. 2,943 0.03 5,958,190 MYR Public Bank Bhd. 33,555 0.32 878,400 MYR QL Resources Bhd. 1,434 0.01 2,502,100 MYR RHB Bank Bhd. 3,481 0.03 1,918,440 MYR RHB Capital Bhd.2/3/4 – – 5,555,543 MYR Sime Darby Bhd. 3,076 0.03 5,555,543 MYR Sime Darby Plantation Bhd. 6,178 0.06 5,555,543 MYR Sime Darby Property Bhd. 1,405 0.01 2,587,383 MYR Telekom Malaysia Bhd. 2,229 0.02 6,506,300 MYR Tenaga Nasional Bhd. 19,718 0.19 3,157,200 MYR Top Glove Corp. Bhd. 3,805 0.04 1,195,600 MYR Westports Holdings Bhd. 1,107 0.01 11,060,171 MYR YTL Corp. Bhd. 3,009 0.03 Total Malaysia 232,954 2.21
Malta (31 May 2018: 0.02%) – –
Mexico (31 May 2018: 2.61%) 5,960,990 MXN Alfa SAB de CV 'A' 5,438 0.05 942,034 MXN Alsea SAB de CV 1,839 0.02 67,378,296 MXN America Movil SAB de CV 'L' 47,378 0.45 817,398 MXN Arca Continental SAB de CV 4,366 0.04
3,894,185 MXN Banco Santander Mexico SA Institucion de Banca Multiple Grupo Financiero Santand 'B' 5,699 0.05
29,989,668 MXN Cemex SAB de CV 12,218 0.12 1,101,578 MXN Coca-Cola Femsa SAB de CV 6,865 0.06 420,700 MXN El Puerto de Liverpool SAB de CV 'C1' 2,354 0.02 7,026,504 MXN Fibra Uno Administracion SA de CV, REIT 9,011 0.09 3,912,734 MXN Fomento Economico Mexicano SAB de CV 36,351 0.34 399,826 MXN Gruma SAB de CV 'B' 3,811 0.04 742,700 MXN Grupo Aeroportuario del Pacifico SAB de CV 'B' 7,263 0.07 409,609 MXN Grupo Aeroportuario del Sureste SAB de CV 'B' 6,463 0.06 3,245,093 MXN Grupo Bimbo SAB de CV 'A' 6,544 0.06 920,388 MXN Grupo Carso SAB de CV 'A1' 3,385 0.03 5,218,019 MXN Grupo Financiero Banorte SAB de CV 'O' 28,360 0.27 4,625,306 MXN Grupo Financiero Inbursa SAB de CV 'O' 6,132 0.06 7,073,173 MXN Grupo Mexico SAB de CV 'B' 17,640 0.17 4,979,144 MXN Grupo Televisa SAB 9,267 0.09 297,711 MXN Industrias Penoles SAB de CV 3,329 0.03 1,145,345 MXN Infraestructura Energetica Nova SAB de CV 4,661 0.04 3,329,282 MXN Kimberly-Clark de Mexico SAB de CV 'A' 6,001 0.06 625,806 MXN Megacable Holdings SAB de CV 2,582 0.02
220
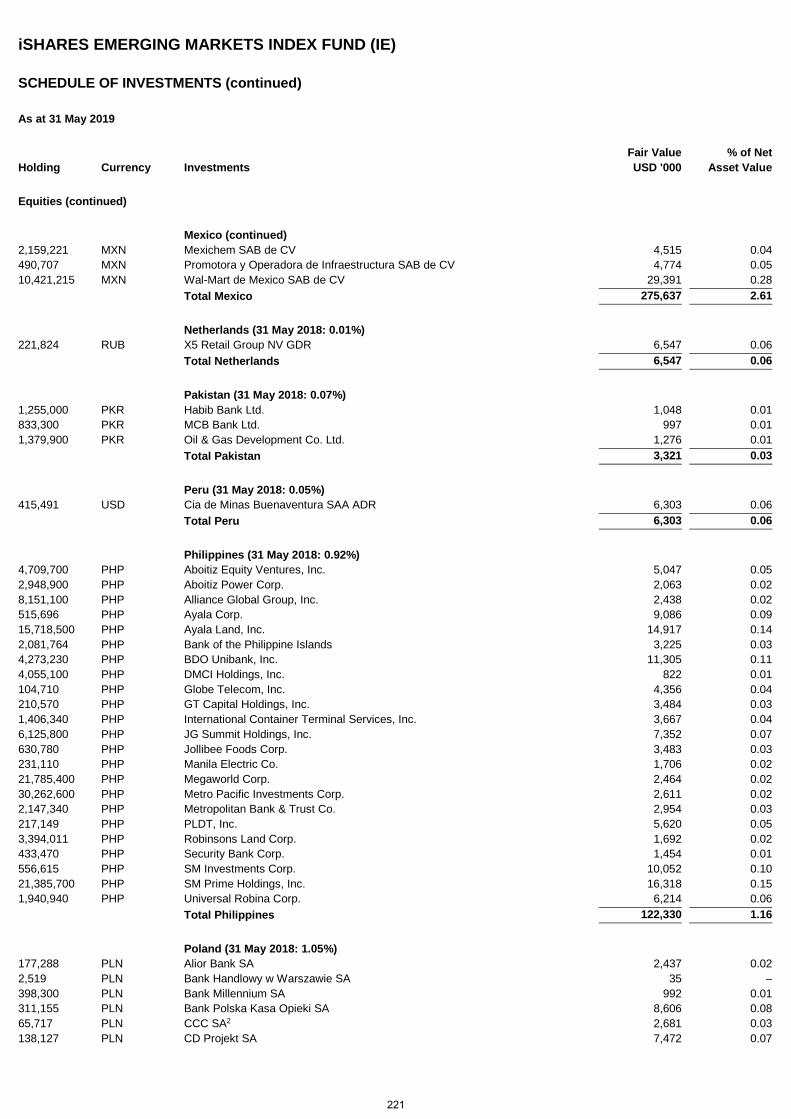
iSHARES EMERGING MARKETS INDEX FUND (IE)
SCHEDULE OF INVESTMENTS (continued)
As at 31 May 2019
Holding Currency Investments Fair Value USD '000
% of Net Asset Value
Equities (continued)
Mexico (continued) 2,159,221 MXN Mexichem SAB de CV 4,515 0.04 490,707 MXN Promotora y Operadora de Infraestructura SAB de CV 4,774 0.05 10,421,215 MXN Wal-Mart de Mexico SAB de CV 29,391 0.28 Total Mexico 275,637 2.61
Netherlands (31 May 2018: 0.01%) 221,824 RUB X5 Retail Group NV GDR 6,547 0.06 Total Netherlands 6,547 0.06
Pakistan (31 May 2018: 0.07%) 1,255,000 PKR Habib Bank Ltd. 1,048 0.01 833,300 PKR MCB Bank Ltd. 997 0.01 1,379,900 PKR Oil & Gas Development Co. Ltd. 1,276 0.01 Total Pakistan 3,321 0.03
Peru (31 May 2018: 0.05%) 415,491 USD Cia de Minas Buenaventura SAA ADR 6,303 0.06 Total Peru 6,303 0.06
Philippines (31 May 2018: 0.92%) 4,709,700 PHP Aboitiz Equity Ventures, Inc. 5,047 0.05 2,948,900 PHP Aboitiz Power Corp. 2,063 0.02 8,151,100 PHP Alliance Global Group, Inc. 2,438 0.02 515,696 PHP Ayala Corp. 9,086 0.09 15,718,500 PHP Ayala Land, Inc. 14,917 0.14 2,081,764 PHP Bank of the Philippine Islands 3,225 0.03 4,273,230 PHP BDO Unibank, Inc. 11,305 0.11 4,055,100 PHP DMCI Holdings, Inc. 822 0.01 104,710 PHP Globe Telecom, Inc. 4,356 0.04 210,570 PHP GT Capital Holdings, Inc. 3,484 0.03 1,406,340 PHP International Container Terminal Services, Inc. 3,667 0.04 6,125,800 PHP JG Summit Holdings, Inc. 7,352 0.07 630,780 PHP Jollibee Foods Corp. 3,483 0.03 231,110 PHP Manila Electric Co. 1,706 0.02 21,785,400 PHP Megaworld Corp. 2,464 0.02 30,262,600 PHP Metro Pacific Investments Corp. 2,611 0.02 2,147,340 PHP Metropolitan Bank & Trust Co. 2,954 0.03 217,149 PHP PLDT, Inc. 5,620 0.05 3,394,011 PHP Robinsons Land Corp. 1,692 0.02 433,470 PHP Security Bank Corp. 1,454 0.01 556,615 PHP SM Investments Corp. 10,052 0.10 21,385,700 PHP SM Prime Holdings, Inc. 16,318 0.15 1,940,940 PHP Universal Robina Corp. 6,214 0.06 Total Philippines 122,330 1.16
Poland (31 May 2018: 1.05%) 177,288 PLN Alior Bank SA 2,437 0.02 2,519 PLN Bank Handlowy w Warszawie SA 35 – 398,300 PLN Bank Millennium SA 992 0.01 311,155 PLN Bank Polska Kasa Opieki SA 8,606 0.08 65,717 PLN CCC SA2 2,681 0.03 138,127 PLN CD Projekt SA 7,472 0.07
221
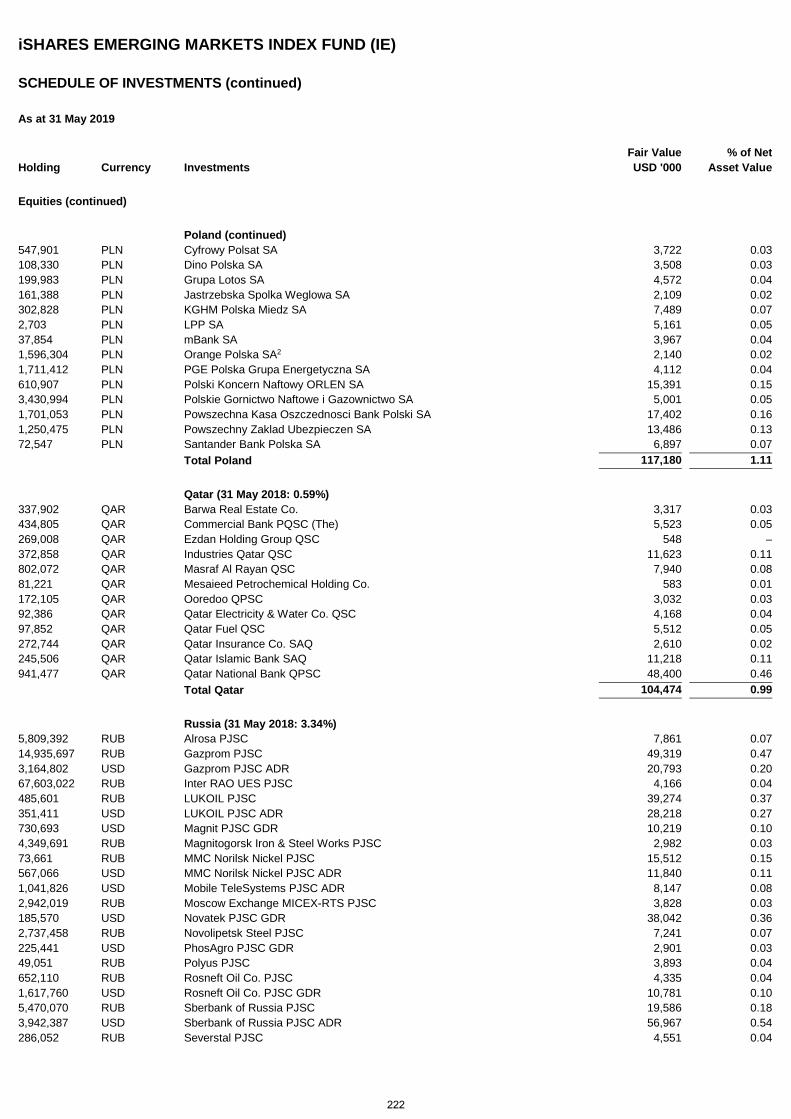
iSHARES EMERGING MARKETS INDEX FUND (IE)
SCHEDULE OF INVESTMENTS (continued)
As at 31 May 2019
Holding Currency Investments Fair Value USD '000
% of Net Asset Value
Equities (continued)
Poland (continued) 547,901 PLN Cyfrowy Polsat SA 3,722 0.03 108,330 PLN Dino Polska SA 3,508 0.03 199,983 PLN Grupa Lotos SA 4,572 0.04 161,388 PLN Jastrzebska Spolka Weglowa SA 2,109 0.02 302,828 PLN KGHM Polska Miedz SA 7,489 0.07 2,703 PLN LPP SA 5,161 0.05 37,854 PLN mBank SA 3,967 0.04 1,596,304 PLN Orange Polska SA2 2,140 0.02 1,711,412 PLN PGE Polska Grupa Energetyczna SA 4,112 0.04 610,907 PLN Polski Koncern Naftowy ORLEN SA 15,391 0.15 3,430,994 PLN Polskie Gornictwo Naftowe i Gazownictwo SA 5,001 0.05 1,701,053 PLN Powszechna Kasa Oszczednosci Bank Polski SA 17,402 0.16 1,250,475 PLN Powszechny Zaklad Ubezpieczen SA 13,486 0.13 72,547 PLN Santander Bank Polska SA 6,897 0.07 Total Poland 117,180 1.11
Qatar (31 May 2018: 0.59%) 337,902 QAR Barwa Real Estate Co. 3,317 0.03 434,805 QAR Commercial Bank PQSC (The) 5,523 0.05 269,008 QAR Ezdan Holding Group QSC 548 – 372,858 QAR Industries Qatar QSC 11,623 0.11 802,072 QAR Masraf Al Rayan QSC 7,940 0.08 81,221 QAR Mesaieed Petrochemical Holding Co. 583 0.01 172,105 QAR Ooredoo QPSC 3,032 0.03 92,386 QAR Qatar Electricity & Water Co. QSC 4,168 0.04 97,852 QAR Qatar Fuel QSC 5,512 0.05 272,744 QAR Qatar Insurance Co. SAQ 2,610 0.02 245,506 QAR Qatar Islamic Bank SAQ 11,218 0.11 941,477 QAR Qatar National Bank QPSC 48,400 0.46 Total Qatar 104,474 0.99
Russia (31 May 2018: 3.34%) 5,809,392 RUB Alrosa PJSC 7,861 0.07 14,935,697 RUB Gazprom PJSC 49,319 0.47 3,164,802 USD Gazprom PJSC ADR 20,793 0.20 67,603,022 RUB Inter RAO UES PJSC 4,166 0.04 485,601 RUB LUKOIL PJSC 39,274 0.37 351,411 USD LUKOIL PJSC ADR 28,218 0.27 730,693 USD Magnit PJSC GDR 10,219 0.10 4,349,691 RUB Magnitogorsk Iron & Steel Works PJSC 2,982 0.03 73,661 RUB MMC Norilsk Nickel PJSC 15,512 0.15 567,066 USD MMC Norilsk Nickel PJSC ADR 11,840 0.11 1,041,826 USD Mobile TeleSystems PJSC ADR 8,147 0.08 2,942,019 RUB Moscow Exchange MICEX-RTS PJSC 3,828 0.03 185,570 USD Novatek PJSC GDR 38,042 0.36 2,737,458 RUB Novolipetsk Steel PJSC 7,241 0.07 225,441 USD PhosAgro PJSC GDR 2,901 0.03 49,051 RUB Polyus PJSC 3,893 0.04 652,110 RUB Rosneft Oil Co. PJSC 4,335 0.04 1,617,760 USD Rosneft Oil Co. PJSC GDR 10,781 0.10 5,470,070 RUB Sberbank of Russia PJSC 19,586 0.18 3,942,387 USD Sberbank of Russia PJSC ADR 56,967 0.54 286,052 RUB Severstal PJSC 4,551 0.04
222
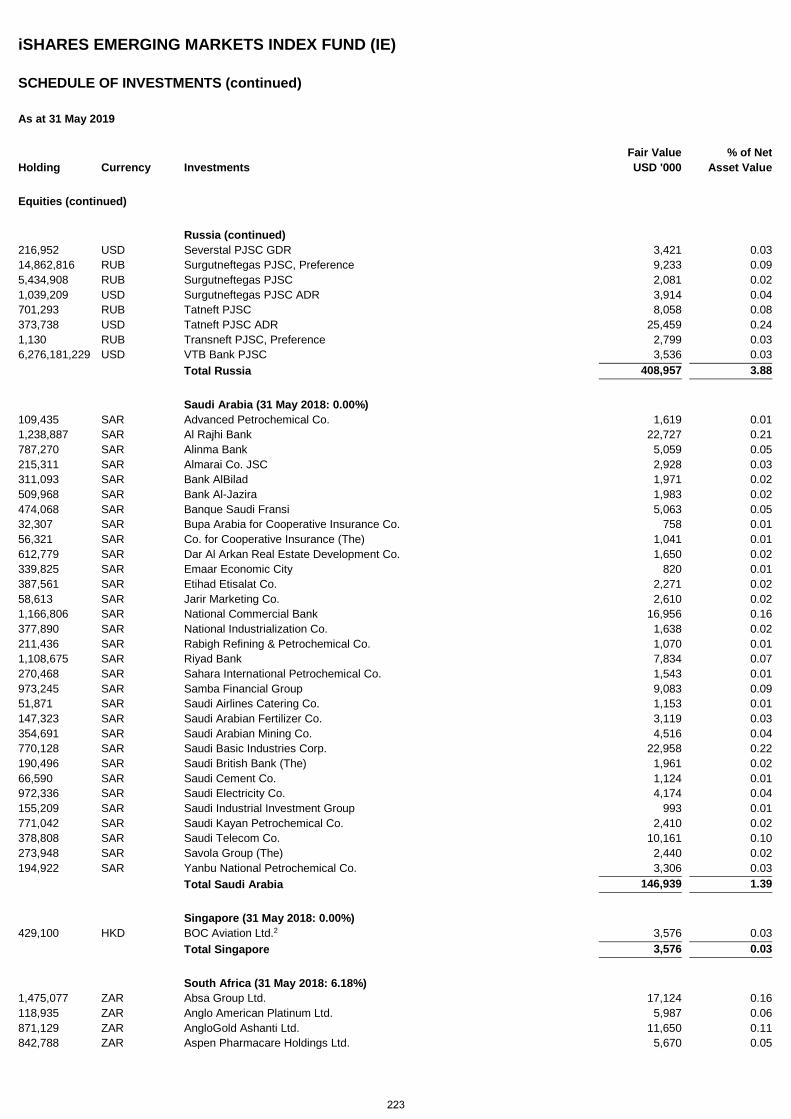
iSHARES EMERGING MARKETS INDEX FUND (IE)
SCHEDULE OF INVESTMENTS (continued)
As at 31 May 2019
Holding Currency Investments Fair Value USD '000
% of Net Asset Value
Equities (continued)
Russia (continued) 216,952 USD Severstal PJSC GDR 3,421 0.03 14,862,816 RUB Surgutneftegas PJSC, Preference 9,233 0.09 5,434,908 RUB Surgutneftegas PJSC 2,081 0.02 1,039,209 USD Surgutneftegas PJSC ADR 3,914 0.04 701,293 RUB Tatneft PJSC 8,058 0.08 373,738 USD Tatneft PJSC ADR 25,459 0.24 1,130 RUB Transneft PJSC, Preference 2,799 0.03 6,276,181,229 USD VTB Bank PJSC 3,536 0.03 Total Russia 408,957 3.88
Saudi Arabia (31 May 2018: 0.00%) 109,435 SAR Advanced Petrochemical Co. 1,619 0.01 1,238,887 SAR Al Rajhi Bank 22,727 0.21 787,270 SAR Alinma Bank 5,059 0.05 215,311 SAR Almarai Co. JSC 2,928 0.03 311,093 SAR Bank AlBilad 1,971 0.02 509,968 SAR Bank Al-Jazira 1,983 0.02 474,068 SAR Banque Saudi Fransi 5,063 0.05 32,307 SAR Bupa Arabia for Cooperative Insurance Co. 758 0.01 56,321 SAR Co. for Cooperative Insurance (The) 1,041 0.01 612,779 SAR Dar Al Arkan Real Estate Development Co. 1,650 0.02 339,825 SAR Emaar Economic City 820 0.01 387,561 SAR Etihad Etisalat Co. 2,271 0.02 58,613 SAR Jarir Marketing Co. 2,610 0.02 1,166,806 SAR National Commercial Bank 16,956 0.16 377,890 SAR National Industrialization Co. 1,638 0.02 211,436 SAR Rabigh Refining & Petrochemical Co. 1,070 0.01 1,108,675 SAR Riyad Bank 7,834 0.07 270,468 SAR Sahara International Petrochemical Co. 1,543 0.01 973,245 SAR Samba Financial Group 9,083 0.09 51,871 SAR Saudi Airlines Catering Co. 1,153 0.01 147,323 SAR Saudi Arabian Fertilizer Co. 3,119 0.03 354,691 SAR Saudi Arabian Mining Co. 4,516 0.04 770,128 SAR Saudi Basic Industries Corp. 22,958 0.22 190,496 SAR Saudi British Bank (The) 1,961 0.02 66,590 SAR Saudi Cement Co. 1,124 0.01 972,336 SAR Saudi Electricity Co. 4,174 0.04 155,209 SAR Saudi Industrial Investment Group 993 0.01 771,042 SAR Saudi Kayan Petrochemical Co. 2,410 0.02 378,808 SAR Saudi Telecom Co. 10,161 0.10 273,948 SAR Savola Group (The) 2,440 0.02 194,922 SAR Yanbu National Petrochemical Co. 3,306 0.03 Total Saudi Arabia 146,939 1.39
Singapore (31 May 2018: 0.00%) 429,100 HKD BOC Aviation Ltd.2 3,576 0.03 Total Singapore 3,576 0.03
South Africa (31 May 2018: 6.18%) 1,475,077 ZAR Absa Group Ltd. 17,124 0.16 118,935 ZAR Anglo American Platinum Ltd. 5,987 0.06 871,129 ZAR AngloGold Ashanti Ltd. 11,650 0.11 842,788 ZAR Aspen Pharmacare Holdings Ltd. 5,670 0.05
223
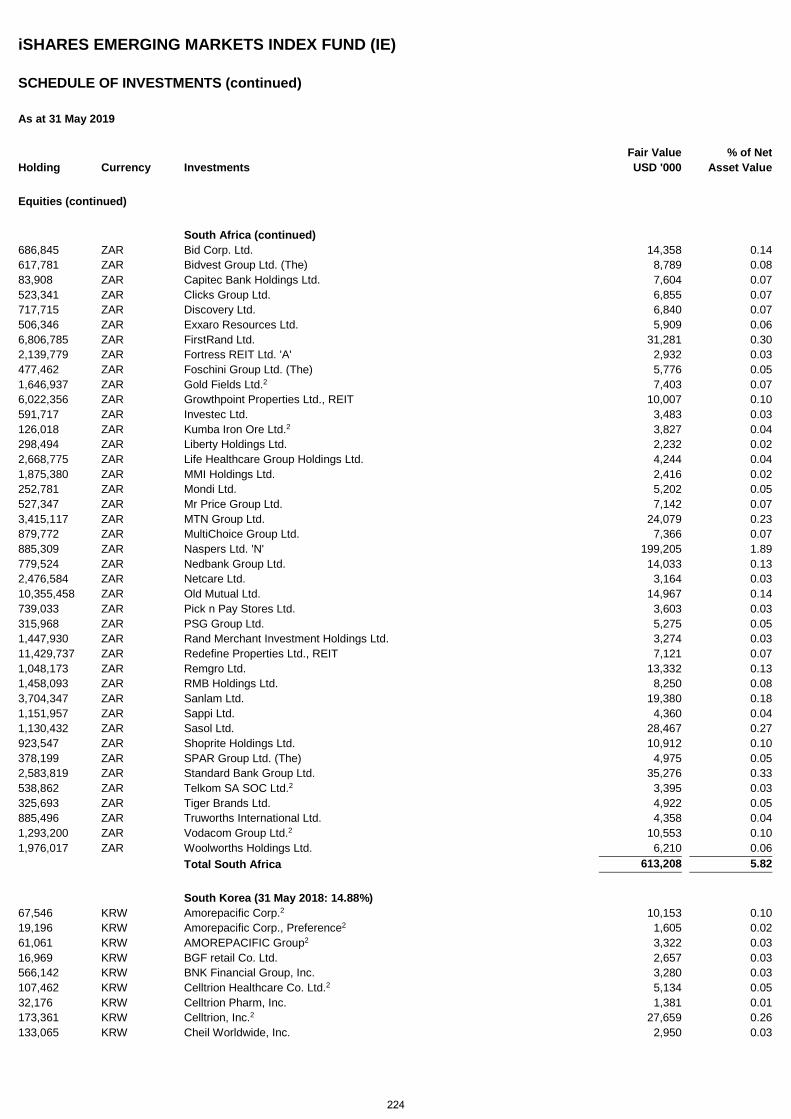
iSHARES EMERGING MARKETS INDEX FUND (IE)
SCHEDULE OF INVESTMENTS (continued)
As at 31 May 2019
Holding Currency Investments Fair Value USD '000
% of Net Asset Value
Equities (continued)
South Africa (continued) 686,845 ZAR Bid Corp. Ltd. 14,358 0.14 617,781 ZAR Bidvest Group Ltd. (The) 8,789 0.08 83,908 ZAR Capitec Bank Holdings Ltd. 7,604 0.07 523,341 ZAR Clicks Group Ltd. 6,855 0.07 717,715 ZAR Discovery Ltd. 6,840 0.07 506,346 ZAR Exxaro Resources Ltd. 5,909 0.06 6,806,785 ZAR FirstRand Ltd. 31,281 0.30 2,139,779 ZAR Fortress REIT Ltd. 'A' 2,932 0.03 477,462 ZAR Foschini Group Ltd. (The) 5,776 0.05 1,646,937 ZAR Gold Fields Ltd.2 7,403 0.07 6,022,356 ZAR Growthpoint Properties Ltd., REIT 10,007 0.10 591,717 ZAR Investec Ltd. 3,483 0.03 126,018 ZAR Kumba Iron Ore Ltd.2 3,827 0.04 298,494 ZAR Liberty Holdings Ltd. 2,232 0.02 2,668,775 ZAR Life Healthcare Group Holdings Ltd. 4,244 0.04 1,875,380 ZAR MMI Holdings Ltd. 2,416 0.02 252,781 ZAR Mondi Ltd. 5,202 0.05 527,347 ZAR Mr Price Group Ltd. 7,142 0.07 3,415,117 ZAR MTN Group Ltd. 24,079 0.23 879,772 ZAR MultiChoice Group Ltd. 7,366 0.07 885,309 ZAR Naspers Ltd. 'N' 199,205 1.89 779,524 ZAR Nedbank Group Ltd. 14,033 0.13 2,476,584 ZAR Netcare Ltd. 3,164 0.03 10,355,458 ZAR Old Mutual Ltd. 14,967 0.14 739,033 ZAR Pick n Pay Stores Ltd. 3,603 0.03 315,968 ZAR PSG Group Ltd. 5,275 0.05 1,447,930 ZAR Rand Merchant Investment Holdings Ltd. 3,274 0.03 11,429,737 ZAR Redefine Properties Ltd., REIT 7,121 0.07 1,048,173 ZAR Remgro Ltd. 13,332 0.13 1,458,093 ZAR RMB Holdings Ltd. 8,250 0.08 3,704,347 ZAR Sanlam Ltd. 19,380 0.18 1,151,957 ZAR Sappi Ltd. 4,360 0.04 1,130,432 ZAR Sasol Ltd. 28,467 0.27 923,547 ZAR Shoprite Holdings Ltd. 10,912 0.10 378,199 ZAR SPAR Group Ltd. (The) 4,975 0.05 2,583,819 ZAR Standard Bank Group Ltd. 35,276 0.33 538,862 ZAR Telkom SA SOC Ltd.2 3,395 0.03 325,693 ZAR Tiger Brands Ltd. 4,922 0.05 885,496 ZAR Truworths International Ltd. 4,358 0.04 1,293,200 ZAR Vodacom Group Ltd.2 10,553 0.10 1,976,017 ZAR Woolworths Holdings Ltd. 6,210 0.06 Total South Africa 613,208 5.82
South Korea (31 May 2018: 14.88%) 67,546 KRW Amorepacific Corp.2 10,153 0.10 19,196 KRW Amorepacific Corp., Preference2 1,605 0.02 61,061 KRW AMOREPACIFIC Group2 3,322 0.03 16,969 KRW BGF retail Co. Ltd. 2,657 0.03 566,142 KRW BNK Financial Group, Inc. 3,280 0.03 107,462 KRW Celltrion Healthcare Co. Ltd.2 5,134 0.05 32,176 KRW Celltrion Pharm, Inc. 1,381 0.01 173,361 KRW Celltrion, Inc.2 27,659 0.26 133,065 KRW Cheil Worldwide, Inc. 2,950 0.03
224
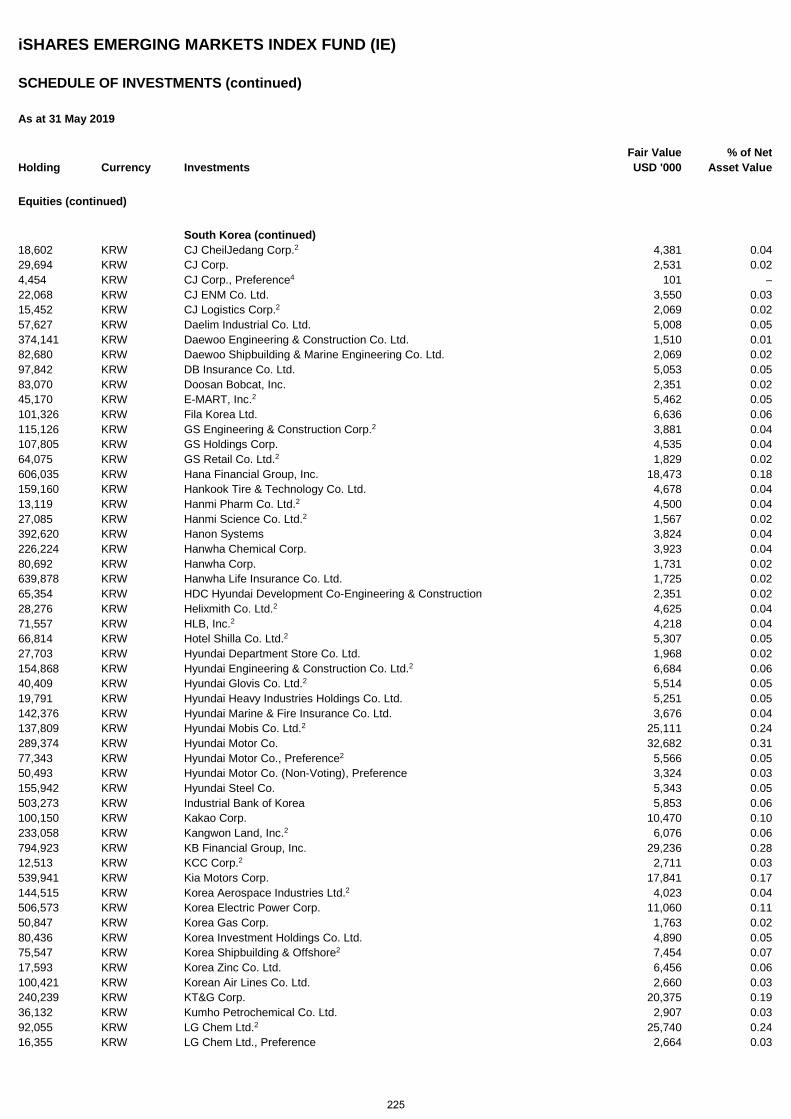
iSHARES EMERGING MARKETS INDEX FUND (IE)
SCHEDULE OF INVESTMENTS (continued)
As at 31 May 2019
Holding Currency Investments Fair Value USD '000
% of Net Asset Value
Equities (continued)
South Korea (continued) 18,602 KRW CJ CheilJedang Corp.2 4,381 0.04 29,694 KRW CJ Corp. 2,531 0.02 4,454 KRW CJ Corp., Preference4 101 – 22,068 KRW CJ ENM Co. Ltd. 3,550 0.03 15,452 KRW CJ Logistics Corp.2 2,069 0.02 57,627 KRW Daelim Industrial Co. Ltd. 5,008 0.05 374,141 KRW Daewoo Engineering & Construction Co. Ltd. 1,510 0.01 82,680 KRW Daewoo Shipbuilding & Marine Engineering Co. Ltd. 2,069 0.02 97,842 KRW DB Insurance Co. Ltd. 5,053 0.05 83,070 KRW Doosan Bobcat, Inc. 2,351 0.02 45,170 KRW E-MART, Inc.2 5,462 0.05 101,326 KRW Fila Korea Ltd. 6,636 0.06 115,126 KRW GS Engineering & Construction Corp.2 3,881 0.04 107,805 KRW GS Holdings Corp. 4,535 0.04 64,075 KRW GS Retail Co. Ltd.2 1,829 0.02 606,035 KRW Hana Financial Group, Inc. 18,473 0.18 159,160 KRW Hankook Tire & Technology Co. Ltd. 4,678 0.04 13,119 KRW Hanmi Pharm Co. Ltd.2 4,500 0.04 27,085 KRW Hanmi Science Co. Ltd.2 1,567 0.02 392,620 KRW Hanon Systems 3,824 0.04 226,224 KRW Hanwha Chemical Corp. 3,923 0.04 80,692 KRW Hanwha Corp. 1,731 0.02 639,878 KRW Hanwha Life Insurance Co. Ltd. 1,725 0.02 65,354 KRW HDC Hyundai Development Co-Engineering & Construction 2,351 0.02 28,276 KRW Helixmith Co. Ltd.2 4,625 0.04 71,557 KRW HLB, Inc.2 4,218 0.04 66,814 KRW Hotel Shilla Co. Ltd.2 5,307 0.05 27,703 KRW Hyundai Department Store Co. Ltd. 1,968 0.02 154,868 KRW Hyundai Engineering & Construction Co. Ltd.2 6,684 0.06 40,409 KRW Hyundai Glovis Co. Ltd.2 5,514 0.05 19,791 KRW Hyundai Heavy Industries Holdings Co. Ltd. 5,251 0.05 142,376 KRW Hyundai Marine & Fire Insurance Co. Ltd. 3,676 0.04 137,809 KRW Hyundai Mobis Co. Ltd.2 25,111 0.24 289,374 KRW Hyundai Motor Co. 32,682 0.31 77,343 KRW Hyundai Motor Co., Preference2 5,566 0.05 50,493 KRW Hyundai Motor Co. (Non-Voting), Preference 3,324 0.03 155,942 KRW Hyundai Steel Co. 5,343 0.05 503,273 KRW Industrial Bank of Korea 5,853 0.06 100,150 KRW Kakao Corp. 10,470 0.10 233,058 KRW Kangwon Land, Inc.2 6,076 0.06 794,923 KRW KB Financial Group, Inc. 29,236 0.28 12,513 KRW KCC Corp.2 2,711 0.03 539,941 KRW Kia Motors Corp. 17,841 0.17 144,515 KRW Korea Aerospace Industries Ltd.2 4,023 0.04 506,573 KRW Korea Electric Power Corp. 11,060 0.11 50,847 KRW Korea Gas Corp. 1,763 0.02 80,436 KRW Korea Investment Holdings Co. Ltd. 4,890 0.05 75,547 KRW Korea Shipbuilding & Offshore2 7,454 0.07 17,593 KRW Korea Zinc Co. Ltd. 6,456 0.06 100,421 KRW Korean Air Lines Co. Ltd. 2,660 0.03 240,239 KRW KT&G Corp. 20,375 0.19 36,132 KRW Kumho Petrochemical Co. Ltd. 2,907 0.03 92,055 KRW LG Chem Ltd.2 25,740 0.24 16,355 KRW LG Chem Ltd., Preference 2,664 0.03
225
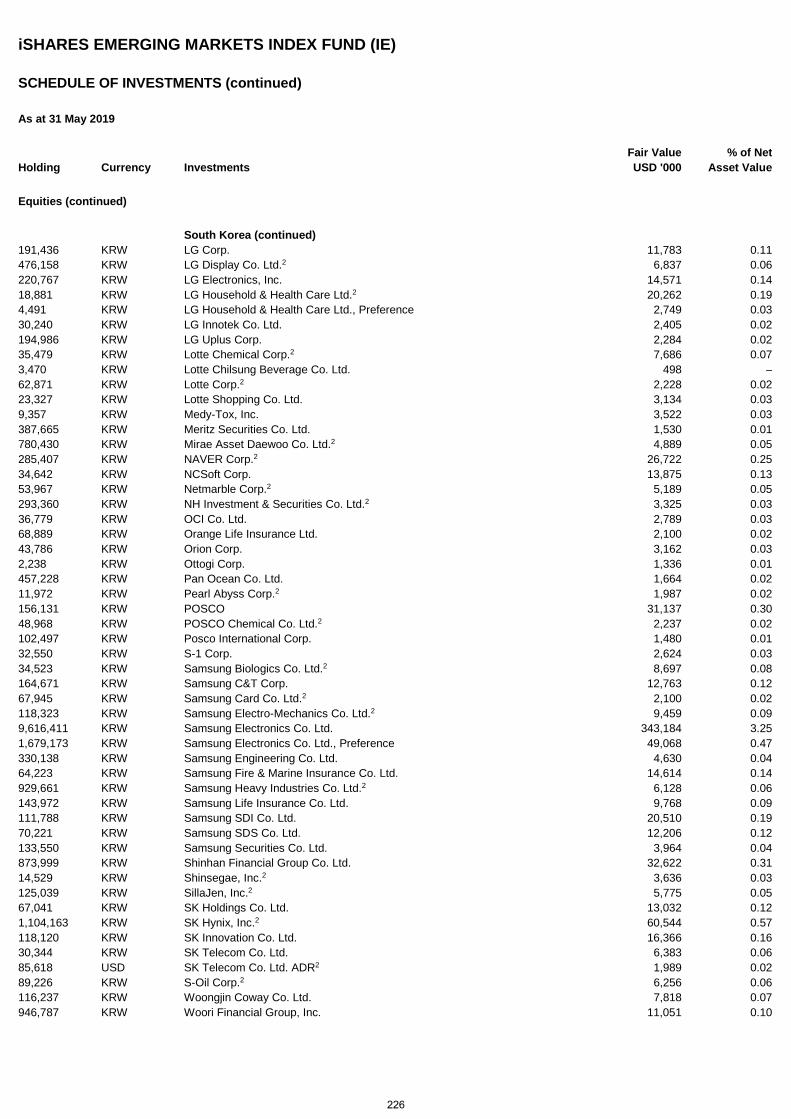
iSHARES EMERGING MARKETS INDEX FUND (IE)
SCHEDULE OF INVESTMENTS (continued)
As at 31 May 2019
Holding Currency Investments Fair Value USD '000
% of Net Asset Value
Equities (continued)
South Korea (continued) 191,436 KRW LG Corp. 11,783 0.11 476,158 KRW LG Display Co. Ltd.2 6,837 0.06 220,767 KRW LG Electronics, Inc. 14,571 0.14 18,881 KRW LG Household & Health Care Ltd.2 20,262 0.19 4,491 KRW LG Household & Health Care Ltd., Preference 2,749 0.03 30,240 KRW LG Innotek Co. Ltd. 2,405 0.02 194,986 KRW LG Uplus Corp. 2,284 0.02 35,479 KRW Lotte Chemical Corp.2 7,686 0.07 3,470 KRW Lotte Chilsung Beverage Co. Ltd. 498 – 62,871 KRW Lotte Corp.2 2,228 0.02 23,327 KRW Lotte Shopping Co. Ltd. 3,134 0.03 9,357 KRW Medy-Tox, Inc. 3,522 0.03 387,665 KRW Meritz Securities Co. Ltd. 1,530 0.01 780,430 KRW Mirae Asset Daewoo Co. Ltd.2 4,889 0.05 285,407 KRW NAVER Corp.2 26,722 0.25 34,642 KRW NCSoft Corp. 13,875 0.13 53,967 KRW Netmarble Corp.2 5,189 0.05 293,360 KRW NH Investment & Securities Co. Ltd.2 3,325 0.03 36,779 KRW OCI Co. Ltd. 2,789 0.03 68,889 KRW Orange Life Insurance Ltd. 2,100 0.02 43,786 KRW Orion Corp. 3,162 0.03 2,238 KRW Ottogi Corp. 1,336 0.01 457,228 KRW Pan Ocean Co. Ltd. 1,664 0.02 11,972 KRW Pearl Abyss Corp.2 1,987 0.02 156,131 KRW POSCO 31,137 0.30 48,968 KRW POSCO Chemical Co. Ltd.2 2,237 0.02 102,497 KRW Posco International Corp. 1,480 0.01 32,550 KRW S-1 Corp. 2,624 0.03 34,523 KRW Samsung Biologics Co. Ltd.2 8,697 0.08 164,671 KRW Samsung C&T Corp. 12,763 0.12 67,945 KRW Samsung Card Co. Ltd.2 2,100 0.02 118,323 KRW Samsung Electro-Mechanics Co. Ltd.2 9,459 0.09 9,616,411 KRW Samsung Electronics Co. Ltd. 343,184 3.25 1,679,173 KRW Samsung Electronics Co. Ltd., Preference 49,068 0.47 330,138 KRW Samsung Engineering Co. Ltd. 4,630 0.04 64,223 KRW Samsung Fire & Marine Insurance Co. Ltd. 14,614 0.14 929,661 KRW Samsung Heavy Industries Co. Ltd.2 6,128 0.06 143,972 KRW Samsung Life Insurance Co. Ltd. 9,768 0.09 111,788 KRW Samsung SDI Co. Ltd. 20,510 0.19 70,221 KRW Samsung SDS Co. Ltd. 12,206 0.12 133,550 KRW Samsung Securities Co. Ltd. 3,964 0.04 873,999 KRW Shinhan Financial Group Co. Ltd. 32,622 0.31 14,529 KRW Shinsegae, Inc.2 3,636 0.03 125,039 KRW SillaJen, Inc.2 5,775 0.05 67,041 KRW SK Holdings Co. Ltd. 13,032 0.12 1,104,163 KRW SK Hynix, Inc.2 60,544 0.57 118,120 KRW SK Innovation Co. Ltd. 16,366 0.16 30,344 KRW SK Telecom Co. Ltd. 6,383 0.06 85,618 USD SK Telecom Co. Ltd. ADR2 1,989 0.02 89,226 KRW S-Oil Corp.2 6,256 0.06 116,237 KRW Woongjin Coway Co. Ltd. 7,818 0.07 946,787 KRW Woori Financial Group, Inc. 11,051 0.10
226
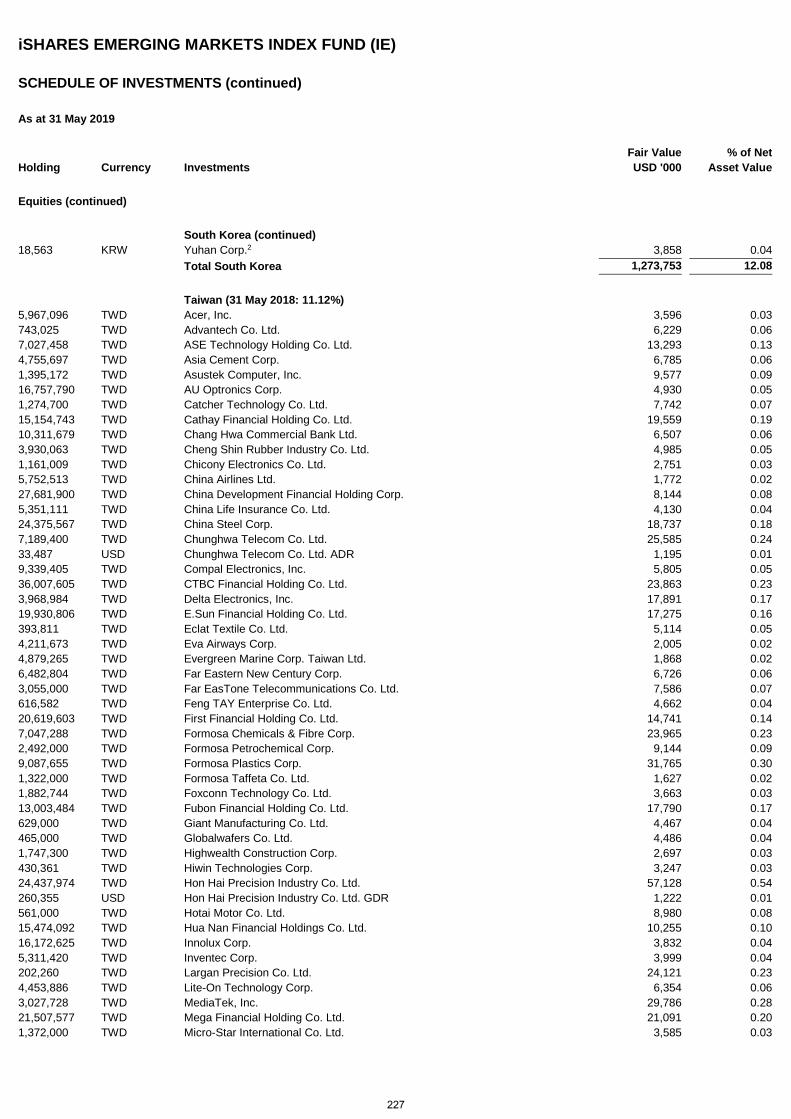
iSHARES EMERGING MARKETS INDEX FUND (IE)
SCHEDULE OF INVESTMENTS (continued)
As at 31 May 2019
Holding Currency Investments Fair Value USD '000
% of Net Asset Value
Equities (continued)
South Korea (continued) 18,563 KRW Yuhan Corp.2 3,858 0.04 Total South Korea 1,273,753 12.08
Taiwan (31 May 2018: 11.12%) 5,967,096 TWD Acer, Inc. 3,596 0.03 743,025 TWD Advantech Co. Ltd. 6,229 0.06 7,027,458 TWD ASE Technology Holding Co. Ltd. 13,293 0.13 4,755,697 TWD Asia Cement Corp. 6,785 0.06 1,395,172 TWD Asustek Computer, Inc. 9,577 0.09 16,757,790 TWD AU Optronics Corp. 4,930 0.05 1,274,700 TWD Catcher Technology Co. Ltd. 7,742 0.07 15,154,743 TWD Cathay Financial Holding Co. Ltd. 19,559 0.19 10,311,679 TWD Chang Hwa Commercial Bank Ltd. 6,507 0.06 3,930,063 TWD Cheng Shin Rubber Industry Co. Ltd. 4,985 0.05 1,161,009 TWD Chicony Electronics Co. Ltd. 2,751 0.03 5,752,513 TWD China Airlines Ltd. 1,772 0.02 27,681,900 TWD China Development Financial Holding Corp. 8,144 0.08 5,351,111 TWD China Life Insurance Co. Ltd. 4,130 0.04 24,375,567 TWD China Steel Corp. 18,737 0.18 7,189,400 TWD Chunghwa Telecom Co. Ltd. 25,585 0.24 33,487 USD Chunghwa Telecom Co. Ltd. ADR 1,195 0.01 9,339,405 TWD Compal Electronics, Inc. 5,805 0.05 36,007,605 TWD CTBC Financial Holding Co. Ltd. 23,863 0.23 3,968,984 TWD Delta Electronics, Inc. 17,891 0.17 19,930,806 TWD E.Sun Financial Holding Co. Ltd. 17,275 0.16 393,811 TWD Eclat Textile Co. Ltd. 5,114 0.05 4,211,673 TWD Eva Airways Corp. 2,005 0.02 4,879,265 TWD Evergreen Marine Corp. Taiwan Ltd. 1,868 0.02 6,482,804 TWD Far Eastern New Century Corp. 6,726 0.06 3,055,000 TWD Far EasTone Telecommunications Co. Ltd. 7,586 0.07 616,582 TWD Feng TAY Enterprise Co. Ltd. 4,662 0.04 20,619,603 TWD First Financial Holding Co. Ltd. 14,741 0.14 7,047,288 TWD Formosa Chemicals & Fibre Corp. 23,965 0.23 2,492,000 TWD Formosa Petrochemical Corp. 9,144 0.09 9,087,655 TWD Formosa Plastics Corp. 31,765 0.30 1,322,000 TWD Formosa Taffeta Co. Ltd. 1,627 0.02 1,882,744 TWD Foxconn Technology Co. Ltd. 3,663 0.03 13,003,484 TWD Fubon Financial Holding Co. Ltd. 17,790 0.17 629,000 TWD Giant Manufacturing Co. Ltd. 4,467 0.04 465,000 TWD Globalwafers Co. Ltd. 4,486 0.04 1,747,300 TWD Highwealth Construction Corp. 2,697 0.03 430,361 TWD Hiwin Technologies Corp. 3,247 0.03 24,437,974 TWD Hon Hai Precision Industry Co. Ltd. 57,128 0.54 260,355 USD Hon Hai Precision Industry Co. Ltd. GDR 1,222 0.01 561,000 TWD Hotai Motor Co. Ltd. 8,980 0.08 15,474,092 TWD Hua Nan Financial Holdings Co. Ltd. 10,255 0.10 16,172,625 TWD Innolux Corp. 3,832 0.04 5,311,420 TWD Inventec Corp. 3,999 0.04 202,260 TWD Largan Precision Co. Ltd. 24,121 0.23 4,453,886 TWD Lite-On Technology Corp. 6,354 0.06 3,027,728 TWD MediaTek, Inc. 29,786 0.28 21,507,577 TWD Mega Financial Holding Co. Ltd. 21,091 0.20 1,372,000 TWD Micro-Star International Co. Ltd. 3,585 0.03
227
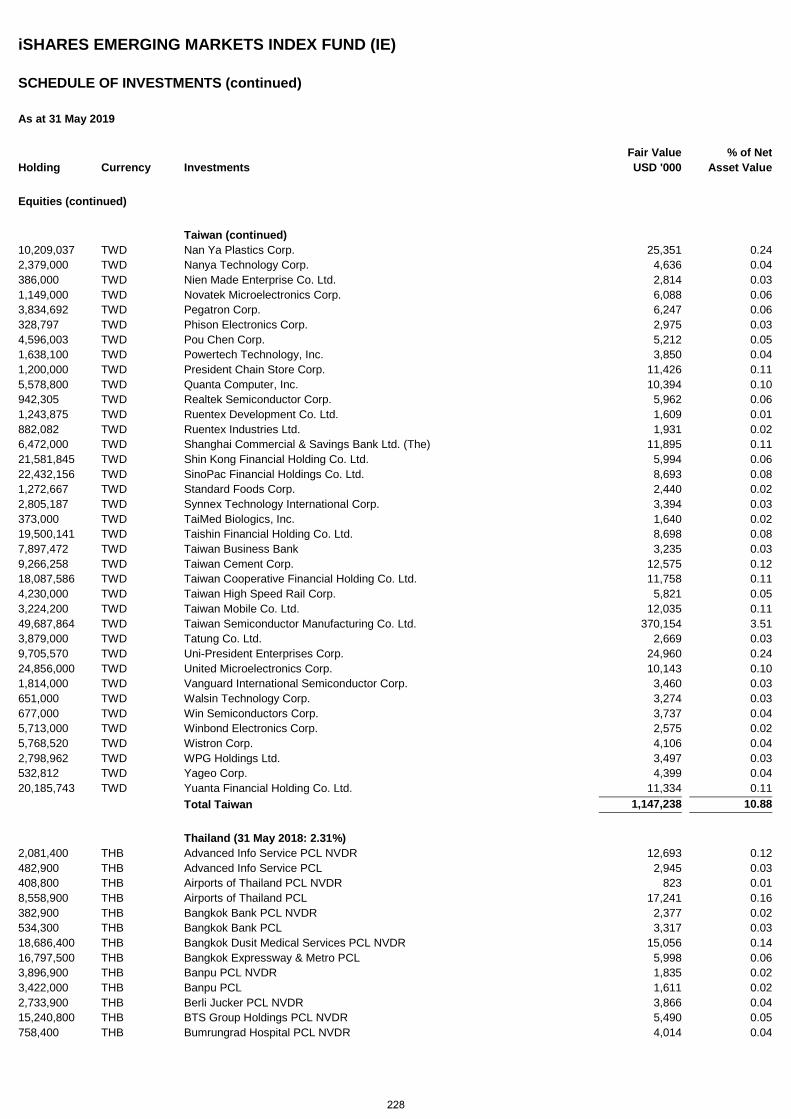
iSHARES EMERGING MARKETS INDEX FUND (IE)
SCHEDULE OF INVESTMENTS (continued)
As at 31 May 2019
Holding Currency Investments Fair Value USD '000
% of Net Asset Value
Equities (continued)
Taiwan (continued) 10,209,037 TWD Nan Ya Plastics Corp. 25,351 0.24 2,379,000 TWD Nanya Technology Corp. 4,636 0.04 386,000 TWD Nien Made Enterprise Co. Ltd. 2,814 0.03 1,149,000 TWD Novatek Microelectronics Corp. 6,088 0.06 3,834,692 TWD Pegatron Corp. 6,247 0.06 328,797 TWD Phison Electronics Corp. 2,975 0.03 4,596,003 TWD Pou Chen Corp. 5,212 0.05 1,638,100 TWD Powertech Technology, Inc. 3,850 0.04 1,200,000 TWD President Chain Store Corp. 11,426 0.11 5,578,800 TWD Quanta Computer, Inc. 10,394 0.10 942,305 TWD Realtek Semiconductor Corp. 5,962 0.06 1,243,875 TWD Ruentex Development Co. Ltd. 1,609 0.01 882,082 TWD Ruentex Industries Ltd. 1,931 0.02 6,472,000 TWD Shanghai Commercial & Savings Bank Ltd. (The) 11,895 0.11 21,581,845 TWD Shin Kong Financial Holding Co. Ltd. 5,994 0.06 22,432,156 TWD SinoPac Financial Holdings Co. Ltd. 8,693 0.08 1,272,667 TWD Standard Foods Corp. 2,440 0.02 2,805,187 TWD Synnex Technology International Corp. 3,394 0.03 373,000 TWD TaiMed Biologics, Inc. 1,640 0.02 19,500,141 TWD Taishin Financial Holding Co. Ltd. 8,698 0.08 7,897,472 TWD Taiwan Business Bank 3,235 0.03 9,266,258 TWD Taiwan Cement Corp. 12,575 0.12 18,087,586 TWD Taiwan Cooperative Financial Holding Co. Ltd. 11,758 0.11 4,230,000 TWD Taiwan High Speed Rail Corp. 5,821 0.05 3,224,200 TWD Taiwan Mobile Co. Ltd. 12,035 0.11 49,687,864 TWD Taiwan Semiconductor Manufacturing Co. Ltd. 370,154 3.51 3,879,000 TWD Tatung Co. Ltd. 2,669 0.03 9,705,570 TWD Uni-President Enterprises Corp. 24,960 0.24 24,856,000 TWD United Microelectronics Corp. 10,143 0.10 1,814,000 TWD Vanguard International Semiconductor Corp. 3,460 0.03 651,000 TWD Walsin Technology Corp. 3,274 0.03 677,000 TWD Win Semiconductors Corp. 3,737 0.04 5,713,000 TWD Winbond Electronics Corp. 2,575 0.02 5,768,520 TWD Wistron Corp. 4,106 0.04 2,798,962 TWD WPG Holdings Ltd. 3,497 0.03 532,812 TWD Yageo Corp. 4,399 0.04 20,185,743 TWD Yuanta Financial Holding Co. Ltd. 11,334 0.11 Total Taiwan 1,147,238 10.88
Thailand (31 May 2018: 2.31%) 2,081,400 THB Advanced Info Service PCL NVDR 12,693 0.12 482,900 THB Advanced Info Service PCL 2,945 0.03 408,800 THB Airports of Thailand PCL NVDR 823 0.01 8,558,900 THB Airports of Thailand PCL 17,241 0.16 382,900 THB Bangkok Bank PCL NVDR 2,377 0.02 534,300 THB Bangkok Bank PCL 3,317 0.03 18,686,400 THB Bangkok Dusit Medical Services PCL NVDR 15,056 0.14 16,797,500 THB Bangkok Expressway & Metro PCL 5,998 0.06 3,896,900 THB Banpu PCL NVDR 1,835 0.02 3,422,000 THB Banpu PCL 1,611 0.02 2,733,900 THB Berli Jucker PCL NVDR 3,866 0.04 15,240,800 THB BTS Group Holdings PCL NVDR 5,490 0.05 758,400 THB Bumrungrad Hospital PCL NVDR 4,014 0.04
228
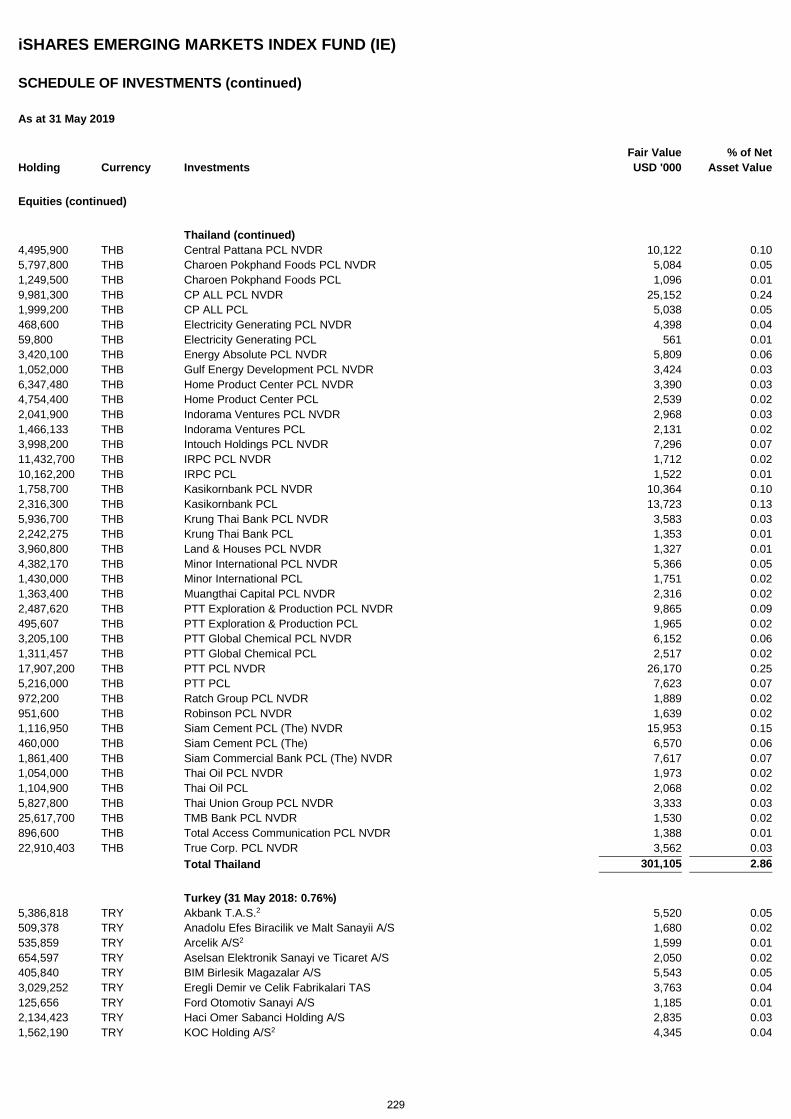
iSHARES EMERGING MARKETS INDEX FUND (IE)
SCHEDULE OF INVESTMENTS (continued)
As at 31 May 2019
Holding Currency Investments Fair Value USD '000
% of Net Asset Value
Equities (continued)
Thailand (continued) 4,495,900 THB Central Pattana PCL NVDR 10,122 0.10 5,797,800 THB Charoen Pokphand Foods PCL NVDR 5,084 0.05 1,249,500 THB Charoen Pokphand Foods PCL 1,096 0.01 9,981,300 THB CP ALL PCL NVDR 25,152 0.24 1,999,200 THB CP ALL PCL 5,038 0.05 468,600 THB Electricity Generating PCL NVDR 4,398 0.04 59,800 THB Electricity Generating PCL 561 0.01 3,420,100 THB Energy Absolute PCL NVDR 5,809 0.06 1,052,000 THB Gulf Energy Development PCL NVDR 3,424 0.03 6,347,480 THB Home Product Center PCL NVDR 3,390 0.03 4,754,400 THB Home Product Center PCL 2,539 0.02 2,041,900 THB Indorama Ventures PCL NVDR 2,968 0.03 1,466,133 THB Indorama Ventures PCL 2,131 0.02 3,998,200 THB Intouch Holdings PCL NVDR 7,296 0.07 11,432,700 THB IRPC PCL NVDR 1,712 0.02 10,162,200 THB IRPC PCL 1,522 0.01 1,758,700 THB Kasikornbank PCL NVDR 10,364 0.10 2,316,300 THB Kasikornbank PCL 13,723 0.13 5,936,700 THB Krung Thai Bank PCL NVDR 3,583 0.03 2,242,275 THB Krung Thai Bank PCL 1,353 0.01 3,960,800 THB Land & Houses PCL NVDR 1,327 0.01 4,382,170 THB Minor International PCL NVDR 5,366 0.05 1,430,000 THB Minor International PCL 1,751 0.02 1,363,400 THB Muangthai Capital PCL NVDR 2,316 0.02 2,487,620 THB PTT Exploration & Production PCL NVDR 9,865 0.09 495,607 THB PTT Exploration & Production PCL 1,965 0.02 3,205,100 THB PTT Global Chemical PCL NVDR 6,152 0.06 1,311,457 THB PTT Global Chemical PCL 2,517 0.02 17,907,200 THB PTT PCL NVDR 26,170 0.25 5,216,000 THB PTT PCL 7,623 0.07 972,200 THB Ratch Group PCL NVDR 1,889 0.02 951,600 THB Robinson PCL NVDR 1,639 0.02 1,116,950 THB Siam Cement PCL (The) NVDR 15,953 0.15 460,000 THB Siam Cement PCL (The) 6,570 0.06 1,861,400 THB Siam Commercial Bank PCL (The) NVDR 7,617 0.07 1,054,000 THB Thai Oil PCL NVDR 1,973 0.02 1,104,900 THB Thai Oil PCL 2,068 0.02 5,827,800 THB Thai Union Group PCL NVDR 3,333 0.03 25,617,700 THB TMB Bank PCL NVDR 1,530 0.02 896,600 THB Total Access Communication PCL NVDR 1,388 0.01 22,910,403 THB True Corp. PCL NVDR 3,562 0.03 Total Thailand 301,105 2.86
Turkey (31 May 2018: 0.76%) 5,386,818 TRY Akbank T.A.S.2 5,520 0.05 509,378 TRY Anadolu Efes Biracilik ve Malt Sanayii A/S 1,680 0.02 535,859 TRY Arcelik A/S2 1,599 0.01 654,597 TRY Aselsan Elektronik Sanayi ve Ticaret A/S 2,050 0.02 405,840 TRY BIM Birlesik Magazalar A/S 5,543 0.05 3,029,252 TRY Eregli Demir ve Celik Fabrikalari TAS 3,763 0.04 125,656 TRY Ford Otomotiv Sanayi A/S 1,185 0.01 2,134,423 TRY Haci Omer Sabanci Holding A/S 2,835 0.03 1,562,190 TRY KOC Holding A/S2 4,345 0.04
229
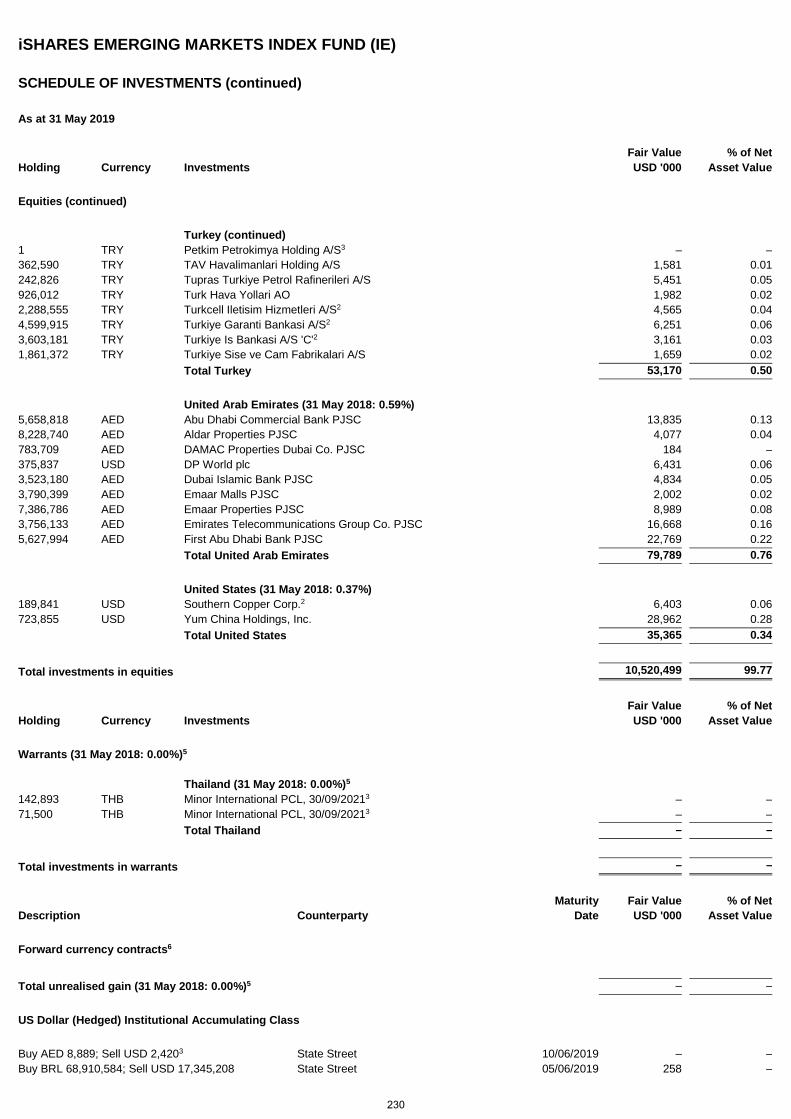
iSHARES EMERGING MARKETS INDEX FUND (IE)
SCHEDULE OF INVESTMENTS (continued)
As at 31 May 2019
Holding Currency Investments Fair Value USD '000
% of Net Asset Value
Equities (continued)
Turkey (continued) 1 TRY Petkim Petrokimya Holding A/S3 – – 362,590 TRY TAV Havalimanlari Holding A/S 1,581 0.01 242,826 TRY Tupras Turkiye Petrol Rafinerileri A/S 5,451 0.05 926,012 TRY Turk Hava Yollari AO 1,982 0.02 2,288,555 TRY Turkcell Iletisim Hizmetleri A/S2 4,565 0.04 4,599,915 TRY Turkiye Garanti Bankasi A/S2 6,251 0.06 3,603,181 TRY Turkiye Is Bankasi A/S 'C'2 3,161 0.03 1,861,372 TRY Turkiye Sise ve Cam Fabrikalari A/S 1,659 0.02 Total Turkey 53,170 0.50
United Arab Emirates (31 May 2018: 0.59%) 5,658,818 AED Abu Dhabi Commercial Bank PJSC 13,835 0.13 8,228,740 AED Aldar Properties PJSC 4,077 0.04 783,709 AED DAMAC Properties Dubai Co. PJSC 184 – 375,837 USD DP World plc 6,431 0.06 3,523,180 AED Dubai Islamic Bank PJSC 4,834 0.05 3,790,399 AED Emaar Malls PJSC 2,002 0.02 7,386,786 AED Emaar Properties PJSC 8,989 0.08 3,756,133 AED Emirates Telecommunications Group Co. PJSC 16,668 0.16 5,627,994 AED First Abu Dhabi Bank PJSC 22,769 0.22 Total United Arab Emirates 79,789 0.76
United States (31 May 2018: 0.37%) 189,841 USD Southern Copper Corp.2 6,403 0.06 723,855 USD Yum China Holdings, Inc. 28,962 0.28 Total United States 35,365 0.34
Total investments in equities 10,520,499 99.77
Holding Currency Investments Fair Value USD '000
% of Net Asset Value
Warrants (31 May 2018: 0.00%)5 Thailand (31 May 2018: 0.00%)5 142,893 THB Minor International PCL, 30/09/20213 – – 71,500 THB Minor International PCL, 30/09/20213 – – Total Thailand – –
Total investments in warrants – –
Maturity Fair Value % of Net Description Counterparty Date USD '000 Asset Value
Forward currency contracts6
Total unrealised gain (31 May 2018: 0.00%)5 – –
US Dollar (Hedged) Institutional Accumulating Class
Buy AED 8,889; Sell USD 2,4203 State Street 10/06/2019 – – Buy BRL 68,910,584; Sell USD 17,345,208 State Street 05/06/2019 258 –
230
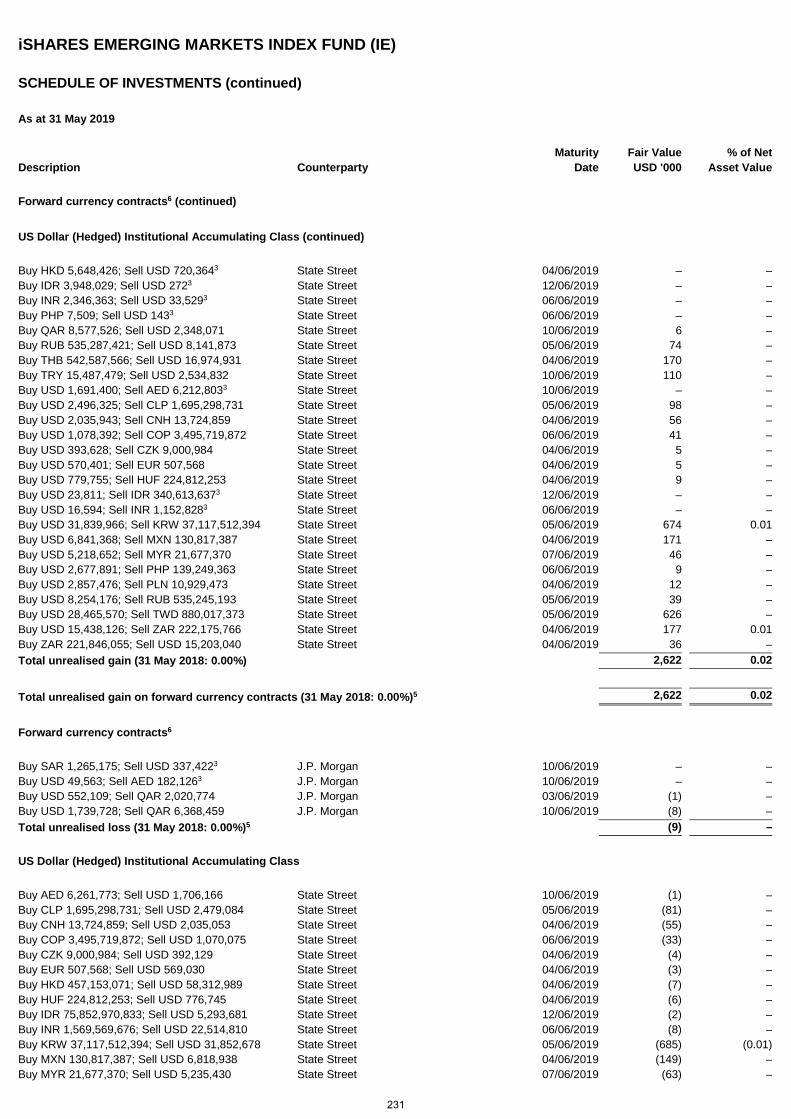
iSHARES EMERGING MARKETS INDEX FUND (IE)
SCHEDULE OF INVESTMENTS (continued)
As at 31 May 2019
Maturity Fair Value % of Net Description Counterparty Date USD '000 Asset Value
Forward currency contracts6 (continued)
US Dollar (Hedged) Institutional Accumulating Class (continued)
Buy HKD 5,648,426; Sell USD 720,3643 State Street 04/06/2019 – – Buy IDR 3,948,029; Sell USD 2723 State Street 12/06/2019 – – Buy INR 2,346,363; Sell USD 33,5293 State Street 06/06/2019 – – Buy PHP 7,509; Sell USD 1433 State Street 06/06/2019 – – Buy QAR 8,577,526; Sell USD 2,348,071 State Street 10/06/2019 6 – Buy RUB 535,287,421; Sell USD 8,141,873 State Street 05/06/2019 74 – Buy THB 542,587,566; Sell USD 16,974,931 State Street 04/06/2019 170 – Buy TRY 15,487,479; Sell USD 2,534,832 State Street 10/06/2019 110 – Buy USD 1,691,400; Sell AED 6,212,8033 State Street 10/06/2019 – – Buy USD 2,496,325; Sell CLP 1,695,298,731 State Street 05/06/2019 98 – Buy USD 2,035,943; Sell CNH 13,724,859 State Street 04/06/2019 56 – Buy USD 1,078,392; Sell COP 3,495,719,872 State Street 06/06/2019 41 – Buy USD 393,628; Sell CZK 9,000,984 State Street 04/06/2019 5 – Buy USD 570,401; Sell EUR 507,568 State Street 04/06/2019 5 – Buy USD 779,755; Sell HUF 224,812,253 State Street 04/06/2019 9 – Buy USD 23,811; Sell IDR 340,613,6373 State Street 12/06/2019 – – Buy USD 16,594; Sell INR 1,152,8283 State Street 06/06/2019 – – Buy USD 31,839,966; Sell KRW 37,117,512,394 State Street 05/06/2019 674 0.01 Buy USD 6,841,368; Sell MXN 130,817,387 State Street 04/06/2019 171 – Buy USD 5,218,652; Sell MYR 21,677,370 State Street 07/06/2019 46 – Buy USD 2,677,891; Sell PHP 139,249,363 State Street 06/06/2019 9 – Buy USD 2,857,476; Sell PLN 10,929,473 State Street 04/06/2019 12 – Buy USD 8,254,176; Sell RUB 535,245,193 State Street 05/06/2019 39 – Buy USD 28,465,570; Sell TWD 880,017,373 State Street 05/06/2019 626 – Buy USD 15,438,126; Sell ZAR 222,175,766 State Street 04/06/2019 177 0.01 Buy ZAR 221,846,055; Sell USD 15,203,040 State Street 04/06/2019 36 – Total unrealised gain (31 May 2018: 0.00%) 2,622 0.02
Total unrealised gain on forward currency contracts (31 May 2018: 0.00%)5 2,622 0.02
Forward currency contracts6
Buy SAR 1,265,175; Sell USD 337,4223 J.P. Morgan 10/06/2019 – – Buy USD 49,563; Sell AED 182,1263 J.P. Morgan 10/06/2019 – – Buy USD 552,109; Sell QAR 2,020,774 J.P. Morgan 03/06/2019 (1) – Buy USD 1,739,728; Sell QAR 6,368,459 J.P. Morgan 10/06/2019 (8) – Total unrealised loss (31 May 2018: 0.00%)5 (9) –
US Dollar (Hedged) Institutional Accumulating Class
Buy AED 6,261,773; Sell USD 1,706,166 State Street 10/06/2019 (1) – Buy CLP 1,695,298,731; Sell USD 2,479,084 State Street 05/06/2019 (81) – Buy CNH 13,724,859; Sell USD 2,035,053 State Street 04/06/2019 (55) – Buy COP 3,495,719,872; Sell USD 1,070,075 State Street 06/06/2019 (33) – Buy CZK 9,000,984; Sell USD 392,129 State Street 04/06/2019 (4) – Buy EUR 507,568; Sell USD 569,030 State Street 04/06/2019 (3) – Buy HKD 457,153,071; Sell USD 58,312,989 State Street 04/06/2019 (7) – Buy HUF 224,812,253; Sell USD 776,745 State Street 04/06/2019 (6) – Buy IDR 75,852,970,833; Sell USD 5,293,681 State Street 12/06/2019 (2) – Buy INR 1,569,569,676; Sell USD 22,514,810 State Street 06/06/2019 (8) – Buy KRW 37,117,512,394; Sell USD 31,852,678 State Street 05/06/2019 (685) (0.01) Buy MXN 130,817,387; Sell USD 6,818,938 State Street 04/06/2019 (149) – Buy MYR 21,677,370; Sell USD 5,235,430 State Street 07/06/2019 (63) –
231
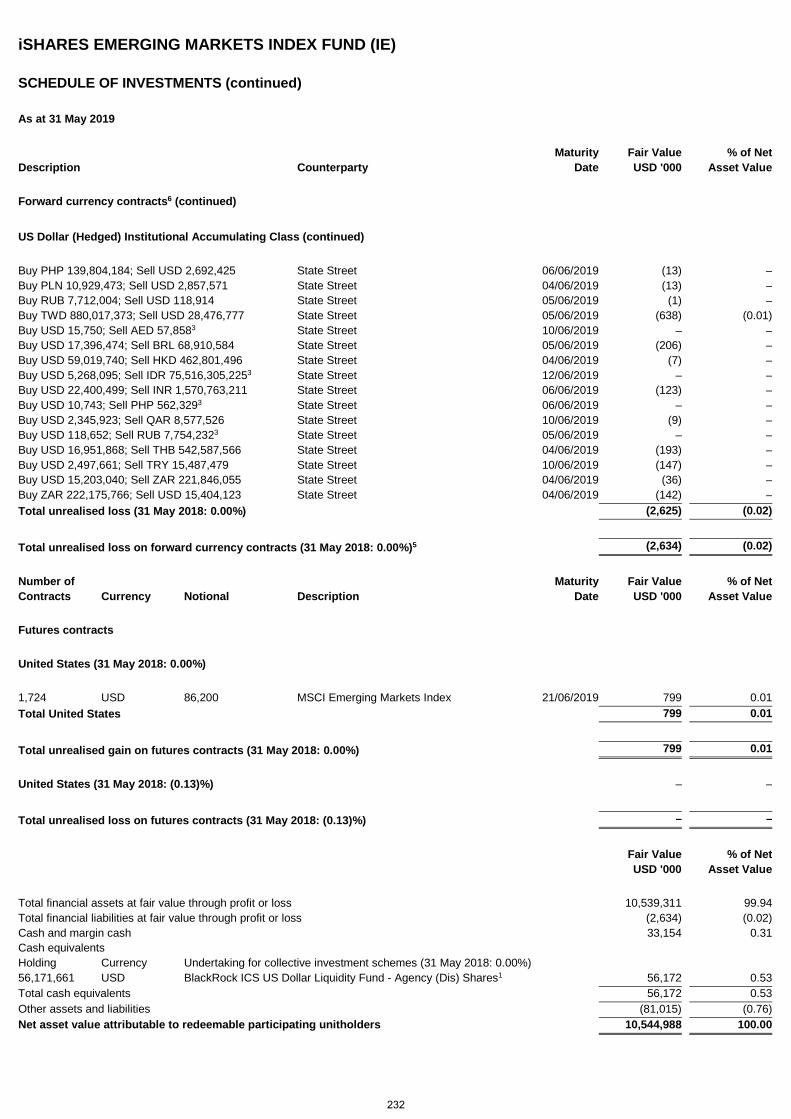
iSHARES EMERGING MARKETS INDEX FUND (IE)
SCHEDULE OF INVESTMENTS (continued)
As at 31 May 2019
Maturity Fair Value % of Net Description Counterparty Date USD '000 Asset Value
Forward currency contracts6 (continued)
US Dollar (Hedged) Institutional Accumulating Class (continued)
Buy PHP 139,804,184; Sell USD 2,692,425 State Street 06/06/2019 (13) – Buy PLN 10,929,473; Sell USD 2,857,571 State Street 04/06/2019 (13) – Buy RUB 7,712,004; Sell USD 118,914 State Street 05/06/2019 (1) – Buy TWD 880,017,373; Sell USD 28,476,777 State Street 05/06/2019 (638) (0.01) Buy USD 15,750; Sell AED 57,8583 State Street 10/06/2019 – – Buy USD 17,396,474; Sell BRL 68,910,584 State Street 05/06/2019 (206) – Buy USD 59,019,740; Sell HKD 462,801,496 State Street 04/06/2019 (7) – Buy USD 5,268,095; Sell IDR 75,516,305,2253 State Street 12/06/2019 – – Buy USD 22,400,499; Sell INR 1,570,763,211 State Street 06/06/2019 (123) – Buy USD 10,743; Sell PHP 562,3293 State Street 06/06/2019 – – Buy USD 2,345,923; Sell QAR 8,577,526 State Street 10/06/2019 (9) – Buy USD 118,652; Sell RUB 7,754,2323 State Street 05/06/2019 – – Buy USD 16,951,868; Sell THB 542,587,566 State Street 04/06/2019 (193) – Buy USD 2,497,661; Sell TRY 15,487,479 State Street 10/06/2019 (147) – Buy USD 15,203,040; Sell ZAR 221,846,055 State Street 04/06/2019 (36) – Buy ZAR 222,175,766; Sell USD 15,404,123 State Street 04/06/2019 (142) – Total unrealised loss (31 May 2018: 0.00%) (2,625) (0.02)
Total unrealised loss on forward currency contracts (31 May 2018: 0.00%)5 (2,634) (0.02)
Number of Maturity Fair Value % of Net Contracts Currency Notional Description Date USD '000 Asset Value
Futures contracts
United States (31 May 2018: 0.00%)
1,724 USD 86,200 MSCI Emerging Markets Index 21/06/2019 799 0.01 Total United States 799 0.01
Total unrealised gain on futures contracts (31 May 2018: 0.00%) 799 0.01
United States (31 May 2018: (0.13)%) – –
Total unrealised loss on futures contracts (31 May 2018: (0.13)%) – –
Fair Value USD '000
% of Net Asset Value
Total financial assets at fair value through profit or loss 10,539,311 99.94 Total financial liabilities at fair value through profit or loss (2,634) (0.02) Cash and margin cash 33,154 0.31 Cash equivalents Holding Currency Undertaking for collective investment schemes (31 May 2018: 0.00%) 56,171,661 USD BlackRock ICS US Dollar Liquidity Fund - Agency (Dis) Shares1 56,172 0.53 Total cash equivalents 56,172 0.53 Other assets and liabilities (81,015) (0.76) Net asset value attributable to redeemable participating unitholders 10,544,988 100.00
232
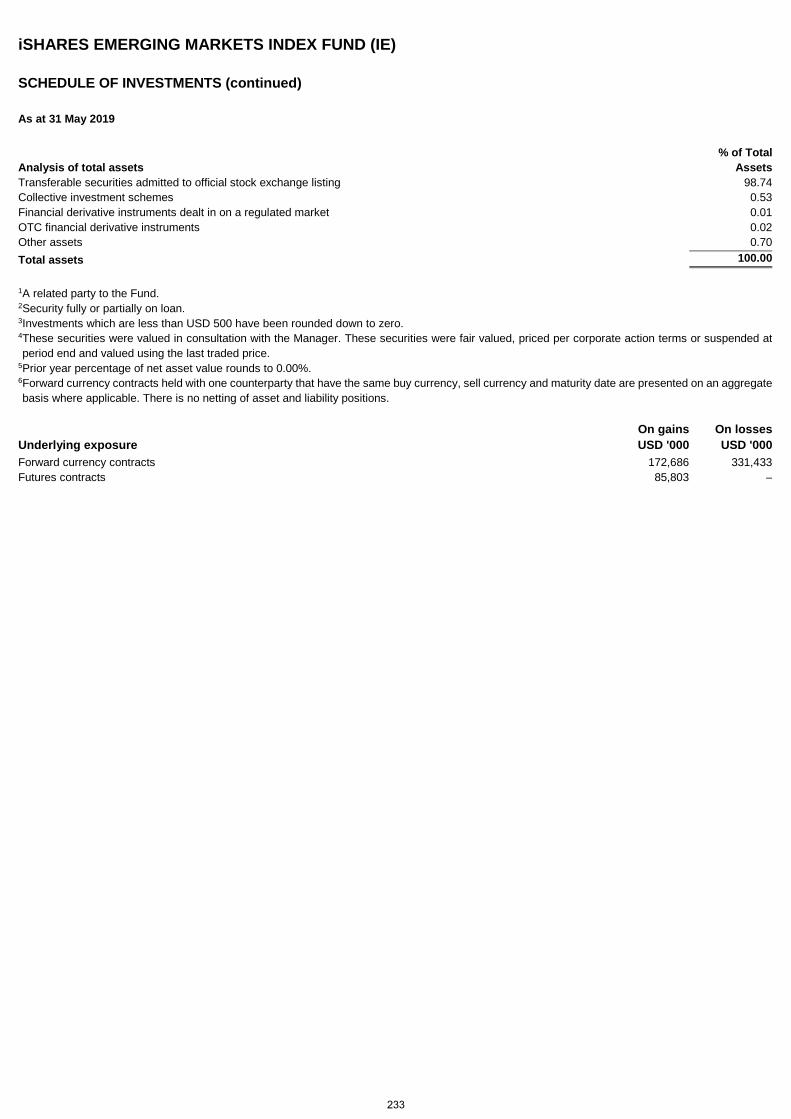
iSHARES EMERGING MARKETS INDEX FUND (IE)
SCHEDULE OF INVESTMENTS (continued)
As at 31 May 2019
Analysis of total assets % of Total
Assets Transferable securities admitted to official stock exchange listing 98.74 Collective investment schemes 0.53 Financial derivative instruments dealt in on a regulated market 0.01 OTC financial derivative instruments 0.02 Other assets 0.70 Total assets 100.00
1 A related party to the Fund. 2 Security fully or partially on loan. 3 Investments which are less than USD 500 have been rounded down to zero. 4 These securities were valued in consultation with the Manager. These securities were fair valued, priced per corporate action terms or suspended at period end and valued using the last traded price.
5 Prior year percentage of net asset value rounds to 0.00%. 6 Forward currency contracts held with one counterparty that have the same buy currency, sell currency and maturity date are presented on an aggregate basis where applicable. There is no netting of asset and liability positions.
Underlying exposure On gains USD '000
On losses USD '000
Forward currency contracts 172,686 331,433 Futures contracts 85,803 –
233
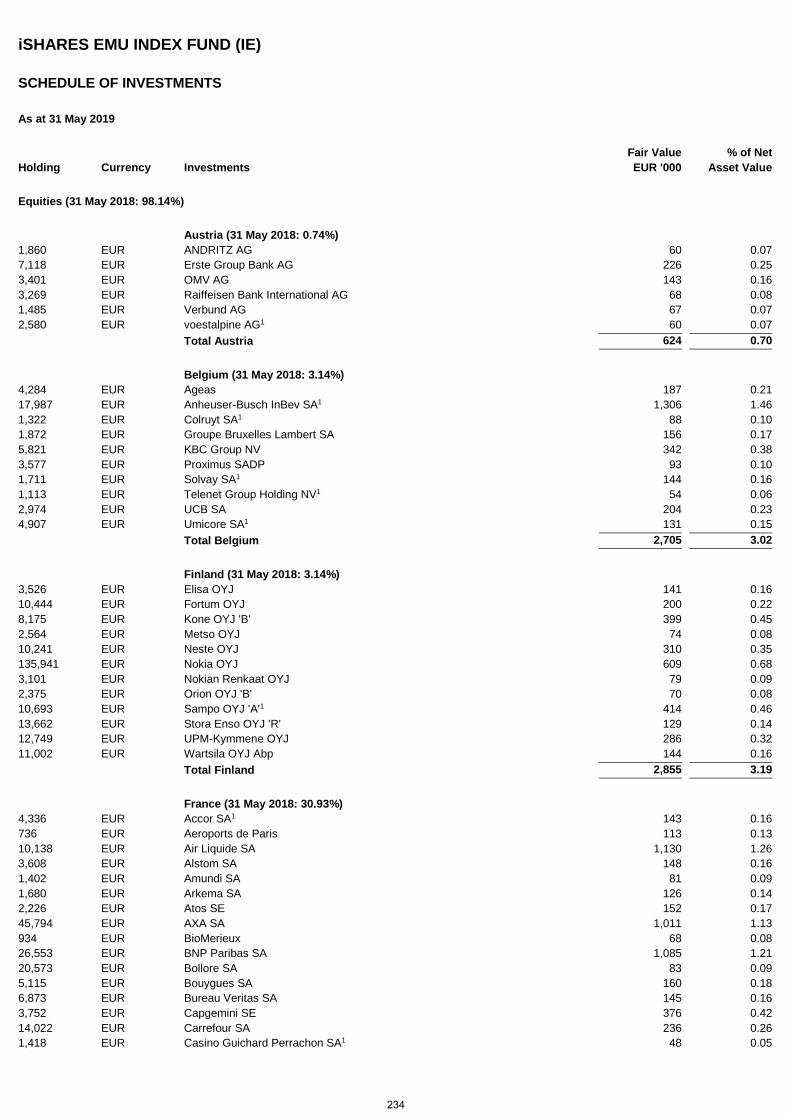
iSHARES EMU INDEX FUND (IE)
SCHEDULE OF INVESTMENTS
As at 31 May 2019
Holding Currency Investments Fair Value EUR '000
% of Net Asset Value
Equities (31 May 2018: 98.14%)
Austria (31 May 2018: 0.74%) 1,860 EUR ANDRITZ AG 60 0.07 7,118 EUR Erste Group Bank AG 226 0.25 3,401 EUR OMV AG 143 0.16 3,269 EUR Raiffeisen Bank International AG 68 0.08 1,485 EUR Verbund AG 67 0.07 2,580 EUR voestalpine AG1 60 0.07 Total Austria 624 0.70
Belgium (31 May 2018: 3.14%) 4,284 EUR Ageas 187 0.21 17,987 EUR Anheuser-Busch InBev SA1 1,306 1.46 1,322 EUR Colruyt SA1 88 0.10 1,872 EUR Groupe Bruxelles Lambert SA 156 0.17 5,821 EUR KBC Group NV 342 0.38 3,577 EUR Proximus SADP 93 0.10 1,711 EUR Solvay SA1 144 0.16 1,113 EUR Telenet Group Holding NV1 54 0.06 2,974 EUR UCB SA 204 0.23 4,907 EUR Umicore SA1 131 0.15 Total Belgium 2,705 3.02
Finland (31 May 2018: 3.14%) 3,526 EUR Elisa OYJ 141 0.16 10,444 EUR Fortum OYJ 200 0.22 8,175 EUR Kone OYJ 'B' 399 0.45 2,564 EUR Metso OYJ 74 0.08 10,241 EUR Neste OYJ 310 0.35 135,941 EUR Nokia OYJ 609 0.68 3,101 EUR Nokian Renkaat OYJ 79 0.09 2,375 EUR Orion OYJ 'B' 70 0.08 10,693 EUR Sampo OYJ 'A'1 414 0.46 13,662 EUR Stora Enso OYJ 'R' 129 0.14 12,749 EUR UPM-Kymmene OYJ 286 0.32 11,002 EUR Wartsila OYJ Abp 144 0.16 Total Finland 2,855 3.19
France (31 May 2018: 30.93%) 4,336 EUR Accor SA1 143 0.16 736 EUR Aeroports de Paris 113 0.13 10,138 EUR Air Liquide SA 1,130 1.26 3,608 EUR Alstom SA 148 0.16 1,402 EUR Amundi SA 81 0.09 1,680 EUR Arkema SA 126 0.14 2,226 EUR Atos SE 152 0.17 45,794 EUR AXA SA 1,011 1.13 934 EUR BioMerieux 68 0.08 26,553 EUR BNP Paribas SA 1,085 1.21 20,573 EUR Bollore SA 83 0.09 5,115 EUR Bouygues SA 160 0.18 6,873 EUR Bureau Veritas SA 145 0.16 3,752 EUR Capgemini SE 376 0.42 14,022 EUR Carrefour SA 236 0.26 1,418 EUR Casino Guichard Perrachon SA1 48 0.05
234
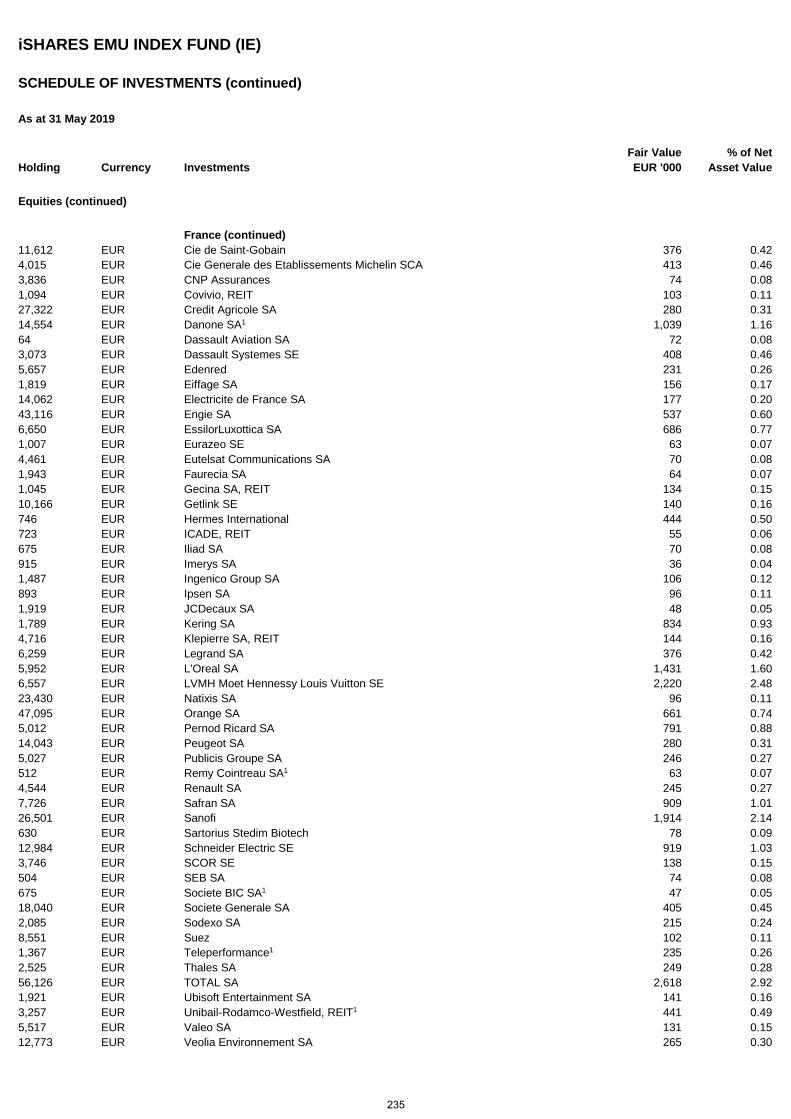
iSHARES EMU INDEX FUND (IE)
SCHEDULE OF INVESTMENTS (continued)
As at 31 May 2019
Holding Currency Investments Fair Value EUR '000
% of Net Asset Value
Equities (continued)
France (continued) 11,612 EUR Cie de Saint-Gobain 376 0.42 4,015 EUR Cie Generale des Etablissements Michelin SCA 413 0.46 3,836 EUR CNP Assurances 74 0.08 1,094 EUR Covivio, REIT 103 0.11 27,322 EUR Credit Agricole SA 280 0.31 14,554 EUR Danone SA1 1,039 1.16 64 EUR Dassault Aviation SA 72 0.08 3,073 EUR Dassault Systemes SE 408 0.46 5,657 EUR Edenred 231 0.26 1,819 EUR Eiffage SA 156 0.17 14,062 EUR Electricite de France SA 177 0.20 43,116 EUR Engie SA 537 0.60 6,650 EUR EssilorLuxottica SA 686 0.77 1,007 EUR Eurazeo SE 63 0.07 4,461 EUR Eutelsat Communications SA 70 0.08 1,943 EUR Faurecia SA 64 0.07 1,045 EUR Gecina SA, REIT 134 0.15 10,166 EUR Getlink SE 140 0.16 746 EUR Hermes International 444 0.50 723 EUR ICADE, REIT 55 0.06 675 EUR Iliad SA 70 0.08 915 EUR Imerys SA 36 0.04 1,487 EUR Ingenico Group SA 106 0.12 893 EUR Ipsen SA 96 0.11 1,919 EUR JCDecaux SA 48 0.05 1,789 EUR Kering SA 834 0.93 4,716 EUR Klepierre SA, REIT 144 0.16 6,259 EUR Legrand SA 376 0.42 5,952 EUR L'Oreal SA 1,431 1.60 6,557 EUR LVMH Moet Hennessy Louis Vuitton SE 2,220 2.48 23,430 EUR Natixis SA 96 0.11 47,095 EUR Orange SA 661 0.74 5,012 EUR Pernod Ricard SA 791 0.88 14,043 EUR Peugeot SA 280 0.31 5,027 EUR Publicis Groupe SA 246 0.27 512 EUR Remy Cointreau SA1 63 0.07 4,544 EUR Renault SA 245 0.27 7,726 EUR Safran SA 909 1.01 26,501 EUR Sanofi 1,914 2.14 630 EUR Sartorius Stedim Biotech 78 0.09 12,984 EUR Schneider Electric SE 919 1.03 3,746 EUR SCOR SE 138 0.15 504 EUR SEB SA 74 0.08 675 EUR Societe BIC SA1 47 0.05 18,040 EUR Societe Generale SA 405 0.45 2,085 EUR Sodexo SA 215 0.24 8,551 EUR Suez 102 0.11 1,367 EUR Teleperformance1 235 0.26 2,525 EUR Thales SA 249 0.28 56,126 EUR TOTAL SA 2,618 2.92 1,921 EUR Ubisoft Entertainment SA 141 0.16 3,257 EUR Unibail-Rodamco-Westfield, REIT1 441 0.49 5,517 EUR Valeo SA 131 0.15 12,773 EUR Veolia Environnement SA 265 0.30
235
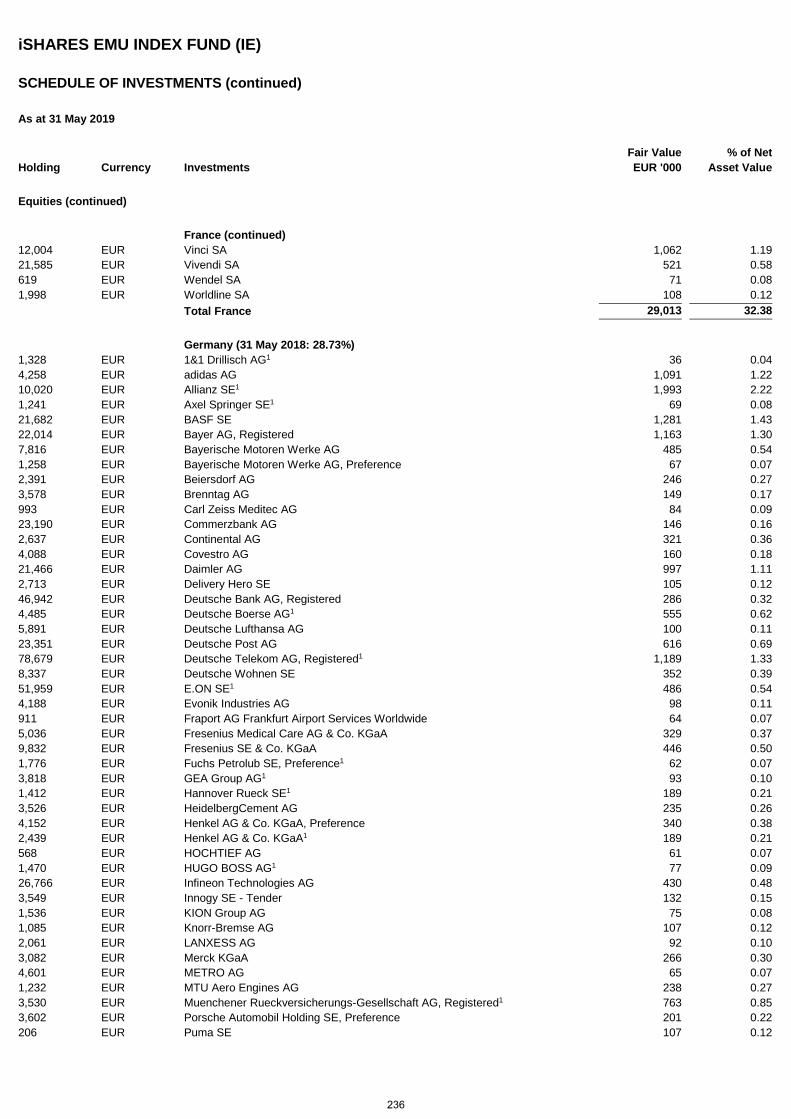
iSHARES EMU INDEX FUND (IE)
SCHEDULE OF INVESTMENTS (continued)
As at 31 May 2019
Holding Currency Investments Fair Value EUR '000
% of Net Asset Value
Equities (continued)
France (continued) 12,004 EUR Vinci SA 1,062 1.19 21,585 EUR Vivendi SA 521 0.58 619 EUR Wendel SA 71 0.08 1,998 EUR Worldline SA 108 0.12 Total France 29,013 32.38
Germany (31 May 2018: 28.73%) 1,328 EUR 1&1 Drillisch AG1 36 0.04 4,258 EUR adidas AG 1,091 1.22 10,020 EUR Allianz SE1 1,993 2.22 1,241 EUR Axel Springer SE1 69 0.08 21,682 EUR BASF SE 1,281 1.43 22,014 EUR Bayer AG, Registered 1,163 1.30 7,816 EUR Bayerische Motoren Werke AG 485 0.54 1,258 EUR Bayerische Motoren Werke AG, Preference 67 0.07 2,391 EUR Beiersdorf AG 246 0.27 3,578 EUR Brenntag AG 149 0.17 993 EUR Carl Zeiss Meditec AG 84 0.09 23,190 EUR Commerzbank AG 146 0.16 2,637 EUR Continental AG 321 0.36 4,088 EUR Covestro AG 160 0.18 21,466 EUR Daimler AG 997 1.11 2,713 EUR Delivery Hero SE 105 0.12 46,942 EUR Deutsche Bank AG, Registered 286 0.32 4,485 EUR Deutsche Boerse AG1 555 0.62 5,891 EUR Deutsche Lufthansa AG 100 0.11 23,351 EUR Deutsche Post AG 616 0.69 78,679 EUR Deutsche Telekom AG, Registered1 1,189 1.33 8,337 EUR Deutsche Wohnen SE 352 0.39 51,959 EUR E.ON SE1 486 0.54 4,188 EUR Evonik Industries AG 98 0.11 911 EUR Fraport AG Frankfurt Airport Services Worldwide 64 0.07 5,036 EUR Fresenius Medical Care AG & Co. KGaA 329 0.37 9,832 EUR Fresenius SE & Co. KGaA 446 0.50 1,776 EUR Fuchs Petrolub SE, Preference1 62 0.07 3,818 EUR GEA Group AG1 93 0.10 1,412 EUR Hannover Rueck SE1 189 0.21 3,526 EUR HeidelbergCement AG 235 0.26 4,152 EUR Henkel AG & Co. KGaA, Preference 340 0.38 2,439 EUR Henkel AG & Co. KGaA1 189 0.21 568 EUR HOCHTIEF AG 61 0.07 1,470 EUR HUGO BOSS AG1 77 0.09 26,766 EUR Infineon Technologies AG 430 0.48 3,549 EUR Innogy SE - Tender 132 0.15 1,536 EUR KION Group AG 75 0.08 1,085 EUR Knorr-Bremse AG 107 0.12 2,061 EUR LANXESS AG 92 0.10 3,082 EUR Merck KGaA 266 0.30 4,601 EUR METRO AG 65 0.07 1,232 EUR MTU Aero Engines AG 238 0.27 3,530 EUR Muenchener Rueckversicherungs-Gesellschaft AG, Registered1 763 0.85 3,602 EUR Porsche Automobil Holding SE, Preference 201 0.22 206 EUR Puma SE 107 0.12
236
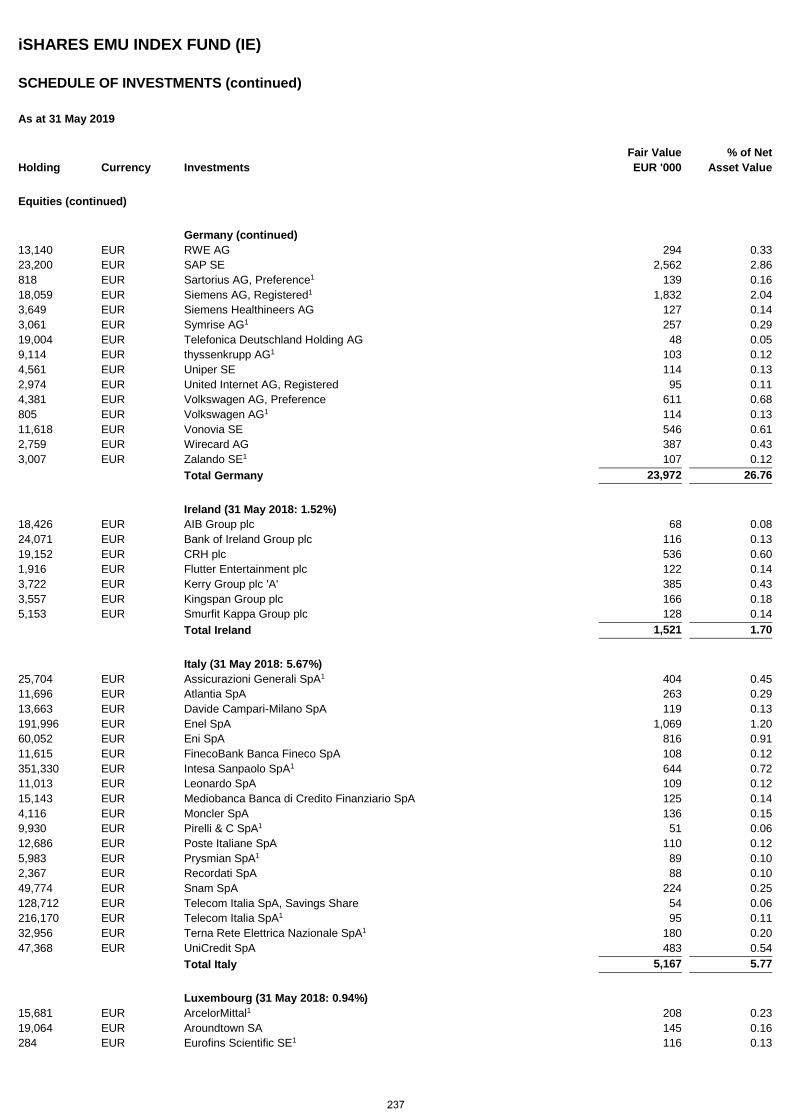
iSHARES EMU INDEX FUND (IE)
SCHEDULE OF INVESTMENTS (continued)
As at 31 May 2019
Holding Currency Investments Fair Value EUR '000
% of Net Asset Value
Equities (continued)
Germany (continued) 13,140 EUR RWE AG 294 0.33 23,200 EUR SAP SE 2,562 2.86 818 EUR Sartorius AG, Preference1 139 0.16 18,059 EUR Siemens AG, Registered1 1,832 2.04 3,649 EUR Siemens Healthineers AG 127 0.14 3,061 EUR Symrise AG1 257 0.29 19,004 EUR Telefonica Deutschland Holding AG 48 0.05 9,114 EUR thyssenkrupp AG1 103 0.12 4,561 EUR Uniper SE 114 0.13 2,974 EUR United Internet AG, Registered 95 0.11 4,381 EUR Volkswagen AG, Preference 611 0.68 805 EUR Volkswagen AG1 114 0.13 11,618 EUR Vonovia SE 546 0.61 2,759 EUR Wirecard AG 387 0.43 3,007 EUR Zalando SE1 107 0.12 Total Germany 23,972 26.76
Ireland (31 May 2018: 1.52%) 18,426 EUR AIB Group plc 68 0.08 24,071 EUR Bank of Ireland Group plc 116 0.13 19,152 EUR CRH plc 536 0.60 1,916 EUR Flutter Entertainment plc 122 0.14 3,722 EUR Kerry Group plc 'A' 385 0.43 3,557 EUR Kingspan Group plc 166 0.18 5,153 EUR Smurfit Kappa Group plc 128 0.14 Total Ireland 1,521 1.70
Italy (31 May 2018: 5.67%) 25,704 EUR Assicurazioni Generali SpA1 404 0.45 11,696 EUR Atlantia SpA 263 0.29 13,663 EUR Davide Campari-Milano SpA 119 0.13 191,996 EUR Enel SpA 1,069 1.20 60,052 EUR Eni SpA 816 0.91 11,615 EUR FinecoBank Banca Fineco SpA 108 0.12 351,330 EUR Intesa Sanpaolo SpA1 644 0.72 11,013 EUR Leonardo SpA 109 0.12 15,143 EUR Mediobanca Banca di Credito Finanziario SpA 125 0.14 4,116 EUR Moncler SpA 136 0.15 9,930 EUR Pirelli & C SpA1 51 0.06 12,686 EUR Poste Italiane SpA 110 0.12 5,983 EUR Prysmian SpA1 89 0.10 2,367 EUR Recordati SpA 88 0.10 49,774 EUR Snam SpA 224 0.25 128,712 EUR Telecom Italia SpA, Savings Share 54 0.06 216,170 EUR Telecom Italia SpA1 95 0.11 32,956 EUR Terna Rete Elettrica Nazionale SpA1 180 0.20 47,368 EUR UniCredit SpA 483 0.54 Total Italy 5,167 5.77
Luxembourg (31 May 2018: 0.94%) 15,681 EUR ArcelorMittal1 208 0.23 19,064 EUR Aroundtown SA 145 0.16 284 EUR Eurofins Scientific SE1 116 0.13
237
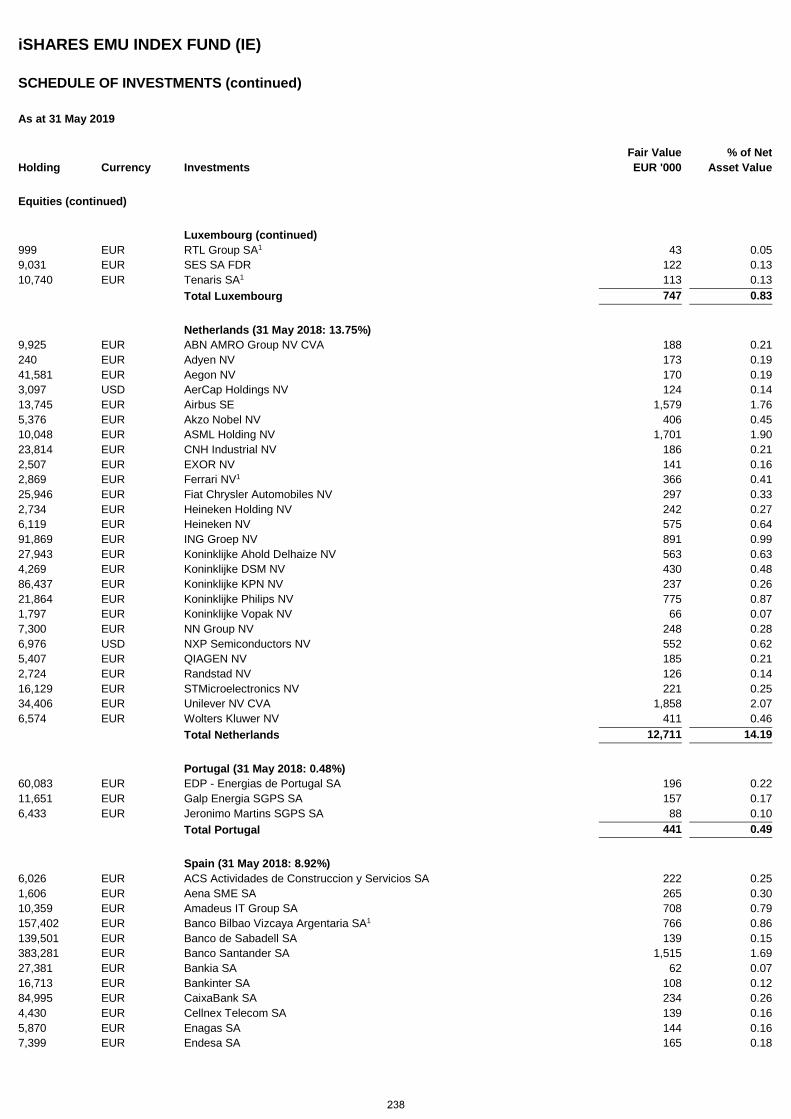
iSHARES EMU INDEX FUND (IE)
SCHEDULE OF INVESTMENTS (continued)
As at 31 May 2019
Holding Currency Investments Fair Value EUR '000
% of Net Asset Value
Equities (continued)
Luxembourg (continued) 999 EUR RTL Group SA1 43 0.05 9,031 EUR SES SA FDR 122 0.13 10,740 EUR Tenaris SA1 113 0.13 Total Luxembourg 747 0.83
Netherlands (31 May 2018: 13.75%) 9,925 EUR ABN AMRO Group NV CVA 188 0.21 240 EUR Adyen NV 173 0.19 41,581 EUR Aegon NV 170 0.19 3,097 USD AerCap Holdings NV 124 0.14 13,745 EUR Airbus SE 1,579 1.76 5,376 EUR Akzo Nobel NV 406 0.45 10,048 EUR ASML Holding NV 1,701 1.90 23,814 EUR CNH Industrial NV 186 0.21 2,507 EUR EXOR NV 141 0.16 2,869 EUR Ferrari NV1 366 0.41 25,946 EUR Fiat Chrysler Automobiles NV 297 0.33 2,734 EUR Heineken Holding NV 242 0.27 6,119 EUR Heineken NV 575 0.64 91,869 EUR ING Groep NV 891 0.99 27,943 EUR Koninklijke Ahold Delhaize NV 563 0.63 4,269 EUR Koninklijke DSM NV 430 0.48 86,437 EUR Koninklijke KPN NV 237 0.26 21,864 EUR Koninklijke Philips NV 775 0.87 1,797 EUR Koninklijke Vopak NV 66 0.07 7,300 EUR NN Group NV 248 0.28 6,976 USD NXP Semiconductors NV 552 0.62 5,407 EUR QIAGEN NV 185 0.21 2,724 EUR Randstad NV 126 0.14 16,129 EUR STMicroelectronics NV 221 0.25 34,406 EUR Unilever NV CVA 1,858 2.07 6,574 EUR Wolters Kluwer NV 411 0.46 Total Netherlands 12,711 14.19
Portugal (31 May 2018: 0.48%) 60,083 EUR EDP - Energias de Portugal SA 196 0.22 11,651 EUR Galp Energia SGPS SA 157 0.17 6,433 EUR Jeronimo Martins SGPS SA 88 0.10 Total Portugal 441 0.49
Spain (31 May 2018: 8.92%) 6,026 EUR ACS Actividades de Construccion y Servicios SA 222 0.25 1,606 EUR Aena SME SA 265 0.30 10,359 EUR Amadeus IT Group SA 708 0.79 157,402 EUR Banco Bilbao Vizcaya Argentaria SA1 766 0.86 139,501 EUR Banco de Sabadell SA 139 0.15 383,281 EUR Banco Santander SA 1,515 1.69 27,381 EUR Bankia SA 62 0.07 16,713 EUR Bankinter SA 108 0.12 84,995 EUR CaixaBank SA 234 0.26 4,430 EUR Cellnex Telecom SA 139 0.16 5,870 EUR Enagas SA 144 0.16 7,399 EUR Endesa SA 165 0.18
238
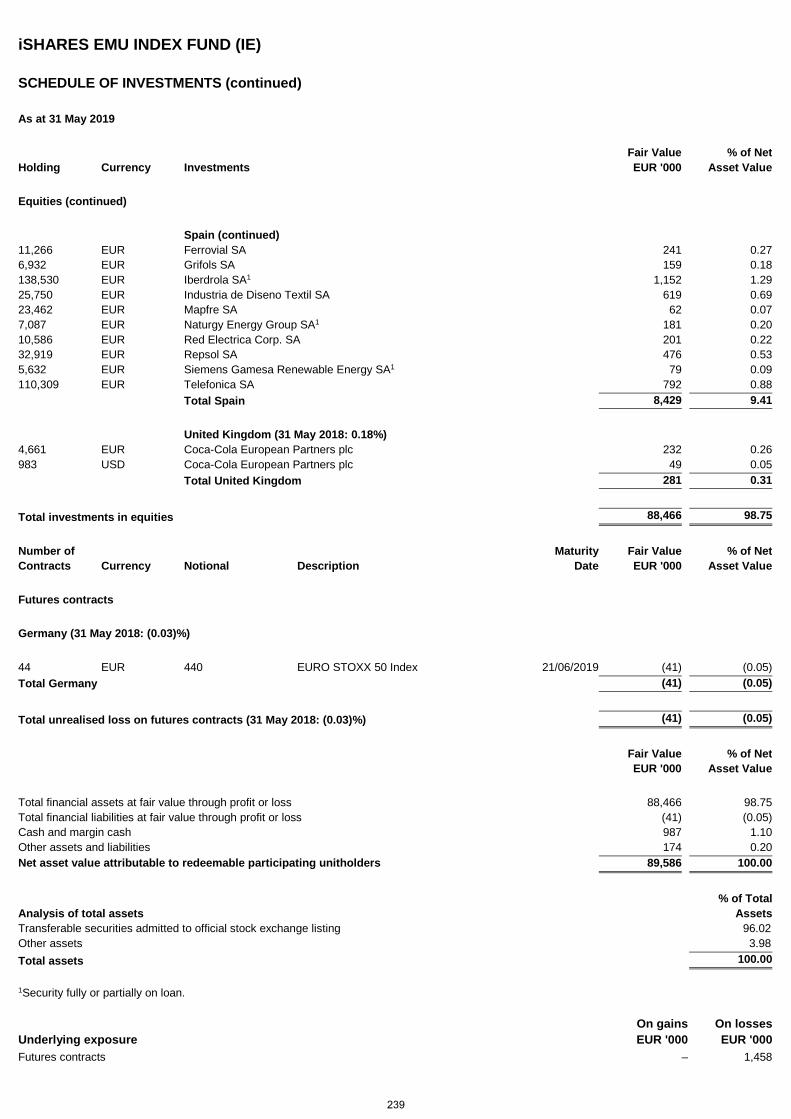
iSHARES EMU INDEX FUND (IE)
SCHEDULE OF INVESTMENTS (continued)
As at 31 May 2019
Holding Currency Investments Fair Value EUR '000
% of Net Asset Value
Equities (continued)
Spain (continued) 11,266 EUR Ferrovial SA 241 0.27 6,932 EUR Grifols SA 159 0.18 138,530 EUR Iberdrola SA1 1,152 1.29 25,750 EUR Industria de Diseno Textil SA 619 0.69 23,462 EUR Mapfre SA 62 0.07 7,087 EUR Naturgy Energy Group SA1 181 0.20 10,586 EUR Red Electrica Corp. SA 201 0.22 32,919 EUR Repsol SA 476 0.53 5,632 EUR Siemens Gamesa Renewable Energy SA1 79 0.09 110,309 EUR Telefonica SA 792 0.88 Total Spain 8,429 9.41
United Kingdom (31 May 2018: 0.18%) 4,661 EUR Coca-Cola European Partners plc 232 0.26 983 USD Coca-Cola European Partners plc 49 0.05 Total United Kingdom 281 0.31
Total investments in equities 88,466 98.75
Number of Maturity Fair Value % of Net Contracts Currency Notional Description Date EUR '000 Asset Value
Futures contracts
Germany (31 May 2018: (0.03)%)
44 EUR 440 EURO STOXX 50 Index 21/06/2019 (41) (0.05) Total Germany (41) (0.05)
Total unrealised loss on futures contracts (31 May 2018: (0.03)%) (41) (0.05)
Fair Value EUR '000
% of Net Asset Value
Total financial assets at fair value through profit or loss 88,466 98.75 Total financial liabilities at fair value through profit or loss (41) (0.05) Cash and margin cash 987 1.10 Other assets and liabilities 174 0.20 Net asset value attributable to redeemable participating unitholders 89,586 100.00
Analysis of total assets % of Total
Assets Transferable securities admitted to official stock exchange listing 96.02 Other assets 3.98 Total assets 100.00
1 Security fully or partially on loan.
Underlying exposure On gains EUR '000
On losses EUR '000
Futures contracts – 1,458
239
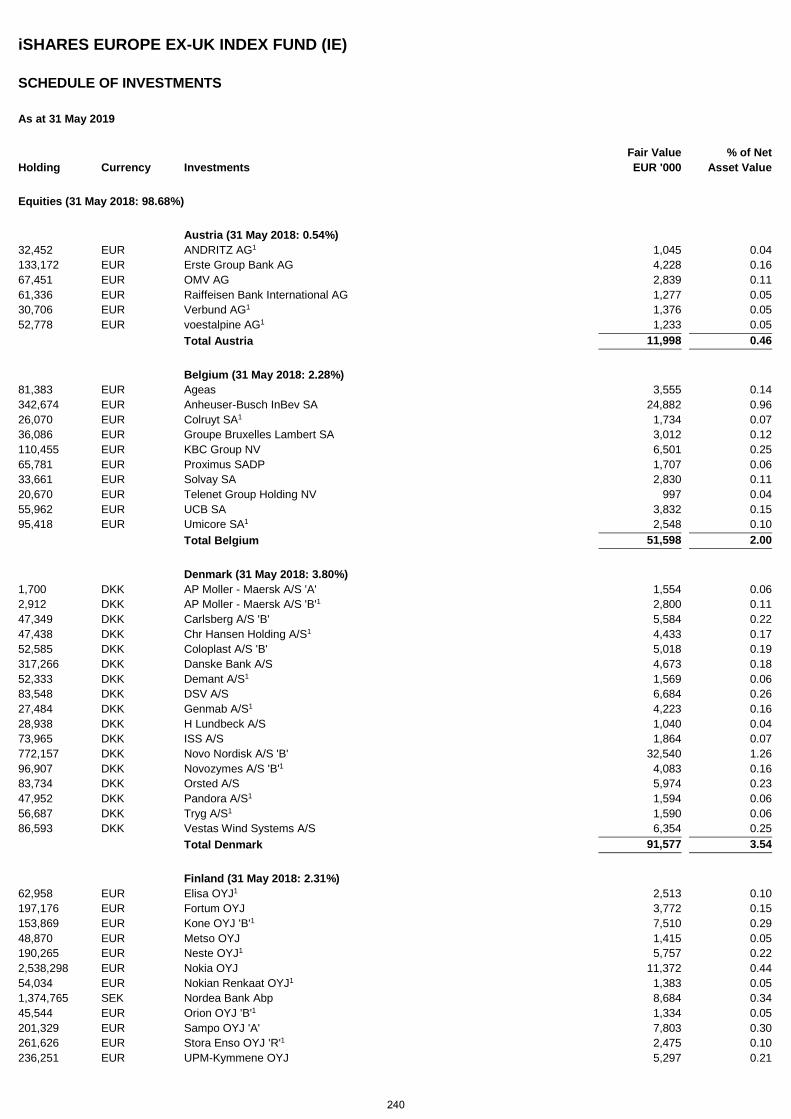
iSHARES EUROPE EX-UK INDEX FUND (IE)
SCHEDULE OF INVESTMENTS
As at 31 May 2019
Holding Currency Investments Fair Value EUR '000
% of Net Asset Value
Equities (31 May 2018: 98.68%)
Austria (31 May 2018: 0.54%) 32,452 EUR ANDRITZ AG1 1,045 0.04 133,172 EUR Erste Group Bank AG 4,228 0.16 67,451 EUR OMV AG 2,839 0.11 61,336 EUR Raiffeisen Bank International AG 1,277 0.05 30,706 EUR Verbund AG1 1,376 0.05 52,778 EUR voestalpine AG1 1,233 0.05 Total Austria 11,998 0.46
Belgium (31 May 2018: 2.28%) 81,383 EUR Ageas 3,555 0.14 342,674 EUR Anheuser-Busch InBev SA 24,882 0.96 26,070 EUR Colruyt SA1 1,734 0.07 36,086 EUR Groupe Bruxelles Lambert SA 3,012 0.12 110,455 EUR KBC Group NV 6,501 0.25 65,781 EUR Proximus SADP 1,707 0.06 33,661 EUR Solvay SA 2,830 0.11 20,670 EUR Telenet Group Holding NV 997 0.04 55,962 EUR UCB SA 3,832 0.15 95,418 EUR Umicore SA1 2,548 0.10 Total Belgium 51,598 2.00
Denmark (31 May 2018: 3.80%) 1,700 DKK AP Moller - Maersk A/S 'A' 1,554 0.06 2,912 DKK AP Moller - Maersk A/S 'B'1 2,800 0.11 47,349 DKK Carlsberg A/S 'B' 5,584 0.22 47,438 DKK Chr Hansen Holding A/S1 4,433 0.17 52,585 DKK Coloplast A/S 'B' 5,018 0.19 317,266 DKK Danske Bank A/S 4,673 0.18 52,333 DKK Demant A/S1 1,569 0.06 83,548 DKK DSV A/S 6,684 0.26 27,484 DKK Genmab A/S1 4,223 0.16 28,938 DKK H Lundbeck A/S 1,040 0.04 73,965 DKK ISS A/S 1,864 0.07 772,157 DKK Novo Nordisk A/S 'B' 32,540 1.26 96,907 DKK Novozymes A/S 'B'1 4,083 0.16 83,734 DKK Orsted A/S 5,974 0.23 47,952 DKK Pandora A/S1 1,594 0.06 56,687 DKK Tryg A/S1 1,590 0.06 86,593 DKK Vestas Wind Systems A/S 6,354 0.25 Total Denmark 91,577 3.54
Finland (31 May 2018: 2.31%) 62,958 EUR Elisa OYJ1 2,513 0.10 197,176 EUR Fortum OYJ 3,772 0.15 153,869 EUR Kone OYJ 'B'1 7,510 0.29 48,870 EUR Metso OYJ 1,415 0.05 190,265 EUR Neste OYJ1 5,757 0.22 2,538,298 EUR Nokia OYJ 11,372 0.44 54,034 EUR Nokian Renkaat OYJ1 1,383 0.05 1,374,765 SEK Nordea Bank Abp 8,684 0.34 45,544 EUR Orion OYJ 'B'1 1,334 0.05 201,329 EUR Sampo OYJ 'A' 7,803 0.30 261,626 EUR Stora Enso OYJ 'R'1 2,475 0.10 236,251 EUR UPM-Kymmene OYJ 5,297 0.21
240
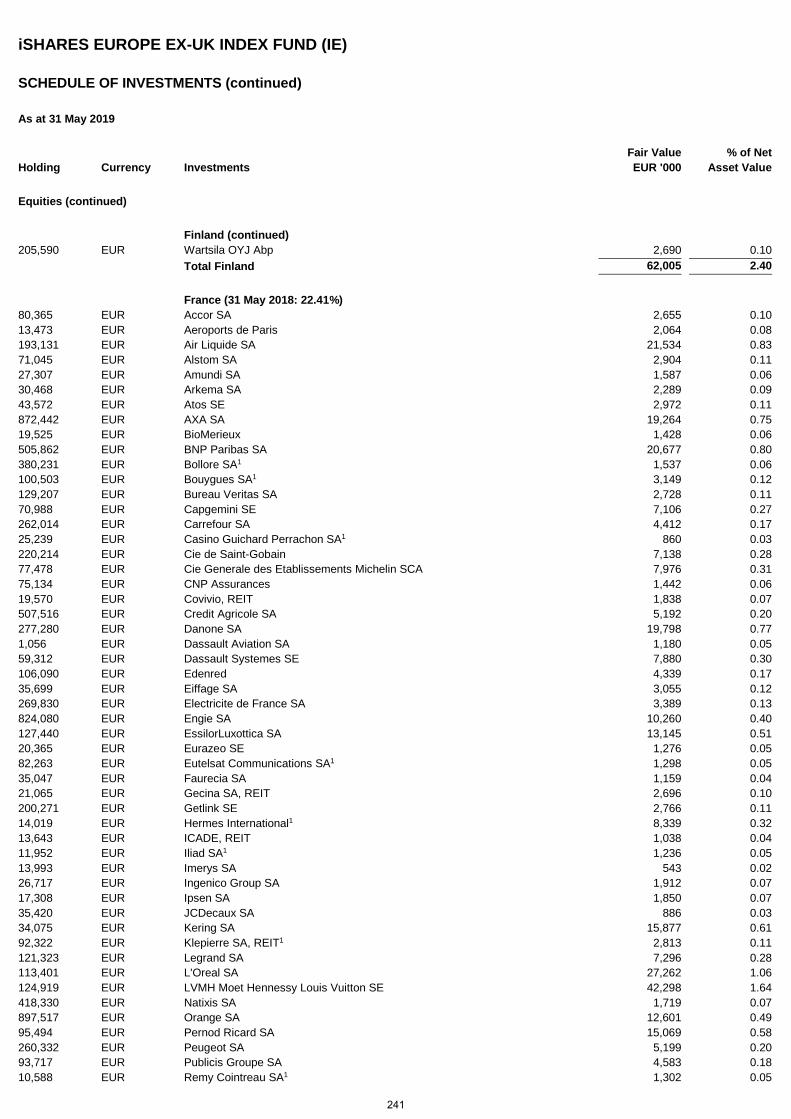
iSHARES EUROPE EX-UK INDEX FUND (IE)
SCHEDULE OF INVESTMENTS (continued)
As at 31 May 2019
Holding Currency Investments Fair Value EUR '000
% of Net Asset Value
Equities (continued)
Finland (continued) 205,590 EUR Wartsila OYJ Abp 2,690 0.10 Total Finland 62,005 2.40
France (31 May 2018: 22.41%) 80,365 EUR Accor SA 2,655 0.10 13,473 EUR Aeroports de Paris 2,064 0.08 193,131 EUR Air Liquide SA 21,534 0.83 71,045 EUR Alstom SA 2,904 0.11 27,307 EUR Amundi SA 1,587 0.06 30,468 EUR Arkema SA 2,289 0.09 43,572 EUR Atos SE 2,972 0.11 872,442 EUR AXA SA 19,264 0.75 19,525 EUR BioMerieux 1,428 0.06 505,862 EUR BNP Paribas SA 20,677 0.80 380,231 EUR Bollore SA1 1,537 0.06 100,503 EUR Bouygues SA1 3,149 0.12 129,207 EUR Bureau Veritas SA 2,728 0.11 70,988 EUR Capgemini SE 7,106 0.27 262,014 EUR Carrefour SA 4,412 0.17 25,239 EUR Casino Guichard Perrachon SA1 860 0.03 220,214 EUR Cie de Saint-Gobain 7,138 0.28 77,478 EUR Cie Generale des Etablissements Michelin SCA 7,976 0.31 75,134 EUR CNP Assurances 1,442 0.06 19,570 EUR Covivio, REIT 1,838 0.07 507,516 EUR Credit Agricole SA 5,192 0.20 277,280 EUR Danone SA 19,798 0.77 1,056 EUR Dassault Aviation SA 1,180 0.05 59,312 EUR Dassault Systemes SE 7,880 0.30 106,090 EUR Edenred 4,339 0.17 35,699 EUR Eiffage SA 3,055 0.12 269,830 EUR Electricite de France SA 3,389 0.13 824,080 EUR Engie SA 10,260 0.40 127,440 EUR EssilorLuxottica SA 13,145 0.51 20,365 EUR Eurazeo SE 1,276 0.05 82,263 EUR Eutelsat Communications SA1 1,298 0.05 35,047 EUR Faurecia SA 1,159 0.04 21,065 EUR Gecina SA, REIT 2,696 0.10 200,271 EUR Getlink SE 2,766 0.11 14,019 EUR Hermes International1 8,339 0.32 13,643 EUR ICADE, REIT 1,038 0.04 11,952 EUR Iliad SA1 1,236 0.05 13,993 EUR Imerys SA 543 0.02 26,717 EUR Ingenico Group SA 1,912 0.07 17,308 EUR Ipsen SA 1,850 0.07 35,420 EUR JCDecaux SA 886 0.03 34,075 EUR Kering SA 15,877 0.61 92,322 EUR Klepierre SA, REIT1 2,813 0.11 121,323 EUR Legrand SA 7,296 0.28 113,401 EUR L'Oreal SA 27,262 1.06 124,919 EUR LVMH Moet Hennessy Louis Vuitton SE 42,298 1.64 418,330 EUR Natixis SA 1,719 0.07 897,517 EUR Orange SA 12,601 0.49 95,494 EUR Pernod Ricard SA 15,069 0.58 260,332 EUR Peugeot SA 5,199 0.20 93,717 EUR Publicis Groupe SA 4,583 0.18 10,588 EUR Remy Cointreau SA1 1,302 0.05
241
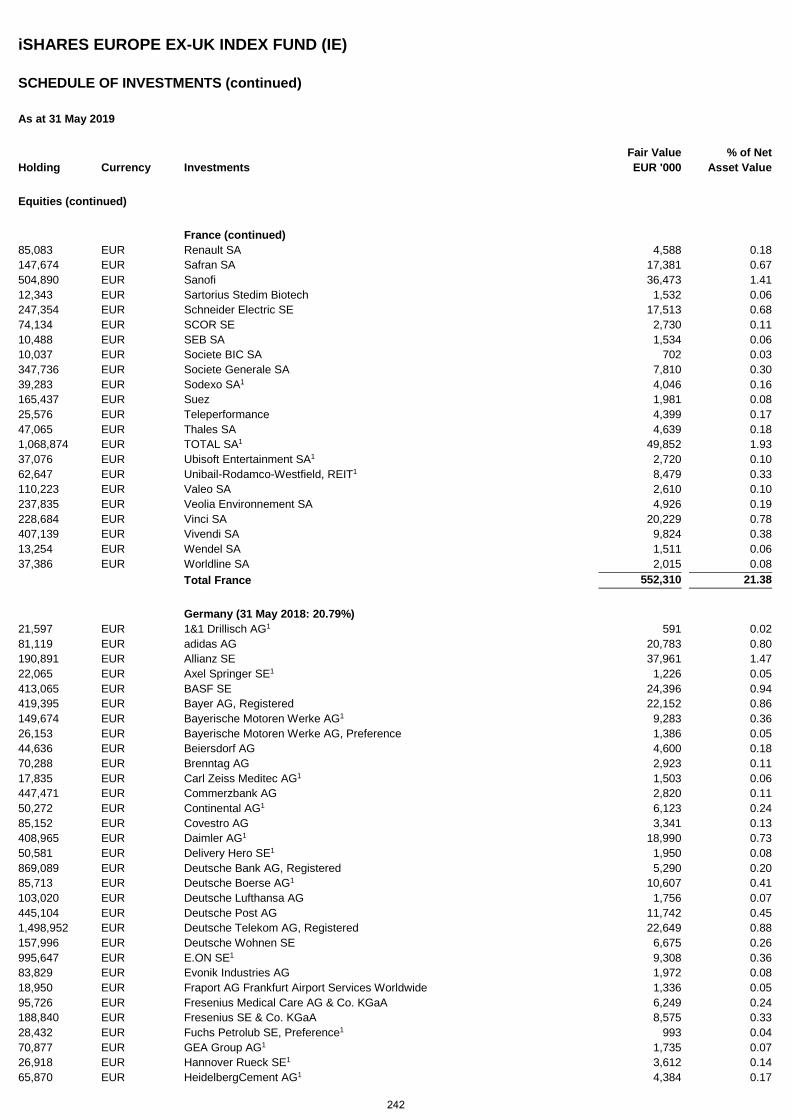
iSHARES EUROPE EX-UK INDEX FUND (IE)
SCHEDULE OF INVESTMENTS (continued)
As at 31 May 2019
Holding Currency Investments Fair Value EUR '000
% of Net Asset Value
Equities (continued)
France (continued) 85,083 EUR Renault SA 4,588 0.18 147,674 EUR Safran SA 17,381 0.67 504,890 EUR Sanofi 36,473 1.41 12,343 EUR Sartorius Stedim Biotech 1,532 0.06 247,354 EUR Schneider Electric SE 17,513 0.68 74,134 EUR SCOR SE 2,730 0.11 10,488 EUR SEB SA 1,534 0.06 10,037 EUR Societe BIC SA 702 0.03 347,736 EUR Societe Generale SA 7,810 0.30 39,283 EUR Sodexo SA1 4,046 0.16 165,437 EUR Suez 1,981 0.08 25,576 EUR Teleperformance 4,399 0.17 47,065 EUR Thales SA 4,639 0.18 1,068,874 EUR TOTAL SA1 49,852 1.93 37,076 EUR Ubisoft Entertainment SA1 2,720 0.10 62,647 EUR Unibail-Rodamco-Westfield, REIT1 8,479 0.33 110,223 EUR Valeo SA 2,610 0.10 237,835 EUR Veolia Environnement SA 4,926 0.19 228,684 EUR Vinci SA 20,229 0.78 407,139 EUR Vivendi SA 9,824 0.38 13,254 EUR Wendel SA 1,511 0.06 37,386 EUR Worldline SA 2,015 0.08 Total France 552,310 21.38
Germany (31 May 2018: 20.79%) 21,597 EUR 1&1 Drillisch AG1 591 0.02 81,119 EUR adidas AG 20,783 0.80 190,891 EUR Allianz SE 37,961 1.47 22,065 EUR Axel Springer SE1 1,226 0.05 413,065 EUR BASF SE 24,396 0.94 419,395 EUR Bayer AG, Registered 22,152 0.86 149,674 EUR Bayerische Motoren Werke AG1 9,283 0.36 26,153 EUR Bayerische Motoren Werke AG, Preference 1,386 0.05 44,636 EUR Beiersdorf AG 4,600 0.18 70,288 EUR Brenntag AG 2,923 0.11 17,835 EUR Carl Zeiss Meditec AG1 1,503 0.06 447,471 EUR Commerzbank AG 2,820 0.11 50,272 EUR Continental AG1 6,123 0.24 85,152 EUR Covestro AG 3,341 0.13 408,965 EUR Daimler AG1 18,990 0.73 50,581 EUR Delivery Hero SE1 1,950 0.08 869,089 EUR Deutsche Bank AG, Registered 5,290 0.20 85,713 EUR Deutsche Boerse AG1 10,607 0.41 103,020 EUR Deutsche Lufthansa AG 1,756 0.07 445,104 EUR Deutsche Post AG 11,742 0.45 1,498,952 EUR Deutsche Telekom AG, Registered 22,649 0.88 157,996 EUR Deutsche Wohnen SE 6,675 0.26 995,647 EUR E.ON SE1 9,308 0.36 83,829 EUR Evonik Industries AG 1,972 0.08 18,950 EUR Fraport AG Frankfurt Airport Services Worldwide 1,336 0.05 95,726 EUR Fresenius Medical Care AG & Co. KGaA 6,249 0.24 188,840 EUR Fresenius SE & Co. KGaA 8,575 0.33 28,432 EUR Fuchs Petrolub SE, Preference1 993 0.04 70,877 EUR GEA Group AG1 1,735 0.07 26,918 EUR Hannover Rueck SE1 3,612 0.14 65,870 EUR HeidelbergCement AG1 4,384 0.17
242
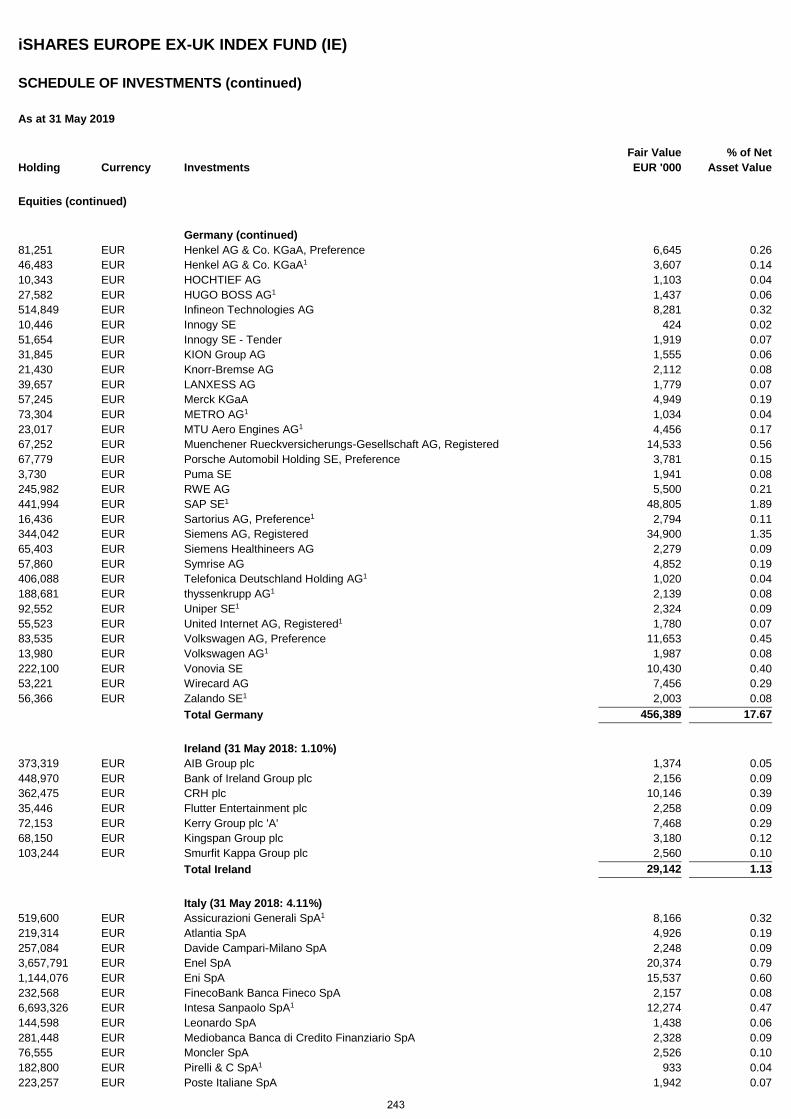
iSHARES EUROPE EX-UK INDEX FUND (IE)
SCHEDULE OF INVESTMENTS (continued)
As at 31 May 2019
Holding Currency Investments Fair Value EUR '000
% of Net Asset Value
Equities (continued)
Germany (continued) 81,251 EUR Henkel AG & Co. KGaA, Preference 6,645 0.26 46,483 EUR Henkel AG & Co. KGaA1 3,607 0.14 10,343 EUR HOCHTIEF AG 1,103 0.04 27,582 EUR HUGO BOSS AG1 1,437 0.06 514,849 EUR Infineon Technologies AG 8,281 0.32 10,446 EUR Innogy SE 424 0.02 51,654 EUR Innogy SE - Tender 1,919 0.07 31,845 EUR KION Group AG 1,555 0.06 21,430 EUR Knorr-Bremse AG 2,112 0.08 39,657 EUR LANXESS AG 1,779 0.07 57,245 EUR Merck KGaA 4,949 0.19 73,304 EUR METRO AG1 1,034 0.04 23,017 EUR MTU Aero Engines AG1 4,456 0.17 67,252 EUR Muenchener Rueckversicherungs-Gesellschaft AG, Registered 14,533 0.56 67,779 EUR Porsche Automobil Holding SE, Preference 3,781 0.15 3,730 EUR Puma SE 1,941 0.08 245,982 EUR RWE AG 5,500 0.21 441,994 EUR SAP SE1 48,805 1.89 16,436 EUR Sartorius AG, Preference1 2,794 0.11 344,042 EUR Siemens AG, Registered 34,900 1.35 65,403 EUR Siemens Healthineers AG 2,279 0.09 57,860 EUR Symrise AG 4,852 0.19 406,088 EUR Telefonica Deutschland Holding AG1 1,020 0.04 188,681 EUR thyssenkrupp AG1 2,139 0.08 92,552 EUR Uniper SE1 2,324 0.09 55,523 EUR United Internet AG, Registered1 1,780 0.07 83,535 EUR Volkswagen AG, Preference 11,653 0.45 13,980 EUR Volkswagen AG1 1,987 0.08 222,100 EUR Vonovia SE 10,430 0.40 53,221 EUR Wirecard AG 7,456 0.29 56,366 EUR Zalando SE1 2,003 0.08 Total Germany 456,389 17.67
Ireland (31 May 2018: 1.10%) 373,319 EUR AIB Group plc 1,374 0.05 448,970 EUR Bank of Ireland Group plc 2,156 0.09 362,475 EUR CRH plc 10,146 0.39 35,446 EUR Flutter Entertainment plc 2,258 0.09 72,153 EUR Kerry Group plc 'A' 7,468 0.29 68,150 EUR Kingspan Group plc 3,180 0.12 103,244 EUR Smurfit Kappa Group plc 2,560 0.10 Total Ireland 29,142 1.13
Italy (31 May 2018: 4.11%) 519,600 EUR Assicurazioni Generali SpA1 8,166 0.32 219,314 EUR Atlantia SpA 4,926 0.19 257,084 EUR Davide Campari-Milano SpA 2,248 0.09 3,657,791 EUR Enel SpA 20,374 0.79 1,144,076 EUR Eni SpA 15,537 0.60 232,568 EUR FinecoBank Banca Fineco SpA 2,157 0.08 6,693,326 EUR Intesa Sanpaolo SpA1 12,274 0.47 144,598 EUR Leonardo SpA 1,438 0.06 281,448 EUR Mediobanca Banca di Credito Finanziario SpA 2,328 0.09 76,555 EUR Moncler SpA 2,526 0.10 182,800 EUR Pirelli & C SpA1 933 0.04 223,257 EUR Poste Italiane SpA 1,942 0.07
243
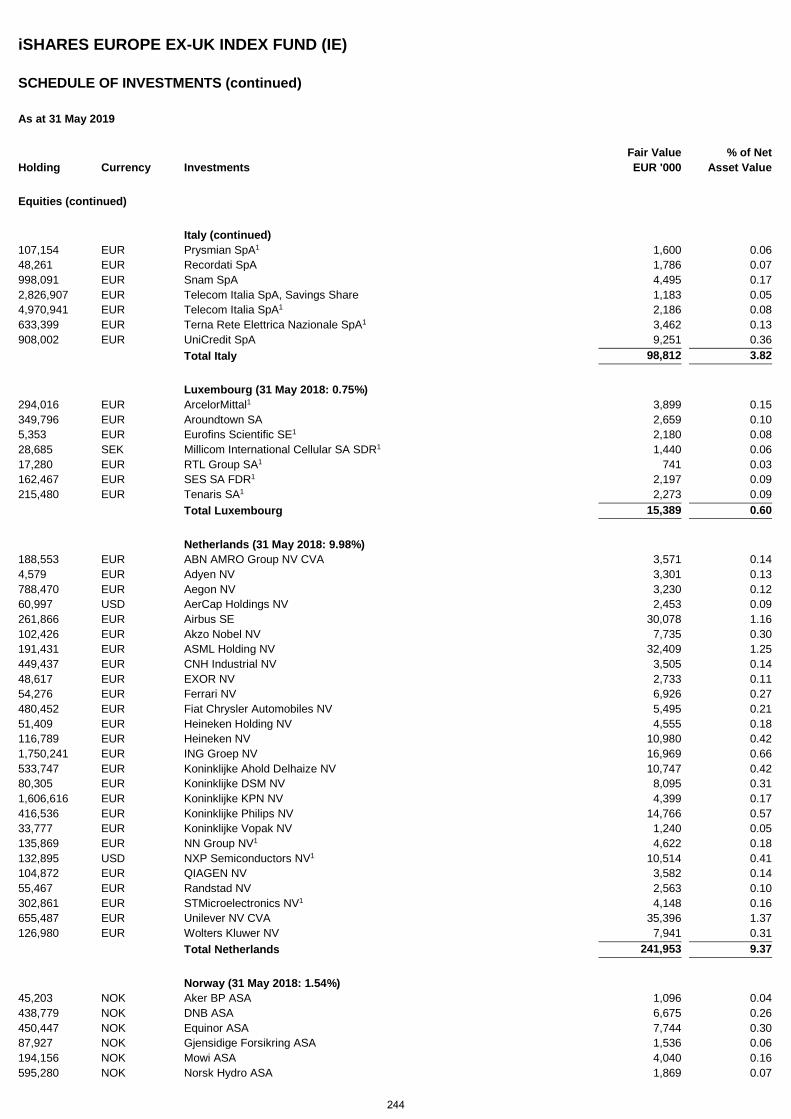
iSHARES EUROPE EX-UK INDEX FUND (IE)
SCHEDULE OF INVESTMENTS (continued)
As at 31 May 2019
Holding Currency Investments Fair Value EUR '000
% of Net Asset Value
Equities (continued)
Italy (continued) 107,154 EUR Prysmian SpA1 1,600 0.06 48,261 EUR Recordati SpA 1,786 0.07 998,091 EUR Snam SpA 4,495 0.17 2,826,907 EUR Telecom Italia SpA, Savings Share 1,183 0.05 4,970,941 EUR Telecom Italia SpA1 2,186 0.08 633,399 EUR Terna Rete Elettrica Nazionale SpA1 3,462 0.13 908,002 EUR UniCredit SpA 9,251 0.36 Total Italy 98,812 3.82
Luxembourg (31 May 2018: 0.75%) 294,016 EUR ArcelorMittal1 3,899 0.15 349,796 EUR Aroundtown SA 2,659 0.10 5,353 EUR Eurofins Scientific SE1 2,180 0.08 28,685 SEK Millicom International Cellular SA SDR1 1,440 0.06 17,280 EUR RTL Group SA1 741 0.03 162,467 EUR SES SA FDR1 2,197 0.09 215,480 EUR Tenaris SA1 2,273 0.09 Total Luxembourg 15,389 0.60
Netherlands (31 May 2018: 9.98%) 188,553 EUR ABN AMRO Group NV CVA 3,571 0.14 4,579 EUR Adyen NV 3,301 0.13 788,470 EUR Aegon NV 3,230 0.12 60,997 USD AerCap Holdings NV 2,453 0.09 261,866 EUR Airbus SE 30,078 1.16 102,426 EUR Akzo Nobel NV 7,735 0.30 191,431 EUR ASML Holding NV 32,409 1.25 449,437 EUR CNH Industrial NV 3,505 0.14 48,617 EUR EXOR NV 2,733 0.11 54,276 EUR Ferrari NV 6,926 0.27 480,452 EUR Fiat Chrysler Automobiles NV 5,495 0.21 51,409 EUR Heineken Holding NV 4,555 0.18 116,789 EUR Heineken NV 10,980 0.42 1,750,241 EUR ING Groep NV 16,969 0.66 533,747 EUR Koninklijke Ahold Delhaize NV 10,747 0.42 80,305 EUR Koninklijke DSM NV 8,095 0.31 1,606,616 EUR Koninklijke KPN NV 4,399 0.17 416,536 EUR Koninklijke Philips NV 14,766 0.57 33,777 EUR Koninklijke Vopak NV 1,240 0.05 135,869 EUR NN Group NV1 4,622 0.18 132,895 USD NXP Semiconductors NV1 10,514 0.41 104,872 EUR QIAGEN NV 3,582 0.14 55,467 EUR Randstad NV 2,563 0.10 302,861 EUR STMicroelectronics NV1 4,148 0.16 655,487 EUR Unilever NV CVA 35,396 1.37 126,980 EUR Wolters Kluwer NV 7,941 0.31 Total Netherlands 241,953 9.37
Norway (31 May 2018: 1.54%) 45,203 NOK Aker BP ASA 1,096 0.04 438,779 NOK DNB ASA 6,675 0.26 450,447 NOK Equinor ASA 7,744 0.30 87,927 NOK Gjensidige Forsikring ASA 1,536 0.06 194,156 NOK Mowi ASA 4,040 0.16 595,280 NOK Norsk Hydro ASA 1,869 0.07
244
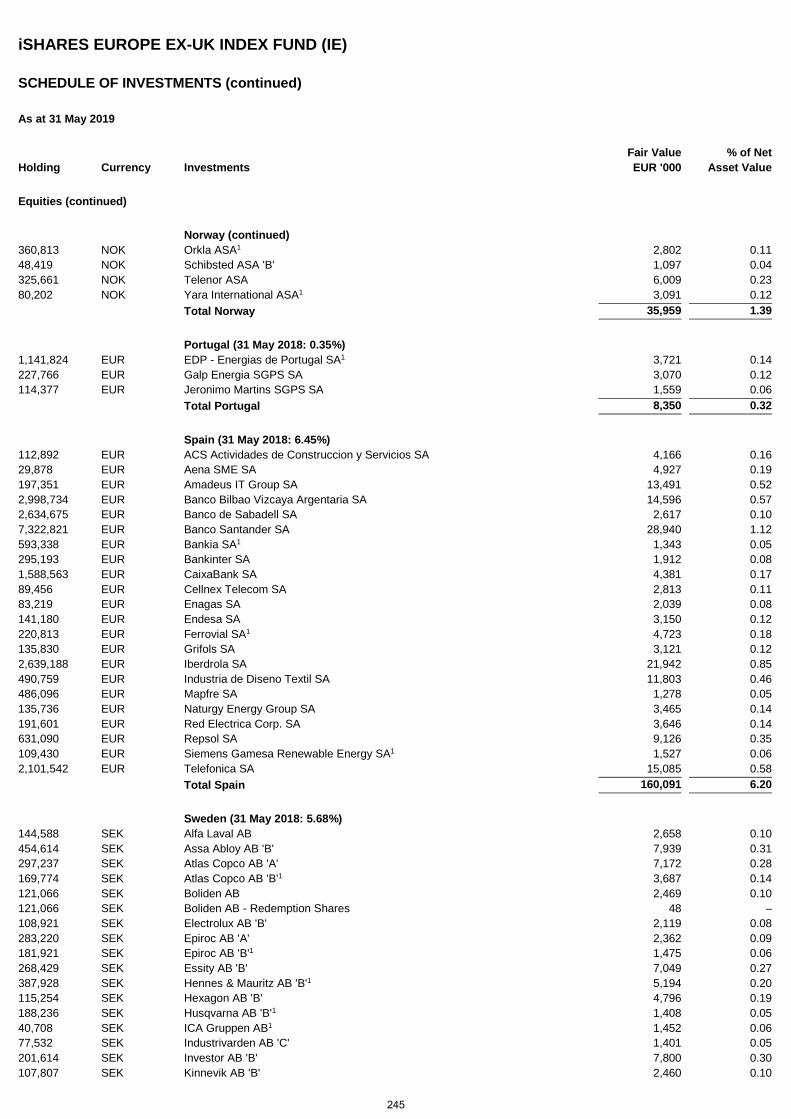
iSHARES EUROPE EX-UK INDEX FUND (IE)
SCHEDULE OF INVESTMENTS (continued)
As at 31 May 2019
Holding Currency Investments Fair Value EUR '000
% of Net Asset Value
Equities (continued)
Norway (continued) 360,813 NOK Orkla ASA1 2,802 0.11 48,419 NOK Schibsted ASA 'B' 1,097 0.04 325,661 NOK Telenor ASA 6,009 0.23 80,202 NOK Yara International ASA1 3,091 0.12 Total Norway 35,959 1.39
Portugal (31 May 2018: 0.35%) 1,141,824 EUR EDP - Energias de Portugal SA1 3,721 0.14 227,766 EUR Galp Energia SGPS SA 3,070 0.12 114,377 EUR Jeronimo Martins SGPS SA 1,559 0.06 Total Portugal 8,350 0.32
Spain (31 May 2018: 6.45%) 112,892 EUR ACS Actividades de Construccion y Servicios SA 4,166 0.16 29,878 EUR Aena SME SA 4,927 0.19 197,351 EUR Amadeus IT Group SA 13,491 0.52 2,998,734 EUR Banco Bilbao Vizcaya Argentaria SA 14,596 0.57 2,634,675 EUR Banco de Sabadell SA 2,617 0.10 7,322,821 EUR Banco Santander SA 28,940 1.12 593,338 EUR Bankia SA1 1,343 0.05 295,193 EUR Bankinter SA 1,912 0.08 1,588,563 EUR CaixaBank SA 4,381 0.17 89,456 EUR Cellnex Telecom SA 2,813 0.11 83,219 EUR Enagas SA 2,039 0.08 141,180 EUR Endesa SA 3,150 0.12 220,813 EUR Ferrovial SA1 4,723 0.18 135,830 EUR Grifols SA 3,121 0.12 2,639,188 EUR Iberdrola SA 21,942 0.85 490,759 EUR Industria de Diseno Textil SA 11,803 0.46 486,096 EUR Mapfre SA 1,278 0.05 135,736 EUR Naturgy Energy Group SA 3,465 0.14 191,601 EUR Red Electrica Corp. SA 3,646 0.14 631,090 EUR Repsol SA 9,126 0.35 109,430 EUR Siemens Gamesa Renewable Energy SA1 1,527 0.06 2,101,542 EUR Telefonica SA 15,085 0.58 Total Spain 160,091 6.20
Sweden (31 May 2018: 5.68%) 144,588 SEK Alfa Laval AB 2,658 0.10 454,614 SEK Assa Abloy AB 'B' 7,939 0.31 297,237 SEK Atlas Copco AB 'A' 7,172 0.28 169,774 SEK Atlas Copco AB 'B'1 3,687 0.14 121,066 SEK Boliden AB 2,469 0.10 121,066 SEK Boliden AB - Redemption Shares 48 – 108,921 SEK Electrolux AB 'B' 2,119 0.08 283,220 SEK Epiroc AB 'A' 2,362 0.09 181,921 SEK Epiroc AB 'B'1 1,475 0.06 268,429 SEK Essity AB 'B' 7,049 0.27 387,928 SEK Hennes & Mauritz AB 'B'1 5,194 0.20 115,254 SEK Hexagon AB 'B' 4,796 0.19 188,236 SEK Husqvarna AB 'B'1 1,408 0.05 40,708 SEK ICA Gruppen AB1 1,452 0.06 77,532 SEK Industrivarden AB 'C' 1,401 0.05 201,614 SEK Investor AB 'B' 7,800 0.30 107,807 SEK Kinnevik AB 'B' 2,460 0.10
245
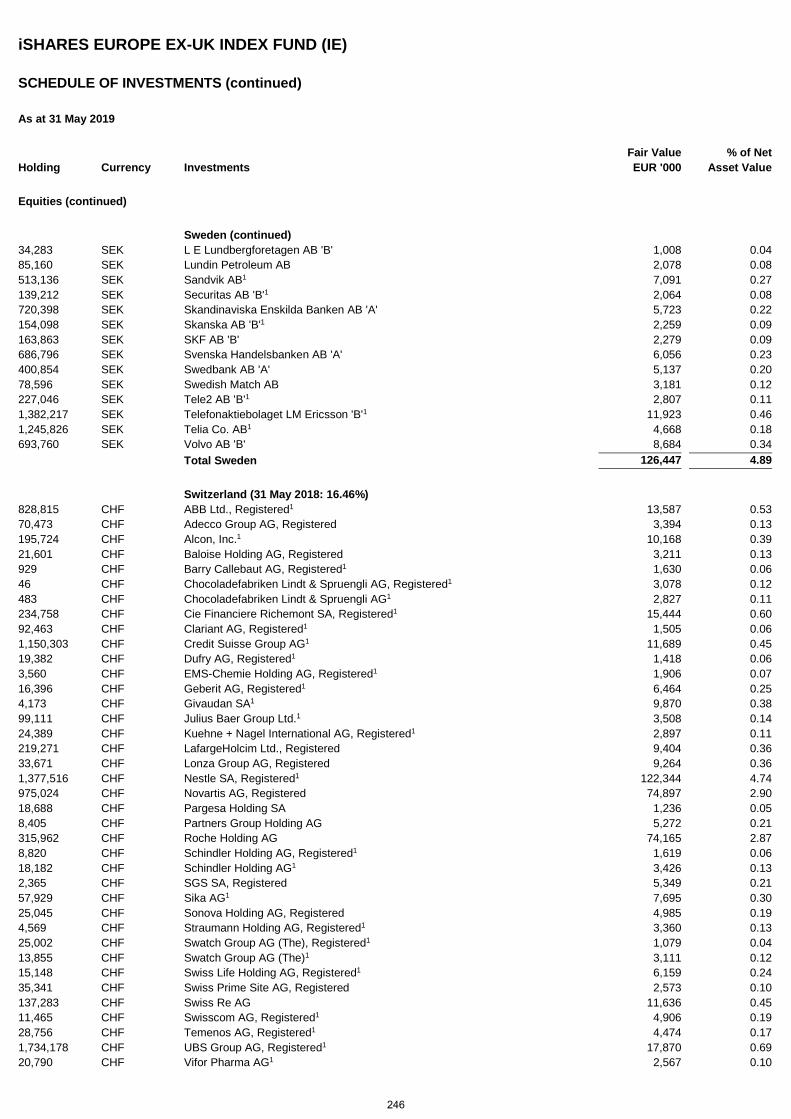
iSHARES EUROPE EX-UK INDEX FUND (IE)
SCHEDULE OF INVESTMENTS (continued)
As at 31 May 2019
Holding Currency Investments Fair Value EUR '000
% of Net Asset Value
Equities (continued)
Sweden (continued) 34,283 SEK L E Lundbergforetagen AB 'B' 1,008 0.04 85,160 SEK Lundin Petroleum AB 2,078 0.08 513,136 SEK Sandvik AB1 7,091 0.27 139,212 SEK Securitas AB 'B'1 2,064 0.08 720,398 SEK Skandinaviska Enskilda Banken AB 'A' 5,723 0.22 154,098 SEK Skanska AB 'B'1 2,259 0.09 163,863 SEK SKF AB 'B' 2,279 0.09 686,796 SEK Svenska Handelsbanken AB 'A' 6,056 0.23 400,854 SEK Swedbank AB 'A' 5,137 0.20 78,596 SEK Swedish Match AB 3,181 0.12 227,046 SEK Tele2 AB 'B'1 2,807 0.11 1,382,217 SEK Telefonaktiebolaget LM Ericsson 'B'1 11,923 0.46 1,245,826 SEK Telia Co. AB1 4,668 0.18 693,760 SEK Volvo AB 'B' 8,684 0.34 Total Sweden 126,447 4.89
Switzerland (31 May 2018: 16.46%) 828,815 CHF ABB Ltd., Registered1 13,587 0.53 70,473 CHF Adecco Group AG, Registered 3,394 0.13 195,724 CHF Alcon, Inc.1 10,168 0.39 21,601 CHF Baloise Holding AG, Registered 3,211 0.13 929 CHF Barry Callebaut AG, Registered1 1,630 0.06 46 CHF Chocoladefabriken Lindt & Spruengli AG, Registered1 3,078 0.12 483 CHF Chocoladefabriken Lindt & Spruengli AG1 2,827 0.11 234,758 CHF Cie Financiere Richemont SA, Registered1 15,444 0.60 92,463 CHF Clariant AG, Registered1 1,505 0.06 1,150,303 CHF Credit Suisse Group AG1 11,689 0.45 19,382 CHF Dufry AG, Registered1 1,418 0.06 3,560 CHF EMS-Chemie Holding AG, Registered1 1,906 0.07 16,396 CHF Geberit AG, Registered1 6,464 0.25 4,173 CHF Givaudan SA1 9,870 0.38 99,111 CHF Julius Baer Group Ltd.1 3,508 0.14 24,389 CHF Kuehne + Nagel International AG, Registered1 2,897 0.11 219,271 CHF LafargeHolcim Ltd., Registered 9,404 0.36 33,671 CHF Lonza Group AG, Registered 9,264 0.36 1,377,516 CHF Nestle SA, Registered1 122,344 4.74 975,024 CHF Novartis AG, Registered 74,897 2.90 18,688 CHF Pargesa Holding SA 1,236 0.05 8,405 CHF Partners Group Holding AG 5,272 0.21 315,962 CHF Roche Holding AG 74,165 2.87 8,820 CHF Schindler Holding AG, Registered1 1,619 0.06 18,182 CHF Schindler Holding AG1 3,426 0.13 2,365 CHF SGS SA, Registered 5,349 0.21 57,929 CHF Sika AG1 7,695 0.30 25,045 CHF Sonova Holding AG, Registered 4,985 0.19 4,569 CHF Straumann Holding AG, Registered1 3,360 0.13 25,002 CHF Swatch Group AG (The), Registered1 1,079 0.04 13,855 CHF Swatch Group AG (The)1 3,111 0.12 15,148 CHF Swiss Life Holding AG, Registered1 6,159 0.24 35,341 CHF Swiss Prime Site AG, Registered 2,573 0.10 137,283 CHF Swiss Re AG 11,636 0.45 11,465 CHF Swisscom AG, Registered1 4,906 0.19 28,756 CHF Temenos AG, Registered1 4,474 0.17 1,734,178 CHF UBS Group AG, Registered1 17,870 0.69 20,790 CHF Vifor Pharma AG1 2,567 0.10
246
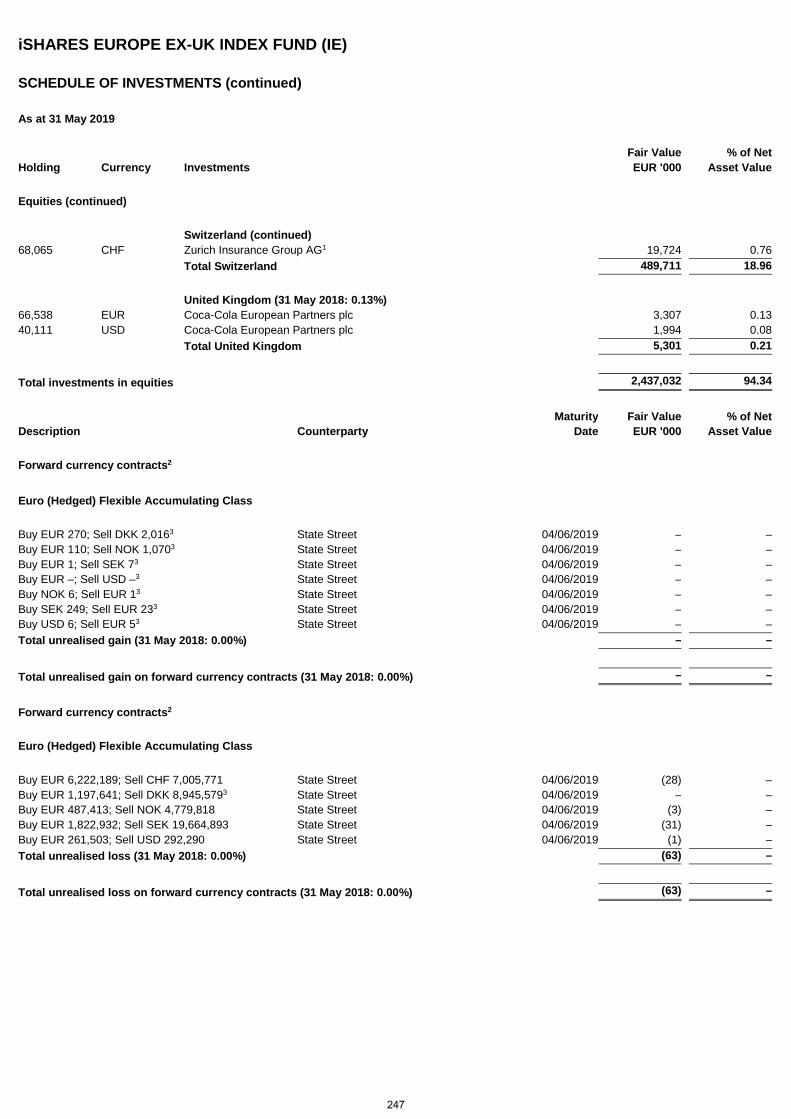
iSHARES EUROPE EX-UK INDEX FUND (IE)
SCHEDULE OF INVESTMENTS (continued)
As at 31 May 2019
Holding Currency Investments Fair Value EUR '000
% of Net Asset Value
Equities (continued)
Switzerland (continued) 68,065 CHF Zurich Insurance Group AG1 19,724 0.76 Total Switzerland 489,711 18.96
United Kingdom (31 May 2018: 0.13%) 66,538 EUR Coca-Cola European Partners plc 3,307 0.13 40,111 USD Coca-Cola European Partners plc 1,994 0.08 Total United Kingdom 5,301 0.21
Total investments in equities 2,437,032 94.34
Maturity Fair Value % of Net Description Counterparty Date EUR '000 Asset Value
Forward currency contracts2
Euro (Hedged) Flexible Accumulating Class
Buy EUR 270; Sell DKK 2,0163 State Street 04/06/2019 – – Buy EUR 110; Sell NOK 1,0703 State Street 04/06/2019 – – Buy EUR 1; Sell SEK 73 State Street 04/06/2019 – – Buy EUR –; Sell USD –3 State Street 04/06/2019 – – Buy NOK 6; Sell EUR 13 State Street 04/06/2019 – – Buy SEK 249; Sell EUR 233 State Street 04/06/2019 – – Buy USD 6; Sell EUR 53 State Street 04/06/2019 – – Total unrealised gain (31 May 2018: 0.00%) – –
Total unrealised gain on forward currency contracts (31 May 2018: 0.00%) – –
Forward currency contracts2
Euro (Hedged) Flexible Accumulating Class
Buy EUR 6,222,189; Sell CHF 7,005,771 State Street 04/06/2019 (28) – Buy EUR 1,197,641; Sell DKK 8,945,5793 State Street 04/06/2019 – – Buy EUR 487,413; Sell NOK 4,779,818 State Street 04/06/2019 (3) – Buy EUR 1,822,932; Sell SEK 19,664,893 State Street 04/06/2019 (31) – Buy EUR 261,503; Sell USD 292,290 State Street 04/06/2019 (1) – Total unrealised loss (31 May 2018: 0.00%) (63) –
Total unrealised loss on forward currency contracts (31 May 2018: 0.00%) (63) –
247
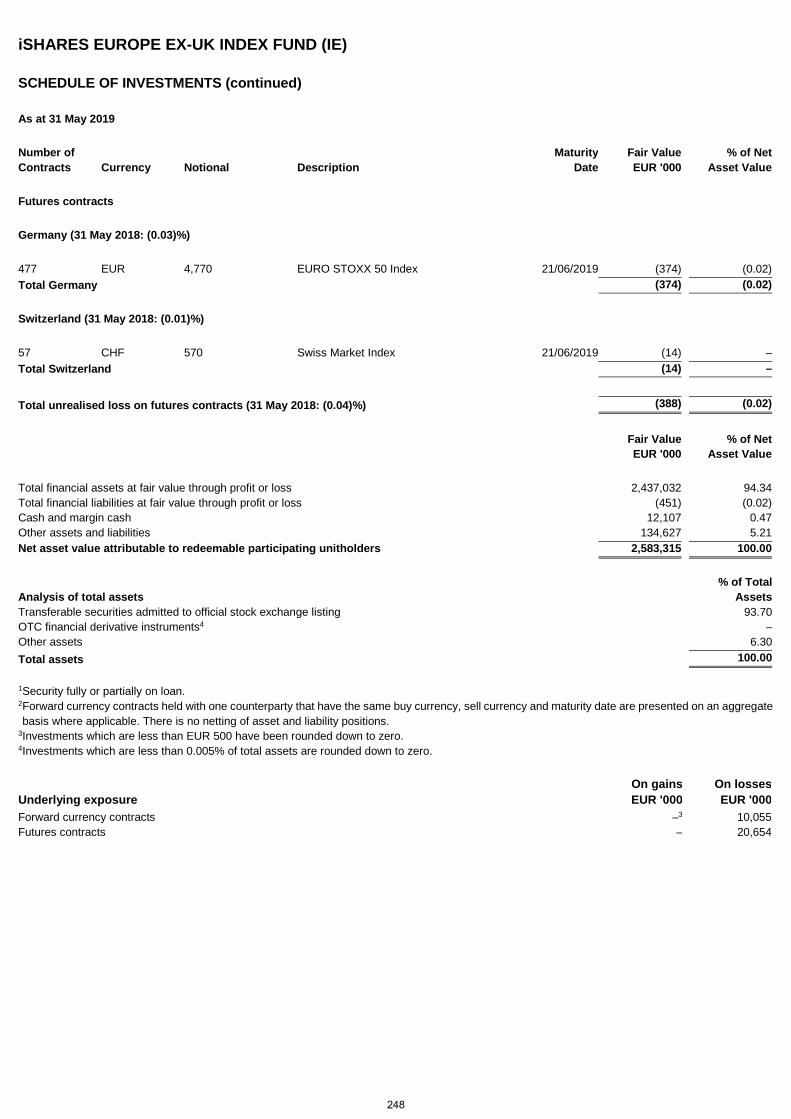
iSHARES EUROPE EX-UK INDEX FUND (IE)
SCHEDULE OF INVESTMENTS (continued)
As at 31 May 2019
Number of Maturity Fair Value % of Net Contracts Currency Notional Description Date EUR '000 Asset Value
Futures contracts
Germany (31 May 2018: (0.03)%)
477 EUR 4,770 EURO STOXX 50 Index 21/06/2019 (374) (0.02) Total Germany (374) (0.02)
Switzerland (31 May 2018: (0.01)%)
57 CHF 570 Swiss Market Index 21/06/2019 (14) – Total Switzerland (14) –
Total unrealised loss on futures contracts (31 May 2018: (0.04)%) (388) (0.02)
Fair Value EUR '000
% of Net Asset Value
Total financial assets at fair value through profit or loss 2,437,032 94.34 Total financial liabilities at fair value through profit or loss (451) (0.02) Cash and margin cash 12,107 0.47 Other assets and liabilities 134,627 5.21 Net asset value attributable to redeemable participating unitholders 2,583,315 100.00
Analysis of total assets % of Total
Assets Transferable securities admitted to official stock exchange listing 93.70 OTC financial derivative instruments4 – Other assets 6.30 Total assets 100.00
1 Security fully or partially on loan. 2 Forward currency contracts held with one counterparty that have the same buy currency, sell currency and maturity date are presented on an aggregate basis where applicable. There is no netting of asset and liability positions.
3 Investments which are less than EUR 500 have been rounded down to zero. 4 Investments which are less than 0.005% of total assets are rounded down to zero.
Underlying exposure On gains EUR '000
On losses EUR '000
Forward currency contracts –3 10,055 Futures contracts – 20,654
248
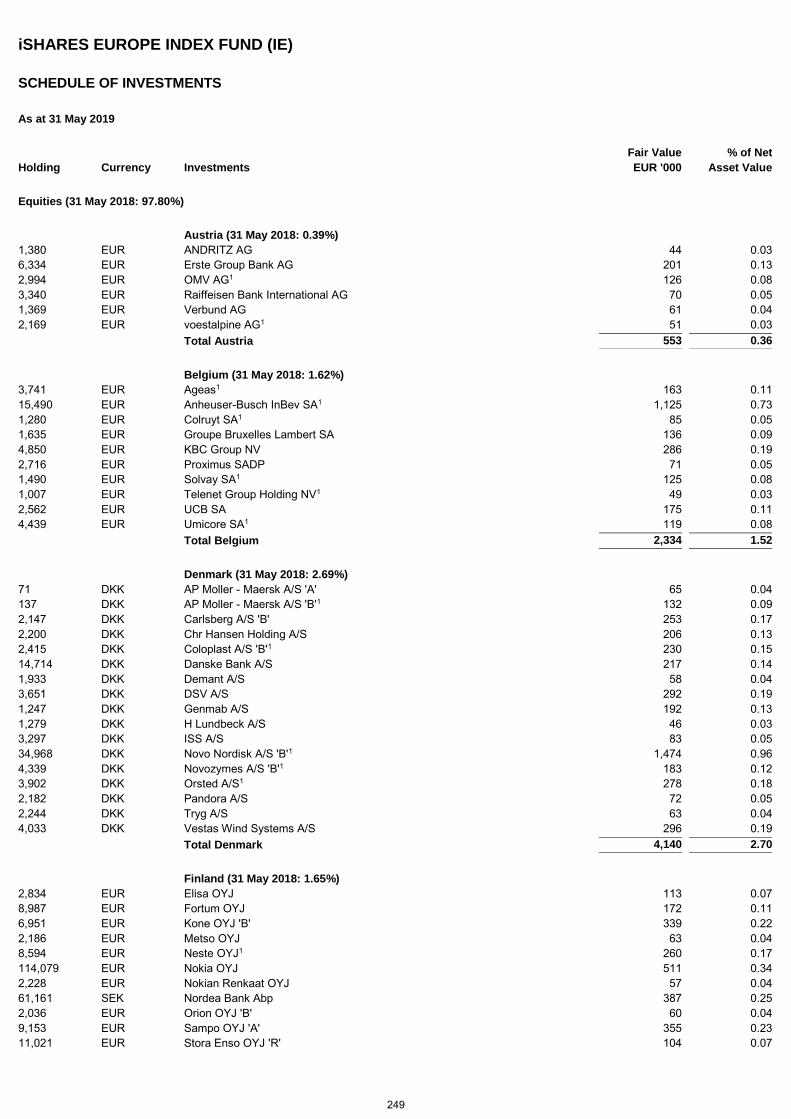
iSHARES EUROPE INDEX FUND (IE)
SCHEDULE OF INVESTMENTS
As at 31 May 2019
Holding Currency Investments Fair Value
EUR '000 % of Net
Asset Value
Equities (31 May 2018: 97.80%)
Austria (31 May 2018: 0.39%) 1,380 EUR ANDRITZ AG 44 0.03 6,334 EUR Erste Group Bank AG 201 0.13 2,994 EUR OMV AG1 126 0.08 3,340 EUR Raiffeisen Bank International AG 70 0.05 1,369 EUR Verbund AG 61 0.04 2,169 EUR voestalpine AG1 51 0.03 Total Austria 553 0.36
Belgium (31 May 2018: 1.62%) 3,741 EUR Ageas1 163 0.11 15,490 EUR Anheuser-Busch InBev SA1 1,125 0.73 1,280 EUR Colruyt SA1 85 0.05 1,635 EUR Groupe Bruxelles Lambert SA 136 0.09 4,850 EUR KBC Group NV 286 0.19 2,716 EUR Proximus SADP 71 0.05 1,490 EUR Solvay SA1 125 0.08 1,007 EUR Telenet Group Holding NV1 49 0.03 2,562 EUR UCB SA 175 0.11 4,439 EUR Umicore SA1 119 0.08 Total Belgium 2,334 1.52
Denmark (31 May 2018: 2.69%) 71 DKK AP Moller - Maersk A/S 'A' 65 0.04 137 DKK AP Moller - Maersk A/S 'B'1 132 0.09 2,147 DKK Carlsberg A/S 'B' 253 0.17 2,200 DKK Chr Hansen Holding A/S 206 0.13 2,415 DKK Coloplast A/S 'B'1 230 0.15 14,714 DKK Danske Bank A/S 217 0.14 1,933 DKK Demant A/S 58 0.04 3,651 DKK DSV A/S 292 0.19 1,247 DKK Genmab A/S 192 0.13 1,279 DKK H Lundbeck A/S 46 0.03 3,297 DKK ISS A/S 83 0.05 34,968 DKK Novo Nordisk A/S 'B'1 1,474 0.96 4,339 DKK Novozymes A/S 'B'1 183 0.12 3,902 DKK Orsted A/S1 278 0.18 2,182 DKK Pandora A/S 72 0.05 2,244 DKK Tryg A/S 63 0.04 4,033 DKK Vestas Wind Systems A/S 296 0.19 Total Denmark 4,140 2.70
Finland (31 May 2018: 1.65%) 2,834 EUR Elisa OYJ 113 0.07 8,987 EUR Fortum OYJ 172 0.11 6,951 EUR Kone OYJ 'B' 339 0.22 2,186 EUR Metso OYJ 63 0.04 8,594 EUR Neste OYJ1 260 0.17 114,079 EUR Nokia OYJ 511 0.34 2,228 EUR Nokian Renkaat OYJ 57 0.04 61,161 SEK Nordea Bank Abp 387 0.25 2,036 EUR Orion OYJ 'B' 60 0.04 9,153 EUR Sampo OYJ 'A' 355 0.23 11,021 EUR Stora Enso OYJ 'R' 104 0.07
249
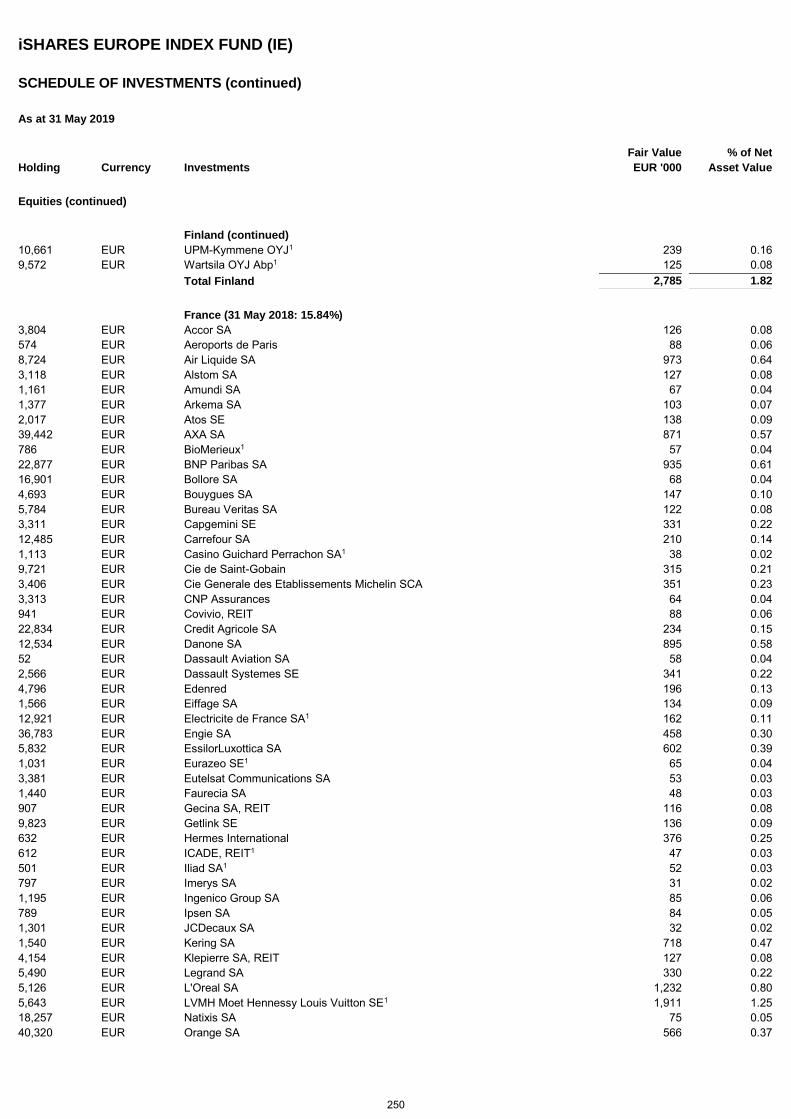
iSHARES EUROPE INDEX FUND (IE)
SCHEDULE OF INVESTMENTS (continued)
As at 31 May 2019
Holding Currency Investments Fair Value
EUR '000 % of Net
Asset Value
Equities (continued)
Finland (continued) 10,661 EUR UPM-Kymmene OYJ1 239 0.16 9,572 EUR Wartsila OYJ Abp1 125 0.08 Total Finland 2,785 1.82
France (31 May 2018: 15.84%) 3,804 EUR Accor SA 126 0.08 574 EUR Aeroports de Paris 88 0.06 8,724 EUR Air Liquide SA 973 0.64 3,118 EUR Alstom SA 127 0.08 1,161 EUR Amundi SA 67 0.04 1,377 EUR Arkema SA 103 0.07 2,017 EUR Atos SE 138 0.09 39,442 EUR AXA SA 871 0.57 786 EUR BioMerieux1 57 0.04 22,877 EUR BNP Paribas SA 935 0.61 16,901 EUR Bollore SA 68 0.04 4,693 EUR Bouygues SA 147 0.10 5,784 EUR Bureau Veritas SA 122 0.08 3,311 EUR Capgemini SE 331 0.22 12,485 EUR Carrefour SA 210 0.14 1,113 EUR Casino Guichard Perrachon SA1 38 0.02 9,721 EUR Cie de Saint-Gobain 315 0.21 3,406 EUR Cie Generale des Etablissements Michelin SCA 351 0.23 3,313 EUR CNP Assurances 64 0.04 941 EUR Covivio, REIT 88 0.06 22,834 EUR Credit Agricole SA 234 0.15 12,534 EUR Danone SA 895 0.58 52 EUR Dassault Aviation SA 58 0.04 2,566 EUR Dassault Systemes SE 341 0.22 4,796 EUR Edenred 196 0.13 1,566 EUR Eiffage SA 134 0.09 12,921 EUR Electricite de France SA1 162 0.11 36,783 EUR Engie SA 458 0.30 5,832 EUR EssilorLuxottica SA 602 0.39 1,031 EUR Eurazeo SE1 65 0.04 3,381 EUR Eutelsat Communications SA 53 0.03 1,440 EUR Faurecia SA 48 0.03 907 EUR Gecina SA, REIT 116 0.08 9,823 EUR Getlink SE 136 0.09 632 EUR Hermes International 376 0.25 612 EUR ICADE, REIT1 47 0.03 501 EUR Iliad SA1 52 0.03 797 EUR Imerys SA 31 0.02 1,195 EUR Ingenico Group SA 85 0.06 789 EUR Ipsen SA 84 0.05 1,301 EUR JCDecaux SA 32 0.02 1,540 EUR Kering SA 718 0.47 4,154 EUR Klepierre SA, REIT 127 0.08 5,490 EUR Legrand SA 330 0.22 5,126 EUR L'Oreal SA 1,232 0.80 5,643 EUR LVMH Moet Hennessy Louis Vuitton SE1 1,911 1.25 18,257 EUR Natixis SA 75 0.05 40,320 EUR Orange SA 566 0.37
250
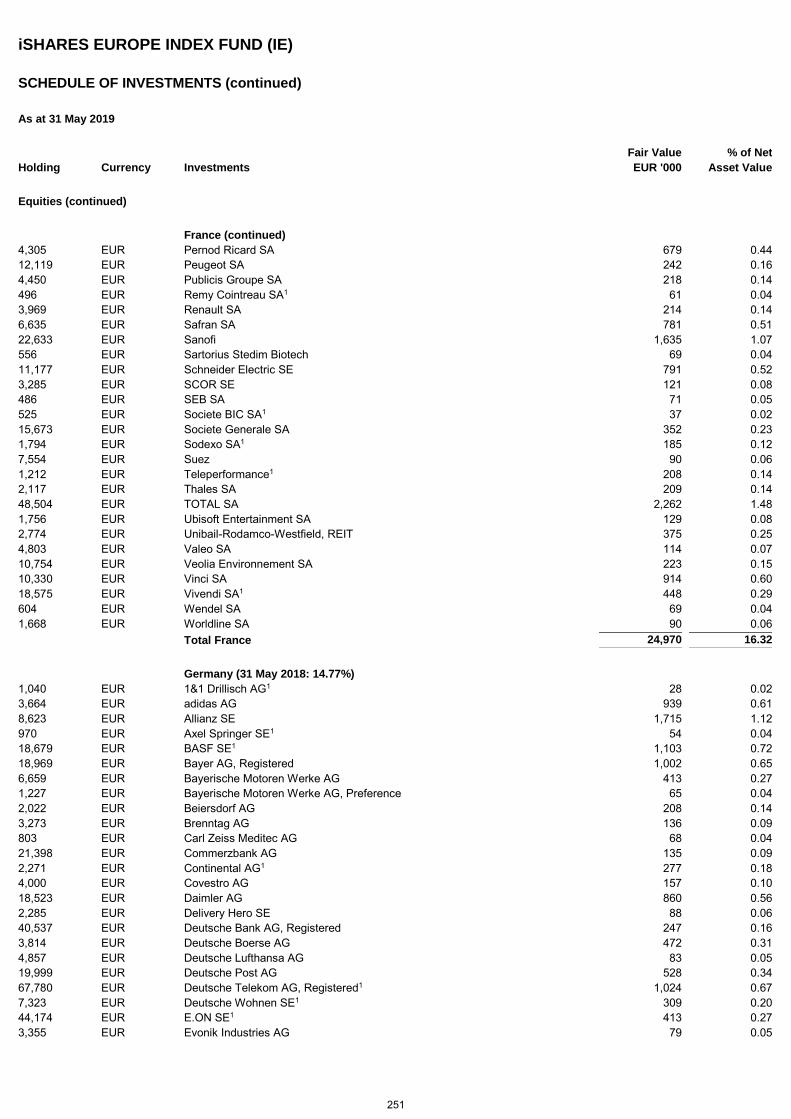
iSHARES EUROPE INDEX FUND (IE)
SCHEDULE OF INVESTMENTS (continued)
As at 31 May 2019
Holding Currency Investments Fair Value
EUR '000 % of Net
Asset Value
Equities (continued)
France (continued) 4,305 EUR Pernod Ricard SA 679 0.44 12,119 EUR Peugeot SA 242 0.16 4,450 EUR Publicis Groupe SA 218 0.14 496 EUR Remy Cointreau SA1 61 0.04 3,969 EUR Renault SA 214 0.14 6,635 EUR Safran SA 781 0.51 22,633 EUR Sanofi 1,635 1.07 556 EUR Sartorius Stedim Biotech 69 0.04 11,177 EUR Schneider Electric SE 791 0.52 3,285 EUR SCOR SE 121 0.08 486 EUR SEB SA 71 0.05 525 EUR Societe BIC SA1 37 0.02 15,673 EUR Societe Generale SA 352 0.23 1,794 EUR Sodexo SA1 185 0.12 7,554 EUR Suez 90 0.06 1,212 EUR Teleperformance1 208 0.14 2,117 EUR Thales SA 209 0.14 48,504 EUR TOTAL SA 2,262 1.48 1,756 EUR Ubisoft Entertainment SA 129 0.08 2,774 EUR Unibail-Rodamco-Westfield, REIT 375 0.25 4,803 EUR Valeo SA 114 0.07 10,754 EUR Veolia Environnement SA 223 0.15 10,330 EUR Vinci SA 914 0.60 18,575 EUR Vivendi SA1 448 0.29 604 EUR Wendel SA 69 0.04 1,668 EUR Worldline SA 90 0.06 Total France 24,970 16.32
Germany (31 May 2018: 14.77%) 1,040 EUR 1&1 Drillisch AG1 28 0.02 3,664 EUR adidas AG 939 0.61 8,623 EUR Allianz SE 1,715 1.12 970 EUR Axel Springer SE1 54 0.04 18,679 EUR BASF SE1 1,103 0.72 18,969 EUR Bayer AG, Registered 1,002 0.65 6,659 EUR Bayerische Motoren Werke AG 413 0.27 1,227 EUR Bayerische Motoren Werke AG, Preference 65 0.04 2,022 EUR Beiersdorf AG 208 0.14 3,273 EUR Brenntag AG 136 0.09 803 EUR Carl Zeiss Meditec AG 68 0.04 21,398 EUR Commerzbank AG 135 0.09 2,271 EUR Continental AG1 277 0.18 4,000 EUR Covestro AG 157 0.10 18,523 EUR Daimler AG 860 0.56 2,285 EUR Delivery Hero SE 88 0.06 40,537 EUR Deutsche Bank AG, Registered 247 0.16 3,814 EUR Deutsche Boerse AG 472 0.31 4,857 EUR Deutsche Lufthansa AG 83 0.05 19,999 EUR Deutsche Post AG 528 0.34 67,780 EUR Deutsche Telekom AG, Registered1 1,024 0.67 7,323 EUR Deutsche Wohnen SE1 309 0.20 44,174 EUR E.ON SE1 413 0.27 3,355 EUR Evonik Industries AG 79 0.05
251
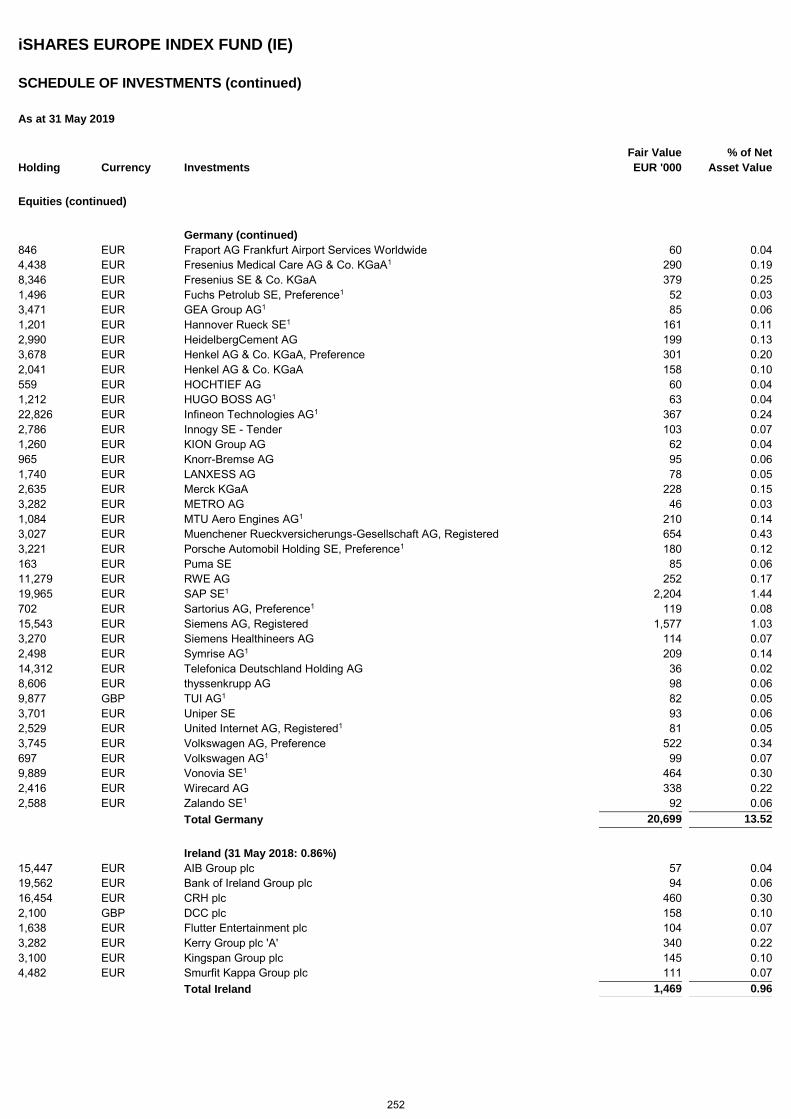
iSHARES EUROPE INDEX FUND (IE)
SCHEDULE OF INVESTMENTS (continued)
As at 31 May 2019
Holding Currency Investments Fair Value
EUR '000 % of Net
Asset Value
Equities (continued)
Germany (continued) 846 EUR Fraport AG Frankfurt Airport Services Worldwide 60 0.04 4,438 EUR Fresenius Medical Care AG & Co. KGaA1 290 0.19 8,346 EUR Fresenius SE & Co. KGaA 379 0.25 1,496 EUR Fuchs Petrolub SE, Preference1 52 0.03 3,471 EUR GEA Group AG1 85 0.06 1,201 EUR Hannover Rueck SE1 161 0.11 2,990 EUR HeidelbergCement AG 199 0.13 3,678 EUR Henkel AG & Co. KGaA, Preference 301 0.20 2,041 EUR Henkel AG & Co. KGaA 158 0.10 559 EUR HOCHTIEF AG 60 0.04 1,212 EUR HUGO BOSS AG1 63 0.04 22,826 EUR Infineon Technologies AG1 367 0.24 2,786 EUR Innogy SE - Tender 103 0.07 1,260 EUR KION Group AG 62 0.04 965 EUR Knorr-Bremse AG 95 0.06 1,740 EUR LANXESS AG 78 0.05 2,635 EUR Merck KGaA 228 0.15 3,282 EUR METRO AG 46 0.03 1,084 EUR MTU Aero Engines AG1 210 0.14 3,027 EUR Muenchener Rueckversicherungs-Gesellschaft AG, Registered 654 0.43 3,221 EUR Porsche Automobil Holding SE, Preference1 180 0.12 163 EUR Puma SE 85 0.06 11,279 EUR RWE AG 252 0.17 19,965 EUR SAP SE1 2,204 1.44 702 EUR Sartorius AG, Preference1 119 0.08 15,543 EUR Siemens AG, Registered 1,577 1.03 3,270 EUR Siemens Healthineers AG 114 0.07 2,498 EUR Symrise AG1 209 0.14 14,312 EUR Telefonica Deutschland Holding AG 36 0.02 8,606 EUR thyssenkrupp AG 98 0.06 9,877 GBP TUI AG1 82 0.05 3,701 EUR Uniper SE 93 0.06 2,529 EUR United Internet AG, Registered1 81 0.05 3,745 EUR Volkswagen AG, Preference 522 0.34 697 EUR Volkswagen AG1 99 0.07 9,889 EUR Vonovia SE1 464 0.30 2,416 EUR Wirecard AG 338 0.22 2,588 EUR Zalando SE1 92 0.06 Total Germany 20,699 13.52
Ireland (31 May 2018: 0.86%) 15,447 EUR AIB Group plc 57 0.04 19,562 EUR Bank of Ireland Group plc 94 0.06 16,454 EUR CRH plc 460 0.30 2,100 GBP DCC plc 158 0.10 1,638 EUR Flutter Entertainment plc 104 0.07 3,282 EUR Kerry Group plc 'A' 340 0.22 3,100 EUR Kingspan Group plc 145 0.10 4,482 EUR Smurfit Kappa Group plc 111 0.07 Total Ireland 1,469 0.96
252
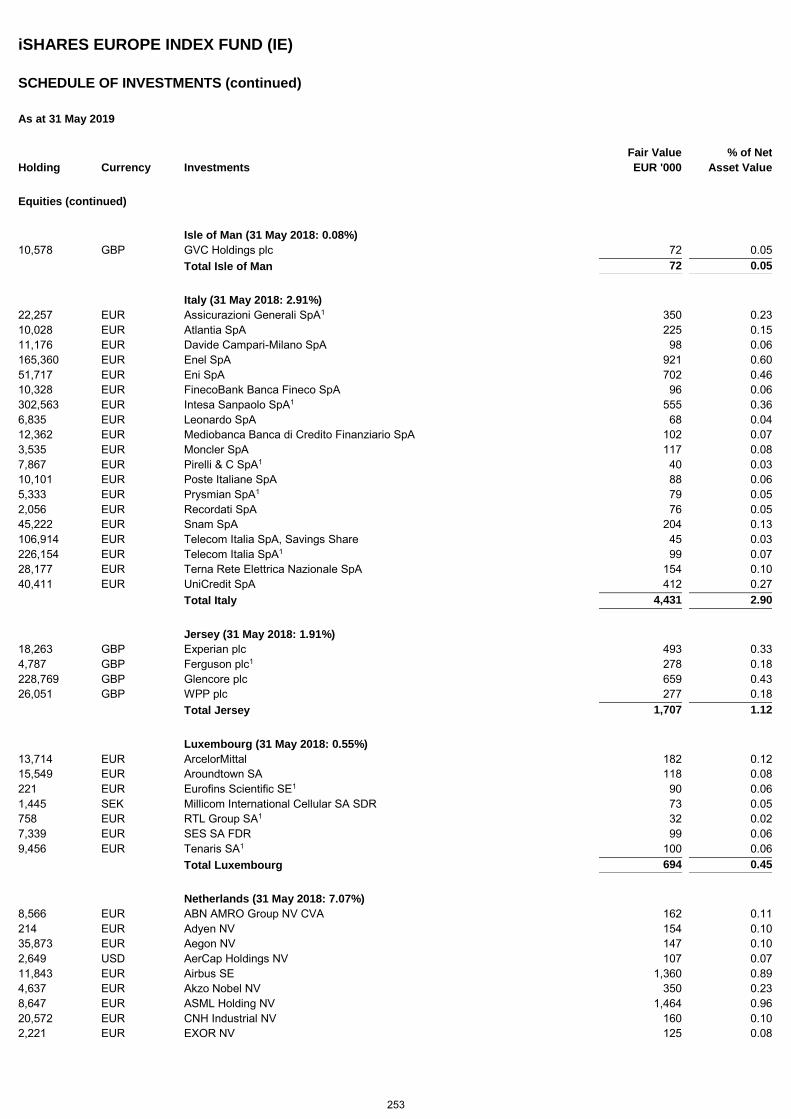
iSHARES EUROPE INDEX FUND (IE)
SCHEDULE OF INVESTMENTS (continued)
As at 31 May 2019
Holding Currency Investments Fair Value
EUR '000 % of Net
Asset Value
Equities (continued)
Isle of Man (31 May 2018: 0.08%) 10,578 GBP GVC Holdings plc 72 0.05 Total Isle of Man 72 0.05
Italy (31 May 2018: 2.91%) 22,257 EUR Assicurazioni Generali SpA1 350 0.23 10,028 EUR Atlantia SpA 225 0.15 11,176 EUR Davide Campari-Milano SpA 98 0.06 165,360 EUR Enel SpA 921 0.60 51,717 EUR Eni SpA 702 0.46 10,328 EUR FinecoBank Banca Fineco SpA 96 0.06 302,563 EUR Intesa Sanpaolo SpA1 555 0.36 6,835 EUR Leonardo SpA 68 0.04 12,362 EUR Mediobanca Banca di Credito Finanziario SpA 102 0.07 3,535 EUR Moncler SpA 117 0.08 7,867 EUR Pirelli & C SpA1 40 0.03 10,101 EUR Poste Italiane SpA 88 0.06 5,333 EUR Prysmian SpA1 79 0.05 2,056 EUR Recordati SpA 76 0.05 45,222 EUR Snam SpA 204 0.13 106,914 EUR Telecom Italia SpA, Savings Share 45 0.03 226,154 EUR Telecom Italia SpA1 99 0.07 28,177 EUR Terna Rete Elettrica Nazionale SpA 154 0.10 40,411 EUR UniCredit SpA 412 0.27 Total Italy 4,431 2.90
Jersey (31 May 2018: 1.91%) 18,263 GBP Experian plc 493 0.33 4,787 GBP Ferguson plc1 278 0.18 228,769 GBP Glencore plc 659 0.43 26,051 GBP WPP plc 277 0.18 Total Jersey 1,707 1.12
Luxembourg (31 May 2018: 0.55%) 13,714 EUR ArcelorMittal 182 0.12 15,549 EUR Aroundtown SA 118 0.08 221 EUR Eurofins Scientific SE1 90 0.06 1,445 SEK Millicom International Cellular SA SDR 73 0.05 758 EUR RTL Group SA1 32 0.02 7,339 EUR SES SA FDR 99 0.06 9,456 EUR Tenaris SA1 100 0.06 Total Luxembourg 694 0.45
Netherlands (31 May 2018: 7.07%) 8,566 EUR ABN AMRO Group NV CVA 162 0.11 214 EUR Adyen NV 154 0.10 35,873 EUR Aegon NV 147 0.10 2,649 USD AerCap Holdings NV 107 0.07 11,843 EUR Airbus SE 1,360 0.89 4,637 EUR Akzo Nobel NV 350 0.23 8,647 EUR ASML Holding NV 1,464 0.96 20,572 EUR CNH Industrial NV 160 0.10 2,221 EUR EXOR NV 125 0.08
253
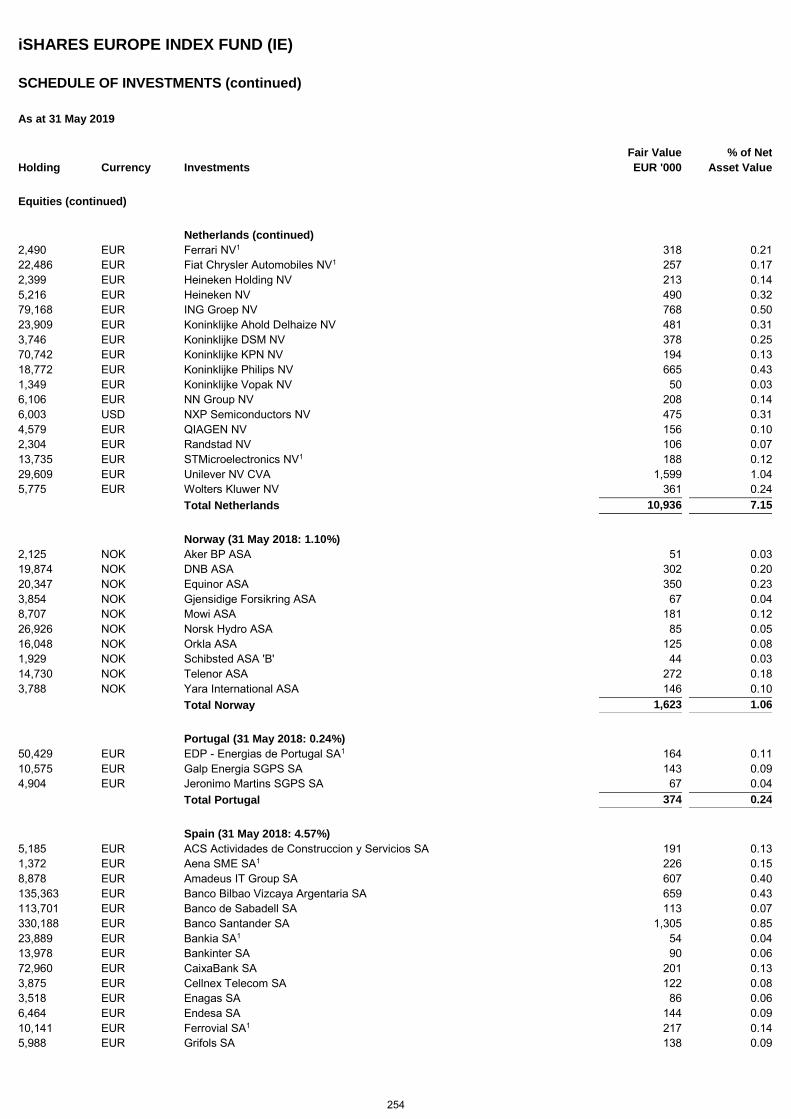
iSHARES EUROPE INDEX FUND (IE)
SCHEDULE OF INVESTMENTS (continued)
As at 31 May 2019
Holding Currency Investments Fair Value
EUR '000 % of Net
Asset Value
Equities (continued)
Netherlands (continued) 2,490 EUR Ferrari NV1 318 0.21 22,486 EUR Fiat Chrysler Automobiles NV1 257 0.17 2,399 EUR Heineken Holding NV 213 0.14 5,216 EUR Heineken NV 490 0.32 79,168 EUR ING Groep NV 768 0.50 23,909 EUR Koninklijke Ahold Delhaize NV 481 0.31 3,746 EUR Koninklijke DSM NV 378 0.25 70,742 EUR Koninklijke KPN NV 194 0.13 18,772 EUR Koninklijke Philips NV 665 0.43 1,349 EUR Koninklijke Vopak NV 50 0.03 6,106 EUR NN Group NV 208 0.14 6,003 USD NXP Semiconductors NV 475 0.31 4,579 EUR QIAGEN NV 156 0.10 2,304 EUR Randstad NV 106 0.07 13,735 EUR STMicroelectronics NV1 188 0.12 29,609 EUR Unilever NV CVA 1,599 1.04 5,775 EUR Wolters Kluwer NV 361 0.24 Total Netherlands 10,936 7.15
Norway (31 May 2018: 1.10%) 2,125 NOK Aker BP ASA 51 0.03 19,874 NOK DNB ASA 302 0.20 20,347 NOK Equinor ASA 350 0.23 3,854 NOK Gjensidige Forsikring ASA 67 0.04 8,707 NOK Mowi ASA 181 0.12 26,926 NOK Norsk Hydro ASA 85 0.05 16,048 NOK Orkla ASA 125 0.08 1,929 NOK Schibsted ASA 'B' 44 0.03 14,730 NOK Telenor ASA 272 0.18 3,788 NOK Yara International ASA 146 0.10 Total Norway 1,623 1.06
Portugal (31 May 2018: 0.24%) 50,429 EUR EDP - Energias de Portugal SA1 164 0.11 10,575 EUR Galp Energia SGPS SA 143 0.09 4,904 EUR Jeronimo Martins SGPS SA 67 0.04 Total Portugal 374 0.24
Spain (31 May 2018: 4.57%) 5,185 EUR ACS Actividades de Construccion y Servicios SA 191 0.13 1,372 EUR Aena SME SA1 226 0.15 8,878 EUR Amadeus IT Group SA 607 0.40 135,363 EUR Banco Bilbao Vizcaya Argentaria SA 659 0.43 113,701 EUR Banco de Sabadell SA 113 0.07 330,188 EUR Banco Santander SA 1,305 0.85 23,889 EUR Bankia SA1 54 0.04 13,978 EUR Bankinter SA 90 0.06 72,960 EUR CaixaBank SA 201 0.13 3,875 EUR Cellnex Telecom SA 122 0.08 3,518 EUR Enagas SA 86 0.06 6,464 EUR Endesa SA 144 0.09 10,141 EUR Ferrovial SA1 217 0.14 5,988 EUR Grifols SA 138 0.09
254
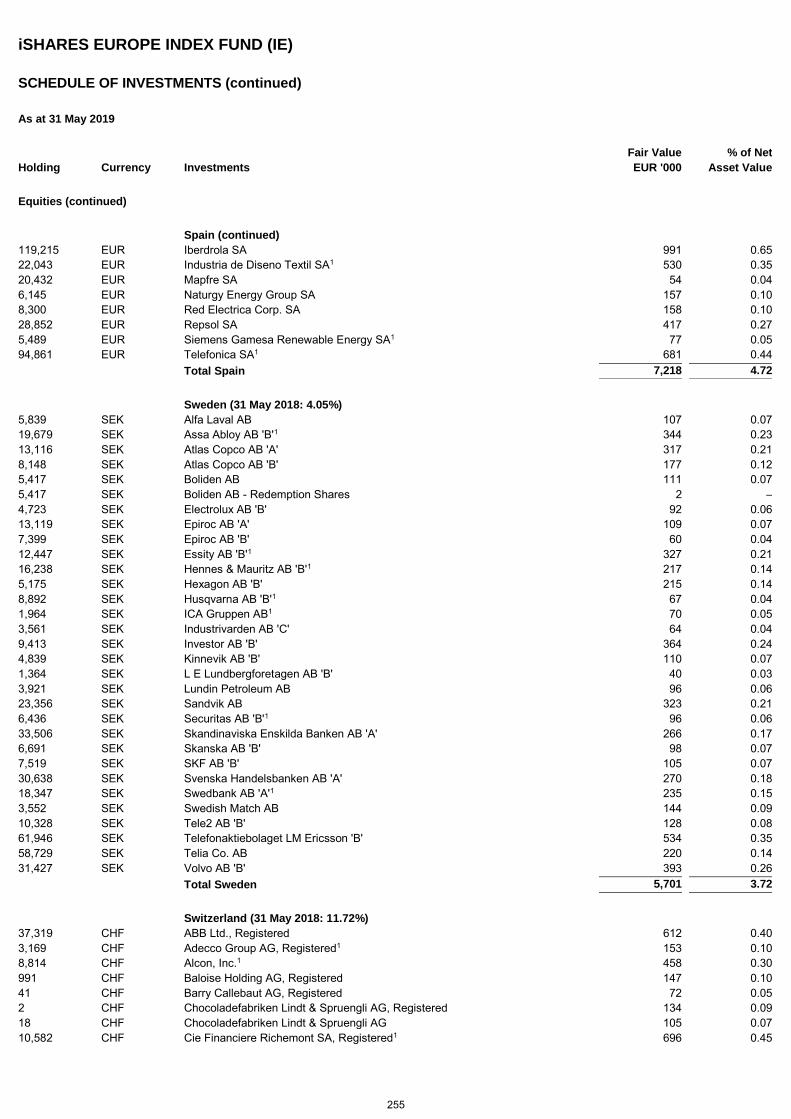
iSHARES EUROPE INDEX FUND (IE)
SCHEDULE OF INVESTMENTS (continued)
As at 31 May 2019
Holding Currency Investments Fair Value
EUR '000 % of Net
Asset Value
Equities (continued)
Spain (continued) 119,215 EUR Iberdrola SA 991 0.65 22,043 EUR Industria de Diseno Textil SA1 530 0.35 20,432 EUR Mapfre SA 54 0.04 6,145 EUR Naturgy Energy Group SA 157 0.10 8,300 EUR Red Electrica Corp. SA 158 0.10 28,852 EUR Repsol SA 417 0.27 5,489 EUR Siemens Gamesa Renewable Energy SA1 77 0.05 94,861 EUR Telefonica SA1 681 0.44 Total Spain 7,218 4.72
Sweden (31 May 2018: 4.05%) 5,839 SEK Alfa Laval AB 107 0.07 19,679 SEK Assa Abloy AB 'B'1 344 0.23 13,116 SEK Atlas Copco AB 'A' 317 0.21 8,148 SEK Atlas Copco AB 'B' 177 0.12 5,417 SEK Boliden AB 111 0.07 5,417 SEK Boliden AB - Redemption Shares 2 – 4,723 SEK Electrolux AB 'B' 92 0.06 13,119 SEK Epiroc AB 'A' 109 0.07 7,399 SEK Epiroc AB 'B' 60 0.04 12,447 SEK Essity AB 'B'1 327 0.21 16,238 SEK Hennes & Mauritz AB 'B'1 217 0.14 5,175 SEK Hexagon AB 'B' 215 0.14 8,892 SEK Husqvarna AB 'B'1 67 0.04 1,964 SEK ICA Gruppen AB1 70 0.05 3,561 SEK Industrivarden AB 'C' 64 0.04 9,413 SEK Investor AB 'B' 364 0.24 4,839 SEK Kinnevik AB 'B' 110 0.07 1,364 SEK L E Lundbergforetagen AB 'B' 40 0.03 3,921 SEK Lundin Petroleum AB 96 0.06 23,356 SEK Sandvik AB 323 0.21 6,436 SEK Securitas AB 'B'1 96 0.06 33,506 SEK Skandinaviska Enskilda Banken AB 'A' 266 0.17 6,691 SEK Skanska AB 'B' 98 0.07 7,519 SEK SKF AB 'B' 105 0.07 30,638 SEK Svenska Handelsbanken AB 'A' 270 0.18 18,347 SEK Swedbank AB 'A'1 235 0.15 3,552 SEK Swedish Match AB 144 0.09 10,328 SEK Tele2 AB 'B' 128 0.08 61,946 SEK Telefonaktiebolaget LM Ericsson 'B' 534 0.35 58,729 SEK Telia Co. AB 220 0.14 31,427 SEK Volvo AB 'B' 393 0.26 Total Sweden 5,701 3.72
Switzerland (31 May 2018: 11.72%) 37,319 CHF ABB Ltd., Registered 612 0.40 3,169 CHF Adecco Group AG, Registered1 153 0.10 8,814 CHF Alcon, Inc.1 458 0.30 991 CHF Baloise Holding AG, Registered 147 0.10 41 CHF Barry Callebaut AG, Registered 72 0.05 2 CHF Chocoladefabriken Lindt & Spruengli AG, Registered 134 0.09 18 CHF Chocoladefabriken Lindt & Spruengli AG 105 0.07 10,582 CHF Cie Financiere Richemont SA, Registered1 696 0.45
255
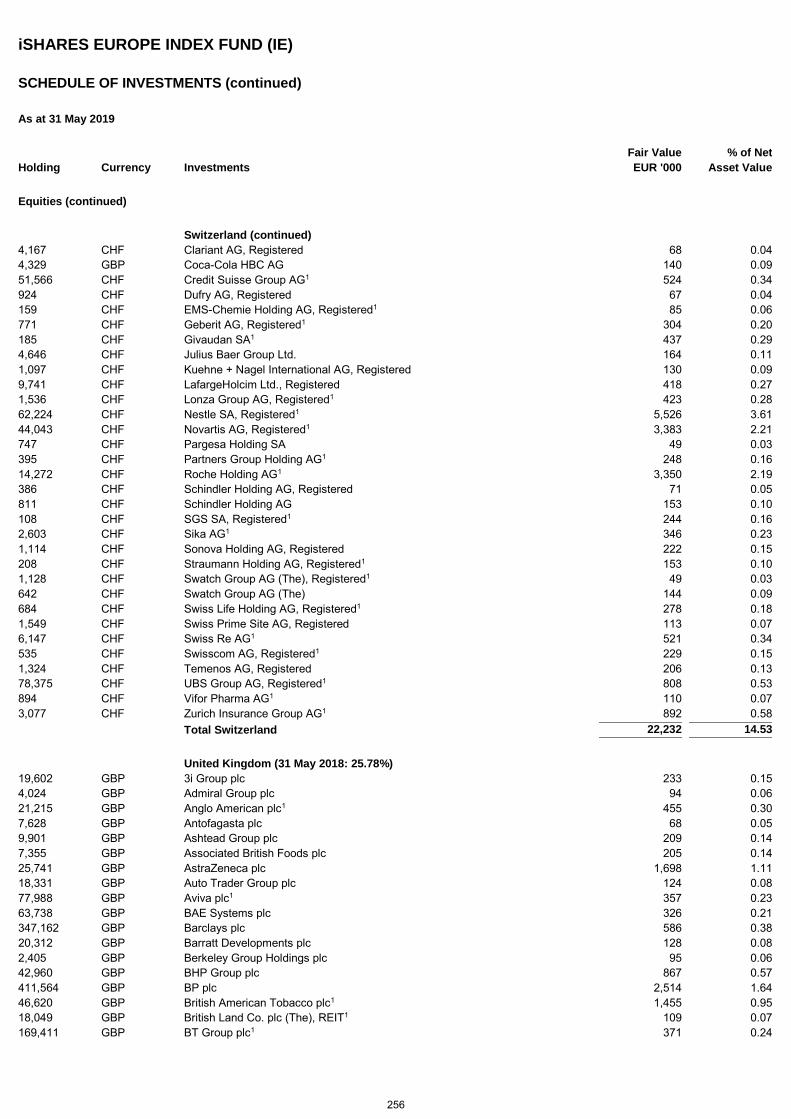
iSHARES EUROPE INDEX FUND (IE)
SCHEDULE OF INVESTMENTS (continued)
As at 31 May 2019
Holding Currency Investments Fair Value
EUR '000 % of Net
Asset Value
Equities (continued)
Switzerland (continued) 4,167 CHF Clariant AG, Registered 68 0.04 4,329 GBP Coca-Cola HBC AG 140 0.09 51,566 CHF Credit Suisse Group AG1 524 0.34 924 CHF Dufry AG, Registered 67 0.04 159 CHF EMS-Chemie Holding AG, Registered1 85 0.06 771 CHF Geberit AG, Registered1 304 0.20 185 CHF Givaudan SA1 437 0.29 4,646 CHF Julius Baer Group Ltd. 164 0.11 1,097 CHF Kuehne + Nagel International AG, Registered 130 0.09 9,741 CHF LafargeHolcim Ltd., Registered 418 0.27 1,536 CHF Lonza Group AG, Registered1 423 0.28 62,224 CHF Nestle SA, Registered1 5,526 3.61 44,043 CHF Novartis AG, Registered1 3,383 2.21 747 CHF Pargesa Holding SA 49 0.03 395 CHF Partners Group Holding AG1 248 0.16 14,272 CHF Roche Holding AG1 3,350 2.19 386 CHF Schindler Holding AG, Registered 71 0.05 811 CHF Schindler Holding AG 153 0.10 108 CHF SGS SA, Registered1 244 0.16 2,603 CHF Sika AG1 346 0.23 1,114 CHF Sonova Holding AG, Registered 222 0.15 208 CHF Straumann Holding AG, Registered1 153 0.10 1,128 CHF Swatch Group AG (The), Registered1 49 0.03 642 CHF Swatch Group AG (The) 144 0.09 684 CHF Swiss Life Holding AG, Registered1 278 0.18 1,549 CHF Swiss Prime Site AG, Registered 113 0.07 6,147 CHF Swiss Re AG1 521 0.34 535 CHF Swisscom AG, Registered1 229 0.15 1,324 CHF Temenos AG, Registered 206 0.13 78,375 CHF UBS Group AG, Registered1 808 0.53 894 CHF Vifor Pharma AG1 110 0.07 3,077 CHF Zurich Insurance Group AG1 892 0.58 Total Switzerland 22,232 14.53
United Kingdom (31 May 2018: 25.78%) 19,602 GBP 3i Group plc 233 0.15 4,024 GBP Admiral Group plc 94 0.06 21,215 GBP Anglo American plc1 455 0.30 7,628 GBP Antofagasta plc 68 0.05 9,901 GBP Ashtead Group plc 209 0.14 7,355 GBP Associated British Foods plc 205 0.14 25,741 GBP AstraZeneca plc 1,698 1.11 18,331 GBP Auto Trader Group plc 124 0.08 77,988 GBP Aviva plc1 357 0.23 63,738 GBP BAE Systems plc 326 0.21 347,162 GBP Barclays plc 586 0.38 20,312 GBP Barratt Developments plc 128 0.08 2,405 GBP Berkeley Group Holdings plc 95 0.06 42,960 GBP BHP Group plc 867 0.57 411,564 GBP BP plc 2,514 1.64 46,620 GBP British American Tobacco plc1 1,455 0.95 18,049 GBP British Land Co. plc (The), REIT1 109 0.07 169,411 GBP BT Group plc1 371 0.24
256
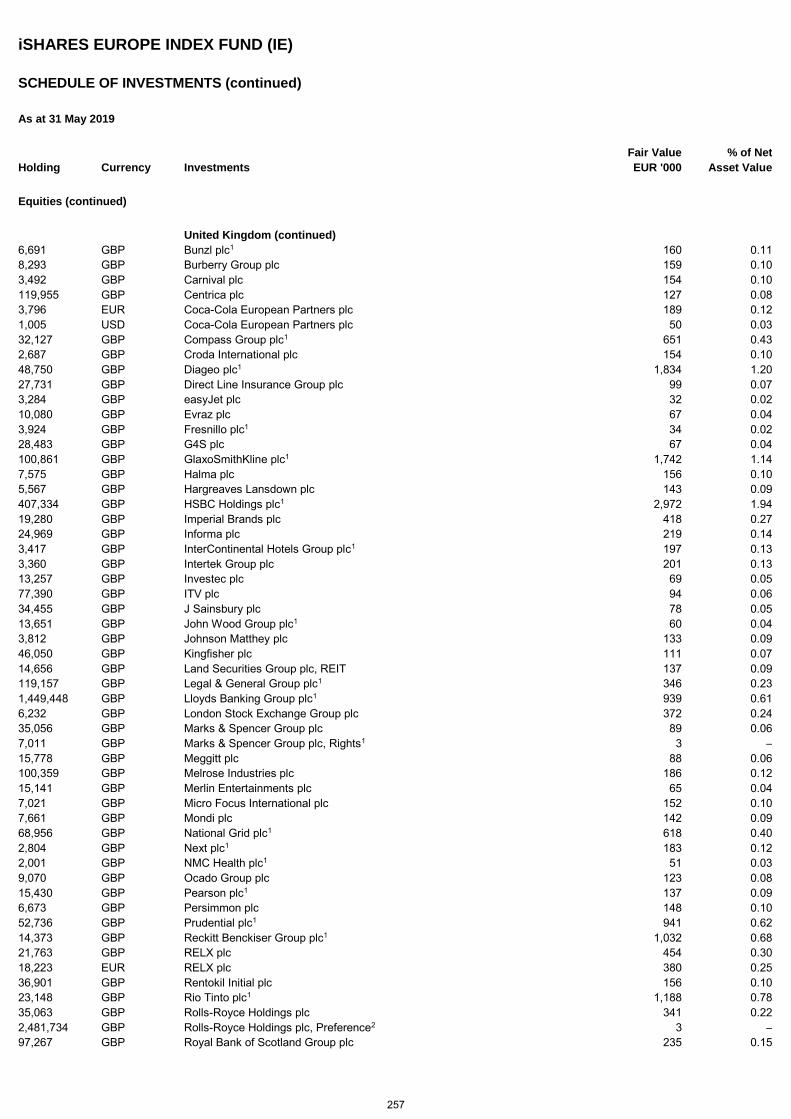
iSHARES EUROPE INDEX FUND (IE)
SCHEDULE OF INVESTMENTS (continued)
As at 31 May 2019
Holding Currency Investments Fair Value
EUR '000 % of Net
Asset Value
Equities (continued)
United Kingdom (continued) 6,691 GBP Bunzl plc1 160 0.11 8,293 GBP Burberry Group plc 159 0.10 3,492 GBP Carnival plc 154 0.10 119,955 GBP Centrica plc 127 0.08 3,796 EUR Coca-Cola European Partners plc 189 0.12 1,005 USD Coca-Cola European Partners plc 50 0.03 32,127 GBP Compass Group plc1 651 0.43 2,687 GBP Croda International plc 154 0.10 48,750 GBP Diageo plc1 1,834 1.20 27,731 GBP Direct Line Insurance Group plc 99 0.07 3,284 GBP easyJet plc 32 0.02 10,080 GBP Evraz plc 67 0.04 3,924 GBP Fresnillo plc1 34 0.02 28,483 GBP G4S plc 67 0.04 100,861 GBP GlaxoSmithKline plc1 1,742 1.14 7,575 GBP Halma plc 156 0.10 5,567 GBP Hargreaves Lansdown plc 143 0.09 407,334 GBP HSBC Holdings plc1 2,972 1.94 19,280 GBP Imperial Brands plc 418 0.27 24,969 GBP Informa plc 219 0.14 3,417 GBP InterContinental Hotels Group plc1 197 0.13 3,360 GBP Intertek Group plc 201 0.13 13,257 GBP Investec plc 69 0.05 77,390 GBP ITV plc 94 0.06 34,455 GBP J Sainsbury plc 78 0.05 13,651 GBP John Wood Group plc1 60 0.04 3,812 GBP Johnson Matthey plc 133 0.09 46,050 GBP Kingfisher plc 111 0.07 14,656 GBP Land Securities Group plc, REIT 137 0.09 119,157 GBP Legal & General Group plc1 346 0.23 1,449,448 GBP Lloyds Banking Group plc1 939 0.61 6,232 GBP London Stock Exchange Group plc 372 0.24 35,056 GBP Marks & Spencer Group plc 89 0.06 7,011 GBP Marks & Spencer Group plc, Rights1 3 – 15,778 GBP Meggitt plc 88 0.06 100,359 GBP Melrose Industries plc 186 0.12 15,141 GBP Merlin Entertainments plc 65 0.04 7,021 GBP Micro Focus International plc 152 0.10 7,661 GBP Mondi plc 142 0.09 68,956 GBP National Grid plc1 618 0.40 2,804 GBP Next plc1 183 0.12 2,001 GBP NMC Health plc1 51 0.03 9,070 GBP Ocado Group plc 123 0.08 15,430 GBP Pearson plc1 137 0.09 6,673 GBP Persimmon plc 148 0.10 52,736 GBP Prudential plc1 941 0.62 14,373 GBP Reckitt Benckiser Group plc1 1,032 0.68 21,763 GBP RELX plc 454 0.30 18,223 EUR RELX plc 380 0.25 36,901 GBP Rentokil Initial plc 156 0.10 23,148 GBP Rio Tinto plc1 1,188 0.78 35,063 GBP Rolls-Royce Holdings plc 341 0.22 2,481,734 GBP Rolls-Royce Holdings plc, Preference2 3 – 97,267 GBP Royal Bank of Scotland Group plc 235 0.15
257
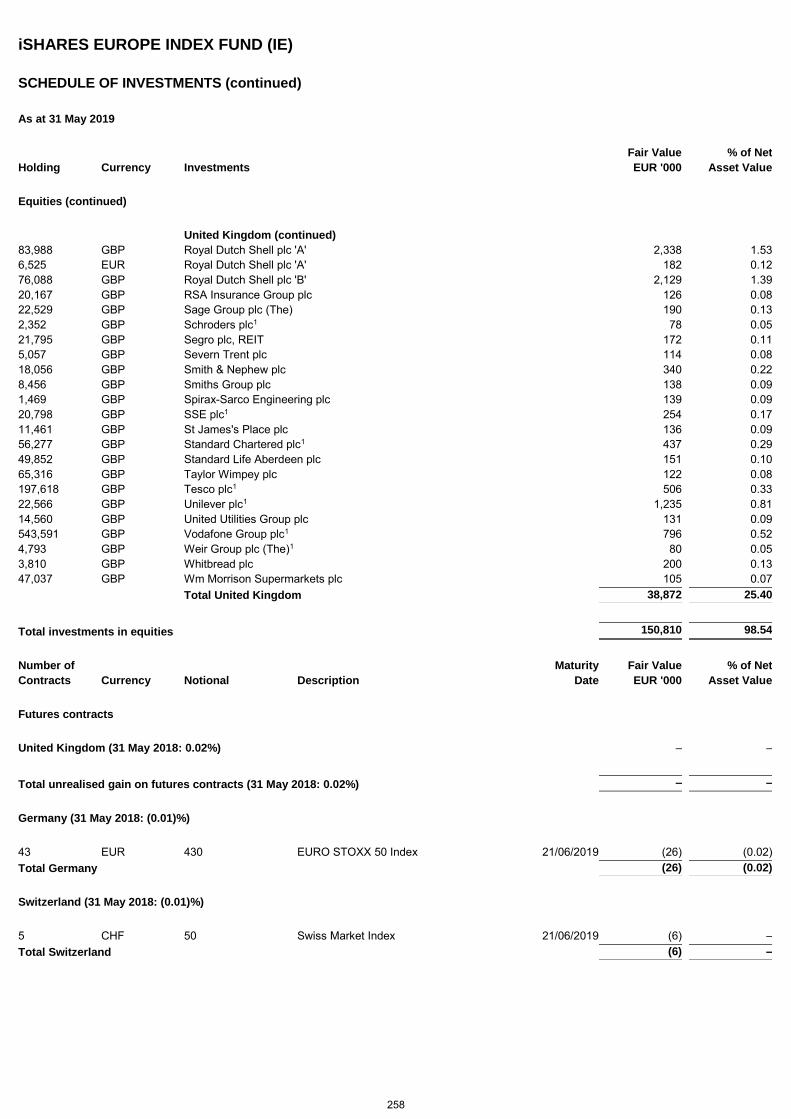
iSHARES EUROPE INDEX FUND (IE)
SCHEDULE OF INVESTMENTS (continued)
As at 31 May 2019
Holding Currency Investments Fair Value
EUR '000 % of Net
Asset Value
Equities (continued)
United Kingdom (continued) 83,988 GBP Royal Dutch Shell plc 'A' 2,338 1.53 6,525 EUR Royal Dutch Shell plc 'A' 182 0.12 76,088 GBP Royal Dutch Shell plc 'B' 2,129 1.39 20,167 GBP RSA Insurance Group plc 126 0.08 22,529 GBP Sage Group plc (The) 190 0.13 2,352 GBP Schroders plc1 78 0.05 21,795 GBP Segro plc, REIT 172 0.11 5,057 GBP Severn Trent plc 114 0.08 18,056 GBP Smith & Nephew plc 340 0.22 8,456 GBP Smiths Group plc 138 0.09 1,469 GBP Spirax-Sarco Engineering plc 139 0.09 20,798 GBP SSE plc1 254 0.17 11,461 GBP St James's Place plc 136 0.09 56,277 GBP Standard Chartered plc1 437 0.29 49,852 GBP Standard Life Aberdeen plc 151 0.10 65,316 GBP Taylor Wimpey plc 122 0.08 197,618 GBP Tesco plc1 506 0.33 22,566 GBP Unilever plc1 1,235 0.81 14,560 GBP United Utilities Group plc 131 0.09 543,591 GBP Vodafone Group plc1 796 0.52 4,793 GBP Weir Group plc (The)1 80 0.05 3,810 GBP Whitbread plc 200 0.13 47,037 GBP Wm Morrison Supermarkets plc 105 0.07 Total United Kingdom 38,872 25.40
Total investments in equities 150,810 98.54
Number of Maturity Fair Value % of Net
Contracts Currency Notional Description Date EUR '000 Asset Value
Futures contracts
United Kingdom (31 May 2018: 0.02%) – –
Total unrealised gain on futures contracts (31 May 2018: 0.02%) – –
Germany (31 May 2018: (0.01)%)
43 EUR 430 EURO STOXX 50 Index 21/06/2019 (26) (0.02) Total Germany (26) (0.02)
Switzerland (31 May 2018: (0.01)%)
5 CHF 50 Swiss Market Index 21/06/2019 (6) – Total Switzerland (6) –
258
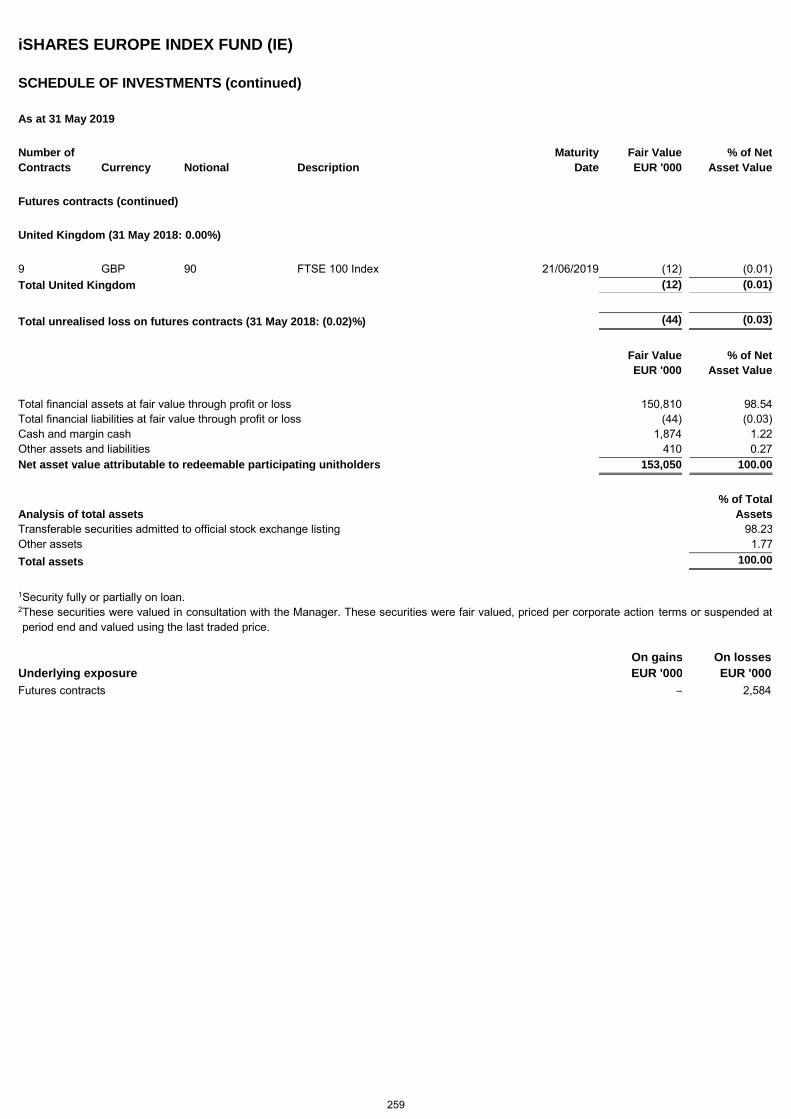
iSHARES EUROPE INDEX FUND (IE)
SCHEDULE OF INVESTMENTS (continued)
As at 31 May 2019
Number of Maturity Fair Value % of Net
Contracts Currency Notional Description Date EUR '000 Asset Value
Futures contracts (continued)
United Kingdom (31 May 2018: 0.00%)
9 GBP 90 FTSE 100 Index 21/06/2019 (12) (0.01) Total United Kingdom (12) (0.01)
Total unrealised loss on futures contracts (31 May 2018: (0.02)%) (44) (0.03)
Fair Value
EUR '000 % of Net
Asset Value
Total financial assets at fair value through profit or loss 150,810 98.54 Total financial liabilities at fair value through profit or loss (44) (0.03) Cash and margin cash 1,874 1.22 Other assets and liabilities 410 0.27 Net asset value attributable to redeemable participating unitholders 153,050 100.00
Analysis of total assets
% of Total
Assets
Transferable securities admitted to official stock exchange listing 98.23 Other assets 1.77 Total assets 100.00
1 Security fully or partially on loan. 2 These securities were valued in consultation with the Manager. These securities were fair valued, priced per corporate action terms or suspended at period end and valued using the last traded price.
Underlying exposure
On gains
EUR '000
On losses
EUR '000
Futures contracts – 2,584
259
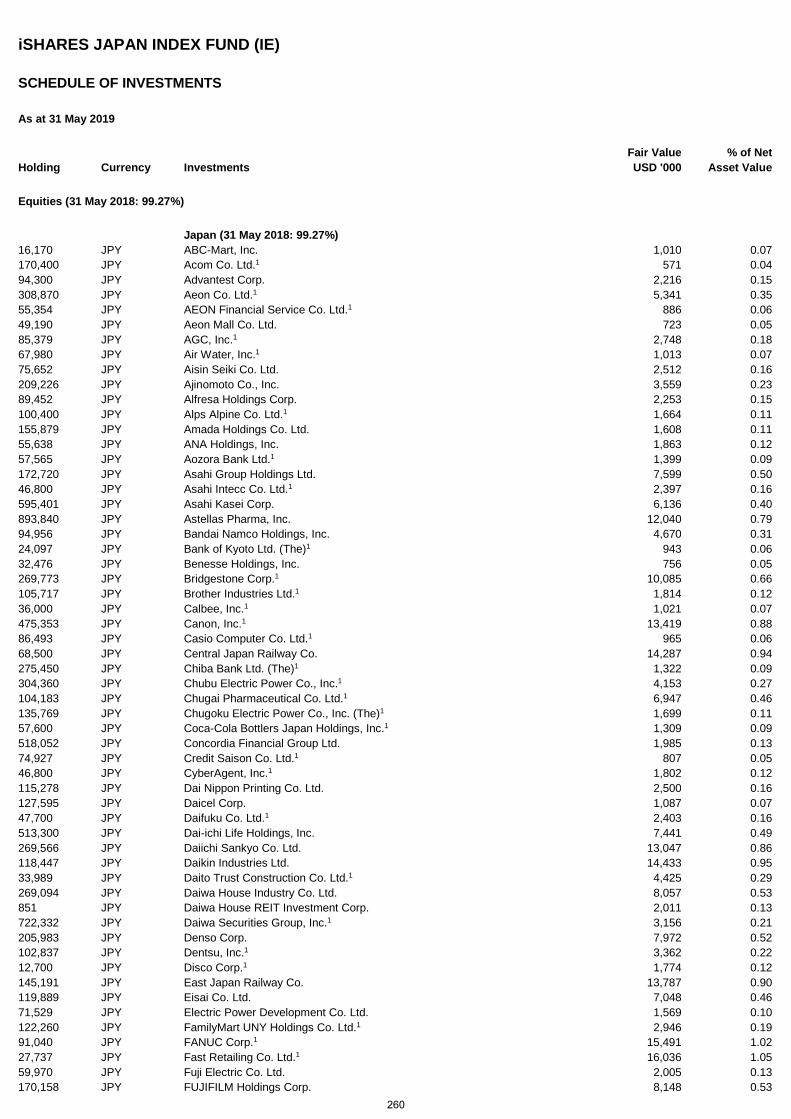
iSHARES JAPAN INDEX FUND (IE)
SCHEDULE OF INVESTMENTS
As at 31 May 2019
Holding Currency Investments Fair Value USD '000
% of Net Asset Value
Equities (31 May 2018: 99.27%)
Japan (31 May 2018: 99.27%) 16,170 JPY ABC-Mart, Inc. 1,010 0.07 170,400 JPY Acom Co. Ltd.1 571 0.04 94,300 JPY Advantest Corp. 2,216 0.15 308,870 JPY Aeon Co. Ltd.1 5,341 0.35 55,354 JPY AEON Financial Service Co. Ltd.1 886 0.06 49,190 JPY Aeon Mall Co. Ltd. 723 0.05 85,379 JPY AGC, Inc.1 2,748 0.18 67,980 JPY Air Water, Inc.1 1,013 0.07 75,652 JPY Aisin Seiki Co. Ltd. 2,512 0.16 209,226 JPY Ajinomoto Co., Inc. 3,559 0.23 89,452 JPY Alfresa Holdings Corp. 2,253 0.15 100,400 JPY Alps Alpine Co. Ltd.1 1,664 0.11 155,879 JPY Amada Holdings Co. Ltd. 1,608 0.11 55,638 JPY ANA Holdings, Inc. 1,863 0.12 57,565 JPY Aozora Bank Ltd.1 1,399 0.09 172,720 JPY Asahi Group Holdings Ltd. 7,599 0.50 46,800 JPY Asahi Intecc Co. Ltd.1 2,397 0.16 595,401 JPY Asahi Kasei Corp. 6,136 0.40 893,840 JPY Astellas Pharma, Inc. 12,040 0.79 94,956 JPY Bandai Namco Holdings, Inc. 4,670 0.31 24,097 JPY Bank of Kyoto Ltd. (The)1 943 0.06 32,476 JPY Benesse Holdings, Inc. 756 0.05 269,773 JPY Bridgestone Corp.1 10,085 0.66 105,717 JPY Brother Industries Ltd.1 1,814 0.12 36,000 JPY Calbee, Inc.1 1,021 0.07 475,353 JPY Canon, Inc.1 13,419 0.88 86,493 JPY Casio Computer Co. Ltd.1 965 0.06 68,500 JPY Central Japan Railway Co. 14,287 0.94 275,450 JPY Chiba Bank Ltd. (The)1 1,322 0.09 304,360 JPY Chubu Electric Power Co., Inc.1 4,153 0.27 104,183 JPY Chugai Pharmaceutical Co. Ltd.1 6,947 0.46 135,769 JPY Chugoku Electric Power Co., Inc. (The)1 1,699 0.11 57,600 JPY Coca-Cola Bottlers Japan Holdings, Inc.1 1,309 0.09 518,052 JPY Concordia Financial Group Ltd. 1,985 0.13 74,927 JPY Credit Saison Co. Ltd.1 807 0.05 46,800 JPY CyberAgent, Inc.1 1,802 0.12 115,278 JPY Dai Nippon Printing Co. Ltd. 2,500 0.16 127,595 JPY Daicel Corp. 1,087 0.07 47,700 JPY Daifuku Co. Ltd.1 2,403 0.16 513,300 JPY Dai-ichi Life Holdings, Inc. 7,441 0.49 269,566 JPY Daiichi Sankyo Co. Ltd. 13,047 0.86 118,447 JPY Daikin Industries Ltd. 14,433 0.95 33,989 JPY Daito Trust Construction Co. Ltd.1 4,425 0.29 269,094 JPY Daiwa House Industry Co. Ltd. 8,057 0.53 851 JPY Daiwa House REIT Investment Corp. 2,011 0.13 722,332 JPY Daiwa Securities Group, Inc.1 3,156 0.21 205,983 JPY Denso Corp. 7,972 0.52 102,837 JPY Dentsu, Inc.1 3,362 0.22 12,700 JPY Disco Corp.1 1,774 0.12 145,191 JPY East Japan Railway Co. 13,787 0.90 119,889 JPY Eisai Co. Ltd. 7,048 0.46 71,529 JPY Electric Power Development Co. Ltd. 1,569 0.10 122,260 JPY FamilyMart UNY Holdings Co. Ltd.1 2,946 0.19 91,040 JPY FANUC Corp.1 15,491 1.02 27,737 JPY Fast Retailing Co. Ltd.1 16,036 1.05 59,970 JPY Fuji Electric Co. Ltd. 2,005 0.13 170,158 JPY FUJIFILM Holdings Corp. 8,148 0.53
260
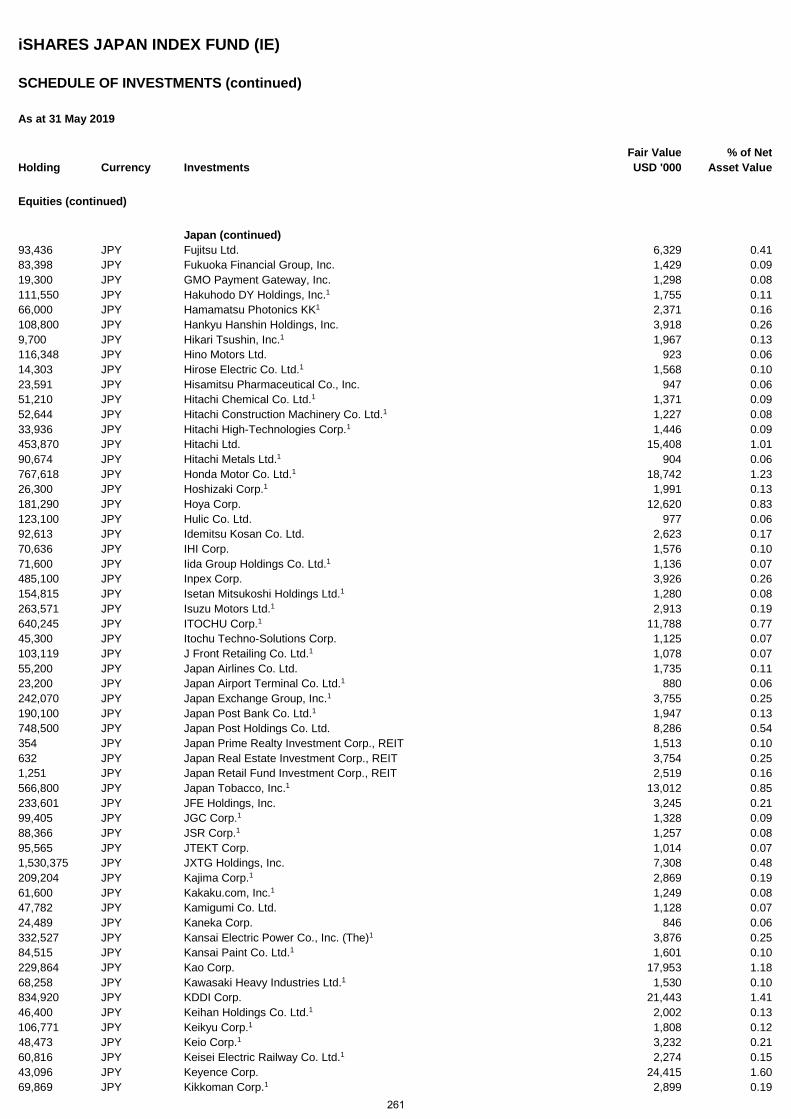
iSHARES JAPAN INDEX FUND (IE)
SCHEDULE OF INVESTMENTS (continued)
As at 31 May 2019
Holding Currency Investments Fair Value USD '000
% of Net Asset Value
Equities (continued)
Japan (continued) 93,436 JPY Fujitsu Ltd. 6,329 0.41 83,398 JPY Fukuoka Financial Group, Inc. 1,429 0.09 19,300 JPY GMO Payment Gateway, Inc. 1,298 0.08 111,550 JPY Hakuhodo DY Holdings, Inc.1 1,755 0.11 66,000 JPY Hamamatsu Photonics KK1 2,371 0.16 108,800 JPY Hankyu Hanshin Holdings, Inc. 3,918 0.26 9,700 JPY Hikari Tsushin, Inc.1 1,967 0.13 116,348 JPY Hino Motors Ltd. 923 0.06 14,303 JPY Hirose Electric Co. Ltd.1 1,568 0.10 23,591 JPY Hisamitsu Pharmaceutical Co., Inc. 947 0.06 51,210 JPY Hitachi Chemical Co. Ltd.1 1,371 0.09 52,644 JPY Hitachi Construction Machinery Co. Ltd.1 1,227 0.08 33,936 JPY Hitachi High-Technologies Corp.1 1,446 0.09 453,870 JPY Hitachi Ltd. 15,408 1.01 90,674 JPY Hitachi Metals Ltd.1 904 0.06 767,618 JPY Honda Motor Co. Ltd.1 18,742 1.23 26,300 JPY Hoshizaki Corp.1 1,991 0.13 181,290 JPY Hoya Corp. 12,620 0.83 123,100 JPY Hulic Co. Ltd. 977 0.06 92,613 JPY Idemitsu Kosan Co. Ltd. 2,623 0.17 70,636 JPY IHI Corp. 1,576 0.10 71,600 JPY Iida Group Holdings Co. Ltd.1 1,136 0.07 485,100 JPY Inpex Corp. 3,926 0.26 154,815 JPY Isetan Mitsukoshi Holdings Ltd.1 1,280 0.08 263,571 JPY Isuzu Motors Ltd.1 2,913 0.19 640,245 JPY ITOCHU Corp.1 11,788 0.77 45,300 JPY Itochu Techno-Solutions Corp. 1,125 0.07 103,119 JPY J Front Retailing Co. Ltd.1 1,078 0.07 55,200 JPY Japan Airlines Co. Ltd. 1,735 0.11 23,200 JPY Japan Airport Terminal Co. Ltd.1 880 0.06 242,070 JPY Japan Exchange Group, Inc.1 3,755 0.25 190,100 JPY Japan Post Bank Co. Ltd.1 1,947 0.13 748,500 JPY Japan Post Holdings Co. Ltd. 8,286 0.54 354 JPY Japan Prime Realty Investment Corp., REIT 1,513 0.10 632 JPY Japan Real Estate Investment Corp., REIT 3,754 0.25 1,251 JPY Japan Retail Fund Investment Corp., REIT 2,519 0.16 566,800 JPY Japan Tobacco, Inc.1 13,012 0.85 233,601 JPY JFE Holdings, Inc. 3,245 0.21 99,405 JPY JGC Corp.1 1,328 0.09 88,366 JPY JSR Corp.1 1,257 0.08 95,565 JPY JTEKT Corp. 1,014 0.07 1,530,375 JPY JXTG Holdings, Inc. 7,308 0.48 209,204 JPY Kajima Corp.1 2,869 0.19 61,600 JPY Kakaku.com, Inc.1 1,249 0.08 47,782 JPY Kamigumi Co. Ltd. 1,128 0.07 24,489 JPY Kaneka Corp. 846 0.06 332,527 JPY Kansai Electric Power Co., Inc. (The)1 3,876 0.25 84,515 JPY Kansai Paint Co. Ltd.1 1,601 0.10 229,864 JPY Kao Corp. 17,953 1.18 68,258 JPY Kawasaki Heavy Industries Ltd.1 1,530 0.10 834,920 JPY KDDI Corp. 21,443 1.41 46,400 JPY Keihan Holdings Co. Ltd.1 2,002 0.13 106,771 JPY Keikyu Corp.1 1,808 0.12 48,473 JPY Keio Corp.1 3,232 0.21 60,816 JPY Keisei Electric Railway Co. Ltd.1 2,274 0.15 43,096 JPY Keyence Corp. 24,415 1.60 69,869 JPY Kikkoman Corp.1 2,899 0.19
261
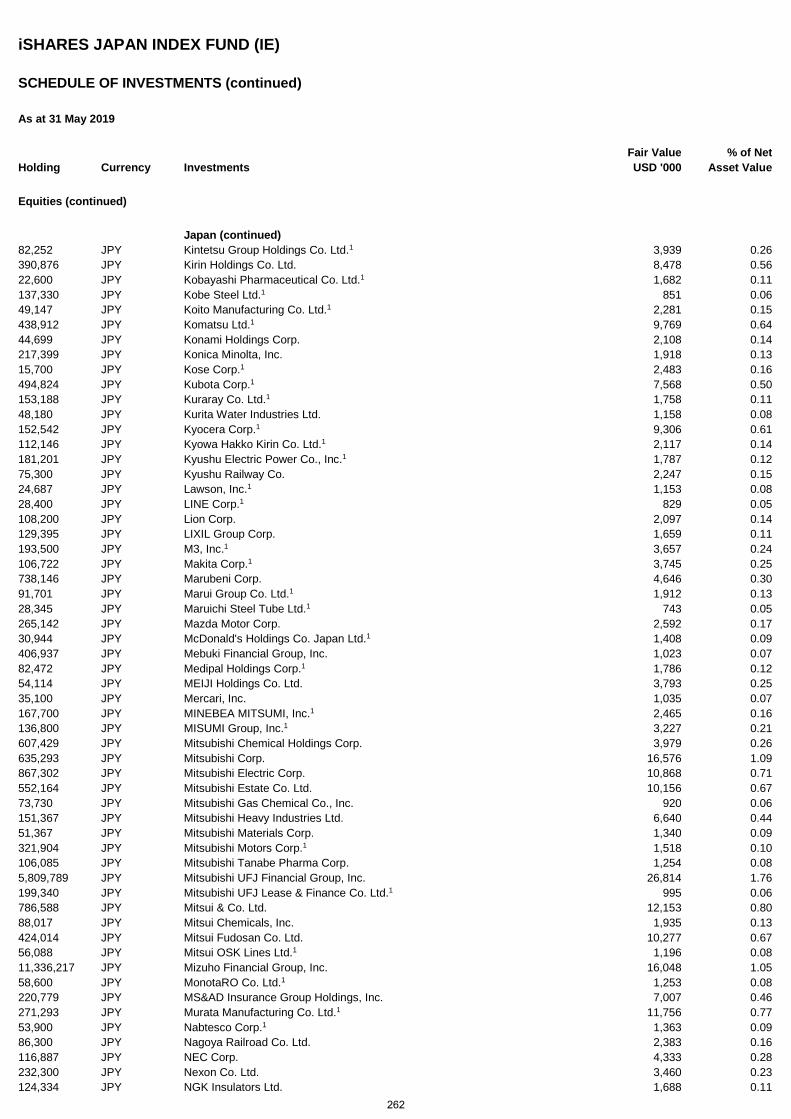
iSHARES JAPAN INDEX FUND (IE)
SCHEDULE OF INVESTMENTS (continued)
As at 31 May 2019
Holding Currency Investments Fair Value USD '000
% of Net Asset Value
Equities (continued)
Japan (continued) 82,252 JPY Kintetsu Group Holdings Co. Ltd.1 3,939 0.26 390,876 JPY Kirin Holdings Co. Ltd. 8,478 0.56 22,600 JPY Kobayashi Pharmaceutical Co. Ltd.1 1,682 0.11 137,330 JPY Kobe Steel Ltd.1 851 0.06 49,147 JPY Koito Manufacturing Co. Ltd.1 2,281 0.15 438,912 JPY Komatsu Ltd.1 9,769 0.64 44,699 JPY Konami Holdings Corp. 2,108 0.14 217,399 JPY Konica Minolta, Inc. 1,918 0.13 15,700 JPY Kose Corp.1 2,483 0.16 494,824 JPY Kubota Corp.1 7,568 0.50 153,188 JPY Kuraray Co. Ltd.1 1,758 0.11 48,180 JPY Kurita Water Industries Ltd. 1,158 0.08 152,542 JPY Kyocera Corp.1 9,306 0.61 112,146 JPY Kyowa Hakko Kirin Co. Ltd.1 2,117 0.14 181,201 JPY Kyushu Electric Power Co., Inc.1 1,787 0.12 75,300 JPY Kyushu Railway Co. 2,247 0.15 24,687 JPY Lawson, Inc.1 1,153 0.08 28,400 JPY LINE Corp.1 829 0.05 108,200 JPY Lion Corp. 2,097 0.14 129,395 JPY LIXIL Group Corp. 1,659 0.11 193,500 JPY M3, Inc.1 3,657 0.24 106,722 JPY Makita Corp.1 3,745 0.25 738,146 JPY Marubeni Corp. 4,646 0.30 91,701 JPY Marui Group Co. Ltd.1 1,912 0.13 28,345 JPY Maruichi Steel Tube Ltd.1 743 0.05 265,142 JPY Mazda Motor Corp. 2,592 0.17 30,944 JPY McDonald's Holdings Co. Japan Ltd.1 1,408 0.09 406,937 JPY Mebuki Financial Group, Inc. 1,023 0.07 82,472 JPY Medipal Holdings Corp.1 1,786 0.12 54,114 JPY MEIJI Holdings Co. Ltd. 3,793 0.25 35,100 JPY Mercari, Inc. 1,035 0.07 167,700 JPY MINEBEA MITSUMI, Inc.1 2,465 0.16 136,800 JPY MISUMI Group, Inc.1 3,227 0.21 607,429 JPY Mitsubishi Chemical Holdings Corp. 3,979 0.26 635,293 JPY Mitsubishi Corp. 16,576 1.09 867,302 JPY Mitsubishi Electric Corp. 10,868 0.71 552,164 JPY Mitsubishi Estate Co. Ltd. 10,156 0.67 73,730 JPY Mitsubishi Gas Chemical Co., Inc. 920 0.06 151,367 JPY Mitsubishi Heavy Industries Ltd. 6,640 0.44 51,367 JPY Mitsubishi Materials Corp. 1,340 0.09 321,904 JPY Mitsubishi Motors Corp.1 1,518 0.10 106,085 JPY Mitsubishi Tanabe Pharma Corp. 1,254 0.08 5,809,789 JPY Mitsubishi UFJ Financial Group, Inc. 26,814 1.76 199,340 JPY Mitsubishi UFJ Lease & Finance Co. Ltd.1 995 0.06 786,588 JPY Mitsui & Co. Ltd. 12,153 0.80 88,017 JPY Mitsui Chemicals, Inc. 1,935 0.13 424,014 JPY Mitsui Fudosan Co. Ltd. 10,277 0.67 56,088 JPY Mitsui OSK Lines Ltd.1 1,196 0.08 11,336,217 JPY Mizuho Financial Group, Inc. 16,048 1.05 58,600 JPY MonotaRO Co. Ltd.1 1,253 0.08 220,779 JPY MS&AD Insurance Group Holdings, Inc. 7,007 0.46 271,293 JPY Murata Manufacturing Co. Ltd.1 11,756 0.77 53,900 JPY Nabtesco Corp.1 1,363 0.09 86,300 JPY Nagoya Railroad Co. Ltd. 2,383 0.16 116,887 JPY NEC Corp. 4,333 0.28 232,300 JPY Nexon Co. Ltd. 3,460 0.23 124,334 JPY NGK Insulators Ltd. 1,688 0.11
262
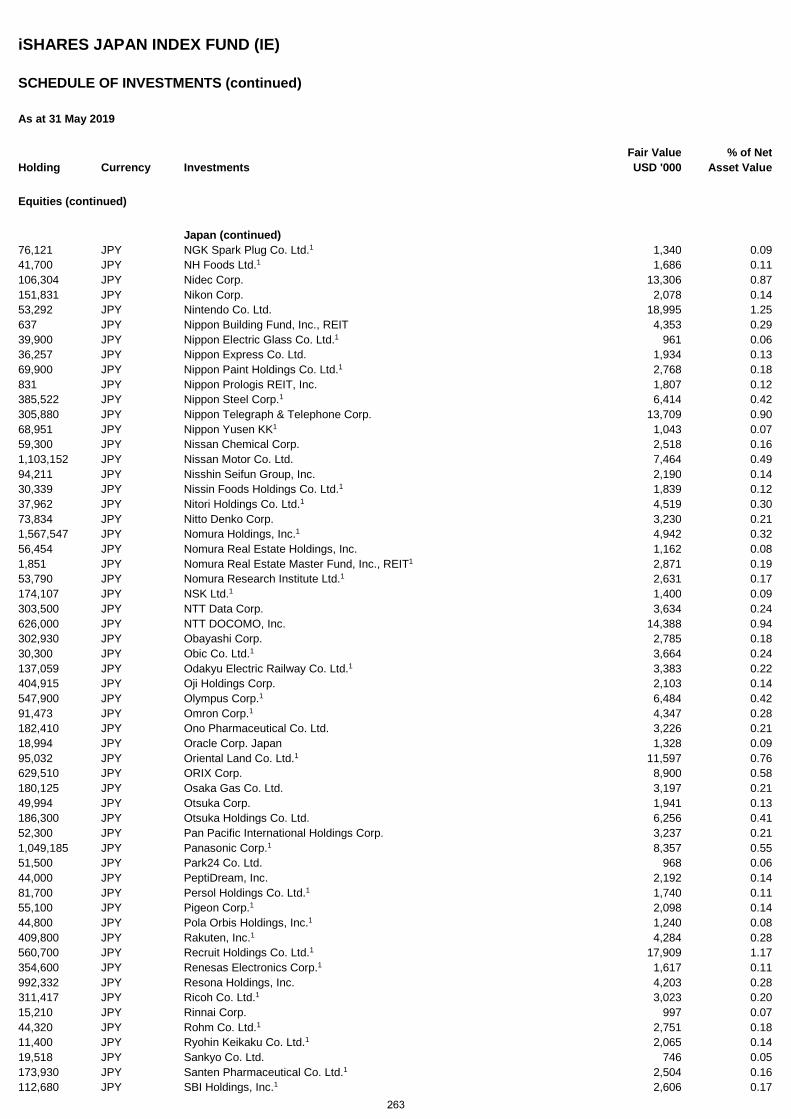
iSHARES JAPAN INDEX FUND (IE)
SCHEDULE OF INVESTMENTS (continued)
As at 31 May 2019
Holding Currency Investments Fair Value USD '000
% of Net Asset Value
Equities (continued)
Japan (continued) 76,121 JPY NGK Spark Plug Co. Ltd.1 1,340 0.09 41,700 JPY NH Foods Ltd.1 1,686 0.11 106,304 JPY Nidec Corp. 13,306 0.87 151,831 JPY Nikon Corp. 2,078 0.14 53,292 JPY Nintendo Co. Ltd. 18,995 1.25 637 JPY Nippon Building Fund, Inc., REIT 4,353 0.29 39,900 JPY Nippon Electric Glass Co. Ltd.1 961 0.06 36,257 JPY Nippon Express Co. Ltd. 1,934 0.13 69,900 JPY Nippon Paint Holdings Co. Ltd.1 2,768 0.18 831 JPY Nippon Prologis REIT, Inc. 1,807 0.12 385,522 JPY Nippon Steel Corp.1 6,414 0.42 305,880 JPY Nippon Telegraph & Telephone Corp. 13,709 0.90 68,951 JPY Nippon Yusen KK1 1,043 0.07 59,300 JPY Nissan Chemical Corp. 2,518 0.16 1,103,152 JPY Nissan Motor Co. Ltd. 7,464 0.49 94,211 JPY Nisshin Seifun Group, Inc. 2,190 0.14 30,339 JPY Nissin Foods Holdings Co. Ltd.1 1,839 0.12 37,962 JPY Nitori Holdings Co. Ltd.1 4,519 0.30 73,834 JPY Nitto Denko Corp. 3,230 0.21 1,567,547 JPY Nomura Holdings, Inc.1 4,942 0.32 56,454 JPY Nomura Real Estate Holdings, Inc. 1,162 0.08 1,851 JPY Nomura Real Estate Master Fund, Inc., REIT1 2,871 0.19 53,790 JPY Nomura Research Institute Ltd.1 2,631 0.17 174,107 JPY NSK Ltd.1 1,400 0.09 303,500 JPY NTT Data Corp. 3,634 0.24 626,000 JPY NTT DOCOMO, Inc. 14,388 0.94 302,930 JPY Obayashi Corp. 2,785 0.18 30,300 JPY Obic Co. Ltd.1 3,664 0.24 137,059 JPY Odakyu Electric Railway Co. Ltd.1 3,383 0.22 404,915 JPY Oji Holdings Corp. 2,103 0.14 547,900 JPY Olympus Corp.1 6,484 0.42 91,473 JPY Omron Corp.1 4,347 0.28 182,410 JPY Ono Pharmaceutical Co. Ltd. 3,226 0.21 18,994 JPY Oracle Corp. Japan 1,328 0.09 95,032 JPY Oriental Land Co. Ltd.1 11,597 0.76 629,510 JPY ORIX Corp. 8,900 0.58 180,125 JPY Osaka Gas Co. Ltd. 3,197 0.21 49,994 JPY Otsuka Corp. 1,941 0.13 186,300 JPY Otsuka Holdings Co. Ltd. 6,256 0.41 52,300 JPY Pan Pacific International Holdings Corp. 3,237 0.21 1,049,185 JPY Panasonic Corp.1 8,357 0.55 51,500 JPY Park24 Co. Ltd. 968 0.06 44,000 JPY PeptiDream, Inc. 2,192 0.14 81,700 JPY Persol Holdings Co. Ltd.1 1,740 0.11 55,100 JPY Pigeon Corp.1 2,098 0.14 44,800 JPY Pola Orbis Holdings, Inc.1 1,240 0.08 409,800 JPY Rakuten, Inc.1 4,284 0.28 560,700 JPY Recruit Holdings Co. Ltd.1 17,909 1.17 354,600 JPY Renesas Electronics Corp.1 1,617 0.11 992,332 JPY Resona Holdings, Inc. 4,203 0.28 311,417 JPY Ricoh Co. Ltd.1 3,023 0.20 15,210 JPY Rinnai Corp. 997 0.07 44,320 JPY Rohm Co. Ltd.1 2,751 0.18 11,400 JPY Ryohin Keikaku Co. Ltd.1 2,065 0.14 19,518 JPY Sankyo Co. Ltd. 746 0.05 173,930 JPY Santen Pharmaceutical Co. Ltd.1 2,504 0.16 112,680 JPY SBI Holdings, Inc.1 2,606 0.17
263
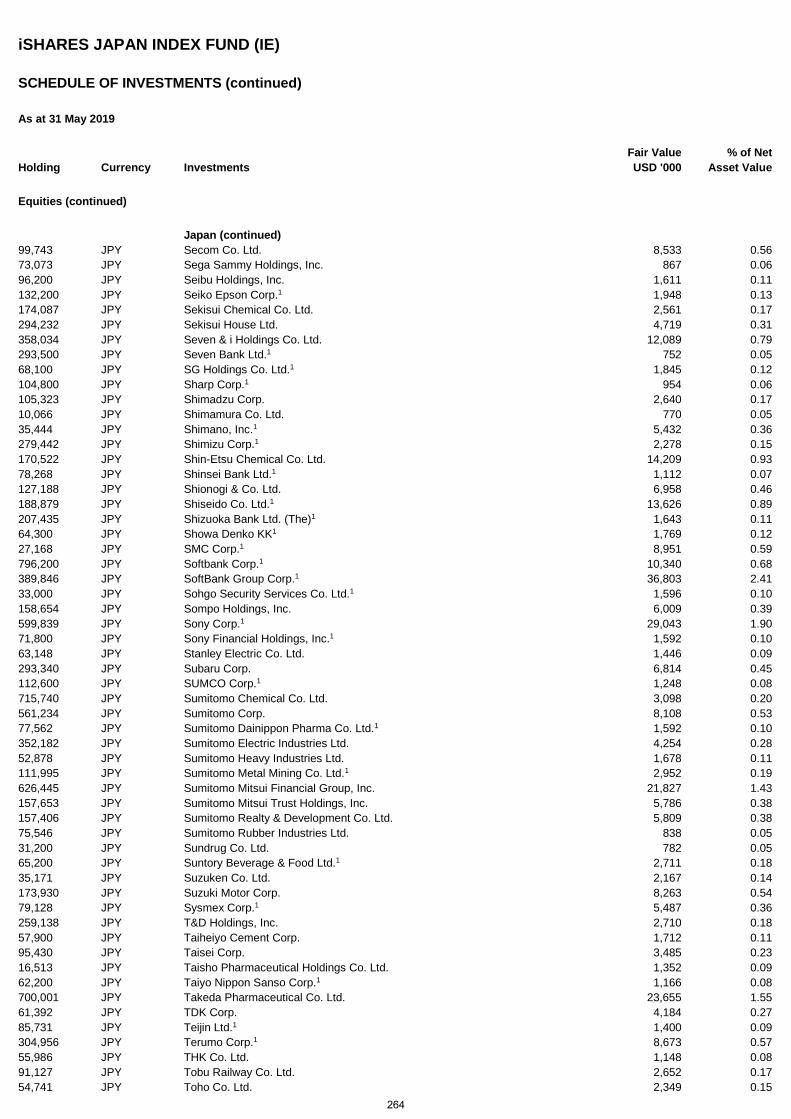
iSHARES JAPAN INDEX FUND (IE)
SCHEDULE OF INVESTMENTS (continued)
As at 31 May 2019
Holding Currency Investments Fair Value USD '000
% of Net Asset Value
Equities (continued)
Japan (continued) 99,743 JPY Secom Co. Ltd. 8,533 0.56 73,073 JPY Sega Sammy Holdings, Inc. 867 0.06 96,200 JPY Seibu Holdings, Inc. 1,611 0.11 132,200 JPY Seiko Epson Corp.1 1,948 0.13 174,087 JPY Sekisui Chemical Co. Ltd. 2,561 0.17 294,232 JPY Sekisui House Ltd. 4,719 0.31 358,034 JPY Seven & i Holdings Co. Ltd. 12,089 0.79 293,500 JPY Seven Bank Ltd.1 752 0.05 68,100 JPY SG Holdings Co. Ltd.1 1,845 0.12 104,800 JPY Sharp Corp.1 954 0.06 105,323 JPY Shimadzu Corp. 2,640 0.17 10,066 JPY Shimamura Co. Ltd. 770 0.05 35,444 JPY Shimano, Inc.1 5,432 0.36 279,442 JPY Shimizu Corp.1 2,278 0.15 170,522 JPY Shin-Etsu Chemical Co. Ltd. 14,209 0.93 78,268 JPY Shinsei Bank Ltd.1 1,112 0.07 127,188 JPY Shionogi & Co. Ltd. 6,958 0.46 188,879 JPY Shiseido Co. Ltd.1 13,626 0.89 207,435 JPY Shizuoka Bank Ltd. (The)1 1,643 0.11 64,300 JPY Showa Denko KK1 1,769 0.12 27,168 JPY SMC Corp.1 8,951 0.59 796,200 JPY Softbank Corp.1 10,340 0.68 389,846 JPY SoftBank Group Corp.1 36,803 2.41 33,000 JPY Sohgo Security Services Co. Ltd.1 1,596 0.10 158,654 JPY Sompo Holdings, Inc. 6,009 0.39 599,839 JPY Sony Corp.1 29,043 1.90 71,800 JPY Sony Financial Holdings, Inc.1 1,592 0.10 63,148 JPY Stanley Electric Co. Ltd. 1,446 0.09 293,340 JPY Subaru Corp. 6,814 0.45 112,600 JPY SUMCO Corp.1 1,248 0.08 715,740 JPY Sumitomo Chemical Co. Ltd. 3,098 0.20 561,234 JPY Sumitomo Corp. 8,108 0.53 77,562 JPY Sumitomo Dainippon Pharma Co. Ltd.1 1,592 0.10 352,182 JPY Sumitomo Electric Industries Ltd. 4,254 0.28 52,878 JPY Sumitomo Heavy Industries Ltd. 1,678 0.11 111,995 JPY Sumitomo Metal Mining Co. Ltd.1 2,952 0.19 626,445 JPY Sumitomo Mitsui Financial Group, Inc. 21,827 1.43 157,653 JPY Sumitomo Mitsui Trust Holdings, Inc. 5,786 0.38 157,406 JPY Sumitomo Realty & Development Co. Ltd. 5,809 0.38 75,546 JPY Sumitomo Rubber Industries Ltd. 838 0.05 31,200 JPY Sundrug Co. Ltd. 782 0.05 65,200 JPY Suntory Beverage & Food Ltd.1 2,711 0.18 35,171 JPY Suzuken Co. Ltd. 2,167 0.14 173,930 JPY Suzuki Motor Corp. 8,263 0.54 79,128 JPY Sysmex Corp.1 5,487 0.36 259,138 JPY T&D Holdings, Inc. 2,710 0.18 57,900 JPY Taiheiyo Cement Corp. 1,712 0.11 95,430 JPY Taisei Corp. 3,485 0.23 16,513 JPY Taisho Pharmaceutical Holdings Co. Ltd. 1,352 0.09 62,200 JPY Taiyo Nippon Sanso Corp.1 1,166 0.08 700,001 JPY Takeda Pharmaceutical Co. Ltd. 23,655 1.55 61,392 JPY TDK Corp. 4,184 0.27 85,731 JPY Teijin Ltd.1 1,400 0.09 304,956 JPY Terumo Corp.1 8,673 0.57 55,986 JPY THK Co. Ltd. 1,148 0.08 91,127 JPY Tobu Railway Co. Ltd. 2,652 0.17 54,741 JPY Toho Co. Ltd. 2,349 0.15
264
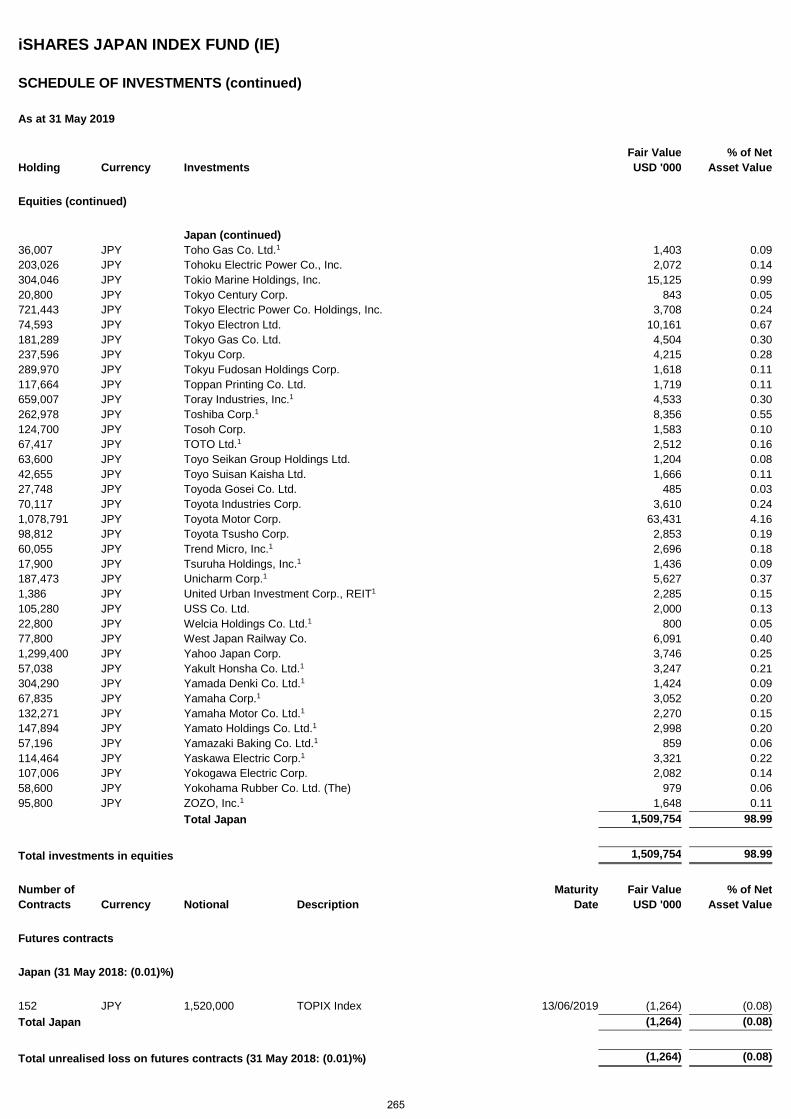
iSHARES JAPAN INDEX FUND (IE)
SCHEDULE OF INVESTMENTS (continued)
As at 31 May 2019
Holding Currency Investments Fair Value USD '000
% of Net Asset Value
Equities (continued)
Japan (continued) 36,007 JPY Toho Gas Co. Ltd.1 1,403 0.09 203,026 JPY Tohoku Electric Power Co., Inc. 2,072 0.14 304,046 JPY Tokio Marine Holdings, Inc. 15,125 0.99 20,800 JPY Tokyo Century Corp. 843 0.05 721,443 JPY Tokyo Electric Power Co. Holdings, Inc. 3,708 0.24 74,593 JPY Tokyo Electron Ltd. 10,161 0.67 181,289 JPY Tokyo Gas Co. Ltd. 4,504 0.30 237,596 JPY Tokyu Corp. 4,215 0.28 289,970 JPY Tokyu Fudosan Holdings Corp. 1,618 0.11 117,664 JPY Toppan Printing Co. Ltd. 1,719 0.11 659,007 JPY Toray Industries, Inc.1 4,533 0.30 262,978 JPY Toshiba Corp.1 8,356 0.55 124,700 JPY Tosoh Corp. 1,583 0.10 67,417 JPY TOTO Ltd.1 2,512 0.16 63,600 JPY Toyo Seikan Group Holdings Ltd. 1,204 0.08 42,655 JPY Toyo Suisan Kaisha Ltd. 1,666 0.11 27,748 JPY Toyoda Gosei Co. Ltd. 485 0.03 70,117 JPY Toyota Industries Corp. 3,610 0.24 1,078,791 JPY Toyota Motor Corp. 63,431 4.16 98,812 JPY Toyota Tsusho Corp. 2,853 0.19 60,055 JPY Trend Micro, Inc.1 2,696 0.18 17,900 JPY Tsuruha Holdings, Inc.1 1,436 0.09 187,473 JPY Unicharm Corp.1 5,627 0.37 1,386 JPY United Urban Investment Corp., REIT1 2,285 0.15 105,280 JPY USS Co. Ltd. 2,000 0.13 22,800 JPY Welcia Holdings Co. Ltd.1 800 0.05 77,800 JPY West Japan Railway Co. 6,091 0.40 1,299,400 JPY Yahoo Japan Corp. 3,746 0.25 57,038 JPY Yakult Honsha Co. Ltd.1 3,247 0.21 304,290 JPY Yamada Denki Co. Ltd.1 1,424 0.09 67,835 JPY Yamaha Corp.1 3,052 0.20 132,271 JPY Yamaha Motor Co. Ltd.1 2,270 0.15 147,894 JPY Yamato Holdings Co. Ltd.1 2,998 0.20 57,196 JPY Yamazaki Baking Co. Ltd.1 859 0.06 114,464 JPY Yaskawa Electric Corp.1 3,321 0.22 107,006 JPY Yokogawa Electric Corp. 2,082 0.14 58,600 JPY Yokohama Rubber Co. Ltd. (The) 979 0.06 95,800 JPY ZOZO, Inc.1 1,648 0.11 Total Japan 1,509,754 98.99
Total investments in equities 1,509,754 98.99
Number of Maturity Fair Value % of Net Contracts Currency Notional Description Date USD '000 Asset Value
Futures contracts
Japan (31 May 2018: (0.01)%)
152 JPY 1,520,000 TOPIX Index 13/06/2019 (1,264) (0.08) Total Japan (1,264) (0.08)
Total unrealised loss on futures contracts (31 May 2018: (0.01)%) (1,264) (0.08)
265
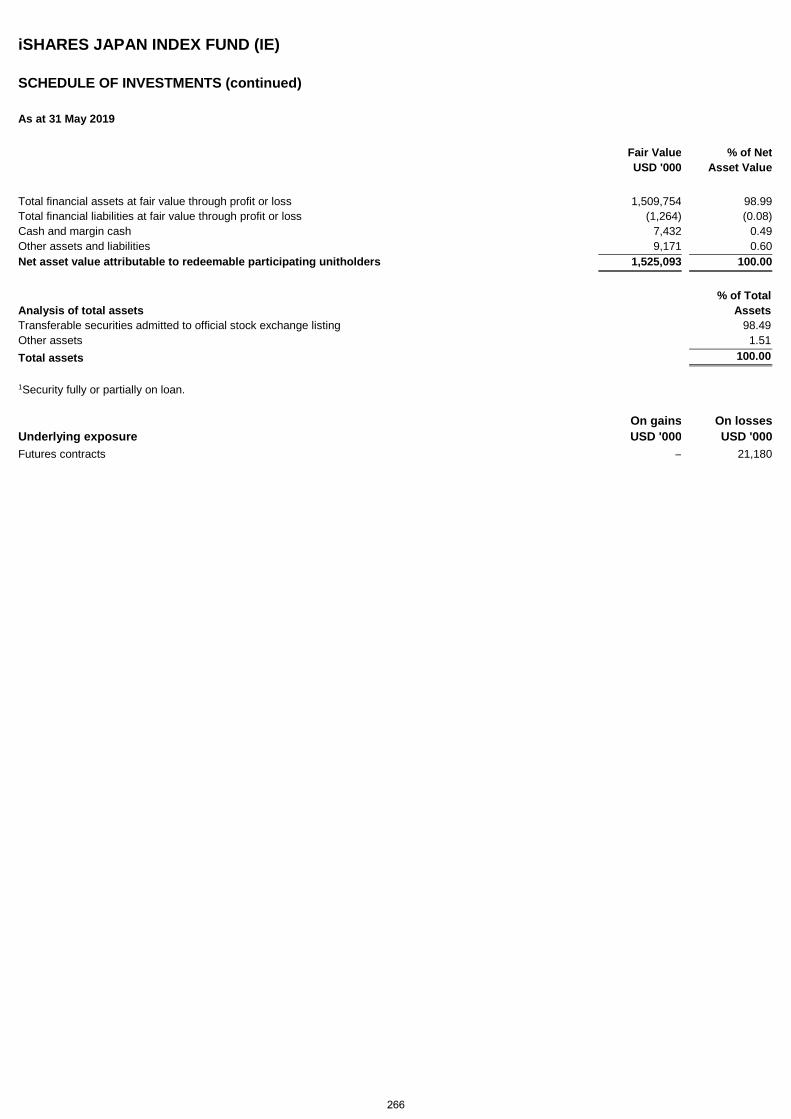
iSHARES JAPAN INDEX FUND (IE)
SCHEDULE OF INVESTMENTS (continued)
As at 31 May 2019
Fair Value USD '000
% of Net Asset Value
Total financial assets at fair value through profit or loss 1,509,754 98.99 Total financial liabilities at fair value through profit or loss (1,264) (0.08) Cash and margin cash 7,432 0.49 Other assets and liabilities 9,171 0.60 Net asset value attributable to redeemable participating unitholders 1,525,093 100.00
Analysis of total assets % of Total
Assets Transferable securities admitted to official stock exchange listing 98.49 Other assets 1.51 Total assets 100.00
1 Security fully or partially on loan.
Underlying exposure On gains USD '000
On losses USD '000
Futures contracts – 21,180
266
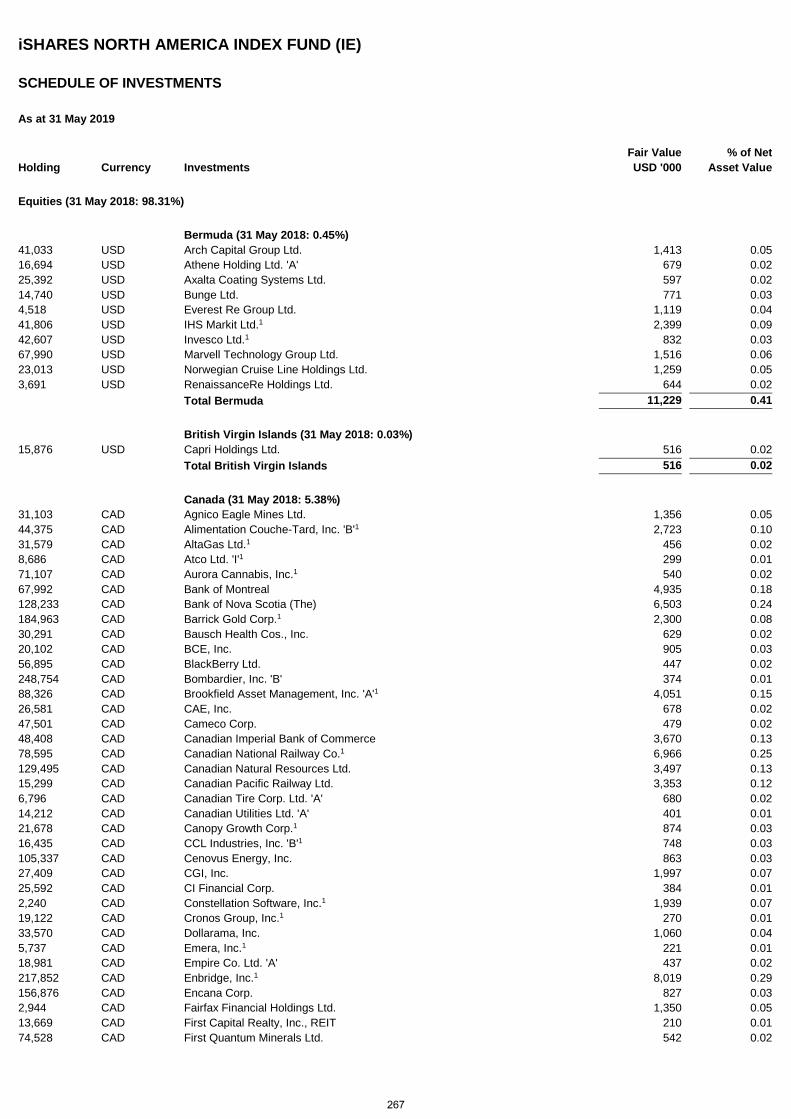
iSHARES NORTH AMERICA INDEX FUND (IE)
SCHEDULE OF INVESTMENTS
As at 31 May 2019
Holding Currency Investments Fair Value USD '000
% of Net Asset Value
Equities (31 May 2018: 98.31%)
Bermuda (31 May 2018: 0.45%) 41,033 USD Arch Capital Group Ltd. 1,413 0.05 16,694 USD Athene Holding Ltd. 'A' 679 0.02 25,392 USD Axalta Coating Systems Ltd. 597 0.02 14,740 USD Bunge Ltd. 771 0.03 4,518 USD Everest Re Group Ltd. 1,119 0.04 41,806 USD IHS Markit Ltd.1 2,399 0.09 42,607 USD Invesco Ltd.1 832 0.03 67,990 USD Marvell Technology Group Ltd. 1,516 0.06 23,013 USD Norwegian Cruise Line Holdings Ltd. 1,259 0.05 3,691 USD RenaissanceRe Holdings Ltd. 644 0.02 Total Bermuda 11,229 0.41
British Virgin Islands (31 May 2018: 0.03%) 15,876 USD Capri Holdings Ltd. 516 0.02 Total British Virgin Islands 516 0.02
Canada (31 May 2018: 5.38%) 31,103 CAD Agnico Eagle Mines Ltd. 1,356 0.05 44,375 CAD Alimentation Couche-Tard, Inc. 'B'1 2,723 0.10 31,579 CAD AltaGas Ltd.1 456 0.02 8,686 CAD Atco Ltd. 'I'1 299 0.01 71,107 CAD Aurora Cannabis, Inc.1 540 0.02 67,992 CAD Bank of Montreal 4,935 0.18 128,233 CAD Bank of Nova Scotia (The) 6,503 0.24 184,963 CAD Barrick Gold Corp.1 2,300 0.08 30,291 CAD Bausch Health Cos., Inc. 629 0.02 20,102 CAD BCE, Inc. 905 0.03 56,895 CAD BlackBerry Ltd. 447 0.02 248,754 CAD Bombardier, Inc. 'B' 374 0.01 88,326 CAD Brookfield Asset Management, Inc. 'A'1 4,051 0.15 26,581 CAD CAE, Inc. 678 0.02 47,501 CAD Cameco Corp. 479 0.02 48,408 CAD Canadian Imperial Bank of Commerce 3,670 0.13 78,595 CAD Canadian National Railway Co.1 6,966 0.25 129,495 CAD Canadian Natural Resources Ltd. 3,497 0.13 15,299 CAD Canadian Pacific Railway Ltd. 3,353 0.12 6,796 CAD Canadian Tire Corp. Ltd. 'A' 680 0.02 14,212 CAD Canadian Utilities Ltd. 'A' 401 0.01 21,678 CAD Canopy Growth Corp.1 874 0.03 16,435 CAD CCL Industries, Inc. 'B'1 748 0.03 105,337 CAD Cenovus Energy, Inc. 863 0.03 27,409 CAD CGI, Inc. 1,997 0.07 25,592 CAD CI Financial Corp. 384 0.01 2,240 CAD Constellation Software, Inc.1 1,939 0.07 19,122 CAD Cronos Group, Inc.1 270 0.01 33,570 CAD Dollarama, Inc. 1,060 0.04 5,737 CAD Emera, Inc.1 221 0.01 18,981 CAD Empire Co. Ltd. 'A' 437 0.02 217,852 CAD Enbridge, Inc.1 8,019 0.29 156,876 CAD Encana Corp. 827 0.03 2,944 CAD Fairfax Financial Holdings Ltd. 1,350 0.05 13,669 CAD First Capital Realty, Inc., REIT 210 0.01 74,528 CAD First Quantum Minerals Ltd. 542 0.02
267
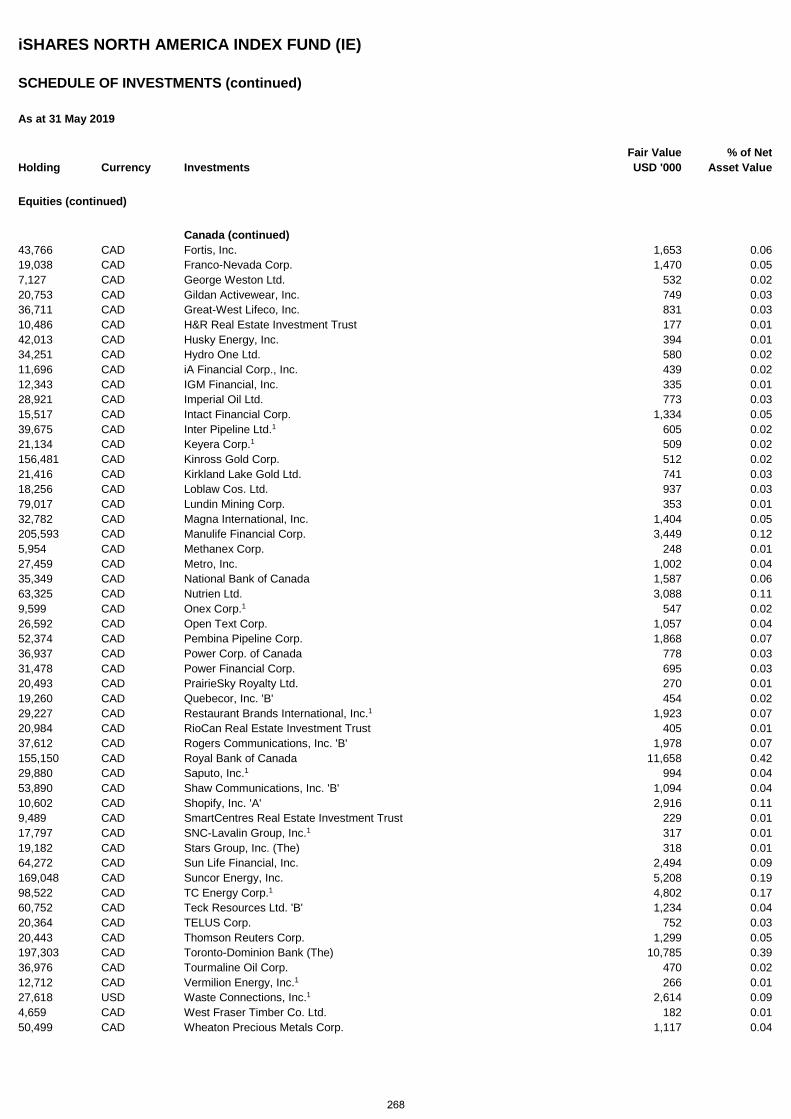
iSHARES NORTH AMERICA INDEX FUND (IE)
SCHEDULE OF INVESTMENTS (continued)
As at 31 May 2019
Holding Currency Investments Fair Value USD '000
% of Net Asset Value
Equities (continued)
Canada (continued) 43,766 CAD Fortis, Inc. 1,653 0.06 19,038 CAD Franco-Nevada Corp. 1,470 0.05 7,127 CAD George Weston Ltd. 532 0.02 20,753 CAD Gildan Activewear, Inc. 749 0.03 36,711 CAD Great-West Lifeco, Inc. 831 0.03 10,486 CAD H&R Real Estate Investment Trust 177 0.01 42,013 CAD Husky Energy, Inc. 394 0.01 34,251 CAD Hydro One Ltd. 580 0.02 11,696 CAD iA Financial Corp., Inc. 439 0.02 12,343 CAD IGM Financial, Inc. 335 0.01 28,921 CAD Imperial Oil Ltd. 773 0.03 15,517 CAD Intact Financial Corp. 1,334 0.05 39,675 CAD Inter Pipeline Ltd.1 605 0.02 21,134 CAD Keyera Corp.1 509 0.02 156,481 CAD Kinross Gold Corp. 512 0.02 21,416 CAD Kirkland Lake Gold Ltd. 741 0.03 18,256 CAD Loblaw Cos. Ltd. 937 0.03 79,017 CAD Lundin Mining Corp. 353 0.01 32,782 CAD Magna International, Inc. 1,404 0.05 205,593 CAD Manulife Financial Corp. 3,449 0.12 5,954 CAD Methanex Corp. 248 0.01 27,459 CAD Metro, Inc. 1,002 0.04 35,349 CAD National Bank of Canada 1,587 0.06 63,325 CAD Nutrien Ltd. 3,088 0.11 9,599 CAD Onex Corp.1 547 0.02 26,592 CAD Open Text Corp. 1,057 0.04 52,374 CAD Pembina Pipeline Corp. 1,868 0.07 36,937 CAD Power Corp. of Canada 778 0.03 31,478 CAD Power Financial Corp. 695 0.03 20,493 CAD PrairieSky Royalty Ltd. 270 0.01 19,260 CAD Quebecor, Inc. 'B' 454 0.02 29,227 CAD Restaurant Brands International, Inc.1 1,923 0.07 20,984 CAD RioCan Real Estate Investment Trust 405 0.01 37,612 CAD Rogers Communications, Inc. 'B' 1,978 0.07 155,150 CAD Royal Bank of Canada 11,658 0.42 29,880 CAD Saputo, Inc.1 994 0.04 53,890 CAD Shaw Communications, Inc. 'B' 1,094 0.04 10,602 CAD Shopify, Inc. 'A' 2,916 0.11 9,489 CAD SmartCentres Real Estate Investment Trust 229 0.01 17,797 CAD SNC-Lavalin Group, Inc.1 317 0.01 19,182 CAD Stars Group, Inc. (The) 318 0.01 64,272 CAD Sun Life Financial, Inc. 2,494 0.09 169,048 CAD Suncor Energy, Inc. 5,208 0.19 98,522 CAD TC Energy Corp.1 4,802 0.17 60,752 CAD Teck Resources Ltd. 'B' 1,234 0.04 20,364 CAD TELUS Corp. 752 0.03 20,443 CAD Thomson Reuters Corp. 1,299 0.05 197,303 CAD Toronto-Dominion Bank (The) 10,785 0.39 36,976 CAD Tourmaline Oil Corp. 470 0.02 12,712 CAD Vermilion Energy, Inc.1 266 0.01 27,618 USD Waste Connections, Inc.1 2,614 0.09 4,659 CAD West Fraser Timber Co. Ltd. 182 0.01 50,499 CAD Wheaton Precious Metals Corp. 1,117 0.04
268
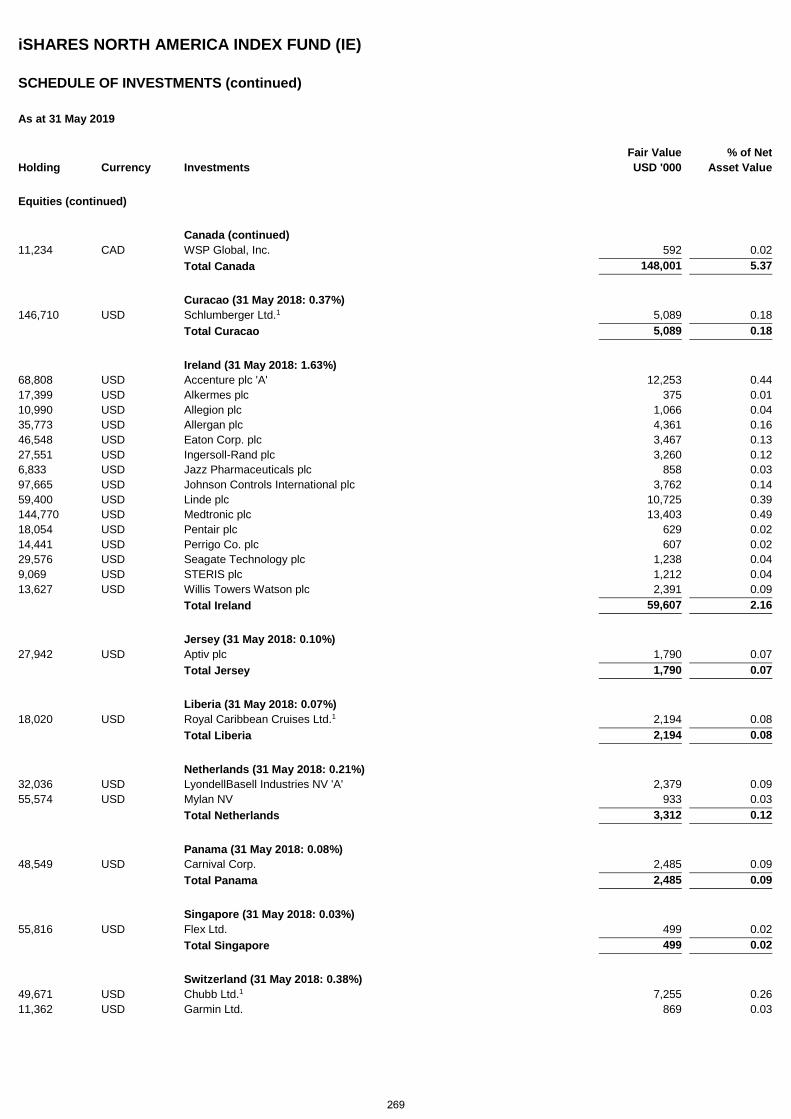
iSHARES NORTH AMERICA INDEX FUND (IE)
SCHEDULE OF INVESTMENTS (continued)
As at 31 May 2019
Holding Currency Investments Fair Value USD '000
% of Net Asset Value
Equities (continued)
Canada (continued) 11,234 CAD WSP Global, Inc. 592 0.02 Total Canada 148,001 5.37
Curacao (31 May 2018: 0.37%) 146,710 USD Schlumberger Ltd.1 5,089 0.18 Total Curacao 5,089 0.18
Ireland (31 May 2018: 1.63%) 68,808 USD Accenture plc 'A' 12,253 0.44 17,399 USD Alkermes plc 375 0.01 10,990 USD Allegion plc 1,066 0.04 35,773 USD Allergan plc 4,361 0.16 46,548 USD Eaton Corp. plc 3,467 0.13 27,551 USD Ingersoll-Rand plc 3,260 0.12 6,833 USD Jazz Pharmaceuticals plc 858 0.03 97,665 USD Johnson Controls International plc 3,762 0.14 59,400 USD Linde plc 10,725 0.39 144,770 USD Medtronic plc 13,403 0.49 18,054 USD Pentair plc 629 0.02 14,441 USD Perrigo Co. plc 607 0.02 29,576 USD Seagate Technology plc 1,238 0.04 9,069 USD STERIS plc 1,212 0.04 13,627 USD Willis Towers Watson plc 2,391 0.09 Total Ireland 59,607 2.16
Jersey (31 May 2018: 0.10%) 27,942 USD Aptiv plc 1,790 0.07 Total Jersey 1,790 0.07
Liberia (31 May 2018: 0.07%) 18,020 USD Royal Caribbean Cruises Ltd.1 2,194 0.08 Total Liberia 2,194 0.08
Netherlands (31 May 2018: 0.21%) 32,036 USD LyondellBasell Industries NV 'A' 2,379 0.09 55,574 USD Mylan NV 933 0.03 Total Netherlands 3,312 0.12
Panama (31 May 2018: 0.08%) 48,549 USD Carnival Corp. 2,485 0.09 Total Panama 2,485 0.09
Singapore (31 May 2018: 0.03%) 55,816 USD Flex Ltd. 499 0.02 Total Singapore 499 0.02
Switzerland (31 May 2018: 0.38%) 49,671 USD Chubb Ltd.1 7,255 0.26 11,362 USD Garmin Ltd. 869 0.03
269
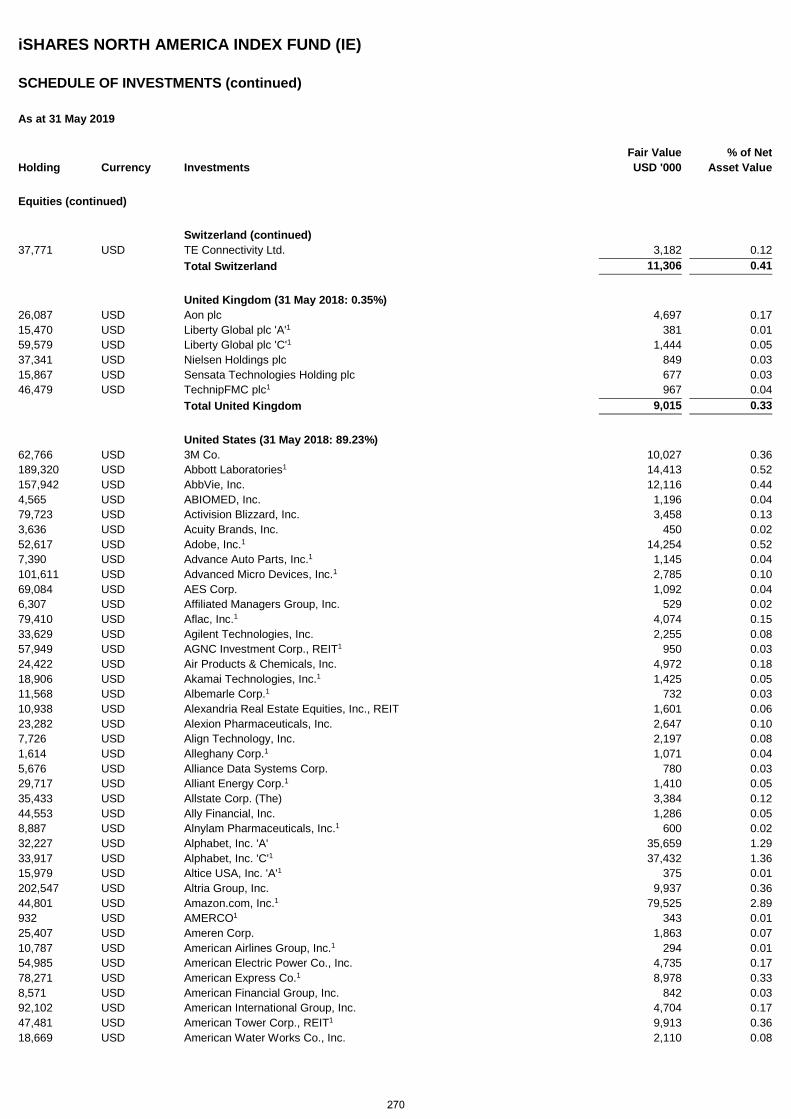
iSHARES NORTH AMERICA INDEX FUND (IE)
SCHEDULE OF INVESTMENTS (continued)
As at 31 May 2019
Holding Currency Investments Fair Value USD '000
% of Net Asset Value
Equities (continued)
Switzerland (continued) 37,771 USD TE Connectivity Ltd. 3,182 0.12 Total Switzerland 11,306 0.41
United Kingdom (31 May 2018: 0.35%) 26,087 USD Aon plc 4,697 0.17 15,470 USD Liberty Global plc 'A'1 381 0.01 59,579 USD Liberty Global plc 'C'1 1,444 0.05 37,341 USD Nielsen Holdings plc 849 0.03 15,867 USD Sensata Technologies Holding plc 677 0.03 46,479 USD TechnipFMC plc1 967 0.04 Total United Kingdom 9,015 0.33
United States (31 May 2018: 89.23%) 62,766 USD 3M Co. 10,027 0.36 189,320 USD Abbott Laboratories1 14,413 0.52 157,942 USD AbbVie, Inc. 12,116 0.44 4,565 USD ABIOMED, Inc. 1,196 0.04 79,723 USD Activision Blizzard, Inc. 3,458 0.13 3,636 USD Acuity Brands, Inc. 450 0.02 52,617 USD Adobe, Inc.1 14,254 0.52 7,390 USD Advance Auto Parts, Inc.1 1,145 0.04 101,611 USD Advanced Micro Devices, Inc.1 2,785 0.10 69,084 USD AES Corp. 1,092 0.04 6,307 USD Affiliated Managers Group, Inc. 529 0.02 79,410 USD Aflac, Inc.1 4,074 0.15 33,629 USD Agilent Technologies, Inc. 2,255 0.08 57,949 USD AGNC Investment Corp., REIT1 950 0.03 24,422 USD Air Products & Chemicals, Inc. 4,972 0.18 18,906 USD Akamai Technologies, Inc.1 1,425 0.05 11,568 USD Albemarle Corp.1 732 0.03 10,938 USD Alexandria Real Estate Equities, Inc., REIT 1,601 0.06 23,282 USD Alexion Pharmaceuticals, Inc. 2,647 0.10 7,726 USD Align Technology, Inc. 2,197 0.08 1,614 USD Alleghany Corp.1 1,071 0.04 5,676 USD Alliance Data Systems Corp. 780 0.03 29,717 USD Alliant Energy Corp.1 1,410 0.05 35,433 USD Allstate Corp. (The) 3,384 0.12 44,553 USD Ally Financial, Inc. 1,286 0.05 8,887 USD Alnylam Pharmaceuticals, Inc.1 600 0.02 32,227 USD Alphabet, Inc. 'A' 35,659 1.29 33,917 USD Alphabet, Inc. 'C'1 37,432 1.36 15,979 USD Altice USA, Inc. 'A'1 375 0.01 202,547 USD Altria Group, Inc. 9,937 0.36 44,801 USD Amazon.com, Inc.1 79,525 2.89 932 USD AMERCO1 343 0.01 25,407 USD Ameren Corp. 1,863 0.07 10,787 USD American Airlines Group, Inc.1 294 0.01 54,985 USD American Electric Power Co., Inc. 4,735 0.17 78,271 USD American Express Co.1 8,978 0.33 8,571 USD American Financial Group, Inc. 842 0.03 92,102 USD American International Group, Inc. 4,704 0.17 47,481 USD American Tower Corp., REIT1 9,913 0.36 18,669 USD American Water Works Co., Inc. 2,110 0.08
270
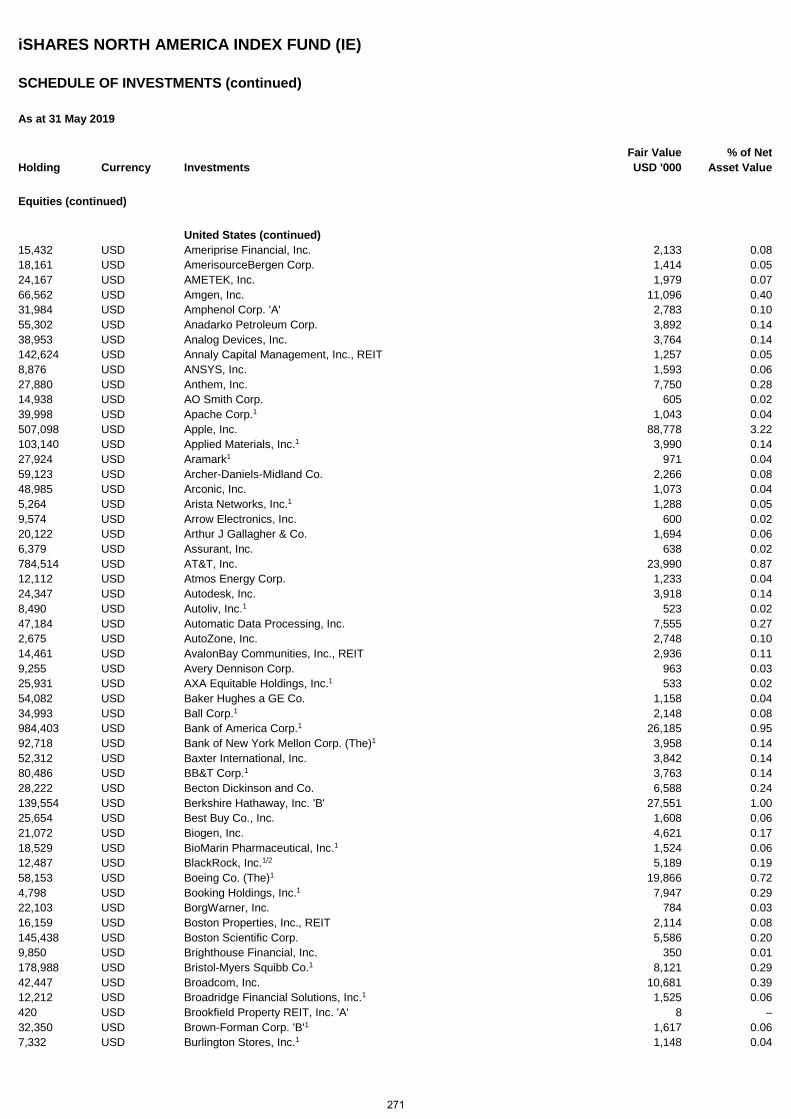
iSHARES NORTH AMERICA INDEX FUND (IE)
SCHEDULE OF INVESTMENTS (continued)
As at 31 May 2019
Holding Currency Investments Fair Value USD '000
% of Net Asset Value
Equities (continued)
United States (continued) 15,432 USD Ameriprise Financial, Inc. 2,133 0.08 18,161 USD AmerisourceBergen Corp. 1,414 0.05 24,167 USD AMETEK, Inc. 1,979 0.07 66,562 USD Amgen, Inc. 11,096 0.40 31,984 USD Amphenol Corp. 'A' 2,783 0.10 55,302 USD Anadarko Petroleum Corp. 3,892 0.14 38,953 USD Analog Devices, Inc. 3,764 0.14 142,624 USD Annaly Capital Management, Inc., REIT 1,257 0.05 8,876 USD ANSYS, Inc. 1,593 0.06 27,880 USD Anthem, Inc. 7,750 0.28 14,938 USD AO Smith Corp. 605 0.02 39,998 USD Apache Corp.1 1,043 0.04 507,098 USD Apple, Inc. 88,778 3.22 103,140 USD Applied Materials, Inc.1 3,990 0.14 27,924 USD Aramark1 971 0.04 59,123 USD Archer-Daniels-Midland Co. 2,266 0.08 48,985 USD Arconic, Inc. 1,073 0.04 5,264 USD Arista Networks, Inc.1 1,288 0.05 9,574 USD Arrow Electronics, Inc. 600 0.02 20,122 USD Arthur J Gallagher & Co. 1,694 0.06 6,379 USD Assurant, Inc. 638 0.02 784,514 USD AT&T, Inc. 23,990 0.87 12,112 USD Atmos Energy Corp. 1,233 0.04 24,347 USD Autodesk, Inc. 3,918 0.14 8,490 USD Autoliv, Inc.1 523 0.02 47,184 USD Automatic Data Processing, Inc. 7,555 0.27 2,675 USD AutoZone, Inc. 2,748 0.10 14,461 USD AvalonBay Communities, Inc., REIT 2,936 0.11 9,255 USD Avery Dennison Corp. 963 0.03 25,931 USD AXA Equitable Holdings, Inc.1 533 0.02 54,082 USD Baker Hughes a GE Co. 1,158 0.04 34,993 USD Ball Corp.1 2,148 0.08 984,403 USD Bank of America Corp.1 26,185 0.95 92,718 USD Bank of New York Mellon Corp. (The)1 3,958 0.14 52,312 USD Baxter International, Inc. 3,842 0.14 80,486 USD BB&T Corp.1 3,763 0.14 28,222 USD Becton Dickinson and Co. 6,588 0.24 139,554 USD Berkshire Hathaway, Inc. 'B' 27,551 1.00 25,654 USD Best Buy Co., Inc. 1,608 0.06 21,072 USD Biogen, Inc. 4,621 0.17 18,529 USD BioMarin Pharmaceutical, Inc.1 1,524 0.06 12,487 USD BlackRock, Inc.1/2 5,189 0.19 58,153 USD Boeing Co. (The)1 19,866 0.72 4,798 USD Booking Holdings, Inc.1 7,947 0.29 22,103 USD BorgWarner, Inc. 784 0.03 16,159 USD Boston Properties, Inc., REIT 2,114 0.08 145,438 USD Boston Scientific Corp. 5,586 0.20 9,850 USD Brighthouse Financial, Inc. 350 0.01 178,988 USD Bristol-Myers Squibb Co.1 8,121 0.29 42,447 USD Broadcom, Inc. 10,681 0.39 12,212 USD Broadridge Financial Solutions, Inc.1 1,525 0.06 420 USD Brookfield Property REIT, Inc. 'A' 8 – 32,350 USD Brown-Forman Corp. 'B'1 1,617 0.06 7,332 USD Burlington Stores, Inc.1 1,148 0.04
271
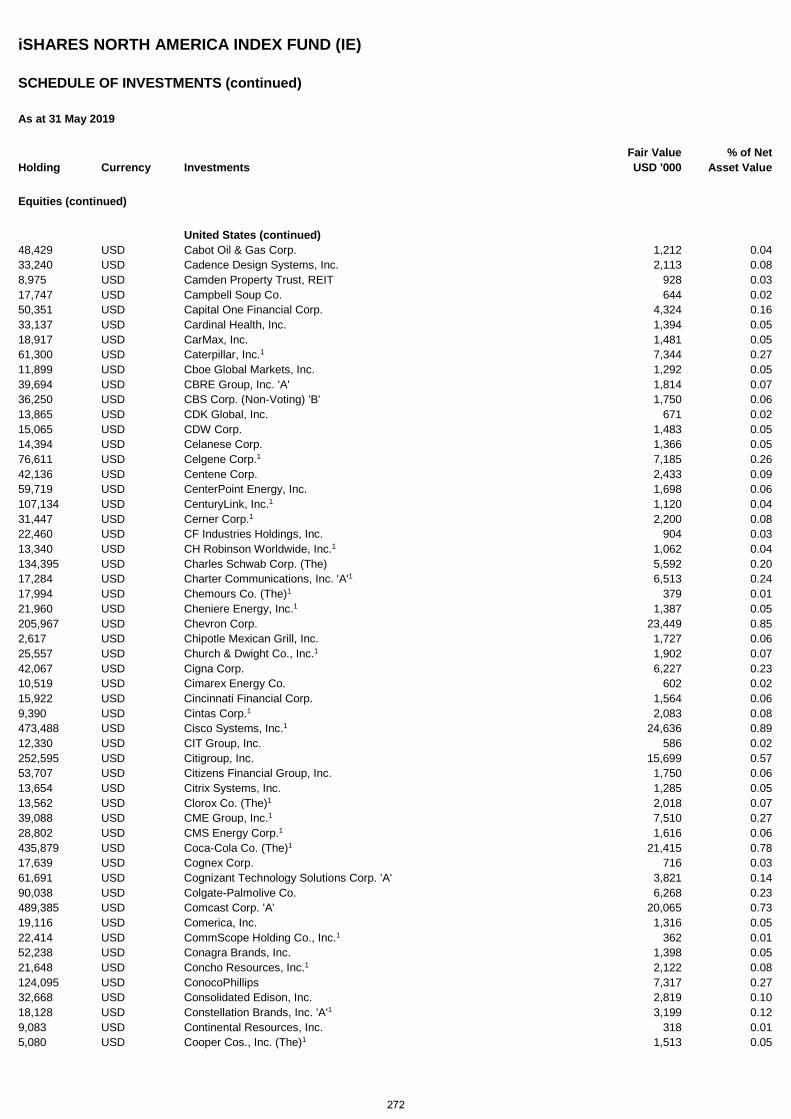
iSHARES NORTH AMERICA INDEX FUND (IE)
SCHEDULE OF INVESTMENTS (continued)
As at 31 May 2019
Holding Currency Investments Fair Value USD '000
% of Net Asset Value
Equities (continued)
United States (continued) 48,429 USD Cabot Oil & Gas Corp. 1,212 0.04 33,240 USD Cadence Design Systems, Inc. 2,113 0.08 8,975 USD Camden Property Trust, REIT 928 0.03 17,747 USD Campbell Soup Co. 644 0.02 50,351 USD Capital One Financial Corp. 4,324 0.16 33,137 USD Cardinal Health, Inc. 1,394 0.05 18,917 USD CarMax, Inc. 1,481 0.05 61,300 USD Caterpillar, Inc.1 7,344 0.27 11,899 USD Cboe Global Markets, Inc. 1,292 0.05 39,694 USD CBRE Group, Inc. 'A' 1,814 0.07 36,250 USD CBS Corp. (Non-Voting) 'B' 1,750 0.06 13,865 USD CDK Global, Inc. 671 0.02 15,065 USD CDW Corp. 1,483 0.05 14,394 USD Celanese Corp. 1,366 0.05 76,611 USD Celgene Corp.1 7,185 0.26 42,136 USD Centene Corp. 2,433 0.09 59,719 USD CenterPoint Energy, Inc. 1,698 0.06 107,134 USD CenturyLink, Inc.1 1,120 0.04 31,447 USD Cerner Corp.1 2,200 0.08 22,460 USD CF Industries Holdings, Inc. 904 0.03 13,340 USD CH Robinson Worldwide, Inc.1 1,062 0.04 134,395 USD Charles Schwab Corp. (The) 5,592 0.20 17,284 USD Charter Communications, Inc. 'A'1 6,513 0.24 17,994 USD Chemours Co. (The)1 379 0.01 21,960 USD Cheniere Energy, Inc.1 1,387 0.05 205,967 USD Chevron Corp. 23,449 0.85 2,617 USD Chipotle Mexican Grill, Inc. 1,727 0.06 25,557 USD Church & Dwight Co., Inc.1 1,902 0.07 42,067 USD Cigna Corp. 6,227 0.23 10,519 USD Cimarex Energy Co. 602 0.02 15,922 USD Cincinnati Financial Corp. 1,564 0.06 9,390 USD Cintas Corp.1 2,083 0.08 473,488 USD Cisco Systems, Inc.1 24,636 0.89 12,330 USD CIT Group, Inc. 586 0.02 252,595 USD Citigroup, Inc. 15,699 0.57 53,707 USD Citizens Financial Group, Inc. 1,750 0.06 13,654 USD Citrix Systems, Inc. 1,285 0.05 13,562 USD Clorox Co. (The)1 2,018 0.07 39,088 USD CME Group, Inc.1 7,510 0.27 28,802 USD CMS Energy Corp.1 1,616 0.06 435,879 USD Coca-Cola Co. (The)1 21,415 0.78 17,639 USD Cognex Corp. 716 0.03 61,691 USD Cognizant Technology Solutions Corp. 'A' 3,821 0.14 90,038 USD Colgate-Palmolive Co. 6,268 0.23 489,385 USD Comcast Corp. 'A' 20,065 0.73 19,116 USD Comerica, Inc. 1,316 0.05 22,414 USD CommScope Holding Co., Inc.1 362 0.01 52,238 USD Conagra Brands, Inc. 1,398 0.05 21,648 USD Concho Resources, Inc.1 2,122 0.08 124,095 USD ConocoPhillips 7,317 0.27 32,668 USD Consolidated Edison, Inc. 2,819 0.10 18,128 USD Constellation Brands, Inc. 'A'1 3,199 0.12 9,083 USD Continental Resources, Inc. 318 0.01 5,080 USD Cooper Cos., Inc. (The)1 1,513 0.05
272
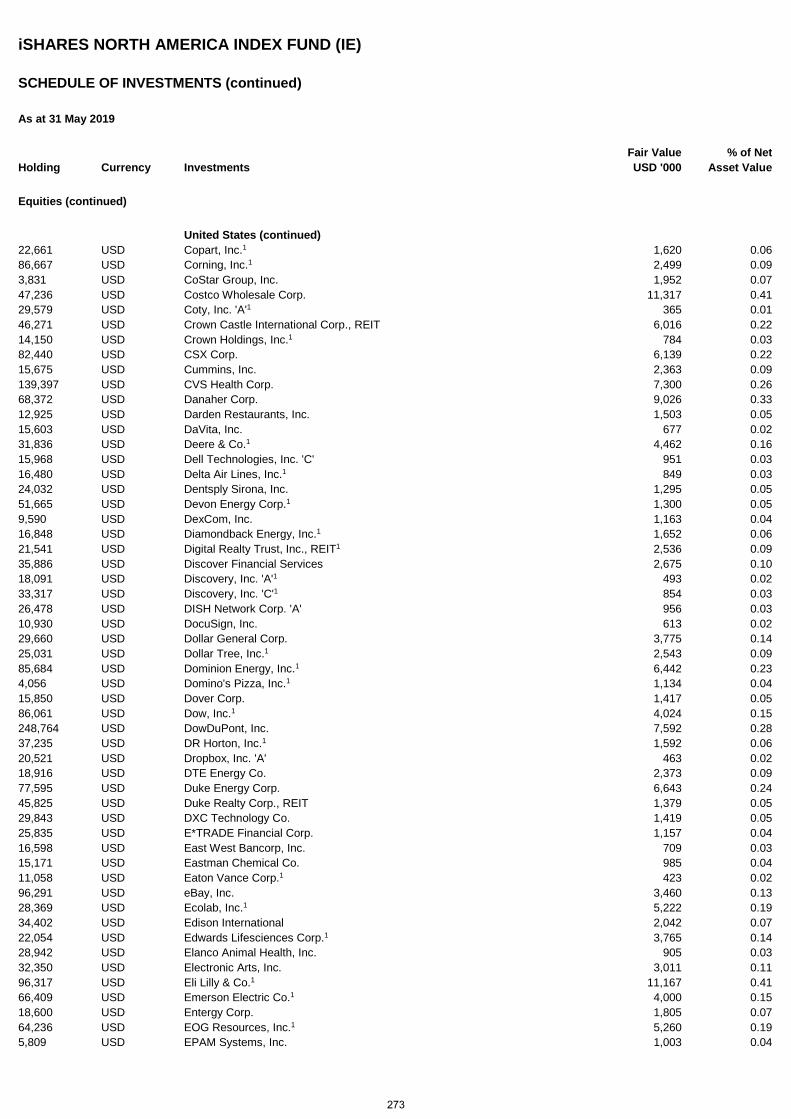
iSHARES NORTH AMERICA INDEX FUND (IE)
SCHEDULE OF INVESTMENTS (continued)
As at 31 May 2019
Holding Currency Investments Fair Value USD '000
% of Net Asset Value
Equities (continued)
United States (continued) 22,661 USD Copart, Inc.1 1,620 0.06 86,667 USD Corning, Inc.1 2,499 0.09 3,831 USD CoStar Group, Inc. 1,952 0.07 47,236 USD Costco Wholesale Corp. 11,317 0.41 29,579 USD Coty, Inc. 'A'1 365 0.01 46,271 USD Crown Castle International Corp., REIT 6,016 0.22 14,150 USD Crown Holdings, Inc.1 784 0.03 82,440 USD CSX Corp. 6,139 0.22 15,675 USD Cummins, Inc. 2,363 0.09 139,397 USD CVS Health Corp. 7,300 0.26 68,372 USD Danaher Corp. 9,026 0.33 12,925 USD Darden Restaurants, Inc. 1,503 0.05 15,603 USD DaVita, Inc. 677 0.02 31,836 USD Deere & Co.1 4,462 0.16 15,968 USD Dell Technologies, Inc. 'C' 951 0.03 16,480 USD Delta Air Lines, Inc.1 849 0.03 24,032 USD Dentsply Sirona, Inc. 1,295 0.05 51,665 USD Devon Energy Corp.1 1,300 0.05 9,590 USD DexCom, Inc. 1,163 0.04 16,848 USD Diamondback Energy, Inc.1 1,652 0.06 21,541 USD Digital Realty Trust, Inc., REIT1 2,536 0.09 35,886 USD Discover Financial Services 2,675 0.10 18,091 USD Discovery, Inc. 'A'1 493 0.02 33,317 USD Discovery, Inc. 'C'1 854 0.03 26,478 USD DISH Network Corp. 'A' 956 0.03 10,930 USD DocuSign, Inc. 613 0.02 29,660 USD Dollar General Corp. 3,775 0.14 25,031 USD Dollar Tree, Inc.1 2,543 0.09 85,684 USD Dominion Energy, Inc.1 6,442 0.23 4,056 USD Domino's Pizza, Inc.1 1,134 0.04 15,850 USD Dover Corp. 1,417 0.05 86,061 USD Dow, Inc.1 4,024 0.15 248,764 USD DowDuPont, Inc. 7,592 0.28 37,235 USD DR Horton, Inc.1 1,592 0.06 20,521 USD Dropbox, Inc. 'A' 463 0.02 18,916 USD DTE Energy Co. 2,373 0.09 77,595 USD Duke Energy Corp. 6,643 0.24 45,825 USD Duke Realty Corp., REIT 1,379 0.05 29,843 USD DXC Technology Co. 1,419 0.05 25,835 USD E*TRADE Financial Corp. 1,157 0.04 16,598 USD East West Bancorp, Inc. 709 0.03 15,171 USD Eastman Chemical Co. 985 0.04 11,058 USD Eaton Vance Corp.1 423 0.02 96,291 USD eBay, Inc. 3,460 0.13 28,369 USD Ecolab, Inc.1 5,222 0.19 34,402 USD Edison International 2,042 0.07 22,054 USD Edwards Lifesciences Corp.1 3,765 0.14 28,942 USD Elanco Animal Health, Inc. 905 0.03 32,350 USD Electronic Arts, Inc. 3,011 0.11 96,317 USD Eli Lilly & Co.1 11,167 0.41 66,409 USD Emerson Electric Co.1 4,000 0.15 18,600 USD Entergy Corp. 1,805 0.07 64,236 USD EOG Resources, Inc.1 5,260 0.19 5,809 USD EPAM Systems, Inc. 1,003 0.04
273
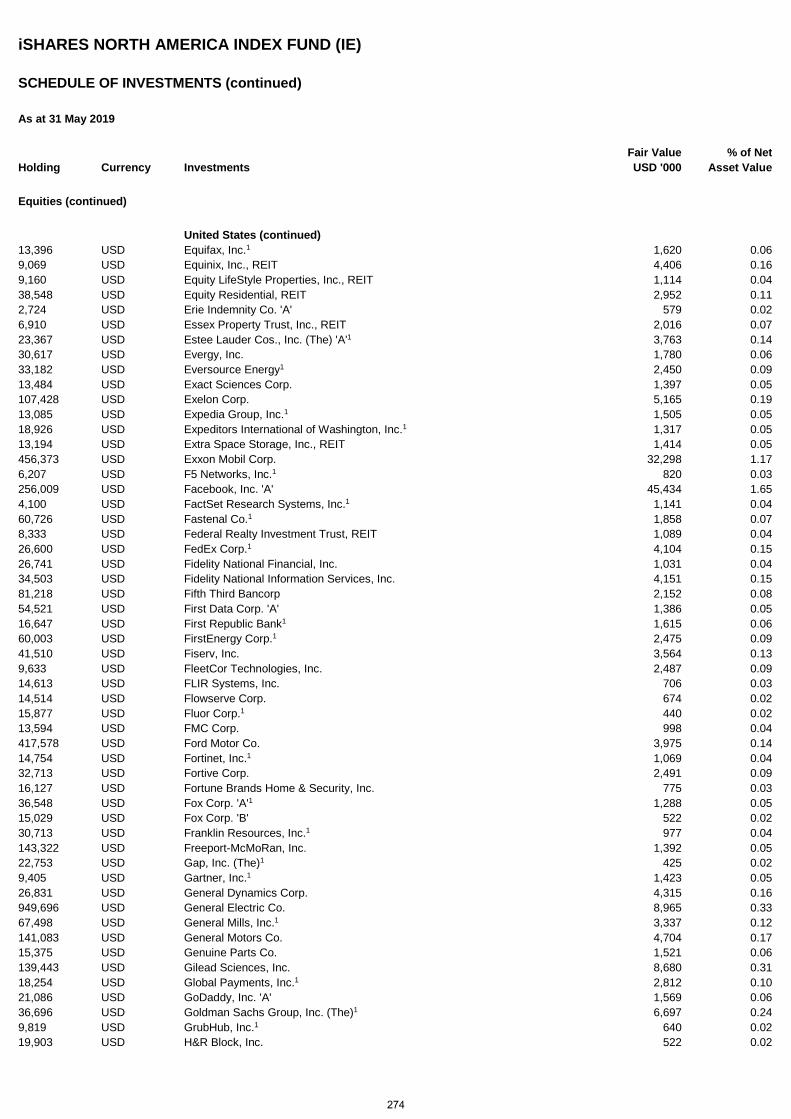
iSHARES NORTH AMERICA INDEX FUND (IE)
SCHEDULE OF INVESTMENTS (continued)
As at 31 May 2019
Holding Currency Investments Fair Value USD '000
% of Net Asset Value
Equities (continued)
United States (continued) 13,396 USD Equifax, Inc.1 1,620 0.06 9,069 USD Equinix, Inc., REIT 4,406 0.16 9,160 USD Equity LifeStyle Properties, Inc., REIT 1,114 0.04 38,548 USD Equity Residential, REIT 2,952 0.11 2,724 USD Erie Indemnity Co. 'A' 579 0.02 6,910 USD Essex Property Trust, Inc., REIT 2,016 0.07 23,367 USD Estee Lauder Cos., Inc. (The) 'A'1 3,763 0.14 30,617 USD Evergy, Inc. 1,780 0.06 33,182 USD Eversource Energy1 2,450 0.09 13,484 USD Exact Sciences Corp. 1,397 0.05 107,428 USD Exelon Corp. 5,165 0.19 13,085 USD Expedia Group, Inc.1 1,505 0.05 18,926 USD Expeditors International of Washington, Inc.1 1,317 0.05 13,194 USD Extra Space Storage, Inc., REIT 1,414 0.05 456,373 USD Exxon Mobil Corp. 32,298 1.17 6,207 USD F5 Networks, Inc.1 820 0.03 256,009 USD Facebook, Inc. 'A' 45,434 1.65 4,100 USD FactSet Research Systems, Inc.1 1,141 0.04 60,726 USD Fastenal Co.1 1,858 0.07 8,333 USD Federal Realty Investment Trust, REIT 1,089 0.04 26,600 USD FedEx Corp.1 4,104 0.15 26,741 USD Fidelity National Financial, Inc. 1,031 0.04 34,503 USD Fidelity National Information Services, Inc. 4,151 0.15 81,218 USD Fifth Third Bancorp 2,152 0.08 54,521 USD First Data Corp. 'A' 1,386 0.05 16,647 USD First Republic Bank1 1,615 0.06 60,003 USD FirstEnergy Corp.1 2,475 0.09 41,510 USD Fiserv, Inc. 3,564 0.13 9,633 USD FleetCor Technologies, Inc. 2,487 0.09 14,613 USD FLIR Systems, Inc. 706 0.03 14,514 USD Flowserve Corp. 674 0.02 15,877 USD Fluor Corp.1 440 0.02 13,594 USD FMC Corp. 998 0.04 417,578 USD Ford Motor Co. 3,975 0.14 14,754 USD Fortinet, Inc.1 1,069 0.04 32,713 USD Fortive Corp. 2,491 0.09 16,127 USD Fortune Brands Home & Security, Inc. 775 0.03 36,548 USD Fox Corp. 'A'1 1,288 0.05 15,029 USD Fox Corp. 'B' 522 0.02 30,713 USD Franklin Resources, Inc.1 977 0.04 143,322 USD Freeport-McMoRan, Inc. 1,392 0.05 22,753 USD Gap, Inc. (The)1 425 0.02 9,405 USD Gartner, Inc.1 1,423 0.05 26,831 USD General Dynamics Corp. 4,315 0.16 949,696 USD General Electric Co. 8,965 0.33 67,498 USD General Mills, Inc.1 3,337 0.12 141,083 USD General Motors Co. 4,704 0.17 15,375 USD Genuine Parts Co. 1,521 0.06 139,443 USD Gilead Sciences, Inc. 8,680 0.31 18,254 USD Global Payments, Inc.1 2,812 0.10 21,086 USD GoDaddy, Inc. 'A' 1,569 0.06 36,696 USD Goldman Sachs Group, Inc. (The)1 6,697 0.24 9,819 USD GrubHub, Inc.1 640 0.02 19,903 USD H&R Block, Inc. 522 0.02
274
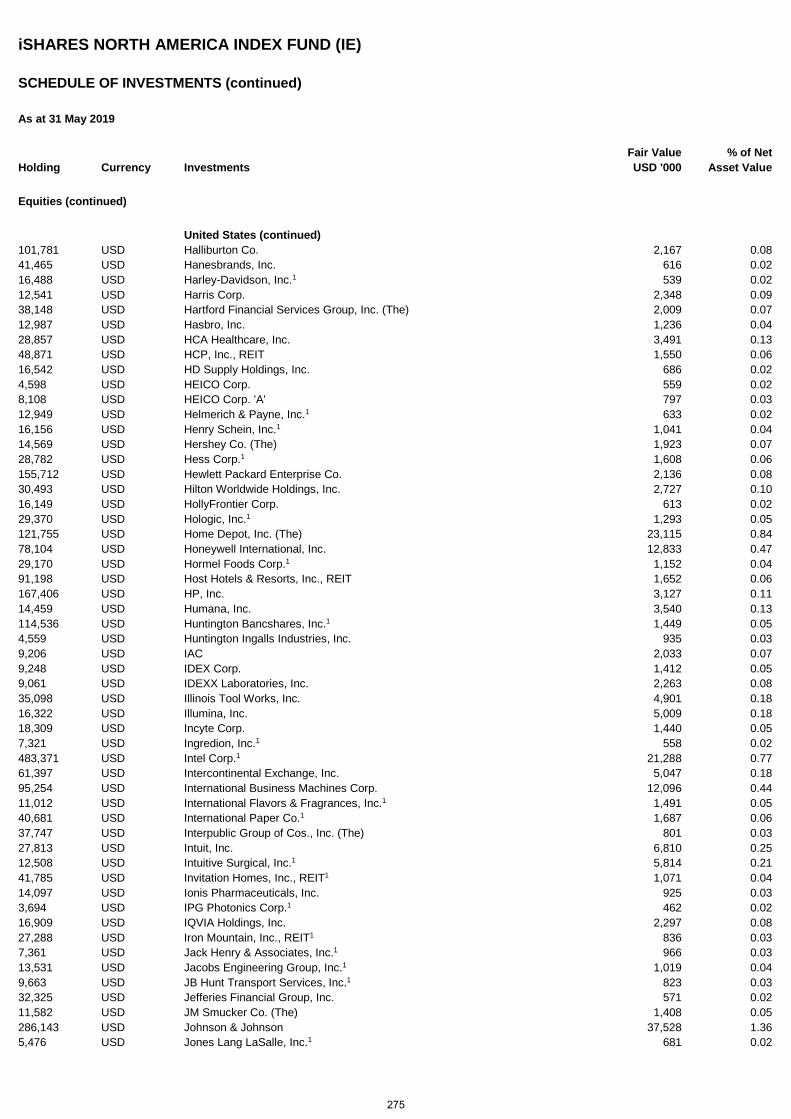
iSHARES NORTH AMERICA INDEX FUND (IE)
SCHEDULE OF INVESTMENTS (continued)
As at 31 May 2019
Holding Currency Investments Fair Value USD '000
% of Net Asset Value
Equities (continued)
United States (continued) 101,781 USD Halliburton Co. 2,167 0.08 41,465 USD Hanesbrands, Inc. 616 0.02 16,488 USD Harley-Davidson, Inc.1 539 0.02 12,541 USD Harris Corp. 2,348 0.09 38,148 USD Hartford Financial Services Group, Inc. (The) 2,009 0.07 12,987 USD Hasbro, Inc. 1,236 0.04 28,857 USD HCA Healthcare, Inc. 3,491 0.13 48,871 USD HCP, Inc., REIT 1,550 0.06 16,542 USD HD Supply Holdings, Inc. 686 0.02 4,598 USD HEICO Corp. 559 0.02 8,108 USD HEICO Corp. 'A' 797 0.03 12,949 USD Helmerich & Payne, Inc.1 633 0.02 16,156 USD Henry Schein, Inc.1 1,041 0.04 14,569 USD Hershey Co. (The) 1,923 0.07 28,782 USD Hess Corp.1 1,608 0.06 155,712 USD Hewlett Packard Enterprise Co. 2,136 0.08 30,493 USD Hilton Worldwide Holdings, Inc. 2,727 0.10 16,149 USD HollyFrontier Corp. 613 0.02 29,370 USD Hologic, Inc.1 1,293 0.05 121,755 USD Home Depot, Inc. (The) 23,115 0.84 78,104 USD Honeywell International, Inc. 12,833 0.47 29,170 USD Hormel Foods Corp.1 1,152 0.04 91,198 USD Host Hotels & Resorts, Inc., REIT 1,652 0.06 167,406 USD HP, Inc. 3,127 0.11 14,459 USD Humana, Inc. 3,540 0.13 114,536 USD Huntington Bancshares, Inc.1 1,449 0.05 4,559 USD Huntington Ingalls Industries, Inc. 935 0.03 9,206 USD IAC 2,033 0.07 9,248 USD IDEX Corp. 1,412 0.05 9,061 USD IDEXX Laboratories, Inc. 2,263 0.08 35,098 USD Illinois Tool Works, Inc. 4,901 0.18 16,322 USD Illumina, Inc. 5,009 0.18 18,309 USD Incyte Corp. 1,440 0.05 7,321 USD Ingredion, Inc.1 558 0.02 483,371 USD Intel Corp.1 21,288 0.77 61,397 USD Intercontinental Exchange, Inc. 5,047 0.18 95,254 USD International Business Machines Corp. 12,096 0.44 11,012 USD International Flavors & Fragrances, Inc.1 1,491 0.05 40,681 USD International Paper Co.1 1,687 0.06 37,747 USD Interpublic Group of Cos., Inc. (The) 801 0.03 27,813 USD Intuit, Inc. 6,810 0.25 12,508 USD Intuitive Surgical, Inc.1 5,814 0.21 41,785 USD Invitation Homes, Inc., REIT1 1,071 0.04 14,097 USD Ionis Pharmaceuticals, Inc. 925 0.03 3,694 USD IPG Photonics Corp.1 462 0.02 16,909 USD IQVIA Holdings, Inc. 2,297 0.08 27,288 USD Iron Mountain, Inc., REIT1 836 0.03 7,361 USD Jack Henry & Associates, Inc.1 966 0.03 13,531 USD Jacobs Engineering Group, Inc.1 1,019 0.04 9,663 USD JB Hunt Transport Services, Inc.1 823 0.03 32,325 USD Jefferies Financial Group, Inc. 571 0.02 11,582 USD JM Smucker Co. (The) 1,408 0.05 286,143 USD Johnson & Johnson 37,528 1.36 5,476 USD Jones Lang LaSalle, Inc.1 681 0.02
275
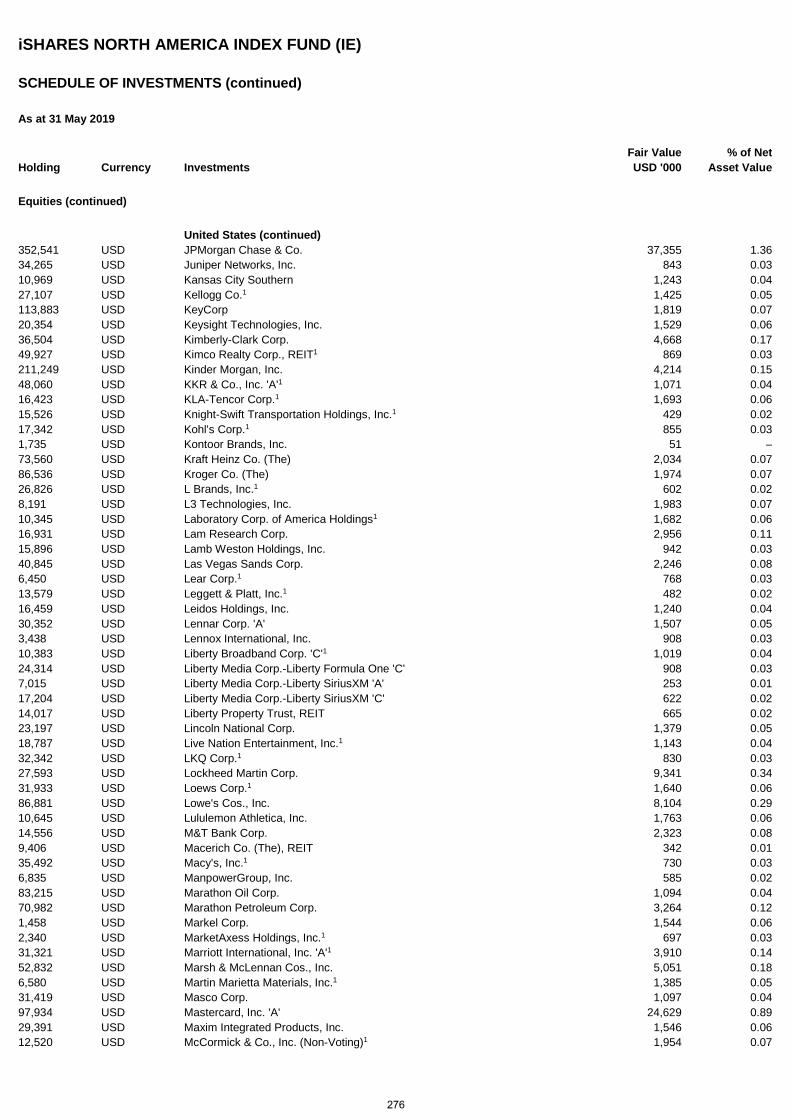
iSHARES NORTH AMERICA INDEX FUND (IE)
SCHEDULE OF INVESTMENTS (continued)
As at 31 May 2019
Holding Currency Investments Fair Value USD '000
% of Net Asset Value
Equities (continued)
United States (continued) 352,541 USD JPMorgan Chase & Co. 37,355 1.36 34,265 USD Juniper Networks, Inc. 843 0.03 10,969 USD Kansas City Southern 1,243 0.04 27,107 USD Kellogg Co.1 1,425 0.05 113,883 USD KeyCorp 1,819 0.07 20,354 USD Keysight Technologies, Inc. 1,529 0.06 36,504 USD Kimberly-Clark Corp. 4,668 0.17 49,927 USD Kimco Realty Corp., REIT1 869 0.03 211,249 USD Kinder Morgan, Inc. 4,214 0.15 48,060 USD KKR & Co., Inc. 'A'1 1,071 0.04 16,423 USD KLA-Tencor Corp.1 1,693 0.06 15,526 USD Knight-Swift Transportation Holdings, Inc.1 429 0.02 17,342 USD Kohl's Corp.1 855 0.03 1,735 USD Kontoor Brands, Inc. 51 – 73,560 USD Kraft Heinz Co. (The) 2,034 0.07 86,536 USD Kroger Co. (The) 1,974 0.07 26,826 USD L Brands, Inc.1 602 0.02 8,191 USD L3 Technologies, Inc. 1,983 0.07 10,345 USD Laboratory Corp. of America Holdings1 1,682 0.06 16,931 USD Lam Research Corp. 2,956 0.11 15,896 USD Lamb Weston Holdings, Inc. 942 0.03 40,845 USD Las Vegas Sands Corp. 2,246 0.08 6,450 USD Lear Corp.1 768 0.03 13,579 USD Leggett & Platt, Inc.1 482 0.02 16,459 USD Leidos Holdings, Inc. 1,240 0.04 30,352 USD Lennar Corp. 'A' 1,507 0.05 3,438 USD Lennox International, Inc. 908 0.03 10,383 USD Liberty Broadband Corp. 'C'1 1,019 0.04 24,314 USD Liberty Media Corp.-Liberty Formula One 'C' 908 0.03 7,015 USD Liberty Media Corp.-Liberty SiriusXM 'A' 253 0.01 17,204 USD Liberty Media Corp.-Liberty SiriusXM 'C' 622 0.02 14,017 USD Liberty Property Trust, REIT 665 0.02 23,197 USD Lincoln National Corp. 1,379 0.05 18,787 USD Live Nation Entertainment, Inc.1 1,143 0.04 32,342 USD LKQ Corp.1 830 0.03 27,593 USD Lockheed Martin Corp. 9,341 0.34 31,933 USD Loews Corp.1 1,640 0.06 86,881 USD Lowe's Cos., Inc. 8,104 0.29 10,645 USD Lululemon Athletica, Inc. 1,763 0.06 14,556 USD M&T Bank Corp. 2,323 0.08 9,406 USD Macerich Co. (The), REIT 342 0.01 35,492 USD Macy's, Inc.1 730 0.03 6,835 USD ManpowerGroup, Inc. 585 0.02 83,215 USD Marathon Oil Corp. 1,094 0.04 70,982 USD Marathon Petroleum Corp. 3,264 0.12 1,458 USD Markel Corp. 1,544 0.06 2,340 USD MarketAxess Holdings, Inc.1 697 0.03 31,321 USD Marriott International, Inc. 'A'1 3,910 0.14 52,832 USD Marsh & McLennan Cos., Inc. 5,051 0.18 6,580 USD Martin Marietta Materials, Inc.1 1,385 0.05 31,419 USD Masco Corp. 1,097 0.04 97,934 USD Mastercard, Inc. 'A' 24,629 0.89 29,391 USD Maxim Integrated Products, Inc. 1,546 0.06 12,520 USD McCormick & Co., Inc. (Non-Voting)1 1,954 0.07
276
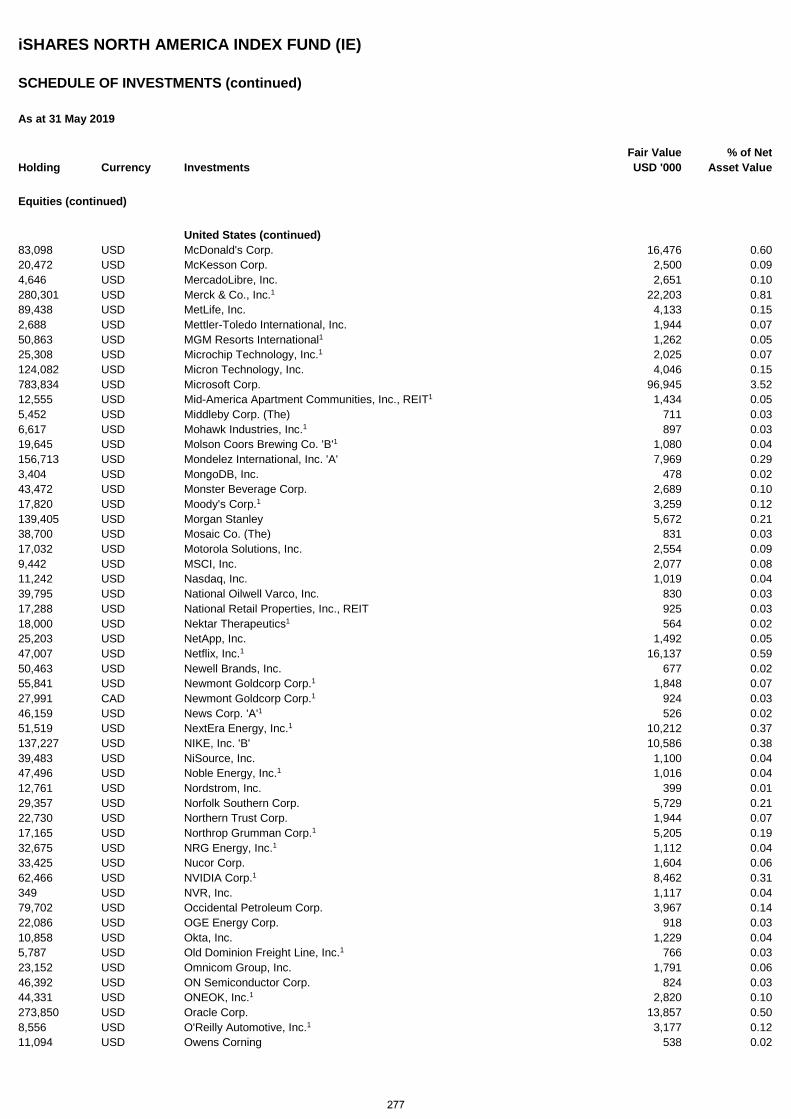
iSHARES NORTH AMERICA INDEX FUND (IE)
SCHEDULE OF INVESTMENTS (continued)
As at 31 May 2019
Holding Currency Investments Fair Value USD '000
% of Net Asset Value
Equities (continued)
United States (continued) 83,098 USD McDonald's Corp. 16,476 0.60 20,472 USD McKesson Corp. 2,500 0.09 4,646 USD MercadoLibre, Inc. 2,651 0.10 280,301 USD Merck & Co., Inc.1 22,203 0.81 89,438 USD MetLife, Inc. 4,133 0.15 2,688 USD Mettler-Toledo International, Inc. 1,944 0.07 50,863 USD MGM Resorts International1 1,262 0.05 25,308 USD Microchip Technology, Inc.1 2,025 0.07 124,082 USD Micron Technology, Inc. 4,046 0.15 783,834 USD Microsoft Corp. 96,945 3.52 12,555 USD Mid-America Apartment Communities, Inc., REIT1 1,434 0.05 5,452 USD Middleby Corp. (The) 711 0.03 6,617 USD Mohawk Industries, Inc.1 897 0.03 19,645 USD Molson Coors Brewing Co. 'B'1 1,080 0.04 156,713 USD Mondelez International, Inc. 'A' 7,969 0.29 3,404 USD MongoDB, Inc. 478 0.02 43,472 USD Monster Beverage Corp. 2,689 0.10 17,820 USD Moody's Corp.1 3,259 0.12 139,405 USD Morgan Stanley 5,672 0.21 38,700 USD Mosaic Co. (The) 831 0.03 17,032 USD Motorola Solutions, Inc. 2,554 0.09 9,442 USD MSCI, Inc. 2,077 0.08 11,242 USD Nasdaq, Inc. 1,019 0.04 39,795 USD National Oilwell Varco, Inc. 830 0.03 17,288 USD National Retail Properties, Inc., REIT 925 0.03 18,000 USD Nektar Therapeutics1 564 0.02 25,203 USD NetApp, Inc. 1,492 0.05 47,007 USD Netflix, Inc.1 16,137 0.59 50,463 USD Newell Brands, Inc. 677 0.02 55,841 USD Newmont Goldcorp Corp.1 1,848 0.07 27,991 CAD Newmont Goldcorp Corp.1 924 0.03 46,159 USD News Corp. 'A'1 526 0.02 51,519 USD NextEra Energy, Inc.1 10,212 0.37 137,227 USD NIKE, Inc. 'B' 10,586 0.38 39,483 USD NiSource, Inc. 1,100 0.04 47,496 USD Noble Energy, Inc.1 1,016 0.04 12,761 USD Nordstrom, Inc. 399 0.01 29,357 USD Norfolk Southern Corp. 5,729 0.21 22,730 USD Northern Trust Corp. 1,944 0.07 17,165 USD Northrop Grumman Corp.1 5,205 0.19 32,675 USD NRG Energy, Inc.1 1,112 0.04 33,425 USD Nucor Corp. 1,604 0.06 62,466 USD NVIDIA Corp.1 8,462 0.31 349 USD NVR, Inc. 1,117 0.04 79,702 USD Occidental Petroleum Corp. 3,967 0.14 22,086 USD OGE Energy Corp. 918 0.03 10,858 USD Okta, Inc. 1,229 0.04 5,787 USD Old Dominion Freight Line, Inc.1 766 0.03 23,152 USD Omnicom Group, Inc. 1,791 0.06 46,392 USD ON Semiconductor Corp. 824 0.03 44,331 USD ONEOK, Inc.1 2,820 0.10 273,850 USD Oracle Corp. 13,857 0.50 8,556 USD O'Reilly Automotive, Inc.1 3,177 0.12 11,094 USD Owens Corning 538 0.02
277
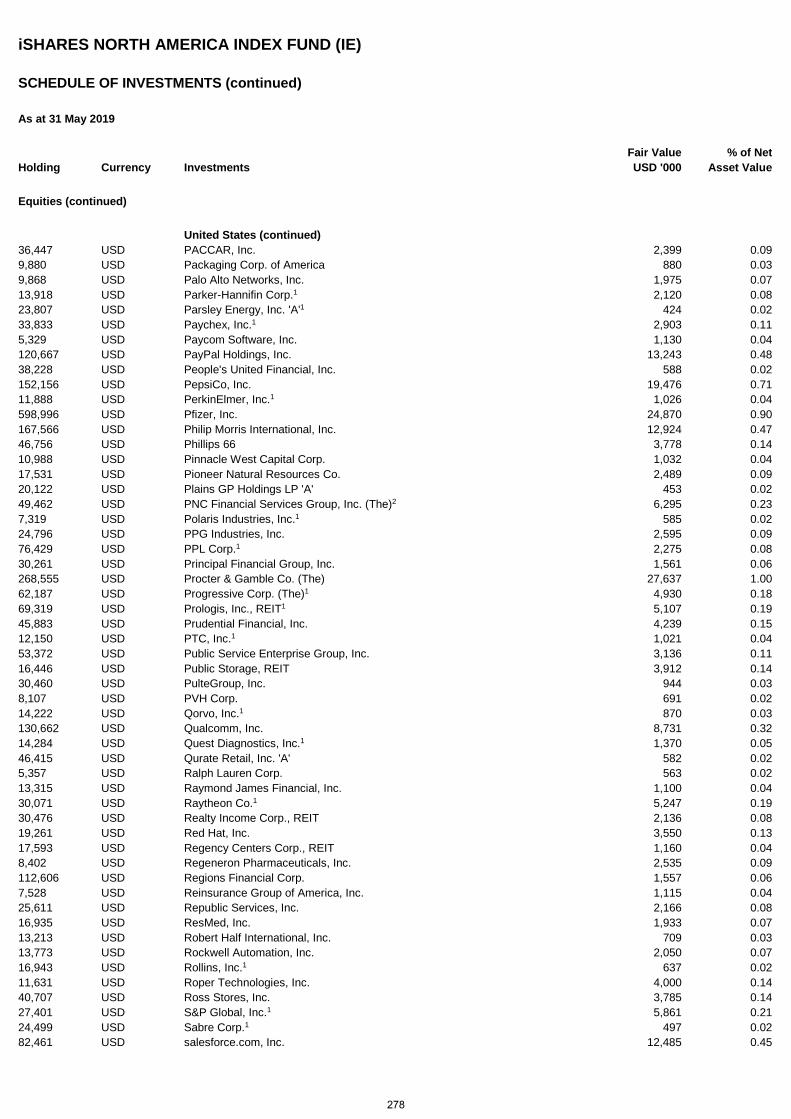
iSHARES NORTH AMERICA INDEX FUND (IE)
SCHEDULE OF INVESTMENTS (continued)
As at 31 May 2019
Holding Currency Investments Fair Value USD '000
% of Net Asset Value
Equities (continued)
United States (continued) 36,447 USD PACCAR, Inc. 2,399 0.09 9,880 USD Packaging Corp. of America 880 0.03 9,868 USD Palo Alto Networks, Inc. 1,975 0.07 13,918 USD Parker-Hannifin Corp.1 2,120 0.08 23,807 USD Parsley Energy, Inc. 'A'1 424 0.02 33,833 USD Paychex, Inc.1 2,903 0.11 5,329 USD Paycom Software, Inc. 1,130 0.04 120,667 USD PayPal Holdings, Inc. 13,243 0.48 38,228 USD People's United Financial, Inc. 588 0.02 152,156 USD PepsiCo, Inc. 19,476 0.71 11,888 USD PerkinElmer, Inc.1 1,026 0.04 598,996 USD Pfizer, Inc. 24,870 0.90 167,566 USD Philip Morris International, Inc. 12,924 0.47 46,756 USD Phillips 66 3,778 0.14 10,988 USD Pinnacle West Capital Corp. 1,032 0.04 17,531 USD Pioneer Natural Resources Co. 2,489 0.09 20,122 USD Plains GP Holdings LP 'A' 453 0.02 49,462 USD PNC Financial Services Group, Inc. (The)2 6,295 0.23 7,319 USD Polaris Industries, Inc.1 585 0.02 24,796 USD PPG Industries, Inc. 2,595 0.09 76,429 USD PPL Corp.1 2,275 0.08 30,261 USD Principal Financial Group, Inc. 1,561 0.06 268,555 USD Procter & Gamble Co. (The) 27,637 1.00 62,187 USD Progressive Corp. (The)1 4,930 0.18 69,319 USD Prologis, Inc., REIT1 5,107 0.19 45,883 USD Prudential Financial, Inc. 4,239 0.15 12,150 USD PTC, Inc.1 1,021 0.04 53,372 USD Public Service Enterprise Group, Inc. 3,136 0.11 16,446 USD Public Storage, REIT 3,912 0.14 30,460 USD PulteGroup, Inc. 944 0.03 8,107 USD PVH Corp. 691 0.02 14,222 USD Qorvo, Inc.1 870 0.03 130,662 USD Qualcomm, Inc. 8,731 0.32 14,284 USD Quest Diagnostics, Inc.1 1,370 0.05 46,415 USD Qurate Retail, Inc. 'A' 582 0.02 5,357 USD Ralph Lauren Corp. 563 0.02 13,315 USD Raymond James Financial, Inc. 1,100 0.04 30,071 USD Raytheon Co.1 5,247 0.19 30,476 USD Realty Income Corp., REIT 2,136 0.08 19,261 USD Red Hat, Inc. 3,550 0.13 17,593 USD Regency Centers Corp., REIT 1,160 0.04 8,402 USD Regeneron Pharmaceuticals, Inc. 2,535 0.09 112,606 USD Regions Financial Corp. 1,557 0.06 7,528 USD Reinsurance Group of America, Inc. 1,115 0.04 25,611 USD Republic Services, Inc. 2,166 0.08 16,935 USD ResMed, Inc. 1,933 0.07 13,213 USD Robert Half International, Inc. 709 0.03 13,773 USD Rockwell Automation, Inc. 2,050 0.07 16,943 USD Rollins, Inc.1 637 0.02 11,631 USD Roper Technologies, Inc. 4,000 0.14 40,707 USD Ross Stores, Inc. 3,785 0.14 27,401 USD S&P Global, Inc.1 5,861 0.21 24,499 USD Sabre Corp.1 497 0.02 82,461 USD salesforce.com, Inc. 12,485 0.45
278
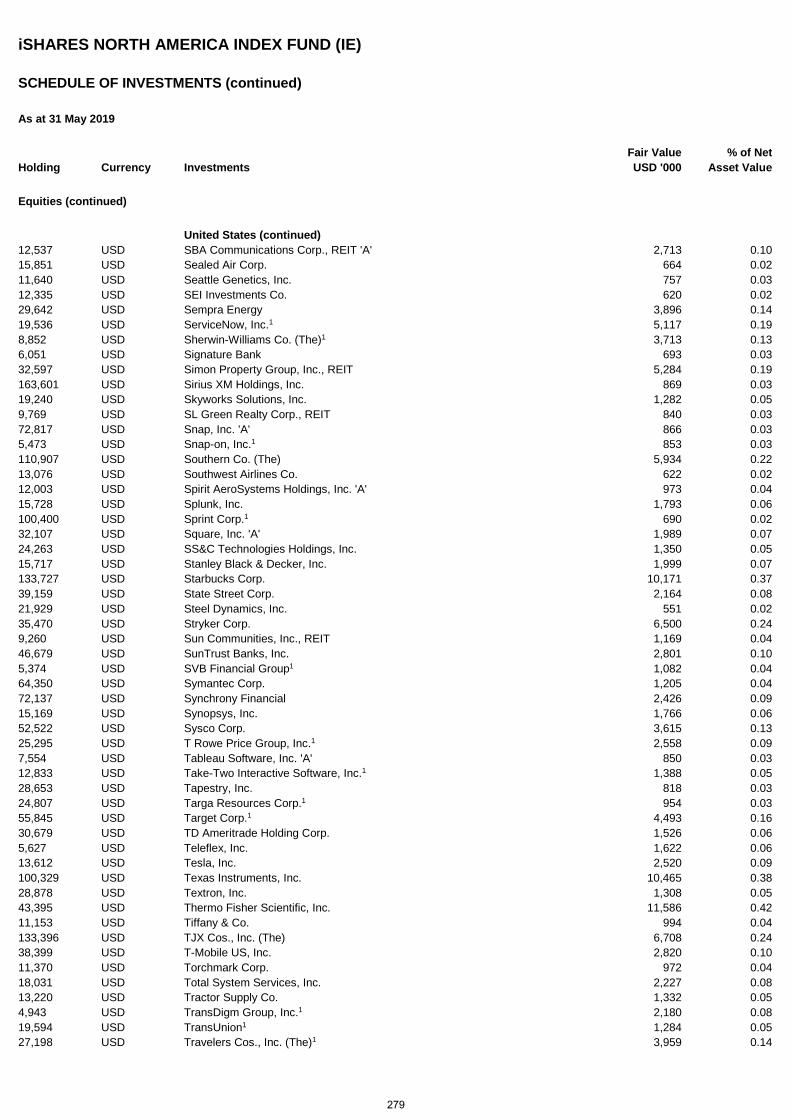
iSHARES NORTH AMERICA INDEX FUND (IE)
SCHEDULE OF INVESTMENTS (continued)
As at 31 May 2019
Holding Currency Investments Fair Value USD '000
% of Net Asset Value
Equities (continued)
United States (continued) 12,537 USD SBA Communications Corp., REIT 'A' 2,713 0.10 15,851 USD Sealed Air Corp. 664 0.02 11,640 USD Seattle Genetics, Inc. 757 0.03 12,335 USD SEI Investments Co. 620 0.02 29,642 USD Sempra Energy 3,896 0.14 19,536 USD ServiceNow, Inc.1 5,117 0.19 8,852 USD Sherwin-Williams Co. (The)1 3,713 0.13 6,051 USD Signature Bank 693 0.03 32,597 USD Simon Property Group, Inc., REIT 5,284 0.19 163,601 USD Sirius XM Holdings, Inc. 869 0.03 19,240 USD Skyworks Solutions, Inc. 1,282 0.05 9,769 USD SL Green Realty Corp., REIT 840 0.03 72,817 USD Snap, Inc. 'A' 866 0.03 5,473 USD Snap-on, Inc.1 853 0.03 110,907 USD Southern Co. (The) 5,934 0.22 13,076 USD Southwest Airlines Co. 622 0.02 12,003 USD Spirit AeroSystems Holdings, Inc. 'A' 973 0.04 15,728 USD Splunk, Inc. 1,793 0.06 100,400 USD Sprint Corp.1 690 0.02 32,107 USD Square, Inc. 'A' 1,989 0.07 24,263 USD SS&C Technologies Holdings, Inc. 1,350 0.05 15,717 USD Stanley Black & Decker, Inc. 1,999 0.07 133,727 USD Starbucks Corp. 10,171 0.37 39,159 USD State Street Corp. 2,164 0.08 21,929 USD Steel Dynamics, Inc. 551 0.02 35,470 USD Stryker Corp. 6,500 0.24 9,260 USD Sun Communities, Inc., REIT 1,169 0.04 46,679 USD SunTrust Banks, Inc. 2,801 0.10 5,374 USD SVB Financial Group1 1,082 0.04 64,350 USD Symantec Corp. 1,205 0.04 72,137 USD Synchrony Financial 2,426 0.09 15,169 USD Synopsys, Inc. 1,766 0.06 52,522 USD Sysco Corp. 3,615 0.13 25,295 USD T Rowe Price Group, Inc.1 2,558 0.09 7,554 USD Tableau Software, Inc. 'A' 850 0.03 12,833 USD Take-Two Interactive Software, Inc.1 1,388 0.05 28,653 USD Tapestry, Inc. 818 0.03 24,807 USD Targa Resources Corp.1 954 0.03 55,845 USD Target Corp.1 4,493 0.16 30,679 USD TD Ameritrade Holding Corp. 1,526 0.06 5,627 USD Teleflex, Inc. 1,622 0.06 13,612 USD Tesla, Inc. 2,520 0.09 100,329 USD Texas Instruments, Inc. 10,465 0.38 28,878 USD Textron, Inc. 1,308 0.05 43,395 USD Thermo Fisher Scientific, Inc. 11,586 0.42 11,153 USD Tiffany & Co. 994 0.04 133,396 USD TJX Cos., Inc. (The) 6,708 0.24 38,399 USD T-Mobile US, Inc. 2,820 0.10 11,370 USD Torchmark Corp. 972 0.04 18,031 USD Total System Services, Inc. 2,227 0.08 13,220 USD Tractor Supply Co. 1,332 0.05 4,943 USD TransDigm Group, Inc.1 2,180 0.08 19,594 USD TransUnion1 1,284 0.05 27,198 USD Travelers Cos., Inc. (The)1 3,959 0.14
279
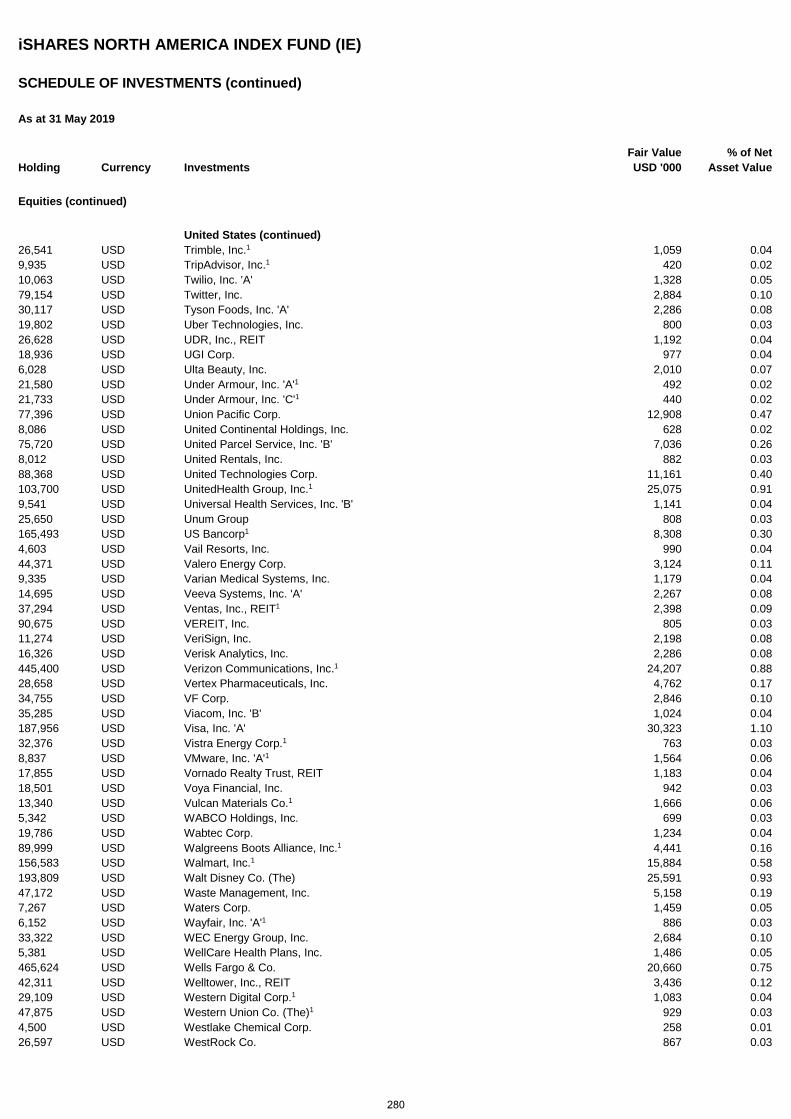
iSHARES NORTH AMERICA INDEX FUND (IE)
SCHEDULE OF INVESTMENTS (continued)
As at 31 May 2019
Holding Currency Investments Fair Value USD '000
% of Net Asset Value
Equities (continued)
United States (continued) 26,541 USD Trimble, Inc.1 1,059 0.04 9,935 USD TripAdvisor, Inc.1 420 0.02 10,063 USD Twilio, Inc. 'A' 1,328 0.05 79,154 USD Twitter, Inc. 2,884 0.10 30,117 USD Tyson Foods, Inc. 'A' 2,286 0.08 19,802 USD Uber Technologies, Inc. 800 0.03 26,628 USD UDR, Inc., REIT 1,192 0.04 18,936 USD UGI Corp. 977 0.04 6,028 USD Ulta Beauty, Inc. 2,010 0.07 21,580 USD Under Armour, Inc. 'A'1 492 0.02 21,733 USD Under Armour, Inc. 'C'1 440 0.02 77,396 USD Union Pacific Corp. 12,908 0.47 8,086 USD United Continental Holdings, Inc. 628 0.02 75,720 USD United Parcel Service, Inc. 'B' 7,036 0.26 8,012 USD United Rentals, Inc. 882 0.03 88,368 USD United Technologies Corp. 11,161 0.40 103,700 USD UnitedHealth Group, Inc.1 25,075 0.91 9,541 USD Universal Health Services, Inc. 'B' 1,141 0.04 25,650 USD Unum Group 808 0.03 165,493 USD US Bancorp1 8,308 0.30 4,603 USD Vail Resorts, Inc. 990 0.04 44,371 USD Valero Energy Corp. 3,124 0.11 9,335 USD Varian Medical Systems, Inc. 1,179 0.04 14,695 USD Veeva Systems, Inc. 'A' 2,267 0.08 37,294 USD Ventas, Inc., REIT1 2,398 0.09 90,675 USD VEREIT, Inc. 805 0.03 11,274 USD VeriSign, Inc. 2,198 0.08 16,326 USD Verisk Analytics, Inc. 2,286 0.08 445,400 USD Verizon Communications, Inc.1 24,207 0.88 28,658 USD Vertex Pharmaceuticals, Inc. 4,762 0.17 34,755 USD VF Corp. 2,846 0.10 35,285 USD Viacom, Inc. 'B' 1,024 0.04 187,956 USD Visa, Inc. 'A' 30,323 1.10 32,376 USD Vistra Energy Corp.1 763 0.03 8,837 USD VMware, Inc. 'A'1 1,564 0.06 17,855 USD Vornado Realty Trust, REIT 1,183 0.04 18,501 USD Voya Financial, Inc. 942 0.03 13,340 USD Vulcan Materials Co.1 1,666 0.06 5,342 USD WABCO Holdings, Inc. 699 0.03 19,786 USD Wabtec Corp. 1,234 0.04 89,999 USD Walgreens Boots Alliance, Inc.1 4,441 0.16 156,583 USD Walmart, Inc.1 15,884 0.58 193,809 USD Walt Disney Co. (The) 25,591 0.93 47,172 USD Waste Management, Inc. 5,158 0.19 7,267 USD Waters Corp. 1,459 0.05 6,152 USD Wayfair, Inc. 'A'1 886 0.03 33,322 USD WEC Energy Group, Inc. 2,684 0.10 5,381 USD WellCare Health Plans, Inc. 1,486 0.05 465,624 USD Wells Fargo & Co. 20,660 0.75 42,311 USD Welltower, Inc., REIT 3,436 0.12 29,109 USD Western Digital Corp.1 1,083 0.04 47,875 USD Western Union Co. (The)1 929 0.03 4,500 USD Westlake Chemical Corp. 258 0.01 26,597 USD WestRock Co. 867 0.03
280
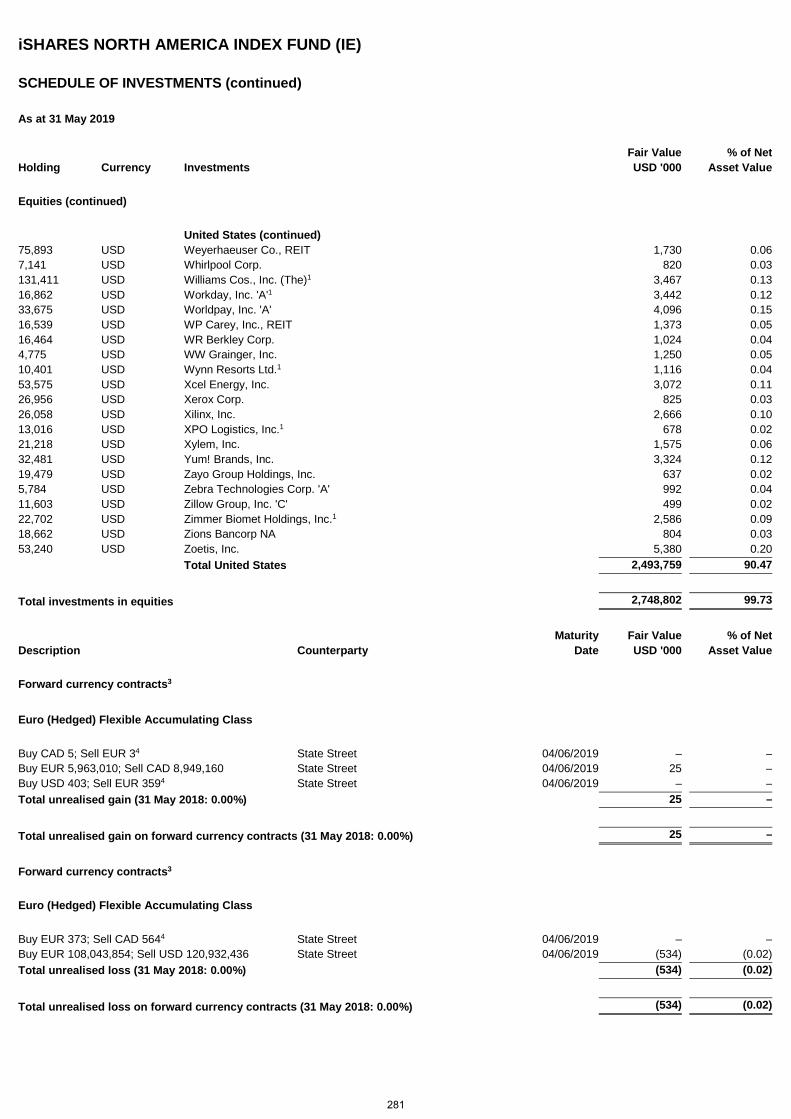
iSHARES NORTH AMERICA INDEX FUND (IE)
SCHEDULE OF INVESTMENTS (continued)
As at 31 May 2019
Holding Currency Investments Fair Value USD '000
% of Net Asset Value
Equities (continued)
United States (continued) 75,893 USD Weyerhaeuser Co., REIT 1,730 0.06 7,141 USD Whirlpool Corp. 820 0.03 131,411 USD Williams Cos., Inc. (The)1 3,467 0.13 16,862 USD Workday, Inc. 'A'1 3,442 0.12 33,675 USD Worldpay, Inc. 'A' 4,096 0.15 16,539 USD WP Carey, Inc., REIT 1,373 0.05 16,464 USD WR Berkley Corp. 1,024 0.04 4,775 USD WW Grainger, Inc. 1,250 0.05 10,401 USD Wynn Resorts Ltd.1 1,116 0.04 53,575 USD Xcel Energy, Inc. 3,072 0.11 26,956 USD Xerox Corp. 825 0.03 26,058 USD Xilinx, Inc. 2,666 0.10 13,016 USD XPO Logistics, Inc.1 678 0.02 21,218 USD Xylem, Inc. 1,575 0.06 32,481 USD Yum! Brands, Inc. 3,324 0.12 19,479 USD Zayo Group Holdings, Inc. 637 0.02 5,784 USD Zebra Technologies Corp. 'A' 992 0.04 11,603 USD Zillow Group, Inc. 'C' 499 0.02 22,702 USD Zimmer Biomet Holdings, Inc.1 2,586 0.09 18,662 USD Zions Bancorp NA 804 0.03 53,240 USD Zoetis, Inc. 5,380 0.20 Total United States 2,493,759 90.47
Total investments in equities 2,748,802 99.73
Maturity Fair Value % of Net Description Counterparty Date USD '000 Asset Value
Forward currency contracts3
Euro (Hedged) Flexible Accumulating Class
Buy CAD 5; Sell EUR 34 State Street 04/06/2019 – – Buy EUR 5,963,010; Sell CAD 8,949,160 State Street 04/06/2019 25 – Buy USD 403; Sell EUR 3594 State Street 04/06/2019 – – Total unrealised gain (31 May 2018: 0.00%) 25 –
Total unrealised gain on forward currency contracts (31 May 2018: 0.00%) 25 –
Forward currency contracts3
Euro (Hedged) Flexible Accumulating Class
Buy EUR 373; Sell CAD 5644 State Street 04/06/2019 – – Buy EUR 108,043,854; Sell USD 120,932,436 State Street 04/06/2019 (534) (0.02) Total unrealised loss (31 May 2018: 0.00%) (534) (0.02)
Total unrealised loss on forward currency contracts (31 May 2018: 0.00%) (534) (0.02)
281
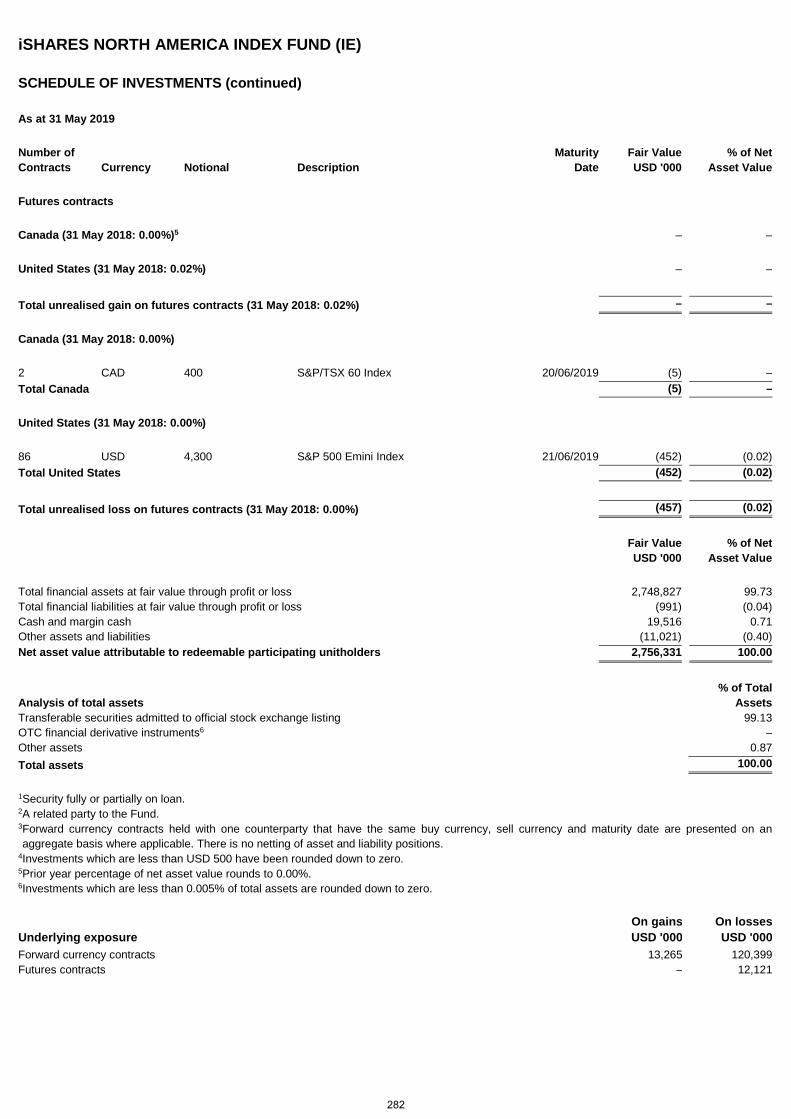
iSHARES NORTH AMERICA INDEX FUND (IE)
SCHEDULE OF INVESTMENTS (continued)
As at 31 May 2019
Number of Maturity Fair Value % of Net Contracts Currency Notional Description Date USD '000 Asset Value
Futures contracts
Canada (31 May 2018: 0.00%)5 – –
United States (31 May 2018: 0.02%) – –
Total unrealised gain on futures contracts (31 May 2018: 0.02%) – –
Canada (31 May 2018: 0.00%)
2 CAD 400 S&P/TSX 60 Index 20/06/2019 (5) – Total Canada (5) –
United States (31 May 2018: 0.00%)
86 USD 4,300 S&P 500 Emini Index 21/06/2019 (452) (0.02) Total United States (452) (0.02)
Total unrealised loss on futures contracts (31 May 2018: 0.00%) (457) (0.02)
Fair Value USD '000
% of Net Asset Value
Total financial assets at fair value through profit or loss 2,748,827 99.73 Total financial liabilities at fair value through profit or loss (991) (0.04) Cash and margin cash 19,516 0.71 Other assets and liabilities (11,021) (0.40) Net asset value attributable to redeemable participating unitholders 2,756,331 100.00
Analysis of total assets % of Total
Assets Transferable securities admitted to official stock exchange listing 99.13 OTC financial derivative instruments6 – Other assets 0.87 Total assets 100.00
1 Security fully or partially on loan. 2 A related party to the Fund. 3 Forward currency contracts held with one counterparty that have the same buy currency, sell currency and maturity date are presented on an aggregate basis where applicable. There is no netting of asset and liability positions.
4 Investments which are less than USD 500 have been rounded down to zero. 5 Prior year percentage of net asset value rounds to 0.00%. 6 Investments which are less than 0.005% of total assets are rounded down to zero.
Underlying exposure On gains USD '000
On losses USD '000
Forward currency contracts 13,265 120,399 Futures contracts – 12,121
282
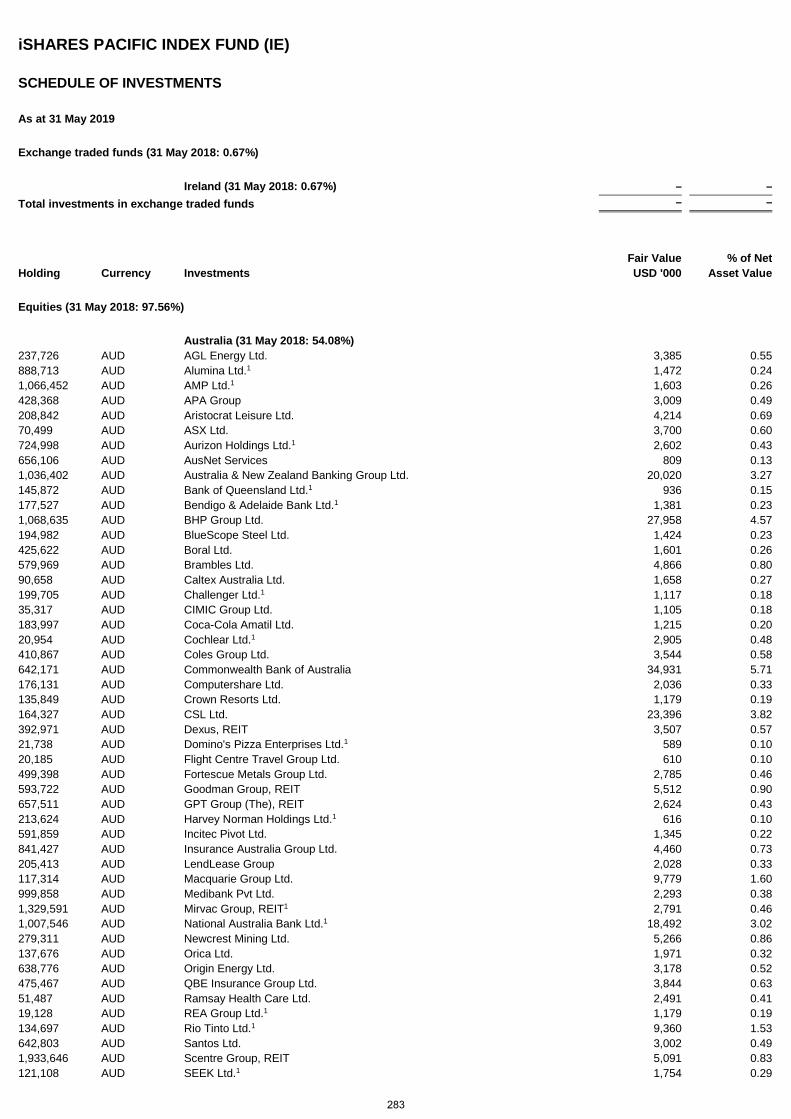
iSHARES PACIFIC INDEX FUND (IE)
SCHEDULE OF INVESTMENTS
As at 31 May 2019
Exchange traded funds (31 May 2018: 0.67%)
Ireland (31 May 2018: 0.67%) – – Total investments in exchange traded funds – –
Holding Currency Investments Fair Value USD '000
% of Net Asset Value
Equities (31 May 2018: 97.56%)
Australia (31 May 2018: 54.08%) 237,726 AUD AGL Energy Ltd. 3,385 0.55 888,713 AUD Alumina Ltd.1 1,472 0.24 1,066,452 AUD AMP Ltd.1 1,603 0.26 428,368 AUD APA Group 3,009 0.49 208,842 AUD Aristocrat Leisure Ltd. 4,214 0.69 70,499 AUD ASX Ltd. 3,700 0.60 724,998 AUD Aurizon Holdings Ltd.1 2,602 0.43 656,106 AUD AusNet Services 809 0.13 1,036,402 AUD Australia & New Zealand Banking Group Ltd. 20,020 3.27 145,872 AUD Bank of Queensland Ltd.1 936 0.15 177,527 AUD Bendigo & Adelaide Bank Ltd.1 1,381 0.23 1,068,635 AUD BHP Group Ltd. 27,958 4.57 194,982 AUD BlueScope Steel Ltd. 1,424 0.23 425,622 AUD Boral Ltd. 1,601 0.26 579,969 AUD Brambles Ltd. 4,866 0.80 90,658 AUD Caltex Australia Ltd. 1,658 0.27 199,705 AUD Challenger Ltd.1 1,117 0.18 35,317 AUD CIMIC Group Ltd. 1,105 0.18 183,997 AUD Coca-Cola Amatil Ltd. 1,215 0.20 20,954 AUD Cochlear Ltd.1 2,905 0.48 410,867 AUD Coles Group Ltd. 3,544 0.58 642,171 AUD Commonwealth Bank of Australia 34,931 5.71 176,131 AUD Computershare Ltd. 2,036 0.33 135,849 AUD Crown Resorts Ltd. 1,179 0.19 164,327 AUD CSL Ltd. 23,396 3.82 392,971 AUD Dexus, REIT 3,507 0.57 21,738 AUD Domino's Pizza Enterprises Ltd.1 589 0.10 20,185 AUD Flight Centre Travel Group Ltd. 610 0.10 499,398 AUD Fortescue Metals Group Ltd. 2,785 0.46 593,722 AUD Goodman Group, REIT 5,512 0.90 657,511 AUD GPT Group (The), REIT 2,624 0.43 213,624 AUD Harvey Norman Holdings Ltd.1 616 0.10 591,859 AUD Incitec Pivot Ltd. 1,345 0.22 841,427 AUD Insurance Australia Group Ltd. 4,460 0.73 205,413 AUD LendLease Group 2,028 0.33 117,314 AUD Macquarie Group Ltd. 9,779 1.60 999,858 AUD Medibank Pvt Ltd. 2,293 0.38 1,329,591 AUD Mirvac Group, REIT1 2,791 0.46 1,007,546 AUD National Australia Bank Ltd.1 18,492 3.02 279,311 AUD Newcrest Mining Ltd. 5,266 0.86 137,676 AUD Orica Ltd. 1,971 0.32 638,776 AUD Origin Energy Ltd. 3,178 0.52 475,467 AUD QBE Insurance Group Ltd. 3,844 0.63 51,487 AUD Ramsay Health Care Ltd. 2,491 0.41 19,128 AUD REA Group Ltd.1 1,179 0.19 134,697 AUD Rio Tinto Ltd.1 9,360 1.53 642,803 AUD Santos Ltd. 3,002 0.49 1,933,646 AUD Scentre Group, REIT 5,091 0.83 121,108 AUD SEEK Ltd.1 1,754 0.29
283
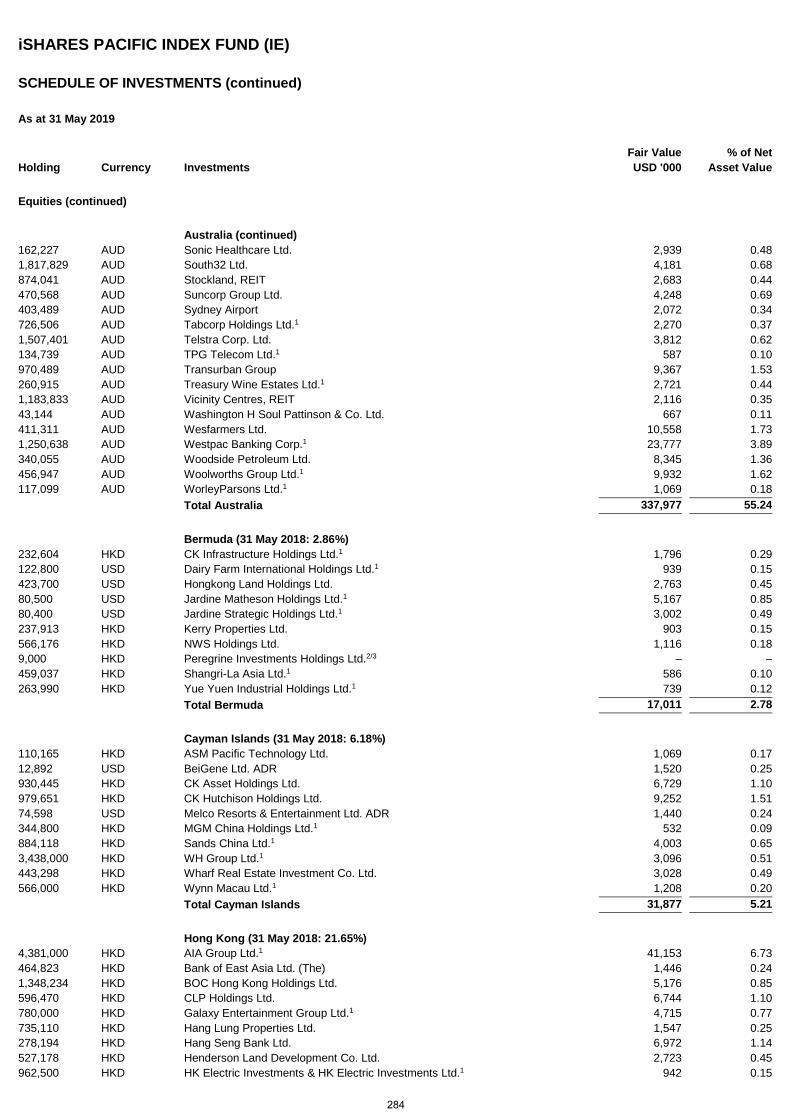
iSHARES PACIFIC INDEX FUND (IE)
SCHEDULE OF INVESTMENTS (continued)
As at 31 May 2019
Holding Currency Investments Fair Value USD '000
% of Net Asset Value
Equities (continued)
Australia (continued) 162,227 AUD Sonic Healthcare Ltd. 2,939 0.48 1,817,829 AUD South32 Ltd. 4,181 0.68 874,041 AUD Stockland, REIT 2,683 0.44 470,568 AUD Suncorp Group Ltd. 4,248 0.69 403,489 AUD Sydney Airport 2,072 0.34 726,506 AUD Tabcorp Holdings Ltd.1 2,270 0.37 1,507,401 AUD Telstra Corp. Ltd. 3,812 0.62 134,739 AUD TPG Telecom Ltd.1 587 0.10 970,489 AUD Transurban Group 9,367 1.53 260,915 AUD Treasury Wine Estates Ltd.1 2,721 0.44 1,183,833 AUD Vicinity Centres, REIT 2,116 0.35 43,144 AUD Washington H Soul Pattinson & Co. Ltd. 667 0.11 411,311 AUD Wesfarmers Ltd. 10,558 1.73 1,250,638 AUD Westpac Banking Corp.1 23,777 3.89 340,055 AUD Woodside Petroleum Ltd. 8,345 1.36 456,947 AUD Woolworths Group Ltd.1 9,932 1.62 117,099 AUD WorleyParsons Ltd.1 1,069 0.18 Total Australia 337,977 55.24
Bermuda (31 May 2018: 2.86%) 232,604 HKD CK Infrastructure Holdings Ltd.1 1,796 0.29 122,800 USD Dairy Farm International Holdings Ltd.1 939 0.15 423,700 USD Hongkong Land Holdings Ltd. 2,763 0.45 80,500 USD Jardine Matheson Holdings Ltd.1 5,167 0.85 80,400 USD Jardine Strategic Holdings Ltd.1 3,002 0.49 237,913 HKD Kerry Properties Ltd. 903 0.15 566,176 HKD NWS Holdings Ltd. 1,116 0.18 9,000 HKD Peregrine Investments Holdings Ltd.2/3 – – 459,037 HKD Shangri-La Asia Ltd.1 586 0.10 263,990 HKD Yue Yuen Industrial Holdings Ltd.1 739 0.12 Total Bermuda 17,011 2.78
Cayman Islands (31 May 2018: 6.18%) 110,165 HKD ASM Pacific Technology Ltd. 1,069 0.17 12,892 USD BeiGene Ltd. ADR 1,520 0.25 930,445 HKD CK Asset Holdings Ltd. 6,729 1.10 979,651 HKD CK Hutchison Holdings Ltd. 9,252 1.51 74,598 USD Melco Resorts & Entertainment Ltd. ADR 1,440 0.24 344,800 HKD MGM China Holdings Ltd.1 532 0.09 884,118 HKD Sands China Ltd.1 4,003 0.65 3,438,000 HKD WH Group Ltd.1 3,096 0.51 443,298 HKD Wharf Real Estate Investment Co. Ltd. 3,028 0.49 566,000 HKD Wynn Macau Ltd.1 1,208 0.20 Total Cayman Islands 31,877 5.21
Hong Kong (31 May 2018: 21.65%) 4,381,000 HKD AIA Group Ltd.1 41,153 6.73 464,823 HKD Bank of East Asia Ltd. (The) 1,446 0.24 1,348,234 HKD BOC Hong Kong Holdings Ltd. 5,176 0.85 596,470 HKD CLP Holdings Ltd. 6,744 1.10 780,000 HKD Galaxy Entertainment Group Ltd.1 4,715 0.77 735,110 HKD Hang Lung Properties Ltd. 1,547 0.25 278,194 HKD Hang Seng Bank Ltd. 6,972 1.14 527,178 HKD Henderson Land Development Co. Ltd. 2,723 0.45 962,500 HKD HK Electric Investments & HK Electric Investments Ltd.1 942 0.15
284
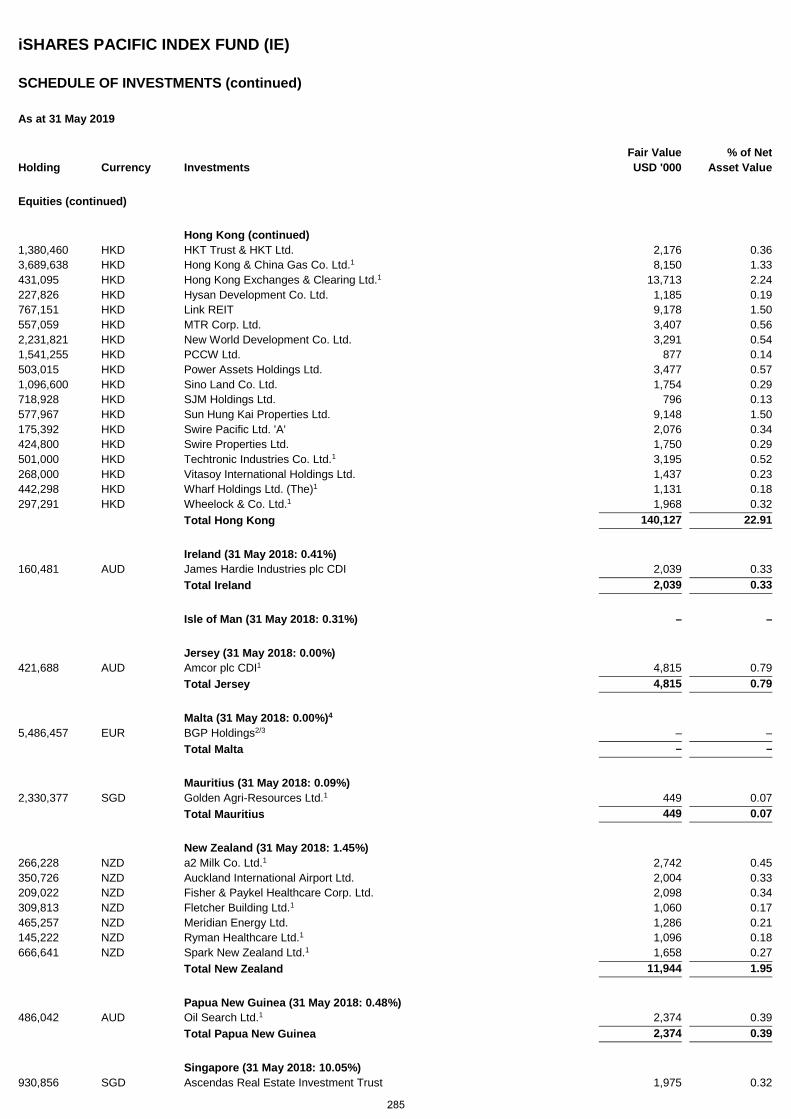
iSHARES PACIFIC INDEX FUND (IE)
SCHEDULE OF INVESTMENTS (continued)
As at 31 May 2019
Holding Currency Investments Fair Value USD '000
% of Net Asset Value
Equities (continued)
Hong Kong (continued) 1,380,460 HKD HKT Trust & HKT Ltd. 2,176 0.36 3,689,638 HKD Hong Kong & China Gas Co. Ltd.1 8,150 1.33 431,095 HKD Hong Kong Exchanges & Clearing Ltd.1 13,713 2.24 227,826 HKD Hysan Development Co. Ltd. 1,185 0.19 767,151 HKD Link REIT 9,178 1.50 557,059 HKD MTR Corp. Ltd. 3,407 0.56 2,231,821 HKD New World Development Co. Ltd. 3,291 0.54 1,541,255 HKD PCCW Ltd. 877 0.14 503,015 HKD Power Assets Holdings Ltd. 3,477 0.57 1,096,600 HKD Sino Land Co. Ltd. 1,754 0.29 718,928 HKD SJM Holdings Ltd. 796 0.13 577,967 HKD Sun Hung Kai Properties Ltd. 9,148 1.50 175,392 HKD Swire Pacific Ltd. 'A' 2,076 0.34 424,800 HKD Swire Properties Ltd. 1,750 0.29 501,000 HKD Techtronic Industries Co. Ltd.1 3,195 0.52 268,000 HKD Vitasoy International Holdings Ltd. 1,437 0.23 442,298 HKD Wharf Holdings Ltd. (The)1 1,131 0.18 297,291 HKD Wheelock & Co. Ltd.1 1,968 0.32 Total Hong Kong 140,127 22.91
Ireland (31 May 2018: 0.41%) 160,481 AUD James Hardie Industries plc CDI 2,039 0.33 Total Ireland 2,039 0.33
Isle of Man (31 May 2018: 0.31%) – –
Jersey (31 May 2018: 0.00%) 421,688 AUD Amcor plc CDI1 4,815 0.79 Total Jersey 4,815 0.79
Malta (31 May 2018: 0.00%)4 5,486,457 EUR BGP Holdings2/3 – – Total Malta – –
Mauritius (31 May 2018: 0.09%) 2,330,377 SGD Golden Agri-Resources Ltd.1 449 0.07 Total Mauritius 449 0.07
New Zealand (31 May 2018: 1.45%) 266,228 NZD a2 Milk Co. Ltd.1 2,742 0.45 350,726 NZD Auckland International Airport Ltd. 2,004 0.33 209,022 NZD Fisher & Paykel Healthcare Corp. Ltd. 2,098 0.34 309,813 NZD Fletcher Building Ltd.1 1,060 0.17 465,257 NZD Meridian Energy Ltd. 1,286 0.21 145,222 NZD Ryman Healthcare Ltd.1 1,096 0.18 666,641 NZD Spark New Zealand Ltd.1 1,658 0.27 Total New Zealand 11,944 1.95
Papua New Guinea (31 May 2018: 0.48%) 486,042 AUD Oil Search Ltd.1 2,374 0.39 Total Papua New Guinea 2,374 0.39
Singapore (31 May 2018: 10.05%) 930,856 SGD Ascendas Real Estate Investment Trust 1,975 0.32
285
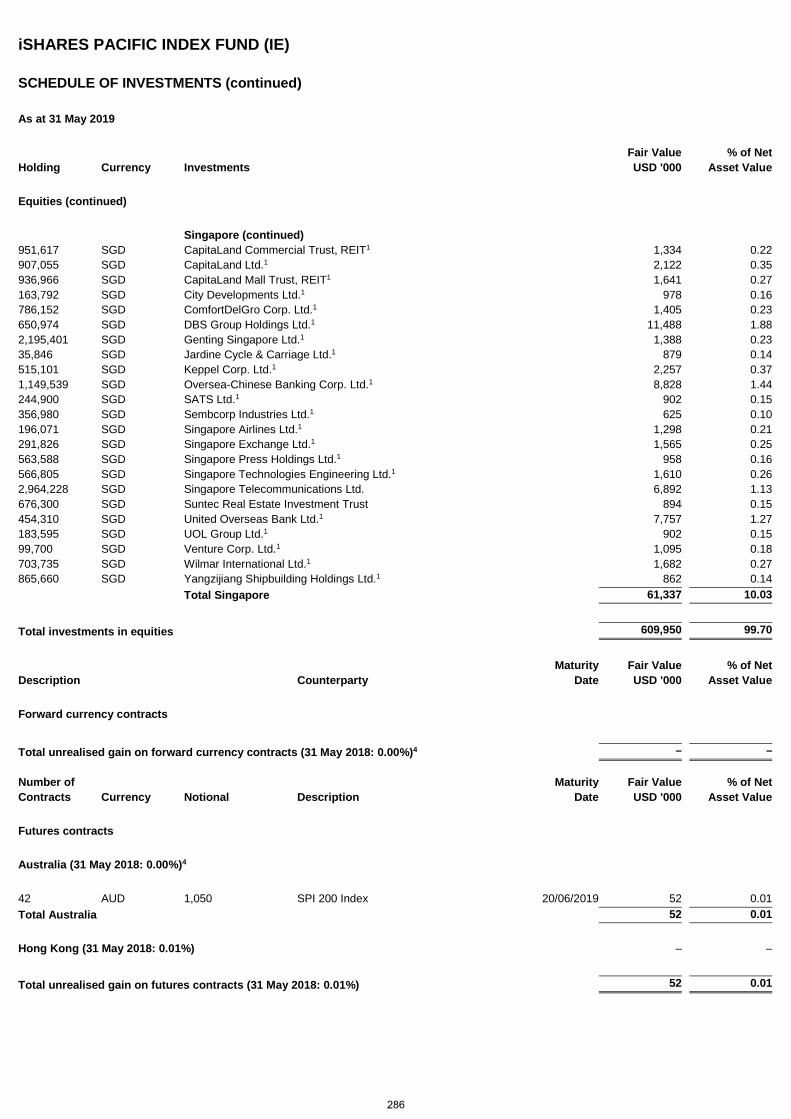
iSHARES PACIFIC INDEX FUND (IE)
SCHEDULE OF INVESTMENTS (continued)
As at 31 May 2019
Holding Currency Investments Fair Value USD '000
% of Net Asset Value
Equities (continued)
Singapore (continued) 951,617 SGD CapitaLand Commercial Trust, REIT1 1,334 0.22 907,055 SGD CapitaLand Ltd.1 2,122 0.35 936,966 SGD CapitaLand Mall Trust, REIT1 1,641 0.27 163,792 SGD City Developments Ltd.1 978 0.16 786,152 SGD ComfortDelGro Corp. Ltd.1 1,405 0.23 650,974 SGD DBS Group Holdings Ltd.1 11,488 1.88 2,195,401 SGD Genting Singapore Ltd.1 1,388 0.23 35,846 SGD Jardine Cycle & Carriage Ltd.1 879 0.14 515,101 SGD Keppel Corp. Ltd.1 2,257 0.37 1,149,539 SGD Oversea-Chinese Banking Corp. Ltd.1 8,828 1.44 244,900 SGD SATS Ltd.1 902 0.15 356,980 SGD Sembcorp Industries Ltd.1 625 0.10 196,071 SGD Singapore Airlines Ltd.1 1,298 0.21 291,826 SGD Singapore Exchange Ltd.1 1,565 0.25 563,588 SGD Singapore Press Holdings Ltd.1 958 0.16 566,805 SGD Singapore Technologies Engineering Ltd.1 1,610 0.26 2,964,228 SGD Singapore Telecommunications Ltd. 6,892 1.13 676,300 SGD Suntec Real Estate Investment Trust 894 0.15 454,310 SGD United Overseas Bank Ltd.1 7,757 1.27 183,595 SGD UOL Group Ltd.1 902 0.15 99,700 SGD Venture Corp. Ltd.1 1,095 0.18 703,735 SGD Wilmar International Ltd.1 1,682 0.27 865,660 SGD Yangzijiang Shipbuilding Holdings Ltd.1 862 0.14 Total Singapore 61,337 10.03
Total investments in equities 609,950 99.70
Maturity Fair Value % of Net Description Counterparty Date USD '000 Asset Value
Forward currency contracts
Total unrealised gain on forward currency contracts (31 May 2018: 0.00%)4 – – Number of Maturity Fair Value % of Net Contracts Currency Notional Description Date USD '000 Asset Value
Futures contracts
Australia (31 May 2018: 0.00%)4
42 AUD 1,050 SPI 200 Index 20/06/2019 52 0.01 Total Australia 52 0.01
Hong Kong (31 May 2018: 0.01%) – –
Total unrealised gain on futures contracts (31 May 2018: 0.01%) 52 0.01
286
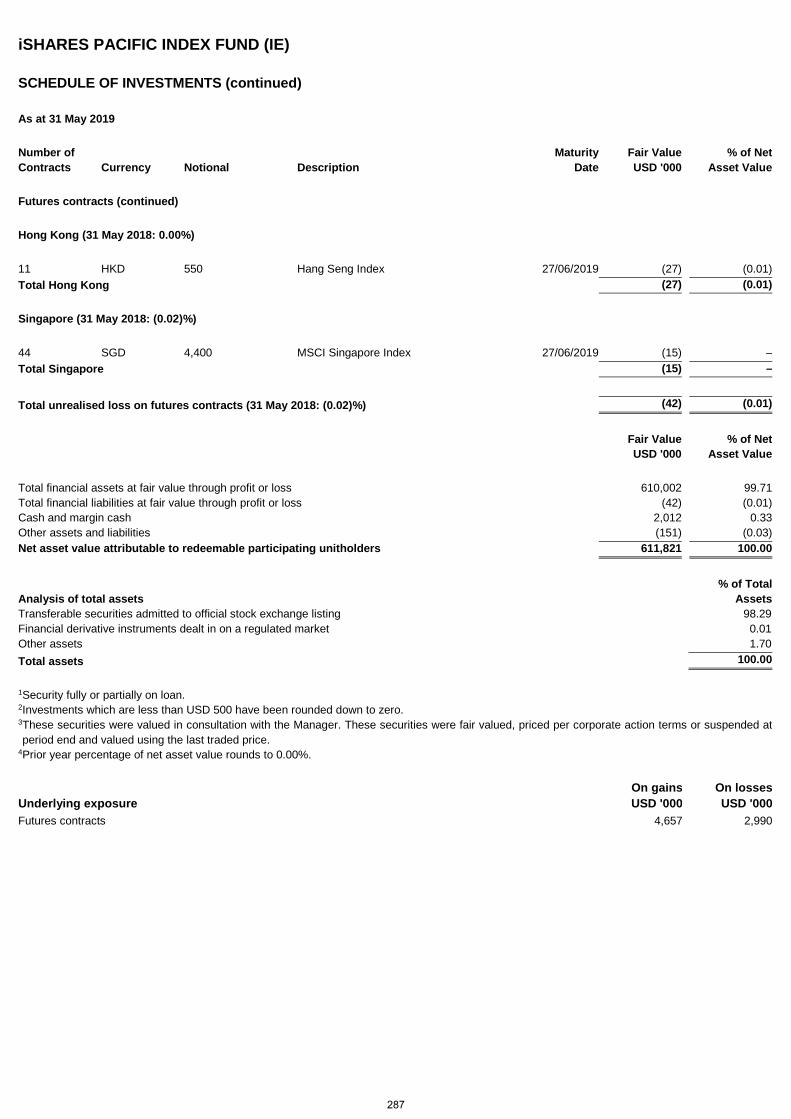
iSHARES PACIFIC INDEX FUND (IE)
SCHEDULE OF INVESTMENTS (continued)
As at 31 May 2019
Number of Maturity Fair Value % of Net Contracts Currency Notional Description Date USD '000 Asset Value
Futures contracts (continued)
Hong Kong (31 May 2018: 0.00%)
11 HKD 550 Hang Seng Index 27/06/2019 (27) (0.01) Total Hong Kong (27) (0.01)
Singapore (31 May 2018: (0.02)%)
44 SGD 4,400 MSCI Singapore Index 27/06/2019 (15) – Total Singapore (15) –
Total unrealised loss on futures contracts (31 May 2018: (0.02)%) (42) (0.01)
Fair Value USD '000
% of Net Asset Value
Total financial assets at fair value through profit or loss 610,002 99.71 Total financial liabilities at fair value through profit or loss (42) (0.01) Cash and margin cash 2,012 0.33 Other assets and liabilities (151) (0.03) Net asset value attributable to redeemable participating unitholders 611,821 100.00
Analysis of total assets % of Total
Assets Transferable securities admitted to official stock exchange listing 98.29 Financial derivative instruments dealt in on a regulated market 0.01 Other assets 1.70 Total assets 100.00
1 Security fully or partially on loan. 2 Investments which are less than USD 500 have been rounded down to zero. 3 These securities were valued in consultation with the Manager. These securities were fair valued, priced per corporate action terms or suspended at period end and valued using the last traded price.
4 Prior year percentage of net asset value rounds to 0.00%.
Underlying exposure On gains USD '000
On losses USD '000
Futures contracts 4,657 2,990
287
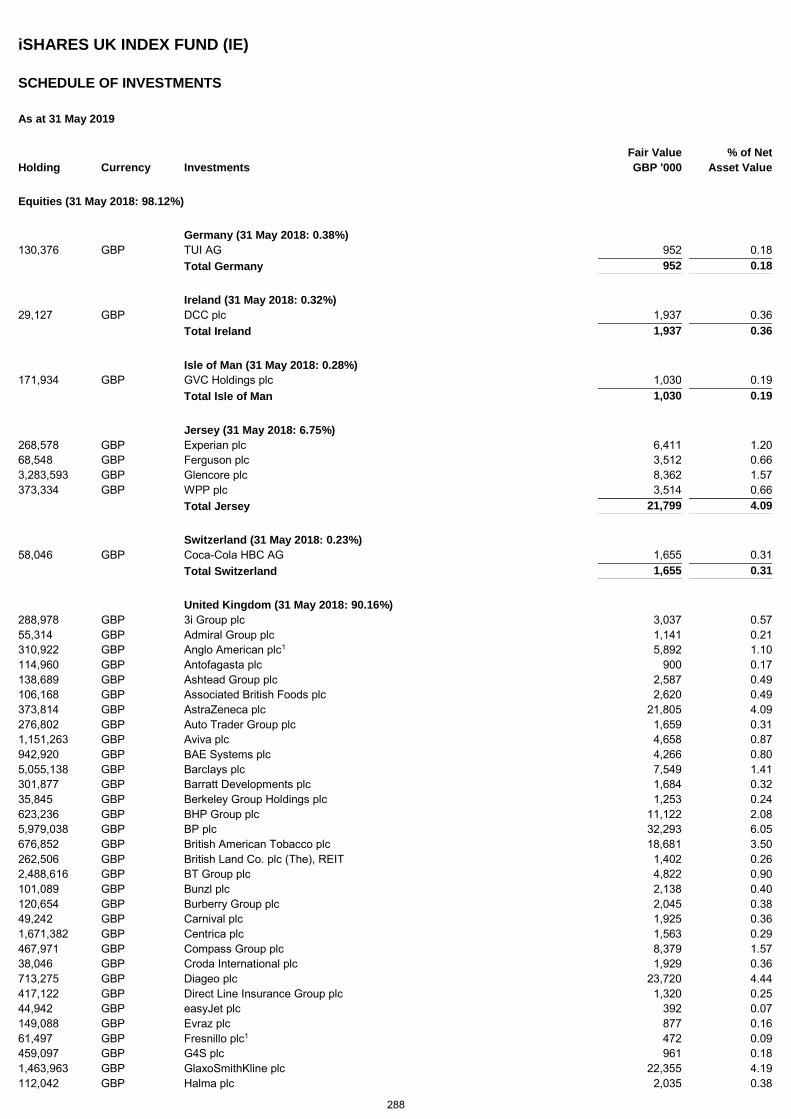
iSHARES UK INDEX FUND (IE)
SCHEDULE OF INVESTMENTS
As at 31 May 2019
Holding Currency Investments Fair Value
GBP '000 % of Net
Asset Value
Equities (31 May 2018: 98.12%)
Germany (31 May 2018: 0.38%) 130,376 GBP TUI AG 952 0.18 Total Germany 952 0.18
Ireland (31 May 2018: 0.32%) 29,127 GBP DCC plc 1,937 0.36 Total Ireland 1,937 0.36
Isle of Man (31 May 2018: 0.28%) 171,934 GBP GVC Holdings plc 1,030 0.19 Total Isle of Man 1,030 0.19
Jersey (31 May 2018: 6.75%) 268,578 GBP Experian plc 6,411 1.20 68,548 GBP Ferguson plc 3,512 0.66 3,283,593 GBP Glencore plc 8,362 1.57 373,334 GBP WPP plc 3,514 0.66 Total Jersey 21,799 4.09
Switzerland (31 May 2018: 0.23%) 58,046 GBP Coca-Cola HBC AG 1,655 0.31 Total Switzerland 1,655 0.31
United Kingdom (31 May 2018: 90.16%) 288,978 GBP 3i Group plc 3,037 0.57 55,314 GBP Admiral Group plc 1,141 0.21 310,922 GBP Anglo American plc1 5,892 1.10 114,960 GBP Antofagasta plc 900 0.17 138,689 GBP Ashtead Group plc 2,587 0.49 106,168 GBP Associated British Foods plc 2,620 0.49 373,814 GBP AstraZeneca plc 21,805 4.09 276,802 GBP Auto Trader Group plc 1,659 0.31 1,151,263 GBP Aviva plc 4,658 0.87 942,920 GBP BAE Systems plc 4,266 0.80 5,055,138 GBP Barclays plc 7,549 1.41 301,877 GBP Barratt Developments plc 1,684 0.32 35,845 GBP Berkeley Group Holdings plc 1,253 0.24 623,236 GBP BHP Group plc 11,122 2.08 5,979,038 GBP BP plc 32,293 6.05 676,852 GBP British American Tobacco plc 18,681 3.50 262,506 GBP British Land Co. plc (The), REIT 1,402 0.26 2,488,616 GBP BT Group plc 4,822 0.90 101,089 GBP Bunzl plc 2,138 0.40 120,654 GBP Burberry Group plc 2,045 0.38 49,242 GBP Carnival plc 1,925 0.36 1,671,382 GBP Centrica plc 1,563 0.29 467,971 GBP Compass Group plc 8,379 1.57 38,046 GBP Croda International plc 1,929 0.36 713,275 GBP Diageo plc 23,720 4.44 417,122 GBP Direct Line Insurance Group plc 1,320 0.25 44,942 GBP easyJet plc 392 0.07 149,088 GBP Evraz plc 877 0.16 61,497 GBP Fresnillo plc1 472 0.09 459,097 GBP G4S plc 961 0.18 1,463,963 GBP GlaxoSmithKline plc 22,355 4.19 112,042 GBP Halma plc 2,035 0.38
288
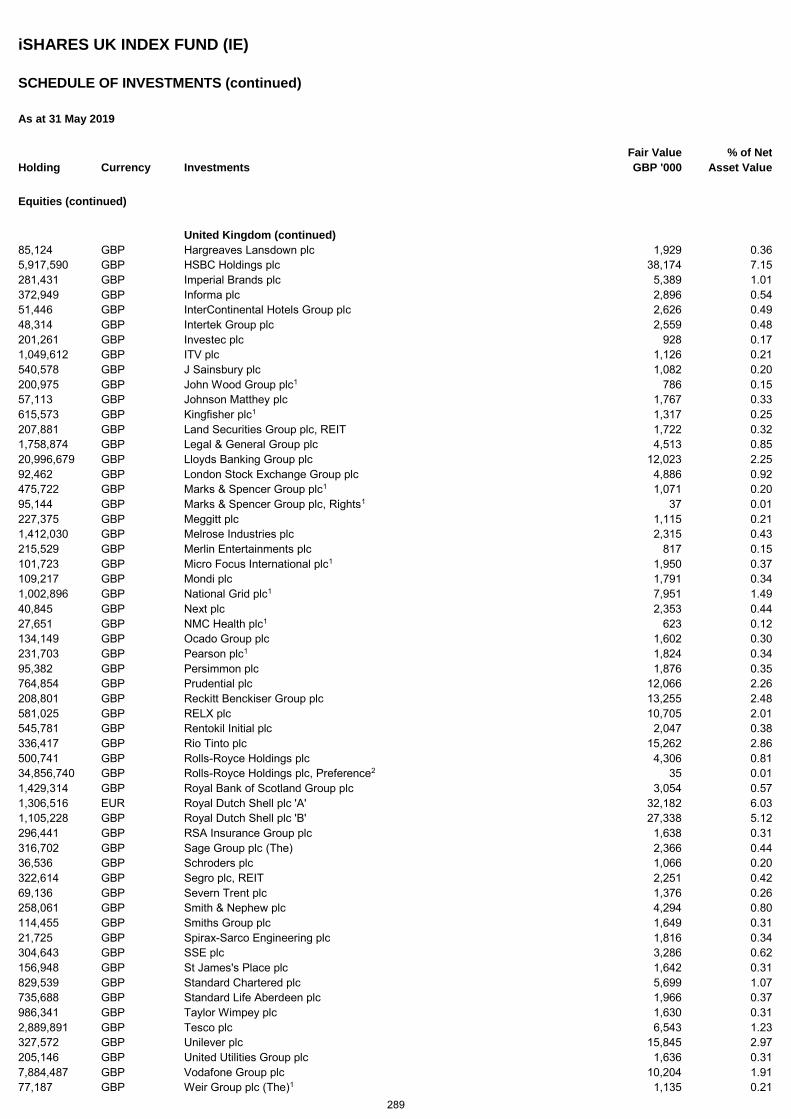
iSHARES UK INDEX FUND (IE)
SCHEDULE OF INVESTMENTS (continued)
As at 31 May 2019
Holding Currency Investments Fair Value
GBP '000 % of Net
Asset Value
Equities (continued)
United Kingdom (continued) 85,124 GBP Hargreaves Lansdown plc 1,929 0.36 5,917,590 GBP HSBC Holdings plc 38,174 7.15 281,431 GBP Imperial Brands plc 5,389 1.01 372,949 GBP Informa plc 2,896 0.54 51,446 GBP InterContinental Hotels Group plc 2,626 0.49 48,314 GBP Intertek Group plc 2,559 0.48 201,261 GBP Investec plc 928 0.17 1,049,612 GBP ITV plc 1,126 0.21 540,578 GBP J Sainsbury plc 1,082 0.20 200,975 GBP John Wood Group plc1 786 0.15 57,113 GBP Johnson Matthey plc 1,767 0.33 615,573 GBP Kingfisher plc1 1,317 0.25 207,881 GBP Land Securities Group plc, REIT 1,722 0.32 1,758,874 GBP Legal & General Group plc 4,513 0.85 20,996,679 GBP Lloyds Banking Group plc 12,023 2.25 92,462 GBP London Stock Exchange Group plc 4,886 0.92 475,722 GBP Marks & Spencer Group plc1 1,071 0.20 95,144 GBP Marks & Spencer Group plc, Rights1 37 0.01 227,375 GBP Meggitt plc 1,115 0.21 1,412,030 GBP Melrose Industries plc 2,315 0.43 215,529 GBP Merlin Entertainments plc 817 0.15 101,723 GBP Micro Focus International plc1 1,950 0.37 109,217 GBP Mondi plc 1,791 0.34 1,002,896 GBP National Grid plc1 7,951 1.49 40,845 GBP Next plc 2,353 0.44 27,651 GBP NMC Health plc1 623 0.12 134,149 GBP Ocado Group plc 1,602 0.30 231,703 GBP Pearson plc1 1,824 0.34 95,382 GBP Persimmon plc 1,876 0.35 764,854 GBP Prudential plc 12,066 2.26 208,801 GBP Reckitt Benckiser Group plc 13,255 2.48 581,025 GBP RELX plc 10,705 2.01 545,781 GBP Rentokil Initial plc 2,047 0.38 336,417 GBP Rio Tinto plc 15,262 2.86 500,741 GBP Rolls-Royce Holdings plc 4,306 0.81 34,856,740 GBP Rolls-Royce Holdings plc, Preference2 35 0.01 1,429,314 GBP Royal Bank of Scotland Group plc 3,054 0.57 1,306,516 EUR Royal Dutch Shell plc 'A' 32,182 6.03 1,105,228 GBP Royal Dutch Shell plc 'B' 27,338 5.12 296,441 GBP RSA Insurance Group plc 1,638 0.31 316,702 GBP Sage Group plc (The) 2,366 0.44 36,536 GBP Schroders plc 1,066 0.20 322,614 GBP Segro plc, REIT 2,251 0.42 69,136 GBP Severn Trent plc 1,376 0.26 258,061 GBP Smith & Nephew plc 4,294 0.80 114,455 GBP Smiths Group plc 1,649 0.31 21,725 GBP Spirax-Sarco Engineering plc 1,816 0.34 304,643 GBP SSE plc 3,286 0.62 156,948 GBP St James's Place plc 1,642 0.31 829,539 GBP Standard Chartered plc 5,699 1.07 735,688 GBP Standard Life Aberdeen plc 1,966 0.37 986,341 GBP Taylor Wimpey plc 1,630 0.31 2,889,891 GBP Tesco plc 6,543 1.23 327,572 GBP Unilever plc 15,845 2.97 205,146 GBP United Utilities Group plc 1,636 0.31 7,884,487 GBP Vodafone Group plc 10,204 1.91 77,187 GBP Weir Group plc (The)1 1,135 0.21
289
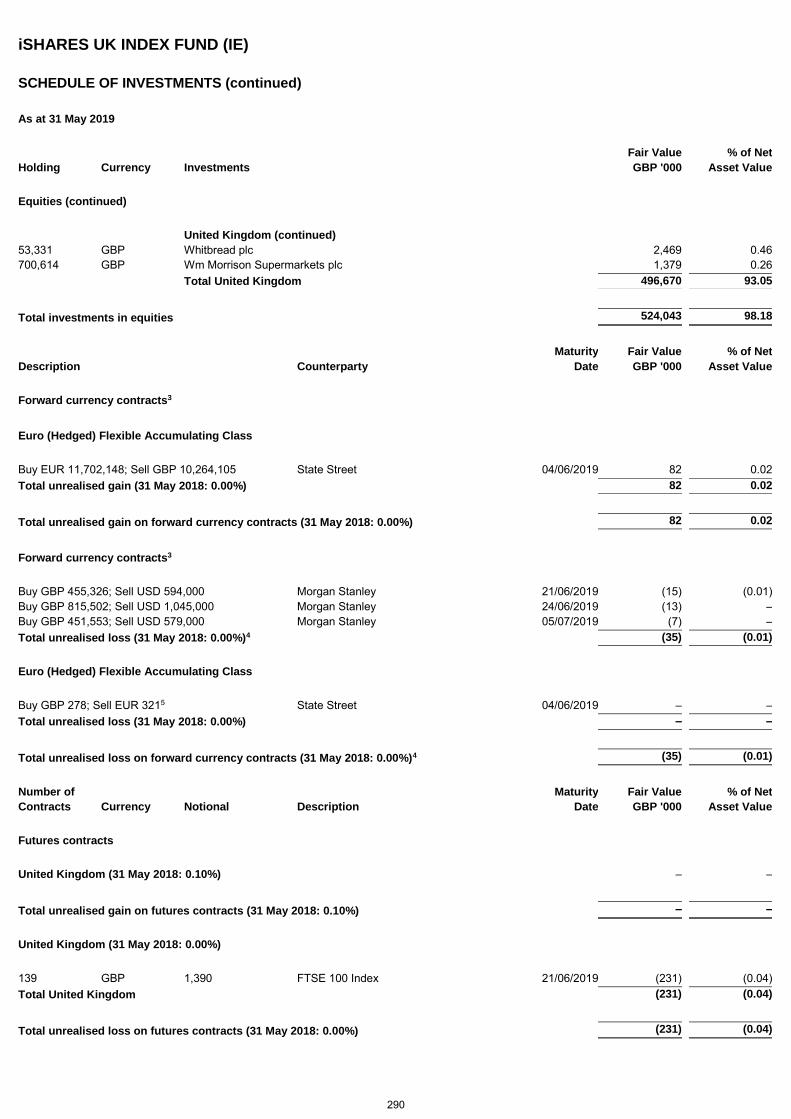
iSHARES UK INDEX FUND (IE)
SCHEDULE OF INVESTMENTS (continued)
As at 31 May 2019
Holding Currency Investments Fair Value
GBP '000 % of Net
Asset Value
Equities (continued)
United Kingdom (continued) 53,331 GBP Whitbread plc 2,469 0.46 700,614 GBP Wm Morrison Supermarkets plc 1,379 0.26 Total United Kingdom 496,670 93.05
Total investments in equities 524,043 98.18
Maturity Fair Value % of Net
Description Counterparty Date GBP '000 Asset Value
Forward currency contracts3
Euro (Hedged) Flexible Accumulating Class
Buy EUR 11,702,148; Sell GBP 10,264,105 State Street 04/06/2019 82 0.02 Total unrealised gain (31 May 2018: 0.00%) 82 0.02
Total unrealised gain on forward currency contracts (31 May 2018: 0.00%) 82 0.02
Forward currency contracts3
Buy GBP 455,326; Sell USD 594,000 Morgan Stanley 21/06/2019 (15) (0.01) Buy GBP 815,502; Sell USD 1,045,000 Morgan Stanley 24/06/2019 (13) – Buy GBP 451,553; Sell USD 579,000 Morgan Stanley 05/07/2019 (7) – Total unrealised loss (31 May 2018: 0.00%)4 (35) (0.01)
Euro (Hedged) Flexible Accumulating Class
Buy GBP 278; Sell EUR 3215 State Street 04/06/2019 – – Total unrealised loss (31 May 2018: 0.00%) – –
Total unrealised loss on forward currency contracts (31 May 2018: 0.00%)4 (35) (0.01)
Number of Maturity Fair Value % of Net
Contracts Currency Notional Description Date GBP '000 Asset Value
Futures contracts
United Kingdom (31 May 2018: 0.10%) – –
Total unrealised gain on futures contracts (31 May 2018: 0.10%) – –
United Kingdom (31 May 2018: 0.00%)
139 GBP 1,390 FTSE 100 Index 21/06/2019 (231) (0.04) Total United Kingdom (231) (0.04)
Total unrealised loss on futures contracts (31 May 2018: 0.00%) (231) (0.04)
290
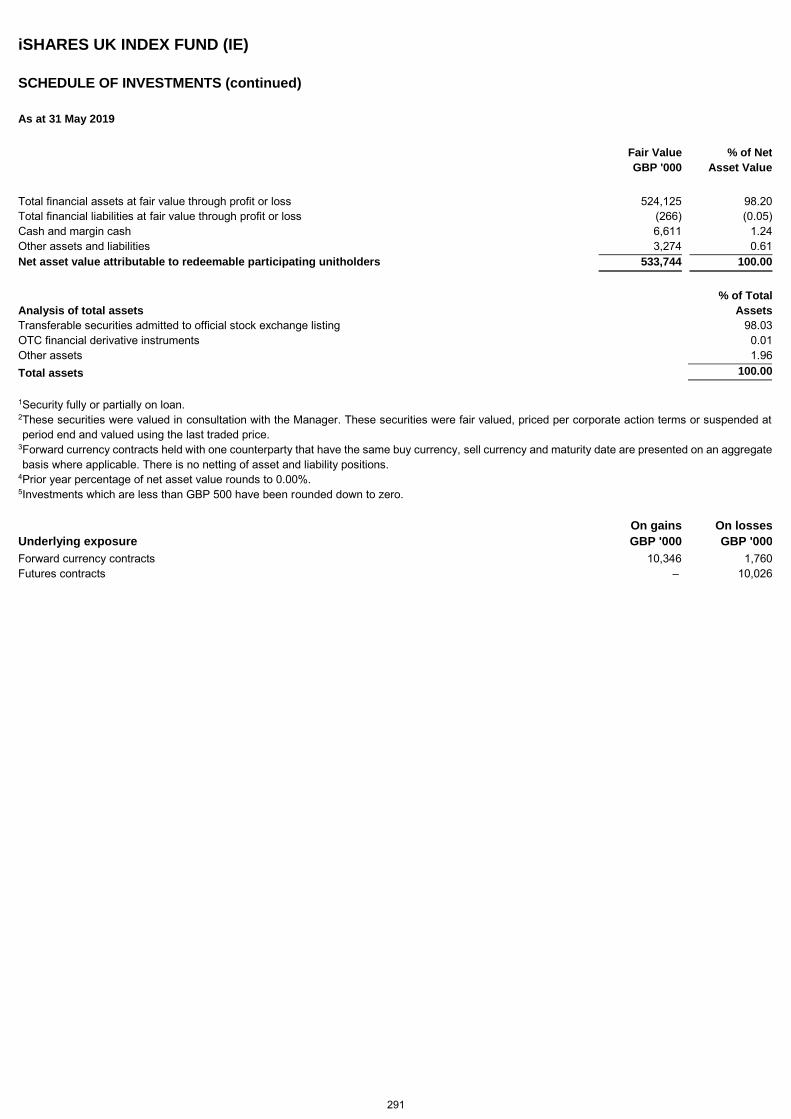
iSHARES UK INDEX FUND (IE)
SCHEDULE OF INVESTMENTS (continued)
As at 31 May 2019
Fair Value
GBP '000 % of Net
Asset Value
Total financial assets at fair value through profit or loss 524,125 98.20 Total financial liabilities at fair value through profit or loss (266) (0.05) Cash and margin cash 6,611 1.24 Other assets and liabilities 3,274 0.61 Net asset value attributable to redeemable participating unitholders 533,744 100.00
Analysis of total assets
% of Total
Assets
Transferable securities admitted to official stock exchange listing 98.03 OTC financial derivative instruments 0.01 Other assets 1.96 Total assets 100.00
1 Security fully or partially on loan. 2 These securities were valued in consultation with the Manager. These securities were fair valued, priced per corporate action terms or suspended at period end and valued using the last traded price.
3 Forward currency contracts held with one counterparty that have the same buy currency, sell currency and maturity date are presented on an aggregate basis where applicable. There is no netting of asset and liability positions.
4 Prior year percentage of net asset value rounds to 0.00%. 5 Investments which are less than GBP 500 have been rounded down to zero.
Underlying exposure
On gains
GBP '000
On losses
GBP '000
Forward currency contracts 10,346 1,760 Futures contracts – 10,026 -
291
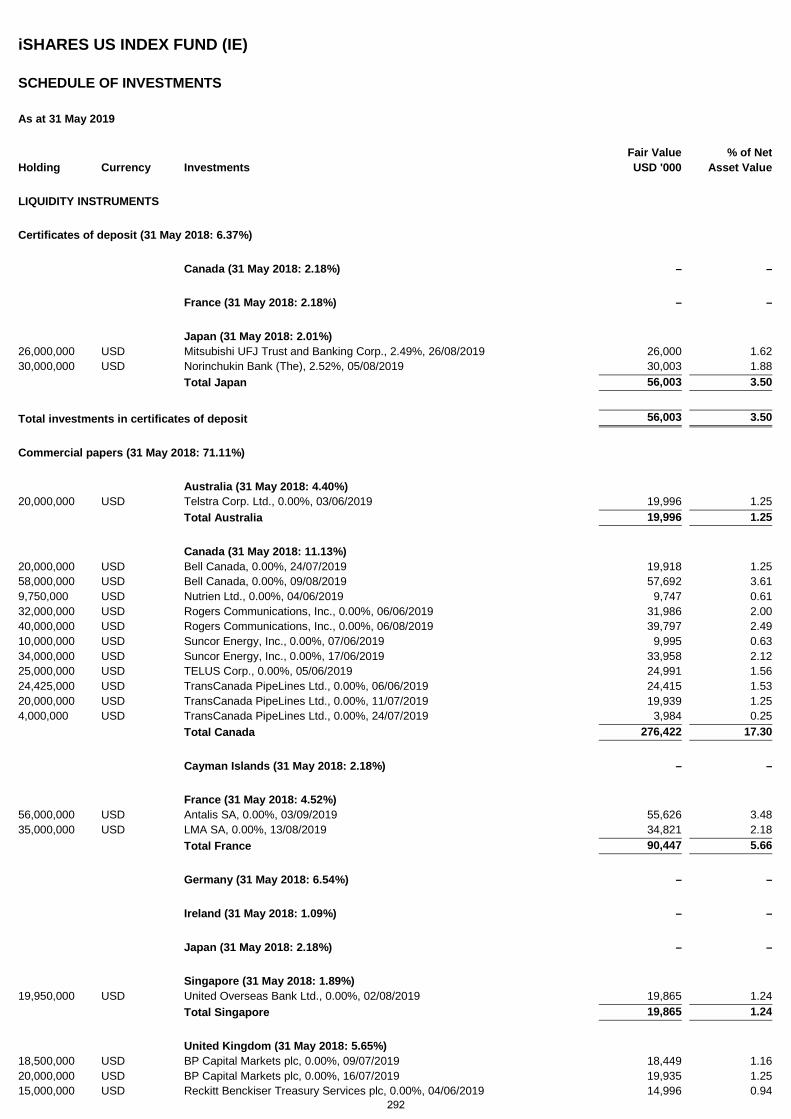
iSHARES US INDEX FUND (IE)
SCHEDULE OF INVESTMENTS
As at 31 May 2019
Holding Currency Investments Fair Value USD '000
% of Net Asset Value
LIQUIDITY INSTRUMENTS
Certificates of deposit (31 May 2018: 6.37%)
Canada (31 May 2018: 2.18%) – –
France (31 May 2018: 2.18%) – –
Japan (31 May 2018: 2.01%) 26,000,000 USD Mitsubishi UFJ Trust and Banking Corp., 2.49%, 26/08/2019 26,000 1.62 30,000,000 USD Norinchukin Bank (The), 2.52%, 05/08/2019 30,003 1.88 Total Japan 56,003 3.50
Total investments in certificates of deposit 56,003 3.50
Commercial papers (31 May 2018: 71.11%)
Australia (31 May 2018: 4.40%) 20,000,000 USD Telstra Corp. Ltd., 0.00%, 03/06/2019 19,996 1.25 Total Australia 19,996 1.25
Canada (31 May 2018: 11.13%) 20,000,000 USD Bell Canada, 0.00%, 24/07/2019 19,918 1.25 58,000,000 USD Bell Canada, 0.00%, 09/08/2019 57,692 3.61 9,750,000 USD Nutrien Ltd., 0.00%, 04/06/2019 9,747 0.61 32,000,000 USD Rogers Communications, Inc., 0.00%, 06/06/2019 31,986 2.00 40,000,000 USD Rogers Communications, Inc., 0.00%, 06/08/2019 39,797 2.49 10,000,000 USD Suncor Energy, Inc., 0.00%, 07/06/2019 9,995 0.63 34,000,000 USD Suncor Energy, Inc., 0.00%, 17/06/2019 33,958 2.12 25,000,000 USD TELUS Corp., 0.00%, 05/06/2019 24,991 1.56 24,425,000 USD TransCanada PipeLines Ltd., 0.00%, 06/06/2019 24,415 1.53 20,000,000 USD TransCanada PipeLines Ltd., 0.00%, 11/07/2019 19,939 1.25 4,000,000 USD TransCanada PipeLines Ltd., 0.00%, 24/07/2019 3,984 0.25 Total Canada 276,422 17.30
Cayman Islands (31 May 2018: 2.18%) – –
France (31 May 2018: 4.52%) 56,000,000 USD Antalis SA, 0.00%, 03/09/2019 55,626 3.48 35,000,000 USD LMA SA, 0.00%, 13/08/2019 34,821 2.18 Total France 90,447 5.66
Germany (31 May 2018: 6.54%) – –
Ireland (31 May 2018: 1.09%) – –
Japan (31 May 2018: 2.18%) – –
Singapore (31 May 2018: 1.89%) 19,950,000 USD United Overseas Bank Ltd., 0.00%, 02/08/2019 19,865 1.24 Total Singapore 19,865 1.24
United Kingdom (31 May 2018: 5.65%) 18,500,000 USD BP Capital Markets plc, 0.00%, 09/07/2019 18,449 1.16 20,000,000 USD BP Capital Markets plc, 0.00%, 16/07/2019 19,935 1.25 15,000,000 USD Reckitt Benckiser Treasury Services plc, 0.00%, 04/06/2019 14,996 0.94
292
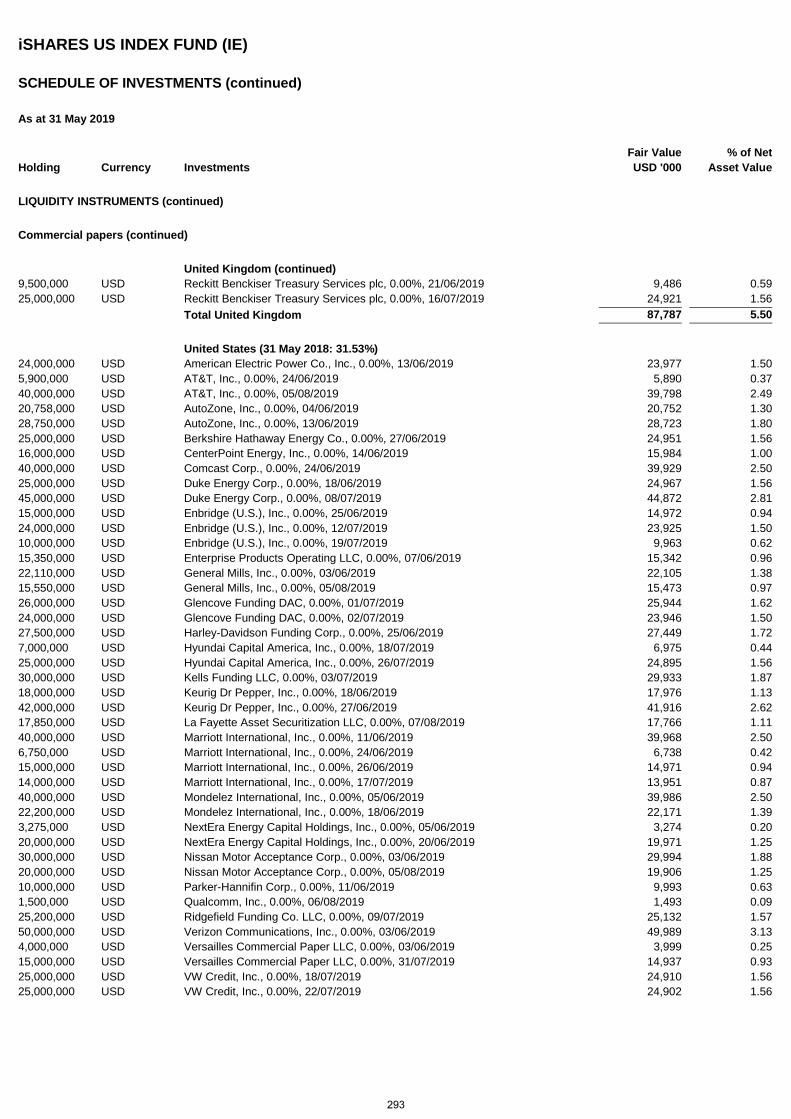
iSHARES US INDEX FUND (IE)
SCHEDULE OF INVESTMENTS (continued)
As at 31 May 2019
Holding Currency Investments Fair Value USD '000
% of Net Asset Value
LIQUIDITY INSTRUMENTS (continued)
Commercial papers (continued)
United Kingdom (continued) 9,500,000 USD Reckitt Benckiser Treasury Services plc, 0.00%, 21/06/2019 9,486 0.59 25,000,000 USD Reckitt Benckiser Treasury Services plc, 0.00%, 16/07/2019 24,921 1.56 Total United Kingdom 87,787 5.50
United States (31 May 2018: 31.53%) 24,000,000 USD American Electric Power Co., Inc., 0.00%, 13/06/2019 23,977 1.50 5,900,000 USD AT&T, Inc., 0.00%, 24/06/2019 5,890 0.37 40,000,000 USD AT&T, Inc., 0.00%, 05/08/2019 39,798 2.49 20,758,000 USD AutoZone, Inc., 0.00%, 04/06/2019 20,752 1.30 28,750,000 USD AutoZone, Inc., 0.00%, 13/06/2019 28,723 1.80 25,000,000 USD Berkshire Hathaway Energy Co., 0.00%, 27/06/2019 24,951 1.56 16,000,000 USD CenterPoint Energy, Inc., 0.00%, 14/06/2019 15,984 1.00 40,000,000 USD Comcast Corp., 0.00%, 24/06/2019 39,929 2.50 25,000,000 USD Duke Energy Corp., 0.00%, 18/06/2019 24,967 1.56 45,000,000 USD Duke Energy Corp., 0.00%, 08/07/2019 44,872 2.81 15,000,000 USD Enbridge (U.S.), Inc., 0.00%, 25/06/2019 14,972 0.94 24,000,000 USD Enbridge (U.S.), Inc., 0.00%, 12/07/2019 23,925 1.50 10,000,000 USD Enbridge (U.S.), Inc., 0.00%, 19/07/2019 9,963 0.62 15,350,000 USD Enterprise Products Operating LLC, 0.00%, 07/06/2019 15,342 0.96 22,110,000 USD General Mills, Inc., 0.00%, 03/06/2019 22,105 1.38 15,550,000 USD General Mills, Inc., 0.00%, 05/08/2019 15,473 0.97 26,000,000 USD Glencove Funding DAC, 0.00%, 01/07/2019 25,944 1.62 24,000,000 USD Glencove Funding DAC, 0.00%, 02/07/2019 23,946 1.50 27,500,000 USD Harley-Davidson Funding Corp., 0.00%, 25/06/2019 27,449 1.72 7,000,000 USD Hyundai Capital America, Inc., 0.00%, 18/07/2019 6,975 0.44 25,000,000 USD Hyundai Capital America, Inc., 0.00%, 26/07/2019 24,895 1.56 30,000,000 USD Kells Funding LLC, 0.00%, 03/07/2019 29,933 1.87 18,000,000 USD Keurig Dr Pepper, Inc., 0.00%, 18/06/2019 17,976 1.13 42,000,000 USD Keurig Dr Pepper, Inc., 0.00%, 27/06/2019 41,916 2.62 17,850,000 USD La Fayette Asset Securitization LLC, 0.00%, 07/08/2019 17,766 1.11 40,000,000 USD Marriott International, Inc., 0.00%, 11/06/2019 39,968 2.50 6,750,000 USD Marriott International, Inc., 0.00%, 24/06/2019 6,738 0.42 15,000,000 USD Marriott International, Inc., 0.00%, 26/06/2019 14,971 0.94 14,000,000 USD Marriott International, Inc., 0.00%, 17/07/2019 13,951 0.87 40,000,000 USD Mondelez International, Inc., 0.00%, 05/06/2019 39,986 2.50 22,200,000 USD Mondelez International, Inc., 0.00%, 18/06/2019 22,171 1.39 3,275,000 USD NextEra Energy Capital Holdings, Inc., 0.00%, 05/06/2019 3,274 0.20 20,000,000 USD NextEra Energy Capital Holdings, Inc., 0.00%, 20/06/2019 19,971 1.25 30,000,000 USD Nissan Motor Acceptance Corp., 0.00%, 03/06/2019 29,994 1.88 20,000,000 USD Nissan Motor Acceptance Corp., 0.00%, 05/08/2019 19,906 1.25 10,000,000 USD Parker-Hannifin Corp., 0.00%, 11/06/2019 9,993 0.63 1,500,000 USD Qualcomm, Inc., 0.00%, 06/08/2019 1,493 0.09 25,200,000 USD Ridgefield Funding Co. LLC, 0.00%, 09/07/2019 25,132 1.57 50,000,000 USD Verizon Communications, Inc., 0.00%, 03/06/2019 49,989 3.13 4,000,000 USD Versailles Commercial Paper LLC, 0.00%, 03/06/2019 3,999 0.25 15,000,000 USD Versailles Commercial Paper LLC, 0.00%, 31/07/2019 14,937 0.93 25,000,000 USD VW Credit, Inc., 0.00%, 18/07/2019 24,910 1.56 25,000,000 USD VW Credit, Inc., 0.00%, 22/07/2019 24,902 1.56
293
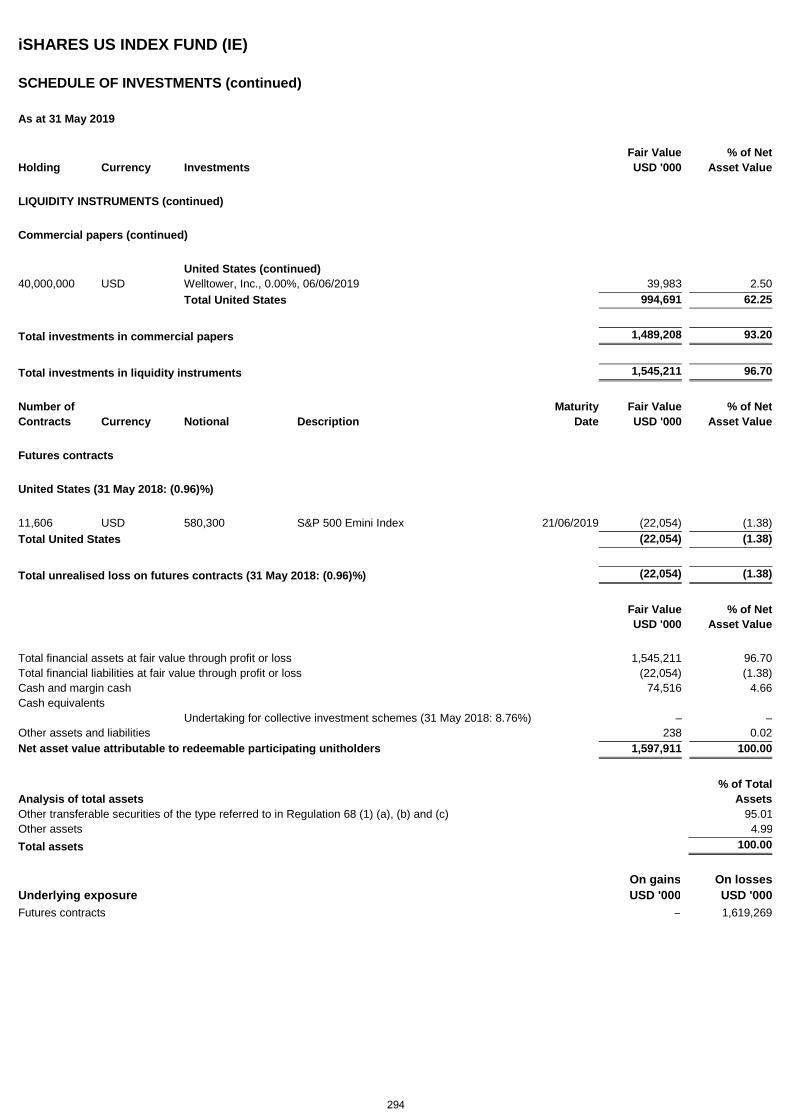
iSHARES US INDEX FUND (IE)
SCHEDULE OF INVESTMENTS (continued)
As at 31 May 2019
Holding Currency Investments Fair Value USD '000
% of Net Asset Value
LIQUIDITY INSTRUMENTS (continued)
Commercial papers (continued)
United States (continued) 40,000,000 USD Welltower, Inc., 0.00%, 06/06/2019 39,983 2.50 Total United States 994,691 62.25
Total investments in commercial papers 1,489,208 93.20
Total investments in liquidity instruments 1,545,211 96.70
Number of Maturity Fair Value % of Net Contracts Currency Notional Description Date USD '000 Asset Value
Futures contracts
United States (31 May 2018: (0.96)%)
11,606 USD 580,300 S&P 500 Emini Index 21/06/2019 (22,054) (1.38) Total United States (22,054) (1.38)
Total unrealised loss on futures contracts (31 May 2018: (0.96)%) (22,054) (1.38)
Fair Value USD '000
% of Net Asset Value
Total financial assets at fair value through profit or loss 1,545,211 96.70 Total financial liabilities at fair value through profit or loss (22,054) (1.38) Cash and margin cash 74,516 4.66 Cash equivalents Undertaking for collective investment schemes (31 May 2018: 8.76%) – – Other assets and liabilities 238 0.02 Net asset value attributable to redeemable participating unitholders 1,597,911 100.00
Analysis of total assets % of Total
Assets Other transferable securities of the type referred to in Regulation 68 (1) (a), (b) and (c) 95.01 Other assets 4.99 Total assets 100.00
Underlying exposure On gains USD '000
On losses USD '000
Futures contracts – 1,619,269
294
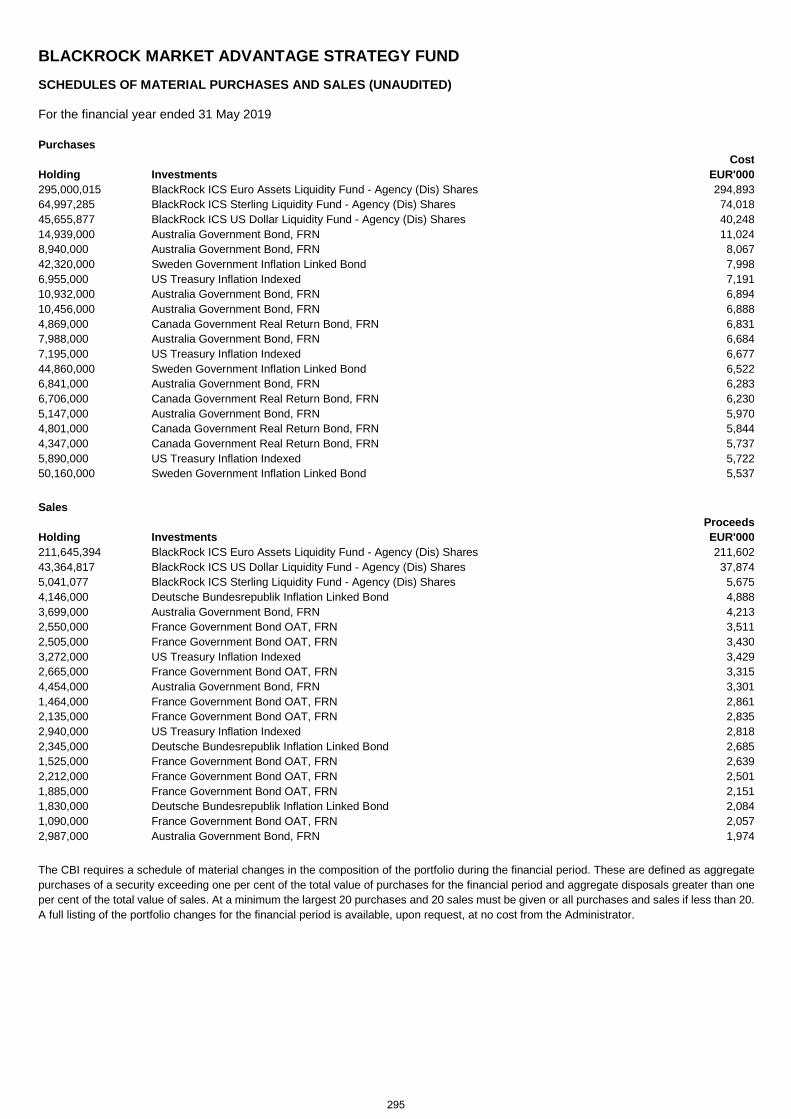
BLACKROCK MARKET ADVANTAGE STRATEGY FUND SCHEDULES OF MATERIAL PURCHASES AND SALES (UNAUDITED)
For the financial year ended 31 May 2019
Purchases Cost Holding Investments EUR'000 295,000,015 BlackRock ICS Euro Assets Liquidity Fund - Agency (Dis) Shares 294,893 64,997,285 BlackRock ICS Sterling Liquidity Fund - Agency (Dis) Shares 74,018 45,655,877 BlackRock ICS US Dollar Liquidity Fund - Agency (Dis) Shares 40,248 14,939,000 Australia Government Bond, FRN 11,024 8,940,000 Australia Government Bond, FRN 8,067 42,320,000 Sweden Government Inflation Linked Bond 7,998 6,955,000 US Treasury Inflation Indexed 7,191 10,932,000 Australia Government Bond, FRN 6,894 10,456,000 Australia Government Bond, FRN 6,888 4,869,000 Canada Government Real Return Bond, FRN 6,831 7,988,000 Australia Government Bond, FRN 6,684 7,195,000 US Treasury Inflation Indexed 6,677 44,860,000 Sweden Government Inflation Linked Bond 6,522 6,841,000 Australia Government Bond, FRN 6,283 6,706,000 Canada Government Real Return Bond, FRN 6,230 5,147,000 Australia Government Bond, FRN 5,970 4,801,000 Canada Government Real Return Bond, FRN 5,844 4,347,000 Canada Government Real Return Bond, FRN 5,737 5,890,000 US Treasury Inflation Indexed 5,722 50,160,000 Sweden Government Inflation Linked Bond 5,537
Sales Proceeds Holding Investments EUR'000 211,645,394 BlackRock ICS Euro Assets Liquidity Fund - Agency (Dis) Shares 211,602 43,364,817 BlackRock ICS US Dollar Liquidity Fund - Agency (Dis) Shares 37,874 5,041,077 BlackRock ICS Sterling Liquidity Fund - Agency (Dis) Shares 5,675 4,146,000 Deutsche Bundesrepublik Inflation Linked Bond 4,888 3,699,000 Australia Government Bond, FRN 4,213 2,550,000 France Government Bond OAT, FRN 3,511 2,505,000 France Government Bond OAT, FRN 3,430 3,272,000 US Treasury Inflation Indexed 3,429 2,665,000 France Government Bond OAT, FRN 3,315 4,454,000 Australia Government Bond, FRN 3,301 1,464,000 France Government Bond OAT, FRN 2,861 2,135,000 France Government Bond OAT, FRN 2,835 2,940,000 US Treasury Inflation Indexed 2,818 2,345,000 Deutsche Bundesrepublik Inflation Linked Bond 2,685 1,525,000 France Government Bond OAT, FRN 2,639 2,212,000 France Government Bond OAT, FRN 2,501 1,885,000 France Government Bond OAT, FRN 2,151 1,830,000 Deutsche Bundesrepublik Inflation Linked Bond 2,084 1,090,000 France Government Bond OAT, FRN 2,057 2,987,000 Australia Government Bond, FRN 1,974
The CBI requires a schedule of material changes in the composition of the portfolio during the financial period. These are defined as aggregate purchases of a security exceeding one per cent of the total value of purchases for the financial period and aggregate disposals greater than one per cent of the total value of sales. At a minimum the largest 20 purchases and 20 sales must be given or all purchases and sales if less than 20. A full listing of the portfolio changes for the financial period is available, upon request, at no cost from the Administrator.
295
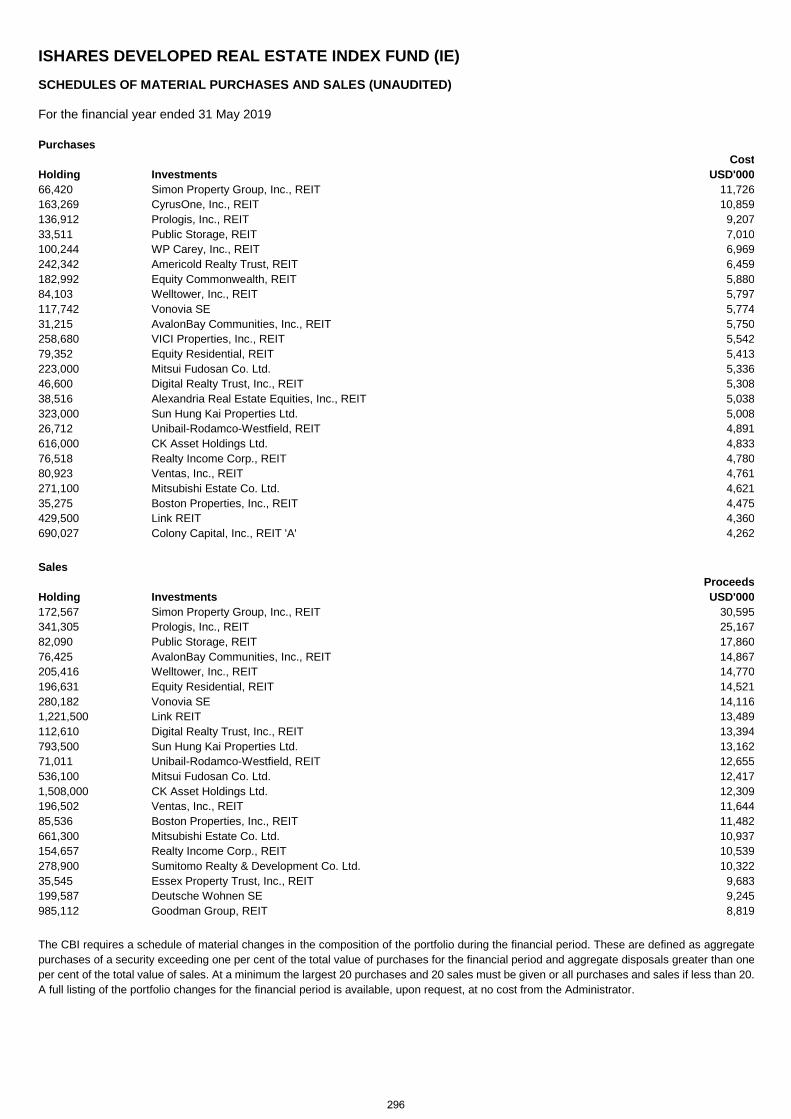
ISHARES DEVELOPED REAL ESTATE INDEX FUND (IE) SCHEDULES OF MATERIAL PURCHASES AND SALES (UNAUDITED)
For the financial year ended 31 May 2019
Purchases Cost Holding Investments USD'000 66,420 Simon Property Group, Inc., REIT 11,726 163,269 CyrusOne, Inc., REIT 10,859 136,912 Prologis, Inc., REIT 9,207 33,511 Public Storage, REIT 7,010 100,244 WP Carey, Inc., REIT 6,969 242,342 Americold Realty Trust, REIT 6,459 182,992 Equity Commonwealth, REIT 5,880 84,103 Welltower, Inc., REIT 5,797 117,742 Vonovia SE 5,774 31,215 AvalonBay Communities, Inc., REIT 5,750 258,680 VICI Properties, Inc., REIT 5,542 79,352 Equity Residential, REIT 5,413 223,000 Mitsui Fudosan Co. Ltd. 5,336 46,600 Digital Realty Trust, Inc., REIT 5,308 38,516 Alexandria Real Estate Equities, Inc., REIT 5,038 323,000 Sun Hung Kai Properties Ltd. 5,008 26,712 Unibail-Rodamco-Westfield, REIT 4,891 616,000 CK Asset Holdings Ltd. 4,833 76,518 Realty Income Corp., REIT 4,780 80,923 Ventas, Inc., REIT 4,761 271,100 Mitsubishi Estate Co. Ltd. 4,621 35,275 Boston Properties, Inc., REIT 4,475 429,500 Link REIT 4,360 690,027 Colony Capital, Inc., REIT 'A' 4,262
Sales Proceeds Holding Investments USD'000 172,567 Simon Property Group, Inc., REIT 30,595 341,305 Prologis, Inc., REIT 25,167 82,090 Public Storage, REIT 17,860 76,425 AvalonBay Communities, Inc., REIT 14,867 205,416 Welltower, Inc., REIT 14,770 196,631 Equity Residential, REIT 14,521 280,182 Vonovia SE 14,116 1,221,500 Link REIT 13,489 112,610 Digital Realty Trust, Inc., REIT 13,394 793,500 Sun Hung Kai Properties Ltd. 13,162 71,011 Unibail-Rodamco-Westfield, REIT 12,655 536,100 Mitsui Fudosan Co. Ltd. 12,417 1,508,000 CK Asset Holdings Ltd. 12,309 196,502 Ventas, Inc., REIT 11,644 85,536 Boston Properties, Inc., REIT 11,482 661,300 Mitsubishi Estate Co. Ltd. 10,937 154,657 Realty Income Corp., REIT 10,539 278,900 Sumitomo Realty & Development Co. Ltd. 10,322 35,545 Essex Property Trust, Inc., REIT 9,683 199,587 Deutsche Wohnen SE 9,245 985,112 Goodman Group, REIT 8,819
The CBI requires a schedule of material changes in the composition of the portfolio during the financial period. These are defined as aggregate purchases of a security exceeding one per cent of the total value of purchases for the financial period and aggregate disposals greater than one per cent of the total value of sales. At a minimum the largest 20 purchases and 20 sales must be given or all purchases and sales if less than 20. A full listing of the portfolio changes for the financial period is available, upon request, at no cost from the Administrator.
296
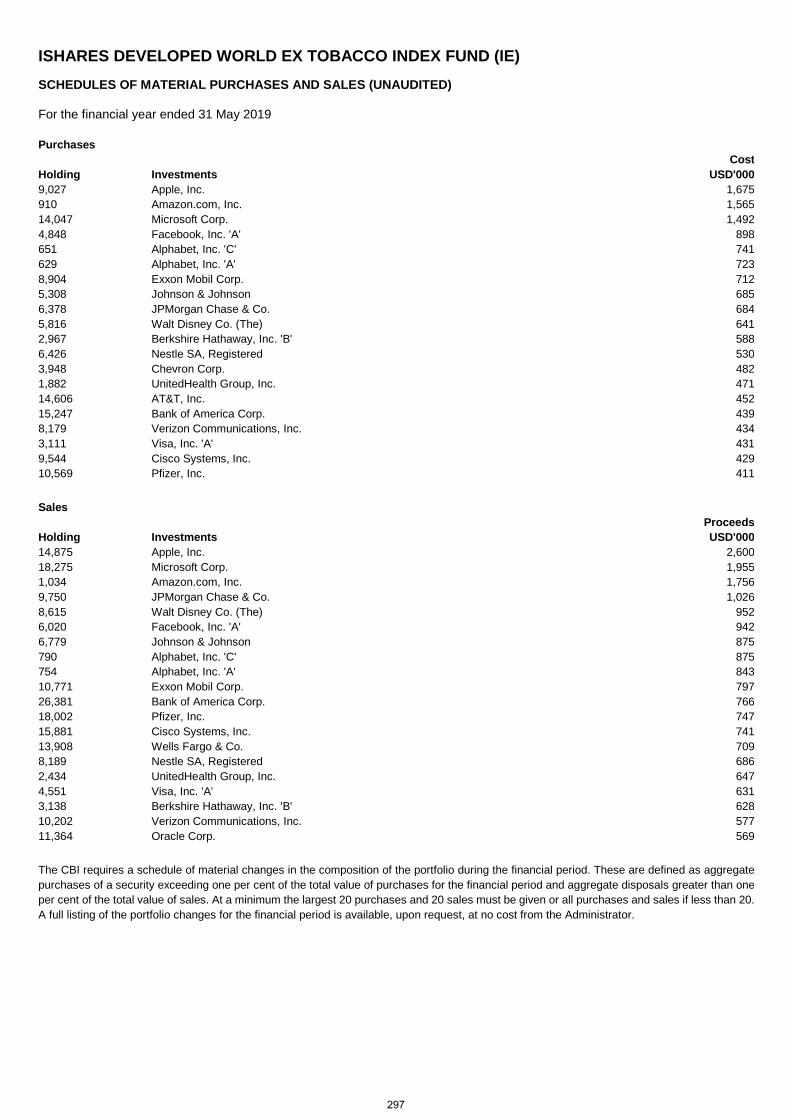
ISHARES DEVELOPED WORLD EX TOBACCO INDEX FUND (IE) SCHEDULES OF MATERIAL PURCHASES AND SALES (UNAUDITED)
For the financial year ended 31 May 2019
Purchases Cost Holding Investments USD'000 9,027 Apple, Inc. 1,675 910 Amazon.com, Inc. 1,565 14,047 Microsoft Corp. 1,492 4,848 Facebook, Inc. 'A' 898 651 Alphabet, Inc. 'C' 741 629 Alphabet, Inc. 'A' 723 8,904 Exxon Mobil Corp. 712 5,308 Johnson & Johnson 685 6,378 JPMorgan Chase & Co. 684 5,816 Walt Disney Co. (The) 641 2,967 Berkshire Hathaway, Inc. 'B' 588 6,426 Nestle SA, Registered 530 3,948 Chevron Corp. 482 1,882 UnitedHealth Group, Inc. 471 14,606 AT&T, Inc. 452 15,247 Bank of America Corp. 439 8,179 Verizon Communications, Inc. 434 3,111 Visa, Inc. 'A' 431 9,544 Cisco Systems, Inc. 429 10,569 Pfizer, Inc. 411
Sales Proceeds Holding Investments USD'000 14,875 Apple, Inc. 2,600 18,275 Microsoft Corp. 1,955 1,034 Amazon.com, Inc. 1,756 9,750 JPMorgan Chase & Co. 1,026 8,615 Walt Disney Co. (The) 952 6,020 Facebook, Inc. 'A' 942 6,779 Johnson & Johnson 875 790 Alphabet, Inc. 'C' 875 754 Alphabet, Inc. 'A' 843 10,771 Exxon Mobil Corp. 797 26,381 Bank of America Corp. 766 18,002 Pfizer, Inc. 747 15,881 Cisco Systems, Inc. 741 13,908 Wells Fargo & Co. 709 8,189 Nestle SA, Registered 686 2,434 UnitedHealth Group, Inc. 647 4,551 Visa, Inc. 'A' 631 3,138 Berkshire Hathaway, Inc. 'B' 628 10,202 Verizon Communications, Inc. 577 11,364 Oracle Corp. 569
The CBI requires a schedule of material changes in the composition of the portfolio during the financial period. These are defined as aggregate purchases of a security exceeding one per cent of the total value of purchases for the financial period and aggregate disposals greater than one per cent of the total value of sales. At a minimum the largest 20 purchases and 20 sales must be given or all purchases and sales if less than 20. A full listing of the portfolio changes for the financial period is available, upon request, at no cost from the Administrator.
297
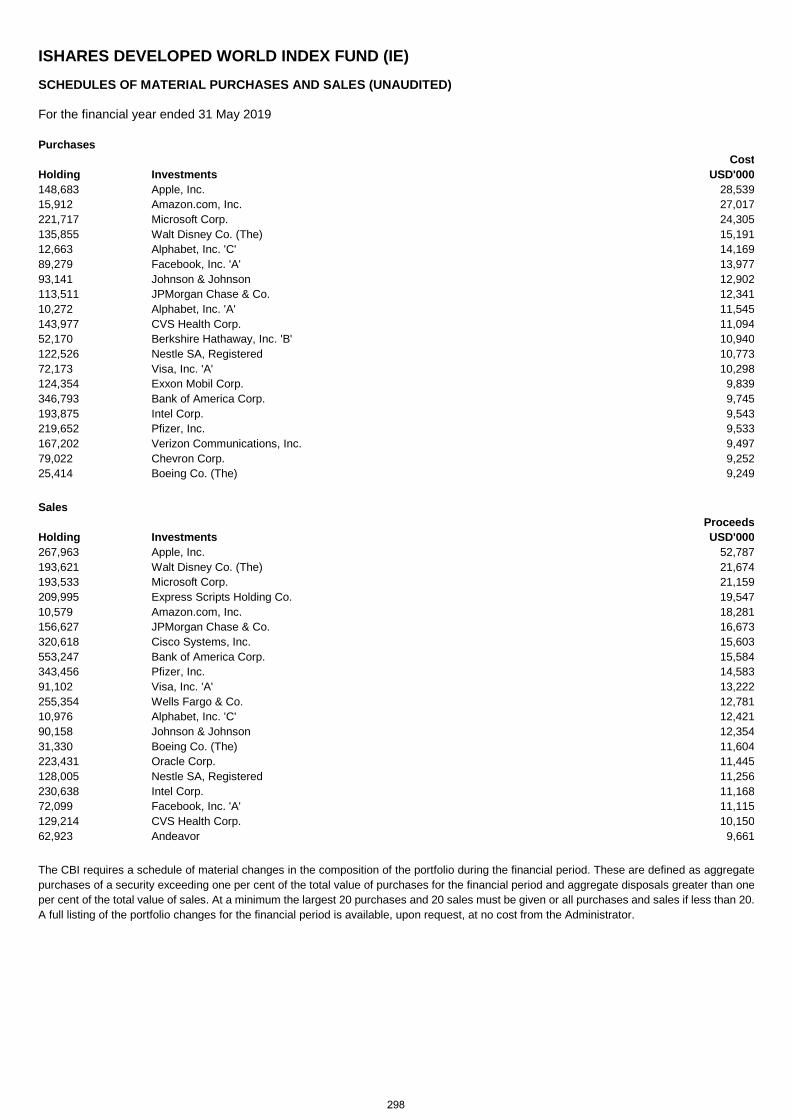
ISHARES DEVELOPED WORLD INDEX FUND (IE) SCHEDULES OF MATERIAL PURCHASES AND SALES (UNAUDITED)
For the financial year ended 31 May 2019
Purchases Cost Holding Investments USD'000 148,683 Apple, Inc. 28,539 15,912 Amazon.com, Inc. 27,017 221,717 Microsoft Corp. 24,305 135,855 Walt Disney Co. (The) 15,191 12,663 Alphabet, Inc. 'C' 14,169 89,279 Facebook, Inc. 'A' 13,977 93,141 Johnson & Johnson 12,902 113,511 JPMorgan Chase & Co. 12,341 10,272 Alphabet, Inc. 'A' 11,545 143,977 CVS Health Corp. 11,094 52,170 Berkshire Hathaway, Inc. 'B' 10,940 122,526 Nestle SA, Registered 10,773 72,173 Visa, Inc. 'A' 10,298 124,354 Exxon Mobil Corp. 9,839 346,793 Bank of America Corp. 9,745 193,875 Intel Corp. 9,543 219,652 Pfizer, Inc. 9,533 167,202 Verizon Communications, Inc. 9,497 79,022 Chevron Corp. 9,252 25,414 Boeing Co. (The) 9,249
Sales Proceeds Holding Investments USD'000 267,963 Apple, Inc. 52,787 193,621 Walt Disney Co. (The) 21,674 193,533 Microsoft Corp. 21,159 209,995 Express Scripts Holding Co. 19,547 10,579 Amazon.com, Inc. 18,281 156,627 JPMorgan Chase & Co. 16,673 320,618 Cisco Systems, Inc. 15,603 553,247 Bank of America Corp. 15,584 343,456 Pfizer, Inc. 14,583 91,102 Visa, Inc. 'A' 13,222 255,354 Wells Fargo & Co. 12,781 10,976 Alphabet, Inc. 'C' 12,421 90,158 Johnson & Johnson 12,354 31,330 Boeing Co. (The) 11,604 223,431 Oracle Corp. 11,445 128,005 Nestle SA, Registered 11,256 230,638 Intel Corp. 11,168 72,099 Facebook, Inc. 'A' 11,115 129,214 CVS Health Corp. 10,150 62,923 Andeavor 9,661
The CBI requires a schedule of material changes in the composition of the portfolio during the financial period. These are defined as aggregate purchases of a security exceeding one per cent of the total value of purchases for the financial period and aggregate disposals greater than one per cent of the total value of sales. At a minimum the largest 20 purchases and 20 sales must be given or all purchases and sales if less than 20. A full listing of the portfolio changes for the financial period is available, upon request, at no cost from the Administrator.
298
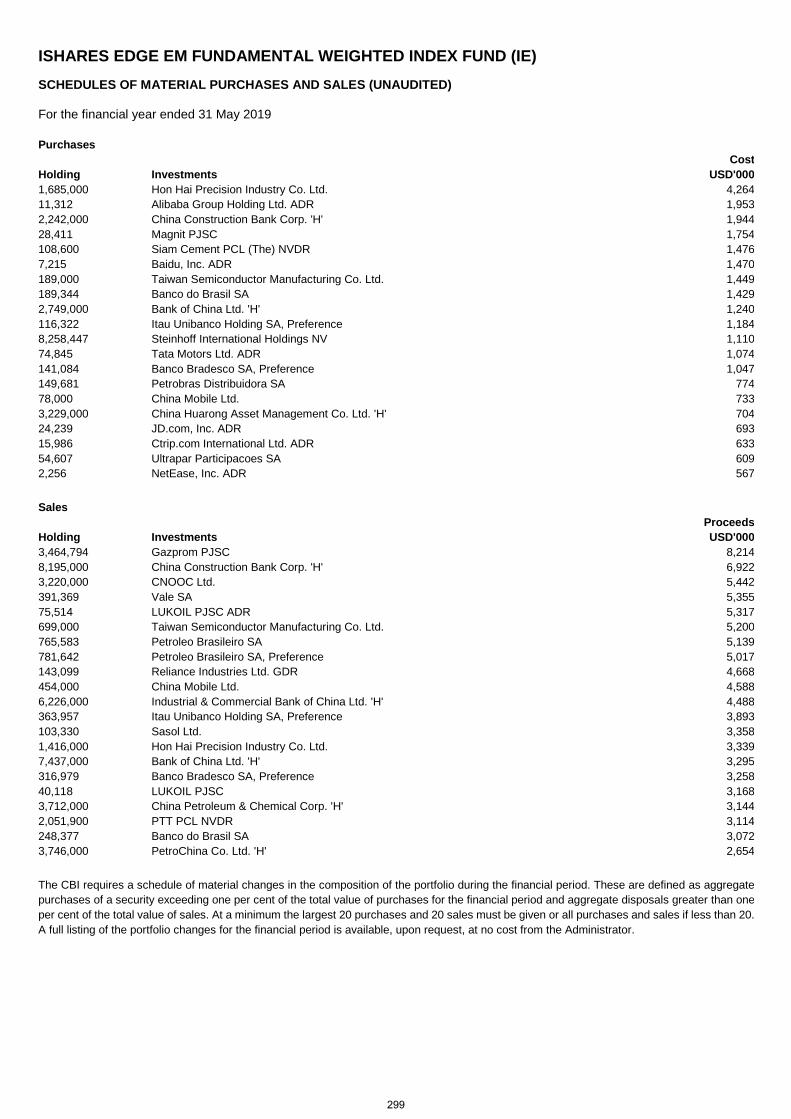
ISHARES EDGE EM FUNDAMENTAL WEIGHTED INDEX FUND (IE) SCHEDULES OF MATERIAL PURCHASES AND SALES (UNAUDITED)
For the financial year ended 31 May 2019
Purchases Cost Holding Investments USD'000 1,685,000 Hon Hai Precision Industry Co. Ltd. 4,264 11,312 Alibaba Group Holding Ltd. ADR 1,953 2,242,000 China Construction Bank Corp. 'H' 1,944 28,411 Magnit PJSC 1,754 108,600 Siam Cement PCL (The) NVDR 1,476 7,215 Baidu, Inc. ADR 1,470 189,000 Taiwan Semiconductor Manufacturing Co. Ltd. 1,449 189,344 Banco do Brasil SA 1,429 2,749,000 Bank of China Ltd. 'H' 1,240 116,322 Itau Unibanco Holding SA, Preference 1,184 8,258,447 Steinhoff International Holdings NV 1,110 74,845 Tata Motors Ltd. ADR 1,074 141,084 Banco Bradesco SA, Preference 1,047 149,681 Petrobras Distribuidora SA 774 78,000 China Mobile Ltd. 733 3,229,000 China Huarong Asset Management Co. Ltd. 'H' 704 24,239 JD.com, Inc. ADR 693 15,986 Ctrip.com International Ltd. ADR 633 54,607 Ultrapar Participacoes SA 609 2,256 NetEase, Inc. ADR 567
Sales Proceeds Holding Investments USD'000 3,464,794 Gazprom PJSC 8,214 8,195,000 China Construction Bank Corp. 'H' 6,922 3,220,000 CNOOC Ltd. 5,442 391,369 Vale SA 5,355 75,514 LUKOIL PJSC ADR 5,317 699,000 Taiwan Semiconductor Manufacturing Co. Ltd. 5,200 765,583 Petroleo Brasileiro SA 5,139 781,642 Petroleo Brasileiro SA, Preference 5,017 143,099 Reliance Industries Ltd. GDR 4,668 454,000 China Mobile Ltd. 4,588 6,226,000 Industrial & Commercial Bank of China Ltd. 'H' 4,488 363,957 Itau Unibanco Holding SA, Preference 3,893 103,330 Sasol Ltd. 3,358 1,416,000 Hon Hai Precision Industry Co. Ltd. 3,339 7,437,000 Bank of China Ltd. 'H' 3,295 316,979 Banco Bradesco SA, Preference 3,258 40,118 LUKOIL PJSC 3,168 3,712,000 China Petroleum & Chemical Corp. 'H' 3,144 2,051,900 PTT PCL NVDR 3,114 248,377 Banco do Brasil SA 3,072 3,746,000 PetroChina Co. Ltd. 'H' 2,654
The CBI requires a schedule of material changes in the composition of the portfolio during the financial period. These are defined as aggregate purchases of a security exceeding one per cent of the total value of purchases for the financial period and aggregate disposals greater than one per cent of the total value of sales. At a minimum the largest 20 purchases and 20 sales must be given or all purchases and sales if less than 20. A full listing of the portfolio changes for the financial period is available, upon request, at no cost from the Administrator.
299
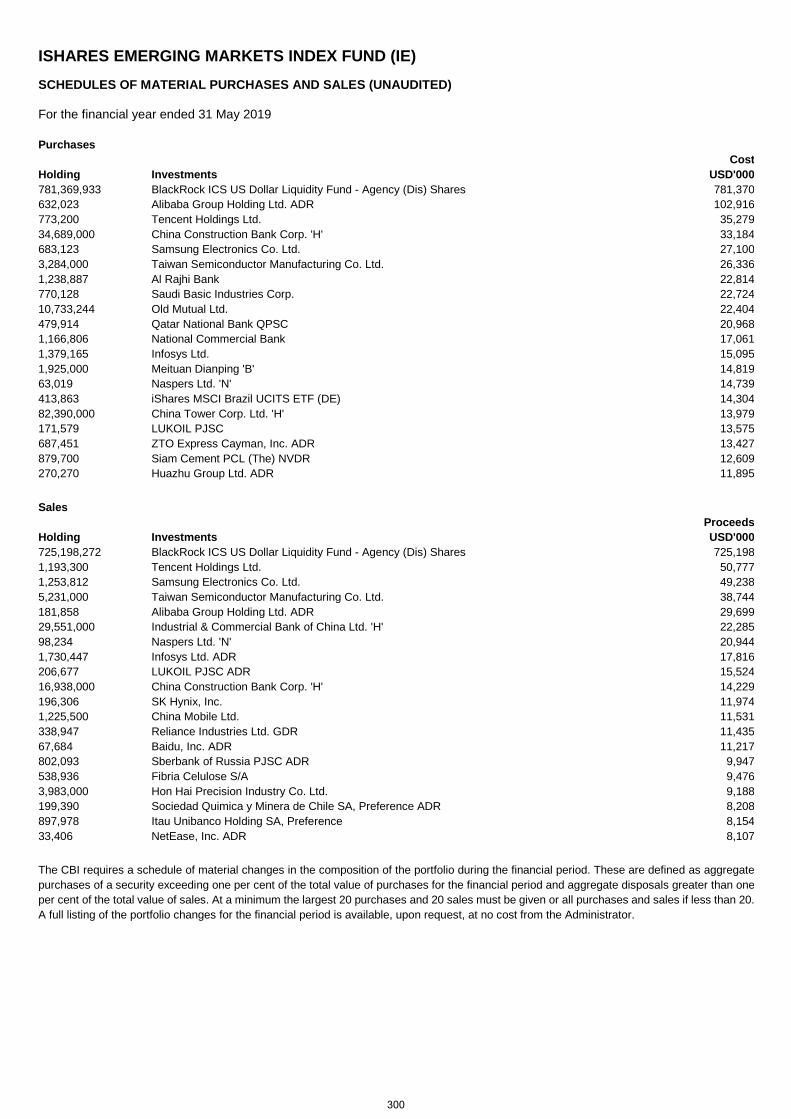
ISHARES EMERGING MARKETS INDEX FUND (IE) SCHEDULES OF MATERIAL PURCHASES AND SALES (UNAUDITED)
For the financial year ended 31 May 2019
Purchases Cost Holding Investments USD'000 781,369,933 BlackRock ICS US Dollar Liquidity Fund - Agency (Dis) Shares 781,370 632,023 Alibaba Group Holding Ltd. ADR 102,916 773,200 Tencent Holdings Ltd. 35,279 34,689,000 China Construction Bank Corp. 'H' 33,184 683,123 Samsung Electronics Co. Ltd. 27,100 3,284,000 Taiwan Semiconductor Manufacturing Co. Ltd. 26,336 1,238,887 Al Rajhi Bank 22,814 770,128 Saudi Basic Industries Corp. 22,724 10,733,244 Old Mutual Ltd. 22,404 479,914 Qatar National Bank QPSC 20,968 1,166,806 National Commercial Bank 17,061 1,379,165 Infosys Ltd. 15,095 1,925,000 Meituan Dianping 'B' 14,819 63,019 Naspers Ltd. 'N' 14,739 413,863 iShares MSCI Brazil UCITS ETF (DE) 14,304 82,390,000 China Tower Corp. Ltd. 'H' 13,979 171,579 LUKOIL PJSC 13,575 687,451 ZTO Express Cayman, Inc. ADR 13,427 879,700 Siam Cement PCL (The) NVDR 12,609 270,270 Huazhu Group Ltd. ADR 11,895
Sales Proceeds Holding Investments USD'000 725,198,272 BlackRock ICS US Dollar Liquidity Fund - Agency (Dis) Shares 725,198 1,193,300 Tencent Holdings Ltd. 50,777 1,253,812 Samsung Electronics Co. Ltd. 49,238 5,231,000 Taiwan Semiconductor Manufacturing Co. Ltd. 38,744 181,858 Alibaba Group Holding Ltd. ADR 29,699 29,551,000 Industrial & Commercial Bank of China Ltd. 'H' 22,285 98,234 Naspers Ltd. 'N' 20,944 1,730,447 Infosys Ltd. ADR 17,816 206,677 LUKOIL PJSC ADR 15,524 16,938,000 China Construction Bank Corp. 'H' 14,229 196,306 SK Hynix, Inc. 11,974 1,225,500 China Mobile Ltd. 11,531 338,947 Reliance Industries Ltd. GDR 11,435 67,684 Baidu, Inc. ADR 11,217 802,093 Sberbank of Russia PJSC ADR 9,947 538,936 Fibria Celulose S/A 9,476 3,983,000 Hon Hai Precision Industry Co. Ltd. 9,188 199,390 Sociedad Quimica y Minera de Chile SA, Preference ADR 8,208 897,978 Itau Unibanco Holding SA, Preference 8,154 33,406 NetEase, Inc. ADR 8,107
The CBI requires a schedule of material changes in the composition of the portfolio during the financial period. These are defined as aggregate purchases of a security exceeding one per cent of the total value of purchases for the financial period and aggregate disposals greater than one per cent of the total value of sales. At a minimum the largest 20 purchases and 20 sales must be given or all purchases and sales if less than 20. A full listing of the portfolio changes for the financial period is available, upon request, at no cost from the Administrator.
300
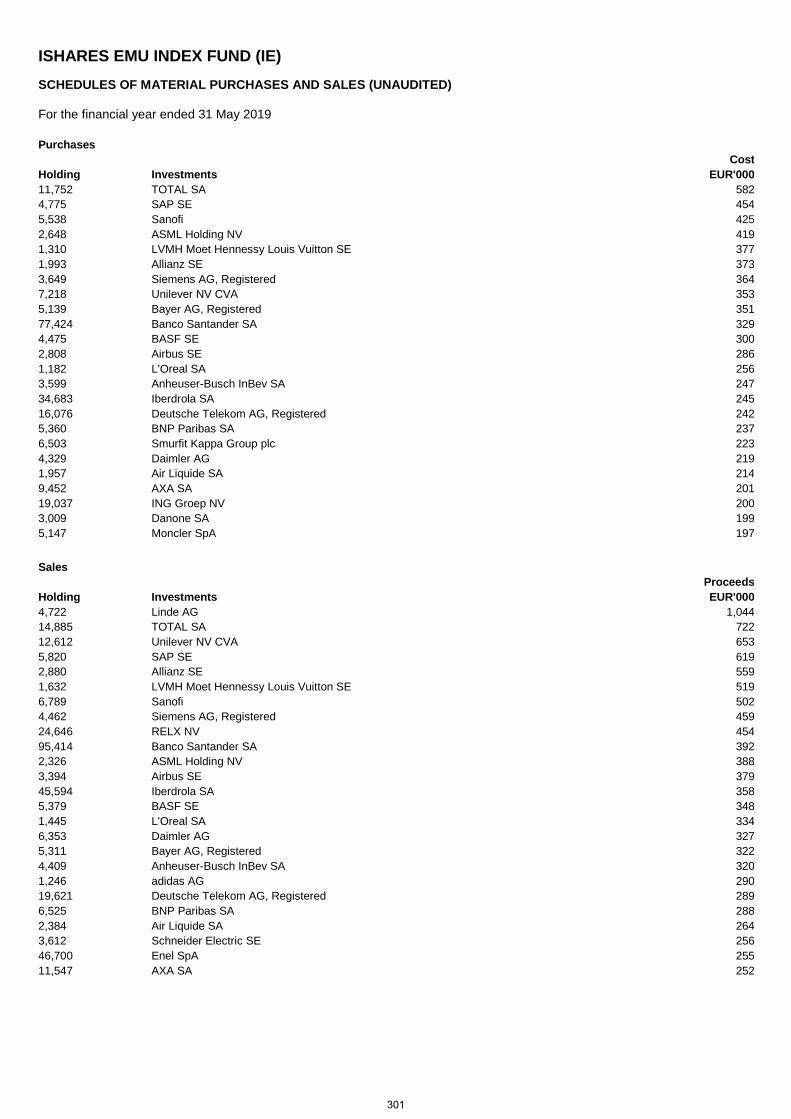
ISHARES EMU INDEX FUND (IE) SCHEDULES OF MATERIAL PURCHASES AND SALES (UNAUDITED)
For the financial year ended 31 May 2019
Purchases Cost Holding Investments EUR'000 11,752 TOTAL SA 582 4,775 SAP SE 454 5,538 Sanofi 425 2,648 ASML Holding NV 419 1,310 LVMH Moet Hennessy Louis Vuitton SE 377 1,993 Allianz SE 373 3,649 Siemens AG, Registered 364 7,218 Unilever NV CVA 353 5,139 Bayer AG, Registered 351 77,424 Banco Santander SA 329 4,475 BASF SE 300 2,808 Airbus SE 286 1,182 L'Oreal SA 256 3,599 Anheuser-Busch InBev SA 247 34,683 Iberdrola SA 245 16,076 Deutsche Telekom AG, Registered 242 5,360 BNP Paribas SA 237 6,503 Smurfit Kappa Group plc 223 4,329 Daimler AG 219 1,957 Air Liquide SA 214 9,452 AXA SA 201 19,037 ING Groep NV 200 3,009 Danone SA 199 5,147 Moncler SpA 197
Sales Proceeds Holding Investments EUR'000 4,722 Linde AG 1,044 14,885 TOTAL SA 722 12,612 Unilever NV CVA 653 5,820 SAP SE 619 2,880 Allianz SE 559 1,632 LVMH Moet Hennessy Louis Vuitton SE 519 6,789 Sanofi 502 4,462 Siemens AG, Registered 459 24,646 RELX NV 454 95,414 Banco Santander SA 392 2,326 ASML Holding NV 388 3,394 Airbus SE 379 45,594 Iberdrola SA 358 5,379 BASF SE 348 1,445 L'Oreal SA 334 6,353 Daimler AG 327 5,311 Bayer AG, Registered 322 4,409 Anheuser-Busch InBev SA 320 1,246 adidas AG 290 19,621 Deutsche Telekom AG, Registered 289 6,525 BNP Paribas SA 288 2,384 Air Liquide SA 264 3,612 Schneider Electric SE 256 46,700 Enel SpA 255 11,547 AXA SA 252
301

ISHARES EMU INDEX FUND (IE) SCHEDULES OF MATERIAL PURCHASES AND SALES (UNAUDITED) (continued)
For the financial year ended 31 May 2019
The CBI requires a schedule of material changes in the composition of the portfolio during the financial period. These are defined as aggregate purchases of a security exceeding one per cent of the total value of purchases for the financial period and aggregate disposals greater than one per cent of the total value of sales. At a minimum the largest 20 purchases and 20 sales must be given or all purchases and sales if less than 20. A full listing of the portfolio changes for the financial period is available, upon request, at no cost from the Administrator.
302
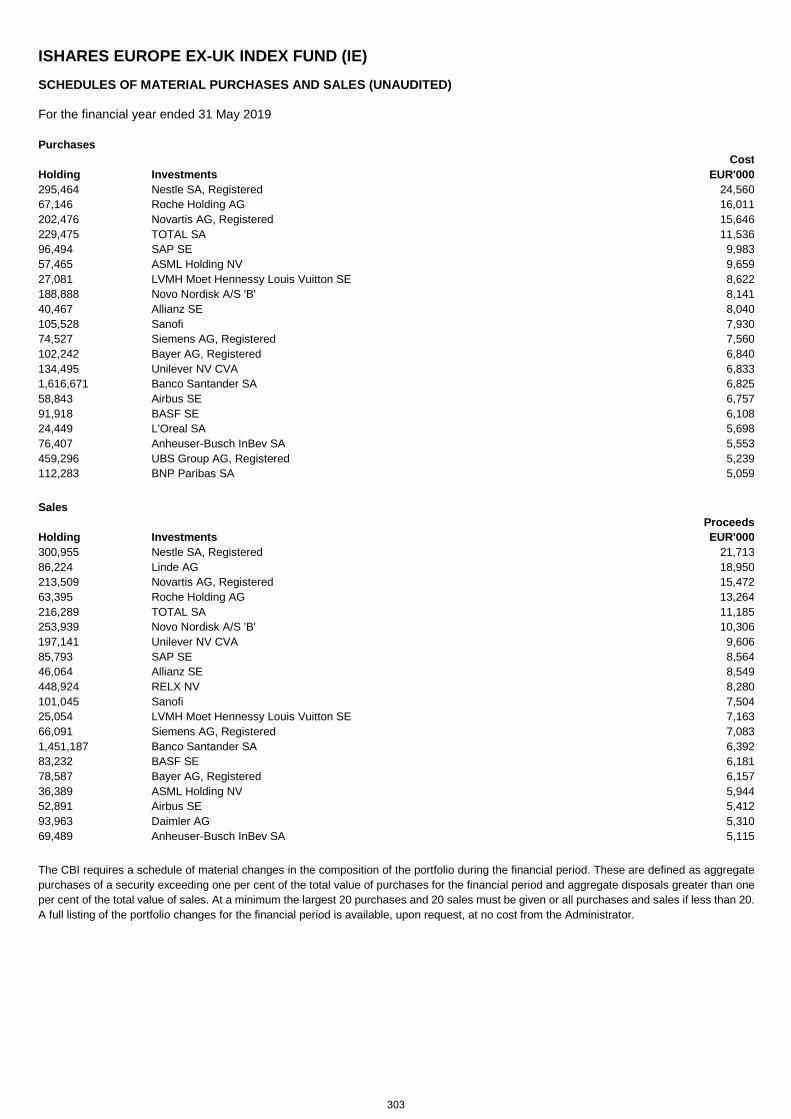
ISHARES EUROPE EX-UK INDEX FUND (IE) SCHEDULES OF MATERIAL PURCHASES AND SALES (UNAUDITED)
For the financial year ended 31 May 2019
Purchases Cost Holding Investments EUR'000 295,464 Nestle SA, Registered 24,560 67,146 Roche Holding AG 16,011 202,476 Novartis AG, Registered 15,646 229,475 TOTAL SA 11,536 96,494 SAP SE 9,983 57,465 ASML Holding NV 9,659 27,081 LVMH Moet Hennessy Louis Vuitton SE 8,622 188,888 Novo Nordisk A/S 'B' 8,141 40,467 Allianz SE 8,040 105,528 Sanofi 7,930 74,527 Siemens AG, Registered 7,560 102,242 Bayer AG, Registered 6,840 134,495 Unilever NV CVA 6,833 1,616,671 Banco Santander SA 6,825 58,843 Airbus SE 6,757 91,918 BASF SE 6,108 24,449 L'Oreal SA 5,698 76,407 Anheuser-Busch InBev SA 5,553 459,296 UBS Group AG, Registered 5,239 112,283 BNP Paribas SA 5,059
Sales Proceeds Holding Investments EUR'000 300,955 Nestle SA, Registered 21,713 86,224 Linde AG 18,950 213,509 Novartis AG, Registered 15,472 63,395 Roche Holding AG 13,264 216,289 TOTAL SA 11,185 253,939 Novo Nordisk A/S 'B' 10,306 197,141 Unilever NV CVA 9,606 85,793 SAP SE 8,564 46,064 Allianz SE 8,549 448,924 RELX NV 8,280 101,045 Sanofi 7,504 25,054 LVMH Moet Hennessy Louis Vuitton SE 7,163 66,091 Siemens AG, Registered 7,083 1,451,187 Banco Santander SA 6,392 83,232 BASF SE 6,181 78,587 Bayer AG, Registered 6,157 36,389 ASML Holding NV 5,944 52,891 Airbus SE 5,412 93,963 Daimler AG 5,310 69,489 Anheuser-Busch InBev SA 5,115
The CBI requires a schedule of material changes in the composition of the portfolio during the financial period. These are defined as aggregate purchases of a security exceeding one per cent of the total value of purchases for the financial period and aggregate disposals greater than one per cent of the total value of sales. At a minimum the largest 20 purchases and 20 sales must be given or all purchases and sales if less than 20. A full listing of the portfolio changes for the financial period is available, upon request, at no cost from the Administrator.
303
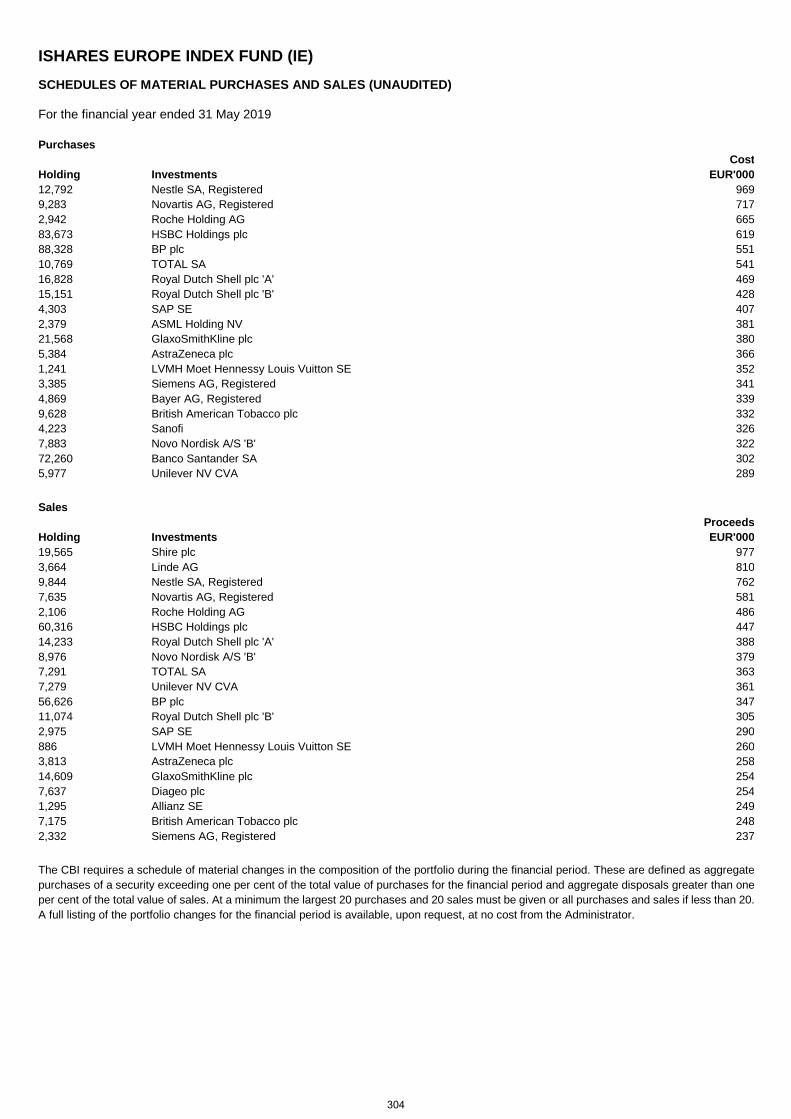
ISHARES EUROPE INDEX FUND (IE) SCHEDULES OF MATERIAL PURCHASES AND SALES (UNAUDITED)
For the financial year ended 31 May 2019
Purchases Cost Holding Investments EUR'000 12,792 Nestle SA, Registered 969 9,283 Novartis AG, Registered 717 2,942 Roche Holding AG 665 83,673 HSBC Holdings plc 619 88,328 BP plc 551 10,769 TOTAL SA 541 16,828 Royal Dutch Shell plc 'A' 469 15,151 Royal Dutch Shell plc 'B' 428 4,303 SAP SE 407 2,379 ASML Holding NV 381 21,568 GlaxoSmithKline plc 380 5,384 AstraZeneca plc 366 1,241 LVMH Moet Hennessy Louis Vuitton SE 352 3,385 Siemens AG, Registered 341 4,869 Bayer AG, Registered 339 9,628 British American Tobacco plc 332 4,223 Sanofi 326 7,883 Novo Nordisk A/S 'B' 322 72,260 Banco Santander SA 302 5,977 Unilever NV CVA 289
Sales Proceeds Holding Investments EUR'000 19,565 Shire plc 977 3,664 Linde AG 810 9,844 Nestle SA, Registered 762 7,635 Novartis AG, Registered 581 2,106 Roche Holding AG 486 60,316 HSBC Holdings plc 447 14,233 Royal Dutch Shell plc 'A' 388 8,976 Novo Nordisk A/S 'B' 379 7,291 TOTAL SA 363 7,279 Unilever NV CVA 361 56,626 BP plc 347 11,074 Royal Dutch Shell plc 'B' 305 2,975 SAP SE 290 886 LVMH Moet Hennessy Louis Vuitton SE 260 3,813 AstraZeneca plc 258 14,609 GlaxoSmithKline plc 254 7,637 Diageo plc 254 1,295 Allianz SE 249 7,175 British American Tobacco plc 248 2,332 Siemens AG, Registered 237
The CBI requires a schedule of material changes in the composition of the portfolio during the financial period. These are defined as aggregate purchases of a security exceeding one per cent of the total value of purchases for the financial period and aggregate disposals greater than one per cent of the total value of sales. At a minimum the largest 20 purchases and 20 sales must be given or all purchases and sales if less than 20. A full listing of the portfolio changes for the financial period is available, upon request, at no cost from the Administrator.
304
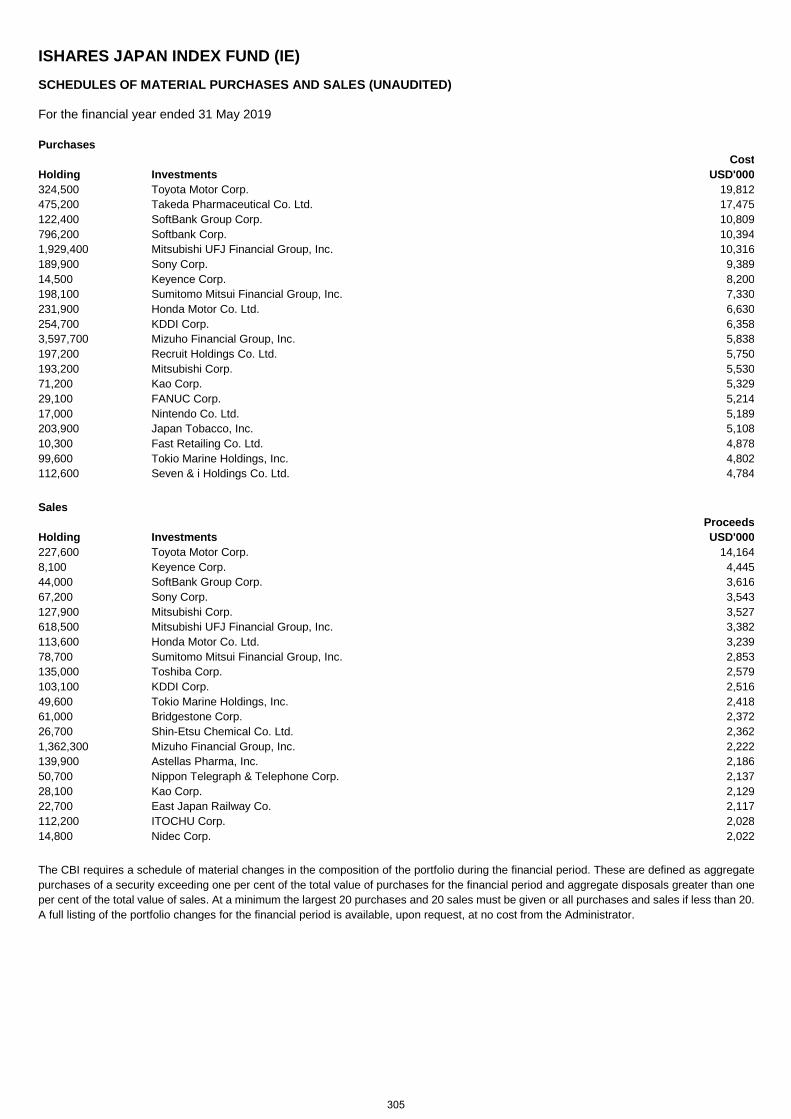
ISHARES JAPAN INDEX FUND (IE) SCHEDULES OF MATERIAL PURCHASES AND SALES (UNAUDITED)
For the financial year ended 31 May 2019
Purchases Cost Holding Investments USD'000 324,500 Toyota Motor Corp. 19,812 475,200 Takeda Pharmaceutical Co. Ltd. 17,475 122,400 SoftBank Group Corp. 10,809 796,200 Softbank Corp. 10,394 1,929,400 Mitsubishi UFJ Financial Group, Inc. 10,316 189,900 Sony Corp. 9,389 14,500 Keyence Corp. 8,200 198,100 Sumitomo Mitsui Financial Group, Inc. 7,330 231,900 Honda Motor Co. Ltd. 6,630 254,700 KDDI Corp. 6,358 3,597,700 Mizuho Financial Group, Inc. 5,838 197,200 Recruit Holdings Co. Ltd. 5,750 193,200 Mitsubishi Corp. 5,530 71,200 Kao Corp. 5,329 29,100 FANUC Corp. 5,214 17,000 Nintendo Co. Ltd. 5,189 203,900 Japan Tobacco, Inc. 5,108 10,300 Fast Retailing Co. Ltd. 4,878 99,600 Tokio Marine Holdings, Inc. 4,802 112,600 Seven & i Holdings Co. Ltd. 4,784
Sales Proceeds Holding Investments USD'000 227,600 Toyota Motor Corp. 14,164 8,100 Keyence Corp. 4,445 44,000 SoftBank Group Corp. 3,616 67,200 Sony Corp. 3,543 127,900 Mitsubishi Corp. 3,527 618,500 Mitsubishi UFJ Financial Group, Inc. 3,382 113,600 Honda Motor Co. Ltd. 3,239 78,700 Sumitomo Mitsui Financial Group, Inc. 2,853 135,000 Toshiba Corp. 2,579 103,100 KDDI Corp. 2,516 49,600 Tokio Marine Holdings, Inc. 2,418 61,000 Bridgestone Corp. 2,372 26,700 Shin-Etsu Chemical Co. Ltd. 2,362 1,362,300 Mizuho Financial Group, Inc. 2,222 139,900 Astellas Pharma, Inc. 2,186 50,700 Nippon Telegraph & Telephone Corp. 2,137 28,100 Kao Corp. 2,129 22,700 East Japan Railway Co. 2,117 112,200 ITOCHU Corp. 2,028 14,800 Nidec Corp. 2,022
The CBI requires a schedule of material changes in the composition of the portfolio during the financial period. These are defined as aggregate purchases of a security exceeding one per cent of the total value of purchases for the financial period and aggregate disposals greater than one per cent of the total value of sales. At a minimum the largest 20 purchases and 20 sales must be given or all purchases and sales if less than 20. A full listing of the portfolio changes for the financial period is available, upon request, at no cost from the Administrator.
305
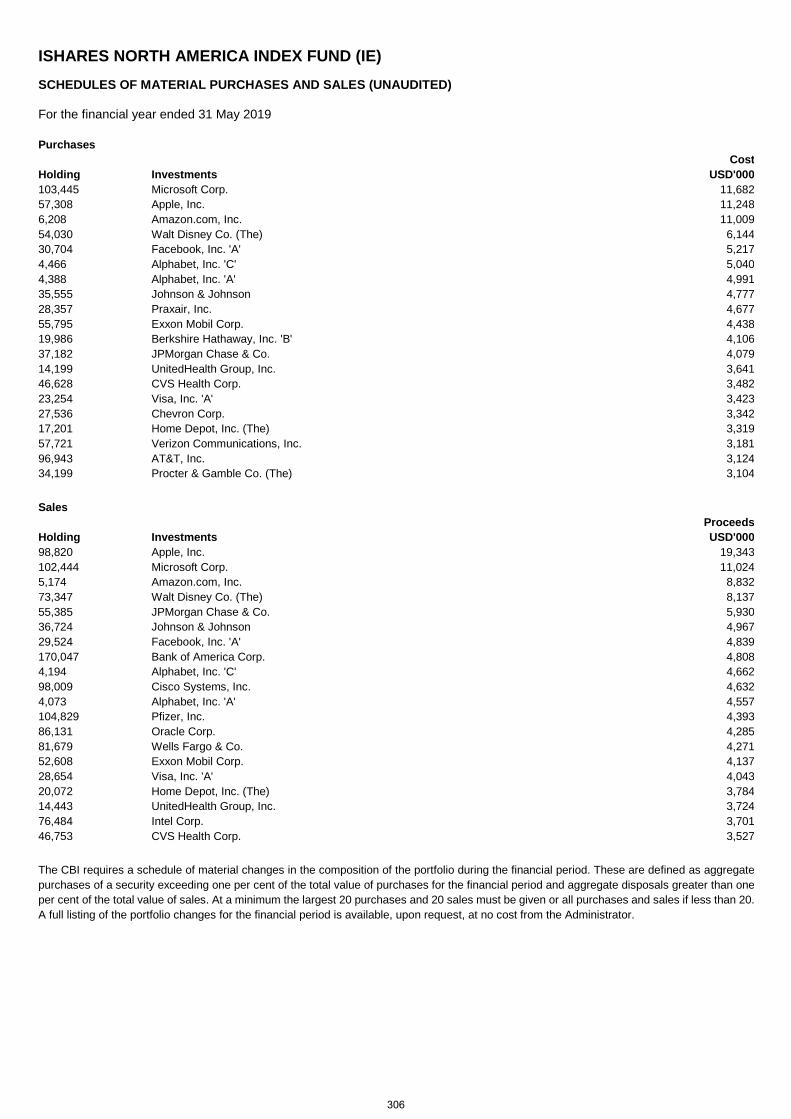
ISHARES NORTH AMERICA INDEX FUND (IE) SCHEDULES OF MATERIAL PURCHASES AND SALES (UNAUDITED)
For the financial year ended 31 May 2019
Purchases Cost Holding Investments USD'000 103,445 Microsoft Corp. 11,682 57,308 Apple, Inc. 11,248 6,208 Amazon.com, Inc. 11,009 54,030 Walt Disney Co. (The) 6,144 30,704 Facebook, Inc. 'A' 5,217 4,466 Alphabet, Inc. 'C' 5,040 4,388 Alphabet, Inc. 'A' 4,991 35,555 Johnson & Johnson 4,777 28,357 Praxair, Inc. 4,677 55,795 Exxon Mobil Corp. 4,438 19,986 Berkshire Hathaway, Inc. 'B' 4,106 37,182 JPMorgan Chase & Co. 4,079 14,199 UnitedHealth Group, Inc. 3,641 46,628 CVS Health Corp. 3,482 23,254 Visa, Inc. 'A' 3,423 27,536 Chevron Corp. 3,342 17,201 Home Depot, Inc. (The) 3,319 57,721 Verizon Communications, Inc. 3,181 96,943 AT&T, Inc. 3,124 34,199 Procter & Gamble Co. (The) 3,104
Sales Proceeds Holding Investments USD'000 98,820 Apple, Inc. 19,343 102,444 Microsoft Corp. 11,024 5,174 Amazon.com, Inc. 8,832 73,347 Walt Disney Co. (The) 8,137 55,385 JPMorgan Chase & Co. 5,930 36,724 Johnson & Johnson 4,967 29,524 Facebook, Inc. 'A' 4,839 170,047 Bank of America Corp. 4,808 4,194 Alphabet, Inc. 'C' 4,662 98,009 Cisco Systems, Inc. 4,632 4,073 Alphabet, Inc. 'A' 4,557 104,829 Pfizer, Inc. 4,393 86,131 Oracle Corp. 4,285 81,679 Wells Fargo & Co. 4,271 52,608 Exxon Mobil Corp. 4,137 28,654 Visa, Inc. 'A' 4,043 20,072 Home Depot, Inc. (The) 3,784 14,443 UnitedHealth Group, Inc. 3,724 76,484 Intel Corp. 3,701 46,753 CVS Health Corp. 3,527
The CBI requires a schedule of material changes in the composition of the portfolio during the financial period. These are defined as aggregate purchases of a security exceeding one per cent of the total value of purchases for the financial period and aggregate disposals greater than one per cent of the total value of sales. At a minimum the largest 20 purchases and 20 sales must be given or all purchases and sales if less than 20. A full listing of the portfolio changes for the financial period is available, upon request, at no cost from the Administrator.
306
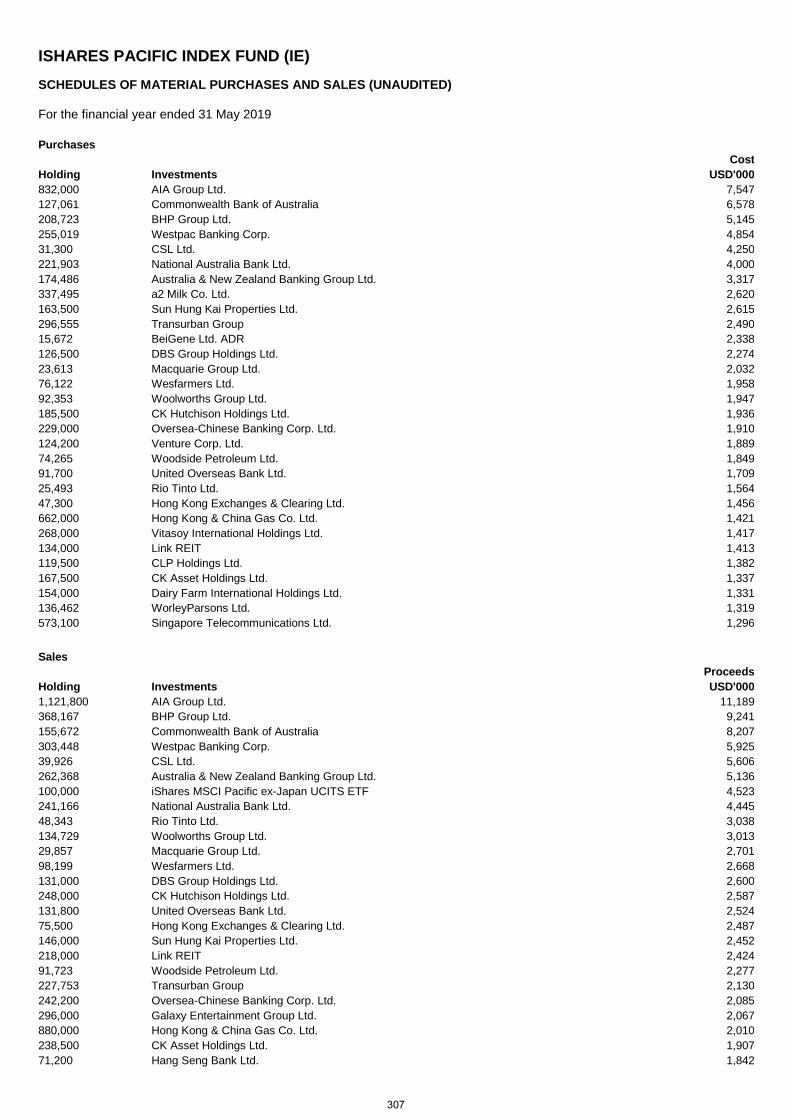
ISHARES PACIFIC INDEX FUND (IE) SCHEDULES OF MATERIAL PURCHASES AND SALES (UNAUDITED)
For the financial year ended 31 May 2019
Purchases Cost Holding Investments USD'000 832,000 AIA Group Ltd. 7,547 127,061 Commonwealth Bank of Australia 6,578 208,723 BHP Group Ltd. 5,145 255,019 Westpac Banking Corp. 4,854 31,300 CSL Ltd. 4,250 221,903 National Australia Bank Ltd. 4,000 174,486 Australia & New Zealand Banking Group Ltd. 3,317 337,495 a2 Milk Co. Ltd. 2,620 163,500 Sun Hung Kai Properties Ltd. 2,615 296,555 Transurban Group 2,490 15,672 BeiGene Ltd. ADR 2,338 126,500 DBS Group Holdings Ltd. 2,274 23,613 Macquarie Group Ltd. 2,032 76,122 Wesfarmers Ltd. 1,958 92,353 Woolworths Group Ltd. 1,947 185,500 CK Hutchison Holdings Ltd. 1,936 229,000 Oversea-Chinese Banking Corp. Ltd. 1,910 124,200 Venture Corp. Ltd. 1,889 74,265 Woodside Petroleum Ltd. 1,849 91,700 United Overseas Bank Ltd. 1,709 25,493 Rio Tinto Ltd. 1,564 47,300 Hong Kong Exchanges & Clearing Ltd. 1,456 662,000 Hong Kong & China Gas Co. Ltd. 1,421 268,000 Vitasoy International Holdings Ltd. 1,417 134,000 Link REIT 1,413 119,500 CLP Holdings Ltd. 1,382 167,500 CK Asset Holdings Ltd. 1,337 154,000 Dairy Farm International Holdings Ltd. 1,331 136,462 WorleyParsons Ltd. 1,319 573,100 Singapore Telecommunications Ltd. 1,296
Sales Proceeds Holding Investments USD'000 1,121,800 AIA Group Ltd. 11,189 368,167 BHP Group Ltd. 9,241 155,672 Commonwealth Bank of Australia 8,207 303,448 Westpac Banking Corp. 5,925 39,926 CSL Ltd. 5,606 262,368 Australia & New Zealand Banking Group Ltd. 5,136 100,000 iShares MSCI Pacific ex-Japan UCITS ETF 4,523 241,166 National Australia Bank Ltd. 4,445 48,343 Rio Tinto Ltd. 3,038 134,729 Woolworths Group Ltd. 3,013 29,857 Macquarie Group Ltd. 2,701 98,199 Wesfarmers Ltd. 2,668 131,000 DBS Group Holdings Ltd. 2,600 248,000 CK Hutchison Holdings Ltd. 2,587 131,800 United Overseas Bank Ltd. 2,524 75,500 Hong Kong Exchanges & Clearing Ltd. 2,487 146,000 Sun Hung Kai Properties Ltd. 2,452 218,000 Link REIT 2,424 91,723 Woodside Petroleum Ltd. 2,277 227,753 Transurban Group 2,130 242,200 Oversea-Chinese Banking Corp. Ltd. 2,085 296,000 Galaxy Entertainment Group Ltd. 2,067 880,000 Hong Kong & China Gas Co. Ltd. 2,010 238,500 CK Asset Holdings Ltd. 1,907 71,200 Hang Seng Bank Ltd. 1,842
307
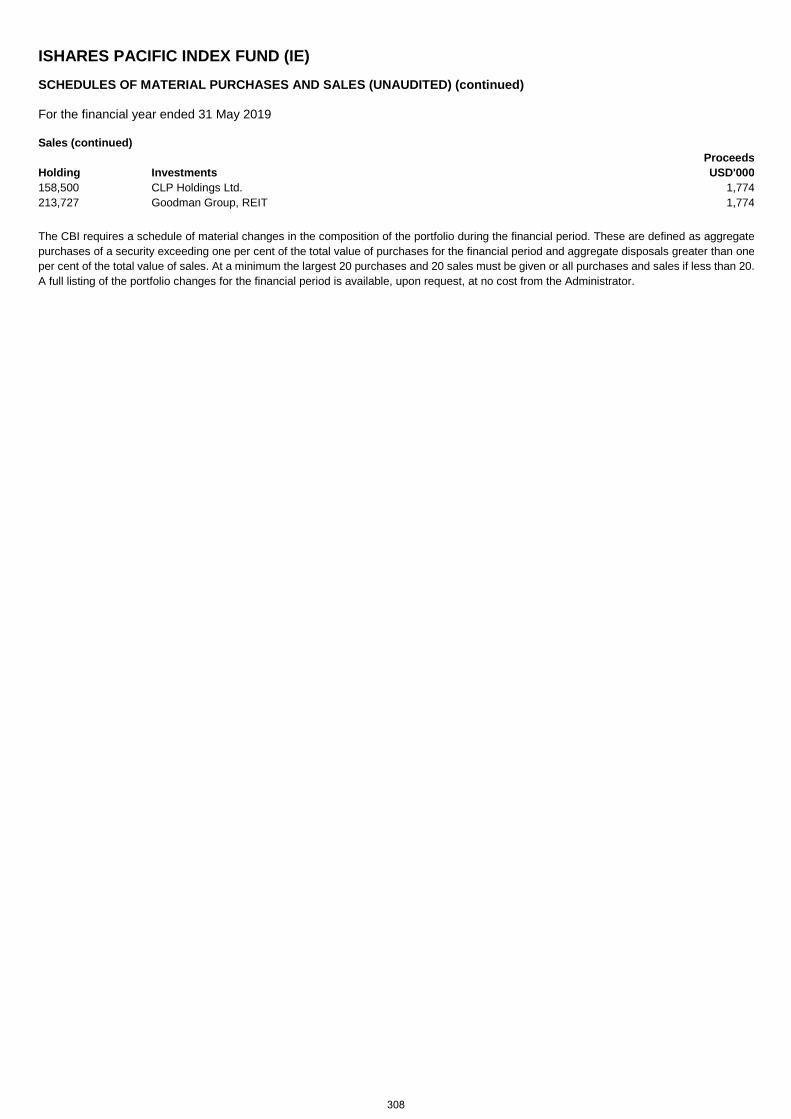
ISHARES PACIFIC INDEX FUND (IE) SCHEDULES OF MATERIAL PURCHASES AND SALES (UNAUDITED) (continued)
For the financial year ended 31 May 2019
Sales (continued) Proceeds Holding Investments USD'000 158,500 CLP Holdings Ltd. 1,774 213,727 Goodman Group, REIT 1,774
The CBI requires a schedule of material changes in the composition of the portfolio during the financial period. These are defined as aggregate purchases of a security exceeding one per cent of the total value of purchases for the financial period and aggregate disposals greater than one per cent of the total value of sales. At a minimum the largest 20 purchases and 20 sales must be given or all purchases and sales if less than 20. A full listing of the portfolio changes for the financial period is available, upon request, at no cost from the Administrator.
308
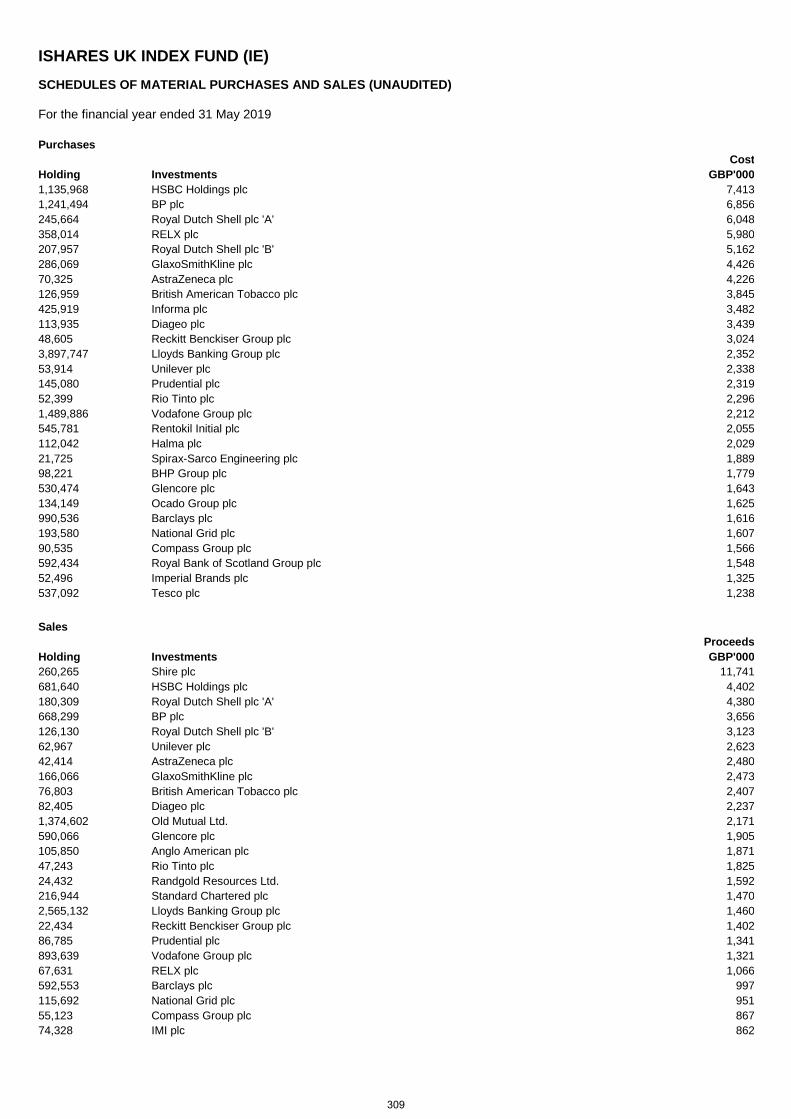
ISHARES UK INDEX FUND (IE) SCHEDULES OF MATERIAL PURCHASES AND SALES (UNAUDITED)
For the financial year ended 31 May 2019
Purchases Cost Holding Investments GBP'000 1,135,968 HSBC Holdings plc 7,413 1,241,494 BP plc 6,856 245,664 Royal Dutch Shell plc 'A' 6,048 358,014 RELX plc 5,980 207,957 Royal Dutch Shell plc 'B' 5,162 286,069 GlaxoSmithKline plc 4,426 70,325 AstraZeneca plc 4,226 126,959 British American Tobacco plc 3,845 425,919 Informa plc 3,482 113,935 Diageo plc 3,439 48,605 Reckitt Benckiser Group plc 3,024 3,897,747 Lloyds Banking Group plc 2,352 53,914 Unilever plc 2,338 145,080 Prudential plc 2,319 52,399 Rio Tinto plc 2,296 1,489,886 Vodafone Group plc 2,212 545,781 Rentokil Initial plc 2,055 112,042 Halma plc 2,029 21,725 Spirax-Sarco Engineering plc 1,889 98,221 BHP Group plc 1,779 530,474 Glencore plc 1,643 134,149 Ocado Group plc 1,625 990,536 Barclays plc 1,616 193,580 National Grid plc 1,607 90,535 Compass Group plc 1,566 592,434 Royal Bank of Scotland Group plc 1,548 52,496 Imperial Brands plc 1,325 537,092 Tesco plc 1,238
Sales Proceeds Holding Investments GBP'000 260,265 Shire plc 11,741 681,640 HSBC Holdings plc 4,402 180,309 Royal Dutch Shell plc 'A' 4,380 668,299 BP plc 3,656 126,130 Royal Dutch Shell plc 'B' 3,123 62,967 Unilever plc 2,623 42,414 AstraZeneca plc 2,480 166,066 GlaxoSmithKline plc 2,473 76,803 British American Tobacco plc 2,407 82,405 Diageo plc 2,237 1,374,602 Old Mutual Ltd. 2,171 590,066 Glencore plc 1,905 105,850 Anglo American plc 1,871 47,243 Rio Tinto plc 1,825 24,432 Randgold Resources Ltd. 1,592 216,944 Standard Chartered plc 1,470 2,565,132 Lloyds Banking Group plc 1,460 22,434 Reckitt Benckiser Group plc 1,402 86,785 Prudential plc 1,341 893,639 Vodafone Group plc 1,321 67,631 RELX plc 1,066 592,553 Barclays plc 997 115,692 National Grid plc 951 55,123 Compass Group plc 867 74,328 IMI plc 862
309

ISHARES UK INDEX FUND (IE) SCHEDULES OF MATERIAL PURCHASES AND SALES (UNAUDITED) (continued)
For the financial year ended 31 May 2019
The CBI requires a schedule of material changes in the composition of the portfolio during the financial period. These are defined as aggregate purchases of a security exceeding one per cent of the total value of purchases for the financial period and aggregate disposals greater than one per cent of the total value of sales. At a minimum the largest 20 purchases and 20 sales must be given or all purchases and sales if less than 20. A full listing of the portfolio changes for the financial period is available, upon request, at no cost from the Administrator.
310
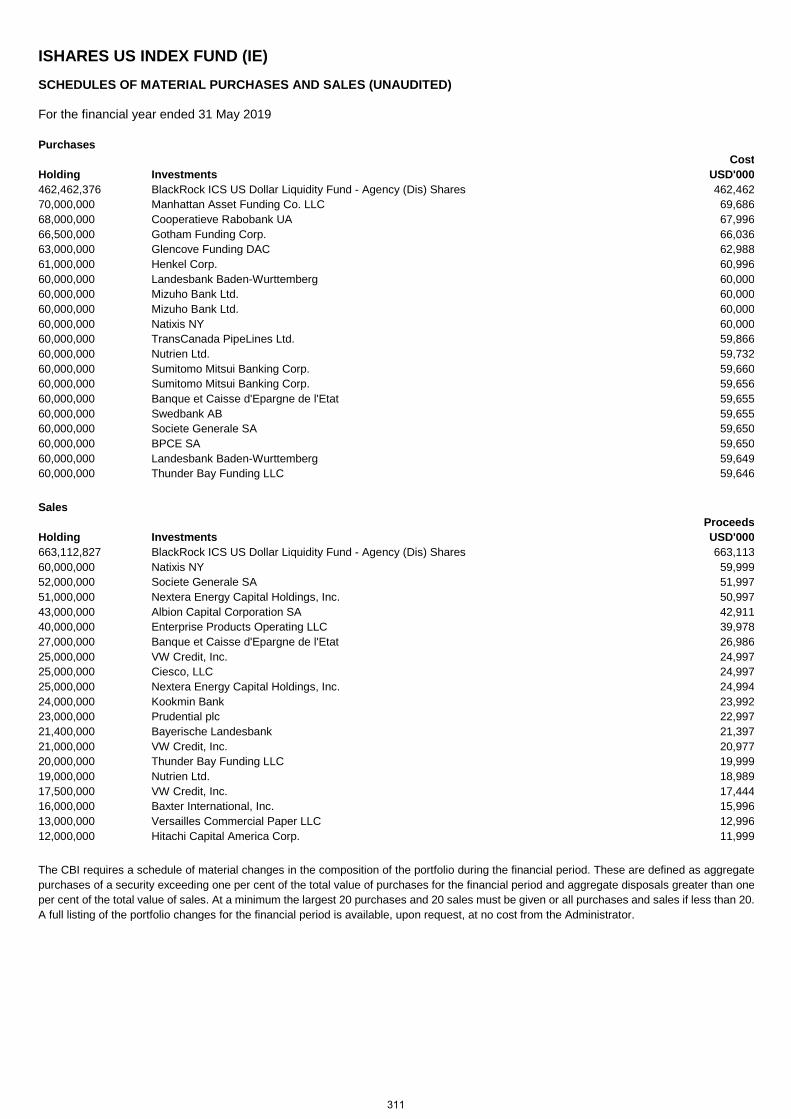
ISHARES US INDEX FUND (IE) SCHEDULES OF MATERIAL PURCHASES AND SALES (UNAUDITED)
For the financial year ended 31 May 2019
Purchases Cost Holding Investments USD'000 462,462,376 BlackRock ICS US Dollar Liquidity Fund - Agency (Dis) Shares 462,462 70,000,000 Manhattan Asset Funding Co. LLC 69,686 68,000,000 Cooperatieve Rabobank UA 67,996 66,500,000 Gotham Funding Corp. 66,036 63,000,000 Glencove Funding DAC 62,988 61,000,000 Henkel Corp. 60,996 60,000,000 Landesbank Baden-Wurttemberg 60,000 60,000,000 Mizuho Bank Ltd. 60,000 60,000,000 Mizuho Bank Ltd. 60,000 60,000,000 Natixis NY 60,000 60,000,000 TransCanada PipeLines Ltd. 59,866 60,000,000 Nutrien Ltd. 59,732 60,000,000 Sumitomo Mitsui Banking Corp. 59,660 60,000,000 Sumitomo Mitsui Banking Corp. 59,656 60,000,000 Banque et Caisse d'Epargne de l'Etat 59,655 60,000,000 Swedbank AB 59,655 60,000,000 Societe Generale SA 59,650 60,000,000 BPCE SA 59,650 60,000,000 Landesbank Baden-Wurttemberg 59,649 60,000,000 Thunder Bay Funding LLC 59,646
Sales Proceeds Holding Investments USD'000 663,112,827 BlackRock ICS US Dollar Liquidity Fund - Agency (Dis) Shares 663,113 60,000,000 Natixis NY 59,999 52,000,000 Societe Generale SA 51,997 51,000,000 Nextera Energy Capital Holdings, Inc. 50,997 43,000,000 Albion Capital Corporation SA 42,911 40,000,000 Enterprise Products Operating LLC 39,978 27,000,000 Banque et Caisse d'Epargne de l'Etat 26,986 25,000,000 VW Credit, Inc. 24,997 25,000,000 Ciesco, LLC 24,997 25,000,000 Nextera Energy Capital Holdings, Inc. 24,994 24,000,000 Kookmin Bank 23,992 23,000,000 Prudential plc 22,997 21,400,000 Bayerische Landesbank 21,397 21,000,000 VW Credit, Inc. 20,977 20,000,000 Thunder Bay Funding LLC 19,999 19,000,000 Nutrien Ltd. 18,989 17,500,000 VW Credit, Inc. 17,444 16,000,000 Baxter International, Inc. 15,996 13,000,000 Versailles Commercial Paper LLC 12,996 12,000,000 Hitachi Capital America Corp. 11,999
The CBI requires a schedule of material changes in the composition of the portfolio during the financial period. These are defined as aggregate purchases of a security exceeding one per cent of the total value of purchases for the financial period and aggregate disposals greater than one per cent of the total value of sales. At a minimum the largest 20 purchases and 20 sales must be given or all purchases and sales if less than 20. A full listing of the portfolio changes for the financial period is available, upon request, at no cost from the Administrator.
311
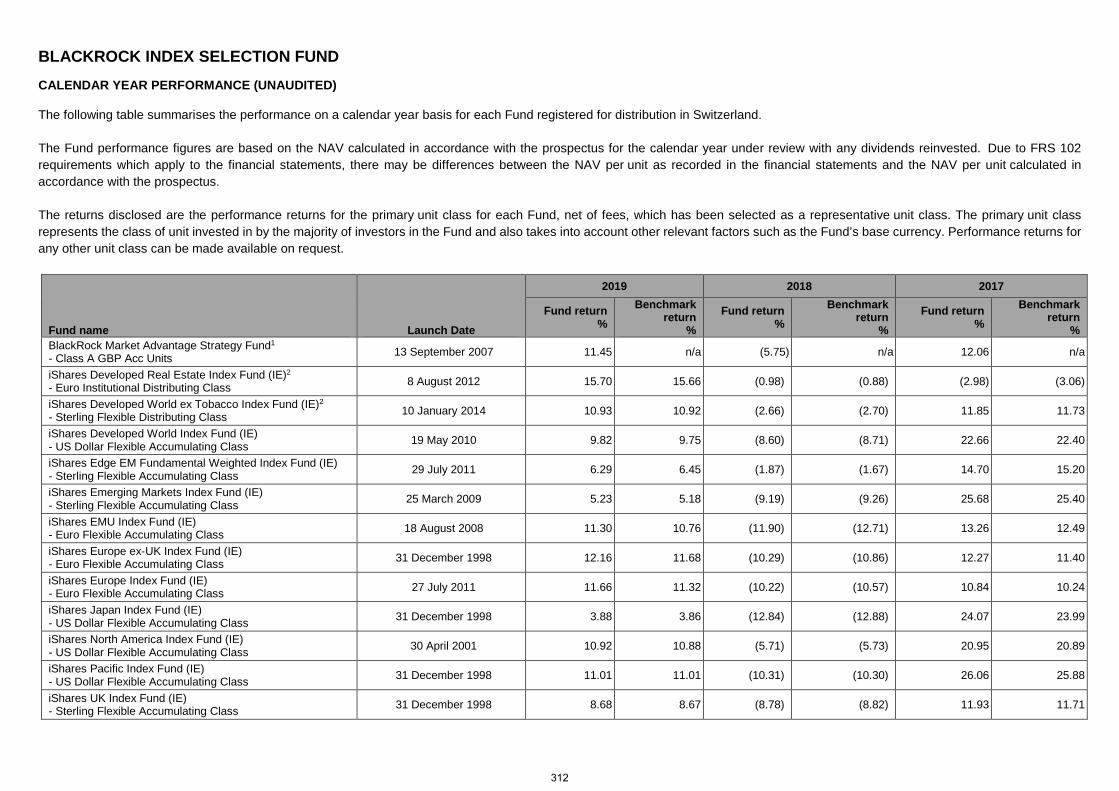
BLACKROCK INDEX SELECTION FUND CALENDAR YEAR PERFORMANCE (UNAUDITED)
The following table summarises the performance on a calendar year basis for each Fund registered for distribution in Switzerland. The Fund performance figures are based on the NAV calculated in accordance with the prospectus for the calendar year under review with any dividends reinvested. Due to FRS 102 requirements which apply to the financial statements, there may be differences between the NAV per unit as recorded in the financial statements and the NAV per unit calculated in accordance with the prospectus. The returns disclosed are the performance returns for the primary unit class for each Fund, net of fees, which has been selected as a representative unit class. The primary unit class represents the class of unit invested in by the majority of investors in the Fund and also takes into account other relevant factors such as the Fund’s base currency. Performance returns for any other unit class can be made available on request.
Fund name Launch Date
2019 2018 2017
Fund return %
Benchmark return
% Fund return
% Benchmark
return %
Fund return %
Benchmark return
% BlackRock Market Advantage Strategy Fund1
- Class A GBP Acc Units 13 September 2007 11.45 n/a (5.75) n/a 12.06 n/a
iShares Developed Real Estate Index Fund (IE)2 - Euro Institutional Distributing Class 8 August 2012 15.70 15.66 (0.98) (0.88) (2.98) (3.06)
iShares Developed World ex Tobacco Index Fund (IE)2 - Sterling Flexible Distributing Class 10 January 2014 10.93 10.92 (2.66) (2.70) 11.85 11.73
iShares Developed World Index Fund (IE) - US Dollar Flexible Accumulating Class 19 May 2010 9.82 9.75 (8.60) (8.71) 22.66 22.40
iShares Edge EM Fundamental Weighted Index Fund (IE) - Sterling Flexible Accumulating Class 29 July 2011 6.29 6.45 (1.87) (1.67) 14.70 15.20
iShares Emerging Markets Index Fund (IE) - Sterling Flexible Accumulating Class 25 March 2009 5.23 5.18 (9.19) (9.26) 25.68 25.40
iShares EMU Index Fund (IE) - Euro Flexible Accumulating Class 18 August 2008 11.30 10.76 (11.90) (12.71) 13.26 12.49
iShares Europe ex-UK Index Fund (IE) - Euro Flexible Accumulating Class 31 December 1998 12.16 11.68 (10.29) (10.86) 12.27 11.40
iShares Europe Index Fund (IE) - Euro Flexible Accumulating Class 27 July 2011 11.66 11.32 (10.22) (10.57) 10.84 10.24
iShares Japan Index Fund (IE) - US Dollar Flexible Accumulating Class 31 December 1998 3.88 3.86 (12.84) (12.88) 24.07 23.99
iShares North America Index Fund (IE) - US Dollar Flexible Accumulating Class 30 April 2001 10.92 10.88 (5.71) (5.73) 20.95 20.89
iShares Pacific Index Fund (IE) - US Dollar Flexible Accumulating Class 31 December 1998 11.01 11.01 (10.31) (10.30) 26.06 25.88
iShares UK Index Fund (IE) - Sterling Flexible Accumulating Class 31 December 1998 8.68 8.67 (8.78) (8.82) 11.93 11.71
312
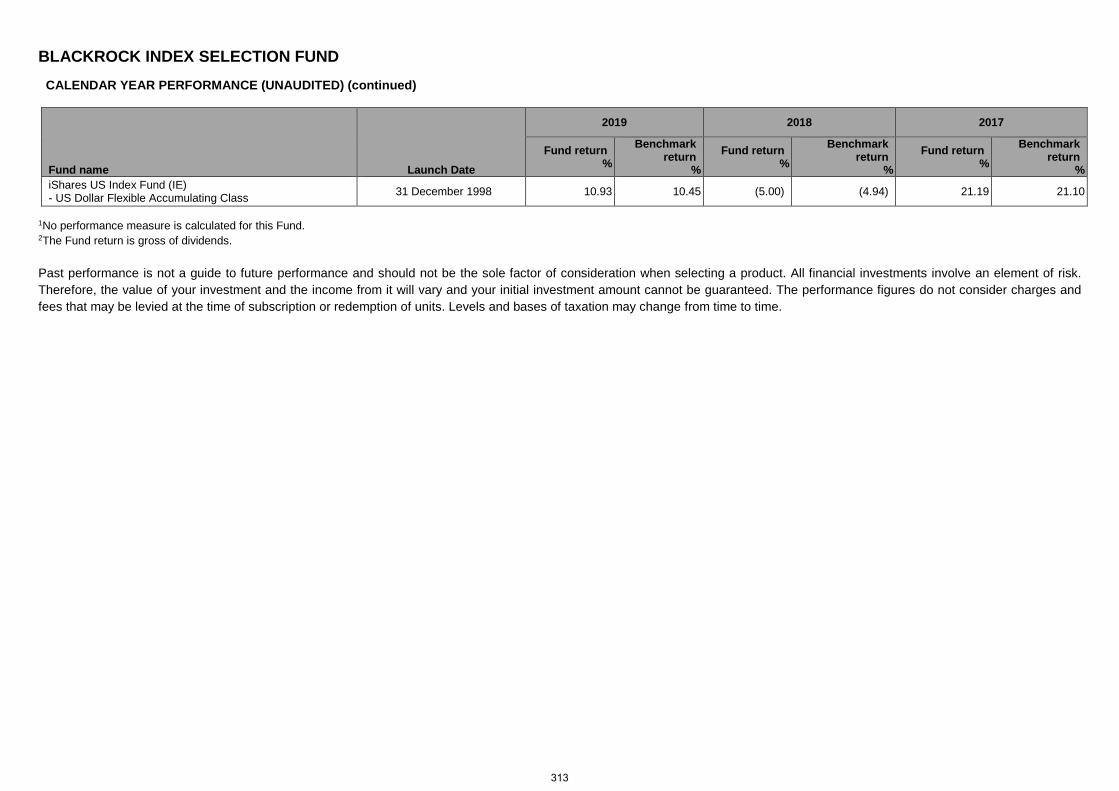
BLACKROCK INDEX SELECTION FUND CALENDAR YEAR PERFORMANCE (UNAUDITED) (continued)
Fund name Launch Date
2019 2018 2017
Fund return %
Benchmark return
%
Fund return %
Benchmark return
%
Fund return %
Benchmark return
% iShares US Index Fund (IE) - US Dollar Flexible Accumulating Class 31 December 1998 10.93 10.45 (5.00) (4.94) 21.19 21.10
1No performance measure is calculated for this Fund. 2The Fund return is gross of dividends. Past performance is not a guide to future performance and should not be the sole factor of consideration when selecting a product. All financial investments involve an element of risk. Therefore, the value of your investment and the income from it will vary and your initial investment amount cannot be guaranteed. The performance figures do not consider charges and fees that may be levied at the time of subscription or redemption of units. Levels and bases of taxation may change from time to time.
313
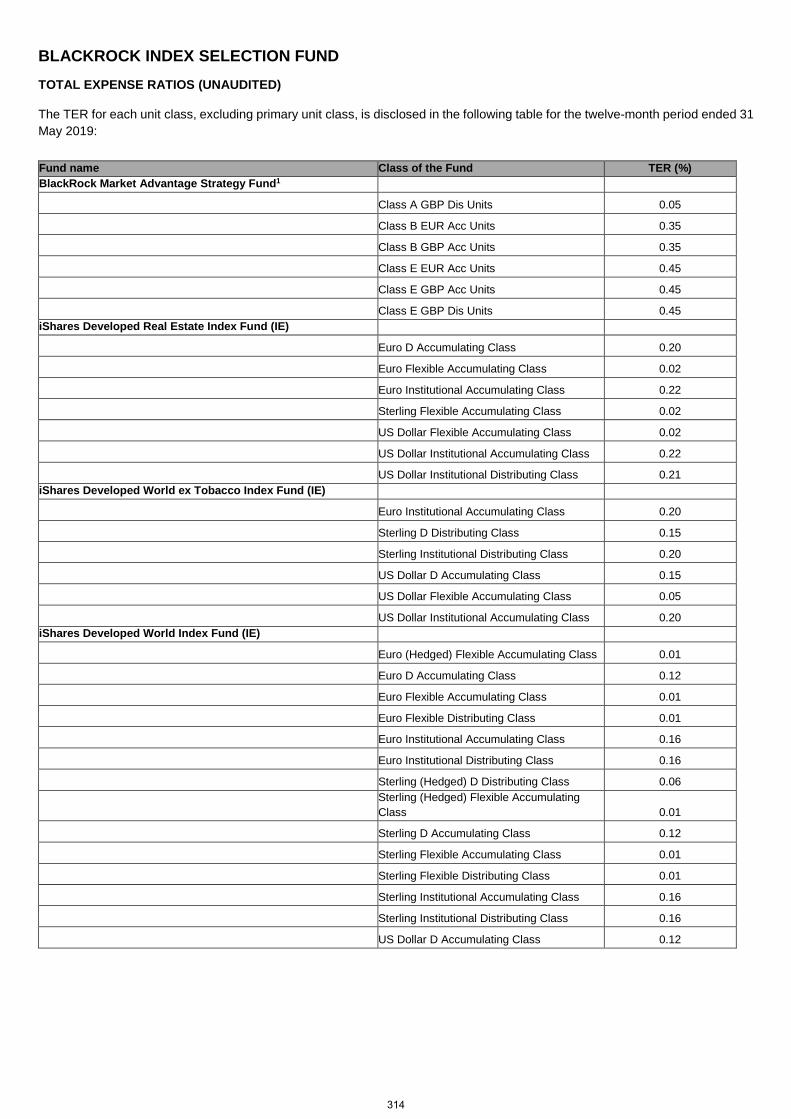
BLACKROCK INDEX SELECTION FUND TOTAL EXPENSE RATIOS (UNAUDITED)
The TER for each unit class, excluding primary unit class, is disclosed in the following table for the twelve-month period ended 31 May 2019:
Fund name Class of the Fund TER (%) BlackRock Market Advantage Strategy Fund1
Class A GBP Dis Units Class A GBP Dis Units 0.05
Class B EUR Acc Units Class B EUR Acc Units 0.35
Class B GBP Acc Units Class B GBP Acc Units 0.35
Class E EUR Acc Units Class E EUR Acc Units 0.45
Class E GBP Acc Units Class E GBP Acc Units 0.45
Class E GBP Dis Units Class E GBP Dis Units 0.45 iShares Developed Real Estate Index Fund (IE)
Euro D Accumulating Class Euro D Accumulating Class 0.20
Euro Flexible Accumulating Class Euro Flexible Accumulating Class 0.02
Euro Institutional Accumulating Class Euro Institutional Accumulating Class 0.22
Sterling Flexible Accumulating Class Sterling Flexible Accumulating Class 0.02
US Dollar Flexible Accumulating Class US Dollar Flexible Accumulating Class 0.02 US Dollar Institutional Accumulating Class US Dollar Institutional Accumulating Class 0.22 US Dollar Institutional Distributing Class US Dollar Institutional Distributing Class 0.21 iShares Developed World ex Tobacco Index Fund (IE)
Euro Institutional Accumulating Class Euro Institutional Accumulating Class 0.20
Sterling D Distributing Class Sterling D Distributing Class 0.15
Sterling Institutional Distributing Class Sterling Institutional Distributing Class 0.20
US Dollar D Accumulating Class US Dollar D Accumulating Class 0.15 US Dollar Flexible Accumulating Class US Dollar Flexible Accumulating Class 0.05
US Dollar Institutional Accumulating Class US Dollar Institutional Accumulating Class 0.20 iShares Developed World Index Fund (IE)
Euro (Hedged) Flexible Accumulating Class Euro (Hedged) Flexible Accumulating Class 0.01
Euro D Accumulating Class Euro D Accumulating Class 0.12
Euro Flexible Accumulating Class Euro Flexible Accumulating Class 0.01
Euro Flexible Distributing Class Euro Flexible Distributing Class 0.01 Euro Institutional Accumulating Class Euro Institutional Accumulating Class 0.16
Euro Institutional Distributing Class Euro Institutional Distributing Class 0.16
Sterling (Hedged) D Distributing Class Sterling (Hedged) D Distributing Class 0.06
Sterling (Hedged) Flexible Accumulating Class Sterling (Hedged) Flexible Accumulating Class 0.01
Sterling D Accumulating Class Sterling D Accumulating Class 0.12
Sterling Flexible Accumulating Class Sterling Flexible Accumulating Class 0.01
Sterling Flexible Distributing Class Sterling Flexible Distributing Class 0.01
Sterling Institutional Accumulating Class Sterling Institutional Accumulating Class 0.16
Sterling Institutional Distributing Class Sterling Institutional Distributing Class 0.16
US Dollar D Accumulating Class US Dollar D Accumulating Class 0.12
314
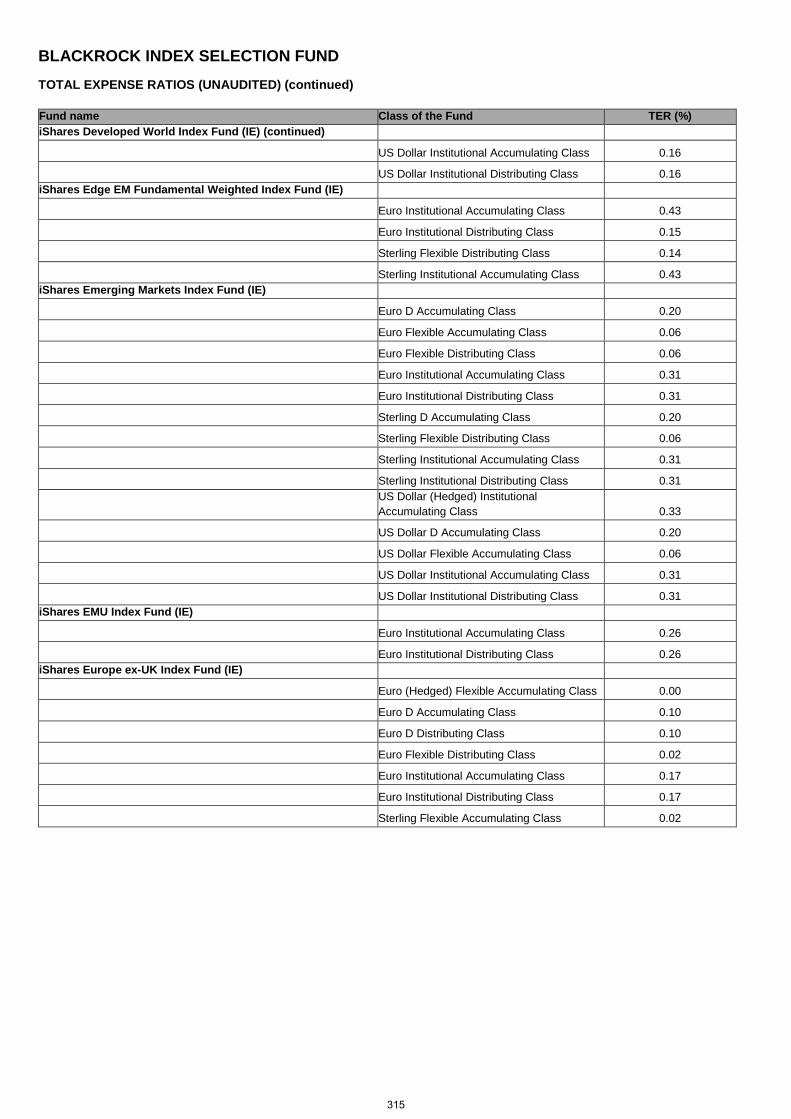
BLACKROCK INDEX SELECTION FUND TOTAL EXPENSE RATIOS (UNAUDITED) (continued)
Fund name Class of the Fund TER (%) iShares Developed World Index Fund (IE) (continued)
US Dollar Institutional Accumulating Class US Dollar Institutional Accumulating Class 0.16 US Dollar Institutional Distributing Class US Dollar Institutional Distributing Class 0.16 iShares Edge EM Fundamental Weighted Index Fund (IE)
Euro Institutional Accumulating Class Euro Institutional Accumulating Class 0.43
Euro Institutional Distributing Class Euro Institutional Distributing Class 0.15
Sterling Flexible Distributing Class Sterling Flexible Distributing Class 0.14
Sterling Institutional Accumulating Class Sterling Institutional Accumulating Class 0.43 iShares Emerging Markets Index Fund (IE)
Euro D Accumulating Class Euro D Accumulating Class 0.20
Euro Flexible Accumulating Class Euro Flexible Accumulating Class 0.06
Euro Flexible Distributing Class Euro Flexible Distributing Class 0.06
Euro Institutional Accumulating Class Euro Institutional Accumulating Class 0.31
Euro Institutional Distributing Class Euro Institutional Distributing Class 0.31
Sterling D Accumulating Class Sterling D Accumulating Class 0.20 Sterling Flexible Distributing Class Sterling Flexible Distributing Class 0.06
Sterling Institutional Accumulating Class Sterling Institutional Accumulating Class 0.31
Sterling Institutional Distributing Class Sterling Institutional Distributing Class 0.31
US Dollar (Hedged) Institutional Accumulating Class US Dollar (Hedged) Institutional Accumulating Class 0.33
US Dollar D Accumulating Class US Dollar D Accumulating Class 0.20
US Dollar Flexible Accumulating Class US Dollar Flexible Accumulating Class 0.06
US Dollar Institutional Accumulating Class US Dollar Institutional Accumulating Class 0.31
US Dollar Institutional Distributing Class US Dollar Institutional Distributing Class 0.31 iShares EMU Index Fund (IE)
Euro Institutional Accumulating Class Euro Institutional Accumulating Class 0.26
Euro Institutional Distributing Class Euro Institutional Distributing Class 0.26 iShares Europe ex-UK Index Fund (IE)
Euro (Hedged) Flexible Accumulating Class Euro (Hedged) Flexible Accumulating Class 0.00
Euro D Accumulating Class Euro D Accumulating Class 0.10
Euro D Distributing Class Euro D Distributing Class 0.10
Euro Flexible Distributing Class Euro Flexible Distributing Class 0.02
Euro Institutional Accumulating Class Euro Institutional Accumulating Class 0.17 Euro Institutional Distributing Class Euro Institutional Distributing Class 0.17
Sterling Flexible Accumulating Class Sterling Flexible Accumulating Class 0.02
315
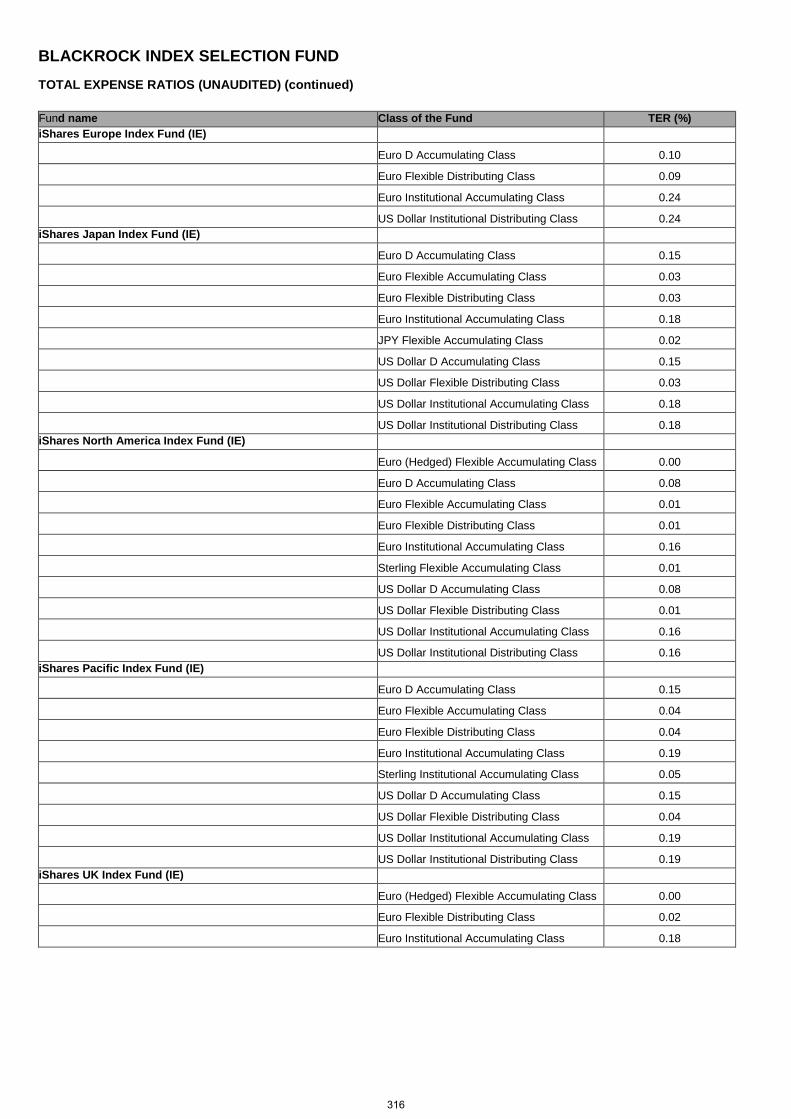
BLACKROCK INDEX SELECTION FUND TOTAL EXPENSE RATIOS (UNAUDITED) (continued)
Fund name Class of the Fund TER (%) iShares Europe Index Fund (IE)
Euro D Accumulating Class Euro D Accumulating Class 0.10
Euro Flexible Distributing Class Euro Flexible Distributing Class 0.09
Euro Institutional Accumulating Class Euro Institutional Accumulating Class 0.24
US Dollar Institutional Distributing Class US Dollar Institutional Distributing Class 0.24 iShares Japan Index Fund (IE)
Euro D Accumulating Class Euro D Accumulating Class 0.15
Euro Flexible Accumulating Class Euro Flexible Accumulating Class 0.03
Euro Flexible Distributing Class Euro Flexible Distributing Class 0.03
Euro Institutional Accumulating Class Euro Institutional Accumulating Class 0.18
JPY Flexible Accumulating Class JPY Flexible Accumulating Class 0.02
US Dollar D Accumulating Class US Dollar D Accumulating Class 0.15 US Dollar Flexible Distributing Class US Dollar Flexible Distributing Class 0.03
US Dollar Institutional Accumulating Class US Dollar Institutional Accumulating Class 0.18
US Dollar Institutional Distributing Class US Dollar Institutional Distributing Class 0.18 iShares North America Index Fund (IE)
Euro (Hedged) Flexible Accumulating Class Euro (Hedged) Flexible Accumulating Class 0.00
Euro D Accumulating Class Euro D Accumulating Class 0.08 Euro Flexible Accumulating Class Euro Flexible Accumulating Class 0.01
Euro Flexible Distributing Class Euro Flexible Distributing Class 0.01
Euro Institutional Accumulating Class Euro Institutional Accumulating Class 0.16
Sterling Flexible Accumulating Class Sterling Flexible Accumulating Class 0.01
US Dollar D Accumulating Class US Dollar D Accumulating Class 0.08
US Dollar Flexible Distributing Class US Dollar Flexible Distributing Class 0.01
US Dollar Institutional Accumulating Class US Dollar Institutional Accumulating Class 0.16 US Dollar Institutional Distributing Class US Dollar Institutional Distributing Class 0.16 iShares Pacific Index Fund (IE)
Euro D Accumulating Class Euro D Accumulating Class 0.15
Euro Flexible Accumulating Class Euro Flexible Accumulating Class 0.04
Euro Flexible Distributing Class Euro Flexible Distributing Class 0.04
Euro Institutional Accumulating Class Euro Institutional Accumulating Class 0.19 Sterling Institutional Accumulating Class Sterling Institutional Accumulating Class 0.05
US Dollar D Accumulating Class US Dollar D Accumulating Class 0.15
US Dollar Flexible Distributing Class US Dollar Flexible Distributing Class 0.04
US Dollar Institutional Accumulating Class US Dollar Institutional Accumulating Class 0.19
US Dollar Institutional Distributing Class US Dollar Institutional Distributing Class 0.19 iShares UK Index Fund (IE)
Euro (Hedged) Flexible Accumulating Class Euro (Hedged) Flexible Accumulating Class 0.00 Euro Flexible Distributing Class Euro Flexible Distributing Class 0.02
Euro Institutional Accumulating Class Euro Institutional Accumulating Class 0.18
316
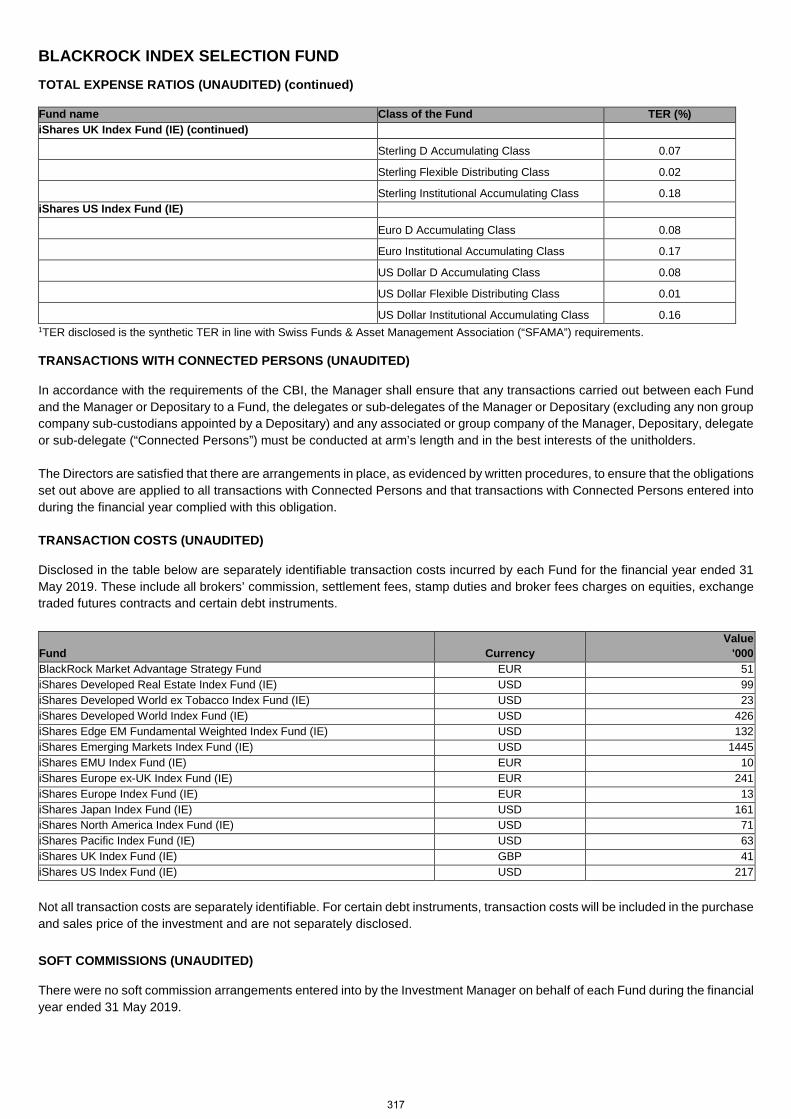
BLACKROCK INDEX SELECTION FUND TOTAL EXPENSE RATIOS (UNAUDITED) (continued)
Fund name Class of the Fund TER (%) iShares UK Index Fund (IE) (continued)
Sterling D Accumulating Class 0.07
Sterling Flexible Distributing Class 0.02
Sterling Institutional Accumulating Class Sterling Institutional Accumulating Class 0.18 iShares US Index Fund (IE)
Euro D Accumulating Class Euro D Accumulating Class 0.08
Euro Institutional Accumulating Class Euro Institutional Accumulating Class 0.17
US Dollar D Accumulating Class US Dollar D Accumulating Class 0.08
US Dollar Flexible Distributing Class US Dollar Flexible Distributing Class 0.01
US Dollar Institutional Accumulating Class US Dollar Institutional Accumulating Class 0.16
1TER disclosed is the synthetic TER in line with Swiss Funds & Asset Management Association (“SFAMA”) requirements.
TRANSACTIONS WITH CONNECTED PERSONS (UNAUDITED)
In accordance with the requirements of the CBI, the Manager shall ensure that any transactions carried out between each Fund and the Manager or Depositary to a Fund, the delegates or sub-delegates of the Manager or Depositary (excluding any non group company sub-custodians appointed by a Depositary) and any associated or group company of the Manager, Depositary, delegate or sub-delegate (“Connected Persons”) must be conducted at arm’s length and in the best interests of the unitholders. The Directors are satisfied that there are arrangements in place, as evidenced by written procedures, to ensure that the obligations set out above are applied to all transactions with Connected Persons and that transactions with Connected Persons entered into during the financial year complied with this obligation. TRANSACTION COSTS (UNAUDITED)
Disclosed in the table below are separately identifiable transaction costs incurred by each Fund for the financial year ended 31 May 2019. These include all brokers’ commission, settlement fees, stamp duties and broker fees charges on equities, exchange traded futures contracts and certain debt instruments.
Fund Currency Value
'000 BlackRock Market Advantage Strategy Fund EUR 51 iShares Developed Real Estate Index Fund (IE) USD 99 iShares Developed World ex Tobacco Index Fund (IE) USD 23 iShares Developed World Index Fund (IE) USD 426 iShares Edge EM Fundamental Weighted Index Fund (IE) USD 132 iShares Emerging Markets Index Fund (IE) USD 1445 iShares EMU Index Fund (IE) EUR 10 iShares Europe ex-UK Index Fund (IE) EUR 241 iShares Europe Index Fund (IE) EUR 13 iShares Japan Index Fund (IE) USD 161 iShares North America Index Fund (IE) USD 71 iShares Pacific Index Fund (IE) USD 63 iShares UK Index Fund (IE) GBP 41 iShares US Index Fund (IE) USD 217
Not all transaction costs are separately identifiable. For certain debt instruments, transaction costs will be included in the purchase and sales price of the investment and are not separately disclosed. SOFT COMMISSIONS (UNAUDITED)
There were no soft commission arrangements entered into by the Investment Manager on behalf of each Fund during the financial year ended 31 May 2019.
317
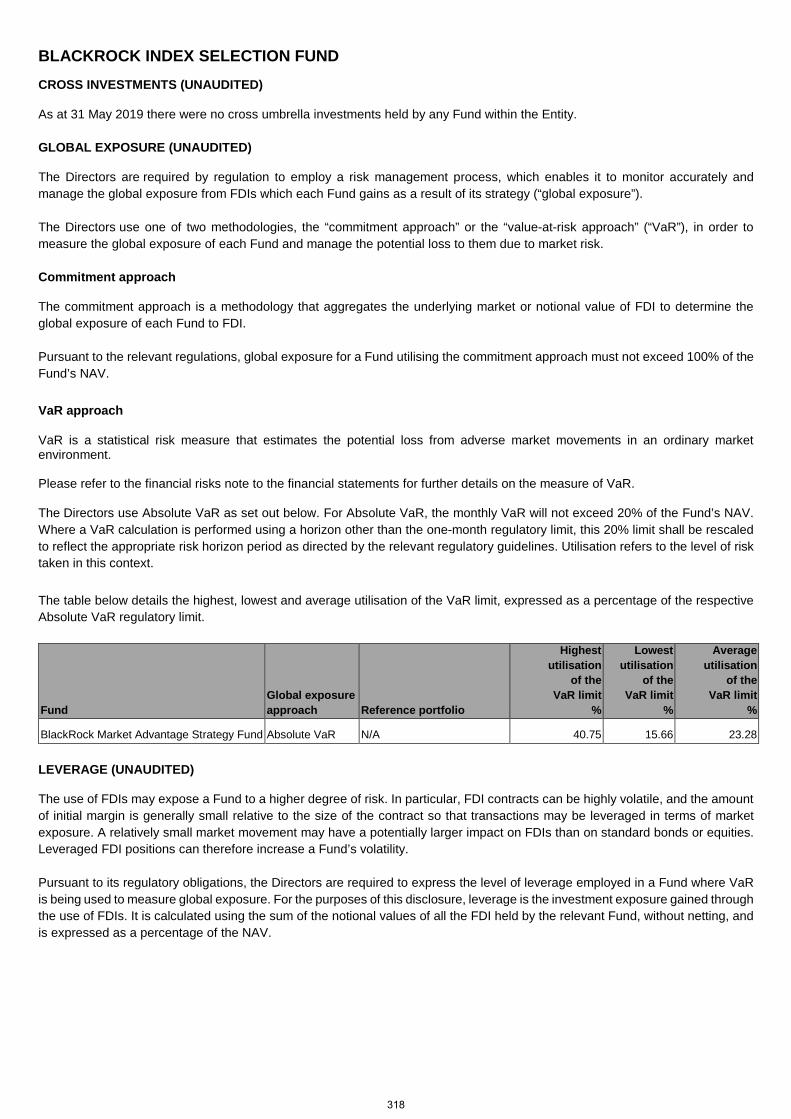
BLACKROCK INDEX SELECTION FUND CROSS INVESTMENTS (UNAUDITED)
As at 31 May 2019 there were no cross umbrella investments held by any Fund within the Entity. GLOBAL EXPOSURE (UNAUDITED)
The Directors are required by regulation to employ a risk management process, which enables it to monitor accurately and manage the global exposure from FDIs which each Fund gains as a result of its strategy (“global exposure”). The Directors use one of two methodologies, the “commitment approach” or the “value-at-risk approach” (“VaR”), in order to measure the global exposure of each Fund and manage the potential loss to them due to market risk. Commitment approach
The commitment approach is a methodology that aggregates the underlying market or notional value of FDI to determine the global exposure of each Fund to FDI. Pursuant to the relevant regulations, global exposure for a Fund utilising the commitment approach must not exceed 100% of the Fund’s NAV. VaR approach
VaR is a statistical risk measure that estimates the potential loss from adverse market movements in an ordinary market environment. Please refer to the financial risks note to the financial statements for further details on the measure of VaR.
The Directors use Absolute VaR as set out below. For Absolute VaR, the monthly VaR will not exceed 20% of the Fund’s NAV. Where a VaR calculation is performed using a horizon other than the one-month regulatory limit, this 20% limit shall be rescaled to reflect the appropriate risk horizon period as directed by the relevant regulatory guidelines. Utilisation refers to the level of risk taken in this context. The table below details the highest, lowest and average utilisation of the VaR limit, expressed as a percentage of the respective Absolute VaR regulatory limit.
Fund Global exposure approach Reference portfolio
Highest utilisation
of the VaR limit
%
Lowest utilisation
of the VaR limit
%
Average utilisation
of the VaR limit
%
BlackRock Market Advantage Strategy Fund Absolute VaR N/A 40.75 15.66 23.28
LEVERAGE (UNAUDITED)
The use of FDIs may expose a Fund to a higher degree of risk. In particular, FDI contracts can be highly volatile, and the amount of initial margin is generally small relative to the size of the contract so that transactions may be leveraged in terms of market exposure. A relatively small market movement may have a potentially larger impact on FDIs than on standard bonds or equities. Leveraged FDI positions can therefore increase a Fund’s volatility.
Pursuant to its regulatory obligations, the Directors are required to express the level of leverage employed in a Fund where VaR is being used to measure global exposure. For the purposes of this disclosure, leverage is the investment exposure gained through the use of FDIs. It is calculated using the sum of the notional values of all the FDI held by the relevant Fund, without netting, and is expressed as a percentage of the NAV.
318
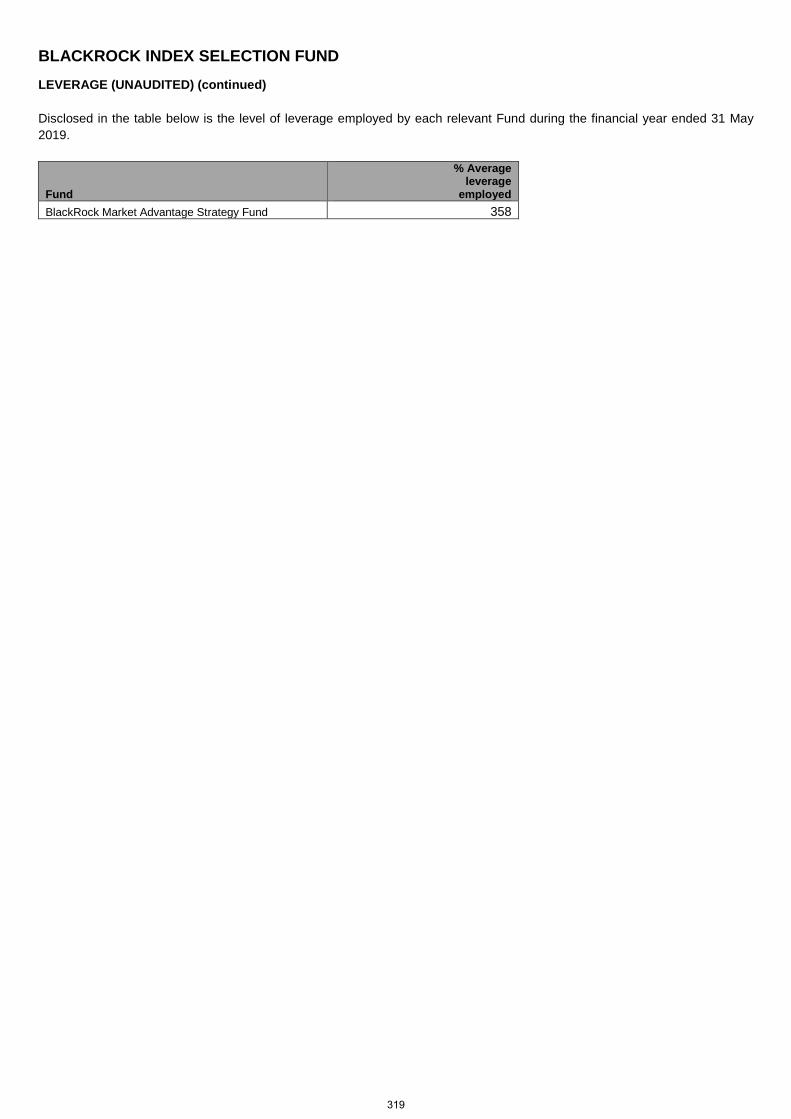
BLACKROCK INDEX SELECTION FUND LEVERAGE (UNAUDITED) (continued) Disclosed in the table below is the level of leverage employed by each relevant Fund during the financial year ended 31 May 2019.
Fund
% Average leverage
employed BlackRock Market Advantage Strategy Fund 358
319
BLACKROCK INDEX SELECTION FUND REPORT ON REMUNERATION (UNAUDITED)
The below disclosures are made in respect of the remuneration policies of the BlackRock group ("BlackRock"), as they apply to BlackRock Asset Management Ireland Limited (the "Manager"). The disclosures are made in accordance with the Directive 2009/65/EC on the coordination of laws, regulations and administrative provisions relating to undertakings for collective investment in transferable securities (“UCITS”), as amended, including in particular by Directive 2014/91/EU of the European Parliament and of the council of 23 July 2014, (the “Directive”), and the "Guidelines on sound remuneration policies under the UCITS Directive and AIFMD" issued by the European Securities and Markets Authority. BlackRock’s UCITS Remuneration Policy (the “UCITS Remuneration Policy”) will apply to the EEA entities within the BlackRock group authorised as a manager of UCITS funds in accordance with the Directive, and will ensure compliance with the requirements of Article 14b of the Directive. The Manager has adopted the UCITS Remuneration Policy, a summary of which is set out below. Remuneration Governance BlackRock’s remuneration governance in EMEA operates as a tiered structure which includes: (a) the Management Development and Compensation Committee (“MDCC”) (which is the global, independent remuneration committee for BlackRock, Inc. and all of its subsidiaries, including the Manager); and (b) the Manager’s board of directors (the “Manager’s Board”). These bodies are responsible for the determination of BlackRock’s remuneration policies.
(a) MDCC
The MDCC’s purposes include:
• providing oversight of: o BlackRock’s executive compensation programmes; o BlackRock’s employee benefit plans; and o such other compensation plans as may be established by BlackRock from time to time for which the MDCC is
deemed as administrator; • reviewing and discussing the compensation discussion and analysis included in the BlackRock, Inc. annual proxy
statement with management and approving the MDCC’s report for inclusion in the proxy statement; • reviewing, assessing and making reports and recommendations to the BlackRock, Inc. board of directors (the “BlackRock,
Inc. Board”) as appropriate on BlackRock’s talent development and succession planning, with the emphasis on performance and succession at the highest management levels; and
• in accordance with applicable UK and European regulations and guidance, to act as the Remuneration Committee for BlackRock’s EMEA regulated entities.
The MDCC directly retains its own independent compensation consultant, Semler Brossy Consulting Group LLC, who has no relationship with BlackRock, Inc. or the BlackRock, Inc. Board that would interfere with its ability to provide independent advice to the MDCC on compensation matters. The BlackRock, Inc. Board has determined that all of the members of the MDCC are “independent” within the meaning of the listing standards of the New York Stock Exchange (NYSE), which requires each meet a “non-employee director” standard. The MDCC held 10 meetings during 2018. The MDCC charter is available on BlackRock, Inc.’s website (www.blackrock.com). Through its regular reviews, the MDCC continues to be satisfied with the principles of BlackRock’s compensation policy and approach.
(b) The Manager’s Board The Manager’s Board has the task of supervising and providing oversight of the UCITS Remuneration Policy as it applies to the Manager and its Identified Staff. The Manager’s Board (through independent review by the relevant control functions) remains satisfied with the implementation of the UCITS Remuneration Policy as it applies to the Manager and its Identified Staff.
320
BLACKROCK INDEX SELECTION FUND REPORT ON REMUNERATION (UNAUDITED) (continued)
Decision-making process Remuneration decisions for employees are made once annually in January following the end of the performance year. This timing allows full-year financial results to be considered along with other non-financial goals and objectives. Although the framework for remuneration decision-making is tied to financial performance, significant discretion is used to determine individual variable remuneration based on achievement of strategic and operating results and other considerations such as management and leadership capabilities. No set formulas are established and no fixed benchmarks are used in determining annual incentive awards. In determining specific individual remuneration amounts, a number of factors are considered including non-financial goals and objectives and overall financial and investment performance. These results are viewed in the aggregate without any specific weighting, and there is no direct correlation between any particular performance measure and the resulting annual incentive award. The variable remuneration awarded to any individual(s) for a particular performance year may also be zero. Annual incentive awards are paid from a bonus pool. The size of the projected bonus pool, including cash and equity awards, is reviewed throughout the year by the MDCC and the final total bonus pool is approved after year-end. As part of this review, the MDCC receives actual and projected financial information over the course of the year as well as final year-end information. The financial information that the MDCC receives and considers includes the current year projected income statement and other financial measures compared with prior year results and the current year budget. The MDCC additionally reviews other metrics of BlackRock’s financial performance (e.g., net inflows of AUM and investment performance) as well as information regarding market conditions and competitive compensation levels. The MDCC regularly considers management’s recommendation as to the percentage of preincentive operating income that will be accrued and reflected as a compensation expense throughout the year for the cash portion of the total annual bonus pool (the “accrual rate”). The accrual rate of the cash portion of the total annual bonus pool may be modified by the MDCC during the year based on its review of the financial information described above. The MDCC does not apply any particular weighting or formula to the information it considers when determining the size of the total bonus pool or the accruals made for the cash portion of the total bonus pool. Following the end of the performance year, the MDCC approves the final bonus pool amount. As part of the year-end review process the Enterprise Risk and Regulatory Compliance departments report to the MDCC on any activities, incidents or events that warrant consideration in making compensation decisions. Individuals are not involved in setting their own remuneration. Control functions Each of the control functions (Enterprise Risk, Legal & Compliance, and Internal Audit) has its own organisational structure which is independent of the business units. The head of each control function is either a member of the Global Executive Committee (“GEC”), the global management committee, or has a reporting obligation to the board of directors of BlackRock Group Limited, the parent company of all of BlackRock’s EMEA regulated entities, including the Manager. Functional bonus pools are determined with reference to the performance of each individual function. The remuneration of the senior members of control functions is directly overseen by the MDCC. Link between pay and performance
There is a clear and well defined pay-for-performance philosophy and compensation programmes which are designed to meet the following key objectives as detailed below:
• appropriately balance BlackRock’s financial results between shareholders and employees; • attract, retain and motivate employees capable of making significant contributions to the long-term success of the
business; • align the interests of senior employees with those of shareholders by awarding BlackRock Inc.’s stock as a significant
part of both annual and long-term incentive awards; • control fixed costs by ensuring that compensation expense varies with profitability; • link a significant portion of an employee’s total compensation to the financial and operational performance of the business
as well as its common stock performance; • discourage excessive risk-taking; and • ensure that client interests are not negatively impacted by remuneration awarded on a short-term, mid-term and/or long-
term basis.
321
BLACKROCK INDEX SELECTION FUND REPORT ON REMUNERATION (UNAUDITED) (continued)
Link between pay and performance (continued)
Driving a high-performance culture is dependent on the ability to measure performance against objectives, values and behaviours in a clear and consistent way. Managers use a 5-point rating scale to provide an overall assessment of an employee’s performance, and employees also provide a self-evaluation. The overall, final rating is reconciled during each employee’s performance appraisal. Employees are assessed on the manner in which performance is attained as well as the absolute performance itself. In keeping with the pay-for-performance philosophy, ratings are used to differentiate and reward individual performance – but don’t pre-determine compensation outcomes. Compensation decisions remain discretionary and are made as part of the year-end compensation process. When setting remuneration levels other factors are considered, as well as individual performance, which may include:
• the performance of the Manager, the funds managed by the Manager and/or the relevant functional department;
• factors relevant to an employee individually; relationships with clients and colleagues; teamwork; skills; any conduct issues; and, subject to any applicable policy, the impact that any relevant leave of absence may have on contribution to the business);
• the management of risk within the risk profiles appropriate for BlackRock's clients;
• strategic business needs, including intentions regarding retention;
• market intelligence; and
• criticality to business. A primary product tool is risk management and, while employees are compensated for strong performance in their management of client assets, they are required to manage risk within the risk profiles appropriate for their clients. Therefore, employees are not rewarded for engaging in high-risk transactions outside of established parameters. Remuneration practices do not provide undue incentives for short-term planning or short-term financial rewards, do not reward unreasonable risk and provide a reasonable balance between the many and substantial risks inherent within the business of investment management, risk management and advisory services. BlackRock operates a total compensation model for remuneration which includes a base salary, which is contractual, and a discretionary bonus scheme. BlackRock operates an annual discretionary bonus scheme. Although all employees are eligible to be considered for a discretionary bonus, there is no contractual obligation to make any award to an employee under its discretionary bonus scheme. In exercising discretion to award a discretionary bonus, the factors listed above (under the heading “Link between pay and performance”) may be taken into account in addition to any other matters which become relevant to the exercise of discretion in the course of the performance year. Discretionary bonus awards for all employees, including executive officers, are subject to a guideline that determines the portion paid in cash and the portion paid in BlackRock, Inc. stock and subject to additional vesting/clawback conditions. Stock awards are subject to further performance adjustment through variation in BlackRock, Inc.’s share price over the vesting period. As total annual compensation increases, a greater portion is deferred into stock. The MDCC adopted this approach in 2006 to substantially increase the retention value and shareholder alignment of the compensation package for eligible employees, including the executive officers. The portion deferred into stock vests into three equal instalments over the three years following grant. Supplementary to the annual discretionary bonus as described above, equity awards from the “Partner Plan” and “Targeted Equity Award Plan” are made to select senior leaders to provide greater linkage with future business results. The long-term incentive awards have been established individually to provide meaningful incentive for continued performance over a multi-year period recognising the scope of the individual’s role, business expertise and leadership skills.
322
BLACKROCK INDEX SELECTION FUND REPORT ON REMUNERATION (UNAUDITED) (continued)
Link between pay and performance (continued)
Selected senior leaders are eligible to receive performance-adjusted equity-based awards from the “BlackRock Performance Incentive Plan” (“BPIP”). Awards made from the BPIP have a three-year performance period based on a measurement of As Adjusted Operating Margin1 and Organic Revenue Growth2. Determination of pay-out will be made based on the firm’s achievement relative to target financial results at the conclusion of the performance period. The maximum number of shares that can be earned is 165% of the award in those situations where both metrics achieve pre-determined financial targets. No shares will be earned where the firm’s financial performance in both of the above metrics is below a pre-determined performance threshold. These metrics have been selected as key measures of shareholder value which endure across market cycles. A limited number of investment professionals have a portion of their annual discretionary bonus (as described above) awarded as deferred cash that notionally tracks investment in selected products managed by the employee. The intention of these awards is to align investment professionals with the investment returns of the products they manage through the deferral of compensation into those products. Clients and external evaluators have increasingly viewed more favourably those products where key investors have “skin in the game” through significant personal investments. Identified Staff The UCITS Remuneration Policy sets out the process that will be applied to identify staff as Identified Staff, being categories of staff of the Manager, including senior management, risk takers, control functions and any employee receiving total remuneration that takes them into the same remuneration bracket as senior management and risk takers, whose professional activities have a material impact on the risk profiles of the Manager or of the funds it manages. The list of Identified Staff will be subject to regular review, being formally reviewed in the event of, but not limited to:
• organisational changes; • new business initiatives; • changes in significant influence function lists; • changes in role responsibilities; and • revised regulatory direction.
Quantitative Remuneration Disclosure The Manager is required under UCITS to make quantitative disclosures of remuneration. These disclosures are made in line with BlackRock’s interpretation of currently available regulatory guidance on quantitative remuneration disclosures. As market or regulatory practice develops BlackRock may consider it appropriate to make changes to the way in which quantitative remuneration disclosures are calculated. Where such changes are made, this may result in disclosures in relation to a fund not being comparable to the disclosures made in the prior year, or in relation to other BlackRock fund disclosures in that same year. Disclosures are provided in relation to (a) the staff of the Manager; (b) staff who are senior management; and (c) staff who have the ability to materially affect the risk profile of the Fund, including individuals who, although not directly employed by the Manager, are assigned by their employer to carry out services directly for the Manager. All individuals included in the aggregated figures disclosed are rewarded in line with BlackRock’s remuneration policy for their responsibilities across the relevant BlackRock business area. As all individuals have a number of areas of responsibilities, only the portion of remuneration for those individuals’ services attributable to the Fund is included in the aggregate figures disclosed.
Members of staff and senior management of the Manager typically provide both UCITS and non-UCITS related services in respect of multiple funds, clients and functions of the Manager and across the broader BlackRock group. Therefore, the figures disclosed are a sum of each individual’s portion of remuneration attributable to the Manager according to an objective apportionment methodology which acknowledges the multiple-service nature of the Manager. Accordingly the figures are not representative of any individual’s actual remuneration or their remuneration structure.
1 As Adjusted Operating Margin: As reported in BlackRock’s external filings, reflects adjusted Operating Income divided by Total Revenue net of distribution and servicing expenses and amortisation of deferred sales commissions. 2 Organic Revenue Growth: Equal to net new base fees plus net new Aladdin revenue generated in the year (in dollars).
323

BLACKROCK INDEX SELECTION FUND REPORT ON REMUNERATION (UNAUDITED) (continued)
Quantitative Remuneration Disclosure (continued)
The amount of the total remuneration awarded by the Manager to its staff which has been attributed to the Manager’s UCITS-related business in respect of the Manager’s financial year ending 31 December 2018 is USD 6.2 million. This figure is comprised of fixed remuneration of USD 2.4 million and variable remuneration of USD 3.8 million. There were a total of 39 beneficiaries of the remuneration described above.
The amount of the aggregate remuneration awarded by the Manager, which has been attributed to the Manager’s UCITS-related business in respect of the Manager’s financial year ending 31 December 2018, to its senior management was USD 0.6 million, and to other members of its staff whose actions have a material impact on the risk profile of the Manager’s UCITS-related business was USD 5.6 million.
324
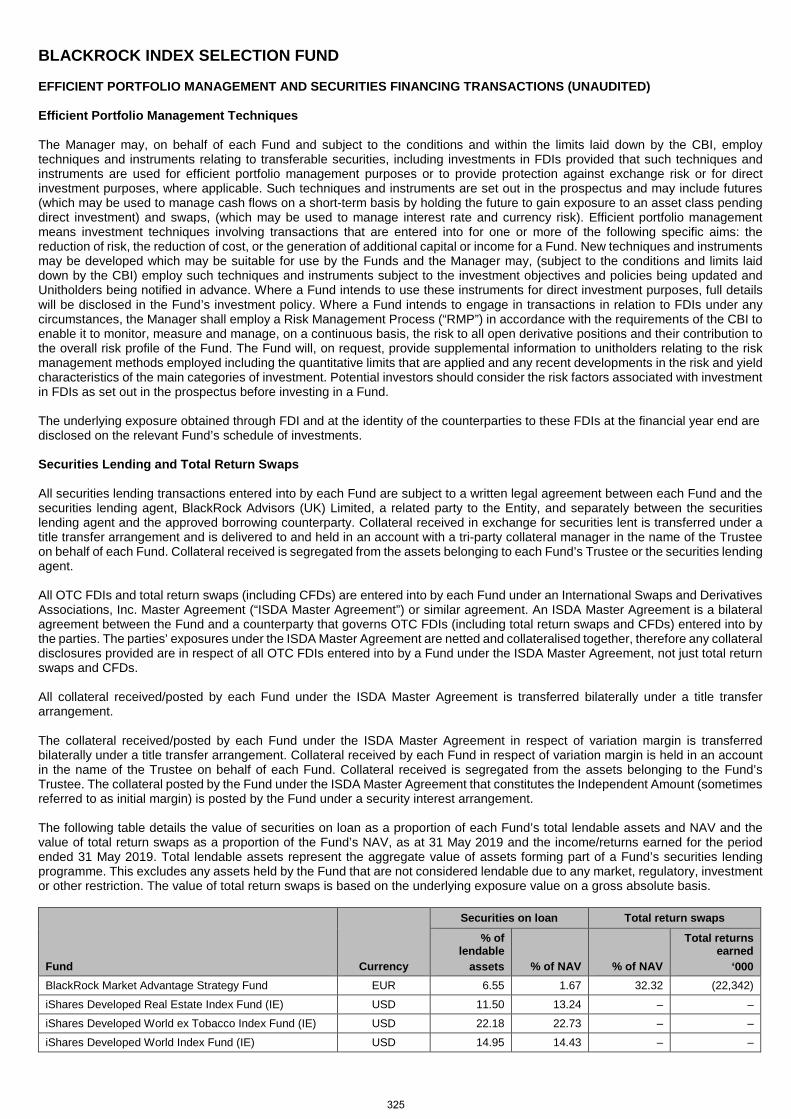
BLACKROCK INDEX SELECTION FUND EFFICIENT PORTFOLIO MANAGEMENT AND SECURITIES FINANCING TRANSACTIONS (UNAUDITED) Efficient Portfolio Management Techniques The Manager may, on behalf of each Fund and subject to the conditions and within the limits laid down by the CBI, employ techniques and instruments relating to transferable securities, including investments in FDIs provided that such techniques and instruments are used for efficient portfolio management purposes or to provide protection against exchange risk or for direct investment purposes, where applicable. Such techniques and instruments are set out in the prospectus and may include futures (which may be used to manage cash flows on a short-term basis by holding the future to gain exposure to an asset class pending direct investment) and swaps, (which may be used to manage interest rate and currency risk). Efficient portfolio management means investment techniques involving transactions that are entered into for one or more of the following specific aims: the reduction of risk, the reduction of cost, or the generation of additional capital or income for a Fund. New techniques and instruments may be developed which may be suitable for use by the Funds and the Manager may, (subject to the conditions and limits laid down by the CBI) employ such techniques and instruments subject to the investment objectives and policies being updated and Unitholders being notified in advance. Where a Fund intends to use these instruments for direct investment purposes, full details will be disclosed in the Fund’s investment policy. Where a Fund intends to engage in transactions in relation to FDIs under any circumstances, the Manager shall employ a Risk Management Process (“RMP”) in accordance with the requirements of the CBI to enable it to monitor, measure and manage, on a continuous basis, the risk to all open derivative positions and their contribution to the overall risk profile of the Fund. The Fund will, on request, provide supplemental information to unitholders relating to the risk management methods employed including the quantitative limits that are applied and any recent developments in the risk and yield characteristics of the main categories of investment. Potential investors should consider the risk factors associated with investment in FDIs as set out in the prospectus before investing in a Fund. The underlying exposure obtained through FDI and at the identity of the counterparties to these FDIs at the financial year end are disclosed on the relevant Fund’s schedule of investments. Securities Lending and Total Return Swaps All securities lending transactions entered into by each Fund are subject to a written legal agreement between each Fund and the securities lending agent, BlackRock Advisors (UK) Limited, a related party to the Entity, and separately between the securities lending agent and the approved borrowing counterparty. Collateral received in exchange for securities lent is transferred under a title transfer arrangement and is delivered to and held in an account with a tri-party collateral manager in the name of the Trustee on behalf of each Fund. Collateral received is segregated from the assets belonging to each Fund’s Trustee or the securities lending agent. All OTC FDIs and total return swaps (including CFDs) are entered into by each Fund under an International Swaps and Derivatives Associations, Inc. Master Agreement (“ISDA Master Agreement”) or similar agreement. An ISDA Master Agreement is a bilateral agreement between the Fund and a counterparty that governs OTC FDIs (including total return swaps and CFDs) entered into by the parties. The parties’ exposures under the ISDA Master Agreement are netted and collateralised together, therefore any collateral disclosures provided are in respect of all OTC FDIs entered into by a Fund under the ISDA Master Agreement, not just total return swaps and CFDs. All collateral received/posted by each Fund under the ISDA Master Agreement is transferred bilaterally under a title transfer arrangement. The collateral received/posted by each Fund under the ISDA Master Agreement in respect of variation margin is transferred bilaterally under a title transfer arrangement. Collateral received by each Fund in respect of variation margin is held in an account in the name of the Trustee on behalf of each Fund. Collateral received is segregated from the assets belonging to the Fund’s Trustee. The collateral posted by the Fund under the ISDA Master Agreement that constitutes the Independent Amount (sometimes referred to as initial margin) is posted by the Fund under a security interest arrangement. The following table details the value of securities on loan as a proportion of each Fund’s total lendable assets and NAV and the value of total return swaps as a proportion of the Fund’s NAV, as at 31 May 2019 and the income/returns earned for the period ended 31 May 2019. Total lendable assets represent the aggregate value of assets forming part of a Fund’s securities lending programme. This excludes any assets held by the Fund that are not considered lendable due to any market, regulatory, investment or other restriction. The value of total return swaps is based on the underlying exposure value on a gross absolute basis.
Fund Currency
Securities on loan Total return swaps
% of lendable
assets % of NAV % of NAV
Total returns earned
‘000 BlackRock Market Advantage Strategy Fund EUR 6.55 1.67 32.32 (22,342)
iShares Developed Real Estate Index Fund (IE) USD 11.50 13.24 – –
iShares Developed World ex Tobacco Index Fund (IE) USD 22.18 22.73 – –
iShares Developed World Index Fund (IE) USD 14.95 14.43 – –
325
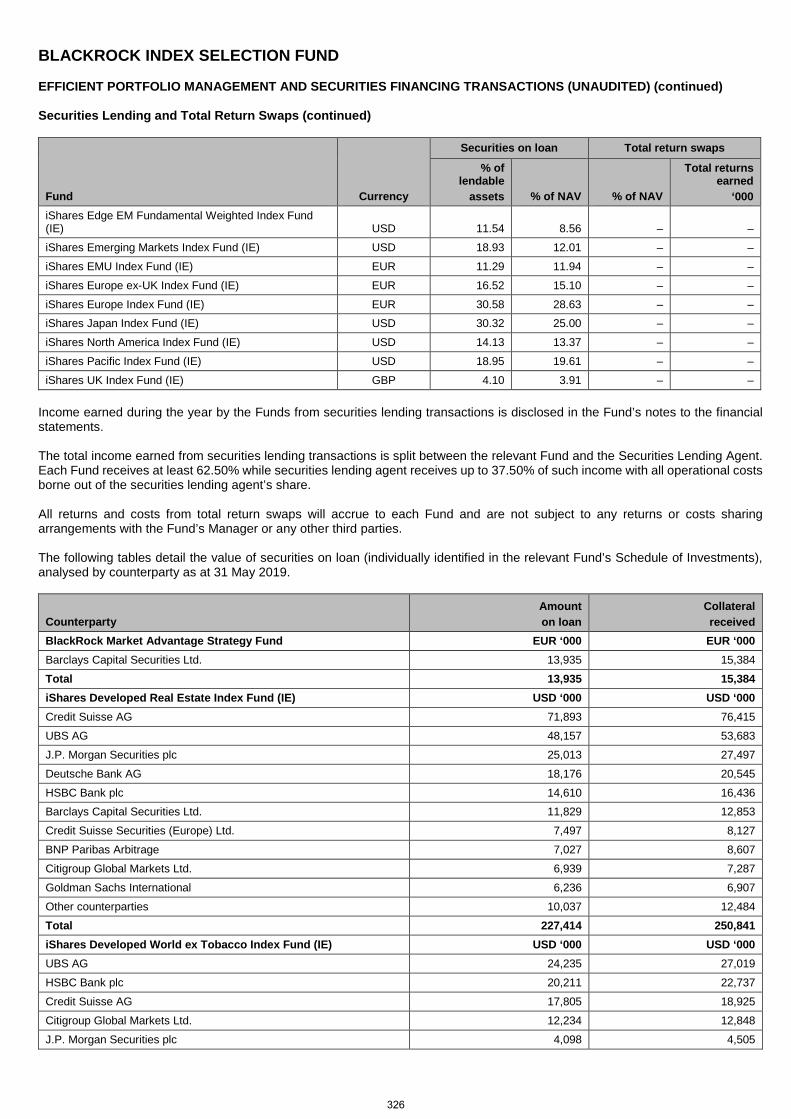
BLACKROCK INDEX SELECTION FUND EFFICIENT PORTFOLIO MANAGEMENT AND SECURITIES FINANCING TRANSACTIONS (UNAUDITED) (continued) Securities Lending and Total Return Swaps (continued)
Fund Currency
Securities on loan Total return swaps
% of lendable
assets % of NAV % of NAV
Total returns earned
‘000 iShares Edge EM Fundamental Weighted Index Fund (IE) USD 11.54 8.56 – –
iShares Emerging Markets Index Fund (IE) USD 18.93 12.01 – –
iShares EMU Index Fund (IE) EUR 11.29 11.94 – –
iShares Europe ex-UK Index Fund (IE) EUR 16.52 15.10 – –
iShares Europe Index Fund (IE) EUR 30.58 28.63 – – iShares Japan Index Fund (IE) USD 30.32 25.00 – –
iShares North America Index Fund (IE) USD 14.13 13.37 – –
iShares Pacific Index Fund (IE) USD 18.95 19.61 – –
iShares UK Index Fund (IE) GBP 4.10 3.91 – – Income earned during the year by the Funds from securities lending transactions is disclosed in the Fund’s notes to the financial statements. The total income earned from securities lending transactions is split between the relevant Fund and the Securities Lending Agent. Each Fund receives at least 62.50% while securities lending agent receives up to 37.50% of such income with all operational costs borne out of the securities lending agent’s share. All returns and costs from total return swaps will accrue to each Fund and are not subject to any returns or costs sharing arrangements with the Fund’s Manager or any other third parties. The following tables detail the value of securities on loan (individually identified in the relevant Fund’s Schedule of Investments), analysed by counterparty as at 31 May 2019.
Counterparty Amount on loan
Collateral received
BlackRock Market Advantage Strategy Fund EUR ‘000 EUR ‘000 Barclays Capital Securities Ltd. 13,935 15,384
Total 13,935 15,384 iShares Developed Real Estate Index Fund (IE) USD ‘000 USD ‘000 Credit Suisse AG 71,893 76,415
UBS AG 48,157 53,683
J.P. Morgan Securities plc 25,013 27,497
Deutsche Bank AG 18,176 20,545
HSBC Bank plc 14,610 16,436 Barclays Capital Securities Ltd. 11,829 12,853
Credit Suisse Securities (Europe) Ltd. 7,497 8,127
BNP Paribas Arbitrage 7,027 8,607
Citigroup Global Markets Ltd. 6,939 7,287
Goldman Sachs International 6,236 6,907
Other counterparties 10,037 12,484
Total 227,414 250,841 iShares Developed World ex Tobacco Index Fund (IE) USD ‘000 USD ‘000 UBS AG 24,235 27,019 HSBC Bank plc 20,211 22,737 Credit Suisse AG 17,805 18,925 Citigroup Global Markets Ltd. 12,234 12,848 J.P. Morgan Securities plc 4,098 4,505
326
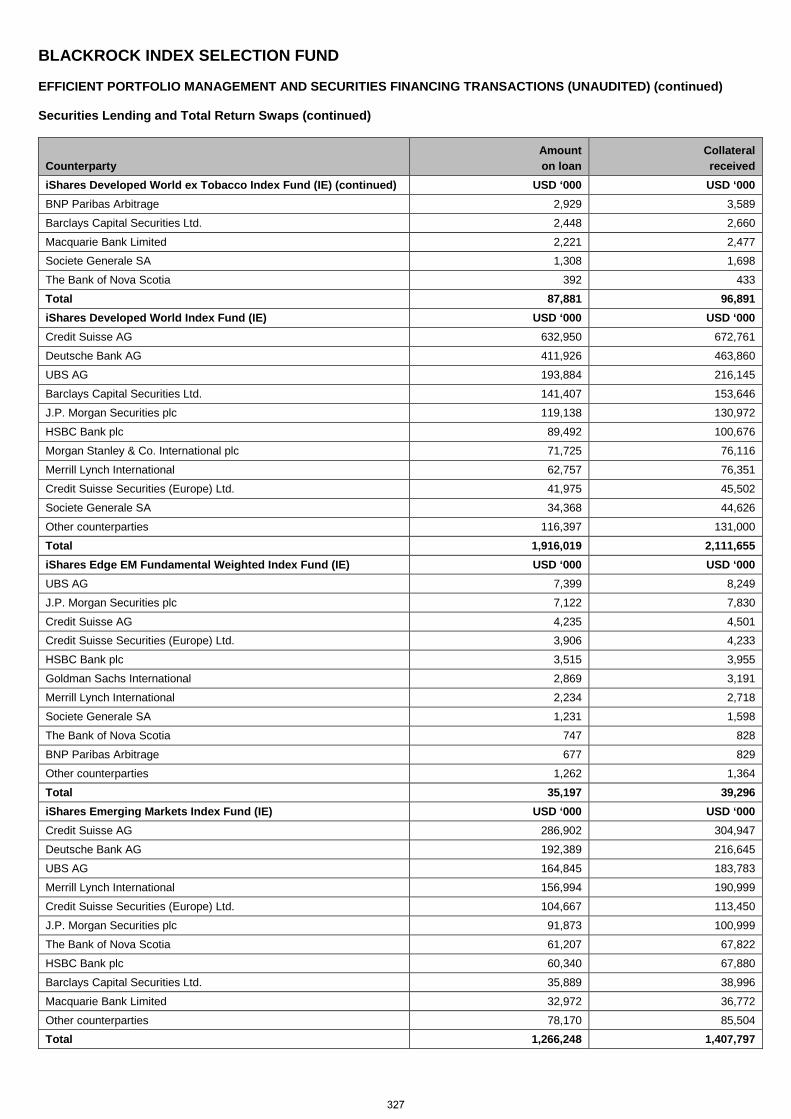
BLACKROCK INDEX SELECTION FUND EFFICIENT PORTFOLIO MANAGEMENT AND SECURITIES FINANCING TRANSACTIONS (UNAUDITED) (continued) Securities Lending and Total Return Swaps (continued)
Counterparty Amount on loan
Collateral received
iShares Developed World ex Tobacco Index Fund (IE) (continued) USD ‘000 USD ‘000 BNP Paribas Arbitrage 2,929 3,589
Barclays Capital Securities Ltd. 2,448 2,660
Macquarie Bank Limited 2,221 2,477 Societe Generale SA 1,308 1,698
The Bank of Nova Scotia 392 433
Total 87,881 96,891 iShares Developed World Index Fund (IE) USD ‘000 USD ‘000 Credit Suisse AG 632,950 672,761
Deutsche Bank AG 411,926 463,860
UBS AG 193,884 216,145
Barclays Capital Securities Ltd. 141,407 153,646
J.P. Morgan Securities plc 119,138 130,972
HSBC Bank plc 89,492 100,676
Morgan Stanley & Co. International plc 71,725 76,116
Merrill Lynch International 62,757 76,351
Credit Suisse Securities (Europe) Ltd. 41,975 45,502
Societe Generale SA 34,368 44,626
Other counterparties 116,397 131,000
Total 1,916,019 2,111,655 iShares Edge EM Fundamental Weighted Index Fund (IE) USD ‘000 USD ‘000 UBS AG 7,399 8,249
J.P. Morgan Securities plc 7,122 7,830
Credit Suisse AG 4,235 4,501 Credit Suisse Securities (Europe) Ltd. 3,906 4,233
HSBC Bank plc 3,515 3,955
Goldman Sachs International 2,869 3,191
Merrill Lynch International 2,234 2,718
Societe Generale SA 1,231 1,598
The Bank of Nova Scotia 747 828
BNP Paribas Arbitrage 677 829
Other counterparties 1,262 1,364
Total 35,197 39,296 iShares Emerging Markets Index Fund (IE) USD ‘000 USD ‘000 Credit Suisse AG 286,902 304,947
Deutsche Bank AG 192,389 216,645
UBS AG 164,845 183,783
Merrill Lynch International 156,994 190,999
Credit Suisse Securities (Europe) Ltd. 104,667 113,450
J.P. Morgan Securities plc 91,873 100,999
The Bank of Nova Scotia 61,207 67,822
HSBC Bank plc 60,340 67,880
Barclays Capital Securities Ltd. 35,889 38,996
Macquarie Bank Limited 32,972 36,772
Other counterparties 78,170 85,504 Total 1,266,248 1,407,797
327
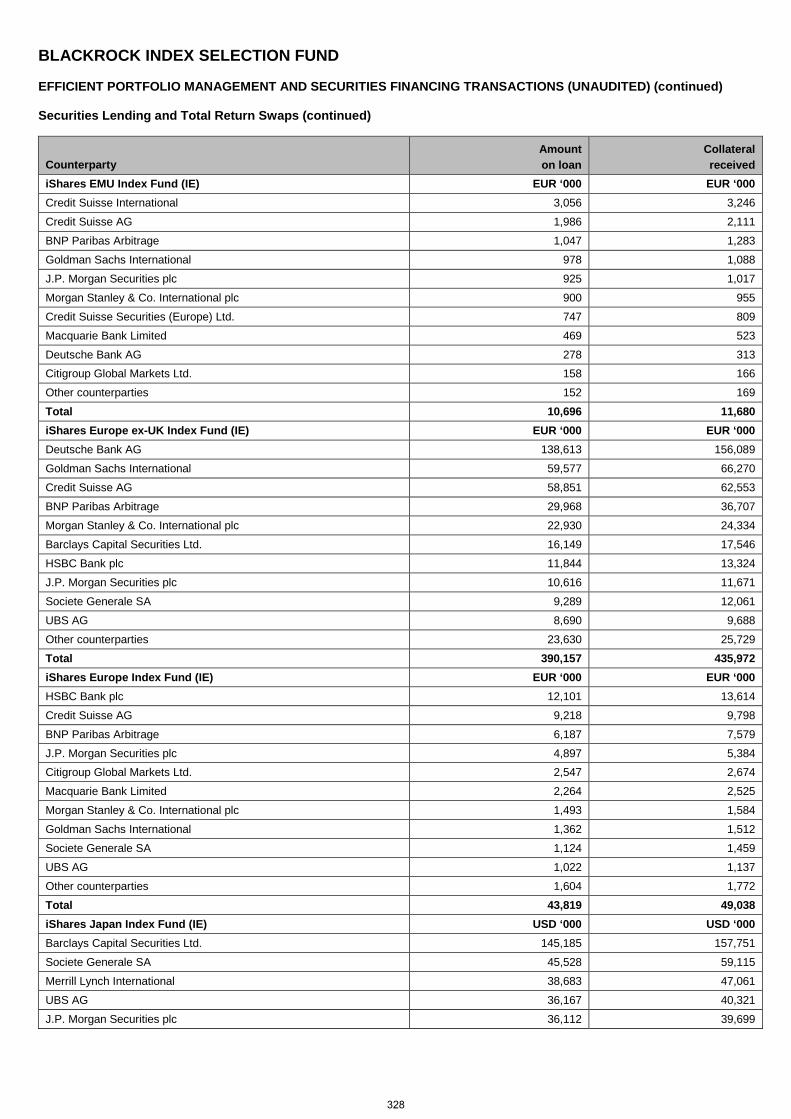
BLACKROCK INDEX SELECTION FUND EFFICIENT PORTFOLIO MANAGEMENT AND SECURITIES FINANCING TRANSACTIONS (UNAUDITED) (continued) Securities Lending and Total Return Swaps (continued)
Counterparty Amount on loan
Collateral received
iShares EMU Index Fund (IE) EUR ‘000 EUR ‘000 Credit Suisse International 3,056 3,246
Credit Suisse AG 1,986 2,111
BNP Paribas Arbitrage 1,047 1,283
Goldman Sachs International 978 1,088
J.P. Morgan Securities plc 925 1,017
Morgan Stanley & Co. International plc 900 955
Credit Suisse Securities (Europe) Ltd. 747 809
Macquarie Bank Limited 469 523
Deutsche Bank AG 278 313 Citigroup Global Markets Ltd. 158 166
Other counterparties 152 169
Total 10,696 11,680 iShares Europe ex-UK Index Fund (IE) EUR ‘000 EUR ‘000 Deutsche Bank AG 138,613 156,089
Goldman Sachs International 59,577 66,270
Credit Suisse AG 58,851 62,553
BNP Paribas Arbitrage 29,968 36,707
Morgan Stanley & Co. International plc 22,930 24,334
Barclays Capital Securities Ltd. 16,149 17,546
HSBC Bank plc 11,844 13,324
J.P. Morgan Securities plc 10,616 11,671
Societe Generale SA 9,289 12,061
UBS AG 8,690 9,688
Other counterparties 23,630 25,729
Total 390,157 435,972 iShares Europe Index Fund (IE) EUR ‘000 EUR ‘000
HSBC Bank plc 12,101 13,614
Credit Suisse AG 9,218 9,798
BNP Paribas Arbitrage 6,187 7,579
J.P. Morgan Securities plc 4,897 5,384 Citigroup Global Markets Ltd. 2,547 2,674
Macquarie Bank Limited 2,264 2,525
Morgan Stanley & Co. International plc 1,493 1,584
Goldman Sachs International 1,362 1,512
Societe Generale SA 1,124 1,459
UBS AG 1,022 1,137
Other counterparties 1,604 1,772
Total 43,819 49,038 iShares Japan Index Fund (IE) USD ‘000 USD ‘000 Barclays Capital Securities Ltd. 145,185 157,751
Societe Generale SA 45,528 59,115
Merrill Lynch International 38,683 47,061
UBS AG 36,167 40,321
J.P. Morgan Securities plc 36,112 39,699
328
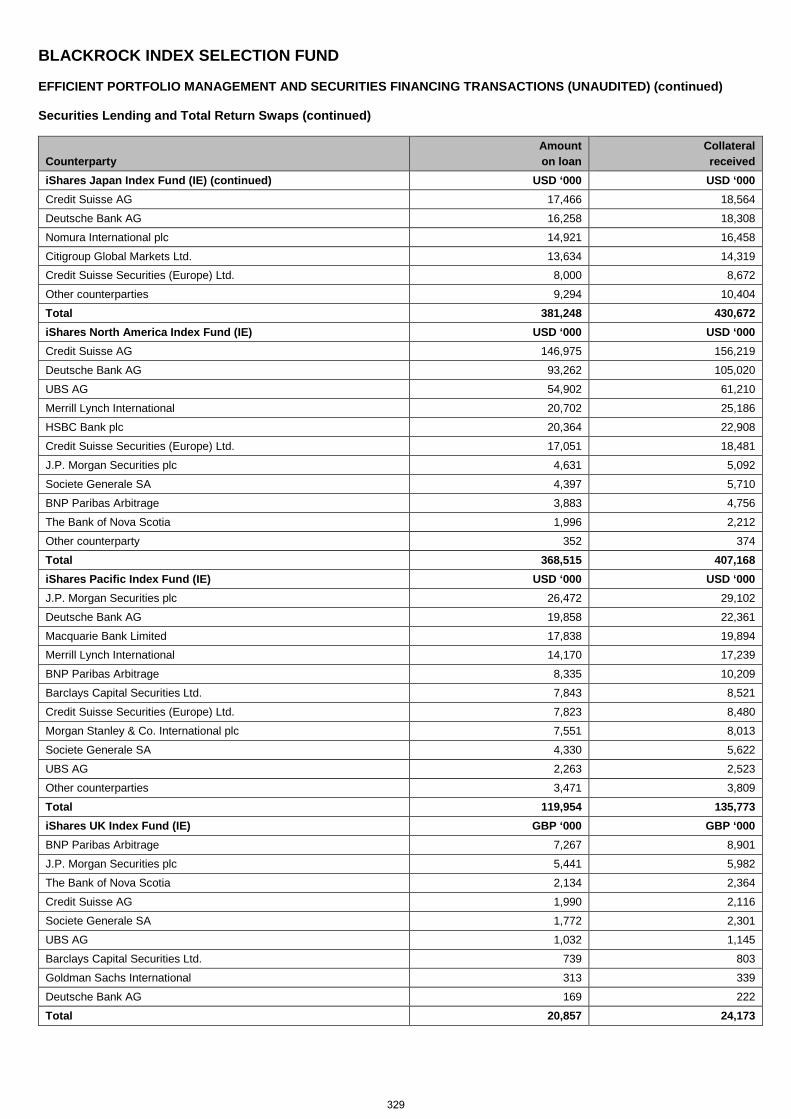
BLACKROCK INDEX SELECTION FUND EFFICIENT PORTFOLIO MANAGEMENT AND SECURITIES FINANCING TRANSACTIONS (UNAUDITED) (continued) Securities Lending and Total Return Swaps (continued)
Counterparty Amount on loan
Collateral received
iShares Japan Index Fund (IE) (continued) USD ‘000 USD ‘000 Credit Suisse AG 17,466 18,564
Deutsche Bank AG 16,258 18,308
Nomura International plc 14,921 16,458
Citigroup Global Markets Ltd. 13,634 14,319 Credit Suisse Securities (Europe) Ltd. 8,000 8,672
Other counterparties 9,294 10,404
Total 381,248 430,672 iShares North America Index Fund (IE) USD ‘000 USD ‘000
Credit Suisse AG 146,975 156,219
Deutsche Bank AG 93,262 105,020
UBS AG 54,902 61,210
Merrill Lynch International 20,702 25,186
HSBC Bank plc 20,364 22,908
Credit Suisse Securities (Europe) Ltd. 17,051 18,481
J.P. Morgan Securities plc 4,631 5,092
Societe Generale SA 4,397 5,710
BNP Paribas Arbitrage 3,883 4,756
The Bank of Nova Scotia 1,996 2,212
Other counterparty 352 374
Total 368,515 407,168 iShares Pacific Index Fund (IE) USD ‘000 USD ‘000
J.P. Morgan Securities plc 26,472 29,102
Deutsche Bank AG 19,858 22,361
Macquarie Bank Limited 17,838 19,894 Merrill Lynch International 14,170 17,239
BNP Paribas Arbitrage 8,335 10,209
Barclays Capital Securities Ltd. 7,843 8,521
Credit Suisse Securities (Europe) Ltd. 7,823 8,480
Morgan Stanley & Co. International plc 7,551 8,013
Societe Generale SA 4,330 5,622
UBS AG 2,263 2,523
Other counterparties 3,471 3,809
Total 119,954 135,773 iShares UK Index Fund (IE) GBP ‘000 GBP ‘000
BNP Paribas Arbitrage 7,267 8,901
J.P. Morgan Securities plc 5,441 5,982
The Bank of Nova Scotia 2,134 2,364
Credit Suisse AG 1,990 2,116
Societe Generale SA 1,772 2,301
UBS AG 1,032 1,145
Barclays Capital Securities Ltd. 739 803
Goldman Sachs International 313 339
Deutsche Bank AG 169 222
Total 20,857 24,173
329
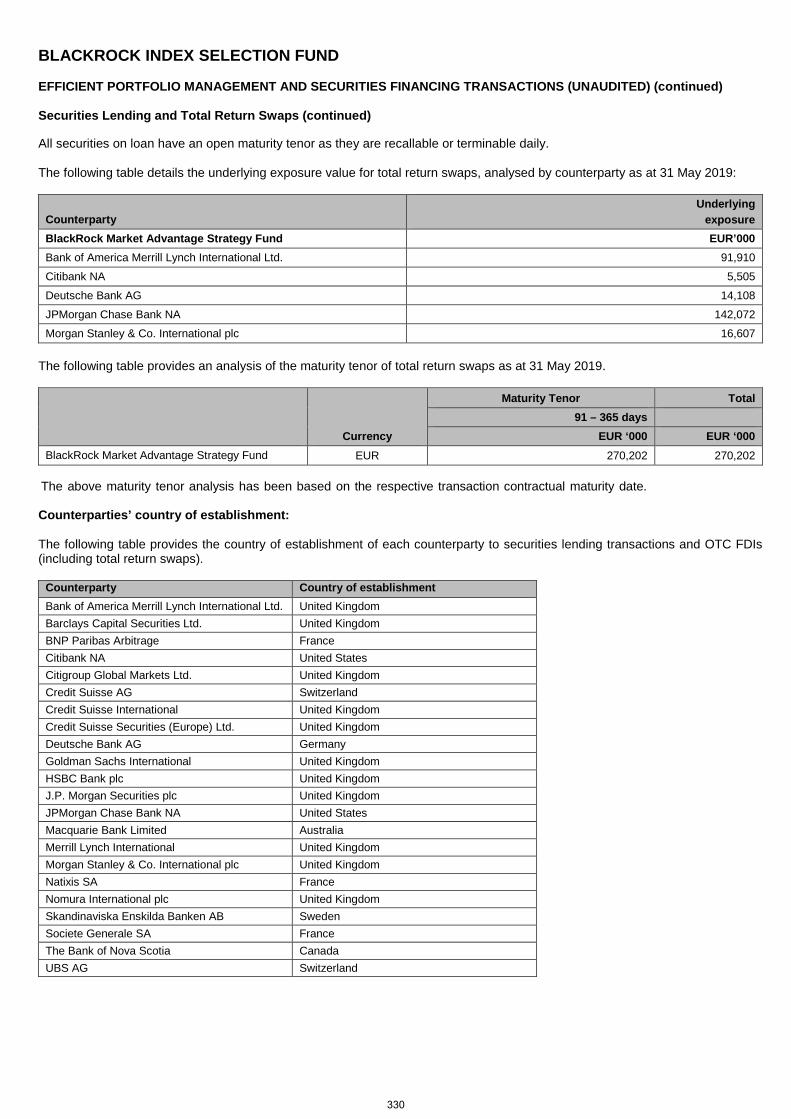
BLACKROCK INDEX SELECTION FUND EFFICIENT PORTFOLIO MANAGEMENT AND SECURITIES FINANCING TRANSACTIONS (UNAUDITED) (continued) Securities Lending and Total Return Swaps (continued)
All securities on loan have an open maturity tenor as they are recallable or terminable daily. The following table details the underlying exposure value for total return swaps, analysed by counterparty as at 31 May 2019:
Counterparty Underlying
exposure BlackRock Market Advantage Strategy Fund EUR’000 Bank of America Merrill Lynch International Ltd. 91,910
Citibank NA 5,505
Deutsche Bank AG 14,108
JPMorgan Chase Bank NA 142,072
Morgan Stanley & Co. International plc 16,607 The following table provides an analysis of the maturity tenor of total return swaps as at 31 May 2019.
Currency
Maturity Tenor Total 91 – 365 days
EUR ‘000 EUR ‘000
BlackRock Market Advantage Strategy Fund EUR 270,202 270,202 The above maturity tenor analysis has been based on the respective transaction contractual maturity date. Counterparties’ country of establishment: The following table provides the country of establishment of each counterparty to securities lending transactions and OTC FDIs (including total return swaps).
Counterparty
Country of establishment
Bank of America Merrill Lynch International Ltd. United Kingdom Barclays Capital Securities Ltd. United Kingdom BNP Paribas Arbitrage France Citibank NA United States Citigroup Global Markets Ltd. United Kingdom Credit Suisse AG Switzerland Credit Suisse International United Kingdom Credit Suisse Securities (Europe) Ltd. United Kingdom Deutsche Bank AG Germany Goldman Sachs International United Kingdom HSBC Bank plc United Kingdom J.P. Morgan Securities plc United Kingdom JPMorgan Chase Bank NA United States Macquarie Bank Limited Australia Merrill Lynch International United Kingdom Morgan Stanley & Co. International plc United Kingdom Natixis SA France Nomura International plc United Kingdom Skandinaviska Enskilda Banken AB Sweden Societe Generale SA France The Bank of Nova Scotia Canada UBS AG Switzerland
330
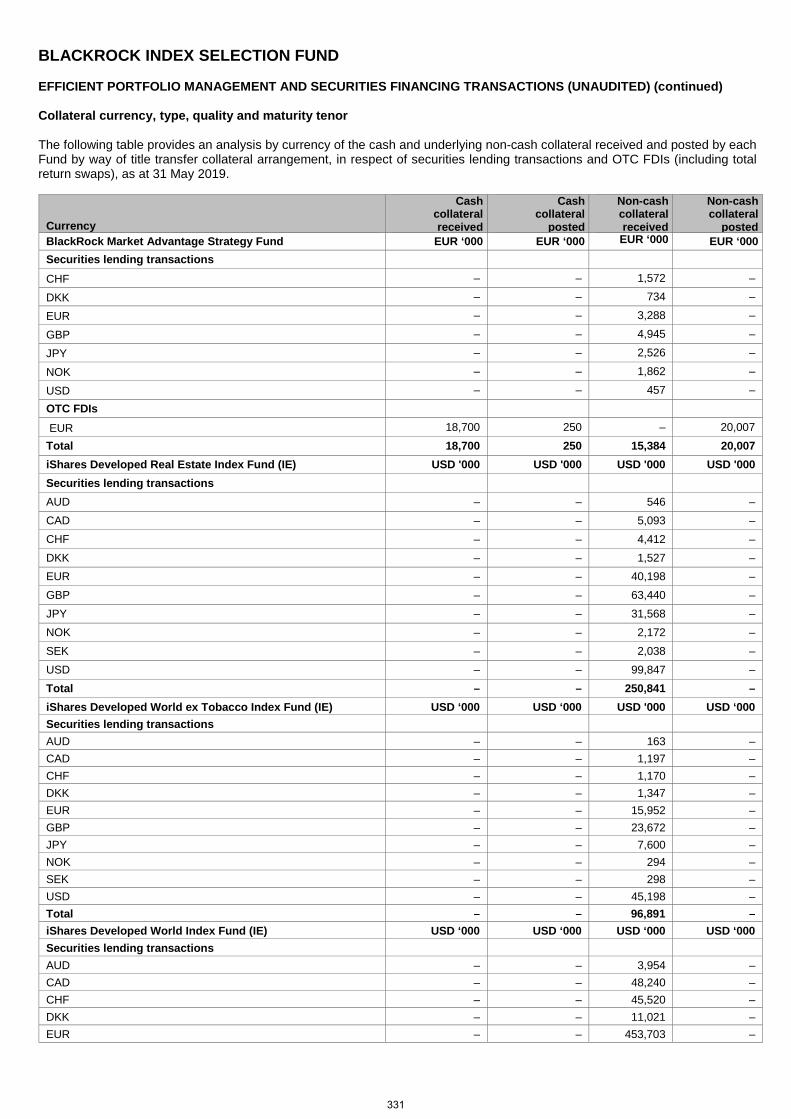
BLACKROCK INDEX SELECTION FUND EFFICIENT PORTFOLIO MANAGEMENT AND SECURITIES FINANCING TRANSACTIONS (UNAUDITED) (continued) Collateral currency, type, quality and maturity tenor The following table provides an analysis by currency of the cash and underlying non-cash collateral received and posted by each Fund by way of title transfer collateral arrangement, in respect of securities lending transactions and OTC FDIs (including total return swaps), as at 31 May 2019.
Currency
Cash collateral received
Cash collateral
posted
Non-cash collateral
received
Non-cash collateral
posted BlackRock Market Advantage Strategy Fund EUR ‘000 EUR ‘000 EUR ‘000 EUR ‘000 Securities lending transactions
CHF – – 1,572 –
DKK – – 734 –
EUR – – 3,288 –
GBP – – 4,945 –
JPY – – 2,526 –
NOK – – 1,862 –
USD – – 457 – OTC FDIs EUR 18,700 250 – 20,007 Total 18,700 250 15,384 20,007 iShares Developed Real Estate Index Fund (IE) USD '000 USD '000 USD '000 USD '000 Securities lending transactions AUD – – 546 – CAD – – 5,093 – CHF – – 4,412 – DKK – – 1,527 – EUR – – 40,198 – GBP – – 63,440 – JPY – – 31,568 – NOK – – 2,172 – SEK – – 2,038 – USD – – 99,847 – Total – – 250,841 – iShares Developed World ex Tobacco Index Fund (IE) USD ‘000 USD ‘000 USD '000 USD ‘000 Securities lending transactions AUD – – 163 – CAD – – 1,197 – CHF – – 1,170 – DKK – – 1,347 – EUR – – 15,952 – GBP – – 23,672 – JPY – – 7,600 – NOK – – 294 – SEK – – 298 – USD – – 45,198 – Total – – 96,891 – iShares Developed World Index Fund (IE) USD ‘000 USD ‘000 USD ‘000 USD ‘000 Securities lending transactions AUD – – 3,954 – CAD – – 48,240 – CHF – – 45,520 – DKK – – 11,021 – EUR – – 453,703 –
331
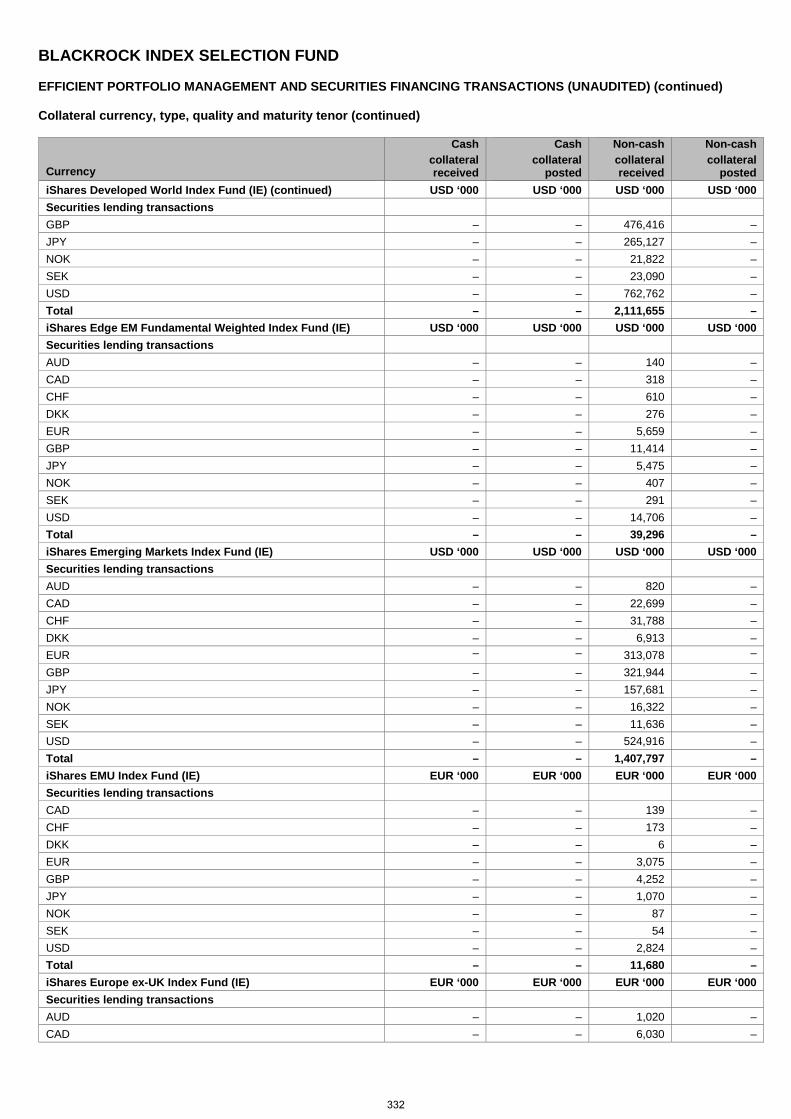
BLACKROCK INDEX SELECTION FUND EFFICIENT PORTFOLIO MANAGEMENT AND SECURITIES FINANCING TRANSACTIONS (UNAUDITED) (continued) Collateral currency, type, quality and maturity tenor (continued)
Currency
Cash collateral received
Cash collateral
posted
Non-cash collateral
received
Non-cash collateral
posted iShares Developed World Index Fund (IE) (continued) USD ‘000 USD ‘000 USD ‘000 USD ‘000 Securities lending transactions GBP – – 476,416 – JPY – – 265,127 – NOK – – 21,822 – SEK – – 23,090 – USD – – 762,762 – Total – – 2,111,655 – iShares Edge EM Fundamental Weighted Index Fund (IE) USD ‘000 USD ‘000 USD ‘000 USD ‘000 Securities lending transactions AUD – – 140 – CAD – – 318 – CHF – – 610 – DKK – – 276 – EUR – – 5,659 – GBP – – 11,414 – JPY – – 5,475 – NOK – – 407 – SEK – – 291 – USD – – 14,706 – Total – – 39,296 – iShares Emerging Markets Index Fund (IE) USD ‘000 USD ‘000 USD ‘000 USD ‘000 Securities lending transactions AUD – – 820 – CAD – – 22,699 – CHF – – 31,788 – DKK – – 6,913 – EUR – – 313,078 – GBP – – 321,944 – JPY – – 157,681 – NOK – – 16,322 – SEK – – 11,636 – USD – – 524,916 – Total – – 1,407,797 – iShares EMU Index Fund (IE) EUR ‘000 EUR ‘000 EUR ‘000 EUR ‘000 Securities lending transactions CAD – – 139 – CHF – – 173 – DKK – – 6 – EUR – – 3,075 – GBP – – 4,252 – JPY – – 1,070 – NOK – – 87 – SEK – – 54 – USD – – 2,824 – Total – – 11,680 – iShares Europe ex-UK Index Fund (IE) EUR ‘000
EUR ‘000 EUR ‘000 EUR ‘000
Securities lending transactions AUD – – 1,020 – CAD – – 6,030 –
332
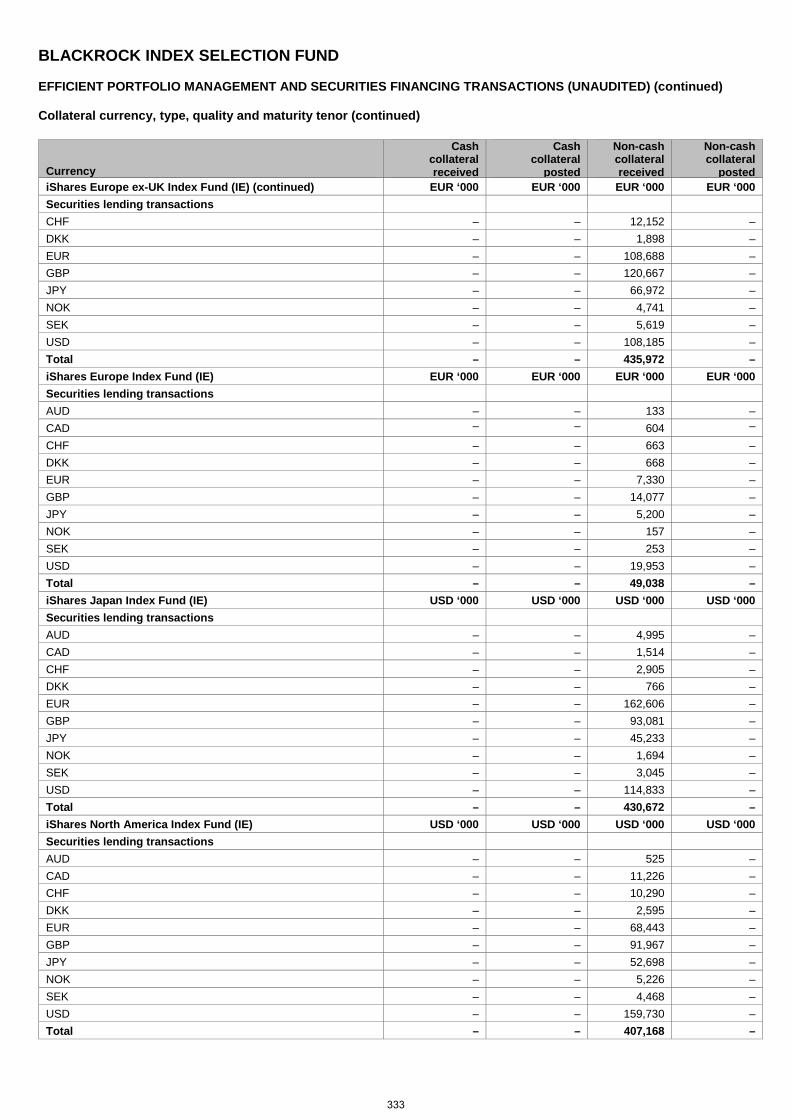
BLACKROCK INDEX SELECTION FUND EFFICIENT PORTFOLIO MANAGEMENT AND SECURITIES FINANCING TRANSACTIONS (UNAUDITED) (continued) Collateral currency, type, quality and maturity tenor (continued)
Currency
Cash collateral received
Cash collateral
posted
Non-cash collateral
received
Non-cash collateral
posted iShares Europe ex-UK Index Fund (IE) (continued) EUR ‘000
EUR ‘000 EUR ‘000 EUR ‘000
Securities lending transactions CHF – – 12,152 – DKK – – 1,898 – EUR – – 108,688 – GBP – – 120,667 – JPY – – 66,972 – NOK – – 4,741 – SEK – – 5,619 – USD – – 108,185 – Total – – 435,972 – iShares Europe Index Fund (IE) EUR ‘000
EUR ‘000 EUR ‘000 EUR ‘000
Securities lending transactions AUD – – 133 – CAD – – 604 – CHF – – 663 – DKK – – 668 – EUR – – 7,330 – GBP – – 14,077 – JPY – – 5,200 – NOK – – 157 – SEK – – 253 – USD – – 19,953 – Total – – 49,038 – iShares Japan Index Fund (IE) USD ‘000
USD ‘000 USD ‘000 USD ‘000
Securities lending transactions AUD – – 4,995 – CAD – – 1,514 – CHF – – 2,905 – DKK – – 766 – EUR – – 162,606 – GBP – – 93,081 – JPY – – 45,233 – NOK – – 1,694 – SEK – – 3,045 – USD – – 114,833 – Total – – 430,672 – iShares North America Index Fund (IE) USD ‘000
USD ‘000 USD ‘000 USD ‘000
Securities lending transactions AUD – – 525 – CAD – – 11,226 – CHF – – 10,290 – DKK – – 2,595 – EUR – – 68,443 – GBP – – 91,967 – JPY – – 52,698 – NOK – – 5,226 – SEK – – 4,468 – USD – – 159,730 – Total – – 407,168 –
333
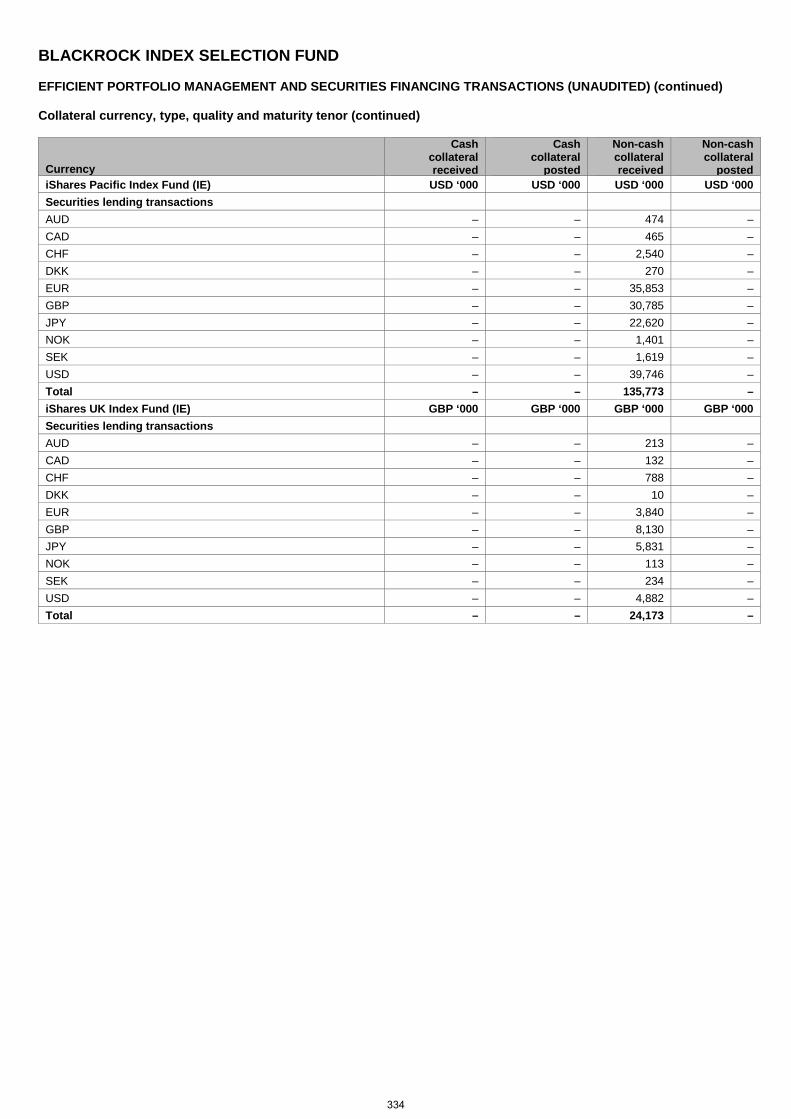
BLACKROCK INDEX SELECTION FUND EFFICIENT PORTFOLIO MANAGEMENT AND SECURITIES FINANCING TRANSACTIONS (UNAUDITED) (continued) Collateral currency, type, quality and maturity tenor (continued)
Currency
Cash collateral received
Cash collateral
posted
Non-cash collateral
received
Non-cash collateral
posted iShares Pacific Index Fund (IE) USD ‘000
USD ‘000 USD ‘000 USD ‘000
Securities lending transactions AUD – – 474 – CAD – – 465 – CHF – – 2,540 – DKK – – 270 – EUR – – 35,853 – GBP – – 30,785 – JPY – – 22,620 – NOK – – 1,401 – SEK – – 1,619 – USD – – 39,746 – Total – – 135,773 – iShares UK Index Fund (IE) GBP ‘000
GBP ‘000 GBP ‘000 GBP ‘000
Securities lending transactions AUD – – 213 – CAD – – 132 – CHF – – 788 – DKK – – 10 – EUR – – 3,840 – GBP – – 8,130 – JPY – – 5,831 – NOK – – 113 – SEK – – 234 – USD – – 4,882 – Total – – 24,173 –
334
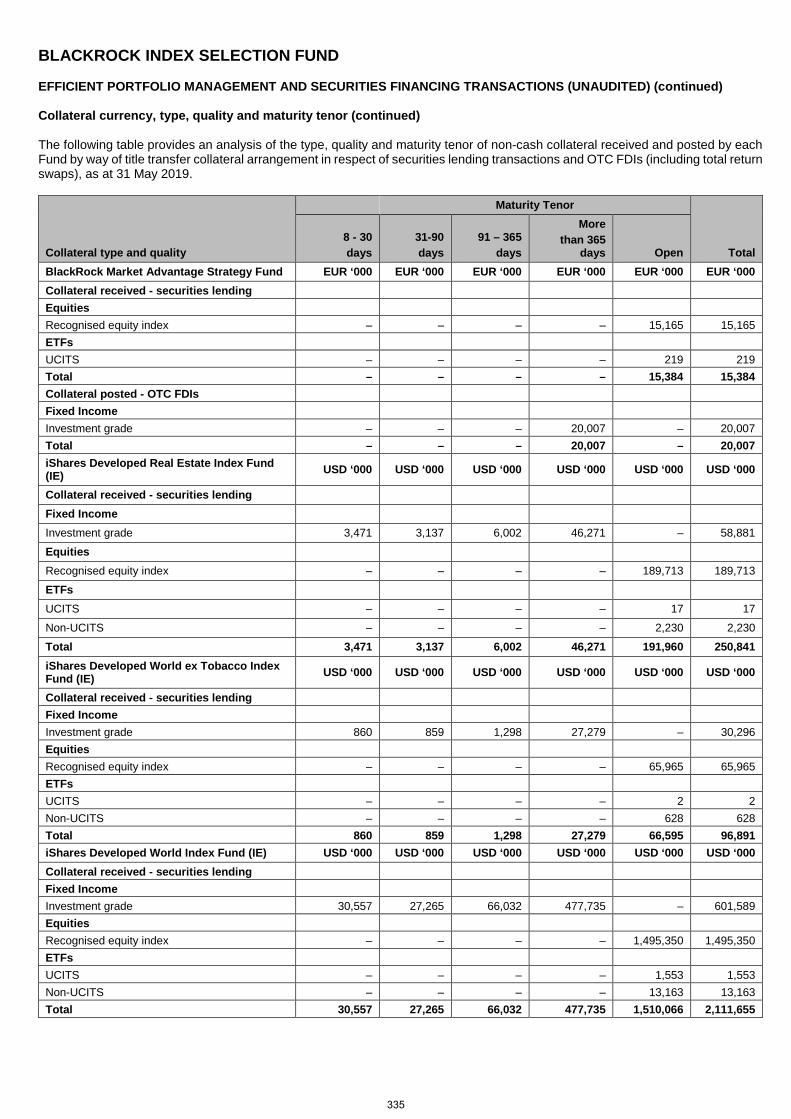
BLACKROCK INDEX SELECTION FUND EFFICIENT PORTFOLIO MANAGEMENT AND SECURITIES FINANCING TRANSACTIONS (UNAUDITED) (continued) Collateral currency, type, quality and maturity tenor (continued) The following table provides an analysis of the type, quality and maturity tenor of non-cash collateral received and posted by each Fund by way of title transfer collateral arrangement in respect of securities lending transactions and OTC FDIs (including total return swaps), as at 31 May 2019.
Collateral type and quality
Maturity Tenor
Total 8 - 30 days
31-90 days
91 – 365 days
More than 365
days Open BlackRock Market Advantage Strategy Fund EUR ‘000 EUR ‘000 EUR ‘000 EUR ‘000 EUR ‘000 EUR ‘000 Collateral received - securities lending Equities Recognised equity index – – – – 15,165 15,165 ETFs UCITS –
– – – 219 219
Total – – – – 15,384 15,384 Collateral posted - OTC FDIs Fixed Income Investment grade – – – 20,007 – 20,007 Total – – – 20,007 – 20,007 iShares Developed Real Estate Index Fund (IE) USD ‘000 USD ‘000 USD ‘000 USD ‘000 USD ‘000 USD ‘000
Collateral received - securities lending Fixed Income
Investment grade 3,471 3,137 6,002 46,271 – 58,881
Equities
Recognised equity index – – – – 189,713 189,713
ETFs
UCITS – – – – 17 17
Non-UCITS – – – – 2,230 2,230
Total 3,471 3,137 6,002 46,271 191,960 250,841 iShares Developed World ex Tobacco Index Fund (IE) USD ‘000 USD ‘000 USD ‘000 USD ‘000 USD ‘000 USD ‘000
Collateral received - securities lending Fixed Income Investment grade 860 859 1,298 27,279 – 30,296 Equities Recognised equity index – – – – 65,965 65,965 ETFs UCITS – – – – 2 2 Non-UCITS – – – – 628 628 Total 860 859 1,298 27,279 66,595 96,891 iShares Developed World Index Fund (IE) USD ‘000 USD ‘000 USD ‘000 USD ‘000 USD ‘000 USD ‘000 Collateral received - securities lending Fixed Income Investment grade 30,557 27,265 66,032 477,735 – 601,589 Equities Recognised equity index – – – – 1,495,350 1,495,350 ETFs UCITS – – – – 1,553 1,553 Non-UCITS – – – – 13,163 13,163 Total 30,557 27,265 66,032 477,735 1,510,066 2,111,655
335
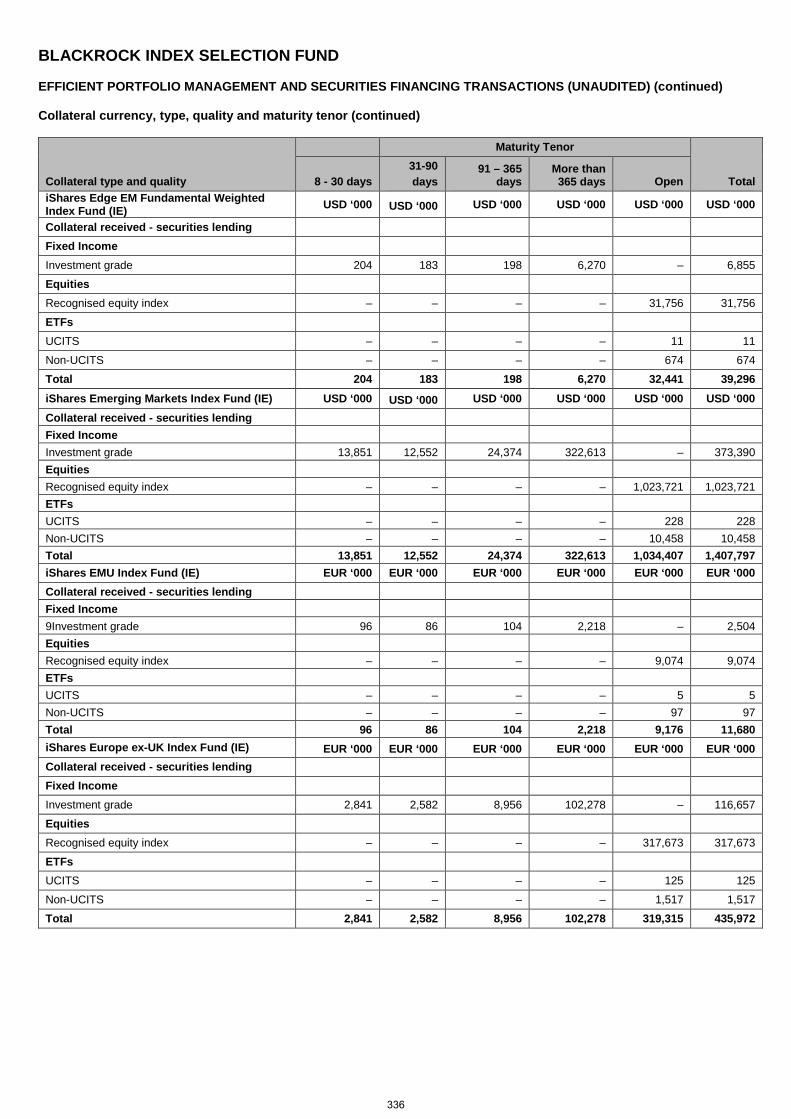
BLACKROCK INDEX SELECTION FUND EFFICIENT PORTFOLIO MANAGEMENT AND SECURITIES FINANCING TRANSACTIONS (UNAUDITED) (continued) Collateral currency, type, quality and maturity tenor (continued)
Collateral type and quality
Maturity Tenor
Total 8 - 30 days 31-90 days
91 – 365 days
More than 365 days Open
iShares Edge EM Fundamental Weighted Index Fund (IE) USD ‘000 USD ‘000 USD ‘000 USD ‘000 USD ‘000 USD ‘000
Collateral received - securities lending Fixed Income
Investment grade 204 183 198 6,270 – 6,855
Equities
Recognised equity index – – – – 31,756 31,756
ETFs
UCITS – – – – 11 11
Non-UCITS – – – – 674 674
Total 204 183 198 6,270 32,441 39,296 iShares Emerging Markets Index Fund (IE) USD ‘000 USD ‘000 USD ‘000 USD ‘000 USD ‘000 USD ‘000 Collateral received - securities lending Fixed Income Investment grade 13,851 12,552 24,374 322,613 – 373,390 Equities Recognised equity index – – – – 1,023,721 1,023,721 ETFs UCITS – – – – 228 228 Non-UCITS – – – – 10,458 10,458 Total 13,851 12,552 24,374 322,613 1,034,407 1,407,797 iShares EMU Index Fund (IE) EUR ‘000 EUR ‘000 EUR ‘000 EUR ‘000 EUR ‘000 EUR ‘000 Collateral received - securities lending Fixed Income 9Investment grade 96 86 104 2,218 – 2,504 Equities Recognised equity index – – – – 9,074 9,074 ETFs UCITS – – – – 5 5 Non-UCITS – – – – 97 97 Total 96 86 104 2,218 9,176 11,680 iShares Europe ex-UK Index Fund (IE) EUR ‘000 EUR ‘000 EUR ‘000 EUR ‘000 EUR ‘000 EUR ‘000 Collateral received - securities lending Fixed Income
Investment grade 2,841 2,582 8,956 102,278 – 116,657
Equities
Recognised equity index – – – – 317,673 317,673
ETFs UCITS – – – – 125 125
Non-UCITS – – – – 1,517 1,517
Total 2,841 2,582 8,956 102,278 319,315 435,972
336

BLACKROCK INDEX SELECTION FUND EFFICIENT PORTFOLIO MANAGEMENT AND SECURITIES FINANCING TRANSACTIONS (UNAUDITED) (continued) Collateral currency, type, quality and maturity tenor (continued)
Collateral type and quality
Maturity Tenor
Total 8 - 30 days 31-90 days
91 – 365 days
More than 365 days Open
iShares Europe Index Fund (IE) EUR ‘000 EUR ‘000 EUR ‘000 EUR ‘000 EUR ‘000 EUR ‘000
Collateral received - securities lending Fixed Income Investment grade 445 415 614 12,667 – 14,141 Equities Recognised equity index – – – – 34,321 34,321 ETFs UCITS – – – – 8 8 Non-UCITS – – – – 568 568 Total 445 415 614 12,667 34,897 49,038 iShares Japan Index Fund (IE) USD ‘000 USD ‘000 USD ‘000 USD ‘000 USD ‘000 USD ‘000 Collateral received - securities lending Fixed Income Investment grade 843 855 29,691 182,481 – 213,870 Equities Recognised equity index – – – – 213,466 213,466 ETFs UCITS – – – – 68 68 Non-UCITS – – – – 3,268 3,268 Total 843 855 29,691 182,481 216,802 430,672 iShares North America Index Fund (IE) USD ‘000 USD ‘000 USD ‘000 USD ‘000 USD ‘000 USD ‘000 Collateral received - securities lending Fixed Income
Investment grade 7,096 6,303 8,724 65,375 – 87,498
Equities
Recognised equity index – – – – 318,407 318,407
ETFs
UCITS – – – – 34 34
Non-UCITS – – – – 1,229 1,229
Total 7,096 6,303 8,724 65,375 319,670 407,168 iShares Pacific Index Fund (IE) USD ‘000 USD ‘000 USD ‘000 USD ‘000 USD ‘000 USD ‘000 Collateral received - securities lending Fixed Income
Investment grade 65 58 2,072 29,664 – 31,859
Equities
Recognised equity index – – – – 101,664 101,664
ETFs
UCITS – – – – 52 52
Non-UCITS – – – – 2,198 2,198
Total 65 58 2,072 29,664 103,914 135,773
337
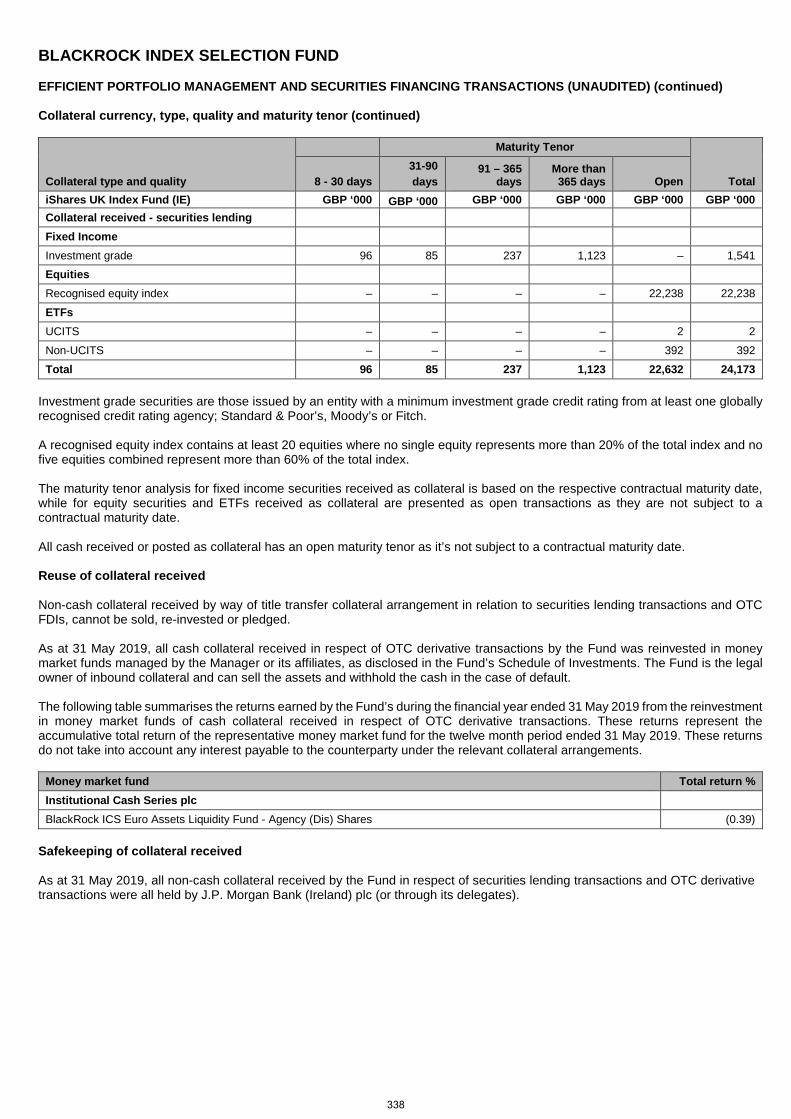
BLACKROCK INDEX SELECTION FUND EFFICIENT PORTFOLIO MANAGEMENT AND SECURITIES FINANCING TRANSACTIONS (UNAUDITED) (continued) Collateral currency, type, quality and maturity tenor (continued)
Collateral type and quality
Maturity Tenor
Total 8 - 30 days 31-90 days
91 – 365 days
More than 365 days Open
iShares UK Index Fund (IE) GBP ‘000 GBP ‘000 GBP ‘000 GBP ‘000 GBP ‘000 GBP ‘000 Collateral received - securities lending Fixed Income
Investment grade 96 85 237 1,123 – 1,541 Equities
Recognised equity index – – – – 22,238 22,238
ETFs
UCITS – – – – 2 2
Non-UCITS – – – – 392 392
Total 96 85 237 1,123 22,632 24,173 Investment grade securities are those issued by an entity with a minimum investment grade credit rating from at least one globally recognised credit rating agency; Standard & Poor’s, Moody’s or Fitch. A recognised equity index contains at least 20 equities where no single equity represents more than 20% of the total index and no five equities combined represent more than 60% of the total index. The maturity tenor analysis for fixed income securities received as collateral is based on the respective contractual maturity date, while for equity securities and ETFs received as collateral are presented as open transactions as they are not subject to a contractual maturity date. All cash received or posted as collateral has an open maturity tenor as it’s not subject to a contractual maturity date. Reuse of collateral received Non-cash collateral received by way of title transfer collateral arrangement in relation to securities lending transactions and OTC FDIs, cannot be sold, re-invested or pledged. As at 31 May 2019, all cash collateral received in respect of OTC derivative transactions by the Fund was reinvested in money market funds managed by the Manager or its affiliates, as disclosed in the Fund’s Schedule of Investments. The Fund is the legal owner of inbound collateral and can sell the assets and withhold the cash in the case of default. The following table summarises the returns earned by the Fund’s during the financial year ended 31 May 2019 from the reinvestment in money market funds of cash collateral received in respect of OTC derivative transactions. These returns represent the accumulative total return of the representative money market fund for the twelve month period ended 31 May 2019. These returns do not take into account any interest payable to the counterparty under the relevant collateral arrangements.
Money market fund Total return % Institutional Cash Series plc
BlackRock ICS Euro Assets Liquidity Fund - Agency (Dis) Shares (0.39) Safekeeping of collateral received As at 31 May 2019, all non-cash collateral received by the Fund in respect of securities lending transactions and OTC derivative transactions were all held by J.P. Morgan Bank (Ireland) plc (or through its delegates).
338
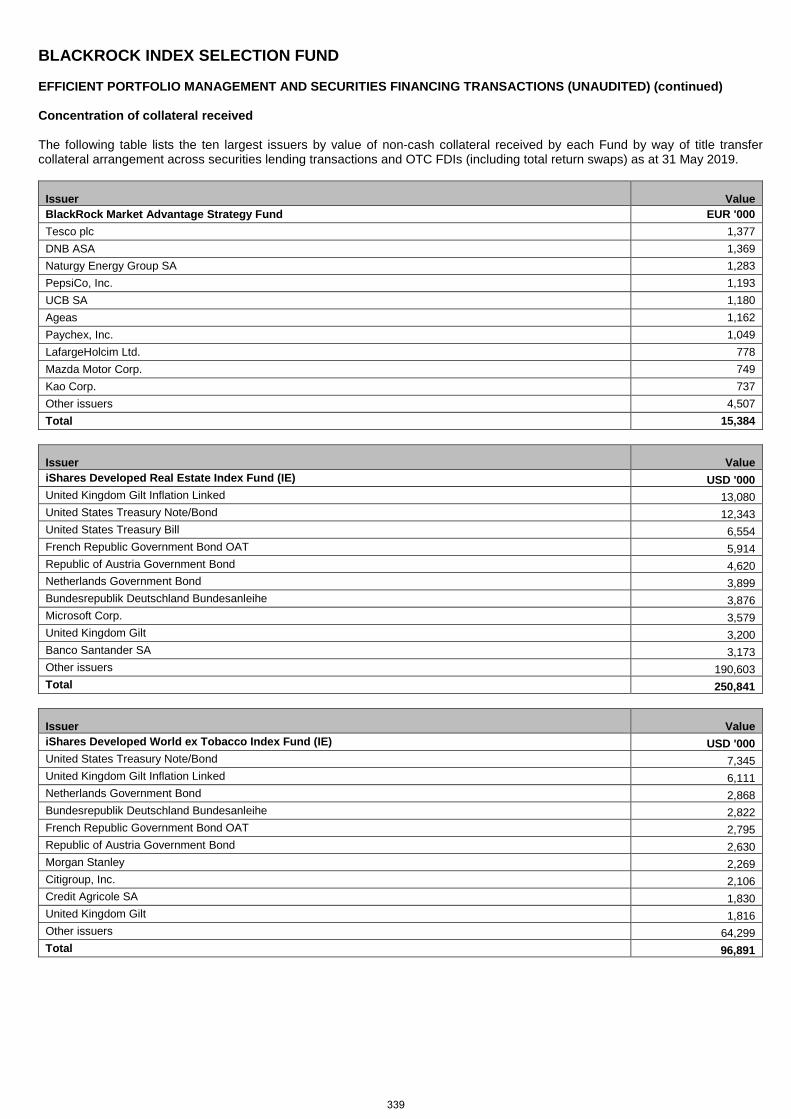
BLACKROCK INDEX SELECTION FUND EFFICIENT PORTFOLIO MANAGEMENT AND SECURITIES FINANCING TRANSACTIONS (UNAUDITED) (continued) Concentration of collateral received The following table lists the ten largest issuers by value of non-cash collateral received by each Fund by way of title transfer collateral arrangement across securities lending transactions and OTC FDIs (including total return swaps) as at 31 May 2019.
Issuer Value BlackRock Market Advantage Strategy Fund EUR '000 Tesco plc 1,377 DNB ASA 1,369 Naturgy Energy Group SA 1,283 PepsiCo, Inc. 1,193 UCB SA 1,180 Ageas 1,162 Paychex, Inc. 1,049 LafargeHolcim Ltd. 778 Mazda Motor Corp. 749 Kao Corp. 737 Other issuers 4,507 Total 15,384
Issuer Value iShares Developed Real Estate Index Fund (IE) USD '000 United Kingdom Gilt Inflation Linked 13,080 United States Treasury Note/Bond 12,343 United States Treasury Bill 6,554 French Republic Government Bond OAT 5,914 Republic of Austria Government Bond 4,620 Netherlands Government Bond 3,899 Bundesrepublik Deutschland Bundesanleihe 3,876 Microsoft Corp. 3,579 United Kingdom Gilt 3,200 Banco Santander SA 3,173 Other issuers 190,603 Total 250,841
Issuer Value iShares Developed World ex Tobacco Index Fund (IE) USD '000 United States Treasury Note/Bond 7,345 United Kingdom Gilt Inflation Linked 6,111 Netherlands Government Bond 2,868 Bundesrepublik Deutschland Bundesanleihe 2,822 French Republic Government Bond OAT 2,795 Republic of Austria Government Bond 2,630 Morgan Stanley 2,269 Citigroup, Inc. 2,106 Credit Agricole SA 1,830 United Kingdom Gilt 1,816 Other issuers 64,299 Total 96,891
339
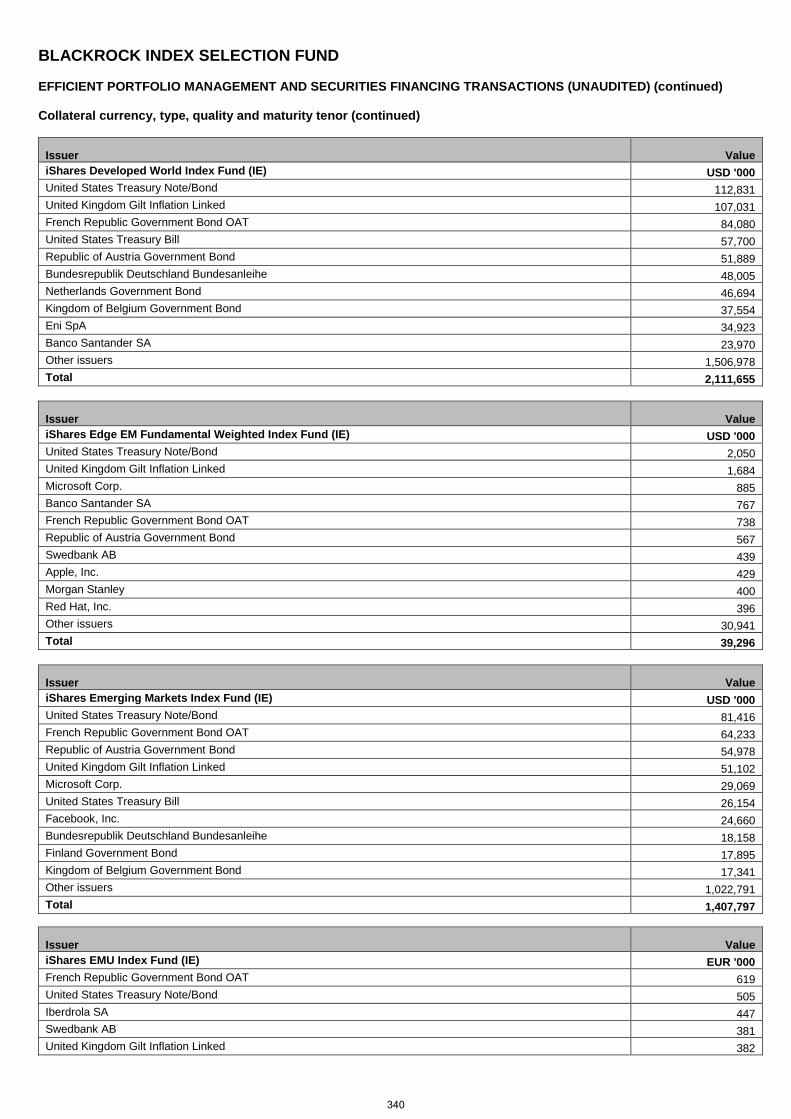
BLACKROCK INDEX SELECTION FUND EFFICIENT PORTFOLIO MANAGEMENT AND SECURITIES FINANCING TRANSACTIONS (UNAUDITED) (continued) Collateral currency, type, quality and maturity tenor (continued)
Issuer Value iShares Developed World Index Fund (IE) USD '000 United States Treasury Note/Bond 112,831 United Kingdom Gilt Inflation Linked 107,031 French Republic Government Bond OAT 84,080 United States Treasury Bill 57,700 Republic of Austria Government Bond 51,889 Bundesrepublik Deutschland Bundesanleihe 48,005 Netherlands Government Bond 46,694 Kingdom of Belgium Government Bond 37,554 Eni SpA 34,923 Banco Santander SA 23,970 Other issuers 1,506,978 Total 2,111,655
Issuer Value iShares Edge EM Fundamental Weighted Index Fund (IE) USD '000 United States Treasury Note/Bond 2,050 United Kingdom Gilt Inflation Linked 1,684 Microsoft Corp. 885 Banco Santander SA 767 French Republic Government Bond OAT 738 Republic of Austria Government Bond 567 Swedbank AB 439 Apple, Inc. 429 Morgan Stanley 400 Red Hat, Inc. 396 Other issuers 30,941 Total 39,296
Issuer Value iShares Emerging Markets Index Fund (IE) USD '000 United States Treasury Note/Bond 81,416 French Republic Government Bond OAT 64,233 Republic of Austria Government Bond 54,978 United Kingdom Gilt Inflation Linked 51,102 Microsoft Corp. 29,069 United States Treasury Bill 26,154 Facebook, Inc. 24,660 Bundesrepublik Deutschland Bundesanleihe 18,158 Finland Government Bond 17,895 Kingdom of Belgium Government Bond 17,341 Other issuers 1,022,791 Total 1,407,797
Issuer Value iShares EMU Index Fund (IE) EUR '000 French Republic Government Bond OAT 619 United States Treasury Note/Bond 505 Iberdrola SA 447 Swedbank AB 381 United Kingdom Gilt Inflation Linked 382
340
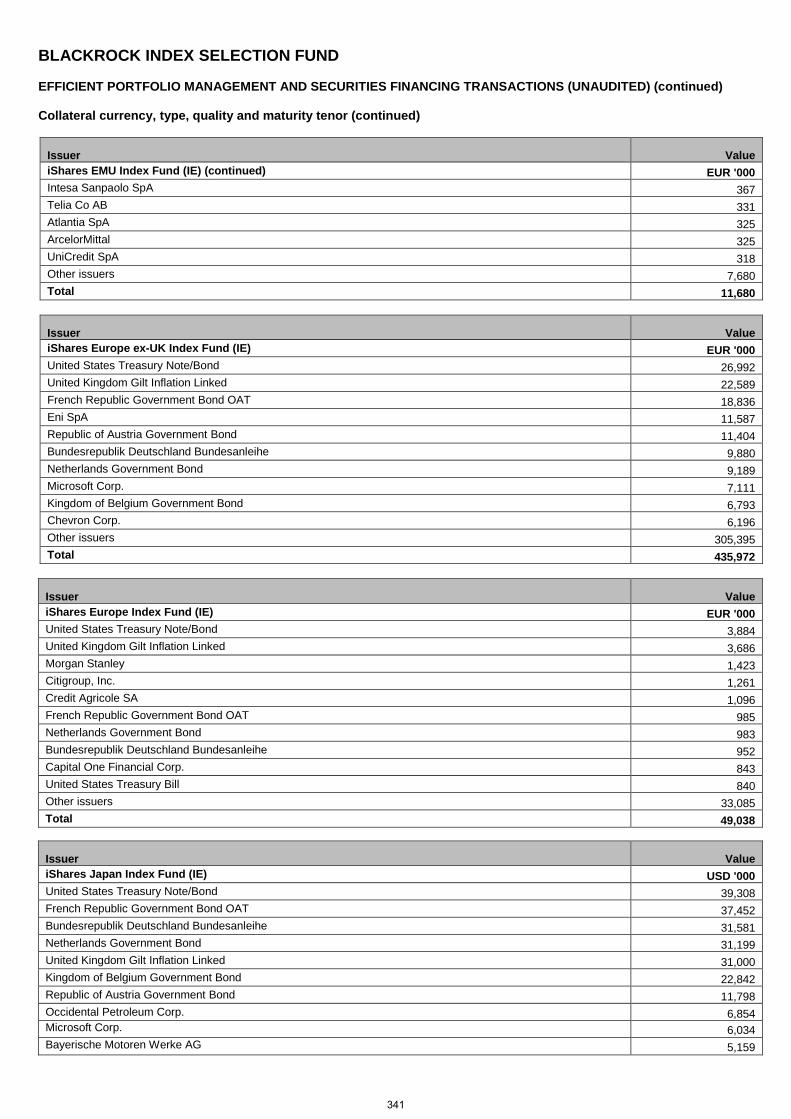
BLACKROCK INDEX SELECTION FUND EFFICIENT PORTFOLIO MANAGEMENT AND SECURITIES FINANCING TRANSACTIONS (UNAUDITED) (continued) Collateral currency, type, quality and maturity tenor (continued)
Issuer Value iShares EMU Index Fund (IE) (continued) EUR '000 Intesa Sanpaolo SpA 367 Telia Co AB 331 Atlantia SpA 325 ArcelorMittal 325 UniCredit SpA 318 Other issuers 7,680 Total 11,680
Issuer Value iShares Europe ex-UK Index Fund (IE) EUR '000 United States Treasury Note/Bond 26,992 United Kingdom Gilt Inflation Linked 22,589 French Republic Government Bond OAT 18,836 Eni SpA 11,587 Republic of Austria Government Bond 11,404 Bundesrepublik Deutschland Bundesanleihe 9,880 Netherlands Government Bond 9,189 Microsoft Corp. 7,111 Kingdom of Belgium Government Bond 6,793 Chevron Corp. 6,196 Other issuers 305,395 Total 435,972
Issuer Value iShares Europe Index Fund (IE) EUR '000 United States Treasury Note/Bond 3,884 United Kingdom Gilt Inflation Linked 3,686 Morgan Stanley 1,423 Citigroup, Inc. 1,261 Credit Agricole SA 1,096 French Republic Government Bond OAT 985 Netherlands Government Bond 983 Bundesrepublik Deutschland Bundesanleihe 952 Capital One Financial Corp. 843 United States Treasury Bill 840 Other issuers 33,085 Total 49,038
Issuer Value iShares Japan Index Fund (IE) USD '000 United States Treasury Note/Bond 39,308 French Republic Government Bond OAT 37,452 Bundesrepublik Deutschland Bundesanleihe 31,581 Netherlands Government Bond 31,199 United Kingdom Gilt Inflation Linked 31,000 Kingdom of Belgium Government Bond 22,842 Republic of Austria Government Bond 11,798 Occidental Petroleum Corp. 6,854 Microsoft Corp. 6,034 Bayerische Motoren Werke AG 5,159
341
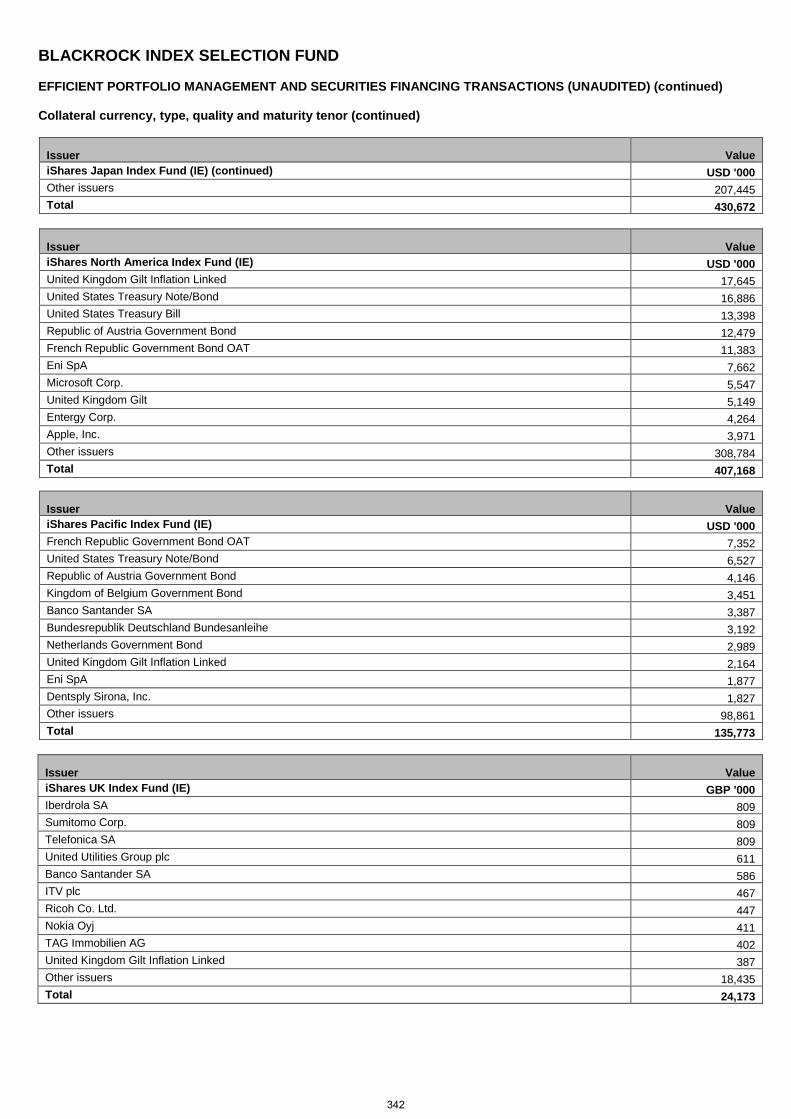
BLACKROCK INDEX SELECTION FUND EFFICIENT PORTFOLIO MANAGEMENT AND SECURITIES FINANCING TRANSACTIONS (UNAUDITED) (continued) Collateral currency, type, quality and maturity tenor (continued)
Issuer Value iShares Japan Index Fund (IE) (continued) USD '000 Other issuers 207,445 Total 430,672
Issuer Value iShares North America Index Fund (IE) USD '000 United Kingdom Gilt Inflation Linked 17,645 United States Treasury Note/Bond 16,886 United States Treasury Bill 13,398 Republic of Austria Government Bond 12,479 French Republic Government Bond OAT 11,383 Eni SpA 7,662 Microsoft Corp. 5,547 United Kingdom Gilt 5,149 Entergy Corp. 4,264 Apple, Inc. 3,971 Other issuers 308,784 Total 407,168
Issuer Value iShares Pacific Index Fund (IE) USD '000 French Republic Government Bond OAT 7,352 United States Treasury Note/Bond 6,527 Republic of Austria Government Bond 4,146 Kingdom of Belgium Government Bond 3,451 Banco Santander SA 3,387 Bundesrepublik Deutschland Bundesanleihe 3,192 Netherlands Government Bond 2,989 United Kingdom Gilt Inflation Linked 2,164 Eni SpA 1,877 Dentsply Sirona, Inc. 1,827 Other issuers 98,861 Total 135,773
Issuer Value iShares UK Index Fund (IE) GBP '000 Iberdrola SA 809 Sumitomo Corp. 809 Telefonica SA 809 United Utilities Group plc 611 Banco Santander SA 586 ITV plc 467 Ricoh Co. Ltd. 447 Nokia Oyj 411 TAG Immobilien AG 402 United Kingdom Gilt Inflation Linked 387 Other issuers 18,435 Total 24,173
342
BLACKROCK INDEX SELECTION FUND EFFICIENT PORTFOLIO MANAGEMENT AND SECURITIES FINANCING TRANSACTIONS (UNAUDITED) (continued) Collateral currency, type, quality and maturity tenor (continued) No securities collateral received from a single issuer, in relation to efficient portfolio management and OTC FDIs, has exceeded 20% of any of the respective Funds’ NAV at the period end date. None of the Funds have been fully collateralised in securities issued or guaranteed by an EU member state at the period end date.
343
BLACKROCK INDEX SELECTION FUND DISCLAIMERS (UNAUDITED) Disclaimer for Reference to Benchmark Index and Index Provider Website In accordance with Central Bank requirements, the Manager, on behalf of the Funds, is required to provide details of the relevant index provider’s website (“Website”) to enable unitholders obtain further details of the relevant Fund’s Benchmark Index (including the index constituents). The Manager has no responsibility for each Website and is not involved in any way in sponsoring, endorsing or otherwise involved in the establishment or maintenance of each Website or the contents thereof. Furthermore, the Manager has no responsibility for the index provider’s Benchmark Index nor for the quality, accuracy or completeness of data in respect of their Benchmark Indices nor that the published indices will be managed in line with their described index methodologies.
S&P 500 Index
The units in the BlackRock Index Selection Fund (“Units”) are not sponsored, endorsed, sold or promoted by Standard & Poor's, a division of The McGraw – Hill Companies, Inc. (“S&P”). S&P makes no representation or warranty, express or implied, to the owners of the Units or any member of the public regarding the advisability of investing in securities generally or in the Units particularly or the ability of the S&P 500 Index to track general stock market performance. S&P's only relationship to the Investment Manager is the licensing of certain trademarks and trade names of S&P and of the S&P 500 Index which is determined, composed and calculated by S&P without regard to the Investment Manager or Units.
S&P has no obligation to take the needs of the Investment Manager or the investors in the Units into consideration in determining, composing or calculating the S&P 500 Index. S&P is not responsible for and has not participated in the determination of the prices and amount of the Units or the timing of the issuance or sale of the Units or in the determination or calculation of the equation by which the Units are to be converted into cash. S&P has no obligation or liability in connection with the administration, marketing or trading of the Units.
S&P does not guarantee the accuracy and/or the completeness of the S&P 500 Index or any data included therein and S&P shall have no liability for any errors, omissions, or interruptions therein. S&P makes no warranty, express or implied, as to results to be obtained by the Investment Manager, investors in the Units or any other person or entity from the use of the S&P 500 Index or any data included therein. S&P makes no express or implied warranties, and expressly disclaims all warranties, of merchantability or fitness for a particular purpose or use with respect to the S&P Index or any data included therein. Without limiting any of the foregoing, in no event shall S&P have any liability for any special, punitive, indirect, or consequential damages (including lost profits), even if notified of the possibility of such damages.
“Standard & Poor's®”, “S&P®”, “S&P 500®”, “Standard & Poor's 500” and “500” are trademarks of The McGraw-Hill Companies, Inc. and have been licensed for use by the Investment Manager. The Units are not sponsored, endorsed, sold or promoted by Standard & Poor's and Standard & Poor’s makes no representation regarding the advisability of investing in the Units.
MSCI Indices (“MSCI Indices”) The Fund/account is not sponsored, endorsed, sold or promoted by MCSI, any of its affiliates, any of its information providers or any other third party involved in, or related to, compiling, computing or creating any MSCI Index (collectively the “MCSI Parties”). The MCSI Indexes are the exclusive property of MSCI. MSCI and the MCSI Index names are service mark(s) of MSCI or its affiliates and have been licensed for use for certain purposes by the Investment Manager. None of the MSCI parties makes any representation or warranty, express or implied, to the issuer or owners of this Fund/account or any other person or entity regarding the advisability of investing in Funds/accounts generally or in this Fund/account particularly or the ability of any MCSI Index to track corresponding stock market performance. MSCI or its affiliates are the licensors of certain trademarks, service marks and trade names and of the MSCI Indexes which are determined, composed and calculated by MSCI without regard to this Fund/account or the issuer or owners of this Fund/account or any other person or entity into consideration in determining, composing or calculating the MSCI Indexes. None of the MSCI parties is responsible for or has participated in the determination of the timing of, prices at, or quantities of this Fund/account to be issued or in the determination or calculation of the equation by or the consideration into which this Fund/account is redeemable. Further, none of the MSCI parties has any obligation or liability to the issuer or owners of this Fund/account or any other person or entity in connection with the administration, marketing or offering of this Fund/account.
344
BLACKROCK INDEX SELECTION FUND DISCLAIMERS (UNAUDITED) (continued) MSCI Indices (“MSCI Indices”) (continued) Although MSCI shall obtain information for inclusion in or for use in the calculation of the MSCI Indexes from sources that MSCI considers reliable, none of the MSCI parties warrants or guarantees the originality, accuracy and/or the completeness of any MSCI Index or any data included therein. None of the MSCI parties make any warranty, express or implied, as to the results to be obtained by the issuer of the Fund/account, owners of the Fund/account, or any other person or entity, from the use of the MSCI Index or any data included therein. None of the MSCI parties shall have any liability for any errors, omissions or interruptions of or in connection with any MSCI Index or any data included therein. Further, none of the MSCI parties makes any express or implied warranties of any kind, and the MSCI parties hereby expressly disclaim all warranties of merchantability and fitness for a particular purpose, with respect to each MSCI Index and any data included therein. Without limiting any of the foregoing, in no event shall any of the MSCI parties have any liability for any direct, indirect, special, punitive, consequential or any other damages (including lost profits) even if notified of the possibility of such damages. No purchaser, seller, owner or holder of this security, account, product or fund, or any other person or entity, should use or refer to any MSCI trade name, trademark or service mark to sponsor, endorse, market or promote this security, account product or fund without first contacting MSCI to determine whether MSCI's permission is required. Under no circumstances may any person or entity claim any affiliation with MSCI without the prior written permission of MSCI. FTSE RAFI Indices The iShares Edge EM Fundamental Weighted Index Fund (IE) is not in any way sponsored, endorsed, sold or promoted by FTSE International Limited (“FTSE”), by the London Stock Exchange Plc (the “Exchange”), The Financial Times Limited (“FT”) or by Research Affiliates LLC (“RA”) (collectively the “Licensor Parties”), and none of the Licensor Parties make any warranty or representation whatsoever, expressly or impliedly, either as to the result to be obtained from the use of any FTSE RAFI indices (the “Indices”) and/or the figure which the said Indices stand at any particular time on any particular day or otherwise. The Indices are compiled and calculated by FTSE in conjunction with RAFI. None of the Licensor Parties shall be liable (whether in negligence or otherwise) to any person for any error in the Index and none of the Licensor Parties shall be under any obligation to advise any person of any error therein. FTSE® is a trade mark of the Exchange and the FT. Fundamental Index® and RAFI® trade names and patent-pending concept are the exclusive property of Research Affiliates®, LLC. Patent Pending: US-2005-0171884-A1, US-2006-0015433-A1, US-2006-0149645-A1, US-2007-00555598-A1.
FTSE EPRA/NAREIT Developed Index
The iShares Developed Real Estate Index Fund (IE) is not in any way sponsored, endorsed, sold or promoted by FTSE International Limited (“FTSE”), by the London Stock Exchange Plc (the “Exchange”), The Financial Times Limited (“FT”) or by Research Affiliates LLC (“RA”) (collectively the “Licensor Parties”), and none of the Licensor Parties make any warranty or representation whatsoever, expressly or impliedly, either as to the result to be obtained from the use of the Fund Benchmark Index and/or the figure which the said Fund Benchmark Index stands at any particular time on any particular day or otherwise. The Index is compiled and calculated by FTSE in conjunction with RA. None of the Licensor Parties shall be liable (whether in negligence or otherwise) to any person for any error in the Index and none of the Licensor Parties shall be under any obligation to advise any person of any error therein. FTSE® is a trade mark of the Exchange and the FT.
345

Want to know more? +44 (0)20 7743 3300 blackrockinternational.com © 2019 BlackRock, Inc. All Rights reserved. BLACKROCK, BLACKROCK SOLUTIONS, iSHARES, SO WHAT DO I DO WITH MY MONEY, INVESTING FOR A NEW WORLD, and BUILT FOR THESE TIMES are registered and unregistered trademarks of BlackRock, Inc. or its subsidiaries in the United States and elsewhere. All other trademarks are those of their respective owners.