invesco funds audited annual report
TRANSCRIPT
Invesco Funds Audited Annual Report Société d’Investissement à Capital Variable For the year ended 28 February 2019 (R.C.S. Luxembourg B34457)
Contact us
Invesco Global Asset Management DAC Central Quay, Riverside IV Sir John Rogersons Quay, Dublin 2, Ireland Telephone: +353 1 439 8000 Website: www.invesco.com
Perivan Financial Print 254788
254788 Invesco SICAV English cover spread 30mm spine.qxp_254788 Invesco SICAV English cover spread 25mm spine 26/06/2019 15:31 Page 1

Registered Office: 2-4 rue Eugène Ruppert, L-2453 Luxembourg No subscription can be accepted on the basis of financial reports alone. Subscriptions, in order to be valid, must be made on the basis of the current Prospectus supplemented by a copy of the latest available Audited Annual Report and a copy of the latest Unaudited Semi-Annual Report, if later than such Audited Annual Report. Copies of the Prospectus, Audited Annual Report and Unaudited Interim Report may be obtained at the Registered Office of the Company (Invesco Funds), 2-4 rue Eugène Ruppert, L-2453 Luxembourg, as well as from the offices of the Invesco Management S.A. in Luxembourg. Notices of all General Meetings will be published in the Luxemburger Wort and, to the extent required by law, in the Mémorial, Recueil des Sociétés et Associations (“Mémorial”) and will be sent to holders of registered Shares at their address in the Register of Shareholders by post at least 8 days prior to meetings. In the event of any discrepancy between translations from English text into foreign languages, please note that the English text will prevail. Equalisation is calculated for tax reporting purposes and is not disclosed in the Audited Annual or Interim Report.
254788 Invesco SICAV English cover spread 30mm spine.qxp_254788 Invesco SICAV English cover spread 25mm spine 26/06/2019 15:31 Page 2
03 Invesco Funds
Page(s) Report of the Board of Directors 06 Statement of Investments Equity Funds Global Invesco Developed Small and Mid-Cap Equity Fund (formerly Invesco Global Smaller Companies Equity Fund) 08 Invesco Emerging Markets Equity Fund 12 Invesco Emerging Market Structured Equity Fund 15 Invesco Global Equity Income Fund 18 Invesco Global Opportunities Fund 20 Invesco Global Small Cap Equity Fund 22 Invesco Global Structured Equity Fund 30 America Invesco Latin American Equity Fund 33 Invesco US Equity Fund 35 Invesco US Equity Flexible Fund 37 Invesco US Structured Equity Fund 39 Invesco US Value Equity Fund 41 Europe Invesco Continental European Equity Fund 43 Invesco Continental European Small Cap Equity Fund 45 Invesco Emerging Europe Equity Fund 47 Invesco Euro Equity Fund 49 Invesco Euro Structured Equity Fund 51 Invesco Pan European Equity Fund 53 Invesco Pan European Equity Income Fund 55 Invesco Pan European Focus Equity Fund 57 Invesco Pan European Small Cap Equity Fund 59 Invesco Pan European Structured Equity Fund 63 Invesco European Growth Equity Fund 66 Invesco UK Equity Fund 68 Invesco UK Equity Income Fund 70 Japan Invesco Japanese Equity Advantage Fund 71 Invesco Japanese Equity Core Fund 73 Invesco Japanese Equity Dividend Growth Fund 75 Invesco Japanese Equity Value Discovery Fund (formerly Invesco Japanese Value Equity Fund) 77 Invesco Nippon Small/Mid Cap Equity Fund 79 Asia Invesco ASEAN Equity Fund 81 Invesco Asia Consumer Demand Fund 83 Invesco Asia Opportunities Equity Fund 85 Invesco Asian Equity Fund 87 Invesco Asian Focus Equity Fund 89 Invesco China Focus Equity Fund 91 Invesco Greater China Equity Fund 93 Invesco India All-Cap Equity Fund 95 Invesco India Equity Fund 96 Invesco Korean Equity Fund 97 Invesco Pacific Equity Fund 98 Invesco PRC Equity Fund 101
Contents
04 Invesco Funds
Page(s) Theme Funds Invesco Energy Fund 103 Invesco Global Consumer Trends Fund (formerly Invesco Global Leisure Fund) 105 Invesco Global Health Care Fund 107 Invesco Global Income Real Estate Securities Fund 109 Invesco Global Real Estate Securities Fund 113 Invesco Gold & Precious Metals Fund 117 Other Equity Funds Invesco Global Equity Market Neutral Fund 119 Invesco Pan European Equity Long/Short Fund 120 Bond Funds Invesco Active Multi-Sector Credit Fund 123 Invesco Asian Bond Fund 137 Invesco Belt and Road Debt Fund 140 Invesco Bond Fund 143 Invesco Emerging Local Currencies Debt Fund 147 Invesco Emerging Markets Bond Fund 150 Invesco Emerging Market Corporate Bond Fund 155 Invesco Emerging Market Flexible Bond Fund 159 Invesco Euro Bond Fund 163 Invesco Euro Corporate Bond Fund 170 Invesco Euro High Yield Bond Fund 174 Invesco Euro Short Term Bond Fund 177 Invesco Euro Ultra-Short Term Debt Fund (formerly Invesco Euro Reserve Fund) 182 Invesco Global Bond Fund 185 Invesco Global Convertible Fund 187 Invesco Unconstrained Bond Fund 190 Invesco Global High Income Fund 194 Invesco Global High Yield Short Term Bond Fund 203 Invesco Global Investment Grade Corporate Bond Fund 206 Invesco Global Total Return (EUR) Bond Fund 215 Invesco Global Unconstrained Bond Fund 218 Invesco India Bond Fund 220 Invesco Real Return (EUR) Bond Fund 223 Invesco Renminbi Fixed Income Fund 225 Invesco Sterling Bond Fund 227 Invesco Strategic Income Fund 231 Invesco UK Investment Grade Bond Fund 235 Invesco USD Ultra-Short Term Debt Fund (formerly Invesco USD Reserve Fund) 238 Invesco US High Yield Bond Fund 240 Invesco US Investment Grade Corporate Bond Fund 245 Mixed Assets Funds Invesco Asia Balanced Fund 249 Invesco Global Income Fund 253 Invesco Global Moderate Allocation Fund 262 Invesco Pan European High Income Fund 268 Invesco Sustainable Allocation Fund 279 Other Mixed Assets Funds Invesco Balanced-Risk Allocation Fund 282 Invesco Balanced-Risk Select Fund 283 Invesco Global Absolute Return Fund 284 Invesco Global Conservative Fund 285 Invesco Global Targeted Returns Fund 289 Invesco Global Targeted Returns Select Fund 308 Invesco Global Targeted Returns Select II Fund 325 Invesco Macro Allocation Strategy Fund 341
Contents
Page(s) Financial Statements Statement of Net Assets 342 Comparative Net Asset Values 358 Statement of Operations and Changes in Net Assets 378 Notes to the Financial Statements 394 Audit Report 548 Other Information (unaudited) UK Reporting Regime 550 PEA Disclosure (Plan d’Epargne en Actions) 554 Additional note for Hong Kong Residents 555 Calculation Methods of the Risk Exposure 555 Remuneration Policy 566 Securities Financing Transaction Regulation 567 Board of Directors 572 Organisation 572
Contents
05 Invesco Funds
Report of the Board of Directors
Dear Shareholders, The following report provides a summary of the financial results of the Invesco Funds for the year ended 28 February 2019 together with a market review for that year. Invesco Funds (the “SICAV”), a UCITS under Part I of the Law of 17 December 2010 on undertakings for collective investment as amended or supplemented from time to time (the “2010 Law”) authorised and supervised by the CSSF in Luxembourg. The SICAV is an umbrella investment company with variable capital having segregated liability between its sub-funds (the “Funds”). The SICAV complies with the principles set out in the Association of the Luxembourg Fund Industry (“ALFI”) Code of Conduct Revision 2013 (the “Code”) issued by ALFI in June 2013.
– The Assets Under Management decreased from USD 63,528,913,881 on 28 February 2018 to USD 56,935,881,957 on 28 February 2019. – The Net Payments from redemption of shares was USD (571,793,773) for the year. – The Net Income for the year ended 28 February 2019 was USD 863,857,816 compared with USD 604,563,896 on 28 February 2018.
The following report covers the year from 1 March 2018 to 28 February 2019.
Market Overview Global equity markets delivered positive returns over the review period. The year 2018 got off to a strong start. Strength in corporate earnings, expectations that synchronised economic growth would continue, and optimism over US tax cuts helped drive up prices in many markets across the world. By February, however, volatility had made a return and global equity markets suffered a sharp correction. The catalyst for the weakness was an increase in government bond yields in major markets especially in the US. A technology-led correction dominated global equity markets in March. Rising trade tensions between the US and China unnerved markets further. Despite strong economic data and the likelihood of good first quarter earnings the market became increasingly concerned by a slew of other factors including the steady retreat of central bank stimulus and concerns that economic growth may have peaked after the best period of synchronised global expansion in a decade. Indeed, economic growth went on to disappoint almost everywhere except for the US, where the equity market continued to be propelled by fiscal stimulus and still-supportive domestic financial conditions. UK and European equity markets were weak on concerns around Brexit, and political uncertainty in Italy affected European equities. The Japanese and Asian equity markets were impacted by a slowing Chinese economy and fears over a tariff war between China and the US. Meanwhile, the pressure that emerging markets had been under earlier in the year had begun to subside as investors welcomed new governments in Brazil and South Africa. Global equity markets were led lower by the US in the fourth quarter, as concerns over economic slowdown and extended valuations intensified. The December slump was among the worst in history and the US equity market was on track for the biggest December fall since the Great Depression of 1931. Markets regained some of the lost ground in January as fears of recession and a trade war eased. By February, global equity markets continued to rally in view of an increased likelihood of a trade deal between the US and China. Furthermore, indications from the US Federal Reserve of a softening of stance of monetary policy normalisation, together with some modest Chinese stimulus, have helped to underpin sentiment. The US equity market was particularly strong over the month, though all major markets delivered positive returns despite more indications of slower economic growth globally. In terms of the fixed income market, the year 2018 began in an upbeat mood following the announcement of tax cutting proposals in the US and relatively strong global growth. This sentiment started to change in late January. Among the catalysts were some company specific weaknesses and an expectation that the recent strength in economic data would lead to interest rates being increased more quickly than previously expected. As the year progressed, further challenges emerged fuelling uncertainty and in turn, market volatility. Among the challenges were rising tensions over global trade and the potential impact this would have on economic growth; the election of a populist Italian government, which contrary to previous statements announced spending commitments that lead to an increase in the country’s budget deficit; emerging market volatility and Brexit. There were also some concerns specific to the financial sector including Deutsche Bank’s profit warning and change in CEO, Aviva’s threat to cancel preference shares it had previously described in marketing material as irredeemable, HSBC’s reclassification of discount perpetual floating rate securities to tier 2 capital and Spanish property transactions and whether banks should pay the charge. European currency high yield bond markets had their first calendar year of negative returns since 2011.
Brexit On 31 October 2019 the UK is due to leave the EU, an event commonly referred to as Brexit. The current exit date may be shortened or extended upon agreement between the UK and EU27. At the date of this report, discussions remain ongoing between the UK and EU27 as to the precise nature of the future relationship. It is unclear at this stage whether a withdrawal agreement will be reached or if the UK will leave the EU under a no-deal scenario. The Directors of the Fund do not believe that Brexit under any of these scenarios will present significant issues that cannot be mitigated, given the Fund will continue to be passported in the UK under the UK’s Temporary Permission Regime. The Fund has registered its sub-funds under the Temporary Permission Regime and this will enable the Fund to continue offering those sub-funds to UK Investors.
06 Invesco Funds
Brexit (continued) The following points were considered in preparation of a hard-Brexit:
l The Bank of New York Mellon (International), Luxembourg Branch has ceased to act as depositary and administration agent, domiciliary and corporate agent and paying agent for the SICAV from 18 March 2019. The Directors decided to appoint The Bank of New York Mellon SA/NV, Luxembourg Branch having its registered office at Vertigo Building – Polaris, 2-4 rue Eugène Ruppert, L-2453 Luxembourg, to replace The Bank of New York Mellon (International), Luxembourg Branch as new depositary and new administration agent, domiciliary and corporate agent and paying agent of the SICAV.
l The sub-funds will be allowed to invest in deposits made with a UK credit institution up to 10% of the sub-fund’s net asset value (NAV).
l The UK-based UCITS will no longer be considered as a UCITS as the UCITS Directive will no longer apply to the United Kingdom when the United Kingdom will leave the European Union. To address such change, the Directors have decided to change the set-up of the Feeder Fund (Invesco UK Equity Income Fund) from investment through the Master Fund (Invesco Income Fund (UK)) to direct investment. On 18 March 2019, the Invesco UK Equity Income Fund ceased to operate as a master feeder structure. Please refer to note 1(c) for additional information.
l Covered bonds issued by UK credit institutions will no longer be eligible to the sub-funds. However, the impact on the sub-funds will be marginal.
l In the context of Brexit, it has been clarified in a prospectus dated 18 March 2019 for Invesco UK Investment Grade Corporate Bond Fund that it is anticipated that the sub-fund may invest more than 35% of NAV of the Fund in debt securities issued and/or guaranteed by the UK government. As a result, there will not be any impact on the way the Invesco UK Investment Grade Corporate Bond Fund is managed.
l Invesco Funds is currently registered for distribution in France and currently eligible for French PEA (Plan d’Epargne en Actions). In the event of a hard Brexit, some current eligible sub-funds will no longer comply with PEA requirement. For further information please refer to the Other Information note on page 554 of the financial statements.
Important information
Where Invesco has expressed views and opinions, these may change. Invesco is a business name of Invesco Asset Management Limited. Perpetual Park, Perpetual Park Drive, Henley-on-Thames, Oxfordshire RG9 1HH, UK. Authorised and regulated by the Financial Conduct Authority. Dated: 25 June 2019
The information contained in this report relates to historical data and bears no relevance for the future development of the Fund.
Report of the Board of Directors (continued)
07 Invesco Funds
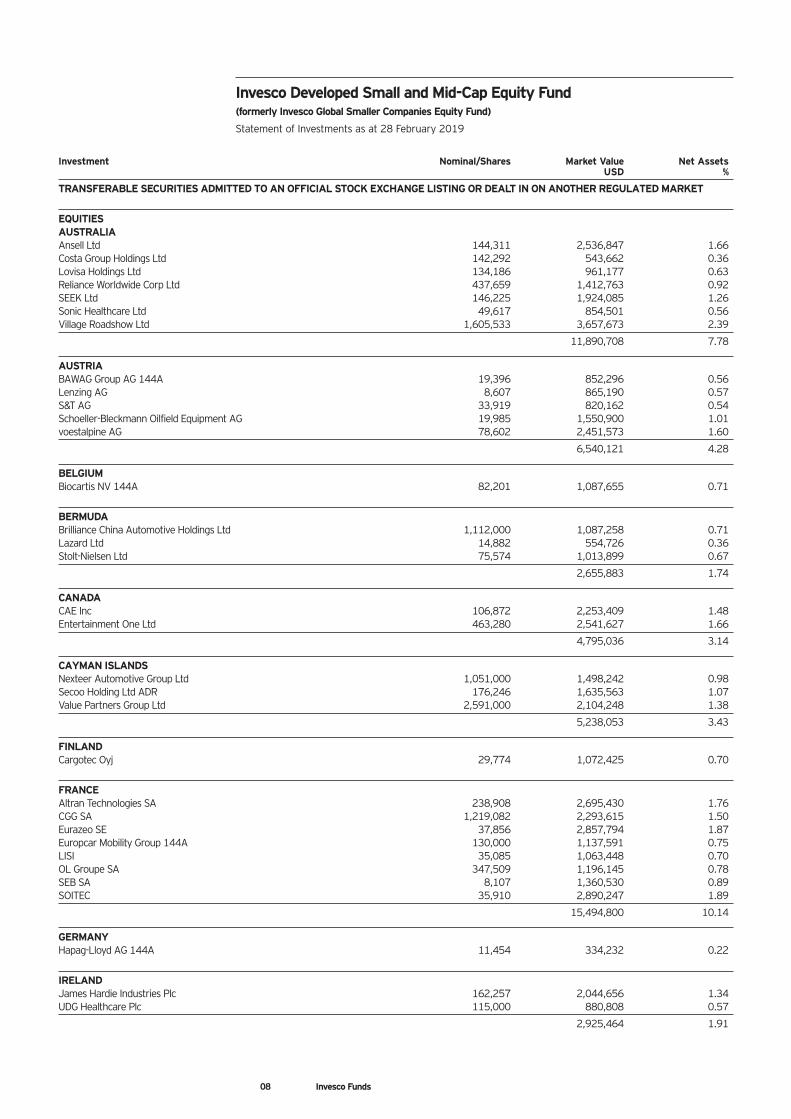
Investment Nominal/Shares Market Value Net Assets USD %
TRANSFERABLE SECURITIES ADMITTED TO AN OFFICIAL STOCK EXCHANGE LISTING OR DEALT IN ON ANOTHER REGULATED MARKET
EQUITIES AUSTRALIA Ansell Ltd 144,311 2,536,847 1.66 Costa Group Holdings Ltd 142,292 543,662 0.36 Lovisa Holdings Ltd 134,186 961,177 0.63 Reliance Worldwide Corp Ltd 437,659 1,412,763 0.92 SEEK Ltd 146,225 1,924,085 1.26 Sonic Healthcare Ltd 49,617 854,501 0.56 Village Roadshow Ltd 1,605,533 3,657,673 2.39
11,890,708 7.78
AUSTRIA BAWAG Group AG 144A 19,396 852,296 0.56 Lenzing AG 8,607 865,190 0.57 S&T AG 33,919 820,162 0.54 Schoeller-Bleckmann Oilfield Equipment AG 19,985 1,550,900 1.01 voestalpine AG 78,602 2,451,573 1.60
6,540,121 4.28
BELGIUM Biocartis NV 144A 82,201 1,087,655 0.71
BERMUDA Brilliance China Automotive Holdings Ltd 1,112,000 1,087,258 0.71 Lazard Ltd 14,882 554,726 0.36 Stolt-Nielsen Ltd 75,574 1,013,899 0.67
2,655,883 1.74
CANADA CAE Inc 106,872 2,253,409 1.48 Entertainment One Ltd 463,280 2,541,627 1.66
4,795,036 3.14
CAYMAN ISLANDS Nexteer Automotive Group Ltd 1,051,000 1,498,242 0.98 Secoo Holding Ltd ADR 176,246 1,635,563 1.07 Value Partners Group Ltd 2,591,000 2,104,248 1.38
5,238,053 3.43
FINLAND Cargotec Oyj 29,774 1,072,425 0.70
FRANCE Altran Technologies SA 238,908 2,695,430 1.76 CGG SA 1,219,082 2,293,615 1.50 Eurazeo SE 37,856 2,857,794 1.87 Europcar Mobility Group 144A 130,000 1,137,591 0.75 LISI 35,085 1,063,448 0.70 OL Groupe SA 347,509 1,196,145 0.78 SEB SA 8,107 1,360,530 0.89 SOITEC 35,910 2,890,247 1.89
15,494,800 10.14
GERMANY Hapag-Lloyd AG 144A 11,454 334,232 0.22
IRELAND James Hardie Industries Plc 162,257 2,044,656 1.34 UDG Healthcare Plc 115,000 880,808 0.57
2,925,464 1.91
Invesco Developed Small and Mid-Cap Equity Fund (formerly Invesco Global Smaller Companies Equity Fund) Statement of Investments as at 28 February 2019
08 Invesco Funds
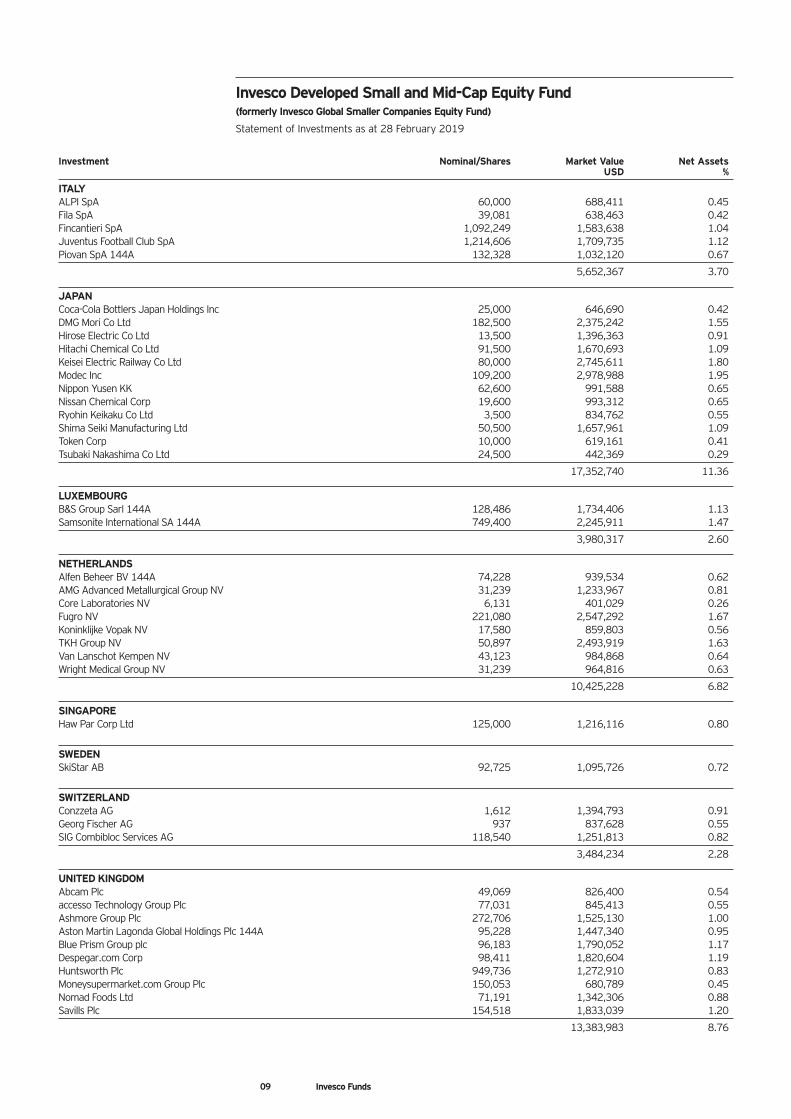
Investment Nominal/Shares Market Value Net Assets USD %
ITALY ALPI SpA 60,000 688,411 0.45 Fila SpA 39,081 638,463 0.42 Fincantieri SpA 1,092,249 1,583,638 1.04 Juventus Football Club SpA 1,214,606 1,709,735 1.12 Piovan SpA 144A 132,328 1,032,120 0.67
5,652,367 3.70
JAPAN Coca-Cola Bottlers Japan Holdings Inc 25,000 646,690 0.42 DMG Mori Co Ltd 182,500 2,375,242 1.55 Hirose Electric Co Ltd 13,500 1,396,363 0.91 Hitachi Chemical Co Ltd 91,500 1,670,693 1.09 Keisei Electric Railway Co Ltd 80,000 2,745,611 1.80 Modec Inc 109,200 2,978,988 1.95 Nippon Yusen KK 62,600 991,588 0.65 Nissan Chemical Corp 19,600 993,312 0.65 Ryohin Keikaku Co Ltd 3,500 834,762 0.55 Shima Seiki Manufacturing Ltd 50,500 1,657,961 1.09 Token Corp 10,000 619,161 0.41 Tsubaki Nakashima Co Ltd 24,500 442,369 0.29
17,352,740 11.36
LUXEMBOURG B&S Group Sarl 144A 128,486 1,734,406 1.13 Samsonite International SA 144A 749,400 2,245,911 1.47
3,980,317 2.60
NETHERLANDS Alfen Beheer BV 144A 74,228 939,534 0.62 AMG Advanced Metallurgical Group NV 31,239 1,233,967 0.81 Core Laboratories NV 6,131 401,029 0.26 Fugro NV 221,080 2,547,292 1.67 Koninklijke Vopak NV 17,580 859,803 0.56 TKH Group NV 50,897 2,493,919 1.63 Van Lanschot Kempen NV 43,123 984,868 0.64 Wright Medical Group NV 31,239 964,816 0.63
10,425,228 6.82
SINGAPORE Haw Par Corp Ltd 125,000 1,216,116 0.80
SWEDEN SkiStar AB 92,725 1,095,726 0.72
SWITZERLAND Conzzeta AG 1,612 1,394,793 0.91 Georg Fischer AG 937 837,628 0.55 SIG Combibloc Services AG 118,540 1,251,813 0.82
3,484,234 2.28
UNITED KINGDOM Abcam Plc 49,069 826,400 0.54 accesso Technology Group Plc 77,031 845,413 0.55 Ashmore Group Plc 272,706 1,525,130 1.00 Aston Martin Lagonda Global Holdings Plc 144A 95,228 1,447,340 0.95 Blue Prism Group plc 96,183 1,790,052 1.17 Despegar.com Corp 98,411 1,820,604 1.19 Huntsworth Plc 949,736 1,272,910 0.83 Moneysupermarket.com Group Plc 150,053 680,789 0.45 Nomad Foods Ltd 71,191 1,342,306 0.88 Savills Plc 154,518 1,833,039 1.20
13,383,983 8.76
09 Invesco Funds
Invesco Developed Small and Mid-Cap Equity Fund (formerly Invesco Global Smaller Companies Equity Fund) Statement of Investments as at 28 February 2019
Investment Nominal/Shares Market Value Net Assets USD %
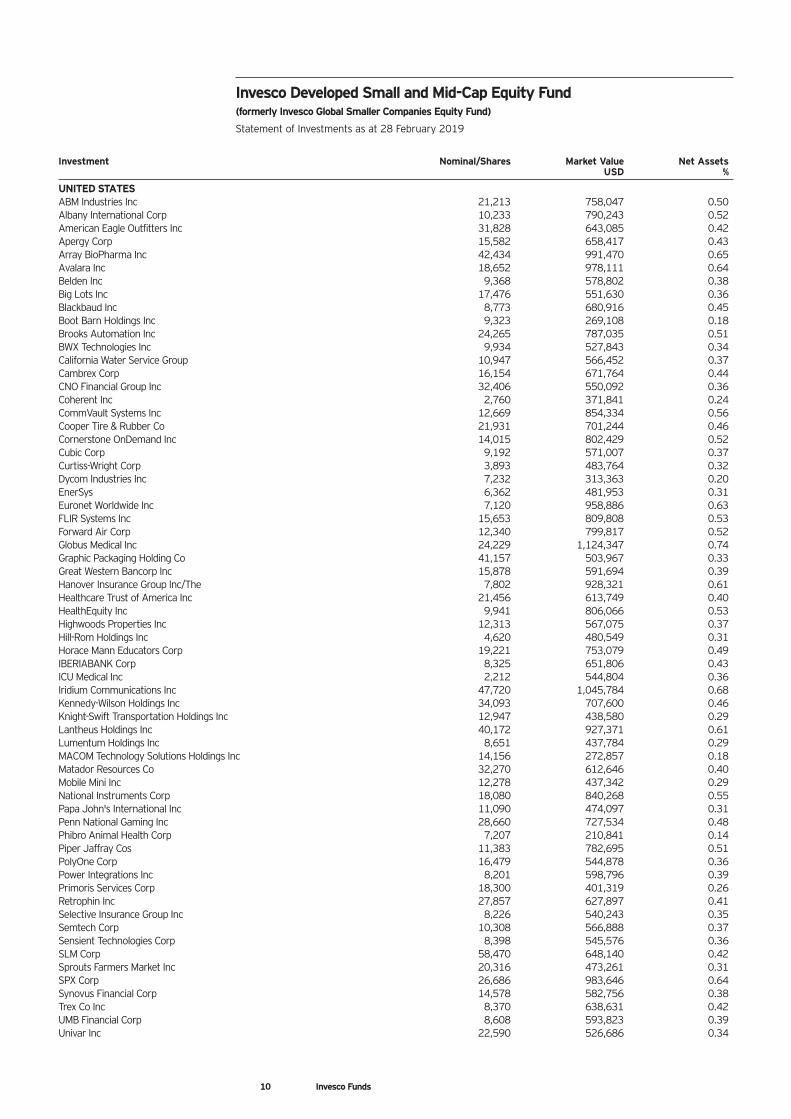
UNITED STATES ABM Industries Inc 21,213 758,047 0.50 Albany International Corp 10,233 790,243 0.52 American Eagle Outfitters Inc 31,828 643,085 0.42 Apergy Corp 15,582 658,417 0.43 Array BioPharma Inc 42,434 991,470 0.65 Avalara Inc 18,652 978,111 0.64 Belden Inc 9,368 578,802 0.38 Big Lots Inc 17,476 551,630 0.36 Blackbaud Inc 8,773 680,916 0.45 Boot Barn Holdings Inc 9,323 269,108 0.18 Brooks Automation Inc 24,265 787,035 0.51 BWX Technologies Inc 9,934 527,843 0.34 California Water Service Group 10,947 566,452 0.37 Cambrex Corp 16,154 671,764 0.44 CNO Financial Group Inc 32,406 550,092 0.36 Coherent Inc 2,760 371,841 0.24 CommVault Systems Inc 12,669 854,334 0.56 Cooper Tire & Rubber Co 21,931 701,244 0.46 Cornerstone OnDemand Inc 14,015 802,429 0.52 Cubic Corp 9,192 571,007 0.37 Curtiss-Wright Corp 3,893 483,764 0.32 Dycom Industries Inc 7,232 313,363 0.20 EnerSys 6,362 481,953 0.31 Euronet Worldwide Inc 7,120 958,886 0.63 FLIR Systems Inc 15,653 809,808 0.53 Forward Air Corp 12,340 799,817 0.52 Globus Medical Inc 24,229 1,124,347 0.74 Graphic Packaging Holding Co 41,157 503,967 0.33 Great Western Bancorp Inc 15,878 591,694 0.39 Hanover Insurance Group Inc/The 7,802 928,321 0.61 Healthcare Trust of America Inc 21,456 613,749 0.40 HealthEquity Inc 9,941 806,066 0.53 Highwoods Properties Inc 12,313 567,075 0.37 Hill-Rom Holdings Inc 4,620 480,549 0.31 Horace Mann Educators Corp 19,221 753,079 0.49 IBERIABANK Corp 8,325 651,806 0.43 ICU Medical Inc 2,212 544,804 0.36 Iridium Communications Inc 47,720 1,045,784 0.68 Kennedy-Wilson Holdings Inc 34,093 707,600 0.46 Knight-Swift Transportation Holdings Inc 12,947 438,580 0.29 Lantheus Holdings Inc 40,172 927,371 0.61 Lumentum Holdings Inc 8,651 437,784 0.29 MACOM Technology Solutions Holdings Inc 14,156 272,857 0.18 Matador Resources Co 32,270 612,646 0.40 Mobile Mini Inc 12,278 437,342 0.29 National Instruments Corp 18,080 840,268 0.55 Papa John's International Inc 11,090 474,097 0.31 Penn National Gaming Inc 28,660 727,534 0.48 Phibro Animal Health Corp 7,207 210,841 0.14 Piper Jaffray Cos 11,383 782,695 0.51 PolyOne Corp 16,479 544,878 0.36 Power Integrations Inc 8,201 598,796 0.39 Primoris Services Corp 18,300 401,319 0.26 Retrophin Inc 27,857 627,897 0.41 Selective Insurance Group Inc 8,226 540,243 0.35 Semtech Corp 10,308 566,888 0.37 Sensient Technologies Corp 8,398 545,576 0.36 SLM Corp 58,470 648,140 0.42 Sprouts Farmers Market Inc 20,316 473,261 0.31 SPX Corp 26,686 983,646 0.64 Synovus Financial Corp 14,578 582,756 0.38 Trex Co Inc 8,370 638,631 0.42 UMB Financial Corp 8,608 593,823 0.39 Univar Inc 22,590 526,686 0.34
10 Invesco Funds
Invesco Developed Small and Mid-Cap Equity Fund (formerly Invesco Global Smaller Companies Equity Fund) Statement of Investments as at 28 February 2019
Investment Nominal/Shares Market Value Net Assets USD %
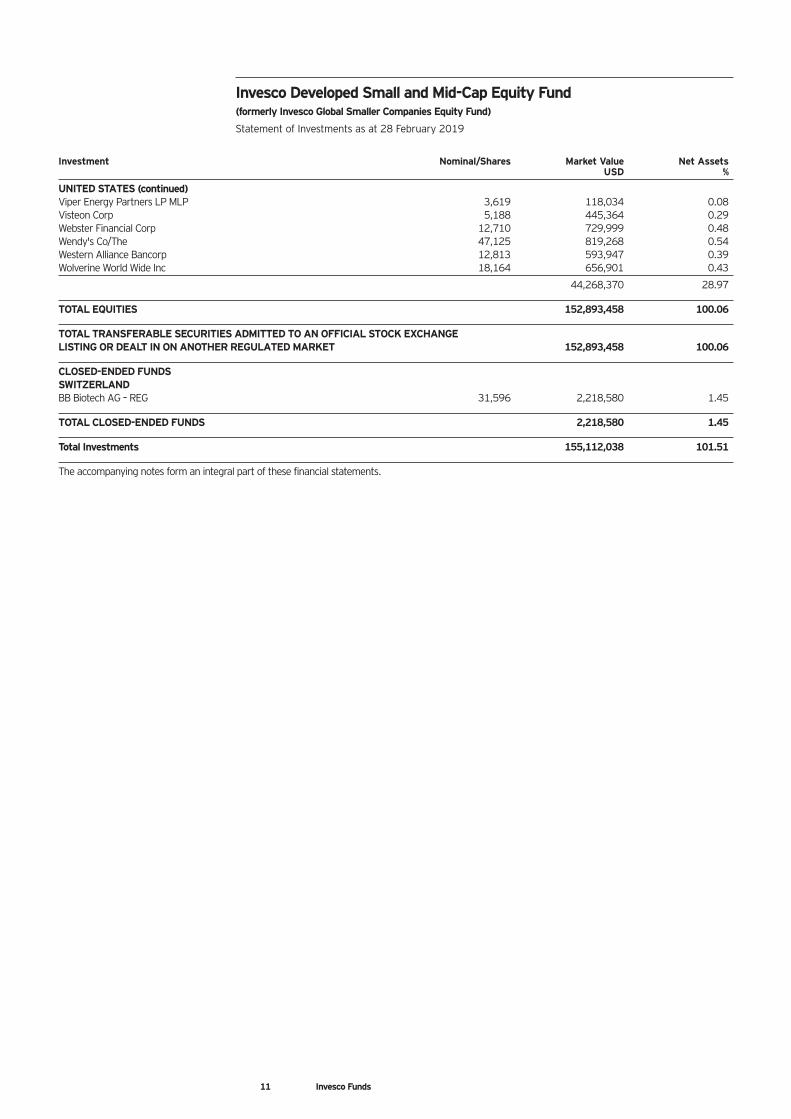
UNITED STATES (continued) Viper Energy Partners LP MLP 3,619 118,034 0.08 Visteon Corp 5,188 445,364 0.29 Webster Financial Corp 12,710 729,999 0.48 Wendy's Co/The 47,125 819,268 0.54 Western Alliance Bancorp 12,813 593,947 0.39 Wolverine World Wide Inc 18,164 656,901 0.43
44,268,370 28.97
TOTAL EQUITIES 152,893,458 100.06
TOTAL TRANSFERABLE SECURITIES ADMITTED TO AN OFFICIAL STOCK EXCHANGE LISTING OR DEALT IN ON ANOTHER REGULATED MARKET 152,893,458 100.06
CLOSED-ENDED FUNDS SWITZERLAND BB Biotech AG – REG 31,596 2,218,580 1.45
TOTAL CLOSED-ENDED FUNDS 2,218,580 1.45
Total Investments 155,112,038 101.51
The accompanying notes form an integral part of these financial statements.
11 Invesco Funds
Invesco Developed Small and Mid-Cap Equity Fund (formerly Invesco Global Smaller Companies Equity Fund) Statement of Investments as at 28 February 2019
Investment Nominal/Shares Market Value Net Assets USD %
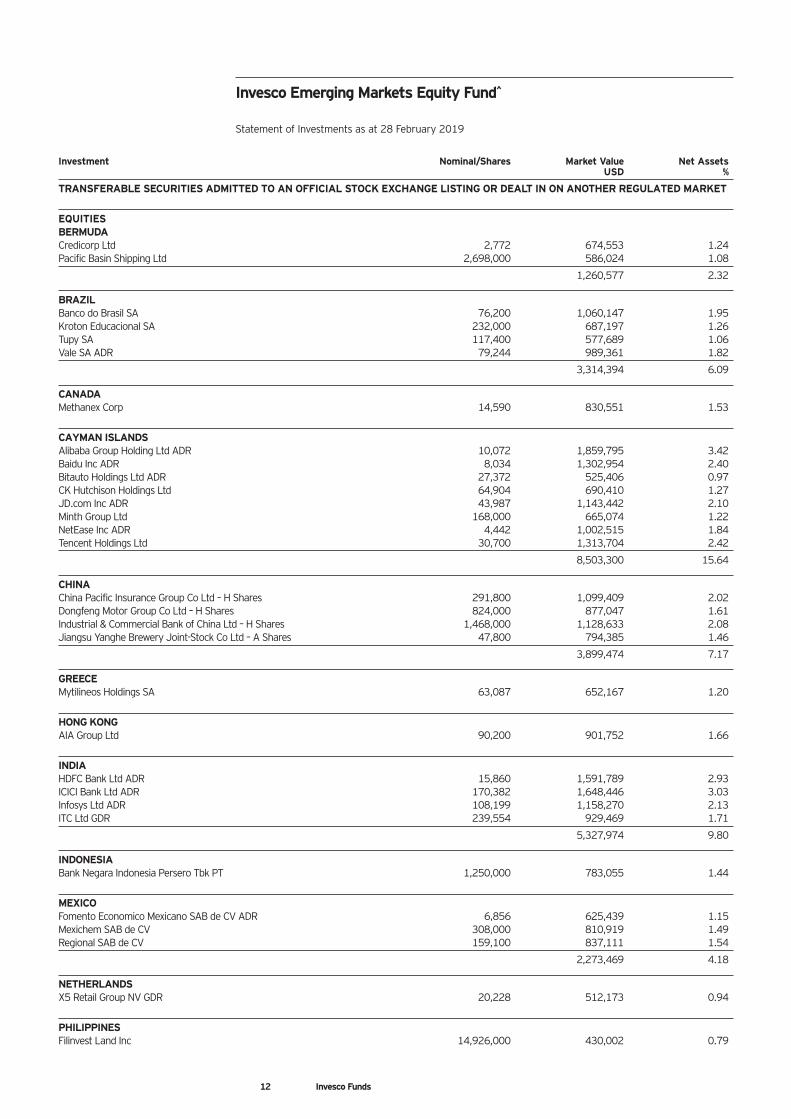
TRANSFERABLE SECURITIES ADMITTED TO AN OFFICIAL STOCK EXCHANGE LISTING OR DEALT IN ON ANOTHER REGULATED MARKET
EQUITIES BERMUDA Credicorp Ltd 2,772 674,553 1.24 Pacific Basin Shipping Ltd 2,698,000 586,024 1.08
1,260,577 2.32
BRAZIL Banco do Brasil SA 76,200 1,060,147 1.95 Kroton Educacional SA 232,000 687,197 1.26 Tupy SA 117,400 577,689 1.06 Vale SA ADR 79,244 989,361 1.82
3,314,394 6.09
CANADA Methanex Corp 14,590 830,551 1.53
CAYMAN ISLANDS Alibaba Group Holding Ltd ADR 10,072 1,859,795 3.42 Baidu Inc ADR 8,034 1,302,954 2.40 Bitauto Holdings Ltd ADR 27,372 525,406 0.97 CK Hutchison Holdings Ltd 64,904 690,410 1.27 JD.com Inc ADR 43,987 1,143,442 2.10 Minth Group Ltd 168,000 665,074 1.22 NetEase Inc ADR 4,442 1,002,515 1.84 Tencent Holdings Ltd 30,700 1,313,704 2.42
8,503,300 15.64
CHINA China Pacific Insurance Group Co Ltd – H Shares 291,800 1,099,409 2.02 Dongfeng Motor Group Co Ltd – H Shares 824,000 877,047 1.61 Industrial & Commercial Bank of China Ltd – H Shares 1,468,000 1,128,633 2.08 Jiangsu Yanghe Brewery Joint-Stock Co Ltd – A Shares 47,800 794,385 1.46
3,899,474 7.17
GREECE Mytilineos Holdings SA 63,087 652,167 1.20
HONG KONG AIA Group Ltd 90,200 901,752 1.66
INDIA HDFC Bank Ltd ADR 15,860 1,591,789 2.93 ICICI Bank Ltd ADR 170,382 1,648,446 3.03 Infosys Ltd ADR 108,199 1,158,270 2.13 ITC Ltd GDR 239,554 929,469 1.71
5,327,974 9.80
INDONESIA Bank Negara Indonesia Persero Tbk PT 1,250,000 783,055 1.44
MEXICO Fomento Economico Mexicano SAB de CV ADR 6,856 625,439 1.15 Mexichem SAB de CV 308,000 810,919 1.49 Regional SAB de CV 159,100 837,111 1.54
2,273,469 4.18
NETHERLANDS X5 Retail Group NV GDR 20,228 512,173 0.94
PHILIPPINES Filinvest Land Inc 14,926,000 430,002 0.79
Invesco Emerging Markets Equity Fund^ Statement of Investments as at 28 February 2019
12 Invesco Funds
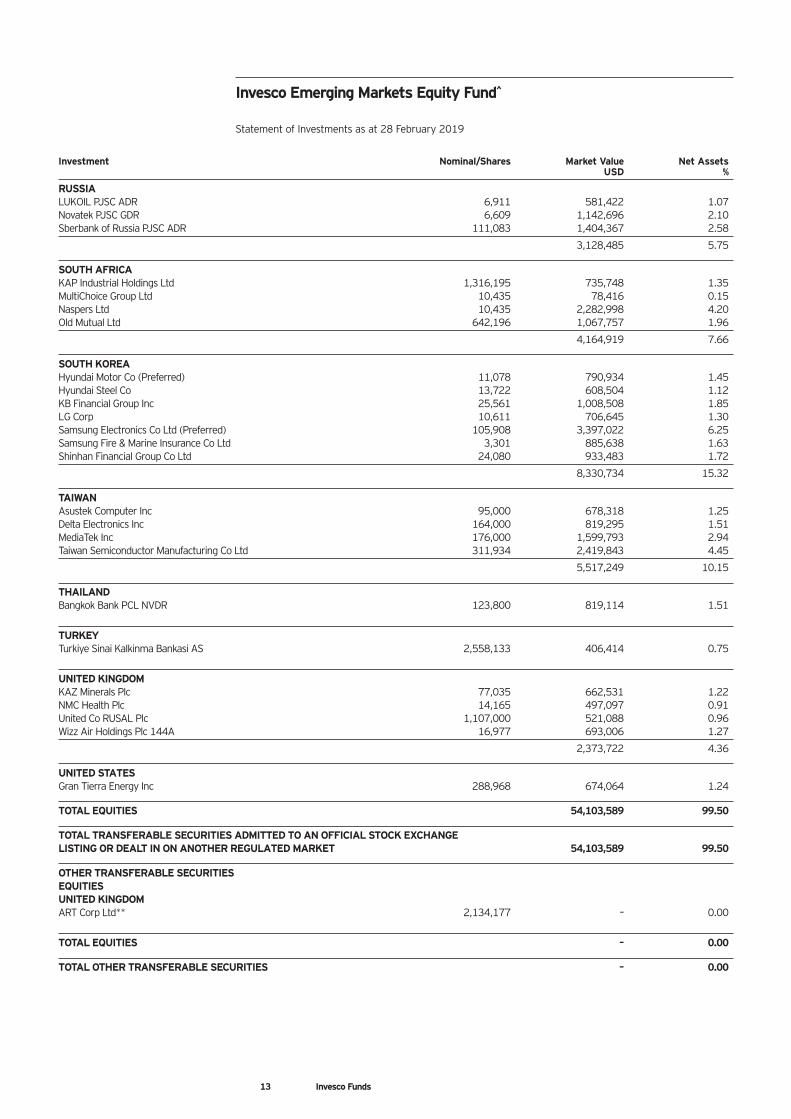
Investment Nominal/Shares Market Value Net Assets USD %
RUSSIA LUKOIL PJSC ADR 6,911 581,422 1.07 Novatek PJSC GDR 6,609 1,142,696 2.10 Sberbank of Russia PJSC ADR 111,083 1,404,367 2.58
3,128,485 5.75
SOUTH AFRICA KAP Industrial Holdings Ltd 1,316,195 735,748 1.35 MultiChoice Group Ltd 10,435 78,416 0.15 Naspers Ltd 10,435 2,282,998 4.20 Old Mutual Ltd 642,196 1,067,757 1.96
4,164,919 7.66
SOUTH KOREA Hyundai Motor Co (Preferred) 11,078 790,934 1.45 Hyundai Steel Co 13,722 608,504 1.12 KB Financial Group Inc 25,561 1,008,508 1.85 LG Corp 10,611 706,645 1.30 Samsung Electronics Co Ltd (Preferred) 105,908 3,397,022 6.25 Samsung Fire & Marine Insurance Co Ltd 3,301 885,638 1.63 Shinhan Financial Group Co Ltd 24,080 933,483 1.72
8,330,734 15.32
TAIWAN Asustek Computer Inc 95,000 678,318 1.25 Delta Electronics Inc 164,000 819,295 1.51 MediaTek Inc 176,000 1,599,793 2.94 Taiwan Semiconductor Manufacturing Co Ltd 311,934 2,419,843 4.45
5,517,249 10.15
THAILAND Bangkok Bank PCL NVDR 123,800 819,114 1.51
TURKEY Turkiye Sinai Kalkinma Bankasi AS 2,558,133 406,414 0.75
UNITED KINGDOM KAZ Minerals Plc 77,035 662,531 1.22 NMC Health Plc 14,165 497,097 0.91 United Co RUSAL Plc 1,107,000 521,088 0.96 Wizz Air Holdings Plc 144A 16,977 693,006 1.27
2,373,722 4.36
UNITED STATES Gran Tierra Energy Inc 288,968 674,064 1.24
TOTAL EQUITIES 54,103,589 99.50
TOTAL TRANSFERABLE SECURITIES ADMITTED TO AN OFFICIAL STOCK EXCHANGE LISTING OR DEALT IN ON ANOTHER REGULATED MARKET 54,103,589 99.50
OTHER TRANSFERABLE SECURITIES EQUITIES UNITED KINGDOM ART Corp Ltd** 2,134,177 – 0.00
TOTAL EQUITIES – 0.00
TOTAL OTHER TRANSFERABLE SECURITIES – 0.00
Invesco Emerging Markets Equity Fund^ Statement of Investments as at 28 February 2019
13 Invesco Funds
Investment Nominal/Shares Market Value Net Assets USD %
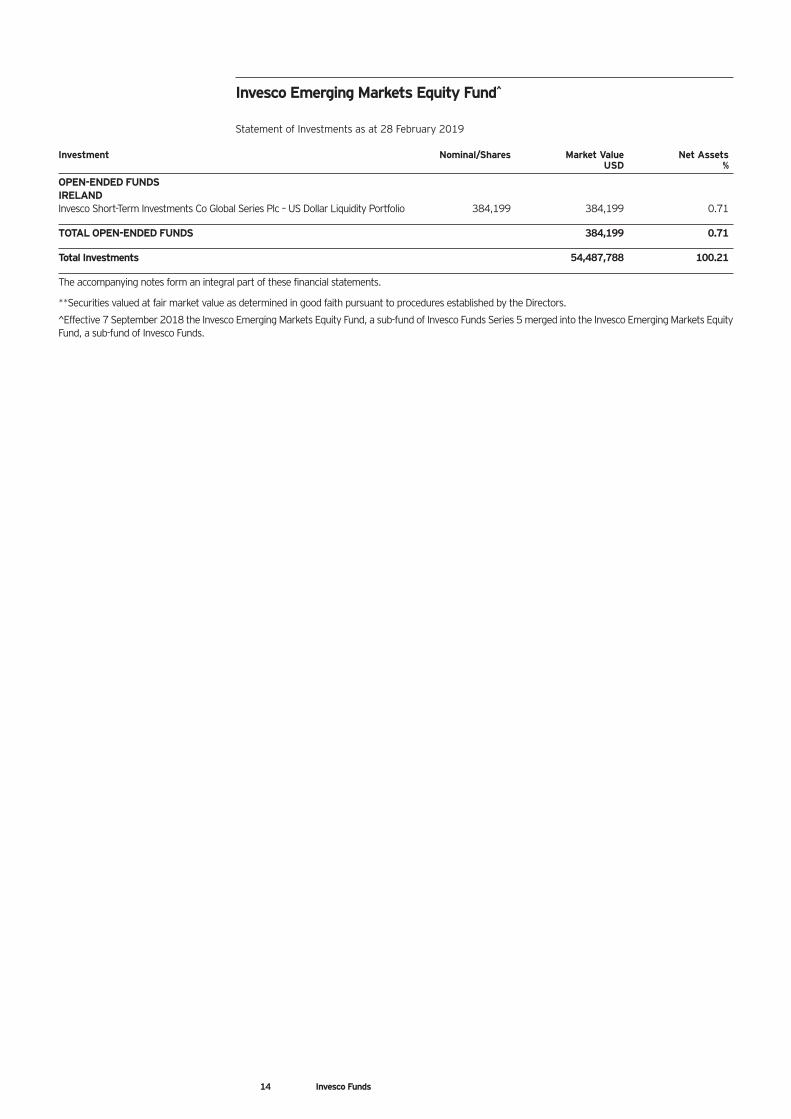
OPEN-ENDED FUNDS IRELAND Invesco Short-Term Investments Co Global Series Plc – US Dollar Liquidity Portfolio 384,199 384,199 0.71
TOTAL OPEN-ENDED FUNDS 384,199 0.71
Total Investments 54,487,788 100.21
The accompanying notes form an integral part of these financial statements.
**Securities valued at fair market value as determined in good faith pursuant to procedures established by the Directors.
^Effective 7 September 2018 the Invesco Emerging Markets Equity Fund, a sub-fund of Invesco Funds Series 5 merged into the Invesco Emerging Markets Equity Fund, a sub-fund of Invesco Funds.
Invesco Emerging Markets Equity Fund^ Statement of Investments as at 28 February 2019
14 Invesco Funds
Investment Nominal/Shares Market Value Net Assets USD %
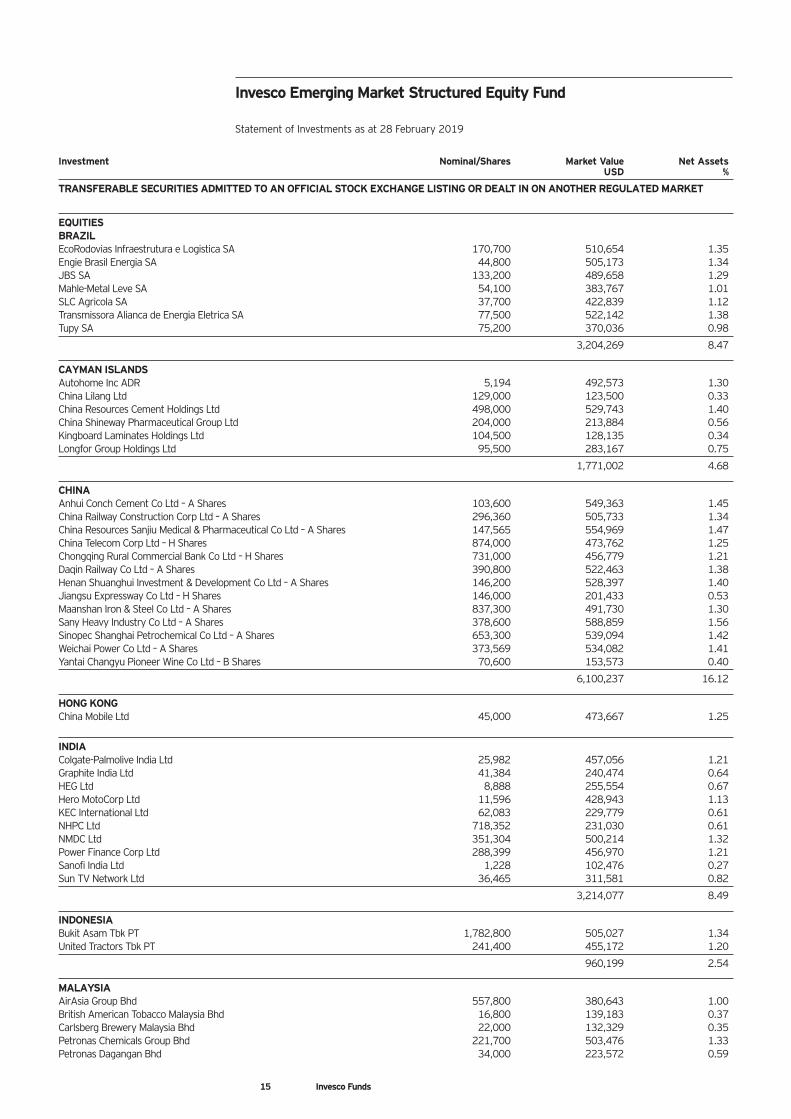
TRANSFERABLE SECURITIES ADMITTED TO AN OFFICIAL STOCK EXCHANGE LISTING OR DEALT IN ON ANOTHER REGULATED MARKET
EQUITIES BRAZIL EcoRodovias Infraestrutura e Logistica SA 170,700 510,654 1.35 Engie Brasil Energia SA 44,800 505,173 1.34 JBS SA 133,200 489,658 1.29 Mahle-Metal Leve SA 54,100 383,767 1.01 SLC Agricola SA 37,700 422,839 1.12 Transmissora Alianca de Energia Eletrica SA 77,500 522,142 1.38 Tupy SA 75,200 370,036 0.98
3,204,269 8.47
CAYMAN ISLANDS Autohome Inc ADR 5,194 492,573 1.30 China Lilang Ltd 129,000 123,500 0.33 China Resources Cement Holdings Ltd 498,000 529,743 1.40 China Shineway Pharmaceutical Group Ltd 204,000 213,884 0.56 Kingboard Laminates Holdings Ltd 104,500 128,135 0.34 Longfor Group Holdings Ltd 95,500 283,167 0.75
1,771,002 4.68
CHINA Anhui Conch Cement Co Ltd – A Shares 103,600 549,363 1.45 China Railway Construction Corp Ltd – A Shares 296,360 505,733 1.34 China Resources Sanjiu Medical & Pharmaceutical Co Ltd – A Shares 147,565 554,969 1.47 China Telecom Corp Ltd – H Shares 874,000 473,762 1.25 Chongqing Rural Commercial Bank Co Ltd – H Shares 731,000 456,779 1.21 Daqin Railway Co Ltd – A Shares 390,800 522,463 1.38 Henan Shuanghui Investment & Development Co Ltd – A Shares 146,200 528,397 1.40 Jiangsu Expressway Co Ltd – H Shares 146,000 201,433 0.53 Maanshan Iron & Steel Co Ltd – A Shares 837,300 491,730 1.30 Sany Heavy Industry Co Ltd – A Shares 378,600 588,859 1.56 Sinopec Shanghai Petrochemical Co Ltd – A Shares 653,300 539,094 1.42 Weichai Power Co Ltd – A Shares 373,569 534,082 1.41 Yantai Changyu Pioneer Wine Co Ltd – B Shares 70,600 153,573 0.40
6,100,237 16.12
HONG KONG China Mobile Ltd 45,000 473,667 1.25
INDIA Colgate-Palmolive India Ltd 25,982 457,056 1.21 Graphite India Ltd 41,384 240,474 0.64 HEG Ltd 8,888 255,554 0.67 Hero MotoCorp Ltd 11,596 428,943 1.13 KEC International Ltd 62,083 229,779 0.61 NHPC Ltd 718,352 231,030 0.61 NMDC Ltd 351,304 500,214 1.32 Power Finance Corp Ltd 288,399 456,970 1.21 Sanofi India Ltd 1,228 102,476 0.27 Sun TV Network Ltd 36,465 311,581 0.82
3,214,077 8.49
INDONESIA Bukit Asam Tbk PT 1,782,800 505,027 1.34 United Tractors Tbk PT 241,400 455,172 1.20
960,199 2.54
MALAYSIA AirAsia Group Bhd 557,800 380,643 1.00 British American Tobacco Malaysia Bhd 16,800 139,183 0.37 Carlsberg Brewery Malaysia Bhd 22,000 132,329 0.35 Petronas Chemicals Group Bhd 221,700 503,476 1.33 Petronas Dagangan Bhd 34,000 223,572 0.59
Invesco Emerging Market Structured Equity Fund Statement of Investments as at 28 February 2019
15 Invesco Funds
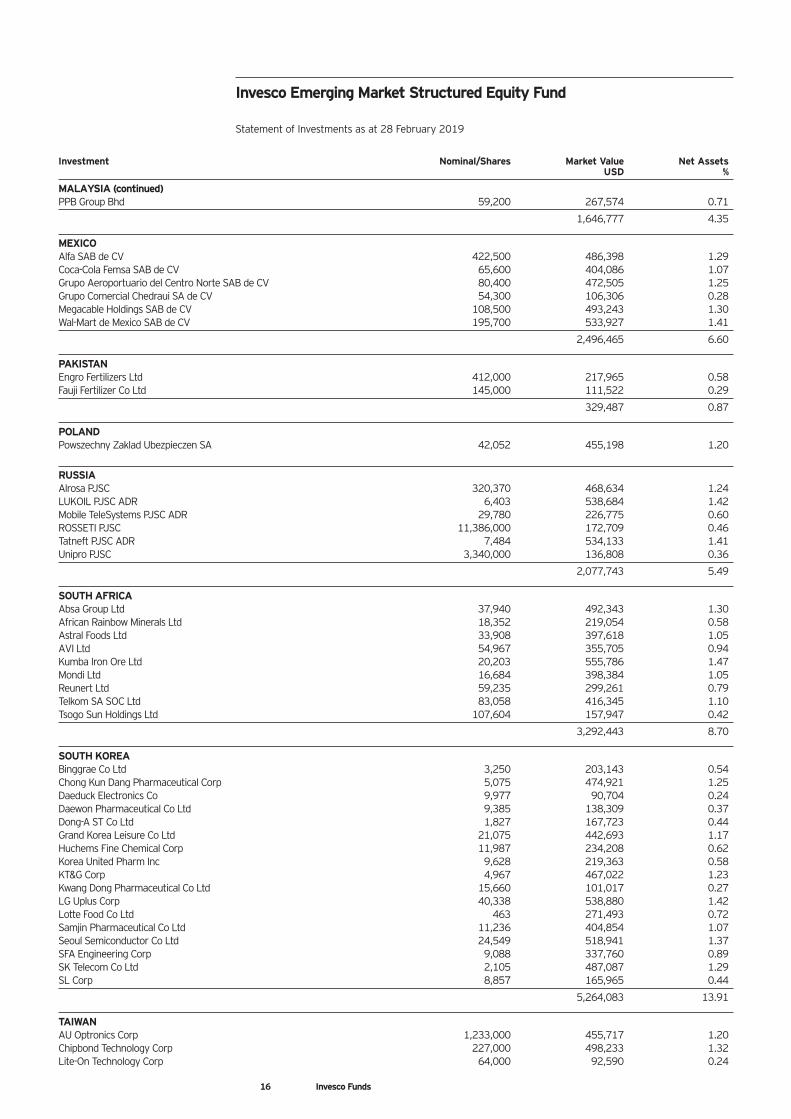
Investment Nominal/Shares Market Value Net Assets USD %
MALAYSIA (continued) PPB Group Bhd 59,200 267,574 0.71
1,646,777 4.35
MEXICO Alfa SAB de CV 422,500 486,398 1.29 Coca-Cola Femsa SAB de CV 65,600 404,086 1.07 Grupo Aeroportuario del Centro Norte SAB de CV 80,400 472,505 1.25 Grupo Comercial Chedraui SA de CV 54,300 106,306 0.28 Megacable Holdings SAB de CV 108,500 493,243 1.30 Wal-Mart de Mexico SAB de CV 195,700 533,927 1.41
2,496,465 6.60
PAKISTAN Engro Fertilizers Ltd 412,000 217,965 0.58 Fauji Fertilizer Co Ltd 145,000 111,522 0.29
329,487 0.87
POLAND Powszechny Zaklad Ubezpieczen SA 42,052 455,198 1.20
RUSSIA Alrosa PJSC 320,370 468,634 1.24 LUKOIL PJSC ADR 6,403 538,684 1.42 Mobile TeleSystems PJSC ADR 29,780 226,775 0.60 ROSSETI PJSC 11,386,000 172,709 0.46 Tatneft PJSC ADR 7,484 534,133 1.41 Unipro PJSC 3,340,000 136,808 0.36
2,077,743 5.49
SOUTH AFRICA Absa Group Ltd 37,940 492,343 1.30 African Rainbow Minerals Ltd 18,352 219,054 0.58 Astral Foods Ltd 33,908 397,618 1.05 AVI Ltd 54,967 355,705 0.94 Kumba Iron Ore Ltd 20,203 555,786 1.47 Mondi Ltd 16,684 398,384 1.05 Reunert Ltd 59,235 299,261 0.79 Telkom SA SOC Ltd 83,058 416,345 1.10 Tsogo Sun Holdings Ltd 107,604 157,947 0.42
3,292,443 8.70
SOUTH KOREA Binggrae Co Ltd 3,250 203,143 0.54 Chong Kun Dang Pharmaceutical Corp 5,075 474,921 1.25 Daeduck Electronics Co 9,977 90,704 0.24 Daewon Pharmaceutical Co Ltd 9,385 138,309 0.37 Dong-A ST Co Ltd 1,827 167,723 0.44 Grand Korea Leisure Co Ltd 21,075 442,693 1.17 Huchems Fine Chemical Corp 11,987 234,208 0.62 Korea United Pharm Inc 9,628 219,363 0.58 KT&G Corp 4,967 467,022 1.23 Kwang Dong Pharmaceutical Co Ltd 15,660 101,017 0.27 LG Uplus Corp 40,338 538,880 1.42 Lotte Food Co Ltd 463 271,493 0.72 Samjin Pharmaceutical Co Ltd 11,236 404,854 1.07 Seoul Semiconductor Co Ltd 24,549 518,941 1.37 SFA Engineering Corp 9,088 337,760 0.89 SK Telecom Co Ltd 2,105 487,087 1.29 SL Corp 8,857 165,965 0.44
5,264,083 13.91
TAIWAN AU Optronics Corp 1,233,000 455,717 1.20 Chipbond Technology Corp 227,000 498,233 1.32 Lite-On Technology Corp 64,000 92,590 0.24
Invesco Emerging Market Structured Equity Fund Statement of Investments as at 28 February 2019
16 Invesco Funds
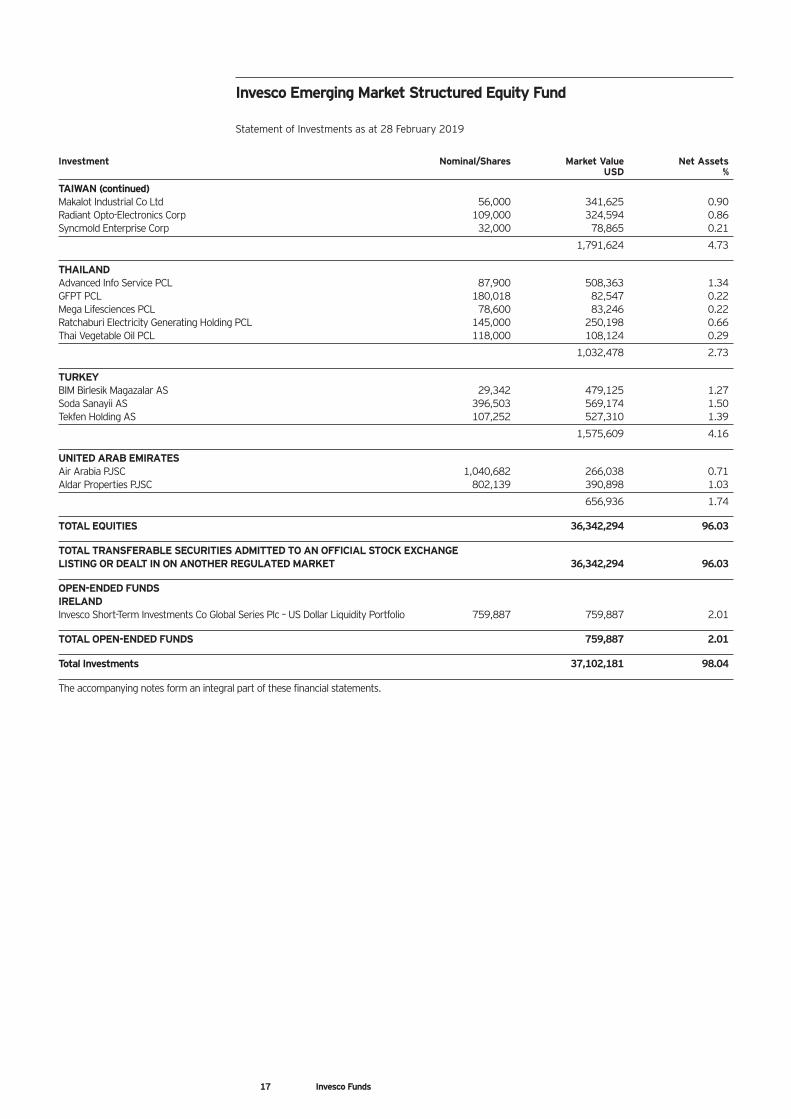
Investment Nominal/Shares Market Value Net Assets USD %
TAIWAN (continued) Makalot Industrial Co Ltd 56,000 341,625 0.90 Radiant Opto-Electronics Corp 109,000 324,594 0.86 Syncmold Enterprise Corp 32,000 78,865 0.21
1,791,624 4.73
THAILAND Advanced Info Service PCL 87,900 508,363 1.34 GFPT PCL 180,018 82,547 0.22 Mega Lifesciences PCL 78,600 83,246 0.22 Ratchaburi Electricity Generating Holding PCL 145,000 250,198 0.66 Thai Vegetable Oil PCL 118,000 108,124 0.29
1,032,478 2.73
TURKEY BIM Birlesik Magazalar AS 29,342 479,125 1.27 Soda Sanayii AS 396,503 569,174 1.50 Tekfen Holding AS 107,252 527,310 1.39
1,575,609 4.16
UNITED ARAB EMIRATES Air Arabia PJSC 1,040,682 266,038 0.71 Aldar Properties PJSC 802,139 390,898 1.03
656,936 1.74
TOTAL EQUITIES 36,342,294 96.03
TOTAL TRANSFERABLE SECURITIES ADMITTED TO AN OFFICIAL STOCK EXCHANGE LISTING OR DEALT IN ON ANOTHER REGULATED MARKET 36,342,294 96.03
OPEN-ENDED FUNDS IRELAND Invesco Short-Term Investments Co Global Series Plc – US Dollar Liquidity Portfolio 759,887 759,887 2.01
TOTAL OPEN-ENDED FUNDS 759,887 2.01
Total Investments 37,102,181 98.04
The accompanying notes form an integral part of these financial statements.
Invesco Emerging Market Structured Equity Fund Statement of Investments as at 28 February 2019
17 Invesco Funds
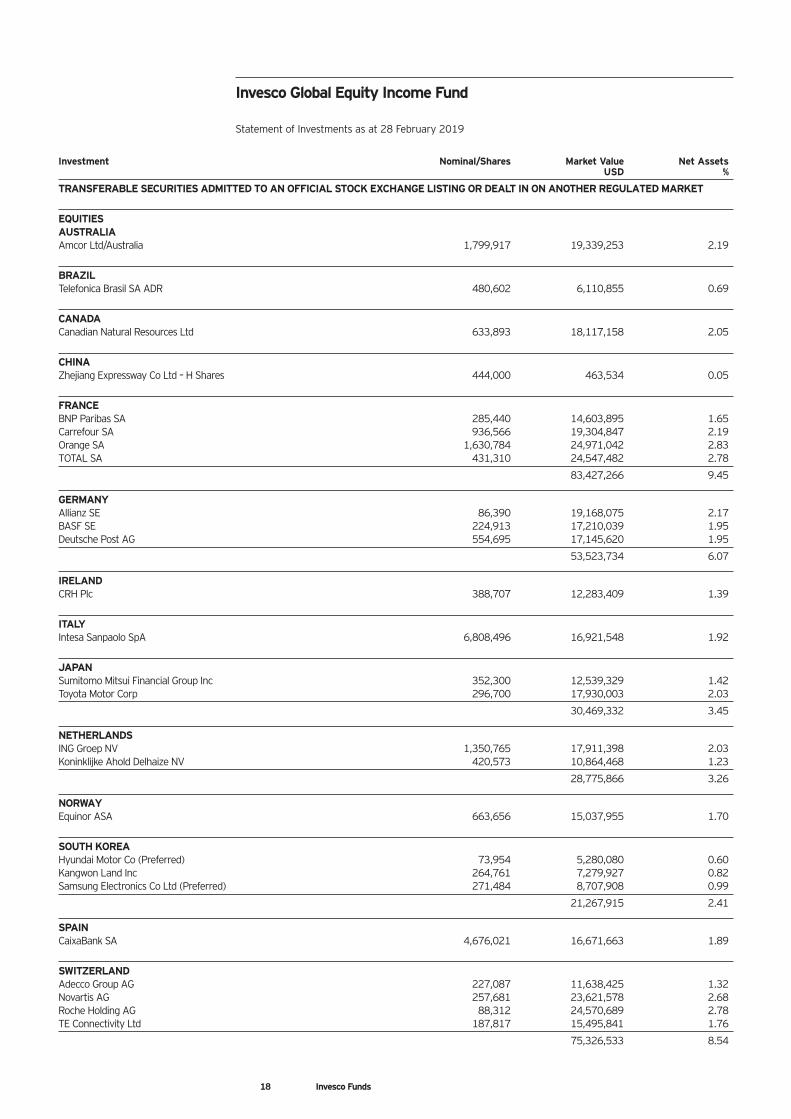
Invesco Global Equity Income Fund Statement of Investments as at 28 February 2019
Investment Nominal/Shares Market Value Net Assets USD %
TRANSFERABLE SECURITIES ADMITTED TO AN OFFICIAL STOCK EXCHANGE LISTING OR DEALT IN ON ANOTHER REGULATED MARKET
EQUITIES AUSTRALIA Amcor Ltd/Australia 1,799,917 19,339,253 2.19
BRAZIL Telefonica Brasil SA ADR 480,602 6,110,855 0.69
CANADA Canadian Natural Resources Ltd 633,893 18,117,158 2.05
CHINA Zhejiang Expressway Co Ltd – H Shares 444,000 463,534 0.05
FRANCE BNP Paribas SA 285,440 14,603,895 1.65 Carrefour SA 936,566 19,304,847 2.19 Orange SA 1,630,784 24,971,042 2.83 TOTAL SA 431,310 24,547,482 2.78
83,427,266 9.45
GERMANY Allianz SE 86,390 19,168,075 2.17 BASF SE 224,913 17,210,039 1.95 Deutsche Post AG 554,695 17,145,620 1.95
53,523,734 6.07
IRELAND CRH Plc 388,707 12,283,409 1.39
ITALY Intesa Sanpaolo SpA 6,808,496 16,921,548 1.92
JAPAN Sumitomo Mitsui Financial Group Inc 352,300 12,539,329 1.42 Toyota Motor Corp 296,700 17,930,003 2.03
30,469,332 3.45
NETHERLANDS ING Groep NV 1,350,765 17,911,398 2.03 Koninklijke Ahold Delhaize NV 420,573 10,864,468 1.23
28,775,866 3.26
NORWAY Equinor ASA 663,656 15,037,955 1.70
SOUTH KOREA Hyundai Motor Co (Preferred) 73,954 5,280,080 0.60 Kangwon Land Inc 264,761 7,279,927 0.82 Samsung Electronics Co Ltd (Preferred) 271,484 8,707,908 0.99
21,267,915 2.41
SPAIN CaixaBank SA 4,676,021 16,671,663 1.89
SWITZERLAND Adecco Group AG 227,087 11,638,425 1.32 Novartis AG 257,681 23,621,578 2.68 Roche Holding AG 88,312 24,570,689 2.78 TE Connectivity Ltd 187,817 15,495,841 1.76
75,326,533 8.54
18 Invesco Funds
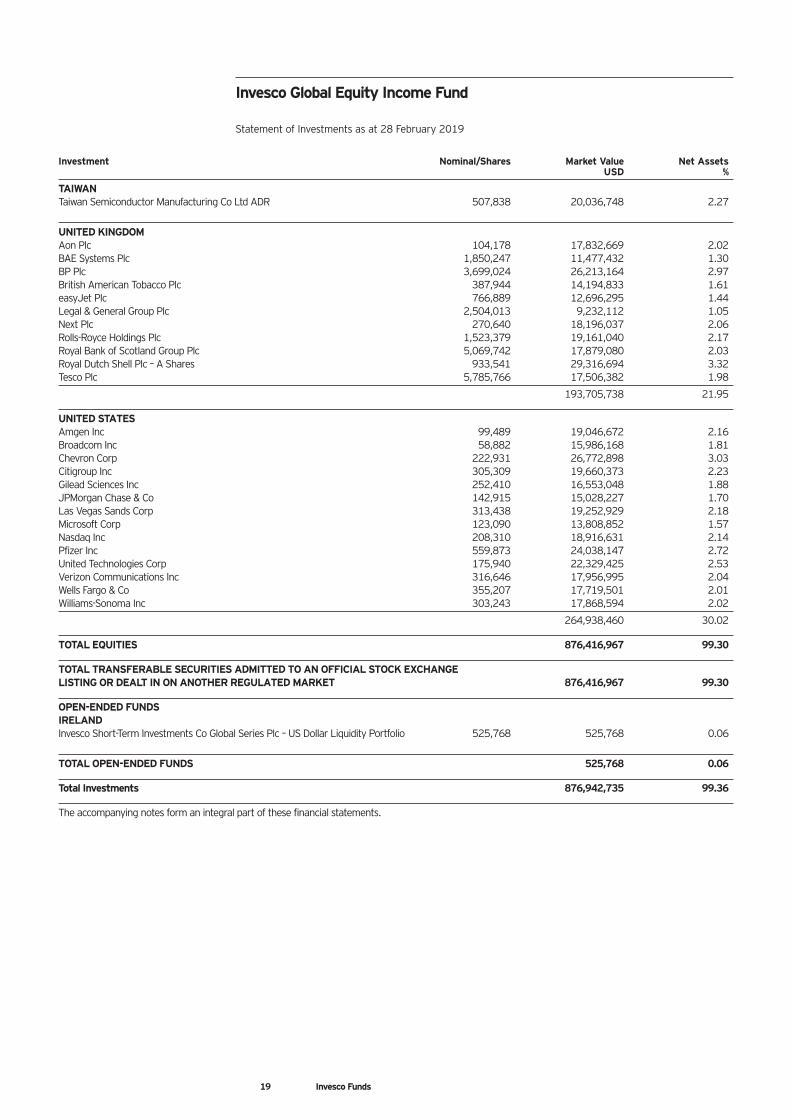
Invesco Global Equity Income Fund Statement of Investments as at 28 February 2019
Investment Nominal/Shares Market Value Net Assets USD %
TAIWAN Taiwan Semiconductor Manufacturing Co Ltd ADR 507,838 20,036,748 2.27
UNITED KINGDOM Aon Plc 104,178 17,832,669 2.02 BAE Systems Plc 1,850,247 11,477,432 1.30 BP Plc 3,699,024 26,213,164 2.97 British American Tobacco Plc 387,944 14,194,833 1.61 easyJet Plc 766,889 12,696,295 1.44 Legal & General Group Plc 2,504,013 9,232,112 1.05 Next Plc 270,640 18,196,037 2.06 Rolls-Royce Holdings Plc 1,523,379 19,161,040 2.17 Royal Bank of Scotland Group Plc 5,069,742 17,879,080 2.03 Royal Dutch Shell Plc – A Shares 933,541 29,316,694 3.32 Tesco Plc 5,785,766 17,506,382 1.98
193,705,738 21.95
UNITED STATES Amgen Inc 99,489 19,046,672 2.16 Broadcom Inc 58,882 15,986,168 1.81 Chevron Corp 222,931 26,772,898 3.03 Citigroup Inc 305,309 19,660,373 2.23 Gilead Sciences Inc 252,410 16,553,048 1.88 JPMorgan Chase & Co 142,915 15,028,227 1.70 Las Vegas Sands Corp 313,438 19,252,929 2.18 Microsoft Corp 123,090 13,808,852 1.57 Nasdaq Inc 208,310 18,916,631 2.14 Pfizer Inc 559,873 24,038,147 2.72 United Technologies Corp 175,940 22,329,425 2.53 Verizon Communications Inc 316,646 17,956,995 2.04 Wells Fargo & Co 355,207 17,719,501 2.01 Williams-Sonoma Inc 303,243 17,868,594 2.02
264,938,460 30.02
TOTAL EQUITIES 876,416,967 99.30
TOTAL TRANSFERABLE SECURITIES ADMITTED TO AN OFFICIAL STOCK EXCHANGE LISTING OR DEALT IN ON ANOTHER REGULATED MARKET 876,416,967 99.30
OPEN-ENDED FUNDS IRELAND Invesco Short-Term Investments Co Global Series Plc – US Dollar Liquidity Portfolio 525,768 525,768 0.06
TOTAL OPEN-ENDED FUNDS 525,768 0.06
Total Investments 876,942,735 99.36
The accompanying notes form an integral part of these financial statements.
19 Invesco Funds
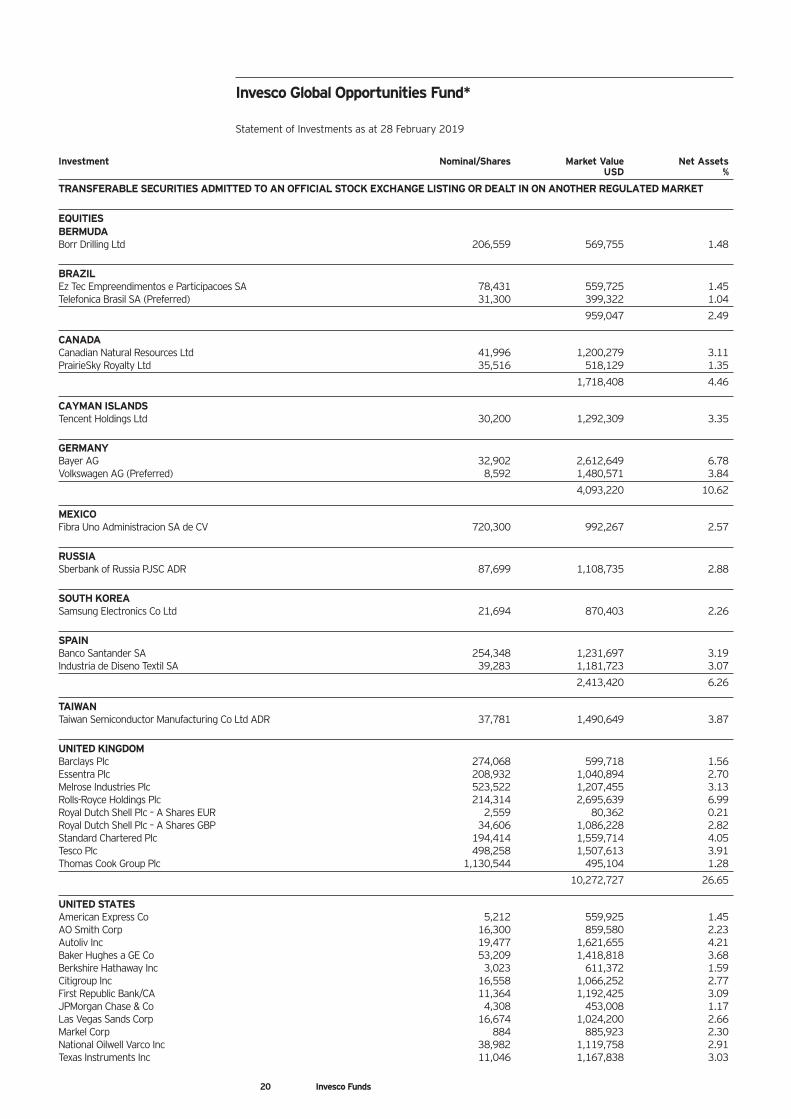
Invesco Global Opportunities Fund* Statement of Investments as at 28 February 2019
Investment Nominal/Shares Market Value Net Assets USD %
TRANSFERABLE SECURITIES ADMITTED TO AN OFFICIAL STOCK EXCHANGE LISTING OR DEALT IN ON ANOTHER REGULATED MARKET
EQUITIES BERMUDA Borr Drilling Ltd 206,559 569,755 1.48
BRAZIL Ez Tec Empreendimentos e Participacoes SA 78,431 559,725 1.45 Telefonica Brasil SA (Preferred) 31,300 399,322 1.04
959,047 2.49
CANADA Canadian Natural Resources Ltd 41,996 1,200,279 3.11 PrairieSky Royalty Ltd 35,516 518,129 1.35
1,718,408 4.46
CAYMAN ISLANDS Tencent Holdings Ltd 30,200 1,292,309 3.35
GERMANY Bayer AG 32,902 2,612,649 6.78 Volkswagen AG (Preferred) 8,592 1,480,571 3.84
4,093,220 10.62
MEXICO Fibra Uno Administracion SA de CV 720,300 992,267 2.57
RUSSIA Sberbank of Russia PJSC ADR 87,699 1,108,735 2.88
SOUTH KOREA Samsung Electronics Co Ltd 21,694 870,403 2.26
SPAIN Banco Santander SA 254,348 1,231,697 3.19 Industria de Diseno Textil SA 39,283 1,181,723 3.07
2,413,420 6.26
TAIWAN Taiwan Semiconductor Manufacturing Co Ltd ADR 37,781 1,490,649 3.87
UNITED KINGDOM Barclays Plc 274,068 599,718 1.56 Essentra Plc 208,932 1,040,894 2.70 Melrose Industries Plc 523,522 1,207,455 3.13 Rolls-Royce Holdings Plc 214,314 2,695,639 6.99 Royal Dutch Shell Plc – A Shares EUR 2,559 80,362 0.21 Royal Dutch Shell Plc – A Shares GBP 34,606 1,086,228 2.82 Standard Chartered Plc 194,414 1,559,714 4.05 Tesco Plc 498,258 1,507,613 3.91 Thomas Cook Group Plc 1,130,544 495,104 1.28
10,272,727 26.65
UNITED STATES American Express Co 5,212 559,925 1.45 AO Smith Corp 16,300 859,580 2.23 Autoliv Inc 19,477 1,621,655 4.21 Baker Hughes a GE Co 53,209 1,418,818 3.68 Berkshire Hathaway Inc 3,023 611,372 1.59 Citigroup Inc 16,558 1,066,252 2.77 First Republic Bank/CA 11,364 1,192,425 3.09 JPMorgan Chase & Co 4,308 453,008 1.17 Las Vegas Sands Corp 16,674 1,024,200 2.66 Markel Corp 884 885,923 2.30 National Oilwell Varco Inc 38,982 1,119,758 2.91 Texas Instruments Inc 11,046 1,167,838 3.03
20 Invesco Funds
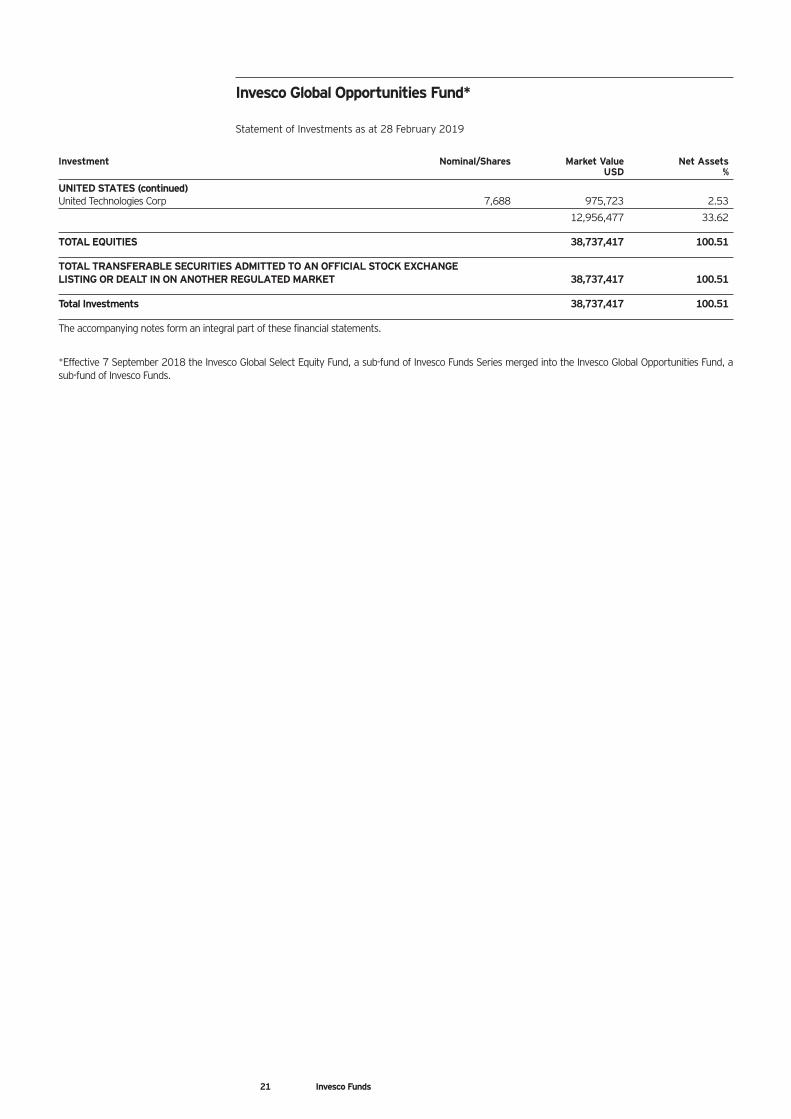
Invesco Global Opportunities Fund* Statement of Investments as at 28 February 2019
Investment Nominal/Shares Market Value Net Assets USD %
UNITED STATES (continued) United Technologies Corp 7,688 975,723 2.53
12,956,477 33.62
TOTAL EQUITIES 38,737,417 100.51
TOTAL TRANSFERABLE SECURITIES ADMITTED TO AN OFFICIAL STOCK EXCHANGE LISTING OR DEALT IN ON ANOTHER REGULATED MARKET 38,737,417 100.51
Total Investments 38,737,417 100.51
The accompanying notes form an integral part of these financial statements.
*Effective 7 September 2018 the Invesco Global Select Equity Fund, a sub-fund of Invesco Funds Series merged into the Invesco Global Opportunities Fund, a sub-fund of Invesco Funds.
21 Invesco Funds
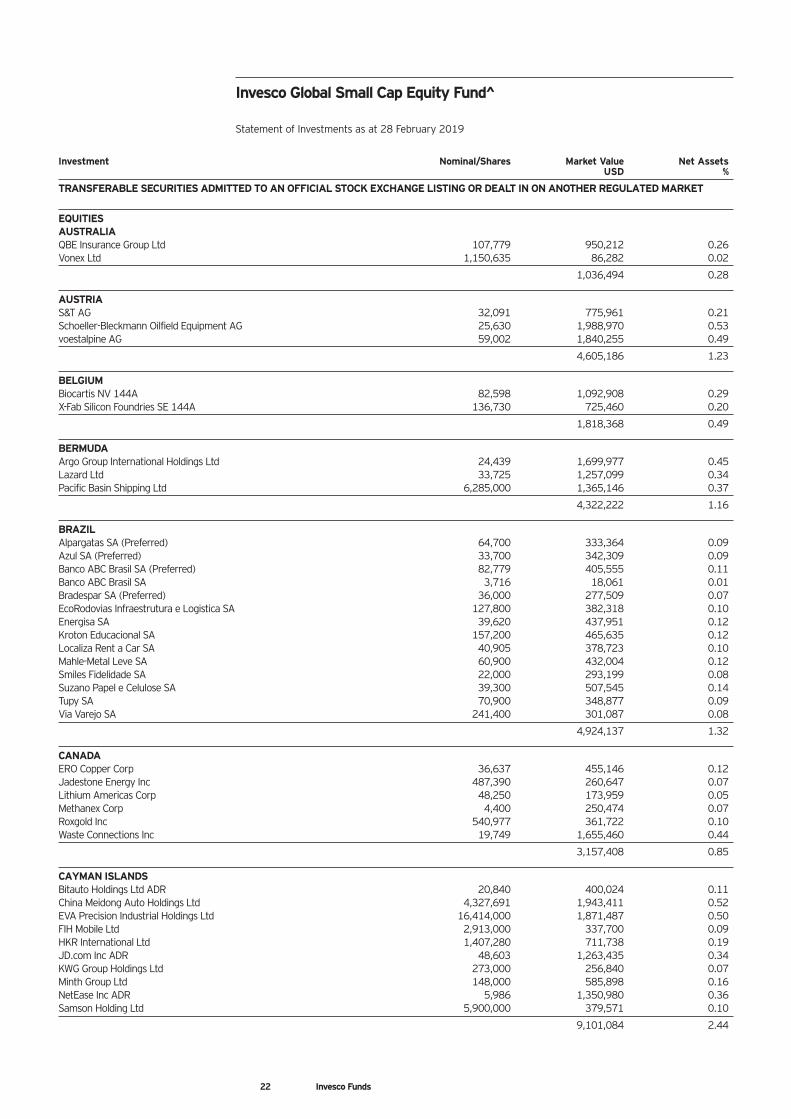
Invesco Global Small Cap Equity Fund^ Statement of Investments as at 28 February 2019
Investment Nominal/Shares Market Value Net Assets USD %
TRANSFERABLE SECURITIES ADMITTED TO AN OFFICIAL STOCK EXCHANGE LISTING OR DEALT IN ON ANOTHER REGULATED MARKET
EQUITIES AUSTRALIA QBE Insurance Group Ltd 107,779 950,212 0.26 Vonex Ltd 1,150,635 86,282 0.02
1,036,494 0.28
AUSTRIA S&T AG 32,091 775,961 0.21 Schoeller-Bleckmann Oilfield Equipment AG 25,630 1,988,970 0.53 voestalpine AG 59,002 1,840,255 0.49
4,605,186 1.23
BELGIUM Biocartis NV 144A 82,598 1,092,908 0.29 X-Fab Silicon Foundries SE 144A 136,730 725,460 0.20
1,818,368 0.49
BERMUDA Argo Group International Holdings Ltd 24,439 1,699,977 0.45 Lazard Ltd 33,725 1,257,099 0.34 Pacific Basin Shipping Ltd 6,285,000 1,365,146 0.37
4,322,222 1.16
BRAZIL Alpargatas SA (Preferred) 64,700 333,364 0.09 Azul SA (Preferred) 33,700 342,309 0.09 Banco ABC Brasil SA (Preferred) 82,779 405,555 0.11 Banco ABC Brasil SA 3,716 18,061 0.01 Bradespar SA (Preferred) 36,000 277,509 0.07 EcoRodovias Infraestrutura e Logistica SA 127,800 382,318 0.10 Energisa SA 39,620 437,951 0.12 Kroton Educacional SA 157,200 465,635 0.12 Localiza Rent a Car SA 40,905 378,723 0.10 Mahle-Metal Leve SA 60,900 432,004 0.12 Smiles Fidelidade SA 22,000 293,199 0.08 Suzano Papel e Celulose SA 39,300 507,545 0.14 Tupy SA 70,900 348,877 0.09 Via Varejo SA 241,400 301,087 0.08
4,924,137 1.32
CANADA ERO Copper Corp 36,637 455,146 0.12 Jadestone Energy Inc 487,390 260,647 0.07 Lithium Americas Corp 48,250 173,959 0.05 Methanex Corp 4,400 250,474 0.07 Roxgold Inc 540,977 361,722 0.10 Waste Connections Inc 19,749 1,655,460 0.44
3,157,408 0.85
CAYMAN ISLANDS Bitauto Holdings Ltd ADR 20,840 400,024 0.11 China Meidong Auto Holdings Ltd 4,327,691 1,943,411 0.52 EVA Precision Industrial Holdings Ltd 16,414,000 1,871,487 0.50 FIH Mobile Ltd 2,913,000 337,700 0.09 HKR International Ltd 1,407,280 711,738 0.19 JD.com Inc ADR 48,603 1,263,435 0.34 KWG Group Holdings Ltd 273,000 256,840 0.07 Minth Group Ltd 148,000 585,898 0.16 NetEase Inc ADR 5,986 1,350,980 0.36 Samson Holding Ltd 5,900,000 379,571 0.10
9,101,084 2.44
22 Invesco Funds
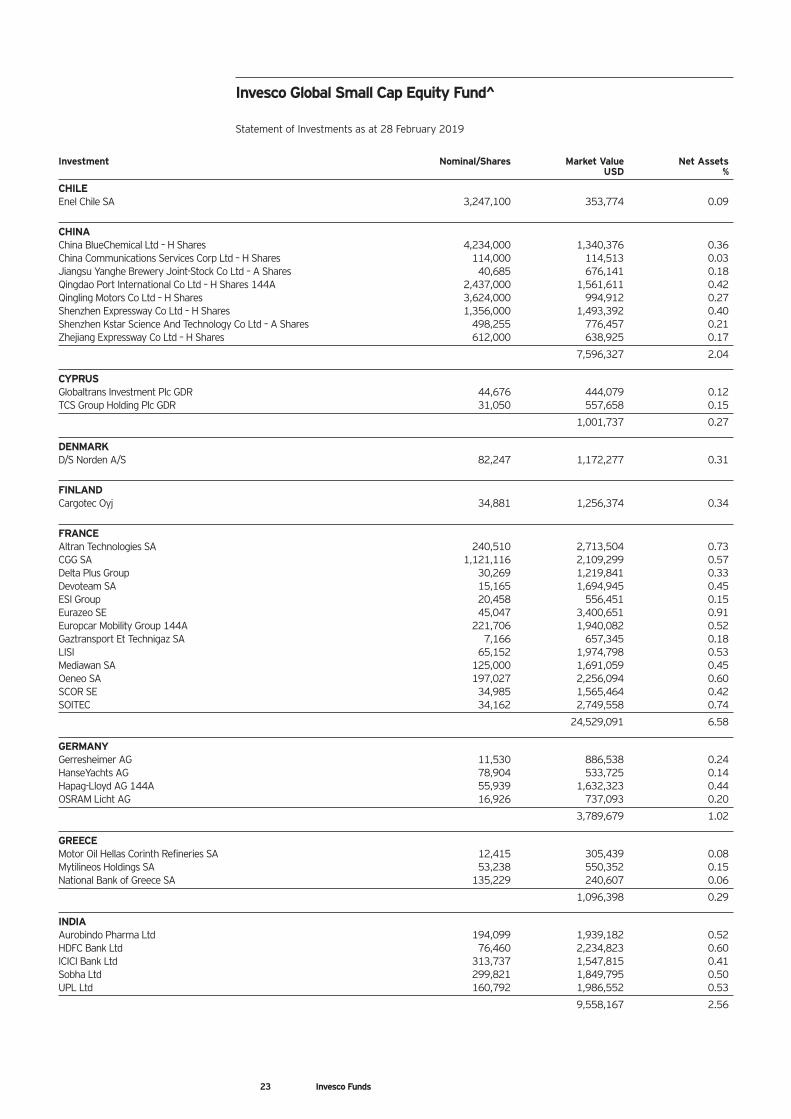
Invesco Global Small Cap Equity Fund^ Statement of Investments as at 28 February 2019
Investment Nominal/Shares Market Value Net Assets USD %
CHILE Enel Chile SA 3,247,100 353,774 0.09
CHINA China BlueChemical Ltd – H Shares 4,234,000 1,340,376 0.36 China Communications Services Corp Ltd – H Shares 114,000 114,513 0.03 Jiangsu Yanghe Brewery Joint-Stock Co Ltd – A Shares 40,685 676,141 0.18 Qingdao Port International Co Ltd – H Shares 144A 2,437,000 1,561,611 0.42 Qingling Motors Co Ltd – H Shares 3,624,000 994,912 0.27 Shenzhen Expressway Co Ltd – H Shares 1,356,000 1,493,392 0.40 Shenzhen Kstar Science And Technology Co Ltd – A Shares 498,255 776,457 0.21 Zhejiang Expressway Co Ltd – H Shares 612,000 638,925 0.17
7,596,327 2.04
CYPRUS Globaltrans Investment Plc GDR 44,676 444,079 0.12 TCS Group Holding Plc GDR 31,050 557,658 0.15
1,001,737 0.27
DENMARK D/S Norden A/S 82,247 1,172,277 0.31
FINLAND Cargotec Oyj 34,881 1,256,374 0.34
FRANCE Altran Technologies SA 240,510 2,713,504 0.73 CGG SA 1,121,116 2,109,299 0.57 Delta Plus Group 30,269 1,219,841 0.33 Devoteam SA 15,165 1,694,945 0.45 ESI Group 20,458 556,451 0.15 Eurazeo SE 45,047 3,400,651 0.91 Europcar Mobility Group 144A 221,706 1,940,082 0.52 Gaztransport Et Technigaz SA 7,166 657,345 0.18 LISI 65,152 1,974,798 0.53 Mediawan SA 125,000 1,691,059 0.45 Oeneo SA 197,027 2,256,094 0.60 SCOR SE 34,985 1,565,464 0.42 SOITEC 34,162 2,749,558 0.74
24,529,091 6.58
GERMANY Gerresheimer AG 11,530 886,538 0.24 HanseYachts AG 78,904 533,725 0.14 Hapag-Lloyd AG 144A 55,939 1,632,323 0.44 OSRAM Licht AG 16,926 737,093 0.20
3,789,679 1.02
GREECE Motor Oil Hellas Corinth Refineries SA 12,415 305,439 0.08 Mytilineos Holdings SA 53,238 550,352 0.15 National Bank of Greece SA 135,229 240,607 0.06
1,096,398 0.29
INDIA Aurobindo Pharma Ltd 194,099 1,939,182 0.52 HDFC Bank Ltd 76,460 2,234,823 0.60 ICICI Bank Ltd 313,737 1,547,815 0.41 Sobha Ltd 299,821 1,849,795 0.50 UPL Ltd 160,792 1,986,552 0.53
9,558,167 2.56
23 Invesco Funds
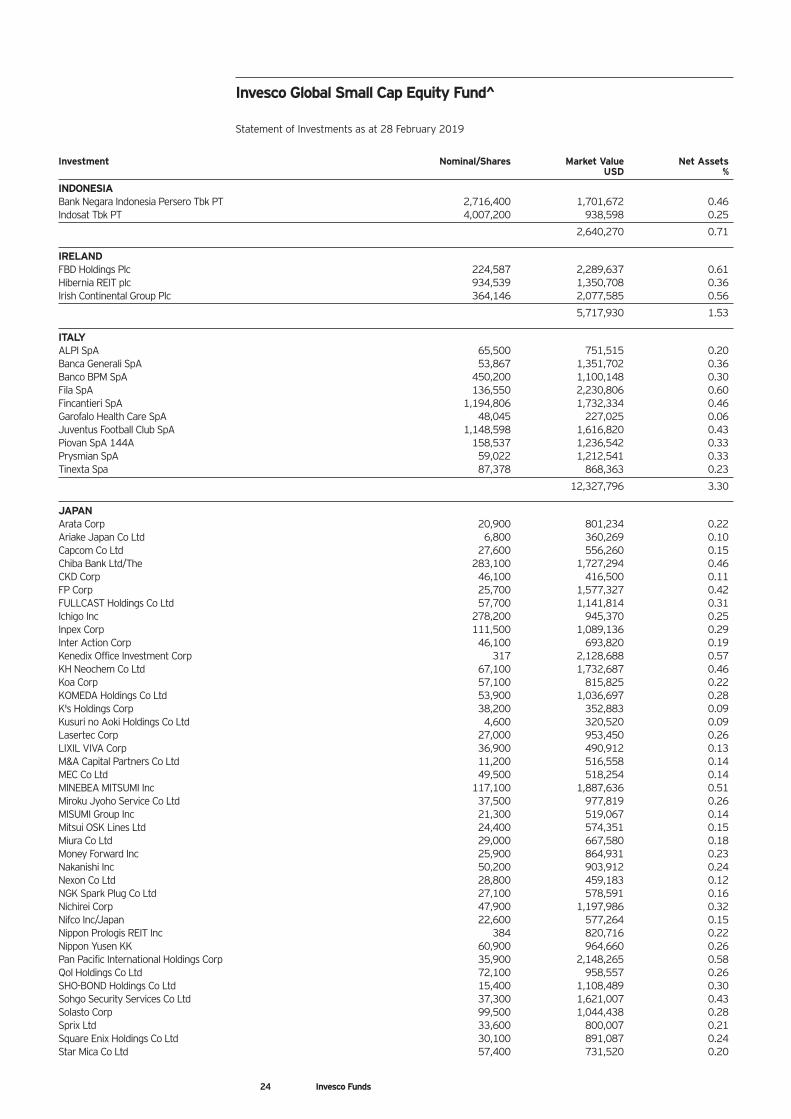
Invesco Global Small Cap Equity Fund^ Statement of Investments as at 28 February 2019
Investment Nominal/Shares Market Value Net Assets USD %
INDONESIA Bank Negara Indonesia Persero Tbk PT 2,716,400 1,701,672 0.46 Indosat Tbk PT 4,007,200 938,598 0.25
2,640,270 0.71
IRELAND FBD Holdings Plc 224,587 2,289,637 0.61 Hibernia REIT plc 934,539 1,350,708 0.36 Irish Continental Group Plc 364,146 2,077,585 0.56
5,717,930 1.53
ITALY ALPI SpA 65,500 751,515 0.20 Banca Generali SpA 53,867 1,351,702 0.36 Banco BPM SpA 450,200 1,100,148 0.30 Fila SpA 136,550 2,230,806 0.60 Fincantieri SpA 1,194,806 1,732,334 0.46 Garofalo Health Care SpA 48,045 227,025 0.06 Juventus Football Club SpA 1,148,598 1,616,820 0.43 Piovan SpA 144A 158,537 1,236,542 0.33 Prysmian SpA 59,022 1,212,541 0.33 Tinexta Spa 87,378 868,363 0.23
12,327,796 3.30
JAPAN Arata Corp 20,900 801,234 0.22 Ariake Japan Co Ltd 6,800 360,269 0.10 Capcom Co Ltd 27,600 556,260 0.15 Chiba Bank Ltd/The 283,100 1,727,294 0.46 CKD Corp 46,100 416,500 0.11 FP Corp 25,700 1,577,327 0.42 FULLCAST Holdings Co Ltd 57,700 1,141,814 0.31 Ichigo Inc 278,200 945,370 0.25 Inpex Corp 111,500 1,089,136 0.29 Inter Action Corp 46,100 693,820 0.19 Kenedix Office Investment Corp 317 2,128,688 0.57 KH Neochem Co Ltd 67,100 1,732,687 0.46 Koa Corp 57,100 815,825 0.22 KOMEDA Holdings Co Ltd 53,900 1,036,697 0.28 K's Holdings Corp 38,200 352,883 0.09 Kusuri no Aoki Holdings Co Ltd 4,600 320,520 0.09 Lasertec Corp 27,000 953,450 0.26 LIXIL VIVA Corp 36,900 490,912 0.13 M&A Capital Partners Co Ltd 11,200 516,558 0.14 MEC Co Ltd 49,500 518,254 0.14 MINEBEA MITSUMI Inc 117,100 1,887,636 0.51 Miroku Jyoho Service Co Ltd 37,500 977,819 0.26 MISUMI Group Inc 21,300 519,067 0.14 Mitsui OSK Lines Ltd 24,400 574,351 0.15 Miura Co Ltd 29,000 667,580 0.18 Money Forward Inc 25,900 864,931 0.23 Nakanishi Inc 50,200 903,912 0.24 Nexon Co Ltd 28,800 459,183 0.12 NGK Spark Plug Co Ltd 27,100 578,591 0.16 Nichirei Corp 47,900 1,197,986 0.32 Nifco Inc/Japan 22,600 577,264 0.15 Nippon Prologis REIT Inc 384 820,716 0.22 Nippon Yusen KK 60,900 964,660 0.26 Pan Pacific International Holdings Corp 35,900 2,148,265 0.58 Qol Holdings Co Ltd 72,100 958,557 0.26 SHO-BOND Holdings Co Ltd 15,400 1,108,489 0.30 Sohgo Security Services Co Ltd 37,300 1,621,007 0.43 Solasto Corp 99,500 1,044,438 0.28 Sprix Ltd 33,600 800,007 0.21 Square Enix Holdings Co Ltd 30,100 891,087 0.24 Star Mica Co Ltd 57,400 731,520 0.20
24 Invesco Funds
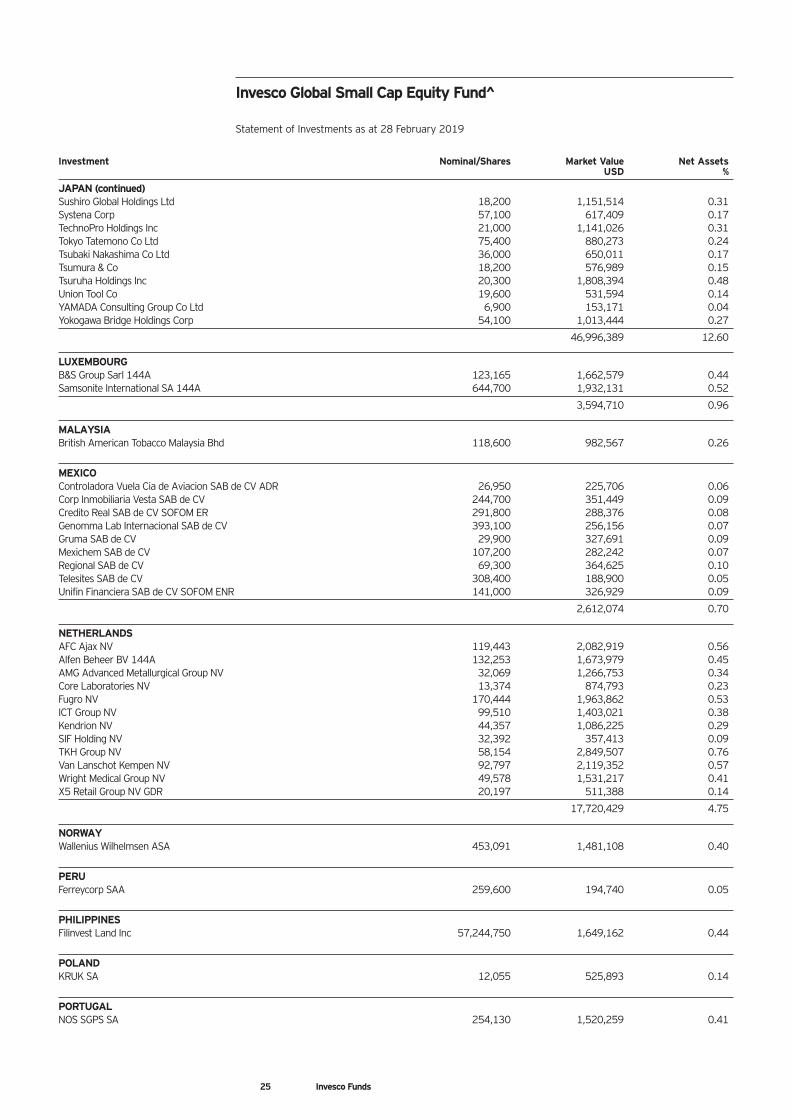
Invesco Global Small Cap Equity Fund^ Statement of Investments as at 28 February 2019
Investment Nominal/Shares Market Value Net Assets USD %
JAPAN (continued) Sushiro Global Holdings Ltd 18,200 1,151,514 0.31 Systena Corp 57,100 617,409 0.17 TechnoPro Holdings Inc 21,000 1,141,026 0.31 Tokyo Tatemono Co Ltd 75,400 880,273 0.24 Tsubaki Nakashima Co Ltd 36,000 650,011 0.17 Tsumura & Co 18,200 576,989 0.15 Tsuruha Holdings Inc 20,300 1,808,394 0.48 Union Tool Co 19,600 531,594 0.14 YAMADA Consulting Group Co Ltd 6,900 153,171 0.04 Yokogawa Bridge Holdings Corp 54,100 1,013,444 0.27
46,996,389 12.60
LUXEMBOURG B&S Group Sarl 144A 123,165 1,662,579 0.44 Samsonite International SA 144A 644,700 1,932,131 0.52
3,594,710 0.96
MALAYSIA British American Tobacco Malaysia Bhd 118,600 982,567 0.26
MEXICO Controladora Vuela Cia de Aviacion SAB de CV ADR 26,950 225,706 0.06 Corp Inmobiliaria Vesta SAB de CV 244,700 351,449 0.09 Credito Real SAB de CV SOFOM ER 291,800 288,376 0.08 Genomma Lab Internacional SAB de CV 393,100 256,156 0.07 Gruma SAB de CV 29,900 327,691 0.09 Mexichem SAB de CV 107,200 282,242 0.07 Regional SAB de CV 69,300 364,625 0.10 Telesites SAB de CV 308,400 188,900 0.05 Unifin Financiera SAB de CV SOFOM ENR 141,000 326,929 0.09
2,612,074 0.70
NETHERLANDS AFC Ajax NV 119,443 2,082,919 0.56 Alfen Beheer BV 144A 132,253 1,673,979 0.45 AMG Advanced Metallurgical Group NV 32,069 1,266,753 0.34 Core Laboratories NV 13,374 874,793 0.23 Fugro NV 170,444 1,963,862 0.53 ICT Group NV 99,510 1,403,021 0.38 Kendrion NV 44,357 1,086,225 0.29 SIF Holding NV 32,392 357,413 0.09 TKH Group NV 58,154 2,849,507 0.76 Van Lanschot Kempen NV 92,797 2,119,352 0.57 Wright Medical Group NV 49,578 1,531,217 0.41 X5 Retail Group NV GDR 20,197 511,388 0.14
17,720,429 4.75
NORWAY Wallenius Wilhelmsen ASA 453,091 1,481,108 0.40
PERU Ferreycorp SAA 259,600 194,740 0.05
PHILIPPINES Filinvest Land Inc 57,244,750 1,649,162 0.44
POLAND KRUK SA 12,055 525,893 0.14
PORTUGAL NOS SGPS SA 254,130 1,520,259 0.41
25 Invesco Funds
Invesco Global Small Cap Equity Fund^ Statement of Investments as at 28 February 2019
Investment Nominal/Shares Market Value Net Assets USD %
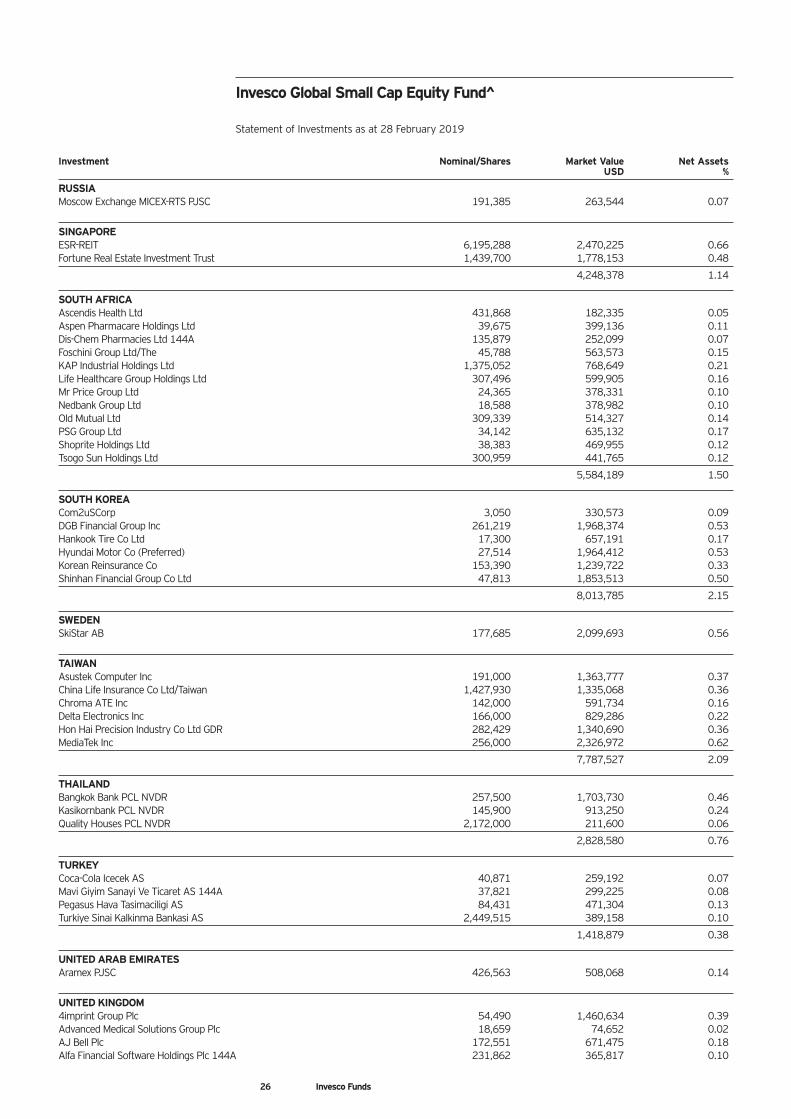
RUSSIA Moscow Exchange MICEX-RTS PJSC 191,385 263,544 0.07
SINGAPORE ESR-REIT 6,195,288 2,470,225 0.66 Fortune Real Estate Investment Trust 1,439,700 1,778,153 0.48
4,248,378 1.14
SOUTH AFRICA Ascendis Health Ltd 431,868 182,335 0.05 Aspen Pharmacare Holdings Ltd 39,675 399,136 0.11 Dis-Chem Pharmacies Ltd 144A 135,879 252,099 0.07 Foschini Group Ltd/The 45,788 563,573 0.15 KAP Industrial Holdings Ltd 1,375,052 768,649 0.21 Life Healthcare Group Holdings Ltd 307,496 599,905 0.16 Mr Price Group Ltd 24,365 378,331 0.10 Nedbank Group Ltd 18,588 378,982 0.10 Old Mutual Ltd 309,339 514,327 0.14 PSG Group Ltd 34,142 635,132 0.17 Shoprite Holdings Ltd 38,383 469,955 0.12 Tsogo Sun Holdings Ltd 300,959 441,765 0.12
5,584,189 1.50
SOUTH KOREA Com2uSCorp 3,050 330,573 0.09 DGB Financial Group Inc 261,219 1,968,374 0.53 Hankook Tire Co Ltd 17,300 657,191 0.17 Hyundai Motor Co (Preferred) 27,514 1,964,412 0.53 Korean Reinsurance Co 153,390 1,239,722 0.33 Shinhan Financial Group Co Ltd 47,813 1,853,513 0.50
8,013,785 2.15
SWEDEN SkiStar AB 177,685 2,099,693 0.56
TAIWAN Asustek Computer Inc 191,000 1,363,777 0.37 China Life Insurance Co Ltd/Taiwan 1,427,930 1,335,068 0.36 Chroma ATE Inc 142,000 591,734 0.16 Delta Electronics Inc 166,000 829,286 0.22 Hon Hai Precision Industry Co Ltd GDR 282,429 1,340,690 0.36 MediaTek Inc 256,000 2,326,972 0.62
7,787,527 2.09
THAILAND Bangkok Bank PCL NVDR 257,500 1,703,730 0.46 Kasikornbank PCL NVDR 145,900 913,250 0.24 Quality Houses PCL NVDR 2,172,000 211,600 0.06
2,828,580 0.76
TURKEY Coca-Cola Icecek AS 40,871 259,192 0.07 Mavi Giyim Sanayi Ve Ticaret AS 144A 37,821 299,225 0.08 Pegasus Hava Tasimaciligi AS 84,431 471,304 0.13 Turkiye Sinai Kalkinma Bankasi AS 2,449,515 389,158 0.10
1,418,879 0.38
UNITED ARAB EMIRATES Aramex PJSC 426,563 508,068 0.14
UNITED KINGDOM 4imprint Group Plc 54,490 1,460,634 0.39 Advanced Medical Solutions Group Plc 18,659 74,652 0.02 AJ Bell Plc 172,551 671,475 0.18 Alfa Financial Software Holdings Plc 144A 231,862 365,817 0.10
26 Invesco Funds
Invesco Global Small Cap Equity Fund^ Statement of Investments as at 28 February 2019
Investment Nominal/Shares Market Value Net Assets USD %
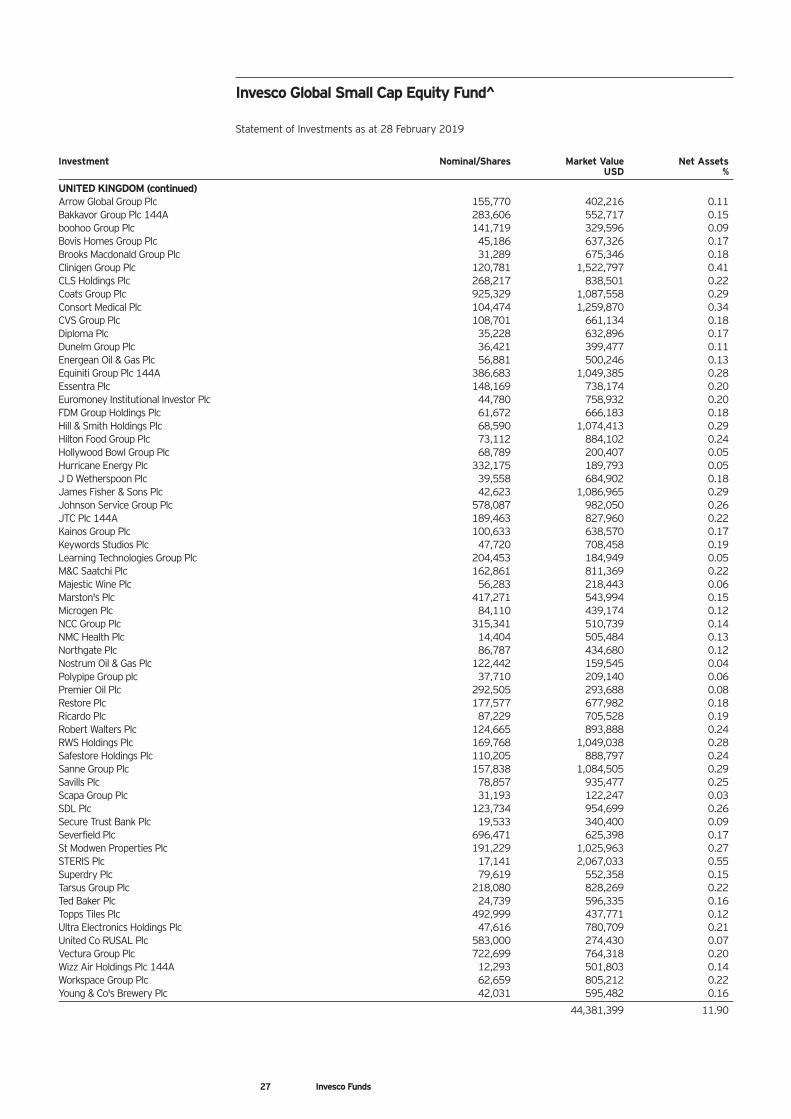
UNITED KINGDOM (continued) Arrow Global Group Plc 155,770 402,216 0.11 Bakkavor Group Plc 144A 283,606 552,717 0.15 boohoo Group Plc 141,719 329,596 0.09 Bovis Homes Group Plc 45,186 637,326 0.17 Brooks Macdonald Group Plc 31,289 675,346 0.18 Clinigen Group Plc 120,781 1,522,797 0.41 CLS Holdings Plc 268,217 838,501 0.22 Coats Group Plc 925,329 1,087,558 0.29 Consort Medical Plc 104,474 1,259,870 0.34 CVS Group Plc 108,701 661,134 0.18 Diploma Plc 35,228 632,896 0.17 Dunelm Group Plc 36,421 399,477 0.11 Energean Oil & Gas Plc 56,881 500,246 0.13 Equiniti Group Plc 144A 386,683 1,049,385 0.28 Essentra Plc 148,169 738,174 0.20 Euromoney Institutional Investor Plc 44,780 758,932 0.20 FDM Group Holdings Plc 61,672 666,183 0.18 Hill & Smith Holdings Plc 68,590 1,074,413 0.29 Hilton Food Group Plc 73,112 884,102 0.24 Hollywood Bowl Group Plc 68,789 200,407 0.05 Hurricane Energy Plc 332,175 189,793 0.05 J D Wetherspoon Plc 39,558 684,902 0.18 James Fisher & Sons Plc 42,623 1,086,965 0.29 Johnson Service Group Plc 578,087 982,050 0.26 JTC Plc 144A 189,463 827,960 0.22 Kainos Group Plc 100,633 638,570 0.17 Keywords Studios Plc 47,720 708,458 0.19 Learning Technologies Group Plc 204,453 184,949 0.05 M&C Saatchi Plc 162,861 811,369 0.22 Majestic Wine Plc 56,283 218,443 0.06 Marston's Plc 417,271 543,994 0.15 Microgen Plc 84,110 439,174 0.12 NCC Group Plc 315,341 510,739 0.14 NMC Health Plc 14,404 505,484 0.13 Northgate Plc 86,787 434,680 0.12 Nostrum Oil & Gas Plc 122,442 159,545 0.04 Polypipe Group plc 37,710 209,140 0.06 Premier Oil Plc 292,505 293,688 0.08 Restore Plc 177,577 677,982 0.18 Ricardo Plc 87,229 705,528 0.19 Robert Walters Plc 124,665 893,888 0.24 RWS Holdings Plc 169,768 1,049,038 0.28 Safestore Holdings Plc 110,205 888,797 0.24 Sanne Group Plc 157,838 1,084,505 0.29 Savills Plc 78,857 935,477 0.25 Scapa Group Plc 31,193 122,247 0.03 SDL Plc 123,734 954,699 0.26 Secure Trust Bank Plc 19,533 340,400 0.09 Severfield Plc 696,471 625,398 0.17 St Modwen Properties Plc 191,229 1,025,963 0.27 STERIS Plc 17,141 2,067,033 0.55 Superdry Plc 79,619 552,358 0.15 Tarsus Group Plc 218,080 828,269 0.22 Ted Baker Plc 24,739 596,335 0.16 Topps Tiles Plc 492,999 437,771 0.12 Ultra Electronics Holdings Plc 47,616 780,709 0.21 United Co RUSAL Plc 583,000 274,430 0.07 Vectura Group Plc 722,699 764,318 0.20 Wizz Air Holdings Plc 144A 12,293 501,803 0.14 Workspace Group Plc 62,659 805,212 0.22 Young & Co's Brewery Plc 42,031 595,482 0.16
44,381,399 11.90
27 Invesco Funds
Invesco Global Small Cap Equity Fund^ Statement of Investments as at 28 February 2019
Investment Nominal/Shares Market Value Net Assets USD %
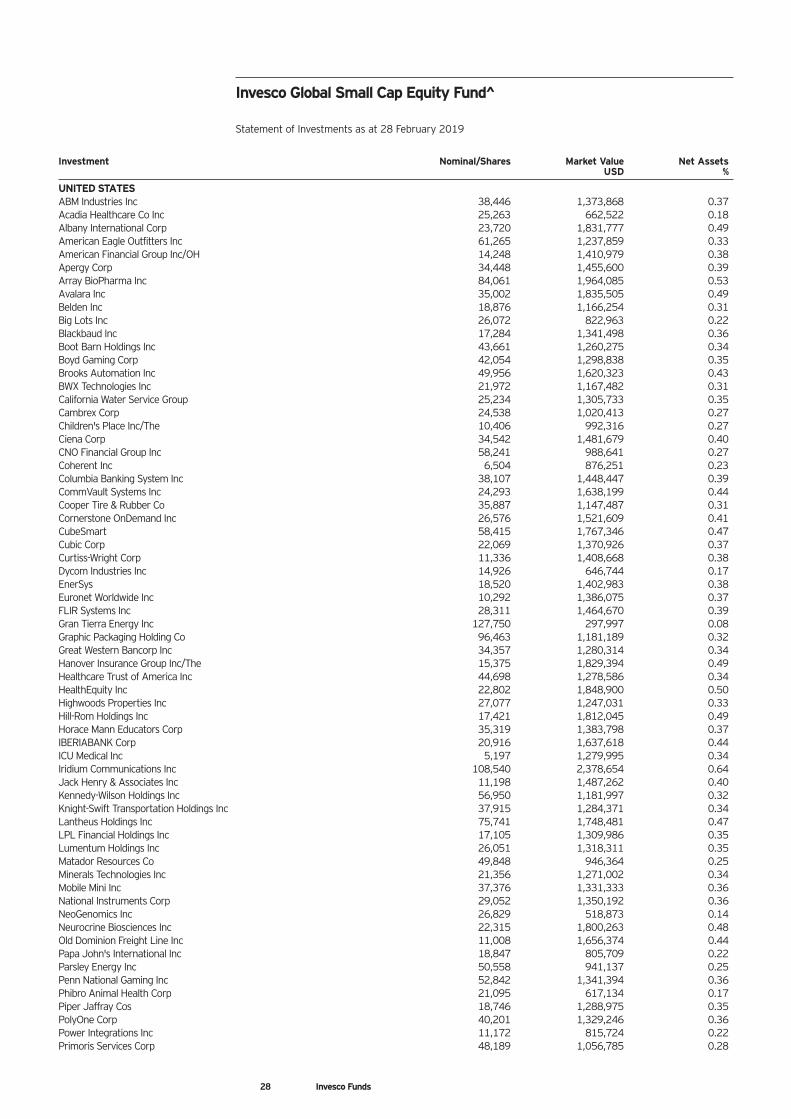
UNITED STATES ABM Industries Inc 38,446 1,373,868 0.37 Acadia Healthcare Co Inc 25,263 662,522 0.18 Albany International Corp 23,720 1,831,777 0.49 American Eagle Outfitters Inc 61,265 1,237,859 0.33 American Financial Group Inc/OH 14,248 1,410,979 0.38 Apergy Corp 34,448 1,455,600 0.39 Array BioPharma Inc 84,061 1,964,085 0.53 Avalara Inc 35,002 1,835,505 0.49 Belden Inc 18,876 1,166,254 0.31 Big Lots Inc 26,072 822,963 0.22 Blackbaud Inc 17,284 1,341,498 0.36 Boot Barn Holdings Inc 43,661 1,260,275 0.34 Boyd Gaming Corp 42,054 1,298,838 0.35 Brooks Automation Inc 49,956 1,620,323 0.43 BWX Technologies Inc 21,972 1,167,482 0.31 California Water Service Group 25,234 1,305,733 0.35 Cambrex Corp 24,538 1,020,413 0.27 Children's Place Inc/The 10,406 992,316 0.27 Ciena Corp 34,542 1,481,679 0.40 CNO Financial Group Inc 58,241 988,641 0.27 Coherent Inc 6,504 876,251 0.23 Columbia Banking System Inc 38,107 1,448,447 0.39 CommVault Systems Inc 24,293 1,638,199 0.44 Cooper Tire & Rubber Co 35,887 1,147,487 0.31 Cornerstone OnDemand Inc 26,576 1,521,609 0.41 CubeSmart 58,415 1,767,346 0.47 Cubic Corp 22,069 1,370,926 0.37 Curtiss-Wright Corp 11,336 1,408,668 0.38 Dycom Industries Inc 14,926 646,744 0.17 EnerSys 18,520 1,402,983 0.38 Euronet Worldwide Inc 10,292 1,386,075 0.37 FLIR Systems Inc 28,311 1,464,670 0.39 Gran Tierra Energy Inc 127,750 297,997 0.08 Graphic Packaging Holding Co 96,463 1,181,189 0.32 Great Western Bancorp Inc 34,357 1,280,314 0.34 Hanover Insurance Group Inc/The 15,375 1,829,394 0.49 Healthcare Trust of America Inc 44,698 1,278,586 0.34 HealthEquity Inc 22,802 1,848,900 0.50 Highwoods Properties Inc 27,077 1,247,031 0.33 Hill-Rom Holdings Inc 17,421 1,812,045 0.49 Horace Mann Educators Corp 35,319 1,383,798 0.37 IBERIABANK Corp 20,916 1,637,618 0.44 ICU Medical Inc 5,197 1,279,995 0.34 Iridium Communications Inc 108,540 2,378,654 0.64 Jack Henry & Associates Inc 11,198 1,487,262 0.40 Kennedy-Wilson Holdings Inc 56,950 1,181,997 0.32 Knight-Swift Transportation Holdings Inc 37,915 1,284,371 0.34 Lantheus Holdings Inc 75,741 1,748,481 0.47 LPL Financial Holdings Inc 17,105 1,309,986 0.35 Lumentum Holdings Inc 26,051 1,318,311 0.35 Matador Resources Co 49,848 946,364 0.25 Minerals Technologies Inc 21,356 1,271,002 0.34 Mobile Mini Inc 37,376 1,331,333 0.36 National Instruments Corp 29,052 1,350,192 0.36 NeoGenomics Inc 26,829 518,873 0.14 Neurocrine Biosciences Inc 22,315 1,800,263 0.48 Old Dominion Freight Line Inc 11,008 1,656,374 0.44 Papa John's International Inc 18,847 805,709 0.22 Parsley Energy Inc 50,558 941,137 0.25 Penn National Gaming Inc 52,842 1,341,394 0.36 Phibro Animal Health Corp 21,095 617,134 0.17 Piper Jaffray Cos 18,746 1,288,975 0.35 PolyOne Corp 40,201 1,329,246 0.36 Power Integrations Inc 11,172 815,724 0.22 Primoris Services Corp 48,189 1,056,785 0.28
28 Invesco Funds
Invesco Global Small Cap Equity Fund^ Statement of Investments as at 28 February 2019
Investment Nominal/Shares Market Value Net Assets USD %
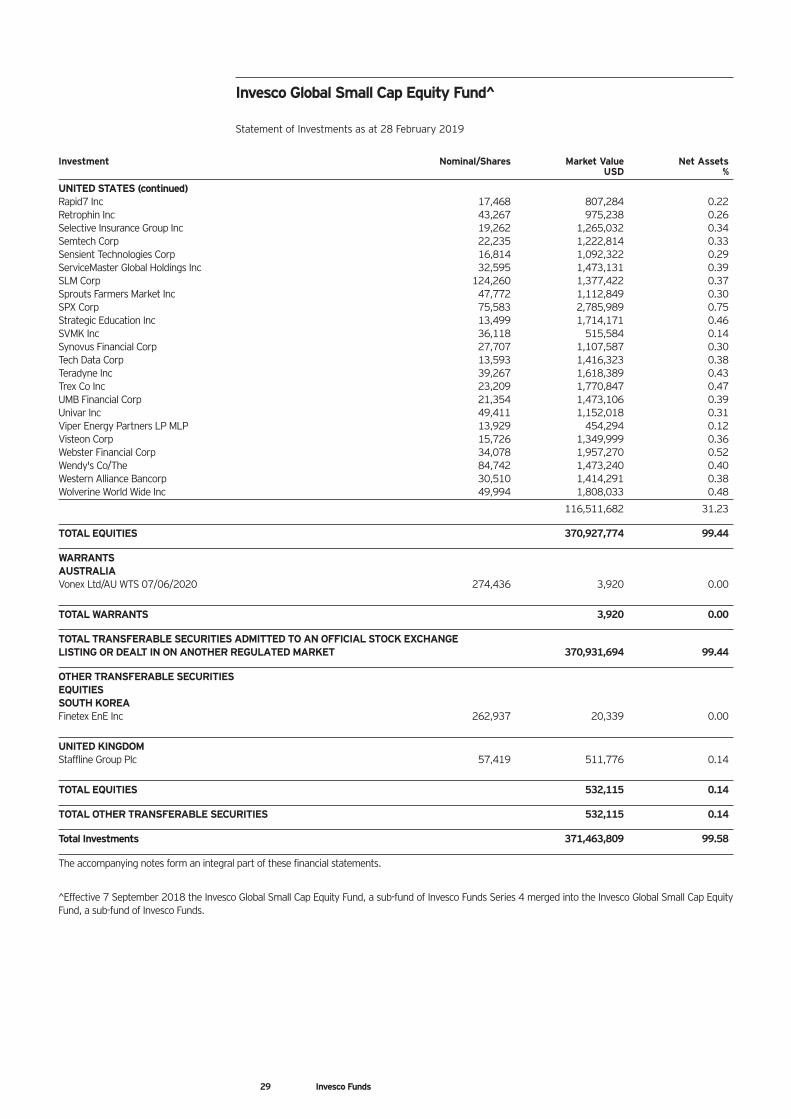
UNITED STATES (continued) Rapid7 Inc 17,468 807,284 0.22 Retrophin Inc 43,267 975,238 0.26 Selective Insurance Group Inc 19,262 1,265,032 0.34 Semtech Corp 22,235 1,222,814 0.33 Sensient Technologies Corp 16,814 1,092,322 0.29 ServiceMaster Global Holdings Inc 32,595 1,473,131 0.39 SLM Corp 124,260 1,377,422 0.37 Sprouts Farmers Market Inc 47,772 1,112,849 0.30 SPX Corp 75,583 2,785,989 0.75 Strategic Education Inc 13,499 1,714,171 0.46 SVMK Inc 36,118 515,584 0.14 Synovus Financial Corp 27,707 1,107,587 0.30 Tech Data Corp 13,593 1,416,323 0.38 Teradyne Inc 39,267 1,618,389 0.43 Trex Co Inc 23,209 1,770,847 0.47 UMB Financial Corp 21,354 1,473,106 0.39 Univar Inc 49,411 1,152,018 0.31 Viper Energy Partners LP MLP 13,929 454,294 0.12 Visteon Corp 15,726 1,349,999 0.36 Webster Financial Corp 34,078 1,957,270 0.52 Wendy's Co/The 84,742 1,473,240 0.40 Western Alliance Bancorp 30,510 1,414,291 0.38 Wolverine World Wide Inc 49,994 1,808,033 0.48
116,511,682 31.23
TOTAL EQUITIES 370,927,774 99.44
WARRANTS AUSTRALIA Vonex Ltd/AU WTS 07/06/2020 274,436 3,920 0.00
TOTAL WARRANTS 3,920 0.00
TOTAL TRANSFERABLE SECURITIES ADMITTED TO AN OFFICIAL STOCK EXCHANGE LISTING OR DEALT IN ON ANOTHER REGULATED MARKET 370,931,694 99.44
OTHER TRANSFERABLE SECURITIES EQUITIES SOUTH KOREA Finetex EnE Inc 262,937 20,339 0.00
UNITED KINGDOM Staffline Group Plc 57,419 511,776 0.14
TOTAL EQUITIES 532,115 0.14
TOTAL OTHER TRANSFERABLE SECURITIES 532,115 0.14
Total Investments 371,463,809 99.58
The accompanying notes form an integral part of these financial statements.
^Effective 7 September 2018 the Invesco Global Small Cap Equity Fund, a sub-fund of Invesco Funds Series 4 merged into the Invesco Global Small Cap Equity Fund, a sub-fund of Invesco Funds.
29 Invesco Funds
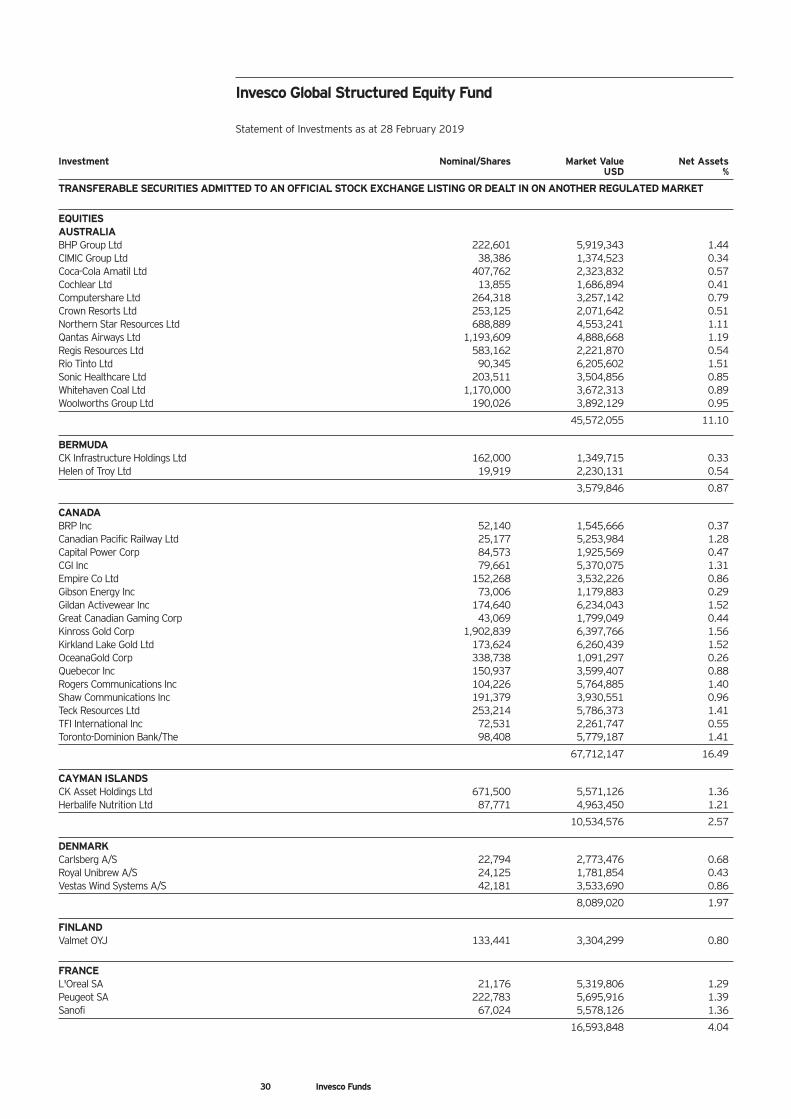
Invesco Global Structured Equity Fund Statement of Investments as at 28 February 2019
Investment Nominal/Shares Market Value Net Assets USD %
TRANSFERABLE SECURITIES ADMITTED TO AN OFFICIAL STOCK EXCHANGE LISTING OR DEALT IN ON ANOTHER REGULATED MARKET
EQUITIES AUSTRALIA BHP Group Ltd 222,601 5,919,343 1.44 CIMIC Group Ltd 38,386 1,374,523 0.34 Coca-Cola Amatil Ltd 407,762 2,323,832 0.57 Cochlear Ltd 13,855 1,686,894 0.41 Computershare Ltd 264,318 3,257,142 0.79 Crown Resorts Ltd 253,125 2,071,642 0.51 Northern Star Resources Ltd 688,889 4,553,241 1.11 Qantas Airways Ltd 1,193,609 4,888,668 1.19 Regis Resources Ltd 583,162 2,221,870 0.54 Rio Tinto Ltd 90,345 6,205,602 1.51 Sonic Healthcare Ltd 203,511 3,504,856 0.85 Whitehaven Coal Ltd 1,170,000 3,672,313 0.89 Woolworths Group Ltd 190,026 3,892,129 0.95
45,572,055 11.10
BERMUDA CK Infrastructure Holdings Ltd 162,000 1,349,715 0.33 Helen of Troy Ltd 19,919 2,230,131 0.54
3,579,846 0.87
CANADA BRP Inc 52,140 1,545,666 0.37 Canadian Pacific Railway Ltd 25,177 5,253,984 1.28 Capital Power Corp 84,573 1,925,569 0.47 CGI Inc 79,661 5,370,075 1.31 Empire Co Ltd 152,268 3,532,226 0.86 Gibson Energy Inc 73,006 1,179,883 0.29 Gildan Activewear Inc 174,640 6,234,043 1.52 Great Canadian Gaming Corp 43,069 1,799,049 0.44 Kinross Gold Corp 1,902,839 6,397,766 1.56 Kirkland Lake Gold Ltd 173,624 6,260,439 1.52 OceanaGold Corp 338,738 1,091,297 0.26 Quebecor Inc 150,937 3,599,407 0.88 Rogers Communications Inc 104,226 5,764,885 1.40 Shaw Communications Inc 191,379 3,930,551 0.96 Teck Resources Ltd 253,214 5,786,373 1.41 TFI International Inc 72,531 2,261,747 0.55 Toronto-Dominion Bank/The 98,408 5,779,187 1.41
67,712,147 16.49
CAYMAN ISLANDS CK Asset Holdings Ltd 671,500 5,571,126 1.36 Herbalife Nutrition Ltd 87,771 4,963,450 1.21
10,534,576 2.57
DENMARK Carlsberg A/S 22,794 2,773,476 0.68 Royal Unibrew A/S 24,125 1,781,854 0.43 Vestas Wind Systems A/S 42,181 3,533,690 0.86
8,089,020 1.97
FINLAND Valmet OYJ 133,441 3,304,299 0.80
FRANCE L'Oreal SA 21,176 5,319,806 1.29 Peugeot SA 222,783 5,695,916 1.39 Sanofi 67,024 5,578,126 1.36
16,593,848 4.04
30 Invesco Funds
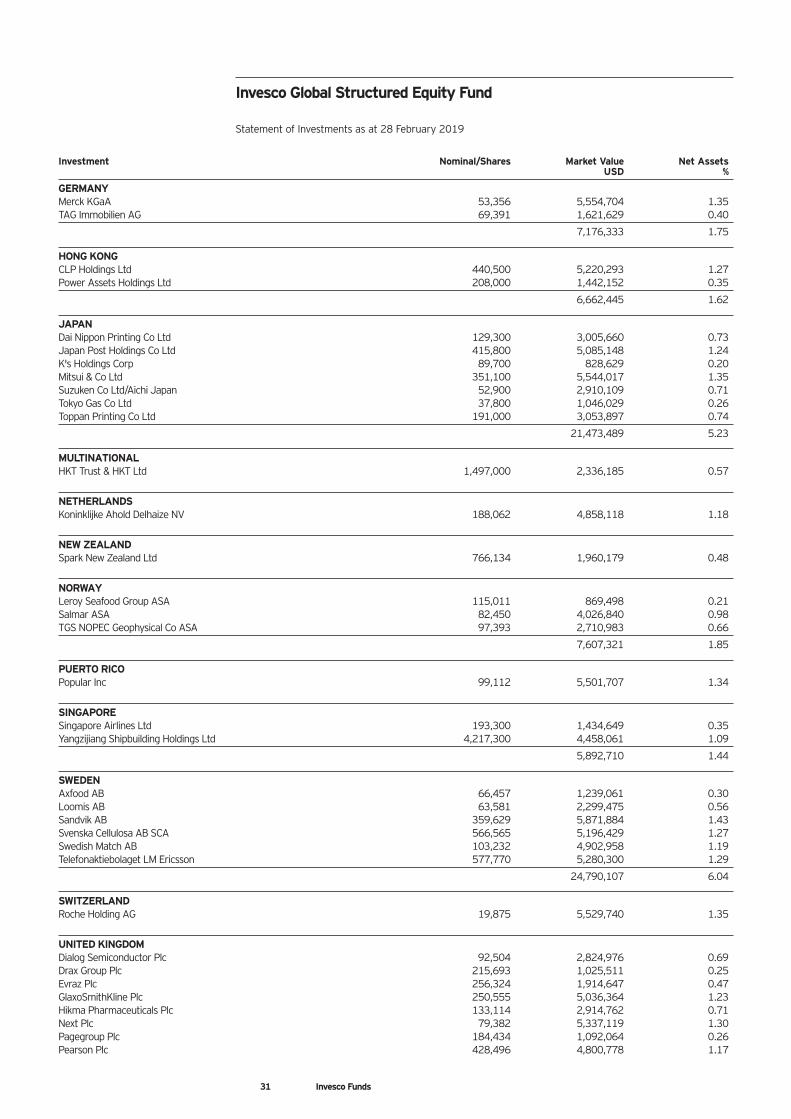
Invesco Global Structured Equity Fund Statement of Investments as at 28 February 2019
Investment Nominal/Shares Market Value Net Assets USD %
GERMANY Merck KGaA 53,356 5,554,704 1.35 TAG Immobilien AG 69,391 1,621,629 0.40
7,176,333 1.75
HONG KONG CLP Holdings Ltd 440,500 5,220,293 1.27 Power Assets Holdings Ltd 208,000 1,442,152 0.35
6,662,445 1.62
JAPAN Dai Nippon Printing Co Ltd 129,300 3,005,660 0.73 Japan Post Holdings Co Ltd 415,800 5,085,148 1.24 K's Holdings Corp 89,700 828,629 0.20 Mitsui & Co Ltd 351,100 5,544,017 1.35 Suzuken Co Ltd/Aichi Japan 52,900 2,910,109 0.71 Tokyo Gas Co Ltd 37,800 1,046,029 0.26 Toppan Printing Co Ltd 191,000 3,053,897 0.74
21,473,489 5.23
MULTINATIONAL HKT Trust & HKT Ltd 1,497,000 2,336,185 0.57
NETHERLANDS Koninklijke Ahold Delhaize NV 188,062 4,858,118 1.18
NEW ZEALAND Spark New Zealand Ltd 766,134 1,960,179 0.48
NORWAY Leroy Seafood Group ASA 115,011 869,498 0.21 Salmar ASA 82,450 4,026,840 0.98 TGS NOPEC Geophysical Co ASA 97,393 2,710,983 0.66
7,607,321 1.85
PUERTO RICO Popular Inc 99,112 5,501,707 1.34
SINGAPORE Singapore Airlines Ltd 193,300 1,434,649 0.35 Yangzijiang Shipbuilding Holdings Ltd 4,217,300 4,458,061 1.09
5,892,710 1.44
SWEDEN Axfood AB 66,457 1,239,061 0.30 Loomis AB 63,581 2,299,475 0.56 Sandvik AB 359,629 5,871,884 1.43 Svenska Cellulosa AB SCA 566,565 5,196,429 1.27 Swedish Match AB 103,232 4,902,958 1.19 Telefonaktiebolaget LM Ericsson 577,770 5,280,300 1.29
24,790,107 6.04
SWITZERLAND Roche Holding AG 19,875 5,529,740 1.35
UNITED KINGDOM Dialog Semiconductor Plc 92,504 2,824,976 0.69 Drax Group Plc 215,693 1,025,511 0.25 Evraz Plc 256,324 1,914,647 0.47 GlaxoSmithKline Plc 250,555 5,036,364 1.23 Hikma Pharmaceuticals Plc 133,114 2,914,762 0.71 Next Plc 79,382 5,337,119 1.30 Pagegroup Plc 184,434 1,092,064 0.26 Pearson Plc 428,496 4,800,778 1.17
31 Invesco Funds
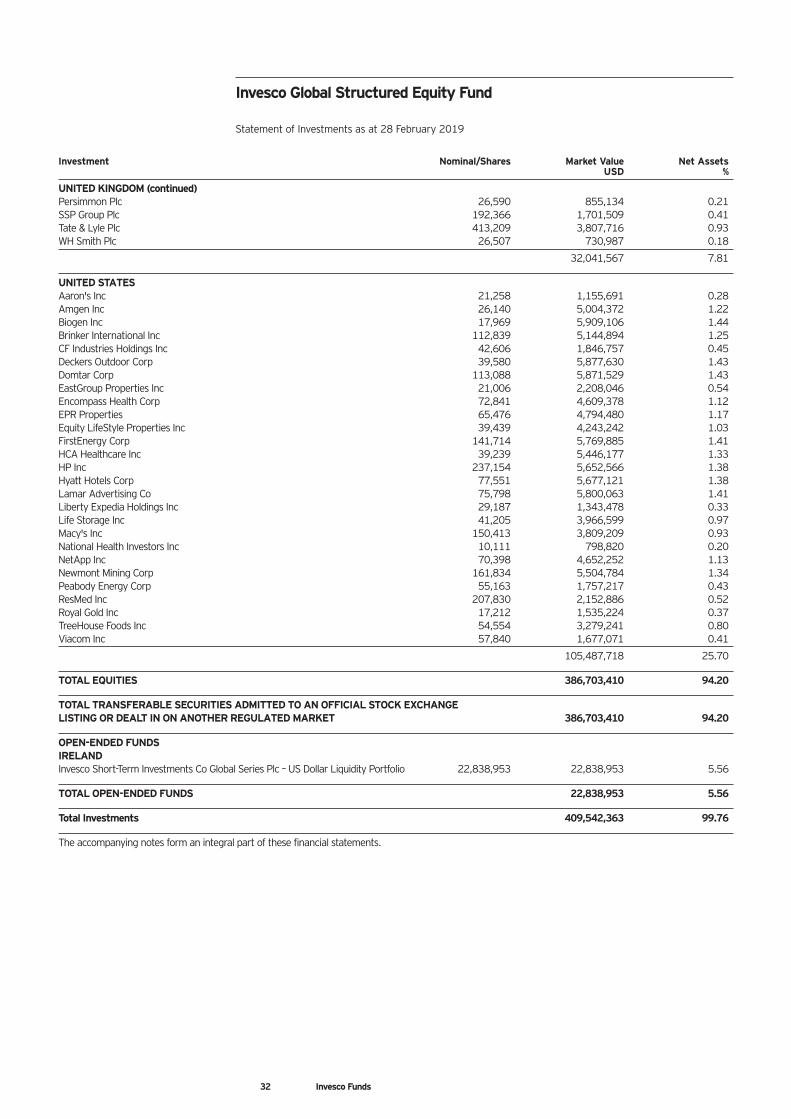
Invesco Global Structured Equity Fund Statement of Investments as at 28 February 2019
Investment Nominal/Shares Market Value Net Assets USD %
UNITED KINGDOM (continued) Persimmon Plc 26,590 855,134 0.21 SSP Group Plc 192,366 1,701,509 0.41 Tate & Lyle Plc 413,209 3,807,716 0.93 WH Smith Plc 26,507 730,987 0.18
32,041,567 7.81
UNITED STATES Aaron's Inc 21,258 1,155,691 0.28 Amgen Inc 26,140 5,004,372 1.22 Biogen Inc 17,969 5,909,106 1.44 Brinker International Inc 112,839 5,144,894 1.25 CF Industries Holdings Inc 42,606 1,846,757 0.45 Deckers Outdoor Corp 39,580 5,877,630 1.43 Domtar Corp 113,088 5,871,529 1.43 EastGroup Properties Inc 21,006 2,208,046 0.54 Encompass Health Corp 72,841 4,609,378 1.12 EPR Properties 65,476 4,794,480 1.17 Equity LifeStyle Properties Inc 39,439 4,243,242 1.03 FirstEnergy Corp 141,714 5,769,885 1.41 HCA Healthcare Inc 39,239 5,446,177 1.33 HP Inc 237,154 5,652,566 1.38 Hyatt Hotels Corp 77,551 5,677,121 1.38 Lamar Advertising Co 75,798 5,800,063 1.41 Liberty Expedia Holdings Inc 29,187 1,343,478 0.33 Life Storage Inc 41,205 3,966,599 0.97 Macy's Inc 150,413 3,809,209 0.93 National Health Investors Inc 10,111 798,820 0.20 NetApp Inc 70,398 4,652,252 1.13 Newmont Mining Corp 161,834 5,504,784 1.34 Peabody Energy Corp 55,163 1,757,217 0.43 ResMed Inc 207,830 2,152,886 0.52 Royal Gold Inc 17,212 1,535,224 0.37 TreeHouse Foods Inc 54,554 3,279,241 0.80 Viacom Inc 57,840 1,677,071 0.41
105,487,718 25.70
TOTAL EQUITIES 386,703,410 94.20
TOTAL TRANSFERABLE SECURITIES ADMITTED TO AN OFFICIAL STOCK EXCHANGE LISTING OR DEALT IN ON ANOTHER REGULATED MARKET 386,703,410 94.20
OPEN-ENDED FUNDS IRELAND Invesco Short-Term Investments Co Global Series Plc – US Dollar Liquidity Portfolio 22,838,953 22,838,953 5.56
TOTAL OPEN-ENDED FUNDS 22,838,953 5.56
Total Investments 409,542,363 99.76
The accompanying notes form an integral part of these financial statements.
32 Invesco Funds
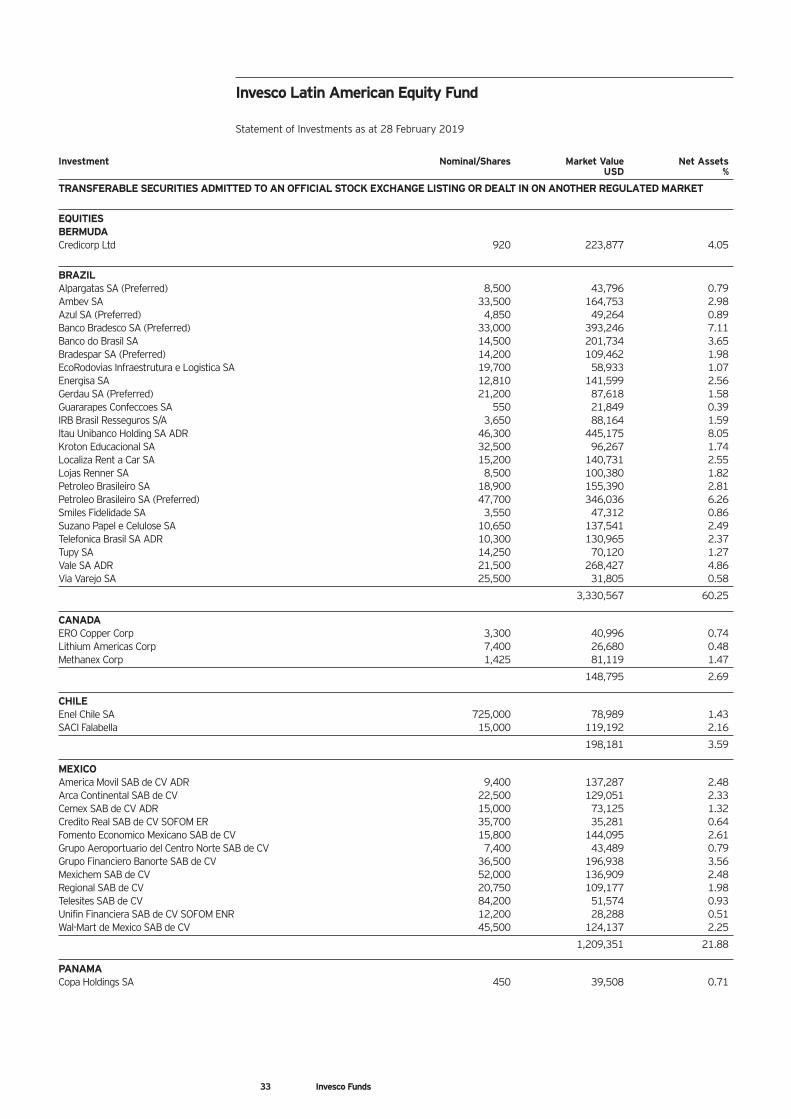
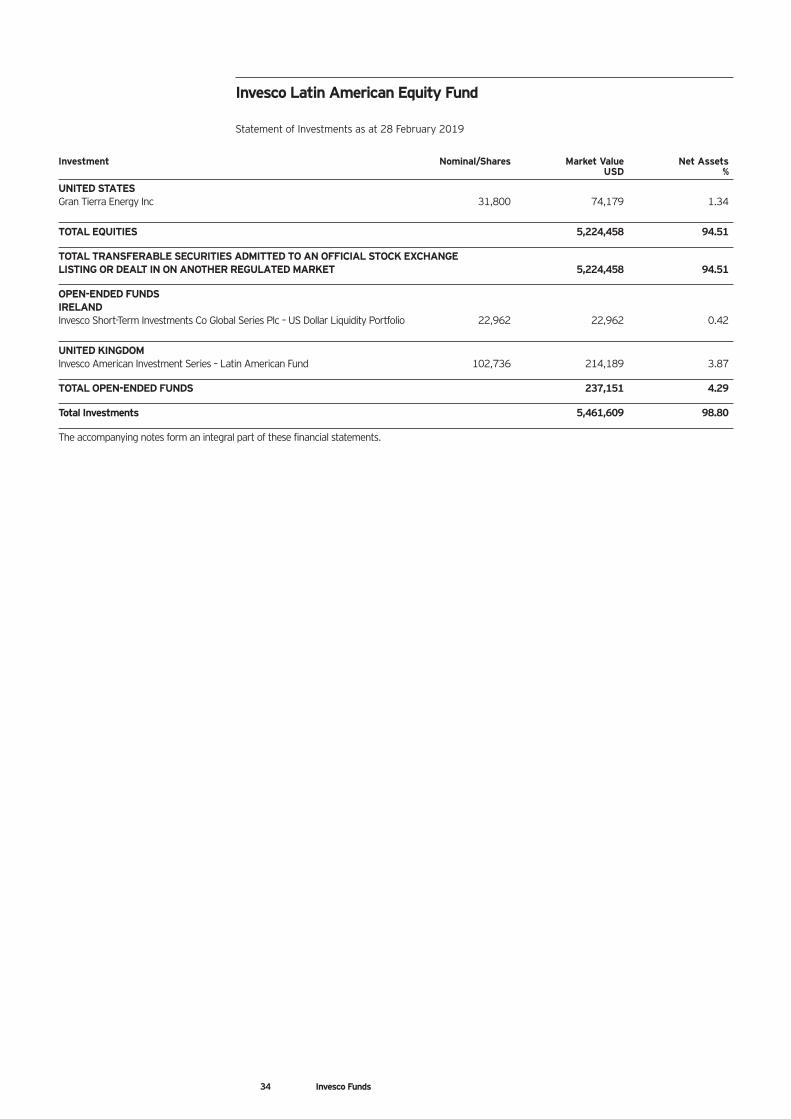
Invesco Latin American Equity Fund Statement of Investments as at 28 February 2019
Investment Nominal/Shares Market Value Net Assets USD %
TRANSFERABLE SECURITIES ADMITTED TO AN OFFICIAL STOCK EXCHANGE LISTING OR DEALT IN ON ANOTHER REGULATED MARKET
EQUITIES BERMUDA Credicorp Ltd 920 223,877 4.05
BRAZIL Alpargatas SA (Preferred) 8,500 43,796 0.79 Ambev SA 33,500 164,753 2.98 Azul SA (Preferred) 4,850 49,264 0.89 Banco Bradesco SA (Preferred) 33,000 393,246 7.11 Banco do Brasil SA 14,500 201,734 3.65 Bradespar SA (Preferred) 14,200 109,462 1.98 EcoRodovias Infraestrutura e Logistica SA 19,700 58,933 1.07 Energisa SA 12,810 141,599 2.56 Gerdau SA (Preferred) 21,200 87,618 1.58 Guararapes Confeccoes SA 550 21,849 0.39 IRB Brasil Resseguros S/A 3,650 88,164 1.59 Itau Unibanco Holding SA ADR 46,300 445,175 8.05 Kroton Educacional SA 32,500 96,267 1.74 Localiza Rent a Car SA 15,200 140,731 2.55 Lojas Renner SA 8,500 100,380 1.82 Petroleo Brasileiro SA 18,900 155,390 2.81 Petroleo Brasileiro SA (Preferred) 47,700 346,036 6.26 Smiles Fidelidade SA 3,550 47,312 0.86 Suzano Papel e Celulose SA 10,650 137,541 2.49 Telefonica Brasil SA ADR 10,300 130,965 2.37 Tupy SA 14,250 70,120 1.27 Vale SA ADR 21,500 268,427 4.86 Via Varejo SA 25,500 31,805 0.58
3,330,567 60.25
CANADA ERO Copper Corp 3,300 40,996 0.74 Lithium Americas Corp 7,400 26,680 0.48 Methanex Corp 1,425 81,119 1.47
148,795 2.69
CHILE Enel Chile SA 725,000 78,989 1.43 SACI Falabella 15,000 119,192 2.16
198,181 3.59
MEXICO America Movil SAB de CV ADR 9,400 137,287 2.48 Arca Continental SAB de CV 22,500 129,051 2.33 Cemex SAB de CV ADR 15,000 73,125 1.32 Credito Real SAB de CV SOFOM ER 35,700 35,281 0.64 Fomento Economico Mexicano SAB de CV 15,800 144,095 2.61 Grupo Aeroportuario del Centro Norte SAB de CV 7,400 43,489 0.79 Grupo Financiero Banorte SAB de CV 36,500 196,938 3.56 Mexichem SAB de CV 52,000 136,909 2.48 Regional SAB de CV 20,750 109,177 1.98 Telesites SAB de CV 84,200 51,574 0.93 Unifin Financiera SAB de CV SOFOM ENR 12,200 28,288 0.51 Wal-Mart de Mexico SAB de CV 45,500 124,137 2.25
1,209,351 21.88
PANAMA Copa Holdings SA 450 39,508 0.71
33 Invesco Funds
Invesco Latin American Equity Fund Statement of Investments as at 28 February 2019
Investment Nominal/Shares Market Value Net Assets USD %
UNITED STATES Gran Tierra Energy Inc 31,800 74,179 1.34
TOTAL EQUITIES 5,224,458 94.51
TOTAL TRANSFERABLE SECURITIES ADMITTED TO AN OFFICIAL STOCK EXCHANGE LISTING OR DEALT IN ON ANOTHER REGULATED MARKET 5,224,458 94.51
OPEN-ENDED FUNDS IRELAND Invesco Short-Term Investments Co Global Series Plc – US Dollar Liquidity Portfolio 22,962 22,962 0.42
UNITED KINGDOM Invesco American Investment Series – Latin American Fund 102,736 214,189 3.87
TOTAL OPEN-ENDED FUNDS 237,151 4.29
Total Investments 5,461,609 98.80
The accompanying notes form an integral part of these financial statements.
34 Invesco Funds
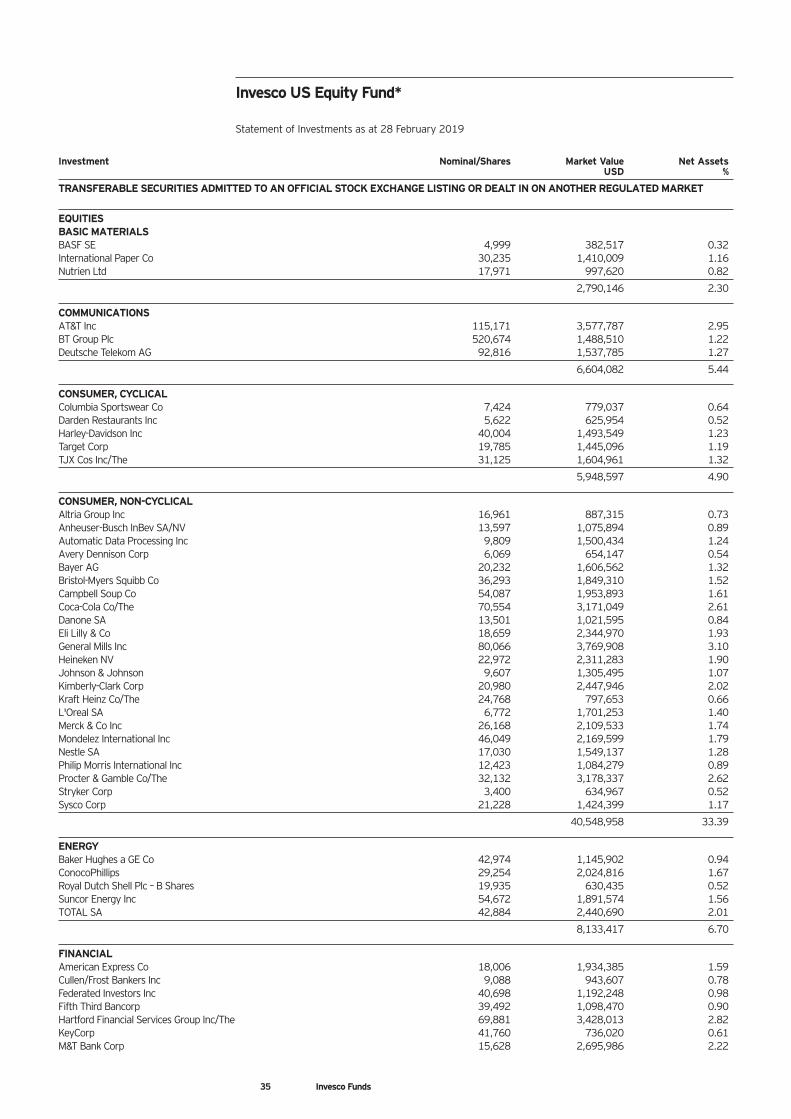
Invesco US Equity Fund* Statement of Investments as at 28 February 2019
Investment Nominal/Shares Market Value Net Assets USD %
TRANSFERABLE SECURITIES ADMITTED TO AN OFFICIAL STOCK EXCHANGE LISTING OR DEALT IN ON ANOTHER REGULATED MARKET
EQUITIES BASIC MATERIALS BASF SE 4,999 382,517 0.32 International Paper Co 30,235 1,410,009 1.16 Nutrien Ltd 17,971 997,620 0.82
2,790,146 2.30
COMMUNICATIONS AT&T Inc 115,171 3,577,787 2.95 BT Group Plc 520,674 1,488,510 1.22 Deutsche Telekom AG 92,816 1,537,785 1.27
6,604,082 5.44
CONSUMER, CYCLICAL Columbia Sportswear Co 7,424 779,037 0.64 Darden Restaurants Inc 5,622 625,954 0.52 Harley-Davidson Inc 40,004 1,493,549 1.23 Target Corp 19,785 1,445,096 1.19 TJX Cos Inc/The 31,125 1,604,961 1.32
5,948,597 4.90
CONSUMER, NON-CYCLICAL Altria Group Inc 16,961 887,315 0.73 Anheuser-Busch InBev SA/NV 13,597 1,075,894 0.89 Automatic Data Processing Inc 9,809 1,500,434 1.24 Avery Dennison Corp 6,069 654,147 0.54 Bayer AG 20,232 1,606,562 1.32 Bristol-Myers Squibb Co 36,293 1,849,310 1.52 Campbell Soup Co 54,087 1,953,893 1.61 Coca-Cola Co/The 70,554 3,171,049 2.61 Danone SA 13,501 1,021,595 0.84 Eli Lilly & Co 18,659 2,344,970 1.93 General Mills Inc 80,066 3,769,908 3.10 Heineken NV 22,972 2,311,283 1.90 Johnson & Johnson 9,607 1,305,495 1.07 Kimberly-Clark Corp 20,980 2,447,946 2.02 Kraft Heinz Co/The 24,768 797,653 0.66 L'Oreal SA 6,772 1,701,253 1.40 Merck & Co Inc 26,168 2,109,533 1.74 Mondelez International Inc 46,049 2,169,599 1.79 Nestle SA 17,030 1,549,137 1.28 Philip Morris International Inc 12,423 1,084,279 0.89 Procter & Gamble Co/The 32,132 3,178,337 2.62 Stryker Corp 3,400 634,967 0.52 Sysco Corp 21,228 1,424,399 1.17
40,548,958 33.39
ENERGY Baker Hughes a GE Co 42,974 1,145,902 0.94 ConocoPhillips 29,254 2,024,816 1.67 Royal Dutch Shell Plc – B Shares 19,935 630,435 0.52 Suncor Energy Inc 54,672 1,891,574 1.56 TOTAL SA 42,884 2,440,690 2.01
8,133,417 6.70
FINANCIAL American Express Co 18,006 1,934,385 1.59 Cullen/Frost Bankers Inc 9,088 943,607 0.78 Federated Investors Inc 40,698 1,192,248 0.98 Fifth Third Bancorp 39,492 1,098,470 0.90 Hartford Financial Services Group Inc/The 69,881 3,428,013 2.82 KeyCorp 41,760 736,020 0.61 M&T Bank Corp 15,628 2,695,986 2.22
35 Invesco Funds
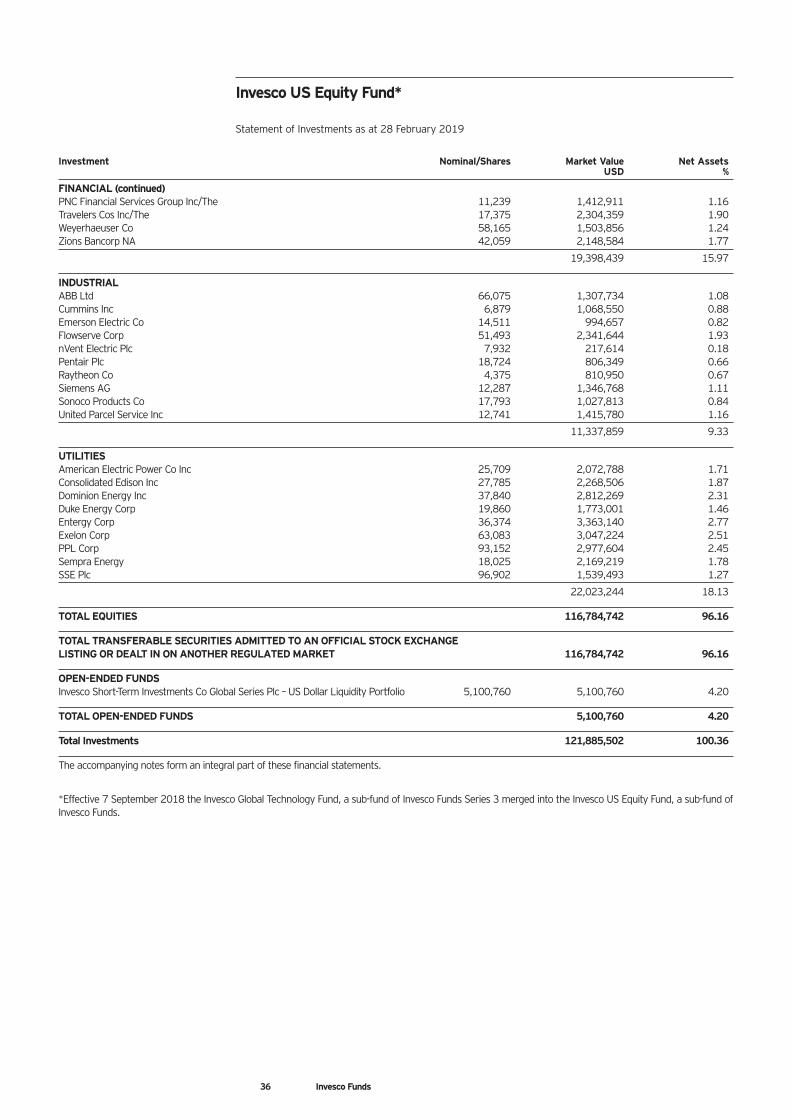
Invesco US Equity Fund* Statement of Investments as at 28 February 2019
Investment Nominal/Shares Market Value Net Assets USD %
FINANCIAL (continued) PNC Financial Services Group Inc/The 11,239 1,412,911 1.16 Travelers Cos Inc/The 17,375 2,304,359 1.90 Weyerhaeuser Co 58,165 1,503,856 1.24 Zions Bancorp NA 42,059 2,148,584 1.77
19,398,439 15.97
INDUSTRIAL ABB Ltd 66,075 1,307,734 1.08 Cummins Inc 6,879 1,068,550 0.88 Emerson Electric Co 14,511 994,657 0.82 Flowserve Corp 51,493 2,341,644 1.93 nVent Electric Plc 7,932 217,614 0.18 Pentair Plc 18,724 806,349 0.66 Raytheon Co 4,375 810,950 0.67 Siemens AG 12,287 1,346,768 1.11 Sonoco Products Co 17,793 1,027,813 0.84 United Parcel Service Inc 12,741 1,415,780 1.16
11,337,859 9.33
UTILITIES American Electric Power Co Inc 25,709 2,072,788 1.71 Consolidated Edison Inc 27,785 2,268,506 1.87 Dominion Energy Inc 37,840 2,812,269 2.31 Duke Energy Corp 19,860 1,773,001 1.46 Entergy Corp 36,374 3,363,140 2.77 Exelon Corp 63,083 3,047,224 2.51 PPL Corp 93,152 2,977,604 2.45 Sempra Energy 18,025 2,169,219 1.78 SSE Plc 96,902 1,539,493 1.27
22,023,244 18.13
TOTAL EQUITIES 116,784,742 96.16
TOTAL TRANSFERABLE SECURITIES ADMITTED TO AN OFFICIAL STOCK EXCHANGE LISTING OR DEALT IN ON ANOTHER REGULATED MARKET 116,784,742 96.16
OPEN-ENDED FUNDS Invesco Short-Term Investments Co Global Series Plc – US Dollar Liquidity Portfolio 5,100,760 5,100,760 4.20
TOTAL OPEN-ENDED FUNDS 5,100,760 4.20
Total Investments 121,885,502 100.36
The accompanying notes form an integral part of these financial statements.
*Effective 7 September 2018 the Invesco Global Technology Fund, a sub-fund of Invesco Funds Series 3 merged into the Invesco US Equity Fund, a sub-fund of Invesco Funds.
36 Invesco Funds
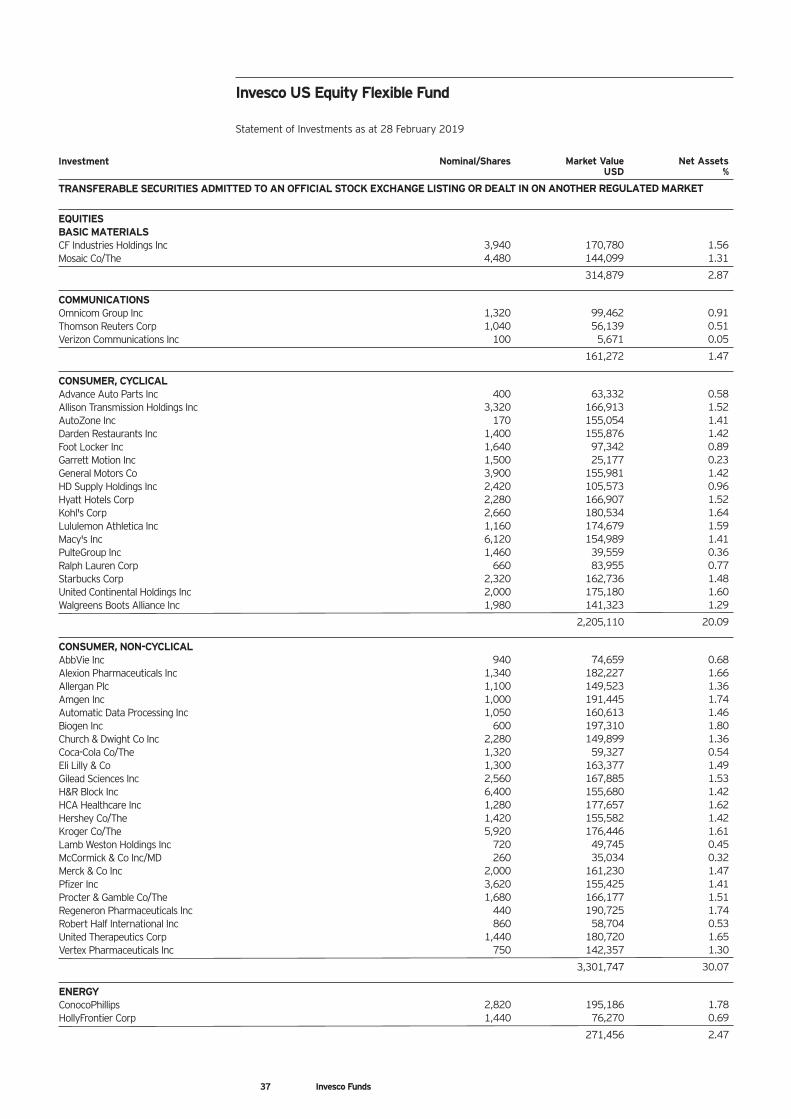
Investment Nominal/Shares Market Value Net Assets USD %
TRANSFERABLE SECURITIES ADMITTED TO AN OFFICIAL STOCK EXCHANGE LISTING OR DEALT IN ON ANOTHER REGULATED MARKET
EQUITIES BASIC MATERIALS CF Industries Holdings Inc 3,940 170,780 1.56 Mosaic Co/The 4,480 144,099 1.31
314,879 2.87
COMMUNICATIONS Omnicom Group Inc 1,320 99,462 0.91 Thomson Reuters Corp 1,040 56,139 0.51 Verizon Communications Inc 100 5,671 0.05
161,272 1.47
CONSUMER, CYCLICAL Advance Auto Parts Inc 400 63,332 0.58 Allison Transmission Holdings Inc 3,320 166,913 1.52 AutoZone Inc 170 155,054 1.41 Darden Restaurants Inc 1,400 155,876 1.42 Foot Locker Inc 1,640 97,342 0.89 Garrett Motion Inc 1,500 25,177 0.23 General Motors Co 3,900 155,981 1.42 HD Supply Holdings Inc 2,420 105,573 0.96 Hyatt Hotels Corp 2,280 166,907 1.52 Kohl's Corp 2,660 180,534 1.64 Lululemon Athletica Inc 1,160 174,679 1.59 Macy's Inc 6,120 154,989 1.41 PulteGroup Inc 1,460 39,559 0.36 Ralph Lauren Corp 660 83,955 0.77 Starbucks Corp 2,320 162,736 1.48 United Continental Holdings Inc 2,000 175,180 1.60 Walgreens Boots Alliance Inc 1,980 141,323 1.29
2,205,110 20.09
CONSUMER, NON-CYCLICAL AbbVie Inc 940 74,659 0.68 Alexion Pharmaceuticals Inc 1,340 182,227 1.66 Allergan Plc 1,100 149,523 1.36 Amgen Inc 1,000 191,445 1.74 Automatic Data Processing Inc 1,050 160,613 1.46 Biogen Inc 600 197,310 1.80 Church & Dwight Co Inc 2,280 149,899 1.36 Coca-Cola Co/The 1,320 59,327 0.54 Eli Lilly & Co 1,300 163,377 1.49 Gilead Sciences Inc 2,560 167,885 1.53 H&R Block Inc 6,400 155,680 1.42 HCA Healthcare Inc 1,280 177,657 1.62 Hershey Co/The 1,420 155,582 1.42 Kroger Co/The 5,920 176,446 1.61 Lamb Weston Holdings Inc 720 49,745 0.45 McCormick & Co Inc/MD 260 35,034 0.32 Merck & Co Inc 2,000 161,230 1.47 Pfizer Inc 3,620 155,425 1.41 Procter & Gamble Co/The 1,680 166,177 1.51 Regeneron Pharmaceuticals Inc 440 190,725 1.74 Robert Half International Inc 860 58,704 0.53 United Therapeutics Corp 1,440 180,720 1.65 Vertex Pharmaceuticals Inc 750 142,357 1.30
3,301,747 30.07
ENERGY ConocoPhillips 2,820 195,186 1.78 HollyFrontier Corp 1,440 76,270 0.69
271,456 2.47
37 Invesco Funds
Invesco US Equity Flexible Fund Statement of Investments as at 28 February 2019
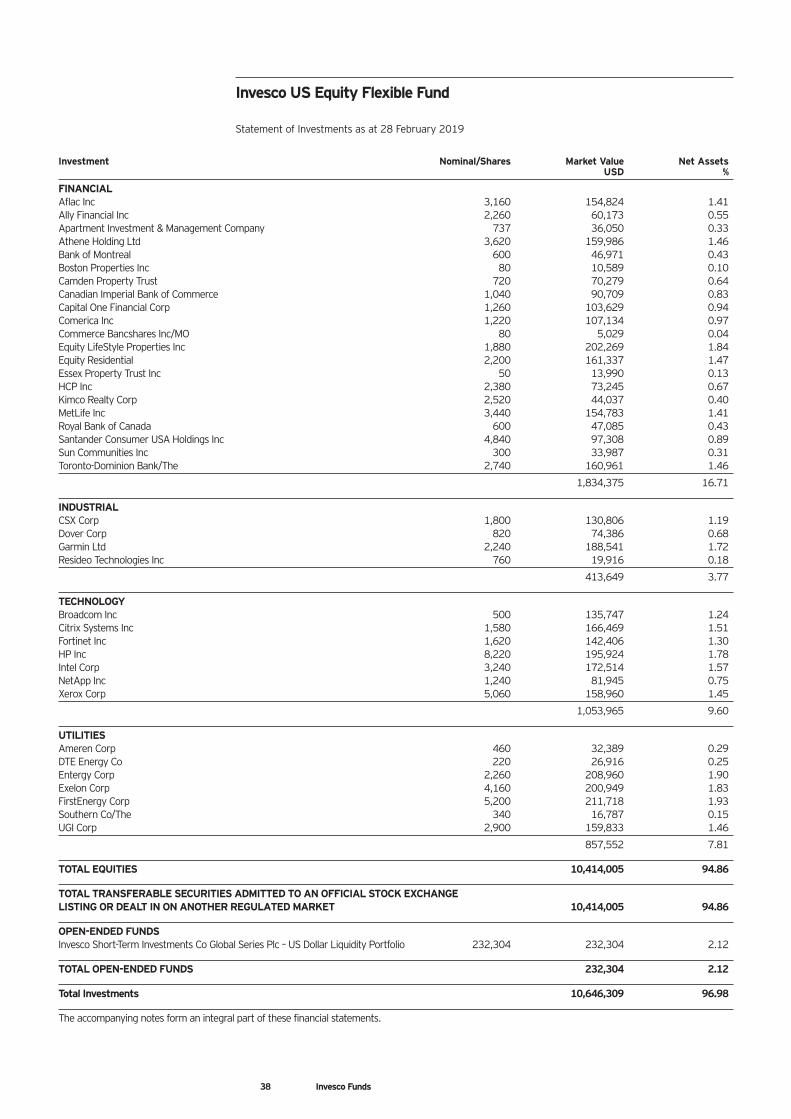
Invesco US Equity Flexible Fund Statement of Investments as at 28 February 2019
Investment Nominal/Shares Market Value Net Assets USD %
FINANCIAL Aflac Inc 3,160 154,824 1.41 Ally Financial Inc 2,260 60,173 0.55 Apartment Investment & Management Company 737 36,050 0.33 Athene Holding Ltd 3,620 159,986 1.46 Bank of Montreal 600 46,971 0.43 Boston Properties Inc 80 10,589 0.10 Camden Property Trust 720 70,279 0.64 Canadian Imperial Bank of Commerce 1,040 90,709 0.83 Capital One Financial Corp 1,260 103,629 0.94 Comerica Inc 1,220 107,134 0.97 Commerce Bancshares Inc/MO 80 5,029 0.04 Equity LifeStyle Properties Inc 1,880 202,269 1.84 Equity Residential 2,200 161,337 1.47 Essex Property Trust Inc 50 13,990 0.13 HCP Inc 2,380 73,245 0.67 Kimco Realty Corp 2,520 44,037 0.40 MetLife Inc 3,440 154,783 1.41 Royal Bank of Canada 600 47,085 0.43 Santander Consumer USA Holdings Inc 4,840 97,308 0.89 Sun Communities Inc 300 33,987 0.31 Toronto-Dominion Bank/The 2,740 160,961 1.46
1,834,375 16.71
INDUSTRIAL CSX Corp 1,800 130,806 1.19 Dover Corp 820 74,386 0.68 Garmin Ltd 2,240 188,541 1.72 Resideo Technologies Inc 760 19,916 0.18
413,649 3.77
TECHNOLOGY Broadcom Inc 500 135,747 1.24 Citrix Systems Inc 1,580 166,469 1.51 Fortinet Inc 1,620 142,406 1.30 HP Inc 8,220 195,924 1.78 Intel Corp 3,240 172,514 1.57 NetApp Inc 1,240 81,945 0.75 Xerox Corp 5,060 158,960 1.45
1,053,965 9.60
UTILITIES Ameren Corp 460 32,389 0.29 DTE Energy Co 220 26,916 0.25 Entergy Corp 2,260 208,960 1.90 Exelon Corp 4,160 200,949 1.83 FirstEnergy Corp 5,200 211,718 1.93 Southern Co/The 340 16,787 0.15 UGI Corp 2,900 159,833 1.46
857,552 7.81
TOTAL EQUITIES 10,414,005 94.86
TOTAL TRANSFERABLE SECURITIES ADMITTED TO AN OFFICIAL STOCK EXCHANGE LISTING OR DEALT IN ON ANOTHER REGULATED MARKET 10,414,005 94.86
OPEN-ENDED FUNDS Invesco Short-Term Investments Co Global Series Plc – US Dollar Liquidity Portfolio 232,304 232,304 2.12
TOTAL OPEN-ENDED FUNDS 232,304 2.12
Total Investments 10,646,309 96.98
The accompanying notes form an integral part of these financial statements.
38 Invesco Funds
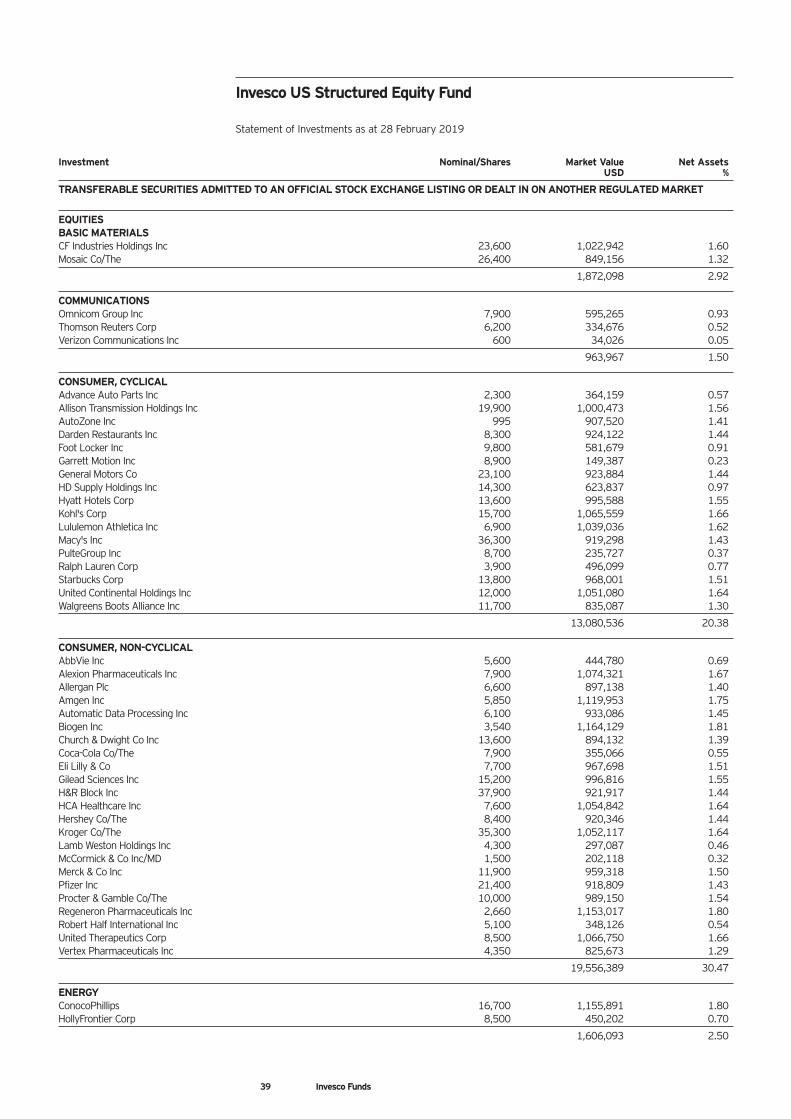
Investment Nominal/Shares Market Value Net Assets USD %
TRANSFERABLE SECURITIES ADMITTED TO AN OFFICIAL STOCK EXCHANGE LISTING OR DEALT IN ON ANOTHER REGULATED MARKET
EQUITIES BASIC MATERIALS CF Industries Holdings Inc 23,600 1,022,942 1.60 Mosaic Co/The 26,400 849,156 1.32
1,872,098 2.92
COMMUNICATIONS Omnicom Group Inc 7,900 595,265 0.93 Thomson Reuters Corp 6,200 334,676 0.52 Verizon Communications Inc 600 34,026 0.05
963,967 1.50
CONSUMER, CYCLICAL Advance Auto Parts Inc 2,300 364,159 0.57 Allison Transmission Holdings Inc 19,900 1,000,473 1.56 AutoZone Inc 995 907,520 1.41 Darden Restaurants Inc 8,300 924,122 1.44 Foot Locker Inc 9,800 581,679 0.91 Garrett Motion Inc 8,900 149,387 0.23 General Motors Co 23,100 923,884 1.44 HD Supply Holdings Inc 14,300 623,837 0.97 Hyatt Hotels Corp 13,600 995,588 1.55 Kohl's Corp 15,700 1,065,559 1.66 Lululemon Athletica Inc 6,900 1,039,036 1.62 Macy's Inc 36,300 919,298 1.43 PulteGroup Inc 8,700 235,727 0.37 Ralph Lauren Corp 3,900 496,099 0.77 Starbucks Corp 13,800 968,001 1.51 United Continental Holdings Inc 12,000 1,051,080 1.64 Walgreens Boots Alliance Inc 11,700 835,087 1.30
13,080,536 20.38
CONSUMER, NON-CYCLICAL AbbVie Inc 5,600 444,780 0.69 Alexion Pharmaceuticals Inc 7,900 1,074,321 1.67 Allergan Plc 6,600 897,138 1.40 Amgen Inc 5,850 1,119,953 1.75 Automatic Data Processing Inc 6,100 933,086 1.45 Biogen Inc 3,540 1,164,129 1.81 Church & Dwight Co Inc 13,600 894,132 1.39 Coca-Cola Co/The 7,900 355,066 0.55 Eli Lilly & Co 7,700 967,698 1.51 Gilead Sciences Inc 15,200 996,816 1.55 H&R Block Inc 37,900 921,917 1.44 HCA Healthcare Inc 7,600 1,054,842 1.64 Hershey Co/The 8,400 920,346 1.44 Kroger Co/The 35,300 1,052,117 1.64 Lamb Weston Holdings Inc 4,300 297,087 0.46 McCormick & Co Inc/MD 1,500 202,118 0.32 Merck & Co Inc 11,900 959,318 1.50 Pfizer Inc 21,400 918,809 1.43 Procter & Gamble Co/The 10,000 989,150 1.54 Regeneron Pharmaceuticals Inc 2,660 1,153,017 1.80 Robert Half International Inc 5,100 348,126 0.54 United Therapeutics Corp 8,500 1,066,750 1.66 Vertex Pharmaceuticals Inc 4,350 825,673 1.29
19,556,389 30.47
ENERGY ConocoPhillips 16,700 1,155,891 1.80 HollyFrontier Corp 8,500 450,202 0.70
1,606,093 2.50
39 Invesco Funds
Invesco US Structured Equity Fund Statement of Investments as at 28 February 2019

40 Invesco Funds
Investment Nominal/Shares Market Value Net Assets USD %
FINANCIAL Aflac Inc 18,700 916,206 1.43 Ally Financial Inc 13,400 356,775 0.56 Apartment Investment & Management Company 4,363 213,416 0.33 Athene Holding Ltd 21,400 945,773 1.47 Bank of Montreal 3,600 281,826 0.44 Boston Properties Inc 500 66,182 0.10 Camden Property Trust 4,300 419,723 0.65 Canadian Imperial Bank of Commerce 6,200 540,764 0.84 Capital One Financial Corp 7,500 616,838 0.96 Comerica Inc 7,200 632,268 0.98 Commerce Bancshares Inc/MO 500 31,430 0.05 Equity LifeStyle Properties Inc 11,200 1,205,008 1.88 Equity Residential 13,000 953,355 1.49 Essex Property Trust Inc 250 69,951 0.11 HCP Inc 14,100 433,928 0.68 Kimco Realty Corp 14,900 260,378 0.41 MetLife Inc 20,400 917,898 1.43 Royal Bank of Canada 3,600 282,510 0.44 Santander Consumer USA Holdings Inc 28,900 581,034 0.90 Sun Communities Inc 1,800 203,922 0.32 Toronto-Dominion Bank/The 16,200 951,669 1.48
10,880,854 16.95
INDUSTRIAL CSX Corp 10,700 777,569 1.21 Dover Corp 4,900 444,504 0.69 Garmin Ltd 13,400 1,127,878 1.76 Resideo Technologies Inc 5,000 131,025 0.21
2,480,976 3.87
TECHNOLOGY Broadcom Inc 2,900 787,336 1.23 Citrix Systems Inc 9,400 990,384 1.54 Fortinet Inc 9,600 843,888 1.32 HP Inc 49,200 1,172,682 1.83 Intel Corp 19,200 1,022,304 1.59 NetApp Inc 7,400 489,029 0.76 Xerox Corp 29,900 939,308 1.46
6,244,931 9.73
UTILITIES Ameren Corp 2,800 197,148 0.31 DTE Energy Co 1,300 159,049 0.25 Entergy Corp 13,400 1,238,964 1.93 Exelon Corp 24,700 1,193,133 1.86 FirstEnergy Corp 30,900 1,258,094 1.96 Southern Co/The 2,000 98,750 0.15 UGI Corp 17,300 953,489 1.49
5,098,627 7.95
TOTAL EQUITIES 61,784,471 96.27
TOTAL TRANSFERABLE SECURITIES ADMITTED TO AN OFFICIAL STOCK EXCHANGE LISTING OR DEALT IN ON ANOTHER REGULATED MARKET 61,784,471 96.27
OPEN-ENDED FUNDS Invesco Short-Term Investments Co Global Series Plc – US Dollar Liquidity Portfolio 2,118,393 2,118,393 3.30
TOTAL OPEN-ENDED FUNDS 2,118,393 3.30
Total Investments 63,902,864 99.57
The accompanying notes form an integral part of these financial statements.
Invesco US Structured Equity Fund Statement of Investments as at 28 February 2019
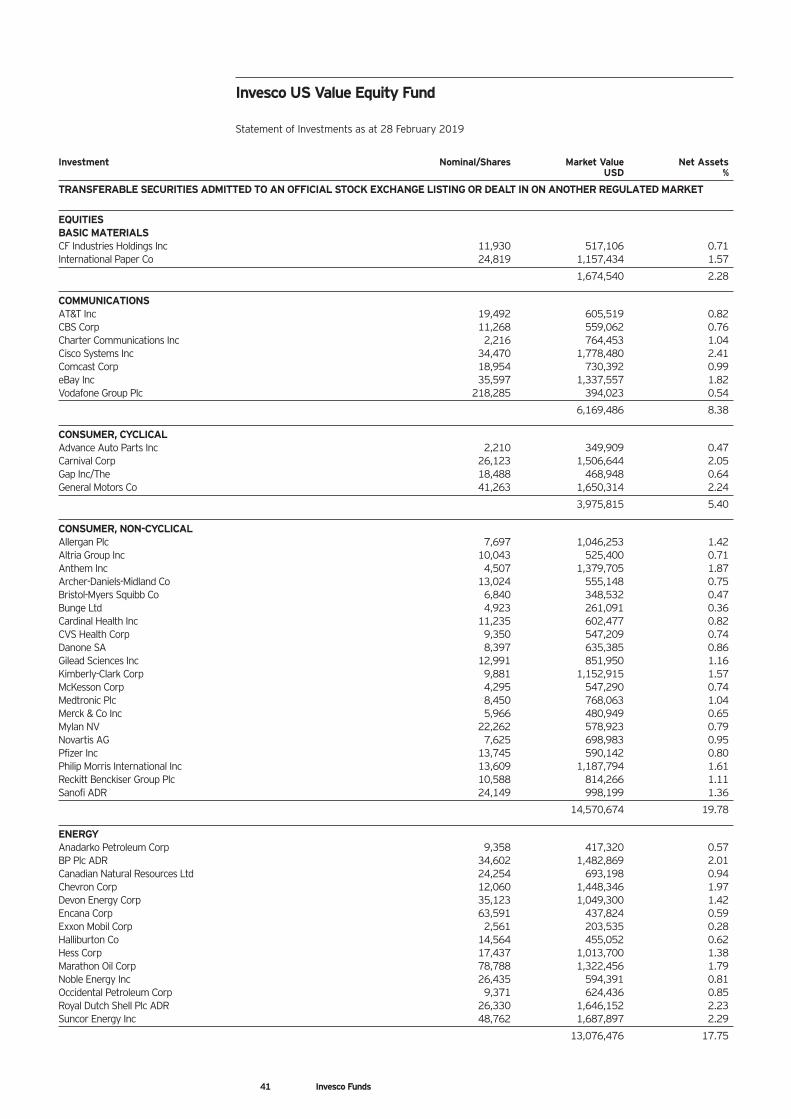
41 Invesco Funds
Investment Nominal/Shares Market Value Net Assets USD %
TRANSFERABLE SECURITIES ADMITTED TO AN OFFICIAL STOCK EXCHANGE LISTING OR DEALT IN ON ANOTHER REGULATED MARKET
EQUITIES BASIC MATERIALS CF Industries Holdings Inc 11,930 517,106 0.71 International Paper Co 24,819 1,157,434 1.57
1,674,540 2.28
COMMUNICATIONS AT&T Inc 19,492 605,519 0.82 CBS Corp 11,268 559,062 0.76 Charter Communications Inc 2,216 764,453 1.04 Cisco Systems Inc 34,470 1,778,480 2.41 Comcast Corp 18,954 730,392 0.99 eBay Inc 35,597 1,337,557 1.82 Vodafone Group Plc 218,285 394,023 0.54
6,169,486 8.38
CONSUMER, CYCLICAL Advance Auto Parts Inc 2,210 349,909 0.47 Carnival Corp 26,123 1,506,644 2.05 Gap Inc/The 18,488 468,948 0.64 General Motors Co 41,263 1,650,314 2.24
3,975,815 5.40
CONSUMER, NON-CYCLICAL Allergan Plc 7,697 1,046,253 1.42 Altria Group Inc 10,043 525,400 0.71 Anthem Inc 4,507 1,379,705 1.87 Archer-Daniels-Midland Co 13,024 555,148 0.75 Bristol-Myers Squibb Co 6,840 348,532 0.47 Bunge Ltd 4,923 261,091 0.36 Cardinal Health Inc 11,235 602,477 0.82 CVS Health Corp 9,350 547,209 0.74 Danone SA 8,397 635,385 0.86 Gilead Sciences Inc 12,991 851,950 1.16 Kimberly-Clark Corp 9,881 1,152,915 1.57 McKesson Corp 4,295 547,290 0.74 Medtronic Plc 8,450 768,063 1.04 Merck & Co Inc 5,966 480,949 0.65 Mylan NV 22,262 578,923 0.79 Novartis AG 7,625 698,983 0.95 Pfizer Inc 13,745 590,142 0.80 Philip Morris International Inc 13,609 1,187,794 1.61 Reckitt Benckiser Group Plc 10,588 814,266 1.11 Sanofi ADR 24,149 998,199 1.36
14,570,674 19.78
ENERGY Anadarko Petroleum Corp 9,358 417,320 0.57 BP Plc ADR 34,602 1,482,869 2.01 Canadian Natural Resources Ltd 24,254 693,198 0.94 Chevron Corp 12,060 1,448,346 1.97 Devon Energy Corp 35,123 1,049,300 1.42 Encana Corp 63,591 437,824 0.59 Exxon Mobil Corp 2,561 203,535 0.28 Halliburton Co 14,564 455,052 0.62 Hess Corp 17,437 1,013,700 1.38 Marathon Oil Corp 78,788 1,322,456 1.79 Noble Energy Inc 26,435 594,391 0.81 Occidental Petroleum Corp 9,371 624,436 0.85 Royal Dutch Shell Plc ADR 26,330 1,646,152 2.23 Suncor Energy Inc 48,762 1,687,897 2.29
13,076,476 17.75
Invesco US Value Equity Fund Statement of Investments as at 28 February 2019
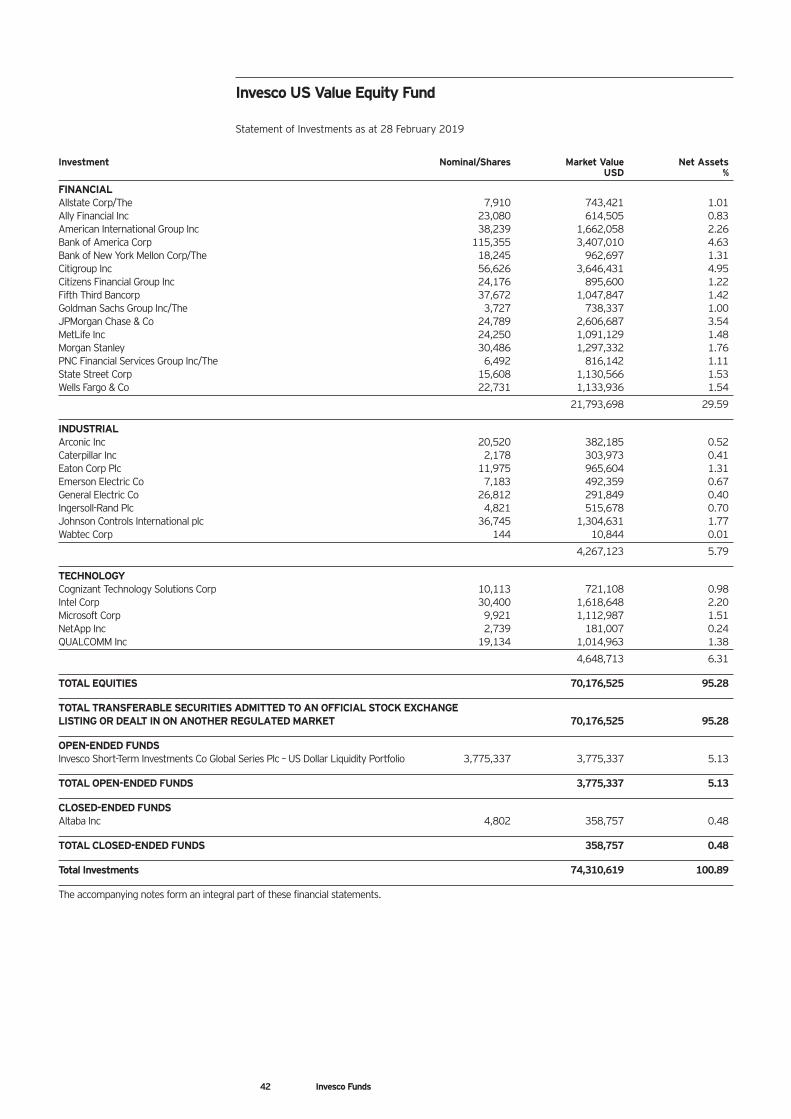
42 Invesco Funds
Investment Nominal/Shares Market Value Net Assets USD %
FINANCIAL Allstate Corp/The 7,910 743,421 1.01 Ally Financial Inc 23,080 614,505 0.83 American International Group Inc 38,239 1,662,058 2.26 Bank of America Corp 115,355 3,407,010 4.63 Bank of New York Mellon Corp/The 18,245 962,697 1.31 Citigroup Inc 56,626 3,646,431 4.95 Citizens Financial Group Inc 24,176 895,600 1.22 Fifth Third Bancorp 37,672 1,047,847 1.42 Goldman Sachs Group Inc/The 3,727 738,337 1.00 JPMorgan Chase & Co 24,789 2,606,687 3.54 MetLife Inc 24,250 1,091,129 1.48 Morgan Stanley 30,486 1,297,332 1.76 PNC Financial Services Group Inc/The 6,492 816,142 1.11 State Street Corp 15,608 1,130,566 1.53 Wells Fargo & Co 22,731 1,133,936 1.54
21,793,698 29.59
INDUSTRIAL Arconic Inc 20,520 382,185 0.52 Caterpillar Inc 2,178 303,973 0.41 Eaton Corp Plc 11,975 965,604 1.31 Emerson Electric Co 7,183 492,359 0.67 General Electric Co 26,812 291,849 0.40 Ingersoll-Rand Plc 4,821 515,678 0.70 Johnson Controls International plc 36,745 1,304,631 1.77 Wabtec Corp 144 10,844 0.01
4,267,123 5.79
TECHNOLOGY Cognizant Technology Solutions Corp 10,113 721,108 0.98 Intel Corp 30,400 1,618,648 2.20 Microsoft Corp 9,921 1,112,987 1.51 NetApp Inc 2,739 181,007 0.24 QUALCOMM Inc 19,134 1,014,963 1.38
4,648,713 6.31
TOTAL EQUITIES 70,176,525 95.28
TOTAL TRANSFERABLE SECURITIES ADMITTED TO AN OFFICIAL STOCK EXCHANGE LISTING OR DEALT IN ON ANOTHER REGULATED MARKET 70,176,525 95.28
OPEN-ENDED FUNDS Invesco Short-Term Investments Co Global Series Plc – US Dollar Liquidity Portfolio 3,775,337 3,775,337 5.13
TOTAL OPEN-ENDED FUNDS 3,775,337 5.13
CLOSED-ENDED FUNDS Altaba Inc 4,802 358,757 0.48
TOTAL CLOSED-ENDED FUNDS 358,757 0.48
Total Investments 74,310,619 100.89
The accompanying notes form an integral part of these financial statements.
Invesco US Value Equity Fund Statement of Investments as at 28 February 2019
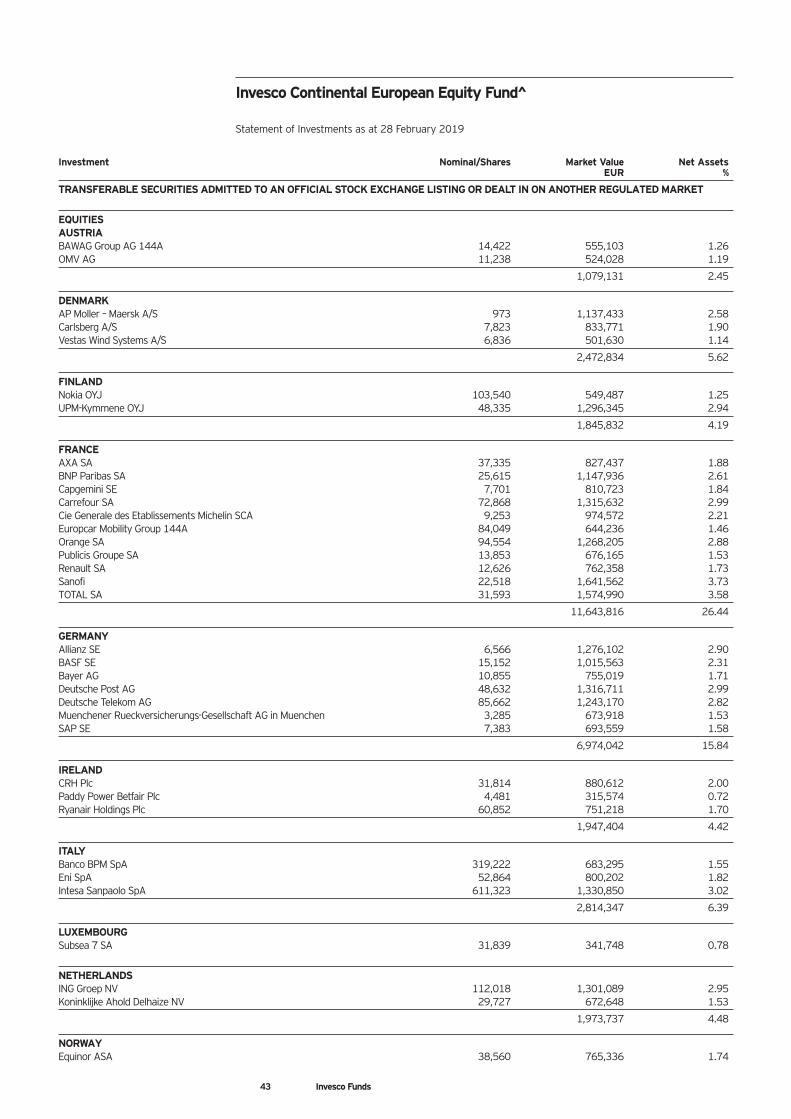
43 Invesco Funds
Investment Nominal/Shares Market Value Net Assets EUR %
TRANSFERABLE SECURITIES ADMITTED TO AN OFFICIAL STOCK EXCHANGE LISTING OR DEALT IN ON ANOTHER REGULATED MARKET
EQUITIES AUSTRIA BAWAG Group AG 144A 14,422 555,103 1.26 OMV AG 11,238 524,028 1.19
1,079,131 2.45
DENMARK AP Moller – Maersk A/S 973 1,137,433 2.58 Carlsberg A/S 7,823 833,771 1.90 Vestas Wind Systems A/S 6,836 501,630 1.14
2,472,834 5.62
FINLAND Nokia OYJ 103,540 549,487 1.25 UPM-Kymmene OYJ 48,335 1,296,345 2.94
1,845,832 4.19
FRANCE AXA SA 37,335 827,437 1.88 BNP Paribas SA 25,615 1,147,936 2.61 Capgemini SE 7,701 810,723 1.84 Carrefour SA 72,868 1,315,632 2.99 Cie Generale des Etablissements Michelin SCA 9,253 974,572 2.21 Europcar Mobility Group 144A 84,049 644,236 1.46 Orange SA 94,554 1,268,205 2.88 Publicis Groupe SA 13,853 676,165 1.53 Renault SA 12,626 762,358 1.73 Sanofi 22,518 1,641,562 3.73 TOTAL SA 31,593 1,574,990 3.58
11,643,816 26.44
GERMANY Allianz SE 6,566 1,276,102 2.90 BASF SE 15,152 1,015,563 2.31 Bayer AG 10,855 755,019 1.71 Deutsche Post AG 48,632 1,316,711 2.99 Deutsche Telekom AG 85,662 1,243,170 2.82 Muenchener Rueckversicherungs-Gesellschaft AG in Muenchen 3,285 673,918 1.53 SAP SE 7,383 693,559 1.58
6,974,042 15.84
IRELAND CRH Plc 31,814 880,612 2.00 Paddy Power Betfair Plc 4,481 315,574 0.72 Ryanair Holdings Plc 60,852 751,218 1.70
1,947,404 4.42
ITALY Banco BPM SpA 319,222 683,295 1.55 Eni SpA 52,864 800,202 1.82 Intesa Sanpaolo SpA 611,323 1,330,850 3.02
2,814,347 6.39
LUXEMBOURG Subsea 7 SA 31,839 341,748 0.78
NETHERLANDS ING Groep NV 112,018 1,301,089 2.95 Koninklijke Ahold Delhaize NV 29,727 672,648 1.53
1,973,737 4.48
NORWAY Equinor ASA 38,560 765,336 1.74
Invesco Continental European Equity Fund^ Statement of Investments as at 28 February 2019
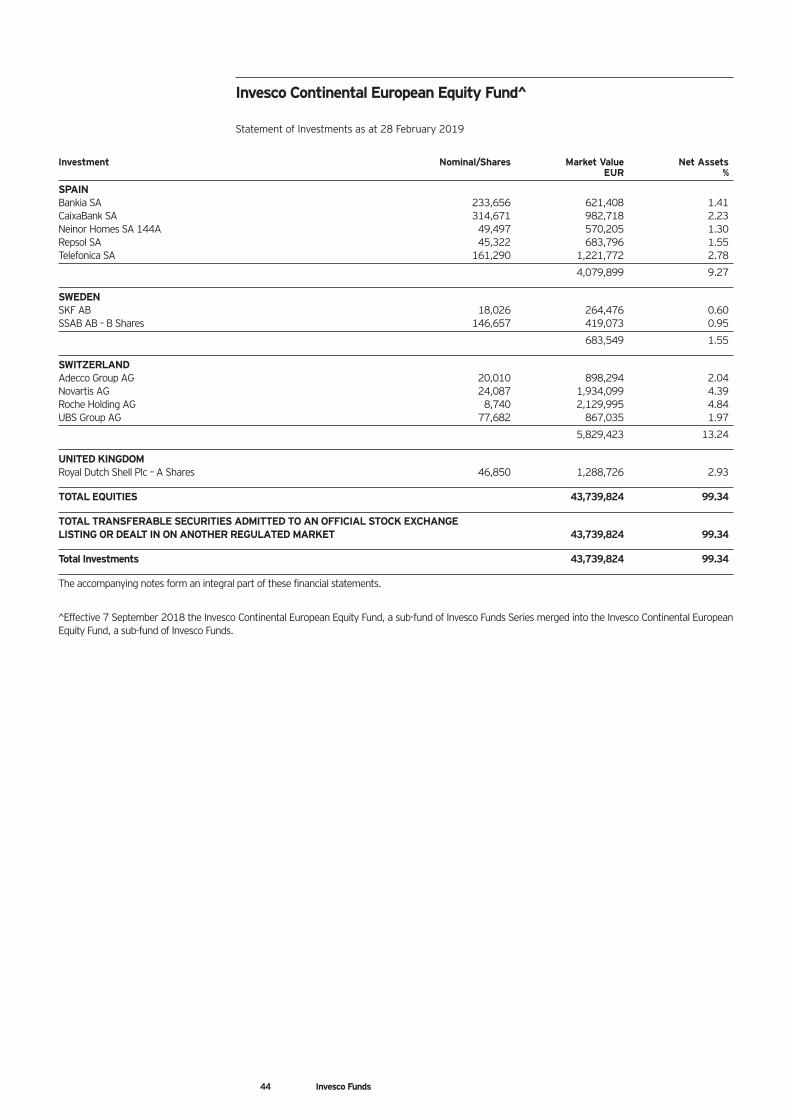
44 Invesco Funds
Investment Nominal/Shares Market Value Net Assets EUR %
SPAIN Bankia SA 233,656 621,408 1.41 CaixaBank SA 314,671 982,718 2.23 Neinor Homes SA 144A 49,497 570,205 1.30 Repsol SA 45,322 683,796 1.55 Telefonica SA 161,290 1,221,772 2.78
4,079,899 9.27
SWEDEN SKF AB 18,026 264,476 0.60 SSAB AB – B Shares 146,657 419,073 0.95
683,549 1.55
SWITZERLAND Adecco Group AG 20,010 898,294 2.04 Novartis AG 24,087 1,934,099 4.39 Roche Holding AG 8,740 2,129,995 4.84 UBS Group AG 77,682 867,035 1.97
5,829,423 13.24
UNITED KINGDOM Royal Dutch Shell Plc – A Shares 46,850 1,288,726 2.93
TOTAL EQUITIES 43,739,824 99.34
TOTAL TRANSFERABLE SECURITIES ADMITTED TO AN OFFICIAL STOCK EXCHANGE LISTING OR DEALT IN ON ANOTHER REGULATED MARKET 43,739,824 99.34
Total Investments 43,739,824 99.34
The accompanying notes form an integral part of these financial statements.
^Effective 7 September 2018 the Invesco Continental European Equity Fund, a sub-fund of Invesco Funds Series merged into the Invesco Continental European Equity Fund, a sub-fund of Invesco Funds.
Invesco Continental European Equity Fund^ Statement of Investments as at 28 February 2019
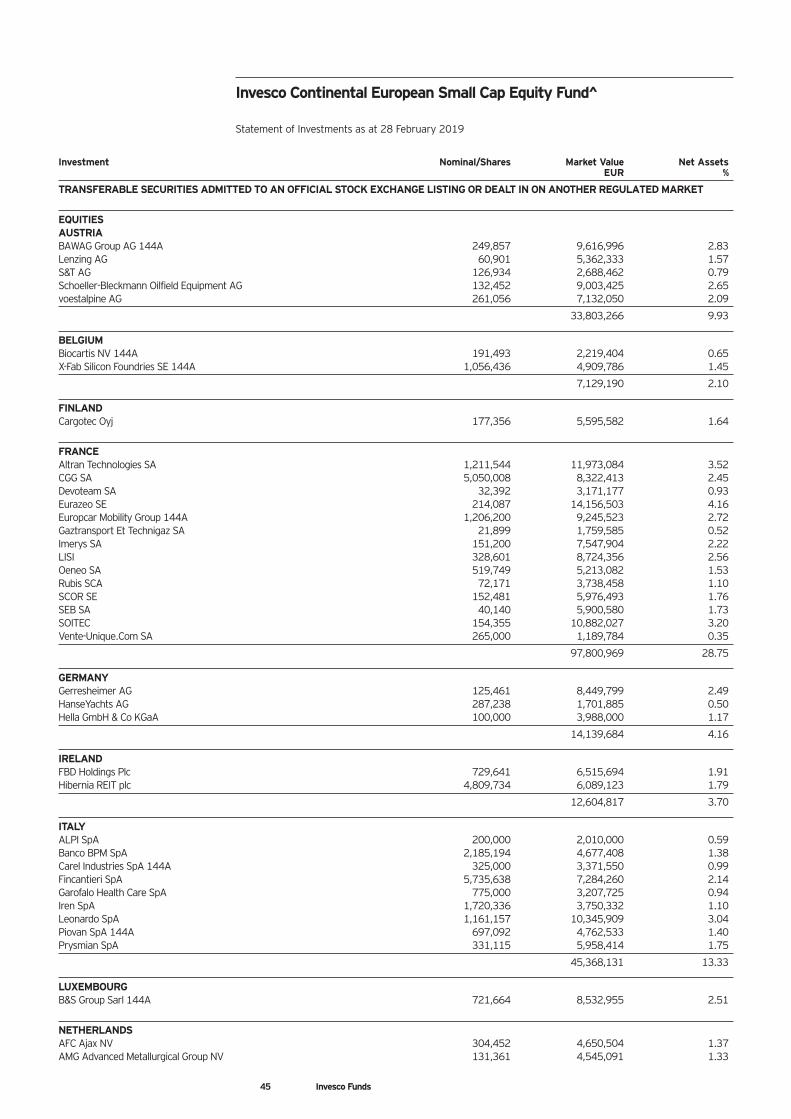
45 Invesco Funds
Investment Nominal/Shares Market Value Net Assets EUR %
TRANSFERABLE SECURITIES ADMITTED TO AN OFFICIAL STOCK EXCHANGE LISTING OR DEALT IN ON ANOTHER REGULATED MARKET
EQUITIES AUSTRIA BAWAG Group AG 144A 249,857 9,616,996 2.83 Lenzing AG 60,901 5,362,333 1.57 S&T AG 126,934 2,688,462 0.79 Schoeller-Bleckmann Oilfield Equipment AG 132,452 9,003,425 2.65 voestalpine AG 261,056 7,132,050 2.09
33,803,266 9.93
BELGIUM Biocartis NV 144A 191,493 2,219,404 0.65 X-Fab Silicon Foundries SE 144A 1,056,436 4,909,786 1.45
7,129,190 2.10
FINLAND Cargotec Oyj 177,356 5,595,582 1.64
FRANCE Altran Technologies SA 1,211,544 11,973,084 3.52 CGG SA 5,050,008 8,322,413 2.45 Devoteam SA 32,392 3,171,177 0.93 Eurazeo SE 214,087 14,156,503 4.16 Europcar Mobility Group 144A 1,206,200 9,245,523 2.72 Gaztransport Et Technigaz SA 21,899 1,759,585 0.52 Imerys SA 151,200 7,547,904 2.22 LISI 328,601 8,724,356 2.56 Oeneo SA 519,749 5,213,082 1.53 Rubis SCA 72,171 3,738,458 1.10 SCOR SE 152,481 5,976,493 1.76 SEB SA 40,140 5,900,580 1.73 SOITEC 154,355 10,882,027 3.20 Vente-Unique.Com SA 265,000 1,189,784 0.35
97,800,969 28.75
GERMANY Gerresheimer AG 125,461 8,449,799 2.49 HanseYachts AG 287,238 1,701,885 0.50 Hella GmbH & Co KGaA 100,000 3,988,000 1.17
14,139,684 4.16
IRELAND FBD Holdings Plc 729,641 6,515,694 1.91 Hibernia REIT plc 4,809,734 6,089,123 1.79
12,604,817 3.70
ITALY ALPI SpA 200,000 2,010,000 0.59 Banco BPM SpA 2,185,194 4,677,408 1.38 Carel Industries SpA 144A 325,000 3,371,550 0.99 Fincantieri SpA 5,735,638 7,284,260 2.14 Garofalo Health Care SpA 775,000 3,207,725 0.94 Iren SpA 1,720,336 3,750,332 1.10 Leonardo SpA 1,161,157 10,345,909 3.04 Piovan SpA 144A 697,092 4,762,533 1.40 Prysmian SpA 331,115 5,958,414 1.75
45,368,131 13.33
LUXEMBOURG B&S Group Sarl 144A 721,664 8,532,955 2.51
NETHERLANDS AFC Ajax NV 304,452 4,650,504 1.37 AMG Advanced Metallurgical Group NV 131,361 4,545,091 1.33
Invesco Continental European Small Cap Equity Fund^ Statement of Investments as at 28 February 2019
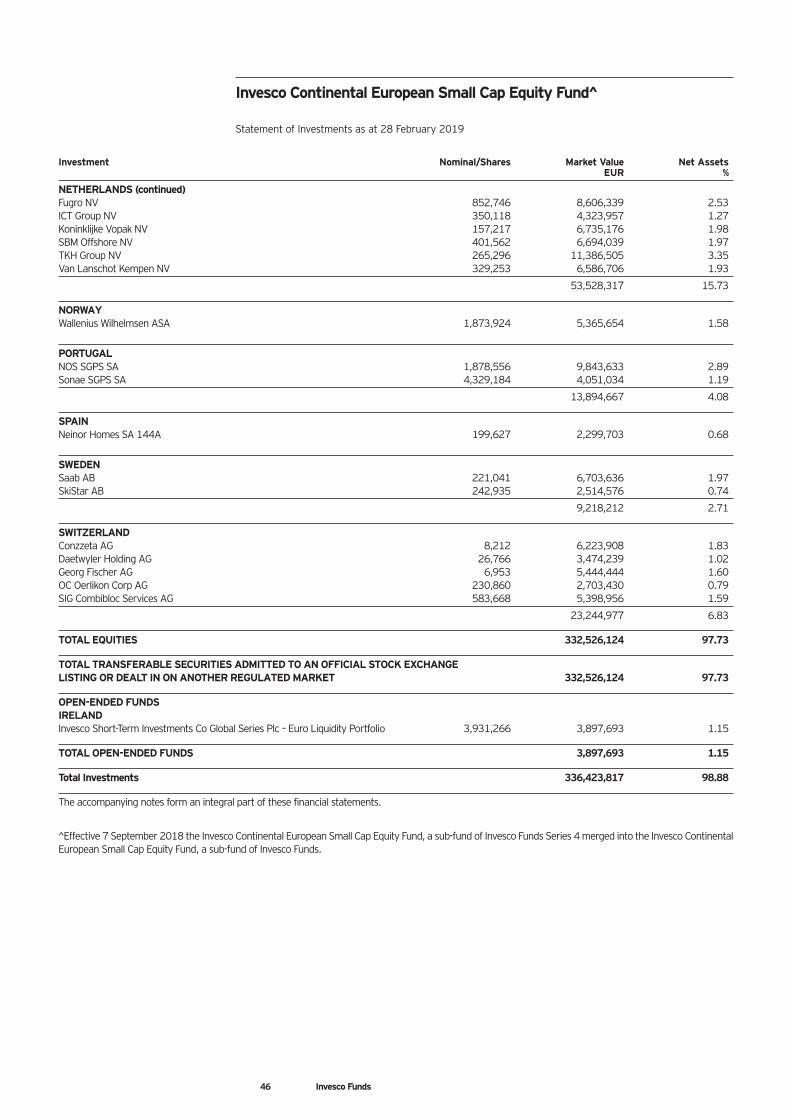
46 Invesco Funds
Investment Nominal/Shares Market Value Net Assets EUR %
NETHERLANDS (continued) Fugro NV 852,746 8,606,339 2.53 ICT Group NV 350,118 4,323,957 1.27 Koninklijke Vopak NV 157,217 6,735,176 1.98 SBM Offshore NV 401,562 6,694,039 1.97 TKH Group NV 265,296 11,386,505 3.35 Van Lanschot Kempen NV 329,253 6,586,706 1.93
53,528,317 15.73
NORWAY Wallenius Wilhelmsen ASA 1,873,924 5,365,654 1.58
PORTUGAL NOS SGPS SA 1,878,556 9,843,633 2.89 Sonae SGPS SA 4,329,184 4,051,034 1.19
13,894,667 4.08
SPAIN Neinor Homes SA 144A 199,627 2,299,703 0.68
SWEDEN Saab AB 221,041 6,703,636 1.97 SkiStar AB 242,935 2,514,576 0.74
9,218,212 2.71
SWITZERLAND Conzzeta AG 8,212 6,223,908 1.83 Daetwyler Holding AG 26,766 3,474,239 1.02 Georg Fischer AG 6,953 5,444,444 1.60 OC Oerlikon Corp AG 230,860 2,703,430 0.79 SIG Combibloc Services AG 583,668 5,398,956 1.59
23,244,977 6.83
TOTAL EQUITIES 332,526,124 97.73
TOTAL TRANSFERABLE SECURITIES ADMITTED TO AN OFFICIAL STOCK EXCHANGE LISTING OR DEALT IN ON ANOTHER REGULATED MARKET 332,526,124 97.73
OPEN-ENDED FUNDS IRELAND Invesco Short-Term Investments Co Global Series Plc – Euro Liquidity Portfolio 3,931,266 3,897,693 1.15
TOTAL OPEN-ENDED FUNDS 3,897,693 1.15
Total Investments 336,423,817 98.88
The accompanying notes form an integral part of these financial statements.
^Effective 7 September 2018 the Invesco Continental European Small Cap Equity Fund, a sub-fund of Invesco Funds Series 4 merged into the Invesco Continental European Small Cap Equity Fund, a sub-fund of Invesco Funds.
Invesco Continental European Small Cap Equity Fund^ Statement of Investments as at 28 February 2019
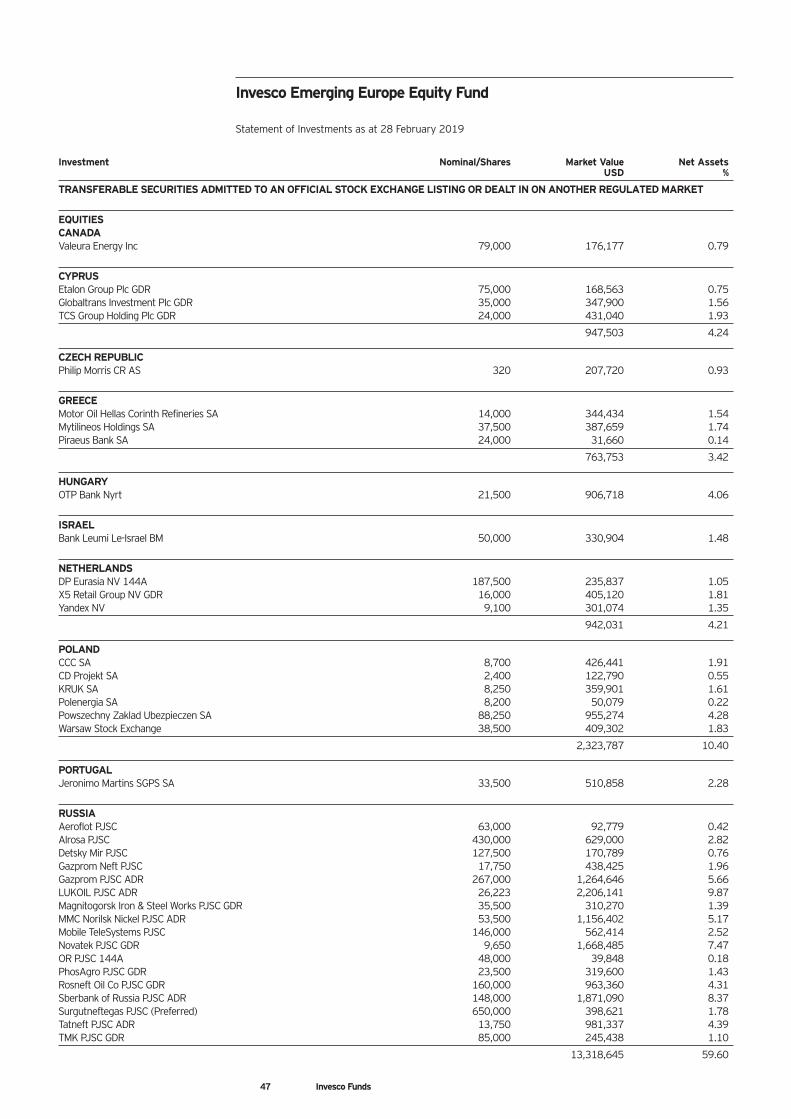
47 Invesco Funds
Investment Nominal/Shares Market Value Net Assets USD %
TRANSFERABLE SECURITIES ADMITTED TO AN OFFICIAL STOCK EXCHANGE LISTING OR DEALT IN ON ANOTHER REGULATED MARKET
EQUITIES CANADA Valeura Energy Inc 79,000 176,177 0.79
CYPRUS Etalon Group Plc GDR 75,000 168,563 0.75 Globaltrans Investment Plc GDR 35,000 347,900 1.56 TCS Group Holding Plc GDR 24,000 431,040 1.93
947,503 4.24
CZECH REPUBLIC Philip Morris CR AS 320 207,720 0.93
GREECE Motor Oil Hellas Corinth Refineries SA 14,000 344,434 1.54 Mytilineos Holdings SA 37,500 387,659 1.74 Piraeus Bank SA 24,000 31,660 0.14
763,753 3.42
HUNGARY OTP Bank Nyrt 21,500 906,718 4.06
ISRAEL Bank Leumi Le-Israel BM 50,000 330,904 1.48
NETHERLANDS DP Eurasia NV 144A 187,500 235,837 1.05 X5 Retail Group NV GDR 16,000 405,120 1.81 Yandex NV 9,100 301,074 1.35
942,031 4.21
POLAND CCC SA 8,700 426,441 1.91 CD Projekt SA 2,400 122,790 0.55 KRUK SA 8,250 359,901 1.61 Polenergia SA 8,200 50,079 0.22 Powszechny Zaklad Ubezpieczen SA 88,250 955,274 4.28 Warsaw Stock Exchange 38,500 409,302 1.83
2,323,787 10.40
PORTUGAL Jeronimo Martins SGPS SA 33,500 510,858 2.28
RUSSIA Aeroflot PJSC 63,000 92,779 0.42 Alrosa PJSC 430,000 629,000 2.82 Detsky Mir PJSC 127,500 170,789 0.76 Gazprom Neft PJSC 17,750 438,425 1.96 Gazprom PJSC ADR 267,000 1,264,646 5.66 LUKOIL PJSC ADR 26,223 2,206,141 9.87 Magnitogorsk Iron & Steel Works PJSC GDR 35,500 310,270 1.39 MMC Norilsk Nickel PJSC ADR 53,500 1,156,402 5.17 Mobile TeleSystems PJSC 146,000 562,414 2.52 Novatek PJSC GDR 9,650 1,668,485 7.47 OR PJSC 144A 48,000 39,848 0.18 PhosAgro PJSC GDR 23,500 319,600 1.43 Rosneft Oil Co PJSC GDR 160,000 963,360 4.31 Sberbank of Russia PJSC ADR 148,000 1,871,090 8.37 Surgutneftegas PJSC (Preferred) 650,000 398,621 1.78 Tatneft PJSC ADR 13,750 981,337 4.39 TMK PJSC GDR 85,000 245,438 1.10
13,318,645 59.60
Invesco Emerging Europe Equity Fund Statement of Investments as at 28 February 2019
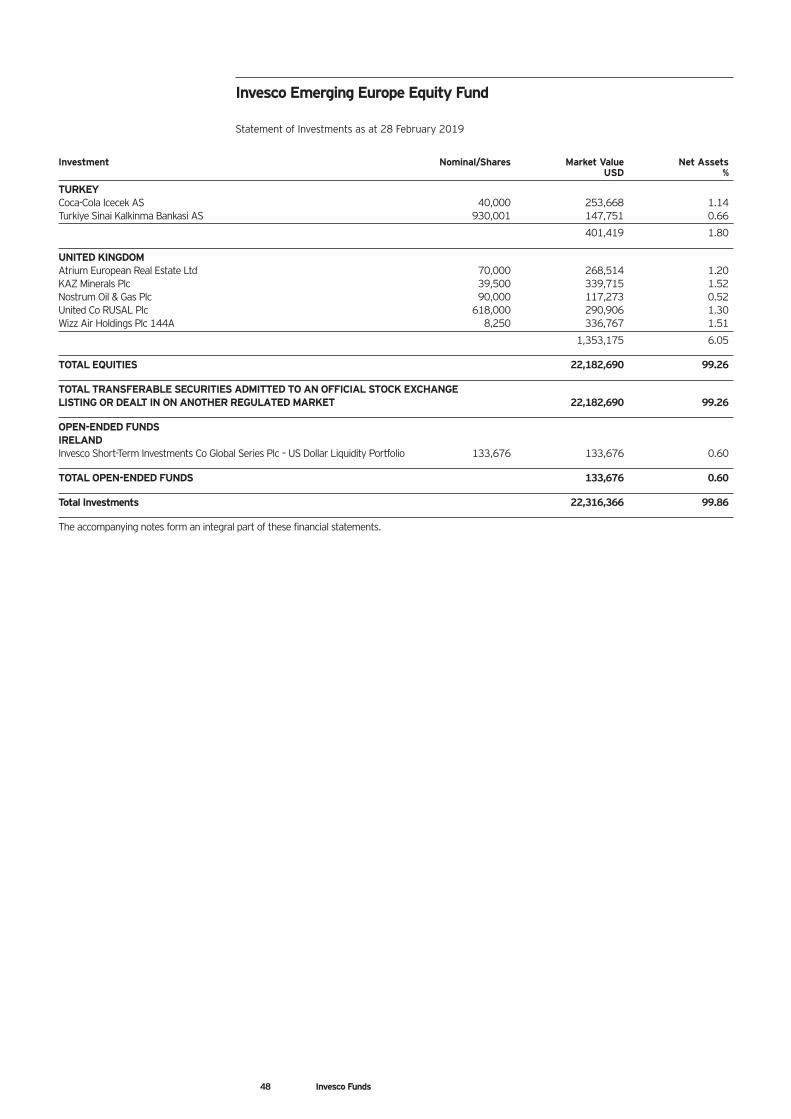
48 Invesco Funds
Investment Nominal/Shares Market Value Net Assets USD %
TURKEY Coca-Cola Icecek AS 40,000 253,668 1.14 Turkiye Sinai Kalkinma Bankasi AS 930,001 147,751 0.66
401,419 1.80
UNITED KINGDOM Atrium European Real Estate Ltd 70,000 268,514 1.20 KAZ Minerals Plc 39,500 339,715 1.52 Nostrum Oil & Gas Plc 90,000 117,273 0.52 United Co RUSAL Plc 618,000 290,906 1.30 Wizz Air Holdings Plc 144A 8,250 336,767 1.51
1,353,175 6.05
TOTAL EQUITIES 22,182,690 99.26
TOTAL TRANSFERABLE SECURITIES ADMITTED TO AN OFFICIAL STOCK EXCHANGE LISTING OR DEALT IN ON ANOTHER REGULATED MARKET 22,182,690 99.26
OPEN-ENDED FUNDS IRELAND Invesco Short-Term Investments Co Global Series Plc – US Dollar Liquidity Portfolio 133,676 133,676 0.60
TOTAL OPEN-ENDED FUNDS 133,676 0.60
Total Investments 22,316,366 99.86
The accompanying notes form an integral part of these financial statements.
Invesco Emerging Europe Equity Fund Statement of Investments as at 28 February 2019
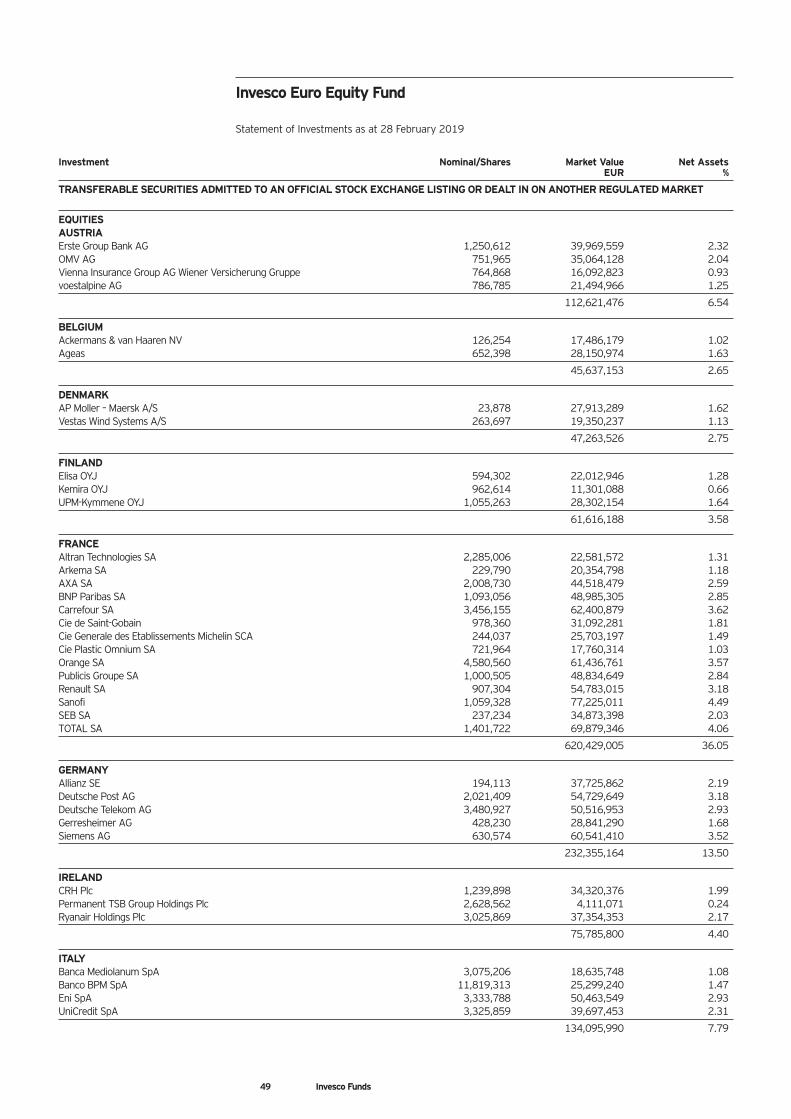
49 Invesco Funds
Investment Nominal/Shares Market Value Net Assets EUR %
TRANSFERABLE SECURITIES ADMITTED TO AN OFFICIAL STOCK EXCHANGE LISTING OR DEALT IN ON ANOTHER REGULATED MARKET
EQUITIES AUSTRIA Erste Group Bank AG 1,250,612 39,969,559 2.32 OMV AG 751,965 35,064,128 2.04 Vienna Insurance Group AG Wiener Versicherung Gruppe 764,868 16,092,823 0.93 voestalpine AG 786,785 21,494,966 1.25
112,621,476 6.54
BELGIUM Ackermans & van Haaren NV 126,254 17,486,179 1.02 Ageas 652,398 28,150,974 1.63
45,637,153 2.65
DENMARK AP Moller – Maersk A/S 23,878 27,913,289 1.62 Vestas Wind Systems A/S 263,697 19,350,237 1.13
47,263,526 2.75
FINLAND Elisa OYJ 594,302 22,012,946 1.28 Kemira OYJ 962,614 11,301,088 0.66 UPM-Kymmene OYJ 1,055,263 28,302,154 1.64
61,616,188 3.58
FRANCE Altran Technologies SA 2,285,006 22,581,572 1.31 Arkema SA 229,790 20,354,798 1.18 AXA SA 2,008,730 44,518,479 2.59 BNP Paribas SA 1,093,056 48,985,305 2.85 Carrefour SA 3,456,155 62,400,879 3.62 Cie de Saint-Gobain 978,360 31,092,281 1.81 Cie Generale des Etablissements Michelin SCA 244,037 25,703,197 1.49 Cie Plastic Omnium SA 721,964 17,760,314 1.03 Orange SA 4,580,560 61,436,761 3.57 Publicis Groupe SA 1,000,505 48,834,649 2.84 Renault SA 907,304 54,783,015 3.18 Sanofi 1,059,328 77,225,011 4.49 SEB SA 237,234 34,873,398 2.03 TOTAL SA 1,401,722 69,879,346 4.06
620,429,005 36.05
GERMANY Allianz SE 194,113 37,725,862 2.19 Deutsche Post AG 2,021,409 54,729,649 3.18 Deutsche Telekom AG 3,480,927 50,516,953 2.93 Gerresheimer AG 428,230 28,841,290 1.68 Siemens AG 630,574 60,541,410 3.52
232,355,164 13.50
IRELAND CRH Plc 1,239,898 34,320,376 1.99 Permanent TSB Group Holdings Plc 2,628,562 4,111,071 0.24 Ryanair Holdings Plc 3,025,869 37,354,353 2.17
75,785,800 4.40
ITALY Banca Mediolanum SpA 3,075,206 18,635,748 1.08 Banco BPM SpA 11,819,313 25,299,240 1.47 Eni SpA 3,333,788 50,463,549 2.93 UniCredit SpA 3,325,859 39,697,453 2.31
134,095,990 7.79
Invesco Euro Equity Fund Statement of Investments as at 28 February 2019
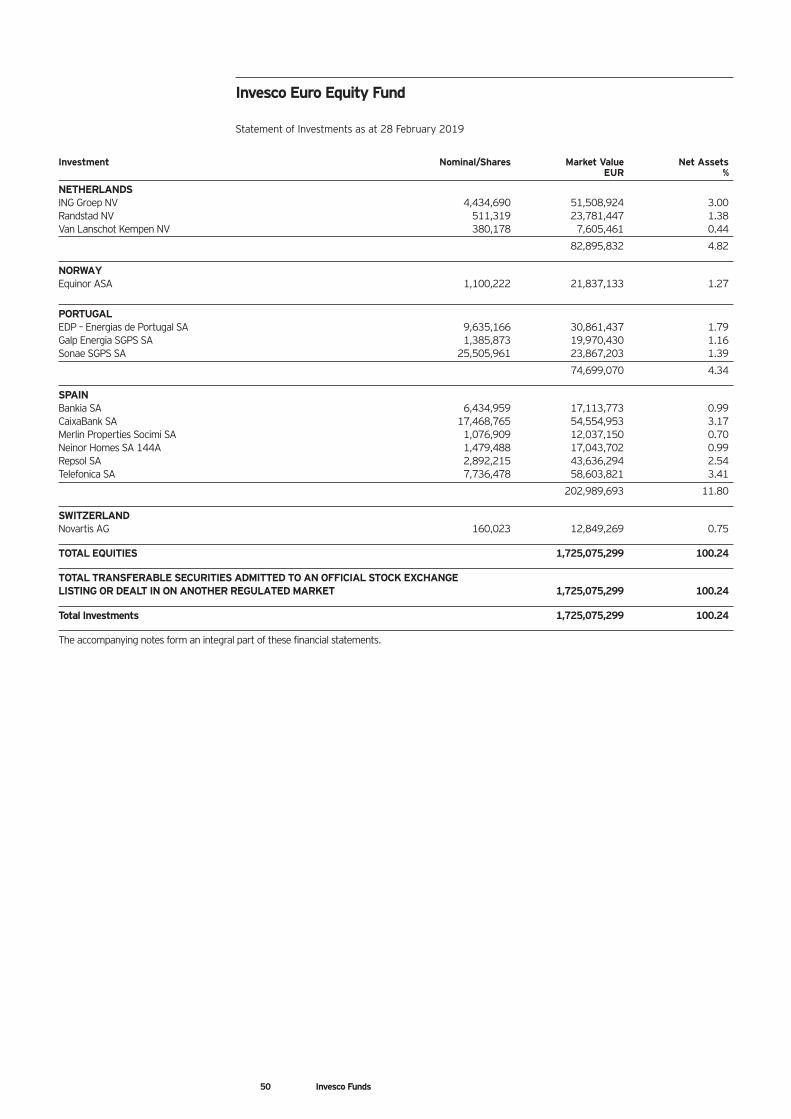
50 Invesco Funds
Investment Nominal/Shares Market Value Net Assets EUR %
NETHERLANDS ING Groep NV 4,434,690 51,508,924 3.00 Randstad NV 511,319 23,781,447 1.38 Van Lanschot Kempen NV 380,178 7,605,461 0.44
82,895,832 4.82
NORWAY Equinor ASA 1,100,222 21,837,133 1.27
PORTUGAL EDP – Energias de Portugal SA 9,635,166 30,861,437 1.79 Galp Energia SGPS SA 1,385,873 19,970,430 1.16 Sonae SGPS SA 25,505,961 23,867,203 1.39
74,699,070 4.34
SPAIN Bankia SA 6,434,959 17,113,773 0.99 CaixaBank SA 17,468,765 54,554,953 3.17 Merlin Properties Socimi SA 1,076,909 12,037,150 0.70 Neinor Homes SA 144A 1,479,488 17,043,702 0.99 Repsol SA 2,892,215 43,636,294 2.54 Telefonica SA 7,736,478 58,603,821 3.41
202,989,693 11.80
SWITZERLAND Novartis AG 160,023 12,849,269 0.75
TOTAL EQUITIES 1,725,075,299 100.24
TOTAL TRANSFERABLE SECURITIES ADMITTED TO AN OFFICIAL STOCK EXCHANGE LISTING OR DEALT IN ON ANOTHER REGULATED MARKET 1,725,075,299 100.24
Total Investments 1,725,075,299 100.24
The accompanying notes form an integral part of these financial statements.
Invesco Euro Equity Fund Statement of Investments as at 28 February 2019
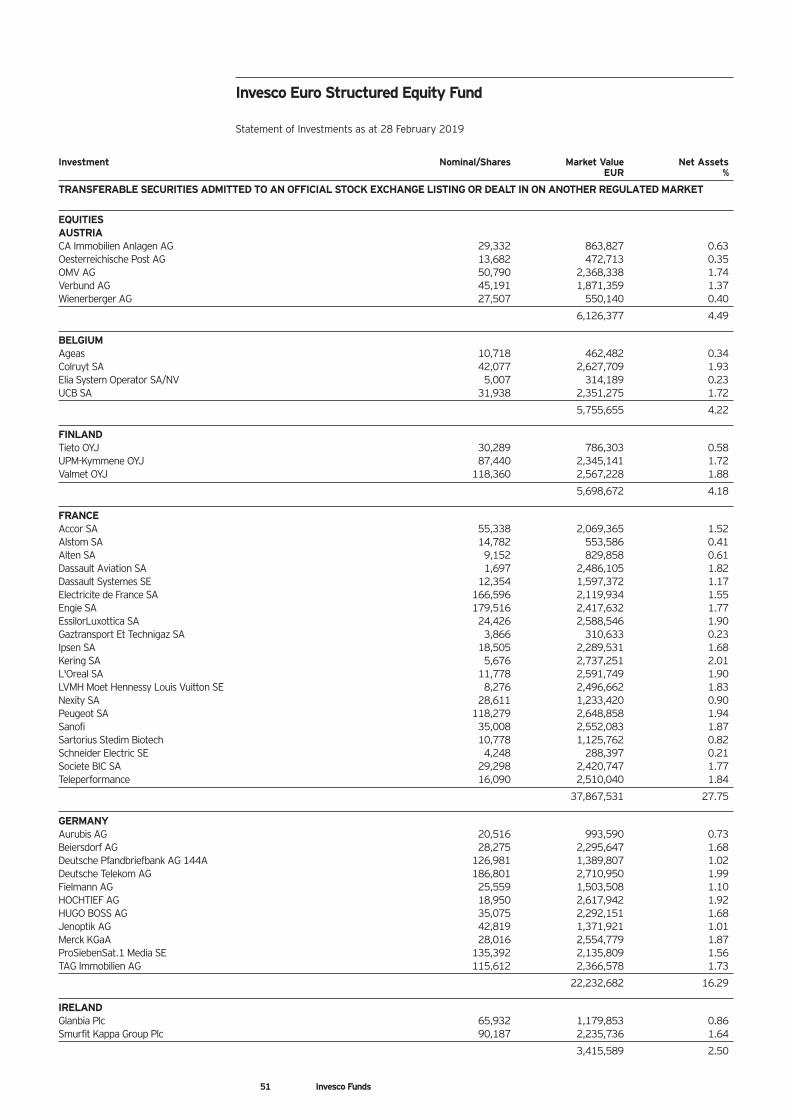
51 Invesco Funds
Investment Nominal/Shares Market Value Net Assets EUR %
TRANSFERABLE SECURITIES ADMITTED TO AN OFFICIAL STOCK EXCHANGE LISTING OR DEALT IN ON ANOTHER REGULATED MARKET
EQUITIES AUSTRIA CA Immobilien Anlagen AG 29,332 863,827 0.63 Oesterreichische Post AG 13,682 472,713 0.35 OMV AG 50,790 2,368,338 1.74 Verbund AG 45,191 1,871,359 1.37 Wienerberger AG 27,507 550,140 0.40
6,126,377 4.49
BELGIUM Ageas 10,718 462,482 0.34 Colruyt SA 42,077 2,627,709 1.93 Elia System Operator SA/NV 5,007 314,189 0.23 UCB SA 31,938 2,351,275 1.72
5,755,655 4.22
FINLAND Tieto OYJ 30,289 786,303 0.58 UPM-Kymmene OYJ 87,440 2,345,141 1.72 Valmet OYJ 118,360 2,567,228 1.88
5,698,672 4.18
FRANCE Accor SA 55,338 2,069,365 1.52 Alstom SA 14,782 553,586 0.41 Alten SA 9,152 829,858 0.61 Dassault Aviation SA 1,697 2,486,105 1.82 Dassault Systemes SE 12,354 1,597,372 1.17 Electricite de France SA 166,596 2,119,934 1.55 Engie SA 179,516 2,417,632 1.77 EssilorLuxottica SA 24,426 2,588,546 1.90 Gaztransport Et Technigaz SA 3,866 310,633 0.23 Ipsen SA 18,505 2,289,531 1.68 Kering SA 5,676 2,737,251 2.01 L'Oreal SA 11,778 2,591,749 1.90 LVMH Moet Hennessy Louis Vuitton SE 8,276 2,496,662 1.83 Nexity SA 28,611 1,233,420 0.90 Peugeot SA 118,279 2,648,858 1.94 Sanofi 35,008 2,552,083 1.87 Sartorius Stedim Biotech 10,778 1,125,762 0.82 Schneider Electric SE 4,248 288,397 0.21 Societe BIC SA 29,298 2,420,747 1.77 Teleperformance 16,090 2,510,040 1.84
37,867,531 27.75
GERMANY Aurubis AG 20,516 993,590 0.73 Beiersdorf AG 28,275 2,295,647 1.68 Deutsche Pfandbriefbank AG 144A 126,981 1,389,807 1.02 Deutsche Telekom AG 186,801 2,710,950 1.99 Fielmann AG 25,559 1,503,508 1.10 HOCHTIEF AG 18,950 2,617,942 1.92 HUGO BOSS AG 35,075 2,292,151 1.68 Jenoptik AG 42,819 1,371,921 1.01 Merck KGaA 28,016 2,554,779 1.87 ProSiebenSat.1 Media SE 135,392 2,135,809 1.56 TAG Immobilien AG 115,612 2,366,578 1.73
22,232,682 16.29
IRELAND Glanbia Plc 65,932 1,179,853 0.86 Smurfit Kappa Group Plc 90,187 2,235,736 1.64
3,415,589 2.50
Invesco Euro Structured Equity Fund Statement of Investments as at 28 February 2019
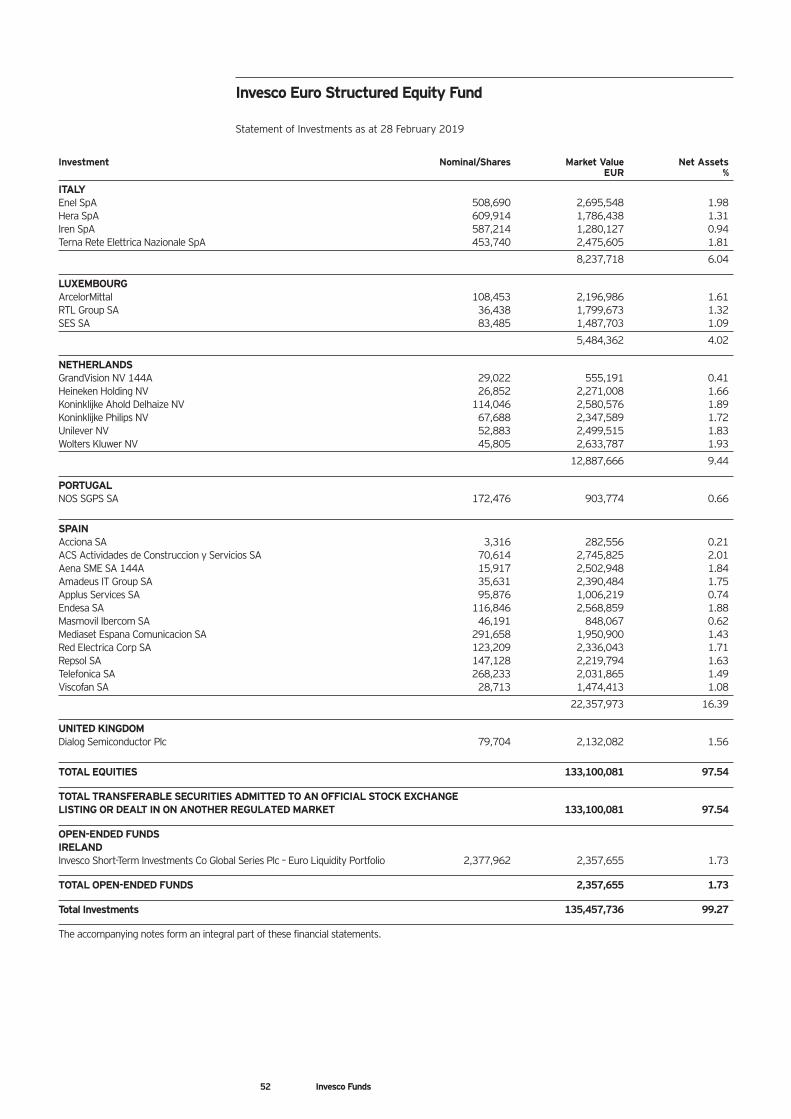
52 Invesco Funds
Investment Nominal/Shares Market Value Net Assets EUR %
ITALY Enel SpA 508,690 2,695,548 1.98 Hera SpA 609,914 1,786,438 1.31 Iren SpA 587,214 1,280,127 0.94 Terna Rete Elettrica Nazionale SpA 453,740 2,475,605 1.81
8,237,718 6.04
LUXEMBOURG ArcelorMittal 108,453 2,196,986 1.61 RTL Group SA 36,438 1,799,673 1.32 SES SA 83,485 1,487,703 1.09
5,484,362 4.02
NETHERLANDS GrandVision NV 144A 29,022 555,191 0.41 Heineken Holding NV 26,852 2,271,008 1.66 Koninklijke Ahold Delhaize NV 114,046 2,580,576 1.89 Koninklijke Philips NV 67,688 2,347,589 1.72 Unilever NV 52,883 2,499,515 1.83 Wolters Kluwer NV 45,805 2,633,787 1.93
12,887,666 9.44
PORTUGAL NOS SGPS SA 172,476 903,774 0.66
SPAIN Acciona SA 3,316 282,556 0.21 ACS Actividades de Construccion y Servicios SA 70,614 2,745,825 2.01 Aena SME SA 144A 15,917 2,502,948 1.84 Amadeus IT Group SA 35,631 2,390,484 1.75 Applus Services SA 95,876 1,006,219 0.74 Endesa SA 116,846 2,568,859 1.88 Masmovil Ibercom SA 46,191 848,067 0.62 Mediaset Espana Comunicacion SA 291,658 1,950,900 1.43 Red Electrica Corp SA 123,209 2,336,043 1.71 Repsol SA 147,128 2,219,794 1.63 Telefonica SA 268,233 2,031,865 1.49 Viscofan SA 28,713 1,474,413 1.08
22,357,973 16.39
UNITED KINGDOM Dialog Semiconductor Plc 79,704 2,132,082 1.56
TOTAL EQUITIES 133,100,081 97.54
TOTAL TRANSFERABLE SECURITIES ADMITTED TO AN OFFICIAL STOCK EXCHANGE LISTING OR DEALT IN ON ANOTHER REGULATED MARKET 133,100,081 97.54
OPEN-ENDED FUNDS IRELAND Invesco Short-Term Investments Co Global Series Plc – Euro Liquidity Portfolio 2,377,962 2,357,655 1.73
TOTAL OPEN-ENDED FUNDS 2,357,655 1.73
Total Investments 135,457,736 99.27
The accompanying notes form an integral part of these financial statements.
Invesco Euro Structured Equity Fund Statement of Investments as at 28 February 2019
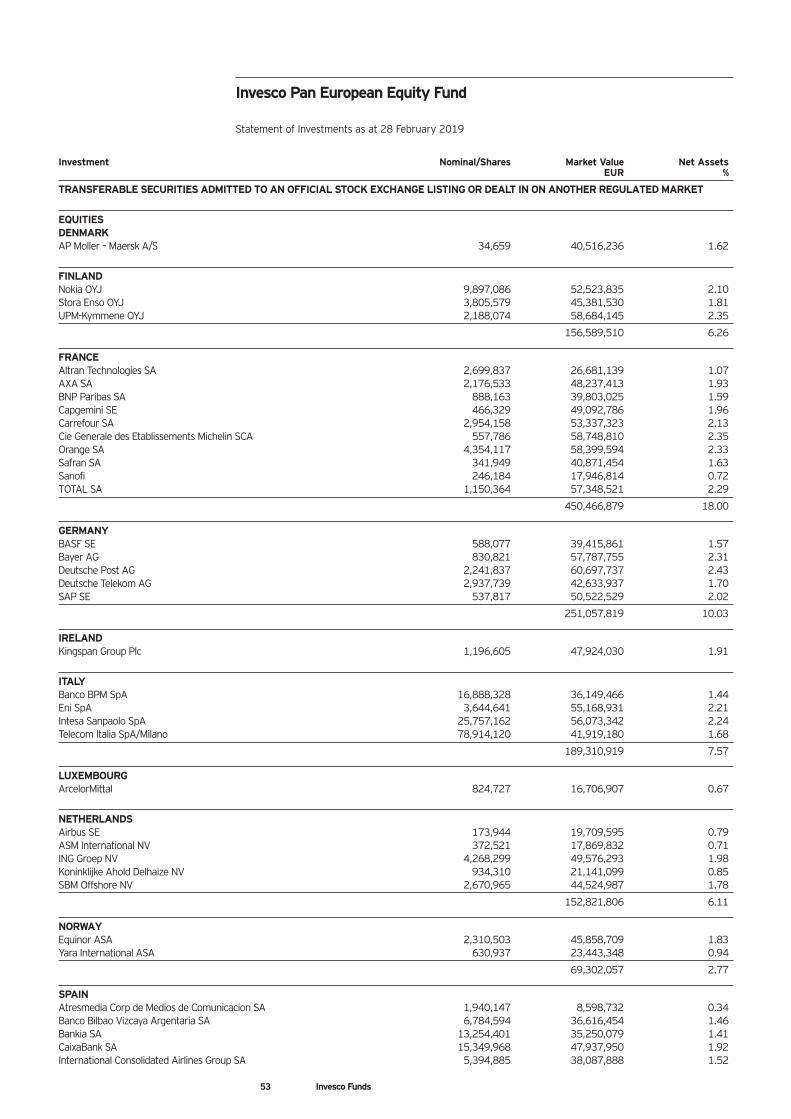
53 Invesco Funds
Investment Nominal/Shares Market Value Net Assets EUR %
TRANSFERABLE SECURITIES ADMITTED TO AN OFFICIAL STOCK EXCHANGE LISTING OR DEALT IN ON ANOTHER REGULATED MARKET
EQUITIES DENMARK AP Moller – Maersk A/S 34,659 40,516,236 1.62
FINLAND Nokia OYJ 9,897,086 52,523,835 2.10 Stora Enso OYJ 3,805,579 45,381,530 1.81 UPM-Kymmene OYJ 2,188,074 58,684,145 2.35
156,589,510 6.26
FRANCE Altran Technologies SA 2,699,837 26,681,139 1.07 AXA SA 2,176,533 48,237,413 1.93 BNP Paribas SA 888,163 39,803,025 1.59 Capgemini SE 466,329 49,092,786 1.96 Carrefour SA 2,954,158 53,337,323 2.13 Cie Generale des Etablissements Michelin SCA 557,786 58,748,810 2.35 Orange SA 4,354,117 58,399,594 2.33 Safran SA 341,949 40,871,454 1.63 Sanofi 246,184 17,946,814 0.72 TOTAL SA 1,150,364 57,348,521 2.29
450,466,879 18.00
GERMANY BASF SE 588,077 39,415,861 1.57 Bayer AG 830,821 57,787,755 2.31 Deutsche Post AG 2,241,837 60,697,737 2.43 Deutsche Telekom AG 2,937,739 42,633,937 1.70 SAP SE 537,817 50,522,529 2.02
251,057,819 10.03
IRELAND Kingspan Group Plc 1,196,605 47,924,030 1.91
ITALY Banco BPM SpA 16,888,328 36,149,466 1.44 Eni SpA 3,644,641 55,168,931 2.21 Intesa Sanpaolo SpA 25,757,162 56,073,342 2.24 Telecom Italia SpA/Milano 78,914,120 41,919,180 1.68
189,310,919 7.57
LUXEMBOURG ArcelorMittal 824,727 16,706,907 0.67
NETHERLANDS Airbus SE 173,944 19,709,595 0.79 ASM International NV 372,521 17,869,832 0.71 ING Groep NV 4,268,299 49,576,293 1.98 Koninklijke Ahold Delhaize NV 934,310 21,141,099 0.85 SBM Offshore NV 2,670,965 44,524,987 1.78
152,821,806 6.11
NORWAY Equinor ASA 2,310,503 45,858,709 1.83 Yara International ASA 630,937 23,443,348 0.94
69,302,057 2.77
SPAIN Atresmedia Corp de Medios de Comunicacion SA 1,940,147 8,598,732 0.34 Banco Bilbao Vizcaya Argentaria SA 6,784,594 36,616,454 1.46 Bankia SA 13,254,401 35,250,079 1.41 CaixaBank SA 15,349,968 47,937,950 1.92 International Consolidated Airlines Group SA 5,394,885 38,087,888 1.52
Invesco Pan European Equity Fund Statement of Investments as at 28 February 2019
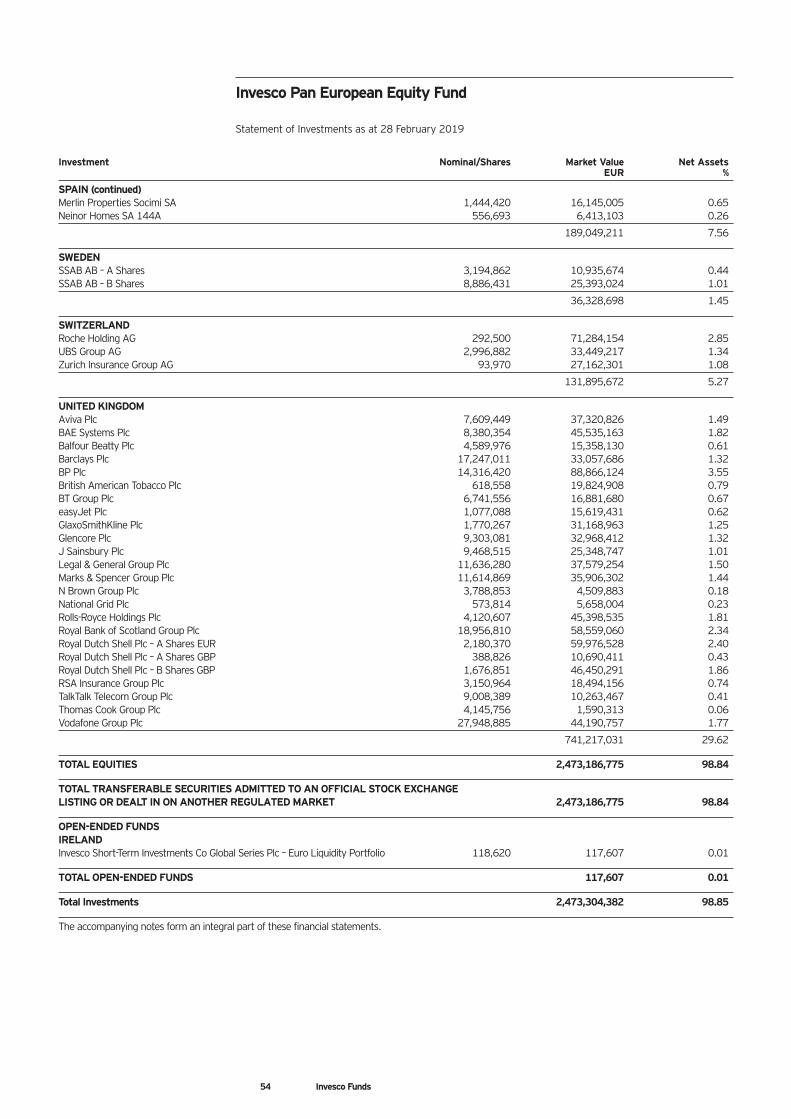
54 Invesco Funds
Investment Nominal/Shares Market Value Net Assets EUR %
SPAIN (continued) Merlin Properties Socimi SA 1,444,420 16,145,005 0.65 Neinor Homes SA 144A 556,693 6,413,103 0.26
189,049,211 7.56
SWEDEN SSAB AB – A Shares 3,194,862 10,935,674 0.44 SSAB AB – B Shares 8,886,431 25,393,024 1.01
36,328,698 1.45
SWITZERLAND Roche Holding AG 292,500 71,284,154 2.85 UBS Group AG 2,996,882 33,449,217 1.34 Zurich Insurance Group AG 93,970 27,162,301 1.08
131,895,672 5.27
UNITED KINGDOM Aviva Plc 7,609,449 37,320,826 1.49 BAE Systems Plc 8,380,354 45,535,163 1.82 Balfour Beatty Plc 4,589,976 15,358,130 0.61 Barclays Plc 17,247,011 33,057,686 1.32 BP Plc 14,316,420 88,866,124 3.55 British American Tobacco Plc 618,558 19,824,908 0.79 BT Group Plc 6,741,556 16,881,680 0.67 easyJet Plc 1,077,088 15,619,431 0.62 GlaxoSmithKline Plc 1,770,267 31,168,963 1.25 Glencore Plc 9,303,081 32,968,412 1.32 J Sainsbury Plc 9,468,515 25,348,747 1.01 Legal & General Group Plc 11,636,280 37,579,254 1.50 Marks & Spencer Group Plc 11,614,869 35,906,302 1.44 N Brown Group Plc 3,788,853 4,509,883 0.18 National Grid Plc 573,814 5,658,004 0.23 Rolls-Royce Holdings Plc 4,120,607 45,398,535 1.81 Royal Bank of Scotland Group Plc 18,956,810 58,559,060 2.34 Royal Dutch Shell Plc – A Shares EUR 2,180,370 59,976,528 2.40 Royal Dutch Shell Plc – A Shares GBP 388,826 10,690,411 0.43 Royal Dutch Shell Plc – B Shares GBP 1,676,851 46,450,291 1.86 RSA Insurance Group Plc 3,150,964 18,494,156 0.74 TalkTalk Telecom Group Plc 9,008,389 10,263,467 0.41 Thomas Cook Group Plc 4,145,756 1,590,313 0.06 Vodafone Group Plc 27,948,885 44,190,757 1.77
741,217,031 29.62
TOTAL EQUITIES 2,473,186,775 98.84
TOTAL TRANSFERABLE SECURITIES ADMITTED TO AN OFFICIAL STOCK EXCHANGE LISTING OR DEALT IN ON ANOTHER REGULATED MARKET 2,473,186,775 98.84
OPEN-ENDED FUNDS IRELAND Invesco Short-Term Investments Co Global Series Plc – Euro Liquidity Portfolio 118,620 117,607 0.01
TOTAL OPEN-ENDED FUNDS 117,607 0.01
Total Investments 2,473,304,382 98.85
The accompanying notes form an integral part of these financial statements.
Invesco Pan European Equity Fund Statement of Investments as at 28 February 2019
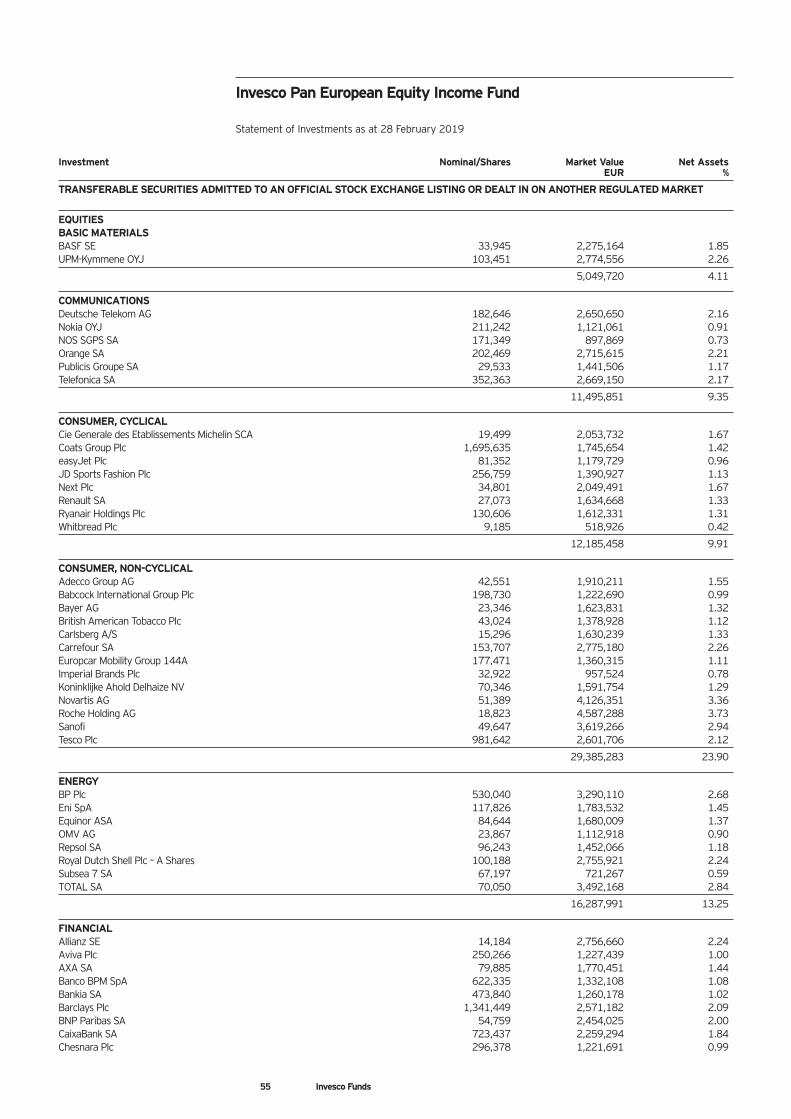
55 Invesco Funds
Investment Nominal/Shares Market Value Net Assets EUR %
TRANSFERABLE SECURITIES ADMITTED TO AN OFFICIAL STOCK EXCHANGE LISTING OR DEALT IN ON ANOTHER REGULATED MARKET
EQUITIES BASIC MATERIALS BASF SE 33,945 2,275,164 1.85 UPM-Kymmene OYJ 103,451 2,774,556 2.26
5,049,720 4.11
COMMUNICATIONS Deutsche Telekom AG 182,646 2,650,650 2.16 Nokia OYJ 211,242 1,121,061 0.91 NOS SGPS SA 171,349 897,869 0.73 Orange SA 202,469 2,715,615 2.21 Publicis Groupe SA 29,533 1,441,506 1.17 Telefonica SA 352,363 2,669,150 2.17
11,495,851 9.35
CONSUMER, CYCLICAL Cie Generale des Etablissements Michelin SCA 19,499 2,053,732 1.67 Coats Group Plc 1,695,635 1,745,654 1.42 easyJet Plc 81,352 1,179,729 0.96 JD Sports Fashion Plc 256,759 1,390,927 1.13 Next Plc 34,801 2,049,491 1.67 Renault SA 27,073 1,634,668 1.33 Ryanair Holdings Plc 130,606 1,612,331 1.31 Whitbread Plc 9,185 518,926 0.42
12,185,458 9.91
CONSUMER, NON-CYCLICAL Adecco Group AG 42,551 1,910,211 1.55 Babcock International Group Plc 198,730 1,222,690 0.99 Bayer AG 23,346 1,623,831 1.32 British American Tobacco Plc 43,024 1,378,928 1.12 Carlsberg A/S 15,296 1,630,239 1.33 Carrefour SA 153,707 2,775,180 2.26 Europcar Mobility Group 144A 177,471 1,360,315 1.11 Imperial Brands Plc 32,922 957,524 0.78 Koninklijke Ahold Delhaize NV 70,346 1,591,754 1.29 Novartis AG 51,389 4,126,351 3.36 Roche Holding AG 18,823 4,587,288 3.73 Sanofi 49,647 3,619,266 2.94 Tesco Plc 981,642 2,601,706 2.12
29,385,283 23.90
ENERGY BP Plc 530,040 3,290,110 2.68 Eni SpA 117,826 1,783,532 1.45 Equinor ASA 84,644 1,680,009 1.37 OMV AG 23,867 1,112,918 0.90 Repsol SA 96,243 1,452,066 1.18 Royal Dutch Shell Plc – A Shares 100,188 2,755,921 2.24 Subsea 7 SA 67,197 721,267 0.59 TOTAL SA 70,050 3,492,168 2.84
16,287,991 13.25
FINANCIAL Allianz SE 14,184 2,756,660 2.24 Aviva Plc 250,266 1,227,439 1.00 AXA SA 79,885 1,770,451 1.44 Banco BPM SpA 622,335 1,332,108 1.08 Bankia SA 473,840 1,260,178 1.02 Barclays Plc 1,341,449 2,571,182 2.09 BNP Paribas SA 54,759 2,454,025 2.00 CaixaBank SA 723,437 2,259,294 1.84 Chesnara Plc 296,378 1,221,691 0.99
Invesco Pan European Equity Income Fund Statement of Investments as at 28 February 2019
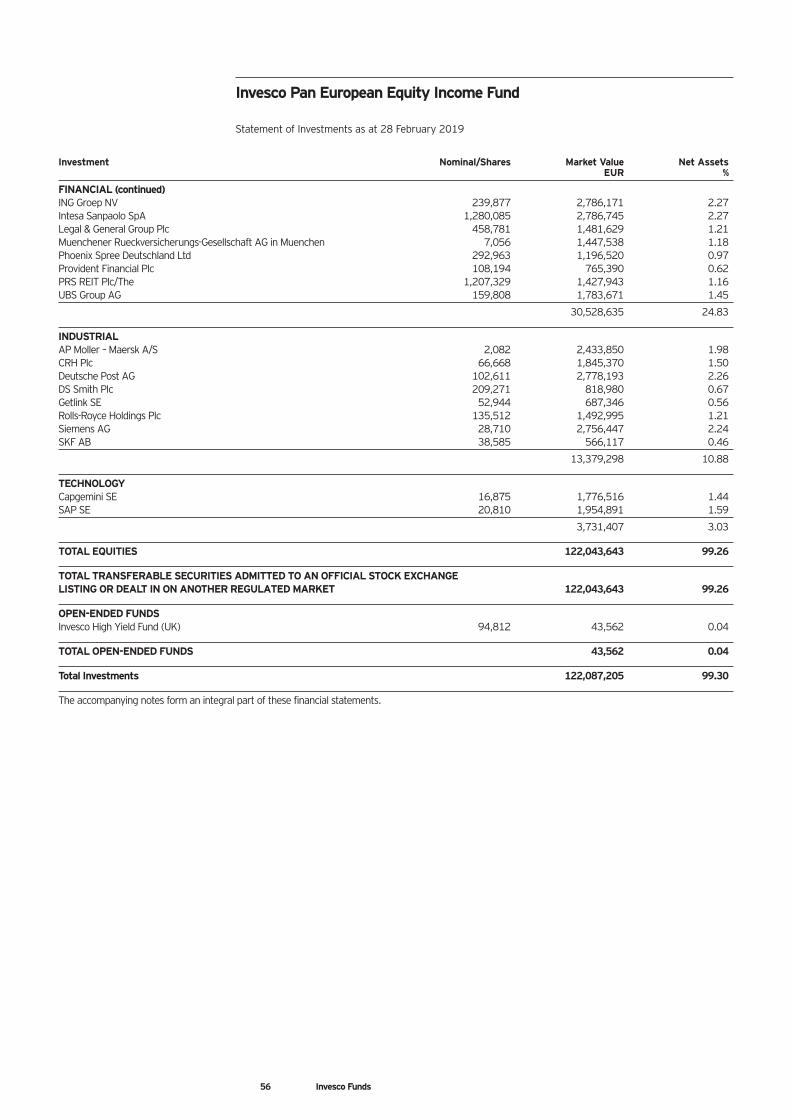
56 Invesco Funds
Investment Nominal/Shares Market Value Net Assets EUR %
FINANCIAL (continued) ING Groep NV 239,877 2,786,171 2.27 Intesa Sanpaolo SpA 1,280,085 2,786,745 2.27 Legal & General Group Plc 458,781 1,481,629 1.21 Muenchener Rueckversicherungs-Gesellschaft AG in Muenchen 7,056 1,447,538 1.18 Phoenix Spree Deutschland Ltd 292,963 1,196,520 0.97 Provident Financial Plc 108,194 765,390 0.62 PRS REIT Plc/The 1,207,329 1,427,943 1.16 UBS Group AG 159,808 1,783,671 1.45
30,528,635 24.83
INDUSTRIAL AP Moller – Maersk A/S 2,082 2,433,850 1.98 CRH Plc 66,668 1,845,370 1.50 Deutsche Post AG 102,611 2,778,193 2.26 DS Smith Plc 209,271 818,980 0.67 Getlink SE 52,944 687,346 0.56 Rolls-Royce Holdings Plc 135,512 1,492,995 1.21 Siemens AG 28,710 2,756,447 2.24 SKF AB 38,585 566,117 0.46
13,379,298 10.88
TECHNOLOGY Capgemini SE 16,875 1,776,516 1.44 SAP SE 20,810 1,954,891 1.59
3,731,407 3.03
TOTAL EQUITIES 122,043,643 99.26
TOTAL TRANSFERABLE SECURITIES ADMITTED TO AN OFFICIAL STOCK EXCHANGE LISTING OR DEALT IN ON ANOTHER REGULATED MARKET 122,043,643 99.26
OPEN-ENDED FUNDS Invesco High Yield Fund (UK) 94,812 43,562 0.04
TOTAL OPEN-ENDED FUNDS 43,562 0.04
Total Investments 122,087,205 99.30
The accompanying notes form an integral part of these financial statements.
Invesco Pan European Equity Income Fund Statement of Investments as at 28 February 2019
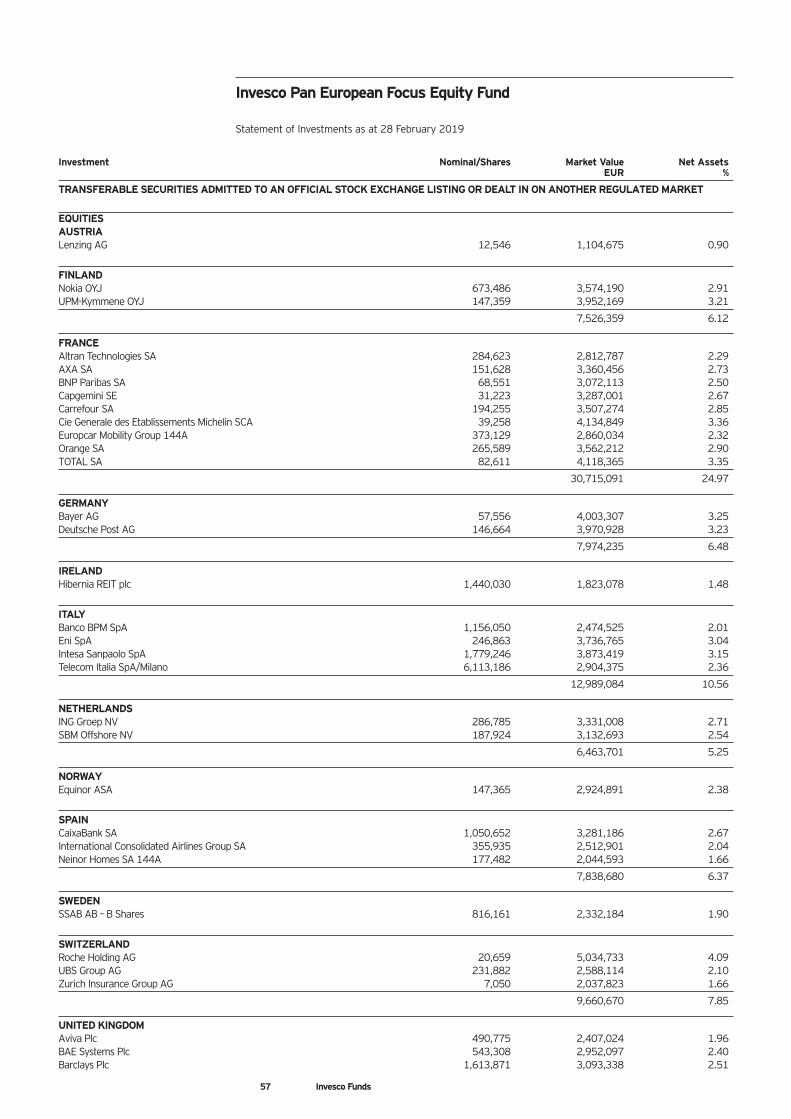
57 Invesco Funds
Investment Nominal/Shares Market Value Net Assets EUR %
TRANSFERABLE SECURITIES ADMITTED TO AN OFFICIAL STOCK EXCHANGE LISTING OR DEALT IN ON ANOTHER REGULATED MARKET EQUITIES AUSTRIA Lenzing AG 12,546 1,104,675 0.90
FINLAND Nokia OYJ 673,486 3,574,190 2.91 UPM-Kymmene OYJ 147,359 3,952,169 3.21
7,526,359 6.12
FRANCE Altran Technologies SA 284,623 2,812,787 2.29 AXA SA 151,628 3,360,456 2.73 BNP Paribas SA 68,551 3,072,113 2.50 Capgemini SE 31,223 3,287,001 2.67 Carrefour SA 194,255 3,507,274 2.85 Cie Generale des Etablissements Michelin SCA 39,258 4,134,849 3.36 Europcar Mobility Group 144A 373,129 2,860,034 2.32 Orange SA 265,589 3,562,212 2.90 TOTAL SA 82,611 4,118,365 3.35
30,715,091 24.97
GERMANY Bayer AG 57,556 4,003,307 3.25 Deutsche Post AG 146,664 3,970,928 3.23
7,974,235 6.48
IRELAND Hibernia REIT plc 1,440,030 1,823,078 1.48
ITALY Banco BPM SpA 1,156,050 2,474,525 2.01 Eni SpA 246,863 3,736,765 3.04 Intesa Sanpaolo SpA 1,779,246 3,873,419 3.15 Telecom Italia SpA/Milano 6,113,186 2,904,375 2.36
12,989,084 10.56
NETHERLANDS ING Groep NV 286,785 3,331,008 2.71 SBM Offshore NV 187,924 3,132,693 2.54
6,463,701 5.25
NORWAY Equinor ASA 147,365 2,924,891 2.38
SPAIN CaixaBank SA 1,050,652 3,281,186 2.67 International Consolidated Airlines Group SA 355,935 2,512,901 2.04 Neinor Homes SA 144A 177,482 2,044,593 1.66
7,838,680 6.37
SWEDEN SSAB AB – B Shares 816,161 2,332,184 1.90
SWITZERLAND Roche Holding AG 20,659 5,034,733 4.09 UBS Group AG 231,882 2,588,114 2.10 Zurich Insurance Group AG 7,050 2,037,823 1.66
9,660,670 7.85
UNITED KINGDOM Aviva Plc 490,775 2,407,024 1.96 BAE Systems Plc 543,308 2,952,097 2.40 Barclays Plc 1,613,871 3,093,338 2.51
Invesco Pan European Focus Equity Fund Statement of Investments as at 28 February 2019
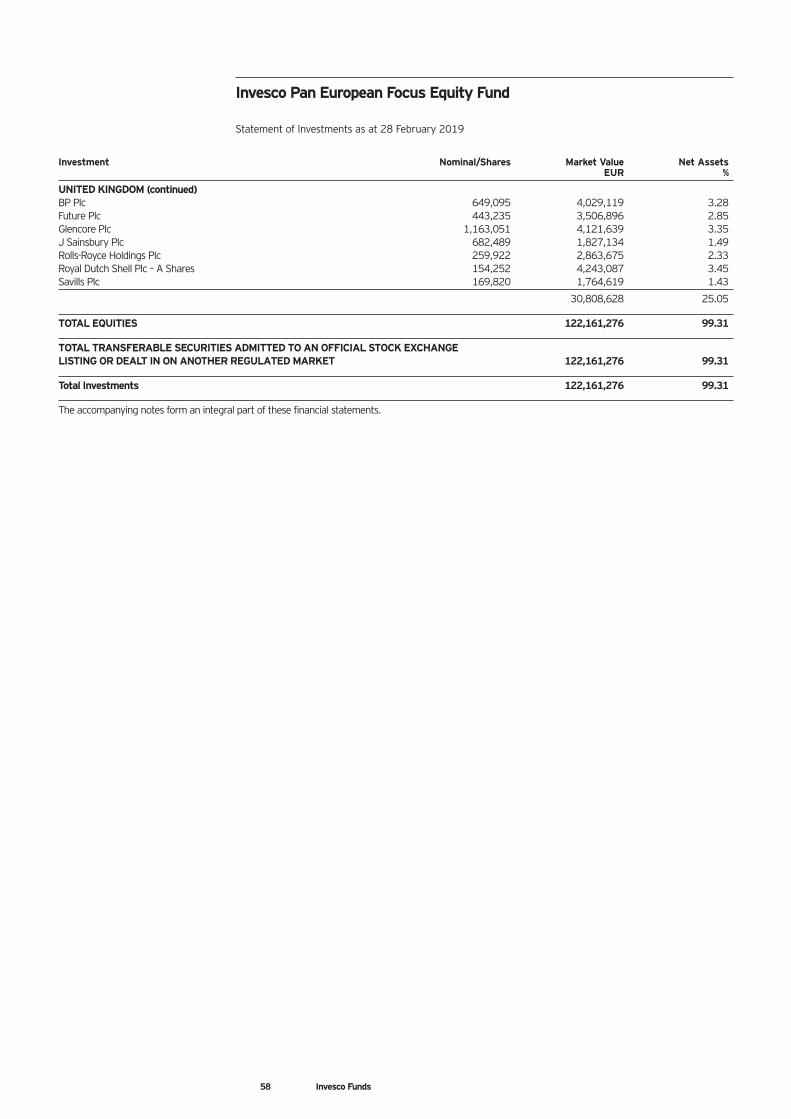
58 Invesco Funds
Investment Nominal/Shares Market Value Net Assets EUR %
UNITED KINGDOM (continued) BP Plc 649,095 4,029,119 3.28 Future Plc 443,235 3,506,896 2.85 Glencore Plc 1,163,051 4,121,639 3.35 J Sainsbury Plc 682,489 1,827,134 1.49 Rolls-Royce Holdings Plc 259,922 2,863,675 2.33 Royal Dutch Shell Plc – A Shares 154,252 4,243,087 3.45 Savills Plc 169,820 1,764,619 1.43
30,808,628 25.05
TOTAL EQUITIES 122,161,276 99.31
TOTAL TRANSFERABLE SECURITIES ADMITTED TO AN OFFICIAL STOCK EXCHANGE LISTING OR DEALT IN ON ANOTHER REGULATED MARKET 122,161,276 99.31
Total Investments 122,161,276 99.31
The accompanying notes form an integral part of these financial statements.
Invesco Pan European Focus Equity Fund Statement of Investments as at 28 February 2019
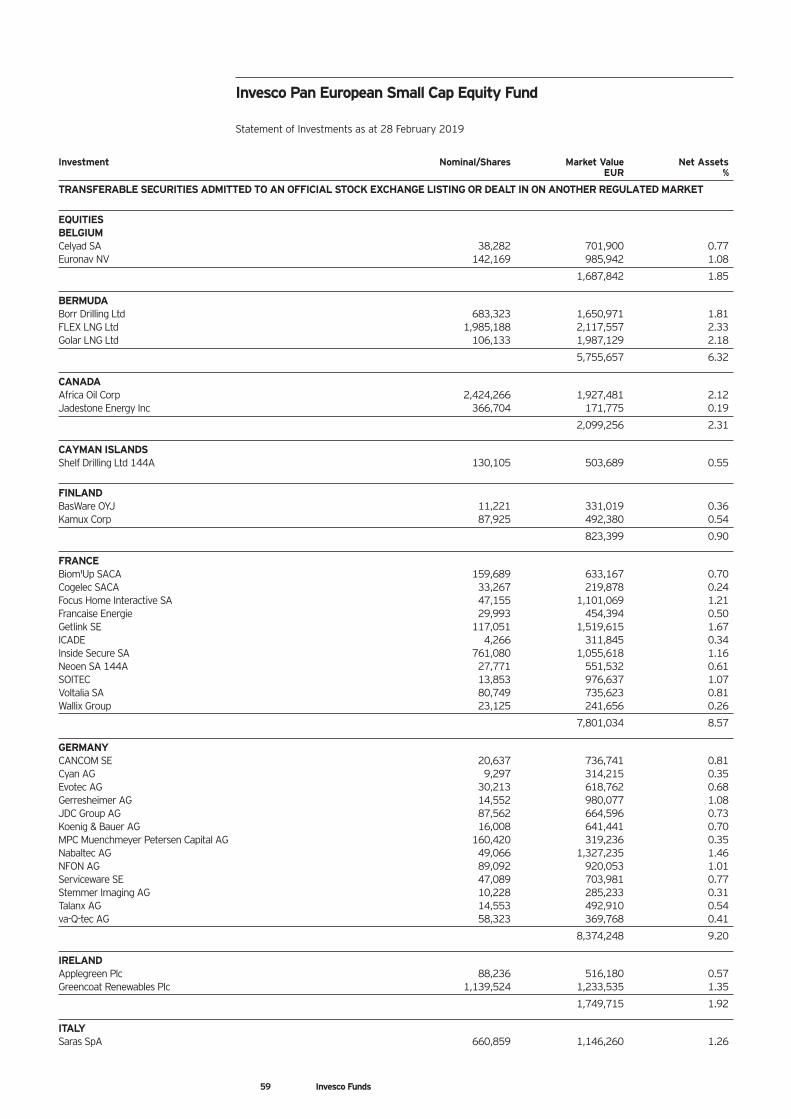
59 Invesco Funds
Investment Nominal/Shares Market Value Net Assets EUR %
TRANSFERABLE SECURITIES ADMITTED TO AN OFFICIAL STOCK EXCHANGE LISTING OR DEALT IN ON ANOTHER REGULATED MARKET
EQUITIES BELGIUM Celyad SA 38,282 701,900 0.77 Euronav NV 142,169 985,942 1.08
1,687,842 1.85
BERMUDA Borr Drilling Ltd 683,323 1,650,971 1.81 FLEX LNG Ltd 1,985,188 2,117,557 2.33 Golar LNG Ltd 106,133 1,987,129 2.18
5,755,657 6.32
CANADA Africa Oil Corp 2,424,266 1,927,481 2.12 Jadestone Energy Inc 366,704 171,775 0.19
2,099,256 2.31
CAYMAN ISLANDS Shelf Drilling Ltd 144A 130,105 503,689 0.55
FINLAND BasWare OYJ 11,221 331,019 0.36 Kamux Corp 87,925 492,380 0.54
823,399 0.90
FRANCE Biom'Up SACA 159,689 633,167 0.70 Cogelec SACA 33,267 219,878 0.24 Focus Home Interactive SA 47,155 1,101,069 1.21 Francaise Energie 29,993 454,394 0.50 Getlink SE 117,051 1,519,615 1.67 ICADE 4,266 311,845 0.34 Inside Secure SA 761,080 1,055,618 1.16 Neoen SA 144A 27,771 551,532 0.61 SOITEC 13,853 976,637 1.07 Voltalia SA 80,749 735,623 0.81 Wallix Group 23,125 241,656 0.26
7,801,034 8.57
GERMANY CANCOM SE 20,637 736,741 0.81 Cyan AG 9,297 314,215 0.35 Evotec AG 30,213 618,762 0.68 Gerresheimer AG 14,552 980,077 1.08 JDC Group AG 87,562 664,596 0.73 Koenig & Bauer AG 16,008 641,441 0.70 MPC Muenchmeyer Petersen Capital AG 160,420 319,236 0.35 Nabaltec AG 49,066 1,327,235 1.46 NFON AG 89,092 920,053 1.01 Serviceware SE 47,089 703,981 0.77 Stemmer Imaging AG 10,228 285,233 0.31 Talanx AG 14,553 492,910 0.54 va-Q-tec AG 58,323 369,768 0.41
8,374,248 9.20
IRELAND Applegreen Plc 88,236 516,180 0.57 Greencoat Renewables Plc 1,139,524 1,233,535 1.35
1,749,715 1.92
ITALY Saras SpA 660,859 1,146,260 1.26
Invesco Pan European Small Cap Equity Fund Statement of Investments as at 28 February 2019
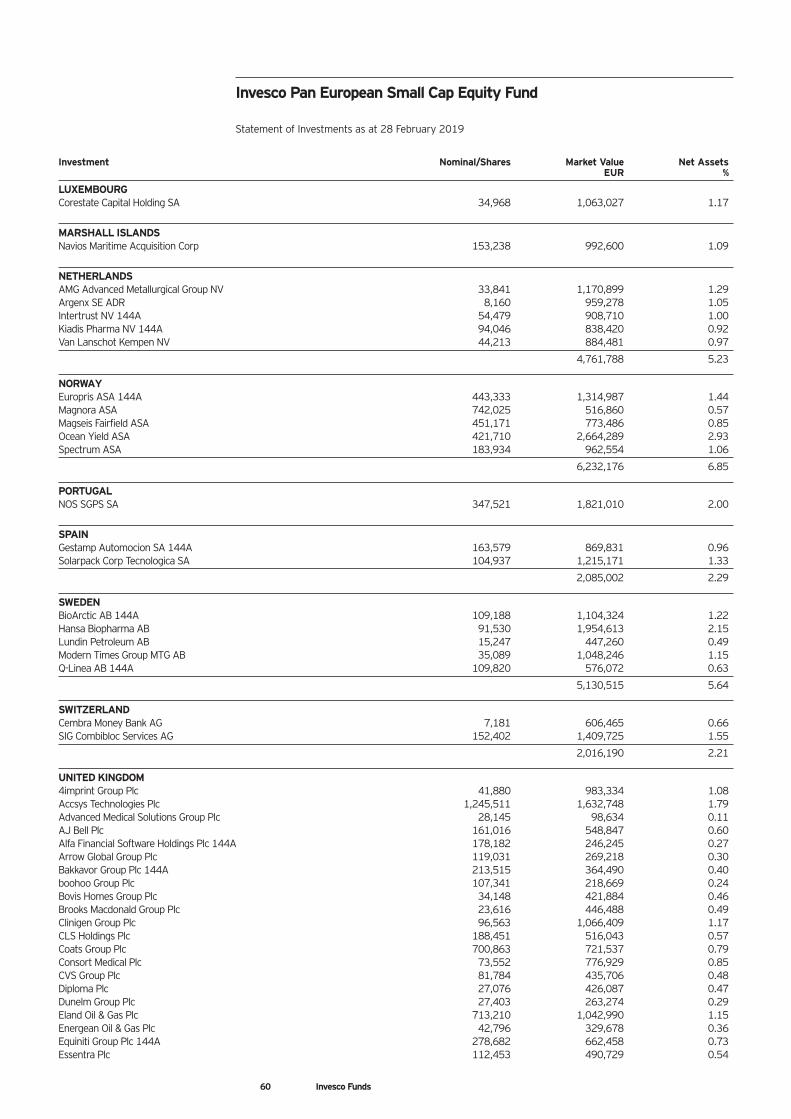
60 Invesco Funds
Investment Nominal/Shares Market Value Net Assets EUR %
LUXEMBOURG Corestate Capital Holding SA 34,968 1,063,027 1.17
MARSHALL ISLANDS Navios Maritime Acquisition Corp 153,238 992,600 1.09
NETHERLANDS AMG Advanced Metallurgical Group NV 33,841 1,170,899 1.29 Argenx SE ADR 8,160 959,278 1.05 Intertrust NV 144A 54,479 908,710 1.00 Kiadis Pharma NV 144A 94,046 838,420 0.92 Van Lanschot Kempen NV 44,213 884,481 0.97
4,761,788 5.23
NORWAY Europris ASA 144A 443,333 1,314,987 1.44 Magnora ASA 742,025 516,860 0.57 Magseis Fairfield ASA 451,171 773,486 0.85 Ocean Yield ASA 421,710 2,664,289 2.93 Spectrum ASA 183,934 962,554 1.06
6,232,176 6.85
PORTUGAL NOS SGPS SA 347,521 1,821,010 2.00
SPAIN Gestamp Automocion SA 144A 163,579 869,831 0.96 Solarpack Corp Tecnologica SA 104,937 1,215,171 1.33
2,085,002 2.29
SWEDEN BioArctic AB 144A 109,188 1,104,324 1.22 Hansa Biopharma AB 91,530 1,954,613 2.15 Lundin Petroleum AB 15,247 447,260 0.49 Modern Times Group MTG AB 35,089 1,048,246 1.15 Q-Linea AB 144A 109,820 576,072 0.63
5,130,515 5.64
SWITZERLAND Cembra Money Bank AG 7,181 606,465 0.66 SIG Combibloc Services AG 152,402 1,409,725 1.55
2,016,190 2.21
UNITED KINGDOM 4imprint Group Plc 41,880 983,334 1.08 Accsys Technologies Plc 1,245,511 1,632,748 1.79 Advanced Medical Solutions Group Plc 28,145 98,634 0.11 AJ Bell Plc 161,016 548,847 0.60 Alfa Financial Software Holdings Plc 144A 178,182 246,245 0.27 Arrow Global Group Plc 119,031 269,218 0.30 Bakkavor Group Plc 144A 213,515 364,490 0.40 boohoo Group Plc 107,341 218,669 0.24 Bovis Homes Group Plc 34,148 421,884 0.46 Brooks Macdonald Group Plc 23,616 446,488 0.49 Clinigen Group Plc 96,563 1,066,409 1.17 CLS Holdings Plc 188,451 516,043 0.57 Coats Group Plc 700,863 721,537 0.79 Consort Medical Plc 73,552 776,929 0.85 CVS Group Plc 81,784 435,706 0.48 Diploma Plc 27,076 426,087 0.47 Dunelm Group Plc 27,403 263,274 0.29 Eland Oil & Gas Plc 713,210 1,042,990 1.15 Energean Oil & Gas Plc 42,796 329,678 0.36 Equiniti Group Plc 144A 278,682 662,458 0.73 Essentra Plc 112,453 490,729 0.54
Invesco Pan European Small Cap Equity Fund Statement of Investments as at 28 February 2019
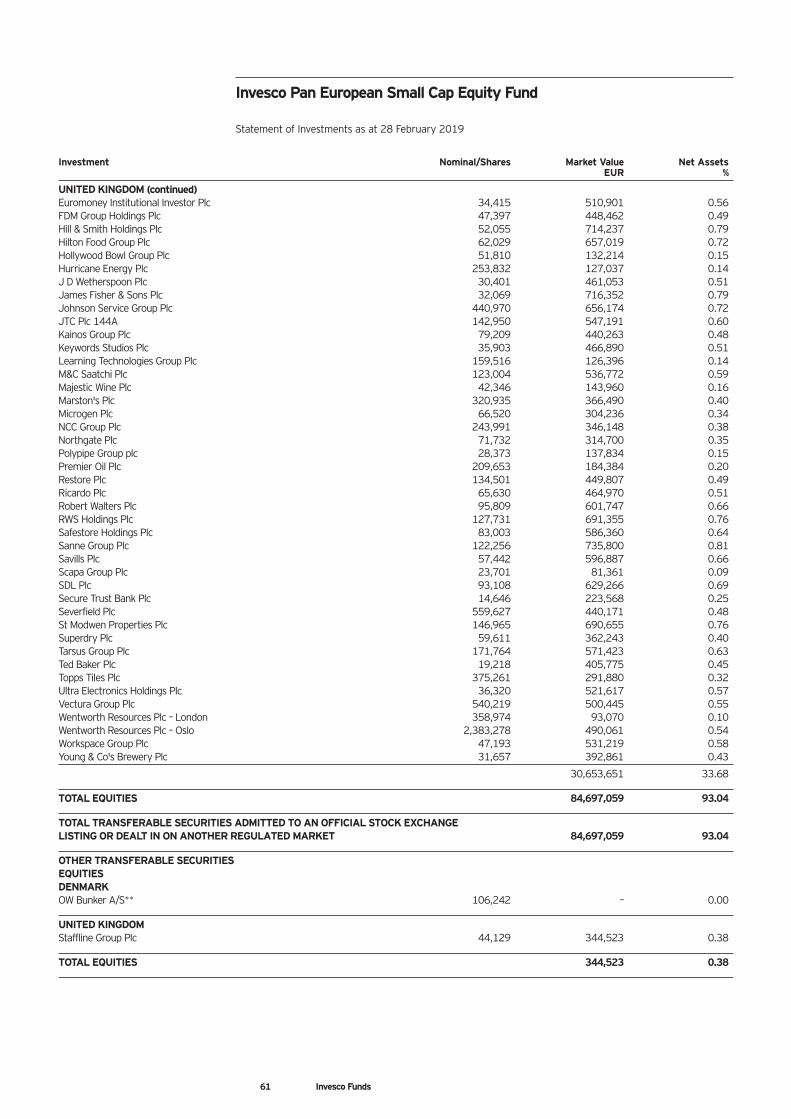
Investment Nominal/Shares Market Value Net Assets EUR %
UNITED KINGDOM (continued) Euromoney Institutional Investor Plc 34,415 510,901 0.56 FDM Group Holdings Plc 47,397 448,462 0.49 Hill & Smith Holdings Plc 52,055 714,237 0.79 Hilton Food Group Plc 62,029 657,019 0.72 Hollywood Bowl Group Plc 51,810 132,214 0.15 Hurricane Energy Plc 253,832 127,037 0.14 J D Wetherspoon Plc 30,401 461,053 0.51 James Fisher & Sons Plc 32,069 716,352 0.79 Johnson Service Group Plc 440,970 656,174 0.72 JTC Plc 144A 142,950 547,191 0.60 Kainos Group Plc 79,209 440,263 0.48 Keywords Studios Plc 35,903 466,890 0.51 Learning Technologies Group Plc 159,516 126,396 0.14 M&C Saatchi Plc 123,004 536,772 0.59 Majestic Wine Plc 42,346 143,960 0.16 Marston's Plc 320,935 366,490 0.40 Microgen Plc 66,520 304,236 0.34 NCC Group Plc 243,991 346,148 0.38 Northgate Plc 71,732 314,700 0.35 Polypipe Group plc 28,373 137,834 0.15 Premier Oil Plc 209,653 184,384 0.20 Restore Plc 134,501 449,807 0.49 Ricardo Plc 65,630 464,970 0.51 Robert Walters Plc 95,809 601,747 0.66 RWS Holdings Plc 127,731 691,355 0.76 Safestore Holdings Plc 83,003 586,360 0.64 Sanne Group Plc 122,256 735,800 0.81 Savills Plc 57,442 596,887 0.66 Scapa Group Plc 23,701 81,361 0.09 SDL Plc 93,108 629,266 0.69 Secure Trust Bank Plc 14,646 223,568 0.25 Severfield Plc 559,627 440,171 0.48 St Modwen Properties Plc 146,965 690,655 0.76 Superdry Plc 59,611 362,243 0.40 Tarsus Group Plc 171,764 571,423 0.63 Ted Baker Plc 19,218 405,775 0.45 Topps Tiles Plc 375,261 291,880 0.32 Ultra Electronics Holdings Plc 36,320 521,617 0.57 Vectura Group Plc 540,219 500,445 0.55 Wentworth Resources Plc – London 358,974 93,070 0.10 Wentworth Resources Plc – Oslo 2,383,278 490,061 0.54 Workspace Group Plc 47,193 531,219 0.58 Young & Co's Brewery Plc 31,657 392,861 0.43
30,653,651 33.68
TOTAL EQUITIES 84,697,059 93.04
TOTAL TRANSFERABLE SECURITIES ADMITTED TO AN OFFICIAL STOCK EXCHANGE LISTING OR DEALT IN ON ANOTHER REGULATED MARKET 84,697,059 93.04
OTHER TRANSFERABLE SECURITIES EQUITIES DENMARK OW Bunker A/S** 106,242 – 0.00
UNITED KINGDOM Staffline Group Plc 44,129 344,523 0.38
TOTAL EQUITIES 344,523 0.38
Invesco Pan European Small Cap Equity Fund Statement of Investments as at 28 February 2019
61 Invesco Funds
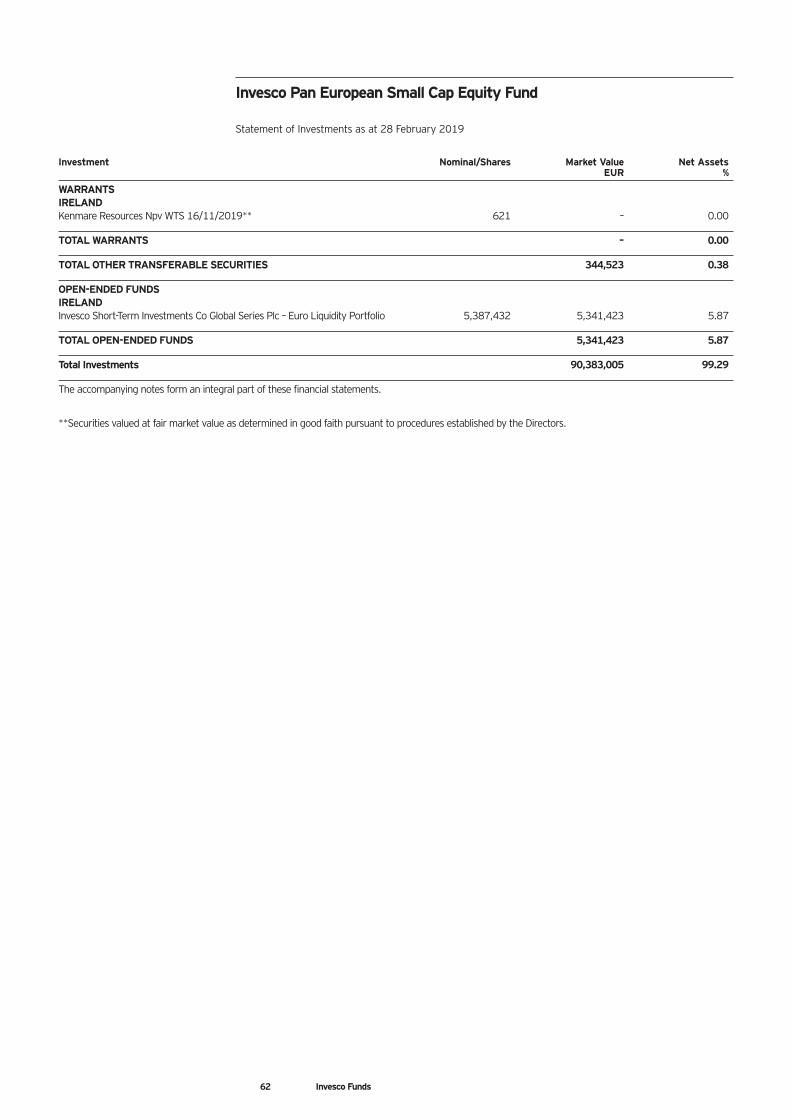
Investment Nominal/Shares Market Value Net Assets EUR %
WARRANTS IRELAND Kenmare Resources Npv WTS 16/11/2019** 621 – 0.00
TOTAL WARRANTS – 0.00
TOTAL OTHER TRANSFERABLE SECURITIES 344,523 0.38
OPEN-ENDED FUNDS IRELAND Invesco Short-Term Investments Co Global Series Plc – Euro Liquidity Portfolio 5,387,432 5,341,423 5.87
TOTAL OPEN-ENDED FUNDS 5,341,423 5.87
Total Investments 90,383,005 99.29
The accompanying notes form an integral part of these financial statements.
**Securities valued at fair market value as determined in good faith pursuant to procedures established by the Directors.
Invesco Pan European Small Cap Equity Fund Statement of Investments as at 28 February 2019
62 Invesco Funds
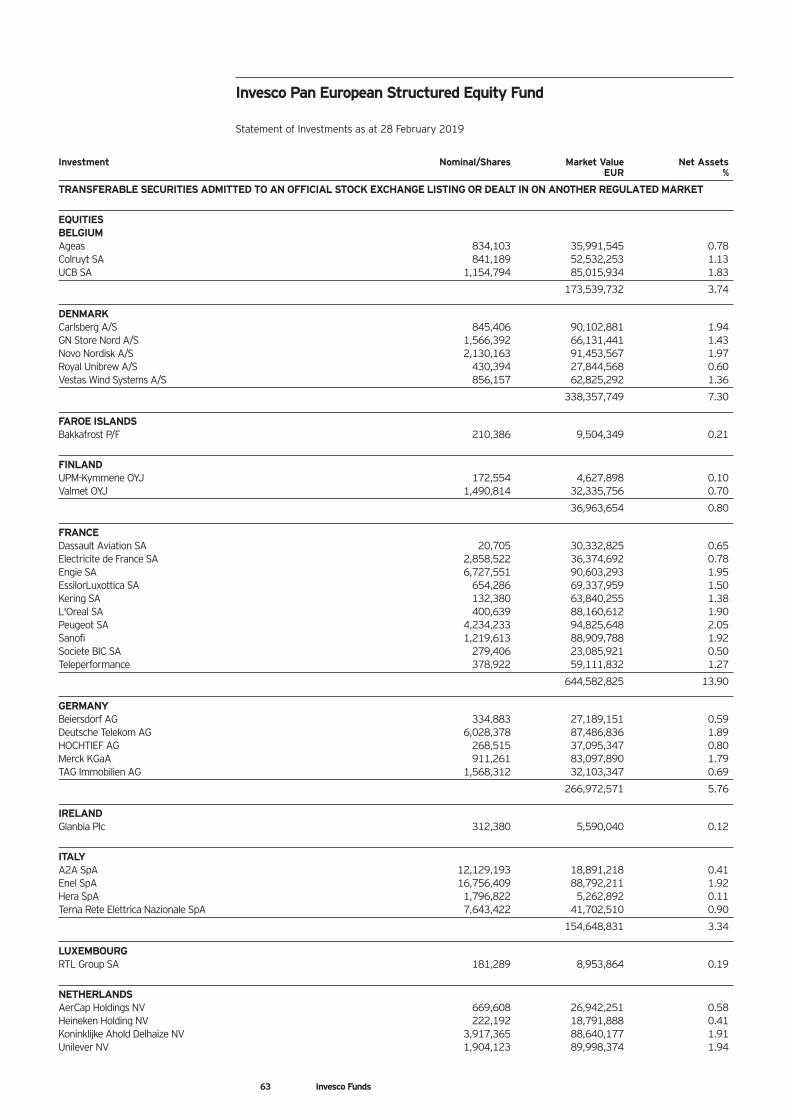
63 Invesco Funds
Investment Nominal/Shares Market Value Net Assets EUR %
TRANSFERABLE SECURITIES ADMITTED TO AN OFFICIAL STOCK EXCHANGE LISTING OR DEALT IN ON ANOTHER REGULATED MARKET
EQUITIES BELGIUM Ageas 834,103 35,991,545 0.78 Colruyt SA 841,189 52,532,253 1.13 UCB SA 1,154,794 85,015,934 1.83
173,539,732 3.74
DENMARK Carlsberg A/S 845,406 90,102,881 1.94 GN Store Nord A/S 1,566,392 66,131,441 1.43 Novo Nordisk A/S 2,130,163 91,453,567 1.97 Royal Unibrew A/S 430,394 27,844,568 0.60 Vestas Wind Systems A/S 856,157 62,825,292 1.36
338,357,749 7.30
FAROE ISLANDS Bakkafrost P/F 210,386 9,504,349 0.21
FINLAND UPM-Kymmene OYJ 172,554 4,627,898 0.10 Valmet OYJ 1,490,814 32,335,756 0.70
36,963,654 0.80
FRANCE Dassault Aviation SA 20,705 30,332,825 0.65 Electricite de France SA 2,858,522 36,374,692 0.78 Engie SA 6,727,551 90,603,293 1.95 EssilorLuxottica SA 654,286 69,337,959 1.50 Kering SA 132,380 63,840,255 1.38 L'Oreal SA 400,639 88,160,612 1.90 Peugeot SA 4,234,233 94,825,648 2.05 Sanofi 1,219,613 88,909,788 1.92 Societe BIC SA 279,406 23,085,921 0.50 Teleperformance 378,922 59,111,832 1.27
644,582,825 13.90
GERMANY Beiersdorf AG 334,883 27,189,151 0.59 Deutsche Telekom AG 6,028,378 87,486,836 1.89 HOCHTIEF AG 268,515 37,095,347 0.80 Merck KGaA 911,261 83,097,890 1.79 TAG Immobilien AG 1,568,312 32,103,347 0.69
266,972,571 5.76
IRELAND Glanbia Plc 312,380 5,590,040 0.12
ITALY A2A SpA 12,129,193 18,891,218 0.41 Enel SpA 16,756,409 88,792,211 1.92 Hera SpA 1,796,822 5,262,892 0.11 Terna Rete Elettrica Nazionale SpA 7,643,422 41,702,510 0.90
154,648,831 3.34
LUXEMBOURG RTL Group SA 181,289 8,953,864 0.19
NETHERLANDS AerCap Holdings NV 669,608 26,942,251 0.58 Heineken Holding NV 222,192 18,791,888 0.41 Koninklijke Ahold Delhaize NV 3,917,365 88,640,177 1.91 Unilever NV 1,904,123 89,998,374 1.94
Invesco Pan European Structured Equity Fund Statement of Investments as at 28 February 2019
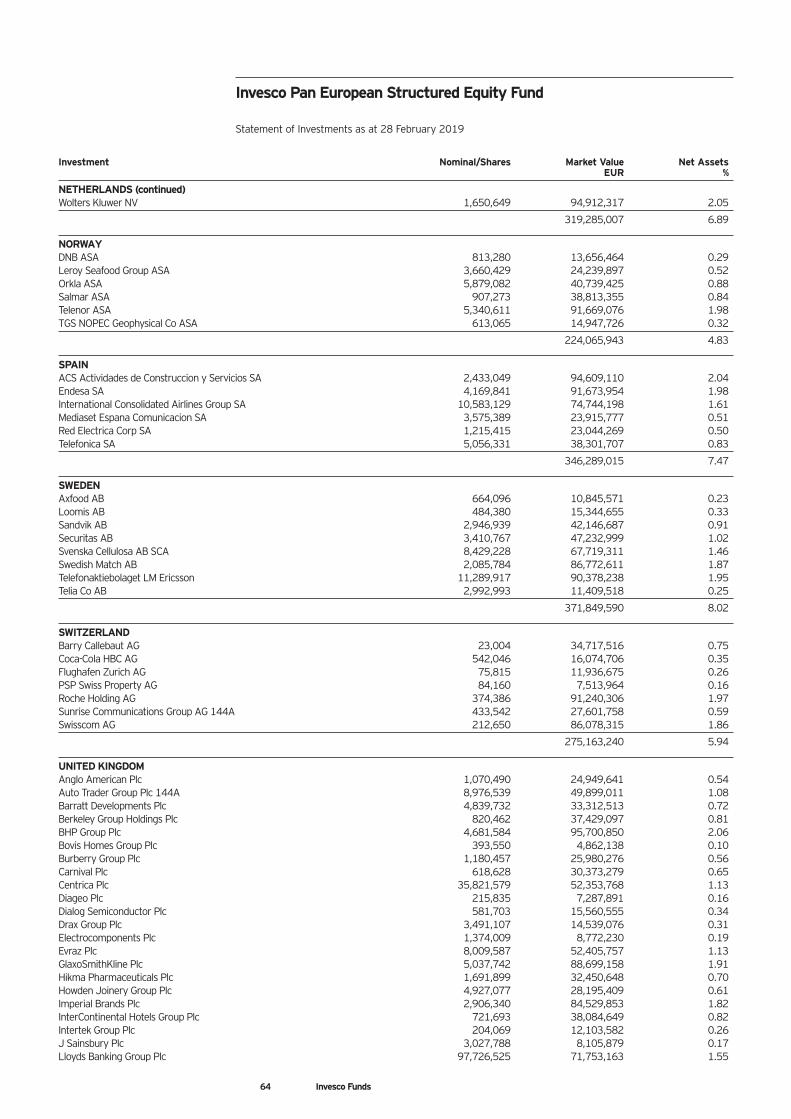
64 Invesco Funds
Investment Nominal/Shares Market Value Net Assets EUR %
NETHERLANDS (continued) Wolters Kluwer NV 1,650,649 94,912,317 2.05
319,285,007 6.89
NORWAY DNB ASA 813,280 13,656,464 0.29 Leroy Seafood Group ASA 3,660,429 24,239,897 0.52 Orkla ASA 5,879,082 40,739,425 0.88 Salmar ASA 907,273 38,813,355 0.84 Telenor ASA 5,340,611 91,669,076 1.98 TGS NOPEC Geophysical Co ASA 613,065 14,947,726 0.32
224,065,943 4.83
SPAIN ACS Actividades de Construccion y Servicios SA 2,433,049 94,609,110 2.04 Endesa SA 4,169,841 91,673,954 1.98 International Consolidated Airlines Group SA 10,583,129 74,744,198 1.61 Mediaset Espana Comunicacion SA 3,575,389 23,915,777 0.51 Red Electrica Corp SA 1,215,415 23,044,269 0.50 Telefonica SA 5,056,331 38,301,707 0.83
346,289,015 7.47
SWEDEN Axfood AB 664,096 10,845,571 0.23 Loomis AB 484,380 15,344,655 0.33 Sandvik AB 2,946,939 42,146,687 0.91 Securitas AB 3,410,767 47,232,999 1.02 Svenska Cellulosa AB SCA 8,429,228 67,719,311 1.46 Swedish Match AB 2,085,784 86,772,611 1.87 Telefonaktiebolaget LM Ericsson 11,289,917 90,378,238 1.95 Telia Co AB 2,992,993 11,409,518 0.25
371,849,590 8.02
SWITZERLAND Barry Callebaut AG 23,004 34,717,516 0.75 Coca-Cola HBC AG 542,046 16,074,706 0.35 Flughafen Zurich AG 75,815 11,936,675 0.26 PSP Swiss Property AG 84,160 7,513,964 0.16 Roche Holding AG 374,386 91,240,306 1.97 Sunrise Communications Group AG 144A 433,542 27,601,758 0.59 Swisscom AG 212,650 86,078,315 1.86
275,163,240 5.94
UNITED KINGDOM Anglo American Plc 1,070,490 24,949,641 0.54 Auto Trader Group Plc 144A 8,976,539 49,899,011 1.08 Barratt Developments Plc 4,839,732 33,312,513 0.72 Berkeley Group Holdings Plc 820,462 37,429,097 0.81 BHP Group Plc 4,681,584 95,700,850 2.06 Bovis Homes Group Plc 393,550 4,862,138 0.10 Burberry Group Plc 1,180,457 25,980,276 0.56 Carnival Plc 618,628 30,373,279 0.65 Centrica Plc 35,821,579 52,353,768 1.13 Diageo Plc 215,835 7,287,891 0.16 Dialog Semiconductor Plc 581,703 15,560,555 0.34 Drax Group Plc 3,491,107 14,539,076 0.31 Electrocomponents Plc 1,374,009 8,772,230 0.19 Evraz Plc 8,009,587 52,405,757 1.13 GlaxoSmithKline Plc 5,037,742 88,699,158 1.91 Hikma Pharmaceuticals Plc 1,691,899 32,450,648 0.70 Howden Joinery Group Plc 4,927,077 28,195,409 0.61 Imperial Brands Plc 2,906,340 84,529,853 1.82 InterContinental Hotels Group Plc 721,693 38,084,649 0.82 Intertek Group Plc 204,069 12,103,582 0.26 J Sainsbury Plc 3,027,788 8,105,879 0.17 Lloyds Banking Group Plc 97,726,525 71,753,163 1.55
Invesco Pan European Structured Equity Fund Statement of Investments as at 28 February 2019
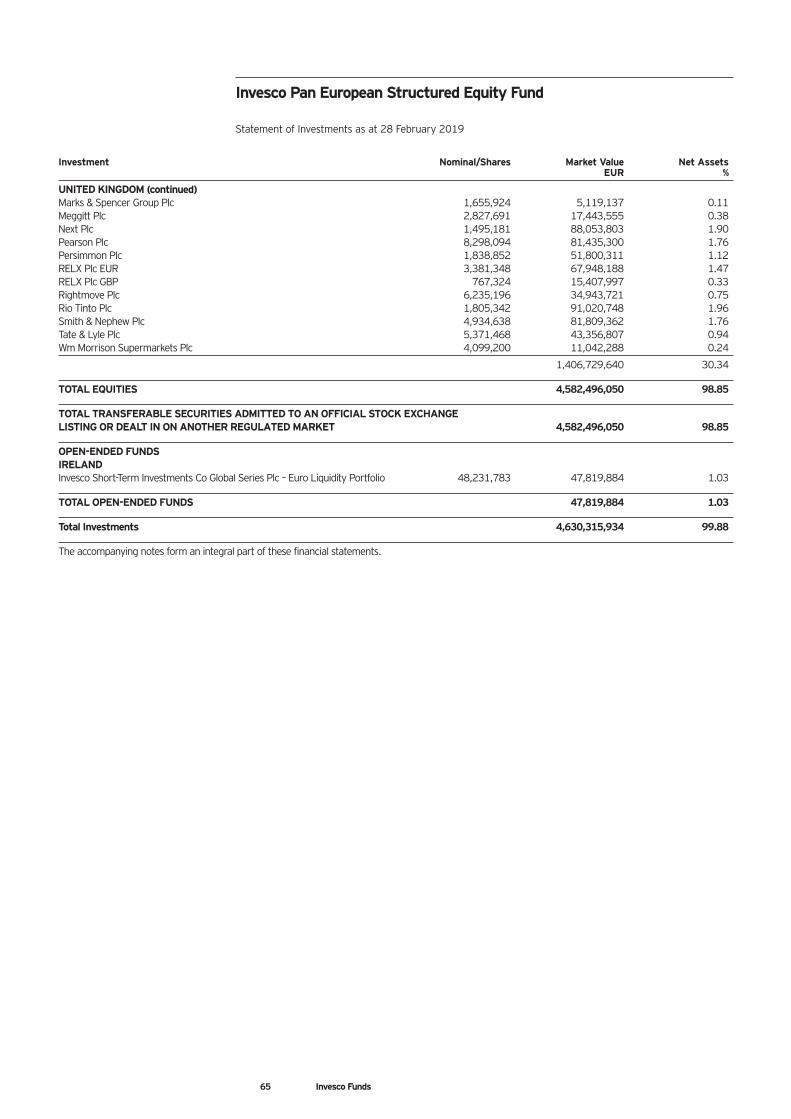
Investment Nominal/Shares Market Value Net Assets EUR %
UNITED KINGDOM (continued) Marks & Spencer Group Plc 1,655,924 5,119,137 0.11 Meggitt Plc 2,827,691 17,443,555 0.38 Next Plc 1,495,181 88,053,803 1.90 Pearson Plc 8,298,094 81,435,300 1.76 Persimmon Plc 1,838,852 51,800,311 1.12 RELX Plc EUR 3,381,348 67,948,188 1.47 RELX Plc GBP 767,324 15,407,997 0.33 Rightmove Plc 6,235,196 34,943,721 0.75 Rio Tinto Plc 1,805,342 91,020,748 1.96 Smith & Nephew Plc 4,934,638 81,809,362 1.76 Tate & Lyle Plc 5,371,468 43,356,807 0.94 Wm Morrison Supermarkets Plc 4,099,200 11,042,288 0.24
1,406,729,640 30.34
TOTAL EQUITIES 4,582,496,050 98.85
TOTAL TRANSFERABLE SECURITIES ADMITTED TO AN OFFICIAL STOCK EXCHANGE LISTING OR DEALT IN ON ANOTHER REGULATED MARKET 4,582,496,050 98.85
OPEN-ENDED FUNDS IRELAND Invesco Short-Term Investments Co Global Series Plc – Euro Liquidity Portfolio 48,231,783 47,819,884 1.03
TOTAL OPEN-ENDED FUNDS 47,819,884 1.03
Total Investments 4,630,315,934 99.88
The accompanying notes form an integral part of these financial statements.
Invesco Pan European Structured Equity Fund Statement of Investments as at 28 February 2019
65 Invesco Funds
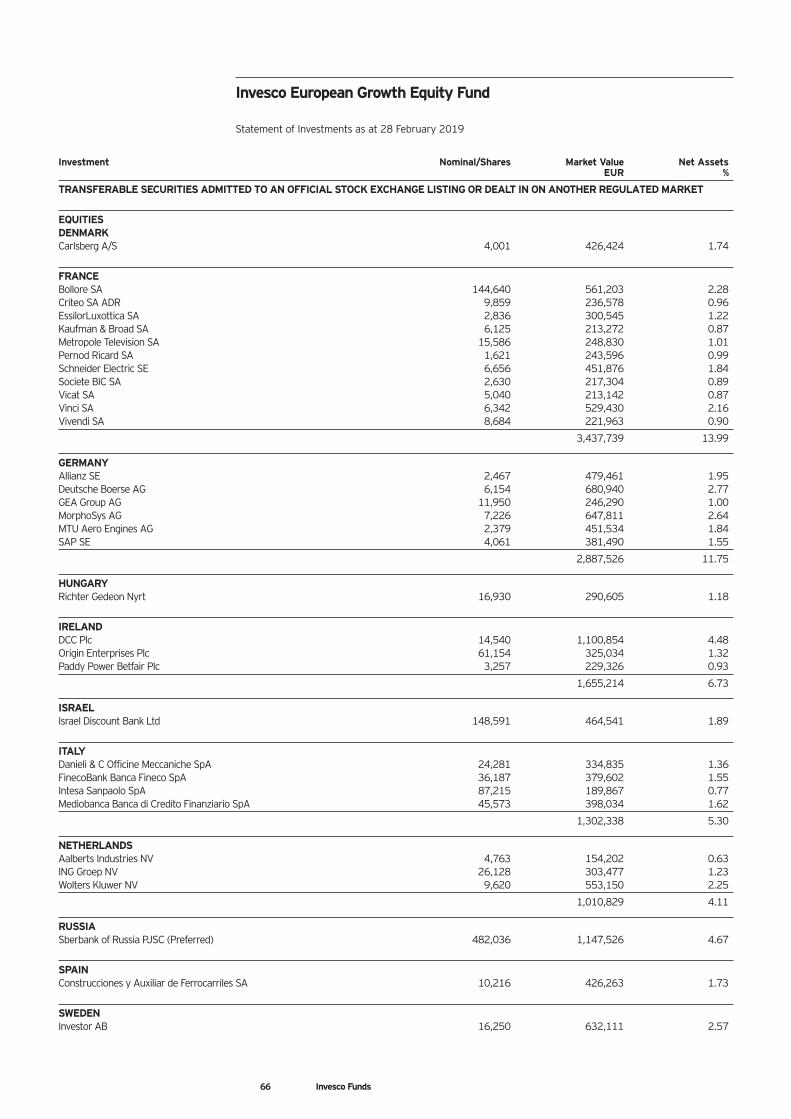
66 Invesco Funds
Investment Nominal/Shares Market Value Net Assets EUR %
TRANSFERABLE SECURITIES ADMITTED TO AN OFFICIAL STOCK EXCHANGE LISTING OR DEALT IN ON ANOTHER REGULATED MARKET
EQUITIES DENMARK Carlsberg A/S 4,001 426,424 1.74
FRANCE Bollore SA 144,640 561,203 2.28 Criteo SA ADR 9,859 236,578 0.96 EssilorLuxottica SA 2,836 300,545 1.22 Kaufman & Broad SA 6,125 213,272 0.87 Metropole Television SA 15,586 248,830 1.01 Pernod Ricard SA 1,621 243,596 0.99 Schneider Electric SE 6,656 451,876 1.84 Societe BIC SA 2,630 217,304 0.89 Vicat SA 5,040 213,142 0.87 Vinci SA 6,342 529,430 2.16 Vivendi SA 8,684 221,963 0.90
3,437,739 13.99
GERMANY Allianz SE 2,467 479,461 1.95 Deutsche Boerse AG 6,154 680,940 2.77 GEA Group AG 11,950 246,290 1.00 MorphoSys AG 7,226 647,811 2.64 MTU Aero Engines AG 2,379 451,534 1.84 SAP SE 4,061 381,490 1.55
2,887,526 11.75
HUNGARY Richter Gedeon Nyrt 16,930 290,605 1.18
IRELAND DCC Plc 14,540 1,100,854 4.48 Origin Enterprises Plc 61,154 325,034 1.32 Paddy Power Betfair Plc 3,257 229,326 0.93
1,655,214 6.73
ISRAEL Israel Discount Bank Ltd 148,591 464,541 1.89
ITALY Danieli & C Officine Meccaniche SpA 24,281 334,835 1.36 FinecoBank Banca Fineco SpA 36,187 379,602 1.55 Intesa Sanpaolo SpA 87,215 189,867 0.77 Mediobanca Banca di Credito Finanziario SpA 45,573 398,034 1.62
1,302,338 5.30
NETHERLANDS Aalberts Industries NV 4,763 154,202 0.63 ING Groep NV 26,128 303,477 1.23 Wolters Kluwer NV 9,620 553,150 2.25
1,010,829 4.11
RUSSIA Sberbank of Russia PJSC (Preferred) 482,036 1,147,526 4.67
SPAIN Construcciones y Auxiliar de Ferrocarriles SA 10,216 426,263 1.73
SWEDEN Investor AB 16,250 632,111 2.57
Invesco European Growth Equity Fund Statement of Investments as at 28 February 2019
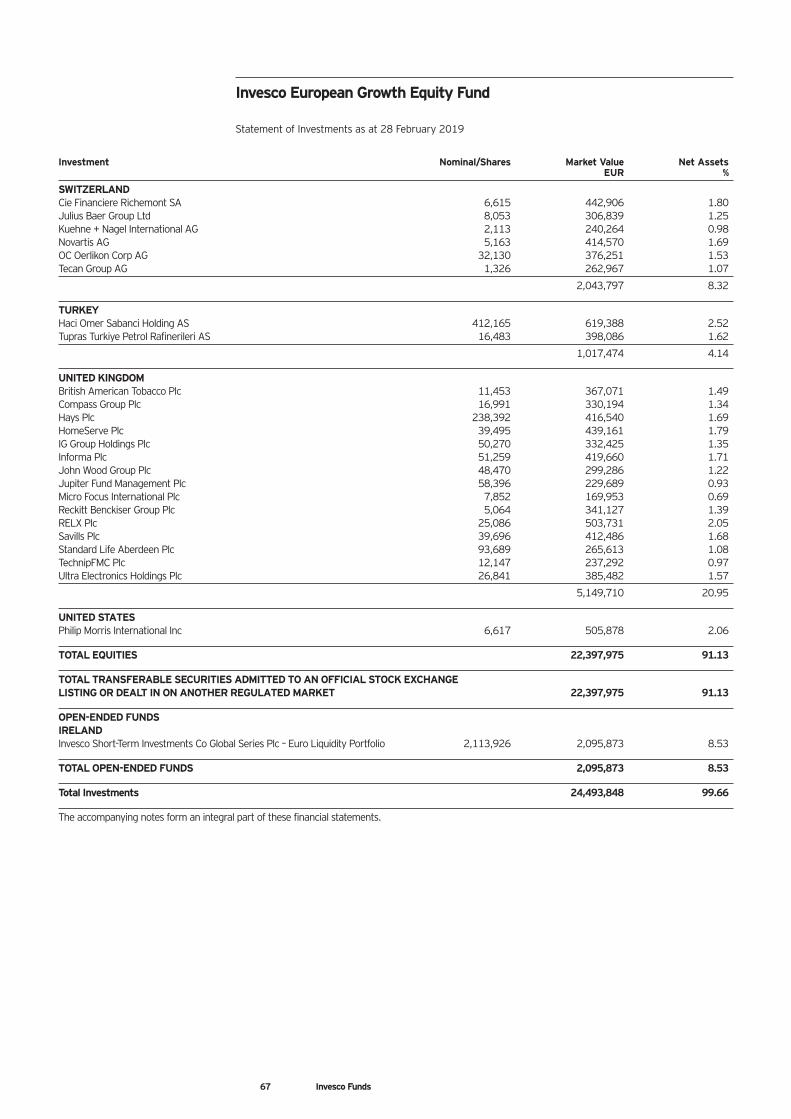
67 Invesco Funds
Investment Nominal/Shares Market Value Net Assets EUR %
SWITZERLAND Cie Financiere Richemont SA 6,615 442,906 1.80 Julius Baer Group Ltd 8,053 306,839 1.25 Kuehne + Nagel International AG 2,113 240,264 0.98 Novartis AG 5,163 414,570 1.69 OC Oerlikon Corp AG 32,130 376,251 1.53 Tecan Group AG 1,326 262,967 1.07
2,043,797 8.32
TURKEY Haci Omer Sabanci Holding AS 412,165 619,388 2.52 Tupras Turkiye Petrol Rafinerileri AS 16,483 398,086 1.62
1,017,474 4.14
UNITED KINGDOM British American Tobacco Plc 11,453 367,071 1.49 Compass Group Plc 16,991 330,194 1.34 Hays Plc 238,392 416,540 1.69 HomeServe Plc 39,495 439,161 1.79 IG Group Holdings Plc 50,270 332,425 1.35 Informa Plc 51,259 419,660 1.71 John Wood Group Plc 48,470 299,286 1.22 Jupiter Fund Management Plc 58,396 229,689 0.93 Micro Focus International Plc 7,852 169,953 0.69 Reckitt Benckiser Group Plc 5,064 341,127 1.39 RELX Plc 25,086 503,731 2.05 Savills Plc 39,696 412,486 1.68 Standard Life Aberdeen Plc 93,689 265,613 1.08 TechnipFMC Plc 12,147 237,292 0.97 Ultra Electronics Holdings Plc 26,841 385,482 1.57
5,149,710 20.95
UNITED STATES Philip Morris International Inc 6,617 505,878 2.06
TOTAL EQUITIES 22,397,975 91.13
TOTAL TRANSFERABLE SECURITIES ADMITTED TO AN OFFICIAL STOCK EXCHANGE LISTING OR DEALT IN ON ANOTHER REGULATED MARKET 22,397,975 91.13
OPEN-ENDED FUNDS IRELAND Invesco Short-Term Investments Co Global Series Plc – Euro Liquidity Portfolio 2,113,926 2,095,873 8.53
TOTAL OPEN-ENDED FUNDS 2,095,873 8.53
Total Investments 24,493,848 99.66
The accompanying notes form an integral part of these financial statements.
Invesco European Growth Equity Fund Statement of Investments as at 28 February 2019
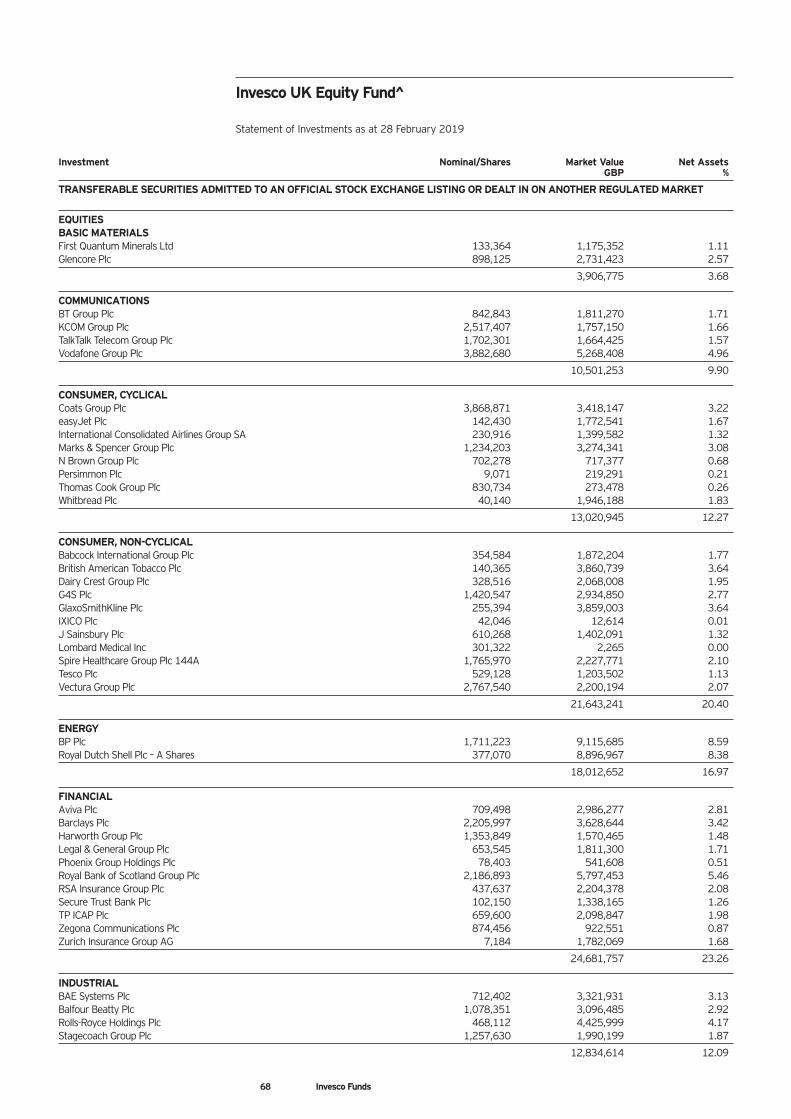
68 Invesco Funds
Investment Nominal/Shares Market Value Net Assets GBP %
TRANSFERABLE SECURITIES ADMITTED TO AN OFFICIAL STOCK EXCHANGE LISTING OR DEALT IN ON ANOTHER REGULATED MARKET
EQUITIES BASIC MATERIALS First Quantum Minerals Ltd 133,364 1,175,352 1.11 Glencore Plc 898,125 2,731,423 2.57
3,906,775 3.68
COMMUNICATIONS BT Group Plc 842,843 1,811,270 1.71 KCOM Group Plc 2,517,407 1,757,150 1.66 TalkTalk Telecom Group Plc 1,702,301 1,664,425 1.57 Vodafone Group Plc 3,882,680 5,268,408 4.96
10,501,253 9.90
CONSUMER, CYCLICAL Coats Group Plc 3,868,871 3,418,147 3.22 easyJet Plc 142,430 1,772,541 1.67 International Consolidated Airlines Group SA 230,916 1,399,582 1.32 Marks & Spencer Group Plc 1,234,203 3,274,341 3.08 N Brown Group Plc 702,278 717,377 0.68 Persimmon Plc 9,071 219,291 0.21 Thomas Cook Group Plc 830,734 273,478 0.26 Whitbread Plc 40,140 1,946,188 1.83
13,020,945 12.27
CONSUMER, NON-CYCLICAL Babcock International Group Plc 354,584 1,872,204 1.77 British American Tobacco Plc 140,365 3,860,739 3.64 Dairy Crest Group Plc 328,516 2,068,008 1.95 G4S Plc 1,420,547 2,934,850 2.77 GlaxoSmithKline Plc 255,394 3,859,003 3.64 IXICO Plc 42,046 12,614 0.01 J Sainsbury Plc 610,268 1,402,091 1.32 Lombard Medical Inc 301,322 2,265 0.00 Spire Healthcare Group Plc 144A 1,765,970 2,227,771 2.10 Tesco Plc 529,128 1,203,502 1.13 Vectura Group Plc 2,767,540 2,200,194 2.07
21,643,241 20.40
ENERGY BP Plc 1,711,223 9,115,685 8.59 Royal Dutch Shell Plc – A Shares 377,070 8,896,967 8.38
18,012,652 16.97
FINANCIAL Aviva Plc 709,498 2,986,277 2.81 Barclays Plc 2,205,997 3,628,644 3.42 Harworth Group Plc 1,353,849 1,570,465 1.48 Legal & General Group Plc 653,545 1,811,300 1.71 Phoenix Group Holdings Plc 78,403 541,608 0.51 Royal Bank of Scotland Group Plc 2,186,893 5,797,453 5.46 RSA Insurance Group Plc 437,637 2,204,378 2.08 Secure Trust Bank Plc 102,150 1,338,165 1.26 TP ICAP Plc 659,600 2,098,847 1.98 Zegona Communications Plc 874,456 922,551 0.87 Zurich Insurance Group AG 7,184 1,782,069 1.68
24,681,757 23.26
INDUSTRIAL BAE Systems Plc 712,402 3,321,931 3.13 Balfour Beatty Plc 1,078,351 3,096,485 2.92 Rolls-Royce Holdings Plc 468,112 4,425,999 4.17 Stagecoach Group Plc 1,257,630 1,990,199 1.87
12,834,614 12.09
Invesco UK Equity Fund^ Statement of Investments as at 28 February 2019
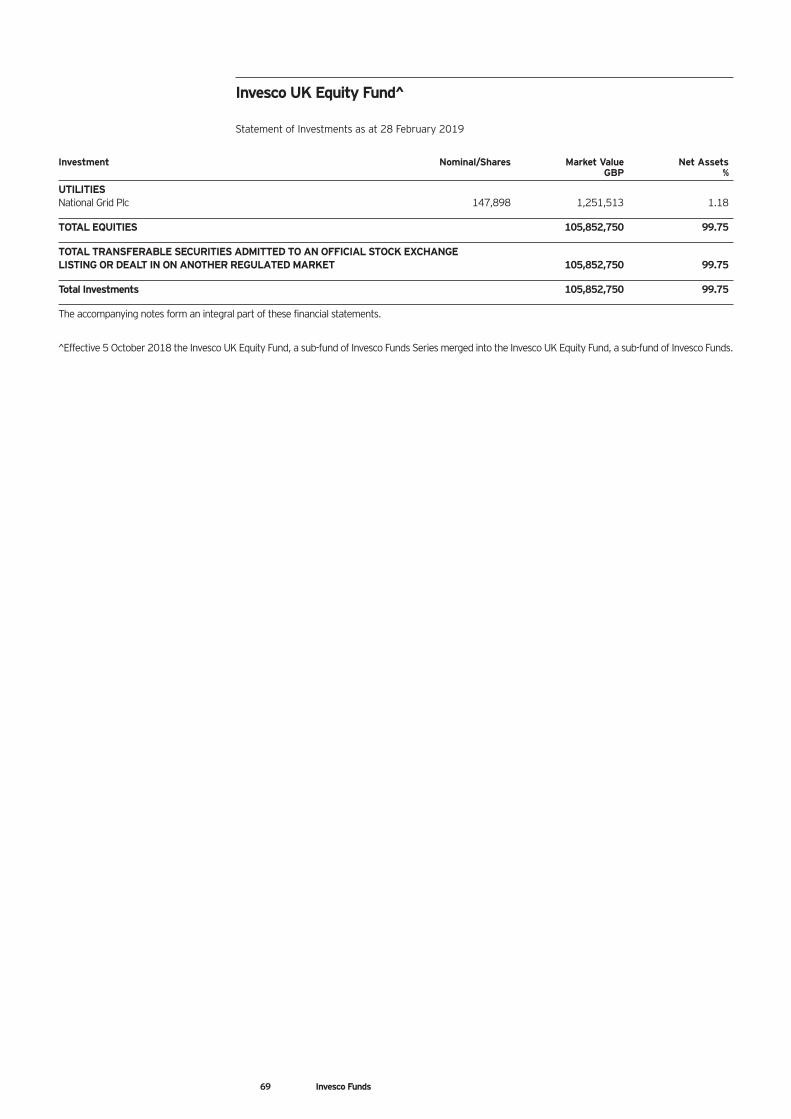
Investment Nominal/Shares Market Value Net Assets GBP %
UTILITIES National Grid Plc 147,898 1,251,513 1.18
TOTAL EQUITIES 105,852,750 99.75
TOTAL TRANSFERABLE SECURITIES ADMITTED TO AN OFFICIAL STOCK EXCHANGE LISTING OR DEALT IN ON ANOTHER REGULATED MARKET 105,852,750 99.75
Total Investments 105,852,750 99.75
The accompanying notes form an integral part of these financial statements.
^Effective 5 October 2018 the Invesco UK Equity Fund, a sub-fund of Invesco Funds Series merged into the Invesco UK Equity Fund, a sub-fund of Invesco Funds.
Invesco UK Equity Fund^ Statement of Investments as at 28 February 2019
69 Invesco Funds
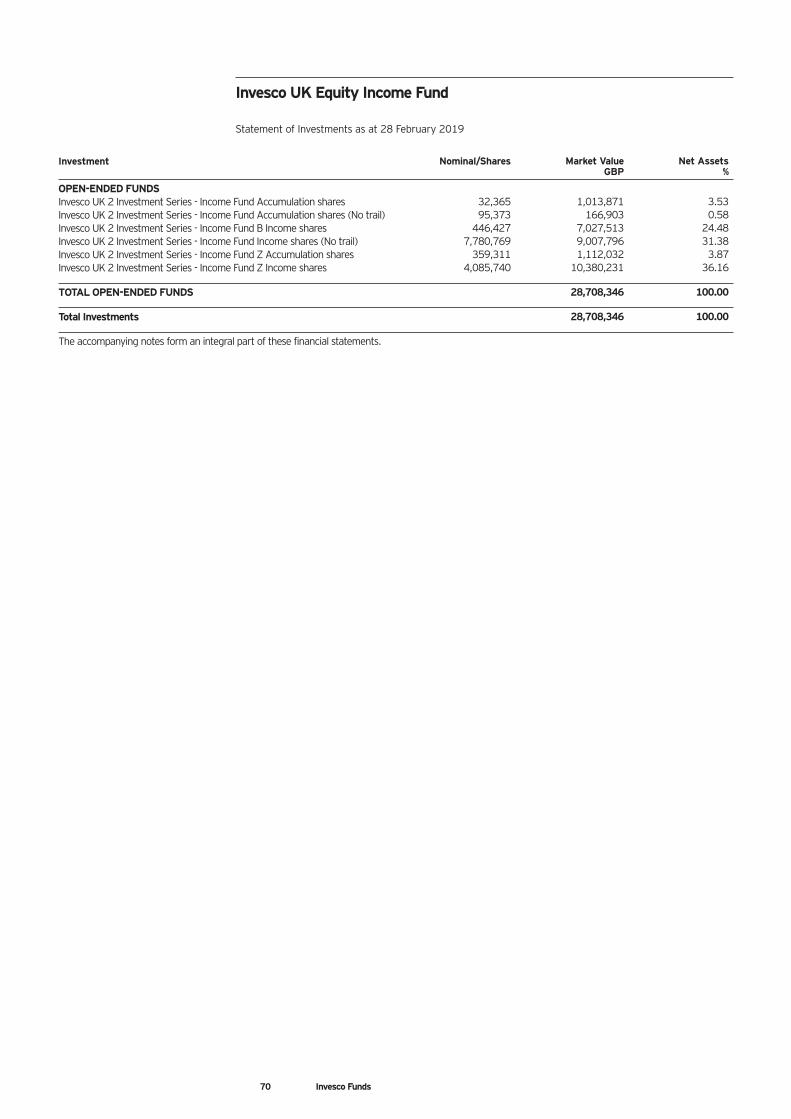
Investment Nominal/Shares Market Value Net Assets GBP %
OPEN-ENDED FUNDS Invesco UK 2 Investment Series - Income Fund Accumulation shares 32,365 1,013,871 3.53 Invesco UK 2 Investment Series - Income Fund Accumulation shares (No trail) 95,373 166,903 0.58 Invesco UK 2 Investment Series - Income Fund B Income shares 446,427 7,027,513 24.48 Invesco UK 2 Investment Series - Income Fund Income shares (No trail) 7,780,769 9,007,796 31.38 Invesco UK 2 Investment Series - Income Fund Z Accumulation shares 359,311 1,112,032 3.87 Invesco UK 2 Investment Series - Income Fund Z Income shares 4,085,740 10,380,231 36.16
TOTAL OPEN-ENDED FUNDS 28,708,346 100.00
Total Investments 28,708,346 100.00
The accompanying notes form an integral part of these financial statements.
70 Invesco Funds
Invesco UK Equity Income Fund Statement of Investments as at 28 February 2019
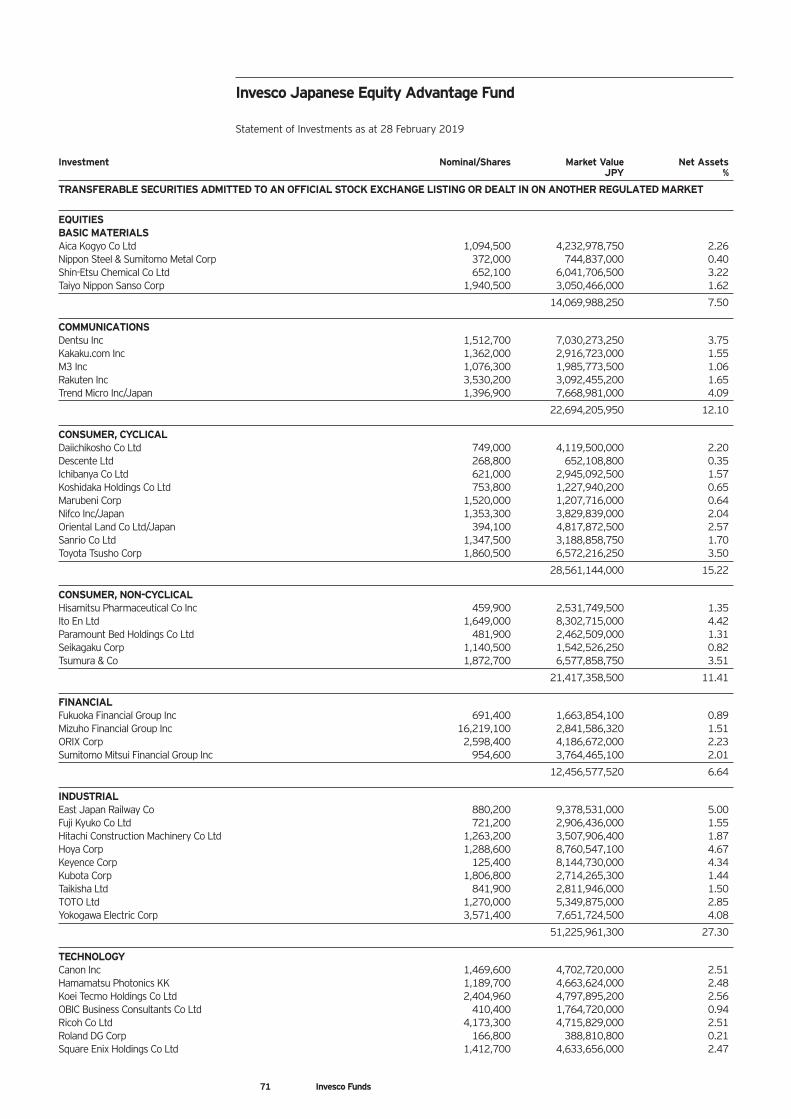
Investment Nominal/Shares Market Value Net Assets JPY %
TRANSFERABLE SECURITIES ADMITTED TO AN OFFICIAL STOCK EXCHANGE LISTING OR DEALT IN ON ANOTHER REGULATED MARKET
EQUITIES BASIC MATERIALS Aica Kogyo Co Ltd 1,094,500 4,232,978,750 2.26 Nippon Steel & Sumitomo Metal Corp 372,000 744,837,000 0.40 Shin-Etsu Chemical Co Ltd 652,100 6,041,706,500 3.22 Taiyo Nippon Sanso Corp 1,940,500 3,050,466,000 1.62
14,069,988,250 7.50
COMMUNICATIONS Dentsu Inc 1,512,700 7,030,273,250 3.75 Kakaku.com Inc 1,362,000 2,916,723,000 1.55 M3 Inc 1,076,300 1,985,773,500 1.06 Rakuten Inc 3,530,200 3,092,455,200 1.65 Trend Micro Inc/Japan 1,396,900 7,668,981,000 4.09
22,694,205,950 12.10
CONSUMER, CYCLICAL Daiichikosho Co Ltd 749,000 4,119,500,000 2.20 Descente Ltd 268,800 652,108,800 0.35 Ichibanya Co Ltd 621,000 2,945,092,500 1.57 Koshidaka Holdings Co Ltd 753,800 1,227,940,200 0.65 Marubeni Corp 1,520,000 1,207,716,000 0.64 Nifco Inc/Japan 1,353,300 3,829,839,000 2.04 Oriental Land Co Ltd/Japan 394,100 4,817,872,500 2.57 Sanrio Co Ltd 1,347,500 3,188,858,750 1.70 Toyota Tsusho Corp 1,860,500 6,572,216,250 3.50
28,561,144,000 15.22
CONSUMER, NON-CYCLICAL Hisamitsu Pharmaceutical Co Inc 459,900 2,531,749,500 1.35 Ito En Ltd 1,649,000 8,302,715,000 4.42 Paramount Bed Holdings Co Ltd 481,900 2,462,509,000 1.31 Seikagaku Corp 1,140,500 1,542,526,250 0.82 Tsumura & Co 1,872,700 6,577,858,750 3.51
21,417,358,500 11.41
FINANCIAL Fukuoka Financial Group Inc 691,400 1,663,854,100 0.89 Mizuho Financial Group Inc 16,219,100 2,841,586,320 1.51 ORIX Corp 2,598,400 4,186,672,000 2.23 Sumitomo Mitsui Financial Group Inc 954,600 3,764,465,100 2.01
12,456,577,520 6.64
INDUSTRIAL East Japan Railway Co 880,200 9,378,531,000 5.00 Fuji Kyuko Co Ltd 721,200 2,906,436,000 1.55 Hitachi Construction Machinery Co Ltd 1,263,200 3,507,906,400 1.87 Hoya Corp 1,288,600 8,760,547,100 4.67 Keyence Corp 125,400 8,144,730,000 4.34 Kubota Corp 1,806,800 2,714,265,300 1.44 Taikisha Ltd 841,900 2,811,946,000 1.50 TOTO Ltd 1,270,000 5,349,875,000 2.85 Yokogawa Electric Corp 3,571,400 7,651,724,500 4.08
51,225,961,300 27.30
TECHNOLOGY Canon Inc 1,469,600 4,702,720,000 2.51 Hamamatsu Photonics KK 1,189,700 4,663,624,000 2.48 Koei Tecmo Holdings Co Ltd 2,404,960 4,797,895,200 2.56 OBIC Business Consultants Co Ltd 410,400 1,764,720,000 0.94 Ricoh Co Ltd 4,173,300 4,715,829,000 2.51 Roland DG Corp 166,800 388,810,800 0.21 Square Enix Holdings Co Ltd 1,412,700 4,633,656,000 2.47
71 Invesco Funds
Invesco Japanese Equity Advantage Fund Statement of Investments as at 28 February 2019
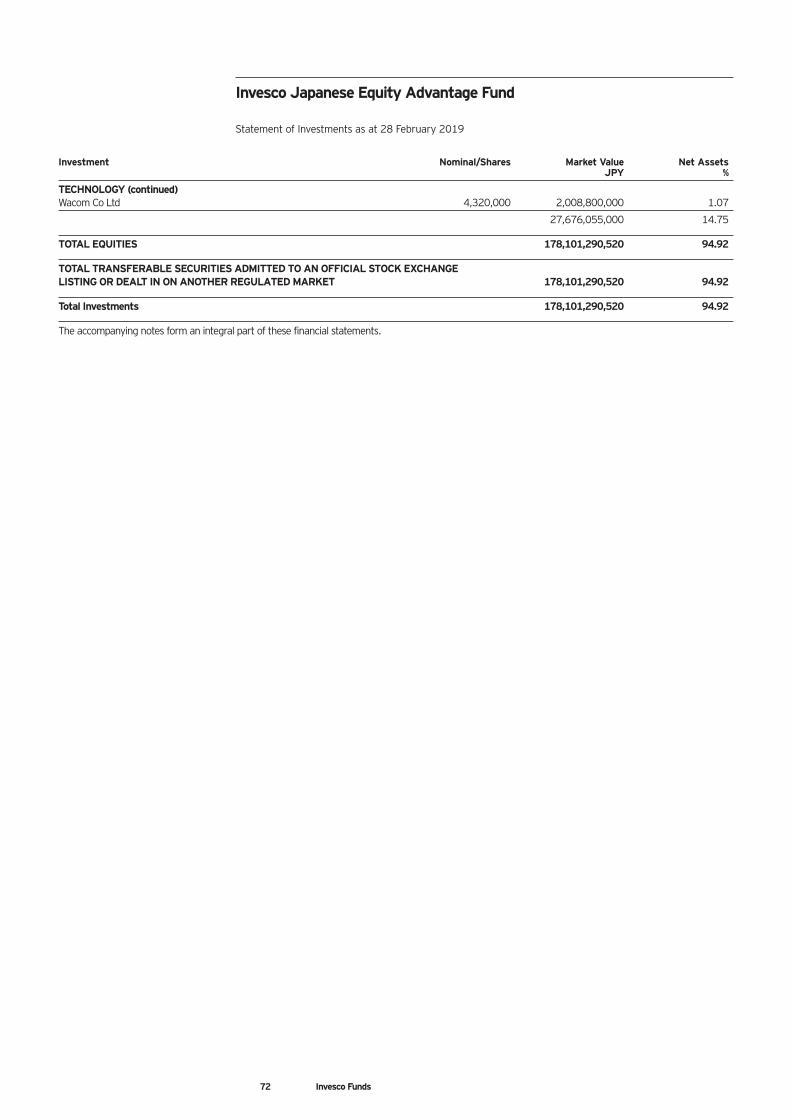
72 Invesco Funds
Investment Nominal/Shares Market Value Net Assets JPY %
TECHNOLOGY (continued) Wacom Co Ltd 4,320,000 2,008,800,000 1.07
27,676,055,000 14.75
TOTAL EQUITIES 178,101,290,520 94.92
TOTAL TRANSFERABLE SECURITIES ADMITTED TO AN OFFICIAL STOCK EXCHANGE LISTING OR DEALT IN ON ANOTHER REGULATED MARKET 178,101,290,520 94.92
Total Investments 178,101,290,520 94.92
The accompanying notes form an integral part of these financial statements.
Invesco Japanese Equity Advantage Fund Statement of Investments as at 28 February 2019
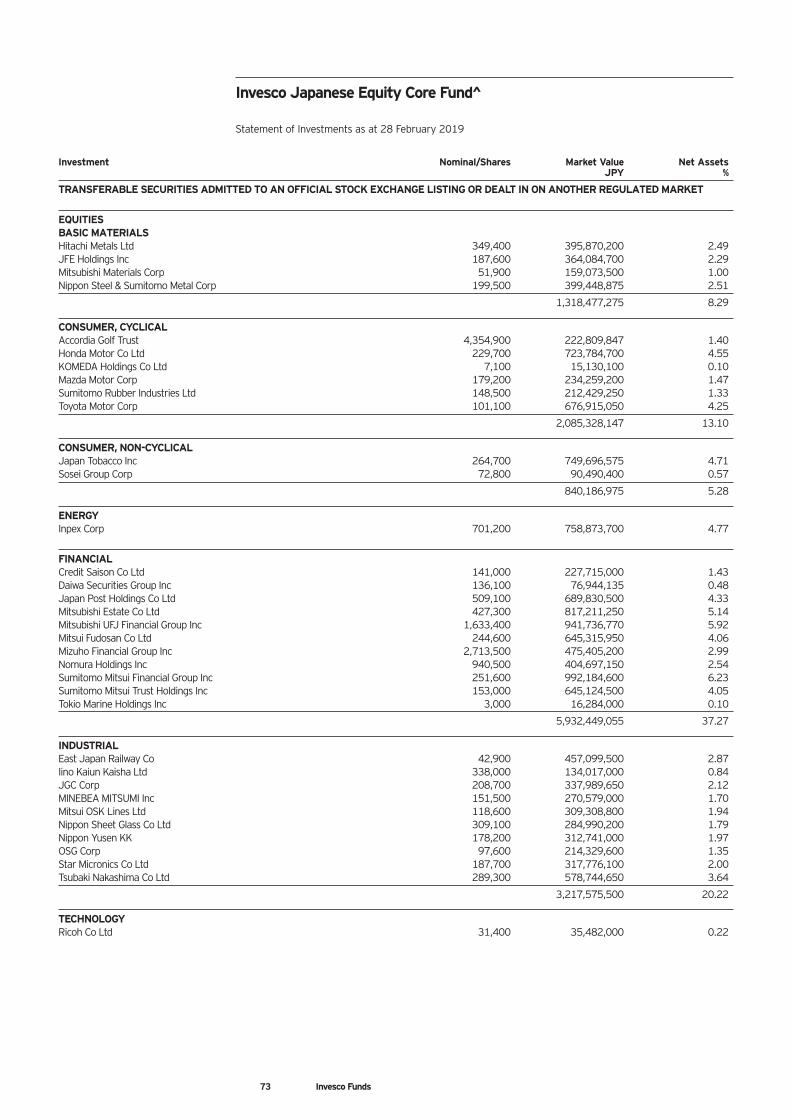
73 Invesco Funds
Investment Nominal/Shares Market Value Net Assets JPY %
TRANSFERABLE SECURITIES ADMITTED TO AN OFFICIAL STOCK EXCHANGE LISTING OR DEALT IN ON ANOTHER REGULATED MARKET
EQUITIES BASIC MATERIALS Hitachi Metals Ltd 349,400 395,870,200 2.49 JFE Holdings Inc 187,600 364,084,700 2.29 Mitsubishi Materials Corp 51,900 159,073,500 1.00 Nippon Steel & Sumitomo Metal Corp 199,500 399,448,875 2.51
1,318,477,275 8.29
CONSUMER, CYCLICAL Accordia Golf Trust 4,354,900 222,809,847 1.40 Honda Motor Co Ltd 229,700 723,784,700 4.55 KOMEDA Holdings Co Ltd 7,100 15,130,100 0.10 Mazda Motor Corp 179,200 234,259,200 1.47 Sumitomo Rubber Industries Ltd 148,500 212,429,250 1.33 Toyota Motor Corp 101,100 676,915,050 4.25
2,085,328,147 13.10
CONSUMER, NON-CYCLICAL Japan Tobacco Inc 264,700 749,696,575 4.71 Sosei Group Corp 72,800 90,490,400 0.57
840,186,975 5.28
ENERGY Inpex Corp 701,200 758,873,700 4.77
FINANCIAL Credit Saison Co Ltd 141,000 227,715,000 1.43 Daiwa Securities Group Inc 136,100 76,944,135 0.48 Japan Post Holdings Co Ltd 509,100 689,830,500 4.33 Mitsubishi Estate Co Ltd 427,300 817,211,250 5.14 Mitsubishi UFJ Financial Group Inc 1,633,400 941,736,770 5.92 Mitsui Fudosan Co Ltd 244,600 645,315,950 4.06 Mizuho Financial Group Inc 2,713,500 475,405,200 2.99 Nomura Holdings Inc 940,500 404,697,150 2.54 Sumitomo Mitsui Financial Group Inc 251,600 992,184,600 6.23 Sumitomo Mitsui Trust Holdings Inc 153,000 645,124,500 4.05 Tokio Marine Holdings Inc 3,000 16,284,000 0.10
5,932,449,055 37.27
INDUSTRIAL East Japan Railway Co 42,900 457,099,500 2.87 Iino Kaiun Kaisha Ltd 338,000 134,017,000 0.84 JGC Corp 208,700 337,989,650 2.12 MINEBEA MITSUMI Inc 151,500 270,579,000 1.70 Mitsui OSK Lines Ltd 118,600 309,308,800 1.94 Nippon Sheet Glass Co Ltd 309,100 284,990,200 1.79 Nippon Yusen KK 178,200 312,741,000 1.97 OSG Corp 97,600 214,329,600 1.35 Star Micronics Co Ltd 187,700 317,776,100 2.00 Tsubaki Nakashima Co Ltd 289,300 578,744,650 3.64
3,217,575,500 20.22
TECHNOLOGY Ricoh Co Ltd 31,400 35,482,000 0.22
Invesco Japanese Equity Core Fund^ Statement of Investments as at 28 February 2019
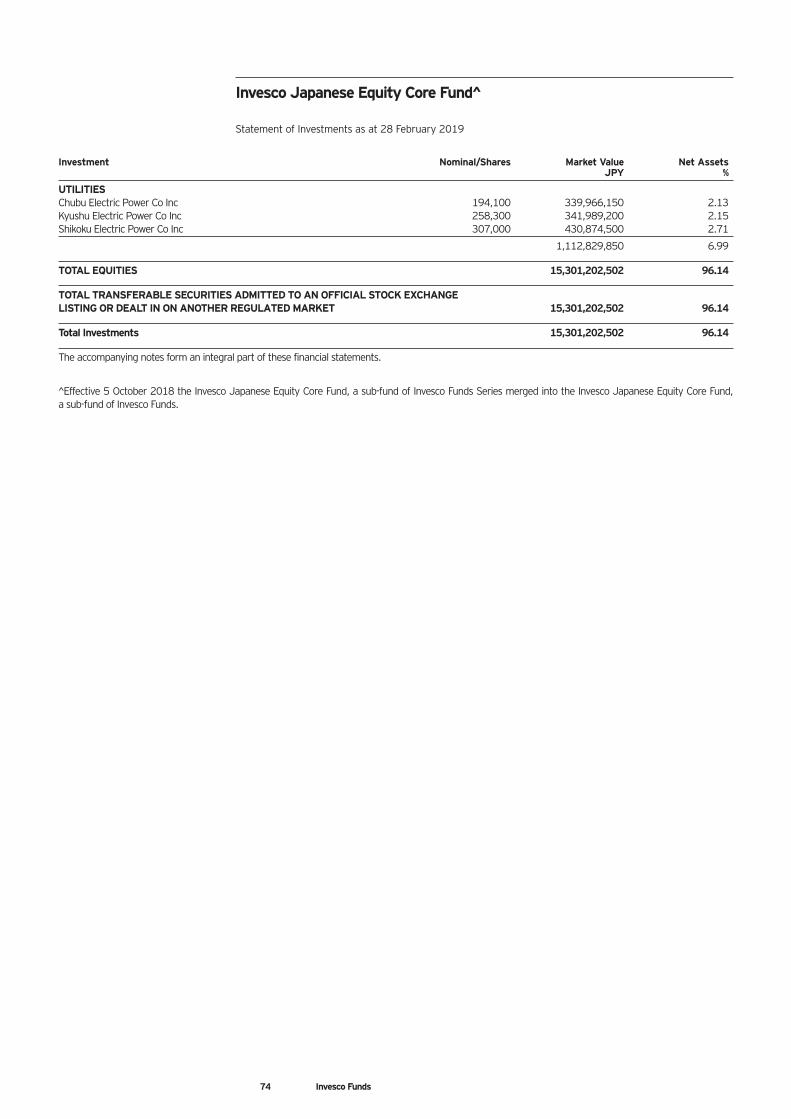
74 Invesco Funds
Investment Nominal/Shares Market Value Net Assets JPY %
UTILITIES Chubu Electric Power Co Inc 194,100 339,966,150 2.13 Kyushu Electric Power Co Inc 258,300 341,989,200 2.15 Shikoku Electric Power Co Inc 307,000 430,874,500 2.71
1,112,829,850 6.99
TOTAL EQUITIES 15,301,202,502 96.14
TOTAL TRANSFERABLE SECURITIES ADMITTED TO AN OFFICIAL STOCK EXCHANGE LISTING OR DEALT IN ON ANOTHER REGULATED MARKET 15,301,202,502 96.14
Total Investments 15,301,202,502 96.14
The accompanying notes form an integral part of these financial statements.
^Effective 5 October 2018 the Invesco Japanese Equity Core Fund, a sub-fund of Invesco Funds Series merged into the Invesco Japanese Equity Core Fund, a sub-fund of Invesco Funds.
Invesco Japanese Equity Core Fund^ Statement of Investments as at 28 February 2019
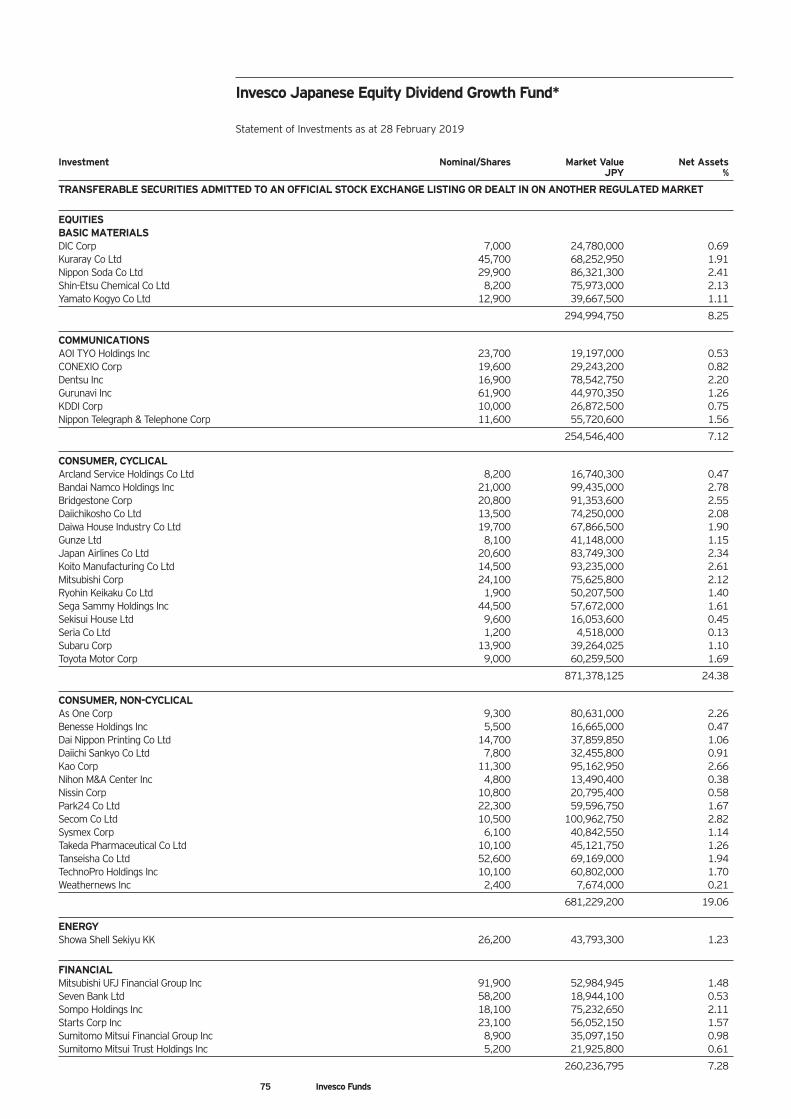
75 Invesco Funds
Investment Nominal/Shares Market Value Net Assets JPY %
TRANSFERABLE SECURITIES ADMITTED TO AN OFFICIAL STOCK EXCHANGE LISTING OR DEALT IN ON ANOTHER REGULATED MARKET
EQUITIES BASIC MATERIALS DIC Corp 7,000 24,780,000 0.69 Kuraray Co Ltd 45,700 68,252,950 1.91 Nippon Soda Co Ltd 29,900 86,321,300 2.41 Shin-Etsu Chemical Co Ltd 8,200 75,973,000 2.13 Yamato Kogyo Co Ltd 12,900 39,667,500 1.11
294,994,750 8.25
COMMUNICATIONS AOI TYO Holdings Inc 23,700 19,197,000 0.53 CONEXIO Corp 19,600 29,243,200 0.82 Dentsu Inc 16,900 78,542,750 2.20 Gurunavi Inc 61,900 44,970,350 1.26 KDDI Corp 10,000 26,872,500 0.75 Nippon Telegraph & Telephone Corp 11,600 55,720,600 1.56
254,546,400 7.12
CONSUMER, CYCLICAL Arcland Service Holdings Co Ltd 8,200 16,740,300 0.47 Bandai Namco Holdings Inc 21,000 99,435,000 2.78 Bridgestone Corp 20,800 91,353,600 2.55 Daiichikosho Co Ltd 13,500 74,250,000 2.08 Daiwa House Industry Co Ltd 19,700 67,866,500 1.90 Gunze Ltd 8,100 41,148,000 1.15 Japan Airlines Co Ltd 20,600 83,749,300 2.34 Koito Manufacturing Co Ltd 14,500 93,235,000 2.61 Mitsubishi Corp 24,100 75,625,800 2.12 Ryohin Keikaku Co Ltd 1,900 50,207,500 1.40 Sega Sammy Holdings Inc 44,500 57,672,000 1.61 Sekisui House Ltd 9,600 16,053,600 0.45 Seria Co Ltd 1,200 4,518,000 0.13 Subaru Corp 13,900 39,264,025 1.10 Toyota Motor Corp 9,000 60,259,500 1.69
871,378,125 24.38
CONSUMER, NON-CYCLICAL As One Corp 9,300 80,631,000 2.26 Benesse Holdings Inc 5,500 16,665,000 0.47 Dai Nippon Printing Co Ltd 14,700 37,859,850 1.06 Daiichi Sankyo Co Ltd 7,800 32,455,800 0.91 Kao Corp 11,300 95,162,950 2.66 Nihon M&A Center Inc 4,800 13,490,400 0.38 Nissin Corp 10,800 20,795,400 0.58 Park24 Co Ltd 22,300 59,596,750 1.67 Secom Co Ltd 10,500 100,962,750 2.82 Sysmex Corp 6,100 40,842,550 1.14 Takeda Pharmaceutical Co Ltd 10,100 45,121,750 1.26 Tanseisha Co Ltd 52,600 69,169,000 1.94 TechnoPro Holdings Inc 10,100 60,802,000 1.70 Weathernews Inc 2,400 7,674,000 0.21
681,229,200 19.06
ENERGY Showa Shell Sekiyu KK 26,200 43,793,300 1.23
FINANCIAL Mitsubishi UFJ Financial Group Inc 91,900 52,984,945 1.48 Seven Bank Ltd 58,200 18,944,100 0.53 Sompo Holdings Inc 18,100 75,232,650 2.11 Starts Corp Inc 23,100 56,052,150 1.57 Sumitomo Mitsui Financial Group Inc 8,900 35,097,150 0.98 Sumitomo Mitsui Trust Holdings Inc 5,200 21,925,800 0.61
260,236,795 7.28
Invesco Japanese Equity Dividend Growth Fund* Statement of Investments as at 28 February 2019
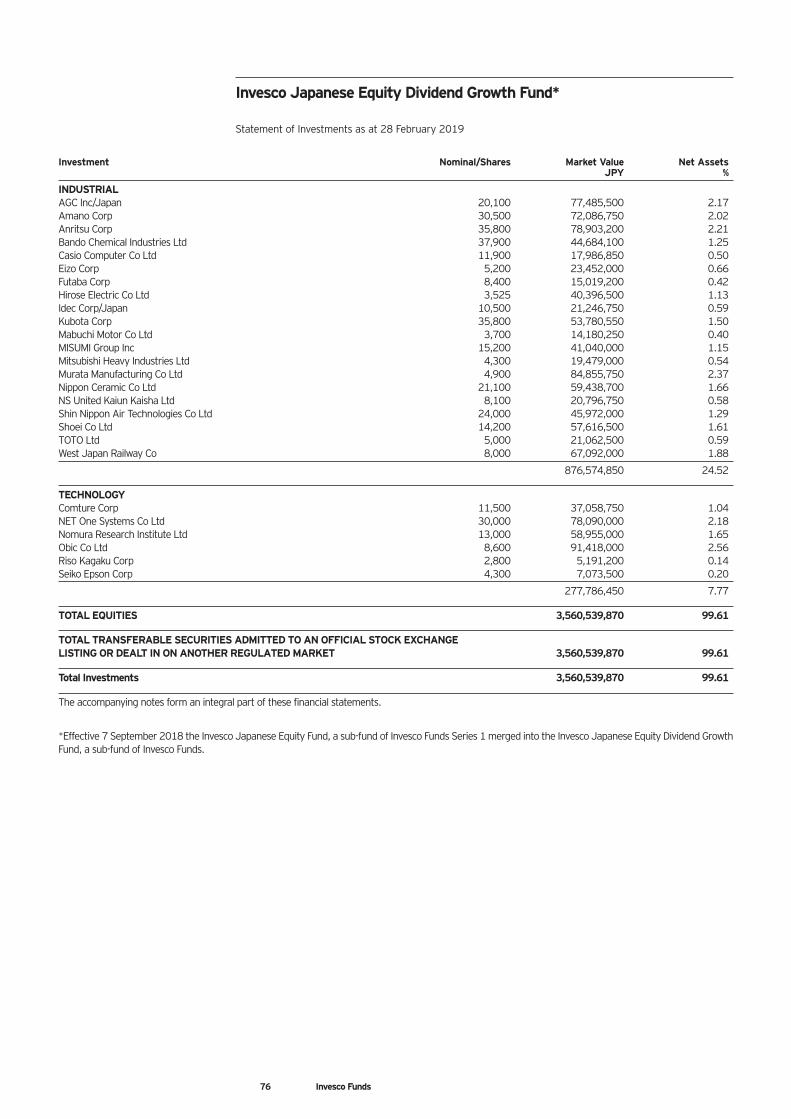
76 Invesco Funds
Investment Nominal/Shares Market Value Net Assets JPY %
INDUSTRIAL AGC Inc/Japan 20,100 77,485,500 2.17 Amano Corp 30,500 72,086,750 2.02 Anritsu Corp 35,800 78,903,200 2.21 Bando Chemical Industries Ltd 37,900 44,684,100 1.25 Casio Computer Co Ltd 11,900 17,986,850 0.50 Eizo Corp 5,200 23,452,000 0.66 Futaba Corp 8,400 15,019,200 0.42 Hirose Electric Co Ltd 3,525 40,396,500 1.13 Idec Corp/Japan 10,500 21,246,750 0.59 Kubota Corp 35,800 53,780,550 1.50 Mabuchi Motor Co Ltd 3,700 14,180,250 0.40 MISUMI Group Inc 15,200 41,040,000 1.15 Mitsubishi Heavy Industries Ltd 4,300 19,479,000 0.54 Murata Manufacturing Co Ltd 4,900 84,855,750 2.37 Nippon Ceramic Co Ltd 21,100 59,438,700 1.66 NS United Kaiun Kaisha Ltd 8,100 20,796,750 0.58 Shin Nippon Air Technologies Co Ltd 24,000 45,972,000 1.29 Shoei Co Ltd 14,200 57,616,500 1.61 TOTO Ltd 5,000 21,062,500 0.59 West Japan Railway Co 8,000 67,092,000 1.88
876,574,850 24.52
TECHNOLOGY Comture Corp 11,500 37,058,750 1.04 NET One Systems Co Ltd 30,000 78,090,000 2.18 Nomura Research Institute Ltd 13,000 58,955,000 1.65 Obic Co Ltd 8,600 91,418,000 2.56 Riso Kagaku Corp 2,800 5,191,200 0.14 Seiko Epson Corp 4,300 7,073,500 0.20
277,786,450 7.77
TOTAL EQUITIES 3,560,539,870 99.61
TOTAL TRANSFERABLE SECURITIES ADMITTED TO AN OFFICIAL STOCK EXCHANGE LISTING OR DEALT IN ON ANOTHER REGULATED MARKET 3,560,539,870 99.61
Total Investments 3,560,539,870 99.61
The accompanying notes form an integral part of these financial statements.
*Effective 7 September 2018 the Invesco Japanese Equity Fund, a sub-fund of Invesco Funds Series 1 merged into the Invesco Japanese Equity Dividend Growth Fund, a sub-fund of Invesco Funds.
Invesco Japanese Equity Dividend Growth Fund* Statement of Investments as at 28 February 2019
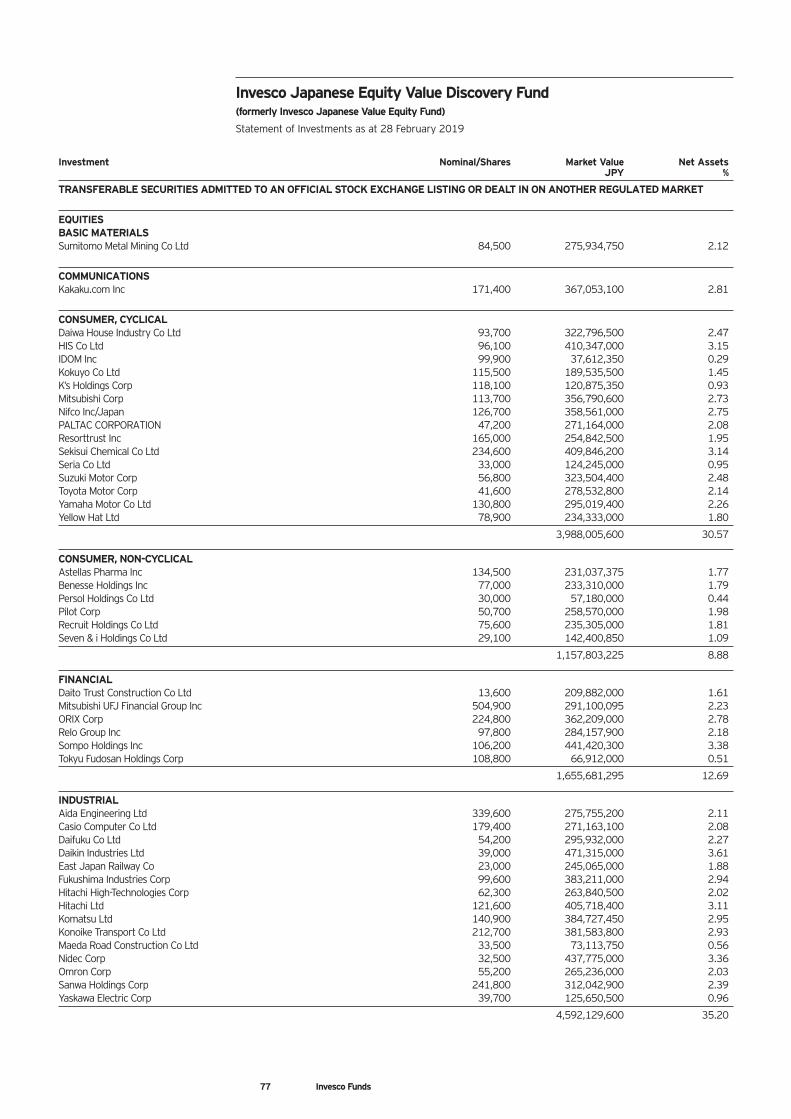
77 Invesco Funds
Investment Nominal/Shares Market Value Net Assets JPY %
TRANSFERABLE SECURITIES ADMITTED TO AN OFFICIAL STOCK EXCHANGE LISTING OR DEALT IN ON ANOTHER REGULATED MARKET
EQUITIES BASIC MATERIALS Sumitomo Metal Mining Co Ltd 84,500 275,934,750 2.12
COMMUNICATIONS Kakaku.com Inc 171,400 367,053,100 2.81
CONSUMER, CYCLICAL Daiwa House Industry Co Ltd 93,700 322,796,500 2.47 HIS Co Ltd 96,100 410,347,000 3.15 IDOM Inc 99,900 37,612,350 0.29 Kokuyo Co Ltd 115,500 189,535,500 1.45 K’s Holdings Corp 118,100 120,875,350 0.93 Mitsubishi Corp 113,700 356,790,600 2.73 Nifco Inc/Japan 126,700 358,561,000 2.75 PALTAC CORPORATION 47,200 271,164,000 2.08 Resorttrust Inc 165,000 254,842,500 1.95 Sekisui Chemical Co Ltd 234,600 409,846,200 3.14 Seria Co Ltd 33,000 124,245,000 0.95 Suzuki Motor Corp 56,800 323,504,400 2.48 Toyota Motor Corp 41,600 278,532,800 2.14 Yamaha Motor Co Ltd 130,800 295,019,400 2.26 Yellow Hat Ltd 78,900 234,333,000 1.80
3,988,005,600 30.57
CONSUMER, NON-CYCLICAL Astellas Pharma Inc 134,500 231,037,375 1.77 Benesse Holdings Inc 77,000 233,310,000 1.79 Persol Holdings Co Ltd 30,000 57,180,000 0.44 Pilot Corp 50,700 258,570,000 1.98 Recruit Holdings Co Ltd 75,600 235,305,000 1.81 Seven & i Holdings Co Ltd 29,100 142,400,850 1.09
1,157,803,225 8.88
FINANCIAL Daito Trust Construction Co Ltd 13,600 209,882,000 1.61 Mitsubishi UFJ Financial Group Inc 504,900 291,100,095 2.23 ORIX Corp 224,800 362,209,000 2.78 Relo Group Inc 97,800 284,157,900 2.18 Sompo Holdings Inc 106,200 441,420,300 3.38 Tokyu Fudosan Holdings Corp 108,800 66,912,000 0.51
1,655,681,295 12.69
INDUSTRIAL Aida Engineering Ltd 339,600 275,755,200 2.11 Casio Computer Co Ltd 179,400 271,163,100 2.08 Daifuku Co Ltd 54,200 295,932,000 2.27 Daikin Industries Ltd 39,000 471,315,000 3.61 East Japan Railway Co 23,000 245,065,000 1.88 Fukushima Industries Corp 99,600 383,211,000 2.94 Hitachi High-Technologies Corp 62,300 263,840,500 2.02 Hitachi Ltd 121,600 405,718,400 3.11 Komatsu Ltd 140,900 384,727,450 2.95 Konoike Transport Co Ltd 212,700 381,583,800 2.93 Maeda Road Construction Co Ltd 33,500 73,113,750 0.56 Nidec Corp 32,500 437,775,000 3.36 Omron Corp 55,200 265,236,000 2.03 Sanwa Holdings Corp 241,800 312,042,900 2.39 Yaskawa Electric Corp 39,700 125,650,500 0.96
4,592,129,600 35.20
Invesco Japanese Equity Value Discovery Fund (formerly Invesco Japanese Value Equity Fund) Statement of Investments as at 28 February 2019
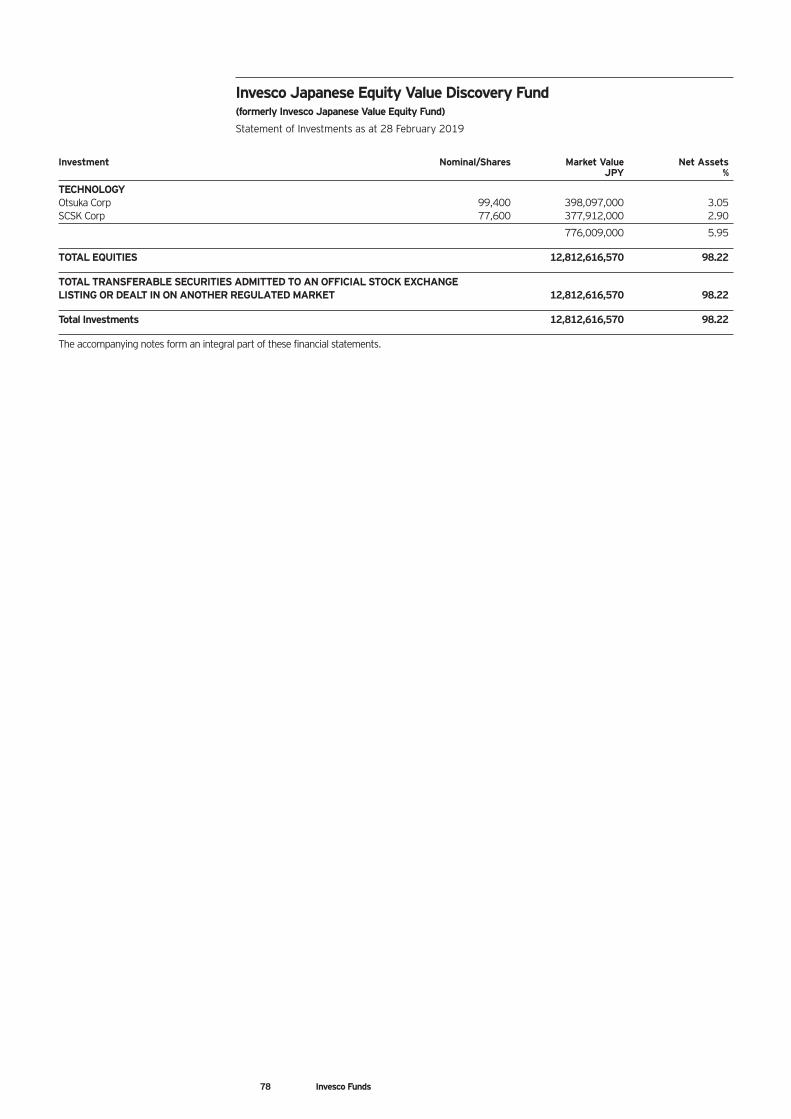
78 Invesco Funds
Investment Nominal/Shares Market Value Net Assets JPY %
TECHNOLOGY Otsuka Corp 99,400 398,097,000 3.05 SCSK Corp 77,600 377,912,000 2.90
776,009,000 5.95
TOTAL EQUITIES 12,812,616,570 98.22
TOTAL TRANSFERABLE SECURITIES ADMITTED TO AN OFFICIAL STOCK EXCHANGE LISTING OR DEALT IN ON ANOTHER REGULATED MARKET 12,812,616,570 98.22
Total Investments 12,812,616,570 98.22
The accompanying notes form an integral part of these financial statements.
Invesco Japanese Equity Value Discovery Fund (formerly Invesco Japanese Value Equity Fund) Statement of Investments as at 28 February 2019
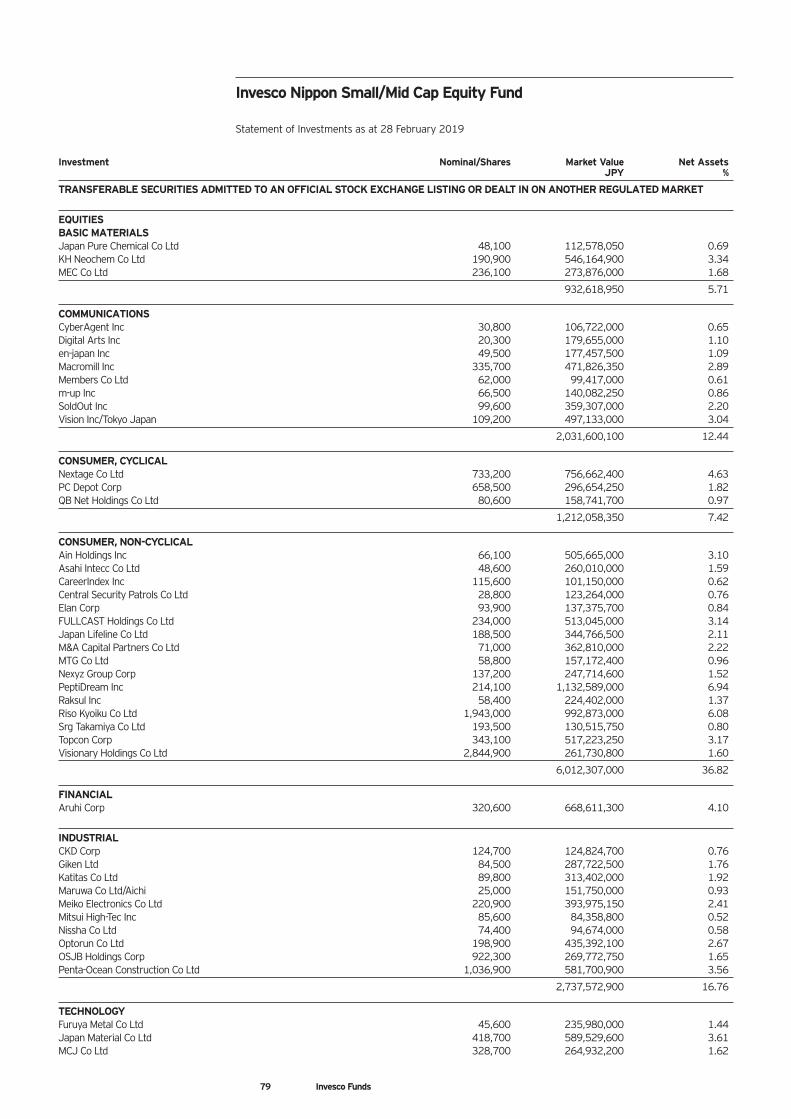
79 Invesco Funds
Investment Nominal/Shares Market Value Net Assets JPY %
TRANSFERABLE SECURITIES ADMITTED TO AN OFFICIAL STOCK EXCHANGE LISTING OR DEALT IN ON ANOTHER REGULATED MARKET
EQUITIES BASIC MATERIALS Japan Pure Chemical Co Ltd 48,100 112,578,050 0.69 KH Neochem Co Ltd 190,900 546,164,900 3.34 MEC Co Ltd 236,100 273,876,000 1.68
932,618,950 5.71
COMMUNICATIONS CyberAgent Inc 30,800 106,722,000 0.65 Digital Arts Inc 20,300 179,655,000 1.10 en-japan Inc 49,500 177,457,500 1.09 Macromill Inc 335,700 471,826,350 2.89 Members Co Ltd 62,000 99,417,000 0.61 m-up Inc 66,500 140,082,250 0.86 SoldOut Inc 99,600 359,307,000 2.20 Vision Inc/Tokyo Japan 109,200 497,133,000 3.04
2,031,600,100 12.44
CONSUMER, CYCLICAL Nextage Co Ltd 733,200 756,662,400 4.63 PC Depot Corp 658,500 296,654,250 1.82 QB Net Holdings Co Ltd 80,600 158,741,700 0.97
1,212,058,350 7.42
CONSUMER, NON-CYCLICAL Ain Holdings Inc 66,100 505,665,000 3.10 Asahi Intecc Co Ltd 48,600 260,010,000 1.59 CareerIndex Inc 115,600 101,150,000 0.62 Central Security Patrols Co Ltd 28,800 123,264,000 0.76 Elan Corp 93,900 137,375,700 0.84 FULLCAST Holdings Co Ltd 234,000 513,045,000 3.14 Japan Lifeline Co Ltd 188,500 344,766,500 2.11 M&A Capital Partners Co Ltd 71,000 362,810,000 2.22 MTG Co Ltd 58,800 157,172,400 0.96 Nexyz Group Corp 137,200 247,714,600 1.52 PeptiDream Inc 214,100 1,132,589,000 6.94 Raksul Inc 58,400 224,402,000 1.37 Riso Kyoiku Co Ltd 1,943,000 992,873,000 6.08 Srg Takamiya Co Ltd 193,500 130,515,750 0.80 Topcon Corp 343,100 517,223,250 3.17 Visionary Holdings Co Ltd 2,844,900 261,730,800 1.60
6,012,307,000 36.82
FINANCIAL Aruhi Corp 320,600 668,611,300 4.10
INDUSTRIAL CKD Corp 124,700 124,824,700 0.76 Giken Ltd 84,500 287,722,500 1.76 Katitas Co Ltd 89,800 313,402,000 1.92 Maruwa Co Ltd/Aichi 25,000 151,750,000 0.93 Meiko Electronics Co Ltd 220,900 393,975,150 2.41 Mitsui High-Tec Inc 85,600 84,358,800 0.52 Nissha Co Ltd 74,400 94,674,000 0.58 Optorun Co Ltd 198,900 435,392,100 2.67 OSJB Holdings Corp 922,300 269,772,750 1.65 Penta-Ocean Construction Co Ltd 1,036,900 581,700,900 3.56
2,737,572,900 16.76
TECHNOLOGY Furuya Metal Co Ltd 45,600 235,980,000 1.44 Japan Material Co Ltd 418,700 589,529,600 3.61 MCJ Co Ltd 328,700 264,932,200 1.62
Invesco Nippon Small/Mid Cap Equity Fund Statement of Investments as at 28 February 2019
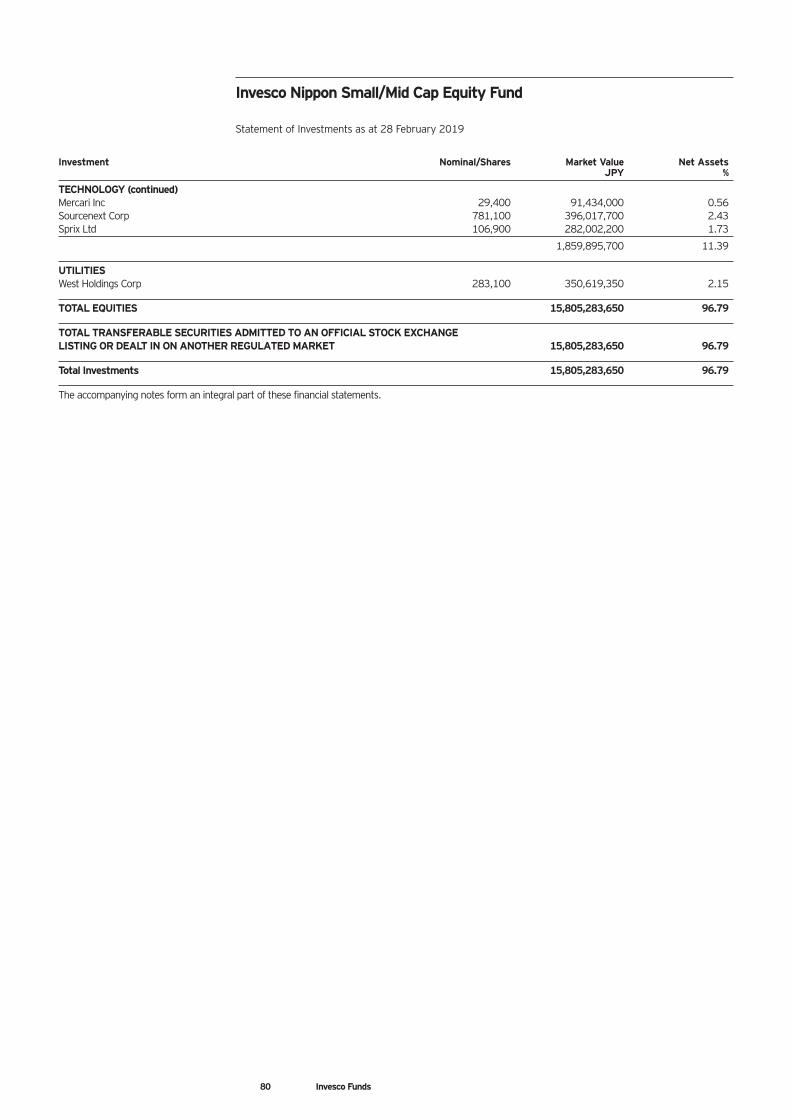
80 Invesco Funds
Investment Nominal/Shares Market Value Net Assets JPY %
TECHNOLOGY (continued) Mercari Inc 29,400 91,434,000 0.56 Sourcenext Corp 781,100 396,017,700 2.43 Sprix Ltd 106,900 282,002,200 1.73
1,859,895,700 11.39
UTILITIES West Holdings Corp 283,100 350,619,350 2.15
TOTAL EQUITIES 15,805,283,650 96.79
TOTAL TRANSFERABLE SECURITIES ADMITTED TO AN OFFICIAL STOCK EXCHANGE LISTING OR DEALT IN ON ANOTHER REGULATED MARKET 15,805,283,650 96.79
Total Investments 15,805,283,650 96.79
The accompanying notes form an integral part of these financial statements.
Invesco Nippon Small/Mid Cap Equity Fund Statement of Investments as at 28 February 2019
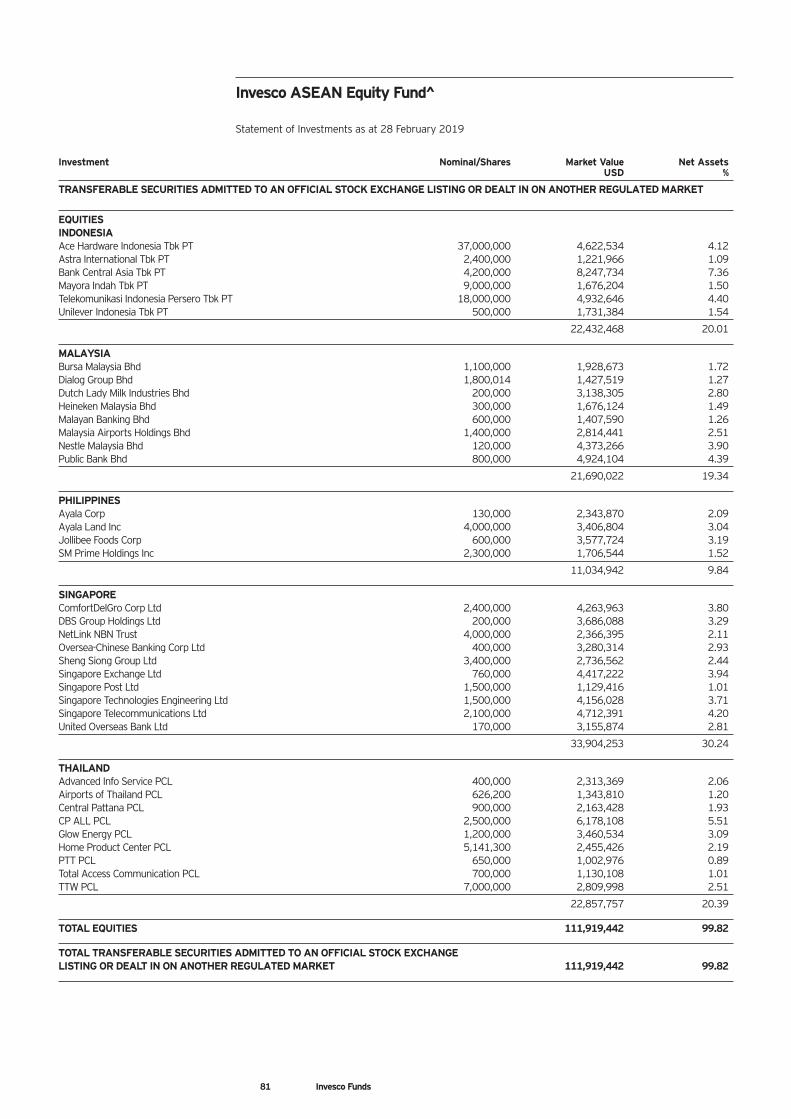
81 Invesco Funds
Investment Nominal/Shares Market Value Net Assets USD %
TRANSFERABLE SECURITIES ADMITTED TO AN OFFICIAL STOCK EXCHANGE LISTING OR DEALT IN ON ANOTHER REGULATED MARKET
EQUITIES INDONESIA Ace Hardware Indonesia Tbk PT 37,000,000 4,622,534 4.12 Astra International Tbk PT 2,400,000 1,221,966 1.09 Bank Central Asia Tbk PT 4,200,000 8,247,734 7.36 Mayora Indah Tbk PT 9,000,000 1,676,204 1.50 Telekomunikasi Indonesia Persero Tbk PT 18,000,000 4,932,646 4.40 Unilever Indonesia Tbk PT 500,000 1,731,384 1.54
22,432,468 20.01
MALAYSIA Bursa Malaysia Bhd 1,100,000 1,928,673 1.72 Dialog Group Bhd 1,800,014 1,427,519 1.27 Dutch Lady Milk Industries Bhd 200,000 3,138,305 2.80 Heineken Malaysia Bhd 300,000 1,676,124 1.49 Malayan Banking Bhd 600,000 1,407,590 1.26 Malaysia Airports Holdings Bhd 1,400,000 2,814,441 2.51 Nestle Malaysia Bhd 120,000 4,373,266 3.90 Public Bank Bhd 800,000 4,924,104 4.39
21,690,022 19.34
PHILIPPINES Ayala Corp 130,000 2,343,870 2.09 Ayala Land Inc 4,000,000 3,406,804 3.04 Jollibee Foods Corp 600,000 3,577,724 3.19 SM Prime Holdings Inc 2,300,000 1,706,544 1.52
11,034,942 9.84
SINGAPORE ComfortDelGro Corp Ltd 2,400,000 4,263,963 3.80 DBS Group Holdings Ltd 200,000 3,686,088 3.29 NetLink NBN Trust 4,000,000 2,366,395 2.11 Oversea-Chinese Banking Corp Ltd 400,000 3,280,314 2.93 Sheng Siong Group Ltd 3,400,000 2,736,562 2.44 Singapore Exchange Ltd 760,000 4,417,222 3.94 Singapore Post Ltd 1,500,000 1,129,416 1.01 Singapore Technologies Engineering Ltd 1,500,000 4,156,028 3.71 Singapore Telecommunications Ltd 2,100,000 4,712,391 4.20 United Overseas Bank Ltd 170,000 3,155,874 2.81
33,904,253 30.24
THAILAND Advanced Info Service PCL 400,000 2,313,369 2.06 Airports of Thailand PCL 626,200 1,343,810 1.20 Central Pattana PCL 900,000 2,163,428 1.93 CP ALL PCL 2,500,000 6,178,108 5.51 Glow Energy PCL 1,200,000 3,460,534 3.09 Home Product Center PCL 5,141,300 2,455,426 2.19 PTT PCL 650,000 1,002,976 0.89 Total Access Communication PCL 700,000 1,130,108 1.01 TTW PCL 7,000,000 2,809,998 2.51
22,857,757 20.39
TOTAL EQUITIES 111,919,442 99.82
TOTAL TRANSFERABLE SECURITIES ADMITTED TO AN OFFICIAL STOCK EXCHANGE LISTING OR DEALT IN ON ANOTHER REGULATED MARKET 111,919,442 99.82
Invesco ASEAN Equity Fund^ Statement of Investments as at 28 February 2019
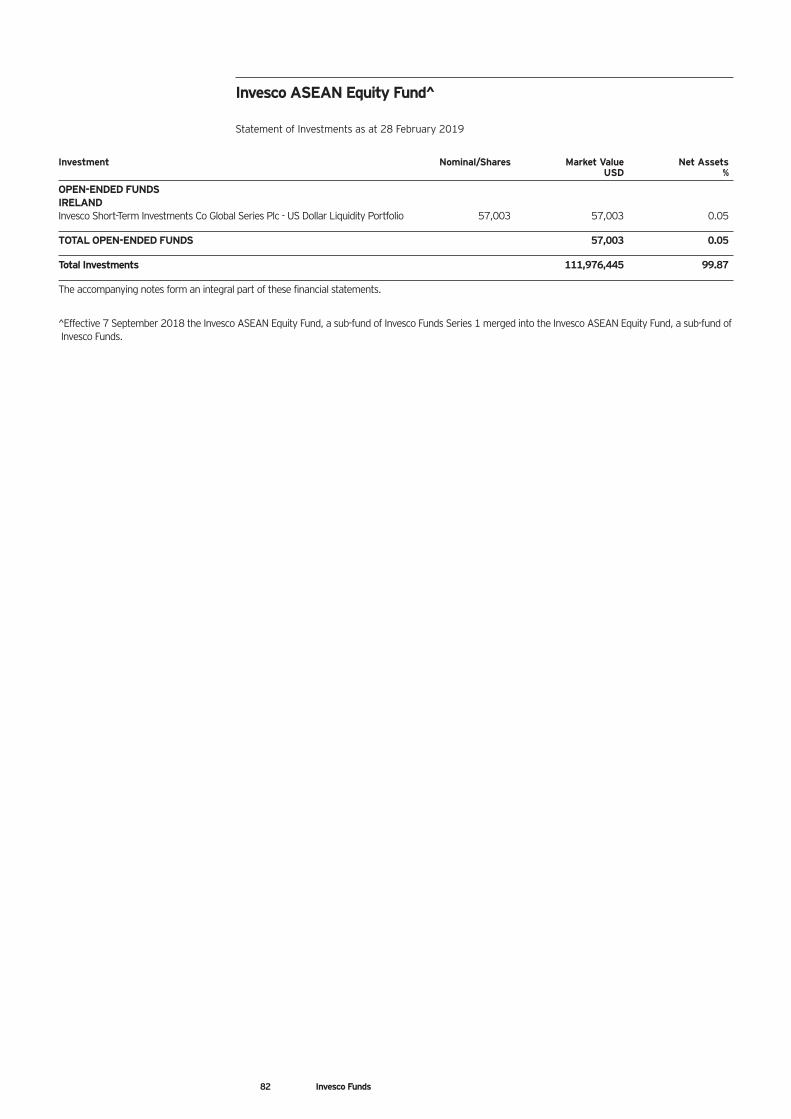
82 Invesco Funds
Investment Nominal/Shares Market Value Net Assets USD %
OPEN-ENDED FUNDS IRELAND Invesco Short-Term Investments Co Global Series Plc - US Dollar Liquidity Portfolio 57,003 57,003 0.05
TOTAL OPEN-ENDED FUNDS 57,003 0.05
Total Investments 111,976,445 99.87
The accompanying notes form an integral part of these financial statements.
^Effective 7 September 2018 the Invesco ASEAN Equity Fund, a sub-fund of Invesco Funds Series 1 merged into the Invesco ASEAN Equity Fund, a sub-fund of Invesco Funds.
Invesco ASEAN Equity Fund^ Statement of Investments as at 28 February 2019
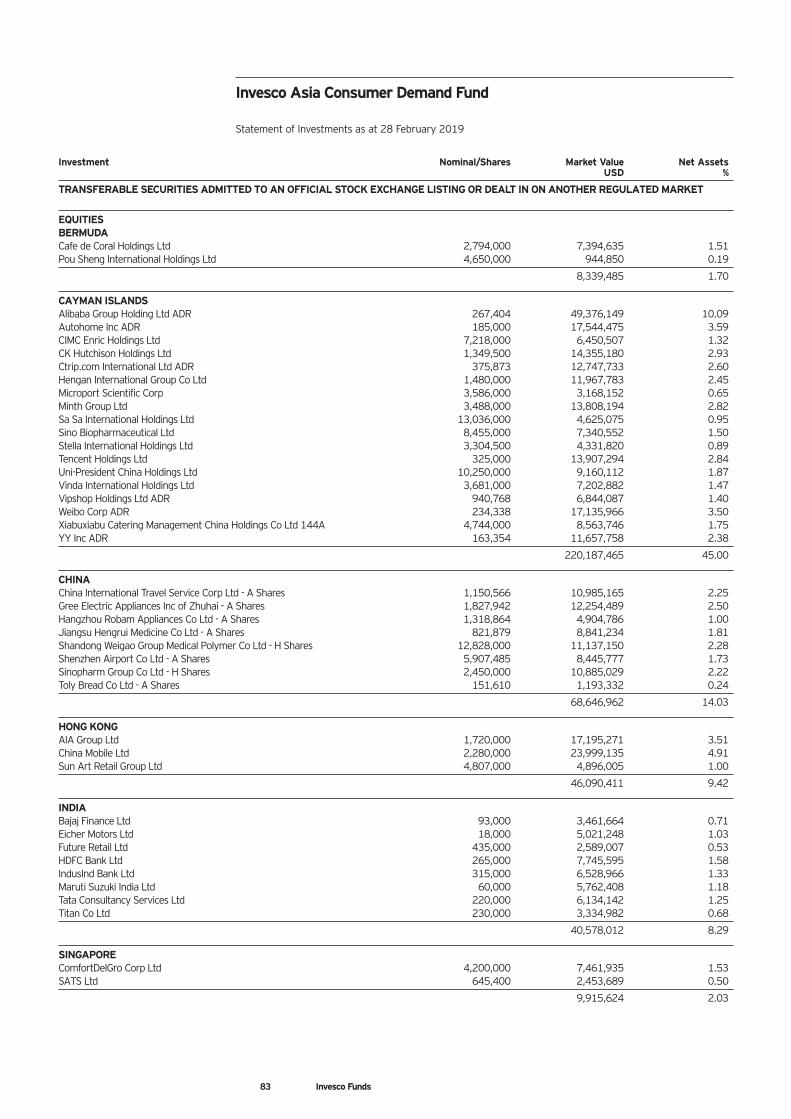
83 Invesco Funds
Investment Nominal/Shares Market Value Net Assets USD %
TRANSFERABLE SECURITIES ADMITTED TO AN OFFICIAL STOCK EXCHANGE LISTING OR DEALT IN ON ANOTHER REGULATED MARKET
EQUITIES BERMUDA Cafe de Coral Holdings Ltd 2,794,000 7,394,635 1.51 Pou Sheng International Holdings Ltd 4,650,000 944,850 0.19
8,339,485 1.70
CAYMAN ISLANDS Alibaba Group Holding Ltd ADR 267,404 49,376,149 10.09 Autohome Inc ADR 185,000 17,544,475 3.59 CIMC Enric Holdings Ltd 7,218,000 6,450,507 1.32 CK Hutchison Holdings Ltd 1,349,500 14,355,180 2.93 Ctrip.com International Ltd ADR 375,873 12,747,733 2.60 Hengan International Group Co Ltd 1,480,000 11,967,783 2.45 Microport Scientific Corp 3,586,000 3,168,152 0.65 Minth Group Ltd 3,488,000 13,808,194 2.82 Sa Sa International Holdings Ltd 13,036,000 4,625,075 0.95 Sino Biopharmaceutical Ltd 8,455,000 7,340,552 1.50 Stella International Holdings Ltd 3,304,500 4,331,820 0.89 Tencent Holdings Ltd 325,000 13,907,294 2.84 Uni-President China Holdings Ltd 10,250,000 9,160,112 1.87 Vinda International Holdings Ltd 3,681,000 7,202,882 1.47 Vipshop Holdings Ltd ADR 940,768 6,844,087 1.40 Weibo Corp ADR 234,338 17,135,966 3.50 Xiabuxiabu Catering Management China Holdings Co Ltd 144A 4,744,000 8,563,746 1.75 YY Inc ADR 163,354 11,657,758 2.38
220,187,465 45.00
CHINA China International Travel Service Corp Ltd - A Shares 1,150,566 10,985,165 2.25 Gree Electric Appliances Inc of Zhuhai - A Shares 1,827,942 12,254,489 2.50 Hangzhou Robam Appliances Co Ltd - A Shares 1,318,864 4,904,786 1.00 Jiangsu Hengrui Medicine Co Ltd - A Shares 821,879 8,841,234 1.81 Shandong Weigao Group Medical Polymer Co Ltd - H Shares 12,828,000 11,137,150 2.28 Shenzhen Airport Co Ltd - A Shares 5,907,485 8,445,777 1.73 Sinopharm Group Co Ltd - H Shares 2,450,000 10,885,029 2.22 Toly Bread Co Ltd - A Shares 151,610 1,193,332 0.24
68,646,962 14.03
HONG KONG AIA Group Ltd 1,720,000 17,195,271 3.51 China Mobile Ltd 2,280,000 23,999,135 4.91 Sun Art Retail Group Ltd 4,807,000 4,896,005 1.00
46,090,411 9.42
INDIA Bajaj Finance Ltd 93,000 3,461,664 0.71 Eicher Motors Ltd 18,000 5,021,248 1.03 Future Retail Ltd 435,000 2,589,007 0.53 HDFC Bank Ltd 265,000 7,745,595 1.58 IndusInd Bank Ltd 315,000 6,528,966 1.33 Maruti Suzuki India Ltd 60,000 5,762,408 1.18 Tata Consultancy Services Ltd 220,000 6,134,142 1.25 Titan Co Ltd 230,000 3,334,982 0.68
40,578,012 8.29
SINGAPORE ComfortDelGro Corp Ltd 4,200,000 7,461,935 1.53 SATS Ltd 645,400 2,453,689 0.50
9,915,624 2.03
Invesco Asia Consumer Demand Fund Statement of Investments as at 28 February 2019
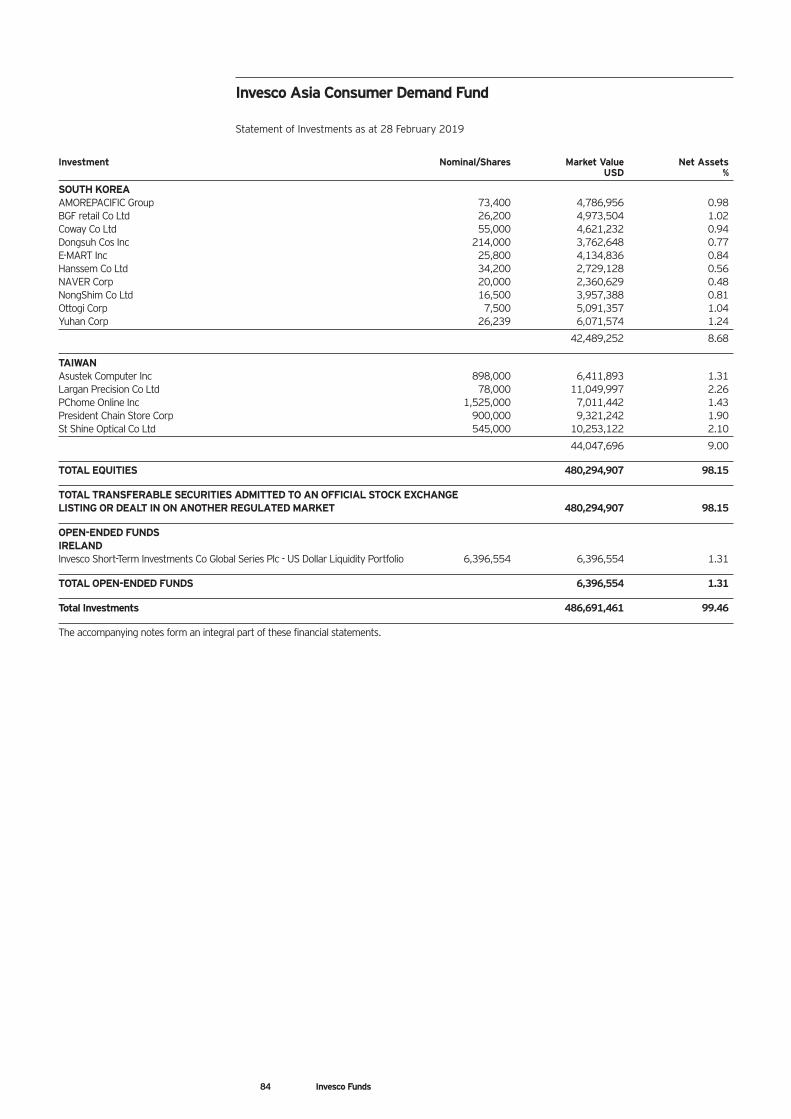
84 Invesco Funds
Investment Nominal/Shares Market Value Net Assets USD %
SOUTH KOREA AMOREPACIFIC Group 73,400 4,786,956 0.98 BGF retail Co Ltd 26,200 4,973,504 1.02 Coway Co Ltd 55,000 4,621,232 0.94 Dongsuh Cos Inc 214,000 3,762,648 0.77 E-MART Inc 25,800 4,134,836 0.84 Hanssem Co Ltd 34,200 2,729,128 0.56 NAVER Corp 20,000 2,360,629 0.48 NongShim Co Ltd 16,500 3,957,388 0.81 Ottogi Corp 7,500 5,091,357 1.04 Yuhan Corp 26,239 6,071,574 1.24
42,489,252 8.68
TAIWAN Asustek Computer Inc 898,000 6,411,893 1.31 Largan Precision Co Ltd 78,000 11,049,997 2.26 PChome Online Inc 1,525,000 7,011,442 1.43 President Chain Store Corp 900,000 9,321,242 1.90 St Shine Optical Co Ltd 545,000 10,253,122 2.10
44,047,696 9.00
TOTAL EQUITIES 480,294,907 98.15
TOTAL TRANSFERABLE SECURITIES ADMITTED TO AN OFFICIAL STOCK EXCHANGE LISTING OR DEALT IN ON ANOTHER REGULATED MARKET 480,294,907 98.15
OPEN-ENDED FUNDS IRELAND Invesco Short-Term Investments Co Global Series Plc - US Dollar Liquidity Portfolio 6,396,554 6,396,554 1.31
TOTAL OPEN-ENDED FUNDS 6,396,554 1.31
Total Investments 486,691,461 99.46
The accompanying notes form an integral part of these financial statements.
Invesco Asia Consumer Demand Fund Statement of Investments as at 28 February 2019
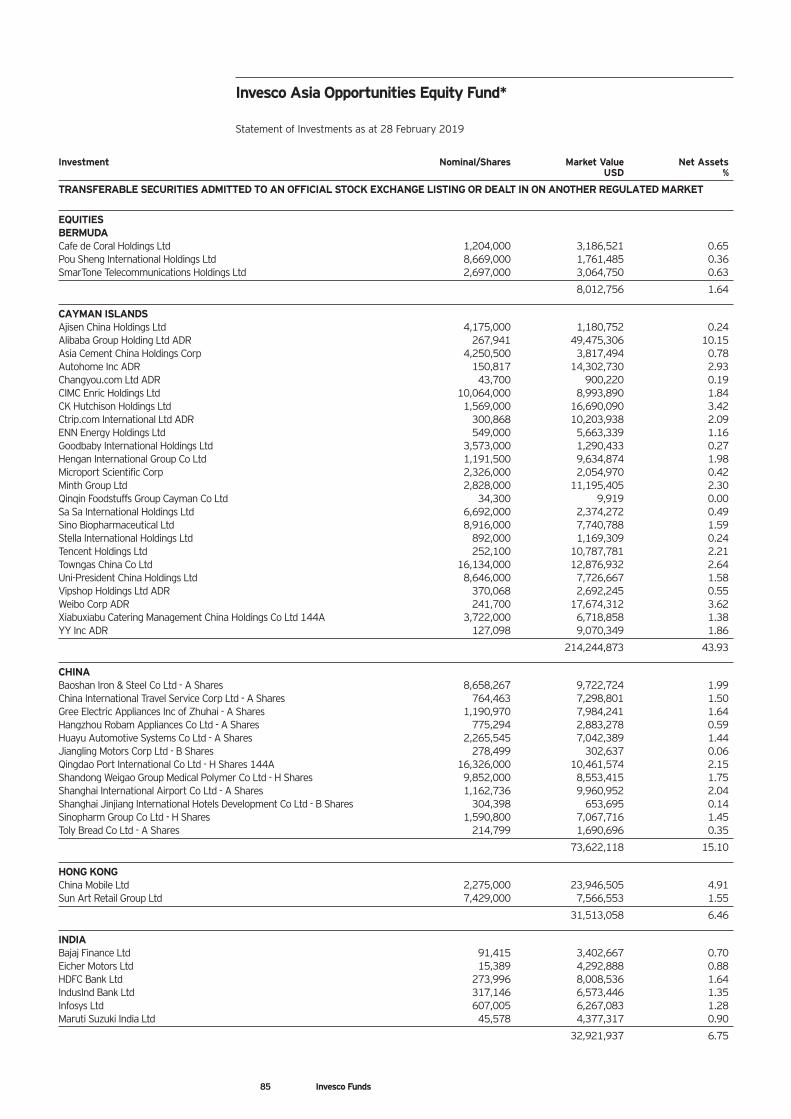
85 Invesco Funds
Investment Nominal/Shares Market Value Net Assets USD %
TRANSFERABLE SECURITIES ADMITTED TO AN OFFICIAL STOCK EXCHANGE LISTING OR DEALT IN ON ANOTHER REGULATED MARKET
EQUITIES BERMUDA Cafe de Coral Holdings Ltd 1,204,000 3,186,521 0.65 Pou Sheng International Holdings Ltd 8,669,000 1,761,485 0.36 SmarTone Telecommunications Holdings Ltd 2,697,000 3,064,750 0.63
8,012,756 1.64
CAYMAN ISLANDS Ajisen China Holdings Ltd 4,175,000 1,180,752 0.24 Alibaba Group Holding Ltd ADR 267,941 49,475,306 10.15 Asia Cement China Holdings Corp 4,250,500 3,817,494 0.78 Autohome Inc ADR 150,817 14,302,730 2.93 Changyou.com Ltd ADR 43,700 900,220 0.19 CIMC Enric Holdings Ltd 10,064,000 8,993,890 1.84 CK Hutchison Holdings Ltd 1,569,000 16,690,090 3.42 Ctrip.com International Ltd ADR 300,868 10,203,938 2.09 ENN Energy Holdings Ltd 549,000 5,663,339 1.16 Goodbaby International Holdings Ltd 3,573,000 1,290,433 0.27 Hengan International Group Co Ltd 1,191,500 9,634,874 1.98 Microport Scientific Corp 2,326,000 2,054,970 0.42 Minth Group Ltd 2,828,000 11,195,405 2.30 Qinqin Foodstuffs Group Cayman Co Ltd 34,300 9,919 0.00 Sa Sa International Holdings Ltd 6,692,000 2,374,272 0.49 Sino Biopharmaceutical Ltd 8,916,000 7,740,788 1.59 Stella International Holdings Ltd 892,000 1,169,309 0.24 Tencent Holdings Ltd 252,100 10,787,781 2.21 Towngas China Co Ltd 16,134,000 12,876,932 2.64 Uni-President China Holdings Ltd 8,646,000 7,726,667 1.58 Vipshop Holdings Ltd ADR 370,068 2,692,245 0.55 Weibo Corp ADR 241,700 17,674,312 3.62 Xiabuxiabu Catering Management China Holdings Co Ltd 144A 3,722,000 6,718,858 1.38 YY Inc ADR 127,098 9,070,349 1.86
214,244,873 43.93
CHINA Baoshan Iron & Steel Co Ltd - A Shares 8,658,267 9,722,724 1.99 China International Travel Service Corp Ltd - A Shares 764,463 7,298,801 1.50 Gree Electric Appliances Inc of Zhuhai - A Shares 1,190,970 7,984,241 1.64 Hangzhou Robam Appliances Co Ltd - A Shares 775,294 2,883,278 0.59 Huayu Automotive Systems Co Ltd - A Shares 2,265,545 7,042,389 1.44 Jiangling Motors Corp Ltd - B Shares 278,499 302,637 0.06 Qingdao Port International Co Ltd - H Shares 144A 16,326,000 10,461,574 2.15 Shandong Weigao Group Medical Polymer Co Ltd - H Shares 9,852,000 8,553,415 1.75 Shanghai International Airport Co Ltd - A Shares 1,162,736 9,960,952 2.04 Shanghai Jinjiang International Hotels Development Co Ltd - B Shares 304,398 653,695 0.14 Sinopharm Group Co Ltd - H Shares 1,590,800 7,067,716 1.45 Toly Bread Co Ltd - A Shares 214,799 1,690,696 0.35
73,622,118 15.10
HONG KONG China Mobile Ltd 2,275,000 23,946,505 4.91 Sun Art Retail Group Ltd 7,429,000 7,566,553 1.55
31,513,058 6.46
INDIA Bajaj Finance Ltd 91,415 3,402,667 0.70 Eicher Motors Ltd 15,389 4,292,888 0.88 HDFC Bank Ltd 273,996 8,008,536 1.64 IndusInd Bank Ltd 317,146 6,573,446 1.35 Infosys Ltd 607,005 6,267,083 1.28 Maruti Suzuki India Ltd 45,578 4,377,317 0.90
32,921,937 6.75
Invesco Asia Opportunities Equity Fund* Statement of Investments as at 28 February 2019
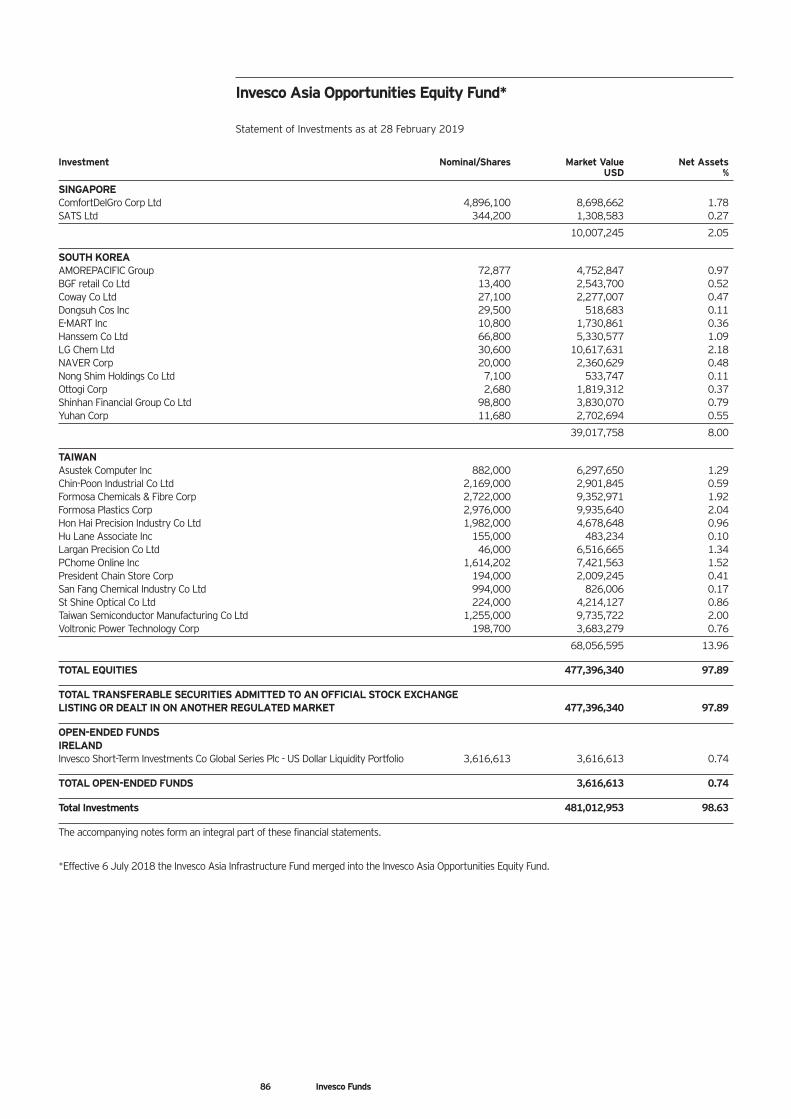
86 Invesco Funds
Investment Nominal/Shares Market Value Net Assets USD %
SINGAPORE ComfortDelGro Corp Ltd 4,896,100 8,698,662 1.78 SATS Ltd 344,200 1,308,583 0.27
10,007,245 2.05
SOUTH KOREA AMOREPACIFIC Group 72,877 4,752,847 0.97 BGF retail Co Ltd 13,400 2,543,700 0.52 Coway Co Ltd 27,100 2,277,007 0.47 Dongsuh Cos Inc 29,500 518,683 0.11 E-MART Inc 10,800 1,730,861 0.36 Hanssem Co Ltd 66,800 5,330,577 1.09 LG Chem Ltd 30,600 10,617,631 2.18 NAVER Corp 20,000 2,360,629 0.48 Nong Shim Holdings Co Ltd 7,100 533,747 0.11 Ottogi Corp 2,680 1,819,312 0.37 Shinhan Financial Group Co Ltd 98,800 3,830,070 0.79 Yuhan Corp 11,680 2,702,694 0.55
39,017,758 8.00
TAIWAN Asustek Computer Inc 882,000 6,297,650 1.29 Chin-Poon Industrial Co Ltd 2,169,000 2,901,845 0.59 Formosa Chemicals & Fibre Corp 2,722,000 9,352,971 1.92 Formosa Plastics Corp 2,976,000 9,935,640 2.04 Hon Hai Precision Industry Co Ltd 1,982,000 4,678,648 0.96 Hu Lane Associate Inc 155,000 483,234 0.10 Largan Precision Co Ltd 46,000 6,516,665 1.34 PChome Online Inc 1,614,202 7,421,563 1.52 President Chain Store Corp 194,000 2,009,245 0.41 San Fang Chemical Industry Co Ltd 994,000 826,006 0.17 St Shine Optical Co Ltd 224,000 4,214,127 0.86 Taiwan Semiconductor Manufacturing Co Ltd 1,255,000 9,735,722 2.00 Voltronic Power Technology Corp 198,700 3,683,279 0.76
68,056,595 13.96
TOTAL EQUITIES 477,396,340 97.89
TOTAL TRANSFERABLE SECURITIES ADMITTED TO AN OFFICIAL STOCK EXCHANGE LISTING OR DEALT IN ON ANOTHER REGULATED MARKET 477,396,340 97.89
OPEN-ENDED FUNDS IRELAND Invesco Short-Term Investments Co Global Series Plc - US Dollar Liquidity Portfolio 3,616,613 3,616,613 0.74
TOTAL OPEN-ENDED FUNDS 3,616,613 0.74
Total Investments 481,012,953 98.63
The accompanying notes form an integral part of these financial statements.
*Effective 6 July 2018 the Invesco Asia Infrastructure Fund merged into the Invesco Asia Opportunities Equity Fund.
Invesco Asia Opportunities Equity Fund* Statement of Investments as at 28 February 2019
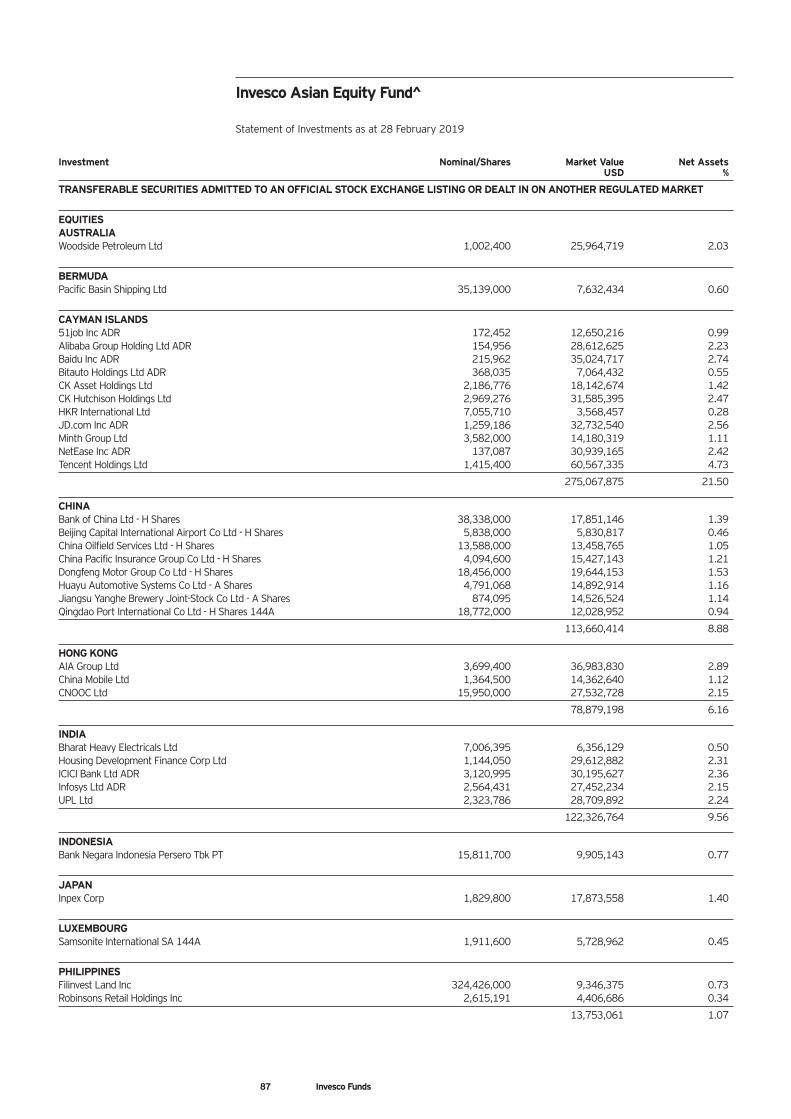
87 Invesco Funds
Investment Nominal/Shares Market Value Net Assets USD %
TRANSFERABLE SECURITIES ADMITTED TO AN OFFICIAL STOCK EXCHANGE LISTING OR DEALT IN ON ANOTHER REGULATED MARKET
EQUITIES AUSTRALIA Woodside Petroleum Ltd 1,002,400 25,964,719 2.03
BERMUDA Pacific Basin Shipping Ltd 35,139,000 7,632,434 0.60
CAYMAN ISLANDS 51job Inc ADR 172,452 12,650,216 0.99 Alibaba Group Holding Ltd ADR 154,956 28,612,625 2.23 Baidu Inc ADR 215,962 35,024,717 2.74 Bitauto Holdings Ltd ADR 368,035 7,064,432 0.55 CK Asset Holdings Ltd 2,186,776 18,142,674 1.42 CK Hutchison Holdings Ltd 2,969,276 31,585,395 2.47 HKR International Ltd 7,055,710 3,568,457 0.28 JD.com Inc ADR 1,259,186 32,732,540 2.56 Minth Group Ltd 3,582,000 14,180,319 1.11 NetEase Inc ADR 137,087 30,939,165 2.42 Tencent Holdings Ltd 1,415,400 60,567,335 4.73
275,067,875 21.50
CHINA Bank of China Ltd - H Shares 38,338,000 17,851,146 1.39 Beijing Capital International Airport Co Ltd - H Shares 5,838,000 5,830,817 0.46 China Oilfield Services Ltd - H Shares 13,588,000 13,458,765 1.05 China Pacific Insurance Group Co Ltd - H Shares 4,094,600 15,427,143 1.21 Dongfeng Motor Group Co Ltd - H Shares 18,456,000 19,644,153 1.53 Huayu Automotive Systems Co Ltd - A Shares 4,791,068 14,892,914 1.16 Jiangsu Yanghe Brewery Joint-Stock Co Ltd - A Shares 874,095 14,526,524 1.14 Qingdao Port International Co Ltd - H Shares 144A 18,772,000 12,028,952 0.94
113,660,414 8.88
HONG KONG AIA Group Ltd 3,699,400 36,983,830 2.89 China Mobile Ltd 1,364,500 14,362,640 1.12 CNOOC Ltd 15,950,000 27,532,728 2.15
78,879,198 6.16
INDIA Bharat Heavy Electricals Ltd 7,006,395 6,356,129 0.50 Housing Development Finance Corp Ltd 1,144,050 29,612,882 2.31 ICICI Bank Ltd ADR 3,120,995 30,195,627 2.36 Infosys Ltd ADR 2,564,431 27,452,234 2.15 UPL Ltd 2,323,786 28,709,892 2.24
122,326,764 9.56
INDONESIA Bank Negara Indonesia Persero Tbk PT 15,811,700 9,905,143 0.77
JAPAN Inpex Corp 1,829,800 17,873,558 1.40
LUXEMBOURG Samsonite International SA 144A 1,911,600 5,728,962 0.45
PHILIPPINES Filinvest Land Inc 324,426,000 9,346,375 0.73 Robinsons Retail Holdings Inc 2,615,191 4,406,686 0.34
13,753,061 1.07
Invesco Asian Equity Fund^ Statement of Investments as at 28 February 2019
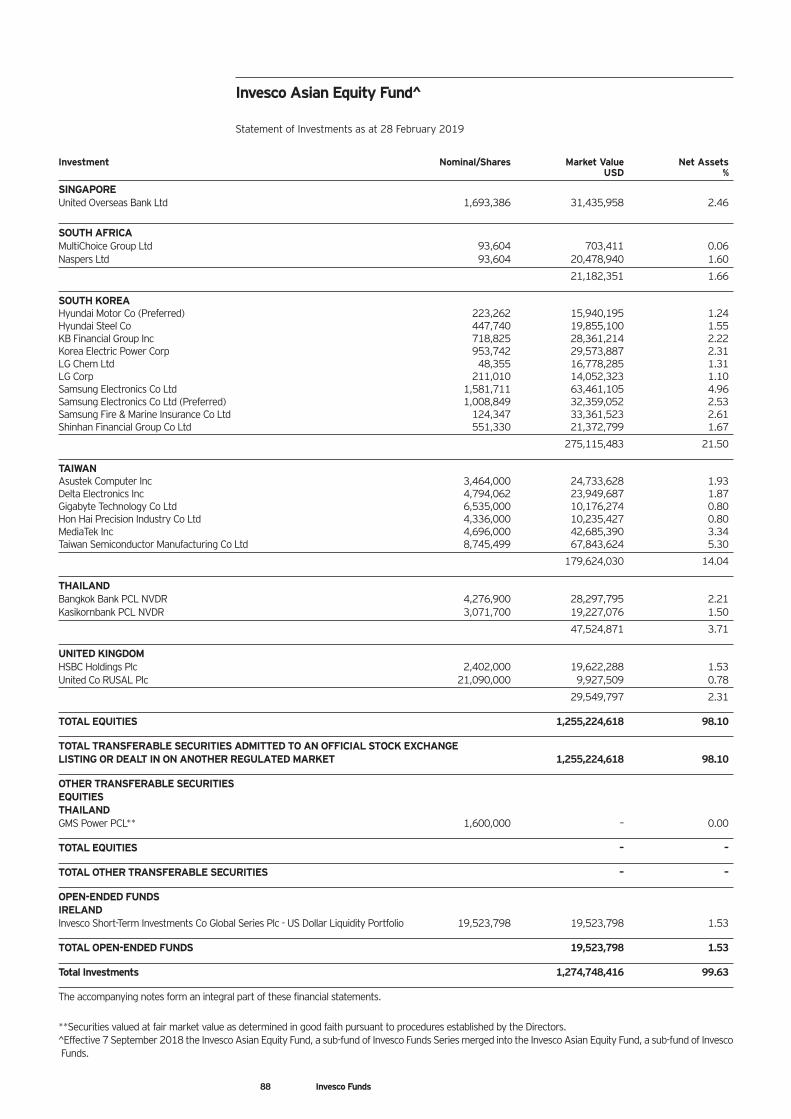
88 Invesco Funds
Investment Nominal/Shares Market Value Net Assets USD %
SINGAPORE United Overseas Bank Ltd 1,693,386 31,435,958 2.46
SOUTH AFRICA MultiChoice Group Ltd 93,604 703,411 0.06 Naspers Ltd 93,604 20,478,940 1.60
21,182,351 1.66
SOUTH KOREA Hyundai Motor Co (Preferred) 223,262 15,940,195 1.24 Hyundai Steel Co 447,740 19,855,100 1.55 KB Financial Group Inc 718,825 28,361,214 2.22 Korea Electric Power Corp 953,742 29,573,887 2.31 LG Chem Ltd 48,355 16,778,285 1.31 LG Corp 211,010 14,052,323 1.10 Samsung Electronics Co Ltd 1,581,711 63,461,105 4.96 Samsung Electronics Co Ltd (Preferred) 1,008,849 32,359,052 2.53 Samsung Fire & Marine Insurance Co Ltd 124,347 33,361,523 2.61 Shinhan Financial Group Co Ltd 551,330 21,372,799 1.67
275,115,483 21.50
TAIWAN Asustek Computer Inc 3,464,000 24,733,628 1.93 Delta Electronics Inc 4,794,062 23,949,687 1.87 Gigabyte Technology Co Ltd 6,535,000 10,176,274 0.80 Hon Hai Precision Industry Co Ltd 4,336,000 10,235,427 0.80 MediaTek Inc 4,696,000 42,685,390 3.34 Taiwan Semiconductor Manufacturing Co Ltd 8,745,499 67,843,624 5.30
179,624,030 14.04
THAILAND Bangkok Bank PCL NVDR 4,276,900 28,297,795 2.21 Kasikornbank PCL NVDR 3,071,700 19,227,076 1.50
47,524,871 3.71
UNITED KINGDOM HSBC Holdings Plc 2,402,000 19,622,288 1.53 United Co RUSAL Plc 21,090,000 9,927,509 0.78
29,549,797 2.31
TOTAL EQUITIES 1,255,224,618 98.10
TOTAL TRANSFERABLE SECURITIES ADMITTED TO AN OFFICIAL STOCK EXCHANGE LISTING OR DEALT IN ON ANOTHER REGULATED MARKET 1,255,224,618 98.10
OTHER TRANSFERABLE SECURITIES EQUITIES THAILAND GMS Power PCL** 1,600,000 – 0.00
TOTAL EQUITIES – –
TOTAL OTHER TRANSFERABLE SECURITIES – –
OPEN-ENDED FUNDS IRELAND Invesco Short-Term Investments Co Global Series Plc - US Dollar Liquidity Portfolio 19,523,798 19,523,798 1.53
TOTAL OPEN-ENDED FUNDS 19,523,798 1.53
Total Investments 1,274,748,416 99.63
The accompanying notes form an integral part of these financial statements.
**Securities valued at fair market value as determined in good faith pursuant to procedures established by the Directors. ^Effective 7 September 2018 the Invesco Asian Equity Fund, a sub-fund of Invesco Funds Series merged into the Invesco Asian Equity Fund, a sub-fund of Invesco Funds.
Invesco Asian Equity Fund^ Statement of Investments as at 28 February 2019
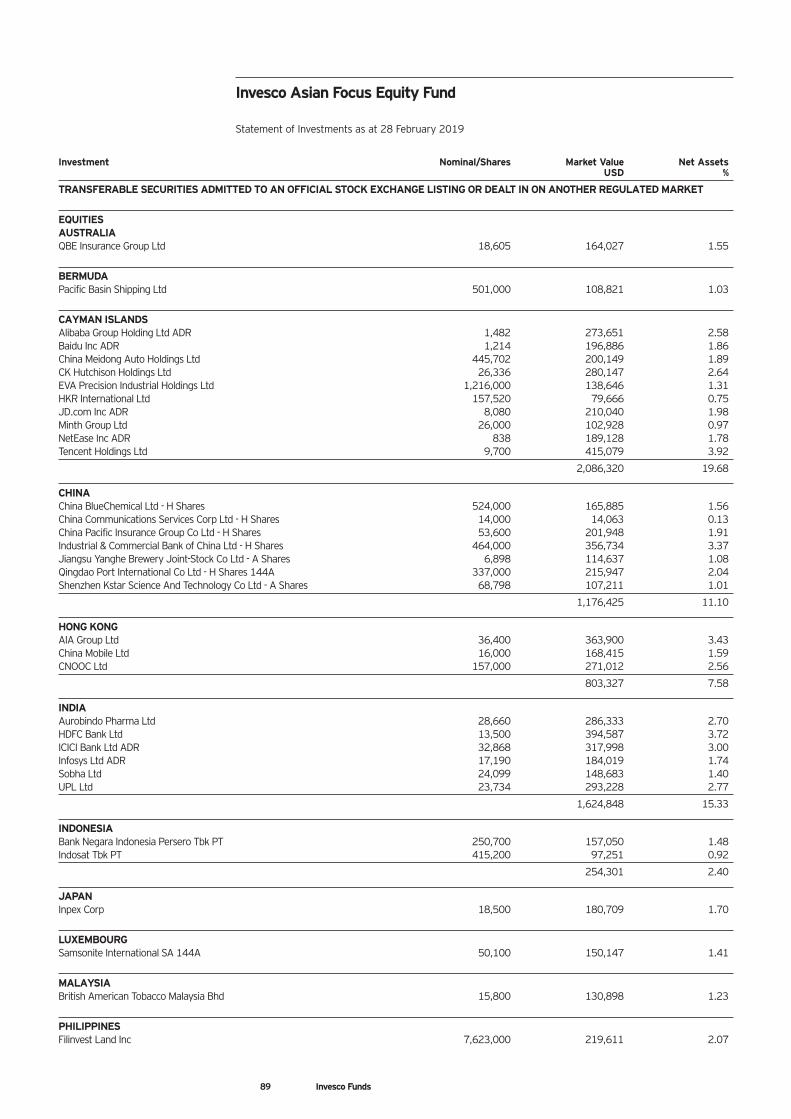
89 Invesco Funds
Investment Nominal/Shares Market Value Net Assets USD %
TRANSFERABLE SECURITIES ADMITTED TO AN OFFICIAL STOCK EXCHANGE LISTING OR DEALT IN ON ANOTHER REGULATED MARKET
EQUITIES AUSTRALIA QBE Insurance Group Ltd 18,605 164,027 1.55
BERMUDA Pacific Basin Shipping Ltd 501,000 108,821 1.03
CAYMAN ISLANDS Alibaba Group Holding Ltd ADR 1,482 273,651 2.58 Baidu Inc ADR 1,214 196,886 1.86 China Meidong Auto Holdings Ltd 445,702 200,149 1.89 CK Hutchison Holdings Ltd 26,336 280,147 2.64 EVA Precision Industrial Holdings Ltd 1,216,000 138,646 1.31 HKR International Ltd 157,520 79,666 0.75 JD.com Inc ADR 8,080 210,040 1.98 Minth Group Ltd 26,000 102,928 0.97 NetEase Inc ADR 838 189,128 1.78 Tencent Holdings Ltd 9,700 415,079 3.92
2,086,320 19.68
CHINA China BlueChemical Ltd - H Shares 524,000 165,885 1.56 China Communications Services Corp Ltd - H Shares 14,000 14,063 0.13 China Pacific Insurance Group Co Ltd - H Shares 53,600 201,948 1.91 Industrial & Commercial Bank of China Ltd - H Shares 464,000 356,734 3.37 Jiangsu Yanghe Brewery Joint-Stock Co Ltd - A Shares 6,898 114,637 1.08 Qingdao Port International Co Ltd - H Shares 144A 337,000 215,947 2.04 Shenzhen Kstar Science And Technology Co Ltd - A Shares 68,798 107,211 1.01
1,176,425 11.10
HONG KONG AIA Group Ltd 36,400 363,900 3.43 China Mobile Ltd 16,000 168,415 1.59 CNOOC Ltd 157,000 271,012 2.56
803,327 7.58
INDIA Aurobindo Pharma Ltd 28,660 286,333 2.70 HDFC Bank Ltd 13,500 394,587 3.72 ICICI Bank Ltd ADR 32,868 317,998 3.00 Infosys Ltd ADR 17,190 184,019 1.74 Sobha Ltd 24,099 148,683 1.40 UPL Ltd 23,734 293,228 2.77
1,624,848 15.33
INDONESIA Bank Negara Indonesia Persero Tbk PT 250,700 157,050 1.48 Indosat Tbk PT 415,200 97,251 0.92
254,301 2.40
JAPAN Inpex Corp 18,500 180,709 1.70
LUXEMBOURG Samsonite International SA 144A 50,100 150,147 1.41
MALAYSIA British American Tobacco Malaysia Bhd 15,800 130,898 1.23
PHILIPPINES Filinvest Land Inc 7,623,000 219,611 2.07
Invesco Asian Focus Equity Fund Statement of Investments as at 28 February 2019
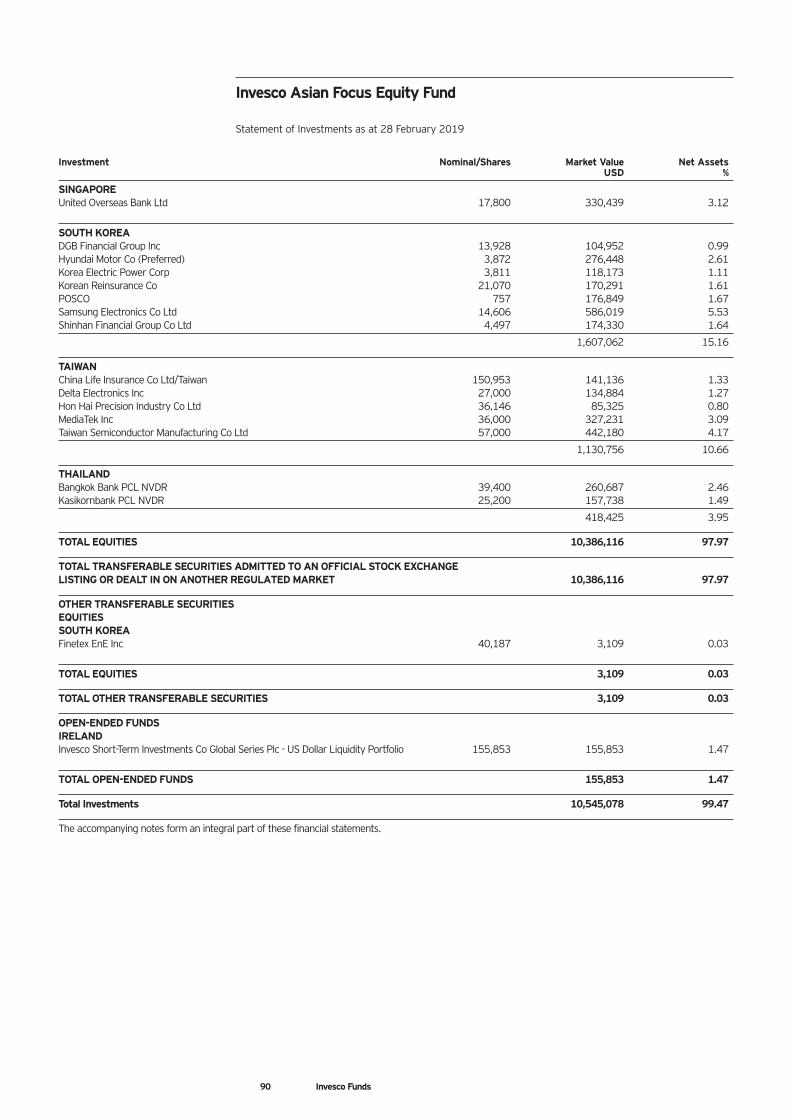
90 Invesco Funds
Investment Nominal/Shares Market Value Net Assets USD %
SINGAPORE United Overseas Bank Ltd 17,800 330,439 3.12
SOUTH KOREA DGB Financial Group Inc 13,928 104,952 0.99 Hyundai Motor Co (Preferred) 3,872 276,448 2.61 Korea Electric Power Corp 3,811 118,173 1.11 Korean Reinsurance Co 21,070 170,291 1.61 POSCO 757 176,849 1.67 Samsung Electronics Co Ltd 14,606 586,019 5.53 Shinhan Financial Group Co Ltd 4,497 174,330 1.64
1,607,062 15.16
TAIWAN China Life Insurance Co Ltd/Taiwan 150,953 141,136 1.33 Delta Electronics Inc 27,000 134,884 1.27 Hon Hai Precision Industry Co Ltd 36,146 85,325 0.80 MediaTek Inc 36,000 327,231 3.09 Taiwan Semiconductor Manufacturing Co Ltd 57,000 442,180 4.17
1,130,756 10.66
THAILAND Bangkok Bank PCL NVDR 39,400 260,687 2.46 Kasikornbank PCL NVDR 25,200 157,738 1.49
418,425 3.95
TOTAL EQUITIES 10,386,116 97.97
TOTAL TRANSFERABLE SECURITIES ADMITTED TO AN OFFICIAL STOCK EXCHANGE LISTING OR DEALT IN ON ANOTHER REGULATED MARKET 10,386,116 97.97
OTHER TRANSFERABLE SECURITIES EQUITIES SOUTH KOREA Finetex EnE Inc 40,187 3,109 0.03
TOTAL EQUITIES 3,109 0.03
TOTAL OTHER TRANSFERABLE SECURITIES 3,109 0.03
OPEN-ENDED FUNDS IRELAND Invesco Short-Term Investments Co Global Series Plc - US Dollar Liquidity Portfolio 155,853 155,853 1.47
TOTAL OPEN-ENDED FUNDS 155,853 1.47
Total Investments 10,545,078 99.47
The accompanying notes form an integral part of these financial statements.
Invesco Asian Focus Equity Fund Statement of Investments as at 28 February 2019
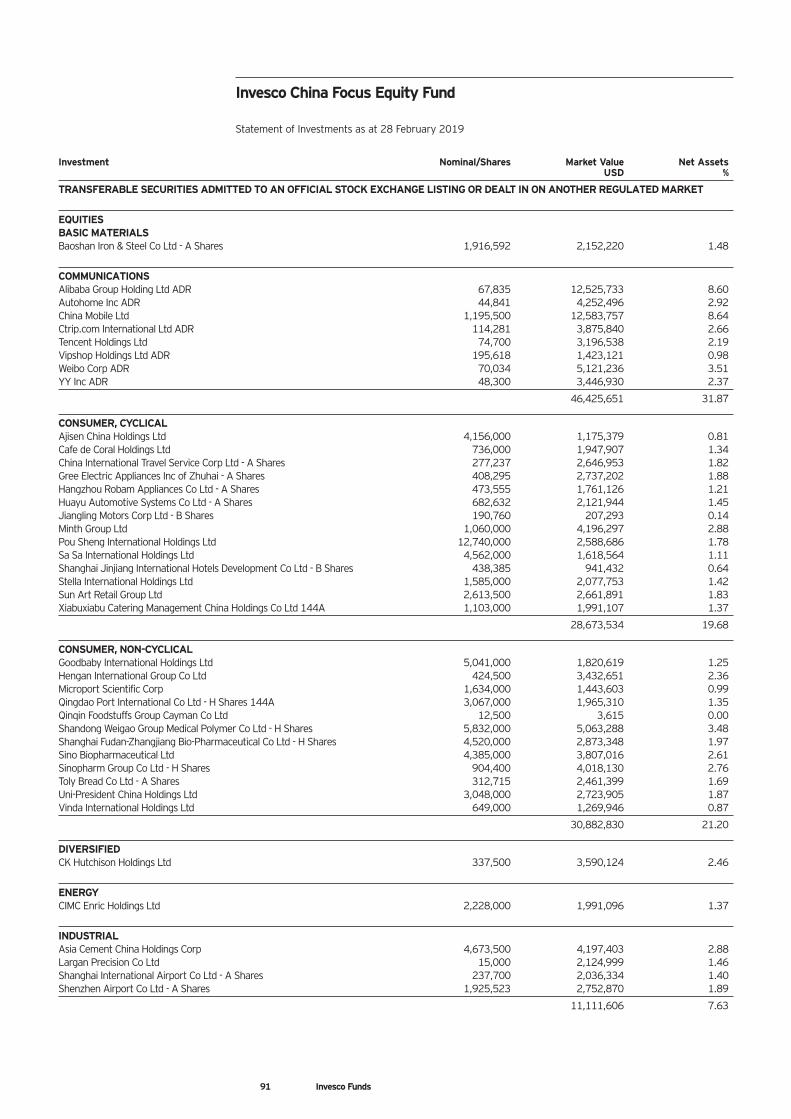
91 Invesco Funds
Investment Nominal/Shares Market Value Net Assets USD %
TRANSFERABLE SECURITIES ADMITTED TO AN OFFICIAL STOCK EXCHANGE LISTING OR DEALT IN ON ANOTHER REGULATED MARKET
EQUITIES BASIC MATERIALS Baoshan Iron & Steel Co Ltd - A Shares 1,916,592 2,152,220 1.48
COMMUNICATIONS Alibaba Group Holding Ltd ADR 67,835 12,525,733 8.60 Autohome Inc ADR 44,841 4,252,496 2.92 China Mobile Ltd 1,195,500 12,583,757 8.64 Ctrip.com International Ltd ADR 114,281 3,875,840 2.66 Tencent Holdings Ltd 74,700 3,196,538 2.19 Vipshop Holdings Ltd ADR 195,618 1,423,121 0.98 Weibo Corp ADR 70,034 5,121,236 3.51 YY Inc ADR 48,300 3,446,930 2.37
46,425,651 31.87
CONSUMER, CYCLICAL Ajisen China Holdings Ltd 4,156,000 1,175,379 0.81 Cafe de Coral Holdings Ltd 736,000 1,947,907 1.34 China International Travel Service Corp Ltd - A Shares 277,237 2,646,953 1.82 Gree Electric Appliances Inc of Zhuhai - A Shares 408,295 2,737,202 1.88 Hangzhou Robam Appliances Co Ltd - A Shares 473,555 1,761,126 1.21 Huayu Automotive Systems Co Ltd - A Shares 682,632 2,121,944 1.45 Jiangling Motors Corp Ltd - B Shares 190,760 207,293 0.14 Minth Group Ltd 1,060,000 4,196,297 2.88 Pou Sheng International Holdings Ltd 12,740,000 2,588,686 1.78 Sa Sa International Holdings Ltd 4,562,000 1,618,564 1.11 Shanghai Jinjiang International Hotels Development Co Ltd - B Shares 438,385 941,432 0.64 Stella International Holdings Ltd 1,585,000 2,077,753 1.42 Sun Art Retail Group Ltd 2,613,500 2,661,891 1.83 Xiabuxiabu Catering Management China Holdings Co Ltd 144A 1,103,000 1,991,107 1.37
28,673,534 19.68
CONSUMER, NON-CYCLICAL Goodbaby International Holdings Ltd 5,041,000 1,820,619 1.25 Hengan International Group Co Ltd 424,500 3,432,651 2.36 Microport Scientific Corp 1,634,000 1,443,603 0.99 Qingdao Port International Co Ltd - H Shares 144A 3,067,000 1,965,310 1.35 Qinqin Foodstuffs Group Cayman Co Ltd 12,500 3,615 0.00 Shandong Weigao Group Medical Polymer Co Ltd - H Shares 5,832,000 5,063,288 3.48 Shanghai Fudan-Zhangjiang Bio-Pharmaceutical Co Ltd - H Shares 4,520,000 2,873,348 1.97 Sino Biopharmaceutical Ltd 4,385,000 3,807,016 2.61 Sinopharm Group Co Ltd - H Shares 904,400 4,018,130 2.76 Toly Bread Co Ltd - A Shares 312,715 2,461,399 1.69 Uni-President China Holdings Ltd 3,048,000 2,723,905 1.87 Vinda International Holdings Ltd 649,000 1,269,946 0.87
30,882,830 21.20
DIVERSIFIED CK Hutchison Holdings Ltd 337,500 3,590,124 2.46
ENERGY CIMC Enric Holdings Ltd 2,228,000 1,991,096 1.37
INDUSTRIAL Asia Cement China Holdings Corp 4,673,500 4,197,403 2.88 Largan Precision Co Ltd 15,000 2,124,999 1.46 Shanghai International Airport Co Ltd - A Shares 237,700 2,036,334 1.40 Shenzhen Airport Co Ltd - A Shares 1,925,523 2,752,870 1.89
11,111,606 7.63
Invesco China Focus Equity Fund Statement of Investments as at 28 February 2019
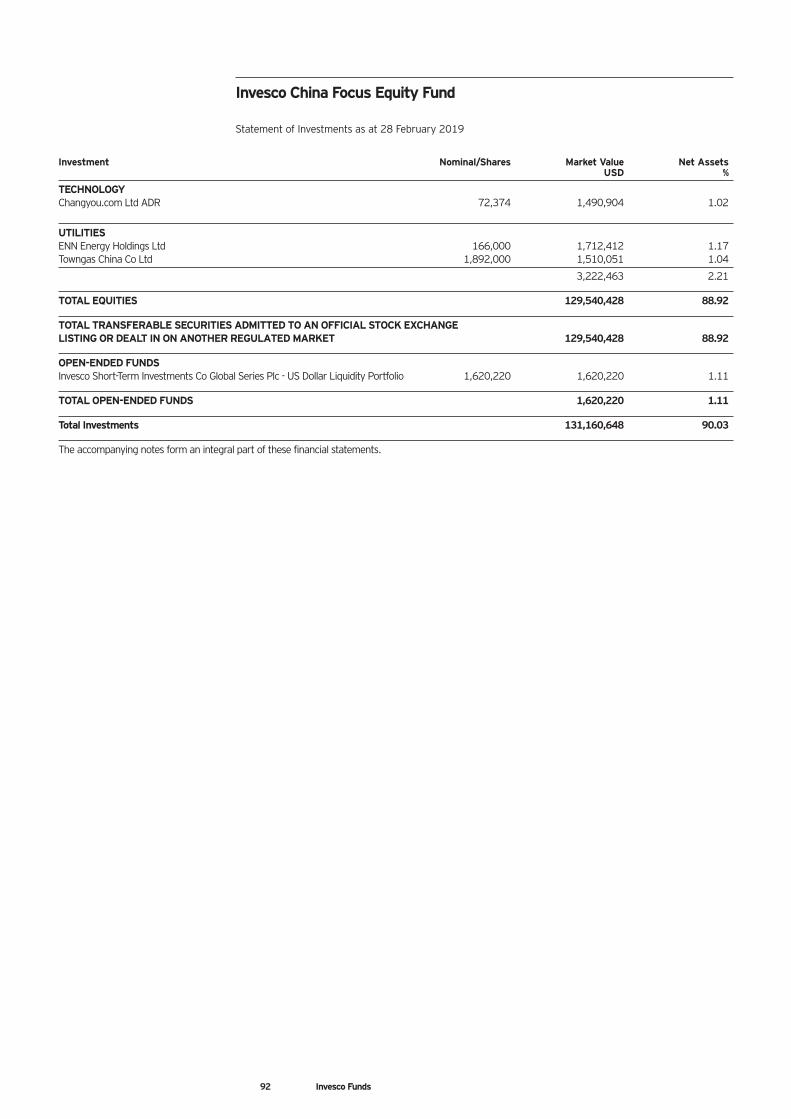
92 Invesco Funds
Investment Nominal/Shares Market Value Net Assets USD %
TECHNOLOGY Changyou.com Ltd ADR 72,374 1,490,904 1.02
UTILITIES ENN Energy Holdings Ltd 166,000 1,712,412 1.17 Towngas China Co Ltd 1,892,000 1,510,051 1.04
3,222,463 2.21
TOTAL EQUITIES 129,540,428 88.92
TOTAL TRANSFERABLE SECURITIES ADMITTED TO AN OFFICIAL STOCK EXCHANGE LISTING OR DEALT IN ON ANOTHER REGULATED MARKET 129,540,428 88.92
OPEN-ENDED FUNDS Invesco Short-Term Investments Co Global Series Plc - US Dollar Liquidity Portfolio 1,620,220 1,620,220 1.11
TOTAL OPEN-ENDED FUNDS 1,620,220 1.11
Total Investments 131,160,648 90.03
The accompanying notes form an integral part of these financial statements.
Invesco China Focus Equity Fund Statement of Investments as at 28 February 2019
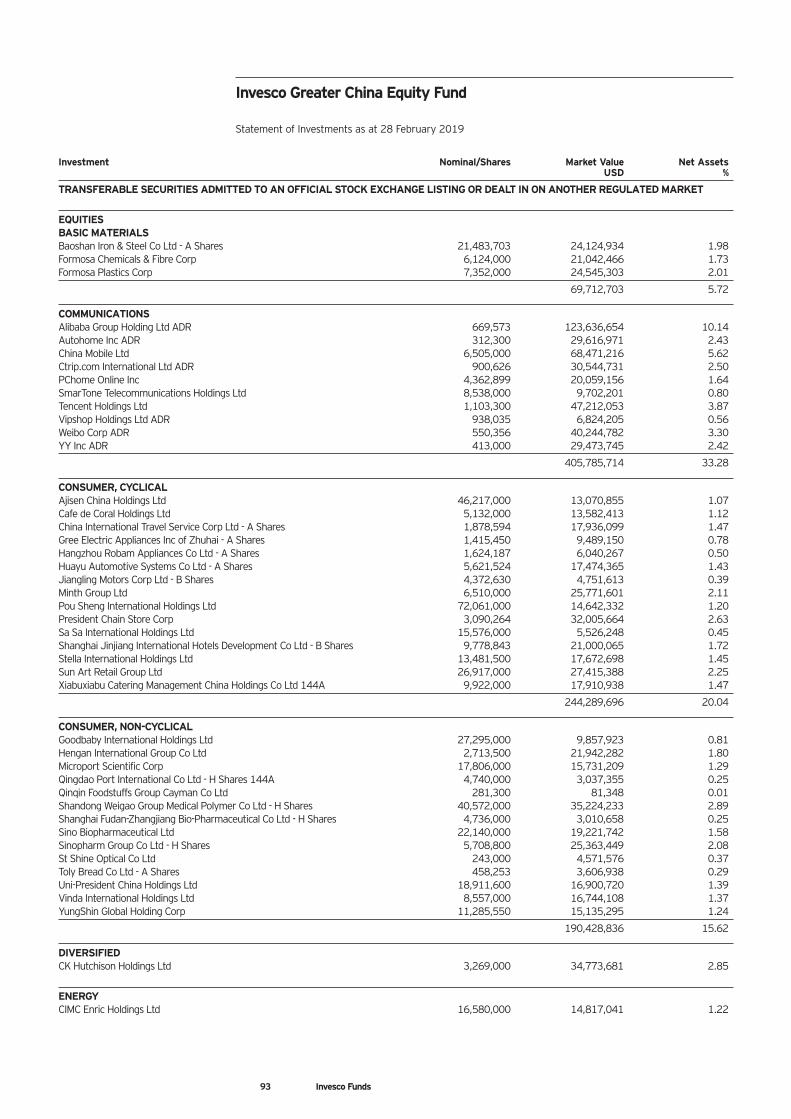
93 Invesco Funds
Investment Nominal/Shares Market Value Net Assets USD %
TRANSFERABLE SECURITIES ADMITTED TO AN OFFICIAL STOCK EXCHANGE LISTING OR DEALT IN ON ANOTHER REGULATED MARKET
EQUITIES BASIC MATERIALS Baoshan Iron & Steel Co Ltd - A Shares 21,483,703 24,124,934 1.98 Formosa Chemicals & Fibre Corp 6,124,000 21,042,466 1.73 Formosa Plastics Corp 7,352,000 24,545,303 2.01
69,712,703 5.72
COMMUNICATIONS Alibaba Group Holding Ltd ADR 669,573 123,636,654 10.14 Autohome Inc ADR 312,300 29,616,971 2.43 China Mobile Ltd 6,505,000 68,471,216 5.62 Ctrip.com International Ltd ADR 900,626 30,544,731 2.50 PChome Online Inc 4,362,899 20,059,156 1.64 SmarTone Telecommunications Holdings Ltd 8,538,000 9,702,201 0.80 Tencent Holdings Ltd 1,103,300 47,212,053 3.87 Vipshop Holdings Ltd ADR 938,035 6,824,205 0.56 Weibo Corp ADR 550,356 40,244,782 3.30 YY Inc ADR 413,000 29,473,745 2.42
405,785,714 33.28
CONSUMER, CYCLICAL Ajisen China Holdings Ltd 46,217,000 13,070,855 1.07 Cafe de Coral Holdings Ltd 5,132,000 13,582,413 1.12 China International Travel Service Corp Ltd - A Shares 1,878,594 17,936,099 1.47 Gree Electric Appliances Inc of Zhuhai - A Shares 1,415,450 9,489,150 0.78 Hangzhou Robam Appliances Co Ltd - A Shares 1,624,187 6,040,267 0.50 Huayu Automotive Systems Co Ltd - A Shares 5,621,524 17,474,365 1.43 Jiangling Motors Corp Ltd - B Shares 4,372,630 4,751,613 0.39 Minth Group Ltd 6,510,000 25,771,601 2.11 Pou Sheng International Holdings Ltd 72,061,000 14,642,332 1.20 President Chain Store Corp 3,090,264 32,005,664 2.63 Sa Sa International Holdings Ltd 15,576,000 5,526,248 0.45 Shanghai Jinjiang International Hotels Development Co Ltd - B Shares 9,778,843 21,000,065 1.72 Stella International Holdings Ltd 13,481,500 17,672,698 1.45 Sun Art Retail Group Ltd 26,917,000 27,415,388 2.25 Xiabuxiabu Catering Management China Holdings Co Ltd 144A 9,922,000 17,910,938 1.47
244,289,696 20.04
CONSUMER, NON-CYCLICAL Goodbaby International Holdings Ltd 27,295,000 9,857,923 0.81 Hengan International Group Co Ltd 2,713,500 21,942,282 1.80 Microport Scientific Corp 17,806,000 15,731,209 1.29 Qingdao Port International Co Ltd - H Shares 144A 4,740,000 3,037,355 0.25 Qinqin Foodstuffs Group Cayman Co Ltd 281,300 81,348 0.01 Shandong Weigao Group Medical Polymer Co Ltd - H Shares 40,572,000 35,224,233 2.89 Shanghai Fudan-Zhangjiang Bio-Pharmaceutical Co Ltd - H Shares 4,736,000 3,010,658 0.25 Sino Biopharmaceutical Ltd 22,140,000 19,221,742 1.58 Sinopharm Group Co Ltd - H Shares 5,708,800 25,363,449 2.08 St Shine Optical Co Ltd 243,000 4,571,576 0.37 Toly Bread Co Ltd - A Shares 458,253 3,606,938 0.29 Uni-President China Holdings Ltd 18,911,600 16,900,720 1.39 Vinda International Holdings Ltd 8,557,000 16,744,108 1.37 YungShin Global Holding Corp 11,285,550 15,135,295 1.24
190,428,836 15.62
DIVERSIFIED CK Hutchison Holdings Ltd 3,269,000 34,773,681 2.85
ENERGY CIMC Enric Holdings Ltd 16,580,000 14,817,041 1.22
Invesco Greater China Equity Fund Statement of Investments as at 28 February 2019
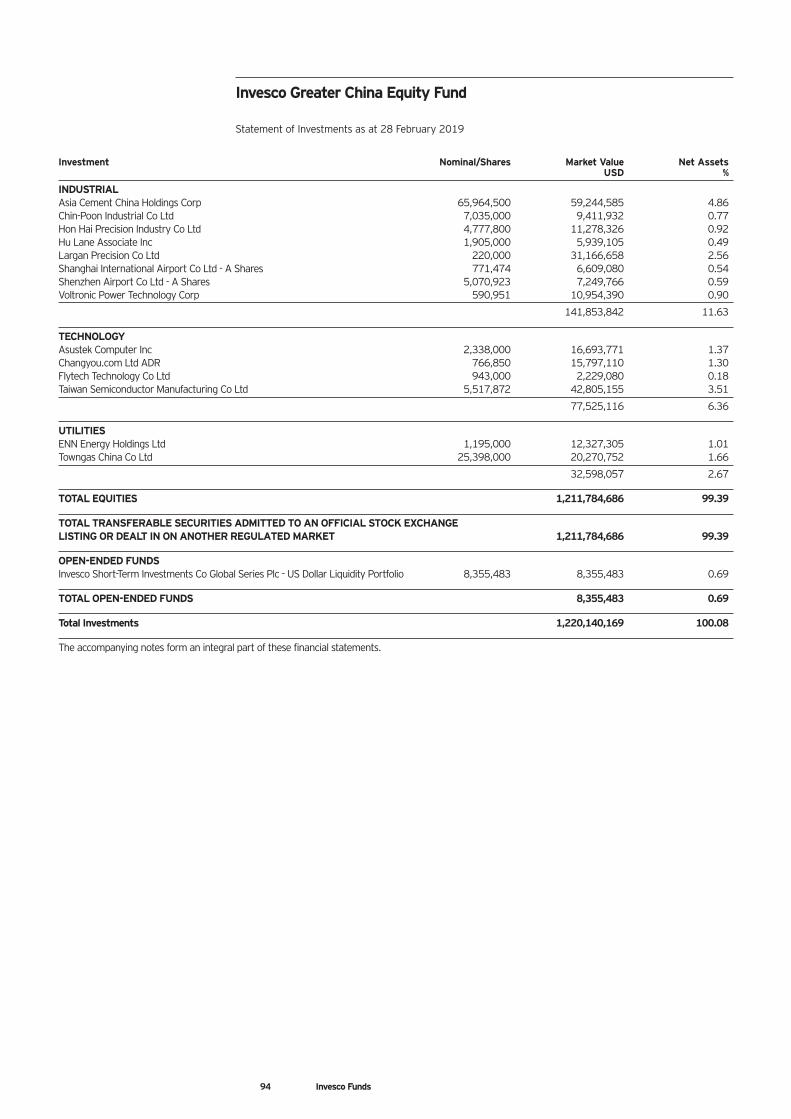
94 Invesco Funds
Investment Nominal/Shares Market Value Net Assets USD %
INDUSTRIAL Asia Cement China Holdings Corp 65,964,500 59,244,585 4.86 Chin-Poon Industrial Co Ltd 7,035,000 9,411,932 0.77 Hon Hai Precision Industry Co Ltd 4,777,800 11,278,326 0.92 Hu Lane Associate Inc 1,905,000 5,939,105 0.49 Largan Precision Co Ltd 220,000 31,166,658 2.56 Shanghai International Airport Co Ltd - A Shares 771,474 6,609,080 0.54 Shenzhen Airport Co Ltd - A Shares 5,070,923 7,249,766 0.59 Voltronic Power Technology Corp 590,951 10,954,390 0.90
141,853,842 11.63
TECHNOLOGY Asustek Computer Inc 2,338,000 16,693,771 1.37 Changyou.com Ltd ADR 766,850 15,797,110 1.30 Flytech Technology Co Ltd 943,000 2,229,080 0.18 Taiwan Semiconductor Manufacturing Co Ltd 5,517,872 42,805,155 3.51
77,525,116 6.36
UTILITIES ENN Energy Holdings Ltd 1,195,000 12,327,305 1.01 Towngas China Co Ltd 25,398,000 20,270,752 1.66
32,598,057 2.67
TOTAL EQUITIES 1,211,784,686 99.39
TOTAL TRANSFERABLE SECURITIES ADMITTED TO AN OFFICIAL STOCK EXCHANGE LISTING OR DEALT IN ON ANOTHER REGULATED MARKET 1,211,784,686 99.39
OPEN-ENDED FUNDS Invesco Short-Term Investments Co Global Series Plc - US Dollar Liquidity Portfolio 8,355,483 8,355,483 0.69
TOTAL OPEN-ENDED FUNDS 8,355,483 0.69
Total Investments 1,220,140,169 100.08
The accompanying notes form an integral part of these financial statements.
Invesco Greater China Equity Fund Statement of Investments as at 28 February 2019
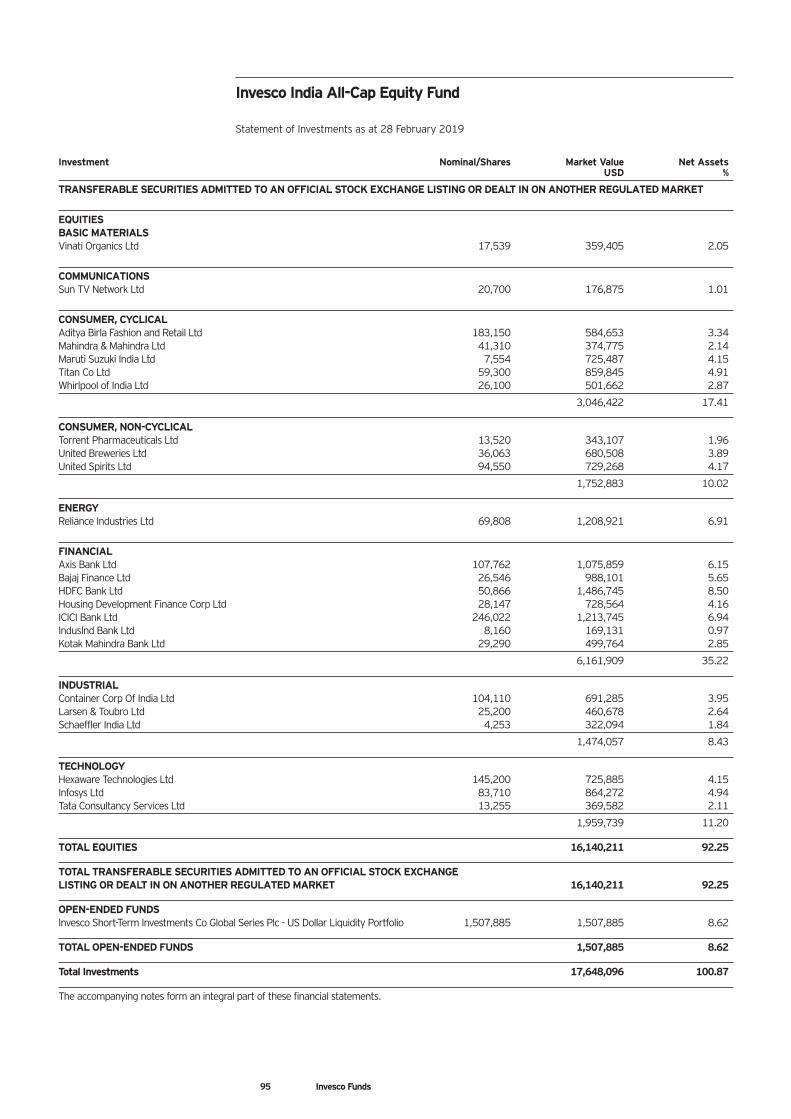
95 Invesco Funds
Investment Nominal/Shares Market Value Net Assets USD %
TRANSFERABLE SECURITIES ADMITTED TO AN OFFICIAL STOCK EXCHANGE LISTING OR DEALT IN ON ANOTHER REGULATED MARKET
EQUITIES BASIC MATERIALS Vinati Organics Ltd 17,539 359,405 2.05
COMMUNICATIONS Sun TV Network Ltd 20,700 176,875 1.01
CONSUMER, CYCLICAL Aditya Birla Fashion and Retail Ltd 183,150 584,653 3.34 Mahindra & Mahindra Ltd 41,310 374,775 2.14 Maruti Suzuki India Ltd 7,554 725,487 4.15 Titan Co Ltd 59,300 859,845 4.91 Whirlpool of India Ltd 26,100 501,662 2.87
3,046,422 17.41
CONSUMER, NON-CYCLICAL Torrent Pharmaceuticals Ltd 13,520 343,107 1.96 United Breweries Ltd 36,063 680,508 3.89 United Spirits Ltd 94,550 729,268 4.17
1,752,883 10.02
ENERGY Reliance Industries Ltd 69,808 1,208,921 6.91
FINANCIAL Axis Bank Ltd 107,762 1,075,859 6.15 Bajaj Finance Ltd 26,546 988,101 5.65 HDFC Bank Ltd 50,866 1,486,745 8.50 Housing Development Finance Corp Ltd 28,147 728,564 4.16 ICICI Bank Ltd 246,022 1,213,745 6.94 IndusInd Bank Ltd 8,160 169,131 0.97 Kotak Mahindra Bank Ltd 29,290 499,764 2.85
6,161,909 35.22
INDUSTRIAL Container Corp Of India Ltd 104,110 691,285 3.95 Larsen & Toubro Ltd 25,200 460,678 2.64 Schaeffler India Ltd 4,253 322,094 1.84
1,474,057 8.43
TECHNOLOGY Hexaware Technologies Ltd 145,200 725,885 4.15 Infosys Ltd 83,710 864,272 4.94 Tata Consultancy Services Ltd 13,255 369,582 2.11
1,959,739 11.20
TOTAL EQUITIES 16,140,211 92.25
TOTAL TRANSFERABLE SECURITIES ADMITTED TO AN OFFICIAL STOCK EXCHANGE LISTING OR DEALT IN ON ANOTHER REGULATED MARKET 16,140,211 92.25
OPEN-ENDED FUNDS Invesco Short-Term Investments Co Global Series Plc - US Dollar Liquidity Portfolio 1,507,885 1,507,885 8.62
TOTAL OPEN-ENDED FUNDS 1,507,885 8.62
Total Investments 17,648,096 100.87
The accompanying notes form an integral part of these financial statements.
Invesco India All-Cap Equity Fund Statement of Investments as at 28 February 2019
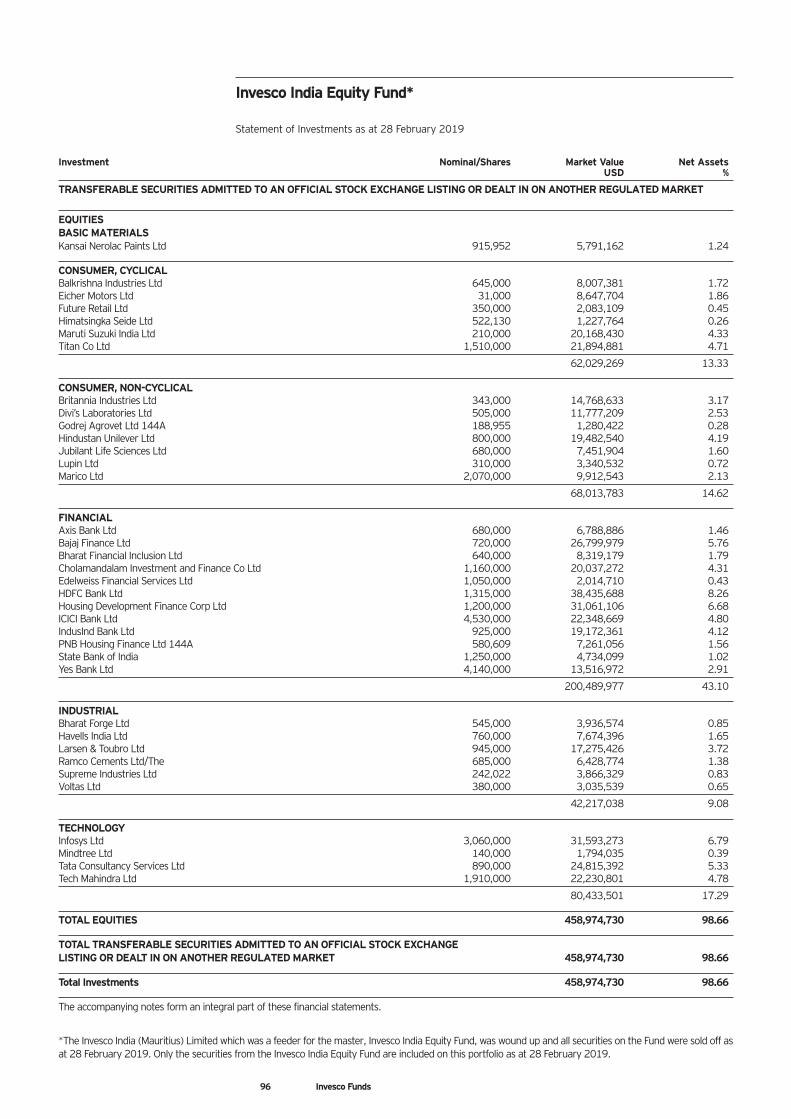
96 Invesco Funds
Investment Nominal/Shares Market Value Net Assets USD %
TRANSFERABLE SECURITIES ADMITTED TO AN OFFICIAL STOCK EXCHANGE LISTING OR DEALT IN ON ANOTHER REGULATED MARKET
EQUITIES BASIC MATERIALS Kansai Nerolac Paints Ltd 915,952 5,791,162 1.24
CONSUMER, CYCLICAL Balkrishna Industries Ltd 645,000 8,007,381 1.72 Eicher Motors Ltd 31,000 8,647,704 1.86 Future Retail Ltd 350,000 2,083,109 0.45 Himatsingka Seide Ltd 522,130 1,227,764 0.26 Maruti Suzuki India Ltd 210,000 20,168,430 4.33 Titan Co Ltd 1,510,000 21,894,881 4.71
62,029,269 13.33
CONSUMER, NON-CYCLICAL Britannia Industries Ltd 343,000 14,768,633 3.17 Divi’s Laboratories Ltd 505,000 11,777,209 2.53 Godrej Agrovet Ltd 144A 188,955 1,280,422 0.28 Hindustan Unilever Ltd 800,000 19,482,540 4.19 Jubilant Life Sciences Ltd 680,000 7,451,904 1.60 Lupin Ltd 310,000 3,340,532 0.72 Marico Ltd 2,070,000 9,912,543 2.13
68,013,783 14.62
FINANCIAL Axis Bank Ltd 680,000 6,788,886 1.46 Bajaj Finance Ltd 720,000 26,799,979 5.76 Bharat Financial Inclusion Ltd 640,000 8,319,179 1.79 Cholamandalam Investment and Finance Co Ltd 1,160,000 20,037,272 4.31 Edelweiss Financial Services Ltd 1,050,000 2,014,710 0.43 HDFC Bank Ltd 1,315,000 38,435,688 8.26 Housing Development Finance Corp Ltd 1,200,000 31,061,106 6.68 ICICI Bank Ltd 4,530,000 22,348,669 4.80 IndusInd Bank Ltd 925,000 19,172,361 4.12 PNB Housing Finance Ltd 144A 580,609 7,261,056 1.56 State Bank of India 1,250,000 4,734,099 1.02 Yes Bank Ltd 4,140,000 13,516,972 2.91
200,489,977 43.10
INDUSTRIAL Bharat Forge Ltd 545,000 3,936,574 0.85 Havells India Ltd 760,000 7,674,396 1.65 Larsen & Toubro Ltd 945,000 17,275,426 3.72 Ramco Cements Ltd/The 685,000 6,428,774 1.38 Supreme Industries Ltd 242,022 3,866,329 0.83 Voltas Ltd 380,000 3,035,539 0.65
42,217,038 9.08
TECHNOLOGY Infosys Ltd 3,060,000 31,593,273 6.79 Mindtree Ltd 140,000 1,794,035 0.39 Tata Consultancy Services Ltd 890,000 24,815,392 5.33 Tech Mahindra Ltd 1,910,000 22,230,801 4.78
80,433,501 17.29
TOTAL EQUITIES 458,974,730 98.66
TOTAL TRANSFERABLE SECURITIES ADMITTED TO AN OFFICIAL STOCK EXCHANGE LISTING OR DEALT IN ON ANOTHER REGULATED MARKET 458,974,730 98.66
Total Investments 458,974,730 98.66
The accompanying notes form an integral part of these financial statements.
*The Invesco India (Mauritius) Limited which was a feeder for the master, Invesco India Equity Fund, was wound up and all securities on the Fund were sold off as at 28 February 2019. Only the securities from the Invesco India Equity Fund are included on this portfolio as at 28 February 2019.
Invesco India Equity Fund* Statement of Investments as at 28 February 2019
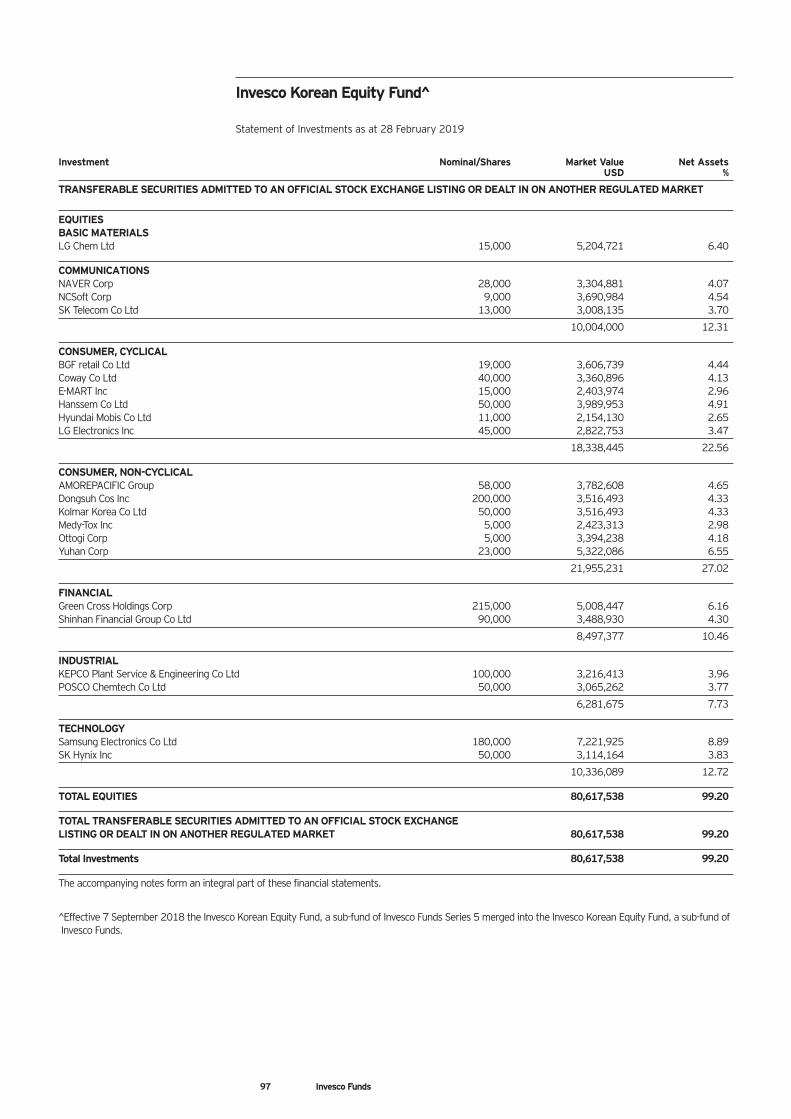
97 Invesco Funds
Investment Nominal/Shares Market Value Net Assets USD %
TRANSFERABLE SECURITIES ADMITTED TO AN OFFICIAL STOCK EXCHANGE LISTING OR DEALT IN ON ANOTHER REGULATED MARKET
EQUITIES BASIC MATERIALS LG Chem Ltd 15,000 5,204,721 6.40
COMMUNICATIONS NAVER Corp 28,000 3,304,881 4.07 NCSoft Corp 9,000 3,690,984 4.54 SK Telecom Co Ltd 13,000 3,008,135 3.70
10,004,000 12.31
CONSUMER, CYCLICAL BGF retail Co Ltd 19,000 3,606,739 4.44 Coway Co Ltd 40,000 3,360,896 4.13 E-MART Inc 15,000 2,403,974 2.96 Hanssem Co Ltd 50,000 3,989,953 4.91 Hyundai Mobis Co Ltd 11,000 2,154,130 2.65 LG Electronics Inc 45,000 2,822,753 3.47
18,338,445 22.56
CONSUMER, NON-CYCLICAL AMOREPACIFIC Group 58,000 3,782,608 4.65 Dongsuh Cos Inc 200,000 3,516,493 4.33 Kolmar Korea Co Ltd 50,000 3,516,493 4.33 Medy-Tox Inc 5,000 2,423,313 2.98 Ottogi Corp 5,000 3,394,238 4.18 Yuhan Corp 23,000 5,322,086 6.55
21,955,231 27.02
FINANCIAL Green Cross Holdings Corp 215,000 5,008,447 6.16 Shinhan Financial Group Co Ltd 90,000 3,488,930 4.30
8,497,377 10.46
INDUSTRIAL KEPCO Plant Service & Engineering Co Ltd 100,000 3,216,413 3.96 POSCO Chemtech Co Ltd 50,000 3,065,262 3.77
6,281,675 7.73
TECHNOLOGY Samsung Electronics Co Ltd 180,000 7,221,925 8.89 SK Hynix Inc 50,000 3,114,164 3.83
10,336,089 12.72
TOTAL EQUITIES 80,617,538 99.20
TOTAL TRANSFERABLE SECURITIES ADMITTED TO AN OFFICIAL STOCK EXCHANGE LISTING OR DEALT IN ON ANOTHER REGULATED MARKET 80,617,538 99.20
Total Investments 80,617,538 99.20
The accompanying notes form an integral part of these financial statements.
^Effective 7 September 2018 the Invesco Korean Equity Fund, a sub-fund of Invesco Funds Series 5 merged into the Invesco Korean Equity Fund, a sub-fund of Invesco Funds.
Invesco Korean Equity Fund^ Statement of Investments as at 28 February 2019
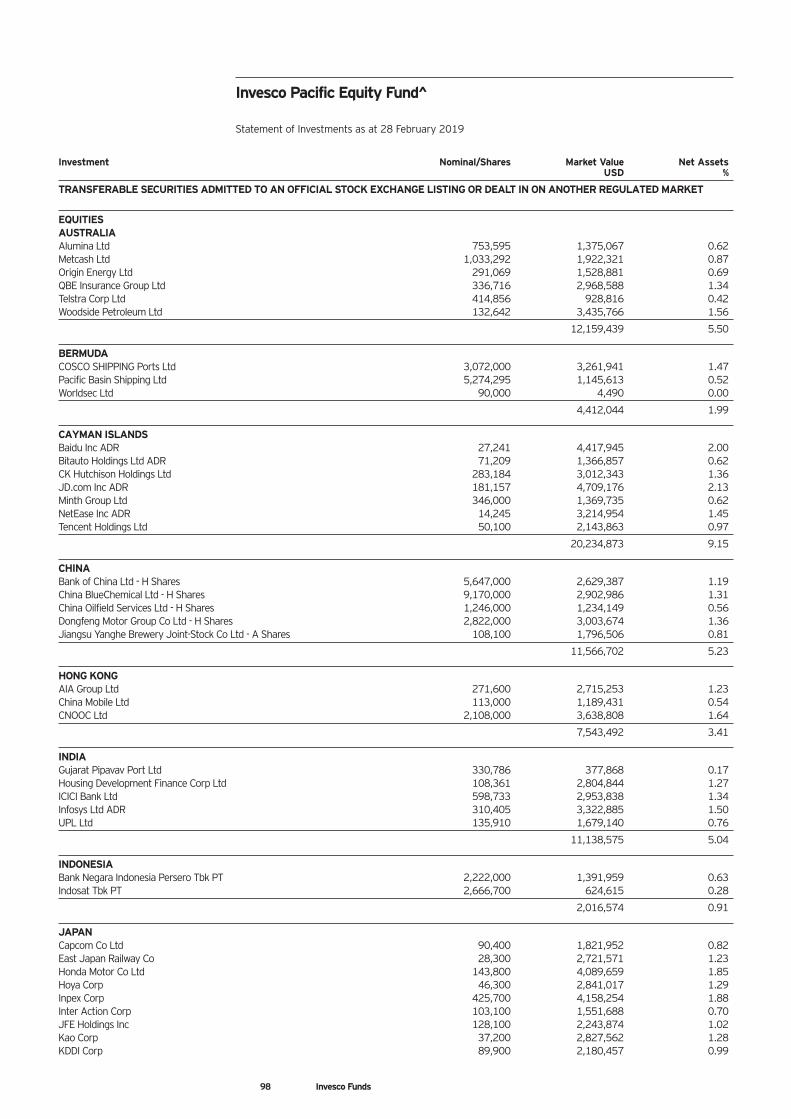
Investment Nominal/Shares Market Value Net Assets USD %
TRANSFERABLE SECURITIES ADMITTED TO AN OFFICIAL STOCK EXCHANGE LISTING OR DEALT IN ON ANOTHER REGULATED MARKET
EQUITIES AUSTRALIA Alumina Ltd 753,595 1,375,067 0.62 Metcash Ltd 1,033,292 1,922,321 0.87 Origin Energy Ltd 291,069 1,528,881 0.69 QBE Insurance Group Ltd 336,716 2,968,588 1.34 Telstra Corp Ltd 414,856 928,816 0.42 Woodside Petroleum Ltd 132,642 3,435,766 1.56
12,159,439 5.50
BERMUDA COSCO SHIPPING Ports Ltd 3,072,000 3,261,941 1.47 Pacific Basin Shipping Ltd 5,274,295 1,145,613 0.52 Worldsec Ltd 90,000 4,490 0.00
4,412,044 1.99
CAYMAN ISLANDS Baidu Inc ADR 27,241 4,417,945 2.00 Bitauto Holdings Ltd ADR 71,209 1,366,857 0.62 CK Hutchison Holdings Ltd 283,184 3,012,343 1.36 JD.com Inc ADR 181,157 4,709,176 2.13 Minth Group Ltd 346,000 1,369,735 0.62 NetEase Inc ADR 14,245 3,214,954 1.45 Tencent Holdings Ltd 50,100 2,143,863 0.97
20,234,873 9.15
CHINA Bank of China Ltd - H Shares 5,647,000 2,629,387 1.19 China BlueChemical Ltd - H Shares 9,170,000 2,902,986 1.31 China Oilfield Services Ltd - H Shares 1,246,000 1,234,149 0.56 Dongfeng Motor Group Co Ltd - H Shares 2,822,000 3,003,674 1.36 Jiangsu Yanghe Brewery Joint-Stock Co Ltd - A Shares 108,100 1,796,506 0.81
11,566,702 5.23
HONG KONG AIA Group Ltd 271,600 2,715,253 1.23 China Mobile Ltd 113,000 1,189,431 0.54 CNOOC Ltd 2,108,000 3,638,808 1.64
7,543,492 3.41
INDIA Gujarat Pipavav Port Ltd 330,786 377,868 0.17 Housing Development Finance Corp Ltd 108,361 2,804,844 1.27 ICICI Bank Ltd 598,733 2,953,838 1.34 Infosys Ltd ADR 310,405 3,322,885 1.50 UPL Ltd 135,910 1,679,140 0.76
11,138,575 5.04
INDONESIA Bank Negara Indonesia Persero Tbk PT 2,222,000 1,391,959 0.63 Indosat Tbk PT 2,666,700 624,615 0.28
2,016,574 0.91
JAPAN Capcom Co Ltd 90,400 1,821,952 0.82 East Japan Railway Co 28,300 2,721,571 1.23 Honda Motor Co Ltd 143,800 4,089,659 1.85 Hoya Corp 46,300 2,841,017 1.29 Inpex Corp 425,700 4,158,254 1.88 Inter Action Corp 103,100 1,551,688 0.70 JFE Holdings Inc 128,100 2,243,874 1.02 Kao Corp 37,200 2,827,562 1.28 KDDI Corp 89,900 2,180,457 0.99
Invesco Pacific Equity Fund^ Statement of Investments as at 28 February 2019
98 Invesco Funds
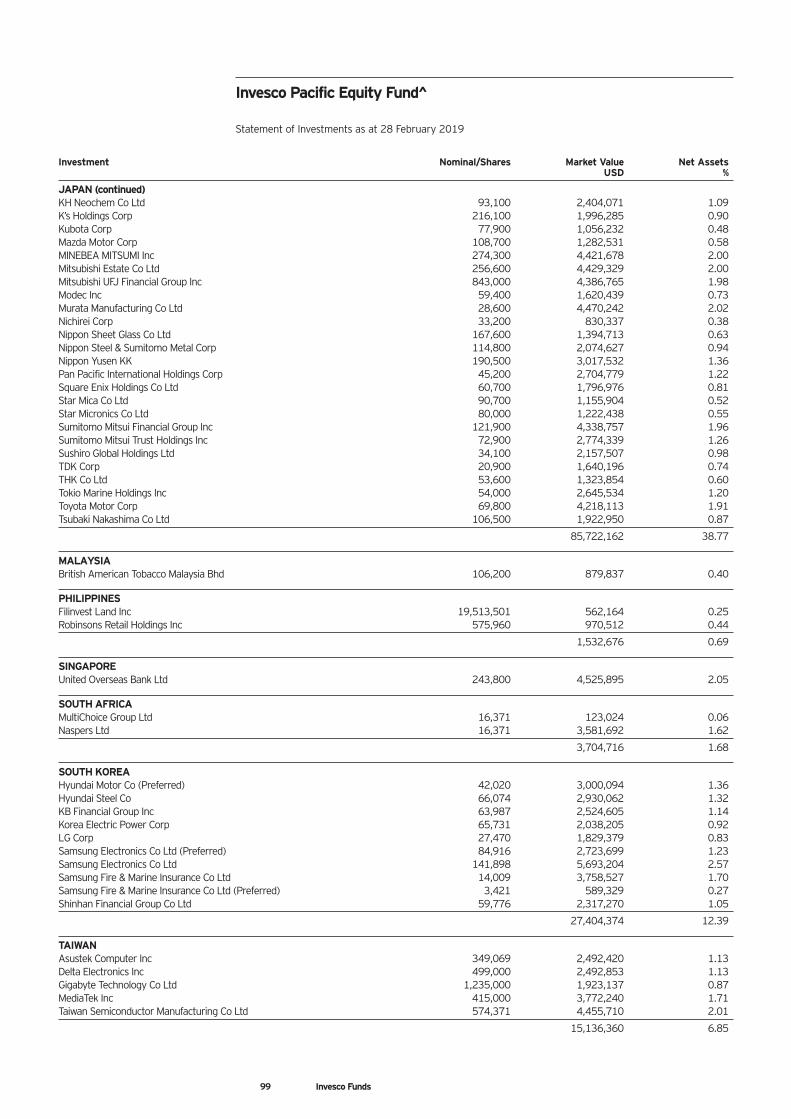
Investment Nominal/Shares Market Value Net Assets USD %
JAPAN (continued) KH Neochem Co Ltd 93,100 2,404,071 1.09 K’s Holdings Corp 216,100 1,996,285 0.90 Kubota Corp 77,900 1,056,232 0.48 Mazda Motor Corp 108,700 1,282,531 0.58 MINEBEA MITSUMI Inc 274,300 4,421,678 2.00 Mitsubishi Estate Co Ltd 256,600 4,429,329 2.00 Mitsubishi UFJ Financial Group Inc 843,000 4,386,765 1.98 Modec Inc 59,400 1,620,439 0.73 Murata Manufacturing Co Ltd 28,600 4,470,242 2.02 Nichirei Corp 33,200 830,337 0.38 Nippon Sheet Glass Co Ltd 167,600 1,394,713 0.63 Nippon Steel & Sumitomo Metal Corp 114,800 2,074,627 0.94 Nippon Yusen KK 190,500 3,017,532 1.36 Pan Pacific International Holdings Corp 45,200 2,704,779 1.22 Square Enix Holdings Co Ltd 60,700 1,796,976 0.81 Star Mica Co Ltd 90,700 1,155,904 0.52 Star Micronics Co Ltd 80,000 1,222,438 0.55 Sumitomo Mitsui Financial Group Inc 121,900 4,338,757 1.96 Sumitomo Mitsui Trust Holdings Inc 72,900 2,774,339 1.26 Sushiro Global Holdings Ltd 34,100 2,157,507 0.98 TDK Corp 20,900 1,640,196 0.74 THK Co Ltd 53,600 1,323,854 0.60 Tokio Marine Holdings Inc 54,000 2,645,534 1.20 Toyota Motor Corp 69,800 4,218,113 1.91 Tsubaki Nakashima Co Ltd 106,500 1,922,950 0.87
85,722,162 38.77
MALAYSIA British American Tobacco Malaysia Bhd 106,200 879,837 0.40
PHILIPPINES Filinvest Land Inc 19,513,501 562,164 0.25 Robinsons Retail Holdings Inc 575,960 970,512 0.44
1,532,676 0.69
SINGAPORE United Overseas Bank Ltd 243,800 4,525,895 2.05
SOUTH AFRICA MultiChoice Group Ltd 16,371 123,024 0.06 Naspers Ltd 16,371 3,581,692 1.62
3,704,716 1.68
SOUTH KOREA Hyundai Motor Co (Preferred) 42,020 3,000,094 1.36 Hyundai Steel Co 66,074 2,930,062 1.32 KB Financial Group Inc 63,987 2,524,605 1.14 Korea Electric Power Corp 65,731 2,038,205 0.92 LG Corp 27,470 1,829,379 0.83 Samsung Electronics Co Ltd (Preferred) 84,916 2,723,699 1.23 Samsung Electronics Co Ltd 141,898 5,693,204 2.57 Samsung Fire & Marine Insurance Co Ltd 14,009 3,758,527 1.70 Samsung Fire & Marine Insurance Co Ltd (Preferred) 3,421 589,329 0.27 Shinhan Financial Group Co Ltd 59,776 2,317,270 1.05
27,404,374 12.39
TAIWAN Asustek Computer Inc 349,069 2,492,420 1.13 Delta Electronics Inc 499,000 2,492,853 1.13 Gigabyte Technology Co Ltd 1,235,000 1,923,137 0.87 MediaTek Inc 415,000 3,772,240 1.71 Taiwan Semiconductor Manufacturing Co Ltd 574,371 4,455,710 2.01
15,136,360 6.85
Invesco Pacific Equity Fund^ Statement of Investments as at 28 February 2019
99 Invesco Funds
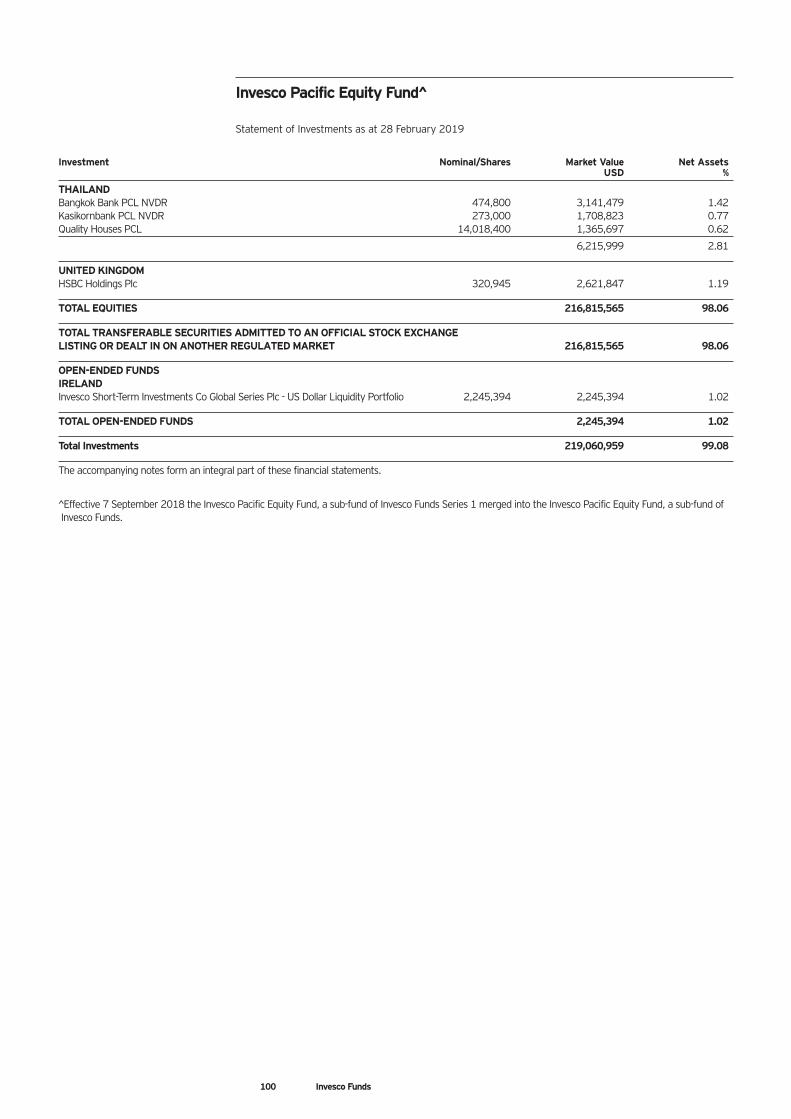
Investment Nominal/Shares Market Value Net Assets USD %
THAILAND Bangkok Bank PCL NVDR 474,800 3,141,479 1.42 Kasikornbank PCL NVDR 273,000 1,708,823 0.77 Quality Houses PCL 14,018,400 1,365,697 0.62
6,215,999 2.81
UNITED KINGDOM HSBC Holdings Plc 320,945 2,621,847 1.19
TOTAL EQUITIES 216,815,565 98.06
TOTAL TRANSFERABLE SECURITIES ADMITTED TO AN OFFICIAL STOCK EXCHANGE LISTING OR DEALT IN ON ANOTHER REGULATED MARKET 216,815,565 98.06
OPEN-ENDED FUNDS IRELAND Invesco Short-Term Investments Co Global Series Plc - US Dollar Liquidity Portfolio 2,245,394 2,245,394 1.02
TOTAL OPEN-ENDED FUNDS 2,245,394 1.02
Total Investments 219,060,959 99.08
The accompanying notes form an integral part of these financial statements.
^Effective 7 September 2018 the Invesco Pacific Equity Fund, a sub-fund of Invesco Funds Series 1 merged into the Invesco Pacific Equity Fund, a sub-fund of Invesco Funds.
Invesco Pacific Equity Fund^ Statement of Investments as at 28 February 2019
100 Invesco Funds
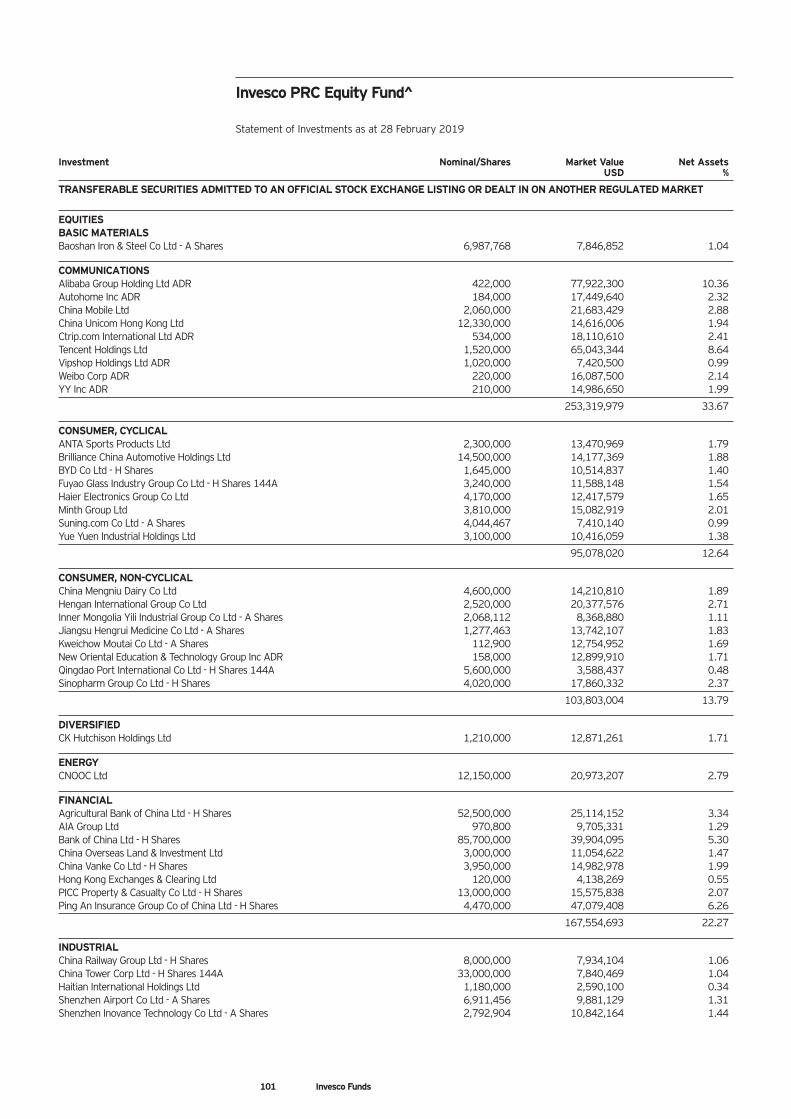
Investment Nominal/Shares Market Value Net Assets USD %
TRANSFERABLE SECURITIES ADMITTED TO AN OFFICIAL STOCK EXCHANGE LISTING OR DEALT IN ON ANOTHER REGULATED MARKET
EQUITIES BASIC MATERIALS Baoshan Iron & Steel Co Ltd - A Shares 6,987,768 7,846,852 1.04
COMMUNICATIONS Alibaba Group Holding Ltd ADR 422,000 77,922,300 10.36 Autohome Inc ADR 184,000 17,449,640 2.32 China Mobile Ltd 2,060,000 21,683,429 2.88 China Unicom Hong Kong Ltd 12,330,000 14,616,006 1.94 Ctrip.com International Ltd ADR 534,000 18,110,610 2.41 Tencent Holdings Ltd 1,520,000 65,043,344 8.64 Vipshop Holdings Ltd ADR 1,020,000 7,420,500 0.99 Weibo Corp ADR 220,000 16,087,500 2.14 YY Inc ADR 210,000 14,986,650 1.99
253,319,979 33.67
CONSUMER, CYCLICAL ANTA Sports Products Ltd 2,300,000 13,470,969 1.79 Brilliance China Automotive Holdings Ltd 14,500,000 14,177,369 1.88 BYD Co Ltd - H Shares 1,645,000 10,514,837 1.40 Fuyao Glass Industry Group Co Ltd - H Shares 144A 3,240,000 11,588,148 1.54 Haier Electronics Group Co Ltd 4,170,000 12,417,579 1.65 Minth Group Ltd 3,810,000 15,082,919 2.01 Suning.com Co Ltd - A Shares 4,044,467 7,410,140 0.99 Yue Yuen Industrial Holdings Ltd 3,100,000 10,416,059 1.38
95,078,020 12.64
CONSUMER, NON-CYCLICAL China Mengniu Dairy Co Ltd 4,600,000 14,210,810 1.89 Hengan International Group Co Ltd 2,520,000 20,377,576 2.71 Inner Mongolia Yili Industrial Group Co Ltd - A Shares 2,068,112 8,368,880 1.11 Jiangsu Hengrui Medicine Co Ltd - A Shares 1,277,463 13,742,107 1.83 Kweichow Moutai Co Ltd - A Shares 112,900 12,754,952 1.69 New Oriental Education & Technology Group Inc ADR 158,000 12,899,910 1.71 Qingdao Port International Co Ltd - H Shares 144A 5,600,000 3,588,437 0.48 Sinopharm Group Co Ltd - H Shares 4,020,000 17,860,332 2.37
103,803,004 13.79
DIVERSIFIED CK Hutchison Holdings Ltd 1,210,000 12,871,261 1.71
ENERGY CNOOC Ltd 12,150,000 20,973,207 2.79
FINANCIAL Agricultural Bank of China Ltd - H Shares 52,500,000 25,114,152 3.34 AIA Group Ltd 970,800 9,705,331 1.29 Bank of China Ltd - H Shares 85,700,000 39,904,095 5.30 China Overseas Land & Investment Ltd 3,000,000 11,054,622 1.47 China Vanke Co Ltd - H Shares 3,950,000 14,982,978 1.99 Hong Kong Exchanges & Clearing Ltd 120,000 4,138,269 0.55 PICC Property & Casualty Co Ltd - H Shares 13,000,000 15,575,838 2.07 Ping An Insurance Group Co of China Ltd - H Shares 4,470,000 47,079,408 6.26
167,554,693 22.27
INDUSTRIAL China Railway Group Ltd - H Shares 8,000,000 7,934,104 1.06 China Tower Corp Ltd - H Shares 144A 33,000,000 7,840,469 1.04 Haitian International Holdings Ltd 1,180,000 2,590,100 0.34 Shenzhen Airport Co Ltd - A Shares 6,911,456 9,881,129 1.31 Shenzhen Inovance Technology Co Ltd - A Shares 2,792,904 10,842,164 1.44
Invesco PRC Equity Fund^ Statement of Investments as at 28 February 2019
101 Invesco Funds
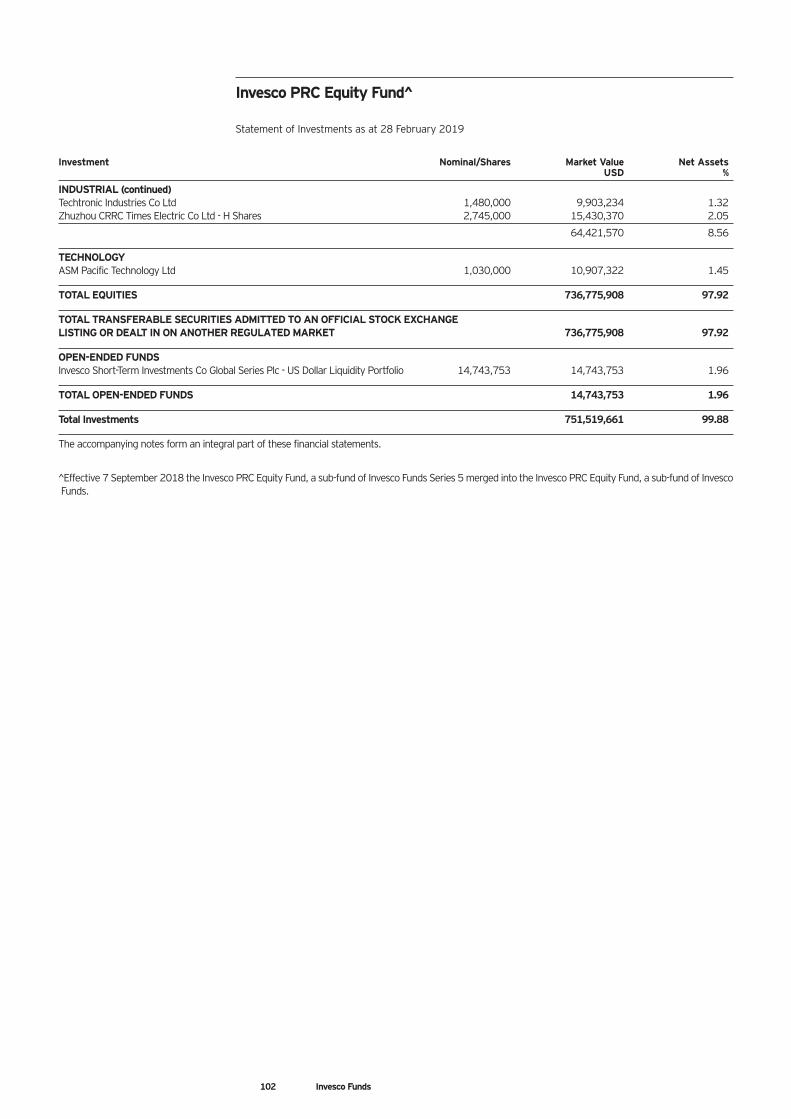
Investment Nominal/Shares Market Value Net Assets USD %
INDUSTRIAL (continued) Techtronic Industries Co Ltd 1,480,000 9,903,234 1.32 Zhuzhou CRRC Times Electric Co Ltd - H Shares 2,745,000 15,430,370 2.05
64,421,570 8.56
TECHNOLOGY ASM Pacific Technology Ltd 1,030,000 10,907,322 1.45
TOTAL EQUITIES 736,775,908 97.92
TOTAL TRANSFERABLE SECURITIES ADMITTED TO AN OFFICIAL STOCK EXCHANGE LISTING OR DEALT IN ON ANOTHER REGULATED MARKET 736,775,908 97.92
OPEN-ENDED FUNDS Invesco Short-Term Investments Co Global Series Plc - US Dollar Liquidity Portfolio 14,743,753 14,743,753 1.96
TOTAL OPEN-ENDED FUNDS 14,743,753 1.96
Total Investments 751,519,661 99.88
The accompanying notes form an integral part of these financial statements.
^Effective 7 September 2018 the Invesco PRC Equity Fund, a sub-fund of Invesco Funds Series 5 merged into the Invesco PRC Equity Fund, a sub-fund of Invesco Funds.
Invesco PRC Equity Fund^ Statement of Investments as at 28 February 2019
102 Invesco Funds
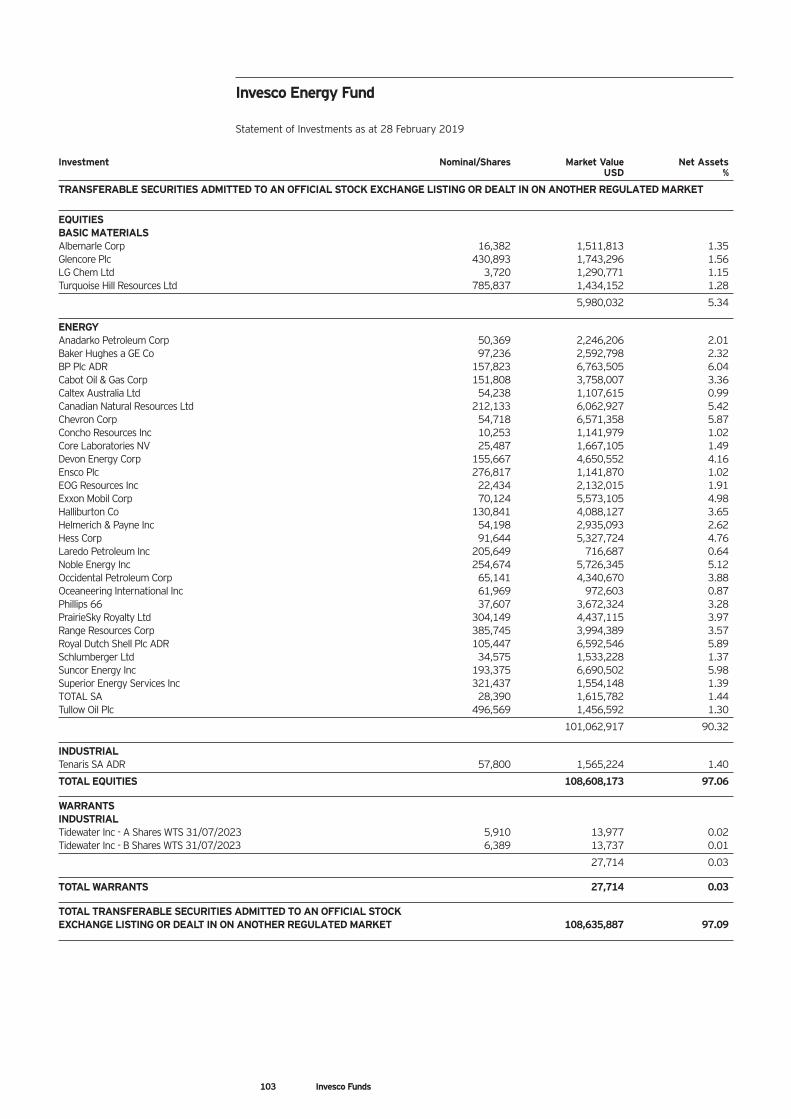
Investment Nominal/Shares Market Value Net Assets USD %
TRANSFERABLE SECURITIES ADMITTED TO AN OFFICIAL STOCK EXCHANGE LISTING OR DEALT IN ON ANOTHER REGULATED MARKET
EQUITIES BASIC MATERIALS Albemarle Corp 16,382 1,511,813 1.35 Glencore Plc 430,893 1,743,296 1.56 LG Chem Ltd 3,720 1,290,771 1.15 Turquoise Hill Resources Ltd 785,837 1,434,152 1.28
5,980,032 5.34
ENERGY Anadarko Petroleum Corp 50,369 2,246,206 2.01 Baker Hughes a GE Co 97,236 2,592,798 2.32 BP Plc ADR 157,823 6,763,505 6.04 Cabot Oil & Gas Corp 151,808 3,758,007 3.36 Caltex Australia Ltd 54,238 1,107,615 0.99 Canadian Natural Resources Ltd 212,133 6,062,927 5.42 Chevron Corp 54,718 6,571,358 5.87 Concho Resources Inc 10,253 1,141,979 1.02 Core Laboratories NV 25,487 1,667,105 1.49 Devon Energy Corp 155,667 4,650,552 4.16 Ensco Plc 276,817 1,141,870 1.02 EOG Resources Inc 22,434 2,132,015 1.91 Exxon Mobil Corp 70,124 5,573,105 4.98 Halliburton Co 130,841 4,088,127 3.65 Helmerich & Payne Inc 54,198 2,935,093 2.62 Hess Corp 91,644 5,327,724 4.76 Laredo Petroleum Inc 205,649 716,687 0.64 Noble Energy Inc 254,674 5,726,345 5.12 Occidental Petroleum Corp 65,141 4,340,670 3.88 Oceaneering International Inc 61,969 972,603 0.87 Phillips 66 37,607 3,672,324 3.28 PrairieSky Royalty Ltd 304,149 4,437,115 3.97 Range Resources Corp 385,745 3,994,389 3.57 Royal Dutch Shell Plc ADR 105,447 6,592,546 5.89 Schlumberger Ltd 34,575 1,533,228 1.37 Suncor Energy Inc 193,375 6,690,502 5.98 Superior Energy Services Inc 321,437 1,554,148 1.39 TOTAL SA 28,390 1,615,782 1.44 Tullow Oil Plc 496,569 1,456,592 1.30
101,062,917 90.32
INDUSTRIAL Tenaris SA ADR 57,800 1,565,224 1.40
TOTAL EQUITIES 108,608,173 97.06
WARRANTS INDUSTRIAL Tidewater Inc - A Shares WTS 31/07/2023 5,910 13,977 0.02 Tidewater Inc - B Shares WTS 31/07/2023 6,389 13,737 0.01
27,714 0.03
TOTAL WARRANTS 27,714 0.03
TOTAL TRANSFERABLE SECURITIES ADMITTED TO AN OFFICIAL STOCK EXCHANGE LISTING OR DEALT IN ON ANOTHER REGULATED MARKET 108,635,887 97.09
Invesco Energy Fund Statement of Investments as at 28 February 2019
103 Invesco Funds
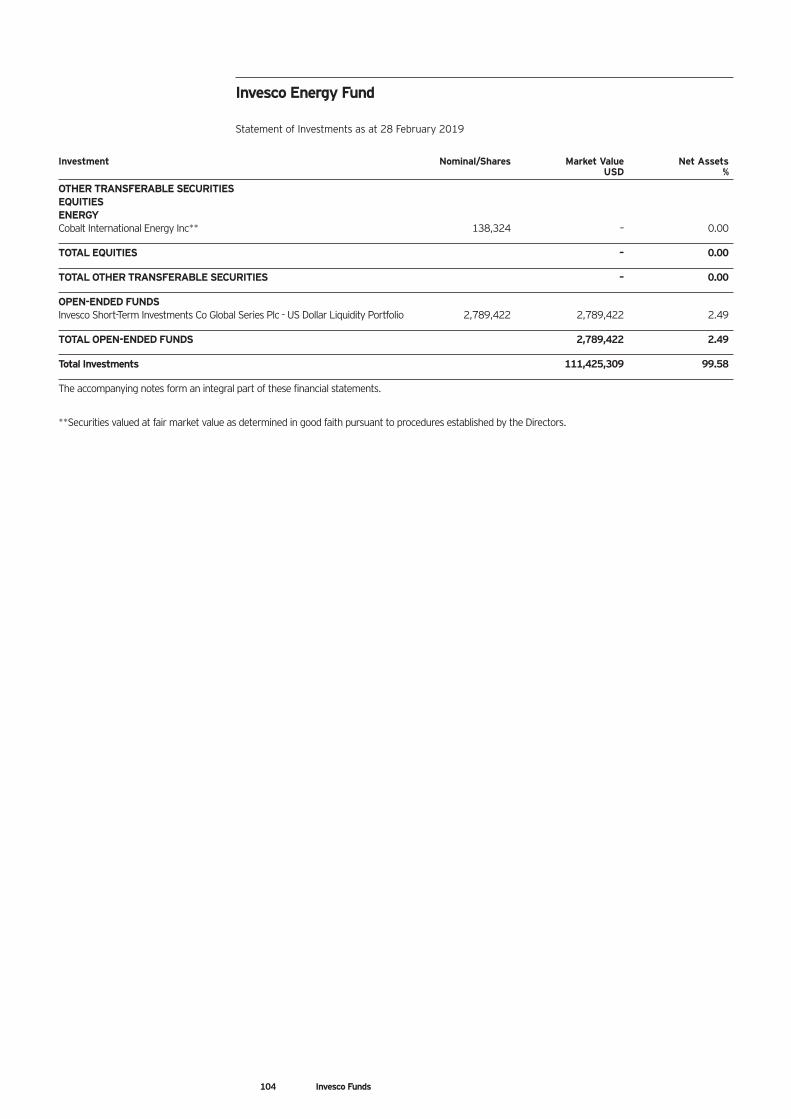
Investment Nominal/Shares Market Value Net Assets USD %
OTHER TRANSFERABLE SECURITIES EQUITIES ENERGY Cobalt International Energy Inc** 138,324 – 0.00
TOTAL EQUITIES – 0.00
TOTAL OTHER TRANSFERABLE SECURITIES – 0.00
OPEN-ENDED FUNDS Invesco Short-Term Investments Co Global Series Plc - US Dollar Liquidity Portfolio 2,789,422 2,789,422 2.49
TOTAL OPEN-ENDED FUNDS 2,789,422 2.49
Total Investments 111,425,309 99.58
The accompanying notes form an integral part of these financial statements.
**Securities valued at fair market value as determined in good faith pursuant to procedures established by the Directors.
Invesco Energy Fund Statement of Investments as at 28 February 2019
104 Invesco Funds
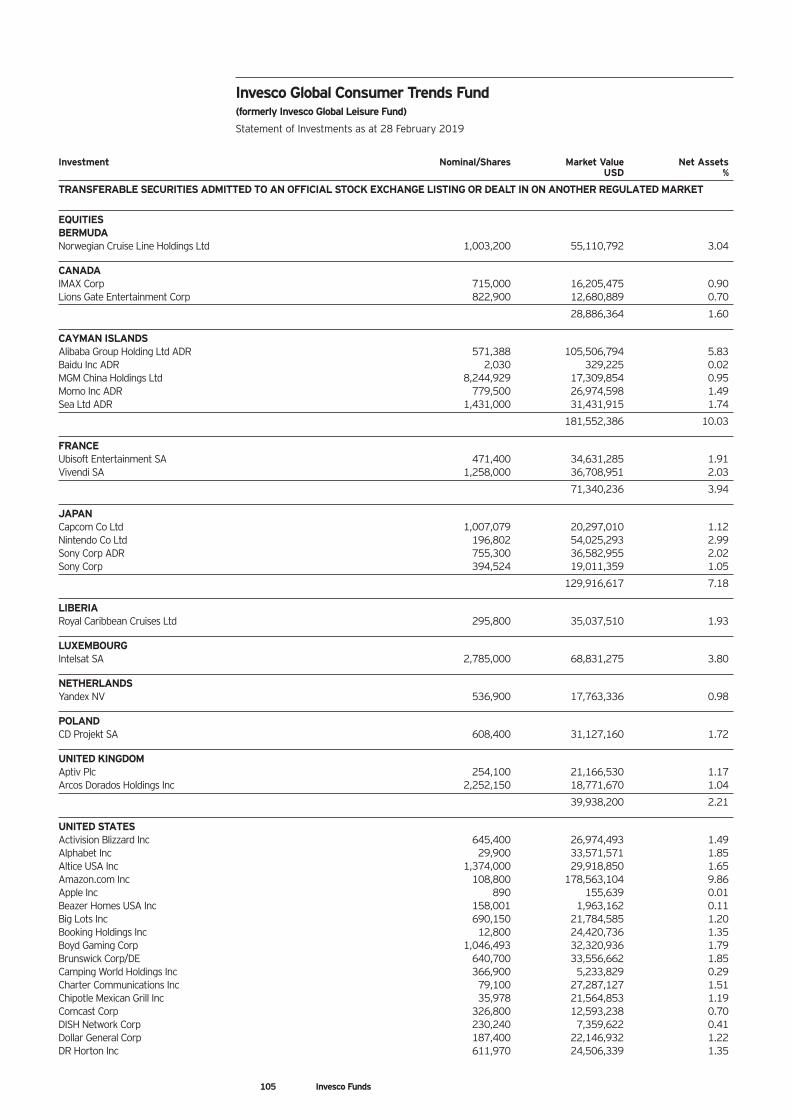
Investment Nominal/Shares Market Value Net Assets USD %
TRANSFERABLE SECURITIES ADMITTED TO AN OFFICIAL STOCK EXCHANGE LISTING OR DEALT IN ON ANOTHER REGULATED MARKET
EQUITIES BERMUDA Norwegian Cruise Line Holdings Ltd 1,003,200 55,110,792 3.04
CANADA IMAX Corp 715,000 16,205,475 0.90 Lions Gate Entertainment Corp 822,900 12,680,889 0.70
28,886,364 1.60
CAYMAN ISLANDS Alibaba Group Holding Ltd ADR 571,388 105,506,794 5.83 Baidu Inc ADR 2,030 329,225 0.02 MGM China Holdings Ltd 8,244,929 17,309,854 0.95 Momo Inc ADR 779,500 26,974,598 1.49 Sea Ltd ADR 1,431,000 31,431,915 1.74
181,552,386 10.03
FRANCE Ubisoft Entertainment SA 471,400 34,631,285 1.91 Vivendi SA 1,258,000 36,708,951 2.03
71,340,236 3.94
JAPAN Capcom Co Ltd 1,007,079 20,297,010 1.12 Nintendo Co Ltd 196,802 54,025,293 2.99 Sony Corp ADR 755,300 36,582,955 2.02 Sony Corp 394,524 19,011,359 1.05
129,916,617 7.18
LIBERIA Royal Caribbean Cruises Ltd 295,800 35,037,510 1.93
LUXEMBOURG Intelsat SA 2,785,000 68,831,275 3.80
NETHERLANDS Yandex NV 536,900 17,763,336 0.98
POLAND CD Projekt SA 608,400 31,127,160 1.72
UNITED KINGDOM Aptiv Plc 254,100 21,166,530 1.17 Arcos Dorados Holdings Inc 2,252,150 18,771,670 1.04
39,938,200 2.21
UNITED STATES Activision Blizzard Inc 645,400 26,974,493 1.49 Alphabet Inc 29,900 33,571,571 1.85 Altice USA Inc 1,374,000 29,918,850 1.65 Amazon.com Inc 108,800 178,563,104 9.86 Apple Inc 890 155,639 0.01 Beazer Homes USA Inc 158,001 1,963,162 0.11 Big Lots Inc 690,150 21,784,585 1.20 Booking Holdings Inc 12,800 24,420,736 1.35 Boyd Gaming Corp 1,046,493 32,320,936 1.79 Brunswick Corp/DE 640,700 33,556,662 1.85 Camping World Holdings Inc 366,900 5,233,829 0.29 Charter Communications Inc 79,100 27,287,127 1.51 Chipotle Mexican Grill Inc 35,978 21,564,853 1.19 Comcast Corp 326,800 12,593,238 0.70 DISH Network Corp 230,240 7,359,622 0.41 Dollar General Corp 187,400 22,146,932 1.22 DR Horton Inc 611,970 24,506,339 1.35
Invesco Global Consumer Trends Fund (formerly Invesco Global Leisure Fund) Statement of Investments as at 28 February 2019
105 Invesco Funds
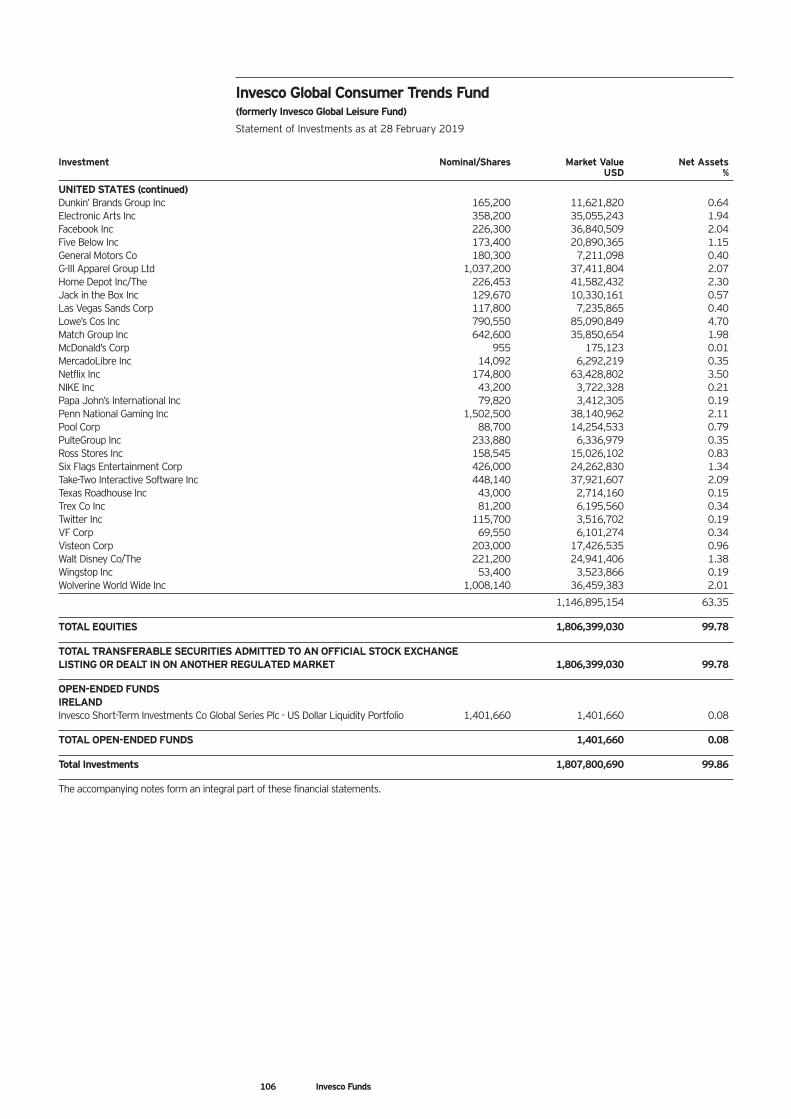
Investment Nominal/Shares Market Value Net Assets USD %
UNITED STATES (continued) Dunkin’ Brands Group Inc 165,200 11,621,820 0.64 Electronic Arts Inc 358,200 35,055,243 1.94 Facebook Inc 226,300 36,840,509 2.04 Five Below Inc 173,400 20,890,365 1.15 General Motors Co 180,300 7,211,098 0.40 G-III Apparel Group Ltd 1,037,200 37,411,804 2.07 Home Depot Inc/The 226,453 41,582,432 2.30 Jack in the Box Inc 129,670 10,330,161 0.57 Las Vegas Sands Corp 117,800 7,235,865 0.40 Lowe’s Cos Inc 790,550 85,090,849 4.70 Match Group Inc 642,600 35,850,654 1.98 McDonald’s Corp 955 175,123 0.01 MercadoLibre Inc 14,092 6,292,219 0.35 Netflix Inc 174,800 63,428,802 3.50 NIKE Inc 43,200 3,722,328 0.21 Papa John’s International Inc 79,820 3,412,305 0.19 Penn National Gaming Inc 1,502,500 38,140,962 2.11 Pool Corp 88,700 14,254,533 0.79 PulteGroup Inc 233,880 6,336,979 0.35 Ross Stores Inc 158,545 15,026,102 0.83 Six Flags Entertainment Corp 426,000 24,262,830 1.34 Take-Two Interactive Software Inc 448,140 37,921,607 2.09 Texas Roadhouse Inc 43,000 2,714,160 0.15 Trex Co Inc 81,200 6,195,560 0.34 Twitter Inc 115,700 3,516,702 0.19 VF Corp 69,550 6,101,274 0.34 Visteon Corp 203,000 17,426,535 0.96 Walt Disney Co/The 221,200 24,941,406 1.38 Wingstop Inc 53,400 3,523,866 0.19 Wolverine World Wide Inc 1,008,140 36,459,383 2.01
1,146,895,154 63.35
TOTAL EQUITIES 1,806,399,030 99.78
TOTAL TRANSFERABLE SECURITIES ADMITTED TO AN OFFICIAL STOCK EXCHANGE LISTING OR DEALT IN ON ANOTHER REGULATED MARKET 1,806,399,030 99.78
OPEN-ENDED FUNDS IRELAND Invesco Short-Term Investments Co Global Series Plc - US Dollar Liquidity Portfolio 1,401,660 1,401,660 0.08
TOTAL OPEN-ENDED FUNDS 1,401,660 0.08
Total Investments 1,807,800,690 99.86
The accompanying notes form an integral part of these financial statements.
106 Invesco Funds
Invesco Global Consumer Trends Fund (formerly Invesco Global Leisure Fund) Statement of Investments as at 28 February 2019
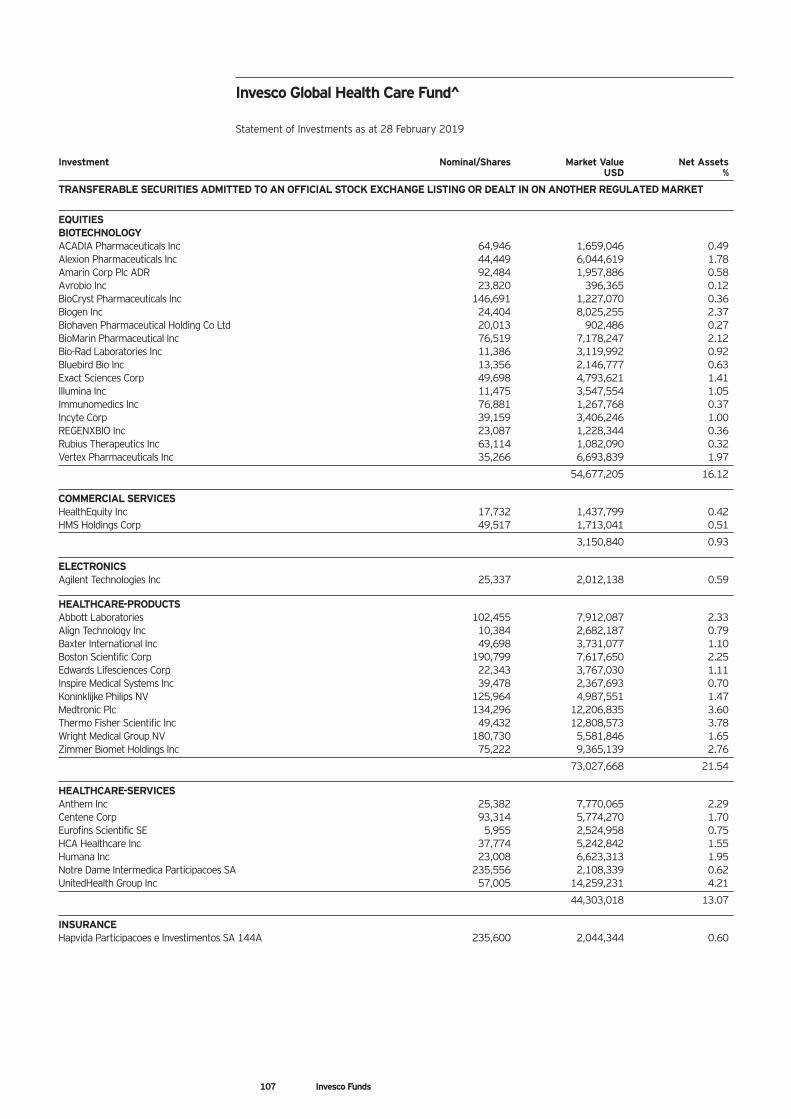
Investment Nominal/Shares Market Value Net Assets USD %
TRANSFERABLE SECURITIES ADMITTED TO AN OFFICIAL STOCK EXCHANGE LISTING OR DEALT IN ON ANOTHER REGULATED MARKET
EQUITIES BIOTECHNOLOGY ACADIA Pharmaceuticals Inc 64,946 1,659,046 0.49 Alexion Pharmaceuticals Inc 44,449 6,044,619 1.78 Amarin Corp Plc ADR 92,484 1,957,886 0.58 Avrobio Inc 23,820 396,365 0.12 BioCryst Pharmaceuticals Inc 146,691 1,227,070 0.36 Biogen Inc 24,404 8,025,255 2.37 Biohaven Pharmaceutical Holding Co Ltd 20,013 902,486 0.27 BioMarin Pharmaceutical Inc 76,519 7,178,247 2.12 Bio-Rad Laboratories Inc 11,386 3,119,992 0.92 Bluebird Bio Inc 13,356 2,146,777 0.63 Exact Sciences Corp 49,698 4,793,621 1.41 Illumina Inc 11,475 3,547,554 1.05 Immunomedics Inc 76,881 1,267,768 0.37 Incyte Corp 39,159 3,406,246 1.00 REGENXBIO Inc 23,087 1,228,344 0.36 Rubius Therapeutics Inc 63,114 1,082,090 0.32 Vertex Pharmaceuticals Inc 35,266 6,693,839 1.97
54,677,205 16.12
COMMERCIAL SERVICES HealthEquity Inc 17,732 1,437,799 0.42 HMS Holdings Corp 49,517 1,713,041 0.51
3,150,840 0.93
ELECTRONICS Agilent Technologies Inc 25,337 2,012,138 0.59
HEALTHCARE-PRODUCTS Abbott Laboratories 102,455 7,912,087 2.33 Align Technology Inc 10,384 2,682,187 0.79 Baxter International Inc 49,698 3,731,077 1.10 Boston Scientific Corp 190,799 7,617,650 2.25 Edwards Lifesciences Corp 22,343 3,767,030 1.11 Inspire Medical Systems Inc 39,478 2,367,693 0.70 Koninklijke Philips NV 125,964 4,987,551 1.47 Medtronic Plc 134,296 12,206,835 3.60 Thermo Fisher Scientific Inc 49,432 12,808,573 3.78 Wright Medical Group NV 180,730 5,581,846 1.65 Zimmer Biomet Holdings Inc 75,222 9,365,139 2.76
73,027,668 21.54
HEALTHCARE-SERVICES Anthem Inc 25,382 7,770,065 2.29 Centene Corp 93,314 5,774,270 1.70 Eurofins Scientific SE 5,955 2,524,958 0.75 HCA Healthcare Inc 37,774 5,242,842 1.55 Humana Inc 23,008 6,623,313 1.95 Notre Dame Intermedica Participacoes SA 235,556 2,108,339 0.62 UnitedHealth Group Inc 57,005 14,259,231 4.21
44,303,018 13.07
INSURANCE Hapvida Participacoes e Investimentos SA 144A 235,600 2,044,344 0.60
Invesco Global Health Care Fund^ Statement of Investments as at 28 February 2019
107 Invesco Funds
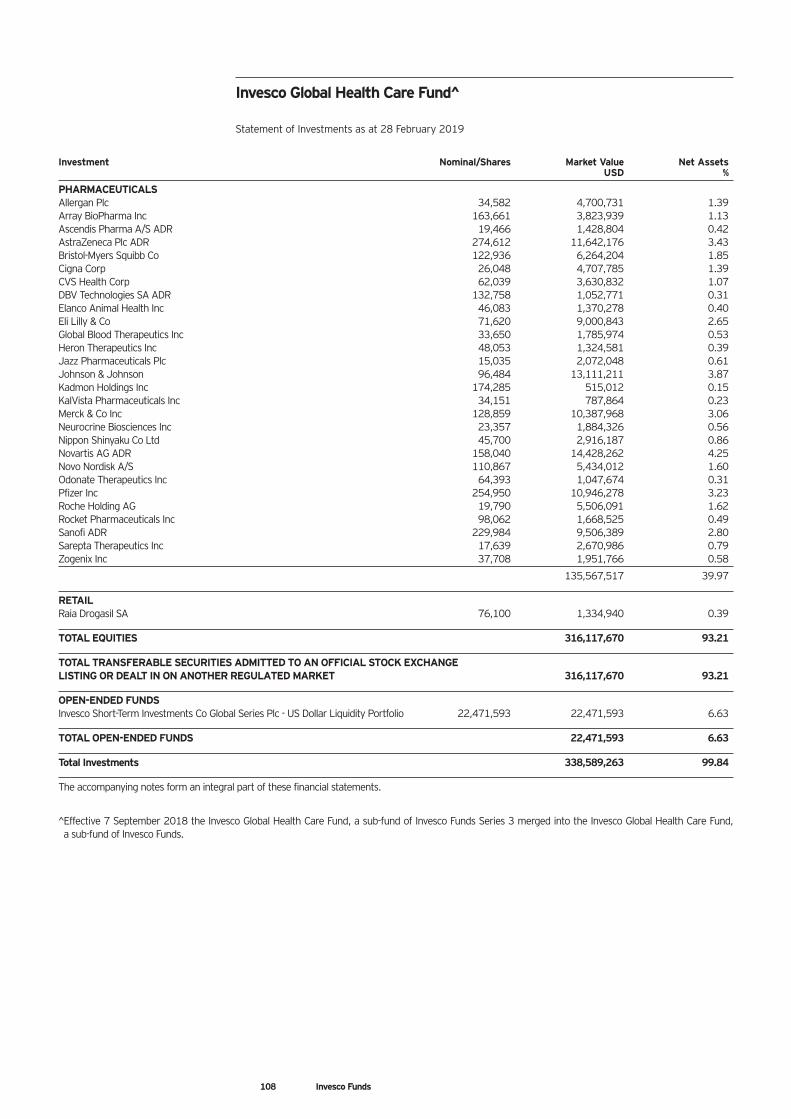
Investment Nominal/Shares Market Value Net Assets USD %
PHARMACEUTICALS Allergan Plc 34,582 4,700,731 1.39 Array BioPharma Inc 163,661 3,823,939 1.13 Ascendis Pharma A/S ADR 19,466 1,428,804 0.42 AstraZeneca Plc ADR 274,612 11,642,176 3.43 Bristol-Myers Squibb Co 122,936 6,264,204 1.85 Cigna Corp 26,048 4,707,785 1.39 CVS Health Corp 62,039 3,630,832 1.07 DBV Technologies SA ADR 132,758 1,052,771 0.31 Elanco Animal Health Inc 46,083 1,370,278 0.40 Eli Lilly & Co 71,620 9,000,843 2.65 Global Blood Therapeutics Inc 33,650 1,785,974 0.53 Heron Therapeutics Inc 48,053 1,324,581 0.39 Jazz Pharmaceuticals Plc 15,035 2,072,048 0.61 Johnson & Johnson 96,484 13,111,211 3.87 Kadmon Holdings Inc 174,285 515,012 0.15 KalVista Pharmaceuticals Inc 34,151 787,864 0.23 Merck & Co Inc 128,859 10,387,968 3.06 Neurocrine Biosciences Inc 23,357 1,884,326 0.56 Nippon Shinyaku Co Ltd 45,700 2,916,187 0.86 Novartis AG ADR 158,040 14,428,262 4.25 Novo Nordisk A/S 110,867 5,434,012 1.60 Odonate Therapeutics Inc 64,393 1,047,674 0.31 Pfizer Inc 254,950 10,946,278 3.23 Roche Holding AG 19,790 5,506,091 1.62 Rocket Pharmaceuticals Inc 98,062 1,668,525 0.49 Sanofi ADR 229,984 9,506,389 2.80 Sarepta Therapeutics Inc 17,639 2,670,986 0.79 Zogenix Inc 37,708 1,951,766 0.58
135,567,517 39.97
RETAIL Raia Drogasil SA 76,100 1,334,940 0.39
TOTAL EQUITIES 316,117,670 93.21
TOTAL TRANSFERABLE SECURITIES ADMITTED TO AN OFFICIAL STOCK EXCHANGE LISTING OR DEALT IN ON ANOTHER REGULATED MARKET 316,117,670 93.21
OPEN-ENDED FUNDS Invesco Short-Term Investments Co Global Series Plc - US Dollar Liquidity Portfolio 22,471,593 22,471,593 6.63
TOTAL OPEN-ENDED FUNDS 22,471,593 6.63
Total Investments 338,589,263 99.84
The accompanying notes form an integral part of these financial statements.
^Effective 7 September 2018 the Invesco Global Health Care Fund, a sub-fund of Invesco Funds Series 3 merged into the Invesco Global Health Care Fund, a sub-fund of Invesco Funds.
Invesco Global Health Care Fund^ Statement of Investments as at 28 February 2019
108 Invesco Funds
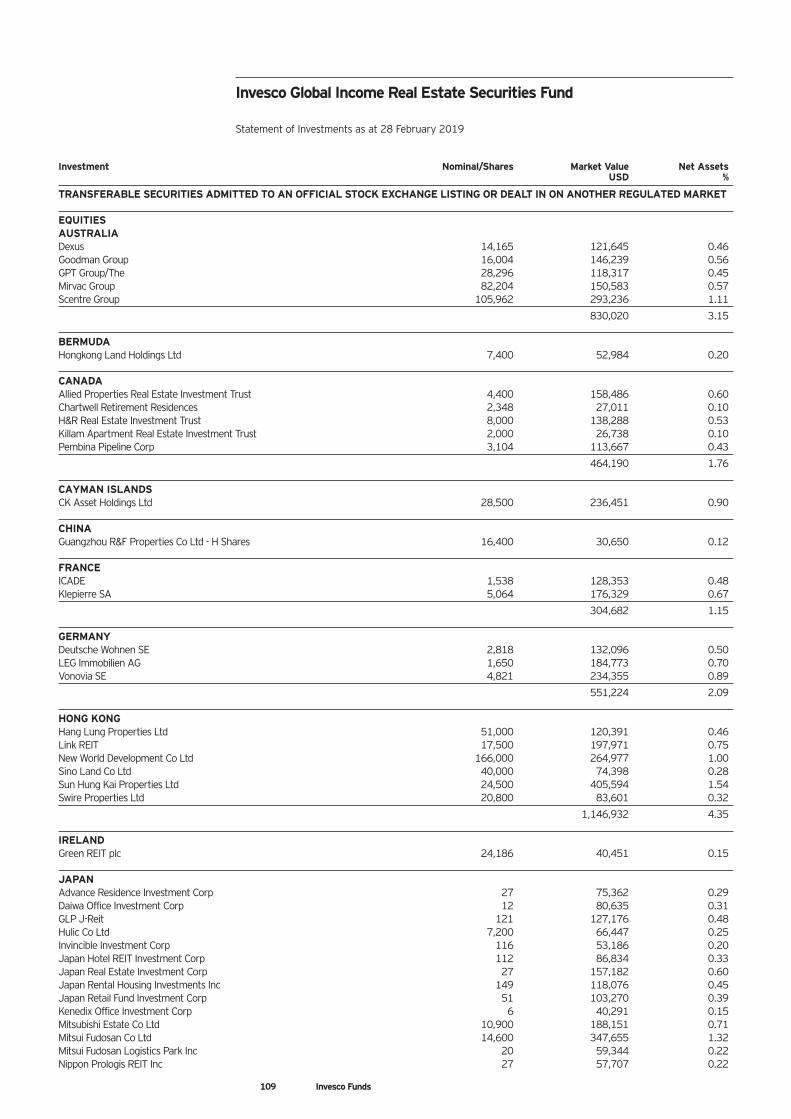
109 Invesco Funds
Investment Nominal/Shares Market Value Net Assets USD %
TRANSFERABLE SECURITIES ADMITTED TO AN OFFICIAL STOCK EXCHANGE LISTING OR DEALT IN ON ANOTHER REGULATED MARKET EQUITIES AUSTRALIA Dexus 14,165 121,645 0.46 Goodman Group 16,004 146,239 0.56 GPT Group/The 28,296 118,317 0.45 Mirvac Group 82,204 150,583 0.57 Scentre Group 105,962 293,236 1.11
830,020 3.15 BERMUDA Hongkong Land Holdings Ltd 7,400 52,984 0.20 CANADA Allied Properties Real Estate Investment Trust 4,400 158,486 0.60 Chartwell Retirement Residences 2,348 27,011 0.10 H&R Real Estate Investment Trust 8,000 138,288 0.53 Killam Apartment Real Estate Investment Trust 2,000 26,738 0.10 Pembina Pipeline Corp 3,104 113,667 0.43
464,190 1.76 CAYMAN ISLANDS CK Asset Holdings Ltd 28,500 236,451 0.90 CHINA Guangzhou R&F Properties Co Ltd - H Shares 16,400 30,650 0.12 FRANCE ICADE 1,538 128,353 0.48 Klepierre SA 5,064 176,329 0.67
304,682 1.15 GERMANY Deutsche Wohnen SE 2,818 132,096 0.50 LEG Immobilien AG 1,650 184,773 0.70 Vonovia SE 4,821 234,355 0.89
551,224 2.09 HONG KONG Hang Lung Properties Ltd 51,000 120,391 0.46 Link REIT 17,500 197,971 0.75 New World Development Co Ltd 166,000 264,977 1.00 Sino Land Co Ltd 40,000 74,398 0.28 Sun Hung Kai Properties Ltd 24,500 405,594 1.54 Swire Properties Ltd 20,800 83,601 0.32
1,146,932 4.35 IRELAND Green REIT plc 24,186 40,451 0.15 JAPAN Advance Residence Investment Corp 27 75,362 0.29 Daiwa Office Investment Corp 12 80,635 0.31 GLP J-Reit 121 127,176 0.48 Hulic Co Ltd 7,200 66,447 0.25 Invincible Investment Corp 116 53,186 0.20 Japan Hotel REIT Investment Corp 112 86,834 0.33 Japan Real Estate Investment Corp 27 157,182 0.60 Japan Rental Housing Investments Inc 149 118,076 0.45 Japan Retail Fund Investment Corp 51 103,270 0.39 Kenedix Office Investment Corp 6 40,291 0.15 Mitsubishi Estate Co Ltd 10,900 188,151 0.71 Mitsui Fudosan Co Ltd 14,600 347,655 1.32 Mitsui Fudosan Logistics Park Inc 20 59,344 0.22 Nippon Prologis REIT Inc 27 57,707 0.22
Invesco Global Income Real Estate Securities Fund Statement of Investments as at 28 February 2019
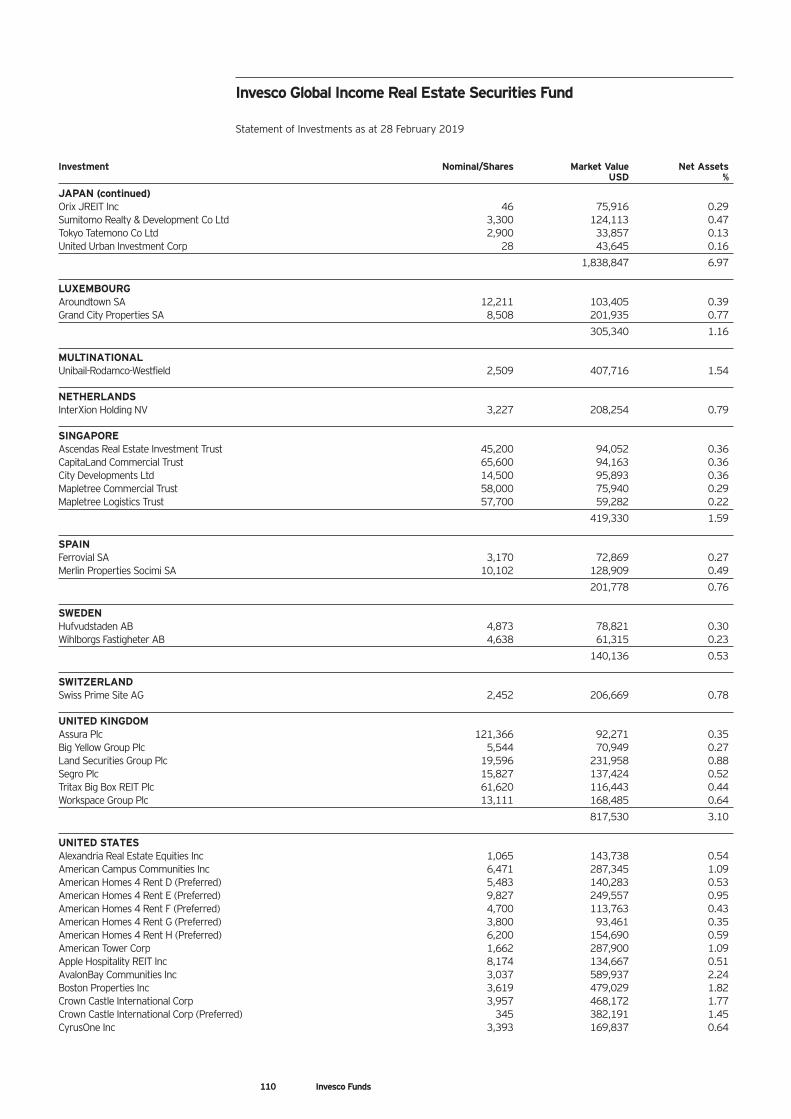
110 Invesco Funds
Investment Nominal/Shares Market Value Net Assets USD %
JAPAN (continued) Orix JREIT Inc 46 75,916 0.29 Sumitomo Realty & Development Co Ltd 3,300 124,113 0.47 Tokyo Tatemono Co Ltd 2,900 33,857 0.13 United Urban Investment Corp 28 43,645 0.16
1,838,847 6.97 LUXEMBOURG Aroundtown SA 12,211 103,405 0.39 Grand City Properties SA 8,508 201,935 0.77
305,340 1.16 MULTINATIONAL Unibail-Rodamco-Westfield 2,509 407,716 1.54 NETHERLANDS InterXion Holding NV 3,227 208,254 0.79 SINGAPORE Ascendas Real Estate Investment Trust 45,200 94,052 0.36 CapitaLand Commercial Trust 65,600 94,163 0.36 City Developments Ltd 14,500 95,893 0.36 Mapletree Commercial Trust 58,000 75,940 0.29 Mapletree Logistics Trust 57,700 59,282 0.22
419,330 1.59 SPAIN Ferrovial SA 3,170 72,869 0.27 Merlin Properties Socimi SA 10,102 128,909 0.49
201,778 0.76 SWEDEN Hufvudstaden AB 4,873 78,821 0.30 Wihlborgs Fastigheter AB 4,638 61,315 0.23
140,136 0.53 SWITZERLAND Swiss Prime Site AG 2,452 206,669 0.78 UNITED KINGDOM Assura Plc 121,366 92,271 0.35 Big Yellow Group Plc 5,544 70,949 0.27 Land Securities Group Plc 19,596 231,958 0.88 Segro Plc 15,827 137,424 0.52 Tritax Big Box REIT Plc 61,620 116,443 0.44 Workspace Group Plc 13,111 168,485 0.64
817,530 3.10 UNITED STATES Alexandria Real Estate Equities Inc 1,065 143,738 0.54 American Campus Communities Inc 6,471 287,345 1.09 American Homes 4 Rent D (Preferred) 5,483 140,283 0.53 American Homes 4 Rent E (Preferred) 9,827 249,557 0.95 American Homes 4 Rent F (Preferred) 4,700 113,763 0.43 American Homes 4 Rent G (Preferred) 3,800 93,461 0.35 American Homes 4 Rent H (Preferred) 6,200 154,690 0.59 American Tower Corp 1,662 287,900 1.09 Apple Hospitality REIT Inc 8,174 134,667 0.51 AvalonBay Communities Inc 3,037 589,937 2.24 Boston Properties Inc 3,619 479,029 1.82 Crown Castle International Corp 3,957 468,172 1.77 Crown Castle International Corp (Preferred) 345 382,191 1.45 CyrusOne Inc 3,393 169,837 0.64
Invesco Global Income Real Estate Securities Fund Statement of Investments as at 28 February 2019
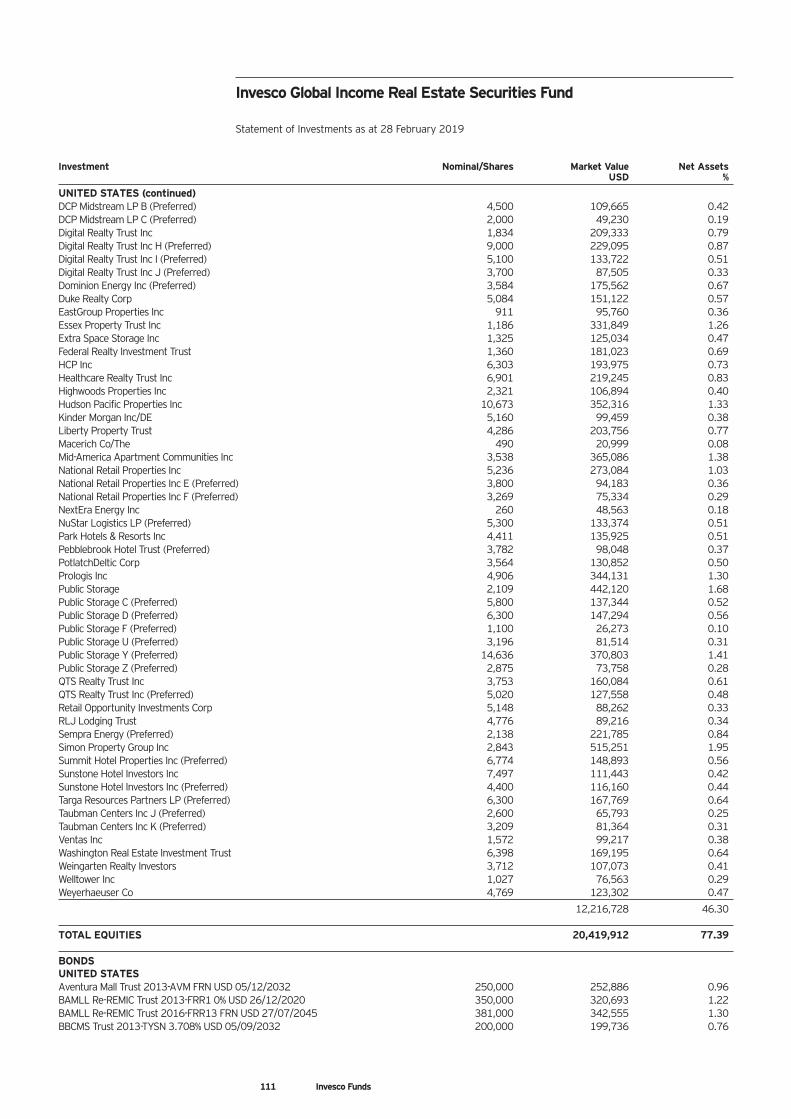
111 Invesco Funds
Investment Nominal/Shares Market Value Net Assets USD %
UNITED STATES (continued) DCP Midstream LP B (Preferred) 4,500 109,665 0.42 DCP Midstream LP C (Preferred) 2,000 49,230 0.19 Digital Realty Trust Inc 1,834 209,333 0.79 Digital Realty Trust Inc H (Preferred) 9,000 229,095 0.87 Digital Realty Trust Inc I (Preferred) 5,100 133,722 0.51 Digital Realty Trust Inc J (Preferred) 3,700 87,505 0.33 Dominion Energy Inc (Preferred) 3,584 175,562 0.67 Duke Realty Corp 5,084 151,122 0.57 EastGroup Properties Inc 911 95,760 0.36 Essex Property Trust Inc 1,186 331,849 1.26 Extra Space Storage Inc 1,325 125,034 0.47 Federal Realty Investment Trust 1,360 181,023 0.69 HCP Inc 6,303 193,975 0.73 Healthcare Realty Trust Inc 6,901 219,245 0.83 Highwoods Properties Inc 2,321 106,894 0.40 Hudson Pacific Properties Inc 10,673 352,316 1.33 Kinder Morgan Inc/DE 5,160 99,459 0.38 Liberty Property Trust 4,286 203,756 0.77 Macerich Co/The 490 20,999 0.08 Mid-America Apartment Communities Inc 3,538 365,086 1.38 National Retail Properties Inc 5,236 273,084 1.03 National Retail Properties Inc E (Preferred) 3,800 94,183 0.36 National Retail Properties Inc F (Preferred) 3,269 75,334 0.29 NextEra Energy Inc 260 48,563 0.18 NuStar Logistics LP (Preferred) 5,300 133,374 0.51 Park Hotels & Resorts Inc 4,411 135,925 0.51 Pebblebrook Hotel Trust (Preferred) 3,782 98,048 0.37 PotlatchDeltic Corp 3,564 130,852 0.50 Prologis Inc 4,906 344,131 1.30 Public Storage 2,109 442,120 1.68 Public Storage C (Preferred) 5,800 137,344 0.52 Public Storage D (Preferred) 6,300 147,294 0.56 Public Storage F (Preferred) 1,100 26,273 0.10 Public Storage U (Preferred) 3,196 81,514 0.31 Public Storage Y (Preferred) 14,636 370,803 1.41 Public Storage Z (Preferred) 2,875 73,758 0.28 QTS Realty Trust Inc 3,753 160,084 0.61 QTS Realty Trust Inc (Preferred) 5,020 127,558 0.48 Retail Opportunity Investments Corp 5,148 88,262 0.33 RLJ Lodging Trust 4,776 89,216 0.34 Sempra Energy (Preferred) 2,138 221,785 0.84 Simon Property Group Inc 2,843 515,251 1.95 Summit Hotel Properties Inc (Preferred) 6,774 148,893 0.56 Sunstone Hotel Investors Inc 7,497 111,443 0.42 Sunstone Hotel Investors Inc (Preferred) 4,400 116,160 0.44 Targa Resources Partners LP (Preferred) 6,300 167,769 0.64 Taubman Centers Inc J (Preferred) 2,600 65,793 0.25 Taubman Centers Inc K (Preferred) 3,209 81,364 0.31 Ventas Inc 1,572 99,217 0.38 Washington Real Estate Investment Trust 6,398 169,195 0.64 Weingarten Realty Investors 3,712 107,073 0.41 Welltower Inc 1,027 76,563 0.29 Weyerhaeuser Co 4,769 123,302 0.47
12,216,728 46.30 TOTAL EQUITIES 20,419,912 77.39 BONDS UNITED STATES Aventura Mall Trust 2013-AVM FRN USD 05/12/2032 250,000 252,886 0.96 BAMLL Re-REMIC Trust 2013-FRR1 0% USD 26/12/2020 350,000 320,693 1.22 BAMLL Re-REMIC Trust 2016-FRR13 FRN USD 27/07/2045 381,000 342,555 1.30 BBCMS Trust 2013-TYSN 3.708% USD 05/09/2032 200,000 199,736 0.76
Invesco Global Income Real Estate Securities Fund Statement of Investments as at 28 February 2019
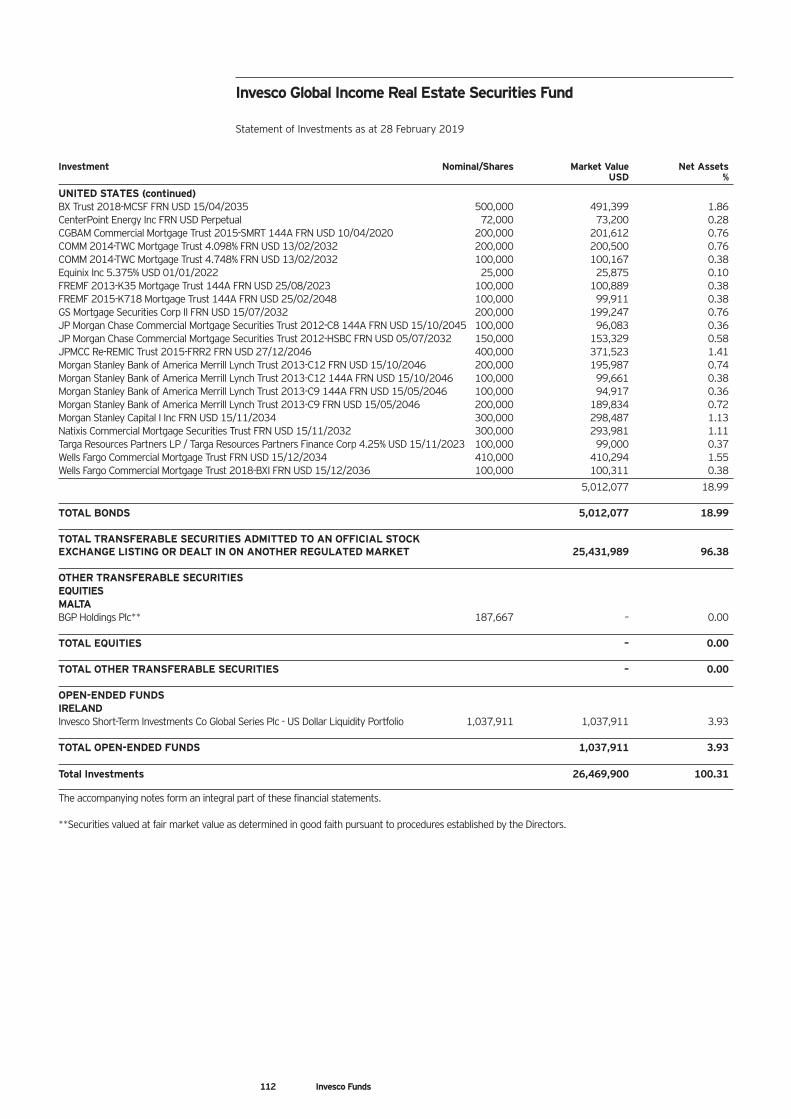
112 Invesco Funds
Investment Nominal/Shares Market Value Net Assets USD %
UNITED STATES (continued) BX Trust 2018-MCSF FRN USD 15/04/2035 500,000 491,399 1.86 CenterPoint Energy Inc FRN USD Perpetual 72,000 73,200 0.28 CGBAM Commercial Mortgage Trust 2015-SMRT 144A FRN USD 10/04/2020 200,000 201,612 0.76 COMM 2014-TWC Mortgage Trust 4.098% FRN USD 13/02/2032 200,000 200,500 0.76 COMM 2014-TWC Mortgage Trust 4.748% FRN USD 13/02/2032 100,000 100,167 0.38 Equinix Inc 5.375% USD 01/01/2022 25,000 25,875 0.10 FREMF 2013-K35 Mortgage Trust 144A FRN USD 25/08/2023 100,000 100,889 0.38 FREMF 2015-K718 Mortgage Trust 144A FRN USD 25/02/2048 100,000 99,911 0.38 GS Mortgage Securities Corp II FRN USD 15/07/2032 200,000 199,247 0.76 JP Morgan Chase Commercial Mortgage Securities Trust 2012-C8 144A FRN USD 15/10/2045 100,000 96,083 0.36 JP Morgan Chase Commercial Mortgage Securities Trust 2012-HSBC FRN USD 05/07/2032 150,000 153,329 0.58 JPMCC Re-REMIC Trust 2015-FRR2 FRN USD 27/12/2046 400,000 371,523 1.41 Morgan Stanley Bank of America Merrill Lynch Trust 2013-C12 FRN USD 15/10/2046 200,000 195,987 0.74 Morgan Stanley Bank of America Merrill Lynch Trust 2013-C12 144A FRN USD 15/10/2046 100,000 99,661 0.38 Morgan Stanley Bank of America Merrill Lynch Trust 2013-C9 144A FRN USD 15/05/2046 100,000 94,917 0.36 Morgan Stanley Bank of America Merrill Lynch Trust 2013-C9 FRN USD 15/05/2046 200,000 189,834 0.72 Morgan Stanley Capital I Inc FRN USD 15/11/2034 300,000 298,487 1.13 Natixis Commercial Mortgage Securities Trust FRN USD 15/11/2032 300,000 293,981 1.11 Targa Resources Partners LP / Targa Resources Partners Finance Corp 4.25% USD 15/11/2023 100,000 99,000 0.37 Wells Fargo Commercial Mortgage Trust FRN USD 15/12/2034 410,000 410,294 1.55 Wells Fargo Commercial Mortgage Trust 2018-BXI FRN USD 15/12/2036 100,000 100,311 0.38
5,012,077 18.99 TOTAL BONDS 5,012,077 18.99 TOTAL TRANSFERABLE SECURITIES ADMITTED TO AN OFFICIAL STOCK EXCHANGE LISTING OR DEALT IN ON ANOTHER REGULATED MARKET 25,431,989 96.38 OTHER TRANSFERABLE SECURITIES EQUITIES MALTA BGP Holdings Plc** 187,667 – 0.00 TOTAL EQUITIES – 0.00 TOTAL OTHER TRANSFERABLE SECURITIES – 0.00 OPEN-ENDED FUNDS IRELAND Invesco Short-Term Investments Co Global Series Plc - US Dollar Liquidity Portfolio 1,037,911 1,037,911 3.93 TOTAL OPEN-ENDED FUNDS 1,037,911 3.93 Total Investments 26,469,900 100.31
The accompanying notes form an integral part of these financial statements. **Securities valued at fair market value as determined in good faith pursuant to procedures established by the Directors.
Invesco Global Income Real Estate Securities Fund Statement of Investments as at 28 February 2019
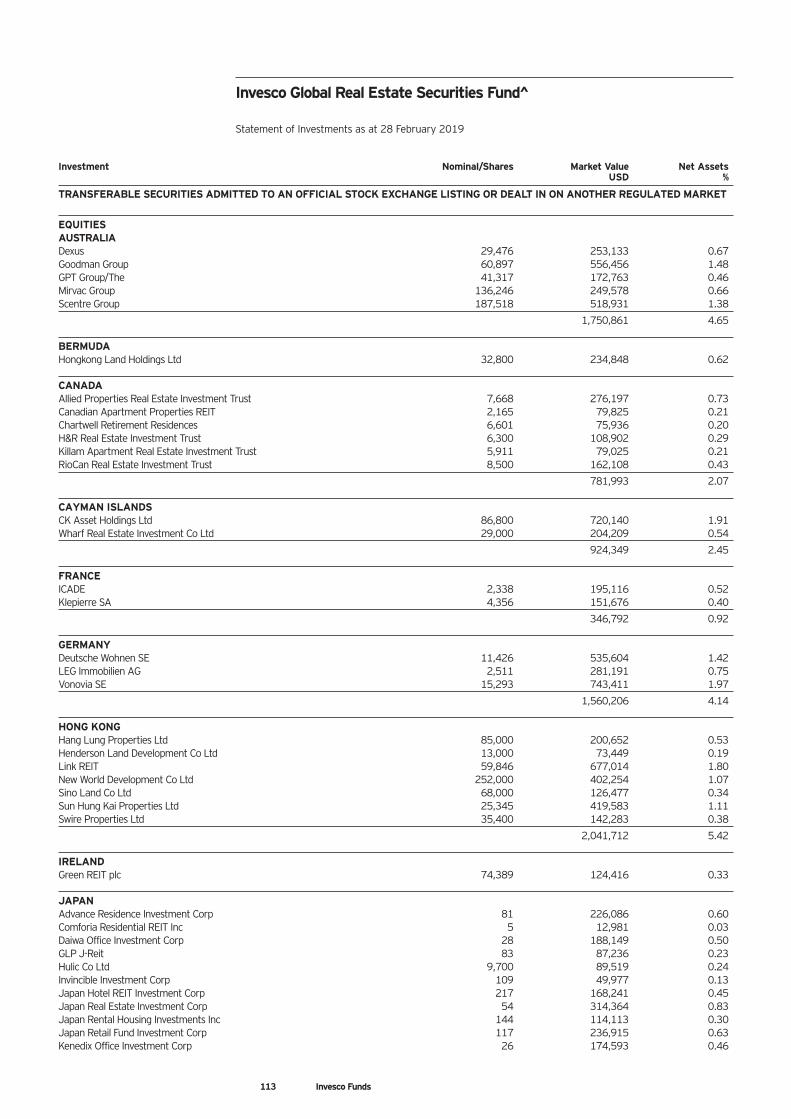
Investment Nominal/Shares Market Value Net Assets USD %
TRANSFERABLE SECURITIES ADMITTED TO AN OFFICIAL STOCK EXCHANGE LISTING OR DEALT IN ON ANOTHER REGULATED MARKET
EQUITIES AUSTRALIA Dexus 29,476 253,133 0.67 Goodman Group 60,897 556,456 1.48 GPT Group/The 41,317 172,763 0.46 Mirvac Group 136,246 249,578 0.66 Scentre Group 187,518 518,931 1.38
1,750,861 4.65 BERMUDA Hongkong Land Holdings Ltd 32,800 234,848 0.62 CANADA Allied Properties Real Estate Investment Trust 7,668 276,197 0.73 Canadian Apartment Properties REIT 2,165 79,825 0.21 Chartwell Retirement Residences 6,601 75,936 0.20 H&R Real Estate Investment Trust 6,300 108,902 0.29 Killam Apartment Real Estate Investment Trust 5,911 79,025 0.21 RioCan Real Estate Investment Trust 8,500 162,108 0.43
781,993 2.07 CAYMAN ISLANDS CK Asset Holdings Ltd 86,800 720,140 1.91 Wharf Real Estate Investment Co Ltd 29,000 204,209 0.54
924,349 2.45 FRANCE ICADE 2,338 195,116 0.52 Klepierre SA 4,356 151,676 0.40
346,792 0.92 GERMANY Deutsche Wohnen SE 11,426 535,604 1.42 LEG Immobilien AG 2,511 281,191 0.75 Vonovia SE 15,293 743,411 1.97
1,560,206 4.14 HONG KONG Hang Lung Properties Ltd 85,000 200,652 0.53 Henderson Land Development Co Ltd 13,000 73,449 0.19 Link REIT 59,846 677,014 1.80 New World Development Co Ltd 252,000 402,254 1.07 Sino Land Co Ltd 68,000 126,477 0.34 Sun Hung Kai Properties Ltd 25,345 419,583 1.11 Swire Properties Ltd 35,400 142,283 0.38
2,041,712 5.42 IRELAND Green REIT plc 74,389 124,416 0.33 JAPAN Advance Residence Investment Corp 81 226,086 0.60 Comforia Residential REIT Inc 5 12,981 0.03 Daiwa Office Investment Corp 28 188,149 0.50 GLP J-Reit 83 87,236 0.23 Hulic Co Ltd 9,700 89,519 0.24 Invincible Investment Corp 109 49,977 0.13 Japan Hotel REIT Investment Corp 217 168,241 0.45 Japan Real Estate Investment Corp 54 314,364 0.83 Japan Rental Housing Investments Inc 144 114,113 0.30 Japan Retail Fund Investment Corp 117 236,915 0.63 Kenedix Office Investment Corp 26 174,593 0.46
Invesco Global Real Estate Securities Fund^ Statement of Investments as at 28 February 2019
113 Invesco Funds
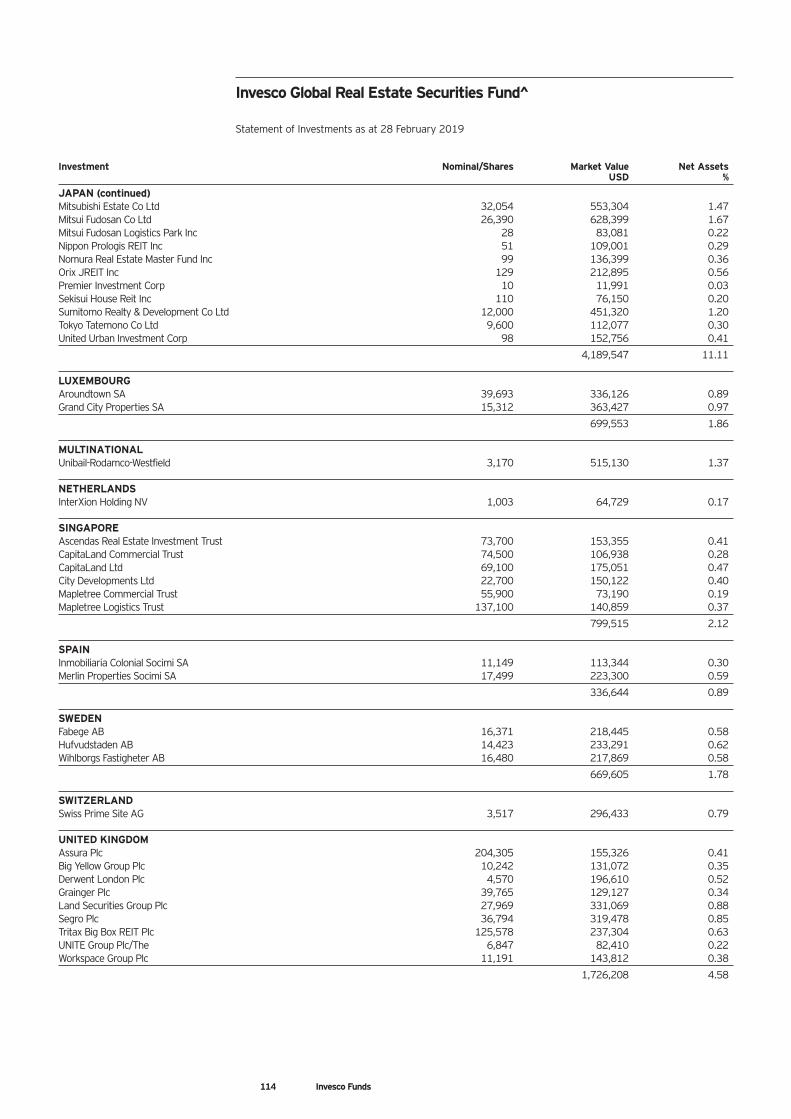
Investment Nominal/Shares Market Value Net Assets USD %
JAPAN (continued) Mitsubishi Estate Co Ltd 32,054 553,304 1.47 Mitsui Fudosan Co Ltd 26,390 628,399 1.67 Mitsui Fudosan Logistics Park Inc 28 83,081 0.22 Nippon Prologis REIT Inc 51 109,001 0.29 Nomura Real Estate Master Fund Inc 99 136,399 0.36 Orix JREIT Inc 129 212,895 0.56 Premier Investment Corp 10 11,991 0.03 Sekisui House Reit Inc 110 76,150 0.20 Sumitomo Realty & Development Co Ltd 12,000 451,320 1.20 Tokyo Tatemono Co Ltd 9,600 112,077 0.30 United Urban Investment Corp 98 152,756 0.41
4,189,547 11.11 LUXEMBOURG Aroundtown SA 39,693 336,126 0.89 Grand City Properties SA 15,312 363,427 0.97
699,553 1.86 MULTINATIONAL Unibail-Rodamco-Westfield 3,170 515,130 1.37 NETHERLANDS InterXion Holding NV 1,003 64,729 0.17 SINGAPORE Ascendas Real Estate Investment Trust 73,700 153,355 0.41 CapitaLand Commercial Trust 74,500 106,938 0.28 CapitaLand Ltd 69,100 175,051 0.47 City Developments Ltd 22,700 150,122 0.40 Mapletree Commercial Trust 55,900 73,190 0.19 Mapletree Logistics Trust 137,100 140,859 0.37
799,515 2.12 SPAIN Inmobiliaria Colonial Socimi SA 11,149 113,344 0.30 Merlin Properties Socimi SA 17,499 223,300 0.59
336,644 0.89 SWEDEN Fabege AB 16,371 218,445 0.58 Hufvudstaden AB 14,423 233,291 0.62 Wihlborgs Fastigheter AB 16,480 217,869 0.58
669,605 1.78 SWITZERLAND Swiss Prime Site AG 3,517 296,433 0.79 UNITED KINGDOM Assura Plc 204,305 155,326 0.41 Big Yellow Group Plc 10,242 131,072 0.35 Derwent London Plc 4,570 196,610 0.52 Grainger Plc 39,765 129,127 0.34 Land Securities Group Plc 27,969 331,069 0.88 Segro Plc 36,794 319,478 0.85 Tritax Big Box REIT Plc 125,578 237,304 0.63 UNITE Group Plc/The 6,847 82,410 0.22 Workspace Group Plc 11,191 143,812 0.38
1,726,208 4.58
Invesco Global Real Estate Securities Fund^ Statement of Investments as at 28 February 2019
114 Invesco Funds
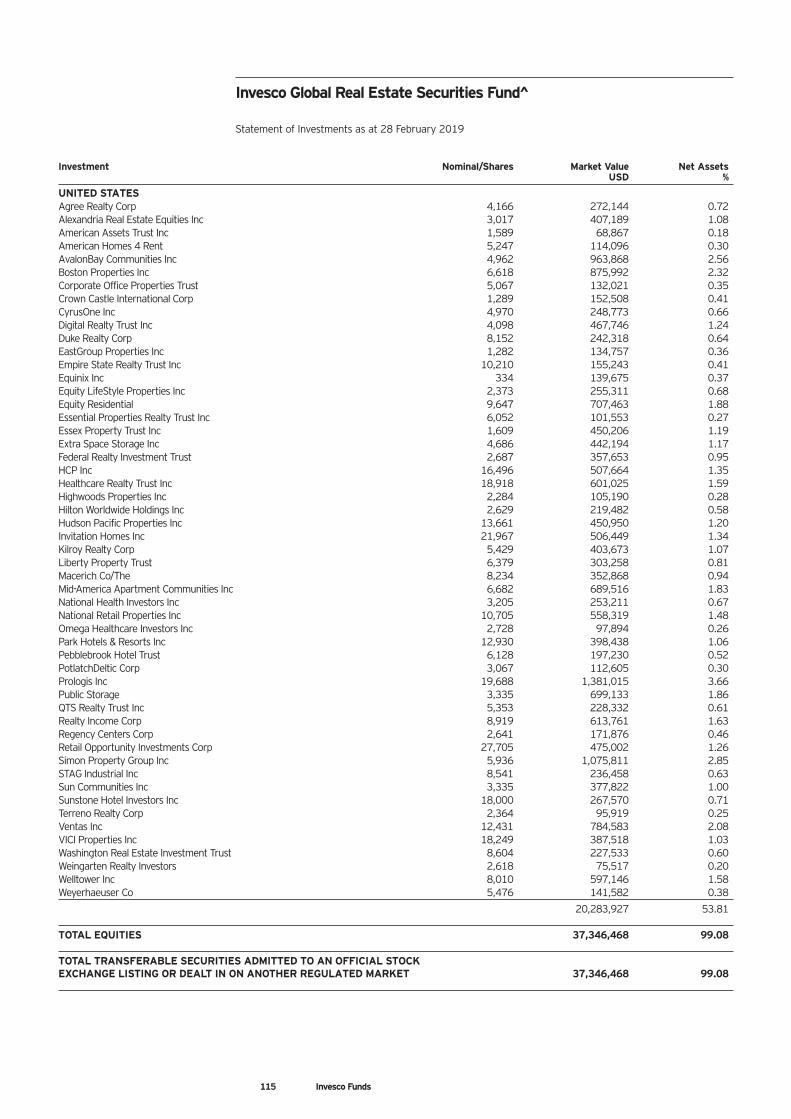
Investment Nominal/Shares Market Value Net Assets USD %
UNITED STATES Agree Realty Corp 4,166 272,144 0.72 Alexandria Real Estate Equities Inc 3,017 407,189 1.08 American Assets Trust Inc 1,589 68,867 0.18 American Homes 4 Rent 5,247 114,096 0.30 AvalonBay Communities Inc 4,962 963,868 2.56 Boston Properties Inc 6,618 875,992 2.32 Corporate Office Properties Trust 5,067 132,021 0.35 Crown Castle International Corp 1,289 152,508 0.41 CyrusOne Inc 4,970 248,773 0.66 Digital Realty Trust Inc 4,098 467,746 1.24 Duke Realty Corp 8,152 242,318 0.64 EastGroup Properties Inc 1,282 134,757 0.36 Empire State Realty Trust Inc 10,210 155,243 0.41 Equinix Inc 334 139,675 0.37 Equity LifeStyle Properties Inc 2,373 255,311 0.68 Equity Residential 9,647 707,463 1.88 Essential Properties Realty Trust Inc 6,052 101,553 0.27 Essex Property Trust Inc 1,609 450,206 1.19 Extra Space Storage Inc 4,686 442,194 1.17 Federal Realty Investment Trust 2,687 357,653 0.95 HCP Inc 16,496 507,664 1.35 Healthcare Realty Trust Inc 18,918 601,025 1.59 Highwoods Properties Inc 2,284 105,190 0.28 Hilton Worldwide Holdings Inc 2,629 219,482 0.58 Hudson Pacific Properties Inc 13,661 450,950 1.20 Invitation Homes Inc 21,967 506,449 1.34 Kilroy Realty Corp 5,429 403,673 1.07 Liberty Property Trust 6,379 303,258 0.81 Macerich Co/The 8,234 352,868 0.94 Mid-America Apartment Communities Inc 6,682 689,516 1.83 National Health Investors Inc 3,205 253,211 0.67 National Retail Properties Inc 10,705 558,319 1.48 Omega Healthcare Investors Inc 2,728 97,894 0.26 Park Hotels & Resorts Inc 12,930 398,438 1.06 Pebblebrook Hotel Trust 6,128 197,230 0.52 PotlatchDeltic Corp 3,067 112,605 0.30 Prologis Inc 19,688 1,381,015 3.66 Public Storage 3,335 699,133 1.86 QTS Realty Trust Inc 5,353 228,332 0.61 Realty Income Corp 8,919 613,761 1.63 Regency Centers Corp 2,641 171,876 0.46 Retail Opportunity Investments Corp 27,705 475,002 1.26 Simon Property Group Inc 5,936 1,075,811 2.85 STAG Industrial Inc 8,541 236,458 0.63 Sun Communities Inc 3,335 377,822 1.00 Sunstone Hotel Investors Inc 18,000 267,570 0.71 Terreno Realty Corp 2,364 95,919 0.25 Ventas Inc 12,431 784,583 2.08 VICI Properties Inc 18,249 387,518 1.03 Washington Real Estate Investment Trust 8,604 227,533 0.60 Weingarten Realty Investors 2,618 75,517 0.20 Welltower Inc 8,010 597,146 1.58 Weyerhaeuser Co 5,476 141,582 0.38
20,283,927 53.81 TOTAL EQUITIES 37,346,468 99.08 TOTAL TRANSFERABLE SECURITIES ADMITTED TO AN OFFICIAL STOCK EXCHANGE LISTING OR DEALT IN ON ANOTHER REGULATED MARKET 37,346,468 99.08
Invesco Global Real Estate Securities Fund^ Statement of Investments as at 28 February 2019
115 Invesco Funds
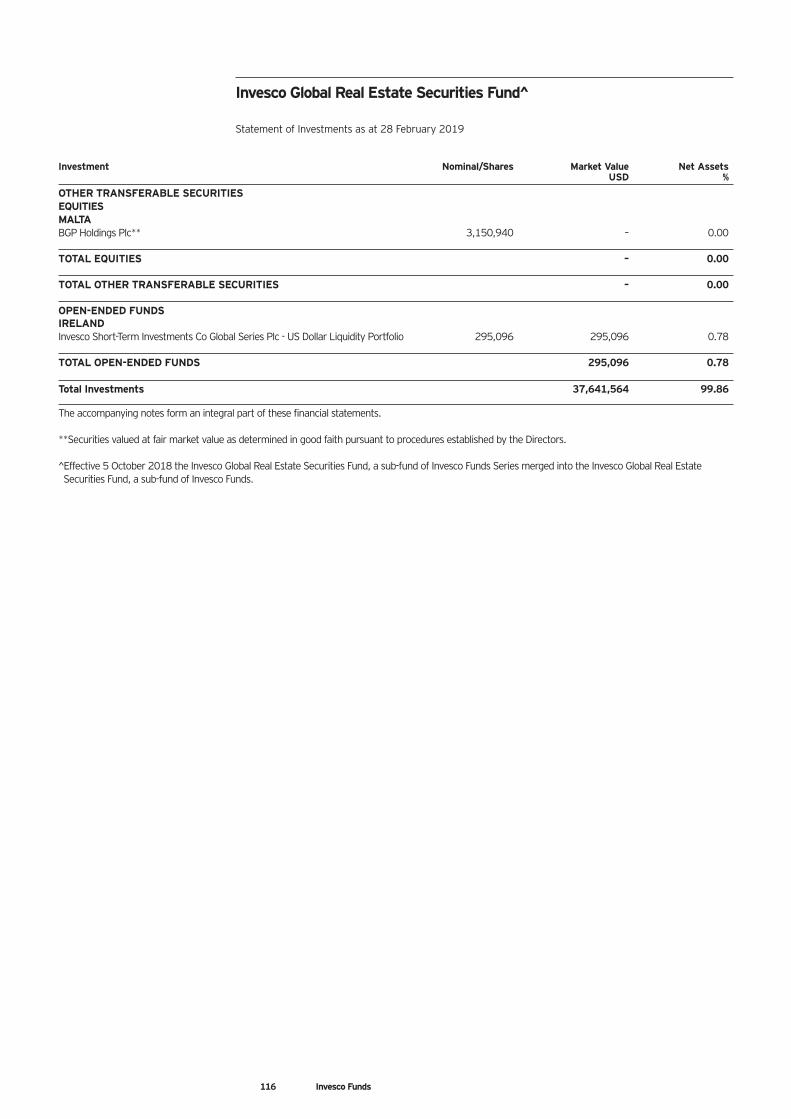
Investment Nominal/Shares Market Value Net Assets USD %
OTHER TRANSFERABLE SECURITIES EQUITIES MALTA BGP Holdings Plc** 3,150,940 – 0.00 TOTAL EQUITIES – 0.00 TOTAL OTHER TRANSFERABLE SECURITIES – 0.00 OPEN-ENDED FUNDS IRELAND Invesco Short-Term Investments Co Global Series Plc - US Dollar Liquidity Portfolio 295,096 295,096 0.78 TOTAL OPEN-ENDED FUNDS 295,096 0.78 Total Investments 37,641,564 99.86
The accompanying notes form an integral part of these financial statements. **Securities valued at fair market value as determined in good faith pursuant to procedures established by the Directors. ^Effective 5 October 2018 the Invesco Global Real Estate Securities Fund, a sub-fund of Invesco Funds Series merged into the Invesco Global Real Estate Securities Fund, a sub-fund of Invesco Funds.
Invesco Global Real Estate Securities Fund^ Statement of Investments as at 28 February 2019
116 Invesco Funds
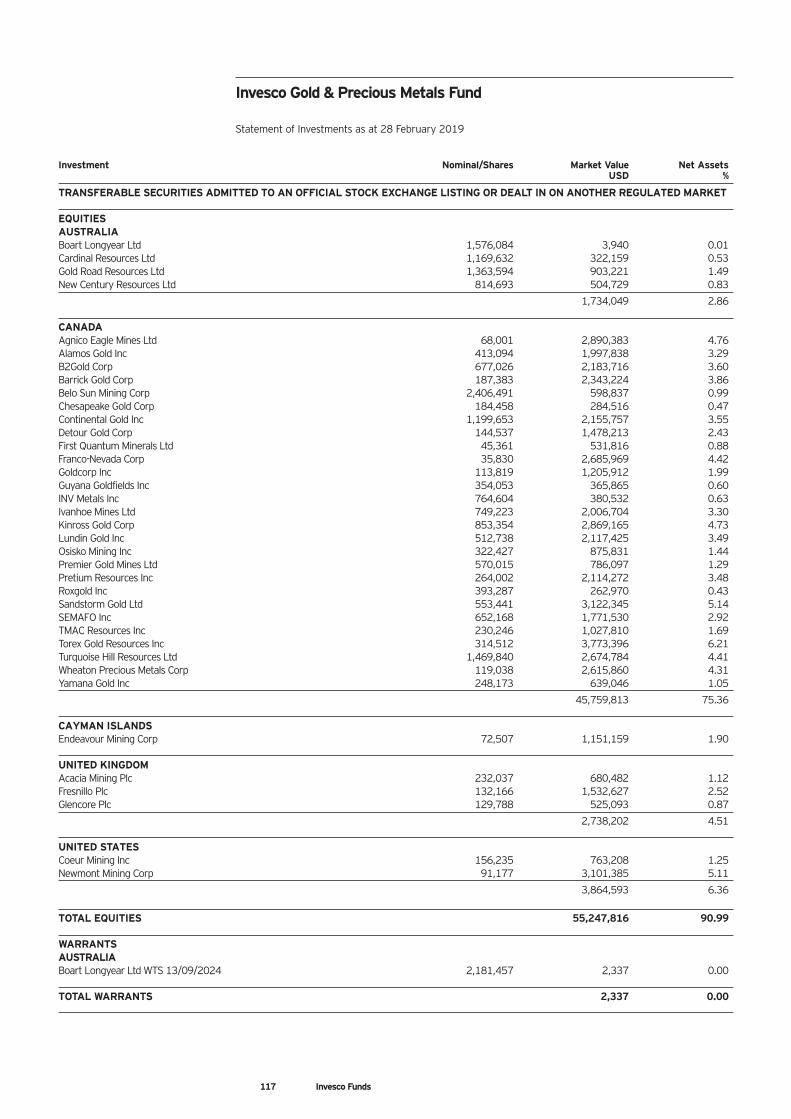
Investment Nominal/Shares Market Value Net Assets USD %
TRANSFERABLE SECURITIES ADMITTED TO AN OFFICIAL STOCK EXCHANGE LISTING OR DEALT IN ON ANOTHER REGULATED MARKET EQUITIES AUSTRALIA Boart Longyear Ltd 1,576,084 3,940 0.01 Cardinal Resources Ltd 1,169,632 322,159 0.53 Gold Road Resources Ltd 1,363,594 903,221 1.49 New Century Resources Ltd 814,693 504,729 0.83
1,734,049 2.86 CANADA Agnico Eagle Mines Ltd 68,001 2,890,383 4.76 Alamos Gold Inc 413,094 1,997,838 3.29 B2Gold Corp 677,026 2,183,716 3.60 Barrick Gold Corp 187,383 2,343,224 3.86 Belo Sun Mining Corp 2,406,491 598,837 0.99 Chesapeake Gold Corp 184,458 284,516 0.47 Continental Gold Inc 1,199,653 2,155,757 3.55 Detour Gold Corp 144,537 1,478,213 2.43 First Quantum Minerals Ltd 45,361 531,816 0.88 Franco-Nevada Corp 35,830 2,685,969 4.42 Goldcorp Inc 113,819 1,205,912 1.99 Guyana Goldfields Inc 354,053 365,865 0.60 INV Metals Inc 764,604 380,532 0.63 Ivanhoe Mines Ltd 749,223 2,006,704 3.30 Kinross Gold Corp 853,354 2,869,165 4.73 Lundin Gold Inc 512,738 2,117,425 3.49 Osisko Mining Inc 322,427 875,831 1.44 Premier Gold Mines Ltd 570,015 786,097 1.29 Pretium Resources Inc 264,002 2,114,272 3.48 Roxgold Inc 393,287 262,970 0.43 Sandstorm Gold Ltd 553,441 3,122,345 5.14 SEMAFO Inc 652,168 1,771,530 2.92 TMAC Resources Inc 230,246 1,027,810 1.69 Torex Gold Resources Inc 314,512 3,773,396 6.21 Turquoise Hill Resources Ltd 1,469,840 2,674,784 4.41 Wheaton Precious Metals Corp 119,038 2,615,860 4.31 Yamana Gold Inc 248,173 639,046 1.05
45,759,813 75.36 CAYMAN ISLANDS Endeavour Mining Corp 72,507 1,151,159 1.90 UNITED KINGDOM Acacia Mining Plc 232,037 680,482 1.12 Fresnillo Plc 132,166 1,532,627 2.52 Glencore Plc 129,788 525,093 0.87
2,738,202 4.51 UNITED STATES Coeur Mining Inc 156,235 763,208 1.25 Newmont Mining Corp 91,177 3,101,385 5.11
3,864,593 6.36 TOTAL EQUITIES 55,247,816 90.99 WARRANTS AUSTRALIA Boart Longyear Ltd WTS 13/09/2024 2,181,457 2,337 0.00 TOTAL WARRANTS 2,337 0.00
Invesco Gold & Precious Metals Fund Statement of Investments as at 28 February 2019
117 Invesco Funds
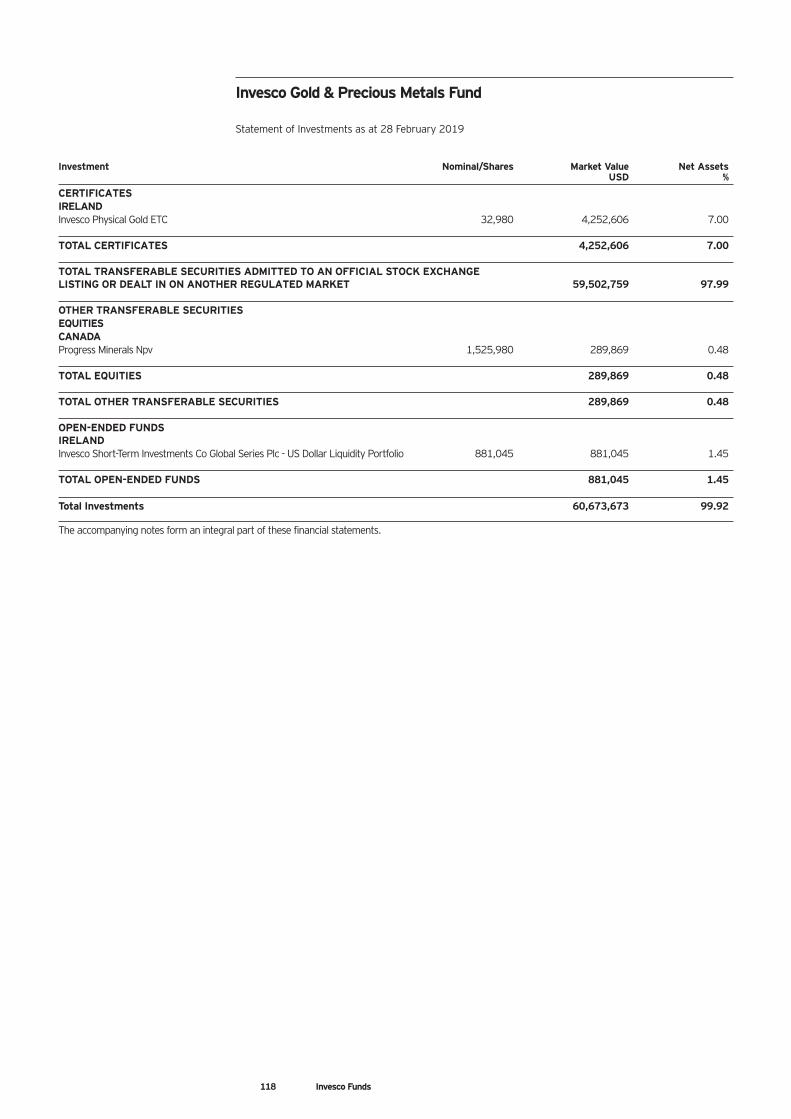
Investment Nominal/Shares Market Value Net Assets USD %
CERTIFICATES IRELAND Invesco Physical Gold ETC 32,980 4,252,606 7.00 TOTAL CERTIFICATES 4,252,606 7.00 TOTAL TRANSFERABLE SECURITIES ADMITTED TO AN OFFICIAL STOCK EXCHANGE LISTING OR DEALT IN ON ANOTHER REGULATED MARKET 59,502,759 97.99 OTHER TRANSFERABLE SECURITIES EQUITIES CANADA Progress Minerals Npv 1,525,980 289,869 0.48 TOTAL EQUITIES 289,869 0.48 TOTAL OTHER TRANSFERABLE SECURITIES 289,869 0.48 OPEN-ENDED FUNDS IRELAND Invesco Short-Term Investments Co Global Series Plc - US Dollar Liquidity Portfolio 881,045 881,045 1.45 TOTAL OPEN-ENDED FUNDS 881,045 1.45 Total Investments 60,673,673 99.92
The accompanying notes form an integral part of these financial statements.
Invesco Gold & Precious Metals Fund Statement of Investments as at 28 February 2019
118 Invesco Funds
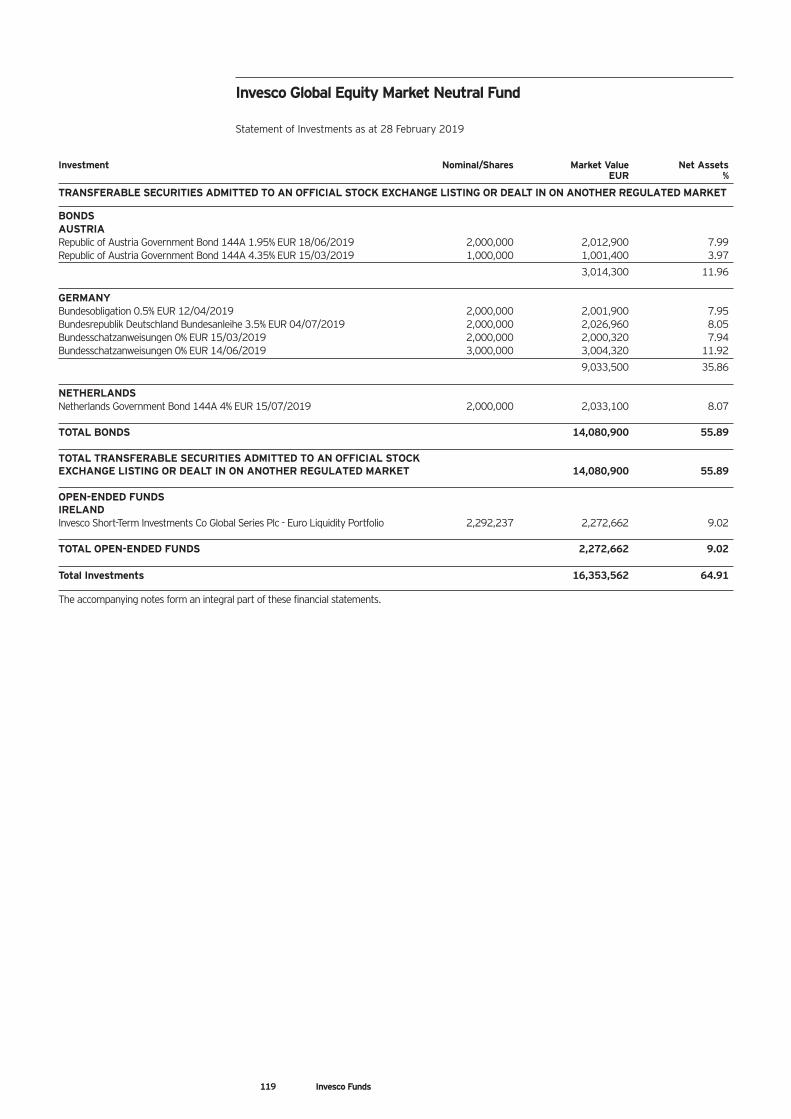
119 Invesco Funds
Investment Nominal/Shares Market Value Net Assets EUR %
TRANSFERABLE SECURITIES ADMITTED TO AN OFFICIAL STOCK EXCHANGE LISTING OR DEALT IN ON ANOTHER REGULATED MARKET BONDS AUSTRIA Republic of Austria Government Bond 144A 1.95% EUR 18/06/2019 2,000,000 2,012,900 7.99 Republic of Austria Government Bond 144A 4.35% EUR 15/03/2019 1,000,000 1,001,400 3.97
3,014,300 11.96 GERMANY Bundesobligation 0.5% EUR 12/04/2019 2,000,000 2,001,900 7.95 Bundesrepublik Deutschland Bundesanleihe 3.5% EUR 04/07/2019 2,000,000 2,026,960 8.05 Bundesschatzanweisungen 0% EUR 15/03/2019 2,000,000 2,000,320 7.94 Bundesschatzanweisungen 0% EUR 14/06/2019 3,000,000 3,004,320 11.92
9,033,500 35.86 NETHERLANDS Netherlands Government Bond 144A 4% EUR 15/07/2019 2,000,000 2,033,100 8.07 TOTAL BONDS 14,080,900 55.89 TOTAL TRANSFERABLE SECURITIES ADMITTED TO AN OFFICIAL STOCK EXCHANGE LISTING OR DEALT IN ON ANOTHER REGULATED MARKET 14,080,900 55.89 OPEN-ENDED FUNDS IRELAND Invesco Short-Term Investments Co Global Series Plc - Euro Liquidity Portfolio 2,292,237 2,272,662 9.02 TOTAL OPEN-ENDED FUNDS 2,272,662 9.02 Total Investments 16,353,562 64.91
The accompanying notes form an integral part of these financial statements.
Invesco Global Equity Market Neutral Fund Statement of Investments as at 28 February 2019
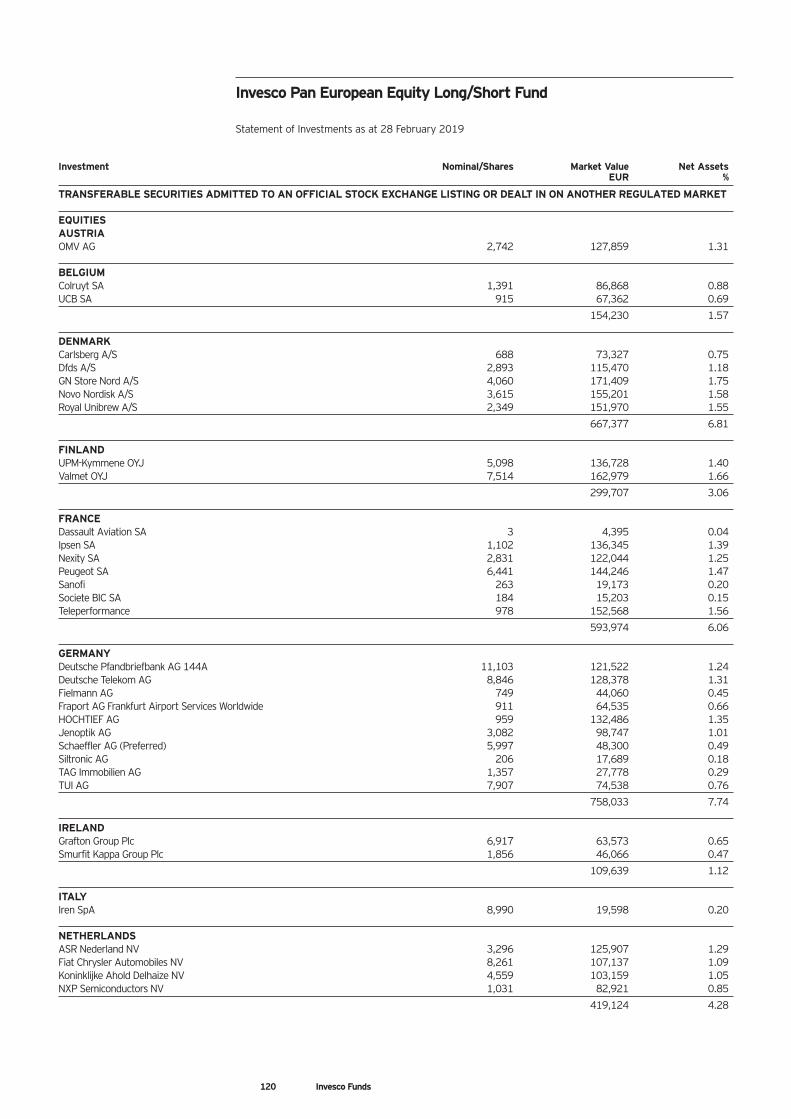
120 Invesco Funds
Investment Nominal/Shares Market Value Net Assets EUR %
TRANSFERABLE SECURITIES ADMITTED TO AN OFFICIAL STOCK EXCHANGE LISTING OR DEALT IN ON ANOTHER REGULATED MARKET EQUITIES AUSTRIA OMV AG 2,742 127,859 1.31 BELGIUM Colruyt SA 1,391 86,868 0.88 UCB SA 915 67,362 0.69
154,230 1.57 DENMARK Carlsberg A/S 688 73,327 0.75 Dfds A/S 2,893 115,470 1.18 GN Store Nord A/S 4,060 171,409 1.75 Novo Nordisk A/S 3,615 155,201 1.58 Royal Unibrew A/S 2,349 151,970 1.55
667,377 6.81 FINLAND UPM-Kymmene OYJ 5,098 136,728 1.40 Valmet OYJ 7,514 162,979 1.66
299,707 3.06 FRANCE Dassault Aviation SA 3 4,395 0.04 Ipsen SA 1,102 136,345 1.39 Nexity SA 2,831 122,044 1.25 Peugeot SA 6,441 144,246 1.47 Sanofi 263 19,173 0.20 Societe BIC SA 184 15,203 0.15 Teleperformance 978 152,568 1.56
593,974 6.06 GERMANY Deutsche Pfandbriefbank AG 144A 11,103 121,522 1.24 Deutsche Telekom AG 8,846 128,378 1.31 Fielmann AG 749 44,060 0.45 Fraport AG Frankfurt Airport Services Worldwide 911 64,535 0.66 HOCHTIEF AG 959 132,486 1.35 Jenoptik AG 3,082 98,747 1.01 Schaeffler AG (Preferred) 5,997 48,300 0.49 Siltronic AG 206 17,689 0.18 TAG Immobilien AG 1,357 27,778 0.29 TUI AG 7,907 74,538 0.76
758,033 7.74 IRELAND Grafton Group Plc 6,917 63,573 0.65 Smurfit Kappa Group Plc 1,856 46,066 0.47
109,639 1.12 ITALY Iren SpA 8,990 19,598 0.20 NETHERLANDS ASR Nederland NV 3,296 125,907 1.29 Fiat Chrysler Automobiles NV 8,261 107,137 1.09 Koninklijke Ahold Delhaize NV 4,559 103,159 1.05 NXP Semiconductors NV 1,031 82,921 0.85
419,124 4.28
Invesco Pan European Equity Long/Short Fund Statement of Investments as at 28 February 2019
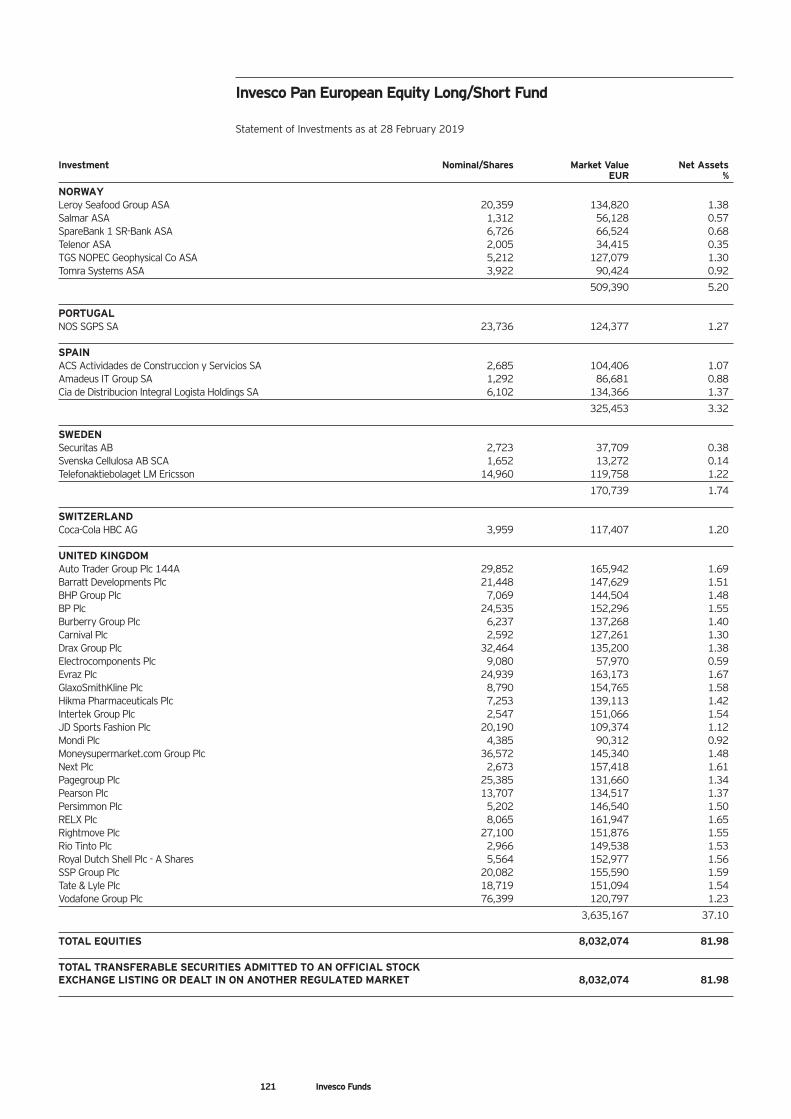
121 Invesco Funds
Investment Nominal/Shares Market Value Net Assets EUR %
NORWAY Leroy Seafood Group ASA 20,359 134,820 1.38 Salmar ASA 1,312 56,128 0.57 SpareBank 1 SR-Bank ASA 6,726 66,524 0.68 Telenor ASA 2,005 34,415 0.35 TGS NOPEC Geophysical Co ASA 5,212 127,079 1.30 Tomra Systems ASA 3,922 90,424 0.92
509,390 5.20 PORTUGAL NOS SGPS SA 23,736 124,377 1.27 SPAIN ACS Actividades de Construccion y Servicios SA 2,685 104,406 1.07 Amadeus IT Group SA 1,292 86,681 0.88 Cia de Distribucion Integral Logista Holdings SA 6,102 134,366 1.37
325,453 3.32 SWEDEN Securitas AB 2,723 37,709 0.38 Svenska Cellulosa AB SCA 1,652 13,272 0.14 Telefonaktiebolaget LM Ericsson 14,960 119,758 1.22
170,739 1.74 SWITZERLAND Coca-Cola HBC AG 3,959 117,407 1.20 UNITED KINGDOM Auto Trader Group Plc 144A 29,852 165,942 1.69 Barratt Developments Plc 21,448 147,629 1.51 BHP Group Plc 7,069 144,504 1.48 BP Plc 24,535 152,296 1.55 Burberry Group Plc 6,237 137,268 1.40 Carnival Plc 2,592 127,261 1.30 Drax Group Plc 32,464 135,200 1.38 Electrocomponents Plc 9,080 57,970 0.59 Evraz Plc 24,939 163,173 1.67 GlaxoSmithKline Plc 8,790 154,765 1.58 Hikma Pharmaceuticals Plc 7,253 139,113 1.42 Intertek Group Plc 2,547 151,066 1.54 JD Sports Fashion Plc 20,190 109,374 1.12 Mondi Plc 4,385 90,312 0.92 Moneysupermarket.com Group Plc 36,572 145,340 1.48 Next Plc 2,673 157,418 1.61 Pagegroup Plc 25,385 131,660 1.34 Pearson Plc 13,707 134,517 1.37 Persimmon Plc 5,202 146,540 1.50 RELX Plc 8,065 161,947 1.65 Rightmove Plc 27,100 151,876 1.55 Rio Tinto Plc 2,966 149,538 1.53 Royal Dutch Shell Plc - A Shares 5,564 152,977 1.56 SSP Group Plc 20,082 155,590 1.59 Tate & Lyle Plc 18,719 151,094 1.54 Vodafone Group Plc 76,399 120,797 1.23
3,635,167 37.10 TOTAL EQUITIES 8,032,074 81.98 TOTAL TRANSFERABLE SECURITIES ADMITTED TO AN OFFICIAL STOCK EXCHANGE LISTING OR DEALT IN ON ANOTHER REGULATED MARKET 8,032,074 81.98
Invesco Pan European Equity Long/Short Fund Statement of Investments as at 28 February 2019
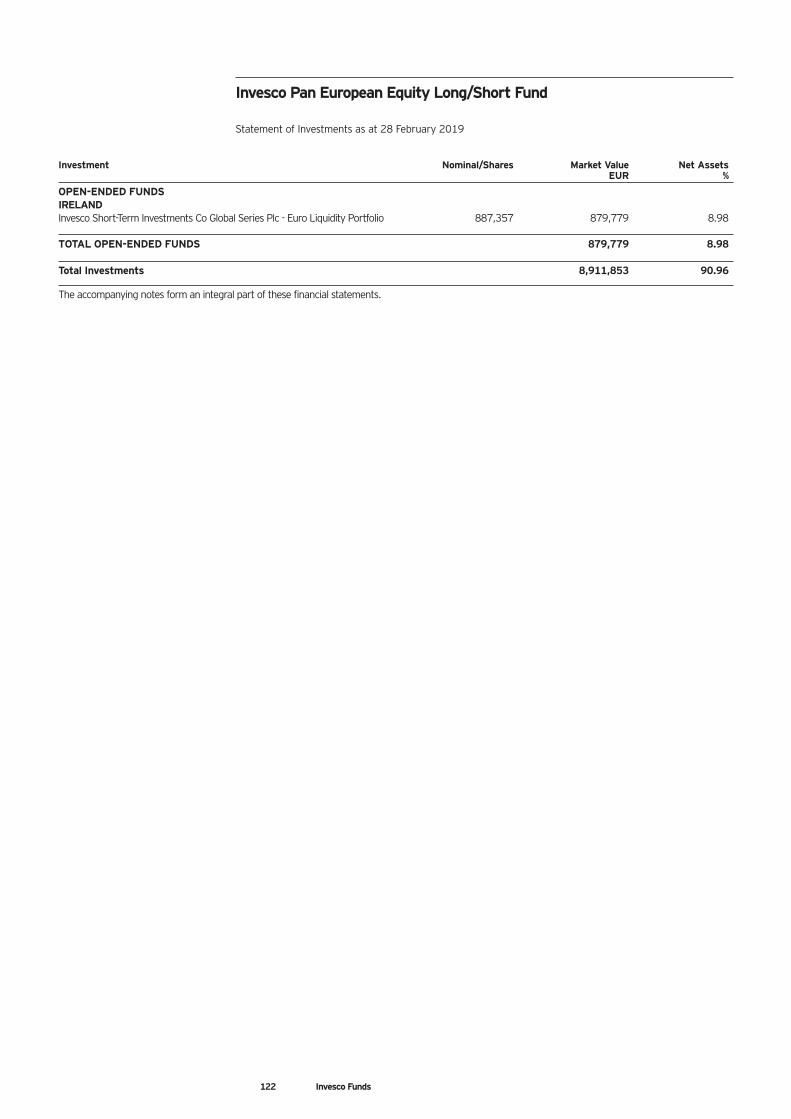
Investment Nominal/Shares Market Value Net Assets EUR %
OPEN-ENDED FUNDS IRELAND Invesco Short-Term Investments Co Global Series Plc - Euro Liquidity Portfolio 887,357 879,779 8.98 TOTAL OPEN-ENDED FUNDS 879,779 8.98 Total Investments 8,911,853 90.96
The accompanying notes form an integral part of these financial statements.
122 Invesco Funds
Invesco Pan European Equity Long/Short Fund Statement of Investments as at 28 February 2019
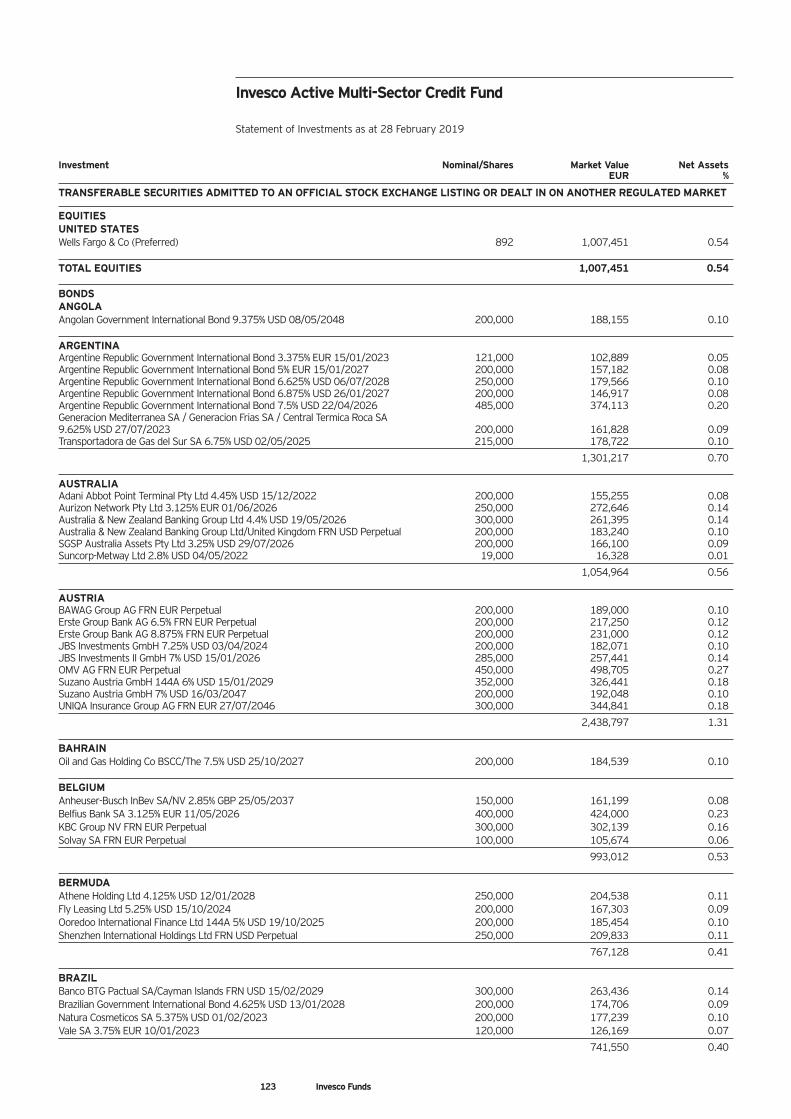
123 Invesco Funds
Invesco Active Multi-Sector Credit Fund Statement of Investments as at 28 February 2019
Investment Nominal/Shares Market Value Net Assets EUR %
TRANSFERABLE SECURITIES ADMITTED TO AN OFFICIAL STOCK EXCHANGE LISTING OR DEALT IN ON ANOTHER REGULATED MARKET EQUITIES UNITED STATES Wells Fargo & Co (Preferred) 892 1,007,451 0.54 TOTAL EQUITIES 1,007,451 0.54 BONDS ANGOLA Angolan Government International Bond 9.375% USD 08/05/2048 200,000 188,155 0.10 ARGENTINA Argentine Republic Government International Bond 3.375% EUR 15/01/2023 121,000 102,889 0.05 Argentine Republic Government International Bond 5% EUR 15/01/2027 200,000 157,182 0.08 Argentine Republic Government International Bond 6.625% USD 06/07/2028 250,000 179,566 0.10 Argentine Republic Government International Bond 6.875% USD 26/01/2027 200,000 146,917 0.08 Argentine Republic Government International Bond 7.5% USD 22/04/2026 485,000 374,113 0.20 Generacion Mediterranea SA / Generacion Frias SA / Central Termica Roca SA 9.625% USD 27/07/2023 200,000 161,828 0.09 Transportadora de Gas del Sur SA 6.75% USD 02/05/2025 215,000 178,722 0.10
1,301,217 0.70 AUSTRALIA Adani Abbot Point Terminal Pty Ltd 4.45% USD 15/12/2022 200,000 155,255 0.08 Aurizon Network Pty Ltd 3.125% EUR 01/06/2026 250,000 272,646 0.14 Australia & New Zealand Banking Group Ltd 4.4% USD 19/05/2026 300,000 261,395 0.14 Australia & New Zealand Banking Group Ltd/United Kingdom FRN USD Perpetual 200,000 183,240 0.10 SGSP Australia Assets Pty Ltd 3.25% USD 29/07/2026 200,000 166,100 0.09 Suncorp-Metway Ltd 2.8% USD 04/05/2022 19,000 16,328 0.01
1,054,964 0.56 AUSTRIA BAWAG Group AG FRN EUR Perpetual 200,000 189,000 0.10 Erste Group Bank AG 6.5% FRN EUR Perpetual 200,000 217,250 0.12 Erste Group Bank AG 8.875% FRN EUR Perpetual 200,000 231,000 0.12 JBS Investments GmbH 7.25% USD 03/04/2024 200,000 182,071 0.10 JBS Investments II GmbH 7% USD 15/01/2026 285,000 257,441 0.14 OMV AG FRN EUR Perpetual 450,000 498,705 0.27 Suzano Austria GmbH 144A 6% USD 15/01/2029 352,000 326,441 0.18 Suzano Austria GmbH 7% USD 16/03/2047 200,000 192,048 0.10 UNIQA Insurance Group AG FRN EUR 27/07/2046 300,000 344,841 0.18
2,438,797 1.31 BAHRAIN Oil and Gas Holding Co BSCC/The 7.5% USD 25/10/2027 200,000 184,539 0.10 BELGIUM Anheuser-Busch InBev SA/NV 2.85% GBP 25/05/2037 150,000 161,199 0.08 Belfius Bank SA 3.125% EUR 11/05/2026 400,000 424,000 0.23 KBC Group NV FRN EUR Perpetual 300,000 302,139 0.16 Solvay SA FRN EUR Perpetual 100,000 105,674 0.06
993,012 0.53 BERMUDA Athene Holding Ltd 4.125% USD 12/01/2028 250,000 204,538 0.11 Fly Leasing Ltd 5.25% USD 15/10/2024 200,000 167,303 0.09 Ooredoo International Finance Ltd 144A 5% USD 19/10/2025 200,000 185,454 0.10 Shenzhen International Holdings Ltd FRN USD Perpetual 250,000 209,833 0.11
767,128 0.41 BRAZIL Banco BTG Pactual SA/Cayman Islands FRN USD 15/02/2029 300,000 263,436 0.14 Brazilian Government International Bond 4.625% USD 13/01/2028 200,000 174,706 0.09 Natura Cosmeticos SA 5.375% USD 01/02/2023 200,000 177,239 0.10 Vale SA 3.75% EUR 10/01/2023 120,000 126,169 0.07
741,550 0.40
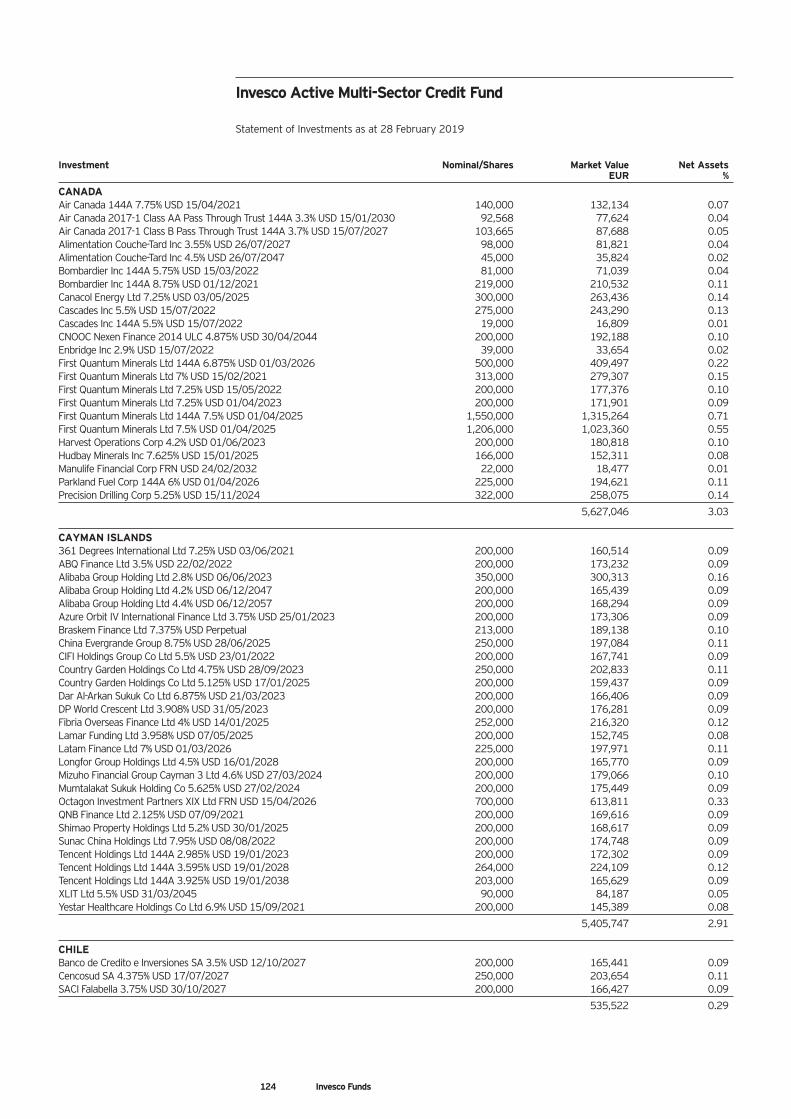
124 Invesco Funds
Investment Nominal/Shares Market Value Net Assets EUR %
CANADA Air Canada 144A 7.75% USD 15/04/2021 140,000 132,134 0.07 Air Canada 2017-1 Class AA Pass Through Trust 144A 3.3% USD 15/01/2030 92,568 77,624 0.04 Air Canada 2017-1 Class B Pass Through Trust 144A 3.7% USD 15/07/2027 103,665 87,688 0.05 Alimentation Couche-Tard Inc 3.55% USD 26/07/2027 98,000 81,821 0.04 Alimentation Couche-Tard Inc 4.5% USD 26/07/2047 45,000 35,824 0.02 Bombardier Inc 144A 5.75% USD 15/03/2022 81,000 71,039 0.04 Bombardier Inc 144A 8.75% USD 01/12/2021 219,000 210,532 0.11 Canacol Energy Ltd 7.25% USD 03/05/2025 300,000 263,436 0.14 Cascades Inc 5.5% USD 15/07/2022 275,000 243,290 0.13 Cascades Inc 144A 5.5% USD 15/07/2022 19,000 16,809 0.01 CNOOC Nexen Finance 2014 ULC 4.875% USD 30/04/2044 200,000 192,188 0.10 Enbridge Inc 2.9% USD 15/07/2022 39,000 33,654 0.02 First Quantum Minerals Ltd 144A 6.875% USD 01/03/2026 500,000 409,497 0.22 First Quantum Minerals Ltd 7% USD 15/02/2021 313,000 279,307 0.15 First Quantum Minerals Ltd 7.25% USD 15/05/2022 200,000 177,376 0.10 First Quantum Minerals Ltd 7.25% USD 01/04/2023 200,000 171,901 0.09 First Quantum Minerals Ltd 144A 7.5% USD 01/04/2025 1,550,000 1,315,264 0.71 First Quantum Minerals Ltd 7.5% USD 01/04/2025 1,206,000 1,023,360 0.55 Harvest Operations Corp 4.2% USD 01/06/2023 200,000 180,818 0.10 Hudbay Minerals Inc 7.625% USD 15/01/2025 166,000 152,311 0.08 Manulife Financial Corp FRN USD 24/02/2032 22,000 18,477 0.01 Parkland Fuel Corp 144A 6% USD 01/04/2026 225,000 194,621 0.11 Precision Drilling Corp 5.25% USD 15/11/2024 322,000 258,075 0.14
5,627,046 3.03 CAYMAN ISLANDS 361 Degrees International Ltd 7.25% USD 03/06/2021 200,000 160,514 0.09 ABQ Finance Ltd 3.5% USD 22/02/2022 200,000 173,232 0.09 Alibaba Group Holding Ltd 2.8% USD 06/06/2023 350,000 300,313 0.16 Alibaba Group Holding Ltd 4.2% USD 06/12/2047 200,000 165,439 0.09 Alibaba Group Holding Ltd 4.4% USD 06/12/2057 200,000 168,294 0.09 Azure Orbit IV International Finance Ltd 3.75% USD 25/01/2023 200,000 173,306 0.09 Braskem Finance Ltd 7.375% USD Perpetual 213,000 189,138 0.10 China Evergrande Group 8.75% USD 28/06/2025 250,000 197,084 0.11 CIFI Holdings Group Co Ltd 5.5% USD 23/01/2022 200,000 167,741 0.09 Country Garden Holdings Co Ltd 4.75% USD 28/09/2023 250,000 202,833 0.11 Country Garden Holdings Co Ltd 5.125% USD 17/01/2025 200,000 159,437 0.09 Dar Al-Arkan Sukuk Co Ltd 6.875% USD 21/03/2023 200,000 166,406 0.09 DP World Crescent Ltd 3.908% USD 31/05/2023 200,000 176,281 0.09 Fibria Overseas Finance Ltd 4% USD 14/01/2025 252,000 216,320 0.12 Lamar Funding Ltd 3.958% USD 07/05/2025 200,000 152,745 0.08 Latam Finance Ltd 7% USD 01/03/2026 225,000 197,971 0.11 Longfor Group Holdings Ltd 4.5% USD 16/01/2028 200,000 165,770 0.09 Mizuho Financial Group Cayman 3 Ltd 4.6% USD 27/03/2024 200,000 179,066 0.10 Mumtalakat Sukuk Holding Co 5.625% USD 27/02/2024 200,000 175,449 0.09 Octagon Investment Partners XIX Ltd FRN USD 15/04/2026 700,000 613,811 0.33 QNB Finance Ltd 2.125% USD 07/09/2021 200,000 169,616 0.09 Shimao Property Holdings Ltd 5.2% USD 30/01/2025 200,000 168,617 0.09 Sunac China Holdings Ltd 7.95% USD 08/08/2022 200,000 174,748 0.09 Tencent Holdings Ltd 144A 2.985% USD 19/01/2023 200,000 172,302 0.09 Tencent Holdings Ltd 144A 3.595% USD 19/01/2028 264,000 224,109 0.12 Tencent Holdings Ltd 144A 3.925% USD 19/01/2038 203,000 165,629 0.09 XLIT Ltd 5.5% USD 31/03/2045 90,000 84,187 0.05 Yestar Healthcare Holdings Co Ltd 6.9% USD 15/09/2021 200,000 145,389 0.08
5,405,747 2.91 CHILE Banco de Credito e Inversiones SA 3.5% USD 12/10/2027 200,000 165,441 0.09 Cencosud SA 4.375% USD 17/07/2027 250,000 203,654 0.11 SACI Falabella 3.75% USD 30/10/2027 200,000 166,427 0.09
535,522 0.29
Invesco Active Multi-Sector Credit Fund Statement of Investments as at 28 February 2019
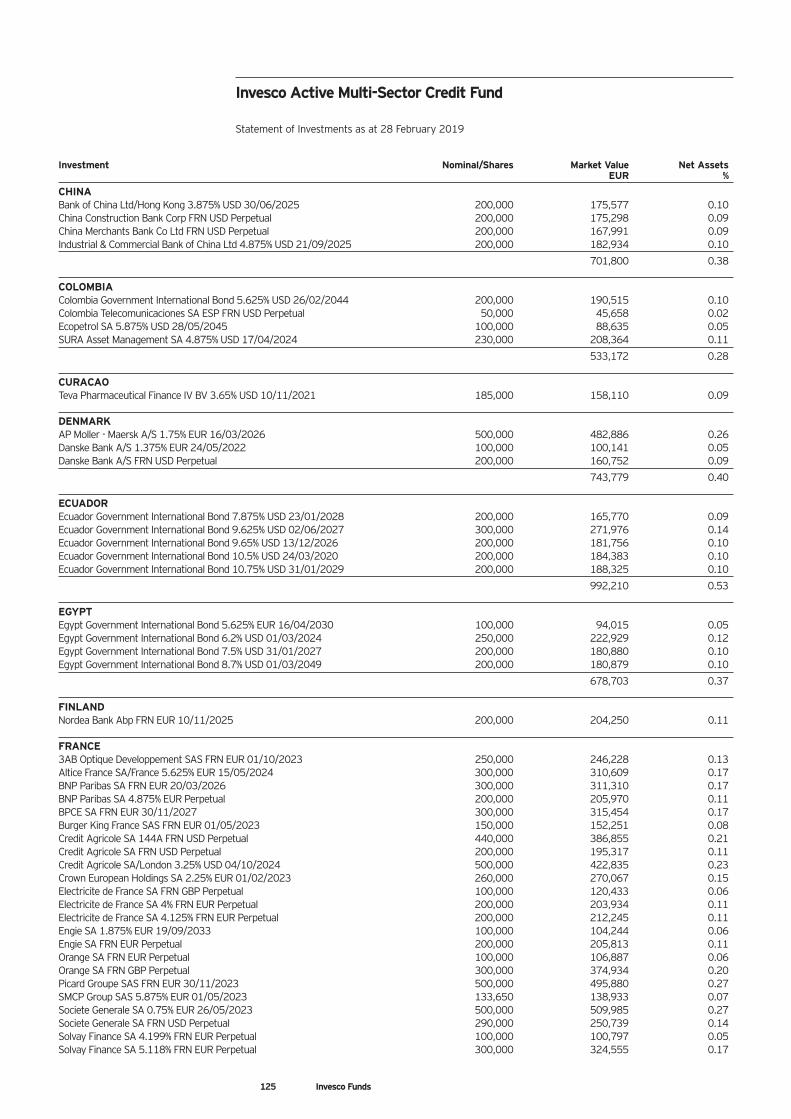
125 Invesco Funds
Investment Nominal/Shares Market Value Net Assets EUR %
CHINA Bank of China Ltd/Hong Kong 3.875% USD 30/06/2025 200,000 175,577 0.10 China Construction Bank Corp FRN USD Perpetual 200,000 175,298 0.09 China Merchants Bank Co Ltd FRN USD Perpetual 200,000 167,991 0.09 Industrial & Commercial Bank of China Ltd 4.875% USD 21/09/2025 200,000 182,934 0.10
701,800 0.38 COLOMBIA Colombia Government International Bond 5.625% USD 26/02/2044 200,000 190,515 0.10 Colombia Telecomunicaciones SA ESP FRN USD Perpetual 50,000 45,658 0.02 Ecopetrol SA 5.875% USD 28/05/2045 100,000 88,635 0.05 SURA Asset Management SA 4.875% USD 17/04/2024 230,000 208,364 0.11
533,172 0.28 CURACAO Teva Pharmaceutical Finance IV BV 3.65% USD 10/11/2021 185,000 158,110 0.09 DENMARK AP Moller - Maersk A/S 1.75% EUR 16/03/2026 500,000 482,886 0.26 Danske Bank A/S 1.375% EUR 24/05/2022 100,000 100,141 0.05 Danske Bank A/S FRN USD Perpetual 200,000 160,752 0.09
743,779 0.40 ECUADOR Ecuador Government International Bond 7.875% USD 23/01/2028 200,000 165,770 0.09 Ecuador Government International Bond 9.625% USD 02/06/2027 300,000 271,976 0.14 Ecuador Government International Bond 9.65% USD 13/12/2026 200,000 181,756 0.10 Ecuador Government International Bond 10.5% USD 24/03/2020 200,000 184,383 0.10 Ecuador Government International Bond 10.75% USD 31/01/2029 200,000 188,325 0.10
992,210 0.53 EGYPT Egypt Government International Bond 5.625% EUR 16/04/2030 100,000 94,015 0.05 Egypt Government International Bond 6.2% USD 01/03/2024 250,000 222,929 0.12 Egypt Government International Bond 7.5% USD 31/01/2027 200,000 180,880 0.10 Egypt Government International Bond 8.7% USD 01/03/2049 200,000 180,879 0.10
678,703 0.37 FINLAND Nordea Bank Abp FRN EUR 10/11/2025 200,000 204,250 0.11 FRANCE 3AB Optique Developpement SAS FRN EUR 01/10/2023 250,000 246,228 0.13 Altice France SA/France 5.625% EUR 15/05/2024 300,000 310,609 0.17 BNP Paribas SA FRN EUR 20/03/2026 300,000 311,310 0.17 BNP Paribas SA 4.875% EUR Perpetual 200,000 205,970 0.11 BPCE SA FRN EUR 30/11/2027 300,000 315,454 0.17 Burger King France SAS FRN EUR 01/05/2023 150,000 152,251 0.08 Credit Agricole SA 144A FRN USD Perpetual 440,000 386,855 0.21 Credit Agricole SA FRN USD Perpetual 200,000 195,317 0.11 Credit Agricole SA/London 3.25% USD 04/10/2024 500,000 422,835 0.23 Crown European Holdings SA 2.25% EUR 01/02/2023 260,000 270,067 0.15 Electricite de France SA FRN GBP Perpetual 100,000 120,433 0.06 Electricite de France SA 4% FRN EUR Perpetual 200,000 203,934 0.11 Electricite de France SA 4.125% FRN EUR Perpetual 200,000 212,245 0.11 Engie SA 1.875% EUR 19/09/2033 100,000 104,244 0.06 Engie SA FRN EUR Perpetual 200,000 205,813 0.11 Orange SA FRN EUR Perpetual 100,000 106,887 0.06 Orange SA FRN GBP Perpetual 300,000 374,934 0.20 Picard Groupe SAS FRN EUR 30/11/2023 500,000 495,880 0.27 SMCP Group SAS 5.875% EUR 01/05/2023 133,650 138,933 0.07 Societe Generale SA 0.75% EUR 26/05/2023 500,000 509,985 0.27 Societe Generale SA FRN USD Perpetual 290,000 250,739 0.14 Solvay Finance SA 4.199% FRN EUR Perpetual 100,000 100,797 0.05 Solvay Finance SA 5.118% FRN EUR Perpetual 300,000 324,555 0.17
Invesco Active Multi-Sector Credit Fund Statement of Investments as at 28 February 2019
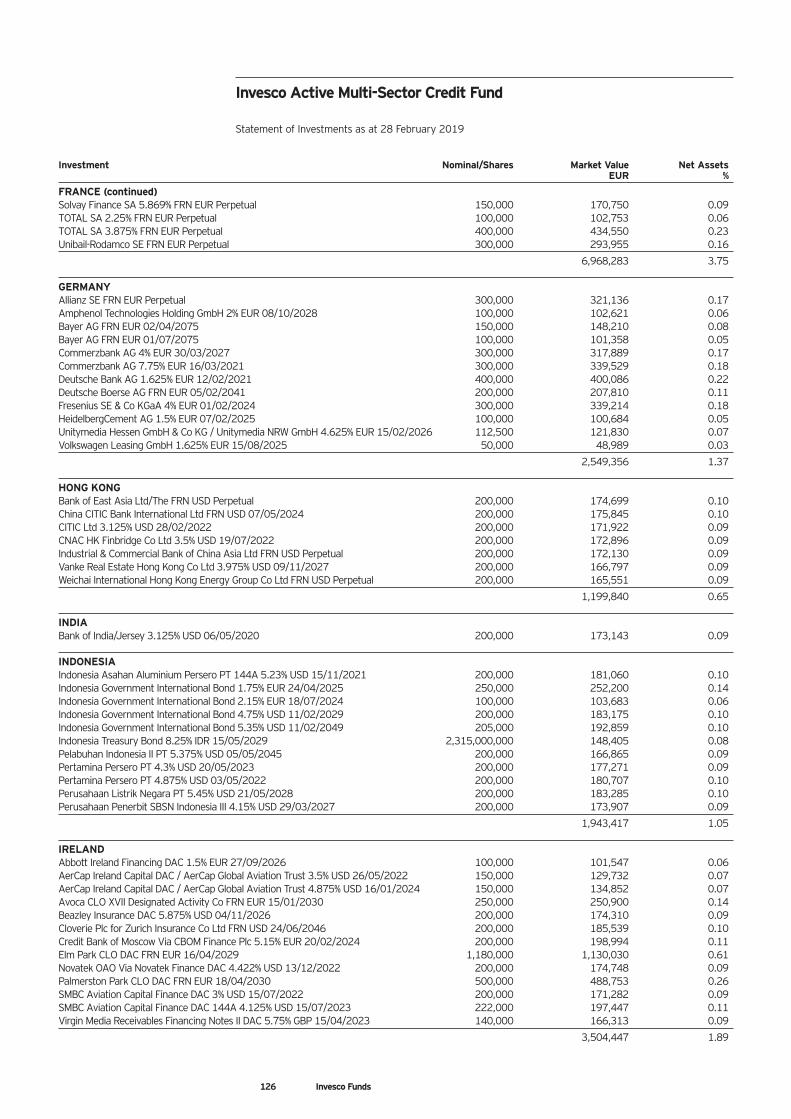
126 Invesco Funds
Investment Nominal/Shares Market Value Net Assets EUR %
FRANCE (continued) Solvay Finance SA 5.869% FRN EUR Perpetual 150,000 170,750 0.09 TOTAL SA 2.25% FRN EUR Perpetual 100,000 102,753 0.06 TOTAL SA 3.875% FRN EUR Perpetual 400,000 434,550 0.23 Unibail-Rodamco SE FRN EUR Perpetual 300,000 293,955 0.16
6,968,283 3.75 GERMANY Allianz SE FRN EUR Perpetual 300,000 321,136 0.17 Amphenol Technologies Holding GmbH 2% EUR 08/10/2028 100,000 102,621 0.06 Bayer AG FRN EUR 02/04/2075 150,000 148,210 0.08 Bayer AG FRN EUR 01/07/2075 100,000 101,358 0.05 Commerzbank AG 4% EUR 30/03/2027 300,000 317,889 0.17 Commerzbank AG 7.75% EUR 16/03/2021 300,000 339,529 0.18 Deutsche Bank AG 1.625% EUR 12/02/2021 400,000 400,086 0.22 Deutsche Boerse AG FRN EUR 05/02/2041 200,000 207,810 0.11 Fresenius SE & Co KGaA 4% EUR 01/02/2024 300,000 339,214 0.18 HeidelbergCement AG 1.5% EUR 07/02/2025 100,000 100,684 0.05 Unitymedia Hessen GmbH & Co KG / Unitymedia NRW GmbH 4.625% EUR 15/02/2026 112,500 121,830 0.07 Volkswagen Leasing GmbH 1.625% EUR 15/08/2025 50,000 48,989 0.03
2,549,356 1.37 HONG KONG Bank of East Asia Ltd/The FRN USD Perpetual 200,000 174,699 0.10 China CITIC Bank International Ltd FRN USD 07/05/2024 200,000 175,845 0.10 CITIC Ltd 3.125% USD 28/02/2022 200,000 171,922 0.09 CNAC HK Finbridge Co Ltd 3.5% USD 19/07/2022 200,000 172,896 0.09 Industrial & Commercial Bank of China Asia Ltd FRN USD Perpetual 200,000 172,130 0.09 Vanke Real Estate Hong Kong Co Ltd 3.975% USD 09/11/2027 200,000 166,797 0.09 Weichai International Hong Kong Energy Group Co Ltd FRN USD Perpetual 200,000 165,551 0.09
1,199,840 0.65 INDIA Bank of India/Jersey 3.125% USD 06/05/2020 200,000 173,143 0.09 INDONESIA Indonesia Asahan Aluminium Persero PT 144A 5.23% USD 15/11/2021 200,000 181,060 0.10 Indonesia Government International Bond 1.75% EUR 24/04/2025 250,000 252,200 0.14 Indonesia Government International Bond 2.15% EUR 18/07/2024 100,000 103,683 0.06 Indonesia Government International Bond 4.75% USD 11/02/2029 200,000 183,175 0.10 Indonesia Government International Bond 5.35% USD 11/02/2049 205,000 192,859 0.10 Indonesia Treasury Bond 8.25% IDR 15/05/2029 2,315,000,000 148,405 0.08 Pelabuhan Indonesia II PT 5.375% USD 05/05/2045 200,000 166,865 0.09 Pertamina Persero PT 4.3% USD 20/05/2023 200,000 177,271 0.09 Pertamina Persero PT 4.875% USD 03/05/2022 200,000 180,707 0.10 Perusahaan Listrik Negara PT 5.45% USD 21/05/2028 200,000 183,285 0.10 Perusahaan Penerbit SBSN Indonesia III 4.15% USD 29/03/2027 200,000 173,907 0.09
1,943,417 1.05 IRELAND Abbott Ireland Financing DAC 1.5% EUR 27/09/2026 100,000 101,547 0.06 AerCap Ireland Capital DAC / AerCap Global Aviation Trust 3.5% USD 26/05/2022 150,000 129,732 0.07 AerCap Ireland Capital DAC / AerCap Global Aviation Trust 4.875% USD 16/01/2024 150,000 134,852 0.07 Avoca CLO XVII Designated Activity Co FRN EUR 15/01/2030 250,000 250,900 0.14 Beazley Insurance DAC 5.875% USD 04/11/2026 200,000 174,310 0.09 Cloverie Plc for Zurich Insurance Co Ltd FRN USD 24/06/2046 200,000 185,539 0.10 Credit Bank of Moscow Via CBOM Finance Plc 5.15% EUR 20/02/2024 200,000 198,994 0.11 Elm Park CLO DAC FRN EUR 16/04/2029 1,180,000 1,130,030 0.61 Novatek OAO Via Novatek Finance DAC 4.422% USD 13/12/2022 200,000 174,748 0.09 Palmerston Park CLO DAC FRN EUR 18/04/2030 500,000 488,753 0.26 SMBC Aviation Capital Finance DAC 3% USD 15/07/2022 200,000 171,282 0.09 SMBC Aviation Capital Finance DAC 144A 4.125% USD 15/07/2023 222,000 197,447 0.11 Virgin Media Receivables Financing Notes II DAC 5.75% GBP 15/04/2023 140,000 166,313 0.09
3,504,447 1.89
Invesco Active Multi-Sector Credit Fund Statement of Investments as at 28 February 2019
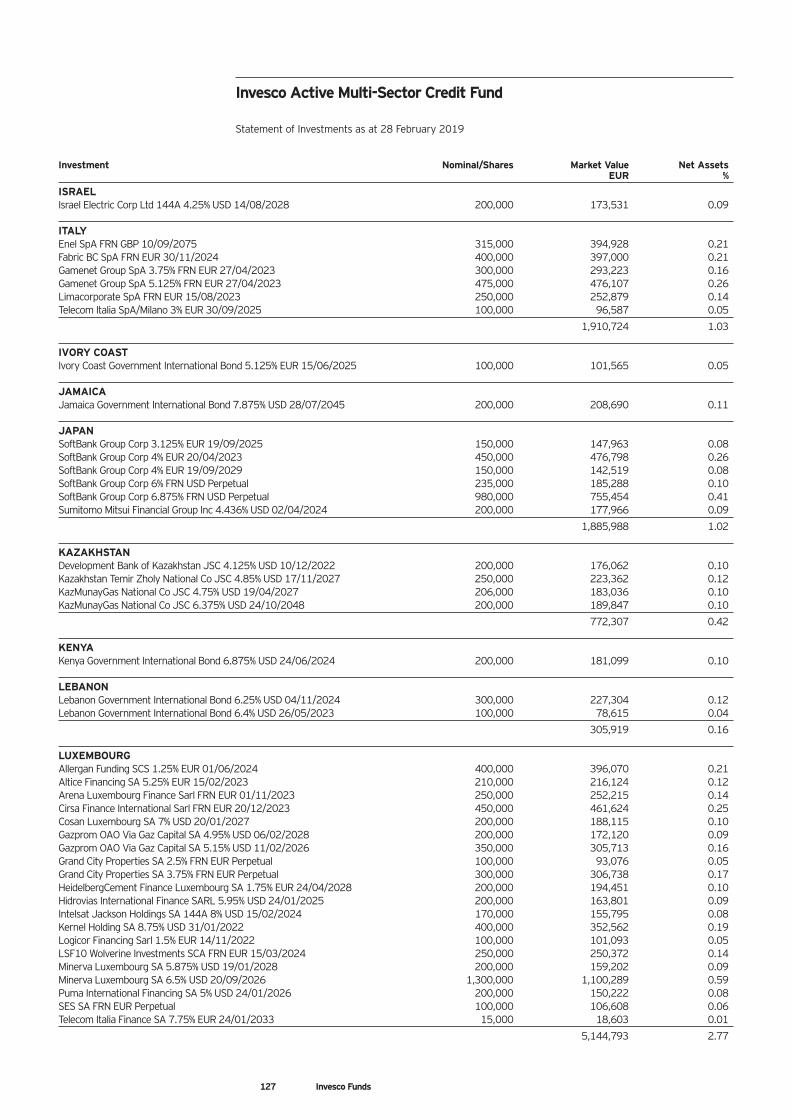
127 Invesco Funds
Investment Nominal/Shares Market Value Net Assets EUR %
ISRAEL Israel Electric Corp Ltd 144A 4.25% USD 14/08/2028 200,000 173,531 0.09 ITALY Enel SpA FRN GBP 10/09/2075 315,000 394,928 0.21 Fabric BC SpA FRN EUR 30/11/2024 400,000 397,000 0.21 Gamenet Group SpA 3.75% FRN EUR 27/04/2023 300,000 293,223 0.16 Gamenet Group SpA 5.125% FRN EUR 27/04/2023 475,000 476,107 0.26 Limacorporate SpA FRN EUR 15/08/2023 250,000 252,879 0.14 Telecom Italia SpA/Milano 3% EUR 30/09/2025 100,000 96,587 0.05
1,910,724 1.03 IVORY COAST Ivory Coast Government International Bond 5.125% EUR 15/06/2025 100,000 101,565 0.05 JAMAICA Jamaica Government International Bond 7.875% USD 28/07/2045 200,000 208,690 0.11 JAPAN SoftBank Group Corp 3.125% EUR 19/09/2025 150,000 147,963 0.08 SoftBank Group Corp 4% EUR 20/04/2023 450,000 476,798 0.26 SoftBank Group Corp 4% EUR 19/09/2029 150,000 142,519 0.08 SoftBank Group Corp 6% FRN USD Perpetual 235,000 185,288 0.10 SoftBank Group Corp 6.875% FRN USD Perpetual 980,000 755,454 0.41 Sumitomo Mitsui Financial Group Inc 4.436% USD 02/04/2024 200,000 177,966 0.09
1,885,988 1.02 KAZAKHSTAN Development Bank of Kazakhstan JSC 4.125% USD 10/12/2022 200,000 176,062 0.10 Kazakhstan Temir Zholy National Co JSC 4.85% USD 17/11/2027 250,000 223,362 0.12 KazMunayGas National Co JSC 4.75% USD 19/04/2027 206,000 183,036 0.10 KazMunayGas National Co JSC 6.375% USD 24/10/2048 200,000 189,847 0.10
772,307 0.42 KENYA Kenya Government International Bond 6.875% USD 24/06/2024 200,000 181,099 0.10 LEBANON Lebanon Government International Bond 6.25% USD 04/11/2024 300,000 227,304 0.12 Lebanon Government International Bond 6.4% USD 26/05/2023 100,000 78,615 0.04
305,919 0.16 LUXEMBOURG Allergan Funding SCS 1.25% EUR 01/06/2024 400,000 396,070 0.21 Altice Financing SA 5.25% EUR 15/02/2023 210,000 216,124 0.12 Arena Luxembourg Finance Sarl FRN EUR 01/11/2023 250,000 252,215 0.14 Cirsa Finance International Sarl FRN EUR 20/12/2023 450,000 461,624 0.25 Cosan Luxembourg SA 7% USD 20/01/2027 200,000 188,115 0.10 Gazprom OAO Via Gaz Capital SA 4.95% USD 06/02/2028 200,000 172,120 0.09 Gazprom OAO Via Gaz Capital SA 5.15% USD 11/02/2026 350,000 305,713 0.16 Grand City Properties SA 2.5% FRN EUR Perpetual 100,000 93,076 0.05 Grand City Properties SA 3.75% FRN EUR Perpetual 300,000 306,738 0.17 HeidelbergCement Finance Luxembourg SA 1.75% EUR 24/04/2028 200,000 194,451 0.10 Hidrovias International Finance SARL 5.95% USD 24/01/2025 200,000 163,801 0.09 Intelsat Jackson Holdings SA 144A 8% USD 15/02/2024 170,000 155,795 0.08 Kernel Holding SA 8.75% USD 31/01/2022 400,000 352,562 0.19 Logicor Financing Sarl 1.5% EUR 14/11/2022 100,000 101,093 0.05 LSF10 Wolverine Investments SCA FRN EUR 15/03/2024 250,000 250,372 0.14 Minerva Luxembourg SA 5.875% USD 19/01/2028 200,000 159,202 0.09 Minerva Luxembourg SA 6.5% USD 20/09/2026 1,300,000 1,100,289 0.59 Puma International Financing SA 5% USD 24/01/2026 200,000 150,222 0.08 SES SA FRN EUR Perpetual 100,000 106,608 0.06 Telecom Italia Finance SA 7.75% EUR 24/01/2033 15,000 18,603 0.01
5,144,793 2.77
Invesco Active Multi-Sector Credit Fund Statement of Investments as at 28 February 2019
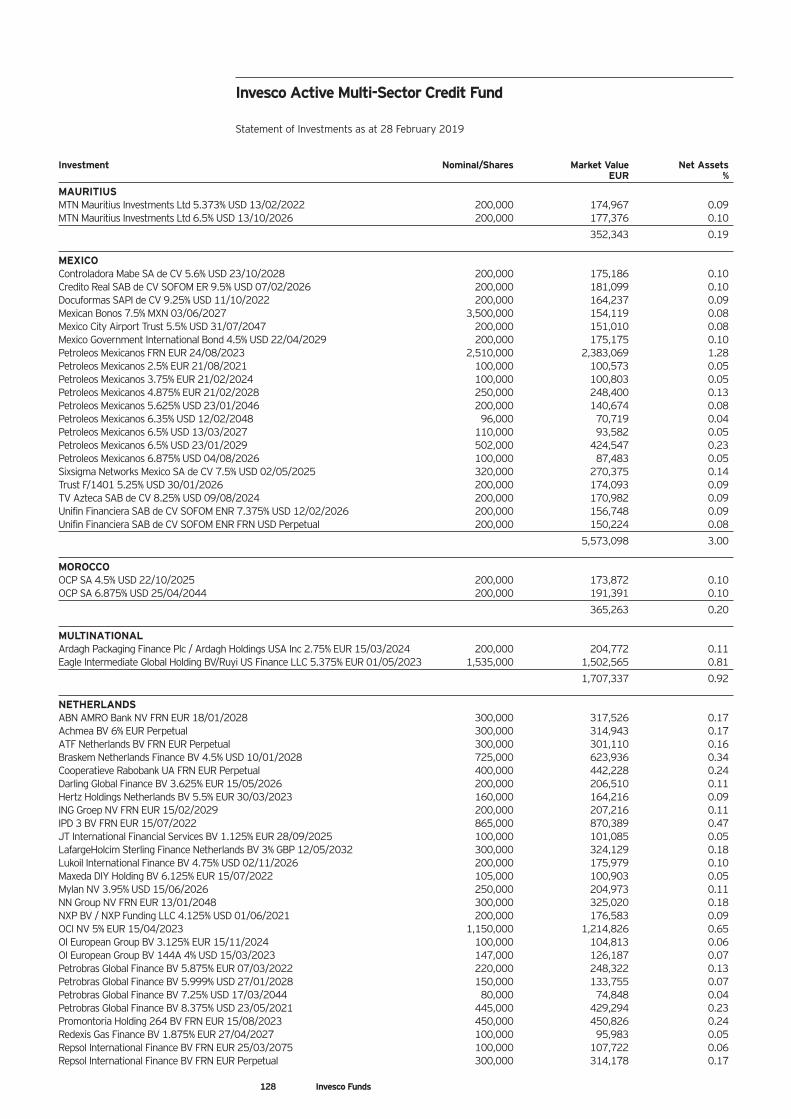
Investment Nominal/Shares Market Value Net Assets EUR %
MAURITIUS MTN Mauritius Investments Ltd 5.373% USD 13/02/2022 200,000 174,967 0.09 MTN Mauritius Investments Ltd 6.5% USD 13/10/2026 200,000 177,376 0.10
352,343 0.19 MEXICO Controladora Mabe SA de CV 5.6% USD 23/10/2028 200,000 175,186 0.10 Credito Real SAB de CV SOFOM ER 9.5% USD 07/02/2026 200,000 181,099 0.10 Docuformas SAPI de CV 9.25% USD 11/10/2022 200,000 164,237 0.09 Mexican Bonos 7.5% MXN 03/06/2027 3,500,000 154,119 0.08 Mexico City Airport Trust 5.5% USD 31/07/2047 200,000 151,010 0.08 Mexico Government International Bond 4.5% USD 22/04/2029 200,000 175,175 0.10 Petroleos Mexicanos FRN EUR 24/08/2023 2,510,000 2,383,069 1.28 Petroleos Mexicanos 2.5% EUR 21/08/2021 100,000 100,573 0.05 Petroleos Mexicanos 3.75% EUR 21/02/2024 100,000 100,803 0.05 Petroleos Mexicanos 4.875% EUR 21/02/2028 250,000 248,400 0.13 Petroleos Mexicanos 5.625% USD 23/01/2046 200,000 140,674 0.08 Petroleos Mexicanos 6.35% USD 12/02/2048 96,000 70,719 0.04 Petroleos Mexicanos 6.5% USD 13/03/2027 110,000 93,582 0.05 Petroleos Mexicanos 6.5% USD 23/01/2029 502,000 424,547 0.23 Petroleos Mexicanos 6.875% USD 04/08/2026 100,000 87,483 0.05 Sixsigma Networks Mexico SA de CV 7.5% USD 02/05/2025 320,000 270,375 0.14 Trust F/1401 5.25% USD 30/01/2026 200,000 174,093 0.09 TV Azteca SAB de CV 8.25% USD 09/08/2024 200,000 170,982 0.09 Unifin Financiera SAB de CV SOFOM ENR 7.375% USD 12/02/2026 200,000 156,748 0.09 Unifin Financiera SAB de CV SOFOM ENR FRN USD Perpetual 200,000 150,224 0.08
5,573,098 3.00 MOROCCO OCP SA 4.5% USD 22/10/2025 200,000 173,872 0.10 OCP SA 6.875% USD 25/04/2044 200,000 191,391 0.10
365,263 0.20 MULTINATIONAL Ardagh Packaging Finance Plc / Ardagh Holdings USA Inc 2.75% EUR 15/03/2024 200,000 204,772 0.11 Eagle Intermediate Global Holding BV/Ruyi US Finance LLC 5.375% EUR 01/05/2023 1,535,000 1,502,565 0.81
1,707,337 0.92 NETHERLANDS ABN AMRO Bank NV FRN EUR 18/01/2028 300,000 317,526 0.17 Achmea BV 6% EUR Perpetual 300,000 314,943 0.17 ATF Netherlands BV FRN EUR Perpetual 300,000 301,110 0.16 Braskem Netherlands Finance BV 4.5% USD 10/01/2028 725,000 623,936 0.34 Cooperatieve Rabobank UA FRN EUR Perpetual 400,000 442,228 0.24 Darling Global Finance BV 3.625% EUR 15/05/2026 200,000 206,510 0.11 Hertz Holdings Netherlands BV 5.5% EUR 30/03/2023 160,000 164,216 0.09 ING Groep NV FRN EUR 15/02/2029 200,000 207,216 0.11 IPD 3 BV FRN EUR 15/07/2022 865,000 870,389 0.47 JT International Financial Services BV 1.125% EUR 28/09/2025 100,000 101,085 0.05 LafargeHolcim Sterling Finance Netherlands BV 3% GBP 12/05/2032 300,000 324,129 0.18 Lukoil International Finance BV 4.75% USD 02/11/2026 200,000 175,979 0.10 Maxeda DIY Holding BV 6.125% EUR 15/07/2022 105,000 100,903 0.05 Mylan NV 3.95% USD 15/06/2026 250,000 204,973 0.11 NN Group NV FRN EUR 13/01/2048 300,000 325,020 0.18 NXP BV / NXP Funding LLC 4.125% USD 01/06/2021 200,000 176,583 0.09 OCI NV 5% EUR 15/04/2023 1,150,000 1,214,826 0.65 OI European Group BV 3.125% EUR 15/11/2024 100,000 104,813 0.06 OI European Group BV 144A 4% USD 15/03/2023 147,000 126,187 0.07 Petrobras Global Finance BV 5.875% EUR 07/03/2022 220,000 248,322 0.13 Petrobras Global Finance BV 5.999% USD 27/01/2028 150,000 133,755 0.07 Petrobras Global Finance BV 7.25% USD 17/03/2044 80,000 74,848 0.04 Petrobras Global Finance BV 8.375% USD 23/05/2021 445,000 429,294 0.23 Promontoria Holding 264 BV FRN EUR 15/08/2023 450,000 450,826 0.24 Redexis Gas Finance BV 1.875% EUR 27/04/2027 100,000 95,983 0.05 Repsol International Finance BV FRN EUR 25/03/2075 100,000 107,722 0.06 Repsol International Finance BV FRN EUR Perpetual 300,000 314,178 0.17
128 Invesco Funds
Invesco Active Multi-Sector Credit Fund Statement of Investments as at 28 February 2019
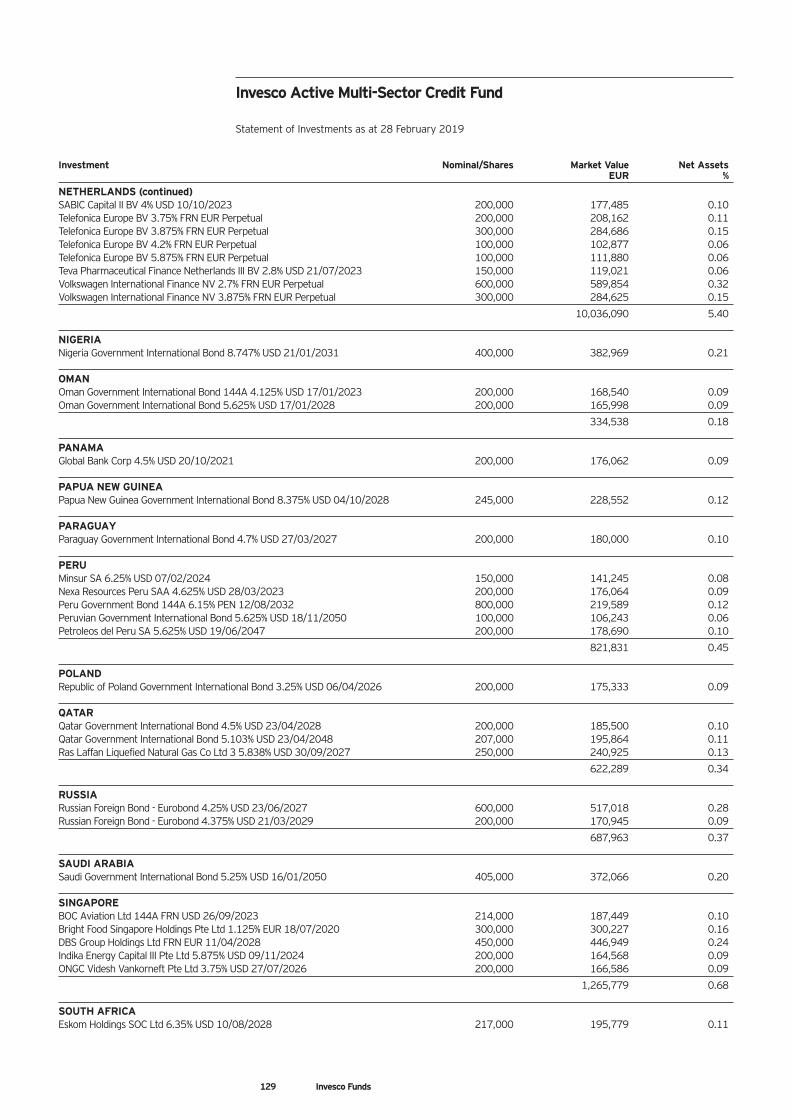
Investment Nominal/Shares Market Value Net Assets EUR %
NETHERLANDS (continued) SABIC Capital II BV 4% USD 10/10/2023 200,000 177,485 0.10 Telefonica Europe BV 3.75% FRN EUR Perpetual 200,000 208,162 0.11 Telefonica Europe BV 3.875% FRN EUR Perpetual 300,000 284,686 0.15 Telefonica Europe BV 4.2% FRN EUR Perpetual 100,000 102,877 0.06 Telefonica Europe BV 5.875% FRN EUR Perpetual 100,000 111,880 0.06 Teva Pharmaceutical Finance Netherlands III BV 2.8% USD 21/07/2023 150,000 119,021 0.06 Volkswagen International Finance NV 2.7% FRN EUR Perpetual 600,000 589,854 0.32 Volkswagen International Finance NV 3.875% FRN EUR Perpetual 300,000 284,625 0.15
10,036,090 5.40 NIGERIA Nigeria Government International Bond 8.747% USD 21/01/2031 400,000 382,969 0.21 OMAN Oman Government International Bond 144A 4.125% USD 17/01/2023 200,000 168,540 0.09 Oman Government International Bond 5.625% USD 17/01/2028 200,000 165,998 0.09
334,538 0.18 PANAMA Global Bank Corp 4.5% USD 20/10/2021 200,000 176,062 0.09 PAPUA NEW GUINEA Papua New Guinea Government International Bond 8.375% USD 04/10/2028 245,000 228,552 0.12 PARAGUAY Paraguay Government International Bond 4.7% USD 27/03/2027 200,000 180,000 0.10 PERU Minsur SA 6.25% USD 07/02/2024 150,000 141,245 0.08 Nexa Resources Peru SAA 4.625% USD 28/03/2023 200,000 176,064 0.09 Peru Government Bond 144A 6.15% PEN 12/08/2032 800,000 219,589 0.12 Peruvian Government International Bond 5.625% USD 18/11/2050 100,000 106,243 0.06 Petroleos del Peru SA 5.625% USD 19/06/2047 200,000 178,690 0.10
821,831 0.45 POLAND Republic of Poland Government International Bond 3.25% USD 06/04/2026 200,000 175,333 0.09 QATAR Qatar Government International Bond 4.5% USD 23/04/2028 200,000 185,500 0.10 Qatar Government International Bond 5.103% USD 23/04/2048 207,000 195,864 0.11 Ras Laffan Liquefied Natural Gas Co Ltd 3 5.838% USD 30/09/2027 250,000 240,925 0.13
622,289 0.34 RUSSIA Russian Foreign Bond - Eurobond 4.25% USD 23/06/2027 600,000 517,018 0.28 Russian Foreign Bond - Eurobond 4.375% USD 21/03/2029 200,000 170,945 0.09
687,963 0.37 SAUDI ARABIA Saudi Government International Bond 5.25% USD 16/01/2050 405,000 372,066 0.20 SINGAPORE BOC Aviation Ltd 144A FRN USD 26/09/2023 214,000 187,449 0.10 Bright Food Singapore Holdings Pte Ltd 1.125% EUR 18/07/2020 300,000 300,227 0.16 DBS Group Holdings Ltd FRN EUR 11/04/2028 450,000 446,949 0.24 Indika Energy Capital III Pte Ltd 5.875% USD 09/11/2024 200,000 164,568 0.09 ONGC Videsh Vankorneft Pte Ltd 3.75% USD 27/07/2026 200,000 166,586 0.09
1,265,779 0.68 SOUTH AFRICA Eskom Holdings SOC Ltd 6.35% USD 10/08/2028 217,000 195,779 0.11
129 Invesco Funds
Invesco Active Multi-Sector Credit Fund Statement of Investments as at 28 February 2019
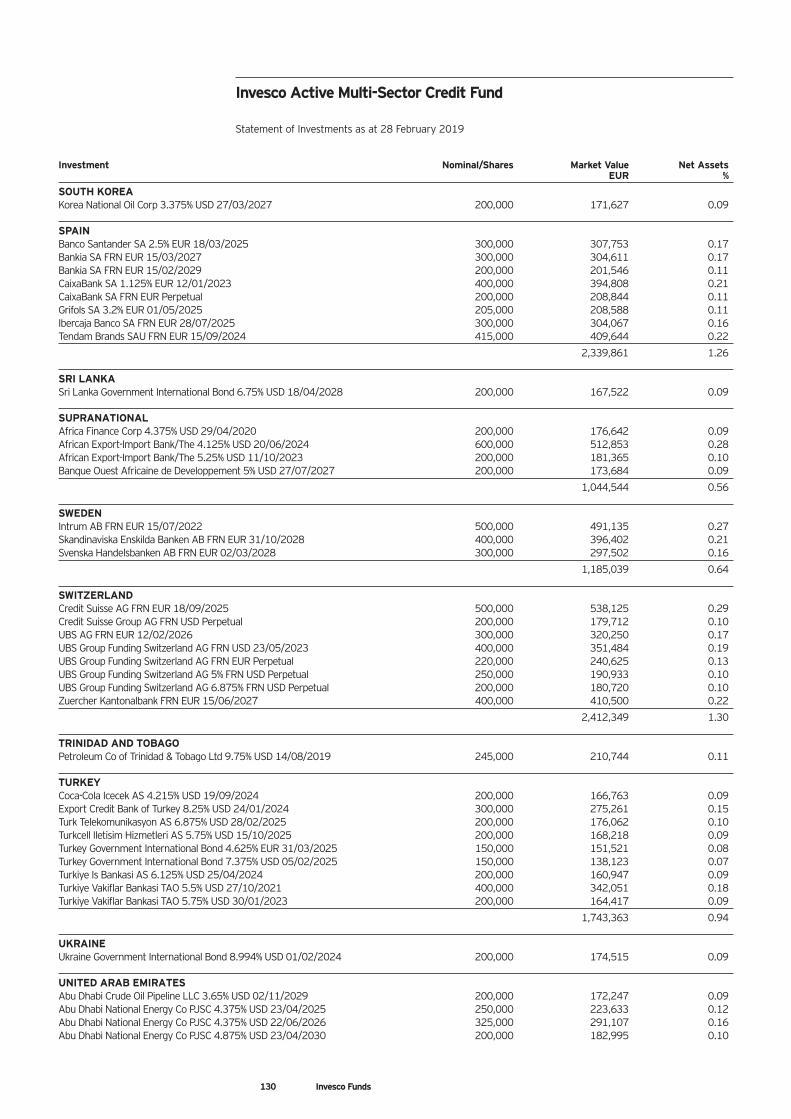
Investment Nominal/Shares Market Value Net Assets EUR %
SOUTH KOREA Korea National Oil Corp 3.375% USD 27/03/2027 200,000 171,627 0.09 SPAIN Banco Santander SA 2.5% EUR 18/03/2025 300,000 307,753 0.17 Bankia SA FRN EUR 15/03/2027 300,000 304,611 0.17 Bankia SA FRN EUR 15/02/2029 200,000 201,546 0.11 CaixaBank SA 1.125% EUR 12/01/2023 400,000 394,808 0.21 CaixaBank SA FRN EUR Perpetual 200,000 208,844 0.11 Grifols SA 3.2% EUR 01/05/2025 205,000 208,588 0.11 Ibercaja Banco SA FRN EUR 28/07/2025 300,000 304,067 0.16 Tendam Brands SAU FRN EUR 15/09/2024 415,000 409,644 0.22
2,339,861 1.26 SRI LANKA Sri Lanka Government International Bond 6.75% USD 18/04/2028 200,000 167,522 0.09 SUPRANATIONAL Africa Finance Corp 4.375% USD 29/04/2020 200,000 176,642 0.09 African Export-Import Bank/The 4.125% USD 20/06/2024 600,000 512,853 0.28 African Export-Import Bank/The 5.25% USD 11/10/2023 200,000 181,365 0.10 Banque Ouest Africaine de Developpement 5% USD 27/07/2027 200,000 173,684 0.09
1,044,544 0.56 SWEDEN Intrum AB FRN EUR 15/07/2022 500,000 491,135 0.27 Skandinaviska Enskilda Banken AB FRN EUR 31/10/2028 400,000 396,402 0.21 Svenska Handelsbanken AB FRN EUR 02/03/2028 300,000 297,502 0.16
1,185,039 0.64 SWITZERLAND Credit Suisse AG FRN EUR 18/09/2025 500,000 538,125 0.29 Credit Suisse Group AG FRN USD Perpetual 200,000 179,712 0.10 UBS AG FRN EUR 12/02/2026 300,000 320,250 0.17 UBS Group Funding Switzerland AG FRN USD 23/05/2023 400,000 351,484 0.19 UBS Group Funding Switzerland AG FRN EUR Perpetual 220,000 240,625 0.13 UBS Group Funding Switzerland AG 5% FRN USD Perpetual 250,000 190,933 0.10 UBS Group Funding Switzerland AG 6.875% FRN USD Perpetual 200,000 180,720 0.10 Zuercher Kantonalbank FRN EUR 15/06/2027 400,000 410,500 0.22
2,412,349 1.30 TRINIDAD AND TOBAGO Petroleum Co of Trinidad & Tobago Ltd 9.75% USD 14/08/2019 245,000 210,744 0.11 TURKEY Coca-Cola Icecek AS 4.215% USD 19/09/2024 200,000 166,763 0.09 Export Credit Bank of Turkey 8.25% USD 24/01/2024 300,000 275,261 0.15 Turk Telekomunikasyon AS 6.875% USD 28/02/2025 200,000 176,062 0.10 Turkcell Iletisim Hizmetleri AS 5.75% USD 15/10/2025 200,000 168,218 0.09 Turkey Government International Bond 4.625% EUR 31/03/2025 150,000 151,521 0.08 Turkey Government International Bond 7.375% USD 05/02/2025 150,000 138,123 0.07 Turkiye Is Bankasi AS 6.125% USD 25/04/2024 200,000 160,947 0.09 Turkiye Vakiflar Bankasi TAO 5.5% USD 27/10/2021 400,000 342,051 0.18 Turkiye Vakiflar Bankasi TAO 5.75% USD 30/01/2023 200,000 164,417 0.09
1,743,363 0.94 UKRAINE Ukraine Government International Bond 8.994% USD 01/02/2024 200,000 174,515 0.09 UNITED ARAB EMIRATES Abu Dhabi Crude Oil Pipeline LLC 3.65% USD 02/11/2029 200,000 172,247 0.09 Abu Dhabi National Energy Co PJSC 4.375% USD 23/04/2025 250,000 223,633 0.12 Abu Dhabi National Energy Co PJSC 4.375% USD 22/06/2026 325,000 291,107 0.16 Abu Dhabi National Energy Co PJSC 4.875% USD 23/04/2030 200,000 182,995 0.10
130 Invesco Funds
Invesco Active Multi-Sector Credit Fund Statement of Investments as at 28 February 2019
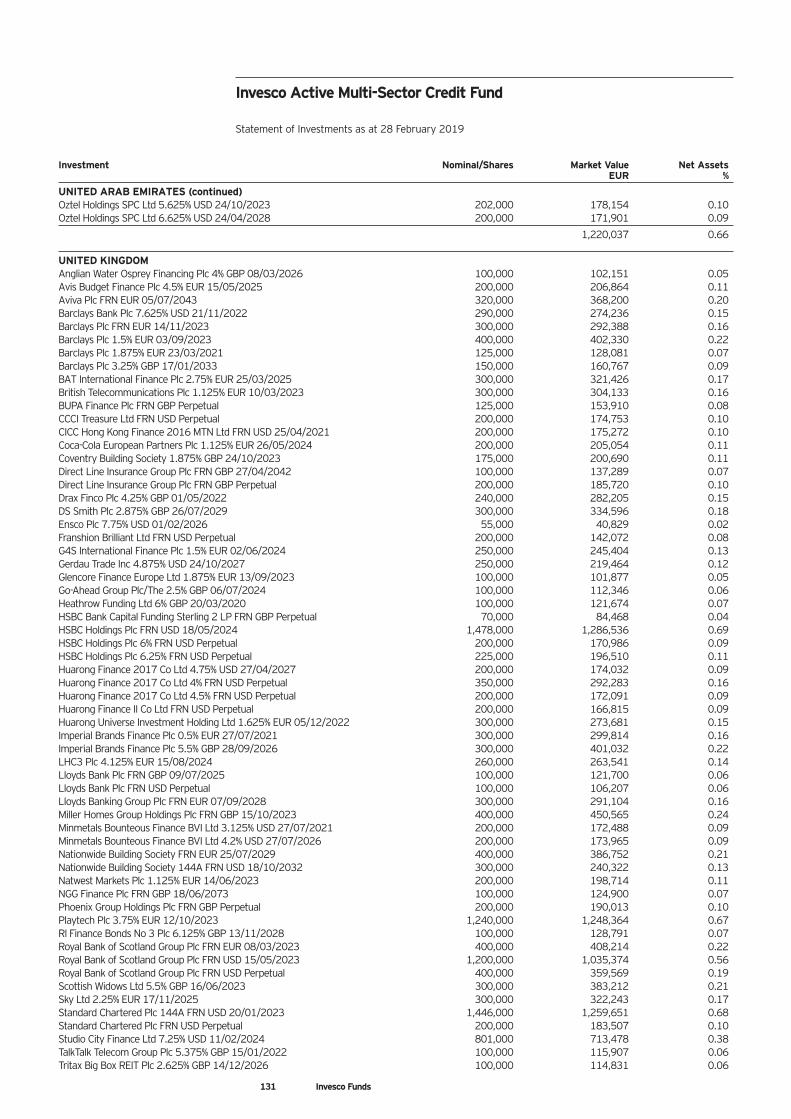
Investment Nominal/Shares Market Value Net Assets EUR %
UNITED ARAB EMIRATES (continued) Oztel Holdings SPC Ltd 5.625% USD 24/10/2023 202,000 178,154 0.10 Oztel Holdings SPC Ltd 6.625% USD 24/04/2028 200,000 171,901 0.09
1,220,037 0.66 UNITED KINGDOM Anglian Water Osprey Financing Plc 4% GBP 08/03/2026 100,000 102,151 0.05 Avis Budget Finance Plc 4.5% EUR 15/05/2025 200,000 206,864 0.11 Aviva Plc FRN EUR 05/07/2043 320,000 368,200 0.20 Barclays Bank Plc 7.625% USD 21/11/2022 290,000 274,236 0.15 Barclays Plc FRN EUR 14/11/2023 300,000 292,388 0.16 Barclays Plc 1.5% EUR 03/09/2023 400,000 402,330 0.22 Barclays Plc 1.875% EUR 23/03/2021 125,000 128,081 0.07 Barclays Plc 3.25% GBP 17/01/2033 150,000 160,767 0.09 BAT International Finance Plc 2.75% EUR 25/03/2025 300,000 321,426 0.17 British Telecommunications Plc 1.125% EUR 10/03/2023 300,000 304,133 0.16 BUPA Finance Plc FRN GBP Perpetual 125,000 153,910 0.08 CCCI Treasure Ltd FRN USD Perpetual 200,000 174,753 0.10 CICC Hong Kong Finance 2016 MTN Ltd FRN USD 25/04/2021 200,000 175,272 0.10 Coca-Cola European Partners Plc 1.125% EUR 26/05/2024 200,000 205,054 0.11 Coventry Building Society 1.875% GBP 24/10/2023 175,000 200,690 0.11 Direct Line Insurance Group Plc FRN GBP 27/04/2042 100,000 137,289 0.07 Direct Line Insurance Group Plc FRN GBP Perpetual 200,000 185,720 0.10 Drax Finco Plc 4.25% GBP 01/05/2022 240,000 282,205 0.15 DS Smith Plc 2.875% GBP 26/07/2029 300,000 334,596 0.18 Ensco Plc 7.75% USD 01/02/2026 55,000 40,829 0.02 Franshion Brilliant Ltd FRN USD Perpetual 200,000 142,072 0.08 G4S International Finance Plc 1.5% EUR 02/06/2024 250,000 245,404 0.13 Gerdau Trade Inc 4.875% USD 24/10/2027 250,000 219,464 0.12 Glencore Finance Europe Ltd 1.875% EUR 13/09/2023 100,000 101,877 0.05 Go-Ahead Group Plc/The 2.5% GBP 06/07/2024 100,000 112,346 0.06 Heathrow Funding Ltd 6% GBP 20/03/2020 100,000 121,674 0.07 HSBC Bank Capital Funding Sterling 2 LP FRN GBP Perpetual 70,000 84,468 0.04 HSBC Holdings Plc FRN USD 18/05/2024 1,478,000 1,286,536 0.69 HSBC Holdings Plc 6% FRN USD Perpetual 200,000 170,986 0.09 HSBC Holdings Plc 6.25% FRN USD Perpetual 225,000 196,510 0.11 Huarong Finance 2017 Co Ltd 4.75% USD 27/04/2027 200,000 174,032 0.09 Huarong Finance 2017 Co Ltd 4% FRN USD Perpetual 350,000 292,283 0.16 Huarong Finance 2017 Co Ltd 4.5% FRN USD Perpetual 200,000 172,091 0.09 Huarong Finance II Co Ltd FRN USD Perpetual 200,000 166,815 0.09 Huarong Universe Investment Holding Ltd 1.625% EUR 05/12/2022 300,000 273,681 0.15 Imperial Brands Finance Plc 0.5% EUR 27/07/2021 300,000 299,814 0.16 Imperial Brands Finance Plc 5.5% GBP 28/09/2026 300,000 401,032 0.22 LHC3 Plc 4.125% EUR 15/08/2024 260,000 263,541 0.14 Lloyds Bank Plc FRN GBP 09/07/2025 100,000 121,700 0.06 Lloyds Bank Plc FRN USD Perpetual 100,000 106,207 0.06 Lloyds Banking Group Plc FRN EUR 07/09/2028 300,000 291,104 0.16 Miller Homes Group Holdings Plc FRN GBP 15/10/2023 400,000 450,565 0.24 Minmetals Bounteous Finance BVI Ltd 3.125% USD 27/07/2021 200,000 172,488 0.09 Minmetals Bounteous Finance BVI Ltd 4.2% USD 27/07/2026 200,000 173,965 0.09 Nationwide Building Society FRN EUR 25/07/2029 400,000 386,752 0.21 Nationwide Building Society 144A FRN USD 18/10/2032 300,000 240,322 0.13 Natwest Markets Plc 1.125% EUR 14/06/2023 200,000 198,714 0.11 NGG Finance Plc FRN GBP 18/06/2073 100,000 124,900 0.07 Phoenix Group Holdings Plc FRN GBP Perpetual 200,000 190,013 0.10 Playtech Plc 3.75% EUR 12/10/2023 1,240,000 1,248,364 0.67 Rl Finance Bonds No 3 Plc 6.125% GBP 13/11/2028 100,000 128,791 0.07 Royal Bank of Scotland Group Plc FRN EUR 08/03/2023 400,000 408,214 0.22 Royal Bank of Scotland Group Plc FRN USD 15/05/2023 1,200,000 1,035,374 0.56 Royal Bank of Scotland Group Plc FRN USD Perpetual 400,000 359,569 0.19 Scottish Widows Ltd 5.5% GBP 16/06/2023 300,000 383,212 0.21 Sky Ltd 2.25% EUR 17/11/2025 300,000 322,243 0.17 Standard Chartered Plc 144A FRN USD 20/01/2023 1,446,000 1,259,651 0.68 Standard Chartered Plc FRN USD Perpetual 200,000 183,507 0.10 Studio City Finance Ltd 7.25% USD 11/02/2024 801,000 713,478 0.38 TalkTalk Telecom Group Plc 5.375% GBP 15/01/2022 100,000 115,907 0.06 Tritax Big Box REIT Plc 2.625% GBP 14/12/2026 100,000 114,831 0.06
131 Invesco Funds
Invesco Active Multi-Sector Credit Fund Statement of Investments as at 28 February 2019
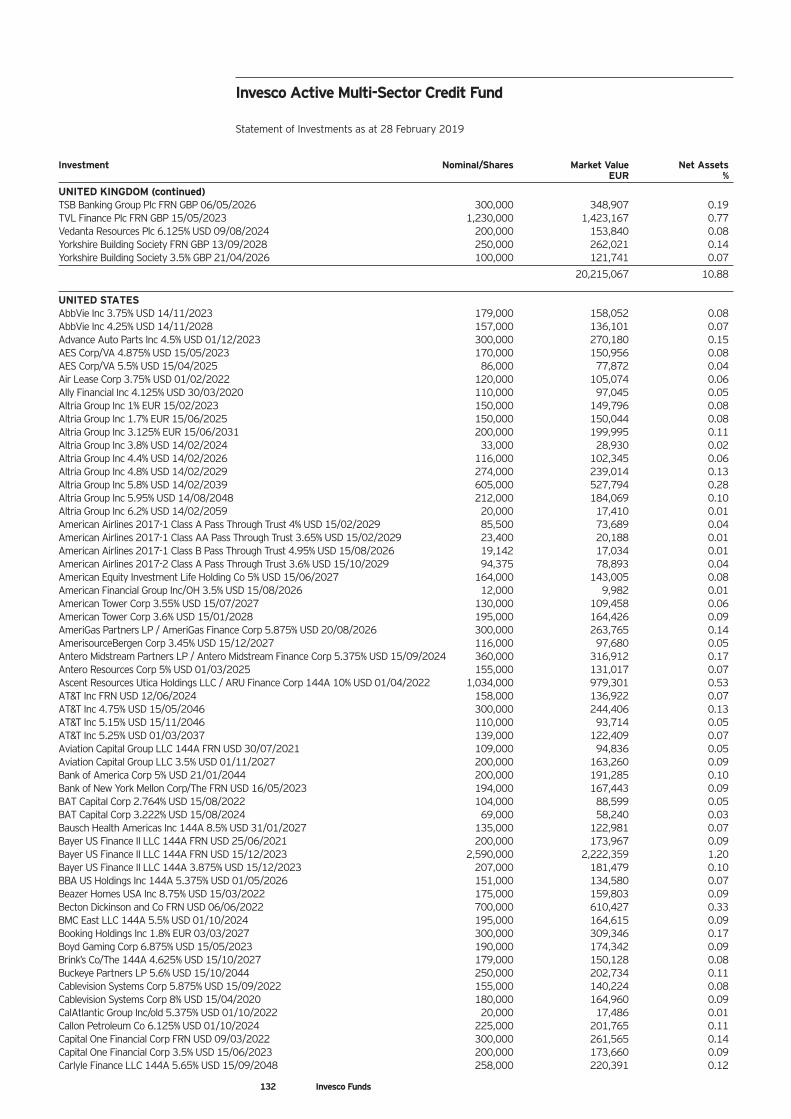
Investment Nominal/Shares Market Value Net Assets EUR %
UNITED KINGDOM (continued) TSB Banking Group Plc FRN GBP 06/05/2026 300,000 348,907 0.19 TVL Finance Plc FRN GBP 15/05/2023 1,230,000 1,423,167 0.77 Vedanta Resources Plc 6.125% USD 09/08/2024 200,000 153,840 0.08 Yorkshire Building Society FRN GBP 13/09/2028 250,000 262,021 0.14 Yorkshire Building Society 3.5% GBP 21/04/2026 100,000 121,741 0.07
20,215,067 10.88 UNITED STATES AbbVie Inc 3.75% USD 14/11/2023 179,000 158,052 0.08 AbbVie Inc 4.25% USD 14/11/2028 157,000 136,101 0.07 Advance Auto Parts Inc 4.5% USD 01/12/2023 300,000 270,180 0.15 AES Corp/VA 4.875% USD 15/05/2023 170,000 150,956 0.08 AES Corp/VA 5.5% USD 15/04/2025 86,000 77,872 0.04 Air Lease Corp 3.75% USD 01/02/2022 120,000 105,074 0.06 Ally Financial Inc 4.125% USD 30/03/2020 110,000 97,045 0.05 Altria Group Inc 1% EUR 15/02/2023 150,000 149,796 0.08 Altria Group Inc 1.7% EUR 15/06/2025 150,000 150,044 0.08 Altria Group Inc 3.125% EUR 15/06/2031 200,000 199,995 0.11 Altria Group Inc 3.8% USD 14/02/2024 33,000 28,930 0.02 Altria Group Inc 4.4% USD 14/02/2026 116,000 102,345 0.06 Altria Group Inc 4.8% USD 14/02/2029 274,000 239,014 0.13 Altria Group Inc 5.8% USD 14/02/2039 605,000 527,794 0.28 Altria Group Inc 5.95% USD 14/08/2048 212,000 184,069 0.10 Altria Group Inc 6.2% USD 14/02/2059 20,000 17,410 0.01 American Airlines 2017-1 Class A Pass Through Trust 4% USD 15/02/2029 85,500 73,689 0.04 American Airlines 2017-1 Class AA Pass Through Trust 3.65% USD 15/02/2029 23,400 20,188 0.01 American Airlines 2017-1 Class B Pass Through Trust 4.95% USD 15/08/2026 19,142 17,034 0.01 American Airlines 2017-2 Class A Pass Through Trust 3.6% USD 15/10/2029 94,375 78,893 0.04 American Equity Investment Life Holding Co 5% USD 15/06/2027 164,000 143,005 0.08 American Financial Group Inc/OH 3.5% USD 15/08/2026 12,000 9,982 0.01 American Tower Corp 3.55% USD 15/07/2027 130,000 109,458 0.06 American Tower Corp 3.6% USD 15/01/2028 195,000 164,426 0.09 AmeriGas Partners LP / AmeriGas Finance Corp 5.875% USD 20/08/2026 300,000 263,765 0.14 AmerisourceBergen Corp 3.45% USD 15/12/2027 116,000 97,680 0.05 Antero Midstream Partners LP / Antero Midstream Finance Corp 5.375% USD 15/09/2024 360,000 316,912 0.17 Antero Resources Corp 5% USD 01/03/2025 155,000 131,017 0.07 Ascent Resources Utica Holdings LLC / ARU Finance Corp 144A 10% USD 01/04/2022 1,034,000 979,301 0.53 AT&T Inc FRN USD 12/06/2024 158,000 136,922 0.07 AT&T Inc 4.75% USD 15/05/2046 300,000 244,406 0.13 AT&T Inc 5.15% USD 15/11/2046 110,000 93,714 0.05 AT&T Inc 5.25% USD 01/03/2037 139,000 122,409 0.07 Aviation Capital Group LLC 144A FRN USD 30/07/2021 109,000 94,836 0.05 Aviation Capital Group LLC 3.5% USD 01/11/2027 200,000 163,260 0.09 Bank of America Corp 5% USD 21/01/2044 200,000 191,285 0.10 Bank of New York Mellon Corp/The FRN USD 16/05/2023 194,000 167,443 0.09 BAT Capital Corp 2.764% USD 15/08/2022 104,000 88,599 0.05 BAT Capital Corp 3.222% USD 15/08/2024 69,000 58,240 0.03 Bausch Health Americas Inc 144A 8.5% USD 31/01/2027 135,000 122,981 0.07 Bayer US Finance II LLC 144A FRN USD 25/06/2021 200,000 173,967 0.09 Bayer US Finance II LLC 144A FRN USD 15/12/2023 2,590,000 2,222,359 1.20 Bayer US Finance II LLC 144A 3.875% USD 15/12/2023 207,000 181,479 0.10 BBA US Holdings Inc 144A 5.375% USD 01/05/2026 151,000 134,580 0.07 Beazer Homes USA Inc 8.75% USD 15/03/2022 175,000 159,803 0.09 Becton Dickinson and Co FRN USD 06/06/2022 700,000 610,427 0.33 BMC East LLC 144A 5.5% USD 01/10/2024 195,000 164,615 0.09 Booking Holdings Inc 1.8% EUR 03/03/2027 300,000 309,346 0.17 Boyd Gaming Corp 6.875% USD 15/05/2023 190,000 174,342 0.09 Brink’s Co/The 144A 4.625% USD 15/10/2027 179,000 150,128 0.08 Buckeye Partners LP 5.6% USD 15/10/2044 250,000 202,734 0.11 Cablevision Systems Corp 5.875% USD 15/09/2022 155,000 140,224 0.08 Cablevision Systems Corp 8% USD 15/04/2020 180,000 164,960 0.09 CalAtlantic Group Inc/old 5.375% USD 01/10/2022 20,000 17,486 0.01 Callon Petroleum Co 6.125% USD 01/10/2024 225,000 201,765 0.11 Capital One Financial Corp FRN USD 09/03/2022 300,000 261,565 0.14 Capital One Financial Corp 3.5% USD 15/06/2023 200,000 173,660 0.09 Carlyle Finance LLC 144A 5.65% USD 15/09/2048 258,000 220,391 0.12
132 Invesco Funds
Invesco Active Multi-Sector Credit Fund Statement of Investments as at 28 February 2019
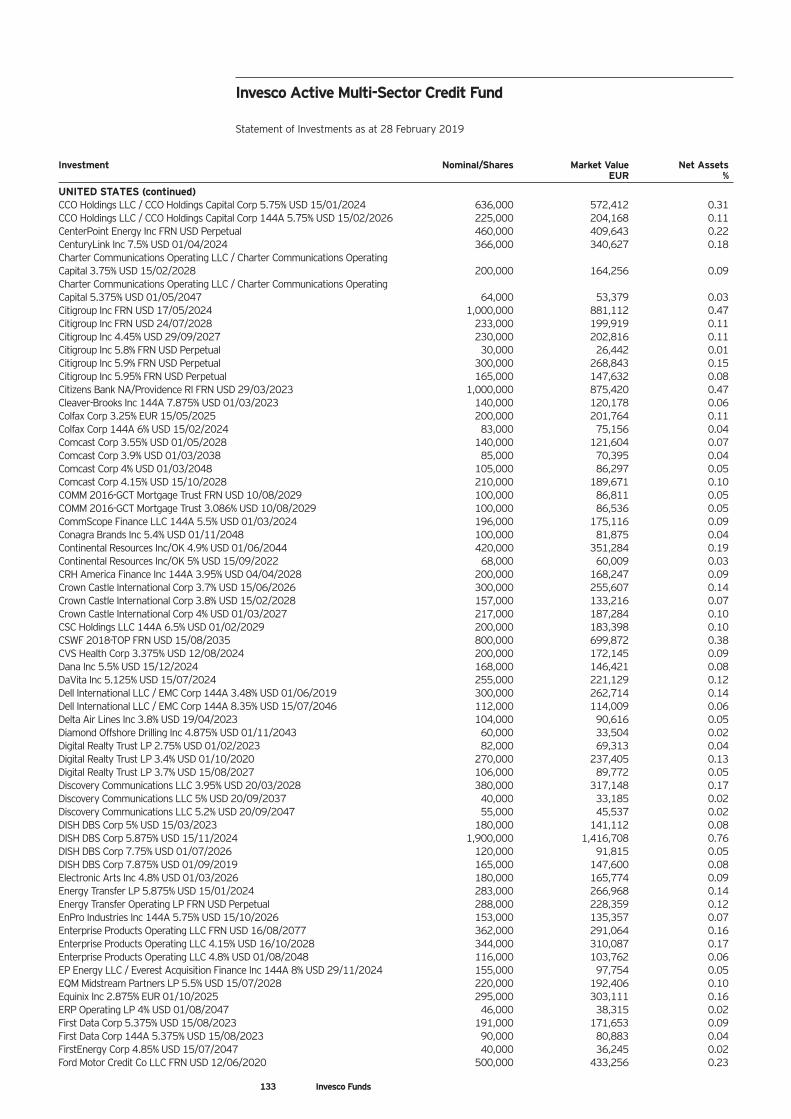
Investment Nominal/Shares Market Value Net Assets EUR %
UNITED STATES (continued) CCO Holdings LLC / CCO Holdings Capital Corp 5.75% USD 15/01/2024 636,000 572,412 0.31 CCO Holdings LLC / CCO Holdings Capital Corp 144A 5.75% USD 15/02/2026 225,000 204,168 0.11 CenterPoint Energy Inc FRN USD Perpetual 460,000 409,643 0.22 CenturyLink Inc 7.5% USD 01/04/2024 366,000 340,627 0.18 Charter Communications Operating LLC / Charter Communications Operating Capital 3.75% USD 15/02/2028 200,000 164,256 0.09 Charter Communications Operating LLC / Charter Communications Operating Capital 5.375% USD 01/05/2047 64,000 53,379 0.03 Citigroup Inc FRN USD 17/05/2024 1,000,000 881,112 0.47 Citigroup Inc FRN USD 24/07/2028 233,000 199,919 0.11 Citigroup Inc 4.45% USD 29/09/2027 230,000 202,816 0.11 Citigroup Inc 5.8% FRN USD Perpetual 30,000 26,442 0.01 Citigroup Inc 5.9% FRN USD Perpetual 300,000 268,843 0.15 Citigroup Inc 5.95% FRN USD Perpetual 165,000 147,632 0.08 Citizens Bank NA/Providence RI FRN USD 29/03/2023 1,000,000 875,420 0.47 Cleaver-Brooks Inc 144A 7.875% USD 01/03/2023 140,000 120,178 0.06 Colfax Corp 3.25% EUR 15/05/2025 200,000 201,764 0.11 Colfax Corp 144A 6% USD 15/02/2024 83,000 75,156 0.04 Comcast Corp 3.55% USD 01/05/2028 140,000 121,604 0.07 Comcast Corp 3.9% USD 01/03/2038 85,000 70,395 0.04 Comcast Corp 4% USD 01/03/2048 105,000 86,297 0.05 Comcast Corp 4.15% USD 15/10/2028 210,000 189,671 0.10 COMM 2016-GCT Mortgage Trust FRN USD 10/08/2029 100,000 86,811 0.05 COMM 2016-GCT Mortgage Trust 3.086% USD 10/08/2029 100,000 86,536 0.05 CommScope Finance LLC 144A 5.5% USD 01/03/2024 196,000 175,116 0.09 Conagra Brands Inc 5.4% USD 01/11/2048 100,000 81,875 0.04 Continental Resources Inc/OK 4.9% USD 01/06/2044 420,000 351,284 0.19 Continental Resources Inc/OK 5% USD 15/09/2022 68,000 60,009 0.03 CRH America Finance Inc 144A 3.95% USD 04/04/2028 200,000 168,247 0.09 Crown Castle International Corp 3.7% USD 15/06/2026 300,000 255,607 0.14 Crown Castle International Corp 3.8% USD 15/02/2028 157,000 133,216 0.07 Crown Castle International Corp 4% USD 01/03/2027 217,000 187,284 0.10 CSC Holdings LLC 144A 6.5% USD 01/02/2029 200,000 183,398 0.10 CSWF 2018-TOP FRN USD 15/08/2035 800,000 699,872 0.38 CVS Health Corp 3.375% USD 12/08/2024 200,000 172,145 0.09 Dana Inc 5.5% USD 15/12/2024 168,000 146,421 0.08 DaVita Inc 5.125% USD 15/07/2024 255,000 221,129 0.12 Dell International LLC / EMC Corp 144A 3.48% USD 01/06/2019 300,000 262,714 0.14 Dell International LLC / EMC Corp 144A 8.35% USD 15/07/2046 112,000 114,009 0.06 Delta Air Lines Inc 3.8% USD 19/04/2023 104,000 90,616 0.05 Diamond Offshore Drilling Inc 4.875% USD 01/11/2043 60,000 33,504 0.02 Digital Realty Trust LP 2.75% USD 01/02/2023 82,000 69,313 0.04 Digital Realty Trust LP 3.4% USD 01/10/2020 270,000 237,405 0.13 Digital Realty Trust LP 3.7% USD 15/08/2027 106,000 89,772 0.05 Discovery Communications LLC 3.95% USD 20/03/2028 380,000 317,148 0.17 Discovery Communications LLC 5% USD 20/09/2037 40,000 33,185 0.02 Discovery Communications LLC 5.2% USD 20/09/2047 55,000 45,537 0.02 DISH DBS Corp 5% USD 15/03/2023 180,000 141,112 0.08 DISH DBS Corp 5.875% USD 15/11/2024 1,900,000 1,416,708 0.76 DISH DBS Corp 7.75% USD 01/07/2026 120,000 91,815 0.05 DISH DBS Corp 7.875% USD 01/09/2019 165,000 147,600 0.08 Electronic Arts Inc 4.8% USD 01/03/2026 180,000 165,774 0.09 Energy Transfer LP 5.875% USD 15/01/2024 283,000 266,968 0.14 Energy Transfer Operating LP FRN USD Perpetual 288,000 228,359 0.12 EnPro Industries Inc 144A 5.75% USD 15/10/2026 153,000 135,357 0.07 Enterprise Products Operating LLC FRN USD 16/08/2077 362,000 291,064 0.16 Enterprise Products Operating LLC 4.15% USD 16/10/2028 344,000 310,087 0.17 Enterprise Products Operating LLC 4.8% USD 01/08/2048 116,000 103,762 0.06 EP Energy LLC / Everest Acquisition Finance Inc 144A 8% USD 29/11/2024 155,000 97,754 0.05 EQM Midstream Partners LP 5.5% USD 15/07/2028 220,000 192,406 0.10 Equinix Inc 2.875% EUR 01/10/2025 295,000 303,111 0.16 ERP Operating LP 4% USD 01/08/2047 46,000 38,315 0.02 First Data Corp 5.375% USD 15/08/2023 191,000 171,653 0.09 First Data Corp 144A 5.375% USD 15/08/2023 90,000 80,883 0.04 FirstEnergy Corp 4.85% USD 15/07/2047 40,000 36,245 0.02 Ford Motor Credit Co LLC FRN USD 12/06/2020 500,000 433,256 0.23
133 Invesco Funds
Invesco Active Multi-Sector Credit Fund Statement of Investments as at 28 February 2019
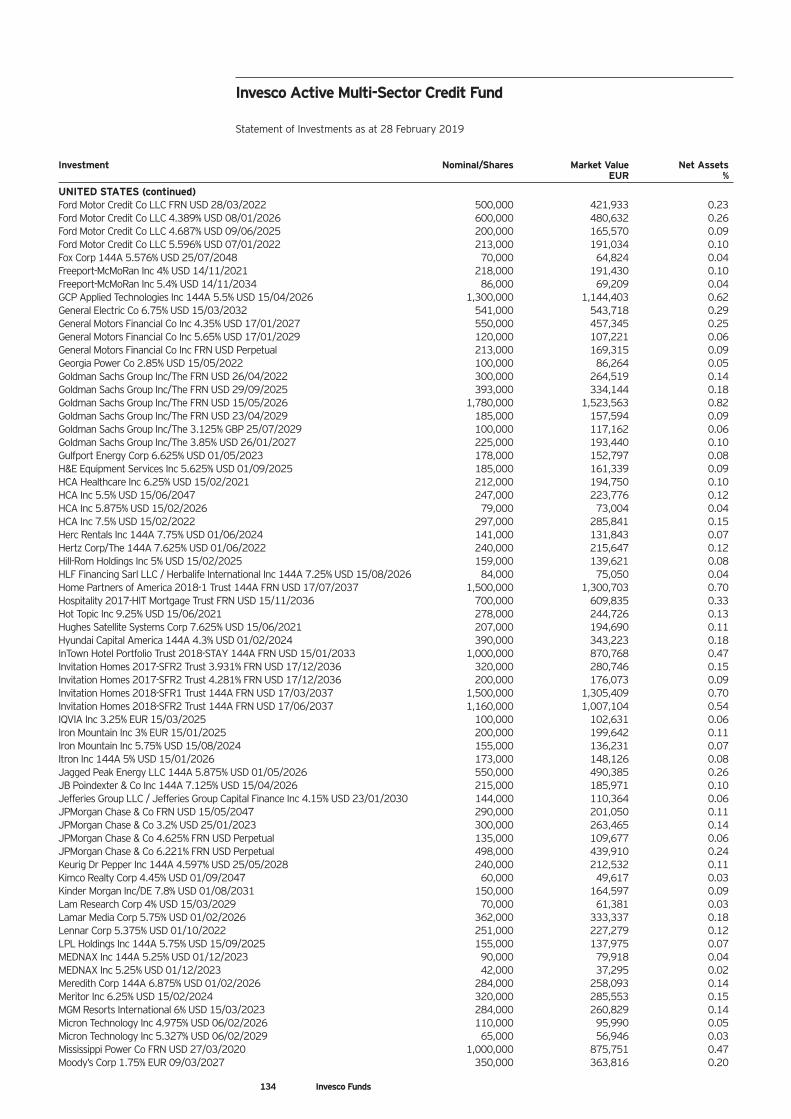
Investment Nominal/Shares Market Value Net Assets EUR %
UNITED STATES (continued) Ford Motor Credit Co LLC FRN USD 28/03/2022 500,000 421,933 0.23 Ford Motor Credit Co LLC 4.389% USD 08/01/2026 600,000 480,632 0.26 Ford Motor Credit Co LLC 4.687% USD 09/06/2025 200,000 165,570 0.09 Ford Motor Credit Co LLC 5.596% USD 07/01/2022 213,000 191,034 0.10 Fox Corp 144A 5.576% USD 25/07/2048 70,000 64,824 0.04 Freeport-McMoRan Inc 4% USD 14/11/2021 218,000 191,430 0.10 Freeport-McMoRan Inc 5.4% USD 14/11/2034 86,000 69,209 0.04 GCP Applied Technologies Inc 144A 5.5% USD 15/04/2026 1,300,000 1,144,403 0.62 General Electric Co 6.75% USD 15/03/2032 541,000 543,718 0.29 General Motors Financial Co Inc 4.35% USD 17/01/2027 550,000 457,345 0.25 General Motors Financial Co Inc 5.65% USD 17/01/2029 120,000 107,221 0.06 General Motors Financial Co Inc FRN USD Perpetual 213,000 169,315 0.09 Georgia Power Co 2.85% USD 15/05/2022 100,000 86,264 0.05 Goldman Sachs Group Inc/The FRN USD 26/04/2022 300,000 264,519 0.14 Goldman Sachs Group Inc/The FRN USD 29/09/2025 393,000 334,144 0.18 Goldman Sachs Group Inc/The FRN USD 15/05/2026 1,780,000 1,523,563 0.82 Goldman Sachs Group Inc/The FRN USD 23/04/2029 185,000 157,594 0.09 Goldman Sachs Group Inc/The 3.125% GBP 25/07/2029 100,000 117,162 0.06 Goldman Sachs Group Inc/The 3.85% USD 26/01/2027 225,000 193,440 0.10 Gulfport Energy Corp 6.625% USD 01/05/2023 178,000 152,797 0.08 H&E Equipment Services Inc 5.625% USD 01/09/2025 185,000 161,339 0.09 HCA Healthcare Inc 6.25% USD 15/02/2021 212,000 194,750 0.10 HCA Inc 5.5% USD 15/06/2047 247,000 223,776 0.12 HCA Inc 5.875% USD 15/02/2026 79,000 73,004 0.04 HCA Inc 7.5% USD 15/02/2022 297,000 285,841 0.15 Herc Rentals Inc 144A 7.75% USD 01/06/2024 141,000 131,843 0.07 Hertz Corp/The 144A 7.625% USD 01/06/2022 240,000 215,647 0.12 Hill-Rom Holdings Inc 5% USD 15/02/2025 159,000 139,621 0.08 HLF Financing Sarl LLC / Herbalife International Inc 144A 7.25% USD 15/08/2026 84,000 75,050 0.04 Home Partners of America 2018-1 Trust 144A FRN USD 17/07/2037 1,500,000 1,300,703 0.70 Hospitality 2017-HIT Mortgage Trust FRN USD 15/11/2036 700,000 609,835 0.33 Hot Topic Inc 9.25% USD 15/06/2021 278,000 244,726 0.13 Hughes Satellite Systems Corp 7.625% USD 15/06/2021 207,000 194,690 0.11 Hyundai Capital America 144A 4.3% USD 01/02/2024 390,000 343,223 0.18 InTown Hotel Portfolio Trust 2018-STAY 144A FRN USD 15/01/2033 1,000,000 870,768 0.47 Invitation Homes 2017-SFR2 Trust 3.931% FRN USD 17/12/2036 320,000 280,746 0.15 Invitation Homes 2017-SFR2 Trust 4.281% FRN USD 17/12/2036 200,000 176,073 0.09 Invitation Homes 2018-SFR1 Trust 144A FRN USD 17/03/2037 1,500,000 1,305,409 0.70 Invitation Homes 2018-SFR2 Trust 144A FRN USD 17/06/2037 1,160,000 1,007,104 0.54 IQVIA Inc 3.25% EUR 15/03/2025 100,000 102,631 0.06 Iron Mountain Inc 3% EUR 15/01/2025 200,000 199,642 0.11 Iron Mountain Inc 5.75% USD 15/08/2024 155,000 136,231 0.07 Itron Inc 144A 5% USD 15/01/2026 173,000 148,126 0.08 Jagged Peak Energy LLC 144A 5.875% USD 01/05/2026 550,000 490,385 0.26 JB Poindexter & Co Inc 144A 7.125% USD 15/04/2026 215,000 185,971 0.10 Jefferies Group LLC / Jefferies Group Capital Finance Inc 4.15% USD 23/01/2030 144,000 110,364 0.06 JPMorgan Chase & Co FRN USD 15/05/2047 290,000 201,050 0.11 JPMorgan Chase & Co 3.2% USD 25/01/2023 300,000 263,465 0.14 JPMorgan Chase & Co 4.625% FRN USD Perpetual 135,000 109,677 0.06 JPMorgan Chase & Co 6.221% FRN USD Perpetual 498,000 439,910 0.24 Keurig Dr Pepper Inc 144A 4.597% USD 25/05/2028 240,000 212,532 0.11 Kimco Realty Corp 4.45% USD 01/09/2047 60,000 49,617 0.03 Kinder Morgan Inc/DE 7.8% USD 01/08/2031 150,000 164,597 0.09 Lam Research Corp 4% USD 15/03/2029 70,000 61,381 0.03 Lamar Media Corp 5.75% USD 01/02/2026 362,000 333,337 0.18 Lennar Corp 5.375% USD 01/10/2022 251,000 227,279 0.12 LPL Holdings Inc 144A 5.75% USD 15/09/2025 155,000 137,975 0.07 MEDNAX Inc 144A 5.25% USD 01/12/2023 90,000 79,918 0.04 MEDNAX Inc 5.25% USD 01/12/2023 42,000 37,295 0.02 Meredith Corp 144A 6.875% USD 01/02/2026 284,000 258,093 0.14 Meritor Inc 6.25% USD 15/02/2024 320,000 285,553 0.15 MGM Resorts International 6% USD 15/03/2023 284,000 260,829 0.14 Micron Technology Inc 4.975% USD 06/02/2026 110,000 95,990 0.05 Micron Technology Inc 5.327% USD 06/02/2029 65,000 56,946 0.03 Mississippi Power Co FRN USD 27/03/2020 1,000,000 875,751 0.47 Moody’s Corp 1.75% EUR 09/03/2027 350,000 363,816 0.20
134 Invesco Funds
Invesco Active Multi-Sector Credit Fund Statement of Investments as at 28 February 2019
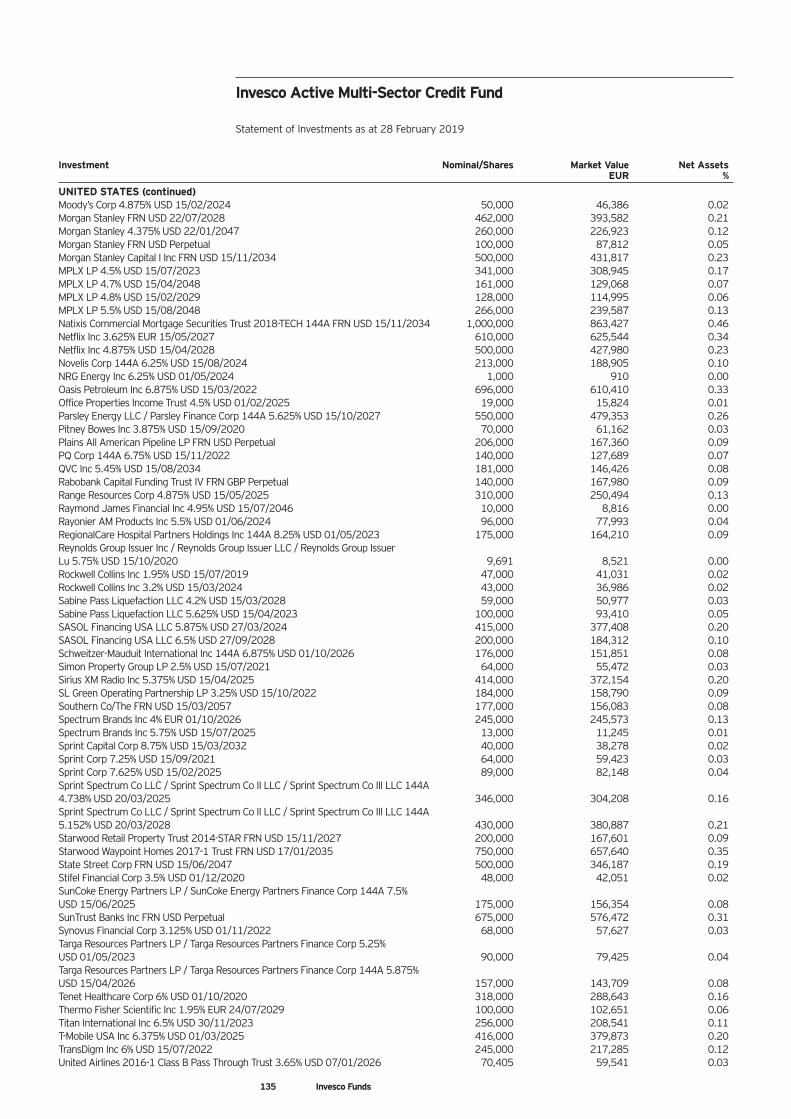
Investment Nominal/Shares Market Value Net Assets EUR %
UNITED STATES (continued) Moody’s Corp 4.875% USD 15/02/2024 50,000 46,386 0.02 Morgan Stanley FRN USD 22/07/2028 462,000 393,582 0.21 Morgan Stanley 4.375% USD 22/01/2047 260,000 226,923 0.12 Morgan Stanley FRN USD Perpetual 100,000 87,812 0.05 Morgan Stanley Capital I Inc FRN USD 15/11/2034 500,000 431,817 0.23 MPLX LP 4.5% USD 15/07/2023 341,000 308,945 0.17 MPLX LP 4.7% USD 15/04/2048 161,000 129,068 0.07 MPLX LP 4.8% USD 15/02/2029 128,000 114,995 0.06 MPLX LP 5.5% USD 15/08/2048 266,000 239,587 0.13 Natixis Commercial Mortgage Securities Trust 2018-TECH 144A FRN USD 15/11/2034 1,000,000 863,427 0.46 Netflix Inc 3.625% EUR 15/05/2027 610,000 625,544 0.34 Netflix Inc 4.875% USD 15/04/2028 500,000 427,980 0.23 Novelis Corp 144A 6.25% USD 15/08/2024 213,000 188,905 0.10 NRG Energy Inc 6.25% USD 01/05/2024 1,000 910 0.00 Oasis Petroleum Inc 6.875% USD 15/03/2022 696,000 610,410 0.33 Office Properties Income Trust 4.5% USD 01/02/2025 19,000 15,824 0.01 Parsley Energy LLC / Parsley Finance Corp 144A 5.625% USD 15/10/2027 550,000 479,353 0.26 Pitney Bowes Inc 3.875% USD 15/09/2020 70,000 61,162 0.03 Plains All American Pipeline LP FRN USD Perpetual 206,000 167,360 0.09 PQ Corp 144A 6.75% USD 15/11/2022 140,000 127,689 0.07 QVC Inc 5.45% USD 15/08/2034 181,000 146,426 0.08 Rabobank Capital Funding Trust IV FRN GBP Perpetual 140,000 167,980 0.09 Range Resources Corp 4.875% USD 15/05/2025 310,000 250,494 0.13 Raymond James Financial Inc 4.95% USD 15/07/2046 10,000 8,816 0.00 Rayonier AM Products Inc 5.5% USD 01/06/2024 96,000 77,993 0.04 RegionalCare Hospital Partners Holdings Inc 144A 8.25% USD 01/05/2023 175,000 164,210 0.09 Reynolds Group Issuer Inc / Reynolds Group Issuer LLC / Reynolds Group Issuer Lu 5.75% USD 15/10/2020 9,691 8,521 0.00 Rockwell Collins Inc 1.95% USD 15/07/2019 47,000 41,031 0.02 Rockwell Collins Inc 3.2% USD 15/03/2024 43,000 36,986 0.02 Sabine Pass Liquefaction LLC 4.2% USD 15/03/2028 59,000 50,977 0.03 Sabine Pass Liquefaction LLC 5.625% USD 15/04/2023 100,000 93,410 0.05 SASOL Financing USA LLC 5.875% USD 27/03/2024 415,000 377,408 0.20 SASOL Financing USA LLC 6.5% USD 27/09/2028 200,000 184,312 0.10 Schweitzer-Mauduit International Inc 144A 6.875% USD 01/10/2026 176,000 151,851 0.08 Simon Property Group LP 2.5% USD 15/07/2021 64,000 55,472 0.03 Sirius XM Radio Inc 5.375% USD 15/04/2025 414,000 372,154 0.20 SL Green Operating Partnership LP 3.25% USD 15/10/2022 184,000 158,790 0.09 Southern Co/The FRN USD 15/03/2057 177,000 156,083 0.08 Spectrum Brands Inc 4% EUR 01/10/2026 245,000 245,573 0.13 Spectrum Brands Inc 5.75% USD 15/07/2025 13,000 11,245 0.01 Sprint Capital Corp 8.75% USD 15/03/2032 40,000 38,278 0.02 Sprint Corp 7.25% USD 15/09/2021 64,000 59,423 0.03 Sprint Corp 7.625% USD 15/02/2025 89,000 82,148 0.04 Sprint Spectrum Co LLC / Sprint Spectrum Co II LLC / Sprint Spectrum Co III LLC 144A 4.738% USD 20/03/2025 346,000 304,208 0.16 Sprint Spectrum Co LLC / Sprint Spectrum Co II LLC / Sprint Spectrum Co III LLC 144A 5.152% USD 20/03/2028 430,000 380,887 0.21 Starwood Retail Property Trust 2014-STAR FRN USD 15/11/2027 200,000 167,601 0.09 Starwood Waypoint Homes 2017-1 Trust FRN USD 17/01/2035 750,000 657,640 0.35 State Street Corp FRN USD 15/06/2047 500,000 346,187 0.19 Stifel Financial Corp 3.5% USD 01/12/2020 48,000 42,051 0.02 SunCoke Energy Partners LP / SunCoke Energy Partners Finance Corp 144A 7.5% USD 15/06/2025 175,000 156,354 0.08 SunTrust Banks Inc FRN USD Perpetual 675,000 576,472 0.31 Synovus Financial Corp 3.125% USD 01/11/2022 68,000 57,627 0.03 Targa Resources Partners LP / Targa Resources Partners Finance Corp 5.25% USD 01/05/2023 90,000 79,425 0.04 Targa Resources Partners LP / Targa Resources Partners Finance Corp 144A 5.875% USD 15/04/2026 157,000 143,709 0.08 Tenet Healthcare Corp 6% USD 01/10/2020 318,000 288,643 0.16 Thermo Fisher Scientific Inc 1.95% EUR 24/07/2029 100,000 102,651 0.06 Titan International Inc 6.5% USD 30/11/2023 256,000 208,541 0.11 T-Mobile USA Inc 6.375% USD 01/03/2025 416,000 379,873 0.20 TransDigm Inc 6% USD 15/07/2022 245,000 217,285 0.12 United Airlines 2016-1 Class B Pass Through Trust 3.65% USD 07/01/2026 70,405 59,541 0.03
135 Invesco Funds
Invesco Active Multi-Sector Credit Fund Statement of Investments as at 28 February 2019
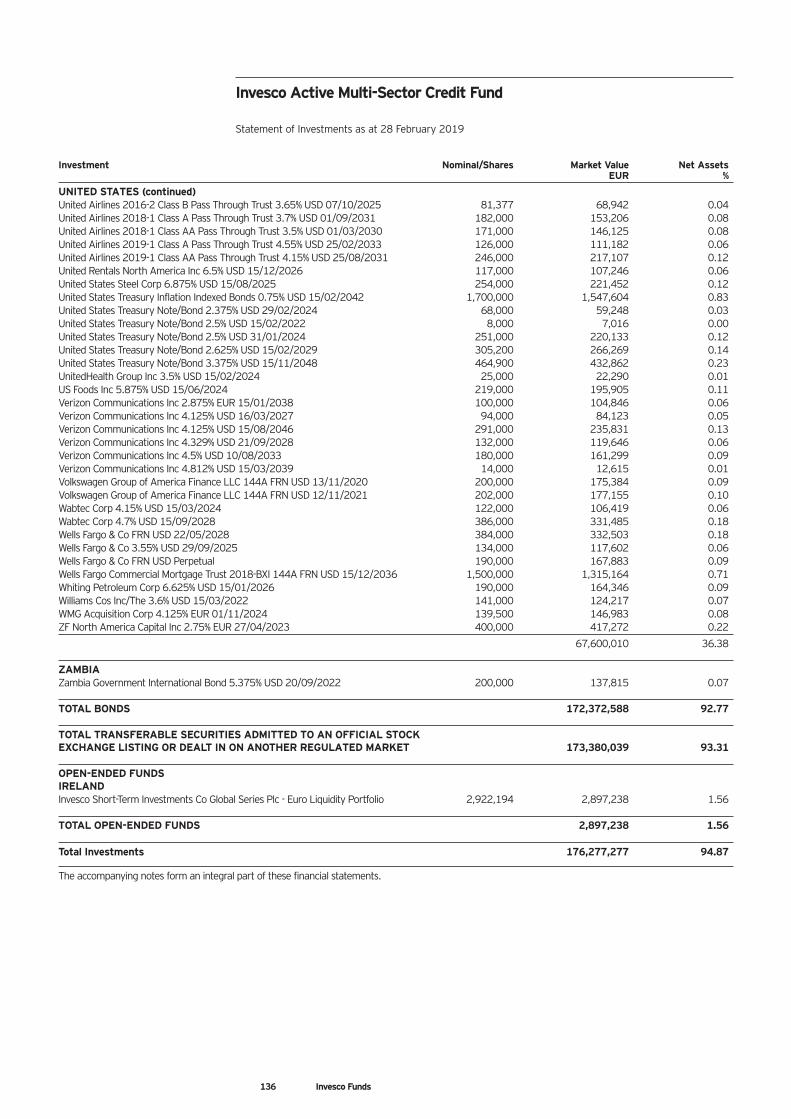
Investment Nominal/Shares Market Value Net Assets EUR %
UNITED STATES (continued) United Airlines 2016-2 Class B Pass Through Trust 3.65% USD 07/10/2025 81,377 68,942 0.04 United Airlines 2018-1 Class A Pass Through Trust 3.7% USD 01/09/2031 182,000 153,206 0.08 United Airlines 2018-1 Class AA Pass Through Trust 3.5% USD 01/03/2030 171,000 146,125 0.08 United Airlines 2019-1 Class A Pass Through Trust 4.55% USD 25/02/2033 126,000 111,182 0.06 United Airlines 2019-1 Class AA Pass Through Trust 4.15% USD 25/08/2031 246,000 217,107 0.12 United Rentals North America Inc 6.5% USD 15/12/2026 117,000 107,246 0.06 United States Steel Corp 6.875% USD 15/08/2025 254,000 221,452 0.12 United States Treasury Inflation Indexed Bonds 0.75% USD 15/02/2042 1,700,000 1,547,604 0.83 United States Treasury Note/Bond 2.375% USD 29/02/2024 68,000 59,248 0.03 United States Treasury Note/Bond 2.5% USD 15/02/2022 8,000 7,016 0.00 United States Treasury Note/Bond 2.5% USD 31/01/2024 251,000 220,133 0.12 United States Treasury Note/Bond 2.625% USD 15/02/2029 305,200 266,269 0.14 United States Treasury Note/Bond 3.375% USD 15/11/2048 464,900 432,862 0.23 UnitedHealth Group Inc 3.5% USD 15/02/2024 25,000 22,290 0.01 US Foods Inc 5.875% USD 15/06/2024 219,000 195,905 0.11 Verizon Communications Inc 2.875% EUR 15/01/2038 100,000 104,846 0.06 Verizon Communications Inc 4.125% USD 16/03/2027 94,000 84,123 0.05 Verizon Communications Inc 4.125% USD 15/08/2046 291,000 235,831 0.13 Verizon Communications Inc 4.329% USD 21/09/2028 132,000 119,646 0.06 Verizon Communications Inc 4.5% USD 10/08/2033 180,000 161,299 0.09 Verizon Communications Inc 4.812% USD 15/03/2039 14,000 12,615 0.01 Volkswagen Group of America Finance LLC 144A FRN USD 13/11/2020 200,000 175,384 0.09 Volkswagen Group of America Finance LLC 144A FRN USD 12/11/2021 202,000 177,155 0.10 Wabtec Corp 4.15% USD 15/03/2024 122,000 106,419 0.06 Wabtec Corp 4.7% USD 15/09/2028 386,000 331,485 0.18 Wells Fargo & Co FRN USD 22/05/2028 384,000 332,503 0.18 Wells Fargo & Co 3.55% USD 29/09/2025 134,000 117,602 0.06 Wells Fargo & Co FRN USD Perpetual 190,000 167,883 0.09 Wells Fargo Commercial Mortgage Trust 2018-BXI 144A FRN USD 15/12/2036 1,500,000 1,315,164 0.71 Whiting Petroleum Corp 6.625% USD 15/01/2026 190,000 164,346 0.09 Williams Cos Inc/The 3.6% USD 15/03/2022 141,000 124,217 0.07 WMG Acquisition Corp 4.125% EUR 01/11/2024 139,500 146,983 0.08 ZF North America Capital Inc 2.75% EUR 27/04/2023 400,000 417,272 0.22
67,600,010 36.38 ZAMBIA Zambia Government International Bond 5.375% USD 20/09/2022 200,000 137,815 0.07 TOTAL BONDS 172,372,588 92.77 TOTAL TRANSFERABLE SECURITIES ADMITTED TO AN OFFICIAL STOCK EXCHANGE LISTING OR DEALT IN ON ANOTHER REGULATED MARKET 173,380,039 93.31 OPEN-ENDED FUNDS IRELAND Invesco Short-Term Investments Co Global Series Plc - Euro Liquidity Portfolio 2,922,194 2,897,238 1.56 TOTAL OPEN-ENDED FUNDS 2,897,238 1.56 Total Investments 176,277,277 94.87
The accompanying notes form an integral part of these financial statements.
136 Invesco Funds
Invesco Active Multi-Sector Credit Fund Statement of Investments as at 28 February 2019
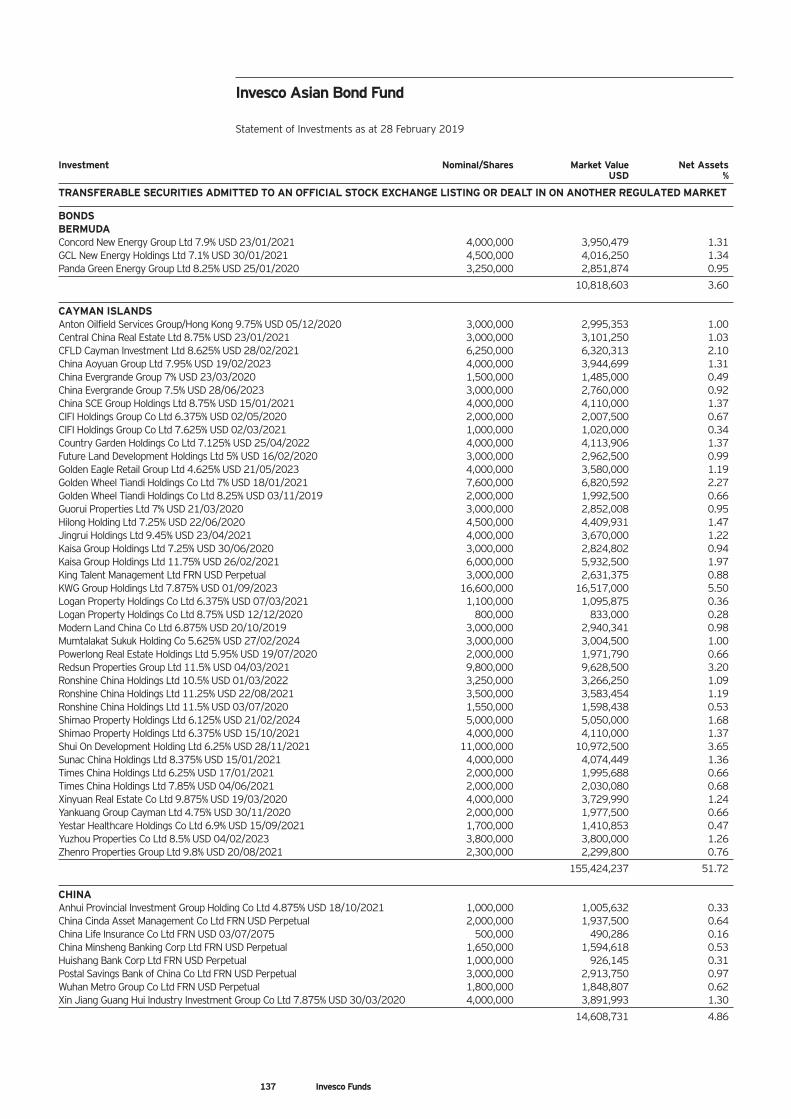
137 Invesco Funds
Investment Nominal/Shares Market Value Net Assets USD %
TRANSFERABLE SECURITIES ADMITTED TO AN OFFICIAL STOCK EXCHANGE LISTING OR DEALT IN ON ANOTHER REGULATED MARKET BONDS BERMUDA Concord New Energy Group Ltd 7.9% USD 23/01/2021 4,000,000 3,950,479 1.31 GCL New Energy Holdings Ltd 7.1% USD 30/01/2021 4,500,000 4,016,250 1.34 Panda Green Energy Group Ltd 8.25% USD 25/01/2020 3,250,000 2,851,874 0.95
10,818,603 3.60 CAYMAN ISLANDS Anton Oilfield Services Group/Hong Kong 9.75% USD 05/12/2020 3,000,000 2,995,353 1.00 Central China Real Estate Ltd 8.75% USD 23/01/2021 3,000,000 3,101,250 1.03 CFLD Cayman Investment Ltd 8.625% USD 28/02/2021 6,250,000 6,320,313 2.10 China Aoyuan Group Ltd 7.95% USD 19/02/2023 4,000,000 3,944,699 1.31 China Evergrande Group 7% USD 23/03/2020 1,500,000 1,485,000 0.49 China Evergrande Group 7.5% USD 28/06/2023 3,000,000 2,760,000 0.92 China SCE Group Holdings Ltd 8.75% USD 15/01/2021 4,000,000 4,110,000 1.37 CIFI Holdings Group Co Ltd 6.375% USD 02/05/2020 2,000,000 2,007,500 0.67 CIFI Holdings Group Co Ltd 7.625% USD 02/03/2021 1,000,000 1,020,000 0.34 Country Garden Holdings Co Ltd 7.125% USD 25/04/2022 4,000,000 4,113,906 1.37 Future Land Development Holdings Ltd 5% USD 16/02/2020 3,000,000 2,962,500 0.99 Golden Eagle Retail Group Ltd 4.625% USD 21/05/2023 4,000,000 3,580,000 1.19 Golden Wheel Tiandi Holdings Co Ltd 7% USD 18/01/2021 7,600,000 6,820,592 2.27 Golden Wheel Tiandi Holdings Co Ltd 8.25% USD 03/11/2019 2,000,000 1,992,500 0.66 Guorui Properties Ltd 7% USD 21/03/2020 3,000,000 2,852,008 0.95 Hilong Holding Ltd 7.25% USD 22/06/2020 4,500,000 4,409,931 1.47 Jingrui Holdings Ltd 9.45% USD 23/04/2021 4,000,000 3,670,000 1.22 Kaisa Group Holdings Ltd 7.25% USD 30/06/2020 3,000,000 2,824,802 0.94 Kaisa Group Holdings Ltd 11.75% USD 26/02/2021 6,000,000 5,932,500 1.97 King Talent Management Ltd FRN USD Perpetual 3,000,000 2,631,375 0.88 KWG Group Holdings Ltd 7.875% USD 01/09/2023 16,600,000 16,517,000 5.50 Logan Property Holdings Co Ltd 6.375% USD 07/03/2021 1,100,000 1,095,875 0.36 Logan Property Holdings Co Ltd 8.75% USD 12/12/2020 800,000 833,000 0.28 Modern Land China Co Ltd 6.875% USD 20/10/2019 3,000,000 2,940,341 0.98 Mumtalakat Sukuk Holding Co 5.625% USD 27/02/2024 3,000,000 3,004,500 1.00 Powerlong Real Estate Holdings Ltd 5.95% USD 19/07/2020 2,000,000 1,971,790 0.66 Redsun Properties Group Ltd 11.5% USD 04/03/2021 9,800,000 9,628,500 3.20 Ronshine China Holdings Ltd 10.5% USD 01/03/2022 3,250,000 3,266,250 1.09 Ronshine China Holdings Ltd 11.25% USD 22/08/2021 3,500,000 3,583,454 1.19 Ronshine China Holdings Ltd 11.5% USD 03/07/2020 1,550,000 1,598,438 0.53 Shimao Property Holdings Ltd 6.125% USD 21/02/2024 5,000,000 5,050,000 1.68 Shimao Property Holdings Ltd 6.375% USD 15/10/2021 4,000,000 4,110,000 1.37 Shui On Development Holding Ltd 6.25% USD 28/11/2021 11,000,000 10,972,500 3.65 Sunac China Holdings Ltd 8.375% USD 15/01/2021 4,000,000 4,074,449 1.36 Times China Holdings Ltd 6.25% USD 17/01/2021 2,000,000 1,995,688 0.66 Times China Holdings Ltd 7.85% USD 04/06/2021 2,000,000 2,030,080 0.68 Xinyuan Real Estate Co Ltd 9.875% USD 19/03/2020 4,000,000 3,729,990 1.24 Yankuang Group Cayman Ltd 4.75% USD 30/11/2020 2,000,000 1,977,500 0.66 Yestar Healthcare Holdings Co Ltd 6.9% USD 15/09/2021 1,700,000 1,410,853 0.47 Yuzhou Properties Co Ltd 8.5% USD 04/02/2023 3,800,000 3,800,000 1.26 Zhenro Properties Group Ltd 9.8% USD 20/08/2021 2,300,000 2,299,800 0.76
155,424,237 51.72 CHINA Anhui Provincial Investment Group Holding Co Ltd 4.875% USD 18/10/2021 1,000,000 1,005,632 0.33 China Cinda Asset Management Co Ltd FRN USD Perpetual 2,000,000 1,937,500 0.64 China Life Insurance Co Ltd FRN USD 03/07/2075 500,000 490,286 0.16 China Minsheng Banking Corp Ltd FRN USD Perpetual 1,650,000 1,594,618 0.53 Huishang Bank Corp Ltd FRN USD Perpetual 1,000,000 926,145 0.31 Postal Savings Bank of China Co Ltd FRN USD Perpetual 3,000,000 2,913,750 0.97 Wuhan Metro Group Co Ltd FRN USD Perpetual 1,800,000 1,848,807 0.62 Xin Jiang Guang Hui Industry Investment Group Co Ltd 7.875% USD 30/03/2020 4,000,000 3,891,993 1.30
14,608,731 4.86
Invesco Asian Bond Fund Statement of Investments as at 28 February 2019
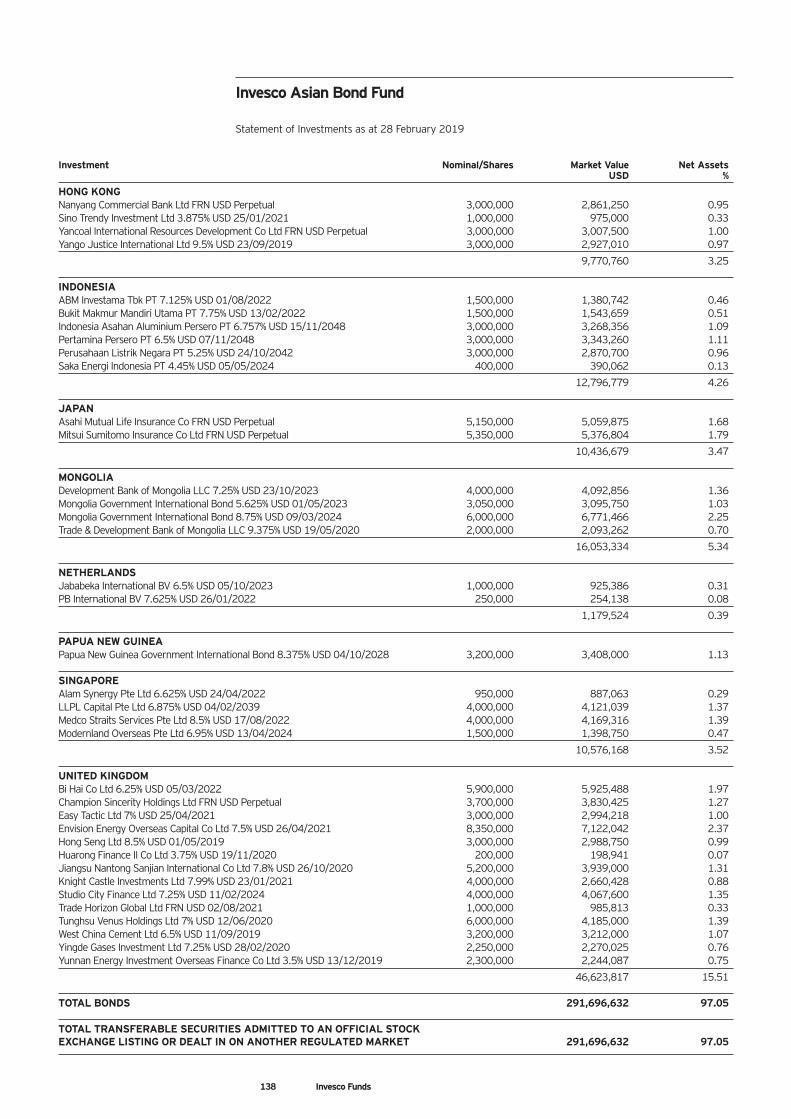
Investment Nominal/Shares Market Value Net Assets USD %
HONG KONG Nanyang Commercial Bank Ltd FRN USD Perpetual 3,000,000 2,861,250 0.95 Sino Trendy Investment Ltd 3.875% USD 25/01/2021 1,000,000 975,000 0.33 Yancoal International Resources Development Co Ltd FRN USD Perpetual 3,000,000 3,007,500 1.00 Yango Justice International Ltd 9.5% USD 23/09/2019 3,000,000 2,927,010 0.97
9,770,760 3.25 INDONESIA ABM Investama Tbk PT 7.125% USD 01/08/2022 1,500,000 1,380,742 0.46 Bukit Makmur Mandiri Utama PT 7.75% USD 13/02/2022 1,500,000 1,543,659 0.51 Indonesia Asahan Aluminium Persero PT 6.757% USD 15/11/2048 3,000,000 3,268,356 1.09 Pertamina Persero PT 6.5% USD 07/11/2048 3,000,000 3,343,260 1.11 Perusahaan Listrik Negara PT 5.25% USD 24/10/2042 3,000,000 2,870,700 0.96 Saka Energi Indonesia PT 4.45% USD 05/05/2024 400,000 390,062 0.13
12,796,779 4.26 JAPAN Asahi Mutual Life Insurance Co FRN USD Perpetual 5,150,000 5,059,875 1.68 Mitsui Sumitomo Insurance Co Ltd FRN USD Perpetual 5,350,000 5,376,804 1.79
10,436,679 3.47 MONGOLIA Development Bank of Mongolia LLC 7.25% USD 23/10/2023 4,000,000 4,092,856 1.36 Mongolia Government International Bond 5.625% USD 01/05/2023 3,050,000 3,095,750 1.03 Mongolia Government International Bond 8.75% USD 09/03/2024 6,000,000 6,771,466 2.25 Trade & Development Bank of Mongolia LLC 9.375% USD 19/05/2020 2,000,000 2,093,262 0.70
16,053,334 5.34 NETHERLANDS Jababeka International BV 6.5% USD 05/10/2023 1,000,000 925,386 0.31 PB International BV 7.625% USD 26/01/2022 250,000 254,138 0.08
1,179,524 0.39 PAPUA NEW GUINEA Papua New Guinea Government International Bond 8.375% USD 04/10/2028 3,200,000 3,408,000 1.13 SINGAPORE Alam Synergy Pte Ltd 6.625% USD 24/04/2022 950,000 887,063 0.29 LLPL Capital Pte Ltd 6.875% USD 04/02/2039 4,000,000 4,121,039 1.37 Medco Straits Services Pte Ltd 8.5% USD 17/08/2022 4,000,000 4,169,316 1.39 Modernland Overseas Pte Ltd 6.95% USD 13/04/2024 1,500,000 1,398,750 0.47
10,576,168 3.52 UNITED KINGDOM Bi Hai Co Ltd 6.25% USD 05/03/2022 5,900,000 5,925,488 1.97 Champion Sincerity Holdings Ltd FRN USD Perpetual 3,700,000 3,830,425 1.27 Easy Tactic Ltd 7% USD 25/04/2021 3,000,000 2,994,218 1.00 Envision Energy Overseas Capital Co Ltd 7.5% USD 26/04/2021 8,350,000 7,122,042 2.37 Hong Seng Ltd 8.5% USD 01/05/2019 3,000,000 2,988,750 0.99 Huarong Finance II Co Ltd 3.75% USD 19/11/2020 200,000 198,941 0.07 Jiangsu Nantong Sanjian International Co Ltd 7.8% USD 26/10/2020 5,200,000 3,939,000 1.31 Knight Castle Investments Ltd 7.99% USD 23/01/2021 4,000,000 2,660,428 0.88 Studio City Finance Ltd 7.25% USD 11/02/2024 4,000,000 4,067,600 1.35 Trade Horizon Global Ltd FRN USD 02/08/2021 1,000,000 985,813 0.33 Tunghsu Venus Holdings Ltd 7% USD 12/06/2020 6,000,000 4,185,000 1.39 West China Cement Ltd 6.5% USD 11/09/2019 3,200,000 3,212,000 1.07 Yingde Gases Investment Ltd 7.25% USD 28/02/2020 2,250,000 2,270,025 0.76 Yunnan Energy Investment Overseas Finance Co Ltd 3.5% USD 13/12/2019 2,300,000 2,244,087 0.75
46,623,817 15.51 TOTAL BONDS 291,696,632 97.05 TOTAL TRANSFERABLE SECURITIES ADMITTED TO AN OFFICIAL STOCK EXCHANGE LISTING OR DEALT IN ON ANOTHER REGULATED MARKET 291,696,632 97.05
138 Invesco Funds
Invesco Asian Bond Fund Statement of Investments as at 28 February 2019

Investment Nominal/Shares Market Value Net Assets USD %
OPEN-ENDED FUNDS IRELAND Invesco Short-Term Investments Co Global Series Plc - US Dollar Liquidity Portfolio 17,182,833 17,182,833 5.72 TOTAL OPEN-ENDED FUNDS 17,182,833 5.72 Total Investments 308,879,465 102.77
The accompanying notes form an integral part of these financial statements.
139 Invesco Funds
Invesco Asian Bond Fund Statement of Investments as at 28 February 2019
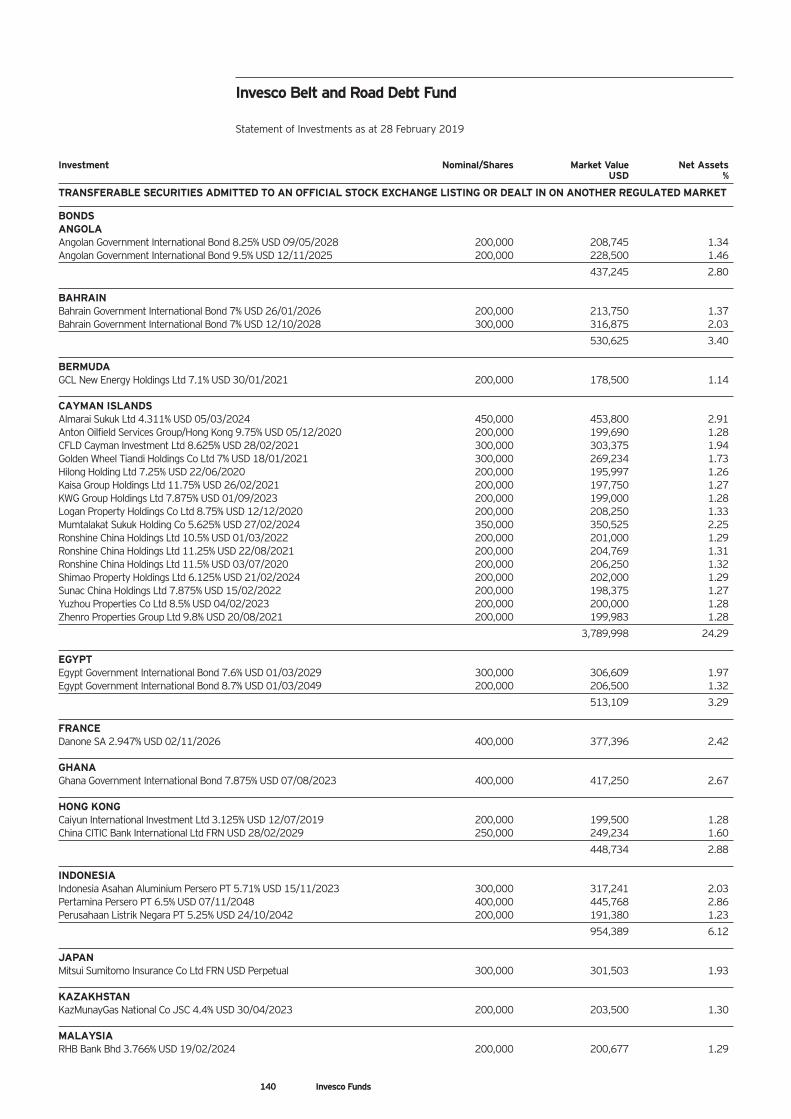
Investment Nominal/Shares Market Value Net Assets USD %
TRANSFERABLE SECURITIES ADMITTED TO AN OFFICIAL STOCK EXCHANGE LISTING OR DEALT IN ON ANOTHER REGULATED MARKET BONDS ANGOLA Angolan Government International Bond 8.25% USD 09/05/2028 200,000 208,745 1.34 Angolan Government International Bond 9.5% USD 12/11/2025 200,000 228,500 1.46
437,245 2.80 BAHRAIN Bahrain Government International Bond 7% USD 26/01/2026 200,000 213,750 1.37 Bahrain Government International Bond 7% USD 12/10/2028 300,000 316,875 2.03
530,625 3.40 BERMUDA GCL New Energy Holdings Ltd 7.1% USD 30/01/2021 200,000 178,500 1.14 CAYMAN ISLANDS Almarai Sukuk Ltd 4.311% USD 05/03/2024 450,000 453,800 2.91 Anton Oilfield Services Group/Hong Kong 9.75% USD 05/12/2020 200,000 199,690 1.28 CFLD Cayman Investment Ltd 8.625% USD 28/02/2021 300,000 303,375 1.94 Golden Wheel Tiandi Holdings Co Ltd 7% USD 18/01/2021 300,000 269,234 1.73 Hilong Holding Ltd 7.25% USD 22/06/2020 200,000 195,997 1.26 Kaisa Group Holdings Ltd 11.75% USD 26/02/2021 200,000 197,750 1.27 KWG Group Holdings Ltd 7.875% USD 01/09/2023 200,000 199,000 1.28 Logan Property Holdings Co Ltd 8.75% USD 12/12/2020 200,000 208,250 1.33 Mumtalakat Sukuk Holding Co 5.625% USD 27/02/2024 350,000 350,525 2.25 Ronshine China Holdings Ltd 10.5% USD 01/03/2022 200,000 201,000 1.29 Ronshine China Holdings Ltd 11.25% USD 22/08/2021 200,000 204,769 1.31 Ronshine China Holdings Ltd 11.5% USD 03/07/2020 200,000 206,250 1.32 Shimao Property Holdings Ltd 6.125% USD 21/02/2024 200,000 202,000 1.29 Sunac China Holdings Ltd 7.875% USD 15/02/2022 200,000 198,375 1.27 Yuzhou Properties Co Ltd 8.5% USD 04/02/2023 200,000 200,000 1.28 Zhenro Properties Group Ltd 9.8% USD 20/08/2021 200,000 199,983 1.28
3,789,998 24.29 EGYPT Egypt Government International Bond 7.6% USD 01/03/2029 300,000 306,609 1.97 Egypt Government International Bond 8.7% USD 01/03/2049 200,000 206,500 1.32
513,109 3.29 FRANCE Danone SA 2.947% USD 02/11/2026 400,000 377,396 2.42 GHANA Ghana Government International Bond 7.875% USD 07/08/2023 400,000 417,250 2.67 HONG KONG Caiyun International Investment Ltd 3.125% USD 12/07/2019 200,000 199,500 1.28 China CITIC Bank International Ltd FRN USD 28/02/2029 250,000 249,234 1.60
448,734 2.88 INDONESIA Indonesia Asahan Aluminium Persero PT 5.71% USD 15/11/2023 300,000 317,241 2.03 Pertamina Persero PT 6.5% USD 07/11/2048 400,000 445,768 2.86 Perusahaan Listrik Negara PT 5.25% USD 24/10/2042 200,000 191,380 1.23
954,389 6.12 JAPAN Mitsui Sumitomo Insurance Co Ltd FRN USD Perpetual 300,000 301,503 1.93 KAZAKHSTAN KazMunayGas National Co JSC 4.4% USD 30/04/2023 200,000 203,500 1.30 MALAYSIA RHB Bank Bhd 3.766% USD 19/02/2024 200,000 200,677 1.29
Invesco Belt and Road Debt Fund Statement of Investments as at 28 February 2019
140 Invesco Funds
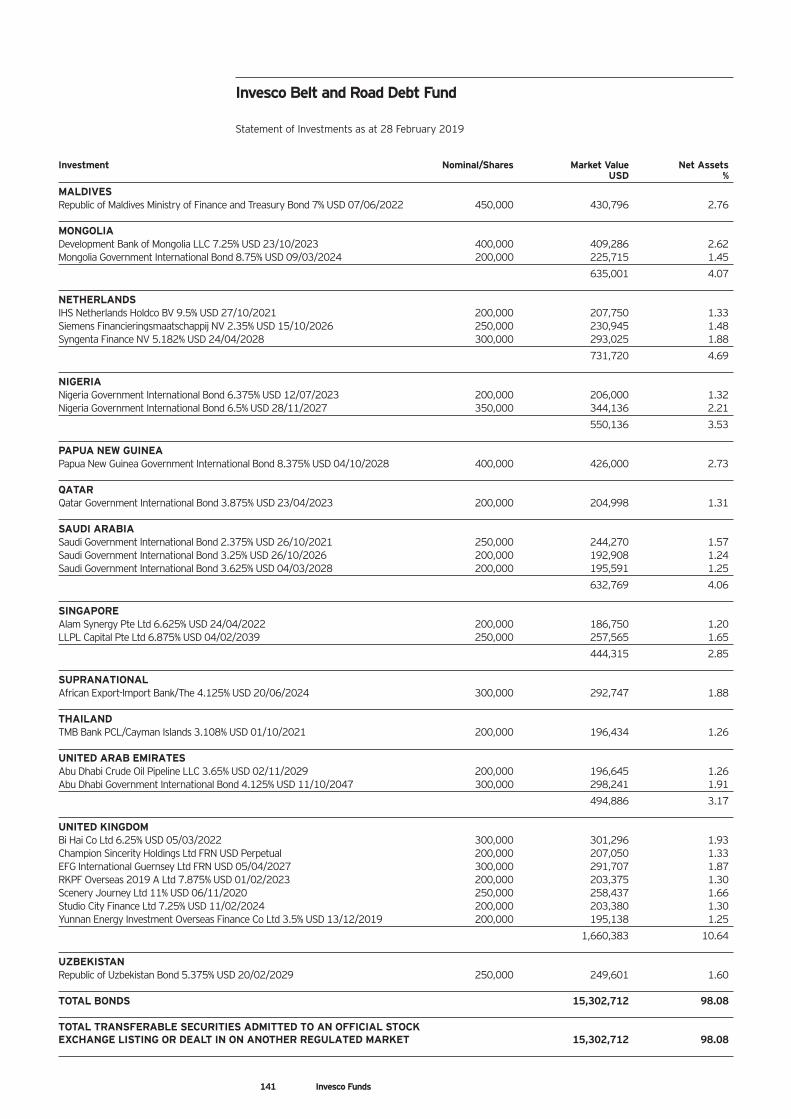
Investment Nominal/Shares Market Value Net Assets USD %
MALDIVES Republic of Maldives Ministry of Finance and Treasury Bond 7% USD 07/06/2022 450,000 430,796 2.76 MONGOLIA Development Bank of Mongolia LLC 7.25% USD 23/10/2023 400,000 409,286 2.62 Mongolia Government International Bond 8.75% USD 09/03/2024 200,000 225,715 1.45
635,001 4.07 NETHERLANDS IHS Netherlands Holdco BV 9.5% USD 27/10/2021 200,000 207,750 1.33 Siemens Financieringsmaatschappij NV 2.35% USD 15/10/2026 250,000 230,945 1.48 Syngenta Finance NV 5.182% USD 24/04/2028 300,000 293,025 1.88
731,720 4.69 NIGERIA Nigeria Government International Bond 6.375% USD 12/07/2023 200,000 206,000 1.32 Nigeria Government International Bond 6.5% USD 28/11/2027 350,000 344,136 2.21
550,136 3.53 PAPUA NEW GUINEA Papua New Guinea Government International Bond 8.375% USD 04/10/2028 400,000 426,000 2.73 QATAR Qatar Government International Bond 3.875% USD 23/04/2023 200,000 204,998 1.31 SAUDI ARABIA Saudi Government International Bond 2.375% USD 26/10/2021 250,000 244,270 1.57 Saudi Government International Bond 3.25% USD 26/10/2026 200,000 192,908 1.24 Saudi Government International Bond 3.625% USD 04/03/2028 200,000 195,591 1.25
632,769 4.06 SINGAPORE Alam Synergy Pte Ltd 6.625% USD 24/04/2022 200,000 186,750 1.20 LLPL Capital Pte Ltd 6.875% USD 04/02/2039 250,000 257,565 1.65
444,315 2.85 SUPRANATIONAL African Export-Import Bank/The 4.125% USD 20/06/2024 300,000 292,747 1.88 THAILAND TMB Bank PCL/Cayman Islands 3.108% USD 01/10/2021 200,000 196,434 1.26 UNITED ARAB EMIRATES Abu Dhabi Crude Oil Pipeline LLC 3.65% USD 02/11/2029 200,000 196,645 1.26 Abu Dhabi Government International Bond 4.125% USD 11/10/2047 300,000 298,241 1.91
494,886 3.17 UNITED KINGDOM Bi Hai Co Ltd 6.25% USD 05/03/2022 300,000 301,296 1.93 Champion Sincerity Holdings Ltd FRN USD Perpetual 200,000 207,050 1.33 EFG International Guernsey Ltd FRN USD 05/04/2027 300,000 291,707 1.87 RKPF Overseas 2019 A Ltd 7.875% USD 01/02/2023 200,000 203,375 1.30 Scenery Journey Ltd 11% USD 06/11/2020 250,000 258,437 1.66 Studio City Finance Ltd 7.25% USD 11/02/2024 200,000 203,380 1.30 Yunnan Energy Investment Overseas Finance Co Ltd 3.5% USD 13/12/2019 200,000 195,138 1.25
1,660,383 10.64 UZBEKISTAN Republic of Uzbekistan Bond 5.375% USD 20/02/2029 250,000 249,601 1.60 TOTAL BONDS 15,302,712 98.08 TOTAL TRANSFERABLE SECURITIES ADMITTED TO AN OFFICIAL STOCK EXCHANGE LISTING OR DEALT IN ON ANOTHER REGULATED MARKET 15,302,712 98.08
Invesco Belt and Road Debt Fund Statement of Investments as at 28 February 2019
141 Invesco Funds
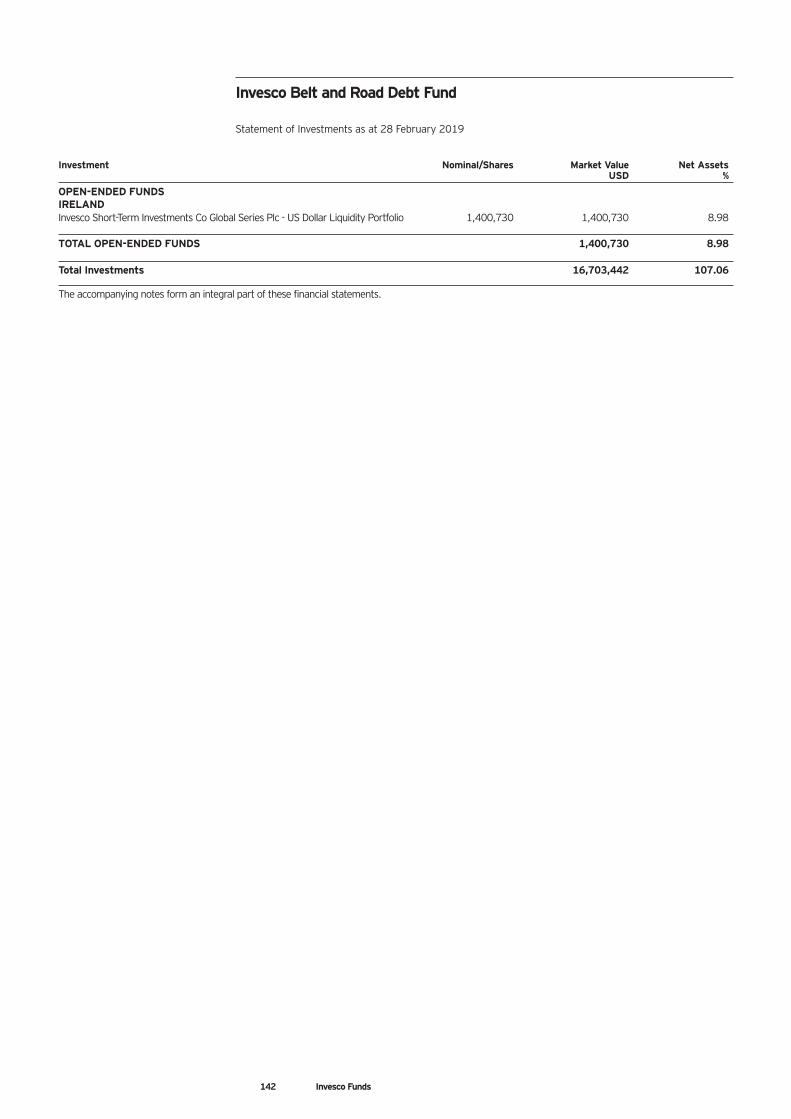
Investment Nominal/Shares Market Value Net Assets USD %
OPEN-ENDED FUNDS IRELAND Invesco Short-Term Investments Co Global Series Plc - US Dollar Liquidity Portfolio 1,400,730 1,400,730 8.98 TOTAL OPEN-ENDED FUNDS 1,400,730 8.98 Total Investments 16,703,442 107.06
The accompanying notes form an integral part of these financial statements.
142 Invesco Funds
Invesco Belt and Road Debt Fund Statement of Investments as at 28 February 2019
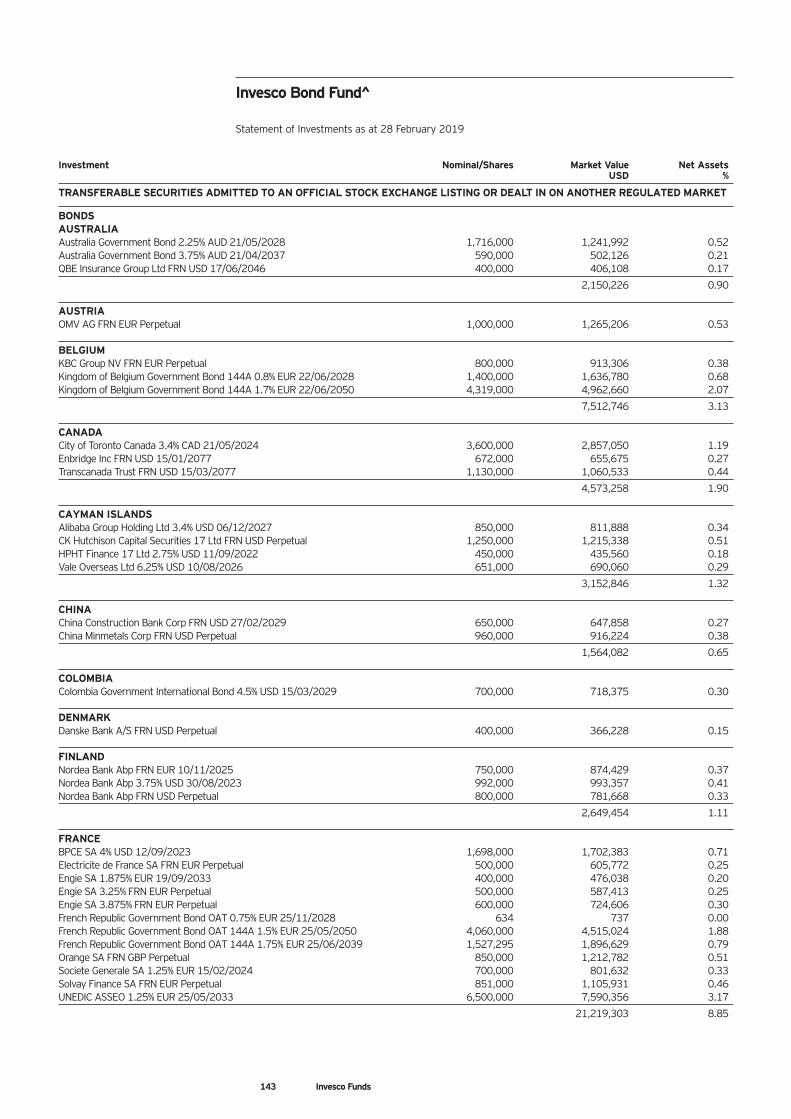
Investment Nominal/Shares Market Value Net Assets USD %
TRANSFERABLE SECURITIES ADMITTED TO AN OFFICIAL STOCK EXCHANGE LISTING OR DEALT IN ON ANOTHER REGULATED MARKET BONDS AUSTRALIA Australia Government Bond 2.25% AUD 21/05/2028 1,716,000 1,241,992 0.52 Australia Government Bond 3.75% AUD 21/04/2037 590,000 502,126 0.21 QBE Insurance Group Ltd FRN USD 17/06/2046 400,000 406,108 0.17
2,150,226 0.90 AUSTRIA OMV AG FRN EUR Perpetual 1,000,000 1,265,206 0.53 BELGIUM KBC Group NV FRN EUR Perpetual 800,000 913,306 0.38 Kingdom of Belgium Government Bond 144A 0.8% EUR 22/06/2028 1,400,000 1,636,780 0.68 Kingdom of Belgium Government Bond 144A 1.7% EUR 22/06/2050 4,319,000 4,962,660 2.07
7,512,746 3.13 CANADA City of Toronto Canada 3.4% CAD 21/05/2024 3,600,000 2,857,050 1.19 Enbridge Inc FRN USD 15/01/2077 672,000 655,675 0.27 Transcanada Trust FRN USD 15/03/2077 1,130,000 1,060,533 0.44
4,573,258 1.90 CAYMAN ISLANDS Alibaba Group Holding Ltd 3.4% USD 06/12/2027 850,000 811,888 0.34 CK Hutchison Capital Securities 17 Ltd FRN USD Perpetual 1,250,000 1,215,338 0.51 HPHT Finance 17 Ltd 2.75% USD 11/09/2022 450,000 435,560 0.18 Vale Overseas Ltd 6.25% USD 10/08/2026 651,000 690,060 0.29
3,152,846 1.32 CHINA China Construction Bank Corp FRN USD 27/02/2029 650,000 647,858 0.27 China Minmetals Corp FRN USD Perpetual 960,000 916,224 0.38
1,564,082 0.65 COLOMBIA Colombia Government International Bond 4.5% USD 15/03/2029 700,000 718,375 0.30 DENMARK Danske Bank A/S FRN USD Perpetual 400,000 366,228 0.15 FINLAND Nordea Bank Abp FRN EUR 10/11/2025 750,000 874,429 0.37 Nordea Bank Abp 3.75% USD 30/08/2023 992,000 993,357 0.41 Nordea Bank Abp FRN USD Perpetual 800,000 781,668 0.33
2,649,454 1.11 FRANCE BPCE SA 4% USD 12/09/2023 1,698,000 1,702,383 0.71 Electricite de France SA FRN EUR Perpetual 500,000 605,772 0.25 Engie SA 1.875% EUR 19/09/2033 400,000 476,038 0.20 Engie SA 3.25% FRN EUR Perpetual 500,000 587,413 0.25 Engie SA 3.875% FRN EUR Perpetual 600,000 724,606 0.30 French Republic Government Bond OAT 0.75% EUR 25/11/2028 634 737 0.00 French Republic Government Bond OAT 144A 1.5% EUR 25/05/2050 4,060,000 4,515,024 1.88 French Republic Government Bond OAT 144A 1.75% EUR 25/06/2039 1,527,295 1,896,629 0.79 Orange SA FRN GBP Perpetual 850,000 1,212,782 0.51 Societe Generale SA 1.25% EUR 15/02/2024 700,000 801,632 0.33 Solvay Finance SA FRN EUR Perpetual 851,000 1,105,931 0.46 UNEDIC ASSEO 1.25% EUR 25/05/2033 6,500,000 7,590,356 3.17
21,219,303 8.85
Invesco Bond Fund^ Statement of Investments as at 28 February 2019
143 Invesco Funds
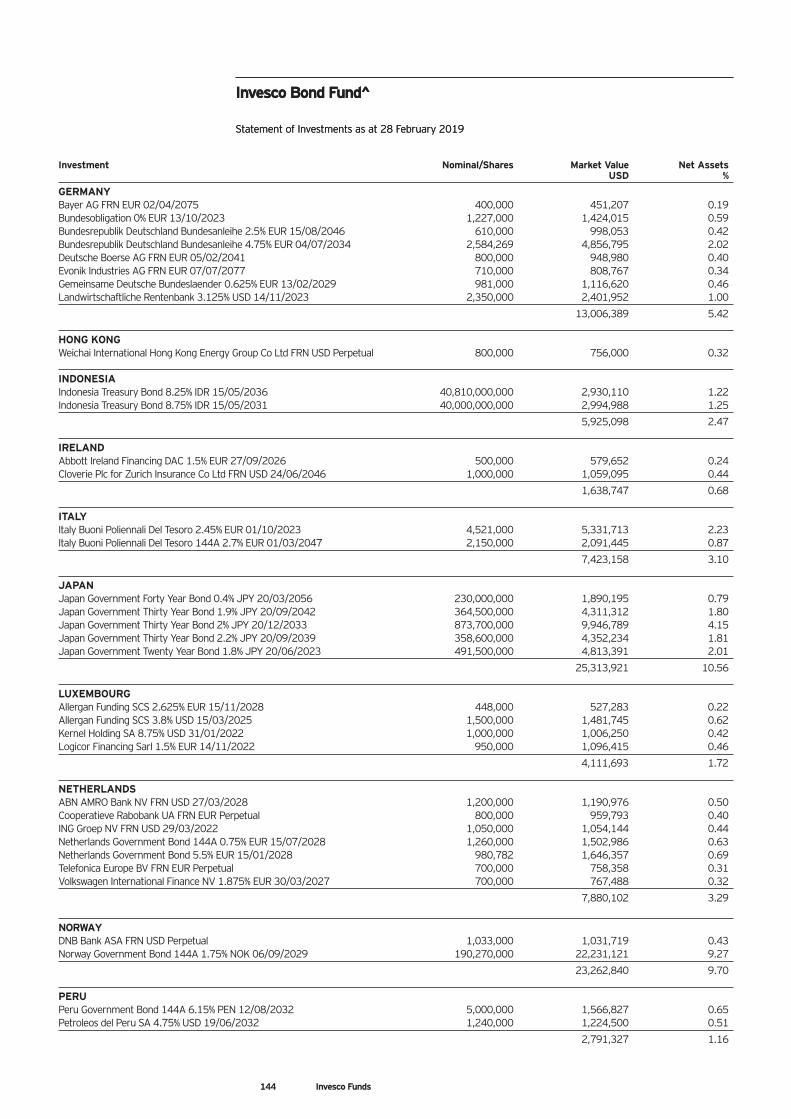
Investment Nominal/Shares Market Value Net Assets USD %
GERMANY Bayer AG FRN EUR 02/04/2075 400,000 451,207 0.19 Bundesobligation 0% EUR 13/10/2023 1,227,000 1,424,015 0.59 Bundesrepublik Deutschland Bundesanleihe 2.5% EUR 15/08/2046 610,000 998,053 0.42 Bundesrepublik Deutschland Bundesanleihe 4.75% EUR 04/07/2034 2,584,269 4,856,795 2.02 Deutsche Boerse AG FRN EUR 05/02/2041 800,000 948,980 0.40 Evonik Industries AG FRN EUR 07/07/2077 710,000 808,767 0.34 Gemeinsame Deutsche Bundeslaender 0.625% EUR 13/02/2029 981,000 1,116,620 0.46 Landwirtschaftliche Rentenbank 3.125% USD 14/11/2023 2,350,000 2,401,952 1.00
13,006,389 5.42 HONG KONG Weichai International Hong Kong Energy Group Co Ltd FRN USD Perpetual 800,000 756,000 0.32 INDONESIA Indonesia Treasury Bond 8.25% IDR 15/05/2036 40,810,000,000 2,930,110 1.22 Indonesia Treasury Bond 8.75% IDR 15/05/2031 40,000,000,000 2,994,988 1.25
5,925,098 2.47 IRELAND Abbott Ireland Financing DAC 1.5% EUR 27/09/2026 500,000 579,652 0.24 Cloverie Plc for Zurich Insurance Co Ltd FRN USD 24/06/2046 1,000,000 1,059,095 0.44
1,638,747 0.68 ITALY Italy Buoni Poliennali Del Tesoro 2.45% EUR 01/10/2023 4,521,000 5,331,713 2.23 Italy Buoni Poliennali Del Tesoro 144A 2.7% EUR 01/03/2047 2,150,000 2,091,445 0.87
7,423,158 3.10 JAPAN Japan Government Forty Year Bond 0.4% JPY 20/03/2056 230,000,000 1,890,195 0.79 Japan Government Thirty Year Bond 1.9% JPY 20/09/2042 364,500,000 4,311,312 1.80 Japan Government Thirty Year Bond 2% JPY 20/12/2033 873,700,000 9,946,789 4.15 Japan Government Thirty Year Bond 2.2% JPY 20/09/2039 358,600,000 4,352,234 1.81 Japan Government Twenty Year Bond 1.8% JPY 20/06/2023 491,500,000 4,813,391 2.01
25,313,921 10.56 LUXEMBOURG Allergan Funding SCS 2.625% EUR 15/11/2028 448,000 527,283 0.22 Allergan Funding SCS 3.8% USD 15/03/2025 1,500,000 1,481,745 0.62 Kernel Holding SA 8.75% USD 31/01/2022 1,000,000 1,006,250 0.42 Logicor Financing Sarl 1.5% EUR 14/11/2022 950,000 1,096,415 0.46
4,111,693 1.72 NETHERLANDS ABN AMRO Bank NV FRN USD 27/03/2028 1,200,000 1,190,976 0.50 Cooperatieve Rabobank UA FRN EUR Perpetual 800,000 959,793 0.40 ING Groep NV FRN USD 29/03/2022 1,050,000 1,054,144 0.44 Netherlands Government Bond 144A 0.75% EUR 15/07/2028 1,260,000 1,502,986 0.63 Netherlands Government Bond 5.5% EUR 15/01/2028 980,782 1,646,357 0.69 Telefonica Europe BV FRN EUR Perpetual 700,000 758,358 0.31 Volkswagen International Finance NV 1.875% EUR 30/03/2027 700,000 767,488 0.32
7,880,102 3.29
NORWAY DNB Bank ASA FRN USD Perpetual 1,033,000 1,031,719 0.43 Norway Government Bond 144A 1.75% NOK 06/09/2029 190,270,000 22,231,121 9.27
23,262,840 9.70 PERU Peru Government Bond 144A 6.15% PEN 12/08/2032 5,000,000 1,566,827 0.65 Petroleos del Peru SA 4.75% USD 19/06/2032 1,240,000 1,224,500 0.51
2,791,327 1.16
144 Invesco Funds
Invesco Bond Fund^ Statement of Investments as at 28 February 2019
Invesco Bond Fund^ Statement of Investments as at 28 February 2019
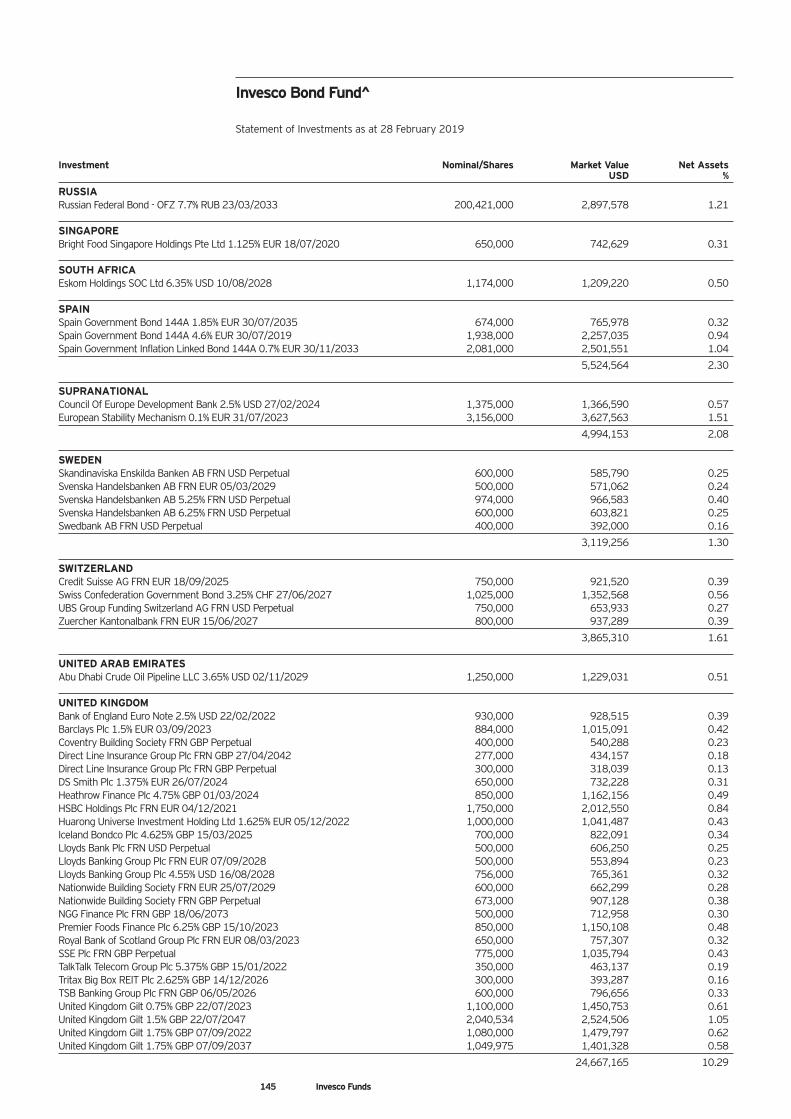
Investment Nominal/Shares Market Value Net Assets USD %
RUSSIA Russian Federal Bond - OFZ 7.7% RUB 23/03/2033 200,421,000 2,897,578 1.21 SINGAPORE Bright Food Singapore Holdings Pte Ltd 1.125% EUR 18/07/2020 650,000 742,629 0.31 SOUTH AFRICA Eskom Holdings SOC Ltd 6.35% USD 10/08/2028 1,174,000 1,209,220 0.50 SPAIN Spain Government Bond 144A 1.85% EUR 30/07/2035 674,000 765,978 0.32 Spain Government Bond 144A 4.6% EUR 30/07/2019 1,938,000 2,257,035 0.94 Spain Government Inflation Linked Bond 144A 0.7% EUR 30/11/2033 2,081,000 2,501,551 1.04
5,524,564 2.30 SUPRANATIONAL Council Of Europe Development Bank 2.5% USD 27/02/2024 1,375,000 1,366,590 0.57 European Stability Mechanism 0.1% EUR 31/07/2023 3,156,000 3,627,563 1.51
4,994,153 2.08 SWEDEN Skandinaviska Enskilda Banken AB FRN USD Perpetual 600,000 585,790 0.25 Svenska Handelsbanken AB FRN EUR 05/03/2029 500,000 571,062 0.24 Svenska Handelsbanken AB 5.25% FRN USD Perpetual 974,000 966,583 0.40 Svenska Handelsbanken AB 6.25% FRN USD Perpetual 600,000 603,821 0.25 Swedbank AB FRN USD Perpetual 400,000 392,000 0.16
3,119,256 1.30 SWITZERLAND Credit Suisse AG FRN EUR 18/09/2025 750,000 921,520 0.39 Swiss Confederation Government Bond 3.25% CHF 27/06/2027 1,025,000 1,352,568 0.56 UBS Group Funding Switzerland AG FRN USD Perpetual 750,000 653,933 0.27 Zuercher Kantonalbank FRN EUR 15/06/2027 800,000 937,289 0.39
3,865,310 1.61 UNITED ARAB EMIRATES Abu Dhabi Crude Oil Pipeline LLC 3.65% USD 02/11/2029 1,250,000 1,229,031 0.51 UNITED KINGDOM Bank of England Euro Note 2.5% USD 22/02/2022 930,000 928,515 0.39 Barclays Plc 1.5% EUR 03/09/2023 884,000 1,015,091 0.42 Coventry Building Society FRN GBP Perpetual 400,000 540,288 0.23 Direct Line Insurance Group Plc FRN GBP 27/04/2042 277,000 434,157 0.18 Direct Line Insurance Group Plc FRN GBP Perpetual 300,000 318,039 0.13 DS Smith Plc 1.375% EUR 26/07/2024 650,000 732,228 0.31 Heathrow Finance Plc 4.75% GBP 01/03/2024 850,000 1,162,156 0.49 HSBC Holdings Plc FRN EUR 04/12/2021 1,750,000 2,012,550 0.84 Huarong Universe Investment Holding Ltd 1.625% EUR 05/12/2022 1,000,000 1,041,487 0.43 Iceland Bondco Plc 4.625% GBP 15/03/2025 700,000 822,091 0.34 Lloyds Bank Plc FRN USD Perpetual 500,000 606,250 0.25 Lloyds Banking Group Plc FRN EUR 07/09/2028 500,000 553,894 0.23 Lloyds Banking Group Plc 4.55% USD 16/08/2028 756,000 765,361 0.32 Nationwide Building Society FRN EUR 25/07/2029 600,000 662,299 0.28 Nationwide Building Society FRN GBP Perpetual 673,000 907,128 0.38 NGG Finance Plc FRN GBP 18/06/2073 500,000 712,958 0.30 Premier Foods Finance Plc 6.25% GBP 15/10/2023 850,000 1,150,108 0.48 Royal Bank of Scotland Group Plc FRN EUR 08/03/2023 650,000 757,307 0.32 SSE Plc FRN GBP Perpetual 775,000 1,035,794 0.43 TalkTalk Telecom Group Plc 5.375% GBP 15/01/2022 350,000 463,137 0.19 Tritax Big Box REIT Plc 2.625% GBP 14/12/2026 300,000 393,287 0.16 TSB Banking Group Plc FRN GBP 06/05/2026 600,000 796,656 0.33 United Kingdom Gilt 0.75% GBP 22/07/2023 1,100,000 1,450,753 0.61 United Kingdom Gilt 1.5% GBP 22/07/2047 2,040,534 2,524,506 1.05 United Kingdom Gilt 1.75% GBP 07/09/2022 1,080,000 1,479,797 0.62 United Kingdom Gilt 1.75% GBP 07/09/2037 1,049,975 1,401,328 0.58
24,667,165 10.29
145 Invesco Funds
Invesco Bond Fund^ Statement of Investments as at 28 February 2019
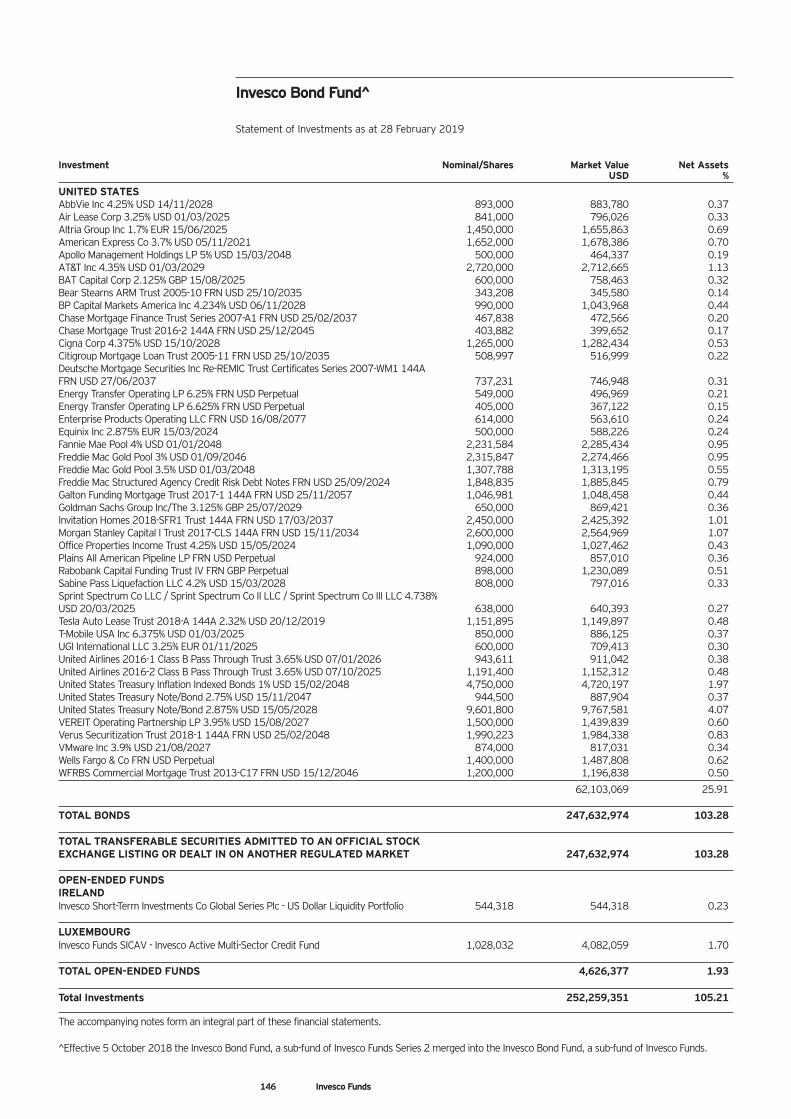
Investment Nominal/Shares Market Value Net Assets USD %
UNITED STATES AbbVie Inc 4.25% USD 14/11/2028 893,000 883,780 0.37 Air Lease Corp 3.25% USD 01/03/2025 841,000 796,026 0.33 Altria Group Inc 1.7% EUR 15/06/2025 1,450,000 1,655,863 0.69 American Express Co 3.7% USD 05/11/2021 1,652,000 1,678,386 0.70 Apollo Management Holdings LP 5% USD 15/03/2048 500,000 464,337 0.19 AT&T Inc 4.35% USD 01/03/2029 2,720,000 2,712,665 1.13 BAT Capital Corp 2.125% GBP 15/08/2025 600,000 758,463 0.32 Bear Stearns ARM Trust 2005-10 FRN USD 25/10/2035 343,208 345,580 0.14 BP Capital Markets America Inc 4.234% USD 06/11/2028 990,000 1,043,968 0.44 Chase Mortgage Finance Trust Series 2007-A1 FRN USD 25/02/2037 467,838 472,566 0.20 Chase Mortgage Trust 2016-2 144A FRN USD 25/12/2045 403,882 399,652 0.17 Cigna Corp 4.375% USD 15/10/2028 1,265,000 1,282,434 0.53 Citigroup Mortgage Loan Trust 2005-11 FRN USD 25/10/2035 508,997 516,999 0.22 Deutsche Mortgage Securities Inc Re-REMIC Trust Certificates Series 2007-WM1 144A FRN USD 27/06/2037 737,231 746,948 0.31 Energy Transfer Operating LP 6.25% FRN USD Perpetual 549,000 496,969 0.21 Energy Transfer Operating LP 6.625% FRN USD Perpetual 405,000 367,122 0.15 Enterprise Products Operating LLC FRN USD 16/08/2077 614,000 563,610 0.24 Equinix Inc 2.875% EUR 15/03/2024 500,000 588,226 0.24 Fannie Mae Pool 4% USD 01/01/2048 2,231,584 2,285,434 0.95 Freddie Mac Gold Pool 3% USD 01/09/2046 2,315,847 2,274,466 0.95 Freddie Mac Gold Pool 3.5% USD 01/03/2048 1,307,788 1,313,195 0.55 Freddie Mac Structured Agency Credit Risk Debt Notes FRN USD 25/09/2024 1,848,835 1,885,845 0.79 Galton Funding Mortgage Trust 2017-1 144A FRN USD 25/11/2057 1,046,981 1,048,458 0.44 Goldman Sachs Group Inc/The 3.125% GBP 25/07/2029 650,000 869,421 0.36 Invitation Homes 2018-SFR1 Trust 144A FRN USD 17/03/2037 2,450,000 2,425,392 1.01 Morgan Stanley Capital I Trust 2017-CLS 144A FRN USD 15/11/2034 2,600,000 2,564,969 1.07 Office Properties Income Trust 4.25% USD 15/05/2024 1,090,000 1,027,462 0.43 Plains All American Pipeline LP FRN USD Perpetual 924,000 857,010 0.36 Rabobank Capital Funding Trust IV FRN GBP Perpetual 898,000 1,230,089 0.51 Sabine Pass Liquefaction LLC 4.2% USD 15/03/2028 808,000 797,016 0.33 Sprint Spectrum Co LLC / Sprint Spectrum Co II LLC / Sprint Spectrum Co III LLC 4.738% USD 20/03/2025 638,000 640,393 0.27 Tesla Auto Lease Trust 2018-A 144A 2.32% USD 20/12/2019 1,151,895 1,149,897 0.48 T-Mobile USA Inc 6.375% USD 01/03/2025 850,000 886,125 0.37 UGI International LLC 3.25% EUR 01/11/2025 600,000 709,413 0.30 United Airlines 2016-1 Class B Pass Through Trust 3.65% USD 07/01/2026 943,611 911,042 0.38 United Airlines 2016-2 Class B Pass Through Trust 3.65% USD 07/10/2025 1,191,400 1,152,312 0.48 United States Treasury Inflation Indexed Bonds 1% USD 15/02/2048 4,750,000 4,720,197 1.97 United States Treasury Note/Bond 2.75% USD 15/11/2047 944,500 887,904 0.37 United States Treasury Note/Bond 2.875% USD 15/05/2028 9,601,800 9,767,581 4.07 VEREIT Operating Partnership LP 3.95% USD 15/08/2027 1,500,000 1,439,839 0.60 Verus Securitization Trust 2018-1 144A FRN USD 25/02/2048 1,990,223 1,984,338 0.83 VMware Inc 3.9% USD 21/08/2027 874,000 817,031 0.34 Wells Fargo & Co FRN USD Perpetual 1,400,000 1,487,808 0.62 WFRBS Commercial Mortgage Trust 2013-C17 FRN USD 15/12/2046 1,200,000 1,196,838 0.50
62,103,069 25.91 TOTAL BONDS 247,632,974 103.28 TOTAL TRANSFERABLE SECURITIES ADMITTED TO AN OFFICIAL STOCK EXCHANGE LISTING OR DEALT IN ON ANOTHER REGULATED MARKET 247,632,974 103.28 OPEN-ENDED FUNDS IRELAND Invesco Short-Term Investments Co Global Series Plc - US Dollar Liquidity Portfolio 544,318 544,318 0.23 LUXEMBOURG Invesco Funds SICAV - Invesco Active Multi-Sector Credit Fund 1,028,032 4,082,059 1.70 TOTAL OPEN-ENDED FUNDS 4,626,377 1.93 Total Investments 252,259,351 105.21
The accompanying notes form an integral part of these financial statements. ^Effective 5 October 2018 the Invesco Bond Fund, a sub-fund of Invesco Funds Series 2 merged into the Invesco Bond Fund, a sub-fund of Invesco Funds.
146 Invesco Funds
Invesco Bond Fund^ Statement of Investments as at 28 February 2019
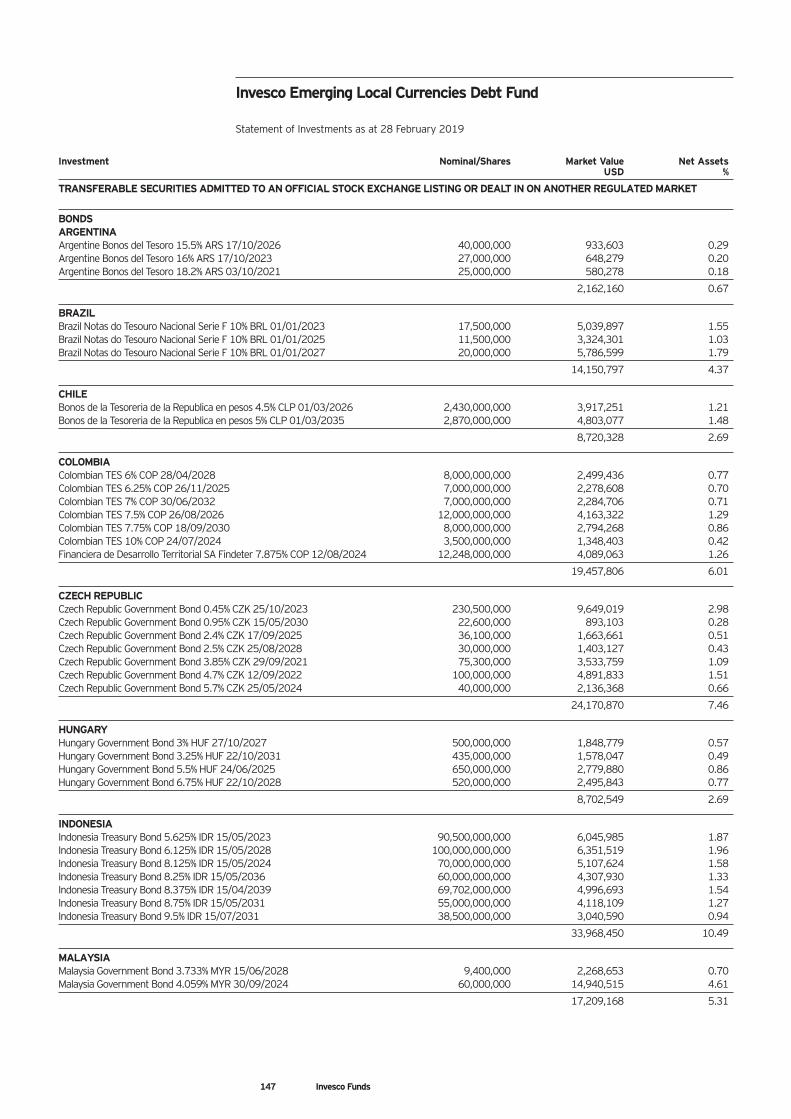
Invesco Emerging Local Currencies Debt Fund Statement of Investments as at 28 February 2019
Investment Nominal/Shares Market Value Net Assets USD %
TRANSFERABLE SECURITIES ADMITTED TO AN OFFICIAL STOCK EXCHANGE LISTING OR DEALT IN ON ANOTHER REGULATED MARKET
BONDS ARGENTINA Argentine Bonos del Tesoro 15.5% ARS 17/10/2026 40,000,000 933,603 0.29 Argentine Bonos del Tesoro 16% ARS 17/10/2023 27,000,000 648,279 0.20 Argentine Bonos del Tesoro 18.2% ARS 03/10/2021 25,000,000 580,278 0.18
2,162,160 0.67
BRAZIL Brazil Notas do Tesouro Nacional Serie F 10% BRL 01/01/2023 17,500,000 5,039,897 1.55 Brazil Notas do Tesouro Nacional Serie F 10% BRL 01/01/2025 11,500,000 3,324,301 1.03 Brazil Notas do Tesouro Nacional Serie F 10% BRL 01/01/2027 20,000,000 5,786,599 1.79
14,150,797 4.37
CHILE Bonos de la Tesoreria de la Republica en pesos 4.5% CLP 01/03/2026 2,430,000,000 3,917,251 1.21 Bonos de la Tesoreria de la Republica en pesos 5% CLP 01/03/2035 2,870,000,000 4,803,077 1.48
8,720,328 2.69
COLOMBIA Colombian TES 6% COP 28/04/2028 8,000,000,000 2,499,436 0.77 Colombian TES 6.25% COP 26/11/2025 7,000,000,000 2,278,608 0.70 Colombian TES 7% COP 30/06/2032 7,000,000,000 2,284,706 0.71 Colombian TES 7.5% COP 26/08/2026 12,000,000,000 4,163,322 1.29 Colombian TES 7.75% COP 18/09/2030 8,000,000,000 2,794,268 0.86 Colombian TES 10% COP 24/07/2024 3,500,000,000 1,348,403 0.42 Financiera de Desarrollo Territorial SA Findeter 7.875% COP 12/08/2024 12,248,000,000 4,089,063 1.26
19,457,806 6.01
CZECH REPUBLIC Czech Republic Government Bond 0.45% CZK 25/10/2023 230,500,000 9,649,019 2.98 Czech Republic Government Bond 0.95% CZK 15/05/2030 22,600,000 893,103 0.28 Czech Republic Government Bond 2.4% CZK 17/09/2025 36,100,000 1,663,661 0.51 Czech Republic Government Bond 2.5% CZK 25/08/2028 30,000,000 1,403,127 0.43 Czech Republic Government Bond 3.85% CZK 29/09/2021 75,300,000 3,533,759 1.09 Czech Republic Government Bond 4.7% CZK 12/09/2022 100,000,000 4,891,833 1.51 Czech Republic Government Bond 5.7% CZK 25/05/2024 40,000,000 2,136,368 0.66
24,170,870 7.46
HUNGARY Hungary Government Bond 3% HUF 27/10/2027 500,000,000 1,848,779 0.57 Hungary Government Bond 3.25% HUF 22/10/2031 435,000,000 1,578,047 0.49 Hungary Government Bond 5.5% HUF 24/06/2025 650,000,000 2,779,880 0.86 Hungary Government Bond 6.75% HUF 22/10/2028 520,000,000 2,495,843 0.77
8,702,549 2.69
INDONESIA Indonesia Treasury Bond 5.625% IDR 15/05/2023 90,500,000,000 6,045,985 1.87 Indonesia Treasury Bond 6.125% IDR 15/05/2028 100,000,000,000 6,351,519 1.96 Indonesia Treasury Bond 8.125% IDR 15/05/2024 70,000,000,000 5,107,624 1.58 Indonesia Treasury Bond 8.25% IDR 15/05/2036 60,000,000,000 4,307,930 1.33 Indonesia Treasury Bond 8.375% IDR 15/04/2039 69,702,000,000 4,996,693 1.54 Indonesia Treasury Bond 8.75% IDR 15/05/2031 55,000,000,000 4,118,109 1.27 Indonesia Treasury Bond 9.5% IDR 15/07/2031 38,500,000,000 3,040,590 0.94
33,968,450 10.49
MALAYSIA Malaysia Government Bond 3.733% MYR 15/06/2028 9,400,000 2,268,653 0.70 Malaysia Government Bond 4.059% MYR 30/09/2024 60,000,000 14,940,515 4.61
17,209,168 5.31
147 Invesco Funds
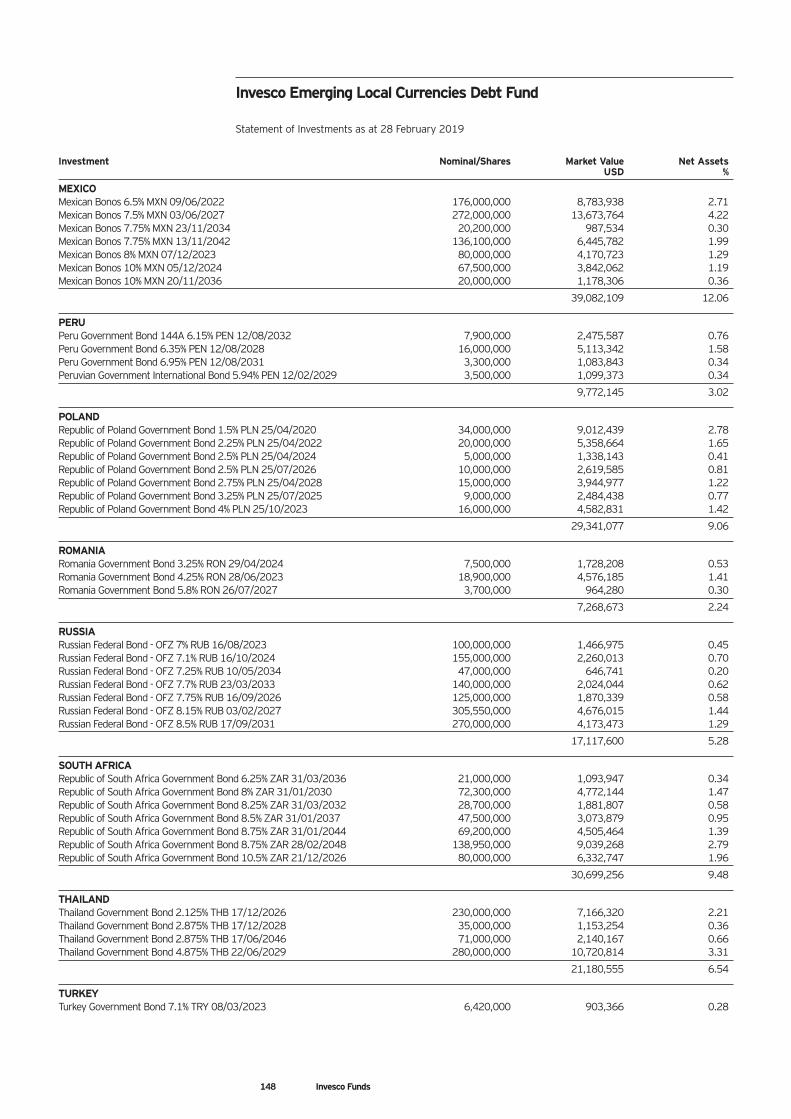
Invesco Emerging Local Currencies Debt Fund Statement of Investments as at 28 February 2019
Investment Nominal/Shares Market Value Net Assets USD %
MEXICO Mexican Bonos 6.5% MXN 09/06/2022 176,000,000 8,783,938 2.71 Mexican Bonos 7.5% MXN 03/06/2027 272,000,000 13,673,764 4.22 Mexican Bonos 7.75% MXN 23/11/2034 20,200,000 987,534 0.30 Mexican Bonos 7.75% MXN 13/11/2042 136,100,000 6,445,782 1.99 Mexican Bonos 8% MXN 07/12/2023 80,000,000 4,170,723 1.29 Mexican Bonos 10% MXN 05/12/2024 67,500,000 3,842,062 1.19 Mexican Bonos 10% MXN 20/11/2036 20,000,000 1,178,306 0.36
39,082,109 12.06
PERU Peru Government Bond 144A 6.15% PEN 12/08/2032 7,900,000 2,475,587 0.76 Peru Government Bond 6.35% PEN 12/08/2028 16,000,000 5,113,342 1.58 Peru Government Bond 6.95% PEN 12/08/2031 3,300,000 1,083,843 0.34 Peruvian Government International Bond 5.94% PEN 12/02/2029 3,500,000 1,099,373 0.34
9,772,145 3.02
POLAND Republic of Poland Government Bond 1.5% PLN 25/04/2020 34,000,000 9,012,439 2.78 Republic of Poland Government Bond 2.25% PLN 25/04/2022 20,000,000 5,358,664 1.65 Republic of Poland Government Bond 2.5% PLN 25/04/2024 5,000,000 1,338,143 0.41 Republic of Poland Government Bond 2.5% PLN 25/07/2026 10,000,000 2,619,585 0.81 Republic of Poland Government Bond 2.75% PLN 25/04/2028 15,000,000 3,944,977 1.22 Republic of Poland Government Bond 3.25% PLN 25/07/2025 9,000,000 2,484,438 0.77 Republic of Poland Government Bond 4% PLN 25/10/2023 16,000,000 4,582,831 1.42
29,341,077 9.06
ROMANIA Romania Government Bond 3.25% RON 29/04/2024 7,500,000 1,728,208 0.53 Romania Government Bond 4.25% RON 28/06/2023 18,900,000 4,576,185 1.41 Romania Government Bond 5.8% RON 26/07/2027 3,700,000 964,280 0.30
7,268,673 2.24
RUSSIA Russian Federal Bond - OFZ 7% RUB 16/08/2023 100,000,000 1,466,975 0.45 Russian Federal Bond - OFZ 7.1% RUB 16/10/2024 155,000,000 2,260,013 0.70 Russian Federal Bond - OFZ 7.25% RUB 10/05/2034 47,000,000 646,741 0.20 Russian Federal Bond - OFZ 7.7% RUB 23/03/2033 140,000,000 2,024,044 0.62 Russian Federal Bond - OFZ 7.75% RUB 16/09/2026 125,000,000 1,870,339 0.58 Russian Federal Bond - OFZ 8.15% RUB 03/02/2027 305,550,000 4,676,015 1.44 Russian Federal Bond - OFZ 8.5% RUB 17/09/2031 270,000,000 4,173,473 1.29
17,117,600 5.28
SOUTH AFRICA Republic of South Africa Government Bond 6.25% ZAR 31/03/2036 21,000,000 1,093,947 0.34 Republic of South Africa Government Bond 8% ZAR 31/01/2030 72,300,000 4,772,144 1.47 Republic of South Africa Government Bond 8.25% ZAR 31/03/2032 28,700,000 1,881,807 0.58 Republic of South Africa Government Bond 8.5% ZAR 31/01/2037 47,500,000 3,073,879 0.95 Republic of South Africa Government Bond 8.75% ZAR 31/01/2044 69,200,000 4,505,464 1.39 Republic of South Africa Government Bond 8.75% ZAR 28/02/2048 138,950,000 9,039,268 2.79 Republic of South Africa Government Bond 10.5% ZAR 21/12/2026 80,000,000 6,332,747 1.96
30,699,256 9.48
THAILAND Thailand Government Bond 2.125% THB 17/12/2026 230,000,000 7,166,320 2.21 Thailand Government Bond 2.875% THB 17/12/2028 35,000,000 1,153,254 0.36 Thailand Government Bond 2.875% THB 17/06/2046 71,000,000 2,140,167 0.66 Thailand Government Bond 4.875% THB 22/06/2029 280,000,000 10,720,814 3.31
21,180,555 6.54
TURKEY Turkey Government Bond 7.1% TRY 08/03/2023 6,420,000 903,366 0.28
148 Invesco Funds
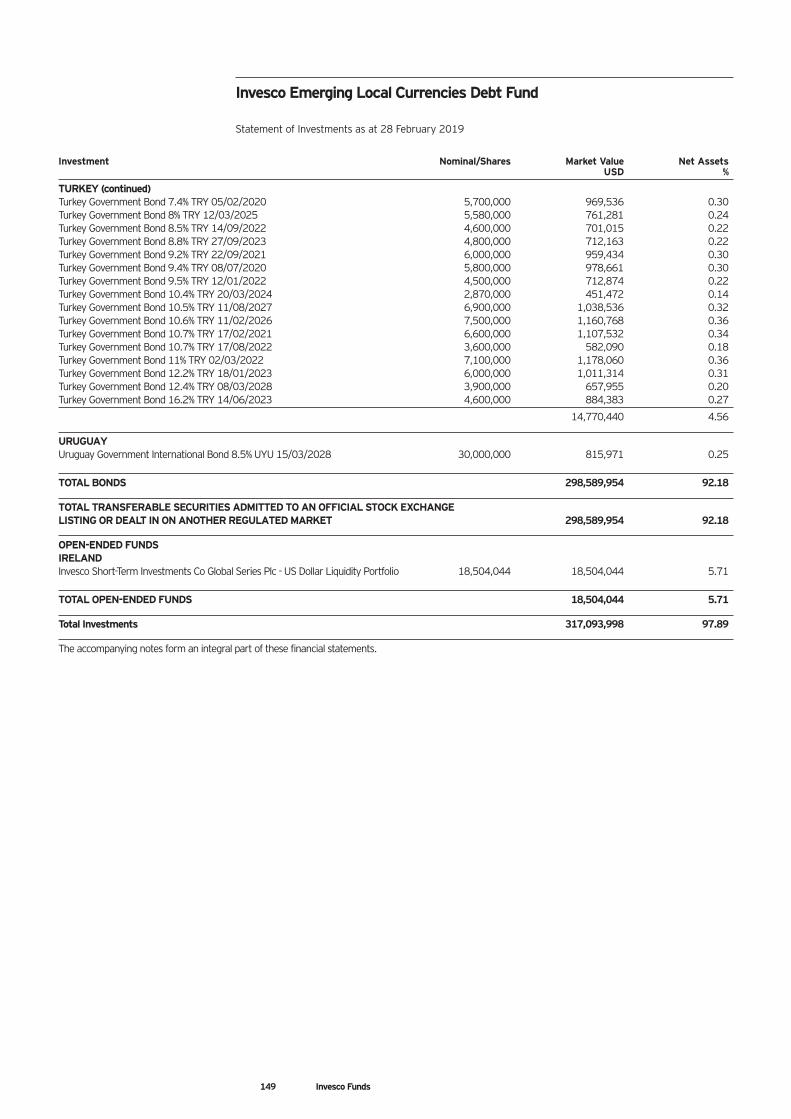
Invesco Emerging Local Currencies Debt Fund Statement of Investments as at 28 February 2019
Investment Nominal/Shares Market Value Net Assets USD %
TURKEY (continued) Turkey Government Bond 7.4% TRY 05/02/2020 5,700,000 969,536 0.30 Turkey Government Bond 8% TRY 12/03/2025 5,580,000 761,281 0.24 Turkey Government Bond 8.5% TRY 14/09/2022 4,600,000 701,015 0.22 Turkey Government Bond 8.8% TRY 27/09/2023 4,800,000 712,163 0.22 Turkey Government Bond 9.2% TRY 22/09/2021 6,000,000 959,434 0.30 Turkey Government Bond 9.4% TRY 08/07/2020 5,800,000 978,661 0.30 Turkey Government Bond 9.5% TRY 12/01/2022 4,500,000 712,874 0.22 Turkey Government Bond 10.4% TRY 20/03/2024 2,870,000 451,472 0.14 Turkey Government Bond 10.5% TRY 11/08/2027 6,900,000 1,038,536 0.32 Turkey Government Bond 10.6% TRY 11/02/2026 7,500,000 1,160,768 0.36 Turkey Government Bond 10.7% TRY 17/02/2021 6,600,000 1,107,532 0.34 Turkey Government Bond 10.7% TRY 17/08/2022 3,600,000 582,090 0.18 Turkey Government Bond 11% TRY 02/03/2022 7,100,000 1,178,060 0.36 Turkey Government Bond 12.2% TRY 18/01/2023 6,000,000 1,011,314 0.31 Turkey Government Bond 12.4% TRY 08/03/2028 3,900,000 657,955 0.20 Turkey Government Bond 16.2% TRY 14/06/2023 4,600,000 884,383 0.27
14,770,440 4.56
URUGUAY Uruguay Government International Bond 8.5% UYU 15/03/2028 30,000,000 815,971 0.25
TOTAL BONDS 298,589,954 92.18
TOTAL TRANSFERABLE SECURITIES ADMITTED TO AN OFFICIAL STOCK EXCHANGE LISTING OR DEALT IN ON ANOTHER REGULATED MARKET 298,589,954 92.18
OPEN-ENDED FUNDS IRELAND Invesco Short-Term Investments Co Global Series Plc - US Dollar Liquidity Portfolio 18,504,044 18,504,044 5.71
TOTAL OPEN-ENDED FUNDS 18,504,044 5.71
Total Investments 317,093,998 97.89
The accompanying notes form an integral part of these financial statements.
149 Invesco Funds
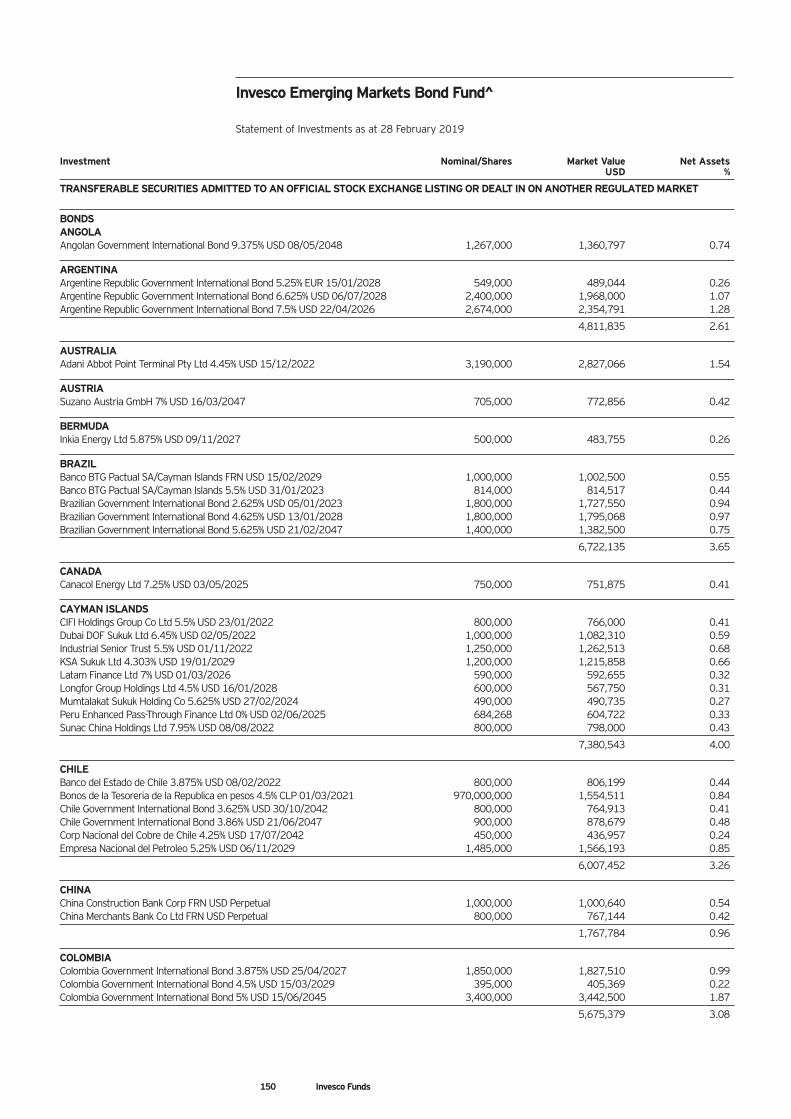
Investment Nominal/Shares Market Value Net Assets USD %
TRANSFERABLE SECURITIES ADMITTED TO AN OFFICIAL STOCK EXCHANGE LISTING OR DEALT IN ON ANOTHER REGULATED MARKET
BONDS ANGOLA Angolan Government International Bond 9.375% USD 08/05/2048 1,267,000 1,360,797 0.74
ARGENTINA Argentine Republic Government International Bond 5.25% EUR 15/01/2028 549,000 489,044 0.26 Argentine Republic Government International Bond 6.625% USD 06/07/2028 2,400,000 1,968,000 1.07 Argentine Republic Government International Bond 7.5% USD 22/04/2026 2,674,000 2,354,791 1.28
4,811,835 2.61
AUSTRALIA Adani Abbot Point Terminal Pty Ltd 4.45% USD 15/12/2022 3,190,000 2,827,066 1.54
AUSTRIA Suzano Austria GmbH 7% USD 16/03/2047 705,000 772,856 0.42
BERMUDA Inkia Energy Ltd 5.875% USD 09/11/2027 500,000 483,755 0.26
BRAZIL Banco BTG Pactual SA/Cayman Islands FRN USD 15/02/2029 1,000,000 1,002,500 0.55 Banco BTG Pactual SA/Cayman Islands 5.5% USD 31/01/2023 814,000 814,517 0.44 Brazilian Government International Bond 2.625% USD 05/01/2023 1,800,000 1,727,550 0.94 Brazilian Government International Bond 4.625% USD 13/01/2028 1,800,000 1,795,068 0.97 Brazilian Government International Bond 5.625% USD 21/02/2047 1,400,000 1,382,500 0.75
6,722,135 3.65
CANADA Canacol Energy Ltd 7.25% USD 03/05/2025 750,000 751,875 0.41
CAYMAN ISLANDS CIFI Holdings Group Co Ltd 5.5% USD 23/01/2022 800,000 766,000 0.41 Dubai DOF Sukuk Ltd 6.45% USD 02/05/2022 1,000,000 1,082,310 0.59 Industrial Senior Trust 5.5% USD 01/11/2022 1,250,000 1,262,513 0.68 KSA Sukuk Ltd 4.303% USD 19/01/2029 1,200,000 1,215,858 0.66 Latam Finance Ltd 7% USD 01/03/2026 590,000 592,655 0.32 Longfor Group Holdings Ltd 4.5% USD 16/01/2028 600,000 567,750 0.31 Mumtalakat Sukuk Holding Co 5.625% USD 27/02/2024 490,000 490,735 0.27 Peru Enhanced Pass-Through Finance Ltd 0% USD 02/06/2025 684,268 604,722 0.33 Sunac China Holdings Ltd 7.95% USD 08/08/2022 800,000 798,000 0.43
7,380,543 4.00
CHILE Banco del Estado de Chile 3.875% USD 08/02/2022 800,000 806,199 0.44 Bonos de la Tesoreria de la Republica en pesos 4.5% CLP 01/03/2021 970,000,000 1,554,511 0.84 Chile Government International Bond 3.625% USD 30/10/2042 800,000 764,913 0.41 Chile Government International Bond 3.86% USD 21/06/2047 900,000 878,679 0.48 Corp Nacional del Cobre de Chile 4.25% USD 17/07/2042 450,000 436,957 0.24 Empresa Nacional del Petroleo 5.25% USD 06/11/2029 1,485,000 1,566,193 0.85
6,007,452 3.26
CHINA China Construction Bank Corp FRN USD Perpetual 1,000,000 1,000,640 0.54 China Merchants Bank Co Ltd FRN USD Perpetual 800,000 767,144 0.42
1,767,784 0.96
COLOMBIA Colombia Government International Bond 3.875% USD 25/04/2027 1,850,000 1,827,510 0.99 Colombia Government International Bond 4.5% USD 15/03/2029 395,000 405,369 0.22 Colombia Government International Bond 5% USD 15/06/2045 3,400,000 3,442,500 1.87
5,675,379 3.08
Invesco Emerging Markets Bond Fund^ Statement of Investments as at 28 February 2019
150 Invesco Funds
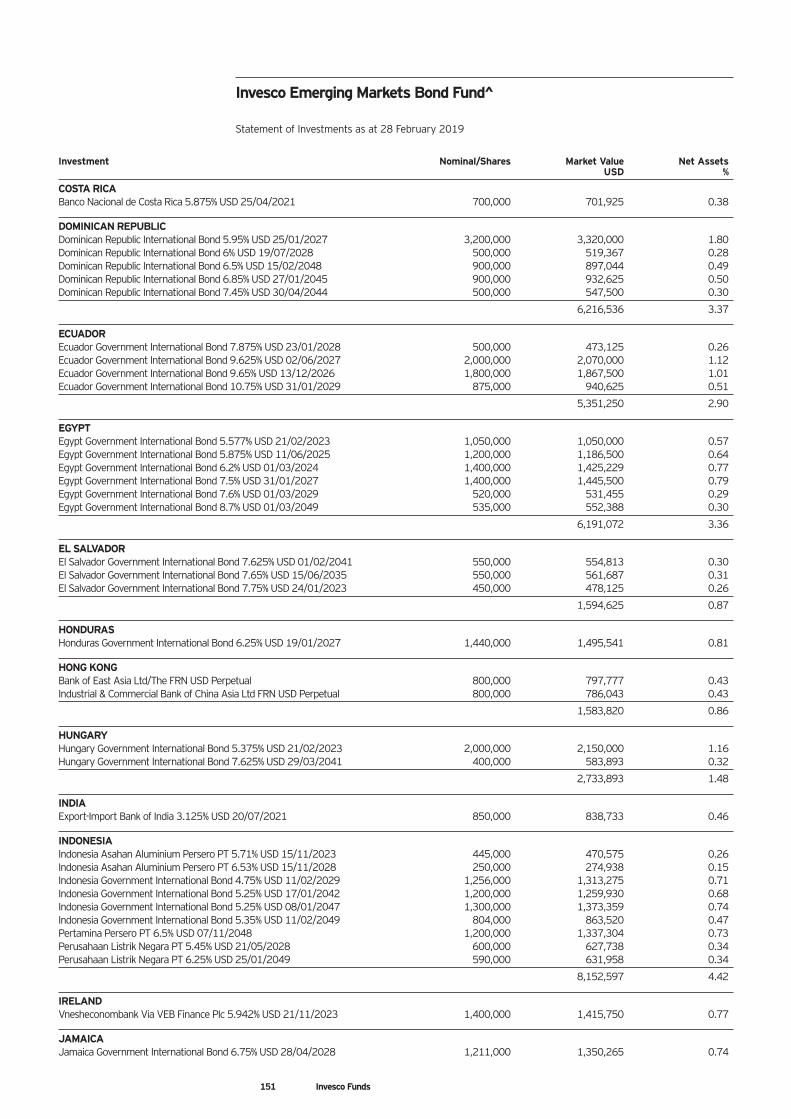
Invesco Emerging Markets Bond Fund^ Statement of Investments as at 28 February 2019
Investment Nominal/Shares Market Value Net Assets USD %
COSTA RICA Banco Nacional de Costa Rica 5.875% USD 25/04/2021 700,000 701,925 0.38
DOMINICAN REPUBLIC Dominican Republic International Bond 5.95% USD 25/01/2027 3,200,000 3,320,000 1.80 Dominican Republic International Bond 6% USD 19/07/2028 500,000 519,367 0.28 Dominican Republic International Bond 6.5% USD 15/02/2048 900,000 897,044 0.49 Dominican Republic International Bond 6.85% USD 27/01/2045 900,000 932,625 0.50 Dominican Republic International Bond 7.45% USD 30/04/2044 500,000 547,500 0.30
6,216,536 3.37
ECUADOR Ecuador Government International Bond 7.875% USD 23/01/2028 500,000 473,125 0.26 Ecuador Government International Bond 9.625% USD 02/06/2027 2,000,000 2,070,000 1.12 Ecuador Government International Bond 9.65% USD 13/12/2026 1,800,000 1,867,500 1.01 Ecuador Government International Bond 10.75% USD 31/01/2029 875,000 940,625 0.51
5,351,250 2.90
EGYPT Egypt Government International Bond 5.577% USD 21/02/2023 1,050,000 1,050,000 0.57 Egypt Government International Bond 5.875% USD 11/06/2025 1,200,000 1,186,500 0.64 Egypt Government International Bond 6.2% USD 01/03/2024 1,400,000 1,425,229 0.77 Egypt Government International Bond 7.5% USD 31/01/2027 1,400,000 1,445,500 0.79 Egypt Government International Bond 7.6% USD 01/03/2029 520,000 531,455 0.29 Egypt Government International Bond 8.7% USD 01/03/2049 535,000 552,388 0.30
6,191,072 3.36
EL SALVADOR El Salvador Government International Bond 7.625% USD 01/02/2041 550,000 554,813 0.30 El Salvador Government International Bond 7.65% USD 15/06/2035 550,000 561,687 0.31 El Salvador Government International Bond 7.75% USD 24/01/2023 450,000 478,125 0.26
1,594,625 0.87
HONDURAS Honduras Government International Bond 6.25% USD 19/01/2027 1,440,000 1,495,541 0.81
HONG KONG Bank of East Asia Ltd/The FRN USD Perpetual 800,000 797,777 0.43 Industrial & Commercial Bank of China Asia Ltd FRN USD Perpetual 800,000 786,043 0.43
1,583,820 0.86
HUNGARY Hungary Government International Bond 5.375% USD 21/02/2023 2,000,000 2,150,000 1.16 Hungary Government International Bond 7.625% USD 29/03/2041 400,000 583,893 0.32
2,733,893 1.48
INDIA Export-Import Bank of India 3.125% USD 20/07/2021 850,000 838,733 0.46
INDONESIA Indonesia Asahan Aluminium Persero PT 5.71% USD 15/11/2023 445,000 470,575 0.26 Indonesia Asahan Aluminium Persero PT 6.53% USD 15/11/2028 250,000 274,938 0.15 Indonesia Government International Bond 4.75% USD 11/02/2029 1,256,000 1,313,275 0.71 Indonesia Government International Bond 5.25% USD 17/01/2042 1,200,000 1,259,930 0.68 Indonesia Government International Bond 5.25% USD 08/01/2047 1,300,000 1,373,359 0.74 Indonesia Government International Bond 5.35% USD 11/02/2049 804,000 863,520 0.47 Pertamina Persero PT 6.5% USD 07/11/2048 1,200,000 1,337,304 0.73 Perusahaan Listrik Negara PT 5.45% USD 21/05/2028 600,000 627,738 0.34 Perusahaan Listrik Negara PT 6.25% USD 25/01/2049 590,000 631,958 0.34
8,152,597 4.42
IRELAND Vnesheconombank Via VEB Finance Plc 5.942% USD 21/11/2023 1,400,000 1,415,750 0.77
JAMAICA Jamaica Government International Bond 6.75% USD 28/04/2028 1,211,000 1,350,265 0.74
151 Invesco Funds
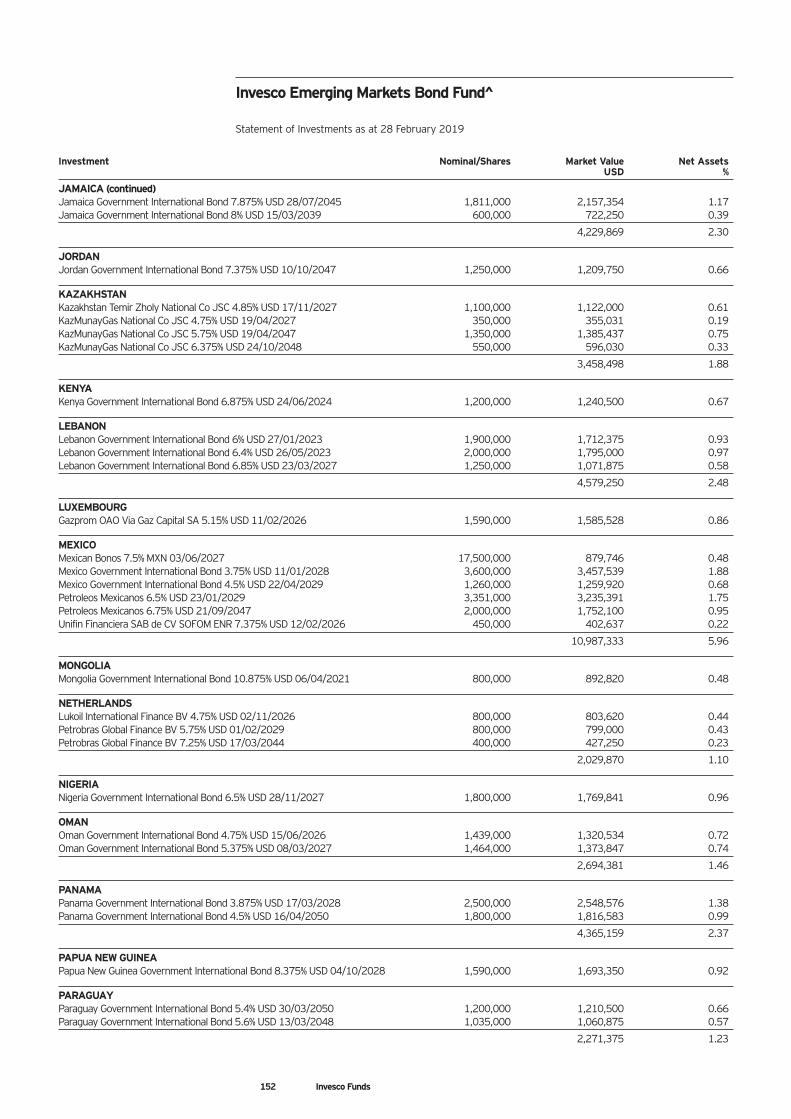
Invesco Emerging Markets Bond Fund^ Statement of Investments as at 28 February 2019
Investment Nominal/Shares Market Value Net Assets USD %
JAMAICA (continued) Jamaica Government International Bond 7.875% USD 28/07/2045 1,811,000 2,157,354 1.17 Jamaica Government International Bond 8% USD 15/03/2039 600,000 722,250 0.39
4,229,869 2.30
JORDAN Jordan Government International Bond 7.375% USD 10/10/2047 1,250,000 1,209,750 0.66
KAZAKHSTAN Kazakhstan Temir Zholy National Co JSC 4.85% USD 17/11/2027 1,100,000 1,122,000 0.61 KazMunayGas National Co JSC 4.75% USD 19/04/2027 350,000 355,031 0.19 KazMunayGas National Co JSC 5.75% USD 19/04/2047 1,350,000 1,385,437 0.75 KazMunayGas National Co JSC 6.375% USD 24/10/2048 550,000 596,030 0.33
3,458,498 1.88
KENYA Kenya Government International Bond 6.875% USD 24/06/2024 1,200,000 1,240,500 0.67
LEBANON Lebanon Government International Bond 6% USD 27/01/2023 1,900,000 1,712,375 0.93 Lebanon Government International Bond 6.4% USD 26/05/2023 2,000,000 1,795,000 0.97 Lebanon Government International Bond 6.85% USD 23/03/2027 1,250,000 1,071,875 0.58
4,579,250 2.48
LUXEMBOURG Gazprom OAO Via Gaz Capital SA 5.15% USD 11/02/2026 1,590,000 1,585,528 0.86
MEXICO Mexican Bonos 7.5% MXN 03/06/2027 17,500,000 879,746 0.48 Mexico Government International Bond 3.75% USD 11/01/2028 3,600,000 3,457,539 1.88 Mexico Government International Bond 4.5% USD 22/04/2029 1,260,000 1,259,920 0.68 Petroleos Mexicanos 6.5% USD 23/01/2029 3,351,000 3,235,391 1.75 Petroleos Mexicanos 6.75% USD 21/09/2047 2,000,000 1,752,100 0.95 Unifin Financiera SAB de CV SOFOM ENR 7.375% USD 12/02/2026 450,000 402,637 0.22
10,987,333 5.96
MONGOLIA Mongolia Government International Bond 10.875% USD 06/04/2021 800,000 892,820 0.48
NETHERLANDS Lukoil International Finance BV 4.75% USD 02/11/2026 800,000 803,620 0.44 Petrobras Global Finance BV 5.75% USD 01/02/2029 800,000 799,000 0.43 Petrobras Global Finance BV 7.25% USD 17/03/2044 400,000 427,250 0.23
2,029,870 1.10
NIGERIA Nigeria Government International Bond 6.5% USD 28/11/2027 1,800,000 1,769,841 0.96
OMAN Oman Government International Bond 4.75% USD 15/06/2026 1,439,000 1,320,534 0.72 Oman Government International Bond 5.375% USD 08/03/2027 1,464,000 1,373,847 0.74
2,694,381 1.46
PANAMA Panama Government International Bond 3.875% USD 17/03/2028 2,500,000 2,548,576 1.38 Panama Government International Bond 4.5% USD 16/04/2050 1,800,000 1,816,583 0.99
4,365,159 2.37
PAPUA NEW GUINEA Papua New Guinea Government International Bond 8.375% USD 04/10/2028 1,590,000 1,693,350 0.92
PARAGUAY Paraguay Government International Bond 5.4% USD 30/03/2050 1,200,000 1,210,500 0.66 Paraguay Government International Bond 5.6% USD 13/03/2048 1,035,000 1,060,875 0.57
2,271,375 1.23
152 Invesco Funds
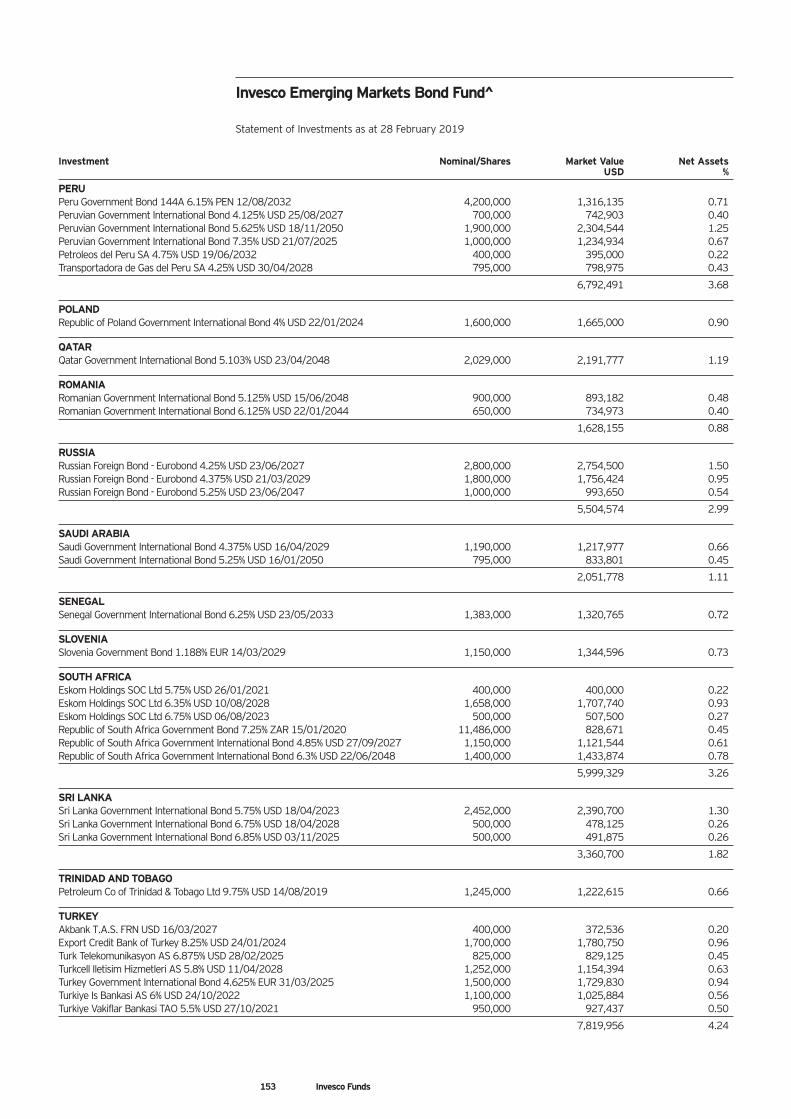
Invesco Emerging Markets Bond Fund^ Statement of Investments as at 28 February 2019
Investment Nominal/Shares Market Value Net Assets USD %
PERU Peru Government Bond 144A 6.15% PEN 12/08/2032 4,200,000 1,316,135 0.71 Peruvian Government International Bond 4.125% USD 25/08/2027 700,000 742,903 0.40 Peruvian Government International Bond 5.625% USD 18/11/2050 1,900,000 2,304,544 1.25 Peruvian Government International Bond 7.35% USD 21/07/2025 1,000,000 1,234,934 0.67 Petroleos del Peru SA 4.75% USD 19/06/2032 400,000 395,000 0.22 Transportadora de Gas del Peru SA 4.25% USD 30/04/2028 795,000 798,975 0.43
6,792,491 3.68
POLAND Republic of Poland Government International Bond 4% USD 22/01/2024 1,600,000 1,665,000 0.90
QATAR Qatar Government International Bond 5.103% USD 23/04/2048 2,029,000 2,191,777 1.19
ROMANIA Romanian Government International Bond 5.125% USD 15/06/2048 900,000 893,182 0.48 Romanian Government International Bond 6.125% USD 22/01/2044 650,000 734,973 0.40
1,628,155 0.88
RUSSIA Russian Foreign Bond - Eurobond 4.25% USD 23/06/2027 2,800,000 2,754,500 1.50 Russian Foreign Bond - Eurobond 4.375% USD 21/03/2029 1,800,000 1,756,424 0.95 Russian Foreign Bond - Eurobond 5.25% USD 23/06/2047 1,000,000 993,650 0.54
5,504,574 2.99
SAUDI ARABIA Saudi Government International Bond 4.375% USD 16/04/2029 1,190,000 1,217,977 0.66 Saudi Government International Bond 5.25% USD 16/01/2050 795,000 833,801 0.45
2,051,778 1.11
SENEGAL Senegal Government International Bond 6.25% USD 23/05/2033 1,383,000 1,320,765 0.72
SLOVENIA Slovenia Government Bond 1.188% EUR 14/03/2029 1,150,000 1,344,596 0.73
SOUTH AFRICA Eskom Holdings SOC Ltd 5.75% USD 26/01/2021 400,000 400,000 0.22 Eskom Holdings SOC Ltd 6.35% USD 10/08/2028 1,658,000 1,707,740 0.93 Eskom Holdings SOC Ltd 6.75% USD 06/08/2023 500,000 507,500 0.27 Republic of South Africa Government Bond 7.25% ZAR 15/01/2020 11,486,000 828,671 0.45 Republic of South Africa Government International Bond 4.85% USD 27/09/2027 1,150,000 1,121,544 0.61 Republic of South Africa Government International Bond 6.3% USD 22/06/2048 1,400,000 1,433,874 0.78
5,999,329 3.26
SRI LANKA Sri Lanka Government International Bond 5.75% USD 18/04/2023 2,452,000 2,390,700 1.30 Sri Lanka Government International Bond 6.75% USD 18/04/2028 500,000 478,125 0.26 Sri Lanka Government International Bond 6.85% USD 03/11/2025 500,000 491,875 0.26
3,360,700 1.82
TRINIDAD AND TOBAGO Petroleum Co of Trinidad & Tobago Ltd 9.75% USD 14/08/2019 1,245,000 1,222,615 0.66
TURKEY Akbank T.A.S. FRN USD 16/03/2027 400,000 372,536 0.20 Export Credit Bank of Turkey 8.25% USD 24/01/2024 1,700,000 1,780,750 0.96 Turk Telekomunikasyon AS 6.875% USD 28/02/2025 825,000 829,125 0.45 Turkcell Iletisim Hizmetleri AS 5.8% USD 11/04/2028 1,252,000 1,154,394 0.63 Turkey Government International Bond 4.625% EUR 31/03/2025 1,500,000 1,729,830 0.94 Turkiye Is Bankasi AS 6% USD 24/10/2022 1,100,000 1,025,884 0.56 Turkiye Vakiflar Bankasi TAO 5.5% USD 27/10/2021 950,000 927,437 0.50
7,819,956 4.24
153 Invesco Funds
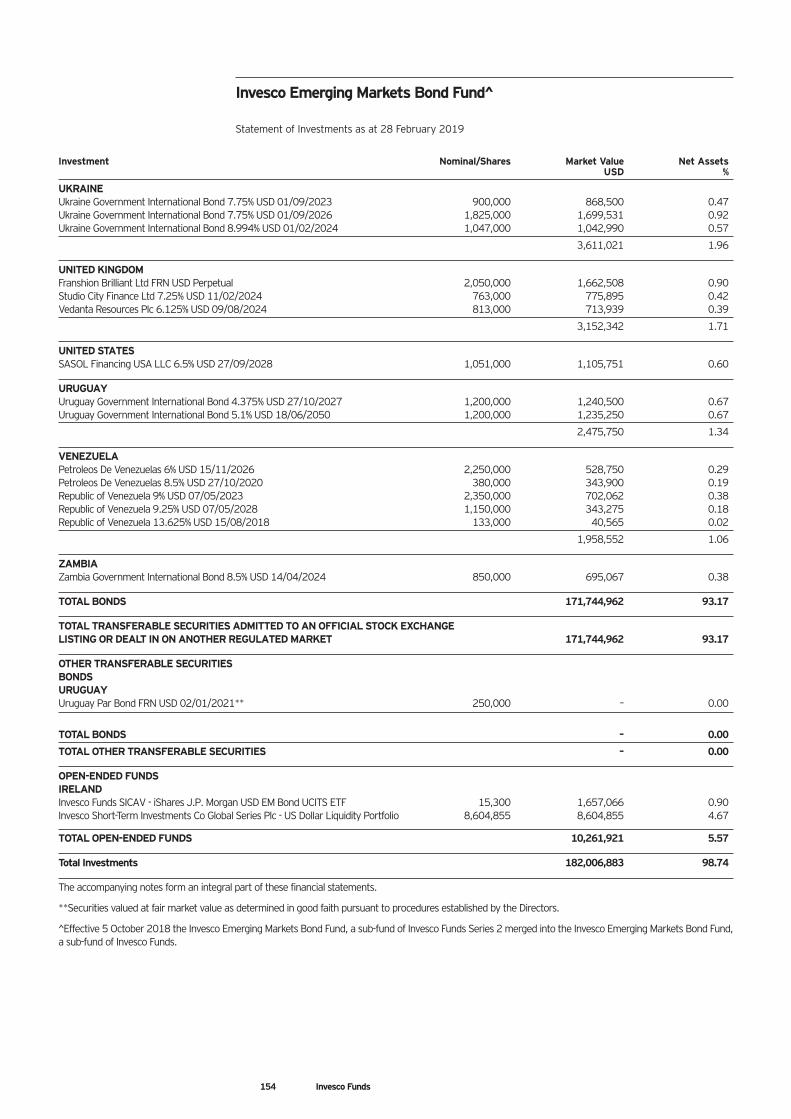
Invesco Emerging Markets Bond Fund^ Statement of Investments as at 28 February 2019
Investment Nominal/Shares Market Value Net Assets USD %
UKRAINE Ukraine Government International Bond 7.75% USD 01/09/2023 900,000 868,500 0.47 Ukraine Government International Bond 7.75% USD 01/09/2026 1,825,000 1,699,531 0.92 Ukraine Government International Bond 8.994% USD 01/02/2024 1,047,000 1,042,990 0.57
3,611,021 1.96
UNITED KINGDOM Franshion Brilliant Ltd FRN USD Perpetual 2,050,000 1,662,508 0.90 Studio City Finance Ltd 7.25% USD 11/02/2024 763,000 775,895 0.42 Vedanta Resources Plc 6.125% USD 09/08/2024 813,000 713,939 0.39
3,152,342 1.71
UNITED STATES SASOL Financing USA LLC 6.5% USD 27/09/2028 1,051,000 1,105,751 0.60
URUGUAY Uruguay Government International Bond 4.375% USD 27/10/2027 1,200,000 1,240,500 0.67 Uruguay Government International Bond 5.1% USD 18/06/2050 1,200,000 1,235,250 0.67
2,475,750 1.34
VENEZUELA Petroleos De Venezuelas 6% USD 15/11/2026 2,250,000 528,750 0.29 Petroleos De Venezuelas 8.5% USD 27/10/2020 380,000 343,900 0.19 Republic of Venezuela 9% USD 07/05/2023 2,350,000 702,062 0.38 Republic of Venezuela 9.25% USD 07/05/2028 1,150,000 343,275 0.18 Republic of Venezuela 13.625% USD 15/08/2018 133,000 40,565 0.02
1,958,552 1.06
ZAMBIA Zambia Government International Bond 8.5% USD 14/04/2024 850,000 695,067 0.38
TOTAL BONDS 171,744,962 93.17
TOTAL TRANSFERABLE SECURITIES ADMITTED TO AN OFFICIAL STOCK EXCHANGE LISTING OR DEALT IN ON ANOTHER REGULATED MARKET 171,744,962 93.17
OTHER TRANSFERABLE SECURITIES BONDS URUGUAY Uruguay Par Bond FRN USD 02/01/2021** 250,000 – 0.00
TOTAL BONDS – 0.00
TOTAL OTHER TRANSFERABLE SECURITIES – 0.00
OPEN-ENDED FUNDS IRELAND Invesco Funds SICAV - iShares J.P. Morgan USD EM Bond UCITS ETF 15,300 1,657,066 0.90 Invesco Short-Term Investments Co Global Series Plc - US Dollar Liquidity Portfolio 8,604,855 8,604,855 4.67
TOTAL OPEN-ENDED FUNDS 10,261,921 5.57
Total Investments 182,006,883 98.74
The accompanying notes form an integral part of these financial statements.
**Securities valued at fair market value as determined in good faith pursuant to procedures established by the Directors.
^Effective 5 October 2018 the Invesco Emerging Markets Bond Fund, a sub-fund of Invesco Funds Series 2 merged into the Invesco Emerging Markets Bond Fund, a sub-fund of Invesco Funds.
154 Invesco Funds
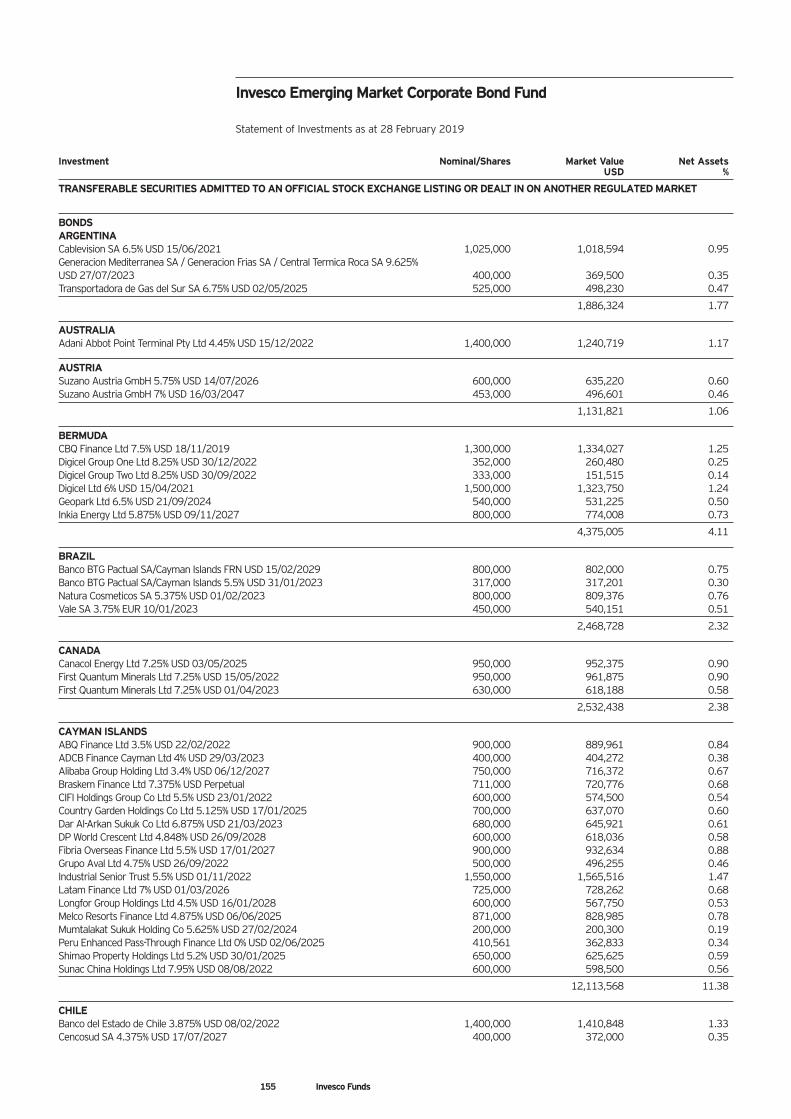
Invesco Emerging Market Corporate Bond Fund Statement of Investments as at 28 February 2019
Investment Nominal/Shares Market Value Net Assets USD %
TRANSFERABLE SECURITIES ADMITTED TO AN OFFICIAL STOCK EXCHANGE LISTING OR DEALT IN ON ANOTHER REGULATED MARKET
BONDS ARGENTINA Cablevision SA 6.5% USD 15/06/2021 1,025,000 1,018,594 0.95 Generacion Mediterranea SA / Generacion Frias SA / Central Termica Roca SA 9.625% USD 27/07/2023 400,000 369,500 0.35 Transportadora de Gas del Sur SA 6.75% USD 02/05/2025 525,000 498,230 0.47
1,886,324 1.77
AUSTRALIA Adani Abbot Point Terminal Pty Ltd 4.45% USD 15/12/2022 1,400,000 1,240,719 1.17
AUSTRIA Suzano Austria GmbH 5.75% USD 14/07/2026 600,000 635,220 0.60 Suzano Austria GmbH 7% USD 16/03/2047 453,000 496,601 0.46
1,131,821 1.06
BERMUDA CBQ Finance Ltd 7.5% USD 18/11/2019 1,300,000 1,334,027 1.25 Digicel Group One Ltd 8.25% USD 30/12/2022 352,000 260,480 0.25 Digicel Group Two Ltd 8.25% USD 30/09/2022 333,000 151,515 0.14 Digicel Ltd 6% USD 15/04/2021 1,500,000 1,323,750 1.24 Geopark Ltd 6.5% USD 21/09/2024 540,000 531,225 0.50 Inkia Energy Ltd 5.875% USD 09/11/2027 800,000 774,008 0.73
4,375,005 4.11
BRAZIL Banco BTG Pactual SA/Cayman Islands FRN USD 15/02/2029 800,000 802,000 0.75 Banco BTG Pactual SA/Cayman Islands 5.5% USD 31/01/2023 317,000 317,201 0.30 Natura Cosmeticos SA 5.375% USD 01/02/2023 800,000 809,376 0.76 Vale SA 3.75% EUR 10/01/2023 450,000 540,151 0.51
2,468,728 2.32
CANADA Canacol Energy Ltd 7.25% USD 03/05/2025 950,000 952,375 0.90 First Quantum Minerals Ltd 7.25% USD 15/05/2022 950,000 961,875 0.90 First Quantum Minerals Ltd 7.25% USD 01/04/2023 630,000 618,188 0.58
2,532,438 2.38
CAYMAN ISLANDS ABQ Finance Ltd 3.5% USD 22/02/2022 900,000 889,961 0.84 ADCB Finance Cayman Ltd 4% USD 29/03/2023 400,000 404,272 0.38 Alibaba Group Holding Ltd 3.4% USD 06/12/2027 750,000 716,372 0.67 Braskem Finance Ltd 7.375% USD Perpetual 711,000 720,776 0.68 CIFI Holdings Group Co Ltd 5.5% USD 23/01/2022 600,000 574,500 0.54 Country Garden Holdings Co Ltd 5.125% USD 17/01/2025 700,000 637,070 0.60 Dar Al-Arkan Sukuk Co Ltd 6.875% USD 21/03/2023 680,000 645,921 0.61 DP World Crescent Ltd 4.848% USD 26/09/2028 600,000 618,036 0.58 Fibria Overseas Finance Ltd 5.5% USD 17/01/2027 900,000 932,634 0.88 Grupo Aval Ltd 4.75% USD 26/09/2022 500,000 496,255 0.46 Industrial Senior Trust 5.5% USD 01/11/2022 1,550,000 1,565,516 1.47 Latam Finance Ltd 7% USD 01/03/2026 725,000 728,262 0.68 Longfor Group Holdings Ltd 4.5% USD 16/01/2028 600,000 567,750 0.53 Melco Resorts Finance Ltd 4.875% USD 06/06/2025 871,000 828,985 0.78 Mumtalakat Sukuk Holding Co 5.625% USD 27/02/2024 200,000 200,300 0.19 Peru Enhanced Pass-Through Finance Ltd 0% USD 02/06/2025 410,561 362,833 0.34 Shimao Property Holdings Ltd 5.2% USD 30/01/2025 650,000 625,625 0.59 Sunac China Holdings Ltd 7.95% USD 08/08/2022 600,000 598,500 0.56
12,113,568 11.38
CHILE Banco del Estado de Chile 3.875% USD 08/02/2022 1,400,000 1,410,848 1.33 Cencosud SA 4.375% USD 17/07/2027 400,000 372,000 0.35
155 Invesco Funds
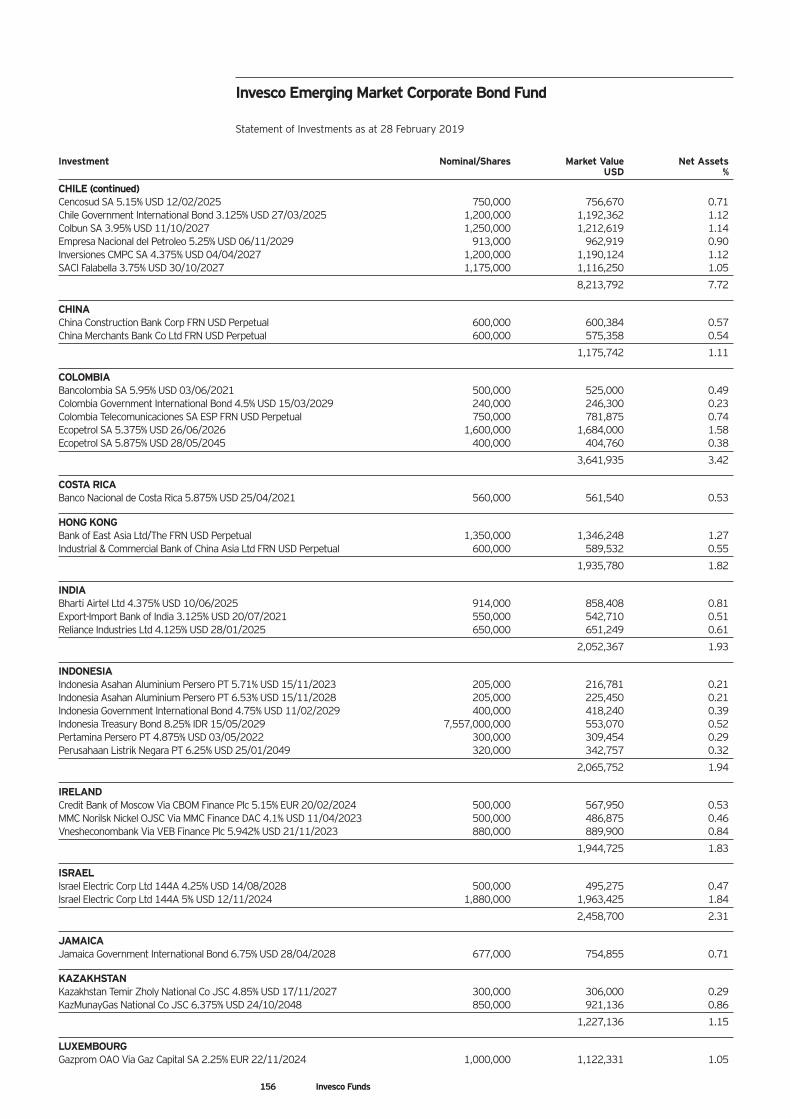
Invesco Emerging Market Corporate Bond Fund Statement of Investments as at 28 February 2019
Investment Nominal/Shares Market Value Net Assets USD %
CHILE (continued) Cencosud SA 5.15% USD 12/02/2025 750,000 756,670 0.71 Chile Government International Bond 3.125% USD 27/03/2025 1,200,000 1,192,362 1.12 Colbun SA 3.95% USD 11/10/2027 1,250,000 1,212,619 1.14 Empresa Nacional del Petroleo 5.25% USD 06/11/2029 913,000 962,919 0.90 Inversiones CMPC SA 4.375% USD 04/04/2027 1,200,000 1,190,124 1.12 SACI Falabella 3.75% USD 30/10/2027 1,175,000 1,116,250 1.05
8,213,792 7.72
CHINA China Construction Bank Corp FRN USD Perpetual 600,000 600,384 0.57 China Merchants Bank Co Ltd FRN USD Perpetual 600,000 575,358 0.54
1,175,742 1.11
COLOMBIA Bancolombia SA 5.95% USD 03/06/2021 500,000 525,000 0.49 Colombia Government International Bond 4.5% USD 15/03/2029 240,000 246,300 0.23 Colombia Telecomunicaciones SA ESP FRN USD Perpetual 750,000 781,875 0.74 Ecopetrol SA 5.375% USD 26/06/2026 1,600,000 1,684,000 1.58 Ecopetrol SA 5.875% USD 28/05/2045 400,000 404,760 0.38
3,641,935 3.42
COSTA RICA Banco Nacional de Costa Rica 5.875% USD 25/04/2021 560,000 561,540 0.53
HONG KONG Bank of East Asia Ltd/The FRN USD Perpetual 1,350,000 1,346,248 1.27 Industrial & Commercial Bank of China Asia Ltd FRN USD Perpetual 600,000 589,532 0.55
1,935,780 1.82
INDIA Bharti Airtel Ltd 4.375% USD 10/06/2025 914,000 858,408 0.81 Export-Import Bank of India 3.125% USD 20/07/2021 550,000 542,710 0.51 Reliance Industries Ltd 4.125% USD 28/01/2025 650,000 651,249 0.61
2,052,367 1.93
INDONESIA Indonesia Asahan Aluminium Persero PT 5.71% USD 15/11/2023 205,000 216,781 0.21 Indonesia Asahan Aluminium Persero PT 6.53% USD 15/11/2028 205,000 225,450 0.21 Indonesia Government International Bond 4.75% USD 11/02/2029 400,000 418,240 0.39 Indonesia Treasury Bond 8.25% IDR 15/05/2029 7,557,000,000 553,070 0.52 Pertamina Persero PT 4.875% USD 03/05/2022 300,000 309,454 0.29 Perusahaan Listrik Negara PT 6.25% USD 25/01/2049 320,000 342,757 0.32
2,065,752 1.94
IRELAND Credit Bank of Moscow Via CBOM Finance Plc 5.15% EUR 20/02/2024 500,000 567,950 0.53 MMC Norilsk Nickel OJSC Via MMC Finance DAC 4.1% USD 11/04/2023 500,000 486,875 0.46 Vnesheconombank Via VEB Finance Plc 5.942% USD 21/11/2023 880,000 889,900 0.84
1,944,725 1.83
ISRAEL Israel Electric Corp Ltd 144A 4.25% USD 14/08/2028 500,000 495,275 0.47 Israel Electric Corp Ltd 144A 5% USD 12/11/2024 1,880,000 1,963,425 1.84
2,458,700 2.31
JAMAICA Jamaica Government International Bond 6.75% USD 28/04/2028 677,000 754,855 0.71
KAZAKHSTAN Kazakhstan Temir Zholy National Co JSC 4.85% USD 17/11/2027 300,000 306,000 0.29 KazMunayGas National Co JSC 6.375% USD 24/10/2048 850,000 921,136 0.86
1,227,136 1.15
LUXEMBOURG Gazprom OAO Via Gaz Capital SA 2.25% EUR 22/11/2024 1,000,000 1,122,331 1.05
156 Invesco Funds
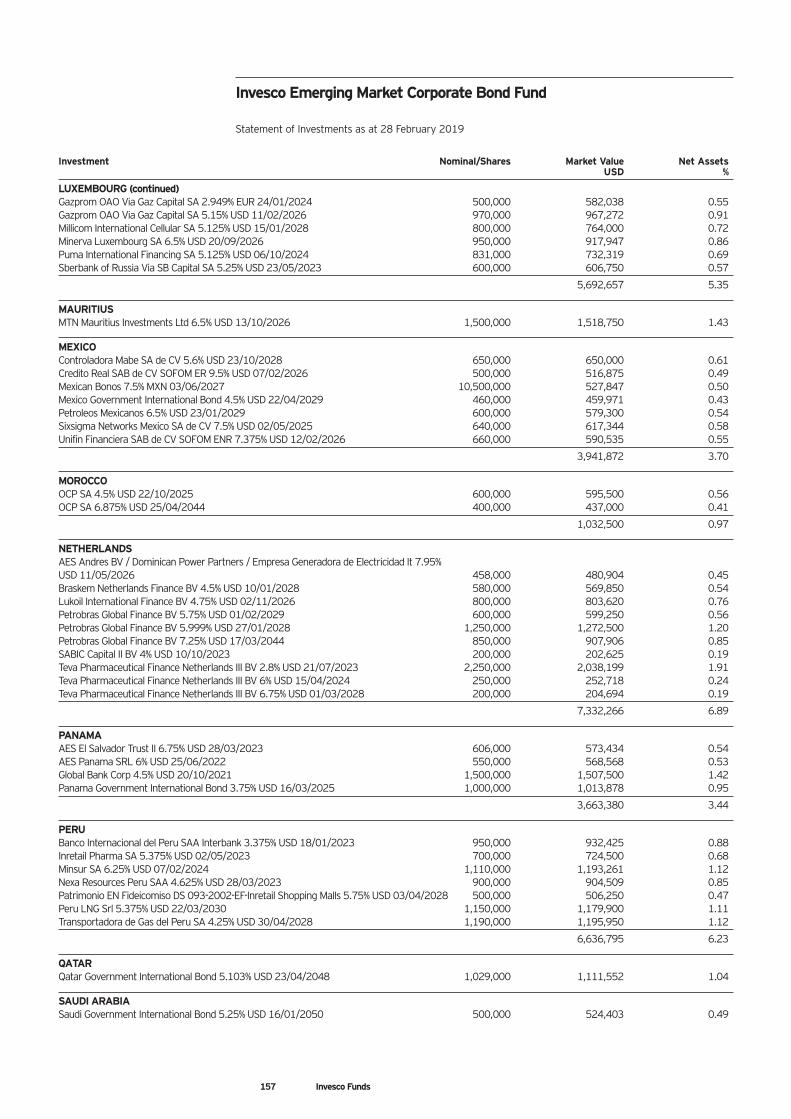
Invesco Emerging Market Corporate Bond Fund Statement of Investments as at 28 February 2019
Investment Nominal/Shares Market Value Net Assets USD %
LUXEMBOURG (continued) Gazprom OAO Via Gaz Capital SA 2.949% EUR 24/01/2024 500,000 582,038 0.55 Gazprom OAO Via Gaz Capital SA 5.15% USD 11/02/2026 970,000 967,272 0.91 Millicom International Cellular SA 5.125% USD 15/01/2028 800,000 764,000 0.72 Minerva Luxembourg SA 6.5% USD 20/09/2026 950,000 917,947 0.86 Puma International Financing SA 5.125% USD 06/10/2024 831,000 732,319 0.69 Sberbank of Russia Via SB Capital SA 5.25% USD 23/05/2023 600,000 606,750 0.57
5,692,657 5.35
MAURITIUS MTN Mauritius Investments Ltd 6.5% USD 13/10/2026 1,500,000 1,518,750 1.43
MEXICO Controladora Mabe SA de CV 5.6% USD 23/10/2028 650,000 650,000 0.61 Credito Real SAB de CV SOFOM ER 9.5% USD 07/02/2026 500,000 516,875 0.49 Mexican Bonos 7.5% MXN 03/06/2027 10,500,000 527,847 0.50 Mexico Government International Bond 4.5% USD 22/04/2029 460,000 459,971 0.43 Petroleos Mexicanos 6.5% USD 23/01/2029 600,000 579,300 0.54 Sixsigma Networks Mexico SA de CV 7.5% USD 02/05/2025 640,000 617,344 0.58 Unifin Financiera SAB de CV SOFOM ENR 7.375% USD 12/02/2026 660,000 590,535 0.55
3,941,872 3.70
MOROCCO OCP SA 4.5% USD 22/10/2025 600,000 595,500 0.56 OCP SA 6.875% USD 25/04/2044 400,000 437,000 0.41
1,032,500 0.97
NETHERLANDS AES Andres BV / Dominican Power Partners / Empresa Generadora de Electricidad It 7.95% USD 11/05/2026 458,000 480,904 0.45 Braskem Netherlands Finance BV 4.5% USD 10/01/2028 580,000 569,850 0.54 Lukoil International Finance BV 4.75% USD 02/11/2026 800,000 803,620 0.76 Petrobras Global Finance BV 5.75% USD 01/02/2029 600,000 599,250 0.56 Petrobras Global Finance BV 5.999% USD 27/01/2028 1,250,000 1,272,500 1.20 Petrobras Global Finance BV 7.25% USD 17/03/2044 850,000 907,906 0.85 SABIC Capital II BV 4% USD 10/10/2023 200,000 202,625 0.19 Teva Pharmaceutical Finance Netherlands III BV 2.8% USD 21/07/2023 2,250,000 2,038,199 1.91 Teva Pharmaceutical Finance Netherlands III BV 6% USD 15/04/2024 250,000 252,718 0.24 Teva Pharmaceutical Finance Netherlands III BV 6.75% USD 01/03/2028 200,000 204,694 0.19
7,332,266 6.89
PANAMA AES El Salvador Trust II 6.75% USD 28/03/2023 606,000 573,434 0.54 AES Panama SRL 6% USD 25/06/2022 550,000 568,568 0.53 Global Bank Corp 4.5% USD 20/10/2021 1,500,000 1,507,500 1.42 Panama Government International Bond 3.75% USD 16/03/2025 1,000,000 1,013,878 0.95
3,663,380 3.44
PERU Banco Internacional del Peru SAA Interbank 3.375% USD 18/01/2023 950,000 932,425 0.88 Inretail Pharma SA 5.375% USD 02/05/2023 700,000 724,500 0.68 Minsur SA 6.25% USD 07/02/2024 1,110,000 1,193,261 1.12 Nexa Resources Peru SAA 4.625% USD 28/03/2023 900,000 904,509 0.85 Patrimonio EN Fideicomiso DS 093-2002-EF-Inretail Shopping Malls 5.75% USD 03/04/2028 500,000 506,250 0.47 Peru LNG Srl 5.375% USD 22/03/2030 1,150,000 1,179,900 1.11 Transportadora de Gas del Peru SA 4.25% USD 30/04/2028 1,190,000 1,195,950 1.12
6,636,795 6.23
QATAR Qatar Government International Bond 5.103% USD 23/04/2048 1,029,000 1,111,552 1.04
SAUDI ARABIA Saudi Government International Bond 5.25% USD 16/01/2050 500,000 524,403 0.49
157 Invesco Funds
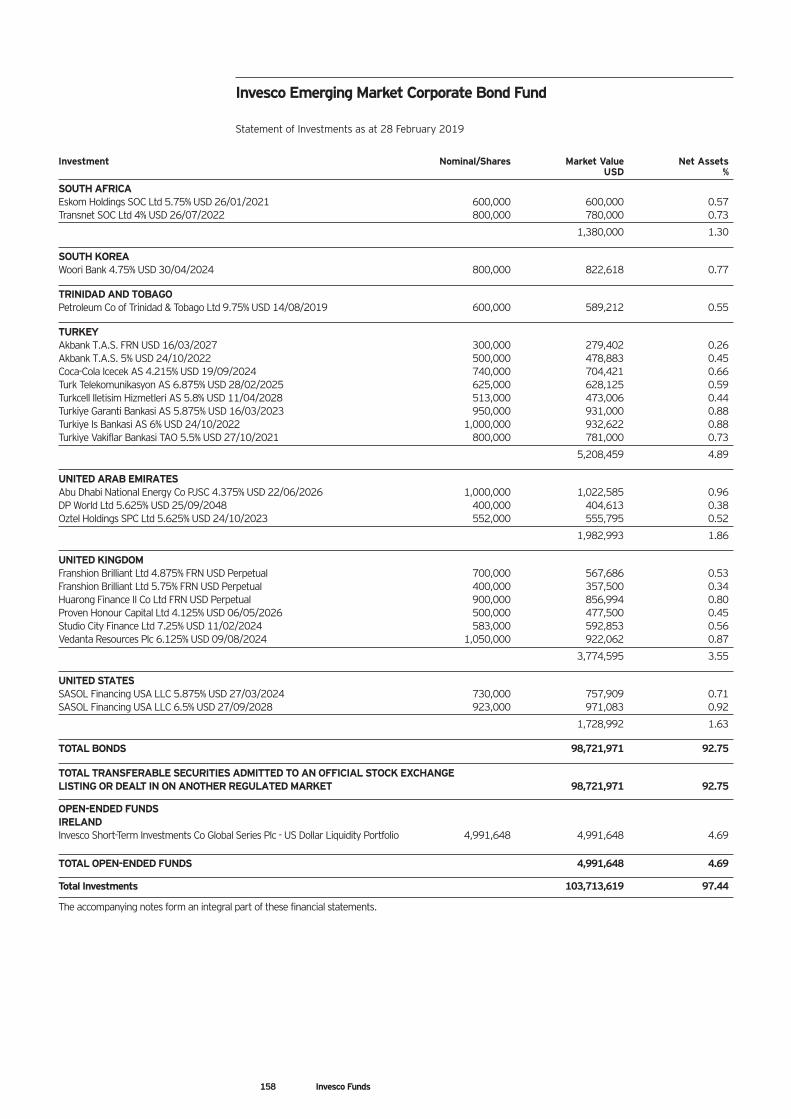
Invesco Emerging Market Corporate Bond Fund Statement of Investments as at 28 February 2019
Investment Nominal/Shares Market Value Net Assets USD %
SOUTH AFRICA Eskom Holdings SOC Ltd 5.75% USD 26/01/2021 600,000 600,000 0.57 Transnet SOC Ltd 4% USD 26/07/2022 800,000 780,000 0.73
1,380,000 1.30
SOUTH KOREA Woori Bank 4.75% USD 30/04/2024 800,000 822,618 0.77
TRINIDAD AND TOBAGO Petroleum Co of Trinidad & Tobago Ltd 9.75% USD 14/08/2019 600,000 589,212 0.55
TURKEY Akbank T.A.S. FRN USD 16/03/2027 300,000 279,402 0.26 Akbank T.A.S. 5% USD 24/10/2022 500,000 478,883 0.45 Coca-Cola Icecek AS 4.215% USD 19/09/2024 740,000 704,421 0.66 Turk Telekomunikasyon AS 6.875% USD 28/02/2025 625,000 628,125 0.59 Turkcell Iletisim Hizmetleri AS 5.8% USD 11/04/2028 513,000 473,006 0.44 Turkiye Garanti Bankasi AS 5.875% USD 16/03/2023 950,000 931,000 0.88 Turkiye Is Bankasi AS 6% USD 24/10/2022 1,000,000 932,622 0.88 Turkiye Vakiflar Bankasi TAO 5.5% USD 27/10/2021 800,000 781,000 0.73
5,208,459 4.89
UNITED ARAB EMIRATES Abu Dhabi National Energy Co PJSC 4.375% USD 22/06/2026 1,000,000 1,022,585 0.96 DP World Ltd 5.625% USD 25/09/2048 400,000 404,613 0.38 Oztel Holdings SPC Ltd 5.625% USD 24/10/2023 552,000 555,795 0.52
1,982,993 1.86
UNITED KINGDOM Franshion Brilliant Ltd 4.875% FRN USD Perpetual 700,000 567,686 0.53 Franshion Brilliant Ltd 5.75% FRN USD Perpetual 400,000 357,500 0.34 Huarong Finance II Co Ltd FRN USD Perpetual 900,000 856,994 0.80 Proven Honour Capital Ltd 4.125% USD 06/05/2026 500,000 477,500 0.45 Studio City Finance Ltd 7.25% USD 11/02/2024 583,000 592,853 0.56 Vedanta Resources Plc 6.125% USD 09/08/2024 1,050,000 922,062 0.87
3,774,595 3.55
UNITED STATES SASOL Financing USA LLC 5.875% USD 27/03/2024 730,000 757,909 0.71 SASOL Financing USA LLC 6.5% USD 27/09/2028 923,000 971,083 0.92
1,728,992 1.63
TOTAL BONDS 98,721,971 92.75
TOTAL TRANSFERABLE SECURITIES ADMITTED TO AN OFFICIAL STOCK EXCHANGE LISTING OR DEALT IN ON ANOTHER REGULATED MARKET 98,721,971 92.75
OPEN-ENDED FUNDS IRELAND Invesco Short-Term Investments Co Global Series Plc - US Dollar Liquidity Portfolio 4,991,648 4,991,648 4.69
TOTAL OPEN-ENDED FUNDS 4,991,648 4.69
Total Investments 103,713,619 97.44
The accompanying notes form an integral part of these financial statements.
158 Invesco Funds
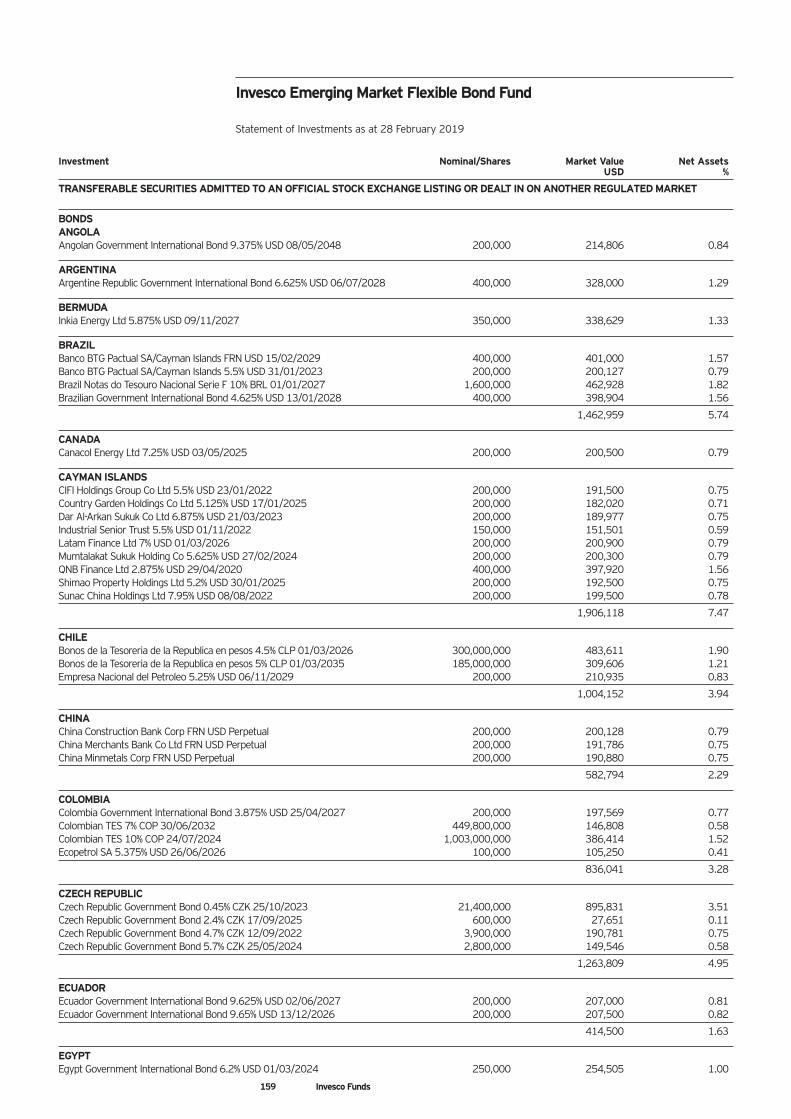
Invesco Emerging Market Flexible Bond Fund Statement of Investments as at 28 February 2019
Investment Nominal/Shares Market Value Net Assets USD %
TRANSFERABLE SECURITIES ADMITTED TO AN OFFICIAL STOCK EXCHANGE LISTING OR DEALT IN ON ANOTHER REGULATED MARKET
BONDS ANGOLA Angolan Government International Bond 9.375% USD 08/05/2048 200,000 214,806 0.84
ARGENTINA Argentine Republic Government International Bond 6.625% USD 06/07/2028 400,000 328,000 1.29
BERMUDA Inkia Energy Ltd 5.875% USD 09/11/2027 350,000 338,629 1.33
BRAZIL Banco BTG Pactual SA/Cayman Islands FRN USD 15/02/2029 400,000 401,000 1.57 Banco BTG Pactual SA/Cayman Islands 5.5% USD 31/01/2023 200,000 200,127 0.79 Brazil Notas do Tesouro Nacional Serie F 10% BRL 01/01/2027 1,600,000 462,928 1.82 Brazilian Government International Bond 4.625% USD 13/01/2028 400,000 398,904 1.56
1,462,959 5.74
CANADA Canacol Energy Ltd 7.25% USD 03/05/2025 200,000 200,500 0.79
CAYMAN ISLANDS CIFI Holdings Group Co Ltd 5.5% USD 23/01/2022 200,000 191,500 0.75 Country Garden Holdings Co Ltd 5.125% USD 17/01/2025 200,000 182,020 0.71 Dar Al-Arkan Sukuk Co Ltd 6.875% USD 21/03/2023 200,000 189,977 0.75 Industrial Senior Trust 5.5% USD 01/11/2022 150,000 151,501 0.59 Latam Finance Ltd 7% USD 01/03/2026 200,000 200,900 0.79 Mumtalakat Sukuk Holding Co 5.625% USD 27/02/2024 200,000 200,300 0.79 QNB Finance Ltd 2.875% USD 29/04/2020 400,000 397,920 1.56 Shimao Property Holdings Ltd 5.2% USD 30/01/2025 200,000 192,500 0.75 Sunac China Holdings Ltd 7.95% USD 08/08/2022 200,000 199,500 0.78
1,906,118 7.47
CHILE Bonos de la Tesoreria de la Republica en pesos 4.5% CLP 01/03/2026 300,000,000 483,611 1.90 Bonos de la Tesoreria de la Republica en pesos 5% CLP 01/03/2035 185,000,000 309,606 1.21 Empresa Nacional del Petroleo 5.25% USD 06/11/2029 200,000 210,935 0.83
1,004,152 3.94
CHINA China Construction Bank Corp FRN USD Perpetual 200,000 200,128 0.79 China Merchants Bank Co Ltd FRN USD Perpetual 200,000 191,786 0.75 China Minmetals Corp FRN USD Perpetual 200,000 190,880 0.75
582,794 2.29
COLOMBIA Colombia Government International Bond 3.875% USD 25/04/2027 200,000 197,569 0.77 Colombian TES 7% COP 30/06/2032 449,800,000 146,808 0.58 Colombian TES 10% COP 24/07/2024 1,003,000,000 386,414 1.52 Ecopetrol SA 5.375% USD 26/06/2026 100,000 105,250 0.41
836,041 3.28
CZECH REPUBLIC Czech Republic Government Bond 0.45% CZK 25/10/2023 21,400,000 895,831 3.51 Czech Republic Government Bond 2.4% CZK 17/09/2025 600,000 27,651 0.11 Czech Republic Government Bond 4.7% CZK 12/09/2022 3,900,000 190,781 0.75 Czech Republic Government Bond 5.7% CZK 25/05/2024 2,800,000 149,546 0.58
1,263,809 4.95
ECUADOR Ecuador Government International Bond 9.625% USD 02/06/2027 200,000 207,000 0.81 Ecuador Government International Bond 9.65% USD 13/12/2026 200,000 207,500 0.82
414,500 1.63
EGYPT Egypt Government International Bond 6.2% USD 01/03/2024 250,000 254,505 1.00
159 Invesco Funds
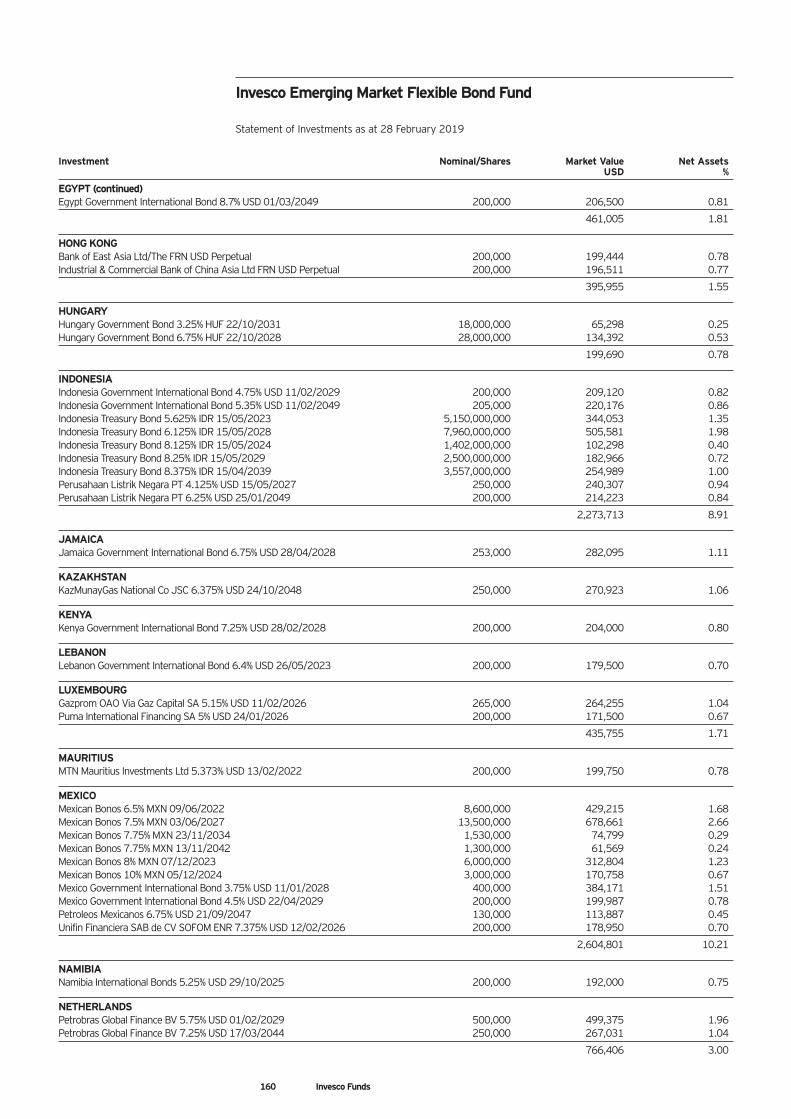
Invesco Emerging Market Flexible Bond Fund Statement of Investments as at 28 February 2019
Investment Nominal/Shares Market Value Net Assets USD %
EGYPT (continued) Egypt Government International Bond 8.7% USD 01/03/2049 200,000 206,500 0.81
461,005 1.81
HONG KONG Bank of East Asia Ltd/The FRN USD Perpetual 200,000 199,444 0.78 Industrial & Commercial Bank of China Asia Ltd FRN USD Perpetual 200,000 196,511 0.77
395,955 1.55
HUNGARY Hungary Government Bond 3.25% HUF 22/10/2031 18,000,000 65,298 0.25 Hungary Government Bond 6.75% HUF 22/10/2028 28,000,000 134,392 0.53
199,690 0.78
INDONESIA Indonesia Government International Bond 4.75% USD 11/02/2029 200,000 209,120 0.82 Indonesia Government International Bond 5.35% USD 11/02/2049 205,000 220,176 0.86 Indonesia Treasury Bond 5.625% IDR 15/05/2023 5,150,000,000 344,053 1.35 Indonesia Treasury Bond 6.125% IDR 15/05/2028 7,960,000,000 505,581 1.98 Indonesia Treasury Bond 8.125% IDR 15/05/2024 1,402,000,000 102,298 0.40 Indonesia Treasury Bond 8.25% IDR 15/05/2029 2,500,000,000 182,966 0.72 Indonesia Treasury Bond 8.375% IDR 15/04/2039 3,557,000,000 254,989 1.00 Perusahaan Listrik Negara PT 4.125% USD 15/05/2027 250,000 240,307 0.94 Perusahaan Listrik Negara PT 6.25% USD 25/01/2049 200,000 214,223 0.84
2,273,713 8.91
JAMAICA Jamaica Government International Bond 6.75% USD 28/04/2028 253,000 282,095 1.11
KAZAKHSTAN KazMunayGas National Co JSC 6.375% USD 24/10/2048 250,000 270,923 1.06
KENYA Kenya Government International Bond 7.25% USD 28/02/2028 200,000 204,000 0.80
LEBANON Lebanon Government International Bond 6.4% USD 26/05/2023 200,000 179,500 0.70
LUXEMBOURG Gazprom OAO Via Gaz Capital SA 5.15% USD 11/02/2026 265,000 264,255 1.04 Puma International Financing SA 5% USD 24/01/2026 200,000 171,500 0.67
435,755 1.71
MAURITIUS MTN Mauritius Investments Ltd 5.373% USD 13/02/2022 200,000 199,750 0.78
MEXICO Mexican Bonos 6.5% MXN 09/06/2022 8,600,000 429,215 1.68 Mexican Bonos 7.5% MXN 03/06/2027 13,500,000 678,661 2.66 Mexican Bonos 7.75% MXN 23/11/2034 1,530,000 74,799 0.29 Mexican Bonos 7.75% MXN 13/11/2042 1,300,000 61,569 0.24 Mexican Bonos 8% MXN 07/12/2023 6,000,000 312,804 1.23 Mexican Bonos 10% MXN 05/12/2024 3,000,000 170,758 0.67 Mexico Government International Bond 3.75% USD 11/01/2028 400,000 384,171 1.51 Mexico Government International Bond 4.5% USD 22/04/2029 200,000 199,987 0.78 Petroleos Mexicanos 6.75% USD 21/09/2047 130,000 113,887 0.45 Unifin Financiera SAB de CV SOFOM ENR 7.375% USD 12/02/2026 200,000 178,950 0.70
2,604,801 10.21
NAMIBIA Namibia International Bonds 5.25% USD 29/10/2025 200,000 192,000 0.75
NETHERLANDS Petrobras Global Finance BV 5.75% USD 01/02/2029 500,000 499,375 1.96 Petrobras Global Finance BV 7.25% USD 17/03/2044 250,000 267,031 1.04
766,406 3.00
160 Invesco Funds
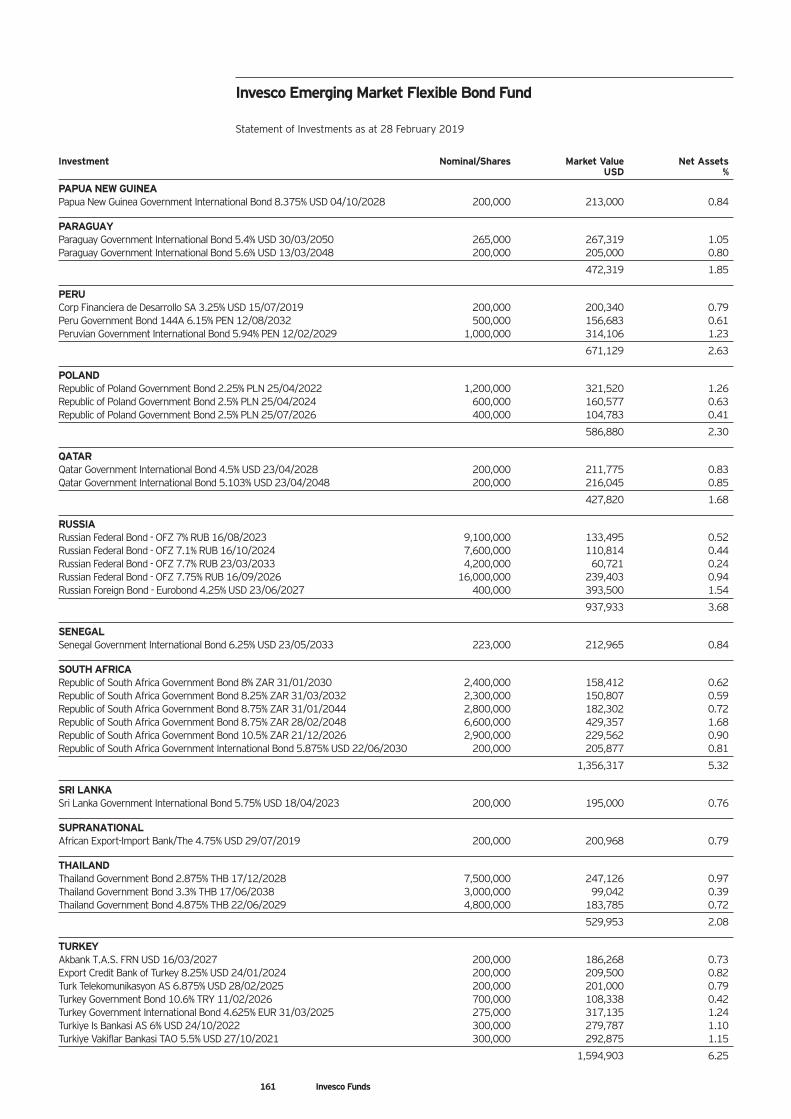
Invesco Emerging Market Flexible Bond Fund Statement of Investments as at 28 February 2019
161 Invesco Funds
Investment Nominal/Shares Market Value Net Assets USD %
PAPUA NEW GUINEA Papua New Guinea Government International Bond 8.375% USD 04/10/2028 200,000 213,000 0.84
PARAGUAY Paraguay Government International Bond 5.4% USD 30/03/2050 265,000 267,319 1.05 Paraguay Government International Bond 5.6% USD 13/03/2048 200,000 205,000 0.80
472,319 1.85
PERU Corp Financiera de Desarrollo SA 3.25% USD 15/07/2019 200,000 200,340 0.79 Peru Government Bond 144A 6.15% PEN 12/08/2032 500,000 156,683 0.61 Peruvian Government International Bond 5.94% PEN 12/02/2029 1,000,000 314,106 1.23
671,129 2.63
POLAND Republic of Poland Government Bond 2.25% PLN 25/04/2022 1,200,000 321,520 1.26 Republic of Poland Government Bond 2.5% PLN 25/04/2024 600,000 160,577 0.63 Republic of Poland Government Bond 2.5% PLN 25/07/2026 400,000 104,783 0.41
586,880 2.30
QATAR Qatar Government International Bond 4.5% USD 23/04/2028 200,000 211,775 0.83 Qatar Government International Bond 5.103% USD 23/04/2048 200,000 216,045 0.85
427,820 1.68
RUSSIA Russian Federal Bond - OFZ 7% RUB 16/08/2023 9,100,000 133,495 0.52 Russian Federal Bond - OFZ 7.1% RUB 16/10/2024 7,600,000 110,814 0.44 Russian Federal Bond - OFZ 7.7% RUB 23/03/2033 4,200,000 60,721 0.24 Russian Federal Bond - OFZ 7.75% RUB 16/09/2026 16,000,000 239,403 0.94 Russian Foreign Bond - Eurobond 4.25% USD 23/06/2027 400,000 393,500 1.54
937,933 3.68
SENEGAL Senegal Government International Bond 6.25% USD 23/05/2033 223,000 212,965 0.84
SOUTH AFRICA Republic of South Africa Government Bond 8% ZAR 31/01/2030 2,400,000 158,412 0.62 Republic of South Africa Government Bond 8.25% ZAR 31/03/2032 2,300,000 150,807 0.59 Republic of South Africa Government Bond 8.75% ZAR 31/01/2044 2,800,000 182,302 0.72 Republic of South Africa Government Bond 8.75% ZAR 28/02/2048 6,600,000 429,357 1.68 Republic of South Africa Government Bond 10.5% ZAR 21/12/2026 2,900,000 229,562 0.90 Republic of South Africa Government International Bond 5.875% USD 22/06/2030 200,000 205,877 0.81
1,356,317 5.32
SRI LANKA Sri Lanka Government International Bond 5.75% USD 18/04/2023 200,000 195,000 0.76
SUPRANATIONAL African Export-Import Bank/The 4.75% USD 29/07/2019 200,000 200,968 0.79
THAILAND Thailand Government Bond 2.875% THB 17/12/2028 7,500,000 247,126 0.97 Thailand Government Bond 3.3% THB 17/06/2038 3,000,000 99,042 0.39 Thailand Government Bond 4.875% THB 22/06/2029 4,800,000 183,785 0.72
529,953 2.08
TURKEY Akbank T.A.S. FRN USD 16/03/2027 200,000 186,268 0.73 Export Credit Bank of Turkey 8.25% USD 24/01/2024 200,000 209,500 0.82 Turk Telekomunikasyon AS 6.875% USD 28/02/2025 200,000 201,000 0.79 Turkey Government Bond 10.6% TRY 11/02/2026 700,000 108,338 0.42 Turkey Government International Bond 4.625% EUR 31/03/2025 275,000 317,135 1.24 Turkiye Is Bankasi AS 6% USD 24/10/2022 300,000 279,787 1.10 Turkiye Vakiflar Bankasi TAO 5.5% USD 27/10/2021 300,000 292,875 1.15
1,594,903 6.25
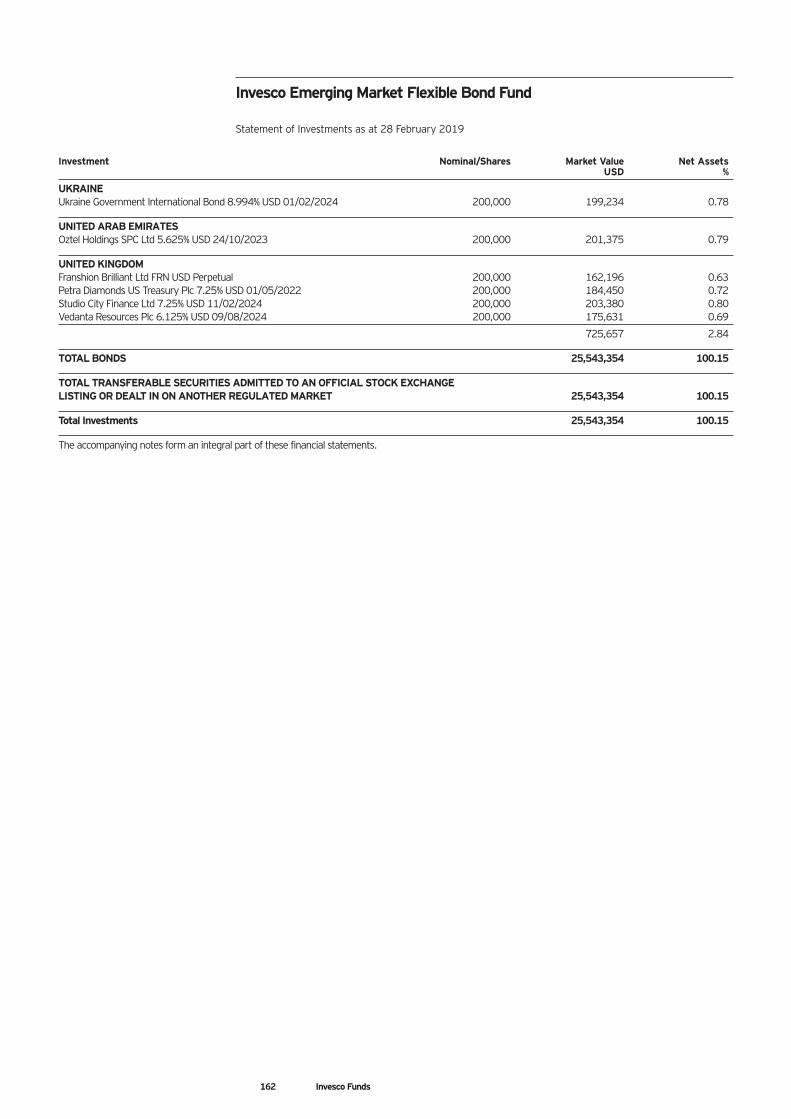
Invesco Emerging Market Flexible Bond Fund Statement of Investments as at 28 February 2019
Investment Nominal/Shares Market Value Net Assets USD %
UKRAINE Ukraine Government International Bond 8.994% USD 01/02/2024 200,000 199,234 0.78
UNITED ARAB EMIRATES Oztel Holdings SPC Ltd 5.625% USD 24/10/2023 200,000 201,375 0.79
UNITED KINGDOM Franshion Brilliant Ltd FRN USD Perpetual 200,000 162,196 0.63 Petra Diamonds US Treasury Plc 7.25% USD 01/05/2022 200,000 184,450 0.72 Studio City Finance Ltd 7.25% USD 11/02/2024 200,000 203,380 0.80 Vedanta Resources Plc 6.125% USD 09/08/2024 200,000 175,631 0.69
725,657 2.84
TOTAL BONDS 25,543,354 100.15
TOTAL TRANSFERABLE SECURITIES ADMITTED TO AN OFFICIAL STOCK EXCHANGE LISTING OR DEALT IN ON ANOTHER REGULATED MARKET 25,543,354 100.15
Total Investments 25,543,354 100.15
The accompanying notes form an integral part of these financial statements.
162 Invesco Funds
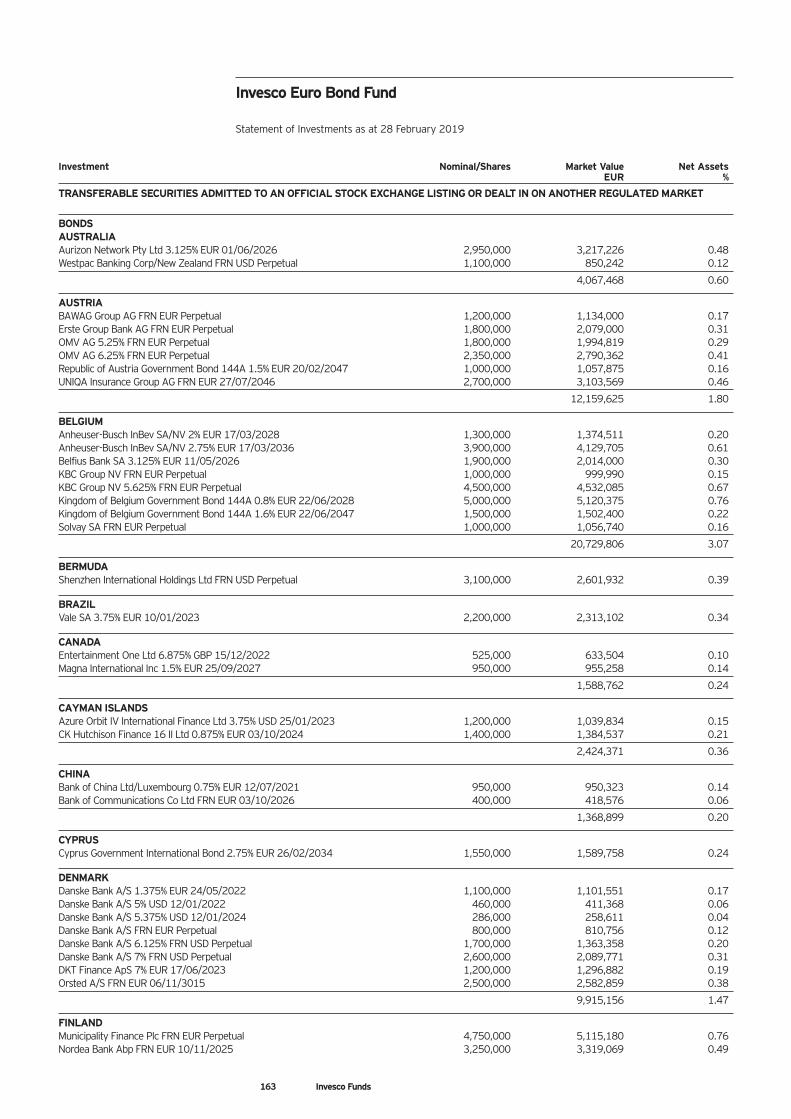
163 Invesco Funds
Investment Nominal/Shares Market Value Net Assets EUR %
TRANSFERABLE SECURITIES ADMITTED TO AN OFFICIAL STOCK EXCHANGE LISTING OR DEALT IN ON ANOTHER REGULATED MARKET
BONDS AUSTRALIA Aurizon Network Pty Ltd 3.125% EUR 01/06/2026 2,950,000 3,217,226 0.48 Westpac Banking Corp/New Zealand FRN USD Perpetual 1,100,000 850,242 0.12
4,067,468 0.60
AUSTRIA BAWAG Group AG FRN EUR Perpetual 1,200,000 1,134,000 0.17 Erste Group Bank AG FRN EUR Perpetual 1,800,000 2,079,000 0.31 OMV AG 5.25% FRN EUR Perpetual 1,800,000 1,994,819 0.29 OMV AG 6.25% FRN EUR Perpetual 2,350,000 2,790,362 0.41 Republic of Austria Government Bond 144A 1.5% EUR 20/02/2047 1,000,000 1,057,875 0.16 UNIQA Insurance Group AG FRN EUR 27/07/2046 2,700,000 3,103,569 0.46
12,159,625 1.80
BELGIUM Anheuser-Busch InBev SA/NV 2% EUR 17/03/2028 1,300,000 1,374,511 0.20 Anheuser-Busch InBev SA/NV 2.75% EUR 17/03/2036 3,900,000 4,129,705 0.61 Belfius Bank SA 3.125% EUR 11/05/2026 1,900,000 2,014,000 0.30 KBC Group NV FRN EUR Perpetual 1,000,000 999,990 0.15 KBC Group NV 5.625% FRN EUR Perpetual 4,500,000 4,532,085 0.67 Kingdom of Belgium Government Bond 144A 0.8% EUR 22/06/2028 5,000,000 5,120,375 0.76 Kingdom of Belgium Government Bond 144A 1.6% EUR 22/06/2047 1,500,000 1,502,400 0.22 Solvay SA FRN EUR Perpetual 1,000,000 1,056,740 0.16
20,729,806 3.07
BERMUDA Shenzhen International Holdings Ltd FRN USD Perpetual 3,100,000 2,601,932 0.39
BRAZIL Vale SA 3.75% EUR 10/01/2023 2,200,000 2,313,102 0.34
CANADA Entertainment One Ltd 6.875% GBP 15/12/2022 525,000 633,504 0.10 Magna International Inc 1.5% EUR 25/09/2027 950,000 955,258 0.14
1,588,762 0.24
CAYMAN ISLANDS Azure Orbit IV International Finance Ltd 3.75% USD 25/01/2023 1,200,000 1,039,834 0.15 CK Hutchison Finance 16 II Ltd 0.875% EUR 03/10/2024 1,400,000 1,384,537 0.21
2,424,371 0.36
CHINA Bank of China Ltd/Luxembourg 0.75% EUR 12/07/2021 950,000 950,323 0.14 Bank of Communications Co Ltd FRN EUR 03/10/2026 400,000 418,576 0.06
1,368,899 0.20
CYPRUS Cyprus Government International Bond 2.75% EUR 26/02/2034 1,550,000 1,589,758 0.24
DENMARK Danske Bank A/S 1.375% EUR 24/05/2022 1,100,000 1,101,551 0.17 Danske Bank A/S 5% USD 12/01/2022 460,000 411,368 0.06 Danske Bank A/S 5.375% USD 12/01/2024 286,000 258,611 0.04 Danske Bank A/S FRN EUR Perpetual 800,000 810,756 0.12 Danske Bank A/S 6.125% FRN USD Perpetual 1,700,000 1,363,358 0.20 Danske Bank A/S 7% FRN USD Perpetual 2,600,000 2,089,771 0.31 DKT Finance ApS 7% EUR 17/06/2023 1,200,000 1,296,882 0.19 Orsted A/S FRN EUR 06/11/3015 2,500,000 2,582,859 0.38
9,915,156 1.47
FINLAND Municipality Finance Plc FRN EUR Perpetual 4,750,000 5,115,180 0.76 Nordea Bank Abp FRN EUR 10/11/2025 3,250,000 3,319,069 0.49
Invesco Euro Bond Fund Statement of Investments as at 28 February 2019
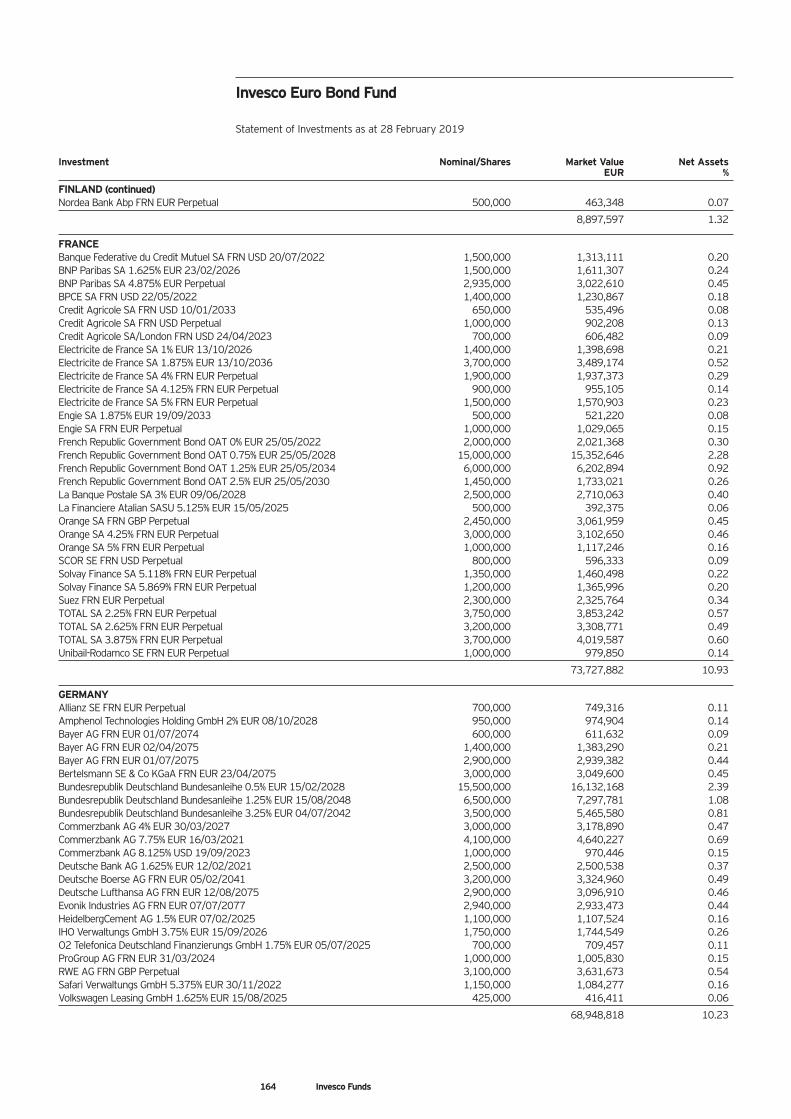
164 Invesco Funds
Invesco Euro Bond Fund Statement of Investments as at 28 February 2019
Investment Nominal/Shares Market Value Net Assets EUR %
FINLAND (continued) Nordea Bank Abp FRN EUR Perpetual 500,000 463,348 0.07
8,897,597 1.32
FRANCE Banque Federative du Credit Mutuel SA FRN USD 20/07/2022 1,500,000 1,313,111 0.20 BNP Paribas SA 1.625% EUR 23/02/2026 1,500,000 1,611,307 0.24 BNP Paribas SA 4.875% EUR Perpetual 2,935,000 3,022,610 0.45 BPCE SA FRN USD 22/05/2022 1,400,000 1,230,867 0.18 Credit Agricole SA FRN USD 10/01/2033 650,000 535,496 0.08 Credit Agricole SA FRN USD Perpetual 1,000,000 902,208 0.13 Credit Agricole SA/London FRN USD 24/04/2023 700,000 606,482 0.09 Electricite de France SA 1% EUR 13/10/2026 1,400,000 1,398,698 0.21 Electricite de France SA 1.875% EUR 13/10/2036 3,700,000 3,489,174 0.52 Electricite de France SA 4% FRN EUR Perpetual 1,900,000 1,937,373 0.29 Electricite de France SA 4.125% FRN EUR Perpetual 900,000 955,105 0.14 Electricite de France SA 5% FRN EUR Perpetual 1,500,000 1,570,903 0.23 Engie SA 1.875% EUR 19/09/2033 500,000 521,220 0.08 Engie SA FRN EUR Perpetual 1,000,000 1,029,065 0.15 French Republic Government Bond OAT 0% EUR 25/05/2022 2,000,000 2,021,368 0.30 French Republic Government Bond OAT 0.75% EUR 25/05/2028 15,000,000 15,352,646 2.28 French Republic Government Bond OAT 1.25% EUR 25/05/2034 6,000,000 6,202,894 0.92 French Republic Government Bond OAT 2.5% EUR 25/05/2030 1,450,000 1,733,021 0.26 La Banque Postale SA 3% EUR 09/06/2028 2,500,000 2,710,063 0.40 La Financiere Atalian SASU 5.125% EUR 15/05/2025 500,000 392,375 0.06 Orange SA FRN GBP Perpetual 2,450,000 3,061,959 0.45 Orange SA 4.25% FRN EUR Perpetual 3,000,000 3,102,650 0.46 Orange SA 5% FRN EUR Perpetual 1,000,000 1,117,246 0.16 SCOR SE FRN USD Perpetual 800,000 596,333 0.09 Solvay Finance SA 5.118% FRN EUR Perpetual 1,350,000 1,460,498 0.22 Solvay Finance SA 5.869% FRN EUR Perpetual 1,200,000 1,365,996 0.20 Suez FRN EUR Perpetual 2,300,000 2,325,764 0.34 TOTAL SA 2.25% FRN EUR Perpetual 3,750,000 3,853,242 0.57 TOTAL SA 2.625% FRN EUR Perpetual 3,200,000 3,308,771 0.49 TOTAL SA 3.875% FRN EUR Perpetual 3,700,000 4,019,587 0.60 Unibail-Rodamco SE FRN EUR Perpetual 1,000,000 979,850 0.14
73,727,882 10.93
GERMANY Allianz SE FRN EUR Perpetual 700,000 749,316 0.11 Amphenol Technologies Holding GmbH 2% EUR 08/10/2028 950,000 974,904 0.14 Bayer AG FRN EUR 01/07/2074 600,000 611,632 0.09 Bayer AG FRN EUR 02/04/2075 1,400,000 1,383,290 0.21 Bayer AG FRN EUR 01/07/2075 2,900,000 2,939,382 0.44 Bertelsmann SE & Co KGaA FRN EUR 23/04/2075 3,000,000 3,049,600 0.45 Bundesrepublik Deutschland Bundesanleihe 0.5% EUR 15/02/2028 15,500,000 16,132,168 2.39 Bundesrepublik Deutschland Bundesanleihe 1.25% EUR 15/08/2048 6,500,000 7,297,781 1.08 Bundesrepublik Deutschland Bundesanleihe 3.25% EUR 04/07/2042 3,500,000 5,465,580 0.81 Commerzbank AG 4% EUR 30/03/2027 3,000,000 3,178,890 0.47 Commerzbank AG 7.75% EUR 16/03/2021 4,100,000 4,640,227 0.69 Commerzbank AG 8.125% USD 19/09/2023 1,000,000 970,446 0.15 Deutsche Bank AG 1.625% EUR 12/02/2021 2,500,000 2,500,538 0.37 Deutsche Boerse AG FRN EUR 05/02/2041 3,200,000 3,324,960 0.49 Deutsche Lufthansa AG FRN EUR 12/08/2075 2,900,000 3,096,910 0.46 Evonik Industries AG FRN EUR 07/07/2077 2,940,000 2,933,473 0.44 HeidelbergCement AG 1.5% EUR 07/02/2025 1,100,000 1,107,524 0.16 IHO Verwaltungs GmbH 3.75% EUR 15/09/2026 1,750,000 1,744,549 0.26 O2 Telefonica Deutschland Finanzierungs GmbH 1.75% EUR 05/07/2025 700,000 709,457 0.11 ProGroup AG FRN EUR 31/03/2024 1,000,000 1,005,830 0.15 RWE AG FRN GBP Perpetual 3,100,000 3,631,673 0.54 Safari Verwaltungs GmbH 5.375% EUR 30/11/2022 1,150,000 1,084,277 0.16 Volkswagen Leasing GmbH 1.625% EUR 15/08/2025 425,000 416,411 0.06
68,948,818 10.23
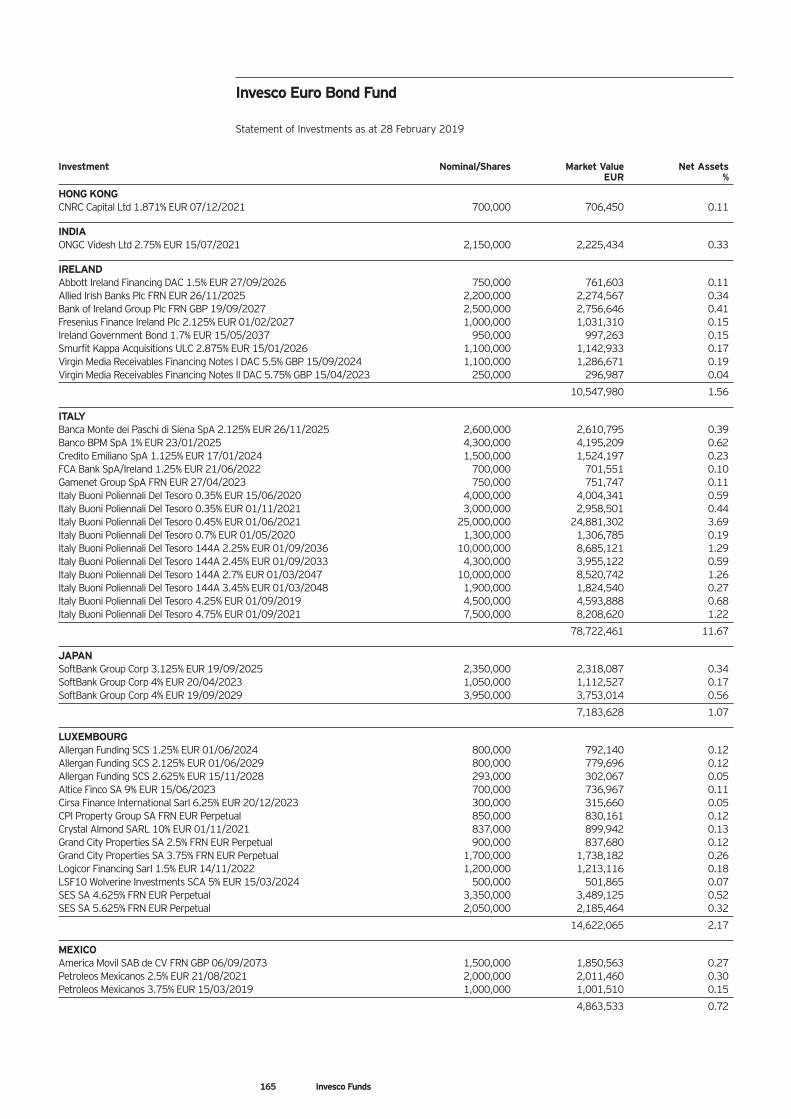
165 Invesco Funds
Invesco Euro Bond Fund Statement of Investments as at 28 February 2019
Investment Nominal/Shares Market Value Net Assets EUR %
HONG KONG CNRC Capital Ltd 1.871% EUR 07/12/2021 700,000 706,450 0.11
INDIA ONGC Videsh Ltd 2.75% EUR 15/07/2021 2,150,000 2,225,434 0.33
IRELAND Abbott Ireland Financing DAC 1.5% EUR 27/09/2026 750,000 761,603 0.11 Allied Irish Banks Plc FRN EUR 26/11/2025 2,200,000 2,274,567 0.34 Bank of Ireland Group Plc FRN GBP 19/09/2027 2,500,000 2,756,646 0.41 Fresenius Finance Ireland Plc 2.125% EUR 01/02/2027 1,000,000 1,031,310 0.15 Ireland Government Bond 1.7% EUR 15/05/2037 950,000 997,263 0.15 Smurfit Kappa Acquisitions ULC 2.875% EUR 15/01/2026 1,100,000 1,142,933 0.17 Virgin Media Receivables Financing Notes I DAC 5.5% GBP 15/09/2024 1,100,000 1,286,671 0.19 Virgin Media Receivables Financing Notes II DAC 5.75% GBP 15/04/2023 250,000 296,987 0.04
10,547,980 1.56
ITALY Banca Monte dei Paschi di Siena SpA 2.125% EUR 26/11/2025 2,600,000 2,610,795 0.39 Banco BPM SpA 1% EUR 23/01/2025 4,300,000 4,195,209 0.62 Credito Emiliano SpA 1.125% EUR 17/01/2024 1,500,000 1,524,197 0.23 FCA Bank SpA/Ireland 1.25% EUR 21/06/2022 700,000 701,551 0.10 Gamenet Group SpA FRN EUR 27/04/2023 750,000 751,747 0.11 Italy Buoni Poliennali Del Tesoro 0.35% EUR 15/06/2020 4,000,000 4,004,341 0.59 Italy Buoni Poliennali Del Tesoro 0.35% EUR 01/11/2021 3,000,000 2,958,501 0.44 Italy Buoni Poliennali Del Tesoro 0.45% EUR 01/06/2021 25,000,000 24,881,302 3.69 Italy Buoni Poliennali Del Tesoro 0.7% EUR 01/05/2020 1,300,000 1,306,785 0.19 Italy Buoni Poliennali Del Tesoro 144A 2.25% EUR 01/09/2036 10,000,000 8,685,121 1.29 Italy Buoni Poliennali Del Tesoro 144A 2.45% EUR 01/09/2033 4,300,000 3,955,122 0.59 Italy Buoni Poliennali Del Tesoro 144A 2.7% EUR 01/03/2047 10,000,000 8,520,742 1.26 Italy Buoni Poliennali Del Tesoro 144A 3.45% EUR 01/03/2048 1,900,000 1,824,540 0.27 Italy Buoni Poliennali Del Tesoro 4.25% EUR 01/09/2019 4,500,000 4,593,888 0.68 Italy Buoni Poliennali Del Tesoro 4.75% EUR 01/09/2021 7,500,000 8,208,620 1.22
78,722,461 11.67
JAPAN SoftBank Group Corp 3.125% EUR 19/09/2025 2,350,000 2,318,087 0.34 SoftBank Group Corp 4% EUR 20/04/2023 1,050,000 1,112,527 0.17 SoftBank Group Corp 4% EUR 19/09/2029 3,950,000 3,753,014 0.56
7,183,628 1.07
LUXEMBOURG Allergan Funding SCS 1.25% EUR 01/06/2024 800,000 792,140 0.12 Allergan Funding SCS 2.125% EUR 01/06/2029 800,000 779,696 0.12 Allergan Funding SCS 2.625% EUR 15/11/2028 293,000 302,067 0.05 Altice Finco SA 9% EUR 15/06/2023 700,000 736,967 0.11 Cirsa Finance International Sarl 6.25% EUR 20/12/2023 300,000 315,660 0.05 CPI Property Group SA FRN EUR Perpetual 850,000 830,161 0.12 Crystal Almond SARL 10% EUR 01/11/2021 837,000 899,942 0.13 Grand City Properties SA 2.5% FRN EUR Perpetual 900,000 837,680 0.12 Grand City Properties SA 3.75% FRN EUR Perpetual 1,700,000 1,738,182 0.26 Logicor Financing Sarl 1.5% EUR 14/11/2022 1,200,000 1,213,116 0.18 LSF10 Wolverine Investments SCA 5% EUR 15/03/2024 500,000 501,865 0.07 SES SA 4.625% FRN EUR Perpetual 3,350,000 3,489,125 0.52 SES SA 5.625% FRN EUR Perpetual 2,050,000 2,185,464 0.32
14,622,065 2.17
MEXICO America Movil SAB de CV FRN GBP 06/09/2073 1,500,000 1,850,563 0.27 Petroleos Mexicanos 2.5% EUR 21/08/2021 2,000,000 2,011,460 0.30 Petroleos Mexicanos 3.75% EUR 15/03/2019 1,000,000 1,001,510 0.15
4,863,533 0.72
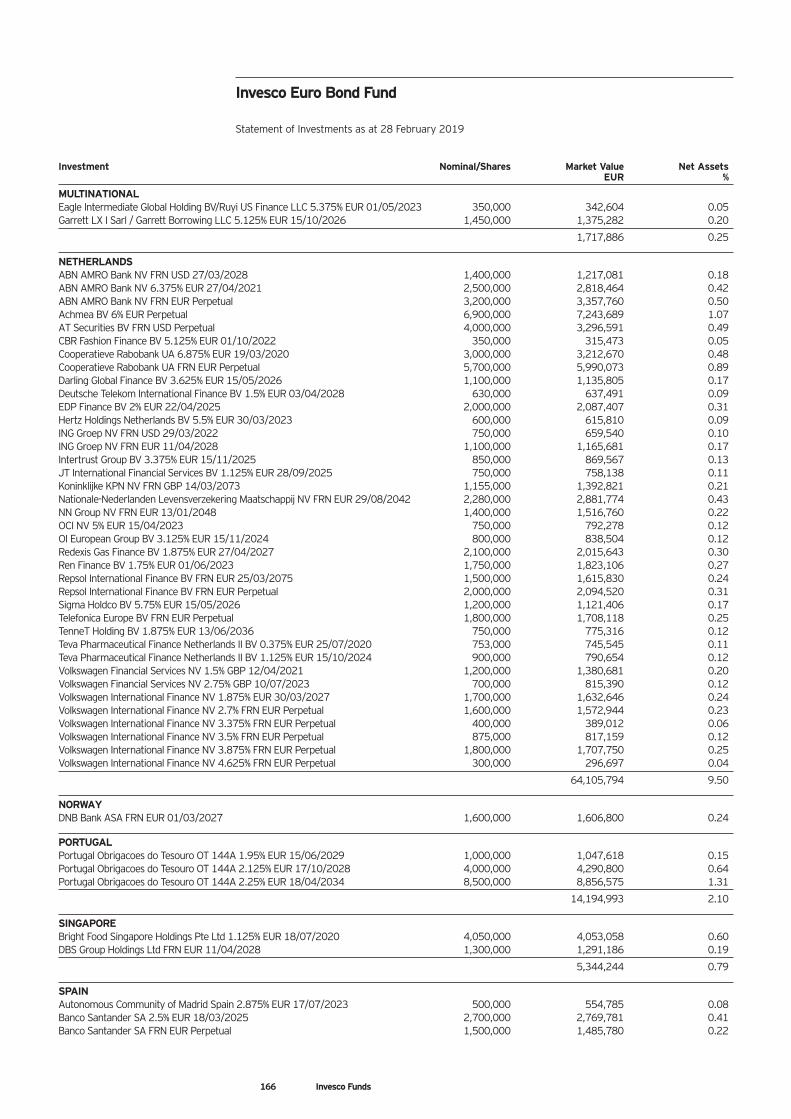
166 Invesco Funds
Investment Nominal/Shares Market Value Net Assets EUR %
MULTINATIONAL Eagle Intermediate Global Holding BV/Ruyi US Finance LLC 5.375% EUR 01/05/2023 350,000 342,604 0.05 Garrett LX I Sarl / Garrett Borrowing LLC 5.125% EUR 15/10/2026 1,450,000 1,375,282 0.20
1,717,886 0.25
NETHERLANDS ABN AMRO Bank NV FRN USD 27/03/2028 1,400,000 1,217,081 0.18 ABN AMRO Bank NV 6.375% EUR 27/04/2021 2,500,000 2,818,464 0.42 ABN AMRO Bank NV FRN EUR Perpetual 3,200,000 3,357,760 0.50 Achmea BV 6% EUR Perpetual 6,900,000 7,243,689 1.07 AT Securities BV FRN USD Perpetual 4,000,000 3,296,591 0.49 CBR Fashion Finance BV 5.125% EUR 01/10/2022 350,000 315,473 0.05 Cooperatieve Rabobank UA 6.875% EUR 19/03/2020 3,000,000 3,212,670 0.48 Cooperatieve Rabobank UA FRN EUR Perpetual 5,700,000 5,990,073 0.89 Darling Global Finance BV 3.625% EUR 15/05/2026 1,100,000 1,135,805 0.17 Deutsche Telekom International Finance BV 1.5% EUR 03/04/2028 630,000 637,491 0.09 EDP Finance BV 2% EUR 22/04/2025 2,000,000 2,087,407 0.31 Hertz Holdings Netherlands BV 5.5% EUR 30/03/2023 600,000 615,810 0.09 ING Groep NV FRN USD 29/03/2022 750,000 659,540 0.10 ING Groep NV FRN EUR 11/04/2028 1,100,000 1,165,681 0.17 Intertrust Group BV 3.375% EUR 15/11/2025 850,000 869,567 0.13 JT International Financial Services BV 1.125% EUR 28/09/2025 750,000 758,138 0.11 Koninklijke KPN NV FRN GBP 14/03/2073 1,155,000 1,392,821 0.21 Nationale-Nederlanden Levensverzekering Maatschappij NV FRN EUR 29/08/2042 2,280,000 2,881,774 0.43 NN Group NV FRN EUR 13/01/2048 1,400,000 1,516,760 0.22 OCI NV 5% EUR 15/04/2023 750,000 792,278 0.12 OI European Group BV 3.125% EUR 15/11/2024 800,000 838,504 0.12 Redexis Gas Finance BV 1.875% EUR 27/04/2027 2,100,000 2,015,643 0.30 Ren Finance BV 1.75% EUR 01/06/2023 1,750,000 1,823,106 0.27 Repsol International Finance BV FRN EUR 25/03/2075 1,500,000 1,615,830 0.24 Repsol International Finance BV FRN EUR Perpetual 2,000,000 2,094,520 0.31 Sigma Holdco BV 5.75% EUR 15/05/2026 1,200,000 1,121,406 0.17 Telefonica Europe BV FRN EUR Perpetual 1,800,000 1,708,118 0.25 TenneT Holding BV 1.875% EUR 13/06/2036 750,000 775,316 0.12 Teva Pharmaceutical Finance Netherlands II BV 0.375% EUR 25/07/2020 753,000 745,545 0.11 Teva Pharmaceutical Finance Netherlands II BV 1.125% EUR 15/10/2024 900,000 790,654 0.12 Volkswagen Financial Services NV 1.5% GBP 12/04/2021 1,200,000 1,380,681 0.20 Volkswagen Financial Services NV 2.75% GBP 10/07/2023 700,000 815,390 0.12 Volkswagen International Finance NV 1.875% EUR 30/03/2027 1,700,000 1,632,646 0.24 Volkswagen International Finance NV 2.7% FRN EUR Perpetual 1,600,000 1,572,944 0.23 Volkswagen International Finance NV 3.375% FRN EUR Perpetual 400,000 389,012 0.06 Volkswagen International Finance NV 3.5% FRN EUR Perpetual 875,000 817,159 0.12 Volkswagen International Finance NV 3.875% FRN EUR Perpetual 1,800,000 1,707,750 0.25 Volkswagen International Finance NV 4.625% FRN EUR Perpetual 300,000 296,697 0.04
64,105,794 9.50
NORWAY DNB Bank ASA FRN EUR 01/03/2027 1,600,000 1,606,800 0.24
PORTUGAL Portugal Obrigacoes do Tesouro OT 144A 1.95% EUR 15/06/2029 1,000,000 1,047,618 0.15 Portugal Obrigacoes do Tesouro OT 144A 2.125% EUR 17/10/2028 4,000,000 4,290,800 0.64 Portugal Obrigacoes do Tesouro OT 144A 2.25% EUR 18/04/2034 8,500,000 8,856,575 1.31
14,194,993 2.10
SINGAPORE Bright Food Singapore Holdings Pte Ltd 1.125% EUR 18/07/2020 4,050,000 4,053,058 0.60 DBS Group Holdings Ltd FRN EUR 11/04/2028 1,300,000 1,291,186 0.19
5,344,244 0.79
SPAIN Autonomous Community of Madrid Spain 2.875% EUR 17/07/2023 500,000 554,785 0.08 Banco Santander SA 2.5% EUR 18/03/2025 2,700,000 2,769,781 0.41 Banco Santander SA FRN EUR Perpetual 1,500,000 1,485,780 0.22
Invesco Euro Bond Fund Statement of Investments as at 28 February 2019
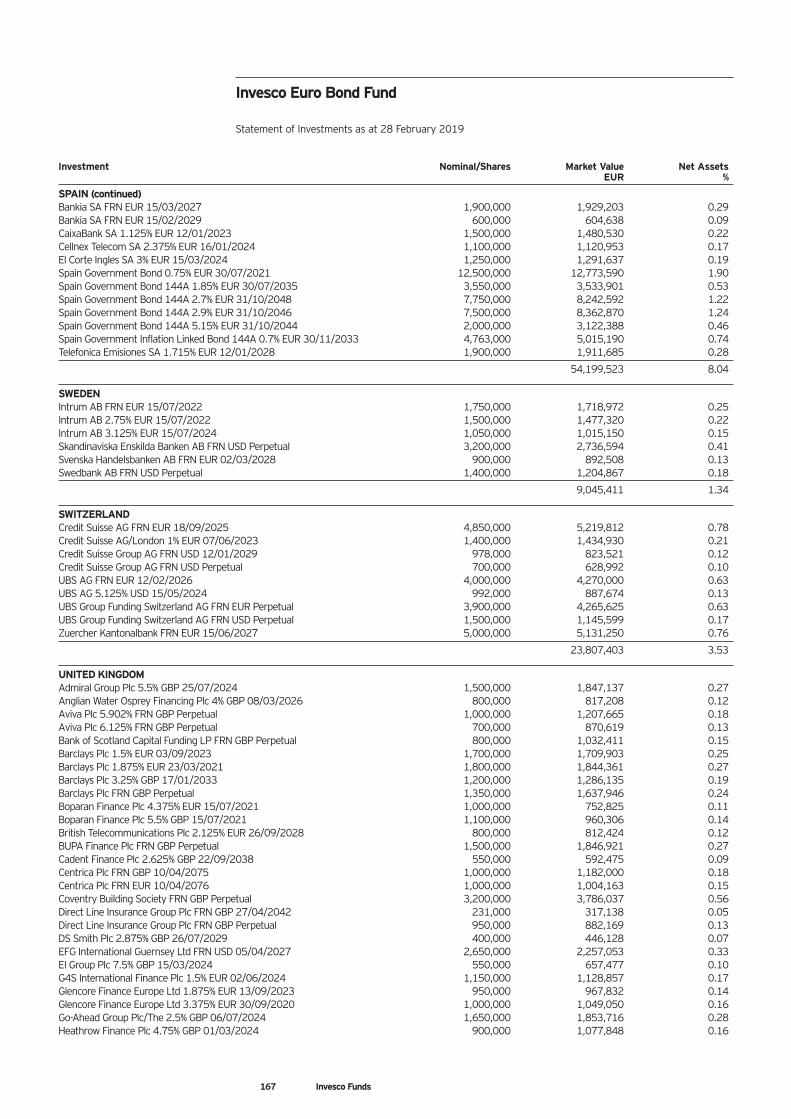
167 Invesco Funds
Invesco Euro Bond Fund Statement of Investments as at 28 February 2019
Investment Nominal/Shares Market Value Net Assets EUR %
SPAIN (continued) Bankia SA FRN EUR 15/03/2027 1,900,000 1,929,203 0.29 Bankia SA FRN EUR 15/02/2029 600,000 604,638 0.09 CaixaBank SA 1.125% EUR 12/01/2023 1,500,000 1,480,530 0.22 Cellnex Telecom SA 2.375% EUR 16/01/2024 1,100,000 1,120,953 0.17 El Corte Ingles SA 3% EUR 15/03/2024 1,250,000 1,291,637 0.19 Spain Government Bond 0.75% EUR 30/07/2021 12,500,000 12,773,590 1.90 Spain Government Bond 144A 1.85% EUR 30/07/2035 3,550,000 3,533,901 0.53 Spain Government Bond 144A 2.7% EUR 31/10/2048 7,750,000 8,242,592 1.22 Spain Government Bond 144A 2.9% EUR 31/10/2046 7,500,000 8,362,870 1.24 Spain Government Bond 144A 5.15% EUR 31/10/2044 2,000,000 3,122,388 0.46 Spain Government Inflation Linked Bond 144A 0.7% EUR 30/11/2033 4,763,000 5,015,190 0.74 Telefonica Emisiones SA 1.715% EUR 12/01/2028 1,900,000 1,911,685 0.28
54,199,523 8.04
SWEDEN Intrum AB FRN EUR 15/07/2022 1,750,000 1,718,972 0.25 Intrum AB 2.75% EUR 15/07/2022 1,500,000 1,477,320 0.22 Intrum AB 3.125% EUR 15/07/2024 1,050,000 1,015,150 0.15 Skandinaviska Enskilda Banken AB FRN USD Perpetual 3,200,000 2,736,594 0.41 Svenska Handelsbanken AB FRN EUR 02/03/2028 900,000 892,508 0.13 Swedbank AB FRN USD Perpetual 1,400,000 1,204,867 0.18
9,045,411 1.34
SWITZERLAND Credit Suisse AG FRN EUR 18/09/2025 4,850,000 5,219,812 0.78 Credit Suisse AG/London 1% EUR 07/06/2023 1,400,000 1,434,930 0.21 Credit Suisse Group AG FRN USD 12/01/2029 978,000 823,521 0.12 Credit Suisse Group AG FRN USD Perpetual 700,000 628,992 0.10 UBS AG FRN EUR 12/02/2026 4,000,000 4,270,000 0.63 UBS AG 5.125% USD 15/05/2024 992,000 887,674 0.13 UBS Group Funding Switzerland AG FRN EUR Perpetual 3,900,000 4,265,625 0.63 UBS Group Funding Switzerland AG FRN USD Perpetual 1,500,000 1,145,599 0.17 Zuercher Kantonalbank FRN EUR 15/06/2027 5,000,000 5,131,250 0.76
23,807,403 3.53
UNITED KINGDOM Admiral Group Plc 5.5% GBP 25/07/2024 1,500,000 1,847,137 0.27 Anglian Water Osprey Financing Plc 4% GBP 08/03/2026 800,000 817,208 0.12 Aviva Plc 5.902% FRN GBP Perpetual 1,000,000 1,207,665 0.18 Aviva Plc 6.125% FRN GBP Perpetual 700,000 870,619 0.13 Bank of Scotland Capital Funding LP FRN GBP Perpetual 800,000 1,032,411 0.15 Barclays Plc 1.5% EUR 03/09/2023 1,700,000 1,709,903 0.25 Barclays Plc 1.875% EUR 23/03/2021 1,800,000 1,844,361 0.27 Barclays Plc 3.25% GBP 17/01/2033 1,200,000 1,286,135 0.19 Barclays Plc FRN GBP Perpetual 1,350,000 1,637,946 0.24 Boparan Finance Plc 4.375% EUR 15/07/2021 1,000,000 752,825 0.11 Boparan Finance Plc 5.5% GBP 15/07/2021 1,100,000 960,306 0.14 British Telecommunications Plc 2.125% EUR 26/09/2028 800,000 812,424 0.12 BUPA Finance Plc FRN GBP Perpetual 1,500,000 1,846,921 0.27 Cadent Finance Plc 2.625% GBP 22/09/2038 550,000 592,475 0.09 Centrica Plc FRN GBP 10/04/2075 1,000,000 1,182,000 0.18 Centrica Plc FRN EUR 10/04/2076 1,000,000 1,004,163 0.15 Coventry Building Society FRN GBP Perpetual 3,200,000 3,786,037 0.56 Direct Line Insurance Group Plc FRN GBP 27/04/2042 231,000 317,138 0.05 Direct Line Insurance Group Plc FRN GBP Perpetual 950,000 882,169 0.13 DS Smith Plc 2.875% GBP 26/07/2029 400,000 446,128 0.07 EFG International Guernsey Ltd FRN USD 05/04/2027 2,650,000 2,257,053 0.33 EI Group Plc 7.5% GBP 15/03/2024 550,000 657,477 0.10 G4S International Finance Plc 1.5% EUR 02/06/2024 1,150,000 1,128,857 0.17 Glencore Finance Europe Ltd 1.875% EUR 13/09/2023 950,000 967,832 0.14 Glencore Finance Europe Ltd 3.375% EUR 30/09/2020 1,000,000 1,049,050 0.16 Go-Ahead Group Plc/The 2.5% GBP 06/07/2024 1,650,000 1,853,716 0.28 Heathrow Finance Plc 4.75% GBP 01/03/2024 900,000 1,077,848 0.16
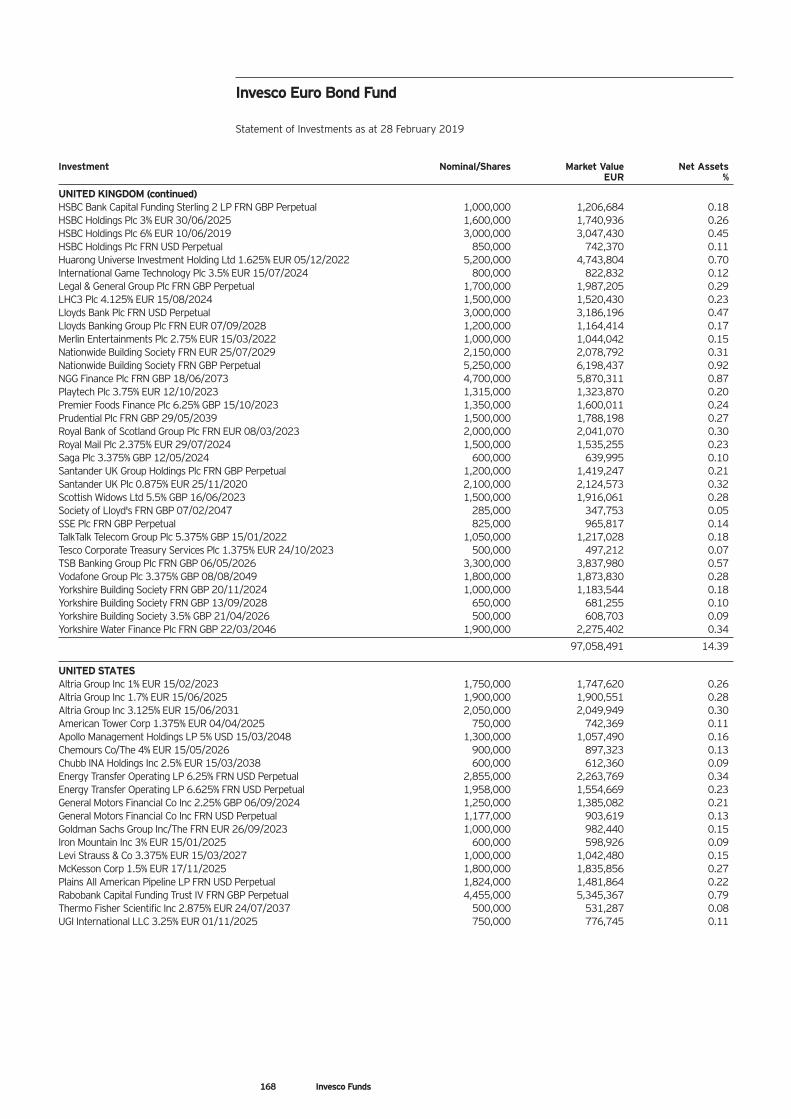
168 Invesco Funds
Investment Nominal/Shares Market Value Net Assets EUR %
UNITED KINGDOM (continued) HSBC Bank Capital Funding Sterling 2 LP FRN GBP Perpetual 1,000,000 1,206,684 0.18 HSBC Holdings Plc 3% EUR 30/06/2025 1,600,000 1,740,936 0.26 HSBC Holdings Plc 6% EUR 10/06/2019 3,000,000 3,047,430 0.45 HSBC Holdings Plc FRN USD Perpetual 850,000 742,370 0.11 Huarong Universe Investment Holding Ltd 1.625% EUR 05/12/2022 5,200,000 4,743,804 0.70 International Game Technology Plc 3.5% EUR 15/07/2024 800,000 822,832 0.12 Legal & General Group Plc FRN GBP Perpetual 1,700,000 1,987,205 0.29 LHC3 Plc 4.125% EUR 15/08/2024 1,500,000 1,520,430 0.23 Lloyds Bank Plc FRN USD Perpetual 3,000,000 3,186,196 0.47 Lloyds Banking Group Plc FRN EUR 07/09/2028 1,200,000 1,164,414 0.17 Merlin Entertainments Plc 2.75% EUR 15/03/2022 1,000,000 1,044,042 0.15 Nationwide Building Society FRN EUR 25/07/2029 2,150,000 2,078,792 0.31 Nationwide Building Society FRN GBP Perpetual 5,250,000 6,198,437 0.92 NGG Finance Plc FRN GBP 18/06/2073 4,700,000 5,870,311 0.87 Playtech Plc 3.75% EUR 12/10/2023 1,315,000 1,323,870 0.20 Premier Foods Finance Plc 6.25% GBP 15/10/2023 1,350,000 1,600,011 0.24 Prudential Plc FRN GBP 29/05/2039 1,500,000 1,788,198 0.27 Royal Bank of Scotland Group Plc FRN EUR 08/03/2023 2,000,000 2,041,070 0.30 Royal Mail Plc 2.375% EUR 29/07/2024 1,500,000 1,535,255 0.23 Saga Plc 3.375% GBP 12/05/2024 600,000 639,995 0.10 Santander UK Group Holdings Plc FRN GBP Perpetual 1,200,000 1,419,247 0.21 Santander UK Plc 0.875% EUR 25/11/2020 2,100,000 2,124,573 0.32 Scottish Widows Ltd 5.5% GBP 16/06/2023 1,500,000 1,916,061 0.28 Society of Lloyd's FRN GBP 07/02/2047 285,000 347,753 0.05 SSE Plc FRN GBP Perpetual 825,000 965,817 0.14 TalkTalk Telecom Group Plc 5.375% GBP 15/01/2022 1,050,000 1,217,028 0.18 Tesco Corporate Treasury Services Plc 1.375% EUR 24/10/2023 500,000 497,212 0.07 TSB Banking Group Plc FRN GBP 06/05/2026 3,300,000 3,837,980 0.57 Vodafone Group Plc 3.375% GBP 08/08/2049 1,800,000 1,873,830 0.28 Yorkshire Building Society FRN GBP 20/11/2024 1,000,000 1,183,544 0.18 Yorkshire Building Society FRN GBP 13/09/2028 650,000 681,255 0.10 Yorkshire Building Society 3.5% GBP 21/04/2026 500,000 608,703 0.09 Yorkshire Water Finance Plc FRN GBP 22/03/2046 1,900,000 2,275,402 0.34
97,058,491 14.39
UNITED STATES Altria Group Inc 1% EUR 15/02/2023 1,750,000 1,747,620 0.26 Altria Group Inc 1.7% EUR 15/06/2025 1,900,000 1,900,551 0.28 Altria Group Inc 3.125% EUR 15/06/2031 2,050,000 2,049,949 0.30 American Tower Corp 1.375% EUR 04/04/2025 750,000 742,369 0.11 Apollo Management Holdings LP 5% USD 15/03/2048 1,300,000 1,057,490 0.16 Chemours Co/The 4% EUR 15/05/2026 900,000 897,323 0.13 Chubb INA Holdings Inc 2.5% EUR 15/03/2038 600,000 612,360 0.09 Energy Transfer Operating LP 6.25% FRN USD Perpetual 2,855,000 2,263,769 0.34 Energy Transfer Operating LP 6.625% FRN USD Perpetual 1,958,000 1,554,669 0.23 General Motors Financial Co Inc 2.25% GBP 06/09/2024 1,250,000 1,385,082 0.21 General Motors Financial Co Inc FRN USD Perpetual 1,177,000 903,619 0.13 Goldman Sachs Group Inc/The FRN EUR 26/09/2023 1,000,000 982,440 0.15 Iron Mountain Inc 3% EUR 15/01/2025 600,000 598,926 0.09 Levi Strauss & Co 3.375% EUR 15/03/2027 1,000,000 1,042,480 0.15 McKesson Corp 1.5% EUR 17/11/2025 1,800,000 1,835,856 0.27 Plains All American Pipeline LP FRN USD Perpetual 1,824,000 1,481,864 0.22 Rabobank Capital Funding Trust IV FRN GBP Perpetual 4,455,000 5,345,367 0.79 Thermo Fisher Scientific Inc 2.875% EUR 24/07/2037 500,000 531,287 0.08 UGI International LLC 3.25% EUR 01/11/2025 750,000 776,745 0.11
Invesco Euro Bond Fund Statement of Investments as at 28 February 2019
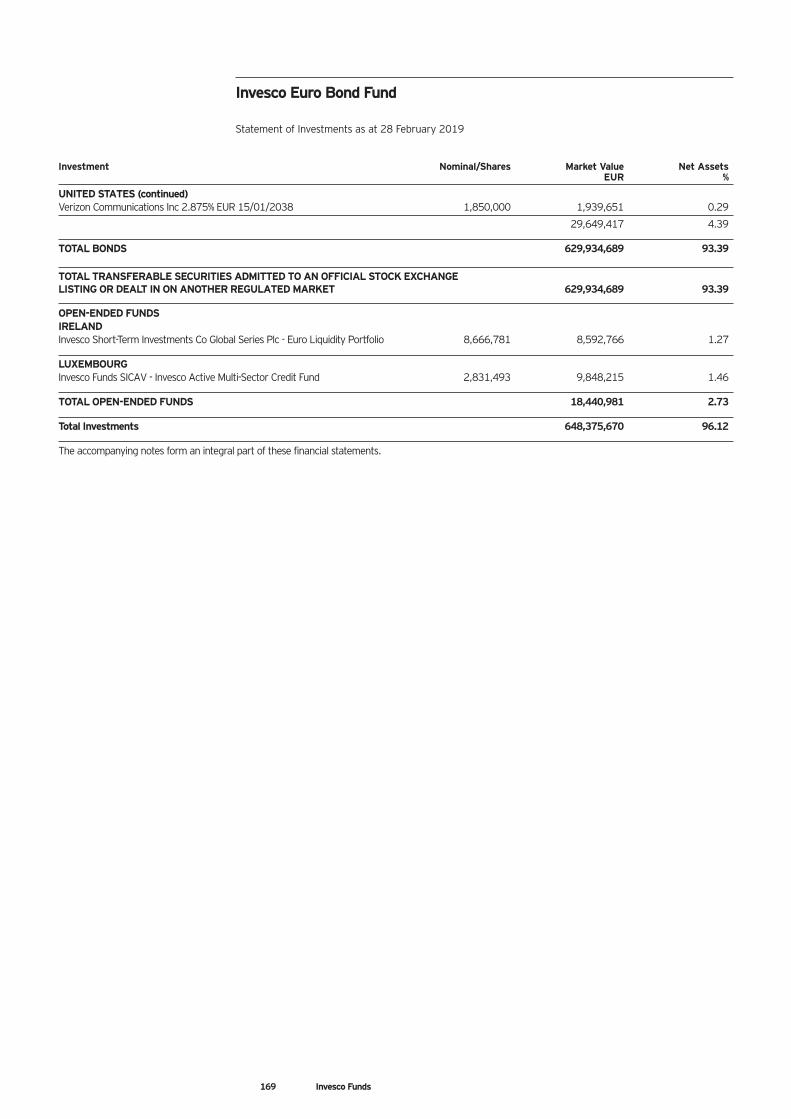
169 Invesco Funds
Investment Nominal/Shares Market Value Net Assets EUR %
UNITED STATES (continued) Verizon Communications Inc 2.875% EUR 15/01/2038 1,850,000 1,939,651 0.29
29,649,417 4.39
TOTAL BONDS 629,934,689 93.39
TOTAL TRANSFERABLE SECURITIES ADMITTED TO AN OFFICIAL STOCK EXCHANGE LISTING OR DEALT IN ON ANOTHER REGULATED MARKET 629,934,689 93.39
OPEN-ENDED FUNDS IRELAND Invesco Short-Term Investments Co Global Series Plc - Euro Liquidity Portfolio 8,666,781 8,592,766 1.27
LUXEMBOURG Invesco Funds SICAV - Invesco Active Multi-Sector Credit Fund 2,831,493 9,848,215 1.46
TOTAL OPEN-ENDED FUNDS 18,440,981 2.73
Total Investments 648,375,670 96.12
The accompanying notes form an integral part of these financial statements.
Invesco Euro Bond Fund Statement of Investments as at 28 February 2019
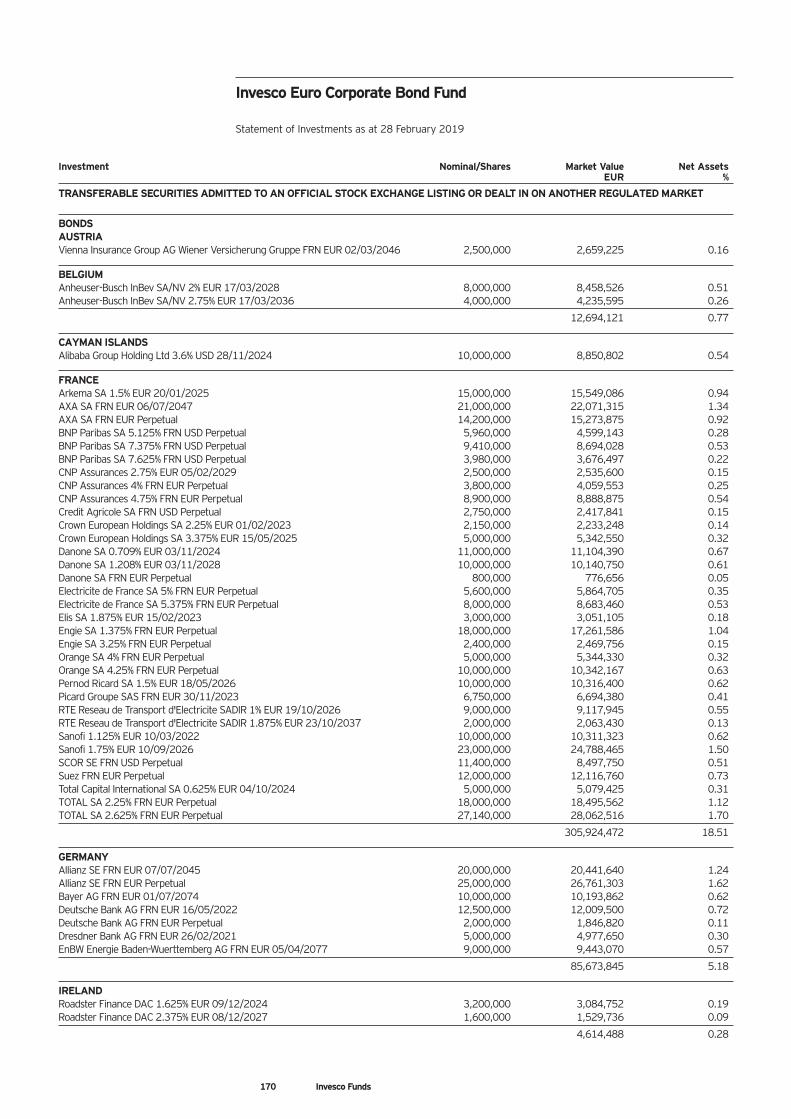
170 Invesco Funds
Investment Nominal/Shares Market Value Net Assets EUR %
TRANSFERABLE SECURITIES ADMITTED TO AN OFFICIAL STOCK EXCHANGE LISTING OR DEALT IN ON ANOTHER REGULATED MARKET
BONDS AUSTRIA Vienna Insurance Group AG Wiener Versicherung Gruppe FRN EUR 02/03/2046 2,500,000 2,659,225 0.16
BELGIUM Anheuser-Busch InBev SA/NV 2% EUR 17/03/2028 8,000,000 8,458,526 0.51 Anheuser-Busch InBev SA/NV 2.75% EUR 17/03/2036 4,000,000 4,235,595 0.26
12,694,121 0.77
CAYMAN ISLANDS Alibaba Group Holding Ltd 3.6% USD 28/11/2024 10,000,000 8,850,802 0.54
FRANCE Arkema SA 1.5% EUR 20/01/2025 15,000,000 15,549,086 0.94 AXA SA FRN EUR 06/07/2047 21,000,000 22,071,315 1.34 AXA SA FRN EUR Perpetual 14,200,000 15,273,875 0.92 BNP Paribas SA 5.125% FRN USD Perpetual 5,960,000 4,599,143 0.28 BNP Paribas SA 7.375% FRN USD Perpetual 9,410,000 8,694,028 0.53 BNP Paribas SA 7.625% FRN USD Perpetual 3,980,000 3,676,497 0.22 CNP Assurances 2.75% EUR 05/02/2029 2,500,000 2,535,600 0.15 CNP Assurances 4% FRN EUR Perpetual 3,800,000 4,059,553 0.25 CNP Assurances 4.75% FRN EUR Perpetual 8,900,000 8,888,875 0.54 Credit Agricole SA FRN USD Perpetual 2,750,000 2,417,841 0.15 Crown European Holdings SA 2.25% EUR 01/02/2023 2,150,000 2,233,248 0.14 Crown European Holdings SA 3.375% EUR 15/05/2025 5,000,000 5,342,550 0.32 Danone SA 0.709% EUR 03/11/2024 11,000,000 11,104,390 0.67 Danone SA 1.208% EUR 03/11/2028 10,000,000 10,140,750 0.61 Danone SA FRN EUR Perpetual 800,000 776,656 0.05 Electricite de France SA 5% FRN EUR Perpetual 5,600,000 5,864,705 0.35 Electricite de France SA 5.375% FRN EUR Perpetual 8,000,000 8,683,460 0.53 Elis SA 1.875% EUR 15/02/2023 3,000,000 3,051,105 0.18 Engie SA 1.375% FRN EUR Perpetual 18,000,000 17,261,586 1.04 Engie SA 3.25% FRN EUR Perpetual 2,400,000 2,469,756 0.15 Orange SA 4% FRN EUR Perpetual 5,000,000 5,344,330 0.32 Orange SA 4.25% FRN EUR Perpetual 10,000,000 10,342,167 0.63 Pernod Ricard SA 1.5% EUR 18/05/2026 10,000,000 10,316,400 0.62 Picard Groupe SAS FRN EUR 30/11/2023 6,750,000 6,694,380 0.41 RTE Reseau de Transport d'Electricite SADIR 1% EUR 19/10/2026 9,000,000 9,117,945 0.55 RTE Reseau de Transport d'Electricite SADIR 1.875% EUR 23/10/2037 2,000,000 2,063,430 0.13 Sanofi 1.125% EUR 10/03/2022 10,000,000 10,311,323 0.62 Sanofi 1.75% EUR 10/09/2026 23,000,000 24,788,465 1.50 SCOR SE FRN USD Perpetual 11,400,000 8,497,750 0.51 Suez FRN EUR Perpetual 12,000,000 12,116,760 0.73 Total Capital International SA 0.625% EUR 04/10/2024 5,000,000 5,079,425 0.31 TOTAL SA 2.25% FRN EUR Perpetual 18,000,000 18,495,562 1.12 TOTAL SA 2.625% FRN EUR Perpetual 27,140,000 28,062,516 1.70
305,924,472 18.51
GERMANY Allianz SE FRN EUR 07/07/2045 20,000,000 20,441,640 1.24 Allianz SE FRN EUR Perpetual 25,000,000 26,761,303 1.62 Bayer AG FRN EUR 01/07/2074 10,000,000 10,193,862 0.62 Deutsche Bank AG FRN EUR 16/05/2022 12,500,000 12,009,500 0.72 Deutsche Bank AG FRN EUR Perpetual 2,000,000 1,846,820 0.11 Dresdner Bank AG FRN EUR 26/02/2021 5,000,000 4,977,650 0.30 EnBW Energie Baden-Wuerttemberg AG FRN EUR 05/04/2077 9,000,000 9,443,070 0.57
85,673,845 5.18
IRELAND Roadster Finance DAC 1.625% EUR 09/12/2024 3,200,000 3,084,752 0.19 Roadster Finance DAC 2.375% EUR 08/12/2027 1,600,000 1,529,736 0.09
4,614,488 0.28
Invesco Euro Corporate Bond Fund Statement of Investments as at 28 February 2019
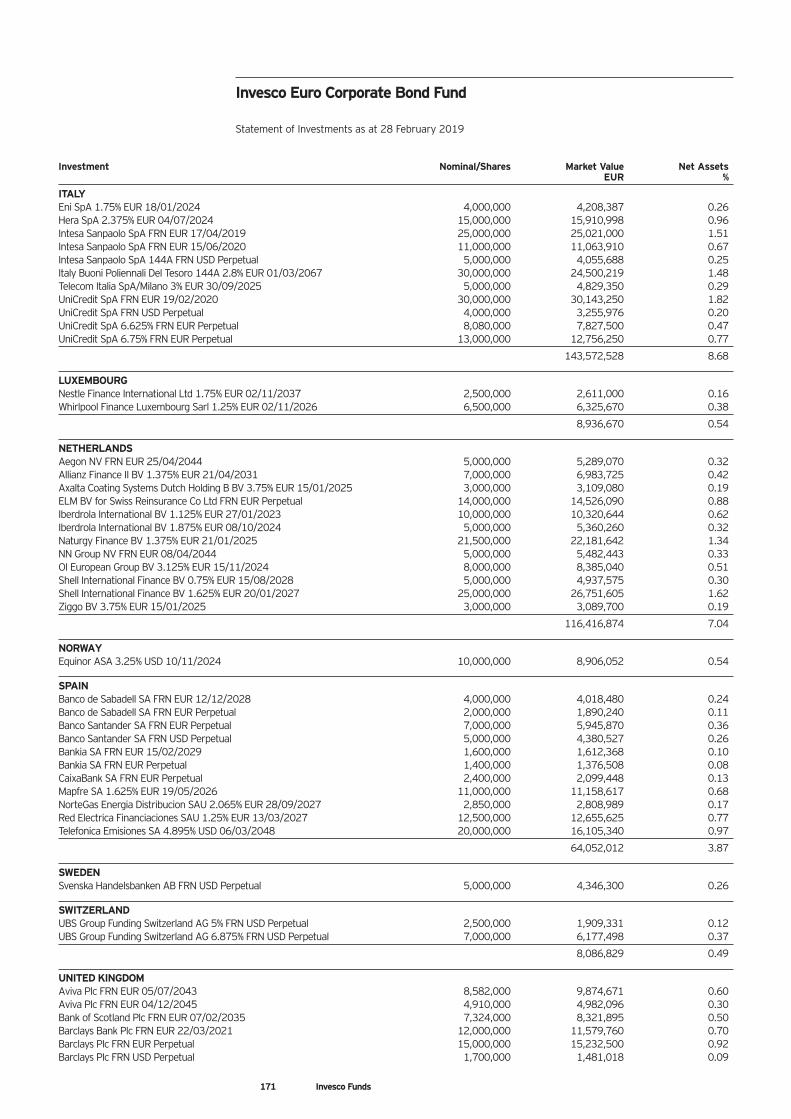
171 Invesco Funds
Investment Nominal/Shares Market Value Net Assets EUR %
ITALY Eni SpA 1.75% EUR 18/01/2024 4,000,000 4,208,387 0.26 Hera SpA 2.375% EUR 04/07/2024 15,000,000 15,910,998 0.96 Intesa Sanpaolo SpA FRN EUR 17/04/2019 25,000,000 25,021,000 1.51 Intesa Sanpaolo SpA FRN EUR 15/06/2020 11,000,000 11,063,910 0.67 Intesa Sanpaolo SpA 144A FRN USD Perpetual 5,000,000 4,055,688 0.25 Italy Buoni Poliennali Del Tesoro 144A 2.8% EUR 01/03/2067 30,000,000 24,500,219 1.48 Telecom Italia SpA/Milano 3% EUR 30/09/2025 5,000,000 4,829,350 0.29 UniCredit SpA FRN EUR 19/02/2020 30,000,000 30,143,250 1.82 UniCredit SpA FRN USD Perpetual 4,000,000 3,255,976 0.20 UniCredit SpA 6.625% FRN EUR Perpetual 8,080,000 7,827,500 0.47 UniCredit SpA 6.75% FRN EUR Perpetual 13,000,000 12,756,250 0.77
143,572,528 8.68
LUXEMBOURG Nestle Finance International Ltd 1.75% EUR 02/11/2037 2,500,000 2,611,000 0.16 Whirlpool Finance Luxembourg Sarl 1.25% EUR 02/11/2026 6,500,000 6,325,670 0.38
8,936,670 0.54
NETHERLANDS Aegon NV FRN EUR 25/04/2044 5,000,000 5,289,070 0.32 Allianz Finance II BV 1.375% EUR 21/04/2031 7,000,000 6,983,725 0.42 Axalta Coating Systems Dutch Holding B BV 3.75% EUR 15/01/2025 3,000,000 3,109,080 0.19 ELM BV for Swiss Reinsurance Co Ltd FRN EUR Perpetual 14,000,000 14,526,090 0.88 Iberdrola International BV 1.125% EUR 27/01/2023 10,000,000 10,320,644 0.62 Iberdrola International BV 1.875% EUR 08/10/2024 5,000,000 5,360,260 0.32 Naturgy Finance BV 1.375% EUR 21/01/2025 21,500,000 22,181,642 1.34 NN Group NV FRN EUR 08/04/2044 5,000,000 5,482,443 0.33 OI European Group BV 3.125% EUR 15/11/2024 8,000,000 8,385,040 0.51 Shell International Finance BV 0.75% EUR 15/08/2028 5,000,000 4,937,575 0.30 Shell International Finance BV 1.625% EUR 20/01/2027 25,000,000 26,751,605 1.62 Ziggo BV 3.75% EUR 15/01/2025 3,000,000 3,089,700 0.19
116,416,874 7.04
NORWAY Equinor ASA 3.25% USD 10/11/2024 10,000,000 8,906,052 0.54
SPAIN Banco de Sabadell SA FRN EUR 12/12/2028 4,000,000 4,018,480 0.24 Banco de Sabadell SA FRN EUR Perpetual 2,000,000 1,890,240 0.11 Banco Santander SA FRN EUR Perpetual 7,000,000 5,945,870 0.36 Banco Santander SA FRN USD Perpetual 5,000,000 4,380,527 0.26 Bankia SA FRN EUR 15/02/2029 1,600,000 1,612,368 0.10 Bankia SA FRN EUR Perpetual 1,400,000 1,376,508 0.08 CaixaBank SA FRN EUR Perpetual 2,400,000 2,099,448 0.13 Mapfre SA 1.625% EUR 19/05/2026 11,000,000 11,158,617 0.68 NorteGas Energia Distribucion SAU 2.065% EUR 28/09/2027 2,850,000 2,808,989 0.17 Red Electrica Financiaciones SAU 1.25% EUR 13/03/2027 12,500,000 12,655,625 0.77 Telefonica Emisiones SA 4.895% USD 06/03/2048 20,000,000 16,105,340 0.97
64,052,012 3.87
SWEDEN Svenska Handelsbanken AB FRN USD Perpetual 5,000,000 4,346,300 0.26
SWITZERLAND UBS Group Funding Switzerland AG 5% FRN USD Perpetual 2,500,000 1,909,331 0.12 UBS Group Funding Switzerland AG 6.875% FRN USD Perpetual 7,000,000 6,177,498 0.37
8,086,829 0.49
UNITED KINGDOM Aviva Plc FRN EUR 05/07/2043 8,582,000 9,874,671 0.60 Aviva Plc FRN EUR 04/12/2045 4,910,000 4,982,096 0.30 Bank of Scotland Plc FRN EUR 07/02/2035 7,324,000 8,321,895 0.50 Barclays Bank Plc FRN EUR 22/03/2021 12,000,000 11,579,760 0.70 Barclays Plc FRN EUR Perpetual 15,000,000 15,232,500 0.92 Barclays Plc FRN USD Perpetual 1,700,000 1,481,018 0.09
Invesco Euro Corporate Bond Fund Statement of Investments as at 28 February 2019
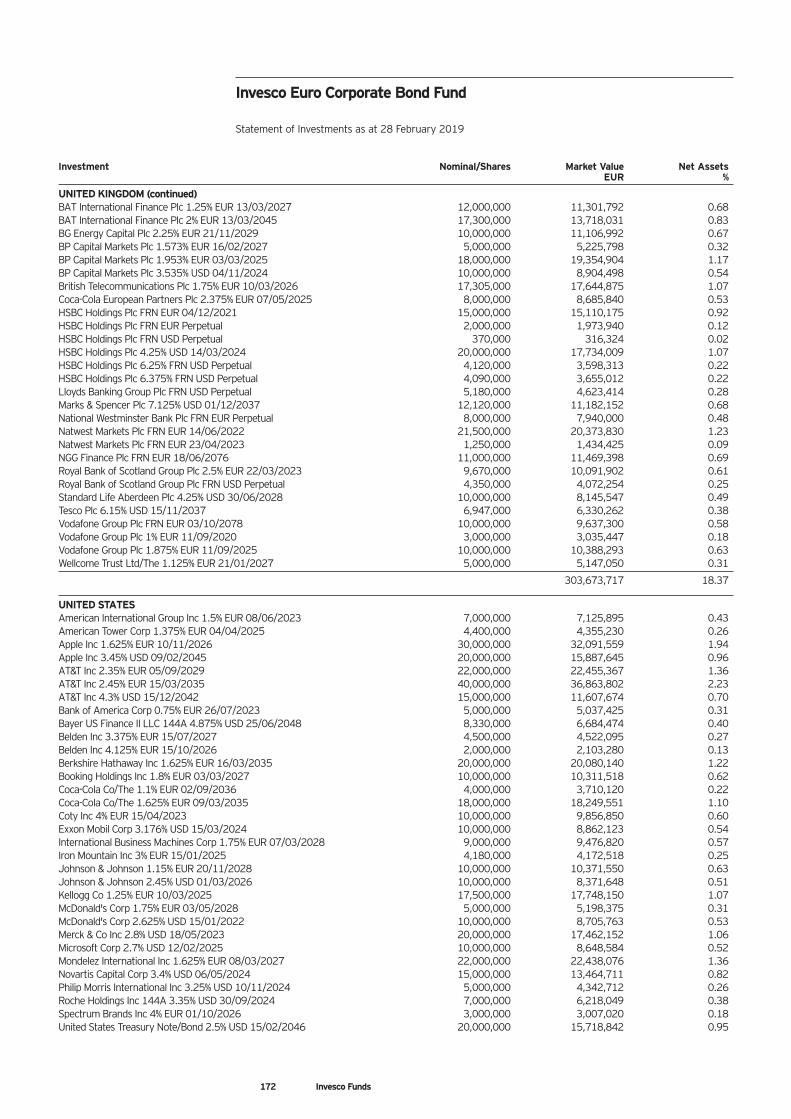
172 Invesco Funds
Investment Nominal/Shares Market Value Net Assets EUR %
UNITED KINGDOM (continued) BAT International Finance Plc 1.25% EUR 13/03/2027 12,000,000 11,301,792 0.68 BAT International Finance Plc 2% EUR 13/03/2045 17,300,000 13,718,031 0.83 BG Energy Capital Plc 2.25% EUR 21/11/2029 10,000,000 11,106,992 0.67 BP Capital Markets Plc 1.573% EUR 16/02/2027 5,000,000 5,225,798 0.32 BP Capital Markets Plc 1.953% EUR 03/03/2025 18,000,000 19,354,904 1.17 BP Capital Markets Plc 3.535% USD 04/11/2024 10,000,000 8,904,498 0.54 British Telecommunications Plc 1.75% EUR 10/03/2026 17,305,000 17,644,875 1.07 Coca-Cola European Partners Plc 2.375% EUR 07/05/2025 8,000,000 8,685,840 0.53 HSBC Holdings Plc FRN EUR 04/12/2021 15,000,000 15,110,175 0.92 HSBC Holdings Plc FRN EUR Perpetual 2,000,000 1,973,940 0.12 HSBC Holdings Plc FRN USD Perpetual 370,000 316,324 0.02 HSBC Holdings Plc 4.25% USD 14/03/2024 20,000,000 17,734,009 1.07 HSBC Holdings Plc 6.25% FRN USD Perpetual 4,120,000 3,598,313 0.22 HSBC Holdings Plc 6.375% FRN USD Perpetual 4,090,000 3,655,012 0.22 Lloyds Banking Group Plc FRN USD Perpetual 5,180,000 4,623,414 0.28 Marks & Spencer Plc 7.125% USD 01/12/2037 12,120,000 11,182,152 0.68 National Westminster Bank Plc FRN EUR Perpetual 8,000,000 7,940,000 0.48 Natwest Markets Plc FRN EUR 14/06/2022 21,500,000 20,373,830 1.23 Natwest Markets Plc FRN EUR 23/04/2023 1,250,000 1,434,425 0.09 NGG Finance Plc FRN EUR 18/06/2076 11,000,000 11,469,398 0.69 Royal Bank of Scotland Group Plc 2.5% EUR 22/03/2023 9,670,000 10,091,902 0.61 Royal Bank of Scotland Group Plc FRN USD Perpetual 4,350,000 4,072,254 0.25 Standard Life Aberdeen Plc 4.25% USD 30/06/2028 10,000,000 8,145,547 0.49 Tesco Plc 6.15% USD 15/11/2037 6,947,000 6,330,262 0.38 Vodafone Group Plc FRN EUR 03/10/2078 10,000,000 9,637,300 0.58 Vodafone Group Plc 1% EUR 11/09/2020 3,000,000 3,035,447 0.18 Vodafone Group Plc 1.875% EUR 11/09/2025 10,000,000 10,388,293 0.63 Wellcome Trust Ltd/The 1.125% EUR 21/01/2027 5,000,000 5,147,050 0.31
303,673,717 18.37
UNITED STATES American International Group Inc 1.5% EUR 08/06/2023 7,000,000 7,125,895 0.43 American Tower Corp 1.375% EUR 04/04/2025 4,400,000 4,355,230 0.26 Apple Inc 1.625% EUR 10/11/2026 30,000,000 32,091,559 1.94 Apple Inc 3.45% USD 09/02/2045 20,000,000 15,887,645 0.96 AT&T Inc 2.35% EUR 05/09/2029 22,000,000 22,455,367 1.36 AT&T Inc 2.45% EUR 15/03/2035 40,000,000 36,863,802 2.23 AT&T Inc 4.3% USD 15/12/2042 15,000,000 11,607,674 0.70 Bank of America Corp 0.75% EUR 26/07/2023 5,000,000 5,037,425 0.31 Bayer US Finance II LLC 144A 4.875% USD 25/06/2048 8,330,000 6,684,474 0.40 Belden Inc 3.375% EUR 15/07/2027 4,500,000 4,522,095 0.27 Belden Inc 4.125% EUR 15/10/2026 2,000,000 2,103,280 0.13 Berkshire Hathaway Inc 1.625% EUR 16/03/2035 20,000,000 20,080,140 1.22 Booking Holdings Inc 1.8% EUR 03/03/2027 10,000,000 10,311,518 0.62 Coca-Cola Co/The 1.1% EUR 02/09/2036 4,000,000 3,710,120 0.22 Coca-Cola Co/The 1.625% EUR 09/03/2035 18,000,000 18,249,551 1.10 Coty Inc 4% EUR 15/04/2023 10,000,000 9,856,850 0.60 Exxon Mobil Corp 3.176% USD 15/03/2024 10,000,000 8,862,123 0.54 International Business Machines Corp 1.75% EUR 07/03/2028 9,000,000 9,476,820 0.57 Iron Mountain Inc 3% EUR 15/01/2025 4,180,000 4,172,518 0.25 Johnson & Johnson 1.15% EUR 20/11/2028 10,000,000 10,371,550 0.63 Johnson & Johnson 2.45% USD 01/03/2026 10,000,000 8,371,648 0.51 Kellogg Co 1.25% EUR 10/03/2025 17,500,000 17,748,150 1.07 McDonald's Corp 1.75% EUR 03/05/2028 5,000,000 5,198,375 0.31 McDonald's Corp 2.625% USD 15/01/2022 10,000,000 8,705,763 0.53 Merck & Co Inc 2.8% USD 18/05/2023 20,000,000 17,462,152 1.06 Microsoft Corp 2.7% USD 12/02/2025 10,000,000 8,648,584 0.52 Mondelez International Inc 1.625% EUR 08/03/2027 22,000,000 22,438,076 1.36 Novartis Capital Corp 3.4% USD 06/05/2024 15,000,000 13,464,711 0.82 Philip Morris International Inc 3.25% USD 10/11/2024 5,000,000 4,342,712 0.26 Roche Holdings Inc 144A 3.35% USD 30/09/2024 7,000,000 6,218,049 0.38 Spectrum Brands Inc 4% EUR 01/10/2026 3,000,000 3,007,020 0.18 United States Treasury Note/Bond 2.5% USD 15/02/2046 20,000,000 15,718,842 0.95
Invesco Euro Corporate Bond Fund Statement of Investments as at 28 February 2019
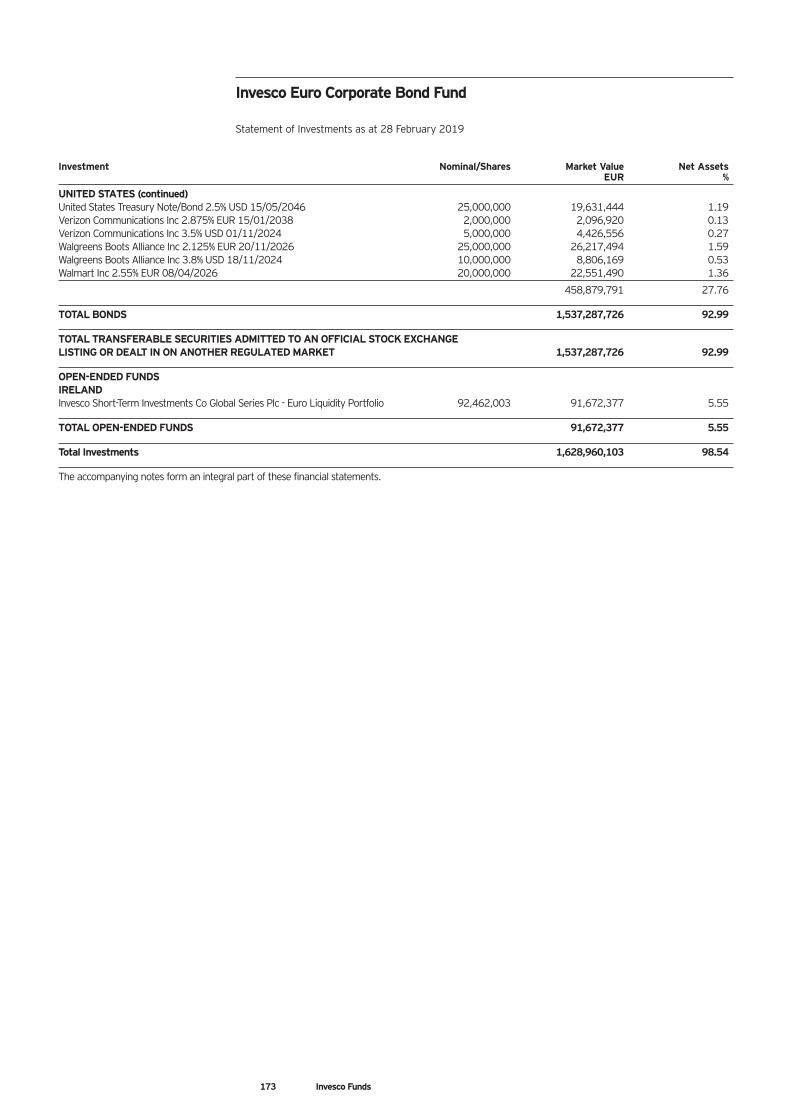
173 Invesco Funds
Investment Nominal/Shares Market Value Net Assets EUR %
UNITED STATES (continued) United States Treasury Note/Bond 2.5% USD 15/05/2046 25,000,000 19,631,444 1.19 Verizon Communications Inc 2.875% EUR 15/01/2038 2,000,000 2,096,920 0.13 Verizon Communications Inc 3.5% USD 01/11/2024 5,000,000 4,426,556 0.27 Walgreens Boots Alliance Inc 2.125% EUR 20/11/2026 25,000,000 26,217,494 1.59 Walgreens Boots Alliance Inc 3.8% USD 18/11/2024 10,000,000 8,806,169 0.53 Walmart Inc 2.55% EUR 08/04/2026 20,000,000 22,551,490 1.36
458,879,791 27.76
TOTAL BONDS 1,537,287,726 92.99
TOTAL TRANSFERABLE SECURITIES ADMITTED TO AN OFFICIAL STOCK EXCHANGE LISTING OR DEALT IN ON ANOTHER REGULATED MARKET 1,537,287,726 92.99
OPEN-ENDED FUNDS IRELAND Invesco Short-Term Investments Co Global Series Plc - Euro Liquidity Portfolio 92,462,003 91,672,377 5.55
TOTAL OPEN-ENDED FUNDS 91,672,377 5.55
Total Investments 1,628,960,103 98.54
The accompanying notes form an integral part of these financial statements.
Invesco Euro Corporate Bond Fund Statement of Investments as at 28 February 2019
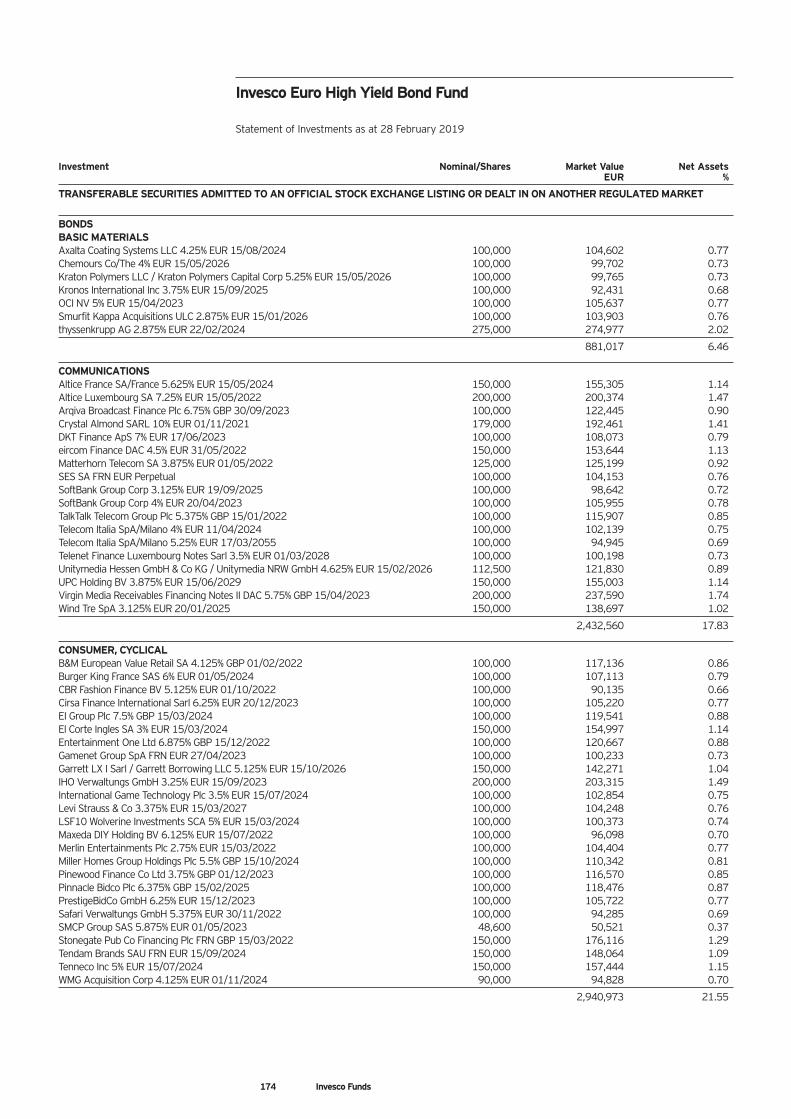
174 Invesco Funds
Investment Nominal/Shares Market Value Net Assets EUR %
TRANSFERABLE SECURITIES ADMITTED TO AN OFFICIAL STOCK EXCHANGE LISTING OR DEALT IN ON ANOTHER REGULATED MARKET
BONDS BASIC MATERIALS Axalta Coating Systems LLC 4.25% EUR 15/08/2024 100,000 104,602 0.77 Chemours Co/The 4% EUR 15/05/2026 100,000 99,702 0.73 Kraton Polymers LLC / Kraton Polymers Capital Corp 5.25% EUR 15/05/2026 100,000 99,765 0.73 Kronos International Inc 3.75% EUR 15/09/2025 100,000 92,431 0.68 OCI NV 5% EUR 15/04/2023 100,000 105,637 0.77 Smurfit Kappa Acquisitions ULC 2.875% EUR 15/01/2026 100,000 103,903 0.76 thyssenkrupp AG 2.875% EUR 22/02/2024 275,000 274,977 2.02
881,017 6.46
COMMUNICATIONS Altice France SA/France 5.625% EUR 15/05/2024 150,000 155,305 1.14 Altice Luxembourg SA 7.25% EUR 15/05/2022 200,000 200,374 1.47 Arqiva Broadcast Finance Plc 6.75% GBP 30/09/2023 100,000 122,445 0.90 Crystal Almond SARL 10% EUR 01/11/2021 179,000 192,461 1.41 DKT Finance ApS 7% EUR 17/06/2023 100,000 108,073 0.79 eircom Finance DAC 4.5% EUR 31/05/2022 150,000 153,644 1.13 Matterhorn Telecom SA 3.875% EUR 01/05/2022 125,000 125,199 0.92 SES SA FRN EUR Perpetual 100,000 104,153 0.76 SoftBank Group Corp 3.125% EUR 19/09/2025 100,000 98,642 0.72 SoftBank Group Corp 4% EUR 20/04/2023 100,000 105,955 0.78 TalkTalk Telecom Group Plc 5.375% GBP 15/01/2022 100,000 115,907 0.85 Telecom Italia SpA/Milano 4% EUR 11/04/2024 100,000 102,139 0.75 Telecom Italia SpA/Milano 5.25% EUR 17/03/2055 100,000 94,945 0.69 Telenet Finance Luxembourg Notes Sarl 3.5% EUR 01/03/2028 100,000 100,198 0.73 Unitymedia Hessen GmbH & Co KG / Unitymedia NRW GmbH 4.625% EUR 15/02/2026 112,500 121,830 0.89 UPC Holding BV 3.875% EUR 15/06/2029 150,000 155,003 1.14 Virgin Media Receivables Financing Notes II DAC 5.75% GBP 15/04/2023 200,000 237,590 1.74 Wind Tre SpA 3.125% EUR 20/01/2025 150,000 138,697 1.02
2,432,560 17.83
CONSUMER, CYCLICAL B&M European Value Retail SA 4.125% GBP 01/02/2022 100,000 117,136 0.86 Burger King France SAS 6% EUR 01/05/2024 100,000 107,113 0.79 CBR Fashion Finance BV 5.125% EUR 01/10/2022 100,000 90,135 0.66 Cirsa Finance International Sarl 6.25% EUR 20/12/2023 100,000 105,220 0.77 EI Group Plc 7.5% GBP 15/03/2024 100,000 119,541 0.88 El Corte Ingles SA 3% EUR 15/03/2024 150,000 154,997 1.14 Entertainment One Ltd 6.875% GBP 15/12/2022 100,000 120,667 0.88 Gamenet Group SpA FRN EUR 27/04/2023 100,000 100,233 0.73 Garrett LX I Sarl / Garrett Borrowing LLC 5.125% EUR 15/10/2026 150,000 142,271 1.04 IHO Verwaltungs GmbH 3.25% EUR 15/09/2023 200,000 203,315 1.49 International Game Technology Plc 3.5% EUR 15/07/2024 100,000 102,854 0.75 Levi Strauss & Co 3.375% EUR 15/03/2027 100,000 104,248 0.76 LSF10 Wolverine Investments SCA 5% EUR 15/03/2024 100,000 100,373 0.74 Maxeda DIY Holding BV 6.125% EUR 15/07/2022 100,000 96,098 0.70 Merlin Entertainments Plc 2.75% EUR 15/03/2022 100,000 104,404 0.77 Miller Homes Group Holdings Plc 5.5% GBP 15/10/2024 100,000 110,342 0.81 Pinewood Finance Co Ltd 3.75% GBP 01/12/2023 100,000 116,570 0.85 Pinnacle Bidco Plc 6.375% GBP 15/02/2025 100,000 118,476 0.87 PrestigeBidCo GmbH 6.25% EUR 15/12/2023 100,000 105,722 0.77 Safari Verwaltungs GmbH 5.375% EUR 30/11/2022 100,000 94,285 0.69 SMCP Group SAS 5.875% EUR 01/05/2023 48,600 50,521 0.37 Stonegate Pub Co Financing Plc FRN GBP 15/03/2022 150,000 176,116 1.29 Tendam Brands SAU FRN EUR 15/09/2024 150,000 148,064 1.09 Tenneco Inc 5% EUR 15/07/2024 150,000 157,444 1.15 WMG Acquisition Corp 4.125% EUR 01/11/2024 90,000 94,828 0.70
2,940,973 21.55
Invesco Euro High Yield Bond Fund Statement of Investments as at 28 February 2019
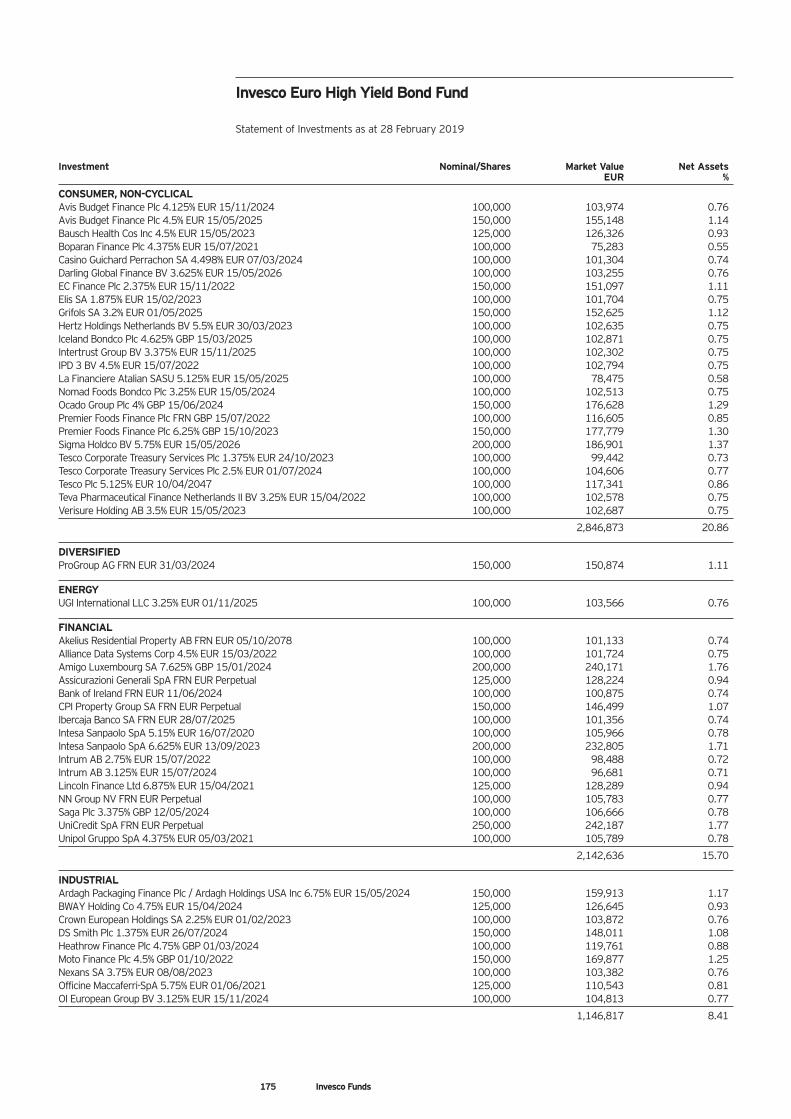
Investment Nominal/Shares Market Value Net Assets EUR %
CONSUMER, NON-CYCLICAL Avis Budget Finance Plc 4.125% EUR 15/11/2024 100,000 103,974 0.76 Avis Budget Finance Plc 4.5% EUR 15/05/2025 150,000 155,148 1.14 Bausch Health Cos Inc 4.5% EUR 15/05/2023 125,000 126,326 0.93 Boparan Finance Plc 4.375% EUR 15/07/2021 100,000 75,283 0.55 Casino Guichard Perrachon SA 4.498% EUR 07/03/2024 100,000 101,304 0.74 Darling Global Finance BV 3.625% EUR 15/05/2026 100,000 103,255 0.76 EC Finance Plc 2.375% EUR 15/11/2022 150,000 151,097 1.11 Elis SA 1.875% EUR 15/02/2023 100,000 101,704 0.75 Grifols SA 3.2% EUR 01/05/2025 150,000 152,625 1.12 Hertz Holdings Netherlands BV 5.5% EUR 30/03/2023 100,000 102,635 0.75 Iceland Bondco Plc 4.625% GBP 15/03/2025 100,000 102,871 0.75 Intertrust Group BV 3.375% EUR 15/11/2025 100,000 102,302 0.75 IPD 3 BV 4.5% EUR 15/07/2022 100,000 102,794 0.75 La Financiere Atalian SASU 5.125% EUR 15/05/2025 100,000 78,475 0.58 Nomad Foods Bondco Plc 3.25% EUR 15/05/2024 100,000 102,513 0.75 Ocado Group Plc 4% GBP 15/06/2024 150,000 176,628 1.29 Premier Foods Finance Plc FRN GBP 15/07/2022 100,000 116,605 0.85 Premier Foods Finance Plc 6.25% GBP 15/10/2023 150,000 177,779 1.30 Sigma Holdco BV 5.75% EUR 15/05/2026 200,000 186,901 1.37 Tesco Corporate Treasury Services Plc 1.375% EUR 24/10/2023 100,000 99,442 0.73 Tesco Corporate Treasury Services Plc 2.5% EUR 01/07/2024 100,000 104,606 0.77 Tesco Plc 5.125% EUR 10/04/2047 100,000 117,341 0.86 Teva Pharmaceutical Finance Netherlands II BV 3.25% EUR 15/04/2022 100,000 102,578 0.75 Verisure Holding AB 3.5% EUR 15/05/2023 100,000 102,687 0.75
2,846,873 20.86
DIVERSIFIED ProGroup AG FRN EUR 31/03/2024 150,000 150,874 1.11
ENERGY UGI International LLC 3.25% EUR 01/11/2025 100,000 103,566 0.76
FINANCIAL Akelius Residential Property AB FRN EUR 05/10/2078 100,000 101,133 0.74 Alliance Data Systems Corp 4.5% EUR 15/03/2022 100,000 101,724 0.75 Amigo Luxembourg SA 7.625% GBP 15/01/2024 200,000 240,171 1.76 Assicurazioni Generali SpA FRN EUR Perpetual 125,000 128,224 0.94 Bank of Ireland FRN EUR 11/06/2024 100,000 100,875 0.74 CPI Property Group SA FRN EUR Perpetual 150,000 146,499 1.07 Ibercaja Banco SA FRN EUR 28/07/2025 100,000 101,356 0.74 Intesa Sanpaolo SpA 5.15% EUR 16/07/2020 100,000 105,966 0.78 Intesa Sanpaolo SpA 6.625% EUR 13/09/2023 200,000 232,805 1.71 Intrum AB 2.75% EUR 15/07/2022 100,000 98,488 0.72 Intrum AB 3.125% EUR 15/07/2024 100,000 96,681 0.71 Lincoln Finance Ltd 6.875% EUR 15/04/2021 125,000 128,289 0.94 NN Group NV FRN EUR Perpetual 100,000 105,783 0.77 Saga Plc 3.375% GBP 12/05/2024 100,000 106,666 0.78 UniCredit SpA FRN EUR Perpetual 250,000 242,187 1.77 Unipol Gruppo SpA 4.375% EUR 05/03/2021 100,000 105,789 0.78
2,142,636 15.70
INDUSTRIAL Ardagh Packaging Finance Plc / Ardagh Holdings USA Inc 6.75% EUR 15/05/2024 150,000 159,913 1.17 BWAY Holding Co 4.75% EUR 15/04/2024 125,000 126,645 0.93 Crown European Holdings SA 2.25% EUR 01/02/2023 100,000 103,872 0.76 DS Smith Plc 1.375% EUR 26/07/2024 150,000 148,011 1.08 Heathrow Finance Plc 4.75% GBP 01/03/2024 100,000 119,761 0.88 Moto Finance Plc 4.5% GBP 01/10/2022 150,000 169,877 1.25 Nexans SA 3.75% EUR 08/08/2023 100,000 103,382 0.76 Officine Maccaferri-SpA 5.75% EUR 01/06/2021 125,000 110,543 0.81 OI European Group BV 3.125% EUR 15/11/2024 100,000 104,813 0.77
1,146,817 8.41
Invesco Euro High Yield Bond Fund Statement of Investments as at 28 February 2019
175 Invesco Funds
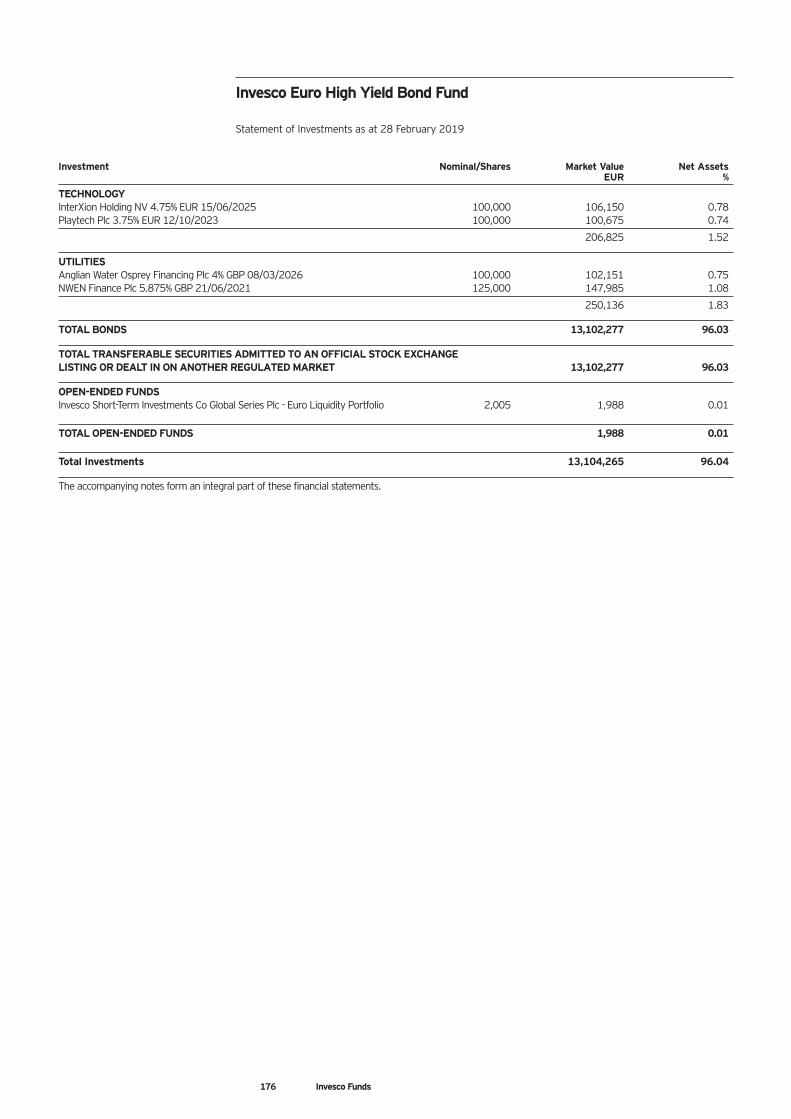
176 Invesco Funds
Investment Nominal/Shares Market Value Net Assets EUR %
TECHNOLOGY InterXion Holding NV 4.75% EUR 15/06/2025 100,000 106,150 0.78 Playtech Plc 3.75% EUR 12/10/2023 100,000 100,675 0.74
206,825 1.52
UTILITIES Anglian Water Osprey Financing Plc 4% GBP 08/03/2026 100,000 102,151 0.75 NWEN Finance Plc 5.875% GBP 21/06/2021 125,000 147,985 1.08
250,136 1.83
TOTAL BONDS 13,102,277 96.03
TOTAL TRANSFERABLE SECURITIES ADMITTED TO AN OFFICIAL STOCK EXCHANGE LISTING OR DEALT IN ON ANOTHER REGULATED MARKET 13,102,277 96.03
OPEN-ENDED FUNDS Invesco Short-Term Investments Co Global Series Plc - Euro Liquidity Portfolio 2,005 1,988 0.01
TOTAL OPEN-ENDED FUNDS 1,988 0.01
Total Investments 13,104,265 96.04
The accompanying notes form an integral part of these financial statements.
Invesco Euro High Yield Bond Fund Statement of Investments as at 28 February 2019
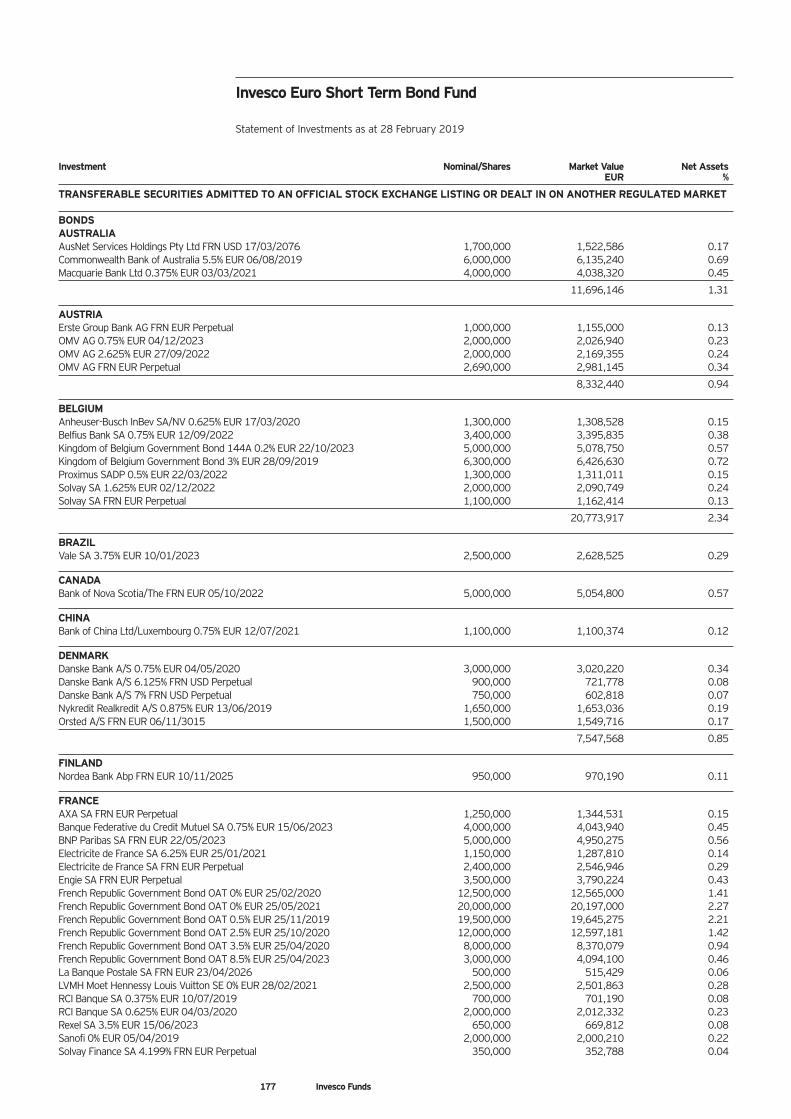
177 Invesco Funds
Investment Nominal/Shares Market Value Net Assets EUR %
TRANSFERABLE SECURITIES ADMITTED TO AN OFFICIAL STOCK EXCHANGE LISTING OR DEALT IN ON ANOTHER REGULATED MARKET BONDS AUSTRALIA AusNet Services Holdings Pty Ltd FRN USD 17/03/2076 1,700,000 1,522,586 0.17 Commonwealth Bank of Australia 5.5% EUR 06/08/2019 6,000,000 6,135,240 0.69 Macquarie Bank Ltd 0.375% EUR 03/03/2021 4,000,000 4,038,320 0.45
11,696,146 1.31
AUSTRIA Erste Group Bank AG FRN EUR Perpetual 1,000,000 1,155,000 0.13 OMV AG 0.75% EUR 04/12/2023 2,000,000 2,026,940 0.23 OMV AG 2.625% EUR 27/09/2022 2,000,000 2,169,355 0.24 OMV AG FRN EUR Perpetual 2,690,000 2,981,145 0.34
8,332,440 0.94
BELGIUM Anheuser-Busch InBev SA/NV 0.625% EUR 17/03/2020 1,300,000 1,308,528 0.15 Belfius Bank SA 0.75% EUR 12/09/2022 3,400,000 3,395,835 0.38 Kingdom of Belgium Government Bond 144A 0.2% EUR 22/10/2023 5,000,000 5,078,750 0.57 Kingdom of Belgium Government Bond 3% EUR 28/09/2019 6,300,000 6,426,630 0.72 Proximus SADP 0.5% EUR 22/03/2022 1,300,000 1,311,011 0.15 Solvay SA 1.625% EUR 02/12/2022 2,000,000 2,090,749 0.24 Solvay SA FRN EUR Perpetual 1,100,000 1,162,414 0.13
20,773,917 2.34
BRAZIL Vale SA 3.75% EUR 10/01/2023 2,500,000 2,628,525 0.29
CANADA Bank of Nova Scotia/The FRN EUR 05/10/2022 5,000,000 5,054,800 0.57
CHINA Bank of China Ltd/Luxembourg 0.75% EUR 12/07/2021 1,100,000 1,100,374 0.12
DENMARK Danske Bank A/S 0.75% EUR 04/05/2020 3,000,000 3,020,220 0.34 Danske Bank A/S 6.125% FRN USD Perpetual 900,000 721,778 0.08 Danske Bank A/S 7% FRN USD Perpetual 750,000 602,818 0.07 Nykredit Realkredit A/S 0.875% EUR 13/06/2019 1,650,000 1,653,036 0.19 Orsted A/S FRN EUR 06/11/3015 1,500,000 1,549,716 0.17
7,547,568 0.85
FINLAND Nordea Bank Abp FRN EUR 10/11/2025 950,000 970,190 0.11
FRANCE AXA SA FRN EUR Perpetual 1,250,000 1,344,531 0.15 Banque Federative du Credit Mutuel SA 0.75% EUR 15/06/2023 4,000,000 4,043,940 0.45 BNP Paribas SA FRN EUR 22/05/2023 5,000,000 4,950,275 0.56 Electricite de France SA 6.25% EUR 25/01/2021 1,150,000 1,287,810 0.14 Electricite de France SA FRN EUR Perpetual 2,400,000 2,546,946 0.29 Engie SA FRN EUR Perpetual 3,500,000 3,790,224 0.43 French Republic Government Bond OAT 0% EUR 25/02/2020 12,500,000 12,565,000 1.41 French Republic Government Bond OAT 0% EUR 25/05/2021 20,000,000 20,197,000 2.27 French Republic Government Bond OAT 0.5% EUR 25/11/2019 19,500,000 19,645,275 2.21 French Republic Government Bond OAT 2.5% EUR 25/10/2020 12,000,000 12,597,181 1.42 French Republic Government Bond OAT 3.5% EUR 25/04/2020 8,000,000 8,370,079 0.94 French Republic Government Bond OAT 8.5% EUR 25/04/2023 3,000,000 4,094,100 0.46 La Banque Postale SA FRN EUR 23/04/2026 500,000 515,429 0.06 LVMH Moet Hennessy Louis Vuitton SE 0% EUR 28/02/2021 2,500,000 2,501,863 0.28 RCI Banque SA 0.375% EUR 10/07/2019 700,000 701,190 0.08 RCI Banque SA 0.625% EUR 04/03/2020 2,000,000 2,012,332 0.23 Rexel SA 3.5% EUR 15/06/2023 650,000 669,812 0.08 Sanofi 0% EUR 05/04/2019 2,000,000 2,000,210 0.22 Solvay Finance SA 4.199% FRN EUR Perpetual 350,000 352,788 0.04
Invesco Euro Short Term Bond Fund Statement of Investments as at 28 February 2019
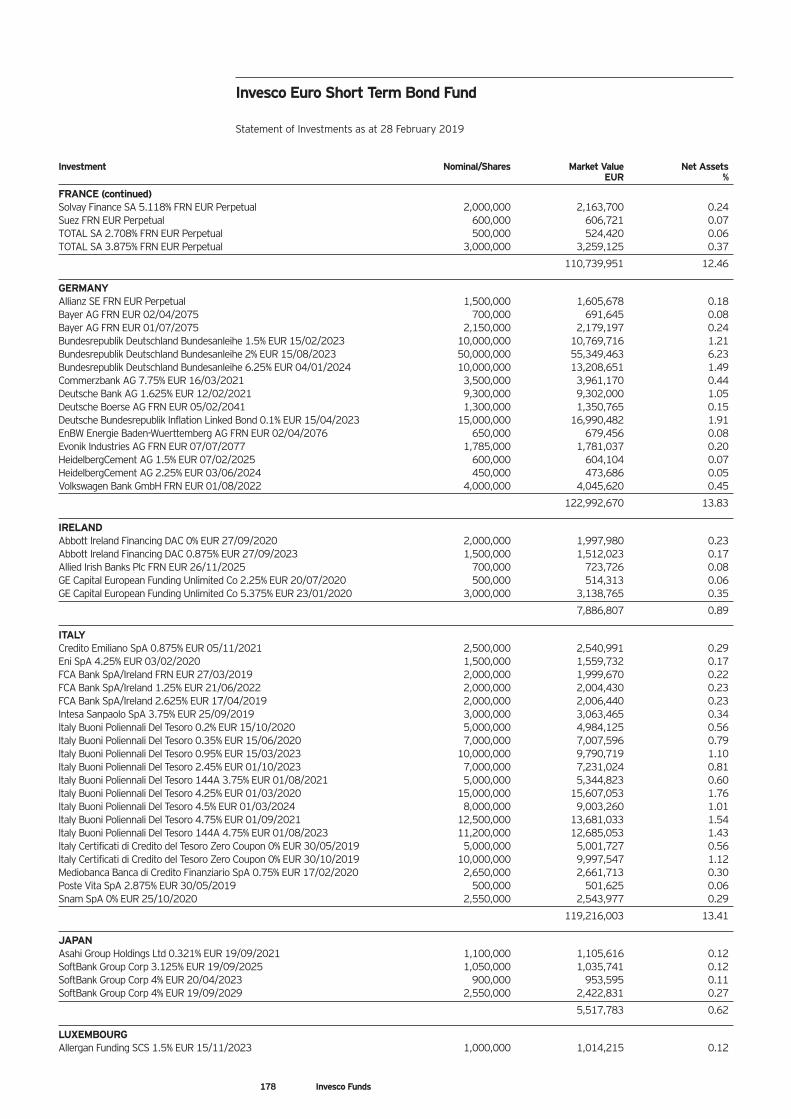
Investment Nominal/Shares Market Value Net Assets EUR %
FRANCE (continued) Solvay Finance SA 5.118% FRN EUR Perpetual 2,000,000 2,163,700 0.24 Suez FRN EUR Perpetual 600,000 606,721 0.07 TOTAL SA 2.708% FRN EUR Perpetual 500,000 524,420 0.06 TOTAL SA 3.875% FRN EUR Perpetual 3,000,000 3,259,125 0.37
110,739,951 12.46
GERMANY Allianz SE FRN EUR Perpetual 1,500,000 1,605,678 0.18 Bayer AG FRN EUR 02/04/2075 700,000 691,645 0.08 Bayer AG FRN EUR 01/07/2075 2,150,000 2,179,197 0.24 Bundesrepublik Deutschland Bundesanleihe 1.5% EUR 15/02/2023 10,000,000 10,769,716 1.21 Bundesrepublik Deutschland Bundesanleihe 2% EUR 15/08/2023 50,000,000 55,349,463 6.23 Bundesrepublik Deutschland Bundesanleihe 6.25% EUR 04/01/2024 10,000,000 13,208,651 1.49 Commerzbank AG 7.75% EUR 16/03/2021 3,500,000 3,961,170 0.44 Deutsche Bank AG 1.625% EUR 12/02/2021 9,300,000 9,302,000 1.05 Deutsche Boerse AG FRN EUR 05/02/2041 1,300,000 1,350,765 0.15 Deutsche Bundesrepublik Inflation Linked Bond 0.1% EUR 15/04/2023 15,000,000 16,990,482 1.91 EnBW Energie Baden-Wuerttemberg AG FRN EUR 02/04/2076 650,000 679,456 0.08 Evonik Industries AG FRN EUR 07/07/2077 1,785,000 1,781,037 0.20 HeidelbergCement AG 1.5% EUR 07/02/2025 600,000 604,104 0.07 HeidelbergCement AG 2.25% EUR 03/06/2024 450,000 473,686 0.05 Volkswagen Bank GmbH FRN EUR 01/08/2022 4,000,000 4,045,620 0.45
122,992,670 13.83
IRELAND Abbott Ireland Financing DAC 0% EUR 27/09/2020 2,000,000 1,997,980 0.23 Abbott Ireland Financing DAC 0.875% EUR 27/09/2023 1,500,000 1,512,023 0.17 Allied Irish Banks Plc FRN EUR 26/11/2025 700,000 723,726 0.08 GE Capital European Funding Unlimited Co 2.25% EUR 20/07/2020 500,000 514,313 0.06 GE Capital European Funding Unlimited Co 5.375% EUR 23/01/2020 3,000,000 3,138,765 0.35
7,886,807 0.89
ITALY Credito Emiliano SpA 0.875% EUR 05/11/2021 2,500,000 2,540,991 0.29 Eni SpA 4.25% EUR 03/02/2020 1,500,000 1,559,732 0.17 FCA Bank SpA/Ireland FRN EUR 27/03/2019 2,000,000 1,999,670 0.22 FCA Bank SpA/Ireland 1.25% EUR 21/06/2022 2,000,000 2,004,430 0.23 FCA Bank SpA/Ireland 2.625% EUR 17/04/2019 2,000,000 2,006,440 0.23 Intesa Sanpaolo SpA 3.75% EUR 25/09/2019 3,000,000 3,063,465 0.34 Italy Buoni Poliennali Del Tesoro 0.2% EUR 15/10/2020 5,000,000 4,984,125 0.56 Italy Buoni Poliennali Del Tesoro 0.35% EUR 15/06/2020 7,000,000 7,007,596 0.79 Italy Buoni Poliennali Del Tesoro 0.95% EUR 15/03/2023 10,000,000 9,790,719 1.10 Italy Buoni Poliennali Del Tesoro 2.45% EUR 01/10/2023 7,000,000 7,231,024 0.81 Italy Buoni Poliennali Del Tesoro 144A 3.75% EUR 01/08/2021 5,000,000 5,344,823 0.60 Italy Buoni Poliennali Del Tesoro 4.25% EUR 01/03/2020 15,000,000 15,607,053 1.76 Italy Buoni Poliennali Del Tesoro 4.5% EUR 01/03/2024 8,000,000 9,003,260 1.01 Italy Buoni Poliennali Del Tesoro 4.75% EUR 01/09/2021 12,500,000 13,681,033 1.54 Italy Buoni Poliennali Del Tesoro 144A 4.75% EUR 01/08/2023 11,200,000 12,685,053 1.43 Italy Certificati di Credito del Tesoro Zero Coupon 0% EUR 30/05/2019 5,000,000 5,001,727 0.56 Italy Certificati di Credito del Tesoro Zero Coupon 0% EUR 30/10/2019 10,000,000 9,997,547 1.12 Mediobanca Banca di Credito Finanziario SpA 0.75% EUR 17/02/2020 2,650,000 2,661,713 0.30 Poste Vita SpA 2.875% EUR 30/05/2019 500,000 501,625 0.06 Snam SpA 0% EUR 25/10/2020 2,550,000 2,543,977 0.29
119,216,003 13.41
JAPAN Asahi Group Holdings Ltd 0.321% EUR 19/09/2021 1,100,000 1,105,616 0.12 SoftBank Group Corp 3.125% EUR 19/09/2025 1,050,000 1,035,741 0.12 SoftBank Group Corp 4% EUR 20/04/2023 900,000 953,595 0.11 SoftBank Group Corp 4% EUR 19/09/2029 2,550,000 2,422,831 0.27
5,517,783 0.62
LUXEMBOURG Allergan Funding SCS 1.5% EUR 15/11/2023 1,000,000 1,014,215 0.12
178 Invesco Funds
Invesco Euro Short Term Bond Fund Statement of Investments as at 28 February 2019
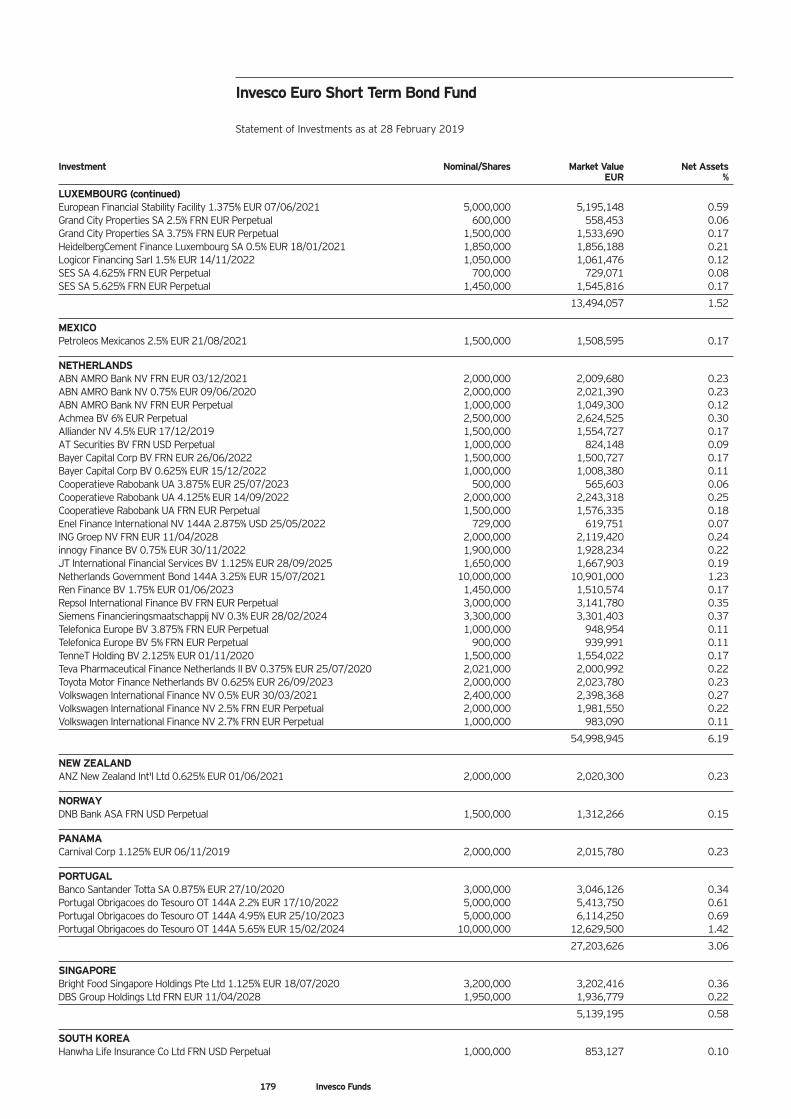
Investment Nominal/Shares Market Value Net Assets EUR %
LUXEMBOURG (continued) European Financial Stability Facility 1.375% EUR 07/06/2021 5,000,000 5,195,148 0.59 Grand City Properties SA 2.5% FRN EUR Perpetual 600,000 558,453 0.06 Grand City Properties SA 3.75% FRN EUR Perpetual 1,500,000 1,533,690 0.17 HeidelbergCement Finance Luxembourg SA 0.5% EUR 18/01/2021 1,850,000 1,856,188 0.21 Logicor Financing Sarl 1.5% EUR 14/11/2022 1,050,000 1,061,476 0.12 SES SA 4.625% FRN EUR Perpetual 700,000 729,071 0.08 SES SA 5.625% FRN EUR Perpetual 1,450,000 1,545,816 0.17
13,494,057 1.52
MEXICO Petroleos Mexicanos 2.5% EUR 21/08/2021 1,500,000 1,508,595 0.17
NETHERLANDS ABN AMRO Bank NV FRN EUR 03/12/2021 2,000,000 2,009,680 0.23 ABN AMRO Bank NV 0.75% EUR 09/06/2020 2,000,000 2,021,390 0.23 ABN AMRO Bank NV FRN EUR Perpetual 1,000,000 1,049,300 0.12 Achmea BV 6% EUR Perpetual 2,500,000 2,624,525 0.30 Alliander NV 4.5% EUR 17/12/2019 1,500,000 1,554,727 0.17 AT Securities BV FRN USD Perpetual 1,000,000 824,148 0.09 Bayer Capital Corp BV FRN EUR 26/06/2022 1,500,000 1,500,727 0.17 Bayer Capital Corp BV 0.625% EUR 15/12/2022 1,000,000 1,008,380 0.11 Cooperatieve Rabobank UA 3.875% EUR 25/07/2023 500,000 565,603 0.06 Cooperatieve Rabobank UA 4.125% EUR 14/09/2022 2,000,000 2,243,318 0.25 Cooperatieve Rabobank UA FRN EUR Perpetual 1,500,000 1,576,335 0.18 Enel Finance International NV 144A 2.875% USD 25/05/2022 729,000 619,751 0.07 ING Groep NV FRN EUR 11/04/2028 2,000,000 2,119,420 0.24 innogy Finance BV 0.75% EUR 30/11/2022 1,900,000 1,928,234 0.22 JT International Financial Services BV 1.125% EUR 28/09/2025 1,650,000 1,667,903 0.19 Netherlands Government Bond 144A 3.25% EUR 15/07/2021 10,000,000 10,901,000 1.23 Ren Finance BV 1.75% EUR 01/06/2023 1,450,000 1,510,574 0.17 Repsol International Finance BV FRN EUR Perpetual 3,000,000 3,141,780 0.35 Siemens Financieringsmaatschappij NV 0.3% EUR 28/02/2024 3,300,000 3,301,403 0.37 Telefonica Europe BV 3.875% FRN EUR Perpetual 1,000,000 948,954 0.11 Telefonica Europe BV 5% FRN EUR Perpetual 900,000 939,991 0.11 TenneT Holding BV 2.125% EUR 01/11/2020 1,500,000 1,554,022 0.17 Teva Pharmaceutical Finance Netherlands II BV 0.375% EUR 25/07/2020 2,021,000 2,000,992 0.22 Toyota Motor Finance Netherlands BV 0.625% EUR 26/09/2023 2,000,000 2,023,780 0.23 Volkswagen International Finance NV 0.5% EUR 30/03/2021 2,400,000 2,398,368 0.27 Volkswagen International Finance NV 2.5% FRN EUR Perpetual 2,000,000 1,981,550 0.22 Volkswagen International Finance NV 2.7% FRN EUR Perpetual 1,000,000 983,090 0.11
54,998,945 6.19
NEW ZEALAND ANZ New Zealand Int'l Ltd 0.625% EUR 01/06/2021 2,000,000 2,020,300 0.23
NORWAY DNB Bank ASA FRN USD Perpetual 1,500,000 1,312,266 0.15
PANAMA Carnival Corp 1.125% EUR 06/11/2019 2,000,000 2,015,780 0.23
PORTUGAL Banco Santander Totta SA 0.875% EUR 27/10/2020 3,000,000 3,046,126 0.34 Portugal Obrigacoes do Tesouro OT 144A 2.2% EUR 17/10/2022 5,000,000 5,413,750 0.61 Portugal Obrigacoes do Tesouro OT 144A 4.95% EUR 25/10/2023 5,000,000 6,114,250 0.69 Portugal Obrigacoes do Tesouro OT 144A 5.65% EUR 15/02/2024 10,000,000 12,629,500 1.42
27,203,626 3.06
SINGAPORE Bright Food Singapore Holdings Pte Ltd 1.125% EUR 18/07/2020 3,200,000 3,202,416 0.36 DBS Group Holdings Ltd FRN EUR 11/04/2028 1,950,000 1,936,779 0.22
5,139,195 0.58
SOUTH KOREA Hanwha Life Insurance Co Ltd FRN USD Perpetual 1,000,000 853,127 0.10
179 Invesco Funds
Invesco Euro Short Term Bond Fund Statement of Investments as at 28 February 2019
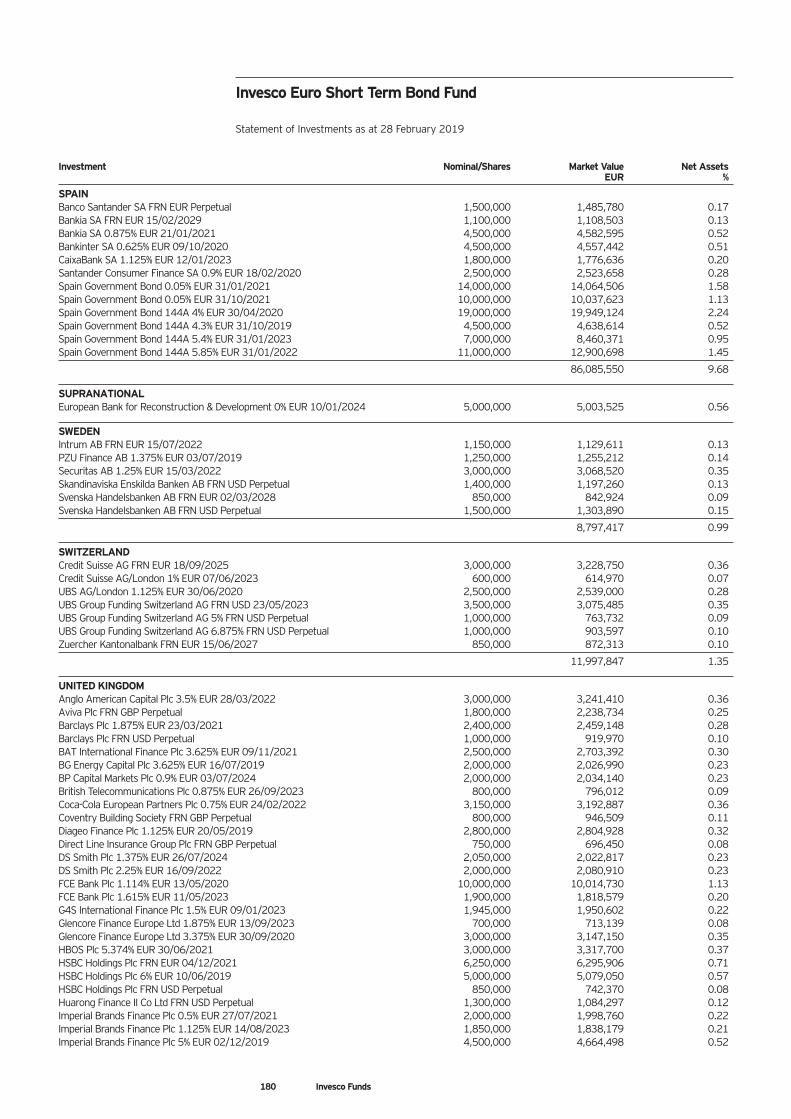
Investment Nominal/Shares Market Value Net Assets EUR %
SPAIN Banco Santander SA FRN EUR Perpetual 1,500,000 1,485,780 0.17 Bankia SA FRN EUR 15/02/2029 1,100,000 1,108,503 0.13 Bankia SA 0.875% EUR 21/01/2021 4,500,000 4,582,595 0.52 Bankinter SA 0.625% EUR 09/10/2020 4,500,000 4,557,442 0.51 CaixaBank SA 1.125% EUR 12/01/2023 1,800,000 1,776,636 0.20 Santander Consumer Finance SA 0.9% EUR 18/02/2020 2,500,000 2,523,658 0.28 Spain Government Bond 0.05% EUR 31/01/2021 14,000,000 14,064,506 1.58 Spain Government Bond 0.05% EUR 31/10/2021 10,000,000 10,037,623 1.13 Spain Government Bond 144A 4% EUR 30/04/2020 19,000,000 19,949,124 2.24 Spain Government Bond 144A 4.3% EUR 31/10/2019 4,500,000 4,638,614 0.52 Spain Government Bond 144A 5.4% EUR 31/01/2023 7,000,000 8,460,371 0.95 Spain Government Bond 144A 5.85% EUR 31/01/2022 11,000,000 12,900,698 1.45
86,085,550 9.68
SUPRANATIONAL European Bank for Reconstruction & Development 0% EUR 10/01/2024 5,000,000 5,003,525 0.56
SWEDEN Intrum AB FRN EUR 15/07/2022 1,150,000 1,129,611 0.13 PZU Finance AB 1.375% EUR 03/07/2019 1,250,000 1,255,212 0.14 Securitas AB 1.25% EUR 15/03/2022 3,000,000 3,068,520 0.35 Skandinaviska Enskilda Banken AB FRN USD Perpetual 1,400,000 1,197,260 0.13 Svenska Handelsbanken AB FRN EUR 02/03/2028 850,000 842,924 0.09 Svenska Handelsbanken AB FRN USD Perpetual 1,500,000 1,303,890 0.15
8,797,417 0.99
SWITZERLAND Credit Suisse AG FRN EUR 18/09/2025 3,000,000 3,228,750 0.36 Credit Suisse AG/London 1% EUR 07/06/2023 600,000 614,970 0.07 UBS AG/London 1.125% EUR 30/06/2020 2,500,000 2,539,000 0.28 UBS Group Funding Switzerland AG FRN USD 23/05/2023 3,500,000 3,075,485 0.35 UBS Group Funding Switzerland AG 5% FRN USD Perpetual 1,000,000 763,732 0.09 UBS Group Funding Switzerland AG 6.875% FRN USD Perpetual 1,000,000 903,597 0.10 Zuercher Kantonalbank FRN EUR 15/06/2027 850,000 872,313 0.10
11,997,847 1.35
UNITED KINGDOM Anglo American Capital Plc 3.5% EUR 28/03/2022 3,000,000 3,241,410 0.36 Aviva Plc FRN GBP Perpetual 1,800,000 2,238,734 0.25 Barclays Plc 1.875% EUR 23/03/2021 2,400,000 2,459,148 0.28 Barclays Plc FRN USD Perpetual 1,000,000 919,970 0.10 BAT International Finance Plc 3.625% EUR 09/11/2021 2,500,000 2,703,392 0.30 BG Energy Capital Plc 3.625% EUR 16/07/2019 2,000,000 2,026,990 0.23 BP Capital Markets Plc 0.9% EUR 03/07/2024 2,000,000 2,034,140 0.23 British Telecommunications Plc 0.875% EUR 26/09/2023 800,000 796,012 0.09 Coca-Cola European Partners Plc 0.75% EUR 24/02/2022 3,150,000 3,192,887 0.36 Coventry Building Society FRN GBP Perpetual 800,000 946,509 0.11 Diageo Finance Plc 1.125% EUR 20/05/2019 2,800,000 2,804,928 0.32 Direct Line Insurance Group Plc FRN GBP Perpetual 750,000 696,450 0.08 DS Smith Plc 1.375% EUR 26/07/2024 2,050,000 2,022,817 0.23 DS Smith Plc 2.25% EUR 16/09/2022 2,000,000 2,080,910 0.23 FCE Bank Plc 1.114% EUR 13/05/2020 10,000,000 10,014,730 1.13 FCE Bank Plc 1.615% EUR 11/05/2023 1,900,000 1,818,579 0.20 G4S International Finance Plc 1.5% EUR 09/01/2023 1,945,000 1,950,602 0.22 Glencore Finance Europe Ltd 1.875% EUR 13/09/2023 700,000 713,139 0.08 Glencore Finance Europe Ltd 3.375% EUR 30/09/2020 3,000,000 3,147,150 0.35 HBOS Plc 5.374% EUR 30/06/2021 3,000,000 3,317,700 0.37 HSBC Holdings Plc FRN EUR 04/12/2021 6,250,000 6,295,906 0.71 HSBC Holdings Plc 6% EUR 10/06/2019 5,000,000 5,079,050 0.57 HSBC Holdings Plc FRN USD Perpetual 850,000 742,370 0.08 Huarong Finance II Co Ltd FRN USD Perpetual 1,300,000 1,084,297 0.12 Imperial Brands Finance Plc 0.5% EUR 27/07/2021 2,000,000 1,998,760 0.22 Imperial Brands Finance Plc 1.125% EUR 14/08/2023 1,850,000 1,838,179 0.21 Imperial Brands Finance Plc 5% EUR 02/12/2019 4,500,000 4,664,498 0.52
180 Invesco Funds
Invesco Euro Short Term Bond Fund Statement of Investments as at 28 February 2019
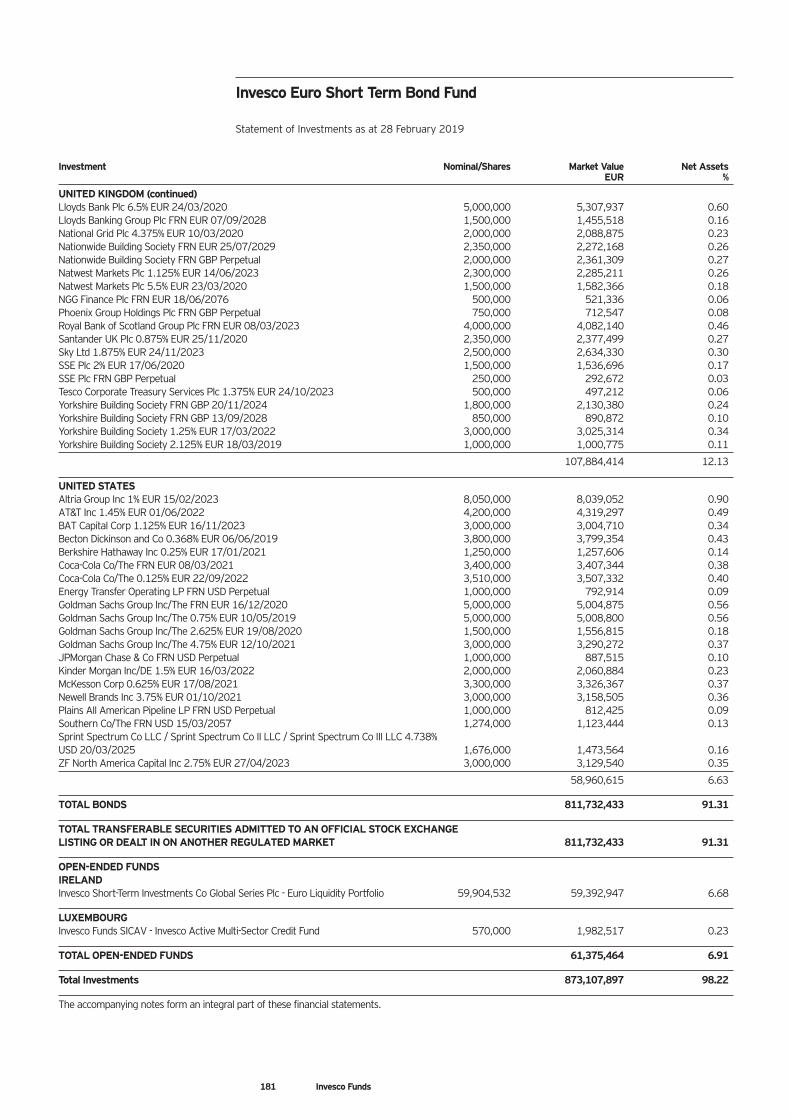
Investment Nominal/Shares Market Value Net Assets EUR %
UNITED KINGDOM (continued) Lloyds Bank Plc 6.5% EUR 24/03/2020 5,000,000 5,307,937 0.60 Lloyds Banking Group Plc FRN EUR 07/09/2028 1,500,000 1,455,518 0.16 National Grid Plc 4.375% EUR 10/03/2020 2,000,000 2,088,875 0.23 Nationwide Building Society FRN EUR 25/07/2029 2,350,000 2,272,168 0.26 Nationwide Building Society FRN GBP Perpetual 2,000,000 2,361,309 0.27 Natwest Markets Plc 1.125% EUR 14/06/2023 2,300,000 2,285,211 0.26 Natwest Markets Plc 5.5% EUR 23/03/2020 1,500,000 1,582,366 0.18 NGG Finance Plc FRN EUR 18/06/2076 500,000 521,336 0.06 Phoenix Group Holdings Plc FRN GBP Perpetual 750,000 712,547 0.08 Royal Bank of Scotland Group Plc FRN EUR 08/03/2023 4,000,000 4,082,140 0.46 Santander UK Plc 0.875% EUR 25/11/2020 2,350,000 2,377,499 0.27 Sky Ltd 1.875% EUR 24/11/2023 2,500,000 2,634,330 0.30 SSE Plc 2% EUR 17/06/2020 1,500,000 1,536,696 0.17 SSE Plc FRN GBP Perpetual 250,000 292,672 0.03 Tesco Corporate Treasury Services Plc 1.375% EUR 24/10/2023 500,000 497,212 0.06 Yorkshire Building Society FRN GBP 20/11/2024 1,800,000 2,130,380 0.24 Yorkshire Building Society FRN GBP 13/09/2028 850,000 890,872 0.10 Yorkshire Building Society 1.25% EUR 17/03/2022 3,000,000 3,025,314 0.34 Yorkshire Building Society 2.125% EUR 18/03/2019 1,000,000 1,000,775 0.11
107,884,414 12.13
UNITED STATES Altria Group Inc 1% EUR 15/02/2023 8,050,000 8,039,052 0.90 AT&T Inc 1.45% EUR 01/06/2022 4,200,000 4,319,297 0.49 BAT Capital Corp 1.125% EUR 16/11/2023 3,000,000 3,004,710 0.34 Becton Dickinson and Co 0.368% EUR 06/06/2019 3,800,000 3,799,354 0.43 Berkshire Hathaway Inc 0.25% EUR 17/01/2021 1,250,000 1,257,606 0.14 Coca-Cola Co/The FRN EUR 08/03/2021 3,400,000 3,407,344 0.38 Coca-Cola Co/The 0.125% EUR 22/09/2022 3,510,000 3,507,332 0.40 Energy Transfer Operating LP FRN USD Perpetual 1,000,000 792,914 0.09 Goldman Sachs Group Inc/The FRN EUR 16/12/2020 5,000,000 5,004,875 0.56 Goldman Sachs Group Inc/The 0.75% EUR 10/05/2019 5,000,000 5,008,800 0.56 Goldman Sachs Group Inc/The 2.625% EUR 19/08/2020 1,500,000 1,556,815 0.18 Goldman Sachs Group Inc/The 4.75% EUR 12/10/2021 3,000,000 3,290,272 0.37 JPMorgan Chase & Co FRN USD Perpetual 1,000,000 887,515 0.10 Kinder Morgan Inc/DE 1.5% EUR 16/03/2022 2,000,000 2,060,884 0.23 McKesson Corp 0.625% EUR 17/08/2021 3,300,000 3,326,367 0.37 Newell Brands Inc 3.75% EUR 01/10/2021 3,000,000 3,158,505 0.36 Plains All American Pipeline LP FRN USD Perpetual 1,000,000 812,425 0.09 Southern Co/The FRN USD 15/03/2057 1,274,000 1,123,444 0.13 Sprint Spectrum Co LLC / Sprint Spectrum Co II LLC / Sprint Spectrum Co III LLC 4.738% USD 20/03/2025 1,676,000 1,473,564 0.16 ZF North America Capital Inc 2.75% EUR 27/04/2023 3,000,000 3,129,540 0.35
58,960,615 6.63
TOTAL BONDS 811,732,433 91.31
TOTAL TRANSFERABLE SECURITIES ADMITTED TO AN OFFICIAL STOCK EXCHANGE LISTING OR DEALT IN ON ANOTHER REGULATED MARKET 811,732,433 91.31
OPEN-ENDED FUNDS IRELAND Invesco Short-Term Investments Co Global Series Plc - Euro Liquidity Portfolio 59,904,532 59,392,947 6.68
LUXEMBOURG Invesco Funds SICAV - Invesco Active Multi-Sector Credit Fund 570,000 1,982,517 0.23
TOTAL OPEN-ENDED FUNDS 61,375,464 6.91
Total Investments 873,107,897 98.22
The accompanying notes form an integral part of these financial statements.
181 Invesco Funds
Invesco Euro Short Term Bond Fund Statement of Investments as at 28 February 2019
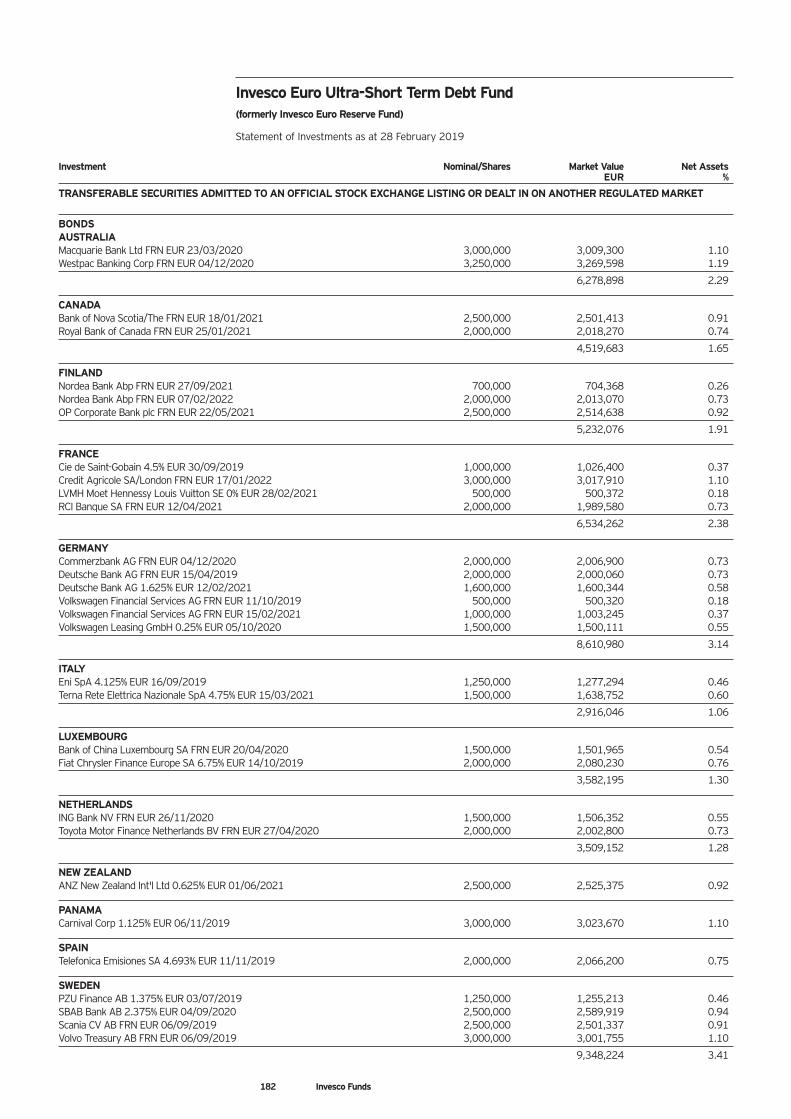
Investment Nominal/Shares Market Value Net Assets EUR %
TRANSFERABLE SECURITIES ADMITTED TO AN OFFICIAL STOCK EXCHANGE LISTING OR DEALT IN ON ANOTHER REGULATED MARKET
BONDS AUSTRALIA Macquarie Bank Ltd FRN EUR 23/03/2020 3,000,000 3,009,300 1.10 Westpac Banking Corp FRN EUR 04/12/2020 3,250,000 3,269,598 1.19
6,278,898 2.29
CANADA Bank of Nova Scotia/The FRN EUR 18/01/2021 2,500,000 2,501,413 0.91 Royal Bank of Canada FRN EUR 25/01/2021 2,000,000 2,018,270 0.74
4,519,683 1.65
FINLAND Nordea Bank Abp FRN EUR 27/09/2021 700,000 704,368 0.26 Nordea Bank Abp FRN EUR 07/02/2022 2,000,000 2,013,070 0.73 OP Corporate Bank plc FRN EUR 22/05/2021 2,500,000 2,514,638 0.92
5,232,076 1.91
FRANCE Cie de Saint-Gobain 4.5% EUR 30/09/2019 1,000,000 1,026,400 0.37 Credit Agricole SA/London FRN EUR 17/01/2022 3,000,000 3,017,910 1.10 LVMH Moet Hennessy Louis Vuitton SE 0% EUR 28/02/2021 500,000 500,372 0.18 RCI Banque SA FRN EUR 12/04/2021 2,000,000 1,989,580 0.73
6,534,262 2.38
GERMANY Commerzbank AG FRN EUR 04/12/2020 2,000,000 2,006,900 0.73 Deutsche Bank AG FRN EUR 15/04/2019 2,000,000 2,000,060 0.73 Deutsche Bank AG 1.625% EUR 12/02/2021 1,600,000 1,600,344 0.58 Volkswagen Financial Services AG FRN EUR 11/10/2019 500,000 500,320 0.18 Volkswagen Financial Services AG FRN EUR 15/02/2021 1,000,000 1,003,245 0.37 Volkswagen Leasing GmbH 0.25% EUR 05/10/2020 1,500,000 1,500,111 0.55
8,610,980 3.14
ITALY Eni SpA 4.125% EUR 16/09/2019 1,250,000 1,277,294 0.46 Terna Rete Elettrica Nazionale SpA 4.75% EUR 15/03/2021 1,500,000 1,638,752 0.60
2,916,046 1.06
LUXEMBOURG Bank of China Luxembourg SA FRN EUR 20/04/2020 1,500,000 1,501,965 0.54 Fiat Chrysler Finance Europe SA 6.75% EUR 14/10/2019 2,000,000 2,080,230 0.76
3,582,195 1.30
NETHERLANDS ING Bank NV FRN EUR 26/11/2020 1,500,000 1,506,352 0.55 Toyota Motor Finance Netherlands BV FRN EUR 27/04/2020 2,000,000 2,002,800 0.73
3,509,152 1.28
NEW ZEALAND ANZ New Zealand Int'l Ltd 0.625% EUR 01/06/2021 2,500,000 2,525,375 0.92
PANAMA Carnival Corp 1.125% EUR 06/11/2019 3,000,000 3,023,670 1.10
SPAIN Telefonica Emisiones SA 4.693% EUR 11/11/2019 2,000,000 2,066,200 0.75
SWEDEN PZU Finance AB 1.375% EUR 03/07/2019 1,250,000 1,255,213 0.46 SBAB Bank AB 2.375% EUR 04/09/2020 2,500,000 2,589,919 0.94 Scania CV AB FRN EUR 06/09/2019 2,500,000 2,501,337 0.91 Volvo Treasury AB FRN EUR 06/09/2019 3,000,000 3,001,755 1.10
9,348,224 3.41
182 Invesco Funds
Invesco Euro Ultra-Short Term Debt Fund (formerly Invesco Euro Reserve Fund) Statement of Investments as at 28 February 2019
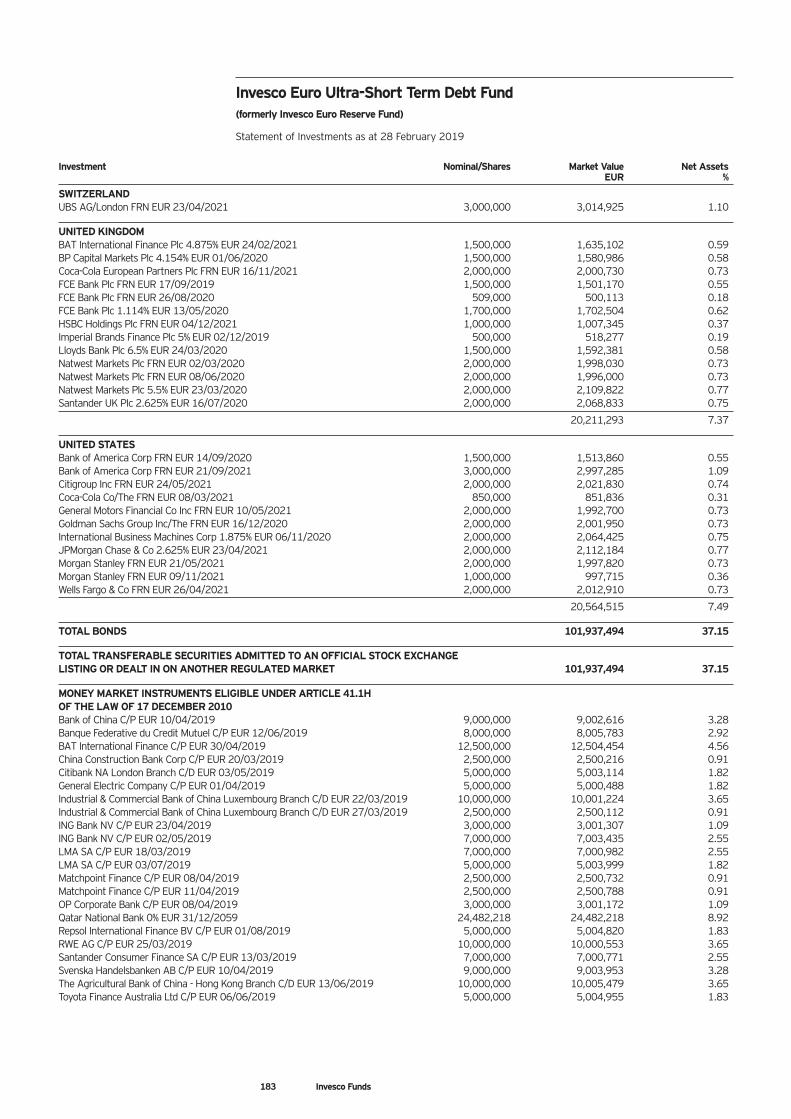
Investment Nominal/Shares Market Value Net Assets EUR %
SWITZERLAND UBS AG/London FRN EUR 23/04/2021 3,000,000 3,014,925 1.10
UNITED KINGDOM BAT International Finance Plc 4.875% EUR 24/02/2021 1,500,000 1,635,102 0.59 BP Capital Markets Plc 4.154% EUR 01/06/2020 1,500,000 1,580,986 0.58 Coca-Cola European Partners Plc FRN EUR 16/11/2021 2,000,000 2,000,730 0.73 FCE Bank Plc FRN EUR 17/09/2019 1,500,000 1,501,170 0.55 FCE Bank Plc FRN EUR 26/08/2020 509,000 500,113 0.18 FCE Bank Plc 1.114% EUR 13/05/2020 1,700,000 1,702,504 0.62 HSBC Holdings Plc FRN EUR 04/12/2021 1,000,000 1,007,345 0.37 Imperial Brands Finance Plc 5% EUR 02/12/2019 500,000 518,277 0.19 Lloyds Bank Plc 6.5% EUR 24/03/2020 1,500,000 1,592,381 0.58 Natwest Markets Plc FRN EUR 02/03/2020 2,000,000 1,998,030 0.73 Natwest Markets Plc FRN EUR 08/06/2020 2,000,000 1,996,000 0.73 Natwest Markets Plc 5.5% EUR 23/03/2020 2,000,000 2,109,822 0.77 Santander UK Plc 2.625% EUR 16/07/2020 2,000,000 2,068,833 0.75
20,211,293 7.37
UNITED STATES Bank of America Corp FRN EUR 14/09/2020 1,500,000 1,513,860 0.55 Bank of America Corp FRN EUR 21/09/2021 3,000,000 2,997,285 1.09 Citigroup Inc FRN EUR 24/05/2021 2,000,000 2,021,830 0.74 Coca-Cola Co/The FRN EUR 08/03/2021 850,000 851,836 0.31 General Motors Financial Co Inc FRN EUR 10/05/2021 2,000,000 1,992,700 0.73 Goldman Sachs Group Inc/The FRN EUR 16/12/2020 2,000,000 2,001,950 0.73 International Business Machines Corp 1.875% EUR 06/11/2020 2,000,000 2,064,425 0.75 JPMorgan Chase & Co 2.625% EUR 23/04/2021 2,000,000 2,112,184 0.77 Morgan Stanley FRN EUR 21/05/2021 2,000,000 1,997,820 0.73 Morgan Stanley FRN EUR 09/11/2021 1,000,000 997,715 0.36 Wells Fargo & Co FRN EUR 26/04/2021 2,000,000 2,012,910 0.73
20,564,515 7.49
TOTAL BONDS 101,937,494 37.15
TOTAL TRANSFERABLE SECURITIES ADMITTED TO AN OFFICIAL STOCK EXCHANGE LISTING OR DEALT IN ON ANOTHER REGULATED MARKET 101,937,494 37.15
MONEY MARKET INSTRUMENTS ELIGIBLE UNDER ARTICLE 41.1H OF THE LAW OF 17 DECEMBER 2010 Bank of China C/P EUR 10/04/2019 9,000,000 9,002,616 3.28 Banque Federative du Credit Mutuel C/P EUR 12/06/2019 8,000,000 8,005,783 2.92 BAT International Finance C/P EUR 30/04/2019 12,500,000 12,504,454 4.56 China Construction Bank Corp C/P EUR 20/03/2019 2,500,000 2,500,216 0.91 Citibank NA London Branch C/D EUR 03/05/2019 5,000,000 5,003,114 1.82 General Electric Company C/P EUR 01/04/2019 5,000,000 5,000,488 1.82 Industrial & Commercial Bank of China Luxembourg Branch C/D EUR 22/03/2019 10,000,000 10,001,224 3.65 Industrial & Commercial Bank of China Luxembourg Branch C/D EUR 27/03/2019 2,500,000 2,500,112 0.91 ING Bank NV C/P EUR 23/04/2019 3,000,000 3,001,307 1.09 ING Bank NV C/P EUR 02/05/2019 7,000,000 7,003,435 2.55 LMA SA C/P EUR 18/03/2019 7,000,000 7,000,982 2.55 LMA SA C/P EUR 03/07/2019 5,000,000 5,003,999 1.82 Matchpoint Finance C/P EUR 08/04/2019 2,500,000 2,500,732 0.91 Matchpoint Finance C/P EUR 11/04/2019 2,500,000 2,500,788 0.91 OP Corporate Bank C/P EUR 08/04/2019 3,000,000 3,001,172 1.09 Qatar National Bank 0% EUR 31/12/2059 24,482,218 24,482,218 8.92 Repsol International Finance BV C/P EUR 01/08/2019 5,000,000 5,004,820 1.83 RWE AG C/P EUR 25/03/2019 10,000,000 10,000,553 3.65 Santander Consumer Finance SA C/P EUR 13/03/2019 7,000,000 7,000,771 2.55 Svenska Handelsbanken AB C/P EUR 10/04/2019 9,000,000 9,003,953 3.28 The Agricultural Bank of China - Hong Kong Branch C/D EUR 13/06/2019 10,000,000 10,005,479 3.65 Toyota Finance Australia Ltd C/P EUR 06/06/2019 5,000,000 5,004,955 1.83
183 Invesco Funds
Invesco Euro Ultra-Short Term Debt Fund (formerly Invesco Euro Reserve Fund) Statement of Investments as at 28 February 2019
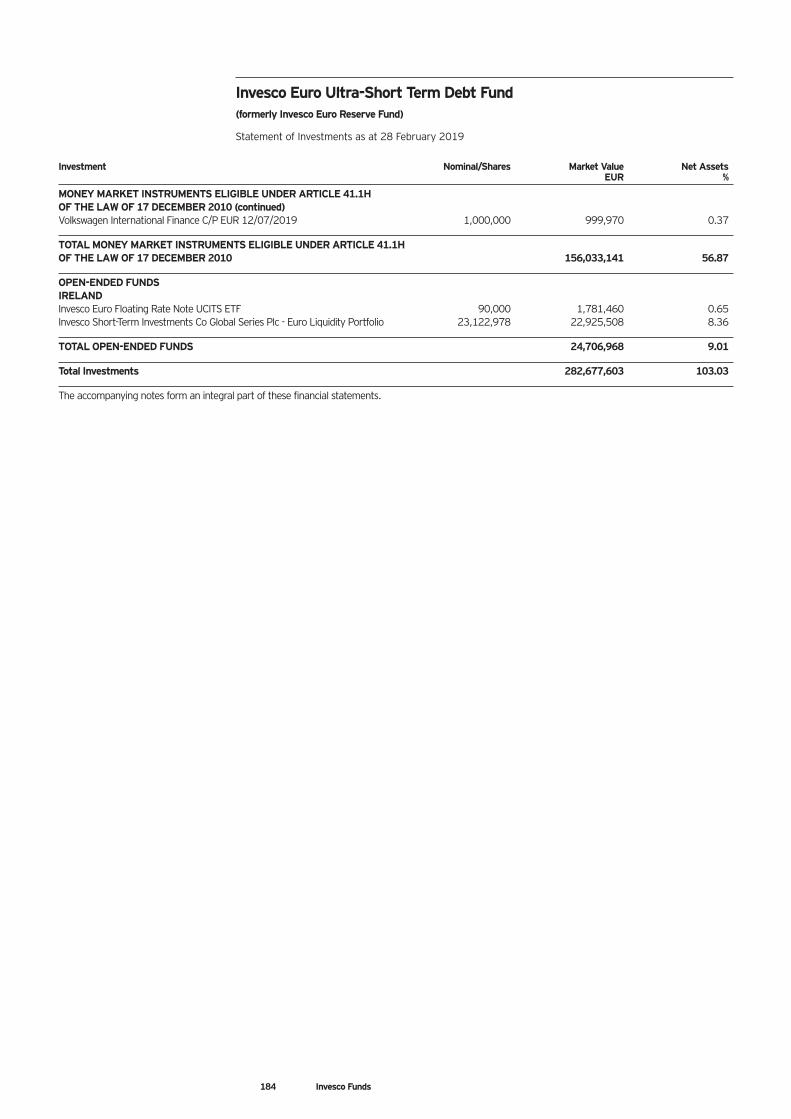
Investment Nominal/Shares Market Value Net Assets EUR %
MONEY MARKET INSTRUMENTS ELIGIBLE UNDER ARTICLE 41.1H OF THE LAW OF 17 DECEMBER 2010 (continued) Volkswagen International Finance C/P EUR 12/07/2019 1,000,000 999,970 0.37
TOTAL MONEY MARKET INSTRUMENTS ELIGIBLE UNDER ARTICLE 41.1H OF THE LAW OF 17 DECEMBER 2010 156,033,141 56.87
OPEN-ENDED FUNDS IRELAND Invesco Euro Floating Rate Note UCITS ETF 90,000 1,781,460 0.65 Invesco Short-Term Investments Co Global Series Plc - Euro Liquidity Portfolio 23,122,978 22,925,508 8.36
TOTAL OPEN-ENDED FUNDS 24,706,968 9.01
Total Investments 282,677,603 103.03
The accompanying notes form an integral part of these financial statements.
184 Invesco Funds
Invesco Euro Ultra-Short Term Debt Fund (formerly Invesco Euro Reserve Fund) Statement of Investments as at 28 February 2019
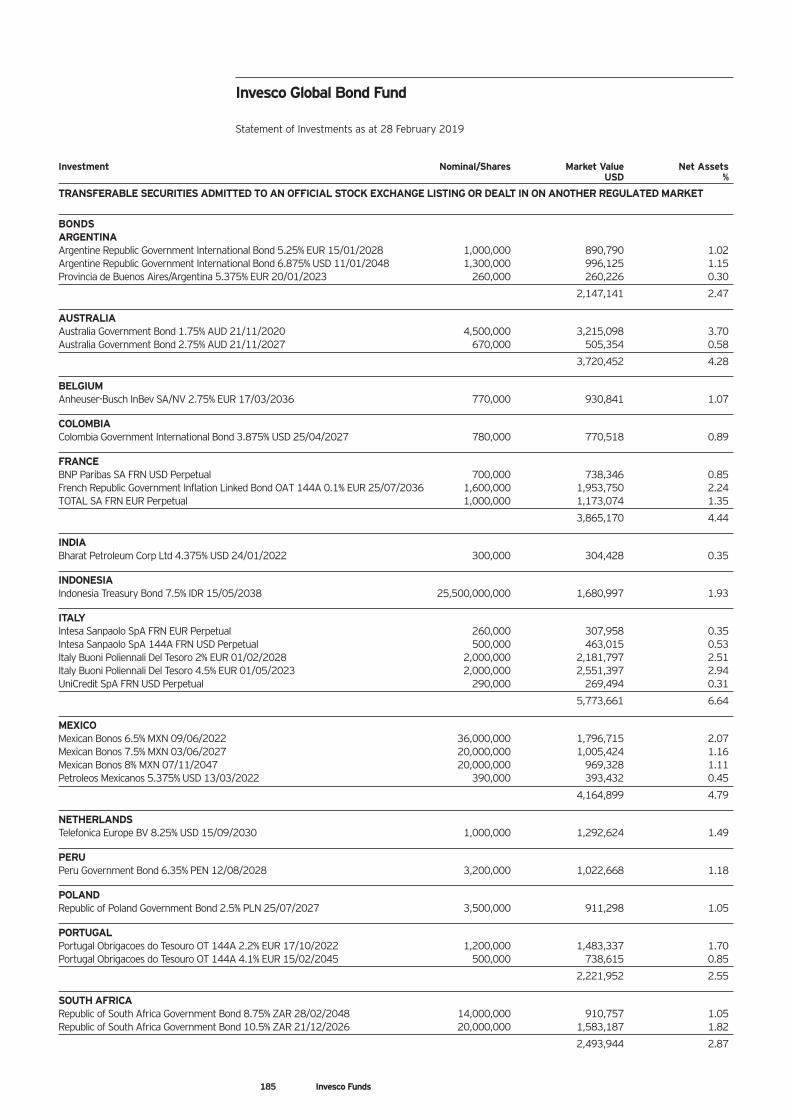
Investment Nominal/Shares Market Value Net Assets USD %
TRANSFERABLE SECURITIES ADMITTED TO AN OFFICIAL STOCK EXCHANGE LISTING OR DEALT IN ON ANOTHER REGULATED MARKET
BONDS ARGENTINA Argentine Republic Government International Bond 5.25% EUR 15/01/2028 1,000,000 890,790 1.02 Argentine Republic Government International Bond 6.875% USD 11/01/2048 1,300,000 996,125 1.15 Provincia de Buenos Aires/Argentina 5.375% EUR 20/01/2023 260,000 260,226 0.30
2,147,141 2.47
AUSTRALIA Australia Government Bond 1.75% AUD 21/11/2020 4,500,000 3,215,098 3.70 Australia Government Bond 2.75% AUD 21/11/2027 670,000 505,354 0.58
3,720,452 4.28
BELGIUM Anheuser-Busch InBev SA/NV 2.75% EUR 17/03/2036 770,000 930,841 1.07
COLOMBIA Colombia Government International Bond 3.875% USD 25/04/2027 780,000 770,518 0.89
FRANCE BNP Paribas SA FRN USD Perpetual 700,000 738,346 0.85 French Republic Government Inflation Linked Bond OAT 144A 0.1% EUR 25/07/2036 1,600,000 1,953,750 2.24 TOTAL SA FRN EUR Perpetual 1,000,000 1,173,074 1.35
3,865,170 4.44
INDIA Bharat Petroleum Corp Ltd 4.375% USD 24/01/2022 300,000 304,428 0.35
INDONESIA Indonesia Treasury Bond 7.5% IDR 15/05/2038 25,500,000,000 1,680,997 1.93
ITALY Intesa Sanpaolo SpA FRN EUR Perpetual 260,000 307,958 0.35 Intesa Sanpaolo SpA 144A FRN USD Perpetual 500,000 463,015 0.53 Italy Buoni Poliennali Del Tesoro 2% EUR 01/02/2028 2,000,000 2,181,797 2.51 Italy Buoni Poliennali Del Tesoro 4.5% EUR 01/05/2023 2,000,000 2,551,397 2.94 UniCredit SpA FRN USD Perpetual 290,000 269,494 0.31
5,773,661 6.64
MEXICO Mexican Bonos 6.5% MXN 09/06/2022 36,000,000 1,796,715 2.07 Mexican Bonos 7.5% MXN 03/06/2027 20,000,000 1,005,424 1.16 Mexican Bonos 8% MXN 07/11/2047 20,000,000 969,328 1.11 Petroleos Mexicanos 5.375% USD 13/03/2022 390,000 393,432 0.45
4,164,899 4.79
NETHERLANDS Telefonica Europe BV 8.25% USD 15/09/2030 1,000,000 1,292,624 1.49
PERU Peru Government Bond 6.35% PEN 12/08/2028 3,200,000 1,022,668 1.18
POLAND Republic of Poland Government Bond 2.5% PLN 25/07/2027 3,500,000 911,298 1.05
PORTUGAL Portugal Obrigacoes do Tesouro OT 144A 2.2% EUR 17/10/2022 1,200,000 1,483,337 1.70 Portugal Obrigacoes do Tesouro OT 144A 4.1% EUR 15/02/2045 500,000 738,615 0.85
2,221,952 2.55
SOUTH AFRICA Republic of South Africa Government Bond 8.75% ZAR 28/02/2048 14,000,000 910,757 1.05 Republic of South Africa Government Bond 10.5% ZAR 21/12/2026 20,000,000 1,583,187 1.82
2,493,944 2.87
185 Invesco Funds
Invesco Global Bond Fund Statement of Investments as at 28 February 2019
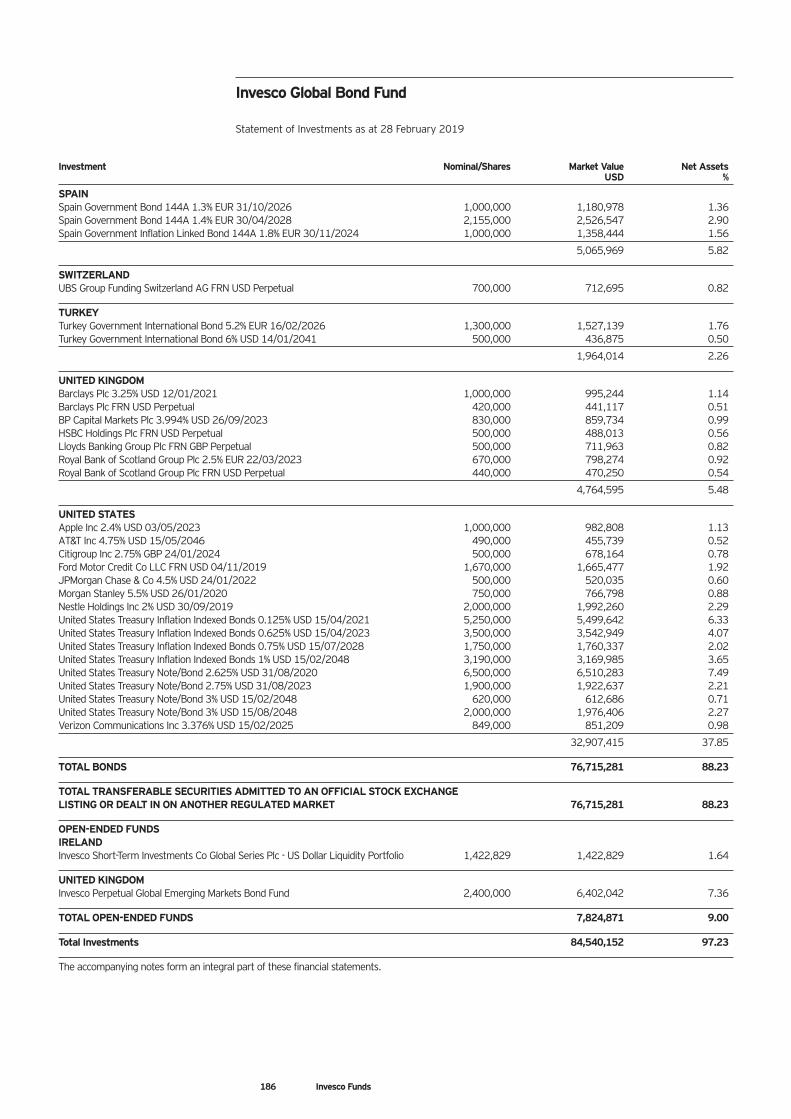
186 Invesco Funds
Investment Nominal/Shares Market Value Net Assets USD %
SPAIN Spain Government Bond 144A 1.3% EUR 31/10/2026 1,000,000 1,180,978 1.36 Spain Government Bond 144A 1.4% EUR 30/04/2028 2,155,000 2,526,547 2.90 Spain Government Inflation Linked Bond 144A 1.8% EUR 30/11/2024 1,000,000 1,358,444 1.56
5,065,969 5.82
SWITZERLAND UBS Group Funding Switzerland AG FRN USD Perpetual 700,000 712,695 0.82
TURKEY Turkey Government International Bond 5.2% EUR 16/02/2026 1,300,000 1,527,139 1.76 Turkey Government International Bond 6% USD 14/01/2041 500,000 436,875 0.50
1,964,014 2.26
UNITED KINGDOM Barclays Plc 3.25% USD 12/01/2021 1,000,000 995,244 1.14 Barclays Plc FRN USD Perpetual 420,000 441,117 0.51 BP Capital Markets Plc 3.994% USD 26/09/2023 830,000 859,734 0.99 HSBC Holdings Plc FRN USD Perpetual 500,000 488,013 0.56 Lloyds Banking Group Plc FRN GBP Perpetual 500,000 711,963 0.82 Royal Bank of Scotland Group Plc 2.5% EUR 22/03/2023 670,000 798,274 0.92 Royal Bank of Scotland Group Plc FRN USD Perpetual 440,000 470,250 0.54
4,764,595 5.48
UNITED STATES Apple Inc 2.4% USD 03/05/2023 1,000,000 982,808 1.13 AT&T Inc 4.75% USD 15/05/2046 490,000 455,739 0.52 Citigroup Inc 2.75% GBP 24/01/2024 500,000 678,164 0.78 Ford Motor Credit Co LLC FRN USD 04/11/2019 1,670,000 1,665,477 1.92 JPMorgan Chase & Co 4.5% USD 24/01/2022 500,000 520,035 0.60 Morgan Stanley 5.5% USD 26/01/2020 750,000 766,798 0.88 Nestle Holdings Inc 2% USD 30/09/2019 2,000,000 1,992,260 2.29 United States Treasury Inflation Indexed Bonds 0.125% USD 15/04/2021 5,250,000 5,499,642 6.33 United States Treasury Inflation Indexed Bonds 0.625% USD 15/04/2023 3,500,000 3,542,949 4.07 United States Treasury Inflation Indexed Bonds 0.75% USD 15/07/2028 1,750,000 1,760,337 2.02 United States Treasury Inflation Indexed Bonds 1% USD 15/02/2048 3,190,000 3,169,985 3.65 United States Treasury Note/Bond 2.625% USD 31/08/2020 6,500,000 6,510,283 7.49 United States Treasury Note/Bond 2.75% USD 31/08/2023 1,900,000 1,922,637 2.21 United States Treasury Note/Bond 3% USD 15/02/2048 620,000 612,686 0.71 United States Treasury Note/Bond 3% USD 15/08/2048 2,000,000 1,976,406 2.27 Verizon Communications Inc 3.376% USD 15/02/2025 849,000 851,209 0.98
32,907,415 37.85
TOTAL BONDS 76,715,281 88.23
TOTAL TRANSFERABLE SECURITIES ADMITTED TO AN OFFICIAL STOCK EXCHANGE LISTING OR DEALT IN ON ANOTHER REGULATED MARKET 76,715,281 88.23
OPEN-ENDED FUNDS IRELAND Invesco Short-Term Investments Co Global Series Plc - US Dollar Liquidity Portfolio 1,422,829 1,422,829 1.64
UNITED KINGDOM Invesco Perpetual Global Emerging Markets Bond Fund 2,400,000 6,402,042 7.36
TOTAL OPEN-ENDED FUNDS 7,824,871 9.00
Total Investments 84,540,152 97.23
The accompanying notes form an integral part of these financial statements.
Invesco Global Bond Fund Statement of Investments as at 28 February 2019
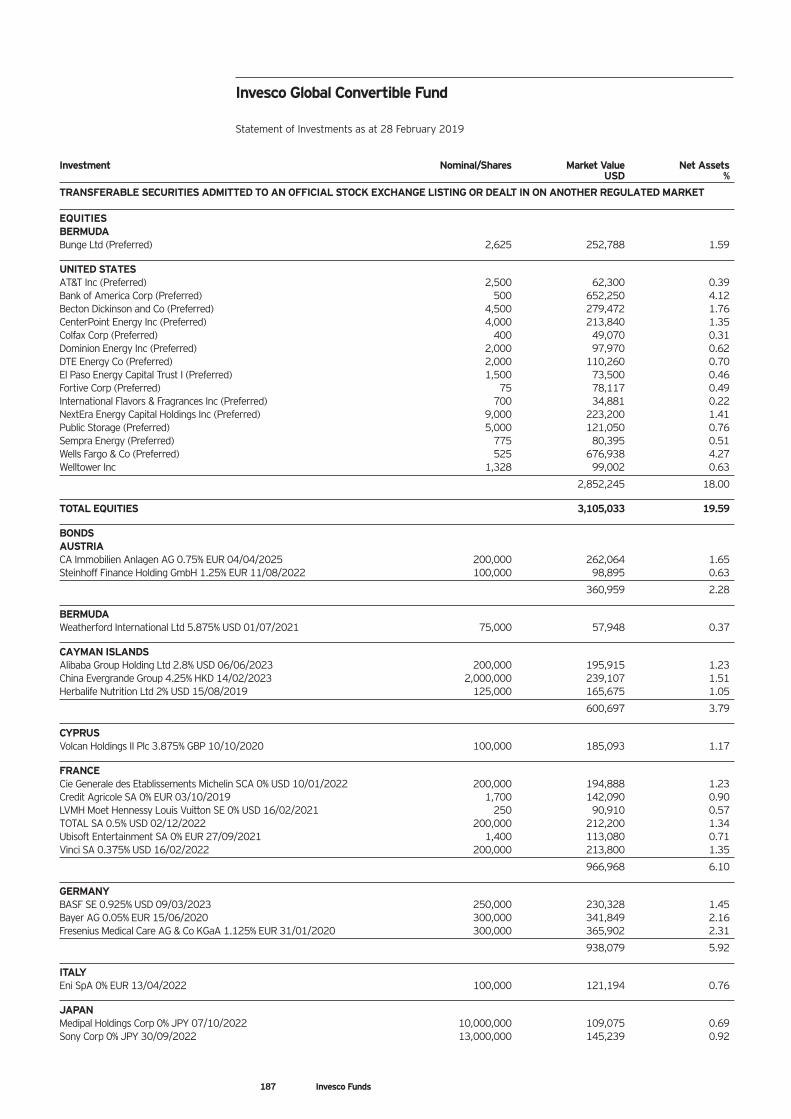
Investment Nominal/Shares Market Value Net Assets USD %
TRANSFERABLE SECURITIES ADMITTED TO AN OFFICIAL STOCK EXCHANGE LISTING OR DEALT IN ON ANOTHER REGULATED MARKET EQUITIES BERMUDA Bunge Ltd (Preferred) 2,625 252,788 1.59
UNITED STATES AT&T Inc (Preferred) 2,500 62,300 0.39 Bank of America Corp (Preferred) 500 652,250 4.12 Becton Dickinson and Co (Preferred) 4,500 279,472 1.76 CenterPoint Energy Inc (Preferred) 4,000 213,840 1.35 Colfax Corp (Preferred) 400 49,070 0.31 Dominion Energy Inc (Preferred) 2,000 97,970 0.62 DTE Energy Co (Preferred) 2,000 110,260 0.70 El Paso Energy Capital Trust I (Preferred) 1,500 73,500 0.46 Fortive Corp (Preferred) 75 78,117 0.49 International Flavors & Fragrances Inc (Preferred) 700 34,881 0.22 NextEra Energy Capital Holdings Inc (Preferred) 9,000 223,200 1.41 Public Storage (Preferred) 5,000 121,050 0.76 Sempra Energy (Preferred) 775 80,395 0.51 Wells Fargo & Co (Preferred) 525 676,938 4.27 Welltower Inc 1,328 99,002 0.63
2,852,245 18.00
TOTAL EQUITIES 3,105,033 19.59
BONDS AUSTRIA CA Immobilien Anlagen AG 0.75% EUR 04/04/2025 200,000 262,064 1.65 Steinhoff Finance Holding GmbH 1.25% EUR 11/08/2022 100,000 98,895 0.63
360,959 2.28
BERMUDA Weatherford International Ltd 5.875% USD 01/07/2021 75,000 57,948 0.37
CAYMAN ISLANDS Alibaba Group Holding Ltd 2.8% USD 06/06/2023 200,000 195,915 1.23 China Evergrande Group 4.25% HKD 14/02/2023 2,000,000 239,107 1.51 Herbalife Nutrition Ltd 2% USD 15/08/2019 125,000 165,675 1.05
600,697 3.79
CYPRUS Volcan Holdings II Plc 3.875% GBP 10/10/2020 100,000 185,093 1.17
FRANCE Cie Generale des Etablissements Michelin SCA 0% USD 10/01/2022 200,000 194,888 1.23 Credit Agricole SA 0% EUR 03/10/2019 1,700 142,090 0.90 LVMH Moet Hennessy Louis Vuitton SE 0% USD 16/02/2021 250 90,910 0.57 TOTAL SA 0.5% USD 02/12/2022 200,000 212,200 1.34 Ubisoft Entertainment SA 0% EUR 27/09/2021 1,400 113,080 0.71 Vinci SA 0.375% USD 16/02/2022 200,000 213,800 1.35
966,968 6.10
GERMANY BASF SE 0.925% USD 09/03/2023 250,000 230,328 1.45 Bayer AG 0.05% EUR 15/06/2020 300,000 341,849 2.16 Fresenius Medical Care AG & Co KGaA 1.125% EUR 31/01/2020 300,000 365,902 2.31
938,079 5.92
ITALY Eni SpA 0% EUR 13/04/2022 100,000 121,194 0.76
JAPAN Medipal Holdings Corp 0% JPY 07/10/2022 10,000,000 109,075 0.69 Sony Corp 0% JPY 30/09/2022 13,000,000 145,239 0.92
Invesco Global Convertible Fund Statement of Investments as at 28 February 2019
187 Invesco Funds
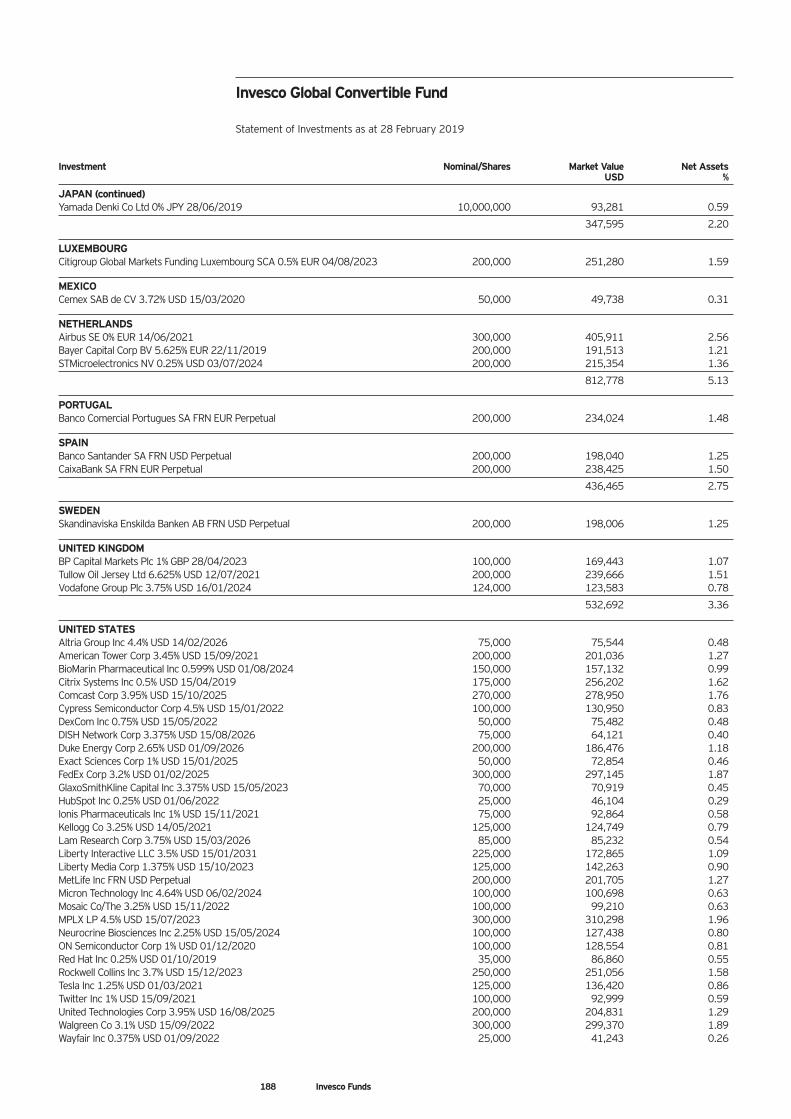
188 Invesco Funds
Investment Nominal/Shares Market Value Net Assets USD %
JAPAN (continued) Yamada Denki Co Ltd 0% JPY 28/06/2019 10,000,000 93,281 0.59
347,595 2.20
LUXEMBOURG Citigroup Global Markets Funding Luxembourg SCA 0.5% EUR 04/08/2023 200,000 251,280 1.59
MEXICO Cemex SAB de CV 3.72% USD 15/03/2020 50,000 49,738 0.31
NETHERLANDS Airbus SE 0% EUR 14/06/2021 300,000 405,911 2.56 Bayer Capital Corp BV 5.625% EUR 22/11/2019 200,000 191,513 1.21 STMicroelectronics NV 0.25% USD 03/07/2024 200,000 215,354 1.36
812,778 5.13
PORTUGAL Banco Comercial Portugues SA FRN EUR Perpetual 200,000 234,024 1.48
SPAIN Banco Santander SA FRN USD Perpetual 200,000 198,040 1.25 CaixaBank SA FRN EUR Perpetual 200,000 238,425 1.50
436,465 2.75
SWEDEN Skandinaviska Enskilda Banken AB FRN USD Perpetual 200,000 198,006 1.25
UNITED KINGDOM BP Capital Markets Plc 1% GBP 28/04/2023 100,000 169,443 1.07 Tullow Oil Jersey Ltd 6.625% USD 12/07/2021 200,000 239,666 1.51 Vodafone Group Plc 3.75% USD 16/01/2024 124,000 123,583 0.78
532,692 3.36
UNITED STATES Altria Group Inc 4.4% USD 14/02/2026 75,000 75,544 0.48 American Tower Corp 3.45% USD 15/09/2021 200,000 201,036 1.27 BioMarin Pharmaceutical Inc 0.599% USD 01/08/2024 150,000 157,132 0.99 Citrix Systems Inc 0.5% USD 15/04/2019 175,000 256,202 1.62 Comcast Corp 3.95% USD 15/10/2025 270,000 278,950 1.76 Cypress Semiconductor Corp 4.5% USD 15/01/2022 100,000 130,950 0.83 DexCom Inc 0.75% USD 15/05/2022 50,000 75,482 0.48 DISH Network Corp 3.375% USD 15/08/2026 75,000 64,121 0.40 Duke Energy Corp 2.65% USD 01/09/2026 200,000 186,476 1.18 Exact Sciences Corp 1% USD 15/01/2025 50,000 72,854 0.46 FedEx Corp 3.2% USD 01/02/2025 300,000 297,145 1.87 GlaxoSmithKline Capital Inc 3.375% USD 15/05/2023 70,000 70,919 0.45 HubSpot Inc 0.25% USD 01/06/2022 25,000 46,104 0.29 Ionis Pharmaceuticals Inc 1% USD 15/11/2021 75,000 92,864 0.58 Kellogg Co 3.25% USD 14/05/2021 125,000 124,749 0.79 Lam Research Corp 3.75% USD 15/03/2026 85,000 85,232 0.54 Liberty Interactive LLC 3.5% USD 15/01/2031 225,000 172,865 1.09 Liberty Media Corp 1.375% USD 15/10/2023 125,000 142,263 0.90 MetLife Inc FRN USD Perpetual 200,000 201,705 1.27 Micron Technology Inc 4.64% USD 06/02/2024 100,000 100,698 0.63 Mosaic Co/The 3.25% USD 15/11/2022 100,000 99,210 0.63 MPLX LP 4.5% USD 15/07/2023 300,000 310,298 1.96 Neurocrine Biosciences Inc 2.25% USD 15/05/2024 100,000 127,438 0.80 ON Semiconductor Corp 1% USD 01/12/2020 100,000 128,554 0.81 Red Hat Inc 0.25% USD 01/10/2019 35,000 86,860 0.55 Rockwell Collins Inc 3.7% USD 15/12/2023 250,000 251,056 1.58 Tesla Inc 1.25% USD 01/03/2021 125,000 136,420 0.86 Twitter Inc 1% USD 15/09/2021 100,000 92,999 0.59 United Technologies Corp 3.95% USD 16/08/2025 200,000 204,831 1.29 Walgreen Co 3.1% USD 15/09/2022 300,000 299,370 1.89 Wayfair Inc 0.375% USD 01/09/2022 25,000 41,243 0.26
Invesco Global Convertible Fund Statement of Investments as at 28 February 2019
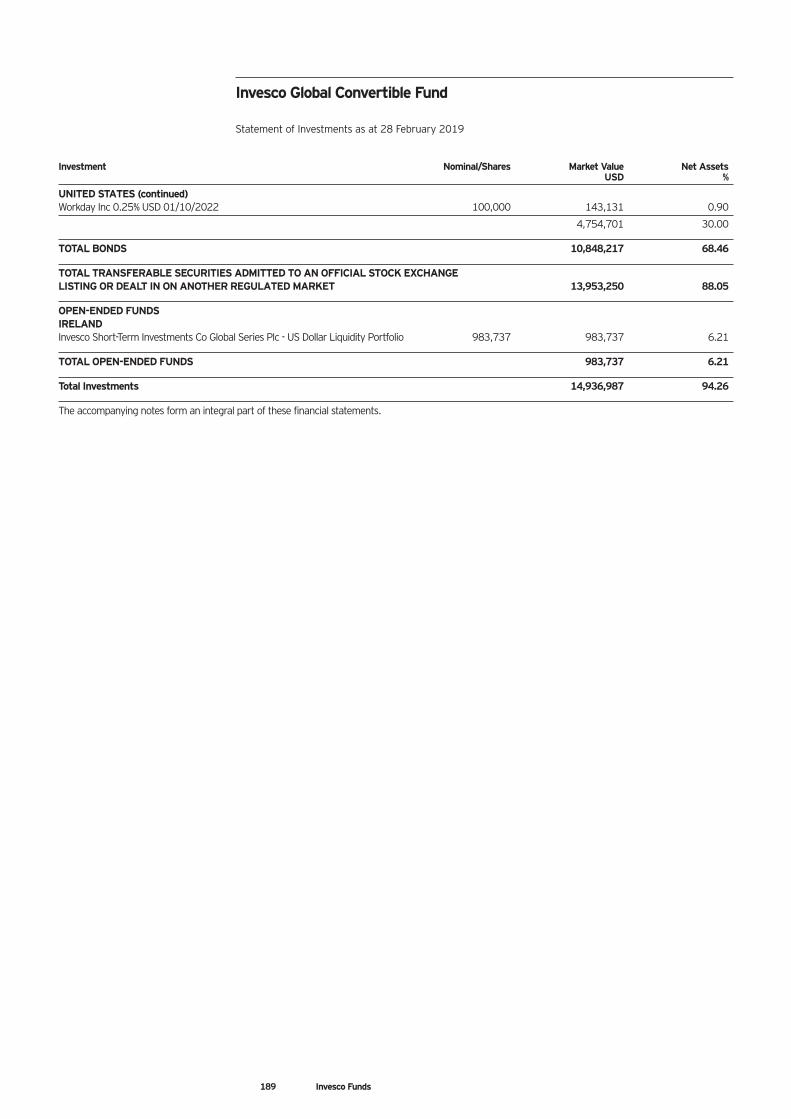
189 Invesco Funds
Investment Nominal/Shares Market Value Net Assets USD %
UNITED STATES (continued) Workday Inc 0.25% USD 01/10/2022 100,000 143,131 0.90
4,754,701 30.00
TOTAL BONDS 10,848,217 68.46
TOTAL TRANSFERABLE SECURITIES ADMITTED TO AN OFFICIAL STOCK EXCHANGE LISTING OR DEALT IN ON ANOTHER REGULATED MARKET 13,953,250 88.05
OPEN-ENDED FUNDS IRELAND Invesco Short-Term Investments Co Global Series Plc - US Dollar Liquidity Portfolio 983,737 983,737 6.21
TOTAL OPEN-ENDED FUNDS 983,737 6.21
Total Investments 14,936,987 94.26
The accompanying notes form an integral part of these financial statements.
Invesco Global Convertible Fund Statement of Investments as at 28 February 2019
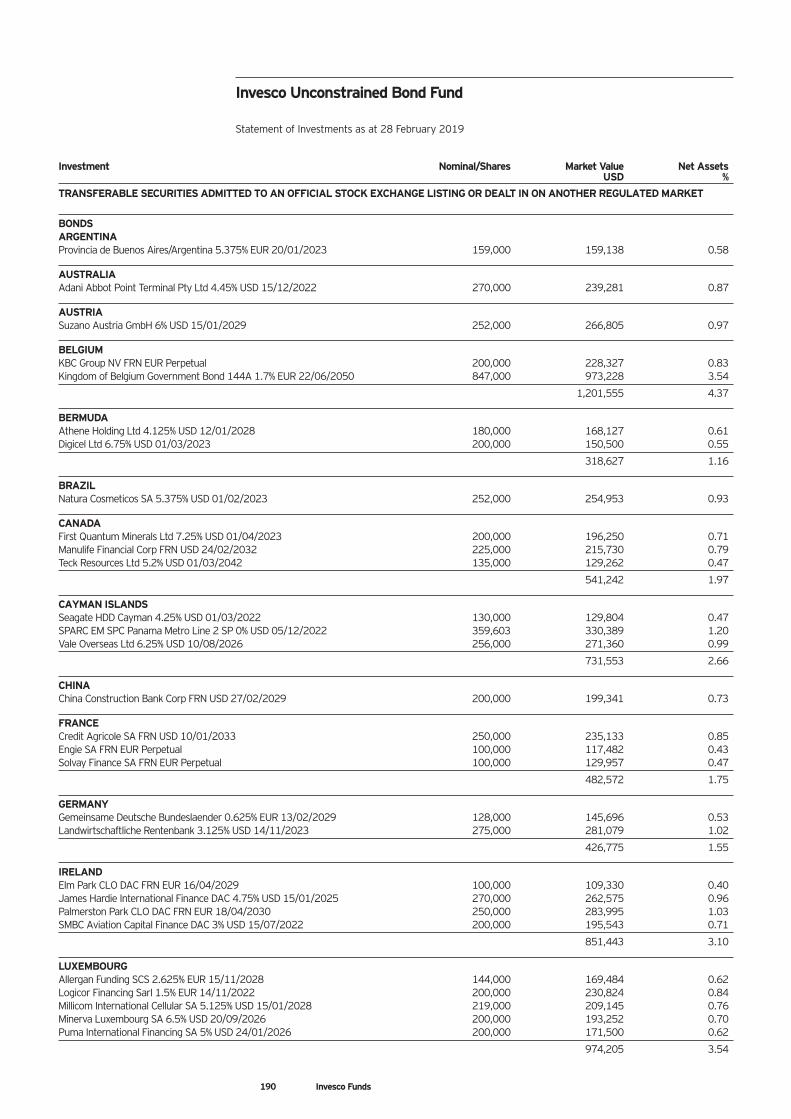
190 Invesco Funds
Investment Nominal/Shares Market Value Net Assets USD %
TRANSFERABLE SECURITIES ADMITTED TO AN OFFICIAL STOCK EXCHANGE LISTING OR DEALT IN ON ANOTHER REGULATED MARKET
BONDS ARGENTINA Provincia de Buenos Aires/Argentina 5.375% EUR 20/01/2023 159,000 159,138 0.58
AUSTRALIA Adani Abbot Point Terminal Pty Ltd 4.45% USD 15/12/2022 270,000 239,281 0.87
AUSTRIA Suzano Austria GmbH 6% USD 15/01/2029 252,000 266,805 0.97
BELGIUM KBC Group NV FRN EUR Perpetual 200,000 228,327 0.83 Kingdom of Belgium Government Bond 144A 1.7% EUR 22/06/2050 847,000 973,228 3.54
1,201,555 4.37
BERMUDA Athene Holding Ltd 4.125% USD 12/01/2028 180,000 168,127 0.61 Digicel Ltd 6.75% USD 01/03/2023 200,000 150,500 0.55
318,627 1.16
BRAZIL Natura Cosmeticos SA 5.375% USD 01/02/2023 252,000 254,953 0.93
CANADA First Quantum Minerals Ltd 7.25% USD 01/04/2023 200,000 196,250 0.71 Manulife Financial Corp FRN USD 24/02/2032 225,000 215,730 0.79 Teck Resources Ltd 5.2% USD 01/03/2042 135,000 129,262 0.47
541,242 1.97
CAYMAN ISLANDS Seagate HDD Cayman 4.25% USD 01/03/2022 130,000 129,804 0.47 SPARC EM SPC Panama Metro Line 2 SP 0% USD 05/12/2022 359,603 330,389 1.20 Vale Overseas Ltd 6.25% USD 10/08/2026 256,000 271,360 0.99
731,553 2.66
CHINA China Construction Bank Corp FRN USD 27/02/2029 200,000 199,341 0.73
FRANCE Credit Agricole SA FRN USD 10/01/2033 250,000 235,133 0.85 Engie SA FRN EUR Perpetual 100,000 117,482 0.43 Solvay Finance SA FRN EUR Perpetual 100,000 129,957 0.47
482,572 1.75
GERMANY Gemeinsame Deutsche Bundeslaender 0.625% EUR 13/02/2029 128,000 145,696 0.53 Landwirtschaftliche Rentenbank 3.125% USD 14/11/2023 275,000 281,079 1.02
426,775 1.55
IRELAND Elm Park CLO DAC FRN EUR 16/04/2029 100,000 109,330 0.40 James Hardie International Finance DAC 4.75% USD 15/01/2025 270,000 262,575 0.96 Palmerston Park CLO DAC FRN EUR 18/04/2030 250,000 283,995 1.03 SMBC Aviation Capital Finance DAC 3% USD 15/07/2022 200,000 195,543 0.71
851,443 3.10
LUXEMBOURG Allergan Funding SCS 2.625% EUR 15/11/2028 144,000 169,484 0.62 Logicor Financing Sarl 1.5% EUR 14/11/2022 200,000 230,824 0.84 Millicom International Cellular SA 5.125% USD 15/01/2028 219,000 209,145 0.76 Minerva Luxembourg SA 6.5% USD 20/09/2026 200,000 193,252 0.70 Puma International Financing SA 5% USD 24/01/2026 200,000 171,500 0.62
974,205 3.54
Invesco Unconstrained Bond Fund Statement of Investments as at 28 February 2019
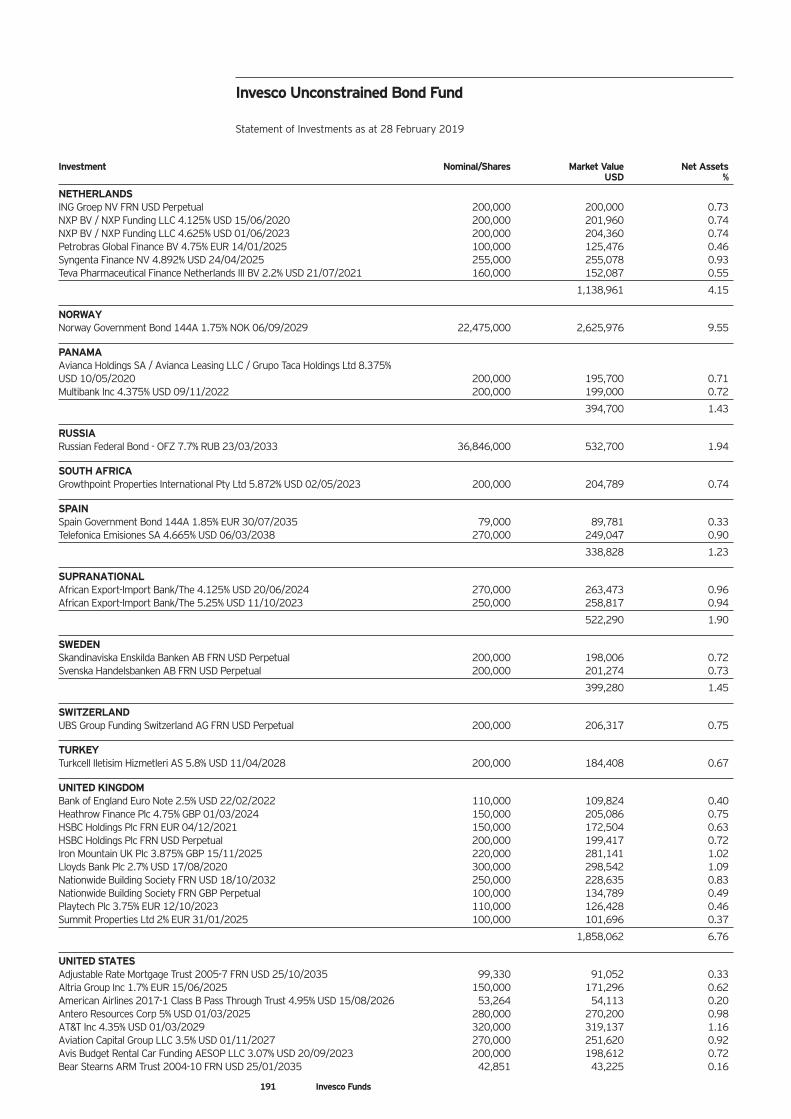
191 Invesco Funds
Investment Nominal/Shares Market Value Net Assets USD %
NETHERLANDS ING Groep NV FRN USD Perpetual 200,000 200,000 0.73 NXP BV / NXP Funding LLC 4.125% USD 15/06/2020 200,000 201,960 0.74 NXP BV / NXP Funding LLC 4.625% USD 01/06/2023 200,000 204,360 0.74 Petrobras Global Finance BV 4.75% EUR 14/01/2025 100,000 125,476 0.46 Syngenta Finance NV 4.892% USD 24/04/2025 255,000 255,078 0.93 Teva Pharmaceutical Finance Netherlands III BV 2.2% USD 21/07/2021 160,000 152,087 0.55
1,138,961 4.15
NORWAY Norway Government Bond 144A 1.75% NOK 06/09/2029 22,475,000 2,625,976 9.55
PANAMA Avianca Holdings SA / Avianca Leasing LLC / Grupo Taca Holdings Ltd 8.375% USD 10/05/2020 200,000 195,700 0.71 Multibank Inc 4.375% USD 09/11/2022 200,000 199,000 0.72
394,700 1.43
RUSSIA Russian Federal Bond - OFZ 7.7% RUB 23/03/2033 36,846,000 532,700 1.94
SOUTH AFRICA Growthpoint Properties International Pty Ltd 5.872% USD 02/05/2023 200,000 204,789 0.74
SPAIN Spain Government Bond 144A 1.85% EUR 30/07/2035 79,000 89,781 0.33 Telefonica Emisiones SA 4.665% USD 06/03/2038 270,000 249,047 0.90
338,828 1.23
SUPRANATIONAL African Export-Import Bank/The 4.125% USD 20/06/2024 270,000 263,473 0.96 African Export-Import Bank/The 5.25% USD 11/10/2023 250,000 258,817 0.94
522,290 1.90
SWEDEN Skandinaviska Enskilda Banken AB FRN USD Perpetual 200,000 198,006 0.72 Svenska Handelsbanken AB FRN USD Perpetual 200,000 201,274 0.73
399,280 1.45
SWITZERLAND UBS Group Funding Switzerland AG FRN USD Perpetual 200,000 206,317 0.75
TURKEY Turkcell Iletisim Hizmetleri AS 5.8% USD 11/04/2028 200,000 184,408 0.67
UNITED KINGDOM Bank of England Euro Note 2.5% USD 22/02/2022 110,000 109,824 0.40 Heathrow Finance Plc 4.75% GBP 01/03/2024 150,000 205,086 0.75 HSBC Holdings Plc FRN EUR 04/12/2021 150,000 172,504 0.63 HSBC Holdings Plc FRN USD Perpetual 200,000 199,417 0.72 Iron Mountain UK Plc 3.875% GBP 15/11/2025 220,000 281,141 1.02 Lloyds Bank Plc 2.7% USD 17/08/2020 300,000 298,542 1.09 Nationwide Building Society FRN USD 18/10/2032 250,000 228,635 0.83 Nationwide Building Society FRN GBP Perpetual 100,000 134,789 0.49 Playtech Plc 3.75% EUR 12/10/2023 110,000 126,428 0.46 Summit Properties Ltd 2% EUR 31/01/2025 100,000 101,696 0.37
1,858,062 6.76
UNITED STATES Adjustable Rate Mortgage Trust 2005-7 FRN USD 25/10/2035 99,330 91,052 0.33 Altria Group Inc 1.7% EUR 15/06/2025 150,000 171,296 0.62 American Airlines 2017-1 Class B Pass Through Trust 4.95% USD 15/08/2026 53,264 54,113 0.20 Antero Resources Corp 5% USD 01/03/2025 280,000 270,200 0.98 AT&T Inc 4.35% USD 01/03/2029 320,000 319,137 1.16 Aviation Capital Group LLC 3.5% USD 01/11/2027 270,000 251,620 0.92 Avis Budget Rental Car Funding AESOP LLC 3.07% USD 20/09/2023 200,000 198,612 0.72 Bear Stearns ARM Trust 2004-10 FRN USD 25/01/2035 42,851 43,225 0.16
Invesco Unconstrained Bond Fund Statement of Investments as at 28 February 2019
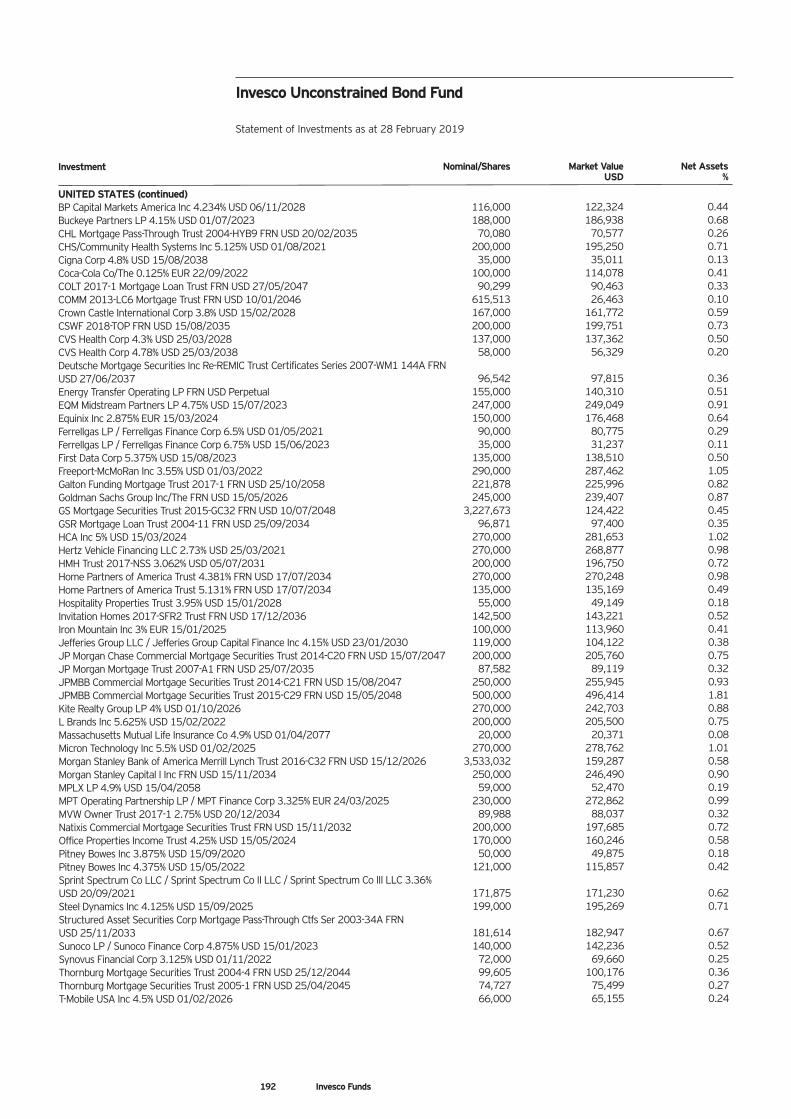
192 Invesco Funds
Investment Nominal/Shares Market Value Net Assets USD %
UNITED STATES (continued) BP Capital Markets America Inc 4.234% USD 06/11/2028 116,000 122,324 0.44 Buckeye Partners LP 4.15% USD 01/07/2023 188,000 186,938 0.68 CHL Mortgage Pass-Through Trust 2004-HYB9 FRN USD 20/02/2035 70,080 70,577 0.26 CHS/Community Health Systems Inc 5.125% USD 01/08/2021 200,000 195,250 0.71 Cigna Corp 4.8% USD 15/08/2038 35,000 35,011 0.13 Coca-Cola Co/The 0.125% EUR 22/09/2022 100,000 114,078 0.41 COLT 2017-1 Mortgage Loan Trust FRN USD 27/05/2047 90,299 90,463 0.33 COMM 2013-LC6 Mortgage Trust FRN USD 10/01/2046 615,513 26,463 0.10 Crown Castle International Corp 3.8% USD 15/02/2028 167,000 161,772 0.59 CSWF 2018-TOP FRN USD 15/08/2035 200,000 199,751 0.73 CVS Health Corp 4.3% USD 25/03/2028 137,000 137,362 0.50 CVS Health Corp 4.78% USD 25/03/2038 58,000 56,329 0.20 Deutsche Mortgage Securities Inc Re-REMIC Trust Certificates Series 2007-WM1 144A FRN USD 27/06/2037 96,542 97,815 0.36 Energy Transfer Operating LP FRN USD Perpetual 155,000 140,310 0.51 EQM Midstream Partners LP 4.75% USD 15/07/2023 247,000 249,049 0.91 Equinix Inc 2.875% EUR 15/03/2024 150,000 176,468 0.64 Ferrellgas LP / Ferrellgas Finance Corp 6.5% USD 01/05/2021 90,000 80,775 0.29 Ferrellgas LP / Ferrellgas Finance Corp 6.75% USD 15/06/2023 35,000 31,237 0.11 First Data Corp 5.375% USD 15/08/2023 135,000 138,510 0.50 Freeport-McMoRan Inc 3.55% USD 01/03/2022 290,000 287,462 1.05 Galton Funding Mortgage Trust 2017-1 FRN USD 25/10/2058 221,878 225,996 0.82 Goldman Sachs Group Inc/The FRN USD 15/05/2026 245,000 239,407 0.87 GS Mortgage Securities Trust 2015-GC32 FRN USD 10/07/2048 3,227,673 124,422 0.45 GSR Mortgage Loan Trust 2004-11 FRN USD 25/09/2034 96,871 97,400 0.35 HCA Inc 5% USD 15/03/2024 270,000 281,653 1.02 Hertz Vehicle Financing LLC 2.73% USD 25/03/2021 270,000 268,877 0.98 HMH Trust 2017-NSS 3.062% USD 05/07/2031 200,000 196,750 0.72 Home Partners of America Trust 4.381% FRN USD 17/07/2034 270,000 270,248 0.98 Home Partners of America Trust 5.131% FRN USD 17/07/2034 135,000 135,169 0.49 Hospitality Properties Trust 3.95% USD 15/01/2028 55,000 49,149 0.18 Invitation Homes 2017-SFR2 Trust FRN USD 17/12/2036 142,500 143,221 0.52 Iron Mountain Inc 3% EUR 15/01/2025 100,000 113,960 0.41 Jefferies Group LLC / Jefferies Group Capital Finance Inc 4.15% USD 23/01/2030 119,000 104,122 0.38 JP Morgan Chase Commercial Mortgage Securities Trust 2014-C20 FRN USD 15/07/2047 200,000 205,760 0.75 JP Morgan Mortgage Trust 2007-A1 FRN USD 25/07/2035 87,582 89,119 0.32 JPMBB Commercial Mortgage Securities Trust 2014-C21 FRN USD 15/08/2047 250,000 255,945 0.93 JPMBB Commercial Mortgage Securities Trust 2015-C29 FRN USD 15/05/2048 500,000 496,414 1.81 Kite Realty Group LP 4% USD 01/10/2026 270,000 242,703 0.88 L Brands Inc 5.625% USD 15/02/2022 200,000 205,500 0.75 Massachusetts Mutual Life Insurance Co 4.9% USD 01/04/2077 20,000 20,371 0.08 Micron Technology Inc 5.5% USD 01/02/2025 270,000 278,762 1.01 Morgan Stanley Bank of America Merrill Lynch Trust 2016-C32 FRN USD 15/12/2026 3,533,032 159,287 0.58 Morgan Stanley Capital I Inc FRN USD 15/11/2034 250,000 246,490 0.90 MPLX LP 4.9% USD 15/04/2058 59,000 52,470 0.19 MPT Operating Partnership LP / MPT Finance Corp 3.325% EUR 24/03/2025 230,000 272,862 0.99 MVW Owner Trust 2017-1 2.75% USD 20/12/2034 89,988 88,037 0.32 Natixis Commercial Mortgage Securities Trust FRN USD 15/11/2032 200,000 197,685 0.72 Office Properties Income Trust 4.25% USD 15/05/2024 170,000 160,246 0.58 Pitney Bowes Inc 3.875% USD 15/09/2020 50,000 49,875 0.18 Pitney Bowes Inc 4.375% USD 15/05/2022 121,000 115,857 0.42 Sprint Spectrum Co LLC / Sprint Spectrum Co II LLC / Sprint Spectrum Co III LLC 3.36% USD 20/09/2021 171,875 171,230 0.62 Steel Dynamics Inc 4.125% USD 15/09/2025 199,000 195,269 0.71 Structured Asset Securities Corp Mortgage Pass-Through Ctfs Ser 2003-34A FRN USD 25/11/2033 181,614 182,947 0.67 Sunoco LP / Sunoco Finance Corp 4.875% USD 15/01/2023 140,000 142,236 0.52 Synovus Financial Corp 3.125% USD 01/11/2022 72,000 69,660 0.25 Thornburg Mortgage Securities Trust 2004-4 FRN USD 25/12/2044 99,605 100,176 0.36 Thornburg Mortgage Securities Trust 2005-1 FRN USD 25/04/2045 74,727 75,499 0.27 T-Mobile USA Inc 4.5% USD 01/02/2026 66,000 65,155 0.24
Invesco Unconstrained Bond Fund Statement of Investments as at 28 February 2019
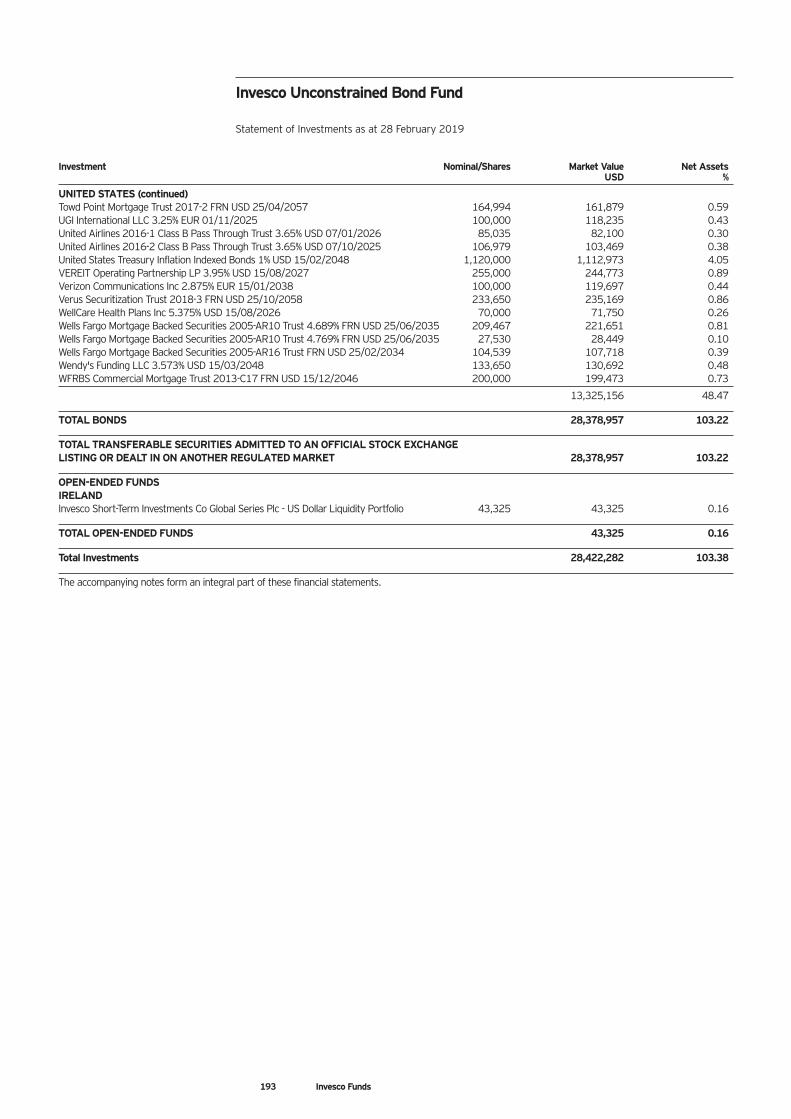
193 Invesco Funds
Investment Nominal/Shares Market Value Net Assets USD %
UNITED STATES (continued) Towd Point Mortgage Trust 2017-2 FRN USD 25/04/2057 164,994 161,879 0.59 UGI International LLC 3.25% EUR 01/11/2025 100,000 118,235 0.43 United Airlines 2016-1 Class B Pass Through Trust 3.65% USD 07/01/2026 85,035 82,100 0.30 United Airlines 2016-2 Class B Pass Through Trust 3.65% USD 07/10/2025 106,979 103,469 0.38 United States Treasury Inflation Indexed Bonds 1% USD 15/02/2048 1,120,000 1,112,973 4.05 VEREIT Operating Partnership LP 3.95% USD 15/08/2027 255,000 244,773 0.89 Verizon Communications Inc 2.875% EUR 15/01/2038 100,000 119,697 0.44 Verus Securitization Trust 2018-3 FRN USD 25/10/2058 233,650 235,169 0.86 WellCare Health Plans Inc 5.375% USD 15/08/2026 70,000 71,750 0.26 Wells Fargo Mortgage Backed Securities 2005-AR10 Trust 4.689% FRN USD 25/06/2035 209,467 221,651 0.81 Wells Fargo Mortgage Backed Securities 2005-AR10 Trust 4.769% FRN USD 25/06/2035 27,530 28,449 0.10 Wells Fargo Mortgage Backed Securities 2005-AR16 Trust FRN USD 25/02/2034 104,539 107,718 0.39 Wendy's Funding LLC 3.573% USD 15/03/2048 133,650 130,692 0.48 WFRBS Commercial Mortgage Trust 2013-C17 FRN USD 15/12/2046 200,000 199,473 0.73
13,325,156 48.47
TOTAL BONDS 28,378,957 103.22
TOTAL TRANSFERABLE SECURITIES ADMITTED TO AN OFFICIAL STOCK EXCHANGE LISTING OR DEALT IN ON ANOTHER REGULATED MARKET 28,378,957 103.22
OPEN-ENDED FUNDS IRELAND Invesco Short-Term Investments Co Global Series Plc - US Dollar Liquidity Portfolio 43,325 43,325 0.16
TOTAL OPEN-ENDED FUNDS 43,325 0.16
Total Investments 28,422,282 103.38
The accompanying notes form an integral part of these financial statements.
Invesco Unconstrained Bond Fund Statement of Investments as at 28 February 2019
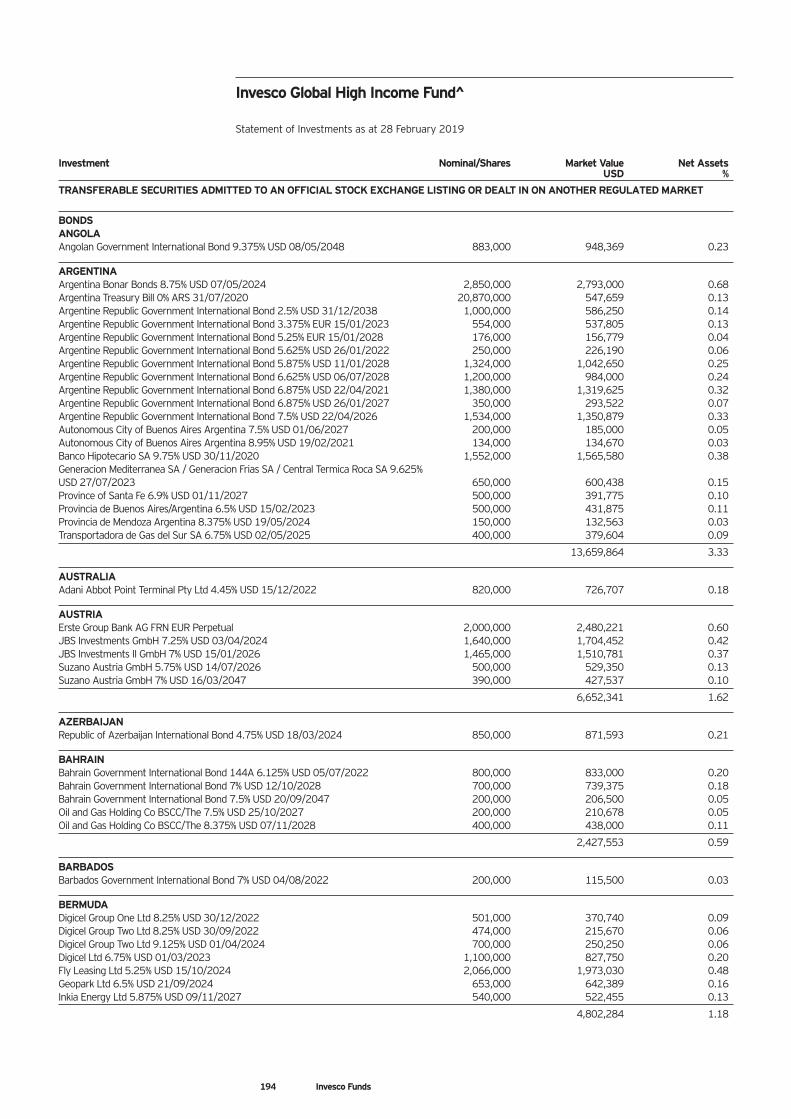
194 Invesco Funds
Investment Nominal/Shares Market Value Net Assets USD %
TRANSFERABLE SECURITIES ADMITTED TO AN OFFICIAL STOCK EXCHANGE LISTING OR DEALT IN ON ANOTHER REGULATED MARKET
BONDS ANGOLA Angolan Government International Bond 9.375% USD 08/05/2048 883,000 948,369 0.23
ARGENTINA Argentina Bonar Bonds 8.75% USD 07/05/2024 2,850,000 2,793,000 0.68 Argentina Treasury Bill 0% ARS 31/07/2020 20,870,000 547,659 0.13 Argentine Republic Government International Bond 2.5% USD 31/12/2038 1,000,000 586,250 0.14 Argentine Republic Government International Bond 3.375% EUR 15/01/2023 554,000 537,805 0.13 Argentine Republic Government International Bond 5.25% EUR 15/01/2028 176,000 156,779 0.04 Argentine Republic Government International Bond 5.625% USD 26/01/2022 250,000 226,190 0.06 Argentine Republic Government International Bond 5.875% USD 11/01/2028 1,324,000 1,042,650 0.25 Argentine Republic Government International Bond 6.625% USD 06/07/2028 1,200,000 984,000 0.24 Argentine Republic Government International Bond 6.875% USD 22/04/2021 1,380,000 1,319,625 0.32 Argentine Republic Government International Bond 6.875% USD 26/01/2027 350,000 293,522 0.07 Argentine Republic Government International Bond 7.5% USD 22/04/2026 1,534,000 1,350,879 0.33 Autonomous City of Buenos Aires Argentina 7.5% USD 01/06/2027 200,000 185,000 0.05 Autonomous City of Buenos Aires Argentina 8.95% USD 19/02/2021 134,000 134,670 0.03 Banco Hipotecario SA 9.75% USD 30/11/2020 1,552,000 1,565,580 0.38 Generacion Mediterranea SA / Generacion Frias SA / Central Termica Roca SA 9.625% USD 27/07/2023 650,000 600,438 0.15 Province of Santa Fe 6.9% USD 01/11/2027 500,000 391,775 0.10 Provincia de Buenos Aires/Argentina 6.5% USD 15/02/2023 500,000 431,875 0.11 Provincia de Mendoza Argentina 8.375% USD 19/05/2024 150,000 132,563 0.03 Transportadora de Gas del Sur SA 6.75% USD 02/05/2025 400,000 379,604 0.09
13,659,864 3.33
AUSTRALIA Adani Abbot Point Terminal Pty Ltd 4.45% USD 15/12/2022 820,000 726,707 0.18
AUSTRIA Erste Group Bank AG FRN EUR Perpetual 2,000,000 2,480,221 0.60 JBS Investments GmbH 7.25% USD 03/04/2024 1,640,000 1,704,452 0.42 JBS Investments II GmbH 7% USD 15/01/2026 1,465,000 1,510,781 0.37 Suzano Austria GmbH 5.75% USD 14/07/2026 500,000 529,350 0.13 Suzano Austria GmbH 7% USD 16/03/2047 390,000 427,537 0.10
6,652,341 1.62
AZERBAIJAN Republic of Azerbaijan International Bond 4.75% USD 18/03/2024 850,000 871,593 0.21
BAHRAIN Bahrain Government International Bond 144A 6.125% USD 05/07/2022 800,000 833,000 0.20 Bahrain Government International Bond 7% USD 12/10/2028 700,000 739,375 0.18 Bahrain Government International Bond 7.5% USD 20/09/2047 200,000 206,500 0.05 Oil and Gas Holding Co BSCC/The 7.5% USD 25/10/2027 200,000 210,678 0.05 Oil and Gas Holding Co BSCC/The 8.375% USD 07/11/2028 400,000 438,000 0.11
2,427,553 0.59
BARBADOS Barbados Government International Bond 7% USD 04/08/2022 200,000 115,500 0.03
BERMUDA Digicel Group One Ltd 8.25% USD 30/12/2022 501,000 370,740 0.09 Digicel Group Two Ltd 8.25% USD 30/09/2022 474,000 215,670 0.06 Digicel Group Two Ltd 9.125% USD 01/04/2024 700,000 250,250 0.06 Digicel Ltd 6.75% USD 01/03/2023 1,100,000 827,750 0.20 Fly Leasing Ltd 5.25% USD 15/10/2024 2,066,000 1,973,030 0.48 Geopark Ltd 6.5% USD 21/09/2024 653,000 642,389 0.16 Inkia Energy Ltd 5.875% USD 09/11/2027 540,000 522,455 0.13
4,802,284 1.18
Invesco Global High Income Fund^ Statement of Investments as at 28 February 2019
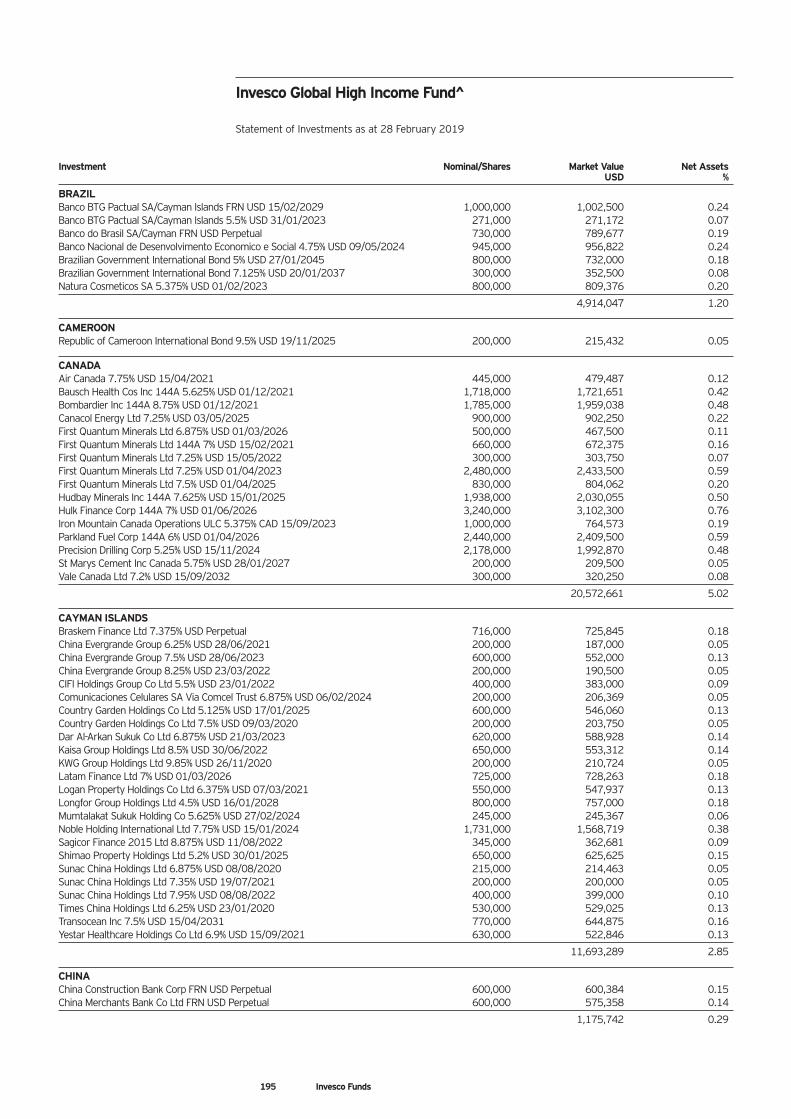
195 Invesco Funds
Investment Nominal/Shares Market Value Net Assets USD %
BRAZIL Banco BTG Pactual SA/Cayman Islands FRN USD 15/02/2029 1,000,000 1,002,500 0.24 Banco BTG Pactual SA/Cayman Islands 5.5% USD 31/01/2023 271,000 271,172 0.07 Banco do Brasil SA/Cayman FRN USD Perpetual 730,000 789,677 0.19 Banco Nacional de Desenvolvimento Economico e Social 4.75% USD 09/05/2024 945,000 956,822 0.24 Brazilian Government International Bond 5% USD 27/01/2045 800,000 732,000 0.18 Brazilian Government International Bond 7.125% USD 20/01/2037 300,000 352,500 0.08 Natura Cosmeticos SA 5.375% USD 01/02/2023 800,000 809,376 0.20
4,914,047 1.20
CAMEROON Republic of Cameroon International Bond 9.5% USD 19/11/2025 200,000 215,432 0.05
CANADA Air Canada 7.75% USD 15/04/2021 445,000 479,487 0.12 Bausch Health Cos Inc 144A 5.625% USD 01/12/2021 1,718,000 1,721,651 0.42 Bombardier Inc 144A 8.75% USD 01/12/2021 1,785,000 1,959,038 0.48 Canacol Energy Ltd 7.25% USD 03/05/2025 900,000 902,250 0.22 First Quantum Minerals Ltd 6.875% USD 01/03/2026 500,000 467,500 0.11 First Quantum Minerals Ltd 144A 7% USD 15/02/2021 660,000 672,375 0.16 First Quantum Minerals Ltd 7.25% USD 15/05/2022 300,000 303,750 0.07 First Quantum Minerals Ltd 7.25% USD 01/04/2023 2,480,000 2,433,500 0.59 First Quantum Minerals Ltd 7.5% USD 01/04/2025 830,000 804,062 0.20 Hudbay Minerals Inc 144A 7.625% USD 15/01/2025 1,938,000 2,030,055 0.50 Hulk Finance Corp 144A 7% USD 01/06/2026 3,240,000 3,102,300 0.76 Iron Mountain Canada Operations ULC 5.375% CAD 15/09/2023 1,000,000 764,573 0.19 Parkland Fuel Corp 144A 6% USD 01/04/2026 2,440,000 2,409,500 0.59 Precision Drilling Corp 5.25% USD 15/11/2024 2,178,000 1,992,870 0.48 St Marys Cement Inc Canada 5.75% USD 28/01/2027 200,000 209,500 0.05 Vale Canada Ltd 7.2% USD 15/09/2032 300,000 320,250 0.08
20,572,661 5.02
CAYMAN ISLANDS Braskem Finance Ltd 7.375% USD Perpetual 716,000 725,845 0.18 China Evergrande Group 6.25% USD 28/06/2021 200,000 187,000 0.05 China Evergrande Group 7.5% USD 28/06/2023 600,000 552,000 0.13 China Evergrande Group 8.25% USD 23/03/2022 200,000 190,500 0.05 CIFI Holdings Group Co Ltd 5.5% USD 23/01/2022 400,000 383,000 0.09 Comunicaciones Celulares SA Via Comcel Trust 6.875% USD 06/02/2024 200,000 206,369 0.05 Country Garden Holdings Co Ltd 5.125% USD 17/01/2025 600,000 546,060 0.13 Country Garden Holdings Co Ltd 7.5% USD 09/03/2020 200,000 203,750 0.05 Dar Al-Arkan Sukuk Co Ltd 6.875% USD 21/03/2023 620,000 588,928 0.14 Kaisa Group Holdings Ltd 8.5% USD 30/06/2022 650,000 553,312 0.14 KWG Group Holdings Ltd 9.85% USD 26/11/2020 200,000 210,724 0.05 Latam Finance Ltd 7% USD 01/03/2026 725,000 728,263 0.18 Logan Property Holdings Co Ltd 6.375% USD 07/03/2021 550,000 547,937 0.13 Longfor Group Holdings Ltd 4.5% USD 16/01/2028 800,000 757,000 0.18 Mumtalakat Sukuk Holding Co 5.625% USD 27/02/2024 245,000 245,367 0.06 Noble Holding International Ltd 7.75% USD 15/01/2024 1,731,000 1,568,719 0.38 Sagicor Finance 2015 Ltd 8.875% USD 11/08/2022 345,000 362,681 0.09 Shimao Property Holdings Ltd 5.2% USD 30/01/2025 650,000 625,625 0.15 Sunac China Holdings Ltd 6.875% USD 08/08/2020 215,000 214,463 0.05 Sunac China Holdings Ltd 7.35% USD 19/07/2021 200,000 200,000 0.05 Sunac China Holdings Ltd 7.95% USD 08/08/2022 400,000 399,000 0.10 Times China Holdings Ltd 6.25% USD 23/01/2020 530,000 529,025 0.13 Transocean Inc 7.5% USD 15/04/2031 770,000 644,875 0.16 Yestar Healthcare Holdings Co Ltd 6.9% USD 15/09/2021 630,000 522,846 0.13
11,693,289 2.85
CHINA China Construction Bank Corp FRN USD Perpetual 600,000 600,384 0.15 China Merchants Bank Co Ltd FRN USD Perpetual 600,000 575,358 0.14
1,175,742 0.29
Invesco Global High Income Fund^ Statement of Investments as at 28 February 2019
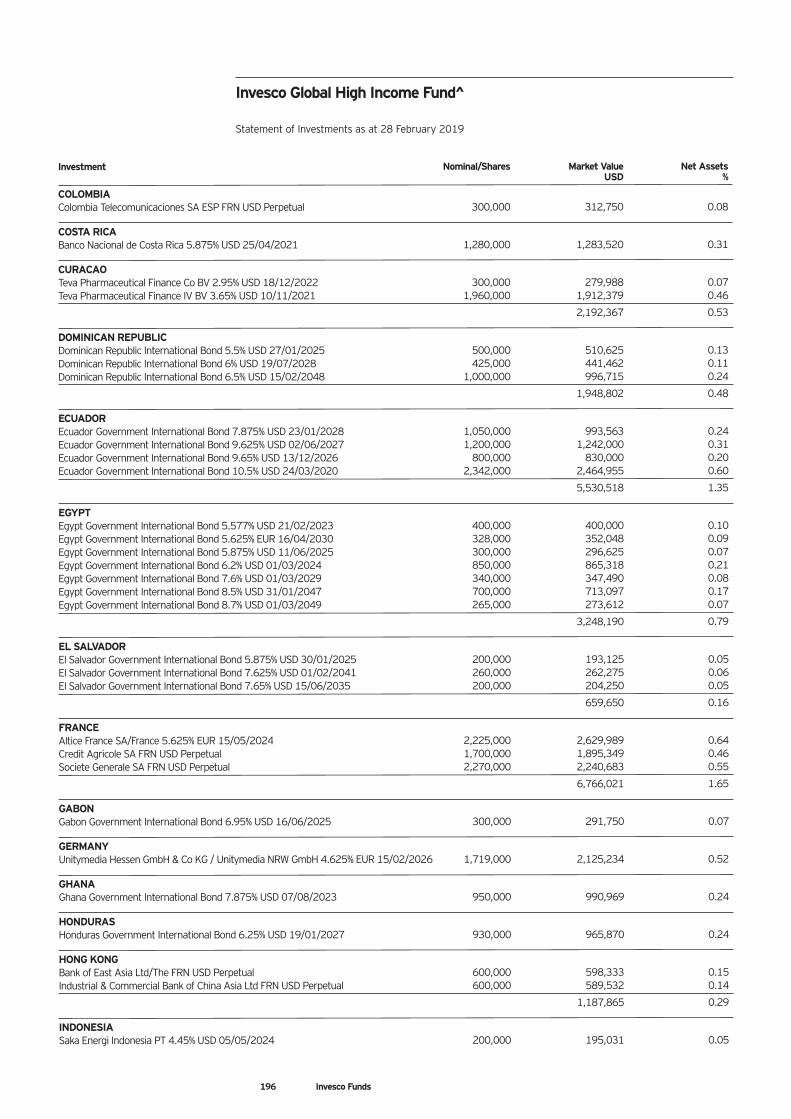
Investment Nominal/Shares Market Value Net Assets USD %
COLOMBIA Colombia Telecomunicaciones SA ESP FRN USD Perpetual 300,000 312,750 0.08
COSTA RICA Banco Nacional de Costa Rica 5.875% USD 25/04/2021 1,280,000 1,283,520 0.31
CURACAO Teva Pharmaceutical Finance Co BV 2.95% USD 18/12/2022 300,000 279,988 0.07 Teva Pharmaceutical Finance IV BV 3.65% USD 10/11/2021 1,960,000 1,912,379 0.46
2,192,367 0.53
DOMINICAN REPUBLIC Dominican Republic International Bond 5.5% USD 27/01/2025 500,000 510,625 0.13 Dominican Republic International Bond 6% USD 19/07/2028 425,000 441,462 0.11 Dominican Republic International Bond 6.5% USD 15/02/2048 1,000,000 996,715 0.24
1,948,802 0.48
ECUADOR Ecuador Government International Bond 7.875% USD 23/01/2028 1,050,000 993,563 0.24 Ecuador Government International Bond 9.625% USD 02/06/2027 1,200,000 1,242,000 0.31 Ecuador Government International Bond 9.65% USD 13/12/2026 800,000 830,000 0.20 Ecuador Government International Bond 10.5% USD 24/03/2020 2,342,000 2,464,955 0.60
5,530,518 1.35
EGYPT Egypt Government International Bond 5.577% USD 21/02/2023 400,000 400,000 0.10 Egypt Government International Bond 5.625% EUR 16/04/2030 328,000 352,048 0.09 Egypt Government International Bond 5.875% USD 11/06/2025 300,000 296,625 0.07 Egypt Government International Bond 6.2% USD 01/03/2024 850,000 865,318 0.21 Egypt Government International Bond 7.6% USD 01/03/2029 340,000 347,490 0.08 Egypt Government International Bond 8.5% USD 31/01/2047 700,000 713,097 0.17 Egypt Government International Bond 8.7% USD 01/03/2049 265,000 273,612 0.07
3,248,190 0.79
EL SALVADOR El Salvador Government International Bond 5.875% USD 30/01/2025 200,000 193,125 0.05 El Salvador Government International Bond 7.625% USD 01/02/2041 260,000 262,275 0.06 El Salvador Government International Bond 7.65% USD 15/06/2035 200,000 204,250 0.05
659,650 0.16
FRANCE Altice France SA/France 5.625% EUR 15/05/2024 2,225,000 2,629,989 0.64 Credit Agricole SA FRN USD Perpetual 1,700,000 1,895,349 0.46 Societe Generale SA FRN USD Perpetual 2,270,000 2,240,683 0.55
6,766,021 1.65
GABON Gabon Government International Bond 6.95% USD 16/06/2025 300,000 291,750 0.07
GERMANY Unitymedia Hessen GmbH & Co KG / Unitymedia NRW GmbH 4.625% EUR 15/02/2026 1,719,000 2,125,234 0.52
GHANA Ghana Government International Bond 7.875% USD 07/08/2023 950,000 990,969 0.24
HONDURAS Honduras Government International Bond 6.25% USD 19/01/2027 930,000 965,870 0.24
HONG KONG Bank of East Asia Ltd/The FRN USD Perpetual 600,000 598,333 0.15 Industrial & Commercial Bank of China Asia Ltd FRN USD Perpetual 600,000 589,532 0.14
1,187,865 0.29
INDONESIA Saka Energi Indonesia PT 4.45% USD 05/05/2024 200,000 195,031 0.05
Invesco Global High Income Fund^ Statement of Investments as at 28 February 2019
196 Invesco Funds
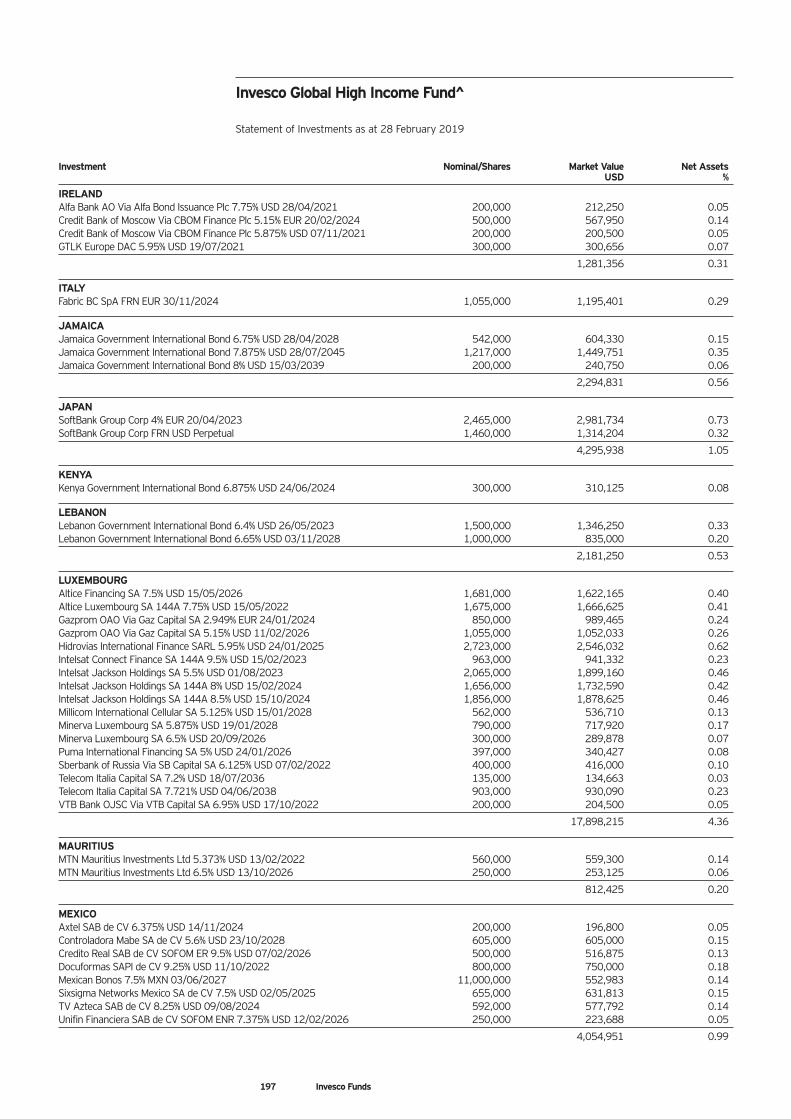
Investment Nominal/Shares Market Value Net Assets USD %
IRELAND Alfa Bank AO Via Alfa Bond Issuance Plc 7.75% USD 28/04/2021 200,000 212,250 0.05 Credit Bank of Moscow Via CBOM Finance Plc 5.15% EUR 20/02/2024 500,000 567,950 0.14 Credit Bank of Moscow Via CBOM Finance Plc 5.875% USD 07/11/2021 200,000 200,500 0.05 GTLK Europe DAC 5.95% USD 19/07/2021 300,000 300,656 0.07
1,281,356 0.31
ITALY Fabric BC SpA FRN EUR 30/11/2024 1,055,000 1,195,401 0.29
JAMAICA Jamaica Government International Bond 6.75% USD 28/04/2028 542,000 604,330 0.15 Jamaica Government International Bond 7.875% USD 28/07/2045 1,217,000 1,449,751 0.35 Jamaica Government International Bond 8% USD 15/03/2039 200,000 240,750 0.06
2,294,831 0.56
JAPAN SoftBank Group Corp 4% EUR 20/04/2023 2,465,000 2,981,734 0.73 SoftBank Group Corp FRN USD Perpetual 1,460,000 1,314,204 0.32
4,295,938 1.05
KENYA Kenya Government International Bond 6.875% USD 24/06/2024 300,000 310,125 0.08
LEBANON Lebanon Government International Bond 6.4% USD 26/05/2023 1,500,000 1,346,250 0.33 Lebanon Government International Bond 6.65% USD 03/11/2028 1,000,000 835,000 0.20
2,181,250 0.53
LUXEMBOURG Altice Financing SA 7.5% USD 15/05/2026 1,681,000 1,622,165 0.40 Altice Luxembourg SA 144A 7.75% USD 15/05/2022 1,675,000 1,666,625 0.41 Gazprom OAO Via Gaz Capital SA 2.949% EUR 24/01/2024 850,000 989,465 0.24 Gazprom OAO Via Gaz Capital SA 5.15% USD 11/02/2026 1,055,000 1,052,033 0.26 Hidrovias International Finance SARL 5.95% USD 24/01/2025 2,723,000 2,546,032 0.62 Intelsat Connect Finance SA 144A 9.5% USD 15/02/2023 963,000 941,332 0.23 Intelsat Jackson Holdings SA 5.5% USD 01/08/2023 2,065,000 1,899,160 0.46 Intelsat Jackson Holdings SA 144A 8% USD 15/02/2024 1,656,000 1,732,590 0.42 Intelsat Jackson Holdings SA 144A 8.5% USD 15/10/2024 1,856,000 1,878,625 0.46 Millicom International Cellular SA 5.125% USD 15/01/2028 562,000 536,710 0.13 Minerva Luxembourg SA 5.875% USD 19/01/2028 790,000 717,920 0.17 Minerva Luxembourg SA 6.5% USD 20/09/2026 300,000 289,878 0.07 Puma International Financing SA 5% USD 24/01/2026 397,000 340,427 0.08 Sberbank of Russia Via SB Capital SA 6.125% USD 07/02/2022 400,000 416,000 0.10 Telecom Italia Capital SA 7.2% USD 18/07/2036 135,000 134,663 0.03 Telecom Italia Capital SA 7.721% USD 04/06/2038 903,000 930,090 0.23 VTB Bank OJSC Via VTB Capital SA 6.95% USD 17/10/2022 200,000 204,500 0.05
17,898,215 4.36
MAURITIUS MTN Mauritius Investments Ltd 5.373% USD 13/02/2022 560,000 559,300 0.14 MTN Mauritius Investments Ltd 6.5% USD 13/10/2026 250,000 253,125 0.06
812,425 0.20
MEXICO Axtel SAB de CV 6.375% USD 14/11/2024 200,000 196,800 0.05 Controladora Mabe SA de CV 5.6% USD 23/10/2028 605,000 605,000 0.15 Credito Real SAB de CV SOFOM ER 9.5% USD 07/02/2026 500,000 516,875 0.13 Docuformas SAPI de CV 9.25% USD 11/10/2022 800,000 750,000 0.18 Mexican Bonos 7.5% MXN 03/06/2027 11,000,000 552,983 0.14 Sixsigma Networks Mexico SA de CV 7.5% USD 02/05/2025 655,000 631,813 0.15 TV Azteca SAB de CV 8.25% USD 09/08/2024 592,000 577,792 0.14 Unifin Financiera SAB de CV SOFOM ENR 7.375% USD 12/02/2026 250,000 223,688 0.05
4,054,951 0.99
Invesco Global High Income Fund^ Statement of Investments as at 28 February 2019
197 Invesco Funds
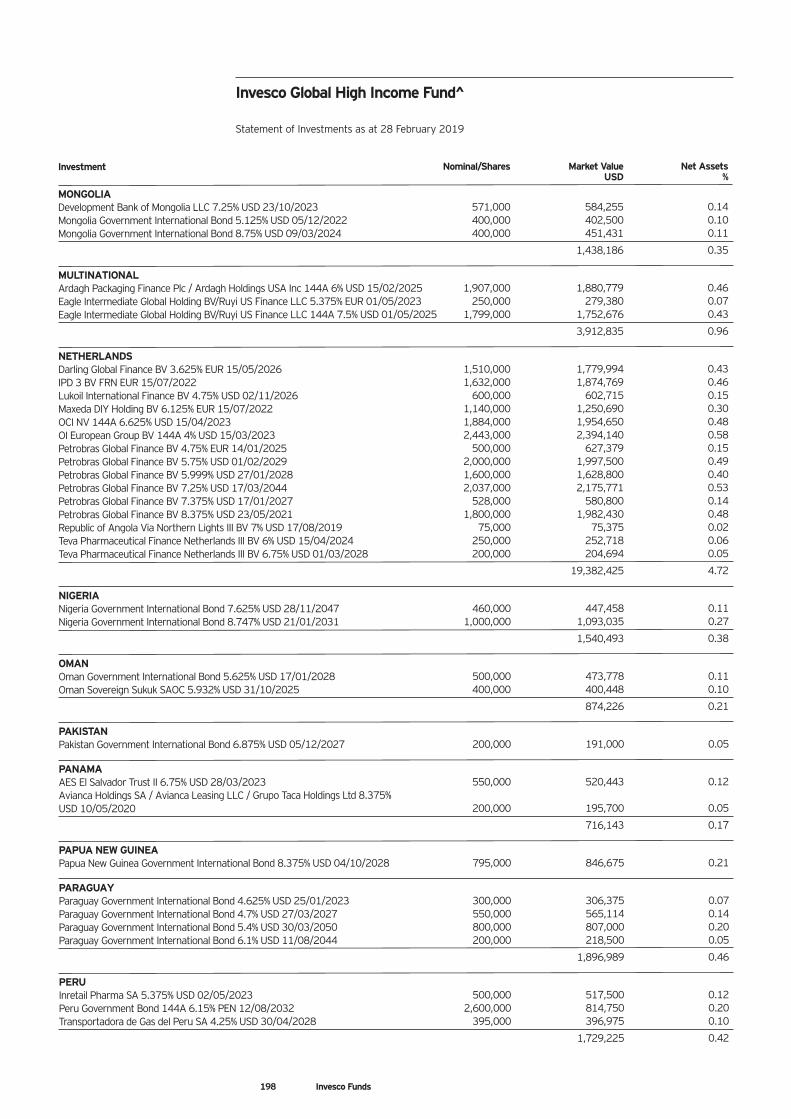
Investment Nominal/Shares Market Value Net Assets USD %
MONGOLIA Development Bank of Mongolia LLC 7.25% USD 23/10/2023 571,000 584,255 0.14 Mongolia Government International Bond 5.125% USD 05/12/2022 400,000 402,500 0.10 Mongolia Government International Bond 8.75% USD 09/03/2024 400,000 451,431 0.11
1,438,186 0.35
MULTINATIONAL Ardagh Packaging Finance Plc / Ardagh Holdings USA Inc 144A 6% USD 15/02/2025 1,907,000 1,880,779 0.46 Eagle Intermediate Global Holding BV/Ruyi US Finance LLC 5.375% EUR 01/05/2023 250,000 279,380 0.07 Eagle Intermediate Global Holding BV/Ruyi US Finance LLC 144A 7.5% USD 01/05/2025 1,799,000 1,752,676 0.43
3,912,835 0.96
NETHERLANDS Darling Global Finance BV 3.625% EUR 15/05/2026 1,510,000 1,779,994 0.43 IPD 3 BV FRN EUR 15/07/2022 1,632,000 1,874,769 0.46 Lukoil International Finance BV 4.75% USD 02/11/2026 600,000 602,715 0.15 Maxeda DIY Holding BV 6.125% EUR 15/07/2022 1,140,000 1,250,690 0.30 OCI NV 144A 6.625% USD 15/04/2023 1,884,000 1,954,650 0.48 OI European Group BV 144A 4% USD 15/03/2023 2,443,000 2,394,140 0.58 Petrobras Global Finance BV 4.75% EUR 14/01/2025 500,000 627,379 0.15 Petrobras Global Finance BV 5.75% USD 01/02/2029 2,000,000 1,997,500 0.49 Petrobras Global Finance BV 5.999% USD 27/01/2028 1,600,000 1,628,800 0.40 Petrobras Global Finance BV 7.25% USD 17/03/2044 2,037,000 2,175,771 0.53 Petrobras Global Finance BV 7.375% USD 17/01/2027 528,000 580,800 0.14 Petrobras Global Finance BV 8.375% USD 23/05/2021 1,800,000 1,982,430 0.48 Republic of Angola Via Northern Lights III BV 7% USD 17/08/2019 75,000 75,375 0.02 Teva Pharmaceutical Finance Netherlands III BV 6% USD 15/04/2024 250,000 252,718 0.06 Teva Pharmaceutical Finance Netherlands III BV 6.75% USD 01/03/2028 200,000 204,694 0.05
19,382,425 4.72
NIGERIA Nigeria Government International Bond 7.625% USD 28/11/2047 460,000 447,458 0.11 Nigeria Government International Bond 8.747% USD 21/01/2031 1,000,000 1,093,035 0.27
1,540,493 0.38
OMAN Oman Government International Bond 5.625% USD 17/01/2028 500,000 473,778 0.11 Oman Sovereign Sukuk SAOC 5.932% USD 31/10/2025 400,000 400,448 0.10
874,226 0.21
PAKISTAN Pakistan Government International Bond 6.875% USD 05/12/2027 200,000 191,000 0.05
PANAMA AES El Salvador Trust II 6.75% USD 28/03/2023 550,000 520,443 0.12 Avianca Holdings SA / Avianca Leasing LLC / Grupo Taca Holdings Ltd 8.375% USD 10/05/2020 200,000 195,700 0.05
716,143 0.17
PAPUA NEW GUINEA Papua New Guinea Government International Bond 8.375% USD 04/10/2028 795,000 846,675 0.21
PARAGUAY Paraguay Government International Bond 4.625% USD 25/01/2023 300,000 306,375 0.07 Paraguay Government International Bond 4.7% USD 27/03/2027 550,000 565,114 0.14 Paraguay Government International Bond 5.4% USD 30/03/2050 800,000 807,000 0.20 Paraguay Government International Bond 6.1% USD 11/08/2044 200,000 218,500 0.05
1,896,989 0.46
PERU Inretail Pharma SA 5.375% USD 02/05/2023 500,000 517,500 0.12 Peru Government Bond 144A 6.15% PEN 12/08/2032 2,600,000 814,750 0.20 Transportadora de Gas del Peru SA 4.25% USD 30/04/2028 395,000 396,975 0.10
1,729,225 0.42
Invesco Global High Income Fund^ Statement of Investments as at 28 February 2019
198 Invesco Funds
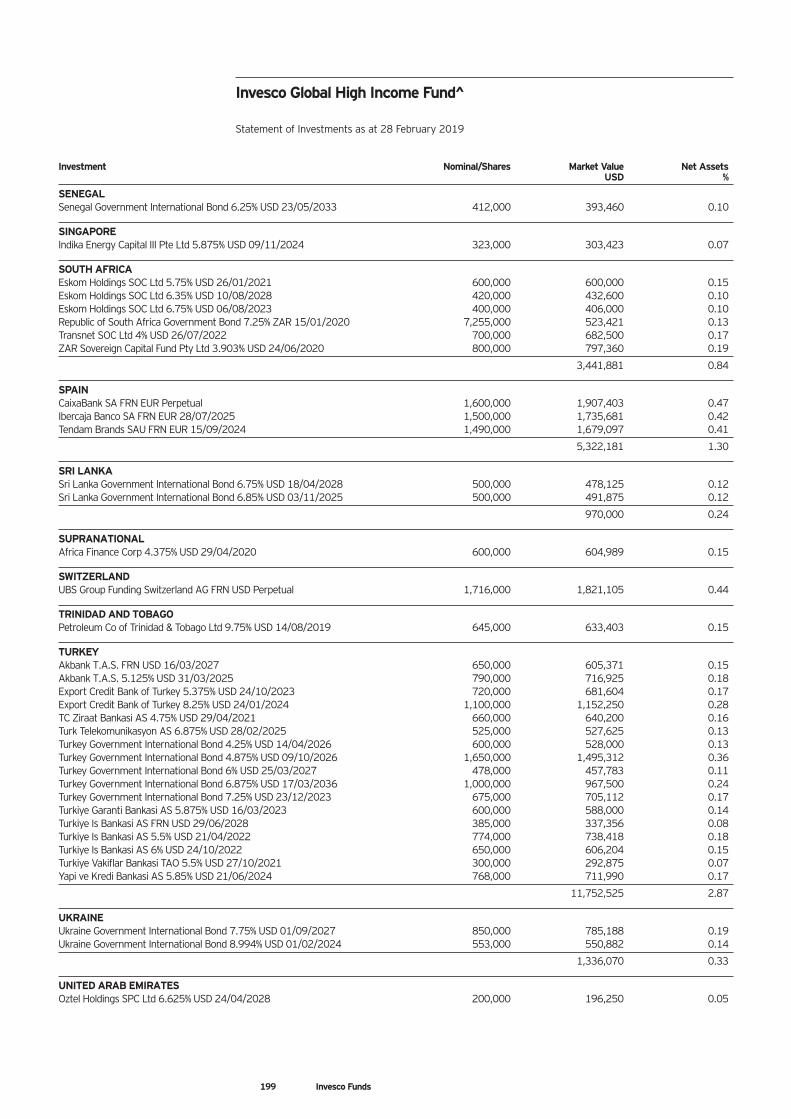
Investment Nominal/Shares Market Value Net Assets USD %
SENEGAL Senegal Government International Bond 6.25% USD 23/05/2033 412,000 393,460 0.10
SINGAPORE Indika Energy Capital III Pte Ltd 5.875% USD 09/11/2024 323,000 303,423 0.07
SOUTH AFRICA Eskom Holdings SOC Ltd 5.75% USD 26/01/2021 600,000 600,000 0.15 Eskom Holdings SOC Ltd 6.35% USD 10/08/2028 420,000 432,600 0.10 Eskom Holdings SOC Ltd 6.75% USD 06/08/2023 400,000 406,000 0.10 Republic of South Africa Government Bond 7.25% ZAR 15/01/2020 7,255,000 523,421 0.13 Transnet SOC Ltd 4% USD 26/07/2022 700,000 682,500 0.17 ZAR Sovereign Capital Fund Pty Ltd 3.903% USD 24/06/2020 800,000 797,360 0.19
3,441,881 0.84
SPAIN CaixaBank SA FRN EUR Perpetual 1,600,000 1,907,403 0.47 Ibercaja Banco SA FRN EUR 28/07/2025 1,500,000 1,735,681 0.42 Tendam Brands SAU FRN EUR 15/09/2024 1,490,000 1,679,097 0.41
5,322,181 1.30
SRI LANKA Sri Lanka Government International Bond 6.75% USD 18/04/2028 500,000 478,125 0.12 Sri Lanka Government International Bond 6.85% USD 03/11/2025 500,000 491,875 0.12
970,000 0.24
SUPRANATIONAL Africa Finance Corp 4.375% USD 29/04/2020 600,000 604,989 0.15
SWITZERLAND UBS Group Funding Switzerland AG FRN USD Perpetual 1,716,000 1,821,105 0.44
TRINIDAD AND TOBAGO Petroleum Co of Trinidad & Tobago Ltd 9.75% USD 14/08/2019 645,000 633,403 0.15
TURKEY Akbank T.A.S. FRN USD 16/03/2027 650,000 605,371 0.15 Akbank T.A.S. 5.125% USD 31/03/2025 790,000 716,925 0.18 Export Credit Bank of Turkey 5.375% USD 24/10/2023 720,000 681,604 0.17 Export Credit Bank of Turkey 8.25% USD 24/01/2024 1,100,000 1,152,250 0.28 TC Ziraat Bankasi AS 4.75% USD 29/04/2021 660,000 640,200 0.16 Turk Telekomunikasyon AS 6.875% USD 28/02/2025 525,000 527,625 0.13 Turkey Government International Bond 4.25% USD 14/04/2026 600,000 528,000 0.13 Turkey Government International Bond 4.875% USD 09/10/2026 1,650,000 1,495,312 0.36 Turkey Government International Bond 6% USD 25/03/2027 478,000 457,783 0.11 Turkey Government International Bond 6.875% USD 17/03/2036 1,000,000 967,500 0.24 Turkey Government International Bond 7.25% USD 23/12/2023 675,000 705,112 0.17 Turkiye Garanti Bankasi AS 5.875% USD 16/03/2023 600,000 588,000 0.14 Turkiye Is Bankasi AS FRN USD 29/06/2028 385,000 337,356 0.08 Turkiye Is Bankasi AS 5.5% USD 21/04/2022 774,000 738,418 0.18 Turkiye Is Bankasi AS 6% USD 24/10/2022 650,000 606,204 0.15 Turkiye Vakiflar Bankasi TAO 5.5% USD 27/10/2021 300,000 292,875 0.07 Yapi ve Kredi Bankasi AS 5.85% USD 21/06/2024 768,000 711,990 0.17
11,752,525 2.87
UKRAINE Ukraine Government International Bond 7.75% USD 01/09/2027 850,000 785,188 0.19 Ukraine Government International Bond 8.994% USD 01/02/2024 553,000 550,882 0.14
1,336,070 0.33
UNITED ARAB EMIRATES Oztel Holdings SPC Ltd 6.625% USD 24/04/2028 200,000 196,250 0.05
Invesco Global High Income Fund^ Statement of Investments as at 28 February 2019
199 Invesco Funds
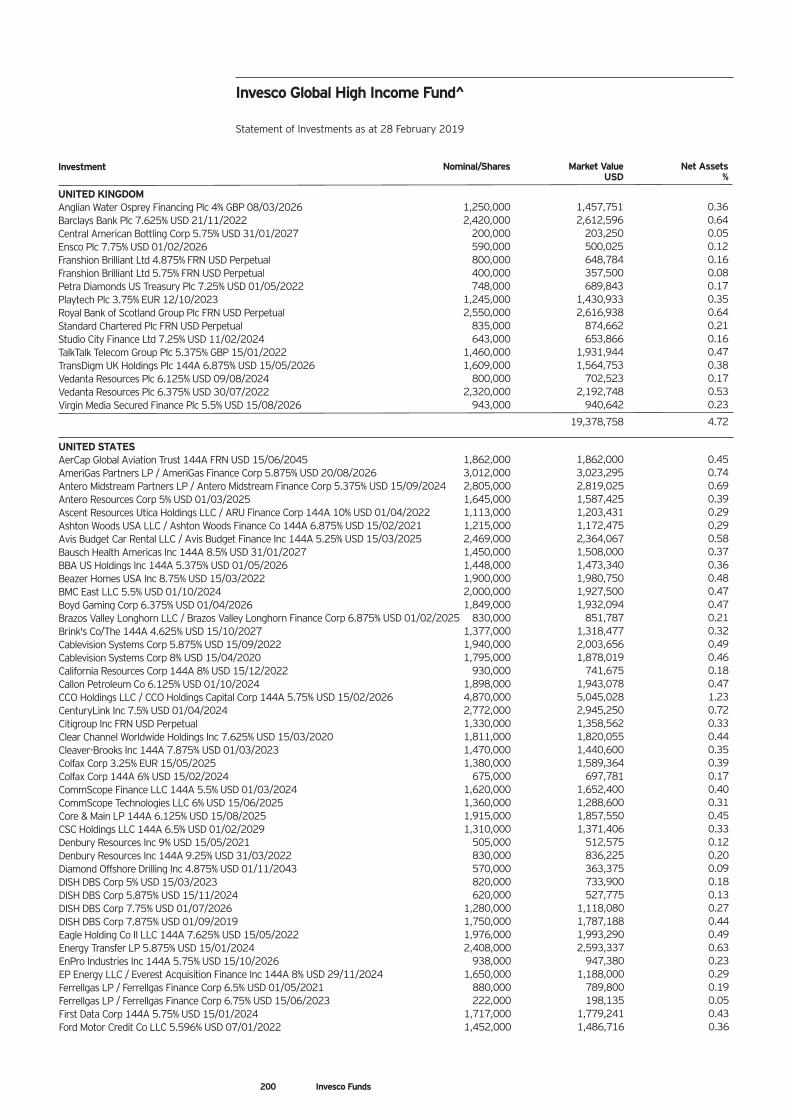
Investment Nominal/Shares Market Value Net Assets USD %
UNITED KINGDOM Anglian Water Osprey Financing Plc 4% GBP 08/03/2026 1,250,000 1,457,751 0.36 Barclays Bank Plc 7.625% USD 21/11/2022 2,420,000 2,612,596 0.64 Central American Bottling Corp 5.75% USD 31/01/2027 200,000 203,250 0.05 Ensco Plc 7.75% USD 01/02/2026 590,000 500,025 0.12 Franshion Brilliant Ltd 4.875% FRN USD Perpetual 800,000 648,784 0.16 Franshion Brilliant Ltd 5.75% FRN USD Perpetual 400,000 357,500 0.08 Petra Diamonds US Treasury Plc 7.25% USD 01/05/2022 748,000 689,843 0.17 Playtech Plc 3.75% EUR 12/10/2023 1,245,000 1,430,933 0.35 Royal Bank of Scotland Group Plc FRN USD Perpetual 2,550,000 2,616,938 0.64 Standard Chartered Plc FRN USD Perpetual 835,000 874,662 0.21 Studio City Finance Ltd 7.25% USD 11/02/2024 643,000 653,866 0.16 TalkTalk Telecom Group Plc 5.375% GBP 15/01/2022 1,460,000 1,931,944 0.47 TransDigm UK Holdings Plc 144A 6.875% USD 15/05/2026 1,609,000 1,564,753 0.38 Vedanta Resources Plc 6.125% USD 09/08/2024 800,000 702,523 0.17 Vedanta Resources Plc 6.375% USD 30/07/2022 2,320,000 2,192,748 0.53 Virgin Media Secured Finance Plc 5.5% USD 15/08/2026 943,000 940,642 0.23
19,378,758 4.72
UNITED STATES AerCap Global Aviation Trust 144A FRN USD 15/06/2045 1,862,000 1,862,000 0.45 AmeriGas Partners LP / AmeriGas Finance Corp 5.875% USD 20/08/2026 3,012,000 3,023,295 0.74 Antero Midstream Partners LP / Antero Midstream Finance Corp 5.375% USD 15/09/2024 2,805,000 2,819,025 0.69 Antero Resources Corp 5% USD 01/03/2025 1,645,000 1,587,425 0.39 Ascent Resources Utica Holdings LLC / ARU Finance Corp 144A 10% USD 01/04/2022 1,113,000 1,203,431 0.29 Ashton Woods USA LLC / Ashton Woods Finance Co 144A 6.875% USD 15/02/2021 1,215,000 1,172,475 0.29 Avis Budget Car Rental LLC / Avis Budget Finance Inc 144A 5.25% USD 15/03/2025 2,469,000 2,364,067 0.58 Bausch Health Americas Inc 144A 8.5% USD 31/01/2027 1,450,000 1,508,000 0.37 BBA US Holdings Inc 144A 5.375% USD 01/05/2026 1,448,000 1,473,340 0.36 Beazer Homes USA Inc 8.75% USD 15/03/2022 1,900,000 1,980,750 0.48 BMC East LLC 5.5% USD 01/10/2024 2,000,000 1,927,500 0.47 Boyd Gaming Corp 6.375% USD 01/04/2026 1,849,000 1,932,094 0.47 Brazos Valley Longhorn LLC / Brazos Valley Longhorn Finance Corp 6.875% USD 01/02/2025 830,000 851,787 0.21 Brink's Co/The 144A 4.625% USD 15/10/2027 1,377,000 1,318,477 0.32 Cablevision Systems Corp 5.875% USD 15/09/2022 1,940,000 2,003,656 0.49 Cablevision Systems Corp 8% USD 15/04/2020 1,795,000 1,878,019 0.46 California Resources Corp 144A 8% USD 15/12/2022 930,000 741,675 0.18 Callon Petroleum Co 6.125% USD 01/10/2024 1,898,000 1,943,078 0.47 CCO Holdings LLC / CCO Holdings Capital Corp 144A 5.75% USD 15/02/2026 4,870,000 5,045,028 1.23 CenturyLink Inc 7.5% USD 01/04/2024 2,772,000 2,945,250 0.72 Citigroup Inc FRN USD Perpetual 1,330,000 1,358,562 0.33 Clear Channel Worldwide Holdings Inc 7.625% USD 15/03/2020 1,811,000 1,820,055 0.44 Cleaver-Brooks Inc 144A 7.875% USD 01/03/2023 1,470,000 1,440,600 0.35 Colfax Corp 3.25% EUR 15/05/2025 1,380,000 1,589,364 0.39 Colfax Corp 144A 6% USD 15/02/2024 675,000 697,781 0.17 CommScope Finance LLC 144A 5.5% USD 01/03/2024 1,620,000 1,652,400 0.40 CommScope Technologies LLC 6% USD 15/06/2025 1,360,000 1,288,600 0.31 Core & Main LP 144A 6.125% USD 15/08/2025 1,915,000 1,857,550 0.45 CSC Holdings LLC 144A 6.5% USD 01/02/2029 1,310,000 1,371,406 0.33 Denbury Resources Inc 9% USD 15/05/2021 505,000 512,575 0.12 Denbury Resources Inc 144A 9.25% USD 31/03/2022 830,000 836,225 0.20 Diamond Offshore Drilling Inc 4.875% USD 01/11/2043 570,000 363,375 0.09 DISH DBS Corp 5% USD 15/03/2023 820,000 733,900 0.18 DISH DBS Corp 5.875% USD 15/11/2024 620,000 527,775 0.13 DISH DBS Corp 7.75% USD 01/07/2026 1,280,000 1,118,080 0.27 DISH DBS Corp 7.875% USD 01/09/2019 1,750,000 1,787,188 0.44 Eagle Holding Co II LLC 144A 7.625% USD 15/05/2022 1,976,000 1,993,290 0.49 Energy Transfer LP 5.875% USD 15/01/2024 2,408,000 2,593,337 0.63 EnPro Industries Inc 144A 5.75% USD 15/10/2026 938,000 947,380 0.23 EP Energy LLC / Everest Acquisition Finance Inc 144A 8% USD 29/11/2024 1,650,000 1,188,000 0.29 Ferrellgas LP / Ferrellgas Finance Corp 6.5% USD 01/05/2021 880,000 789,800 0.19 Ferrellgas LP / Ferrellgas Finance Corp 6.75% USD 15/06/2023 222,000 198,135 0.05 First Data Corp 144A 5.75% USD 15/01/2024 1,717,000 1,779,241 0.43 Ford Motor Credit Co LLC 5.596% USD 07/01/2022 1,452,000 1,486,716 0.36
Invesco Global High Income Fund^ Statement of Investments as at 28 February 2019
200 Invesco Funds
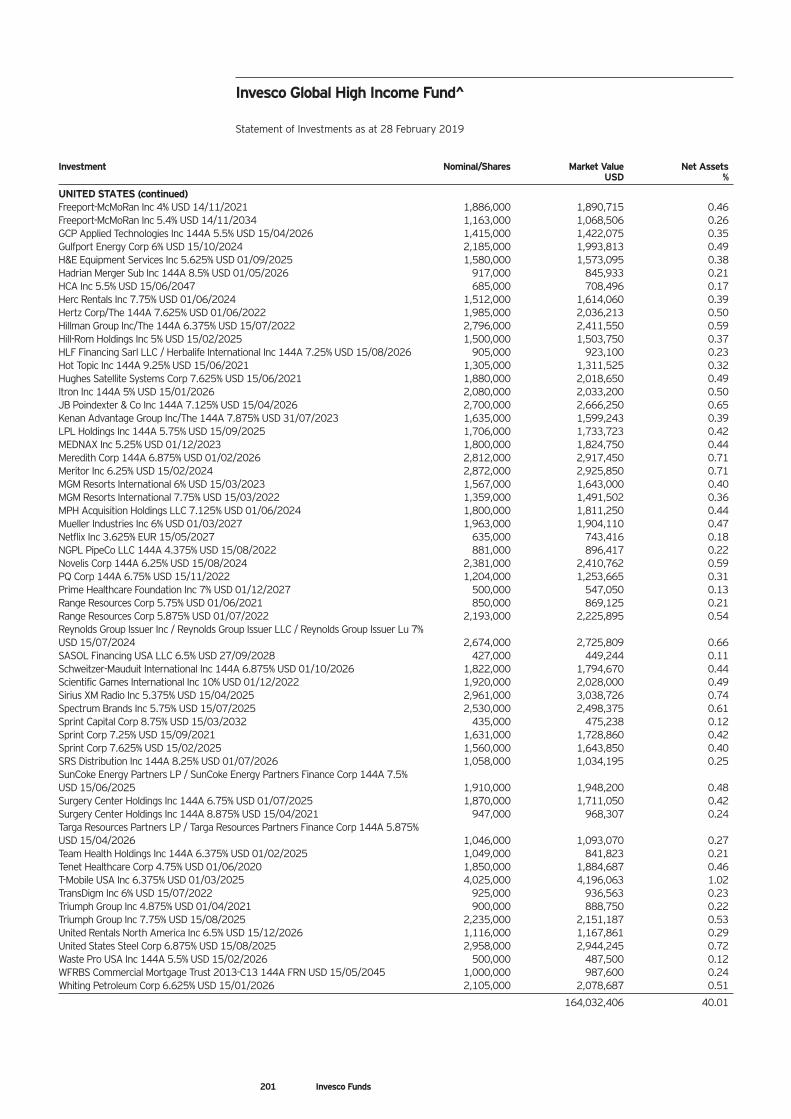
Investment Nominal/Shares Market Value Net Assets USD %
UNITED STATES (continued) Freeport-McMoRan Inc 4% USD 14/11/2021 1,886,000 1,890,715 0.46 Freeport-McMoRan Inc 5.4% USD 14/11/2034 1,163,000 1,068,506 0.26 GCP Applied Technologies Inc 144A 5.5% USD 15/04/2026 1,415,000 1,422,075 0.35 Gulfport Energy Corp 6% USD 15/10/2024 2,185,000 1,993,813 0.49 H&E Equipment Services Inc 5.625% USD 01/09/2025 1,580,000 1,573,095 0.38 Hadrian Merger Sub Inc 144A 8.5% USD 01/05/2026 917,000 845,933 0.21 HCA Inc 5.5% USD 15/06/2047 685,000 708,496 0.17 Herc Rentals Inc 7.75% USD 01/06/2024 1,512,000 1,614,060 0.39 Hertz Corp/The 144A 7.625% USD 01/06/2022 1,985,000 2,036,213 0.50 Hillman Group Inc/The 144A 6.375% USD 15/07/2022 2,796,000 2,411,550 0.59 Hill-Rom Holdings Inc 5% USD 15/02/2025 1,500,000 1,503,750 0.37 HLF Financing Sarl LLC / Herbalife International Inc 144A 7.25% USD 15/08/2026 905,000 923,100 0.23 Hot Topic Inc 144A 9.25% USD 15/06/2021 1,305,000 1,311,525 0.32 Hughes Satellite Systems Corp 7.625% USD 15/06/2021 1,880,000 2,018,650 0.49 Itron Inc 144A 5% USD 15/01/2026 2,080,000 2,033,200 0.50 JB Poindexter & Co Inc 144A 7.125% USD 15/04/2026 2,700,000 2,666,250 0.65 Kenan Advantage Group Inc/The 144A 7.875% USD 31/07/2023 1,635,000 1,599,243 0.39 LPL Holdings Inc 144A 5.75% USD 15/09/2025 1,706,000 1,733,723 0.42 MEDNAX Inc 5.25% USD 01/12/2023 1,800,000 1,824,750 0.44 Meredith Corp 144A 6.875% USD 01/02/2026 2,812,000 2,917,450 0.71 Meritor Inc 6.25% USD 15/02/2024 2,872,000 2,925,850 0.71 MGM Resorts International 6% USD 15/03/2023 1,567,000 1,643,000 0.40 MGM Resorts International 7.75% USD 15/03/2022 1,359,000 1,491,502 0.36 MPH Acquisition Holdings LLC 7.125% USD 01/06/2024 1,800,000 1,811,250 0.44 Mueller Industries Inc 6% USD 01/03/2027 1,963,000 1,904,110 0.47 Netflix Inc 3.625% EUR 15/05/2027 635,000 743,416 0.18 NGPL PipeCo LLC 144A 4.375% USD 15/08/2022 881,000 896,417 0.22 Novelis Corp 144A 6.25% USD 15/08/2024 2,381,000 2,410,762 0.59 PQ Corp 144A 6.75% USD 15/11/2022 1,204,000 1,253,665 0.31 Prime Healthcare Foundation Inc 7% USD 01/12/2027 500,000 547,050 0.13 Range Resources Corp 5.75% USD 01/06/2021 850,000 869,125 0.21 Range Resources Corp 5.875% USD 01/07/2022 2,193,000 2,225,895 0.54 Reynolds Group Issuer Inc / Reynolds Group Issuer LLC / Reynolds Group Issuer Lu 7% USD 15/07/2024 2,674,000 2,725,809 0.66 SASOL Financing USA LLC 6.5% USD 27/09/2028 427,000 449,244 0.11 Schweitzer-Mauduit International Inc 144A 6.875% USD 01/10/2026 1,822,000 1,794,670 0.44 Scientific Games International Inc 10% USD 01/12/2022 1,920,000 2,028,000 0.49 Sirius XM Radio Inc 5.375% USD 15/04/2025 2,961,000 3,038,726 0.74 Spectrum Brands Inc 5.75% USD 15/07/2025 2,530,000 2,498,375 0.61 Sprint Capital Corp 8.75% USD 15/03/2032 435,000 475,238 0.12 Sprint Corp 7.25% USD 15/09/2021 1,631,000 1,728,860 0.42 Sprint Corp 7.625% USD 15/02/2025 1,560,000 1,643,850 0.40 SRS Distribution Inc 144A 8.25% USD 01/07/2026 1,058,000 1,034,195 0.25 SunCoke Energy Partners LP / SunCoke Energy Partners Finance Corp 144A 7.5% USD 15/06/2025 1,910,000 1,948,200 0.48 Surgery Center Holdings Inc 144A 6.75% USD 01/07/2025 1,870,000 1,711,050 0.42 Surgery Center Holdings Inc 144A 8.875% USD 15/04/2021 947,000 968,307 0.24 Targa Resources Partners LP / Targa Resources Partners Finance Corp 144A 5.875% USD 15/04/2026 1,046,000 1,093,070 0.27 Team Health Holdings Inc 144A 6.375% USD 01/02/2025 1,049,000 841,823 0.21 Tenet Healthcare Corp 4.75% USD 01/06/2020 1,850,000 1,884,687 0.46 T-Mobile USA Inc 6.375% USD 01/03/2025 4,025,000 4,196,063 1.02 TransDigm Inc 6% USD 15/07/2022 925,000 936,563 0.23 Triumph Group Inc 4.875% USD 01/04/2021 900,000 888,750 0.22 Triumph Group Inc 7.75% USD 15/08/2025 2,235,000 2,151,187 0.53 United Rentals North America Inc 6.5% USD 15/12/2026 1,116,000 1,167,861 0.29 United States Steel Corp 6.875% USD 15/08/2025 2,958,000 2,944,245 0.72 Waste Pro USA Inc 144A 5.5% USD 15/02/2026 500,000 487,500 0.12 WFRBS Commercial Mortgage Trust 2013-C13 144A FRN USD 15/05/2045 1,000,000 987,600 0.24 Whiting Petroleum Corp 6.625% USD 15/01/2026 2,105,000 2,078,687 0.51
164,032,406 40.01
Invesco Global High Income Fund^ Statement of Investments as at 28 February 2019
201 Invesco Funds
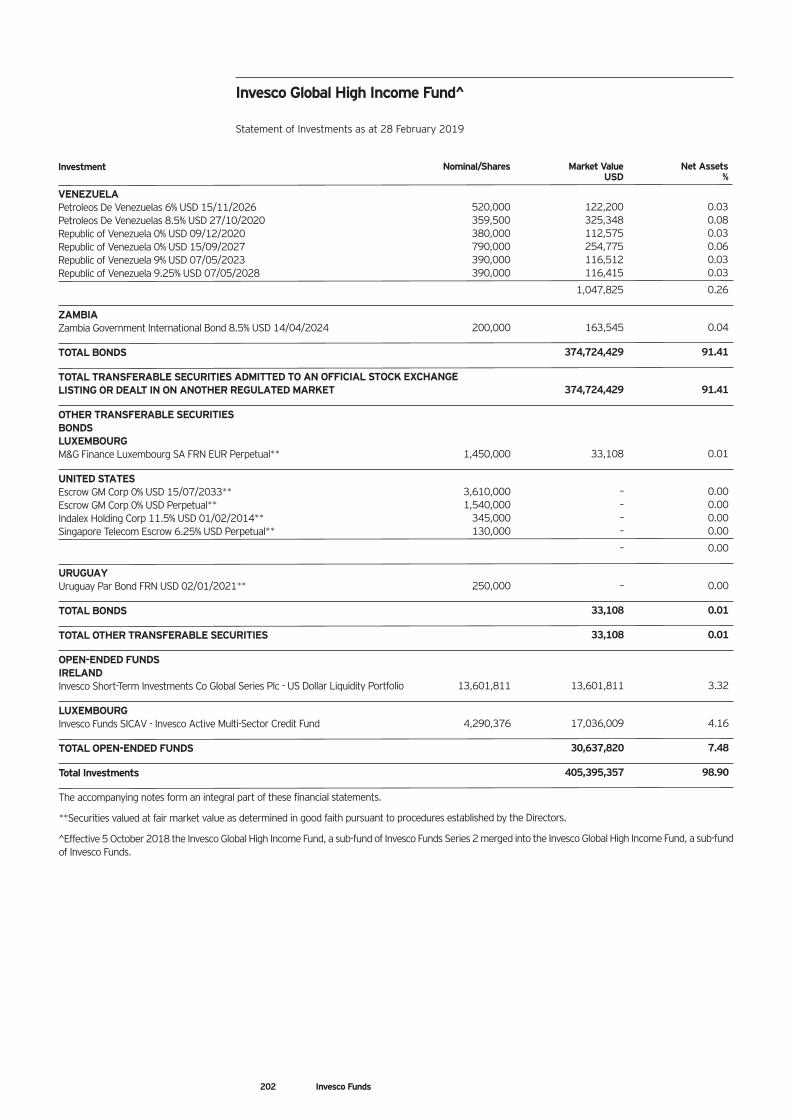
Investment Nominal/Shares Market Value Net Assets USD %
VENEZUELA Petroleos De Venezuelas 6% USD 15/11/2026 520,000 122,200 0.03 Petroleos De Venezuelas 8.5% USD 27/10/2020 359,500 325,348 0.08 Republic of Venezuela 0% USD 09/12/2020 380,000 112,575 0.03 Republic of Venezuela 0% USD 15/09/2027 790,000 254,775 0.06 Republic of Venezuela 9% USD 07/05/2023 390,000 116,512 0.03 Republic of Venezuela 9.25% USD 07/05/2028 390,000 116,415 0.03
1,047,825 0.26
ZAMBIA Zambia Government International Bond 8.5% USD 14/04/2024 200,000 163,545 0.04
TOTAL BONDS 374,724,429 91.41
TOTAL TRANSFERABLE SECURITIES ADMITTED TO AN OFFICIAL STOCK EXCHANGE LISTING OR DEALT IN ON ANOTHER REGULATED MARKET 374,724,429 91.41
OTHER TRANSFERABLE SECURITIES BONDS LUXEMBOURG M&G Finance Luxembourg SA FRN EUR Perpetual** 1,450,000 33,108 0.01
UNITED STATES Escrow GM Corp 0% USD 15/07/2033** 3,610,000 – 0.00 Escrow GM Corp 0% USD Perpetual** 1,540,000 – 0.00 Indalex Holding Corp 11.5% USD 01/02/2014** 345,000 – 0.00 Singapore Telecom Escrow 6.25% USD Perpetual** 130,000 – 0.00
– 0.00
URUGUAY Uruguay Par Bond FRN USD 02/01/2021** 250,000 – 0.00
TOTAL BONDS 33,108 0.01
TOTAL OTHER TRANSFERABLE SECURITIES 33,108 0.01
OPEN-ENDED FUNDS IRELAND Invesco Short-Term Investments Co Global Series Plc - US Dollar Liquidity Portfolio 13,601,811 13,601,811 3.32
LUXEMBOURG Invesco Funds SICAV - Invesco Active Multi-Sector Credit Fund 4,290,376 17,036,009 4.16
TOTAL OPEN-ENDED FUNDS 30,637,820 7.48
Total Investments 405,395,357 98.90
The accompanying notes form an integral part of these financial statements.
**Securities valued at fair market value as determined in good faith pursuant to procedures established by the Directors.
^Effective 5 October 2018 the Invesco Global High Income Fund, a sub-fund of Invesco Funds Series 2 merged into the Invesco Global High Income Fund, a sub-fund of Invesco Funds.
Invesco Global High Income Fund^ Statement of Investments as at 28 February 2019
202 Invesco Funds
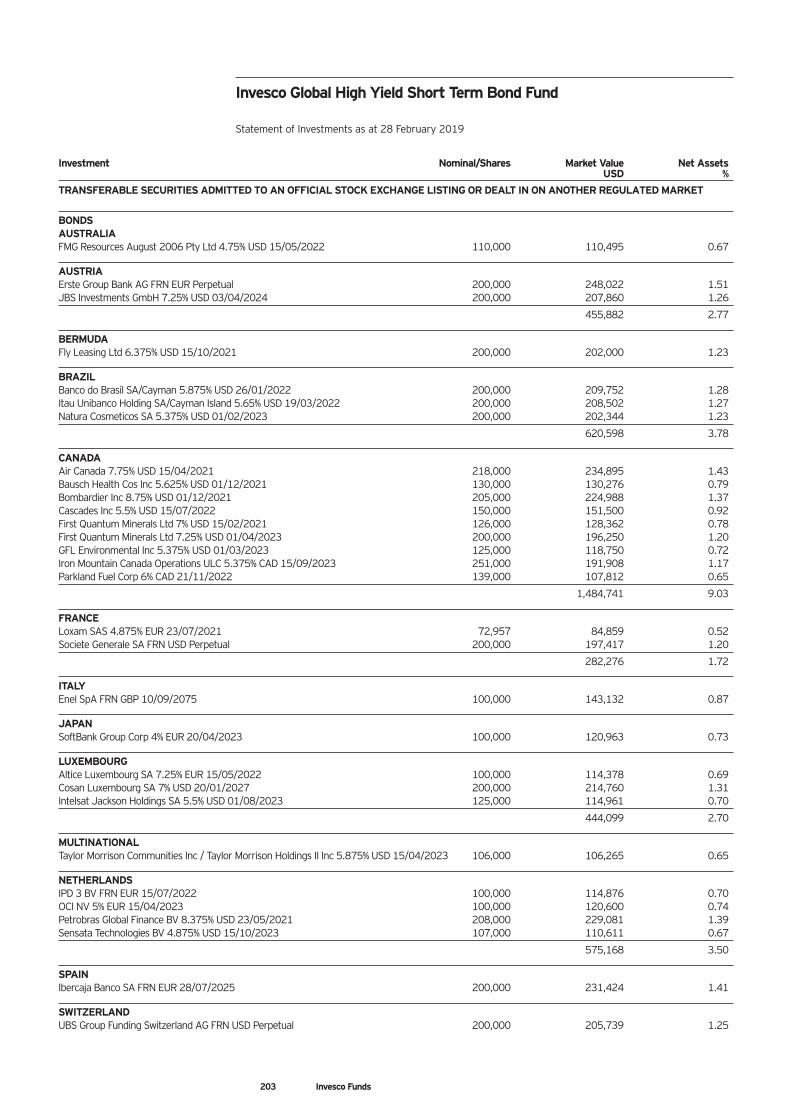
Investment Nominal/Shares Market Value Net Assets USD %
TRANSFERABLE SECURITIES ADMITTED TO AN OFFICIAL STOCK EXCHANGE LISTING OR DEALT IN ON ANOTHER REGULATED MARKET
BONDS AUSTRALIA FMG Resources August 2006 Pty Ltd 4.75% USD 15/05/2022 110,000 110,495 0.67
AUSTRIA Erste Group Bank AG FRN EUR Perpetual 200,000 248,022 1.51 JBS Investments GmbH 7.25% USD 03/04/2024 200,000 207,860 1.26
455,882 2.77
BERMUDA Fly Leasing Ltd 6.375% USD 15/10/2021 200,000 202,000 1.23
BRAZIL Banco do Brasil SA/Cayman 5.875% USD 26/01/2022 200,000 209,752 1.28 Itau Unibanco Holding SA/Cayman Island 5.65% USD 19/03/2022 200,000 208,502 1.27 Natura Cosmeticos SA 5.375% USD 01/02/2023 200,000 202,344 1.23
620,598 3.78
CANADA Air Canada 7.75% USD 15/04/2021 218,000 234,895 1.43 Bausch Health Cos Inc 5.625% USD 01/12/2021 130,000 130,276 0.79 Bombardier Inc 8.75% USD 01/12/2021 205,000 224,988 1.37 Cascades Inc 5.5% USD 15/07/2022 150,000 151,500 0.92 First Quantum Minerals Ltd 7% USD 15/02/2021 126,000 128,362 0.78 First Quantum Minerals Ltd 7.25% USD 01/04/2023 200,000 196,250 1.20 GFL Environmental Inc 5.375% USD 01/03/2023 125,000 118,750 0.72 Iron Mountain Canada Operations ULC 5.375% CAD 15/09/2023 251,000 191,908 1.17 Parkland Fuel Corp 6% CAD 21/11/2022 139,000 107,812 0.65
1,484,741 9.03
FRANCE Loxam SAS 4.875% EUR 23/07/2021 72,957 84,859 0.52 Societe Generale SA FRN USD Perpetual 200,000 197,417 1.20
282,276 1.72
ITALY Enel SpA FRN GBP 10/09/2075 100,000 143,132 0.87
JAPAN SoftBank Group Corp 4% EUR 20/04/2023 100,000 120,963 0.73
LUXEMBOURG Altice Luxembourg SA 7.25% EUR 15/05/2022 100,000 114,378 0.69 Cosan Luxembourg SA 7% USD 20/01/2027 200,000 214,760 1.31 Intelsat Jackson Holdings SA 5.5% USD 01/08/2023 125,000 114,961 0.70
444,099 2.70
MULTINATIONAL Taylor Morrison Communities Inc / Taylor Morrison Holdings II Inc 5.875% USD 15/04/2023 106,000 106,265 0.65
NETHERLANDS IPD 3 BV FRN EUR 15/07/2022 100,000 114,876 0.70 OCI NV 5% EUR 15/04/2023 100,000 120,600 0.74 Petrobras Global Finance BV 8.375% USD 23/05/2021 208,000 229,081 1.39 Sensata Technologies BV 4.875% USD 15/10/2023 107,000 110,611 0.67
575,168 3.50
SPAIN Ibercaja Banco SA FRN EUR 28/07/2025 200,000 231,424 1.41
SWITZERLAND UBS Group Funding Switzerland AG FRN USD Perpetual 200,000 205,739 1.25
Invesco Global High Yield Short Term Bond Fund Statement of Investments as at 28 February 2019
203 Invesco Funds
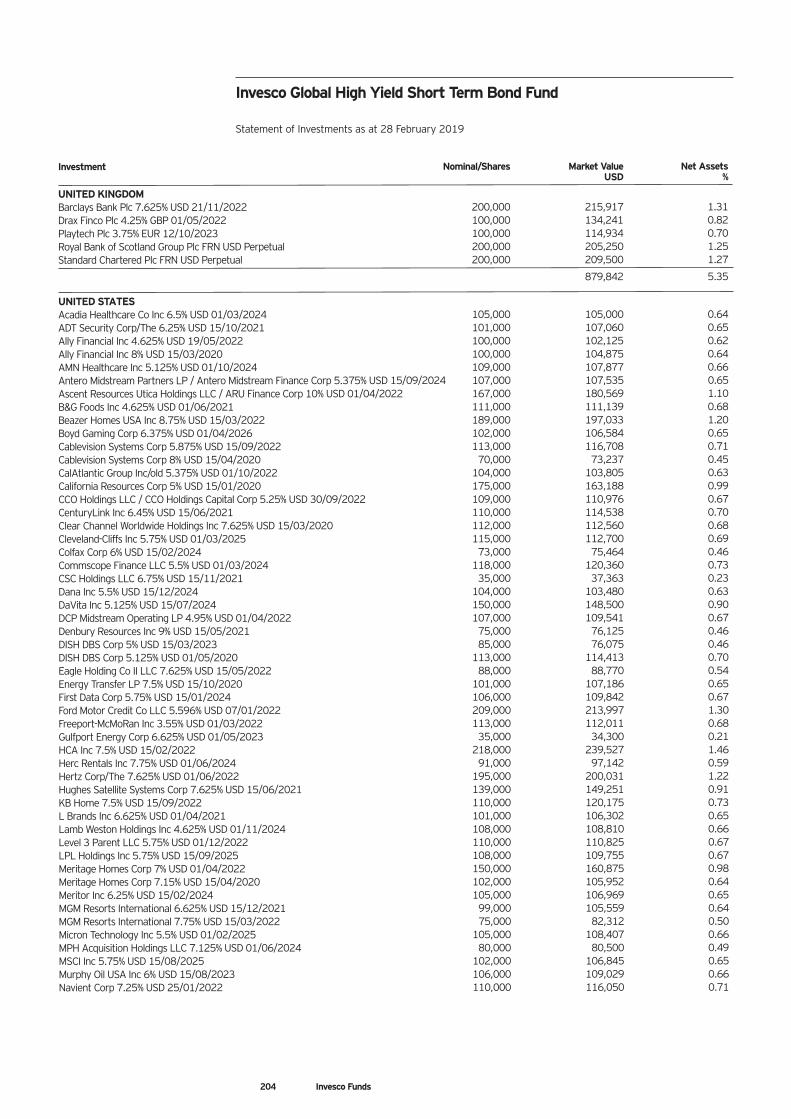
Investment Nominal/Shares Market Value Net Assets USD %
UNITED KINGDOM Barclays Bank Plc 7.625% USD 21/11/2022 200,000 215,917 1.31 Drax Finco Plc 4.25% GBP 01/05/2022 100,000 134,241 0.82 Playtech Plc 3.75% EUR 12/10/2023 100,000 114,934 0.70 Royal Bank of Scotland Group Plc FRN USD Perpetual 200,000 205,250 1.25 Standard Chartered Plc FRN USD Perpetual 200,000 209,500 1.27
879,842 5.35
UNITED STATES Acadia Healthcare Co Inc 6.5% USD 01/03/2024 105,000 105,000 0.64 ADT Security Corp/The 6.25% USD 15/10/2021 101,000 107,060 0.65 Ally Financial Inc 4.625% USD 19/05/2022 100,000 102,125 0.62 Ally Financial Inc 8% USD 15/03/2020 100,000 104,875 0.64 AMN Healthcare Inc 5.125% USD 01/10/2024 109,000 107,877 0.66 Antero Midstream Partners LP / Antero Midstream Finance Corp 5.375% USD 15/09/2024 107,000 107,535 0.65 Ascent Resources Utica Holdings LLC / ARU Finance Corp 10% USD 01/04/2022 167,000 180,569 1.10 B&G Foods Inc 4.625% USD 01/06/2021 111,000 111,139 0.68 Beazer Homes USA Inc 8.75% USD 15/03/2022 189,000 197,033 1.20 Boyd Gaming Corp 6.375% USD 01/04/2026 102,000 106,584 0.65 Cablevision Systems Corp 5.875% USD 15/09/2022 113,000 116,708 0.71 Cablevision Systems Corp 8% USD 15/04/2020 70,000 73,237 0.45 CalAtlantic Group Inc/old 5.375% USD 01/10/2022 104,000 103,805 0.63 California Resources Corp 5% USD 15/01/2020 175,000 163,188 0.99 CCO Holdings LLC / CCO Holdings Capital Corp 5.25% USD 30/09/2022 109,000 110,976 0.67 CenturyLink Inc 6.45% USD 15/06/2021 110,000 114,538 0.70 Clear Channel Worldwide Holdings Inc 7.625% USD 15/03/2020 112,000 112,560 0.68 Cleveland-Cliffs Inc 5.75% USD 01/03/2025 115,000 112,700 0.69 Colfax Corp 6% USD 15/02/2024 73,000 75,464 0.46 Commscope Finance LLC 5.5% USD 01/03/2024 118,000 120,360 0.73 CSC Holdings LLC 6.75% USD 15/11/2021 35,000 37,363 0.23 Dana Inc 5.5% USD 15/12/2024 104,000 103,480 0.63 DaVita Inc 5.125% USD 15/07/2024 150,000 148,500 0.90 DCP Midstream Operating LP 4.95% USD 01/04/2022 107,000 109,541 0.67 Denbury Resources Inc 9% USD 15/05/2021 75,000 76,125 0.46 DISH DBS Corp 5% USD 15/03/2023 85,000 76,075 0.46 DISH DBS Corp 5.125% USD 01/05/2020 113,000 114,413 0.70 Eagle Holding Co II LLC 7.625% USD 15/05/2022 88,000 88,770 0.54 Energy Transfer LP 7.5% USD 15/10/2020 101,000 107,186 0.65 First Data Corp 5.75% USD 15/01/2024 106,000 109,842 0.67 Ford Motor Credit Co LLC 5.596% USD 07/01/2022 209,000 213,997 1.30 Freeport-McMoRan Inc 3.55% USD 01/03/2022 113,000 112,011 0.68 Gulfport Energy Corp 6.625% USD 01/05/2023 35,000 34,300 0.21 HCA Inc 7.5% USD 15/02/2022 218,000 239,527 1.46 Herc Rentals Inc 7.75% USD 01/06/2024 91,000 97,142 0.59 Hertz Corp/The 7.625% USD 01/06/2022 195,000 200,031 1.22 Hughes Satellite Systems Corp 7.625% USD 15/06/2021 139,000 149,251 0.91 KB Home 7.5% USD 15/09/2022 110,000 120,175 0.73 L Brands Inc 6.625% USD 01/04/2021 101,000 106,302 0.65 Lamb Weston Holdings Inc 4.625% USD 01/11/2024 108,000 108,810 0.66 Level 3 Parent LLC 5.75% USD 01/12/2022 110,000 110,825 0.67 LPL Holdings Inc 5.75% USD 15/09/2025 108,000 109,755 0.67 Meritage Homes Corp 7% USD 01/04/2022 150,000 160,875 0.98 Meritage Homes Corp 7.15% USD 15/04/2020 102,000 105,952 0.64 Meritor Inc 6.25% USD 15/02/2024 105,000 106,969 0.65 MGM Resorts International 6.625% USD 15/12/2021 99,000 105,559 0.64 MGM Resorts International 7.75% USD 15/03/2022 75,000 82,312 0.50 Micron Technology Inc 5.5% USD 01/02/2025 105,000 108,407 0.66 MPH Acquisition Holdings LLC 7.125% USD 01/06/2024 80,000 80,500 0.49 MSCI Inc 5.75% USD 15/08/2025 102,000 106,845 0.65 Murphy Oil USA Inc 6% USD 15/08/2023 106,000 109,029 0.66 Navient Corp 7.25% USD 25/01/2022 110,000 116,050 0.71
Invesco Global High Yield Short Term Bond Fund Statement of Investments as at 28 February 2019
204 Invesco Funds
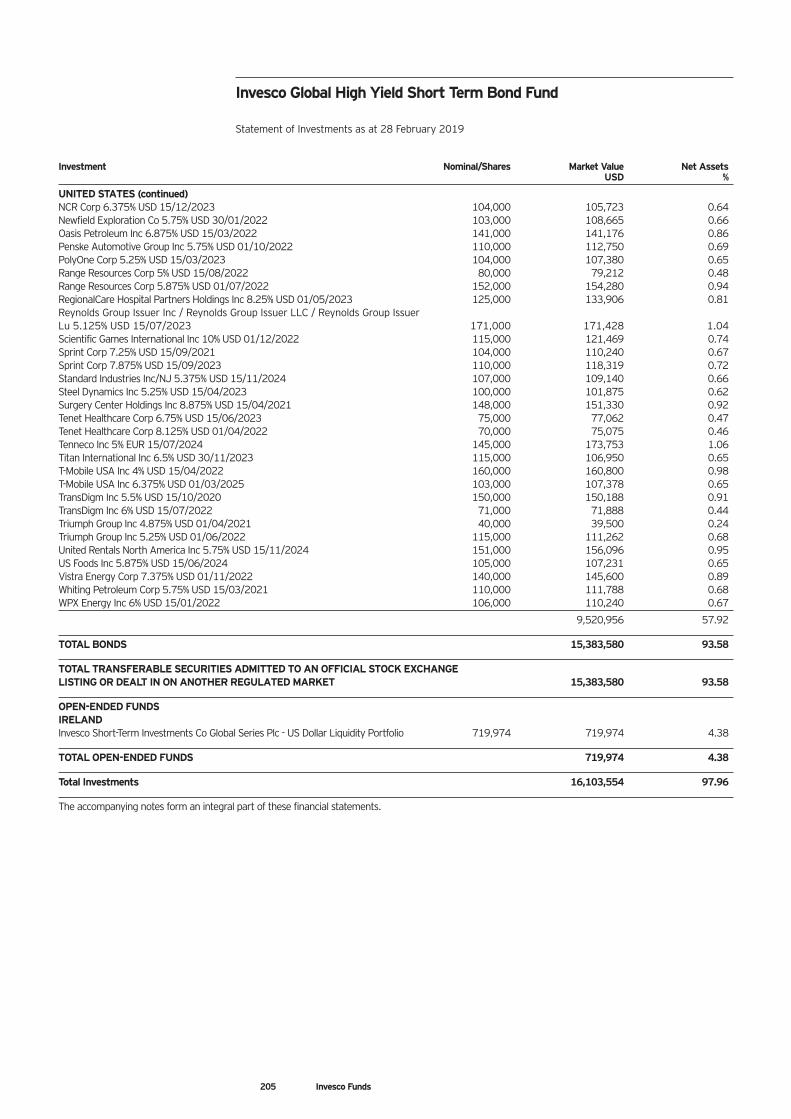
Investment Nominal/Shares Market Value Net Assets USD %
UNITED STATES (continued) NCR Corp 6.375% USD 15/12/2023 104,000 105,723 0.64 Newfield Exploration Co 5.75% USD 30/01/2022 103,000 108,665 0.66 Oasis Petroleum Inc 6.875% USD 15/03/2022 141,000 141,176 0.86 Penske Automotive Group Inc 5.75% USD 01/10/2022 110,000 112,750 0.69 PolyOne Corp 5.25% USD 15/03/2023 104,000 107,380 0.65 Range Resources Corp 5% USD 15/08/2022 80,000 79,212 0.48 Range Resources Corp 5.875% USD 01/07/2022 152,000 154,280 0.94 RegionalCare Hospital Partners Holdings Inc 8.25% USD 01/05/2023 125,000 133,906 0.81 Reynolds Group Issuer Inc / Reynolds Group Issuer LLC / Reynolds Group Issuer Lu 5.125% USD 15/07/2023 171,000 171,428 1.04 Scientific Games International Inc 10% USD 01/12/2022 115,000 121,469 0.74 Sprint Corp 7.25% USD 15/09/2021 104,000 110,240 0.67 Sprint Corp 7.875% USD 15/09/2023 110,000 118,319 0.72 Standard Industries Inc/NJ 5.375% USD 15/11/2024 107,000 109,140 0.66 Steel Dynamics Inc 5.25% USD 15/04/2023 100,000 101,875 0.62 Surgery Center Holdings Inc 8.875% USD 15/04/2021 148,000 151,330 0.92 Tenet Healthcare Corp 6.75% USD 15/06/2023 75,000 77,062 0.47 Tenet Healthcare Corp 8.125% USD 01/04/2022 70,000 75,075 0.46 Tenneco Inc 5% EUR 15/07/2024 145,000 173,753 1.06 Titan International Inc 6.5% USD 30/11/2023 115,000 106,950 0.65 T-Mobile USA Inc 4% USD 15/04/2022 160,000 160,800 0.98 T-Mobile USA Inc 6.375% USD 01/03/2025 103,000 107,378 0.65 TransDigm Inc 5.5% USD 15/10/2020 150,000 150,188 0.91 TransDigm Inc 6% USD 15/07/2022 71,000 71,888 0.44 Triumph Group Inc 4.875% USD 01/04/2021 40,000 39,500 0.24 Triumph Group Inc 5.25% USD 01/06/2022 115,000 111,262 0.68 United Rentals North America Inc 5.75% USD 15/11/2024 151,000 156,096 0.95 US Foods Inc 5.875% USD 15/06/2024 105,000 107,231 0.65 Vistra Energy Corp 7.375% USD 01/11/2022 140,000 145,600 0.89 Whiting Petroleum Corp 5.75% USD 15/03/2021 110,000 111,788 0.68 WPX Energy Inc 6% USD 15/01/2022 106,000 110,240 0.67
9,520,956 57.92
TOTAL BONDS 15,383,580 93.58
TOTAL TRANSFERABLE SECURITIES ADMITTED TO AN OFFICIAL STOCK EXCHANGE LISTING OR DEALT IN ON ANOTHER REGULATED MARKET 15,383,580 93.58
OPEN-ENDED FUNDS IRELAND Invesco Short-Term Investments Co Global Series Plc - US Dollar Liquidity Portfolio 719,974 719,974 4.38
TOTAL OPEN-ENDED FUNDS 719,974 4.38
Total Investments 16,103,554 97.96
The accompanying notes form an integral part of these financial statements.
Invesco Global High Yield Short Term Bond Fund Statement of Investments as at 28 February 2019
205 Invesco Funds
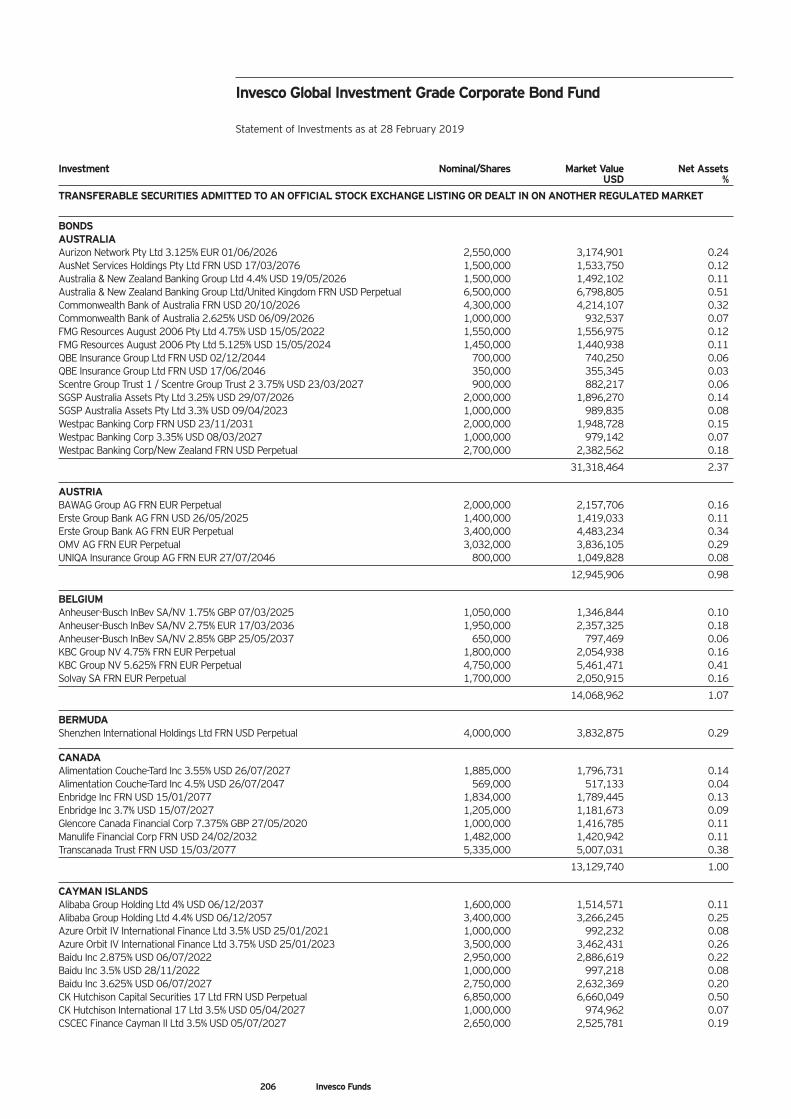
Investment Nominal/Shares Market Value Net Assets USD %
TRANSFERABLE SECURITIES ADMITTED TO AN OFFICIAL STOCK EXCHANGE LISTING OR DEALT IN ON ANOTHER REGULATED MARKET
BONDS AUSTRALIA Aurizon Network Pty Ltd 3.125% EUR 01/06/2026 2,550,000 3,174,901 0.24 AusNet Services Holdings Pty Ltd FRN USD 17/03/2076 1,500,000 1,533,750 0.12 Australia & New Zealand Banking Group Ltd 4.4% USD 19/05/2026 1,500,000 1,492,102 0.11 Australia & New Zealand Banking Group Ltd/United Kingdom FRN USD Perpetual 6,500,000 6,798,805 0.51 Commonwealth Bank of Australia FRN USD 20/10/2026 4,300,000 4,214,107 0.32 Commonwealth Bank of Australia 2.625% USD 06/09/2026 1,000,000 932,537 0.07 FMG Resources August 2006 Pty Ltd 4.75% USD 15/05/2022 1,550,000 1,556,975 0.12 FMG Resources August 2006 Pty Ltd 5.125% USD 15/05/2024 1,450,000 1,440,938 0.11 QBE Insurance Group Ltd FRN USD 02/12/2044 700,000 740,250 0.06 QBE Insurance Group Ltd FRN USD 17/06/2046 350,000 355,345 0.03 Scentre Group Trust 1 / Scentre Group Trust 2 3.75% USD 23/03/2027 900,000 882,217 0.06 SGSP Australia Assets Pty Ltd 3.25% USD 29/07/2026 2,000,000 1,896,270 0.14 SGSP Australia Assets Pty Ltd 3.3% USD 09/04/2023 1,000,000 989,835 0.08 Westpac Banking Corp FRN USD 23/11/2031 2,000,000 1,948,728 0.15 Westpac Banking Corp 3.35% USD 08/03/2027 1,000,000 979,142 0.07 Westpac Banking Corp/New Zealand FRN USD Perpetual 2,700,000 2,382,562 0.18
31,318,464 2.37
AUSTRIA BAWAG Group AG FRN EUR Perpetual 2,000,000 2,157,706 0.16 Erste Group Bank AG FRN USD 26/05/2025 1,400,000 1,419,033 0.11 Erste Group Bank AG FRN EUR Perpetual 3,400,000 4,483,234 0.34 OMV AG FRN EUR Perpetual 3,032,000 3,836,105 0.29 UNIQA Insurance Group AG FRN EUR 27/07/2046 800,000 1,049,828 0.08
12,945,906 0.98
BELGIUM Anheuser-Busch InBev SA/NV 1.75% GBP 07/03/2025 1,050,000 1,346,844 0.10 Anheuser-Busch InBev SA/NV 2.75% EUR 17/03/2036 1,950,000 2,357,325 0.18 Anheuser-Busch InBev SA/NV 2.85% GBP 25/05/2037 650,000 797,469 0.06 KBC Group NV 4.75% FRN EUR Perpetual 1,800,000 2,054,938 0.16 KBC Group NV 5.625% FRN EUR Perpetual 4,750,000 5,461,471 0.41 Solvay SA FRN EUR Perpetual 1,700,000 2,050,915 0.16
14,068,962 1.07
BERMUDA Shenzhen International Holdings Ltd FRN USD Perpetual 4,000,000 3,832,875 0.29
CANADA Alimentation Couche-Tard Inc 3.55% USD 26/07/2027 1,885,000 1,796,731 0.14 Alimentation Couche-Tard Inc 4.5% USD 26/07/2047 569,000 517,133 0.04 Enbridge Inc FRN USD 15/01/2077 1,834,000 1,789,445 0.13 Enbridge Inc 3.7% USD 15/07/2027 1,205,000 1,181,673 0.09 Glencore Canada Financial Corp 7.375% GBP 27/05/2020 1,000,000 1,416,785 0.11 Manulife Financial Corp FRN USD 24/02/2032 1,482,000 1,420,942 0.11 Transcanada Trust FRN USD 15/03/2077 5,335,000 5,007,031 0.38
13,129,740 1.00
CAYMAN ISLANDS Alibaba Group Holding Ltd 4% USD 06/12/2037 1,600,000 1,514,571 0.11 Alibaba Group Holding Ltd 4.4% USD 06/12/2057 3,400,000 3,266,245 0.25 Azure Orbit IV International Finance Ltd 3.5% USD 25/01/2021 1,000,000 992,232 0.08 Azure Orbit IV International Finance Ltd 3.75% USD 25/01/2023 3,500,000 3,462,431 0.26 Baidu Inc 2.875% USD 06/07/2022 2,950,000 2,886,619 0.22 Baidu Inc 3.5% USD 28/11/2022 1,000,000 997,218 0.08 Baidu Inc 3.625% USD 06/07/2027 2,750,000 2,632,369 0.20 CK Hutchison Capital Securities 17 Ltd FRN USD Perpetual 6,850,000 6,660,049 0.50 CK Hutchison International 17 Ltd 3.5% USD 05/04/2027 1,000,000 974,962 0.07 CSCEC Finance Cayman II Ltd 3.5% USD 05/07/2027 2,650,000 2,525,781 0.19
Invesco Global Investment Grade Corporate Bond Fund Statement of Investments as at 28 February 2019
206 Invesco Funds
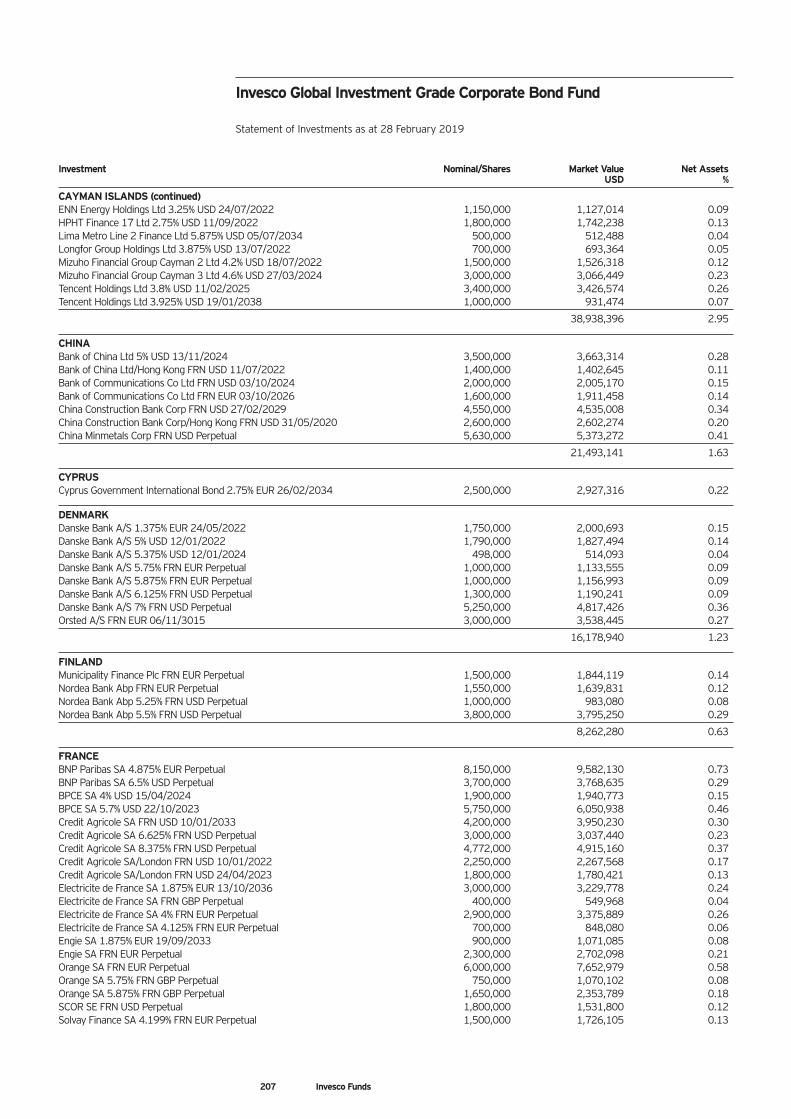
Investment Nominal/Shares Market Value Net Assets USD %
CAYMAN ISLANDS (continued) ENN Energy Holdings Ltd 3.25% USD 24/07/2022 1,150,000 1,127,014 0.09 HPHT Finance 17 Ltd 2.75% USD 11/09/2022 1,800,000 1,742,238 0.13 Lima Metro Line 2 Finance Ltd 5.875% USD 05/07/2034 500,000 512,488 0.04 Longfor Group Holdings Ltd 3.875% USD 13/07/2022 700,000 693,364 0.05 Mizuho Financial Group Cayman 2 Ltd 4.2% USD 18/07/2022 1,500,000 1,526,318 0.12 Mizuho Financial Group Cayman 3 Ltd 4.6% USD 27/03/2024 3,000,000 3,066,449 0.23 Tencent Holdings Ltd 3.8% USD 11/02/2025 3,400,000 3,426,574 0.26 Tencent Holdings Ltd 3.925% USD 19/01/2038 1,000,000 931,474 0.07
38,938,396 2.95
CHINA Bank of China Ltd 5% USD 13/11/2024 3,500,000 3,663,314 0.28 Bank of China Ltd/Hong Kong FRN USD 11/07/2022 1,400,000 1,402,645 0.11 Bank of Communications Co Ltd FRN USD 03/10/2024 2,000,000 2,005,170 0.15 Bank of Communications Co Ltd FRN EUR 03/10/2026 1,600,000 1,911,458 0.14 China Construction Bank Corp FRN USD 27/02/2029 4,550,000 4,535,008 0.34 China Construction Bank Corp/Hong Kong FRN USD 31/05/2020 2,600,000 2,602,274 0.20 China Minmetals Corp FRN USD Perpetual 5,630,000 5,373,272 0.41
21,493,141 1.63
CYPRUS Cyprus Government International Bond 2.75% EUR 26/02/2034 2,500,000 2,927,316 0.22
DENMARK Danske Bank A/S 1.375% EUR 24/05/2022 1,750,000 2,000,693 0.15 Danske Bank A/S 5% USD 12/01/2022 1,790,000 1,827,494 0.14 Danske Bank A/S 5.375% USD 12/01/2024 498,000 514,093 0.04 Danske Bank A/S 5.75% FRN EUR Perpetual 1,000,000 1,133,555 0.09 Danske Bank A/S 5.875% FRN EUR Perpetual 1,000,000 1,156,993 0.09 Danske Bank A/S 6.125% FRN USD Perpetual 1,300,000 1,190,241 0.09 Danske Bank A/S 7% FRN USD Perpetual 5,250,000 4,817,426 0.36 Orsted A/S FRN EUR 06/11/3015 3,000,000 3,538,445 0.27
16,178,940 1.23
FINLAND Municipality Finance Plc FRN EUR Perpetual 1,500,000 1,844,119 0.14 Nordea Bank Abp FRN EUR Perpetual 1,550,000 1,639,831 0.12 Nordea Bank Abp 5.25% FRN USD Perpetual 1,000,000 983,080 0.08 Nordea Bank Abp 5.5% FRN USD Perpetual 3,800,000 3,795,250 0.29
8,262,280 0.63
FRANCE BNP Paribas SA 4.875% EUR Perpetual 8,150,000 9,582,130 0.73 BNP Paribas SA 6.5% USD Perpetual 3,700,000 3,768,635 0.29 BPCE SA 4% USD 15/04/2024 1,900,000 1,940,773 0.15 BPCE SA 5.7% USD 22/10/2023 5,750,000 6,050,938 0.46 Credit Agricole SA FRN USD 10/01/2033 4,200,000 3,950,230 0.30 Credit Agricole SA 6.625% FRN USD Perpetual 3,000,000 3,037,440 0.23 Credit Agricole SA 8.375% FRN USD Perpetual 4,772,000 4,915,160 0.37 Credit Agricole SA/London FRN USD 10/01/2022 2,250,000 2,267,568 0.17 Credit Agricole SA/London FRN USD 24/04/2023 1,800,000 1,780,421 0.13 Electricite de France SA 1.875% EUR 13/10/2036 3,000,000 3,229,778 0.24 Electricite de France SA FRN GBP Perpetual 400,000 549,968 0.04 Electricite de France SA 4% FRN EUR Perpetual 2,900,000 3,375,889 0.26 Electricite de France SA 4.125% FRN EUR Perpetual 700,000 848,080 0.06 Engie SA 1.875% EUR 19/09/2033 900,000 1,071,085 0.08 Engie SA FRN EUR Perpetual 2,300,000 2,702,098 0.21 Orange SA FRN EUR Perpetual 6,000,000 7,652,979 0.58 Orange SA 5.75% FRN GBP Perpetual 750,000 1,070,102 0.08 Orange SA 5.875% FRN GBP Perpetual 1,650,000 2,353,789 0.18 SCOR SE FRN USD Perpetual 1,800,000 1,531,800 0.12 Solvay Finance SA 4.199% FRN EUR Perpetual 1,500,000 1,726,105 0.13
Invesco Global Investment Grade Corporate Bond Fund Statement of Investments as at 28 February 2019
207 Invesco Funds
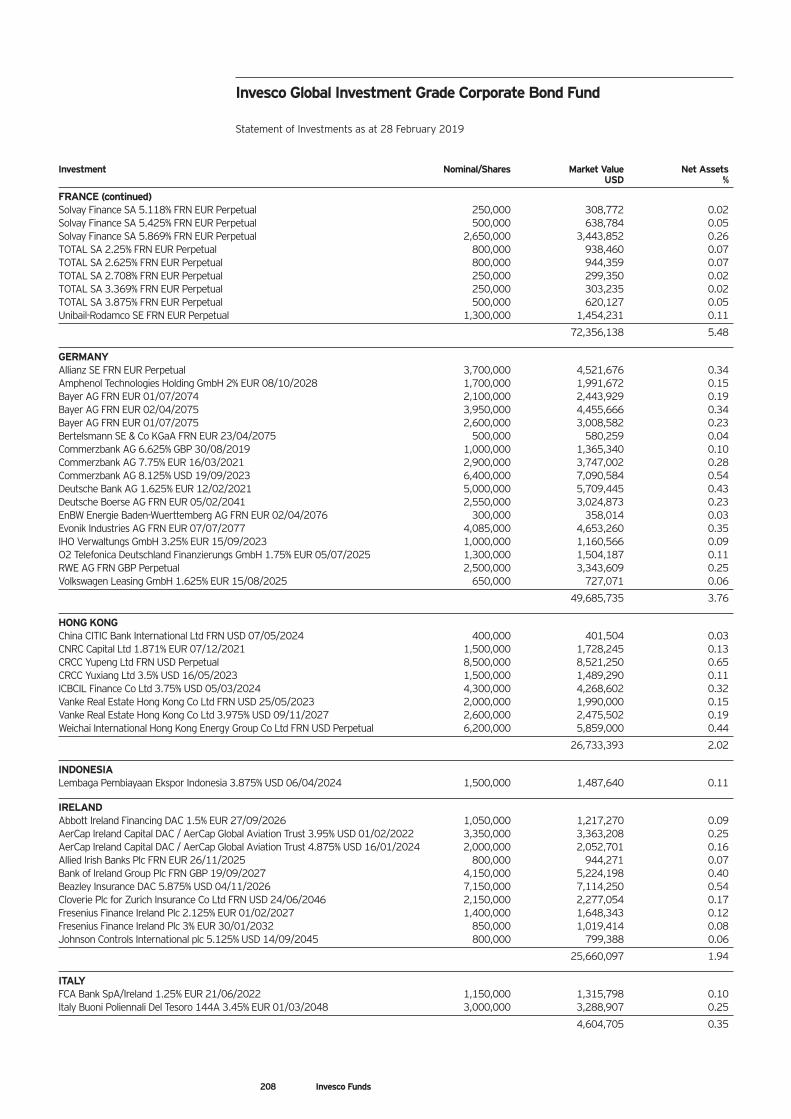
Investment Nominal/Shares Market Value Net Assets USD %
FRANCE (continued) Solvay Finance SA 5.118% FRN EUR Perpetual 250,000 308,772 0.02 Solvay Finance SA 5.425% FRN EUR Perpetual 500,000 638,784 0.05 Solvay Finance SA 5.869% FRN EUR Perpetual 2,650,000 3,443,852 0.26 TOTAL SA 2.25% FRN EUR Perpetual 800,000 938,460 0.07 TOTAL SA 2.625% FRN EUR Perpetual 800,000 944,359 0.07 TOTAL SA 2.708% FRN EUR Perpetual 250,000 299,350 0.02 TOTAL SA 3.369% FRN EUR Perpetual 250,000 303,235 0.02 TOTAL SA 3.875% FRN EUR Perpetual 500,000 620,127 0.05 Unibail-Rodamco SE FRN EUR Perpetual 1,300,000 1,454,231 0.11
72,356,138 5.48
GERMANY Allianz SE FRN EUR Perpetual 3,700,000 4,521,676 0.34 Amphenol Technologies Holding GmbH 2% EUR 08/10/2028 1,700,000 1,991,672 0.15 Bayer AG FRN EUR 01/07/2074 2,100,000 2,443,929 0.19 Bayer AG FRN EUR 02/04/2075 3,950,000 4,455,666 0.34 Bayer AG FRN EUR 01/07/2075 2,600,000 3,008,582 0.23 Bertelsmann SE & Co KGaA FRN EUR 23/04/2075 500,000 580,259 0.04 Commerzbank AG 6.625% GBP 30/08/2019 1,000,000 1,365,340 0.10 Commerzbank AG 7.75% EUR 16/03/2021 2,900,000 3,747,002 0.28 Commerzbank AG 8.125% USD 19/09/2023 6,400,000 7,090,584 0.54 Deutsche Bank AG 1.625% EUR 12/02/2021 5,000,000 5,709,445 0.43 Deutsche Boerse AG FRN EUR 05/02/2041 2,550,000 3,024,873 0.23 EnBW Energie Baden-Wuerttemberg AG FRN EUR 02/04/2076 300,000 358,014 0.03 Evonik Industries AG FRN EUR 07/07/2077 4,085,000 4,653,260 0.35 IHO Verwaltungs GmbH 3.25% EUR 15/09/2023 1,000,000 1,160,566 0.09 O2 Telefonica Deutschland Finanzierungs GmbH 1.75% EUR 05/07/2025 1,300,000 1,504,187 0.11 RWE AG FRN GBP Perpetual 2,500,000 3,343,609 0.25 Volkswagen Leasing GmbH 1.625% EUR 15/08/2025 650,000 727,071 0.06
49,685,735 3.76
HONG KONG China CITIC Bank International Ltd FRN USD 07/05/2024 400,000 401,504 0.03 CNRC Capital Ltd 1.871% EUR 07/12/2021 1,500,000 1,728,245 0.13 CRCC Yupeng Ltd FRN USD Perpetual 8,500,000 8,521,250 0.65 CRCC Yuxiang Ltd 3.5% USD 16/05/2023 1,500,000 1,489,290 0.11 ICBCIL Finance Co Ltd 3.75% USD 05/03/2024 4,300,000 4,268,602 0.32 Vanke Real Estate Hong Kong Co Ltd FRN USD 25/05/2023 2,000,000 1,990,000 0.15 Vanke Real Estate Hong Kong Co Ltd 3.975% USD 09/11/2027 2,600,000 2,475,502 0.19 Weichai International Hong Kong Energy Group Co Ltd FRN USD Perpetual 6,200,000 5,859,000 0.44
26,733,393 2.02
INDONESIA Lembaga Pembiayaan Ekspor Indonesia 3.875% USD 06/04/2024 1,500,000 1,487,640 0.11
IRELAND Abbott Ireland Financing DAC 1.5% EUR 27/09/2026 1,050,000 1,217,270 0.09 AerCap Ireland Capital DAC / AerCap Global Aviation Trust 3.95% USD 01/02/2022 3,350,000 3,363,208 0.25 AerCap Ireland Capital DAC / AerCap Global Aviation Trust 4.875% USD 16/01/2024 2,000,000 2,052,701 0.16 Allied Irish Banks Plc FRN EUR 26/11/2025 800,000 944,271 0.07 Bank of Ireland Group Plc FRN GBP 19/09/2027 4,150,000 5,224,198 0.40 Beazley Insurance DAC 5.875% USD 04/11/2026 7,150,000 7,114,250 0.54 Cloverie Plc for Zurich Insurance Co Ltd FRN USD 24/06/2046 2,150,000 2,277,054 0.17 Fresenius Finance Ireland Plc 2.125% EUR 01/02/2027 1,400,000 1,648,343 0.12 Fresenius Finance Ireland Plc 3% EUR 30/01/2032 850,000 1,019,414 0.08 Johnson Controls International plc 5.125% USD 14/09/2045 800,000 799,388 0.06
25,660,097 1.94
ITALY FCA Bank SpA/Ireland 1.25% EUR 21/06/2022 1,150,000 1,315,798 0.10 Italy Buoni Poliennali Del Tesoro 144A 3.45% EUR 01/03/2048 3,000,000 3,288,907 0.25
4,604,705 0.35
Invesco Global Investment Grade Corporate Bond Fund Statement of Investments as at 28 February 2019
208 Invesco Funds
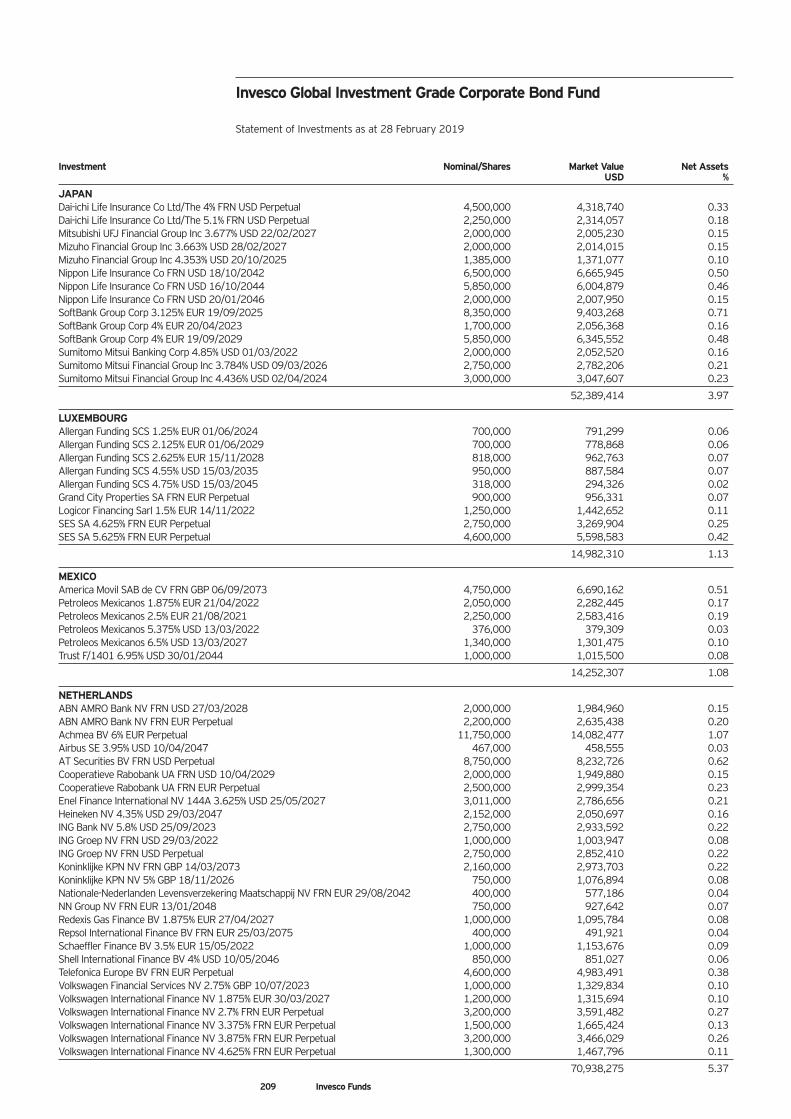
Investment Nominal/Shares Market Value Net Assets USD %
JAPAN Dai-ichi Life Insurance Co Ltd/The 4% FRN USD Perpetual 4,500,000 4,318,740 0.33 Dai-ichi Life Insurance Co Ltd/The 5.1% FRN USD Perpetual 2,250,000 2,314,057 0.18 Mitsubishi UFJ Financial Group Inc 3.677% USD 22/02/2027 2,000,000 2,005,230 0.15 Mizuho Financial Group Inc 3.663% USD 28/02/2027 2,000,000 2,014,015 0.15 Mizuho Financial Group Inc 4.353% USD 20/10/2025 1,385,000 1,371,077 0.10 Nippon Life Insurance Co FRN USD 18/10/2042 6,500,000 6,665,945 0.50 Nippon Life Insurance Co FRN USD 16/10/2044 5,850,000 6,004,879 0.46 Nippon Life Insurance Co FRN USD 20/01/2046 2,000,000 2,007,950 0.15 SoftBank Group Corp 3.125% EUR 19/09/2025 8,350,000 9,403,268 0.71 SoftBank Group Corp 4% EUR 20/04/2023 1,700,000 2,056,368 0.16 SoftBank Group Corp 4% EUR 19/09/2029 5,850,000 6,345,552 0.48 Sumitomo Mitsui Banking Corp 4.85% USD 01/03/2022 2,000,000 2,052,520 0.16 Sumitomo Mitsui Financial Group Inc 3.784% USD 09/03/2026 2,750,000 2,782,206 0.21 Sumitomo Mitsui Financial Group Inc 4.436% USD 02/04/2024 3,000,000 3,047,607 0.23
52,389,414 3.97
LUXEMBOURG Allergan Funding SCS 1.25% EUR 01/06/2024 700,000 791,299 0.06 Allergan Funding SCS 2.125% EUR 01/06/2029 700,000 778,868 0.06 Allergan Funding SCS 2.625% EUR 15/11/2028 818,000 962,763 0.07 Allergan Funding SCS 4.55% USD 15/03/2035 950,000 887,584 0.07 Allergan Funding SCS 4.75% USD 15/03/2045 318,000 294,326 0.02 Grand City Properties SA FRN EUR Perpetual 900,000 956,331 0.07 Logicor Financing Sarl 1.5% EUR 14/11/2022 1,250,000 1,442,652 0.11 SES SA 4.625% FRN EUR Perpetual 2,750,000 3,269,904 0.25 SES SA 5.625% FRN EUR Perpetual 4,600,000 5,598,583 0.42
14,982,310 1.13
MEXICO America Movil SAB de CV FRN GBP 06/09/2073 4,750,000 6,690,162 0.51 Petroleos Mexicanos 1.875% EUR 21/04/2022 2,050,000 2,282,445 0.17 Petroleos Mexicanos 2.5% EUR 21/08/2021 2,250,000 2,583,416 0.19 Petroleos Mexicanos 5.375% USD 13/03/2022 376,000 379,309 0.03 Petroleos Mexicanos 6.5% USD 13/03/2027 1,340,000 1,301,475 0.10 Trust F/1401 6.95% USD 30/01/2044 1,000,000 1,015,500 0.08
14,252,307 1.08
NETHERLANDS ABN AMRO Bank NV FRN USD 27/03/2028 2,000,000 1,984,960 0.15 ABN AMRO Bank NV FRN EUR Perpetual 2,200,000 2,635,438 0.20 Achmea BV 6% EUR Perpetual 11,750,000 14,082,477 1.07 Airbus SE 3.95% USD 10/04/2047 467,000 458,555 0.03 AT Securities BV FRN USD Perpetual 8,750,000 8,232,726 0.62 Cooperatieve Rabobank UA FRN USD 10/04/2029 2,000,000 1,949,880 0.15 Cooperatieve Rabobank UA FRN EUR Perpetual 2,500,000 2,999,354 0.23 Enel Finance International NV 144A 3.625% USD 25/05/2027 3,011,000 2,786,656 0.21 Heineken NV 4.35% USD 29/03/2047 2,152,000 2,050,697 0.16 ING Bank NV 5.8% USD 25/09/2023 2,750,000 2,933,592 0.22 ING Groep NV FRN USD 29/03/2022 1,000,000 1,003,947 0.08 ING Groep NV FRN USD Perpetual 2,750,000 2,852,410 0.22 Koninklijke KPN NV FRN GBP 14/03/2073 2,160,000 2,973,703 0.22 Koninklijke KPN NV 5% GBP 18/11/2026 750,000 1,076,894 0.08 Nationale-Nederlanden Levensverzekering Maatschappij NV FRN EUR 29/08/2042 400,000 577,186 0.04 NN Group NV FRN EUR 13/01/2048 750,000 927,642 0.07 Redexis Gas Finance BV 1.875% EUR 27/04/2027 1,000,000 1,095,784 0.08 Repsol International Finance BV FRN EUR 25/03/2075 400,000 491,921 0.04 Schaeffler Finance BV 3.5% EUR 15/05/2022 1,000,000 1,153,676 0.09 Shell International Finance BV 4% USD 10/05/2046 850,000 851,027 0.06 Telefonica Europe BV FRN EUR Perpetual 4,600,000 4,983,491 0.38 Volkswagen Financial Services NV 2.75% GBP 10/07/2023 1,000,000 1,329,834 0.10 Volkswagen International Finance NV 1.875% EUR 30/03/2027 1,200,000 1,315,694 0.10 Volkswagen International Finance NV 2.7% FRN EUR Perpetual 3,200,000 3,591,482 0.27 Volkswagen International Finance NV 3.375% FRN EUR Perpetual 1,500,000 1,665,424 0.13 Volkswagen International Finance NV 3.875% FRN EUR Perpetual 3,200,000 3,466,029 0.26 Volkswagen International Finance NV 4.625% FRN EUR Perpetual 1,300,000 1,467,796 0.11
70,938,275 5.37
Invesco Global Investment Grade Corporate Bond Fund Statement of Investments as at 28 February 2019
209 Invesco Funds
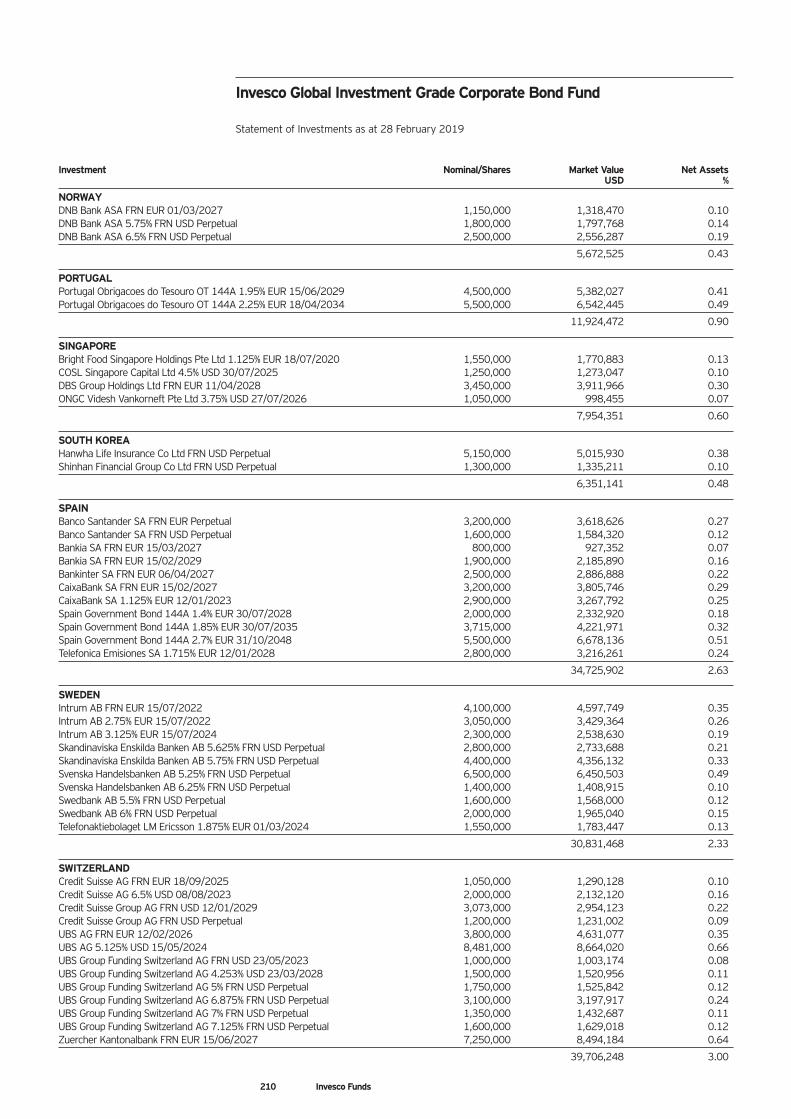
Investment Nominal/Shares Market Value Net Assets USD %
NORWAY DNB Bank ASA FRN EUR 01/03/2027 1,150,000 1,318,470 0.10 DNB Bank ASA 5.75% FRN USD Perpetual 1,800,000 1,797,768 0.14 DNB Bank ASA 6.5% FRN USD Perpetual 2,500,000 2,556,287 0.19
5,672,525 0.43
PORTUGAL Portugal Obrigacoes do Tesouro OT 144A 1.95% EUR 15/06/2029 4,500,000 5,382,027 0.41 Portugal Obrigacoes do Tesouro OT 144A 2.25% EUR 18/04/2034 5,500,000 6,542,445 0.49
11,924,472 0.90
SINGAPORE Bright Food Singapore Holdings Pte Ltd 1.125% EUR 18/07/2020 1,550,000 1,770,883 0.13 COSL Singapore Capital Ltd 4.5% USD 30/07/2025 1,250,000 1,273,047 0.10 DBS Group Holdings Ltd FRN EUR 11/04/2028 3,450,000 3,911,966 0.30 ONGC Videsh Vankorneft Pte Ltd 3.75% USD 27/07/2026 1,050,000 998,455 0.07
7,954,351 0.60
SOUTH KOREA Hanwha Life Insurance Co Ltd FRN USD Perpetual 5,150,000 5,015,930 0.38 Shinhan Financial Group Co Ltd FRN USD Perpetual 1,300,000 1,335,211 0.10
6,351,141 0.48
SPAIN Banco Santander SA FRN EUR Perpetual 3,200,000 3,618,626 0.27 Banco Santander SA FRN USD Perpetual 1,600,000 1,584,320 0.12 Bankia SA FRN EUR 15/03/2027 800,000 927,352 0.07 Bankia SA FRN EUR 15/02/2029 1,900,000 2,185,890 0.16 Bankinter SA FRN EUR 06/04/2027 2,500,000 2,886,888 0.22 CaixaBank SA FRN EUR 15/02/2027 3,200,000 3,805,746 0.29 CaixaBank SA 1.125% EUR 12/01/2023 2,900,000 3,267,792 0.25 Spain Government Bond 144A 1.4% EUR 30/07/2028 2,000,000 2,332,920 0.18 Spain Government Bond 144A 1.85% EUR 30/07/2035 3,715,000 4,221,971 0.32 Spain Government Bond 144A 2.7% EUR 31/10/2048 5,500,000 6,678,136 0.51 Telefonica Emisiones SA 1.715% EUR 12/01/2028 2,800,000 3,216,261 0.24
34,725,902 2.63
SWEDEN Intrum AB FRN EUR 15/07/2022 4,100,000 4,597,749 0.35 Intrum AB 2.75% EUR 15/07/2022 3,050,000 3,429,364 0.26 Intrum AB 3.125% EUR 15/07/2024 2,300,000 2,538,630 0.19 Skandinaviska Enskilda Banken AB 5.625% FRN USD Perpetual 2,800,000 2,733,688 0.21 Skandinaviska Enskilda Banken AB 5.75% FRN USD Perpetual 4,400,000 4,356,132 0.33 Svenska Handelsbanken AB 5.25% FRN USD Perpetual 6,500,000 6,450,503 0.49 Svenska Handelsbanken AB 6.25% FRN USD Perpetual 1,400,000 1,408,915 0.10 Swedbank AB 5.5% FRN USD Perpetual 1,600,000 1,568,000 0.12 Swedbank AB 6% FRN USD Perpetual 2,000,000 1,965,040 0.15 Telefonaktiebolaget LM Ericsson 1.875% EUR 01/03/2024 1,550,000 1,783,447 0.13
30,831,468 2.33
SWITZERLAND Credit Suisse AG FRN EUR 18/09/2025 1,050,000 1,290,128 0.10 Credit Suisse AG 6.5% USD 08/08/2023 2,000,000 2,132,120 0.16 Credit Suisse Group AG FRN USD 12/01/2029 3,073,000 2,954,123 0.22 Credit Suisse Group AG FRN USD Perpetual 1,200,000 1,231,002 0.09 UBS AG FRN EUR 12/02/2026 3,800,000 4,631,077 0.35 UBS AG 5.125% USD 15/05/2024 8,481,000 8,664,020 0.66 UBS Group Funding Switzerland AG FRN USD 23/05/2023 1,000,000 1,003,174 0.08 UBS Group Funding Switzerland AG 4.253% USD 23/03/2028 1,500,000 1,520,956 0.11 UBS Group Funding Switzerland AG 5% FRN USD Perpetual 1,750,000 1,525,842 0.12 UBS Group Funding Switzerland AG 6.875% FRN USD Perpetual 3,100,000 3,197,917 0.24 UBS Group Funding Switzerland AG 7% FRN USD Perpetual 1,350,000 1,432,687 0.11 UBS Group Funding Switzerland AG 7.125% FRN USD Perpetual 1,600,000 1,629,018 0.12 Zuercher Kantonalbank FRN EUR 15/06/2027 7,250,000 8,494,184 0.64
39,706,248 3.00
Invesco Global Investment Grade Corporate Bond Fund Statement of Investments as at 28 February 2019
210 Invesco Funds
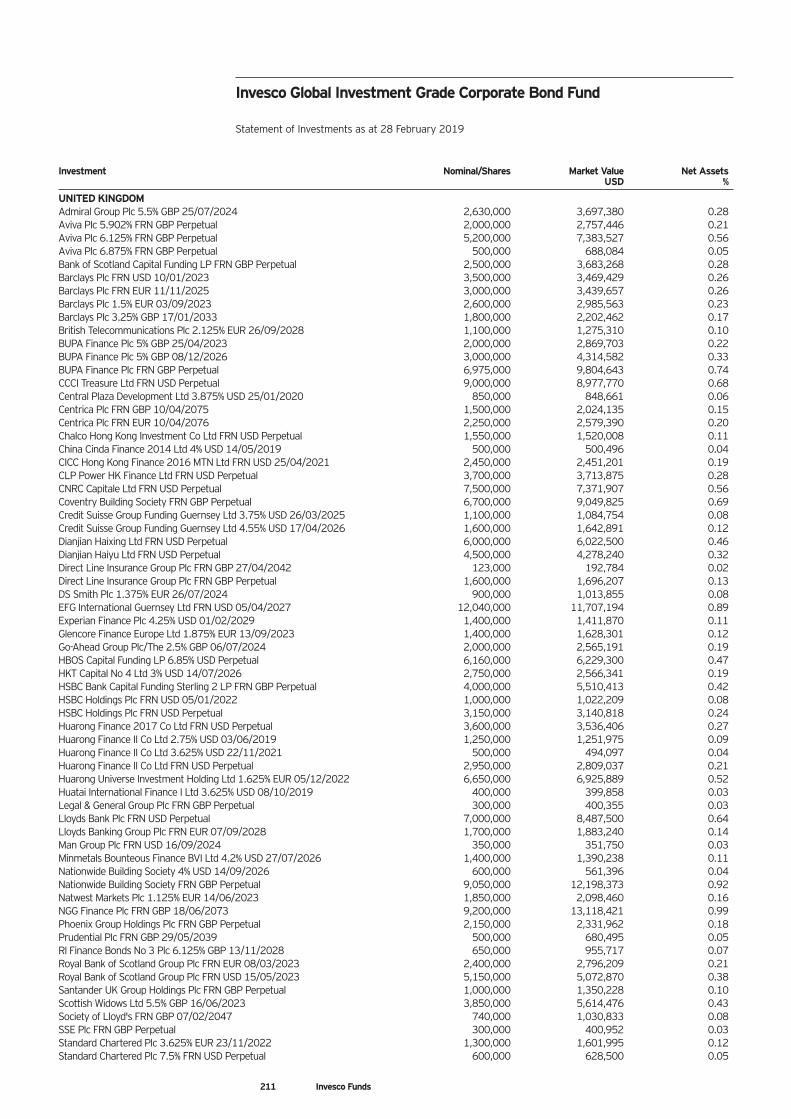
Investment Nominal/Shares Market Value Net Assets USD %
UNITED KINGDOM Admiral Group Plc 5.5% GBP 25/07/2024 2,630,000 3,697,380 0.28 Aviva Plc 5.902% FRN GBP Perpetual 2,000,000 2,757,446 0.21 Aviva Plc 6.125% FRN GBP Perpetual 5,200,000 7,383,527 0.56 Aviva Plc 6.875% FRN GBP Perpetual 500,000 688,084 0.05 Bank of Scotland Capital Funding LP FRN GBP Perpetual 2,500,000 3,683,268 0.28 Barclays Plc FRN USD 10/01/2023 3,500,000 3,469,429 0.26 Barclays Plc FRN EUR 11/11/2025 3,000,000 3,439,657 0.26 Barclays Plc 1.5% EUR 03/09/2023 2,600,000 2,985,563 0.23 Barclays Plc 3.25% GBP 17/01/2033 1,800,000 2,202,462 0.17 British Telecommunications Plc 2.125% EUR 26/09/2028 1,100,000 1,275,310 0.10 BUPA Finance Plc 5% GBP 25/04/2023 2,000,000 2,869,703 0.22 BUPA Finance Plc 5% GBP 08/12/2026 3,000,000 4,314,582 0.33 BUPA Finance Plc FRN GBP Perpetual 6,975,000 9,804,643 0.74 CCCI Treasure Ltd FRN USD Perpetual 9,000,000 8,977,770 0.68 Central Plaza Development Ltd 3.875% USD 25/01/2020 850,000 848,661 0.06 Centrica Plc FRN GBP 10/04/2075 1,500,000 2,024,135 0.15 Centrica Plc FRN EUR 10/04/2076 2,250,000 2,579,390 0.20 Chalco Hong Kong Investment Co Ltd FRN USD Perpetual 1,550,000 1,520,008 0.11 China Cinda Finance 2014 Ltd 4% USD 14/05/2019 500,000 500,496 0.04 CICC Hong Kong Finance 2016 MTN Ltd FRN USD 25/04/2021 2,450,000 2,451,201 0.19 CLP Power HK Finance Ltd FRN USD Perpetual 3,700,000 3,713,875 0.28 CNRC Capitale Ltd FRN USD Perpetual 7,500,000 7,371,907 0.56 Coventry Building Society FRN GBP Perpetual 6,700,000 9,049,825 0.69 Credit Suisse Group Funding Guernsey Ltd 3.75% USD 26/03/2025 1,100,000 1,084,754 0.08 Credit Suisse Group Funding Guernsey Ltd 4.55% USD 17/04/2026 1,600,000 1,642,891 0.12 Dianjian Haixing Ltd FRN USD Perpetual 6,000,000 6,022,500 0.46 Dianjian Haiyu Ltd FRN USD Perpetual 4,500,000 4,278,240 0.32 Direct Line Insurance Group Plc FRN GBP 27/04/2042 123,000 192,784 0.02 Direct Line Insurance Group Plc FRN GBP Perpetual 1,600,000 1,696,207 0.13 DS Smith Plc 1.375% EUR 26/07/2024 900,000 1,013,855 0.08 EFG International Guernsey Ltd FRN USD 05/04/2027 12,040,000 11,707,194 0.89 Experian Finance Plc 4.25% USD 01/02/2029 1,400,000 1,411,870 0.11 Glencore Finance Europe Ltd 1.875% EUR 13/09/2023 1,400,000 1,628,301 0.12 Go-Ahead Group Plc/The 2.5% GBP 06/07/2024 2,000,000 2,565,191 0.19 HBOS Capital Funding LP 6.85% USD Perpetual 6,160,000 6,229,300 0.47 HKT Capital No 4 Ltd 3% USD 14/07/2026 2,750,000 2,566,341 0.19 HSBC Bank Capital Funding Sterling 2 LP FRN GBP Perpetual 4,000,000 5,510,413 0.42 HSBC Holdings Plc FRN USD 05/01/2022 1,000,000 1,022,209 0.08 HSBC Holdings Plc FRN USD Perpetual 3,150,000 3,140,818 0.24 Huarong Finance 2017 Co Ltd FRN USD Perpetual 3,600,000 3,536,406 0.27 Huarong Finance II Co Ltd 2.75% USD 03/06/2019 1,250,000 1,251,975 0.09 Huarong Finance II Co Ltd 3.625% USD 22/11/2021 500,000 494,097 0.04 Huarong Finance II Co Ltd FRN USD Perpetual 2,950,000 2,809,037 0.21 Huarong Universe Investment Holding Ltd 1.625% EUR 05/12/2022 6,650,000 6,925,889 0.52 Huatai International Finance I Ltd 3.625% USD 08/10/2019 400,000 399,858 0.03 Legal & General Group Plc FRN GBP Perpetual 300,000 400,355 0.03 Lloyds Bank Plc FRN USD Perpetual 7,000,000 8,487,500 0.64 Lloyds Banking Group Plc FRN EUR 07/09/2028 1,700,000 1,883,240 0.14 Man Group Plc FRN USD 16/09/2024 350,000 351,750 0.03 Minmetals Bounteous Finance BVI Ltd 4.2% USD 27/07/2026 1,400,000 1,390,238 0.11 Nationwide Building Society 4% USD 14/09/2026 600,000 561,396 0.04 Nationwide Building Society FRN GBP Perpetual 9,050,000 12,198,373 0.92 Natwest Markets Plc 1.125% EUR 14/06/2023 1,850,000 2,098,460 0.16 NGG Finance Plc FRN GBP 18/06/2073 9,200,000 13,118,421 0.99 Phoenix Group Holdings Plc FRN GBP Perpetual 2,150,000 2,331,962 0.18 Prudential Plc FRN GBP 29/05/2039 500,000 680,495 0.05 Rl Finance Bonds No 3 Plc 6.125% GBP 13/11/2028 650,000 955,717 0.07 Royal Bank of Scotland Group Plc FRN EUR 08/03/2023 2,400,000 2,796,209 0.21 Royal Bank of Scotland Group Plc FRN USD 15/05/2023 5,150,000 5,072,870 0.38 Santander UK Group Holdings Plc FRN GBP Perpetual 1,000,000 1,350,228 0.10 Scottish Widows Ltd 5.5% GBP 16/06/2023 3,850,000 5,614,476 0.43 Society of Lloyd's FRN GBP 07/02/2047 740,000 1,030,833 0.08 SSE Plc FRN GBP Perpetual 300,000 400,952 0.03 Standard Chartered Plc 3.625% EUR 23/11/2022 1,300,000 1,601,995 0.12 Standard Chartered Plc 7.5% FRN USD Perpetual 600,000 628,500 0.05
Invesco Global Investment Grade Corporate Bond Fund Statement of Investments as at 28 February 2019
211 Invesco Funds
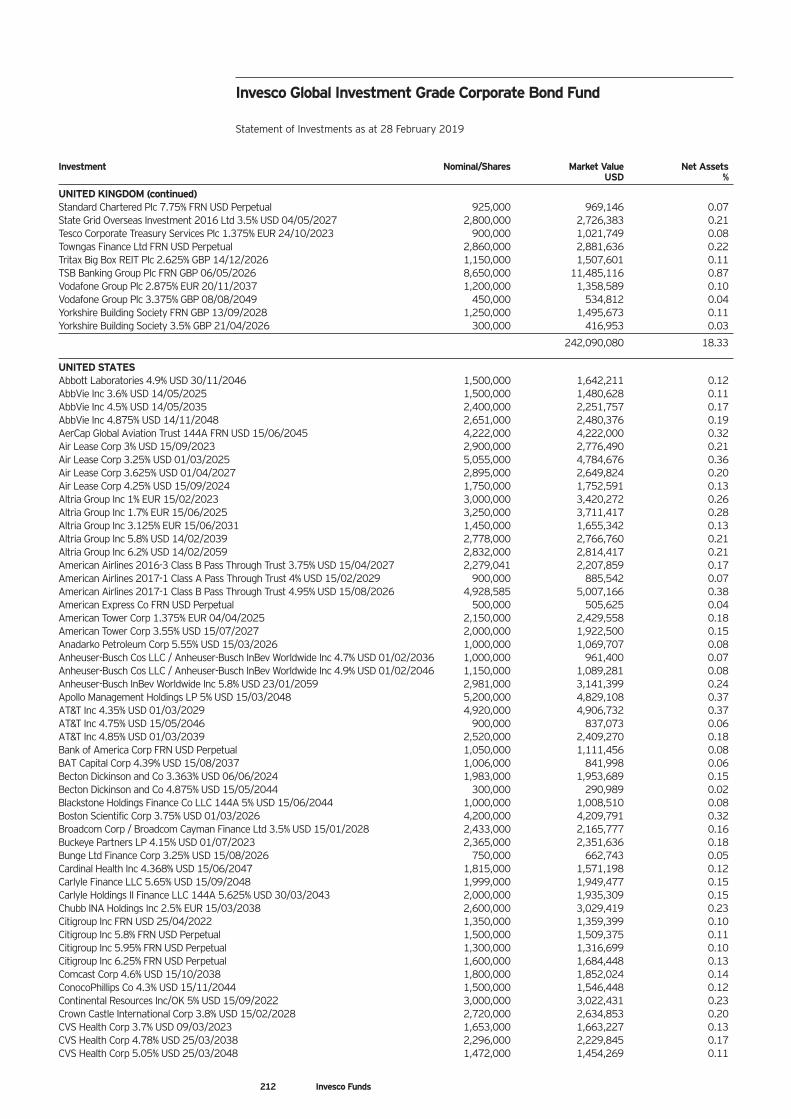
Investment Nominal/Shares Market Value Net Assets USD %
UNITED KINGDOM (continued) Standard Chartered Plc 7.75% FRN USD Perpetual 925,000 969,146 0.07 State Grid Overseas Investment 2016 Ltd 3.5% USD 04/05/2027 2,800,000 2,726,383 0.21 Tesco Corporate Treasury Services Plc 1.375% EUR 24/10/2023 900,000 1,021,749 0.08 Towngas Finance Ltd FRN USD Perpetual 2,860,000 2,881,636 0.22 Tritax Big Box REIT Plc 2.625% GBP 14/12/2026 1,150,000 1,507,601 0.11 TSB Banking Group Plc FRN GBP 06/05/2026 8,650,000 11,485,116 0.87 Vodafone Group Plc 2.875% EUR 20/11/2037 1,200,000 1,358,589 0.10 Vodafone Group Plc 3.375% GBP 08/08/2049 450,000 534,812 0.04 Yorkshire Building Society FRN GBP 13/09/2028 1,250,000 1,495,673 0.11 Yorkshire Building Society 3.5% GBP 21/04/2026 300,000 416,953 0.03
242,090,080 18.33
UNITED STATES Abbott Laboratories 4.9% USD 30/11/2046 1,500,000 1,642,211 0.12 AbbVie Inc 3.6% USD 14/05/2025 1,500,000 1,480,628 0.11 AbbVie Inc 4.5% USD 14/05/2035 2,400,000 2,251,757 0.17 AbbVie Inc 4.875% USD 14/11/2048 2,651,000 2,480,376 0.19 AerCap Global Aviation Trust 144A FRN USD 15/06/2045 4,222,000 4,222,000 0.32 Air Lease Corp 3% USD 15/09/2023 2,900,000 2,776,490 0.21 Air Lease Corp 3.25% USD 01/03/2025 5,055,000 4,784,676 0.36 Air Lease Corp 3.625% USD 01/04/2027 2,895,000 2,649,824 0.20 Air Lease Corp 4.25% USD 15/09/2024 1,750,000 1,752,591 0.13 Altria Group Inc 1% EUR 15/02/2023 3,000,000 3,420,272 0.26 Altria Group Inc 1.7% EUR 15/06/2025 3,250,000 3,711,417 0.28 Altria Group Inc 3.125% EUR 15/06/2031 1,450,000 1,655,342 0.13 Altria Group Inc 5.8% USD 14/02/2039 2,778,000 2,766,760 0.21 Altria Group Inc 6.2% USD 14/02/2059 2,832,000 2,814,417 0.21 American Airlines 2016-3 Class B Pass Through Trust 3.75% USD 15/04/2027 2,279,041 2,207,859 0.17 American Airlines 2017-1 Class A Pass Through Trust 4% USD 15/02/2029 900,000 885,542 0.07 American Airlines 2017-1 Class B Pass Through Trust 4.95% USD 15/08/2026 4,928,585 5,007,166 0.38 American Express Co FRN USD Perpetual 500,000 505,625 0.04 American Tower Corp 1.375% EUR 04/04/2025 2,150,000 2,429,558 0.18 American Tower Corp 3.55% USD 15/07/2027 2,000,000 1,922,500 0.15 Anadarko Petroleum Corp 5.55% USD 15/03/2026 1,000,000 1,069,707 0.08 Anheuser-Busch Cos LLC / Anheuser-Busch InBev Worldwide Inc 4.7% USD 01/02/2036 1,000,000 961,400 0.07 Anheuser-Busch Cos LLC / Anheuser-Busch InBev Worldwide Inc 4.9% USD 01/02/2046 1,150,000 1,089,281 0.08 Anheuser-Busch InBev Worldwide Inc 5.8% USD 23/01/2059 2,981,000 3,141,399 0.24 Apollo Management Holdings LP 5% USD 15/03/2048 5,200,000 4,829,108 0.37 AT&T Inc 4.35% USD 01/03/2029 4,920,000 4,906,732 0.37 AT&T Inc 4.75% USD 15/05/2046 900,000 837,073 0.06 AT&T Inc 4.85% USD 01/03/2039 2,520,000 2,409,270 0.18 Bank of America Corp FRN USD Perpetual 1,050,000 1,111,456 0.08 BAT Capital Corp 4.39% USD 15/08/2037 1,006,000 841,998 0.06 Becton Dickinson and Co 3.363% USD 06/06/2024 1,983,000 1,953,689 0.15 Becton Dickinson and Co 4.875% USD 15/05/2044 300,000 290,989 0.02 Blackstone Holdings Finance Co LLC 144A 5% USD 15/06/2044 1,000,000 1,008,510 0.08 Boston Scientific Corp 3.75% USD 01/03/2026 4,200,000 4,209,791 0.32 Broadcom Corp / Broadcom Cayman Finance Ltd 3.5% USD 15/01/2028 2,433,000 2,165,777 0.16 Buckeye Partners LP 4.15% USD 01/07/2023 2,365,000 2,351,636 0.18 Bunge Ltd Finance Corp 3.25% USD 15/08/2026 750,000 662,743 0.05 Cardinal Health Inc 4.368% USD 15/06/2047 1,815,000 1,571,198 0.12 Carlyle Finance LLC 5.65% USD 15/09/2048 1,999,000 1,949,477 0.15 Carlyle Holdings II Finance LLC 144A 5.625% USD 30/03/2043 2,000,000 1,935,309 0.15 Chubb INA Holdings Inc 2.5% EUR 15/03/2038 2,600,000 3,029,419 0.23 Citigroup Inc FRN USD 25/04/2022 1,350,000 1,359,399 0.10 Citigroup Inc 5.8% FRN USD Perpetual 1,500,000 1,509,375 0.11 Citigroup Inc 5.95% FRN USD Perpetual 1,300,000 1,316,699 0.10 Citigroup Inc 6.25% FRN USD Perpetual 1,600,000 1,684,448 0.13 Comcast Corp 4.6% USD 15/10/2038 1,800,000 1,852,024 0.14 ConocoPhillips Co 4.3% USD 15/11/2044 1,500,000 1,546,448 0.12 Continental Resources Inc/OK 5% USD 15/09/2022 3,000,000 3,022,431 0.23 Crown Castle International Corp 3.8% USD 15/02/2028 2,720,000 2,634,853 0.20 CVS Health Corp 3.7% USD 09/03/2023 1,653,000 1,663,227 0.13 CVS Health Corp 4.78% USD 25/03/2038 2,296,000 2,229,845 0.17 CVS Health Corp 5.05% USD 25/03/2048 1,472,000 1,454,269 0.11
Invesco Global Investment Grade Corporate Bond Fund Statement of Investments as at 28 February 2019
212 Invesco Funds
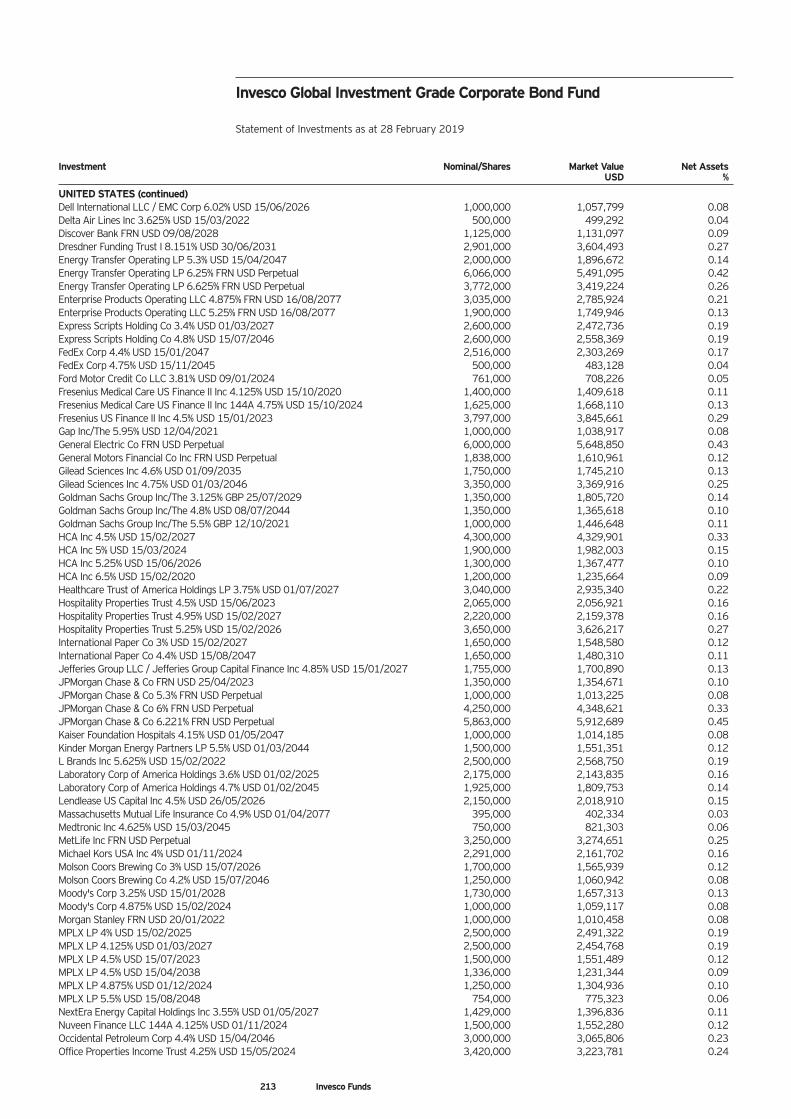
Investment Nominal/Shares Market Value Net Assets USD %
UNITED STATES (continued) Dell International LLC / EMC Corp 6.02% USD 15/06/2026 1,000,000 1,057,799 0.08 Delta Air Lines Inc 3.625% USD 15/03/2022 500,000 499,292 0.04 Discover Bank FRN USD 09/08/2028 1,125,000 1,131,097 0.09 Dresdner Funding Trust I 8.151% USD 30/06/2031 2,901,000 3,604,493 0.27 Energy Transfer Operating LP 5.3% USD 15/04/2047 2,000,000 1,896,672 0.14 Energy Transfer Operating LP 6.25% FRN USD Perpetual 6,066,000 5,491,095 0.42 Energy Transfer Operating LP 6.625% FRN USD Perpetual 3,772,000 3,419,224 0.26 Enterprise Products Operating LLC 4.875% FRN USD 16/08/2077 3,035,000 2,785,924 0.21 Enterprise Products Operating LLC 5.25% FRN USD 16/08/2077 1,900,000 1,749,946 0.13 Express Scripts Holding Co 3.4% USD 01/03/2027 2,600,000 2,472,736 0.19 Express Scripts Holding Co 4.8% USD 15/07/2046 2,600,000 2,558,369 0.19 FedEx Corp 4.4% USD 15/01/2047 2,516,000 2,303,269 0.17 FedEx Corp 4.75% USD 15/11/2045 500,000 483,128 0.04 Ford Motor Credit Co LLC 3.81% USD 09/01/2024 761,000 708,226 0.05 Fresenius Medical Care US Finance II Inc 4.125% USD 15/10/2020 1,400,000 1,409,618 0.11 Fresenius Medical Care US Finance II Inc 144A 4.75% USD 15/10/2024 1,625,000 1,668,110 0.13 Fresenius US Finance II Inc 4.5% USD 15/01/2023 3,797,000 3,845,661 0.29 Gap Inc/The 5.95% USD 12/04/2021 1,000,000 1,038,917 0.08 General Electric Co FRN USD Perpetual 6,000,000 5,648,850 0.43 General Motors Financial Co Inc FRN USD Perpetual 1,838,000 1,610,961 0.12 Gilead Sciences Inc 4.6% USD 01/09/2035 1,750,000 1,745,210 0.13 Gilead Sciences Inc 4.75% USD 01/03/2046 3,350,000 3,369,916 0.25 Goldman Sachs Group Inc/The 3.125% GBP 25/07/2029 1,350,000 1,805,720 0.14 Goldman Sachs Group Inc/The 4.8% USD 08/07/2044 1,350,000 1,365,618 0.10 Goldman Sachs Group Inc/The 5.5% GBP 12/10/2021 1,000,000 1,446,648 0.11 HCA Inc 4.5% USD 15/02/2027 4,300,000 4,329,901 0.33 HCA Inc 5% USD 15/03/2024 1,900,000 1,982,003 0.15 HCA Inc 5.25% USD 15/06/2026 1,300,000 1,367,477 0.10 HCA Inc 6.5% USD 15/02/2020 1,200,000 1,235,664 0.09 Healthcare Trust of America Holdings LP 3.75% USD 01/07/2027 3,040,000 2,935,340 0.22 Hospitality Properties Trust 4.5% USD 15/06/2023 2,065,000 2,056,921 0.16 Hospitality Properties Trust 4.95% USD 15/02/2027 2,220,000 2,159,378 0.16 Hospitality Properties Trust 5.25% USD 15/02/2026 3,650,000 3,626,217 0.27 International Paper Co 3% USD 15/02/2027 1,650,000 1,548,580 0.12 International Paper Co 4.4% USD 15/08/2047 1,650,000 1,480,310 0.11 Jefferies Group LLC / Jefferies Group Capital Finance Inc 4.85% USD 15/01/2027 1,755,000 1,700,890 0.13 JPMorgan Chase & Co FRN USD 25/04/2023 1,350,000 1,354,671 0.10 JPMorgan Chase & Co 5.3% FRN USD Perpetual 1,000,000 1,013,225 0.08 JPMorgan Chase & Co 6% FRN USD Perpetual 4,250,000 4,348,621 0.33 JPMorgan Chase & Co 6.221% FRN USD Perpetual 5,863,000 5,912,689 0.45 Kaiser Foundation Hospitals 4.15% USD 01/05/2047 1,000,000 1,014,185 0.08 Kinder Morgan Energy Partners LP 5.5% USD 01/03/2044 1,500,000 1,551,351 0.12 L Brands Inc 5.625% USD 15/02/2022 2,500,000 2,568,750 0.19 Laboratory Corp of America Holdings 3.6% USD 01/02/2025 2,175,000 2,143,835 0.16 Laboratory Corp of America Holdings 4.7% USD 01/02/2045 1,925,000 1,809,753 0.14 Lendlease US Capital Inc 4.5% USD 26/05/2026 2,150,000 2,018,910 0.15 Massachusetts Mutual Life Insurance Co 4.9% USD 01/04/2077 395,000 402,334 0.03 Medtronic Inc 4.625% USD 15/03/2045 750,000 821,303 0.06 MetLife Inc FRN USD Perpetual 3,250,000 3,274,651 0.25 Michael Kors USA Inc 4% USD 01/11/2024 2,291,000 2,161,702 0.16 Molson Coors Brewing Co 3% USD 15/07/2026 1,700,000 1,565,939 0.12 Molson Coors Brewing Co 4.2% USD 15/07/2046 1,250,000 1,060,942 0.08 Moody's Corp 3.25% USD 15/01/2028 1,730,000 1,657,313 0.13 Moody's Corp 4.875% USD 15/02/2024 1,000,000 1,059,117 0.08 Morgan Stanley FRN USD 20/01/2022 1,000,000 1,010,458 0.08 MPLX LP 4% USD 15/02/2025 2,500,000 2,491,322 0.19 MPLX LP 4.125% USD 01/03/2027 2,500,000 2,454,768 0.19 MPLX LP 4.5% USD 15/07/2023 1,500,000 1,551,489 0.12 MPLX LP 4.5% USD 15/04/2038 1,336,000 1,231,344 0.09 MPLX LP 4.875% USD 01/12/2024 1,250,000 1,304,936 0.10 MPLX LP 5.5% USD 15/08/2048 754,000 775,323 0.06 NextEra Energy Capital Holdings Inc 3.55% USD 01/05/2027 1,429,000 1,396,836 0.11 Nuveen Finance LLC 144A 4.125% USD 01/11/2024 1,500,000 1,552,280 0.12 Occidental Petroleum Corp 4.4% USD 15/04/2046 3,000,000 3,065,806 0.23 Office Properties Income Trust 4.25% USD 15/05/2024 3,420,000 3,223,781 0.24
Invesco Global Investment Grade Corporate Bond Fund Statement of Investments as at 28 February 2019
213 Invesco Funds
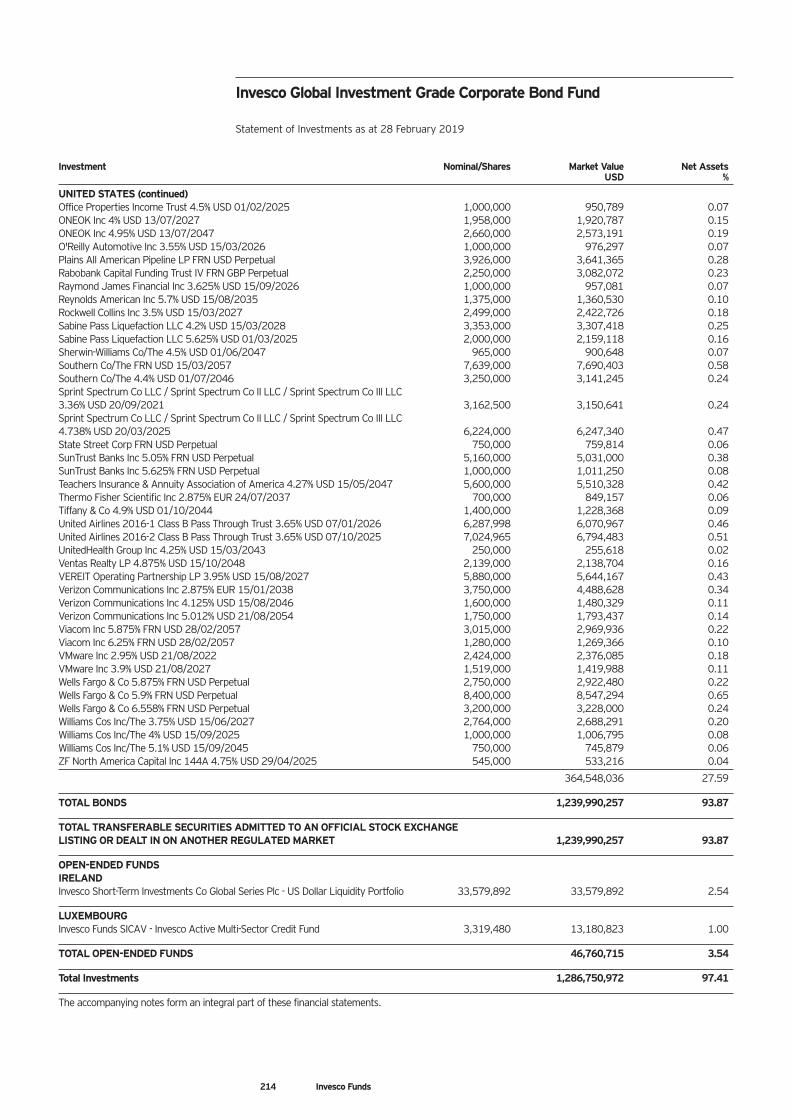
Investment Nominal/Shares Market Value Net Assets USD %
UNITED STATES (continued) Office Properties Income Trust 4.5% USD 01/02/2025 1,000,000 950,789 0.07 ONEOK Inc 4% USD 13/07/2027 1,958,000 1,920,787 0.15 ONEOK Inc 4.95% USD 13/07/2047 2,660,000 2,573,191 0.19 O'Reilly Automotive Inc 3.55% USD 15/03/2026 1,000,000 976,297 0.07 Plains All American Pipeline LP FRN USD Perpetual 3,926,000 3,641,365 0.28 Rabobank Capital Funding Trust IV FRN GBP Perpetual 2,250,000 3,082,072 0.23 Raymond James Financial Inc 3.625% USD 15/09/2026 1,000,000 957,081 0.07 Reynolds American Inc 5.7% USD 15/08/2035 1,375,000 1,360,530 0.10 Rockwell Collins Inc 3.5% USD 15/03/2027 2,499,000 2,422,726 0.18 Sabine Pass Liquefaction LLC 4.2% USD 15/03/2028 3,353,000 3,307,418 0.25 Sabine Pass Liquefaction LLC 5.625% USD 01/03/2025 2,000,000 2,159,118 0.16 Sherwin-Williams Co/The 4.5% USD 01/06/2047 965,000 900,648 0.07 Southern Co/The FRN USD 15/03/2057 7,639,000 7,690,403 0.58 Southern Co/The 4.4% USD 01/07/2046 3,250,000 3,141,245 0.24 Sprint Spectrum Co LLC / Sprint Spectrum Co II LLC / Sprint Spectrum Co III LLC 3.36% USD 20/09/2021 3,162,500 3,150,641 0.24 Sprint Spectrum Co LLC / Sprint Spectrum Co II LLC / Sprint Spectrum Co III LLC 4.738% USD 20/03/2025 6,224,000 6,247,340 0.47 State Street Corp FRN USD Perpetual 750,000 759,814 0.06 SunTrust Banks Inc 5.05% FRN USD Perpetual 5,160,000 5,031,000 0.38 SunTrust Banks Inc 5.625% FRN USD Perpetual 1,000,000 1,011,250 0.08 Teachers Insurance & Annuity Association of America 4.27% USD 15/05/2047 5,600,000 5,510,328 0.42 Thermo Fisher Scientific Inc 2.875% EUR 24/07/2037 700,000 849,157 0.06 Tiffany & Co 4.9% USD 01/10/2044 1,400,000 1,228,368 0.09 United Airlines 2016-1 Class B Pass Through Trust 3.65% USD 07/01/2026 6,287,998 6,070,967 0.46 United Airlines 2016-2 Class B Pass Through Trust 3.65% USD 07/10/2025 7,024,965 6,794,483 0.51 UnitedHealth Group Inc 4.25% USD 15/03/2043 250,000 255,618 0.02 Ventas Realty LP 4.875% USD 15/10/2048 2,139,000 2,138,704 0.16 VEREIT Operating Partnership LP 3.95% USD 15/08/2027 5,880,000 5,644,167 0.43 Verizon Communications Inc 2.875% EUR 15/01/2038 3,750,000 4,488,628 0.34 Verizon Communications Inc 4.125% USD 15/08/2046 1,600,000 1,480,329 0.11 Verizon Communications Inc 5.012% USD 21/08/2054 1,750,000 1,793,437 0.14 Viacom Inc 5.875% FRN USD 28/02/2057 3,015,000 2,969,936 0.22 Viacom Inc 6.25% FRN USD 28/02/2057 1,280,000 1,269,366 0.10 VMware Inc 2.95% USD 21/08/2022 2,424,000 2,376,085 0.18 VMware Inc 3.9% USD 21/08/2027 1,519,000 1,419,988 0.11 Wells Fargo & Co 5.875% FRN USD Perpetual 2,750,000 2,922,480 0.22 Wells Fargo & Co 5.9% FRN USD Perpetual 8,400,000 8,547,294 0.65 Wells Fargo & Co 6.558% FRN USD Perpetual 3,200,000 3,228,000 0.24 Williams Cos Inc/The 3.75% USD 15/06/2027 2,764,000 2,688,291 0.20 Williams Cos Inc/The 4% USD 15/09/2025 1,000,000 1,006,795 0.08 Williams Cos Inc/The 5.1% USD 15/09/2045 750,000 745,879 0.06 ZF North America Capital Inc 144A 4.75% USD 29/04/2025 545,000 533,216 0.04
364,548,036 27.59
TOTAL BONDS 1,239,990,257 93.87
TOTAL TRANSFERABLE SECURITIES ADMITTED TO AN OFFICIAL STOCK EXCHANGE LISTING OR DEALT IN ON ANOTHER REGULATED MARKET 1,239,990,257 93.87
OPEN-ENDED FUNDS IRELAND Invesco Short-Term Investments Co Global Series Plc - US Dollar Liquidity Portfolio 33,579,892 33,579,892 2.54
LUXEMBOURG Invesco Funds SICAV - Invesco Active Multi-Sector Credit Fund 3,319,480 13,180,823 1.00
TOTAL OPEN-ENDED FUNDS 46,760,715 3.54
Total Investments 1,286,750,972 97.41
The accompanying notes form an integral part of these financial statements.
Invesco Global Investment Grade Corporate Bond Fund Statement of Investments as at 28 February 2019
214 Invesco Funds
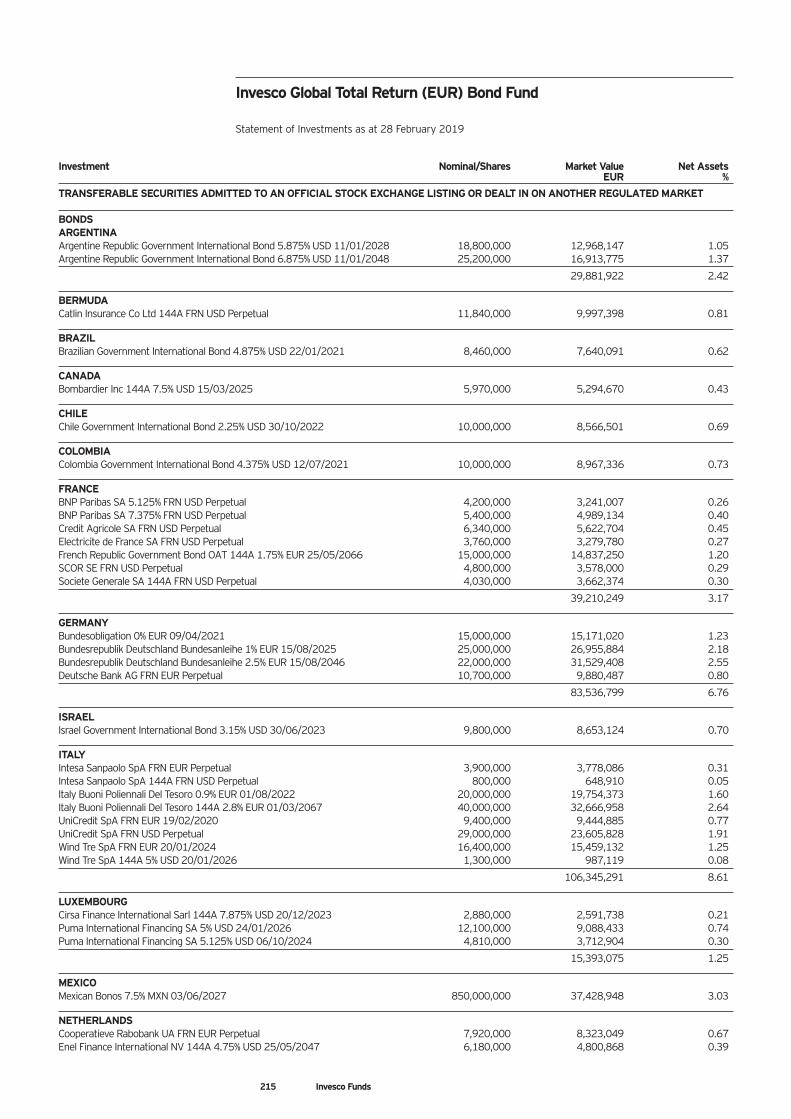
Investment Nominal/Shares Market Value Net Assets EUR %
TRANSFERABLE SECURITIES ADMITTED TO AN OFFICIAL STOCK EXCHANGE LISTING OR DEALT IN ON ANOTHER REGULATED MARKET BONDS ARGENTINA Argentine Republic Government International Bond 5.875% USD 11/01/2028 18,800,000 12,968,147 1.05 Argentine Republic Government International Bond 6.875% USD 11/01/2048 25,200,000 16,913,775 1.37
29,881,922 2.42
BERMUDA Catlin Insurance Co Ltd 144A FRN USD Perpetual 11,840,000 9,997,398 0.81
BRAZIL Brazilian Government International Bond 4.875% USD 22/01/2021 8,460,000 7,640,091 0.62
CANADA Bombardier Inc 144A 7.5% USD 15/03/2025 5,970,000 5,294,670 0.43
CHILE Chile Government International Bond 2.25% USD 30/10/2022 10,000,000 8,566,501 0.69
COLOMBIA Colombia Government International Bond 4.375% USD 12/07/2021 10,000,000 8,967,336 0.73
FRANCE BNP Paribas SA 5.125% FRN USD Perpetual 4,200,000 3,241,007 0.26 BNP Paribas SA 7.375% FRN USD Perpetual 5,400,000 4,989,134 0.40 Credit Agricole SA FRN USD Perpetual 6,340,000 5,622,704 0.45 Electricite de France SA FRN USD Perpetual 3,760,000 3,279,780 0.27 French Republic Government Bond OAT 144A 1.75% EUR 25/05/2066 15,000,000 14,837,250 1.20 SCOR SE FRN USD Perpetual 4,800,000 3,578,000 0.29 Societe Generale SA 144A FRN USD Perpetual 4,030,000 3,662,374 0.30
39,210,249 3.17
GERMANY Bundesobligation 0% EUR 09/04/2021 15,000,000 15,171,020 1.23 Bundesrepublik Deutschland Bundesanleihe 1% EUR 15/08/2025 25,000,000 26,955,884 2.18 Bundesrepublik Deutschland Bundesanleihe 2.5% EUR 15/08/2046 22,000,000 31,529,408 2.55 Deutsche Bank AG FRN EUR Perpetual 10,700,000 9,880,487 0.80
83,536,799 6.76
ISRAEL Israel Government International Bond 3.15% USD 30/06/2023 9,800,000 8,653,124 0.70
ITALY Intesa Sanpaolo SpA FRN EUR Perpetual 3,900,000 3,778,086 0.31 Intesa Sanpaolo SpA 144A FRN USD Perpetual 800,000 648,910 0.05 Italy Buoni Poliennali Del Tesoro 0.9% EUR 01/08/2022 20,000,000 19,754,373 1.60 Italy Buoni Poliennali Del Tesoro 144A 2.8% EUR 01/03/2067 40,000,000 32,666,958 2.64 UniCredit SpA FRN EUR 19/02/2020 9,400,000 9,444,885 0.77 UniCredit SpA FRN USD Perpetual 29,000,000 23,605,828 1.91 Wind Tre SpA FRN EUR 20/01/2024 16,400,000 15,459,132 1.25 Wind Tre SpA 144A 5% USD 20/01/2026 1,300,000 987,119 0.08
106,345,291 8.61
LUXEMBOURG Cirsa Finance International Sarl 144A 7.875% USD 20/12/2023 2,880,000 2,591,738 0.21 Puma International Financing SA 5% USD 24/01/2026 12,100,000 9,088,433 0.74 Puma International Financing SA 5.125% USD 06/10/2024 4,810,000 3,712,904 0.30
15,393,075 1.25
MEXICO Mexican Bonos 7.5% MXN 03/06/2027 850,000,000 37,428,948 3.03
NETHERLANDS Cooperatieve Rabobank UA FRN EUR Perpetual 7,920,000 8,323,049 0.67 Enel Finance International NV 144A 4.75% USD 25/05/2047 6,180,000 4,800,868 0.39
Invesco Global Total Return (EUR) Bond Fund Statement of Investments as at 28 February 2019
215 Invesco Funds
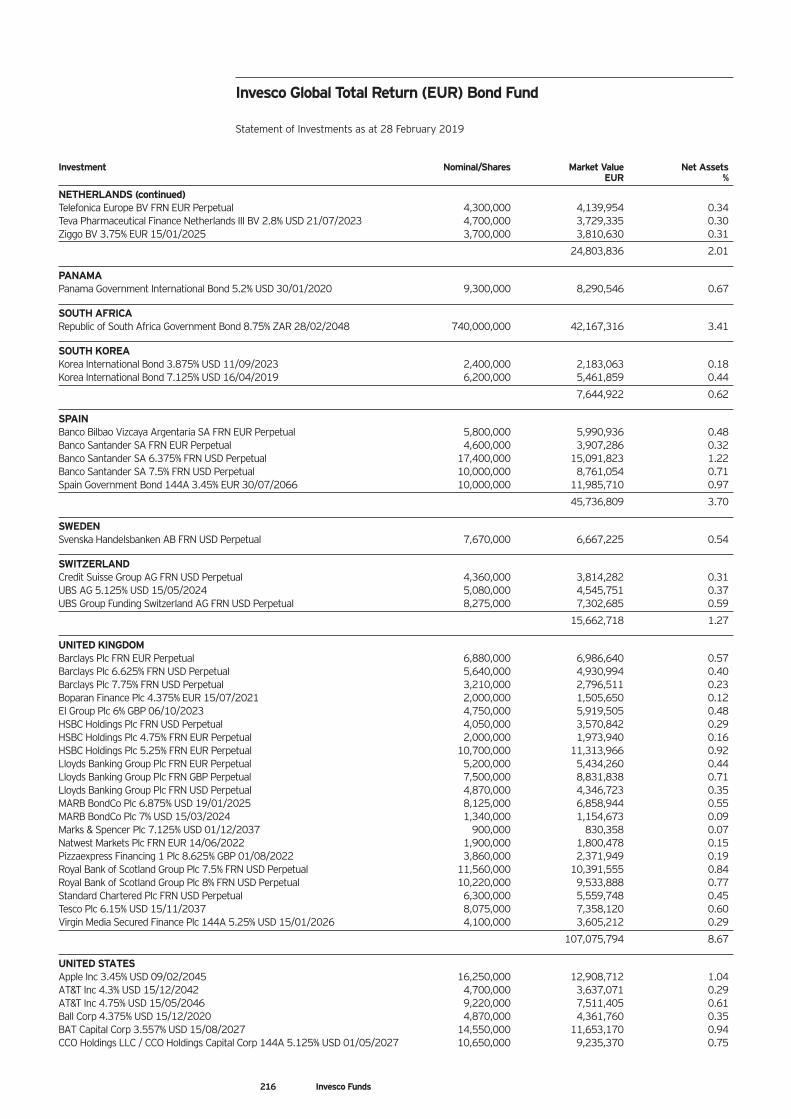
Investment Nominal/Shares Market Value Net Assets EUR %
NETHERLANDS (continued) Telefonica Europe BV FRN EUR Perpetual 4,300,000 4,139,954 0.34 Teva Pharmaceutical Finance Netherlands III BV 2.8% USD 21/07/2023 4,700,000 3,729,335 0.30 Ziggo BV 3.75% EUR 15/01/2025 3,700,000 3,810,630 0.31
24,803,836 2.01
PANAMA Panama Government International Bond 5.2% USD 30/01/2020 9,300,000 8,290,546 0.67
SOUTH AFRICA Republic of South Africa Government Bond 8.75% ZAR 28/02/2048 740,000,000 42,167,316 3.41
SOUTH KOREA Korea International Bond 3.875% USD 11/09/2023 2,400,000 2,183,063 0.18 Korea International Bond 7.125% USD 16/04/2019 6,200,000 5,461,859 0.44
7,644,922 0.62
SPAIN Banco Bilbao Vizcaya Argentaria SA FRN EUR Perpetual 5,800,000 5,990,936 0.48 Banco Santander SA FRN EUR Perpetual 4,600,000 3,907,286 0.32 Banco Santander SA 6.375% FRN USD Perpetual 17,400,000 15,091,823 1.22 Banco Santander SA 7.5% FRN USD Perpetual 10,000,000 8,761,054 0.71 Spain Government Bond 144A 3.45% EUR 30/07/2066 10,000,000 11,985,710 0.97
45,736,809 3.70
SWEDEN Svenska Handelsbanken AB FRN USD Perpetual 7,670,000 6,667,225 0.54
SWITZERLAND Credit Suisse Group AG FRN USD Perpetual 4,360,000 3,814,282 0.31 UBS AG 5.125% USD 15/05/2024 5,080,000 4,545,751 0.37 UBS Group Funding Switzerland AG FRN USD Perpetual 8,275,000 7,302,685 0.59
15,662,718 1.27
UNITED KINGDOM Barclays Plc FRN EUR Perpetual 6,880,000 6,986,640 0.57 Barclays Plc 6.625% FRN USD Perpetual 5,640,000 4,930,994 0.40 Barclays Plc 7.75% FRN USD Perpetual 3,210,000 2,796,511 0.23 Boparan Finance Plc 4.375% EUR 15/07/2021 2,000,000 1,505,650 0.12 EI Group Plc 6% GBP 06/10/2023 4,750,000 5,919,505 0.48 HSBC Holdings Plc FRN USD Perpetual 4,050,000 3,570,842 0.29 HSBC Holdings Plc 4.75% FRN EUR Perpetual 2,000,000 1,973,940 0.16 HSBC Holdings Plc 5.25% FRN EUR Perpetual 10,700,000 11,313,966 0.92 Lloyds Banking Group Plc FRN EUR Perpetual 5,200,000 5,434,260 0.44 Lloyds Banking Group Plc FRN GBP Perpetual 7,500,000 8,831,838 0.71 Lloyds Banking Group Plc FRN USD Perpetual 4,870,000 4,346,723 0.35 MARB BondCo Plc 6.875% USD 19/01/2025 8,125,000 6,858,944 0.55 MARB BondCo Plc 7% USD 15/03/2024 1,340,000 1,154,673 0.09 Marks & Spencer Plc 7.125% USD 01/12/2037 900,000 830,358 0.07 Natwest Markets Plc FRN EUR 14/06/2022 1,900,000 1,800,478 0.15 Pizzaexpress Financing 1 Plc 8.625% GBP 01/08/2022 3,860,000 2,371,949 0.19 Royal Bank of Scotland Group Plc 7.5% FRN USD Perpetual 11,560,000 10,391,555 0.84 Royal Bank of Scotland Group Plc 8% FRN USD Perpetual 10,220,000 9,533,888 0.77 Standard Chartered Plc FRN USD Perpetual 6,300,000 5,559,748 0.45 Tesco Plc 6.15% USD 15/11/2037 8,075,000 7,358,120 0.60 Virgin Media Secured Finance Plc 144A 5.25% USD 15/01/2026 4,100,000 3,605,212 0.29
107,075,794 8.67
UNITED STATES Apple Inc 3.45% USD 09/02/2045 16,250,000 12,908,712 1.04 AT&T Inc 4.3% USD 15/12/2042 4,700,000 3,637,071 0.29 AT&T Inc 4.75% USD 15/05/2046 9,220,000 7,511,405 0.61 Ball Corp 4.375% USD 15/12/2020 4,870,000 4,361,760 0.35 BAT Capital Corp 3.557% USD 15/08/2027 14,550,000 11,653,170 0.94 CCO Holdings LLC / CCO Holdings Capital Corp 144A 5.125% USD 01/05/2027 10,650,000 9,235,370 0.75
Invesco Global Total Return (EUR) Bond Fund Statement of Investments as at 28 February 2019
216 Invesco Funds
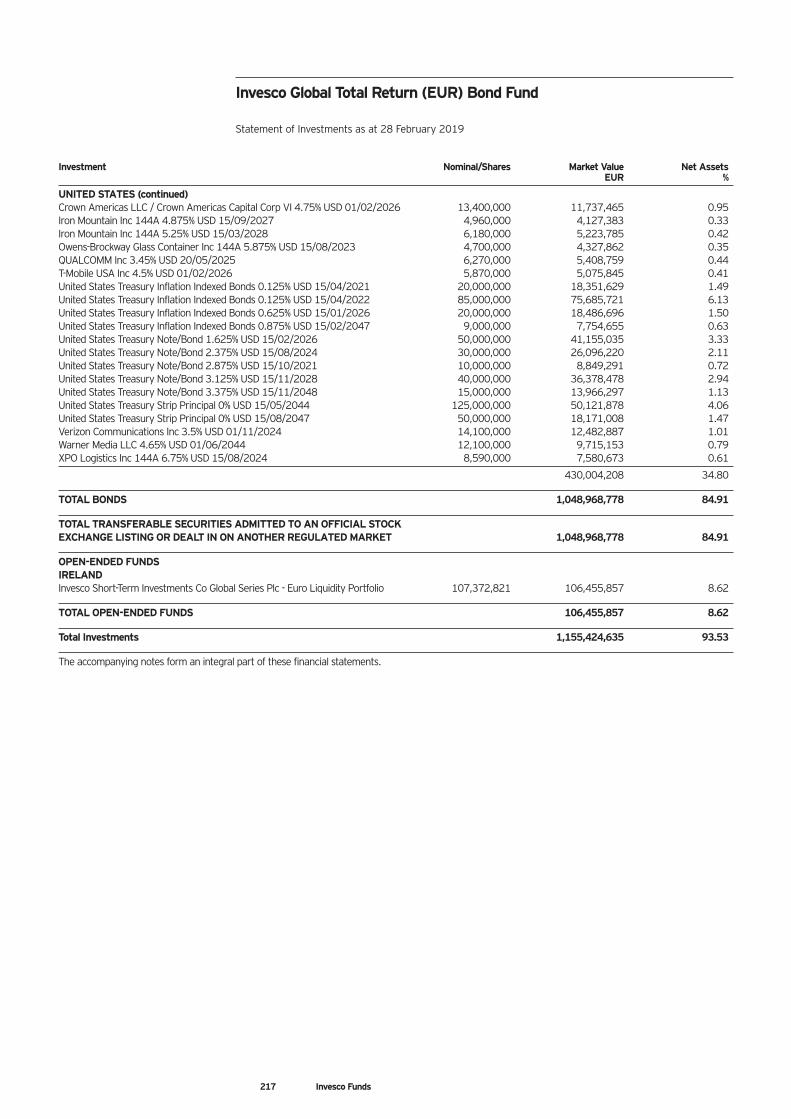
Investment Nominal/Shares Market Value Net Assets EUR %
UNITED STATES (continued) Crown Americas LLC / Crown Americas Capital Corp VI 4.75% USD 01/02/2026 13,400,000 11,737,465 0.95 Iron Mountain Inc 144A 4.875% USD 15/09/2027 4,960,000 4,127,383 0.33 Iron Mountain Inc 144A 5.25% USD 15/03/2028 6,180,000 5,223,785 0.42 Owens-Brockway Glass Container Inc 144A 5.875% USD 15/08/2023 4,700,000 4,327,862 0.35 QUALCOMM Inc 3.45% USD 20/05/2025 6,270,000 5,408,759 0.44 T-Mobile USA Inc 4.5% USD 01/02/2026 5,870,000 5,075,845 0.41 United States Treasury Inflation Indexed Bonds 0.125% USD 15/04/2021 20,000,000 18,351,629 1.49 United States Treasury Inflation Indexed Bonds 0.125% USD 15/04/2022 85,000,000 75,685,721 6.13 United States Treasury Inflation Indexed Bonds 0.625% USD 15/01/2026 20,000,000 18,486,696 1.50 United States Treasury Inflation Indexed Bonds 0.875% USD 15/02/2047 9,000,000 7,754,655 0.63 United States Treasury Note/Bond 1.625% USD 15/02/2026 50,000,000 41,155,035 3.33 United States Treasury Note/Bond 2.375% USD 15/08/2024 30,000,000 26,096,220 2.11 United States Treasury Note/Bond 2.875% USD 15/10/2021 10,000,000 8,849,291 0.72 United States Treasury Note/Bond 3.125% USD 15/11/2028 40,000,000 36,378,478 2.94 United States Treasury Note/Bond 3.375% USD 15/11/2048 15,000,000 13,966,297 1.13 United States Treasury Strip Principal 0% USD 15/05/2044 125,000,000 50,121,878 4.06 United States Treasury Strip Principal 0% USD 15/08/2047 50,000,000 18,171,008 1.47 Verizon Communications Inc 3.5% USD 01/11/2024 14,100,000 12,482,887 1.01 Warner Media LLC 4.65% USD 01/06/2044 12,100,000 9,715,153 0.79 XPO Logistics Inc 144A 6.75% USD 15/08/2024 8,590,000 7,580,673 0.61
430,004,208 34.80
TOTAL BONDS 1,048,968,778 84.91
TOTAL TRANSFERABLE SECURITIES ADMITTED TO AN OFFICIAL STOCK EXCHANGE LISTING OR DEALT IN ON ANOTHER REGULATED MARKET 1,048,968,778 84.91
OPEN-ENDED FUNDS IRELAND Invesco Short-Term Investments Co Global Series Plc - Euro Liquidity Portfolio 107,372,821 106,455,857 8.62
TOTAL OPEN-ENDED FUNDS 106,455,857 8.62
Total Investments 1,155,424,635 93.53
The accompanying notes form an integral part of these financial statements.
Invesco Global Total Return (EUR) Bond Fund Statement of Investments as at 28 February 2019
217 Invesco Funds
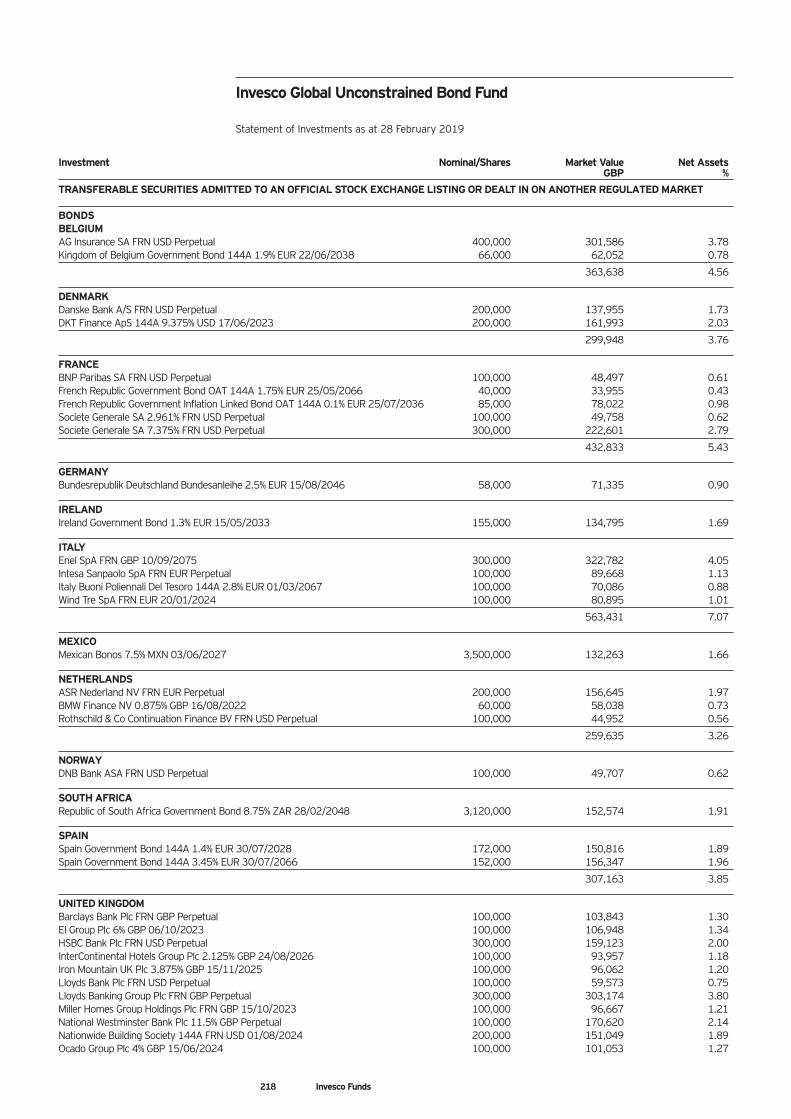
Investment Nominal/Shares Market Value Net Assets GBP %
TRANSFERABLE SECURITIES ADMITTED TO AN OFFICIAL STOCK EXCHANGE LISTING OR DEALT IN ON ANOTHER REGULATED MARKET BONDS BELGIUM AG Insurance SA FRN USD Perpetual 400,000 301,586 3.78 Kingdom of Belgium Government Bond 144A 1.9% EUR 22/06/2038 66,000 62,052 0.78
363,638 4.56
DENMARK Danske Bank A/S FRN USD Perpetual 200,000 137,955 1.73 DKT Finance ApS 144A 9.375% USD 17/06/2023 200,000 161,993 2.03
299,948 3.76
FRANCE BNP Paribas SA FRN USD Perpetual 100,000 48,497 0.61 French Republic Government Bond OAT 144A 1.75% EUR 25/05/2066 40,000 33,955 0.43 French Republic Government Inflation Linked Bond OAT 144A 0.1% EUR 25/07/2036 85,000 78,022 0.98 Societe Generale SA 2.961% FRN USD Perpetual 100,000 49,758 0.62 Societe Generale SA 7.375% FRN USD Perpetual 300,000 222,601 2.79
432,833 5.43
GERMANY Bundesrepublik Deutschland Bundesanleihe 2.5% EUR 15/08/2046 58,000 71,335 0.90
IRELAND Ireland Government Bond 1.3% EUR 15/05/2033 155,000 134,795 1.69
ITALY Enel SpA FRN GBP 10/09/2075 300,000 322,782 4.05 Intesa Sanpaolo SpA FRN EUR Perpetual 100,000 89,668 1.13 Italy Buoni Poliennali Del Tesoro 144A 2.8% EUR 01/03/2067 100,000 70,086 0.88 Wind Tre SpA FRN EUR 20/01/2024 100,000 80,895 1.01
563,431 7.07
MEXICO Mexican Bonos 7.5% MXN 03/06/2027 3,500,000 132,263 1.66
NETHERLANDS ASR Nederland NV FRN EUR Perpetual 200,000 156,645 1.97 BMW Finance NV 0.875% GBP 16/08/2022 60,000 58,038 0.73 Rothschild & Co Continuation Finance BV FRN USD Perpetual 100,000 44,952 0.56
259,635 3.26
NORWAY DNB Bank ASA FRN USD Perpetual 100,000 49,707 0.62
SOUTH AFRICA Republic of South Africa Government Bond 8.75% ZAR 28/02/2048 3,120,000 152,574 1.91
SPAIN Spain Government Bond 144A 1.4% EUR 30/07/2028 172,000 150,816 1.89 Spain Government Bond 144A 3.45% EUR 30/07/2066 152,000 156,347 1.96
307,163 3.85
UNITED KINGDOM Barclays Bank Plc FRN GBP Perpetual 100,000 103,843 1.30 EI Group Plc 6% GBP 06/10/2023 100,000 106,948 1.34 HSBC Bank Plc FRN USD Perpetual 300,000 159,123 2.00 InterContinental Hotels Group Plc 2.125% GBP 24/08/2026 100,000 93,957 1.18 Iron Mountain UK Plc 3.875% GBP 15/11/2025 100,000 96,062 1.20 Lloyds Bank Plc FRN USD Perpetual 100,000 59,573 0.75 Lloyds Banking Group Plc FRN GBP Perpetual 300,000 303,174 3.80 Miller Homes Group Holdings Plc FRN GBP 15/10/2023 100,000 96,667 1.21 National Westminster Bank Plc 11.5% GBP Perpetual 100,000 170,620 2.14 Nationwide Building Society 144A FRN USD 01/08/2024 200,000 151,049 1.89 Ocado Group Plc 4% GBP 15/06/2024 100,000 101,053 1.27
Invesco Global Unconstrained Bond Fund Statement of Investments as at 28 February 2019
218 Invesco Funds
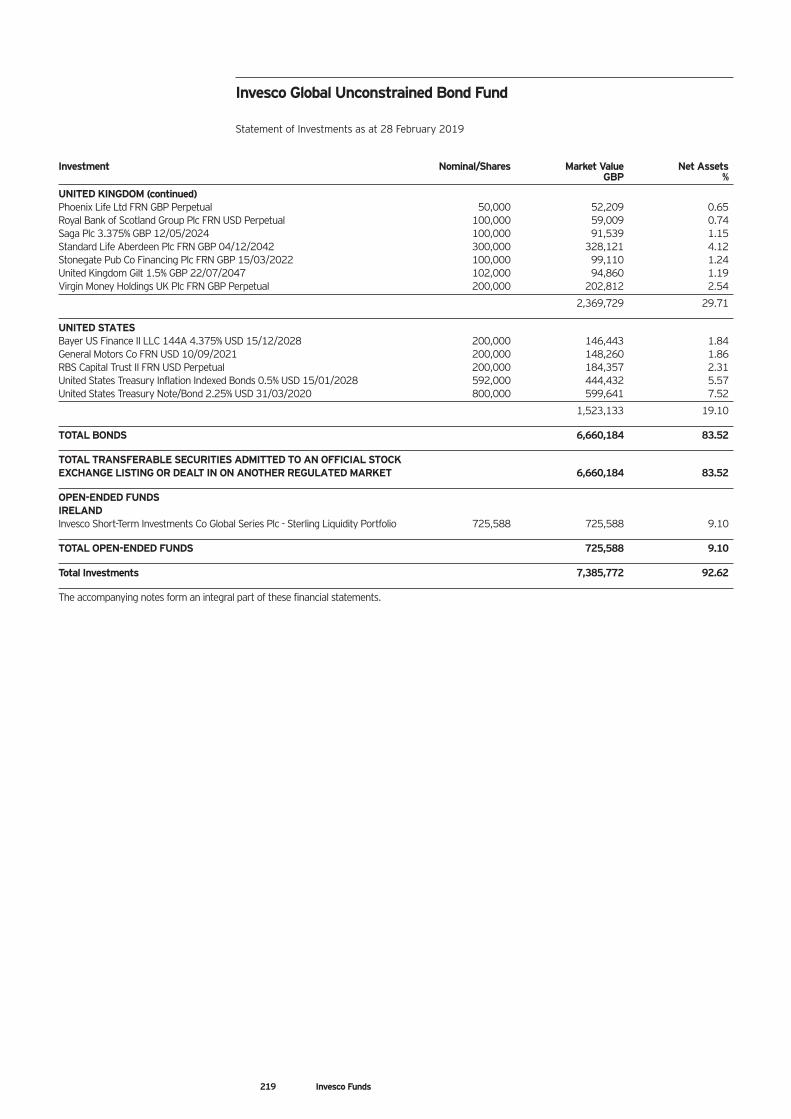
Investment Nominal/Shares Market Value Net Assets GBP %
UNITED KINGDOM (continued) Phoenix Life Ltd FRN GBP Perpetual 50,000 52,209 0.65 Royal Bank of Scotland Group Plc FRN USD Perpetual 100,000 59,009 0.74 Saga Plc 3.375% GBP 12/05/2024 100,000 91,539 1.15 Standard Life Aberdeen Plc FRN GBP 04/12/2042 300,000 328,121 4.12 Stonegate Pub Co Financing Plc FRN GBP 15/03/2022 100,000 99,110 1.24 United Kingdom Gilt 1.5% GBP 22/07/2047 102,000 94,860 1.19 Virgin Money Holdings UK Plc FRN GBP Perpetual 200,000 202,812 2.54
2,369,729 29.71
UNITED STATES Bayer US Finance II LLC 144A 4.375% USD 15/12/2028 200,000 146,443 1.84 General Motors Co FRN USD 10/09/2021 200,000 148,260 1.86 RBS Capital Trust II FRN USD Perpetual 200,000 184,357 2.31 United States Treasury Inflation Indexed Bonds 0.5% USD 15/01/2028 592,000 444,432 5.57 United States Treasury Note/Bond 2.25% USD 31/03/2020 800,000 599,641 7.52
1,523,133 19.10
TOTAL BONDS 6,660,184 83.52
TOTAL TRANSFERABLE SECURITIES ADMITTED TO AN OFFICIAL STOCK EXCHANGE LISTING OR DEALT IN ON ANOTHER REGULATED MARKET 6,660,184 83.52
OPEN-ENDED FUNDS IRELAND Invesco Short-Term Investments Co Global Series Plc - Sterling Liquidity Portfolio 725,588 725,588 9.10
TOTAL OPEN-ENDED FUNDS 725,588 9.10
Total Investments 7,385,772 92.62
The accompanying notes form an integral part of these financial statements.
Invesco Global Unconstrained Bond Fund Statement of Investments as at 28 February 2019
219 Invesco Funds
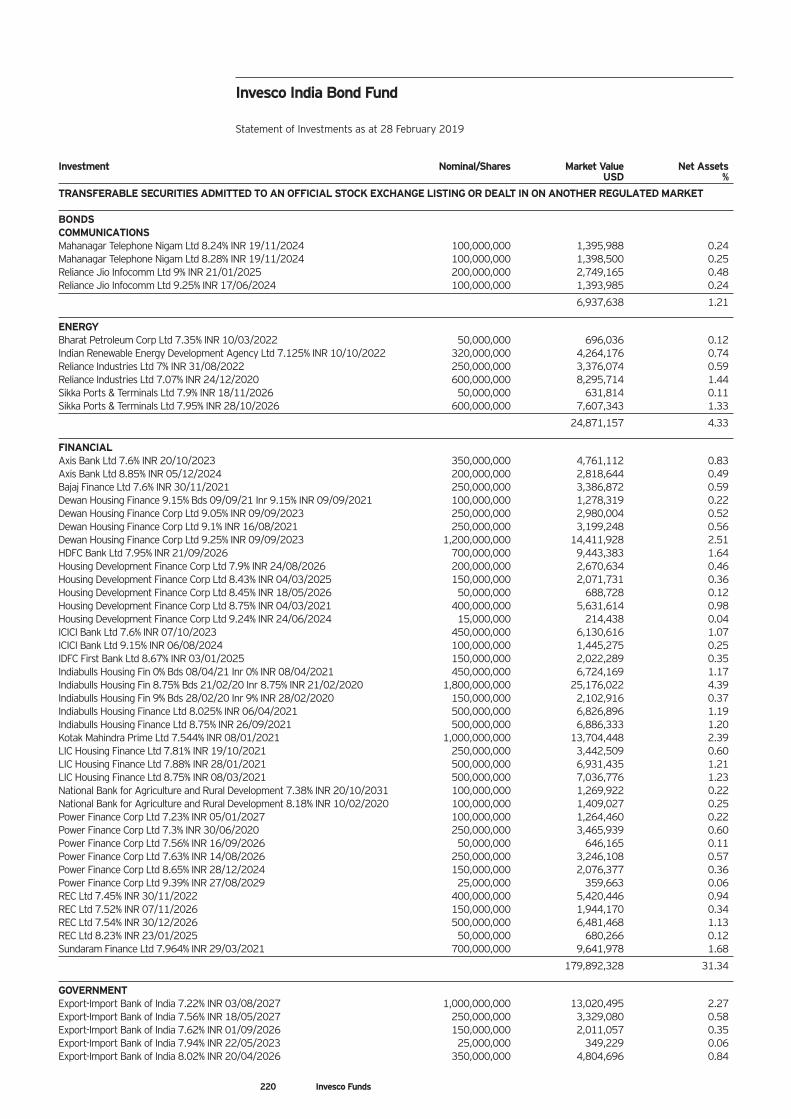
Investment Nominal/Shares Market Value Net Assets USD %
TRANSFERABLE SECURITIES ADMITTED TO AN OFFICIAL STOCK EXCHANGE LISTING OR DEALT IN ON ANOTHER REGULATED MARKET BONDS COMMUNICATIONS Mahanagar Telephone Nigam Ltd 8.24% INR 19/11/2024 100,000,000 1,395,988 0.24 Mahanagar Telephone Nigam Ltd 8.28% INR 19/11/2024 100,000,000 1,398,500 0.25 Reliance Jio Infocomm Ltd 9% INR 21/01/2025 200,000,000 2,749,165 0.48 Reliance Jio Infocomm Ltd 9.25% INR 17/06/2024 100,000,000 1,393,985 0.24
6,937,638 1.21
ENERGY Bharat Petroleum Corp Ltd 7.35% INR 10/03/2022 50,000,000 696,036 0.12 Indian Renewable Energy Development Agency Ltd 7.125% INR 10/10/2022 320,000,000 4,264,176 0.74 Reliance Industries Ltd 7% INR 31/08/2022 250,000,000 3,376,074 0.59 Reliance Industries Ltd 7.07% INR 24/12/2020 600,000,000 8,295,714 1.44 Sikka Ports & Terminals Ltd 7.9% INR 18/11/2026 50,000,000 631,814 0.11 Sikka Ports & Terminals Ltd 7.95% INR 28/10/2026 600,000,000 7,607,343 1.33
24,871,157 4.33
FINANCIAL Axis Bank Ltd 7.6% INR 20/10/2023 350,000,000 4,761,112 0.83 Axis Bank Ltd 8.85% INR 05/12/2024 200,000,000 2,818,644 0.49 Bajaj Finance Ltd 7.6% INR 30/11/2021 250,000,000 3,386,872 0.59 Dewan Housing Finance 9.15% Bds 09/09/21 Inr 9.15% INR 09/09/2021 100,000,000 1,278,319 0.22 Dewan Housing Finance Corp Ltd 9.05% INR 09/09/2023 250,000,000 2,980,004 0.52 Dewan Housing Finance Corp Ltd 9.1% INR 16/08/2021 250,000,000 3,199,248 0.56 Dewan Housing Finance Corp Ltd 9.25% INR 09/09/2023 1,200,000,000 14,411,928 2.51 HDFC Bank Ltd 7.95% INR 21/09/2026 700,000,000 9,443,383 1.64 Housing Development Finance Corp Ltd 7.9% INR 24/08/2026 200,000,000 2,670,634 0.46 Housing Development Finance Corp Ltd 8.43% INR 04/03/2025 150,000,000 2,071,731 0.36 Housing Development Finance Corp Ltd 8.45% INR 18/05/2026 50,000,000 688,728 0.12 Housing Development Finance Corp Ltd 8.75% INR 04/03/2021 400,000,000 5,631,614 0.98 Housing Development Finance Corp Ltd 9.24% INR 24/06/2024 15,000,000 214,438 0.04 ICICI Bank Ltd 7.6% INR 07/10/2023 450,000,000 6,130,616 1.07 ICICI Bank Ltd 9.15% INR 06/08/2024 100,000,000 1,445,275 0.25 IDFC First Bank Ltd 8.67% INR 03/01/2025 150,000,000 2,022,289 0.35 Indiabulls Housing Fin 0% Bds 08/04/21 Inr 0% INR 08/04/2021 450,000,000 6,724,169 1.17 Indiabulls Housing Fin 8.75% Bds 21/02/20 Inr 8.75% INR 21/02/2020 1,800,000,000 25,176,022 4.39 Indiabulls Housing Fin 9% Bds 28/02/20 Inr 9% INR 28/02/2020 150,000,000 2,102,916 0.37 Indiabulls Housing Finance Ltd 8.025% INR 06/04/2021 500,000,000 6,826,896 1.19 Indiabulls Housing Finance Ltd 8.75% INR 26/09/2021 500,000,000 6,886,333 1.20 Kotak Mahindra Prime Ltd 7.544% INR 08/01/2021 1,000,000,000 13,704,448 2.39 LIC Housing Finance Ltd 7.81% INR 19/10/2021 250,000,000 3,442,509 0.60 LIC Housing Finance Ltd 7.88% INR 28/01/2021 500,000,000 6,931,435 1.21 LIC Housing Finance Ltd 8.75% INR 08/03/2021 500,000,000 7,036,776 1.23 National Bank for Agriculture and Rural Development 7.38% INR 20/10/2031 100,000,000 1,269,922 0.22 National Bank for Agriculture and Rural Development 8.18% INR 10/02/2020 100,000,000 1,409,027 0.25 Power Finance Corp Ltd 7.23% INR 05/01/2027 100,000,000 1,264,460 0.22 Power Finance Corp Ltd 7.3% INR 30/06/2020 250,000,000 3,465,939 0.60 Power Finance Corp Ltd 7.56% INR 16/09/2026 50,000,000 646,165 0.11 Power Finance Corp Ltd 7.63% INR 14/08/2026 250,000,000 3,246,108 0.57 Power Finance Corp Ltd 8.65% INR 28/12/2024 150,000,000 2,076,377 0.36 Power Finance Corp Ltd 9.39% INR 27/08/2029 25,000,000 359,663 0.06 REC Ltd 7.45% INR 30/11/2022 400,000,000 5,420,446 0.94 REC Ltd 7.52% INR 07/11/2026 150,000,000 1,944,170 0.34 REC Ltd 7.54% INR 30/12/2026 500,000,000 6,481,468 1.13 REC Ltd 8.23% INR 23/01/2025 50,000,000 680,266 0.12 Sundaram Finance Ltd 7.964% INR 29/03/2021 700,000,000 9,641,978 1.68
179,892,328 31.34
GOVERNMENT Export-Import Bank of India 7.22% INR 03/08/2027 1,000,000,000 13,020,495 2.27 Export-Import Bank of India 7.56% INR 18/05/2027 250,000,000 3,329,080 0.58 Export-Import Bank of India 7.62% INR 01/09/2026 150,000,000 2,011,057 0.35 Export-Import Bank of India 7.94% INR 22/05/2023 25,000,000 349,229 0.06 Export-Import Bank of India 8.02% INR 20/04/2026 350,000,000 4,804,696 0.84
Invesco India Bond Fund Statement of Investments as at 28 February 2019
220 Invesco Funds
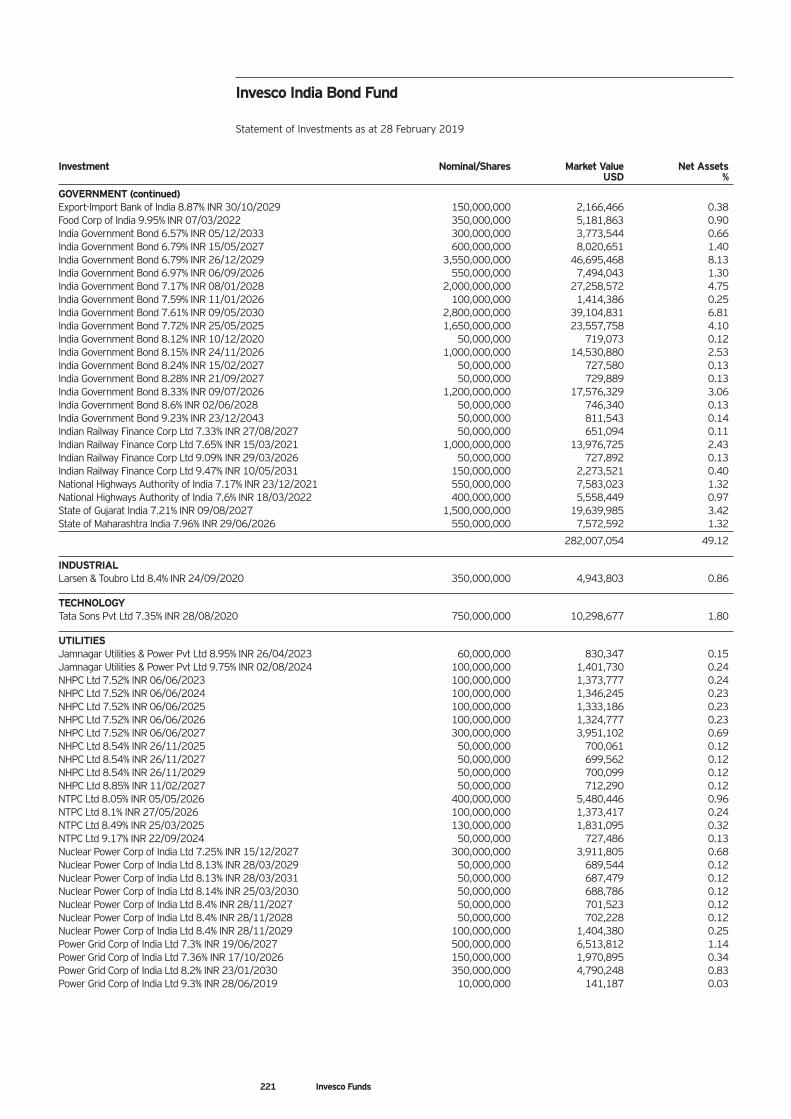
Investment Nominal/Shares Market Value Net Assets USD %
GOVERNMENT (continued) Export-Import Bank of India 8.87% INR 30/10/2029 150,000,000 2,166,466 0.38 Food Corp of India 9.95% INR 07/03/2022 350,000,000 5,181,863 0.90 India Government Bond 6.57% INR 05/12/2033 300,000,000 3,773,544 0.66 India Government Bond 6.79% INR 15/05/2027 600,000,000 8,020,651 1.40 India Government Bond 6.79% INR 26/12/2029 3,550,000,000 46,695,468 8.13 India Government Bond 6.97% INR 06/09/2026 550,000,000 7,494,043 1.30 India Government Bond 7.17% INR 08/01/2028 2,000,000,000 27,258,572 4.75 India Government Bond 7.59% INR 11/01/2026 100,000,000 1,414,386 0.25 India Government Bond 7.61% INR 09/05/2030 2,800,000,000 39,104,831 6.81 India Government Bond 7.72% INR 25/05/2025 1,650,000,000 23,557,758 4.10 India Government Bond 8.12% INR 10/12/2020 50,000,000 719,073 0.12 India Government Bond 8.15% INR 24/11/2026 1,000,000,000 14,530,880 2.53 India Government Bond 8.24% INR 15/02/2027 50,000,000 727,580 0.13 India Government Bond 8.28% INR 21/09/2027 50,000,000 729,889 0.13 India Government Bond 8.33% INR 09/07/2026 1,200,000,000 17,576,329 3.06 India Government Bond 8.6% INR 02/06/2028 50,000,000 746,340 0.13 India Government Bond 9.23% INR 23/12/2043 50,000,000 811,543 0.14 Indian Railway Finance Corp Ltd 7.33% INR 27/08/2027 50,000,000 651,094 0.11 Indian Railway Finance Corp Ltd 7.65% INR 15/03/2021 1,000,000,000 13,976,725 2.43 Indian Railway Finance Corp Ltd 9.09% INR 29/03/2026 50,000,000 727,892 0.13 Indian Railway Finance Corp Ltd 9.47% INR 10/05/2031 150,000,000 2,273,521 0.40 National Highways Authority of India 7.17% INR 23/12/2021 550,000,000 7,583,023 1.32 National Highways Authority of India 7.6% INR 18/03/2022 400,000,000 5,558,449 0.97 State of Gujarat India 7.21% INR 09/08/2027 1,500,000,000 19,639,985 3.42 State of Maharashtra India 7.96% INR 29/06/2026 550,000,000 7,572,592 1.32
282,007,054 49.12
INDUSTRIAL Larsen & Toubro Ltd 8.4% INR 24/09/2020 350,000,000 4,943,803 0.86
TECHNOLOGY Tata Sons Pvt Ltd 7.35% INR 28/08/2020 750,000,000 10,298,677 1.80
UTILITIES Jamnagar Utilities & Power Pvt Ltd 8.95% INR 26/04/2023 60,000,000 830,347 0.15 Jamnagar Utilities & Power Pvt Ltd 9.75% INR 02/08/2024 100,000,000 1,401,730 0.24 NHPC Ltd 7.52% INR 06/06/2023 100,000,000 1,373,777 0.24 NHPC Ltd 7.52% INR 06/06/2024 100,000,000 1,346,245 0.23 NHPC Ltd 7.52% INR 06/06/2025 100,000,000 1,333,186 0.23 NHPC Ltd 7.52% INR 06/06/2026 100,000,000 1,324,777 0.23 NHPC Ltd 7.52% INR 06/06/2027 300,000,000 3,951,102 0.69 NHPC Ltd 8.54% INR 26/11/2025 50,000,000 700,061 0.12 NHPC Ltd 8.54% INR 26/11/2027 50,000,000 699,562 0.12 NHPC Ltd 8.54% INR 26/11/2029 50,000,000 700,099 0.12 NHPC Ltd 8.85% INR 11/02/2027 50,000,000 712,290 0.12 NTPC Ltd 8.05% INR 05/05/2026 400,000,000 5,480,446 0.96 NTPC Ltd 8.1% INR 27/05/2026 100,000,000 1,373,417 0.24 NTPC Ltd 8.49% INR 25/03/2025 130,000,000 1,831,095 0.32 NTPC Ltd 9.17% INR 22/09/2024 50,000,000 727,486 0.13 Nuclear Power Corp of India Ltd 7.25% INR 15/12/2027 300,000,000 3,911,805 0.68 Nuclear Power Corp of India Ltd 8.13% INR 28/03/2029 50,000,000 689,544 0.12 Nuclear Power Corp of India Ltd 8.13% INR 28/03/2031 50,000,000 687,479 0.12 Nuclear Power Corp of India Ltd 8.14% INR 25/03/2030 50,000,000 688,786 0.12 Nuclear Power Corp of India Ltd 8.4% INR 28/11/2027 50,000,000 701,523 0.12 Nuclear Power Corp of India Ltd 8.4% INR 28/11/2028 50,000,000 702,228 0.12 Nuclear Power Corp of India Ltd 8.4% INR 28/11/2029 100,000,000 1,404,380 0.25 Power Grid Corp of India Ltd 7.3% INR 19/06/2027 500,000,000 6,513,812 1.14 Power Grid Corp of India Ltd 7.36% INR 17/10/2026 150,000,000 1,970,895 0.34 Power Grid Corp of India Ltd 8.2% INR 23/01/2030 350,000,000 4,790,248 0.83 Power Grid Corp of India Ltd 9.3% INR 28/06/2019 10,000,000 141,187 0.03
Invesco India Bond Fund Statement of Investments as at 28 February 2019
221 Invesco Funds
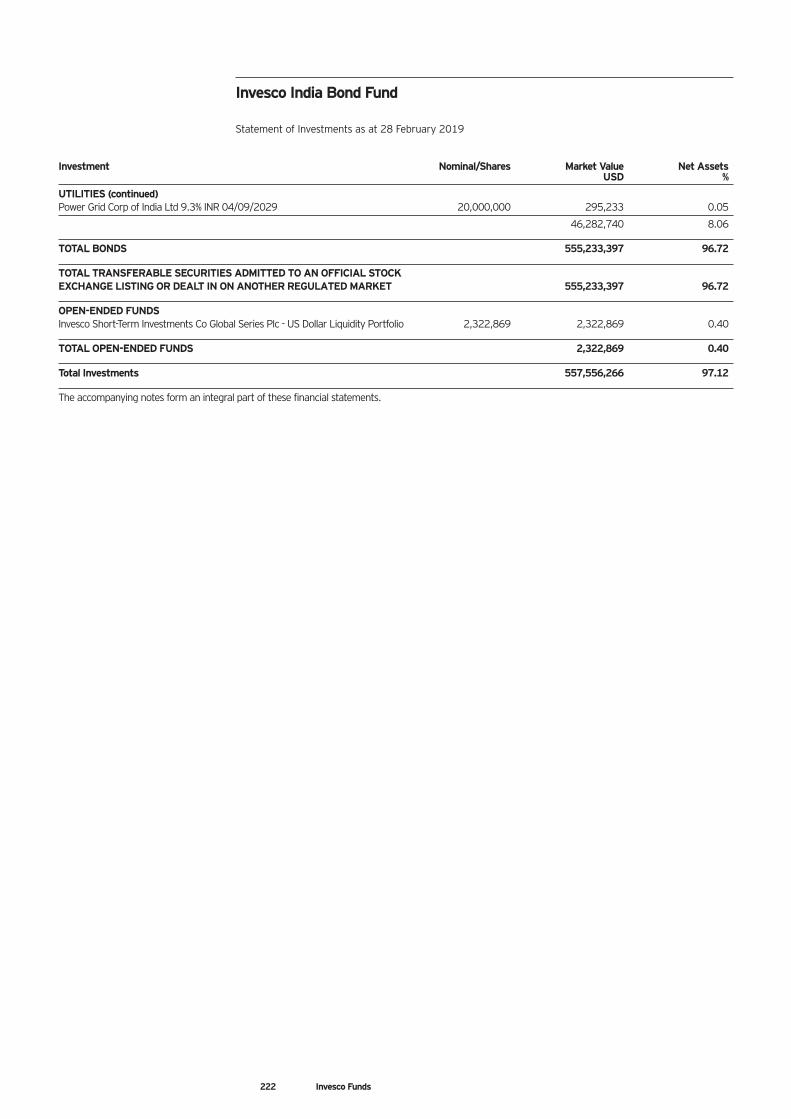
Investment Nominal/Shares Market Value Net Assets USD %
UTILITIES (continued) Power Grid Corp of India Ltd 9.3% INR 04/09/2029 20,000,000 295,233 0.05
46,282,740 8.06
TOTAL BONDS 555,233,397 96.72
TOTAL TRANSFERABLE SECURITIES ADMITTED TO AN OFFICIAL STOCK EXCHANGE LISTING OR DEALT IN ON ANOTHER REGULATED MARKET 555,233,397 96.72
OPEN-ENDED FUNDS Invesco Short-Term Investments Co Global Series Plc - US Dollar Liquidity Portfolio 2,322,869 2,322,869 0.40
TOTAL OPEN-ENDED FUNDS 2,322,869 0.40
Total Investments 557,556,266 97.12
The accompanying notes form an integral part of these financial statements.
Invesco India Bond Fund Statement of Investments as at 28 February 2019
222 Invesco Funds
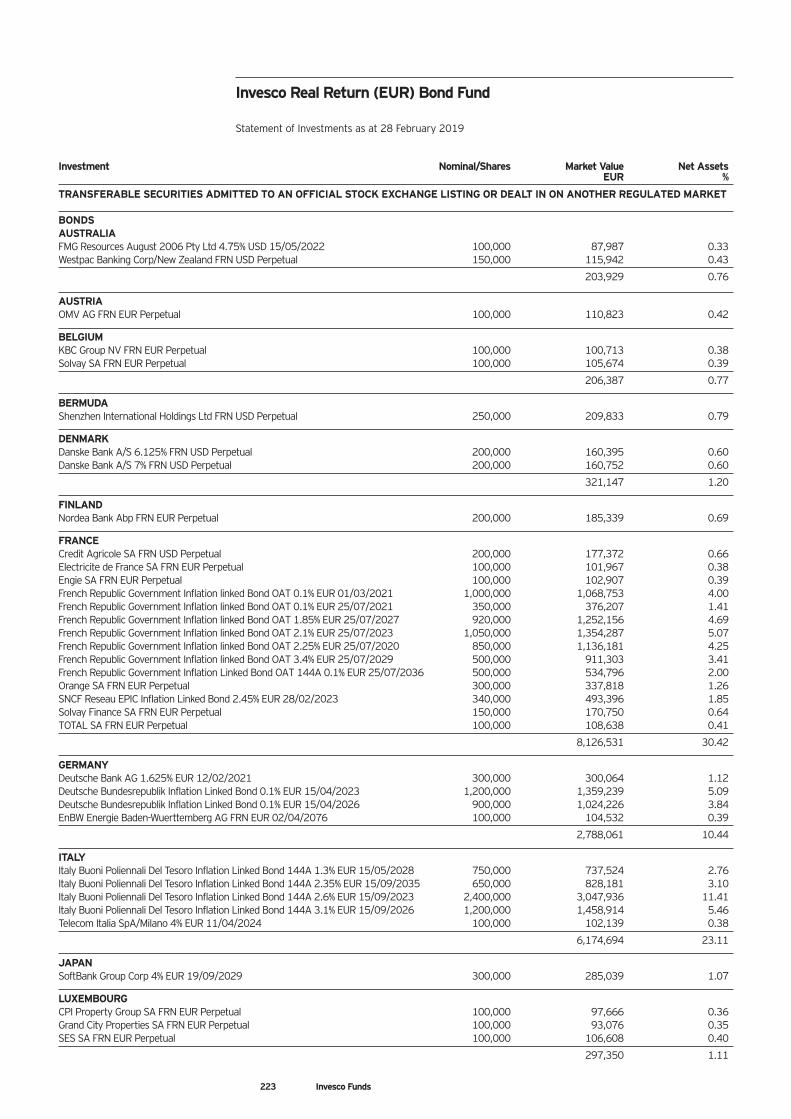
Investment Nominal/Shares Market Value Net Assets EUR %
TRANSFERABLE SECURITIES ADMITTED TO AN OFFICIAL STOCK EXCHANGE LISTING OR DEALT IN ON ANOTHER REGULATED MARKET BONDS AUSTRALIA FMG Resources August 2006 Pty Ltd 4.75% USD 15/05/2022 100,000 87,987 0.33 Westpac Banking Corp/New Zealand FRN USD Perpetual 150,000 115,942 0.43
203,929 0.76
AUSTRIA OMV AG FRN EUR Perpetual 100,000 110,823 0.42
BELGIUM KBC Group NV FRN EUR Perpetual 100,000 100,713 0.38 Solvay SA FRN EUR Perpetual 100,000 105,674 0.39
206,387 0.77
BERMUDA Shenzhen International Holdings Ltd FRN USD Perpetual 250,000 209,833 0.79
DENMARK Danske Bank A/S 6.125% FRN USD Perpetual 200,000 160,395 0.60 Danske Bank A/S 7% FRN USD Perpetual 200,000 160,752 0.60
321,147 1.20
FINLAND Nordea Bank Abp FRN EUR Perpetual 200,000 185,339 0.69
FRANCE Credit Agricole SA FRN USD Perpetual 200,000 177,372 0.66 Electricite de France SA FRN EUR Perpetual 100,000 101,967 0.38 Engie SA FRN EUR Perpetual 100,000 102,907 0.39 French Republic Government Inflation linked Bond OAT 0.1% EUR 01/03/2021 1,000,000 1,068,753 4.00 French Republic Government Inflation linked Bond OAT 0.1% EUR 25/07/2021 350,000 376,207 1.41 French Republic Government Inflation linked Bond OAT 1.85% EUR 25/07/2027 920,000 1,252,156 4.69 French Republic Government Inflation linked Bond OAT 2.1% EUR 25/07/2023 1,050,000 1,354,287 5.07 French Republic Government Inflation linked Bond OAT 2.25% EUR 25/07/2020 850,000 1,136,181 4.25 French Republic Government Inflation linked Bond OAT 3.4% EUR 25/07/2029 500,000 911,303 3.41 French Republic Government Inflation Linked Bond OAT 144A 0.1% EUR 25/07/2036 500,000 534,796 2.00 Orange SA FRN EUR Perpetual 300,000 337,818 1.26 SNCF Reseau EPIC Inflation Linked Bond 2.45% EUR 28/02/2023 340,000 493,396 1.85 Solvay Finance SA FRN EUR Perpetual 150,000 170,750 0.64 TOTAL SA FRN EUR Perpetual 100,000 108,638 0.41
8,126,531 30.42
GERMANY Deutsche Bank AG 1.625% EUR 12/02/2021 300,000 300,064 1.12 Deutsche Bundesrepublik Inflation Linked Bond 0.1% EUR 15/04/2023 1,200,000 1,359,239 5.09 Deutsche Bundesrepublik Inflation Linked Bond 0.1% EUR 15/04/2026 900,000 1,024,226 3.84 EnBW Energie Baden-Wuerttemberg AG FRN EUR 02/04/2076 100,000 104,532 0.39
2,788,061 10.44
ITALY Italy Buoni Poliennali Del Tesoro Inflation Linked Bond 144A 1.3% EUR 15/05/2028 750,000 737,524 2.76 Italy Buoni Poliennali Del Tesoro Inflation Linked Bond 144A 2.35% EUR 15/09/2035 650,000 828,181 3.10 Italy Buoni Poliennali Del Tesoro Inflation Linked Bond 144A 2.6% EUR 15/09/2023 2,400,000 3,047,936 11.41 Italy Buoni Poliennali Del Tesoro Inflation Linked Bond 144A 3.1% EUR 15/09/2026 1,200,000 1,458,914 5.46 Telecom Italia SpA/Milano 4% EUR 11/04/2024 100,000 102,139 0.38
6,174,694 23.11
JAPAN SoftBank Group Corp 4% EUR 19/09/2029 300,000 285,039 1.07
LUXEMBOURG CPI Property Group SA FRN EUR Perpetual 100,000 97,666 0.36 Grand City Properties SA FRN EUR Perpetual 100,000 93,076 0.35 SES SA FRN EUR Perpetual 100,000 106,608 0.40
297,350 1.11
Invesco Real Return (EUR) Bond Fund Statement of Investments as at 28 February 2019
223 Invesco Funds
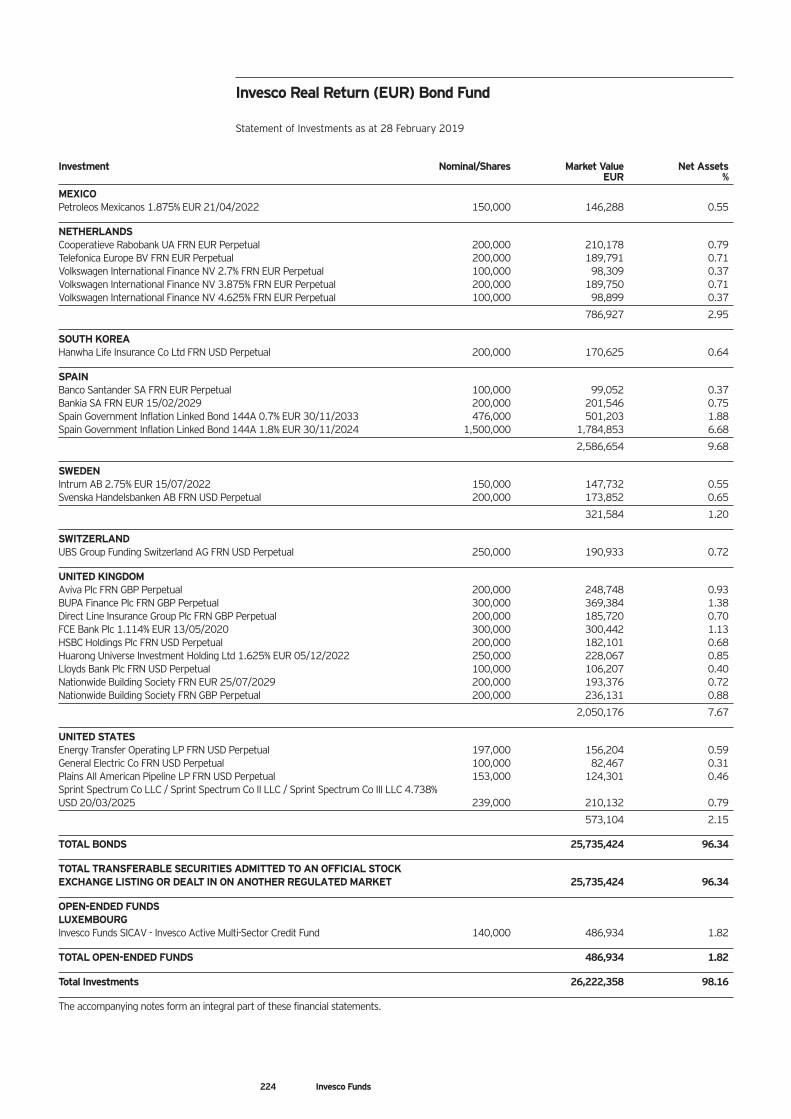
Investment Nominal/Shares Market Value Net Assets EUR %
MEXICO Petroleos Mexicanos 1.875% EUR 21/04/2022 150,000 146,288 0.55
NETHERLANDS Cooperatieve Rabobank UA FRN EUR Perpetual 200,000 210,178 0.79 Telefonica Europe BV FRN EUR Perpetual 200,000 189,791 0.71 Volkswagen International Finance NV 2.7% FRN EUR Perpetual 100,000 98,309 0.37 Volkswagen International Finance NV 3.875% FRN EUR Perpetual 200,000 189,750 0.71 Volkswagen International Finance NV 4.625% FRN EUR Perpetual 100,000 98,899 0.37
786,927 2.95
SOUTH KOREA Hanwha Life Insurance Co Ltd FRN USD Perpetual 200,000 170,625 0.64
SPAIN Banco Santander SA FRN EUR Perpetual 100,000 99,052 0.37 Bankia SA FRN EUR 15/02/2029 200,000 201,546 0.75 Spain Government Inflation Linked Bond 144A 0.7% EUR 30/11/2033 476,000 501,203 1.88 Spain Government Inflation Linked Bond 144A 1.8% EUR 30/11/2024 1,500,000 1,784,853 6.68
2,586,654 9.68
SWEDEN Intrum AB 2.75% EUR 15/07/2022 150,000 147,732 0.55 Svenska Handelsbanken AB FRN USD Perpetual 200,000 173,852 0.65
321,584 1.20
SWITZERLAND UBS Group Funding Switzerland AG FRN USD Perpetual 250,000 190,933 0.72
UNITED KINGDOM Aviva Plc FRN GBP Perpetual 200,000 248,748 0.93 BUPA Finance Plc FRN GBP Perpetual 300,000 369,384 1.38 Direct Line Insurance Group Plc FRN GBP Perpetual 200,000 185,720 0.70 FCE Bank Plc 1.114% EUR 13/05/2020 300,000 300,442 1.13 HSBC Holdings Plc FRN USD Perpetual 200,000 182,101 0.68 Huarong Universe Investment Holding Ltd 1.625% EUR 05/12/2022 250,000 228,067 0.85 Lloyds Bank Plc FRN USD Perpetual 100,000 106,207 0.40 Nationwide Building Society FRN EUR 25/07/2029 200,000 193,376 0.72 Nationwide Building Society FRN GBP Perpetual 200,000 236,131 0.88
2,050,176 7.67
UNITED STATES Energy Transfer Operating LP FRN USD Perpetual 197,000 156,204 0.59 General Electric Co FRN USD Perpetual 100,000 82,467 0.31 Plains All American Pipeline LP FRN USD Perpetual 153,000 124,301 0.46 Sprint Spectrum Co LLC / Sprint Spectrum Co II LLC / Sprint Spectrum Co III LLC 4.738% USD 20/03/2025 239,000 210,132 0.79
573,104 2.15
TOTAL BONDS 25,735,424 96.34
TOTAL TRANSFERABLE SECURITIES ADMITTED TO AN OFFICIAL STOCK EXCHANGE LISTING OR DEALT IN ON ANOTHER REGULATED MARKET 25,735,424 96.34
OPEN-ENDED FUNDS LUXEMBOURG Invesco Funds SICAV - Invesco Active Multi-Sector Credit Fund 140,000 486,934 1.82
TOTAL OPEN-ENDED FUNDS 486,934 1.82
Total Investments 26,222,358 98.16
The accompanying notes form an integral part of these financial statements.
Invesco Real Return (EUR) Bond Fund Statement of Investments as at 28 February 2019
224 Invesco Funds
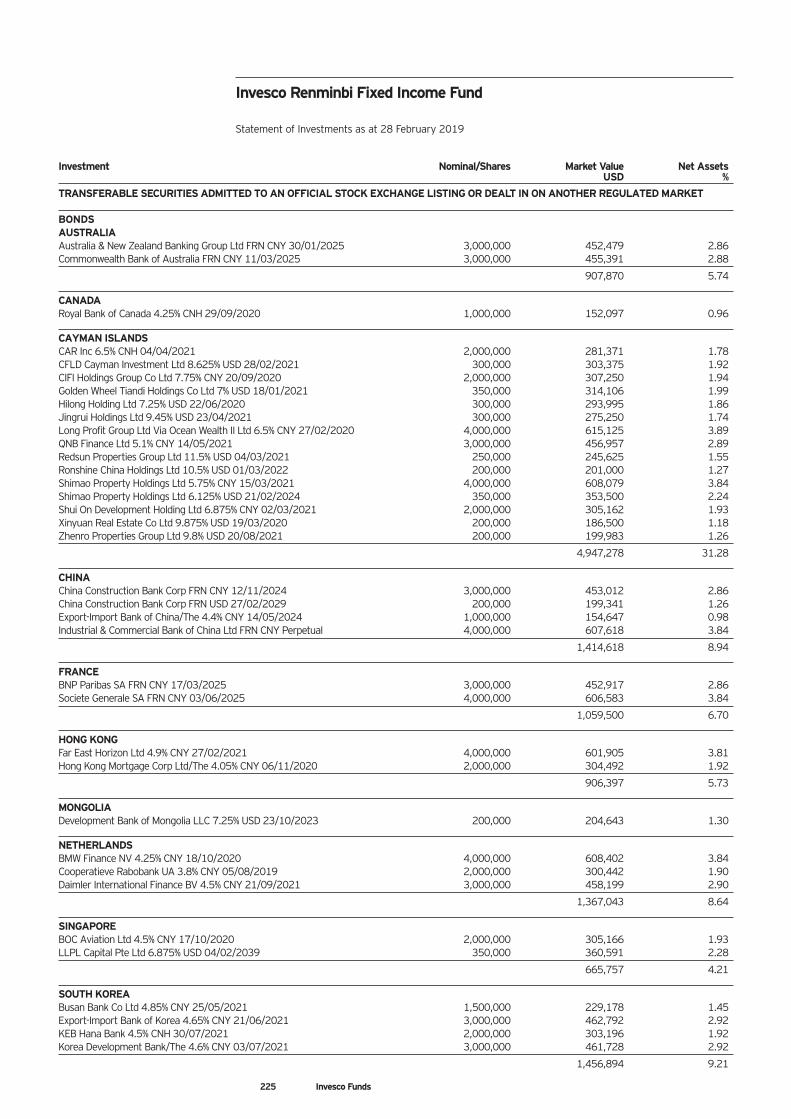
Investment Nominal/Shares Market Value Net Assets USD %
TRANSFERABLE SECURITIES ADMITTED TO AN OFFICIAL STOCK EXCHANGE LISTING OR DEALT IN ON ANOTHER REGULATED MARKET BONDS AUSTRALIA Australia & New Zealand Banking Group Ltd FRN CNY 30/01/2025 3,000,000 452,479 2.86 Commonwealth Bank of Australia FRN CNY 11/03/2025 3,000,000 455,391 2.88
907,870 5.74
CANADA Royal Bank of Canada 4.25% CNH 29/09/2020 1,000,000 152,097 0.96
CAYMAN ISLANDS CAR Inc 6.5% CNH 04/04/2021 2,000,000 281,371 1.78 CFLD Cayman Investment Ltd 8.625% USD 28/02/2021 300,000 303,375 1.92 CIFI Holdings Group Co Ltd 7.75% CNY 20/09/2020 2,000,000 307,250 1.94 Golden Wheel Tiandi Holdings Co Ltd 7% USD 18/01/2021 350,000 314,106 1.99 Hilong Holding Ltd 7.25% USD 22/06/2020 300,000 293,995 1.86 Jingrui Holdings Ltd 9.45% USD 23/04/2021 300,000 275,250 1.74 Long Profit Group Ltd Via Ocean Wealth II Ltd 6.5% CNY 27/02/2020 4,000,000 615,125 3.89 QNB Finance Ltd 5.1% CNY 14/05/2021 3,000,000 456,957 2.89 Redsun Properties Group Ltd 11.5% USD 04/03/2021 250,000 245,625 1.55 Ronshine China Holdings Ltd 10.5% USD 01/03/2022 200,000 201,000 1.27 Shimao Property Holdings Ltd 5.75% CNY 15/03/2021 4,000,000 608,079 3.84 Shimao Property Holdings Ltd 6.125% USD 21/02/2024 350,000 353,500 2.24 Shui On Development Holding Ltd 6.875% CNY 02/03/2021 2,000,000 305,162 1.93 Xinyuan Real Estate Co Ltd 9.875% USD 19/03/2020 200,000 186,500 1.18 Zhenro Properties Group Ltd 9.8% USD 20/08/2021 200,000 199,983 1.26
4,947,278 31.28
CHINA China Construction Bank Corp FRN CNY 12/11/2024 3,000,000 453,012 2.86 China Construction Bank Corp FRN USD 27/02/2029 200,000 199,341 1.26 Export-Import Bank of China/The 4.4% CNY 14/05/2024 1,000,000 154,647 0.98 Industrial & Commercial Bank of China Ltd FRN CNY Perpetual 4,000,000 607,618 3.84
1,414,618 8.94
FRANCE BNP Paribas SA FRN CNY 17/03/2025 3,000,000 452,917 2.86 Societe Generale SA FRN CNY 03/06/2025 4,000,000 606,583 3.84
1,059,500 6.70
HONG KONG Far East Horizon Ltd 4.9% CNY 27/02/2021 4,000,000 601,905 3.81 Hong Kong Mortgage Corp Ltd/The 4.05% CNY 06/11/2020 2,000,000 304,492 1.92
906,397 5.73
MONGOLIA Development Bank of Mongolia LLC 7.25% USD 23/10/2023 200,000 204,643 1.30
NETHERLANDS BMW Finance NV 4.25% CNY 18/10/2020 4,000,000 608,402 3.84 Cooperatieve Rabobank UA 3.8% CNY 05/08/2019 2,000,000 300,442 1.90 Daimler International Finance BV 4.5% CNY 21/09/2021 3,000,000 458,199 2.90
1,367,043 8.64
SINGAPORE BOC Aviation Ltd 4.5% CNY 17/10/2020 2,000,000 305,166 1.93 LLPL Capital Pte Ltd 6.875% USD 04/02/2039 350,000 360,591 2.28
665,757 4.21
SOUTH KOREA Busan Bank Co Ltd 4.85% CNY 25/05/2021 1,500,000 229,178 1.45 Export-Import Bank of Korea 4.65% CNY 21/06/2021 3,000,000 462,792 2.92 KEB Hana Bank 4.5% CNH 30/07/2021 2,000,000 303,196 1.92 Korea Development Bank/The 4.6% CNY 03/07/2021 3,000,000 461,728 2.92
1,456,894 9.21
225 Invesco Funds
Invesco Renminbi Fixed Income Fund Statement of Investments as at 28 February 2019
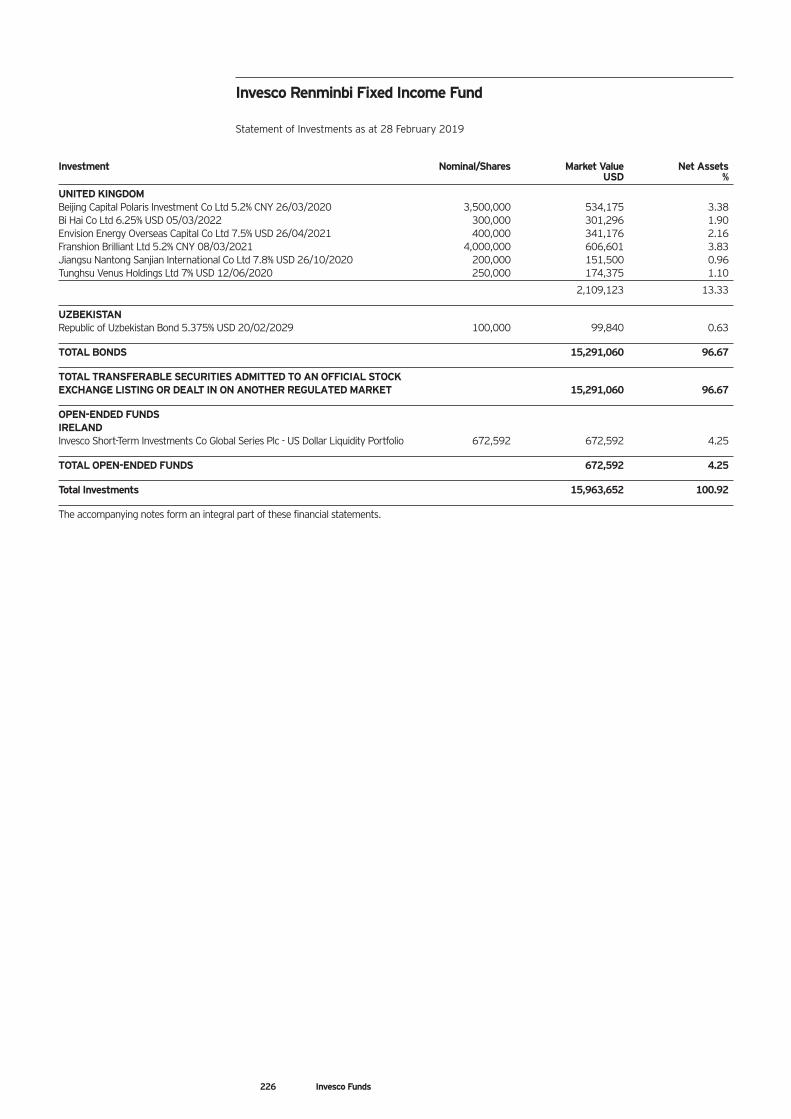
Investment Nominal/Shares Market Value Net Assets USD %
UNITED KINGDOM Beijing Capital Polaris Investment Co Ltd 5.2% CNY 26/03/2020 3,500,000 534,175 3.38 Bi Hai Co Ltd 6.25% USD 05/03/2022 300,000 301,296 1.90 Envision Energy Overseas Capital Co Ltd 7.5% USD 26/04/2021 400,000 341,176 2.16 Franshion Brilliant Ltd 5.2% CNY 08/03/2021 4,000,000 606,601 3.83 Jiangsu Nantong Sanjian International Co Ltd 7.8% USD 26/10/2020 200,000 151,500 0.96 Tunghsu Venus Holdings Ltd 7% USD 12/06/2020 250,000 174,375 1.10
2,109,123 13.33
UZBEKISTAN Republic of Uzbekistan Bond 5.375% USD 20/02/2029 100,000 99,840 0.63
TOTAL BONDS 15,291,060 96.67
TOTAL TRANSFERABLE SECURITIES ADMITTED TO AN OFFICIAL STOCK EXCHANGE LISTING OR DEALT IN ON ANOTHER REGULATED MARKET 15,291,060 96.67
OPEN-ENDED FUNDS IRELAND Invesco Short-Term Investments Co Global Series Plc - US Dollar Liquidity Portfolio 672,592 672,592 4.25
TOTAL OPEN-ENDED FUNDS 672,592 4.25
Total Investments 15,963,652 100.92
The accompanying notes form an integral part of these financial statements.
Invesco Renminbi Fixed Income Fund Statement of Investments as at 28 February 2019
226 Invesco Funds
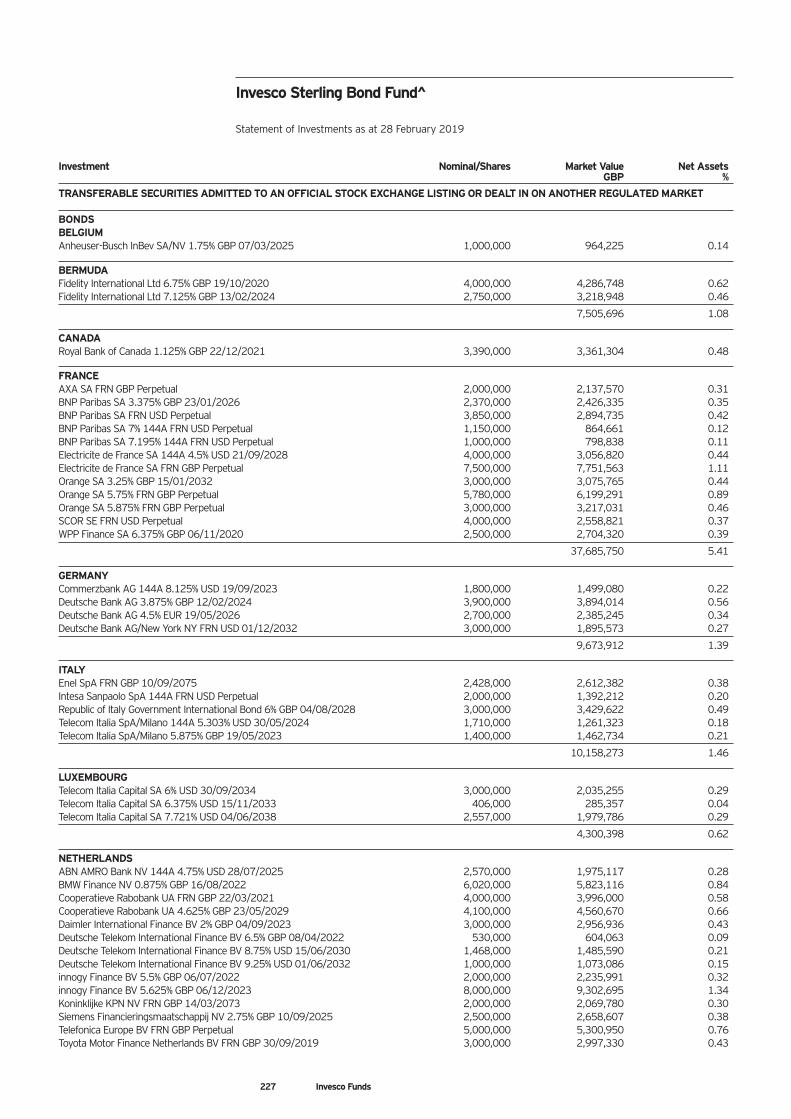
Investment Nominal/Shares Market Value Net Assets GBP %
TRANSFERABLE SECURITIES ADMITTED TO AN OFFICIAL STOCK EXCHANGE LISTING OR DEALT IN ON ANOTHER REGULATED MARKET BONDS BELGIUM Anheuser-Busch InBev SA/NV 1.75% GBP 07/03/2025 1,000,000 964,225 0.14
BERMUDA Fidelity International Ltd 6.75% GBP 19/10/2020 4,000,000 4,286,748 0.62 Fidelity International Ltd 7.125% GBP 13/02/2024 2,750,000 3,218,948 0.46
7,505,696 1.08
CANADA Royal Bank of Canada 1.125% GBP 22/12/2021 3,390,000 3,361,304 0.48
FRANCE AXA SA FRN GBP Perpetual 2,000,000 2,137,570 0.31 BNP Paribas SA 3.375% GBP 23/01/2026 2,370,000 2,426,335 0.35 BNP Paribas SA FRN USD Perpetual 3,850,000 2,894,735 0.42 BNP Paribas SA 7% 144A FRN USD Perpetual 1,150,000 864,661 0.12 BNP Paribas SA 7.195% 144A FRN USD Perpetual 1,000,000 798,838 0.11 Electricite de France SA 144A 4.5% USD 21/09/2028 4,000,000 3,056,820 0.44 Electricite de France SA FRN GBP Perpetual 7,500,000 7,751,563 1.11 Orange SA 3.25% GBP 15/01/2032 3,000,000 3,075,765 0.44 Orange SA 5.75% FRN GBP Perpetual 5,780,000 6,199,291 0.89 Orange SA 5.875% FRN GBP Perpetual 3,000,000 3,217,031 0.46 SCOR SE FRN USD Perpetual 4,000,000 2,558,821 0.37 WPP Finance SA 6.375% GBP 06/11/2020 2,500,000 2,704,320 0.39
37,685,750 5.41
GERMANY Commerzbank AG 144A 8.125% USD 19/09/2023 1,800,000 1,499,080 0.22 Deutsche Bank AG 3.875% GBP 12/02/2024 3,900,000 3,894,014 0.56 Deutsche Bank AG 4.5% EUR 19/05/2026 2,700,000 2,385,245 0.34 Deutsche Bank AG/New York NY FRN USD 01/12/2032 3,000,000 1,895,573 0.27
9,673,912 1.39
ITALY Enel SpA FRN GBP 10/09/2075 2,428,000 2,612,382 0.38 Intesa Sanpaolo SpA 144A FRN USD Perpetual 2,000,000 1,392,212 0.20 Republic of Italy Government International Bond 6% GBP 04/08/2028 3,000,000 3,429,622 0.49 Telecom Italia SpA/Milano 144A 5.303% USD 30/05/2024 1,710,000 1,261,323 0.18 Telecom Italia SpA/Milano 5.875% GBP 19/05/2023 1,400,000 1,462,734 0.21
10,158,273 1.46
LUXEMBOURG Telecom Italia Capital SA 6% USD 30/09/2034 3,000,000 2,035,255 0.29 Telecom Italia Capital SA 6.375% USD 15/11/2033 406,000 285,357 0.04 Telecom Italia Capital SA 7.721% USD 04/06/2038 2,557,000 1,979,786 0.29
4,300,398 0.62
NETHERLANDS ABN AMRO Bank NV 144A 4.75% USD 28/07/2025 2,570,000 1,975,117 0.28 BMW Finance NV 0.875% GBP 16/08/2022 6,020,000 5,823,116 0.84 Cooperatieve Rabobank UA FRN GBP 22/03/2021 4,000,000 3,996,000 0.58 Cooperatieve Rabobank UA 4.625% GBP 23/05/2029 4,100,000 4,560,670 0.66 Daimler International Finance BV 2% GBP 04/09/2023 3,000,000 2,956,936 0.43 Deutsche Telekom International Finance BV 6.5% GBP 08/04/2022 530,000 604,063 0.09 Deutsche Telekom International Finance BV 8.75% USD 15/06/2030 1,468,000 1,485,590 0.21 Deutsche Telekom International Finance BV 9.25% USD 01/06/2032 1,000,000 1,073,086 0.15 innogy Finance BV 5.5% GBP 06/07/2022 2,000,000 2,235,991 0.32 innogy Finance BV 5.625% GBP 06/12/2023 8,000,000 9,302,695 1.34 Koninklijke KPN NV FRN GBP 14/03/2073 2,000,000 2,069,780 0.30 Siemens Financieringsmaatschappij NV 2.75% GBP 10/09/2025 2,500,000 2,658,607 0.38 Telefonica Europe BV FRN GBP Perpetual 5,000,000 5,300,950 0.76 Toyota Motor Finance Netherlands BV FRN GBP 30/09/2019 3,000,000 2,997,330 0.43
Invesco Sterling Bond Fund^ Statement of Investments as at 28 February 2019
227 Invesco Funds
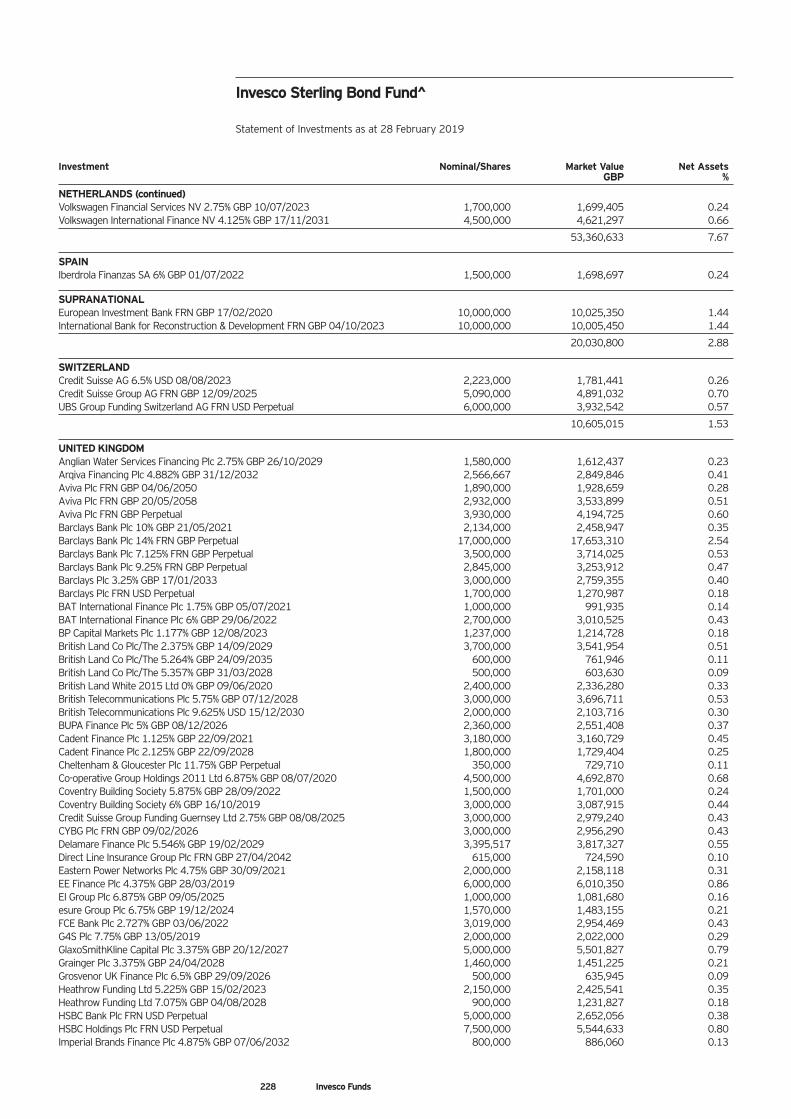
Invesco Sterling Bond Fund^ Statement of Investments as at 28 February 2019
Investment Nominal/Shares Market Value Net Assets GBP %
NETHERLANDS (continued) Volkswagen Financial Services NV 2.75% GBP 10/07/2023 1,700,000 1,699,405 0.24 Volkswagen International Finance NV 4.125% GBP 17/11/2031 4,500,000 4,621,297 0.66
53,360,633 7.67
SPAIN Iberdrola Finanzas SA 6% GBP 01/07/2022 1,500,000 1,698,697 0.24
SUPRANATIONAL European Investment Bank FRN GBP 17/02/2020 10,000,000 10,025,350 1.44 International Bank for Reconstruction & Development FRN GBP 04/10/2023 10,000,000 10,005,450 1.44
20,030,800 2.88
SWITZERLAND Credit Suisse AG 6.5% USD 08/08/2023 2,223,000 1,781,441 0.26 Credit Suisse Group AG FRN GBP 12/09/2025 5,090,000 4,891,032 0.70 UBS Group Funding Switzerland AG FRN USD Perpetual 6,000,000 3,932,542 0.57
10,605,015 1.53
UNITED KINGDOM Anglian Water Services Financing Plc 2.75% GBP 26/10/2029 1,580,000 1,612,437 0.23 Arqiva Financing Plc 4.882% GBP 31/12/2032 2,566,667 2,849,846 0.41 Aviva Plc FRN GBP 04/06/2050 1,890,000 1,928,659 0.28 Aviva Plc FRN GBP 20/05/2058 2,932,000 3,533,899 0.51 Aviva Plc FRN GBP Perpetual 3,930,000 4,194,725 0.60 Barclays Bank Plc 10% GBP 21/05/2021 2,134,000 2,458,947 0.35 Barclays Bank Plc 14% FRN GBP Perpetual 17,000,000 17,653,310 2.54 Barclays Bank Plc 7.125% FRN GBP Perpetual 3,500,000 3,714,025 0.53 Barclays Bank Plc 9.25% FRN GBP Perpetual 2,845,000 3,253,912 0.47 Barclays Plc 3.25% GBP 17/01/2033 3,000,000 2,759,355 0.40 Barclays Plc FRN USD Perpetual 1,700,000 1,270,987 0.18 BAT International Finance Plc 1.75% GBP 05/07/2021 1,000,000 991,935 0.14 BAT International Finance Plc 6% GBP 29/06/2022 2,700,000 3,010,525 0.43 BP Capital Markets Plc 1.177% GBP 12/08/2023 1,237,000 1,214,728 0.18 British Land Co Plc/The 2.375% GBP 14/09/2029 3,700,000 3,541,954 0.51 British Land Co Plc/The 5.264% GBP 24/09/2035 600,000 761,946 0.11 British Land Co Plc/The 5.357% GBP 31/03/2028 500,000 603,630 0.09 British Land White 2015 Ltd 0% GBP 09/06/2020 2,400,000 2,336,280 0.33 British Telecommunications Plc 5.75% GBP 07/12/2028 3,000,000 3,696,711 0.53 British Telecommunications Plc 9.625% USD 15/12/2030 2,000,000 2,103,716 0.30 BUPA Finance Plc 5% GBP 08/12/2026 2,360,000 2,551,408 0.37 Cadent Finance Plc 1.125% GBP 22/09/2021 3,180,000 3,160,729 0.45 Cadent Finance Plc 2.125% GBP 22/09/2028 1,800,000 1,729,404 0.25 Cheltenham & Gloucester Plc 11.75% GBP Perpetual 350,000 729,710 0.11 Co-operative Group Holdings 2011 Ltd 6.875% GBP 08/07/2020 4,500,000 4,692,870 0.68 Coventry Building Society 5.875% GBP 28/09/2022 1,500,000 1,701,000 0.24 Coventry Building Society 6% GBP 16/10/2019 3,000,000 3,087,915 0.44 Credit Suisse Group Funding Guernsey Ltd 2.75% GBP 08/08/2025 3,000,000 2,979,240 0.43 CYBG Plc FRN GBP 09/02/2026 3,000,000 2,956,290 0.43 Delamare Finance Plc 5.546% GBP 19/02/2029 3,395,517 3,817,327 0.55 Direct Line Insurance Group Plc FRN GBP 27/04/2042 615,000 724,590 0.10 Eastern Power Networks Plc 4.75% GBP 30/09/2021 2,000,000 2,158,118 0.31 EE Finance Plc 4.375% GBP 28/03/2019 6,000,000 6,010,350 0.86 EI Group Plc 6.875% GBP 09/05/2025 1,000,000 1,081,680 0.16 esure Group Plc 6.75% GBP 19/12/2024 1,570,000 1,483,155 0.21 FCE Bank Plc 2.727% GBP 03/06/2022 3,019,000 2,954,469 0.43 G4S Plc 7.75% GBP 13/05/2019 2,000,000 2,022,000 0.29 GlaxoSmithKline Capital Plc 3.375% GBP 20/12/2027 5,000,000 5,501,827 0.79 Grainger Plc 3.375% GBP 24/04/2028 1,460,000 1,451,225 0.21 Grosvenor UK Finance Plc 6.5% GBP 29/09/2026 500,000 635,945 0.09 Heathrow Funding Ltd 5.225% GBP 15/02/2023 2,150,000 2,425,541 0.35 Heathrow Funding Ltd 7.075% GBP 04/08/2028 900,000 1,231,827 0.18 HSBC Bank Plc FRN USD Perpetual 5,000,000 2,652,056 0.38 HSBC Holdings Plc FRN USD Perpetual 7,500,000 5,544,633 0.80 Imperial Brands Finance Plc 4.875% GBP 07/06/2032 800,000 886,060 0.13
228 Invesco Funds
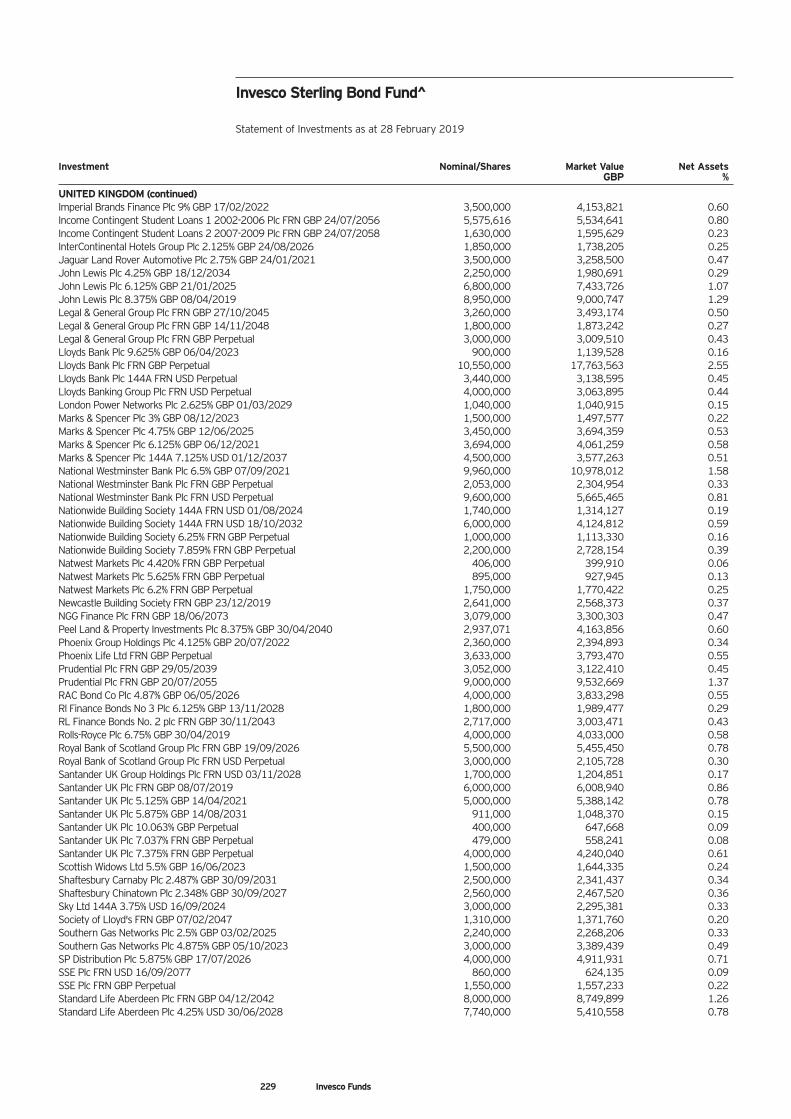
Invesco Sterling Bond Fund^ Statement of Investments as at 28 February 2019
Investment Nominal/Shares Market Value Net Assets GBP %
UNITED KINGDOM (continued) Imperial Brands Finance Plc 9% GBP 17/02/2022 3,500,000 4,153,821 0.60 Income Contingent Student Loans 1 2002-2006 Plc FRN GBP 24/07/2056 5,575,616 5,534,641 0.80 Income Contingent Student Loans 2 2007-2009 Plc FRN GBP 24/07/2058 1,630,000 1,595,629 0.23 InterContinental Hotels Group Plc 2.125% GBP 24/08/2026 1,850,000 1,738,205 0.25 Jaguar Land Rover Automotive Plc 2.75% GBP 24/01/2021 3,500,000 3,258,500 0.47 John Lewis Plc 4.25% GBP 18/12/2034 2,250,000 1,980,691 0.29 John Lewis Plc 6.125% GBP 21/01/2025 6,800,000 7,433,726 1.07 John Lewis Plc 8.375% GBP 08/04/2019 8,950,000 9,000,747 1.29 Legal & General Group Plc FRN GBP 27/10/2045 3,260,000 3,493,174 0.50 Legal & General Group Plc FRN GBP 14/11/2048 1,800,000 1,873,242 0.27 Legal & General Group Plc FRN GBP Perpetual 3,000,000 3,009,510 0.43 Lloyds Bank Plc 9.625% GBP 06/04/2023 900,000 1,139,528 0.16 Lloyds Bank Plc FRN GBP Perpetual 10,550,000 17,763,563 2.55 Lloyds Bank Plc 144A FRN USD Perpetual 3,440,000 3,138,595 0.45 Lloyds Banking Group Plc FRN USD Perpetual 4,000,000 3,063,895 0.44 London Power Networks Plc 2.625% GBP 01/03/2029 1,040,000 1,040,915 0.15 Marks & Spencer Plc 3% GBP 08/12/2023 1,500,000 1,497,577 0.22 Marks & Spencer Plc 4.75% GBP 12/06/2025 3,450,000 3,694,359 0.53 Marks & Spencer Plc 6.125% GBP 06/12/2021 3,694,000 4,061,259 0.58 Marks & Spencer Plc 144A 7.125% USD 01/12/2037 4,500,000 3,577,263 0.51 National Westminster Bank Plc 6.5% GBP 07/09/2021 9,960,000 10,978,012 1.58 National Westminster Bank Plc FRN GBP Perpetual 2,053,000 2,304,954 0.33 National Westminster Bank Plc FRN USD Perpetual 9,600,000 5,665,465 0.81 Nationwide Building Society 144A FRN USD 01/08/2024 1,740,000 1,314,127 0.19 Nationwide Building Society 144A FRN USD 18/10/2032 6,000,000 4,124,812 0.59 Nationwide Building Society 6.25% FRN GBP Perpetual 1,000,000 1,113,330 0.16 Nationwide Building Society 7.859% FRN GBP Perpetual 2,200,000 2,728,154 0.39 Natwest Markets Plc 4.420% FRN GBP Perpetual 406,000 399,910 0.06 Natwest Markets Plc 5.625% FRN GBP Perpetual 895,000 927,945 0.13 Natwest Markets Plc 6.2% FRN GBP Perpetual 1,750,000 1,770,422 0.25 Newcastle Building Society FRN GBP 23/12/2019 2,641,000 2,568,373 0.37 NGG Finance Plc FRN GBP 18/06/2073 3,079,000 3,300,303 0.47 Peel Land & Property Investments Plc 8.375% GBP 30/04/2040 2,937,071 4,163,856 0.60 Phoenix Group Holdings Plc 4.125% GBP 20/07/2022 2,360,000 2,394,893 0.34 Phoenix Life Ltd FRN GBP Perpetual 3,633,000 3,793,470 0.55 Prudential Plc FRN GBP 29/05/2039 3,052,000 3,122,410 0.45 Prudential Plc FRN GBP 20/07/2055 9,000,000 9,532,669 1.37 RAC Bond Co Plc 4.87% GBP 06/05/2026 4,000,000 3,833,298 0.55 Rl Finance Bonds No 3 Plc 6.125% GBP 13/11/2028 1,800,000 1,989,477 0.29 RL Finance Bonds No. 2 plc FRN GBP 30/11/2043 2,717,000 3,003,471 0.43 Rolls-Royce Plc 6.75% GBP 30/04/2019 4,000,000 4,033,000 0.58 Royal Bank of Scotland Group Plc FRN GBP 19/09/2026 5,500,000 5,455,450 0.78 Royal Bank of Scotland Group Plc FRN USD Perpetual 3,000,000 2,105,728 0.30 Santander UK Group Holdings Plc FRN USD 03/11/2028 1,700,000 1,204,851 0.17 Santander UK Plc FRN GBP 08/07/2019 6,000,000 6,008,940 0.86 Santander UK Plc 5.125% GBP 14/04/2021 5,000,000 5,388,142 0.78 Santander UK Plc 5.875% GBP 14/08/2031 911,000 1,048,370 0.15 Santander UK Plc 10.063% GBP Perpetual 400,000 647,668 0.09 Santander UK Plc 7.037% FRN GBP Perpetual 479,000 558,241 0.08 Santander UK Plc 7.375% FRN GBP Perpetual 4,000,000 4,240,040 0.61 Scottish Widows Ltd 5.5% GBP 16/06/2023 1,500,000 1,644,335 0.24 Shaftesbury Carnaby Plc 2.487% GBP 30/09/2031 2,500,000 2,341,437 0.34 Shaftesbury Chinatown Plc 2.348% GBP 30/09/2027 2,560,000 2,467,520 0.36 Sky Ltd 144A 3.75% USD 16/09/2024 3,000,000 2,295,381 0.33 Society of Lloyd's FRN GBP 07/02/2047 1,310,000 1,371,760 0.20 Southern Gas Networks Plc 2.5% GBP 03/02/2025 2,240,000 2,268,206 0.33 Southern Gas Networks Plc 4.875% GBP 05/10/2023 3,000,000 3,389,439 0.49 SP Distribution Plc 5.875% GBP 17/07/2026 4,000,000 4,911,931 0.71 SSE Plc FRN USD 16/09/2077 860,000 624,135 0.09 SSE Plc FRN GBP Perpetual 1,550,000 1,557,233 0.22 Standard Life Aberdeen Plc FRN GBP 04/12/2042 8,000,000 8,749,899 1.26 Standard Life Aberdeen Plc 4.25% USD 30/06/2028 7,740,000 5,410,558 0.78
229 Invesco Funds
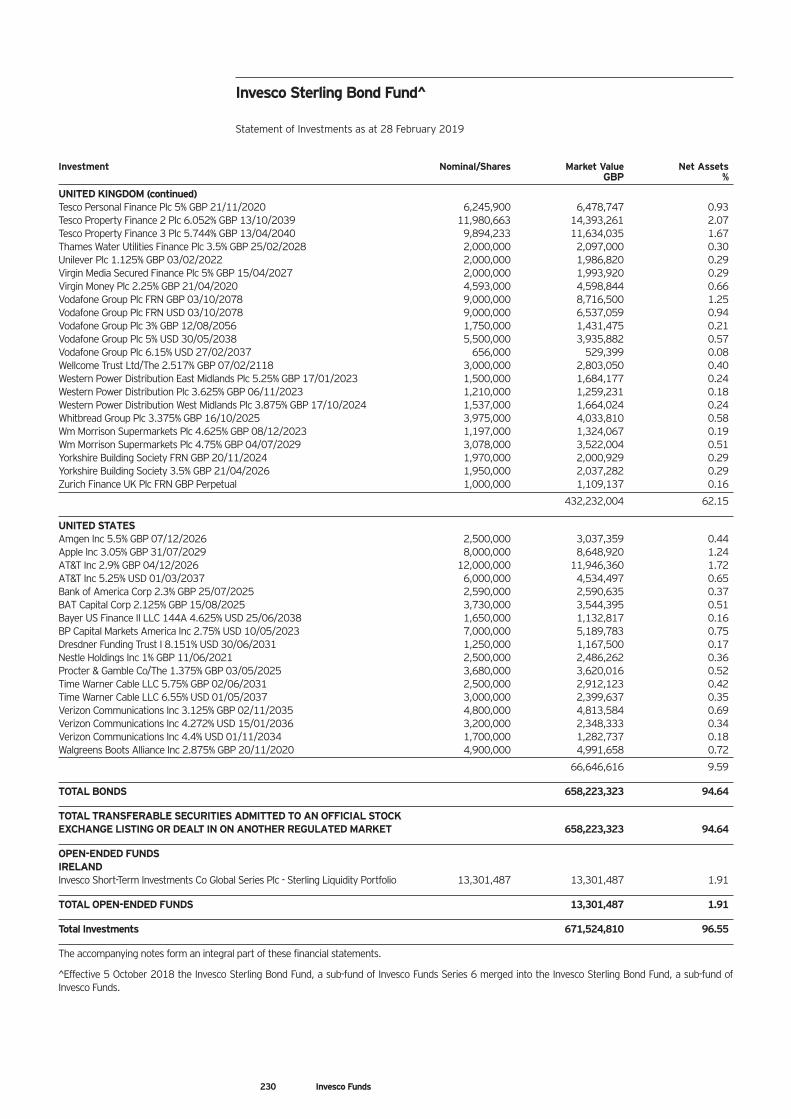
Investment Nominal/Shares Market Value Net Assets GBP %
UNITED KINGDOM (continued) Tesco Personal Finance Plc 5% GBP 21/11/2020 6,245,900 6,478,747 0.93 Tesco Property Finance 2 Plc 6.052% GBP 13/10/2039 11,980,663 14,393,261 2.07 Tesco Property Finance 3 Plc 5.744% GBP 13/04/2040 9,894,233 11,634,035 1.67 Thames Water Utilities Finance Plc 3.5% GBP 25/02/2028 2,000,000 2,097,000 0.30 Unilever Plc 1.125% GBP 03/02/2022 2,000,000 1,986,820 0.29 Virgin Media Secured Finance Plc 5% GBP 15/04/2027 2,000,000 1,993,920 0.29 Virgin Money Plc 2.25% GBP 21/04/2020 4,593,000 4,598,844 0.66 Vodafone Group Plc FRN GBP 03/10/2078 9,000,000 8,716,500 1.25 Vodafone Group Plc FRN USD 03/10/2078 9,000,000 6,537,059 0.94 Vodafone Group Plc 3% GBP 12/08/2056 1,750,000 1,431,475 0.21 Vodafone Group Plc 5% USD 30/05/2038 5,500,000 3,935,882 0.57 Vodafone Group Plc 6.15% USD 27/02/2037 656,000 529,399 0.08 Wellcome Trust Ltd/The 2.517% GBP 07/02/2118 3,000,000 2,803,050 0.40 Western Power Distribution East Midlands Plc 5.25% GBP 17/01/2023 1,500,000 1,684,177 0.24 Western Power Distribution Plc 3.625% GBP 06/11/2023 1,210,000 1,259,231 0.18 Western Power Distribution West Midlands Plc 3.875% GBP 17/10/2024 1,537,000 1,664,024 0.24 Whitbread Group Plc 3.375% GBP 16/10/2025 3,975,000 4,033,810 0.58 Wm Morrison Supermarkets Plc 4.625% GBP 08/12/2023 1,197,000 1,324,067 0.19 Wm Morrison Supermarkets Plc 4.75% GBP 04/07/2029 3,078,000 3,522,004 0.51 Yorkshire Building Society FRN GBP 20/11/2024 1,970,000 2,000,929 0.29 Yorkshire Building Society 3.5% GBP 21/04/2026 1,950,000 2,037,282 0.29 Zurich Finance UK Plc FRN GBP Perpetual 1,000,000 1,109,137 0.16
432,232,004 62.15
UNITED STATES Amgen Inc 5.5% GBP 07/12/2026 2,500,000 3,037,359 0.44 Apple Inc 3.05% GBP 31/07/2029 8,000,000 8,648,920 1.24 AT&T Inc 2.9% GBP 04/12/2026 12,000,000 11,946,360 1.72 AT&T Inc 5.25% USD 01/03/2037 6,000,000 4,534,497 0.65 Bank of America Corp 2.3% GBP 25/07/2025 2,590,000 2,590,635 0.37 BAT Capital Corp 2.125% GBP 15/08/2025 3,730,000 3,544,395 0.51 Bayer US Finance II LLC 144A 4.625% USD 25/06/2038 1,650,000 1,132,817 0.16 BP Capital Markets America Inc 2.75% USD 10/05/2023 7,000,000 5,189,783 0.75 Dresdner Funding Trust I 8.151% USD 30/06/2031 1,250,000 1,167,500 0.17 Nestle Holdings Inc 1% GBP 11/06/2021 2,500,000 2,486,262 0.36 Procter & Gamble Co/The 1.375% GBP 03/05/2025 3,680,000 3,620,016 0.52 Time Warner Cable LLC 5.75% GBP 02/06/2031 2,500,000 2,912,123 0.42 Time Warner Cable LLC 6.55% USD 01/05/2037 3,000,000 2,399,637 0.35 Verizon Communications Inc 3.125% GBP 02/11/2035 4,800,000 4,813,584 0.69 Verizon Communications Inc 4.272% USD 15/01/2036 3,200,000 2,348,333 0.34 Verizon Communications Inc 4.4% USD 01/11/2034 1,700,000 1,282,737 0.18 Walgreens Boots Alliance Inc 2.875% GBP 20/11/2020 4,900,000 4,991,658 0.72
66,646,616 9.59
TOTAL BONDS 658,223,323 94.64
TOTAL TRANSFERABLE SECURITIES ADMITTED TO AN OFFICIAL STOCK EXCHANGE LISTING OR DEALT IN ON ANOTHER REGULATED MARKET 658,223,323 94.64
OPEN-ENDED FUNDS IRELAND Invesco Short-Term Investments Co Global Series Plc - Sterling Liquidity Portfolio 13,301,487 13,301,487 1.91
TOTAL OPEN-ENDED FUNDS 13,301,487 1.91
Total Investments 671,524,810 96.55
The accompanying notes form an integral part of these financial statements.
^Effective 5 October 2018 the Invesco Sterling Bond Fund, a sub-fund of Invesco Funds Series 6 merged into the Invesco Sterling Bond Fund, a sub-fund of Invesco Funds.
Invesco Sterling Bond Fund^ Statement of Investments as at 28 February 2019
230 Invesco Funds
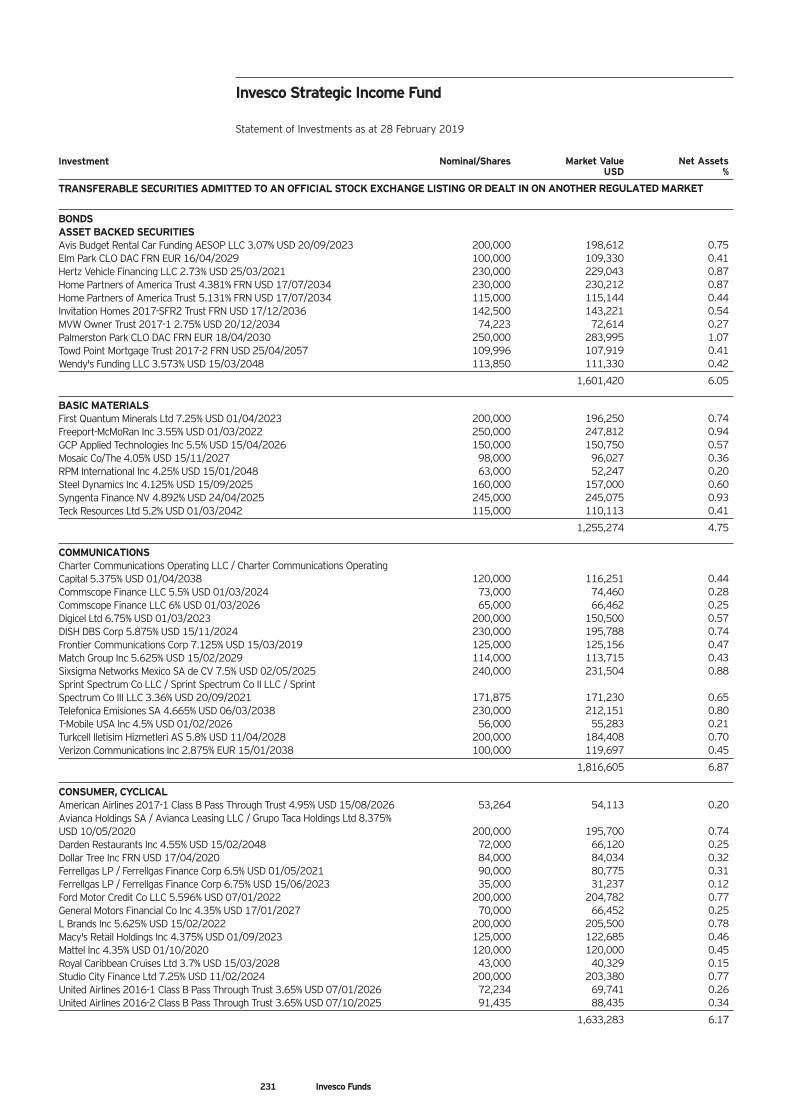
Investment Nominal/Shares Market Value Net Assets USD %
TRANSFERABLE SECURITIES ADMITTED TO AN OFFICIAL STOCK EXCHANGE LISTING OR DEALT IN ON ANOTHER REGULATED MARKET
BONDS ASSET BACKED SECURITIES Avis Budget Rental Car Funding AESOP LLC 3.07% USD 20/09/2023 200,000 198,612 0.75 Elm Park CLO DAC FRN EUR 16/04/2029 100,000 109,330 0.41 Hertz Vehicle Financing LLC 2.73% USD 25/03/2021 230,000 229,043 0.87 Home Partners of America Trust 4.381% FRN USD 17/07/2034 230,000 230,212 0.87 Home Partners of America Trust 5.131% FRN USD 17/07/2034 115,000 115,144 0.44 Invitation Homes 2017-SFR2 Trust FRN USD 17/12/2036 142,500 143,221 0.54 MVW Owner Trust 2017-1 2.75% USD 20/12/2034 74,223 72,614 0.27 Palmerston Park CLO DAC FRN EUR 18/04/2030 250,000 283,995 1.07 Towd Point Mortgage Trust 2017-2 FRN USD 25/04/2057 109,996 107,919 0.41 Wendy's Funding LLC 3.573% USD 15/03/2048 113,850 111,330 0.42
1,601,420 6.05
BASIC MATERIALS First Quantum Minerals Ltd 7.25% USD 01/04/2023 200,000 196,250 0.74 Freeport-McMoRan Inc 3.55% USD 01/03/2022 250,000 247,812 0.94 GCP Applied Technologies Inc 5.5% USD 15/04/2026 150,000 150,750 0.57 Mosaic Co/The 4.05% USD 15/11/2027 98,000 96,027 0.36 RPM International Inc 4.25% USD 15/01/2048 63,000 52,247 0.20 Steel Dynamics Inc 4.125% USD 15/09/2025 160,000 157,000 0.60 Syngenta Finance NV 4.892% USD 24/04/2025 245,000 245,075 0.93 Teck Resources Ltd 5.2% USD 01/03/2042 115,000 110,113 0.41
1,255,274 4.75
COMMUNICATIONS Charter Communications Operating LLC / Charter Communications Operating Capital 5.375% USD 01/04/2038 120,000 116,251 0.44 Commscope Finance LLC 5.5% USD 01/03/2024 73,000 74,460 0.28 Commscope Finance LLC 6% USD 01/03/2026 65,000 66,462 0.25 Digicel Ltd 6.75% USD 01/03/2023 200,000 150,500 0.57 DISH DBS Corp 5.875% USD 15/11/2024 230,000 195,788 0.74 Frontier Communications Corp 7.125% USD 15/03/2019 125,000 125,156 0.47 Match Group Inc 5.625% USD 15/02/2029 114,000 113,715 0.43 Sixsigma Networks Mexico SA de CV 7.5% USD 02/05/2025 240,000 231,504 0.88 Sprint Spectrum Co LLC / Sprint Spectrum Co II LLC / Sprint Spectrum Co III LLC 3.36% USD 20/09/2021 171,875 171,230 0.65 Telefonica Emisiones SA 4.665% USD 06/03/2038 230,000 212,151 0.80 T-Mobile USA Inc 4.5% USD 01/02/2026 56,000 55,283 0.21 Turkcell Iletisim Hizmetleri AS 5.8% USD 11/04/2028 200,000 184,408 0.70 Verizon Communications Inc 2.875% EUR 15/01/2038 100,000 119,697 0.45
1,816,605 6.87
CONSUMER, CYCLICAL American Airlines 2017-1 Class B Pass Through Trust 4.95% USD 15/08/2026 53,264 54,113 0.20 Avianca Holdings SA / Avianca Leasing LLC / Grupo Taca Holdings Ltd 8.375% USD 10/05/2020 200,000 195,700 0.74 Darden Restaurants Inc 4.55% USD 15/02/2048 72,000 66,120 0.25 Dollar Tree Inc FRN USD 17/04/2020 84,000 84,034 0.32 Ferrellgas LP / Ferrellgas Finance Corp 6.5% USD 01/05/2021 90,000 80,775 0.31 Ferrellgas LP / Ferrellgas Finance Corp 6.75% USD 15/06/2023 35,000 31,237 0.12 Ford Motor Credit Co LLC 5.596% USD 07/01/2022 200,000 204,782 0.77 General Motors Financial Co Inc 4.35% USD 17/01/2027 70,000 66,452 0.25 L Brands Inc 5.625% USD 15/02/2022 200,000 205,500 0.78 Macy's Retail Holdings Inc 4.375% USD 01/09/2023 125,000 122,685 0.46 Mattel Inc 4.35% USD 01/10/2020 120,000 120,000 0.45 Royal Caribbean Cruises Ltd 3.7% USD 15/03/2028 43,000 40,329 0.15 Studio City Finance Ltd 7.25% USD 11/02/2024 200,000 203,380 0.77 United Airlines 2016-1 Class B Pass Through Trust 3.65% USD 07/01/2026 72,234 69,741 0.26 United Airlines 2016-2 Class B Pass Through Trust 3.65% USD 07/10/2025 91,435 88,435 0.34
1,633,283 6.17
231 Invesco Funds
Invesco Strategic Income Fund Statement of Investments as at 28 February 2019
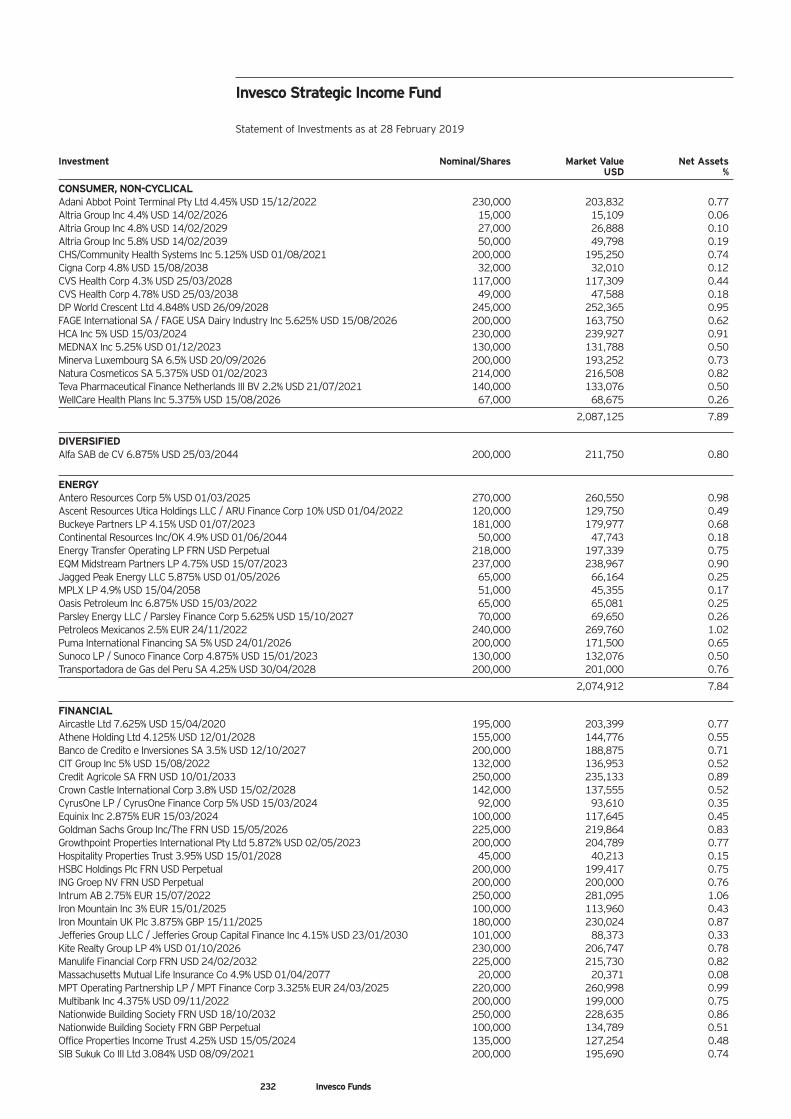
Invesco Strategic Income Fund Statement of Investments as at 28 February 2019
Investment Nominal/Shares Market Value Net Assets USD %
CONSUMER, NON-CYCLICAL Adani Abbot Point Terminal Pty Ltd 4.45% USD 15/12/2022 230,000 203,832 0.77 Altria Group Inc 4.4% USD 14/02/2026 15,000 15,109 0.06 Altria Group Inc 4.8% USD 14/02/2029 27,000 26,888 0.10 Altria Group Inc 5.8% USD 14/02/2039 50,000 49,798 0.19 CHS/Community Health Systems Inc 5.125% USD 01/08/2021 200,000 195,250 0.74 Cigna Corp 4.8% USD 15/08/2038 32,000 32,010 0.12 CVS Health Corp 4.3% USD 25/03/2028 117,000 117,309 0.44 CVS Health Corp 4.78% USD 25/03/2038 49,000 47,588 0.18 DP World Crescent Ltd 4.848% USD 26/09/2028 245,000 252,365 0.95 FAGE International SA / FAGE USA Dairy Industry Inc 5.625% USD 15/08/2026 200,000 163,750 0.62 HCA Inc 5% USD 15/03/2024 230,000 239,927 0.91 MEDNAX Inc 5.25% USD 01/12/2023 130,000 131,788 0.50 Minerva Luxembourg SA 6.5% USD 20/09/2026 200,000 193,252 0.73 Natura Cosmeticos SA 5.375% USD 01/02/2023 214,000 216,508 0.82 Teva Pharmaceutical Finance Netherlands III BV 2.2% USD 21/07/2021 140,000 133,076 0.50 WellCare Health Plans Inc 5.375% USD 15/08/2026 67,000 68,675 0.26
2,087,125 7.89
DIVERSIFIED Alfa SAB de CV 6.875% USD 25/03/2044 200,000 211,750 0.80
ENERGY Antero Resources Corp 5% USD 01/03/2025 270,000 260,550 0.98 Ascent Resources Utica Holdings LLC / ARU Finance Corp 10% USD 01/04/2022 120,000 129,750 0.49 Buckeye Partners LP 4.15% USD 01/07/2023 181,000 179,977 0.68 Continental Resources Inc/OK 4.9% USD 01/06/2044 50,000 47,743 0.18 Energy Transfer Operating LP FRN USD Perpetual 218,000 197,339 0.75 EQM Midstream Partners LP 4.75% USD 15/07/2023 237,000 238,967 0.90 Jagged Peak Energy LLC 5.875% USD 01/05/2026 65,000 66,164 0.25 MPLX LP 4.9% USD 15/04/2058 51,000 45,355 0.17 Oasis Petroleum Inc 6.875% USD 15/03/2022 65,000 65,081 0.25 Parsley Energy LLC / Parsley Finance Corp 5.625% USD 15/10/2027 70,000 69,650 0.26 Petroleos Mexicanos 2.5% EUR 24/11/2022 240,000 269,760 1.02 Puma International Financing SA 5% USD 24/01/2026 200,000 171,500 0.65 Sunoco LP / Sunoco Finance Corp 4.875% USD 15/01/2023 130,000 132,076 0.50 Transportadora de Gas del Peru SA 4.25% USD 30/04/2028 200,000 201,000 0.76
2,074,912 7.84
FINANCIAL Aircastle Ltd 7.625% USD 15/04/2020 195,000 203,399 0.77 Athene Holding Ltd 4.125% USD 12/01/2028 155,000 144,776 0.55 Banco de Credito e Inversiones SA 3.5% USD 12/10/2027 200,000 188,875 0.71 CIT Group Inc 5% USD 15/08/2022 132,000 136,953 0.52 Credit Agricole SA FRN USD 10/01/2033 250,000 235,133 0.89 Crown Castle International Corp 3.8% USD 15/02/2028 142,000 137,555 0.52 CyrusOne LP / CyrusOne Finance Corp 5% USD 15/03/2024 92,000 93,610 0.35 Equinix Inc 2.875% EUR 15/03/2024 100,000 117,645 0.45 Goldman Sachs Group Inc/The FRN USD 15/05/2026 225,000 219,864 0.83 Growthpoint Properties International Pty Ltd 5.872% USD 02/05/2023 200,000 204,789 0.77 Hospitality Properties Trust 3.95% USD 15/01/2028 45,000 40,213 0.15 HSBC Holdings Plc FRN USD Perpetual 200,000 199,417 0.75 ING Groep NV FRN USD Perpetual 200,000 200,000 0.76 Intrum AB 2.75% EUR 15/07/2022 250,000 281,095 1.06 Iron Mountain Inc 3% EUR 15/01/2025 100,000 113,960 0.43 Iron Mountain UK Plc 3.875% GBP 15/11/2025 180,000 230,024 0.87 Jefferies Group LLC / Jefferies Group Capital Finance Inc 4.15% USD 23/01/2030 101,000 88,373 0.33 Kite Realty Group LP 4% USD 01/10/2026 230,000 206,747 0.78 Manulife Financial Corp FRN USD 24/02/2032 225,000 215,730 0.82 Massachusetts Mutual Life Insurance Co 4.9% USD 01/04/2077 20,000 20,371 0.08 MPT Operating Partnership LP / MPT Finance Corp 3.325% EUR 24/03/2025 220,000 260,998 0.99 Multibank Inc 4.375% USD 09/11/2022 200,000 199,000 0.75 Nationwide Building Society FRN USD 18/10/2032 250,000 228,635 0.86 Nationwide Building Society FRN GBP Perpetual 100,000 134,789 0.51 Office Properties Income Trust 4.25% USD 15/05/2024 135,000 127,254 0.48 SIB Sukuk Co III Ltd 3.084% USD 08/09/2021 200,000 195,690 0.74
232 Invesco Funds
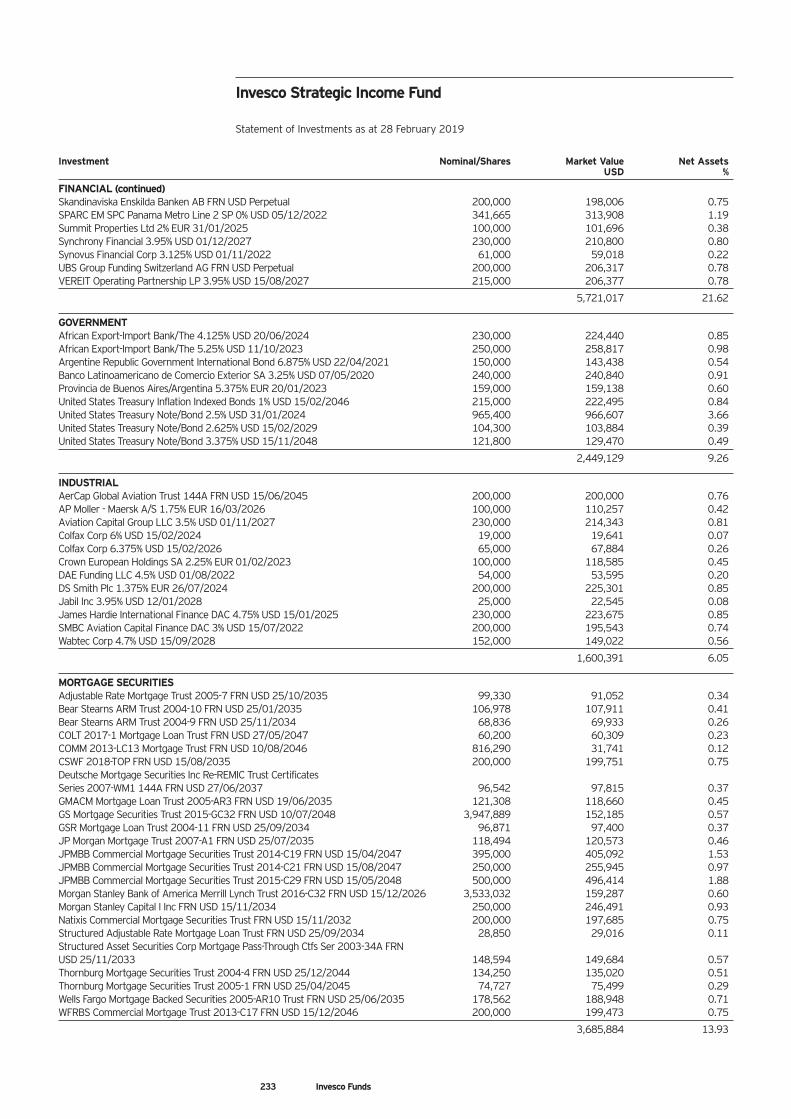
Invesco Strategic Income Fund Statement of Investments as at 28 February 2019
Investment Nominal/Shares Market Value Net Assets USD %
FINANCIAL (continued) Skandinaviska Enskilda Banken AB FRN USD Perpetual 200,000 198,006 0.75 SPARC EM SPC Panama Metro Line 2 SP 0% USD 05/12/2022 341,665 313,908 1.19 Summit Properties Ltd 2% EUR 31/01/2025 100,000 101,696 0.38 Synchrony Financial 3.95% USD 01/12/2027 230,000 210,800 0.80 Synovus Financial Corp 3.125% USD 01/11/2022 61,000 59,018 0.22 UBS Group Funding Switzerland AG FRN USD Perpetual 200,000 206,317 0.78 VEREIT Operating Partnership LP 3.95% USD 15/08/2027 215,000 206,377 0.78
5,721,017 21.62
GOVERNMENT African Export-Import Bank/The 4.125% USD 20/06/2024 230,000 224,440 0.85 African Export-Import Bank/The 5.25% USD 11/10/2023 250,000 258,817 0.98 Argentine Republic Government International Bond 6.875% USD 22/04/2021 150,000 143,438 0.54 Banco Latinoamericano de Comercio Exterior SA 3.25% USD 07/05/2020 240,000 240,840 0.91 Provincia de Buenos Aires/Argentina 5.375% EUR 20/01/2023 159,000 159,138 0.60 United States Treasury Inflation Indexed Bonds 1% USD 15/02/2046 215,000 222,495 0.84 United States Treasury Note/Bond 2.5% USD 31/01/2024 965,400 966,607 3.66 United States Treasury Note/Bond 2.625% USD 15/02/2029 104,300 103,884 0.39 United States Treasury Note/Bond 3.375% USD 15/11/2048 121,800 129,470 0.49
2,449,129 9.26
INDUSTRIAL AerCap Global Aviation Trust 144A FRN USD 15/06/2045 200,000 200,000 0.76 AP Moller - Maersk A/S 1.75% EUR 16/03/2026 100,000 110,257 0.42 Aviation Capital Group LLC 3.5% USD 01/11/2027 230,000 214,343 0.81 Colfax Corp 6% USD 15/02/2024 19,000 19,641 0.07 Colfax Corp 6.375% USD 15/02/2026 65,000 67,884 0.26 Crown European Holdings SA 2.25% EUR 01/02/2023 100,000 118,585 0.45 DAE Funding LLC 4.5% USD 01/08/2022 54,000 53,595 0.20 DS Smith Plc 1.375% EUR 26/07/2024 200,000 225,301 0.85 Jabil Inc 3.95% USD 12/01/2028 25,000 22,545 0.08 James Hardie International Finance DAC 4.75% USD 15/01/2025 230,000 223,675 0.85 SMBC Aviation Capital Finance DAC 3% USD 15/07/2022 200,000 195,543 0.74 Wabtec Corp 4.7% USD 15/09/2028 152,000 149,022 0.56
1,600,391 6.05
MORTGAGE SECURITIES Adjustable Rate Mortgage Trust 2005-7 FRN USD 25/10/2035 99,330 91,052 0.34 Bear Stearns ARM Trust 2004-10 FRN USD 25/01/2035 106,978 107,911 0.41 Bear Stearns ARM Trust 2004-9 FRN USD 25/11/2034 68,836 69,933 0.26 COLT 2017-1 Mortgage Loan Trust FRN USD 27/05/2047 60,200 60,309 0.23 COMM 2013-LC13 Mortgage Trust FRN USD 10/08/2046 816,290 31,741 0.12 CSWF 2018-TOP FRN USD 15/08/2035 200,000 199,751 0.75 Deutsche Mortgage Securities Inc Re-REMIC Trust Certificates Series 2007-WM1 144A FRN USD 27/06/2037 96,542 97,815 0.37 GMACM Mortgage Loan Trust 2005-AR3 FRN USD 19/06/2035 121,308 118,660 0.45 GS Mortgage Securities Trust 2015-GC32 FRN USD 10/07/2048 3,947,889 152,185 0.57 GSR Mortgage Loan Trust 2004-11 FRN USD 25/09/2034 96,871 97,400 0.37 JP Morgan Mortgage Trust 2007-A1 FRN USD 25/07/2035 118,494 120,573 0.46 JPMBB Commercial Mortgage Securities Trust 2014-C19 FRN USD 15/04/2047 395,000 405,092 1.53 JPMBB Commercial Mortgage Securities Trust 2014-C21 FRN USD 15/08/2047 250,000 255,945 0.97 JPMBB Commercial Mortgage Securities Trust 2015-C29 FRN USD 15/05/2048 500,000 496,414 1.88 Morgan Stanley Bank of America Merrill Lynch Trust 2016-C32 FRN USD 15/12/2026 3,533,032 159,287 0.60 Morgan Stanley Capital I Inc FRN USD 15/11/2034 250,000 246,491 0.93 Natixis Commercial Mortgage Securities Trust FRN USD 15/11/2032 200,000 197,685 0.75 Structured Adjustable Rate Mortgage Loan Trust FRN USD 25/09/2034 28,850 29,016 0.11 Structured Asset Securities Corp Mortgage Pass-Through Ctfs Ser 2003-34A FRN USD 25/11/2033 148,594 149,684 0.57 Thornburg Mortgage Securities Trust 2004-4 FRN USD 25/12/2044 134,250 135,020 0.51 Thornburg Mortgage Securities Trust 2005-1 FRN USD 25/04/2045 74,727 75,499 0.29 Wells Fargo Mortgage Backed Securities 2005-AR10 Trust FRN USD 25/06/2035 178,562 188,948 0.71 WFRBS Commercial Mortgage Trust 2013-C17 FRN USD 15/12/2046 200,000 199,473 0.75
3,685,884 13.93
233 Invesco Funds
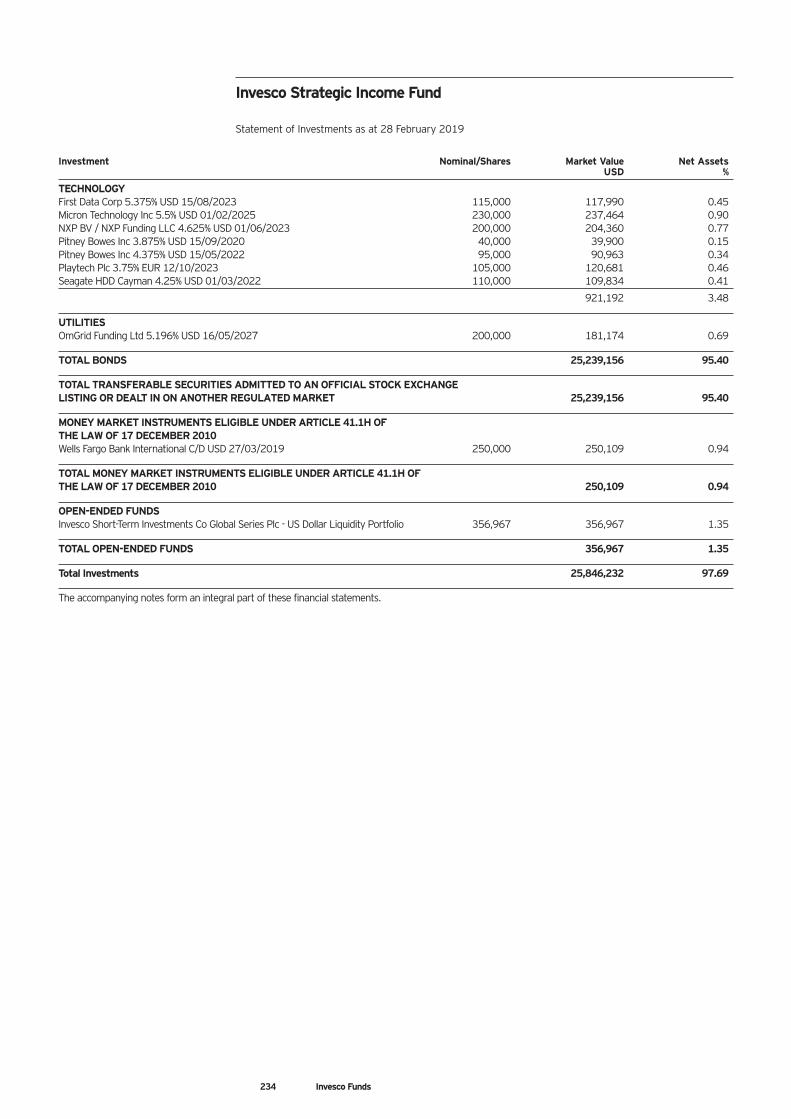
Invesco Strategic Income Fund Statement of Investments as at 28 February 2019
Investment Nominal/Shares Market Value Net Assets USD %
TECHNOLOGY First Data Corp 5.375% USD 15/08/2023 115,000 117,990 0.45 Micron Technology Inc 5.5% USD 01/02/2025 230,000 237,464 0.90 NXP BV / NXP Funding LLC 4.625% USD 01/06/2023 200,000 204,360 0.77 Pitney Bowes Inc 3.875% USD 15/09/2020 40,000 39,900 0.15 Pitney Bowes Inc 4.375% USD 15/05/2022 95,000 90,963 0.34 Playtech Plc 3.75% EUR 12/10/2023 105,000 120,681 0.46 Seagate HDD Cayman 4.25% USD 01/03/2022 110,000 109,834 0.41
921,192 3.48
UTILITIES OmGrid Funding Ltd 5.196% USD 16/05/2027 200,000 181,174 0.69
TOTAL BONDS 25,239,156 95.40
TOTAL TRANSFERABLE SECURITIES ADMITTED TO AN OFFICIAL STOCK EXCHANGE LISTING OR DEALT IN ON ANOTHER REGULATED MARKET 25,239,156 95.40
MONEY MARKET INSTRUMENTS ELIGIBLE UNDER ARTICLE 41.1H OF THE LAW OF 17 DECEMBER 2010 Wells Fargo Bank International C/D USD 27/03/2019 250,000 250,109 0.94
TOTAL MONEY MARKET INSTRUMENTS ELIGIBLE UNDER ARTICLE 41.1H OF THE LAW OF 17 DECEMBER 2010 250,109 0.94
OPEN-ENDED FUNDS Invesco Short-Term Investments Co Global Series Plc - US Dollar Liquidity Portfolio 356,967 356,967 1.35
TOTAL OPEN-ENDED FUNDS 356,967 1.35
Total Investments 25,846,232 97.69
The accompanying notes form an integral part of these financial statements.
234 Invesco Funds
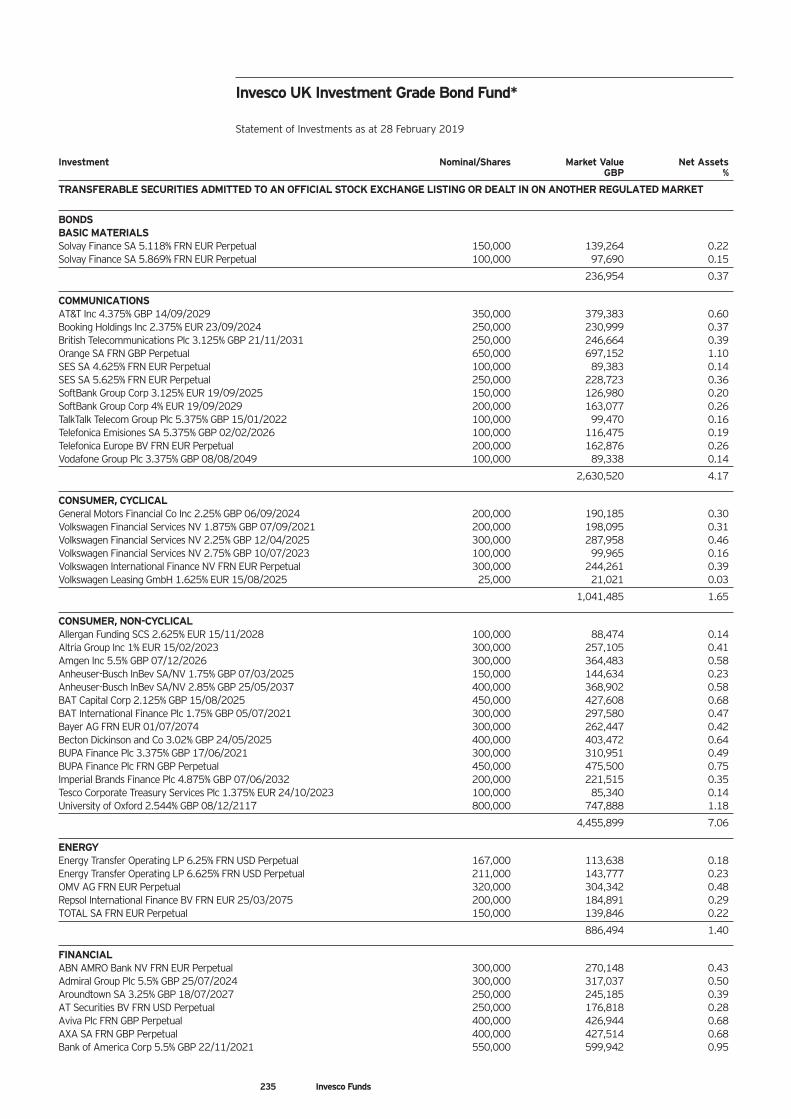
Investment Nominal/Shares Market Value Net Assets GBP %
TRANSFERABLE SECURITIES ADMITTED TO AN OFFICIAL STOCK EXCHANGE LISTING OR DEALT IN ON ANOTHER REGULATED MARKET
BONDS BASIC MATERIALS Solvay Finance SA 5.118% FRN EUR Perpetual 150,000 139,264 0.22 Solvay Finance SA 5.869% FRN EUR Perpetual 100,000 97,690 0.15
236,954 0.37
COMMUNICATIONS AT&T Inc 4.375% GBP 14/09/2029 350,000 379,383 0.60 Booking Holdings Inc 2.375% EUR 23/09/2024 250,000 230,999 0.37 British Telecommunications Plc 3.125% GBP 21/11/2031 250,000 246,664 0.39 Orange SA FRN GBP Perpetual 650,000 697,152 1.10 SES SA 4.625% FRN EUR Perpetual 100,000 89,383 0.14 SES SA 5.625% FRN EUR Perpetual 250,000 228,723 0.36 SoftBank Group Corp 3.125% EUR 19/09/2025 150,000 126,980 0.20 SoftBank Group Corp 4% EUR 19/09/2029 200,000 163,077 0.26 TalkTalk Telecom Group Plc 5.375% GBP 15/01/2022 100,000 99,470 0.16 Telefonica Emisiones SA 5.375% GBP 02/02/2026 100,000 116,475 0.19 Telefonica Europe BV FRN EUR Perpetual 200,000 162,876 0.26 Vodafone Group Plc 3.375% GBP 08/08/2049 100,000 89,338 0.14
2,630,520 4.17
CONSUMER, CYCLICAL General Motors Financial Co Inc 2.25% GBP 06/09/2024 200,000 190,185 0.30 Volkswagen Financial Services NV 1.875% GBP 07/09/2021 200,000 198,095 0.31 Volkswagen Financial Services NV 2.25% GBP 12/04/2025 300,000 287,958 0.46 Volkswagen Financial Services NV 2.75% GBP 10/07/2023 100,000 99,965 0.16 Volkswagen International Finance NV FRN EUR Perpetual 300,000 244,261 0.39 Volkswagen Leasing GmbH 1.625% EUR 15/08/2025 25,000 21,021 0.03
1,041,485 1.65
CONSUMER, NON-CYCLICAL Allergan Funding SCS 2.625% EUR 15/11/2028 100,000 88,474 0.14 Altria Group Inc 1% EUR 15/02/2023 300,000 257,105 0.41 Amgen Inc 5.5% GBP 07/12/2026 300,000 364,483 0.58 Anheuser-Busch InBev SA/NV 1.75% GBP 07/03/2025 150,000 144,634 0.23 Anheuser-Busch InBev SA/NV 2.85% GBP 25/05/2037 400,000 368,902 0.58 BAT Capital Corp 2.125% GBP 15/08/2025 450,000 427,608 0.68 BAT International Finance Plc 1.75% GBP 05/07/2021 300,000 297,580 0.47 Bayer AG FRN EUR 01/07/2074 300,000 262,447 0.42 Becton Dickinson and Co 3.02% GBP 24/05/2025 400,000 403,472 0.64 BUPA Finance Plc 3.375% GBP 17/06/2021 300,000 310,951 0.49 BUPA Finance Plc FRN GBP Perpetual 450,000 475,500 0.75 Imperial Brands Finance Plc 4.875% GBP 07/06/2032 200,000 221,515 0.35 Tesco Corporate Treasury Services Plc 1.375% EUR 24/10/2023 100,000 85,340 0.14 University of Oxford 2.544% GBP 08/12/2117 800,000 747,888 1.18
4,455,899 7.06
ENERGY Energy Transfer Operating LP 6.25% FRN USD Perpetual 167,000 113,638 0.18 Energy Transfer Operating LP 6.625% FRN USD Perpetual 211,000 143,777 0.23 OMV AG FRN EUR Perpetual 320,000 304,342 0.48 Repsol International Finance BV FRN EUR 25/03/2075 200,000 184,891 0.29 TOTAL SA FRN EUR Perpetual 150,000 139,846 0.22
886,494 1.40
FINANCIAL ABN AMRO Bank NV FRN EUR Perpetual 300,000 270,148 0.43 Admiral Group Plc 5.5% GBP 25/07/2024 300,000 317,037 0.50 Aroundtown SA 3.25% GBP 18/07/2027 250,000 245,185 0.39 AT Securities BV FRN USD Perpetual 250,000 176,818 0.28 Aviva Plc FRN GBP Perpetual 400,000 426,944 0.68 AXA SA FRN GBP Perpetual 400,000 427,514 0.68 Bank of America Corp 5.5% GBP 22/11/2021 550,000 599,942 0.95
235 Invesco Funds
Invesco UK Investment Grade Bond Fund* Statement of Investments as at 28 February 2019
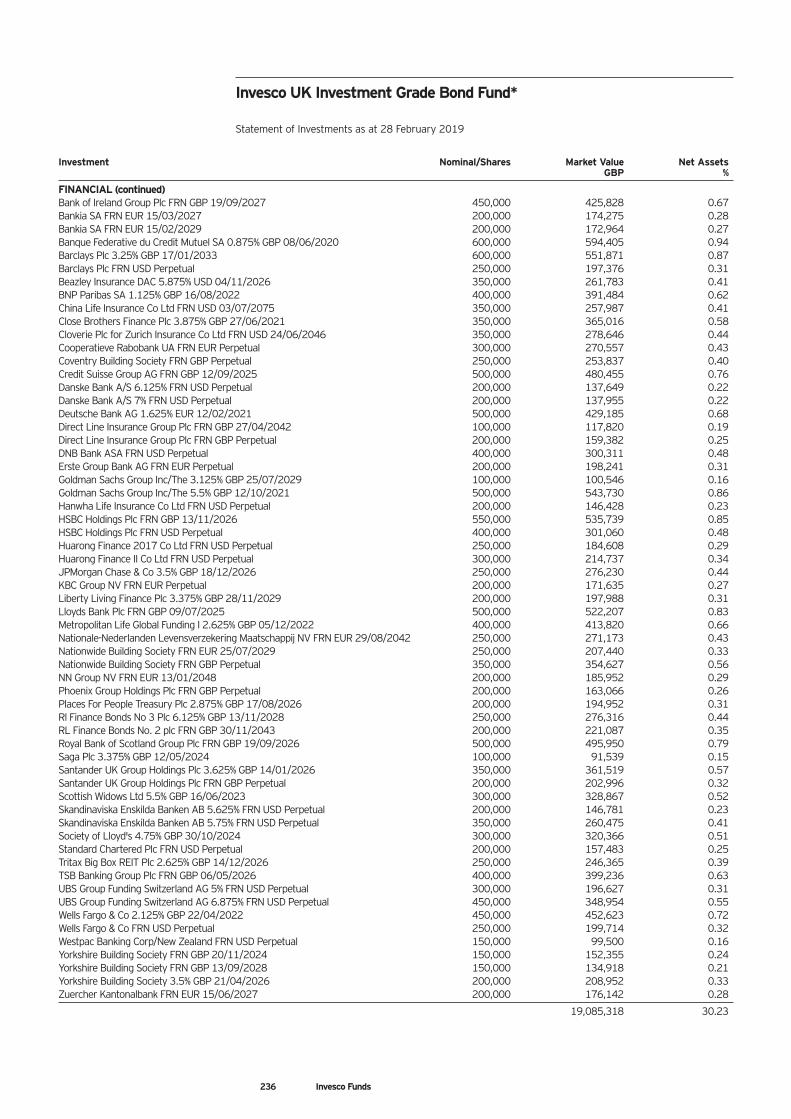
236 Invesco Funds
Investment Nominal/Shares Market Value Net Assets GBP %
FINANCIAL (continued) Bank of Ireland Group Plc FRN GBP 19/09/2027 450,000 425,828 0.67 Bankia SA FRN EUR 15/03/2027 200,000 174,275 0.28 Bankia SA FRN EUR 15/02/2029 200,000 172,964 0.27 Banque Federative du Credit Mutuel SA 0.875% GBP 08/06/2020 600,000 594,405 0.94 Barclays Plc 3.25% GBP 17/01/2033 600,000 551,871 0.87 Barclays Plc FRN USD Perpetual 250,000 197,376 0.31 Beazley Insurance DAC 5.875% USD 04/11/2026 350,000 261,783 0.41 BNP Paribas SA 1.125% GBP 16/08/2022 400,000 391,484 0.62 China Life Insurance Co Ltd FRN USD 03/07/2075 350,000 257,987 0.41 Close Brothers Finance Plc 3.875% GBP 27/06/2021 350,000 365,016 0.58 Cloverie Plc for Zurich Insurance Co Ltd FRN USD 24/06/2046 350,000 278,646 0.44 Cooperatieve Rabobank UA FRN EUR Perpetual 300,000 270,557 0.43 Coventry Building Society FRN GBP Perpetual 250,000 253,837 0.40 Credit Suisse Group AG FRN GBP 12/09/2025 500,000 480,455 0.76 Danske Bank A/S 6.125% FRN USD Perpetual 200,000 137,649 0.22 Danske Bank A/S 7% FRN USD Perpetual 200,000 137,955 0.22 Deutsche Bank AG 1.625% EUR 12/02/2021 500,000 429,185 0.68 Direct Line Insurance Group Plc FRN GBP 27/04/2042 100,000 117,820 0.19 Direct Line Insurance Group Plc FRN GBP Perpetual 200,000 159,382 0.25 DNB Bank ASA FRN USD Perpetual 400,000 300,311 0.48 Erste Group Bank AG FRN EUR Perpetual 200,000 198,241 0.31 Goldman Sachs Group Inc/The 3.125% GBP 25/07/2029 100,000 100,546 0.16 Goldman Sachs Group Inc/The 5.5% GBP 12/10/2021 500,000 543,730 0.86 Hanwha Life Insurance Co Ltd FRN USD Perpetual 200,000 146,428 0.23 HSBC Holdings Plc FRN GBP 13/11/2026 550,000 535,739 0.85 HSBC Holdings Plc FRN USD Perpetual 400,000 301,060 0.48 Huarong Finance 2017 Co Ltd FRN USD Perpetual 250,000 184,608 0.29 Huarong Finance II Co Ltd FRN USD Perpetual 300,000 214,737 0.34 JPMorgan Chase & Co 3.5% GBP 18/12/2026 250,000 276,230 0.44 KBC Group NV FRN EUR Perpetual 200,000 171,635 0.27 Liberty Living Finance Plc 3.375% GBP 28/11/2029 200,000 197,988 0.31 Lloyds Bank Plc FRN GBP 09/07/2025 500,000 522,207 0.83 Metropolitan Life Global Funding I 2.625% GBP 05/12/2022 400,000 413,820 0.66 Nationale-Nederlanden Levensverzekering Maatschappij NV FRN EUR 29/08/2042 250,000 271,173 0.43 Nationwide Building Society FRN EUR 25/07/2029 250,000 207,440 0.33 Nationwide Building Society FRN GBP Perpetual 350,000 354,627 0.56 NN Group NV FRN EUR 13/01/2048 200,000 185,952 0.29 Phoenix Group Holdings Plc FRN GBP Perpetual 200,000 163,066 0.26 Places For People Treasury Plc 2.875% GBP 17/08/2026 200,000 194,952 0.31 Rl Finance Bonds No 3 Plc 6.125% GBP 13/11/2028 250,000 276,316 0.44 RL Finance Bonds No. 2 plc FRN GBP 30/11/2043 200,000 221,087 0.35 Royal Bank of Scotland Group Plc FRN GBP 19/09/2026 500,000 495,950 0.79 Saga Plc 3.375% GBP 12/05/2024 100,000 91,539 0.15 Santander UK Group Holdings Plc 3.625% GBP 14/01/2026 350,000 361,519 0.57 Santander UK Group Holdings Plc FRN GBP Perpetual 200,000 202,996 0.32 Scottish Widows Ltd 5.5% GBP 16/06/2023 300,000 328,867 0.52 Skandinaviska Enskilda Banken AB 5.625% FRN USD Perpetual 200,000 146,781 0.23 Skandinaviska Enskilda Banken AB 5.75% FRN USD Perpetual 350,000 260,475 0.41 Society of Lloyd's 4.75% GBP 30/10/2024 300,000 320,366 0.51 Standard Chartered Plc FRN USD Perpetual 200,000 157,483 0.25 Tritax Big Box REIT Plc 2.625% GBP 14/12/2026 250,000 246,365 0.39 TSB Banking Group Plc FRN GBP 06/05/2026 400,000 399,236 0.63 UBS Group Funding Switzerland AG 5% FRN USD Perpetual 300,000 196,627 0.31 UBS Group Funding Switzerland AG 6.875% FRN USD Perpetual 450,000 348,954 0.55 Wells Fargo & Co 2.125% GBP 22/04/2022 450,000 452,623 0.72 Wells Fargo & Co FRN USD Perpetual 250,000 199,714 0.32 Westpac Banking Corp/New Zealand FRN USD Perpetual 150,000 99,500 0.16 Yorkshire Building Society FRN GBP 20/11/2024 150,000 152,355 0.24 Yorkshire Building Society FRN GBP 13/09/2028 150,000 134,918 0.21 Yorkshire Building Society 3.5% GBP 21/04/2026 200,000 208,952 0.33 Zuercher Kantonalbank FRN EUR 15/06/2027 200,000 176,142 0.28
19,085,318 30.23
Invesco UK Investment Grade Bond Fund* Statement of Investments as at 28 February 2019
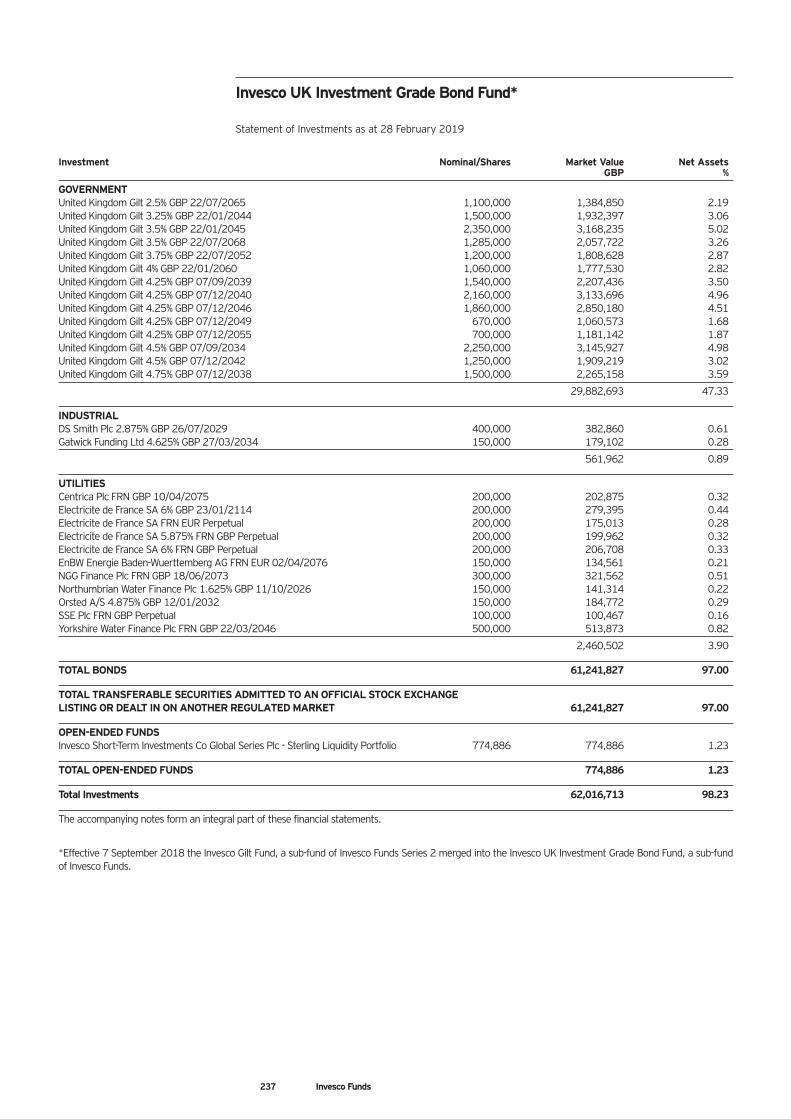
237 Invesco Funds
Investment Nominal/Shares Market Value Net Assets GBP %
GOVERNMENT United Kingdom Gilt 2.5% GBP 22/07/2065 1,100,000 1,384,850 2.19 United Kingdom Gilt 3.25% GBP 22/01/2044 1,500,000 1,932,397 3.06 United Kingdom Gilt 3.5% GBP 22/01/2045 2,350,000 3,168,235 5.02 United Kingdom Gilt 3.5% GBP 22/07/2068 1,285,000 2,057,722 3.26 United Kingdom Gilt 3.75% GBP 22/07/2052 1,200,000 1,808,628 2.87 United Kingdom Gilt 4% GBP 22/01/2060 1,060,000 1,777,530 2.82 United Kingdom Gilt 4.25% GBP 07/09/2039 1,540,000 2,207,436 3.50 United Kingdom Gilt 4.25% GBP 07/12/2040 2,160,000 3,133,696 4.96 United Kingdom Gilt 4.25% GBP 07/12/2046 1,860,000 2,850,180 4.51 United Kingdom Gilt 4.25% GBP 07/12/2049 670,000 1,060,573 1.68 United Kingdom Gilt 4.25% GBP 07/12/2055 700,000 1,181,142 1.87 United Kingdom Gilt 4.5% GBP 07/09/2034 2,250,000 3,145,927 4.98 United Kingdom Gilt 4.5% GBP 07/12/2042 1,250,000 1,909,219 3.02 United Kingdom Gilt 4.75% GBP 07/12/2038 1,500,000 2,265,158 3.59
29,882,693 47.33
INDUSTRIAL DS Smith Plc 2.875% GBP 26/07/2029 400,000 382,860 0.61 Gatwick Funding Ltd 4.625% GBP 27/03/2034 150,000 179,102 0.28
561,962 0.89
UTILITIES Centrica Plc FRN GBP 10/04/2075 200,000 202,875 0.32 Electricite de France SA 6% GBP 23/01/2114 200,000 279,395 0.44 Electricite de France SA FRN EUR Perpetual 200,000 175,013 0.28 Electricite de France SA 5.875% FRN GBP Perpetual 200,000 199,962 0.32 Electricite de France SA 6% FRN GBP Perpetual 200,000 206,708 0.33 EnBW Energie Baden-Wuerttemberg AG FRN EUR 02/04/2076 150,000 134,561 0.21 NGG Finance Plc FRN GBP 18/06/2073 300,000 321,562 0.51 Northumbrian Water Finance Plc 1.625% GBP 11/10/2026 150,000 141,314 0.22 Orsted A/S 4.875% GBP 12/01/2032 150,000 184,772 0.29 SSE Plc FRN GBP Perpetual 100,000 100,467 0.16 Yorkshire Water Finance Plc FRN GBP 22/03/2046 500,000 513,873 0.82
2,460,502 3.90
TOTAL BONDS 61,241,827 97.00
TOTAL TRANSFERABLE SECURITIES ADMITTED TO AN OFFICIAL STOCK EXCHANGE LISTING OR DEALT IN ON ANOTHER REGULATED MARKET 61,241,827 97.00
OPEN-ENDED FUNDS Invesco Short-Term Investments Co Global Series Plc - Sterling Liquidity Portfolio 774,886 774,886 1.23
TOTAL OPEN-ENDED FUNDS 774,886 1.23
Total Investments 62,016,713 98.23
The accompanying notes form an integral part of these financial statements.
*Effective 7 September 2018 the Invesco Gilt Fund, a sub-fund of Invesco Funds Series 2 merged into the Invesco UK Investment Grade Bond Fund, a sub-fund of Invesco Funds.
Invesco UK Investment Grade Bond Fund* Statement of Investments as at 28 February 2019
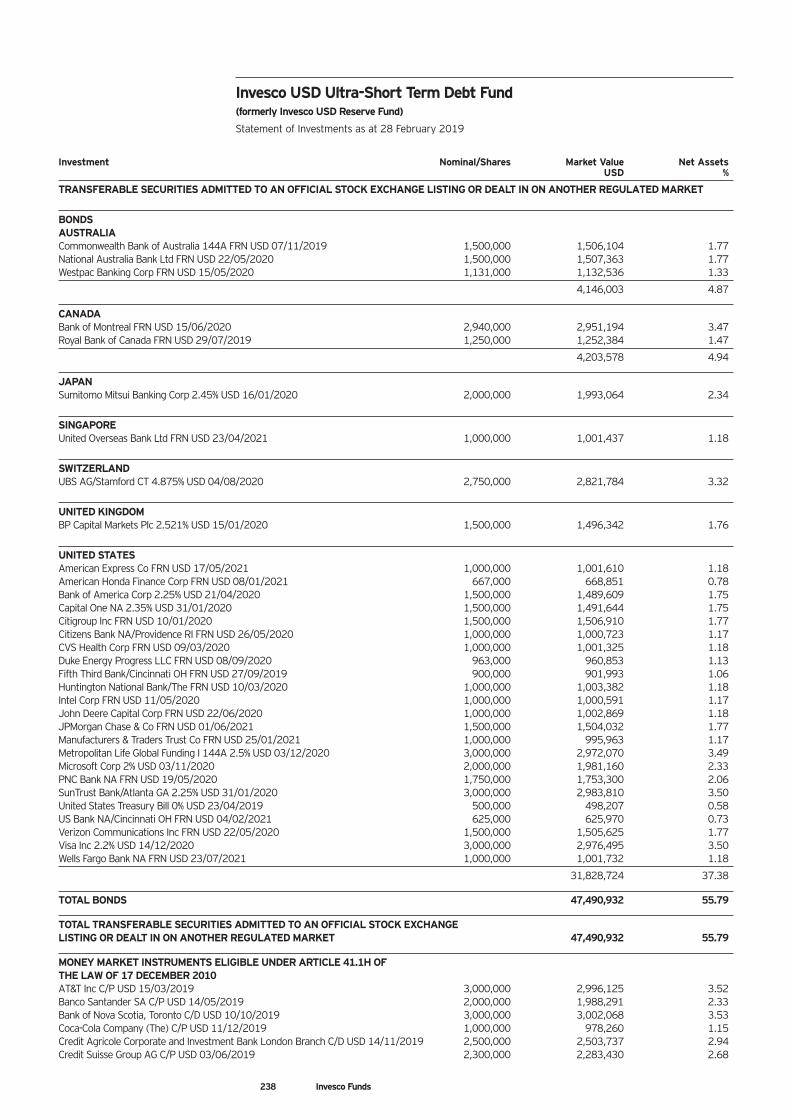
238 Invesco Funds
Investment Nominal/Shares Market Value Net Assets USD %
TRANSFERABLE SECURITIES ADMITTED TO AN OFFICIAL STOCK EXCHANGE LISTING OR DEALT IN ON ANOTHER REGULATED MARKET
BONDS AUSTRALIA Commonwealth Bank of Australia 144A FRN USD 07/11/2019 1,500,000 1,506,104 1.77 National Australia Bank Ltd FRN USD 22/05/2020 1,500,000 1,507,363 1.77 Westpac Banking Corp FRN USD 15/05/2020 1,131,000 1,132,536 1.33
4,146,003 4.87
CANADA Bank of Montreal FRN USD 15/06/2020 2,940,000 2,951,194 3.47 Royal Bank of Canada FRN USD 29/07/2019 1,250,000 1,252,384 1.47
4,203,578 4.94
JAPAN Sumitomo Mitsui Banking Corp 2.45% USD 16/01/2020 2,000,000 1,993,064 2.34
SINGAPORE United Overseas Bank Ltd FRN USD 23/04/2021 1,000,000 1,001,437 1.18
SWITZERLAND UBS AG/Stamford CT 4.875% USD 04/08/2020 2,750,000 2,821,784 3.32
UNITED KINGDOM BP Capital Markets Plc 2.521% USD 15/01/2020 1,500,000 1,496,342 1.76
UNITED STATES American Express Co FRN USD 17/05/2021 1,000,000 1,001,610 1.18 American Honda Finance Corp FRN USD 08/01/2021 667,000 668,851 0.78 Bank of America Corp 2.25% USD 21/04/2020 1,500,000 1,489,609 1.75 Capital One NA 2.35% USD 31/01/2020 1,500,000 1,491,644 1.75 Citigroup Inc FRN USD 10/01/2020 1,500,000 1,506,910 1.77 Citizens Bank NA/Providence RI FRN USD 26/05/2020 1,000,000 1,000,723 1.17 CVS Health Corp FRN USD 09/03/2020 1,000,000 1,001,325 1.18 Duke Energy Progress LLC FRN USD 08/09/2020 963,000 960,853 1.13 Fifth Third Bank/Cincinnati OH FRN USD 27/09/2019 900,000 901,993 1.06 Huntington National Bank/The FRN USD 10/03/2020 1,000,000 1,003,382 1.18 Intel Corp FRN USD 11/05/2020 1,000,000 1,000,591 1.17 John Deere Capital Corp FRN USD 22/06/2020 1,000,000 1,002,869 1.18 JPMorgan Chase & Co FRN USD 01/06/2021 1,500,000 1,504,032 1.77 Manufacturers & Traders Trust Co FRN USD 25/01/2021 1,000,000 995,963 1.17 Metropolitan Life Global Funding I 144A 2.5% USD 03/12/2020 3,000,000 2,972,070 3.49 Microsoft Corp 2% USD 03/11/2020 2,000,000 1,981,160 2.33 PNC Bank NA FRN USD 19/05/2020 1,750,000 1,753,300 2.06 SunTrust Bank/Atlanta GA 2.25% USD 31/01/2020 3,000,000 2,983,810 3.50 United States Treasury Bill 0% USD 23/04/2019 500,000 498,207 0.58 US Bank NA/Cincinnati OH FRN USD 04/02/2021 625,000 625,970 0.73 Verizon Communications Inc FRN USD 22/05/2020 1,500,000 1,505,625 1.77 Visa Inc 2.2% USD 14/12/2020 3,000,000 2,976,495 3.50 Wells Fargo Bank NA FRN USD 23/07/2021 1,000,000 1,001,732 1.18
31,828,724 37.38
TOTAL BONDS 47,490,932 55.79
TOTAL TRANSFERABLE SECURITIES ADMITTED TO AN OFFICIAL STOCK EXCHANGE LISTING OR DEALT IN ON ANOTHER REGULATED MARKET 47,490,932 55.79
MONEY MARKET INSTRUMENTS ELIGIBLE UNDER ARTICLE 41.1H OF THE LAW OF 17 DECEMBER 2010 AT&T Inc C/P USD 15/03/2019 3,000,000 2,996,125 3.52 Banco Santander SA C/P USD 14/05/2019 2,000,000 1,988,291 2.33 Bank of Nova Scotia, Toronto C/D USD 10/10/2019 3,000,000 3,002,068 3.53 Coca-Cola Company (The) C/P USD 11/12/2019 1,000,000 978,260 1.15 Credit Agricole Corporate and Investment Bank London Branch C/D USD 14/11/2019 2,500,000 2,503,737 2.94 Credit Suisse Group AG C/P USD 03/06/2019 2,300,000 2,283,430 2.68
Invesco USD Ultra-Short Term Debt Fund (formerly Invesco USD Reserve Fund) Statement of Investments as at 28 February 2019
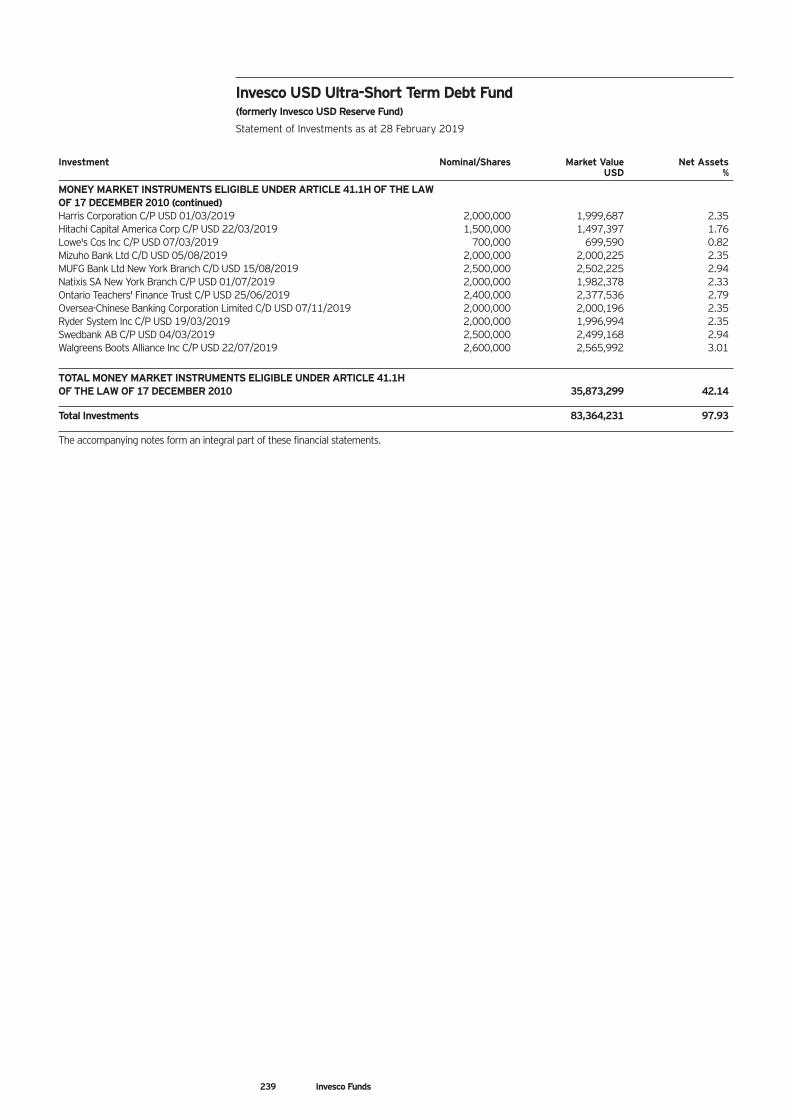
239 Invesco Funds
Investment Nominal/Shares Market Value Net Assets USD %
MONEY MARKET INSTRUMENTS ELIGIBLE UNDER ARTICLE 41.1H OF THE LAW OF 17 DECEMBER 2010 (continued) Harris Corporation C/P USD 01/03/2019 2,000,000 1,999,687 2.35 Hitachi Capital America Corp C/P USD 22/03/2019 1,500,000 1,497,397 1.76 Lowe's Cos Inc C/P USD 07/03/2019 700,000 699,590 0.82 Mizuho Bank Ltd C/D USD 05/08/2019 2,000,000 2,000,225 2.35 MUFG Bank Ltd New York Branch C/D USD 15/08/2019 2,500,000 2,502,225 2.94 Natixis SA New York Branch C/P USD 01/07/2019 2,000,000 1,982,378 2.33 Ontario Teachers' Finance Trust C/P USD 25/06/2019 2,400,000 2,377,536 2.79 Oversea-Chinese Banking Corporation Limited C/D USD 07/11/2019 2,000,000 2,000,196 2.35 Ryder System Inc C/P USD 19/03/2019 2,000,000 1,996,994 2.35 Swedbank AB C/P USD 04/03/2019 2,500,000 2,499,168 2.94 Walgreens Boots Alliance Inc C/P USD 22/07/2019 2,600,000 2,565,992 3.01
TOTAL MONEY MARKET INSTRUMENTS ELIGIBLE UNDER ARTICLE 41.1H OF THE LAW OF 17 DECEMBER 2010 35,873,299 42.14
Total Investments 83,364,231 97.93
The accompanying notes form an integral part of these financial statements.
Invesco USD Ultra-Short Term Debt Fund (formerly Invesco USD Reserve Fund) Statement of Investments as at 28 February 2019
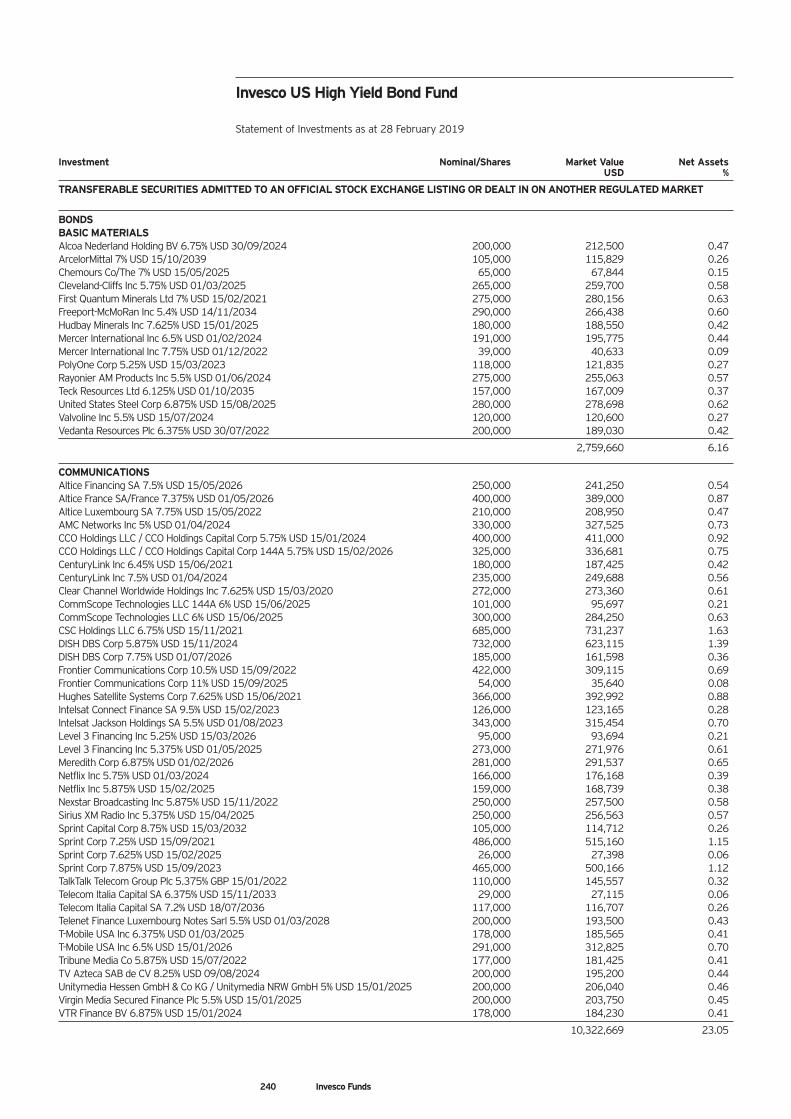
240 Invesco Funds
Investment Nominal/Shares Market Value Net Assets USD %
TRANSFERABLE SECURITIES ADMITTED TO AN OFFICIAL STOCK EXCHANGE LISTING OR DEALT IN ON ANOTHER REGULATED MARKET
BONDS BASIC MATERIALS Alcoa Nederland Holding BV 6.75% USD 30/09/2024 200,000 212,500 0.47 ArcelorMittal 7% USD 15/10/2039 105,000 115,829 0.26 Chemours Co/The 7% USD 15/05/2025 65,000 67,844 0.15 Cleveland-Cliffs Inc 5.75% USD 01/03/2025 265,000 259,700 0.58 First Quantum Minerals Ltd 7% USD 15/02/2021 275,000 280,156 0.63 Freeport-McMoRan Inc 5.4% USD 14/11/2034 290,000 266,438 0.60 Hudbay Minerals Inc 7.625% USD 15/01/2025 180,000 188,550 0.42 Mercer International Inc 6.5% USD 01/02/2024 191,000 195,775 0.44 Mercer International Inc 7.75% USD 01/12/2022 39,000 40,633 0.09 PolyOne Corp 5.25% USD 15/03/2023 118,000 121,835 0.27 Rayonier AM Products Inc 5.5% USD 01/06/2024 275,000 255,063 0.57 Teck Resources Ltd 6.125% USD 01/10/2035 157,000 167,009 0.37 United States Steel Corp 6.875% USD 15/08/2025 280,000 278,698 0.62 Valvoline Inc 5.5% USD 15/07/2024 120,000 120,600 0.27 Vedanta Resources Plc 6.375% USD 30/07/2022 200,000 189,030 0.42
2,759,660 6.16
COMMUNICATIONS Altice Financing SA 7.5% USD 15/05/2026 250,000 241,250 0.54 Altice France SA/France 7.375% USD 01/05/2026 400,000 389,000 0.87 Altice Luxembourg SA 7.75% USD 15/05/2022 210,000 208,950 0.47 AMC Networks Inc 5% USD 01/04/2024 330,000 327,525 0.73 CCO Holdings LLC / CCO Holdings Capital Corp 5.75% USD 15/01/2024 400,000 411,000 0.92 CCO Holdings LLC / CCO Holdings Capital Corp 144A 5.75% USD 15/02/2026 325,000 336,681 0.75 CenturyLink Inc 6.45% USD 15/06/2021 180,000 187,425 0.42 CenturyLink Inc 7.5% USD 01/04/2024 235,000 249,688 0.56 Clear Channel Worldwide Holdings Inc 7.625% USD 15/03/2020 272,000 273,360 0.61 CommScope Technologies LLC 144A 6% USD 15/06/2025 101,000 95,697 0.21 CommScope Technologies LLC 6% USD 15/06/2025 300,000 284,250 0.63 CSC Holdings LLC 6.75% USD 15/11/2021 685,000 731,237 1.63 DISH DBS Corp 5.875% USD 15/11/2024 732,000 623,115 1.39 DISH DBS Corp 7.75% USD 01/07/2026 185,000 161,598 0.36 Frontier Communications Corp 10.5% USD 15/09/2022 422,000 309,115 0.69 Frontier Communications Corp 11% USD 15/09/2025 54,000 35,640 0.08 Hughes Satellite Systems Corp 7.625% USD 15/06/2021 366,000 392,992 0.88 Intelsat Connect Finance SA 9.5% USD 15/02/2023 126,000 123,165 0.28 Intelsat Jackson Holdings SA 5.5% USD 01/08/2023 343,000 315,454 0.70 Level 3 Financing Inc 5.25% USD 15/03/2026 95,000 93,694 0.21 Level 3 Financing Inc 5.375% USD 01/05/2025 273,000 271,976 0.61 Meredith Corp 6.875% USD 01/02/2026 281,000 291,537 0.65 Netflix Inc 5.75% USD 01/03/2024 166,000 176,168 0.39 Netflix Inc 5.875% USD 15/02/2025 159,000 168,739 0.38 Nexstar Broadcasting Inc 5.875% USD 15/11/2022 250,000 257,500 0.58 Sirius XM Radio Inc 5.375% USD 15/04/2025 250,000 256,563 0.57 Sprint Capital Corp 8.75% USD 15/03/2032 105,000 114,712 0.26 Sprint Corp 7.25% USD 15/09/2021 486,000 515,160 1.15 Sprint Corp 7.625% USD 15/02/2025 26,000 27,398 0.06 Sprint Corp 7.875% USD 15/09/2023 465,000 500,166 1.12 TalkTalk Telecom Group Plc 5.375% GBP 15/01/2022 110,000 145,557 0.32 Telecom Italia Capital SA 6.375% USD 15/11/2033 29,000 27,115 0.06 Telecom Italia Capital SA 7.2% USD 18/07/2036 117,000 116,707 0.26 Telenet Finance Luxembourg Notes Sarl 5.5% USD 01/03/2028 200,000 193,500 0.43 T-Mobile USA Inc 6.375% USD 01/03/2025 178,000 185,565 0.41 T-Mobile USA Inc 6.5% USD 15/01/2026 291,000 312,825 0.70 Tribune Media Co 5.875% USD 15/07/2022 177,000 181,425 0.41 TV Azteca SAB de CV 8.25% USD 09/08/2024 200,000 195,200 0.44 Unitymedia Hessen GmbH & Co KG / Unitymedia NRW GmbH 5% USD 15/01/2025 200,000 206,040 0.46 Virgin Media Secured Finance Plc 5.5% USD 15/01/2025 200,000 203,750 0.45 VTR Finance BV 6.875% USD 15/01/2024 178,000 184,230 0.41
10,322,669 23.05
Invesco US High Yield Bond Fund Statement of Investments as at 28 February 2019
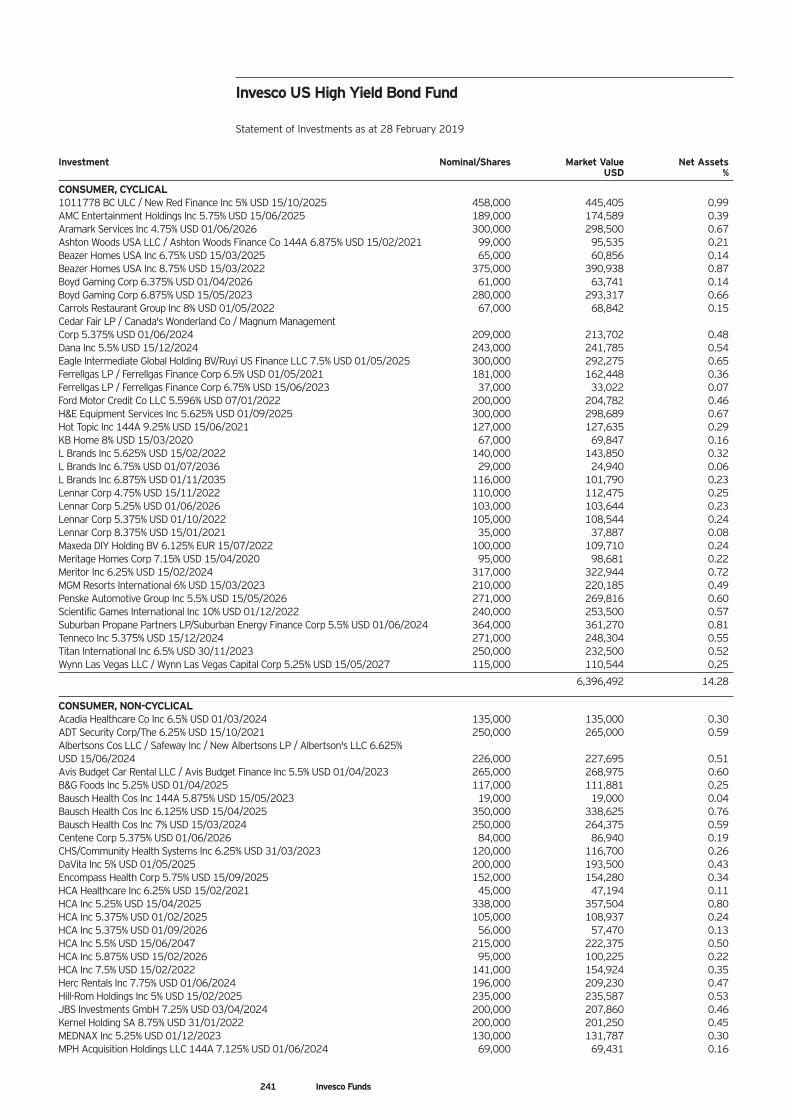
241 Invesco Funds
Investment Nominal/Shares Market Value Net Assets USD %
CONSUMER, CYCLICAL 1011778 BC ULC / New Red Finance Inc 5% USD 15/10/2025 458,000 445,405 0.99 AMC Entertainment Holdings Inc 5.75% USD 15/06/2025 189,000 174,589 0.39 Aramark Services Inc 4.75% USD 01/06/2026 300,000 298,500 0.67 Ashton Woods USA LLC / Ashton Woods Finance Co 144A 6.875% USD 15/02/2021 99,000 95,535 0.21 Beazer Homes USA Inc 6.75% USD 15/03/2025 65,000 60,856 0.14 Beazer Homes USA Inc 8.75% USD 15/03/2022 375,000 390,938 0.87 Boyd Gaming Corp 6.375% USD 01/04/2026 61,000 63,741 0.14 Boyd Gaming Corp 6.875% USD 15/05/2023 280,000 293,317 0.66 Carrols Restaurant Group Inc 8% USD 01/05/2022 67,000 68,842 0.15 Cedar Fair LP / Canada's Wonderland Co / Magnum Management Corp 5.375% USD 01/06/2024 209,000 213,702 0.48 Dana Inc 5.5% USD 15/12/2024 243,000 241,785 0.54 Eagle Intermediate Global Holding BV/Ruyi US Finance LLC 7.5% USD 01/05/2025 300,000 292,275 0.65 Ferrellgas LP / Ferrellgas Finance Corp 6.5% USD 01/05/2021 181,000 162,448 0.36 Ferrellgas LP / Ferrellgas Finance Corp 6.75% USD 15/06/2023 37,000 33,022 0.07 Ford Motor Credit Co LLC 5.596% USD 07/01/2022 200,000 204,782 0.46 H&E Equipment Services Inc 5.625% USD 01/09/2025 300,000 298,689 0.67 Hot Topic Inc 144A 9.25% USD 15/06/2021 127,000 127,635 0.29 KB Home 8% USD 15/03/2020 67,000 69,847 0.16 L Brands Inc 5.625% USD 15/02/2022 140,000 143,850 0.32 L Brands Inc 6.75% USD 01/07/2036 29,000 24,940 0.06 L Brands Inc 6.875% USD 01/11/2035 116,000 101,790 0.23 Lennar Corp 4.75% USD 15/11/2022 110,000 112,475 0.25 Lennar Corp 5.25% USD 01/06/2026 103,000 103,644 0.23 Lennar Corp 5.375% USD 01/10/2022 105,000 108,544 0.24 Lennar Corp 8.375% USD 15/01/2021 35,000 37,887 0.08 Maxeda DIY Holding BV 6.125% EUR 15/07/2022 100,000 109,710 0.24 Meritage Homes Corp 7.15% USD 15/04/2020 95,000 98,681 0.22 Meritor Inc 6.25% USD 15/02/2024 317,000 322,944 0.72 MGM Resorts International 6% USD 15/03/2023 210,000 220,185 0.49 Penske Automotive Group Inc 5.5% USD 15/05/2026 271,000 269,816 0.60 Scientific Games International Inc 10% USD 01/12/2022 240,000 253,500 0.57 Suburban Propane Partners LP/Suburban Energy Finance Corp 5.5% USD 01/06/2024 364,000 361,270 0.81 Tenneco Inc 5.375% USD 15/12/2024 271,000 248,304 0.55 Titan International Inc 6.5% USD 30/11/2023 250,000 232,500 0.52 Wynn Las Vegas LLC / Wynn Las Vegas Capital Corp 5.25% USD 15/05/2027 115,000 110,544 0.25
6,396,492 14.28
CONSUMER, NON-CYCLICAL Acadia Healthcare Co Inc 6.5% USD 01/03/2024 135,000 135,000 0.30 ADT Security Corp/The 6.25% USD 15/10/2021 250,000 265,000 0.59 Albertsons Cos LLC / Safeway Inc / New Albertsons LP / Albertson's LLC 6.625% USD 15/06/2024 226,000 227,695 0.51 Avis Budget Car Rental LLC / Avis Budget Finance Inc 5.5% USD 01/04/2023 265,000 268,975 0.60 B&G Foods Inc 5.25% USD 01/04/2025 117,000 111,881 0.25 Bausch Health Cos Inc 144A 5.875% USD 15/05/2023 19,000 19,000 0.04 Bausch Health Cos Inc 6.125% USD 15/04/2025 350,000 338,625 0.76 Bausch Health Cos Inc 7% USD 15/03/2024 250,000 264,375 0.59 Centene Corp 5.375% USD 01/06/2026 84,000 86,940 0.19 CHS/Community Health Systems Inc 6.25% USD 31/03/2023 120,000 116,700 0.26 DaVita Inc 5% USD 01/05/2025 200,000 193,500 0.43 Encompass Health Corp 5.75% USD 15/09/2025 152,000 154,280 0.34 HCA Healthcare Inc 6.25% USD 15/02/2021 45,000 47,194 0.11 HCA Inc 5.25% USD 15/04/2025 338,000 357,504 0.80 HCA Inc 5.375% USD 01/02/2025 105,000 108,937 0.24 HCA Inc 5.375% USD 01/09/2026 56,000 57,470 0.13 HCA Inc 5.5% USD 15/06/2047 215,000 222,375 0.50 HCA Inc 5.875% USD 15/02/2026 95,000 100,225 0.22 HCA Inc 7.5% USD 15/02/2022 141,000 154,924 0.35 Herc Rentals Inc 7.75% USD 01/06/2024 196,000 209,230 0.47 Hill-Rom Holdings Inc 5% USD 15/02/2025 235,000 235,587 0.53 JBS Investments GmbH 7.25% USD 03/04/2024 200,000 207,860 0.46 Kernel Holding SA 8.75% USD 31/01/2022 200,000 201,250 0.45 MEDNAX Inc 5.25% USD 01/12/2023 130,000 131,787 0.30 MPH Acquisition Holdings LLC 144A 7.125% USD 01/06/2024 69,000 69,431 0.16
Invesco US High Yield Bond Fund Statement of Investments as at 28 February 2019
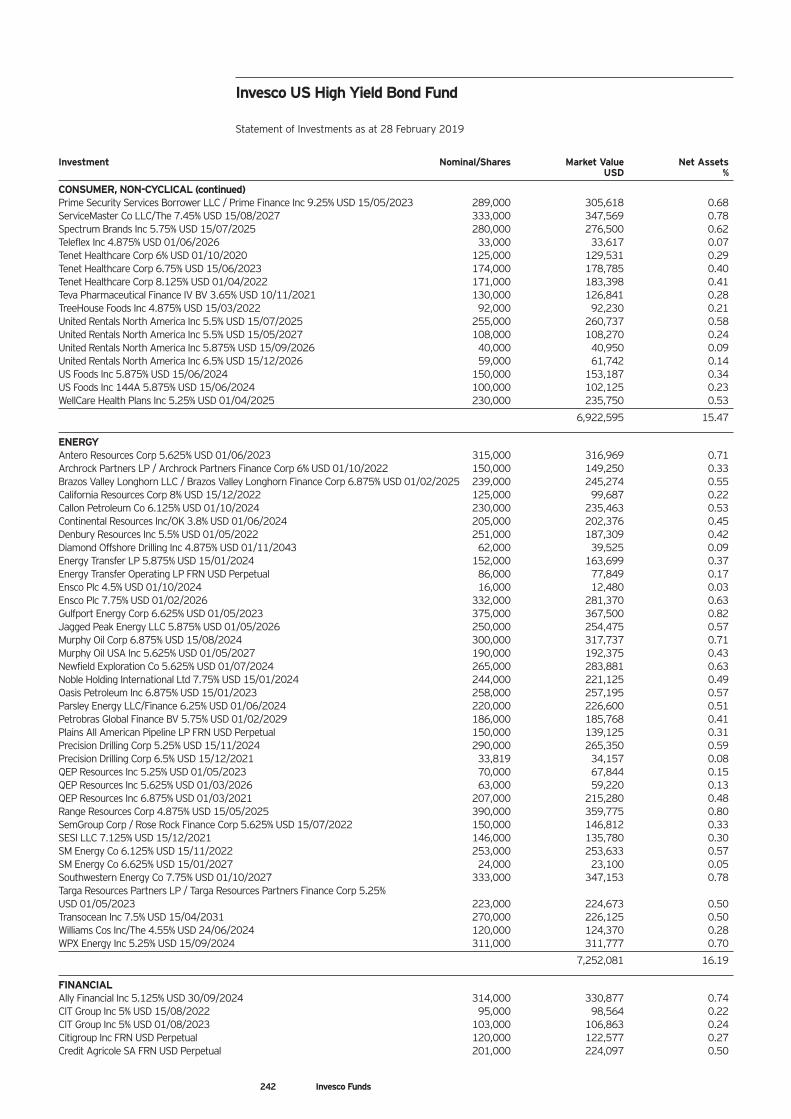
242 Invesco Funds
Investment Nominal/Shares Market Value Net Assets USD %
CONSUMER, NON-CYCLICAL (continued) Prime Security Services Borrower LLC / Prime Finance Inc 9.25% USD 15/05/2023 289,000 305,618 0.68 ServiceMaster Co LLC/The 7.45% USD 15/08/2027 333,000 347,569 0.78 Spectrum Brands Inc 5.75% USD 15/07/2025 280,000 276,500 0.62 Teleflex Inc 4.875% USD 01/06/2026 33,000 33,617 0.07 Tenet Healthcare Corp 6% USD 01/10/2020 125,000 129,531 0.29 Tenet Healthcare Corp 6.75% USD 15/06/2023 174,000 178,785 0.40 Tenet Healthcare Corp 8.125% USD 01/04/2022 171,000 183,398 0.41 Teva Pharmaceutical Finance IV BV 3.65% USD 10/11/2021 130,000 126,841 0.28 TreeHouse Foods Inc 4.875% USD 15/03/2022 92,000 92,230 0.21 United Rentals North America Inc 5.5% USD 15/07/2025 255,000 260,737 0.58 United Rentals North America Inc 5.5% USD 15/05/2027 108,000 108,270 0.24 United Rentals North America Inc 5.875% USD 15/09/2026 40,000 40,950 0.09 United Rentals North America Inc 6.5% USD 15/12/2026 59,000 61,742 0.14 US Foods Inc 5.875% USD 15/06/2024 150,000 153,187 0.34 US Foods Inc 144A 5.875% USD 15/06/2024 100,000 102,125 0.23 WellCare Health Plans Inc 5.25% USD 01/04/2025 230,000 235,750 0.53
6,922,595 15.47
ENERGY Antero Resources Corp 5.625% USD 01/06/2023 315,000 316,969 0.71 Archrock Partners LP / Archrock Partners Finance Corp 6% USD 01/10/2022 150,000 149,250 0.33 Brazos Valley Longhorn LLC / Brazos Valley Longhorn Finance Corp 6.875% USD 01/02/2025 239,000 245,274 0.55 California Resources Corp 8% USD 15/12/2022 125,000 99,687 0.22 Callon Petroleum Co 6.125% USD 01/10/2024 230,000 235,463 0.53 Continental Resources Inc/OK 3.8% USD 01/06/2024 205,000 202,376 0.45 Denbury Resources Inc 5.5% USD 01/05/2022 251,000 187,309 0.42 Diamond Offshore Drilling Inc 4.875% USD 01/11/2043 62,000 39,525 0.09 Energy Transfer LP 5.875% USD 15/01/2024 152,000 163,699 0.37 Energy Transfer Operating LP FRN USD Perpetual 86,000 77,849 0.17 Ensco Plc 4.5% USD 01/10/2024 16,000 12,480 0.03 Ensco Plc 7.75% USD 01/02/2026 332,000 281,370 0.63 Gulfport Energy Corp 6.625% USD 01/05/2023 375,000 367,500 0.82 Jagged Peak Energy LLC 5.875% USD 01/05/2026 250,000 254,475 0.57 Murphy Oil Corp 6.875% USD 15/08/2024 300,000 317,737 0.71 Murphy Oil USA Inc 5.625% USD 01/05/2027 190,000 192,375 0.43 Newfield Exploration Co 5.625% USD 01/07/2024 265,000 283,881 0.63 Noble Holding International Ltd 7.75% USD 15/01/2024 244,000 221,125 0.49 Oasis Petroleum Inc 6.875% USD 15/01/2023 258,000 257,195 0.57 Parsley Energy LLC/Finance 6.25% USD 01/06/2024 220,000 226,600 0.51 Petrobras Global Finance BV 5.75% USD 01/02/2029 186,000 185,768 0.41 Plains All American Pipeline LP FRN USD Perpetual 150,000 139,125 0.31 Precision Drilling Corp 5.25% USD 15/11/2024 290,000 265,350 0.59 Precision Drilling Corp 6.5% USD 15/12/2021 33,819 34,157 0.08 QEP Resources Inc 5.25% USD 01/05/2023 70,000 67,844 0.15 QEP Resources Inc 5.625% USD 01/03/2026 63,000 59,220 0.13 QEP Resources Inc 6.875% USD 01/03/2021 207,000 215,280 0.48 Range Resources Corp 4.875% USD 15/05/2025 390,000 359,775 0.80 SemGroup Corp / Rose Rock Finance Corp 5.625% USD 15/07/2022 150,000 146,812 0.33 SESI LLC 7.125% USD 15/12/2021 146,000 135,780 0.30 SM Energy Co 6.125% USD 15/11/2022 253,000 253,633 0.57 SM Energy Co 6.625% USD 15/01/2027 24,000 23,100 0.05 Southwestern Energy Co 7.75% USD 01/10/2027 333,000 347,153 0.78 Targa Resources Partners LP / Targa Resources Partners Finance Corp 5.25% USD 01/05/2023 223,000 224,673 0.50 Transocean Inc 7.5% USD 15/04/2031 270,000 226,125 0.50 Williams Cos Inc/The 4.55% USD 24/06/2024 120,000 124,370 0.28 WPX Energy Inc 5.25% USD 15/09/2024 311,000 311,777 0.70
7,252,081 16.19
FINANCIAL Ally Financial Inc 5.125% USD 30/09/2024 314,000 330,877 0.74 CIT Group Inc 5% USD 15/08/2022 95,000 98,564 0.22 CIT Group Inc 5% USD 01/08/2023 103,000 106,863 0.24 Citigroup Inc FRN USD Perpetual 120,000 122,577 0.27 Credit Agricole SA FRN USD Perpetual 201,000 224,097 0.50
Invesco US High Yield Bond Fund Statement of Investments as at 28 February 2019
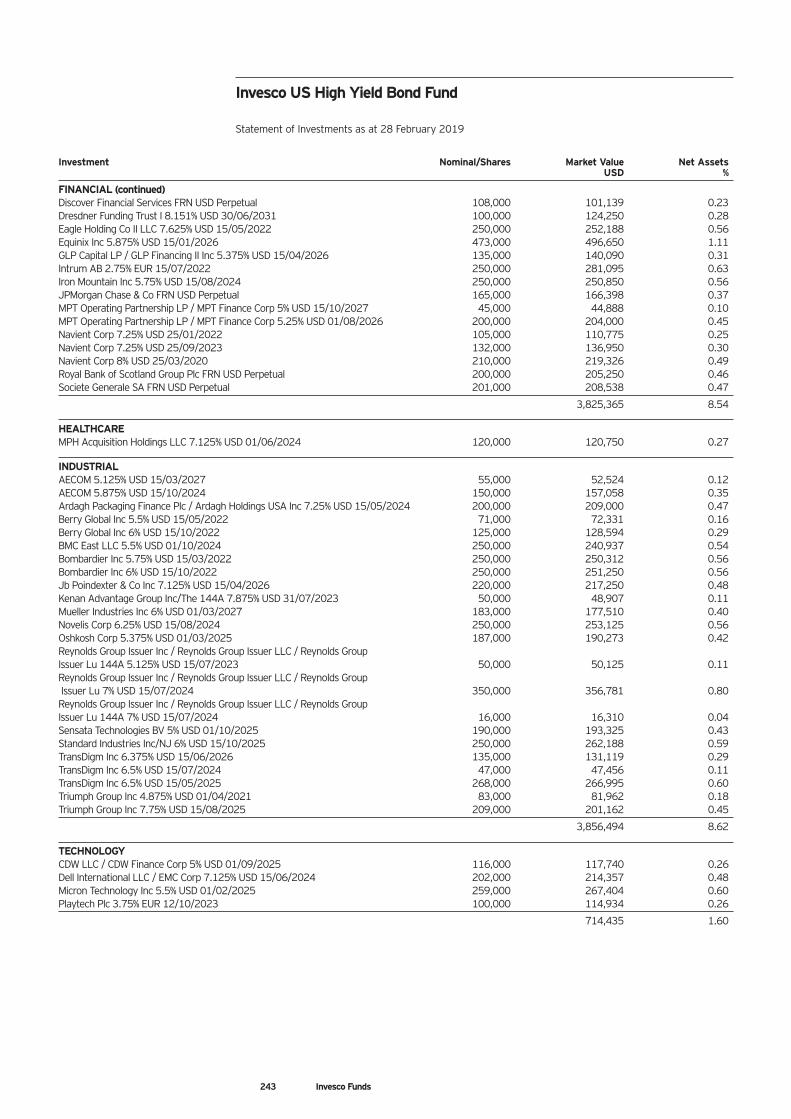
243 Invesco Funds
Investment Nominal/Shares Market Value Net Assets USD %
FINANCIAL (continued) Discover Financial Services FRN USD Perpetual 108,000 101,139 0.23 Dresdner Funding Trust I 8.151% USD 30/06/2031 100,000 124,250 0.28 Eagle Holding Co II LLC 7.625% USD 15/05/2022 250,000 252,188 0.56 Equinix Inc 5.875% USD 15/01/2026 473,000 496,650 1.11 GLP Capital LP / GLP Financing II Inc 5.375% USD 15/04/2026 135,000 140,090 0.31 Intrum AB 2.75% EUR 15/07/2022 250,000 281,095 0.63 Iron Mountain Inc 5.75% USD 15/08/2024 250,000 250,850 0.56 JPMorgan Chase & Co FRN USD Perpetual 165,000 166,398 0.37 MPT Operating Partnership LP / MPT Finance Corp 5% USD 15/10/2027 45,000 44,888 0.10 MPT Operating Partnership LP / MPT Finance Corp 5.25% USD 01/08/2026 200,000 204,000 0.45 Navient Corp 7.25% USD 25/01/2022 105,000 110,775 0.25 Navient Corp 7.25% USD 25/09/2023 132,000 136,950 0.30 Navient Corp 8% USD 25/03/2020 210,000 219,326 0.49 Royal Bank of Scotland Group Plc FRN USD Perpetual 200,000 205,250 0.46 Societe Generale SA FRN USD Perpetual 201,000 208,538 0.47
3,825,365 8.54
HEALTHCARE MPH Acquisition Holdings LLC 7.125% USD 01/06/2024 120,000 120,750 0.27
INDUSTRIAL AECOM 5.125% USD 15/03/2027 55,000 52,524 0.12 AECOM 5.875% USD 15/10/2024 150,000 157,058 0.35 Ardagh Packaging Finance Plc / Ardagh Holdings USA Inc 7.25% USD 15/05/2024 200,000 209,000 0.47 Berry Global Inc 5.5% USD 15/05/2022 71,000 72,331 0.16 Berry Global Inc 6% USD 15/10/2022 125,000 128,594 0.29 BMC East LLC 5.5% USD 01/10/2024 250,000 240,937 0.54 Bombardier Inc 5.75% USD 15/03/2022 250,000 250,312 0.56 Bombardier Inc 6% USD 15/10/2022 250,000 251,250 0.56 Jb Poindexter & Co Inc 7.125% USD 15/04/2026 220,000 217,250 0.48 Kenan Advantage Group Inc/The 144A 7.875% USD 31/07/2023 50,000 48,907 0.11 Mueller Industries Inc 6% USD 01/03/2027 183,000 177,510 0.40 Novelis Corp 6.25% USD 15/08/2024 250,000 253,125 0.56 Oshkosh Corp 5.375% USD 01/03/2025 187,000 190,273 0.42 Reynolds Group Issuer Inc / Reynolds Group Issuer LLC / Reynolds Group Issuer Lu 144A 5.125% USD 15/07/2023 50,000 50,125 0.11 Reynolds Group Issuer Inc / Reynolds Group Issuer LLC / Reynolds Group Issuer Lu 7% USD 15/07/2024 350,000 356,781 0.80 Reynolds Group Issuer Inc / Reynolds Group Issuer LLC / Reynolds Group Issuer Lu 144A 7% USD 15/07/2024 16,000 16,310 0.04 Sensata Technologies BV 5% USD 01/10/2025 190,000 193,325 0.43 Standard Industries Inc/NJ 6% USD 15/10/2025 250,000 262,188 0.59 TransDigm Inc 6.375% USD 15/06/2026 135,000 131,119 0.29 TransDigm Inc 6.5% USD 15/07/2024 47,000 47,456 0.11 TransDigm Inc 6.5% USD 15/05/2025 268,000 266,995 0.60 Triumph Group Inc 4.875% USD 01/04/2021 83,000 81,962 0.18 Triumph Group Inc 7.75% USD 15/08/2025 209,000 201,162 0.45
3,856,494 8.62
TECHNOLOGY CDW LLC / CDW Finance Corp 5% USD 01/09/2025 116,000 117,740 0.26 Dell International LLC / EMC Corp 7.125% USD 15/06/2024 202,000 214,357 0.48 Micron Technology Inc 5.5% USD 01/02/2025 259,000 267,404 0.60 Playtech Plc 3.75% EUR 12/10/2023 100,000 114,934 0.26
714,435 1.60
Invesco US High Yield Bond Fund Statement of Investments as at 28 February 2019
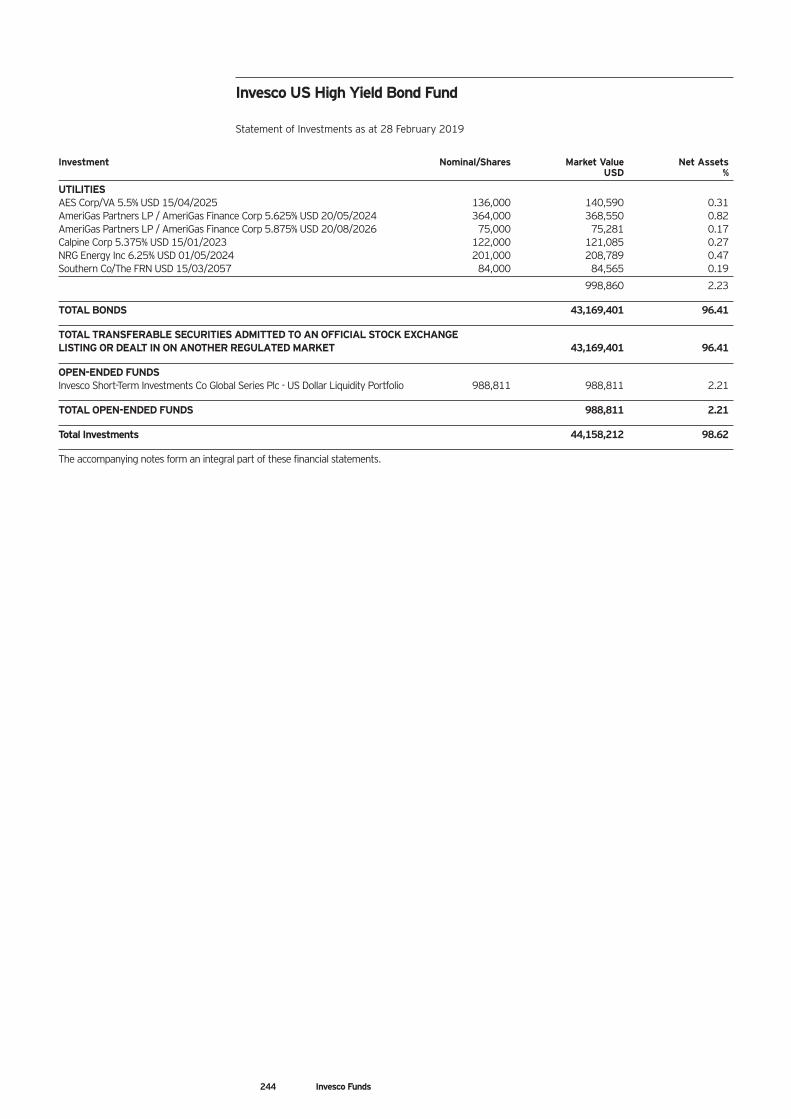
244 Invesco Funds
Investment Nominal/Shares Market Value Net Assets USD %
UTILITIES AES Corp/VA 5.5% USD 15/04/2025 136,000 140,590 0.31 AmeriGas Partners LP / AmeriGas Finance Corp 5.625% USD 20/05/2024 364,000 368,550 0.82 AmeriGas Partners LP / AmeriGas Finance Corp 5.875% USD 20/08/2026 75,000 75,281 0.17 Calpine Corp 5.375% USD 15/01/2023 122,000 121,085 0.27 NRG Energy Inc 6.25% USD 01/05/2024 201,000 208,789 0.47 Southern Co/The FRN USD 15/03/2057 84,000 84,565 0.19
998,860 2.23
TOTAL BONDS 43,169,401 96.41
TOTAL TRANSFERABLE SECURITIES ADMITTED TO AN OFFICIAL STOCK EXCHANGE LISTING OR DEALT IN ON ANOTHER REGULATED MARKET 43,169,401 96.41
OPEN-ENDED FUNDS Invesco Short-Term Investments Co Global Series Plc - US Dollar Liquidity Portfolio 988,811 988,811 2.21
TOTAL OPEN-ENDED FUNDS 988,811 2.21
Total Investments 44,158,212 98.62
The accompanying notes form an integral part of these financial statements.
Invesco US High Yield Bond Fund Statement of Investments as at 28 February 2019
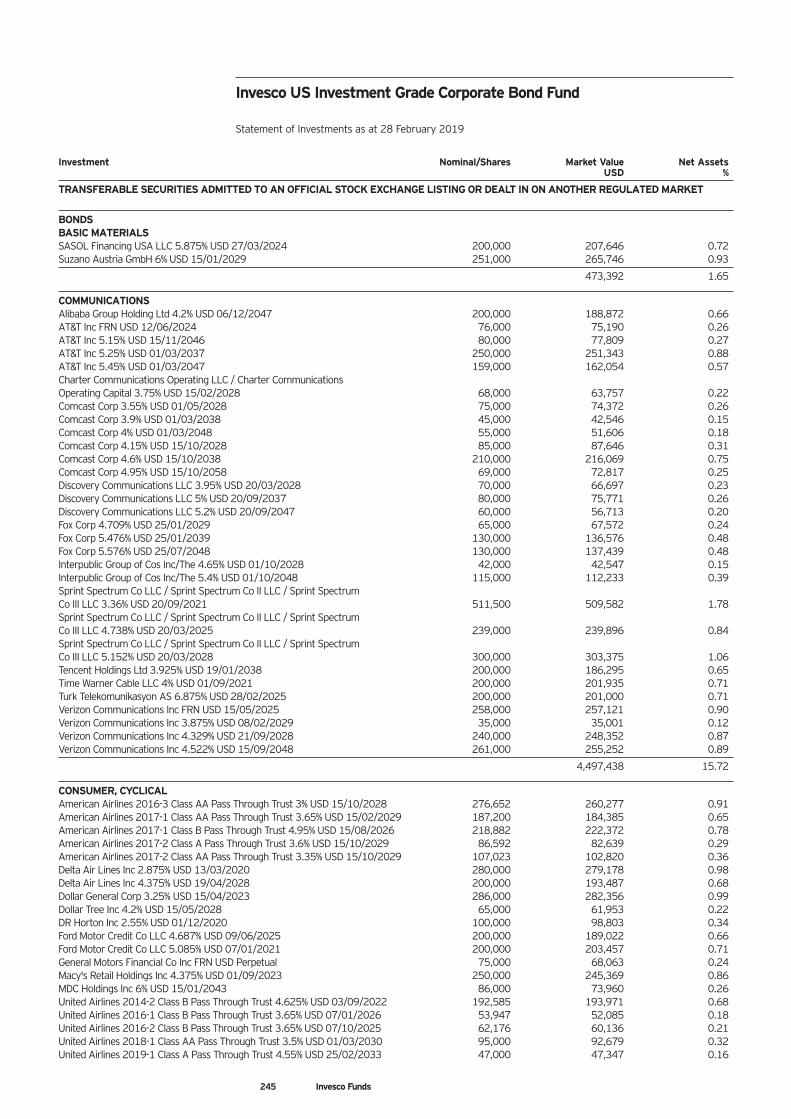
245 Invesco Funds
Investment Nominal/Shares Market Value Net Assets USD %
TRANSFERABLE SECURITIES ADMITTED TO AN OFFICIAL STOCK EXCHANGE LISTING OR DEALT IN ON ANOTHER REGULATED MARKET
BONDS BASIC MATERIALS SASOL Financing USA LLC 5.875% USD 27/03/2024 200,000 207,646 0.72 Suzano Austria GmbH 6% USD 15/01/2029 251,000 265,746 0.93
473,392 1.65
COMMUNICATIONS Alibaba Group Holding Ltd 4.2% USD 06/12/2047 200,000 188,872 0.66 AT&T Inc FRN USD 12/06/2024 76,000 75,190 0.26 AT&T Inc 5.15% USD 15/11/2046 80,000 77,809 0.27 AT&T Inc 5.25% USD 01/03/2037 250,000 251,343 0.88 AT&T Inc 5.45% USD 01/03/2047 159,000 162,054 0.57 Charter Communications Operating LLC / Charter Communications Operating Capital 3.75% USD 15/02/2028 68,000 63,757 0.22 Comcast Corp 3.55% USD 01/05/2028 75,000 74,372 0.26 Comcast Corp 3.9% USD 01/03/2038 45,000 42,546 0.15 Comcast Corp 4% USD 01/03/2048 55,000 51,606 0.18 Comcast Corp 4.15% USD 15/10/2028 85,000 87,646 0.31 Comcast Corp 4.6% USD 15/10/2038 210,000 216,069 0.75 Comcast Corp 4.95% USD 15/10/2058 69,000 72,817 0.25 Discovery Communications LLC 3.95% USD 20/03/2028 70,000 66,697 0.23 Discovery Communications LLC 5% USD 20/09/2037 80,000 75,771 0.26 Discovery Communications LLC 5.2% USD 20/09/2047 60,000 56,713 0.20 Fox Corp 4.709% USD 25/01/2029 65,000 67,572 0.24 Fox Corp 5.476% USD 25/01/2039 130,000 136,576 0.48 Fox Corp 5.576% USD 25/07/2048 130,000 137,439 0.48 Interpublic Group of Cos Inc/The 4.65% USD 01/10/2028 42,000 42,547 0.15 Interpublic Group of Cos Inc/The 5.4% USD 01/10/2048 115,000 112,233 0.39 Sprint Spectrum Co LLC / Sprint Spectrum Co II LLC / Sprint Spectrum Co III LLC 3.36% USD 20/09/2021 511,500 509,582 1.78 Sprint Spectrum Co LLC / Sprint Spectrum Co II LLC / Sprint Spectrum Co III LLC 4.738% USD 20/03/2025 239,000 239,896 0.84 Sprint Spectrum Co LLC / Sprint Spectrum Co II LLC / Sprint Spectrum Co III LLC 5.152% USD 20/03/2028 300,000 303,375 1.06 Tencent Holdings Ltd 3.925% USD 19/01/2038 200,000 186,295 0.65 Time Warner Cable LLC 4% USD 01/09/2021 200,000 201,935 0.71 Turk Telekomunikasyon AS 6.875% USD 28/02/2025 200,000 201,000 0.71 Verizon Communications Inc FRN USD 15/05/2025 258,000 257,121 0.90 Verizon Communications Inc 3.875% USD 08/02/2029 35,000 35,001 0.12 Verizon Communications Inc 4.329% USD 21/09/2028 240,000 248,352 0.87 Verizon Communications Inc 4.522% USD 15/09/2048 261,000 255,252 0.89
4,497,438 15.72
CONSUMER, CYCLICAL American Airlines 2016-3 Class AA Pass Through Trust 3% USD 15/10/2028 276,652 260,277 0.91 American Airlines 2017-1 Class AA Pass Through Trust 3.65% USD 15/02/2029 187,200 184,385 0.65 American Airlines 2017-1 Class B Pass Through Trust 4.95% USD 15/08/2026 218,882 222,372 0.78 American Airlines 2017-2 Class A Pass Through Trust 3.6% USD 15/10/2029 86,592 82,639 0.29 American Airlines 2017-2 Class AA Pass Through Trust 3.35% USD 15/10/2029 107,023 102,820 0.36 Delta Air Lines Inc 2.875% USD 13/03/2020 280,000 279,178 0.98 Delta Air Lines Inc 4.375% USD 19/04/2028 200,000 193,487 0.68 Dollar General Corp 3.25% USD 15/04/2023 286,000 282,356 0.99 Dollar Tree Inc 4.2% USD 15/05/2028 65,000 61,953 0.22 DR Horton Inc 2.55% USD 01/12/2020 100,000 98,803 0.34 Ford Motor Credit Co LLC 4.687% USD 09/06/2025 200,000 189,022 0.66 Ford Motor Credit Co LLC 5.085% USD 07/01/2021 200,000 203,457 0.71 General Motors Financial Co Inc FRN USD Perpetual 75,000 68,063 0.24 Macy's Retail Holdings Inc 4.375% USD 01/09/2023 250,000 245,369 0.86 MDC Holdings Inc 6% USD 15/01/2043 86,000 73,960 0.26 United Airlines 2014-2 Class B Pass Through Trust 4.625% USD 03/09/2022 192,585 193,971 0.68 United Airlines 2016-1 Class B Pass Through Trust 3.65% USD 07/01/2026 53,947 52,085 0.18 United Airlines 2016-2 Class B Pass Through Trust 3.65% USD 07/10/2025 62,176 60,136 0.21 United Airlines 2018-1 Class AA Pass Through Trust 3.5% USD 01/03/2030 95,000 92,679 0.32 United Airlines 2019-1 Class A Pass Through Trust 4.55% USD 25/02/2033 47,000 47,347 0.16
Invesco US Investment Grade Corporate Bond Fund Statement of Investments as at 28 February 2019
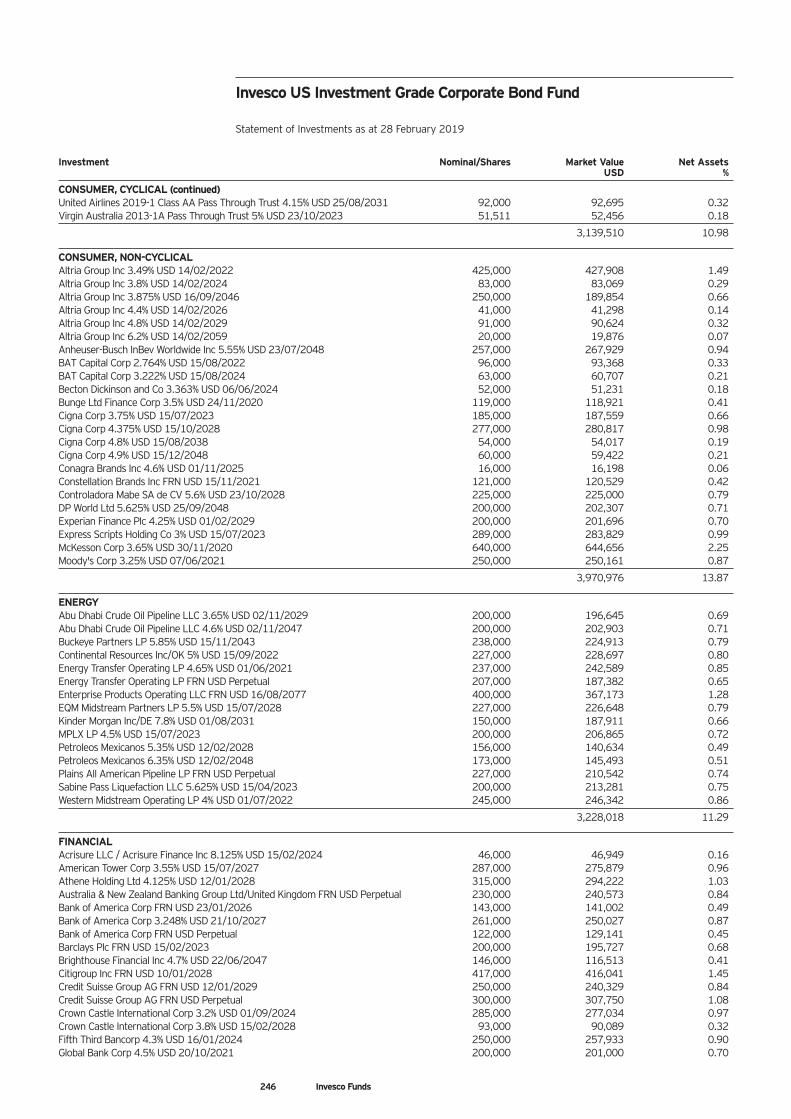
246 Invesco Funds
Investment Nominal/Shares Market Value Net Assets USD %
CONSUMER, CYCLICAL (continued) United Airlines 2019-1 Class AA Pass Through Trust 4.15% USD 25/08/2031 92,000 92,695 0.32 Virgin Australia 2013-1A Pass Through Trust 5% USD 23/10/2023 51,511 52,456 0.18
3,139,510 10.98
CONSUMER, NON-CYCLICAL Altria Group Inc 3.49% USD 14/02/2022 425,000 427,908 1.49 Altria Group Inc 3.8% USD 14/02/2024 83,000 83,069 0.29 Altria Group Inc 3.875% USD 16/09/2046 250,000 189,854 0.66 Altria Group Inc 4.4% USD 14/02/2026 41,000 41,298 0.14 Altria Group Inc 4.8% USD 14/02/2029 91,000 90,624 0.32 Altria Group Inc 6.2% USD 14/02/2059 20,000 19,876 0.07 Anheuser-Busch InBev Worldwide Inc 5.55% USD 23/07/2048 257,000 267,929 0.94 BAT Capital Corp 2.764% USD 15/08/2022 96,000 93,368 0.33 BAT Capital Corp 3.222% USD 15/08/2024 63,000 60,707 0.21 Becton Dickinson and Co 3.363% USD 06/06/2024 52,000 51,231 0.18 Bunge Ltd Finance Corp 3.5% USD 24/11/2020 119,000 118,921 0.41 Cigna Corp 3.75% USD 15/07/2023 185,000 187,559 0.66 Cigna Corp 4.375% USD 15/10/2028 277,000 280,817 0.98 Cigna Corp 4.8% USD 15/08/2038 54,000 54,017 0.19 Cigna Corp 4.9% USD 15/12/2048 60,000 59,422 0.21 Conagra Brands Inc 4.6% USD 01/11/2025 16,000 16,198 0.06 Constellation Brands Inc FRN USD 15/11/2021 121,000 120,529 0.42 Controladora Mabe SA de CV 5.6% USD 23/10/2028 225,000 225,000 0.79 DP World Ltd 5.625% USD 25/09/2048 200,000 202,307 0.71 Experian Finance Plc 4.25% USD 01/02/2029 200,000 201,696 0.70 Express Scripts Holding Co 3% USD 15/07/2023 289,000 283,829 0.99 McKesson Corp 3.65% USD 30/11/2020 640,000 644,656 2.25 Moody's Corp 3.25% USD 07/06/2021 250,000 250,161 0.87
3,970,976 13.87
ENERGY Abu Dhabi Crude Oil Pipeline LLC 3.65% USD 02/11/2029 200,000 196,645 0.69 Abu Dhabi Crude Oil Pipeline LLC 4.6% USD 02/11/2047 200,000 202,903 0.71 Buckeye Partners LP 5.85% USD 15/11/2043 238,000 224,913 0.79 Continental Resources Inc/OK 5% USD 15/09/2022 227,000 228,697 0.80 Energy Transfer Operating LP 4.65% USD 01/06/2021 237,000 242,589 0.85 Energy Transfer Operating LP FRN USD Perpetual 207,000 187,382 0.65 Enterprise Products Operating LLC FRN USD 16/08/2077 400,000 367,173 1.28 EQM Midstream Partners LP 5.5% USD 15/07/2028 227,000 226,648 0.79 Kinder Morgan Inc/DE 7.8% USD 01/08/2031 150,000 187,911 0.66 MPLX LP 4.5% USD 15/07/2023 200,000 206,865 0.72 Petroleos Mexicanos 5.35% USD 12/02/2028 156,000 140,634 0.49 Petroleos Mexicanos 6.35% USD 12/02/2048 173,000 145,493 0.51 Plains All American Pipeline LP FRN USD Perpetual 227,000 210,542 0.74 Sabine Pass Liquefaction LLC 5.625% USD 15/04/2023 200,000 213,281 0.75 Western Midstream Operating LP 4% USD 01/07/2022 245,000 246,342 0.86
3,228,018 11.29
FINANCIAL Acrisure LLC / Acrisure Finance Inc 8.125% USD 15/02/2024 46,000 46,949 0.16 American Tower Corp 3.55% USD 15/07/2027 287,000 275,879 0.96 Athene Holding Ltd 4.125% USD 12/01/2028 315,000 294,222 1.03 Australia & New Zealand Banking Group Ltd/United Kingdom FRN USD Perpetual 230,000 240,573 0.84 Bank of America Corp FRN USD 23/01/2026 143,000 141,002 0.49 Bank of America Corp 3.248% USD 21/10/2027 261,000 250,027 0.87 Bank of America Corp FRN USD Perpetual 122,000 129,141 0.45 Barclays Plc FRN USD 15/02/2023 200,000 195,727 0.68 Brighthouse Financial Inc 4.7% USD 22/06/2047 146,000 116,513 0.41 Citigroup Inc FRN USD 10/01/2028 417,000 416,041 1.45 Credit Suisse Group AG FRN USD 12/01/2029 250,000 240,329 0.84 Credit Suisse Group AG FRN USD Perpetual 300,000 307,750 1.08 Crown Castle International Corp 3.2% USD 01/09/2024 285,000 277,034 0.97 Crown Castle International Corp 3.8% USD 15/02/2028 93,000 90,089 0.32 Fifth Third Bancorp 4.3% USD 16/01/2024 250,000 257,933 0.90 Global Bank Corp 4.5% USD 20/10/2021 200,000 201,000 0.70
Invesco US Investment Grade Corporate Bond Fund Statement of Investments as at 28 February 2019
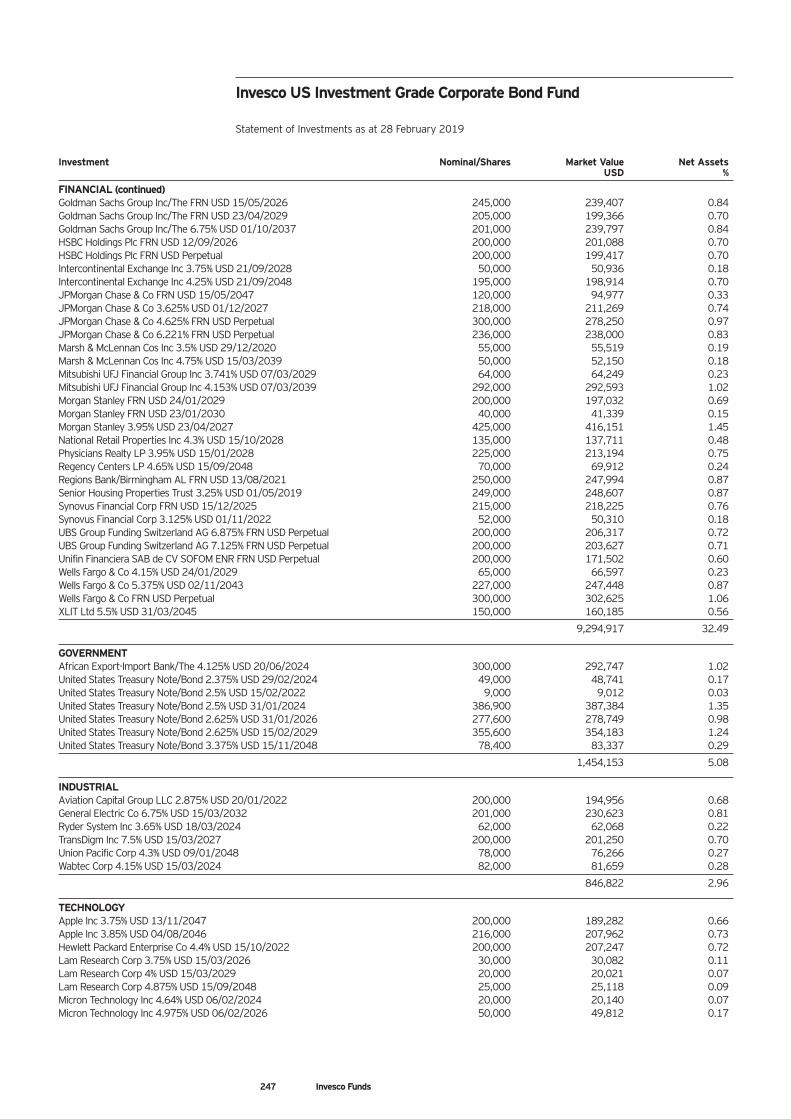
247 Invesco Funds
Investment Nominal/Shares Market Value Net Assets USD %
FINANCIAL (continued) Goldman Sachs Group Inc/The FRN USD 15/05/2026 245,000 239,407 0.84 Goldman Sachs Group Inc/The FRN USD 23/04/2029 205,000 199,366 0.70 Goldman Sachs Group Inc/The 6.75% USD 01/10/2037 201,000 239,797 0.84 HSBC Holdings Plc FRN USD 12/09/2026 200,000 201,088 0.70 HSBC Holdings Plc FRN USD Perpetual 200,000 199,417 0.70 Intercontinental Exchange Inc 3.75% USD 21/09/2028 50,000 50,936 0.18 Intercontinental Exchange Inc 4.25% USD 21/09/2048 195,000 198,914 0.70 JPMorgan Chase & Co FRN USD 15/05/2047 120,000 94,977 0.33 JPMorgan Chase & Co 3.625% USD 01/12/2027 218,000 211,269 0.74 JPMorgan Chase & Co 4.625% FRN USD Perpetual 300,000 278,250 0.97 JPMorgan Chase & Co 6.221% FRN USD Perpetual 236,000 238,000 0.83 Marsh & McLennan Cos Inc 3.5% USD 29/12/2020 55,000 55,519 0.19 Marsh & McLennan Cos Inc 4.75% USD 15/03/2039 50,000 52,150 0.18 Mitsubishi UFJ Financial Group Inc 3.741% USD 07/03/2029 64,000 64,249 0.23 Mitsubishi UFJ Financial Group Inc 4.153% USD 07/03/2039 292,000 292,593 1.02 Morgan Stanley FRN USD 24/01/2029 200,000 197,032 0.69 Morgan Stanley FRN USD 23/01/2030 40,000 41,339 0.15 Morgan Stanley 3.95% USD 23/04/2027 425,000 416,151 1.45 National Retail Properties Inc 4.3% USD 15/10/2028 135,000 137,711 0.48 Physicians Realty LP 3.95% USD 15/01/2028 225,000 213,194 0.75 Regency Centers LP 4.65% USD 15/09/2048 70,000 69,912 0.24 Regions Bank/Birmingham AL FRN USD 13/08/2021 250,000 247,994 0.87 Senior Housing Properties Trust 3.25% USD 01/05/2019 249,000 248,607 0.87 Synovus Financial Corp FRN USD 15/12/2025 215,000 218,225 0.76 Synovus Financial Corp 3.125% USD 01/11/2022 52,000 50,310 0.18 UBS Group Funding Switzerland AG 6.875% FRN USD Perpetual 200,000 206,317 0.72 UBS Group Funding Switzerland AG 7.125% FRN USD Perpetual 200,000 203,627 0.71 Unifin Financiera SAB de CV SOFOM ENR FRN USD Perpetual 200,000 171,502 0.60 Wells Fargo & Co 4.15% USD 24/01/2029 65,000 66,597 0.23 Wells Fargo & Co 5.375% USD 02/11/2043 227,000 247,448 0.87 Wells Fargo & Co FRN USD Perpetual 300,000 302,625 1.06 XLIT Ltd 5.5% USD 31/03/2045 150,000 160,185 0.56
9,294,917 32.49
GOVERNMENT African Export-Import Bank/The 4.125% USD 20/06/2024 300,000 292,747 1.02 United States Treasury Note/Bond 2.375% USD 29/02/2024 49,000 48,741 0.17 United States Treasury Note/Bond 2.5% USD 15/02/2022 9,000 9,012 0.03 United States Treasury Note/Bond 2.5% USD 31/01/2024 386,900 387,384 1.35 United States Treasury Note/Bond 2.625% USD 31/01/2026 277,600 278,749 0.98 United States Treasury Note/Bond 2.625% USD 15/02/2029 355,600 354,183 1.24 United States Treasury Note/Bond 3.375% USD 15/11/2048 78,400 83,337 0.29
1,454,153 5.08
INDUSTRIAL Aviation Capital Group LLC 2.875% USD 20/01/2022 200,000 194,956 0.68 General Electric Co 6.75% USD 15/03/2032 201,000 230,623 0.81 Ryder System Inc 3.65% USD 18/03/2024 62,000 62,068 0.22 TransDigm Inc 7.5% USD 15/03/2027 200,000 201,250 0.70 Union Pacific Corp 4.3% USD 09/01/2048 78,000 76,266 0.27 Wabtec Corp 4.15% USD 15/03/2024 82,000 81,659 0.28
846,822 2.96
TECHNOLOGY Apple Inc 3.75% USD 13/11/2047 200,000 189,282 0.66 Apple Inc 3.85% USD 04/08/2046 216,000 207,962 0.73 Hewlett Packard Enterprise Co 4.4% USD 15/10/2022 200,000 207,247 0.72 Lam Research Corp 3.75% USD 15/03/2026 30,000 30,082 0.11 Lam Research Corp 4% USD 15/03/2029 20,000 20,021 0.07 Lam Research Corp 4.875% USD 15/09/2048 25,000 25,118 0.09 Micron Technology Inc 4.64% USD 06/02/2024 20,000 20,140 0.07 Micron Technology Inc 4.975% USD 06/02/2026 50,000 49,812 0.17
Invesco US Investment Grade Corporate Bond Fund Statement of Investments as at 28 February 2019
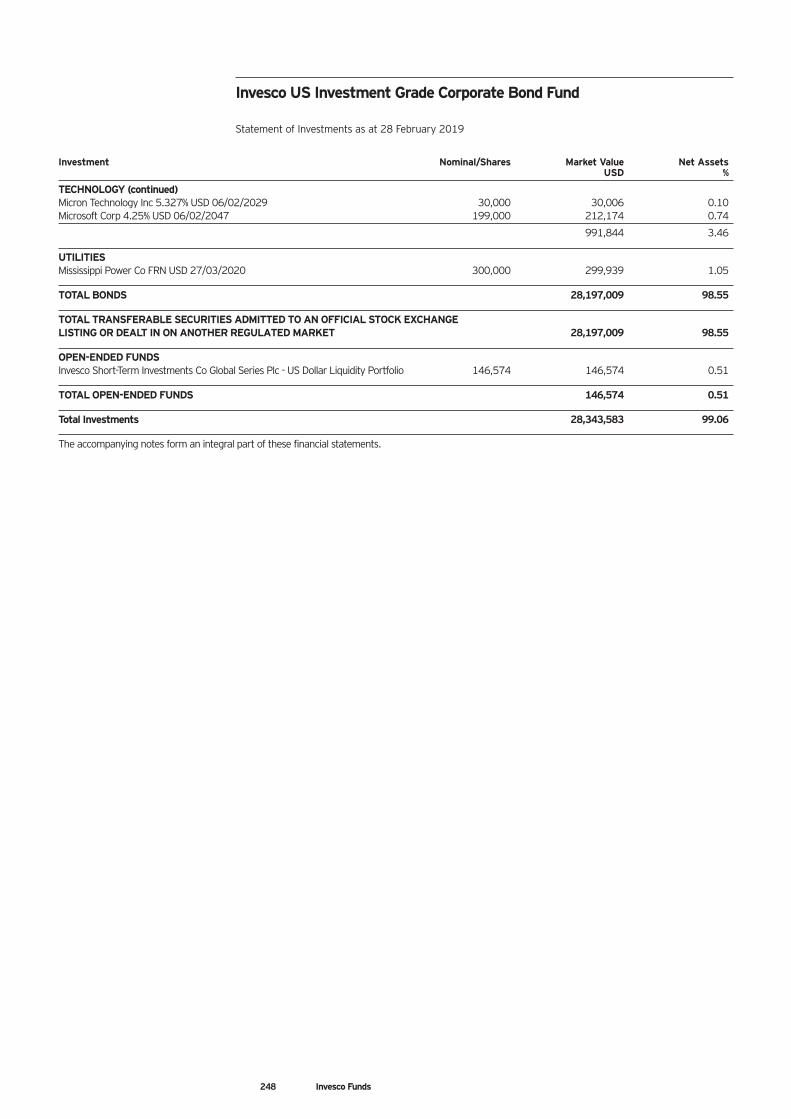
248 Invesco Funds
Investment Nominal/Shares Market Value Net Assets USD %
TECHNOLOGY (continued) Micron Technology Inc 5.327% USD 06/02/2029 30,000 30,006 0.10 Microsoft Corp 4.25% USD 06/02/2047 199,000 212,174 0.74
991,844 3.46
UTILITIES Mississippi Power Co FRN USD 27/03/2020 300,000 299,939 1.05
TOTAL BONDS 28,197,009 98.55
TOTAL TRANSFERABLE SECURITIES ADMITTED TO AN OFFICIAL STOCK EXCHANGE LISTING OR DEALT IN ON ANOTHER REGULATED MARKET 28,197,009 98.55
OPEN-ENDED FUNDS Invesco Short-Term Investments Co Global Series Plc - US Dollar Liquidity Portfolio 146,574 146,574 0.51
TOTAL OPEN-ENDED FUNDS 146,574 0.51
Total Investments 28,343,583 99.06
The accompanying notes form an integral part of these financial statements.
Invesco US Investment Grade Corporate Bond Fund Statement of Investments as at 28 February 2019
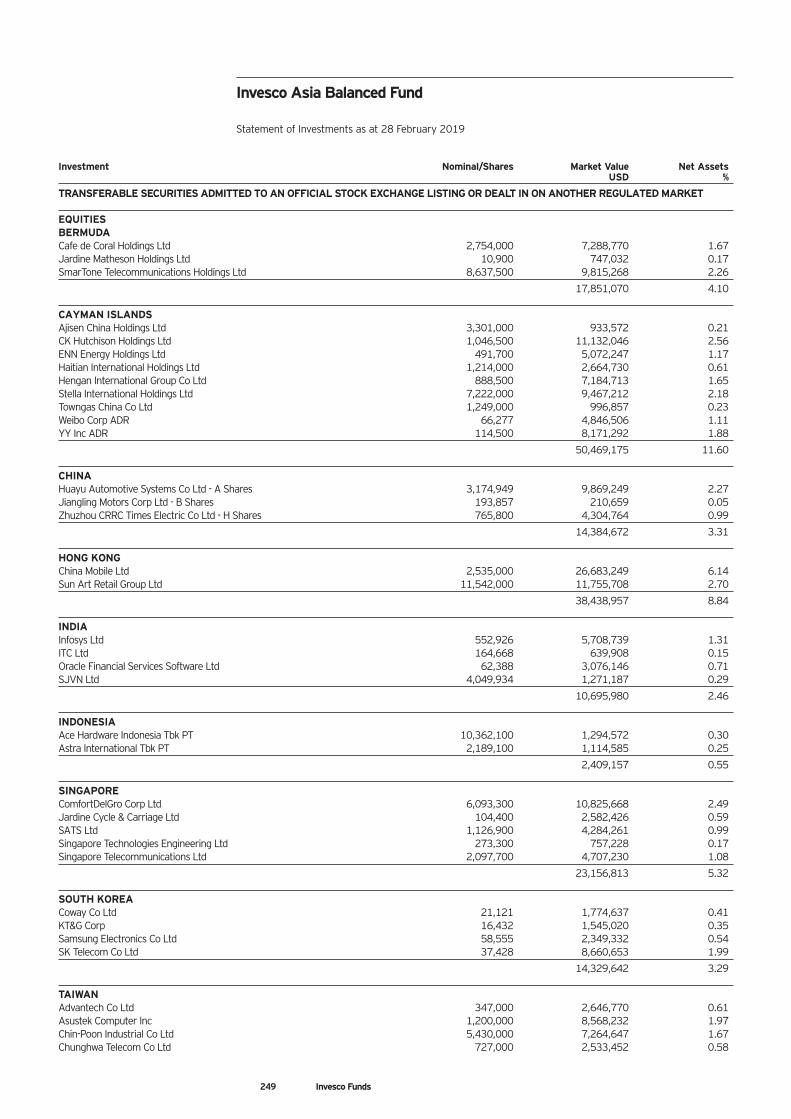
249 Invesco Funds
Investment Nominal/Shares Market Value Net Assets USD %
TRANSFERABLE SECURITIES ADMITTED TO AN OFFICIAL STOCK EXCHANGE LISTING OR DEALT IN ON ANOTHER REGULATED MARKET EQUITIES BERMUDA Cafe de Coral Holdings Ltd 2,754,000 7,288,770 1.67 Jardine Matheson Holdings Ltd 10,900 747,032 0.17 SmarTone Telecommunications Holdings Ltd 8,637,500 9,815,268 2.26
17,851,070 4.10 CAYMAN ISLANDS Ajisen China Holdings Ltd 3,301,000 933,572 0.21 CK Hutchison Holdings Ltd 1,046,500 11,132,046 2.56 ENN Energy Holdings Ltd 491,700 5,072,247 1.17 Haitian International Holdings Ltd 1,214,000 2,664,730 0.61 Hengan International Group Co Ltd 888,500 7,184,713 1.65 Stella International Holdings Ltd 7,222,000 9,467,212 2.18 Towngas China Co Ltd 1,249,000 996,857 0.23 Weibo Corp ADR 66,277 4,846,506 1.11 YY Inc ADR 114,500 8,171,292 1.88
50,469,175 11.60 CHINA Huayu Automotive Systems Co Ltd - A Shares 3,174,949 9,869,249 2.27 Jiangling Motors Corp Ltd - B Shares 193,857 210,659 0.05 Zhuzhou CRRC Times Electric Co Ltd - H Shares 765,800 4,304,764 0.99
14,384,672 3.31 HONG KONG China Mobile Ltd 2,535,000 26,683,249 6.14 Sun Art Retail Group Ltd 11,542,000 11,755,708 2.70
38,438,957 8.84 INDIA Infosys Ltd 552,926 5,708,739 1.31 ITC Ltd 164,668 639,908 0.15 Oracle Financial Services Software Ltd 62,388 3,076,146 0.71 SJVN Ltd 4,049,934 1,271,187 0.29
10,695,980 2.46 INDONESIA Ace Hardware Indonesia Tbk PT 10,362,100 1,294,572 0.30 Astra International Tbk PT 2,189,100 1,114,585 0.25
2,409,157 0.55 SINGAPORE ComfortDelGro Corp Ltd 6,093,300 10,825,668 2.49 Jardine Cycle & Carriage Ltd 104,400 2,582,426 0.59 SATS Ltd 1,126,900 4,284,261 0.99 Singapore Technologies Engineering Ltd 273,300 757,228 0.17 Singapore Telecommunications Ltd 2,097,700 4,707,230 1.08
23,156,813 5.32 SOUTH KOREA Coway Co Ltd 21,121 1,774,637 0.41 KT&G Corp 16,432 1,545,020 0.35 Samsung Electronics Co Ltd 58,555 2,349,332 0.54 SK Telecom Co Ltd 37,428 8,660,653 1.99
14,329,642 3.29 TAIWAN Advantech Co Ltd 347,000 2,646,770 0.61 Asustek Computer Inc 1,200,000 8,568,232 1.97 Chin-Poon Industrial Co Ltd 5,430,000 7,264,647 1.67 Chunghwa Telecom Co Ltd 727,000 2,533,452 0.58
Invesco Asia Balanced Fund Statement of Investments as at 28 February 2019
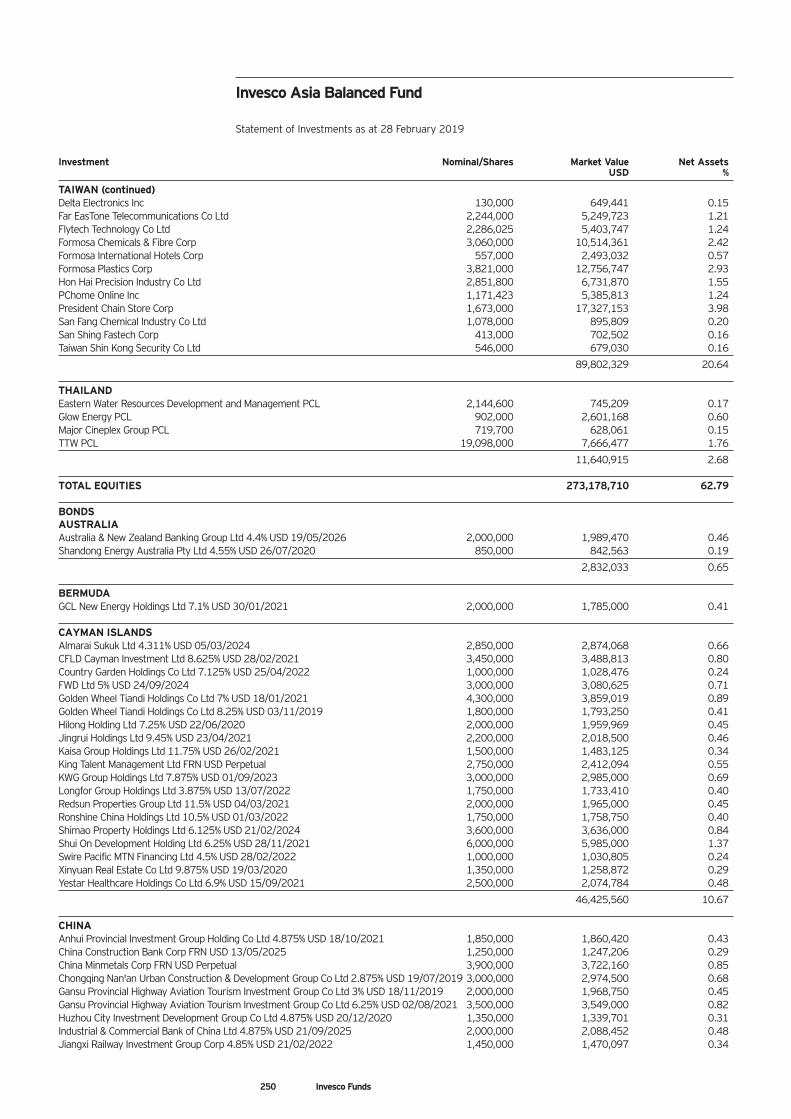
250 Invesco Funds
Invesco Asia Balanced Fund Statement of Investments as at 28 February 2019
Investment Nominal/Shares Market Value Net Assets USD %
TAIWAN (continued) Delta Electronics Inc 130,000 649,441 0.15 Far EasTone Telecommunications Co Ltd 2,244,000 5,249,723 1.21 Flytech Technology Co Ltd 2,286,025 5,403,747 1.24 Formosa Chemicals & Fibre Corp 3,060,000 10,514,361 2.42 Formosa International Hotels Corp 557,000 2,493,032 0.57 Formosa Plastics Corp 3,821,000 12,756,747 2.93 Hon Hai Precision Industry Co Ltd 2,851,800 6,731,870 1.55 PChome Online Inc 1,171,423 5,385,813 1.24 President Chain Store Corp 1,673,000 17,327,153 3.98 San Fang Chemical Industry Co Ltd 1,078,000 895,809 0.20 San Shing Fastech Corp 413,000 702,502 0.16 Taiwan Shin Kong Security Co Ltd 546,000 679,030 0.16
89,802,329 20.64 THAILAND Eastern Water Resources Development and Management PCL 2,144,600 745,209 0.17 Glow Energy PCL 902,000 2,601,168 0.60 Major Cineplex Group PCL 719,700 628,061 0.15 TTW PCL 19,098,000 7,666,477 1.76
11,640,915 2.68 TOTAL EQUITIES 273,178,710 62.79 BONDS AUSTRALIA Australia & New Zealand Banking Group Ltd 4.4% USD 19/05/2026 2,000,000 1,989,470 0.46 Shandong Energy Australia Pty Ltd 4.55% USD 26/07/2020 850,000 842,563 0.19
2,832,033 0.65 BERMUDA GCL New Energy Holdings Ltd 7.1% USD 30/01/2021 2,000,000 1,785,000 0.41 CAYMAN ISLANDS Almarai Sukuk Ltd 4.311% USD 05/03/2024 2,850,000 2,874,068 0.66 CFLD Cayman Investment Ltd 8.625% USD 28/02/2021 3,450,000 3,488,813 0.80 Country Garden Holdings Co Ltd 7.125% USD 25/04/2022 1,000,000 1,028,476 0.24 FWD Ltd 5% USD 24/09/2024 3,000,000 3,080,625 0.71 Golden Wheel Tiandi Holdings Co Ltd 7% USD 18/01/2021 4,300,000 3,859,019 0.89 Golden Wheel Tiandi Holdings Co Ltd 8.25% USD 03/11/2019 1,800,000 1,793,250 0.41 Hilong Holding Ltd 7.25% USD 22/06/2020 2,000,000 1,959,969 0.45 Jingrui Holdings Ltd 9.45% USD 23/04/2021 2,200,000 2,018,500 0.46 Kaisa Group Holdings Ltd 11.75% USD 26/02/2021 1,500,000 1,483,125 0.34 King Talent Management Ltd FRN USD Perpetual 2,750,000 2,412,094 0.55 KWG Group Holdings Ltd 7.875% USD 01/09/2023 3,000,000 2,985,000 0.69 Longfor Group Holdings Ltd 3.875% USD 13/07/2022 1,750,000 1,733,410 0.40 Redsun Properties Group Ltd 11.5% USD 04/03/2021 2,000,000 1,965,000 0.45 Ronshine China Holdings Ltd 10.5% USD 01/03/2022 1,750,000 1,758,750 0.40 Shimao Property Holdings Ltd 6.125% USD 21/02/2024 3,600,000 3,636,000 0.84 Shui On Development Holding Ltd 6.25% USD 28/11/2021 6,000,000 5,985,000 1.37 Swire Pacific MTN Financing Ltd 4.5% USD 28/02/2022 1,000,000 1,030,805 0.24 Xinyuan Real Estate Co Ltd 9.875% USD 19/03/2020 1,350,000 1,258,872 0.29 Yestar Healthcare Holdings Co Ltd 6.9% USD 15/09/2021 2,500,000 2,074,784 0.48
46,425,560 10.67 CHINA Anhui Provincial Investment Group Holding Co Ltd 4.875% USD 18/10/2021 1,850,000 1,860,420 0.43 China Construction Bank Corp FRN USD 13/05/2025 1,250,000 1,247,206 0.29 China Minmetals Corp FRN USD Perpetual 3,900,000 3,722,160 0.85 Chongqing Nan'an Urban Construction & Development Group Co Ltd 2.875% USD 19/07/2019 3,000,000 2,974,500 0.68 Gansu Provincial Highway Aviation Tourism Investment Group Co Ltd 3% USD 18/11/2019 2,000,000 1,968,750 0.45 Gansu Provincial Highway Aviation Tourism Investment Group Co Ltd 6.25% USD 02/08/2021 3,500,000 3,549,000 0.82 Huzhou City Investment Development Group Co Ltd 4.875% USD 20/12/2020 1,350,000 1,339,701 0.31 Industrial & Commercial Bank of China Ltd 4.875% USD 21/09/2025 2,000,000 2,088,452 0.48 Jiangxi Railway Investment Group Corp 4.85% USD 21/02/2022 1,450,000 1,470,097 0.34
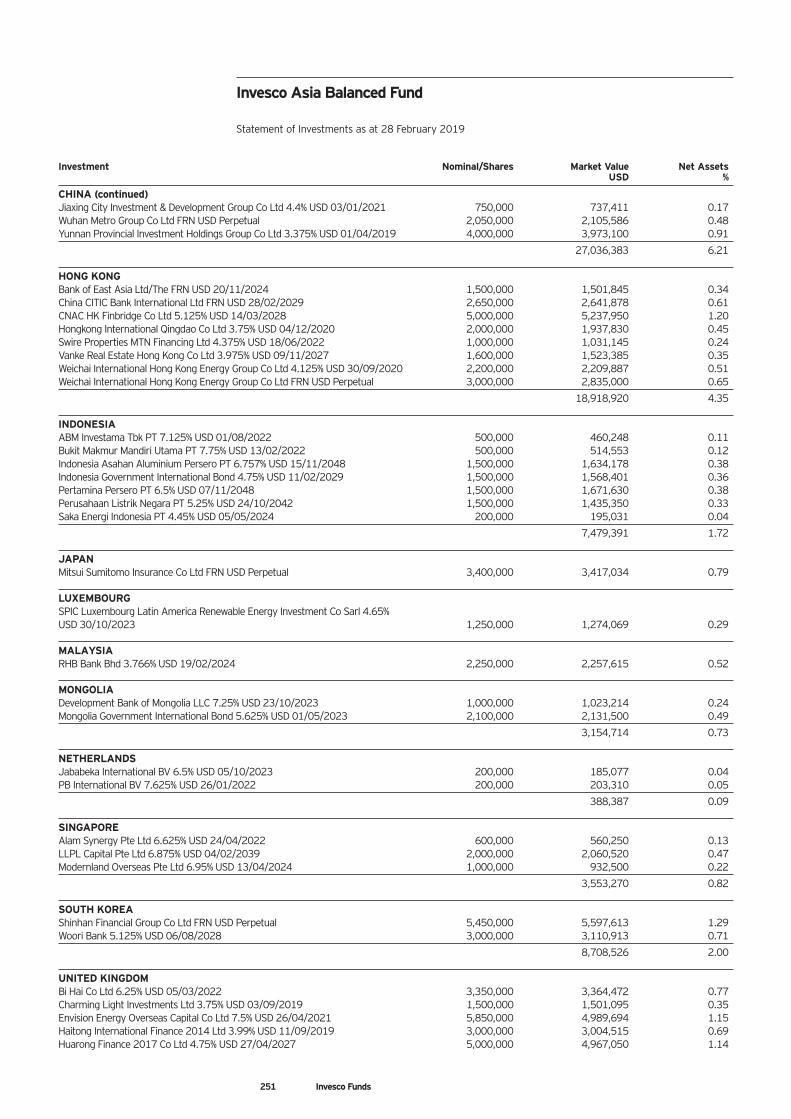
Invesco Asia Balanced Fund Statement of Investments as at 28 February 2019
Investment Nominal/Shares Market Value Net Assets USD %
CHINA (continued) Jiaxing City Investment & Development Group Co Ltd 4.4% USD 03/01/2021 750,000 737,411 0.17 Wuhan Metro Group Co Ltd FRN USD Perpetual 2,050,000 2,105,586 0.48 Yunnan Provincial Investment Holdings Group Co Ltd 3.375% USD 01/04/2019 4,000,000 3,973,100 0.91
27,036,383 6.21 HONG KONG Bank of East Asia Ltd/The FRN USD 20/11/2024 1,500,000 1,501,845 0.34 China CITIC Bank International Ltd FRN USD 28/02/2029 2,650,000 2,641,878 0.61 CNAC HK Finbridge Co Ltd 5.125% USD 14/03/2028 5,000,000 5,237,950 1.20 Hongkong International Qingdao Co Ltd 3.75% USD 04/12/2020 2,000,000 1,937,830 0.45 Swire Properties MTN Financing Ltd 4.375% USD 18/06/2022 1,000,000 1,031,145 0.24 Vanke Real Estate Hong Kong Co Ltd 3.975% USD 09/11/2027 1,600,000 1,523,385 0.35 Weichai International Hong Kong Energy Group Co Ltd 4.125% USD 30/09/2020 2,200,000 2,209,887 0.51 Weichai International Hong Kong Energy Group Co Ltd FRN USD Perpetual 3,000,000 2,835,000 0.65
18,918,920 4.35 INDONESIA ABM Investama Tbk PT 7.125% USD 01/08/2022 500,000 460,248 0.11 Bukit Makmur Mandiri Utama PT 7.75% USD 13/02/2022 500,000 514,553 0.12 Indonesia Asahan Aluminium Persero PT 6.757% USD 15/11/2048 1,500,000 1,634,178 0.38 Indonesia Government International Bond 4.75% USD 11/02/2029 1,500,000 1,568,401 0.36 Pertamina Persero PT 6.5% USD 07/11/2048 1,500,000 1,671,630 0.38 Perusahaan Listrik Negara PT 5.25% USD 24/10/2042 1,500,000 1,435,350 0.33 Saka Energi Indonesia PT 4.45% USD 05/05/2024 200,000 195,031 0.04
7,479,391 1.72 JAPAN Mitsui Sumitomo Insurance Co Ltd FRN USD Perpetual 3,400,000 3,417,034 0.79 LUXEMBOURG SPIC Luxembourg Latin America Renewable Energy Investment Co Sarl 4.65% USD 30/10/2023 1,250,000 1,274,069 0.29 MALAYSIA RHB Bank Bhd 3.766% USD 19/02/2024 2,250,000 2,257,615 0.52 MONGOLIA Development Bank of Mongolia LLC 7.25% USD 23/10/2023 1,000,000 1,023,214 0.24 Mongolia Government International Bond 5.625% USD 01/05/2023 2,100,000 2,131,500 0.49
3,154,714 0.73 NETHERLANDS Jababeka International BV 6.5% USD 05/10/2023 200,000 185,077 0.04 PB International BV 7.625% USD 26/01/2022 200,000 203,310 0.05
388,387 0.09 SINGAPORE Alam Synergy Pte Ltd 6.625% USD 24/04/2022 600,000 560,250 0.13 LLPL Capital Pte Ltd 6.875% USD 04/02/2039 2,000,000 2,060,520 0.47 Modernland Overseas Pte Ltd 6.95% USD 13/04/2024 1,000,000 932,500 0.22
3,553,270 0.82 SOUTH KOREA Shinhan Financial Group Co Ltd FRN USD Perpetual 5,450,000 5,597,613 1.29 Woori Bank 5.125% USD 06/08/2028 3,000,000 3,110,913 0.71
8,708,526 2.00 UNITED KINGDOM Bi Hai Co Ltd 6.25% USD 05/03/2022 3,350,000 3,364,472 0.77 Charming Light Investments Ltd 3.75% USD 03/09/2019 1,500,000 1,501,095 0.35 Envision Energy Overseas Capital Co Ltd 7.5% USD 26/04/2021 5,850,000 4,989,694 1.15 Haitong International Finance 2014 Ltd 3.99% USD 11/09/2019 3,000,000 3,004,515 0.69 Huarong Finance 2017 Co Ltd 4.75% USD 27/04/2027 5,000,000 4,967,050 1.14
251 Invesco Funds
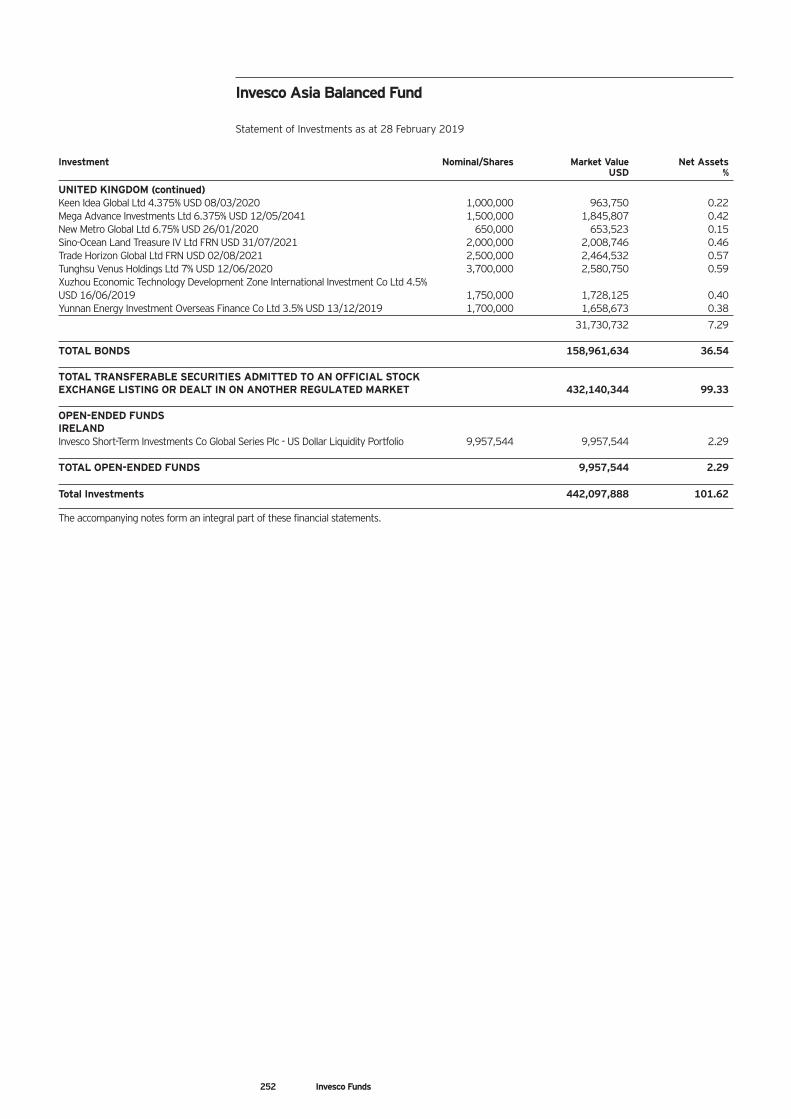
Investment Nominal/Shares Market Value Net Assets USD %
UNITED KINGDOM (continued) Keen Idea Global Ltd 4.375% USD 08/03/2020 1,000,000 963,750 0.22 Mega Advance Investments Ltd 6.375% USD 12/05/2041 1,500,000 1,845,807 0.42 New Metro Global Ltd 6.75% USD 26/01/2020 650,000 653,523 0.15 Sino-Ocean Land Treasure IV Ltd FRN USD 31/07/2021 2,000,000 2,008,746 0.46 Trade Horizon Global Ltd FRN USD 02/08/2021 2,500,000 2,464,532 0.57 Tunghsu Venus Holdings Ltd 7% USD 12/06/2020 3,700,000 2,580,750 0.59 Xuzhou Economic Technology Development Zone International Investment Co Ltd 4.5% USD 16/06/2019 1,750,000 1,728,125 0.40 Yunnan Energy Investment Overseas Finance Co Ltd 3.5% USD 13/12/2019 1,700,000 1,658,673 0.38
31,730,732 7.29 TOTAL BONDS 158,961,634 36.54 TOTAL TRANSFERABLE SECURITIES ADMITTED TO AN OFFICIAL STOCK EXCHANGE LISTING OR DEALT IN ON ANOTHER REGULATED MARKET 432,140,344 99.33 OPEN-ENDED FUNDS IRELAND Invesco Short-Term Investments Co Global Series Plc - US Dollar Liquidity Portfolio 9,957,544 9,957,544 2.29 TOTAL OPEN-ENDED FUNDS 9,957,544 2.29 Total Investments 442,097,888 101.62
The accompanying notes form an integral part of these financial statements.
Invesco Asia Balanced Fund Statement of Investments as at 28 February 2019
252 Invesco Funds
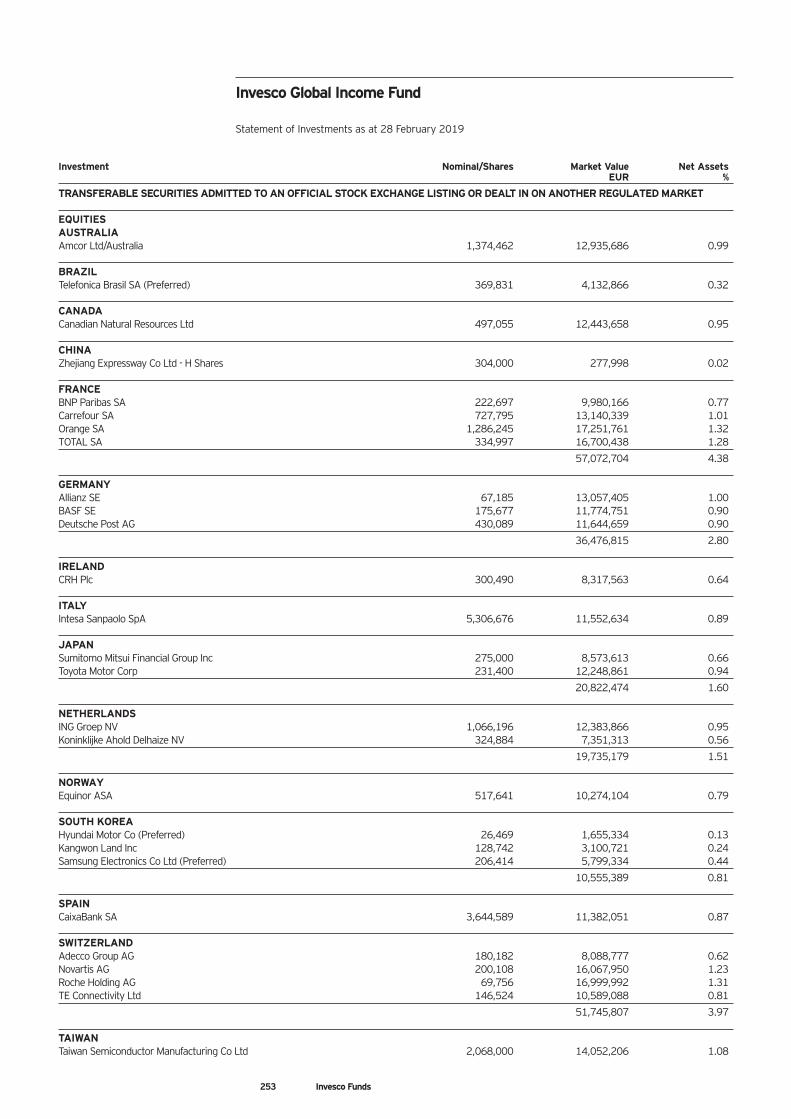
Invesco Global Income Fund Statement of Investments as at 28 February 2019
Investment Nominal/Shares Market Value Net Assets EUR %
TRANSFERABLE SECURITIES ADMITTED TO AN OFFICIAL STOCK EXCHANGE LISTING OR DEALT IN ON ANOTHER REGULATED MARKET EQUITIES AUSTRALIA Amcor Ltd/Australia 1,374,462 12,935,686 0.99 BRAZIL Telefonica Brasil SA (Preferred) 369,831 4,132,866 0.32 CANADA Canadian Natural Resources Ltd 497,055 12,443,658 0.95 CHINA Zhejiang Expressway Co Ltd - H Shares 304,000 277,998 0.02 FRANCE BNP Paribas SA 222,697 9,980,166 0.77 Carrefour SA 727,795 13,140,339 1.01 Orange SA 1,286,245 17,251,761 1.32 TOTAL SA 334,997 16,700,438 1.28
57,072,704 4.38 GERMANY Allianz SE 67,185 13,057,405 1.00 BASF SE 175,677 11,774,751 0.90 Deutsche Post AG 430,089 11,644,659 0.90
36,476,815 2.80 IRELAND CRH Plc 300,490 8,317,563 0.64 ITALY Intesa Sanpaolo SpA 5,306,676 11,552,634 0.89 JAPAN Sumitomo Mitsui Financial Group Inc 275,000 8,573,613 0.66 Toyota Motor Corp 231,400 12,248,861 0.94
20,822,474 1.60 NETHERLANDS ING Groep NV 1,066,196 12,383,866 0.95 Koninklijke Ahold Delhaize NV 324,884 7,351,313 0.56
19,735,179 1.51 NORWAY Equinor ASA 517,641 10,274,104 0.79 SOUTH KOREA Hyundai Motor Co (Preferred) 26,469 1,655,334 0.13 Kangwon Land Inc 128,742 3,100,721 0.24 Samsung Electronics Co Ltd (Preferred) 206,414 5,799,334 0.44
10,555,389 0.81 SPAIN CaixaBank SA 3,644,589 11,382,051 0.87 SWITZERLAND Adecco Group AG 180,182 8,088,777 0.62 Novartis AG 200,108 16,067,950 1.23 Roche Holding AG 69,756 16,999,992 1.31 TE Connectivity Ltd 146,524 10,589,088 0.81
51,745,807 3.97 TAIWAN Taiwan Semiconductor Manufacturing Co Ltd 2,068,000 14,052,206 1.08
253 Invesco Funds
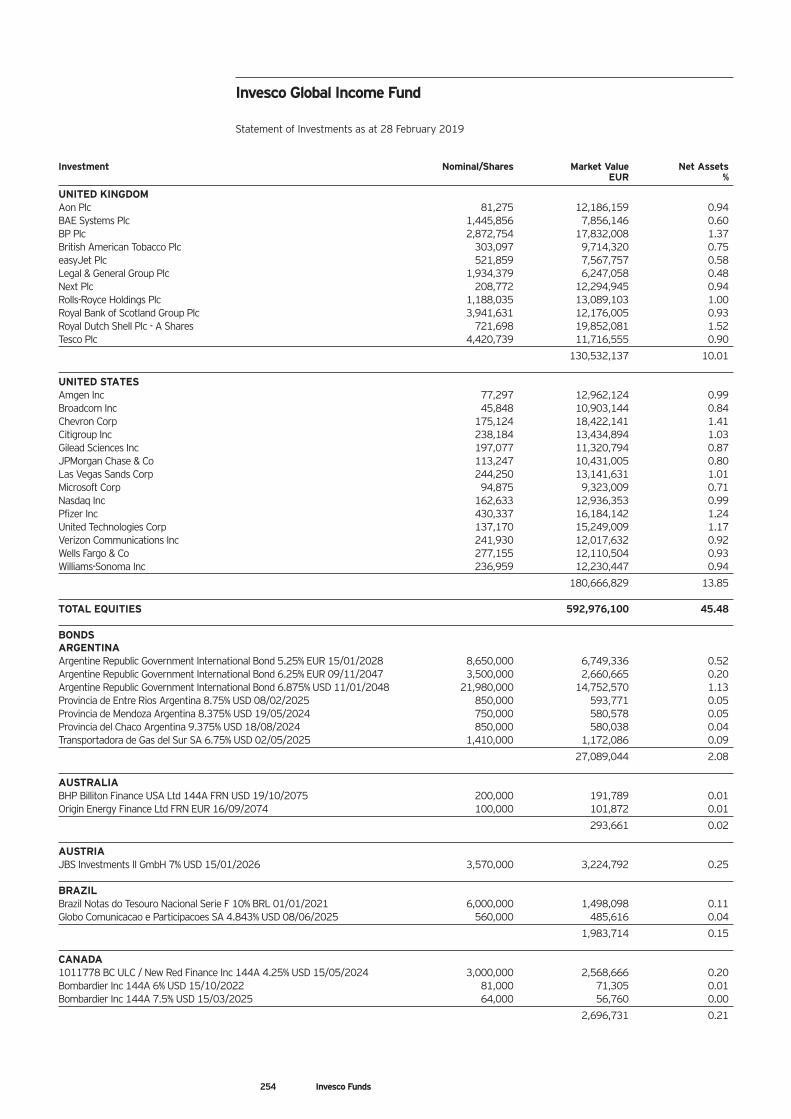
Investment Nominal/Shares Market Value Net Assets EUR %
UNITED KINGDOM Aon Plc 81,275 12,186,159 0.94 BAE Systems Plc 1,445,856 7,856,146 0.60 BP Plc 2,872,754 17,832,008 1.37 British American Tobacco Plc 303,097 9,714,320 0.75 easyJet Plc 521,859 7,567,757 0.58 Legal & General Group Plc 1,934,379 6,247,058 0.48 Next Plc 208,772 12,294,945 0.94 Rolls-Royce Holdings Plc 1,188,035 13,089,103 1.00 Royal Bank of Scotland Group Plc 3,941,631 12,176,005 0.93 Royal Dutch Shell Plc - A Shares 721,698 19,852,081 1.52 Tesco Plc 4,420,739 11,716,555 0.90
130,532,137 10.01 UNITED STATES Amgen Inc 77,297 12,962,124 0.99 Broadcom Inc 45,848 10,903,144 0.84 Chevron Corp 175,124 18,422,141 1.41 Citigroup Inc 238,184 13,434,894 1.03 Gilead Sciences Inc 197,077 11,320,794 0.87 JPMorgan Chase & Co 113,247 10,431,005 0.80 Las Vegas Sands Corp 244,250 13,141,631 1.01 Microsoft Corp 94,875 9,323,009 0.71 Nasdaq Inc 162,633 12,936,353 0.99 Pfizer Inc 430,337 16,184,142 1.24 United Technologies Corp 137,170 15,249,009 1.17 Verizon Communications Inc 241,930 12,017,632 0.92 Wells Fargo & Co 277,155 12,110,504 0.93 Williams-Sonoma Inc 236,959 12,230,447 0.94
180,666,829 13.85 TOTAL EQUITIES 592,976,100 45.48 BONDS ARGENTINA Argentine Republic Government International Bond 5.25% EUR 15/01/2028 8,650,000 6,749,336 0.52 Argentine Republic Government International Bond 6.25% EUR 09/11/2047 3,500,000 2,660,665 0.20 Argentine Republic Government International Bond 6.875% USD 11/01/2048 21,980,000 14,752,570 1.13 Provincia de Entre Rios Argentina 8.75% USD 08/02/2025 850,000 593,771 0.05 Provincia de Mendoza Argentina 8.375% USD 19/05/2024 750,000 580,578 0.05 Provincia del Chaco Argentina 9.375% USD 18/08/2024 850,000 580,038 0.04 Transportadora de Gas del Sur SA 6.75% USD 02/05/2025 1,410,000 1,172,086 0.09
27,089,044 2.08 AUSTRALIA BHP Billiton Finance USA Ltd 144A FRN USD 19/10/2075 200,000 191,789 0.01 Origin Energy Finance Ltd FRN EUR 16/09/2074 100,000 101,872 0.01
293,661 0.02 AUSTRIA JBS Investments II GmbH 7% USD 15/01/2026 3,570,000 3,224,792 0.25 BRAZIL Brazil Notas do Tesouro Nacional Serie F 10% BRL 01/01/2021 6,000,000 1,498,098 0.11 Globo Comunicacao e Participacoes SA 4.843% USD 08/06/2025 560,000 485,616 0.04
1,983,714 0.15 CANADA 1011778 BC ULC / New Red Finance Inc 144A 4.25% USD 15/05/2024 3,000,000 2,568,666 0.20 Bombardier Inc 144A 6% USD 15/10/2022 81,000 71,305 0.01 Bombardier Inc 144A 7.5% USD 15/03/2025 64,000 56,760 0.00
2,696,731 0.21
Invesco Global Income Fund Statement of Investments as at 28 February 2019
254 Invesco Funds
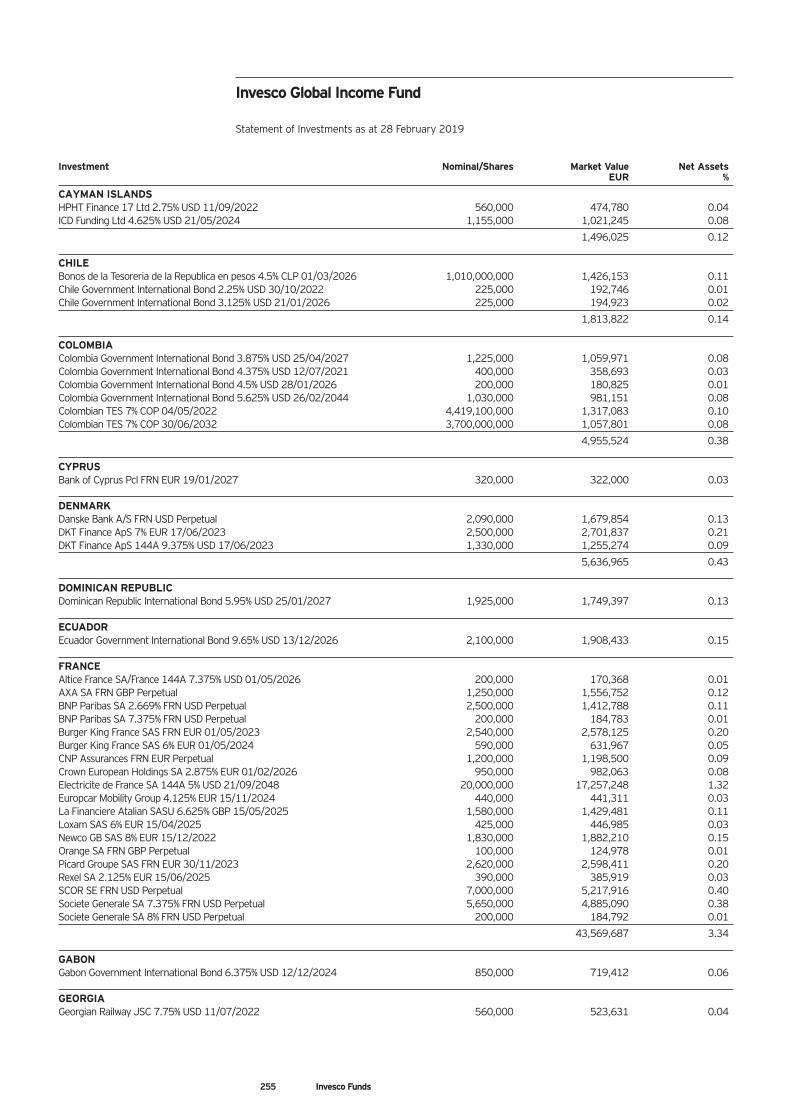
Invesco Global Income Fund Statement of Investments as at 28 February 2019
Investment Nominal/Shares Market Value Net Assets EUR %
CAYMAN ISLANDS HPHT Finance 17 Ltd 2.75% USD 11/09/2022 560,000 474,780 0.04 ICD Funding Ltd 4.625% USD 21/05/2024 1,155,000 1,021,245 0.08
1,496,025 0.12 CHILE Bonos de la Tesoreria de la Republica en pesos 4.5% CLP 01/03/2026 1,010,000,000 1,426,153 0.11 Chile Government International Bond 2.25% USD 30/10/2022 225,000 192,746 0.01 Chile Government International Bond 3.125% USD 21/01/2026 225,000 194,923 0.02
1,813,822 0.14 COLOMBIA Colombia Government International Bond 3.875% USD 25/04/2027 1,225,000 1,059,971 0.08 Colombia Government International Bond 4.375% USD 12/07/2021 400,000 358,693 0.03 Colombia Government International Bond 4.5% USD 28/01/2026 200,000 180,825 0.01 Colombia Government International Bond 5.625% USD 26/02/2044 1,030,000 981,151 0.08 Colombian TES 7% COP 04/05/2022 4,419,100,000 1,317,083 0.10 Colombian TES 7% COP 30/06/2032 3,700,000,000 1,057,801 0.08
4,955,524 0.38 CYPRUS Bank of Cyprus Pcl FRN EUR 19/01/2027 320,000 322,000 0.03 DENMARK Danske Bank A/S FRN USD Perpetual 2,090,000 1,679,854 0.13 DKT Finance ApS 7% EUR 17/06/2023 2,500,000 2,701,837 0.21 DKT Finance ApS 144A 9.375% USD 17/06/2023 1,330,000 1,255,274 0.09
5,636,965 0.43 DOMINICAN REPUBLIC Dominican Republic International Bond 5.95% USD 25/01/2027 1,925,000 1,749,397 0.13 ECUADOR Ecuador Government International Bond 9.65% USD 13/12/2026 2,100,000 1,908,433 0.15 FRANCE Altice France SA/France 144A 7.375% USD 01/05/2026 200,000 170,368 0.01 AXA SA FRN GBP Perpetual 1,250,000 1,556,752 0.12 BNP Paribas SA 2.669% FRN USD Perpetual 2,500,000 1,412,788 0.11 BNP Paribas SA 7.375% FRN USD Perpetual 200,000 184,783 0.01 Burger King France SAS FRN EUR 01/05/2023 2,540,000 2,578,125 0.20 Burger King France SAS 6% EUR 01/05/2024 590,000 631,967 0.05 CNP Assurances FRN EUR Perpetual 1,200,000 1,198,500 0.09 Crown European Holdings SA 2.875% EUR 01/02/2026 950,000 982,063 0.08 Electricite de France SA 144A 5% USD 21/09/2048 20,000,000 17,257,248 1.32 Europcar Mobility Group 4.125% EUR 15/11/2024 440,000 441,311 0.03 La Financiere Atalian SASU 6.625% GBP 15/05/2025 1,580,000 1,429,481 0.11 Loxam SAS 6% EUR 15/04/2025 425,000 446,985 0.03 Newco GB SAS 8% EUR 15/12/2022 1,830,000 1,882,210 0.15 Orange SA FRN GBP Perpetual 100,000 124,978 0.01 Picard Groupe SAS FRN EUR 30/11/2023 2,620,000 2,598,411 0.20 Rexel SA 2.125% EUR 15/06/2025 390,000 385,919 0.03 SCOR SE FRN USD Perpetual 7,000,000 5,217,916 0.40 Societe Generale SA 7.375% FRN USD Perpetual 5,650,000 4,885,090 0.38 Societe Generale SA 8% FRN USD Perpetual 200,000 184,792 0.01
43,569,687 3.34 GABON Gabon Government International Bond 6.375% USD 12/12/2024 850,000 719,412 0.06 GEORGIA Georgian Railway JSC 7.75% USD 11/07/2022 560,000 523,631 0.04
255 Invesco Funds
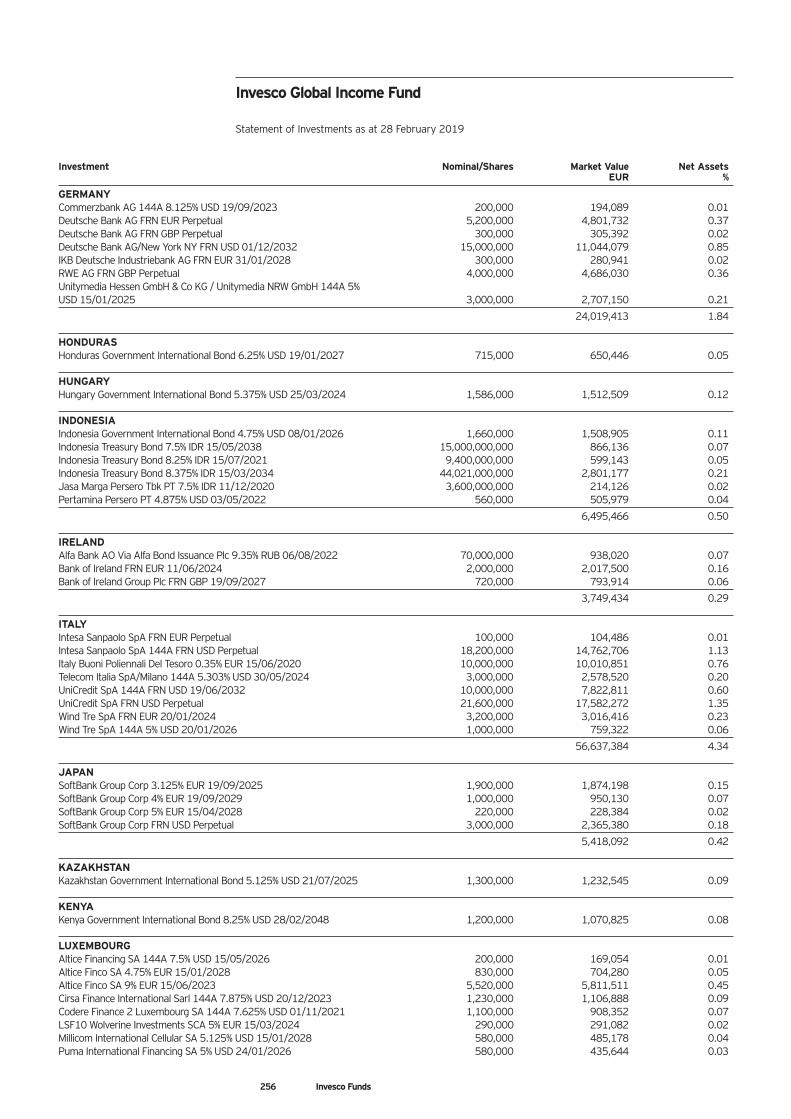
Investment Nominal/Shares Market Value Net Assets EUR %
GERMANY Commerzbank AG 144A 8.125% USD 19/09/2023 200,000 194,089 0.01 Deutsche Bank AG FRN EUR Perpetual 5,200,000 4,801,732 0.37 Deutsche Bank AG FRN GBP Perpetual 300,000 305,392 0.02 Deutsche Bank AG/New York NY FRN USD 01/12/2032 15,000,000 11,044,079 0.85 IKB Deutsche Industriebank AG FRN EUR 31/01/2028 300,000 280,941 0.02 RWE AG FRN GBP Perpetual 4,000,000 4,686,030 0.36 Unitymedia Hessen GmbH & Co KG / Unitymedia NRW GmbH 144A 5% USD 15/01/2025 3,000,000 2,707,150 0.21
24,019,413 1.84 HONDURAS Honduras Government International Bond 6.25% USD 19/01/2027 715,000 650,446 0.05 HUNGARY Hungary Government International Bond 5.375% USD 25/03/2024 1,586,000 1,512,509 0.12 INDONESIA Indonesia Government International Bond 4.75% USD 08/01/2026 1,660,000 1,508,905 0.11 Indonesia Treasury Bond 7.5% IDR 15/05/2038 15,000,000,000 866,136 0.07 Indonesia Treasury Bond 8.25% IDR 15/07/2021 9,400,000,000 599,143 0.05 Indonesia Treasury Bond 8.375% IDR 15/03/2034 44,021,000,000 2,801,177 0.21 Jasa Marga Persero Tbk PT 7.5% IDR 11/12/2020 3,600,000,000 214,126 0.02 Pertamina Persero PT 4.875% USD 03/05/2022 560,000 505,979 0.04
6,495,466 0.50 IRELAND Alfa Bank AO Via Alfa Bond Issuance Plc 9.35% RUB 06/08/2022 70,000,000 938,020 0.07 Bank of Ireland FRN EUR 11/06/2024 2,000,000 2,017,500 0.16 Bank of Ireland Group Plc FRN GBP 19/09/2027 720,000 793,914 0.06
3,749,434 0.29 ITALY Intesa Sanpaolo SpA FRN EUR Perpetual 100,000 104,486 0.01 Intesa Sanpaolo SpA 144A FRN USD Perpetual 18,200,000 14,762,706 1.13 Italy Buoni Poliennali Del Tesoro 0.35% EUR 15/06/2020 10,000,000 10,010,851 0.76 Telecom Italia SpA/Milano 144A 5.303% USD 30/05/2024 3,000,000 2,578,520 0.20 UniCredit SpA 144A FRN USD 19/06/2032 10,000,000 7,822,811 0.60 UniCredit SpA FRN USD Perpetual 21,600,000 17,582,272 1.35 Wind Tre SpA FRN EUR 20/01/2024 3,200,000 3,016,416 0.23 Wind Tre SpA 144A 5% USD 20/01/2026 1,000,000 759,322 0.06
56,637,384 4.34 JAPAN SoftBank Group Corp 3.125% EUR 19/09/2025 1,900,000 1,874,198 0.15 SoftBank Group Corp 4% EUR 19/09/2029 1,000,000 950,130 0.07 SoftBank Group Corp 5% EUR 15/04/2028 220,000 228,384 0.02 SoftBank Group Corp FRN USD Perpetual 3,000,000 2,365,380 0.18
5,418,092 0.42 KAZAKHSTAN Kazakhstan Government International Bond 5.125% USD 21/07/2025 1,300,000 1,232,545 0.09 KENYA Kenya Government International Bond 8.25% USD 28/02/2048 1,200,000 1,070,825 0.08 LUXEMBOURG Altice Financing SA 144A 7.5% USD 15/05/2026 200,000 169,054 0.01 Altice Finco SA 4.75% EUR 15/01/2028 830,000 704,280 0.05 Altice Finco SA 9% EUR 15/06/2023 5,520,000 5,811,511 0.45 Cirsa Finance International Sarl 144A 7.875% USD 20/12/2023 1,230,000 1,106,888 0.09 Codere Finance 2 Luxembourg SA 144A 7.625% USD 01/11/2021 1,100,000 908,352 0.07 LSF10 Wolverine Investments SCA 5% EUR 15/03/2024 290,000 291,082 0.02 Millicom International Cellular SA 5.125% USD 15/01/2028 580,000 485,178 0.04 Puma International Financing SA 5% USD 24/01/2026 580,000 435,644 0.03
Invesco Global Income Fund Statement of Investments as at 28 February 2019
256 Invesco Funds
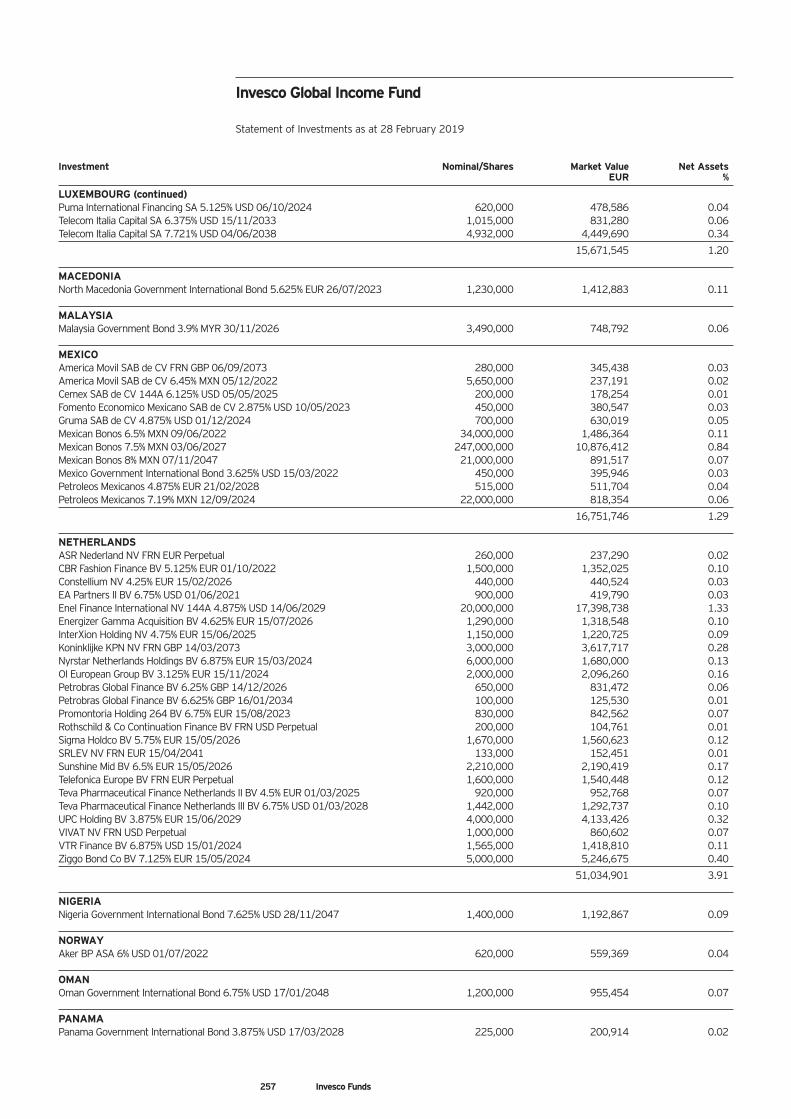
Invesco Global Income Fund Statement of Investments as at 28 February 2019
Investment Nominal/Shares Market Value Net Assets EUR %
LUXEMBOURG (continued) Puma International Financing SA 5.125% USD 06/10/2024 620,000 478,586 0.04 Telecom Italia Capital SA 6.375% USD 15/11/2033 1,015,000 831,280 0.06 Telecom Italia Capital SA 7.721% USD 04/06/2038 4,932,000 4,449,690 0.34
15,671,545 1.20 MACEDONIA North Macedonia Government International Bond 5.625% EUR 26/07/2023 1,230,000 1,412,883 0.11 MALAYSIA Malaysia Government Bond 3.9% MYR 30/11/2026 3,490,000 748,792 0.06 MEXICO America Movil SAB de CV FRN GBP 06/09/2073 280,000 345,438 0.03 America Movil SAB de CV 6.45% MXN 05/12/2022 5,650,000 237,191 0.02 Cemex SAB de CV 144A 6.125% USD 05/05/2025 200,000 178,254 0.01 Fomento Economico Mexicano SAB de CV 2.875% USD 10/05/2023 450,000 380,547 0.03 Gruma SAB de CV 4.875% USD 01/12/2024 700,000 630,019 0.05 Mexican Bonos 6.5% MXN 09/06/2022 34,000,000 1,486,364 0.11 Mexican Bonos 7.5% MXN 03/06/2027 247,000,000 10,876,412 0.84 Mexican Bonos 8% MXN 07/11/2047 21,000,000 891,517 0.07 Mexico Government International Bond 3.625% USD 15/03/2022 450,000 395,946 0.03 Petroleos Mexicanos 4.875% EUR 21/02/2028 515,000 511,704 0.04 Petroleos Mexicanos 7.19% MXN 12/09/2024 22,000,000 818,354 0.06
16,751,746 1.29 NETHERLANDS ASR Nederland NV FRN EUR Perpetual 260,000 237,290 0.02 CBR Fashion Finance BV 5.125% EUR 01/10/2022 1,500,000 1,352,025 0.10 Constellium NV 4.25% EUR 15/02/2026 440,000 440,524 0.03 EA Partners II BV 6.75% USD 01/06/2021 900,000 419,790 0.03 Enel Finance International NV 144A 4.875% USD 14/06/2029 20,000,000 17,398,738 1.33 Energizer Gamma Acquisition BV 4.625% EUR 15/07/2026 1,290,000 1,318,548 0.10 InterXion Holding NV 4.75% EUR 15/06/2025 1,150,000 1,220,725 0.09 Koninklijke KPN NV FRN GBP 14/03/2073 3,000,000 3,617,717 0.28 Nyrstar Netherlands Holdings BV 6.875% EUR 15/03/2024 6,000,000 1,680,000 0.13 OI European Group BV 3.125% EUR 15/11/2024 2,000,000 2,096,260 0.16 Petrobras Global Finance BV 6.25% GBP 14/12/2026 650,000 831,472 0.06 Petrobras Global Finance BV 6.625% GBP 16/01/2034 100,000 125,530 0.01 Promontoria Holding 264 BV 6.75% EUR 15/08/2023 830,000 842,562 0.07 Rothschild & Co Continuation Finance BV FRN USD Perpetual 200,000 104,761 0.01 Sigma Holdco BV 5.75% EUR 15/05/2026 1,670,000 1,560,623 0.12 SRLEV NV FRN EUR 15/04/2041 133,000 152,451 0.01 Sunshine Mid BV 6.5% EUR 15/05/2026 2,210,000 2,190,419 0.17 Telefonica Europe BV FRN EUR Perpetual 1,600,000 1,540,448 0.12 Teva Pharmaceutical Finance Netherlands II BV 4.5% EUR 01/03/2025 920,000 952,768 0.07 Teva Pharmaceutical Finance Netherlands III BV 6.75% USD 01/03/2028 1,442,000 1,292,737 0.10 UPC Holding BV 3.875% EUR 15/06/2029 4,000,000 4,133,426 0.32 VIVAT NV FRN USD Perpetual 1,000,000 860,602 0.07 VTR Finance BV 6.875% USD 15/01/2024 1,565,000 1,418,810 0.11 Ziggo Bond Co BV 7.125% EUR 15/05/2024 5,000,000 5,246,675 0.40
51,034,901 3.91 NIGERIA Nigeria Government International Bond 7.625% USD 28/11/2047 1,400,000 1,192,867 0.09 NORWAY Aker BP ASA 6% USD 01/07/2022 620,000 559,369 0.04 OMAN Oman Government International Bond 6.75% USD 17/01/2048 1,200,000 955,454 0.07 PANAMA Panama Government International Bond 3.875% USD 17/03/2028 225,000 200,914 0.02
257 Invesco Funds
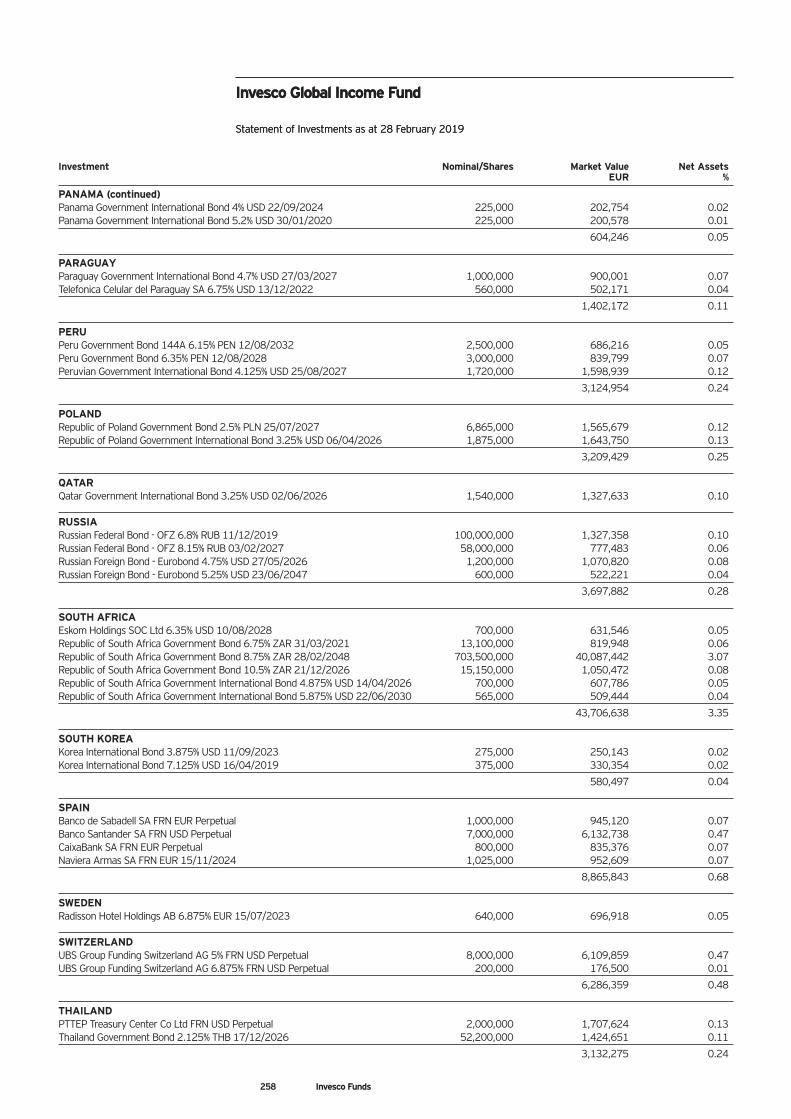
Investment Nominal/Shares Market Value Net Assets EUR %
PANAMA (continued) Panama Government International Bond 4% USD 22/09/2024 225,000 202,754 0.02 Panama Government International Bond 5.2% USD 30/01/2020 225,000 200,578 0.01
604,246 0.05 PARAGUAY Paraguay Government International Bond 4.7% USD 27/03/2027 1,000,000 900,001 0.07 Telefonica Celular del Paraguay SA 6.75% USD 13/12/2022 560,000 502,171 0.04
1,402,172 0.11 PERU Peru Government Bond 144A 6.15% PEN 12/08/2032 2,500,000 686,216 0.05 Peru Government Bond 6.35% PEN 12/08/2028 3,000,000 839,799 0.07 Peruvian Government International Bond 4.125% USD 25/08/2027 1,720,000 1,598,939 0.12
3,124,954 0.24 POLAND Republic of Poland Government Bond 2.5% PLN 25/07/2027 6,865,000 1,565,679 0.12 Republic of Poland Government International Bond 3.25% USD 06/04/2026 1,875,000 1,643,750 0.13
3,209,429 0.25 QATAR Qatar Government International Bond 3.25% USD 02/06/2026 1,540,000 1,327,633 0.10 RUSSIA Russian Federal Bond - OFZ 6.8% RUB 11/12/2019 100,000,000 1,327,358 0.10 Russian Federal Bond - OFZ 8.15% RUB 03/02/2027 58,000,000 777,483 0.06 Russian Foreign Bond - Eurobond 4.75% USD 27/05/2026 1,200,000 1,070,820 0.08 Russian Foreign Bond - Eurobond 5.25% USD 23/06/2047 600,000 522,221 0.04
3,697,882 0.28 SOUTH AFRICA Eskom Holdings SOC Ltd 6.35% USD 10/08/2028 700,000 631,546 0.05 Republic of South Africa Government Bond 6.75% ZAR 31/03/2021 13,100,000 819,948 0.06 Republic of South Africa Government Bond 8.75% ZAR 28/02/2048 703,500,000 40,087,442 3.07 Republic of South Africa Government Bond 10.5% ZAR 21/12/2026 15,150,000 1,050,472 0.08 Republic of South Africa Government International Bond 4.875% USD 14/04/2026 700,000 607,786 0.05 Republic of South Africa Government International Bond 5.875% USD 22/06/2030 565,000 509,444 0.04
43,706,638 3.35 SOUTH KOREA Korea International Bond 3.875% USD 11/09/2023 275,000 250,143 0.02 Korea International Bond 7.125% USD 16/04/2019 375,000 330,354 0.02
580,497 0.04 SPAIN Banco de Sabadell SA FRN EUR Perpetual 1,000,000 945,120 0.07 Banco Santander SA FRN USD Perpetual 7,000,000 6,132,738 0.47 CaixaBank SA FRN EUR Perpetual 800,000 835,376 0.07 Naviera Armas SA FRN EUR 15/11/2024 1,025,000 952,609 0.07
8,865,843 0.68 SWEDEN Radisson Hotel Holdings AB 6.875% EUR 15/07/2023 640,000 696,918 0.05 SWITZERLAND UBS Group Funding Switzerland AG 5% FRN USD Perpetual 8,000,000 6,109,859 0.47 UBS Group Funding Switzerland AG 6.875% FRN USD Perpetual 200,000 176,500 0.01
6,286,359 0.48 THAILAND PTTEP Treasury Center Co Ltd FRN USD Perpetual 2,000,000 1,707,624 0.13 Thailand Government Bond 2.125% THB 17/12/2026 52,200,000 1,424,651 0.11
3,132,275 0.24
Invesco Global Income Fund Statement of Investments as at 28 February 2019
258 Invesco Funds
Invesco Global Income Fund Statement of Investments as at 28 February 2019
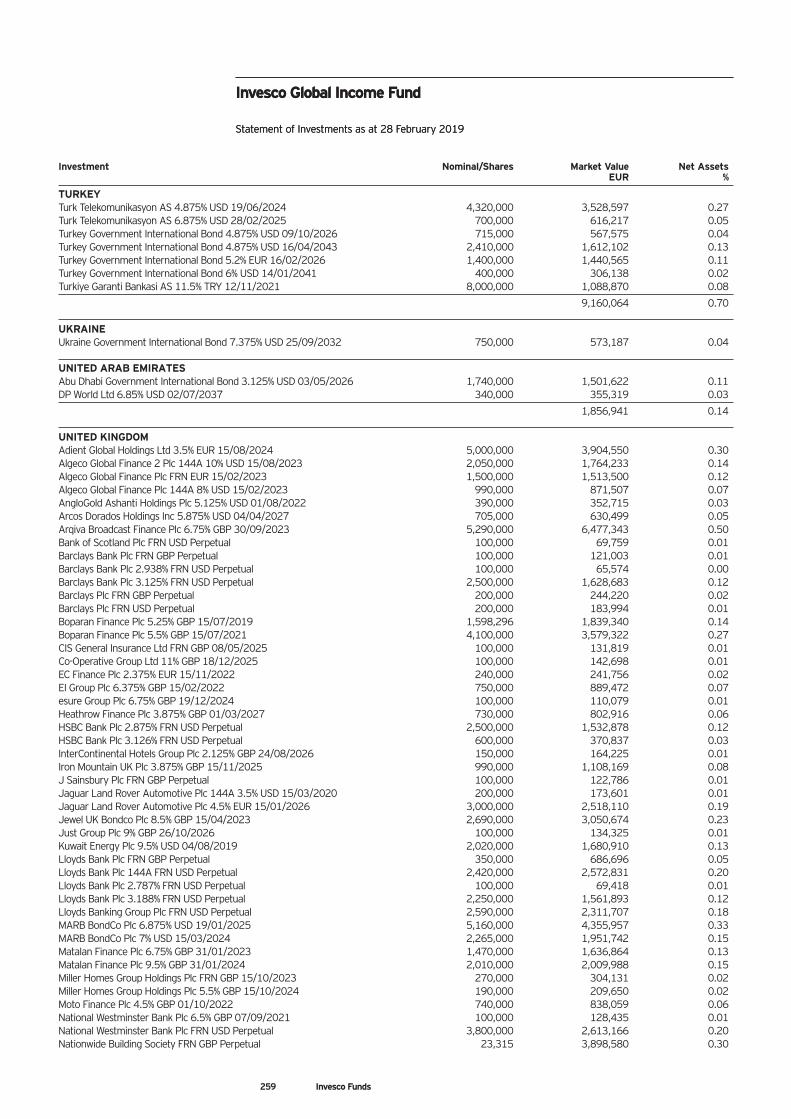
Investment Nominal/Shares Market Value Net Assets EUR %
TURKEY Turk Telekomunikasyon AS 4.875% USD 19/06/2024 4,320,000 3,528,597 0.27 Turk Telekomunikasyon AS 6.875% USD 28/02/2025 700,000 616,217 0.05 Turkey Government International Bond 4.875% USD 09/10/2026 715,000 567,575 0.04 Turkey Government International Bond 4.875% USD 16/04/2043 2,410,000 1,612,102 0.13 Turkey Government International Bond 5.2% EUR 16/02/2026 1,400,000 1,440,565 0.11 Turkey Government International Bond 6% USD 14/01/2041 400,000 306,138 0.02 Turkiye Garanti Bankasi AS 11.5% TRY 12/11/2021 8,000,000 1,088,870 0.08
9,160,064 0.70 UKRAINE Ukraine Government International Bond 7.375% USD 25/09/2032 750,000 573,187 0.04 UNITED ARAB EMIRATES Abu Dhabi Government International Bond 3.125% USD 03/05/2026 1,740,000 1,501,622 0.11 DP World Ltd 6.85% USD 02/07/2037 340,000 355,319 0.03
1,856,941 0.14 UNITED KINGDOM Adient Global Holdings Ltd 3.5% EUR 15/08/2024 5,000,000 3,904,550 0.30 Algeco Global Finance 2 Plc 144A 10% USD 15/08/2023 2,050,000 1,764,233 0.14 Algeco Global Finance Plc FRN EUR 15/02/2023 1,500,000 1,513,500 0.12 Algeco Global Finance Plc 144A 8% USD 15/02/2023 990,000 871,507 0.07 AngloGold Ashanti Holdings Plc 5.125% USD 01/08/2022 390,000 352,715 0.03 Arcos Dorados Holdings Inc 5.875% USD 04/04/2027 705,000 630,499 0.05 Arqiva Broadcast Finance Plc 6.75% GBP 30/09/2023 5,290,000 6,477,343 0.50 Bank of Scotland Plc FRN USD Perpetual 100,000 69,759 0.01 Barclays Bank Plc FRN GBP Perpetual 100,000 121,003 0.01 Barclays Bank Plc 2.938% FRN USD Perpetual 100,000 65,574 0.00 Barclays Bank Plc 3.125% FRN USD Perpetual 2,500,000 1,628,683 0.12 Barclays Plc FRN GBP Perpetual 200,000 244,220 0.02 Barclays Plc FRN USD Perpetual 200,000 183,994 0.01 Boparan Finance Plc 5.25% GBP 15/07/2019 1,598,296 1,839,340 0.14 Boparan Finance Plc 5.5% GBP 15/07/2021 4,100,000 3,579,322 0.27 CIS General Insurance Ltd FRN GBP 08/05/2025 100,000 131,819 0.01 Co-Operative Group Ltd 11% GBP 18/12/2025 100,000 142,698 0.01 EC Finance Plc 2.375% EUR 15/11/2022 240,000 241,756 0.02 EI Group Plc 6.375% GBP 15/02/2022 750,000 889,472 0.07 esure Group Plc 6.75% GBP 19/12/2024 100,000 110,079 0.01 Heathrow Finance Plc 3.875% GBP 01/03/2027 730,000 802,916 0.06 HSBC Bank Plc 2.875% FRN USD Perpetual 2,500,000 1,532,878 0.12 HSBC Bank Plc 3.126% FRN USD Perpetual 600,000 370,837 0.03 InterContinental Hotels Group Plc 2.125% GBP 24/08/2026 150,000 164,225 0.01 Iron Mountain UK Plc 3.875% GBP 15/11/2025 990,000 1,108,169 0.08 J Sainsbury Plc FRN GBP Perpetual 100,000 122,786 0.01 Jaguar Land Rover Automotive Plc 144A 3.5% USD 15/03/2020 200,000 173,601 0.01 Jaguar Land Rover Automotive Plc 4.5% EUR 15/01/2026 3,000,000 2,518,110 0.19 Jewel UK Bondco Plc 8.5% GBP 15/04/2023 2,690,000 3,050,674 0.23 Just Group Plc 9% GBP 26/10/2026 100,000 134,325 0.01 Kuwait Energy Plc 9.5% USD 04/08/2019 2,020,000 1,680,910 0.13 Lloyds Bank Plc FRN GBP Perpetual 350,000 686,696 0.05 Lloyds Bank Plc 144A FRN USD Perpetual 2,420,000 2,572,831 0.20 Lloyds Bank Plc 2.787% FRN USD Perpetual 100,000 69,418 0.01 Lloyds Bank Plc 3.188% FRN USD Perpetual 2,250,000 1,561,893 0.12 Lloyds Banking Group Plc FRN USD Perpetual 2,590,000 2,311,707 0.18 MARB BondCo Plc 6.875% USD 19/01/2025 5,160,000 4,355,957 0.33 MARB BondCo Plc 7% USD 15/03/2024 2,265,000 1,951,742 0.15 Matalan Finance Plc 6.75% GBP 31/01/2023 1,470,000 1,636,864 0.13 Matalan Finance Plc 9.5% GBP 31/01/2024 2,010,000 2,009,988 0.15 Miller Homes Group Holdings Plc FRN GBP 15/10/2023 270,000 304,131 0.02 Miller Homes Group Holdings Plc 5.5% GBP 15/10/2024 190,000 209,650 0.02 Moto Finance Plc 4.5% GBP 01/10/2022 740,000 838,059 0.06 National Westminster Bank Plc 6.5% GBP 07/09/2021 100,000 128,435 0.01 National Westminster Bank Plc FRN USD Perpetual 3,800,000 2,613,166 0.20 Nationwide Building Society FRN GBP Perpetual 23,315 3,898,580 0.30
Invesco Global Income Fund Statement of Investments as at 28 February 2019
259 Invesco Funds
Invesco Global Income Fund Statement of Investments as at 28 February 2019
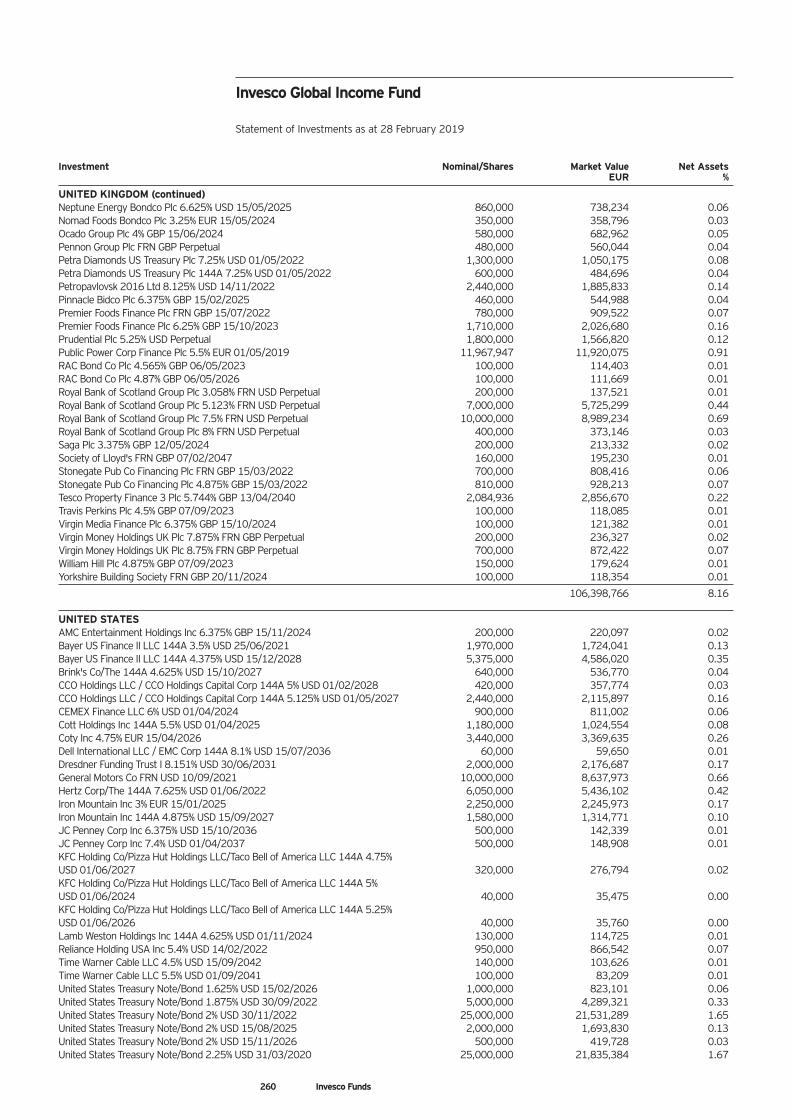
Investment Nominal/Shares Market Value Net Assets EUR %
UNITED KINGDOM (continued) Neptune Energy Bondco Plc 6.625% USD 15/05/2025 860,000 738,234 0.06 Nomad Foods Bondco Plc 3.25% EUR 15/05/2024 350,000 358,796 0.03 Ocado Group Plc 4% GBP 15/06/2024 580,000 682,962 0.05 Pennon Group Plc FRN GBP Perpetual 480,000 560,044 0.04 Petra Diamonds US Treasury Plc 7.25% USD 01/05/2022 1,300,000 1,050,175 0.08 Petra Diamonds US Treasury Plc 144A 7.25% USD 01/05/2022 600,000 484,696 0.04 Petropavlovsk 2016 Ltd 8.125% USD 14/11/2022 2,440,000 1,885,833 0.14 Pinnacle Bidco Plc 6.375% GBP 15/02/2025 460,000 544,988 0.04 Premier Foods Finance Plc FRN GBP 15/07/2022 780,000 909,522 0.07 Premier Foods Finance Plc 6.25% GBP 15/10/2023 1,710,000 2,026,680 0.16 Prudential Plc 5.25% USD Perpetual 1,800,000 1,566,820 0.12 Public Power Corp Finance Plc 5.5% EUR 01/05/2019 11,967,947 11,920,075 0.91 RAC Bond Co Plc 4.565% GBP 06/05/2023 100,000 114,403 0.01 RAC Bond Co Plc 4.87% GBP 06/05/2026 100,000 111,669 0.01 Royal Bank of Scotland Group Plc 3.058% FRN USD Perpetual 200,000 137,521 0.01 Royal Bank of Scotland Group Plc 5.123% FRN USD Perpetual 7,000,000 5,725,299 0.44 Royal Bank of Scotland Group Plc 7.5% FRN USD Perpetual 10,000,000 8,989,234 0.69 Royal Bank of Scotland Group Plc 8% FRN USD Perpetual 400,000 373,146 0.03 Saga Plc 3.375% GBP 12/05/2024 200,000 213,332 0.02 Society of Lloyd's FRN GBP 07/02/2047 160,000 195,230 0.01 Stonegate Pub Co Financing Plc FRN GBP 15/03/2022 700,000 808,416 0.06 Stonegate Pub Co Financing Plc 4.875% GBP 15/03/2022 810,000 928,213 0.07 Tesco Property Finance 3 Plc 5.744% GBP 13/04/2040 2,084,936 2,856,670 0.22 Travis Perkins Plc 4.5% GBP 07/09/2023 100,000 118,085 0.01 Virgin Media Finance Plc 6.375% GBP 15/10/2024 100,000 121,382 0.01 Virgin Money Holdings UK Plc 7.875% FRN GBP Perpetual 200,000 236,327 0.02 Virgin Money Holdings UK Plc 8.75% FRN GBP Perpetual 700,000 872,422 0.07 William Hill Plc 4.875% GBP 07/09/2023 150,000 179,624 0.01 Yorkshire Building Society FRN GBP 20/11/2024 100,000 118,354 0.01
106,398,766 8.16 UNITED STATES AMC Entertainment Holdings Inc 6.375% GBP 15/11/2024 200,000 220,097 0.02 Bayer US Finance II LLC 144A 3.5% USD 25/06/2021 1,970,000 1,724,041 0.13 Bayer US Finance II LLC 144A 4.375% USD 15/12/2028 5,375,000 4,586,020 0.35 Brink's Co/The 144A 4.625% USD 15/10/2027 640,000 536,770 0.04 CCO Holdings LLC / CCO Holdings Capital Corp 144A 5% USD 01/02/2028 420,000 357,774 0.03 CCO Holdings LLC / CCO Holdings Capital Corp 144A 5.125% USD 01/05/2027 2,440,000 2,115,897 0.16 CEMEX Finance LLC 6% USD 01/04/2024 900,000 811,002 0.06 Cott Holdings Inc 144A 5.5% USD 01/04/2025 1,180,000 1,024,554 0.08 Coty Inc 4.75% EUR 15/04/2026 3,440,000 3,369,635 0.26 Dell International LLC / EMC Corp 144A 8.1% USD 15/07/2036 60,000 59,650 0.01 Dresdner Funding Trust I 8.151% USD 30/06/2031 2,000,000 2,176,687 0.17 General Motors Co FRN USD 10/09/2021 10,000,000 8,637,973 0.66 Hertz Corp/The 144A 7.625% USD 01/06/2022 6,050,000 5,436,102 0.42 Iron Mountain Inc 3% EUR 15/01/2025 2,250,000 2,245,973 0.17 Iron Mountain Inc 144A 4.875% USD 15/09/2027 1,580,000 1,314,771 0.10 JC Penney Corp Inc 6.375% USD 15/10/2036 500,000 142,339 0.01 JC Penney Corp Inc 7.4% USD 01/04/2037 500,000 148,908 0.01 KFC Holding Co/Pizza Hut Holdings LLC/Taco Bell of America LLC 144A 4.75% USD 01/06/2027 320,000 276,794 0.02 KFC Holding Co/Pizza Hut Holdings LLC/Taco Bell of America LLC 144A 5% USD 01/06/2024 40,000 35,475 0.00 KFC Holding Co/Pizza Hut Holdings LLC/Taco Bell of America LLC 144A 5.25% USD 01/06/2026 40,000 35,760 0.00 Lamb Weston Holdings Inc 144A 4.625% USD 01/11/2024 130,000 114,725 0.01 Reliance Holding USA Inc 5.4% USD 14/02/2022 950,000 866,542 0.07 Time Warner Cable LLC 4.5% USD 15/09/2042 140,000 103,626 0.01 Time Warner Cable LLC 5.5% USD 01/09/2041 100,000 83,209 0.01 United States Treasury Note/Bond 1.625% USD 15/02/2026 1,000,000 823,101 0.06 United States Treasury Note/Bond 1.875% USD 30/09/2022 5,000,000 4,289,321 0.33 United States Treasury Note/Bond 2% USD 30/11/2022 25,000,000 21,531,289 1.65 United States Treasury Note/Bond 2% USD 15/08/2025 2,000,000 1,693,830 0.13 United States Treasury Note/Bond 2% USD 15/11/2026 500,000 419,728 0.03 United States Treasury Note/Bond 2.25% USD 31/03/2020 25,000,000 21,835,384 1.67
Invesco Global Income Fund Statement of Investments as at 28 February 2019
260 Invesco Funds
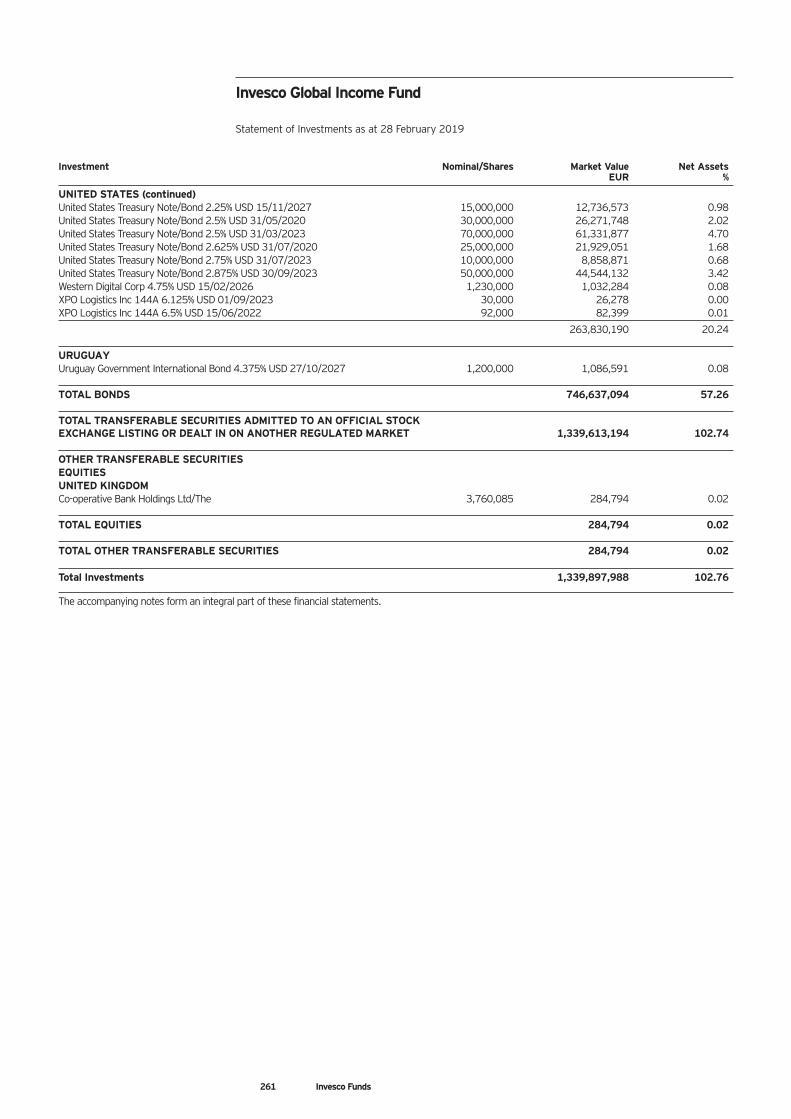
Investment Nominal/Shares Market Value Net Assets EUR %
UNITED STATES (continued) United States Treasury Note/Bond 2.25% USD 15/11/2027 15,000,000 12,736,573 0.98 United States Treasury Note/Bond 2.5% USD 31/05/2020 30,000,000 26,271,748 2.02 United States Treasury Note/Bond 2.5% USD 31/03/2023 70,000,000 61,331,877 4.70 United States Treasury Note/Bond 2.625% USD 31/07/2020 25,000,000 21,929,051 1.68 United States Treasury Note/Bond 2.75% USD 31/07/2023 10,000,000 8,858,871 0.68 United States Treasury Note/Bond 2.875% USD 30/09/2023 50,000,000 44,544,132 3.42 Western Digital Corp 4.75% USD 15/02/2026 1,230,000 1,032,284 0.08 XPO Logistics Inc 144A 6.125% USD 01/09/2023 30,000 26,278 0.00 XPO Logistics Inc 144A 6.5% USD 15/06/2022 92,000 82,399 0.01
263,830,190 20.24 URUGUAY Uruguay Government International Bond 4.375% USD 27/10/2027 1,200,000 1,086,591 0.08 TOTAL BONDS 746,637,094 57.26 TOTAL TRANSFERABLE SECURITIES ADMITTED TO AN OFFICIAL STOCK EXCHANGE LISTING OR DEALT IN ON ANOTHER REGULATED MARKET 1,339,613,194 102.74 OTHER TRANSFERABLE SECURITIES EQUITIES UNITED KINGDOM Co-operative Bank Holdings Ltd/The 3,760,085 284,794 0.02 TOTAL EQUITIES 284,794 0.02 TOTAL OTHER TRANSFERABLE SECURITIES 284,794 0.02 Total Investments 1,339,897,988 102.76
The accompanying notes form an integral part of these financial statements.
Invesco Global Income Fund Statement of Investments as at 28 February 2019
261 Invesco Funds
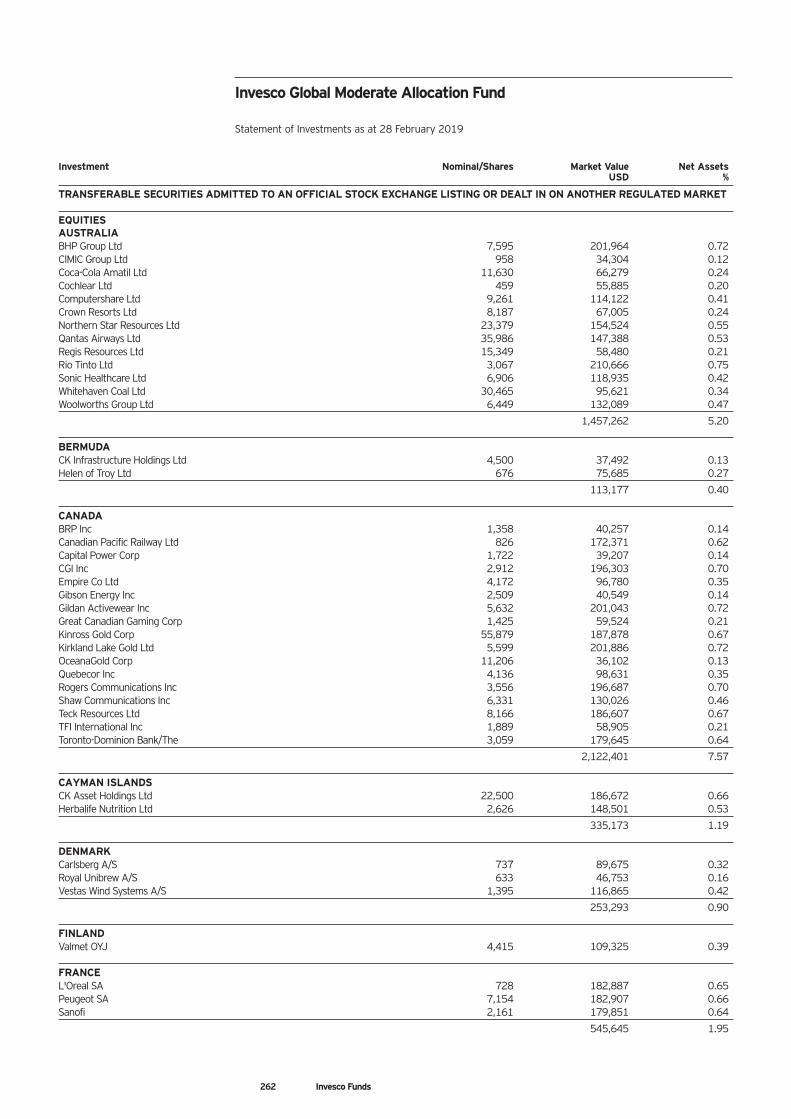
Invesco Global Moderate Allocation Fund Statement of Investments as at 28 February 2019
Investment Nominal/Shares Market Value Net Assets USD %
TRANSFERABLE SECURITIES ADMITTED TO AN OFFICIAL STOCK EXCHANGE LISTING OR DEALT IN ON ANOTHER REGULATED MARKET EQUITIES AUSTRALIA BHP Group Ltd 7,595 201,964 0.72 CIMIC Group Ltd 958 34,304 0.12 Coca-Cola Amatil Ltd 11,630 66,279 0.24 Cochlear Ltd 459 55,885 0.20 Computershare Ltd 9,261 114,122 0.41 Crown Resorts Ltd 8,187 67,005 0.24 Northern Star Resources Ltd 23,379 154,524 0.55 Qantas Airways Ltd 35,986 147,388 0.53 Regis Resources Ltd 15,349 58,480 0.21 Rio Tinto Ltd 3,067 210,666 0.75 Sonic Healthcare Ltd 6,906 118,935 0.42 Whitehaven Coal Ltd 30,465 95,621 0.34 Woolworths Group Ltd 6,449 132,089 0.47
1,457,262 5.20 BERMUDA CK Infrastructure Holdings Ltd 4,500 37,492 0.13 Helen of Troy Ltd 676 75,685 0.27
113,177 0.40 CANADA BRP Inc 1,358 40,257 0.14 Canadian Pacific Railway Ltd 826 172,371 0.62 Capital Power Corp 1,722 39,207 0.14 CGI Inc 2,912 196,303 0.70 Empire Co Ltd 4,172 96,780 0.35 Gibson Energy Inc 2,509 40,549 0.14 Gildan Activewear Inc 5,632 201,043 0.72 Great Canadian Gaming Corp 1,425 59,524 0.21 Kinross Gold Corp 55,879 187,878 0.67 Kirkland Lake Gold Ltd 5,599 201,886 0.72 OceanaGold Corp 11,206 36,102 0.13 Quebecor Inc 4,136 98,631 0.35 Rogers Communications Inc 3,556 196,687 0.70 Shaw Communications Inc 6,331 130,026 0.46 Teck Resources Ltd 8,166 186,607 0.67 TFI International Inc 1,889 58,905 0.21 Toronto-Dominion Bank/The 3,059 179,645 0.64
2,122,401 7.57 CAYMAN ISLANDS CK Asset Holdings Ltd 22,500 186,672 0.66 Herbalife Nutrition Ltd 2,626 148,501 0.53
335,173 1.19 DENMARK Carlsberg A/S 737 89,675 0.32 Royal Unibrew A/S 633 46,753 0.16 Vestas Wind Systems A/S 1,395 116,865 0.42
253,293 0.90 FINLAND Valmet OYJ 4,415 109,325 0.39 FRANCE L'Oreal SA 728 182,887 0.65 Peugeot SA 7,154 182,907 0.66 Sanofi 2,161 179,851 0.64
545,645 1.95
262 Invesco Funds
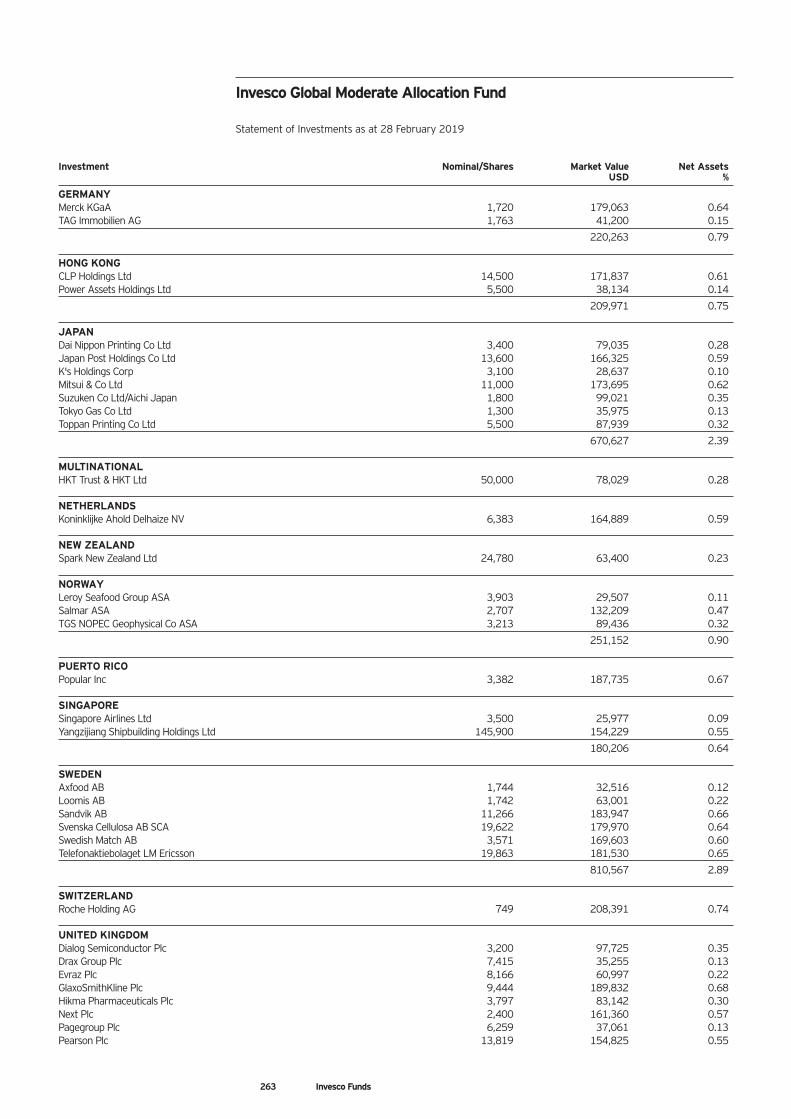
Investment Nominal/Shares Market Value Net Assets USD %
GERMANY Merck KGaA 1,720 179,063 0.64 TAG Immobilien AG 1,763 41,200 0.15
220,263 0.79 HONG KONG CLP Holdings Ltd 14,500 171,837 0.61 Power Assets Holdings Ltd 5,500 38,134 0.14
209,971 0.75 JAPAN Dai Nippon Printing Co Ltd 3,400 79,035 0.28 Japan Post Holdings Co Ltd 13,600 166,325 0.59 K's Holdings Corp 3,100 28,637 0.10 Mitsui & Co Ltd 11,000 173,695 0.62 Suzuken Co Ltd/Aichi Japan 1,800 99,021 0.35 Tokyo Gas Co Ltd 1,300 35,975 0.13 Toppan Printing Co Ltd 5,500 87,939 0.32
670,627 2.39 MULTINATIONAL HKT Trust & HKT Ltd 50,000 78,029 0.28 NETHERLANDS Koninklijke Ahold Delhaize NV 6,383 164,889 0.59 NEW ZEALAND Spark New Zealand Ltd 24,780 63,400 0.23 NORWAY Leroy Seafood Group ASA 3,903 29,507 0.11 Salmar ASA 2,707 132,209 0.47 TGS NOPEC Geophysical Co ASA 3,213 89,436 0.32
251,152 0.90 PUERTO RICO Popular Inc 3,382 187,735 0.67 SINGAPORE Singapore Airlines Ltd 3,500 25,977 0.09 Yangzijiang Shipbuilding Holdings Ltd 145,900 154,229 0.55
180,206 0.64 SWEDEN Axfood AB 1,744 32,516 0.12 Loomis AB 1,742 63,001 0.22 Sandvik AB 11,266 183,947 0.66 Svenska Cellulosa AB SCA 19,622 179,970 0.64 Swedish Match AB 3,571 169,603 0.60 Telefonaktiebolaget LM Ericsson 19,863 181,530 0.65
810,567 2.89 SWITZERLAND Roche Holding AG 749 208,391 0.74 UNITED KINGDOM Dialog Semiconductor Plc 3,200 97,725 0.35 Drax Group Plc 7,415 35,255 0.13 Evraz Plc 8,166 60,997 0.22 GlaxoSmithKline Plc 9,444 189,832 0.68 Hikma Pharmaceuticals Plc 3,797 83,142 0.30 Next Plc 2,400 161,360 0.57 Pagegroup Plc 6,259 37,061 0.13 Pearson Plc 13,819 154,825 0.55
Invesco Global Moderate Allocation Fund Statement of Investments as at 28 February 2019
263 Invesco Funds
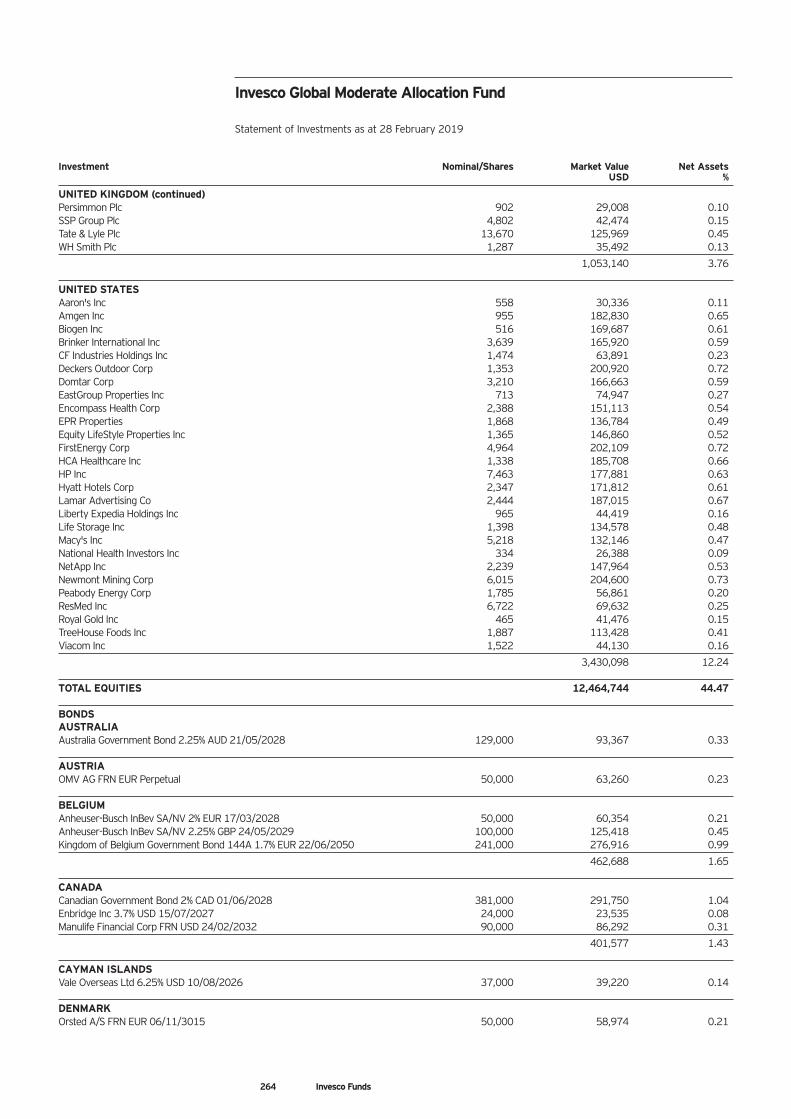
Invesco Global Moderate Allocation Fund Statement of Investments as at 28 February 2019
Investment Nominal/Shares Market Value Net Assets USD %
UNITED KINGDOM (continued) Persimmon Plc 902 29,008 0.10 SSP Group Plc 4,802 42,474 0.15 Tate & Lyle Plc 13,670 125,969 0.45 WH Smith Plc 1,287 35,492 0.13
1,053,140 3.76 UNITED STATES Aaron's Inc 558 30,336 0.11 Amgen Inc 955 182,830 0.65 Biogen Inc 516 169,687 0.61 Brinker International Inc 3,639 165,920 0.59 CF Industries Holdings Inc 1,474 63,891 0.23 Deckers Outdoor Corp 1,353 200,920 0.72 Domtar Corp 3,210 166,663 0.59 EastGroup Properties Inc 713 74,947 0.27 Encompass Health Corp 2,388 151,113 0.54 EPR Properties 1,868 136,784 0.49 Equity LifeStyle Properties Inc 1,365 146,860 0.52 FirstEnergy Corp 4,964 202,109 0.72 HCA Healthcare Inc 1,338 185,708 0.66 HP Inc 7,463 177,881 0.63 Hyatt Hotels Corp 2,347 171,812 0.61 Lamar Advertising Co 2,444 187,015 0.67 Liberty Expedia Holdings Inc 965 44,419 0.16 Life Storage Inc 1,398 134,578 0.48 Macy's Inc 5,218 132,146 0.47 National Health Investors Inc 334 26,388 0.09 NetApp Inc 2,239 147,964 0.53 Newmont Mining Corp 6,015 204,600 0.73 Peabody Energy Corp 1,785 56,861 0.20 ResMed Inc 6,722 69,632 0.25 Royal Gold Inc 465 41,476 0.15 TreeHouse Foods Inc 1,887 113,428 0.41 Viacom Inc 1,522 44,130 0.16
3,430,098 12.24 TOTAL EQUITIES 12,464,744 44.47 BONDS AUSTRALIA Australia Government Bond 2.25% AUD 21/05/2028 129,000 93,367 0.33 AUSTRIA OMV AG FRN EUR Perpetual 50,000 63,260 0.23 BELGIUM Anheuser-Busch InBev SA/NV 2% EUR 17/03/2028 50,000 60,354 0.21 Anheuser-Busch InBev SA/NV 2.25% GBP 24/05/2029 100,000 125,418 0.45 Kingdom of Belgium Government Bond 144A 1.7% EUR 22/06/2050 241,000 276,916 0.99
462,688 1.65 CANADA Canadian Government Bond 2% CAD 01/06/2028 381,000 291,750 1.04 Enbridge Inc 3.7% USD 15/07/2027 24,000 23,535 0.08 Manulife Financial Corp FRN USD 24/02/2032 90,000 86,292 0.31
401,577 1.43 CAYMAN ISLANDS Vale Overseas Ltd 6.25% USD 10/08/2026 37,000 39,220 0.14 DENMARK Orsted A/S FRN EUR 06/11/3015 50,000 58,974 0.21
264 Invesco Funds
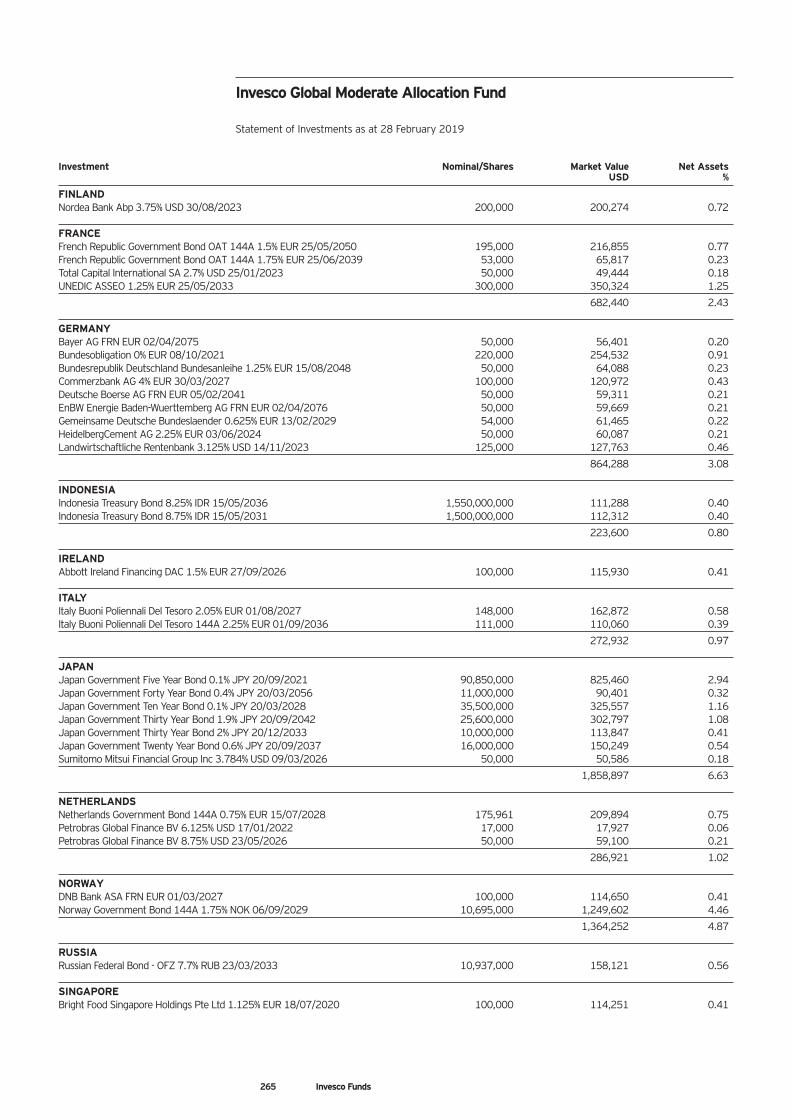
Invesco Global Moderate Allocation Fund Statement of Investments as at 28 February 2019
Investment Nominal/Shares Market Value Net Assets USD %
FINLAND Nordea Bank Abp 3.75% USD 30/08/2023 200,000 200,274 0.72 FRANCE French Republic Government Bond OAT 144A 1.5% EUR 25/05/2050 195,000 216,855 0.77 French Republic Government Bond OAT 144A 1.75% EUR 25/06/2039 53,000 65,817 0.23 Total Capital International SA 2.7% USD 25/01/2023 50,000 49,444 0.18 UNEDIC ASSEO 1.25% EUR 25/05/2033 300,000 350,324 1.25
682,440 2.43 GERMANY Bayer AG FRN EUR 02/04/2075 50,000 56,401 0.20 Bundesobligation 0% EUR 08/10/2021 220,000 254,532 0.91 Bundesrepublik Deutschland Bundesanleihe 1.25% EUR 15/08/2048 50,000 64,088 0.23 Commerzbank AG 4% EUR 30/03/2027 100,000 120,972 0.43 Deutsche Boerse AG FRN EUR 05/02/2041 50,000 59,311 0.21 EnBW Energie Baden-Wuerttemberg AG FRN EUR 02/04/2076 50,000 59,669 0.21 Gemeinsame Deutsche Bundeslaender 0.625% EUR 13/02/2029 54,000 61,465 0.22 HeidelbergCement AG 2.25% EUR 03/06/2024 50,000 60,087 0.21 Landwirtschaftliche Rentenbank 3.125% USD 14/11/2023 125,000 127,763 0.46
864,288 3.08 INDONESIA Indonesia Treasury Bond 8.25% IDR 15/05/2036 1,550,000,000 111,288 0.40 Indonesia Treasury Bond 8.75% IDR 15/05/2031 1,500,000,000 112,312 0.40
223,600 0.80 IRELAND Abbott Ireland Financing DAC 1.5% EUR 27/09/2026 100,000 115,930 0.41 ITALY Italy Buoni Poliennali Del Tesoro 2.05% EUR 01/08/2027 148,000 162,872 0.58 Italy Buoni Poliennali Del Tesoro 144A 2.25% EUR 01/09/2036 111,000 110,060 0.39
272,932 0.97 JAPAN Japan Government Five Year Bond 0.1% JPY 20/09/2021 90,850,000 825,460 2.94 Japan Government Forty Year Bond 0.4% JPY 20/03/2056 11,000,000 90,401 0.32 Japan Government Ten Year Bond 0.1% JPY 20/03/2028 35,500,000 325,557 1.16 Japan Government Thirty Year Bond 1.9% JPY 20/09/2042 25,600,000 302,797 1.08 Japan Government Thirty Year Bond 2% JPY 20/12/2033 10,000,000 113,847 0.41 Japan Government Twenty Year Bond 0.6% JPY 20/09/2037 16,000,000 150,249 0.54 Sumitomo Mitsui Financial Group Inc 3.784% USD 09/03/2026 50,000 50,586 0.18
1,858,897 6.63 NETHERLANDS Netherlands Government Bond 144A 0.75% EUR 15/07/2028 175,961 209,894 0.75 Petrobras Global Finance BV 6.125% USD 17/01/2022 17,000 17,927 0.06 Petrobras Global Finance BV 8.75% USD 23/05/2026 50,000 59,100 0.21
286,921 1.02 NORWAY DNB Bank ASA FRN EUR 01/03/2027 100,000 114,650 0.41 Norway Government Bond 144A 1.75% NOK 06/09/2029 10,695,000 1,249,602 4.46
1,364,252 4.87 RUSSIA Russian Federal Bond - OFZ 7.7% RUB 23/03/2033 10,937,000 158,121 0.56 SINGAPORE Bright Food Singapore Holdings Pte Ltd 1.125% EUR 18/07/2020 100,000 114,251 0.41
265 Invesco Funds
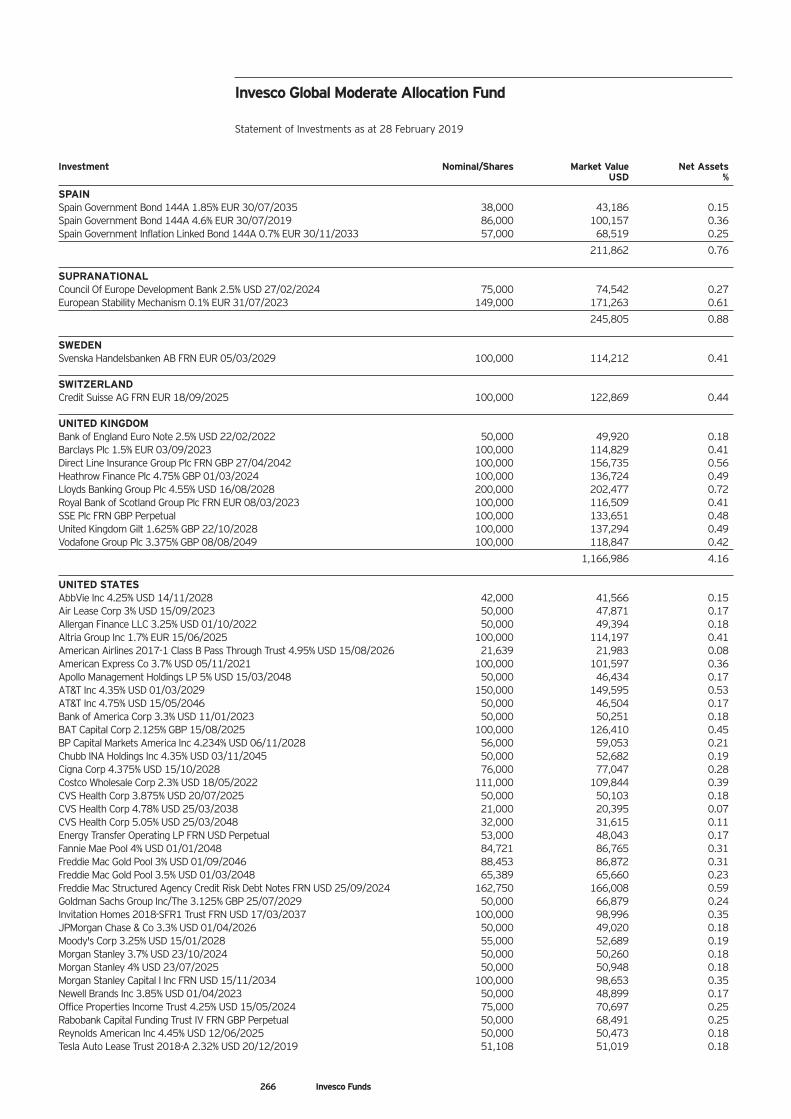
Invesco Global Moderate Allocation Fund Statement of Investments as at 28 February 2019
Investment Nominal/Shares Market Value Net Assets USD %
SPAIN Spain Government Bond 144A 1.85% EUR 30/07/2035 38,000 43,186 0.15 Spain Government Bond 144A 4.6% EUR 30/07/2019 86,000 100,157 0.36 Spain Government Inflation Linked Bond 144A 0.7% EUR 30/11/2033 57,000 68,519 0.25
211,862 0.76 SUPRANATIONAL Council Of Europe Development Bank 2.5% USD 27/02/2024 75,000 74,542 0.27 European Stability Mechanism 0.1% EUR 31/07/2023 149,000 171,263 0.61
245,805 0.88 SWEDEN Svenska Handelsbanken AB FRN EUR 05/03/2029 100,000 114,212 0.41 SWITZERLAND Credit Suisse AG FRN EUR 18/09/2025 100,000 122,869 0.44 UNITED KINGDOM Bank of England Euro Note 2.5% USD 22/02/2022 50,000 49,920 0.18 Barclays Plc 1.5% EUR 03/09/2023 100,000 114,829 0.41 Direct Line Insurance Group Plc FRN GBP 27/04/2042 100,000 156,735 0.56 Heathrow Finance Plc 4.75% GBP 01/03/2024 100,000 136,724 0.49 Lloyds Banking Group Plc 4.55% USD 16/08/2028 200,000 202,477 0.72 Royal Bank of Scotland Group Plc FRN EUR 08/03/2023 100,000 116,509 0.41 SSE Plc FRN GBP Perpetual 100,000 133,651 0.48 United Kingdom Gilt 1.625% GBP 22/10/2028 100,000 137,294 0.49 Vodafone Group Plc 3.375% GBP 08/08/2049 100,000 118,847 0.42
1,166,986 4.16 UNITED STATES AbbVie Inc 4.25% USD 14/11/2028 42,000 41,566 0.15 Air Lease Corp 3% USD 15/09/2023 50,000 47,871 0.17 Allergan Finance LLC 3.25% USD 01/10/2022 50,000 49,394 0.18 Altria Group Inc 1.7% EUR 15/06/2025 100,000 114,197 0.41 American Airlines 2017-1 Class B Pass Through Trust 4.95% USD 15/08/2026 21,639 21,983 0.08 American Express Co 3.7% USD 05/11/2021 100,000 101,597 0.36 Apollo Management Holdings LP 5% USD 15/03/2048 50,000 46,434 0.17 AT&T Inc 4.35% USD 01/03/2029 150,000 149,595 0.53 AT&T Inc 4.75% USD 15/05/2046 50,000 46,504 0.17 Bank of America Corp 3.3% USD 11/01/2023 50,000 50,251 0.18 BAT Capital Corp 2.125% GBP 15/08/2025 100,000 126,410 0.45 BP Capital Markets America Inc 4.234% USD 06/11/2028 56,000 59,053 0.21 Chubb INA Holdings Inc 4.35% USD 03/11/2045 50,000 52,682 0.19 Cigna Corp 4.375% USD 15/10/2028 76,000 77,047 0.28 Costco Wholesale Corp 2.3% USD 18/05/2022 111,000 109,844 0.39 CVS Health Corp 3.875% USD 20/07/2025 50,000 50,103 0.18 CVS Health Corp 4.78% USD 25/03/2038 21,000 20,395 0.07 CVS Health Corp 5.05% USD 25/03/2048 32,000 31,615 0.11 Energy Transfer Operating LP FRN USD Perpetual 53,000 48,043 0.17 Fannie Mae Pool 4% USD 01/01/2048 84,721 86,765 0.31 Freddie Mac Gold Pool 3% USD 01/09/2046 88,453 86,872 0.31 Freddie Mac Gold Pool 3.5% USD 01/03/2048 65,389 65,660 0.23 Freddie Mac Structured Agency Credit Risk Debt Notes FRN USD 25/09/2024 162,750 166,008 0.59 Goldman Sachs Group Inc/The 3.125% GBP 25/07/2029 50,000 66,879 0.24 Invitation Homes 2018-SFR1 Trust FRN USD 17/03/2037 100,000 98,996 0.35 JPMorgan Chase & Co 3.3% USD 01/04/2026 50,000 49,020 0.18 Moody's Corp 3.25% USD 15/01/2028 55,000 52,689 0.19 Morgan Stanley 3.7% USD 23/10/2024 50,000 50,260 0.18 Morgan Stanley 4% USD 23/07/2025 50,000 50,948 0.18 Morgan Stanley Capital I Inc FRN USD 15/11/2034 100,000 98,653 0.35 Newell Brands Inc 3.85% USD 01/04/2023 50,000 48,899 0.17 Office Properties Income Trust 4.25% USD 15/05/2024 75,000 70,697 0.25 Rabobank Capital Funding Trust IV FRN GBP Perpetual 50,000 68,491 0.25 Reynolds American Inc 4.45% USD 12/06/2025 50,000 50,473 0.18 Tesla Auto Lease Trust 2018-A 2.32% USD 20/12/2019 51,108 51,019 0.18
266 Invesco Funds
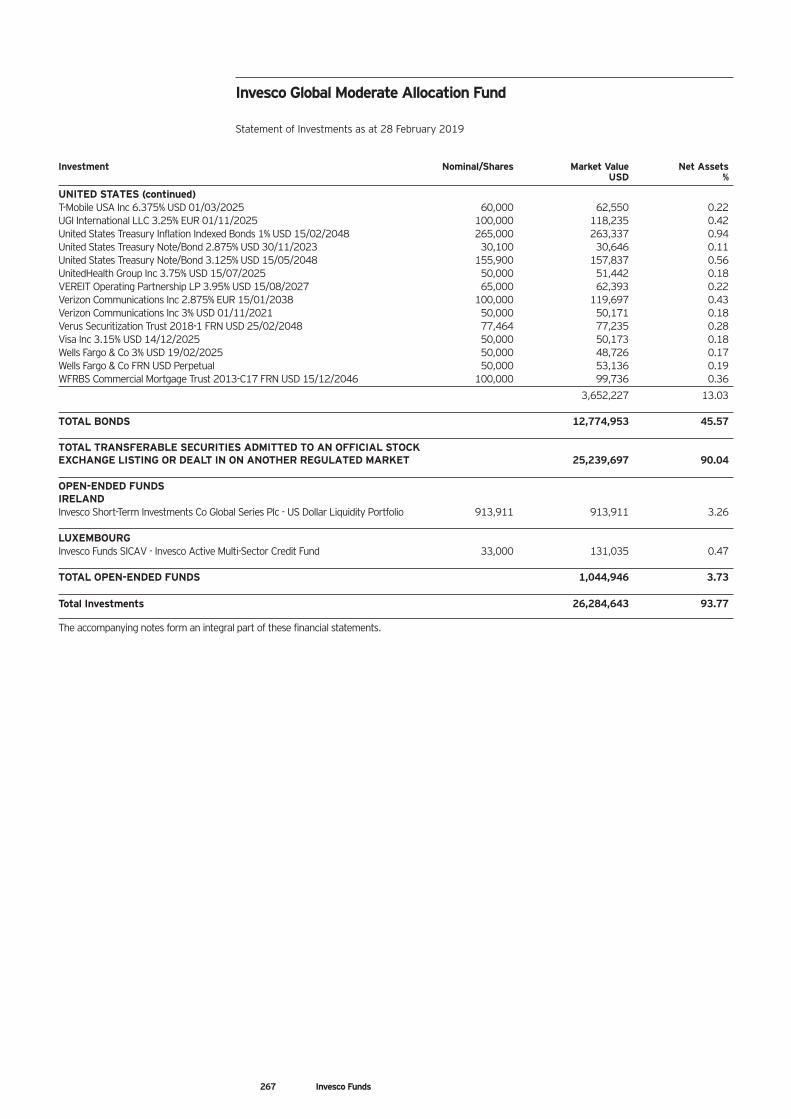
Invesco Global Moderate Allocation Fund Statement of Investments as at 28 February 2019
Investment Nominal/Shares Market Value Net Assets USD %
UNITED STATES (continued) T-Mobile USA Inc 6.375% USD 01/03/2025 60,000 62,550 0.22 UGI International LLC 3.25% EUR 01/11/2025 100,000 118,235 0.42 United States Treasury Inflation Indexed Bonds 1% USD 15/02/2048 265,000 263,337 0.94 United States Treasury Note/Bond 2.875% USD 30/11/2023 30,100 30,646 0.11 United States Treasury Note/Bond 3.125% USD 15/05/2048 155,900 157,837 0.56 UnitedHealth Group Inc 3.75% USD 15/07/2025 50,000 51,442 0.18 VEREIT Operating Partnership LP 3.95% USD 15/08/2027 65,000 62,393 0.22 Verizon Communications Inc 2.875% EUR 15/01/2038 100,000 119,697 0.43 Verizon Communications Inc 3% USD 01/11/2021 50,000 50,171 0.18 Verus Securitization Trust 2018-1 FRN USD 25/02/2048 77,464 77,235 0.28 Visa Inc 3.15% USD 14/12/2025 50,000 50,173 0.18 Wells Fargo & Co 3% USD 19/02/2025 50,000 48,726 0.17 Wells Fargo & Co FRN USD Perpetual 50,000 53,136 0.19 WFRBS Commercial Mortgage Trust 2013-C17 FRN USD 15/12/2046 100,000 99,736 0.36
3,652,227 13.03 TOTAL BONDS 12,774,953 45.57 TOTAL TRANSFERABLE SECURITIES ADMITTED TO AN OFFICIAL STOCK EXCHANGE LISTING OR DEALT IN ON ANOTHER REGULATED MARKET 25,239,697 90.04 OPEN-ENDED FUNDS IRELAND Invesco Short-Term Investments Co Global Series Plc - US Dollar Liquidity Portfolio 913,911 913,911 3.26 LUXEMBOURG Invesco Funds SICAV - Invesco Active Multi-Sector Credit Fund 33,000 131,035 0.47 TOTAL OPEN-ENDED FUNDS 1,044,946 3.73 Total Investments 26,284,643 93.77
The accompanying notes form an integral part of these financial statements.
267 Invesco Funds
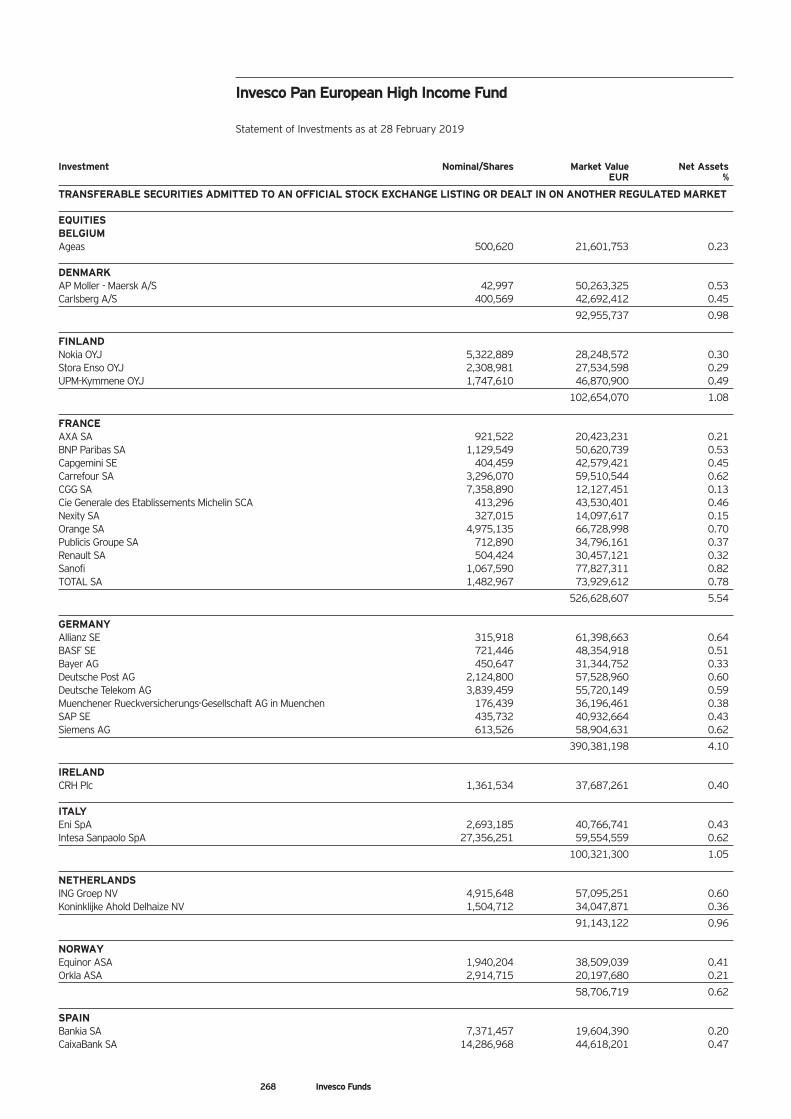
Investment Nominal/Shares Market Value Net Assets EUR %
TRANSFERABLE SECURITIES ADMITTED TO AN OFFICIAL STOCK EXCHANGE LISTING OR DEALT IN ON ANOTHER REGULATED MARKET EQUITIES BELGIUM Ageas 500,620 21,601,753 0.23 DENMARK AP Moller - Maersk A/S 42,997 50,263,325 0.53 Carlsberg A/S 400,569 42,692,412 0.45
92,955,737 0.98 FINLAND Nokia OYJ 5,322,889 28,248,572 0.30 Stora Enso OYJ 2,308,981 27,534,598 0.29 UPM-Kymmene OYJ 1,747,610 46,870,900 0.49
102,654,070 1.08 FRANCE AXA SA 921,522 20,423,231 0.21 BNP Paribas SA 1,129,549 50,620,739 0.53 Capgemini SE 404,459 42,579,421 0.45 Carrefour SA 3,296,070 59,510,544 0.62 CGG SA 7,358,890 12,127,451 0.13 Cie Generale des Etablissements Michelin SCA 413,296 43,530,401 0.46 Nexity SA 327,015 14,097,617 0.15 Orange SA 4,975,135 66,728,998 0.70 Publicis Groupe SA 712,890 34,796,161 0.37 Renault SA 504,424 30,457,121 0.32 Sanofi 1,067,590 77,827,311 0.82 TOTAL SA 1,482,967 73,929,612 0.78
526,628,607 5.54 GERMANY Allianz SE 315,918 61,398,663 0.64 BASF SE 721,446 48,354,918 0.51 Bayer AG 450,647 31,344,752 0.33 Deutsche Post AG 2,124,800 57,528,960 0.60 Deutsche Telekom AG 3,839,459 55,720,149 0.59 Muenchener Rueckversicherungs-Gesellschaft AG in Muenchen 176,439 36,196,461 0.38 SAP SE 435,732 40,932,664 0.43 Siemens AG 613,526 58,904,631 0.62
390,381,198 4.10 IRELAND CRH Plc 1,361,534 37,687,261 0.40 ITALY Eni SpA 2,693,185 40,766,741 0.43 Intesa Sanpaolo SpA 27,356,251 59,554,559 0.62
100,321,300 1.05 NETHERLANDS ING Groep NV 4,915,648 57,095,251 0.60 Koninklijke Ahold Delhaize NV 1,504,712 34,047,871 0.36
91,143,122 0.96 NORWAY Equinor ASA 1,940,204 38,509,039 0.41 Orkla ASA 2,914,715 20,197,680 0.21
58,706,719 0.62 SPAIN Bankia SA 7,371,457 19,604,390 0.20 CaixaBank SA 14,286,968 44,618,201 0.47
Invesco Pan European High Income Fund Statement of Investments as at 28 February 2019
268 Invesco Funds
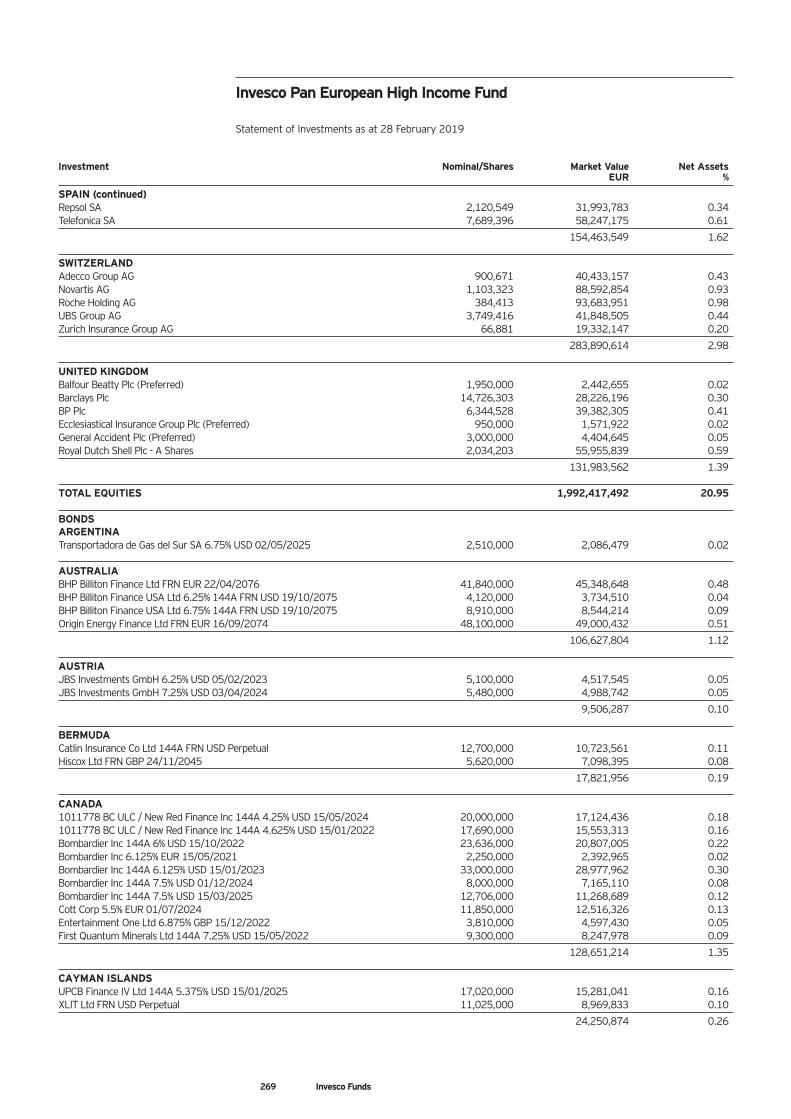
Investment Nominal/Shares Market Value Net Assets EUR %
SPAIN (continued) Repsol SA 2,120,549 31,993,783 0.34 Telefonica SA 7,689,396 58,247,175 0.61
154,463,549 1.62 SWITZERLAND Adecco Group AG 900,671 40,433,157 0.43 Novartis AG 1,103,323 88,592,854 0.93 Roche Holding AG 384,413 93,683,951 0.98 UBS Group AG 3,749,416 41,848,505 0.44 Zurich Insurance Group AG 66,881 19,332,147 0.20
283,890,614 2.98 UNITED KINGDOM Balfour Beatty Plc (Preferred) 1,950,000 2,442,655 0.02 Barclays Plc 14,726,303 28,226,196 0.30 BP Plc 6,344,528 39,382,305 0.41 Ecclesiastical Insurance Group Plc (Preferred) 950,000 1,571,922 0.02 General Accident Plc (Preferred) 3,000,000 4,404,645 0.05 Royal Dutch Shell Plc - A Shares 2,034,203 55,955,839 0.59
131,983,562 1.39 TOTAL EQUITIES 1,992,417,492 20.95 BONDS ARGENTINA Transportadora de Gas del Sur SA 6.75% USD 02/05/2025 2,510,000 2,086,479 0.02 AUSTRALIA BHP Billiton Finance Ltd FRN EUR 22/04/2076 41,840,000 45,348,648 0.48 BHP Billiton Finance USA Ltd 6.25% 144A FRN USD 19/10/2075 4,120,000 3,734,510 0.04 BHP Billiton Finance USA Ltd 6.75% 144A FRN USD 19/10/2075 8,910,000 8,544,214 0.09 Origin Energy Finance Ltd FRN EUR 16/09/2074 48,100,000 49,000,432 0.51
106,627,804 1.12 AUSTRIA JBS Investments GmbH 6.25% USD 05/02/2023 5,100,000 4,517,545 0.05 JBS Investments GmbH 7.25% USD 03/04/2024 5,480,000 4,988,742 0.05
9,506,287 0.10 BERMUDA Catlin Insurance Co Ltd 144A FRN USD Perpetual 12,700,000 10,723,561 0.11 Hiscox Ltd FRN GBP 24/11/2045 5,620,000 7,098,395 0.08
17,821,956 0.19 CANADA 1011778 BC ULC / New Red Finance Inc 144A 4.25% USD 15/05/2024 20,000,000 17,124,436 0.18 1011778 BC ULC / New Red Finance Inc 144A 4.625% USD 15/01/2022 17,690,000 15,553,313 0.16 Bombardier Inc 144A 6% USD 15/10/2022 23,636,000 20,807,005 0.22 Bombardier Inc 6.125% EUR 15/05/2021 2,250,000 2,392,965 0.02 Bombardier Inc 144A 6.125% USD 15/01/2023 33,000,000 28,977,962 0.30 Bombardier Inc 144A 7.5% USD 01/12/2024 8,000,000 7,165,110 0.08 Bombardier Inc 144A 7.5% USD 15/03/2025 12,706,000 11,268,689 0.12 Cott Corp 5.5% EUR 01/07/2024 11,850,000 12,516,326 0.13 Entertainment One Ltd 6.875% GBP 15/12/2022 3,810,000 4,597,430 0.05 First Quantum Minerals Ltd 144A 7.25% USD 15/05/2022 9,300,000 8,247,978 0.09
128,651,214 1.35 CAYMAN ISLANDS UPCB Finance IV Ltd 144A 5.375% USD 15/01/2025 17,020,000 15,281,041 0.16 XLIT Ltd FRN USD Perpetual 11,025,000 8,969,833 0.10
24,250,874 0.26
Invesco Pan European High Income Fund Statement of Investments as at 28 February 2019
269 Invesco Funds
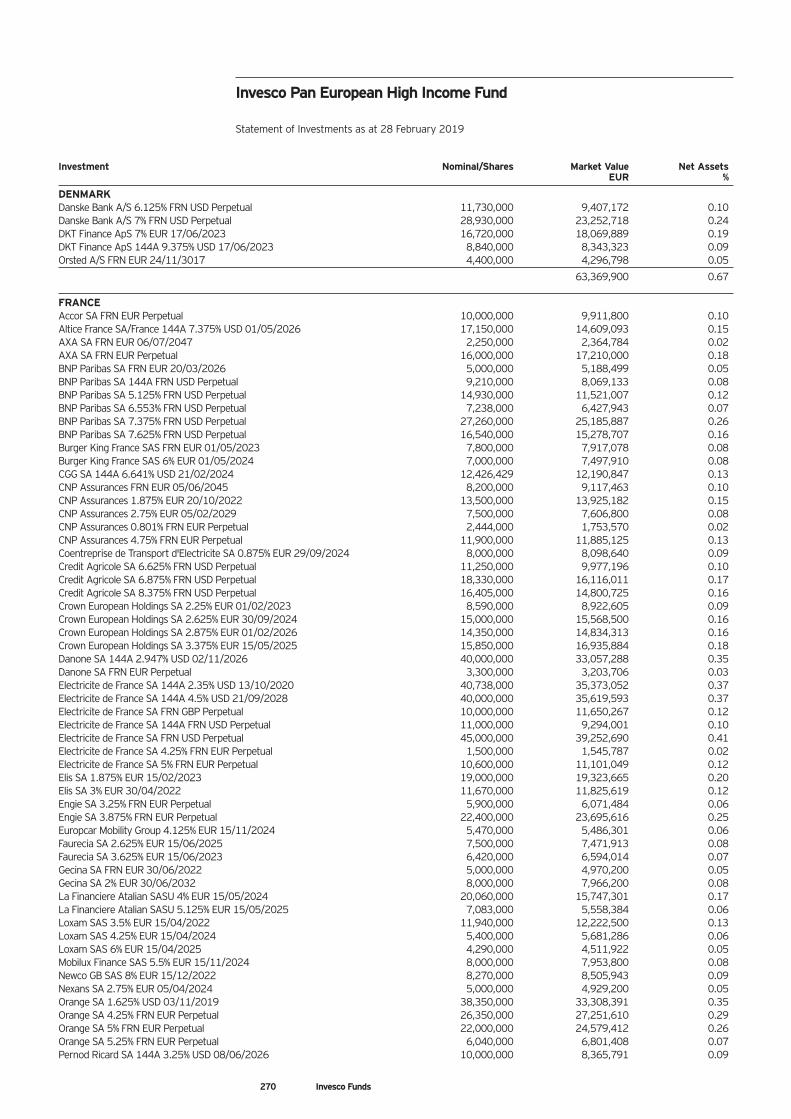
Investment Nominal/Shares Market Value Net Assets EUR %
DENMARK Danske Bank A/S 6.125% FRN USD Perpetual 11,730,000 9,407,172 0.10 Danske Bank A/S 7% FRN USD Perpetual 28,930,000 23,252,718 0.24 DKT Finance ApS 7% EUR 17/06/2023 16,720,000 18,069,889 0.19 DKT Finance ApS 144A 9.375% USD 17/06/2023 8,840,000 8,343,323 0.09 Orsted A/S FRN EUR 24/11/3017 4,400,000 4,296,798 0.05
63,369,900 0.67 FRANCE Accor SA FRN EUR Perpetual 10,000,000 9,911,800 0.10 Altice France SA/France 144A 7.375% USD 01/05/2026 17,150,000 14,609,093 0.15 AXA SA FRN EUR 06/07/2047 2,250,000 2,364,784 0.02 AXA SA FRN EUR Perpetual 16,000,000 17,210,000 0.18 BNP Paribas SA FRN EUR 20/03/2026 5,000,000 5,188,499 0.05 BNP Paribas SA 144A FRN USD Perpetual 9,210,000 8,069,133 0.08 BNP Paribas SA 5.125% FRN USD Perpetual 14,930,000 11,521,007 0.12 BNP Paribas SA 6.553% FRN USD Perpetual 7,238,000 6,427,943 0.07 BNP Paribas SA 7.375% FRN USD Perpetual 27,260,000 25,185,887 0.26 BNP Paribas SA 7.625% FRN USD Perpetual 16,540,000 15,278,707 0.16 Burger King France SAS FRN EUR 01/05/2023 7,800,000 7,917,078 0.08 Burger King France SAS 6% EUR 01/05/2024 7,000,000 7,497,910 0.08 CGG SA 144A 6.641% USD 21/02/2024 12,426,429 12,190,847 0.13 CNP Assurances FRN EUR 05/06/2045 8,200,000 9,117,463 0.10 CNP Assurances 1.875% EUR 20/10/2022 13,500,000 13,925,182 0.15 CNP Assurances 2.75% EUR 05/02/2029 7,500,000 7,606,800 0.08 CNP Assurances 0.801% FRN EUR Perpetual 2,444,000 1,753,570 0.02 CNP Assurances 4.75% FRN EUR Perpetual 11,900,000 11,885,125 0.13 Coentreprise de Transport d'Electricite SA 0.875% EUR 29/09/2024 8,000,000 8,098,640 0.09 Credit Agricole SA 6.625% FRN USD Perpetual 11,250,000 9,977,196 0.10 Credit Agricole SA 6.875% FRN USD Perpetual 18,330,000 16,116,011 0.17 Credit Agricole SA 8.375% FRN USD Perpetual 16,405,000 14,800,725 0.16 Crown European Holdings SA 2.25% EUR 01/02/2023 8,590,000 8,922,605 0.09 Crown European Holdings SA 2.625% EUR 30/09/2024 15,000,000 15,568,500 0.16 Crown European Holdings SA 2.875% EUR 01/02/2026 14,350,000 14,834,313 0.16 Crown European Holdings SA 3.375% EUR 15/05/2025 15,850,000 16,935,884 0.18 Danone SA 144A 2.947% USD 02/11/2026 40,000,000 33,057,288 0.35 Danone SA FRN EUR Perpetual 3,300,000 3,203,706 0.03 Electricite de France SA 144A 2.35% USD 13/10/2020 40,738,000 35,373,052 0.37 Electricite de France SA 144A 4.5% USD 21/09/2028 40,000,000 35,619,593 0.37 Electricite de France SA FRN GBP Perpetual 10,000,000 11,650,267 0.12 Electricite de France SA 144A FRN USD Perpetual 11,000,000 9,294,001 0.10 Electricite de France SA FRN USD Perpetual 45,000,000 39,252,690 0.41 Electricite de France SA 4.25% FRN EUR Perpetual 1,500,000 1,545,787 0.02 Electricite de France SA 5% FRN EUR Perpetual 10,600,000 11,101,049 0.12 Elis SA 1.875% EUR 15/02/2023 19,000,000 19,323,665 0.20 Elis SA 3% EUR 30/04/2022 11,670,000 11,825,619 0.12 Engie SA 3.25% FRN EUR Perpetual 5,900,000 6,071,484 0.06 Engie SA 3.875% FRN EUR Perpetual 22,400,000 23,695,616 0.25 Europcar Mobility Group 4.125% EUR 15/11/2024 5,470,000 5,486,301 0.06 Faurecia SA 2.625% EUR 15/06/2025 7,500,000 7,471,913 0.08 Faurecia SA 3.625% EUR 15/06/2023 6,420,000 6,594,014 0.07 Gecina SA FRN EUR 30/06/2022 5,000,000 4,970,200 0.05 Gecina SA 2% EUR 30/06/2032 8,000,000 7,966,200 0.08 La Financiere Atalian SASU 4% EUR 15/05/2024 20,060,000 15,747,301 0.17 La Financiere Atalian SASU 5.125% EUR 15/05/2025 7,083,000 5,558,384 0.06 Loxam SAS 3.5% EUR 15/04/2022 11,940,000 12,222,500 0.13 Loxam SAS 4.25% EUR 15/04/2024 5,400,000 5,681,286 0.06 Loxam SAS 6% EUR 15/04/2025 4,290,000 4,511,922 0.05 Mobilux Finance SAS 5.5% EUR 15/11/2024 8,000,000 7,953,800 0.08 Newco GB SAS 8% EUR 15/12/2022 8,270,000 8,505,943 0.09 Nexans SA 2.75% EUR 05/04/2024 5,000,000 4,929,200 0.05 Orange SA 1.625% USD 03/11/2019 38,350,000 33,308,391 0.35 Orange SA 4.25% FRN EUR Perpetual 26,350,000 27,251,610 0.29 Orange SA 5% FRN EUR Perpetual 22,000,000 24,579,412 0.26 Orange SA 5.25% FRN EUR Perpetual 6,040,000 6,801,408 0.07 Pernod Ricard SA 144A 3.25% USD 08/06/2026 10,000,000 8,365,791 0.09
Invesco Pan European High Income Fund Statement of Investments as at 28 February 2019
270 Invesco Funds
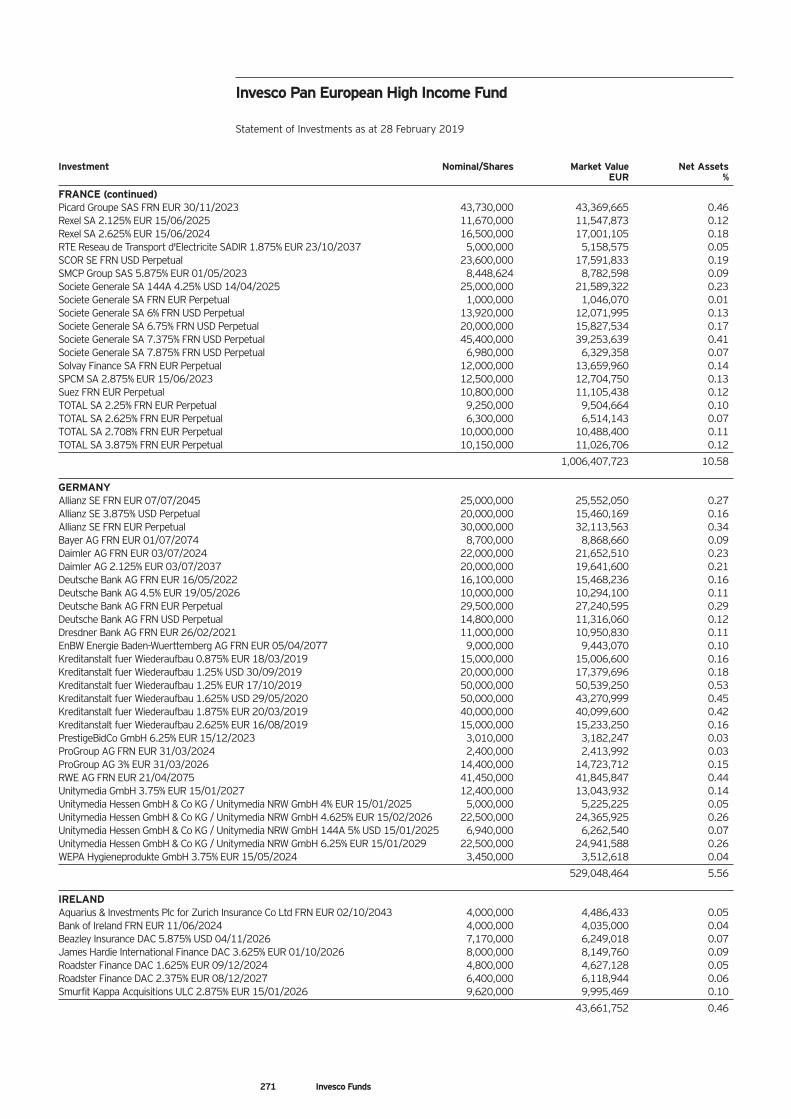
Investment Nominal/Shares Market Value Net Assets EUR %
FRANCE (continued) Picard Groupe SAS FRN EUR 30/11/2023 43,730,000 43,369,665 0.46 Rexel SA 2.125% EUR 15/06/2025 11,670,000 11,547,873 0.12 Rexel SA 2.625% EUR 15/06/2024 16,500,000 17,001,105 0.18 RTE Reseau de Transport d'Electricite SADIR 1.875% EUR 23/10/2037 5,000,000 5,158,575 0.05 SCOR SE FRN USD Perpetual 23,600,000 17,591,833 0.19 SMCP Group SAS 5.875% EUR 01/05/2023 8,448,624 8,782,598 0.09 Societe Generale SA 144A 4.25% USD 14/04/2025 25,000,000 21,589,322 0.23 Societe Generale SA FRN EUR Perpetual 1,000,000 1,046,070 0.01 Societe Generale SA 6% FRN USD Perpetual 13,920,000 12,071,995 0.13 Societe Generale SA 6.75% FRN USD Perpetual 20,000,000 15,827,534 0.17 Societe Generale SA 7.375% FRN USD Perpetual 45,400,000 39,253,639 0.41 Societe Generale SA 7.875% FRN USD Perpetual 6,980,000 6,329,358 0.07 Solvay Finance SA FRN EUR Perpetual 12,000,000 13,659,960 0.14 SPCM SA 2.875% EUR 15/06/2023 12,500,000 12,704,750 0.13 Suez FRN EUR Perpetual 10,800,000 11,105,438 0.12 TOTAL SA 2.25% FRN EUR Perpetual 9,250,000 9,504,664 0.10 TOTAL SA 2.625% FRN EUR Perpetual 6,300,000 6,514,143 0.07 TOTAL SA 2.708% FRN EUR Perpetual 10,000,000 10,488,400 0.11 TOTAL SA 3.875% FRN EUR Perpetual 10,150,000 11,026,706 0.12
1,006,407,723 10.58 GERMANY Allianz SE FRN EUR 07/07/2045 25,000,000 25,552,050 0.27 Allianz SE 3.875% USD Perpetual 20,000,000 15,460,169 0.16 Allianz SE FRN EUR Perpetual 30,000,000 32,113,563 0.34 Bayer AG FRN EUR 01/07/2074 8,700,000 8,868,660 0.09 Daimler AG FRN EUR 03/07/2024 22,000,000 21,652,510 0.23 Daimler AG 2.125% EUR 03/07/2037 20,000,000 19,641,600 0.21 Deutsche Bank AG FRN EUR 16/05/2022 16,100,000 15,468,236 0.16 Deutsche Bank AG 4.5% EUR 19/05/2026 10,000,000 10,294,100 0.11 Deutsche Bank AG FRN EUR Perpetual 29,500,000 27,240,595 0.29 Deutsche Bank AG FRN USD Perpetual 14,800,000 11,316,060 0.12 Dresdner Bank AG FRN EUR 26/02/2021 11,000,000 10,950,830 0.11 EnBW Energie Baden-Wuerttemberg AG FRN EUR 05/04/2077 9,000,000 9,443,070 0.10 Kreditanstalt fuer Wiederaufbau 0.875% EUR 18/03/2019 15,000,000 15,006,600 0.16 Kreditanstalt fuer Wiederaufbau 1.25% USD 30/09/2019 20,000,000 17,379,696 0.18 Kreditanstalt fuer Wiederaufbau 1.25% EUR 17/10/2019 50,000,000 50,539,250 0.53 Kreditanstalt fuer Wiederaufbau 1.625% USD 29/05/2020 50,000,000 43,270,999 0.45 Kreditanstalt fuer Wiederaufbau 1.875% EUR 20/03/2019 40,000,000 40,099,600 0.42 Kreditanstalt fuer Wiederaufbau 2.625% EUR 16/08/2019 15,000,000 15,233,250 0.16 PrestigeBidCo GmbH 6.25% EUR 15/12/2023 3,010,000 3,182,247 0.03 ProGroup AG FRN EUR 31/03/2024 2,400,000 2,413,992 0.03 ProGroup AG 3% EUR 31/03/2026 14,400,000 14,723,712 0.15 RWE AG FRN EUR 21/04/2075 41,450,000 41,845,847 0.44 Unitymedia GmbH 3.75% EUR 15/01/2027 12,400,000 13,043,932 0.14 Unitymedia Hessen GmbH & Co KG / Unitymedia NRW GmbH 4% EUR 15/01/2025 5,000,000 5,225,225 0.05 Unitymedia Hessen GmbH & Co KG / Unitymedia NRW GmbH 4.625% EUR 15/02/2026 22,500,000 24,365,925 0.26 Unitymedia Hessen GmbH & Co KG / Unitymedia NRW GmbH 144A 5% USD 15/01/2025 6,940,000 6,262,540 0.07 Unitymedia Hessen GmbH & Co KG / Unitymedia NRW GmbH 6.25% EUR 15/01/2029 22,500,000 24,941,588 0.26 WEPA Hygieneprodukte GmbH 3.75% EUR 15/05/2024 3,450,000 3,512,618 0.04
529,048,464 5.56 IRELAND Aquarius & Investments Plc for Zurich Insurance Co Ltd FRN EUR 02/10/2043 4,000,000 4,486,433 0.05 Bank of Ireland FRN EUR 11/06/2024 4,000,000 4,035,000 0.04 Beazley Insurance DAC 5.875% USD 04/11/2026 7,170,000 6,249,018 0.07 James Hardie International Finance DAC 3.625% EUR 01/10/2026 8,000,000 8,149,760 0.09 Roadster Finance DAC 1.625% EUR 09/12/2024 4,800,000 4,627,128 0.05 Roadster Finance DAC 2.375% EUR 08/12/2027 6,400,000 6,118,944 0.06 Smurfit Kappa Acquisitions ULC 2.875% EUR 15/01/2026 9,620,000 9,995,469 0.10
43,661,752 0.46
Invesco Pan European High Income Fund Statement of Investments as at 28 February 2019
271 Invesco Funds
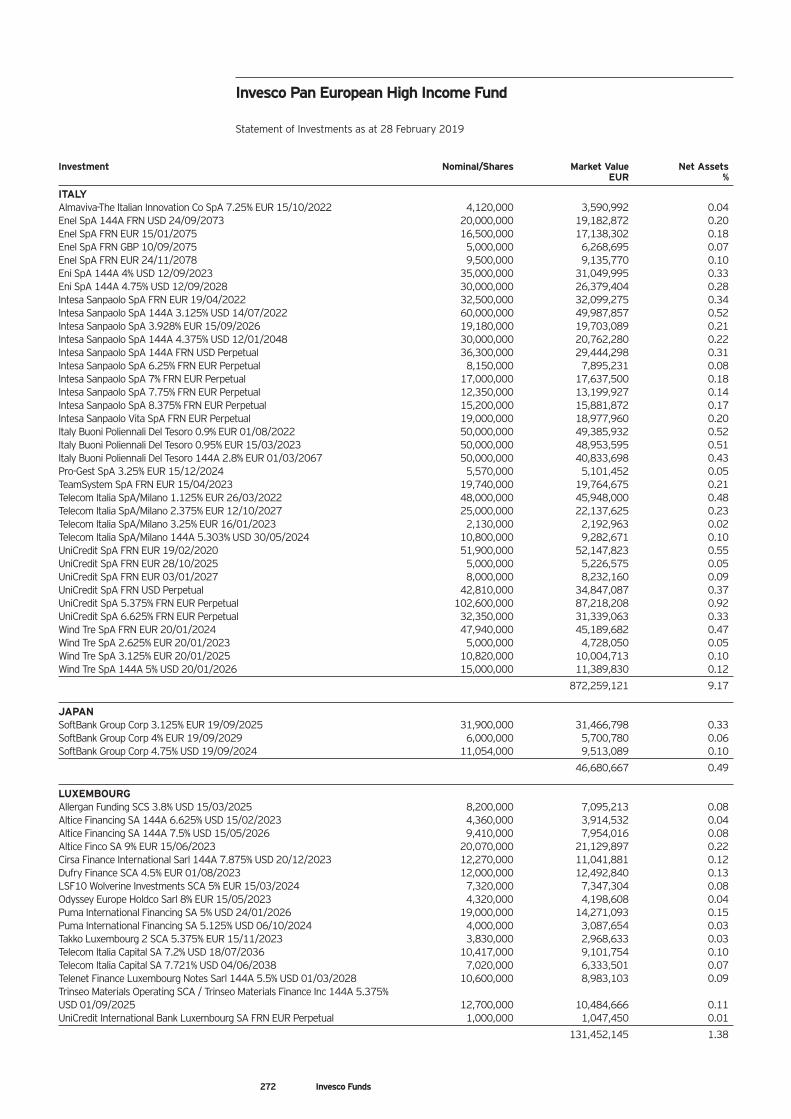
Investment Nominal/Shares Market Value Net Assets EUR %
ITALY Almaviva-The Italian Innovation Co SpA 7.25% EUR 15/10/2022 4,120,000 3,590,992 0.04 Enel SpA 144A FRN USD 24/09/2073 20,000,000 19,182,872 0.20 Enel SpA FRN EUR 15/01/2075 16,500,000 17,138,302 0.18 Enel SpA FRN GBP 10/09/2075 5,000,000 6,268,695 0.07 Enel SpA FRN EUR 24/11/2078 9,500,000 9,135,770 0.10 Eni SpA 144A 4% USD 12/09/2023 35,000,000 31,049,995 0.33 Eni SpA 144A 4.75% USD 12/09/2028 30,000,000 26,379,404 0.28 Intesa Sanpaolo SpA FRN EUR 19/04/2022 32,500,000 32,099,275 0.34 Intesa Sanpaolo SpA 144A 3.125% USD 14/07/2022 60,000,000 49,987,857 0.52 Intesa Sanpaolo SpA 3.928% EUR 15/09/2026 19,180,000 19,703,089 0.21 Intesa Sanpaolo SpA 144A 4.375% USD 12/01/2048 30,000,000 20,762,280 0.22 Intesa Sanpaolo SpA 144A FRN USD Perpetual 36,300,000 29,444,298 0.31 Intesa Sanpaolo SpA 6.25% FRN EUR Perpetual 8,150,000 7,895,231 0.08 Intesa Sanpaolo SpA 7% FRN EUR Perpetual 17,000,000 17,637,500 0.18 Intesa Sanpaolo SpA 7.75% FRN EUR Perpetual 12,350,000 13,199,927 0.14 Intesa Sanpaolo SpA 8.375% FRN EUR Perpetual 15,200,000 15,881,872 0.17 Intesa Sanpaolo Vita SpA FRN EUR Perpetual 19,000,000 18,977,960 0.20 Italy Buoni Poliennali Del Tesoro 0.9% EUR 01/08/2022 50,000,000 49,385,932 0.52 Italy Buoni Poliennali Del Tesoro 0.95% EUR 15/03/2023 50,000,000 48,953,595 0.51 Italy Buoni Poliennali Del Tesoro 144A 2.8% EUR 01/03/2067 50,000,000 40,833,698 0.43 Pro-Gest SpA 3.25% EUR 15/12/2024 5,570,000 5,101,452 0.05 TeamSystem SpA FRN EUR 15/04/2023 19,740,000 19,764,675 0.21 Telecom Italia SpA/Milano 1.125% EUR 26/03/2022 48,000,000 45,948,000 0.48 Telecom Italia SpA/Milano 2.375% EUR 12/10/2027 25,000,000 22,137,625 0.23 Telecom Italia SpA/Milano 3.25% EUR 16/01/2023 2,130,000 2,192,963 0.02 Telecom Italia SpA/Milano 144A 5.303% USD 30/05/2024 10,800,000 9,282,671 0.10 UniCredit SpA FRN EUR 19/02/2020 51,900,000 52,147,823 0.55 UniCredit SpA FRN EUR 28/10/2025 5,000,000 5,226,575 0.05 UniCredit SpA FRN EUR 03/01/2027 8,000,000 8,232,160 0.09 UniCredit SpA FRN USD Perpetual 42,810,000 34,847,087 0.37 UniCredit SpA 5.375% FRN EUR Perpetual 102,600,000 87,218,208 0.92 UniCredit SpA 6.625% FRN EUR Perpetual 32,350,000 31,339,063 0.33 Wind Tre SpA FRN EUR 20/01/2024 47,940,000 45,189,682 0.47 Wind Tre SpA 2.625% EUR 20/01/2023 5,000,000 4,728,050 0.05 Wind Tre SpA 3.125% EUR 20/01/2025 10,820,000 10,004,713 0.10 Wind Tre SpA 144A 5% USD 20/01/2026 15,000,000 11,389,830 0.12
872,259,121 9.17 JAPAN SoftBank Group Corp 3.125% EUR 19/09/2025 31,900,000 31,466,798 0.33 SoftBank Group Corp 4% EUR 19/09/2029 6,000,000 5,700,780 0.06 SoftBank Group Corp 4.75% USD 19/09/2024 11,054,000 9,513,089 0.10
46,680,667 0.49 LUXEMBOURG Allergan Funding SCS 3.8% USD 15/03/2025 8,200,000 7,095,213 0.08 Altice Financing SA 144A 6.625% USD 15/02/2023 4,360,000 3,914,532 0.04 Altice Financing SA 144A 7.5% USD 15/05/2026 9,410,000 7,954,016 0.08 Altice Finco SA 9% EUR 15/06/2023 20,070,000 21,129,897 0.22 Cirsa Finance International Sarl 144A 7.875% USD 20/12/2023 12,270,000 11,041,881 0.12 Dufry Finance SCA 4.5% EUR 01/08/2023 12,000,000 12,492,840 0.13 LSF10 Wolverine Investments SCA 5% EUR 15/03/2024 7,320,000 7,347,304 0.08 Odyssey Europe Holdco Sarl 8% EUR 15/05/2023 4,320,000 4,198,608 0.04 Puma International Financing SA 5% USD 24/01/2026 19,000,000 14,271,093 0.15 Puma International Financing SA 5.125% USD 06/10/2024 4,000,000 3,087,654 0.03 Takko Luxembourg 2 SCA 5.375% EUR 15/11/2023 3,830,000 2,968,633 0.03 Telecom Italia Capital SA 7.2% USD 18/07/2036 10,417,000 9,101,754 0.10 Telecom Italia Capital SA 7.721% USD 04/06/2038 7,020,000 6,333,501 0.07 Telenet Finance Luxembourg Notes Sarl 144A 5.5% USD 01/03/2028 10,600,000 8,983,103 0.09 Trinseo Materials Operating SCA / Trinseo Materials Finance Inc 144A 5.375% USD 01/09/2025 12,700,000 10,484,666 0.11 UniCredit International Bank Luxembourg SA FRN EUR Perpetual 1,000,000 1,047,450 0.01
131,452,145 1.38
Invesco Pan European High Income Fund Statement of Investments as at 28 February 2019
272 Invesco Funds
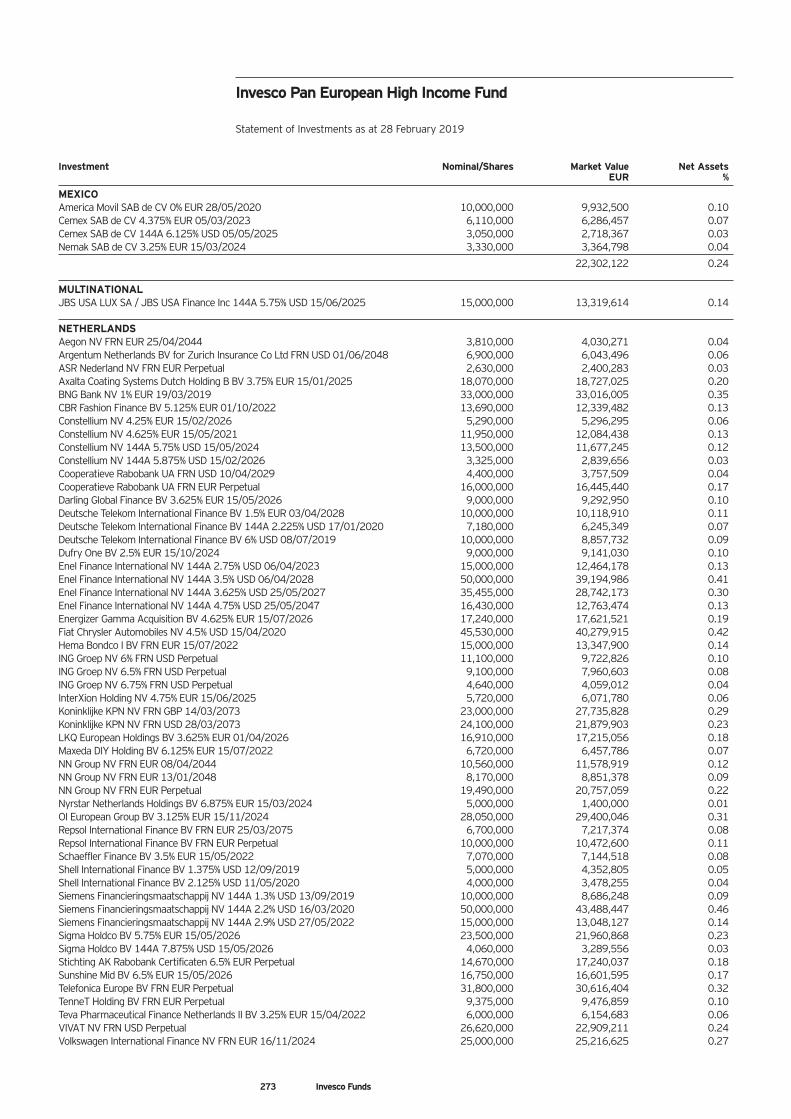
Investment Nominal/Shares Market Value Net Assets EUR %
MEXICO America Movil SAB de CV 0% EUR 28/05/2020 10,000,000 9,932,500 0.10 Cemex SAB de CV 4.375% EUR 05/03/2023 6,110,000 6,286,457 0.07 Cemex SAB de CV 144A 6.125% USD 05/05/2025 3,050,000 2,718,367 0.03 Nemak SAB de CV 3.25% EUR 15/03/2024 3,330,000 3,364,798 0.04
22,302,122 0.24 MULTINATIONAL JBS USA LUX SA / JBS USA Finance Inc 144A 5.75% USD 15/06/2025 15,000,000 13,319,614 0.14 NETHERLANDS Aegon NV FRN EUR 25/04/2044 3,810,000 4,030,271 0.04 Argentum Netherlands BV for Zurich Insurance Co Ltd FRN USD 01/06/2048 6,900,000 6,043,496 0.06 ASR Nederland NV FRN EUR Perpetual 2,630,000 2,400,283 0.03 Axalta Coating Systems Dutch Holding B BV 3.75% EUR 15/01/2025 18,070,000 18,727,025 0.20 BNG Bank NV 1% EUR 19/03/2019 33,000,000 33,016,005 0.35 CBR Fashion Finance BV 5.125% EUR 01/10/2022 13,690,000 12,339,482 0.13 Constellium NV 4.25% EUR 15/02/2026 5,290,000 5,296,295 0.06 Constellium NV 4.625% EUR 15/05/2021 11,950,000 12,084,438 0.13 Constellium NV 144A 5.75% USD 15/05/2024 13,500,000 11,677,245 0.12 Constellium NV 144A 5.875% USD 15/02/2026 3,325,000 2,839,656 0.03 Cooperatieve Rabobank UA FRN USD 10/04/2029 4,400,000 3,757,509 0.04 Cooperatieve Rabobank UA FRN EUR Perpetual 16,000,000 16,445,440 0.17 Darling Global Finance BV 3.625% EUR 15/05/2026 9,000,000 9,292,950 0.10 Deutsche Telekom International Finance BV 1.5% EUR 03/04/2028 10,000,000 10,118,910 0.11 Deutsche Telekom International Finance BV 144A 2.225% USD 17/01/2020 7,180,000 6,245,349 0.07 Deutsche Telekom International Finance BV 6% USD 08/07/2019 10,000,000 8,857,732 0.09 Dufry One BV 2.5% EUR 15/10/2024 9,000,000 9,141,030 0.10 Enel Finance International NV 144A 2.75% USD 06/04/2023 15,000,000 12,464,178 0.13 Enel Finance International NV 144A 3.5% USD 06/04/2028 50,000,000 39,194,986 0.41 Enel Finance International NV 144A 3.625% USD 25/05/2027 35,455,000 28,742,173 0.30 Enel Finance International NV 144A 4.75% USD 25/05/2047 16,430,000 12,763,474 0.13 Energizer Gamma Acquisition BV 4.625% EUR 15/07/2026 17,240,000 17,621,521 0.19 Fiat Chrysler Automobiles NV 4.5% USD 15/04/2020 45,530,000 40,279,915 0.42 Hema Bondco I BV FRN EUR 15/07/2022 15,000,000 13,347,900 0.14 ING Groep NV 6% FRN USD Perpetual 11,100,000 9,722,826 0.10 ING Groep NV 6.5% FRN USD Perpetual 9,100,000 7,960,603 0.08 ING Groep NV 6.75% FRN USD Perpetual 4,640,000 4,059,012 0.04 InterXion Holding NV 4.75% EUR 15/06/2025 5,720,000 6,071,780 0.06 Koninklijke KPN NV FRN GBP 14/03/2073 23,000,000 27,735,828 0.29 Koninklijke KPN NV FRN USD 28/03/2073 24,100,000 21,879,903 0.23 LKQ European Holdings BV 3.625% EUR 01/04/2026 16,910,000 17,215,056 0.18 Maxeda DIY Holding BV 6.125% EUR 15/07/2022 6,720,000 6,457,786 0.07 NN Group NV FRN EUR 08/04/2044 10,560,000 11,578,919 0.12 NN Group NV FRN EUR 13/01/2048 8,170,000 8,851,378 0.09 NN Group NV FRN EUR Perpetual 19,490,000 20,757,059 0.22 Nyrstar Netherlands Holdings BV 6.875% EUR 15/03/2024 5,000,000 1,400,000 0.01 OI European Group BV 3.125% EUR 15/11/2024 28,050,000 29,400,046 0.31 Repsol International Finance BV FRN EUR 25/03/2075 6,700,000 7,217,374 0.08 Repsol International Finance BV FRN EUR Perpetual 10,000,000 10,472,600 0.11 Schaeffler Finance BV 3.5% EUR 15/05/2022 7,070,000 7,144,518 0.08 Shell International Finance BV 1.375% USD 12/09/2019 5,000,000 4,352,805 0.05 Shell International Finance BV 2.125% USD 11/05/2020 4,000,000 3,478,255 0.04 Siemens Financieringsmaatschappij NV 144A 1.3% USD 13/09/2019 10,000,000 8,686,248 0.09 Siemens Financieringsmaatschappij NV 144A 2.2% USD 16/03/2020 50,000,000 43,488,447 0.46 Siemens Financieringsmaatschappij NV 144A 2.9% USD 27/05/2022 15,000,000 13,048,127 0.14 Sigma Holdco BV 5.75% EUR 15/05/2026 23,500,000 21,960,868 0.23 Sigma Holdco BV 144A 7.875% USD 15/05/2026 4,060,000 3,289,556 0.03 Stichting AK Rabobank Certificaten 6.5% EUR Perpetual 14,670,000 17,240,037 0.18 Sunshine Mid BV 6.5% EUR 15/05/2026 16,750,000 16,601,595 0.17 Telefonica Europe BV FRN EUR Perpetual 31,800,000 30,616,404 0.32 TenneT Holding BV FRN EUR Perpetual 9,375,000 9,476,859 0.10 Teva Pharmaceutical Finance Netherlands II BV 3.25% EUR 15/04/2022 6,000,000 6,154,683 0.06 VIVAT NV FRN USD Perpetual 26,620,000 22,909,211 0.24 Volkswagen International Finance NV FRN EUR 16/11/2024 25,000,000 25,216,625 0.27
Invesco Pan European High Income Fund Statement of Investments as at 28 February 2019
273 Invesco Funds
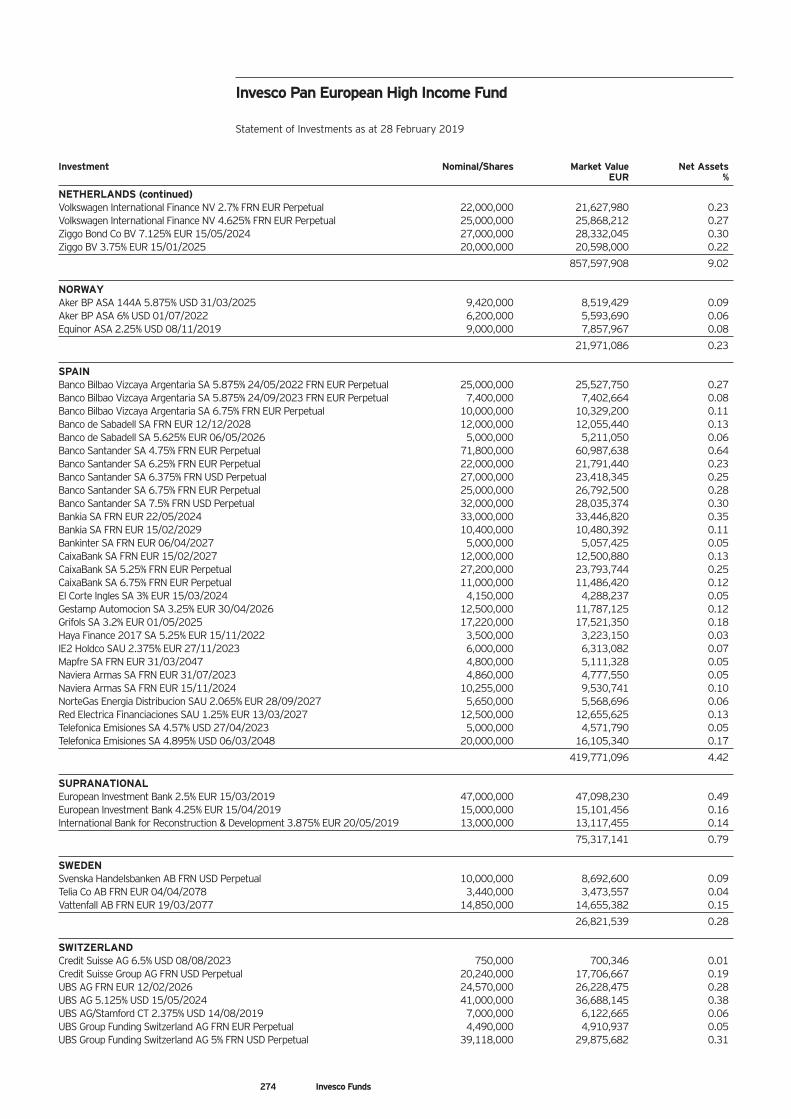
Investment Nominal/Shares Market Value Net Assets EUR %
NETHERLANDS (continued) Volkswagen International Finance NV 2.7% FRN EUR Perpetual 22,000,000 21,627,980 0.23 Volkswagen International Finance NV 4.625% FRN EUR Perpetual 25,000,000 25,868,212 0.27 Ziggo Bond Co BV 7.125% EUR 15/05/2024 27,000,000 28,332,045 0.30 Ziggo BV 3.75% EUR 15/01/2025 20,000,000 20,598,000 0.22
857,597,908 9.02 NORWAY Aker BP ASA 144A 5.875% USD 31/03/2025 9,420,000 8,519,429 0.09 Aker BP ASA 6% USD 01/07/2022 6,200,000 5,593,690 0.06 Equinor ASA 2.25% USD 08/11/2019 9,000,000 7,857,967 0.08
21,971,086 0.23 SPAIN Banco Bilbao Vizcaya Argentaria SA 5.875% 24/05/2022 FRN EUR Perpetual 25,000,000 25,527,750 0.27 Banco Bilbao Vizcaya Argentaria SA 5.875% 24/09/2023 FRN EUR Perpetual 7,400,000 7,402,664 0.08 Banco Bilbao Vizcaya Argentaria SA 6.75% FRN EUR Perpetual 10,000,000 10,329,200 0.11 Banco de Sabadell SA FRN EUR 12/12/2028 12,000,000 12,055,440 0.13 Banco de Sabadell SA 5.625% EUR 06/05/2026 5,000,000 5,211,050 0.06 Banco Santander SA 4.75% FRN EUR Perpetual 71,800,000 60,987,638 0.64 Banco Santander SA 6.25% FRN EUR Perpetual 22,000,000 21,791,440 0.23 Banco Santander SA 6.375% FRN USD Perpetual 27,000,000 23,418,345 0.25 Banco Santander SA 6.75% FRN EUR Perpetual 25,000,000 26,792,500 0.28 Banco Santander SA 7.5% FRN USD Perpetual 32,000,000 28,035,374 0.30 Bankia SA FRN EUR 22/05/2024 33,000,000 33,446,820 0.35 Bankia SA FRN EUR 15/02/2029 10,400,000 10,480,392 0.11 Bankinter SA FRN EUR 06/04/2027 5,000,000 5,057,425 0.05 CaixaBank SA FRN EUR 15/02/2027 12,000,000 12,500,880 0.13 CaixaBank SA 5.25% FRN EUR Perpetual 27,200,000 23,793,744 0.25 CaixaBank SA 6.75% FRN EUR Perpetual 11,000,000 11,486,420 0.12 El Corte Ingles SA 3% EUR 15/03/2024 4,150,000 4,288,237 0.05 Gestamp Automocion SA 3.25% EUR 30/04/2026 12,500,000 11,787,125 0.12 Grifols SA 3.2% EUR 01/05/2025 17,220,000 17,521,350 0.18 Haya Finance 2017 SA 5.25% EUR 15/11/2022 3,500,000 3,223,150 0.03 IE2 Holdco SAU 2.375% EUR 27/11/2023 6,000,000 6,313,082 0.07 Mapfre SA FRN EUR 31/03/2047 4,800,000 5,111,328 0.05 Naviera Armas SA FRN EUR 31/07/2023 4,860,000 4,777,550 0.05 Naviera Armas SA FRN EUR 15/11/2024 10,255,000 9,530,741 0.10 NorteGas Energia Distribucion SAU 2.065% EUR 28/09/2027 5,650,000 5,568,696 0.06 Red Electrica Financiaciones SAU 1.25% EUR 13/03/2027 12,500,000 12,655,625 0.13 Telefonica Emisiones SA 4.57% USD 27/04/2023 5,000,000 4,571,790 0.05 Telefonica Emisiones SA 4.895% USD 06/03/2048 20,000,000 16,105,340 0.17
419,771,096 4.42 SUPRANATIONAL European Investment Bank 2.5% EUR 15/03/2019 47,000,000 47,098,230 0.49 European Investment Bank 4.25% EUR 15/04/2019 15,000,000 15,101,456 0.16 International Bank for Reconstruction & Development 3.875% EUR 20/05/2019 13,000,000 13,117,455 0.14
75,317,141 0.79 SWEDEN Svenska Handelsbanken AB FRN USD Perpetual 10,000,000 8,692,600 0.09 Telia Co AB FRN EUR 04/04/2078 3,440,000 3,473,557 0.04 Vattenfall AB FRN EUR 19/03/2077 14,850,000 14,655,382 0.15
26,821,539 0.28 SWITZERLAND Credit Suisse AG 6.5% USD 08/08/2023 750,000 700,346 0.01 Credit Suisse Group AG FRN USD Perpetual 20,240,000 17,706,667 0.19 UBS AG FRN EUR 12/02/2026 24,570,000 26,228,475 0.28 UBS AG 5.125% USD 15/05/2024 41,000,000 36,688,145 0.38 UBS AG/Stamford CT 2.375% USD 14/08/2019 7,000,000 6,122,665 0.06 UBS Group Funding Switzerland AG FRN EUR Perpetual 4,490,000 4,910,937 0.05 UBS Group Funding Switzerland AG 5% FRN USD Perpetual 39,118,000 29,875,682 0.31
Invesco Pan European High Income Fund Statement of Investments as at 28 February 2019
274 Invesco Funds
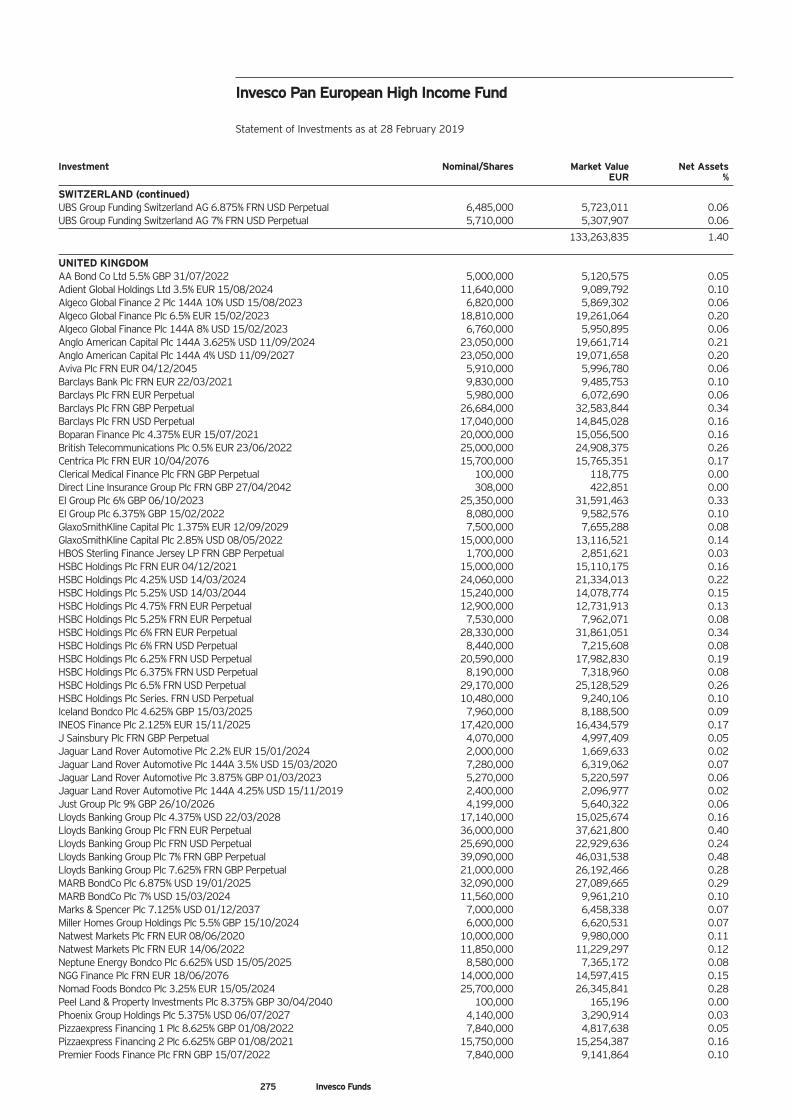
Investment Nominal/Shares Market Value Net Assets EUR %
SWITZERLAND (continued) UBS Group Funding Switzerland AG 6.875% FRN USD Perpetual 6,485,000 5,723,011 0.06 UBS Group Funding Switzerland AG 7% FRN USD Perpetual 5,710,000 5,307,907 0.06
133,263,835 1.40 UNITED KINGDOM AA Bond Co Ltd 5.5% GBP 31/07/2022 5,000,000 5,120,575 0.05 Adient Global Holdings Ltd 3.5% EUR 15/08/2024 11,640,000 9,089,792 0.10 Algeco Global Finance 2 Plc 144A 10% USD 15/08/2023 6,820,000 5,869,302 0.06 Algeco Global Finance Plc 6.5% EUR 15/02/2023 18,810,000 19,261,064 0.20 Algeco Global Finance Plc 144A 8% USD 15/02/2023 6,760,000 5,950,895 0.06 Anglo American Capital Plc 144A 3.625% USD 11/09/2024 23,050,000 19,661,714 0.21 Anglo American Capital Plc 144A 4% USD 11/09/2027 23,050,000 19,071,658 0.20 Aviva Plc FRN EUR 04/12/2045 5,910,000 5,996,780 0.06 Barclays Bank Plc FRN EUR 22/03/2021 9,830,000 9,485,753 0.10 Barclays Plc FRN EUR Perpetual 5,980,000 6,072,690 0.06 Barclays Plc FRN GBP Perpetual 26,684,000 32,583,844 0.34 Barclays Plc FRN USD Perpetual 17,040,000 14,845,028 0.16 Boparan Finance Plc 4.375% EUR 15/07/2021 20,000,000 15,056,500 0.16 British Telecommunications Plc 0.5% EUR 23/06/2022 25,000,000 24,908,375 0.26 Centrica Plc FRN EUR 10/04/2076 15,700,000 15,765,351 0.17 Clerical Medical Finance Plc FRN GBP Perpetual 100,000 118,775 0.00 Direct Line Insurance Group Plc FRN GBP 27/04/2042 308,000 422,851 0.00 EI Group Plc 6% GBP 06/10/2023 25,350,000 31,591,463 0.33 EI Group Plc 6.375% GBP 15/02/2022 8,080,000 9,582,576 0.10 GlaxoSmithKline Capital Plc 1.375% EUR 12/09/2029 7,500,000 7,655,288 0.08 GlaxoSmithKline Capital Plc 2.85% USD 08/05/2022 15,000,000 13,116,521 0.14 HBOS Sterling Finance Jersey LP FRN GBP Perpetual 1,700,000 2,851,621 0.03 HSBC Holdings Plc FRN EUR 04/12/2021 15,000,000 15,110,175 0.16 HSBC Holdings Plc 4.25% USD 14/03/2024 24,060,000 21,334,013 0.22 HSBC Holdings Plc 5.25% USD 14/03/2044 15,240,000 14,078,774 0.15 HSBC Holdings Plc 4.75% FRN EUR Perpetual 12,900,000 12,731,913 0.13 HSBC Holdings Plc 5.25% FRN EUR Perpetual 7,530,000 7,962,071 0.08 HSBC Holdings Plc 6% FRN EUR Perpetual 28,330,000 31,861,051 0.34 HSBC Holdings Plc 6% FRN USD Perpetual 8,440,000 7,215,608 0.08 HSBC Holdings Plc 6.25% FRN USD Perpetual 20,590,000 17,982,830 0.19 HSBC Holdings Plc 6.375% FRN USD Perpetual 8,190,000 7,318,960 0.08 HSBC Holdings Plc 6.5% FRN USD Perpetual 29,170,000 25,128,529 0.26 HSBC Holdings Plc Series. FRN USD Perpetual 10,480,000 9,240,106 0.10 Iceland Bondco Plc 4.625% GBP 15/03/2025 7,960,000 8,188,500 0.09 INEOS Finance Plc 2.125% EUR 15/11/2025 17,420,000 16,434,579 0.17 J Sainsbury Plc FRN GBP Perpetual 4,070,000 4,997,409 0.05 Jaguar Land Rover Automotive Plc 2.2% EUR 15/01/2024 2,000,000 1,669,633 0.02 Jaguar Land Rover Automotive Plc 144A 3.5% USD 15/03/2020 7,280,000 6,319,062 0.07 Jaguar Land Rover Automotive Plc 3.875% GBP 01/03/2023 5,270,000 5,220,597 0.06 Jaguar Land Rover Automotive Plc 144A 4.25% USD 15/11/2019 2,400,000 2,096,977 0.02 Just Group Plc 9% GBP 26/10/2026 4,199,000 5,640,322 0.06 Lloyds Banking Group Plc 4.375% USD 22/03/2028 17,140,000 15,025,674 0.16 Lloyds Banking Group Plc FRN EUR Perpetual 36,000,000 37,621,800 0.40 Lloyds Banking Group Plc FRN USD Perpetual 25,690,000 22,929,636 0.24 Lloyds Banking Group Plc 7% FRN GBP Perpetual 39,090,000 46,031,538 0.48 Lloyds Banking Group Plc 7.625% FRN GBP Perpetual 21,000,000 26,192,466 0.28 MARB BondCo Plc 6.875% USD 19/01/2025 32,090,000 27,089,665 0.29 MARB BondCo Plc 7% USD 15/03/2024 11,560,000 9,961,210 0.10 Marks & Spencer Plc 7.125% USD 01/12/2037 7,000,000 6,458,338 0.07 Miller Homes Group Holdings Plc 5.5% GBP 15/10/2024 6,000,000 6,620,531 0.07 Natwest Markets Plc FRN EUR 08/06/2020 10,000,000 9,980,000 0.11 Natwest Markets Plc FRN EUR 14/06/2022 11,850,000 11,229,297 0.12 Neptune Energy Bondco Plc 6.625% USD 15/05/2025 8,580,000 7,365,172 0.08 NGG Finance Plc FRN EUR 18/06/2076 14,000,000 14,597,415 0.15 Nomad Foods Bondco Plc 3.25% EUR 15/05/2024 25,700,000 26,345,841 0.28 Peel Land & Property Investments Plc 8.375% GBP 30/04/2040 100,000 165,196 0.00 Phoenix Group Holdings Plc 5.375% USD 06/07/2027 4,140,000 3,290,914 0.03 Pizzaexpress Financing 1 Plc 8.625% GBP 01/08/2022 7,840,000 4,817,638 0.05 Pizzaexpress Financing 2 Plc 6.625% GBP 01/08/2021 15,750,000 15,254,387 0.16 Premier Foods Finance Plc FRN GBP 15/07/2022 7,840,000 9,141,864 0.10
Invesco Pan European High Income Fund Statement of Investments as at 28 February 2019
275 Invesco Funds
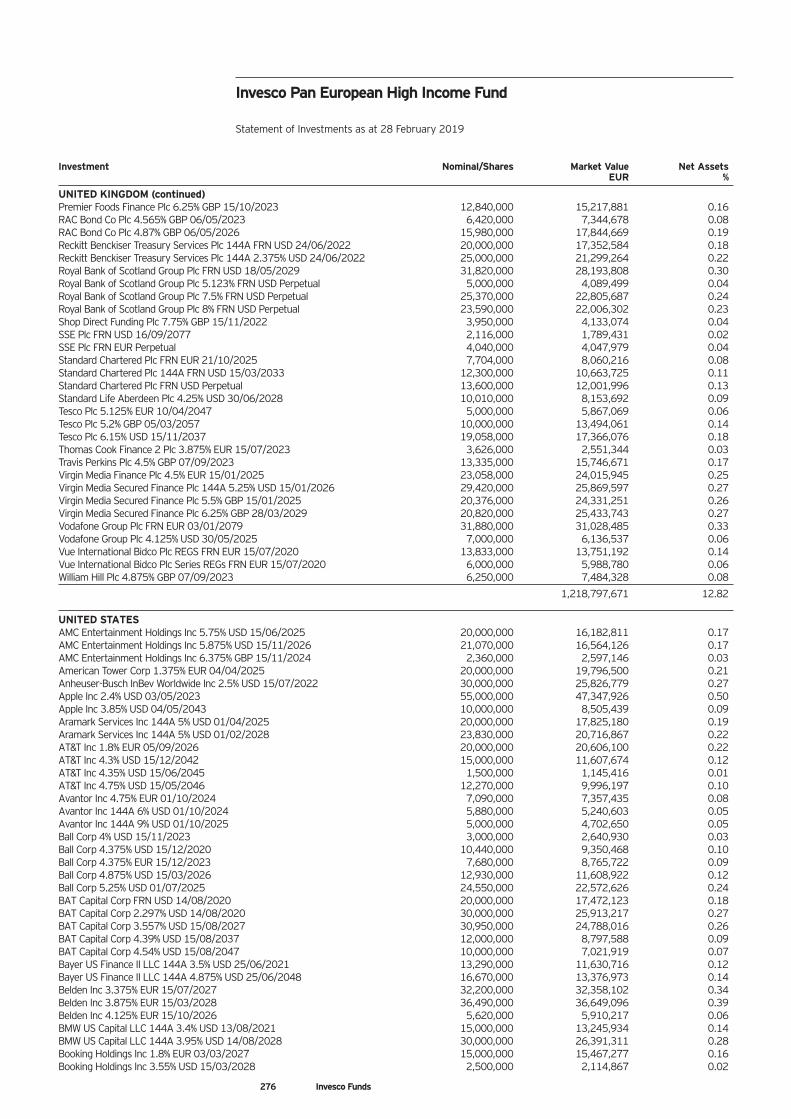
Investment Nominal/Shares Market Value Net Assets EUR %
UNITED KINGDOM (continued) Premier Foods Finance Plc 6.25% GBP 15/10/2023 12,840,000 15,217,881 0.16 RAC Bond Co Plc 4.565% GBP 06/05/2023 6,420,000 7,344,678 0.08 RAC Bond Co Plc 4.87% GBP 06/05/2026 15,980,000 17,844,669 0.19 Reckitt Benckiser Treasury Services Plc 144A FRN USD 24/06/2022 20,000,000 17,352,584 0.18 Reckitt Benckiser Treasury Services Plc 144A 2.375% USD 24/06/2022 25,000,000 21,299,264 0.22 Royal Bank of Scotland Group Plc FRN USD 18/05/2029 31,820,000 28,193,808 0.30 Royal Bank of Scotland Group Plc 5.123% FRN USD Perpetual 5,000,000 4,089,499 0.04 Royal Bank of Scotland Group Plc 7.5% FRN USD Perpetual 25,370,000 22,805,687 0.24 Royal Bank of Scotland Group Plc 8% FRN USD Perpetual 23,590,000 22,006,302 0.23 Shop Direct Funding Plc 7.75% GBP 15/11/2022 3,950,000 4,133,074 0.04 SSE Plc FRN USD 16/09/2077 2,116,000 1,789,431 0.02 SSE Plc FRN EUR Perpetual 4,040,000 4,047,979 0.04 Standard Chartered Plc FRN EUR 21/10/2025 7,704,000 8,060,216 0.08 Standard Chartered Plc 144A FRN USD 15/03/2033 12,300,000 10,663,725 0.11 Standard Chartered Plc FRN USD Perpetual 13,600,000 12,001,996 0.13 Standard Life Aberdeen Plc 4.25% USD 30/06/2028 10,010,000 8,153,692 0.09 Tesco Plc 5.125% EUR 10/04/2047 5,000,000 5,867,069 0.06 Tesco Plc 5.2% GBP 05/03/2057 10,000,000 13,494,061 0.14 Tesco Plc 6.15% USD 15/11/2037 19,058,000 17,366,076 0.18 Thomas Cook Finance 2 Plc 3.875% EUR 15/07/2023 3,626,000 2,551,344 0.03 Travis Perkins Plc 4.5% GBP 07/09/2023 13,335,000 15,746,671 0.17 Virgin Media Finance Plc 4.5% EUR 15/01/2025 23,058,000 24,015,945 0.25 Virgin Media Secured Finance Plc 144A 5.25% USD 15/01/2026 29,420,000 25,869,597 0.27 Virgin Media Secured Finance Plc 5.5% GBP 15/01/2025 20,376,000 24,331,251 0.26 Virgin Media Secured Finance Plc 6.25% GBP 28/03/2029 20,820,000 25,433,743 0.27 Vodafone Group Plc FRN EUR 03/01/2079 31,880,000 31,028,485 0.33 Vodafone Group Plc 4.125% USD 30/05/2025 7,000,000 6,136,537 0.06 Vue International Bidco Plc REGS FRN EUR 15/07/2020 13,833,000 13,751,192 0.14 Vue International Bidco Plc Series REGs FRN EUR 15/07/2020 6,000,000 5,988,780 0.06 William Hill Plc 4.875% GBP 07/09/2023 6,250,000 7,484,328 0.08
1,218,797,671 12.82 UNITED STATES AMC Entertainment Holdings Inc 5.75% USD 15/06/2025 20,000,000 16,182,811 0.17 AMC Entertainment Holdings Inc 5.875% USD 15/11/2026 21,070,000 16,564,126 0.17 AMC Entertainment Holdings Inc 6.375% GBP 15/11/2024 2,360,000 2,597,146 0.03 American Tower Corp 1.375% EUR 04/04/2025 20,000,000 19,796,500 0.21 Anheuser-Busch InBev Worldwide Inc 2.5% USD 15/07/2022 30,000,000 25,826,779 0.27 Apple Inc 2.4% USD 03/05/2023 55,000,000 47,347,926 0.50 Apple Inc 3.85% USD 04/05/2043 10,000,000 8,505,439 0.09 Aramark Services Inc 144A 5% USD 01/04/2025 20,000,000 17,825,180 0.19 Aramark Services Inc 144A 5% USD 01/02/2028 23,830,000 20,716,867 0.22 AT&T Inc 1.8% EUR 05/09/2026 20,000,000 20,606,100 0.22 AT&T Inc 4.3% USD 15/12/2042 15,000,000 11,607,674 0.12 AT&T Inc 4.35% USD 15/06/2045 1,500,000 1,145,416 0.01 AT&T Inc 4.75% USD 15/05/2046 12,270,000 9,996,197 0.10 Avantor Inc 4.75% EUR 01/10/2024 7,090,000 7,357,435 0.08 Avantor Inc 144A 6% USD 01/10/2024 5,880,000 5,240,603 0.05 Avantor Inc 144A 9% USD 01/10/2025 5,000,000 4,702,650 0.05 Ball Corp 4% USD 15/11/2023 3,000,000 2,640,930 0.03 Ball Corp 4.375% USD 15/12/2020 10,440,000 9,350,468 0.10 Ball Corp 4.375% EUR 15/12/2023 7,680,000 8,765,722 0.09 Ball Corp 4.875% USD 15/03/2026 12,930,000 11,608,922 0.12 Ball Corp 5.25% USD 01/07/2025 24,550,000 22,572,626 0.24 BAT Capital Corp FRN USD 14/08/2020 20,000,000 17,472,123 0.18 BAT Capital Corp 2.297% USD 14/08/2020 30,000,000 25,913,217 0.27 BAT Capital Corp 3.557% USD 15/08/2027 30,950,000 24,788,016 0.26 BAT Capital Corp 4.39% USD 15/08/2037 12,000,000 8,797,588 0.09 BAT Capital Corp 4.54% USD 15/08/2047 10,000,000 7,021,919 0.07 Bayer US Finance II LLC 144A 3.5% USD 25/06/2021 13,290,000 11,630,716 0.12 Bayer US Finance II LLC 144A 4.875% USD 25/06/2048 16,670,000 13,376,973 0.14 Belden Inc 3.375% EUR 15/07/2027 32,200,000 32,358,102 0.34 Belden Inc 3.875% EUR 15/03/2028 36,490,000 36,649,096 0.39 Belden Inc 4.125% EUR 15/10/2026 5,620,000 5,910,217 0.06 BMW US Capital LLC 144A 3.4% USD 13/08/2021 15,000,000 13,245,934 0.14 BMW US Capital LLC 144A 3.95% USD 14/08/2028 30,000,000 26,391,311 0.28 Booking Holdings Inc 1.8% EUR 03/03/2027 15,000,000 15,467,277 0.16 Booking Holdings Inc 3.55% USD 15/03/2028 2,500,000 2,114,867 0.02
Invesco Pan European High Income Fund Statement of Investments as at 28 February 2019
276 Invesco Funds
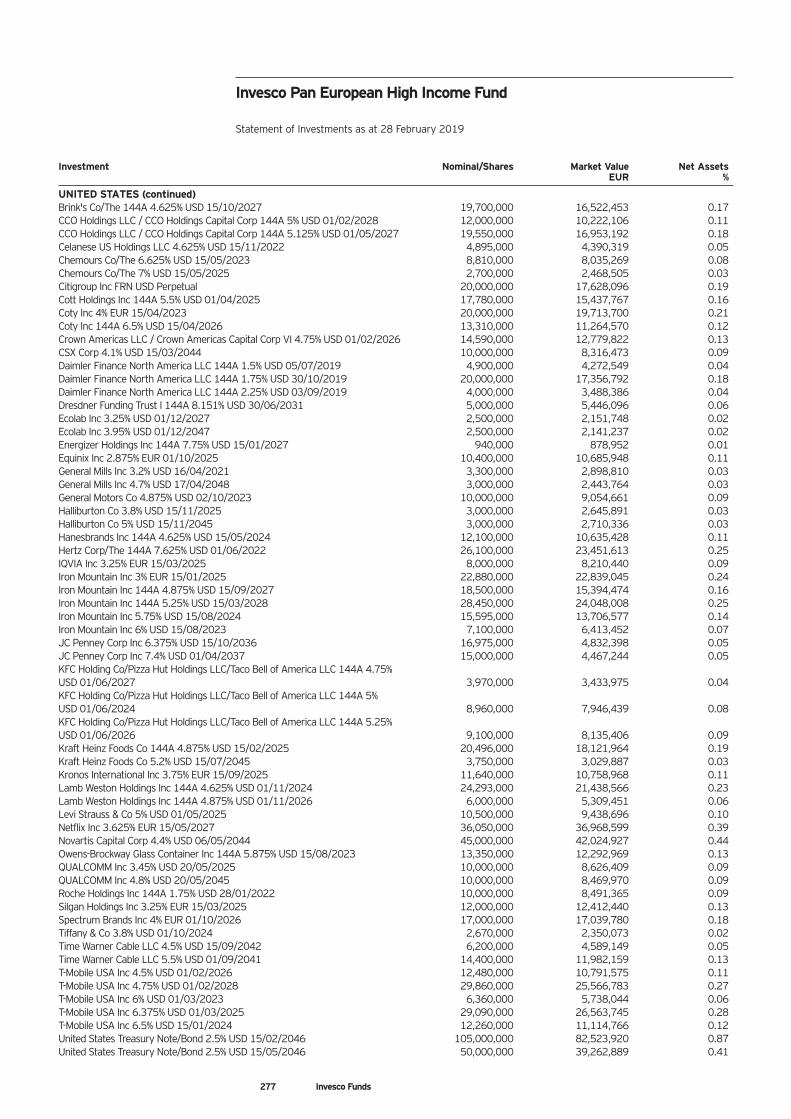
Investment Nominal/Shares Market Value Net Assets EUR %
UNITED STATES (continued) Brink's Co/The 144A 4.625% USD 15/10/2027 19,700,000 16,522,453 0.17 CCO Holdings LLC / CCO Holdings Capital Corp 144A 5% USD 01/02/2028 12,000,000 10,222,106 0.11 CCO Holdings LLC / CCO Holdings Capital Corp 144A 5.125% USD 01/05/2027 19,550,000 16,953,192 0.18 Celanese US Holdings LLC 4.625% USD 15/11/2022 4,895,000 4,390,319 0.05 Chemours Co/The 6.625% USD 15/05/2023 8,810,000 8,035,269 0.08 Chemours Co/The 7% USD 15/05/2025 2,700,000 2,468,505 0.03 Citigroup Inc FRN USD Perpetual 20,000,000 17,628,096 0.19 Cott Holdings Inc 144A 5.5% USD 01/04/2025 17,780,000 15,437,767 0.16 Coty Inc 4% EUR 15/04/2023 20,000,000 19,713,700 0.21 Coty Inc 144A 6.5% USD 15/04/2026 13,310,000 11,264,570 0.12 Crown Americas LLC / Crown Americas Capital Corp VI 4.75% USD 01/02/2026 14,590,000 12,779,822 0.13 CSX Corp 4.1% USD 15/03/2044 10,000,000 8,316,473 0.09 Daimler Finance North America LLC 144A 1.5% USD 05/07/2019 4,900,000 4,272,549 0.04 Daimler Finance North America LLC 144A 1.75% USD 30/10/2019 20,000,000 17,356,792 0.18 Daimler Finance North America LLC 144A 2.25% USD 03/09/2019 4,000,000 3,488,386 0.04 Dresdner Funding Trust I 144A 8.151% USD 30/06/2031 5,000,000 5,446,096 0.06 Ecolab Inc 3.25% USD 01/12/2027 2,500,000 2,151,748 0.02 Ecolab Inc 3.95% USD 01/12/2047 2,500,000 2,141,237 0.02 Energizer Holdings Inc 144A 7.75% USD 15/01/2027 940,000 878,952 0.01 Equinix Inc 2.875% EUR 01/10/2025 10,400,000 10,685,948 0.11 General Mills Inc 3.2% USD 16/04/2021 3,300,000 2,898,810 0.03 General Mills Inc 4.7% USD 17/04/2048 3,000,000 2,443,764 0.03 General Motors Co 4.875% USD 02/10/2023 10,000,000 9,054,661 0.09 Halliburton Co 3.8% USD 15/11/2025 3,000,000 2,645,891 0.03 Halliburton Co 5% USD 15/11/2045 3,000,000 2,710,336 0.03 Hanesbrands Inc 144A 4.625% USD 15/05/2024 12,100,000 10,635,428 0.11 Hertz Corp/The 144A 7.625% USD 01/06/2022 26,100,000 23,451,613 0.25 IQVIA Inc 3.25% EUR 15/03/2025 8,000,000 8,210,440 0.09 Iron Mountain Inc 3% EUR 15/01/2025 22,880,000 22,839,045 0.24 Iron Mountain Inc 144A 4.875% USD 15/09/2027 18,500,000 15,394,474 0.16 Iron Mountain Inc 144A 5.25% USD 15/03/2028 28,450,000 24,048,008 0.25 Iron Mountain Inc 5.75% USD 15/08/2024 15,595,000 13,706,577 0.14 Iron Mountain Inc 6% USD 15/08/2023 7,100,000 6,413,452 0.07 JC Penney Corp Inc 6.375% USD 15/10/2036 16,975,000 4,832,398 0.05 JC Penney Corp Inc 7.4% USD 01/04/2037 15,000,000 4,467,244 0.05 KFC Holding Co/Pizza Hut Holdings LLC/Taco Bell of America LLC 144A 4.75% USD 01/06/2027 3,970,000 3,433,975 0.04 KFC Holding Co/Pizza Hut Holdings LLC/Taco Bell of America LLC 144A 5% USD 01/06/2024 8,960,000 7,946,439 0.08 KFC Holding Co/Pizza Hut Holdings LLC/Taco Bell of America LLC 144A 5.25% USD 01/06/2026 9,100,000 8,135,406 0.09 Kraft Heinz Foods Co 144A 4.875% USD 15/02/2025 20,496,000 18,121,964 0.19 Kraft Heinz Foods Co 5.2% USD 15/07/2045 3,750,000 3,029,887 0.03 Kronos International Inc 3.75% EUR 15/09/2025 11,640,000 10,758,968 0.11 Lamb Weston Holdings Inc 144A 4.625% USD 01/11/2024 24,293,000 21,438,566 0.23 Lamb Weston Holdings Inc 144A 4.875% USD 01/11/2026 6,000,000 5,309,451 0.06 Levi Strauss & Co 5% USD 01/05/2025 10,500,000 9,438,696 0.10 Netflix Inc 3.625% EUR 15/05/2027 36,050,000 36,968,599 0.39 Novartis Capital Corp 4.4% USD 06/05/2044 45,000,000 42,024,927 0.44 Owens-Brockway Glass Container Inc 144A 5.875% USD 15/08/2023 13,350,000 12,292,969 0.13 QUALCOMM Inc 3.45% USD 20/05/2025 10,000,000 8,626,409 0.09 QUALCOMM Inc 4.8% USD 20/05/2045 10,000,000 8,469,970 0.09 Roche Holdings Inc 144A 1.75% USD 28/01/2022 10,000,000 8,491,365 0.09 Silgan Holdings Inc 3.25% EUR 15/03/2025 12,000,000 12,412,440 0.13 Spectrum Brands Inc 4% EUR 01/10/2026 17,000,000 17,039,780 0.18 Tiffany & Co 3.8% USD 01/10/2024 2,670,000 2,350,073 0.02 Time Warner Cable LLC 4.5% USD 15/09/2042 6,200,000 4,589,149 0.05 Time Warner Cable LLC 5.5% USD 01/09/2041 14,400,000 11,982,159 0.13 T-Mobile USA Inc 4.5% USD 01/02/2026 12,480,000 10,791,575 0.11 T-Mobile USA Inc 4.75% USD 01/02/2028 29,860,000 25,566,783 0.27 T-Mobile USA Inc 6% USD 01/03/2023 6,360,000 5,738,044 0.06 T-Mobile USA Inc 6.375% USD 01/03/2025 29,090,000 26,563,745 0.28 T-Mobile USA Inc 6.5% USD 15/01/2024 12,260,000 11,114,766 0.12 United States Treasury Note/Bond 2.5% USD 15/02/2046 105,000,000 82,523,920 0.87 United States Treasury Note/Bond 2.5% USD 15/05/2046 50,000,000 39,262,889 0.41
Invesco Pan European High Income Fund Statement of Investments as at 28 February 2019
277 Invesco Funds
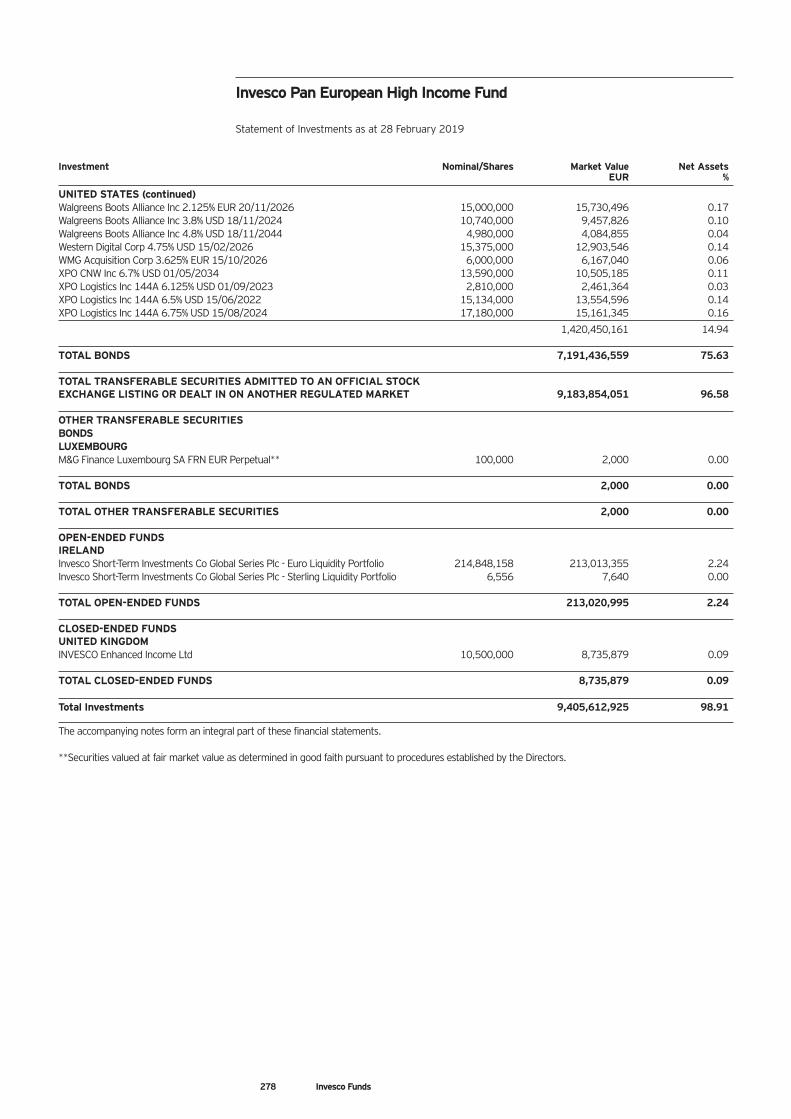
Investment Nominal/Shares Market Value Net Assets EUR %
UNITED STATES (continued) Walgreens Boots Alliance Inc 2.125% EUR 20/11/2026 15,000,000 15,730,496 0.17 Walgreens Boots Alliance Inc 3.8% USD 18/11/2024 10,740,000 9,457,826 0.10 Walgreens Boots Alliance Inc 4.8% USD 18/11/2044 4,980,000 4,084,855 0.04 Western Digital Corp 4.75% USD 15/02/2026 15,375,000 12,903,546 0.14 WMG Acquisition Corp 3.625% EUR 15/10/2026 6,000,000 6,167,040 0.06 XPO CNW Inc 6.7% USD 01/05/2034 13,590,000 10,505,185 0.11 XPO Logistics Inc 144A 6.125% USD 01/09/2023 2,810,000 2,461,364 0.03 XPO Logistics Inc 144A 6.5% USD 15/06/2022 15,134,000 13,554,596 0.14 XPO Logistics Inc 144A 6.75% USD 15/08/2024 17,180,000 15,161,345 0.16
1,420,450,161 14.94 TOTAL BONDS 7,191,436,559 75.63 TOTAL TRANSFERABLE SECURITIES ADMITTED TO AN OFFICIAL STOCK EXCHANGE LISTING OR DEALT IN ON ANOTHER REGULATED MARKET 9,183,854,051 96.58 OTHER TRANSFERABLE SECURITIES BONDS LUXEMBOURG M&G Finance Luxembourg SA FRN EUR Perpetual** 100,000 2,000 0.00 TOTAL BONDS 2,000 0.00 TOTAL OTHER TRANSFERABLE SECURITIES 2,000 0.00 OPEN-ENDED FUNDS IRELAND Invesco Short-Term Investments Co Global Series Plc - Euro Liquidity Portfolio 214,848,158 213,013,355 2.24 Invesco Short-Term Investments Co Global Series Plc - Sterling Liquidity Portfolio 6,556 7,640 0.00 TOTAL OPEN-ENDED FUNDS 213,020,995 2.24 CLOSED-ENDED FUNDS UNITED KINGDOM INVESCO Enhanced Income Ltd 10,500,000 8,735,879 0.09 TOTAL CLOSED-ENDED FUNDS 8,735,879 0.09 Total Investments 9,405,612,925 98.91
The accompanying notes form an integral part of these financial statements. **Securities valued at fair market value as determined in good faith pursuant to procedures established by the Directors.
Invesco Pan European High Income Fund Statement of Investments as at 28 February 2019
278 Invesco Funds
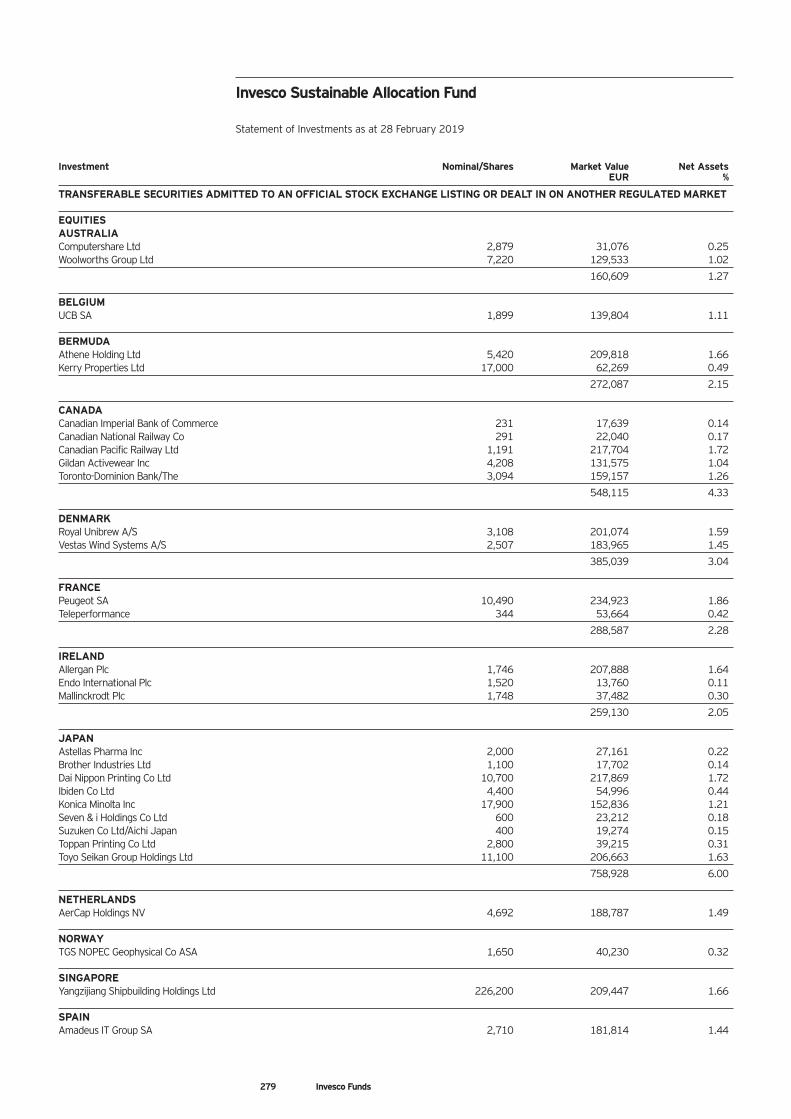
Investment Nominal/Shares Market Value Net Assets EUR %
TRANSFERABLE SECURITIES ADMITTED TO AN OFFICIAL STOCK EXCHANGE LISTING OR DEALT IN ON ANOTHER REGULATED MARKET EQUITIES AUSTRALIA Computershare Ltd 2,879 31,076 0.25 Woolworths Group Ltd 7,220 129,533 1.02
160,609 1.27 BELGIUM UCB SA 1,899 139,804 1.11 BERMUDA Athene Holding Ltd 5,420 209,818 1.66 Kerry Properties Ltd 17,000 62,269 0.49
272,087 2.15 CANADA Canadian Imperial Bank of Commerce 231 17,639 0.14 Canadian National Railway Co 291 22,040 0.17 Canadian Pacific Railway Ltd 1,191 217,704 1.72 Gildan Activewear Inc 4,208 131,575 1.04 Toronto-Dominion Bank/The 3,094 159,157 1.26
548,115 4.33 DENMARK Royal Unibrew A/S 3,108 201,074 1.59 Vestas Wind Systems A/S 2,507 183,965 1.45
385,039 3.04 FRANCE Peugeot SA 10,490 234,923 1.86 Teleperformance 344 53,664 0.42
288,587 2.28 IRELAND Allergan Plc 1,746 207,888 1.64 Endo International Plc 1,520 13,760 0.11 Mallinckrodt Plc 1,748 37,482 0.30
259,130 2.05 JAPAN Astellas Pharma Inc 2,000 27,161 0.22 Brother Industries Ltd 1,100 17,702 0.14 Dai Nippon Printing Co Ltd 10,700 217,869 1.72 Ibiden Co Ltd 4,400 54,996 0.44 Konica Minolta Inc 17,900 152,836 1.21 Seven & i Holdings Co Ltd 600 23,212 0.18 Suzuken Co Ltd/Aichi Japan 400 19,274 0.15 Toppan Printing Co Ltd 2,800 39,215 0.31 Toyo Seikan Group Holdings Ltd 11,100 206,663 1.63
758,928 6.00 NETHERLANDS AerCap Holdings NV 4,692 188,787 1.49 NORWAY TGS NOPEC Geophysical Co ASA 1,650 40,230 0.32 SINGAPORE Yangzijiang Shipbuilding Holdings Ltd 226,200 209,447 1.66 SPAIN Amadeus IT Group SA 2,710 181,814 1.44
Invesco Sustainable Allocation Fund Statement of Investments as at 28 February 2019
279 Invesco Funds
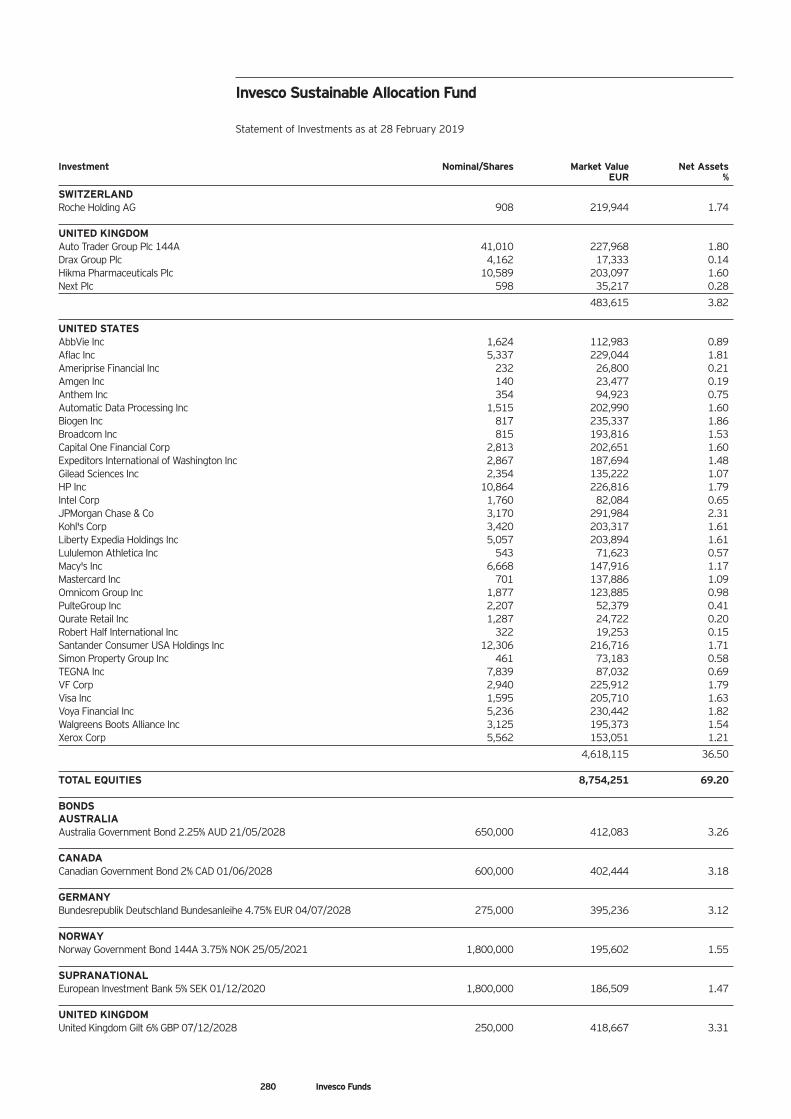
Investment Nominal/Shares Market Value Net Assets EUR %
SWITZERLAND Roche Holding AG 908 219,944 1.74 UNITED KINGDOM Auto Trader Group Plc 144A 41,010 227,968 1.80 Drax Group Plc 4,162 17,333 0.14 Hikma Pharmaceuticals Plc 10,589 203,097 1.60 Next Plc 598 35,217 0.28
483,615 3.82 UNITED STATES AbbVie Inc 1,624 112,983 0.89 Aflac Inc 5,337 229,044 1.81 Ameriprise Financial Inc 232 26,800 0.21 Amgen Inc 140 23,477 0.19 Anthem Inc 354 94,923 0.75 Automatic Data Processing Inc 1,515 202,990 1.60 Biogen Inc 817 235,337 1.86 Broadcom Inc 815 193,816 1.53 Capital One Financial Corp 2,813 202,651 1.60 Expeditors International of Washington Inc 2,867 187,694 1.48 Gilead Sciences Inc 2,354 135,222 1.07 HP Inc 10,864 226,816 1.79 Intel Corp 1,760 82,084 0.65 JPMorgan Chase & Co 3,170 291,984 2.31 Kohl's Corp 3,420 203,317 1.61 Liberty Expedia Holdings Inc 5,057 203,894 1.61 Lululemon Athletica Inc 543 71,623 0.57 Macy's Inc 6,668 147,916 1.17 Mastercard Inc 701 137,886 1.09 Omnicom Group Inc 1,877 123,885 0.98 PulteGroup Inc 2,207 52,379 0.41 Qurate Retail Inc 1,287 24,722 0.20 Robert Half International Inc 322 19,253 0.15 Santander Consumer USA Holdings Inc 12,306 216,716 1.71 Simon Property Group Inc 461 73,183 0.58 TEGNA Inc 7,839 87,032 0.69 VF Corp 2,940 225,912 1.79 Visa Inc 1,595 205,710 1.63 Voya Financial Inc 5,236 230,442 1.82 Walgreens Boots Alliance Inc 3,125 195,373 1.54 Xerox Corp 5,562 153,051 1.21
4,618,115 36.50 TOTAL EQUITIES 8,754,251 69.20 BONDS AUSTRALIA Australia Government Bond 2.25% AUD 21/05/2028 650,000 412,083 3.26 CANADA Canadian Government Bond 2% CAD 01/06/2028 600,000 402,444 3.18 GERMANY Bundesrepublik Deutschland Bundesanleihe 4.75% EUR 04/07/2028 275,000 395,236 3.12 NORWAY Norway Government Bond 144A 3.75% NOK 25/05/2021 1,800,000 195,602 1.55 SUPRANATIONAL European Investment Bank 5% SEK 01/12/2020 1,800,000 186,509 1.47 UNITED KINGDOM United Kingdom Gilt 6% GBP 07/12/2028 250,000 418,667 3.31
Invesco Sustainable Allocation Fund Statement of Investments as at 28 February 2019
280 Invesco Funds
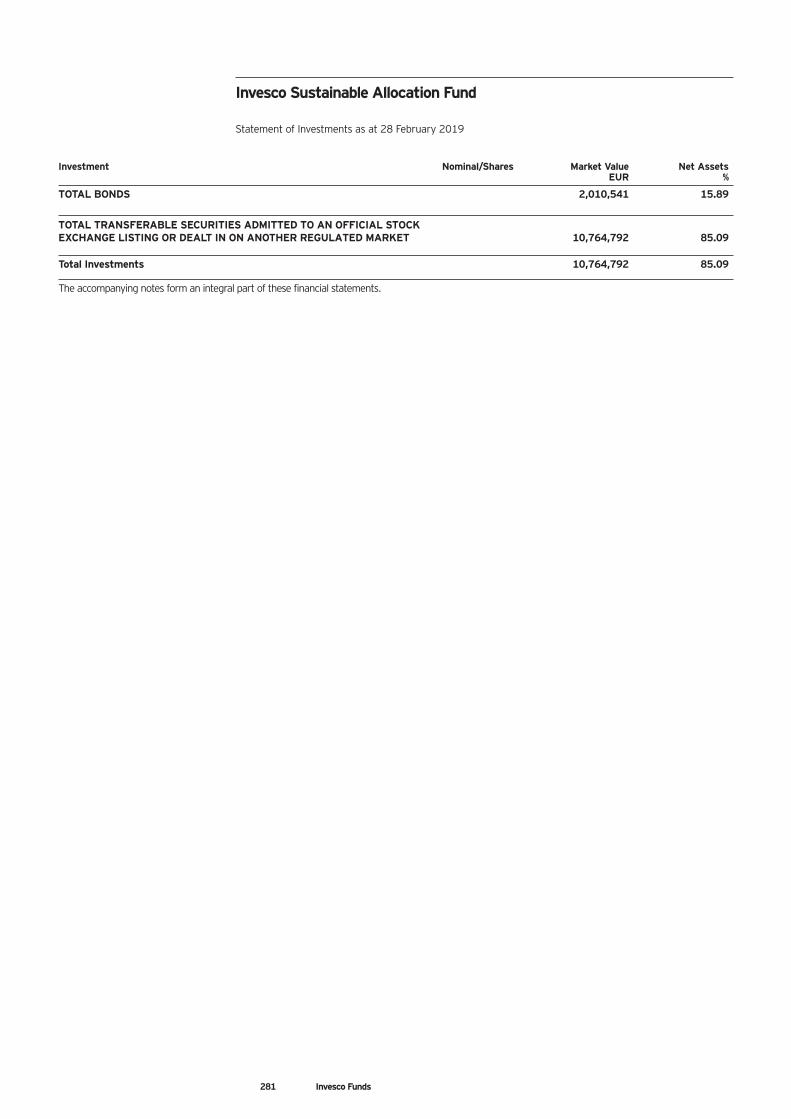
Investment Nominal/Shares Market Value Net Assets EUR %
TOTAL BONDS 2,010,541 15.89
TOTAL TRANSFERABLE SECURITIES ADMITTED TO AN OFFICIAL STOCK EXCHANGE LISTING OR DEALT IN ON ANOTHER REGULATED MARKET 10,764,792 85.09 Total Investments 10,764,792 85.09
The accompanying notes form an integral part of these financial statements.
Invesco Sustainable Allocation Fund Statement of Investments as at 28 February 2019
281 Invesco Funds
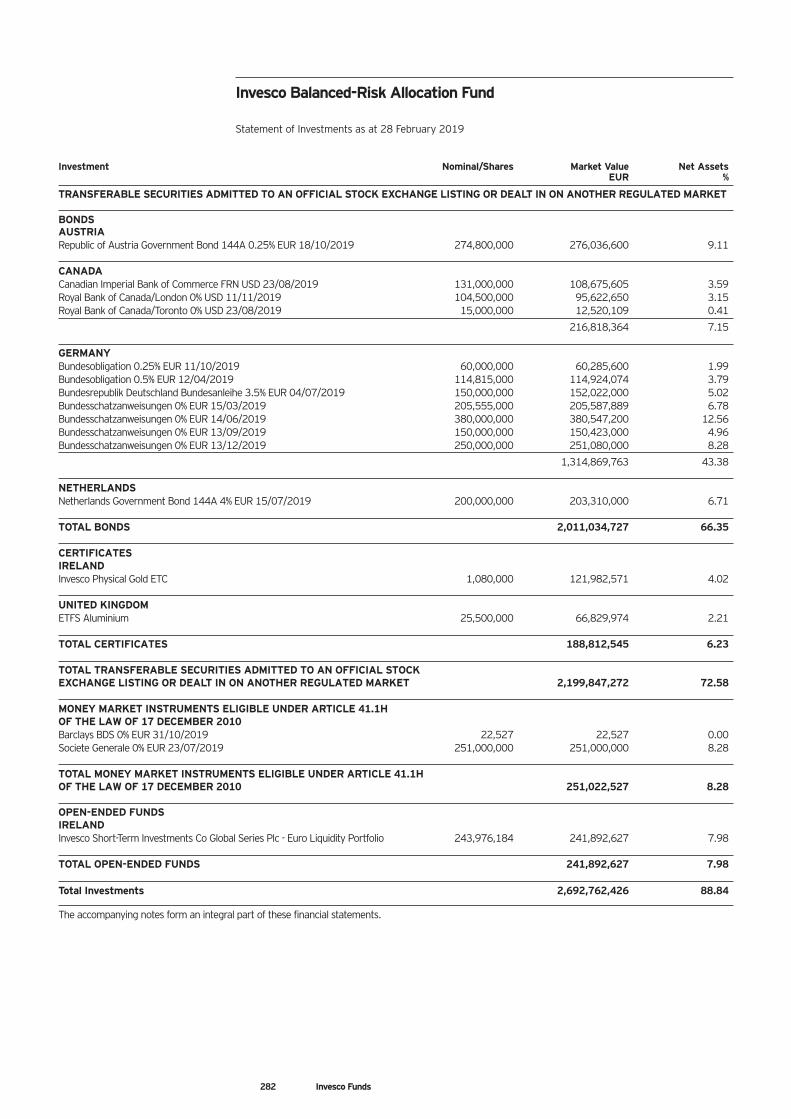
Investment Nominal/Shares Market Value Net Assets EUR %
TRANSFERABLE SECURITIES ADMITTED TO AN OFFICIAL STOCK EXCHANGE LISTING OR DEALT IN ON ANOTHER REGULATED MARKET BONDS AUSTRIA Republic of Austria Government Bond 144A 0.25% EUR 18/10/2019 274,800,000 276,036,600 9.11 CANADA Canadian Imperial Bank of Commerce FRN USD 23/08/2019 131,000,000 108,675,605 3.59 Royal Bank of Canada/London 0% USD 11/11/2019 104,500,000 95,622,650 3.15 Royal Bank of Canada/Toronto 0% USD 23/08/2019 15,000,000 12,520,109 0.41
216,818,364 7.15 GERMANY Bundesobligation 0.25% EUR 11/10/2019 60,000,000 60,285,600 1.99 Bundesobligation 0.5% EUR 12/04/2019 114,815,000 114,924,074 3.79 Bundesrepublik Deutschland Bundesanleihe 3.5% EUR 04/07/2019 150,000,000 152,022,000 5.02 Bundesschatzanweisungen 0% EUR 15/03/2019 205,555,000 205,587,889 6.78 Bundesschatzanweisungen 0% EUR 14/06/2019 380,000,000 380,547,200 12.56 Bundesschatzanweisungen 0% EUR 13/09/2019 150,000,000 150,423,000 4.96 Bundesschatzanweisungen 0% EUR 13/12/2019 250,000,000 251,080,000 8.28
1,314,869,763 43.38 NETHERLANDS Netherlands Government Bond 144A 4% EUR 15/07/2019 200,000,000 203,310,000 6.71 TOTAL BONDS 2,011,034,727 66.35 CERTIFICATES IRELAND Invesco Physical Gold ETC 1,080,000 121,982,571 4.02 UNITED KINGDOM ETFS Aluminium 25,500,000 66,829,974 2.21 TOTAL CERTIFICATES 188,812,545 6.23 TOTAL TRANSFERABLE SECURITIES ADMITTED TO AN OFFICIAL STOCK EXCHANGE LISTING OR DEALT IN ON ANOTHER REGULATED MARKET 2,199,847,272 72.58 MONEY MARKET INSTRUMENTS ELIGIBLE UNDER ARTICLE 41.1H OF THE LAW OF 17 DECEMBER 2010 Barclays BDS 0% EUR 31/10/2019 22,527 22,527 0.00 Societe Generale 0% EUR 23/07/2019 251,000,000 251,000,000 8.28 TOTAL MONEY MARKET INSTRUMENTS ELIGIBLE UNDER ARTICLE 41.1H OF THE LAW OF 17 DECEMBER 2010 251,022,527 8.28 OPEN-ENDED FUNDS IRELAND Invesco Short-Term Investments Co Global Series Plc - Euro Liquidity Portfolio 243,976,184 241,892,627 7.98 TOTAL OPEN-ENDED FUNDS 241,892,627 7.98 Total Investments 2,692,762,426 88.84
The accompanying notes form an integral part of these financial statements.
Invesco Balanced-Risk Allocation Fund Statement of Investments as at 28 February 2019
282 Invesco Funds
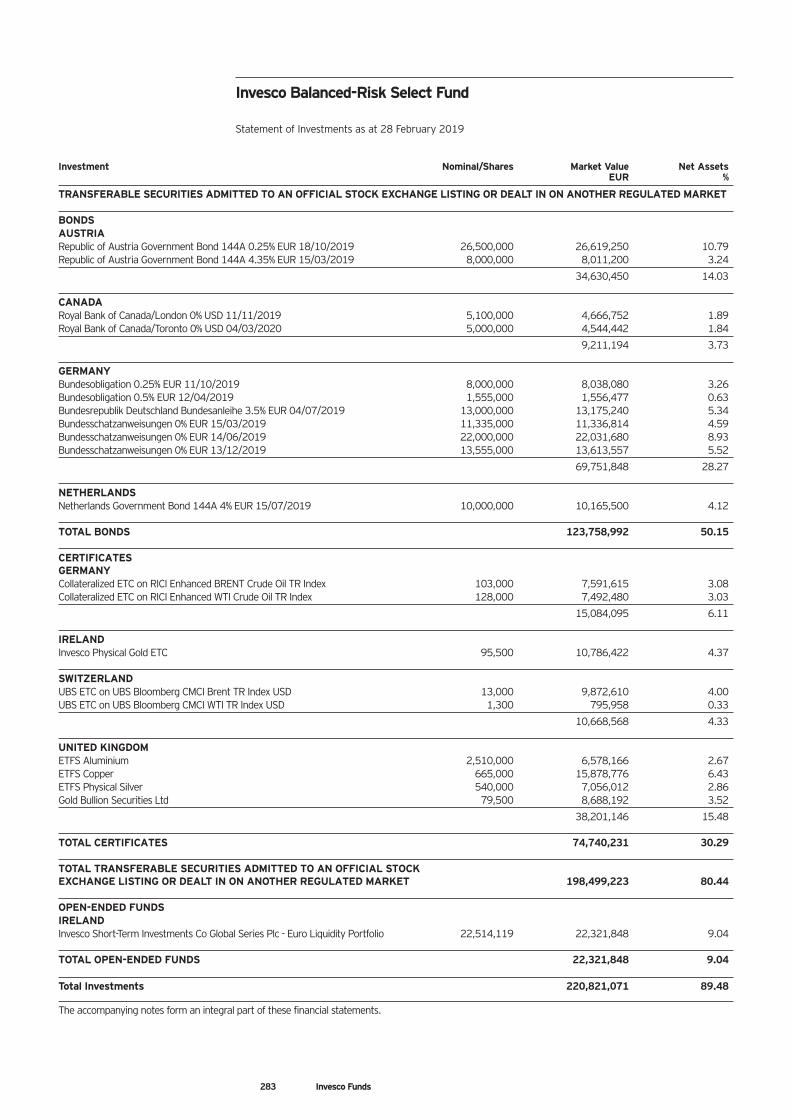
Investment Nominal/Shares Market Value Net Assets EUR %
TRANSFERABLE SECURITIES ADMITTED TO AN OFFICIAL STOCK EXCHANGE LISTING OR DEALT IN ON ANOTHER REGULATED MARKET BONDS AUSTRIA Republic of Austria Government Bond 144A 0.25% EUR 18/10/2019 26,500,000 26,619,250 10.79 Republic of Austria Government Bond 144A 4.35% EUR 15/03/2019 8,000,000 8,011,200 3.24
34,630,450 14.03 CANADA Royal Bank of Canada/London 0% USD 11/11/2019 5,100,000 4,666,752 1.89 Royal Bank of Canada/Toronto 0% USD 04/03/2020 5,000,000 4,544,442 1.84
9,211,194 3.73 GERMANY Bundesobligation 0.25% EUR 11/10/2019 8,000,000 8,038,080 3.26 Bundesobligation 0.5% EUR 12/04/2019 1,555,000 1,556,477 0.63 Bundesrepublik Deutschland Bundesanleihe 3.5% EUR 04/07/2019 13,000,000 13,175,240 5.34 Bundesschatzanweisungen 0% EUR 15/03/2019 11,335,000 11,336,814 4.59 Bundesschatzanweisungen 0% EUR 14/06/2019 22,000,000 22,031,680 8.93 Bundesschatzanweisungen 0% EUR 13/12/2019 13,555,000 13,613,557 5.52
69,751,848 28.27 NETHERLANDS Netherlands Government Bond 144A 4% EUR 15/07/2019 10,000,000 10,165,500 4.12 TOTAL BONDS 123,758,992 50.15 CERTIFICATES GERMANY Collateralized ETC on RICI Enhanced BRENT Crude Oil TR Index 103,000 7,591,615 3.08 Collateralized ETC on RICI Enhanced WTI Crude Oil TR Index 128,000 7,492,480 3.03
15,084,095 6.11 IRELAND Invesco Physical Gold ETC 95,500 10,786,422 4.37 SWITZERLAND UBS ETC on UBS Bloomberg CMCI Brent TR Index USD 13,000 9,872,610 4.00 UBS ETC on UBS Bloomberg CMCI WTI TR Index USD 1,300 795,958 0.33
10,668,568 4.33 UNITED KINGDOM ETFS Aluminium 2,510,000 6,578,166 2.67 ETFS Copper 665,000 15,878,776 6.43 ETFS Physical Silver 540,000 7,056,012 2.86 Gold Bullion Securities Ltd 79,500 8,688,192 3.52
38,201,146 15.48 TOTAL CERTIFICATES 74,740,231 30.29 TOTAL TRANSFERABLE SECURITIES ADMITTED TO AN OFFICIAL STOCK EXCHANGE LISTING OR DEALT IN ON ANOTHER REGULATED MARKET 198,499,223 80.44 OPEN-ENDED FUNDS IRELAND Invesco Short-Term Investments Co Global Series Plc - Euro Liquidity Portfolio 22,514,119 22,321,848 9.04 TOTAL OPEN-ENDED FUNDS 22,321,848 9.04 Total Investments 220,821,071 89.48
The accompanying notes form an integral part of these financial statements.
Invesco Balanced-Risk Select Fund Statement of Investments as at 28 February 2019
283 Invesco Funds
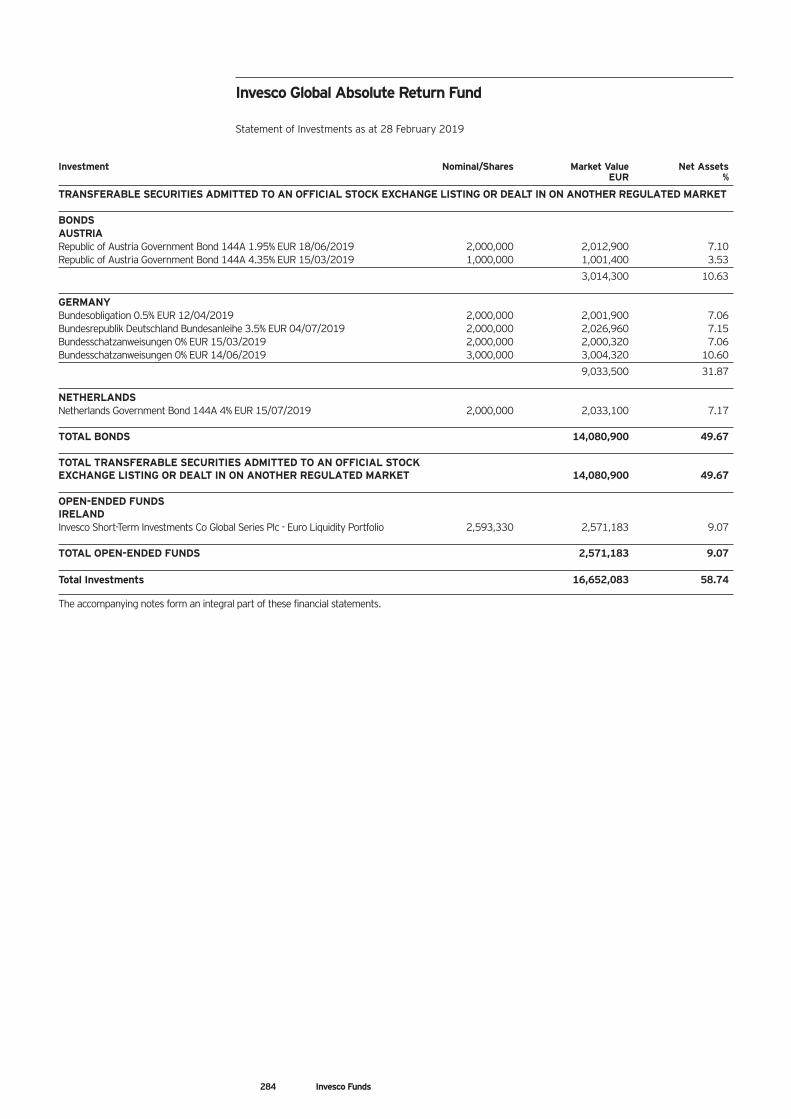
Investment Nominal/Shares Market Value Net Assets EUR %
TRANSFERABLE SECURITIES ADMITTED TO AN OFFICIAL STOCK EXCHANGE LISTING OR DEALT IN ON ANOTHER REGULATED MARKET BONDS AUSTRIA Republic of Austria Government Bond 144A 1.95% EUR 18/06/2019 2,000,000 2,012,900 7.10 Republic of Austria Government Bond 144A 4.35% EUR 15/03/2019 1,000,000 1,001,400 3.53
3,014,300 10.63 GERMANY Bundesobligation 0.5% EUR 12/04/2019 2,000,000 2,001,900 7.06 Bundesrepublik Deutschland Bundesanleihe 3.5% EUR 04/07/2019 2,000,000 2,026,960 7.15 Bundesschatzanweisungen 0% EUR 15/03/2019 2,000,000 2,000,320 7.06 Bundesschatzanweisungen 0% EUR 14/06/2019 3,000,000 3,004,320 10.60
9,033,500 31.87 NETHERLANDS Netherlands Government Bond 144A 4% EUR 15/07/2019 2,000,000 2,033,100 7.17 TOTAL BONDS 14,080,900 49.67 TOTAL TRANSFERABLE SECURITIES ADMITTED TO AN OFFICIAL STOCK EXCHANGE LISTING OR DEALT IN ON ANOTHER REGULATED MARKET 14,080,900 49.67 OPEN-ENDED FUNDS IRELAND Invesco Short-Term Investments Co Global Series Plc - Euro Liquidity Portfolio 2,593,330 2,571,183 9.07 TOTAL OPEN-ENDED FUNDS 2,571,183 9.07 Total Investments 16,652,083 58.74
The accompanying notes form an integral part of these financial statements.
Invesco Global Absolute Return Fund Statement of Investments as at 28 February 2019
284 Invesco Funds
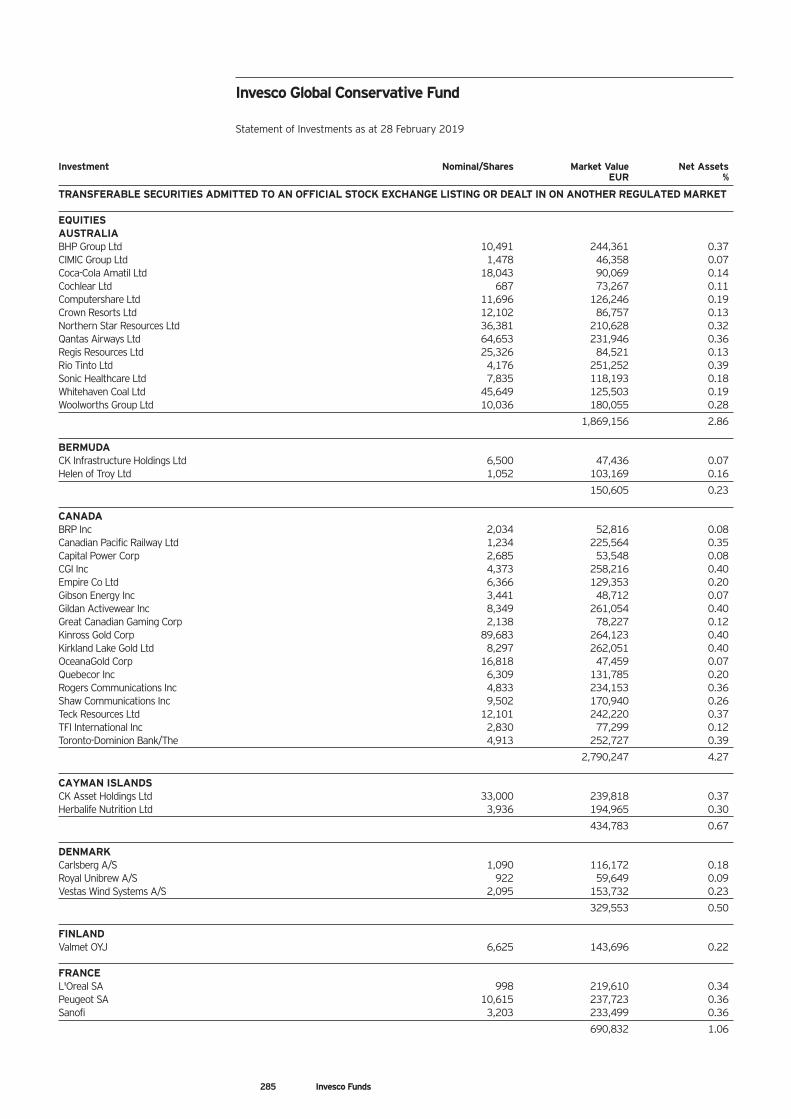
Investment Nominal/Shares Market Value Net Assets EUR %
TRANSFERABLE SECURITIES ADMITTED TO AN OFFICIAL STOCK EXCHANGE LISTING OR DEALT IN ON ANOTHER REGULATED MARKET EQUITIES AUSTRALIA BHP Group Ltd 10,491 244,361 0.37 CIMIC Group Ltd 1,478 46,358 0.07 Coca-Cola Amatil Ltd 18,043 90,069 0.14 Cochlear Ltd 687 73,267 0.11 Computershare Ltd 11,696 126,246 0.19 Crown Resorts Ltd 12,102 86,757 0.13 Northern Star Resources Ltd 36,381 210,628 0.32 Qantas Airways Ltd 64,653 231,946 0.36 Regis Resources Ltd 25,326 84,521 0.13 Rio Tinto Ltd 4,176 251,252 0.39 Sonic Healthcare Ltd 7,835 118,193 0.18 Whitehaven Coal Ltd 45,649 125,503 0.19 Woolworths Group Ltd 10,036 180,055 0.28
1,869,156 2.86 BERMUDA CK Infrastructure Holdings Ltd 6,500 47,436 0.07 Helen of Troy Ltd 1,052 103,169 0.16
150,605 0.23 CANADA BRP Inc 2,034 52,816 0.08 Canadian Pacific Railway Ltd 1,234 225,564 0.35 Capital Power Corp 2,685 53,548 0.08 CGI Inc 4,373 258,216 0.40 Empire Co Ltd 6,366 129,353 0.20 Gibson Energy Inc 3,441 48,712 0.07 Gildan Activewear Inc 8,349 261,054 0.40 Great Canadian Gaming Corp 2,138 78,227 0.12 Kinross Gold Corp 89,683 264,123 0.40 Kirkland Lake Gold Ltd 8,297 262,051 0.40 OceanaGold Corp 16,818 47,459 0.07 Quebecor Inc 6,309 131,785 0.20 Rogers Communications Inc 4,833 234,153 0.36 Shaw Communications Inc 9,502 170,940 0.26 Teck Resources Ltd 12,101 242,220 0.37 TFI International Inc 2,830 77,299 0.12 Toronto-Dominion Bank/The 4,913 252,727 0.39
2,790,247 4.27 CAYMAN ISLANDS CK Asset Holdings Ltd 33,000 239,818 0.37 Herbalife Nutrition Ltd 3,936 194,965 0.30
434,783 0.67 DENMARK Carlsberg A/S 1,090 116,172 0.18 Royal Unibrew A/S 922 59,649 0.09 Vestas Wind Systems A/S 2,095 153,732 0.23
329,553 0.50 FINLAND Valmet OYJ 6,625 143,696 0.22 FRANCE L'Oreal SA 998 219,610 0.34 Peugeot SA 10,615 237,723 0.36 Sanofi 3,203 233,499 0.36
690,832 1.06
Invesco Global Conservative Fund Statement of Investments as at 28 February 2019
285 Invesco Funds
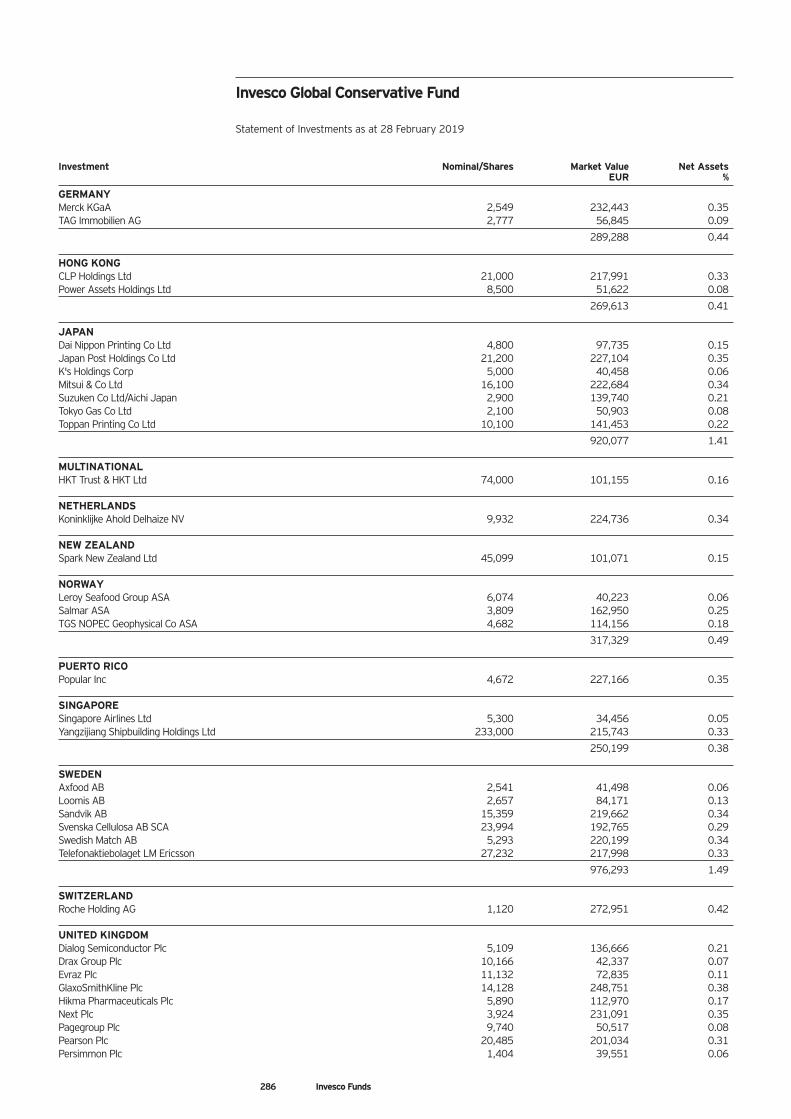
Investment Nominal/Shares Market Value Net Assets EUR %
GERMANY Merck KGaA 2,549 232,443 0.35 TAG Immobilien AG 2,777 56,845 0.09
289,288 0.44 HONG KONG CLP Holdings Ltd 21,000 217,991 0.33 Power Assets Holdings Ltd 8,500 51,622 0.08
269,613 0.41 JAPAN Dai Nippon Printing Co Ltd 4,800 97,735 0.15 Japan Post Holdings Co Ltd 21,200 227,104 0.35 K's Holdings Corp 5,000 40,458 0.06 Mitsui & Co Ltd 16,100 222,684 0.34 Suzuken Co Ltd/Aichi Japan 2,900 139,740 0.21 Tokyo Gas Co Ltd 2,100 50,903 0.08 Toppan Printing Co Ltd 10,100 141,453 0.22
920,077 1.41 MULTINATIONAL HKT Trust & HKT Ltd 74,000 101,155 0.16 NETHERLANDS Koninklijke Ahold Delhaize NV 9,932 224,736 0.34 NEW ZEALAND Spark New Zealand Ltd 45,099 101,071 0.15 NORWAY Leroy Seafood Group ASA 6,074 40,223 0.06 Salmar ASA 3,809 162,950 0.25 TGS NOPEC Geophysical Co ASA 4,682 114,156 0.18
317,329 0.49 PUERTO RICO Popular Inc 4,672 227,166 0.35 SINGAPORE Singapore Airlines Ltd 5,300 34,456 0.05 Yangzijiang Shipbuilding Holdings Ltd 233,000 215,743 0.33
250,199 0.38 SWEDEN Axfood AB 2,541 41,498 0.06 Loomis AB 2,657 84,171 0.13 Sandvik AB 15,359 219,662 0.34 Svenska Cellulosa AB SCA 23,994 192,765 0.29 Swedish Match AB 5,293 220,199 0.34 Telefonaktiebolaget LM Ericsson 27,232 217,998 0.33
976,293 1.49 SWITZERLAND Roche Holding AG 1,120 272,951 0.42 UNITED KINGDOM Dialog Semiconductor Plc 5,109 136,666 0.21 Drax Group Plc 10,166 42,337 0.07 Evraz Plc 11,132 72,835 0.11 GlaxoSmithKline Plc 14,128 248,751 0.38 Hikma Pharmaceuticals Plc 5,890 112,970 0.17 Next Plc 3,924 231,091 0.35 Pagegroup Plc 9,740 50,517 0.08 Pearson Plc 20,485 201,034 0.31 Persimmon Plc 1,404 39,551 0.06
Invesco Global Conservative Fund Statement of Investments as at 28 February 2019
286 Invesco Funds
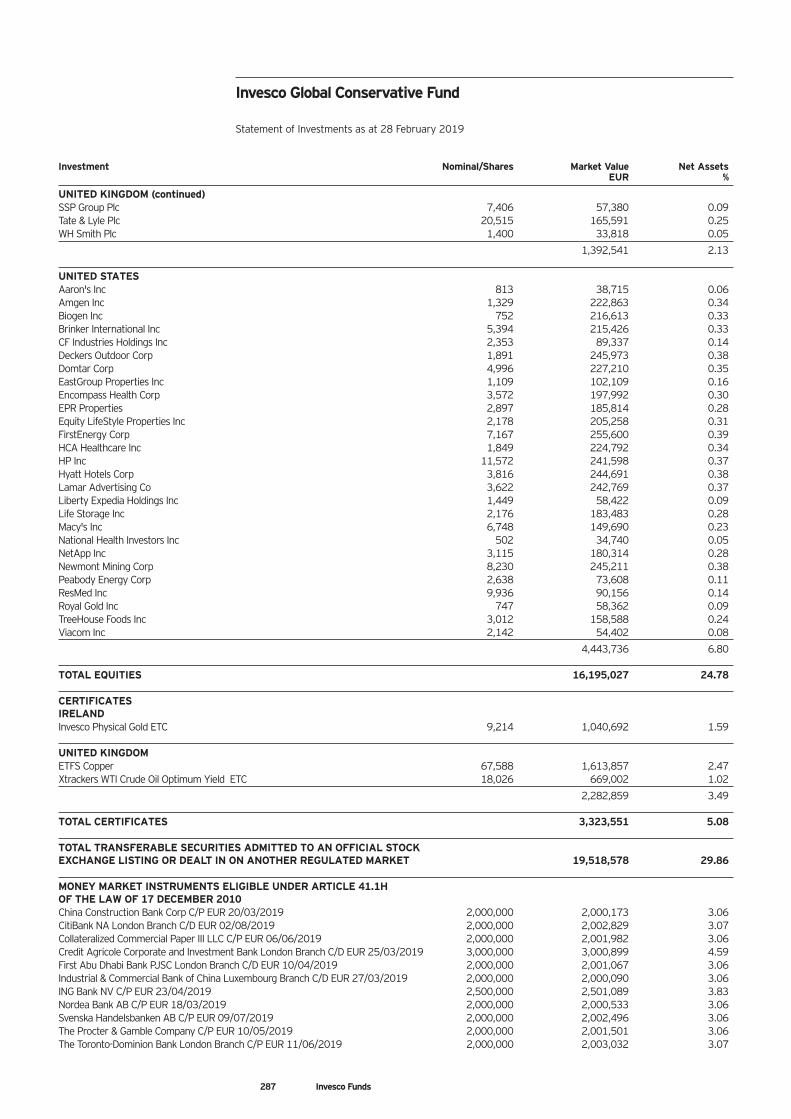
Investment Nominal/Shares Market Value Net Assets EUR %
UNITED KINGDOM (continued) SSP Group Plc 7,406 57,380 0.09 Tate & Lyle Plc 20,515 165,591 0.25 WH Smith Plc 1,400 33,818 0.05
1,392,541 2.13 UNITED STATES Aaron's Inc 813 38,715 0.06 Amgen Inc 1,329 222,863 0.34 Biogen Inc 752 216,613 0.33 Brinker International Inc 5,394 215,426 0.33 CF Industries Holdings Inc 2,353 89,337 0.14 Deckers Outdoor Corp 1,891 245,973 0.38 Domtar Corp 4,996 227,210 0.35 EastGroup Properties Inc 1,109 102,109 0.16 Encompass Health Corp 3,572 197,992 0.30 EPR Properties 2,897 185,814 0.28 Equity LifeStyle Properties Inc 2,178 205,258 0.31 FirstEnergy Corp 7,167 255,600 0.39 HCA Healthcare Inc 1,849 224,792 0.34 HP Inc 11,572 241,598 0.37 Hyatt Hotels Corp 3,816 244,691 0.38 Lamar Advertising Co 3,622 242,769 0.37 Liberty Expedia Holdings Inc 1,449 58,422 0.09 Life Storage Inc 2,176 183,483 0.28 Macy's Inc 6,748 149,690 0.23 National Health Investors Inc 502 34,740 0.05 NetApp Inc 3,115 180,314 0.28 Newmont Mining Corp 8,230 245,211 0.38 Peabody Energy Corp 2,638 73,608 0.11 ResMed Inc 9,936 90,156 0.14 Royal Gold Inc 747 58,362 0.09 TreeHouse Foods Inc 3,012 158,588 0.24 Viacom Inc 2,142 54,402 0.08
4,443,736 6.80 TOTAL EQUITIES 16,195,027 24.78 CERTIFICATES IRELAND Invesco Physical Gold ETC 9,214 1,040,692 1.59 UNITED KINGDOM ETFS Copper 67,588 1,613,857 2.47 Xtrackers WTI Crude Oil Optimum Yield ETC 18,026 669,002 1.02
2,282,859 3.49 TOTAL CERTIFICATES 3,323,551 5.08 TOTAL TRANSFERABLE SECURITIES ADMITTED TO AN OFFICIAL STOCK EXCHANGE LISTING OR DEALT IN ON ANOTHER REGULATED MARKET 19,518,578 29.86 MONEY MARKET INSTRUMENTS ELIGIBLE UNDER ARTICLE 41.1H OF THE LAW OF 17 DECEMBER 2010 China Construction Bank Corp C/P EUR 20/03/2019 2,000,000 2,000,173 3.06 CitiBank NA London Branch C/D EUR 02/08/2019 2,000,000 2,002,829 3.07 Collateralized Commercial Paper III LLC C/P EUR 06/06/2019 2,000,000 2,001,982 3.06 Credit Agricole Corporate and Investment Bank London Branch C/D EUR 25/03/2019 3,000,000 3,000,899 4.59 First Abu Dhabi Bank PJSC London Branch C/D EUR 10/04/2019 2,000,000 2,001,067 3.06 Industrial & Commercial Bank of China Luxembourg Branch C/D EUR 27/03/2019 2,000,000 2,000,090 3.06 ING Bank NV C/P EUR 23/04/2019 2,500,000 2,501,089 3.83 Nordea Bank AB C/P EUR 18/03/2019 2,000,000 2,000,533 3.06 Svenska Handelsbanken AB C/P EUR 09/07/2019 2,000,000 2,002,496 3.06 The Procter & Gamble Company C/P EUR 10/05/2019 2,000,000 2,001,501 3.06 The Toronto-Dominion Bank London Branch C/P EUR 11/06/2019 2,000,000 2,003,032 3.07
Invesco Global Conservative Fund Statement of Investments as at 28 February 2019
287 Invesco Funds
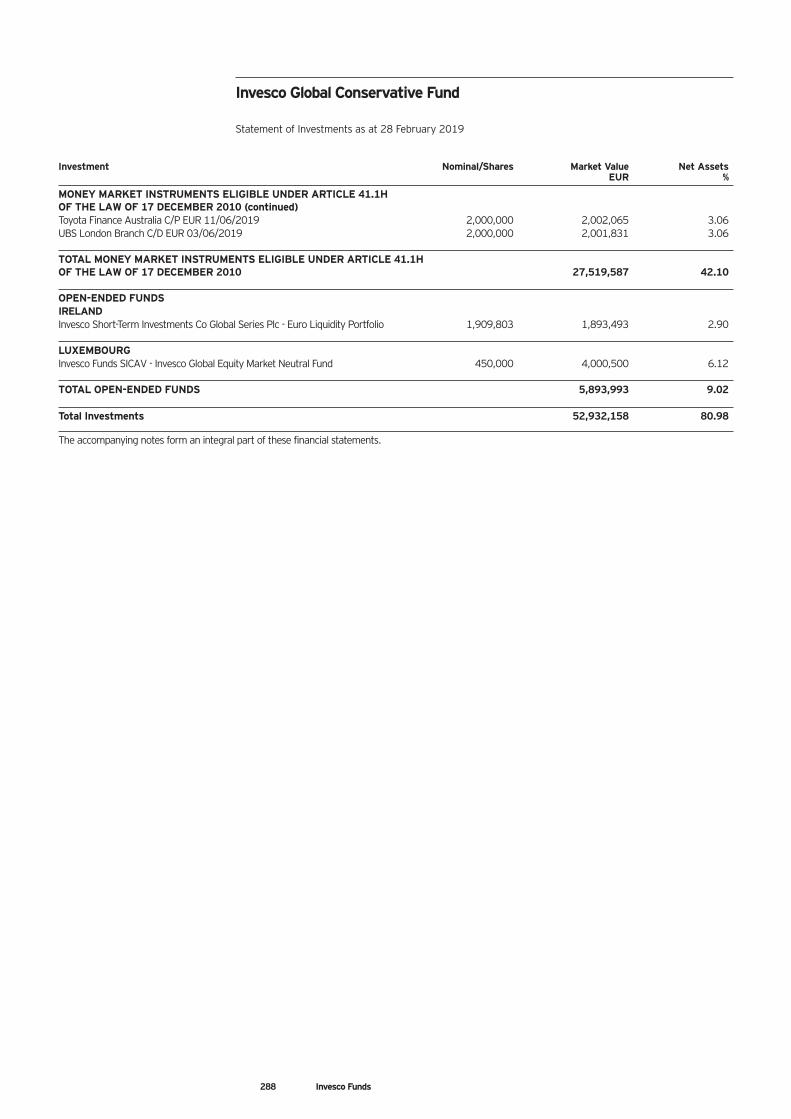
Investment Nominal/Shares Market Value Net Assets EUR %
MONEY MARKET INSTRUMENTS ELIGIBLE UNDER ARTICLE 41.1H OF THE LAW OF 17 DECEMBER 2010 (continued) Toyota Finance Australia C/P EUR 11/06/2019 2,000,000 2,002,065 3.06 UBS London Branch C/D EUR 03/06/2019 2,000,000 2,001,831 3.06 TOTAL MONEY MARKET INSTRUMENTS ELIGIBLE UNDER ARTICLE 41.1H OF THE LAW OF 17 DECEMBER 2010 27,519,587 42.10 OPEN-ENDED FUNDS IRELAND Invesco Short-Term Investments Co Global Series Plc - Euro Liquidity Portfolio 1,909,803 1,893,493 2.90 LUXEMBOURG Invesco Funds SICAV - Invesco Global Equity Market Neutral Fund 450,000 4,000,500 6.12 TOTAL OPEN-ENDED FUNDS 5,893,993 9.02 Total Investments 52,932,158 80.98
The accompanying notes form an integral part of these financial statements.
Invesco Global Conservative Fund Statement of Investments as at 28 February 2019
288 Invesco Funds

Investment Nominal/Shares Market Value Net Assets EUR %
TRANSFERABLE SECURITIES ADMITTED TO AN OFFICIAL STOCK EXCHANGE LISTING OR DEALT IN ON ANOTHER REGULATED MARKET EQUITIES AUSTRALIA Alumina Ltd 1,423,010 2,274,382 0.06 Amcor Ltd/Australia 234,360 2,205,669 0.05 Metcash Ltd 2,193,048 3,573,719 0.09 Newcrest Mining Ltd 290,423 4,418,340 0.11 Nine Entertainment Co Holdings Ltd 1,245,584 1,330,449 0.03 Origin Energy Ltd 573,571 2,638,970 0.07 QBE Insurance Group Ltd 897,840 6,933,533 0.17 Telstra Corp Ltd 1,440,103 2,824,201 0.07 Woodside Petroleum Ltd 291,177 6,606,465 0.17
32,805,728 0.82 AUSTRIA Verbund AG 30,456 1,261,183 0.03
BELGIUM Colruyt SA 49,621 3,098,832 0.08 UCB SA 37,323 2,747,719 0.07
5,846,551 0.15 BERMUDA Borr Drilling Ltd 644,227 1,556,511 0.04 Hiscox Ltd 335,035 6,158,553 0.15 Lancashire Holdings Ltd 443,360 3,396,811 0.09 Pacific Basin Shipping Ltd 2,886,000 549,085 0.01
11,660,960 0.29 BRAZIL Ez Tec Empreendimentos e Participacoes SA 214,100 1,338,362 0.03 Kroton Educacional SA 226,200 586,889 0.02 Telefonica Brasil SA (Preferred) 184,473 2,061,488 0.05
3,986,739 0.10 CANADA Agnico Eagle Mines Ltd 80,159 2,984,433 0.08 Barrick Gold Corp 231,851 2,536,070 0.06 Canadian Natural Resources Ltd 211,711 5,300,137 0.13 First Quantum Minerals Ltd 186,407 1,914,303 0.05 Methanex Corp 24,679 1,234,876 0.03 PrairieSky Royalty Ltd 107,942 1,379,349 0.03 Wheaton Precious Metals Corp 51,018 982,023 0.03
16,331,191 0.41 CAYMAN ISLANDS 51job Inc ADR 811 52,110 0.00 Baidu Inc ADR 53,739 7,634,075 0.19 Bitauto Holdings Ltd ADR 128,923 2,167,644 0.05 Changyou.com Ltd ADR 42,394 764,964 0.02 CK Asset Holdings Ltd 348,516 2,532,732 0.06 CK Hutchison Holdings Ltd 881,456 8,213,077 0.21 FIH Mobile Ltd 530,000 53,819 0.00 HKR International Ltd 415,360 184,007 0.01 JD.com Inc ADR 292,542 6,661,125 0.17 Minth Group Ltd 656,000 2,274,750 0.06 NetEase Inc ADR 26,580 5,254,566 0.13 Sohu.com Ltd ADR 44,059 787,289 0.02 Tencent Holdings Ltd 228,400 8,561,008 0.21
45,141,166 1.13
Invesco Global Targeted Returns Fund Statement of Investments as at 28 February 2019
289 Invesco Funds
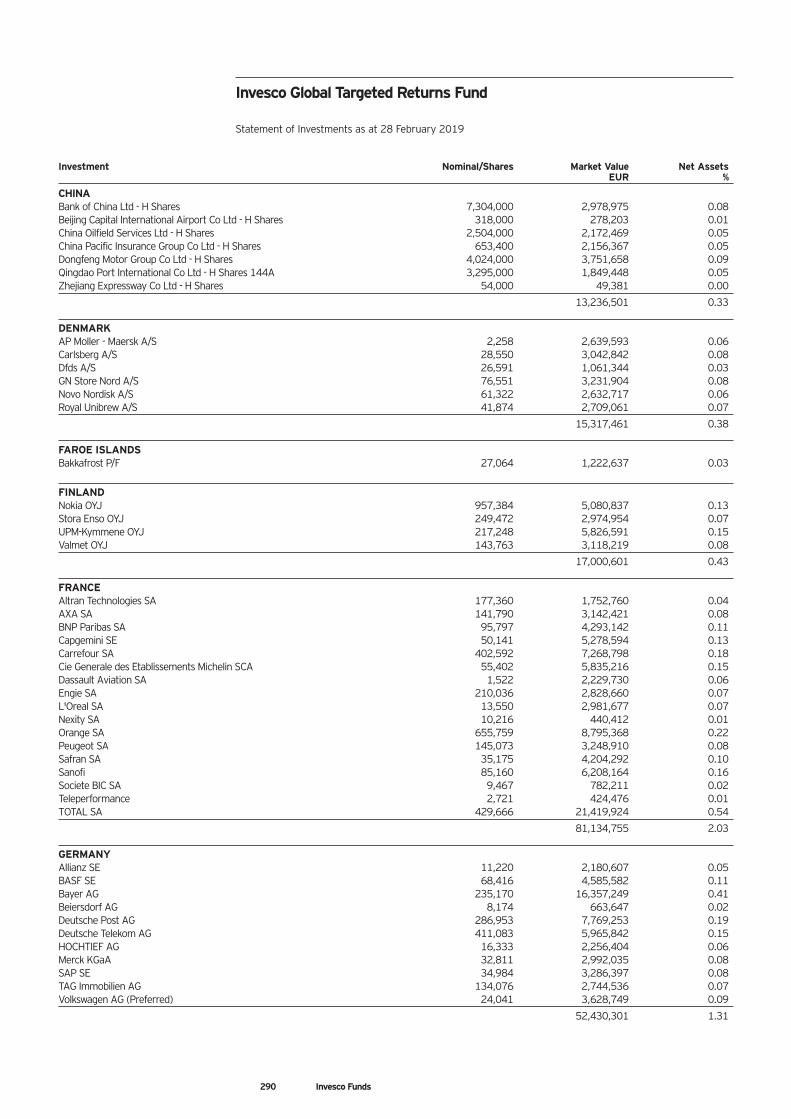
Investment Nominal/Shares Market Value Net Assets EUR %
CHINA Bank of China Ltd - H Shares 7,304,000 2,978,975 0.08 Beijing Capital International Airport Co Ltd - H Shares 318,000 278,203 0.01 China Oilfield Services Ltd - H Shares 2,504,000 2,172,469 0.05 China Pacific Insurance Group Co Ltd - H Shares 653,400 2,156,367 0.05 Dongfeng Motor Group Co Ltd - H Shares 4,024,000 3,751,658 0.09 Qingdao Port International Co Ltd - H Shares 144A 3,295,000 1,849,448 0.05 Zhejiang Expressway Co Ltd - H Shares 54,000 49,381 0.00
13,236,501 0.33 DENMARK AP Moller - Maersk A/S 2,258 2,639,593 0.06 Carlsberg A/S 28,550 3,042,842 0.08 Dfds A/S 26,591 1,061,344 0.03 GN Store Nord A/S 76,551 3,231,904 0.08 Novo Nordisk A/S 61,322 2,632,717 0.06 Royal Unibrew A/S 41,874 2,709,061 0.07
15,317,461 0.38 FAROE ISLANDS Bakkafrost P/F 27,064 1,222,637 0.03
FINLAND Nokia OYJ 957,384 5,080,837 0.13 Stora Enso OYJ 249,472 2,974,954 0.07 UPM-Kymmene OYJ 217,248 5,826,591 0.15 Valmet OYJ 143,763 3,118,219 0.08
17,000,601 0.43 FRANCE Altran Technologies SA 177,360 1,752,760 0.04 AXA SA 141,790 3,142,421 0.08 BNP Paribas SA 95,797 4,293,142 0.11 Capgemini SE 50,141 5,278,594 0.13 Carrefour SA 402,592 7,268,798 0.18 Cie Generale des Etablissements Michelin SCA 55,402 5,835,216 0.15 Dassault Aviation SA 1,522 2,229,730 0.06 Engie SA 210,036 2,828,660 0.07 L'Oreal SA 13,550 2,981,677 0.07 Nexity SA 10,216 440,412 0.01 Orange SA 655,759 8,795,368 0.22 Peugeot SA 145,073 3,248,910 0.08 Safran SA 35,175 4,204,292 0.10 Sanofi 85,160 6,208,164 0.16 Societe BIC SA 9,467 782,211 0.02 Teleperformance 2,721 424,476 0.01 TOTAL SA 429,666 21,419,924 0.54
81,134,755 2.03 GERMANY Allianz SE 11,220 2,180,607 0.05 BASF SE 68,416 4,585,582 0.11 Bayer AG 235,170 16,357,249 0.41 Beiersdorf AG 8,174 663,647 0.02 Deutsche Post AG 286,953 7,769,253 0.19 Deutsche Telekom AG 411,083 5,965,842 0.15 HOCHTIEF AG 16,333 2,256,404 0.06 Merck KGaA 32,811 2,992,035 0.08 SAP SE 34,984 3,286,397 0.08 TAG Immobilien AG 134,076 2,744,536 0.07 Volkswagen AG (Preferred) 24,041 3,628,749 0.09
52,430,301 1.31
Invesco Global Targeted Returns Fund Statement of Investments as at 28 February 2019
290 Invesco Funds
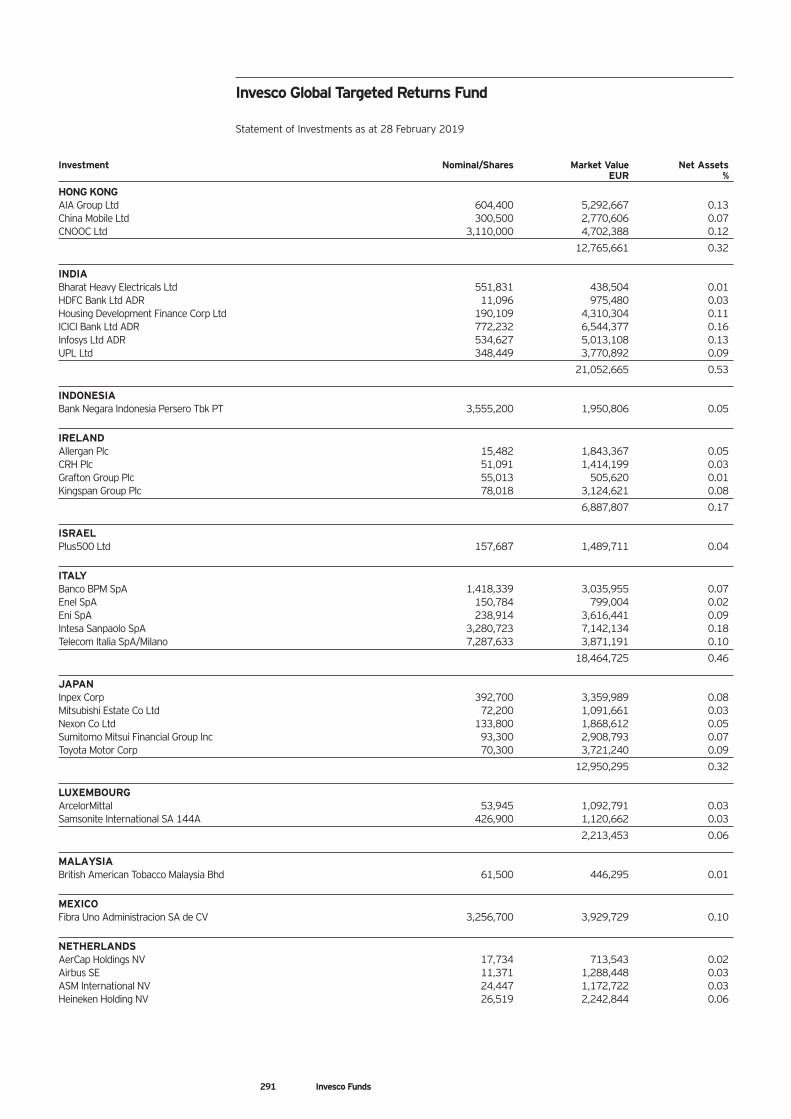
Invesco Global Targeted Returns Fund Statement of Investments as at 28 February 2019
291 Invesco Funds
Investment Nominal/Shares Market Value Net Assets EUR %
HONG KONG AIA Group Ltd 604,400 5,292,667 0.13 China Mobile Ltd 300,500 2,770,606 0.07 CNOOC Ltd 3,110,000 4,702,388 0.12
12,765,661 0.32 INDIA Bharat Heavy Electricals Ltd 551,831 438,504 0.01 HDFC Bank Ltd ADR 11,096 975,480 0.03 Housing Development Finance Corp Ltd 190,109 4,310,304 0.11 ICICI Bank Ltd ADR 772,232 6,544,377 0.16 Infosys Ltd ADR 534,627 5,013,108 0.13 UPL Ltd 348,449 3,770,892 0.09
21,052,665 0.53 INDONESIA Bank Negara Indonesia Persero Tbk PT 3,555,200 1,950,806 0.05
IRELAND Allergan Plc 15,482 1,843,367 0.05 CRH Plc 51,091 1,414,199 0.03 Grafton Group Plc 55,013 505,620 0.01 Kingspan Group Plc 78,018 3,124,621 0.08
6,887,807 0.17 ISRAEL Plus500 Ltd 157,687 1,489,711 0.04
ITALY Banco BPM SpA 1,418,339 3,035,955 0.07 Enel SpA 150,784 799,004 0.02 Eni SpA 238,914 3,616,441 0.09 Intesa Sanpaolo SpA 3,280,723 7,142,134 0.18 Telecom Italia SpA/Milano 7,287,633 3,871,191 0.10
18,464,725 0.46 JAPAN Inpex Corp 392,700 3,359,989 0.08 Mitsubishi Estate Co Ltd 72,200 1,091,661 0.03 Nexon Co Ltd 133,800 1,868,612 0.05 Sumitomo Mitsui Financial Group Inc 93,300 2,908,793 0.07 Toyota Motor Corp 70,300 3,721,240 0.09
12,950,295 0.32 LUXEMBOURG ArcelorMittal 53,945 1,092,791 0.03 Samsonite International SA 144A 426,900 1,120,662 0.03
2,213,453 0.06 MALAYSIA British American Tobacco Malaysia Bhd 61,500 446,295 0.01
MEXICO Fibra Uno Administracion SA de CV 3,256,700 3,929,729 0.10
NETHERLANDS AerCap Holdings NV 17,734 713,543 0.02 Airbus SE 11,371 1,288,448 0.03 ASM International NV 24,447 1,172,722 0.03 Heineken Holding NV 26,519 2,242,844 0.06
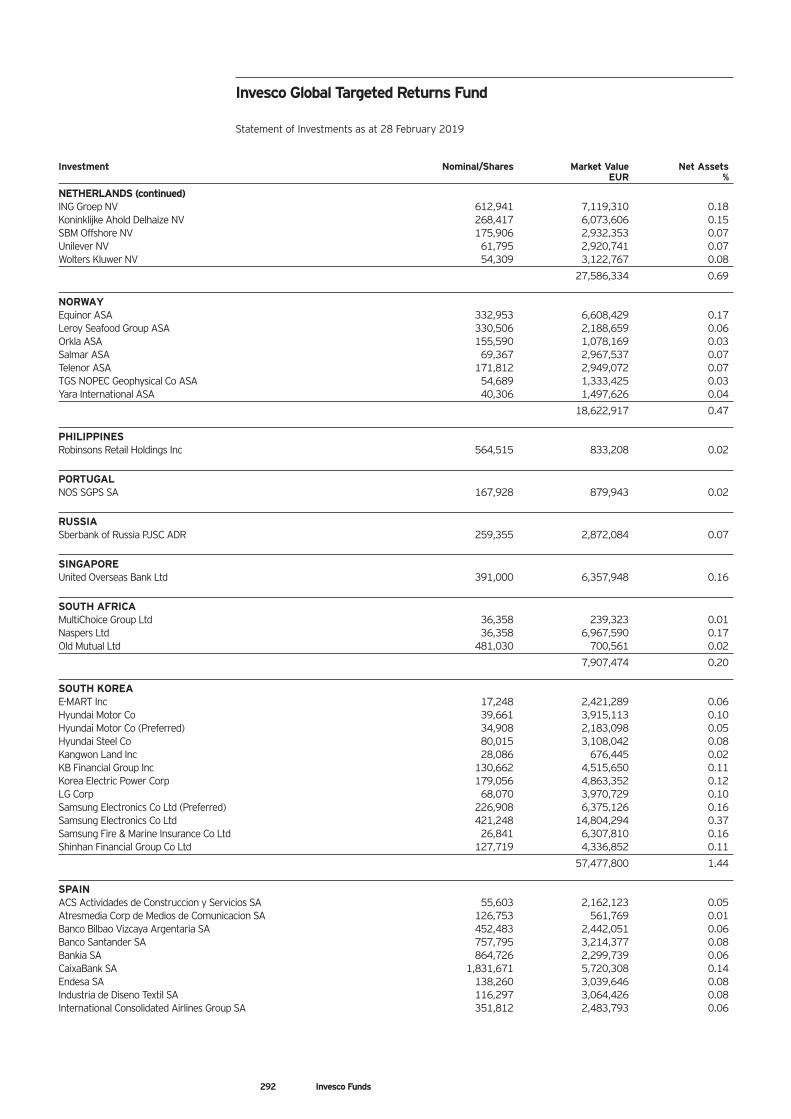
Investment Nominal/Shares Market Value Net Assets EUR %
NETHERLANDS (continued) ING Groep NV 612,941 7,119,310 0.18 Koninklijke Ahold Delhaize NV 268,417 6,073,606 0.15 SBM Offshore NV 175,906 2,932,353 0.07 Unilever NV 61,795 2,920,741 0.07 Wolters Kluwer NV 54,309 3,122,767 0.08
27,586,334 0.69 NORWAY Equinor ASA 332,953 6,608,429 0.17 Leroy Seafood Group ASA 330,506 2,188,659 0.06 Orkla ASA 155,590 1,078,169 0.03 Salmar ASA 69,367 2,967,537 0.07 Telenor ASA 171,812 2,949,072 0.07 TGS NOPEC Geophysical Co ASA 54,689 1,333,425 0.03 Yara International ASA 40,306 1,497,626 0.04
18,622,917 0.47 PHILIPPINES Robinsons Retail Holdings Inc 564,515 833,208 0.02
PORTUGAL NOS SGPS SA 167,928 879,943 0.02
RUSSIA Sberbank of Russia PJSC ADR 259,355 2,872,084 0.07
SINGAPORE United Overseas Bank Ltd 391,000 6,357,948 0.16
SOUTH AFRICA MultiChoice Group Ltd 36,358 239,323 0.01 Naspers Ltd 36,358 6,967,590 0.17 Old Mutual Ltd 481,030 700,561 0.02
7,907,474 0.20 SOUTH KOREA E-MART Inc 17,248 2,421,289 0.06 Hyundai Motor Co 39,661 3,915,113 0.10 Hyundai Motor Co (Preferred) 34,908 2,183,098 0.05 Hyundai Steel Co 80,015 3,108,042 0.08 Kangwon Land Inc 28,086 676,445 0.02 KB Financial Group Inc 130,662 4,515,650 0.11 Korea Electric Power Corp 179,056 4,863,352 0.12 LG Corp 68,070 3,970,729 0.10 Samsung Electronics Co Ltd (Preferred) 226,908 6,375,126 0.16 Samsung Electronics Co Ltd 421,248 14,804,294 0.37 Samsung Fire & Marine Insurance Co Ltd 26,841 6,307,810 0.16 Shinhan Financial Group Co Ltd 127,719 4,336,852 0.11
57,477,800 1.44 SPAIN ACS Actividades de Construccion y Servicios SA 55,603 2,162,123 0.05 Atresmedia Corp de Medios de Comunicacion SA 126,753 561,769 0.01 Banco Bilbao Vizcaya Argentaria SA 452,483 2,442,051 0.06 Banco Santander SA 757,795 3,214,377 0.08 Bankia SA 864,726 2,299,739 0.06 CaixaBank SA 1,831,671 5,720,308 0.14 Endesa SA 138,260 3,039,646 0.08 Industria de Diseno Textil SA 116,297 3,064,426 0.08 International Consolidated Airlines Group SA 351,812 2,483,793 0.06
Invesco Global Targeted Returns Fund Statement of Investments as at 28 February 2019
292 Invesco Funds
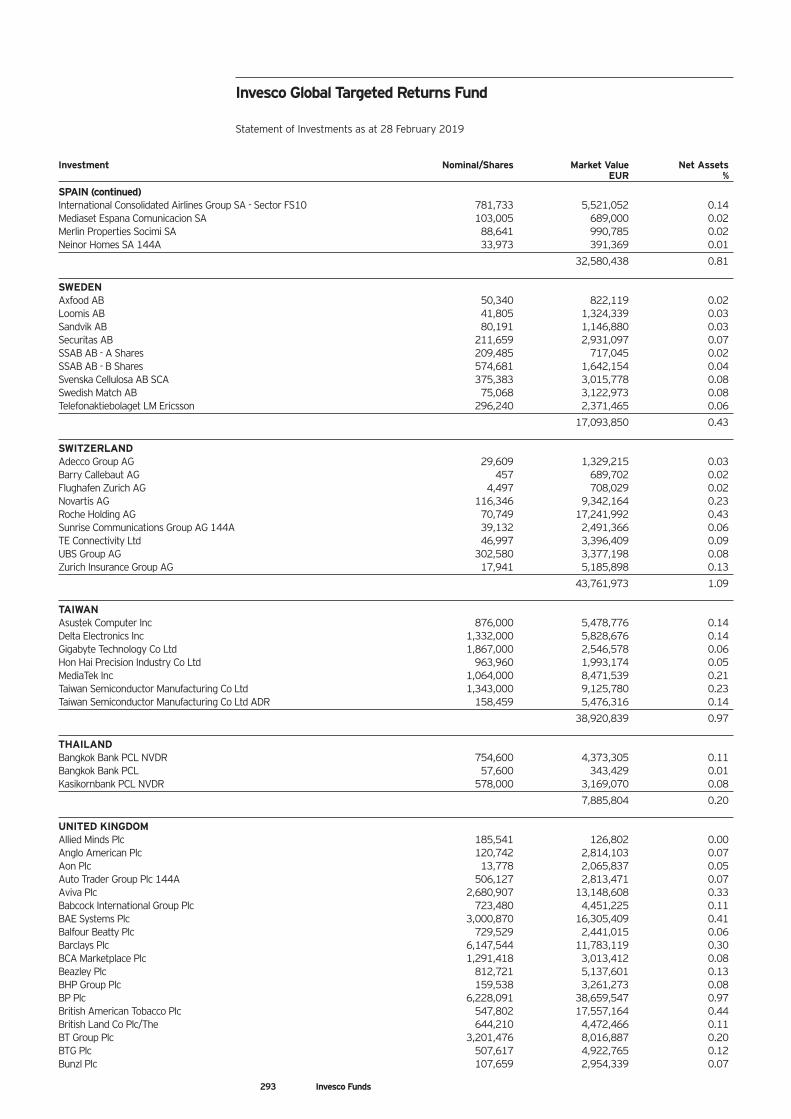
Investment Nominal/Shares Market Value Net Assets EUR %
SPAIN (continued) International Consolidated Airlines Group SA - Sector FS10 781,733 5,521,052 0.14 Mediaset Espana Comunicacion SA 103,005 689,000 0.02 Merlin Properties Socimi SA 88,641 990,785 0.02 Neinor Homes SA 144A 33,973 391,369 0.01
32,580,438 0.81 SWEDEN Axfood AB 50,340 822,119 0.02 Loomis AB 41,805 1,324,339 0.03 Sandvik AB 80,191 1,146,880 0.03 Securitas AB 211,659 2,931,097 0.07 SSAB AB - A Shares 209,485 717,045 0.02 SSAB AB - B Shares 574,681 1,642,154 0.04 Svenska Cellulosa AB SCA 375,383 3,015,778 0.08 Swedish Match AB 75,068 3,122,973 0.08 Telefonaktiebolaget LM Ericsson 296,240 2,371,465 0.06
17,093,850 0.43 SWITZERLAND Adecco Group AG 29,609 1,329,215 0.03 Barry Callebaut AG 457 689,702 0.02 Flughafen Zurich AG 4,497 708,029 0.02 Novartis AG 116,346 9,342,164 0.23 Roche Holding AG 70,749 17,241,992 0.43 Sunrise Communications Group AG 144A 39,132 2,491,366 0.06 TE Connectivity Ltd 46,997 3,396,409 0.09 UBS Group AG 302,580 3,377,198 0.08 Zurich Insurance Group AG 17,941 5,185,898 0.13
43,761,973 1.09 TAIWAN Asustek Computer Inc 876,000 5,478,776 0.14 Delta Electronics Inc 1,332,000 5,828,676 0.14 Gigabyte Technology Co Ltd 1,867,000 2,546,578 0.06 Hon Hai Precision Industry Co Ltd 963,960 1,993,174 0.05 MediaTek Inc 1,064,000 8,471,539 0.21 Taiwan Semiconductor Manufacturing Co Ltd 1,343,000 9,125,780 0.23 Taiwan Semiconductor Manufacturing Co Ltd ADR 158,459 5,476,316 0.14
38,920,839 0.97 THAILAND Bangkok Bank PCL NVDR 754,600 4,373,305 0.11 Bangkok Bank PCL 57,600 343,429 0.01 Kasikornbank PCL NVDR 578,000 3,169,070 0.08
7,885,804 0.20 UNITED KINGDOM Allied Minds Plc 185,541 126,802 0.00 Anglo American Plc 120,742 2,814,103 0.07 Aon Plc 13,778 2,065,837 0.05 Auto Trader Group Plc 144A 506,127 2,813,471 0.07 Aviva Plc 2,680,907 13,148,608 0.33 Babcock International Group Plc 723,480 4,451,225 0.11 BAE Systems Plc 3,000,870 16,305,409 0.41 Balfour Beatty Plc 729,529 2,441,015 0.06 Barclays Plc 6,147,544 11,783,119 0.30 BCA Marketplace Plc 1,291,418 3,013,412 0.08 Beazley Plc 812,721 5,137,601 0.13 BHP Group Plc 159,538 3,261,273 0.08 BP Plc 6,228,091 38,659,547 0.97 British American Tobacco Plc 547,802 17,557,164 0.44 British Land Co Plc/The 644,210 4,472,466 0.11 BT Group Plc 3,201,476 8,016,887 0.20 BTG Plc 507,617 4,922,765 0.12 Bunzl Plc 107,659 2,954,339 0.07
Invesco Global Targeted Returns Fund Statement of Investments as at 28 February 2019
293 Invesco Funds

Investment Nominal/Shares Market Value Net Assets EUR %
UNITED KINGDOM (continued) Capita Plc 2,072,383 2,939,469 0.07 Centrica Plc 1,820,180 2,660,220 0.07 Dairy Crest Group Plc 296,447 2,174,513 0.05 Derwent London Plc 155,716 5,868,031 0.15 Drax Group Plc 570,858 2,377,397 0.06 easyJet Plc 728,451 10,563,659 0.26 Essentra Plc 662,227 2,889,867 0.07 Evraz Plc 478,038 3,127,745 0.08 G4S Plc 3,711,635 8,935,414 0.22 General Accident Plc (Preferred) 525,915 772,156 0.02 GlaxoSmithKline Plc 562,607 9,905,781 0.25 Glencore Plc 1,842,312 6,528,816 0.16 Greggs Plc 49,762 1,033,876 0.03 Hikma Pharmaceuticals Plc 148,762 2,853,257 0.07 Howden Joinery Group Plc 121,376 694,579 0.02 HSBC Holdings Plc 476,000 3,406,066 0.09 Imperial Brands Plc 303,082 8,815,031 0.22 Inchcape Plc 85,589 553,017 0.01 Intertek Group Plc 6,724 398,809 0.01 J Sainsbury Plc 1,233,801 3,303,085 0.08 KCOM Group Plc 646,779 526,054 0.01 Legal & General Group Plc 4,842,801 15,639,779 0.39 Marks & Spencer Group Plc 2,616,096 8,087,421 0.20 Melrose Industries Plc 1,541,930 3,115,087 0.08 Moneysupermarket.com Group Plc 146,652 582,808 0.01 N Brown Group Plc 505,033 601,142 0.02 National Grid Plc 273,947 2,701,212 0.07 NewRiver REIT Plc 1,910,860 4,893,019 0.12 Next Plc 187,923 11,067,112 0.28 Pagegroup Plc 251,228 1,303,001 0.03 Pearson Plc 288,444 2,830,713 0.07 Persimmon Plc 61,880 1,743,155 0.04 Phoenix Group Holdings Plc 98,828 795,521 0.02 Provident Financial Plc 708,829 5,014,421 0.13 RELX Plc 157,679 3,166,221 0.08 Rentokil Initial Plc 650,726 2,628,503 0.07 Rightmove Plc 219,188 1,228,389 0.03 Rio Tinto Plc 58,599 2,954,412 0.07 Rolls-Royce Holdings Plc 1,754,857 19,334,030 0.48 Royal Bank of Scotland Group Plc 5,483,279 16,938,275 0.42 Royal Dutch Shell Plc - A Shares EUR 370,770 10,198,956 0.26 Royal Dutch Shell Plc - A Shares GBP 923,336 25,386,268 0.64 Royal Dutch Shell Plc - B Shares GBP 165,535 4,585,469 0.12 RSA Insurance Group Plc 980,686 5,756,003 0.14 Smith & Nephew Plc 120,197 1,992,697 0.05 SSP Group Plc 107,891 835,912 0.02 Stagecoach Group Plc 1,326,437 2,445,961 0.06 Standard Chartered Plc GBP 166,458 1,164,567 0.03 Standard Chartered Plc HKD 578,350 4,064,225 0.10 TalkTalk Telecom Group Plc 1,804,174 2,055,537 0.05 Tate & Lyle Plc 387,163 3,125,058 0.08 Tesco Plc 4,329,289 11,474,179 0.29 Thomas Cook Group Plc 6,390,172 2,451,272 0.06 TP ICAP Plc 409,031 1,516,616 0.04 Vectura Group Plc 999,728 926,122 0.02 Vodafone Group Plc 7,994,026 12,639,576 0.32 WH Smith Plc 32,595 787,353 0.02 Whitbread Plc 60,499 3,418,021 0.09
423,719,898 10.60 UNITED STATES Altria Group Inc 143,815 6,590,220 0.17 American Express Co 26,502 2,493,870 0.06 Amgen Inc 13,256 2,222,931 0.06 Anthem Inc 6,982 1,872,183 0.05
Invesco Global Targeted Returns Fund Statement of Investments as at 28 February 2019
294 Invesco Funds
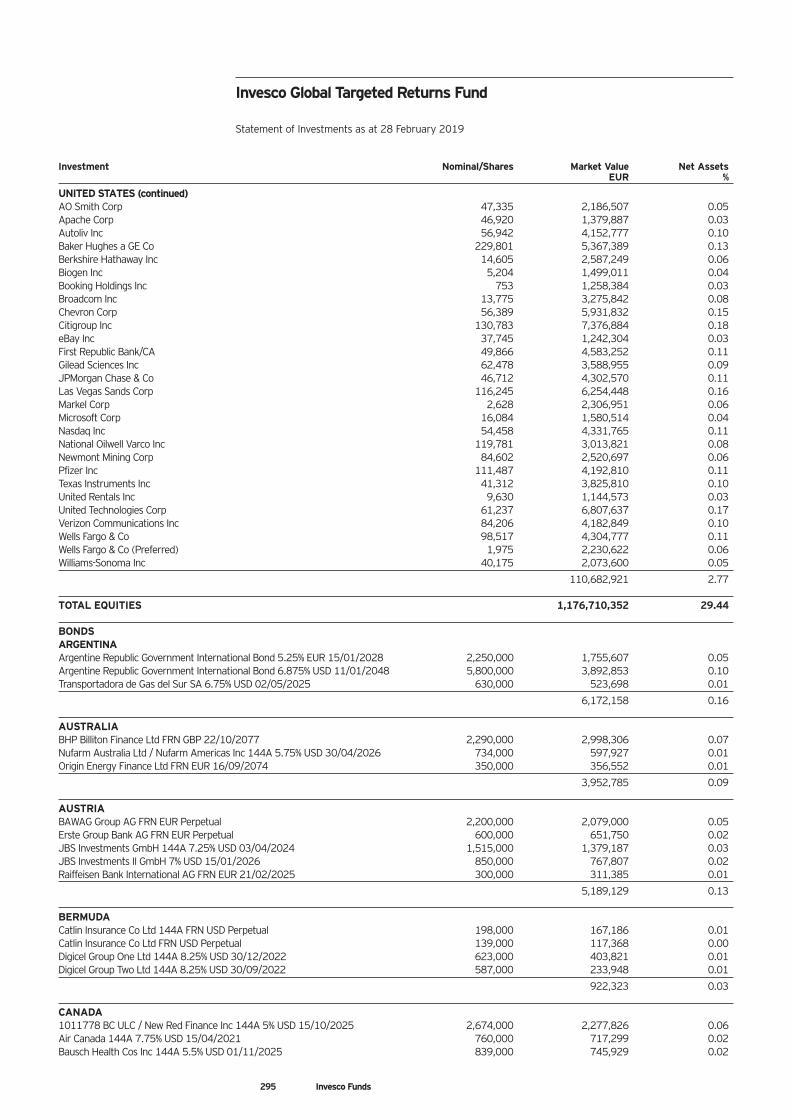
Investment Nominal/Shares Market Value Net Assets EUR %
UNITED STATES (continued) AO Smith Corp 47,335 2,186,507 0.05 Apache Corp 46,920 1,379,887 0.03 Autoliv Inc 56,942 4,152,777 0.10 Baker Hughes a GE Co 229,801 5,367,389 0.13 Berkshire Hathaway Inc 14,605 2,587,249 0.06 Biogen Inc 5,204 1,499,011 0.04 Booking Holdings Inc 753 1,258,384 0.03 Broadcom Inc 13,775 3,275,842 0.08 Chevron Corp 56,389 5,931,832 0.15 Citigroup Inc 130,783 7,376,884 0.18 eBay Inc 37,745 1,242,304 0.03 First Republic Bank/CA 49,866 4,583,252 0.11 Gilead Sciences Inc 62,478 3,588,955 0.09 JPMorgan Chase & Co 46,712 4,302,570 0.11 Las Vegas Sands Corp 116,245 6,254,448 0.16 Markel Corp 2,628 2,306,951 0.06 Microsoft Corp 16,084 1,580,514 0.04 Nasdaq Inc 54,458 4,331,765 0.11 National Oilwell Varco Inc 119,781 3,013,821 0.08 Newmont Mining Corp 84,602 2,520,697 0.06 Pfizer Inc 111,487 4,192,810 0.11 Texas Instruments Inc 41,312 3,825,810 0.10 United Rentals Inc 9,630 1,144,573 0.03 United Technologies Corp 61,237 6,807,637 0.17 Verizon Communications Inc 84,206 4,182,849 0.10 Wells Fargo & Co 98,517 4,304,777 0.11 Wells Fargo & Co (Preferred) 1,975 2,230,622 0.06 Williams-Sonoma Inc 40,175 2,073,600 0.05
110,682,921 2.77 TOTAL EQUITIES 1,176,710,352 29.44 BONDS ARGENTINA Argentine Republic Government International Bond 5.25% EUR 15/01/2028 2,250,000 1,755,607 0.05 Argentine Republic Government International Bond 6.875% USD 11/01/2048 5,800,000 3,892,853 0.10 Transportadora de Gas del Sur SA 6.75% USD 02/05/2025 630,000 523,698 0.01
6,172,158 0.16 AUSTRALIA BHP Billiton Finance Ltd FRN GBP 22/10/2077 2,290,000 2,998,306 0.07 Nufarm Australia Ltd / Nufarm Americas Inc 144A 5.75% USD 30/04/2026 734,000 597,927 0.01 Origin Energy Finance Ltd FRN EUR 16/09/2074 350,000 356,552 0.01
3,952,785 0.09 AUSTRIA BAWAG Group AG FRN EUR Perpetual 2,200,000 2,079,000 0.05 Erste Group Bank AG FRN EUR Perpetual 600,000 651,750 0.02 JBS Investments GmbH 144A 7.25% USD 03/04/2024 1,515,000 1,379,187 0.03 JBS Investments II GmbH 7% USD 15/01/2026 850,000 767,807 0.02 Raiffeisen Bank International AG FRN EUR 21/02/2025 300,000 311,385 0.01
5,189,129 0.13 BERMUDA Catlin Insurance Co Ltd 144A FRN USD Perpetual 198,000 167,186 0.01 Catlin Insurance Co Ltd FRN USD Perpetual 139,000 117,368 0.00 Digicel Group One Ltd 144A 8.25% USD 30/12/2022 623,000 403,821 0.01 Digicel Group Two Ltd 144A 8.25% USD 30/09/2022 587,000 233,948 0.01
922,323 0.03 CANADA 1011778 BC ULC / New Red Finance Inc 144A 5% USD 15/10/2025 2,674,000 2,277,826 0.06 Air Canada 144A 7.75% USD 15/04/2021 760,000 717,299 0.02 Bausch Health Cos Inc 144A 5.5% USD 01/11/2025 839,000 745,929 0.02
Invesco Global Targeted Returns Fund Statement of Investments as at 28 February 2019
295 Invesco Funds
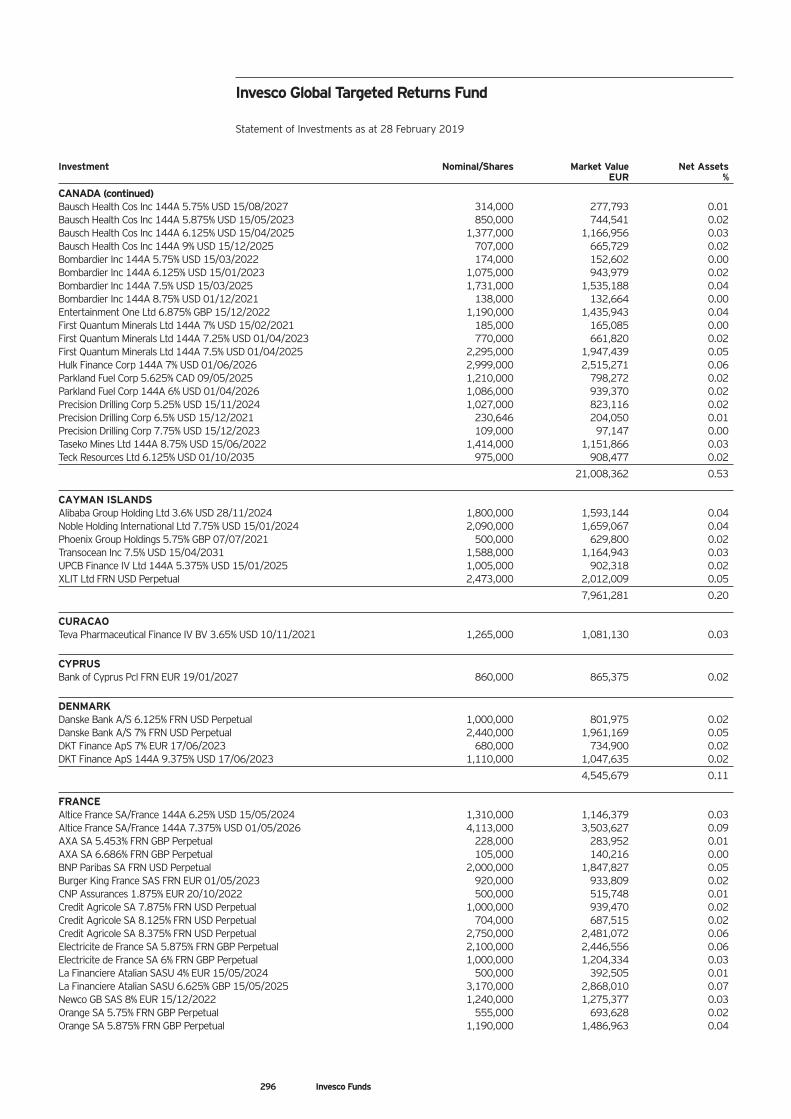
Investment Nominal/Shares Market Value Net Assets EUR %
CANADA (continued) Bausch Health Cos Inc 144A 5.75% USD 15/08/2027 314,000 277,793 0.01 Bausch Health Cos Inc 144A 5.875% USD 15/05/2023 850,000 744,541 0.02 Bausch Health Cos Inc 144A 6.125% USD 15/04/2025 1,377,000 1,166,956 0.03 Bausch Health Cos Inc 144A 9% USD 15/12/2025 707,000 665,729 0.02 Bombardier Inc 144A 5.75% USD 15/03/2022 174,000 152,602 0.00 Bombardier Inc 144A 6.125% USD 15/01/2023 1,075,000 943,979 0.02 Bombardier Inc 144A 7.5% USD 15/03/2025 1,731,000 1,535,188 0.04 Bombardier Inc 144A 8.75% USD 01/12/2021 138,000 132,664 0.00 Entertainment One Ltd 6.875% GBP 15/12/2022 1,190,000 1,435,943 0.04 First Quantum Minerals Ltd 144A 7% USD 15/02/2021 185,000 165,085 0.00 First Quantum Minerals Ltd 144A 7.25% USD 01/04/2023 770,000 661,820 0.02 First Quantum Minerals Ltd 144A 7.5% USD 01/04/2025 2,295,000 1,947,439 0.05 Hulk Finance Corp 144A 7% USD 01/06/2026 2,999,000 2,515,271 0.06 Parkland Fuel Corp 5.625% CAD 09/05/2025 1,210,000 798,272 0.02 Parkland Fuel Corp 144A 6% USD 01/04/2026 1,086,000 939,370 0.02 Precision Drilling Corp 5.25% USD 15/11/2024 1,027,000 823,116 0.02 Precision Drilling Corp 6.5% USD 15/12/2021 230,646 204,050 0.01 Precision Drilling Corp 7.75% USD 15/12/2023 109,000 97,147 0.00 Taseko Mines Ltd 144A 8.75% USD 15/06/2022 1,414,000 1,151,866 0.03 Teck Resources Ltd 6.125% USD 01/10/2035 975,000 908,477 0.02
21,008,362 0.53 CAYMAN ISLANDS Alibaba Group Holding Ltd 3.6% USD 28/11/2024 1,800,000 1,593,144 0.04 Noble Holding International Ltd 7.75% USD 15/01/2024 2,090,000 1,659,067 0.04 Phoenix Group Holdings 5.75% GBP 07/07/2021 500,000 629,800 0.02 Transocean Inc 7.5% USD 15/04/2031 1,588,000 1,164,943 0.03 UPCB Finance IV Ltd 144A 5.375% USD 15/01/2025 1,005,000 902,318 0.02 XLIT Ltd FRN USD Perpetual 2,473,000 2,012,009 0.05
7,961,281 0.20 CURACAO Teva Pharmaceutical Finance IV BV 3.65% USD 10/11/2021 1,265,000 1,081,130 0.03
CYPRUS Bank of Cyprus Pcl FRN EUR 19/01/2027 860,000 865,375 0.02
DENMARK Danske Bank A/S 6.125% FRN USD Perpetual 1,000,000 801,975 0.02 Danske Bank A/S 7% FRN USD Perpetual 2,440,000 1,961,169 0.05 DKT Finance ApS 7% EUR 17/06/2023 680,000 734,900 0.02 DKT Finance ApS 144A 9.375% USD 17/06/2023 1,110,000 1,047,635 0.02
4,545,679 0.11 FRANCE Altice France SA/France 144A 6.25% USD 15/05/2024 1,310,000 1,146,379 0.03 Altice France SA/France 144A 7.375% USD 01/05/2026 4,113,000 3,503,627 0.09 AXA SA 5.453% FRN GBP Perpetual 228,000 283,952 0.01 AXA SA 6.686% FRN GBP Perpetual 105,000 140,216 0.00 BNP Paribas SA FRN USD Perpetual 2,000,000 1,847,827 0.05 Burger King France SAS FRN EUR 01/05/2023 920,000 933,809 0.02 CNP Assurances 1.875% EUR 20/10/2022 500,000 515,748 0.01 Credit Agricole SA 7.875% FRN USD Perpetual 1,000,000 939,470 0.02 Credit Agricole SA 8.125% FRN USD Perpetual 704,000 687,515 0.02 Credit Agricole SA 8.375% FRN USD Perpetual 2,750,000 2,481,072 0.06 Electricite de France SA 5.875% FRN GBP Perpetual 2,100,000 2,446,556 0.06 Electricite de France SA 6% FRN GBP Perpetual 1,000,000 1,204,334 0.03 La Financiere Atalian SASU 4% EUR 15/05/2024 500,000 392,505 0.01 La Financiere Atalian SASU 6.625% GBP 15/05/2025 3,170,000 2,868,010 0.07 Newco GB SAS 8% EUR 15/12/2022 1,240,000 1,275,377 0.03 Orange SA 5.75% FRN GBP Perpetual 555,000 693,628 0.02 Orange SA 5.875% FRN GBP Perpetual 1,190,000 1,486,963 0.04
Invesco Global Targeted Returns Fund Statement of Investments as at 28 February 2019
296 Invesco Funds
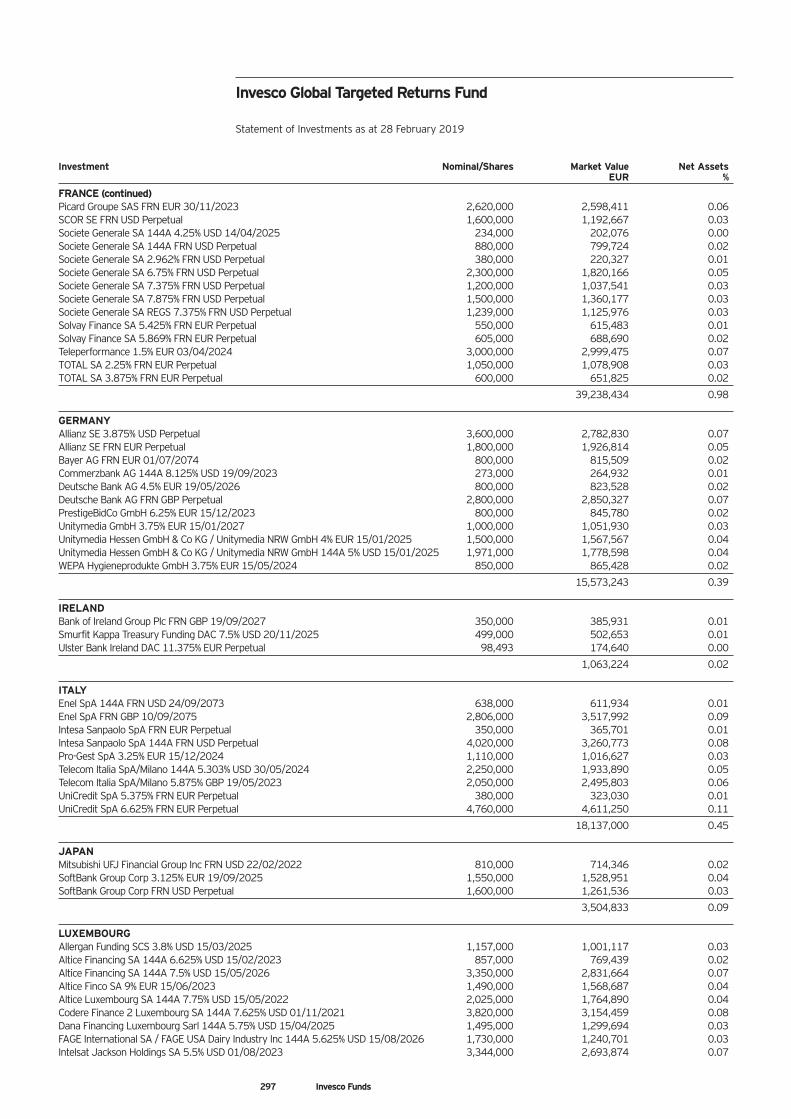
Investment Nominal/Shares Market Value Net Assets EUR %
FRANCE (continued) Picard Groupe SAS FRN EUR 30/11/2023 2,620,000 2,598,411 0.06 SCOR SE FRN USD Perpetual 1,600,000 1,192,667 0.03 Societe Generale SA 144A 4.25% USD 14/04/2025 234,000 202,076 0.00 Societe Generale SA 144A FRN USD Perpetual 880,000 799,724 0.02 Societe Generale SA 2.962% FRN USD Perpetual 380,000 220,327 0.01 Societe Generale SA 6.75% FRN USD Perpetual 2,300,000 1,820,166 0.05 Societe Generale SA 7.375% FRN USD Perpetual 1,200,000 1,037,541 0.03 Societe Generale SA 7.875% FRN USD Perpetual 1,500,000 1,360,177 0.03 Societe Generale SA REGS 7.375% FRN USD Perpetual 1,239,000 1,125,976 0.03 Solvay Finance SA 5.425% FRN EUR Perpetual 550,000 615,483 0.01 Solvay Finance SA 5.869% FRN EUR Perpetual 605,000 688,690 0.02 Teleperformance 1.5% EUR 03/04/2024 3,000,000 2,999,475 0.07 TOTAL SA 2.25% FRN EUR Perpetual 1,050,000 1,078,908 0.03 TOTAL SA 3.875% FRN EUR Perpetual 600,000 651,825 0.02
39,238,434 0.98 GERMANY Allianz SE 3.875% USD Perpetual 3,600,000 2,782,830 0.07 Allianz SE FRN EUR Perpetual 1,800,000 1,926,814 0.05 Bayer AG FRN EUR 01/07/2074 800,000 815,509 0.02 Commerzbank AG 144A 8.125% USD 19/09/2023 273,000 264,932 0.01 Deutsche Bank AG 4.5% EUR 19/05/2026 800,000 823,528 0.02 Deutsche Bank AG FRN GBP Perpetual 2,800,000 2,850,327 0.07 PrestigeBidCo GmbH 6.25% EUR 15/12/2023 800,000 845,780 0.02 Unitymedia GmbH 3.75% EUR 15/01/2027 1,000,000 1,051,930 0.03 Unitymedia Hessen GmbH & Co KG / Unitymedia NRW GmbH 4% EUR 15/01/2025 1,500,000 1,567,567 0.04 Unitymedia Hessen GmbH & Co KG / Unitymedia NRW GmbH 144A 5% USD 15/01/2025 1,971,000 1,778,598 0.04 WEPA Hygieneprodukte GmbH 3.75% EUR 15/05/2024 850,000 865,428 0.02
15,573,243 0.39 IRELAND Bank of Ireland Group Plc FRN GBP 19/09/2027 350,000 385,931 0.01 Smurfit Kappa Treasury Funding DAC 7.5% USD 20/11/2025 499,000 502,653 0.01 Ulster Bank Ireland DAC 11.375% EUR Perpetual 98,493 174,640 0.00
1,063,224 0.02 ITALY Enel SpA 144A FRN USD 24/09/2073 638,000 611,934 0.01 Enel SpA FRN GBP 10/09/2075 2,806,000 3,517,992 0.09 Intesa Sanpaolo SpA FRN EUR Perpetual 350,000 365,701 0.01 Intesa Sanpaolo SpA 144A FRN USD Perpetual 4,020,000 3,260,773 0.08 Pro-Gest SpA 3.25% EUR 15/12/2024 1,110,000 1,016,627 0.03 Telecom Italia SpA/Milano 144A 5.303% USD 30/05/2024 2,250,000 1,933,890 0.05 Telecom Italia SpA/Milano 5.875% GBP 19/05/2023 2,050,000 2,495,803 0.06 UniCredit SpA 5.375% FRN EUR Perpetual 380,000 323,030 0.01 UniCredit SpA 6.625% FRN EUR Perpetual 4,760,000 4,611,250 0.11
18,137,000 0.45 JAPAN Mitsubishi UFJ Financial Group Inc FRN USD 22/02/2022 810,000 714,346 0.02 SoftBank Group Corp 3.125% EUR 19/09/2025 1,550,000 1,528,951 0.04 SoftBank Group Corp FRN USD Perpetual 1,600,000 1,261,536 0.03
3,504,833 0.09 LUXEMBOURG Allergan Funding SCS 3.8% USD 15/03/2025 1,157,000 1,001,117 0.03 Altice Financing SA 144A 6.625% USD 15/02/2023 857,000 769,439 0.02 Altice Financing SA 144A 7.5% USD 15/05/2026 3,350,000 2,831,664 0.07 Altice Finco SA 9% EUR 15/06/2023 1,490,000 1,568,687 0.04 Altice Luxembourg SA 144A 7.75% USD 15/05/2022 2,025,000 1,764,890 0.04 Codere Finance 2 Luxembourg SA 144A 7.625% USD 01/11/2021 3,820,000 3,154,459 0.08 Dana Financing Luxembourg Sarl 144A 5.75% USD 15/04/2025 1,495,000 1,299,694 0.03 FAGE International SA / FAGE USA Dairy Industry Inc 144A 5.625% USD 15/08/2026 1,730,000 1,240,701 0.03 Intelsat Jackson Holdings SA 5.5% USD 01/08/2023 3,344,000 2,693,874 0.07
Invesco Global Targeted Returns Fund Statement of Investments as at 28 February 2019
297 Invesco Funds
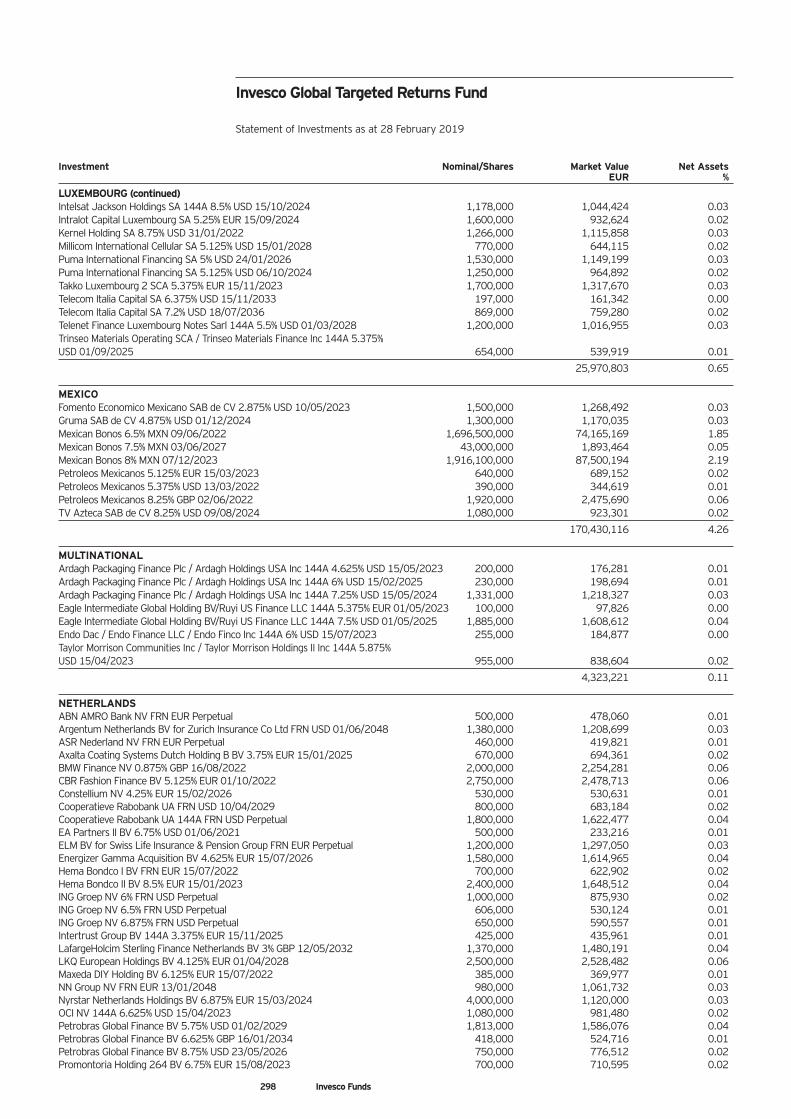
Investment Nominal/Shares Market Value Net Assets EUR %
LUXEMBOURG (continued) Intelsat Jackson Holdings SA 144A 8.5% USD 15/10/2024 1,178,000 1,044,424 0.03 Intralot Capital Luxembourg SA 5.25% EUR 15/09/2024 1,600,000 932,624 0.02 Kernel Holding SA 8.75% USD 31/01/2022 1,266,000 1,115,858 0.03 Millicom International Cellular SA 5.125% USD 15/01/2028 770,000 644,115 0.02 Puma International Financing SA 5% USD 24/01/2026 1,530,000 1,149,199 0.03 Puma International Financing SA 5.125% USD 06/10/2024 1,250,000 964,892 0.02 Takko Luxembourg 2 SCA 5.375% EUR 15/11/2023 1,700,000 1,317,670 0.03 Telecom Italia Capital SA 6.375% USD 15/11/2033 197,000 161,342 0.00 Telecom Italia Capital SA 7.2% USD 18/07/2036 869,000 759,280 0.02 Telenet Finance Luxembourg Notes Sarl 144A 5.5% USD 01/03/2028 1,200,000 1,016,955 0.03 Trinseo Materials Operating SCA / Trinseo Materials Finance Inc 144A 5.375% USD 01/09/2025 654,000 539,919 0.01
25,970,803 0.65 MEXICO Fomento Economico Mexicano SAB de CV 2.875% USD 10/05/2023 1,500,000 1,268,492 0.03 Gruma SAB de CV 4.875% USD 01/12/2024 1,300,000 1,170,035 0.03 Mexican Bonos 6.5% MXN 09/06/2022 1,696,500,000 74,165,169 1.85 Mexican Bonos 7.5% MXN 03/06/2027 43,000,000 1,893,464 0.05 Mexican Bonos 8% MXN 07/12/2023 1,916,100,000 87,500,194 2.19 Petroleos Mexicanos 5.125% EUR 15/03/2023 640,000 689,152 0.02 Petroleos Mexicanos 5.375% USD 13/03/2022 390,000 344,619 0.01 Petroleos Mexicanos 8.25% GBP 02/06/2022 1,920,000 2,475,690 0.06 TV Azteca SAB de CV 8.25% USD 09/08/2024 1,080,000 923,301 0.02
170,430,116 4.26 MULTINATIONAL Ardagh Packaging Finance Plc / Ardagh Holdings USA Inc 144A 4.625% USD 15/05/2023 200,000 176,281 0.01 Ardagh Packaging Finance Plc / Ardagh Holdings USA Inc 144A 6% USD 15/02/2025 230,000 198,694 0.01 Ardagh Packaging Finance Plc / Ardagh Holdings USA Inc 144A 7.25% USD 15/05/2024 1,331,000 1,218,327 0.03 Eagle Intermediate Global Holding BV/Ruyi US Finance LLC 144A 5.375% EUR 01/05/2023 100,000 97,826 0.00 Eagle Intermediate Global Holding BV/Ruyi US Finance LLC 144A 7.5% USD 01/05/2025 1,885,000 1,608,612 0.04 Endo Dac / Endo Finance LLC / Endo Finco Inc 144A 6% USD 15/07/2023 255,000 184,877 0.00 Taylor Morrison Communities Inc / Taylor Morrison Holdings II Inc 144A 5.875% USD 15/04/2023 955,000 838,604 0.02
4,323,221 0.11 NETHERLANDS ABN AMRO Bank NV FRN EUR Perpetual 500,000 478,060 0.01 Argentum Netherlands BV for Zurich Insurance Co Ltd FRN USD 01/06/2048 1,380,000 1,208,699 0.03 ASR Nederland NV FRN EUR Perpetual 460,000 419,821 0.01 Axalta Coating Systems Dutch Holding B BV 3.75% EUR 15/01/2025 670,000 694,361 0.02 BMW Finance NV 0.875% GBP 16/08/2022 2,000,000 2,254,281 0.06 CBR Fashion Finance BV 5.125% EUR 01/10/2022 2,750,000 2,478,713 0.06 Constellium NV 4.25% EUR 15/02/2026 530,000 530,631 0.01 Cooperatieve Rabobank UA FRN USD 10/04/2029 800,000 683,184 0.02 Cooperatieve Rabobank UA 144A FRN USD Perpetual 1,800,000 1,622,477 0.04 EA Partners II BV 6.75% USD 01/06/2021 500,000 233,216 0.01 ELM BV for Swiss Life Insurance & Pension Group FRN EUR Perpetual 1,200,000 1,297,050 0.03 Energizer Gamma Acquisition BV 4.625% EUR 15/07/2026 1,580,000 1,614,965 0.04 Hema Bondco I BV FRN EUR 15/07/2022 700,000 622,902 0.02 Hema Bondco II BV 8.5% EUR 15/01/2023 2,400,000 1,648,512 0.04 ING Groep NV 6% FRN USD Perpetual 1,000,000 875,930 0.02 ING Groep NV 6.5% FRN USD Perpetual 606,000 530,124 0.01 ING Groep NV 6.875% FRN USD Perpetual 650,000 590,557 0.01 Intertrust Group BV 144A 3.375% EUR 15/11/2025 425,000 435,961 0.01 LafargeHolcim Sterling Finance Netherlands BV 3% GBP 12/05/2032 1,370,000 1,480,191 0.04 LKQ European Holdings BV 4.125% EUR 01/04/2028 2,500,000 2,528,482 0.06 Maxeda DIY Holding BV 6.125% EUR 15/07/2022 385,000 369,977 0.01 NN Group NV FRN EUR 13/01/2048 980,000 1,061,732 0.03 Nyrstar Netherlands Holdings BV 6.875% EUR 15/03/2024 4,000,000 1,120,000 0.03 OCI NV 144A 6.625% USD 15/04/2023 1,080,000 981,480 0.02 Petrobras Global Finance BV 5.75% USD 01/02/2029 1,813,000 1,586,076 0.04 Petrobras Global Finance BV 6.625% GBP 16/01/2034 418,000 524,716 0.01 Petrobras Global Finance BV 8.75% USD 23/05/2026 750,000 776,512 0.02 Promontoria Holding 264 BV 6.75% EUR 15/08/2023 700,000 710,595 0.02
Invesco Global Targeted Returns Fund Statement of Investments as at 28 February 2019
298 Invesco Funds
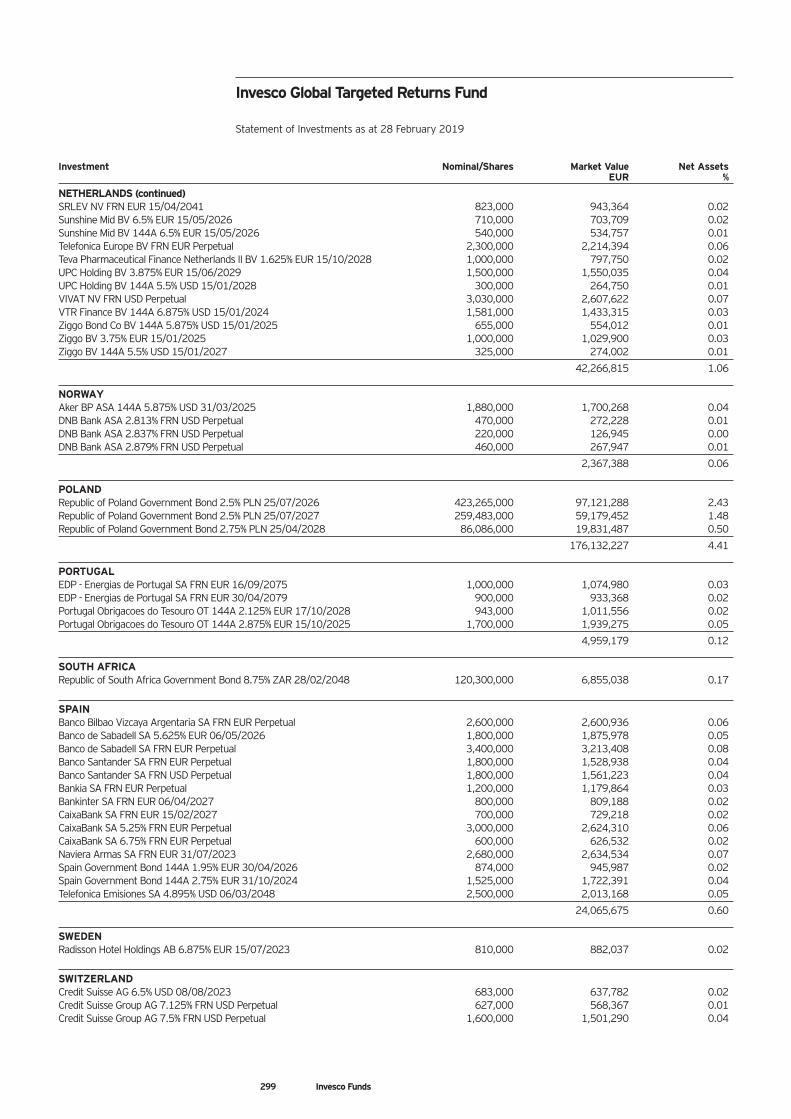
Investment Nominal/Shares Market Value Net Assets EUR %
NETHERLANDS (continued) SRLEV NV FRN EUR 15/04/2041 823,000 943,364 0.02 Sunshine Mid BV 6.5% EUR 15/05/2026 710,000 703,709 0.02 Sunshine Mid BV 144A 6.5% EUR 15/05/2026 540,000 534,757 0.01 Telefonica Europe BV FRN EUR Perpetual 2,300,000 2,214,394 0.06 Teva Pharmaceutical Finance Netherlands II BV 1.625% EUR 15/10/2028 1,000,000 797,750 0.02 UPC Holding BV 3.875% EUR 15/06/2029 1,500,000 1,550,035 0.04 UPC Holding BV 144A 5.5% USD 15/01/2028 300,000 264,750 0.01 VIVAT NV FRN USD Perpetual 3,030,000 2,607,622 0.07 VTR Finance BV 144A 6.875% USD 15/01/2024 1,581,000 1,433,315 0.03 Ziggo Bond Co BV 144A 5.875% USD 15/01/2025 655,000 554,012 0.01 Ziggo BV 3.75% EUR 15/01/2025 1,000,000 1,029,900 0.03 Ziggo BV 144A 5.5% USD 15/01/2027 325,000 274,002 0.01
42,266,815 1.06 NORWAY Aker BP ASA 144A 5.875% USD 31/03/2025 1,880,000 1,700,268 0.04 DNB Bank ASA 2.813% FRN USD Perpetual 470,000 272,228 0.01 DNB Bank ASA 2.837% FRN USD Perpetual 220,000 126,945 0.00 DNB Bank ASA 2.879% FRN USD Perpetual 460,000 267,947 0.01
2,367,388 0.06 POLAND Republic of Poland Government Bond 2.5% PLN 25/07/2026 423,265,000 97,121,288 2.43 Republic of Poland Government Bond 2.5% PLN 25/07/2027 259,483,000 59,179,452 1.48 Republic of Poland Government Bond 2.75% PLN 25/04/2028 86,086,000 19,831,487 0.50
176,132,227 4.41 PORTUGAL EDP - Energias de Portugal SA FRN EUR 16/09/2075 1,000,000 1,074,980 0.03 EDP - Energias de Portugal SA FRN EUR 30/04/2079 900,000 933,368 0.02 Portugal Obrigacoes do Tesouro OT 144A 2.125% EUR 17/10/2028 943,000 1,011,556 0.02 Portugal Obrigacoes do Tesouro OT 144A 2.875% EUR 15/10/2025 1,700,000 1,939,275 0.05
4,959,179 0.12 SOUTH AFRICA Republic of South Africa Government Bond 8.75% ZAR 28/02/2048 120,300,000 6,855,038 0.17
SPAIN Banco Bilbao Vizcaya Argentaria SA FRN EUR Perpetual 2,600,000 2,600,936 0.06 Banco de Sabadell SA 5.625% EUR 06/05/2026 1,800,000 1,875,978 0.05 Banco de Sabadell SA FRN EUR Perpetual 3,400,000 3,213,408 0.08 Banco Santander SA FRN EUR Perpetual 1,800,000 1,528,938 0.04 Banco Santander SA FRN USD Perpetual 1,800,000 1,561,223 0.04 Bankia SA FRN EUR Perpetual 1,200,000 1,179,864 0.03 Bankinter SA FRN EUR 06/04/2027 800,000 809,188 0.02 CaixaBank SA FRN EUR 15/02/2027 700,000 729,218 0.02 CaixaBank SA 5.25% FRN EUR Perpetual 3,000,000 2,624,310 0.06 CaixaBank SA 6.75% FRN EUR Perpetual 600,000 626,532 0.02 Naviera Armas SA FRN EUR 31/07/2023 2,680,000 2,634,534 0.07 Spain Government Bond 144A 1.95% EUR 30/04/2026 874,000 945,987 0.02 Spain Government Bond 144A 2.75% EUR 31/10/2024 1,525,000 1,722,391 0.04 Telefonica Emisiones SA 4.895% USD 06/03/2048 2,500,000 2,013,168 0.05
24,065,675 0.60 SWEDEN Radisson Hotel Holdings AB 6.875% EUR 15/07/2023 810,000 882,037 0.02
SWITZERLAND Credit Suisse AG 6.5% USD 08/08/2023 683,000 637,782 0.02 Credit Suisse Group AG 7.125% FRN USD Perpetual 627,000 568,367 0.01 Credit Suisse Group AG 7.5% FRN USD Perpetual 1,600,000 1,501,290 0.04
Invesco Global Targeted Returns Fund Statement of Investments as at 28 February 2019
299 Invesco Funds
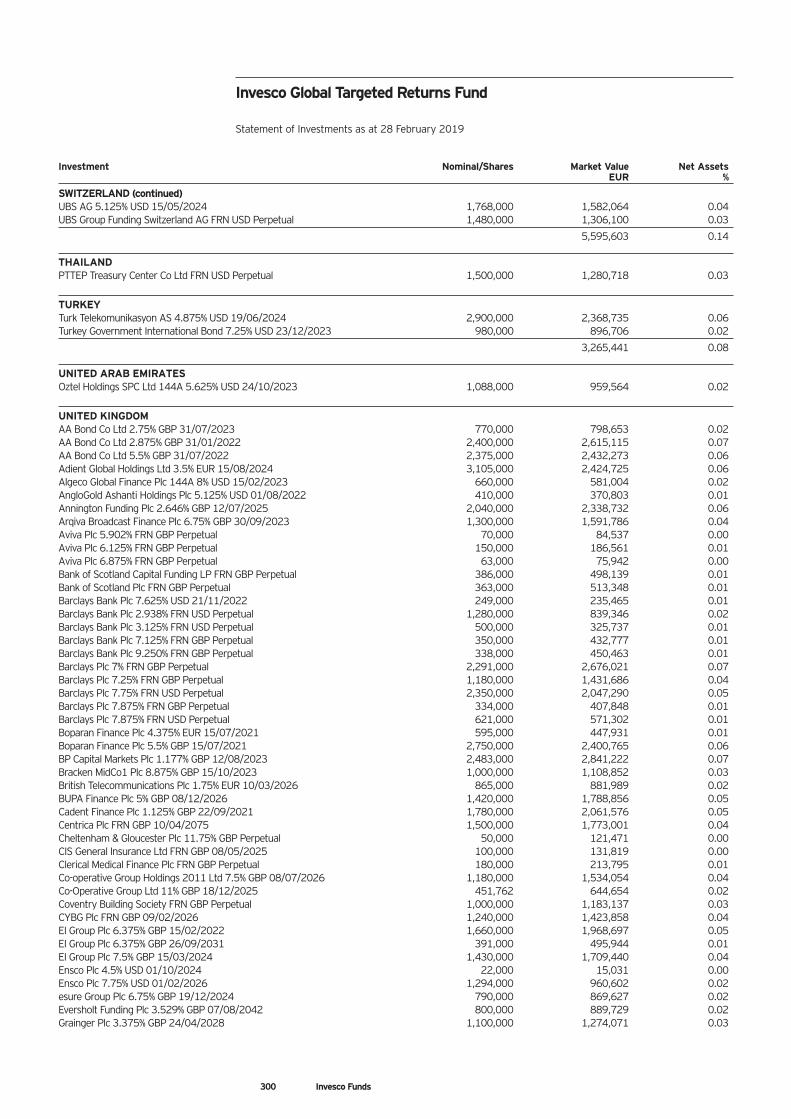
Investment Nominal/Shares Market Value Net Assets EUR %
SWITZERLAND (continued) UBS AG 5.125% USD 15/05/2024 1,768,000 1,582,064 0.04 UBS Group Funding Switzerland AG FRN USD Perpetual 1,480,000 1,306,100 0.03
5,595,603 0.14 THAILAND PTTEP Treasury Center Co Ltd FRN USD Perpetual 1,500,000 1,280,718 0.03
TURKEY Turk Telekomunikasyon AS 4.875% USD 19/06/2024 2,900,000 2,368,735 0.06 Turkey Government International Bond 7.25% USD 23/12/2023 980,000 896,706 0.02
3,265,441 0.08 UNITED ARAB EMIRATES Oztel Holdings SPC Ltd 144A 5.625% USD 24/10/2023 1,088,000 959,564 0.02
UNITED KINGDOM AA Bond Co Ltd 2.75% GBP 31/07/2023 770,000 798,653 0.02 AA Bond Co Ltd 2.875% GBP 31/01/2022 2,400,000 2,615,115 0.07 AA Bond Co Ltd 5.5% GBP 31/07/2022 2,375,000 2,432,273 0.06 Adient Global Holdings Ltd 3.5% EUR 15/08/2024 3,105,000 2,424,725 0.06 Algeco Global Finance Plc 144A 8% USD 15/02/2023 660,000 581,004 0.02 AngloGold Ashanti Holdings Plc 5.125% USD 01/08/2022 410,000 370,803 0.01 Annington Funding Plc 2.646% GBP 12/07/2025 2,040,000 2,338,732 0.06 Arqiva Broadcast Finance Plc 6.75% GBP 30/09/2023 1,300,000 1,591,786 0.04 Aviva Plc 5.902% FRN GBP Perpetual 70,000 84,537 0.00 Aviva Plc 6.125% FRN GBP Perpetual 150,000 186,561 0.01 Aviva Plc 6.875% FRN GBP Perpetual 63,000 75,942 0.00 Bank of Scotland Capital Funding LP FRN GBP Perpetual 386,000 498,139 0.01 Bank of Scotland Plc FRN GBP Perpetual 363,000 513,348 0.01 Barclays Bank Plc 7.625% USD 21/11/2022 249,000 235,465 0.01 Barclays Bank Plc 2.938% FRN USD Perpetual 1,280,000 839,346 0.02 Barclays Bank Plc 3.125% FRN USD Perpetual 500,000 325,737 0.01 Barclays Bank Plc 7.125% FRN GBP Perpetual 350,000 432,777 0.01 Barclays Bank Plc 9.250% FRN GBP Perpetual 338,000 450,463 0.01 Barclays Plc 7% FRN GBP Perpetual 2,291,000 2,676,021 0.07 Barclays Plc 7.25% FRN GBP Perpetual 1,180,000 1,431,686 0.04 Barclays Plc 7.75% FRN USD Perpetual 2,350,000 2,047,290 0.05 Barclays Plc 7.875% FRN GBP Perpetual 334,000 407,848 0.01 Barclays Plc 7.875% FRN USD Perpetual 621,000 571,302 0.01 Boparan Finance Plc 4.375% EUR 15/07/2021 595,000 447,931 0.01 Boparan Finance Plc 5.5% GBP 15/07/2021 2,750,000 2,400,765 0.06 BP Capital Markets Plc 1.177% GBP 12/08/2023 2,483,000 2,841,222 0.07 Bracken MidCo1 Plc 8.875% GBP 15/10/2023 1,000,000 1,108,852 0.03 British Telecommunications Plc 1.75% EUR 10/03/2026 865,000 881,989 0.02 BUPA Finance Plc 5% GBP 08/12/2026 1,420,000 1,788,856 0.05 Cadent Finance Plc 1.125% GBP 22/09/2021 1,780,000 2,061,576 0.05 Centrica Plc FRN GBP 10/04/2075 1,500,000 1,773,001 0.04 Cheltenham & Gloucester Plc 11.75% GBP Perpetual 50,000 121,471 0.00 CIS General Insurance Ltd FRN GBP 08/05/2025 100,000 131,819 0.00 Clerical Medical Finance Plc FRN GBP Perpetual 180,000 213,795 0.01 Co-operative Group Holdings 2011 Ltd 7.5% GBP 08/07/2026 1,180,000 1,534,054 0.04 Co-Operative Group Ltd 11% GBP 18/12/2025 451,762 644,654 0.02 Coventry Building Society FRN GBP Perpetual 1,000,000 1,183,137 0.03 CYBG Plc FRN GBP 09/02/2026 1,240,000 1,423,858 0.04 EI Group Plc 6.375% GBP 15/02/2022 1,660,000 1,968,697 0.05 EI Group Plc 6.375% GBP 26/09/2031 391,000 495,944 0.01 EI Group Plc 7.5% GBP 15/03/2024 1,430,000 1,709,440 0.04 Ensco Plc 4.5% USD 01/10/2024 22,000 15,031 0.00 Ensco Plc 7.75% USD 01/02/2026 1,294,000 960,602 0.02 esure Group Plc 6.75% GBP 19/12/2024 790,000 869,627 0.02 Eversholt Funding Plc 3.529% GBP 07/08/2042 800,000 889,729 0.02 Grainger Plc 3.375% GBP 24/04/2028 1,100,000 1,274,071 0.03
Invesco Global Targeted Returns Fund Statement of Investments as at 28 February 2019
300 Invesco Funds
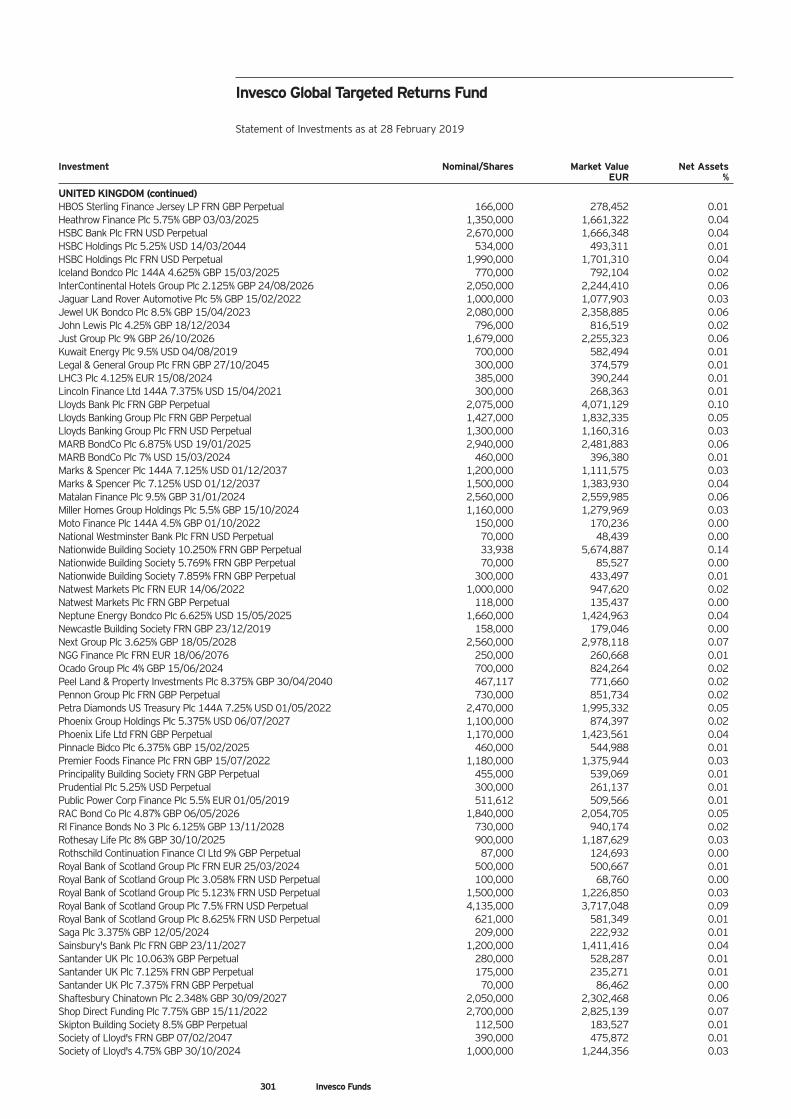
Investment Nominal/Shares Market Value Net Assets EUR %
UNITED KINGDOM (continued) HBOS Sterling Finance Jersey LP FRN GBP Perpetual 166,000 278,452 0.01 Heathrow Finance Plc 5.75% GBP 03/03/2025 1,350,000 1,661,322 0.04 HSBC Bank Plc FRN USD Perpetual 2,670,000 1,666,348 0.04 HSBC Holdings Plc 5.25% USD 14/03/2044 534,000 493,311 0.01 HSBC Holdings Plc FRN USD Perpetual 1,990,000 1,701,310 0.04 Iceland Bondco Plc 144A 4.625% GBP 15/03/2025 770,000 792,104 0.02 InterContinental Hotels Group Plc 2.125% GBP 24/08/2026 2,050,000 2,244,410 0.06 Jaguar Land Rover Automotive Plc 5% GBP 15/02/2022 1,000,000 1,077,903 0.03 Jewel UK Bondco Plc 8.5% GBP 15/04/2023 2,080,000 2,358,885 0.06 John Lewis Plc 4.25% GBP 18/12/2034 796,000 816,519 0.02 Just Group Plc 9% GBP 26/10/2026 1,679,000 2,255,323 0.06 Kuwait Energy Plc 9.5% USD 04/08/2019 700,000 582,494 0.01 Legal & General Group Plc FRN GBP 27/10/2045 300,000 374,579 0.01 LHC3 Plc 4.125% EUR 15/08/2024 385,000 390,244 0.01 Lincoln Finance Ltd 144A 7.375% USD 15/04/2021 300,000 268,363 0.01 Lloyds Bank Plc FRN GBP Perpetual 2,075,000 4,071,129 0.10 Lloyds Banking Group Plc FRN GBP Perpetual 1,427,000 1,832,335 0.05 Lloyds Banking Group Plc FRN USD Perpetual 1,300,000 1,160,316 0.03 MARB BondCo Plc 6.875% USD 19/01/2025 2,940,000 2,481,883 0.06 MARB BondCo Plc 7% USD 15/03/2024 460,000 396,380 0.01 Marks & Spencer Plc 144A 7.125% USD 01/12/2037 1,200,000 1,111,575 0.03 Marks & Spencer Plc 7.125% USD 01/12/2037 1,500,000 1,383,930 0.04 Matalan Finance Plc 9.5% GBP 31/01/2024 2,560,000 2,559,985 0.06 Miller Homes Group Holdings Plc 5.5% GBP 15/10/2024 1,160,000 1,279,969 0.03 Moto Finance Plc 144A 4.5% GBP 01/10/2022 150,000 170,236 0.00 National Westminster Bank Plc FRN USD Perpetual 70,000 48,439 0.00 Nationwide Building Society 10.250% FRN GBP Perpetual 33,938 5,674,887 0.14 Nationwide Building Society 5.769% FRN GBP Perpetual 70,000 85,527 0.00 Nationwide Building Society 7.859% FRN GBP Perpetual 300,000 433,497 0.01 Natwest Markets Plc FRN EUR 14/06/2022 1,000,000 947,620 0.02 Natwest Markets Plc FRN GBP Perpetual 118,000 135,437 0.00 Neptune Energy Bondco Plc 6.625% USD 15/05/2025 1,660,000 1,424,963 0.04 Newcastle Building Society FRN GBP 23/12/2019 158,000 179,046 0.00 Next Group Plc 3.625% GBP 18/05/2028 2,560,000 2,978,118 0.07 NGG Finance Plc FRN EUR 18/06/2076 250,000 260,668 0.01 Ocado Group Plc 4% GBP 15/06/2024 700,000 824,264 0.02 Peel Land & Property Investments Plc 8.375% GBP 30/04/2040 467,117 771,660 0.02 Pennon Group Plc FRN GBP Perpetual 730,000 851,734 0.02 Petra Diamonds US Treasury Plc 144A 7.25% USD 01/05/2022 2,470,000 1,995,332 0.05 Phoenix Group Holdings Plc 5.375% USD 06/07/2027 1,100,000 874,397 0.02 Phoenix Life Ltd FRN GBP Perpetual 1,170,000 1,423,561 0.04 Pinnacle Bidco Plc 6.375% GBP 15/02/2025 460,000 544,988 0.01 Premier Foods Finance Plc FRN GBP 15/07/2022 1,180,000 1,375,944 0.03 Principality Building Society FRN GBP Perpetual 455,000 539,069 0.01 Prudential Plc 5.25% USD Perpetual 300,000 261,137 0.01 Public Power Corp Finance Plc 5.5% EUR 01/05/2019 511,612 509,566 0.01 RAC Bond Co Plc 4.87% GBP 06/05/2026 1,840,000 2,054,705 0.05 Rl Finance Bonds No 3 Plc 6.125% GBP 13/11/2028 730,000 940,174 0.02 Rothesay Life Plc 8% GBP 30/10/2025 900,000 1,187,629 0.03 Rothschild Continuation Finance CI Ltd 9% GBP Perpetual 87,000 124,693 0.00 Royal Bank of Scotland Group Plc FRN EUR 25/03/2024 500,000 500,667 0.01 Royal Bank of Scotland Group Plc 3.058% FRN USD Perpetual 100,000 68,760 0.00 Royal Bank of Scotland Group Plc 5.123% FRN USD Perpetual 1,500,000 1,226,850 0.03 Royal Bank of Scotland Group Plc 7.5% FRN USD Perpetual 4,135,000 3,717,048 0.09 Royal Bank of Scotland Group Plc 8.625% FRN USD Perpetual 621,000 581,349 0.01 Saga Plc 3.375% GBP 12/05/2024 209,000 222,932 0.01 Sainsbury's Bank Plc FRN GBP 23/11/2027 1,200,000 1,411,416 0.04 Santander UK Plc 10.063% GBP Perpetual 280,000 528,287 0.01 Santander UK Plc 7.125% FRN GBP Perpetual 175,000 235,271 0.01 Santander UK Plc 7.375% FRN GBP Perpetual 70,000 86,462 0.00 Shaftesbury Chinatown Plc 2.348% GBP 30/09/2027 2,050,000 2,302,468 0.06 Shop Direct Funding Plc 7.75% GBP 15/11/2022 2,700,000 2,825,139 0.07 Skipton Building Society 8.5% GBP Perpetual 112,500 183,527 0.01 Society of Lloyd's FRN GBP 07/02/2047 390,000 475,872 0.01 Society of Lloyd's 4.75% GBP 30/10/2024 1,000,000 1,244,356 0.03
Invesco Global Targeted Returns Fund Statement of Investments as at 28 February 2019
301 Invesco Funds
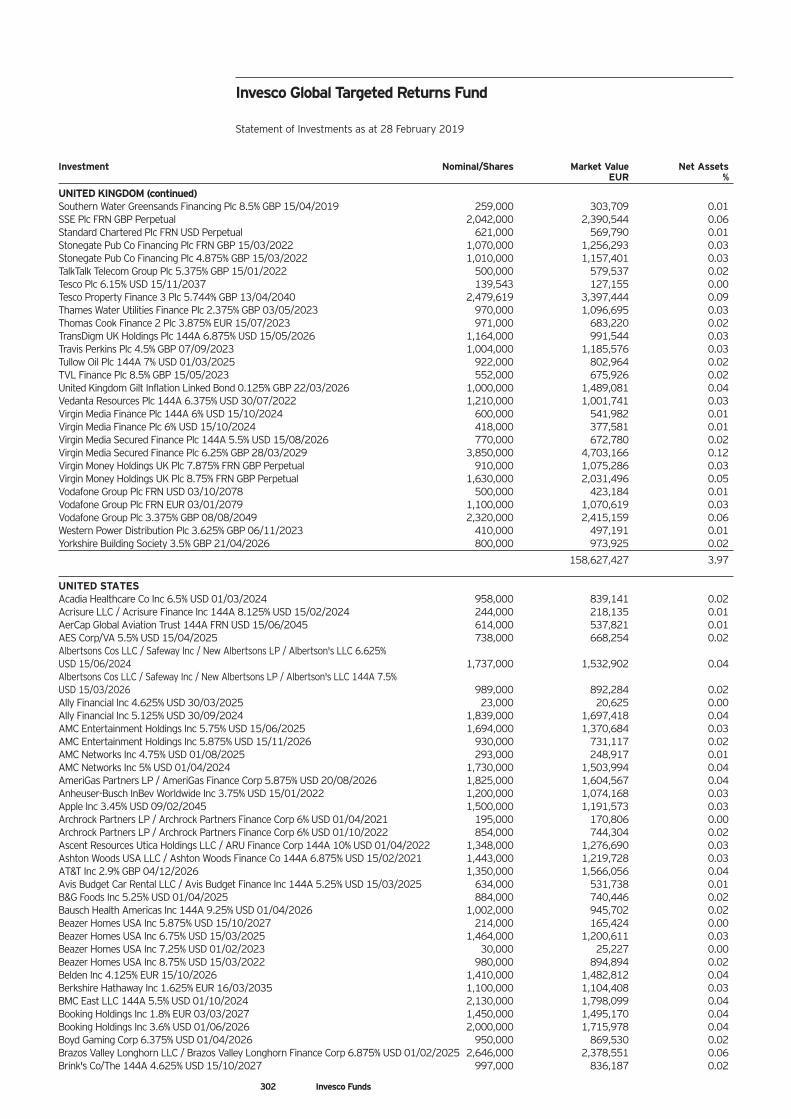
Investment Nominal/Shares Market Value Net Assets EUR %
UNITED KINGDOM (continued) Southern Water Greensands Financing Plc 8.5% GBP 15/04/2019 259,000 303,709 0.01 SSE Plc FRN GBP Perpetual 2,042,000 2,390,544 0.06 Standard Chartered Plc FRN USD Perpetual 621,000 569,790 0.01 Stonegate Pub Co Financing Plc FRN GBP 15/03/2022 1,070,000 1,256,293 0.03 Stonegate Pub Co Financing Plc 4.875% GBP 15/03/2022 1,010,000 1,157,401 0.03 TalkTalk Telecom Group Plc 5.375% GBP 15/01/2022 500,000 579,537 0.02 Tesco Plc 6.15% USD 15/11/2037 139,543 127,155 0.00 Tesco Property Finance 3 Plc 5.744% GBP 13/04/2040 2,479,619 3,397,444 0.09 Thames Water Utilities Finance Plc 2.375% GBP 03/05/2023 970,000 1,096,695 0.03 Thomas Cook Finance 2 Plc 3.875% EUR 15/07/2023 971,000 683,220 0.02 TransDigm UK Holdings Plc 144A 6.875% USD 15/05/2026 1,164,000 991,544 0.03 Travis Perkins Plc 4.5% GBP 07/09/2023 1,004,000 1,185,576 0.03 Tullow Oil Plc 144A 7% USD 01/03/2025 922,000 802,964 0.02 TVL Finance Plc 8.5% GBP 15/05/2023 552,000 675,926 0.02 United Kingdom Gilt Inflation Linked Bond 0.125% GBP 22/03/2026 1,000,000 1,489,081 0.04 Vedanta Resources Plc 144A 6.375% USD 30/07/2022 1,210,000 1,001,741 0.03 Virgin Media Finance Plc 144A 6% USD 15/10/2024 600,000 541,982 0.01 Virgin Media Finance Plc 6% USD 15/10/2024 418,000 377,581 0.01 Virgin Media Secured Finance Plc 144A 5.5% USD 15/08/2026 770,000 672,780 0.02 Virgin Media Secured Finance Plc 6.25% GBP 28/03/2029 3,850,000 4,703,166 0.12 Virgin Money Holdings UK Plc 7.875% FRN GBP Perpetual 910,000 1,075,286 0.03 Virgin Money Holdings UK Plc 8.75% FRN GBP Perpetual 1,630,000 2,031,496 0.05 Vodafone Group Plc FRN USD 03/10/2078 500,000 423,184 0.01 Vodafone Group Plc FRN EUR 03/01/2079 1,100,000 1,070,619 0.03 Vodafone Group Plc 3.375% GBP 08/08/2049 2,320,000 2,415,159 0.06 Western Power Distribution Plc 3.625% GBP 06/11/2023 410,000 497,191 0.01 Yorkshire Building Society 3.5% GBP 21/04/2026 800,000 973,925 0.02
158,627,427 3.97 UNITED STATES Acadia Healthcare Co Inc 6.5% USD 01/03/2024 958,000 839,141 0.02 Acrisure LLC / Acrisure Finance Inc 144A 8.125% USD 15/02/2024 244,000 218,135 0.01 AerCap Global Aviation Trust 144A FRN USD 15/06/2045 614,000 537,821 0.01 AES Corp/VA 5.5% USD 15/04/2025 738,000 668,254 0.02 Albertsons Cos LLC / Safeway Inc / New Albertsons LP / Albertson's LLC 6.625% USD 15/06/2024 1,737,000 1,532,902 0.04 Albertsons Cos LLC / Safeway Inc / New Albertsons LP / Albertson's LLC 144A 7.5% USD 15/03/2026 989,000 892,284 0.02 Ally Financial Inc 4.625% USD 30/03/2025 23,000 20,625 0.00 Ally Financial Inc 5.125% USD 30/09/2024 1,839,000 1,697,418 0.04 AMC Entertainment Holdings Inc 5.75% USD 15/06/2025 1,694,000 1,370,684 0.03 AMC Entertainment Holdings Inc 5.875% USD 15/11/2026 930,000 731,117 0.02 AMC Networks Inc 4.75% USD 01/08/2025 293,000 248,917 0.01 AMC Networks Inc 5% USD 01/04/2024 1,730,000 1,503,994 0.04 AmeriGas Partners LP / AmeriGas Finance Corp 5.875% USD 20/08/2026 1,825,000 1,604,567 0.04 Anheuser-Busch InBev Worldwide Inc 3.75% USD 15/01/2022 1,200,000 1,074,168 0.03 Apple Inc 3.45% USD 09/02/2045 1,500,000 1,191,573 0.03 Archrock Partners LP / Archrock Partners Finance Corp 6% USD 01/04/2021 195,000 170,806 0.00 Archrock Partners LP / Archrock Partners Finance Corp 6% USD 01/10/2022 854,000 744,304 0.02 Ascent Resources Utica Holdings LLC / ARU Finance Corp 144A 10% USD 01/04/2022 1,348,000 1,276,690 0.03 Ashton Woods USA LLC / Ashton Woods Finance Co 144A 6.875% USD 15/02/2021 1,443,000 1,219,728 0.03 AT&T Inc 2.9% GBP 04/12/2026 1,350,000 1,566,056 0.04 Avis Budget Car Rental LLC / Avis Budget Finance Inc 144A 5.25% USD 15/03/2025 634,000 531,738 0.01 B&G Foods Inc 5.25% USD 01/04/2025 884,000 740,446 0.02 Bausch Health Americas Inc 144A 9.25% USD 01/04/2026 1,002,000 945,702 0.02 Beazer Homes USA Inc 5.875% USD 15/10/2027 214,000 165,424 0.00 Beazer Homes USA Inc 6.75% USD 15/03/2025 1,464,000 1,200,611 0.03 Beazer Homes USA Inc 7.25% USD 01/02/2023 30,000 25,227 0.00 Beazer Homes USA Inc 8.75% USD 15/03/2022 980,000 894,894 0.02 Belden Inc 4.125% EUR 15/10/2026 1,410,000 1,482,812 0.04 Berkshire Hathaway Inc 1.625% EUR 16/03/2035 1,100,000 1,104,408 0.03 BMC East LLC 144A 5.5% USD 01/10/2024 2,130,000 1,798,099 0.04 Booking Holdings Inc 1.8% EUR 03/03/2027 1,450,000 1,495,170 0.04 Booking Holdings Inc 3.6% USD 01/06/2026 2,000,000 1,715,978 0.04 Boyd Gaming Corp 6.375% USD 01/04/2026 950,000 869,530 0.02 Brazos Valley Longhorn LLC / Brazos Valley Longhorn Finance Corp 6.875% USD 01/02/2025 2,646,000 2,378,551 0.06 Brink's Co/The 144A 4.625% USD 15/10/2027 997,000 836,187 0.02
Invesco Global Targeted Returns Fund Statement of Investments as at 28 February 2019
302 Invesco Funds
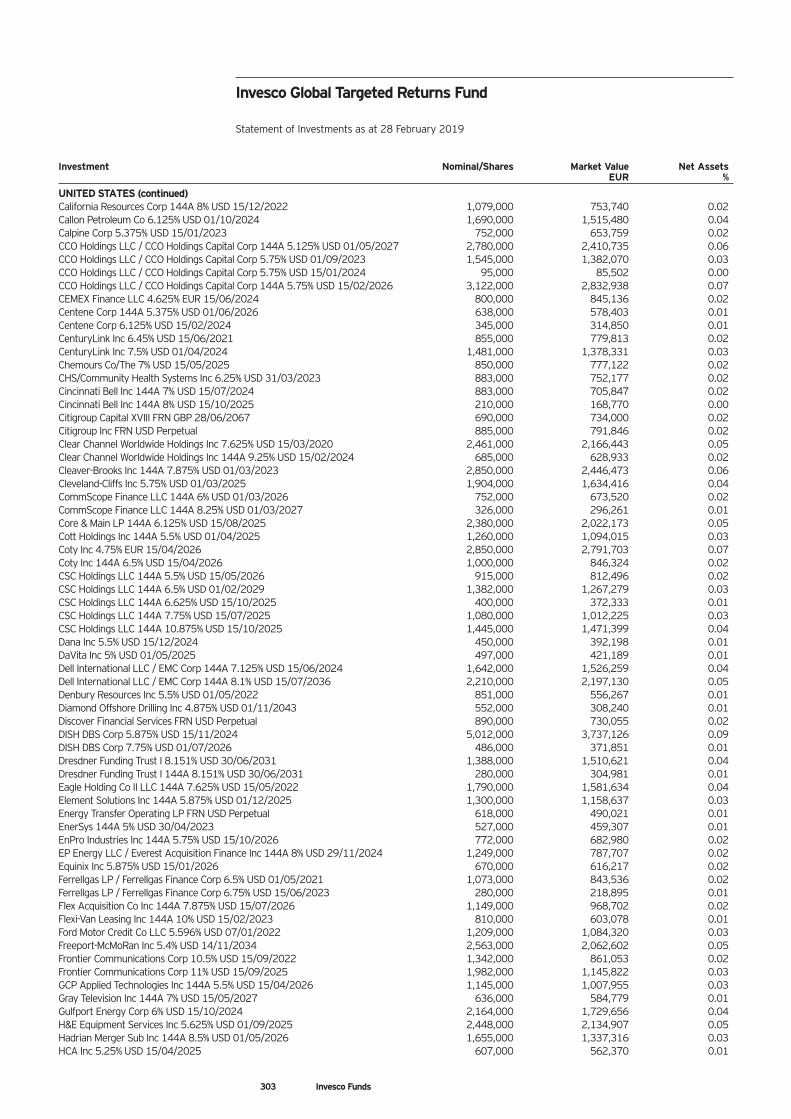
Investment Nominal/Shares Market Value Net Assets EUR %
UNITED STATES (continued) California Resources Corp 144A 8% USD 15/12/2022 1,079,000 753,740 0.02 Callon Petroleum Co 6.125% USD 01/10/2024 1,690,000 1,515,480 0.04 Calpine Corp 5.375% USD 15/01/2023 752,000 653,759 0.02 CCO Holdings LLC / CCO Holdings Capital Corp 144A 5.125% USD 01/05/2027 2,780,000 2,410,735 0.06 CCO Holdings LLC / CCO Holdings Capital Corp 5.75% USD 01/09/2023 1,545,000 1,382,070 0.03 CCO Holdings LLC / CCO Holdings Capital Corp 5.75% USD 15/01/2024 95,000 85,502 0.00 CCO Holdings LLC / CCO Holdings Capital Corp 144A 5.75% USD 15/02/2026 3,122,000 2,832,938 0.07 CEMEX Finance LLC 4.625% EUR 15/06/2024 800,000 845,136 0.02 Centene Corp 144A 5.375% USD 01/06/2026 638,000 578,403 0.01 Centene Corp 6.125% USD 15/02/2024 345,000 314,850 0.01 CenturyLink Inc 6.45% USD 15/06/2021 855,000 779,813 0.02 CenturyLink Inc 7.5% USD 01/04/2024 1,481,000 1,378,331 0.03 Chemours Co/The 7% USD 15/05/2025 850,000 777,122 0.02 CHS/Community Health Systems Inc 6.25% USD 31/03/2023 883,000 752,177 0.02 Cincinnati Bell Inc 144A 7% USD 15/07/2024 883,000 705,847 0.02 Cincinnati Bell Inc 144A 8% USD 15/10/2025 210,000 168,770 0.00 Citigroup Capital XVIII FRN GBP 28/06/2067 690,000 734,000 0.02 Citigroup Inc FRN USD Perpetual 885,000 791,846 0.02 Clear Channel Worldwide Holdings Inc 7.625% USD 15/03/2020 2,461,000 2,166,443 0.05 Clear Channel Worldwide Holdings Inc 144A 9.25% USD 15/02/2024 685,000 628,933 0.02 Cleaver-Brooks Inc 144A 7.875% USD 01/03/2023 2,850,000 2,446,473 0.06 Cleveland-Cliffs Inc 5.75% USD 01/03/2025 1,904,000 1,634,416 0.04 CommScope Finance LLC 144A 6% USD 01/03/2026 752,000 673,520 0.02 CommScope Finance LLC 144A 8.25% USD 01/03/2027 326,000 296,261 0.01 Core & Main LP 144A 6.125% USD 15/08/2025 2,380,000 2,022,173 0.05 Cott Holdings Inc 144A 5.5% USD 01/04/2025 1,260,000 1,094,015 0.03 Coty Inc 4.75% EUR 15/04/2026 2,850,000 2,791,703 0.07 Coty Inc 144A 6.5% USD 15/04/2026 1,000,000 846,324 0.02 CSC Holdings LLC 144A 5.5% USD 15/05/2026 915,000 812,496 0.02 CSC Holdings LLC 144A 6.5% USD 01/02/2029 1,382,000 1,267,279 0.03 CSC Holdings LLC 144A 6.625% USD 15/10/2025 400,000 372,333 0.01 CSC Holdings LLC 144A 7.75% USD 15/07/2025 1,080,000 1,012,225 0.03 CSC Holdings LLC 144A 10.875% USD 15/10/2025 1,445,000 1,471,399 0.04 Dana Inc 5.5% USD 15/12/2024 450,000 392,198 0.01 DaVita Inc 5% USD 01/05/2025 497,000 421,189 0.01 Dell International LLC / EMC Corp 144A 7.125% USD 15/06/2024 1,642,000 1,526,259 0.04 Dell International LLC / EMC Corp 144A 8.1% USD 15/07/2036 2,210,000 2,197,130 0.05 Denbury Resources Inc 5.5% USD 01/05/2022 851,000 556,267 0.01 Diamond Offshore Drilling Inc 4.875% USD 01/11/2043 552,000 308,240 0.01 Discover Financial Services FRN USD Perpetual 890,000 730,055 0.02 DISH DBS Corp 5.875% USD 15/11/2024 5,012,000 3,737,126 0.09 DISH DBS Corp 7.75% USD 01/07/2026 486,000 371,851 0.01 Dresdner Funding Trust I 8.151% USD 30/06/2031 1,388,000 1,510,621 0.04 Dresdner Funding Trust I 144A 8.151% USD 30/06/2031 280,000 304,981 0.01 Eagle Holding Co II LLC 144A 7.625% USD 15/05/2022 1,790,000 1,581,634 0.04 Element Solutions Inc 144A 5.875% USD 01/12/2025 1,300,000 1,158,637 0.03 Energy Transfer Operating LP FRN USD Perpetual 618,000 490,021 0.01 EnerSys 144A 5% USD 30/04/2023 527,000 459,307 0.01 EnPro Industries Inc 144A 5.75% USD 15/10/2026 772,000 682,980 0.02 EP Energy LLC / Everest Acquisition Finance Inc 144A 8% USD 29/11/2024 1,249,000 787,707 0.02 Equinix Inc 5.875% USD 15/01/2026 670,000 616,217 0.02 Ferrellgas LP / Ferrellgas Finance Corp 6.5% USD 01/05/2021 1,073,000 843,536 0.02 Ferrellgas LP / Ferrellgas Finance Corp 6.75% USD 15/06/2023 280,000 218,895 0.01 Flex Acquisition Co Inc 144A 7.875% USD 15/07/2026 1,149,000 968,702 0.02 Flexi-Van Leasing Inc 144A 10% USD 15/02/2023 810,000 603,078 0.01 Ford Motor Credit Co LLC 5.596% USD 07/01/2022 1,209,000 1,084,320 0.03 Freeport-McMoRan Inc 5.4% USD 14/11/2034 2,563,000 2,062,602 0.05 Frontier Communications Corp 10.5% USD 15/09/2022 1,342,000 861,053 0.02 Frontier Communications Corp 11% USD 15/09/2025 1,982,000 1,145,822 0.03 GCP Applied Technologies Inc 144A 5.5% USD 15/04/2026 1,145,000 1,007,955 0.03 Gray Television Inc 144A 7% USD 15/05/2027 636,000 584,779 0.01 Gulfport Energy Corp 6% USD 15/10/2024 2,164,000 1,729,656 0.04 H&E Equipment Services Inc 5.625% USD 01/09/2025 2,448,000 2,134,907 0.05 Hadrian Merger Sub Inc 144A 8.5% USD 01/05/2026 1,655,000 1,337,316 0.03 HCA Inc 5.25% USD 15/04/2025 607,000 562,370 0.01
Invesco Global Targeted Returns Fund Statement of Investments as at 28 February 2019
303 Invesco Funds
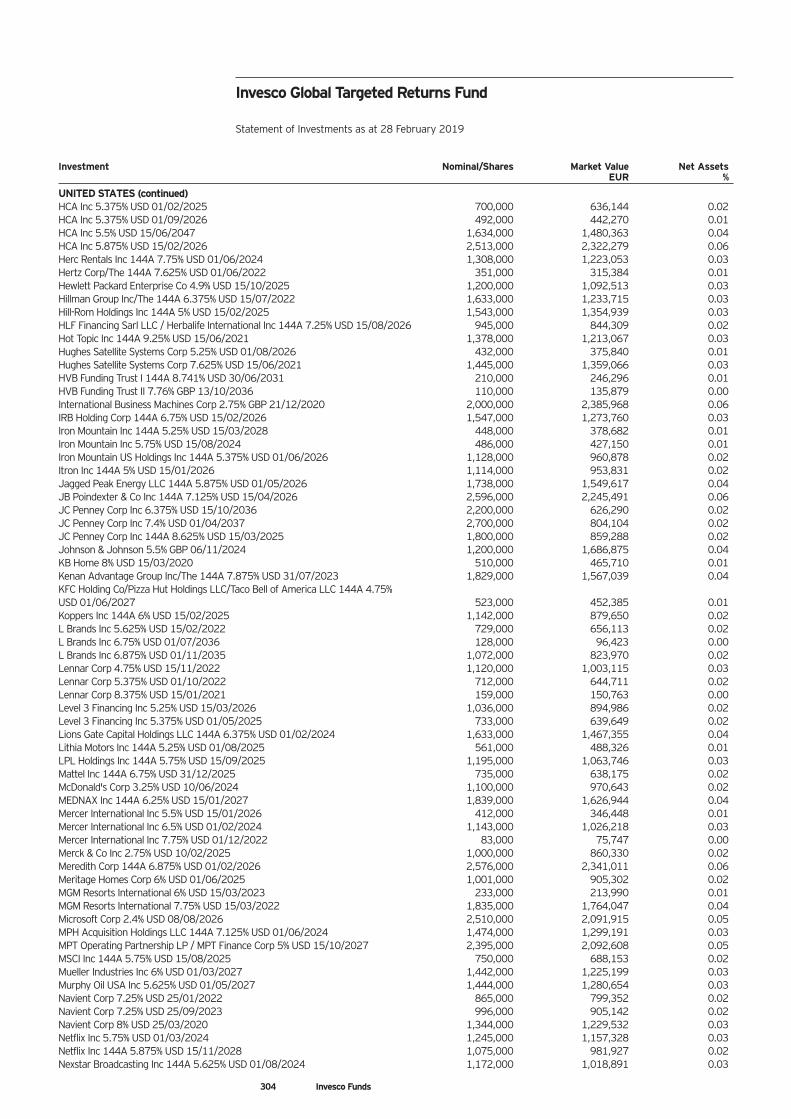
Investment Nominal/Shares Market Value Net Assets EUR %
UNITED STATES (continued) HCA Inc 5.375% USD 01/02/2025 700,000 636,144 0.02 HCA Inc 5.375% USD 01/09/2026 492,000 442,270 0.01 HCA Inc 5.5% USD 15/06/2047 1,634,000 1,480,363 0.04 HCA Inc 5.875% USD 15/02/2026 2,513,000 2,322,279 0.06 Herc Rentals Inc 144A 7.75% USD 01/06/2024 1,308,000 1,223,053 0.03 Hertz Corp/The 144A 7.625% USD 01/06/2022 351,000 315,384 0.01 Hewlett Packard Enterprise Co 4.9% USD 15/10/2025 1,200,000 1,092,513 0.03 Hillman Group Inc/The 144A 6.375% USD 15/07/2022 1,633,000 1,233,715 0.03 Hill-Rom Holdings Inc 144A 5% USD 15/02/2025 1,543,000 1,354,939 0.03 HLF Financing Sarl LLC / Herbalife International Inc 144A 7.25% USD 15/08/2026 945,000 844,309 0.02 Hot Topic Inc 144A 9.25% USD 15/06/2021 1,378,000 1,213,067 0.03 Hughes Satellite Systems Corp 5.25% USD 01/08/2026 432,000 375,840 0.01 Hughes Satellite Systems Corp 7.625% USD 15/06/2021 1,445,000 1,359,066 0.03 HVB Funding Trust I 144A 8.741% USD 30/06/2031 210,000 246,296 0.01 HVB Funding Trust II 7.76% GBP 13/10/2036 110,000 135,879 0.00 International Business Machines Corp 2.75% GBP 21/12/2020 2,000,000 2,385,968 0.06 IRB Holding Corp 144A 6.75% USD 15/02/2026 1,547,000 1,273,760 0.03 Iron Mountain Inc 144A 5.25% USD 15/03/2028 448,000 378,682 0.01 Iron Mountain Inc 5.75% USD 15/08/2024 486,000 427,150 0.01 Iron Mountain US Holdings Inc 144A 5.375% USD 01/06/2026 1,128,000 960,878 0.02 Itron Inc 144A 5% USD 15/01/2026 1,114,000 953,831 0.02 Jagged Peak Energy LLC 144A 5.875% USD 01/05/2026 1,738,000 1,549,617 0.04 JB Poindexter & Co Inc 144A 7.125% USD 15/04/2026 2,596,000 2,245,491 0.06 JC Penney Corp Inc 6.375% USD 15/10/2036 2,200,000 626,290 0.02 JC Penney Corp Inc 7.4% USD 01/04/2037 2,700,000 804,104 0.02 JC Penney Corp Inc 144A 8.625% USD 15/03/2025 1,800,000 859,288 0.02 Johnson & Johnson 5.5% GBP 06/11/2024 1,200,000 1,686,875 0.04 KB Home 8% USD 15/03/2020 510,000 465,710 0.01 Kenan Advantage Group Inc/The 144A 7.875% USD 31/07/2023 1,829,000 1,567,039 0.04 KFC Holding Co/Pizza Hut Holdings LLC/Taco Bell of America LLC 144A 4.75% USD 01/06/2027 523,000 452,385 0.01 Koppers Inc 144A 6% USD 15/02/2025 1,142,000 879,650 0.02 L Brands Inc 5.625% USD 15/02/2022 729,000 656,113 0.02 L Brands Inc 6.75% USD 01/07/2036 128,000 96,423 0.00 L Brands Inc 6.875% USD 01/11/2035 1,072,000 823,970 0.02 Lennar Corp 4.75% USD 15/11/2022 1,120,000 1,003,115 0.03 Lennar Corp 5.375% USD 01/10/2022 712,000 644,711 0.02 Lennar Corp 8.375% USD 15/01/2021 159,000 150,763 0.00 Level 3 Financing Inc 5.25% USD 15/03/2026 1,036,000 894,986 0.02 Level 3 Financing Inc 5.375% USD 01/05/2025 733,000 639,649 0.02 Lions Gate Capital Holdings LLC 144A 6.375% USD 01/02/2024 1,633,000 1,467,355 0.04 Lithia Motors Inc 144A 5.25% USD 01/08/2025 561,000 488,326 0.01 LPL Holdings Inc 144A 5.75% USD 15/09/2025 1,195,000 1,063,746 0.03 Mattel Inc 144A 6.75% USD 31/12/2025 735,000 638,175 0.02 McDonald's Corp 3.25% USD 10/06/2024 1,100,000 970,643 0.02 MEDNAX Inc 144A 6.25% USD 15/01/2027 1,839,000 1,626,944 0.04 Mercer International Inc 5.5% USD 15/01/2026 412,000 346,448 0.01 Mercer International Inc 6.5% USD 01/02/2024 1,143,000 1,026,218 0.03 Mercer International Inc 7.75% USD 01/12/2022 83,000 75,747 0.00 Merck & Co Inc 2.75% USD 10/02/2025 1,000,000 860,330 0.02 Meredith Corp 144A 6.875% USD 01/02/2026 2,576,000 2,341,011 0.06 Meritage Homes Corp 6% USD 01/06/2025 1,001,000 905,302 0.02 MGM Resorts International 6% USD 15/03/2023 233,000 213,990 0.01 MGM Resorts International 7.75% USD 15/03/2022 1,835,000 1,764,047 0.04 Microsoft Corp 2.4% USD 08/08/2026 2,510,000 2,091,915 0.05 MPH Acquisition Holdings LLC 144A 7.125% USD 01/06/2024 1,474,000 1,299,191 0.03 MPT Operating Partnership LP / MPT Finance Corp 5% USD 15/10/2027 2,395,000 2,092,608 0.05 MSCI Inc 144A 5.75% USD 15/08/2025 750,000 688,153 0.02 Mueller Industries Inc 6% USD 01/03/2027 1,442,000 1,225,199 0.03 Murphy Oil USA Inc 5.625% USD 01/05/2027 1,444,000 1,280,654 0.03 Navient Corp 7.25% USD 25/01/2022 865,000 799,352 0.02 Navient Corp 7.25% USD 25/09/2023 996,000 905,142 0.02 Navient Corp 8% USD 25/03/2020 1,344,000 1,229,532 0.03 Netflix Inc 5.75% USD 01/03/2024 1,245,000 1,157,328 0.03 Netflix Inc 144A 5.875% USD 15/11/2028 1,075,000 981,927 0.02 Nexstar Broadcasting Inc 144A 5.625% USD 01/08/2024 1,172,000 1,018,891 0.03
Invesco Global Targeted Returns Fund Statement of Investments as at 28 February 2019
304 Invesco Funds
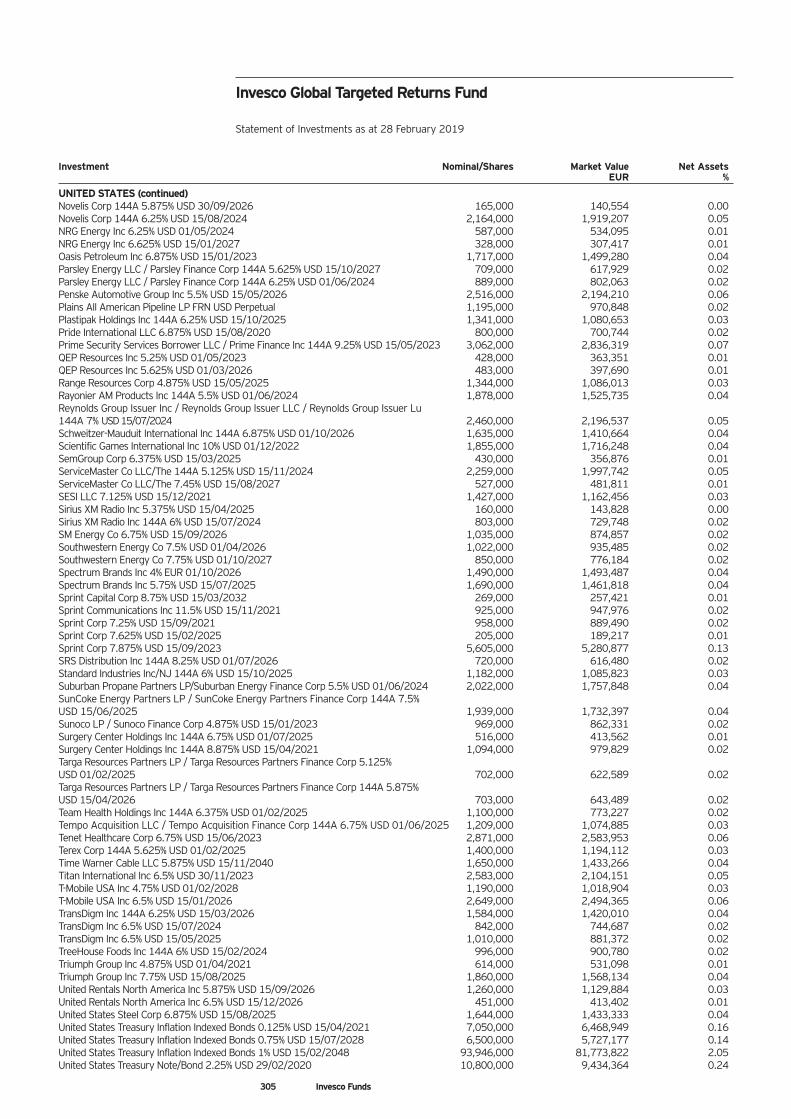
Investment Nominal/Shares Market Value Net Assets EUR %
UNITED STATES (continued) Novelis Corp 144A 5.875% USD 30/09/2026 165,000 140,554 0.00 Novelis Corp 144A 6.25% USD 15/08/2024 2,164,000 1,919,207 0.05 NRG Energy Inc 6.25% USD 01/05/2024 587,000 534,095 0.01 NRG Energy Inc 6.625% USD 15/01/2027 328,000 307,417 0.01 Oasis Petroleum Inc 6.875% USD 15/01/2023 1,717,000 1,499,280 0.04 Parsley Energy LLC / Parsley Finance Corp 144A 5.625% USD 15/10/2027 709,000 617,929 0.02 Parsley Energy LLC / Parsley Finance Corp 144A 6.25% USD 01/06/2024 889,000 802,063 0.02 Penske Automotive Group Inc 5.5% USD 15/05/2026 2,516,000 2,194,210 0.06 Plains All American Pipeline LP FRN USD Perpetual 1,195,000 970,848 0.02 Plastipak Holdings Inc 144A 6.25% USD 15/10/2025 1,341,000 1,080,653 0.03 Pride International LLC 6.875% USD 15/08/2020 800,000 700,744 0.02 Prime Security Services Borrower LLC / Prime Finance Inc 144A 9.25% USD 15/05/2023 3,062,000 2,836,319 0.07 QEP Resources Inc 5.25% USD 01/05/2023 428,000 363,351 0.01 QEP Resources Inc 5.625% USD 01/03/2026 483,000 397,690 0.01 Range Resources Corp 4.875% USD 15/05/2025 1,344,000 1,086,013 0.03 Rayonier AM Products Inc 144A 5.5% USD 01/06/2024 1,878,000 1,525,735 0.04 Reynolds Group Issuer Inc / Reynolds Group Issuer LLC / Reynolds Group Issuer Lu 144A 7% USD 15/07/2024 2,460,000 2,196,537 0.05 Schweitzer-Mauduit International Inc 144A 6.875% USD 01/10/2026 1,635,000 1,410,664 0.04 Scientific Games International Inc 10% USD 01/12/2022 1,855,000 1,716,248 0.04 SemGroup Corp 6.375% USD 15/03/2025 430,000 356,876 0.01 ServiceMaster Co LLC/The 144A 5.125% USD 15/11/2024 2,259,000 1,997,742 0.05 ServiceMaster Co LLC/The 7.45% USD 15/08/2027 527,000 481,811 0.01 SESI LLC 7.125% USD 15/12/2021 1,427,000 1,162,456 0.03 Sirius XM Radio Inc 5.375% USD 15/04/2025 160,000 143,828 0.00 Sirius XM Radio Inc 144A 6% USD 15/07/2024 803,000 729,748 0.02 SM Energy Co 6.75% USD 15/09/2026 1,035,000 874,857 0.02 Southwestern Energy Co 7.5% USD 01/04/2026 1,022,000 935,485 0.02 Southwestern Energy Co 7.75% USD 01/10/2027 850,000 776,184 0.02 Spectrum Brands Inc 4% EUR 01/10/2026 1,490,000 1,493,487 0.04 Spectrum Brands Inc 5.75% USD 15/07/2025 1,690,000 1,461,818 0.04 Sprint Capital Corp 8.75% USD 15/03/2032 269,000 257,421 0.01 Sprint Communications Inc 11.5% USD 15/11/2021 925,000 947,976 0.02 Sprint Corp 7.25% USD 15/09/2021 958,000 889,490 0.02 Sprint Corp 7.625% USD 15/02/2025 205,000 189,217 0.01 Sprint Corp 7.875% USD 15/09/2023 5,605,000 5,280,877 0.13 SRS Distribution Inc 144A 8.25% USD 01/07/2026 720,000 616,480 0.02 Standard Industries Inc/NJ 144A 6% USD 15/10/2025 1,182,000 1,085,823 0.03 Suburban Propane Partners LP/Suburban Energy Finance Corp 5.5% USD 01/06/2024 2,022,000 1,757,848 0.04 SunCoke Energy Partners LP / SunCoke Energy Partners Finance Corp 144A 7.5% USD 15/06/2025 1,939,000 1,732,397 0.04 Sunoco LP / Sunoco Finance Corp 4.875% USD 15/01/2023 969,000 862,331 0.02 Surgery Center Holdings Inc 144A 6.75% USD 01/07/2025 516,000 413,562 0.01 Surgery Center Holdings Inc 144A 8.875% USD 15/04/2021 1,094,000 979,829 0.02 Targa Resources Partners LP / Targa Resources Partners Finance Corp 5.125% USD 01/02/2025 702,000 622,589 0.02 Targa Resources Partners LP / Targa Resources Partners Finance Corp 144A 5.875% USD 15/04/2026 703,000 643,489 0.02 Team Health Holdings Inc 144A 6.375% USD 01/02/2025 1,100,000 773,227 0.02 Tempo Acquisition LLC / Tempo Acquisition Finance Corp 144A 6.75% USD 01/06/2025 1,209,000 1,074,885 0.03 Tenet Healthcare Corp 6.75% USD 15/06/2023 2,871,000 2,583,953 0.06 Terex Corp 144A 5.625% USD 01/02/2025 1,400,000 1,194,112 0.03 Time Warner Cable LLC 5.875% USD 15/11/2040 1,650,000 1,433,266 0.04 Titan International Inc 6.5% USD 30/11/2023 2,583,000 2,104,151 0.05 T-Mobile USA Inc 4.75% USD 01/02/2028 1,190,000 1,018,904 0.03 T-Mobile USA Inc 6.5% USD 15/01/2026 2,649,000 2,494,365 0.06 TransDigm Inc 144A 6.25% USD 15/03/2026 1,584,000 1,420,010 0.04 TransDigm Inc 6.5% USD 15/07/2024 842,000 744,687 0.02 TransDigm Inc 6.5% USD 15/05/2025 1,010,000 881,372 0.02 TreeHouse Foods Inc 144A 6% USD 15/02/2024 996,000 900,780 0.02 Triumph Group Inc 4.875% USD 01/04/2021 614,000 531,098 0.01 Triumph Group Inc 7.75% USD 15/08/2025 1,860,000 1,568,134 0.04 United Rentals North America Inc 5.875% USD 15/09/2026 1,260,000 1,129,884 0.03 United Rentals North America Inc 6.5% USD 15/12/2026 451,000 413,402 0.01 United States Steel Corp 6.875% USD 15/08/2025 1,644,000 1,433,333 0.04 United States Treasury Inflation Indexed Bonds 0.125% USD 15/04/2021 7,050,000 6,468,949 0.16 United States Treasury Inflation Indexed Bonds 0.75% USD 15/07/2028 6,500,000 5,727,177 0.14 United States Treasury Inflation Indexed Bonds 1% USD 15/02/2048 93,946,000 81,773,822 2.05 United States Treasury Note/Bond 2.25% USD 29/02/2020 10,800,000 9,434,364 0.24
Invesco Global Targeted Returns Fund Statement of Investments as at 28 February 2019
305 Invesco Funds
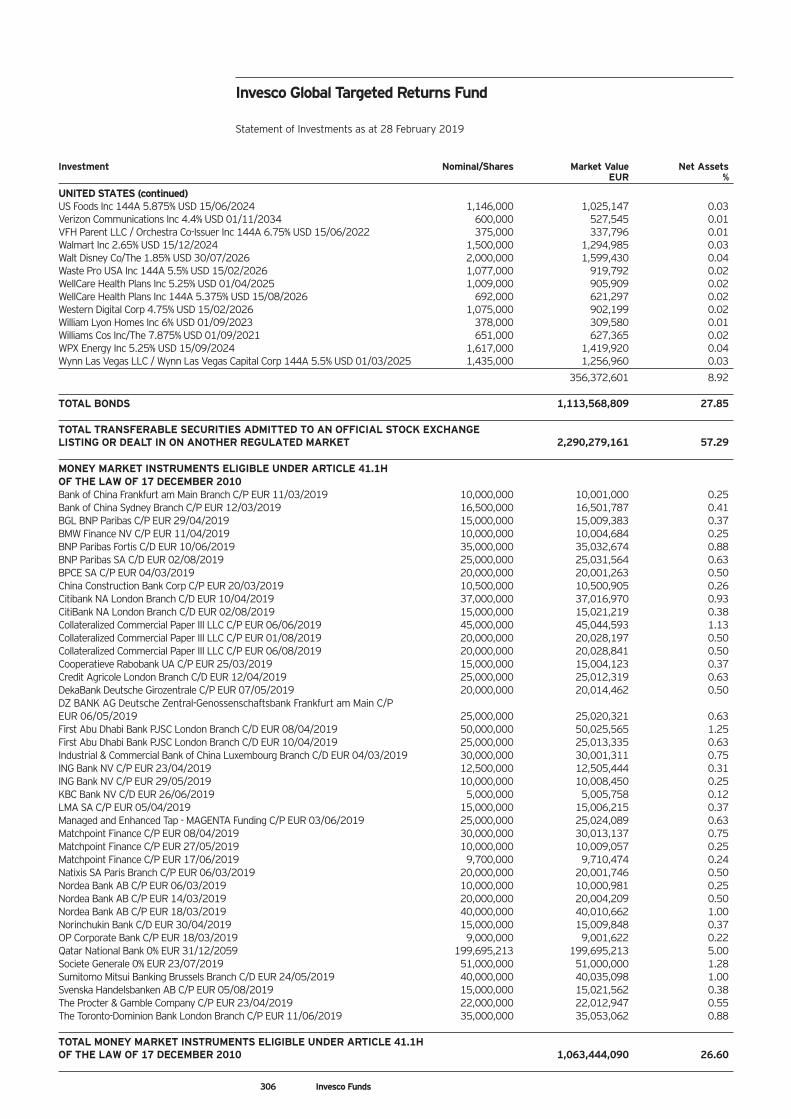
Investment Nominal/Shares Market Value Net Assets EUR %
UNITED STATES (continued) US Foods Inc 144A 5.875% USD 15/06/2024 1,146,000 1,025,147 0.03 Verizon Communications Inc 4.4% USD 01/11/2034 600,000 527,545 0.01 VFH Parent LLC / Orchestra Co-Issuer Inc 144A 6.75% USD 15/06/2022 375,000 337,796 0.01 Walmart Inc 2.65% USD 15/12/2024 1,500,000 1,294,985 0.03 Walt Disney Co/The 1.85% USD 30/07/2026 2,000,000 1,599,430 0.04 Waste Pro USA Inc 144A 5.5% USD 15/02/2026 1,077,000 919,792 0.02 WellCare Health Plans Inc 5.25% USD 01/04/2025 1,009,000 905,909 0.02 WellCare Health Plans Inc 144A 5.375% USD 15/08/2026 692,000 621,297 0.02 Western Digital Corp 4.75% USD 15/02/2026 1,075,000 902,199 0.02 William Lyon Homes Inc 6% USD 01/09/2023 378,000 309,580 0.01 Williams Cos Inc/The 7.875% USD 01/09/2021 651,000 627,365 0.02 WPX Energy Inc 5.25% USD 15/09/2024 1,617,000 1,419,920 0.04 Wynn Las Vegas LLC / Wynn Las Vegas Capital Corp 144A 5.5% USD 01/03/2025 1,435,000 1,256,960 0.03
356,372,601 8.92 TOTAL BONDS 1,113,568,809 27.85 TOTAL TRANSFERABLE SECURITIES ADMITTED TO AN OFFICIAL STOCK EXCHANGE LISTING OR DEALT IN ON ANOTHER REGULATED MARKET 2,290,279,161 57.29 MONEY MARKET INSTRUMENTS ELIGIBLE UNDER ARTICLE 41.1H OF THE LAW OF 17 DECEMBER 2010 Bank of China Frankfurt am Main Branch C/P EUR 11/03/2019 10,000,000 10,001,000 0.25 Bank of China Sydney Branch C/P EUR 12/03/2019 16,500,000 16,501,787 0.41 BGL BNP Paribas C/P EUR 29/04/2019 15,000,000 15,009,383 0.37 BMW Finance NV C/P EUR 11/04/2019 10,000,000 10,004,684 0.25 BNP Paribas Fortis C/D EUR 10/06/2019 35,000,000 35,032,674 0.88 BNP Paribas SA C/D EUR 02/08/2019 25,000,000 25,031,564 0.63 BPCE SA C/P EUR 04/03/2019 20,000,000 20,001,263 0.50 China Construction Bank Corp C/P EUR 20/03/2019 10,500,000 10,500,905 0.26 Citibank NA London Branch C/D EUR 10/04/2019 37,000,000 37,016,970 0.93 CitiBank NA London Branch C/D EUR 02/08/2019 15,000,000 15,021,219 0.38 Collateralized Commercial Paper III LLC C/P EUR 06/06/2019 45,000,000 45,044,593 1.13 Collateralized Commercial Paper III LLC C/P EUR 01/08/2019 20,000,000 20,028,197 0.50 Collateralized Commercial Paper III LLC C/P EUR 06/08/2019 20,000,000 20,028,841 0.50 Cooperatieve Rabobank UA C/P EUR 25/03/2019 15,000,000 15,004,123 0.37 Credit Agricole London Branch C/D EUR 12/04/2019 25,000,000 25,012,319 0.63 DekaBank Deutsche Girozentrale C/P EUR 07/05/2019 20,000,000 20,014,462 0.50 DZ BANK AG Deutsche Zentral-Genossenschaftsbank Frankfurt am Main C/P EUR 06/05/2019 25,000,000 25,020,321 0.63 First Abu Dhabi Bank PJSC London Branch C/D EUR 08/04/2019 50,000,000 50,025,565 1.25 First Abu Dhabi Bank PJSC London Branch C/D EUR 10/04/2019 25,000,000 25,013,335 0.63 Industrial & Commercial Bank of China Luxembourg Branch C/D EUR 04/03/2019 30,000,000 30,001,311 0.75 ING Bank NV C/P EUR 23/04/2019 12,500,000 12,505,444 0.31 ING Bank NV C/P EUR 29/05/2019 10,000,000 10,008,450 0.25 KBC Bank NV C/D EUR 26/06/2019 5,000,000 5,005,758 0.12 LMA SA C/P EUR 05/04/2019 15,000,000 15,006,215 0.37 Managed and Enhanced Tap - MAGENTA Funding C/P EUR 03/06/2019 25,000,000 25,024,089 0.63 Matchpoint Finance C/P EUR 08/04/2019 30,000,000 30,013,137 0.75 Matchpoint Finance C/P EUR 27/05/2019 10,000,000 10,009,057 0.25 Matchpoint Finance C/P EUR 17/06/2019 9,700,000 9,710,474 0.24 Natixis SA Paris Branch C/P EUR 06/03/2019 20,000,000 20,001,746 0.50 Nordea Bank AB C/P EUR 06/03/2019 10,000,000 10,000,981 0.25 Nordea Bank AB C/P EUR 14/03/2019 20,000,000 20,004,209 0.50 Nordea Bank AB C/P EUR 18/03/2019 40,000,000 40,010,662 1.00 Norinchukin Bank C/D EUR 30/04/2019 15,000,000 15,009,848 0.37 OP Corporate Bank C/P EUR 18/03/2019 9,000,000 9,001,622 0.22 Qatar National Bank 0% EUR 31/12/2059 199,695,213 199,695,213 5.00 Societe Generale 0% EUR 23/07/2019 51,000,000 51,000,000 1.28 Sumitomo Mitsui Banking Brussels Branch C/D EUR 24/05/2019 40,000,000 40,035,098 1.00 Svenska Handelsbanken AB C/P EUR 05/08/2019 15,000,000 15,021,562 0.38 The Procter & Gamble Company C/P EUR 23/04/2019 22,000,000 22,012,947 0.55 The Toronto-Dominion Bank London Branch C/P EUR 11/06/2019 35,000,000 35,053,062 0.88 TOTAL MONEY MARKET INSTRUMENTS ELIGIBLE UNDER ARTICLE 41.1H OF THE LAW OF 17 DECEMBER 2010 1,063,444,090 26.60
Invesco Global Targeted Returns Fund Statement of Investments as at 28 February 2019
306 Invesco Funds
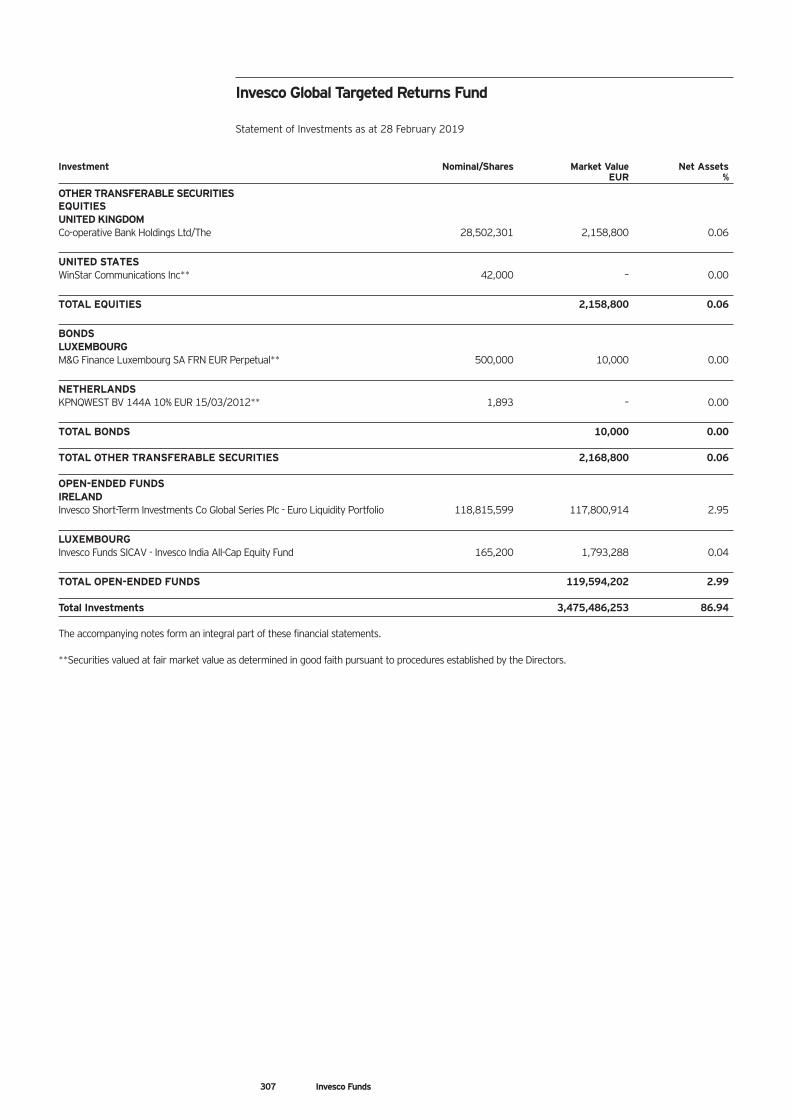
Investment Nominal/Shares Market Value Net Assets EUR %
OTHER TRANSFERABLE SECURITIES EQUITIES UNITED KINGDOM Co-operative Bank Holdings Ltd/The 28,502,301 2,158,800 0.06
UNITED STATES WinStar Communications Inc** 42,000 – 0.00
TOTAL EQUITIES 2,158,800 0.06
BONDS LUXEMBOURG M&G Finance Luxembourg SA FRN EUR Perpetual** 500,000 10,000 0.00
NETHERLANDS KPNQWEST BV 144A 10% EUR 15/03/2012** 1,893 – 0.00
TOTAL BONDS 10,000 0.00 TOTAL OTHER TRANSFERABLE SECURITIES 2,168,800 0.06 OPEN-ENDED FUNDS IRELAND Invesco Short-Term Investments Co Global Series Plc - Euro Liquidity Portfolio 118,815,599 117,800,914 2.95
LUXEMBOURG Invesco Funds SICAV - Invesco India All-Cap Equity Fund 165,200 1,793,288 0.04
TOTAL OPEN-ENDED FUNDS 119,594,202 2.99 Total Investments 3,475,486,253 86.94 The accompanying notes form an integral part of these financial statements. **Securities valued at fair market value as determined in good faith pursuant to procedures established by the Directors.
Invesco Global Targeted Returns Fund Statement of Investments as at 28 February 2019
307 Invesco Funds
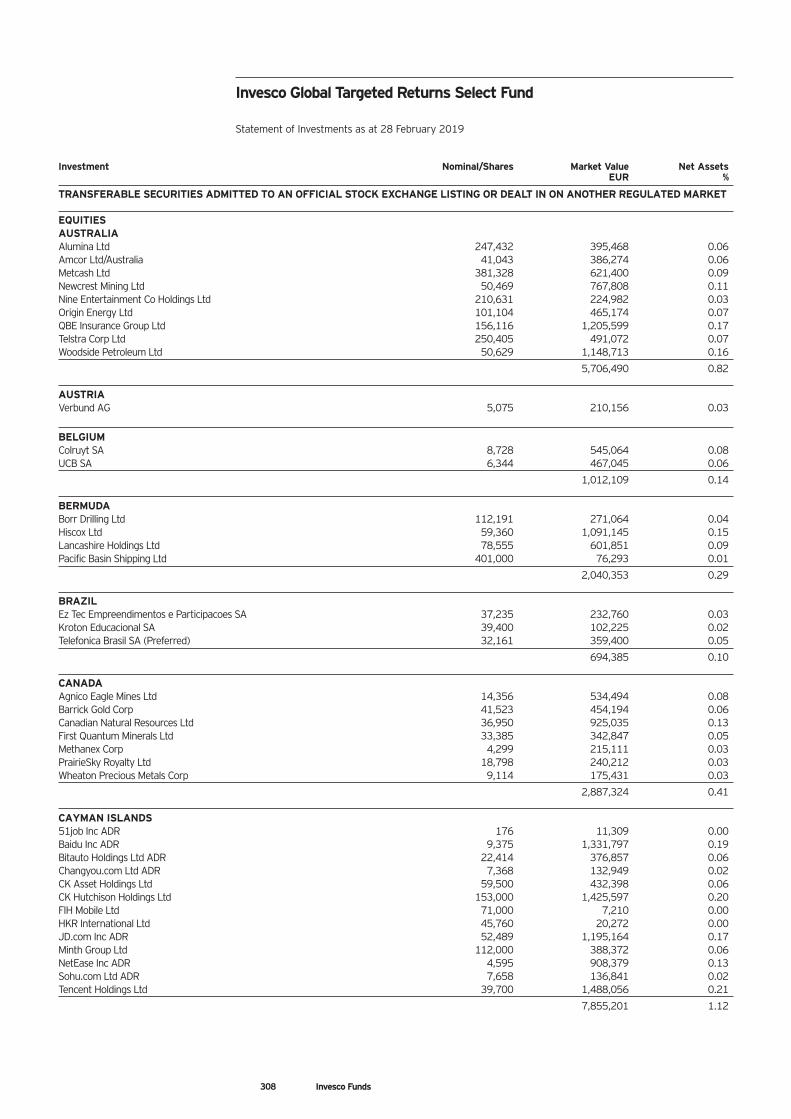
Investment Nominal/Shares Market Value Net Assets EUR %
TRANSFERABLE SECURITIES ADMITTED TO AN OFFICIAL STOCK EXCHANGE LISTING OR DEALT IN ON ANOTHER REGULATED MARKET EQUITIES AUSTRALIA Alumina Ltd 247,432 395,468 0.06 Amcor Ltd/Australia 41,043 386,274 0.06 Metcash Ltd 381,328 621,400 0.09 Newcrest Mining Ltd 50,469 767,808 0.11 Nine Entertainment Co Holdings Ltd 210,631 224,982 0.03 Origin Energy Ltd 101,104 465,174 0.07 QBE Insurance Group Ltd 156,116 1,205,599 0.17 Telstra Corp Ltd 250,405 491,072 0.07 Woodside Petroleum Ltd 50,629 1,148,713 0.16
5,706,490 0.82 AUSTRIA Verbund AG 5,075 210,156 0.03
BELGIUM Colruyt SA 8,728 545,064 0.08 UCB SA 6,344 467,045 0.06
1,012,109 0.14 BERMUDA Borr Drilling Ltd 112,191 271,064 0.04 Hiscox Ltd 59,360 1,091,145 0.15 Lancashire Holdings Ltd 78,555 601,851 0.09 Pacific Basin Shipping Ltd 401,000 76,293 0.01
2,040,353 0.29 BRAZIL Ez Tec Empreendimentos e Participacoes SA 37,235 232,760 0.03 Kroton Educacional SA 39,400 102,225 0.02 Telefonica Brasil SA (Preferred) 32,161 359,400 0.05
694,385 0.10 CANADA Agnico Eagle Mines Ltd 14,356 534,494 0.08 Barrick Gold Corp 41,523 454,194 0.06 Canadian Natural Resources Ltd 36,950 925,035 0.13 First Quantum Minerals Ltd 33,385 342,847 0.05 Methanex Corp 4,299 215,111 0.03 PrairieSky Royalty Ltd 18,798 240,212 0.03 Wheaton Precious Metals Corp 9,114 175,431 0.03
2,887,324 0.41 CAYMAN ISLANDS 51job Inc ADR 176 11,309 0.00 Baidu Inc ADR 9,375 1,331,797 0.19 Bitauto Holdings Ltd ADR 22,414 376,857 0.06 Changyou.com Ltd ADR 7,368 132,949 0.02 CK Asset Holdings Ltd 59,500 432,398 0.06 CK Hutchison Holdings Ltd 153,000 1,425,597 0.20 FIH Mobile Ltd 71,000 7,210 0.00 HKR International Ltd 45,760 20,272 0.00 JD.com Inc ADR 52,489 1,195,164 0.17 Minth Group Ltd 112,000 388,372 0.06 NetEase Inc ADR 4,595 908,379 0.13 Sohu.com Ltd ADR 7,658 136,841 0.02 Tencent Holdings Ltd 39,700 1,488,056 0.21
7,855,201 1.12
Invesco Global Targeted Returns Select Fund Statement of Investments as at 28 February 2019
308 Invesco Funds
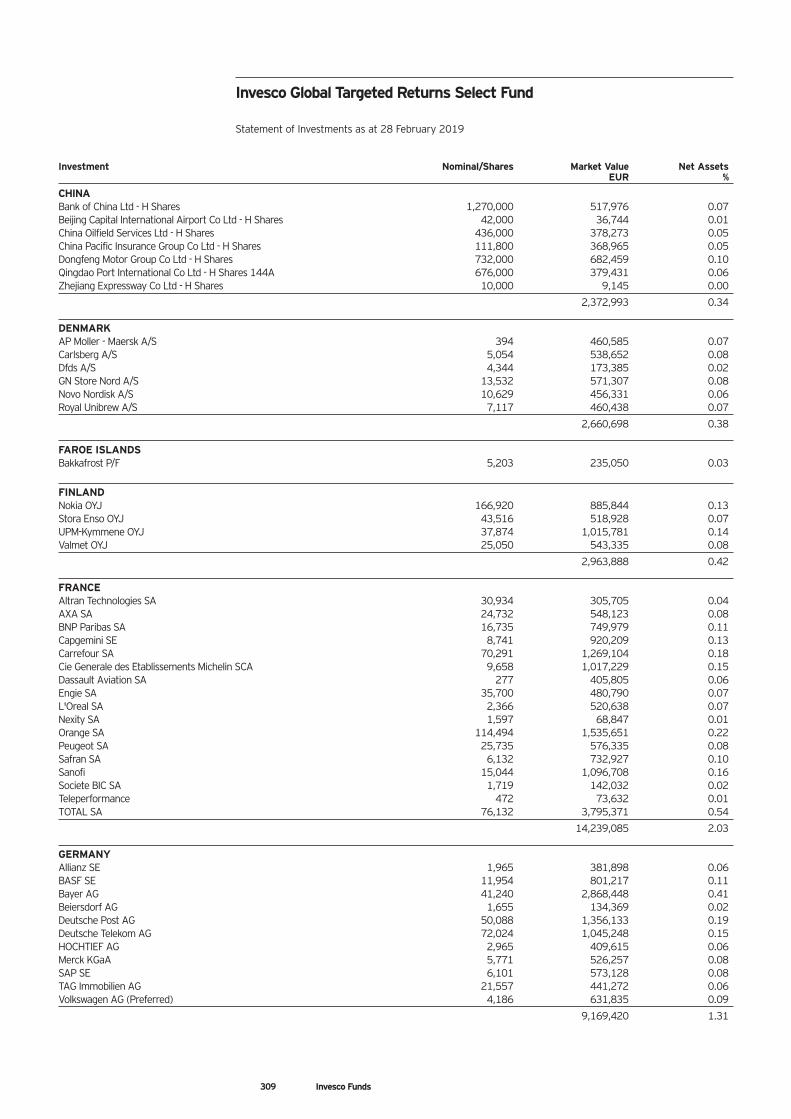
Investment Nominal/Shares Market Value Net Assets EUR %
CHINA Bank of China Ltd - H Shares 1,270,000 517,976 0.07 Beijing Capital International Airport Co Ltd - H Shares 42,000 36,744 0.01 China Oilfield Services Ltd - H Shares 436,000 378,273 0.05 China Pacific Insurance Group Co Ltd - H Shares 111,800 368,965 0.05 Dongfeng Motor Group Co Ltd - H Shares 732,000 682,459 0.10 Qingdao Port International Co Ltd - H Shares 144A 676,000 379,431 0.06 Zhejiang Expressway Co Ltd - H Shares 10,000 9,145 0.00
2,372,993 0.34 DENMARK AP Moller - Maersk A/S 394 460,585 0.07 Carlsberg A/S 5,054 538,652 0.08 Dfds A/S 4,344 173,385 0.02 GN Store Nord A/S 13,532 571,307 0.08 Novo Nordisk A/S 10,629 456,331 0.06 Royal Unibrew A/S 7,117 460,438 0.07
2,660,698 0.38 FAROE ISLANDS Bakkafrost P/F 5,203 235,050 0.03
FINLAND Nokia OYJ 166,920 885,844 0.13 Stora Enso OYJ 43,516 518,928 0.07 UPM-Kymmene OYJ 37,874 1,015,781 0.14 Valmet OYJ 25,050 543,335 0.08
2,963,888 0.42 FRANCE Altran Technologies SA 30,934 305,705 0.04 AXA SA 24,732 548,123 0.08 BNP Paribas SA 16,735 749,979 0.11 Capgemini SE 8,741 920,209 0.13 Carrefour SA 70,291 1,269,104 0.18 Cie Generale des Etablissements Michelin SCA 9,658 1,017,229 0.15 Dassault Aviation SA 277 405,805 0.06 Engie SA 35,700 480,790 0.07 L'Oreal SA 2,366 520,638 0.07 Nexity SA 1,597 68,847 0.01 Orange SA 114,494 1,535,651 0.22 Peugeot SA 25,735 576,335 0.08 Safran SA 6,132 732,927 0.10 Sanofi 15,044 1,096,708 0.16 Societe BIC SA 1,719 142,032 0.02 Teleperformance 472 73,632 0.01 TOTAL SA 76,132 3,795,371 0.54
14,239,085 2.03 GERMANY Allianz SE 1,965 381,898 0.06 BASF SE 11,954 801,217 0.11 Bayer AG 41,240 2,868,448 0.41 Beiersdorf AG 1,655 134,369 0.02 Deutsche Post AG 50,088 1,356,133 0.19 Deutsche Telekom AG 72,024 1,045,248 0.15 HOCHTIEF AG 2,965 409,615 0.06 Merck KGaA 5,771 526,257 0.08 SAP SE 6,101 573,128 0.08 TAG Immobilien AG 21,557 441,272 0.06 Volkswagen AG (Preferred) 4,186 631,835 0.09
9,169,420 1.31
Invesco Global Targeted Returns Select Fund Statement of Investments as at 28 February 2019
309 Invesco Funds
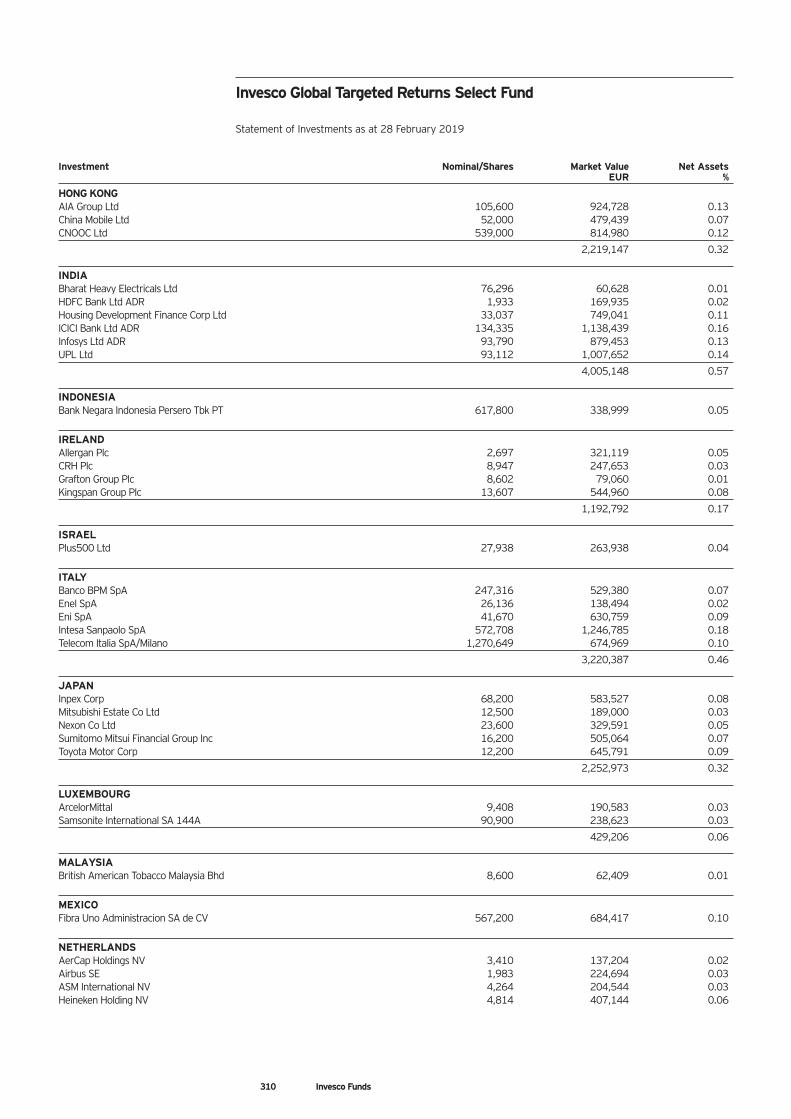
Investment Nominal/Shares Market Value Net Assets EUR %
HONG KONG AIA Group Ltd 105,600 924,728 0.13 China Mobile Ltd 52,000 479,439 0.07 CNOOC Ltd 539,000 814,980 0.12
2,219,147 0.32 INDIA Bharat Heavy Electricals Ltd 76,296 60,628 0.01 HDFC Bank Ltd ADR 1,933 169,935 0.02 Housing Development Finance Corp Ltd 33,037 749,041 0.11 ICICI Bank Ltd ADR 134,335 1,138,439 0.16 Infosys Ltd ADR 93,790 879,453 0.13 UPL Ltd 93,112 1,007,652 0.14
4,005,148 0.57 INDONESIA Bank Negara Indonesia Persero Tbk PT 617,800 338,999 0.05
IRELAND Allergan Plc 2,697 321,119 0.05 CRH Plc 8,947 247,653 0.03 Grafton Group Plc 8,602 79,060 0.01 Kingspan Group Plc 13,607 544,960 0.08
1,192,792 0.17 ISRAEL Plus500 Ltd 27,938 263,938 0.04
ITALY Banco BPM SpA 247,316 529,380 0.07 Enel SpA 26,136 138,494 0.02 Eni SpA 41,670 630,759 0.09 Intesa Sanpaolo SpA 572,708 1,246,785 0.18 Telecom Italia SpA/Milano 1,270,649 674,969 0.10
3,220,387 0.46 JAPAN Inpex Corp 68,200 583,527 0.08 Mitsubishi Estate Co Ltd 12,500 189,000 0.03 Nexon Co Ltd 23,600 329,591 0.05 Sumitomo Mitsui Financial Group Inc 16,200 505,064 0.07 Toyota Motor Corp 12,200 645,791 0.09
2,252,973 0.32 LUXEMBOURG ArcelorMittal 9,408 190,583 0.03 Samsonite International SA 144A 90,900 238,623 0.03
429,206 0.06 MALAYSIA British American Tobacco Malaysia Bhd 8,600 62,409 0.01
MEXICO Fibra Uno Administracion SA de CV 567,200 684,417 0.10
NETHERLANDS AerCap Holdings NV 3,410 137,204 0.02 Airbus SE 1,983 224,694 0.03 ASM International NV 4,264 204,544 0.03 Heineken Holding NV 4,814 407,144 0.06
Invesco Global Targeted Returns Select Fund Statement of Investments as at 28 February 2019
310 Invesco Funds
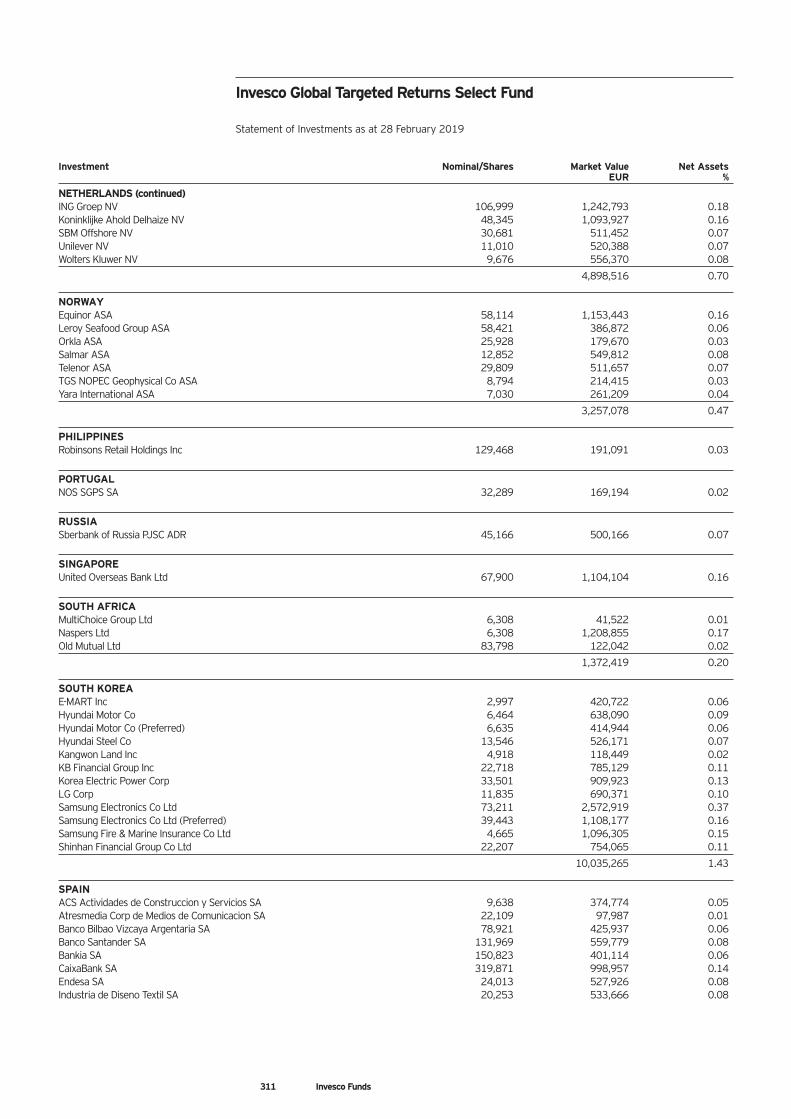
Investment Nominal/Shares Market Value Net Assets EUR %
NETHERLANDS (continued) ING Groep NV 106,999 1,242,793 0.18 Koninklijke Ahold Delhaize NV 48,345 1,093,927 0.16 SBM Offshore NV 30,681 511,452 0.07 Unilever NV 11,010 520,388 0.07 Wolters Kluwer NV 9,676 556,370 0.08
4,898,516 0.70 NORWAY Equinor ASA 58,114 1,153,443 0.16 Leroy Seafood Group ASA 58,421 386,872 0.06 Orkla ASA 25,928 179,670 0.03 Salmar ASA 12,852 549,812 0.08 Telenor ASA 29,809 511,657 0.07 TGS NOPEC Geophysical Co ASA 8,794 214,415 0.03 Yara International ASA 7,030 261,209 0.04
3,257,078 0.47 PHILIPPINES Robinsons Retail Holdings Inc 129,468 191,091 0.03
PORTUGAL NOS SGPS SA 32,289 169,194 0.02
RUSSIA Sberbank of Russia PJSC ADR 45,166 500,166 0.07
SINGAPORE United Overseas Bank Ltd 67,900 1,104,104 0.16
SOUTH AFRICA MultiChoice Group Ltd 6,308 41,522 0.01 Naspers Ltd 6,308 1,208,855 0.17 Old Mutual Ltd 83,798 122,042 0.02
1,372,419 0.20 SOUTH KOREA E-MART Inc 2,997 420,722 0.06 Hyundai Motor Co 6,464 638,090 0.09 Hyundai Motor Co (Preferred) 6,635 414,944 0.06 Hyundai Steel Co 13,546 526,171 0.07 Kangwon Land Inc 4,918 118,449 0.02 KB Financial Group Inc 22,718 785,129 0.11 Korea Electric Power Corp 33,501 909,923 0.13 LG Corp 11,835 690,371 0.10 Samsung Electronics Co Ltd 73,211 2,572,919 0.37 Samsung Electronics Co Ltd (Preferred) 39,443 1,108,177 0.16 Samsung Fire & Marine Insurance Co Ltd 4,665 1,096,305 0.15 Shinhan Financial Group Co Ltd 22,207 754,065 0.11
10,035,265 1.43 SPAIN ACS Actividades de Construccion y Servicios SA 9,638 374,774 0.05 Atresmedia Corp de Medios de Comunicacion SA 22,109 97,987 0.01 Banco Bilbao Vizcaya Argentaria SA 78,921 425,937 0.06 Banco Santander SA 131,969 559,779 0.08 Bankia SA 150,823 401,114 0.06 CaixaBank SA 319,871 998,957 0.14 Endesa SA 24,013 527,926 0.08 Industria de Diseno Textil SA 20,253 533,666 0.08
Invesco Global Targeted Returns Select Fund Statement of Investments as at 28 February 2019
311 Invesco Funds

Investment Nominal/Shares Market Value Net Assets EUR %
SPAIN (continued) International Consolidated Airlines Group SA EUR 61,362 433,216 0.06 International Consolidated Airlines Group SA GBP 136,975 967,397 0.14 Mediaset Espana Comunicacion SA 21,596 144,456 0.02 Merlin Properties Socimi SA 15,461 172,815 0.02 Neinor Homes SA 144A 5,925 68,256 0.01
5,706,280 0.81 SWEDEN Axfood AB 8,726 142,507 0.02 Loomis AB 6,967 220,707 0.03 Sandvik AB 15,418 220,506 0.03 Securitas AB 34,031 471,268 0.07 SSAB AB - A Shares 36,540 125,073 0.02 SSAB AB - B Shares 100,234 286,419 0.04 Svenska Cellulosa AB SCA 69,985 562,250 0.08 Swedish Match AB 12,759 530,799 0.08 Telefonaktiebolaget LM Ericsson 47,630 381,289 0.05
2,940,818 0.42 SWITZERLAND Adecco Group AG 5,185 232,766 0.03 Barry Callebaut AG 100 150,920 0.02 Flughafen Zurich AG 816 128,475 0.02 Novartis AG 20,543 1,649,529 0.24 Roche Holding AG 12,351 3,010,019 0.43 Sunrise Communications Group AG 144A 6,292 400,585 0.06 TE Connectivity Ltd 8,209 593,253 0.09 UBS Group AG 52,751 588,772 0.08 Zurich Insurance Group AG 3,182 919,766 0.13
7,674,085 1.10 TAIWAN Asustek Computer Inc 145,000 906,875 0.13 Delta Electronics Inc 219,000 958,318 0.14 Gigabyte Technology Co Ltd 324,000 441,934 0.06 Hon Hai Precision Industry Co Ltd 168,240 347,869 0.05 MediaTek Inc 184,000 1,465,003 0.21 Taiwan Semiconductor Manufacturing Co Ltd 217,000 1,474,530 0.21 Taiwan Semiconductor Manufacturing Co Ltd ADR 30,757 1,062,957 0.15
6,657,486 0.95 THAILAND Bangkok Bank PCL NVDR 137,300 795,726 0.12 Bangkok Bank PCL 3,600 21,464 0.00 Kasikornbank PCL NVDR 101,800 558,151 0.08
1,375,341 0.20 UNITED KINGDOM Anglo American Plc 19,414 452,477 0.06 Aon Plc 2,413 361,799 0.05 Auto Trader Group Plc 144A 87,727 487,659 0.07 Aviva Plc 475,603 2,332,613 0.33 Babcock International Group Plc 128,690 791,768 0.11 BAE Systems Plc 531,056 2,885,525 0.41 Balfour Beatty Plc 129,847 434,470 0.06 Barclays Plc 1,087,201 2,083,859 0.30 BCA Marketplace Plc 228,814 533,918 0.08 Beazley Plc 143,997 910,274 0.13 BHP Group Plc 27,148 554,959 0.08 BP Plc 1,102,691 6,844,719 0.98 British American Tobacco Plc 97,135 3,113,196 0.44 British Land Co Plc/The 114,139 792,417 0.11 BT Group Plc 567,809 1,421,863 0.20 BTG Plc 66,833 648,133 0.09 Bunzl Plc 19,074 523,422 0.08
Invesco Global Targeted Returns Select Fund Statement of Investments as at 28 February 2019
312 Invesco Funds
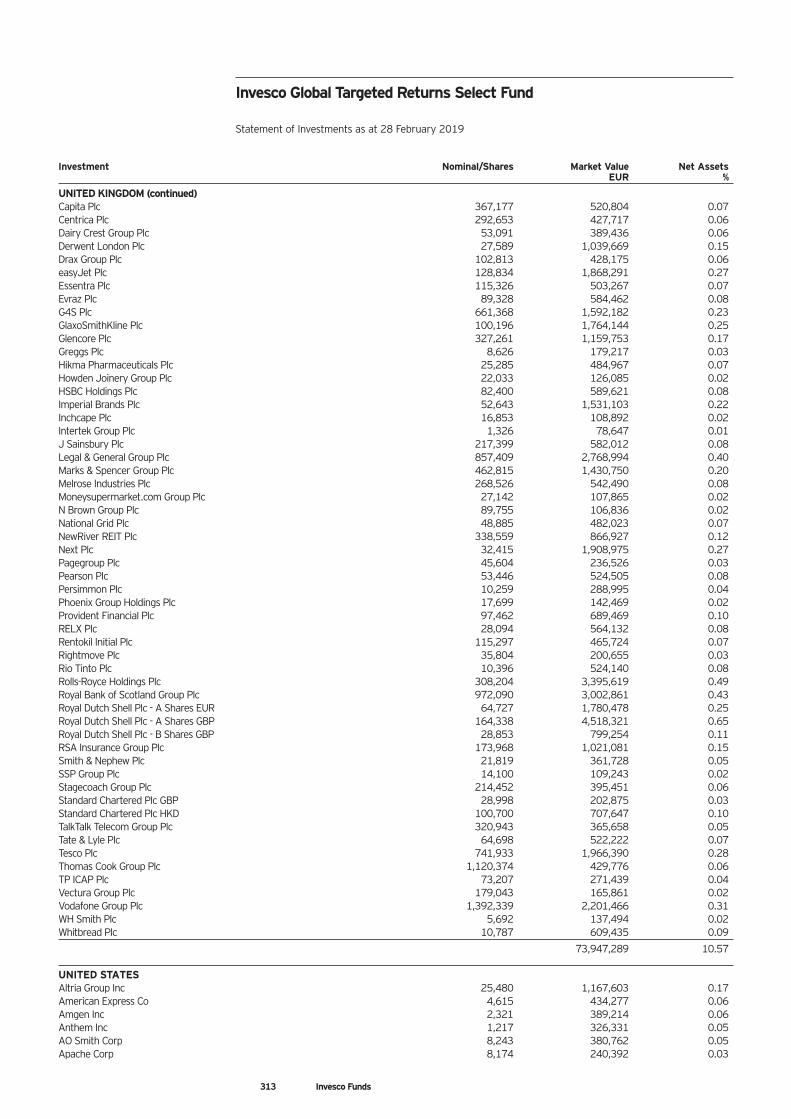
Investment Nominal/Shares Market Value Net Assets EUR %
UNITED KINGDOM (continued) Capita Plc 367,177 520,804 0.07 Centrica Plc 292,653 427,717 0.06 Dairy Crest Group Plc 53,091 389,436 0.06 Derwent London Plc 27,589 1,039,669 0.15 Drax Group Plc 102,813 428,175 0.06 easyJet Plc 128,834 1,868,291 0.27 Essentra Plc 115,326 503,267 0.07 Evraz Plc 89,328 584,462 0.08 G4S Plc 661,368 1,592,182 0.23 GlaxoSmithKline Plc 100,196 1,764,144 0.25 Glencore Plc 327,261 1,159,753 0.17 Greggs Plc 8,626 179,217 0.03 Hikma Pharmaceuticals Plc 25,285 484,967 0.07 Howden Joinery Group Plc 22,033 126,085 0.02 HSBC Holdings Plc 82,400 589,621 0.08 Imperial Brands Plc 52,643 1,531,103 0.22 Inchcape Plc 16,853 108,892 0.02 Intertek Group Plc 1,326 78,647 0.01 J Sainsbury Plc 217,399 582,012 0.08 Legal & General Group Plc 857,409 2,768,994 0.40 Marks & Spencer Group Plc 462,815 1,430,750 0.20 Melrose Industries Plc 268,526 542,490 0.08 Moneysupermarket.com Group Plc 27,142 107,865 0.02 N Brown Group Plc 89,755 106,836 0.02 National Grid Plc 48,885 482,023 0.07 NewRiver REIT Plc 338,559 866,927 0.12 Next Plc 32,415 1,908,975 0.27 Pagegroup Plc 45,604 236,526 0.03 Pearson Plc 53,446 524,505 0.08 Persimmon Plc 10,259 288,995 0.04 Phoenix Group Holdings Plc 17,699 142,469 0.02 Provident Financial Plc 97,462 689,469 0.10 RELX Plc 28,094 564,132 0.08 Rentokil Initial Plc 115,297 465,724 0.07 Rightmove Plc 35,804 200,655 0.03 Rio Tinto Plc 10,396 524,140 0.08 Rolls-Royce Holdings Plc 308,204 3,395,619 0.49 Royal Bank of Scotland Group Plc 972,090 3,002,861 0.43 Royal Dutch Shell Plc - A Shares EUR 64,727 1,780,478 0.25 Royal Dutch Shell Plc - A Shares GBP 164,338 4,518,321 0.65 Royal Dutch Shell Plc - B Shares GBP 28,853 799,254 0.11 RSA Insurance Group Plc 173,968 1,021,081 0.15 Smith & Nephew Plc 21,819 361,728 0.05 SSP Group Plc 14,100 109,243 0.02 Stagecoach Group Plc 214,452 395,451 0.06 Standard Chartered Plc GBP 28,998 202,875 0.03 Standard Chartered Plc HKD 100,700 707,647 0.10 TalkTalk Telecom Group Plc 320,943 365,658 0.05 Tate & Lyle Plc 64,698 522,222 0.07 Tesco Plc 741,933 1,966,390 0.28 Thomas Cook Group Plc 1,120,374 429,776 0.06 TP ICAP Plc 73,207 271,439 0.04 Vectura Group Plc 179,043 165,861 0.02 Vodafone Group Plc 1,392,339 2,201,466 0.31 WH Smith Plc 5,692 137,494 0.02 Whitbread Plc 10,787 609,435 0.09
73,947,289 10.57 UNITED STATES Altria Group Inc 25,480 1,167,603 0.17 American Express Co 4,615 434,277 0.06 Amgen Inc 2,321 389,214 0.06 Anthem Inc 1,217 326,331 0.05 AO Smith Corp 8,243 380,762 0.05 Apache Corp 8,174 240,392 0.03
Invesco Global Targeted Returns Select Fund Statement of Investments as at 28 February 2019
313 Invesco Funds
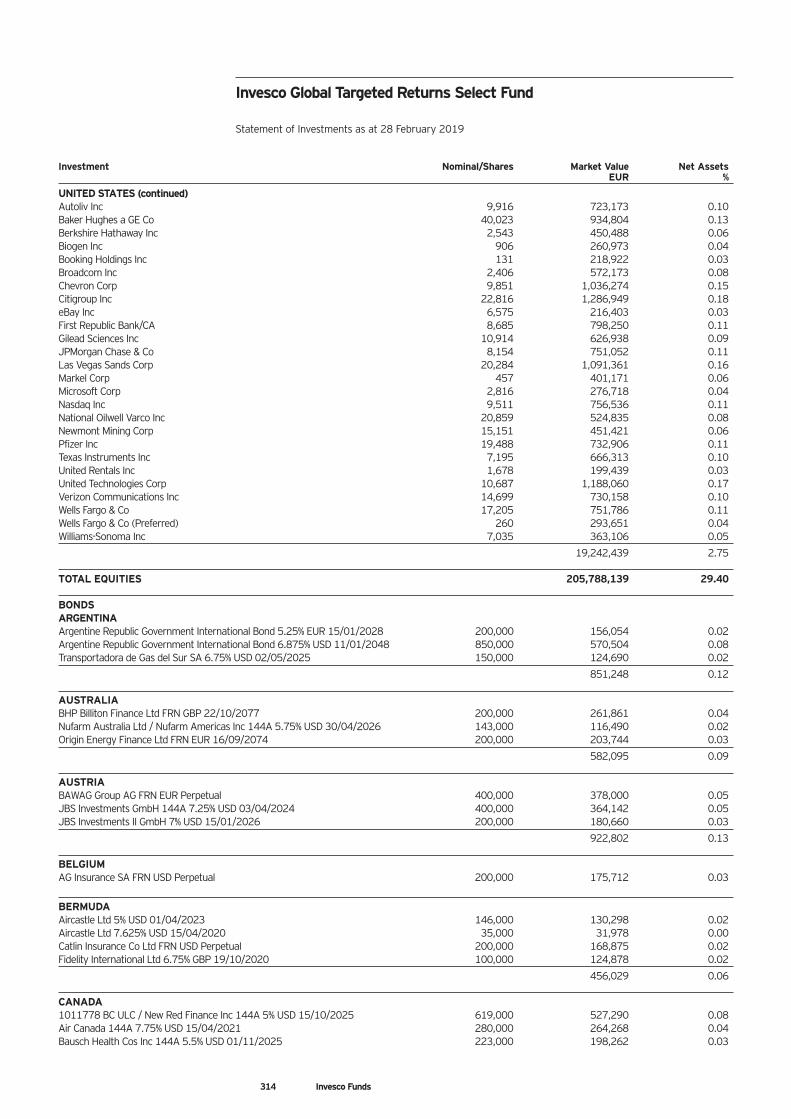
Investment Nominal/Shares Market Value Net Assets EUR %
UNITED STATES (continued) Autoliv Inc 9,916 723,173 0.10 Baker Hughes a GE Co 40,023 934,804 0.13 Berkshire Hathaway Inc 2,543 450,488 0.06 Biogen Inc 906 260,973 0.04 Booking Holdings Inc 131 218,922 0.03 Broadcom Inc 2,406 572,173 0.08 Chevron Corp 9,851 1,036,274 0.15 Citigroup Inc 22,816 1,286,949 0.18 eBay Inc 6,575 216,403 0.03 First Republic Bank/CA 8,685 798,250 0.11 Gilead Sciences Inc 10,914 626,938 0.09 JPMorgan Chase & Co 8,154 751,052 0.11 Las Vegas Sands Corp 20,284 1,091,361 0.16 Markel Corp 457 401,171 0.06 Microsoft Corp 2,816 276,718 0.04 Nasdaq Inc 9,511 756,536 0.11 National Oilwell Varco Inc 20,859 524,835 0.08 Newmont Mining Corp 15,151 451,421 0.06 Pfizer Inc 19,488 732,906 0.11 Texas Instruments Inc 7,195 666,313 0.10 United Rentals Inc 1,678 199,439 0.03 United Technologies Corp 10,687 1,188,060 0.17 Verizon Communications Inc 14,699 730,158 0.10 Wells Fargo & Co 17,205 751,786 0.11 Wells Fargo & Co (Preferred) 260 293,651 0.04 Williams-Sonoma Inc 7,035 363,106 0.05
19,242,439 2.75 TOTAL EQUITIES 205,788,139 29.40 BONDS ARGENTINA Argentine Republic Government International Bond 5.25% EUR 15/01/2028 200,000 156,054 0.02 Argentine Republic Government International Bond 6.875% USD 11/01/2048 850,000 570,504 0.08 Transportadora de Gas del Sur SA 6.75% USD 02/05/2025 150,000 124,690 0.02
851,248 0.12 AUSTRALIA BHP Billiton Finance Ltd FRN GBP 22/10/2077 200,000 261,861 0.04 Nufarm Australia Ltd / Nufarm Americas Inc 144A 5.75% USD 30/04/2026 143,000 116,490 0.02 Origin Energy Finance Ltd FRN EUR 16/09/2074 200,000 203,744 0.03
582,095 0.09 AUSTRIA BAWAG Group AG FRN EUR Perpetual 400,000 378,000 0.05 JBS Investments GmbH 144A 7.25% USD 03/04/2024 400,000 364,142 0.05 JBS Investments II GmbH 7% USD 15/01/2026 200,000 180,660 0.03
922,802 0.13 BELGIUM AG Insurance SA FRN USD Perpetual 200,000 175,712 0.03
BERMUDA Aircastle Ltd 5% USD 01/04/2023 146,000 130,298 0.02 Aircastle Ltd 7.625% USD 15/04/2020 35,000 31,978 0.00 Catlin Insurance Co Ltd FRN USD Perpetual 200,000 168,875 0.02 Fidelity International Ltd 6.75% GBP 19/10/2020 100,000 124,878 0.02
456,029 0.06 CANADA 1011778 BC ULC / New Red Finance Inc 144A 5% USD 15/10/2025 619,000 527,290 0.08 Air Canada 144A 7.75% USD 15/04/2021 280,000 264,268 0.04 Bausch Health Cos Inc 144A 5.5% USD 01/11/2025 223,000 198,262 0.03
Invesco Global Targeted Returns Select Fund Statement of Investments as at 28 February 2019
314 Invesco Funds
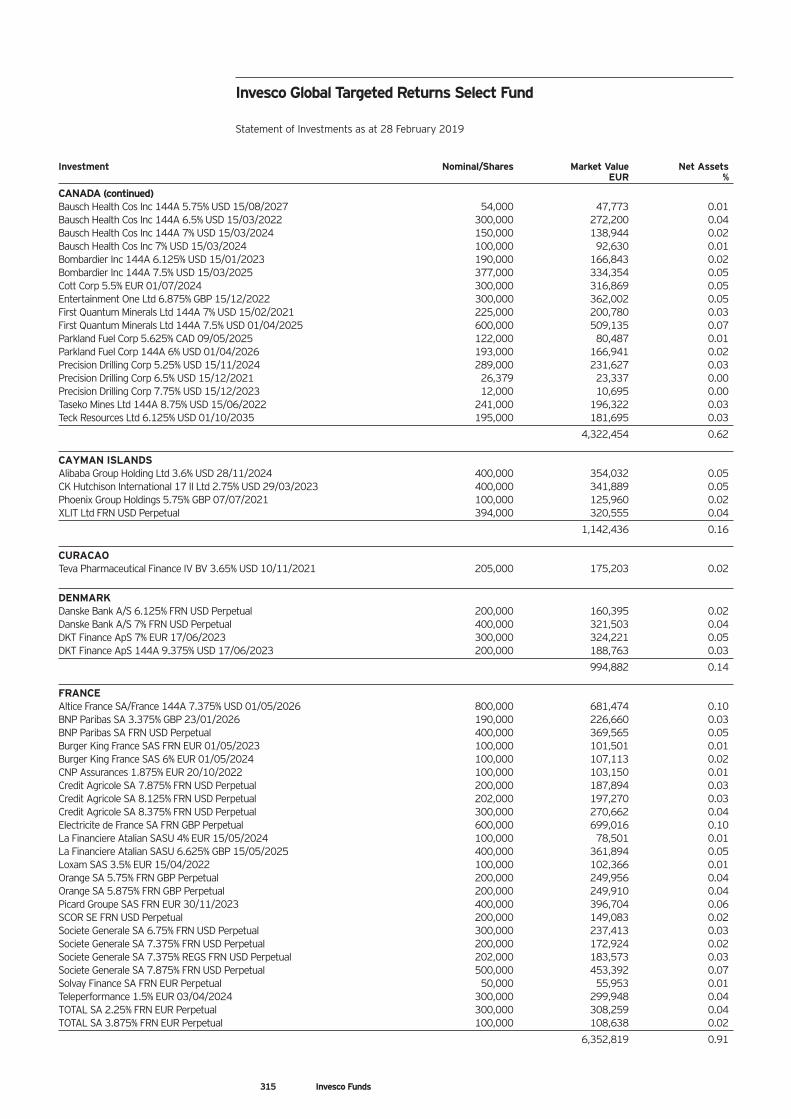
Investment Nominal/Shares Market Value Net Assets EUR %
CANADA (continued) Bausch Health Cos Inc 144A 5.75% USD 15/08/2027 54,000 47,773 0.01 Bausch Health Cos Inc 144A 6.5% USD 15/03/2022 300,000 272,200 0.04 Bausch Health Cos Inc 144A 7% USD 15/03/2024 150,000 138,944 0.02 Bausch Health Cos Inc 7% USD 15/03/2024 100,000 92,630 0.01 Bombardier Inc 144A 6.125% USD 15/01/2023 190,000 166,843 0.02 Bombardier Inc 144A 7.5% USD 15/03/2025 377,000 334,354 0.05 Cott Corp 5.5% EUR 01/07/2024 300,000 316,869 0.05 Entertainment One Ltd 6.875% GBP 15/12/2022 300,000 362,002 0.05 First Quantum Minerals Ltd 144A 7% USD 15/02/2021 225,000 200,780 0.03 First Quantum Minerals Ltd 144A 7.5% USD 01/04/2025 600,000 509,135 0.07 Parkland Fuel Corp 5.625% CAD 09/05/2025 122,000 80,487 0.01 Parkland Fuel Corp 144A 6% USD 01/04/2026 193,000 166,941 0.02 Precision Drilling Corp 5.25% USD 15/11/2024 289,000 231,627 0.03 Precision Drilling Corp 6.5% USD 15/12/2021 26,379 23,337 0.00 Precision Drilling Corp 7.75% USD 15/12/2023 12,000 10,695 0.00 Taseko Mines Ltd 144A 8.75% USD 15/06/2022 241,000 196,322 0.03 Teck Resources Ltd 6.125% USD 01/10/2035 195,000 181,695 0.03
4,322,454 0.62 CAYMAN ISLANDS Alibaba Group Holding Ltd 3.6% USD 28/11/2024 400,000 354,032 0.05 CK Hutchison International 17 II Ltd 2.75% USD 29/03/2023 400,000 341,889 0.05 Phoenix Group Holdings 5.75% GBP 07/07/2021 100,000 125,960 0.02 XLIT Ltd FRN USD Perpetual 394,000 320,555 0.04
1,142,436 0.16 CURACAO Teva Pharmaceutical Finance IV BV 3.65% USD 10/11/2021 205,000 175,203 0.02
DENMARK Danske Bank A/S 6.125% FRN USD Perpetual 200,000 160,395 0.02 Danske Bank A/S 7% FRN USD Perpetual 400,000 321,503 0.04 DKT Finance ApS 7% EUR 17/06/2023 300,000 324,221 0.05 DKT Finance ApS 144A 9.375% USD 17/06/2023 200,000 188,763 0.03
994,882 0.14 FRANCE Altice France SA/France 144A 7.375% USD 01/05/2026 800,000 681,474 0.10 BNP Paribas SA 3.375% GBP 23/01/2026 190,000 226,660 0.03 BNP Paribas SA FRN USD Perpetual 400,000 369,565 0.05 Burger King France SAS FRN EUR 01/05/2023 100,000 101,501 0.01 Burger King France SAS 6% EUR 01/05/2024 100,000 107,113 0.02 CNP Assurances 1.875% EUR 20/10/2022 100,000 103,150 0.01 Credit Agricole SA 7.875% FRN USD Perpetual 200,000 187,894 0.03 Credit Agricole SA 8.125% FRN USD Perpetual 202,000 197,270 0.03 Credit Agricole SA 8.375% FRN USD Perpetual 300,000 270,662 0.04 Electricite de France SA FRN GBP Perpetual 600,000 699,016 0.10 La Financiere Atalian SASU 4% EUR 15/05/2024 100,000 78,501 0.01 La Financiere Atalian SASU 6.625% GBP 15/05/2025 400,000 361,894 0.05 Loxam SAS 3.5% EUR 15/04/2022 100,000 102,366 0.01 Orange SA 5.75% FRN GBP Perpetual 200,000 249,956 0.04 Orange SA 5.875% FRN GBP Perpetual 200,000 249,910 0.04 Picard Groupe SAS FRN EUR 30/11/2023 400,000 396,704 0.06 SCOR SE FRN USD Perpetual 200,000 149,083 0.02 Societe Generale SA 6.75% FRN USD Perpetual 300,000 237,413 0.03 Societe Generale SA 7.375% FRN USD Perpetual 200,000 172,924 0.02 Societe Generale SA 7.375% REGS FRN USD Perpetual 202,000 183,573 0.03 Societe Generale SA 7.875% FRN USD Perpetual 500,000 453,392 0.07 Solvay Finance SA FRN EUR Perpetual 50,000 55,953 0.01 Teleperformance 1.5% EUR 03/04/2024 300,000 299,948 0.04 TOTAL SA 2.25% FRN EUR Perpetual 300,000 308,259 0.04 TOTAL SA 3.875% FRN EUR Perpetual 100,000 108,638 0.02
6,352,819 0.91
Invesco Global Targeted Returns Select Fund Statement of Investments as at 28 February 2019
315 Invesco Funds
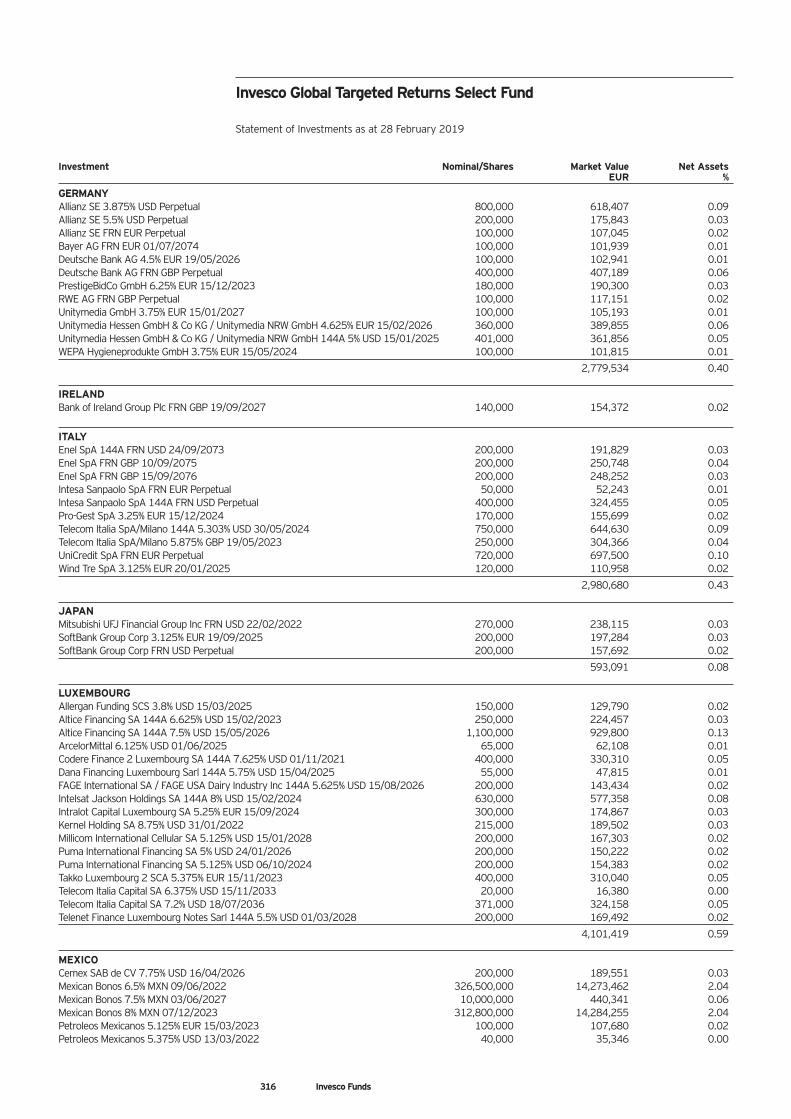
Investment Nominal/Shares Market Value Net Assets EUR %
GERMANY Allianz SE 3.875% USD Perpetual 800,000 618,407 0.09 Allianz SE 5.5% USD Perpetual 200,000 175,843 0.03 Allianz SE FRN EUR Perpetual 100,000 107,045 0.02 Bayer AG FRN EUR 01/07/2074 100,000 101,939 0.01 Deutsche Bank AG 4.5% EUR 19/05/2026 100,000 102,941 0.01 Deutsche Bank AG FRN GBP Perpetual 400,000 407,189 0.06 PrestigeBidCo GmbH 6.25% EUR 15/12/2023 180,000 190,300 0.03 RWE AG FRN GBP Perpetual 100,000 117,151 0.02 Unitymedia GmbH 3.75% EUR 15/01/2027 100,000 105,193 0.01 Unitymedia Hessen GmbH & Co KG / Unitymedia NRW GmbH 4.625% EUR 15/02/2026 360,000 389,855 0.06 Unitymedia Hessen GmbH & Co KG / Unitymedia NRW GmbH 144A 5% USD 15/01/2025 401,000 361,856 0.05 WEPA Hygieneprodukte GmbH 3.75% EUR 15/05/2024 100,000 101,815 0.01
2,779,534 0.40 IRELAND Bank of Ireland Group Plc FRN GBP 19/09/2027 140,000 154,372 0.02
ITALY Enel SpA 144A FRN USD 24/09/2073 200,000 191,829 0.03 Enel SpA FRN GBP 10/09/2075 200,000 250,748 0.04 Enel SpA FRN GBP 15/09/2076 200,000 248,252 0.03 Intesa Sanpaolo SpA FRN EUR Perpetual 50,000 52,243 0.01 Intesa Sanpaolo SpA 144A FRN USD Perpetual 400,000 324,455 0.05 Pro-Gest SpA 3.25% EUR 15/12/2024 170,000 155,699 0.02 Telecom Italia SpA/Milano 144A 5.303% USD 30/05/2024 750,000 644,630 0.09 Telecom Italia SpA/Milano 5.875% GBP 19/05/2023 250,000 304,366 0.04 UniCredit SpA FRN EUR Perpetual 720,000 697,500 0.10 Wind Tre SpA 3.125% EUR 20/01/2025 120,000 110,958 0.02
2,980,680 0.43 JAPAN Mitsubishi UFJ Financial Group Inc FRN USD 22/02/2022 270,000 238,115 0.03 SoftBank Group Corp 3.125% EUR 19/09/2025 200,000 197,284 0.03 SoftBank Group Corp FRN USD Perpetual 200,000 157,692 0.02
593,091 0.08 LUXEMBOURG Allergan Funding SCS 3.8% USD 15/03/2025 150,000 129,790 0.02 Altice Financing SA 144A 6.625% USD 15/02/2023 250,000 224,457 0.03 Altice Financing SA 144A 7.5% USD 15/05/2026 1,100,000 929,800 0.13 ArcelorMittal 6.125% USD 01/06/2025 65,000 62,108 0.01 Codere Finance 2 Luxembourg SA 144A 7.625% USD 01/11/2021 400,000 330,310 0.05 Dana Financing Luxembourg Sarl 144A 5.75% USD 15/04/2025 55,000 47,815 0.01 FAGE International SA / FAGE USA Dairy Industry Inc 144A 5.625% USD 15/08/2026 200,000 143,434 0.02 Intelsat Jackson Holdings SA 144A 8% USD 15/02/2024 630,000 577,358 0.08 Intralot Capital Luxembourg SA 5.25% EUR 15/09/2024 300,000 174,867 0.03 Kernel Holding SA 8.75% USD 31/01/2022 215,000 189,502 0.03 Millicom International Cellular SA 5.125% USD 15/01/2028 200,000 167,303 0.02 Puma International Financing SA 5% USD 24/01/2026 200,000 150,222 0.02 Puma International Financing SA 5.125% USD 06/10/2024 200,000 154,383 0.02 Takko Luxembourg 2 SCA 5.375% EUR 15/11/2023 400,000 310,040 0.05 Telecom Italia Capital SA 6.375% USD 15/11/2033 20,000 16,380 0.00 Telecom Italia Capital SA 7.2% USD 18/07/2036 371,000 324,158 0.05 Telenet Finance Luxembourg Notes Sarl 144A 5.5% USD 01/03/2028 200,000 169,492 0.02
4,101,419 0.59 MEXICO Cemex SAB de CV 7.75% USD 16/04/2026 200,000 189,551 0.03 Mexican Bonos 6.5% MXN 09/06/2022 326,500,000 14,273,462 2.04 Mexican Bonos 7.5% MXN 03/06/2027 10,000,000 440,341 0.06 Mexican Bonos 8% MXN 07/12/2023 312,800,000 14,284,255 2.04 Petroleos Mexicanos 5.125% EUR 15/03/2023 100,000 107,680 0.02 Petroleos Mexicanos 5.375% USD 13/03/2022 40,000 35,346 0.00
Invesco Global Targeted Returns Select Fund Statement of Investments as at 28 February 2019
316 Invesco Funds
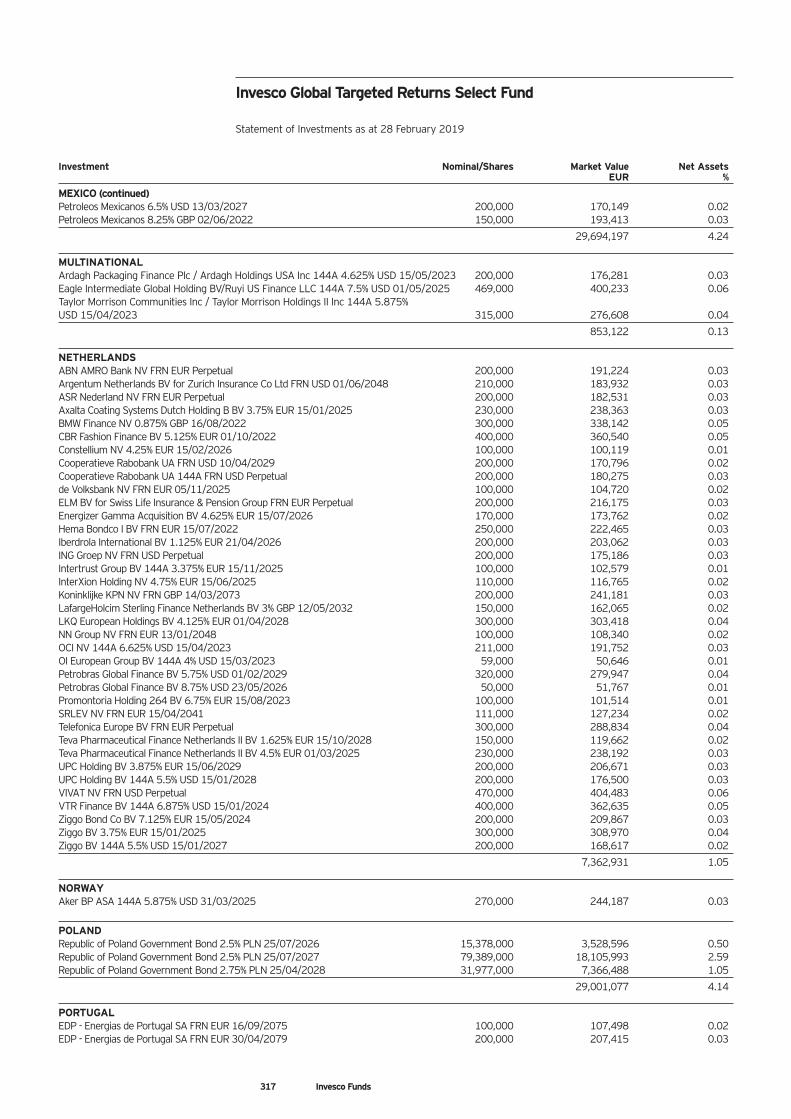
Investment Nominal/Shares Market Value Net Assets EUR %
MEXICO (continued) Petroleos Mexicanos 6.5% USD 13/03/2027 200,000 170,149 0.02 Petroleos Mexicanos 8.25% GBP 02/06/2022 150,000 193,413 0.03
29,694,197 4.24 MULTINATIONAL Ardagh Packaging Finance Plc / Ardagh Holdings USA Inc 144A 4.625% USD 15/05/2023 200,000 176,281 0.03 Eagle Intermediate Global Holding BV/Ruyi US Finance LLC 144A 7.5% USD 01/05/2025 469,000 400,233 0.06 Taylor Morrison Communities Inc / Taylor Morrison Holdings II Inc 144A 5.875% USD 15/04/2023 315,000 276,608 0.04
853,122 0.13 NETHERLANDS ABN AMRO Bank NV FRN EUR Perpetual 200,000 191,224 0.03 Argentum Netherlands BV for Zurich Insurance Co Ltd FRN USD 01/06/2048 210,000 183,932 0.03 ASR Nederland NV FRN EUR Perpetual 200,000 182,531 0.03 Axalta Coating Systems Dutch Holding B BV 3.75% EUR 15/01/2025 230,000 238,363 0.03 BMW Finance NV 0.875% GBP 16/08/2022 300,000 338,142 0.05 CBR Fashion Finance BV 5.125% EUR 01/10/2022 400,000 360,540 0.05 Constellium NV 4.25% EUR 15/02/2026 100,000 100,119 0.01 Cooperatieve Rabobank UA FRN USD 10/04/2029 200,000 170,796 0.02 Cooperatieve Rabobank UA 144A FRN USD Perpetual 200,000 180,275 0.03 de Volksbank NV FRN EUR 05/11/2025 100,000 104,720 0.02 ELM BV for Swiss Life Insurance & Pension Group FRN EUR Perpetual 200,000 216,175 0.03 Energizer Gamma Acquisition BV 4.625% EUR 15/07/2026 170,000 173,762 0.02 Hema Bondco I BV FRN EUR 15/07/2022 250,000 222,465 0.03 Iberdrola International BV 1.125% EUR 21/04/2026 200,000 203,062 0.03 ING Groep NV FRN USD Perpetual 200,000 175,186 0.03 Intertrust Group BV 144A 3.375% EUR 15/11/2025 100,000 102,579 0.01 InterXion Holding NV 4.75% EUR 15/06/2025 110,000 116,765 0.02 Koninklijke KPN NV FRN GBP 14/03/2073 200,000 241,181 0.03 LafargeHolcim Sterling Finance Netherlands BV 3% GBP 12/05/2032 150,000 162,065 0.02 LKQ European Holdings BV 4.125% EUR 01/04/2028 300,000 303,418 0.04 NN Group NV FRN EUR 13/01/2048 100,000 108,340 0.02 OCI NV 144A 6.625% USD 15/04/2023 211,000 191,752 0.03 OI European Group BV 144A 4% USD 15/03/2023 59,000 50,646 0.01 Petrobras Global Finance BV 5.75% USD 01/02/2029 320,000 279,947 0.04 Petrobras Global Finance BV 8.75% USD 23/05/2026 50,000 51,767 0.01 Promontoria Holding 264 BV 6.75% EUR 15/08/2023 100,000 101,514 0.01 SRLEV NV FRN EUR 15/04/2041 111,000 127,234 0.02 Telefonica Europe BV FRN EUR Perpetual 300,000 288,834 0.04 Teva Pharmaceutical Finance Netherlands II BV 1.625% EUR 15/10/2028 150,000 119,662 0.02 Teva Pharmaceutical Finance Netherlands II BV 4.5% EUR 01/03/2025 230,000 238,192 0.03 UPC Holding BV 3.875% EUR 15/06/2029 200,000 206,671 0.03 UPC Holding BV 144A 5.5% USD 15/01/2028 200,000 176,500 0.03 VIVAT NV FRN USD Perpetual 470,000 404,483 0.06 VTR Finance BV 144A 6.875% USD 15/01/2024 400,000 362,635 0.05 Ziggo Bond Co BV 7.125% EUR 15/05/2024 200,000 209,867 0.03 Ziggo BV 3.75% EUR 15/01/2025 300,000 308,970 0.04 Ziggo BV 144A 5.5% USD 15/01/2027 200,000 168,617 0.02
7,362,931 1.05 NORWAY Aker BP ASA 144A 5.875% USD 31/03/2025 270,000 244,187 0.03
POLAND Republic of Poland Government Bond 2.5% PLN 25/07/2026 15,378,000 3,528,596 0.50 Republic of Poland Government Bond 2.5% PLN 25/07/2027 79,389,000 18,105,993 2.59 Republic of Poland Government Bond 2.75% PLN 25/04/2028 31,977,000 7,366,488 1.05
29,001,077 4.14 PORTUGAL EDP - Energias de Portugal SA FRN EUR 16/09/2075 100,000 107,498 0.02 EDP - Energias de Portugal SA FRN EUR 30/04/2079 200,000 207,415 0.03
Invesco Global Targeted Returns Select Fund Statement of Investments as at 28 February 2019
317 Invesco Funds
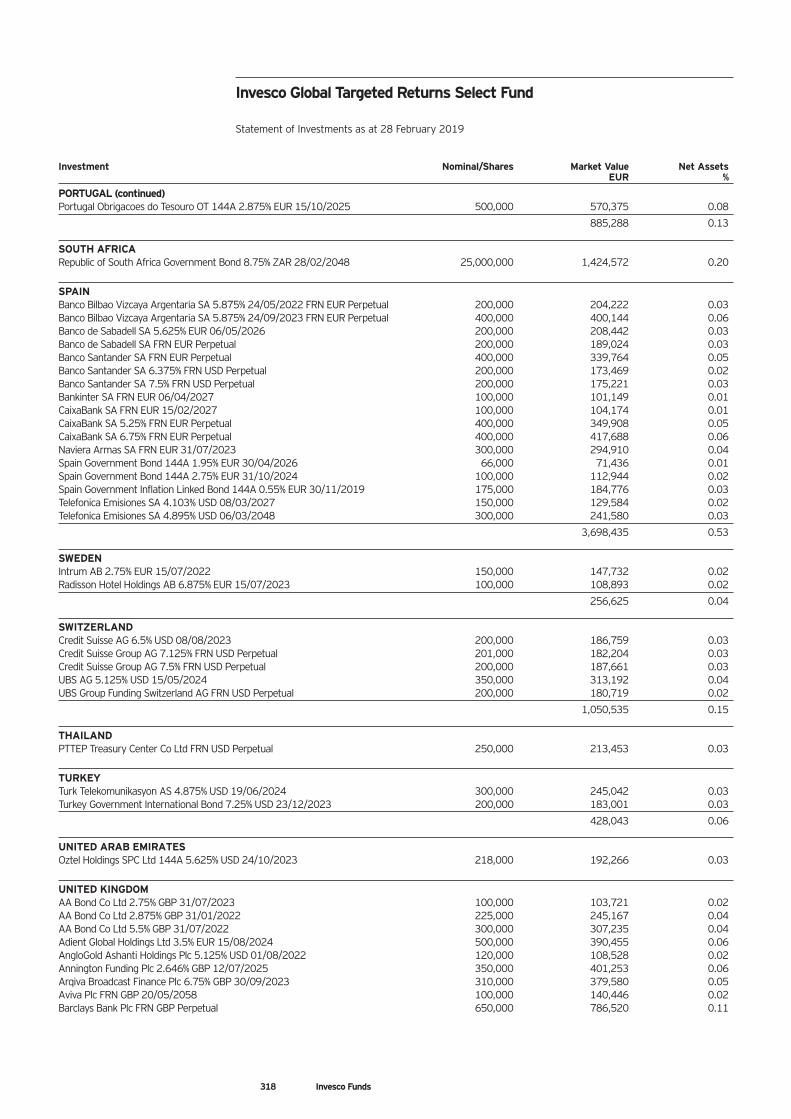
Investment Nominal/Shares Market Value Net Assets EUR %
PORTUGAL (continued) Portugal Obrigacoes do Tesouro OT 144A 2.875% EUR 15/10/2025 500,000 570,375 0.08
885,288 0.13 SOUTH AFRICA Republic of South Africa Government Bond 8.75% ZAR 28/02/2048 25,000,000 1,424,572 0.20
SPAIN Banco Bilbao Vizcaya Argentaria SA 5.875% 24/05/2022 FRN EUR Perpetual 200,000 204,222 0.03 Banco Bilbao Vizcaya Argentaria SA 5.875% 24/09/2023 FRN EUR Perpetual 400,000 400,144 0.06 Banco de Sabadell SA 5.625% EUR 06/05/2026 200,000 208,442 0.03 Banco de Sabadell SA FRN EUR Perpetual 200,000 189,024 0.03 Banco Santander SA FRN EUR Perpetual 400,000 339,764 0.05 Banco Santander SA 6.375% FRN USD Perpetual 200,000 173,469 0.02 Banco Santander SA 7.5% FRN USD Perpetual 200,000 175,221 0.03 Bankinter SA FRN EUR 06/04/2027 100,000 101,149 0.01 CaixaBank SA FRN EUR 15/02/2027 100,000 104,174 0.01 CaixaBank SA 5.25% FRN EUR Perpetual 400,000 349,908 0.05 CaixaBank SA 6.75% FRN EUR Perpetual 400,000 417,688 0.06 Naviera Armas SA FRN EUR 31/07/2023 300,000 294,910 0.04 Spain Government Bond 144A 1.95% EUR 30/04/2026 66,000 71,436 0.01 Spain Government Bond 144A 2.75% EUR 31/10/2024 100,000 112,944 0.02 Spain Government Inflation Linked Bond 144A 0.55% EUR 30/11/2019 175,000 184,776 0.03 Telefonica Emisiones SA 4.103% USD 08/03/2027 150,000 129,584 0.02 Telefonica Emisiones SA 4.895% USD 06/03/2048 300,000 241,580 0.03
3,698,435 0.53 SWEDEN Intrum AB 2.75% EUR 15/07/2022 150,000 147,732 0.02 Radisson Hotel Holdings AB 6.875% EUR 15/07/2023 100,000 108,893 0.02
256,625 0.04 SWITZERLAND Credit Suisse AG 6.5% USD 08/08/2023 200,000 186,759 0.03 Credit Suisse Group AG 7.125% FRN USD Perpetual 201,000 182,204 0.03 Credit Suisse Group AG 7.5% FRN USD Perpetual 200,000 187,661 0.03 UBS AG 5.125% USD 15/05/2024 350,000 313,192 0.04 UBS Group Funding Switzerland AG FRN USD Perpetual 200,000 180,719 0.02
1,050,535 0.15 THAILAND PTTEP Treasury Center Co Ltd FRN USD Perpetual 250,000 213,453 0.03
TURKEY Turk Telekomunikasyon AS 4.875% USD 19/06/2024 300,000 245,042 0.03 Turkey Government International Bond 7.25% USD 23/12/2023 200,000 183,001 0.03
428,043 0.06 UNITED ARAB EMIRATES Oztel Holdings SPC Ltd 144A 5.625% USD 24/10/2023 218,000 192,266 0.03
UNITED KINGDOM AA Bond Co Ltd 2.75% GBP 31/07/2023 100,000 103,721 0.02 AA Bond Co Ltd 2.875% GBP 31/01/2022 225,000 245,167 0.04 AA Bond Co Ltd 5.5% GBP 31/07/2022 300,000 307,235 0.04 Adient Global Holdings Ltd 3.5% EUR 15/08/2024 500,000 390,455 0.06 AngloGold Ashanti Holdings Plc 5.125% USD 01/08/2022 120,000 108,528 0.02 Annington Funding Plc 2.646% GBP 12/07/2025 350,000 401,253 0.06 Arqiva Broadcast Finance Plc 6.75% GBP 30/09/2023 310,000 379,580 0.05 Aviva Plc FRN GBP 20/05/2058 100,000 140,446 0.02 Barclays Bank Plc FRN GBP Perpetual 650,000 786,520 0.11
Invesco Global Targeted Returns Select Fund Statement of Investments as at 28 February 2019
318 Invesco Funds
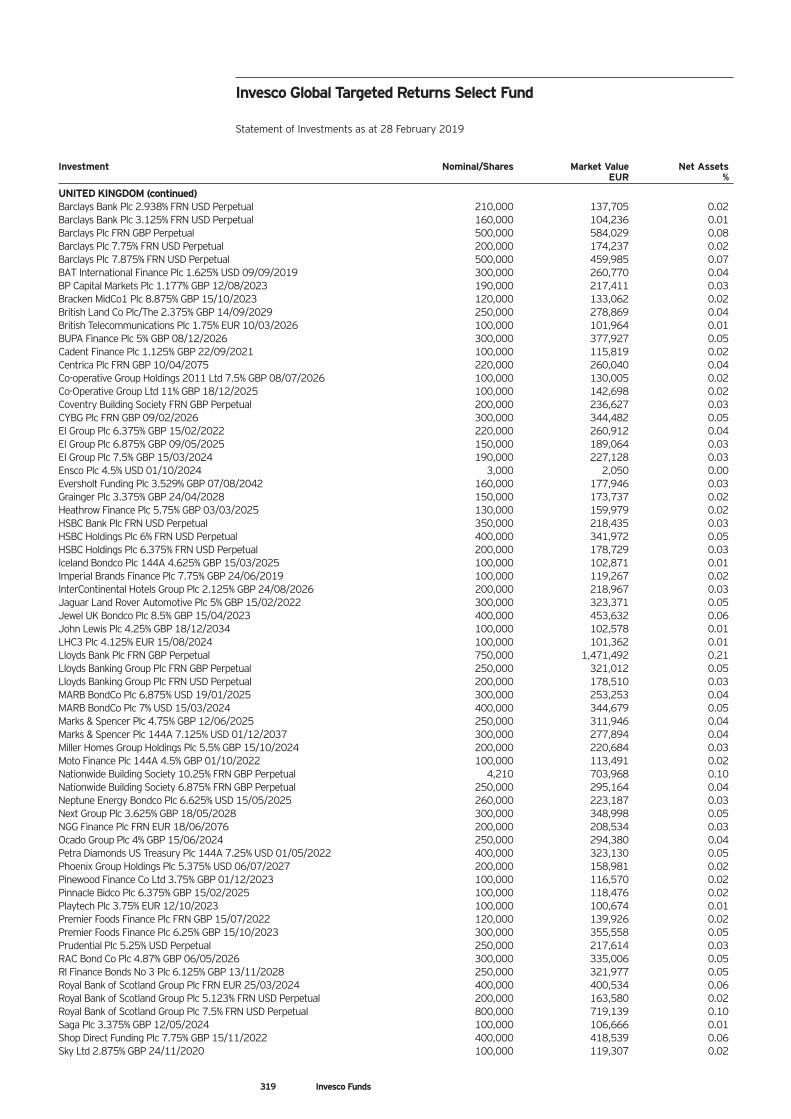
Investment Nominal/Shares Market Value Net Assets EUR %
UNITED KINGDOM (continued) Barclays Bank Plc 2.938% FRN USD Perpetual 210,000 137,705 0.02 Barclays Bank Plc 3.125% FRN USD Perpetual 160,000 104,236 0.01 Barclays Plc FRN GBP Perpetual 500,000 584,029 0.08 Barclays Plc 7.75% FRN USD Perpetual 200,000 174,237 0.02 Barclays Plc 7.875% FRN USD Perpetual 500,000 459,985 0.07 BAT International Finance Plc 1.625% USD 09/09/2019 300,000 260,770 0.04 BP Capital Markets Plc 1.177% GBP 12/08/2023 190,000 217,411 0.03 Bracken MidCo1 Plc 8.875% GBP 15/10/2023 120,000 133,062 0.02 British Land Co Plc/The 2.375% GBP 14/09/2029 250,000 278,869 0.04 British Telecommunications Plc 1.75% EUR 10/03/2026 100,000 101,964 0.01 BUPA Finance Plc 5% GBP 08/12/2026 300,000 377,927 0.05 Cadent Finance Plc 1.125% GBP 22/09/2021 100,000 115,819 0.02 Centrica Plc FRN GBP 10/04/2075 220,000 260,040 0.04 Co-operative Group Holdings 2011 Ltd 7.5% GBP 08/07/2026 100,000 130,005 0.02 Co-Operative Group Ltd 11% GBP 18/12/2025 100,000 142,698 0.02 Coventry Building Society FRN GBP Perpetual 200,000 236,627 0.03 CYBG Plc FRN GBP 09/02/2026 300,000 344,482 0.05 EI Group Plc 6.375% GBP 15/02/2022 220,000 260,912 0.04 EI Group Plc 6.875% GBP 09/05/2025 150,000 189,064 0.03 EI Group Plc 7.5% GBP 15/03/2024 190,000 227,128 0.03 Ensco Plc 4.5% USD 01/10/2024 3,000 2,050 0.00 Eversholt Funding Plc 3.529% GBP 07/08/2042 160,000 177,946 0.03 Grainger Plc 3.375% GBP 24/04/2028 150,000 173,737 0.02 Heathrow Finance Plc 5.75% GBP 03/03/2025 130,000 159,979 0.02 HSBC Bank Plc FRN USD Perpetual 350,000 218,435 0.03 HSBC Holdings Plc 6% FRN USD Perpetual 400,000 341,972 0.05 HSBC Holdings Plc 6.375% FRN USD Perpetual 200,000 178,729 0.03 Iceland Bondco Plc 144A 4.625% GBP 15/03/2025 100,000 102,871 0.01 Imperial Brands Finance Plc 7.75% GBP 24/06/2019 100,000 119,267 0.02 InterContinental Hotels Group Plc 2.125% GBP 24/08/2026 200,000 218,967 0.03 Jaguar Land Rover Automotive Plc 5% GBP 15/02/2022 300,000 323,371 0.05 Jewel UK Bondco Plc 8.5% GBP 15/04/2023 400,000 453,632 0.06 John Lewis Plc 4.25% GBP 18/12/2034 100,000 102,578 0.01 LHC3 Plc 4.125% EUR 15/08/2024 100,000 101,362 0.01 Lloyds Bank Plc FRN GBP Perpetual 750,000 1,471,492 0.21 Lloyds Banking Group Plc FRN GBP Perpetual 250,000 321,012 0.05 Lloyds Banking Group Plc FRN USD Perpetual 200,000 178,510 0.03 MARB BondCo Plc 6.875% USD 19/01/2025 300,000 253,253 0.04 MARB BondCo Plc 7% USD 15/03/2024 400,000 344,679 0.05 Marks & Spencer Plc 4.75% GBP 12/06/2025 250,000 311,946 0.04 Marks & Spencer Plc 144A 7.125% USD 01/12/2037 300,000 277,894 0.04 Miller Homes Group Holdings Plc 5.5% GBP 15/10/2024 200,000 220,684 0.03 Moto Finance Plc 144A 4.5% GBP 01/10/2022 100,000 113,491 0.02 Nationwide Building Society 10.25% FRN GBP Perpetual 4,210 703,968 0.10 Nationwide Building Society 6.875% FRN GBP Perpetual 250,000 295,164 0.04 Neptune Energy Bondco Plc 6.625% USD 15/05/2025 260,000 223,187 0.03 Next Group Plc 3.625% GBP 18/05/2028 300,000 348,998 0.05 NGG Finance Plc FRN EUR 18/06/2076 200,000 208,534 0.03 Ocado Group Plc 4% GBP 15/06/2024 250,000 294,380 0.04 Petra Diamonds US Treasury Plc 144A 7.25% USD 01/05/2022 400,000 323,130 0.05 Phoenix Group Holdings Plc 5.375% USD 06/07/2027 200,000 158,981 0.02 Pinewood Finance Co Ltd 3.75% GBP 01/12/2023 100,000 116,570 0.02 Pinnacle Bidco Plc 6.375% GBP 15/02/2025 100,000 118,476 0.02 Playtech Plc 3.75% EUR 12/10/2023 100,000 100,674 0.01 Premier Foods Finance Plc FRN GBP 15/07/2022 120,000 139,926 0.02 Premier Foods Finance Plc 6.25% GBP 15/10/2023 300,000 355,558 0.05 Prudential Plc 5.25% USD Perpetual 250,000 217,614 0.03 RAC Bond Co Plc 4.87% GBP 06/05/2026 300,000 335,006 0.05 Rl Finance Bonds No 3 Plc 6.125% GBP 13/11/2028 250,000 321,977 0.05 Royal Bank of Scotland Group Plc FRN EUR 25/03/2024 400,000 400,534 0.06 Royal Bank of Scotland Group Plc 5.123% FRN USD Perpetual 200,000 163,580 0.02 Royal Bank of Scotland Group Plc 7.5% FRN USD Perpetual 800,000 719,139 0.10 Saga Plc 3.375% GBP 12/05/2024 100,000 106,666 0.01 Shop Direct Funding Plc 7.75% GBP 15/11/2022 400,000 418,539 0.06 Sky Ltd 2.875% GBP 24/11/2020 100,000 119,307 0.02
Invesco Global Targeted Returns Select Fund Statement of Investments as at 28 February 2019
319 Invesco Funds
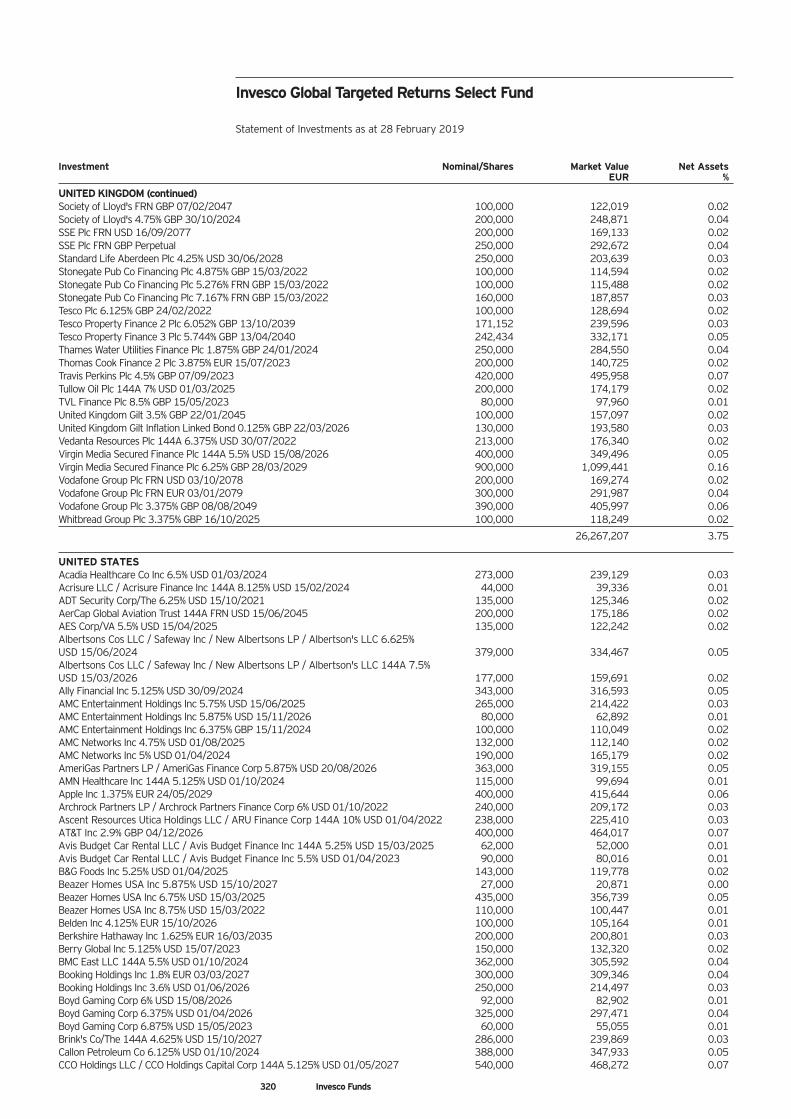
Investment Nominal/Shares Market Value Net Assets EUR %
UNITED KINGDOM (continued) Society of Lloyd's FRN GBP 07/02/2047 100,000 122,019 0.02 Society of Lloyd's 4.75% GBP 30/10/2024 200,000 248,871 0.04 SSE Plc FRN USD 16/09/2077 200,000 169,133 0.02 SSE Plc FRN GBP Perpetual 250,000 292,672 0.04 Standard Life Aberdeen Plc 4.25% USD 30/06/2028 250,000 203,639 0.03 Stonegate Pub Co Financing Plc 4.875% GBP 15/03/2022 100,000 114,594 0.02 Stonegate Pub Co Financing Plc 5.276% FRN GBP 15/03/2022 100,000 115,488 0.02 Stonegate Pub Co Financing Plc 7.167% FRN GBP 15/03/2022 160,000 187,857 0.03 Tesco Plc 6.125% GBP 24/02/2022 100,000 128,694 0.02 Tesco Property Finance 2 Plc 6.052% GBP 13/10/2039 171,152 239,596 0.03 Tesco Property Finance 3 Plc 5.744% GBP 13/04/2040 242,434 332,171 0.05 Thames Water Utilities Finance Plc 1.875% GBP 24/01/2024 250,000 284,550 0.04 Thomas Cook Finance 2 Plc 3.875% EUR 15/07/2023 200,000 140,725 0.02 Travis Perkins Plc 4.5% GBP 07/09/2023 420,000 495,958 0.07 Tullow Oil Plc 144A 7% USD 01/03/2025 200,000 174,179 0.02 TVL Finance Plc 8.5% GBP 15/05/2023 80,000 97,960 0.01 United Kingdom Gilt 3.5% GBP 22/01/2045 100,000 157,097 0.02 United Kingdom Gilt Inflation Linked Bond 0.125% GBP 22/03/2026 130,000 193,580 0.03 Vedanta Resources Plc 144A 6.375% USD 30/07/2022 213,000 176,340 0.02 Virgin Media Secured Finance Plc 144A 5.5% USD 15/08/2026 400,000 349,496 0.05 Virgin Media Secured Finance Plc 6.25% GBP 28/03/2029 900,000 1,099,441 0.16 Vodafone Group Plc FRN USD 03/10/2078 200,000 169,274 0.02 Vodafone Group Plc FRN EUR 03/01/2079 300,000 291,987 0.04 Vodafone Group Plc 3.375% GBP 08/08/2049 390,000 405,997 0.06 Whitbread Group Plc 3.375% GBP 16/10/2025 100,000 118,249 0.02
26,267,207 3.75 UNITED STATES Acadia Healthcare Co Inc 6.5% USD 01/03/2024 273,000 239,129 0.03 Acrisure LLC / Acrisure Finance Inc 144A 8.125% USD 15/02/2024 44,000 39,336 0.01 ADT Security Corp/The 6.25% USD 15/10/2021 135,000 125,346 0.02 AerCap Global Aviation Trust 144A FRN USD 15/06/2045 200,000 175,186 0.02 AES Corp/VA 5.5% USD 15/04/2025 135,000 122,242 0.02 Albertsons Cos LLC / Safeway Inc / New Albertsons LP / Albertson's LLC 6.625% USD 15/06/2024 379,000 334,467 0.05 Albertsons Cos LLC / Safeway Inc / New Albertsons LP / Albertson's LLC 144A 7.5% USD 15/03/2026 177,000 159,691 0.02 Ally Financial Inc 5.125% USD 30/09/2024 343,000 316,593 0.05 AMC Entertainment Holdings Inc 5.75% USD 15/06/2025 265,000 214,422 0.03 AMC Entertainment Holdings Inc 5.875% USD 15/11/2026 80,000 62,892 0.01 AMC Entertainment Holdings Inc 6.375% GBP 15/11/2024 100,000 110,049 0.02 AMC Networks Inc 4.75% USD 01/08/2025 132,000 112,140 0.02 AMC Networks Inc 5% USD 01/04/2024 190,000 165,179 0.02 AmeriGas Partners LP / AmeriGas Finance Corp 5.875% USD 20/08/2026 363,000 319,155 0.05 AMN Healthcare Inc 144A 5.125% USD 01/10/2024 115,000 99,694 0.01 Apple Inc 1.375% EUR 24/05/2029 400,000 415,644 0.06 Archrock Partners LP / Archrock Partners Finance Corp 6% USD 01/10/2022 240,000 209,172 0.03 Ascent Resources Utica Holdings LLC / ARU Finance Corp 144A 10% USD 01/04/2022 238,000 225,410 0.03 AT&T Inc 2.9% GBP 04/12/2026 400,000 464,017 0.07 Avis Budget Car Rental LLC / Avis Budget Finance Inc 144A 5.25% USD 15/03/2025 62,000 52,000 0.01 Avis Budget Car Rental LLC / Avis Budget Finance Inc 5.5% USD 01/04/2023 90,000 80,016 0.01 B&G Foods Inc 5.25% USD 01/04/2025 143,000 119,778 0.02 Beazer Homes USA Inc 5.875% USD 15/10/2027 27,000 20,871 0.00 Beazer Homes USA Inc 6.75% USD 15/03/2025 435,000 356,739 0.05 Beazer Homes USA Inc 8.75% USD 15/03/2022 110,000 100,447 0.01 Belden Inc 4.125% EUR 15/10/2026 100,000 105,164 0.01 Berkshire Hathaway Inc 1.625% EUR 16/03/2035 200,000 200,801 0.03 Berry Global Inc 5.125% USD 15/07/2023 150,000 132,320 0.02 BMC East LLC 144A 5.5% USD 01/10/2024 362,000 305,592 0.04 Booking Holdings Inc 1.8% EUR 03/03/2027 300,000 309,346 0.04 Booking Holdings Inc 3.6% USD 01/06/2026 250,000 214,497 0.03 Boyd Gaming Corp 6% USD 15/08/2026 92,000 82,902 0.01 Boyd Gaming Corp 6.375% USD 01/04/2026 325,000 297,471 0.04 Boyd Gaming Corp 6.875% USD 15/05/2023 60,000 55,055 0.01 Brink's Co/The 144A 4.625% USD 15/10/2027 286,000 239,869 0.03 Callon Petroleum Co 6.125% USD 01/10/2024 388,000 347,933 0.05 CCO Holdings LLC / CCO Holdings Capital Corp 144A 5.125% USD 01/05/2027 540,000 468,272 0.07
Invesco Global Targeted Returns Select Fund Statement of Investments as at 28 February 2019
320 Invesco Funds
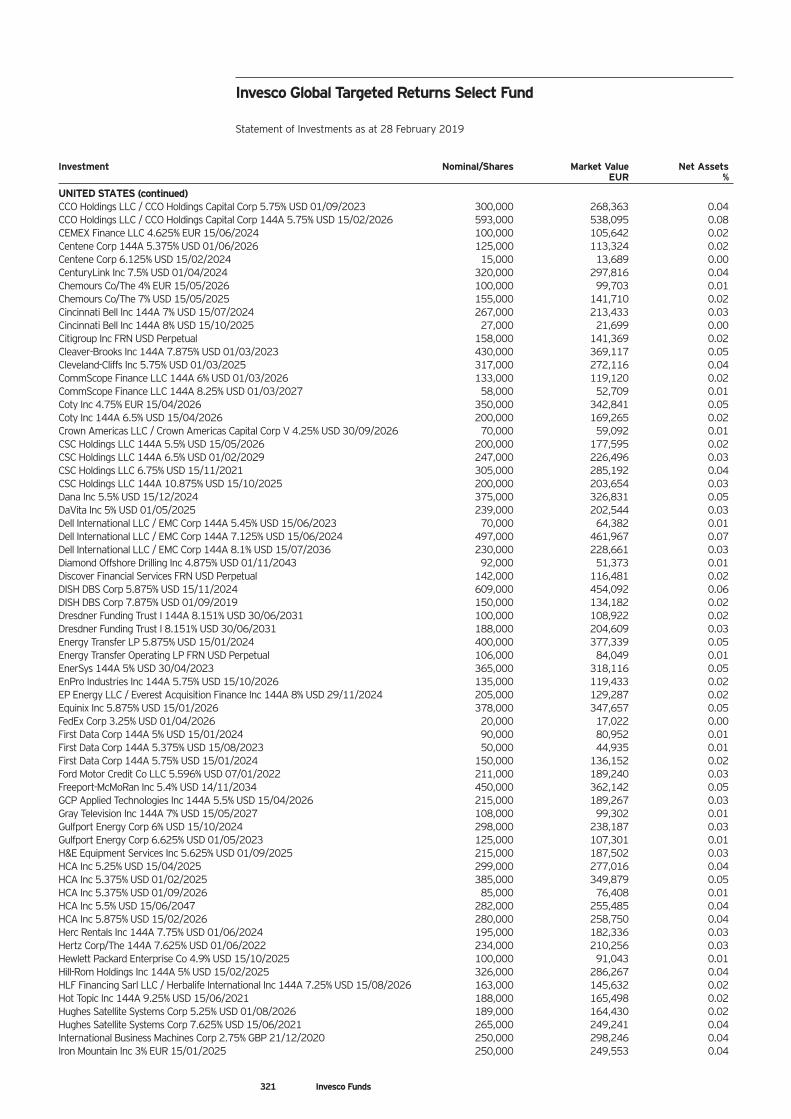
Investment Nominal/Shares Market Value Net Assets EUR %
UNITED STATES (continued) CCO Holdings LLC / CCO Holdings Capital Corp 5.75% USD 01/09/2023 300,000 268,363 0.04 CCO Holdings LLC / CCO Holdings Capital Corp 144A 5.75% USD 15/02/2026 593,000 538,095 0.08 CEMEX Finance LLC 4.625% EUR 15/06/2024 100,000 105,642 0.02 Centene Corp 144A 5.375% USD 01/06/2026 125,000 113,324 0.02 Centene Corp 6.125% USD 15/02/2024 15,000 13,689 0.00 CenturyLink Inc 7.5% USD 01/04/2024 320,000 297,816 0.04 Chemours Co/The 4% EUR 15/05/2026 100,000 99,703 0.01 Chemours Co/The 7% USD 15/05/2025 155,000 141,710 0.02 Cincinnati Bell Inc 144A 7% USD 15/07/2024 267,000 213,433 0.03 Cincinnati Bell Inc 144A 8% USD 15/10/2025 27,000 21,699 0.00 Citigroup Inc FRN USD Perpetual 158,000 141,369 0.02 Cleaver-Brooks Inc 144A 7.875% USD 01/03/2023 430,000 369,117 0.05 Cleveland-Cliffs Inc 5.75% USD 01/03/2025 317,000 272,116 0.04 CommScope Finance LLC 144A 6% USD 01/03/2026 133,000 119,120 0.02 CommScope Finance LLC 144A 8.25% USD 01/03/2027 58,000 52,709 0.01 Coty Inc 4.75% EUR 15/04/2026 350,000 342,841 0.05 Coty Inc 144A 6.5% USD 15/04/2026 200,000 169,265 0.02 Crown Americas LLC / Crown Americas Capital Corp V 4.25% USD 30/09/2026 70,000 59,092 0.01 CSC Holdings LLC 144A 5.5% USD 15/05/2026 200,000 177,595 0.02 CSC Holdings LLC 144A 6.5% USD 01/02/2029 247,000 226,496 0.03 CSC Holdings LLC 6.75% USD 15/11/2021 305,000 285,192 0.04 CSC Holdings LLC 144A 10.875% USD 15/10/2025 200,000 203,654 0.03 Dana Inc 5.5% USD 15/12/2024 375,000 326,831 0.05 DaVita Inc 5% USD 01/05/2025 239,000 202,544 0.03 Dell International LLC / EMC Corp 144A 5.45% USD 15/06/2023 70,000 64,382 0.01 Dell International LLC / EMC Corp 144A 7.125% USD 15/06/2024 497,000 461,967 0.07 Dell International LLC / EMC Corp 144A 8.1% USD 15/07/2036 230,000 228,661 0.03 Diamond Offshore Drilling Inc 4.875% USD 01/11/2043 92,000 51,373 0.01 Discover Financial Services FRN USD Perpetual 142,000 116,481 0.02 DISH DBS Corp 5.875% USD 15/11/2024 609,000 454,092 0.06 DISH DBS Corp 7.875% USD 01/09/2019 150,000 134,182 0.02 Dresdner Funding Trust I 144A 8.151% USD 30/06/2031 100,000 108,922 0.02 Dresdner Funding Trust I 8.151% USD 30/06/2031 188,000 204,609 0.03 Energy Transfer LP 5.875% USD 15/01/2024 400,000 377,339 0.05 Energy Transfer Operating LP FRN USD Perpetual 106,000 84,049 0.01 EnerSys 144A 5% USD 30/04/2023 365,000 318,116 0.05 EnPro Industries Inc 144A 5.75% USD 15/10/2026 135,000 119,433 0.02 EP Energy LLC / Everest Acquisition Finance Inc 144A 8% USD 29/11/2024 205,000 129,287 0.02 Equinix Inc 5.875% USD 15/01/2026 378,000 347,657 0.05 FedEx Corp 3.25% USD 01/04/2026 20,000 17,022 0.00 First Data Corp 144A 5% USD 15/01/2024 90,000 80,952 0.01 First Data Corp 144A 5.375% USD 15/08/2023 50,000 44,935 0.01 First Data Corp 144A 5.75% USD 15/01/2024 150,000 136,152 0.02 Ford Motor Credit Co LLC 5.596% USD 07/01/2022 211,000 189,240 0.03 Freeport-McMoRan Inc 5.4% USD 14/11/2034 450,000 362,142 0.05 GCP Applied Technologies Inc 144A 5.5% USD 15/04/2026 215,000 189,267 0.03 Gray Television Inc 144A 7% USD 15/05/2027 108,000 99,302 0.01 Gulfport Energy Corp 6% USD 15/10/2024 298,000 238,187 0.03 Gulfport Energy Corp 6.625% USD 01/05/2023 125,000 107,301 0.01 H&E Equipment Services Inc 5.625% USD 01/09/2025 215,000 187,502 0.03 HCA Inc 5.25% USD 15/04/2025 299,000 277,016 0.04 HCA Inc 5.375% USD 01/02/2025 385,000 349,879 0.05 HCA Inc 5.375% USD 01/09/2026 85,000 76,408 0.01 HCA Inc 5.5% USD 15/06/2047 282,000 255,485 0.04 HCA Inc 5.875% USD 15/02/2026 280,000 258,750 0.04 Herc Rentals Inc 144A 7.75% USD 01/06/2024 195,000 182,336 0.03 Hertz Corp/The 144A 7.625% USD 01/06/2022 234,000 210,256 0.03 Hewlett Packard Enterprise Co 4.9% USD 15/10/2025 100,000 91,043 0.01 Hill-Rom Holdings Inc 144A 5% USD 15/02/2025 326,000 286,267 0.04 HLF Financing Sarl LLC / Herbalife International Inc 144A 7.25% USD 15/08/2026 163,000 145,632 0.02 Hot Topic Inc 144A 9.25% USD 15/06/2021 188,000 165,498 0.02 Hughes Satellite Systems Corp 5.25% USD 01/08/2026 189,000 164,430 0.02 Hughes Satellite Systems Corp 7.625% USD 15/06/2021 265,000 249,241 0.04 International Business Machines Corp 2.75% GBP 21/12/2020 250,000 298,246 0.04 Iron Mountain Inc 3% EUR 15/01/2025 250,000 249,553 0.04
Invesco Global Targeted Returns Select Fund Statement of Investments as at 28 February 2019
321 Invesco Funds
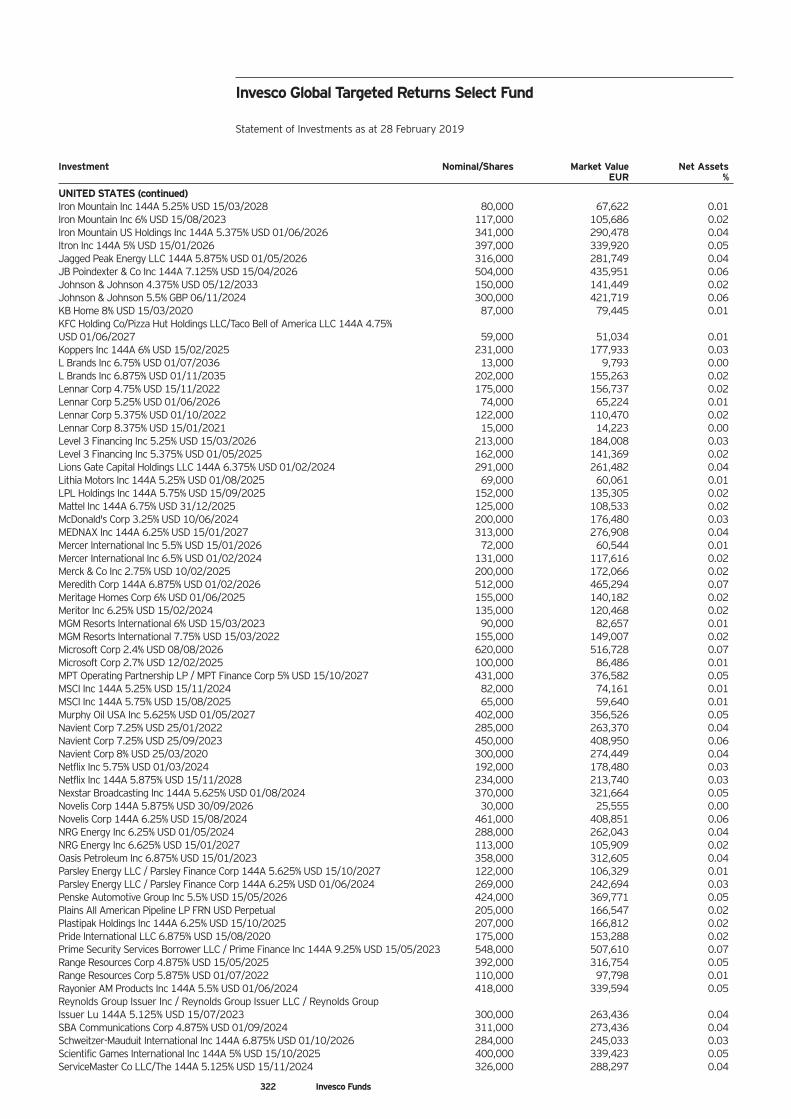
Investment Nominal/Shares Market Value Net Assets EUR %
UNITED STATES (continued) Iron Mountain Inc 144A 5.25% USD 15/03/2028 80,000 67,622 0.01 Iron Mountain Inc 6% USD 15/08/2023 117,000 105,686 0.02 Iron Mountain US Holdings Inc 144A 5.375% USD 01/06/2026 341,000 290,478 0.04 Itron Inc 144A 5% USD 15/01/2026 397,000 339,920 0.05 Jagged Peak Energy LLC 144A 5.875% USD 01/05/2026 316,000 281,749 0.04 JB Poindexter & Co Inc 144A 7.125% USD 15/04/2026 504,000 435,951 0.06 Johnson & Johnson 4.375% USD 05/12/2033 150,000 141,449 0.02 Johnson & Johnson 5.5% GBP 06/11/2024 300,000 421,719 0.06 KB Home 8% USD 15/03/2020 87,000 79,445 0.01 KFC Holding Co/Pizza Hut Holdings LLC/Taco Bell of America LLC 144A 4.75% USD 01/06/2027 59,000 51,034 0.01 Koppers Inc 144A 6% USD 15/02/2025 231,000 177,933 0.03 L Brands Inc 6.75% USD 01/07/2036 13,000 9,793 0.00 L Brands Inc 6.875% USD 01/11/2035 202,000 155,263 0.02 Lennar Corp 4.75% USD 15/11/2022 175,000 156,737 0.02 Lennar Corp 5.25% USD 01/06/2026 74,000 65,224 0.01 Lennar Corp 5.375% USD 01/10/2022 122,000 110,470 0.02 Lennar Corp 8.375% USD 15/01/2021 15,000 14,223 0.00 Level 3 Financing Inc 5.25% USD 15/03/2026 213,000 184,008 0.03 Level 3 Financing Inc 5.375% USD 01/05/2025 162,000 141,369 0.02 Lions Gate Capital Holdings LLC 144A 6.375% USD 01/02/2024 291,000 261,482 0.04 Lithia Motors Inc 144A 5.25% USD 01/08/2025 69,000 60,061 0.01 LPL Holdings Inc 144A 5.75% USD 15/09/2025 152,000 135,305 0.02 Mattel Inc 144A 6.75% USD 31/12/2025 125,000 108,533 0.02 McDonald's Corp 3.25% USD 10/06/2024 200,000 176,480 0.03 MEDNAX Inc 144A 6.25% USD 15/01/2027 313,000 276,908 0.04 Mercer International Inc 5.5% USD 15/01/2026 72,000 60,544 0.01 Mercer International Inc 6.5% USD 01/02/2024 131,000 117,616 0.02 Merck & Co Inc 2.75% USD 10/02/2025 200,000 172,066 0.02 Meredith Corp 144A 6.875% USD 01/02/2026 512,000 465,294 0.07 Meritage Homes Corp 6% USD 01/06/2025 155,000 140,182 0.02 Meritor Inc 6.25% USD 15/02/2024 135,000 120,468 0.02 MGM Resorts International 6% USD 15/03/2023 90,000 82,657 0.01 MGM Resorts International 7.75% USD 15/03/2022 155,000 149,007 0.02 Microsoft Corp 2.4% USD 08/08/2026 620,000 516,728 0.07 Microsoft Corp 2.7% USD 12/02/2025 100,000 86,486 0.01 MPT Operating Partnership LP / MPT Finance Corp 5% USD 15/10/2027 431,000 376,582 0.05 MSCI Inc 144A 5.25% USD 15/11/2024 82,000 74,161 0.01 MSCI Inc 144A 5.75% USD 15/08/2025 65,000 59,640 0.01 Murphy Oil USA Inc 5.625% USD 01/05/2027 402,000 356,526 0.05 Navient Corp 7.25% USD 25/01/2022 285,000 263,370 0.04 Navient Corp 7.25% USD 25/09/2023 450,000 408,950 0.06 Navient Corp 8% USD 25/03/2020 300,000 274,449 0.04 Netflix Inc 5.75% USD 01/03/2024 192,000 178,480 0.03 Netflix Inc 144A 5.875% USD 15/11/2028 234,000 213,740 0.03 Nexstar Broadcasting Inc 144A 5.625% USD 01/08/2024 370,000 321,664 0.05 Novelis Corp 144A 5.875% USD 30/09/2026 30,000 25,555 0.00 Novelis Corp 144A 6.25% USD 15/08/2024 461,000 408,851 0.06 NRG Energy Inc 6.25% USD 01/05/2024 288,000 262,043 0.04 NRG Energy Inc 6.625% USD 15/01/2027 113,000 105,909 0.02 Oasis Petroleum Inc 6.875% USD 15/01/2023 358,000 312,605 0.04 Parsley Energy LLC / Parsley Finance Corp 144A 5.625% USD 15/10/2027 122,000 106,329 0.01 Parsley Energy LLC / Parsley Finance Corp 144A 6.25% USD 01/06/2024 269,000 242,694 0.03 Penske Automotive Group Inc 5.5% USD 15/05/2026 424,000 369,771 0.05 Plains All American Pipeline LP FRN USD Perpetual 205,000 166,547 0.02 Plastipak Holdings Inc 144A 6.25% USD 15/10/2025 207,000 166,812 0.02 Pride International LLC 6.875% USD 15/08/2020 175,000 153,288 0.02 Prime Security Services Borrower LLC / Prime Finance Inc 144A 9.25% USD 15/05/2023 548,000 507,610 0.07 Range Resources Corp 4.875% USD 15/05/2025 392,000 316,754 0.05 Range Resources Corp 5.875% USD 01/07/2022 110,000 97,798 0.01 Rayonier AM Products Inc 144A 5.5% USD 01/06/2024 418,000 339,594 0.05 Reynolds Group Issuer Inc / Reynolds Group Issuer LLC / Reynolds Group Issuer Lu 144A 5.125% USD 15/07/2023 300,000 263,436 0.04 SBA Communications Corp 4.875% USD 01/09/2024 311,000 273,436 0.04 Schweitzer-Mauduit International Inc 144A 6.875% USD 01/10/2026 284,000 245,033 0.03 Scientific Games International Inc 144A 5% USD 15/10/2025 400,000 339,423 0.05 ServiceMaster Co LLC/The 144A 5.125% USD 15/11/2024 326,000 288,297 0.04
Invesco Global Targeted Returns Select Fund Statement of Investments as at 28 February 2019
322 Invesco Funds
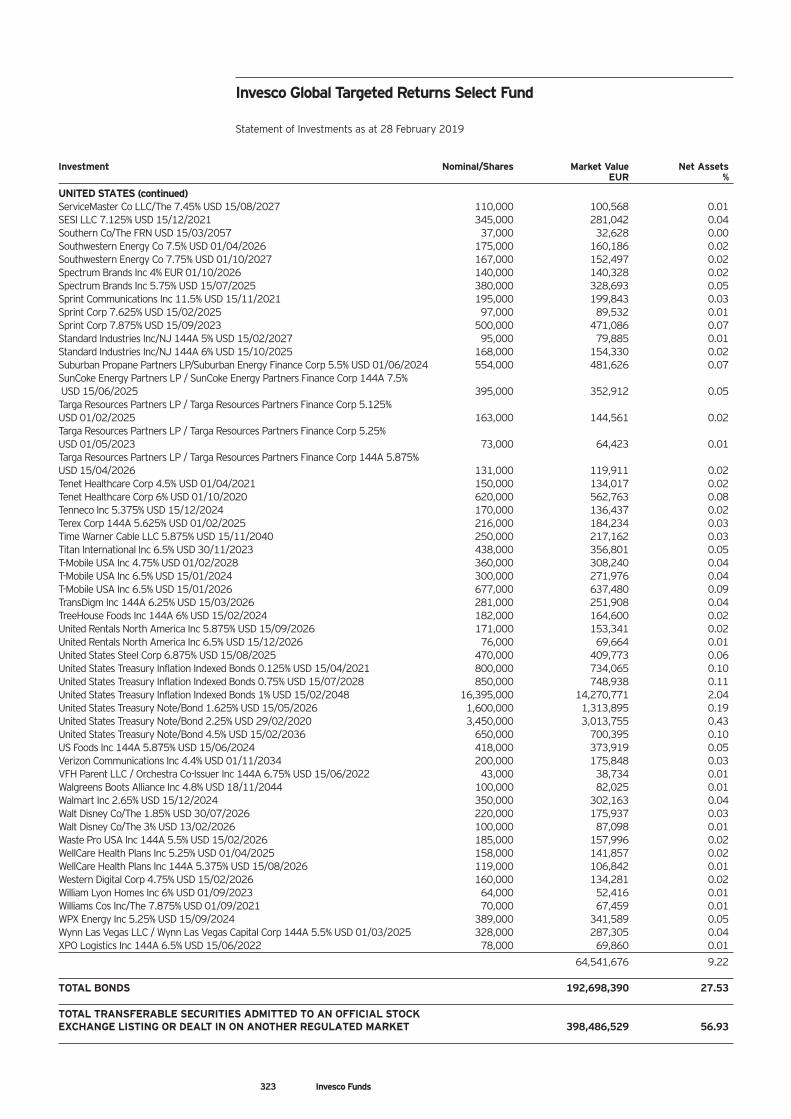
Investment Nominal/Shares Market Value Net Assets EUR %
UNITED STATES (continued) ServiceMaster Co LLC/The 7.45% USD 15/08/2027 110,000 100,568 0.01 SESI LLC 7.125% USD 15/12/2021 345,000 281,042 0.04 Southern Co/The FRN USD 15/03/2057 37,000 32,628 0.00 Southwestern Energy Co 7.5% USD 01/04/2026 175,000 160,186 0.02 Southwestern Energy Co 7.75% USD 01/10/2027 167,000 152,497 0.02 Spectrum Brands Inc 4% EUR 01/10/2026 140,000 140,328 0.02 Spectrum Brands Inc 5.75% USD 15/07/2025 380,000 328,693 0.05 Sprint Communications Inc 11.5% USD 15/11/2021 195,000 199,843 0.03 Sprint Corp 7.625% USD 15/02/2025 97,000 89,532 0.01 Sprint Corp 7.875% USD 15/09/2023 500,000 471,086 0.07 Standard Industries Inc/NJ 144A 5% USD 15/02/2027 95,000 79,885 0.01 Standard Industries Inc/NJ 144A 6% USD 15/10/2025 168,000 154,330 0.02 Suburban Propane Partners LP/Suburban Energy Finance Corp 5.5% USD 01/06/2024 554,000 481,626 0.07 SunCoke Energy Partners LP / SunCoke Energy Partners Finance Corp 144A 7.5% USD 15/06/2025 395,000 352,912 0.05 Targa Resources Partners LP / Targa Resources Partners Finance Corp 5.125% USD 01/02/2025 163,000 144,561 0.02 Targa Resources Partners LP / Targa Resources Partners Finance Corp 5.25% USD 01/05/2023 73,000 64,423 0.01 Targa Resources Partners LP / Targa Resources Partners Finance Corp 144A 5.875% USD 15/04/2026 131,000 119,911 0.02 Tenet Healthcare Corp 4.5% USD 01/04/2021 150,000 134,017 0.02 Tenet Healthcare Corp 6% USD 01/10/2020 620,000 562,763 0.08 Tenneco Inc 5.375% USD 15/12/2024 170,000 136,437 0.02 Terex Corp 144A 5.625% USD 01/02/2025 216,000 184,234 0.03 Time Warner Cable LLC 5.875% USD 15/11/2040 250,000 217,162 0.03 Titan International Inc 6.5% USD 30/11/2023 438,000 356,801 0.05 T-Mobile USA Inc 4.75% USD 01/02/2028 360,000 308,240 0.04 T-Mobile USA Inc 6.5% USD 15/01/2024 300,000 271,976 0.04 T-Mobile USA Inc 6.5% USD 15/01/2026 677,000 637,480 0.09 TransDigm Inc 144A 6.25% USD 15/03/2026 281,000 251,908 0.04 TreeHouse Foods Inc 144A 6% USD 15/02/2024 182,000 164,600 0.02 United Rentals North America Inc 5.875% USD 15/09/2026 171,000 153,341 0.02 United Rentals North America Inc 6.5% USD 15/12/2026 76,000 69,664 0.01 United States Steel Corp 6.875% USD 15/08/2025 470,000 409,773 0.06 United States Treasury Inflation Indexed Bonds 0.125% USD 15/04/2021 800,000 734,065 0.10 United States Treasury Inflation Indexed Bonds 0.75% USD 15/07/2028 850,000 748,938 0.11 United States Treasury Inflation Indexed Bonds 1% USD 15/02/2048 16,395,000 14,270,771 2.04 United States Treasury Note/Bond 1.625% USD 15/05/2026 1,600,000 1,313,895 0.19 United States Treasury Note/Bond 2.25% USD 29/02/2020 3,450,000 3,013,755 0.43 United States Treasury Note/Bond 4.5% USD 15/02/2036 650,000 700,395 0.10 US Foods Inc 144A 5.875% USD 15/06/2024 418,000 373,919 0.05 Verizon Communications Inc 4.4% USD 01/11/2034 200,000 175,848 0.03 VFH Parent LLC / Orchestra Co-Issuer Inc 144A 6.75% USD 15/06/2022 43,000 38,734 0.01 Walgreens Boots Alliance Inc 4.8% USD 18/11/2044 100,000 82,025 0.01 Walmart Inc 2.65% USD 15/12/2024 350,000 302,163 0.04 Walt Disney Co/The 1.85% USD 30/07/2026 220,000 175,937 0.03 Walt Disney Co/The 3% USD 13/02/2026 100,000 87,098 0.01 Waste Pro USA Inc 144A 5.5% USD 15/02/2026 185,000 157,996 0.02 WellCare Health Plans Inc 5.25% USD 01/04/2025 158,000 141,857 0.02 WellCare Health Plans Inc 144A 5.375% USD 15/08/2026 119,000 106,842 0.01 Western Digital Corp 4.75% USD 15/02/2026 160,000 134,281 0.02 William Lyon Homes Inc 6% USD 01/09/2023 64,000 52,416 0.01 Williams Cos Inc/The 7.875% USD 01/09/2021 70,000 67,459 0.01 WPX Energy Inc 5.25% USD 15/09/2024 389,000 341,589 0.05 Wynn Las Vegas LLC / Wynn Las Vegas Capital Corp 144A 5.5% USD 01/03/2025 328,000 287,305 0.04 XPO Logistics Inc 144A 6.5% USD 15/06/2022 78,000 69,860 0.01
64,541,676 9.22 TOTAL BONDS 192,698,390 27.53 TOTAL TRANSFERABLE SECURITIES ADMITTED TO AN OFFICIAL STOCK EXCHANGE LISTING OR DEALT IN ON ANOTHER REGULATED MARKET 398,486,529 56.93
Invesco Global Targeted Returns Select Fund Statement of Investments as at 28 February 2019
323 Invesco Funds
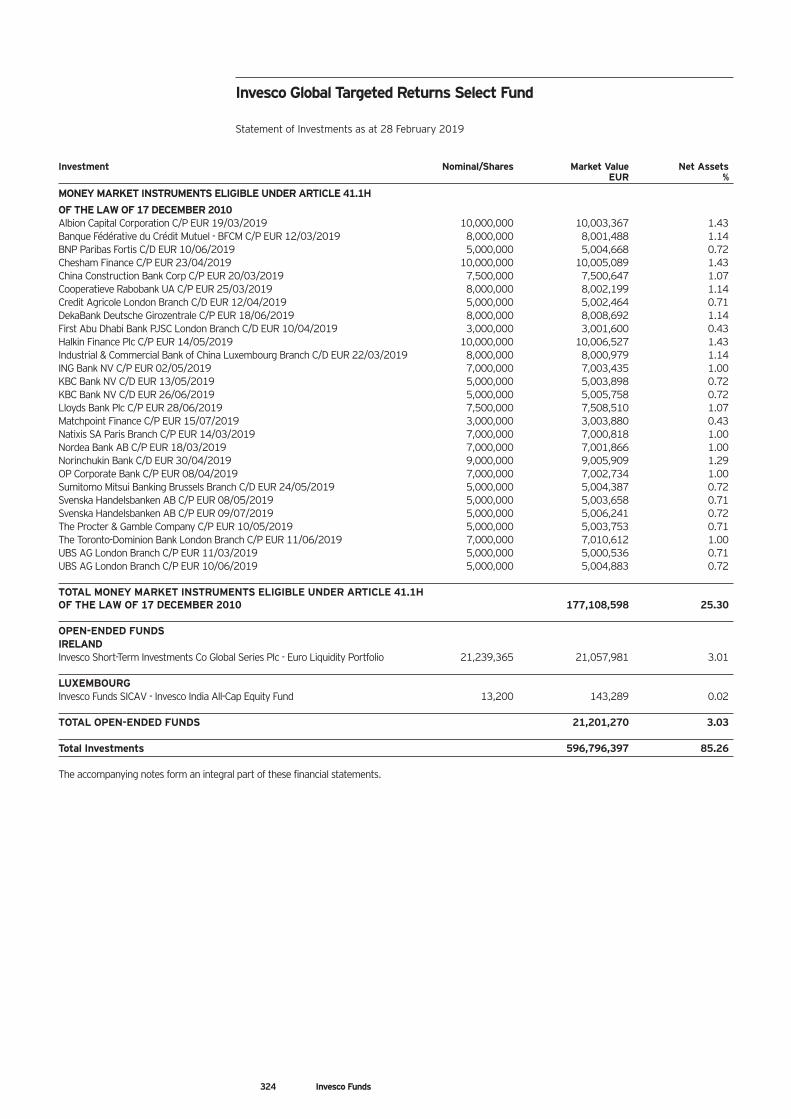
Investment Nominal/Shares Market Value Net Assets EUR %
MONEY MARKET INSTRUMENTS ELIGIBLE UNDER ARTICLE 41.1H
OF THE LAW OF 17 DECEMBER 2010 Albion Capital Corporation C/P EUR 19/03/2019 10,000,000 10,003,367 1.43 Banque Fédérative du Crédit Mutuel - BFCM C/P EUR 12/03/2019 8,000,000 8,001,488 1.14 BNP Paribas Fortis C/D EUR 10/06/2019 5,000,000 5,004,668 0.72 Chesham Finance C/P EUR 23/04/2019 10,000,000 10,005,089 1.43 China Construction Bank Corp C/P EUR 20/03/2019 7,500,000 7,500,647 1.07 Cooperatieve Rabobank UA C/P EUR 25/03/2019 8,000,000 8,002,199 1.14 Credit Agricole London Branch C/D EUR 12/04/2019 5,000,000 5,002,464 0.71 DekaBank Deutsche Girozentrale C/P EUR 18/06/2019 8,000,000 8,008,692 1.14 First Abu Dhabi Bank PJSC London Branch C/D EUR 10/04/2019 3,000,000 3,001,600 0.43 Halkin Finance Plc C/P EUR 14/05/2019 10,000,000 10,006,527 1.43 Industrial & Commercial Bank of China Luxembourg Branch C/D EUR 22/03/2019 8,000,000 8,000,979 1.14 ING Bank NV C/P EUR 02/05/2019 7,000,000 7,003,435 1.00 KBC Bank NV C/D EUR 13/05/2019 5,000,000 5,003,898 0.72 KBC Bank NV C/D EUR 26/06/2019 5,000,000 5,005,758 0.72 Lloyds Bank Plc C/P EUR 28/06/2019 7,500,000 7,508,510 1.07 Matchpoint Finance C/P EUR 15/07/2019 3,000,000 3,003,880 0.43 Natixis SA Paris Branch C/P EUR 14/03/2019 7,000,000 7,000,818 1.00 Nordea Bank AB C/P EUR 18/03/2019 7,000,000 7,001,866 1.00 Norinchukin Bank C/D EUR 30/04/2019 9,000,000 9,005,909 1.29 OP Corporate Bank C/P EUR 08/04/2019 7,000,000 7,002,734 1.00 Sumitomo Mitsui Banking Brussels Branch C/D EUR 24/05/2019 5,000,000 5,004,387 0.72 Svenska Handelsbanken AB C/P EUR 08/05/2019 5,000,000 5,003,658 0.71 Svenska Handelsbanken AB C/P EUR 09/07/2019 5,000,000 5,006,241 0.72 The Procter & Gamble Company C/P EUR 10/05/2019 5,000,000 5,003,753 0.71 The Toronto-Dominion Bank London Branch C/P EUR 11/06/2019 7,000,000 7,010,612 1.00 UBS AG London Branch C/P EUR 11/03/2019 5,000,000 5,000,536 0.71 UBS AG London Branch C/P EUR 10/06/2019 5,000,000 5,004,883 0.72 TOTAL MONEY MARKET INSTRUMENTS ELIGIBLE UNDER ARTICLE 41.1H OF THE LAW OF 17 DECEMBER 2010 177,108,598 25.30 OPEN-ENDED FUNDS IRELAND Invesco Short-Term Investments Co Global Series Plc - Euro Liquidity Portfolio 21,239,365 21,057,981 3.01 LUXEMBOURG Invesco Funds SICAV - Invesco India All-Cap Equity Fund 13,200 143,289 0.02 TOTAL OPEN-ENDED FUNDS 21,201,270 3.03 Total Investments 596,796,397 85.26 The accompanying notes form an integral part of these financial statements.
Invesco Global Targeted Returns Select Fund Statement of Investments as at 28 February 2019
324 Invesco Funds
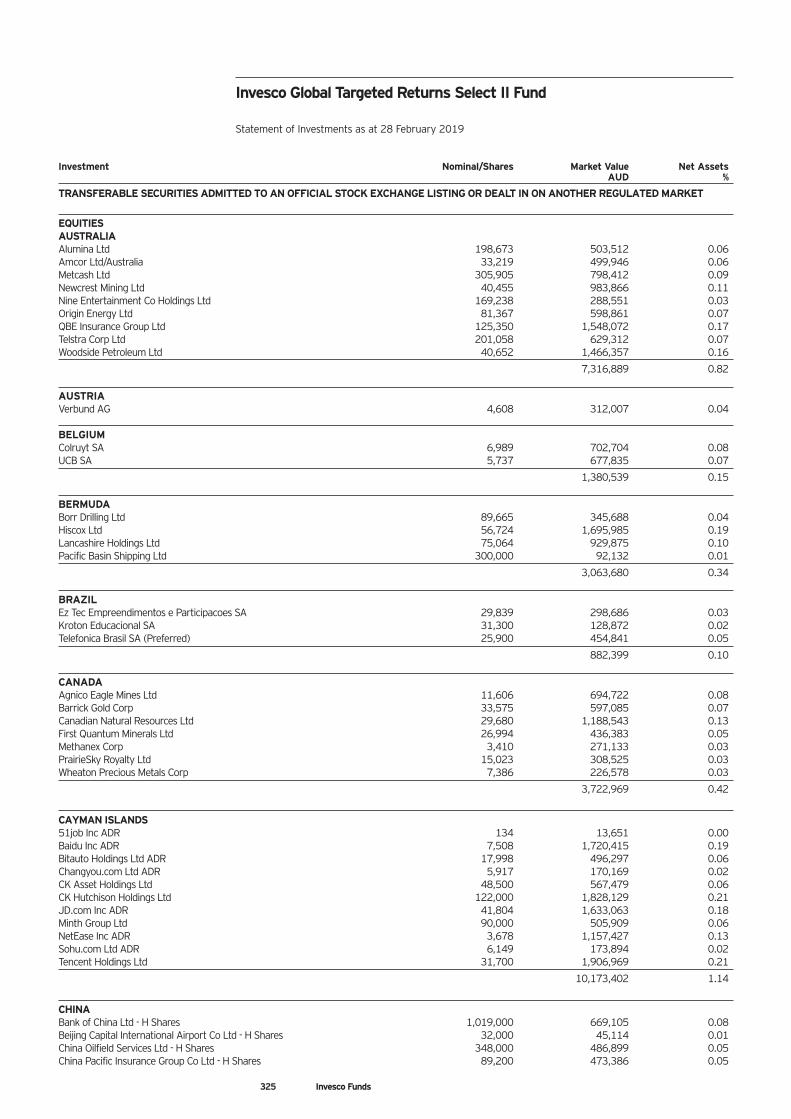
325 Invesco Funds
Investment Nominal/Shares Market Value Net Assets AUD %
TRANSFERABLE SECURITIES ADMITTED TO AN OFFICIAL STOCK EXCHANGE LISTING OR DEALT IN ON ANOTHER REGULATED MARKET
EQUITIES AUSTRALIA Alumina Ltd 198,673 503,512 0.06 Amcor Ltd/Australia 33,219 499,946 0.06 Metcash Ltd 305,905 798,412 0.09 Newcrest Mining Ltd 40,455 983,866 0.11 Nine Entertainment Co Holdings Ltd 169,238 288,551 0.03 Origin Energy Ltd 81,367 598,861 0.07 QBE Insurance Group Ltd 125,350 1,548,072 0.17 Telstra Corp Ltd 201,058 629,312 0.07 Woodside Petroleum Ltd 40,652 1,466,357 0.16
7,316,889 0.82
AUSTRIA Verbund AG 4,608 312,007 0.04 BELGIUM Colruyt SA 6,989 702,704 0.08 UCB SA 5,737 677,835 0.07
1,380,539 0.15
BERMUDA Borr Drilling Ltd 89,665 345,688 0.04 Hiscox Ltd 56,724 1,695,985 0.19 Lancashire Holdings Ltd 75,064 929,875 0.10 Pacific Basin Shipping Ltd 300,000 92,132 0.01
3,063,680 0.34
BRAZIL Ez Tec Empreendimentos e Participacoes SA 29,839 298,686 0.03 Kroton Educacional SA 31,300 128,872 0.02 Telefonica Brasil SA (Preferred) 25,900 454,841 0.05
882,399 0.10
CANADA Agnico Eagle Mines Ltd 11,606 694,722 0.08 Barrick Gold Corp 33,575 597,085 0.07 Canadian Natural Resources Ltd 29,680 1,188,543 0.13 First Quantum Minerals Ltd 26,994 436,383 0.05 Methanex Corp 3,410 271,133 0.03 PrairieSky Royalty Ltd 15,023 308,525 0.03 Wheaton Precious Metals Corp 7,386 226,578 0.03
3,722,969 0.42
CAYMAN ISLANDS 51job Inc ADR 134 13,651 0.00 Baidu Inc ADR 7,508 1,720,415 0.19 Bitauto Holdings Ltd ADR 17,998 496,297 0.06 Changyou.com Ltd ADR 5,917 170,169 0.02 CK Asset Holdings Ltd 48,500 567,479 0.06 CK Hutchison Holdings Ltd 122,000 1,828,129 0.21 JD.com Inc ADR 41,804 1,633,063 0.18 Minth Group Ltd 90,000 505,909 0.06 NetEase Inc ADR 3,678 1,157,427 0.13 Sohu.com Ltd ADR 6,149 173,894 0.02 Tencent Holdings Ltd 31,700 1,906,969 0.21
10,173,402 1.14
CHINA Bank of China Ltd - H Shares 1,019,000 669,105 0.08 Beijing Capital International Airport Co Ltd - H Shares 32,000 45,114 0.01 China Oilfield Services Ltd - H Shares 348,000 486,899 0.05 China Pacific Insurance Group Co Ltd - H Shares 89,200 473,386 0.05
Invesco Global Targeted Returns Select II Fund Statement of Investments as at 28 February 2019
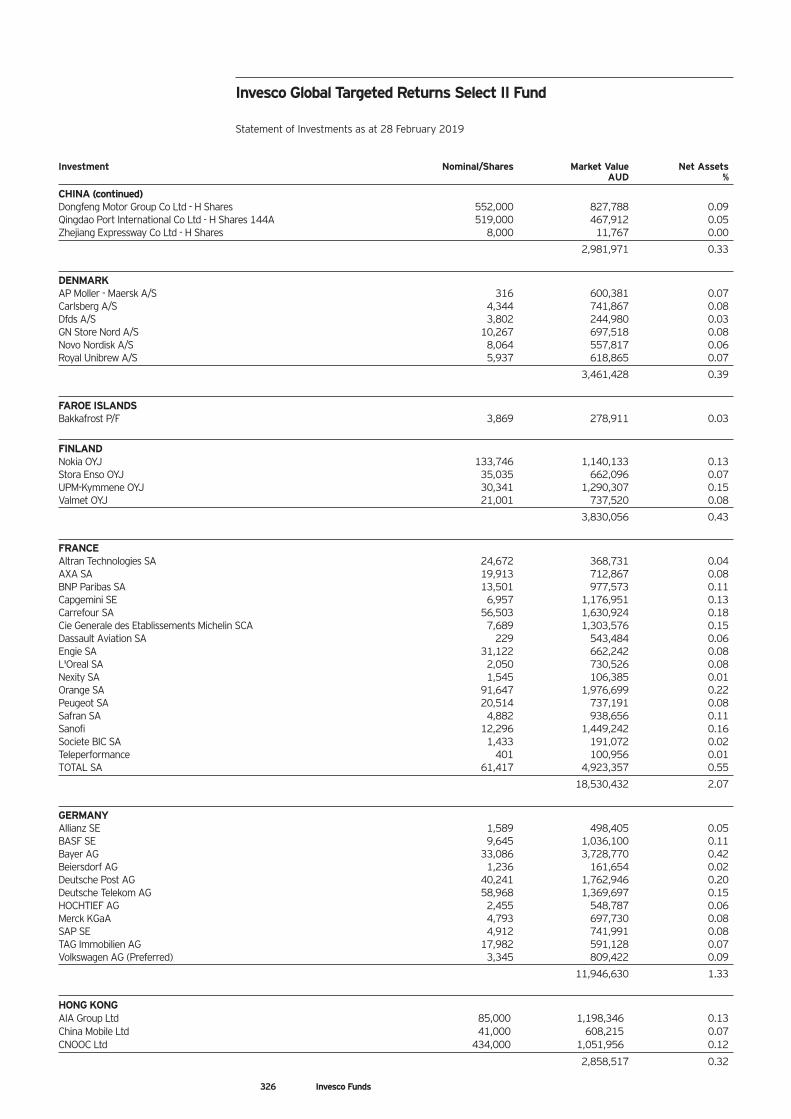
326 Invesco Funds
Invesco Global Targeted Returns Select II Fund Statement of Investments as at 28 February 2019
Investment Nominal/Shares Market Value Net Assets AUD %
CHINA (continued) Dongfeng Motor Group Co Ltd - H Shares 552,000 827,788 0.09 Qingdao Port International Co Ltd - H Shares 144A 519,000 467,912 0.05 Zhejiang Expressway Co Ltd - H Shares 8,000 11,767 0.00
2,981,971 0.33
DENMARK AP Moller - Maersk A/S 316 600,381 0.07 Carlsberg A/S 4,344 741,867 0.08 Dfds A/S 3,802 244,980 0.03 GN Store Nord A/S 10,267 697,518 0.08 Novo Nordisk A/S 8,064 557,817 0.06 Royal Unibrew A/S 5,937 618,865 0.07
3,461,428 0.39
FAROE ISLANDS Bakkafrost P/F 3,869 278,911 0.03
FINLAND Nokia OYJ 133,746 1,140,133 0.13 Stora Enso OYJ 35,035 662,096 0.07 UPM-Kymmene OYJ 30,341 1,290,307 0.15 Valmet OYJ 21,001 737,520 0.08
3,830,056 0.43
FRANCE Altran Technologies SA 24,672 368,731 0.04 AXA SA 19,913 712,867 0.08 BNP Paribas SA 13,501 977,573 0.11 Capgemini SE 6,957 1,176,951 0.13 Carrefour SA 56,503 1,630,924 0.18 Cie Generale des Etablissements Michelin SCA 7,689 1,303,576 0.15 Dassault Aviation SA 229 543,484 0.06 Engie SA 31,122 662,242 0.08 L'Oreal SA 2,050 730,526 0.08 Nexity SA 1,545 106,385 0.01 Orange SA 91,647 1,976,699 0.22 Peugeot SA 20,514 737,191 0.08 Safran SA 4,882 938,656 0.11 Sanofi 12,296 1,449,242 0.16 Societe BIC SA 1,433 191,072 0.02 Teleperformance 401 100,956 0.01 TOTAL SA 61,417 4,923,357 0.55
18,530,432 2.07
GERMANY Allianz SE 1,589 498,405 0.05 BASF SE 9,645 1,036,100 0.11 Bayer AG 33,086 3,728,770 0.42 Beiersdorf AG 1,236 161,654 0.02 Deutsche Post AG 40,241 1,762,946 0.20 Deutsche Telekom AG 58,968 1,369,697 0.15 HOCHTIEF AG 2,455 548,787 0.06 Merck KGaA 4,793 697,730 0.08 SAP SE 4,912 741,991 0.08 TAG Immobilien AG 17,982 591,128 0.07 Volkswagen AG (Preferred) 3,345 809,422 0.09
11,946,630 1.33
HONG KONG AIA Group Ltd 85,000 1,198,346 0.13 China Mobile Ltd 41,000 608,215 0.07 CNOOC Ltd 434,000 1,051,956 0.12
2,858,517 0.32
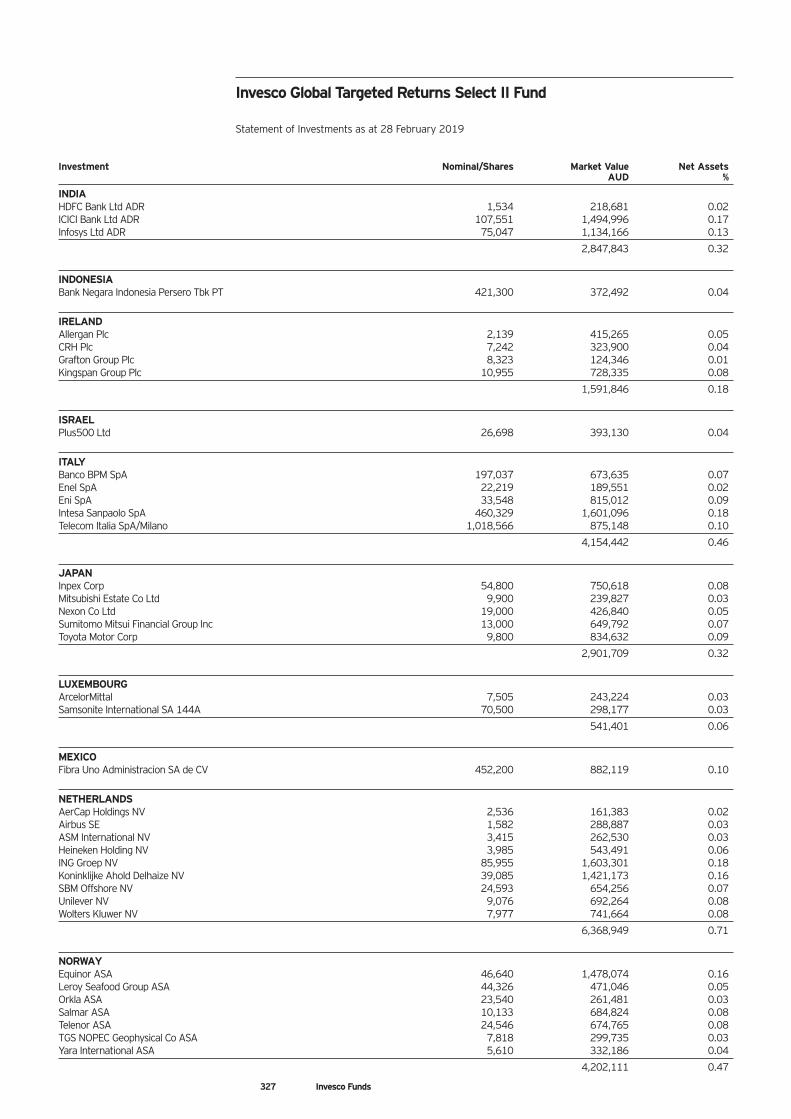
327 Invesco Funds
Invesco Global Targeted Returns Select II Fund Statement of Investments as at 28 February 2019
Investment Nominal/Shares Market Value Net Assets AUD %
INDIA HDFC Bank Ltd ADR 1,534 218,681 0.02 ICICI Bank Ltd ADR 107,551 1,494,996 0.17 Infosys Ltd ADR 75,047 1,134,166 0.13
2,847,843 0.32
INDONESIA Bank Negara Indonesia Persero Tbk PT 421,300 372,492 0.04
IRELAND Allergan Plc 2,139 415,265 0.05 CRH Plc 7,242 323,900 0.04 Grafton Group Plc 8,323 124,346 0.01 Kingspan Group Plc 10,955 728,335 0.08
1,591,846 0.18
ISRAEL Plus500 Ltd 26,698 393,130 0.04
ITALY Banco BPM SpA 197,037 673,635 0.07 Enel SpA 22,219 189,551 0.02 Eni SpA 33,548 815,012 0.09 Intesa Sanpaolo SpA 460,329 1,601,096 0.18 Telecom Italia SpA/Milano 1,018,566 875,148 0.10
4,154,442 0.46
JAPAN Inpex Corp 54,800 750,618 0.08 Mitsubishi Estate Co Ltd 9,900 239,827 0.03 Nexon Co Ltd 19,000 426,840 0.05 Sumitomo Mitsui Financial Group Inc 13,000 649,792 0.07 Toyota Motor Corp 9,800 834,632 0.09
2,901,709 0.32
LUXEMBOURG ArcelorMittal 7,505 243,224 0.03 Samsonite International SA 144A 70,500 298,177 0.03
541,401 0.06
MEXICO Fibra Uno Administracion SA de CV 452,200 882,119 0.10
NETHERLANDS AerCap Holdings NV 2,536 161,383 0.02 Airbus SE 1,582 288,887 0.03 ASM International NV 3,415 262,530 0.03 Heineken Holding NV 3,985 543,491 0.06 ING Groep NV 85,955 1,603,301 0.18 Koninklijke Ahold Delhaize NV 39,085 1,421,173 0.16 SBM Offshore NV 24,593 654,256 0.07 Unilever NV 9,076 692,264 0.08 Wolters Kluwer NV 7,977 741,664 0.08
6,368,949 0.71
NORWAY Equinor ASA 46,640 1,478,074 0.16 Leroy Seafood Group ASA 44,326 471,046 0.05 Orkla ASA 23,540 261,481 0.03 Salmar ASA 10,133 684,824 0.08 Telenor ASA 24,546 674,765 0.08 TGS NOPEC Geophysical Co ASA 7,818 299,735 0.03 Yara International ASA 5,610 332,186 0.04
4,202,111 0.47
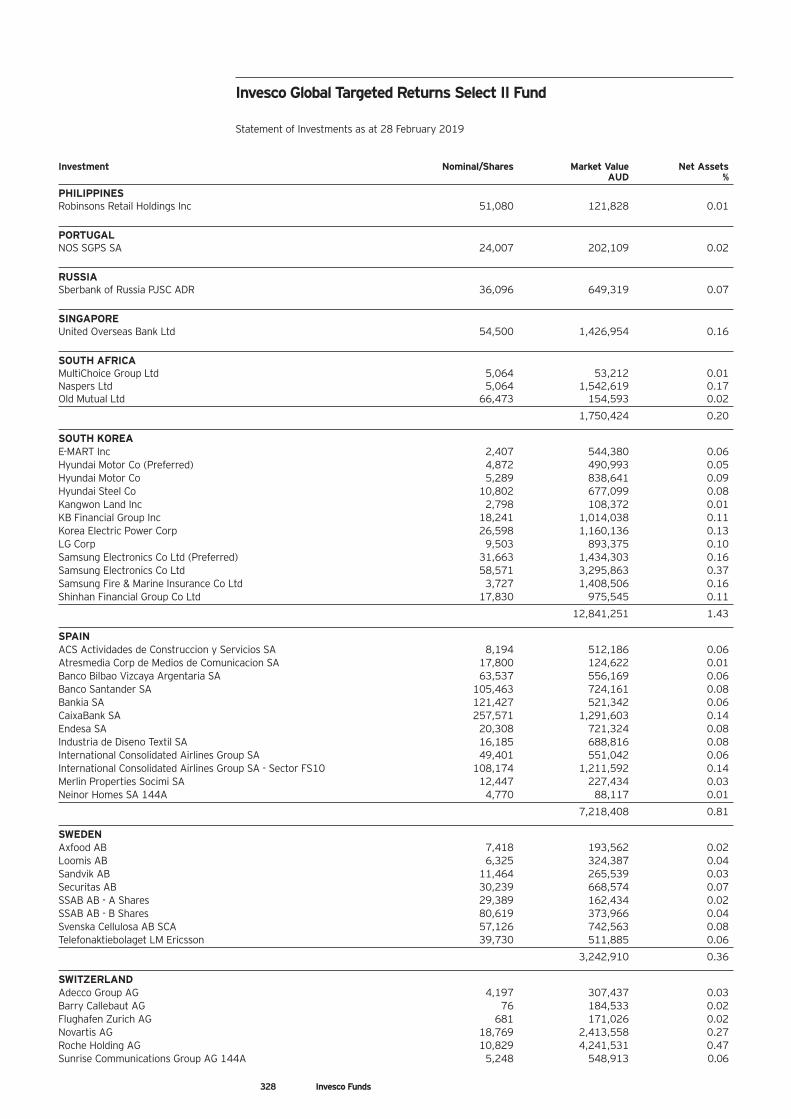
328 Invesco Funds
Investment Nominal/Shares Market Value Net Assets AUD %
PHILIPPINES Robinsons Retail Holdings Inc 51,080 121,828 0.01
PORTUGAL NOS SGPS SA 24,007 202,109 0.02
RUSSIA Sberbank of Russia PJSC ADR 36,096 649,319 0.07
SINGAPORE United Overseas Bank Ltd 54,500 1,426,954 0.16
SOUTH AFRICA MultiChoice Group Ltd 5,064 53,212 0.01 Naspers Ltd 5,064 1,542,619 0.17 Old Mutual Ltd 66,473 154,593 0.02
1,750,424 0.20
SOUTH KOREA E-MART Inc 2,407 544,380 0.06 Hyundai Motor Co (Preferred) 4,872 490,993 0.05 Hyundai Motor Co 5,289 838,641 0.09 Hyundai Steel Co 10,802 677,099 0.08 Kangwon Land Inc 2,798 108,372 0.01 KB Financial Group Inc 18,241 1,014,038 0.11 Korea Electric Power Corp 26,598 1,160,136 0.13 LG Corp 9,503 893,375 0.10 Samsung Electronics Co Ltd (Preferred) 31,663 1,434,303 0.16 Samsung Electronics Co Ltd 58,571 3,295,863 0.37 Samsung Fire & Marine Insurance Co Ltd 3,727 1,408,506 0.16 Shinhan Financial Group Co Ltd 17,830 975,545 0.11
12,841,251 1.43
SPAIN ACS Actividades de Construccion y Servicios SA 8,194 512,186 0.06 Atresmedia Corp de Medios de Comunicacion SA 17,800 124,622 0.01 Banco Bilbao Vizcaya Argentaria SA 63,537 556,169 0.06 Banco Santander SA 105,463 724,161 0.08 Bankia SA 121,427 521,342 0.06 CaixaBank SA 257,571 1,291,603 0.14 Endesa SA 20,308 721,324 0.08 Industria de Diseno Textil SA 16,185 688,816 0.08 International Consolidated Airlines Group SA 49,401 551,042 0.06 International Consolidated Airlines Group SA - Sector FS10 108,174 1,211,592 0.14 Merlin Properties Socimi SA 12,447 227,434 0.03 Neinor Homes SA 144A 4,770 88,117 0.01
7,218,408 0.81
SWEDEN Axfood AB 7,418 193,562 0.02 Loomis AB 6,325 324,387 0.04 Sandvik AB 11,464 265,539 0.03 Securitas AB 30,239 668,574 0.07 SSAB AB - A Shares 29,389 162,434 0.02 SSAB AB - B Shares 80,619 373,966 0.04 Svenska Cellulosa AB SCA 57,126 742,563 0.08 Telefonaktiebolaget LM Ericsson 39,730 511,885 0.06
3,242,910 0.36
SWITZERLAND Adecco Group AG 4,197 307,437 0.03 Barry Callebaut AG 76 184,533 0.02 Flughafen Zurich AG 681 171,026 0.02 Novartis AG 18,769 2,413,558 0.27 Roche Holding AG 10,829 4,241,531 0.47 Sunrise Communications Group AG 144A 5,248 548,913 0.06
Invesco Global Targeted Returns Select II Fund Statement of Investments as at 28 February 2019
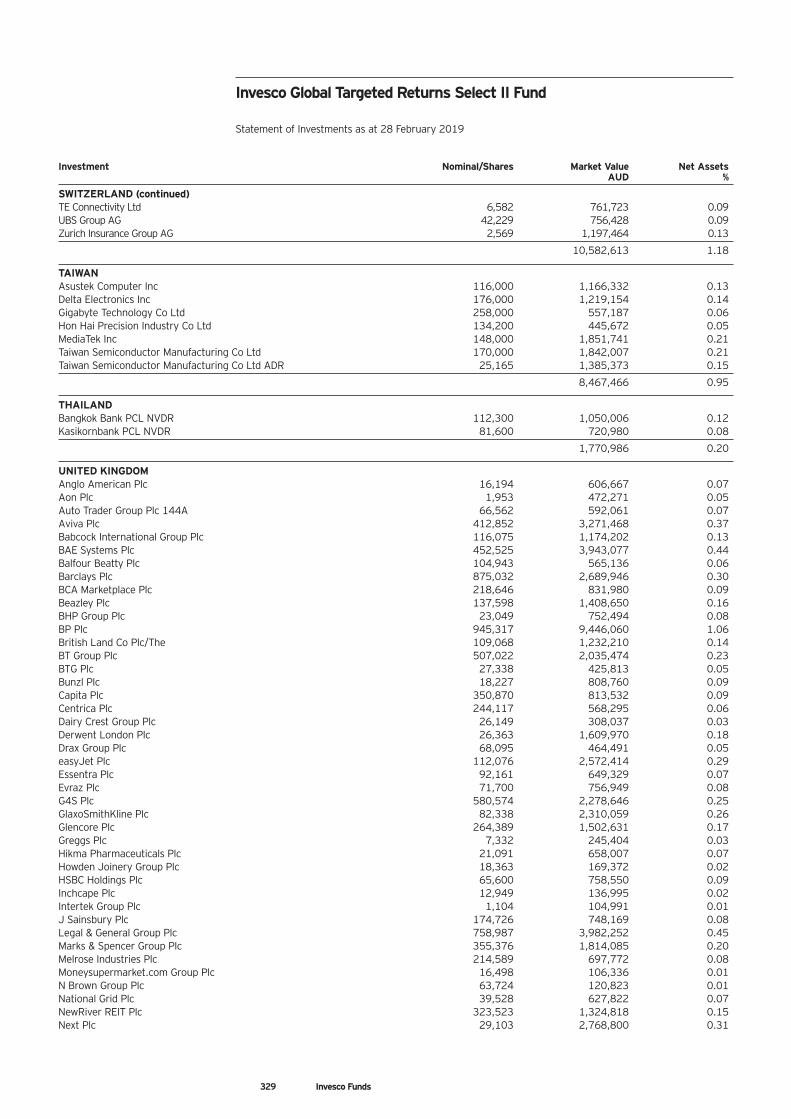
329 Invesco Funds
Invesco Global Targeted Returns Select II Fund Statement of Investments as at 28 February 2019
Investment Nominal/Shares Market Value Net Assets AUD %
SWITZERLAND (continued) TE Connectivity Ltd 6,582 761,723 0.09 UBS Group AG 42,229 756,428 0.09 Zurich Insurance Group AG 2,569 1,197,464 0.13
10,582,613 1.18
TAIWAN Asustek Computer Inc 116,000 1,166,332 0.13 Delta Electronics Inc 176,000 1,219,154 0.14 Gigabyte Technology Co Ltd 258,000 557,187 0.06 Hon Hai Precision Industry Co Ltd 134,200 445,672 0.05 MediaTek Inc 148,000 1,851,741 0.21 Taiwan Semiconductor Manufacturing Co Ltd 170,000 1,842,007 0.21 Taiwan Semiconductor Manufacturing Co Ltd ADR 25,165 1,385,373 0.15
8,467,466 0.95
THAILAND Bangkok Bank PCL NVDR 112,300 1,050,006 0.12 Kasikornbank PCL NVDR 81,600 720,980 0.08
1,770,986 0.20
UNITED KINGDOM Anglo American Plc 16,194 606,667 0.07 Aon Plc 1,953 472,271 0.05 Auto Trader Group Plc 144A 66,562 592,061 0.07 Aviva Plc 412,852 3,271,468 0.37 Babcock International Group Plc 116,075 1,174,202 0.13 BAE Systems Plc 452,525 3,943,077 0.44 Balfour Beatty Plc 104,943 565,136 0.06 Barclays Plc 875,032 2,689,946 0.30 BCA Marketplace Plc 218,646 831,980 0.09 Beazley Plc 137,598 1,408,650 0.16 BHP Group Plc 23,049 752,494 0.08 BP Plc 945,317 9,446,060 1.06 British Land Co Plc/The 109,068 1,232,210 0.14 BT Group Plc 507,022 2,035,474 0.23 BTG Plc 27,338 425,813 0.05 Bunzl Plc 18,227 808,760 0.09 Capita Plc 350,870 813,532 0.09 Centrica Plc 244,117 568,295 0.06 Dairy Crest Group Plc 26,149 308,037 0.03 Derwent London Plc 26,363 1,609,970 0.18 Drax Group Plc 68,095 464,491 0.05 easyJet Plc 112,076 2,572,414 0.29 Essentra Plc 92,161 649,329 0.07 Evraz Plc 71,700 756,949 0.08 G4S Plc 580,574 2,278,646 0.25 GlaxoSmithKline Plc 82,338 2,310,059 0.26 Glencore Plc 264,389 1,502,631 0.17 Greggs Plc 7,332 245,404 0.03 Hikma Pharmaceuticals Plc 21,091 658,007 0.07 Howden Joinery Group Plc 18,363 169,372 0.02 HSBC Holdings Plc 65,600 758,550 0.09 Inchcape Plc 12,949 136,995 0.02 Intertek Group Plc 1,104 104,991 0.01 J Sainsbury Plc 174,726 748,169 0.08 Legal & General Group Plc 758,987 3,982,252 0.45 Marks & Spencer Group Plc 355,376 1,814,085 0.20 Melrose Industries Plc 214,589 697,772 0.08 Moneysupermarket.com Group Plc 16,498 106,336 0.01 N Brown Group Plc 63,724 120,823 0.01 National Grid Plc 39,528 627,822 0.07 NewRiver REIT Plc 323,523 1,324,818 0.15 Next Plc 29,103 2,768,800 0.31
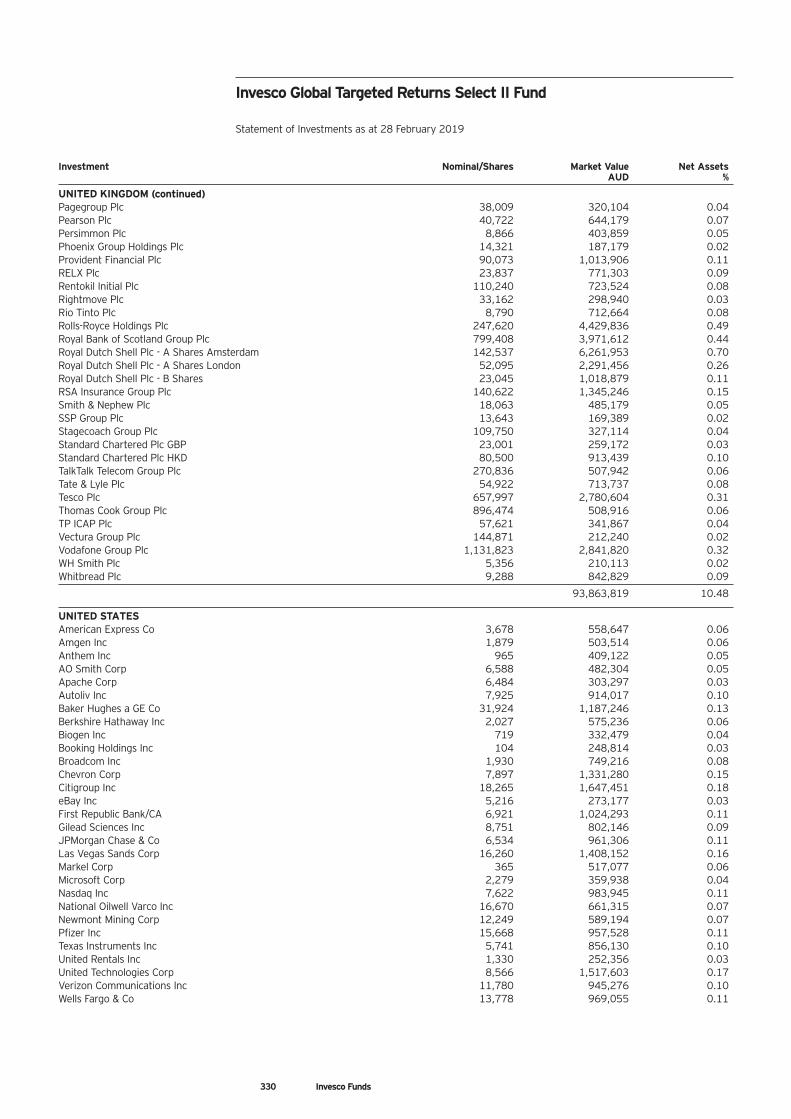
330 Invesco Funds
Investment Nominal/Shares Market Value Net Assets AUD %
UNITED KINGDOM (continued) Pagegroup Plc 38,009 320,104 0.04 Pearson Plc 40,722 644,179 0.07 Persimmon Plc 8,866 403,859 0.05 Phoenix Group Holdings Plc 14,321 187,179 0.02 Provident Financial Plc 90,073 1,013,906 0.11 RELX Plc 23,837 771,303 0.09 Rentokil Initial Plc 110,240 723,524 0.08 Rightmove Plc 33,162 298,940 0.03 Rio Tinto Plc 8,790 712,664 0.08 Rolls-Royce Holdings Plc 247,620 4,429,836 0.49 Royal Bank of Scotland Group Plc 799,408 3,971,612 0.44 Royal Dutch Shell Plc - A Shares Amsterdam 142,537 6,261,953 0.70 Royal Dutch Shell Plc - A Shares London 52,095 2,291,456 0.26 Royal Dutch Shell Plc - B Shares 23,045 1,018,879 0.11 RSA Insurance Group Plc 140,622 1,345,246 0.15 Smith & Nephew Plc 18,063 485,179 0.05 SSP Group Plc 13,643 169,389 0.02 Stagecoach Group Plc 109,750 327,114 0.04 Standard Chartered Plc GBP 23,001 259,172 0.03 Standard Chartered Plc HKD 80,500 913,439 0.10 TalkTalk Telecom Group Plc 270,836 507,942 0.06 Tate & Lyle Plc 54,922 713,737 0.08 Tesco Plc 657,997 2,780,604 0.31 Thomas Cook Group Plc 896,474 508,916 0.06 TP ICAP Plc 57,621 341,867 0.04 Vectura Group Plc 144,871 212,240 0.02 Vodafone Group Plc 1,131,823 2,841,820 0.32 WH Smith Plc 5,356 210,113 0.02 Whitbread Plc 9,288 842,829 0.09
93,863,819 10.48
UNITED STATES American Express Co 3,678 558,647 0.06 Amgen Inc 1,879 503,514 0.06 Anthem Inc 965 409,122 0.05 AO Smith Corp 6,588 482,304 0.05 Apache Corp 6,484 303,297 0.03 Autoliv Inc 7,925 914,017 0.10 Baker Hughes a GE Co 31,924 1,187,246 0.13 Berkshire Hathaway Inc 2,027 575,236 0.06 Biogen Inc 719 332,479 0.04 Booking Holdings Inc 104 248,814 0.03 Broadcom Inc 1,930 749,216 0.08 Chevron Corp 7,897 1,331,280 0.15 Citigroup Inc 18,265 1,647,451 0.18 eBay Inc 5,216 273,177 0.03 First Republic Bank/CA 6,921 1,024,293 0.11 Gilead Sciences Inc 8,751 802,146 0.09 JPMorgan Chase & Co 6,534 961,306 0.11 Las Vegas Sands Corp 16,260 1,408,152 0.16 Markel Corp 365 517,077 0.06 Microsoft Corp 2,279 359,938 0.04 Nasdaq Inc 7,622 983,945 0.11 National Oilwell Varco Inc 16,670 661,315 0.07 Newmont Mining Corp 12,249 589,194 0.07 Pfizer Inc 15,668 957,528 0.11 Texas Instruments Inc 5,741 856,130 0.10 United Rentals Inc 1,330 252,356 0.03 United Technologies Corp 8,566 1,517,603 0.17 Verizon Communications Inc 11,780 945,276 0.10 Wells Fargo & Co 13,778 969,055 0.11
Invesco Global Targeted Returns Select II Fund Statement of Investments as at 28 February 2019
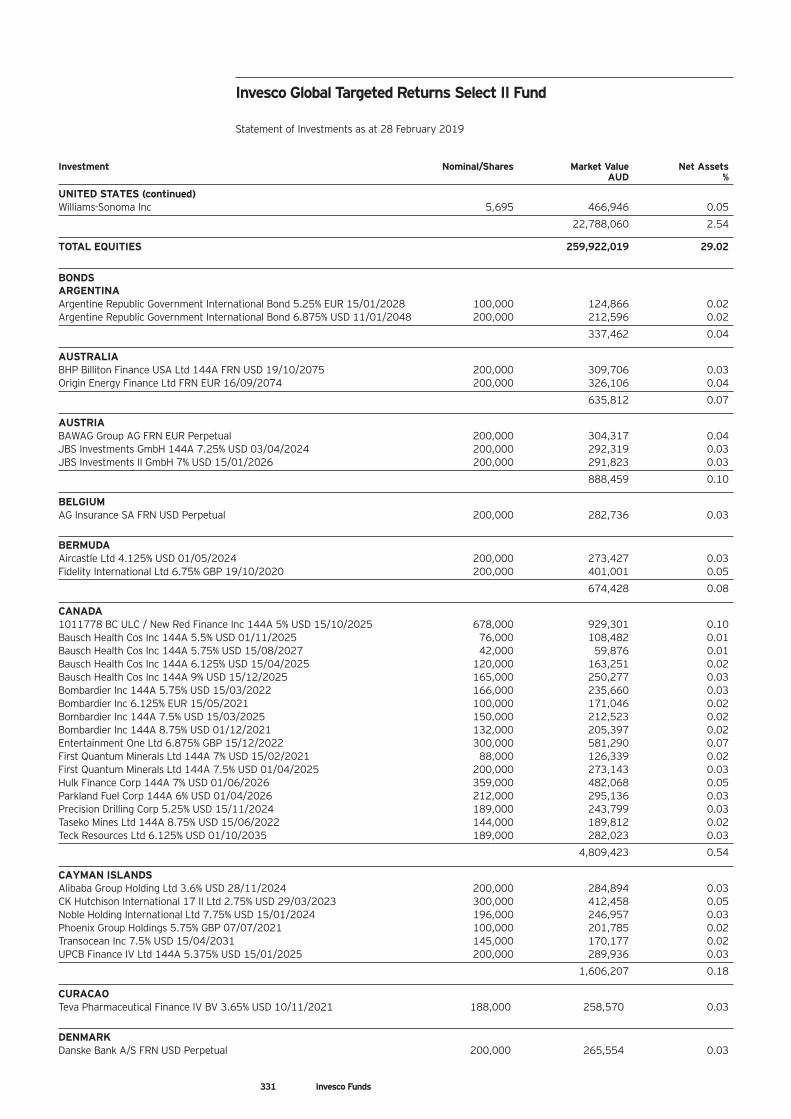
331 Invesco Funds
Investment Nominal/Shares Market Value Net Assets AUD %
UNITED STATES (continued) Williams-Sonoma Inc 5,695 466,946 0.05
22,788,060 2.54
TOTAL EQUITIES 259,922,019 29.02
BONDS ARGENTINA Argentine Republic Government International Bond 5.25% EUR 15/01/2028 100,000 124,866 0.02 Argentine Republic Government International Bond 6.875% USD 11/01/2048 200,000 212,596 0.02
337,462 0.04
AUSTRALIA BHP Billiton Finance USA Ltd 144A FRN USD 19/10/2075 200,000 309,706 0.03 Origin Energy Finance Ltd FRN EUR 16/09/2074 200,000 326,106 0.04
635,812 0.07
AUSTRIA BAWAG Group AG FRN EUR Perpetual 200,000 304,317 0.04 JBS Investments GmbH 144A 7.25% USD 03/04/2024 200,000 292,319 0.03 JBS Investments II GmbH 7% USD 15/01/2026 200,000 291,823 0.03
888,459 0.10
BELGIUM AG Insurance SA FRN USD Perpetual 200,000 282,736 0.03
BERMUDA Aircastle Ltd 4.125% USD 01/05/2024 200,000 273,427 0.03 Fidelity International Ltd 6.75% GBP 19/10/2020 200,000 401,001 0.05
674,428 0.08
CANADA 1011778 BC ULC / New Red Finance Inc 144A 5% USD 15/10/2025 678,000 929,301 0.10 Bausch Health Cos Inc 144A 5.5% USD 01/11/2025 76,000 108,482 0.01 Bausch Health Cos Inc 144A 5.75% USD 15/08/2027 42,000 59,876 0.01 Bausch Health Cos Inc 144A 6.125% USD 15/04/2025 120,000 163,251 0.02 Bausch Health Cos Inc 144A 9% USD 15/12/2025 165,000 250,277 0.03 Bombardier Inc 144A 5.75% USD 15/03/2022 166,000 235,660 0.03 Bombardier Inc 6.125% EUR 15/05/2021 100,000 171,046 0.02 Bombardier Inc 144A 7.5% USD 15/03/2025 150,000 212,523 0.02 Bombardier Inc 144A 8.75% USD 01/12/2021 132,000 205,397 0.02 Entertainment One Ltd 6.875% GBP 15/12/2022 300,000 581,290 0.07 First Quantum Minerals Ltd 144A 7% USD 15/02/2021 88,000 126,339 0.02 First Quantum Minerals Ltd 144A 7.5% USD 01/04/2025 200,000 273,143 0.03 Hulk Finance Corp 144A 7% USD 01/06/2026 359,000 482,068 0.05 Parkland Fuel Corp 144A 6% USD 01/04/2026 212,000 295,136 0.03 Precision Drilling Corp 5.25% USD 15/11/2024 189,000 243,799 0.03 Taseko Mines Ltd 144A 8.75% USD 15/06/2022 144,000 189,812 0.02 Teck Resources Ltd 6.125% USD 01/10/2035 189,000 282,023 0.03
4,809,423 0.54
CAYMAN ISLANDS Alibaba Group Holding Ltd 3.6% USD 28/11/2024 200,000 284,894 0.03 CK Hutchison International 17 II Ltd 2.75% USD 29/03/2023 300,000 412,458 0.05 Noble Holding International Ltd 7.75% USD 15/01/2024 196,000 246,957 0.03 Phoenix Group Holdings 5.75% GBP 07/07/2021 100,000 201,785 0.02 Transocean Inc 7.5% USD 15/04/2031 145,000 170,177 0.02 UPCB Finance IV Ltd 144A 5.375% USD 15/01/2025 200,000 289,936 0.03
1,606,207 0.18
CURACAO Teva Pharmaceutical Finance IV BV 3.65% USD 10/11/2021 188,000 258,570 0.03
DENMARK Danske Bank A/S FRN USD Perpetual 200,000 265,554 0.03
Invesco Global Targeted Returns Select II Fund Statement of Investments as at 28 February 2019
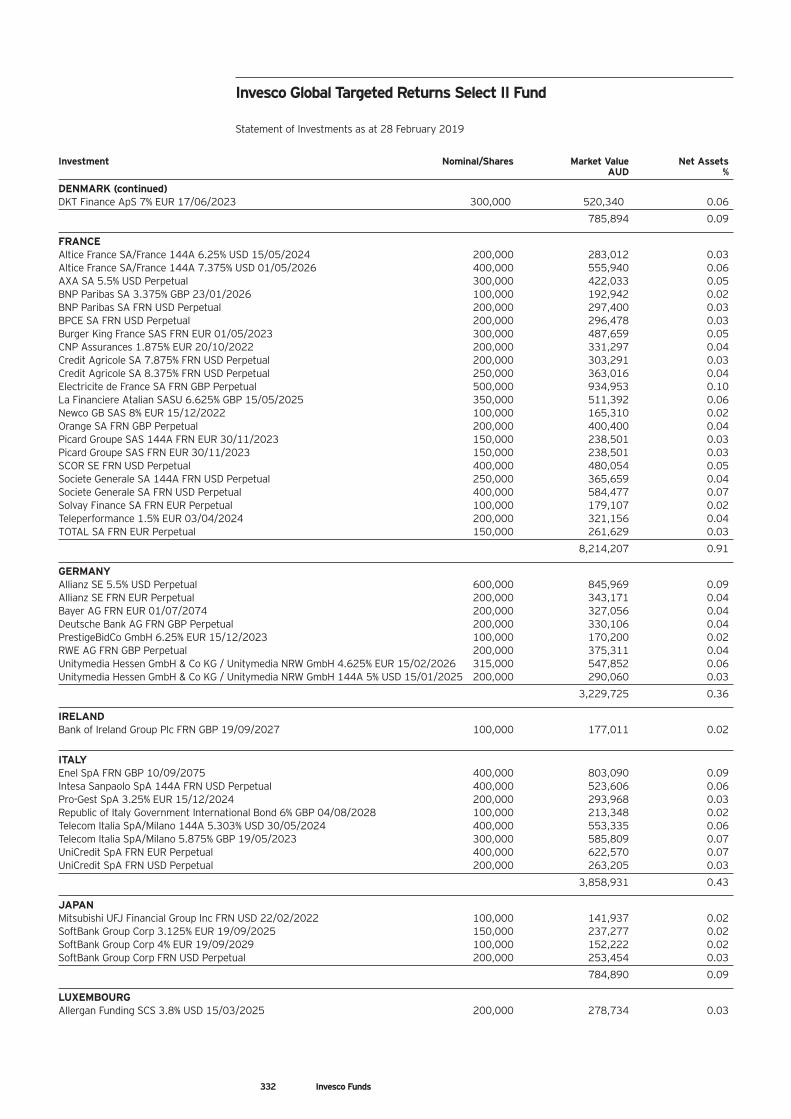
332 Invesco Funds
Investment Nominal/Shares Market Value Net Assets AUD %
DENMARK (continued) DKT Finance ApS 7% EUR 17/06/2023 300,000 520,340 0.06
785,894 0.09
FRANCE Altice France SA/France 144A 6.25% USD 15/05/2024 200,000 283,012 0.03 Altice France SA/France 144A 7.375% USD 01/05/2026 400,000 555,940 0.06 AXA SA 5.5% USD Perpetual 300,000 422,033 0.05 BNP Paribas SA 3.375% GBP 23/01/2026 100,000 192,942 0.02 BNP Paribas SA FRN USD Perpetual 200,000 297,400 0.03 BPCE SA FRN USD Perpetual 200,000 296,478 0.03 Burger King France SAS FRN EUR 01/05/2023 300,000 487,659 0.05 CNP Assurances 1.875% EUR 20/10/2022 200,000 331,297 0.04 Credit Agricole SA 7.875% FRN USD Perpetual 200,000 303,291 0.03 Credit Agricole SA 8.375% FRN USD Perpetual 250,000 363,016 0.04 Electricite de France SA FRN GBP Perpetual 500,000 934,953 0.10 La Financiere Atalian SASU 6.625% GBP 15/05/2025 350,000 511,392 0.06 Newco GB SAS 8% EUR 15/12/2022 100,000 165,310 0.02 Orange SA FRN GBP Perpetual 200,000 400,400 0.04 Picard Groupe SAS 144A FRN EUR 30/11/2023 150,000 238,501 0.03 Picard Groupe SAS FRN EUR 30/11/2023 150,000 238,501 0.03 SCOR SE FRN USD Perpetual 400,000 480,054 0.05 Societe Generale SA 144A FRN USD Perpetual 250,000 365,659 0.04 Societe Generale SA FRN USD Perpetual 400,000 584,477 0.07 Solvay Finance SA FRN EUR Perpetual 100,000 179,107 0.02 Teleperformance 1.5% EUR 03/04/2024 200,000 321,156 0.04 TOTAL SA FRN EUR Perpetual 150,000 261,629 0.03
8,214,207 0.91
GERMANY Allianz SE 5.5% USD Perpetual 600,000 845,969 0.09 Allianz SE FRN EUR Perpetual 200,000 343,171 0.04 Bayer AG FRN EUR 01/07/2074 200,000 327,056 0.04 Deutsche Bank AG FRN GBP Perpetual 200,000 330,106 0.04 PrestigeBidCo GmbH 6.25% EUR 15/12/2023 100,000 170,200 0.02 RWE AG FRN GBP Perpetual 200,000 375,311 0.04 Unitymedia Hessen GmbH & Co KG / Unitymedia NRW GmbH 4.625% EUR 15/02/2026 315,000 547,852 0.06 Unitymedia Hessen GmbH & Co KG / Unitymedia NRW GmbH 144A 5% USD 15/01/2025 200,000 290,060 0.03
3,229,725 0.36
IRELAND Bank of Ireland Group Plc FRN GBP 19/09/2027 100,000 177,011 0.02
ITALY Enel SpA FRN GBP 10/09/2075 400,000 803,090 0.09 Intesa Sanpaolo SpA 144A FRN USD Perpetual 400,000 523,606 0.06 Pro-Gest SpA 3.25% EUR 15/12/2024 200,000 293,968 0.03 Republic of Italy Government International Bond 6% GBP 04/08/2028 100,000 213,348 0.02 Telecom Italia SpA/Milano 144A 5.303% USD 30/05/2024 400,000 553,335 0.06 Telecom Italia SpA/Milano 5.875% GBP 19/05/2023 300,000 585,809 0.07 UniCredit SpA FRN EUR Perpetual 400,000 622,570 0.07 UniCredit SpA FRN USD Perpetual 200,000 263,205 0.03
3,858,931 0.43
JAPAN Mitsubishi UFJ Financial Group Inc FRN USD 22/02/2022 100,000 141,937 0.02 SoftBank Group Corp 3.125% EUR 19/09/2025 150,000 237,277 0.02 SoftBank Group Corp 4% EUR 19/09/2029 100,000 152,222 0.02 SoftBank Group Corp FRN USD Perpetual 200,000 253,454 0.03
784,890 0.09
LUXEMBOURG Allergan Funding SCS 3.8% USD 15/03/2025 200,000 278,734 0.03
Invesco Global Targeted Returns Select II Fund Statement of Investments as at 28 February 2019
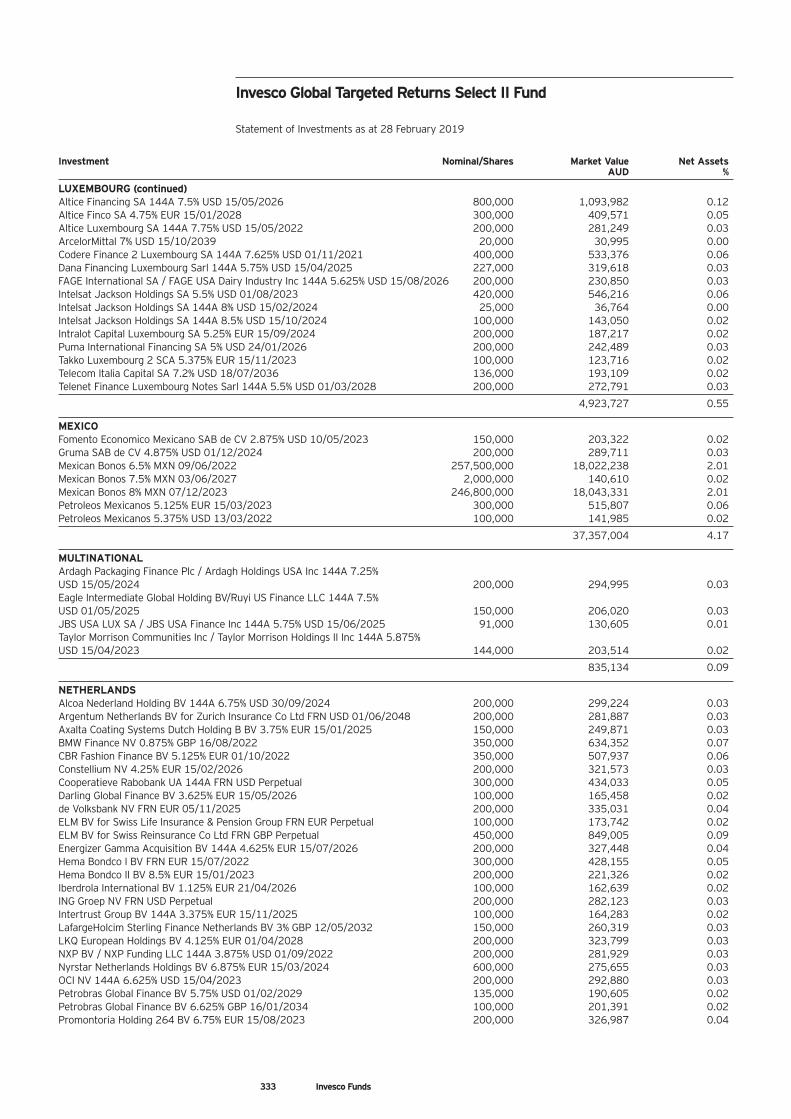
333 Invesco Funds
Investment Nominal/Shares Market Value Net Assets AUD %
LUXEMBOURG (continued) Altice Financing SA 144A 7.5% USD 15/05/2026 800,000 1,093,982 0.12 Altice Finco SA 4.75% EUR 15/01/2028 300,000 409,571 0.05 Altice Luxembourg SA 144A 7.75% USD 15/05/2022 200,000 281,249 0.03 ArcelorMittal 7% USD 15/10/2039 20,000 30,995 0.00 Codere Finance 2 Luxembourg SA 144A 7.625% USD 01/11/2021 400,000 533,376 0.06 Dana Financing Luxembourg Sarl 144A 5.75% USD 15/04/2025 227,000 319,618 0.03 FAGE International SA / FAGE USA Dairy Industry Inc 144A 5.625% USD 15/08/2026 200,000 230,850 0.03 Intelsat Jackson Holdings SA 5.5% USD 01/08/2023 420,000 546,216 0.06 Intelsat Jackson Holdings SA 144A 8% USD 15/02/2024 25,000 36,764 0.00 Intelsat Jackson Holdings SA 144A 8.5% USD 15/10/2024 100,000 143,050 0.02 Intralot Capital Luxembourg SA 5.25% EUR 15/09/2024 200,000 187,217 0.02 Puma International Financing SA 5% USD 24/01/2026 200,000 242,489 0.03 Takko Luxembourg 2 SCA 5.375% EUR 15/11/2023 100,000 123,716 0.02 Telecom Italia Capital SA 7.2% USD 18/07/2036 136,000 193,109 0.02 Telenet Finance Luxembourg Notes Sarl 144A 5.5% USD 01/03/2028 200,000 272,791 0.03
4,923,727 0.55
MEXICO Fomento Economico Mexicano SAB de CV 2.875% USD 10/05/2023 150,000 203,322 0.02 Gruma SAB de CV 4.875% USD 01/12/2024 200,000 289,711 0.03 Mexican Bonos 6.5% MXN 09/06/2022 257,500,000 18,022,238 2.01 Mexican Bonos 7.5% MXN 03/06/2027 2,000,000 140,610 0.02 Mexican Bonos 8% MXN 07/12/2023 246,800,000 18,043,331 2.01 Petroleos Mexicanos 5.125% EUR 15/03/2023 300,000 515,807 0.06 Petroleos Mexicanos 5.375% USD 13/03/2022 100,000 141,985 0.02
37,357,004 4.17
MULTINATIONAL Ardagh Packaging Finance Plc / Ardagh Holdings USA Inc 144A 7.25% USD 15/05/2024 200,000 294,995 0.03 Eagle Intermediate Global Holding BV/Ruyi US Finance LLC 144A 7.5% USD 01/05/2025 150,000 206,020 0.03 JBS USA LUX SA / JBS USA Finance Inc 144A 5.75% USD 15/06/2025 91,000 130,605 0.01 Taylor Morrison Communities Inc / Taylor Morrison Holdings II Inc 144A 5.875% USD 15/04/2023 144,000 203,514 0.02
835,134 0.09
NETHERLANDS Alcoa Nederland Holding BV 144A 6.75% USD 30/09/2024 200,000 299,224 0.03 Argentum Netherlands BV for Zurich Insurance Co Ltd FRN USD 01/06/2048 200,000 281,887 0.03 Axalta Coating Systems Dutch Holding B BV 3.75% EUR 15/01/2025 150,000 249,871 0.03 BMW Finance NV 0.875% GBP 16/08/2022 350,000 634,352 0.07 CBR Fashion Finance BV 5.125% EUR 01/10/2022 350,000 507,937 0.06 Constellium NV 4.25% EUR 15/02/2026 200,000 321,573 0.03 Cooperatieve Rabobank UA 144A FRN USD Perpetual 300,000 434,033 0.05 Darling Global Finance BV 3.625% EUR 15/05/2026 100,000 165,458 0.02 de Volksbank NV FRN EUR 05/11/2025 200,000 335,031 0.04 ELM BV for Swiss Life Insurance & Pension Group FRN EUR Perpetual 100,000 173,742 0.02 ELM BV for Swiss Reinsurance Co Ltd FRN GBP Perpetual 450,000 849,005 0.09 Energizer Gamma Acquisition BV 144A 4.625% EUR 15/07/2026 200,000 327,448 0.04 Hema Bondco I BV FRN EUR 15/07/2022 300,000 428,155 0.05 Hema Bondco II BV 8.5% EUR 15/01/2023 200,000 221,326 0.02 Iberdrola International BV 1.125% EUR 21/04/2026 100,000 162,639 0.02 ING Groep NV FRN USD Perpetual 200,000 282,123 0.03 Intertrust Group BV 144A 3.375% EUR 15/11/2025 100,000 164,283 0.02 LafargeHolcim Sterling Finance Netherlands BV 3% GBP 12/05/2032 150,000 260,319 0.03 LKQ European Holdings BV 4.125% EUR 01/04/2028 200,000 323,799 0.03 NXP BV / NXP Funding LLC 144A 3.875% USD 01/09/2022 200,000 281,929 0.03 Nyrstar Netherlands Holdings BV 6.875% EUR 15/03/2024 600,000 275,655 0.03 OCI NV 144A 6.625% USD 15/04/2023 200,000 292,880 0.03 Petrobras Global Finance BV 5.75% USD 01/02/2029 135,000 190,605 0.02 Petrobras Global Finance BV 6.625% GBP 16/01/2034 100,000 201,391 0.02 Promontoria Holding 264 BV 6.75% EUR 15/08/2023 200,000 326,987 0.04
Invesco Global Targeted Returns Select II Fund Statement of Investments as at 28 February 2019
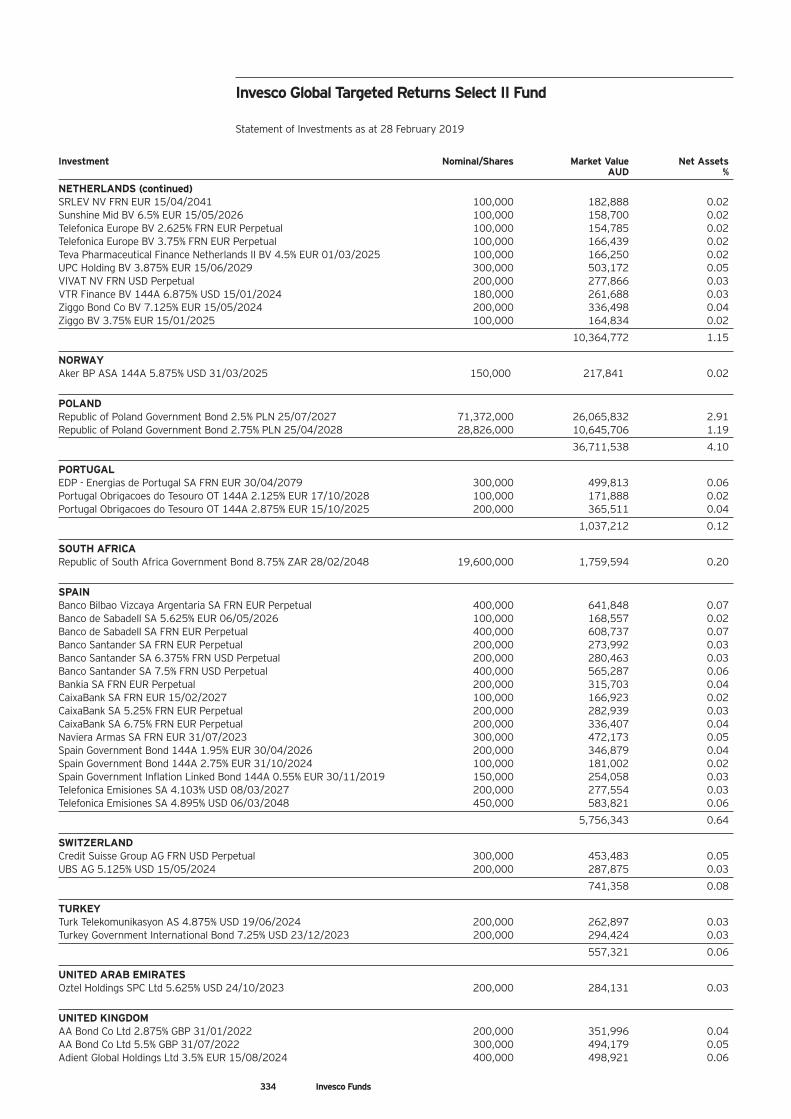
334 Invesco Funds
Investment Nominal/Shares Market Value Net Assets AUD %
NETHERLANDS (continued) SRLEV NV FRN EUR 15/04/2041 100,000 182,888 0.02 Sunshine Mid BV 6.5% EUR 15/05/2026 100,000 158,700 0.02 Telefonica Europe BV 2.625% FRN EUR Perpetual 100,000 154,785 0.02 Telefonica Europe BV 3.75% FRN EUR Perpetual 100,000 166,439 0.02 Teva Pharmaceutical Finance Netherlands II BV 4.5% EUR 01/03/2025 100,000 166,250 0.02 UPC Holding BV 3.875% EUR 15/06/2029 300,000 503,172 0.05 VIVAT NV FRN USD Perpetual 200,000 277,866 0.03 VTR Finance BV 144A 6.875% USD 15/01/2024 180,000 261,688 0.03 Ziggo Bond Co BV 7.125% EUR 15/05/2024 200,000 336,498 0.04 Ziggo BV 3.75% EUR 15/01/2025 100,000 164,834 0.02
10,364,772 1.15
NORWAY Aker BP ASA 144A 5.875% USD 31/03/2025 150,000 217,841 0.02
POLAND Republic of Poland Government Bond 2.5% PLN 25/07/2027 71,372,000 26,065,832 2.91 Republic of Poland Government Bond 2.75% PLN 25/04/2028 28,826,000 10,645,706 1.19
36,711,538 4.10
PORTUGAL EDP - Energias de Portugal SA FRN EUR 30/04/2079 300,000 499,813 0.06 Portugal Obrigacoes do Tesouro OT 144A 2.125% EUR 17/10/2028 100,000 171,888 0.02 Portugal Obrigacoes do Tesouro OT 144A 2.875% EUR 15/10/2025 200,000 365,511 0.04
1,037,212 0.12
SOUTH AFRICA Republic of South Africa Government Bond 8.75% ZAR 28/02/2048 19,600,000 1,759,594 0.20
SPAIN Banco Bilbao Vizcaya Argentaria SA FRN EUR Perpetual 400,000 641,848 0.07 Banco de Sabadell SA 5.625% EUR 06/05/2026 100,000 168,557 0.02 Banco de Sabadell SA FRN EUR Perpetual 400,000 608,737 0.07 Banco Santander SA FRN EUR Perpetual 200,000 273,992 0.03 Banco Santander SA 6.375% FRN USD Perpetual 200,000 280,463 0.03 Banco Santander SA 7.5% FRN USD Perpetual 400,000 565,287 0.06 Bankia SA FRN EUR Perpetual 200,000 315,703 0.04 CaixaBank SA FRN EUR 15/02/2027 100,000 166,923 0.02 CaixaBank SA 5.25% FRN EUR Perpetual 200,000 282,939 0.03 CaixaBank SA 6.75% FRN EUR Perpetual 200,000 336,407 0.04 Naviera Armas SA FRN EUR 31/07/2023 300,000 472,173 0.05 Spain Government Bond 144A 1.95% EUR 30/04/2026 200,000 346,879 0.04 Spain Government Bond 144A 2.75% EUR 31/10/2024 100,000 181,002 0.02 Spain Government Inflation Linked Bond 144A 0.55% EUR 30/11/2019 150,000 254,058 0.03 Telefonica Emisiones SA 4.103% USD 08/03/2027 200,000 277,554 0.03 Telefonica Emisiones SA 4.895% USD 06/03/2048 450,000 583,821 0.06
5,756,343 0.64
SWITZERLAND Credit Suisse Group AG FRN USD Perpetual 300,000 453,483 0.05 UBS AG 5.125% USD 15/05/2024 200,000 287,875 0.03
741,358 0.08
TURKEY Turk Telekomunikasyon AS 4.875% USD 19/06/2024 200,000 262,897 0.03 Turkey Government International Bond 7.25% USD 23/12/2023 200,000 294,424 0.03
557,321 0.06
UNITED ARAB EMIRATES Oztel Holdings SPC Ltd 5.625% USD 24/10/2023 200,000 284,131 0.03
UNITED KINGDOM AA Bond Co Ltd 2.875% GBP 31/01/2022 200,000 351,996 0.04 AA Bond Co Ltd 5.5% GBP 31/07/2022 300,000 494,179 0.05 Adient Global Holdings Ltd 3.5% EUR 15/08/2024 400,000 498,921 0.06
Invesco Global Targeted Returns Select II Fund Statement of Investments as at 28 February 2019
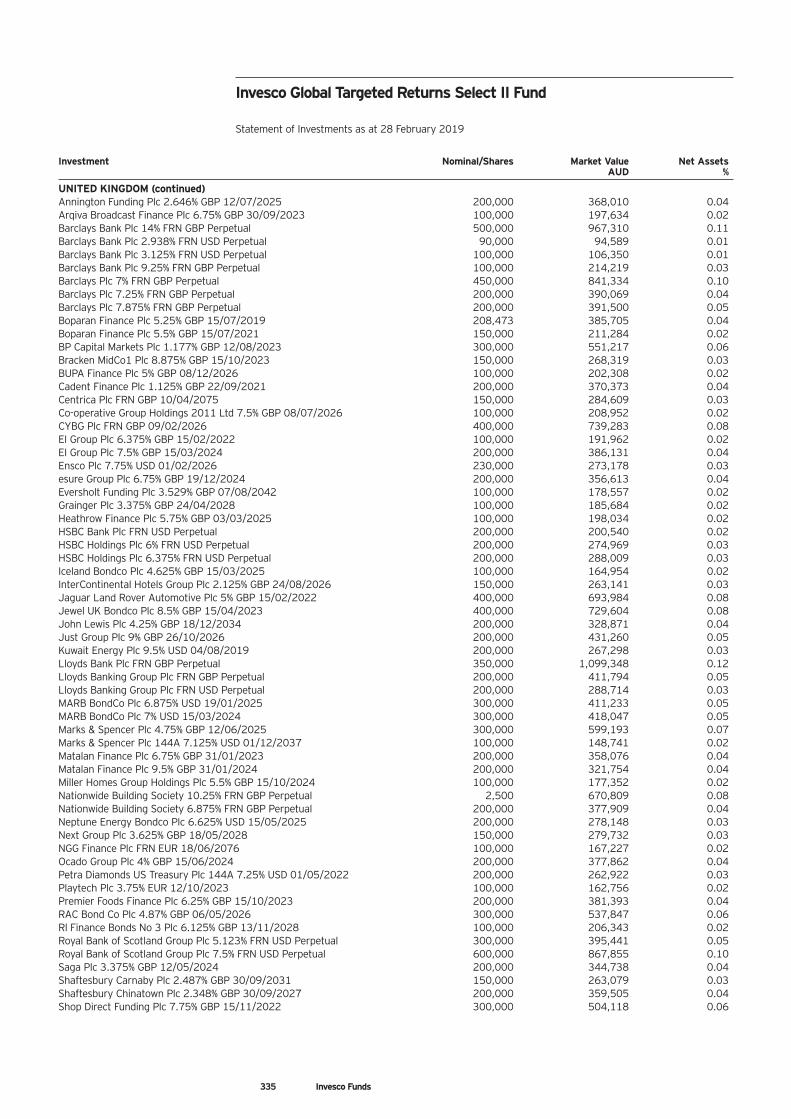
335 Invesco Funds
Investment Nominal/Shares Market Value Net Assets AUD %
UNITED KINGDOM (continued) Annington Funding Plc 2.646% GBP 12/07/2025 200,000 368,010 0.04 Arqiva Broadcast Finance Plc 6.75% GBP 30/09/2023 100,000 197,634 0.02 Barclays Bank Plc 14% FRN GBP Perpetual 500,000 967,310 0.11 Barclays Bank Plc 2.938% FRN USD Perpetual 90,000 94,589 0.01 Barclays Bank Plc 3.125% FRN USD Perpetual 100,000 106,350 0.01 Barclays Bank Plc 9.25% FRN GBP Perpetual 100,000 214,219 0.03 Barclays Plc 7% FRN GBP Perpetual 450,000 841,334 0.10 Barclays Plc 7.25% FRN GBP Perpetual 200,000 390,069 0.04 Barclays Plc 7.875% FRN GBP Perpetual 200,000 391,500 0.05 Boparan Finance Plc 5.25% GBP 15/07/2019 208,473 385,705 0.04 Boparan Finance Plc 5.5% GBP 15/07/2021 150,000 211,284 0.02 BP Capital Markets Plc 1.177% GBP 12/08/2023 300,000 551,217 0.06 Bracken MidCo1 Plc 8.875% GBP 15/10/2023 150,000 268,319 0.03 BUPA Finance Plc 5% GBP 08/12/2026 100,000 202,308 0.02 Cadent Finance Plc 1.125% GBP 22/09/2021 200,000 370,373 0.04 Centrica Plc FRN GBP 10/04/2075 150,000 284,609 0.03 Co-operative Group Holdings 2011 Ltd 7.5% GBP 08/07/2026 100,000 208,952 0.02 CYBG Plc FRN GBP 09/02/2026 400,000 739,283 0.08 EI Group Plc 6.375% GBP 15/02/2022 100,000 191,962 0.02 EI Group Plc 7.5% GBP 15/03/2024 200,000 386,131 0.04 Ensco Plc 7.75% USD 01/02/2026 230,000 273,178 0.03 esure Group Plc 6.75% GBP 19/12/2024 200,000 356,613 0.04 Eversholt Funding Plc 3.529% GBP 07/08/2042 100,000 178,557 0.02 Grainger Plc 3.375% GBP 24/04/2028 100,000 185,684 0.02 Heathrow Finance Plc 5.75% GBP 03/03/2025 100,000 198,034 0.02 HSBC Bank Plc FRN USD Perpetual 200,000 200,540 0.02 HSBC Holdings Plc 6% FRN USD Perpetual 200,000 274,969 0.03 HSBC Holdings Plc 6.375% FRN USD Perpetual 200,000 288,009 0.03 Iceland Bondco Plc 4.625% GBP 15/03/2025 100,000 164,954 0.02 InterContinental Hotels Group Plc 2.125% GBP 24/08/2026 150,000 263,141 0.03 Jaguar Land Rover Automotive Plc 5% GBP 15/02/2022 400,000 693,984 0.08 Jewel UK Bondco Plc 8.5% GBP 15/04/2023 400,000 729,604 0.08 John Lewis Plc 4.25% GBP 18/12/2034 200,000 328,871 0.04 Just Group Plc 9% GBP 26/10/2026 200,000 431,260 0.05 Kuwait Energy Plc 9.5% USD 04/08/2019 200,000 267,298 0.03 Lloyds Bank Plc FRN GBP Perpetual 350,000 1,099,348 0.12 Lloyds Banking Group Plc FRN GBP Perpetual 200,000 411,794 0.05 Lloyds Banking Group Plc FRN USD Perpetual 200,000 288,714 0.03 MARB BondCo Plc 6.875% USD 19/01/2025 300,000 411,233 0.05 MARB BondCo Plc 7% USD 15/03/2024 300,000 418,047 0.05 Marks & Spencer Plc 4.75% GBP 12/06/2025 300,000 599,193 0.07 Marks & Spencer Plc 144A 7.125% USD 01/12/2037 100,000 148,741 0.02 Matalan Finance Plc 6.75% GBP 31/01/2023 200,000 358,076 0.04 Matalan Finance Plc 9.5% GBP 31/01/2024 200,000 321,754 0.04 Miller Homes Group Holdings Plc 5.5% GBP 15/10/2024 100,000 177,352 0.02 Nationwide Building Society 10.25% FRN GBP Perpetual 2,500 670,809 0.08 Nationwide Building Society 6.875% FRN GBP Perpetual 200,000 377,909 0.04 Neptune Energy Bondco Plc 6.625% USD 15/05/2025 200,000 278,148 0.03 Next Group Plc 3.625% GBP 18/05/2028 150,000 279,732 0.03 NGG Finance Plc FRN EUR 18/06/2076 100,000 167,227 0.02 Ocado Group Plc 4% GBP 15/06/2024 200,000 377,862 0.04 Petra Diamonds US Treasury Plc 144A 7.25% USD 01/05/2022 200,000 262,922 0.03 Playtech Plc 3.75% EUR 12/10/2023 100,000 162,756 0.02 Premier Foods Finance Plc 6.25% GBP 15/10/2023 200,000 381,393 0.04 RAC Bond Co Plc 4.87% GBP 06/05/2026 300,000 537,847 0.06 Rl Finance Bonds No 3 Plc 6.125% GBP 13/11/2028 100,000 206,343 0.02 Royal Bank of Scotland Group Plc 5.123% FRN USD Perpetual 300,000 395,441 0.05 Royal Bank of Scotland Group Plc 7.5% FRN USD Perpetual 600,000 867,855 0.10 Saga Plc 3.375% GBP 12/05/2024 200,000 344,738 0.04 Shaftesbury Carnaby Plc 2.487% GBP 30/09/2031 150,000 263,079 0.03 Shaftesbury Chinatown Plc 2.348% GBP 30/09/2027 200,000 359,505 0.04 Shop Direct Funding Plc 7.75% GBP 15/11/2022 300,000 504,118 0.06
Invesco Global Targeted Returns Select II Fund Statement of Investments as at 28 February 2019
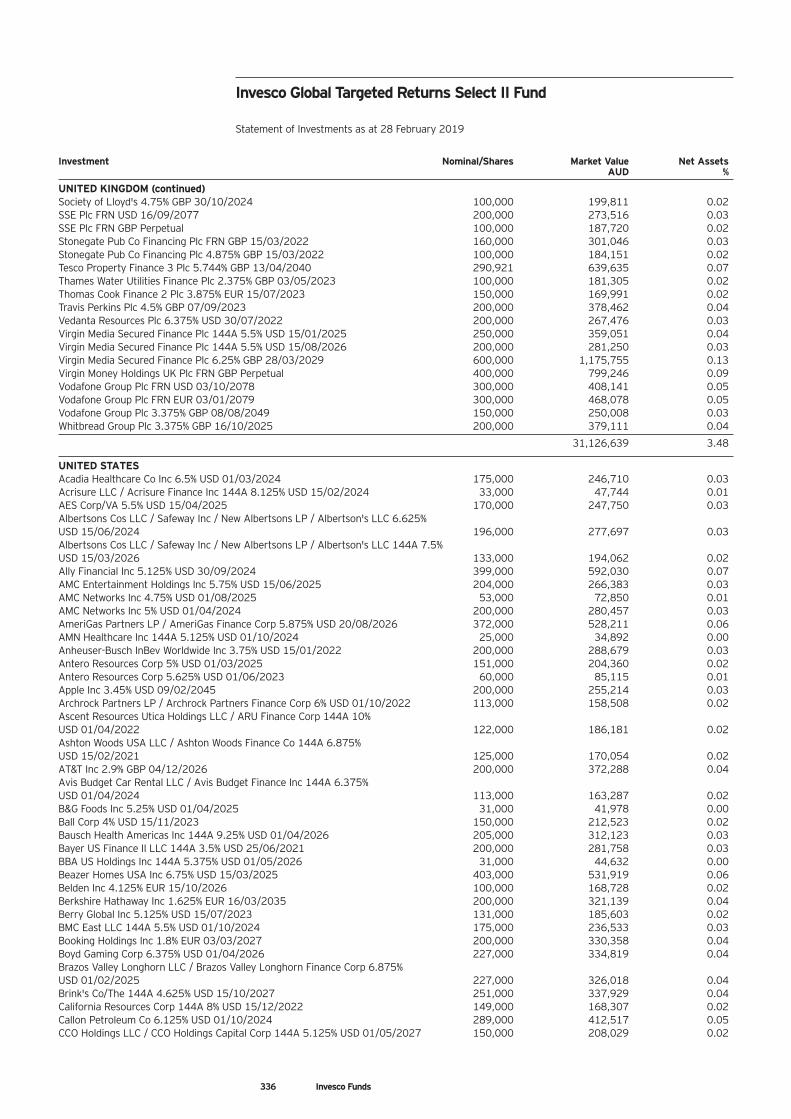
Investment Nominal/Shares Market Value Net Assets AUD %
UNITED KINGDOM (continued) Society of Lloyd's 4.75% GBP 30/10/2024 100,000 199,811 0.02 SSE Plc FRN USD 16/09/2077 200,000 273,516 0.03 SSE Plc FRN GBP Perpetual 100,000 187,720 0.02 Stonegate Pub Co Financing Plc FRN GBP 15/03/2022 160,000 301,046 0.03 Stonegate Pub Co Financing Plc 4.875% GBP 15/03/2022 100,000 184,151 0.02 Tesco Property Finance 3 Plc 5.744% GBP 13/04/2040 290,921 639,635 0.07 Thames Water Utilities Finance Plc 2.375% GBP 03/05/2023 100,000 181,305 0.02 Thomas Cook Finance 2 Plc 3.875% EUR 15/07/2023 150,000 169,991 0.02 Travis Perkins Plc 4.5% GBP 07/09/2023 200,000 378,462 0.04 Vedanta Resources Plc 6.375% USD 30/07/2022 200,000 267,476 0.03 Virgin Media Secured Finance Plc 144A 5.5% USD 15/01/2025 250,000 359,051 0.04 Virgin Media Secured Finance Plc 144A 5.5% USD 15/08/2026 200,000 281,250 0.03 Virgin Media Secured Finance Plc 6.25% GBP 28/03/2029 600,000 1,175,755 0.13 Virgin Money Holdings UK Plc FRN GBP Perpetual 400,000 799,246 0.09 Vodafone Group Plc FRN USD 03/10/2078 300,000 408,141 0.05 Vodafone Group Plc FRN EUR 03/01/2079 300,000 468,078 0.05 Vodafone Group Plc 3.375% GBP 08/08/2049 150,000 250,008 0.03 Whitbread Group Plc 3.375% GBP 16/10/2025 200,000 379,111 0.04
31,126,639 3.48
UNITED STATES Acadia Healthcare Co Inc 6.5% USD 01/03/2024 175,000 246,710 0.03 Acrisure LLC / Acrisure Finance Inc 144A 8.125% USD 15/02/2024 33,000 47,744 0.01 AES Corp/VA 5.5% USD 15/04/2025 170,000 247,750 0.03 Albertsons Cos LLC / Safeway Inc / New Albertsons LP / Albertson's LLC 6.625% USD 15/06/2024 196,000 277,697 0.03 Albertsons Cos LLC / Safeway Inc / New Albertsons LP / Albertson's LLC 144A 7.5% USD 15/03/2026 133,000 194,062 0.02 Ally Financial Inc 5.125% USD 30/09/2024 399,000 592,030 0.07 AMC Entertainment Holdings Inc 5.75% USD 15/06/2025 204,000 266,383 0.03 AMC Networks Inc 4.75% USD 01/08/2025 53,000 72,850 0.01 AMC Networks Inc 5% USD 01/04/2024 200,000 280,457 0.03 AmeriGas Partners LP / AmeriGas Finance Corp 5.875% USD 20/08/2026 372,000 528,211 0.06 AMN Healthcare Inc 144A 5.125% USD 01/10/2024 25,000 34,892 0.00 Anheuser-Busch InBev Worldwide Inc 3.75% USD 15/01/2022 200,000 288,679 0.03 Antero Resources Corp 5% USD 01/03/2025 151,000 204,360 0.02 Antero Resources Corp 5.625% USD 01/06/2023 60,000 85,115 0.01 Apple Inc 3.45% USD 09/02/2045 200,000 255,214 0.03 Archrock Partners LP / Archrock Partners Finance Corp 6% USD 01/10/2022 113,000 158,508 0.02 Ascent Resources Utica Holdings LLC / ARU Finance Corp 144A 10% USD 01/04/2022 122,000 186,181 0.02 Ashton Woods USA LLC / Ashton Woods Finance Co 144A 6.875% USD 15/02/2021 125,000 170,054 0.02 AT&T Inc 2.9% GBP 04/12/2026 200,000 372,288 0.04 Avis Budget Car Rental LLC / Avis Budget Finance Inc 144A 6.375% USD 01/04/2024 113,000 163,287 0.02 B&G Foods Inc 5.25% USD 01/04/2025 31,000 41,978 0.00 Ball Corp 4% USD 15/11/2023 150,000 212,523 0.02 Bausch Health Americas Inc 144A 9.25% USD 01/04/2026 205,000 312,123 0.03 Bayer US Finance II LLC 144A 3.5% USD 25/06/2021 200,000 281,758 0.03 BBA US Holdings Inc 144A 5.375% USD 01/05/2026 31,000 44,632 0.00 Beazer Homes USA Inc 6.75% USD 15/03/2025 403,000 531,919 0.06 Belden Inc 4.125% EUR 15/10/2026 100,000 168,728 0.02 Berkshire Hathaway Inc 1.625% EUR 16/03/2035 200,000 321,139 0.04 Berry Global Inc 5.125% USD 15/07/2023 131,000 185,603 0.02 BMC East LLC 144A 5.5% USD 01/10/2024 175,000 236,533 0.03 Booking Holdings Inc 1.8% EUR 03/03/2027 200,000 330,358 0.04 Boyd Gaming Corp 6.375% USD 01/04/2026 227,000 334,819 0.04 Brazos Valley Longhorn LLC / Brazos Valley Longhorn Finance Corp 6.875% USD 01/02/2025 227,000 326,018 0.04 Brink's Co/The 144A 4.625% USD 15/10/2027 251,000 337,929 0.04 California Resources Corp 144A 8% USD 15/12/2022 149,000 168,307 0.02 Callon Petroleum Co 6.125% USD 01/10/2024 289,000 412,517 0.05 CCO Holdings LLC / CCO Holdings Capital Corp 144A 5.125% USD 01/05/2027 150,000 208,029 0.02
336 Invesco Funds
Invesco Global Targeted Returns Select II Fund Statement of Investments as at 28 February 2019
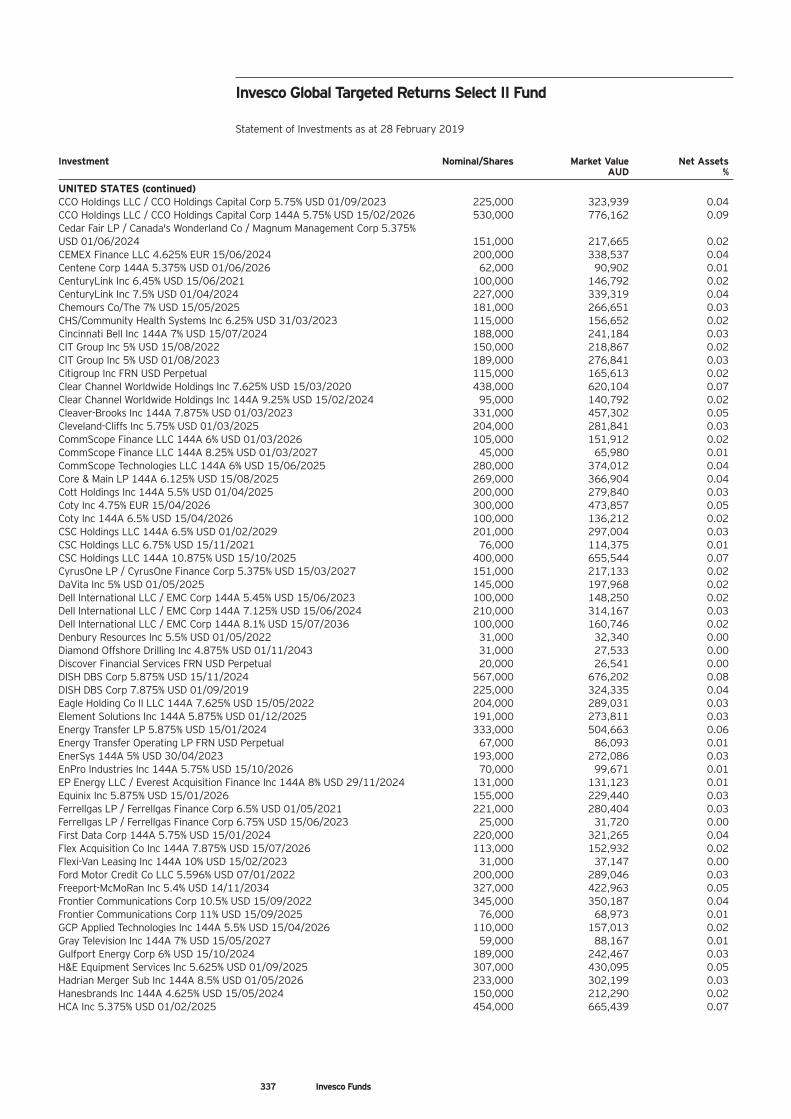
Investment Nominal/Shares Market Value Net Assets AUD %
UNITED STATES (continued) CCO Holdings LLC / CCO Holdings Capital Corp 5.75% USD 01/09/2023 225,000 323,939 0.04 CCO Holdings LLC / CCO Holdings Capital Corp 144A 5.75% USD 15/02/2026 530,000 776,162 0.09 Cedar Fair LP / Canada's Wonderland Co / Magnum Management Corp 5.375% USD 01/06/2024 151,000 217,665 0.02 CEMEX Finance LLC 4.625% EUR 15/06/2024 200,000 338,537 0.04 Centene Corp 144A 5.375% USD 01/06/2026 62,000 90,902 0.01 CenturyLink Inc 6.45% USD 15/06/2021 100,000 146,792 0.02 CenturyLink Inc 7.5% USD 01/04/2024 227,000 339,319 0.04 Chemours Co/The 7% USD 15/05/2025 181,000 266,651 0.03 CHS/Community Health Systems Inc 6.25% USD 31/03/2023 115,000 156,652 0.02 Cincinnati Bell Inc 144A 7% USD 15/07/2024 188,000 241,184 0.03 CIT Group Inc 5% USD 15/08/2022 150,000 218,867 0.02 CIT Group Inc 5% USD 01/08/2023 189,000 276,841 0.03 Citigroup Inc FRN USD Perpetual 115,000 165,613 0.02 Clear Channel Worldwide Holdings Inc 7.625% USD 15/03/2020 438,000 620,104 0.07 Clear Channel Worldwide Holdings Inc 144A 9.25% USD 15/02/2024 95,000 140,792 0.02 Cleaver-Brooks Inc 144A 7.875% USD 01/03/2023 331,000 457,302 0.05 Cleveland-Cliffs Inc 5.75% USD 01/03/2025 204,000 281,841 0.03 CommScope Finance LLC 144A 6% USD 01/03/2026 105,000 151,912 0.02 CommScope Finance LLC 144A 8.25% USD 01/03/2027 45,000 65,980 0.01 CommScope Technologies LLC 144A 6% USD 15/06/2025 280,000 374,012 0.04 Core & Main LP 144A 6.125% USD 15/08/2025 269,000 366,904 0.04 Cott Holdings Inc 144A 5.5% USD 01/04/2025 200,000 279,840 0.03 Coty Inc 4.75% EUR 15/04/2026 300,000 473,857 0.05 Coty Inc 144A 6.5% USD 15/04/2026 100,000 136,212 0.02 CSC Holdings LLC 144A 6.5% USD 01/02/2029 201,000 297,004 0.03 CSC Holdings LLC 6.75% USD 15/11/2021 76,000 114,375 0.01 CSC Holdings LLC 144A 10.875% USD 15/10/2025 400,000 655,544 0.07 CyrusOne LP / CyrusOne Finance Corp 5.375% USD 15/03/2027 151,000 217,133 0.02 DaVita Inc 5% USD 01/05/2025 145,000 197,968 0.02 Dell International LLC / EMC Corp 144A 5.45% USD 15/06/2023 100,000 148,250 0.02 Dell International LLC / EMC Corp 144A 7.125% USD 15/06/2024 210,000 314,167 0.03 Dell International LLC / EMC Corp 144A 8.1% USD 15/07/2036 100,000 160,746 0.02 Denbury Resources Inc 5.5% USD 01/05/2022 31,000 32,340 0.00 Diamond Offshore Drilling Inc 4.875% USD 01/11/2043 31,000 27,533 0.00 Discover Financial Services FRN USD Perpetual 20,000 26,541 0.00 DISH DBS Corp 5.875% USD 15/11/2024 567,000 676,202 0.08 DISH DBS Corp 7.875% USD 01/09/2019 225,000 324,335 0.04 Eagle Holding Co II LLC 144A 7.625% USD 15/05/2022 204,000 289,031 0.03 Element Solutions Inc 144A 5.875% USD 01/12/2025 191,000 273,811 0.03 Energy Transfer LP 5.875% USD 15/01/2024 333,000 504,663 0.06 Energy Transfer Operating LP FRN USD Perpetual 67,000 86,093 0.01 EnerSys 144A 5% USD 30/04/2023 193,000 272,086 0.03 EnPro Industries Inc 144A 5.75% USD 15/10/2026 70,000 99,671 0.01 EP Energy LLC / Everest Acquisition Finance Inc 144A 8% USD 29/11/2024 131,000 131,123 0.01 Equinix Inc 5.875% USD 15/01/2026 155,000 229,440 0.03 Ferrellgas LP / Ferrellgas Finance Corp 6.5% USD 01/05/2021 221,000 280,404 0.03 Ferrellgas LP / Ferrellgas Finance Corp 6.75% USD 15/06/2023 25,000 31,720 0.00 First Data Corp 144A 5.75% USD 15/01/2024 220,000 321,265 0.04 Flex Acquisition Co Inc 144A 7.875% USD 15/07/2026 113,000 152,932 0.02 Flexi-Van Leasing Inc 144A 10% USD 15/02/2023 31,000 37,147 0.00 Ford Motor Credit Co LLC 5.596% USD 07/01/2022 200,000 289,046 0.03 Freeport-McMoRan Inc 5.4% USD 14/11/2034 327,000 422,963 0.05 Frontier Communications Corp 10.5% USD 15/09/2022 345,000 350,187 0.04 Frontier Communications Corp 11% USD 15/09/2025 76,000 68,973 0.01 GCP Applied Technologies Inc 144A 5.5% USD 15/04/2026 110,000 157,013 0.02 Gray Television Inc 144A 7% USD 15/05/2027 59,000 88,167 0.01 Gulfport Energy Corp 6% USD 15/10/2024 189,000 242,467 0.03 H&E Equipment Services Inc 5.625% USD 01/09/2025 307,000 430,095 0.05 Hadrian Merger Sub Inc 144A 8.5% USD 01/05/2026 233,000 302,199 0.03 Hanesbrands Inc 144A 4.625% USD 15/05/2024 150,000 212,290 0.02 HCA Inc 5.375% USD 01/02/2025 454,000 665,439 0.07
337 Invesco Funds
Invesco Global Targeted Returns Select II Fund Statement of Investments as at 28 February 2019
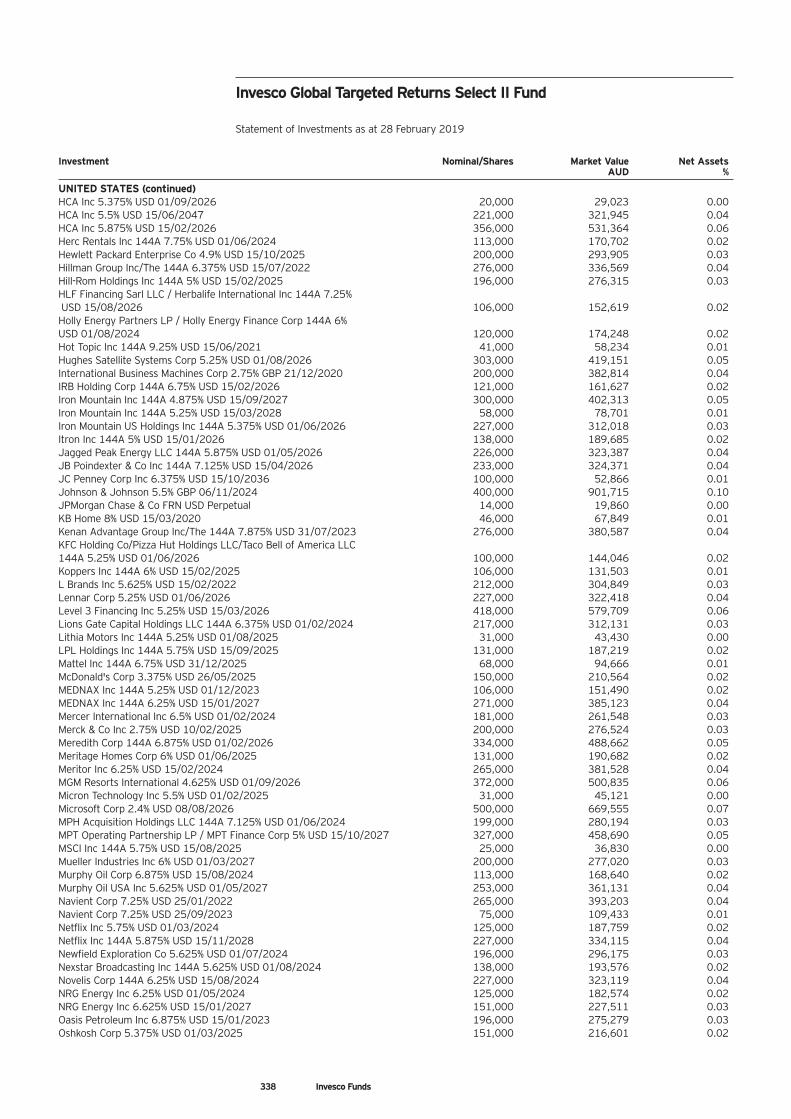
Investment Nominal/Shares Market Value Net Assets AUD %
UNITED STATES (continued) HCA Inc 5.375% USD 01/09/2026 20,000 29,023 0.00 HCA Inc 5.5% USD 15/06/2047 221,000 321,945 0.04 HCA Inc 5.875% USD 15/02/2026 356,000 531,364 0.06 Herc Rentals Inc 144A 7.75% USD 01/06/2024 113,000 170,702 0.02 Hewlett Packard Enterprise Co 4.9% USD 15/10/2025 200,000 293,905 0.03 Hillman Group Inc/The 144A 6.375% USD 15/07/2022 276,000 336,569 0.04 Hill-Rom Holdings Inc 144A 5% USD 15/02/2025 196,000 276,315 0.03 HLF Financing Sarl LLC / Herbalife International Inc 144A 7.25% USD 15/08/2026 106,000 152,619 0.02 Holly Energy Partners LP / Holly Energy Finance Corp 144A 6% USD 01/08/2024 120,000 174,248 0.02 Hot Topic Inc 144A 9.25% USD 15/06/2021 41,000 58,234 0.01 Hughes Satellite Systems Corp 5.25% USD 01/08/2026 303,000 419,151 0.05 International Business Machines Corp 2.75% GBP 21/12/2020 200,000 382,814 0.04 IRB Holding Corp 144A 6.75% USD 15/02/2026 121,000 161,627 0.02 Iron Mountain Inc 144A 4.875% USD 15/09/2027 300,000 402,313 0.05 Iron Mountain Inc 144A 5.25% USD 15/03/2028 58,000 78,701 0.01 Iron Mountain US Holdings Inc 144A 5.375% USD 01/06/2026 227,000 312,018 0.03 Itron Inc 144A 5% USD 15/01/2026 138,000 189,685 0.02 Jagged Peak Energy LLC 144A 5.875% USD 01/05/2026 226,000 323,387 0.04 JB Poindexter & Co Inc 144A 7.125% USD 15/04/2026 233,000 324,371 0.04 JC Penney Corp Inc 6.375% USD 15/10/2036 100,000 52,866 0.01 Johnson & Johnson 5.5% GBP 06/11/2024 400,000 901,715 0.10 JPMorgan Chase & Co FRN USD Perpetual 14,000 19,860 0.00 KB Home 8% USD 15/03/2020 46,000 67,849 0.01 Kenan Advantage Group Inc/The 144A 7.875% USD 31/07/2023 276,000 380,587 0.04 KFC Holding Co/Pizza Hut Holdings LLC/Taco Bell of America LLC 144A 5.25% USD 01/06/2026 100,000 144,046 0.02 Koppers Inc 144A 6% USD 15/02/2025 106,000 131,503 0.01 L Brands Inc 5.625% USD 15/02/2022 212,000 304,849 0.03 Lennar Corp 5.25% USD 01/06/2026 227,000 322,418 0.04 Level 3 Financing Inc 5.25% USD 15/03/2026 418,000 579,709 0.06 Lions Gate Capital Holdings LLC 144A 6.375% USD 01/02/2024 217,000 312,131 0.03 Lithia Motors Inc 144A 5.25% USD 01/08/2025 31,000 43,430 0.00 LPL Holdings Inc 144A 5.75% USD 15/09/2025 131,000 187,219 0.02 Mattel Inc 144A 6.75% USD 31/12/2025 68,000 94,666 0.01 McDonald's Corp 3.375% USD 26/05/2025 150,000 210,564 0.02 MEDNAX Inc 144A 5.25% USD 01/12/2023 106,000 151,490 0.02 MEDNAX Inc 144A 6.25% USD 15/01/2027 271,000 385,123 0.04 Mercer International Inc 6.5% USD 01/02/2024 181,000 261,548 0.03 Merck & Co Inc 2.75% USD 10/02/2025 200,000 276,524 0.03 Meredith Corp 144A 6.875% USD 01/02/2026 334,000 488,662 0.05 Meritage Homes Corp 6% USD 01/06/2025 131,000 190,682 0.02 Meritor Inc 6.25% USD 15/02/2024 265,000 381,528 0.04 MGM Resorts International 4.625% USD 01/09/2026 372,000 500,835 0.06 Micron Technology Inc 5.5% USD 01/02/2025 31,000 45,121 0.00 Microsoft Corp 2.4% USD 08/08/2026 500,000 669,555 0.07 MPH Acquisition Holdings LLC 144A 7.125% USD 01/06/2024 199,000 280,194 0.03 MPT Operating Partnership LP / MPT Finance Corp 5% USD 15/10/2027 327,000 458,690 0.05 MSCI Inc 144A 5.75% USD 15/08/2025 25,000 36,830 0.00 Mueller Industries Inc 6% USD 01/03/2027 200,000 277,020 0.03 Murphy Oil Corp 6.875% USD 15/08/2024 113,000 168,640 0.02 Murphy Oil USA Inc 5.625% USD 01/05/2027 253,000 361,131 0.04 Navient Corp 7.25% USD 25/01/2022 265,000 393,203 0.04 Navient Corp 7.25% USD 25/09/2023 75,000 109,433 0.01 Netflix Inc 5.75% USD 01/03/2024 125,000 187,759 0.02 Netflix Inc 144A 5.875% USD 15/11/2028 227,000 334,115 0.04 Newfield Exploration Co 5.625% USD 01/07/2024 196,000 296,175 0.03 Nexstar Broadcasting Inc 144A 5.625% USD 01/08/2024 138,000 193,576 0.02 Novelis Corp 144A 6.25% USD 15/08/2024 227,000 323,119 0.04 NRG Energy Inc 6.25% USD 01/05/2024 125,000 182,574 0.02 NRG Energy Inc 6.625% USD 15/01/2027 151,000 227,511 0.03 Oasis Petroleum Inc 6.875% USD 15/01/2023 196,000 275,279 0.03 Oshkosh Corp 5.375% USD 01/03/2025 151,000 216,601 0.02
338 Invesco Funds
Invesco Global Targeted Returns Select II Fund Statement of Investments as at 28 February 2019
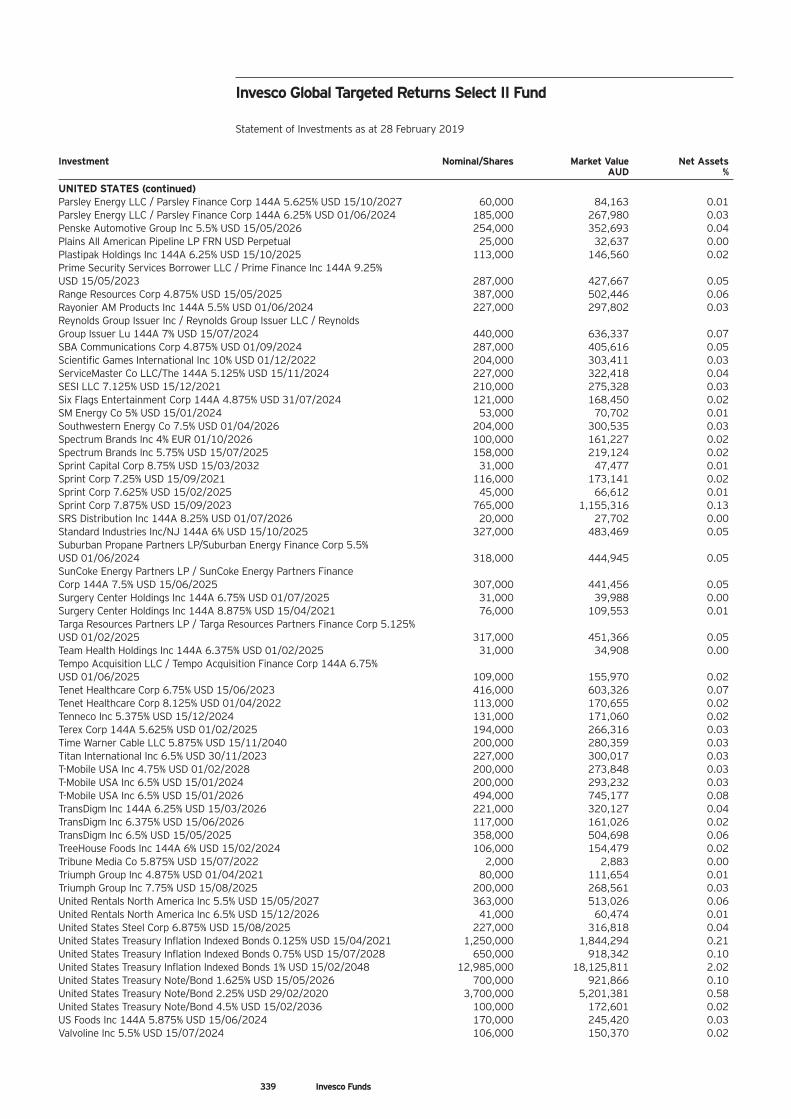
Investment Nominal/Shares Market Value Net Assets AUD %
UNITED STATES (continued) Parsley Energy LLC / Parsley Finance Corp 144A 5.625% USD 15/10/2027 60,000 84,163 0.01 Parsley Energy LLC / Parsley Finance Corp 144A 6.25% USD 01/06/2024 185,000 267,980 0.03 Penske Automotive Group Inc 5.5% USD 15/05/2026 254,000 352,693 0.04 Plains All American Pipeline LP FRN USD Perpetual 25,000 32,637 0.00 Plastipak Holdings Inc 144A 6.25% USD 15/10/2025 113,000 146,560 0.02 Prime Security Services Borrower LLC / Prime Finance Inc 144A 9.25% USD 15/05/2023 287,000 427,667 0.05 Range Resources Corp 4.875% USD 15/05/2025 387,000 502,446 0.06 Rayonier AM Products Inc 144A 5.5% USD 01/06/2024 227,000 297,802 0.03 Reynolds Group Issuer Inc / Reynolds Group Issuer LLC / Reynolds Group Issuer Lu 144A 7% USD 15/07/2024 440,000 636,337 0.07 SBA Communications Corp 4.875% USD 01/09/2024 287,000 405,616 0.05 Scientific Games International Inc 10% USD 01/12/2022 204,000 303,411 0.03 ServiceMaster Co LLC/The 144A 5.125% USD 15/11/2024 227,000 322,418 0.04 SESI LLC 7.125% USD 15/12/2021 210,000 275,328 0.03 Six Flags Entertainment Corp 144A 4.875% USD 31/07/2024 121,000 168,450 0.02 SM Energy Co 5% USD 15/01/2024 53,000 70,702 0.01 Southwestern Energy Co 7.5% USD 01/04/2026 204,000 300,535 0.03 Spectrum Brands Inc 4% EUR 01/10/2026 100,000 161,227 0.02 Spectrum Brands Inc 5.75% USD 15/07/2025 158,000 219,124 0.02 Sprint Capital Corp 8.75% USD 15/03/2032 31,000 47,477 0.01 Sprint Corp 7.25% USD 15/09/2021 116,000 173,141 0.02 Sprint Corp 7.625% USD 15/02/2025 45,000 66,612 0.01 Sprint Corp 7.875% USD 15/09/2023 765,000 1,155,316 0.13 SRS Distribution Inc 144A 8.25% USD 01/07/2026 20,000 27,702 0.00 Standard Industries Inc/NJ 144A 6% USD 15/10/2025 327,000 483,469 0.05 Suburban Propane Partners LP/Suburban Energy Finance Corp 5.5% USD 01/06/2024 318,000 444,945 0.05 SunCoke Energy Partners LP / SunCoke Energy Partners Finance Corp 144A 7.5% USD 15/06/2025 307,000 441,456 0.05 Surgery Center Holdings Inc 144A 6.75% USD 01/07/2025 31,000 39,988 0.00 Surgery Center Holdings Inc 144A 8.875% USD 15/04/2021 76,000 109,553 0.01 Targa Resources Partners LP / Targa Resources Partners Finance Corp 5.125% USD 01/02/2025 317,000 451,366 0.05 Team Health Holdings Inc 144A 6.375% USD 01/02/2025 31,000 34,908 0.00 Tempo Acquisition LLC / Tempo Acquisition Finance Corp 144A 6.75% USD 01/06/2025 109,000 155,970 0.02 Tenet Healthcare Corp 6.75% USD 15/06/2023 416,000 603,326 0.07 Tenet Healthcare Corp 8.125% USD 01/04/2022 113,000 170,655 0.02 Tenneco Inc 5.375% USD 15/12/2024 131,000 171,060 0.02 Terex Corp 144A 5.625% USD 01/02/2025 194,000 266,316 0.03 Time Warner Cable LLC 5.875% USD 15/11/2040 200,000 280,359 0.03 Titan International Inc 6.5% USD 30/11/2023 227,000 300,017 0.03 T-Mobile USA Inc 4.75% USD 01/02/2028 200,000 273,848 0.03 T-Mobile USA Inc 6.5% USD 15/01/2024 200,000 293,232 0.03 T-Mobile USA Inc 6.5% USD 15/01/2026 494,000 745,177 0.08 TransDigm Inc 144A 6.25% USD 15/03/2026 221,000 320,127 0.04 TransDigm Inc 6.375% USD 15/06/2026 117,000 161,026 0.02 TransDigm Inc 6.5% USD 15/05/2025 358,000 504,698 0.06 TreeHouse Foods Inc 144A 6% USD 15/02/2024 106,000 154,479 0.02 Tribune Media Co 5.875% USD 15/07/2022 2,000 2,883 0.00 Triumph Group Inc 4.875% USD 01/04/2021 80,000 111,654 0.01 Triumph Group Inc 7.75% USD 15/08/2025 200,000 268,561 0.03 United Rentals North America Inc 5.5% USD 15/05/2027 363,000 513,026 0.06 United Rentals North America Inc 6.5% USD 15/12/2026 41,000 60,474 0.01 United States Steel Corp 6.875% USD 15/08/2025 227,000 316,818 0.04 United States Treasury Inflation Indexed Bonds 0.125% USD 15/04/2021 1,250,000 1,844,294 0.21 United States Treasury Inflation Indexed Bonds 0.75% USD 15/07/2028 650,000 918,342 0.10 United States Treasury Inflation Indexed Bonds 1% USD 15/02/2048 12,985,000 18,125,811 2.02 United States Treasury Note/Bond 1.625% USD 15/05/2026 700,000 921,866 0.10 United States Treasury Note/Bond 2.25% USD 29/02/2020 3,700,000 5,201,381 0.58 United States Treasury Note/Bond 4.5% USD 15/02/2036 100,000 172,601 0.02 US Foods Inc 144A 5.875% USD 15/06/2024 170,000 245,420 0.03 Valvoline Inc 5.5% USD 15/07/2024 106,000 150,370 0.02
339 Invesco Funds
Invesco Global Targeted Returns Select II Fund Statement of Investments as at 28 February 2019
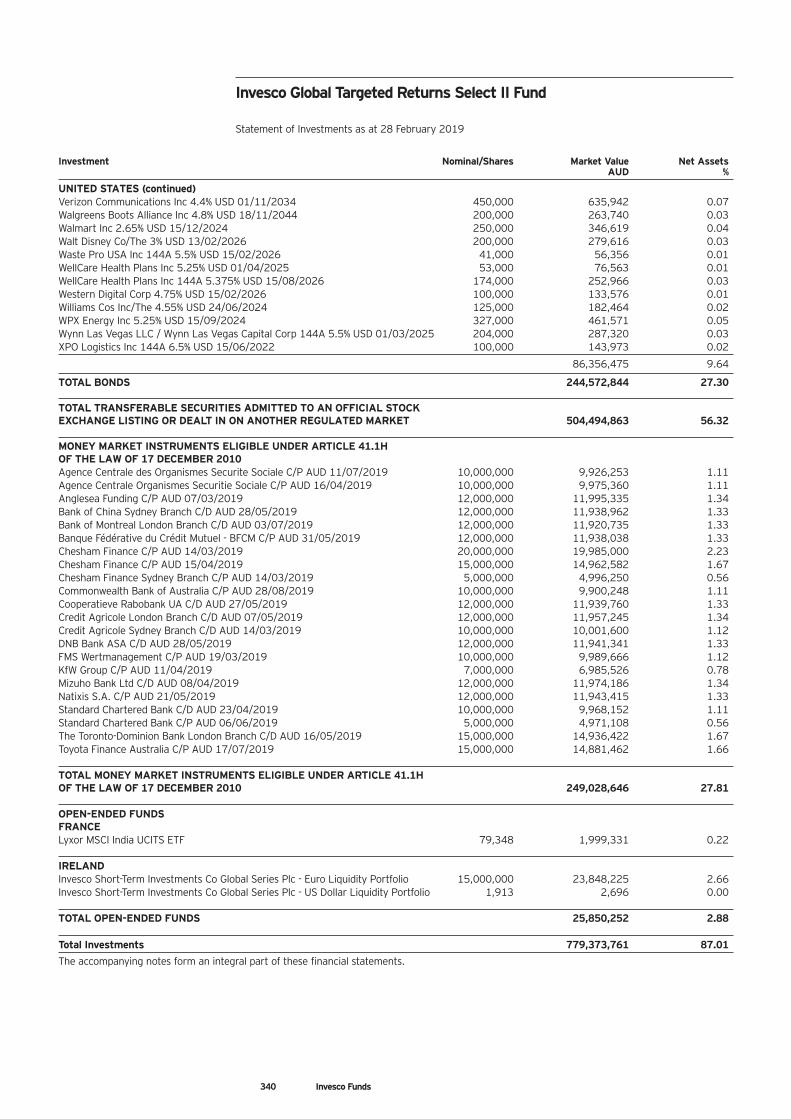
Investment Nominal/Shares Market Value Net Assets AUD %
UNITED STATES (continued) Verizon Communications Inc 4.4% USD 01/11/2034 450,000 635,942 0.07 Walgreens Boots Alliance Inc 4.8% USD 18/11/2044 200,000 263,740 0.03 Walmart Inc 2.65% USD 15/12/2024 250,000 346,619 0.04 Walt Disney Co/The 3% USD 13/02/2026 200,000 279,616 0.03 Waste Pro USA Inc 144A 5.5% USD 15/02/2026 41,000 56,356 0.01 WellCare Health Plans Inc 5.25% USD 01/04/2025 53,000 76,563 0.01 WellCare Health Plans Inc 144A 5.375% USD 15/08/2026 174,000 252,966 0.03 Western Digital Corp 4.75% USD 15/02/2026 100,000 133,576 0.01 Williams Cos Inc/The 4.55% USD 24/06/2024 125,000 182,464 0.02 WPX Energy Inc 5.25% USD 15/09/2024 327,000 461,571 0.05 Wynn Las Vegas LLC / Wynn Las Vegas Capital Corp 144A 5.5% USD 01/03/2025 204,000 287,320 0.03 XPO Logistics Inc 144A 6.5% USD 15/06/2022 100,000 143,973 0.02
86,356,475 9.64
TOTAL BONDS 244,572,844 27.30 TOTAL TRANSFERABLE SECURITIES ADMITTED TO AN OFFICIAL STOCK EXCHANGE LISTING OR DEALT IN ON ANOTHER REGULATED MARKET 504,494,863 56.32 MONEY MARKET INSTRUMENTS ELIGIBLE UNDER ARTICLE 41.1H OF THE LAW OF 17 DECEMBER 2010 Agence Centrale des Organismes Securite Sociale C/P AUD 11/07/2019 10,000,000 9,926,253 1.11 Agence Centrale Organismes Securitie Sociale C/P AUD 16/04/2019 10,000,000 9,975,360 1.11 Anglesea Funding C/P AUD 07/03/2019 12,000,000 11,995,335 1.34 Bank of China Sydney Branch C/D AUD 28/05/2019 12,000,000 11,938,962 1.33 Bank of Montreal London Branch C/D AUD 03/07/2019 12,000,000 11,920,735 1.33 Banque Fédérative du Crédit Mutuel - BFCM C/P AUD 31/05/2019 12,000,000 11,938,038 1.33 Chesham Finance C/P AUD 14/03/2019 20,000,000 19,985,000 2.23 Chesham Finance C/P AUD 15/04/2019 15,000,000 14,962,582 1.67 Chesham Finance Sydney Branch C/P AUD 14/03/2019 5,000,000 4,996,250 0.56 Commonwealth Bank of Australia C/P AUD 28/08/2019 10,000,000 9,900,248 1.11 Cooperatieve Rabobank UA C/D AUD 27/05/2019 12,000,000 11,939,760 1.33 Credit Agricole London Branch C/D AUD 07/05/2019 12,000,000 11,957,245 1.34 Credit Agricole Sydney Branch C/D AUD 14/03/2019 10,000,000 10,001,600 1.12 DNB Bank ASA C/D AUD 28/05/2019 12,000,000 11,941,341 1.33 FMS Wertmanagement C/P AUD 19/03/2019 10,000,000 9,989,666 1.12 KfW Group C/P AUD 11/04/2019 7,000,000 6,985,526 0.78 Mizuho Bank Ltd C/D AUD 08/04/2019 12,000,000 11,974,186 1.34 Natixis S.A. C/P AUD 21/05/2019 12,000,000 11,943,415 1.33 Standard Chartered Bank C/D AUD 23/04/2019 10,000,000 9,968,152 1.11 Standard Chartered Bank C/P AUD 06/06/2019 5,000,000 4,971,108 0.56 The Toronto-Dominion Bank London Branch C/D AUD 16/05/2019 15,000,000 14,936,422 1.67 Toyota Finance Australia C/P AUD 17/07/2019 15,000,000 14,881,462 1.66 TOTAL MONEY MARKET INSTRUMENTS ELIGIBLE UNDER ARTICLE 41.1H OF THE LAW OF 17 DECEMBER 2010 249,028,646 27.81 OPEN-ENDED FUNDS FRANCE Lyxor MSCI India UCITS ETF 79,348 1,999,331 0.22 IRELAND Invesco Short-Term Investments Co Global Series Plc - Euro Liquidity Portfolio 15,000,000 23,848,225 2.66 Invesco Short-Term Investments Co Global Series Plc - US Dollar Liquidity Portfolio 1,913 2,696 0.00 TOTAL OPEN-ENDED FUNDS 25,850,252 2.88 Total Investments 779,373,761 87.01
The accompanying notes form an integral part of these financial statements.
340 Invesco Funds
Invesco Global Targeted Returns Select II Fund Statement of Investments as at 28 February 2019
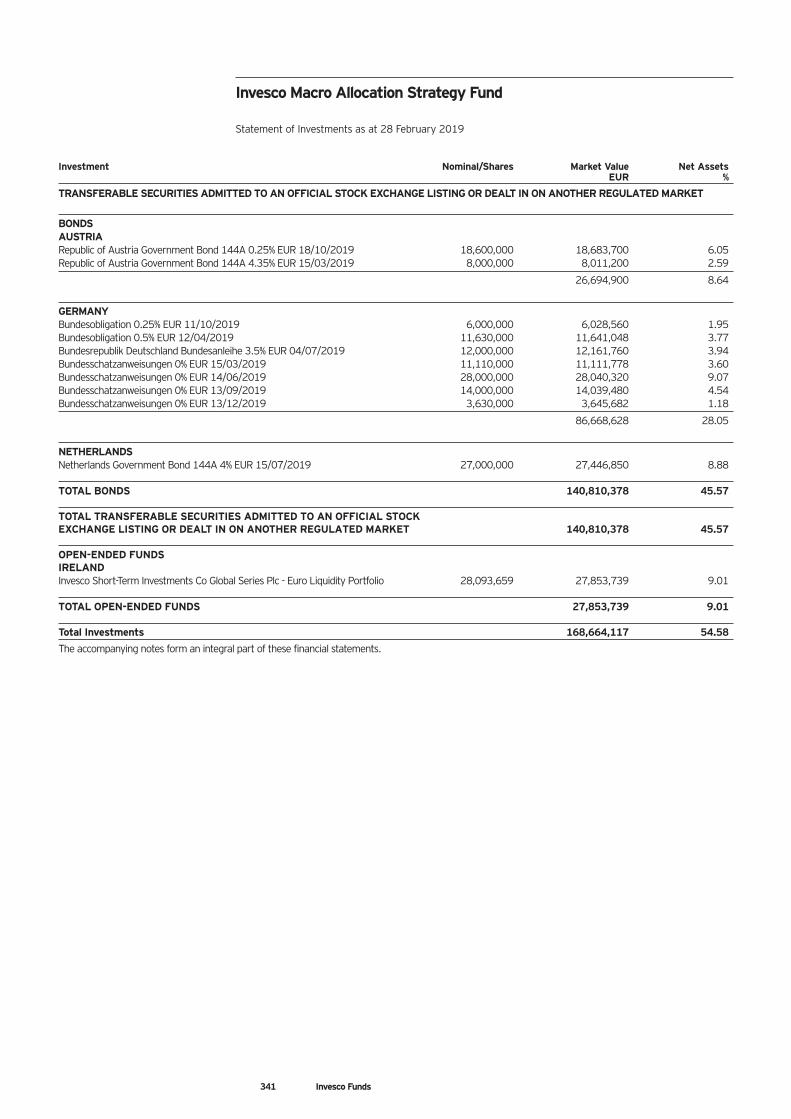
341 Invesco Funds
Investment Nominal/Shares Market Value Net Assets EUR %
TRANSFERABLE SECURITIES ADMITTED TO AN OFFICIAL STOCK EXCHANGE LISTING OR DEALT IN ON ANOTHER REGULATED MARKET
BONDS AUSTRIA Republic of Austria Government Bond 144A 0.25% EUR 18/10/2019 18,600,000 18,683,700 6.05 Republic of Austria Government Bond 144A 4.35% EUR 15/03/2019 8,000,000 8,011,200 2.59
26,694,900 8.64
GERMANY Bundesobligation 0.25% EUR 11/10/2019 6,000,000 6,028,560 1.95 Bundesobligation 0.5% EUR 12/04/2019 11,630,000 11,641,048 3.77 Bundesrepublik Deutschland Bundesanleihe 3.5% EUR 04/07/2019 12,000,000 12,161,760 3.94 Bundesschatzanweisungen 0% EUR 15/03/2019 11,110,000 11,111,778 3.60 Bundesschatzanweisungen 0% EUR 14/06/2019 28,000,000 28,040,320 9.07 Bundesschatzanweisungen 0% EUR 13/09/2019 14,000,000 14,039,480 4.54 Bundesschatzanweisungen 0% EUR 13/12/2019 3,630,000 3,645,682 1.18
86,668,628 28.05
NETHERLANDS Netherlands Government Bond 144A 4% EUR 15/07/2019 27,000,000 27,446,850 8.88 TOTAL BONDS 140,810,378 45.57 TOTAL TRANSFERABLE SECURITIES ADMITTED TO AN OFFICIAL STOCK EXCHANGE LISTING OR DEALT IN ON ANOTHER REGULATED MARKET 140,810,378 45.57 OPEN-ENDED FUNDS IRELAND Invesco Short-Term Investments Co Global Series Plc - Euro Liquidity Portfolio 28,093,659 27,853,739 9.01 TOTAL OPEN-ENDED FUNDS 27,853,739 9.01 Total Investments 168,664,117 54.58
The accompanying notes form an integral part of these financial statements.
Invesco Macro Allocation Strategy Fund Statement of Investments as at 28 February 2019
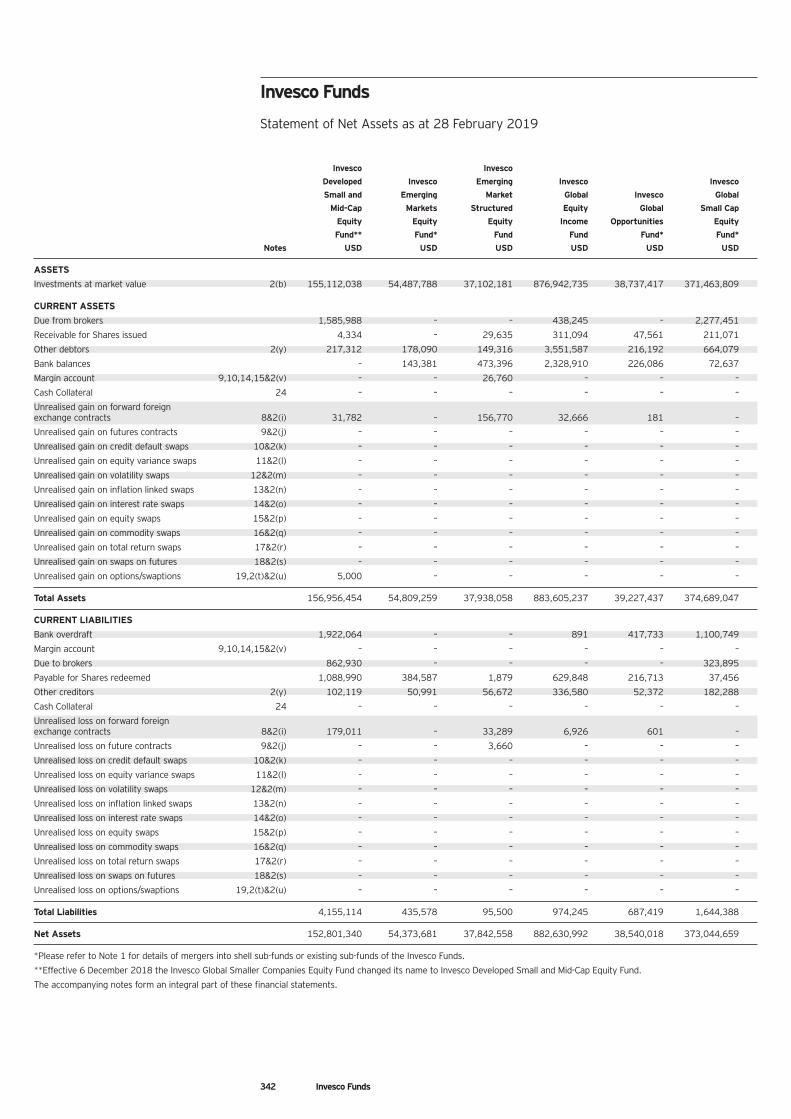
Invesco Invesco
Developed Invesco Emerging Invesco Invesco
Small and Emerging Market Global Invesco Global
Mid-Cap Markets Structured Equity Global Small Cap
Equity Equity Equity Income Opportunities Equity
Fund** Fund* Fund Fund Fund* Fund*
Notes USD USD USD USD USD USD
ASSETS
Investments at market value 2(b) 155,112,038 54,487,788 37,102,181 876,942,735 38,737,417 371,463,809
CURRENT ASSETS
Due from brokers 1,585,988 – – 438,245 – 2,277,451
Receivable for Shares issued 4,334 – 29,635 311,094 47,561 211,071
Other debtors 2(y) 217,312 178,090 149,316 3,551,587 216,192 664,079
Bank balances – 143,381 473,396 2,328,910 226,086 72,637
Margin account 9,10,14,15&2(v) – – 26,760 – – –
Cash Collateral 24 – – – – – –
Unrealised gain on forward foreign exchange contracts 8&2(i) 31,782 – 156,770 32,666 181 –
Unrealised gain on futures contracts 9&2(j) – – – – – –
Unrealised gain on credit default swaps 10&2(k) – – – – – –
Unrealised gain on equity variance swaps 11&2(l) – – – – – –
Unrealised gain on volatility swaps 12&2(m) – – – – – –
Unrealised gain on inflation linked swaps 13&2(n) – – – – – –
Unrealised gain on interest rate swaps 14&2(o) – – – – – –
Unrealised gain on equity swaps 15&2(p) – – – – – –
Unrealised gain on commodity swaps 16&2(q) – – – – – –
Unrealised gain on total return swaps 17&2(r) – – – – – –
Unrealised gain on swaps on futures 18&2(s) – – – – – –
Unrealised gain on options/swaptions 19,2(t)&2(u) 5,000 – – – – –
Total Assets 156,956,454 54,809,259 37,938,058 883,605,237 39,227,437 374,689,047
CURRENT LIABILITIES
Bank overdraft 1,922,064 – – 891 417,733 1,100,749
Margin account 9,10,14,15&2(v) – – – – – –
Due to brokers 862,930 – – – – 323,895
Payable for Shares redeemed 1,088,990 384,587 1,879 629,848 216,713 37,456
Other creditors 2(y) 102,119 50,991 56,672 336,580 52,372 182,288
Cash Collateral 24 – – – – – –
Unrealised loss on forward foreign exchange contracts 8&2(i) 179,011 – 33,289 6,926 601 –
Unrealised loss on future contracts 9&2(j) – – 3,660 – – –
Unrealised loss on credit default swaps 10&2(k) – – – – – –
Unrealised loss on equity variance swaps 11&2(l) – – – – – –
Unrealised loss on volatility swaps 12&2(m) – – – – – –
Unrealised loss on inflation linked swaps 13&2(n) – – – – – –
Unrealised loss on interest rate swaps 14&2(o) – – – – – –
Unrealised loss on equity swaps 15&2(p) – – – – – –
Unrealised loss on commodity swaps 16&2(q) – – – – – –
Unrealised loss on total return swaps 17&2(r) – – – – – –
Unrealised loss on swaps on futures 18&2(s) – – – – – –
Unrealised loss on options/swaptions 19,2(t)&2(u) – – – – – –
Total Liabilities 4,155,114 435,578 95,500 974,245 687,419 1,644,388
Net Assets 152,801,340 54,373,681 37,842,558 882,630,992 38,540,018 373,044,659
*Please refer to Note 1 for details of mergers into shell sub-funds or existing sub-funds of the Invesco Funds.
**Effective 6 December 2018 the Invesco Global Smaller Companies Equity Fund changed its name to Invesco Developed Small and Mid-Cap Equity Fund.
The accompanying notes form an integral part of these financial statements.
342 Invesco Funds
Invesco Funds Statement of Net Assets as at 28 February 2019
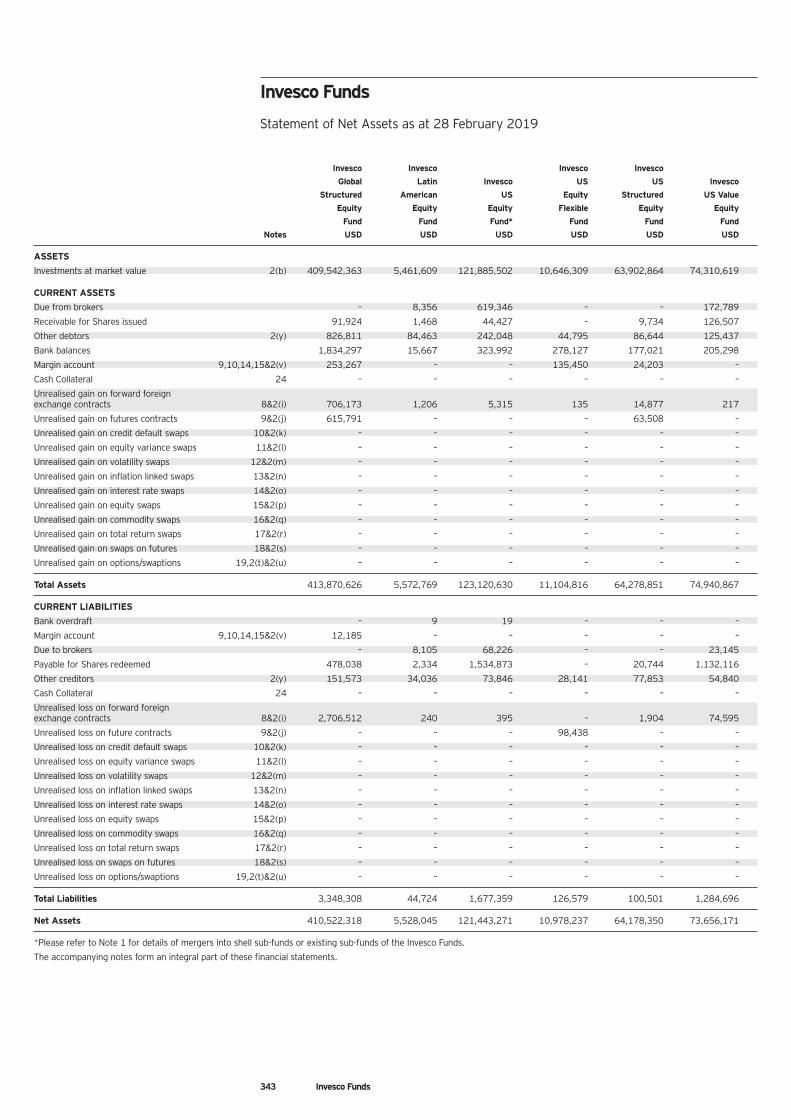
343 Invesco Funds
Invesco Funds Statement of Net Assets as at 28 February 2019
Invesco Invesco Invesco Invesco
Global Latin Invesco US US Invesco
Structured American US Equity Structured US Value
Equity Equity Equity Flexible Equity Equity
Fund Fund Fund* Fund Fund Fund
Notes USD USD USD USD USD USD
ASSETS
Investments at market value 2(b) 409,542,363 5,461,609 121,885,502 10,646,309 63,902,864 74,310,619
CURRENT ASSETS
Due from brokers – 8,356 619,346 – – 172,789
Receivable for Shares issued 91,924 1,468 44,427 – 9,734 126,507
Other debtors 2(y) 826,811 84,463 242,048 44,795 86,644 125,437
Bank balances 1,834,297 15,667 323,992 278,127 177,021 205,298
Margin account 9,10,14,15&2(v) 253,267 – – 135,450 24,203 –
Cash Collateral 24 – – – – – –
Unrealised gain on forward foreign exchange contracts 8&2(i) 706,173 1,206 5,315 135 14,877 217
Unrealised gain on futures contracts 9&2(j) 615,791 – – – 63,508 –
Unrealised gain on credit default swaps 10&2(k) – – – – – –
Unrealised gain on equity variance swaps 11&2(l) – – – – – –
Unrealised gain on volatility swaps 12&2(m) – – – – – –
Unrealised gain on inflation linked swaps 13&2(n) – – – – – –
Unrealised gain on interest rate swaps 14&2(o) – – – – – –
Unrealised gain on equity swaps 15&2(p) – – – – – –
Unrealised gain on commodity swaps 16&2(q) – – – – – –
Unrealised gain on total return swaps 17&2(r) – – – – – –
Unrealised gain on swaps on futures 18&2(s) – – – – – –
Unrealised gain on options/swaptions 19,2(t)&2(u) – – – – – –
Total Assets 413,870,626 5,572,769 123,120,630 11,104,816 64,278,851 74,940,867
CURRENT LIABILITIES
Bank overdraft – 9 19 – – –
Margin account 9,10,14,15&2(v) 12,185 – – – – –
Due to brokers – 8,105 68,226 – – 23,145
Payable for Shares redeemed 478,038 2,334 1,534,873 – 20,744 1,132,116
Other creditors 2(y) 151,573 34,036 73,846 28,141 77,853 54,840
Cash Collateral 24 – – – – – –
Unrealised loss on forward foreign exchange contracts 8&2(i) 2,706,512 240 395 – 1,904 74,595
Unrealised loss on future contracts 9&2(j) – – – 98,438 – –
Unrealised loss on credit default swaps 10&2(k) – – – – – –
Unrealised loss on equity variance swaps 11&2(l) – – – – – –
Unrealised loss on volatility swaps 12&2(m) – – – – – –
Unrealised loss on inflation linked swaps 13&2(n) – – – – – –
Unrealised loss on interest rate swaps 14&2(o) – – – – – –
Unrealised loss on equity swaps 15&2(p) – – – – – –
Unrealised loss on commodity swaps 16&2(q) – – – – – –
Unrealised loss on total return swaps 17&2(r) – – – – – –
Unrealised loss on swaps on futures 18&2(s) – – – – – –
Unrealised loss on options/swaptions 19,2(t)&2(u) – – – – – –
Total Liabilities 3,348,308 44,724 1,677,359 126,579 100,501 1,284,696
Net Assets 410,522,318 5,528,045 121,443,271 10,978,237 64,178,350 73,656,171
*Please refer to Note 1 for details of mergers into shell sub-funds or existing sub-funds of the Invesco Funds.
The accompanying notes form an integral part of these financial statements.
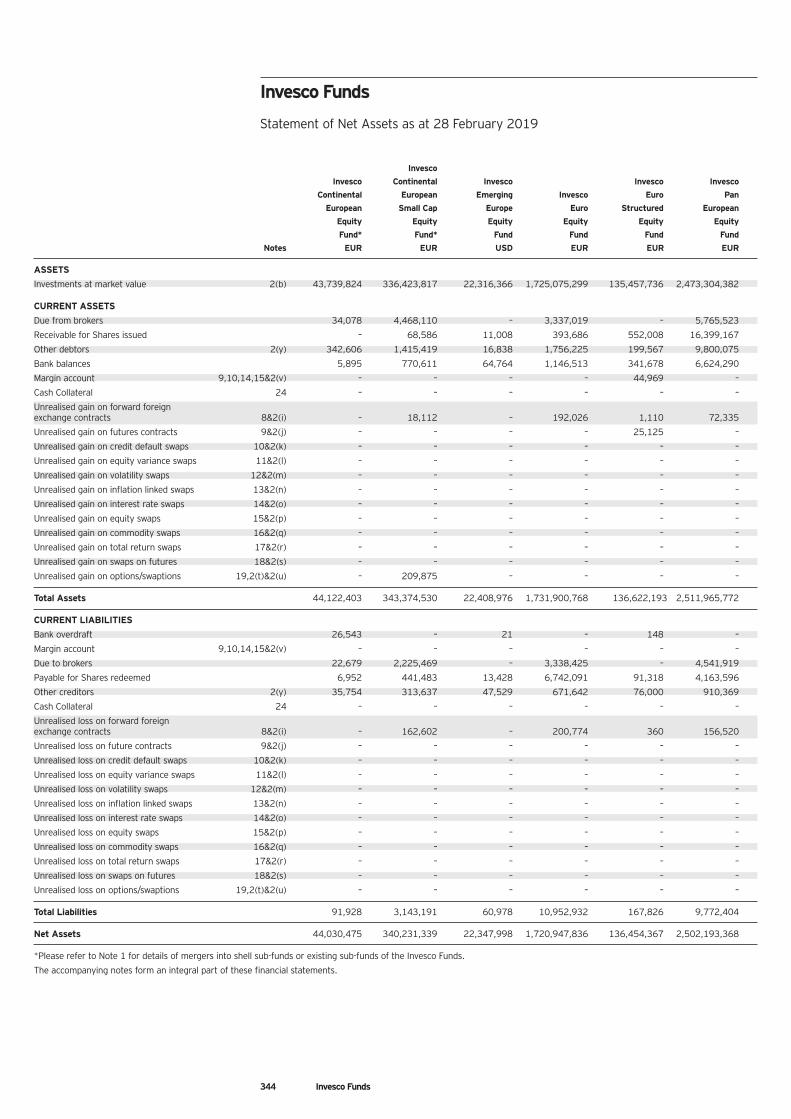
344 Invesco Funds
Invesco Funds Statement of Net Assets as at 28 February 2019
Invesco
Invesco Continental Invesco Invesco Invesco
Continental European Emerging Invesco Euro Pan
European Small Cap Europe Euro Structured European
Equity Equity Equity Equity Equity Equity
Fund* Fund* Fund Fund Fund Fund
Notes EUR EUR USD EUR EUR EUR
ASSETS
Investments at market value 2(b) 43,739,824 336,423,817 22,316,366 1,725,075,299 135,457,736 2,473,304,382
CURRENT ASSETS
Due from brokers 34,078 4,468,110 – 3,337,019 – 5,765,523
Receivable for Shares issued – 68,586 11,008 393,686 552,008 16,399,167
Other debtors 2(y) 342,606 1,415,419 16,838 1,756,225 199,567 9,800,075
Bank balances 5,895 770,611 64,764 1,146,513 341,678 6,624,290
Margin account 9,10,14,15&2(v) – – – – 44,969 –
Cash Collateral 24 – – – – – –
Unrealised gain on forward foreign exchange contracts 8&2(i) – 18,112 – 192,026 1,110 72,335
Unrealised gain on futures contracts 9&2(j) – – – – 25,125 –
Unrealised gain on credit default swaps 10&2(k) – – – – – –
Unrealised gain on equity variance swaps 11&2(l) – – – – – –
Unrealised gain on volatility swaps 12&2(m) – – – – – –
Unrealised gain on inflation linked swaps 13&2(n) – – – – – –
Unrealised gain on interest rate swaps 14&2(o) – – – – – –
Unrealised gain on equity swaps 15&2(p) – – – – – –
Unrealised gain on commodity swaps 16&2(q) – – – – – –
Unrealised gain on total return swaps 17&2(r) – – – – – –
Unrealised gain on swaps on futures 18&2(s) – – – – – –
Unrealised gain on options/swaptions 19,2(t)&2(u) – 209,875 – – – –
Total Assets 44,122,403 343,374,530 22,408,976 1,731,900,768 136,622,193 2,511,965,772
CURRENT LIABILITIES
Bank overdraft 26,543 – 21 – 148 –
Margin account 9,10,14,15&2(v) – – – – – –
Due to brokers 22,679 2,225,469 – 3,338,425 – 4,541,919
Payable for Shares redeemed 6,952 441,483 13,428 6,742,091 91,318 4,163,596
Other creditors 2(y) 35,754 313,637 47,529 671,642 76,000 910,369
Cash Collateral 24 – – – – – –
Unrealised loss on forward foreign exchange contracts 8&2(i) – 162,602 – 200,774 360 156,520
Unrealised loss on future contracts 9&2(j) – – – – – –
Unrealised loss on credit default swaps 10&2(k) – – – – – –
Unrealised loss on equity variance swaps 11&2(l) – – – – – –
Unrealised loss on volatility swaps 12&2(m) – – – – – –
Unrealised loss on inflation linked swaps 13&2(n) – – – – – –
Unrealised loss on interest rate swaps 14&2(o) – – – – – –
Unrealised loss on equity swaps 15&2(p) – – – – – –
Unrealised loss on commodity swaps 16&2(q) – – – – – –
Unrealised loss on total return swaps 17&2(r) – – – – – –
Unrealised loss on swaps on futures 18&2(s) – – – – – –
Unrealised loss on options/swaptions 19,2(t)&2(u) – – – – – –
Total Liabilities 91,928 3,143,191 60,978 10,952,932 167,826 9,772,404
Net Assets 44,030,475 340,231,339 22,347,998 1,720,947,836 136,454,367 2,502,193,368
*Please refer to Note 1 for details of mergers into shell sub-funds or existing sub-funds of the Invesco Funds.
The accompanying notes form an integral part of these financial statements.
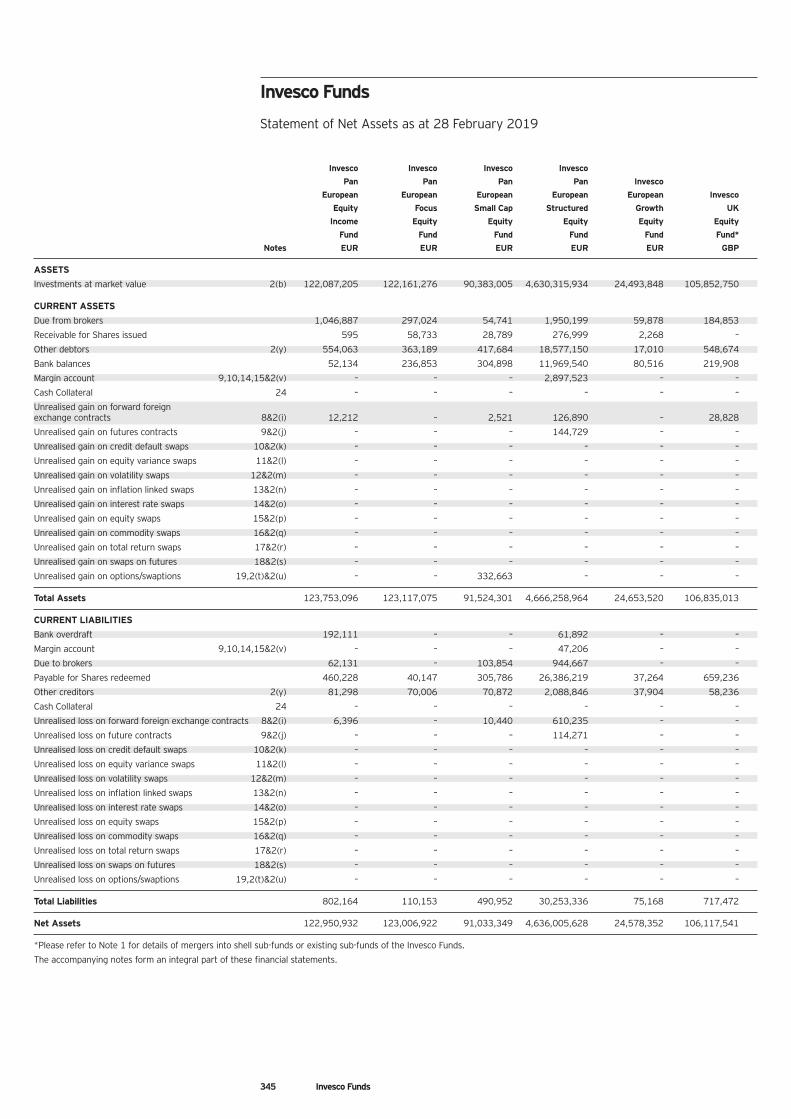
345 Invesco Funds
Invesco Funds Statement of Net Assets as at 28 February 2019
Invesco Invesco Invesco Invesco
Pan Pan Pan Pan Invesco
European European European European European Invesco
Equity Focus Small Cap Structured Growth UK
Income Equity Equity Equity Equity Equity
Fund Fund Fund Fund Fund Fund*
Notes EUR EUR EUR EUR EUR GBP
ASSETS
Investments at market value 2(b) 122,087,205 122,161,276 90,383,005 4,630,315,934 24,493,848 105,852,750
CURRENT ASSETS
Due from brokers 1,046,887 297,024 54,741 1,950,199 59,878 184,853
Receivable for Shares issued 595 58,733 28,789 276,999 2,268 –
Other debtors 2(y) 554,063 363,189 417,684 18,577,150 17,010 548,674
Bank balances 52,134 236,853 304,898 11,969,540 80,516 219,908
Margin account 9,10,14,15&2(v) – – – 2,897,523 – –
Cash Collateral 24 – – – – – –
Unrealised gain on forward foreign exchange contracts 8&2(i) 12,212 – 2,521 126,890 – 28,828
Unrealised gain on futures contracts 9&2(j) – – – 144,729 – –
Unrealised gain on credit default swaps 10&2(k) – – – – – –
Unrealised gain on equity variance swaps 11&2(l) – – – – – –
Unrealised gain on volatility swaps 12&2(m) – – – – – –
Unrealised gain on inflation linked swaps 13&2(n) – – – – – –
Unrealised gain on interest rate swaps 14&2(o) – – – – – –
Unrealised gain on equity swaps 15&2(p) – – – – – –
Unrealised gain on commodity swaps 16&2(q) – – – – – –
Unrealised gain on total return swaps 17&2(r) – – – – – –
Unrealised gain on swaps on futures 18&2(s) – – – – – –
Unrealised gain on options/swaptions 19,2(t)&2(u) – – 332,663 – – –
Total Assets 123,753,096 123,117,075 91,524,301 4,666,258,964 24,653,520 106,835,013
CURRENT LIABILITIES
Bank overdraft 192,111 – – 61,892 – –
Margin account 9,10,14,15&2(v) – – – 47,206 – –
Due to brokers 62,131 – 103,854 944,667 – –
Payable for Shares redeemed 460,228 40,147 305,786 26,386,219 37,264 659,236
Other creditors 2(y) 81,298 70,006 70,872 2,088,846 37,904 58,236
Cash Collateral 24 – – – – – –
Unrealised loss on forward foreign exchange contracts 8&2(i) 6,396 – 10,440 610,235 – –
Unrealised loss on future contracts 9&2(j) – – – 114,271 – –
Unrealised loss on credit default swaps 10&2(k) – – – – – –
Unrealised loss on equity variance swaps 11&2(l) – – – – – –
Unrealised loss on volatility swaps 12&2(m) – – – – – –
Unrealised loss on inflation linked swaps 13&2(n) – – – – – –
Unrealised loss on interest rate swaps 14&2(o) – – – – – –
Unrealised loss on equity swaps 15&2(p) – – – – – –
Unrealised loss on commodity swaps 16&2(q) – – – – – –
Unrealised loss on total return swaps 17&2(r) – – – – – –
Unrealised loss on swaps on futures 18&2(s) – – – – – –
Unrealised loss on options/swaptions 19,2(t)&2(u) – – – – – –
Total Liabilities 802,164 110,153 490,952 30,253,336 75,168 717,472
Net Assets 122,950,932 123,006,922 91,033,349 4,636,005,628 24,578,352 106,117,541
*Please refer to Note 1 for details of mergers into shell sub-funds or existing sub-funds of the Invesco Funds.
The accompanying notes form an integral part of these financial statements.
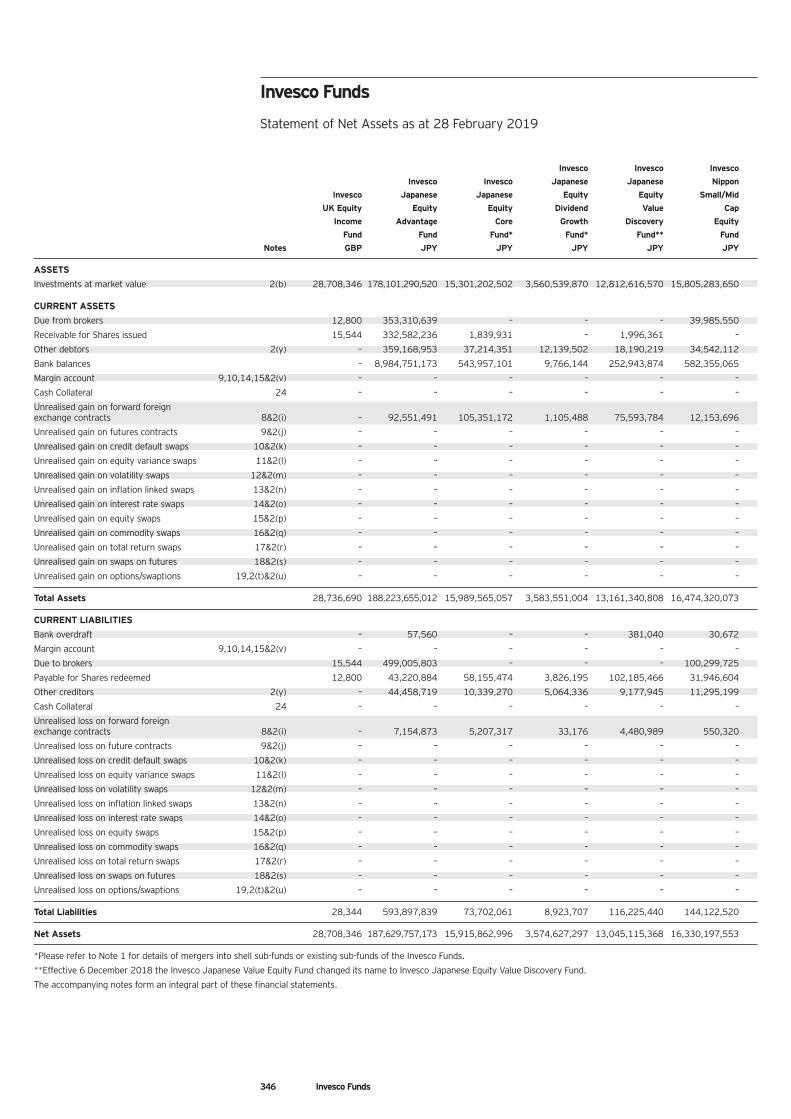
Invesco Funds Statement of Net Assets as at 28 February 2019
346 Invesco Funds
Invesco Invesco Invesco
Invesco Invesco Japanese Japanese Nippon
Invesco Japanese Japanese Equity Equity Small/Mid
UK Equity Equity Equity Dividend Value Cap
Income Advantage Core Growth Discovery Equity
Fund Fund Fund* Fund* Fund** Fund
Notes GBP JPY JPY JPY JPY JPY
ASSETS
Investments at market value 2(b) 28,708,346 178,101,290,520 15,301,202,502 3,560,539,870 12,812,616,570 15,805,283,650
CURRENT ASSETS
Due from brokers 12,800 353,310,639 – – – 39,985,550
Receivable for Shares issued 15,544 332,582,236 1,839,931 – 1,996,361 –
Other debtors 2(y) – 359,168,953 37,214,351 12,139,502 18,190,219 34,542,112
Bank balances – 8,984,751,173 543,957,101 9,766,144 252,943,874 582,355,065
Margin account 9,10,14,15&2(v) – – – – – –
Cash Collateral 24 – – – – – –
Unrealised gain on forward foreign exchange contracts 8&2(i) – 92,551,491 105,351,172 1,105,488 75,593,784 12,153,696
Unrealised gain on futures contracts 9&2(j) – – – – – –
Unrealised gain on credit default swaps 10&2(k) – – – – – –
Unrealised gain on equity variance swaps 11&2(l) – – – – – –
Unrealised gain on volatility swaps 12&2(m) – – – – – –
Unrealised gain on inflation linked swaps 13&2(n) – – – – – –
Unrealised gain on interest rate swaps 14&2(o) – – – – – –
Unrealised gain on equity swaps 15&2(p) – – – – – –
Unrealised gain on commodity swaps 16&2(q) – – – – – –
Unrealised gain on total return swaps 17&2(r) – – – – – –
Unrealised gain on swaps on futures 18&2(s) – – – – – –
Unrealised gain on options/swaptions 19,2(t)&2(u) – – – – – –
Total Assets 28,736,690 188,223,655,012 15,989,565,057 3,583,551,004 13,161,340,808 16,474,320,073
CURRENT LIABILITIES
Bank overdraft – 57,560 – – 381,040 30,672
Margin account 9,10,14,15&2(v) – – – – – –
Due to brokers 15,544 499,005,803 – – – 100,299,725
Payable for Shares redeemed 12,800 43,220,884 58,155,474 3,826,195 102,185,466 31,946,604
Other creditors 2(y) – 44,458,719 10,339,270 5,064,336 9,177,945 11,295,199
Cash Collateral 24 – – – – – –
Unrealised loss on forward foreign exchange contracts 8&2(i) – 7,154,873 5,207,317 33,176 4,480,989 550,320
Unrealised loss on future contracts 9&2(j) – – – – – –
Unrealised loss on credit default swaps 10&2(k) – – – – – –
Unrealised loss on equity variance swaps 11&2(l) – – – – – –
Unrealised loss on volatility swaps 12&2(m) – – – – – –
Unrealised loss on inflation linked swaps 13&2(n) – – – – – –
Unrealised loss on interest rate swaps 14&2(o) – – – – – –
Unrealised loss on equity swaps 15&2(p) – – – – – –
Unrealised loss on commodity swaps 16&2(q) – – – – – –
Unrealised loss on total return swaps 17&2(r) – – – – – –
Unrealised loss on swaps on futures 18&2(s) – – – – – –
Unrealised loss on options/swaptions 19,2(t)&2(u) – – – – – –
Total Liabilities 28,344 593,897,839 73,702,061 8,923,707 116,225,440 144,122,520
Net Assets 28,708,346 187,629,757,173 15,915,862,996 3,574,627,297 13,045,115,368 16,330,197,553
*Please refer to Note 1 for details of mergers into shell sub-funds or existing sub-funds of the Invesco Funds.
**Effective 6 December 2018 the Invesco Japanese Value Equity Fund changed its name to Invesco Japanese Equity Value Discovery Fund.
The accompanying notes form an integral part of these financial statements.
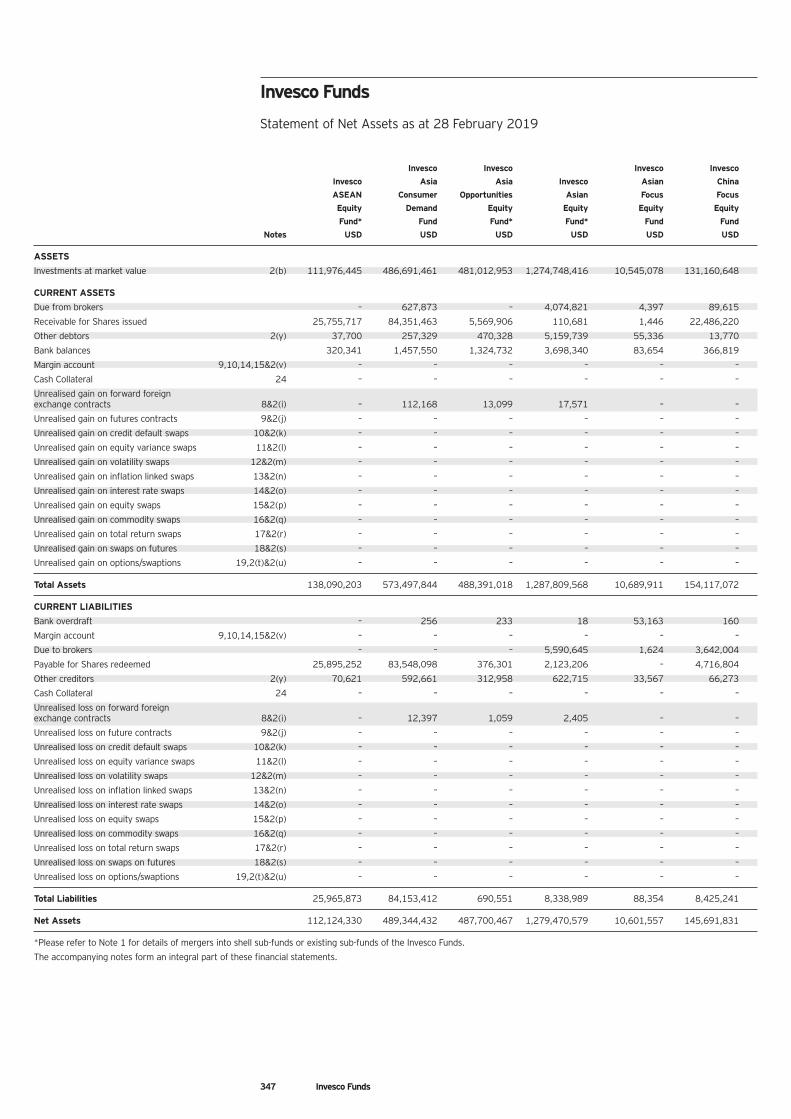
Invesco Funds Statement of Net Assets as at 28 February 2019
347 Invesco Funds
Invesco Invesco Invesco Invesco
Invesco Asia Asia Invesco Asian China
ASEAN Consumer Opportunities Asian Focus Focus
Equity Demand Equity Equity Equity Equity
Fund* Fund Fund* Fund* Fund Fund
Notes USD USD USD USD USD USD
ASSETS
Investments at market value 2(b) 111,976,445 486,691,461 481,012,953 1,274,748,416 10,545,078 131,160,648
CURRENT ASSETS
Due from brokers – 627,873 – 4,074,821 4,397 89,615
Receivable for Shares issued 25,755,717 84,351,463 5,569,906 110,681 1,446 22,486,220
Other debtors 2(y) 37,700 257,329 470,328 5,159,739 55,336 13,770
Bank balances 320,341 1,457,550 1,324,732 3,698,340 83,654 366,819
Margin account 9,10,14,15&2(v) – – – – – –
Cash Collateral 24 – – – – – –
Unrealised gain on forward foreign exchange contracts 8&2(i) – 112,168 13,099 17,571 – –
Unrealised gain on futures contracts 9&2(j) – – – – – –
Unrealised gain on credit default swaps 10&2(k) – – – – – –
Unrealised gain on equity variance swaps 11&2(l) – – – – – –
Unrealised gain on volatility swaps 12&2(m) – – – – – –
Unrealised gain on inflation linked swaps 13&2(n) – – – – – –
Unrealised gain on interest rate swaps 14&2(o) – – – – – –
Unrealised gain on equity swaps 15&2(p) – – – – – –
Unrealised gain on commodity swaps 16&2(q) – – – – – –
Unrealised gain on total return swaps 17&2(r) – – – – – –
Unrealised gain on swaps on futures 18&2(s) – – – – – –
Unrealised gain on options/swaptions 19,2(t)&2(u) – – – – – –
Total Assets 138,090,203 573,497,844 488,391,018 1,287,809,568 10,689,911 154,117,072
CURRENT LIABILITIES
Bank overdraft – 256 233 18 53,163 160
Margin account 9,10,14,15&2(v) – – – – – –
Due to brokers – – – 5,590,645 1,624 3,642,004
Payable for Shares redeemed 25,895,252 83,548,098 376,301 2,123,206 – 4,716,804
Other creditors 2(y) 70,621 592,661 312,958 622,715 33,567 66,273
Cash Collateral 24 – – – – – –
Unrealised loss on forward foreign exchange contracts 8&2(i) – 12,397 1,059 2,405 – –
Unrealised loss on future contracts 9&2(j) – – – – – –
Unrealised loss on credit default swaps 10&2(k) – – – – – –
Unrealised loss on equity variance swaps 11&2(l) – – – – – –
Unrealised loss on volatility swaps 12&2(m) – – – – – –
Unrealised loss on inflation linked swaps 13&2(n) – – – – – –
Unrealised loss on interest rate swaps 14&2(o) – – – – – –
Unrealised loss on equity swaps 15&2(p) – – – – – –
Unrealised loss on commodity swaps 16&2(q) – – – – – –
Unrealised loss on total return swaps 17&2(r) – – – – – –
Unrealised loss on swaps on futures 18&2(s) – – – – – –
Unrealised loss on options/swaptions 19,2(t)&2(u) – – – – – –
Total Liabilities 25,965,873 84,153,412 690,551 8,338,989 88,354 8,425,241
Net Assets 112,124,330 489,344,432 487,700,467 1,279,470,579 10,601,557 145,691,831
*Please refer to Note 1 for details of mergers into shell sub-funds or existing sub-funds of the Invesco Funds.
The accompanying notes form an integral part of these financial statements.
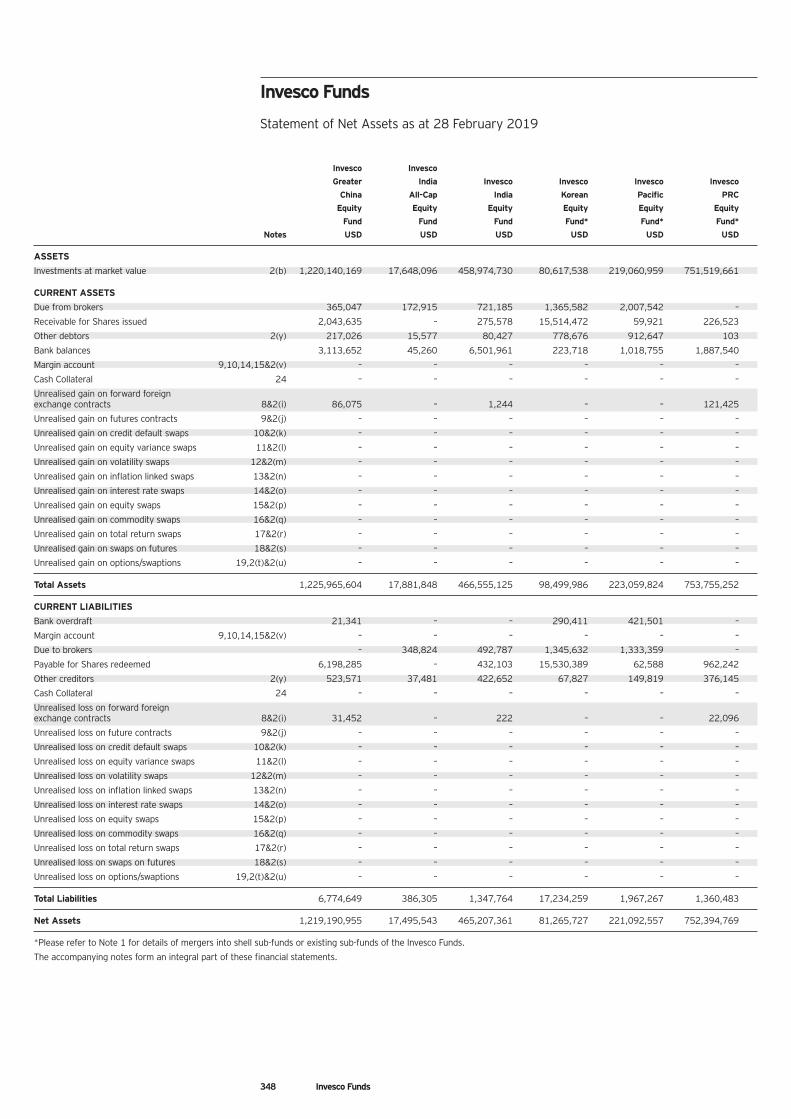
Invesco Funds Statement of Net Assets as at 28 February 2019
Invesco Invesco
Greater India Invesco Invesco Invesco Invesco
China All-Cap India Korean Pacific PRC
Equity Equity Equity Equity Equity Equity
Fund Fund Fund Fund* Fund* Fund*
Notes USD USD USD USD USD USD
ASSETS
Investments at market value 2(b) 1,220,140,169 17,648,096 458,974,730 80,617,538 219,060,959 751,519,661
CURRENT ASSETS
Due from brokers 365,047 172,915 721,185 1,365,582 2,007,542 –
Receivable for Shares issued 2,043,635 – 275,578 15,514,472 59,921 226,523
Other debtors 2(y) 217,026 15,577 80,427 778,676 912,647 103
Bank balances 3,113,652 45,260 6,501,961 223,718 1,018,755 1,887,540
Margin account 9,10,14,15&2(v) – – – – – –
Cash Collateral 24 – – – – – –
Unrealised gain on forward foreign exchange contracts 8&2(i) 86,075 – 1,244 – – 121,425
Unrealised gain on futures contracts 9&2(j) – – – – – –
Unrealised gain on credit default swaps 10&2(k) – – – – – –
Unrealised gain on equity variance swaps 11&2(l) – – – – – –
Unrealised gain on volatility swaps 12&2(m) – – – – – –
Unrealised gain on inflation linked swaps 13&2(n) – – – – – –
Unrealised gain on interest rate swaps 14&2(o) – – – – – –
Unrealised gain on equity swaps 15&2(p) – – – – – –
Unrealised gain on commodity swaps 16&2(q) – – – – – –
Unrealised gain on total return swaps 17&2(r) – – – – – –
Unrealised gain on swaps on futures 18&2(s) – – – – – –
Unrealised gain on options/swaptions 19,2(t)&2(u) – – – – – –
Total Assets 1,225,965,604 17,881,848 466,555,125 98,499,986 223,059,824 753,755,252
CURRENT LIABILITIES
Bank overdraft 21,341 – – 290,411 421,501 –
Margin account 9,10,14,15&2(v) – – – – – –
Due to brokers – 348,824 492,787 1,345,632 1,333,359 –
Payable for Shares redeemed 6,198,285 – 432,103 15,530,389 62,588 962,242
Other creditors 2(y) 523,571 37,481 422,652 67,827 149,819 376,145
Cash Collateral 24 – – – – – –
Unrealised loss on forward foreign exchange contracts 8&2(i) 31,452 – 222 – – 22,096
Unrealised loss on future contracts 9&2(j) – – – – – –
Unrealised loss on credit default swaps 10&2(k) – – – – – –
Unrealised loss on equity variance swaps 11&2(l) – – – – – –
Unrealised loss on volatility swaps 12&2(m) – – – – – –
Unrealised loss on inflation linked swaps 13&2(n) – – – – – –
Unrealised loss on interest rate swaps 14&2(o) – – – – – –
Unrealised loss on equity swaps 15&2(p) – – – – – –
Unrealised loss on commodity swaps 16&2(q) – – – – – –
Unrealised loss on total return swaps 17&2(r) – – – – – –
Unrealised loss on swaps on futures 18&2(s) – – – – – –
Unrealised loss on options/swaptions 19,2(t)&2(u) – – – – – –
Total Liabilities 6,774,649 386,305 1,347,764 17,234,259 1,967,267 1,360,483
Net Assets 1,219,190,955 17,495,543 465,207,361 81,265,727 221,092,557 752,394,769
*Please refer to Note 1 for details of mergers into shell sub-funds or existing sub-funds of the Invesco Funds.
The accompanying notes form an integral part of these financial statements.
348 Invesco Funds
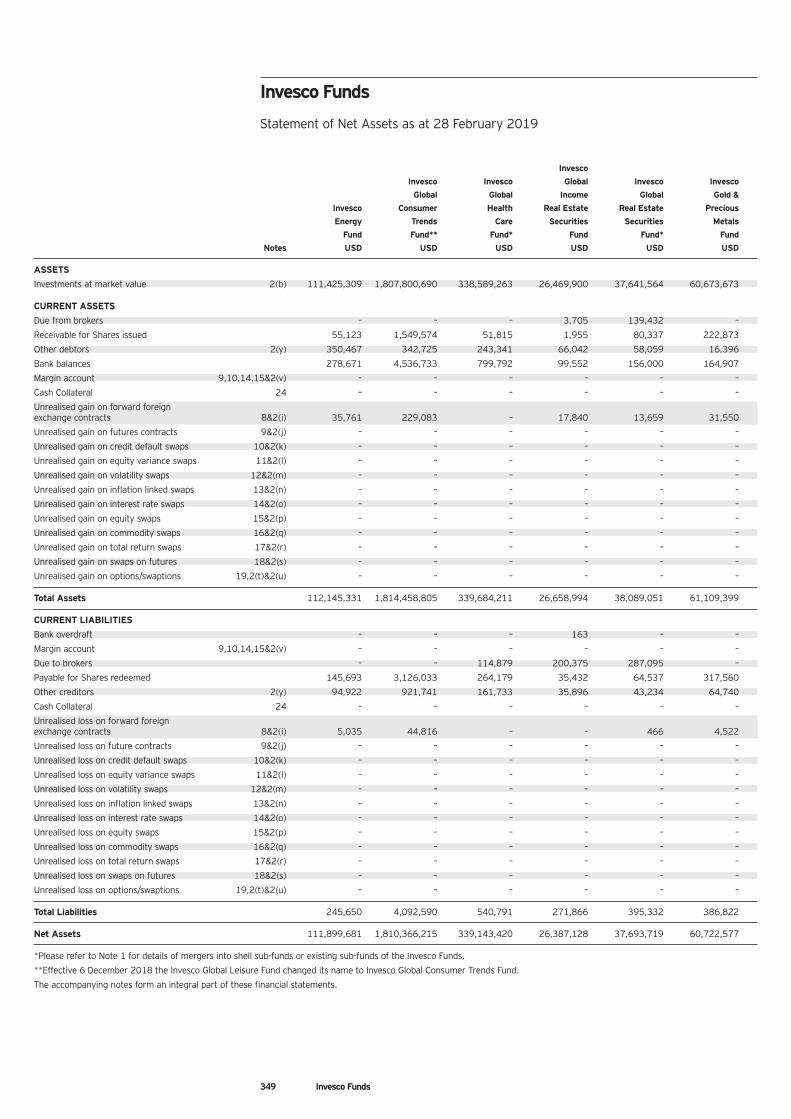
Invesco Funds Statement of Net Assets as at 28 February 2019
Invesco
Invesco Invesco Global Invesco Invesco
Global Global Income Global Gold &
Invesco Consumer Health Real Estate Real Estate Precious
Energy Trends Care Securities Securities Metals
Fund Fund** Fund* Fund Fund* Fund
Notes USD USD USD USD USD USD
ASSETS
Investments at market value 2(b) 111,425,309 1,807,800,690 338,589,263 26,469,900 37,641,564 60,673,673
CURRENT ASSETS
Due from brokers – – – 3,705 139,432 –
Receivable for Shares issued 55,123 1,549,574 51,815 1,955 80,337 222,873
Other debtors 2(y) 350,467 342,725 243,341 66,042 58,059 16,396
Bank balances 278,671 4,536,733 799,792 99,552 156,000 164,907
Margin account 9,10,14,15&2(v) – – – – – –
Cash Collateral 24 – – – – – –
Unrealised gain on forward foreign exchange contracts 8&2(i) 35,761 229,083 – 17,840 13,659 31,550
Unrealised gain on futures contracts 9&2(j) – – – – – –
Unrealised gain on credit default swaps 10&2(k) – – – – – –
Unrealised gain on equity variance swaps 11&2(l) – – – – – –
Unrealised gain on volatility swaps 12&2(m) – – – – – –
Unrealised gain on inflation linked swaps 13&2(n) – – – – – –
Unrealised gain on interest rate swaps 14&2(o) – – – – – –
Unrealised gain on equity swaps 15&2(p) – – – – – –
Unrealised gain on commodity swaps 16&2(q) – – – – – –
Unrealised gain on total return swaps 17&2(r) – – – – – –
Unrealised gain on swaps on futures 18&2(s) – – – – – –
Unrealised gain on options/swaptions 19,2(t)&2(u) – – – – – –
Total Assets 112,145,331 1,814,458,805 339,684,211 26,658,994 38,089,051 61,109,399
CURRENT LIABILITIES
Bank overdraft – – – 163 – –
Margin account 9,10,14,15&2(v) – – – – – –
Due to brokers – – 114,879 200,375 287,095 –
Payable for Shares redeemed 145,693 3,126,033 264,179 35,432 64,537 317,560
Other creditors 2(y) 94,922 921,741 161,733 35,896 43,234 64,740
Cash Collateral 24 – – – – – –
Unrealised loss on forward foreign exchange contracts 8&2(i) 5,035 44,816 – – 466 4,522
Unrealised loss on future contracts 9&2(j) – – – – – –
Unrealised loss on credit default swaps 10&2(k) – – – – – –
Unrealised loss on equity variance swaps 11&2(l) – – – – – –
Unrealised loss on volatility swaps 12&2(m) – – – – – –
Unrealised loss on inflation linked swaps 13&2(n) – – – – – –
Unrealised loss on interest rate swaps 14&2(o) – – – – – –
Unrealised loss on equity swaps 15&2(p) – – – – – –
Unrealised loss on commodity swaps 16&2(q) – – – – – –
Unrealised loss on total return swaps 17&2(r) – – – – – –
Unrealised loss on swaps on futures 18&2(s) – – – – – –
Unrealised loss on options/swaptions 19,2(t)&2(u) – – – – – –
Total Liabilities 245,650 4,092,590 540,791 271,866 395,332 386,822
Net Assets 111,899,681 1,810,366,215 339,143,420 26,387,128 37,693,719 60,722,577
*Please refer to Note 1 for details of mergers into shell sub-funds or existing sub-funds of the Invesco Funds.
**Effective 6 December 2018 the Invesco Global Leisure Fund changed its name to Invesco Global Consumer Trends Fund.
The accompanying notes form an integral part of these financial statements.
349 Invesco Funds
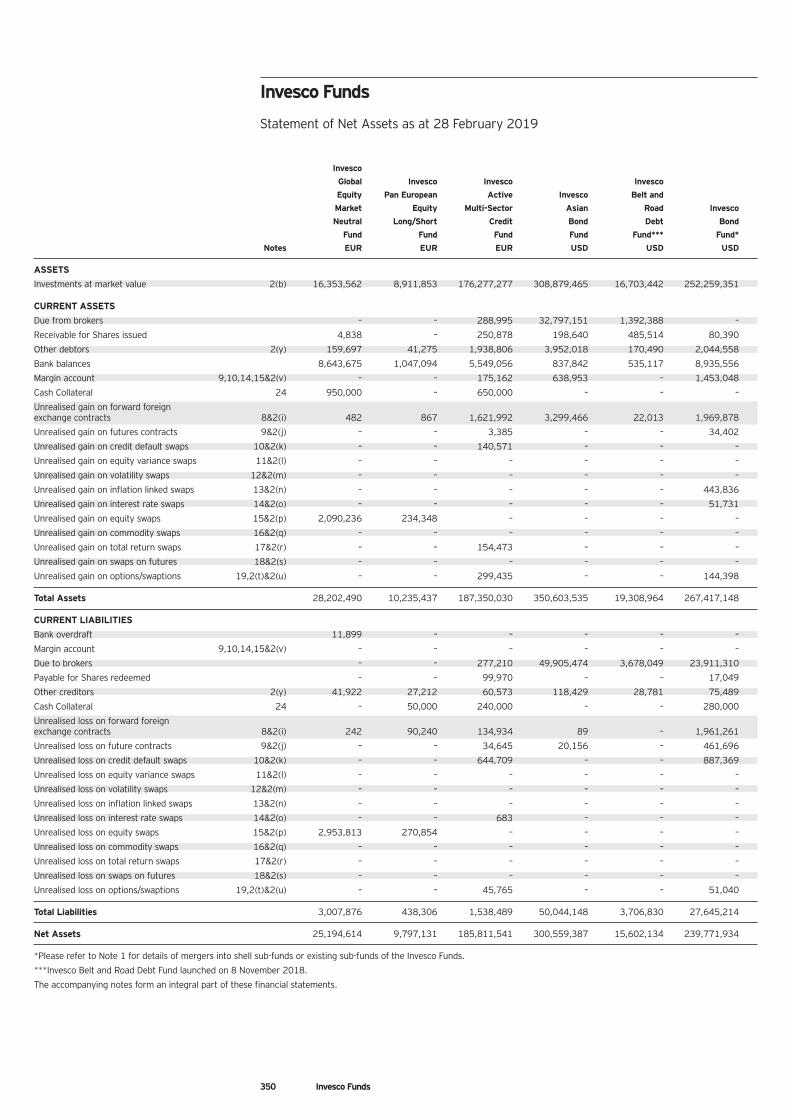
Invesco Funds Statement of Net Assets as at 28 February 2019
Invesco
Global Invesco Invesco Invesco
Equity Pan European Active Invesco Belt and
Market Equity Multi-Sector Asian Road Invesco
Neutral Long/Short Credit Bond Debt Bond
Fund Fund Fund Fund Fund*** Fund*
Notes EUR EUR EUR USD USD USD
ASSETS
Investments at market value 2(b) 16,353,562 8,911,853 176,277,277 308,879,465 16,703,442 252,259,351
CURRENT ASSETS
Due from brokers – – 288,995 32,797,151 1,392,388 –
Receivable for Shares issued 4,838 – 250,878 198,640 485,514 80,390
Other debtors 2(y) 159,697 41,275 1,938,806 3,952,018 170,490 2,044,558
Bank balances 8,643,675 1,047,094 5,549,056 837,842 535,117 8,935,556
Margin account 9,10,14,15&2(v) – – 175,162 638,953 – 1,453,048
Cash Collateral 24 950,000 – 650,000 – – –
Unrealised gain on forward foreign exchange contracts 8&2(i) 482 867 1,621,992 3,299,466 22,013 1,969,878
Unrealised gain on futures contracts 9&2(j) – – 3,385 – – 34,402
Unrealised gain on credit default swaps 10&2(k) – – 140,571 – – –
Unrealised gain on equity variance swaps 11&2(l) – – – – – –
Unrealised gain on volatility swaps 12&2(m) – – – – – –
Unrealised gain on inflation linked swaps 13&2(n) – – – – – 443,836
Unrealised gain on interest rate swaps 14&2(o) – – – – – 51,731
Unrealised gain on equity swaps 15&2(p) 2,090,236 234,348 – – – –
Unrealised gain on commodity swaps 16&2(q) – – – – – –
Unrealised gain on total return swaps 17&2(r) – – 154,473 – – –
Unrealised gain on swaps on futures 18&2(s) – – – – – –
Unrealised gain on options/swaptions 19,2(t)&2(u) – – 299,435 – – 144,398
Total Assets 28,202,490 10,235,437 187,350,030 350,603,535 19,308,964 267,417,148
CURRENT LIABILITIES
Bank overdraft 11,899 – – – – –
Margin account 9,10,14,15&2(v) – – – – – –
Due to brokers – – 277,210 49,905,474 3,678,049 23,911,310
Payable for Shares redeemed – – 99,970 – – 17,049
Other creditors 2(y) 41,922 27,212 60,573 118,429 28,781 75,489
Cash Collateral 24 – 50,000 240,000 – – 280,000
Unrealised loss on forward foreign exchange contracts 8&2(i) 242 90,240 134,934 89 – 1,961,261
Unrealised loss on future contracts 9&2(j) – – 34,645 20,156 – 461,696
Unrealised loss on credit default swaps 10&2(k) – – 644,709 – – 887,369
Unrealised loss on equity variance swaps 11&2(l) – – – – – –
Unrealised loss on volatility swaps 12&2(m) – – – – – –
Unrealised loss on inflation linked swaps 13&2(n) – – – – – –
Unrealised loss on interest rate swaps 14&2(o) – – 683 – – –
Unrealised loss on equity swaps 15&2(p) 2,953,813 270,854 – – – –
Unrealised loss on commodity swaps 16&2(q) – – – – – –
Unrealised loss on total return swaps 17&2(r) – – – – – –
Unrealised loss on swaps on futures 18&2(s) – – – – – –
Unrealised loss on options/swaptions 19,2(t)&2(u) – – 45,765 – – 51,040
Total Liabilities 3,007,876 438,306 1,538,489 50,044,148 3,706,830 27,645,214
Net Assets 25,194,614 9,797,131 185,811,541 300,559,387 15,602,134 239,771,934
*Please refer to Note 1 for details of mergers into shell sub-funds or existing sub-funds of the Invesco Funds.
***Invesco Belt and Road Debt Fund launched on 8 November 2018.
The accompanying notes form an integral part of these financial statements.
350 Invesco Funds
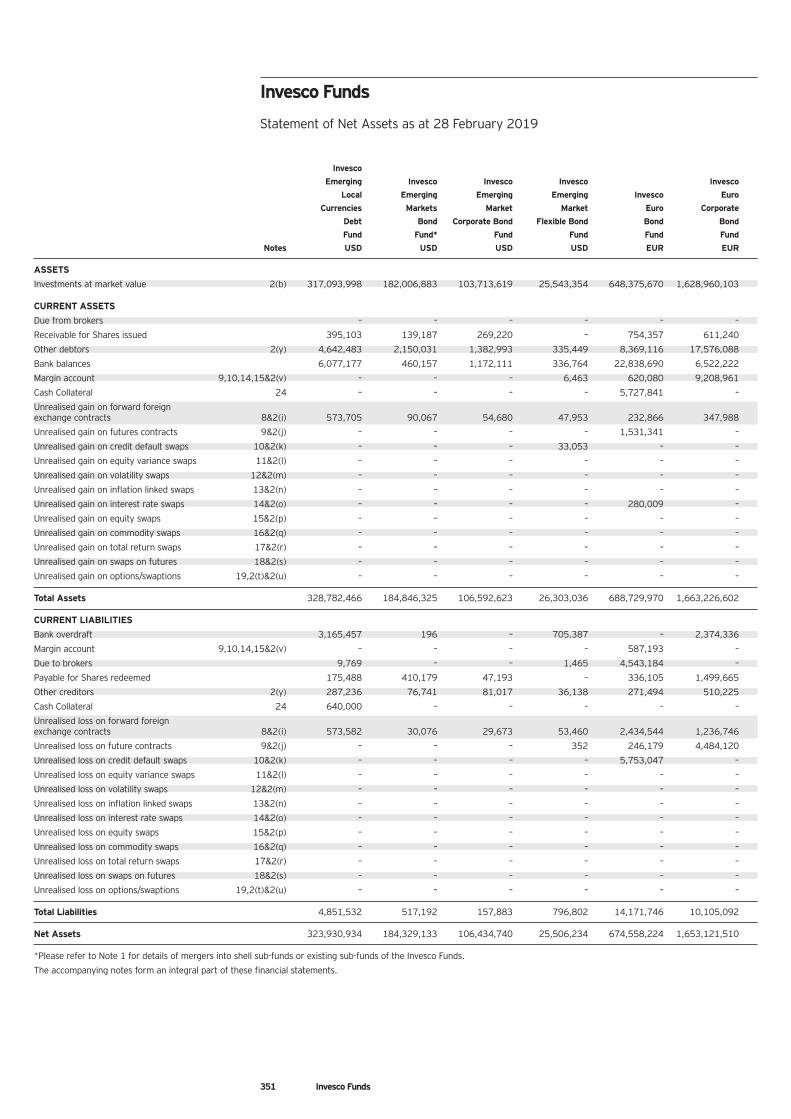
Invesco Funds Statement of Net Assets as at 28 February 2019
Invesco
Emerging Invesco Invesco Invesco Invesco
Local Emerging Emerging Emerging Invesco Euro
Currencies Markets Market Market Euro Corporate
Debt Bond Corporate Bond Flexible Bond Bond Bond
Fund Fund* Fund Fund Fund Fund
Notes USD USD USD USD EUR EUR
ASSETS
Investments at market value 2(b) 317,093,998 182,006,883 103,713,619 25,543,354 648,375,670 1,628,960,103
CURRENT ASSETS
Due from brokers – – – – – –
Receivable for Shares issued 395,103 139,187 269,220 – 754,357 611,240
Other debtors 2(y) 4,642,483 2,150,031 1,382,993 335,449 8,369,116 17,576,088
Bank balances 6,077,177 460,157 1,172,111 336,764 22,838,690 6,522,222
Margin account 9,10,14,15&2(v) – – – 6,463 620,080 9,208,961
Cash Collateral 24 – – – – 5,727,841 –
Unrealised gain on forward foreign exchange contracts 8&2(i) 573,705 90,067 54,680 47,953 232,866 347,988
Unrealised gain on futures contracts 9&2(j) – – – – 1,531,341 –
Unrealised gain on credit default swaps 10&2(k) – – – 33,053 – –
Unrealised gain on equity variance swaps 11&2(l) – – – – – –
Unrealised gain on volatility swaps 12&2(m) – – – – – –
Unrealised gain on inflation linked swaps 13&2(n) – – – – – –
Unrealised gain on interest rate swaps 14&2(o) – – – – 280,009 –
Unrealised gain on equity swaps 15&2(p) – – – – – –
Unrealised gain on commodity swaps 16&2(q) – – – – – –
Unrealised gain on total return swaps 17&2(r) – – – – – –
Unrealised gain on swaps on futures 18&2(s) – – – – – –
Unrealised gain on options/swaptions 19,2(t)&2(u) – – – – – –
Total Assets 328,782,466 184,846,325 106,592,623 26,303,036 688,729,970 1,663,226,602
CURRENT LIABILITIES
Bank overdraft 3,165,457 196 – 705,387 – 2,374,336
Margin account 9,10,14,15&2(v) – – – – 587,193 –
Due to brokers 9,769 – – 1,465 4,543,184 –
Payable for Shares redeemed 175,488 410,179 47,193 – 336,105 1,499,665
Other creditors 2(y) 287,236 76,741 81,017 36,138 271,494 510,225
Cash Collateral 24 640,000 – – – – –
Unrealised loss on forward foreign exchange contracts 8&2(i) 573,582 30,076 29,673 53,460 2,434,544 1,236,746
Unrealised loss on future contracts 9&2(j) – – – 352 246,179 4,484,120
Unrealised loss on credit default swaps 10&2(k) – – – – 5,753,047 –
Unrealised loss on equity variance swaps 11&2(l) – – – – – –
Unrealised loss on volatility swaps 12&2(m) – – – – – –
Unrealised loss on inflation linked swaps 13&2(n) – – – – – –
Unrealised loss on interest rate swaps 14&2(o) – – – – – –
Unrealised loss on equity swaps 15&2(p) – – – – – –
Unrealised loss on commodity swaps 16&2(q) – – – – – –
Unrealised loss on total return swaps 17&2(r) – – – – – –
Unrealised loss on swaps on futures 18&2(s) – – – – – –
Unrealised loss on options/swaptions 19,2(t)&2(u) – – – – – –
Total Liabilities 4,851,532 517,192 157,883 796,802 14,171,746 10,105,092
Net Assets 323,930,934 184,329,133 106,434,740 25,506,234 674,558,224 1,653,121,510
*Please refer to Note 1 for details of mergers into shell sub-funds or existing sub-funds of the Invesco Funds.
The accompanying notes form an integral part of these financial statements.
351 Invesco Funds
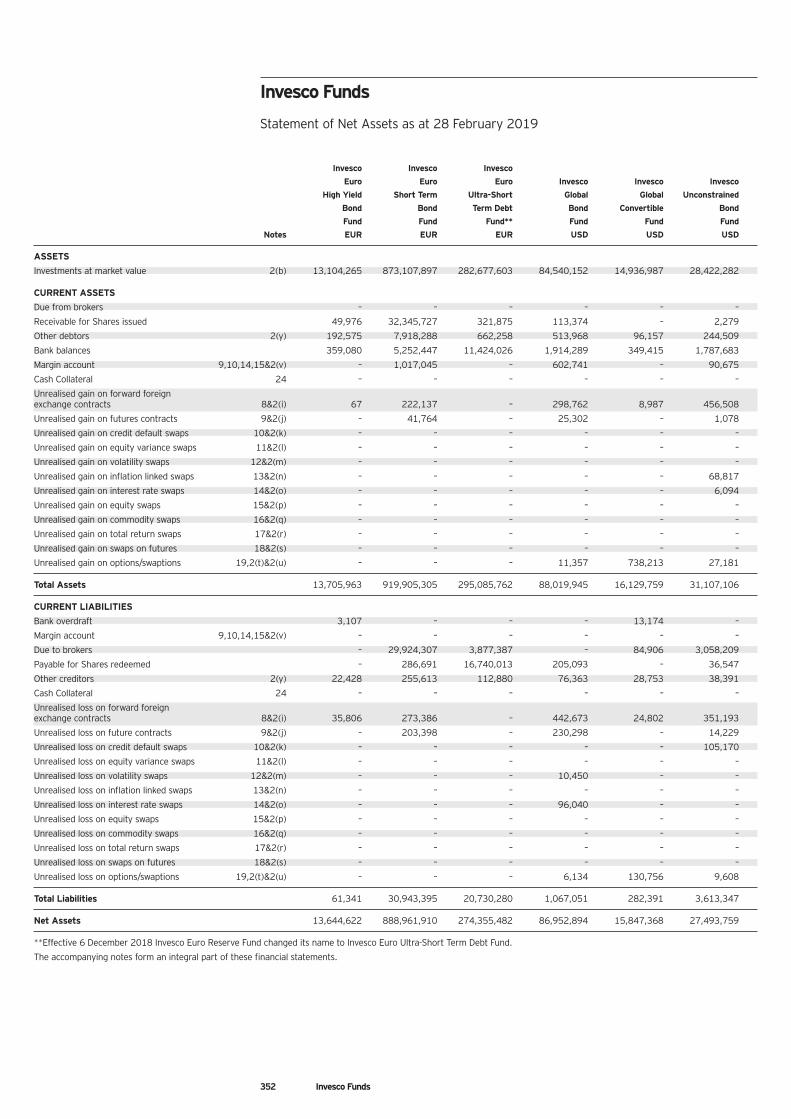
Invesco Funds Statement of Net Assets as at 28 February 2019
Invesco Invesco Invesco
Euro Euro Euro Invesco Invesco Invesco
High Yield Short Term Ultra-Short Global Global Unconstrained
Bond Bond Term Debt Bond Convertible Bond
Fund Fund Fund** Fund Fund Fund
Notes EUR EUR EUR USD USD USD
ASSETS
Investments at market value 2(b) 13,104,265 873,107,897 282,677,603 84,540,152 14,936,987 28,422,282
CURRENT ASSETS
Due from brokers – – – – – –
Receivable for Shares issued 49,976 32,345,727 321,875 113,374 – 2,279
Other debtors 2(y) 192,575 7,918,288 662,258 513,968 96,157 244,509
Bank balances 359,080 5,252,447 11,424,026 1,914,289 349,415 1,787,683
Margin account 9,10,14,15&2(v) – 1,017,045 – 602,741 – 90,675
Cash Collateral 24 – – – – – –
Unrealised gain on forward foreign exchange contracts 8&2(i) 67 222,137 – 298,762 8,987 456,508
Unrealised gain on futures contracts 9&2(j) – 41,764 – 25,302 – 1,078
Unrealised gain on credit default swaps 10&2(k) – – – – – –
Unrealised gain on equity variance swaps 11&2(l) – – – – – –
Unrealised gain on volatility swaps 12&2(m) – – – – – –
Unrealised gain on inflation linked swaps 13&2(n) – – – – – 68,817
Unrealised gain on interest rate swaps 14&2(o) – – – – – 6,094
Unrealised gain on equity swaps 15&2(p) – – – – – –
Unrealised gain on commodity swaps 16&2(q) – – – – – –
Unrealised gain on total return swaps 17&2(r) – – – – – –
Unrealised gain on swaps on futures 18&2(s) – – – – – –
Unrealised gain on options/swaptions 19,2(t)&2(u) – – – 11,357 738,213 27,181
Total Assets 13,705,963 919,905,305 295,085,762 88,019,945 16,129,759 31,107,106
CURRENT LIABILITIES
Bank overdraft 3,107 – – – 13,174 –
Margin account 9,10,14,15&2(v) – – – – – –
Due to brokers – 29,924,307 3,877,387 – 84,906 3,058,209
Payable for Shares redeemed – 286,691 16,740,013 205,093 – 36,547
Other creditors 2(y) 22,428 255,613 112,880 76,363 28,753 38,391
Cash Collateral 24 – – – – – –
Unrealised loss on forward foreign exchange contracts 8&2(i) 35,806 273,386 – 442,673 24,802 351,193
Unrealised loss on future contracts 9&2(j) – 203,398 – 230,298 – 14,229
Unrealised loss on credit default swaps 10&2(k) – – – – – 105,170
Unrealised loss on equity variance swaps 11&2(l) – – – – – –
Unrealised loss on volatility swaps 12&2(m) – – – 10,450 – –
Unrealised loss on inflation linked swaps 13&2(n) – – – – – –
Unrealised loss on interest rate swaps 14&2(o) – – – 96,040 – –
Unrealised loss on equity swaps 15&2(p) – – – – – –
Unrealised loss on commodity swaps 16&2(q) – – – – – –
Unrealised loss on total return swaps 17&2(r) – – – – – –
Unrealised loss on swaps on futures 18&2(s) – – – – – –
Unrealised loss on options/swaptions 19,2(t)&2(u) – – – 6,134 130,756 9,608
Total Liabilities 61,341 30,943,395 20,730,280 1,067,051 282,391 3,613,347
Net Assets 13,644,622 888,961,910 274,355,482 86,952,894 15,847,368 27,493,759
**Effective 6 December 2018 Invesco Euro Reserve Fund changed its name to Invesco Euro Ultra-Short Term Debt Fund.
The accompanying notes form an integral part of these financial statements.
352 Invesco Funds
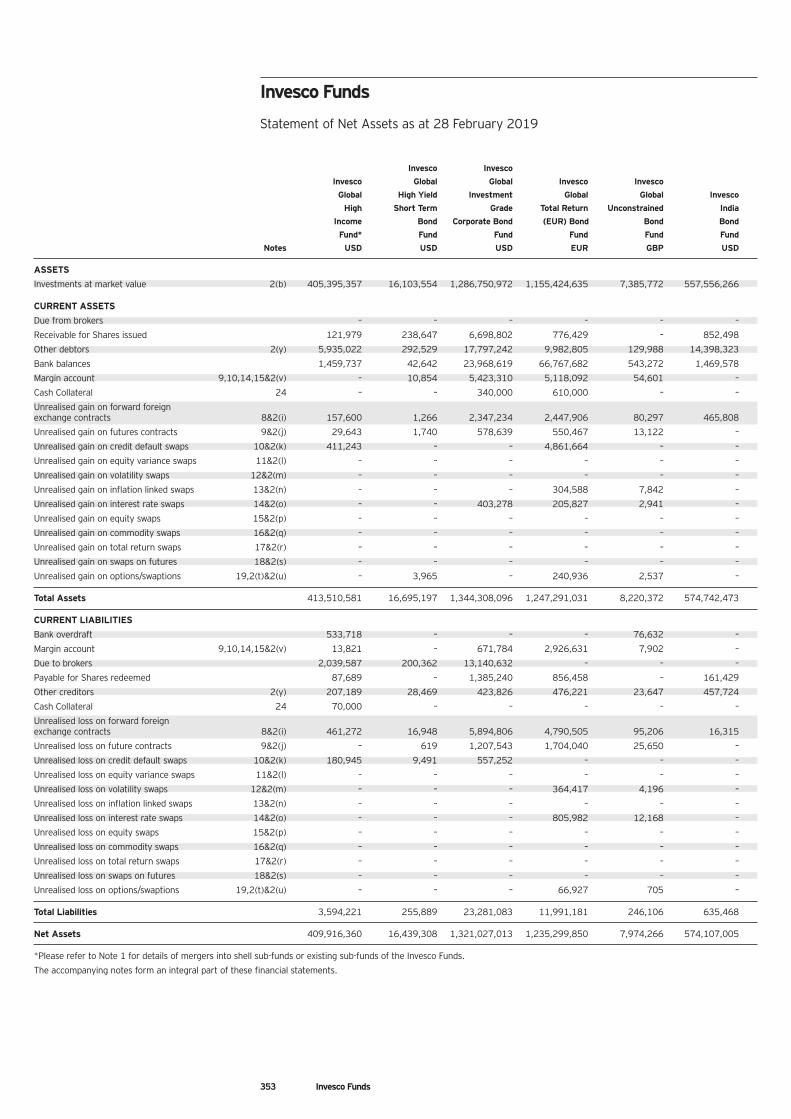
Invesco Funds Statement of Net Assets as at 28 February 2019
Invesco Invesco
Invesco Global Global Invesco Invesco
Global High Yield Investment Global Global Invesco
High Short Term Grade Total Return Unconstrained India
Income Bond Corporate Bond (EUR) Bond Bond Bond
Fund* Fund Fund Fund Fund Fund
Notes USD USD USD EUR GBP USD
ASSETS
Investments at market value 2(b) 405,395,357 16,103,554 1,286,750,972 1,155,424,635 7,385,772 557,556,266
CURRENT ASSETS
Due from brokers – – – – – –
Receivable for Shares issued 121,979 238,647 6,698,802 776,429 – 852,498
Other debtors 2(y) 5,935,022 292,529 17,797,242 9,982,805 129,988 14,398,323
Bank balances 1,459,737 42,642 23,968,619 66,767,682 543,272 1,469,578
Margin account 9,10,14,15&2(v) – 10,854 5,423,310 5,118,092 54,601 –
Cash Collateral 24 – – 340,000 610,000 – –
Unrealised gain on forward foreign exchange contracts 8&2(i) 157,600 1,266 2,347,234 2,447,906 80,297 465,808
Unrealised gain on futures contracts 9&2(j) 29,643 1,740 578,639 550,467 13,122 –
Unrealised gain on credit default swaps 10&2(k) 411,243 – – 4,861,664 – –
Unrealised gain on equity variance swaps 11&2(l) – – – – – –
Unrealised gain on volatility swaps 12&2(m) – – – – – –
Unrealised gain on inflation linked swaps 13&2(n) – – – 304,588 7,842 –
Unrealised gain on interest rate swaps 14&2(o) – – 403,278 205,827 2,941 –
Unrealised gain on equity swaps 15&2(p) – – – – – –
Unrealised gain on commodity swaps 16&2(q) – – – – – –
Unrealised gain on total return swaps 17&2(r) – – – – – –
Unrealised gain on swaps on futures 18&2(s) – – – – – –
Unrealised gain on options/swaptions 19,2(t)&2(u) – 3,965 – 240,936 2,537 –
Total Assets 413,510,581 16,695,197 1,344,308,096 1,247,291,031 8,220,372 574,742,473
CURRENT LIABILITIES
Bank overdraft 533,718 – – – 76,632 –
Margin account 9,10,14,15&2(v) 13,821 – 671,784 2,926,631 7,902 –
Due to brokers 2,039,587 200,362 13,140,632 – – –
Payable for Shares redeemed 87,689 – 1,385,240 856,458 – 161,429
Other creditors 2(y) 207,189 28,469 423,826 476,221 23,647 457,724
Cash Collateral 24 70,000 – – – – –
Unrealised loss on forward foreign exchange contracts 8&2(i) 461,272 16,948 5,894,806 4,790,505 95,206 16,315
Unrealised loss on future contracts 9&2(j) – 619 1,207,543 1,704,040 25,650 –
Unrealised loss on credit default swaps 10&2(k) 180,945 9,491 557,252 – – –
Unrealised loss on equity variance swaps 11&2(l) – – – – – –
Unrealised loss on volatility swaps 12&2(m) – – – 364,417 4,196 –
Unrealised loss on inflation linked swaps 13&2(n) – – – – – –
Unrealised loss on interest rate swaps 14&2(o) – – – 805,982 12,168 –
Unrealised loss on equity swaps 15&2(p) – – – – – –
Unrealised loss on commodity swaps 16&2(q) – – – – – –
Unrealised loss on total return swaps 17&2(r) – – – – – –
Unrealised loss on swaps on futures 18&2(s) – – – – – –
Unrealised loss on options/swaptions 19,2(t)&2(u) – – – 66,927 705 –
Total Liabilities 3,594,221 255,889 23,281,083 11,991,181 246,106 635,468
Net Assets 409,916,360 16,439,308 1,321,027,013 1,235,299,850 7,974,266 574,107,005
*Please refer to Note 1 for details of mergers into shell sub-funds or existing sub-funds of the Invesco Funds.
The accompanying notes form an integral part of these financial statements.
353 Invesco Funds
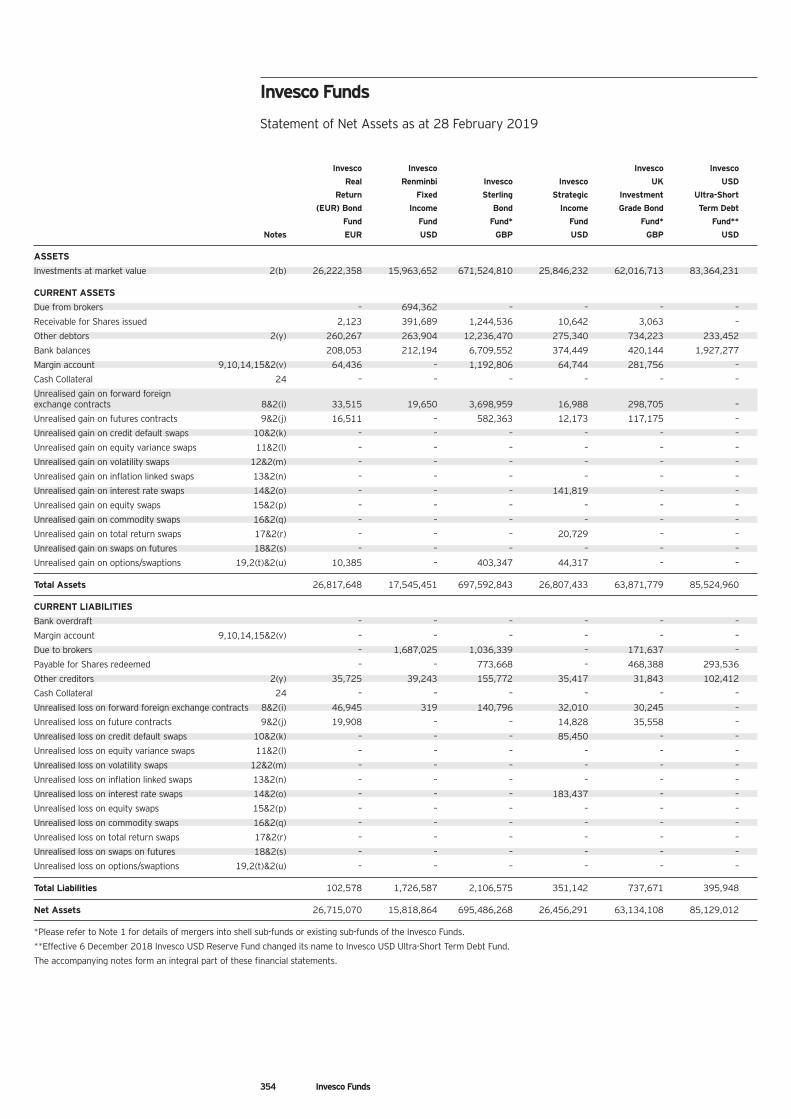
Invesco Funds Statement of Net Assets as at 28 February 2019
Invesco Invesco Invesco Invesco
Real Renminbi Invesco Invesco UK USD
Return Fixed Sterling Strategic Investment Ultra-Short
(EUR) Bond Income Bond Income Grade Bond Term Debt
Fund Fund Fund* Fund Fund* Fund**
Notes EUR USD GBP USD GBP USD
ASSETS
Investments at market value 2(b) 26,222,358 15,963,652 671,524,810 25,846,232 62,016,713 83,364,231
CURRENT ASSETS
Due from brokers – 694,362 – – – –
Receivable for Shares issued 2,123 391,689 1,244,536 10,642 3,063 –
Other debtors 2(y) 260,267 263,904 12,236,470 275,340 734,223 233,452
Bank balances 208,053 212,194 6,709,552 374,449 420,144 1,927,277
Margin account 9,10,14,15&2(v) 64,436 – 1,192,806 64,744 281,756 –
Cash Collateral 24 – – – – – –
Unrealised gain on forward foreign exchange contracts 8&2(i) 33,515 19,650 3,698,959 16,988 298,705 –
Unrealised gain on futures contracts 9&2(j) 16,511 – 582,363 12,173 117,175 –
Unrealised gain on credit default swaps 10&2(k) – – – – – –
Unrealised gain on equity variance swaps 11&2(l) – – – – – –
Unrealised gain on volatility swaps 12&2(m) – – – – – –
Unrealised gain on inflation linked swaps 13&2(n) – – – – – –
Unrealised gain on interest rate swaps 14&2(o) – – – 141,819 – –
Unrealised gain on equity swaps 15&2(p) – – – – – –
Unrealised gain on commodity swaps 16&2(q) – – – – – –
Unrealised gain on total return swaps 17&2(r) – – – 20,729 – –
Unrealised gain on swaps on futures 18&2(s) – – – – – –
Unrealised gain on options/swaptions 19,2(t)&2(u) 10,385 – 403,347 44,317 – –
Total Assets 26,817,648 17,545,451 697,592,843 26,807,433 63,871,779 85,524,960
CURRENT LIABILITIES
Bank overdraft – – – – – –
Margin account 9,10,14,15&2(v) – – – – – –
Due to brokers – 1,687,025 1,036,339 – 171,637 –
Payable for Shares redeemed – – 773,668 – 468,388 293,536
Other creditors 2(y) 35,725 39,243 155,772 35,417 31,843 102,412
Cash Collateral 24 – – – – – –
Unrealised loss on forward foreign exchange contracts 8&2(i) 46,945 319 140,796 32,010 30,245 –
Unrealised loss on future contracts 9&2(j) 19,908 – – 14,828 35,558 –
Unrealised loss on credit default swaps 10&2(k) – – – 85,450 – –
Unrealised loss on equity variance swaps 11&2(l) – – – – – –
Unrealised loss on volatility swaps 12&2(m) – – – – – –
Unrealised loss on inflation linked swaps 13&2(n) – – – – – –
Unrealised loss on interest rate swaps 14&2(o) – – – 183,437 – –
Unrealised loss on equity swaps 15&2(p) – – – – – –
Unrealised loss on commodity swaps 16&2(q) – – – – – –
Unrealised loss on total return swaps 17&2(r) – – – – – –
Unrealised loss on swaps on futures 18&2(s) – – – – – –
Unrealised loss on options/swaptions 19,2(t)&2(u) – – – – – –
Total Liabilities 102,578 1,726,587 2,106,575 351,142 737,671 395,948
Net Assets 26,715,070 15,818,864 695,486,268 26,456,291 63,134,108 85,129,012
*Please refer to Note 1 for details of mergers into shell sub-funds or existing sub-funds of the Invesco Funds.
**Effective 6 December 2018 Invesco USD Reserve Fund changed its name to Invesco USD Ultra-Short Term Debt Fund.
The accompanying notes form an integral part of these financial statements.
354 Invesco Funds
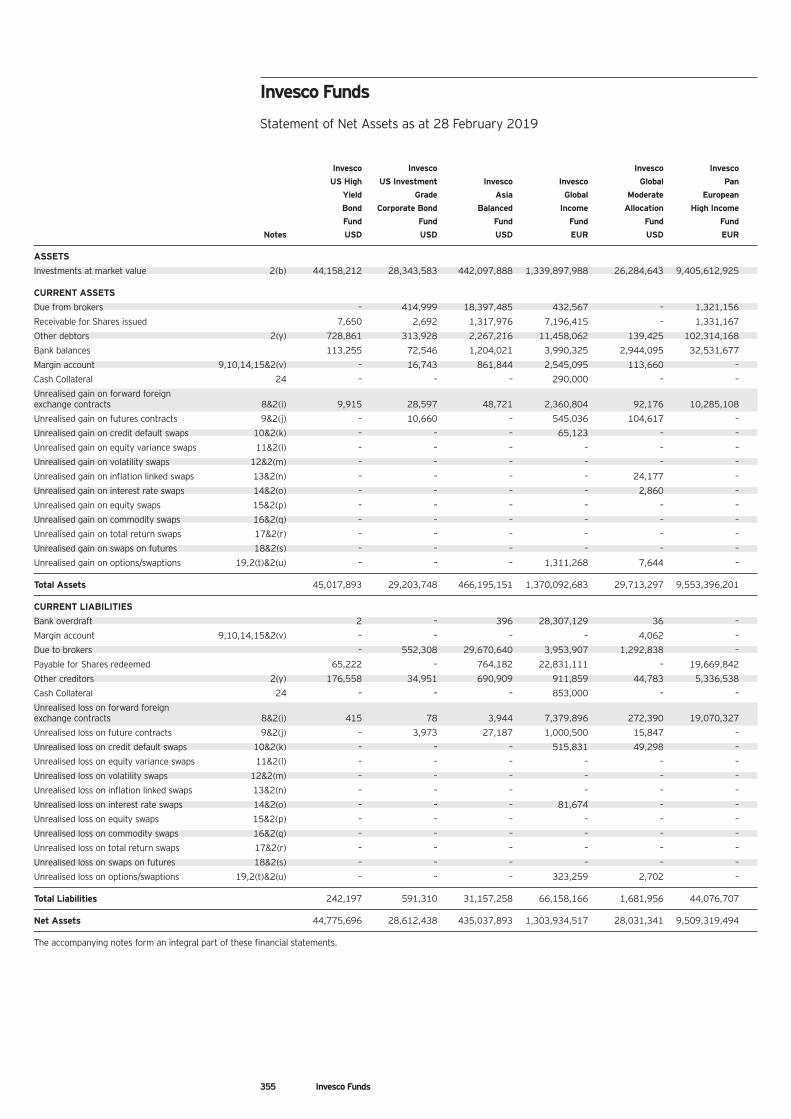
Invesco Funds Statement of Net Assets as at 28 February 2019
355 Invesco Funds
Invesco Invesco Invesco Invesco
US High US Investment Invesco Invesco Global Pan
Yield Grade Asia Global Moderate European
Bond Corporate Bond Balanced Income Allocation High Income
Fund Fund Fund Fund Fund Fund
Notes USD USD USD EUR USD EUR
ASSETS
Investments at market value 2(b) 44,158,212 28,343,583 442,097,888 1,339,897,988 26,284,643 9,405,612,925
CURRENT ASSETS
Due from brokers – 414,999 18,397,485 432,567 – 1,321,156
Receivable for Shares issued 7,650 2,692 1,317,976 7,196,415 – 1,331,167
Other debtors 2(y) 728,861 313,928 2,267,216 11,458,062 139,425 102,314,168
Bank balances 113,255 72,546 1,204,021 3,990,325 2,944,095 32,531,677
Margin account 9,10,14,15&2(v) – 16,743 861,844 2,545,095 113,660 –
Cash Collateral 24 – – – 290,000 – –
Unrealised gain on forward foreign exchange contracts 8&2(i) 9,915 28,597 48,721 2,360,804 92,176 10,285,108
Unrealised gain on futures contracts 9&2(j) – 10,660 – 545,036 104,617 –
Unrealised gain on credit default swaps 10&2(k) – – – 65,123 – –
Unrealised gain on equity variance swaps 11&2(l) – – – – – –
Unrealised gain on volatility swaps 12&2(m) – – – – – –
Unrealised gain on inflation linked swaps 13&2(n) – – – – 24,177 –
Unrealised gain on interest rate swaps 14&2(o) – – – – 2,860 –
Unrealised gain on equity swaps 15&2(p) – – – – – –
Unrealised gain on commodity swaps 16&2(q) – – – – – –
Unrealised gain on total return swaps 17&2(r) – – – – – –
Unrealised gain on swaps on futures 18&2(s) – – – – – –
Unrealised gain on options/swaptions 19,2(t)&2(u) – – – 1,311,268 7,644 –
Total Assets 45,017,893 29,203,748 466,195,151 1,370,092,683 29,713,297 9,553,396,201
CURRENT LIABILITIES
Bank overdraft 2 – 396 28,307,129 36 –
Margin account 9,10,14,15&2(v) – – – – 4,062 –
Due to brokers – 552,308 29,670,640 3,953,907 1,292,838 –
Payable for Shares redeemed 65,222 – 764,182 22,831,111 – 19,669,842
Other creditors 2(y) 176,558 34,951 690,909 911,859 44,783 5,336,538
Cash Collateral 24 – – – 853,000 – –
Unrealised loss on forward foreign exchange contracts 8&2(i) 415 78 3,944 7,379,896 272,390 19,070,327
Unrealised loss on future contracts 9&2(j) – 3,973 27,187 1,000,500 15,847 –
Unrealised loss on credit default swaps 10&2(k) – – – 515,831 49,298 –
Unrealised loss on equity variance swaps 11&2(l) – – – – – –
Unrealised loss on volatility swaps 12&2(m) – – – – – –
Unrealised loss on inflation linked swaps 13&2(n) – – – – – –
Unrealised loss on interest rate swaps 14&2(o) – – – 81,674 – –
Unrealised loss on equity swaps 15&2(p) – – – – – –
Unrealised loss on commodity swaps 16&2(q) – – – – – –
Unrealised loss on total return swaps 17&2(r) – – – – – –
Unrealised loss on swaps on futures 18&2(s) – – – – – –
Unrealised loss on options/swaptions 19,2(t)&2(u) – – – 323,259 2,702 –
Total Liabilities 242,197 591,310 31,157,258 66,158,166 1,681,956 44,076,707
Net Assets 44,775,696 28,612,438 435,037,893 1,303,934,517 28,031,341 9,509,319,494
The accompanying notes form an integral part of these financial statements.
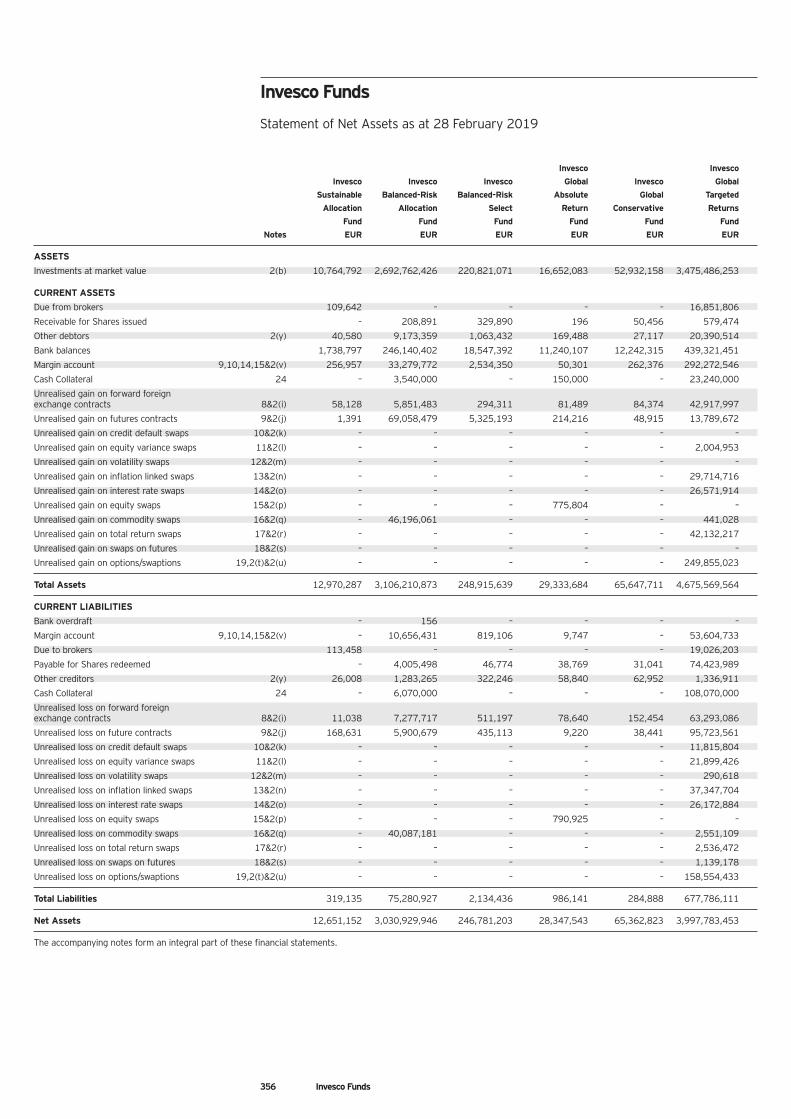
Invesco Funds Statement of Net Assets as at 28 February 2019
356 Invesco Funds
Invesco Invesco
Invesco Invesco Invesco Global Invesco Global
Sustainable Balanced-Risk Balanced-Risk Absolute Global Targeted
Allocation Allocation Select Return Conservative Returns
Fund Fund Fund Fund Fund Fund
Notes EUR EUR EUR EUR EUR EUR
ASSETS
Investments at market value 2(b) 10,764,792 2,692,762,426 220,821,071 16,652,083 52,932,158 3,475,486,253
CURRENT ASSETS
Due from brokers 109,642 – – – – 16,851,806
Receivable for Shares issued – 208,891 329,890 196 50,456 579,474
Other debtors 2(y) 40,580 9,173,359 1,063,432 169,488 27,117 20,390,514
Bank balances 1,738,797 246,140,402 18,547,392 11,240,107 12,242,315 439,321,451
Margin account 9,10,14,15&2(v) 256,957 33,279,772 2,534,350 50,301 262,376 292,272,546
Cash Collateral 24 – 3,540,000 – 150,000 – 23,240,000
Unrealised gain on forward foreign exchange contracts 8&2(i) 58,128 5,851,483 294,311 81,489 84,374 42,917,997
Unrealised gain on futures contracts 9&2(j) 1,391 69,058,479 5,325,193 214,216 48,915 13,789,672
Unrealised gain on credit default swaps 10&2(k) – – – – – –
Unrealised gain on equity variance swaps 11&2(l) – – – – – 2,004,953
Unrealised gain on volatility swaps 12&2(m) – – – – – –
Unrealised gain on inflation linked swaps 13&2(n) – – – – – 29,714,716
Unrealised gain on interest rate swaps 14&2(o) – – – – – 26,571,914
Unrealised gain on equity swaps 15&2(p) – – – 775,804 – –
Unrealised gain on commodity swaps 16&2(q) – 46,196,061 – – – 441,028
Unrealised gain on total return swaps 17&2(r) – – – – – 42,132,217
Unrealised gain on swaps on futures 18&2(s) – – – – – –
Unrealised gain on options/swaptions 19,2(t)&2(u) – – – – – 249,855,023
Total Assets 12,970,287 3,106,210,873 248,915,639 29,333,684 65,647,711 4,675,569,564
CURRENT LIABILITIES
Bank overdraft – 156 – – – –
Margin account 9,10,14,15&2(v) – 10,656,431 819,106 9,747 – 53,604,733
Due to brokers 113,458 – – – – 19,026,203
Payable for Shares redeemed – 4,005,498 46,774 38,769 31,041 74,423,989
Other creditors 2(y) 26,008 1,283,265 322,246 58,840 62,952 1,336,911
Cash Collateral 24 – 6,070,000 – – – 108,070,000
Unrealised loss on forward foreign exchange contracts 8&2(i) 11,038 7,277,717 511,197 78,640 152,454 63,293,086
Unrealised loss on future contracts 9&2(j) 168,631 5,900,679 435,113 9,220 38,441 95,723,561
Unrealised loss on credit default swaps 10&2(k) – – – – – 11,815,804
Unrealised loss on equity variance swaps 11&2(l) – – – – – 21,899,426
Unrealised loss on volatility swaps 12&2(m) – – – – – 290,618
Unrealised loss on inflation linked swaps 13&2(n) – – – – – 37,347,704
Unrealised loss on interest rate swaps 14&2(o) – – – – – 26,172,884
Unrealised loss on equity swaps 15&2(p) – – – 790,925 – –
Unrealised loss on commodity swaps 16&2(q) – 40,087,181 – – – 2,551,109
Unrealised loss on total return swaps 17&2(r) – – – – – 2,536,472
Unrealised loss on swaps on futures 18&2(s) – – – – – 1,139,178
Unrealised loss on options/swaptions 19,2(t)&2(u) – – – – – 158,554,433
Total Liabilities 319,135 75,280,927 2,134,436 986,141 284,888 677,786,111
Net Assets 12,651,152 3,030,929,946 246,781,203 28,347,543 65,362,823 3,997,783,453
The accompanying notes form an integral part of these financial statements.
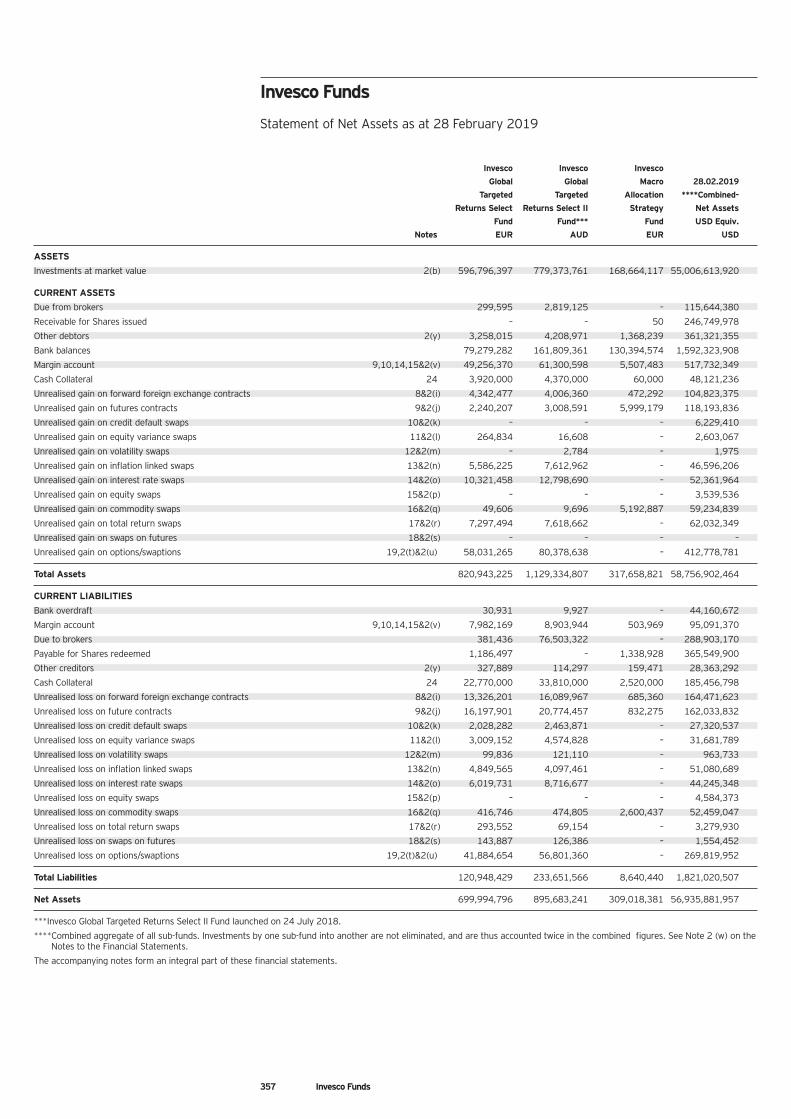
Invesco Funds Statement of Net Assets as at 28 February 2019
357 Invesco Funds
Invesco Invesco Invesco
Global Global Macro 28.02.2019
Targeted Targeted Allocation ****Combined-
Returns Select Returns Select II Strategy Net Assets
Fund Fund*** Fund USD Equiv.
Notes EUR AUD EUR USD
ASSETS
Investments at market value 2(b) 596,796,397 779,373,761 168,664,117 55,006,613,920
CURRENT ASSETS
Due from brokers 299,595 2,819,125 – 115,644,380
Receivable for Shares issued – – 50 246,749,978
Other debtors 2(y) 3,258,015 4,208,971 1,368,239 361,321,355
Bank balances 79,279,282 161,809,361 130,394,574 1,592,323,908
Margin account 9,10,14,15&2(v) 49,256,370 61,300,598 5,507,483 517,732,349
Cash Collateral 24 3,920,000 4,370,000 60,000 48,121,236
Unrealised gain on forward foreign exchange contracts 8&2(i) 4,342,477 4,006,360 472,292 104,823,375
Unrealised gain on futures contracts 9&2(j) 2,240,207 3,008,591 5,999,179 118,193,836
Unrealised gain on credit default swaps 10&2(k) – – – 6,229,410
Unrealised gain on equity variance swaps 11&2(l) 264,834 16,608 – 2,603,067
Unrealised gain on volatility swaps 12&2(m) – 2,784 – 1,975
Unrealised gain on inflation linked swaps 13&2(n) 5,586,225 7,612,962 – 46,596,206
Unrealised gain on interest rate swaps 14&2(o) 10,321,458 12,798,690 – 52,361,964
Unrealised gain on equity swaps 15&2(p) – – – 3,539,536
Unrealised gain on commodity swaps 16&2(q) 49,606 9,696 5,192,887 59,234,839
Unrealised gain on total return swaps 17&2(r) 7,297,494 7,618,662 – 62,032,349
Unrealised gain on swaps on futures 18&2(s) – – – –
Unrealised gain on options/swaptions 19,2(t)&2(u) 58,031,265 80,378,638 – 412,778,781
Total Assets 820,943,225 1,129,334,807 317,658,821 58,756,902,464
CURRENT LIABILITIES
Bank overdraft 30,931 9,927 – 44,160,672
Margin account 9,10,14,15&2(v) 7,982,169 8,903,944 503,969 95,091,370
Due to brokers 381,436 76,503,322 – 288,903,170
Payable for Shares redeemed 1,186,497 – 1,338,928 365,549,900
Other creditors 2(y) 327,889 114,297 159,471 28,363,292
Cash Collateral 24 22,770,000 33,810,000 2,520,000 185,456,798
Unrealised loss on forward foreign exchange contracts 8&2(i) 13,326,201 16,089,967 685,360 164,471,623
Unrealised loss on future contracts 9&2(j) 16,197,901 20,774,457 832,275 162,033,832
Unrealised loss on credit default swaps 10&2(k) 2,028,282 2,463,871 – 27,320,537
Unrealised loss on equity variance swaps 11&2(l) 3,009,152 4,574,828 – 31,681,789
Unrealised loss on volatility swaps 12&2(m) 99,836 121,110 – 963,733
Unrealised loss on inflation linked swaps 13&2(n) 4,849,565 4,097,461 – 51,080,689
Unrealised loss on interest rate swaps 14&2(o) 6,019,731 8,716,677 – 44,245,348
Unrealised loss on equity swaps 15&2(p) – – – 4,584,373
Unrealised loss on commodity swaps 16&2(q) 416,746 474,805 2,600,437 52,459,047
Unrealised loss on total return swaps 17&2(r) 293,552 69,154 – 3,279,930
Unrealised loss on swaps on futures 18&2(s) 143,887 126,386 – 1,554,452
Unrealised loss on options/swaptions 19,2(t)&2(u) 41,884,654 56,801,360 – 269,819,952
Total Liabilities 120,948,429 233,651,566 8,640,440 1,821,020,507
Net Assets 699,994,796 895,683,241 309,018,381 56,935,881,957
***Invesco Global Targeted Returns Select II Fund launched on 24 July 2018.
****Combined aggregate of all sub-funds. Investments by one sub-fund into another are not eliminated, and are thus accounted twice in the combined figures. See Note 2 (w) on the Notes to the Financial Statements.
The accompanying notes form an integral part of these financial statements.
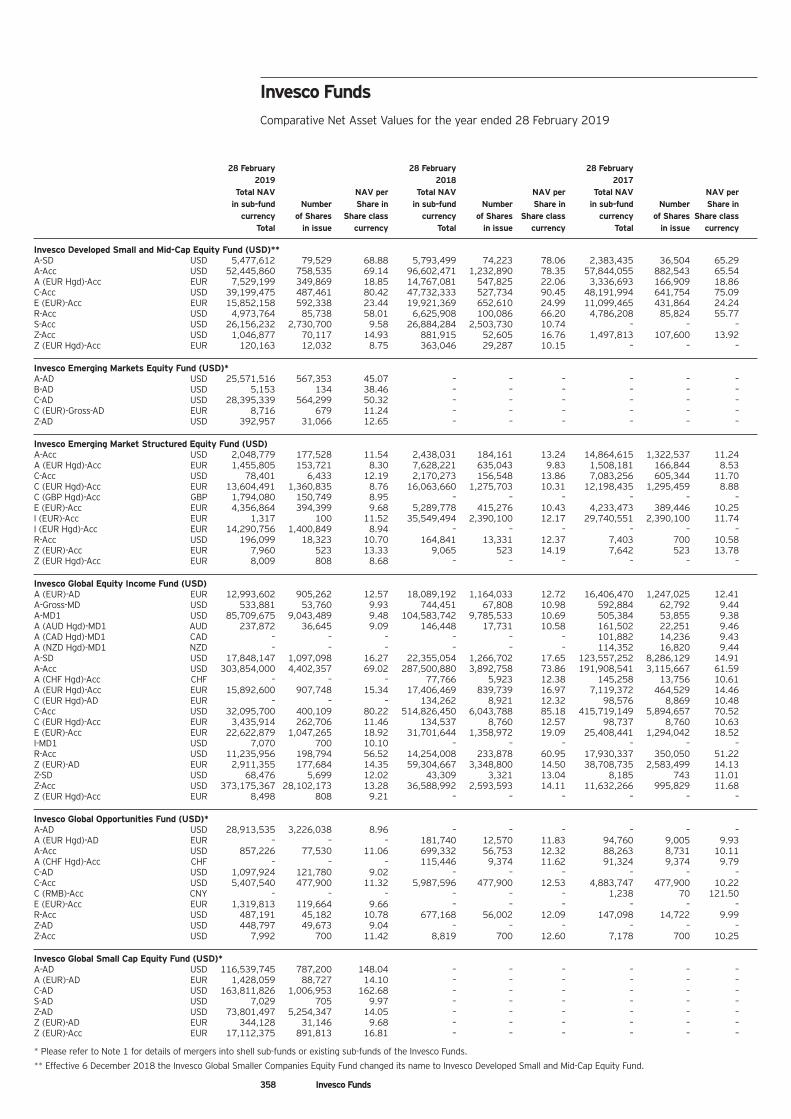
358 Invesco Funds
28 February 28 February 28 February 2019 2018 2017
Total NAV NAV per Total NAV NAV per Total NAV NAV per in sub-fund Number Share in in sub-fund Number Share in in sub-fund Number Share in
currency of Shares Share class currency of Shares Share class currency of Shares Share class Total in issue currency Total in issue currency Total in issue currency
Invesco Developed Small and Mid-Cap Equity Fund (USD)** A-SD USD 5,477,612 79,529 68.88 5,793,499 74,223 78.06 2,383,435 36,504 65.29 A-Acc USD 52,445,860 758,535 69.14 96,602,471 1,232,890 78.35 57,844,055 882,543 65.54 A (EUR Hgd)-Acc EUR 7,529,199 349,869 18.85 14,767,081 547,825 22.06 3,336,693 166,909 18.86 C-Acc USD 39,199,475 487,461 80.42 47,732,333 527,734 90.45 48,191,994 641,754 75.09 E (EUR)-Acc EUR 15,852,158 592,338 23.44 19,921,369 652,610 24.99 11,099,465 431,864 24.24 R-Acc USD 4,973,764 85,738 58.01 6,625,908 100,086 66.20 4,786,208 85,824 55.77 S-Acc USD 26,156,232 2,730,700 9.58 26,884,284 2,503,730 10.74 – – – Z-Acc USD 1,046,877 70,117 14.93 881,915 52,605 16.76 1,497,813 107,600 13.92 Z (EUR Hgd)-Acc EUR 120,163 12,032 8.75 363,046 29,287 10.15 – – –
Invesco Emerging Markets Equity Fund (USD)* A-AD USD 25,571,516 567,353 45.07 – – – – – – B-AD USD 5,153 134 38.46 – – – – – – C-AD USD 28,395,339 564,299 50.32 – – – – – – C (EUR)-Gross-AD EUR 8,716 679 11.24 – – – – – – Z-AD USD 392,957 31,066 12.65 – – – – – –
Invesco Emerging Market Structured Equity Fund (USD) A-Acc USD 2,048,779 177,528 11.54 2,438,031 184,161 13.24 14,864,615 1,322,537 11.24 A (EUR Hgd)-Acc EUR 1,455,805 153,721 8.30 7,628,221 635,043 9.83 1,508,181 166,844 8.53 C-Acc USD 78,401 6,433 12.19 2,170,273 156,548 13.86 7,083,256 605,344 11.70 C (EUR Hgd)-Acc EUR 13,604,491 1,360,835 8.76 16,063,660 1,275,703 10.31 12,198,435 1,295,459 8.88 C (GBP Hgd)-Acc GBP 1,794,080 150,749 8.95 – – – – – – E (EUR)-Acc EUR 4,356,864 394,399 9.68 5,289,778 415,276 10.43 4,233,473 389,446 10.25 I (EUR)-Acc EUR 1,317 100 11.52 35,549,494 2,390,100 12.17 29,740,551 2,390,100 11.74 I (EUR Hgd)-Acc EUR 14,290,756 1,400,849 8.94 – – – – – – R-Acc USD 196,099 18,323 10.70 164,841 13,331 12.37 7,403 700 10.58 Z (EUR)-Acc EUR 7,960 523 13.33 9,065 523 14.19 7,642 523 13.78 Z (EUR Hgd)-Acc EUR 8,009 808 8.68 – – – – – –
Invesco Global Equity Income Fund (USD) A (EUR)-AD EUR 12,993,602 905,262 12.57 18,089,192 1,164,033 12.72 16,406,470 1,247,025 12.41 A-Gross-MD USD 533,881 53,760 9.93 744,451 67,808 10.98 592,884 62,792 9.44 A-MD1 USD 85,709,675 9,043,489 9.48 104,583,742 9,785,533 10.69 505,384 53,855 9.38 A (AUD Hgd)-MD1 AUD 237,872 36,645 9.09 146,448 17,731 10.58 161,502 22,251 9.46 A (CAD Hgd)-MD1 CAD – – – – – – 101,882 14,236 9.43 A (NZD Hgd)-MD1 NZD – – – – – – 114,352 16,820 9.44 A-SD USD 17,848,147 1,097,098 16.27 22,355,054 1,266,702 17.65 123,557,252 8,286,129 14.91 A-Acc USD 303,854,000 4,402,357 69.02 287,500,880 3,892,758 73.86 191,908,541 3,115,667 61.59 A (CHF Hgd)-Acc CHF – – – 77,766 5,923 12.38 145,258 13,756 10.61 A (EUR Hgd)-Acc EUR 15,892,600 907,748 15.34 17,406,469 839,739 16.97 7,119,372 464,529 14.46 C (EUR Hgd)-AD EUR – – – 134,262 8,921 12.32 98,576 8,869 10.48 C-Acc USD 32,095,700 400,109 80.22 514,826,450 6,043,788 85.18 415,719,149 5,894,657 70.52 C (EUR Hgd)-Acc EUR 3,435,914 262,706 11.46 134,537 8,760 12.57 98,737 8,760 10.63 E (EUR)-Acc EUR 22,622,879 1,047,265 18.92 31,701,644 1,358,972 19.09 25,408,441 1,294,042 18.52 I-MD1 USD 7,070 700 10.10 – – – – – – R-Acc USD 11,235,956 198,794 56.52 14,254,008 233,878 60.95 17,930,337 350,050 51.22 Z (EUR)-AD EUR 2,911,355 177,684 14.35 59,304,667 3,348,800 14.50 38,708,735 2,583,499 14.13 Z-SD USD 68,476 5,699 12.02 43,309 3,321 13.04 8,185 743 11.01 Z-Acc USD 373,175,367 28,102,173 13.28 36,588,992 2,593,593 14.11 11,632,266 995,829 11.68 Z (EUR Hgd)-Acc EUR 8,498 808 9.21 – – – – – –
Invesco Global Opportunities Fund (USD)* A-AD USD 28,913,535 3,226,038 8.96 – – – – – – A (EUR Hgd)-AD EUR – – – 181,740 12,570 11.83 94,760 9,005 9.93 A-Acc USD 857,226 77,530 11.06 699,332 56,753 12.32 88,263 8,731 10.11 A (CHF Hgd)-Acc CHF – – – 115,446 9,374 11.62 91,324 9,374 9.79 C-AD USD 1,097,924 121,780 9.02 – – – – – – C-Acc USD 5,407,540 477,900 11.32 5,987,596 477,900 12.53 4,883,747 477,900 10.22 C (RMB)-Acc CNY – – – – – – 1,238 70 121.50 E (EUR)-Acc EUR 1,319,813 119,664 9.66 – – – – – – R-Acc USD 487,191 45,182 10.78 677,168 56,002 12.09 147,098 14,722 9.99 Z-AD USD 448,797 49,673 9.04 – – – – – – Z-Acc USD 7,992 700 11.42 8,819 700 12.60 7,178 700 10.25
Invesco Global Small Cap Equity Fund (USD)* A-AD USD 116,539,745 787,200 148.04 – – – – – – A (EUR)-AD EUR 1,428,059 88,727 14.10 – – – – – – C-AD USD 163,811,826 1,006,953 162.68 – – – – – – S-AD USD 7,029 705 9.97 – – – – – – Z-AD USD 73,801,497 5,254,347 14.05 – – – – – – Z (EUR)-AD EUR 344,128 31,146 9.68 – – – – – – Z (EUR)-Acc EUR 17,112,375 891,813 16.81 – – – – – –
* Please refer to Note 1 for details of mergers into shell sub-funds or existing sub-funds of the Invesco Funds.
** Effective 6 December 2018 the Invesco Global Smaller Companies Equity Fund changed its name to Invesco Developed Small and Mid-Cap Equity Fund.
Invesco Funds Comparative Net Asset Values for the year ended 28 February 2019
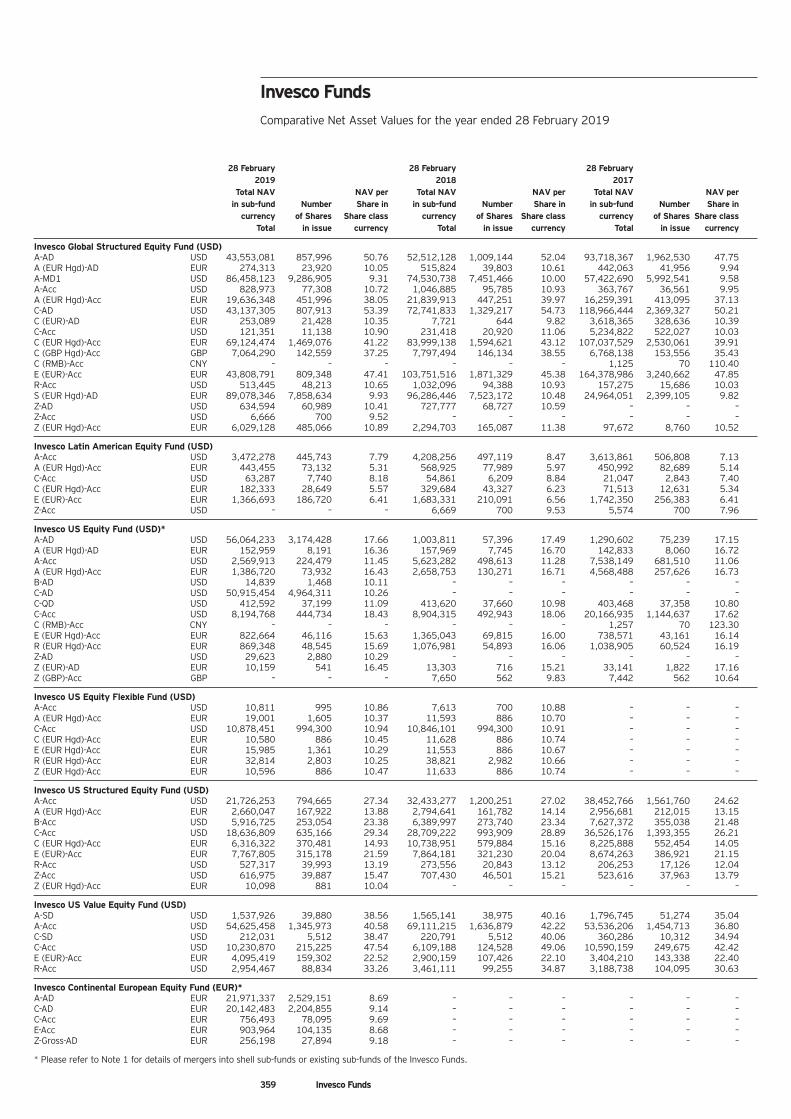
359 Invesco Funds
28 February 28 February 28 February 2019 2018 2017
Total NAV NAV per Total NAV NAV per Total NAV NAV per in sub-fund Number Share in in sub-fund Number Share in in sub-fund Number Share in
currency of Shares Share class currency of Shares Share class currency of Shares Share class Total in issue currency Total in issue currency Total in issue currency
Invesco Global Structured Equity Fund (USD) A-AD USD 43,553,081 857,996 50.76 52,512,128 1,009,144 52.04 93,718,367 1,962,530 47.75 A (EUR Hgd)-AD EUR 274,313 23,920 10.05 515,824 39,803 10.61 442,063 41,956 9.94 A-MD1 USD 86,458,123 9,286,905 9.31 74,530,738 7,451,466 10.00 57,422,690 5,992,541 9.58 A-Acc USD 828,973 77,308 10.72 1,046,885 95,785 10.93 363,767 36,561 9.95 A (EUR Hgd)-Acc EUR 19,636,348 451,996 38.05 21,839,913 447,251 39.97 16,259,391 413,095 37.13 C-AD USD 43,137,305 807,913 53.39 72,741,833 1,329,217 54.73 118,966,444 2,369,327 50.21 C (EUR)-AD EUR 253,089 21,428 10.35 7,721 644 9.82 3,618,365 328,636 10.39 C-Acc USD 121,351 11,138 10.90 231,418 20,920 11.06 5,234,822 522,027 10.03 C (EUR Hgd)-Acc EUR 69,124,474 1,469,076 41.22 83,999,138 1,594,621 43.12 107,037,529 2,530,061 39.91 C (GBP Hgd)-Acc GBP 7,064,290 142,559 37.25 7,797,494 146,134 38.55 6,768,138 153,556 35.43 C (RMB)-Acc CNY – – – – – – 1,125 70 110.40 E (EUR)-Acc EUR 43,808,791 809,348 47.41 103,751,516 1,871,329 45.38 164,378,986 3,240,662 47.85 R-Acc USD 513,445 48,213 10.65 1,032,096 94,388 10.93 157,275 15,686 10.03 S (EUR Hgd)-AD EUR 89,078,346 7,858,634 9.93 96,286,446 7,523,172 10.48 24,964,051 2,399,105 9.82 Z-AD USD 634,594 60,989 10.41 727,777 68,727 10.59 – – – Z-Acc USD 6,666 700 9.52 – – – – – – Z (EUR Hgd)-Acc EUR 6,029,128 485,066 10.89 2,294,703 165,087 11.38 97,672 8,760 10.52
Invesco Latin American Equity Fund (USD) A-Acc USD 3,472,278 445,743 7.79 4,208,256 497,119 8.47 3,613,861 506,808 7.13 A (EUR Hgd)-Acc EUR 443,455 73,132 5.31 568,925 77,989 5.97 450,992 82,689 5.14 C-Acc USD 63,287 7,740 8.18 54,861 6,209 8.84 21,047 2,843 7.40 C (EUR Hgd)-Acc EUR 182,333 28,649 5.57 329,684 43,327 6.23 71,513 12,631 5.34 E (EUR)-Acc EUR 1,366,693 186,720 6.41 1,683,331 210,091 6.56 1,742,350 256,383 6.41 Z-Acc USD – – – 6,669 700 9.53 5,574 700 7.96
Invesco US Equity Fund (USD)* A-AD USD 56,064,233 3,174,428 17.66 1,003,811 57,396 17.49 1,290,602 75,239 17.15 A (EUR Hgd)-AD EUR 152,959 8,191 16.36 157,969 7,745 16.70 142,833 8,060 16.72 A-Acc USD 2,569,913 224,479 11.45 5,623,282 498,613 11.28 7,538,149 681,510 11.06 A (EUR Hgd)-Acc EUR 1,386,720 73,932 16.43 2,658,753 130,271 16.71 4,568,488 257,626 16.73 B-AD USD 14,839 1,468 10.11 – – – – – – C-AD USD 50,915,454 4,964,311 10.26 – – – – – – C-QD USD 412,592 37,199 11.09 413,620 37,660 10.98 403,468 37,358 10.80 C-Acc USD 8,194,768 444,734 18.43 8,904,315 492,943 18.06 20,166,935 1,144,637 17.62 C (RMB)-Acc CNY – – – – – – 1,257 70 123.30 E (EUR Hgd)-Acc EUR 822,664 46,116 15.63 1,365,043 69,815 16.00 738,571 43,161 16.14 R (EUR Hgd)-Acc EUR 869,348 48,545 15.69 1,076,981 54,893 16.06 1,038,905 60,524 16.19 Z-AD USD 29,623 2,880 10.29 – – – – – – Z (EUR)-AD EUR 10,159 541 16.45 13,303 716 15.21 33,141 1,822 17.16 Z (GBP)-Acc GBP – – – 7,650 562 9.83 7,442 562 10.64
Invesco US Equity Flexible Fund (USD) A-Acc USD 10,811 995 10.86 7,613 700 10.88 – – – A (EUR Hgd)-Acc EUR 19,001 1,605 10.37 11,593 886 10.70 – – – C-Acc USD 10,878,451 994,300 10.94 10,846,101 994,300 10.91 – – – C (EUR Hgd)-Acc EUR 10,580 886 10.45 11,628 886 10.74 – – – E (EUR Hgd)-Acc EUR 15,985 1,361 10.29 11,553 886 10.67 – – – R (EUR Hgd)-Acc EUR 32,814 2,803 10.25 38,821 2,982 10.66 – – – Z (EUR Hgd)-Acc EUR 10,596 886 10.47 11,633 886 10.74 – – –
Invesco US Structured Equity Fund (USD) A-Acc USD 21,726,253 794,665 27.34 32,433,277 1,200,251 27.02 38,452,766 1,561,760 24.62 A (EUR Hgd)-Acc EUR 2,660,047 167,922 13.88 2,794,641 161,782 14.14 2,956,681 212,015 13.15 B-Acc USD 5,916,725 253,054 23.38 6,389,997 273,740 23.34 7,627,372 355,038 21.48 C-Acc USD 18,636,809 635,166 29.34 28,709,222 993,909 28.89 36,526,176 1,393,355 26.21 C (EUR Hgd)-Acc EUR 6,316,322 370,481 14.93 10,738,951 579,884 15.16 8,225,888 552,454 14.05 E (EUR)-Acc EUR 7,767,805 315,178 21.59 7,864,181 321,230 20.04 8,674,263 386,921 21.15 R-Acc USD 527,317 39,993 13.19 273,556 20,843 13.12 206,253 17,126 12.04 Z-Acc USD 616,975 39,887 15.47 707,430 46,501 15.21 523,616 37,963 13.79 Z (EUR Hgd)-Acc EUR 10,098 881 10.04 – – – – – –
Invesco US Value Equity Fund (USD) A-SD USD 1,537,926 39,880 38.56 1,565,141 38,975 40.16 1,796,745 51,274 35.04 A-Acc USD 54,625,458 1,345,973 40.58 69,111,215 1,636,879 42.22 53,536,206 1,454,713 36.80 C-SD USD 212,031 5,512 38.47 220,791 5,512 40.06 360,286 10,312 34.94 C-Acc USD 10,230,870 215,225 47.54 6,109,188 124,528 49.06 10,590,159 249,675 42.42 E (EUR)-Acc EUR 4,095,419 159,302 22.52 2,900,159 107,426 22.10 3,404,210 143,338 22.40 R-Acc USD 2,954,467 88,834 33.26 3,461,111 99,255 34.87 3,188,738 104,095 30.63
Invesco Continental European Equity Fund (EUR)* A-AD EUR 21,971,337 2,529,151 8.69 – – – – – – C-AD EUR 20,142,483 2,204,855 9.14 – – – – – – C-Acc EUR 756,493 78,095 9.69 – – – – – – E-Acc EUR 903,964 104,135 8.68 – – – – – – Z-Gross-AD EUR 256,198 27,894 9.18 – – – – – –
* Please refer to Note 1 for details of mergers into shell sub-funds or existing sub-funds of the Invesco Funds.
Invesco Funds Comparative Net Asset Values for the year ended 28 February 2019
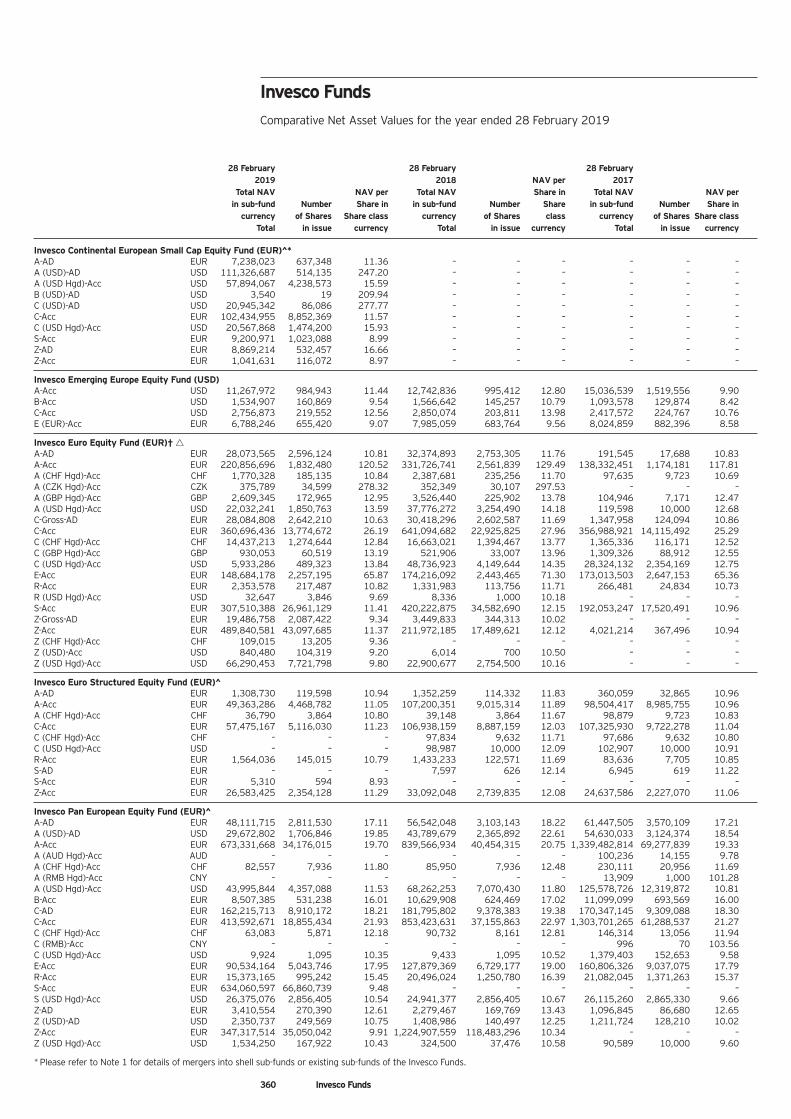
360 Invesco Funds
28 February 28 February 28 February 2019 2018 NAV per 2017
Total NAV NAV per Total NAV Share in Total NAV NAV per in sub-fund Number Share in in sub-fund Number Share in sub-fund Number Share in
currency of Shares Share class currency of Shares class currency of Shares Share class Total in issue currency Total in issue currency Total in issue currency
Invesco Continental European Small Cap Equity Fund (EUR)^* A-AD EUR 7,238,023 637,348 11.36 – – – – – – A (USD)-AD USD 111,326,687 514,135 247.20 – – – – – – A (USD Hgd)-Acc USD 57,894,067 4,238,573 15.59 – – – – – – B (USD)-AD USD 3,540 19 209.94 – – – – – – C (USD)-AD USD 20,945,342 86,086 277.77 – – – – – – C-Acc EUR 102,434,955 8,852,369 11.57 – – – – – – C (USD Hgd)-Acc USD 20,567,868 1,474,200 15.93 – – – – – – S-Acc EUR 9,200,971 1,023,088 8.99 – – – – – – Z-AD EUR 8,869,214 532,457 16.66 – – – – – – Z-Acc EUR 1,041,631 116,072 8.97 – – – – – –
Invesco Emerging Europe Equity Fund (USD) A-Acc USD 11,267,972 984,943 11.44 12,742,836 995,412 12.80 15,036,539 1,519,556 9.90 B-Acc USD 1,534,907 160,869 9.54 1,566,642 145,257 10.79 1,093,578 129,874 8.42 C-Acc USD 2,756,873 219,552 12.56 2,850,074 203,811 13.98 2,417,572 224,767 10.76 E (EUR)-Acc EUR 6,788,246 655,420 9.07 7,985,059 683,764 9.56 8,024,859 882,396 8.58
Invesco Euro Equity Fund (EUR)† Δ A-AD EUR 28,073,565 2,596,124 10.81 32,374,893 2,753,305 11.76 191,545 17,688 10.83 A-Acc EUR 220,856,696 1,832,480 120.52 331,726,741 2,561,839 129.49 138,332,451 1,174,181 117.81 A (CHF Hgd)-Acc CHF 1,770,328 185,135 10.84 2,387,681 235,256 11.70 97,635 9,723 10.69 A (CZK Hgd)-Acc CZK 375,789 34,599 278.32 352,349 30,107 297.53 – – – A (GBP Hgd)-Acc GBP 2,609,345 172,965 12.95 3,526,440 225,902 13.78 104,946 7,171 12.47 A (USD Hgd)-Acc USD 22,032,241 1,850,763 13.59 37,776,272 3,254,490 14.18 119,598 10,000 12.68 C-Gross-AD EUR 28,084,808 2,642,210 10.63 30,418,296 2,602,587 11.69 1,347,958 124,094 10.86 C-Acc EUR 360,696,436 13,774,672 26.19 641,094,682 22,925,825 27.96 356,988,921 14,115,492 25.29 C (CHF Hgd)-Acc CHF 14,437,213 1,274,644 12.84 16,663,021 1,394,467 13.77 1,365,336 116,171 12.52 C (GBP Hgd)-Acc GBP 930,053 60,519 13.19 521,906 33,007 13.96 1,309,326 88,912 12.55 C (USD Hgd)-Acc USD 5,933,286 489,323 13.84 48,736,923 4,149,644 14.35 28,324,132 2,354,169 12.75 E-Acc EUR 148,684,178 2,257,195 65.87 174,216,092 2,443,465 71.30 173,013,503 2,647,153 65.36 R-Acc EUR 2,353,578 217,487 10.82 1,331,983 113,756 11.71 266,481 24,834 10.73 R (USD Hgd)-Acc USD 32,647 3,846 9.69 8,336 1,000 10.18 – – – S-Acc EUR 307,510,388 26,961,129 11.41 420,222,875 34,582,690 12.15 192,053,247 17,520,491 10.96 Z-Gross-AD EUR 19,486,758 2,087,422 9.34 3,449,833 344,313 10.02 – – – Z-Acc EUR 489,840,581 43,097,685 11.37 211,972,185 17,489,621 12.12 4,021,214 367,496 10.94 Z (CHF Hgd)-Acc CHF 109,015 13,205 9.36 – – – – – – Z (USD)-Acc USD 840,480 104,319 9.20 6,014 700 10.50 – – – Z (USD Hgd)-Acc USD 66,290,453 7,721,798 9.80 22,900,677 2,754,500 10.16 – – –
Invesco Euro Structured Equity Fund (EUR)^ A-AD EUR 1,308,730 119,598 10.94 1,352,259 114,332 11.83 360,059 32,865 10.96 A-Acc EUR 49,363,286 4,468,782 11.05 107,200,351 9,015,314 11.89 98,504,417 8,985,755 10.96 A (CHF Hgd)-Acc CHF 36,790 3,864 10.80 39,148 3,864 11.67 98,879 9,723 10.83 C-Acc EUR 57,475,167 5,116,030 11.23 106,938,159 8,887,159 12.03 107,325,930 9,722,278 11.04 C (CHF Hgd)-Acc CHF – – – 97,834 9,632 11.71 97,686 9,632 10.80 C (USD Hgd)-Acc USD – – – 98,987 10,000 12.09 102,907 10,000 10.91 R-Acc EUR 1,564,036 145,015 10.79 1,433,233 122,571 11.69 83,636 7,705 10.85 S-AD EUR – – – 7,597 626 12.14 6,945 619 11.22 S-Acc EUR 5,310 594 8.93 – – – – – – Z-Acc EUR 26,583,425 2,354,128 11.29 33,092,048 2,739,835 12.08 24,637,586 2,227,070 11.06
Invesco Pan European Equity Fund (EUR)^ A-AD EUR 48,111,715 2,811,530 17.11 56,542,048 3,103,143 18.22 61,447,505 3,570,109 17.21 A (USD)-AD USD 29,672,802 1,706,846 19.85 43,789,679 2,365,892 22.61 54,630,033 3,124,374 18.54 A-Acc EUR 673,331,668 34,176,015 19.70 839,566,934 40,454,315 20.75 1,339,482,814 69,277,839 19.33 A (AUD Hgd)-Acc AUD – – – – – – 100,236 14,155 9.78 A (CHF Hgd)-Acc CHF 82,557 7,936 11.80 85,950 7,936 12.48 230,111 20,956 11.69 A (RMB Hgd)-Acc CNY – – – – – – 13,909 1,000 101.28 A (USD Hgd)-Acc USD 43,995,844 4,357,088 11.53 68,262,253 7,070,430 11.80 125,578,726 12,319,872 10.81 B-Acc EUR 8,507,385 531,238 16.01 10,629,908 624,469 17.02 11,099,099 693,569 16.00 C-AD EUR 162,215,713 8,910,172 18.21 181,795,802 9,378,383 19.38 170,347,145 9,309,088 18.30 C-Acc EUR 413,592,671 18,855,434 21.93 853,423,631 37,155,863 22.97 1,303,701,265 61,288,537 21.27 C (CHF Hgd)-Acc CHF 63,083 5,871 12.18 90,732 8,161 12.81 146,314 13,056 11.94 C (RMB)-Acc CNY – – – – – – 996 70 103.56 C (USD Hgd)-Acc USD 9,924 1,095 10.35 9,433 1,095 10.52 1,379,403 152,653 9.58 E-Acc EUR 90,534,164 5,043,746 17.95 127,879,369 6,729,177 19.00 160,806,326 9,037,075 17.79 R-Acc EUR 15,373,165 995,242 15.45 20,496,024 1,250,780 16.39 21,082,045 1,371,263 15.37 S-Acc EUR 634,060,597 66,860,739 9.48 – – – – – – S (USD Hgd)-Acc USD 26,375,076 2,856,405 10.54 24,941,377 2,856,405 10.67 26,115,260 2,865,330 9.66 Z-AD EUR 3,410,554 270,390 12.61 2,279,467 169,769 13.43 1,096,845 86,680 12.65 Z (USD)-AD USD 2,350,737 249,569 10.75 1,408,986 140,497 12.25 1,211,724 128,210 10.02 Z-Acc EUR 347,317,514 35,050,042 9.91 1,224,907,559 118,483,296 10.34 – – – Z (USD Hgd)-Acc USD 1,534,250 167,922 10.43 324,500 37,476 10.58 90,589 10,000 9.60
* Please refer to Note 1 for details of mergers into shell sub-funds or existing sub-funds of the Invesco Funds.
Invesco Funds Comparative Net Asset Values for the year ended 28 February 2019
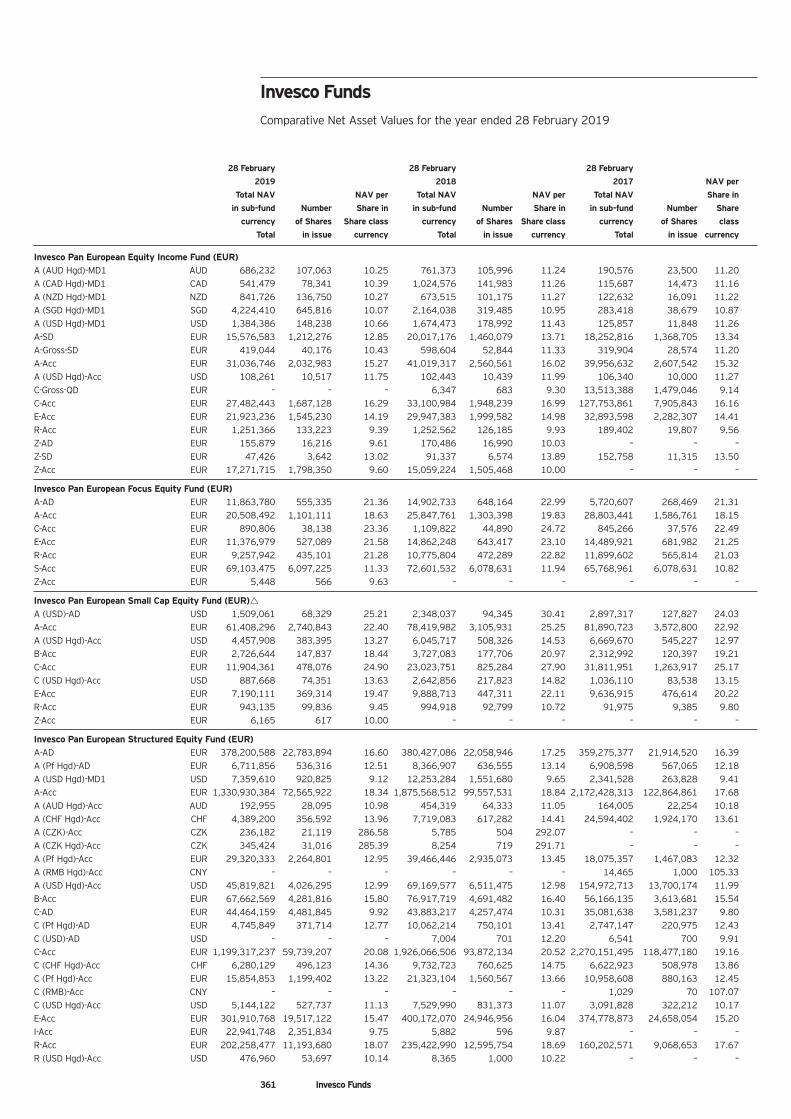
361 Invesco Funds
28 February 28 February 28 February
2019 2018 2017 NAV per
Total NAV NAV per Total NAV NAV per Total NAV Share in
in sub-fund Number Share in in sub-fund Number Share in in sub-fund Number Share
currency of Shares Share class currency of Shares Share class currency of Shares class
Total in issue currency Total in issue currency Total in issue currency
Invesco Pan European Equity Income Fund (EUR) A (AUD Hgd)-MD1 AUD 686,232 107,063 10.25 761,373 105,996 11.24 190,576 23,500 11.20 A (CAD Hgd)-MD1 CAD 541,479 78,341 10.39 1,024,576 141,983 11.26 115,687 14,473 11.16 A (NZD Hgd)-MD1 NZD 841,726 136,750 10.27 673,515 101,175 11.27 122,632 16,091 11.22 A (SGD Hgd)-MD1 SGD 4,224,410 645,816 10.07 2,164,038 319,485 10.95 283,418 38,679 10.87 A (USD Hgd)-MD1 USD 1,384,386 148,238 10.66 1,674,473 178,992 11.43 125,857 11,848 11.26 A-SD EUR 15,576,583 1,212,276 12.85 20,017,176 1,460,079 13.71 18,252,816 1,368,705 13.34 A-Gross-SD EUR 419,044 40,176 10.43 598,604 52,844 11.33 319,904 28,574 11.20 A-Acc EUR 31,036,746 2,032,983 15.27 41,019,317 2,560,561 16.02 39,956,632 2,607,542 15.32 A (USD Hgd)-Acc USD 108,261 10,517 11.75 102,443 10,439 11.99 106,340 10,000 11.27 C-Gross-QD EUR – – – 6,347 683 9.30 13,513,388 1,479,046 9.14 C-Acc EUR 27,482,443 1,687,128 16.29 33,100,984 1,948,239 16.99 127,753,861 7,905,843 16.16 E-Acc EUR 21,923,236 1,545,230 14.19 29,947,383 1,999,582 14.98 32,893,598 2,282,307 14.41 R-Acc EUR 1,251,366 133,223 9.39 1,252,562 126,185 9.93 189,402 19,807 9.56 Z-AD EUR 155,879 16,216 9.61 170,486 16,990 10.03 – – – Z-SD EUR 47,426 3,642 13.02 91,337 6,574 13.89 152,758 11,315 13.50 Z-Acc EUR 17,271,715 1,798,350 9.60 15,059,224 1,505,468 10.00 – – –
Invesco Pan European Focus Equity Fund (EUR) A-AD EUR 11,863,780 555,335 21.36 14,902,733 648,164 22.99 5,720,607 268,469 21.31 A-Acc EUR 20,508,492 1,101,111 18.63 25,847,761 1,303,398 19.83 28,803,441 1,586,761 18.15 C-Acc EUR 890,806 38,138 23.36 1,109,822 44,890 24.72 845,266 37,576 22.49 E-Acc EUR 11,376,979 527,089 21.58 14,862,248 643,417 23.10 14,489,921 681,982 21.25 R-Acc EUR 9,257,942 435,101 21.28 10,775,804 472,289 22.82 11,899,602 565,814 21.03 S-Acc EUR 69,103,475 6,097,225 11.33 72,601,532 6,078,631 11.94 65,768,961 6,078,631 10.82 Z-Acc EUR 5,448 566 9.63 – – – – – –
Invesco Pan European Small Cap Equity Fund (EUR)Δ A (USD)-AD USD 1,509,061 68,329 25.21 2,348,037 94,345 30.41 2,897,317 127,827 24.03 A-Acc EUR 61,408,296 2,740,843 22.40 78,419,982 3,105,931 25.25 81,890,723 3,572,800 22.92 A (USD Hgd)-Acc USD 4,457,908 383,395 13.27 6,045,717 508,326 14.53 6,669,670 545,227 12.97 B-Acc EUR 2,726,644 147,837 18.44 3,727,083 177,706 20.97 2,312,992 120,397 19.21 C-Acc EUR 11,904,361 478,076 24.90 23,023,751 825,284 27.90 31,811,951 1,263,917 25.17 C (USD Hgd)-Acc USD 887,668 74,351 13.63 2,642,856 217,823 14.82 1,036,110 83,538 13.15 E-Acc EUR 7,190,111 369,314 19.47 9,888,713 447,311 22.11 9,636,915 476,614 20.22 R-Acc EUR 943,135 99,836 9.45 994,918 92,799 10.72 91,975 9,385 9.80 Z-Acc EUR 6,165 617 10.00 – – – – – –
Invesco Pan European Structured Equity Fund (EUR) A-AD EUR 378,200,588 22,783,894 16.60 380,427,086 22,058,946 17.25 359,275,377 21,914,520 16.39 A (Pf Hgd)-AD EUR 6,711,856 536,316 12.51 8,366,907 636,555 13.14 6,908,598 567,065 12.18 A (USD Hgd)-MD1 USD 7,359,610 920,825 9.12 12,253,284 1,551,680 9.65 2,341,528 263,828 9.41 A-Acc EUR 1,330,930,384 72,565,922 18.34 1,875,568,512 99,557,531 18.84 2,172,428,313 122,864,861 17.68 A (AUD Hgd)-Acc AUD 192,955 28,095 10.98 454,319 64,333 11.05 164,005 22,254 10.18 A (CHF Hgd)-Acc CHF 4,389,200 356,592 13.96 7,719,083 617,282 14.41 24,594,402 1,924,170 13.61 A (CZK)-Acc CZK 236,182 21,119 286.58 5,785 504 292.07 – – – A (CZK Hgd)-Acc CZK 345,424 31,016 285.39 8,254 719 291.71 – – – A (Pf Hgd)-Acc EUR 29,320,333 2,264,801 12.95 39,466,446 2,935,073 13.45 18,075,357 1,467,083 12.32 A (RMB Hgd)-Acc CNY – – – – – – 14,465 1,000 105.33 A (USD Hgd)-Acc USD 45,819,821 4,026,295 12.99 69,169,577 6,511,475 12.98 154,972,713 13,700,174 11.99 B-Acc EUR 67,662,569 4,281,816 15.80 76,917,719 4,691,482 16.40 56,166,135 3,613,681 15.54 C-AD EUR 44,464,159 4,481,845 9.92 43,883,217 4,257,474 10.31 35,081,638 3,581,237 9.80 C (Pf Hgd)-AD EUR 4,745,849 371,714 12.77 10,062,214 750,101 13.41 2,747,147 220,975 12.43 C (USD)-AD USD – – – 7,004 701 12.20 6,541 700 9.91 C-Acc EUR 1,199,317,237 59,739,207 20.08 1,926,066,506 93,872,134 20.52 2,270,151,495 118,477,180 19.16 C (CHF Hgd)-Acc CHF 6,280,129 496,123 14.36 9,732,723 760,625 14.75 6,622,923 508,978 13.86 C (Pf Hgd)-Acc EUR 15,854,853 1,199,402 13.22 21,323,104 1,560,567 13.66 10,958,608 880,163 12.45 C (RMB)-Acc CNY – – – – – – 1,029 70 107.07 C (USD Hgd)-Acc USD 5,144,122 527,737 11.13 7,529,990 831,373 11.07 3,091,828 322,212 10.17 E-Acc EUR 301,910,768 19,517,122 15.47 400,172,070 24,946,956 16.04 374,778,873 24,658,054 15.20 I-Acc EUR 22,941,748 2,351,834 9.75 5,882 596 9.87 – – – R-Acc EUR 202,258,477 11,193,680 18.07 235,422,990 12,595,754 18.69 160,202,571 9,068,653 17.67 R (USD Hgd)-Acc USD 476,960 53,697 10.14 8,365 1,000 10.22 – – –
Invesco Funds Comparative Net Asset Values for the year ended 28 February 2019
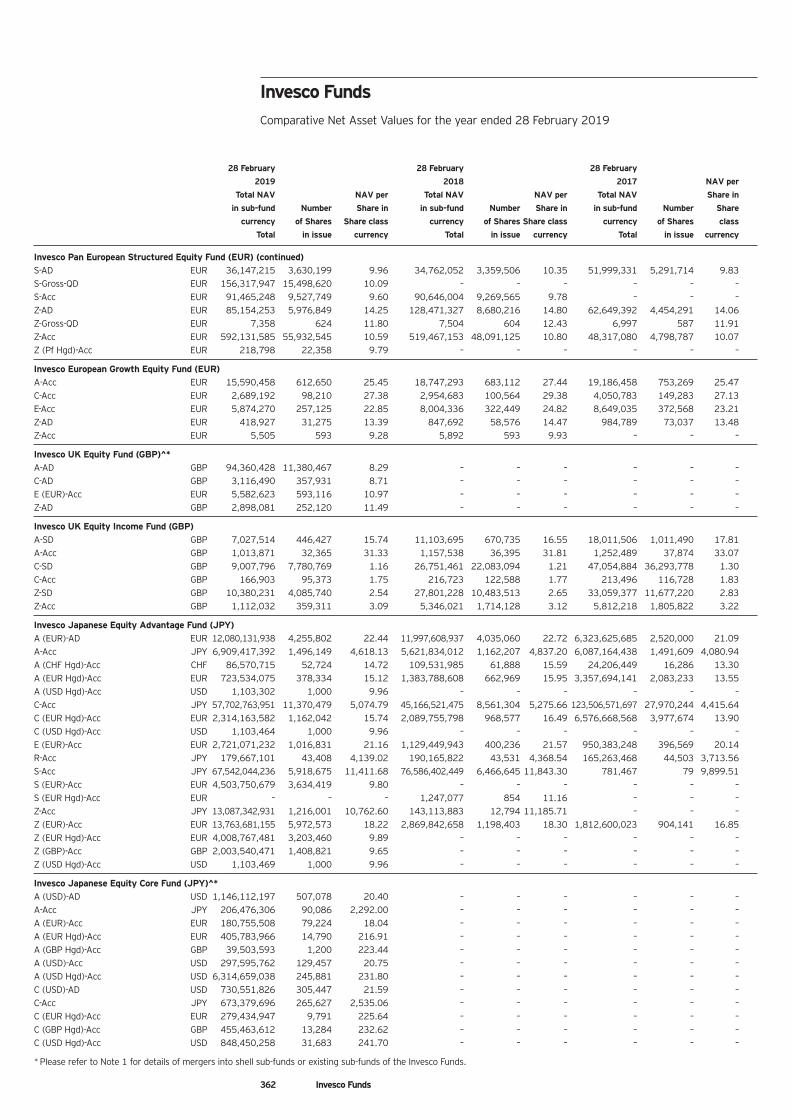
362 Invesco Funds
28 February 28 February 28 February
2019 2018 2017 NAV per
Total NAV NAV per Total NAV NAV per Total NAV Share in
in sub-fund Number Share in in sub-fund Number Share in in sub-fund Number Share
currency of Shares Share class currency of Shares Share class currency of Shares class
Total in issue currency Total in issue currency Total in issue currency
Invesco Pan European Structured Equity Fund (EUR) (continued) S-AD EUR 36,147,215 3,630,199 9.96 34,762,052 3,359,506 10.35 51,999,331 5,291,714 9.83 S-Gross-QD EUR 156,317,947 15,498,620 10.09 – – – – – – S-Acc EUR 91,465,248 9,527,749 9.60 90,646,004 9,269,565 9.78 – – – Z-AD EUR 85,154,253 5,976,849 14.25 128,471,327 8,680,216 14.80 62,649,392 4,454,291 14.06 Z-Gross-QD EUR 7,358 624 11.80 7,504 604 12.43 6,997 587 11.91 Z-Acc EUR 592,131,585 55,932,545 10.59 519,467,153 48,091,125 10.80 48,317,080 4,798,787 10.07 Z (Pf Hgd)-Acc EUR 218,798 22,358 9.79 – – – – – –
Invesco European Growth Equity Fund (EUR) A-Acc EUR 15,590,458 612,650 25.45 18,747,293 683,112 27.44 19,186,458 753,269 25.47 C-Acc EUR 2,689,192 98,210 27.38 2,954,683 100,564 29.38 4,050,783 149,283 27.13 E-Acc EUR 5,874,270 257,125 22.85 8,004,336 322,449 24.82 8,649,035 372,568 23.21 Z-AD EUR 418,927 31,275 13.39 847,692 58,576 14.47 984,789 73,037 13.48 Z-Acc EUR 5,505 593 9.28 5,892 593 9.93 – – –
Invesco UK Equity Fund (GBP)^* A-AD GBP 94,360,428 11,380,467 8.29 – – – – – – C-AD GBP 3,116,490 357,931 8.71 – – – – – – E (EUR)-Acc EUR 5,582,623 593,116 10.97 – – – – – – Z-AD GBP 2,898,081 252,120 11.49 – – – – – –
Invesco UK Equity Income Fund (GBP) A-SD GBP 7,027,514 446,427 15.74 11,103,695 670,735 16.55 18,011,506 1,011,490 17.81 A-Acc GBP 1,013,871 32,365 31.33 1,157,538 36,395 31.81 1,252,489 37,874 33.07 C-SD GBP 9,007,796 7,780,769 1.16 26,751,461 22,083,094 1.21 47,054,884 36,293,778 1.30 C-Acc GBP 166,903 95,373 1.75 216,723 122,588 1.77 213,496 116,728 1.83 Z-SD GBP 10,380,231 4,085,740 2.54 27,801,228 10,483,513 2.65 33,059,377 11,677,220 2.83 Z-Acc GBP 1,112,032 359,311 3.09 5,346,021 1,714,128 3.12 5,812,218 1,805,822 3.22
Invesco Japanese Equity Advantage Fund (JPY) A (EUR)-AD EUR 12,080,131,938 4,255,802 22.44 11,997,608,937 4,035,060 22.72 6,323,625,685 2,520,000 21.09 A-Acc JPY 6,909,417,392 1,496,149 4,618.13 5,621,834,012 1,162,207 4,837.20 6,087,164,438 1,491,609 4,080.94 A (CHF Hgd)-Acc CHF 86,570,715 52,724 14.72 109,531,985 61,888 15.59 24,206,449 16,286 13.30 A (EUR Hgd)-Acc EUR 723,534,075 378,334 15.12 1,383,788,608 662,969 15.95 3,357,694,141 2,083,233 13.55 A (USD Hgd)-Acc USD 1,103,302 1,000 9.96 – – – – – – C-Acc JPY 57,702,763,951 11,370,479 5,074.79 45,166,521,475 8,561,304 5,275.66 123,506,571,697 27,970,244 4,415.64 C (EUR Hgd)-Acc EUR 2,314,163,582 1,162,042 15.74 2,089,755,798 968,577 16.49 6,576,668,568 3,977,674 13.90 C (USD Hgd)-Acc USD 1,103,464 1,000 9.96 – – – – – – E (EUR)-Acc EUR 2,721,071,232 1,016,831 21.16 1,129,449,943 400,236 21.57 950,383,248 396,569 20.14 R-Acc JPY 179,667,101 43,408 4,139.02 190,165,822 43,531 4,368.54 165,263,468 44,503 3,713.56 S-Acc JPY 67,542,044,236 5,918,675 11,411.68 76,586,402,449 6,466,645 11,843.30 781,467 79 9,899.51 S (EUR)-Acc EUR 4,503,750,679 3,634,419 9.80 – – – – – – S (EUR Hgd)-Acc EUR – – – 1,247,077 854 11.16 – – – Z-Acc JPY 13,087,342,931 1,216,001 10,762.60 143,113,883 12,794 11,185.71 – – – Z (EUR)-Acc EUR 13,763,681,155 5,972,573 18.22 2,869,842,658 1,198,403 18.30 1,812,600,023 904,141 16.85 Z (EUR Hgd)-Acc EUR 4,008,767,481 3,203,460 9.89 – – – – – – Z (GBP)-Acc GBP 2,003,540,471 1,408,821 9.65 – – – – – – Z (USD Hgd)-Acc USD 1,103,469 1,000 9.96 – – – – – –
Invesco Japanese Equity Core Fund (JPY)^* A (USD)-AD USD 1,146,112,197 507,078 20.40 – – – – – – A-Acc JPY 206,476,306 90,086 2,292.00 – – – – – – A (EUR)-Acc EUR 180,755,508 79,224 18.04 – – – – – – A (EUR Hgd)-Acc EUR 405,783,966 14,790 216.91 – – – – – – A (GBP Hgd)-Acc GBP 39,503,593 1,200 223.44 – – – – – – A (USD)-Acc USD 297,595,762 129,457 20.75 – – – – – – A (USD Hgd)-Acc USD 6,314,659,038 245,881 231.80 – – – – – – C (USD)-AD USD 730,551,826 305,447 21.59 – – – – – – C-Acc JPY 673,379,696 265,627 2,535.06 – – – – – – C (EUR Hgd)-Acc EUR 279,434,947 9,791 225.64 – – – – – – C (GBP Hgd)-Acc GBP 455,463,612 13,284 232.62 – – – – – – C (USD Hgd)-Acc USD 848,450,258 31,683 241.70 – – – – – –
* Please refer to Note 1 for details of mergers into shell sub-funds or existing sub-funds of the Invesco Funds.
Invesco Funds Comparative Net Asset Values for the year ended 28 February 2019
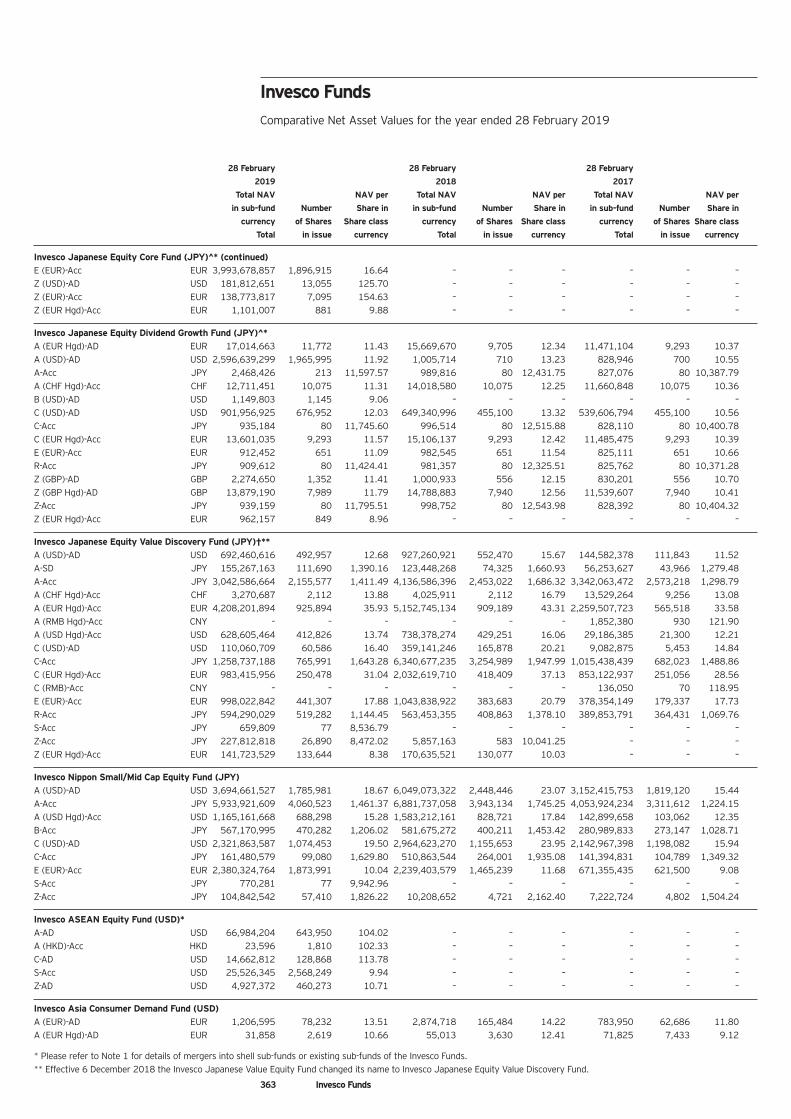
363 Invesco Funds
28 February 28 February 28 February
2019 2018 2017
Total NAV NAV per Total NAV NAV per Total NAV NAV per
in sub-fund Number Share in in sub-fund Number Share in in sub-fund Number Share in
currency of Shares Share class currency of Shares Share class currency of Shares Share class
Total in issue currency Total in issue currency Total in issue currency
Invesco Japanese Equity Core Fund (JPY)^* (continued) E (EUR)-Acc EUR 3,993,678,857 1,896,915 16.64 – – – – – – Z (USD)-AD USD 181,812,651 13,055 125.70 – – – – – – Z (EUR)-Acc EUR 138,773,817 7,095 154.63 – – – – – – Z (EUR Hgd)-Acc EUR 1,101,007 881 9.88 – – – – – –
Invesco Japanese Equity Dividend Growth Fund (JPY)^* A (EUR Hgd)-AD EUR 17,014,663 11,772 11.43 15,669,670 9,705 12.34 11,471,104 9,293 10.37 A (USD)-AD USD 2,596,639,299 1,965,995 11.92 1,005,714 710 13.23 828,946 700 10.55 A-Acc JPY 2,468,426 213 11,597.57 989,816 80 12,431.75 827,076 80 10,387.79 A (CHF Hgd)-Acc CHF 12,711,451 10,075 11.31 14,018,580 10,075 12.25 11,660,848 10,075 10.36 B (USD)-AD USD 1,149,803 1,145 9.06 – – – – – – C (USD)-AD USD 901,956,925 676,952 12.03 649,340,996 455,100 13.32 539,606,794 455,100 10.56 C-Acc JPY 935,184 80 11,745.60 996,514 80 12,515.88 828,110 80 10,400.78 C (EUR Hgd)-Acc EUR 13,601,035 9,293 11.57 15,106,137 9,293 12.42 11,485,475 9,293 10.39 E (EUR)-Acc EUR 912,452 651 11.09 982,545 651 11.54 825,111 651 10.66 R-Acc JPY 909,612 80 11,424.41 981,357 80 12,325.51 825,762 80 10,371.28 Z (GBP)-AD GBP 2,274,650 1,352 11.41 1,000,933 556 12.15 830,201 556 10.70 Z (GBP Hgd)-AD GBP 13,879,190 7,989 11.79 14,788,883 7,940 12.56 11,539,607 7,940 10.41 Z-Acc JPY 939,159 80 11,795.51 998,752 80 12,543.98 828,392 80 10,404.32 Z (EUR Hgd)-Acc EUR 962,157 849 8.96 – – – – – –
Invesco Japanese Equity Value Discovery Fund (JPY)†** A (USD)-AD USD 692,460,616 492,957 12.68 927,260,921 552,470 15.67 144,582,378 111,843 11.52 A-SD JPY 155,267,163 111,690 1,390.16 123,448,268 74,325 1,660.93 56,253,627 43,966 1,279.48 A-Acc JPY 3,042,586,664 2,155,577 1,411.49 4,136,586,396 2,453,022 1,686.32 3,342,063,472 2,573,218 1,298.79 A (CHF Hgd)-Acc CHF 3,270,687 2,112 13.88 4,025,911 2,112 16.79 13,529,264 9,256 13.08 A (EUR Hgd)-Acc EUR 4,208,201,894 925,894 35.93 5,152,745,134 909,189 43.31 2,259,507,723 565,518 33.58 A (RMB Hgd)-Acc CNY – – – – – – 1,852,380 930 121.90 A (USD Hgd)-Acc USD 628,605,464 412,826 13.74 738,378,274 429,251 16.06 29,186,385 21,300 12.21 C (USD)-AD USD 110,060,709 60,586 16.40 359,141,246 165,878 20.21 9,082,875 5,453 14.84 C-Acc JPY 1,258,737,188 765,991 1,643.28 6,340,677,235 3,254,989 1,947.99 1,015,438,439 682,023 1,488.86 C (EUR Hgd)-Acc EUR 983,415,956 250,478 31.04 2,032,619,710 418,409 37.13 853,122,937 251,056 28.56 C (RMB)-Acc CNY – – – – – – 136,050 70 118.95 E (EUR)-Acc EUR 998,022,842 441,307 17.88 1,043,838,922 383,683 20.79 378,354,149 179,337 17.73 R-Acc JPY 594,290,029 519,282 1,144.45 563,453,355 408,863 1,378.10 389,853,791 364,431 1,069.76 S-Acc JPY 659,809 77 8,536.79 – – – – – – Z-Acc JPY 227,812,818 26,890 8,472.02 5,857,163 583 10,041.25 – – – Z (EUR Hgd)-Acc EUR 141,723,529 133,644 8.38 170,635,521 130,077 10.03 – – –
Invesco Nippon Small/Mid Cap Equity Fund (JPY) A (USD)-AD USD 3,694,661,527 1,785,981 18.67 6,049,073,322 2,448,446 23.07 3,152,415,753 1,819,120 15.44 A-Acc JPY 5,933,921,609 4,060,523 1,461.37 6,881,737,058 3,943,134 1,745.25 4,053,924,234 3,311,612 1,224.15 A (USD Hgd)-Acc USD 1,165,161,668 688,298 15.28 1,583,212,161 828,721 17.84 142,899,658 103,062 12.35 B-Acc JPY 567,170,995 470,282 1,206.02 581,675,272 400,211 1,453.42 280,989,833 273,147 1,028.71 C (USD)-AD USD 2,321,863,587 1,074,453 19.50 2,964,623,270 1,155,653 23.95 2,142,967,398 1,198,082 15.94 C-Acc JPY 161,480,579 99,080 1,629.80 510,863,544 264,001 1,935.08 141,394,831 104,789 1,349.32 E (EUR)-Acc EUR 2,380,324,764 1,873,991 10.04 2,239,403,579 1,465,239 11.68 671,355,435 621,500 9.08 S-Acc JPY 770,281 77 9,942.96 – – – – – – Z-Acc JPY 104,842,542 57,410 1,826.22 10,208,652 4,721 2,162.40 7,222,724 4,802 1,504.24
Invesco ASEAN Equity Fund (USD)* A-AD USD 66,984,204 643,950 104.02 – – – – – – A (HKD)-Acc HKD 23,596 1,810 102.33 – – – – – – C-AD USD 14,662,812 128,868 113.78 – – – – – – S-Acc USD 25,526,345 2,568,249 9.94 – – – – – – Z-AD USD 4,927,372 460,273 10.71 – – – – – –
Invesco Asia Consumer Demand Fund (USD) A (EUR)-AD EUR 1,206,595 78,232 13.51 2,874,718 165,484 14.22 783,950 62,686 11.80 A (EUR Hgd)-AD EUR 31,858 2,619 10.66 55,013 3,630 12.41 71,825 7,433 9.12
* Please refer to Note 1 for details of mergers into shell sub-funds or existing sub-funds of the Invesco Funds. ** Effective 6 December 2018 the Invesco Japanese Value Equity Fund changed its name to Invesco Japanese Equity Value Discovery Fund.
Invesco Funds Comparative Net Asset Values for the year ended 28 February 2019
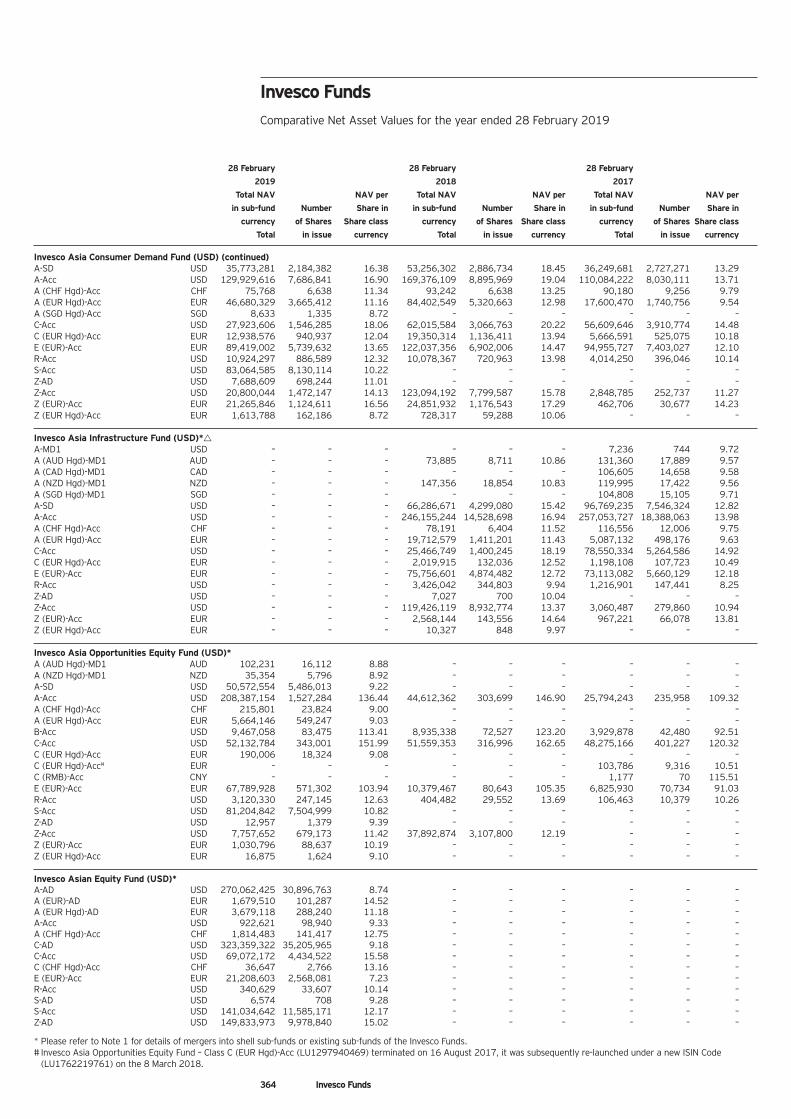
364 Invesco Funds
28 February 28 February 28 February
2019 2018 2017
Total NAV NAV per Total NAV NAV per Total NAV NAV per
in sub-fund Number Share in in sub-fund Number Share in in sub-fund Number Share in
currency of Shares Share class currency of Shares Share class currency of Shares Share class
Total in issue currency Total in issue currency Total in issue currency
Invesco Asia Consumer Demand Fund (USD) (continued) A-SD USD 35,773,281 2,184,382 16.38 53,256,302 2,886,734 18.45 36,249,681 2,727,271 13.29 A-Acc USD 129,929,616 7,686,841 16.90 169,376,109 8,895,969 19.04 110,084,222 8,030,111 13.71 A (CHF Hgd)-Acc CHF 75,768 6,638 11.34 93,242 6,638 13.25 90,180 9,256 9.79 A (EUR Hgd)-Acc EUR 46,680,329 3,665,412 11.16 84,402,549 5,320,663 12.98 17,600,470 1,740,756 9.54 A (SGD Hgd)-Acc SGD 8,633 1,335 8.72 – – – – – – C-Acc USD 27,923,606 1,546,285 18.06 62,015,584 3,066,763 20.22 56,609,646 3,910,774 14.48 C (EUR Hgd)-Acc EUR 12,938,576 940,937 12.04 19,350,314 1,136,411 13.94 5,666,591 525,075 10.18 E (EUR)-Acc EUR 89,419,002 5,739,632 13.65 122,037,356 6,902,006 14.47 94,955,727 7,403,027 12.10 R-Acc USD 10,924,297 886,589 12.32 10,078,367 720,963 13.98 4,014,250 396,046 10.14 S-Acc USD 83,064,585 8,130,114 10.22 – – – – – – Z-AD USD 7,688,609 698,244 11.01 – – – – – – Z-Acc USD 20,800,044 1,472,147 14.13 123,094,192 7,799,587 15.78 2,848,785 252,737 11.27 Z (EUR)-Acc EUR 21,265,846 1,124,611 16.56 24,851,932 1,176,543 17.29 462,706 30,677 14.23 Z (EUR Hgd)-Acc EUR 1,613,788 162,186 8.72 728,317 59,288 10.06 – – –
Invesco Asia Infrastructure Fund (USD)*Δ A-MD1 USD – – – – – – 7,236 744 9.72 A (AUD Hgd)-MD1 AUD – – – 73,885 8,711 10.86 131,360 17,889 9.57 A (CAD Hgd)-MD1 CAD – – – – – – 106,605 14,658 9.58 A (NZD Hgd)-MD1 NZD – – – 147,356 18,854 10.83 119,995 17,422 9.56 A (SGD Hgd)-MD1 SGD – – – – – – 104,808 15,105 9.71 A-SD USD – – – 66,286,671 4,299,080 15.42 96,769,235 7,546,324 12.82 A-Acc USD – – – 246,155,244 14,528,698 16.94 257,053,727 18,388,063 13.98 A (CHF Hgd)-Acc CHF – – – 78,191 6,404 11.52 116,556 12,006 9.75 A (EUR Hgd)-Acc EUR – – – 19,712,579 1,411,201 11.43 5,087,132 498,176 9.63 C-Acc USD – – – 25,466,749 1,400,245 18.19 78,550,334 5,264,586 14.92 C (EUR Hgd)-Acc EUR – – – 2,019,915 132,036 12.52 1,198,108 107,723 10.49 E (EUR)-Acc EUR – – – 75,756,601 4,874,482 12.72 73,113,082 5,660,129 12.18 R-Acc USD – – – 3,426,042 344,803 9.94 1,216,901 147,441 8.25 Z-AD USD – – – 7,027 700 10.04 – – – Z-Acc USD – – – 119,426,119 8,932,774 13.37 3,060,487 279,860 10.94 Z (EUR)-Acc EUR – – – 2,568,144 143,556 14.64 967,221 66,078 13.81 Z (EUR Hgd)-Acc EUR – – – 10,327 848 9.97 – – –
Invesco Asia Opportunities Equity Fund (USD)* A (AUD Hgd)-MD1 AUD 102,231 16,112 8.88 – – – – – – A (NZD Hgd)-MD1 NZD 35,354 5,796 8.92 – – – – – – A-SD USD 50,572,554 5,486,013 9.22 – – – – – – A-Acc USD 208,387,154 1,527,284 136.44 44,612,362 303,699 146.90 25,794,243 235,958 109.32 A (CHF Hgd)-Acc CHF 215,801 23,824 9.00 – – – – – – A (EUR Hgd)-Acc EUR 5,664,146 549,247 9.03 – – – – – – B-Acc USD 9,467,058 83,475 113.41 8,935,338 72,527 123.20 3,929,878 42,480 92.51 C-Acc USD 52,132,784 343,001 151.99 51,559,353 316,996 162.65 48,275,166 401,227 120.32 C (EUR Hgd)-Acc EUR 190,006 18,324 9.08 – – – – – – C (EUR Hgd)-Acc# EUR – – – – – – 103,786 9,316 10.51 C (RMB)-Acc CNY – – – – – – 1,177 70 115.51 E (EUR)-Acc EUR 67,789,928 571,302 103.94 10,379,467 80,643 105.35 6,825,930 70,734 91.03 R-Acc USD 3,120,330 247,145 12.63 404,482 29,552 13.69 106,463 10,379 10.26 S-Acc USD 81,204,842 7,504,999 10.82 – – – – – – Z-AD USD 12,957 1,379 9.39 – – – – – – Z-Acc USD 7,757,652 679,173 11.42 37,892,874 3,107,800 12.19 – – – Z (EUR)-Acc EUR 1,030,796 88,637 10.19 – – – – – – Z (EUR Hgd)-Acc EUR 16,875 1,624 9.10 – – – – – –
Invesco Asian Equity Fund (USD)* A-AD USD 270,062,425 30,896,763 8.74 – – – – – – A (EUR)-AD EUR 1,679,510 101,287 14.52 – – – – – – A (EUR Hgd)-AD EUR 3,679,118 288,240 11.18 – – – – – – A-Acc USD 922,621 98,940 9.33 – – – – – – A (CHF Hgd)-Acc CHF 1,814,483 141,417 12.75 – – – – – – C-AD USD 323,359,322 35,205,965 9.18 – – – – – – C-Acc USD 69,072,172 4,434,522 15.58 – – – – – – C (CHF Hgd)-Acc CHF 36,647 2,766 13.16 – – – – – – E (EUR)-Acc EUR 21,208,603 2,568,081 7.23 – – – – – – R-Acc USD 340,629 33,607 10.14 – – – – – – S-AD USD 6,574 708 9.28 – – – – – – S-Acc USD 141,034,642 11,585,171 12.17 – – – – – – Z-AD USD 149,833,973 9,978,840 15.02 – – – – – –
* Please refer to Note 1 for details of mergers into shell sub-funds or existing sub-funds of the Invesco Funds. # Invesco Asia Opportunities Equity Fund – Class C (EUR Hgd)-Acc (LU1297940469) terminated on 16 August 2017, it was subsequently re-launched under a new ISIN Code
(LU1762219761) on the 8 March 2018.
Invesco Funds Comparative Net Asset Values for the year ended 28 February 2019
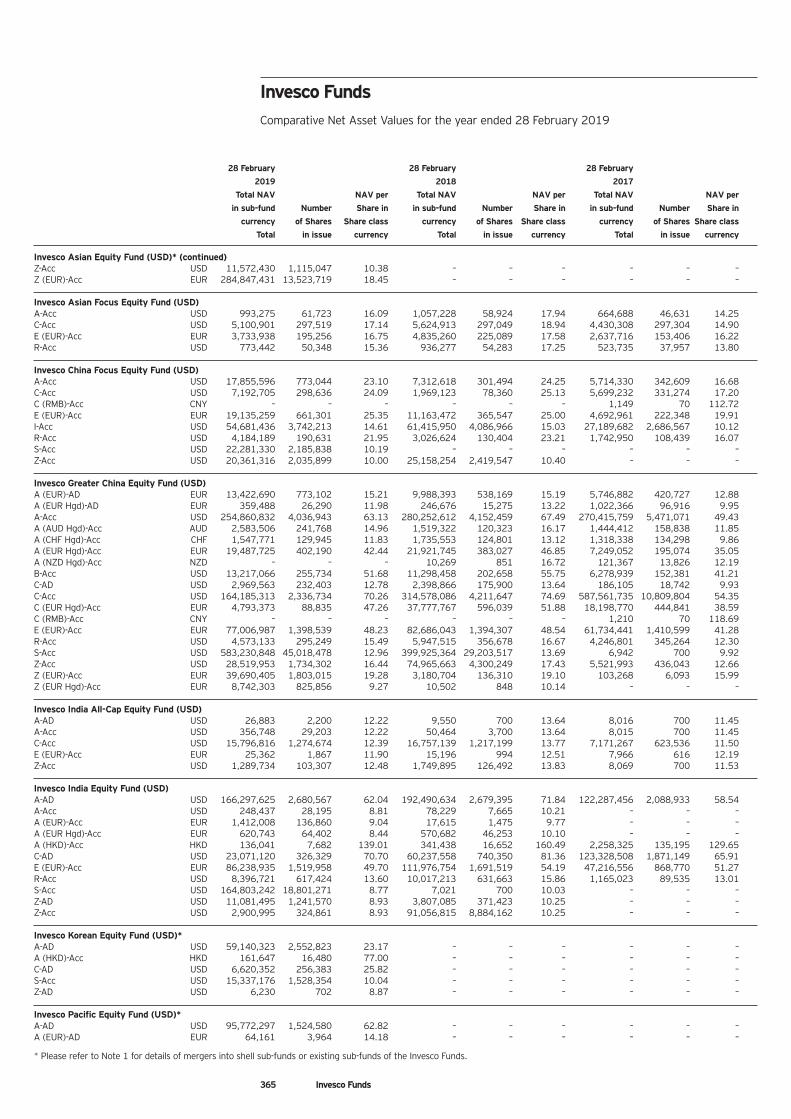
365 Invesco Funds
28 February 28 February 28 February
2019 2018 2017
Total NAV NAV per Total NAV NAV per Total NAV NAV per
in sub-fund Number Share in in sub-fund Number Share in in sub-fund Number Share in
currency of Shares Share class currency of Shares Share class currency of Shares Share class
Total in issue currency Total in issue currency Total in issue currency
Invesco Asian Equity Fund (USD)* (continued) Z-Acc USD 11,572,430 1,115,047 10.38 – – – – – – Z (EUR)-Acc EUR 284,847,431 13,523,719 18.45 – – – – – –
Invesco Asian Focus Equity Fund (USD) A-Acc USD 993,275 61,723 16.09 1,057,228 58,924 17.94 664,688 46,631 14.25 C-Acc USD 5,100,901 297,519 17.14 5,624,913 297,049 18.94 4,430,308 297,304 14.90 E (EUR)-Acc EUR 3,733,938 195,256 16.75 4,835,260 225,089 17.58 2,637,716 153,406 16.22 R-Acc USD 773,442 50,348 15.36 936,277 54,283 17.25 523,735 37,957 13.80
Invesco China Focus Equity Fund (USD) A-Acc USD 17,855,596 773,044 23.10 7,312,618 301,494 24.25 5,714,330 342,609 16.68 C-Acc USD 7,192,705 298,636 24.09 1,969,123 78,360 25.13 5,699,232 331,274 17.20 C (RMB)-Acc CNY – – – – – – 1,149 70 112.72 E (EUR)-Acc EUR 19,135,259 661,301 25.35 11,163,472 365,547 25.00 4,692,961 222,348 19.91 I-Acc USD 54,681,436 3,742,213 14.61 61,415,950 4,086,966 15.03 27,189,682 2,686,567 10.12 R-Acc USD 4,184,189 190,631 21.95 3,026,624 130,404 23.21 1,742,950 108,439 16.07 S-Acc USD 22,281,330 2,185,838 10.19 – – – – – – Z-Acc USD 20,361,316 2,035,899 10.00 25,158,254 2,419,547 10.40 – – –
Invesco Greater China Equity Fund (USD) A (EUR)-AD EUR 13,422,690 773,102 15.21 9,988,393 538,169 15.19 5,746,882 420,727 12.88 A (EUR Hgd)-AD EUR 359,488 26,290 11.98 246,676 15,275 13.22 1,022,366 96,916 9.95 A-Acc USD 254,860,832 4,036,943 63.13 280,252,612 4,152,459 67.49 270,415,759 5,471,071 49.43 A (AUD Hgd)-Acc AUD 2,583,506 241,768 14.96 1,519,322 120,323 16.17 1,444,412 158,838 11.85 A (CHF Hgd)-Acc CHF 1,547,771 129,945 11.83 1,735,553 124,801 13.12 1,318,338 134,298 9.86 A (EUR Hgd)-Acc EUR 19,487,725 402,190 42.44 21,921,745 383,027 46.85 7,249,052 195,074 35.05 A (NZD Hgd)-Acc NZD – – – 10,269 851 16.72 121,367 13,826 12.19 B-Acc USD 13,217,066 255,734 51.68 11,298,458 202,658 55.75 6,278,939 152,381 41.21 C-AD USD 2,969,563 232,403 12.78 2,398,866 175,900 13.64 186,105 18,742 9.93 C-Acc USD 164,185,313 2,336,734 70.26 314,578,086 4,211,647 74.69 587,561,735 10,809,804 54.35 C (EUR Hgd)-Acc EUR 4,793,373 88,835 47.26 37,777,767 596,039 51.88 18,198,770 444,841 38.59 C (RMB)-Acc CNY – – – – – – 1,210 70 118.69 E (EUR)-Acc EUR 77,006,987 1,398,539 48.23 82,686,043 1,394,307 48.54 61,734,441 1,410,599 41.28 R-Acc USD 4,573,133 295,249 15.49 5,947,515 356,678 16.67 4,246,801 345,264 12.30 S-Acc USD 583,230,848 45,018,478 12.96 399,925,364 29,203,517 13.69 6,942 700 9.92 Z-Acc USD 28,519,953 1,734,302 16.44 74,965,663 4,300,249 17.43 5,521,993 436,043 12.66 Z (EUR)-Acc EUR 39,690,405 1,803,015 19.28 3,180,704 136,310 19.10 103,268 6,093 15.99 Z (EUR Hgd)-Acc EUR 8,742,303 825,856 9.27 10,502 848 10.14 – – –
Invesco India All-Cap Equity Fund (USD) A-AD USD 26,883 2,200 12.22 9,550 700 13.64 8,016 700 11.45 A-Acc USD 356,748 29,203 12.22 50,464 3,700 13.64 8,015 700 11.45 C-Acc USD 15,796,816 1,274,674 12.39 16,757,139 1,217,199 13.77 7,171,267 623,536 11.50 E (EUR)-Acc EUR 25,362 1,867 11.90 15,196 994 12.51 7,966 616 12.19 Z-Acc USD 1,289,734 103,307 12.48 1,749,895 126,492 13.83 8,069 700 11.53
Invesco India Equity Fund (USD) A-AD USD 166,297,625 2,680,567 62.04 192,490,634 2,679,395 71.84 122,287,456 2,088,933 58.54 A-Acc USD 248,437 28,195 8.81 78,229 7,665 10.21 – – – A (EUR)-Acc EUR 1,412,008 136,860 9.04 17,615 1,475 9.77 – – – A (EUR Hgd)-Acc EUR 620,743 64,402 8.44 570,682 46,253 10.10 – – – A (HKD)-Acc HKD 136,041 7,682 139.01 341,438 16,652 160.49 2,258,325 135,195 129.65 C-AD USD 23,071,120 326,329 70.70 60,237,558 740,350 81.36 123,328,508 1,871,149 65.91 E (EUR)-Acc EUR 86,238,935 1,519,958 49.70 111,976,754 1,691,519 54.19 47,216,556 868,770 51.27 R-Acc USD 8,396,721 617,424 13.60 10,017,213 631,663 15.86 1,165,023 89,535 13.01 S-Acc USD 164,803,242 18,801,271 8.77 7,021 700 10.03 – – – Z-AD USD 11,081,495 1,241,570 8.93 3,807,085 371,423 10.25 – – – Z-Acc USD 2,900,995 324,861 8.93 91,056,815 8,884,162 10.25 – – –
Invesco Korean Equity Fund (USD)* A-AD USD 59,140,323 2,552,823 23.17 – – – – – – A (HKD)-Acc HKD 161,647 16,480 77.00 – – – – – – C-AD USD 6,620,352 256,383 25.82 – – – – – – S-Acc USD 15,337,176 1,528,354 10.04 – – – – – – Z-AD USD 6,230 702 8.87 – – – – – –
Invesco Pacific Equity Fund (USD)* A-AD USD 95,772,297 1,524,580 62.82 – – – – – – A (EUR)-AD EUR 64,161 3,964 14.18 – – – – – –
* Please refer to Note 1 for details of mergers into shell sub-funds or existing sub-funds of the Invesco Funds.
Invesco Funds Comparative Net Asset Values for the year ended 28 February 2019
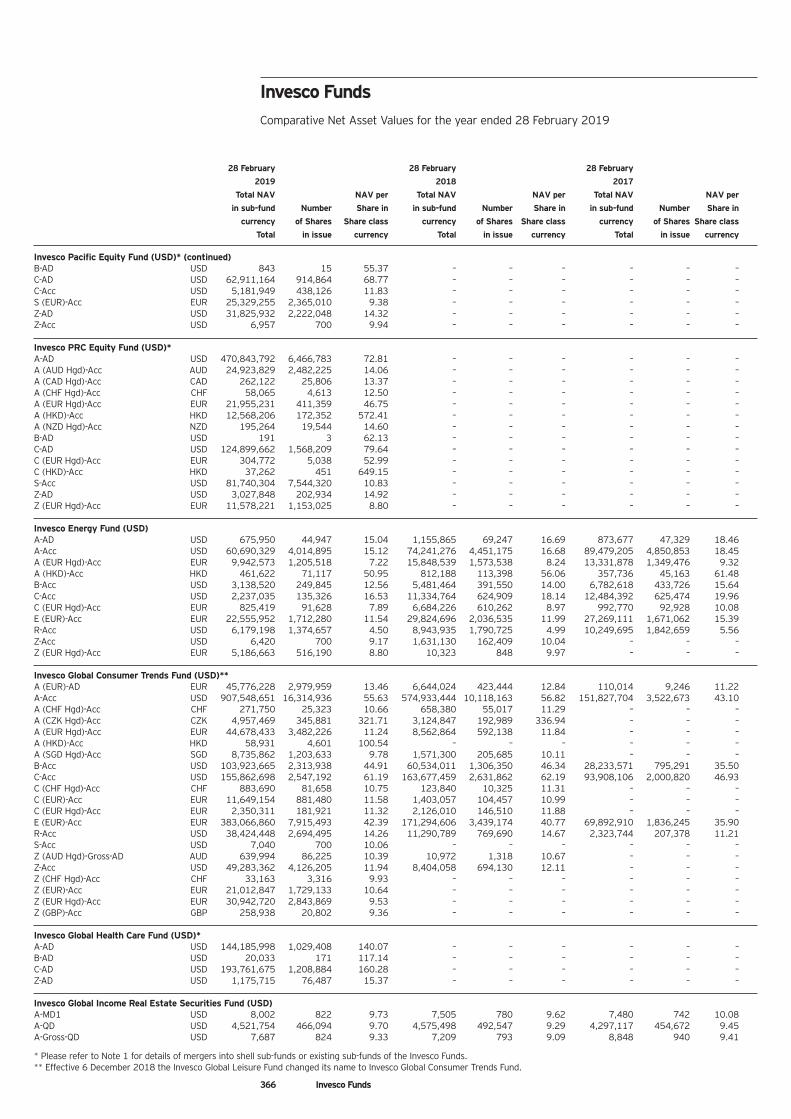
366 Invesco Funds
28 February 28 February 28 February
2019 2018 2017
Total NAV NAV per Total NAV NAV per Total NAV NAV per
in sub-fund Number Share in in sub-fund Number Share in in sub-fund Number Share in
currency of Shares Share class currency of Shares Share class currency of Shares Share class
Total in issue currency Total in issue currency Total in issue currency
Invesco Pacific Equity Fund (USD)* (continued) B-AD USD 843 15 55.37 – – – – – – C-AD USD 62,911,164 914,864 68.77 – – – – – – C-Acc USD 5,181,949 438,126 11.83 – – – – – – S (EUR)-Acc EUR 25,329,255 2,365,010 9.38 – – – – – – Z-AD USD 31,825,932 2,222,048 14.32 – – – – – – Z-Acc USD 6,957 700 9.94 – – – – – –
Invesco PRC Equity Fund (USD)* A-AD USD 470,843,792 6,466,783 72.81 – – – – – – A (AUD Hgd)-Acc AUD 24,923,829 2,482,225 14.06 – – – – – – A (CAD Hgd)-Acc CAD 262,122 25,806 13.37 – – – – – – A (CHF Hgd)-Acc CHF 58,065 4,613 12.50 – – – – – – A (EUR Hgd)-Acc EUR 21,955,231 411,359 46.75 – – – – – – A (HKD)-Acc HKD 12,568,206 172,352 572.41 – – – – – – A (NZD Hgd)-Acc NZD 195,264 19,544 14.60 – – – – – – B-AD USD 191 3 62.13 – – – – – – C-AD USD 124,899,662 1,568,209 79.64 – – – – – – C (EUR Hgd)-Acc EUR 304,772 5,038 52.99 – – – – – – C (HKD)-Acc HKD 37,262 451 649.15 – – – – – – S-Acc USD 81,740,304 7,544,320 10.83 – – – – – – Z-AD USD 3,027,848 202,934 14.92 – – – – – – Z (EUR Hgd)-Acc EUR 11,578,221 1,153,025 8.80 – – – – – –
Invesco Energy Fund (USD) A-AD USD 675,950 44,947 15.04 1,155,865 69,247 16.69 873,677 47,329 18.46 A-Acc USD 60,690,329 4,014,895 15.12 74,241,276 4,451,175 16.68 89,479,205 4,850,853 18.45 A (EUR Hgd)-Acc EUR 9,942,573 1,205,518 7.22 15,848,539 1,573,538 8.24 13,331,878 1,349,476 9.32 A (HKD)-Acc HKD 461,622 71,117 50.95 812,188 113,398 56.06 357,736 45,163 61.48 B-Acc USD 3,138,520 249,845 12.56 5,481,464 391,550 14.00 6,782,618 433,726 15.64 C-Acc USD 2,237,035 135,326 16.53 11,334,764 624,909 18.14 12,484,392 625,474 19.96 C (EUR Hgd)-Acc EUR 825,419 91,628 7.89 6,684,226 610,262 8.97 992,770 92,928 10.08 E (EUR)-Acc EUR 22,555,952 1,712,280 11.54 29,824,696 2,036,535 11.99 27,269,111 1,671,062 15.39 R-Acc USD 6,179,198 1,374,657 4.50 8,943,935 1,790,725 4.99 10,249,695 1,842,659 5.56 Z-Acc USD 6,420 700 9.17 1,631,130 162,409 10.04 – – – Z (EUR Hgd)-Acc EUR 5,186,663 516,190 8.80 10,323 848 9.97 – – –
Invesco Global Consumer Trends Fund (USD)** A (EUR)-AD EUR 45,776,228 2,979,959 13.46 6,644,024 423,444 12.84 110,014 9,246 11.22 A-Acc USD 907,548,651 16,314,936 55.63 574,933,444 10,118,163 56.82 151,827,704 3,522,673 43.10 A (CHF Hgd)-Acc CHF 271,750 25,323 10.66 658,380 55,017 11.29 – – – A (CZK Hgd)-Acc CZK 4,957,469 345,881 321.71 3,124,847 192,989 336.94 – – – A (EUR Hgd)-Acc EUR 44,678,433 3,482,226 11.24 8,562,864 592,138 11.84 – – – A (HKD)-Acc HKD 58,931 4,601 100.54 – – – – – – A (SGD Hgd)-Acc SGD 8,735,862 1,203,633 9.78 1,571,300 205,685 10.11 – – – B-Acc USD 103,923,665 2,313,938 44.91 60,534,011 1,306,350 46.34 28,233,571 795,291 35.50 C-Acc USD 155,862,698 2,547,192 61.19 163,677,459 2,631,862 62.19 93,908,106 2,000,820 46.93 C (CHF Hgd)-Acc CHF 883,690 81,658 10.75 123,840 10,325 11.31 – – – C (EUR)-Acc EUR 11,649,154 881,480 11.58 1,403,057 104,457 10.99 – – – C (EUR Hgd)-Acc EUR 2,350,311 181,921 11.32 2,126,010 146,510 11.88 – – – E (EUR)-Acc EUR 383,066,860 7,915,493 42.39 171,294,606 3,439,174 40.77 69,892,910 1,836,245 35.90 R-Acc USD 38,424,448 2,694,495 14.26 11,290,789 769,690 14.67 2,323,744 207,378 11.21 S-Acc USD 7,040 700 10.06 – – – – – – Z (AUD Hgd)-Gross-AD AUD 639,994 86,225 10.39 10,972 1,318 10.67 – – – Z-Acc USD 49,283,362 4,126,205 11.94 8,404,058 694,130 12.11 – – – Z (CHF Hgd)-Acc CHF 33,163 3,316 9.93 – – – – – – Z (EUR)-Acc EUR 21,012,847 1,729,133 10.64 – – – – – – Z (EUR Hgd)-Acc EUR 30,942,720 2,843,869 9.53 – – – – – – Z (GBP)-Acc GBP 258,938 20,802 9.36 – – – – – –
Invesco Global Health Care Fund (USD)* A-AD USD 144,185,998 1,029,408 140.07 – – – – – – B-AD USD 20,033 171 117.14 – – – – – – C-AD USD 193,761,675 1,208,884 160.28 – – – – – – Z-AD USD 1,175,715 76,487 15.37 – – – – – –
Invesco Global Income Real Estate Securities Fund (USD) A-MD1 USD 8,002 822 9.73 7,505 780 9.62 7,480 742 10.08 A-QD USD 4,521,754 466,094 9.70 4,575,498 492,547 9.29 4,297,117 454,672 9.45 A-Gross-QD USD 7,687 824 9.33 7,209 793 9.09 8,848 940 9.41
* Please refer to Note 1 for details of mergers into shell sub-funds or existing sub-funds of the Invesco Funds. ** Effective 6 December 2018 the Invesco Global Leisure Fund changed its name to Invesco Global Consumer Trends Fund.
Invesco Funds Comparative Net Asset Values for the year ended 28 February 2019
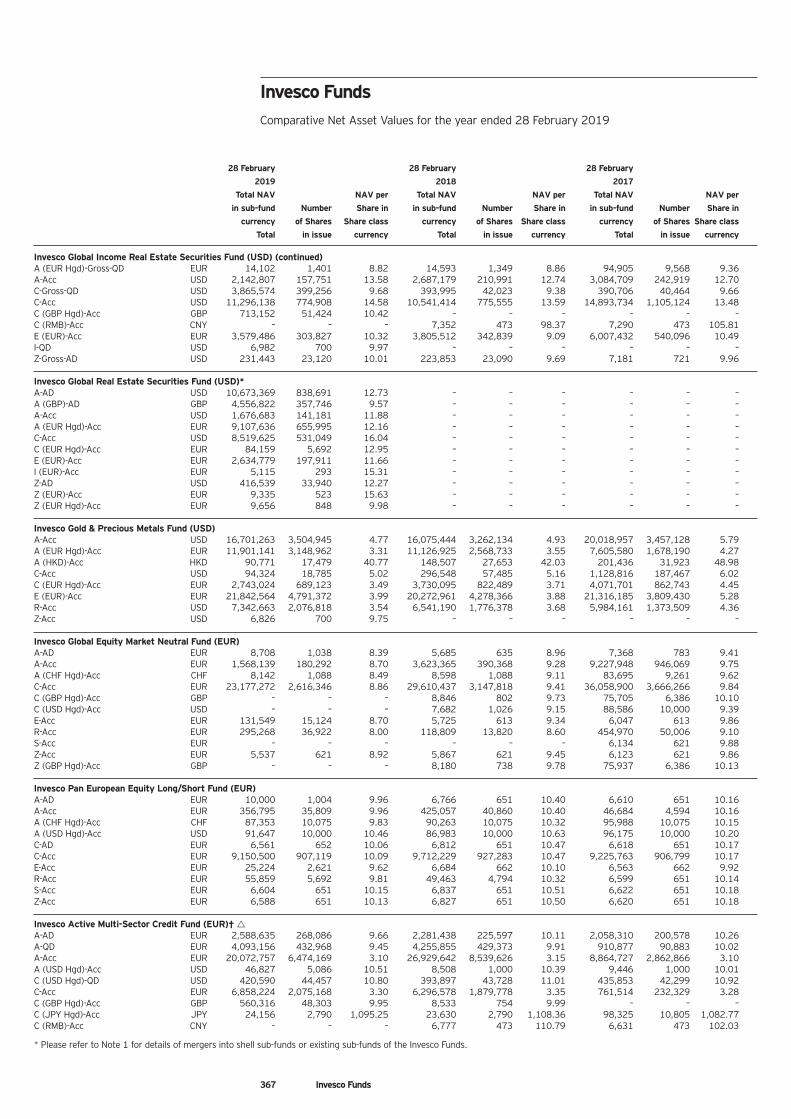
367 Invesco Funds
28 February 28 February 28 February
2019 2018 2017
Total NAV NAV per Total NAV NAV per Total NAV NAV per
in sub-fund Number Share in in sub-fund Number Share in in sub-fund Number Share in
currency of Shares Share class currency of Shares Share class currency of Shares Share class
Total in issue currency Total in issue currency Total in issue currency
Invesco Global Income Real Estate Securities Fund (USD) (continued) A (EUR Hgd)-Gross-QD EUR 14,102 1,401 8.82 14,593 1,349 8.86 94,905 9,568 9.36 A-Acc USD 2,142,807 157,751 13.58 2,687,179 210,991 12.74 3,084,709 242,919 12.70 C-Gross-QD USD 3,865,574 399,256 9.68 393,995 42,023 9.38 390,706 40,464 9.66 C-Acc USD 11,296,138 774,908 14.58 10,541,414 775,555 13.59 14,893,734 1,105,124 13.48 C (GBP Hgd)-Acc GBP 713,152 51,424 10.42 – – – – – – C (RMB)-Acc CNY – – – 7,352 473 98.37 7,290 473 105.81 E (EUR)-Acc EUR 3,579,486 303,827 10.32 3,805,512 342,839 9.09 6,007,432 540,096 10.49 I-QD USD 6,982 700 9.97 – – – – – – Z-Gross-AD USD 231,443 23,120 10.01 223,853 23,090 9.69 7,181 721 9.96
Invesco Global Real Estate Securities Fund (USD)* A-AD USD 10,673,369 838,691 12.73 – – – – – – A (GBP)-AD GBP 4,556,822 357,746 9.57 – – – – – – A-Acc USD 1,676,683 141,181 11.88 – – – – – – A (EUR Hgd)-Acc EUR 9,107,636 655,995 12.16 – – – – – – C-Acc USD 8,519,625 531,049 16.04 – – – – – – C (EUR Hgd)-Acc EUR 84,159 5,692 12.95 – – – – – – E (EUR)-Acc EUR 2,634,779 197,911 11.66 – – – – – – I (EUR)-Acc EUR 5,115 293 15.31 – – – – – – Z-AD USD 416,539 33,940 12.27 – – – – – – Z (EUR)-Acc EUR 9,335 523 15.63 – – – – – – Z (EUR Hgd)-Acc EUR 9,656 848 9.98 – – – – – –
Invesco Gold & Precious Metals Fund (USD) A-Acc USD 16,701,263 3,504,945 4.77 16,075,444 3,262,134 4.93 20,018,957 3,457,128 5.79 A (EUR Hgd)-Acc EUR 11,901,141 3,148,962 3.31 11,126,925 2,568,733 3.55 7,605,580 1,678,190 4.27 A (HKD)-Acc HKD 90,771 17,479 40.77 148,507 27,653 42.03 201,436 31,923 48.98 C-Acc USD 94,324 18,785 5.02 296,548 57,485 5.16 1,128,816 187,467 6.02 C (EUR Hgd)-Acc EUR 2,743,024 689,123 3.49 3,730,095 822,489 3.71 4,071,701 862,743 4.45 E (EUR)-Acc EUR 21,842,564 4,791,372 3.99 20,272,961 4,278,366 3.88 21,316,185 3,809,430 5.28 R-Acc USD 7,342,663 2,076,818 3.54 6,541,190 1,776,378 3.68 5,984,161 1,373,509 4.36 Z-Acc USD 6,826 700 9.75 – – – – – –
Invesco Global Equity Market Neutral Fund (EUR) A-AD EUR 8,708 1,038 8.39 5,685 635 8.96 7,368 783 9.41 A-Acc EUR 1,568,139 180,292 8.70 3,623,365 390,368 9.28 9,227,948 946,069 9.75 A (CHF Hgd)-Acc CHF 8,142 1,088 8.49 8,598 1,088 9.11 83,695 9,261 9.62 C-Acc EUR 23,177,272 2,616,346 8.86 29,610,437 3,147,818 9.41 36,058,900 3,666,266 9.84 C (GBP Hgd)-Acc GBP – – – 8,846 802 9.73 75,705 6,386 10.10 C (USD Hgd)-Acc USD – – – 7,682 1,026 9.15 88,586 10,000 9.39 E-Acc EUR 131,549 15,124 8.70 5,725 613 9.34 6,047 613 9.86 R-Acc EUR 295,268 36,922 8.00 118,809 13,820 8.60 454,970 50,006 9.10 S-Acc EUR – – – – – – 6,134 621 9.88 Z-Acc EUR 5,537 621 8.92 5,867 621 9.45 6,123 621 9.86 Z (GBP Hgd)-Acc GBP – – – 8,180 738 9.78 75,937 6,386 10.13
Invesco Pan European Equity Long/Short Fund (EUR) A-AD EUR 10,000 1,004 9.96 6,766 651 10.40 6,610 651 10.16 A-Acc EUR 356,795 35,809 9.96 425,057 40,860 10.40 46,684 4,594 10.16 A (CHF Hgd)-Acc CHF 87,353 10,075 9.83 90,263 10,075 10.32 95,988 10,075 10.15 A (USD Hgd)-Acc USD 91,647 10,000 10.46 86,983 10,000 10.63 96,175 10,000 10.20 C-AD EUR 6,561 652 10.06 6,812 651 10.47 6,618 651 10.17 C-Acc EUR 9,150,500 907,119 10.09 9,712,229 927,283 10.47 9,225,763 906,799 10.17 E-Acc EUR 25,224 2,621 9.62 6,684 662 10.10 6,563 662 9.92 R-Acc EUR 55,859 5,692 9.81 49,463 4,794 10.32 6,599 651 10.14 S-Acc EUR 6,604 651 10.15 6,837 651 10.51 6,622 651 10.18 Z-Acc EUR 6,588 651 10.13 6,827 651 10.50 6,620 651 10.18
Invesco Active Multi-Sector Credit Fund (EUR)† A-AD EUR 2,588,635 268,086 9.66 2,281,438 225,597 10.11 2,058,310 200,578 10.26 A-QD EUR 4,093,156 432,968 9.45 4,255,855 429,373 9.91 910,877 90,883 10.02 A-Acc EUR 20,072,757 6,474,169 3.10 26,929,642 8,539,626 3.15 8,864,727 2,862,866 3.10 A (USD Hgd)-Acc USD 46,827 5,086 10.51 8,508 1,000 10.39 9,446 1,000 10.01 C (USD Hgd)-QD USD 420,590 44,457 10.80 393,897 43,728 11.01 435,853 42,299 10.92 C-Acc EUR 6,858,224 2,075,168 3.30 6,296,578 1,879,778 3.35 761,514 232,329 3.28 C (GBP Hgd)-Acc GBP 560,316 48,303 9.95 8,533 754 9.99 – – – C (JPY Hgd)-Acc JPY 24,156 2,790 1,095.25 23,630 2,790 1,108.36 98,325 10,805 1,082.77 C (RMB)-Acc CNY – – – 6,777 473 110.79 6,631 473 102.03
* Please refer to Note 1 for details of mergers into shell sub-funds or existing sub-funds of the Invesco Funds.
Invesco Funds Comparative Net Asset Values for the year ended 28 February 2019
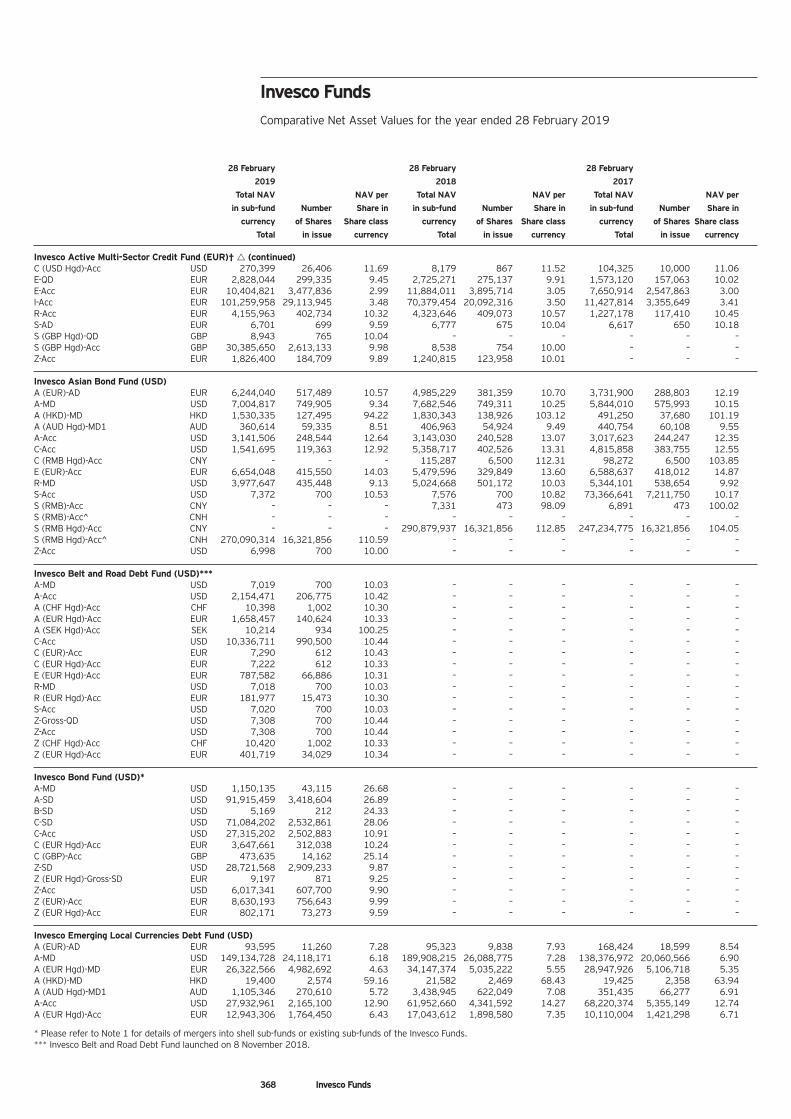
368 Invesco Funds
28 February 28 February 28 February
2019 2018 2017
Total NAV NAV per Total NAV NAV per Total NAV NAV per
in sub-fund Number Share in in sub-fund Number Share in in sub-fund Number Share in
currency of Shares Share class currency of Shares Share class currency of Shares Share class
Total in issue currency Total in issue currency Total in issue currency
Invesco Active Multi-Sector Credit Fund (EUR)† Δ(continued) C (USD Hgd)-Acc USD 270,399 26,406 11.69 8,179 867 11.52 104,325 10,000 11.06 E-QD EUR 2,828,044 299,335 9.45 2,725,271 275,137 9.91 1,573,120 157,063 10.02 E-Acc EUR 10,404,821 3,477,836 2.99 11,884,011 3,895,714 3.05 7,650,914 2,547,863 3.00 I-Acc EUR 101,259,958 29,113,945 3.48 70,379,454 20,092,316 3.50 11,427,814 3,355,649 3.41 R-Acc EUR 4,155,963 402,734 10.32 4,323,646 409,073 10.57 1,227,178 117,410 10.45 S-AD EUR 6,701 699 9.59 6,777 675 10.04 6,617 650 10.18 S (GBP Hgd)-QD GBP 8,943 765 10.04 – – – – – – S (GBP Hgd)-Acc GBP 30,385,650 2,613,133 9.98 8,538 754 10.00 – – – Z-Acc EUR 1,826,400 184,709 9.89 1,240,815 123,958 10.01 – – –
Invesco Asian Bond Fund (USD) A (EUR)-AD EUR 6,244,040 517,489 10.57 4,985,229 381,359 10.70 3,731,900 288,803 12.19 A-MD USD 7,004,817 749,905 9.34 7,682,546 749,311 10.25 5,844,010 575,993 10.15 A (HKD)-MD HKD 1,530,335 127,495 94.22 1,830,343 138,926 103.12 491,250 37,680 101.19 A (AUD Hgd)-MD1 AUD 360,614 59,335 8.51 406,963 54,924 9.49 440,754 60,108 9.55 A-Acc USD 3,141,506 248,544 12.64 3,143,030 240,528 13.07 3,017,623 244,247 12.35 C-Acc USD 1,541,695 119,363 12.92 5,358,717 402,526 13.31 4,815,858 383,755 12.55 C (RMB Hgd)-Acc CNY – – – 115,287 6,500 112.31 98,272 6,500 103.85 E (EUR)-Acc EUR 6,654,048 415,550 14.03 5,479,596 329,849 13.60 6,588,637 418,012 14.87 R-MD USD 3,977,647 435,448 9.13 5,024,668 501,172 10.03 5,344,101 538,654 9.92 S-Acc USD 7,372 700 10.53 7,576 700 10.82 73,366,641 7,211,750 10.17 S (RMB)-Acc CNY – – – 7,331 473 98.09 6,891 473 100.02 S (RMB)-Acc^ CNH – – – – – – – – – S (RMB Hgd)-Acc CNY – – – 290,879,937 16,321,856 112.85 247,234,775 16,321,856 104.05 S (RMB Hgd)-Acc^ CNH 270,090,314 16,321,856 110.59 – – – – – – Z-Acc USD 6,998 700 10.00 – – – – – –
Invesco Belt and Road Debt Fund (USD)*** A-MD USD 7,019 700 10.03 – – – – – – A-Acc USD 2,154,471 206,775 10.42 – – – – – – A (CHF Hgd)-Acc CHF 10,398 1,002 10.30 – – – – – – A (EUR Hgd)-Acc EUR 1,658,457 140,624 10.33 – – – – – – A (SEK Hgd)-Acc SEK 10,214 934 100.25 – – – – – – C-Acc USD 10,336,711 990,500 10.44 – – – – – – C (EUR)-Acc EUR 7,290 612 10.43 – – – – – – C (EUR Hgd)-Acc EUR 7,222 612 10.33 – – – – – – E (EUR Hgd)-Acc EUR 787,582 66,886 10.31 – – – – – – R-MD USD 7,018 700 10.03 – – – – – – R (EUR Hgd)-Acc EUR 181,977 15,473 10.30 – – – – – – S-Acc USD 7,020 700 10.03 – – – – – – Z-Gross-QD USD 7,308 700 10.44 – – – – – – Z-Acc USD 7,308 700 10.44 – – – – – – Z (CHF Hgd)-Acc CHF 10,420 1,002 10.33 – – – – – – Z (EUR Hgd)-Acc EUR 401,719 34,029 10.34 – – – – – –
Invesco Bond Fund (USD)* A-MD USD 1,150,135 43,115 26.68 – – – – – – A-SD USD 91,915,459 3,418,604 26.89 – – – – – – B-SD USD 5,169 212 24.33 – – – – – – C-SD USD 71,084,202 2,532,861 28.06 – – – – – – C-Acc USD 27,315,202 2,502,883 10.91 – – – – – – C (EUR Hgd)-Acc EUR 3,647,661 312,038 10.24 – – – – – – C (GBP)-Acc GBP 473,635 14,162 25.14 – – – – – – Z-SD USD 28,721,568 2,909,233 9.87 – – – – – – Z (EUR Hgd)-Gross-SD EUR 9,197 871 9.25 – – – – – – Z-Acc USD 6,017,341 607,700 9.90 – – – – – – Z (EUR)-Acc EUR 8,630,193 756,643 9.99 – – – – – – Z (EUR Hgd)-Acc EUR 802,171 73,273 9.59 – – – – – –
Invesco Emerging Local Currencies Debt Fund (USD) A (EUR)-AD EUR 93,595 11,260 7.28 95,323 9,838 7.93 168,424 18,599 8.54 A-MD USD 149,134,728 24,118,171 6.18 189,908,215 26,088,775 7.28 138,376,972 20,060,566 6.90 A (EUR Hgd)-MD EUR 26,322,566 4,982,692 4.63 34,147,374 5,035,222 5.55 28,947,926 5,106,718 5.35 A (HKD)-MD HKD 19,400 2,574 59.16 21,582 2,469 68.43 19,425 2,358 63.94 A (AUD Hgd)-MD1 AUD 1,105,346 270,610 5.72 3,438,945 622,049 7.08 351,435 66,277 6.91 A-Acc USD 27,932,961 2,165,100 12.90 61,952,660 4,341,592 14.27 68,220,374 5,355,149 12.74 A (EUR Hgd)-Acc EUR 12,943,306 1,764,450 6.43 17,043,612 1,898,580 7.35 10,110,004 1,421,298 6.71
* Please refer to Note 1 for details of mergers into shell sub-funds or existing sub-funds of the Invesco Funds. *** Invesco Belt and Road Debt Fund launched on 8 November 2018.
Invesco Funds Comparative Net Asset Values for the year ended 28 February 2019
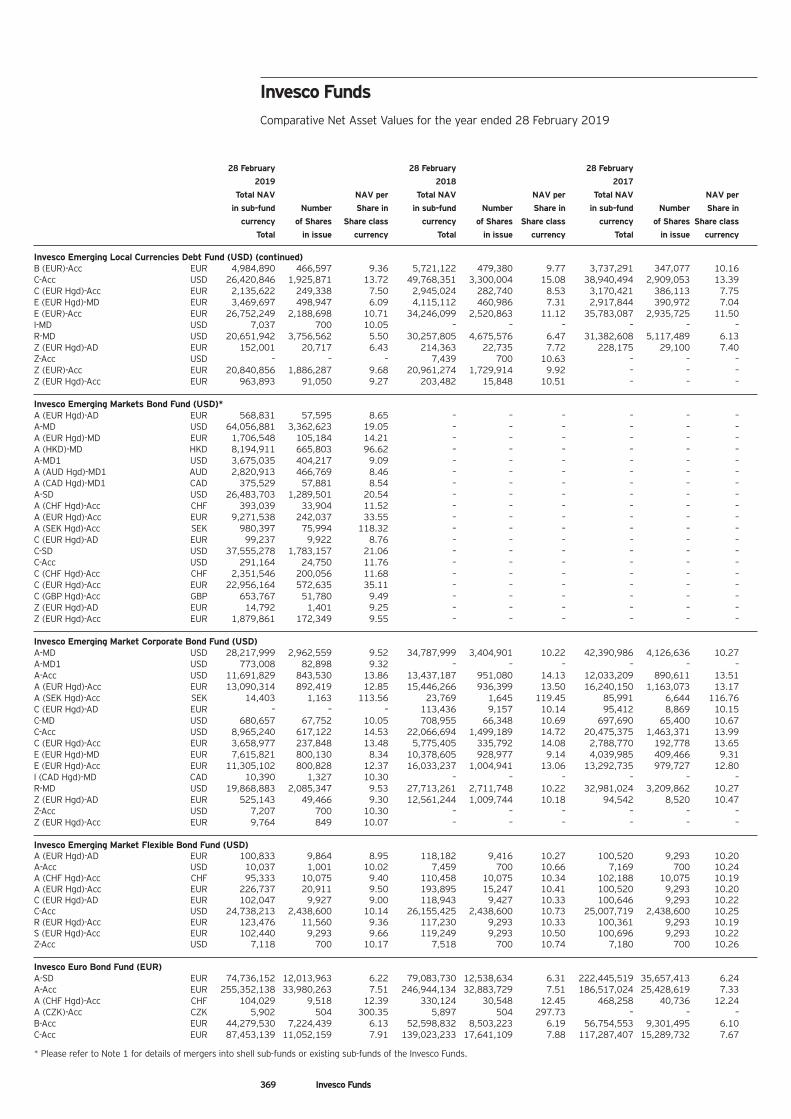
369 Invesco Funds
28 February 28 February 28 February
2019 2018 2017
Total NAV NAV per Total NAV NAV per Total NAV NAV per
in sub-fund Number Share in in sub-fund Number Share in in sub-fund Number Share in
currency of Shares Share class currency of Shares Share class currency of Shares Share class
Total in issue currency Total in issue currency Total in issue currency
Invesco Emerging Local Currencies Debt Fund (USD) (continued) B (EUR)-Acc EUR 4,984,890 466,597 9.36 5,721,122 479,380 9.77 3,737,291 347,077 10.16 C-Acc USD 26,420,846 1,925,871 13.72 49,768,351 3,300,004 15.08 38,940,494 2,909,053 13.39 C (EUR Hgd)-Acc EUR 2,135,622 249,338 7.50 2,945,024 282,740 8.53 3,170,421 386,113 7.75 E (EUR Hgd)-MD EUR 3,469,697 498,947 6.09 4,115,112 460,986 7.31 2,917,844 390,972 7.04 E (EUR)-Acc EUR 26,752,249 2,188,698 10.71 34,246,099 2,520,863 11.12 35,783,087 2,935,725 11.50 I-MD USD 7,037 700 10.05 – – – – – – R-MD USD 20,651,942 3,756,562 5.50 30,257,805 4,675,576 6.47 31,382,608 5,117,489 6.13 Z (EUR Hgd)-AD EUR 152,001 20,717 6.43 214,363 22,735 7.72 228,175 29,100 7.40 Z-Acc USD – – – 7,439 700 10.63 – – – Z (EUR)-Acc EUR 20,840,856 1,886,287 9.68 20,961,274 1,729,914 9.92 – – – Z (EUR Hgd)-Acc EUR 963,893 91,050 9.27 203,482 15,848 10.51 – – –
Invesco Emerging Markets Bond Fund (USD)* A (EUR Hgd)-AD EUR 568,831 57,595 8.65 – – – – – – A-MD USD 64,056,881 3,362,623 19.05 – – – – – – A (EUR Hgd)-MD EUR 1,706,548 105,184 14.21 – – – – – – A (HKD)-MD HKD 8,194,911 665,803 96.62 – – – – – – A-MD1 USD 3,675,035 404,217 9.09 – – – – – – A (AUD Hgd)-MD1 AUD 2,820,913 466,769 8.46 – – – – – – A (CAD Hgd)-MD1 CAD 375,529 57,881 8.54 – – – – – – A-SD USD 26,483,703 1,289,501 20.54 – – – – – – A (CHF Hgd)-Acc CHF 393,039 33,904 11.52 – – – – – – A (EUR Hgd)-Acc EUR 9,271,538 242,037 33.55 – – – – – – A (SEK Hgd)-Acc SEK 980,397 75,994 118.32 – – – – – – C (EUR Hgd)-AD EUR 99,237 9,922 8.76 – – – – – – C-SD USD 37,555,278 1,783,157 21.06 – – – – – – C-Acc USD 291,164 24,750 11.76 – – – – – – C (CHF Hgd)-Acc CHF 2,351,546 200,056 11.68 – – – – – – C (EUR Hgd)-Acc EUR 22,956,164 572,635 35.11 – – – – – – C (GBP Hgd)-Acc GBP 653,767 51,780 9.49 – – – – – – Z (EUR Hgd)-AD EUR 14,792 1,401 9.25 – – – – – – Z (EUR Hgd)-Acc EUR 1,879,861 172,349 9.55 – – – – – –
Invesco Emerging Market Corporate Bond Fund (USD) A-MD USD 28,217,999 2,962,559 9.52 34,787,999 3,404,901 10.22 42,390,986 4,126,636 10.27 A-MD1 USD 773,008 82,898 9.32 – – – – – – A-Acc USD 11,691,829 843,530 13.86 13,437,187 951,080 14.13 12,033,209 890,611 13.51 A (EUR Hgd)-Acc EUR 13,090,314 892,419 12.85 15,446,266 936,399 13.50 16,240,150 1,163,073 13.17 A (SEK Hgd)-Acc SEK 14,403 1,163 113.56 23,769 1,645 119.45 85,991 6,644 116.76 C (EUR Hgd)-AD EUR – – – 113,436 9,157 10.14 95,412 8,869 10.15 C-MD USD 680,657 67,752 10.05 708,955 66,348 10.69 697,690 65,400 10.67 C-Acc USD 8,965,240 617,122 14.53 22,066,694 1,499,189 14.72 20,475,375 1,463,371 13.99 C (EUR Hgd)-Acc EUR 3,658,977 237,848 13.48 5,775,405 335,792 14.08 2,788,770 192,778 13.65 E (EUR Hgd)-MD EUR 7,615,821 800,130 8.34 10,378,605 928,977 9.14 4,039,985 409,466 9.31 E (EUR Hgd)-Acc EUR 11,305,102 800,828 12.37 16,033,237 1,004,941 13.06 13,292,735 979,727 12.80 I (CAD Hgd)-MD CAD 10,390 1,327 10.30 – – – – – – R-MD USD 19,868,883 2,085,347 9.53 27,713,261 2,711,748 10.22 32,981,024 3,209,862 10.27 Z (EUR Hgd)-AD EUR 525,143 49,466 9.30 12,561,244 1,009,744 10.18 94,542 8,520 10.47 Z-Acc USD 7,207 700 10.30 – – – – – – Z (EUR Hgd)-Acc EUR 9,764 849 10.07 – – – – – –
Invesco Emerging Market Flexible Bond Fund (USD) A (EUR Hgd)-AD EUR 100,833 9,864 8.95 118,182 9,416 10.27 100,520 9,293 10.20 A-Acc USD 10,037 1,001 10.02 7,459 700 10.66 7,169 700 10.24 A (CHF Hgd)-Acc CHF 95,333 10,075 9.40 110,458 10,075 10.34 102,188 10,075 10.19 A (EUR Hgd)-Acc EUR 226,737 20,911 9.50 193,895 15,247 10.41 100,520 9,293 10.20 C (EUR Hgd)-AD EUR 102,047 9,927 9.00 118,943 9,427 10.33 100,646 9,293 10.22 C-Acc USD 24,738,213 2,438,600 10.14 26,155,425 2,438,600 10.73 25,007,719 2,438,600 10.25 R (EUR Hgd)-Acc EUR 123,476 11,560 9.36 117,230 9,293 10.33 100,361 9,293 10.19 S (EUR Hgd)-Acc EUR 102,440 9,293 9.66 119,249 9,293 10.50 100,696 9,293 10.22 Z-Acc USD 7,118 700 10.17 7,518 700 10.74 7,180 700 10.26
Invesco Euro Bond Fund (EUR) A-SD EUR 74,736,152 12,013,963 6.22 79,083,730 12,538,634 6.31 222,445,519 35,657,413 6.24 A-Acc EUR 255,352,138 33,980,263 7.51 246,944,134 32,883,729 7.51 186,517,024 25,428,619 7.33 A (CHF Hgd)-Acc CHF 104,029 9,518 12.39 330,124 30,548 12.45 468,258 40,736 12.24 A (CZK)-Acc CZK 5,902 504 300.35 5,897 504 297.73 – – – B-Acc EUR 44,279,530 7,224,439 6.13 52,598,832 8,503,223 6.19 56,754,553 9,301,495 6.10 C-Acc EUR 87,453,139 11,052,159 7.91 139,023,233 17,641,109 7.88 117,287,407 15,289,732 7.67
* Please refer to Note 1 for details of mergers into shell sub-funds or existing sub-funds of the Invesco Funds.
Invesco Funds Comparative Net Asset Values for the year ended 28 February 2019
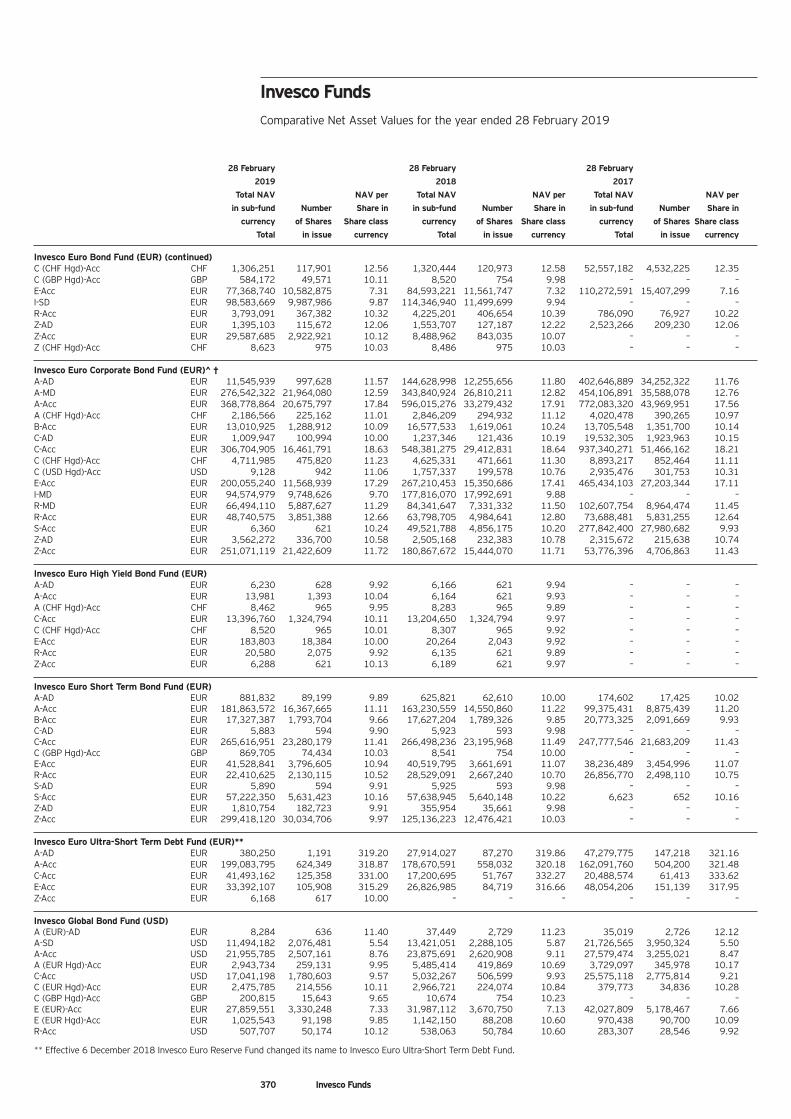
370 Invesco Funds
28 February 28 February 28 February
2019 2018 2017
Total NAV NAV per Total NAV NAV per Total NAV NAV per
in sub-fund Number Share in in sub-fund Number Share in in sub-fund Number Share in
currency of Shares Share class currency of Shares Share class currency of Shares Share class
Total in issue currency Total in issue currency Total in issue currency
Invesco Euro Bond Fund (EUR) (continued) C (CHF Hgd)-Acc CHF 1,306,251 117,901 12.56 1,320,444 120,973 12.58 52,557,182 4,532,225 12.35 C (GBP Hgd)-Acc GBP 584,172 49,571 10.11 8,520 754 9.98 – – – E-Acc EUR 77,368,740 10,582,875 7.31 84,593,221 11,561,747 7.32 110,272,591 15,407,299 7.16 I-SD EUR 98,583,669 9,987,986 9.87 114,346,940 11,499,699 9.94 – – – R-Acc EUR 3,793,091 367,382 10.32 4,225,201 406,654 10.39 786,090 76,927 10.22 Z-AD EUR 1,395,103 115,672 12.06 1,553,707 127,187 12.22 2,523,266 209,230 12.06 Z-Acc EUR 29,587,685 2,922,921 10.12 8,488,962 843,035 10.07 – – – Z (CHF Hgd)-Acc CHF 8,623 975 10.03 8,486 975 10.03 – – –
Invesco Euro Corporate Bond Fund (EUR)^ † A-AD EUR 11,545,939 997,628 11.57 144,628,998 12,255,656 11.80 402,646,889 34,252,322 11.76 A-MD EUR 276,542,322 21,964,080 12.59 343,840,924 26,810,211 12.82 454,106,891 35,588,078 12.76 A-Acc EUR 368,778,864 20,675,797 17.84 596,015,276 33,279,432 17.91 772,083,320 43,969,951 17.56 A (CHF Hgd)-Acc CHF 2,186,566 225,162 11.01 2,846,209 294,932 11.12 4,020,478 390,265 10.97 B-Acc EUR 13,010,925 1,288,912 10.09 16,577,533 1,619,061 10.24 13,705,548 1,351,700 10.14 C-AD EUR 1,009,947 100,994 10.00 1,237,346 121,436 10.19 19,532,305 1,923,963 10.15 C-Acc EUR 306,704,905 16,461,791 18.63 548,381,275 29,412,831 18.64 937,340,271 51,466,162 18.21 C (CHF Hgd)-Acc CHF 4,711,985 475,820 11.23 4,625,331 471,661 11.30 8,893,217 852,464 11.11 C (USD Hgd)-Acc USD 9,128 942 11.06 1,757,337 199,578 10.76 2,935,476 301,753 10.31 E-Acc EUR 200,055,240 11,568,939 17.29 267,210,453 15,350,686 17.41 465,434,103 27,203,344 17.11 I-MD EUR 94,574,979 9,748,626 9.70 177,816,070 17,992,691 9.88 – – – R-MD EUR 66,494,110 5,887,627 11.29 84,341,647 7,331,332 11.50 102,607,754 8,964,474 11.45 R-Acc EUR 48,740,575 3,851,388 12.66 63,798,705 4,984,641 12.80 73,688,481 5,831,255 12.64 S-Acc EUR 6,360 621 10.24 49,521,788 4,856,175 10.20 277,842,400 27,980,682 9.93 Z-AD EUR 3,562,272 336,700 10.58 2,505,168 232,383 10.78 2,315,672 215,638 10.74 Z-Acc EUR 251,071,119 21,422,609 11.72 180,867,672 15,444,070 11.71 53,776,396 4,706,863 11.43
Invesco Euro High Yield Bond Fund (EUR) A-AD EUR 6,230 628 9.92 6,166 621 9.94 – – – A-Acc EUR 13,981 1,393 10.04 6,164 621 9.93 – – – A (CHF Hgd)-Acc CHF 8,462 965 9.95 8,283 965 9.89 – – – C-Acc EUR 13,396,760 1,324,794 10.11 13,204,650 1,324,794 9.97 – – – C (CHF Hgd)-Acc CHF 8,520 965 10.01 8,307 965 9.92 – – – E-Acc EUR 183,803 18,384 10.00 20,264 2,043 9.92 – – – R-Acc EUR 20,580 2,075 9.92 6,135 621 9.89 – – – Z-Acc EUR 6,288 621 10.13 6,189 621 9.97 – – –
Invesco Euro Short Term Bond Fund (EUR) A-AD EUR 881,832 89,199 9.89 625,821 62,610 10.00 174,602 17,425 10.02 A-Acc EUR 181,863,572 16,367,665 11.11 163,230,559 14,550,860 11.22 99,375,431 8,875,439 11.20 B-Acc EUR 17,327,387 1,793,704 9.66 17,627,204 1,789,326 9.85 20,773,325 2,091,669 9.93 C-AD EUR 5,883 594 9.90 5,923 593 9.98 – – – C-Acc EUR 265,616,951 23,280,179 11.41 266,498,236 23,195,968 11.49 247,777,546 21,683,209 11.43 C (GBP Hgd)-Acc GBP 869,705 74,434 10.03 8,541 754 10.00 – – – E-Acc EUR 41,528,841 3,796,605 10.94 40,519,795 3,661,691 11.07 38,236,489 3,454,996 11.07 R-Acc EUR 22,410,625 2,130,115 10.52 28,529,091 2,667,240 10.70 26,856,770 2,498,110 10.75 S-AD EUR 5,890 594 9.91 5,925 593 9.98 – – – S-Acc EUR 57,222,350 5,631,423 10.16 57,638,945 5,640,148 10.22 6,623 652 10.16 Z-AD EUR 1,810,754 182,723 9.91 355,954 35,661 9.98 – – – Z-Acc EUR 299,418,120 30,034,706 9.97 125,136,223 12,476,421 10.03 – – –
Invesco Euro Ultra-Short Term Debt Fund (EUR)** A-AD EUR 380,250 1,191 319.20 27,914,027 87,270 319.86 47,279,775 147,218 321.16 A-Acc EUR 199,083,795 624,349 318.87 178,670,591 558,032 320.18 162,091,760 504,200 321.48 C-Acc EUR 41,493,162 125,358 331.00 17,200,695 51,767 332.27 20,488,574 61,413 333.62 E-Acc EUR 33,392,107 105,908 315.29 26,826,985 84,719 316.66 48,054,206 151,139 317.95 Z-Acc EUR 6,168 617 10.00 – – – – – –
Invesco Global Bond Fund (USD) A (EUR)-AD EUR 8,284 636 11.40 37,449 2,729 11.23 35,019 2,726 12.12 A-SD USD 11,494,182 2,076,481 5.54 13,421,051 2,288,105 5.87 21,726,565 3,950,324 5.50 A-Acc USD 21,955,785 2,507,161 8.76 23,875,691 2,620,908 9.11 27,579,474 3,255,021 8.47 A (EUR Hgd)-Acc EUR 2,943,734 259,131 9.95 5,485,414 419,869 10.69 3,729,097 345,978 10.17 C-Acc USD 17,041,198 1,780,603 9.57 5,032,267 506,599 9.93 25,575,118 2,775,814 9.21 C (EUR Hgd)-Acc EUR 2,475,785 214,556 10.11 2,966,721 224,074 10.84 379,773 34,836 10.28 C (GBP Hgd)-Acc GBP 200,815 15,643 9.65 10,674 754 10.23 – – – E (EUR)-Acc EUR 27,859,551 3,330,248 7.33 31,987,112 3,670,750 7.13 42,027,809 5,178,467 7.66 E (EUR Hgd)-Acc EUR 1,025,543 91,198 9.85 1,142,150 88,208 10.60 970,438 90,700 10.09 R-Acc USD 507,707 50,174 10.12 538,063 50,784 10.60 283,307 28,546 9.92
** Effective 6 December 2018 Invesco Euro Reserve Fund changed its name to Invesco Euro Ultra-Short Term Debt Fund.
Invesco Funds Comparative Net Asset Values for the year ended 28 February 2019
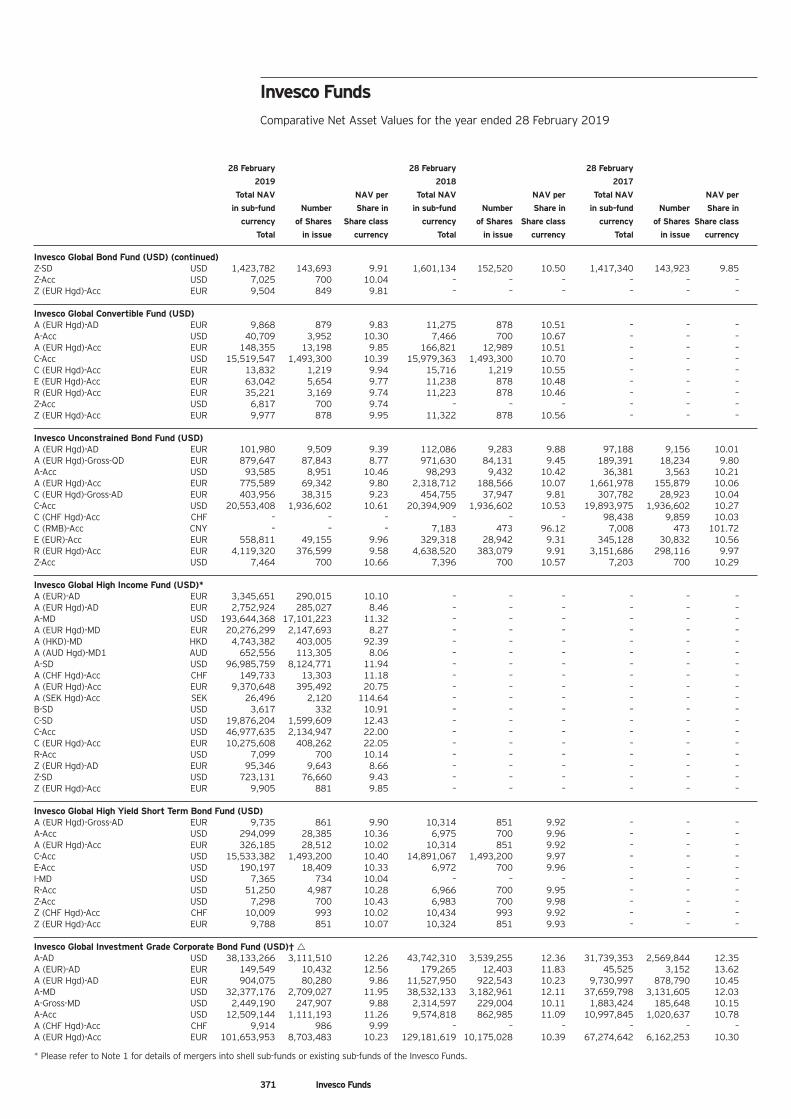
371 Invesco Funds
28 February 28 February 28 February
2019 2018 2017
Total NAV NAV per Total NAV NAV per Total NAV NAV per
in sub-fund Number Share in in sub-fund Number Share in in sub-fund Number Share in
currency of Shares Share class currency of Shares Share class currency of Shares Share class
Total in issue currency Total in issue currency Total in issue currency
Invesco Global Bond Fund (USD) (continued) Z-SD USD 1,423,782 143,693 9.91 1,601,134 152,520 10.50 1,417,340 143,923 9.85 Z-Acc USD 7,025 700 10.04 – – – – – – Z (EUR Hgd)-Acc EUR 9,504 849 9.81 – – – – – –
Invesco Global Convertible Fund (USD) A (EUR Hgd)-AD EUR 9,868 879 9.83 11,275 878 10.51 – – – A-Acc USD 40,709 3,952 10.30 7,466 700 10.67 – – – A (EUR Hgd)-Acc EUR 148,355 13,198 9.85 166,821 12,989 10.51 – – – C-Acc USD 15,519,547 1,493,300 10.39 15,979,363 1,493,300 10.70 – – – C (EUR Hgd)-Acc EUR 13,832 1,219 9.94 15,716 1,219 10.55 – – – E (EUR Hgd)-Acc EUR 63,042 5,654 9.77 11,238 878 10.48 – – – R (EUR Hgd)-Acc EUR 35,221 3,169 9.74 11,223 878 10.46 – – – Z-Acc USD 6,817 700 9.74 – – – – – – Z (EUR Hgd)-Acc EUR 9,977 878 9.95 11,322 878 10.56 – – –
Invesco Unconstrained Bond Fund (USD) A (EUR Hgd)-AD EUR 101,980 9,509 9.39 112,086 9,283 9.88 97,188 9,156 10.01 A (EUR Hgd)-Gross-QD EUR 879,647 87,843 8.77 971,630 84,131 9.45 189,391 18,234 9.80 A-Acc USD 93,585 8,951 10.46 98,293 9,432 10.42 36,381 3,563 10.21 A (EUR Hgd)-Acc EUR 775,589 69,342 9.80 2,318,712 188,566 10.07 1,661,978 155,879 10.06 C (EUR Hgd)-Gross-AD EUR 403,956 38,315 9.23 454,755 37,947 9.81 307,782 28,923 10.04 C-Acc USD 20,553,408 1,936,602 10.61 20,394,909 1,936,602 10.53 19,893,975 1,936,602 10.27 C (CHF Hgd)-Acc CHF – – – – – – 98,438 9,859 10.03 C (RMB)-Acc CNY – – – 7,183 473 96.12 7,008 473 101.72 E (EUR)-Acc EUR 558,811 49,155 9.96 329,318 28,942 9.31 345,128 30,832 10.56 R (EUR Hgd)-Acc EUR 4,119,320 376,599 9.58 4,638,520 383,079 9.91 3,151,686 298,116 9.97 Z-Acc USD 7,464 700 10.66 7,396 700 10.57 7,203 700 10.29
Invesco Global High Income Fund (USD)* A (EUR)-AD EUR 3,345,651 290,015 10.10 – – – – – – A (EUR Hgd)-AD EUR 2,752,924 285,027 8.46 – – – – – – A-MD USD 193,644,368 17,101,223 11.32 – – – – – – A (EUR Hgd)-MD EUR 20,276,299 2,147,693 8.27 – – – – – – A (HKD)-MD HKD 4,743,382 403,005 92.39 – – – – – – A (AUD Hgd)-MD1 AUD 652,556 113,305 8.06 – – – – – – A-SD USD 96,985,759 8,124,771 11.94 – – – – – – A (CHF Hgd)-Acc CHF 149,733 13,303 11.18 – – – – – – A (EUR Hgd)-Acc EUR 9,370,648 395,492 20.75 – – – – – – A (SEK Hgd)-Acc SEK 26,496 2,120 114.64 – – – – – – B-SD USD 3,617 332 10.91 – – – – – – C-SD USD 19,876,204 1,599,609 12.43 – – – – – – C-Acc USD 46,977,635 2,134,947 22.00 – – – – – – C (EUR Hgd)-Acc EUR 10,275,608 408,262 22.05 – – – – – – R-Acc USD 7,099 700 10.14 – – – – – – Z (EUR Hgd)-AD EUR 95,346 9,643 8.66 – – – – – – Z-SD USD 723,131 76,660 9.43 – – – – – – Z (EUR Hgd)-Acc EUR 9,905 881 9.85 – – – – – –
Invesco Global High Yield Short Term Bond Fund (USD) A (EUR Hgd)-Gross-AD EUR 9,735 861 9.90 10,314 851 9.92 – – – A-Acc USD 294,099 28,385 10.36 6,975 700 9.96 – – – A (EUR Hgd)-Acc EUR 326,185 28,512 10.02 10,314 851 9.92 – – – C-Acc USD 15,533,382 1,493,200 10.40 14,891,067 1,493,200 9.97 – – – E-Acc USD 190,197 18,409 10.33 6,972 700 9.96 – – – I-MD USD 7,365 734 10.04 – – – – – – R-Acc USD 51,250 4,987 10.28 6,966 700 9.95 – – – Z-Acc USD 7,298 700 10.43 6,983 700 9.98 – – – Z (CHF Hgd)-Acc CHF 10,009 993 10.02 10,434 993 9.92 – – – Z (EUR Hgd)-Acc EUR 9,788 851 10.07 10,324 851 9.93 – – –
Invesco Global Investment Grade Corporate Bond Fund (USD)† A-AD USD 38,133,266 3,111,510 12.26 43,742,310 3,539,255 12.36 31,739,353 2,569,844 12.35 A (EUR)-AD EUR 149,549 10,432 12.56 179,265 12,403 11.83 45,525 3,152 13.62 A (EUR Hgd)-AD EUR 904,075 80,280 9.86 11,527,950 922,543 10.23 9,730,997 878,790 10.45 A-MD USD 32,377,176 2,709,027 11.95 38,532,133 3,182,961 12.11 37,659,798 3,131,605 12.03 A-Gross-MD USD 2,449,190 247,907 9.88 2,314,597 229,004 10.11 1,883,424 185,648 10.15 A-Acc USD 12,509,144 1,111,193 11.26 9,574,818 862,985 11.09 10,997,845 1,020,637 10.78 A (CHF Hgd)-Acc CHF 9,914 986 9.99 – – – – – – A (EUR Hgd)-Acc EUR 101,653,953 8,703,483 10.23 129,181,619 10,175,028 10.39 67,274,642 6,162,253 10.30
* Please refer to Note 1 for details of mergers into shell sub-funds or existing sub-funds of the Invesco Funds.
Invesco Funds Comparative Net Asset Values for the year ended 28 February 2019
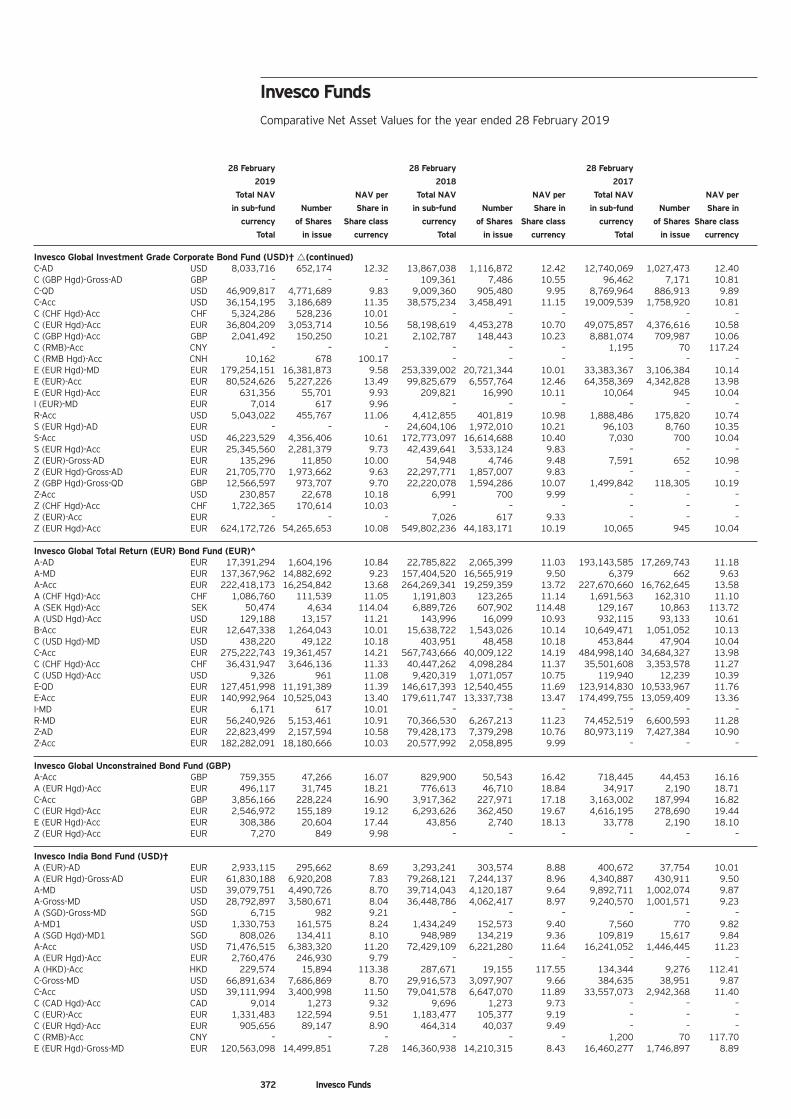
372 Invesco Funds
28 February 28 February 28 February
2019 2018 2017
Total NAV NAV per Total NAV NAV per Total NAV NAV per
in sub-fund Number Share in in sub-fund Number Share in in sub-fund Number Share in
currency of Shares Share class currency of Shares Share class currency of Shares Share class
Total in issue currency Total in issue currency Total in issue currency
Invesco Global Investment Grade Corporate Bond Fund (USD)† (continued) C-AD USD 8,033,716 652,174 12.32 13,867,038 1,116,872 12.42 12,740,069 1,027,473 12.40 C (GBP Hgd)-Gross-AD GBP – – – 109,361 7,486 10.55 96,462 7,171 10.81 C-QD USD 46,909,817 4,771,689 9.83 9,009,360 905,480 9.95 8,769,964 886,913 9.89 C-Acc USD 36,154,195 3,186,689 11.35 38,575,234 3,458,491 11.15 19,009,539 1,758,920 10.81 C (CHF Hgd)-Acc CHF 5,324,286 528,236 10.01 – – – – – – C (EUR Hgd)-Acc EUR 36,804,209 3,053,714 10.56 58,198,619 4,453,278 10.70 49,075,857 4,376,616 10.58 C (GBP Hgd)-Acc GBP 2,041,492 150,250 10.21 2,102,787 148,443 10.23 8,881,074 709,987 10.06 C (RMB)-Acc CNY – – – – – – 1,195 70 117.24 C (RMB Hgd)-Acc CNH 10,162 678 100.17 – – – – – – E (EUR Hgd)-MD EUR 179,254,151 16,381,873 9.58 253,339,002 20,721,344 10.01 33,383,367 3,106,384 10.14 E (EUR)-Acc EUR 80,524,626 5,227,226 13.49 99,825,679 6,557,764 12.46 64,358,369 4,342,828 13.98 E (EUR Hgd)-Acc EUR 631,356 55,701 9.93 209,821 16,990 10.11 10,064 945 10.04 I (EUR)-MD EUR 7,014 617 9.96 – – – – – – R-Acc USD 5,043,022 455,767 11.06 4,412,855 401,819 10.98 1,888,486 175,820 10.74 S (EUR Hgd)-AD EUR – – – 24,604,106 1,972,010 10.21 96,103 8,760 10.35 S-Acc USD 46,223,529 4,356,406 10.61 172,773,097 16,614,688 10.40 7,030 700 10.04 S (EUR Hgd)-Acc EUR 25,345,560 2,281,379 9.73 42,439,641 3,533,124 9.83 – – – Z (EUR)-Gross-AD EUR 135,296 11,850 10.00 54,948 4,746 9.48 7,591 652 10.98 Z (EUR Hgd)-Gross-AD EUR 21,705,770 1,973,662 9.63 22,297,771 1,857,007 9.83 – – – Z (GBP Hgd)-Gross-QD GBP 12,566,597 973,707 9.70 22,220,078 1,594,286 10.07 1,499,842 118,305 10.19 Z-Acc USD 230,857 22,678 10.18 6,991 700 9.99 – – – Z (CHF Hgd)-Acc CHF 1,722,365 170,614 10.03 – – – – – – Z (EUR)-Acc EUR – – – 7,026 617 9.33 – – – Z (EUR Hgd)-Acc EUR 624,172,726 54,265,653 10.08 549,802,236 44,183,171 10.19 10,065 945 10.04
Invesco Global Total Return (EUR) Bond Fund (EUR)^ A-AD EUR 17,391,294 1,604,196 10.84 22,785,822 2,065,399 11.03 193,143,585 17,269,743 11.18 A-MD EUR 137,367,962 14,882,692 9.23 157,404,520 16,565,919 9.50 6,379 662 9.63 A-Acc EUR 222,418,173 16,254,842 13.68 264,269,341 19,259,359 13.72 227,670,660 16,762,645 13.58 A (CHF Hgd)-Acc CHF 1,086,760 111,539 11.05 1,191,803 123,265 11.14 1,691,563 162,310 11.10 A (SEK Hgd)-Acc SEK 50,474 4,634 114.04 6,889,726 607,902 114.48 129,167 10,863 113.72 A (USD Hgd)-Acc USD 129,188 13,157 11.21 143,996 16,099 10.93 932,115 93,133 10.61 B-Acc EUR 12,647,338 1,264,043 10.01 15,638,722 1,543,026 10.14 10,649,471 1,051,052 10.13 C (USD Hgd)-MD USD 438,220 49,122 10.18 403,951 48,458 10.18 453,844 47,904 10.04 C-Acc EUR 275,222,743 19,361,457 14.21 567,743,666 40,009,122 14.19 484,998,140 34,684,327 13.98 C (CHF Hgd)-Acc CHF 36,431,947 3,646,136 11.33 40,447,262 4,098,284 11.37 35,501,608 3,353,578 11.27 C (USD Hgd)-Acc USD 9,326 961 11.08 9,420,319 1,071,057 10.75 119,940 12,239 10.39 E-QD EUR 127,451,998 11,191,389 11.39 146,617,393 12,540,455 11.69 123,914,830 10,533,967 11.76 E-Acc EUR 140,992,964 10,525,043 13.40 179,611,747 13,337,738 13.47 174,499,755 13,059,409 13.36 I-MD EUR 6,171 617 10.01 – – – – – – R-MD EUR 56,240,926 5,153,461 10.91 70,366,530 6,267,213 11.23 74,452,519 6,600,593 11.28 Z-AD EUR 22,823,499 2,157,594 10.58 79,428,173 7,379,298 10.76 80,973,119 7,427,384 10.90 Z-Acc EUR 182,282,091 18,180,666 10.03 20,577,992 2,058,895 9.99 – – –
Invesco Global Unconstrained Bond Fund (GBP) A-Acc GBP 759,355 47,266 16.07 829,900 50,543 16.42 718,445 44,453 16.16 A (EUR Hgd)-Acc EUR 496,117 31,745 18.21 776,613 46,710 18.84 34,917 2,190 18.71 C-Acc GBP 3,856,166 228,224 16.90 3,917,362 227,971 17.18 3,163,002 187,994 16.82 C (EUR Hgd)-Acc EUR 2,546,972 155,189 19.12 6,293,626 362,450 19.67 4,616,195 278,690 19.44 E (EUR Hgd)-Acc EUR 308,386 20,604 17.44 43,856 2,740 18.13 33,778 2,190 18.10 Z (EUR Hgd)-Acc EUR 7,270 849 9.98 – – – – – –
Invesco India Bond Fund (USD)† A (EUR)-AD EUR 2,933,115 295,662 8.69 3,293,241 303,574 8.88 400,672 37,754 10.01 A (EUR Hgd)-Gross-AD EUR 61,830,188 6,920,208 7.83 79,268,121 7,244,137 8.96 4,340,887 430,911 9.50 A-MD USD 39,079,751 4,490,726 8.70 39,714,043 4,120,187 9.64 9,892,711 1,002,074 9.87 A-Gross-MD USD 28,792,897 3,580,671 8.04 36,448,786 4,062,417 8.97 9,240,570 1,001,571 9.23 A (SGD)-Gross-MD SGD 6,715 982 9.21 – – – – – – A-MD1 USD 1,330,753 161,575 8.24 1,434,249 152,573 9.40 7,560 770 9.82 A (SGD Hgd)-MD1 SGD 808,026 134,411 8.10 948,989 134,219 9.36 109,819 15,617 9.84 A-Acc USD 71,476,515 6,383,320 11.20 72,429,109 6,221,280 11.64 16,241,052 1,446,445 11.23 A (EUR Hgd)-Acc EUR 2,760,476 246,930 9.79 – – – – – – A (HKD)-Acc HKD 229,574 15,894 113.38 287,671 19,155 117.55 134,344 9,276 112.41 C-Gross-MD USD 66,891,634 7,686,869 8.70 29,916,573 3,097,907 9.66 384,635 38,951 9.87 C-Acc USD 39,111,994 3,400,998 11.50 79,041,578 6,647,070 11.89 33,557,073 2,942,368 11.40 C (CAD Hgd)-Acc CAD 9,014 1,273 9.32 9,696 1,273 9.73 – – – C (EUR)-Acc EUR 1,331,483 122,594 9.51 1,183,477 105,377 9.19 – – – C (EUR Hgd)-Acc EUR 905,656 89,147 8.90 464,314 40,037 9.49 – – – C (RMB)-Acc CNY – – – – – – 1,200 70 117.70 E (EUR Hgd)-Gross-MD EUR 120,563,098 14,499,851 7.28 146,360,938 14,210,315 8.43 16,460,277 1,746,897 8.89
Invesco Funds Comparative Net Asset Values for the year ended 28 February 2019
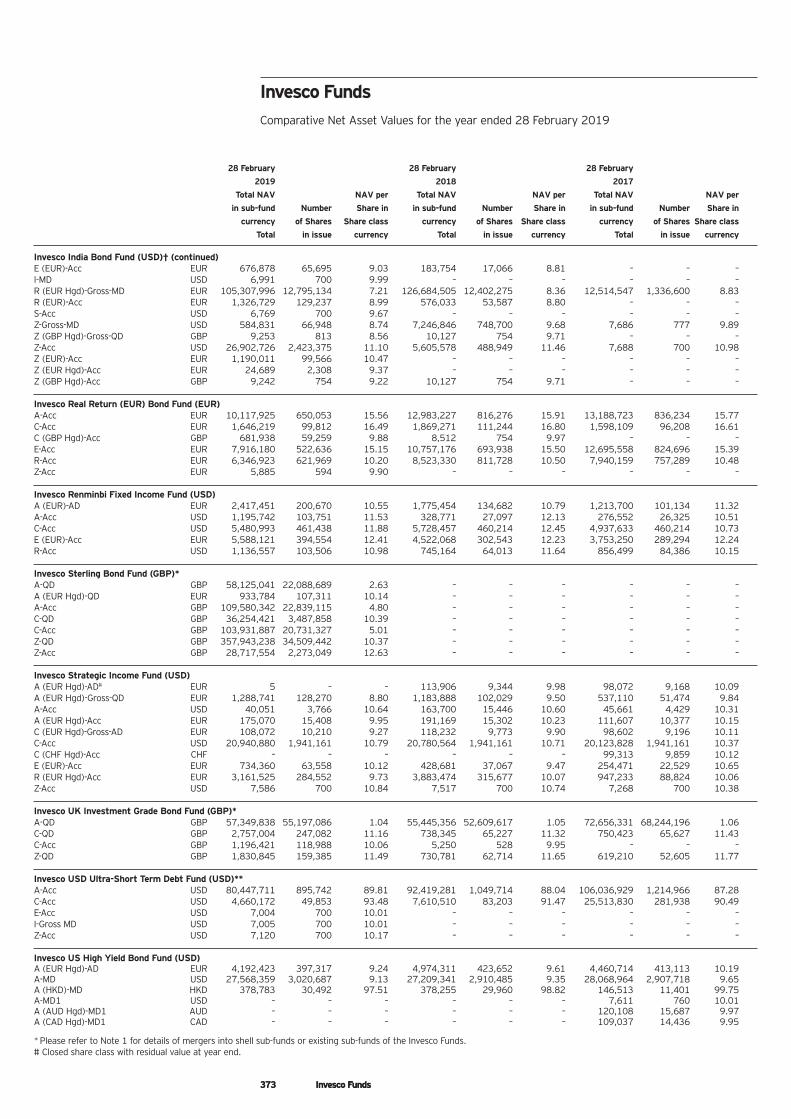
373 Invesco Funds373 Invesco Funds
28 February 28 February 28 February
2019 2018 2017
Total NAV NAV per Total NAV NAV per Total NAV NAV per
in sub-fund Number Share in in sub-fund Number Share in in sub-fund Number Share in
currency of Shares Share class currency of Shares Share class currency of Shares Share class
Total in issue currency Total in issue currency Total in issue currency
Invesco India Bond Fund (USD)† (continued) E (EUR)-Acc EUR 676,878 65,695 9.03 183,754 17,066 8.81 – – – I-MD USD 6,991 700 9.99 – – – – – – R (EUR Hgd)-Gross-MD EUR 105,307,996 12,795,134 7.21 126,684,505 12,402,275 8.36 12,514,547 1,336,600 8.83 R (EUR)-Acc EUR 1,326,729 129,237 8.99 576,033 53,587 8.80 – – – S-Acc USD 6,769 700 9.67 – – – – – – Z-Gross-MD USD 584,831 66,948 8.74 7,246,846 748,700 9.68 7,686 777 9.89 Z (GBP Hgd)-Gross-QD GBP 9,253 813 8.56 10,127 754 9.71 – – – Z-Acc USD 26,902,726 2,423,375 11.10 5,605,578 488,949 11.46 7,688 700 10.98 Z (EUR)-Acc EUR 1,190,011 99,566 10.47 – – – – – – Z (EUR Hgd)-Acc EUR 24,689 2,308 9.37 – – – – – – Z (GBP Hgd)-Acc GBP 9,242 754 9.22 10,127 754 9.71 – – –
Invesco Real Return (EUR) Bond Fund (EUR) A-Acc EUR 10,117,925 650,053 15.56 12,983,227 816,276 15.91 13,188,723 836,234 15.77 C-Acc EUR 1,646,219 99,812 16.49 1,869,271 111,244 16.80 1,598,109 96,208 16.61 C (GBP Hgd)-Acc GBP 681,938 59,259 9.88 8,512 754 9.97 – – – E-Acc EUR 7,916,180 522,636 15.15 10,757,176 693,938 15.50 12,695,558 824,696 15.39 R-Acc EUR 6,346,923 621,969 10.20 8,523,330 811,728 10.50 7,940,159 757,289 10.48 Z-Acc EUR 5,885 594 9.90 – – – – – –
Invesco Renminbi Fixed Income Fund (USD) A (EUR)-AD EUR 2,417,451 200,670 10.55 1,775,454 134,682 10.79 1,213,700 101,134 11.32 A-Acc USD 1,195,742 103,751 11.53 328,771 27,097 12.13 276,552 26,325 10.51 C-Acc USD 5,480,993 461,438 11.88 5,728,457 460,214 12.45 4,937,633 460,214 10.73 E (EUR)-Acc EUR 5,588,121 394,554 12.41 4,522,068 302,543 12.23 3,753,250 289,294 12.24 R-Acc USD 1,136,557 103,506 10.98 745,164 64,013 11.64 856,499 84,386 10.15
Invesco Sterling Bond Fund (GBP)* A-QD GBP 58,125,041 22,088,689 2.63 – – – – – – A (EUR Hgd)-QD EUR 933,784 107,311 10.14 – – – – – – A-Acc GBP 109,580,342 22,839,115 4.80 – – – – – – C-QD GBP 36,254,421 3,487,858 10.39 – – – – – – C-Acc GBP 103,931,887 20,731,327 5.01 – – – – – – Z-QD GBP 357,943,238 34,509,442 10.37 – – – – – – Z-Acc GBP 28,717,554 2,273,049 12.63 – – – – – –
Invesco Strategic Income Fund (USD) A (EUR Hgd)-AD# EUR 5 – – 113,906 9,344 9.98 98,072 9,168 10.09 A (EUR Hgd)-Gross-QD EUR 1,288,741 128,270 8.80 1,183,888 102,029 9.50 537,110 51,474 9.84 A-Acc USD 40,051 3,766 10.64 163,700 15,446 10.60 45,661 4,429 10.31 A (EUR Hgd)-Acc EUR 175,070 15,408 9.95 191,169 15,302 10.23 111,607 10,377 10.15 C (EUR Hgd)-Gross-AD EUR 108,072 10,210 9.27 118,232 9,773 9.90 98,602 9,196 10.11 C-Acc USD 20,940,880 1,941,161 10.79 20,780,564 1,941,161 10.71 20,123,828 1,941,161 10.37 C (CHF Hgd)-Acc CHF – – – – – – 99,313 9,859 10.12 E (EUR)-Acc EUR 734,360 63,558 10.12 428,681 37,067 9.47 254,471 22,529 10.65 R (EUR Hgd)-Acc EUR 3,161,525 284,552 9.73 3,883,474 315,677 10.07 947,233 88,824 10.06 Z-Acc USD 7,586 700 10.84 7,517 700 10.74 7,268 700 10.38
Invesco UK Investment Grade Bond Fund (GBP)* A-QD GBP 57,349,838 55,197,086 1.04 55,445,356 52,609,617 1.05 72,656,331 68,244,196 1.06 C-QD GBP 2,757,004 247,082 11.16 738,345 65,227 11.32 750,423 65,627 11.43 C-Acc GBP 1,196,421 118,988 10.06 5,250 528 9.95 – – – Z-QD GBP 1,830,845 159,385 11.49 730,781 62,714 11.65 619,210 52,605 11.77
Invesco USD Ultra-Short Term Debt Fund (USD)** A-Acc USD 80,447,711 895,742 89.81 92,419,281 1,049,714 88.04 106,036,929 1,214,966 87.28 C-Acc USD 4,660,172 49,853 93.48 7,610,510 83,203 91.47 25,513,830 281,938 90.49 E-Acc USD 7,004 700 10.01 – – – – – – I-Gross MD USD 7,005 700 10.01 – – – – – – Z-Acc USD 7,120 700 10.17 – – – – – –
Invesco US High Yield Bond Fund (USD) A (EUR Hgd)-AD EUR 4,192,423 397,317 9.24 4,974,311 423,652 9.61 4,460,714 413,113 10.19 A-MD USD 27,568,359 3,020,687 9.13 27,209,341 2,910,485 9.35 28,068,964 2,907,718 9.65 A (HKD)-MD HKD 378,783 30,492 97.51 378,255 29,960 98.82 146,513 11,401 99.75 A-MD1 USD – – – – – – 7,611 760 10.01 A (AUD Hgd)-MD1 AUD – – – – – – 120,108 15,687 9.97 A (CAD Hgd)-MD1 CAD – – – – – – 109,037 14,436 9.95
* Please refer to Note 1 for details of mergers into shell sub-funds or existing sub-funds of the Invesco Funds. # Closed share class with residual value at year end.
Invesco Funds Comparative Net Asset Values for the year ended 28 February 2019
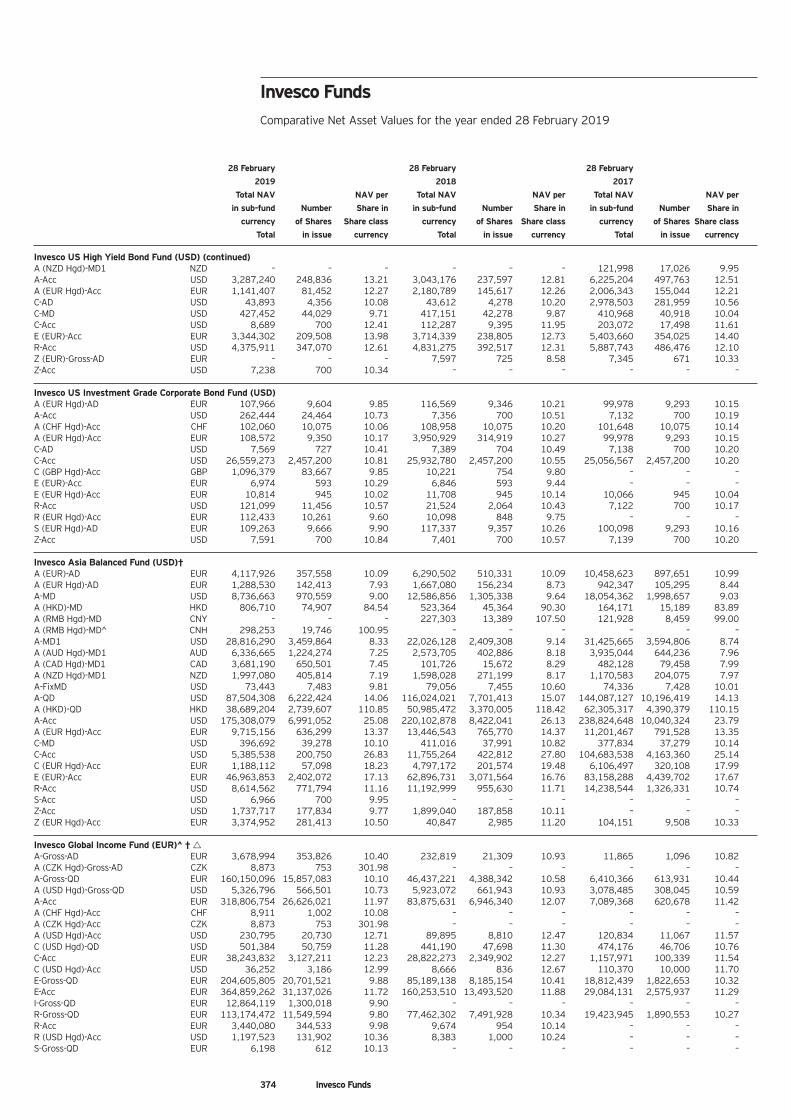
374 Invesco Funds
28 February 28 February 28 February
2019 2018 2017
Total NAV NAV per Total NAV NAV per Total NAV NAV per
in sub-fund Number Share in in sub-fund Number Share in in sub-fund Number Share in
currency of Shares Share class currency of Shares Share class currency of Shares Share class
Total in issue currency Total in issue currency Total in issue currency
Invesco US High Yield Bond Fund (USD) (continued) A (NZD Hgd)-MD1 NZD – – – – – – 121,998 17,026 9.95 A-Acc USD 3,287,240 248,836 13.21 3,043,176 237,597 12.81 6,225,204 497,763 12.51 A (EUR Hgd)-Acc EUR 1,141,407 81,452 12.27 2,180,789 145,617 12.26 2,006,343 155,044 12.21 C-AD USD 43,893 4,356 10.08 43,612 4,278 10.20 2,978,503 281,959 10.56 C-MD USD 427,452 44,029 9.71 417,151 42,278 9.87 410,968 40,918 10.04 C-Acc USD 8,689 700 12.41 112,287 9,395 11.95 203,072 17,498 11.61 E (EUR)-Acc EUR 3,344,302 209,508 13.98 3,714,339 238,805 12.73 5,403,660 354,025 14.40 R-Acc USD 4,375,911 347,070 12.61 4,831,275 392,517 12.31 5,887,743 486,476 12.10 Z (EUR)-Gross-AD EUR – – – 7,597 725 8.58 7,345 671 10.33 Z-Acc USD 7,238 700 10.34 – – – – – –
Invesco US Investment Grade Corporate Bond Fund (USD) A (EUR Hgd)-AD EUR 107,966 9,604 9.85 116,569 9,346 10.21 99,978 9,293 10.15 A-Acc USD 262,444 24,464 10.73 7,356 700 10.51 7,132 700 10.19 A (CHF Hgd)-Acc CHF 102,060 10,075 10.06 108,958 10,075 10.20 101,648 10,075 10.14 A (EUR Hgd)-Acc EUR 108,572 9,350 10.17 3,950,929 314,919 10.27 99,978 9,293 10.15 C-AD USD 7,569 727 10.41 7,389 704 10.49 7,138 700 10.20 C-Acc USD 26,559,273 2,457,200 10.81 25,932,780 2,457,200 10.55 25,056,567 2,457,200 10.20 C (GBP Hgd)-Acc GBP 1,096,379 83,667 9.85 10,221 754 9.80 – – – E (EUR)-Acc EUR 6,974 593 10.29 6,846 593 9.44 – – – E (EUR Hgd)-Acc EUR 10,814 945 10.02 11,708 945 10.14 10,066 945 10.04 R-Acc USD 121,099 11,456 10.57 21,524 2,064 10.43 7,122 700 10.17 R (EUR Hgd)-Acc EUR 112,433 10,261 9.60 10,098 848 9.75 – – – S (EUR Hgd)-AD EUR 109,263 9,666 9.90 117,337 9,357 10.26 100,098 9,293 10.16 Z-Acc USD 7,591 700 10.84 7,401 700 10.57 7,139 700 10.20
Invesco Asia Balanced Fund (USD)† A (EUR)-AD EUR 4,117,926 357,558 10.09 6,290,502 510,331 10.09 10,458,623 897,651 10.99 A (EUR Hgd)-AD EUR 1,288,530 142,413 7.93 1,667,080 156,234 8.73 942,347 105,295 8.44 A-MD USD 8,736,663 970,559 9.00 12,586,856 1,305,338 9.64 18,054,362 1,998,657 9.03 A (HKD)-MD HKD 806,710 74,907 84.54 523,364 45,364 90.30 164,171 15,189 83.89 A (RMB Hgd)-MD CNY – – – 227,303 13,389 107.50 121,928 8,459 99.00 A (RMB Hgd)-MD^ CNH 298,253 19,746 100.95 – – – – – – A-MD1 USD 28,816,290 3,459,864 8.33 22,026,128 2,409,308 9.14 31,425,665 3,594,806 8.74 A (AUD Hgd)-MD1 AUD 6,336,665 1,224,274 7.25 2,573,705 402,886 8.18 3,935,044 644,236 7.96 A (CAD Hgd)-MD1 CAD 3,681,190 650,501 7.45 101,726 15,672 8.29 482,128 79,458 7.99 A (NZD Hgd)-MD1 NZD 1,997,080 405,814 7.19 1,598,028 271,199 8.17 1,170,583 204,075 7.97 A-FixMD USD 73,443 7,483 9.81 79,056 7,455 10.60 74,336 7,428 10.01 A-QD USD 87,504,308 6,222,424 14.06 116,024,021 7,701,413 15.07 144,087,127 10,196,419 14.13 A (HKD)-QD HKD 38,689,204 2,739,607 110.85 50,985,472 3,370,005 118.42 62,305,317 4,390,379 110.15 A-Acc USD 175,308,079 6,991,052 25.08 220,102,878 8,422,041 26.13 238,824,648 10,040,324 23.79 A (EUR Hgd)-Acc EUR 9,715,156 636,299 13.37 13,446,543 765,770 14.37 11,201,467 791,528 13.35 C-MD USD 396,692 39,278 10.10 411,016 37,991 10.82 377,834 37,279 10.14 C-Acc USD 5,385,538 200,750 26.83 11,755,264 422,812 27.80 104,683,538 4,163,360 25.14 C (EUR Hgd)-Acc EUR 1,188,112 57,098 18.23 4,797,172 201,574 19.48 6,106,497 320,108 17.99 E (EUR)-Acc EUR 46,963,853 2,402,072 17.13 62,896,731 3,071,564 16.76 83,158,288 4,439,702 17.67 R-Acc USD 8,614,562 771,794 11.16 11,192,999 955,630 11.71 14,238,544 1,326,331 10.74 S-Acc USD 6,966 700 9.95 – – – – – – Z-Acc USD 1,737,717 177,834 9.77 1,899,040 187,858 10.11 – – – Z (EUR Hgd)-Acc EUR 3,374,952 281,413 10.50 40,847 2,985 11.20 104,151 9,508 10.33
Invesco Global Income Fund (EUR)^ † Δ A-Gross-AD EUR 3,678,994 353,826 10.40 232,819 21,309 10.93 11,865 1,096 10.82 A (CZK Hgd)-Gross-AD CZK 8,873 753 301.98 – – – – – – A-Gross-QD EUR 160,150,096 15,857,083 10.10 46,437,221 4,388,342 10.58 6,410,366 613,931 10.44 A (USD Hgd)-Gross-QD USD 5,326,796 566,501 10.73 5,923,072 661,943 10.93 3,078,485 308,045 10.59 A-Acc EUR 318,806,754 26,626,021 11.97 83,875,631 6,946,340 12.07 7,089,368 620,678 11.42 A (CHF Hgd)-Acc CHF 8,911 1,002 10.08 – – – – – – A (CZK Hgd)-Acc CZK 8,873 753 301.98 – – – – – – A (USD Hgd)-Acc USD 230,795 20,730 12.71 89,895 8,810 12.47 120,834 11,067 11.57 C (USD Hgd)-QD USD 501,384 50,759 11.28 441,190 47,698 11.30 474,176 46,706 10.76 C-Acc EUR 38,243,832 3,127,211 12.23 28,822,273 2,349,902 12.27 1,157,971 100,339 11.54 C (USD Hgd)-Acc USD 36,252 3,186 12.99 8,666 836 12.67 110,370 10,000 11.70 E-Gross-QD EUR 204,605,805 20,701,521 9.88 85,189,138 8,185,154 10.41 18,812,439 1,822,653 10.32 E-Acc EUR 364,859,262 31,137,026 11.72 160,253,510 13,493,520 11.88 29,084,131 2,575,937 11.29 I-Gross-QD EUR 12,864,119 1,300,018 9.90 – – – – – – R-Gross-QD EUR 113,174,472 11,549,594 9.80 77,462,302 7,491,928 10.34 19,423,945 1,890,553 10.27 R-Acc EUR 3,440,080 344,533 9.98 9,674 954 10.14 – – – R (USD Hgd)-Acc USD 1,197,523 131,902 10.36 8,383 1,000 10.24 – – – S-Gross-QD EUR 6,198 612 10.13 – – – – – –
Invesco Funds Comparative Net Asset Values for the year ended 28 February 2019
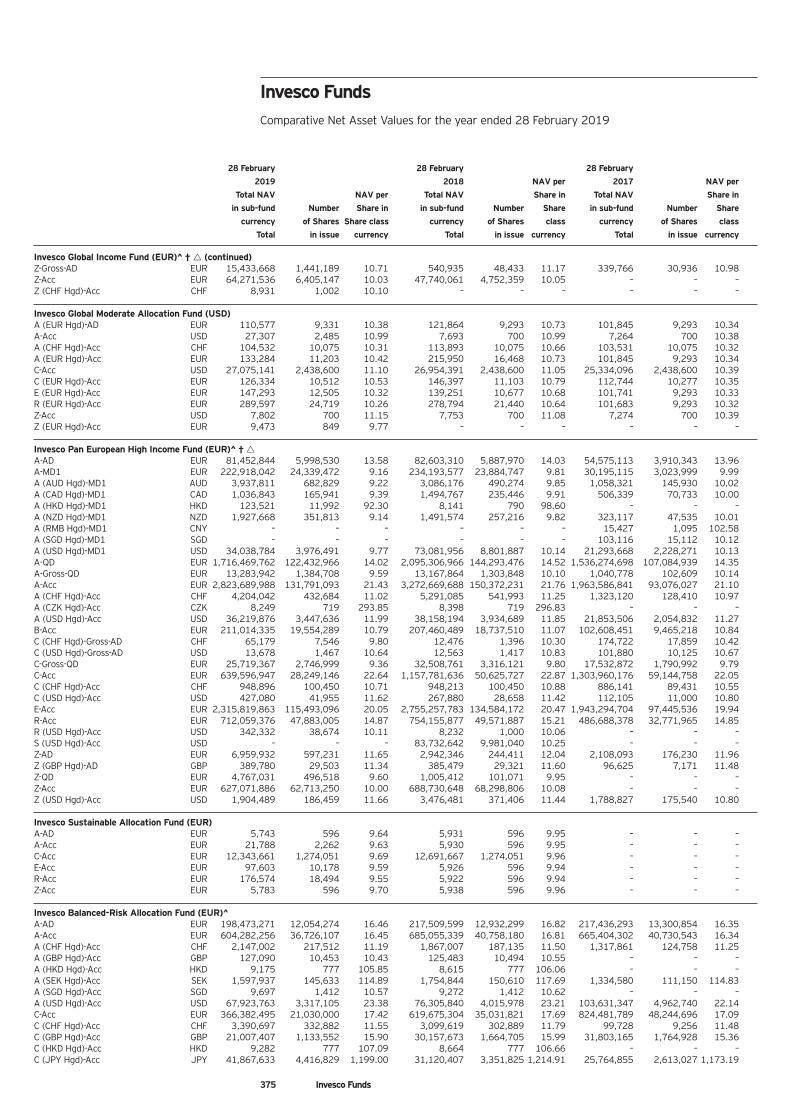
375 Invesco Funds
Invesco Funds Comparative Net Asset Values for the year ended 28 February 2019
28 February 28 February 28 February
2019 2018 NAV per 2017 NAV per
Total NAV NAV per Total NAV Share in Total NAV Share in
in sub-fund Number Share in in sub-fund Number Share in sub-fund Number Share
currency of Shares Share class currency of Shares class currency of Shares class
Total in issue currency Total in issue currency Total in issue currency
Invesco Global Income Fund (EUR)^ † Δ(continued) Z-Gross-AD EUR 15,433,668 1,441,189 10.71 540,935 48,433 11.17 339,766 30,936 10.98 Z-Acc EUR 64,271,536 6,405,147 10.03 47,740,061 4,752,359 10.05 – – – Z (CHF Hgd)-Acc CHF 8,931 1,002 10.10 – – – – – –
Invesco Global Moderate Allocation Fund (USD) A (EUR Hgd)-AD EUR 110,577 9,331 10.38 121,864 9,293 10.73 101,845 9,293 10.34 A-Acc USD 27,307 2,485 10.99 7,693 700 10.99 7,264 700 10.38 A (CHF Hgd)-Acc CHF 104,532 10,075 10.31 113,893 10,075 10.66 103,531 10,075 10.32 A (EUR Hgd)-Acc EUR 133,284 11,203 10.42 215,950 16,468 10.73 101,845 9,293 10.34 C-Acc USD 27,075,141 2,438,600 11.10 26,954,391 2,438,600 11.05 25,334,096 2,438,600 10.39 C (EUR Hgd)-Acc EUR 126,334 10,512 10.53 146,397 11,103 10.79 112,744 10,277 10.35 E (EUR Hgd)-Acc EUR 147,293 12,505 10.32 139,251 10,677 10.68 101,741 9,293 10.33 R (EUR Hgd)-Acc EUR 289,597 24,719 10.26 278,794 21,440 10.64 101,683 9,293 10.32 Z-Acc USD 7,802 700 11.15 7,753 700 11.08 7,274 700 10.39 Z (EUR Hgd)-Acc EUR 9,473 849 9.77 – – – – – –
Invesco Pan European High Income Fund (EUR)^ † Δ A-AD EUR 81,452,844 5,998,530 13.58 82,603,310 5,887,970 14.03 54,575,113 3,910,343 13.96 A-MD1 EUR 222,918,042 24,339,472 9.16 234,193,577 23,884,747 9.81 30,195,115 3,023,999 9.99 A (AUD Hgd)-MD1 AUD 3,937,811 682,829 9.22 3,086,176 490,274 9.85 1,058,321 145,930 10.02 A (CAD Hgd)-MD1 CAD 1,036,843 165,941 9.39 1,494,767 235,446 9.91 506,339 70,733 10.00 A (HKD Hgd)-MD1 HKD 123,521 11,992 92.30 8,141 790 98.60 – – – A (NZD Hgd)-MD1 NZD 1,927,668 351,813 9.14 1,491,574 257,216 9.82 323,117 47,535 10.01 A (RMB Hgd)-MD1 CNY – – – – – – 15,427 1,095 102.58 A (SGD Hgd)-MD1 SGD – – – – – – 103,116 15,112 10.12 A (USD Hgd)-MD1 USD 34,038,784 3,976,491 9.77 73,081,956 8,801,887 10.14 21,293,668 2,228,271 10.13 A-QD EUR 1,716,469,762 122,432,966 14.02 2,095,306,966 144,293,476 14.52 1,536,274,698 107,084,939 14.35 A-Gross-QD EUR 13,283,942 1,384,708 9.59 13,167,864 1,303,848 10.10 1,040,778 102,609 10.14 A-Acc EUR 2,823,689,988 131,791,093 21.43 3,272,669,688 150,372,231 21.76 1,963,586,841 93,076,027 21.10 A (CHF Hgd)-Acc CHF 4,204,042 432,684 11.02 5,291,085 541,993 11.25 1,323,120 128,410 10.97 A (CZK Hgd)-Acc CZK 8,249 719 293.85 8,398 719 296.83 – – – A (USD Hgd)-Acc USD 36,219,876 3,447,636 11.99 38,158,194 3,934,689 11.85 21,853,506 2,054,832 11.27 B-Acc EUR 211,014,335 19,554,289 10.79 207,460,489 18,737,510 11.07 102,608,451 9,465,218 10.84 C (CHF Hgd)-Gross-AD CHF 65,179 7,546 9.80 12,476 1,396 10.30 174,722 17,859 10.42 C (USD Hgd)-Gross-AD USD 13,678 1,467 10.64 12,563 1,417 10.83 101,880 10,125 10.67 C-Gross-QD EUR 25,719,367 2,746,999 9.36 32,508,761 3,316,121 9.80 17,532,872 1,790,992 9.79 C-Acc EUR 639,596,947 28,249,146 22.64 1,157,781,636 50,625,727 22.87 1,303,960,176 59,144,758 22.05 C (CHF Hgd)-Acc CHF 948,896 100,450 10.71 948,213 100,450 10.88 886,141 89,431 10.55 C (USD Hgd)-Acc USD 427,080 41,955 11.62 267,880 28,658 11.42 112,105 11,000 10.80 E-Acc EUR 2,315,819,863 115,493,096 20.05 2,755,257,783 134,584,172 20.47 1,943,294,704 97,445,536 19.94 R-Acc EUR 712,059,376 47,883,005 14.87 754,155,877 49,571,887 15.21 486,688,378 32,771,965 14.85 R (USD Hgd)-Acc USD 342,332 38,674 10.11 8,232 1,000 10.06 – – – S (USD Hgd)-Acc USD – – – 83,732,642 9,981,040 10.25 – – – Z-AD EUR 6,959,932 597,231 11.65 2,942,346 244,411 12.04 2,108,093 176,230 11.96 Z (GBP Hgd)-AD GBP 389,780 29,503 11.34 385,479 29,321 11.60 96,625 7,171 11.48 Z-QD EUR 4,767,031 496,518 9.60 1,005,412 101,071 9.95 – – – Z-Acc EUR 627,071,886 62,713,250 10.00 688,730,648 68,298,806 10.08 – – – Z (USD Hgd)-Acc USD 1,904,489 186,459 11.66 3,476,481 371,406 11.44 1,788,827 175,540 10.80
Invesco Sustainable Allocation Fund (EUR) A-AD EUR 5,743 596 9.64 5,931 596 9.95 – – – A-Acc EUR 21,788 2,262 9.63 5,930 596 9.95 – – – C-Acc EUR 12,343,661 1,274,051 9.69 12,691,667 1,274,051 9.96 – – – E-Acc EUR 97,603 10,178 9.59 5,926 596 9.94 – – – R-Acc EUR 176,574 18,494 9.55 5,922 596 9.94 – – – Z-Acc EUR 5,783 596 9.70 5,938 596 9.96 – – –
Invesco Balanced-Risk Allocation Fund (EUR)^ A-AD EUR 198,473,271 12,054,274 16.46 217,509,599 12,932,299 16.82 217,436,293 13,300,854 16.35 A-Acc EUR 604,282,256 36,726,107 16.45 685,055,339 40,758,180 16.81 665,404,302 40,730,543 16.34 A (CHF Hgd)-Acc CHF 2,147,002 217,512 11.19 1,867,007 187,135 11.50 1,317,861 124,758 11.25 A (GBP Hgd)-Acc GBP 127,090 10,453 10.43 125,483 10,494 10.55 – – – A (HKD Hgd)-Acc HKD 9,175 777 105.85 8,615 777 106.06 – – – A (SEK Hgd)-Acc SEK 1,597,937 145,633 114.89 1,754,844 150,610 117.69 1,334,580 111,150 114.83 A (SGD Hgd)-Acc SGD 9,697 1,412 10.57 9,272 1,412 10.62 – – – A (USD Hgd)-Acc USD 67,923,763 3,317,105 23.38 76,305,840 4,015,978 23.21 103,631,347 4,962,740 22.14 C-Acc EUR 366,382,495 21,030,000 17.42 619,675,304 35,031,821 17.69 824,481,789 48,244,696 17.09 C (CHF Hgd)-Acc CHF 3,390,697 332,882 11.55 3,099,619 302,889 11.79 99,728 9,256 11.48 C (GBP Hgd)-Acc GBP 21,007,407 1,133,552 15.90 30,157,673 1,664,705 15.99 31,803,165 1,764,928 15.36 C (HKD Hgd)-Acc HKD 9,282 777 107.09 8,664 777 106.66 – – – C (JPY Hgd)-Acc JPY 41,867,633 4,416,829 1,199.00 31,120,407 3,351,825 1,214.91 25,764,855 2,613,027 1,173.19
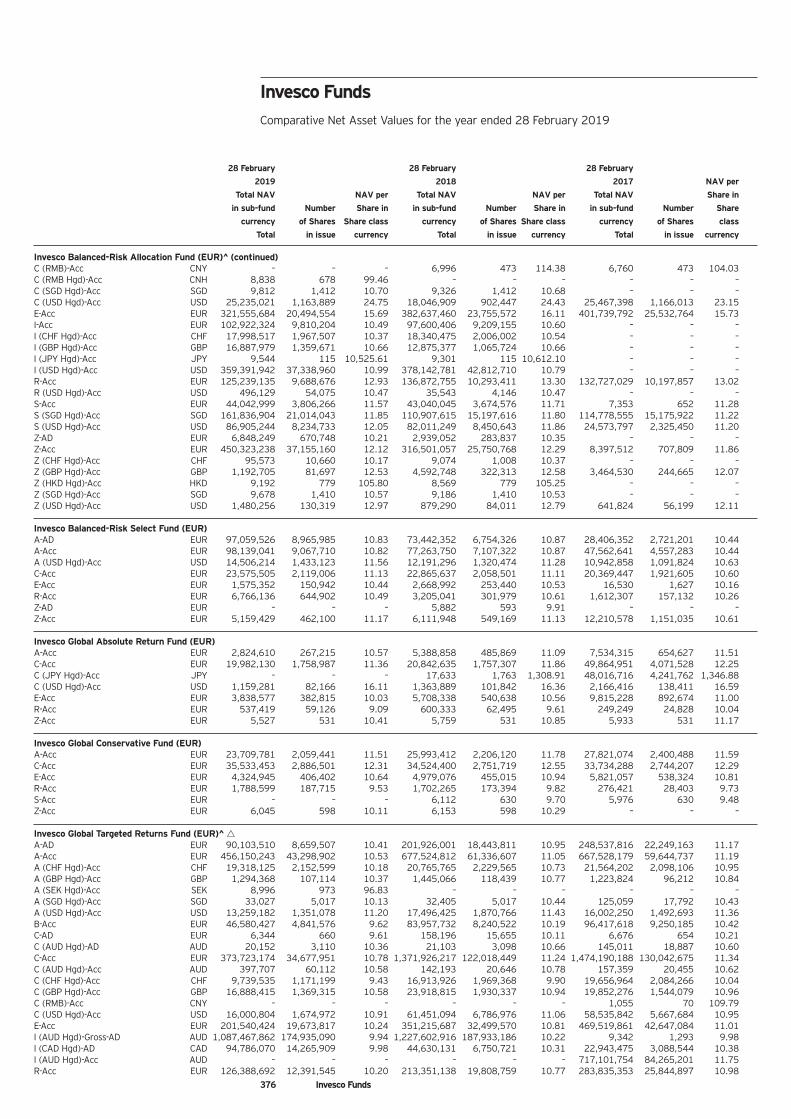
376 Invesco Funds
Invesco Funds Comparative Net Asset Values for the year ended 28 February 2019
28 February 28 February 28 February
2019 2018 2017 NAV per
Total NAV NAV per Total NAV NAV per Total NAV Share in
in sub-fund Number Share in in sub-fund Number Share in in sub-fund Number Share
currency of Shares Share class currency of Shares Share class currency of Shares class
Total in issue currency Total in issue currency Total in issue currency
Invesco Balanced-Risk Allocation Fund (EUR)^ Δ(continued) C (RMB)-Acc CNY – – – 6,996 473 114.38 6,760 473 104.03 C (RMB Hgd)-Acc CNH 8,838 678 99.46 – – – – – – C (SGD Hgd)-Acc SGD 9,812 1,412 10.70 9,326 1,412 10.68 – – – C (USD Hgd)-Acc USD 25,235,021 1,163,889 24.75 18,046,909 902,447 24.43 25,467,398 1,166,013 23.15 E-Acc EUR 321,555,684 20,494,554 15.69 382,637,460 23,755,572 16.11 401,739,792 25,532,764 15.73 I-Acc EUR 102,922,324 9,810,204 10.49 97,600,406 9,209,155 10.60 – – – I (CHF Hgd)-Acc CHF 17,998,517 1,967,507 10.37 18,340,475 2,006,002 10.54 – – – I (GBP Hgd)-Acc GBP 16,887,979 1,359,671 10.66 12,875,377 1,065,724 10.66 – – – I (JPY Hgd)-Acc JPY 9,544 115 10,525.61 9,301 115 10,612.10 – – – I (USD Hgd)-Acc USD 359,391,942 37,338,960 10.99 378,142,781 42,812,710 10.79 – – – R-Acc EUR 125,239,135 9,688,676 12.93 136,872,755 10,293,411 13.30 132,727,029 10,197,857 13.02 R (USD Hgd)-Acc USD 496,129 54,075 10.47 35,543 4,146 10.47 – – – S-Acc EUR 44,042,999 3,806,266 11.57 43,040,045 3,674,576 11.71 7,353 652 11.28 S (SGD Hgd)-Acc SGD 161,836,904 21,014,043 11.85 110,907,615 15,197,616 11.80 114,778,555 15,175,922 11.22 S (USD Hgd)-Acc USD 86,905,244 8,234,733 12.05 82,011,249 8,450,643 11.86 24,573,797 2,325,450 11.20 Z-AD EUR 6,848,249 670,748 10.21 2,939,052 283,837 10.35 – – – Z-Acc EUR 450,323,238 37,155,160 12.12 316,501,057 25,750,768 12.29 8,397,512 707,809 11.86 Z (CHF Hgd)-Acc CHF 95,573 10,660 10.17 9,074 1,008 10.37 – – – Z (GBP Hgd)-Acc GBP 1,192,705 81,697 12.53 4,592,748 322,313 12.58 3,464,530 244,665 12.07 Z (HKD Hgd)-Acc HKD 9,192 779 105.80 8,569 779 105.25 – – – Z (SGD Hgd)-Acc SGD 9,678 1,410 10.57 9,186 1,410 10.53 – – – Z (USD Hgd)-Acc USD 1,480,256 130,319 12.97 879,290 84,011 12.79 641,824 56,199 12.11
Invesco Balanced-Risk Select Fund (EUR) A-AD EUR 97,059,526 8,965,985 10.83 73,442,352 6,754,326 10.87 28,406,352 2,721,201 10.44 A-Acc EUR 98,139,041 9,067,710 10.82 77,263,750 7,107,322 10.87 47,562,641 4,557,283 10.44 A (USD Hgd)-Acc USD 14,506,214 1,433,123 11.56 12,191,296 1,320,474 11.28 10,942,858 1,091,824 10.63 C-Acc EUR 23,575,505 2,119,006 11.13 22,865,637 2,058,501 11.11 20,369,447 1,921,605 10.60 E-Acc EUR 1,575,352 150,942 10.44 2,668,992 253,440 10.53 16,530 1,627 10.16 R-Acc EUR 6,766,136 644,902 10.49 3,205,041 301,979 10.61 1,612,307 157,132 10.26 Z-AD EUR – – – 5,882 593 9.91 – – – Z-Acc EUR 5,159,429 462,100 11.17 6,111,948 549,169 11.13 12,210,578 1,151,035 10.61
Invesco Global Absolute Return Fund (EUR) A-Acc EUR 2,824,610 267,215 10.57 5,388,858 485,869 11.09 7,534,315 654,627 11.51 C-Acc EUR 19,982,130 1,758,987 11.36 20,842,635 1,757,307 11.86 49,864,951 4,071,528 12.25 C (JPY Hgd)-Acc JPY – – – 17,633 1,763 1,308.91 48,016,716 4,241,762 1,346.88 C (USD Hgd)-Acc USD 1,159,281 82,166 16.11 1,363,889 101,842 16.36 2,166,416 138,411 16.59 E-Acc EUR 3,838,577 382,815 10.03 5,708,338 540,638 10.56 9,815,228 892,674 11.00 R-Acc EUR 537,419 59,126 9.09 600,333 62,495 9.61 249,249 24,828 10.04 Z-Acc EUR 5,527 531 10.41 5,759 531 10.85 5,933 531 11.17
Invesco Global Conservative Fund (EUR) A-Acc EUR 23,709,781 2,059,441 11.51 25,993,412 2,206,120 11.78 27,821,074 2,400,488 11.59 C-Acc EUR 35,533,453 2,886,501 12.31 34,524,400 2,751,719 12.55 33,734,288 2,744,207 12.29 E-Acc EUR 4,324,945 406,402 10.64 4,979,076 455,015 10.94 5,821,057 538,324 10.81 R-Acc EUR 1,788,599 187,715 9.53 1,702,265 173,394 9.82 276,421 28,403 9.73 S-Acc EUR – – – 6,112 630 9.70 5,976 630 9.48 Z-Acc EUR 6,045 598 10.11 6,153 598 10.29 – – –
Invesco Global Targeted Returns Fund (EUR)^ Δ A-AD EUR 90,103,510 8,659,507 10.41 201,926,001 18,443,811 10.95 248,537,816 22,249,163 11.17 A-Acc EUR 456,150,243 43,298,902 10.53 677,524,812 61,336,607 11.05 667,528,179 59,644,737 11.19 A (CHF Hgd)-Acc CHF 19,318,125 2,152,599 10.18 20,765,765 2,229,565 10.73 21,564,202 2,098,106 10.95 A (GBP Hgd)-Acc GBP 1,294,368 107,114 10.37 1,445,066 118,439 10.77 1,223,824 96,212 10.84 A (SEK Hgd)-Acc SEK 8,996 973 96.83 – – – – – – A (SGD Hgd)-Acc SGD 33,027 5,017 10.13 32,405 5,017 10.44 125,059 17,792 10.43 A (USD Hgd)-Acc USD 13,259,182 1,351,078 11.20 17,496,425 1,870,766 11.43 16,002,250 1,492,693 11.36 B-Acc EUR 46,580,427 4,841,576 9.62 83,957,732 8,240,522 10.19 96,417,618 9,250,185 10.42 C-AD EUR 6,344 660 9.61 158,196 15,655 10.11 6,676 654 10.21 C (AUD Hgd)-AD AUD 20,152 3,110 10.36 21,103 3,098 10.66 145,011 18,887 10.60 C-Acc EUR 373,723,174 34,677,951 10.78 1,371,926,217 122,018,449 11.24 1,474,190,188 130,042,675 11.34 C (AUD Hgd)-Acc AUD 397,707 60,112 10.58 142,193 20,646 10.78 157,359 20,455 10.62 C (CHF Hgd)-Acc CHF 9,739,535 1,171,199 9.43 16,913,926 1,969,368 9.90 19,656,964 2,084,266 10.04 C (GBP Hgd)-Acc GBP 16,888,415 1,369,315 10.58 23,918,815 1,930,337 10.94 19,852,276 1,544,079 10.96 C (RMB)-Acc CNY – – – – – – 1,055 70 109.79 C (USD Hgd)-Acc USD 16,000,804 1,674,972 10.91 61,451,094 6,786,976 11.06 58,535,842 5,667,684 10.95 E-Acc EUR 201,540,424 19,673,817 10.24 351,215,687 32,499,570 10.81 469,519,861 42,647,084 11.01 I (AUD Hgd)-Gross-AD AUD 1,087,467,862 174,935,090 9.94 1,227,602,916 187,933,186 10.22 9,342 1,293 9.98 I (CAD Hgd)-AD CAD 94,786,070 14,265,909 9.98 44,630,131 6,750,721 10.31 22,943,475 3,088,544 10.38 I (AUD Hgd)-Acc AUD – – – – – – 717,101,754 84,265,201 11.75 R-Acc EUR 126,388,692 12,391,545 10.20 213,351,138 19,808,759 10.77 283,835,353 25,844,897 10.98

377 Invesco Funds
Invesco Funds Comparative Net Asset Values for the year ended 28 February 2019
28 February 28 February 28 February
2019 2018 2017
Total NAV NAV per Total NAV NAV per Total NAV NAV per
in sub-fund Number Share in in sub-fund Number Share in in sub-fund Number Share in
currency of Shares Share class currency of Shares Share class currency of Shares Share class
Total in issue currency Total in issue currency Total in issue currency
Invesco Global Targeted Returns Fund (EUR)^ Δ ΔΔ(continued) R (USD Hgd)-Acc USD 106,663 12,820 9.50 17,621 2,206 9.76 – – – S-Acc EUR 480,685,251 49,156,892 9.78 230,619,254 22,668,243 10.17 155,707,404 15,220,630 10.23 S (CHF Hgd)-Acc CHF – – – 8,781 998 10.14 96,690 10,056 10.24 S (GBP Hgd)-Acc GBP – – – 88,254 7,703 10.11 91,318 7,703 10.10 S (SEK Hgd)-Acc SEK 122,129,194 13,487,433 94.81 101,904,029 10,407,323 98.91 9,361 897 99.78 S (SGD)-Acc SGD – – – 6,562 986 10.76 6,598 986 9.93 S (SGD Hgd)-Acc SGD – – – 8,760 1,408 10.05 9,473 1,408 9.98 S (USD Hgd)-Acc USD 45,289,047 4,971,266 10.40 1,123,093,199 130,372,645 10.52 1,278,668,332 130,523,780 10.39 Z-AD EUR 298,333 31,865 9.36 435,091 44,523 9.77 – – – Z-Acc EUR 490,340,644 45,150,563 10.86 680,003,886 60,132,653 11.31 33,430,876 2,937,146 11.38 Z (CHF Hgd)-Acc CHF 42,982,374 5,161,157 9.44 47,915,990 5,582,343 9.89 47,434,169 5,041,124 10.02 Z (GBP Hgd)-Acc GBP 194,331,663 16,643,411 10.02 231,195,883 19,748,153 10.33 170,018,764 14,022,671 10.33 Z (USD Hgd)-Acc USD 55,032,368 6,060,335 10.37 100,972,163 11,751,359 10.50 85,725,945 8,764,419 10.37
Invesco Global Targeted Returns Select Fund (EUR)^ Δ A-AD EUR 56,055,069 5,906,710 9.49 197,411,628 19,782,967 9.98 153,569,132 15,123,719 10.15 A (USD Hgd)-AD USD 2,805,188 321,649 9.96 6,631,443 795,698 10.18 5,942,611 620,759 10.15 A-Acc EUR 1,181,822 124,179 9.52 1,993,313 199,502 9.99 2,412,501 238,613 10.11 C-Acc EUR 37,926,457 3,922,888 9.67 38,703,367 3,831,874 10.10 859,675 84,534 10.17 C (JPY Hgd)-Acc JPY 259,694,470 3,379,334 9,720.36 371,238,906 4,787,834 10,145.96 175,151,715 2,042,236 10,204.52 E-Acc EUR 501,583 54,169 9.26 694,795 71,045 9.78 110,207 11,067 9.96 I-Acc EUR – – – 6,846 662 10.34 6,822 662 10.31 I (JPY Hgd)-Acc JPY – – – 88,074 1,112 10,362.70 96,388 1,112 10,312.28 R-Acc EUR 474,092 51,347 9.23 600,070 61,463 9.76 44,167 4,439 9.95 S-AD EUR 259,564,614 27,290,557 9.51 267,715,961 26,760,153 10.00 132,336,815 12,990,806 10.19 S-Acc EUR 6,460 662 9.76 6,729 662 10.17 6,757 662 10.21 S (JPY Hgd)-Acc JPY 78,399,013 1,037,353 9,559.49 60,685,175 798,012 9,950.66 9,459 113 9,979.54 Z-AD EUR 5,626 594 9.48 5,867 593 9.89 – – – Z-Acc EUR 1,125,019 115,590 9.73 1,407,730 138,726 10.15 1,766,390 173,199 10.20
Invesco Global Targeted Returns Select II Fund (AUD)*** I-AD AUD 895,683,241 90,304,347 9.92 – – – – – –
Invesco Macro Allocation Strategy Fund (EUR) A-AD EUR 6,248,561 612,733 10.20 2,699,350 246,817 10.94 600,205 58,214 10.31 A-Acc EUR 86,368,345 7,637,624 11.31 77,031,335 6,352,201 12.13 18,651,168 1,631,454 11.43 A (CHF Hgd)-Acc CHF 52,110 5,349 11.05 56,127 5,429 11.91 108,078 10,181 11.31 A (USD Hgd)-Acc USD 59,412 5,611 12.09 8,250 800 12.60 109,611 10,000 11.62 C-Acc EUR 22,874,481 1,980,413 11.55 60,954,413 4,951,864 12.31 15,604,585 1,352,930 11.53 C (CHF Hgd)-Acc CHF 7,950 986 9.15 – – – – – – C (GBP Hgd)-Acc GBP 853,817 76,717 9.55 – – – – – – C (USD Hgd)-Acc USD 912,350 99,396 10.48 895,922 100,933 10.84 – – – E-Acc EUR 19,243,122 1,911,952 10.06 13,962,286 1,287,181 10.85 991,410 96,474 10.28 R-Acc EUR 47,851,941 4,333,045 11.04 51,486,304 4,317,181 11.93 12,552,961 1,108,798 11.32 S-Acc EUR 5,554 599 9.28 – – – – – – Z-AD EUR 5,600 593 9.44 5,966 593 10.05 – – – Z-Acc EUR 124,527,181 10,743,986 11.59 3,960,861 321,052 12.34 7,169 621 11.55 Z (CHF Hgd)-Acc CHF 7,957 986 9.16 – – – – – –
***Invesco Global Targeted Returns Select II Fund launched on 24 July 2018.
^ Sub-fund which swung the price on the NAV at 28 February 2019. Reconciliation between un-swung NAV and published swung NAV is disclosed in note 20 to the financial statements.
† Sub-fund which swung the price on the NAV at 28 February 2018.
Δ Sub-fund which swung the price on the NAV at 28 February 2017. For all swing sub-funds above denoted by ^, †, Δ the total NAV in sub-fund currency will not be the same as the NAV per the Statement of Net Assets due to the swing at the year end date.
l Acc = Accumulation l AD = Annual Distribution l MD = Monthly Distribution l QD = Quarterly Distribution l SD = Semi-Annual Distribution
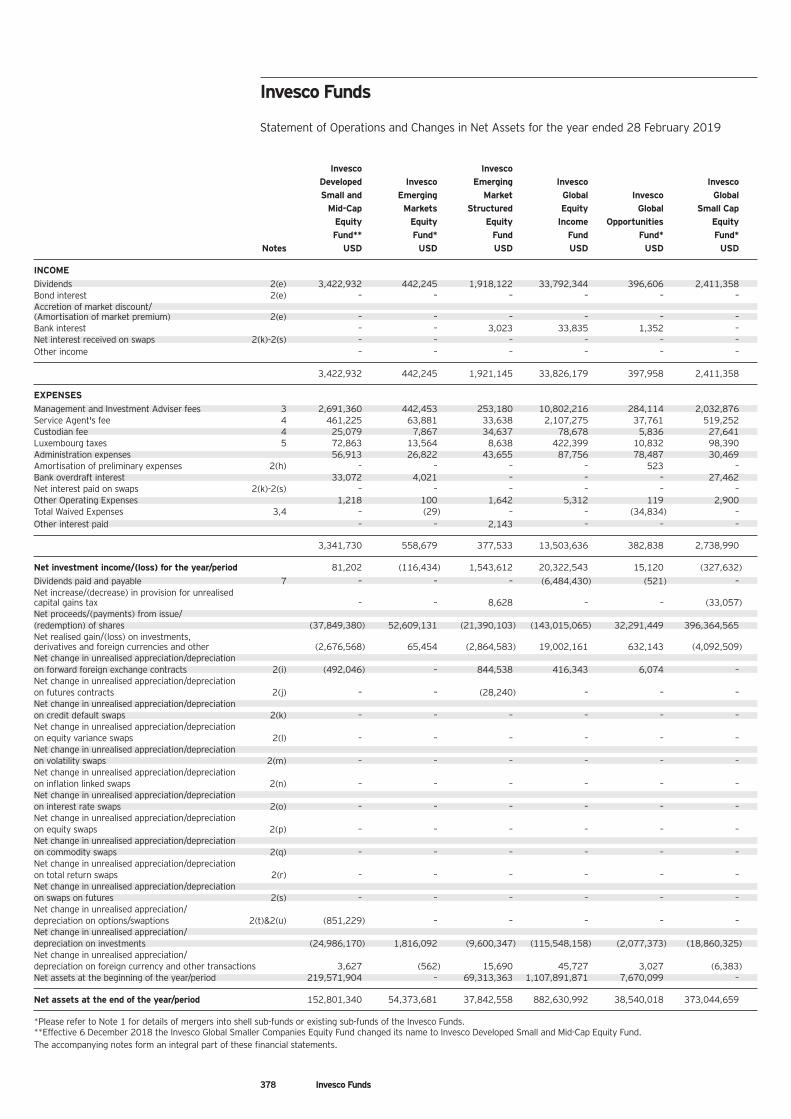
378 Invesco Funds
Invesco Invesco Developed Invesco Emerging Invesco Invesco Small and Emerging Market Global Invesco Global
Mid-Cap Markets Structured Equity Global Small Cap Equity Equity Equity Income Opportunities Equity Fund** Fund* Fund Fund Fund* Fund*
Notes USD USD USD USD USD USD
INCOME Dividends 2(e) 3,422,932 442,245 1,918,122 33,792,344 396,606 2,411,358 Bond interest 2(e) – – – – – – Accretion of market discount/ (Amortisation of market premium) 2(e) – – – – – – Bank interest – – 3,023 33,835 1,352 – Net interest received on swaps 2(k)-2(s) – – – – – – Other income – – – – – –
3,422,932 442,245 1,921,145 33,826,179 397,958 2,411,358
EXPENSES Management and Investment Adviser fees 3 2,691,360 442,453 253,180 10,802,216 284,114 2,032,876 Service Agent's fee 4 461,225 63,881 33,638 2,107,275 37,761 519,252 Custodian fee 4 25,079 7,867 34,637 78,678 5,836 27,641 Luxembourg taxes 5 72,863 13,564 8,638 422,399 10,832 98,390 Administration expenses 56,913 26,822 43,655 87,756 78,487 30,469 Amortisation of preliminary expenses 2(h) – – – – 523 – Bank overdraft interest 33,072 4,021 – – – 27,462 Net interest paid on swaps 2(k)-2(s) – – – – – – Other Operating Expenses 1,218 100 1,642 5,312 119 2,900 Total Waived Expenses 3,4 – (29) – – (34,834) – Other interest paid – – 2,143 – – –
3,341,730 558,679 377,533 13,503,636 382,838 2,738,990
Net investment income/(loss) for the year/period 81,202 (116,434) 1,543,612 20,322,543 15,120 (327,632) Dividends paid and payable 7 – – – (6,484,430) (521) – Net increase/(decrease) in provision for unrealised capital gains tax – – 8,628 – – (33,057) Net proceeds/(payments) from issue/ (redemption) of shares (37,849,380) 52,609,131 (21,390,103) (143,015,065) 32,291,449 396,364,565 Net realised gain/(loss) on investments, derivatives and foreign currencies and other (2,676,568) 65,454 (2,864,583) 19,002,161 632,143 (4,092,509) Net change in unrealised appreciation/depreciation on forward foreign exchange contracts 2(i) (492,046) – 844,538 416,343 6,074 – Net change in unrealised appreciation/depreciation on futures contracts 2(j) – – (28,240) – – – Net change in unrealised appreciation/depreciation on credit default swaps 2(k) – – – – – – Net change in unrealised appreciation/depreciation on equity variance swaps 2(l) – – – – – – Net change in unrealised appreciation/depreciation on volatility swaps 2(m) – – – – – – Net change in unrealised appreciation/depreciation on inflation linked swaps 2(n) – – – – – – Net change in unrealised appreciation/depreciation on interest rate swaps 2(o) – – – – – – Net change in unrealised appreciation/depreciation on equity swaps 2(p) – – – – – – Net change in unrealised appreciation/depreciation on commodity swaps 2(q) – – – – – – Net change in unrealised appreciation/depreciation on total return swaps 2(r) – – – – – – Net change in unrealised appreciation/depreciation on swaps on futures 2(s) – – – – – – Net change in unrealised appreciation/ depreciation on options/swaptions 2(t)&2(u) (851,229) – – – – – Net change in unrealised appreciation/ depreciation on investments (24,986,170) 1,816,092 (9,600,347) (115,548,158) (2,077,373) (18,860,325) Net change in unrealised appreciation/ depreciation on foreign currency and other transactions 3,627 (562) 15,690 45,727 3,027 (6,383) Net assets at the beginning of the year/period 219,571,904 – 69,313,363 1,107,891,871 7,670,099 –
Net assets at the end of the year/period 152,801,340 54,373,681 37,842,558 882,630,992 38,540,018 373,044,659
*Please refer to Note 1 for details of mergers into shell sub-funds or existing sub-funds of the Invesco Funds. **Effective 6 December 2018 the Invesco Global Smaller Companies Equity Fund changed its name to Invesco Developed Small and Mid-Cap Equity Fund. The accompanying notes form an integral part of these financial statements.
Invesco Funds Statement of Operations and Changes in Net Assets for the year ended 28 February 2019

379 Invesco Funds
Invesco Invesco Invesco Invesco Global Latin Invesco US US Invesco
Structured American US Equity Structured US Value Equity Equity Equity Flexible Equity Equity
Fund Fund Fund* Fund Fund Fund Notes USD USD USD USD USD USD
INCOME Dividends 2(e) 11,806,680 157,211 1,648,151 174,616 1,248,787 1,639,071 Bond interest 2(e) – – – – – – Accretion of market discount/ (Amortisation of market premium) 2(e) – – – – – – Bank interest 29,103 134 3,032 3,402 5,000 4,989 Net interest received on swaps 2(k)-2(s) – – – – – – Other income – – – – – –
11,835,783 157,345 1,651,183 178,018 1,253,787 1,644,060
EXPENSES Management and Investment Adviser fees 3 3,962,764 89,452 903,179 66,946 728,385 1,111,239 Service Agent's fee 4 798,536 15,984 124,347 16,615 151,861 173,017 Custodian fee 4 59,173 10,760 5,334 1,863 6,946 10,566 Luxembourg taxes 5 176,171 2,048 35,183 4,631 25,606 32,975 Administration expenses 85,335 28,500 117,641 31,477 52,869 39,688 Amortisation of preliminary expenses 2(h) – – – – – – Bank overdraft interest – – – – – – Net interest paid on swaps 2(k)-2(s) – – – – – – Other Operating Expenses 12,732 111 1,216 143 2,120 2,943 Total Waived Expenses 3,4 – (31,328) (30,174) (30,214) – – Other interest paid – – – – – –
5,094,711 115,527 1,156,726 91,461 967,787 1,370,428
Net investment income for the year/period 6,741,072 41,818 494,457 86,557 286,000 273,632 Dividends paid and payable 7 (7,666,874) – (8,802) – – (3,479) Net increase/(decrease) in provision for unrealised capital gains tax – – – – – – Net proceeds/(payments) from issue/ (redemption) of shares (70,942,349) (602,102) 102,670,907 18,339 (25,099,709) (5,656,742) Net realised gain/(loss) on investments, derivatives and foreign currencies and other 2,541,684 (128,155) (377,812) 198,456 5,972,242 6,238,033 Net change in unrealised appreciation/ depreciation on forward foreign exchange contracts 2(i) 929,155 22,921 131,064 2,168 331,310 (117,739) Net change in unrealised appreciation/ depreciation on futures contracts 2(j) 758,749 – – (63,570) 27,977 – Net change in unrealised appreciation/ depreciation on credit default swaps 2(k) – – – – – – Net change in unrealised appreciation/ depreciation on equity variance swaps 2(l) – – – – – – Net change in unrealised appreciation/ depreciation on volatility swaps 2(m) – – – – – – Net change in unrealised appreciation/ depreciation on inflation linked swaps 2(n) – – – – – – Net change in unrealised appreciation/ depreciation on interest rate swaps 2(o) – – – – – – Net change in unrealised appreciation/ depreciation on equity swaps 2(p) – – – – – – Net change in unrealised appreciation/ depreciation on commodity swaps 2(q) – – – – – – Net change in unrealised appreciation/ depreciation on total return swaps 2(r) – – – – – – Net change in unrealised appreciation/ depreciation on swaps on futures 2(s) – – – – – – Net change in unrealised appreciation/ depreciation on options/swaptions 2(t)&2(u) – – – – – – Net change in unrealised appreciation/ depreciation on investments (41,150,459) (658,929) (2,693,008) (202,658) (7,250,502) (10,446,227) Net change in unrealised appreciation/depreciation on foreign currency and other transactions (4,290) 766 1,738 1 (223) 1,089 Net assets at the beginning of the year/period 519,315,630 6,851,726 21,224,727 10,938,944 89,911,255 83,367,604
Net assets at the end of the year/period 410,522,318 5,528,045 121,443,271 10,978,237 64,178,350 73,656,171
*Please refer to Note 1 for details of mergers into shell sub-funds or existing sub-funds of the Invesco Funds.
The accompanying notes form an integral part of these financial statements.
Invesco Funds Statement of Operations and Changes in Net Assets for the year ended 28 February 2019
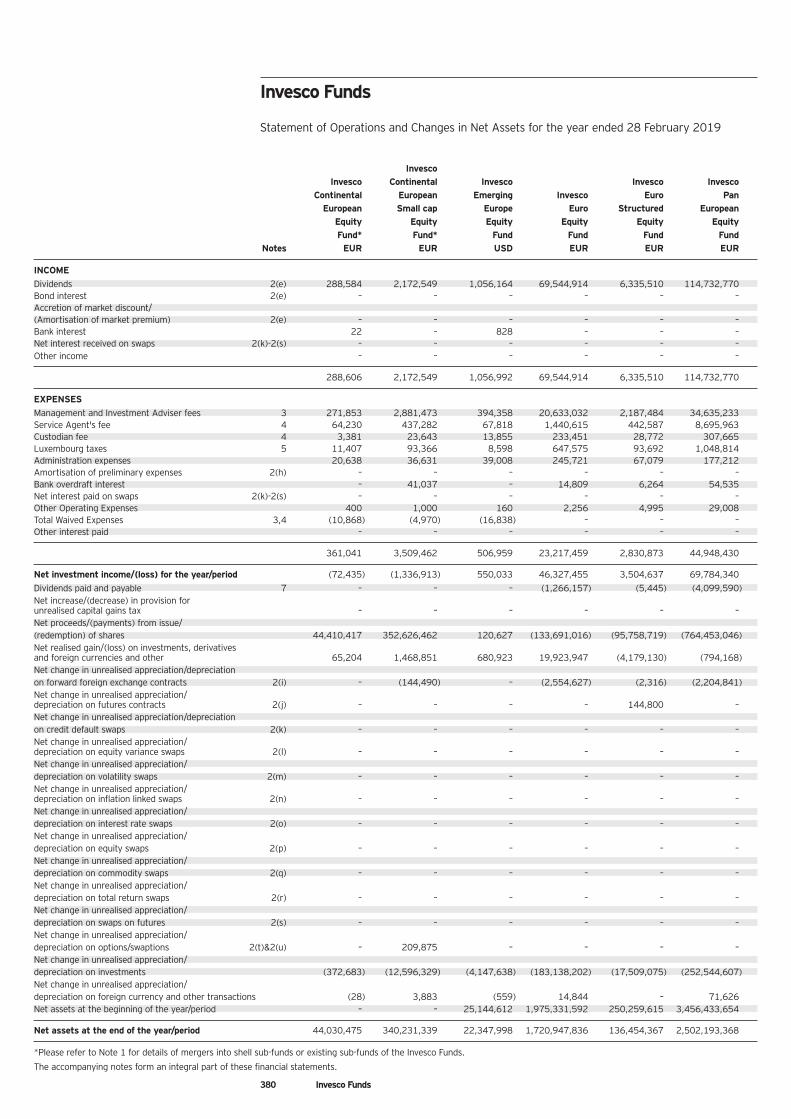
380 Invesco Funds
Invesco Invesco Continental Invesco Invesco Invesco
Continental European Emerging Invesco Euro Pan European Small cap Europe Euro Structured European
Equity Equity Equity Equity Equity Equity Fund* Fund* Fund Fund Fund Fund
Notes EUR EUR USD EUR EUR EUR
INCOME Dividends 2(e) 288,584 2,172,549 1,056,164 69,544,914 6,335,510 114,732,770 Bond interest 2(e) – – – – – – Accretion of market discount/ (Amortisation of market premium) 2(e) – – – – – – Bank interest 22 – 828 – – – Net interest received on swaps 2(k)-2(s) – – – – – – Other income – – – – – –
288,606 2,172,549 1,056,992 69,544,914 6,335,510 114,732,770
EXPENSES Management and Investment Adviser fees 3 271,853 2,881,473 394,358 20,633,032 2,187,484 34,635,233 Service Agent's fee 4 64,230 437,282 67,818 1,440,615 442,587 8,695,963 Custodian fee 4 3,381 23,643 13,855 233,451 28,772 307,665 Luxembourg taxes 5 11,407 93,366 8,598 647,575 93,692 1,048,814 Administration expenses 20,638 36,631 39,008 245,721 67,079 177,212 Amortisation of preliminary expenses 2(h) – – – – – – Bank overdraft interest – 41,037 – 14,809 6,264 54,535 Net interest paid on swaps 2(k)-2(s) – – – – – – Other Operating Expenses 400 1,000 160 2,256 4,995 29,008 Total Waived Expenses 3,4 (10,868) (4,970) (16,838) – – – Other interest paid – – – – – –
361,041 3,509,462 506,959 23,217,459 2,830,873 44,948,430
Net investment income/(loss) for the year/period (72,435) (1,336,913) 550,033 46,327,455 3,504,637 69,784,340 Dividends paid and payable 7 – – – (1,266,157) (5,445) (4,099,590) Net increase/(decrease) in provision for unrealised capital gains tax – – – – – – Net proceeds/(payments) from issue/ (redemption) of shares 44,410,417 352,626,462 120,627 (133,691,016) (95,758,719) (764,453,046) Net realised gain/(loss) on investments, derivatives and foreign currencies and other 65,204 1,468,851 680,923 19,923,947 (4,179,130) (794,168) Net change in unrealised appreciation/depreciation on forward foreign exchange contracts 2(i) – (144,490) – (2,554,627) (2,316) (2,204,841) Net change in unrealised appreciation/ depreciation on futures contracts 2(j) – – – – 144,800 – Net change in unrealised appreciation/depreciation on credit default swaps 2(k) – – – – – – Net change in unrealised appreciation/ depreciation on equity variance swaps 2(l) – – – – – – Net change in unrealised appreciation/ depreciation on volatility swaps 2(m) – – – – – – Net change in unrealised appreciation/ depreciation on inflation linked swaps 2(n) – – – – – – Net change in unrealised appreciation/ depreciation on interest rate swaps 2(o) – – – – – – Net change in unrealised appreciation/ depreciation on equity swaps 2(p) – – – – – – Net change in unrealised appreciation/ depreciation on commodity swaps 2(q) – – – – – – Net change in unrealised appreciation/ depreciation on total return swaps 2(r) – – – – – – Net change in unrealised appreciation/ depreciation on swaps on futures 2(s) – – – – – – Net change in unrealised appreciation/ depreciation on options/swaptions 2(t)&2(u) – 209,875 – – – – Net change in unrealised appreciation/ depreciation on investments (372,683) (12,596,329) (4,147,638) (183,138,202) (17,509,075) (252,544,607) Net change in unrealised appreciation/ depreciation on foreign currency and other transactions (28) 3,883 (559) 14,844 – 71,626 Net assets at the beginning of the year/period – – 25,144,612 1,975,331,592 250,259,615 3,456,433,654
Net assets at the end of the year/period 44,030,475 340,231,339 22,347,998 1,720,947,836 136,454,367 2,502,193,368
*Please refer to Note 1 for details of mergers into shell sub-funds or existing sub-funds of the Invesco Funds.
The accompanying notes form an integral part of these financial statements.
Invesco Funds Statement of Operations and Changes in Net Assets for the year ended 28 February 2019
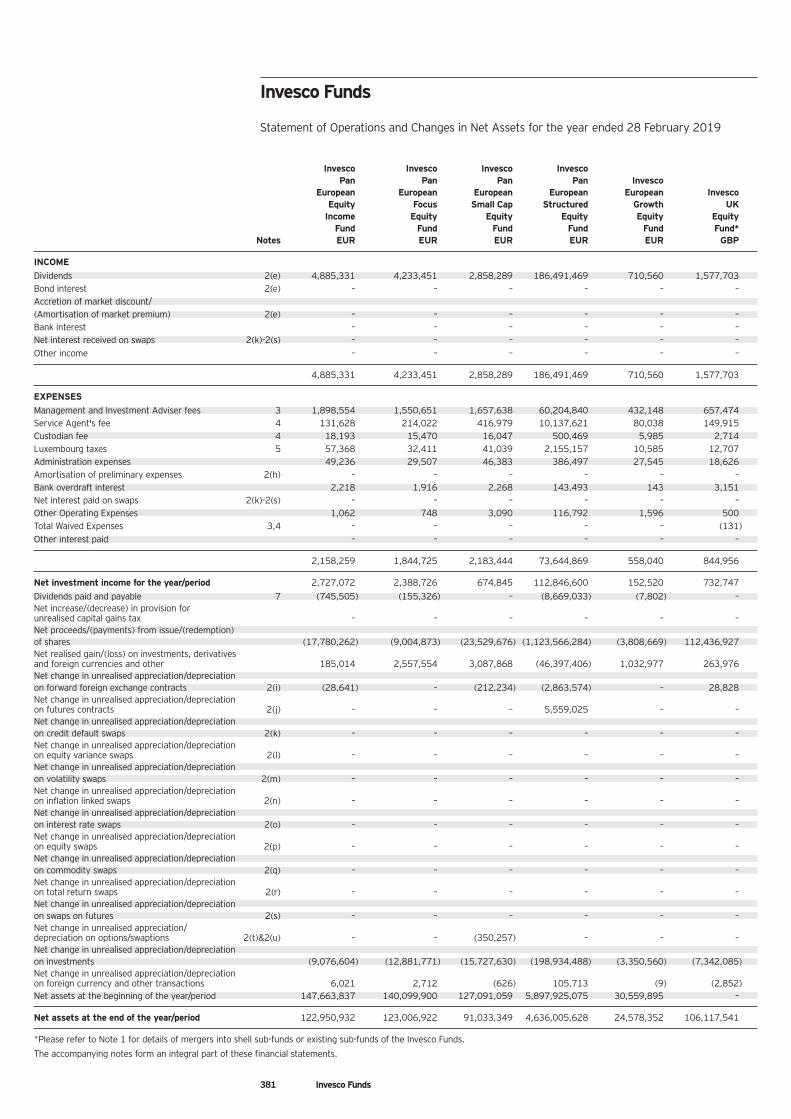
381 Invesco Funds
Invesco Invesco Invesco Invesco Pan Pan Pan Pan Invesco
European European European European European Invesco Equity Focus Small Cap Structured Growth UK
Income Equity Equity Equity Equity Equity Fund Fund Fund Fund Fund Fund*
Notes EUR EUR EUR EUR EUR GBP
INCOME Dividends 2(e) 4,885,331 4,233,451 2,858,289 186,491,469 710,560 1,577,703 Bond interest 2(e) – – – – – – Accretion of market discount/ (Amortisation of market premium) 2(e) – – – – – – Bank interest – – – – – – Net interest received on swaps 2(k)-2(s) – – – – – – Other income – – – – – –
4,885,331 4,233,451 2,858,289 186,491,469 710,560 1,577,703
EXPENSES Management and Investment Adviser fees 3 1,898,554 1,550,651 1,657,638 60,204,840 432,148 657,474 Service Agent's fee 4 131,628 214,022 416,979 10,137,621 80,038 149,915 Custodian fee 4 18,193 15,470 16,047 500,469 5,985 2,714 Luxembourg taxes 5 57,368 32,411 41,039 2,155,157 10,585 12,707 Administration expenses 49,236 29,507 46,383 386,497 27,545 18,626 Amortisation of preliminary expenses 2(h) – – – – – – Bank overdraft interest 2,218 1,916 2,268 143,493 143 3,151 Net interest paid on swaps 2(k)-2(s) – – – – – – Other Operating Expenses 1,062 748 3,090 116,792 1,596 500 Total Waived Expenses 3,4 – – – – – (131) Other interest paid – – – – – –
2,158,259 1,844,725 2,183,444 73,644,869 558,040 844,956
Net investment income for the year/period 2,727,072 2,388,726 674,845 112,846,600 152,520 732,747 Dividends paid and payable 7 (745,505) (155,326) – (8,669,033) (7,802) – Net increase/(decrease) in provision for unrealised capital gains tax – – – – – – Net proceeds/(payments) from issue/(redemption) of shares (17,780,262) (9,004,873) (23,529,676) (1,123,566,284) (3,808,669) 112,436,927 Net realised gain/(loss) on investments, derivatives and foreign currencies and other 185,014 2,557,554 3,087,868 (46,397,406) 1,032,977 263,976 Net change in unrealised appreciation/depreciation on forward foreign exchange contracts 2(i) (28,641) – (212,234) (2,863,574) – 28,828 Net change in unrealised appreciation/depreciation on futures contracts 2(j) – – – 5,559,025 – – Net change in unrealised appreciation/depreciation on credit default swaps 2(k) – – – – – – Net change in unrealised appreciation/depreciation on equity variance swaps 2(l) – – – – – – Net change in unrealised appreciation/depreciation on volatility swaps 2(m) – – – – – – Net change in unrealised appreciation/depreciation on inflation linked swaps 2(n) – – – – – – Net change in unrealised appreciation/depreciation on interest rate swaps 2(o) – – – – – – Net change in unrealised appreciation/depreciation on equity swaps 2(p) – – – – – – Net change in unrealised appreciation/depreciation on commodity swaps 2(q) – – – – – – Net change in unrealised appreciation/depreciation on total return swaps 2(r) – – – – – – Net change in unrealised appreciation/depreciation on swaps on futures 2(s) – – – – – – Net change in unrealised appreciation/ depreciation on options/swaptions 2(t)&2(u) – – (350,257) – – – Net change in unrealised appreciation/depreciation on investments (9,076,604) (12,881,771) (15,727,630) (198,934,488) (3,350,560) (7,342,085) Net change in unrealised appreciation/depreciation on foreign currency and other transactions 6,021 2,712 (626) 105,713 (9) (2,852) Net assets at the beginning of the year/period 147,663,837 140,099,900 127,091,059 5,897,925,075 30,559,895 –
Net assets at the end of the year/period 122,950,932 123,006,922 91,033,349 4,636,005,628 24,578,352 106,117,541
*Please refer to Note 1 for details of mergers into shell sub-funds or existing sub-funds of the Invesco Funds.
The accompanying notes form an integral part of these financial statements.
Invesco Funds Statement of Operations and Changes in Net Assets for the year ended 28 February 2019
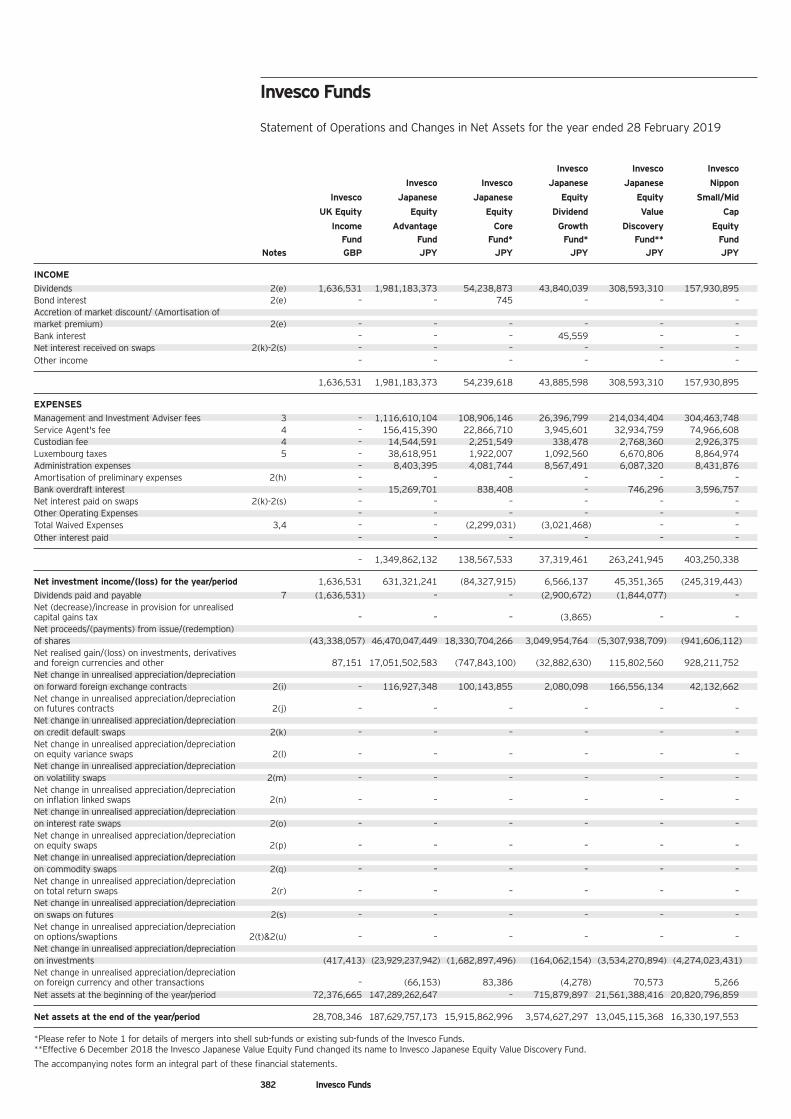
382 Invesco Funds
Invesco Invesco Invesco
Invesco Invesco Japanese Japanese Nippon
Invesco Japanese Japanese Equity Equity Small/Mid
UK Equity Equity Equity Dividend Value Cap
Income Advantage Core Growth Discovery Equity Fund Fund Fund* Fund* Fund** Fund
Notes GBP JPY JPY JPY JPY JPY
INCOME Dividends 2(e) 1,636,531 1,981,183,373 54,238,873 43,840,039 308,593,310 157,930,895 Bond interest 2(e) – – 745 – – – Accretion of market discount/ (Amortisation of market premium) 2(e) – – – – – – Bank interest – – – 45,559 – – Net interest received on swaps 2(k)-2(s) – – – – – – Other income – – – – – –
1,636,531 1,981,183,373 54,239,618 43,885,598 308,593,310 157,930,895
EXPENSES Management and Investment Adviser fees 3 – 1,116,610,104 108,906,146 26,396,799 214,034,404 304,463,748 Service Agent's fee 4 – 156,415,390 22,866,710 3,945,601 32,934,759 74,966,608 Custodian fee 4 – 14,544,591 2,251,549 338,478 2,768,360 2,926,375 Luxembourg taxes 5 – 38,618,951 1,922,007 1,092,560 6,670,806 8,864,974 Administration expenses – 8,403,395 4,081,744 8,567,491 6,087,320 8,431,876 Amortisation of preliminary expenses 2(h) – – – – – – Bank overdraft interest – 15,269,701 838,408 – 746,296 3,596,757 Net interest paid on swaps 2(k)-2(s) – – – – – – Other Operating Expenses – – – – – – Total Waived Expenses 3,4 – – (2,299,031) (3,021,468) – – Other interest paid – – – – – –
– 1,349,862,132 138,567,533 37,319,461 263,241,945 403,250,338
Net investment income/(loss) for the year/period 1,636,531 631,321,241 (84,327,915) 6,566,137 45,351,365 (245,319,443) Dividends paid and payable 7 (1,636,531) – – (2,900,672) (1,844,077) – Net (decrease)/increase in provision for unrealised capital gains tax – – – (3,865) – – Net proceeds/(payments) from issue/(redemption) of shares (43,338,057) 46,470,047,449 18,330,704,266 3,049,954,764 (5,307,938,709) (941,606,112) Net realised gain/(loss) on investments, derivatives and foreign currencies and other 87,151 17,051,502,583 (747,843,100) (32,882,630) 115,802,560 928,211,752 Net change in unrealised appreciation/depreciation on forward foreign exchange contracts 2(i) – 116,927,348 100,143,855 2,080,098 166,556,134 42,132,662 Net change in unrealised appreciation/depreciation on futures contracts 2(j) – – – – – – Net change in unrealised appreciation/depreciation on credit default swaps 2(k) – – – – – – Net change in unrealised appreciation/depreciation on equity variance swaps 2(l) – – – – – – Net change in unrealised appreciation/depreciation on volatility swaps 2(m) – – – – – – Net change in unrealised appreciation/depreciation on inflation linked swaps 2(n) – – – – – – Net change in unrealised appreciation/depreciation on interest rate swaps 2(o) – – – – – – Net change in unrealised appreciation/depreciation on equity swaps 2(p) – – – – – – Net change in unrealised appreciation/depreciation on commodity swaps 2(q) – – – – – – Net change in unrealised appreciation/depreciation on total return swaps 2(r) – – – – – – Net change in unrealised appreciation/depreciation on swaps on futures 2(s) – – – – – – Net change in unrealised appreciation/depreciation on options/swaptions 2(t)&2(u) – – – – – – Net change in unrealised appreciation/depreciation on investments (417,413) (23,929,237,942) (1,682,897,496) (164,062,154) (3,534,270,894) (4,274,023,431) Net change in unrealised appreciation/depreciation on foreign currency and other transactions – (66,153) 83,386 (4,278) 70,573 5,266 Net assets at the beginning of the year/period 72,376,665 147,289,262,647 – 715,879,897 21,561,388,416 20,820,796,859
Net assets at the end of the year/period 28,708,346 187,629,757,173 15,915,862,996 3,574,627,297 13,045,115,368 16,330,197,553
*Please refer to Note 1 for details of mergers into shell sub-funds or existing sub-funds of the Invesco Funds. **Effective 6 December 2018 the Invesco Japanese Value Equity Fund changed its name to Invesco Japanese Equity Value Discovery Fund.
The accompanying notes form an integral part of these financial statements.
Invesco Funds Statement of Operations and Changes in Net Assets for the year ended 28 February 2019
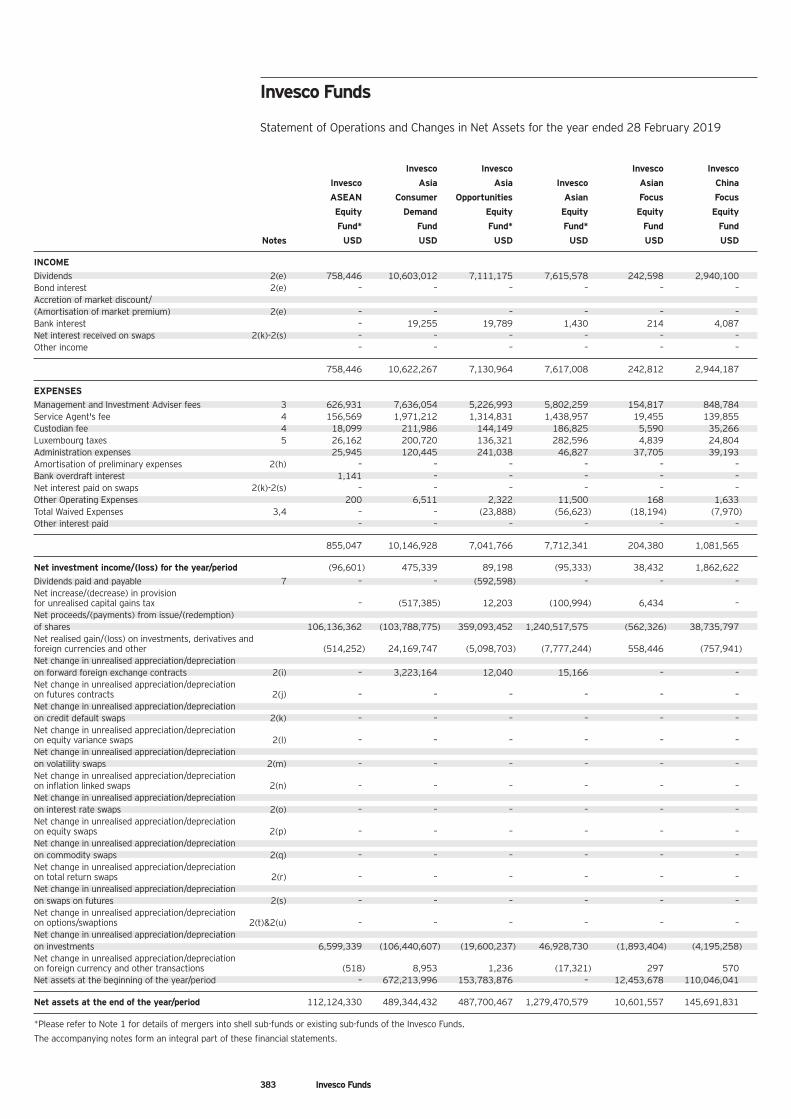
383 Invesco Funds
Invesco Invesco Invesco Invesco
Invesco Asia Asia Invesco Asian China
ASEAN Consumer Opportunities Asian Focus Focus
Equity Demand Equity Equity Equity Equity
Fund* Fund Fund* Fund* Fund Fund
Notes USD USD USD USD USD USD
INCOME Dividends 2(e) 758,446 10,603,012 7,111,175 7,615,578 242,598 2,940,100 Bond interest 2(e) – – – – – – Accretion of market discount/ (Amortisation of market premium) 2(e) – – – – – – Bank interest – 19,255 19,789 1,430 214 4,087 Net interest received on swaps 2(k)-2(s) – – – – – – Other income – – – – – –
758,446 10,622,267 7,130,964 7,617,008 242,812 2,944,187
EXPENSES Management and Investment Adviser fees 3 626,931 7,636,054 5,226,993 5,802,259 154,817 848,784 Service Agent's fee 4 156,569 1,971,212 1,314,831 1,438,957 19,455 139,855 Custodian fee 4 18,099 211,986 144,149 186,825 5,590 35,266 Luxembourg taxes 5 26,162 200,720 136,321 282,596 4,839 24,804 Administration expenses 25,945 120,445 241,038 46,827 37,705 39,193 Amortisation of preliminary expenses 2(h) – – – – – – Bank overdraft interest 1,141 – – – – – Net interest paid on swaps 2(k)-2(s) – – – – – – Other Operating Expenses 200 6,511 2,322 11,500 168 1,633 Total Waived Expenses 3,4 – – (23,888) (56,623) (18,194) (7,970) Other interest paid – – – – – –
855,047 10,146,928 7,041,766 7,712,341 204,380 1,081,565
Net investment income/(loss) for the year/period (96,601) 475,339 89,198 (95,333) 38,432 1,862,622 Dividends paid and payable 7 – – (592,598) – – – Net increase/(decrease) in provision for unrealised capital gains tax – (517,385) 12,203 (100,994) 6,434 – Net proceeds/(payments) from issue/(redemption) of shares 106,136,362 (103,788,775) 359,093,452 1,240,517,575 (562,326) 38,735,797 Net realised gain/(loss) on investments, derivatives and foreign currencies and other (514,252) 24,169,747 (5,098,703) (7,777,244) 558,446 (757,941) Net change in unrealised appreciation/depreciation on forward foreign exchange contracts 2(i) – 3,223,164 12,040 15,166 – – Net change in unrealised appreciation/depreciation on futures contracts 2(j) – – – – – – Net change in unrealised appreciation/depreciation on credit default swaps 2(k) – – – – – – Net change in unrealised appreciation/depreciation on equity variance swaps 2(l) – – – – – – Net change in unrealised appreciation/depreciation on volatility swaps 2(m) – – – – – – Net change in unrealised appreciation/depreciation on inflation linked swaps 2(n) – – – – – – Net change in unrealised appreciation/depreciation on interest rate swaps 2(o) – – – – – – Net change in unrealised appreciation/depreciation on equity swaps 2(p) – – – – – – Net change in unrealised appreciation/depreciation on commodity swaps 2(q) – – – – – – Net change in unrealised appreciation/depreciation on total return swaps 2(r) – – – – – – Net change in unrealised appreciation/depreciation on swaps on futures 2(s) – – – – – – Net change in unrealised appreciation/depreciation on options/swaptions 2(t)&2(u) – – – – – – Net change in unrealised appreciation/depreciation on investments 6,599,339 (106,440,607) (19,600,237) 46,928,730 (1,893,404) (4,195,258) Net change in unrealised appreciation/depreciation on foreign currency and other transactions (518) 8,953 1,236 (17,321) 297 570 Net assets at the beginning of the year/period – 672,213,996 153,783,876 – 12,453,678 110,046,041
Net assets at the end of the year/period 112,124,330 489,344,432 487,700,467 1,279,470,579 10,601,557 145,691,831
*Please refer to Note 1 for details of mergers into shell sub-funds or existing sub-funds of the Invesco Funds.
The accompanying notes form an integral part of these financial statements.
Invesco Funds Statement of Operations and Changes in Net Assets for the year ended 28 February 2019
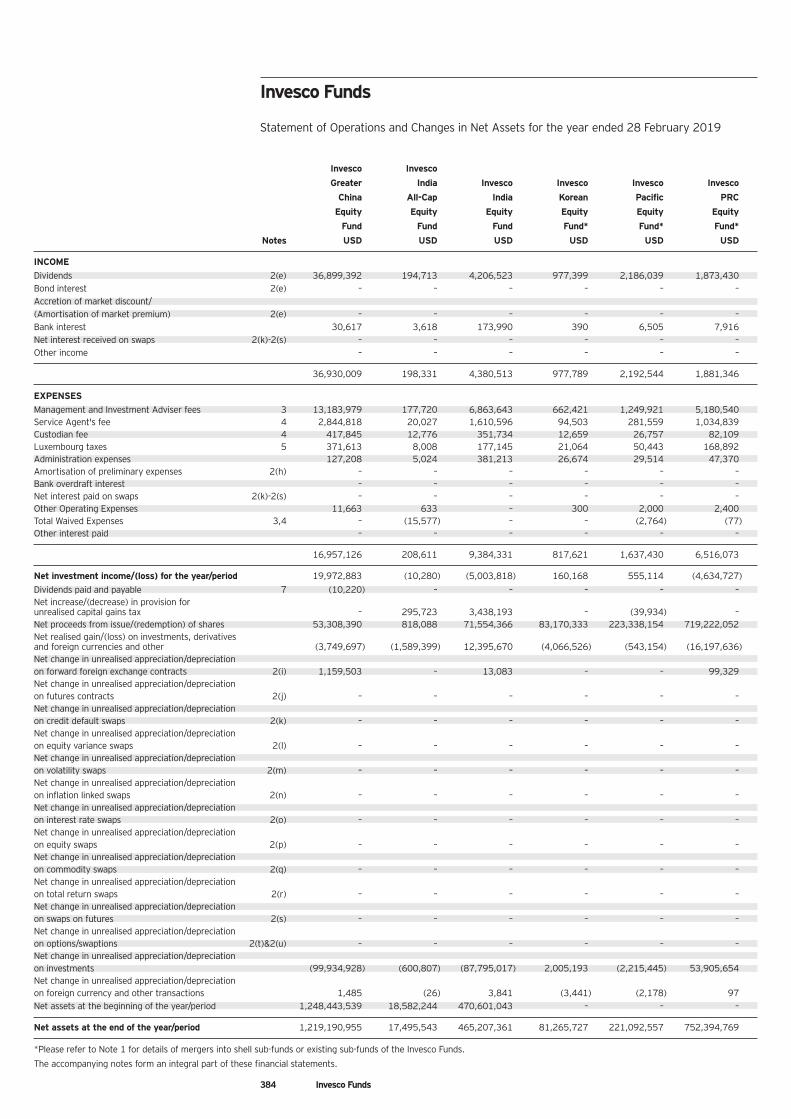
384 Invesco Funds
Invesco Invesco
Greater India Invesco Invesco Invesco Invesco
China All-Cap India Korean Pacific PRC
Equity Equity Equity Equity Equity Equity
Fund Fund Fund Fund* Fund* Fund*
Notes USD USD USD USD USD USD
INCOME Dividends 2(e) 36,899,392 194,713 4,206,523 977,399 2,186,039 1,873,430 Bond interest 2(e) – – – – – – Accretion of market discount/ (Amortisation of market premium) 2(e) – – – – – – Bank interest 30,617 3,618 173,990 390 6,505 7,916 Net interest received on swaps 2(k)-2(s) – – – – – – Other income – – – – – –
36,930,009 198,331 4,380,513 977,789 2,192,544 1,881,346
EXPENSES Management and Investment Adviser fees 3 13,183,979 177,720 6,863,643 662,421 1,249,921 5,180,540 Service Agent's fee 4 2,844,818 20,027 1,610,596 94,503 281,559 1,034,839 Custodian fee 4 417,845 12,776 351,734 12,659 26,757 82,109 Luxembourg taxes 5 371,613 8,008 177,145 21,064 50,443 168,892 Administration expenses 127,208 5,024 381,213 26,674 29,514 47,370 Amortisation of preliminary expenses 2(h) – – – – – – Bank overdraft interest – – – – – – Net interest paid on swaps 2(k)-2(s) – – – – – – Other Operating Expenses 11,663 633 – 300 2,000 2,400 Total Waived Expenses 3,4 – (15,577) – – (2,764) (77) Other interest paid – – – – – –
16,957,126 208,611 9,384,331 817,621 1,637,430 6,516,073
Net investment income/(loss) for the year/period 19,972,883 (10,280) (5,003,818) 160,168 555,114 (4,634,727) Dividends paid and payable 7 (10,220) – – – – – Net increase/(decrease) in provision for unrealised capital gains tax – 295,723 3,438,193 – (39,934) – Net proceeds from issue/(redemption) of shares 53,308,390 818,088 71,554,366 83,170,333 223,338,154 719,222,052 Net realised gain/(loss) on investments, derivatives and foreign currencies and other (3,749,697) (1,589,399) 12,395,670 (4,066,526) (543,154) (16,197,636) Net change in unrealised appreciation/depreciation on forward foreign exchange contracts 2(i) 1,159,503 – 13,083 – – 99,329 Net change in unrealised appreciation/depreciation on futures contracts 2(j) – – – – – – Net change in unrealised appreciation/depreciation on credit default swaps 2(k) – – – – – – Net change in unrealised appreciation/depreciation on equity variance swaps 2(l) – – – – – – Net change in unrealised appreciation/depreciation on volatility swaps 2(m) – – – – – – Net change in unrealised appreciation/depreciation on inflation linked swaps 2(n) – – – – – – Net change in unrealised appreciation/depreciation on interest rate swaps 2(o) – – – – – – Net change in unrealised appreciation/depreciation on equity swaps 2(p) – – – – – – Net change in unrealised appreciation/depreciation on commodity swaps 2(q) – – – – – – Net change in unrealised appreciation/depreciation on total return swaps 2(r) – – – – – – Net change in unrealised appreciation/depreciation on swaps on futures 2(s) – – – – – – Net change in unrealised appreciation/depreciation on options/swaptions 2(t)&2(u) – – – – – – Net change in unrealised appreciation/depreciation on investments (99,934,928) (600,807) (87,795,017) 2,005,193 (2,215,445) 53,905,654 Net change in unrealised appreciation/depreciation on foreign currency and other transactions 1,485 (26) 3,841 (3,441) (2,178) 97 Net assets at the beginning of the year/period 1,248,443,539 18,582,244 470,601,043 – – –
Net assets at the end of the year/period 1,219,190,955 17,495,543 465,207,361 81,265,727 221,092,557 752,394,769
*Please refer to Note 1 for details of mergers into shell sub-funds or existing sub-funds of the Invesco Funds.
The accompanying notes form an integral part of these financial statements.
Invesco Funds Statement of Operations and Changes in Net Assets for the year ended 28 February 2019
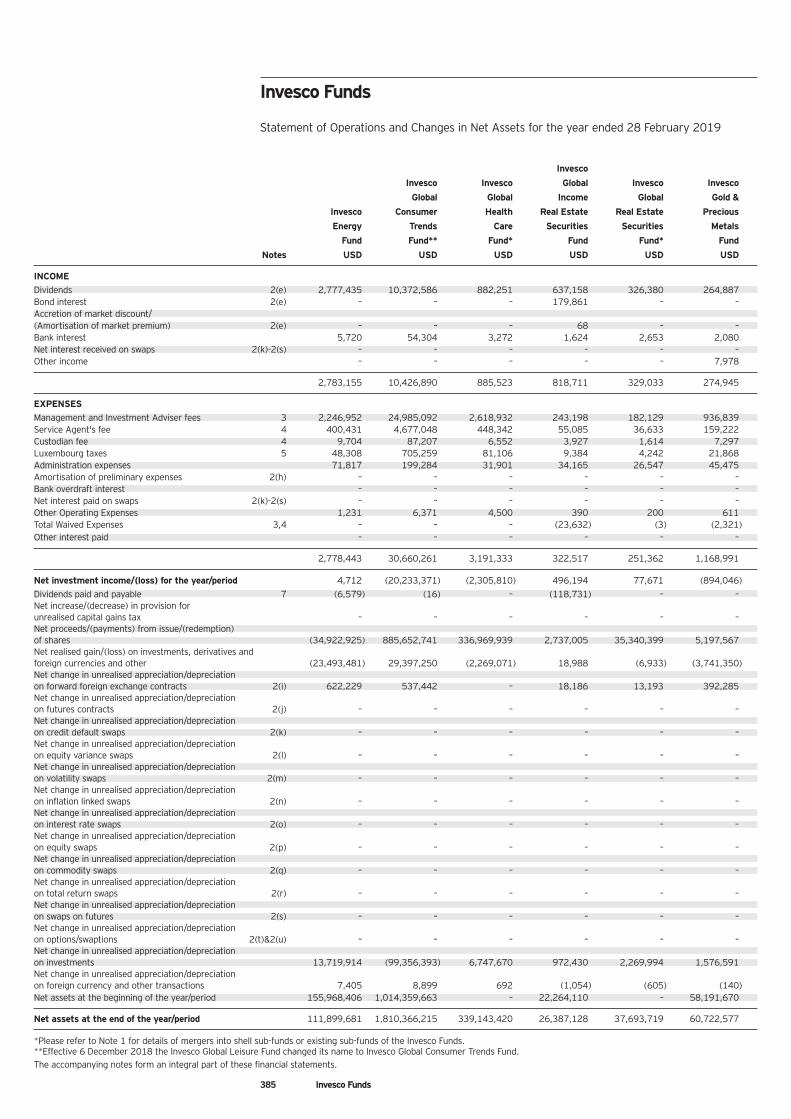
385 Invesco Funds
Invesco
Invesco Invesco Global Invesco Invesco
Global Global Income Global Gold &
Invesco Consumer Health Real Estate Real Estate Precious
Energy Trends Care Securities Securities Metals
Fund Fund** Fund* Fund Fund* Fund
Notes USD USD USD USD USD USD
INCOME Dividends 2(e) 2,777,435 10,372,586 882,251 637,158 326,380 264,887 Bond interest 2(e) – – – 179,861 – – Accretion of market discount/ (Amortisation of market premium) 2(e) – – – 68 – – Bank interest 5,720 54,304 3,272 1,624 2,653 2,080 Net interest received on swaps 2(k)-2(s) – – – – – – Other income – – – – – 7,978
2,783,155 10,426,890 885,523 818,711 329,033 274,945
EXPENSES Management and Investment Adviser fees 3 2,246,952 24,985,092 2,618,932 243,198 182,129 936,839 Service Agent's fee 4 400,431 4,677,048 448,342 55,085 36,633 159,222 Custodian fee 4 9,704 87,207 6,552 3,927 1,614 7,297 Luxembourg taxes 5 48,308 705,259 81,106 9,384 4,242 21,868 Administration expenses 71,817 199,284 31,901 34,165 26,547 45,475 Amortisation of preliminary expenses 2(h) – – – – – – Bank overdraft interest – – – – – – Net interest paid on swaps 2(k)-2(s) – – – – – – Other Operating Expenses 1,231 6,371 4,500 390 200 611 Total Waived Expenses 3,4 – – – (23,632) (3) (2,321) Other interest paid – – – – – –
2,778,443 30,660,261 3,191,333 322,517 251,362 1,168,991
Net investment income/(loss) for the year/period 4,712 (20,233,371) (2,305,810) 496,194 77,671 (894,046) Dividends paid and payable 7 (6,579) (16) – (118,731) – – Net increase/(decrease) in provision for unrealised capital gains tax – – – – – – Net proceeds/(payments) from issue/(redemption) of shares (34,922,925) 885,652,741 336,969,939 2,737,005 35,340,399 5,197,567 Net realised gain/(loss) on investments, derivatives and foreign currencies and other (23,493,481) 29,397,250 (2,269,071) 18,988 (6,933) (3,741,350) Net change in unrealised appreciation/depreciation on forward foreign exchange contracts 2(i) 622,229 537,442 – 18,186 13,193 392,285 Net change in unrealised appreciation/depreciation on futures contracts 2(j) – – – – – – Net change in unrealised appreciation/depreciation on credit default swaps 2(k) – – – – – – Net change in unrealised appreciation/depreciation on equity variance swaps 2(l) – – – – – – Net change in unrealised appreciation/depreciation on volatility swaps 2(m) – – – – – – Net change in unrealised appreciation/depreciation on inflation linked swaps 2(n) – – – – – – Net change in unrealised appreciation/depreciation on interest rate swaps 2(o) – – – – – – Net change in unrealised appreciation/depreciation on equity swaps 2(p) – – – – – – Net change in unrealised appreciation/depreciation on commodity swaps 2(q) – – – – – – Net change in unrealised appreciation/depreciation on total return swaps 2(r) – – – – – – Net change in unrealised appreciation/depreciation on swaps on futures 2(s) – – – – – – Net change in unrealised appreciation/depreciation on options/swaptions 2(t)&2(u) – – – – – – Net change in unrealised appreciation/depreciation on investments 13,719,914 (99,356,393) 6,747,670 972,430 2,269,994 1,576,591 Net change in unrealised appreciation/depreciation on foreign currency and other transactions 7,405 8,899 692 (1,054) (605) (140) Net assets at the beginning of the year/period 155,968,406 1,014,359,663 – 22,264,110 – 58,191,670
Net assets at the end of the year/period 111,899,681 1,810,366,215 339,143,420 26,387,128 37,693,719 60,722,577
*Please refer to Note 1 for details of mergers into shell sub-funds or existing sub-funds of the Invesco Funds. **Effective 6 December 2018 the Invesco Global Leisure Fund changed its name to Invesco Global Consumer Trends Fund. The accompanying notes form an integral part of these financial statements.
Invesco Funds Statement of Operations and Changes in Net Assets for the year ended 28 February 2019
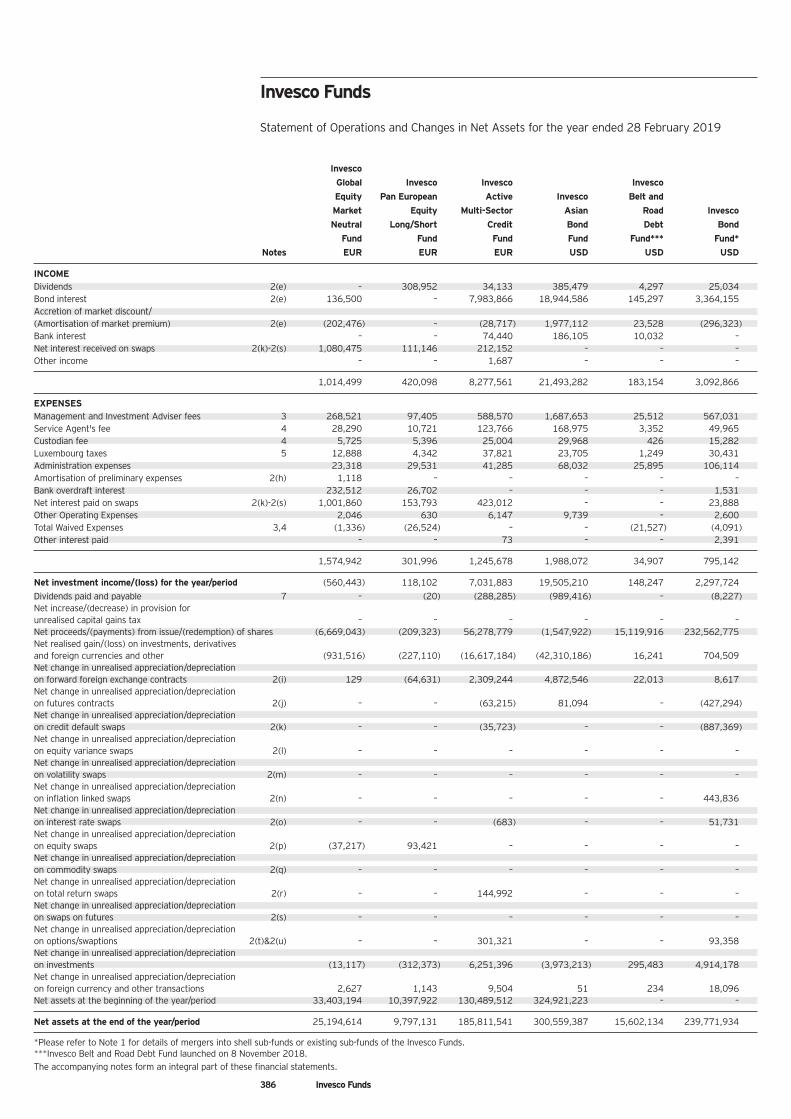
386 Invesco Funds
Invesco
Global Invesco Invesco Invesco
Equity Pan European Active Invesco Belt and
Market Equity Multi-Sector Asian Road Invesco
Neutral Long/Short Credit Bond Debt Bond
Fund Fund Fund Fund Fund*** Fund*
Notes EUR EUR EUR USD USD USD
INCOME Dividends 2(e) – 308,952 34,133 385,479 4,297 25,034 Bond interest 2(e) 136,500 – 7,983,866 18,944,586 145,297 3,364,155 Accretion of market discount/ (Amortisation of market premium) 2(e) (202,476) – (28,717) 1,977,112 23,528 (296,323) Bank interest – – 74,440 186,105 10,032 – Net interest received on swaps 2(k)-2(s) 1,080,475 111,146 212,152 – – – Other income – – 1,687 – – –
1,014,499 420,098 8,277,561 21,493,282 183,154 3,092,866
EXPENSES Management and Investment Adviser fees 3 268,521 97,405 588,570 1,687,653 25,512 567,031 Service Agent's fee 4 28,290 10,721 123,766 168,975 3,352 49,965 Custodian fee 4 5,725 5,396 25,004 29,968 426 15,282 Luxembourg taxes 5 12,888 4,342 37,821 23,705 1,249 30,431 Administration expenses 23,318 29,531 41,285 68,032 25,895 106,114 Amortisation of preliminary expenses 2(h) 1,118 – – – – – Bank overdraft interest 232,512 26,702 – – – 1,531 Net interest paid on swaps 2(k)-2(s) 1,001,860 153,793 423,012 – – 23,888 Other Operating Expenses 2,046 630 6,147 9,739 – 2,600 Total Waived Expenses 3,4 (1,336) (26,524) – – (21,527) (4,091) Other interest paid – – 73 – – 2,391
1,574,942 301,996 1,245,678 1,988,072 34,907 795,142
Net investment income/(loss) for the year/period (560,443) 118,102 7,031,883 19,505,210 148,247 2,297,724 Dividends paid and payable 7 – (20) (288,285) (989,416) – (8,227) Net increase/(decrease) in provision for unrealised capital gains tax – – – – – – Net proceeds/(payments) from issue/(redemption) of shares (6,669,043) (209,323) 56,278,779 (1,547,922) 15,119,916 232,562,775 Net realised gain/(loss) on investments, derivatives and foreign currencies and other (931,516) (227,110) (16,617,184) (42,310,186) 16,241 704,509 Net change in unrealised appreciation/depreciation on forward foreign exchange contracts 2(i) 129 (64,631) 2,309,244 4,872,546 22,013 8,617 Net change in unrealised appreciation/depreciation on futures contracts 2(j) – – (63,215) 81,094 – (427,294) Net change in unrealised appreciation/depreciation on credit default swaps 2(k) – – (35,723) – – (887,369) Net change in unrealised appreciation/depreciation on equity variance swaps 2(l) – – – – – – Net change in unrealised appreciation/depreciation on volatility swaps 2(m) – – – – – – Net change in unrealised appreciation/depreciation on inflation linked swaps 2(n) – – – – – 443,836 Net change in unrealised appreciation/depreciation on interest rate swaps 2(o) – – (683) – – 51,731 Net change in unrealised appreciation/depreciation on equity swaps 2(p) (37,217) 93,421 – – – – Net change in unrealised appreciation/depreciation on commodity swaps 2(q) – – – – – – Net change in unrealised appreciation/depreciation on total return swaps 2(r) – – 144,992 – – – Net change in unrealised appreciation/depreciation on swaps on futures 2(s) – – – – – – Net change in unrealised appreciation/depreciation on options/swaptions 2(t)&2(u) – – 301,321 – – 93,358 Net change in unrealised appreciation/depreciation on investments (13,117) (312,373) 6,251,396 (3,973,213) 295,483 4,914,178 Net change in unrealised appreciation/depreciation on foreign currency and other transactions 2,627 1,143 9,504 51 234 18,096 Net assets at the beginning of the year/period 33,403,194 10,397,922 130,489,512 324,921,223 – –
Net assets at the end of the year/period 25,194,614 9,797,131 185,811,541 300,559,387 15,602,134 239,771,934
*Please refer to Note 1 for details of mergers into shell sub-funds or existing sub-funds of the Invesco Funds. ***Invesco Belt and Road Debt Fund launched on 8 November 2018. The accompanying notes form an integral part of these financial statements.
Invesco Funds Statement of Operations and Changes in Net Assets for the year ended 28 February 2019
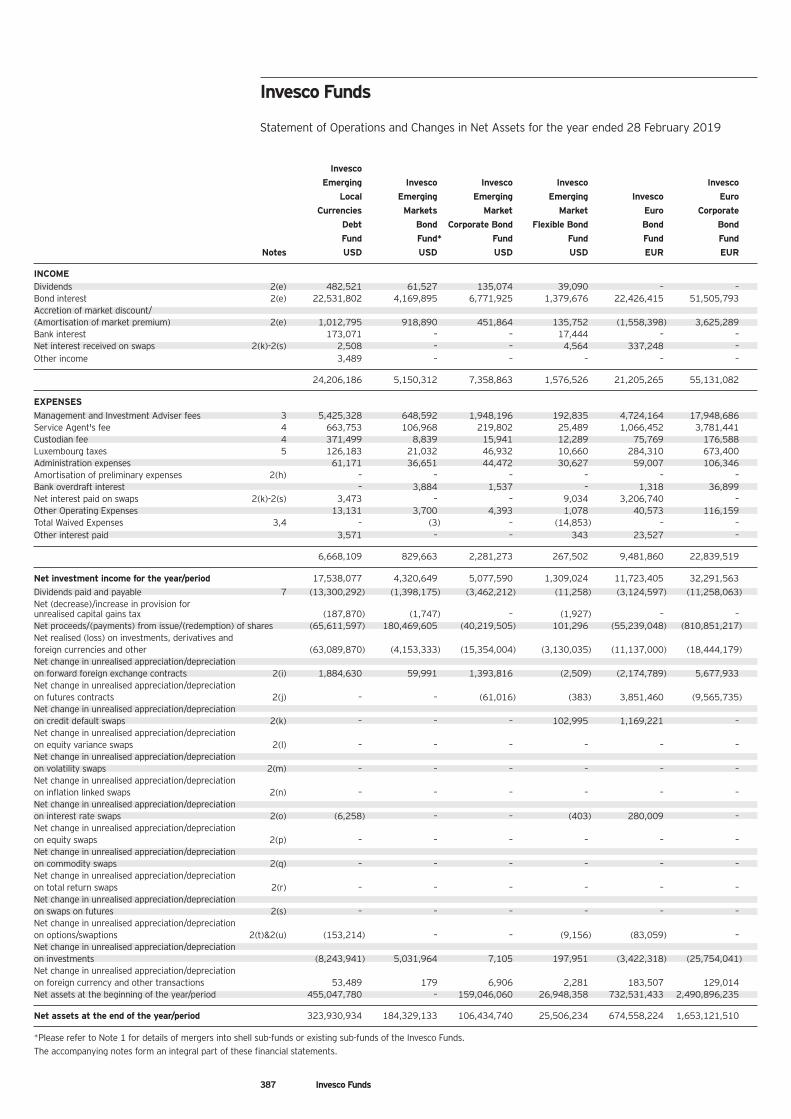
387 Invesco Funds
Invesco
Emerging Invesco Invesco Invesco Invesco
Local Emerging Emerging Emerging Invesco Euro
Currencies Markets Market Market Euro Corporate
Debt Bond Corporate Bond Flexible Bond Bond Bond
Fund Fund* Fund Fund Fund Fund
Notes USD USD USD USD EUR EUR
INCOME Dividends 2(e) 482,521 61,527 135,074 39,090 – – Bond interest 2(e) 22,531,802 4,169,895 6,771,925 1,379,676 22,426,415 51,505,793 Accretion of market discount/ (Amortisation of market premium) 2(e) 1,012,795 918,890 451,864 135,752 (1,558,398) 3,625,289 Bank interest 173,071 – – 17,444 – – Net interest received on swaps 2(k)-2(s) 2,508 – – 4,564 337,248 – Other income 3,489 – – – – –
24,206,186 5,150,312 7,358,863 1,576,526 21,205,265 55,131,082
EXPENSES Management and Investment Adviser fees 3 5,425,328 648,592 1,948,196 192,835 4,724,164 17,948,686 Service Agent's fee 4 663,753 106,968 219,802 25,489 1,066,452 3,781,441 Custodian fee 4 371,499 8,839 15,941 12,289 75,769 176,588 Luxembourg taxes 5 126,183 21,032 46,932 10,660 284,310 673,400 Administration expenses 61,171 36,651 44,472 30,627 59,007 106,346 Amortisation of preliminary expenses 2(h) – – – – – – Bank overdraft interest – 3,884 1,537 – 1,318 36,899 Net interest paid on swaps 2(k)-2(s) 3,473 – – 9,034 3,206,740 – Other Operating Expenses 13,131 3,700 4,393 1,078 40,573 116,159 Total Waived Expenses 3,4 – (3) – (14,853) – – Other interest paid 3,571 – – 343 23,527 –
6,668,109 829,663 2,281,273 267,502 9,481,860 22,839,519
Net investment income for the year/period 17,538,077 4,320,649 5,077,590 1,309,024 11,723,405 32,291,563 Dividends paid and payable 7 (13,300,292) (1,398,175) (3,462,212) (11,258) (3,124,597) (11,258,063) Net (decrease)/increase in provision for unrealised capital gains tax (187,870) (1,747) – (1,927) – – Net proceeds/(payments) from issue/(redemption) of shares (65,611,597) 180,469,605 (40,219,505) 101,296 (55,239,048) (810,851,217) Net realised (loss) on investments, derivatives and foreign currencies and other (63,089,870) (4,153,333) (15,354,004) (3,130,035) (11,137,000) (18,444,179) Net change in unrealised appreciation/depreciation on forward foreign exchange contracts 2(i) 1,884,630 59,991 1,393,816 (2,509) (2,174,789) 5,677,933 Net change in unrealised appreciation/depreciation on futures contracts 2(j) – – (61,016) (383) 3,851,460 (9,565,735) Net change in unrealised appreciation/depreciation on credit default swaps 2(k) – – – 102,995 1,169,221 – Net change in unrealised appreciation/depreciation on equity variance swaps 2(l) – – – – – – Net change in unrealised appreciation/depreciation on volatility swaps 2(m) – – – – – – Net change in unrealised appreciation/depreciation on inflation linked swaps 2(n) – – – – – – Net change in unrealised appreciation/depreciation on interest rate swaps 2(o) (6,258) – – (403) 280,009 – Net change in unrealised appreciation/depreciation on equity swaps 2(p) – – – – – – Net change in unrealised appreciation/depreciation on commodity swaps 2(q) – – – – – – Net change in unrealised appreciation/depreciation on total return swaps 2(r) – – – – – – Net change in unrealised appreciation/depreciation on swaps on futures 2(s) – – – – – – Net change in unrealised appreciation/depreciation on options/swaptions 2(t)&2(u) (153,214) – – (9,156) (83,059) – Net change in unrealised appreciation/depreciation on investments (8,243,941) 5,031,964 7,105 197,951 (3,422,318) (25,754,041) Net change in unrealised appreciation/depreciation on foreign currency and other transactions 53,489 179 6,906 2,281 183,507 129,014 Net assets at the beginning of the year/period 455,047,780 – 159,046,060 26,948,358 732,531,433 2,490,896,235
Net assets at the end of the year/period 323,930,934 184,329,133 106,434,740 25,506,234 674,558,224 1,653,121,510
*Please refer to Note 1 for details of mergers into shell sub-funds or existing sub-funds of the Invesco Funds. The accompanying notes form an integral part of these financial statements.
Invesco Funds Statement of Operations and Changes in Net Assets for the year ended 28 February 2019
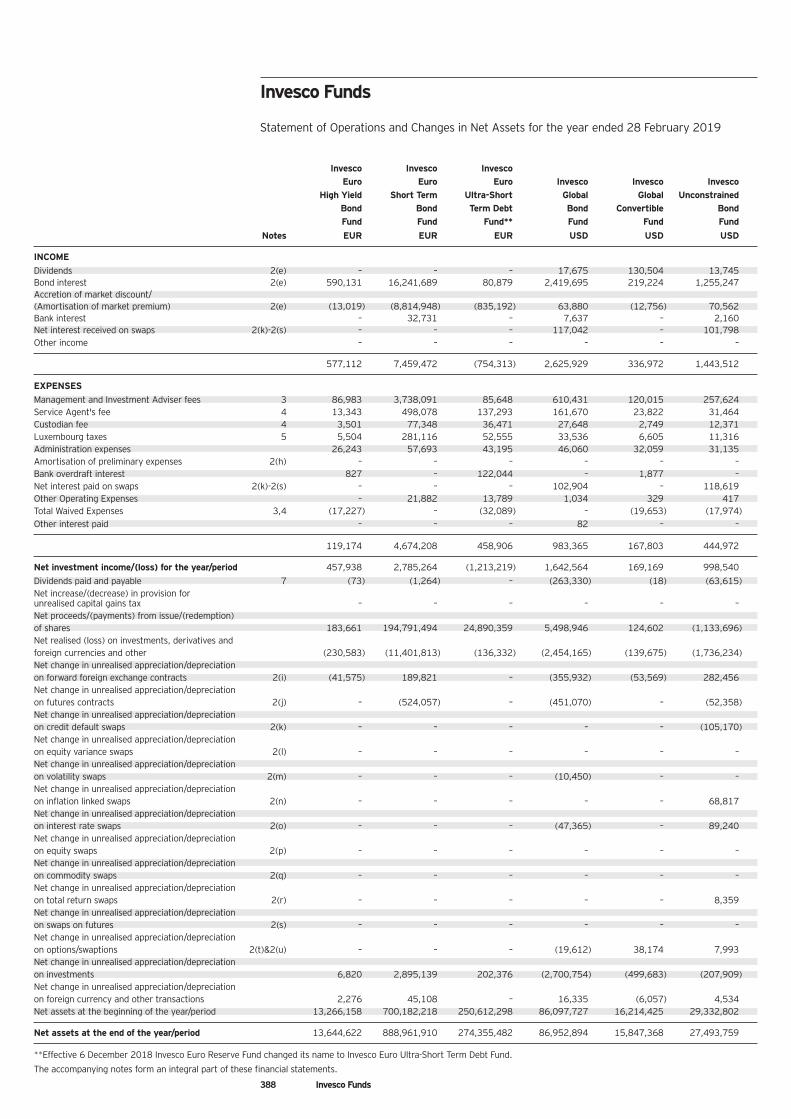
388 Invesco Funds
Invesco Invesco Invesco Euro Euro Euro Invesco Invesco Invesco
High Yield Short Term Ultra-Short Global Global Unconstrained Bond Bond Term Debt Bond Convertible Bond Fund Fund Fund** Fund Fund Fund
Notes EUR EUR EUR USD USD USD
INCOME Dividends 2(e) – – – 17,675 130,504 13,745 Bond interest 2(e) 590,131 16,241,689 80,879 2,419,695 219,224 1,255,247 Accretion of market discount/ (Amortisation of market premium) 2(e) (13,019) (8,814,948) (835,192) 63,880 (12,756) 70,562 Bank interest – 32,731 – 7,637 – 2,160 Net interest received on swaps 2(k)-2(s) – – – 117,042 – 101,798 Other income – – – – – –
577,112 7,459,472 (754,313) 2,625,929 336,972 1,443,512
EXPENSES Management and Investment Adviser fees 3 86,983 3,738,091 85,648 610,431 120,015 257,624 Service Agent's fee 4 13,343 498,078 137,293 161,670 23,822 31,464 Custodian fee 4 3,501 77,348 36,471 27,648 2,749 12,371 Luxembourg taxes 5 5,504 281,116 52,555 33,536 6,605 11,316 Administration expenses 26,243 57,693 43,195 46,060 32,059 31,135 Amortisation of preliminary expenses 2(h) – – – – – – Bank overdraft interest 827 – 122,044 – 1,877 – Net interest paid on swaps 2(k)-2(s) – – – 102,904 – 118,619 Other Operating Expenses – 21,882 13,789 1,034 329 417 Total Waived Expenses 3,4 (17,227) – (32,089) – (19,653) (17,974) Other interest paid – – – 82 – –
119,174 4,674,208 458,906 983,365 167,803 444,972
Net investment income/(loss) for the year/period 457,938 2,785,264 (1,213,219) 1,642,564 169,169 998,540 Dividends paid and payable 7 (73) (1,264) – (263,330) (18) (63,615) Net increase/(decrease) in provision for unrealised capital gains tax – – – – – – Net proceeds/(payments) from issue/(redemption) of shares 183,661 194,791,494 24,890,359 5,498,946 124,602 (1,133,696) Net realised (loss) on investments, derivatives and foreign currencies and other (230,583) (11,401,813) (136,332) (2,454,165) (139,675) (1,736,234) Net change in unrealised appreciation/depreciation on forward foreign exchange contracts 2(i) (41,575) 189,821 – (355,932) (53,569) 282,456 Net change in unrealised appreciation/depreciation on futures contracts 2(j) – (524,057) – (451,070) – (52,358) Net change in unrealised appreciation/depreciation on credit default swaps 2(k) – – – – – (105,170) Net change in unrealised appreciation/depreciation on equity variance swaps 2(l) – – – – – – Net change in unrealised appreciation/depreciation on volatility swaps 2(m) – – – (10,450) – – Net change in unrealised appreciation/depreciation on inflation linked swaps 2(n) – – – – – 68,817 Net change in unrealised appreciation/depreciation on interest rate swaps 2(o) – – – (47,365) – 89,240 Net change in unrealised appreciation/depreciation on equity swaps 2(p) – – – – – – Net change in unrealised appreciation/depreciation on commodity swaps 2(q) – – – – – – Net change in unrealised appreciation/depreciation on total return swaps 2(r) – – – – – 8,359 Net change in unrealised appreciation/depreciation on swaps on futures 2(s) – – – – – – Net change in unrealised appreciation/depreciation on options/swaptions 2(t)&2(u) – – – (19,612) 38,174 7,993 Net change in unrealised appreciation/depreciation on investments 6,820 2,895,139 202,376 (2,700,754) (499,683) (207,909) Net change in unrealised appreciation/depreciation on foreign currency and other transactions 2,276 45,108 – 16,335 (6,057) 4,534 Net assets at the beginning of the year/period 13,266,158 700,182,218 250,612,298 86,097,727 16,214,425 29,332,802
Net assets at the end of the year/period 13,644,622 888,961,910 274,355,482 86,952,894 15,847,368 27,493,759
**Effective 6 December 2018 Invesco Euro Reserve Fund changed its name to Invesco Euro Ultra-Short Term Debt Fund.
The accompanying notes form an integral part of these financial statements.
Invesco Funds Statement of Operations and Changes in Net Assets for the year ended 28 February 2019
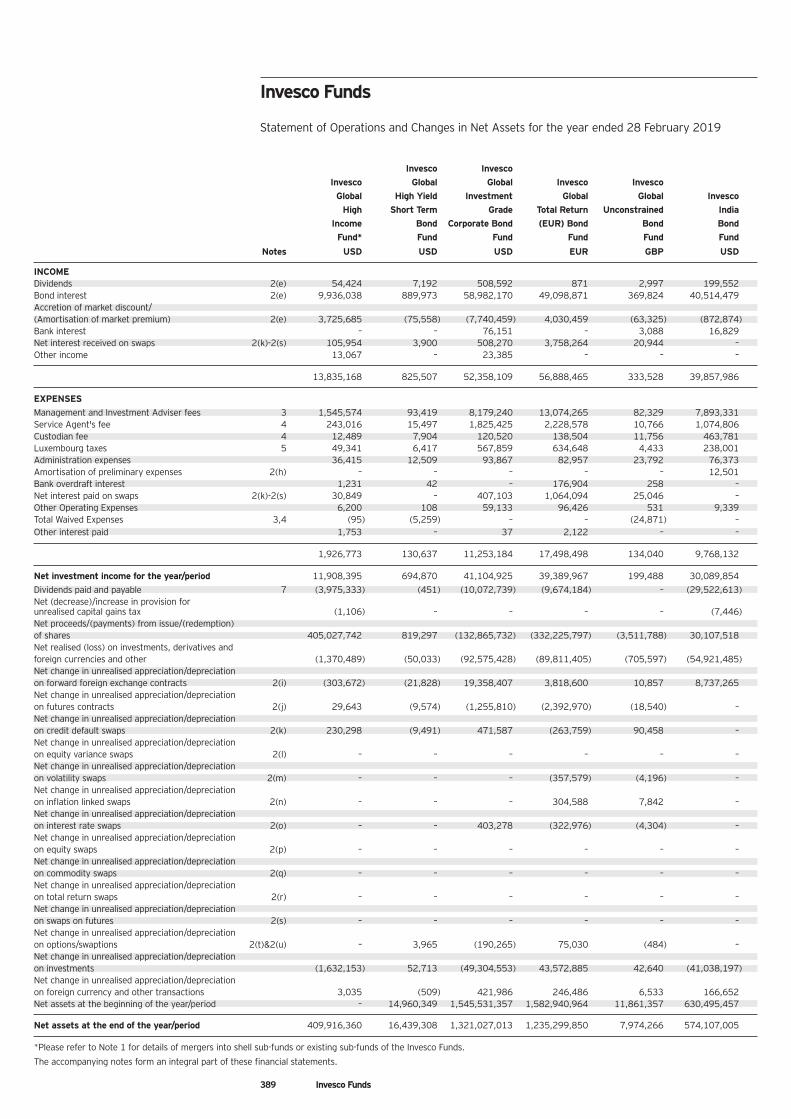
389 Invesco Funds
Invesco Invesco Invesco Global Global Invesco Invesco
Global High Yield Investment Global Global Invesco High Short Term Grade Total Return Unconstrained India
Income Bond Corporate Bond (EUR) Bond Bond Bond Fund* Fund Fund Fund Fund Fund
Notes USD USD USD EUR GBP USD
INCOME Dividends 2(e) 54,424 7,192 508,592 871 2,997 199,552 Bond interest 2(e) 9,936,038 889,973 58,982,170 49,098,871 369,824 40,514,479 Accretion of market discount/ (Amortisation of market premium) 2(e) 3,725,685 (75,558) (7,740,459) 4,030,459 (63,325) (872,874) Bank interest – – 76,151 – 3,088 16,829 Net interest received on swaps 2(k)-2(s) 105,954 3,900 508,270 3,758,264 20,944 – Other income 13,067 – 23,385 – – –
13,835,168 825,507 52,358,109 56,888,465 333,528 39,857,986
EXPENSES Management and Investment Adviser fees 3 1,545,574 93,419 8,179,240 13,074,265 82,329 7,893,331 Service Agent's fee 4 243,016 15,497 1,825,425 2,228,578 10,766 1,074,806 Custodian fee 4 12,489 7,904 120,520 138,504 11,756 463,781 Luxembourg taxes 5 49,341 6,417 567,859 634,648 4,433 238,001 Administration expenses 36,415 12,509 93,867 82,957 23,792 76,373 Amortisation of preliminary expenses 2(h) – – – – – 12,501 Bank overdraft interest 1,231 42 – 176,904 258 – Net interest paid on swaps 2(k)-2(s) 30,849 – 407,103 1,064,094 25,046 – Other Operating Expenses 6,200 108 59,133 96,426 531 9,339 Total Waived Expenses 3,4 (95) (5,259) – – (24,871) – Other interest paid 1,753 – 37 2,122 – –
1,926,773 130,637 11,253,184 17,498,498 134,040 9,768,132
Net investment income for the year/period 11,908,395 694,870 41,104,925 39,389,967 199,488 30,089,854 Dividends paid and payable 7 (3,975,333) (451) (10,072,739) (9,674,184) – (29,522,613) Net (decrease)/increase in provision for unrealised capital gains tax (1,106) – – – – (7,446) Net proceeds/(payments) from issue/(redemption) of shares 405,027,742 819,297 (132,865,732) (332,225,797) (3,511,788) 30,107,518 Net realised (loss) on investments, derivatives and foreign currencies and other (1,370,489) (50,033) (92,575,428) (89,811,405) (705,597) (54,921,485) Net change in unrealised appreciation/depreciation on forward foreign exchange contracts 2(i) (303,672) (21,828) 19,358,407 3,818,600 10,857 8,737,265 Net change in unrealised appreciation/depreciation on futures contracts 2(j) 29,643 (9,574) (1,255,810) (2,392,970) (18,540) – Net change in unrealised appreciation/depreciation on credit default swaps 2(k) 230,298 (9,491) 471,587 (263,759) 90,458 – Net change in unrealised appreciation/depreciation on equity variance swaps 2(l) – – – – – – Net change in unrealised appreciation/depreciation on volatility swaps 2(m) – – – (357,579) (4,196) – Net change in unrealised appreciation/depreciation on inflation linked swaps 2(n) – – – 304,588 7,842 – Net change in unrealised appreciation/depreciation on interest rate swaps 2(o) – – 403,278 (322,976) (4,304) – Net change in unrealised appreciation/depreciation on equity swaps 2(p) – – – – – – Net change in unrealised appreciation/depreciation on commodity swaps 2(q) – – – – – – Net change in unrealised appreciation/depreciation on total return swaps 2(r) – – – – – – Net change in unrealised appreciation/depreciation on swaps on futures 2(s) – – – – – – Net change in unrealised appreciation/depreciation on options/swaptions 2(t)&2(u) – 3,965 (190,265) 75,030 (484) – Net change in unrealised appreciation/depreciation on investments (1,632,153) 52,713 (49,304,553) 43,572,885 42,640 (41,038,197) Net change in unrealised appreciation/depreciation on foreign currency and other transactions 3,035 (509) 421,986 246,486 6,533 166,652 Net assets at the beginning of the year/period – 14,960,349 1,545,531,357 1,582,940,964 11,861,357 630,495,457
Net assets at the end of the year/period 409,916,360 16,439,308 1,321,027,013 1,235,299,850 7,974,266 574,107,005
*Please refer to Note 1 for details of mergers into shell sub-funds or existing sub-funds of the Invesco Funds.
The accompanying notes form an integral part of these financial statements.
Invesco Funds Statement of Operations and Changes in Net Assets for the year ended 28 February 2019
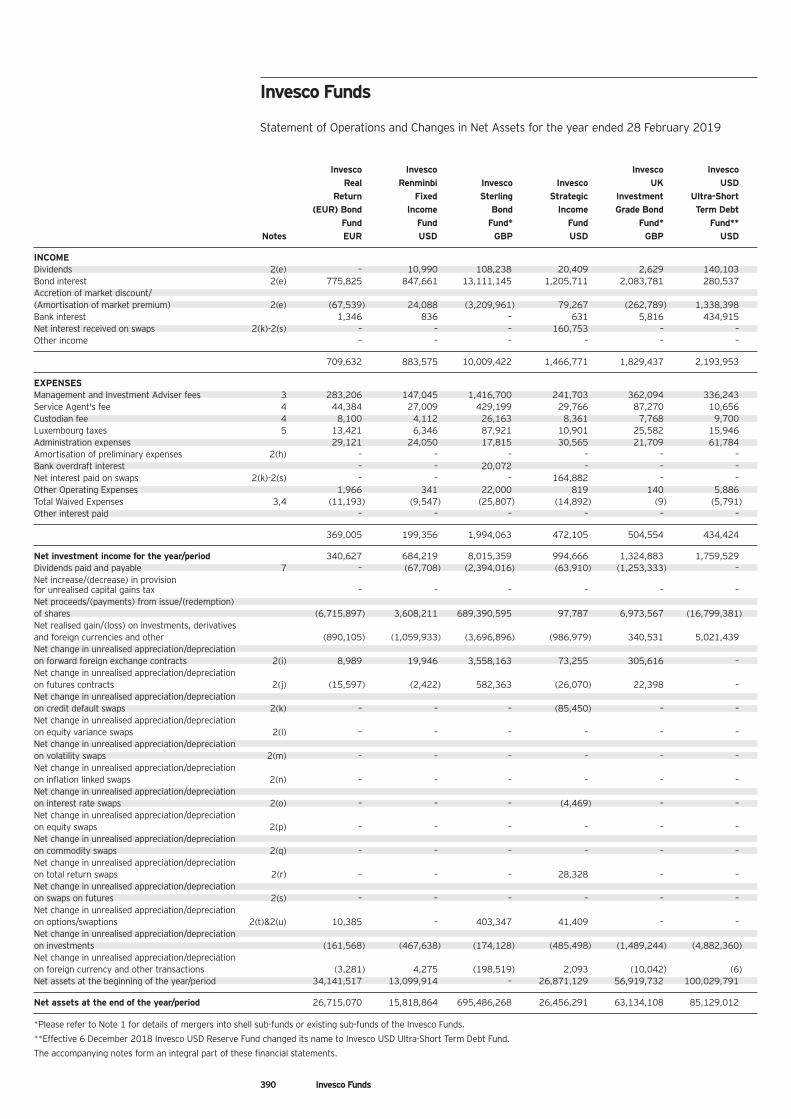
390 Invesco Funds
Invesco Invesco Invesco Invesco Real Renminbi Invesco Invesco UK USD
Return Fixed Sterling Strategic Investment Ultra-Short (EUR) Bond Income Bond Income Grade Bond Term Debt
Fund Fund Fund* Fund Fund* Fund** Notes EUR USD GBP USD GBP USD
INCOME Dividends 2(e) – 10,990 108,238 20,409 2,629 140,103 Bond interest 2(e) 775,825 847,661 13,111,145 1,205,711 2,083,781 280,537 Accretion of market discount/ (Amortisation of market premium) 2(e) (67,539) 24,088 (3,209,961) 79,267 (262,789) 1,338,398 Bank interest 1,346 836 – 631 5,816 434,915 Net interest received on swaps 2(k)-2(s) – – – 160,753 – – Other income – – – – – –
709,632 883,575 10,009,422 1,466,771 1,829,437 2,193,953
EXPENSES Management and Investment Adviser fees 3 283,206 147,045 1,416,700 241,703 362,094 336,243 Service Agent's fee 4 44,384 27,009 429,199 29,766 87,270 10,656 Custodian fee 4 8,100 4,112 26,163 8,361 7,768 9,700 Luxembourg taxes 5 13,421 6,346 87,921 10,901 25,582 15,946 Administration expenses 29,121 24,050 17,815 30,565 21,709 61,784 Amortisation of preliminary expenses 2(h) – – – – – – Bank overdraft interest – – 20,072 – – – Net interest paid on swaps 2(k)-2(s) – – – 164,882 – – Other Operating Expenses 1,966 341 22,000 819 140 5,886 Total Waived Expenses 3,4 (11,193) (9,547) (25,807) (14,892) (9) (5,791) Other interest paid – – – – – –
369,005 199,356 1,994,063 472,105 504,554 434,424
Net investment income for the year/period 340,627 684,219 8,015,359 994,666 1,324,883 1,759,529 Dividends paid and payable 7 – (67,708) (2,394,016) (63,910) (1,253,333) – Net increase/(decrease) in provision for unrealised capital gains tax – – – – – – Net proceeds/(payments) from issue/(redemption) of shares (6,715,897) 3,608,211 689,390,595 97,787 6,973,567 (16,799,381) Net realised gain/(loss) on investments, derivatives and foreign currencies and other (890,105) (1,059,933) (3,696,896) (986,979) 340,531 5,021,439 Net change in unrealised appreciation/depreciation on forward foreign exchange contracts 2(i) 8,989 19,946 3,558,163 73,255 305,616 – Net change in unrealised appreciation/depreciation on futures contracts 2(j) (15,597) (2,422) 582,363 (26,070) 22,398 – Net change in unrealised appreciation/depreciation on credit default swaps 2(k) – – – (85,450) – – Net change in unrealised appreciation/depreciation on equity variance swaps 2(l) – – – – – – Net change in unrealised appreciation/depreciation on volatility swaps 2(m) – – – – – – Net change in unrealised appreciation/depreciation on inflation linked swaps 2(n) – – – – – – Net change in unrealised appreciation/depreciation on interest rate swaps 2(o) – – – (4,469) – – Net change in unrealised appreciation/depreciation on equity swaps 2(p) – – – – – – Net change in unrealised appreciation/depreciation on commodity swaps 2(q) – – – – – – Net change in unrealised appreciation/depreciation on total return swaps 2(r) – – – 28,328 – – Net change in unrealised appreciation/depreciation on swaps on futures 2(s) – – – – – – Net change in unrealised appreciation/depreciation on options/swaptions 2(t)&2(u) 10,385 – 403,347 41,409 – – Net change in unrealised appreciation/depreciation on investments (161,568) (467,638) (174,128) (485,498) (1,489,244) (4,882,360) Net change in unrealised appreciation/depreciation on foreign currency and other transactions (3,281) 4,275 (198,519) 2,093 (10,042) (6) Net assets at the beginning of the year/period 34,141,517 13,099,914 – 26,871,129 56,919,732 100,029,791
Net assets at the end of the year/period 26,715,070 15,818,864 695,486,268 26,456,291 63,134,108 85,129,012
*Please refer to Note 1 for details of mergers into shell sub-funds or existing sub-funds of the Invesco Funds.
**Effective 6 December 2018 Invesco USD Reserve Fund changed its name to Invesco USD Ultra-Short Term Debt Fund.
The accompanying notes form an integral part of these financial statements.
Invesco Funds Statement of Operations and Changes in Net Assets for the year ended 28 February 2019
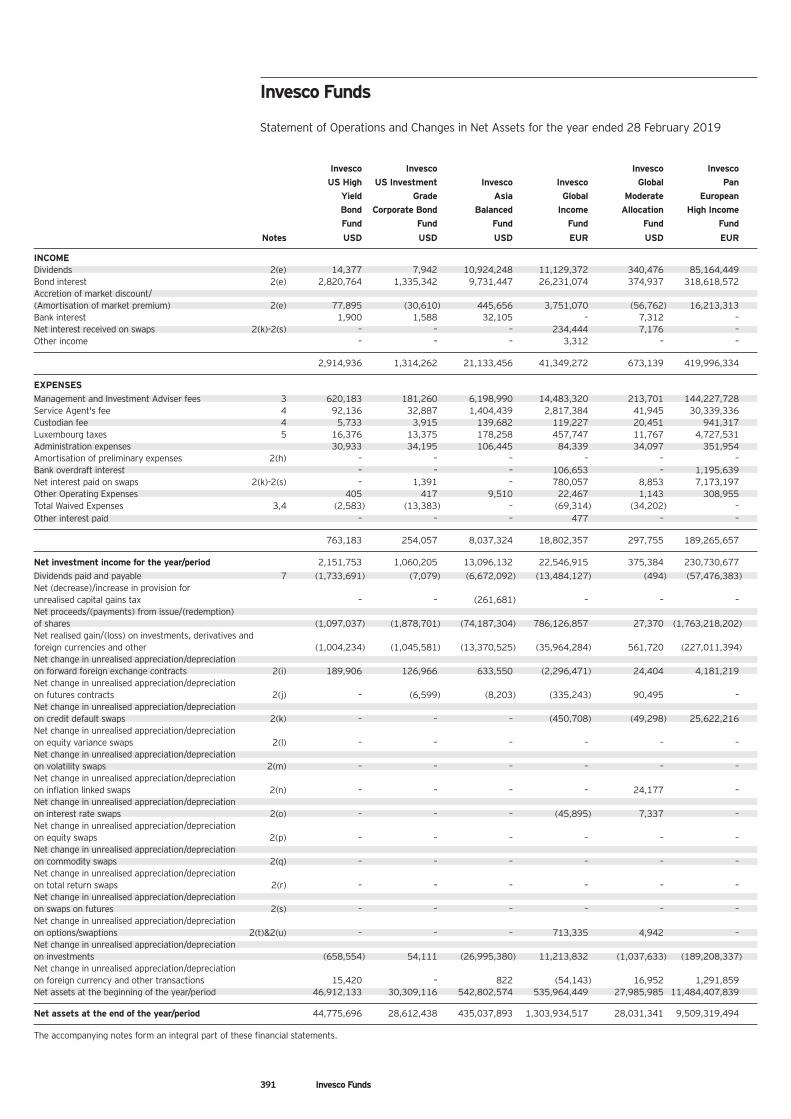
391 Invesco Funds
Invesco Invesco Invesco Invesco US High US Investment Invesco Invesco Global Pan
Yield Grade Asia Global Moderate European Bond Corporate Bond Balanced Income Allocation High Income Fund Fund Fund Fund Fund Fund
Notes USD USD USD EUR USD EUR
INCOME Dividends 2(e) 14,377 7,942 10,924,248 11,129,372 340,476 85,164,449 Bond interest 2(e) 2,820,764 1,335,342 9,731,447 26,231,074 374,937 318,618,572 Accretion of market discount/ (Amortisation of market premium) 2(e) 77,895 (30,610) 445,656 3,751,070 (56,762) 16,213,313 Bank interest 1,900 1,588 32,105 – 7,312 – Net interest received on swaps 2(k)-2(s) – – – 234,444 7,176 – Other income – – – 3,312 – –
2,914,936 1,314,262 21,133,456 41,349,272 673,139 419,996,334
EXPENSES Management and Investment Adviser fees 3 620,183 181,260 6,198,990 14,483,320 213,701 144,227,728 Service Agent's fee 4 92,136 32,887 1,404,439 2,817,384 41,945 30,339,336 Custodian fee 4 5,733 3,915 139,682 119,227 20,451 941,317 Luxembourg taxes 5 16,376 13,375 178,258 457,747 11,767 4,727,531 Administration expenses 30,933 34,195 106,445 84,339 34,097 351,954 Amortisation of preliminary expenses 2(h) – – – – – – Bank overdraft interest – – – 106,653 – 1,195,639 Net interest paid on swaps 2(k)-2(s) – 1,391 – 780,057 8,853 7,173,197 Other Operating Expenses 405 417 9,510 22,467 1,143 308,955 Total Waived Expenses 3,4 (2,583) (13,383) – (69,314) (34,202) – Other interest paid – – – 477 – –
763,183 254,057 8,037,324 18,802,357 297,755 189,265,657
Net investment income for the year/period 2,151,753 1,060,205 13,096,132 22,546,915 375,384 230,730,677 Dividends paid and payable 7 (1,733,691) (7,079) (6,672,092) (13,484,127) (494) (57,476,383) Net (decrease)/increase in provision for unrealised capital gains tax – – (261,681) – – – Net proceeds/(payments) from issue/(redemption) of shares (1,097,037) (1,878,701) (74,187,304) 786,126,857 27,370 (1,763,218,202) Net realised gain/(loss) on investments, derivatives and foreign currencies and other (1,004,234) (1,045,581) (13,370,525) (35,964,284) 561,720 (227,011,394) Net change in unrealised appreciation/depreciation on forward foreign exchange contracts 2(i) 189,906 126,966 633,550 (2,296,471) 24,404 4,181,219 Net change in unrealised appreciation/depreciation on futures contracts 2(j) – (6,599) (8,203) (335,243) 90,495 – Net change in unrealised appreciation/depreciation on credit default swaps 2(k) – – – (450,708) (49,298) 25,622,216 Net change in unrealised appreciation/depreciation on equity variance swaps 2(l) – – – – – – Net change in unrealised appreciation/depreciation on volatility swaps 2(m) – – – – – – Net change in unrealised appreciation/depreciation on inflation linked swaps 2(n) – – – – 24,177 – Net change in unrealised appreciation/depreciation on interest rate swaps 2(o) – – – (45,895) 7,337 – Net change in unrealised appreciation/depreciation on equity swaps 2(p) – – – – – – Net change in unrealised appreciation/depreciation on commodity swaps 2(q) – – – – – – Net change in unrealised appreciation/depreciation on total return swaps 2(r) – – – – – – Net change in unrealised appreciation/depreciation on swaps on futures 2(s) – – – – – – Net change in unrealised appreciation/depreciation on options/swaptions 2(t)&2(u) – – – 713,335 4,942 – Net change in unrealised appreciation/depreciation on investments (658,554) 54,111 (26,995,380) 11,213,832 (1,037,633) (189,208,337) Net change in unrealised appreciation/depreciation on foreign currency and other transactions 15,420 – 822 (54,143) 16,952 1,291,859 Net assets at the beginning of the year/period 46,912,133 30,309,116 542,802,574 535,964,449 27,985,985 11,484,407,839
Net assets at the end of the year/period 44,775,696 28,612,438 435,037,893 1,303,934,517 28,031,341 9,509,319,494
The accompanying notes form an integral part of these financial statements.
Invesco Funds Statement of Operations and Changes in Net Assets for the year ended 28 February 2019
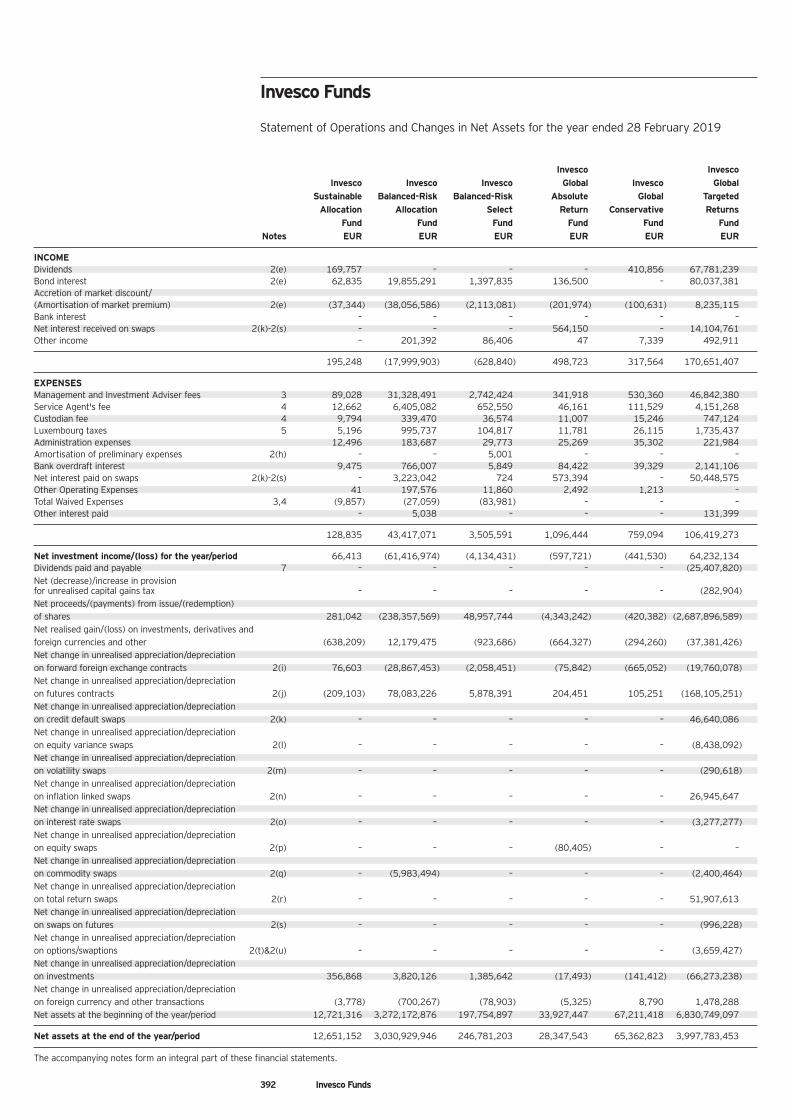
392 Invesco Funds
Invesco Invesco Invesco Invesco Invesco Global Invesco Global
Sustainable Balanced-Risk Balanced-Risk Absolute Global Targeted Allocation Allocation Select Return Conservative Returns
Fund Fund Fund Fund Fund Fund Notes EUR EUR EUR EUR EUR EUR
INCOME Dividends 2(e) 169,757 – – – 410,856 67,781,239 Bond interest 2(e) 62,835 19,855,291 1,397,835 136,500 – 80,037,381 Accretion of market discount/ (Amortisation of market premium) 2(e) (37,344) (38,056,586) (2,113,081) (201,974) (100,631) 8,235,115 Bank interest – – – – – – Net interest received on swaps 2(k)-2(s) – – – 564,150 – 14,104,761 Other income – 201,392 86,406 47 7,339 492,911
195,248 (17,999,903) (628,840) 498,723 317,564 170,651,407
EXPENSES Management and Investment Adviser fees 3 89,028 31,328,491 2,742,424 341,918 530,360 46,842,380 Service Agent's fee 4 12,662 6,405,082 652,550 46,161 111,529 4,151,268 Custodian fee 4 9,794 339,470 36,574 11,007 15,246 747,124 Luxembourg taxes 5 5,196 995,737 104,817 11,781 26,115 1,735,437 Administration expenses 12,496 183,687 29,773 25,269 35,302 221,984 Amortisation of preliminary expenses 2(h) – – 5,001 – – – Bank overdraft interest 9,475 766,007 5,849 84,422 39,329 2,141,106 Net interest paid on swaps 2(k)-2(s) – 3,223,042 724 573,394 – 50,448,575 Other Operating Expenses 41 197,576 11,860 2,492 1,213 – Total Waived Expenses 3,4 (9,857) (27,059) (83,981) – – – Other interest paid – 5,038 – – – 131,399
128,835 43,417,071 3,505,591 1,096,444 759,094 106,419,273
Net investment income/(loss) for the year/period 66,413 (61,416,974) (4,134,431) (597,721) (441,530) 64,232,134 Dividends paid and payable 7 – – – – – (25,407,820) Net (decrease)/increase in provision for unrealised capital gains tax – – – – – (282,904) Net proceeds/(payments) from issue/(redemption) of shares 281,042 (238,357,569) 48,957,744 (4,343,242) (420,382) (2,687,896,589) Net realised gain/(loss) on investments, derivatives and foreign currencies and other (638,209) 12,179,475 (923,686) (664,327) (294,260) (37,381,426) Net change in unrealised appreciation/depreciation on forward foreign exchange contracts 2(i) 76,603 (28,867,453) (2,058,451) (75,842) (665,052) (19,760,078) Net change in unrealised appreciation/depreciation on futures contracts 2(j) (209,103) 78,083,226 5,878,391 204,451 105,251 (168,105,251) Net change in unrealised appreciation/depreciation on credit default swaps 2(k) – – – – – 46,640,086 Net change in unrealised appreciation/depreciation on equity variance swaps 2(l) – – – – – (8,438,092) Net change in unrealised appreciation/depreciation on volatility swaps 2(m) – – – – – (290,618) Net change in unrealised appreciation/depreciation on inflation linked swaps 2(n) – – – – – 26,945,647 Net change in unrealised appreciation/depreciation on interest rate swaps 2(o) – – – – – (3,277,277) Net change in unrealised appreciation/depreciation on equity swaps 2(p) – – – (80,405) – – Net change in unrealised appreciation/depreciation on commodity swaps 2(q) – (5,983,494) – – – (2,400,464) Net change in unrealised appreciation/depreciation on total return swaps 2(r) – – – – – 51,907,613 Net change in unrealised appreciation/depreciation on swaps on futures 2(s) – – – – – (996,228) Net change in unrealised appreciation/depreciation on options/swaptions 2(t)&2(u) – – – – – (3,659,427) Net change in unrealised appreciation/depreciation on investments 356,868 3,820,126 1,385,642 (17,493) (141,412) (66,273,238) Net change in unrealised appreciation/depreciation on foreign currency and other transactions (3,778) (700,267) (78,903) (5,325) 8,790 1,478,288 Net assets at the beginning of the year/period 12,721,316 3,272,172,876 197,754,897 33,927,447 67,211,418 6,830,749,097
Net assets at the end of the year/period 12,651,152 3,030,929,946 246,781,203 28,347,543 65,362,823 3,997,783,453
The accompanying notes form an integral part of these financial statements.
Invesco Funds Statement of Operations and Changes in Net Assets for the year ended 28 February 2019
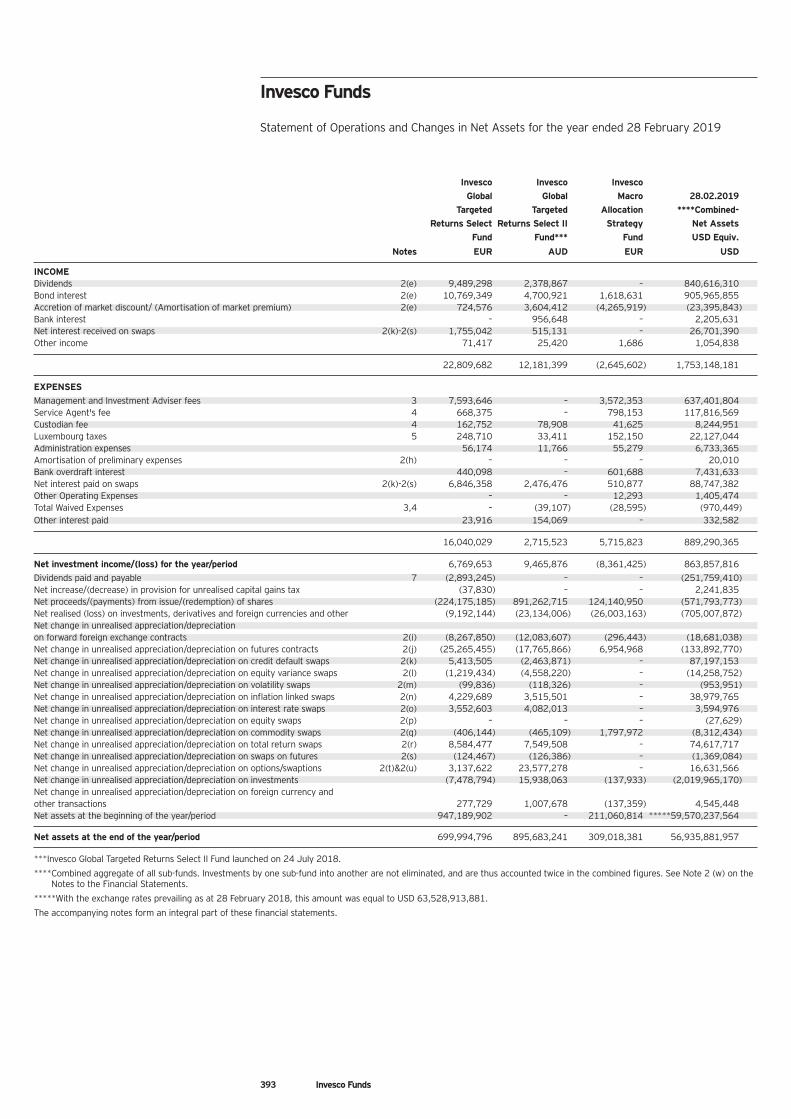
393 Invesco Funds
Invesco Invesco Invesco Global Global Macro 28.02.2019 Targeted Targeted Allocation ****Combined- Returns Select Returns Select II Strategy Net Assets Fund Fund*** Fund USD Equiv.
Notes EUR AUD EUR USD
INCOME Dividends 2(e) 9,489,298 2,378,867 – 840,616,310 Bond interest 2(e) 10,769,349 4,700,921 1,618,631 905,965,855 Accretion of market discount/ (Amortisation of market premium) 2(e) 724,576 3,604,412 (4,265,919) (23,395,843) Bank interest – 956,648 – 2,205,631 Net interest received on swaps 2(k)-2(s) 1,755,042 515,131 – 26,701,390 Other income 71,417 25,420 1,686 1,054,838
22,809,682 12,181,399 (2,645,602) 1,753,148,181
EXPENSES Management and Investment Adviser fees 3 7,593,646 – 3,572,353 637,401,804 Service Agent's fee 4 668,375 – 798,153 117,816,569 Custodian fee 4 162,752 78,908 41,625 8,244,951 Luxembourg taxes 5 248,710 33,411 152,150 22,127,044 Administration expenses 56,174 11,766 55,279 6,733,365 Amortisation of preliminary expenses 2(h) – – – 20,010 Bank overdraft interest 440,098 – 601,688 7,431,633 Net interest paid on swaps 2(k)-2(s) 6,846,358 2,476,476 510,877 88,747,382 Other Operating Expenses – – 12,293 1,405,474 Total Waived Expenses 3,4 – (39,107) (28,595) (970,449) Other interest paid 23,916 154,069 – 332,582
16,040,029 2,715,523 5,715,823 889,290,365
Net investment income/(loss) for the year/period 6,769,653 9,465,876 (8,361,425) 863,857,816 Dividends paid and payable 7 (2,893,245) – – (251,759,410) Net increase/(decrease) in provision for unrealised capital gains tax (37,830) – – 2,241,835 Net proceeds/(payments) from issue/(redemption) of shares (224,175,185) 891,262,715 124,140,950 (571,793,773) Net realised (loss) on investments, derivatives and foreign currencies and other (9,192,144) (23,134,006) (26,003,163) (705,007,872) Net change in unrealised appreciation/depreciation on forward foreign exchange contracts 2(i) (8,267,850) (12,083,607) (296,443) (18,681,038) Net change in unrealised appreciation/depreciation on futures contracts 2(j) (25,265,455) (17,765,866) 6,954,968 (133,892,770) Net change in unrealised appreciation/depreciation on credit default swaps 2(k) 5,413,505 (2,463,871) – 87,197,153 Net change in unrealised appreciation/depreciation on equity variance swaps 2(l) (1,219,434) (4,558,220) – (14,258,752) Net change in unrealised appreciation/depreciation on volatility swaps 2(m) (99,836) (118,326) – (953,951) Net change in unrealised appreciation/depreciation on inflation linked swaps 2(n) 4,229,689 3,515,501 – 38,979,765 Net change in unrealised appreciation/depreciation on interest rate swaps 2(o) 3,552,603 4,082,013 – 3,594,976 Net change in unrealised appreciation/depreciation on equity swaps 2(p) – – – (27,629) Net change in unrealised appreciation/depreciation on commodity swaps 2(q) (406,144) (465,109) 1,797,972 (8,312,434) Net change in unrealised appreciation/depreciation on total return swaps 2(r) 8,584,477 7,549,508 – 74,617,717 Net change in unrealised appreciation/depreciation on swaps on futures 2(s) (124,467) (126,386) – (1,369,084) Net change in unrealised appreciation/depreciation on options/swaptions 2(t)&2(u) 3,137,622 23,577,278 – 16,631,566 Net change in unrealised appreciation/depreciation on investments (7,478,794) 15,938,063 (137,933) (2,019,965,170) Net change in unrealised appreciation/depreciation on foreign currency and other transactions 277,729 1,007,678 (137,359) 4,545,448 Net assets at the beginning of the year/period 947,189,902 – 211,060,814 *****59,570,237,564
Net assets at the end of the year/period 699,994,796 895,683,241 309,018,381 56,935,881,957
***Invesco Global Targeted Returns Select II Fund launched on 24 July 2018.
****Combined aggregate of all sub-funds. Investments by one sub-fund into another are not eliminated, and are thus accounted twice in the combined figures. See Note 2 (w) on the Notes to the Financial Statements.
*****With the exchange rates prevailing as at 28 February 2018, this amount was equal to USD 63,528,913,881.
The accompanying notes form an integral part of these financial statements.
Invesco Funds Statement of Operations and Changes in Net Assets for the year ended 28 February 2019
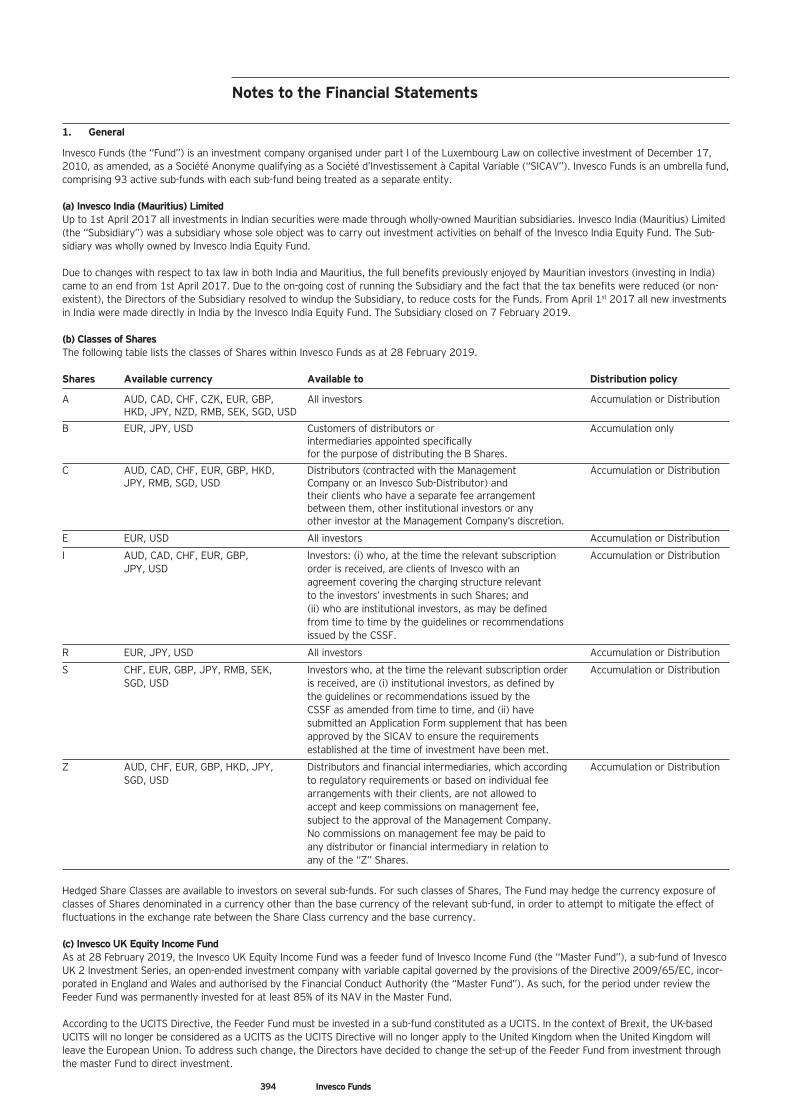
394 Invesco Funds
Notes to the Financial Statements
1. General
Invesco Funds (the “Fund”) is an investment company organised under part I of the Luxembourg Law on collective investment of December 17, 2010, as amended, as a Société Anonyme qualifying as a Société d’Investissement à Capital Variable (“SICAV”). Invesco Funds is an umbrella fund, comprising 93 active sub-funds with each sub-fund being treated as a separate entity. (a) Invesco India (Mauritius) Limited Up to 1st April 2017 all investments in Indian securities were made through wholly-owned Mauritian subsidiaries. Invesco India (Mauritius) Limited (the “Subsidiary”) was a subsidiary whose sole object was to carry out investment activities on behalf of the Invesco India Equity Fund. The Sub-sidiary was wholly owned by Invesco India Equity Fund. Due to changes with respect to tax law in both India and Mauritius, the full benefits previously enjoyed by Mauritian investors (investing in India) came to an end from 1st April 2017. Due to the on-going cost of running the Subsidiary and the fact that the tax benefits were reduced (or non-existent), the Directors of the Subsidiary resolved to windup the Subsidiary, to reduce costs for the Funds. From April 1st 2017 all new investments in India were made directly in India by the Invesco India Equity Fund. The Subsidiary closed on 7 February 2019. (b) Classes of Shares The following table lists the classes of Shares within Invesco Funds as at 28 February 2019. Shares Available currency Available to Distribution policy
A AUD, CAD, CHF, CZK, EUR, GBP, All investors Accumulation or Distribution HKD, JPY, NZD, RMB, SEK, SGD, USD
B EUR, JPY, USD Customers of distributors or Accumulation only intermediaries appointed specifically for the purpose of distributing the B Shares.
C AUD, CAD, CHF, EUR, GBP, HKD, Distributors (contracted with the Management Accumulation or Distribution JPY, RMB, SGD, USD Company or an Invesco Sub-Distributor) and
their clients who have a separate fee arrangement between them, other institutional investors or any other investor at the Management Company’s discretion.
E EUR, USD All investors Accumulation or Distribution
I AUD, CAD, CHF, EUR, GBP, Investors: (i) who, at the time the relevant subscription Accumulation or Distribution JPY, USD order is received, are clients of Invesco with an
agreement covering the charging structure relevant to the investors’ investments in such Shares; and (ii) who are institutional investors, as may be defined from time to time by the guidelines or recommendations issued by the CSSF.
R EUR, JPY, USD All investors Accumulation or Distribution
S CHF, EUR, GBP, JPY, RMB, SEK, Investors who, at the time the relevant subscription order Accumulation or Distribution SGD, USD is received, are (i) institutional investors, as defined by
the guidelines or recommendations issued by the CSSF as amended from time to time, and (ii) have submitted an Application Form supplement that has been approved by the SICAV to ensure the requirements established at the time of investment have been met.
Z AUD, CHF, EUR, GBP, HKD, JPY, Distributors and financial intermediaries, which according Accumulation or Distribution SGD, USD to regulatory requirements or based on individual fee
arrangements with their clients, are not allowed to accept and keep commissions on management fee, subject to the approval of the Management Company. No commissions on management fee may be paid to any distributor or financial intermediary in relation to any of the “Z” Shares.
Hedged Share Classes are available to investors on several sub-funds. For such classes of Shares, The Fund may hedge the currency exposure of classes of Shares denominated in a currency other than the base currency of the relevant sub-fund, in order to attempt to mitigate the effect of fluctuations in the exchange rate between the Share Class currency and the base currency. (c) Invesco UK Equity Income Fund As at 28 February 2019, the Invesco UK Equity Income Fund was a feeder fund of Invesco Income Fund (the “Master Fund”), a sub-fund of Invesco UK 2 Investment Series, an open-ended investment company with variable capital governed by the provisions of the Directive 2009/65/EC, incor-porated in England and Wales and authorised by the Financial Conduct Authority (the “Master Fund”). As such, for the period under review the Feeder Fund was permanently invested for at least 85% of its NAV in the Master Fund. According to the UCITS Directive, the Feeder Fund must be invested in a sub-fund constituted as a UCITS. In the context of Brexit, the UK-based UCITS will no longer be considered as a UCITS as the UCITS Directive will no longer apply to the United Kingdom when the United Kingdom will leave the European Union. To address such change, the Directors have decided to change the set-up of the Feeder Fund from investment through the master Fund to direct investment.
395 Invesco Funds
1. General (continued)
(c) Invesco UK Equity Income Fund (continued) The process to move the Feeder Fund to a direct investment vehicle occurred on the 18 March 2019 the investment objective and policy was also amended in order to be aligned with the current Master Fund. Investment Objective and Policy of the Master Fund for the Financial Year Ending 28 February 2019 As at the 28 February 2019, the Master Fund aimed to achieve a reasonable level of income, together with capital growth. The Master Fund invested primarily in UK companies, with the balance invested internationally. In pursuing this objective, the fund manager included investments that they consider appropriate which include transferable securities, unlisted securities, money market instruments, warrants, collective investment schemes, deposits and other permitted investments and transactions. Based on the audited annual report of the Master Fund as of 31 March 2019, the Master Fund invests 4.95% of its Net Assets in unquoted securities.
The prospectus, KIIDs, Articles of Incorporation, the most recent annual and interim reports and the material contracts of the Master Fund are available on the website http://www.invescoperpetual.co.uk.
Fund name Net Assets Value as at Total Expenses for period from 28 February 2019 01 March 2018 to 28 February 2019
GBP GBP
Invesco Perpetual Income Fund (Master Fund) 3,303,509,953 53,467,600
Invesco UK Equity Income Fund (Feeder Fund) 28,708,346 –
All of the fees of the Invesco UK Equity Income Fund are paid by the Management Company.
Based on the above figures the percentage ownership of the Master Fund is 0.87%.
(d) Activity of the Fund Activity on the Fund since 28 February 2018:
Share Class Launch Effective 8 March 2018 the following Share Classes were launched:
Invesco Emerging Market Structured Equity Fund Z (EUR Hedged) Accumulation Invesco Global Equity Income Fund Z (EUR Hedged) Accumulation Invesco Global Opportunities Fund A (USD) Annual Distribution Invesco Global Opportunities Fund C (USD) Annual Distribution Invesco Global Opportunities Fund E (EUR) Accumulation Invesco Global Opportunities Fund Z (USD) Annual Distribution Invesco US Equity Fund B (USD) Annual Distribution Invesco US Equity Fund C (USD) Annual Distribution Invesco US Equity Fund Z (USD) Annual Distribution Invesco Pan European Focus Equity Fund Z (EUR) Accumulation Invesco Pan European Structured Equity Fund Z (EUR Portfolio Hedged) Accumulation Invesco Japanese Equity Advantage Fund Z (EUR Hedged) Accumulation Invesco Japanese Equity Dividend Growth Fund B (USD) Annual Distribution Invesco Asia Opportunities Equity Fund A (USD) Semi-Annual Distribution Invesco Asia Opportunities Equity Fund A (AUD Hedged) Monthly Distribution-1 Invesco Asia Opportunities Equity Fund A (NZD Hedged) Monthly Distribution-1 Invesco Asia Opportunities Equity Fund A (CHF Hedged) Accumulation Invesco Asia Opportunities Equity Fund A (EUR Hedged) Accumulation Invesco Asia Opportunities Equity Fund C (EUR Hedged) Accumulation Invesco Asia Opportunities Equity Fund Z (USD) Annual Distribution Invesco Asia Opportunities Equity Fund Z (EUR) Accumulation Invesco Asia Opportunities Equity Fund Z (EUR Hedged) Accumulation Invesco Global Leisure Fund Z (EUR) Accumulation Invesco Global Leisure Fund Z (EUR Hedged) Accumulation Invesco Global Income Real Estate Securities Fund C (GBP Hedged) Accumulation Invesco Gold & Precious Metals Fund Z (USD) Accumulation Invesco Emerging Market Corporate Bond Fund A (USD) Monthly Distribution-1 Invesco Global High Yield Short Term Bond Fund I (USD) Monthly Distribution Invesco India Bond Fund A (SGD) Gross - Monthly Distribution Invesco India Bond Fund S (USD) Accumulation Invesco India Bond Fund Z (EUR) Accumulation Invesco India Bond Fund Z (EUR Hedged) Accumulation Invesco Macro Allocation Strategy Fund C (GBP Hedged) Accumulation
Share Class Liquidation Effective 8 March 2018 the following Share Classes were liquidated:
Invesco Global Opportunities Fund A (CHF Hedged) Accumulation Invesco US Equity Fund Z (GBP) Accumulation Invesco Pan European Structured Equity Fund C (USD) Annual Distribution Invesco Greater China Equity Fund A (NZD Hedged) Accumulation
Notes to the Financial Statements (continued)
396 Invesco Funds
1. General (continued)
(d) Activity of the Fund (continued) Share Class Liquidation (continued)
Invesco Global Income Real Estate Securities Fund C (RMB) Accumulation Invesco Active Multi-Sector Credit Fund C (RMB) Accumulation Invesco Asian Bond Fund C (RMB Hedged) Accumulation Invesco Unconstrained Bond Fund C (RMB) Accumulation Invesco Balanced-Risk Allocation Fund C (RMB) Accumulation Invesco Global Conservative Fund S (EUR) Accumulation Invesco Global Targeted Returns Select Fund I (EUR) Accumulation
Prospectus On the 4 April 2018 a new Prospectus was issued. Effective 4 April 2018 there was a management fee reduction on the Euro Short Term Bond Fund classes affected. Share class Previous Management fees Reviewed Management fees A 0.70% 0.60% B 0.70% 0.60% C 0.40% 0.40% E 0.90% 0.80% R 0.70% 0.60% S 0.35% 0.30% Z 0.35% 0.30% Share Class Launch Effective 13 June 2018 the following Share Classes were launched:
Invesco Emerging Market Structured Equity Fund C (GBP Hedged) Accumulation Invesco Emerging Market Structured Equity Fund I (EUR Hedged) Accumulation Invesco Global Structured Equity Fund Z (USD) Accumulation Invesco Euro Equity Fund Z (CHF Hedged) Accumulation Invesco Euro Structured Equity Fund S (EUR) Accumulation Invesco Japanese Equity Dividend Growth Fund Z (EUR Hedged) Accumulation Invesco Japanese Value Equity Fund S (JPY) Accumulation Invesco Asia Consumer Demand Fund A (SGD Hedged) Accumulation Invesco Global Leisure Fund Z (GBP) Accumulation Invesco Emerging Market Corporate Bond Fund Z (EUR Hedged) Accumulation Invesco Emerging Market Corporate Bond Fund Z (USD) Accumulation Invesco Global Bond Fund Z (EUR Hedged) Accumulation Invesco Global Bond Fund Z (USD) Accumulation Invesco Global Convertible Fund Z (USD) Accumulation Invesco Global Investment Grade Corporate Bond Fund A (CHF Hedged) Accumulation Invesco Global Investment Grade Corporate Bond Fund C (CHF Hedged) Accumulation Invesco Global Investment Grade Corporate Bond Fund Z (CHF Hedged) Accumulation Invesco Global Unconstrained Bond Fund Z (EUR Hedged) Accumulation Invesco India Bond Fund A (EUR Hedged) Accumulation Invesco Real Return (EUR) Bond Fund Z (EUR) Accumulation Invesco USD Reserve Fund Z (USD) Accumulation Invesco US High Yield Bond Fund Z (USD) Accumulation Invesco Global Income Fund I (EUR) Gross - Quarterly Distribution Invesco Global Moderate Allocation Fund Z (EUR Hedged) Accumulation Invesco Global Targeted Returns Fund A (SEK Hedged) Accumulation Invesco Macro Allocation Strategy Fund C (CHF Hedged) Accumulation Invesco Macro Allocation Strategy Fund Z (CHF Hedged) Accumulation
Sub-fund Merger Effective 6 July 2018 the Invesco Asia Infrastructure Fund merged into the Invesco Asia Opportunities Equity Fund. Addendum An Addendum dated 24 July 2018 was issued to the Prospectus dated 4 April 2018. Sub-fund Launch Effective 24 July 2018 the following sub-fund was launched:
Invesco Global Targeted Returns Select II Fund
Notes to the Financial Statements (continued)
397 Invesco Funds
1. General (continued)
(d) Activity of the Fund (continued) Share Class Launch Effective 24 July 2018 the following Share Classes were launched:
Invesco Pan European Equity Fund S (EUR) Accumulation Invesco Macro Allocation Strategy Fund S (EUR) Accumulation
A merger proposal was undertaken in order to simplify Invesco’s cross-border fund offering and improve the client experience. This was achieved by reducing the number of umbrellas, thereby creating efficiencies for clients in their interaction with Invesco. The receiving sub-funds were set up with the same characteristics as the merging fund, thereby allowing for long term continuity and track record of the strategy. As Invesco Funds has a wider distribution network than Invesco Funds Series & Invesco Funds Series 1,2,3,4,5 & 6 (sub-funds mentioned below), which were Irish Umbrella unit trusts authorised by the Central Bank of Ireland it was envisaged that this network would also help increase the assets under management of the Receiving Funds. This will benefit Shareholders through an increase in economies of scale. On the effective dates noted below there were four sub-funds that merged into existing sub-funds of Invesco Funds and seventeen sub-funds that merged into shell sub-funds, detail noted in the below table Irish Umbrella merging sub-funds Invesco Funds receiving sub-funds Effective date of Merger Type of Merger
Invesco Funds Series Invesco Asian Equity Fund Invesco Asian Equity Fund 7 September 2018 Merged into shell sub-fund Invesco Continental European Invesco Continental European 7 September 2018 Merged into shell sub-fund Equity Fund Equity Fund Invesco Global Select Equity Fund Invesco Global Opportunities Fund 7 September 2018 Merged into existing sub-fund Invesco Global Real Estate Invesco Global Real Estate 5 October 2018 Merged into shell sub-fund Securities Fund Securities Fund Invesco Japanese Equity Core Fund Invesco Japanese Equity Core Fund 5 October 2018 Merged into shell sub-fund Invesco UK Equity Fund Invesco UK Equity Fund 5 October 2018 Merged into shell sub-fund Invesco Funds Series 1 - Merging Fund Invesco ASEAN Equity Fund Invesco ASEAN Equity Fund 7 September 2018 Merged into shell sub-fund Invesco Japanese Equity Fund Invesco Japanese Equity Dividend 7 September 2018 Merged into existing sub-fund
Growth Fund Invesco Pacific Equity Fund Invesco Pacific Equity Fund 7 September 2018 Merged into shell sub-fund Invesco Funds Series 2 Invesco Gilt Fund Invesco UK Investment Grade 7 September 2018 Merged into existing sub-fund
Bond Fund Invesco Bond Fund Invesco Bond Fund 5 October 2018 Merged into shell sub-fund Invesco Emerging Markets Bond Fund Invesco Emerging Markets Bond Fund 5 October 2018 Merged into shell sub-fund Invesco Global High Income Fund Invesco Global High Income Fund 5 October 2018 Merged into shell sub-fund Invesco Funds Series 3 Invesco Global Health Care Fund Invesco Global Health Care Fund 7 September 2018 Merged into shell sub-fund Invesco Global Technology Fund Invesco US Equity Fund 7 September 2018 Merged into existing sub-fund Invesco Funds Series 4 Invesco Continental European Invesco Continental European 7 September 2018 Merged into shell sub-fund Small Cap Equity Fund Small Cap Equity Fund Invesco Global Small Cap Equity Fund Invesco Global Small Cap Equity Fund 7 September 2018 Merged into shell sub-fund Invesco Funds Series 5 Invesco Emerging Markets Equity Fund Invesco Emerging Markets Equity Fund 7 September 2018 Merged into shell sub-fund Invesco Korean Equity Fund Invesco Korean Equity Fund 7 September 2018 Merged into shell sub-fund Invesco PRC Equity Fund Invesco PRC Equity Fund 7 September 2018 Merged into shell sub-fund Invesco Funds Series 6 Invesco Sterling Bond Fund Invesco Sterling Bond Fund 5 October 2018 Merged into shell sub-fund Prospectus Effective 26 September 2018 there was a reduction in the Service Agent fee on the Z class from 0.20% to 0.15% on the Invesco Pan European Structured Equity Fund. On the 8 October 2018 a new Prospectus was issued. Sub-fund Launch Effective 8 November 2018 the following sub-funds was launched:
Invesco Belt and Road Debt Fund
Notes to the Financial Statements (continued)
398 Invesco Funds
1. General (continued)
(d) Activity of the Fund (continued) Share Class Launch Effective 8 November 2018 the following share classes were launched:
Invesco Pan European Structured Equity Fund S (EUR) Gross - Quarterly Distribution Invesco Japanese Equity Advantage Fund S (EUR) Accumulation Invesco Japanese Equity Advantage Fund Z (GBP) Accumulation Invesco Asia Consumer Demand Fund Z (USD) Annual Distribution Invesco Asia Opportunities Equity Fund S (USD) Accumulation Invesco Global Leisure Fund A (HKD) Accumulation Invesco Global Leisure Fund S (USD) Accumulation Invesco Global Leisure Fund Z (CHF Hedged) Accumulation Invesco Emerging Market Corporate Bond Fund I (CAD Hedged) Monthly Distribution Invesco Global Income Fund A (CHF Hedged) Accumulation Invesco Global Income Fund S (EUR) Gross - Quarterly Distribution Invesco Global Income Fund Z (CHF Hedged) Accumulation
Sub-fund name change Effective 6 December 2018 the following sub-funds name were changed:
Invesco Global Smaller Companies Equity Fund changed its name to Invesco Developed Small and Mid-Cap Equity Fund. Invesco Japanese Value Equity Fund changed its name to Invesco Japanese Equity Value Discovery Fund. Invesco Global Leisure Fund changed its name to Invesco Global Consumer Trends Fund. Invesco Euro Reserve Fund changed its name to Invesco Euro Ultra-Short Term Debt Fund. Invesco USD Reserve Fund changed its name to Invesco USD Ultra-Short Term Debt Fund.
Share Class Launch Effective 21 February 2019 the following share classes were launched:
Invesco Global Equity Income Fund I (USD) Monthly Distribution-1 Invesco US Structured Equity Fund Z (EUR Hedged) Accumulation Invesco Pan European Small Cap Equity Fund Z (EUR) Accumulation Invesco Japanese Equity Advantage Fund A (USD Hedged) Accumulation Invesco Japanese Equity Advantage Fund C (USD Hedged) Accumulation Invesco Japanese Equity Advantage Fund Z (USD Hedged) Accumulation Invesco Japanese Equity Core Fund Z (EUR Hedged) Accumulation Invesco Nippon Small/Mid Cap Equity Fund S (JPY) Accumulation Invesco ASEAN Equity Fund S (USD) Accumulation Invesco Asia Consumer Demand Fund S (USD) Accumulation Invesco China Focus Equity Fund S (USD) Accumulation Invesco Korean Equity Fund S (USD) Accumulation Invesco Pacific Equity Fund Z (USD) Accumulation Invesco Global Income Real Estate Securities Fund I (USD) Quarterly Distribution Invesco Active Multi-Sector Credit Fund S (GBP Hedged) Quarterly Distribution Invesco Asian Bond Fund Z (USD) Accumulation Invesco Belt and Road Debt Fund A (USD) Monthly Distribution Invesco Belt and Road Debt Fund A (SEK Hedged) Accumulation Invesco Belt and Road Debt Fund R (USD) Monthly Distribution Invesco Belt and Road Debt Fund S (USD) Accumulation Invesco Emerging Local Currencies Debt Fund I (USD) Monthly Distribution Invesco Euro Ultra-Short Term Debt Fund Z (EUR) Accumulation Invesco Global Investment Grade Corporate Bond Fund C (RMB Hedged) Accumulation Invesco Global Investment Grade Corporate Bond Fund I (EUR) Monthly Distribution Invesco Global Total Return (EUR) Bond Fund I (EUR) Monthly Distribution Invesco India Bond Fund I (USD) Monthly Distribution Invesco USD Ultra-Short Term Debt Fund E (USD) Accumulation Invesco USD Ultra-Short Term Debt Fund I (USD) Gross - Monthly Distribution Invesco Asia Balanced Fund S (USD) Accumulation Invesco Global Income Fund A (CZK Hedged) Gross - Annual Distribution Invesco Global Income Fund A (CZK Hedged) Accumulation Invesco Balanced-Risk Allocation Fund C (RMB Hedged) Accumulation
Share Class Liquidation Effective 21 February 2019 the following share classes were liquidated:
Invesco Global Equity Income Fund A (CHF Hedged) Accumulation Invesco Global Equity Income Fund C (EUR Hedged) Annual Distribution Invesco Global Opportunities Fund A (EUR Hedged) Annual Distribution Invesco Latin American Equity Fund Z (USD) Accumulation Invesco Euro Structured Equity Fund C (CHF Hedged) Accumulation
Notes to the Financial Statements (continued)
399 Invesco Funds
1. General (continued)
(d) Activity of the Fund (continued) Share Class Liquidation (continued)
Invesco Euro Structured Equity Fund C (USD Hedged) Accumulation Invesco Euro Structured Equity Fund S (EUR) Annual Distribution Invesco Pan European Equity Income Fund C (EUR) Gross - Quarterly Distribution Invesco Japanese Equity Advantage Fund S (EUR Hedged) Accumulation Invesco Global Equity Market Neutral Fund C (GBP Hedged) Accumulation Invesco Global Equity Market Neutral Fund C (USD Hedged) Accumulation Invesco Global Equity Market Neutral Fund Z (GBP Hedged) Accumulation Invesco Asian Bond Fund S (RMB) Accumulation Invesco Emerging Local Currencies Debt Fund Z (USD) Accumulation Invesco Emerging Market Corporate Bond Fund C (EUR Hedged) Annual Distribution Invesco Global Investment Grade Corporate Bond Fund C (GBP Hedged) Gross - Annual Distribution Invesco Global Investment Grade Corporate Bond Fund S (EUR Hedged) Annual Distribution Invesco Global Investment Grade Corporate Bond Fund Z (EUR) Accumulation Invesco Strategic Income Fund A (EUR Hedged) Annual Distribution Invesco US High Yield Bond Fund Z (EUR) Gross - Annual Distribution Invesco Pan European High Income Fund S (USD Hedged) Accumulation Invesco Balanced-Risk Select Fund Z (EUR) Annual Distribution Invesco Global Absolute Return Fund C (JPY Hedged) Accumulation Invesco Global Targeted Returns Fund S (CHF Hedged) Accumulation Invesco Global Targeted Returns Fund S (GBP Hedged) Accumulation Invesco Global Targeted Returns Fund S (SGD) Accumulation Invesco Global Targeted Returns Fund S (SGD Hedged) Accumulation Invesco Global Targeted Returns Select Fund I (JPY Hedged) Accumulation
(e) Activity of the Fund since 28 February 2019: Effective 18 March 2019 the Invesco Continental European Small Cap Equity Fund had a fee reduction as follows:
Share Class Current Management Fee Proposed New Management Fee A 2.00% 1.50% B 2.00% 1.50% C 1.50% 1.00% S 1.00% 0.75% Z 1.00% 0.75% Prospectus On 18 March 2019 a new prospectus was issued, an addendum to the prospectus was issued in May 2019. Sub-fund name change Effective 18 March 2019 the Invesco Unconstrained Bond Fund changed name to Invesco Global Flexible Bond Fund. Invesco UK Equity Income Fund On 18 March 2019 the Invesco UK Equity Income Fund ceased to operate as a master feeder structure Share Class Launch Effective 28 March 2019 the following share classes were launched:
Invesco UK Equity Income Fund Z (EUR) Accumulation Invesco UK Equity Income Fund Z (USD) Accumulation Invesco Japanese Equity Advantage Fund A (EUR Hedged) Annual Distribution Invesco Japanese Equity Advantage Fund C (EUR Hedged) Gross - Annual Distribution Invesco Japanese Equity Advantage Fund C (JPY) Gross - Annual Distribution Invesco Japanese Equity Advantage Fund C (USD) Gross - Annual Distribution Invesco Japanese Equity Advantage Fund C (USD Hedged) Gross - Annual Distribution Invesco Japanese Equity Advantage Fund S (EUR Hedged) Gross - Annual Distribution Invesco Japanese Equity Advantage Fund S (USD) Gross - Annual Distribution Invesco Japanese Equity Advantage Fund S (USD Hedged) Gross - Annual Distribution Invesco Japanese Equity Advantage Fund S (EUR Hedged) Accumulation Invesco Japanese Equity Advantage Fund Z (EUR Hedged) Gross - Annual Distribution Invesco Japanese Equity Advantage Fund Z (JPY) Gross - Annual Distribution Invesco Japanese Equity Advantage Fund Z (USD Hedged) Gross - Annual Distribution
Sub-fund name change Effective 11 April 2019 the Invesco European Growth Equity Fund changed name to Invesco Pan European Structured Responsible Equity Fund. Share Class Launch Effective 22 May 2019 the following share classes were launched:
Invesco US Equity Fund Z (GBP) Accumulation Invesco US Value Equity Fund Z (EUR) Accumulation
Notes to the Financial Statements (continued)
400 Invesco Funds
1. General (continued)
(e) Activity of the Fund since 28 February 2019: (continued) Share Class Launch (continued)
Invesco US Value Equity Fund Z (GBP) Accumulation Invesco Euro Structured Equity Fund Z (GBP) Accumulation Invesco Japanese Equity Advantage Fund Z (USD) Accumulation Invesco Japanese Equity Core Fund Z (JPY) Accumulation Invesco Japanese Equity Dividend Growth Fund Z (GBP) Accumulation Invesco Japanese Equity Value Discovery Fund Z (GBP) Accumulation Invesco Asia Consumer Demand Fund Z (GBP) Accumulation Invesco Asian Equity Fund S (EUR) Accumulation Invesco China Focus Equity Fund Z (EUR) Annual Distribution Invesco China Focus Equity Fund Z (GBP) Accumulation Invesco India Equity Fund Z (EUR) Accumulation Invesco Global Income Real Estate Securities Fund A (EUR Hedged) Accumulation Invesco Global Income Real Estate Securities Fund A (GBP) Annual Distribution Invesco Global Income Real Estate Securities Fund A (USD) Annual Distribution Invesco Global Income Real Estate Securities Fund I (AUD Hedged) Quarterly Distribution Invesco Global Income Real Estate Securities Fund C (EUR Hedged) Accumulation Invesco Global Income Real Estate Securities Fund Z (USD) Annual Distribution Invesco Global Income Real Estate Securities Fund Z (GBP Hedged) Accumulation Invesco Gold & Precious Metals Fund Z (EUR Hedged) Accumulation Invesco Active Multi-Sector Credit Fund Z (GBP Hedged) Accumulation Invesco Belt and Road Debt Fund Z (EUR) Accumulation Invesco Belt and Road Debt Fund Z (GBP Hedged) Accumulation Invesco Bond Fund S (EUR) Accumulation Invesco Bond Fund S (EUR Hedged) Accumulation Invesco Emerging Markets Bond Fund Z (EUR) Accumulation Invesco Euro Bond Fund Z (GBP Hedged) Accumulation Invesco Euro Short Term Bond Fund Z (GBP Hedged) Accumulation Invesco Global High Income Fund Z (EUR) Accumulation Invesco Global Investment Grade Corporate Bond Fund Z (EUR) Accumulation Invesco Global Investment Grade Corporate Bond Fund Z (GBP Hedged) Accumulation Invesco Real Return (EUR) Bond Fund Z (GBP Hedged) Accumulation Invesco UK Investment Grade Bond Fund Z (GBP) Accumulation Invesco US Investment Grade Corporate Bond Fund Z (GBP Hedged) Accumulation Invesco Pan European High Income Fund S (EUR) Accumulation Invesco Macro Allocation Strategy Fund Z (GBP Hedged) Accumulation
Share Class Liquidation Effective 22 May 2019 the following share classes were liquidated:
Invesco Global Real Estate Securities Fund Class I (EUR) Accumulation Invesco Global Real Estate Securities Fund Class Z (EUR Hedged) Accumulation Invesco Global Real Estate Securities Fund Class Z (EUR) Accumulation
Effective 17 June 2019 the Invesco Belt and Road Fund and Invesco Emerging Market Flexible Bond Fund had a management fee reduction as follows:
Share Class Current Management Fee Proposed New Management Fee S 0.63% 0.62% Z 0.63% 0.62%
Share Class Launch Effective 24 June 2019 the following share classes were launched:
Invesco Euro Equity Fund P1 (Accumulation) CHF Hedged Invesco Euro Equity Fund PI1 (Accumulation) CHF Hedged Invesco Euro Equity Fund P1 (Accumulation) EUR Invesco Euro Equity Fund PI1 (Accumulation) EUR Invesco Euro Equity Fund P1 (Accumulation) GBP Hedged Invesco Euro Equity Fund P1 (Accumulation) USD Hedged Invesco Euro Equity Fund PI1 (Accumulation) USD Hedged
2. Summary of Significant Accounting Policies (a) The accompanying financial statements have been prepared in accordance with the format prescribed by Luxembourg regulations. Combined figures appearing in the Statement of Net Assets are for statistical purposes only and should not be used by investors with holdings in one or more sub-funds.
Notes to the Financial Statements (continued)
401 Invesco Funds
2. Summary of Significant Accounting Policies (continued)
(b) Valuation of investments Investments, including financial derivative instruments, are valued on the basis of the latest dealing price or the latest available midmarket quota-tion (the midpoint between the latest quoted bid and offer prices) of the securities on the relevant securities market on which the investments of the Fund are traded, quoted or dealt as at the Valuation Point on that day. Where investments of a sub-fund are both listed on a stock exchange and dealt by market makers outside the stock exchange on which the investments are listed, then the SICAV will determine the principal market for the investments in question and they are valued at the latest available price in that market. Securities which are not quoted or dealt in any stock exchange but which are dealt in on any other regulated market are valued in a manner as near as possible to that described above. If no price quotation is available for any of the securities held by a sub-fund or if the value as determined pursuant to the points above is not represen-tative of the fair market value of the relevant securities, the value of such securities is based on the reasonably foreseeable sales price determined prudently and in good faith. Short-term money-market Instruments are valued based on amortised cost method. The financial statements have been prepared on the basis of the last Net Asset Values determined in the accounting period. In accordance with the Prospectus, Net Asset Values were calculated by reference to the latest available prices at 1.00 p.m. (Luxembourg time) on 28 February 2019 for all the Invesco sub-funds apart from Global Targeted Returns Select II Fund which is valued at 4 p.m. Eastern Standard Time (EST) on 28 February 2019. (c) Impact on Values By way of information, if the Fund had calculated the Net Asset Values solely with a view to publication, the market prices used to value the invest-ment portfolio would have been the closing prices on 28 February 2019 for the entire investment portfolio, including the American and European equities. However, these Net Asset Values would not have been significantly different from those shown in these audited financial statements ex-cept for the following sub-funds:
Invesco Global Consumer Trends Fund; an decrease in the Net Asset Value of approximately 0.71% would have been observed. Invesco Energy Fund; an decrease in the Net Asset Value of approximately 0.68% would have been observed. Invesco Gold & Precious Metals Fund; an decrease in the Net Asset Value of approximately 0.64% would have been observed. Invesco Latin American Equity Fund; an decrease in the Net Asset Value of approximately 1.42% would have been observed.
(d) Cost of sales of investments Any surplus or deficit on sales of investments is determined on the basis of average cost. (e) Income from investments Dividend income is accounted for on an ex-dividend basis. Income arising on fixed interest securities and deposit interest is accrued on a day-to-day basis. Amortisation/Accretion of Premium/Discount is disclosed under the Income section on the Statement of Operations and Changes in Net Assets (disclosed at year end only). Amortisation is the process of decreasing the book value of a bond purchased at a premium until the book value is equal to the par value at the time of maturity. As the book value is reduced, it is accounted for as a reduction in net investment income. Accretion is the process of writing up the book value of a bond purchased at a discount. As the book value is increased, it is accounted for as an increase in net investment income. The Amortisation/Accretion approach provides a consistent accounting treatment over the life of bond-like as-sets of the capital gain or loss associated with holding these assets. (f) Foreign exchange Transactions in currencies other than the designated currency for each sub-fund are translated at the rates of exchange ruling at the time of the transactions. The market value of the investments and other assets and liabilities in currencies other than the designated currency for each sub-fund are translated at the rates of exchange ruling at the year end. The main exchange rates used as at 28 February 2019: Currency USD 1.00 Currency USD 1.00 Currency USD 1.00
AED 3.6732 GBP 0.7517 PHP 51.7200 ARS 38.7745 HKD 7.8497 PKR 138.6000 AUD 1.4002 HUF 276.8362 PLN 3.7743 BRL 3.7322 IDR 14,067.5004 RON 4.1534 CAD 1.3161 ILS 3.6045 RUB 65.7100 CHF 0.9933 INR 71.1262 SEK 9.1716 CLP 649.3751 JPY 110.7950 SGD 1.3480 CNH 6.6833 KRW 1,124.7001 THB 31.5125 CNY 6.6862 MXN 19.1750 TRY 5.3188 COP 3,070.5002 MYR 4.0665 TWD 30.7765 CZK 22.4456 NOK 8.5197 UYU 32.6850 DKK 6.5354 NZD 1.4618 ZAR 13.9625 EUR 0.8759 PEN 3.2993
Notes to the Financial Statements (continued)
402 Invesco Funds
2. Summary of Significant Accounting Policies (continued)
(f) Foreign exchange (continued) The exchange rates used for the sub-fund Invesco Global Targeted Returns Select II Fund are as at 4 p.m. EST on 28 February 2019: Currency USD 1.00 Currency USD 1.00 Currency USD 1.00
AUD 1.4098 HKD 7.8497 PLN 3.7839 BRL 3.7561 IDR 14,067.5005 RUB 65.9300 CAD 1.3159 INR 71.1262 SEK 9.2360 CHF 0.9981 JPY 111.4650 SGD 1.3520 CNH 6.7009 KRW 1,124.7000 THB 31.5125 DKK 6.5594 MXN 19.2814 TWD 30.7765 EUR 0.8791 NOK 8.5566 ZAR 14.0938 GBP 0.7539 PHP 51.7200 (g) Expenses allocation Where the Fund incurs an expense which relates to a particular sub-fund, such expense is allocated to the relevant sub-fund. In cases where an ex-pense cannot be considered as being attributable to a particular sub-fund, such expense is allocated between sub-funds on the basis of their re-spective Net Asset Values. (h) Preliminary expenses The preliminary expenses will be amortised over the first 5 years. Sub-funds are subject to a maximum amortisation in any accounting year of 0.05% of the average Net Asset Value. Any unamortised expenses at the end of the 5 years or liquidation date will be borne by the Management Company. Preliminary Expenses for Funds launched after October 2015 will be absorbed by the Management Company. (i) Forward foreign exchange contracts The unrealised gain or loss on open forward foreign exchange contracts is calculated as the difference between the contracted rate and the rate to close out the contract and is disclosed in the Statement of Net Assets (see note 8 for details). Realised gains or losses include net results on contracts which have been settled or offset on other contracts and are recorded in the Statement of Operations and Changes in Net Assets (dis-closed at year end only). The unrealised appreciation/depreciation is disclosed in the Statement of Net Assets under “Unrealised gain/(loss) on for-ward foreign exchange contracts” (see note 8 for details). Realised gains/(losses) and changes in unrealised appreciation/depreciation as a result thereof are included in the Statement of Operations and Changes in Net Assets respectively under “Net realised gain/(loss) on investments, deriva-tives and foreign currencies and other” and “Net change in unrealised appreciation/depreciation on forward foreign exchange contracts” (disclosed at year end only). Non-Deliverable Forwards (“NDF”) are short-term forward contracts on thinly traded or non-convertible foreign currencies. Those contracts are valued on the basis of forward exchange rates prevailing at the closing date and applicable to the remaining period until the expiration date. The unrealised gains or losses resulting from NDF are included in the Statement of Net Assets. The NDF are normally quoted and settled in USD. The NDF are disclosed together with other forward foreign exchange contracts in note 8. (j) Futures contracts A futures contract is a legal agreement to buy or sell a particular commodity or financial instrument at a predetermined price at a specified time in the future. Futures contracts are initially recognised at cost and subsequently are re-measured at market value. Market values are obtained from quoted market prices and exchange rates. All futures contracts are carried in assets when amounts are receivable by the Fund and in liabilities when amounts are payable by the Fund. Changes in market values of futures contracts are included in the Statement of Net Assets (see note 9 for details). The unrealised appreciation /depreciation is disclosed in the Statement of Net Assets under “Unrealised gain/(loss) on futures contracts” (see note 9 for details). Realised gains/(losses) and changes in unrealised appreciation/depreciation as a result thereof are included in the State-ment of Operations and Changes in Net Assets respectively under “Net realised gain/(loss) on investments, derivatives and foreign currencies and other” and “Net change in unrealised appreciation/depreciation on futures contracts” (disclosed at year end only). (k) Credit default swaps A credit default swap is a credit derivative transaction in which two parties enter into an agreement, whereby one party pays the other a fixed peri-odic coupon for the specified life of the agreement. The other party makes no payments unless a credit event, relating to a predetermined refer-ence asset occurs. If such an event occurs, the party will then make a payment to the first party and the swap will terminate. The credit default swaps are marked to market daily based upon quotations from market makers and recorded in the Statement of Net Assets (see note 10 for de-tails). The unrealised appreciation /depreciation is disclosed in the Statement of Net Assets under “Unrealised gain/(loss) on credit default swaps” (see note 10 for details). Realised gains/(losses) and changes in unrealised appreciation/depreciation as a result thereof are included in the State-ment of Operations and Changes in Net Assets respectively under “Net realised gain/(loss) on investments, derivatives and foreign currencies and other” and “Net change in unrealised appreciation/depreciation on credit default swaps” (disclosed at year end only). (l) Equity variance swaps An equity variance swap is a bilateral agreement in which each party agrees to exchange cash flows based on the measured variance of a specified underlying asset. One party agrees to exchange a “fixed rate” or strike price payment for the “floating rate” or realised price variance on the underlying asset with respect to the variance notional amount. At the maturity date, a net cash flow is exchanged, where the payoff amount is equivalent to the difference between the realised price variance of the underlying asset and the strike price multiplied by the variance notional amount. Equity variance swaps are marked to market at each NAV calculation date. The estimated market value is based on the valuation el-ements laid down in the contracts, and is obtained from third party pricing agents, market makers or internal models. The unrealised appreci-ation/depreciation is disclosed in the Statement of Net Assets under “Unrealised gain/(loss) on equity variance swaps” (see note 11 for details). Realised gains/(losses) and changes in unrealised appreciation /depreciation as a result thereof are included in the Statement of Operations and Changes in Net Assets respectively under “Net realised gain/(loss) on investments, derivatives and foreign currencies and other” and “Net change in unrealised appreciation/depreciation on equity variance swaps” (disclosed at year end only).
Notes to the Financial Statements (continued)
403 Invesco Funds
2. Summary of Significant Accounting Policies (continued)
(m) Volatility swaps A volatility swap is a bilateral agreement in which each party agrees to exchange cash flows based on the measured volatility of a specified under-lying asset. One party agrees to exchange a “fixed rate” or strike price payment for the “floating rate” or realised price volatility on the underlying asset with respect to the volatility notional amount. At the maturity date, a net cash flow is exchanged, where the payoff amount is equivalent to the difference between the realised price volatility of the underlying asset and the strike price multiplied by the volatility notional amount. Volatility swaps are marked to market at each ‘NAV calculation date. The estimated market value is based on the valuation elements laid down in the contracts, and is obtained from third party pricing agents, market makers or internal models. The unrealised appreciation/depreciation is disclosed in the Statement of Net Assets under “Unrealised gain/(loss) on volatility swaps” (see note 12 for details). Realised gains/(losses) and changes in unrealised appreciation/depreciation as a result thereof are included in the Statement of Operations and Changes in Net Assets respectively under “Net realised gain/(loss) on investments, derivatives and foreign currencies and other” and “Net change in unrealised appreciation/depreciation on volatility swaps” (disclosed at year end only). (n) Inflation linked swaps An inflation linked swap is a swap used to transfer inflation risk from one party to another through an exchange of cash flows. In an inflation linked swap, one party pays a fixed rate on a notional principal amount, while the other party pays a floating rate linked to an inflation index. Inflation linked swaps are marked to market at each NAV calculation date. The estimated market value is based on the valuation elements laid down in the contracts, and is obtained from third party pricing agents, market makers or internal models. The unrealised appreciation/depreciation is disclosed in the Statement of Net Assets under “Unrealised gain/(loss) on inflation linked swaps” (see note 13 for details). Realised gains/(losses) and changes in unrealised appreciation /depreciation as a result thereof are included in the Statement of Operations and Changes in Net Assets re-spectively under “Net realised gain/(loss) on investments, derivatives and foreign currencies and other” and “Net change in unrealised appreci-ation/depreciation on inflation linked swaps” (disclosed at year end only). (o) Interest rate swaps An interest rate swap is a bilateral agreement in which each of the parties agrees to exchange a series of interest payments for another series of payments (usually fixed/floating) based on a notional amount that serves as a computation basis and that is usually not exchanged. The interest rate swaps are marked to market daily based upon quotations from market makers and recorded in the Statement of Net Assets (see note 14 for details). The unrealised appreciation/depreciation is disclosed in the Statement of Net Assets under “Unrealised gain/(loss) on interest rate swaps” (see note 14 for details). Realised gains/(losses) and changes in unrealised appreciation/depreciation as a result thereof are included in the State-ment of Operations and Changes in Net Assets respectively under “Net realised gain/(loss) on investments, derivatives and foreign currencies and other” and “Net change in unrealised appreciation/depreciation on interest rate swaps” (disclosed at year end only). (p) Equity swaps An equity swap is a derivative transaction in which the Fund and the counterparty enter into an agreement whereby one party pays the returns generated by an equity or a basket of equities. The other party pays interest based on the agreed notional amount of the transaction. The value of equity swap transactions is the net present value of all cash flows, both inflows and outflows. Equity swaps are recorded in the Statement of Net Assets (see note 15 for details). The unrealised appreciation/depreciation is disclosed in the Statement of Net Assets under “Unrealised gain/(loss) on equity swaps” (see note 15 for details). Realised gains/(losses) and changes in unrealised appreciation/depreciation as a result thereof are in-cluded in the Statement of Operations and Changes in Net Assets respectively under “Net realised gain/(loss) on investments, derivatives and for-eign currencies and other” and “Net change in unrealised appreciation/depreciation on equity swaps” (disclosed at year end only). (q) Commodity swaps A commodity swap is similar to a Fixed-Floating interest rate swap. The difference is that in an interest rate swap the floating leg is based on stan-dard interest rates such as LIBOR, EURIBOR etc. but in a commodity swap the floating leg is based on the price of underlying commodity index. No commodities are exchanged during the trade. Commodity swaps are marked-to-market using valuation sources/methods and the fair value is re-corded on the Statement of Net Assets under “Unrealised gain/(loss) on commodity swaps” (see note 16 for details). The realised gains/(losses) and change in unrealised gains and losses are shown in the “Net realised gain/(loss) on investments, derivatives and foreign currencies and other” and the “Net change in unrealised appreciation/depreciation on commodity swaps” respectively in the Statement of Operations and Changes in Net Assets (disclosed at year end only). (r) Total return swaps A total return swap is a financial contract whereby one party agrees to pay another party the total return of a defined asset in return for receiving a floating rate return. The Fund enters into unfunded swap agreements on behalf of the particular sub-fund. Total return swaps are marked-to-mar-ket using valuation sources/methods and fair value is recorded in the Statement of Net Assets. Total return swap positions are valued using models which utilise observable data to the extent practicable and contain assumptions on the application of this data. Changes in data inputs and as-sumptions about these factors could affect the reported fair value of the total return swaps. The unrealised appreciation/depreciation is disclosed in the Statement of Net Assets under “Unrealised gain/(loss) on total return swaps” (see note 17 for details). Realised gains/(losses) and changes in unrealised appreciation/depreciation as a result thereof are included in the Statement of Operations and Changes in Net Assets respectively under “Net realised gain/(loss) on investments, derivatives and foreign currencies and other” and “Net change in unrealised appreciation/depreci-ation on total return swaps” (disclosed at year end only).
Notes to the Financial Statements (continued)
404 Invesco Funds
2. Summary of Significant Accounting Policies (continued)
(s) Swaps on futures The swaps on future is a financial contract whereby one party agrees to pay another party a fee or a premium depending on the underlying fu-tures price at close compared to the underlying futures price at open and whether they are long or short. The Fund enters into unfunded swap agreements on behalf of the particular sub-fund. Swaps on futures are marked-to-market using valuation sources/methods and the fair value is re-corded in the Statement of Net Assets. Swaps on future positions are valued using models which utilise observable data to the extent practicable and contain assumptions on the application of this data. Changes in data inputs and assumptions about these factors could affect the reported fair value of the swaps on future. The unrealised appreciation /depreciation is disclosed in the Statement of Net Assets under “Unrealised gain/(loss) on swaps on future” (see note 18 for details). Realised gains/(losses) and changes in unrealised appreciation/depreciation as a result thereof are included in the Statement of Operations and Changes in Net Assets respectively under “Net realised gain/(loss) on investments, derivatives and foreign currencies and other” and “Net change in unrealised appreciation/depreciation on swaps on futures” (disclosed at year end only). (t) Options A purchaser of a put option has the right, but not the obligation, to sell the underlying instrument at an agreed upon price (“strike price”) to the option seller. A purchaser of a call option has the right, but not the obligation, to purchase the underlying instrument at the strike price from the option seller. Purchased options – Premiums paid by the Fund for purchased options are included in the Statement of Net Assets as an investment. The option is adjusted daily to reflect the current market value of the option and the change is recorded as unrealised appreciation or depreciation. If the option is allowed to expire the Fund will lose the entire premium it paid and record a realised loss for the premium amount. Premiums paid for purchased options which are exercised or closed are added to the amounts paid or offset against the proceeds on the underlying investment transaction to determine the realised gain/loss or cost basis of the security. Written options - Premiums received by the Fund for written options are included in the Statement of Net Assets. The amount of the liability is ad-justed daily to reflect the current market value of the written option and the change in market value is recorded as unrealised appreciation or de-preciation. Premiums received from written options that expire are treated as realised gains. The Fund records a realised gain or loss on written options based on whether the cost of the closing transaction exceeds the premium received. If a call option is exercised by the option buyer, the premium received by the Fund is added to the proceeds from the sale of the underlying security to the option buyer and compared to the cost of the closing transaction to determine whether there has been a realised gain or loss. If a put option is exercised by an option buyer, the premium received by the option seller reduces the cost basis of the purchased security. Written uncovered call options subject the Fund to unlimited risk of loss. Written covered call options limit the upside potential of a security above the strike price. Written put options subject the Fund to risk of loss if the value of the security declines below the exercise price minus the put premium. Outstanding options traded on a regulated market are valued based on the closing price or the last available market price of the instruments. OTC options are marked to market based upon daily prices obtained from third party pricing agents and verified against the value from the counter-party. The unrealised gain/(loss) on options is included in the Statement of Net Assets (see note 19 for details). The unrealised appreciation/depreciation is disclosed in the Statement of Net Assets under “Unrealised gain/(loss) on options/swaptions” (see note 19 for details). Realised gains/(losses) and changes in unrealised appreciation/depreciation as a result thereof are included in the Statement of Op-erations and Changes in Net Assets respectively under “Net realised gain/(loss) on investments, derivatives and foreign currencies and other” and “Net change in unrealised appreciation/depreciation on options/swaptions” (disclosed at year end only). (u) Swaption A swaption (swap option) is the option to enter into an interest rate swap or some other type of swap. In exchange for an option premium, the buyer gains the right but not the obligation to enter into a specified swap agreement with the issuer on a specified future date. There are two dif-ferent kinds of swaptions: a payer swaption and a receiver swaption. In a payer swaption, the purchaser has the right, but not the obligation, to enter into a swap contract where he becomes the fixed-rate payer and the floating-rate receiver. A receiver swaption is the opposite; the purchaser has the option to enter into a swap contract where he will receive the fixed rate and pay the floating rate. The unrealised appreciation/depreciation is disclosed in the Statement of Net Assets under “Unrealised gain/(loss) on options/swaptions” (see note 19 for details). Realised gains/(losses) and changes in unrealised appreciation/depreciation as a result thereof are included in the Statement of Operations and Changes in Net Assets re-spectively under “Net realised gain/(loss) on investments, derivatives and foreign currencies and other” and “Net change in unrealised appreci-ation/depreciation on options/swaptions” (disclosed at year end only). (v) Margin Accounts Margin accounts represent the variation margin held at brokers for futures contracts, interest rate swaps, equity swaps and credit default swaps. Margin is only applicable to centrally cleared positions. (w) Cross Investments Cross sub-fund investment holdings were not eliminated from the combined figures. At 28 February 2019, the total cross sub-fund investment holdings on: Invesco Bond Fund amounted to USD 4,082,059 into Invesco Active Multi-Sector Credit Fund. Invesco Euro Bond Fund amounted to EUR 9,848,215 into Invesco Active Multi-Sector Credit Fund (USD equivalent (year end rate 1 USD=EUR 0.8759) is USD 11,243,150). Invesco Euro Short Term Bond Fund amounted to EUR 1,982,517 into Invesco Active Multi-Sector Credit Fund (USD equivalent (year end rate 1 USD=EUR 0.8759) is USD 2,263,327). Invesco Global High Income Fund amounted to USD 17,036,009 into Invesco Active Multi-Sector Credit Fund. Invesco Global Investment Grade Corporate Bond Fund amounted to USD 13,180,823 into Invesco Active Multi-Sector Credit Fund. Invesco Real Return (EUR) Bond Fund amounted to EUR 486,934 into Invesco Active Multi-Sector Credit Fund (USD equivalent (year end rate 1 USD=EUR 0.8759) is USD 555,905).
Notes to the Financial Statements (continued)
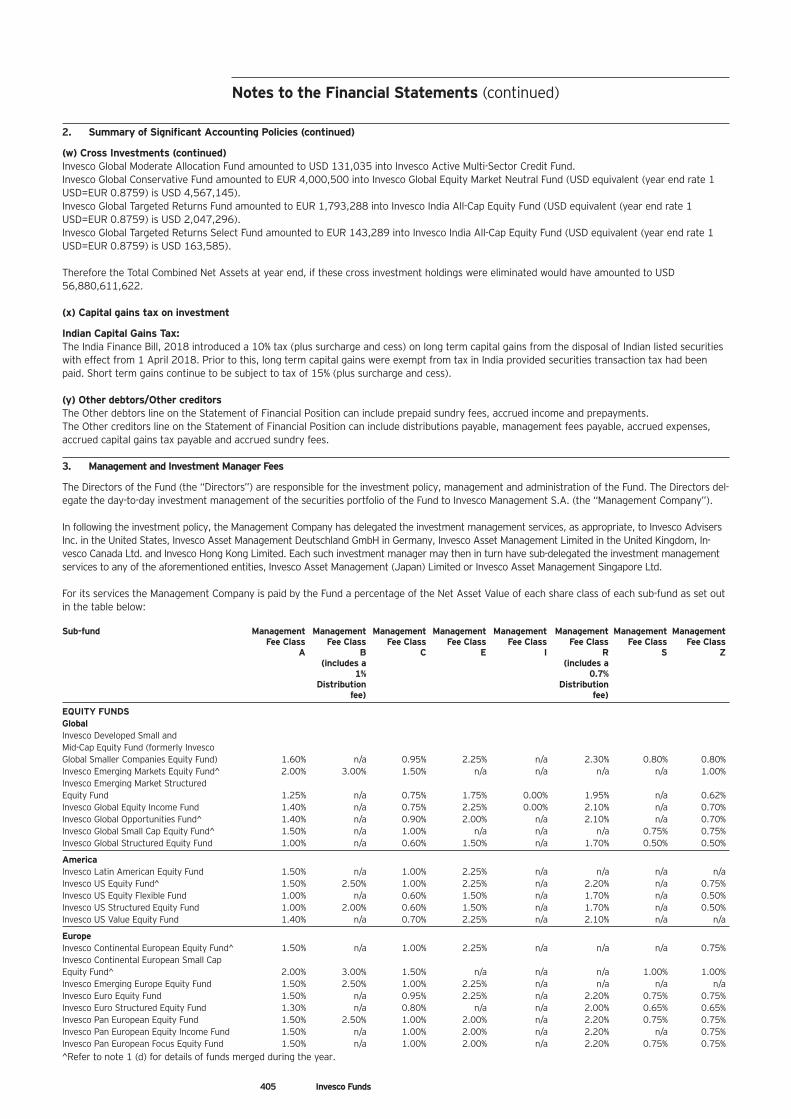
405 Invesco Funds
2. Summary of Significant Accounting Policies (continued)
(w) Cross Investments (continued) Invesco Global Moderate Allocation Fund amounted to USD 131,035 into Invesco Active Multi-Sector Credit Fund. Invesco Global Conservative Fund amounted to EUR 4,000,500 into Invesco Global Equity Market Neutral Fund (USD equivalent (year end rate 1 USD=EUR 0.8759) is USD 4,567,145). Invesco Global Targeted Returns Fund amounted to EUR 1,793,288 into Invesco India All-Cap Equity Fund (USD equivalent (year end rate 1 USD=EUR 0.8759) is USD 2,047,296). Invesco Global Targeted Returns Select Fund amounted to EUR 143,289 into Invesco India All-Cap Equity Fund (USD equivalent (year end rate 1 USD=EUR 0.8759) is USD 163,585). Therefore the Total Combined Net Assets at year end, if these cross investment holdings were eliminated would have amounted to USD 56,880,611,622. (x) Capital gains tax on investment
Indian Capital Gains Tax: The India Finance Bill, 2018 introduced a 10% tax (plus surcharge and cess) on long term capital gains from the disposal of Indian listed securities with effect from 1 April 2018. Prior to this, long term capital gains were exempt from tax in India provided securities transaction tax had been paid. Short term gains continue to be subject to tax of 15% (plus surcharge and cess). (y) Other debtors/Other creditors The Other debtors line on the Statement of Financial Position can include prepaid sundry fees, accrued income and prepayments. The Other creditors line on the Statement of Financial Position can include distributions payable, management fees payable, accrued expenses, accrued capital gains tax payable and accrued sundry fees. 3. Management and Investment Manager Fees
The Directors of the Fund (the “Directors”) are responsible for the investment policy, management and administration of the Fund. The Directors del-egate the day-to-day investment management of the securities portfolio of the Fund to Invesco Management S.A. (the “Management Company”). In following the investment policy, the Management Company has delegated the investment management services, as appropriate, to Invesco Advisers Inc. in the United States, Invesco Asset Management Deutschland GmbH in Germany, Invesco Asset Management Limited in the United Kingdom, In-vesco Canada Ltd. and Invesco Hong Kong Limited. Each such investment manager may then in turn have sub-delegated the investment management services to any of the aforementioned entities, Invesco Asset Management (Japan) Limited or Invesco Asset Management Singapore Ltd. For its services the Management Company is paid by the Fund a percentage of the Net Asset Value of each share class of each sub-fund as set out in the table below: Sub-fund Management Management Management Management Management Management Management Management Fee Class Fee Class Fee Class Fee Class Fee Class Fee Class Fee Class Fee Class A B C E I R S Z (includes a (includes a 1% 0.7% Distribution Distribution fee) fee)
EQUITY FUNDS Global Invesco Developed Small and Mid-Cap Equity Fund (formerly Invesco Global Smaller Companies Equity Fund) 1.60% n/a 0.95% 2.25% n/a 2.30% 0.80% 0.80% Invesco Emerging Markets Equity Fund^ 2.00% 3.00% 1.50% n/a n/a n/a n/a 1.00% Invesco Emerging Market Structured Equity Fund 1.25% n/a 0.75% 1.75% 0.00% 1.95% n/a 0.62% Invesco Global Equity Income Fund 1.40% n/a 0.75% 2.25% 0.00% 2.10% n/a 0.70% Invesco Global Opportunities Fund^ 1.40% n/a 0.90% 2.00% n/a 2.10% n/a 0.70% Invesco Global Small Cap Equity Fund^ 1.50% n/a 1.00% n/a n/a n/a 0.75% 0.75% Invesco Global Structured Equity Fund 1.00% n/a 0.60% 1.50% n/a 1.70% 0.50% 0.50%
America Invesco Latin American Equity Fund 1.50% n/a 1.00% 2.25% n/a n/a n/a n/a Invesco US Equity Fund^ 1.50% 2.50% 1.00% 2.25% n/a 2.20% n/a 0.75% Invesco US Equity Flexible Fund 1.00% n/a 0.60% 1.50% n/a 1.70% n/a 0.50% Invesco US Structured Equity Fund 1.00% 2.00% 0.60% 1.50% n/a 1.70% n/a 0.50% Invesco US Value Equity Fund 1.40% n/a 0.70% 2.25% n/a 2.10% n/a n/a
Europe Invesco Continental European Equity Fund^ 1.50% n/a 1.00% 2.25% n/a n/a n/a 0.75% Invesco Continental European Small Cap Equity Fund^ 2.00% 3.00% 1.50% n/a n/a n/a 1.00% 1.00% Invesco Emerging Europe Equity Fund 1.50% 2.50% 1.00% 2.25% n/a n/a n/a n/a Invesco Euro Equity Fund 1.50% n/a 0.95% 2.25% n/a 2.20% 0.75% 0.75% Invesco Euro Structured Equity Fund 1.30% n/a 0.80% n/a n/a 2.00% 0.65% 0.65% Invesco Pan European Equity Fund 1.50% 2.50% 1.00% 2.00% n/a 2.20% 0.75% 0.75% Invesco Pan European Equity Income Fund 1.50% n/a 1.00% 2.00% n/a 2.20% n/a 0.75% Invesco Pan European Focus Equity Fund 1.50% n/a 1.00% 2.00% n/a 2.20% 0.75% 0.75% ^Refer to note 1 (d) for details of funds merged during the year.
Notes to the Financial Statements (continued)
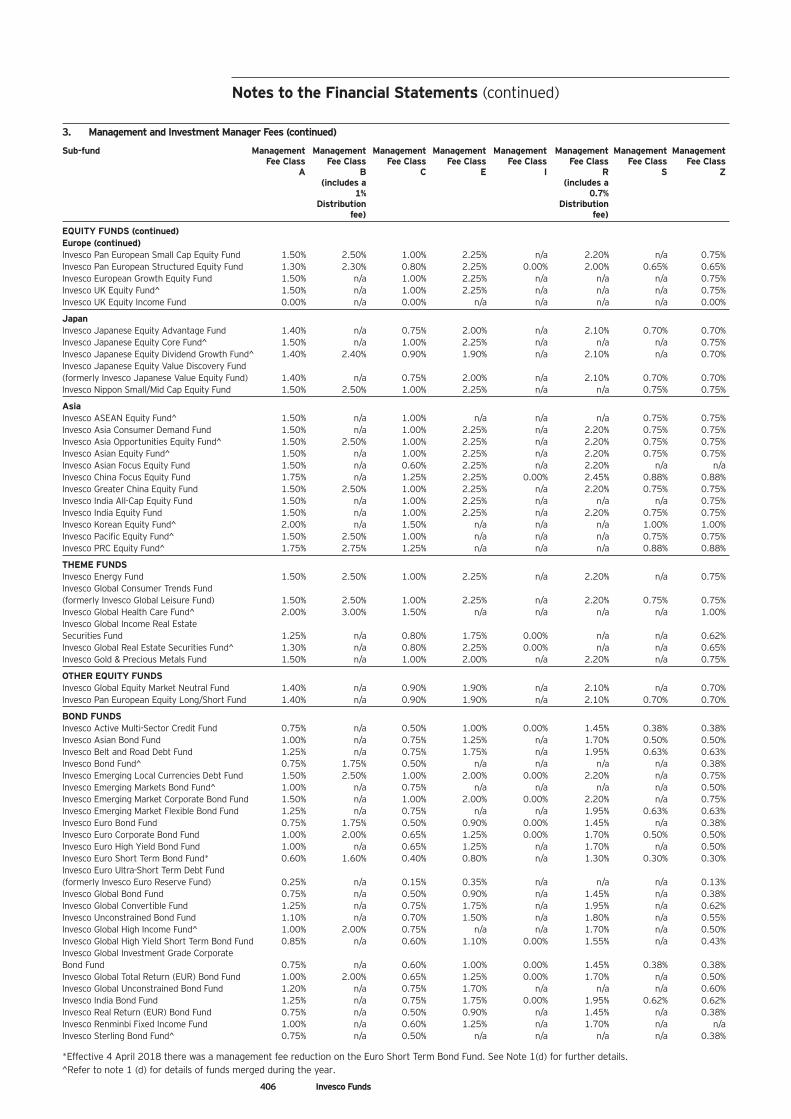
406 Invesco Funds
3. Management and Investment Manager Fees (continued)
Sub-fund Management Management Management Management Management Management Management Management Fee Class Fee Class Fee Class Fee Class Fee Class Fee Class Fee Class Fee Class A B C E I R S Z (includes a (includes a 1% 0.7% Distribution Distribution fee) fee)
EQUITY FUNDS (continued) Europe (continued) Invesco Pan European Small Cap Equity Fund 1.50% 2.50% 1.00% 2.25% n/a 2.20% n/a 0.75% Invesco Pan European Structured Equity Fund 1.30% 2.30% 0.80% 2.25% 0.00% 2.00% 0.65% 0.65% Invesco European Growth Equity Fund 1.50% n/a 1.00% 2.25% n/a n/a n/a 0.75% Invesco UK Equity Fund^ 1.50% n/a 1.00% 2.25% n/a n/a n/a 0.75% Invesco UK Equity Income Fund 0.00% n/a 0.00% n/a n/a n/a n/a 0.00%
Japan Invesco Japanese Equity Advantage Fund 1.40% n/a 0.75% 2.00% n/a 2.10% 0.70% 0.70% Invesco Japanese Equity Core Fund^ 1.50% n/a 1.00% 2.25% n/a n/a n/a 0.75% Invesco Japanese Equity Dividend Growth Fund^ 1.40% 2.40% 0.90% 1.90% n/a 2.10% n/a 0.70% Invesco Japanese Equity Value Discovery Fund (formerly Invesco Japanese Value Equity Fund) 1.40% n/a 0.75% 2.00% n/a 2.10% 0.70% 0.70% Invesco Nippon Small/Mid Cap Equity Fund 1.50% 2.50% 1.00% 2.25% n/a n/a 0.75% 0.75%
Asia Invesco ASEAN Equity Fund^ 1.50% n/a 1.00% n/a n/a n/a 0.75% 0.75% Invesco Asia Consumer Demand Fund 1.50% n/a 1.00% 2.25% n/a 2.20% 0.75% 0.75% Invesco Asia Opportunities Equity Fund^ 1.50% 2.50% 1.00% 2.25% n/a 2.20% 0.75% 0.75% Invesco Asian Equity Fund^ 1.50% n/a 1.00% 2.25% n/a 2.20% 0.75% 0.75% Invesco Asian Focus Equity Fund 1.50% n/a 0.60% 2.25% n/a 2.20% n/a n/a Invesco China Focus Equity Fund 1.75% n/a 1.25% 2.25% 0.00% 2.45% 0.88% 0.88% Invesco Greater China Equity Fund 1.50% 2.50% 1.00% 2.25% n/a 2.20% 0.75% 0.75% Invesco India All-Cap Equity Fund 1.50% n/a 1.00% 2.25% n/a n/a n/a 0.75% Invesco India Equity Fund 1.50% n/a 1.00% 2.25% n/a 2.20% 0.75% 0.75% Invesco Korean Equity Fund^ 2.00% n/a 1.50% n/a n/a n/a 1.00% 1.00% Invesco Pacific Equity Fund^ 1.50% 2.50% 1.00% n/a n/a n/a 0.75% 0.75% Invesco PRC Equity Fund^ 1.75% 2.75% 1.25% n/a n/a n/a 0.88% 0.88%
THEME FUNDS Invesco Energy Fund 1.50% 2.50% 1.00% 2.25% n/a 2.20% n/a 0.75% Invesco Global Consumer Trends Fund (formerly Invesco Global Leisure Fund) 1.50% 2.50% 1.00% 2.25% n/a 2.20% 0.75% 0.75% Invesco Global Health Care Fund^ 2.00% 3.00% 1.50% n/a n/a n/a n/a 1.00% Invesco Global Income Real Estate Securities Fund 1.25% n/a 0.80% 1.75% 0.00% n/a n/a 0.62% Invesco Global Real Estate Securities Fund^ 1.30% n/a 0.80% 2.25% 0.00% n/a n/a 0.65% Invesco Gold & Precious Metals Fund 1.50% n/a 1.00% 2.00% n/a 2.20% n/a 0.75%
OTHER EQUITY FUNDS Invesco Global Equity Market Neutral Fund 1.40% n/a 0.90% 1.90% n/a 2.10% n/a 0.70% Invesco Pan European Equity Long/Short Fund 1.40% n/a 0.90% 1.90% n/a 2.10% 0.70% 0.70%
BOND FUNDS Invesco Active Multi-Sector Credit Fund 0.75% n/a 0.50% 1.00% 0.00% 1.45% 0.38% 0.38% Invesco Asian Bond Fund 1.00% n/a 0.75% 1.25% n/a 1.70% 0.50% 0.50% Invesco Belt and Road Debt Fund 1.25% n/a 0.75% 1.75% n/a 1.95% 0.63% 0.63% Invesco Bond Fund^ 0.75% 1.75% 0.50% n/a n/a n/a n/a 0.38% Invesco Emerging Local Currencies Debt Fund 1.50% 2.50% 1.00% 2.00% 0.00% 2.20% n/a 0.75% Invesco Emerging Markets Bond Fund^ 1.00% n/a 0.75% n/a n/a n/a n/a 0.50% Invesco Emerging Market Corporate Bond Fund 1.50% n/a 1.00% 2.00% 0.00% 2.20% n/a 0.75% Invesco Emerging Market Flexible Bond Fund 1.25% n/a 0.75% n/a n/a 1.95% 0.63% 0.63% Invesco Euro Bond Fund 0.75% 1.75% 0.50% 0.90% 0.00% 1.45% n/a 0.38% Invesco Euro Corporate Bond Fund 1.00% 2.00% 0.65% 1.25% 0.00% 1.70% 0.50% 0.50% Invesco Euro High Yield Bond Fund 1.00% n/a 0.65% 1.25% n/a 1.70% n/a 0.50% Invesco Euro Short Term Bond Fund* 0.60% 1.60% 0.40% 0.80% n/a 1.30% 0.30% 0.30% Invesco Euro Ultra-Short Term Debt Fund (formerly Invesco Euro Reserve Fund) 0.25% n/a 0.15% 0.35% n/a n/a n/a 0.13% Invesco Global Bond Fund 0.75% n/a 0.50% 0.90% n/a 1.45% n/a 0.38% Invesco Global Convertible Fund 1.25% n/a 0.75% 1.75% n/a 1.95% n/a 0.62% Invesco Unconstrained Bond Fund 1.10% n/a 0.70% 1.50% n/a 1.80% n/a 0.55% Invesco Global High Income Fund^ 1.00% 2.00% 0.75% n/a n/a 1.70% n/a 0.50% Invesco Global High Yield Short Term Bond Fund 0.85% n/a 0.60% 1.10% 0.00% 1.55% n/a 0.43% Invesco Global Investment Grade Corporate Bond Fund 0.75% n/a 0.60% 1.00% 0.00% 1.45% 0.38% 0.38% Invesco Global Total Return (EUR) Bond Fund 1.00% 2.00% 0.65% 1.25% 0.00% 1.70% n/a 0.50% Invesco Global Unconstrained Bond Fund 1.20% n/a 0.75% 1.70% n/a n/a n/a 0.60% Invesco India Bond Fund 1.25% n/a 0.75% 1.75% 0.00% 1.95% 0.62% 0.62% Invesco Real Return (EUR) Bond Fund 0.75% n/a 0.50% 0.90% n/a 1.45% n/a 0.38% Invesco Renminbi Fixed Income Fund 1.00% n/a 0.60% 1.25% n/a 1.70% n/a n/a Invesco Sterling Bond Fund^ 0.75% n/a 0.50% n/a n/a n/a n/a 0.38%
*Effective 4 April 2018 there was a management fee reduction on the Euro Short Term Bond Fund. See Note 1(d) for further details. ^Refer to note 1 (d) for details of funds merged during the year.
Notes to the Financial Statements (continued)
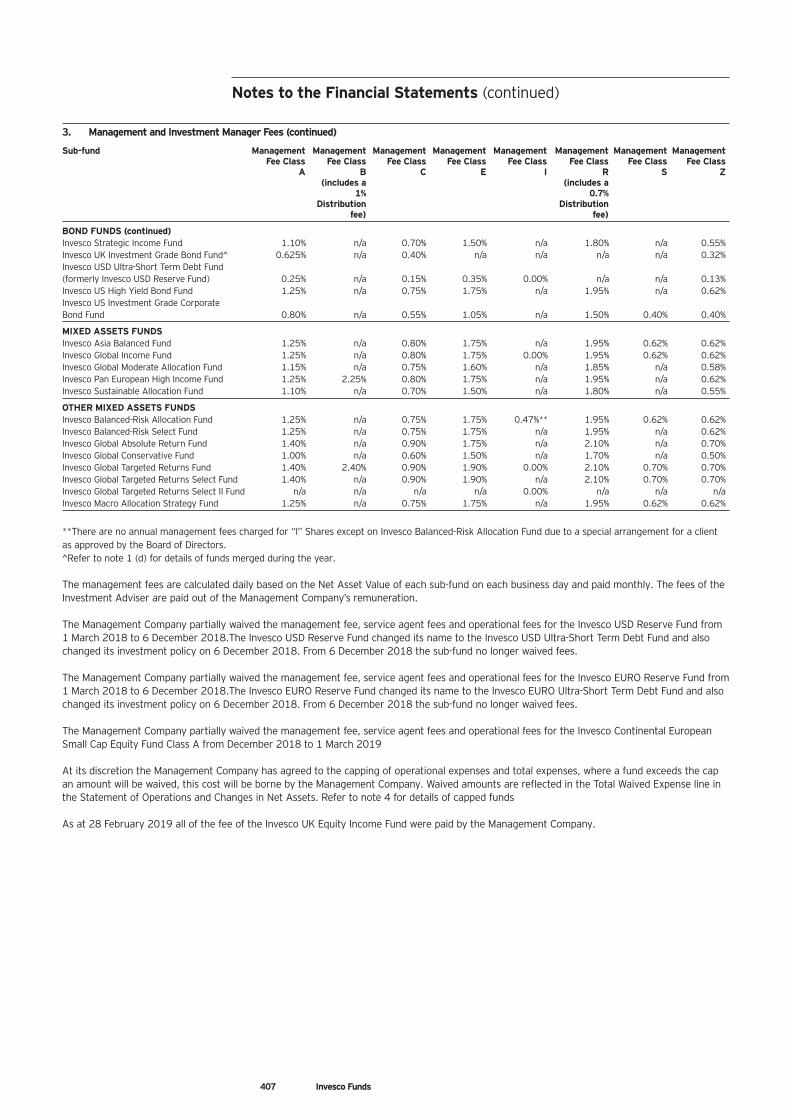
407 Invesco Funds
3. Management and Investment Manager Fees (continued)
Sub-fund Management Management Management Management Management Management Management Management Fee Class Fee Class Fee Class Fee Class Fee Class Fee Class Fee Class Fee Class A B C E I R S Z (includes a (includes a 1% 0.7% Distribution Distribution fee) fee)
BOND FUNDS (continued) Invesco Strategic Income Fund 1.10% n/a 0.70% 1.50% n/a 1.80% n/a 0.55% Invesco UK Investment Grade Bond Fund^ 0.625% n/a 0.40% n/a n/a n/a n/a 0.32% Invesco USD Ultra-Short Term Debt Fund (formerly Invesco USD Reserve Fund) 0.25% n/a 0.15% 0.35% 0.00% n/a n/a 0.13% Invesco US High Yield Bond Fund 1.25% n/a 0.75% 1.75% n/a 1.95% n/a 0.62% Invesco US Investment Grade Corporate Bond Fund 0.80% n/a 0.55% 1.05% n/a 1.50% 0.40% 0.40%
MIXED ASSETS FUNDS Invesco Asia Balanced Fund 1.25% n/a 0.80% 1.75% n/a 1.95% 0.62% 0.62% Invesco Global Income Fund 1.25% n/a 0.80% 1.75% 0.00% 1.95% 0.62% 0.62% Invesco Global Moderate Allocation Fund 1.15% n/a 0.75% 1.60% n/a 1.85% n/a 0.58% Invesco Pan European High Income Fund 1.25% 2.25% 0.80% 1.75% n/a 1.95% n/a 0.62% Invesco Sustainable Allocation Fund 1.10% n/a 0.70% 1.50% n/a 1.80% n/a 0.55%
OTHER MIXED ASSETS FUNDS Invesco Balanced-Risk Allocation Fund 1.25% n/a 0.75% 1.75% 0.47%** 1.95% 0.62% 0.62% Invesco Balanced-Risk Select Fund 1.25% n/a 0.75% 1.75% n/a 1.95% n/a 0.62% Invesco Global Absolute Return Fund 1.40% n/a 0.90% 1.75% n/a 2.10% n/a 0.70% Invesco Global Conservative Fund 1.00% n/a 0.60% 1.50% n/a 1.70% n/a 0.50% Invesco Global Targeted Returns Fund 1.40% 2.40% 0.90% 1.90% 0.00% 2.10% 0.70% 0.70% Invesco Global Targeted Returns Select Fund 1.40% n/a 0.90% 1.90% n/a 2.10% 0.70% 0.70% Invesco Global Targeted Returns Select II Fund n/a n/a n/a n/a 0.00% n/a n/a n/a Invesco Macro Allocation Strategy Fund 1.25% n/a 0.75% 1.75% n/a 1.95% 0.62% 0.62%
**There are no annual management fees charged for “I” Shares except on Invesco Balanced-Risk Allocation Fund due to a special arrangement for a client as approved by the Board of Directors. ^Refer to note 1 (d) for details of funds merged during the year. The management fees are calculated daily based on the Net Asset Value of each sub-fund on each business day and paid monthly. The fees of the Investment Adviser are paid out of the Management Company’s remuneration. The Management Company partially waived the management fee, service agent fees and operational fees for the Invesco USD Reserve Fund from 1 March 2018 to 6 December 2018.The Invesco USD Reserve Fund changed its name to the Invesco USD Ultra-Short Term Debt Fund and also changed its investment policy on 6 December 2018. From 6 December 2018 the sub-fund no longer waived fees. The Management Company partially waived the management fee, service agent fees and operational fees for the Invesco EURO Reserve Fund from 1 March 2018 to 6 December 2018.The Invesco EURO Reserve Fund changed its name to the Invesco EURO Ultra-Short Term Debt Fund and also changed its investment policy on 6 December 2018. From 6 December 2018 the sub-fund no longer waived fees. The Management Company partially waived the management fee, service agent fees and operational fees for the Invesco Continental European Small Cap Equity Fund Class A from December 2018 to 1 March 2019 At its discretion the Management Company has agreed to the capping of operational expenses and total expenses, where a fund exceeds the cap an amount will be waived, this cost will be borne by the Management Company. Waived amounts are reflected in the Total Waived Expense line in the Statement of Operations and Changes in Net Assets. Refer to note 4 for details of capped funds As at 28 February 2019 all of the fee of the Invesco UK Equity Income Fund were paid by the Management Company.
Notes to the Financial Statements (continued)
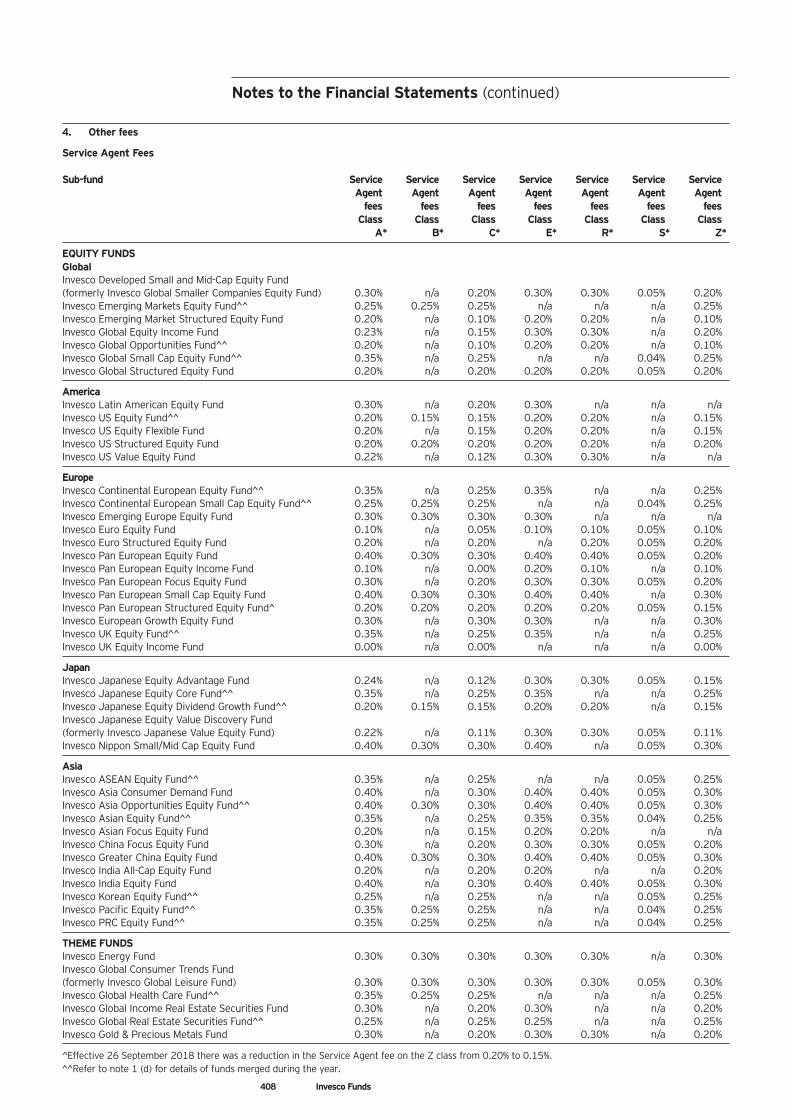
408 Invesco Funds
4. Other fees
Service Agent Fees Sub-fund Service Service Service Service Service Service Service
Agent Agent Agent Agent Agent Agent Agent fees fees fees fees fees fees fees
Class Class Class Class Class Class Class A* B* C* E* R* S* Z*
EQUITY FUNDS Global Invesco Developed Small and Mid-Cap Equity Fund (formerly Invesco Global Smaller Companies Equity Fund) 0.30% n/a 0.20% 0.30% 0.30% 0.05% 0.20% Invesco Emerging Markets Equity Fund^^ 0.25% 0.25% 0.25% n/a n/a n/a 0.25% Invesco Emerging Market Structured Equity Fund 0.20% n/a 0.10% 0.20% 0.20% n/a 0.10% Invesco Global Equity Income Fund 0.23% n/a 0.15% 0.30% 0.30% n/a 0.20% Invesco Global Opportunities Fund^^ 0.20% n/a 0.10% 0.20% 0.20% n/a 0.10% Invesco Global Small Cap Equity Fund^^ 0.35% n/a 0.25% n/a n/a 0.04% 0.25% Invesco Global Structured Equity Fund 0.20% n/a 0.20% 0.20% 0.20% 0.05% 0.20%
America Invesco Latin American Equity Fund 0.30% n/a 0.20% 0.30% n/a n/a n/a Invesco US Equity Fund^^ 0.20% 0.15% 0.15% 0.20% 0.20% n/a 0.15% Invesco US Equity Flexible Fund 0.20% n/a 0.15% 0.20% 0.20% n/a 0.15% Invesco US Structured Equity Fund 0.20% 0.20% 0.20% 0.20% 0.20% n/a 0.20% Invesco US Value Equity Fund 0.22% n/a 0.12% 0.30% 0.30% n/a n/a
Europe Invesco Continental European Equity Fund^^ 0.35% n/a 0.25% 0.35% n/a n/a 0.25% Invesco Continental European Small Cap Equity Fund^^ 0.25% 0.25% 0.25% n/a n/a 0.04% 0.25% Invesco Emerging Europe Equity Fund 0.30% 0.30% 0.30% 0.30% n/a n/a n/a Invesco Euro Equity Fund 0.10% n/a 0.05% 0.10% 0.10% 0.05% 0.10% Invesco Euro Structured Equity Fund 0.20% n/a 0.20% n/a 0.20% 0.05% 0.20% Invesco Pan European Equity Fund 0.40% 0.30% 0.30% 0.40% 0.40% 0.05% 0.20% Invesco Pan European Equity Income Fund 0.10% n/a 0.00% 0.20% 0.10% n/a 0.10% Invesco Pan European Focus Equity Fund 0.30% n/a 0.20% 0.30% 0.30% 0.05% 0.20% Invesco Pan European Small Cap Equity Fund 0.40% 0.30% 0.30% 0.40% 0.40% n/a 0.30% Invesco Pan European Structured Equity Fund^ 0.20% 0.20% 0.20% 0.20% 0.20% 0.05% 0.15% Invesco European Growth Equity Fund 0.30% n/a 0.30% 0.30% n/a n/a 0.30% Invesco UK Equity Fund^^ 0.35% n/a 0.25% 0.35% n/a n/a 0.25% Invesco UK Equity Income Fund 0.00% n/a 0.00% n/a n/a n/a 0.00%
Japan Invesco Japanese Equity Advantage Fund 0.24% n/a 0.12% 0.30% 0.30% 0.05% 0.15% Invesco Japanese Equity Core Fund^^ 0.35% n/a 0.25% 0.35% n/a n/a 0.25% Invesco Japanese Equity Dividend Growth Fund^^ 0.20% 0.15% 0.15% 0.20% 0.20% n/a 0.15% Invesco Japanese Equity Value Discovery Fund (formerly Invesco Japanese Value Equity Fund) 0.22% n/a 0.11% 0.30% 0.30% 0.05% 0.11% Invesco Nippon Small/Mid Cap Equity Fund 0.40% 0.30% 0.30% 0.40% n/a 0.05% 0.30%
Asia Invesco ASEAN Equity Fund^^ 0.35% n/a 0.25% n/a n/a 0.05% 0.25% Invesco Asia Consumer Demand Fund 0.40% n/a 0.30% 0.40% 0.40% 0.05% 0.30% Invesco Asia Opportunities Equity Fund^^ 0.40% 0.30% 0.30% 0.40% 0.40% 0.05% 0.30% Invesco Asian Equity Fund^^ 0.35% n/a 0.25% 0.35% 0.35% 0.04% 0.25% Invesco Asian Focus Equity Fund 0.20% n/a 0.15% 0.20% 0.20% n/a n/a Invesco China Focus Equity Fund 0.30% n/a 0.20% 0.30% 0.30% 0.05% 0.20% Invesco Greater China Equity Fund 0.40% 0.30% 0.30% 0.40% 0.40% 0.05% 0.30% Invesco India All-Cap Equity Fund 0.20% n/a 0.20% 0.20% n/a n/a 0.20% Invesco India Equity Fund 0.40% n/a 0.30% 0.40% 0.40% 0.05% 0.30% Invesco Korean Equity Fund^^ 0.25% n/a 0.25% n/a n/a 0.05% 0.25% Invesco Pacific Equity Fund^^ 0.35% 0.25% 0.25% n/a n/a 0.04% 0.25% Invesco PRC Equity Fund^^ 0.35% 0.25% 0.25% n/a n/a 0.04% 0.25%
THEME FUNDS Invesco Energy Fund 0.30% 0.30% 0.30% 0.30% 0.30% n/a 0.30% Invesco Global Consumer Trends Fund (formerly Invesco Global Leisure Fund) 0.30% 0.30% 0.30% 0.30% 0.30% 0.05% 0.30% Invesco Global Health Care Fund^^ 0.35% 0.25% 0.25% n/a n/a n/a 0.25% Invesco Global Income Real Estate Securities Fund 0.30% n/a 0.20% 0.30% n/a n/a 0.20% Invesco Global Real Estate Securities Fund^^ 0.25% n/a 0.25% 0.25% n/a n/a 0.25% Invesco Gold & Precious Metals Fund 0.30% n/a 0.20% 0.30% 0.30% n/a 0.20%
^Effective 26 September 2018 there was a reduction in the Service Agent fee on the Z class from 0.20% to 0.15%. ^^Refer to note 1 (d) for details of funds merged during the year.
Notes to the Financial Statements (continued)
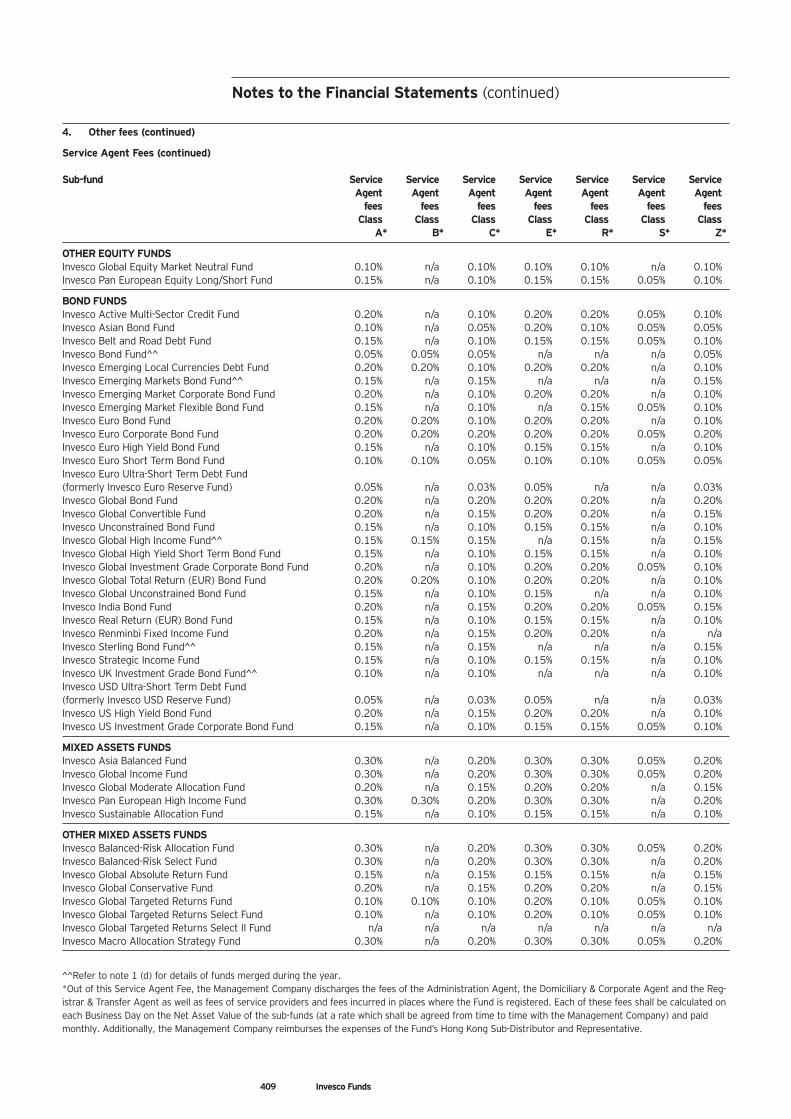
409 Invesco Funds
4. Other fees (continued)
Service Agent Fees (continued) Sub-fund Service Service Service Service Service Service Service
Agent Agent Agent Agent Agent Agent Agent fees fees fees fees fees fees fees
Class Class Class Class Class Class Class A* B* C* E* R* S* Z*
OTHER EQUITY FUNDS Invesco Global Equity Market Neutral Fund 0.10% n/a 0.10% 0.10% 0.10% n/a 0.10% Invesco Pan European Equity Long/Short Fund 0.15% n/a 0.10% 0.15% 0.15% 0.05% 0.10%
BOND FUNDS Invesco Active Multi-Sector Credit Fund 0.20% n/a 0.10% 0.20% 0.20% 0.05% 0.10% Invesco Asian Bond Fund 0.10% n/a 0.05% 0.20% 0.10% 0.05% 0.05% Invesco Belt and Road Debt Fund 0.15% n/a 0.10% 0.15% 0.15% 0.05% 0.10% Invesco Bond Fund^^ 0.05% 0.05% 0.05% n/a n/a n/a 0.05% Invesco Emerging Local Currencies Debt Fund 0.20% 0.20% 0.10% 0.20% 0.20% n/a 0.10% Invesco Emerging Markets Bond Fund^^ 0.15% n/a 0.15% n/a n/a n/a 0.15% Invesco Emerging Market Corporate Bond Fund 0.20% n/a 0.10% 0.20% 0.20% n/a 0.10% Invesco Emerging Market Flexible Bond Fund 0.15% n/a 0.10% n/a 0.15% 0.05% 0.10% Invesco Euro Bond Fund 0.20% 0.20% 0.10% 0.20% 0.20% n/a 0.10% Invesco Euro Corporate Bond Fund 0.20% 0.20% 0.20% 0.20% 0.20% 0.05% 0.20% Invesco Euro High Yield Bond Fund 0.15% n/a 0.10% 0.15% 0.15% n/a 0.10% Invesco Euro Short Term Bond Fund 0.10% 0.10% 0.05% 0.10% 0.10% 0.05% 0.05% Invesco Euro Ultra-Short Term Debt Fund (formerly Invesco Euro Reserve Fund) 0.05% n/a 0.03% 0.05% n/a n/a 0.03% Invesco Global Bond Fund 0.20% n/a 0.20% 0.20% 0.20% n/a 0.20% Invesco Global Convertible Fund 0.20% n/a 0.15% 0.20% 0.20% n/a 0.15% Invesco Unconstrained Bond Fund 0.15% n/a 0.10% 0.15% 0.15% n/a 0.10% Invesco Global High Income Fund^^ 0.15% 0.15% 0.15% n/a 0.15% n/a 0.15% Invesco Global High Yield Short Term Bond Fund 0.15% n/a 0.10% 0.15% 0.15% n/a 0.10% Invesco Global Investment Grade Corporate Bond Fund 0.20% n/a 0.10% 0.20% 0.20% 0.05% 0.10% Invesco Global Total Return (EUR) Bond Fund 0.20% 0.20% 0.10% 0.20% 0.20% n/a 0.10% Invesco Global Unconstrained Bond Fund 0.15% n/a 0.10% 0.15% n/a n/a 0.10% Invesco India Bond Fund 0.20% n/a 0.15% 0.20% 0.20% 0.05% 0.15% Invesco Real Return (EUR) Bond Fund 0.15% n/a 0.10% 0.15% 0.15% n/a 0.10% Invesco Renminbi Fixed Income Fund 0.20% n/a 0.15% 0.20% 0.20% n/a n/a Invesco Sterling Bond Fund^^ 0.15% n/a 0.15% n/a n/a n/a 0.15% Invesco Strategic Income Fund 0.15% n/a 0.10% 0.15% 0.15% n/a 0.10% Invesco UK Investment Grade Bond Fund^^ 0.10% n/a 0.10% n/a n/a n/a 0.10% Invesco USD Ultra-Short Term Debt Fund (formerly Invesco USD Reserve Fund) 0.05% n/a 0.03% 0.05% n/a n/a 0.03% Invesco US High Yield Bond Fund 0.20% n/a 0.15% 0.20% 0.20% n/a 0.10% Invesco US Investment Grade Corporate Bond Fund 0.15% n/a 0.10% 0.15% 0.15% 0.05% 0.10%
MIXED ASSETS FUNDS Invesco Asia Balanced Fund 0.30% n/a 0.20% 0.30% 0.30% 0.05% 0.20% Invesco Global Income Fund 0.30% n/a 0.20% 0.30% 0.30% 0.05% 0.20% Invesco Global Moderate Allocation Fund 0.20% n/a 0.15% 0.20% 0.20% n/a 0.15% Invesco Pan European High Income Fund 0.30% 0.30% 0.20% 0.30% 0.30% n/a 0.20% Invesco Sustainable Allocation Fund 0.15% n/a 0.10% 0.15% 0.15% n/a 0.10%
OTHER MIXED ASSETS FUNDS Invesco Balanced-Risk Allocation Fund 0.30% n/a 0.20% 0.30% 0.30% 0.05% 0.20% Invesco Balanced-Risk Select Fund 0.30% n/a 0.20% 0.30% 0.30% n/a 0.20% Invesco Global Absolute Return Fund 0.15% n/a 0.15% 0.15% 0.15% n/a 0.15% Invesco Global Conservative Fund 0.20% n/a 0.15% 0.20% 0.20% n/a 0.15% Invesco Global Targeted Returns Fund 0.10% 0.10% 0.10% 0.20% 0.10% 0.05% 0.10% Invesco Global Targeted Returns Select Fund 0.10% n/a 0.10% 0.20% 0.10% 0.05% 0.10% Invesco Global Targeted Returns Select II Fund n/a n/a n/a n/a n/a n/a n/a Invesco Macro Allocation Strategy Fund 0.30% n/a 0.20% 0.30% 0.30% 0.05% 0.20%
^^Refer to note 1 (d) for details of funds merged during the year. *Out of this Service Agent Fee, the Management Company discharges the fees of the Administration Agent, the Domiciliary & Corporate Agent and the Reg-istrar & Transfer Agent as well as fees of service providers and fees incurred in places where the Fund is registered. Each of these fees shall be calculated on each Business Day on the Net Asset Value of the sub-funds (at a rate which shall be agreed from time to time with the Management Company) and paid monthly. Additionally, the Management Company reimburses the expenses of the Fund’s Hong Kong Sub-Distributor and Representative.
Notes to the Financial Statements (continued)
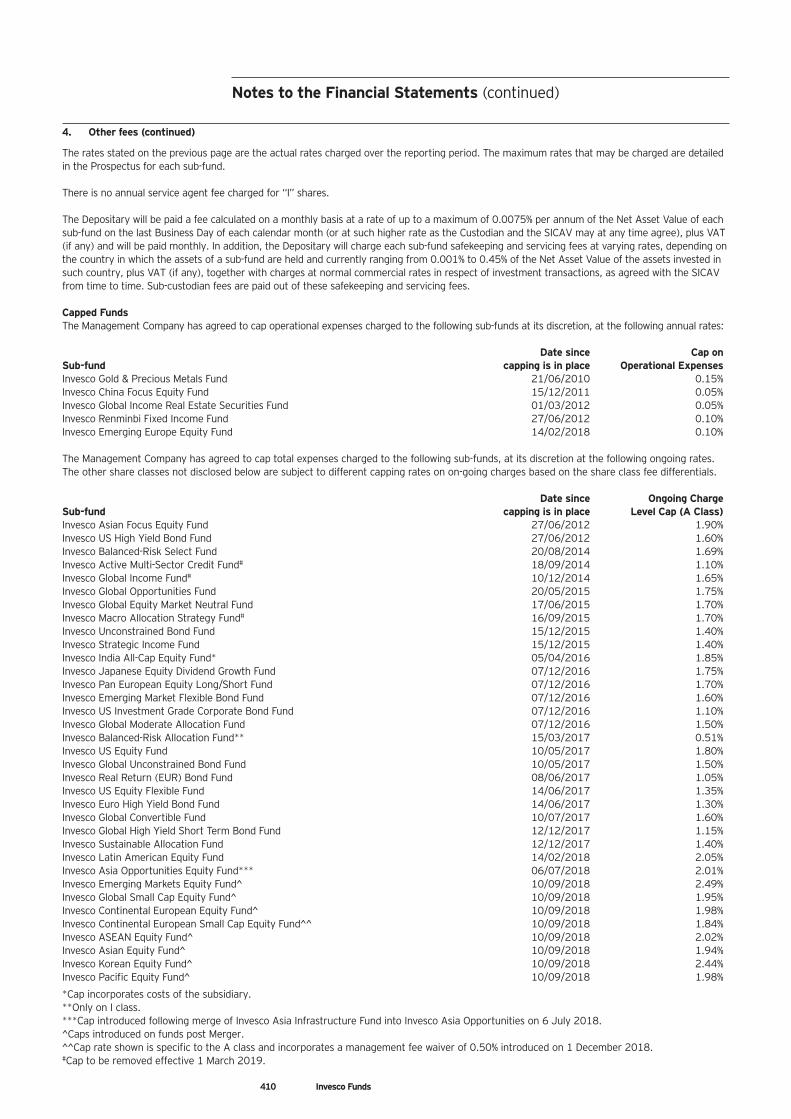
410 Invesco Funds
4. Other fees (continued)
The rates stated on the previous page are the actual rates charged over the reporting period. The maximum rates that may be charged are detailed in the Prospectus for each sub-fund. There is no annual service agent fee charged for “I” shares. The Depositary will be paid a fee calculated on a monthly basis at a rate of up to a maximum of 0.0075% per annum of the Net Asset Value of each sub-fund on the last Business Day of each calendar month (or at such higher rate as the Custodian and the SICAV may at any time agree), plus VAT (if any) and will be paid monthly. In addition, the Depositary will charge each sub-fund safekeeping and servicing fees at varying rates, depending on the country in which the assets of a sub-fund are held and currently ranging from 0.001% to 0.45% of the Net Asset Value of the assets invested in such country, plus VAT (if any), together with charges at normal commercial rates in respect of investment transactions, as agreed with the SICAV from time to time. Sub-custodian fees are paid out of these safekeeping and servicing fees. Capped Funds The Management Company has agreed to cap operational expenses charged to the following sub-funds at its discretion, at the following annual rates: Date since Cap on Sub-fund capping is in place Operational Expenses Invesco Gold & Precious Metals Fund 21/06/2010 0.15% Invesco China Focus Equity Fund 15/12/2011 0.05% Invesco Global Income Real Estate Securities Fund 01/03/2012 0.05% Invesco Renminbi Fixed Income Fund 27/06/2012 0.10% Invesco Emerging Europe Equity Fund 14/02/2018 0.10% The Management Company has agreed to cap total expenses charged to the following sub-funds, at its discretion at the following ongoing rates. The other share classes not disclosed below are subject to different capping rates on on-going charges based on the share class fee differentials. Date since Ongoing Charge Sub-fund capping is in place Level Cap (A Class) Invesco Asian Focus Equity Fund 27/06/2012 1.90% Invesco US High Yield Bond Fund 27/06/2012 1.60% Invesco Balanced-Risk Select Fund 20/08/2014 1.69% Invesco Active Multi-Sector Credit Fund# 18/09/2014 1.10% Invesco Global Income Fund# 10/12/2014 1.65% Invesco Global Opportunities Fund 20/05/2015 1.75% Invesco Global Equity Market Neutral Fund 17/06/2015 1.70% Invesco Macro Allocation Strategy Fund# 16/09/2015 1.70% Invesco Unconstrained Bond Fund 15/12/2015 1.40% Invesco Strategic Income Fund 15/12/2015 1.40% Invesco India All-Cap Equity Fund* 05/04/2016 1.85% Invesco Japanese Equity Dividend Growth Fund 07/12/2016 1.75% Invesco Pan European Equity Long/Short Fund 07/12/2016 1.70% Invesco Emerging Market Flexible Bond Fund 07/12/2016 1.60% Invesco US Investment Grade Corporate Bond Fund 07/12/2016 1.10% Invesco Global Moderate Allocation Fund 07/12/2016 1.50% Invesco Balanced-Risk Allocation Fund** 15/03/2017 0.51% Invesco US Equity Fund 10/05/2017 1.80% Invesco Global Unconstrained Bond Fund 10/05/2017 1.50% Invesco Real Return (EUR) Bond Fund 08/06/2017 1.05% Invesco US Equity Flexible Fund 14/06/2017 1.35% Invesco Euro High Yield Bond Fund 14/06/2017 1.30% Invesco Global Convertible Fund 10/07/2017 1.60% Invesco Global High Yield Short Term Bond Fund 12/12/2017 1.15% Invesco Sustainable Allocation Fund 12/12/2017 1.40% Invesco Latin American Equity Fund 14/02/2018 2.05% Invesco Asia Opportunities Equity Fund*** 06/07/2018 2.01% Invesco Emerging Markets Equity Fund^ 10/09/2018 2.49% Invesco Global Small Cap Equity Fund^ 10/09/2018 1.95% Invesco Continental European Equity Fund^ 10/09/2018 1.98% Invesco Continental European Small Cap Equity Fund^^ 10/09/2018 1.84% Invesco ASEAN Equity Fund^ 10/09/2018 2.02% Invesco Asian Equity Fund^ 10/09/2018 1.94% Invesco Korean Equity Fund^ 10/09/2018 2.44% Invesco Pacific Equity Fund^ 10/09/2018 1.98%
*Cap incorporates costs of the subsidiary. **Only on I class. ***Cap introduced following merge of Invesco Asia Infrastructure Fund into Invesco Asia Opportunities on 6 July 2018. ^Caps introduced on funds post Merger. ^^Cap rate shown is specific to the A class and incorporates a management fee waiver of 0.50% introduced on 1 December 2018. #Cap to be removed effective 1 March 2019.
Notes to the Financial Statements (continued)
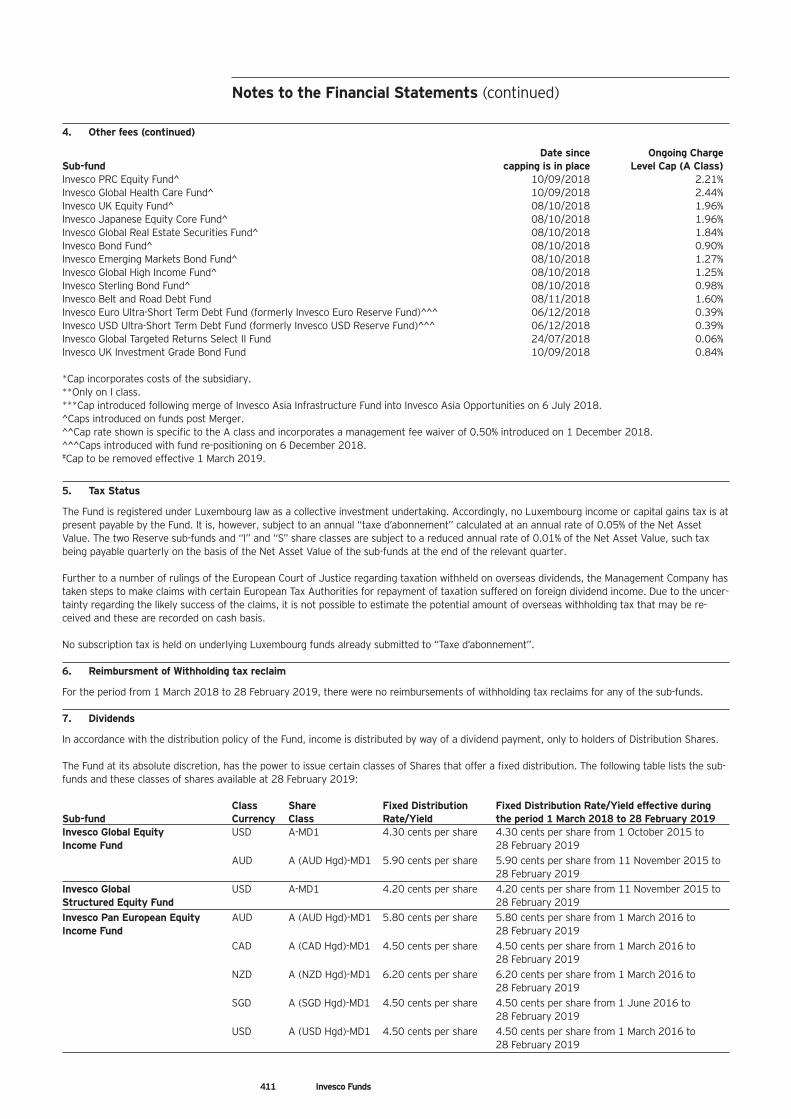
411 Invesco Funds
4. Other fees (continued)
Date since Ongoing Charge Sub-fund capping is in place Level Cap (A Class) Invesco PRC Equity Fund^ 10/09/2018 2.21% Invesco Global Health Care Fund^ 10/09/2018 2.44% Invesco UK Equity Fund^ 08/10/2018 1.96% Invesco Japanese Equity Core Fund^ 08/10/2018 1.96% Invesco Global Real Estate Securities Fund^ 08/10/2018 1.84% Invesco Bond Fund^ 08/10/2018 0.90% Invesco Emerging Markets Bond Fund^ 08/10/2018 1.27% Invesco Global High Income Fund^ 08/10/2018 1.25% Invesco Sterling Bond Fund^ 08/10/2018 0.98% Invesco Belt and Road Debt Fund 08/11/2018 1.60% Invesco Euro Ultra-Short Term Debt Fund (formerly Invesco Euro Reserve Fund)^^^ 06/12/2018 0.39% Invesco USD Ultra-Short Term Debt Fund (formerly Invesco USD Reserve Fund)^^^ 06/12/2018 0.39% Invesco Global Targeted Returns Select II Fund 24/07/2018 0.06% Invesco UK Investment Grade Bond Fund 10/09/2018 0.84% *Cap incorporates costs of the subsidiary. **Only on I class. ***Cap introduced following merge of Invesco Asia Infrastructure Fund into Invesco Asia Opportunities on 6 July 2018. ^Caps introduced on funds post Merger. ^^Cap rate shown is specific to the A class and incorporates a management fee waiver of 0.50% introduced on 1 December 2018. ^^^Caps introduced with fund re-positioning on 6 December 2018. #Cap to be removed effective 1 March 2019.
5. Tax Status
The Fund is registered under Luxembourg law as a collective investment undertaking. Accordingly, no Luxembourg income or capital gains tax is at present payable by the Fund. It is, however, subject to an annual “taxe d’abonnement” calculated at an annual rate of 0.05% of the Net Asset Value. The two Reserve sub-funds and “I” and “S” share classes are subject to a reduced annual rate of 0.01% of the Net Asset Value, such tax being payable quarterly on the basis of the Net Asset Value of the sub-funds at the end of the relevant quarter. Further to a number of rulings of the European Court of Justice regarding taxation withheld on overseas dividends, the Management Company has taken steps to make claims with certain European Tax Authorities for repayment of taxation suffered on foreign dividend income. Due to the uncer-tainty regarding the likely success of the claims, it is not possible to estimate the potential amount of overseas withholding tax that may be re-ceived and these are recorded on cash basis. No subscription tax is held on underlying Luxembourg funds already submitted to “Taxe d’abonnement”. 6. Reimbursment of Withholding tax reclaim
For the period from 1 March 2018 to 28 February 2019, there were no reimbursements of withholding tax reclaims for any of the sub-funds. 7. Dividends
In accordance with the distribution policy of the Fund, income is distributed by way of a dividend payment, only to holders of Distribution Shares. The Fund at its absolute discretion, has the power to issue certain classes of Shares that offer a fixed distribution. The following table lists the sub-funds and these classes of shares available at 28 February 2019: Class Share Fixed Distribution Fixed Distribution Rate/Yield effective during Sub-fund Currency Class Rate/Yield the period 1 March 2018 to 28 February 2019 Invesco Global Equity USD A-MD1 4.30 cents per share 4.30 cents per share from 1 October 2015 to Income Fund 28 February 2019 AUD A (AUD Hgd)-MD1 5.90 cents per share 5.90 cents per share from 11 November 2015 to 28 February 2019 Invesco Global USD A-MD1 4.20 cents per share 4.20 cents per share from 11 November 2015 to Structured Equity Fund 28 February 2019 Invesco Pan European Equity AUD A (AUD Hgd)-MD1 5.80 cents per share 5.80 cents per share from 1 March 2016 to Income Fund 28 February 2019 CAD A (CAD Hgd)-MD1 4.50 cents per share 4.50 cents per share from 1 March 2016 to 28 February 2019 NZD A (NZD Hgd)-MD1 6.20 cents per share 6.20 cents per share from 1 March 2016 to 28 February 2019 SGD A (SGD Hgd)-MD1 4.50 cents per share 4.50 cents per share from 1 June 2016 to 28 February 2019 USD A (USD Hgd)-MD1 4.50 cents per share 4.50 cents per share from 1 March 2016 to 28 February 2019
Notes to the Financial Statements (continued)
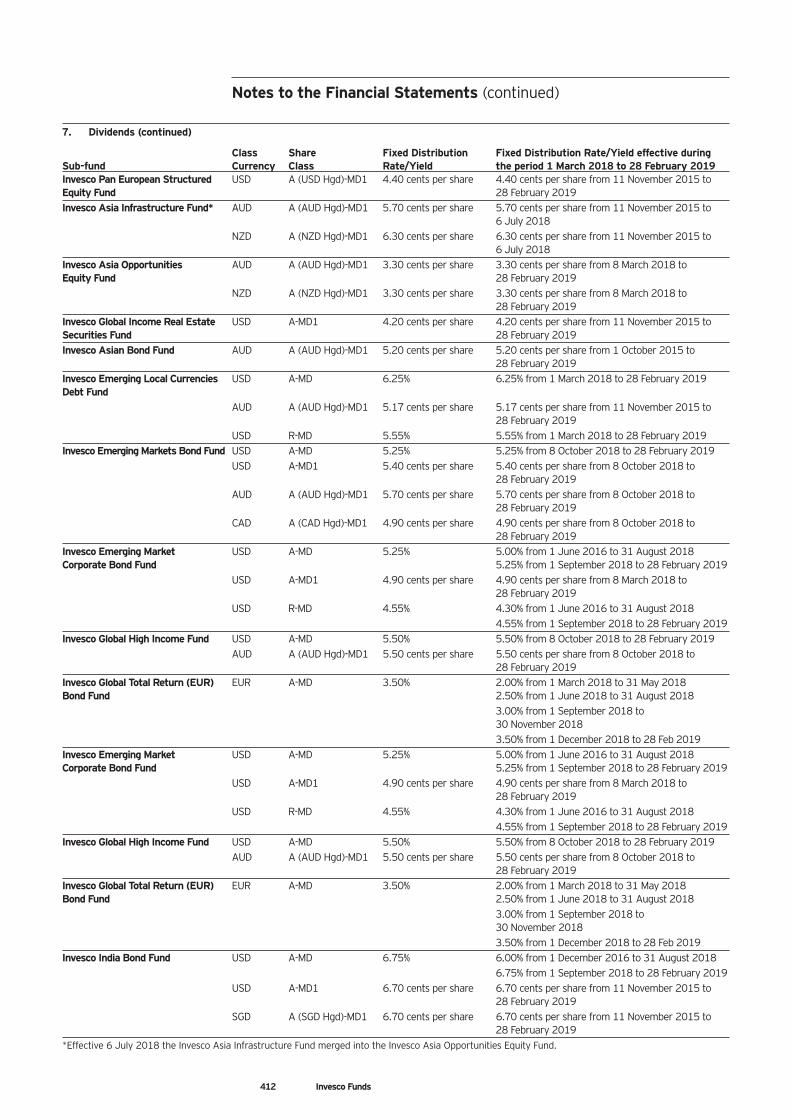
412 Invesco Funds
7. Dividends (continued)
Class Share Fixed Distribution Fixed Distribution Rate/Yield effective during Sub-fund Currency Class Rate/Yield the period 1 March 2018 to 28 February 2019 Invesco Pan European Structured USD A (USD Hgd)-MD1 4.40 cents per share 4.40 cents per share from 11 November 2015 to Equity Fund 28 February 2019 Invesco Asia Infrastructure Fund* AUD A (AUD Hgd)-MD1 5.70 cents per share 5.70 cents per share from 11 November 2015 to 6 July 2018 NZD A (NZD Hgd)-MD1 6.30 cents per share 6.30 cents per share from 11 November 2015 to 6 July 2018 Invesco Asia Opportunities AUD A (AUD Hgd)-MD1 3.30 cents per share 3.30 cents per share from 8 March 2018 to Equity Fund 28 February 2019 NZD A (NZD Hgd)-MD1 3.30 cents per share 3.30 cents per share from 8 March 2018 to 28 February 2019 Invesco Global Income Real Estate USD A-MD1 4.20 cents per share 4.20 cents per share from 11 November 2015 to Securities Fund 28 February 2019 Invesco Asian Bond Fund AUD A (AUD Hgd)-MD1 5.20 cents per share 5.20 cents per share from 1 October 2015 to 28 February 2019 Invesco Emerging Local Currencies USD A-MD 6.25% 6.25% from 1 March 2018 to 28 February 2019 Debt Fund AUD A (AUD Hgd)-MD1 5.17 cents per share 5.17 cents per share from 11 November 2015 to 28 February 2019 USD R-MD 5.55% 5.55% from 1 March 2018 to 28 February 2019 Invesco Emerging Markets Bond Fund USD A-MD 5.25% 5.25% from 8 October 2018 to 28 February 2019 USD A-MD1 5.40 cents per share 5.40 cents per share from 8 October 2018 to 28 February 2019 AUD A (AUD Hgd)-MD1 5.70 cents per share 5.70 cents per share from 8 October 2018 to 28 February 2019 CAD A (CAD Hgd)-MD1 4.90 cents per share 4.90 cents per share from 8 October 2018 to 28 February 2019 Invesco Emerging Market USD A-MD 5.25% 5.00% from 1 June 2016 to 31 August 2018 Corporate Bond Fund 5.25% from 1 September 2018 to 28 February 2019 USD A-MD1 4.90 cents per share 4.90 cents per share from 8 March 2018 to 28 February 2019 USD R-MD 4.55% 4.30% from 1 June 2016 to 31 August 2018 4.55% from 1 September 2018 to 28 February 2019 Invesco Global High Income Fund USD A-MD 5.50% 5.50% from 8 October 2018 to 28 February 2019 AUD A (AUD Hgd)-MD1 5.50 cents per share 5.50 cents per share from 8 October 2018 to 28 February 2019 Invesco Global Total Return (EUR) EUR A-MD 3.50% 2.00% from 1 March 2018 to 31 May 2018 Bond Fund 2.50% from 1 June 2018 to 31 August 2018 3.00% from 1 September 2018 to 30 November 2018 3.50% from 1 December 2018 to 28 Feb 2019 Invesco Emerging Market USD A-MD 5.25% 5.00% from 1 June 2016 to 31 August 2018 Corporate Bond Fund 5.25% from 1 September 2018 to 28 February 2019 USD A-MD1 4.90 cents per share 4.90 cents per share from 8 March 2018 to 28 February 2019 USD R-MD 4.55% 4.30% from 1 June 2016 to 31 August 2018 4.55% from 1 September 2018 to 28 February 2019 Invesco Global High Income Fund USD A-MD 5.50% 5.50% from 8 October 2018 to 28 February 2019 AUD A (AUD Hgd)-MD1 5.50 cents per share 5.50 cents per share from 8 October 2018 to 28 February 2019 Invesco Global Total Return (EUR) EUR A-MD 3.50% 2.00% from 1 March 2018 to 31 May 2018 Bond Fund 2.50% from 1 June 2018 to 31 August 2018 3.00% from 1 September 2018 to 30 November 2018 3.50% from 1 December 2018 to 28 Feb 2019 Invesco India Bond Fund USD A-MD 6.75% 6.00% from 1 December 2016 to 31 August 2018 6.75% from 1 September 2018 to 28 February 2019 USD A-MD1 6.70 cents per share 6.70 cents per share from 11 November 2015 to 28 February 2019 SGD A (SGD Hgd)-MD1 6.70 cents per share 6.70 cents per share from 11 November 2015 to 28 February 2019 *Effective 6 July 2018 the Invesco Asia Infrastructure Fund merged into the Invesco Asia Opportunities Equity Fund.
Notes to the Financial Statements (continued)
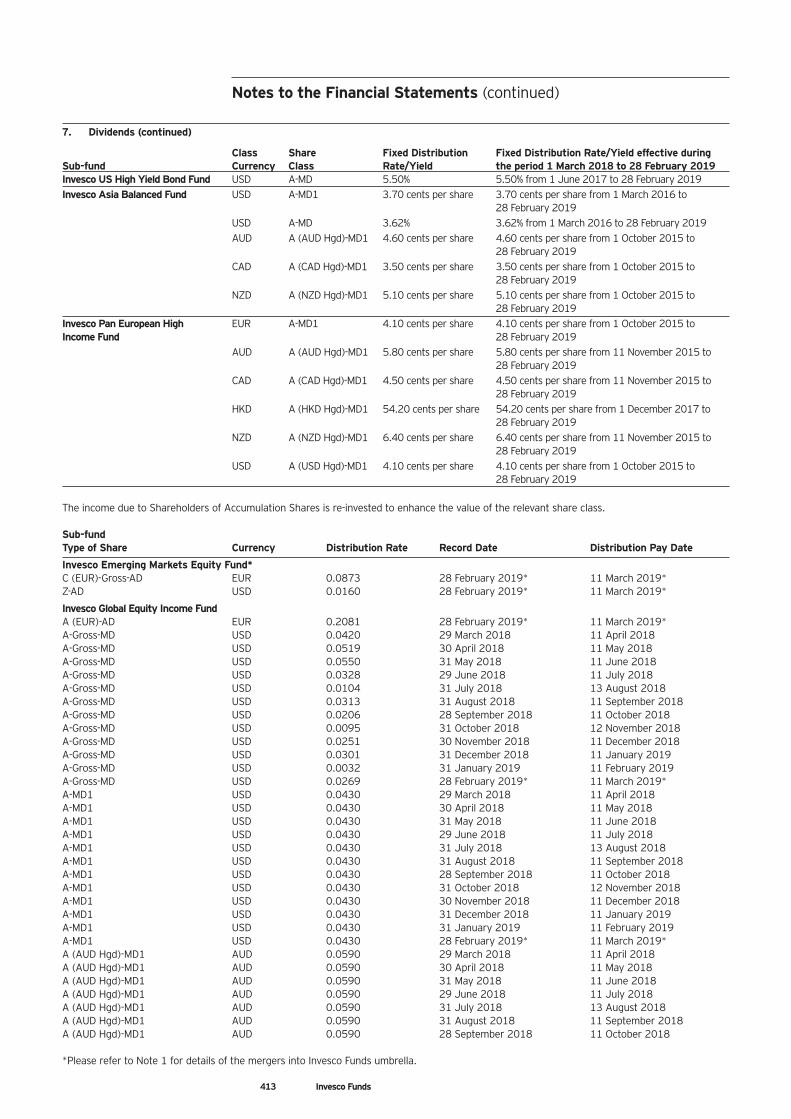
413 Invesco Funds
7. Dividends (continued)
Class Share Fixed Distribution Fixed Distribution Rate/Yield effective during Sub-fund Currency Class Rate/Yield the period 1 March 2018 to 28 February 2019 Invesco US High Yield Bond Fund USD A-MD 5.50% 5.50% from 1 June 2017 to 28 February 2019 Invesco Asia Balanced Fund USD A-MD1 3.70 cents per share 3.70 cents per share from 1 March 2016 to 28 February 2019 USD A-MD 3.62% 3.62% from 1 March 2016 to 28 February 2019 AUD A (AUD Hgd)-MD1 4.60 cents per share 4.60 cents per share from 1 October 2015 to 28 February 2019 CAD A (CAD Hgd)-MD1 3.50 cents per share 3.50 cents per share from 1 October 2015 to 28 February 2019 NZD A (NZD Hgd)-MD1 5.10 cents per share 5.10 cents per share from 1 October 2015 to 28 February 2019 Invesco Pan European High EUR A-MD1 4.10 cents per share 4.10 cents per share from 1 October 2015 to Income Fund 28 February 2019 AUD A (AUD Hgd)-MD1 5.80 cents per share 5.80 cents per share from 11 November 2015 to 28 February 2019 CAD A (CAD Hgd)-MD1 4.50 cents per share 4.50 cents per share from 11 November 2015 to 28 February 2019 HKD A (HKD Hgd)-MD1 54.20 cents per share 54.20 cents per share from 1 December 2017 to 28 February 2019 NZD A (NZD Hgd)-MD1 6.40 cents per share 6.40 cents per share from 11 November 2015 to 28 February 2019 USD A (USD Hgd)-MD1 4.10 cents per share 4.10 cents per share from 1 October 2015 to 28 February 2019 The income due to Shareholders of Accumulation Shares is re-invested to enhance the value of the relevant share class. Sub-fund Type of Share Currency Distribution Rate Record Date Distribution Pay Date
Invesco Emerging Markets Equity Fund* C (EUR)-Gross-AD EUR 0.0873 28 February 2019* 11 March 2019* Z-AD USD 0.0160 28 February 2019* 11 March 2019*
Invesco Global Equity Income Fund A (EUR)-AD EUR 0.2081 28 February 2019* 11 March 2019* A-Gross-MD USD 0.0420 29 March 2018 11 April 2018 A-Gross-MD USD 0.0519 30 April 2018 11 May 2018 A-Gross-MD USD 0.0550 31 May 2018 11 June 2018 A-Gross-MD USD 0.0328 29 June 2018 11 July 2018 A-Gross-MD USD 0.0104 31 July 2018 13 August 2018 A-Gross-MD USD 0.0313 31 August 2018 11 September 2018 A-Gross-MD USD 0.0206 28 September 2018 11 October 2018 A-Gross-MD USD 0.0095 31 October 2018 12 November 2018 A-Gross-MD USD 0.0251 30 November 2018 11 December 2018 A-Gross-MD USD 0.0301 31 December 2018 11 January 2019 A-Gross-MD USD 0.0032 31 January 2019 11 February 2019 A-Gross-MD USD 0.0269 28 February 2019* 11 March 2019* A-MD1 USD 0.0430 29 March 2018 11 April 2018 A-MD1 USD 0.0430 30 April 2018 11 May 2018 A-MD1 USD 0.0430 31 May 2018 11 June 2018 A-MD1 USD 0.0430 29 June 2018 11 July 2018 A-MD1 USD 0.0430 31 July 2018 13 August 2018 A-MD1 USD 0.0430 31 August 2018 11 September 2018 A-MD1 USD 0.0430 28 September 2018 11 October 2018 A-MD1 USD 0.0430 31 October 2018 12 November 2018 A-MD1 USD 0.0430 30 November 2018 11 December 2018 A-MD1 USD 0.0430 31 December 2018 11 January 2019 A-MD1 USD 0.0430 31 January 2019 11 February 2019 A-MD1 USD 0.0430 28 February 2019* 11 March 2019* A (AUD Hgd)-MD1 AUD 0.0590 29 March 2018 11 April 2018 A (AUD Hgd)-MD1 AUD 0.0590 30 April 2018 11 May 2018 A (AUD Hgd)-MD1 AUD 0.0590 31 May 2018 11 June 2018 A (AUD Hgd)-MD1 AUD 0.0590 29 June 2018 11 July 2018 A (AUD Hgd)-MD1 AUD 0.0590 31 July 2018 13 August 2018 A (AUD Hgd)-MD1 AUD 0.0590 31 August 2018 11 September 2018 A (AUD Hgd)-MD1 AUD 0.0590 28 September 2018 11 October 2018 *Please refer to Note 1 for details of the mergers into Invesco Funds umbrella.
Notes to the Financial Statements (continued)
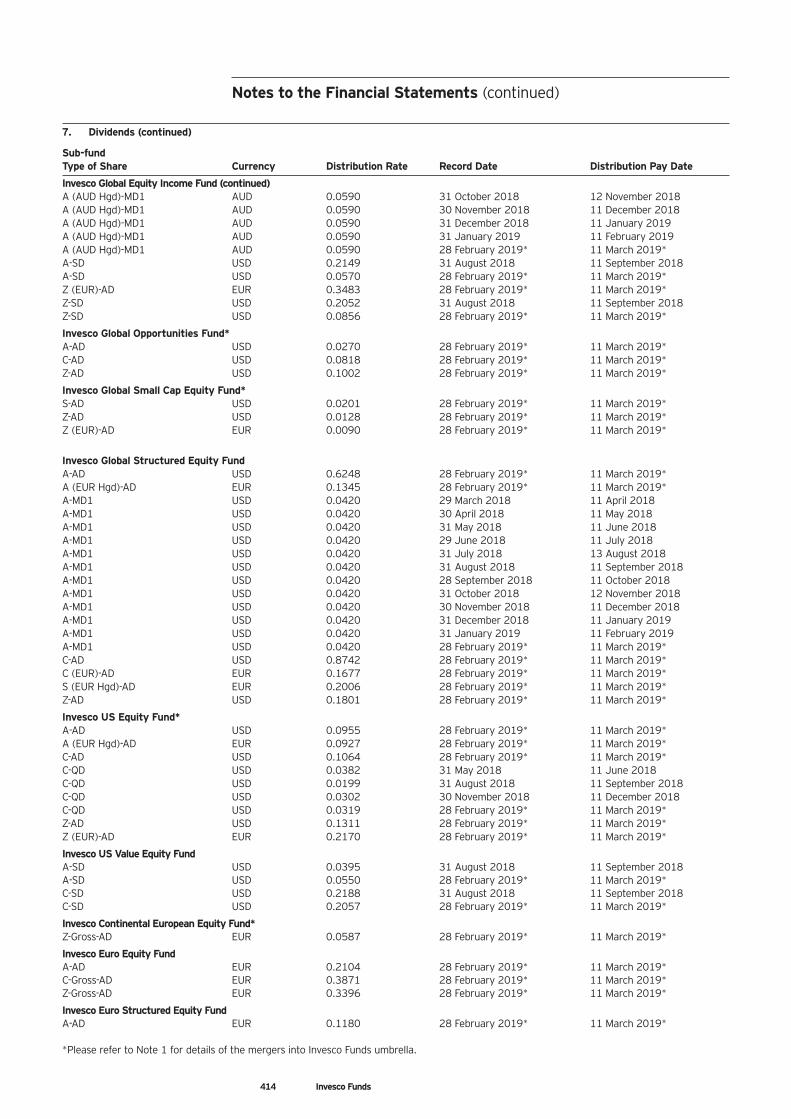
414 Invesco Funds
7. Dividends (continued)
Sub-fund Type of Share Currency Distribution Rate Record Date Distribution Pay Date
Invesco Global Equity Income Fund (continued) A (AUD Hgd)-MD1 AUD 0.0590 31 October 2018 12 November 2018 A (AUD Hgd)-MD1 AUD 0.0590 30 November 2018 11 December 2018 A (AUD Hgd)-MD1 AUD 0.0590 31 December 2018 11 January 2019 A (AUD Hgd)-MD1 AUD 0.0590 31 January 2019 11 February 2019 A (AUD Hgd)-MD1 AUD 0.0590 28 February 2019* 11 March 2019* A-SD USD 0.2149 31 August 2018 11 September 2018 A-SD USD 0.0570 28 February 2019* 11 March 2019* Z (EUR)-AD EUR 0.3483 28 February 2019* 11 March 2019* Z-SD USD 0.2052 31 August 2018 11 September 2018 Z-SD USD 0.0856 28 February 2019* 11 March 2019*
Invesco Global Opportunities Fund* A-AD USD 0.0270 28 February 2019* 11 March 2019* C-AD USD 0.0818 28 February 2019* 11 March 2019* Z-AD USD 0.1002 28 February 2019* 11 March 2019*
Invesco Global Small Cap Equity Fund* S-AD USD 0.0201 28 February 2019* 11 March 2019* Z-AD USD 0.0128 28 February 2019* 11 March 2019* Z (EUR)-AD EUR 0.0090 28 February 2019* 11 March 2019*
Invesco Global Structured Equity Fund A-AD USD 0.6248 28 February 2019* 11 March 2019* A (EUR Hgd)-AD EUR 0.1345 28 February 2019* 11 March 2019* A-MD1 USD 0.0420 29 March 2018 11 April 2018 A-MD1 USD 0.0420 30 April 2018 11 May 2018 A-MD1 USD 0.0420 31 May 2018 11 June 2018 A-MD1 USD 0.0420 29 June 2018 11 July 2018 A-MD1 USD 0.0420 31 July 2018 13 August 2018 A-MD1 USD 0.0420 31 August 2018 11 September 2018 A-MD1 USD 0.0420 28 September 2018 11 October 2018 A-MD1 USD 0.0420 31 October 2018 12 November 2018 A-MD1 USD 0.0420 30 November 2018 11 December 2018 A-MD1 USD 0.0420 31 December 2018 11 January 2019 A-MD1 USD 0.0420 31 January 2019 11 February 2019 A-MD1 USD 0.0420 28 February 2019* 11 March 2019* C-AD USD 0.8742 28 February 2019* 11 March 2019* C (EUR)-AD EUR 0.1677 28 February 2019* 11 March 2019* S (EUR Hgd)-AD EUR 0.2006 28 February 2019* 11 March 2019* Z-AD USD 0.1801 28 February 2019* 11 March 2019*
Invesco US Equity Fund* A-AD USD 0.0955 28 February 2019* 11 March 2019* A (EUR Hgd)-AD EUR 0.0927 28 February 2019* 11 March 2019* C-AD USD 0.1064 28 February 2019* 11 March 2019* C-QD USD 0.0382 31 May 2018 11 June 2018 C-QD USD 0.0199 31 August 2018 11 September 2018 C-QD USD 0.0302 30 November 2018 11 December 2018 C-QD USD 0.0319 28 February 2019* 11 March 2019* Z-AD USD 0.1311 28 February 2019* 11 March 2019* Z (EUR)-AD EUR 0.2170 28 February 2019* 11 March 2019*
Invesco US Value Equity Fund A-SD USD 0.0395 31 August 2018 11 September 2018 A-SD USD 0.0550 28 February 2019* 11 March 2019* C-SD USD 0.2188 31 August 2018 11 September 2018 C-SD USD 0.2057 28 February 2019* 11 March 2019*
Invesco Continental European Equity Fund* Z-Gross-AD EUR 0.0587 28 February 2019* 11 March 2019*
Invesco Euro Equity Fund A-AD EUR 0.2104 28 February 2019* 11 March 2019* C-Gross-AD EUR 0.3871 28 February 2019* 11 March 2019* Z-Gross-AD EUR 0.3396 28 February 2019* 11 March 2019*
Invesco Euro Structured Equity Fund A-AD EUR 0.1180 28 February 2019* 11 March 2019* *Please refer to Note 1 for details of the mergers into Invesco Funds umbrella.
Notes to the Financial Statements (continued)
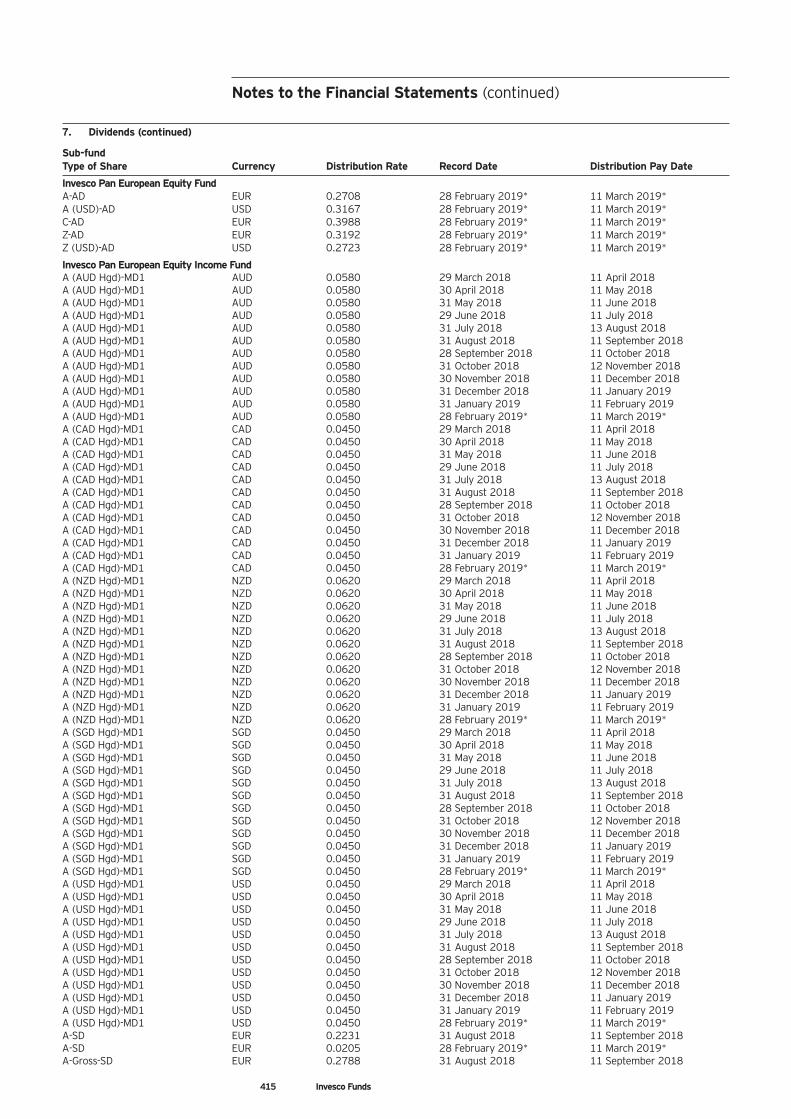
Notes to the Financial Statements (continued)
7. Dividends (continued)
Sub-fund Type of Share Currency Distribution Rate Record Date Distribution Pay Date
Invesco Pan European Equity Fund A-AD EUR 0.2708 28 February 2019* 11 March 2019* A (USD)-AD USD 0.3167 28 February 2019* 11 March 2019* C-AD EUR 0.3988 28 February 2019* 11 March 2019* Z-AD EUR 0.3192 28 February 2019* 11 March 2019* Z (USD)-AD USD 0.2723 28 February 2019* 11 March 2019*
Invesco Pan European Equity Income Fund A (AUD Hgd)-MD1 AUD 0.0580 29 March 2018 11 April 2018 A (AUD Hgd)-MD1 AUD 0.0580 30 April 2018 11 May 2018 A (AUD Hgd)-MD1 AUD 0.0580 31 May 2018 11 June 2018 A (AUD Hgd)-MD1 AUD 0.0580 29 June 2018 11 July 2018 A (AUD Hgd)-MD1 AUD 0.0580 31 July 2018 13 August 2018 A (AUD Hgd)-MD1 AUD 0.0580 31 August 2018 11 September 2018 A (AUD Hgd)-MD1 AUD 0.0580 28 September 2018 11 October 2018 A (AUD Hgd)-MD1 AUD 0.0580 31 October 2018 12 November 2018 A (AUD Hgd)-MD1 AUD 0.0580 30 November 2018 11 December 2018 A (AUD Hgd)-MD1 AUD 0.0580 31 December 2018 11 January 2019 A (AUD Hgd)-MD1 AUD 0.0580 31 January 2019 11 February 2019 A (AUD Hgd)-MD1 AUD 0.0580 28 February 2019* 11 March 2019* A (CAD Hgd)-MD1 CAD 0.0450 29 March 2018 11 April 2018 A (CAD Hgd)-MD1 CAD 0.0450 30 April 2018 11 May 2018 A (CAD Hgd)-MD1 CAD 0.0450 31 May 2018 11 June 2018 A (CAD Hgd)-MD1 CAD 0.0450 29 June 2018 11 July 2018 A (CAD Hgd)-MD1 CAD 0.0450 31 July 2018 13 August 2018 A (CAD Hgd)-MD1 CAD 0.0450 31 August 2018 11 September 2018 A (CAD Hgd)-MD1 CAD 0.0450 28 September 2018 11 October 2018 A (CAD Hgd)-MD1 CAD 0.0450 31 October 2018 12 November 2018 A (CAD Hgd)-MD1 CAD 0.0450 30 November 2018 11 December 2018 A (CAD Hgd)-MD1 CAD 0.0450 31 December 2018 11 January 2019 A (CAD Hgd)-MD1 CAD 0.0450 31 January 2019 11 February 2019 A (CAD Hgd)-MD1 CAD 0.0450 28 February 2019* 11 March 2019* A (NZD Hgd)-MD1 NZD 0.0620 29 March 2018 11 April 2018 A (NZD Hgd)-MD1 NZD 0.0620 30 April 2018 11 May 2018 A (NZD Hgd)-MD1 NZD 0.0620 31 May 2018 11 June 2018 A (NZD Hgd)-MD1 NZD 0.0620 29 June 2018 11 July 2018 A (NZD Hgd)-MD1 NZD 0.0620 31 July 2018 13 August 2018 A (NZD Hgd)-MD1 NZD 0.0620 31 August 2018 11 September 2018 A (NZD Hgd)-MD1 NZD 0.0620 28 September 2018 11 October 2018 A (NZD Hgd)-MD1 NZD 0.0620 31 October 2018 12 November 2018 A (NZD Hgd)-MD1 NZD 0.0620 30 November 2018 11 December 2018 A (NZD Hgd)-MD1 NZD 0.0620 31 December 2018 11 January 2019 A (NZD Hgd)-MD1 NZD 0.0620 31 January 2019 11 February 2019 A (NZD Hgd)-MD1 NZD 0.0620 28 February 2019* 11 March 2019* A (SGD Hgd)-MD1 SGD 0.0450 29 March 2018 11 April 2018 A (SGD Hgd)-MD1 SGD 0.0450 30 April 2018 11 May 2018 A (SGD Hgd)-MD1 SGD 0.0450 31 May 2018 11 June 2018 A (SGD Hgd)-MD1 SGD 0.0450 29 June 2018 11 July 2018 A (SGD Hgd)-MD1 SGD 0.0450 31 July 2018 13 August 2018 A (SGD Hgd)-MD1 SGD 0.0450 31 August 2018 11 September 2018 A (SGD Hgd)-MD1 SGD 0.0450 28 September 2018 11 October 2018 A (SGD Hgd)-MD1 SGD 0.0450 31 October 2018 12 November 2018 A (SGD Hgd)-MD1 SGD 0.0450 30 November 2018 11 December 2018 A (SGD Hgd)-MD1 SGD 0.0450 31 December 2018 11 January 2019 A (SGD Hgd)-MD1 SGD 0.0450 31 January 2019 11 February 2019 A (SGD Hgd)-MD1 SGD 0.0450 28 February 2019* 11 March 2019* A (USD Hgd)-MD1 USD 0.0450 29 March 2018 11 April 2018 A (USD Hgd)-MD1 USD 0.0450 30 April 2018 11 May 2018 A (USD Hgd)-MD1 USD 0.0450 31 May 2018 11 June 2018 A (USD Hgd)-MD1 USD 0.0450 29 June 2018 11 July 2018 A (USD Hgd)-MD1 USD 0.0450 31 July 2018 13 August 2018 A (USD Hgd)-MD1 USD 0.0450 31 August 2018 11 September 2018 A (USD Hgd)-MD1 USD 0.0450 28 September 2018 11 October 2018 A (USD Hgd)-MD1 USD 0.0450 31 October 2018 12 November 2018 A (USD Hgd)-MD1 USD 0.0450 30 November 2018 11 December 2018 A (USD Hgd)-MD1 USD 0.0450 31 December 2018 11 January 2019 A (USD Hgd)-MD1 USD 0.0450 31 January 2019 11 February 2019 A (USD Hgd)-MD1 USD 0.0450 28 February 2019* 11 March 2019* A-SD EUR 0.2231 31 August 2018 11 September 2018 A-SD EUR 0.0205 28 February 2019* 11 March 2019* A-Gross-SD EUR 0.2788 31 August 2018 11 September 2018
415 Invesco Funds
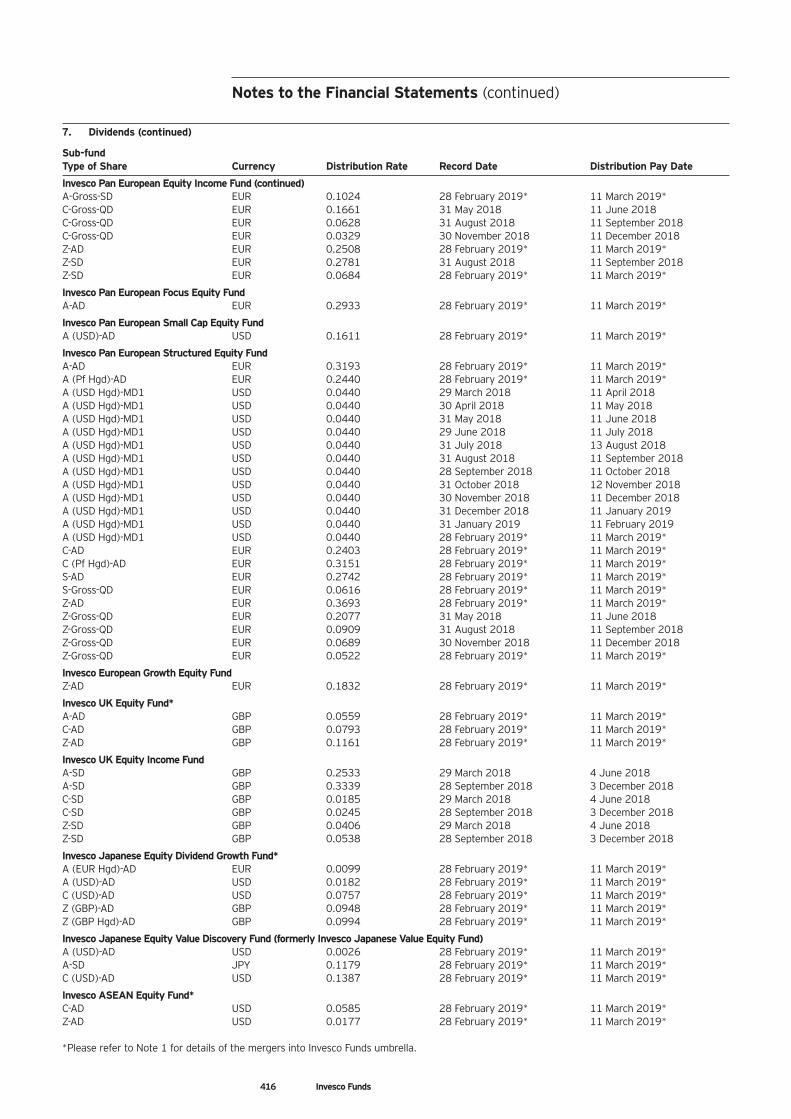
7. Dividends (continued)
Sub-fund Type of Share Currency Distribution Rate Record Date Distribution Pay Date
Invesco Pan European Equity Income Fund (continued) A-Gross-SD EUR 0.1024 28 February 2019* 11 March 2019* C-Gross-QD EUR 0.1661 31 May 2018 11 June 2018 C-Gross-QD EUR 0.0628 31 August 2018 11 September 2018 C-Gross-QD EUR 0.0329 30 November 2018 11 December 2018 Z-AD EUR 0.2508 28 February 2019* 11 March 2019* Z-SD EUR 0.2781 31 August 2018 11 September 2018 Z-SD EUR 0.0684 28 February 2019* 11 March 2019*
Invesco Pan European Focus Equity Fund A-AD EUR 0.2933 28 February 2019* 11 March 2019*
Invesco Pan European Small Cap Equity Fund A (USD)-AD USD 0.1611 28 February 2019* 11 March 2019*
Invesco Pan European Structured Equity Fund A-AD EUR 0.3193 28 February 2019* 11 March 2019* A (Pf Hgd)-AD EUR 0.2440 28 February 2019* 11 March 2019* A (USD Hgd)-MD1 USD 0.0440 29 March 2018 11 April 2018 A (USD Hgd)-MD1 USD 0.0440 30 April 2018 11 May 2018 A (USD Hgd)-MD1 USD 0.0440 31 May 2018 11 June 2018 A (USD Hgd)-MD1 USD 0.0440 29 June 2018 11 July 2018 A (USD Hgd)-MD1 USD 0.0440 31 July 2018 13 August 2018 A (USD Hgd)-MD1 USD 0.0440 31 August 2018 11 September 2018 A (USD Hgd)-MD1 USD 0.0440 28 September 2018 11 October 2018 A (USD Hgd)-MD1 USD 0.0440 31 October 2018 12 November 2018 A (USD Hgd)-MD1 USD 0.0440 30 November 2018 11 December 2018 A (USD Hgd)-MD1 USD 0.0440 31 December 2018 11 January 2019 A (USD Hgd)-MD1 USD 0.0440 31 January 2019 11 February 2019 A (USD Hgd)-MD1 USD 0.0440 28 February 2019* 11 March 2019* C-AD EUR 0.2403 28 February 2019* 11 March 2019* C (Pf Hgd)-AD EUR 0.3151 28 February 2019* 11 March 2019* S-AD EUR 0.2742 28 February 2019* 11 March 2019* S-Gross-QD EUR 0.0616 28 February 2019* 11 March 2019* Z-AD EUR 0.3693 28 February 2019* 11 March 2019* Z-Gross-QD EUR 0.2077 31 May 2018 11 June 2018 Z-Gross-QD EUR 0.0909 31 August 2018 11 September 2018 Z-Gross-QD EUR 0.0689 30 November 2018 11 December 2018 Z-Gross-QD EUR 0.0522 28 February 2019* 11 March 2019*
Invesco European Growth Equity Fund Z-AD EUR 0.1832 28 February 2019* 11 March 2019*
Invesco UK Equity Fund* A-AD GBP 0.0559 28 February 2019* 11 March 2019* C-AD GBP 0.0793 28 February 2019* 11 March 2019* Z-AD GBP 0.1161 28 February 2019* 11 March 2019*
Invesco UK Equity Income Fund A-SD GBP 0.2533 29 March 2018 4 June 2018 A-SD GBP 0.3339 28 September 2018 3 December 2018 C-SD GBP 0.0185 29 March 2018 4 June 2018 C-SD GBP 0.0245 28 September 2018 3 December 2018 Z-SD GBP 0.0406 29 March 2018 4 June 2018 Z-SD GBP 0.0538 28 September 2018 3 December 2018
Invesco Japanese Equity Dividend Growth Fund* A (EUR Hgd)-AD EUR 0.0099 28 February 2019* 11 March 2019* A (USD)-AD USD 0.0182 28 February 2019* 11 March 2019* C (USD)-AD USD 0.0757 28 February 2019* 11 March 2019* Z (GBP)-AD GBP 0.0948 28 February 2019* 11 March 2019* Z (GBP Hgd)-AD GBP 0.0994 28 February 2019* 11 March 2019*
Invesco Japanese Equity Value Discovery Fund (formerly Invesco Japanese Value Equity Fund) A (USD)-AD USD 0.0026 28 February 2019* 11 March 2019* A-SD JPY 0.1179 28 February 2019* 11 March 2019* C (USD)-AD USD 0.1387 28 February 2019* 11 March 2019*
Invesco ASEAN Equity Fund* C-AD USD 0.0585 28 February 2019* 11 March 2019* Z-AD USD 0.0177 28 February 2019* 11 March 2019* *Please refer to Note 1 for details of the mergers into Invesco Funds umbrella.
416 Invesco Funds
Notes to the Financial Statements (continued)
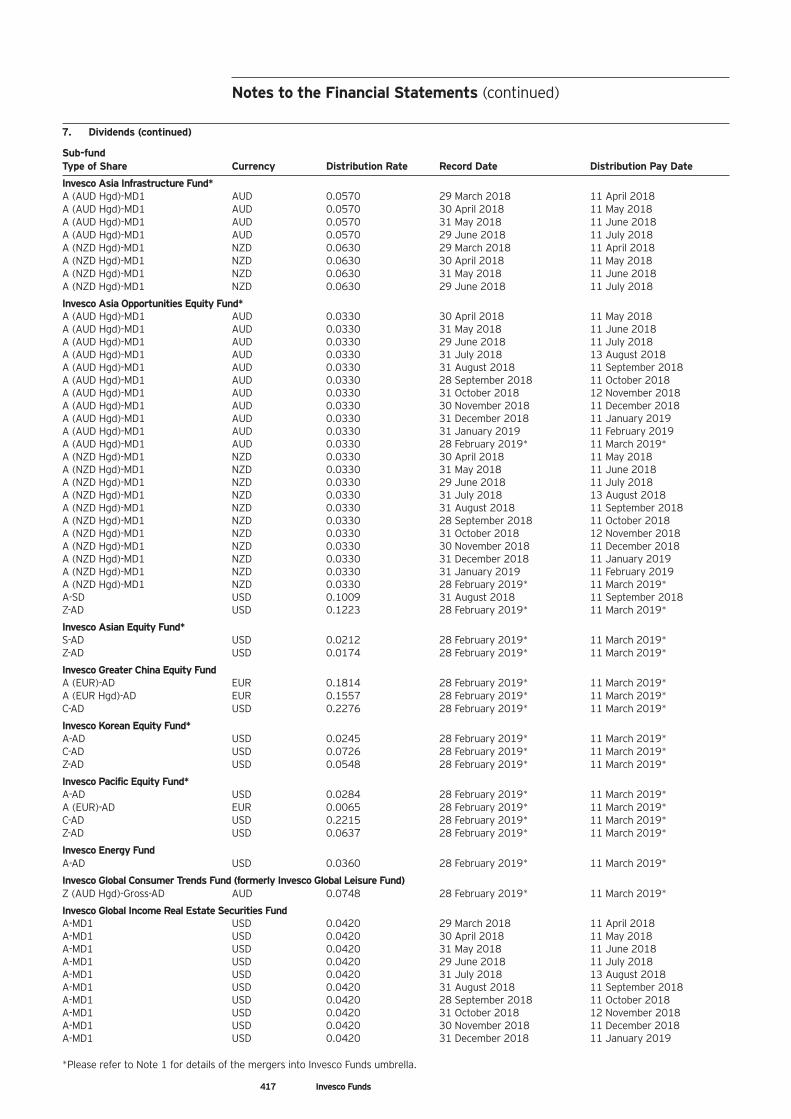
Notes to the Financial Statements (continued)
7. Dividends (continued)
Sub-fund Type of Share Currency Distribution Rate Record Date Distribution Pay Date
Invesco Asia Infrastructure Fund* A (AUD Hgd)-MD1 AUD 0.0570 29 March 2018 11 April 2018 A (AUD Hgd)-MD1 AUD 0.0570 30 April 2018 11 May 2018 A (AUD Hgd)-MD1 AUD 0.0570 31 May 2018 11 June 2018 A (AUD Hgd)-MD1 AUD 0.0570 29 June 2018 11 July 2018 A (NZD Hgd)-MD1 NZD 0.0630 29 March 2018 11 April 2018 A (NZD Hgd)-MD1 NZD 0.0630 30 April 2018 11 May 2018 A (NZD Hgd)-MD1 NZD 0.0630 31 May 2018 11 June 2018 A (NZD Hgd)-MD1 NZD 0.0630 29 June 2018 11 July 2018
Invesco Asia Opportunities Equity Fund* A (AUD Hgd)-MD1 AUD 0.0330 30 April 2018 11 May 2018 A (AUD Hgd)-MD1 AUD 0.0330 31 May 2018 11 June 2018 A (AUD Hgd)-MD1 AUD 0.0330 29 June 2018 11 July 2018 A (AUD Hgd)-MD1 AUD 0.0330 31 July 2018 13 August 2018 A (AUD Hgd)-MD1 AUD 0.0330 31 August 2018 11 September 2018 A (AUD Hgd)-MD1 AUD 0.0330 28 September 2018 11 October 2018 A (AUD Hgd)-MD1 AUD 0.0330 31 October 2018 12 November 2018 A (AUD Hgd)-MD1 AUD 0.0330 30 November 2018 11 December 2018 A (AUD Hgd)-MD1 AUD 0.0330 31 December 2018 11 January 2019 A (AUD Hgd)-MD1 AUD 0.0330 31 January 2019 11 February 2019 A (AUD Hgd)-MD1 AUD 0.0330 28 February 2019* 11 March 2019* A (NZD Hgd)-MD1 NZD 0.0330 30 April 2018 11 May 2018 A (NZD Hgd)-MD1 NZD 0.0330 31 May 2018 11 June 2018 A (NZD Hgd)-MD1 NZD 0.0330 29 June 2018 11 July 2018 A (NZD Hgd)-MD1 NZD 0.0330 31 July 2018 13 August 2018 A (NZD Hgd)-MD1 NZD 0.0330 31 August 2018 11 September 2018 A (NZD Hgd)-MD1 NZD 0.0330 28 September 2018 11 October 2018 A (NZD Hgd)-MD1 NZD 0.0330 31 October 2018 12 November 2018 A (NZD Hgd)-MD1 NZD 0.0330 30 November 2018 11 December 2018 A (NZD Hgd)-MD1 NZD 0.0330 31 December 2018 11 January 2019 A (NZD Hgd)-MD1 NZD 0.0330 31 January 2019 11 February 2019 A (NZD Hgd)-MD1 NZD 0.0330 28 February 2019* 11 March 2019* A-SD USD 0.1009 31 August 2018 11 September 2018 Z-AD USD 0.1223 28 February 2019* 11 March 2019*
Invesco Asian Equity Fund* S-AD USD 0.0212 28 February 2019* 11 March 2019* Z-AD USD 0.0174 28 February 2019* 11 March 2019*
Invesco Greater China Equity Fund A (EUR)-AD EUR 0.1814 28 February 2019* 11 March 2019* A (EUR Hgd)-AD EUR 0.1557 28 February 2019* 11 March 2019* C-AD USD 0.2276 28 February 2019* 11 March 2019*
Invesco Korean Equity Fund* A-AD USD 0.0245 28 February 2019* 11 March 2019* C-AD USD 0.0726 28 February 2019* 11 March 2019* Z-AD USD 0.0548 28 February 2019* 11 March 2019*
Invesco Pacific Equity Fund* A-AD USD 0.0284 28 February 2019* 11 March 2019* A (EUR)-AD EUR 0.0065 28 February 2019* 11 March 2019* C-AD USD 0.2215 28 February 2019* 11 March 2019* Z-AD USD 0.0637 28 February 2019* 11 March 2019*
Invesco Energy Fund A-AD USD 0.0360 28 February 2019* 11 March 2019*
Invesco Global Consumer Trends Fund (formerly Invesco Global Leisure Fund) Z (AUD Hgd)-Gross-AD AUD 0.0748 28 February 2019* 11 March 2019*
Invesco Global Income Real Estate Securities Fund A-MD1 USD 0.0420 29 March 2018 11 April 2018 A-MD1 USD 0.0420 30 April 2018 11 May 2018 A-MD1 USD 0.0420 31 May 2018 11 June 2018 A-MD1 USD 0.0420 29 June 2018 11 July 2018 A-MD1 USD 0.0420 31 July 2018 13 August 2018 A-MD1 USD 0.0420 31 August 2018 11 September 2018 A-MD1 USD 0.0420 28 September 2018 11 October 2018 A-MD1 USD 0.0420 31 October 2018 12 November 2018 A-MD1 USD 0.0420 30 November 2018 11 December 2018 A-MD1 USD 0.0420 31 December 2018 11 January 2019 *Please refer to Note 1 for details of the mergers into Invesco Funds umbrella.
417 Invesco Funds
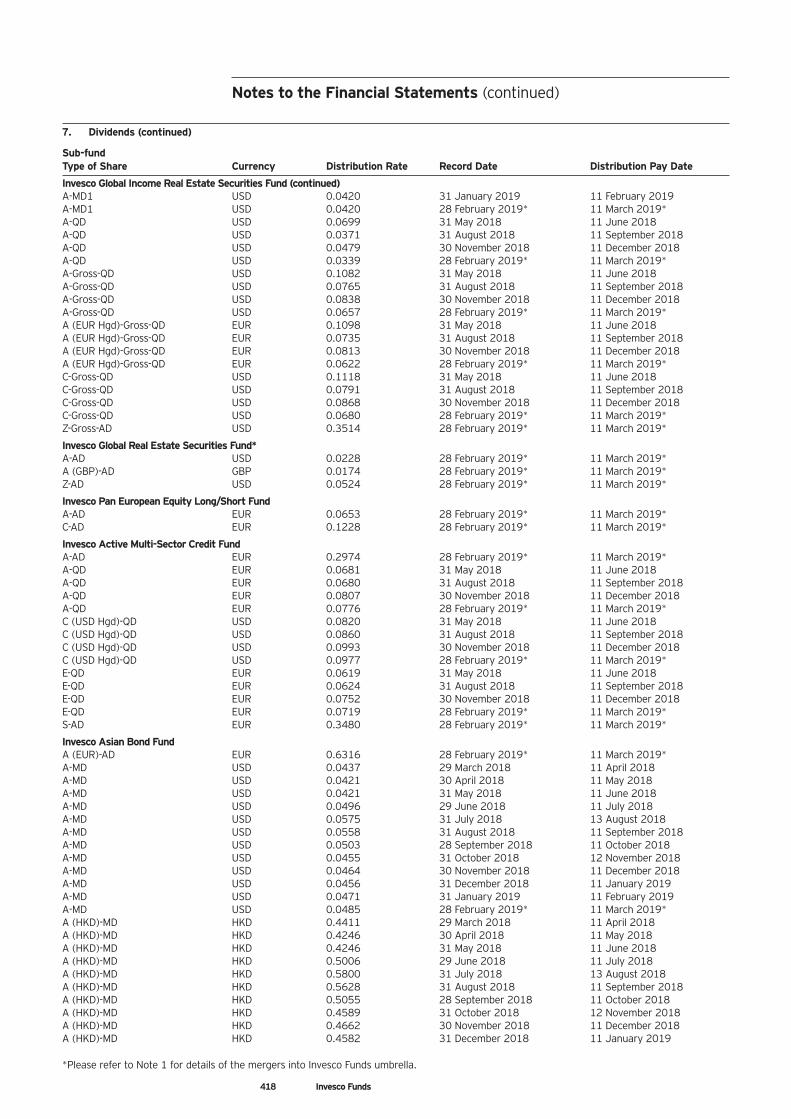
Notes to the Financial Statements (continued)
7. Dividends (continued)
Sub-fund Type of Share Currency Distribution Rate Record Date Distribution Pay Date
Invesco Global Income Real Estate Securities Fund (continued) A-MD1 USD 0.0420 31 January 2019 11 February 2019 A-MD1 USD 0.0420 28 February 2019* 11 March 2019* A-QD USD 0.0699 31 May 2018 11 June 2018 A-QD USD 0.0371 31 August 2018 11 September 2018 A-QD USD 0.0479 30 November 2018 11 December 2018 A-QD USD 0.0339 28 February 2019* 11 March 2019* A-Gross-QD USD 0.1082 31 May 2018 11 June 2018 A-Gross-QD USD 0.0765 31 August 2018 11 September 2018 A-Gross-QD USD 0.0838 30 November 2018 11 December 2018 A-Gross-QD USD 0.0657 28 February 2019* 11 March 2019* A (EUR Hgd)-Gross-QD EUR 0.1098 31 May 2018 11 June 2018 A (EUR Hgd)-Gross-QD EUR 0.0735 31 August 2018 11 September 2018 A (EUR Hgd)-Gross-QD EUR 0.0813 30 November 2018 11 December 2018 A (EUR Hgd)-Gross-QD EUR 0.0622 28 February 2019* 11 March 2019* C-Gross-QD USD 0.1118 31 May 2018 11 June 2018 C-Gross-QD USD 0.0791 31 August 2018 11 September 2018 C-Gross-QD USD 0.0868 30 November 2018 11 December 2018 C-Gross-QD USD 0.0680 28 February 2019* 11 March 2019* Z-Gross-AD USD 0.3514 28 February 2019* 11 March 2019*
Invesco Global Real Estate Securities Fund* A-AD USD 0.0228 28 February 2019* 11 March 2019* A (GBP)-AD GBP 0.0174 28 February 2019* 11 March 2019* Z-AD USD 0.0524 28 February 2019* 11 March 2019*
Invesco Pan European Equity Long/Short Fund A-AD EUR 0.0653 28 February 2019* 11 March 2019* C-AD EUR 0.1228 28 February 2019* 11 March 2019*
Invesco Active Multi-Sector Credit Fund A-AD EUR 0.2974 28 February 2019* 11 March 2019* A-QD EUR 0.0681 31 May 2018 11 June 2018 A-QD EUR 0.0680 31 August 2018 11 September 2018 A-QD EUR 0.0807 30 November 2018 11 December 2018 A-QD EUR 0.0776 28 February 2019* 11 March 2019* C (USD Hgd)-QD USD 0.0820 31 May 2018 11 June 2018 C (USD Hgd)-QD USD 0.0860 31 August 2018 11 September 2018 C (USD Hgd)-QD USD 0.0993 30 November 2018 11 December 2018 C (USD Hgd)-QD USD 0.0977 28 February 2019* 11 March 2019* E-QD EUR 0.0619 31 May 2018 11 June 2018 E-QD EUR 0.0624 31 August 2018 11 September 2018 E-QD EUR 0.0752 30 November 2018 11 December 2018 E-QD EUR 0.0719 28 February 2019* 11 March 2019* S-AD EUR 0.3480 28 February 2019* 11 March 2019*
Invesco Asian Bond Fund A (EUR)-AD EUR 0.6316 28 February 2019* 11 March 2019* A-MD USD 0.0437 29 March 2018 11 April 2018 A-MD USD 0.0421 30 April 2018 11 May 2018 A-MD USD 0.0421 31 May 2018 11 June 2018 A-MD USD 0.0496 29 June 2018 11 July 2018 A-MD USD 0.0575 31 July 2018 13 August 2018 A-MD USD 0.0558 31 August 2018 11 September 2018 A-MD USD 0.0503 28 September 2018 11 October 2018 A-MD USD 0.0455 31 October 2018 12 November 2018 A-MD USD 0.0464 30 November 2018 11 December 2018 A-MD USD 0.0456 31 December 2018 11 January 2019 A-MD USD 0.0471 31 January 2019 11 February 2019 A-MD USD 0.0485 28 February 2019* 11 March 2019* A (HKD)-MD HKD 0.4411 29 March 2018 11 April 2018 A (HKD)-MD HKD 0.4246 30 April 2018 11 May 2018 A (HKD)-MD HKD 0.4246 31 May 2018 11 June 2018 A (HKD)-MD HKD 0.5006 29 June 2018 11 July 2018 A (HKD)-MD HKD 0.5800 31 July 2018 13 August 2018 A (HKD)-MD HKD 0.5628 31 August 2018 11 September 2018 A (HKD)-MD HKD 0.5055 28 September 2018 11 October 2018 A (HKD)-MD HKD 0.4589 31 October 2018 12 November 2018 A (HKD)-MD HKD 0.4662 30 November 2018 11 December 2018 A (HKD)-MD HKD 0.4582 31 December 2018 11 January 2019 *Please refer to Note 1 for details of the mergers into Invesco Funds umbrella.
418 Invesco Funds
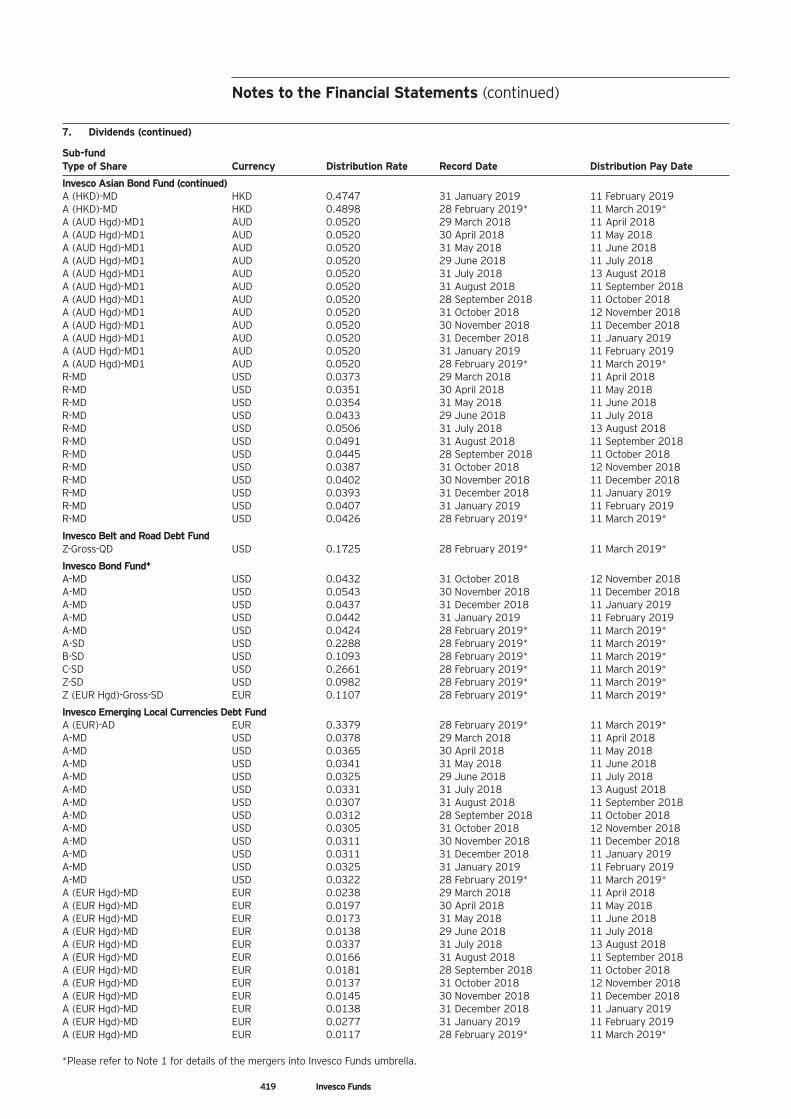
Notes to the Financial Statements (continued)
7. Dividends (continued)
Sub-fund Type of Share Currency Distribution Rate Record Date Distribution Pay Date
Invesco Asian Bond Fund (continued) A (HKD)-MD HKD 0.4747 31 January 2019 11 February 2019 A (HKD)-MD HKD 0.4898 28 February 2019* 11 March 2019* A (AUD Hgd)-MD1 AUD 0.0520 29 March 2018 11 April 2018 A (AUD Hgd)-MD1 AUD 0.0520 30 April 2018 11 May 2018 A (AUD Hgd)-MD1 AUD 0.0520 31 May 2018 11 June 2018 A (AUD Hgd)-MD1 AUD 0.0520 29 June 2018 11 July 2018 A (AUD Hgd)-MD1 AUD 0.0520 31 July 2018 13 August 2018 A (AUD Hgd)-MD1 AUD 0.0520 31 August 2018 11 September 2018 A (AUD Hgd)-MD1 AUD 0.0520 28 September 2018 11 October 2018 A (AUD Hgd)-MD1 AUD 0.0520 31 October 2018 12 November 2018 A (AUD Hgd)-MD1 AUD 0.0520 30 November 2018 11 December 2018 A (AUD Hgd)-MD1 AUD 0.0520 31 December 2018 11 January 2019 A (AUD Hgd)-MD1 AUD 0.0520 31 January 2019 11 February 2019 A (AUD Hgd)-MD1 AUD 0.0520 28 February 2019* 11 March 2019* R-MD USD 0.0373 29 March 2018 11 April 2018 R-MD USD 0.0351 30 April 2018 11 May 2018 R-MD USD 0.0354 31 May 2018 11 June 2018 R-MD USD 0.0433 29 June 2018 11 July 2018 R-MD USD 0.0506 31 July 2018 13 August 2018 R-MD USD 0.0491 31 August 2018 11 September 2018 R-MD USD 0.0445 28 September 2018 11 October 2018 R-MD USD 0.0387 31 October 2018 12 November 2018 R-MD USD 0.0402 30 November 2018 11 December 2018 R-MD USD 0.0393 31 December 2018 11 January 2019 R-MD USD 0.0407 31 January 2019 11 February 2019 R-MD USD 0.0426 28 February 2019* 11 March 2019*
Invesco Belt and Road Debt Fund Z-Gross-QD USD 0.1725 28 February 2019* 11 March 2019*
Invesco Bond Fund* A-MD USD 0.0432 31 October 2018 12 November 2018 A-MD USD 0.0543 30 November 2018 11 December 2018 A-MD USD 0.0437 31 December 2018 11 January 2019 A-MD USD 0.0442 31 January 2019 11 February 2019 A-MD USD 0.0424 28 February 2019* 11 March 2019* A-SD USD 0.2288 28 February 2019* 11 March 2019* B-SD USD 0.1093 28 February 2019* 11 March 2019* C-SD USD 0.2661 28 February 2019* 11 March 2019* Z-SD USD 0.0982 28 February 2019* 11 March 2019* Z (EUR Hgd)-Gross-SD EUR 0.1107 28 February 2019* 11 March 2019*
Invesco Emerging Local Currencies Debt Fund A (EUR)-AD EUR 0.3379 28 February 2019* 11 March 2019* A-MD USD 0.0378 29 March 2018 11 April 2018 A-MD USD 0.0365 30 April 2018 11 May 2018 A-MD USD 0.0341 31 May 2018 11 June 2018 A-MD USD 0.0325 29 June 2018 11 July 2018 A-MD USD 0.0331 31 July 2018 13 August 2018 A-MD USD 0.0307 31 August 2018 11 September 2018 A-MD USD 0.0312 28 September 2018 11 October 2018 A-MD USD 0.0305 31 October 2018 12 November 2018 A-MD USD 0.0311 30 November 2018 11 December 2018 A-MD USD 0.0311 31 December 2018 11 January 2019 A-MD USD 0.0325 31 January 2019 11 February 2019 A-MD USD 0.0322 28 February 2019* 11 March 2019* A (EUR Hgd)-MD EUR 0.0238 29 March 2018 11 April 2018 A (EUR Hgd)-MD EUR 0.0197 30 April 2018 11 May 2018 A (EUR Hgd)-MD EUR 0.0173 31 May 2018 11 June 2018 A (EUR Hgd)-MD EUR 0.0138 29 June 2018 11 July 2018 A (EUR Hgd)-MD EUR 0.0337 31 July 2018 13 August 2018 A (EUR Hgd)-MD EUR 0.0166 31 August 2018 11 September 2018 A (EUR Hgd)-MD EUR 0.0181 28 September 2018 11 October 2018 A (EUR Hgd)-MD EUR 0.0137 31 October 2018 12 November 2018 A (EUR Hgd)-MD EUR 0.0145 30 November 2018 11 December 2018 A (EUR Hgd)-MD EUR 0.0138 31 December 2018 11 January 2019 A (EUR Hgd)-MD EUR 0.0277 31 January 2019 11 February 2019 A (EUR Hgd)-MD EUR 0.0117 28 February 2019* 11 March 2019* *Please refer to Note 1 for details of the mergers into Invesco Funds umbrella.
419 Invesco Funds
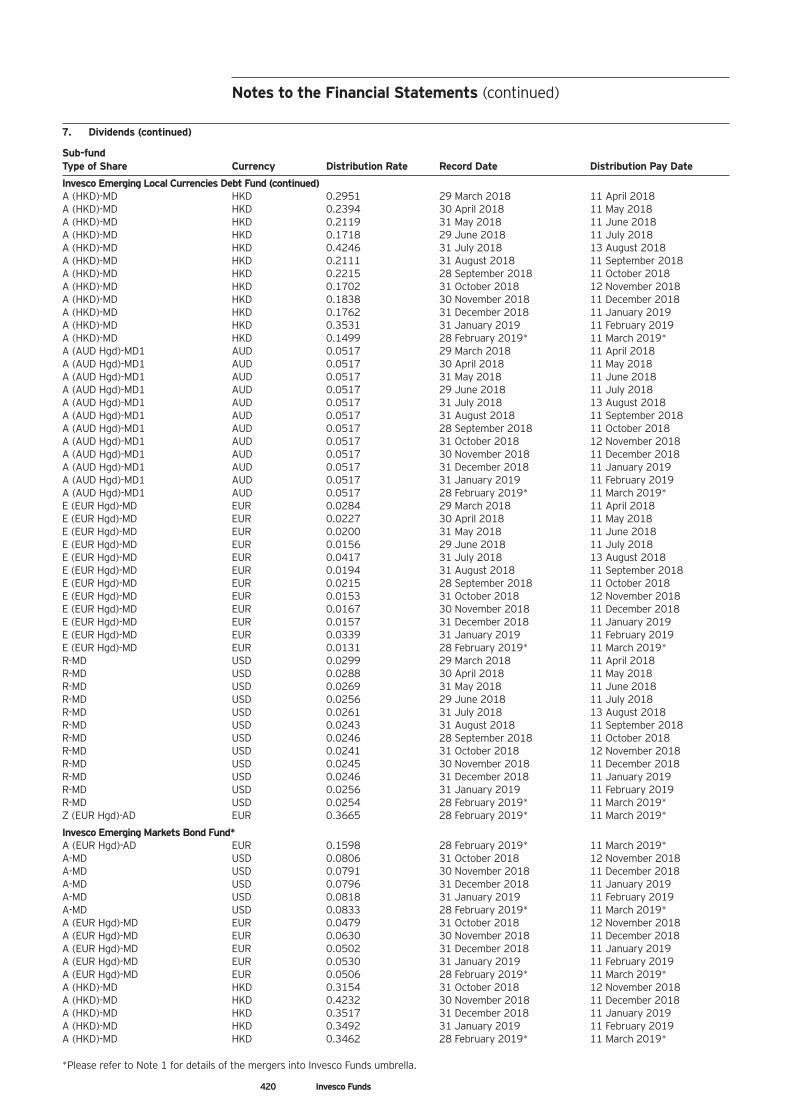
Notes to the Financial Statements (continued)
420 Invesco Funds
7. Dividends (continued)
Sub-fund Type of Share Currency Distribution Rate Record Date Distribution Pay Date
Invesco Emerging Local Currencies Debt Fund (continued) A (HKD)-MD HKD 0.2951 29 March 2018 11 April 2018 A (HKD)-MD HKD 0.2394 30 April 2018 11 May 2018 A (HKD)-MD HKD 0.2119 31 May 2018 11 June 2018 A (HKD)-MD HKD 0.1718 29 June 2018 11 July 2018 A (HKD)-MD HKD 0.4246 31 July 2018 13 August 2018 A (HKD)-MD HKD 0.2111 31 August 2018 11 September 2018 A (HKD)-MD HKD 0.2215 28 September 2018 11 October 2018 A (HKD)-MD HKD 0.1702 31 October 2018 12 November 2018 A (HKD)-MD HKD 0.1838 30 November 2018 11 December 2018 A (HKD)-MD HKD 0.1762 31 December 2018 11 January 2019 A (HKD)-MD HKD 0.3531 31 January 2019 11 February 2019 A (HKD)-MD HKD 0.1499 28 February 2019* 11 March 2019* A (AUD Hgd)-MD1 AUD 0.0517 29 March 2018 11 April 2018 A (AUD Hgd)-MD1 AUD 0.0517 30 April 2018 11 May 2018 A (AUD Hgd)-MD1 AUD 0.0517 31 May 2018 11 June 2018 A (AUD Hgd)-MD1 AUD 0.0517 29 June 2018 11 July 2018 A (AUD Hgd)-MD1 AUD 0.0517 31 July 2018 13 August 2018 A (AUD Hgd)-MD1 AUD 0.0517 31 August 2018 11 September 2018 A (AUD Hgd)-MD1 AUD 0.0517 28 September 2018 11 October 2018 A (AUD Hgd)-MD1 AUD 0.0517 31 October 2018 12 November 2018 A (AUD Hgd)-MD1 AUD 0.0517 30 November 2018 11 December 2018 A (AUD Hgd)-MD1 AUD 0.0517 31 December 2018 11 January 2019 A (AUD Hgd)-MD1 AUD 0.0517 31 January 2019 11 February 2019 A (AUD Hgd)-MD1 AUD 0.0517 28 February 2019* 11 March 2019* E (EUR Hgd)-MD EUR 0.0284 29 March 2018 11 April 2018 E (EUR Hgd)-MD EUR 0.0227 30 April 2018 11 May 2018 E (EUR Hgd)-MD EUR 0.0200 31 May 2018 11 June 2018 E (EUR Hgd)-MD EUR 0.0156 29 June 2018 11 July 2018 E (EUR Hgd)-MD EUR 0.0417 31 July 2018 13 August 2018 E (EUR Hgd)-MD EUR 0.0194 31 August 2018 11 September 2018 E (EUR Hgd)-MD EUR 0.0215 28 September 2018 11 October 2018 E (EUR Hgd)-MD EUR 0.0153 31 October 2018 12 November 2018 E (EUR Hgd)-MD EUR 0.0167 30 November 2018 11 December 2018 E (EUR Hgd)-MD EUR 0.0157 31 December 2018 11 January 2019 E (EUR Hgd)-MD EUR 0.0339 31 January 2019 11 February 2019 E (EUR Hgd)-MD EUR 0.0131 28 February 2019* 11 March 2019* R-MD USD 0.0299 29 March 2018 11 April 2018 R-MD USD 0.0288 30 April 2018 11 May 2018 R-MD USD 0.0269 31 May 2018 11 June 2018 R-MD USD 0.0256 29 June 2018 11 July 2018 R-MD USD 0.0261 31 July 2018 13 August 2018 R-MD USD 0.0243 31 August 2018 11 September 2018 R-MD USD 0.0246 28 September 2018 11 October 2018 R-MD USD 0.0241 31 October 2018 12 November 2018 R-MD USD 0.0245 30 November 2018 11 December 2018 R-MD USD 0.0246 31 December 2018 11 January 2019 R-MD USD 0.0256 31 January 2019 11 February 2019 R-MD USD 0.0254 28 February 2019* 11 March 2019* Z (EUR Hgd)-AD EUR 0.3665 28 February 2019* 11 March 2019*
Invesco Emerging Markets Bond Fund* A (EUR Hgd)-AD EUR 0.1598 28 February 2019* 11 March 2019* A-MD USD 0.0806 31 October 2018 12 November 2018 A-MD USD 0.0791 30 November 2018 11 December 2018 A-MD USD 0.0796 31 December 2018 11 January 2019 A-MD USD 0.0818 31 January 2019 11 February 2019 A-MD USD 0.0833 28 February 2019* 11 March 2019* A (EUR Hgd)-MD EUR 0.0479 31 October 2018 12 November 2018 A (EUR Hgd)-MD EUR 0.0630 30 November 2018 11 December 2018 A (EUR Hgd)-MD EUR 0.0502 31 December 2018 11 January 2019 A (EUR Hgd)-MD EUR 0.0530 31 January 2019 11 February 2019 A (EUR Hgd)-MD EUR 0.0506 28 February 2019* 11 March 2019* A (HKD)-MD HKD 0.3154 31 October 2018 12 November 2018 A (HKD)-MD HKD 0.4232 30 November 2018 11 December 2018 A (HKD)-MD HKD 0.3517 31 December 2018 11 January 2019 A (HKD)-MD HKD 0.3492 31 January 2019 11 February 2019 A (HKD)-MD HKD 0.3462 28 February 2019* 11 March 2019* *Please refer to Note 1 for details of the mergers into Invesco Funds umbrella.
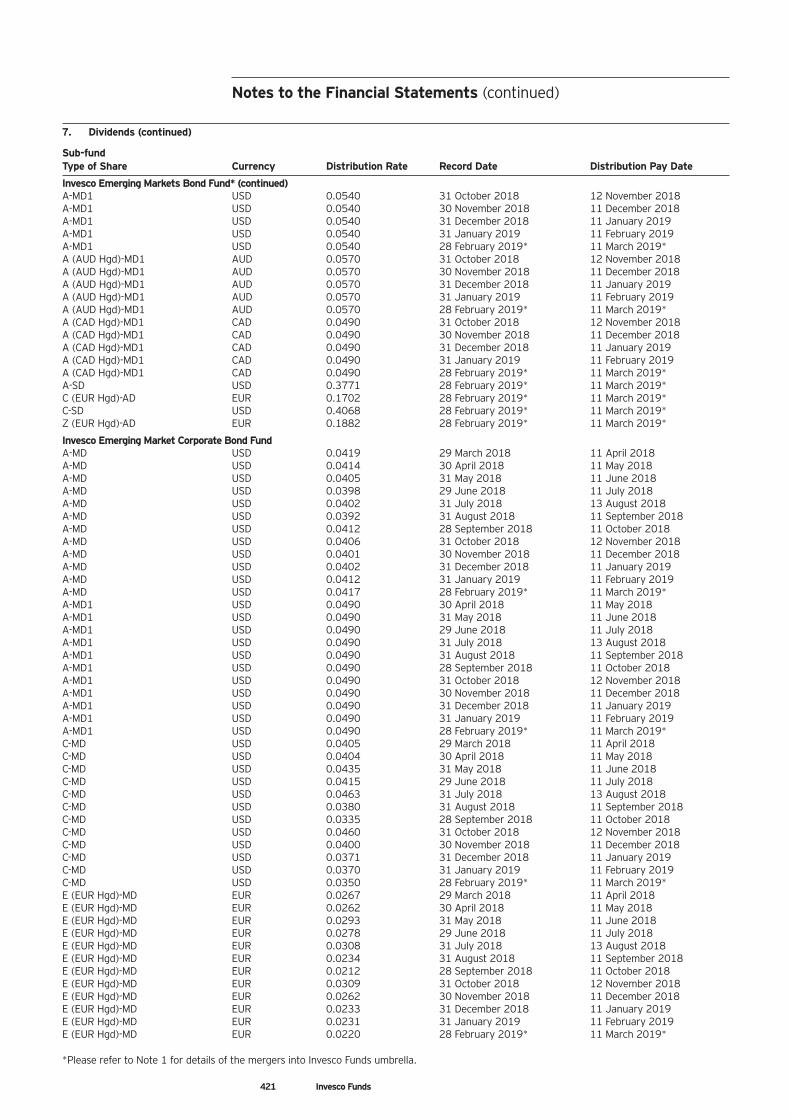
Notes to the Financial Statements (continued)
421 Invesco Funds
7. Dividends (continued)
Sub-fund Type of Share Currency Distribution Rate Record Date Distribution Pay Date
Invesco Emerging Markets Bond Fund* (continued) A-MD1 USD 0.0540 31 October 2018 12 November 2018 A-MD1 USD 0.0540 30 November 2018 11 December 2018 A-MD1 USD 0.0540 31 December 2018 11 January 2019 A-MD1 USD 0.0540 31 January 2019 11 February 2019 A-MD1 USD 0.0540 28 February 2019* 11 March 2019* A (AUD Hgd)-MD1 AUD 0.0570 31 October 2018 12 November 2018 A (AUD Hgd)-MD1 AUD 0.0570 30 November 2018 11 December 2018 A (AUD Hgd)-MD1 AUD 0.0570 31 December 2018 11 January 2019 A (AUD Hgd)-MD1 AUD 0.0570 31 January 2019 11 February 2019 A (AUD Hgd)-MD1 AUD 0.0570 28 February 2019* 11 March 2019* A (CAD Hgd)-MD1 CAD 0.0490 31 October 2018 12 November 2018 A (CAD Hgd)-MD1 CAD 0.0490 30 November 2018 11 December 2018 A (CAD Hgd)-MD1 CAD 0.0490 31 December 2018 11 January 2019 A (CAD Hgd)-MD1 CAD 0.0490 31 January 2019 11 February 2019 A (CAD Hgd)-MD1 CAD 0.0490 28 February 2019* 11 March 2019* A-SD USD 0.3771 28 February 2019* 11 March 2019* C (EUR Hgd)-AD EUR 0.1702 28 February 2019* 11 March 2019* C-SD USD 0.4068 28 February 2019* 11 March 2019* Z (EUR Hgd)-AD EUR 0.1882 28 February 2019* 11 March 2019*
Invesco Emerging Market Corporate Bond Fund A-MD USD 0.0419 29 March 2018 11 April 2018 A-MD USD 0.0414 30 April 2018 11 May 2018 A-MD USD 0.0405 31 May 2018 11 June 2018 A-MD USD 0.0398 29 June 2018 11 July 2018 A-MD USD 0.0402 31 July 2018 13 August 2018 A-MD USD 0.0392 31 August 2018 11 September 2018 A-MD USD 0.0412 28 September 2018 11 October 2018 A-MD USD 0.0406 31 October 2018 12 November 2018 A-MD USD 0.0401 30 November 2018 11 December 2018 A-MD USD 0.0402 31 December 2018 11 January 2019 A-MD USD 0.0412 31 January 2019 11 February 2019 A-MD USD 0.0417 28 February 2019* 11 March 2019* A-MD1 USD 0.0490 30 April 2018 11 May 2018 A-MD1 USD 0.0490 31 May 2018 11 June 2018 A-MD1 USD 0.0490 29 June 2018 11 July 2018 A-MD1 USD 0.0490 31 July 2018 13 August 2018 A-MD1 USD 0.0490 31 August 2018 11 September 2018 A-MD1 USD 0.0490 28 September 2018 11 October 2018 A-MD1 USD 0.0490 31 October 2018 12 November 2018 A-MD1 USD 0.0490 30 November 2018 11 December 2018 A-MD1 USD 0.0490 31 December 2018 11 January 2019 A-MD1 USD 0.0490 31 January 2019 11 February 2019 A-MD1 USD 0.0490 28 February 2019* 11 March 2019* C-MD USD 0.0405 29 March 2018 11 April 2018 C-MD USD 0.0404 30 April 2018 11 May 2018 C-MD USD 0.0435 31 May 2018 11 June 2018 C-MD USD 0.0415 29 June 2018 11 July 2018 C-MD USD 0.0463 31 July 2018 13 August 2018 C-MD USD 0.0380 31 August 2018 11 September 2018 C-MD USD 0.0335 28 September 2018 11 October 2018 C-MD USD 0.0460 31 October 2018 12 November 2018 C-MD USD 0.0400 30 November 2018 11 December 2018 C-MD USD 0.0371 31 December 2018 11 January 2019 C-MD USD 0.0370 31 January 2019 11 February 2019 C-MD USD 0.0350 28 February 2019* 11 March 2019* E (EUR Hgd)-MD EUR 0.0267 29 March 2018 11 April 2018 E (EUR Hgd)-MD EUR 0.0262 30 April 2018 11 May 2018 E (EUR Hgd)-MD EUR 0.0293 31 May 2018 11 June 2018 E (EUR Hgd)-MD EUR 0.0278 29 June 2018 11 July 2018 E (EUR Hgd)-MD EUR 0.0308 31 July 2018 13 August 2018 E (EUR Hgd)-MD EUR 0.0234 31 August 2018 11 September 2018 E (EUR Hgd)-MD EUR 0.0212 28 September 2018 11 October 2018 E (EUR Hgd)-MD EUR 0.0309 31 October 2018 12 November 2018 E (EUR Hgd)-MD EUR 0.0262 30 November 2018 11 December 2018 E (EUR Hgd)-MD EUR 0.0233 31 December 2018 11 January 2019 E (EUR Hgd)-MD EUR 0.0231 31 January 2019 11 February 2019 E (EUR Hgd)-MD EUR 0.0220 28 February 2019* 11 March 2019* *Please refer to Note 1 for details of the mergers into Invesco Funds umbrella.
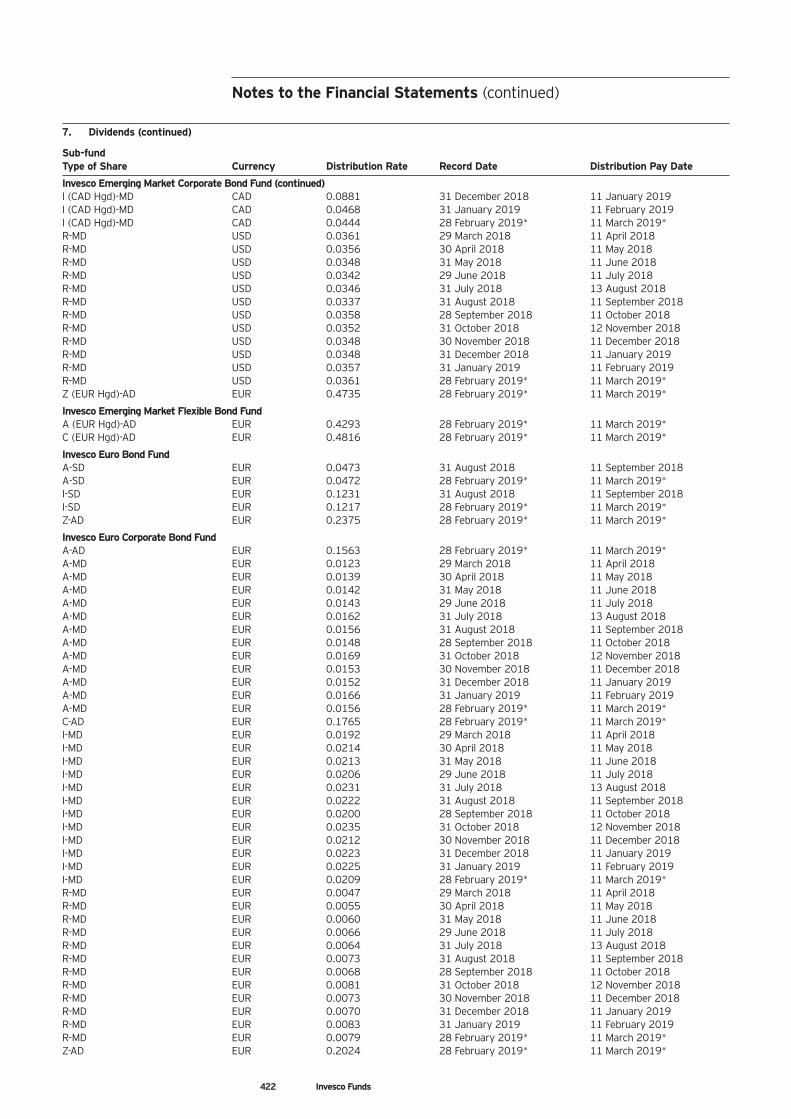
Notes to the Financial Statements (continued)
422 Invesco Funds
7. Dividends (continued)
Sub-fund Type of Share Currency Distribution Rate Record Date Distribution Pay Date
Invesco Emerging Market Corporate Bond Fund (continued) I (CAD Hgd)-MD CAD 0.0881 31 December 2018 11 January 2019 I (CAD Hgd)-MD CAD 0.0468 31 January 2019 11 February 2019 I (CAD Hgd)-MD CAD 0.0444 28 February 2019* 11 March 2019* R-MD USD 0.0361 29 March 2018 11 April 2018 R-MD USD 0.0356 30 April 2018 11 May 2018 R-MD USD 0.0348 31 May 2018 11 June 2018 R-MD USD 0.0342 29 June 2018 11 July 2018 R-MD USD 0.0346 31 July 2018 13 August 2018 R-MD USD 0.0337 31 August 2018 11 September 2018 R-MD USD 0.0358 28 September 2018 11 October 2018 R-MD USD 0.0352 31 October 2018 12 November 2018 R-MD USD 0.0348 30 November 2018 11 December 2018 R-MD USD 0.0348 31 December 2018 11 January 2019 R-MD USD 0.0357 31 January 2019 11 February 2019 R-MD USD 0.0361 28 February 2019* 11 March 2019* Z (EUR Hgd)-AD EUR 0.4735 28 February 2019* 11 March 2019*
Invesco Emerging Market Flexible Bond Fund A (EUR Hgd)-AD EUR 0.4293 28 February 2019* 11 March 2019* C (EUR Hgd)-AD EUR 0.4816 28 February 2019* 11 March 2019*
Invesco Euro Bond Fund A-SD EUR 0.0473 31 August 2018 11 September 2018 A-SD EUR 0.0472 28 February 2019* 11 March 2019* I-SD EUR 0.1231 31 August 2018 11 September 2018 I-SD EUR 0.1217 28 February 2019* 11 March 2019* Z-AD EUR 0.2375 28 February 2019* 11 March 2019*
Invesco Euro Corporate Bond Fund A-AD EUR 0.1563 28 February 2019* 11 March 2019* A-MD EUR 0.0123 29 March 2018 11 April 2018 A-MD EUR 0.0139 30 April 2018 11 May 2018 A-MD EUR 0.0142 31 May 2018 11 June 2018 A-MD EUR 0.0143 29 June 2018 11 July 2018 A-MD EUR 0.0162 31 July 2018 13 August 2018 A-MD EUR 0.0156 31 August 2018 11 September 2018 A-MD EUR 0.0148 28 September 2018 11 October 2018 A-MD EUR 0.0169 31 October 2018 12 November 2018 A-MD EUR 0.0153 30 November 2018 11 December 2018 A-MD EUR 0.0152 31 December 2018 11 January 2019 A-MD EUR 0.0166 31 January 2019 11 February 2019 A-MD EUR 0.0156 28 February 2019* 11 March 2019* C-AD EUR 0.1765 28 February 2019* 11 March 2019* I-MD EUR 0.0192 29 March 2018 11 April 2018 I-MD EUR 0.0214 30 April 2018 11 May 2018 I-MD EUR 0.0213 31 May 2018 11 June 2018 I-MD EUR 0.0206 29 June 2018 11 July 2018 I-MD EUR 0.0231 31 July 2018 13 August 2018 I-MD EUR 0.0222 31 August 2018 11 September 2018 I-MD EUR 0.0200 28 September 2018 11 October 2018 I-MD EUR 0.0235 31 October 2018 12 November 2018 I-MD EUR 0.0212 30 November 2018 11 December 2018 I-MD EUR 0.0223 31 December 2018 11 January 2019 I-MD EUR 0.0225 31 January 2019 11 February 2019 I-MD EUR 0.0209 28 February 2019* 11 March 2019* R-MD EUR 0.0047 29 March 2018 11 April 2018 R-MD EUR 0.0055 30 April 2018 11 May 2018 R-MD EUR 0.0060 31 May 2018 11 June 2018 R-MD EUR 0.0066 29 June 2018 11 July 2018 R-MD EUR 0.0064 31 July 2018 13 August 2018 R-MD EUR 0.0073 31 August 2018 11 September 2018 R-MD EUR 0.0068 28 September 2018 11 October 2018 R-MD EUR 0.0081 31 October 2018 12 November 2018 R-MD EUR 0.0073 30 November 2018 11 December 2018 R-MD EUR 0.0070 31 December 2018 11 January 2019 R-MD EUR 0.0083 31 January 2019 11 February 2019 R-MD EUR 0.0079 28 February 2019* 11 March 2019* Z-AD EUR 0.2024 28 February 2019* 11 March 2019*
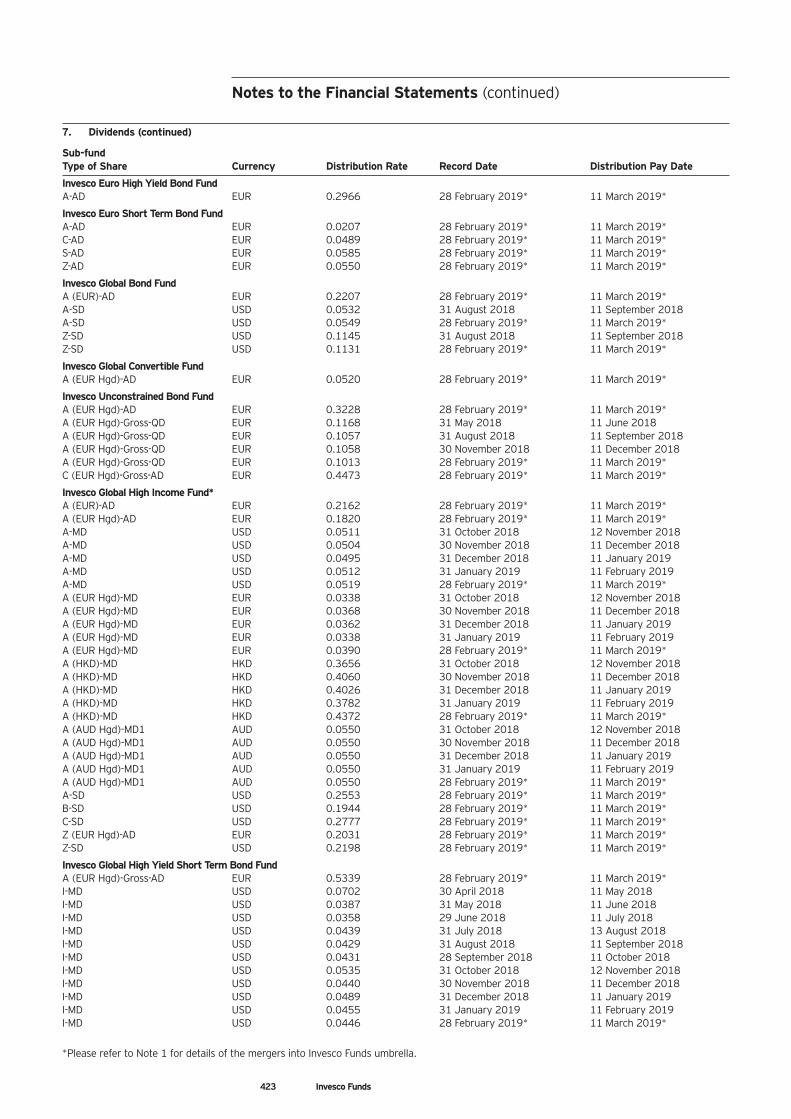
Notes to the Financial Statements (continued)
423 Invesco Funds
7. Dividends (continued)
Sub-fund Type of Share Currency Distribution Rate Record Date Distribution Pay Date
Invesco Euro High Yield Bond Fund A-AD EUR 0.2966 28 February 2019* 11 March 2019*
Invesco Euro Short Term Bond Fund A-AD EUR 0.0207 28 February 2019* 11 March 2019* C-AD EUR 0.0489 28 February 2019* 11 March 2019* S-AD EUR 0.0585 28 February 2019* 11 March 2019* Z-AD EUR 0.0550 28 February 2019* 11 March 2019*
Invesco Global Bond Fund A (EUR)-AD EUR 0.2207 28 February 2019* 11 March 2019* A-SD USD 0.0532 31 August 2018 11 September 2018 A-SD USD 0.0549 28 February 2019* 11 March 2019* Z-SD USD 0.1145 31 August 2018 11 September 2018 Z-SD USD 0.1131 28 February 2019* 11 March 2019*
Invesco Global Convertible Fund A (EUR Hgd)-AD EUR 0.0520 28 February 2019* 11 March 2019*
Invesco Unconstrained Bond Fund A (EUR Hgd)-AD EUR 0.3228 28 February 2019* 11 March 2019* A (EUR Hgd)-Gross-QD EUR 0.1168 31 May 2018 11 June 2018 A (EUR Hgd)-Gross-QD EUR 0.1057 31 August 2018 11 September 2018 A (EUR Hgd)-Gross-QD EUR 0.1058 30 November 2018 11 December 2018 A (EUR Hgd)-Gross-QD EUR 0.1013 28 February 2019* 11 March 2019* C (EUR Hgd)-Gross-AD EUR 0.4473 28 February 2019* 11 March 2019*
Invesco Global High Income Fund* A (EUR)-AD EUR 0.2162 28 February 2019* 11 March 2019* A (EUR Hgd)-AD EUR 0.1820 28 February 2019* 11 March 2019* A-MD USD 0.0511 31 October 2018 12 November 2018 A-MD USD 0.0504 30 November 2018 11 December 2018 A-MD USD 0.0495 31 December 2018 11 January 2019 A-MD USD 0.0512 31 January 2019 11 February 2019 A-MD USD 0.0519 28 February 2019* 11 March 2019* A (EUR Hgd)-MD EUR 0.0338 31 October 2018 12 November 2018 A (EUR Hgd)-MD EUR 0.0368 30 November 2018 11 December 2018 A (EUR Hgd)-MD EUR 0.0362 31 December 2018 11 January 2019 A (EUR Hgd)-MD EUR 0.0338 31 January 2019 11 February 2019 A (EUR Hgd)-MD EUR 0.0390 28 February 2019* 11 March 2019* A (HKD)-MD HKD 0.3656 31 October 2018 12 November 2018 A (HKD)-MD HKD 0.4060 30 November 2018 11 December 2018 A (HKD)-MD HKD 0.4026 31 December 2018 11 January 2019 A (HKD)-MD HKD 0.3782 31 January 2019 11 February 2019 A (HKD)-MD HKD 0.4372 28 February 2019* 11 March 2019* A (AUD Hgd)-MD1 AUD 0.0550 31 October 2018 12 November 2018 A (AUD Hgd)-MD1 AUD 0.0550 30 November 2018 11 December 2018 A (AUD Hgd)-MD1 AUD 0.0550 31 December 2018 11 January 2019 A (AUD Hgd)-MD1 AUD 0.0550 31 January 2019 11 February 2019 A (AUD Hgd)-MD1 AUD 0.0550 28 February 2019* 11 March 2019* A-SD USD 0.2553 28 February 2019* 11 March 2019* B-SD USD 0.1944 28 February 2019* 11 March 2019* C-SD USD 0.2777 28 February 2019* 11 March 2019* Z (EUR Hgd)-AD EUR 0.2031 28 February 2019* 11 March 2019* Z-SD USD 0.2198 28 February 2019* 11 March 2019*
Invesco Global High Yield Short Term Bond Fund A (EUR Hgd)-Gross-AD EUR 0.5339 28 February 2019* 11 March 2019* I-MD USD 0.0702 30 April 2018 11 May 2018 I-MD USD 0.0387 31 May 2018 11 June 2018 I-MD USD 0.0358 29 June 2018 11 July 2018 I-MD USD 0.0439 31 July 2018 13 August 2018 I-MD USD 0.0429 31 August 2018 11 September 2018 I-MD USD 0.0431 28 September 2018 11 October 2018 I-MD USD 0.0535 31 October 2018 12 November 2018 I-MD USD 0.0440 30 November 2018 11 December 2018 I-MD USD 0.0489 31 December 2018 11 January 2019 I-MD USD 0.0455 31 January 2019 11 February 2019 I-MD USD 0.0446 28 February 2019* 11 March 2019*
*Please refer to Note 1 for details of the mergers into Invesco Funds umbrella.
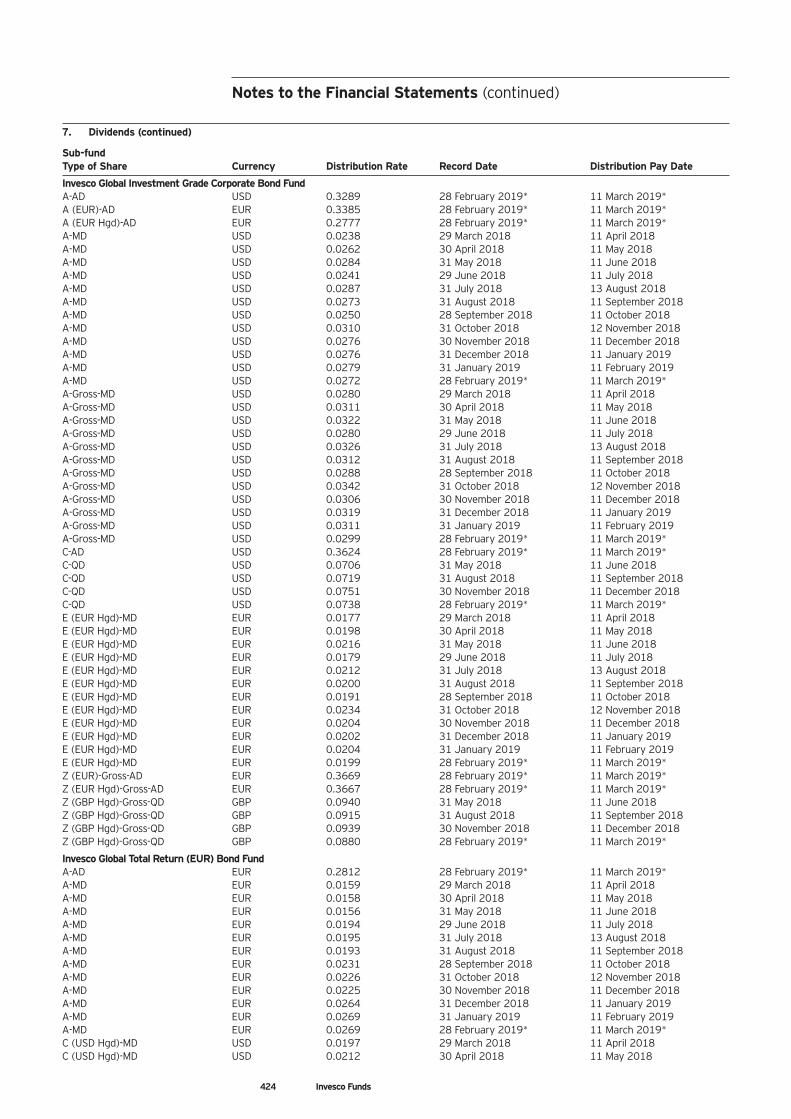
424 Invesco Funds
Notes to the Financial Statements (continued)
7. Dividends (continued)
Sub-fund Type of Share Currency Distribution Rate Record Date Distribution Pay Date
Invesco Global Investment Grade Corporate Bond Fund A-AD USD 0.3289 28 February 2019* 11 March 2019* A (EUR)-AD EUR 0.3385 28 February 2019* 11 March 2019* A (EUR Hgd)-AD EUR 0.2777 28 February 2019* 11 March 2019* A-MD USD 0.0238 29 March 2018 11 April 2018 A-MD USD 0.0262 30 April 2018 11 May 2018 A-MD USD 0.0284 31 May 2018 11 June 2018 A-MD USD 0.0241 29 June 2018 11 July 2018 A-MD USD 0.0287 31 July 2018 13 August 2018 A-MD USD 0.0273 31 August 2018 11 September 2018 A-MD USD 0.0250 28 September 2018 11 October 2018 A-MD USD 0.0310 31 October 2018 12 November 2018 A-MD USD 0.0276 30 November 2018 11 December 2018 A-MD USD 0.0276 31 December 2018 11 January 2019 A-MD USD 0.0279 31 January 2019 11 February 2019 A-MD USD 0.0272 28 February 2019* 11 March 2019* A-Gross-MD USD 0.0280 29 March 2018 11 April 2018 A-Gross-MD USD 0.0311 30 April 2018 11 May 2018 A-Gross-MD USD 0.0322 31 May 2018 11 June 2018 A-Gross-MD USD 0.0280 29 June 2018 11 July 2018 A-Gross-MD USD 0.0326 31 July 2018 13 August 2018 A-Gross-MD USD 0.0312 31 August 2018 11 September 2018 A-Gross-MD USD 0.0288 28 September 2018 11 October 2018 A-Gross-MD USD 0.0342 31 October 2018 12 November 2018 A-Gross-MD USD 0.0306 30 November 2018 11 December 2018 A-Gross-MD USD 0.0319 31 December 2018 11 January 2019 A-Gross-MD USD 0.0311 31 January 2019 11 February 2019 A-Gross-MD USD 0.0299 28 February 2019* 11 March 2019* C-AD USD 0.3624 28 February 2019* 11 March 2019* C-QD USD 0.0706 31 May 2018 11 June 2018 C-QD USD 0.0719 31 August 2018 11 September 2018 C-QD USD 0.0751 30 November 2018 11 December 2018 C-QD USD 0.0738 28 February 2019* 11 March 2019* E (EUR Hgd)-MD EUR 0.0177 29 March 2018 11 April 2018 E (EUR Hgd)-MD EUR 0.0198 30 April 2018 11 May 2018 E (EUR Hgd)-MD EUR 0.0216 31 May 2018 11 June 2018 E (EUR Hgd)-MD EUR 0.0179 29 June 2018 11 July 2018 E (EUR Hgd)-MD EUR 0.0212 31 July 2018 13 August 2018 E (EUR Hgd)-MD EUR 0.0200 31 August 2018 11 September 2018 E (EUR Hgd)-MD EUR 0.0191 28 September 2018 11 October 2018 E (EUR Hgd)-MD EUR 0.0234 31 October 2018 12 November 2018 E (EUR Hgd)-MD EUR 0.0204 30 November 2018 11 December 2018 E (EUR Hgd)-MD EUR 0.0202 31 December 2018 11 January 2019 E (EUR Hgd)-MD EUR 0.0204 31 January 2019 11 February 2019 E (EUR Hgd)-MD EUR 0.0199 28 February 2019* 11 March 2019* Z (EUR)-Gross-AD EUR 0.3669 28 February 2019* 11 March 2019* Z (EUR Hgd)-Gross-AD EUR 0.3667 28 February 2019* 11 March 2019* Z (GBP Hgd)-Gross-QD GBP 0.0940 31 May 2018 11 June 2018 Z (GBP Hgd)-Gross-QD GBP 0.0915 31 August 2018 11 September 2018 Z (GBP Hgd)-Gross-QD GBP 0.0939 30 November 2018 11 December 2018 Z (GBP Hgd)-Gross-QD GBP 0.0880 28 February 2019* 11 March 2019*
Invesco Global Total Return (EUR) Bond Fund A-AD EUR 0.2812 28 February 2019* 11 March 2019* A-MD EUR 0.0159 29 March 2018 11 April 2018 A-MD EUR 0.0158 30 April 2018 11 May 2018 A-MD EUR 0.0156 31 May 2018 11 June 2018 A-MD EUR 0.0194 29 June 2018 11 July 2018 A-MD EUR 0.0195 31 July 2018 13 August 2018 A-MD EUR 0.0193 31 August 2018 11 September 2018 A-MD EUR 0.0231 28 September 2018 11 October 2018 A-MD EUR 0.0226 31 October 2018 12 November 2018 A-MD EUR 0.0225 30 November 2018 11 December 2018 A-MD EUR 0.0264 31 December 2018 11 January 2019 A-MD EUR 0.0269 31 January 2019 11 February 2019 A-MD EUR 0.0269 28 February 2019* 11 March 2019* C (USD Hgd)-MD USD 0.0197 29 March 2018 11 April 2018 C (USD Hgd)-MD USD 0.0212 30 April 2018 11 May 2018
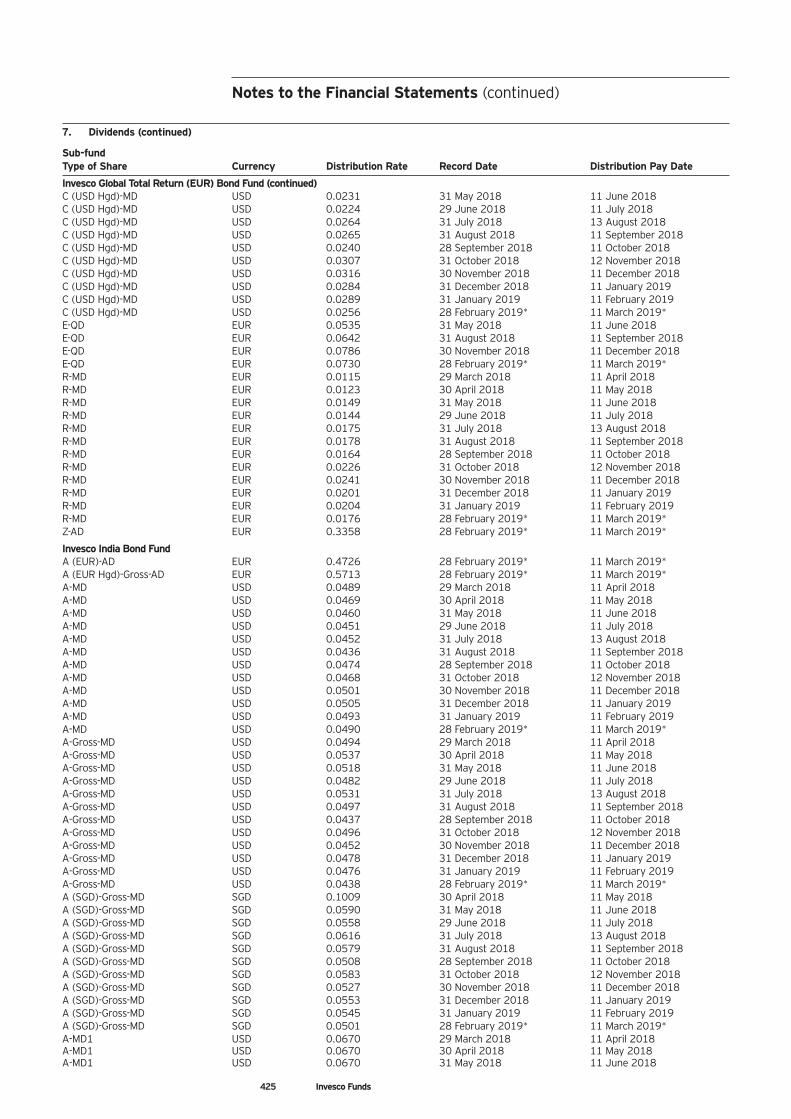
Notes to the Financial Statements (continued)
425 Invesco Funds
7. Dividends (continued)
Sub-fund Type of Share Currency Distribution Rate Record Date Distribution Pay Date
Invesco Global Total Return (EUR) Bond Fund (continued) C (USD Hgd)-MD USD 0.0231 31 May 2018 11 June 2018 C (USD Hgd)-MD USD 0.0224 29 June 2018 11 July 2018 C (USD Hgd)-MD USD 0.0264 31 July 2018 13 August 2018 C (USD Hgd)-MD USD 0.0265 31 August 2018 11 September 2018 C (USD Hgd)-MD USD 0.0240 28 September 2018 11 October 2018 C (USD Hgd)-MD USD 0.0307 31 October 2018 12 November 2018 C (USD Hgd)-MD USD 0.0316 30 November 2018 11 December 2018 C (USD Hgd)-MD USD 0.0284 31 December 2018 11 January 2019 C (USD Hgd)-MD USD 0.0289 31 January 2019 11 February 2019 C (USD Hgd)-MD USD 0.0256 28 February 2019* 11 March 2019* E-QD EUR 0.0535 31 May 2018 11 June 2018 E-QD EUR 0.0642 31 August 2018 11 September 2018 E-QD EUR 0.0786 30 November 2018 11 December 2018 E-QD EUR 0.0730 28 February 2019* 11 March 2019* R-MD EUR 0.0115 29 March 2018 11 April 2018 R-MD EUR 0.0123 30 April 2018 11 May 2018 R-MD EUR 0.0149 31 May 2018 11 June 2018 R-MD EUR 0.0144 29 June 2018 11 July 2018 R-MD EUR 0.0175 31 July 2018 13 August 2018 R-MD EUR 0.0178 31 August 2018 11 September 2018 R-MD EUR 0.0164 28 September 2018 11 October 2018 R-MD EUR 0.0226 31 October 2018 12 November 2018 R-MD EUR 0.0241 30 November 2018 11 December 2018 R-MD EUR 0.0201 31 December 2018 11 January 2019 R-MD EUR 0.0204 31 January 2019 11 February 2019 R-MD EUR 0.0176 28 February 2019* 11 March 2019* Z-AD EUR 0.3358 28 February 2019* 11 March 2019*
Invesco India Bond Fund A (EUR)-AD EUR 0.4726 28 February 2019* 11 March 2019* A (EUR Hgd)-Gross-AD EUR 0.5713 28 February 2019* 11 March 2019* A-MD USD 0.0489 29 March 2018 11 April 2018 A-MD USD 0.0469 30 April 2018 11 May 2018 A-MD USD 0.0460 31 May 2018 11 June 2018 A-MD USD 0.0451 29 June 2018 11 July 2018 A-MD USD 0.0452 31 July 2018 13 August 2018 A-MD USD 0.0436 31 August 2018 11 September 2018 A-MD USD 0.0474 28 September 2018 11 October 2018 A-MD USD 0.0468 31 October 2018 12 November 2018 A-MD USD 0.0501 30 November 2018 11 December 2018 A-MD USD 0.0505 31 December 2018 11 January 2019 A-MD USD 0.0493 31 January 2019 11 February 2019 A-MD USD 0.0490 28 February 2019* 11 March 2019* A-Gross-MD USD 0.0494 29 March 2018 11 April 2018 A-Gross-MD USD 0.0537 30 April 2018 11 May 2018 A-Gross-MD USD 0.0518 31 May 2018 11 June 2018 A-Gross-MD USD 0.0482 29 June 2018 11 July 2018 A-Gross-MD USD 0.0531 31 July 2018 13 August 2018 A-Gross-MD USD 0.0497 31 August 2018 11 September 2018 A-Gross-MD USD 0.0437 28 September 2018 11 October 2018 A-Gross-MD USD 0.0496 31 October 2018 12 November 2018 A-Gross-MD USD 0.0452 30 November 2018 11 December 2018 A-Gross-MD USD 0.0478 31 December 2018 11 January 2019 A-Gross-MD USD 0.0476 31 January 2019 11 February 2019 A-Gross-MD USD 0.0438 28 February 2019* 11 March 2019* A (SGD)-Gross-MD SGD 0.1009 30 April 2018 11 May 2018 A (SGD)-Gross-MD SGD 0.0590 31 May 2018 11 June 2018 A (SGD)-Gross-MD SGD 0.0558 29 June 2018 11 July 2018 A (SGD)-Gross-MD SGD 0.0616 31 July 2018 13 August 2018 A (SGD)-Gross-MD SGD 0.0579 31 August 2018 11 September 2018 A (SGD)-Gross-MD SGD 0.0508 28 September 2018 11 October 2018 A (SGD)-Gross-MD SGD 0.0583 31 October 2018 12 November 2018 A (SGD)-Gross-MD SGD 0.0527 30 November 2018 11 December 2018 A (SGD)-Gross-MD SGD 0.0553 31 December 2018 11 January 2019 A (SGD)-Gross-MD SGD 0.0545 31 January 2019 11 February 2019 A (SGD)-Gross-MD SGD 0.0501 28 February 2019* 11 March 2019* A-MD1 USD 0.0670 29 March 2018 11 April 2018 A-MD1 USD 0.0670 30 April 2018 11 May 2018 A-MD1 USD 0.0670 31 May 2018 11 June 2018
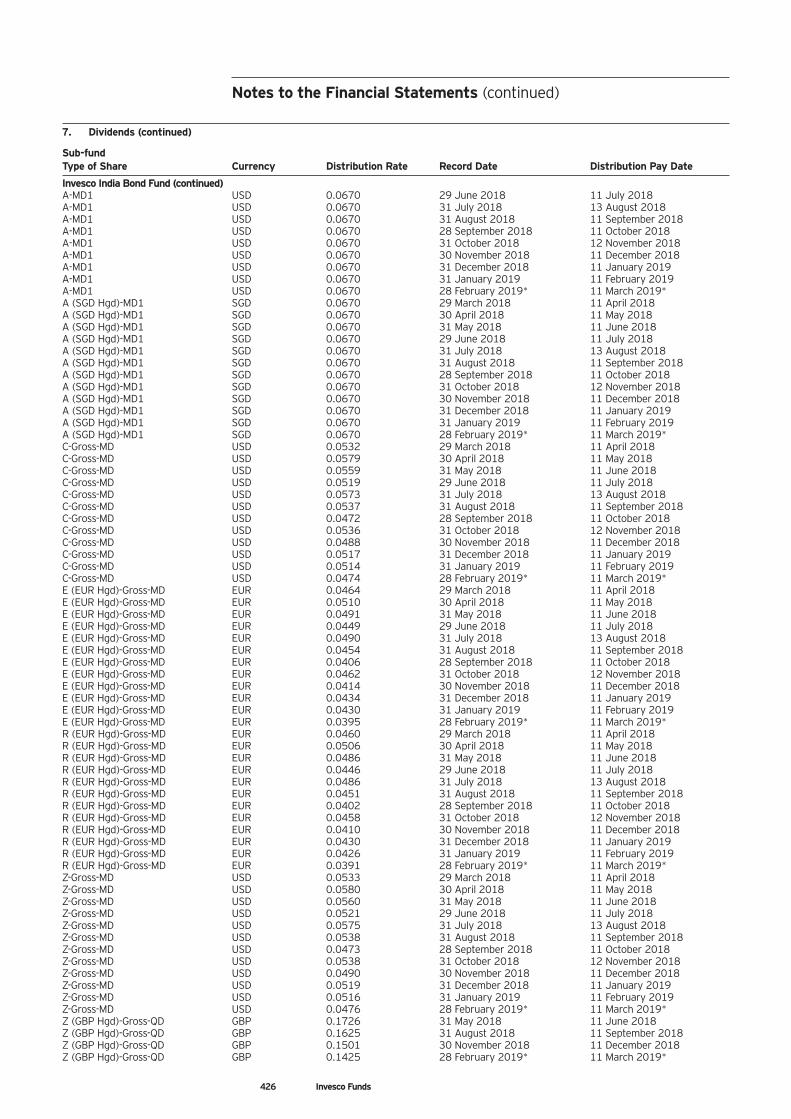
426 Invesco Funds
Notes to the Financial Statements (continued)
7. Dividends (continued)
Sub-fund Type of Share Currency Distribution Rate Record Date Distribution Pay Date
Invesco India Bond Fund (continued) A-MD1 USD 0.0670 29 June 2018 11 July 2018 A-MD1 USD 0.0670 31 July 2018 13 August 2018 A-MD1 USD 0.0670 31 August 2018 11 September 2018 A-MD1 USD 0.0670 28 September 2018 11 October 2018 A-MD1 USD 0.0670 31 October 2018 12 November 2018 A-MD1 USD 0.0670 30 November 2018 11 December 2018 A-MD1 USD 0.0670 31 December 2018 11 January 2019 A-MD1 USD 0.0670 31 January 2019 11 February 2019 A-MD1 USD 0.0670 28 February 2019* 11 March 2019* A (SGD Hgd)-MD1 SGD 0.0670 29 March 2018 11 April 2018 A (SGD Hgd)-MD1 SGD 0.0670 30 April 2018 11 May 2018 A (SGD Hgd)-MD1 SGD 0.0670 31 May 2018 11 June 2018 A (SGD Hgd)-MD1 SGD 0.0670 29 June 2018 11 July 2018 A (SGD Hgd)-MD1 SGD 0.0670 31 July 2018 13 August 2018 A (SGD Hgd)-MD1 SGD 0.0670 31 August 2018 11 September 2018 A (SGD Hgd)-MD1 SGD 0.0670 28 September 2018 11 October 2018 A (SGD Hgd)-MD1 SGD 0.0670 31 October 2018 12 November 2018 A (SGD Hgd)-MD1 SGD 0.0670 30 November 2018 11 December 2018 A (SGD Hgd)-MD1 SGD 0.0670 31 December 2018 11 January 2019 A (SGD Hgd)-MD1 SGD 0.0670 31 January 2019 11 February 2019 A (SGD Hgd)-MD1 SGD 0.0670 28 February 2019* 11 March 2019* C-Gross-MD USD 0.0532 29 March 2018 11 April 2018 C-Gross-MD USD 0.0579 30 April 2018 11 May 2018 C-Gross-MD USD 0.0559 31 May 2018 11 June 2018 C-Gross-MD USD 0.0519 29 June 2018 11 July 2018 C-Gross-MD USD 0.0573 31 July 2018 13 August 2018 C-Gross-MD USD 0.0537 31 August 2018 11 September 2018 C-Gross-MD USD 0.0472 28 September 2018 11 October 2018 C-Gross-MD USD 0.0536 31 October 2018 12 November 2018 C-Gross-MD USD 0.0488 30 November 2018 11 December 2018 C-Gross-MD USD 0.0517 31 December 2018 11 January 2019 C-Gross-MD USD 0.0514 31 January 2019 11 February 2019 C-Gross-MD USD 0.0474 28 February 2019* 11 March 2019* E (EUR Hgd)-Gross-MD EUR 0.0464 29 March 2018 11 April 2018 E (EUR Hgd)-Gross-MD EUR 0.0510 30 April 2018 11 May 2018 E (EUR Hgd)-Gross-MD EUR 0.0491 31 May 2018 11 June 2018 E (EUR Hgd)-Gross-MD EUR 0.0449 29 June 2018 11 July 2018 E (EUR Hgd)-Gross-MD EUR 0.0490 31 July 2018 13 August 2018 E (EUR Hgd)-Gross-MD EUR 0.0454 31 August 2018 11 September 2018 E (EUR Hgd)-Gross-MD EUR 0.0406 28 September 2018 11 October 2018 E (EUR Hgd)-Gross-MD EUR 0.0462 31 October 2018 12 November 2018 E (EUR Hgd)-Gross-MD EUR 0.0414 30 November 2018 11 December 2018 E (EUR Hgd)-Gross-MD EUR 0.0434 31 December 2018 11 January 2019 E (EUR Hgd)-Gross-MD EUR 0.0430 31 January 2019 11 February 2019 E (EUR Hgd)-Gross-MD EUR 0.0395 28 February 2019* 11 March 2019* R (EUR Hgd)-Gross-MD EUR 0.0460 29 March 2018 11 April 2018 R (EUR Hgd)-Gross-MD EUR 0.0506 30 April 2018 11 May 2018 R (EUR Hgd)-Gross-MD EUR 0.0486 31 May 2018 11 June 2018 R (EUR Hgd)-Gross-MD EUR 0.0446 29 June 2018 11 July 2018 R (EUR Hgd)-Gross-MD EUR 0.0486 31 July 2018 13 August 2018 R (EUR Hgd)-Gross-MD EUR 0.0451 31 August 2018 11 September 2018 R (EUR Hgd)-Gross-MD EUR 0.0402 28 September 2018 11 October 2018 R (EUR Hgd)-Gross-MD EUR 0.0458 31 October 2018 12 November 2018 R (EUR Hgd)-Gross-MD EUR 0.0410 30 November 2018 11 December 2018 R (EUR Hgd)-Gross-MD EUR 0.0430 31 December 2018 11 January 2019 R (EUR Hgd)-Gross-MD EUR 0.0426 31 January 2019 11 February 2019 R (EUR Hgd)-Gross-MD EUR 0.0391 28 February 2019* 11 March 2019* Z-Gross-MD USD 0.0533 29 March 2018 11 April 2018 Z-Gross-MD USD 0.0580 30 April 2018 11 May 2018 Z-Gross-MD USD 0.0560 31 May 2018 11 June 2018 Z-Gross-MD USD 0.0521 29 June 2018 11 July 2018 Z-Gross-MD USD 0.0575 31 July 2018 13 August 2018 Z-Gross-MD USD 0.0538 31 August 2018 11 September 2018 Z-Gross-MD USD 0.0473 28 September 2018 11 October 2018 Z-Gross-MD USD 0.0538 31 October 2018 12 November 2018 Z-Gross-MD USD 0.0490 30 November 2018 11 December 2018 Z-Gross-MD USD 0.0519 31 December 2018 11 January 2019 Z-Gross-MD USD 0.0516 31 January 2019 11 February 2019 Z-Gross-MD USD 0.0476 28 February 2019* 11 March 2019* Z (GBP Hgd)-Gross-QD GBP 0.1726 31 May 2018 11 June 2018 Z (GBP Hgd)-Gross-QD GBP 0.1625 31 August 2018 11 September 2018 Z (GBP Hgd)-Gross-QD GBP 0.1501 30 November 2018 11 December 2018 Z (GBP Hgd)-Gross-QD GBP 0.1425 28 February 2019* 11 March 2019*
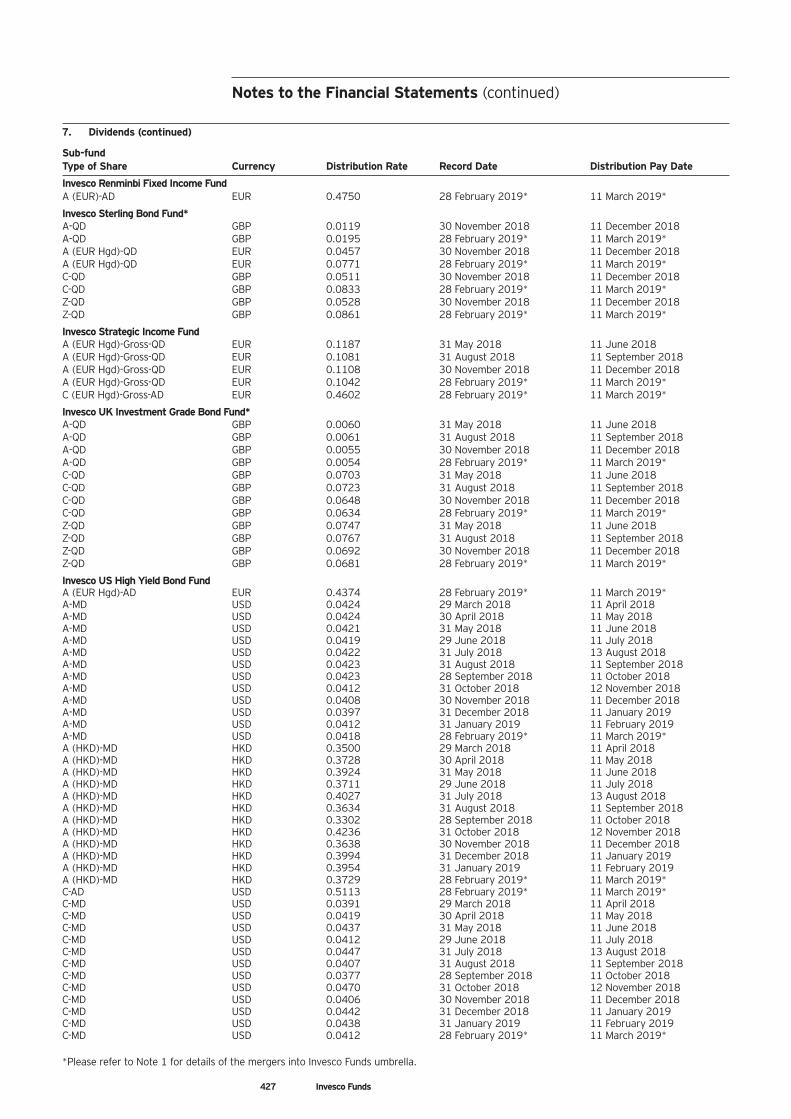
Notes to the Financial Statements (continued)
427 Invesco Funds
7. Dividends (continued)
Sub-fund Type of Share Currency Distribution Rate Record Date Distribution Pay Date
Invesco Renminbi Fixed Income Fund A (EUR)-AD EUR 0.4750 28 February 2019* 11 March 2019*
Invesco Sterling Bond Fund* A-QD GBP 0.0119 30 November 2018 11 December 2018 A-QD GBP 0.0195 28 February 2019* 11 March 2019* A (EUR Hgd)-QD EUR 0.0457 30 November 2018 11 December 2018 A (EUR Hgd)-QD EUR 0.0771 28 February 2019* 11 March 2019* C-QD GBP 0.0511 30 November 2018 11 December 2018 C-QD GBP 0.0833 28 February 2019* 11 March 2019* Z-QD GBP 0.0528 30 November 2018 11 December 2018 Z-QD GBP 0.0861 28 February 2019* 11 March 2019*
Invesco Strategic Income Fund A (EUR Hgd)-Gross-QD EUR 0.1187 31 May 2018 11 June 2018 A (EUR Hgd)-Gross-QD EUR 0.1081 31 August 2018 11 September 2018 A (EUR Hgd)-Gross-QD EUR 0.1108 30 November 2018 11 December 2018 A (EUR Hgd)-Gross-QD EUR 0.1042 28 February 2019* 11 March 2019* C (EUR Hgd)-Gross-AD EUR 0.4602 28 February 2019* 11 March 2019*
Invesco UK Investment Grade Bond Fund* A-QD GBP 0.0060 31 May 2018 11 June 2018 A-QD GBP 0.0061 31 August 2018 11 September 2018 A-QD GBP 0.0055 30 November 2018 11 December 2018 A-QD GBP 0.0054 28 February 2019* 11 March 2019* C-QD GBP 0.0703 31 May 2018 11 June 2018 C-QD GBP 0.0723 31 August 2018 11 September 2018 C-QD GBP 0.0648 30 November 2018 11 December 2018 C-QD GBP 0.0634 28 February 2019* 11 March 2019* Z-QD GBP 0.0747 31 May 2018 11 June 2018 Z-QD GBP 0.0767 31 August 2018 11 September 2018 Z-QD GBP 0.0692 30 November 2018 11 December 2018 Z-QD GBP 0.0681 28 February 2019* 11 March 2019*
Invesco US High Yield Bond Fund A (EUR Hgd)-AD EUR 0.4374 28 February 2019* 11 March 2019* A-MD USD 0.0424 29 March 2018 11 April 2018 A-MD USD 0.0424 30 April 2018 11 May 2018 A-MD USD 0.0421 31 May 2018 11 June 2018 A-MD USD 0.0419 29 June 2018 11 July 2018 A-MD USD 0.0422 31 July 2018 13 August 2018 A-MD USD 0.0423 31 August 2018 11 September 2018 A-MD USD 0.0423 28 September 2018 11 October 2018 A-MD USD 0.0412 31 October 2018 12 November 2018 A-MD USD 0.0408 30 November 2018 11 December 2018 A-MD USD 0.0397 31 December 2018 11 January 2019 A-MD USD 0.0412 31 January 2019 11 February 2019 A-MD USD 0.0418 28 February 2019* 11 March 2019* A (HKD)-MD HKD 0.3500 29 March 2018 11 April 2018 A (HKD)-MD HKD 0.3728 30 April 2018 11 May 2018 A (HKD)-MD HKD 0.3924 31 May 2018 11 June 2018 A (HKD)-MD HKD 0.3711 29 June 2018 11 July 2018 A (HKD)-MD HKD 0.4027 31 July 2018 13 August 2018 A (HKD)-MD HKD 0.3634 31 August 2018 11 September 2018 A (HKD)-MD HKD 0.3302 28 September 2018 11 October 2018 A (HKD)-MD HKD 0.4236 31 October 2018 12 November 2018 A (HKD)-MD HKD 0.3638 30 November 2018 11 December 2018 A (HKD)-MD HKD 0.3994 31 December 2018 11 January 2019 A (HKD)-MD HKD 0.3954 31 January 2019 11 February 2019 A (HKD)-MD HKD 0.3729 28 February 2019* 11 March 2019* C-AD USD 0.5113 28 February 2019* 11 March 2019* C-MD USD 0.0391 29 March 2018 11 April 2018 C-MD USD 0.0419 30 April 2018 11 May 2018 C-MD USD 0.0437 31 May 2018 11 June 2018 C-MD USD 0.0412 29 June 2018 11 July 2018 C-MD USD 0.0447 31 July 2018 13 August 2018 C-MD USD 0.0407 31 August 2018 11 September 2018 C-MD USD 0.0377 28 September 2018 11 October 2018 C-MD USD 0.0470 31 October 2018 12 November 2018 C-MD USD 0.0406 30 November 2018 11 December 2018 C-MD USD 0.0442 31 December 2018 11 January 2019 C-MD USD 0.0438 31 January 2019 11 February 2019 C-MD USD 0.0412 28 February 2019* 11 March 2019* *Please refer to Note 1 for details of the mergers into Invesco Funds umbrella.
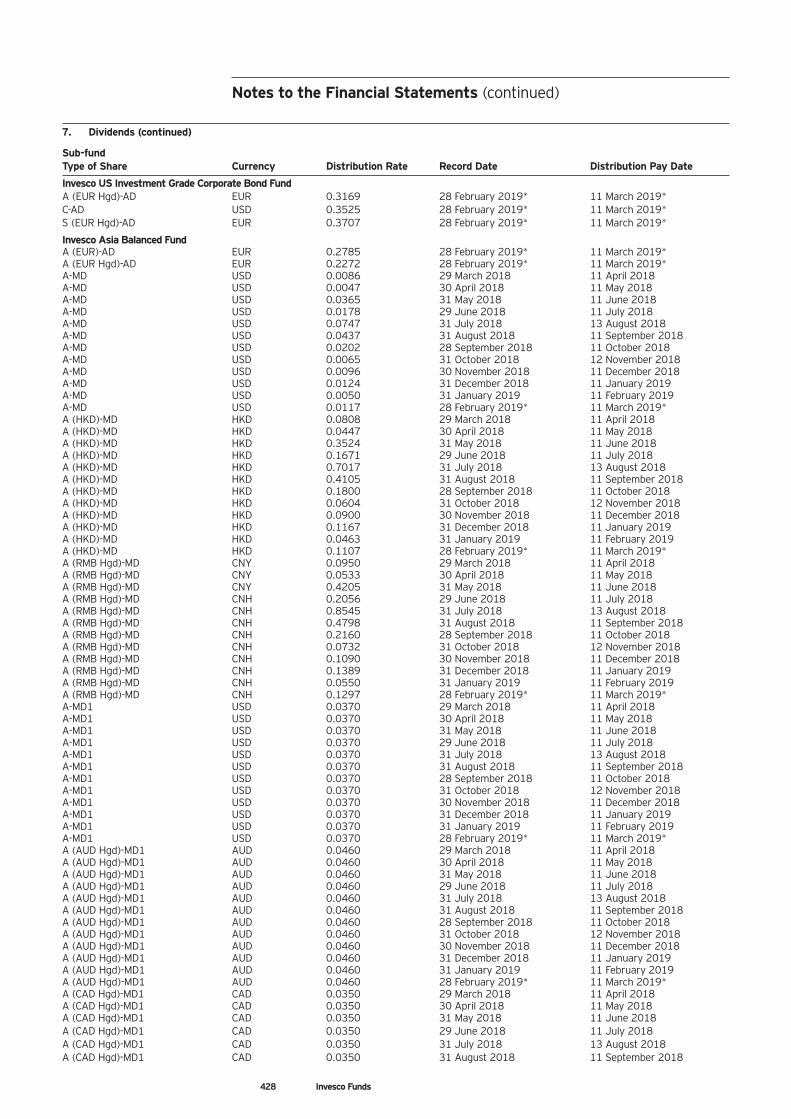
428 Invesco Funds
Notes to the Financial Statements (continued)
7. Dividends (continued)
Sub-fund Type of Share Currency Distribution Rate Record Date Distribution Pay Date
Invesco US Investment Grade Corporate Bond Fund A (EUR Hgd)-AD EUR 0.3169 28 February 2019* 11 March 2019* C-AD USD 0.3525 28 February 2019* 11 March 2019* S (EUR Hgd)-AD EUR 0.3707 28 February 2019* 11 March 2019*
Invesco Asia Balanced Fund A (EUR)-AD EUR 0.2785 28 February 2019* 11 March 2019* A (EUR Hgd)-AD EUR 0.2272 28 February 2019* 11 March 2019* A-MD USD 0.0086 29 March 2018 11 April 2018 A-MD USD 0.0047 30 April 2018 11 May 2018 A-MD USD 0.0365 31 May 2018 11 June 2018 A-MD USD 0.0178 29 June 2018 11 July 2018 A-MD USD 0.0747 31 July 2018 13 August 2018 A-MD USD 0.0437 31 August 2018 11 September 2018 A-MD USD 0.0202 28 September 2018 11 October 2018 A-MD USD 0.0065 31 October 2018 12 November 2018 A-MD USD 0.0096 30 November 2018 11 December 2018 A-MD USD 0.0124 31 December 2018 11 January 2019 A-MD USD 0.0050 31 January 2019 11 February 2019 A-MD USD 0.0117 28 February 2019* 11 March 2019* A (HKD)-MD HKD 0.0808 29 March 2018 11 April 2018 A (HKD)-MD HKD 0.0447 30 April 2018 11 May 2018 A (HKD)-MD HKD 0.3524 31 May 2018 11 June 2018 A (HKD)-MD HKD 0.1671 29 June 2018 11 July 2018 A (HKD)-MD HKD 0.7017 31 July 2018 13 August 2018 A (HKD)-MD HKD 0.4105 31 August 2018 11 September 2018 A (HKD)-MD HKD 0.1800 28 September 2018 11 October 2018 A (HKD)-MD HKD 0.0604 31 October 2018 12 November 2018 A (HKD)-MD HKD 0.0900 30 November 2018 11 December 2018 A (HKD)-MD HKD 0.1167 31 December 2018 11 January 2019 A (HKD)-MD HKD 0.0463 31 January 2019 11 February 2019 A (HKD)-MD HKD 0.1107 28 February 2019* 11 March 2019* A (RMB Hgd)-MD CNY 0.0950 29 March 2018 11 April 2018 A (RMB Hgd)-MD CNY 0.0533 30 April 2018 11 May 2018 A (RMB Hgd)-MD CNY 0.4205 31 May 2018 11 June 2018 A (RMB Hgd)-MD CNH 0.2056 29 June 2018 11 July 2018 A (RMB Hgd)-MD CNH 0.8545 31 July 2018 13 August 2018 A (RMB Hgd)-MD CNH 0.4798 31 August 2018 11 September 2018 A (RMB Hgd)-MD CNH 0.2160 28 September 2018 11 October 2018 A (RMB Hgd)-MD CNH 0.0732 31 October 2018 12 November 2018 A (RMB Hgd)-MD CNH 0.1090 30 November 2018 11 December 2018 A (RMB Hgd)-MD CNH 0.1389 31 December 2018 11 January 2019 A (RMB Hgd)-MD CNH 0.0550 31 January 2019 11 February 2019 A (RMB Hgd)-MD CNH 0.1297 28 February 2019* 11 March 2019* A-MD1 USD 0.0370 29 March 2018 11 April 2018 A-MD1 USD 0.0370 30 April 2018 11 May 2018 A-MD1 USD 0.0370 31 May 2018 11 June 2018 A-MD1 USD 0.0370 29 June 2018 11 July 2018 A-MD1 USD 0.0370 31 July 2018 13 August 2018 A-MD1 USD 0.0370 31 August 2018 11 September 2018 A-MD1 USD 0.0370 28 September 2018 11 October 2018 A-MD1 USD 0.0370 31 October 2018 12 November 2018 A-MD1 USD 0.0370 30 November 2018 11 December 2018 A-MD1 USD 0.0370 31 December 2018 11 January 2019 A-MD1 USD 0.0370 31 January 2019 11 February 2019 A-MD1 USD 0.0370 28 February 2019* 11 March 2019* A (AUD Hgd)-MD1 AUD 0.0460 29 March 2018 11 April 2018 A (AUD Hgd)-MD1 AUD 0.0460 30 April 2018 11 May 2018 A (AUD Hgd)-MD1 AUD 0.0460 31 May 2018 11 June 2018 A (AUD Hgd)-MD1 AUD 0.0460 29 June 2018 11 July 2018 A (AUD Hgd)-MD1 AUD 0.0460 31 July 2018 13 August 2018 A (AUD Hgd)-MD1 AUD 0.0460 31 August 2018 11 September 2018 A (AUD Hgd)-MD1 AUD 0.0460 28 September 2018 11 October 2018 A (AUD Hgd)-MD1 AUD 0.0460 31 October 2018 12 November 2018 A (AUD Hgd)-MD1 AUD 0.0460 30 November 2018 11 December 2018 A (AUD Hgd)-MD1 AUD 0.0460 31 December 2018 11 January 2019 A (AUD Hgd)-MD1 AUD 0.0460 31 January 2019 11 February 2019 A (AUD Hgd)-MD1 AUD 0.0460 28 February 2019* 11 March 2019* A (CAD Hgd)-MD1 CAD 0.0350 29 March 2018 11 April 2018 A (CAD Hgd)-MD1 CAD 0.0350 30 April 2018 11 May 2018 A (CAD Hgd)-MD1 CAD 0.0350 31 May 2018 11 June 2018 A (CAD Hgd)-MD1 CAD 0.0350 29 June 2018 11 July 2018 A (CAD Hgd)-MD1 CAD 0.0350 31 July 2018 13 August 2018 A (CAD Hgd)-MD1 CAD 0.0350 31 August 2018 11 September 2018
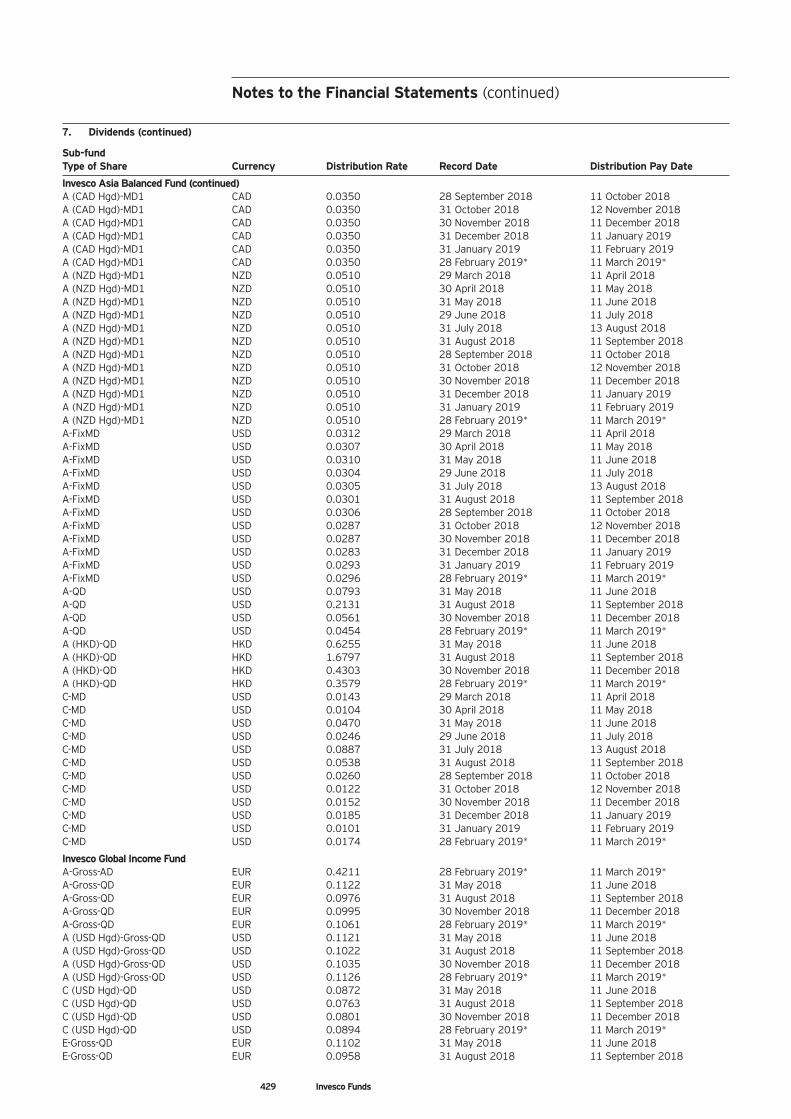
Notes to the Financial Statements (continued)
7. Dividends (continued)
Sub-fund Type of Share Currency Distribution Rate Record Date Distribution Pay Date
Invesco Asia Balanced Fund (continued) A (CAD Hgd)-MD1 CAD 0.0350 28 September 2018 11 October 2018 A (CAD Hgd)-MD1 CAD 0.0350 31 October 2018 12 November 2018 A (CAD Hgd)-MD1 CAD 0.0350 30 November 2018 11 December 2018 A (CAD Hgd)-MD1 CAD 0.0350 31 December 2018 11 January 2019 A (CAD Hgd)-MD1 CAD 0.0350 31 January 2019 11 February 2019 A (CAD Hgd)-MD1 CAD 0.0350 28 February 2019* 11 March 2019* A (NZD Hgd)-MD1 NZD 0.0510 29 March 2018 11 April 2018 A (NZD Hgd)-MD1 NZD 0.0510 30 April 2018 11 May 2018 A (NZD Hgd)-MD1 NZD 0.0510 31 May 2018 11 June 2018 A (NZD Hgd)-MD1 NZD 0.0510 29 June 2018 11 July 2018 A (NZD Hgd)-MD1 NZD 0.0510 31 July 2018 13 August 2018 A (NZD Hgd)-MD1 NZD 0.0510 31 August 2018 11 September 2018 A (NZD Hgd)-MD1 NZD 0.0510 28 September 2018 11 October 2018 A (NZD Hgd)-MD1 NZD 0.0510 31 October 2018 12 November 2018 A (NZD Hgd)-MD1 NZD 0.0510 30 November 2018 11 December 2018 A (NZD Hgd)-MD1 NZD 0.0510 31 December 2018 11 January 2019 A (NZD Hgd)-MD1 NZD 0.0510 31 January 2019 11 February 2019 A (NZD Hgd)-MD1 NZD 0.0510 28 February 2019* 11 March 2019* A-FixMD USD 0.0312 29 March 2018 11 April 2018 A-FixMD USD 0.0307 30 April 2018 11 May 2018 A-FixMD USD 0.0310 31 May 2018 11 June 2018 A-FixMD USD 0.0304 29 June 2018 11 July 2018 A-FixMD USD 0.0305 31 July 2018 13 August 2018 A-FixMD USD 0.0301 31 August 2018 11 September 2018 A-FixMD USD 0.0306 28 September 2018 11 October 2018 A-FixMD USD 0.0287 31 October 2018 12 November 2018 A-FixMD USD 0.0287 30 November 2018 11 December 2018 A-FixMD USD 0.0283 31 December 2018 11 January 2019 A-FixMD USD 0.0293 31 January 2019 11 February 2019 A-FixMD USD 0.0296 28 February 2019* 11 March 2019* A-QD USD 0.0793 31 May 2018 11 June 2018 A-QD USD 0.2131 31 August 2018 11 September 2018 A-QD USD 0.0561 30 November 2018 11 December 2018 A-QD USD 0.0454 28 February 2019* 11 March 2019* A (HKD)-QD HKD 0.6255 31 May 2018 11 June 2018 A (HKD)-QD HKD 1.6797 31 August 2018 11 September 2018 A (HKD)-QD HKD 0.4303 30 November 2018 11 December 2018 A (HKD)-QD HKD 0.3579 28 February 2019* 11 March 2019* C-MD USD 0.0143 29 March 2018 11 April 2018 C-MD USD 0.0104 30 April 2018 11 May 2018 C-MD USD 0.0470 31 May 2018 11 June 2018 C-MD USD 0.0246 29 June 2018 11 July 2018 C-MD USD 0.0887 31 July 2018 13 August 2018 C-MD USD 0.0538 31 August 2018 11 September 2018 C-MD USD 0.0260 28 September 2018 11 October 2018 C-MD USD 0.0122 31 October 2018 12 November 2018 C-MD USD 0.0152 30 November 2018 11 December 2018 C-MD USD 0.0185 31 December 2018 11 January 2019 C-MD USD 0.0101 31 January 2019 11 February 2019 C-MD USD 0.0174 28 February 2019* 11 March 2019*
Invesco Global Income Fund A-Gross-AD EUR 0.4211 28 February 2019* 11 March 2019* A-Gross-QD EUR 0.1122 31 May 2018 11 June 2018 A-Gross-QD EUR 0.0976 31 August 2018 11 September 2018 A-Gross-QD EUR 0.0995 30 November 2018 11 December 2018 A-Gross-QD EUR 0.1061 28 February 2019* 11 March 2019* A (USD Hgd)-Gross-QD USD 0.1121 31 May 2018 11 June 2018 A (USD Hgd)-Gross-QD USD 0.1022 31 August 2018 11 September 2018 A (USD Hgd)-Gross-QD USD 0.1035 30 November 2018 11 December 2018 A (USD Hgd)-Gross-QD USD 0.1126 28 February 2019* 11 March 2019* C (USD Hgd)-QD USD 0.0872 31 May 2018 11 June 2018 C (USD Hgd)-QD USD 0.0763 31 August 2018 11 September 2018 C (USD Hgd)-QD USD 0.0801 30 November 2018 11 December 2018 C (USD Hgd)-QD USD 0.0894 28 February 2019* 11 March 2019* E-Gross-QD EUR 0.1102 31 May 2018 11 June 2018 E-Gross-QD EUR 0.0958 31 August 2018 11 September 2018
429 Invesco Funds
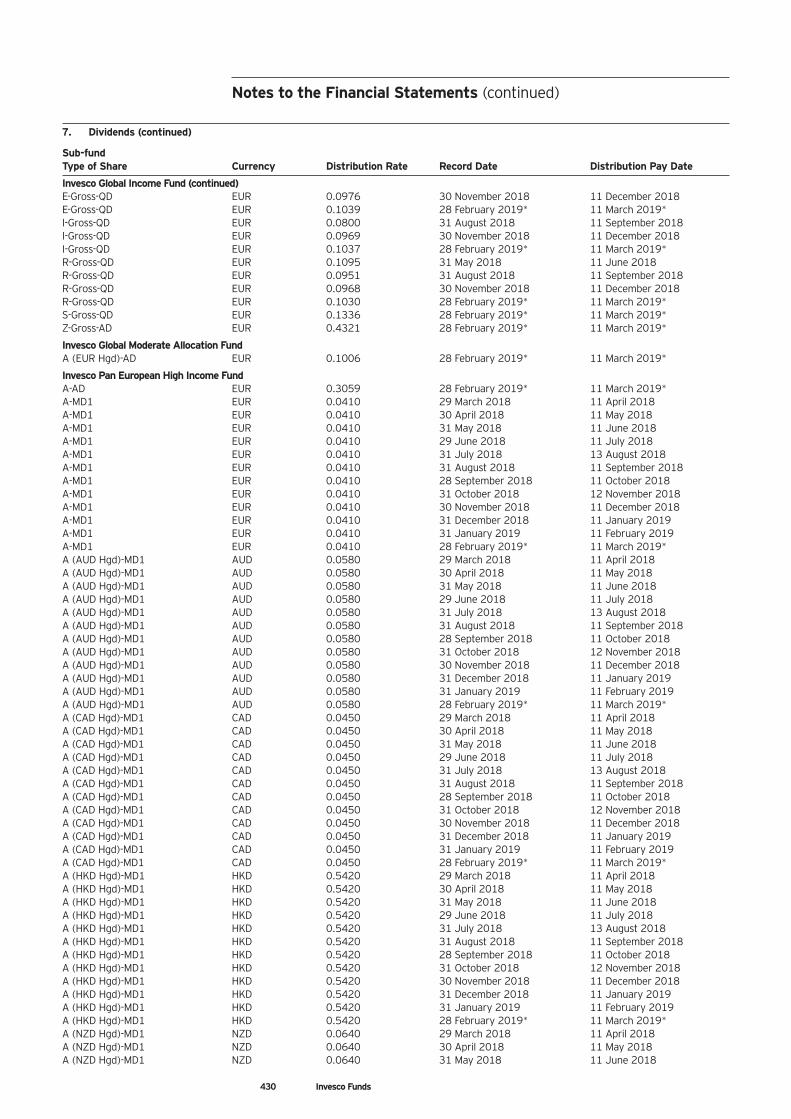
Notes to the Financial Statements (continued)
7. Dividends (continued)
Sub-fund Type of Share Currency Distribution Rate Record Date Distribution Pay Date
Invesco Global Income Fund (continued) E-Gross-QD EUR 0.0976 30 November 2018 11 December 2018 E-Gross-QD EUR 0.1039 28 February 2019* 11 March 2019* I-Gross-QD EUR 0.0800 31 August 2018 11 September 2018 I-Gross-QD EUR 0.0969 30 November 2018 11 December 2018 I-Gross-QD EUR 0.1037 28 February 2019* 11 March 2019* R-Gross-QD EUR 0.1095 31 May 2018 11 June 2018 R-Gross-QD EUR 0.0951 31 August 2018 11 September 2018 R-Gross-QD EUR 0.0968 30 November 2018 11 December 2018 R-Gross-QD EUR 0.1030 28 February 2019* 11 March 2019* S-Gross-QD EUR 0.1336 28 February 2019* 11 March 2019* Z-Gross-AD EUR 0.4321 28 February 2019* 11 March 2019*
Invesco Global Moderate Allocation Fund A (EUR Hgd)-AD EUR 0.1006 28 February 2019* 11 March 2019*
Invesco Pan European High Income Fund A-AD EUR 0.3059 28 February 2019* 11 March 2019* A-MD1 EUR 0.0410 29 March 2018 11 April 2018 A-MD1 EUR 0.0410 30 April 2018 11 May 2018 A-MD1 EUR 0.0410 31 May 2018 11 June 2018 A-MD1 EUR 0.0410 29 June 2018 11 July 2018 A-MD1 EUR 0.0410 31 July 2018 13 August 2018 A-MD1 EUR 0.0410 31 August 2018 11 September 2018 A-MD1 EUR 0.0410 28 September 2018 11 October 2018 A-MD1 EUR 0.0410 31 October 2018 12 November 2018 A-MD1 EUR 0.0410 30 November 2018 11 December 2018 A-MD1 EUR 0.0410 31 December 2018 11 January 2019 A-MD1 EUR 0.0410 31 January 2019 11 February 2019 A-MD1 EUR 0.0410 28 February 2019* 11 March 2019* A (AUD Hgd)-MD1 AUD 0.0580 29 March 2018 11 April 2018 A (AUD Hgd)-MD1 AUD 0.0580 30 April 2018 11 May 2018 A (AUD Hgd)-MD1 AUD 0.0580 31 May 2018 11 June 2018 A (AUD Hgd)-MD1 AUD 0.0580 29 June 2018 11 July 2018 A (AUD Hgd)-MD1 AUD 0.0580 31 July 2018 13 August 2018 A (AUD Hgd)-MD1 AUD 0.0580 31 August 2018 11 September 2018 A (AUD Hgd)-MD1 AUD 0.0580 28 September 2018 11 October 2018 A (AUD Hgd)-MD1 AUD 0.0580 31 October 2018 12 November 2018 A (AUD Hgd)-MD1 AUD 0.0580 30 November 2018 11 December 2018 A (AUD Hgd)-MD1 AUD 0.0580 31 December 2018 11 January 2019 A (AUD Hgd)-MD1 AUD 0.0580 31 January 2019 11 February 2019 A (AUD Hgd)-MD1 AUD 0.0580 28 February 2019* 11 March 2019* A (CAD Hgd)-MD1 CAD 0.0450 29 March 2018 11 April 2018 A (CAD Hgd)-MD1 CAD 0.0450 30 April 2018 11 May 2018 A (CAD Hgd)-MD1 CAD 0.0450 31 May 2018 11 June 2018 A (CAD Hgd)-MD1 CAD 0.0450 29 June 2018 11 July 2018 A (CAD Hgd)-MD1 CAD 0.0450 31 July 2018 13 August 2018 A (CAD Hgd)-MD1 CAD 0.0450 31 August 2018 11 September 2018 A (CAD Hgd)-MD1 CAD 0.0450 28 September 2018 11 October 2018 A (CAD Hgd)-MD1 CAD 0.0450 31 October 2018 12 November 2018 A (CAD Hgd)-MD1 CAD 0.0450 30 November 2018 11 December 2018 A (CAD Hgd)-MD1 CAD 0.0450 31 December 2018 11 January 2019 A (CAD Hgd)-MD1 CAD 0.0450 31 January 2019 11 February 2019 A (CAD Hgd)-MD1 CAD 0.0450 28 February 2019* 11 March 2019* A (HKD Hgd)-MD1 HKD 0.5420 29 March 2018 11 April 2018 A (HKD Hgd)-MD1 HKD 0.5420 30 April 2018 11 May 2018 A (HKD Hgd)-MD1 HKD 0.5420 31 May 2018 11 June 2018 A (HKD Hgd)-MD1 HKD 0.5420 29 June 2018 11 July 2018 A (HKD Hgd)-MD1 HKD 0.5420 31 July 2018 13 August 2018 A (HKD Hgd)-MD1 HKD 0.5420 31 August 2018 11 September 2018 A (HKD Hgd)-MD1 HKD 0.5420 28 September 2018 11 October 2018 A (HKD Hgd)-MD1 HKD 0.5420 31 October 2018 12 November 2018 A (HKD Hgd)-MD1 HKD 0.5420 30 November 2018 11 December 2018 A (HKD Hgd)-MD1 HKD 0.5420 31 December 2018 11 January 2019 A (HKD Hgd)-MD1 HKD 0.5420 31 January 2019 11 February 2019 A (HKD Hgd)-MD1 HKD 0.5420 28 February 2019* 11 March 2019* A (NZD Hgd)-MD1 NZD 0.0640 29 March 2018 11 April 2018 A (NZD Hgd)-MD1 NZD 0.0640 30 April 2018 11 May 2018 A (NZD Hgd)-MD1 NZD 0.0640 31 May 2018 11 June 2018
430 Invesco Funds
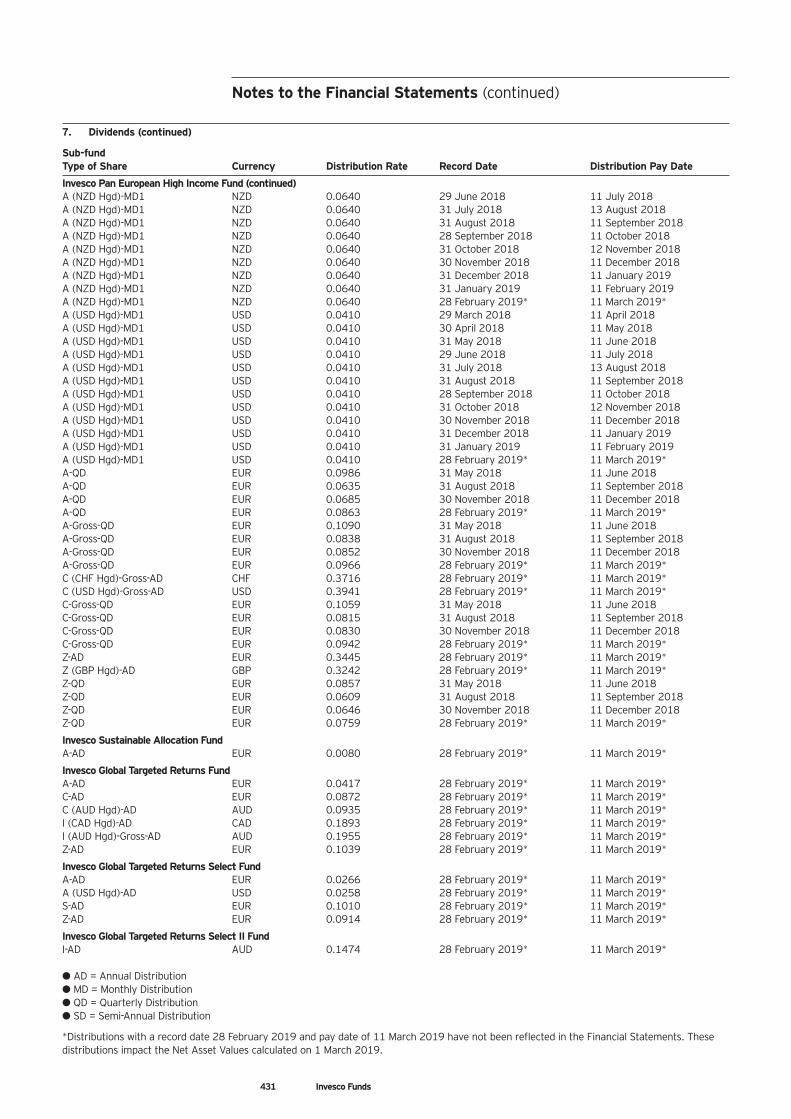
Notes to the Financial Statements (continued)
7. Dividends (continued)
Sub-fund Type of Share Currency Distribution Rate Record Date Distribution Pay Date
Invesco Pan European High Income Fund (continued) A (NZD Hgd)-MD1 NZD 0.0640 29 June 2018 11 July 2018 A (NZD Hgd)-MD1 NZD 0.0640 31 July 2018 13 August 2018 A (NZD Hgd)-MD1 NZD 0.0640 31 August 2018 11 September 2018 A (NZD Hgd)-MD1 NZD 0.0640 28 September 2018 11 October 2018 A (NZD Hgd)-MD1 NZD 0.0640 31 October 2018 12 November 2018 A (NZD Hgd)-MD1 NZD 0.0640 30 November 2018 11 December 2018 A (NZD Hgd)-MD1 NZD 0.0640 31 December 2018 11 January 2019 A (NZD Hgd)-MD1 NZD 0.0640 31 January 2019 11 February 2019 A (NZD Hgd)-MD1 NZD 0.0640 28 February 2019* 11 March 2019* A (USD Hgd)-MD1 USD 0.0410 29 March 2018 11 April 2018 A (USD Hgd)-MD1 USD 0.0410 30 April 2018 11 May 2018 A (USD Hgd)-MD1 USD 0.0410 31 May 2018 11 June 2018 A (USD Hgd)-MD1 USD 0.0410 29 June 2018 11 July 2018 A (USD Hgd)-MD1 USD 0.0410 31 July 2018 13 August 2018 A (USD Hgd)-MD1 USD 0.0410 31 August 2018 11 September 2018 A (USD Hgd)-MD1 USD 0.0410 28 September 2018 11 October 2018 A (USD Hgd)-MD1 USD 0.0410 31 October 2018 12 November 2018 A (USD Hgd)-MD1 USD 0.0410 30 November 2018 11 December 2018 A (USD Hgd)-MD1 USD 0.0410 31 December 2018 11 January 2019 A (USD Hgd)-MD1 USD 0.0410 31 January 2019 11 February 2019 A (USD Hgd)-MD1 USD 0.0410 28 February 2019* 11 March 2019* A-QD EUR 0.0986 31 May 2018 11 June 2018 A-QD EUR 0.0635 31 August 2018 11 September 2018 A-QD EUR 0.0685 30 November 2018 11 December 2018 A-QD EUR 0.0863 28 February 2019* 11 March 2019* A-Gross-QD EUR 0.1090 31 May 2018 11 June 2018 A-Gross-QD EUR 0.0838 31 August 2018 11 September 2018 A-Gross-QD EUR 0.0852 30 November 2018 11 December 2018 A-Gross-QD EUR 0.0966 28 February 2019* 11 March 2019* C (CHF Hgd)-Gross-AD CHF 0.3716 28 February 2019* 11 March 2019* C (USD Hgd)-Gross-AD USD 0.3941 28 February 2019* 11 March 2019* C-Gross-QD EUR 0.1059 31 May 2018 11 June 2018 C-Gross-QD EUR 0.0815 31 August 2018 11 September 2018 C-Gross-QD EUR 0.0830 30 November 2018 11 December 2018 C-Gross-QD EUR 0.0942 28 February 2019* 11 March 2019* Z-AD EUR 0.3445 28 February 2019* 11 March 2019* Z (GBP Hgd)-AD GBP 0.3242 28 February 2019* 11 March 2019* Z-QD EUR 0.0857 31 May 2018 11 June 2018 Z-QD EUR 0.0609 31 August 2018 11 September 2018 Z-QD EUR 0.0646 30 November 2018 11 December 2018 Z-QD EUR 0.0759 28 February 2019* 11 March 2019*
Invesco Sustainable Allocation Fund A-AD EUR 0.0080 28 February 2019* 11 March 2019*
Invesco Global Targeted Returns Fund A-AD EUR 0.0417 28 February 2019* 11 March 2019* C-AD EUR 0.0872 28 February 2019* 11 March 2019* C (AUD Hgd)-AD AUD 0.0935 28 February 2019* 11 March 2019* I (CAD Hgd)-AD CAD 0.1893 28 February 2019* 11 March 2019* I (AUD Hgd)-Gross-AD AUD 0.1955 28 February 2019* 11 March 2019* Z-AD EUR 0.1039 28 February 2019* 11 March 2019*
Invesco Global Targeted Returns Select Fund A-AD EUR 0.0266 28 February 2019* 11 March 2019* A (USD Hgd)-AD USD 0.0258 28 February 2019* 11 March 2019* S-AD EUR 0.1010 28 February 2019* 11 March 2019* Z-AD EUR 0.0914 28 February 2019* 11 March 2019*
Invesco Global Targeted Returns Select II Fund I-AD AUD 0.1474 28 February 2019* 11 March 2019*
● AD = Annual Distribution ● MD = Monthly Distribution ● QD = Quarterly Distribution ● SD = Semi-Annual Distribution
*Distributions with a record date 28 February 2019 and pay date of 11 March 2019 have not been reflected in the Financial Statements. These distributions impact the Net Asset Values calculated on 1 March 2019.
431 Invesco Funds
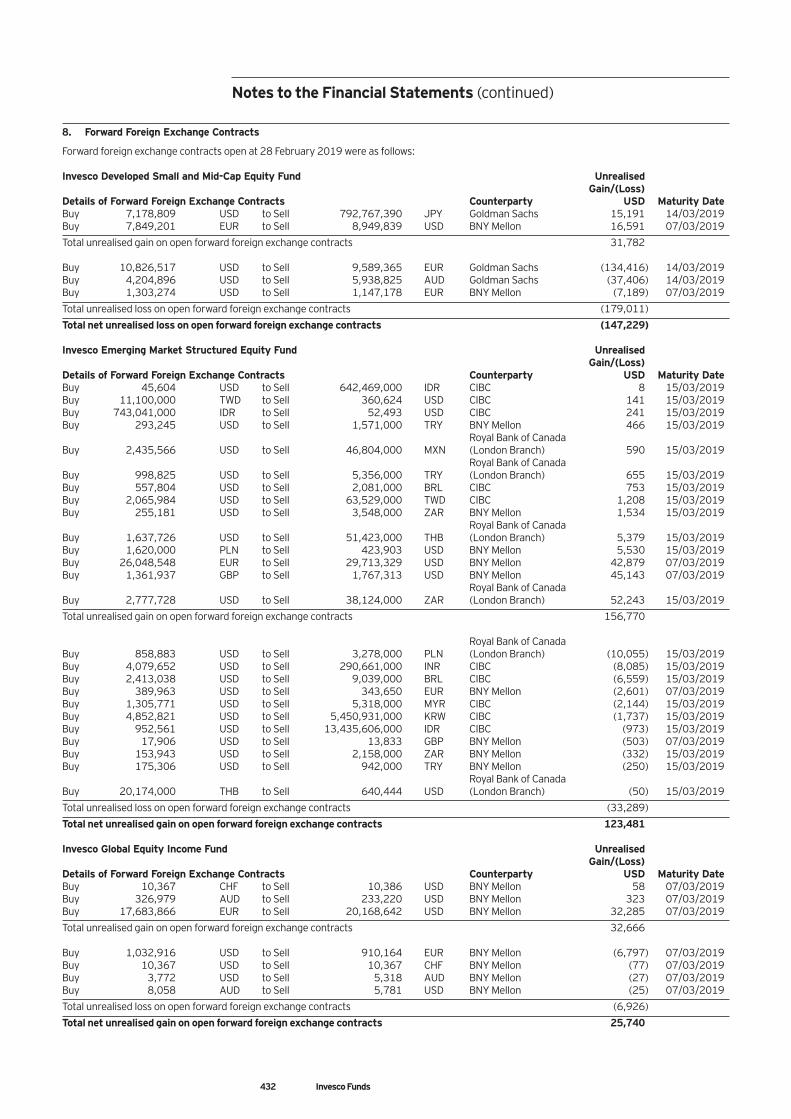
432 Invesco Funds
8. Forward Foreign Exchange Contracts Forward foreign exchange contracts open at 28 February 2019 were as follows: Invesco Developed Small and Mid-Cap Equity Fund Unrealised Gain/(Loss) Details of Forward Foreign Exchange Contracts Counterparty USD Maturity Date Buy 7,178,809 USD to Sell 792,767,390 JPY Goldman Sachs 15,191 14/03/2019 Buy 7,849,201 EUR to Sell 8,949,839 USD BNY Mellon 16,591 07/03/2019
Total unrealised gain on open forward foreign exchange contracts 31,782 Buy 10,826,517 USD to Sell 9,589,365 EUR Goldman Sachs (134,416) 14/03/2019 Buy 4,204,896 USD to Sell 5,938,825 AUD Goldman Sachs (37,406) 14/03/2019 Buy 1,303,274 USD to Sell 1,147,178 EUR BNY Mellon (7,189) 07/03/2019
Total unrealised loss on open forward foreign exchange contracts (179,011)
Total net unrealised loss on open forward foreign exchange contracts (147,229) Invesco Emerging Market Structured Equity Fund Unrealised Gain/(Loss) Details of Forward Foreign Exchange Contracts Counterparty USD Maturity Date Buy 45,604 USD to Sell 642,469,000 IDR CIBC 8 15/03/2019 Buy 11,100,000 TWD to Sell 360,624 USD CIBC 141 15/03/2019 Buy 743,041,000 IDR to Sell 52,493 USD CIBC 241 15/03/2019 Buy 293,245 USD to Sell 1,571,000 TRY BNY Mellon 466 15/03/2019 Royal Bank of Canada Buy 2,435,566 USD to Sell 46,804,000 MXN (London Branch) 590 15/03/2019 Royal Bank of Canada Buy 998,825 USD to Sell 5,356,000 TRY (London Branch) 655 15/03/2019 Buy 557,804 USD to Sell 2,081,000 BRL CIBC 753 15/03/2019 Buy 2,065,984 USD to Sell 63,529,000 TWD CIBC 1,208 15/03/2019 Buy 255,181 USD to Sell 3,548,000 ZAR BNY Mellon 1,534 15/03/2019 Royal Bank of Canada Buy 1,637,726 USD to Sell 51,423,000 THB (London Branch) 5,379 15/03/2019 Buy 1,620,000 PLN to Sell 423,903 USD BNY Mellon 5,530 15/03/2019 Buy 26,048,548 EUR to Sell 29,713,329 USD BNY Mellon 42,879 07/03/2019 Buy 1,361,937 GBP to Sell 1,767,313 USD BNY Mellon 45,143 07/03/2019 Royal Bank of Canada Buy 2,777,728 USD to Sell 38,124,000 ZAR (London Branch) 52,243 15/03/2019
Total unrealised gain on open forward foreign exchange contracts 156,770 Royal Bank of Canada Buy 858,883 USD to Sell 3,278,000 PLN (London Branch) (10,055) 15/03/2019 Buy 4,079,652 USD to Sell 290,661,000 INR CIBC (8,085) 15/03/2019 Buy 2,413,038 USD to Sell 9,039,000 BRL CIBC (6,559) 15/03/2019 Buy 389,963 USD to Sell 343,650 EUR BNY Mellon (2,601) 07/03/2019 Buy 1,305,771 USD to Sell 5,318,000 MYR CIBC (2,144) 15/03/2019 Buy 4,852,821 USD to Sell 5,450,931,000 KRW CIBC (1,737) 15/03/2019 Buy 952,561 USD to Sell 13,435,606,000 IDR CIBC (973) 15/03/2019 Buy 17,906 USD to Sell 13,833 GBP BNY Mellon (503) 07/03/2019 Buy 153,943 USD to Sell 2,158,000 ZAR BNY Mellon (332) 15/03/2019 Buy 175,306 USD to Sell 942,000 TRY BNY Mellon (250) 15/03/2019 Royal Bank of Canada Buy 20,174,000 THB to Sell 640,444 USD (London Branch) (50) 15/03/2019
Total unrealised loss on open forward foreign exchange contracts (33,289)
Total net unrealised gain on open forward foreign exchange contracts 123,481 Invesco Global Equity Income Fund Unrealised Gain/(Loss) Details of Forward Foreign Exchange Contracts Counterparty USD Maturity Date Buy 10,367 CHF to Sell 10,386 USD BNY Mellon 58 07/03/2019 Buy 326,979 AUD to Sell 233,220 USD BNY Mellon 323 07/03/2019 Buy 17,683,866 EUR to Sell 20,168,642 USD BNY Mellon 32,285 07/03/2019
Total unrealised gain on open forward foreign exchange contracts 32,666 Buy 1,032,916 USD to Sell 910,164 EUR BNY Mellon (6,797) 07/03/2019 Buy 10,367 USD to Sell 10,367 CHF BNY Mellon (77) 07/03/2019 Buy 3,772 USD to Sell 5,318 AUD BNY Mellon (27) 07/03/2019 Buy 8,058 AUD to Sell 5,781 USD BNY Mellon (25) 07/03/2019
Total unrealised loss on open forward foreign exchange contracts (6,926)
Total net unrealised gain on open forward foreign exchange contracts 25,740
Notes to the Financial Statements (continued)
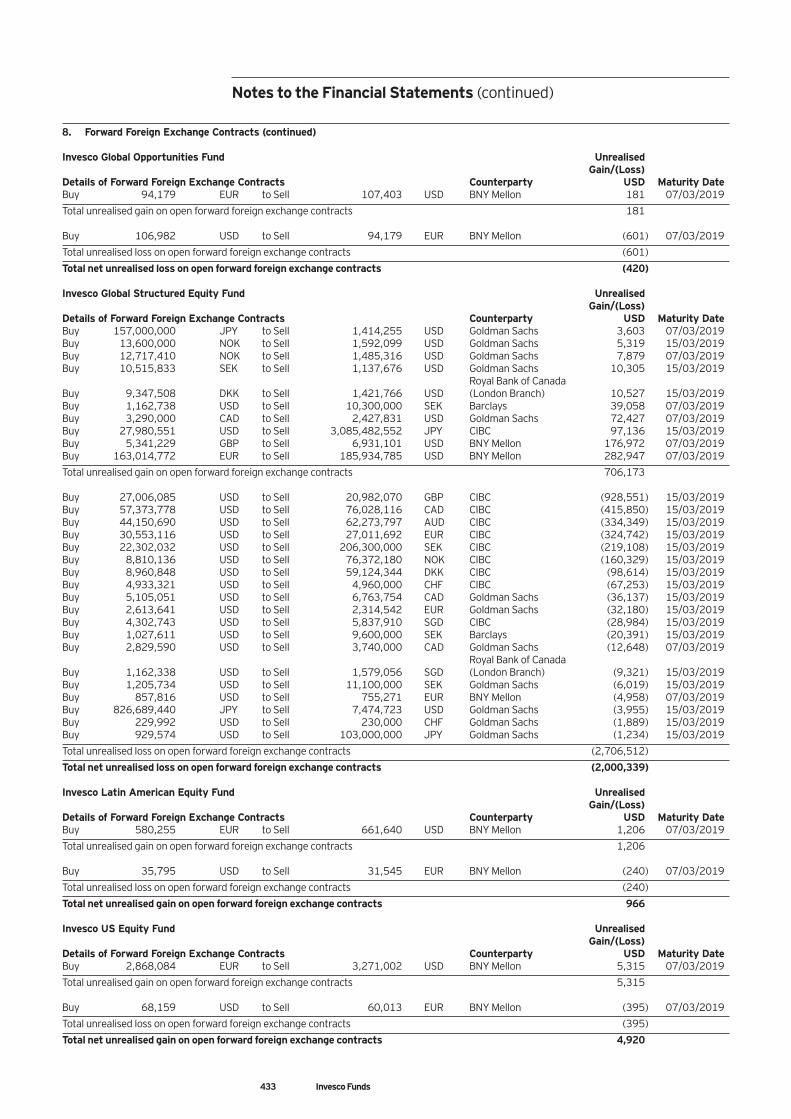
433 Invesco Funds
8. Forward Foreign Exchange Contracts (continued) Invesco Global Opportunities Fund Unrealised Gain/(Loss) Details of Forward Foreign Exchange Contracts Counterparty USD Maturity Date Buy 94,179 EUR to Sell 107,403 USD BNY Mellon 181 07/03/2019
Total unrealised gain on open forward foreign exchange contracts 181 Buy 106,982 USD to Sell 94,179 EUR BNY Mellon (601) 07/03/2019
Total unrealised loss on open forward foreign exchange contracts (601)
Total net unrealised loss on open forward foreign exchange contracts (420) Invesco Global Structured Equity Fund Unrealised Gain/(Loss) Details of Forward Foreign Exchange Contracts Counterparty USD Maturity Date Buy 157,000,000 JPY to Sell 1,414,255 USD Goldman Sachs 3,603 07/03/2019 Buy 13,600,000 NOK to Sell 1,592,099 USD Goldman Sachs 5,319 15/03/2019 Buy 12,717,410 NOK to Sell 1,485,316 USD Goldman Sachs 7,879 07/03/2019 Buy 10,515,833 SEK to Sell 1,137,676 USD Goldman Sachs 10,305 15/03/2019 Royal Bank of Canada Buy 9,347,508 DKK to Sell 1,421,766 USD (London Branch) 10,527 15/03/2019 Buy 1,162,738 USD to Sell 10,300,000 SEK Barclays 39,058 07/03/2019 Buy 3,290,000 CAD to Sell 2,427,831 USD Goldman Sachs 72,427 07/03/2019 Buy 27,980,551 USD to Sell 3,085,482,552 JPY CIBC 97,136 15/03/2019 Buy 5,341,229 GBP to Sell 6,931,101 USD BNY Mellon 176,972 07/03/2019 Buy 163,014,772 EUR to Sell 185,934,785 USD BNY Mellon 282,947 07/03/2019
Total unrealised gain on open forward foreign exchange contracts 706,173 Buy 27,006,085 USD to Sell 20,982,070 GBP CIBC (928,551) 15/03/2019 Buy 57,373,778 USD to Sell 76,028,116 CAD CIBC (415,850) 15/03/2019 Buy 44,150,690 USD to Sell 62,273,797 AUD CIBC (334,349) 15/03/2019 Buy 30,553,116 USD to Sell 27,011,692 EUR CIBC (324,742) 15/03/2019 Buy 22,302,032 USD to Sell 206,300,000 SEK CIBC (219,108) 15/03/2019 Buy 8,810,136 USD to Sell 76,372,180 NOK CIBC (160,329) 15/03/2019 Buy 8,960,848 USD to Sell 59,124,344 DKK CIBC (98,614) 15/03/2019 Buy 4,933,321 USD to Sell 4,960,000 CHF CIBC (67,253) 15/03/2019 Buy 5,105,051 USD to Sell 6,763,754 CAD Goldman Sachs (36,137) 15/03/2019 Buy 2,613,641 USD to Sell 2,314,542 EUR Goldman Sachs (32,180) 15/03/2019 Buy 4,302,743 USD to Sell 5,837,910 SGD CIBC (28,984) 15/03/2019 Buy 1,027,611 USD to Sell 9,600,000 SEK Barclays (20,391) 15/03/2019 Buy 2,829,590 USD to Sell 3,740,000 CAD Goldman Sachs (12,648) 07/03/2019 Royal Bank of Canada Buy 1,162,338 USD to Sell 1,579,056 SGD (London Branch) (9,321) 15/03/2019 Buy 1,205,734 USD to Sell 11,100,000 SEK Goldman Sachs (6,019) 15/03/2019 Buy 857,816 USD to Sell 755,271 EUR BNY Mellon (4,958) 07/03/2019 Buy 826,689,440 JPY to Sell 7,474,723 USD Goldman Sachs (3,955) 15/03/2019 Buy 229,992 USD to Sell 230,000 CHF Goldman Sachs (1,889) 15/03/2019 Buy 929,574 USD to Sell 103,000,000 JPY Goldman Sachs (1,234) 15/03/2019
Total unrealised loss on open forward foreign exchange contracts (2,706,512)
Total net unrealised loss on open forward foreign exchange contracts (2,000,339) Invesco Latin American Equity Fund Unrealised Gain/(Loss) Details of Forward Foreign Exchange Contracts Counterparty USD Maturity Date Buy 580,255 EUR to Sell 661,640 USD BNY Mellon 1,206 07/03/2019
Total unrealised gain on open forward foreign exchange contracts 1,206 Buy 35,795 USD to Sell 31,545 EUR BNY Mellon (240) 07/03/2019
Total unrealised loss on open forward foreign exchange contracts (240)
Total net unrealised gain on open forward foreign exchange contracts 966 Invesco US Equity Fund Unrealised Gain/(Loss) Details of Forward Foreign Exchange Contracts Counterparty USD Maturity Date Buy 2,868,084 EUR to Sell 3,271,002 USD BNY Mellon 5,315 07/03/2019
Total unrealised gain on open forward foreign exchange contracts 5,315 Buy 68,159 USD to Sell 60,013 EUR BNY Mellon (395) 07/03/2019
Total unrealised loss on open forward foreign exchange contracts (395)
Total net unrealised gain on open forward foreign exchange contracts 4,920
Notes to the Financial Statements (continued)
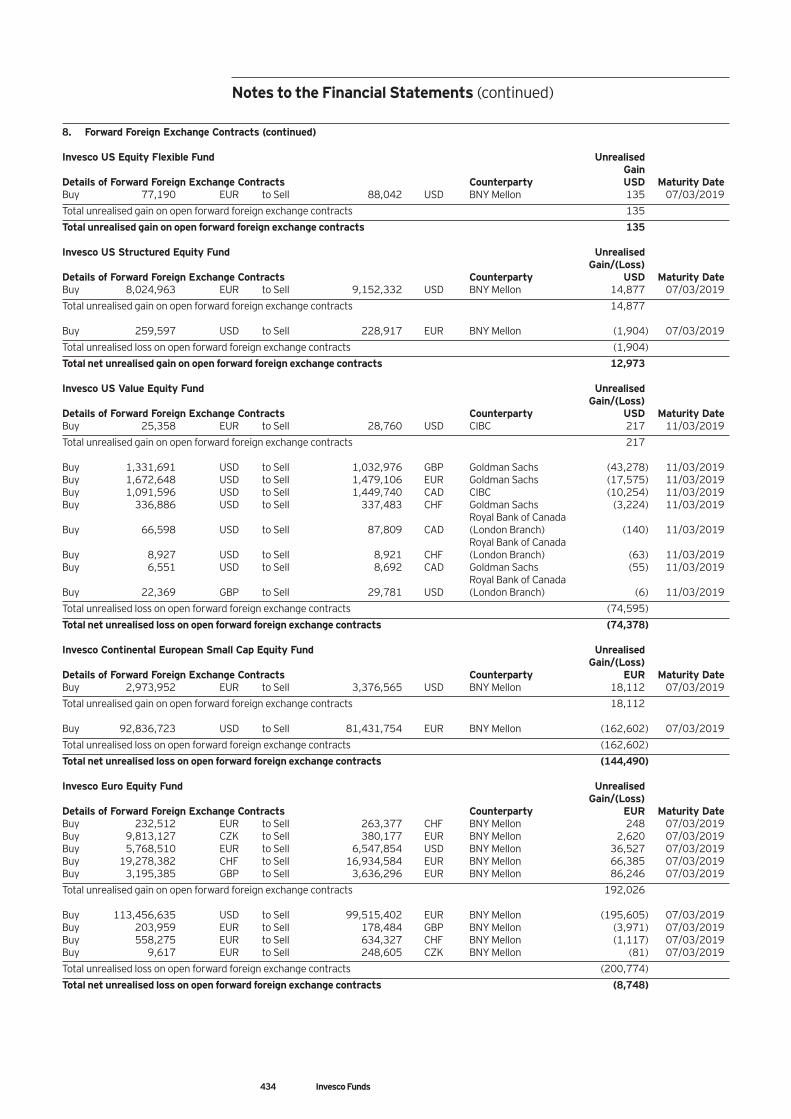
434 Invesco Funds
8. Forward Foreign Exchange Contracts (continued) Invesco US Equity Flexible Fund Unrealised Gain Details of Forward Foreign Exchange Contracts Counterparty USD Maturity Date Buy 77,190 EUR to Sell 88,042 USD BNY Mellon 135 07/03/2019
Total unrealised gain on open forward foreign exchange contracts 135
Total unrealised gain on open forward foreign exchange contracts 135 Invesco US Structured Equity Fund Unrealised Gain/(Loss) Details of Forward Foreign Exchange Contracts Counterparty USD Maturity Date Buy 8,024,963 EUR to Sell 9,152,332 USD BNY Mellon 14,877 07/03/2019
Total unrealised gain on open forward foreign exchange contracts 14,877 Buy 259,597 USD to Sell 228,917 EUR BNY Mellon (1,904) 07/03/2019
Total unrealised loss on open forward foreign exchange contracts (1,904)
Total net unrealised gain on open forward foreign exchange contracts 12,973 Invesco US Value Equity Fund Unrealised Gain/(Loss) Details of Forward Foreign Exchange Contracts Counterparty USD Maturity Date Buy 25,358 EUR to Sell 28,760 USD CIBC 217 11/03/2019
Total unrealised gain on open forward foreign exchange contracts 217 Buy 1,331,691 USD to Sell 1,032,976 GBP Goldman Sachs (43,278) 11/03/2019 Buy 1,672,648 USD to Sell 1,479,106 EUR Goldman Sachs (17,575) 11/03/2019 Buy 1,091,596 USD to Sell 1,449,740 CAD CIBC (10,254) 11/03/2019 Buy 336,886 USD to Sell 337,483 CHF Goldman Sachs (3,224) 11/03/2019 Royal Bank of Canada Buy 66,598 USD to Sell 87,809 CAD (London Branch) (140) 11/03/2019 Royal Bank of Canada Buy 8,927 USD to Sell 8,921 CHF (London Branch) (63) 11/03/2019 Buy 6,551 USD to Sell 8,692 CAD Goldman Sachs (55) 11/03/2019 Royal Bank of Canada Buy 22,369 GBP to Sell 29,781 USD (London Branch) (6) 11/03/2019
Total unrealised loss on open forward foreign exchange contracts (74,595)
Total net unrealised loss on open forward foreign exchange contracts (74,378) Invesco Continental European Small Cap Equity Fund Unrealised Gain/(Loss) Details of Forward Foreign Exchange Contracts Counterparty EUR Maturity Date Buy 2,973,952 EUR to Sell 3,376,565 USD BNY Mellon 18,112 07/03/2019
Total unrealised gain on open forward foreign exchange contracts 18,112 Buy 92,836,723 USD to Sell 81,431,754 EUR BNY Mellon (162,602) 07/03/2019
Total unrealised loss on open forward foreign exchange contracts (162,602)
Total net unrealised loss on open forward foreign exchange contracts (144,490) Invesco Euro Equity Fund Unrealised Gain/(Loss) Details of Forward Foreign Exchange Contracts Counterparty EUR Maturity Date Buy 232,512 EUR to Sell 263,377 CHF BNY Mellon 248 07/03/2019 Buy 9,813,127 CZK to Sell 380,177 EUR BNY Mellon 2,620 07/03/2019 Buy 5,768,510 EUR to Sell 6,547,854 USD BNY Mellon 36,527 07/03/2019 Buy 19,278,382 CHF to Sell 16,934,584 EUR BNY Mellon 66,385 07/03/2019 Buy 3,195,385 GBP to Sell 3,636,296 EUR BNY Mellon 86,246 07/03/2019
Total unrealised gain on open forward foreign exchange contracts 192,026 Buy 113,456,635 USD to Sell 99,515,402 EUR BNY Mellon (195,605) 07/03/2019 Buy 203,959 EUR to Sell 178,484 GBP BNY Mellon (3,971) 07/03/2019 Buy 558,275 EUR to Sell 634,327 CHF BNY Mellon (1,117) 07/03/2019 Buy 9,617 EUR to Sell 248,605 CZK BNY Mellon (81) 07/03/2019
Total unrealised loss on open forward foreign exchange contracts (200,774)
Total net unrealised loss on open forward foreign exchange contracts (8,748)
Notes to the Financial Statements (continued)
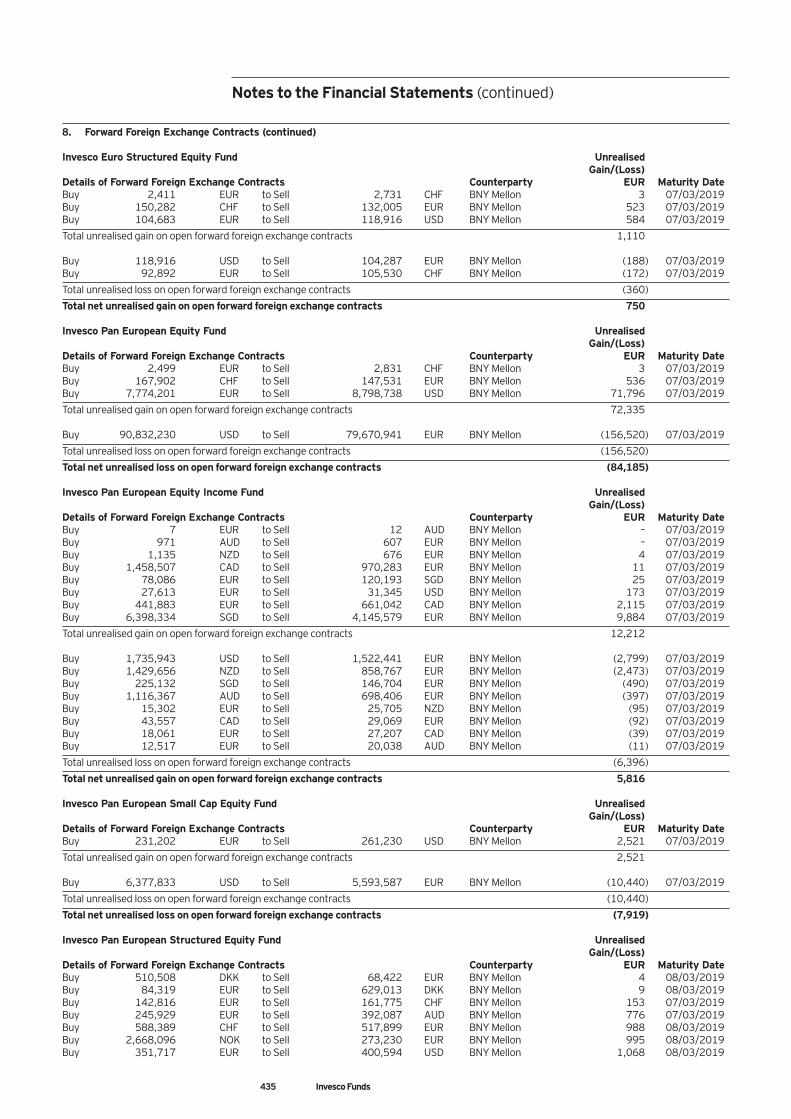
435 Invesco Funds
8. Forward Foreign Exchange Contracts (continued) Invesco Euro Structured Equity Fund Unrealised Gain/(Loss) Details of Forward Foreign Exchange Contracts Counterparty EUR Maturity Date Buy 2,411 EUR to Sell 2,731 CHF BNY Mellon 3 07/03/2019 Buy 150,282 CHF to Sell 132,005 EUR BNY Mellon 523 07/03/2019 Buy 104,683 EUR to Sell 118,916 USD BNY Mellon 584 07/03/2019
Total unrealised gain on open forward foreign exchange contracts 1,110 Buy 118,916 USD to Sell 104,287 EUR BNY Mellon (188) 07/03/2019 Buy 92,892 EUR to Sell 105,530 CHF BNY Mellon (172) 07/03/2019
Total unrealised loss on open forward foreign exchange contracts (360)
Total net unrealised gain on open forward foreign exchange contracts 750 Invesco Pan European Equity Fund Unrealised Gain/(Loss) Details of Forward Foreign Exchange Contracts Counterparty EUR Maturity Date Buy 2,499 EUR to Sell 2,831 CHF BNY Mellon 3 07/03/2019 Buy 167,902 CHF to Sell 147,531 EUR BNY Mellon 536 07/03/2019 Buy 7,774,201 EUR to Sell 8,798,738 USD BNY Mellon 71,796 07/03/2019
Total unrealised gain on open forward foreign exchange contracts 72,335 Buy 90,832,230 USD to Sell 79,670,941 EUR BNY Mellon (156,520) 07/03/2019
Total unrealised loss on open forward foreign exchange contracts (156,520)
Total net unrealised loss on open forward foreign exchange contracts (84,185) Invesco Pan European Equity Income Fund Unrealised Gain/(Loss) Details of Forward Foreign Exchange Contracts Counterparty EUR Maturity Date Buy 7 EUR to Sell 12 AUD BNY Mellon – 07/03/2019 Buy 971 AUD to Sell 607 EUR BNY Mellon – 07/03/2019 Buy 1,135 NZD to Sell 676 EUR BNY Mellon 4 07/03/2019 Buy 1,458,507 CAD to Sell 970,283 EUR BNY Mellon 11 07/03/2019 Buy 78,086 EUR to Sell 120,193 SGD BNY Mellon 25 07/03/2019 Buy 27,613 EUR to Sell 31,345 USD BNY Mellon 173 07/03/2019 Buy 441,883 EUR to Sell 661,042 CAD BNY Mellon 2,115 07/03/2019 Buy 6,398,334 SGD to Sell 4,145,579 EUR BNY Mellon 9,884 07/03/2019
Total unrealised gain on open forward foreign exchange contracts 12,212 Buy 1,735,943 USD to Sell 1,522,441 EUR BNY Mellon (2,799) 07/03/2019 Buy 1,429,656 NZD to Sell 858,767 EUR BNY Mellon (2,473) 07/03/2019 Buy 225,132 SGD to Sell 146,704 EUR BNY Mellon (490) 07/03/2019 Buy 1,116,367 AUD to Sell 698,406 EUR BNY Mellon (397) 07/03/2019 Buy 15,302 EUR to Sell 25,705 NZD BNY Mellon (95) 07/03/2019 Buy 43,557 CAD to Sell 29,069 EUR BNY Mellon (92) 07/03/2019 Buy 18,061 EUR to Sell 27,207 CAD BNY Mellon (39) 07/03/2019 Buy 12,517 EUR to Sell 20,038 AUD BNY Mellon (11) 07/03/2019
Total unrealised loss on open forward foreign exchange contracts (6,396)
Total net unrealised gain on open forward foreign exchange contracts 5,816 Invesco Pan European Small Cap Equity Fund Unrealised Gain/(Loss) Details of Forward Foreign Exchange Contracts Counterparty EUR Maturity Date Buy 231,202 EUR to Sell 261,230 USD BNY Mellon 2,521 07/03/2019
Total unrealised gain on open forward foreign exchange contracts 2,521 Buy 6,377,833 USD to Sell 5,593,587 EUR BNY Mellon (10,440) 07/03/2019
Total unrealised loss on open forward foreign exchange contracts (10,440)
Total net unrealised loss on open forward foreign exchange contracts (7,919) Invesco Pan European Structured Equity Fund Unrealised Gain/(Loss) Details of Forward Foreign Exchange Contracts Counterparty EUR Maturity Date Buy 510,508 DKK to Sell 68,422 EUR BNY Mellon 4 08/03/2019 Buy 84,319 EUR to Sell 629,013 DKK BNY Mellon 9 08/03/2019 Buy 142,816 EUR to Sell 161,775 CHF BNY Mellon 153 07/03/2019 Buy 245,929 EUR to Sell 392,087 AUD BNY Mellon 776 07/03/2019 Buy 588,389 CHF to Sell 517,899 EUR BNY Mellon 988 08/03/2019 Buy 2,668,096 NOK to Sell 273,230 EUR BNY Mellon 995 08/03/2019 Buy 351,717 EUR to Sell 400,594 USD BNY Mellon 1,068 08/03/2019
Notes to the Financial Statements (continued)
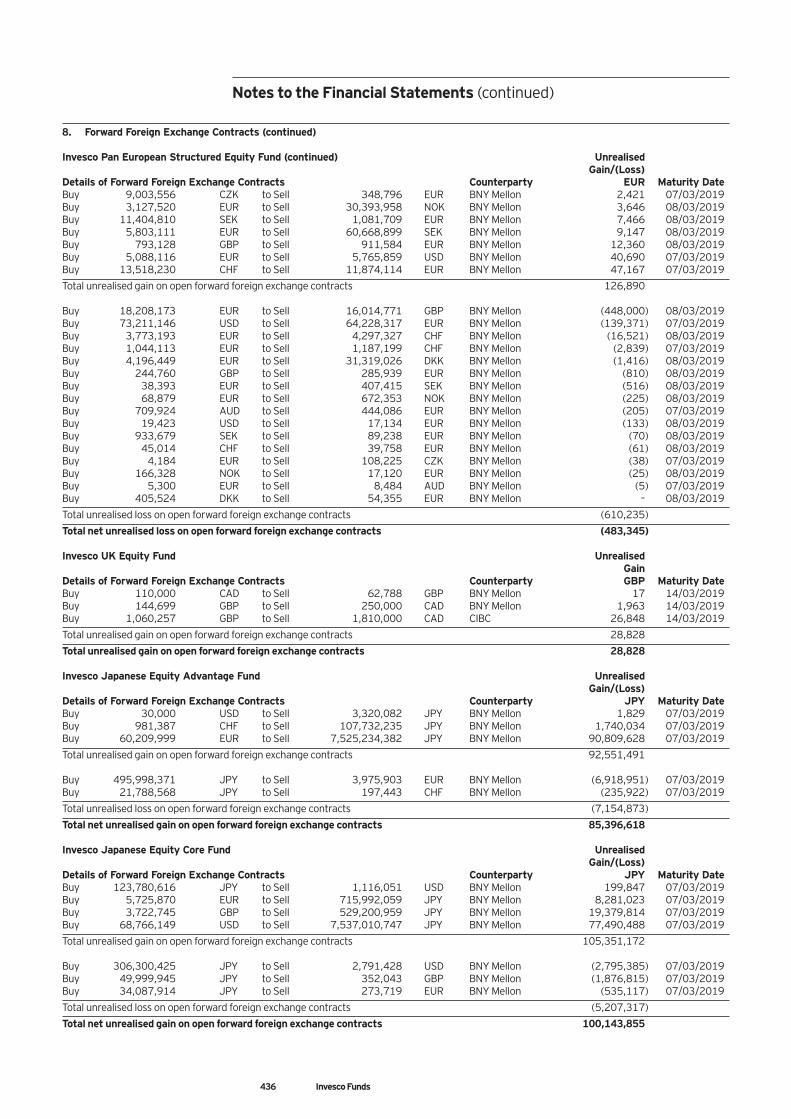
436 Invesco Funds
8. Forward Foreign Exchange Contracts (continued) Invesco Pan European Structured Equity Fund (continued) Unrealised Gain/(Loss) Details of Forward Foreign Exchange Contracts Counterparty EUR Maturity Date Buy 9,003,556 CZK to Sell 348,796 EUR BNY Mellon 2,421 07/03/2019 Buy 3,127,520 EUR to Sell 30,393,958 NOK BNY Mellon 3,646 08/03/2019 Buy 11,404,810 SEK to Sell 1,081,709 EUR BNY Mellon 7,466 08/03/2019 Buy 5,803,111 EUR to Sell 60,668,899 SEK BNY Mellon 9,147 08/03/2019 Buy 793,128 GBP to Sell 911,584 EUR BNY Mellon 12,360 08/03/2019 Buy 5,088,116 EUR to Sell 5,765,859 USD BNY Mellon 40,690 07/03/2019 Buy 13,518,230 CHF to Sell 11,874,114 EUR BNY Mellon 47,167 07/03/2019
Total unrealised gain on open forward foreign exchange contracts 126,890 Buy 18,208,173 EUR to Sell 16,014,771 GBP BNY Mellon (448,000) 08/03/2019 Buy 73,211,146 USD to Sell 64,228,317 EUR BNY Mellon (139,371) 07/03/2019 Buy 3,773,193 EUR to Sell 4,297,327 CHF BNY Mellon (16,521) 08/03/2019 Buy 1,044,113 EUR to Sell 1,187,199 CHF BNY Mellon (2,839) 07/03/2019 Buy 4,196,449 EUR to Sell 31,319,026 DKK BNY Mellon (1,416) 08/03/2019 Buy 244,760 GBP to Sell 285,939 EUR BNY Mellon (810) 08/03/2019 Buy 38,393 EUR to Sell 407,415 SEK BNY Mellon (516) 08/03/2019 Buy 68,879 EUR to Sell 672,353 NOK BNY Mellon (225) 08/03/2019 Buy 709,924 AUD to Sell 444,086 EUR BNY Mellon (205) 07/03/2019 Buy 19,423 USD to Sell 17,134 EUR BNY Mellon (133) 08/03/2019 Buy 933,679 SEK to Sell 89,238 EUR BNY Mellon (70) 08/03/2019 Buy 45,014 CHF to Sell 39,758 EUR BNY Mellon (61) 08/03/2019 Buy 4,184 EUR to Sell 108,225 CZK BNY Mellon (38) 07/03/2019 Buy 166,328 NOK to Sell 17,120 EUR BNY Mellon (25) 08/03/2019 Buy 5,300 EUR to Sell 8,484 AUD BNY Mellon (5) 07/03/2019 Buy 405,524 DKK to Sell 54,355 EUR BNY Mellon – 08/03/2019
Total unrealised loss on open forward foreign exchange contracts (610,235)
Total net unrealised loss on open forward foreign exchange contracts (483,345) Invesco UK Equity Fund Unrealised Gain Details of Forward Foreign Exchange Contracts Counterparty GBP Maturity Date Buy 110,000 CAD to Sell 62,788 GBP BNY Mellon 17 14/03/2019 Buy 144,699 GBP to Sell 250,000 CAD BNY Mellon 1,963 14/03/2019 Buy 1,060,257 GBP to Sell 1,810,000 CAD CIBC 26,848 14/03/2019
Total unrealised gain on open forward foreign exchange contracts 28,828
Total unrealised gain on open forward foreign exchange contracts 28,828 Invesco Japanese Equity Advantage Fund Unrealised Gain/(Loss) Details of Forward Foreign Exchange Contracts Counterparty JPY Maturity Date Buy 30,000 USD to Sell 3,320,082 JPY BNY Mellon 1,829 07/03/2019 Buy 981,387 CHF to Sell 107,732,235 JPY BNY Mellon 1,740,034 07/03/2019 Buy 60,209,999 EUR to Sell 7,525,234,382 JPY BNY Mellon 90,809,628 07/03/2019
Total unrealised gain on open forward foreign exchange contracts 92,551,491 Buy 495,998,371 JPY to Sell 3,975,903 EUR BNY Mellon (6,918,951) 07/03/2019 Buy 21,788,568 JPY to Sell 197,443 CHF BNY Mellon (235,922) 07/03/2019
Total unrealised loss on open forward foreign exchange contracts (7,154,873)
Total net unrealised gain on open forward foreign exchange contracts 85,396,618 Invesco Japanese Equity Core Fund Unrealised Gain/(Loss) Details of Forward Foreign Exchange Contracts Counterparty JPY Maturity Date Buy 123,780,616 JPY to Sell 1,116,051 USD BNY Mellon 199,847 07/03/2019 Buy 5,725,870 EUR to Sell 715,992,059 JPY BNY Mellon 8,281,023 07/03/2019 Buy 3,722,745 GBP to Sell 529,200,959 JPY BNY Mellon 19,379,814 07/03/2019 Buy 68,766,149 USD to Sell 7,537,010,747 JPY BNY Mellon 77,490,488 07/03/2019
Total unrealised gain on open forward foreign exchange contracts 105,351,172 Buy 306,300,425 JPY to Sell 2,791,428 USD BNY Mellon (2,795,385) 07/03/2019 Buy 49,999,945 JPY to Sell 352,043 GBP BNY Mellon (1,876,815) 07/03/2019 Buy 34,087,914 JPY to Sell 273,719 EUR BNY Mellon (535,117) 07/03/2019
Total unrealised loss on open forward foreign exchange contracts (5,207,317)
Total net unrealised gain on open forward foreign exchange contracts 100,143,855
Notes to the Financial Statements (continued)
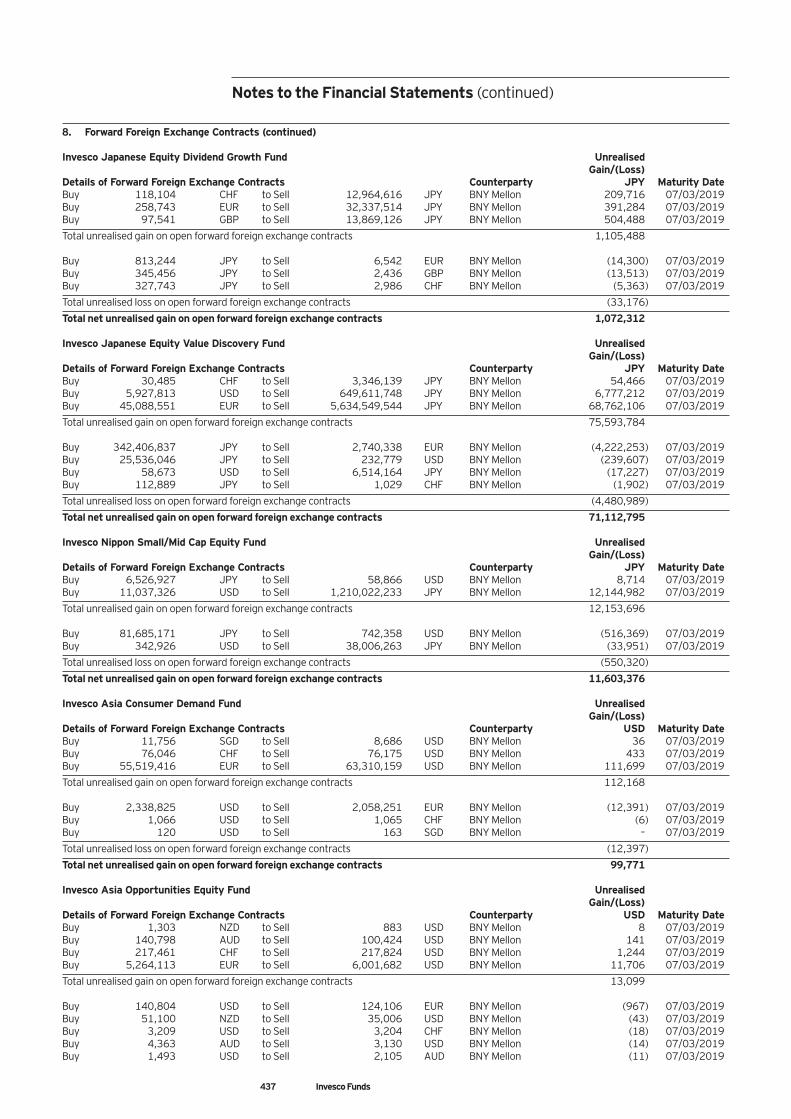
437 Invesco Funds
8. Forward Foreign Exchange Contracts (continued) Invesco Japanese Equity Dividend Growth Fund Unrealised Gain/(Loss) Details of Forward Foreign Exchange Contracts Counterparty JPY Maturity Date Buy 118,104 CHF to Sell 12,964,616 JPY BNY Mellon 209,716 07/03/2019 Buy 258,743 EUR to Sell 32,337,514 JPY BNY Mellon 391,284 07/03/2019 Buy 97,541 GBP to Sell 13,869,126 JPY BNY Mellon 504,488 07/03/2019
Total unrealised gain on open forward foreign exchange contracts 1,105,488 Buy 813,244 JPY to Sell 6,542 EUR BNY Mellon (14,300) 07/03/2019 Buy 345,456 JPY to Sell 2,436 GBP BNY Mellon (13,513) 07/03/2019 Buy 327,743 JPY to Sell 2,986 CHF BNY Mellon (5,363) 07/03/2019
Total unrealised loss on open forward foreign exchange contracts (33,176)
Total net unrealised gain on open forward foreign exchange contracts 1,072,312 Invesco Japanese Equity Value Discovery Fund Unrealised Gain/(Loss) Details of Forward Foreign Exchange Contracts Counterparty JPY Maturity Date Buy 30,485 CHF to Sell 3,346,139 JPY BNY Mellon 54,466 07/03/2019 Buy 5,927,813 USD to Sell 649,611,748 JPY BNY Mellon 6,777,212 07/03/2019 Buy 45,088,551 EUR to Sell 5,634,549,544 JPY BNY Mellon 68,762,106 07/03/2019
Total unrealised gain on open forward foreign exchange contracts 75,593,784 Buy 342,406,837 JPY to Sell 2,740,338 EUR BNY Mellon (4,222,253) 07/03/2019 Buy 25,536,046 JPY to Sell 232,779 USD BNY Mellon (239,607) 07/03/2019 Buy 58,673 USD to Sell 6,514,164 JPY BNY Mellon (17,227) 07/03/2019 Buy 112,889 JPY to Sell 1,029 CHF BNY Mellon (1,902) 07/03/2019
Total unrealised loss on open forward foreign exchange contracts (4,480,989)
Total net unrealised gain on open forward foreign exchange contracts 71,112,795 Invesco Nippon Small/Mid Cap Equity Fund Unrealised Gain/(Loss) Details of Forward Foreign Exchange Contracts Counterparty JPY Maturity Date Buy 6,526,927 JPY to Sell 58,866 USD BNY Mellon 8,714 07/03/2019 Buy 11,037,326 USD to Sell 1,210,022,233 JPY BNY Mellon 12,144,982 07/03/2019
Total unrealised gain on open forward foreign exchange contracts 12,153,696 Buy 81,685,171 JPY to Sell 742,358 USD BNY Mellon (516,369) 07/03/2019 Buy 342,926 USD to Sell 38,006,263 JPY BNY Mellon (33,951) 07/03/2019
Total unrealised loss on open forward foreign exchange contracts (550,320)
Total net unrealised gain on open forward foreign exchange contracts 11,603,376 Invesco Asia Consumer Demand Fund Unrealised Gain/(Loss) Details of Forward Foreign Exchange Contracts Counterparty USD Maturity Date Buy 11,756 SGD to Sell 8,686 USD BNY Mellon 36 07/03/2019 Buy 76,046 CHF to Sell 76,175 USD BNY Mellon 433 07/03/2019 Buy 55,519,416 EUR to Sell 63,310,159 USD BNY Mellon 111,699 07/03/2019
Total unrealised gain on open forward foreign exchange contracts 112,168 Buy 2,338,825 USD to Sell 2,058,251 EUR BNY Mellon (12,391) 07/03/2019 Buy 1,066 USD to Sell 1,065 CHF BNY Mellon (6) 07/03/2019 Buy 120 USD to Sell 163 SGD BNY Mellon – 07/03/2019
Total unrealised loss on open forward foreign exchange contracts (12,397)
Total net unrealised gain on open forward foreign exchange contracts 99,771 Invesco Asia Opportunities Equity Fund Unrealised Gain/(Loss) Details of Forward Foreign Exchange Contracts Counterparty USD Maturity Date Buy 1,303 NZD to Sell 883 USD BNY Mellon 8 07/03/2019 Buy 140,798 AUD to Sell 100,424 USD BNY Mellon 141 07/03/2019 Buy 217,461 CHF to Sell 217,824 USD BNY Mellon 1,244 07/03/2019 Buy 5,264,113 EUR to Sell 6,001,682 USD BNY Mellon 11,706 07/03/2019
Total unrealised gain on open forward foreign exchange contracts 13,099 Buy 140,804 USD to Sell 124,106 EUR BNY Mellon (967) 07/03/2019 Buy 51,100 NZD to Sell 35,006 USD BNY Mellon (43) 07/03/2019 Buy 3,209 USD to Sell 3,204 CHF BNY Mellon (18) 07/03/2019 Buy 4,363 AUD to Sell 3,130 USD BNY Mellon (14) 07/03/2019 Buy 1,493 USD to Sell 2,105 AUD BNY Mellon (11) 07/03/2019
Notes to the Financial Statements (continued)
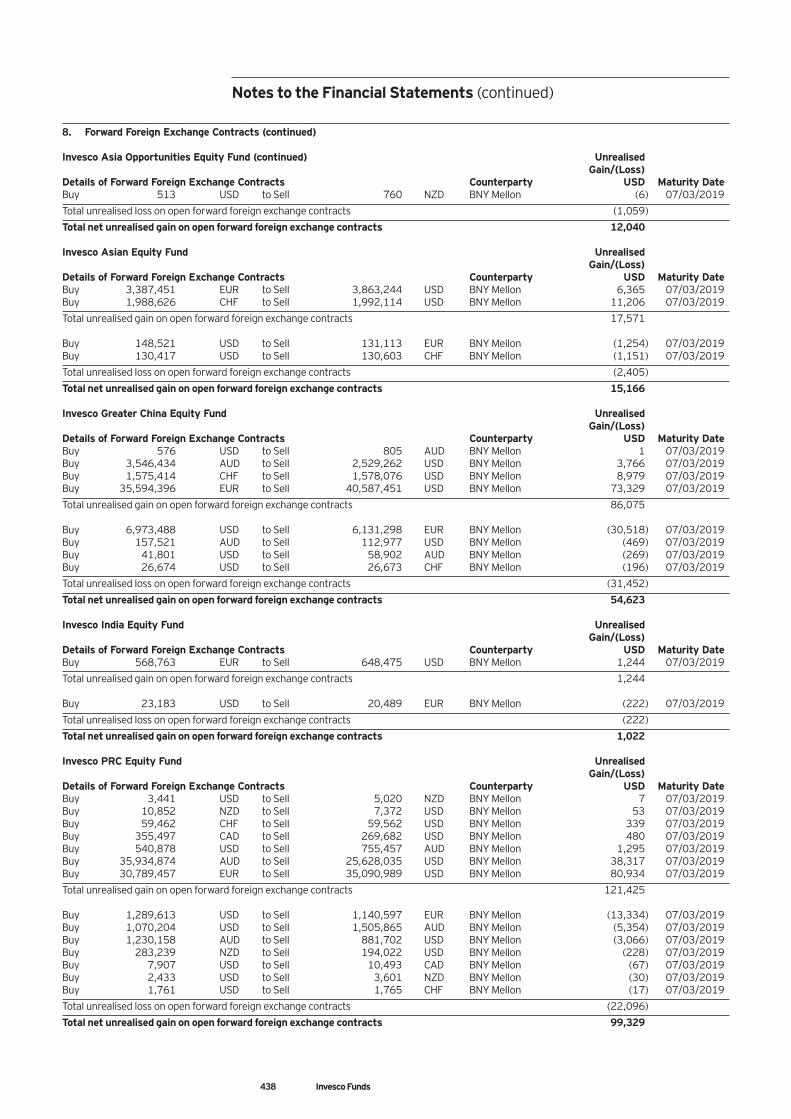
438 Invesco Funds
8. Forward Foreign Exchange Contracts (continued) Invesco Asia Opportunities Equity Fund (continued) Unrealised Gain/(Loss) Details of Forward Foreign Exchange Contracts Counterparty USD Maturity Date Buy 513 USD to Sell 760 NZD BNY Mellon (6) 07/03/2019
Total unrealised loss on open forward foreign exchange contracts (1,059)
Total net unrealised gain on open forward foreign exchange contracts 12,040 Invesco Asian Equity Fund Unrealised Gain/(Loss) Details of Forward Foreign Exchange Contracts Counterparty USD Maturity Date Buy 3,387,451 EUR to Sell 3,863,244 USD BNY Mellon 6,365 07/03/2019 Buy 1,988,626 CHF to Sell 1,992,114 USD BNY Mellon 11,206 07/03/2019
Total unrealised gain on open forward foreign exchange contracts 17,571 Buy 148,521 USD to Sell 131,113 EUR BNY Mellon (1,254) 07/03/2019 Buy 130,417 USD to Sell 130,603 CHF BNY Mellon (1,151) 07/03/2019
Total unrealised loss on open forward foreign exchange contracts (2,405)
Total net unrealised gain on open forward foreign exchange contracts 15,166 Invesco Greater China Equity Fund Unrealised Gain/(Loss) Details of Forward Foreign Exchange Contracts Counterparty USD Maturity Date Buy 576 USD to Sell 805 AUD BNY Mellon 1 07/03/2019 Buy 3,546,434 AUD to Sell 2,529,262 USD BNY Mellon 3,766 07/03/2019 Buy 1,575,414 CHF to Sell 1,578,076 USD BNY Mellon 8,979 07/03/2019 Buy 35,594,396 EUR to Sell 40,587,451 USD BNY Mellon 73,329 07/03/2019
Total unrealised gain on open forward foreign exchange contracts 86,075 Buy 6,973,488 USD to Sell 6,131,298 EUR BNY Mellon (30,518) 07/03/2019 Buy 157,521 AUD to Sell 112,977 USD BNY Mellon (469) 07/03/2019 Buy 41,801 USD to Sell 58,902 AUD BNY Mellon (269) 07/03/2019 Buy 26,674 USD to Sell 26,673 CHF BNY Mellon (196) 07/03/2019
Total unrealised loss on open forward foreign exchange contracts (31,452)
Total net unrealised gain on open forward foreign exchange contracts 54,623 Invesco India Equity Fund Unrealised Gain/(Loss) Details of Forward Foreign Exchange Contracts Counterparty USD Maturity Date Buy 568,763 EUR to Sell 648,475 USD BNY Mellon 1,244 07/03/2019
Total unrealised gain on open forward foreign exchange contracts 1,244 Buy 23,183 USD to Sell 20,489 EUR BNY Mellon (222) 07/03/2019
Total unrealised loss on open forward foreign exchange contracts (222)
Total net unrealised gain on open forward foreign exchange contracts 1,022 Invesco PRC Equity Fund Unrealised Gain/(Loss) Details of Forward Foreign Exchange Contracts Counterparty USD Maturity Date Buy 3,441 USD to Sell 5,020 NZD BNY Mellon 7 07/03/2019 Buy 10,852 NZD to Sell 7,372 USD BNY Mellon 53 07/03/2019 Buy 59,462 CHF to Sell 59,562 USD BNY Mellon 339 07/03/2019 Buy 355,497 CAD to Sell 269,682 USD BNY Mellon 480 07/03/2019 Buy 540,878 USD to Sell 755,457 AUD BNY Mellon 1,295 07/03/2019 Buy 35,934,874 AUD to Sell 25,628,035 USD BNY Mellon 38,317 07/03/2019 Buy 30,789,457 EUR to Sell 35,090,989 USD BNY Mellon 80,934 07/03/2019
Total unrealised gain on open forward foreign exchange contracts 121,425 Buy 1,289,613 USD to Sell 1,140,597 EUR BNY Mellon (13,334) 07/03/2019 Buy 1,070,204 USD to Sell 1,505,865 AUD BNY Mellon (5,354) 07/03/2019 Buy 1,230,158 AUD to Sell 881,702 USD BNY Mellon (3,066) 07/03/2019 Buy 283,239 NZD to Sell 194,022 USD BNY Mellon (228) 07/03/2019 Buy 7,907 USD to Sell 10,493 CAD BNY Mellon (67) 07/03/2019 Buy 2,433 USD to Sell 3,601 NZD BNY Mellon (30) 07/03/2019 Buy 1,761 USD to Sell 1,765 CHF BNY Mellon (17) 07/03/2019
Total unrealised loss on open forward foreign exchange contracts (22,096)
Total net unrealised gain on open forward foreign exchange contracts 99,329
Notes to the Financial Statements (continued)
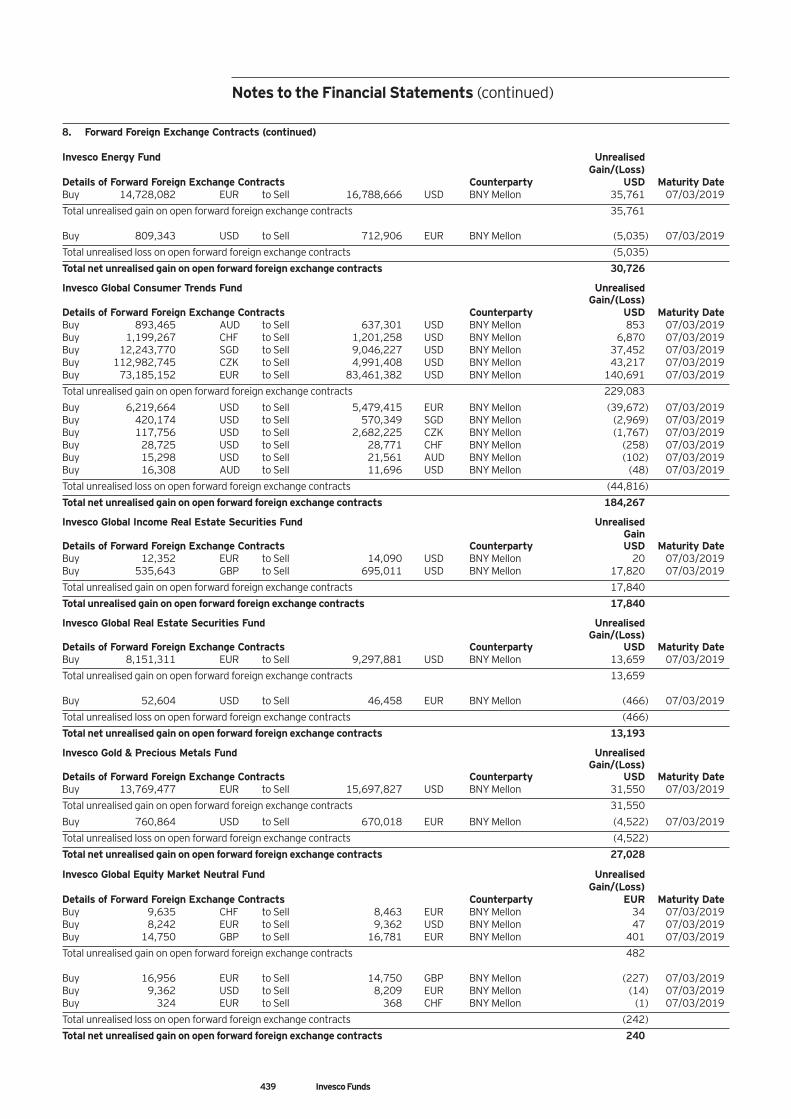
439 Invesco Funds
8. Forward Foreign Exchange Contracts (continued) Invesco Energy Fund Unrealised Gain/(Loss) Details of Forward Foreign Exchange Contracts Counterparty USD Maturity Date Buy 14,728,082 EUR to Sell 16,788,666 USD BNY Mellon 35,761 07/03/2019
Total unrealised gain on open forward foreign exchange contracts 35,761 Buy 809,343 USD to Sell 712,906 EUR BNY Mellon (5,035) 07/03/2019
Total unrealised loss on open forward foreign exchange contracts (5,035)
Total net unrealised gain on open forward foreign exchange contracts 30,726
Invesco Global Consumer Trends Fund Unrealised Gain/(Loss) Details of Forward Foreign Exchange Contracts Counterparty USD Maturity Date Buy 893,465 AUD to Sell 637,301 USD BNY Mellon 853 07/03/2019 Buy 1,199,267 CHF to Sell 1,201,258 USD BNY Mellon 6,870 07/03/2019 Buy 12,243,770 SGD to Sell 9,046,227 USD BNY Mellon 37,452 07/03/2019 Buy 112,982,745 CZK to Sell 4,991,408 USD BNY Mellon 43,217 07/03/2019 Buy 73,185,152 EUR to Sell 83,461,382 USD BNY Mellon 140,691 07/03/2019
Total unrealised gain on open forward foreign exchange contracts 229,083
Buy 6,219,664 USD to Sell 5,479,415 EUR BNY Mellon (39,672) 07/03/2019 Buy 420,174 USD to Sell 570,349 SGD BNY Mellon (2,969) 07/03/2019 Buy 117,756 USD to Sell 2,682,225 CZK BNY Mellon (1,767) 07/03/2019 Buy 28,725 USD to Sell 28,771 CHF BNY Mellon (258) 07/03/2019 Buy 15,298 USD to Sell 21,561 AUD BNY Mellon (102) 07/03/2019 Buy 16,308 AUD to Sell 11,696 USD BNY Mellon (48) 07/03/2019
Total unrealised loss on open forward foreign exchange contracts (44,816)
Total net unrealised gain on open forward foreign exchange contracts 184,267
Invesco Global Income Real Estate Securities Fund Unrealised Gain Details of Forward Foreign Exchange Contracts Counterparty USD Maturity Date Buy 12,352 EUR to Sell 14,090 USD BNY Mellon 20 07/03/2019 Buy 535,643 GBP to Sell 695,011 USD BNY Mellon 17,820 07/03/2019
Total unrealised gain on open forward foreign exchange contracts 17,840
Total unrealised gain on open forward foreign exchange contracts 17,840
Invesco Global Real Estate Securities Fund Unrealised Gain/(Loss) Details of Forward Foreign Exchange Contracts Counterparty USD Maturity Date Buy 8,151,311 EUR to Sell 9,297,881 USD BNY Mellon 13,659 07/03/2019
Total unrealised gain on open forward foreign exchange contracts 13,659 Buy 52,604 USD to Sell 46,458 EUR BNY Mellon (466) 07/03/2019
Total unrealised loss on open forward foreign exchange contracts (466)
Total net unrealised gain on open forward foreign exchange contracts 13,193
Invesco Gold & Precious Metals Fund Unrealised Gain/(Loss) Details of Forward Foreign Exchange Contracts Counterparty USD Maturity Date Buy 13,769,477 EUR to Sell 15,697,827 USD BNY Mellon 31,550 07/03/2019
Total unrealised gain on open forward foreign exchange contracts 31,550
Buy 760,864 USD to Sell 670,018 EUR BNY Mellon (4,522) 07/03/2019
Total unrealised loss on open forward foreign exchange contracts (4,522)
Total net unrealised gain on open forward foreign exchange contracts 27,028
Invesco Global Equity Market Neutral Fund Unrealised Gain/(Loss) Details of Forward Foreign Exchange Contracts Counterparty EUR Maturity Date Buy 9,635 CHF to Sell 8,463 EUR BNY Mellon 34 07/03/2019 Buy 8,242 EUR to Sell 9,362 USD BNY Mellon 47 07/03/2019 Buy 14,750 GBP to Sell 16,781 EUR BNY Mellon 401 07/03/2019
Total unrealised gain on open forward foreign exchange contracts 482 Buy 16,956 EUR to Sell 14,750 GBP BNY Mellon (227) 07/03/2019 Buy 9,362 USD to Sell 8,209 EUR BNY Mellon (14) 07/03/2019 Buy 324 EUR to Sell 368 CHF BNY Mellon (1) 07/03/2019
Total unrealised loss on open forward foreign exchange contracts (242)
Total net unrealised gain on open forward foreign exchange contracts 240
Notes to the Financial Statements (continued)
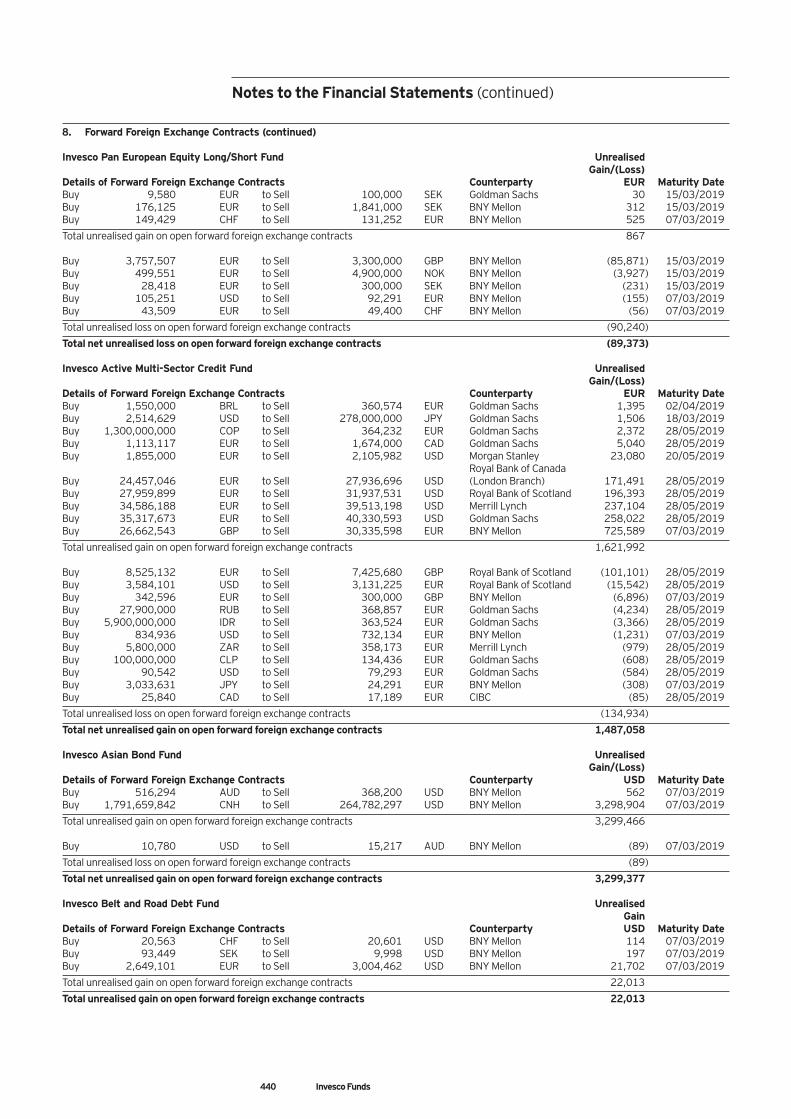
440 Invesco Funds
8. Forward Foreign Exchange Contracts (continued) Invesco Pan European Equity Long/Short Fund Unrealised Gain/(Loss) Details of Forward Foreign Exchange Contracts Counterparty EUR Maturity Date Buy 9,580 EUR to Sell 100,000 SEK Goldman Sachs 30 15/03/2019 Buy 176,125 EUR to Sell 1,841,000 SEK BNY Mellon 312 15/03/2019 Buy 149,429 CHF to Sell 131,252 EUR BNY Mellon 525 07/03/2019
Total unrealised gain on open forward foreign exchange contracts 867 Buy 3,757,507 EUR to Sell 3,300,000 GBP BNY Mellon (85,871) 15/03/2019 Buy 499,551 EUR to Sell 4,900,000 NOK BNY Mellon (3,927) 15/03/2019 Buy 28,418 EUR to Sell 300,000 SEK BNY Mellon (231) 15/03/2019 Buy 105,251 USD to Sell 92,291 EUR BNY Mellon (155) 07/03/2019 Buy 43,509 EUR to Sell 49,400 CHF BNY Mellon (56) 07/03/2019
Total unrealised loss on open forward foreign exchange contracts (90,240)
Total net unrealised loss on open forward foreign exchange contracts (89,373) Invesco Active Multi-Sector Credit Fund Unrealised Gain/(Loss) Details of Forward Foreign Exchange Contracts Counterparty EUR Maturity Date Buy 1,550,000 BRL to Sell 360,574 EUR Goldman Sachs 1,395 02/04/2019 Buy 2,514,629 USD to Sell 278,000,000 JPY Goldman Sachs 1,506 18/03/2019 Buy 1,300,000,000 COP to Sell 364,232 EUR Goldman Sachs 2,372 28/05/2019 Buy 1,113,117 EUR to Sell 1,674,000 CAD Goldman Sachs 5,040 28/05/2019 Buy 1,855,000 EUR to Sell 2,105,982 USD Morgan Stanley 23,080 20/05/2019 Royal Bank of Canada Buy 24,457,046 EUR to Sell 27,936,696 USD (London Branch) 171,491 28/05/2019 Buy 27,959,899 EUR to Sell 31,937,531 USD Royal Bank of Scotland 196,393 28/05/2019 Buy 34,586,188 EUR to Sell 39,513,198 USD Merrill Lynch 237,104 28/05/2019 Buy 35,317,673 EUR to Sell 40,330,593 USD Goldman Sachs 258,022 28/05/2019 Buy 26,662,543 GBP to Sell 30,335,598 EUR BNY Mellon 725,589 07/03/2019
Total unrealised gain on open forward foreign exchange contracts 1,621,992 Buy 8,525,132 EUR to Sell 7,425,680 GBP Royal Bank of Scotland (101,101) 28/05/2019 Buy 3,584,101 USD to Sell 3,131,225 EUR Royal Bank of Scotland (15,542) 28/05/2019 Buy 342,596 EUR to Sell 300,000 GBP BNY Mellon (6,896) 07/03/2019 Buy 27,900,000 RUB to Sell 368,857 EUR Goldman Sachs (4,234) 28/05/2019 Buy 5,900,000,000 IDR to Sell 363,524 EUR Goldman Sachs (3,366) 28/05/2019 Buy 834,936 USD to Sell 732,134 EUR BNY Mellon (1,231) 07/03/2019 Buy 5,800,000 ZAR to Sell 358,173 EUR Merrill Lynch (979) 28/05/2019 Buy 100,000,000 CLP to Sell 134,436 EUR Goldman Sachs (608) 28/05/2019 Buy 90,542 USD to Sell 79,293 EUR Goldman Sachs (584) 28/05/2019 Buy 3,033,631 JPY to Sell 24,291 EUR BNY Mellon (308) 07/03/2019 Buy 25,840 CAD to Sell 17,189 EUR CIBC (85) 28/05/2019
Total unrealised loss on open forward foreign exchange contracts (134,934)
Total net unrealised gain on open forward foreign exchange contracts 1,487,058 Invesco Asian Bond Fund Unrealised Gain/(Loss) Details of Forward Foreign Exchange Contracts Counterparty USD Maturity Date Buy 516,294 AUD to Sell 368,200 USD BNY Mellon 562 07/03/2019 Buy 1,791,659,842 CNH to Sell 264,782,297 USD BNY Mellon 3,298,904 07/03/2019
Total unrealised gain on open forward foreign exchange contracts 3,299,466 Buy 10,780 USD to Sell 15,217 AUD BNY Mellon (89) 07/03/2019
Total unrealised loss on open forward foreign exchange contracts (89)
Total net unrealised gain on open forward foreign exchange contracts 3,299,377 Invesco Belt and Road Debt Fund Unrealised Gain Details of Forward Foreign Exchange Contracts Counterparty USD Maturity Date Buy 20,563 CHF to Sell 20,601 USD BNY Mellon 114 07/03/2019 Buy 93,449 SEK to Sell 9,998 USD BNY Mellon 197 07/03/2019 Buy 2,649,101 EUR to Sell 3,004,462 USD BNY Mellon 21,702 07/03/2019
Total unrealised gain on open forward foreign exchange contracts 22,013
Total unrealised gain on open forward foreign exchange contracts 22,013
Notes to the Financial Statements (continued)
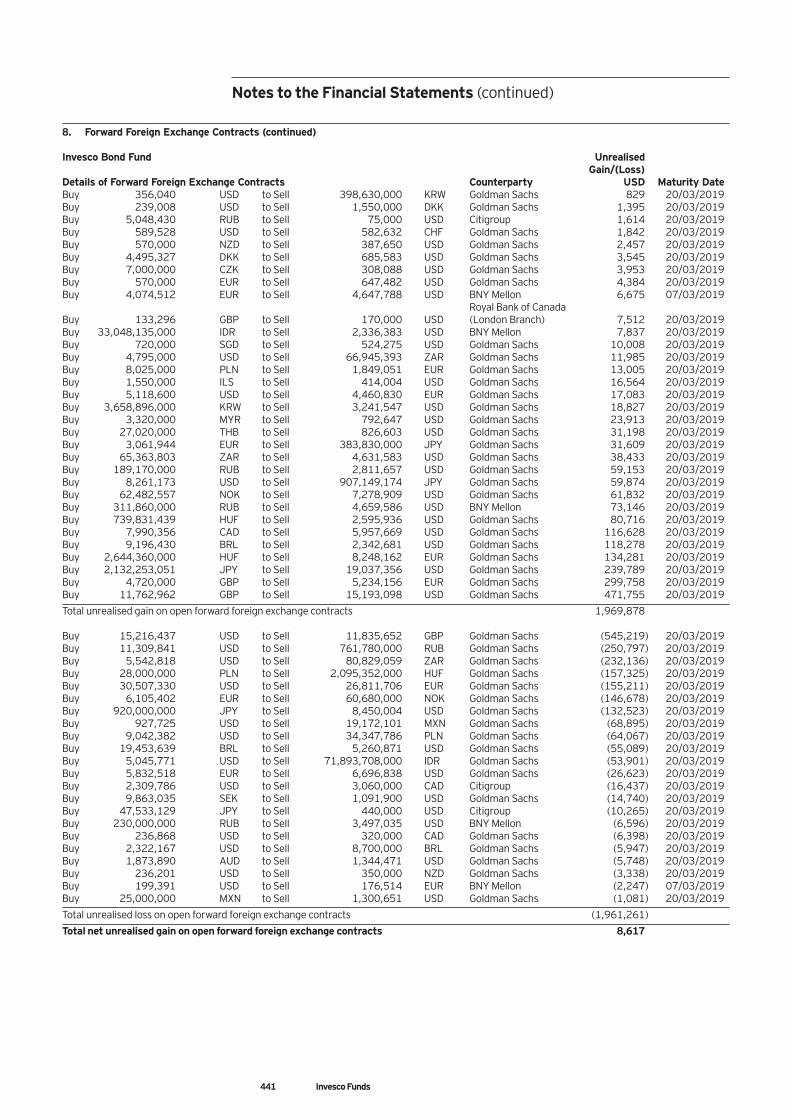
441 Invesco Funds
8. Forward Foreign Exchange Contracts (continued) Invesco Bond Fund Unrealised Gain/(Loss) Details of Forward Foreign Exchange Contracts Counterparty USD Maturity Date Buy 356,040 USD to Sell 398,630,000 KRW Goldman Sachs 829 20/03/2019 Buy 239,008 USD to Sell 1,550,000 DKK Goldman Sachs 1,395 20/03/2019 Buy 5,048,430 RUB to Sell 75,000 USD Citigroup 1,614 20/03/2019 Buy 589,528 USD to Sell 582,632 CHF Goldman Sachs 1,842 20/03/2019 Buy 570,000 NZD to Sell 387,650 USD Goldman Sachs 2,457 20/03/2019 Buy 4,495,327 DKK to Sell 685,583 USD Goldman Sachs 3,545 20/03/2019 Buy 7,000,000 CZK to Sell 308,088 USD Goldman Sachs 3,953 20/03/2019 Buy 570,000 EUR to Sell 647,482 USD Goldman Sachs 4,384 20/03/2019 Buy 4,074,512 EUR to Sell 4,647,788 USD BNY Mellon 6,675 07/03/2019 Royal Bank of Canada Buy 133,296 GBP to Sell 170,000 USD (London Branch) 7,512 20/03/2019 Buy 33,048,135,000 IDR to Sell 2,336,383 USD BNY Mellon 7,837 20/03/2019 Buy 720,000 SGD to Sell 524,275 USD Goldman Sachs 10,008 20/03/2019 Buy 4,795,000 USD to Sell 66,945,393 ZAR Goldman Sachs 11,985 20/03/2019 Buy 8,025,000 PLN to Sell 1,849,051 EUR Goldman Sachs 13,005 20/03/2019 Buy 1,550,000 ILS to Sell 414,004 USD Goldman Sachs 16,564 20/03/2019 Buy 5,118,600 USD to Sell 4,460,830 EUR Goldman Sachs 17,083 20/03/2019 Buy 3,658,896,000 KRW to Sell 3,241,547 USD Goldman Sachs 18,827 20/03/2019 Buy 3,320,000 MYR to Sell 792,647 USD Goldman Sachs 23,913 20/03/2019 Buy 27,020,000 THB to Sell 826,603 USD Goldman Sachs 31,198 20/03/2019 Buy 3,061,944 EUR to Sell 383,830,000 JPY Goldman Sachs 31,609 20/03/2019 Buy 65,363,803 ZAR to Sell 4,631,583 USD Goldman Sachs 38,433 20/03/2019 Buy 189,170,000 RUB to Sell 2,811,657 USD Goldman Sachs 59,153 20/03/2019 Buy 8,261,173 USD to Sell 907,149,174 JPY Goldman Sachs 59,874 20/03/2019 Buy 62,482,557 NOK to Sell 7,278,909 USD Goldman Sachs 61,832 20/03/2019 Buy 311,860,000 RUB to Sell 4,659,586 USD BNY Mellon 73,146 20/03/2019 Buy 739,831,439 HUF to Sell 2,595,936 USD Goldman Sachs 80,716 20/03/2019 Buy 7,990,356 CAD to Sell 5,957,669 USD Goldman Sachs 116,628 20/03/2019 Buy 9,196,430 BRL to Sell 2,342,681 USD Goldman Sachs 118,278 20/03/2019 Buy 2,644,360,000 HUF to Sell 8,248,162 EUR Goldman Sachs 134,281 20/03/2019 Buy 2,132,253,051 JPY to Sell 19,037,356 USD Goldman Sachs 239,789 20/03/2019 Buy 4,720,000 GBP to Sell 5,234,156 EUR Goldman Sachs 299,758 20/03/2019 Buy 11,762,962 GBP to Sell 15,193,098 USD Goldman Sachs 471,755 20/03/2019
Total unrealised gain on open forward foreign exchange contracts 1,969,878 Buy 15,216,437 USD to Sell 11,835,652 GBP Goldman Sachs (545,219) 20/03/2019 Buy 11,309,841 USD to Sell 761,780,000 RUB Goldman Sachs (250,797) 20/03/2019 Buy 5,542,818 USD to Sell 80,829,059 ZAR Goldman Sachs (232,136) 20/03/2019 Buy 28,000,000 PLN to Sell 2,095,352,000 HUF Goldman Sachs (157,325) 20/03/2019 Buy 30,507,330 USD to Sell 26,811,706 EUR Goldman Sachs (155,211) 20/03/2019 Buy 6,105,402 EUR to Sell 60,680,000 NOK Goldman Sachs (146,678) 20/03/2019 Buy 920,000,000 JPY to Sell 8,450,004 USD Goldman Sachs (132,523) 20/03/2019 Buy 927,725 USD to Sell 19,172,101 MXN Goldman Sachs (68,895) 20/03/2019 Buy 9,042,382 USD to Sell 34,347,786 PLN Goldman Sachs (64,067) 20/03/2019 Buy 19,453,639 BRL to Sell 5,260,871 USD Goldman Sachs (55,089) 20/03/2019 Buy 5,045,771 USD to Sell 71,893,708,000 IDR Goldman Sachs (53,901) 20/03/2019 Buy 5,832,518 EUR to Sell 6,696,838 USD Goldman Sachs (26,623) 20/03/2019 Buy 2,309,786 USD to Sell 3,060,000 CAD Citigroup (16,437) 20/03/2019 Buy 9,863,035 SEK to Sell 1,091,900 USD Goldman Sachs (14,740) 20/03/2019 Buy 47,533,129 JPY to Sell 440,000 USD Citigroup (10,265) 20/03/2019 Buy 230,000,000 RUB to Sell 3,497,035 USD BNY Mellon (6,596) 20/03/2019 Buy 236,868 USD to Sell 320,000 CAD Goldman Sachs (6,398) 20/03/2019 Buy 2,322,167 USD to Sell 8,700,000 BRL Goldman Sachs (5,947) 20/03/2019 Buy 1,873,890 AUD to Sell 1,344,471 USD Goldman Sachs (5,748) 20/03/2019 Buy 236,201 USD to Sell 350,000 NZD Goldman Sachs (3,338) 20/03/2019 Buy 199,391 USD to Sell 176,514 EUR BNY Mellon (2,247) 07/03/2019 Buy 25,000,000 MXN to Sell 1,300,651 USD Goldman Sachs (1,081) 20/03/2019
Total unrealised loss on open forward foreign exchange contracts (1,961,261)
Total net unrealised gain on open forward foreign exchange contracts 8,617
Notes to the Financial Statements (continued)
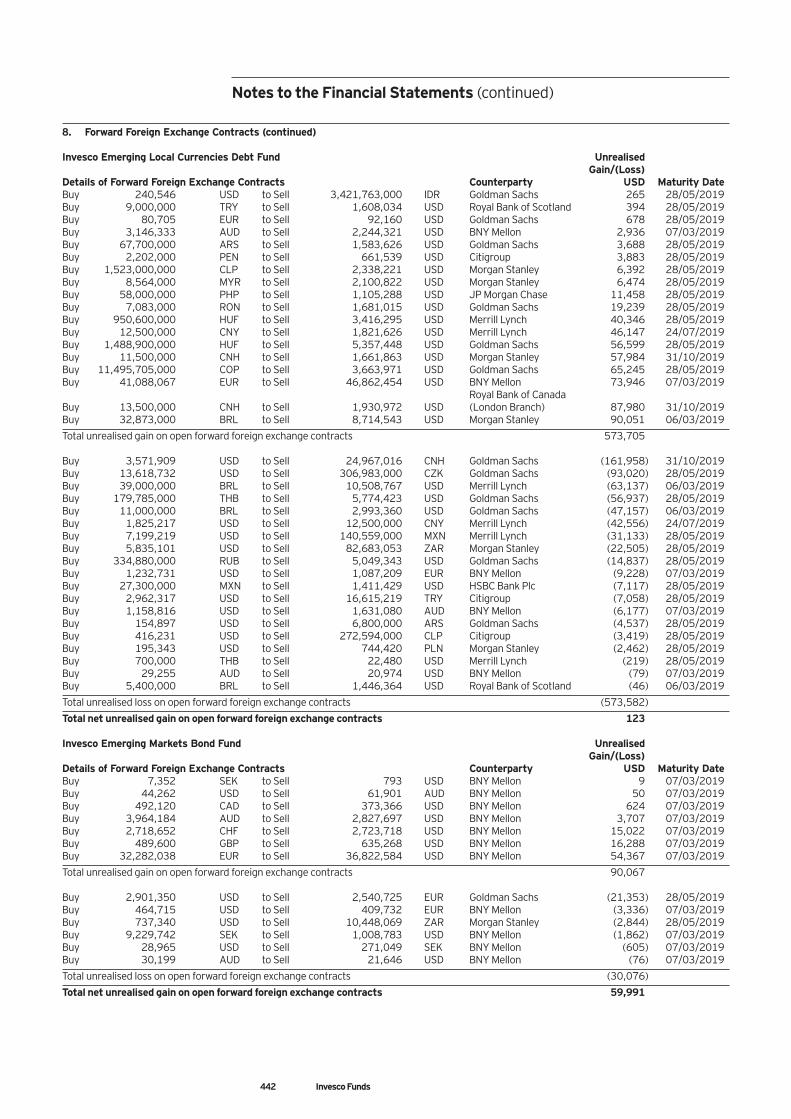
442 Invesco Funds
8. Forward Foreign Exchange Contracts (continued) Invesco Emerging Local Currencies Debt Fund Unrealised Gain/(Loss) Details of Forward Foreign Exchange Contracts Counterparty USD Maturity Date Buy 240,546 USD to Sell 3,421,763,000 IDR Goldman Sachs 265 28/05/2019 Buy 9,000,000 TRY to Sell 1,608,034 USD Royal Bank of Scotland 394 28/05/2019 Buy 80,705 EUR to Sell 92,160 USD Goldman Sachs 678 28/05/2019 Buy 3,146,333 AUD to Sell 2,244,321 USD BNY Mellon 2,936 07/03/2019 Buy 67,700,000 ARS to Sell 1,583,626 USD Goldman Sachs 3,688 28/05/2019 Buy 2,202,000 PEN to Sell 661,539 USD Citigroup 3,883 28/05/2019 Buy 1,523,000,000 CLP to Sell 2,338,221 USD Morgan Stanley 6,392 28/05/2019 Buy 8,564,000 MYR to Sell 2,100,822 USD Morgan Stanley 6,474 28/05/2019 Buy 58,000,000 PHP to Sell 1,105,288 USD JP Morgan Chase 11,458 28/05/2019 Buy 7,083,000 RON to Sell 1,681,015 USD Goldman Sachs 19,239 28/05/2019 Buy 950,600,000 HUF to Sell 3,416,295 USD Merrill Lynch 40,346 28/05/2019 Buy 12,500,000 CNY to Sell 1,821,626 USD Merrill Lynch 46,147 24/07/2019 Buy 1,488,900,000 HUF to Sell 5,357,448 USD Goldman Sachs 56,599 28/05/2019 Buy 11,500,000 CNH to Sell 1,661,863 USD Morgan Stanley 57,984 31/10/2019 Buy 11,495,705,000 COP to Sell 3,663,971 USD Goldman Sachs 65,245 28/05/2019 Buy 41,088,067 EUR to Sell 46,862,454 USD BNY Mellon 73,946 07/03/2019 Royal Bank of Canada Buy 13,500,000 CNH to Sell 1,930,972 USD (London Branch) 87,980 31/10/2019 Buy 32,873,000 BRL to Sell 8,714,543 USD Morgan Stanley 90,051 06/03/2019
Total unrealised gain on open forward foreign exchange contracts 573,705 Buy 3,571,909 USD to Sell 24,967,016 CNH Goldman Sachs (161,958) 31/10/2019 Buy 13,618,732 USD to Sell 306,983,000 CZK Goldman Sachs (93,020) 28/05/2019 Buy 39,000,000 BRL to Sell 10,508,767 USD Merrill Lynch (63,137) 06/03/2019 Buy 179,785,000 THB to Sell 5,774,423 USD Goldman Sachs (56,937) 28/05/2019 Buy 11,000,000 BRL to Sell 2,993,360 USD Goldman Sachs (47,157) 06/03/2019 Buy 1,825,217 USD to Sell 12,500,000 CNY Merrill Lynch (42,556) 24/07/2019 Buy 7,199,219 USD to Sell 140,559,000 MXN Merrill Lynch (31,133) 28/05/2019 Buy 5,835,101 USD to Sell 82,683,053 ZAR Morgan Stanley (22,505) 28/05/2019 Buy 334,880,000 RUB to Sell 5,049,343 USD Goldman Sachs (14,837) 28/05/2019 Buy 1,232,731 USD to Sell 1,087,209 EUR BNY Mellon (9,228) 07/03/2019 Buy 27,300,000 MXN to Sell 1,411,429 USD HSBC Bank Plc (7,117) 28/05/2019 Buy 2,962,317 USD to Sell 16,615,219 TRY Citigroup (7,058) 28/05/2019 Buy 1,158,816 USD to Sell 1,631,080 AUD BNY Mellon (6,177) 07/03/2019 Buy 154,897 USD to Sell 6,800,000 ARS Goldman Sachs (4,537) 28/05/2019 Buy 416,231 USD to Sell 272,594,000 CLP Citigroup (3,419) 28/05/2019 Buy 195,343 USD to Sell 744,420 PLN Morgan Stanley (2,462) 28/05/2019 Buy 700,000 THB to Sell 22,480 USD Merrill Lynch (219) 28/05/2019 Buy 29,255 AUD to Sell 20,974 USD BNY Mellon (79) 07/03/2019 Buy 5,400,000 BRL to Sell 1,446,364 USD Royal Bank of Scotland (46) 06/03/2019
Total unrealised loss on open forward foreign exchange contracts (573,582)
Total net unrealised gain on open forward foreign exchange contracts 123 Invesco Emerging Markets Bond Fund Unrealised Gain/(Loss) Details of Forward Foreign Exchange Contracts Counterparty USD Maturity Date Buy 7,352 SEK to Sell 793 USD BNY Mellon 9 07/03/2019 Buy 44,262 USD to Sell 61,901 AUD BNY Mellon 50 07/03/2019 Buy 492,120 CAD to Sell 373,366 USD BNY Mellon 624 07/03/2019 Buy 3,964,184 AUD to Sell 2,827,697 USD BNY Mellon 3,707 07/03/2019 Buy 2,718,652 CHF to Sell 2,723,718 USD BNY Mellon 15,022 07/03/2019 Buy 489,600 GBP to Sell 635,268 USD BNY Mellon 16,288 07/03/2019 Buy 32,282,038 EUR to Sell 36,822,584 USD BNY Mellon 54,367 07/03/2019
Total unrealised gain on open forward foreign exchange contracts 90,067 Buy 2,901,350 USD to Sell 2,540,725 EUR Goldman Sachs (21,353) 28/05/2019 Buy 464,715 USD to Sell 409,732 EUR BNY Mellon (3,336) 07/03/2019 Buy 737,340 USD to Sell 10,448,069 ZAR Morgan Stanley (2,844) 28/05/2019 Buy 9,229,742 SEK to Sell 1,008,783 USD BNY Mellon (1,862) 07/03/2019 Buy 28,965 USD to Sell 271,049 SEK BNY Mellon (605) 07/03/2019 Buy 30,199 AUD to Sell 21,646 USD BNY Mellon (76) 07/03/2019
Total unrealised loss on open forward foreign exchange contracts (30,076)
Total net unrealised gain on open forward foreign exchange contracts 59,991
Notes to the Financial Statements (continued)
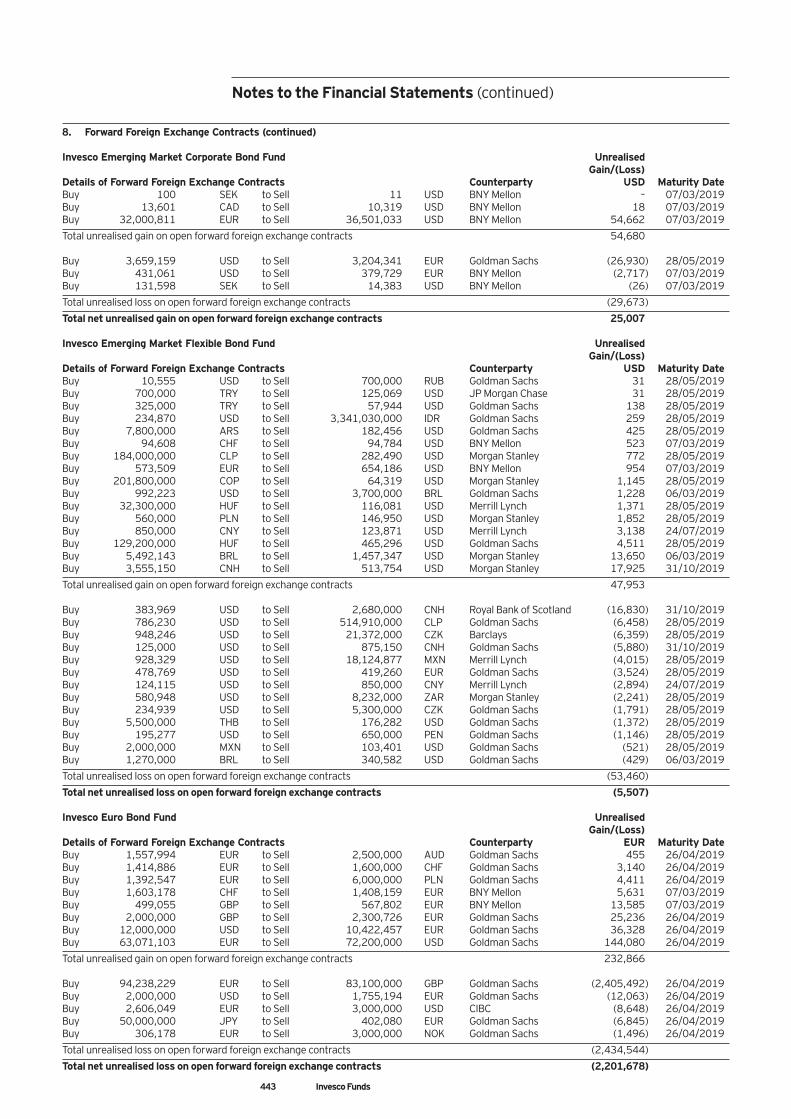
443 Invesco Funds
8. Forward Foreign Exchange Contracts (continued) Invesco Emerging Market Corporate Bond Fund Unrealised Gain/(Loss) Details of Forward Foreign Exchange Contracts Counterparty USD Maturity Date Buy 100 SEK to Sell 11 USD BNY Mellon – 07/03/2019 Buy 13,601 CAD to Sell 10,319 USD BNY Mellon 18 07/03/2019 Buy 32,000,811 EUR to Sell 36,501,033 USD BNY Mellon 54,662 07/03/2019
Total unrealised gain on open forward foreign exchange contracts 54,680 Buy 3,659,159 USD to Sell 3,204,341 EUR Goldman Sachs (26,930) 28/05/2019 Buy 431,061 USD to Sell 379,729 EUR BNY Mellon (2,717) 07/03/2019 Buy 131,598 SEK to Sell 14,383 USD BNY Mellon (26) 07/03/2019
Total unrealised loss on open forward foreign exchange contracts (29,673)
Total net unrealised gain on open forward foreign exchange contracts 25,007 Invesco Emerging Market Flexible Bond Fund Unrealised Gain/(Loss) Details of Forward Foreign Exchange Contracts Counterparty USD Maturity Date Buy 10,555 USD to Sell 700,000 RUB Goldman Sachs 31 28/05/2019 Buy 700,000 TRY to Sell 125,069 USD JP Morgan Chase 31 28/05/2019 Buy 325,000 TRY to Sell 57,944 USD Goldman Sachs 138 28/05/2019 Buy 234,870 USD to Sell 3,341,030,000 IDR Goldman Sachs 259 28/05/2019 Buy 7,800,000 ARS to Sell 182,456 USD Goldman Sachs 425 28/05/2019 Buy 94,608 CHF to Sell 94,784 USD BNY Mellon 523 07/03/2019 Buy 184,000,000 CLP to Sell 282,490 USD Morgan Stanley 772 28/05/2019 Buy 573,509 EUR to Sell 654,186 USD BNY Mellon 954 07/03/2019 Buy 201,800,000 COP to Sell 64,319 USD Morgan Stanley 1,145 28/05/2019 Buy 992,223 USD to Sell 3,700,000 BRL Goldman Sachs 1,228 06/03/2019 Buy 32,300,000 HUF to Sell 116,081 USD Merrill Lynch 1,371 28/05/2019 Buy 560,000 PLN to Sell 146,950 USD Morgan Stanley 1,852 28/05/2019 Buy 850,000 CNY to Sell 123,871 USD Merrill Lynch 3,138 24/07/2019 Buy 129,200,000 HUF to Sell 465,296 USD Goldman Sachs 4,511 28/05/2019 Buy 5,492,143 BRL to Sell 1,457,347 USD Morgan Stanley 13,650 06/03/2019 Buy 3,555,150 CNH to Sell 513,754 USD Morgan Stanley 17,925 31/10/2019
Total unrealised gain on open forward foreign exchange contracts 47,953 Buy 383,969 USD to Sell 2,680,000 CNH Royal Bank of Scotland (16,830) 31/10/2019 Buy 786,230 USD to Sell 514,910,000 CLP Goldman Sachs (6,458) 28/05/2019 Buy 948,246 USD to Sell 21,372,000 CZK Barclays (6,359) 28/05/2019 Buy 125,000 USD to Sell 875,150 CNH Goldman Sachs (5,880) 31/10/2019 Buy 928,329 USD to Sell 18,124,877 MXN Merrill Lynch (4,015) 28/05/2019 Buy 478,769 USD to Sell 419,260 EUR Goldman Sachs (3,524) 28/05/2019 Buy 124,115 USD to Sell 850,000 CNY Merrill Lynch (2,894) 24/07/2019 Buy 580,948 USD to Sell 8,232,000 ZAR Morgan Stanley (2,241) 28/05/2019 Buy 234,939 USD to Sell 5,300,000 CZK Goldman Sachs (1,791) 28/05/2019 Buy 5,500,000 THB to Sell 176,282 USD Goldman Sachs (1,372) 28/05/2019 Buy 195,277 USD to Sell 650,000 PEN Goldman Sachs (1,146) 28/05/2019 Buy 2,000,000 MXN to Sell 103,401 USD Goldman Sachs (521) 28/05/2019 Buy 1,270,000 BRL to Sell 340,582 USD Goldman Sachs (429) 06/03/2019
Total unrealised loss on open forward foreign exchange contracts (53,460)
Total net unrealised loss on open forward foreign exchange contracts (5,507) Invesco Euro Bond Fund Unrealised Gain/(Loss) Details of Forward Foreign Exchange Contracts Counterparty EUR Maturity Date Buy 1,557,994 EUR to Sell 2,500,000 AUD Goldman Sachs 455 26/04/2019 Buy 1,414,886 EUR to Sell 1,600,000 CHF Goldman Sachs 3,140 26/04/2019 Buy 1,392,547 EUR to Sell 6,000,000 PLN Goldman Sachs 4,411 26/04/2019 Buy 1,603,178 CHF to Sell 1,408,159 EUR BNY Mellon 5,631 07/03/2019 Buy 499,055 GBP to Sell 567,802 EUR BNY Mellon 13,585 07/03/2019 Buy 2,000,000 GBP to Sell 2,300,726 EUR Goldman Sachs 25,236 26/04/2019 Buy 12,000,000 USD to Sell 10,422,457 EUR Goldman Sachs 36,328 26/04/2019 Buy 63,071,103 EUR to Sell 72,200,000 USD Goldman Sachs 144,080 26/04/2019
Total unrealised gain on open forward foreign exchange contracts 232,866 Buy 94,238,229 EUR to Sell 83,100,000 GBP Goldman Sachs (2,405,492) 26/04/2019 Buy 2,000,000 USD to Sell 1,755,194 EUR Goldman Sachs (12,063) 26/04/2019 Buy 2,606,049 EUR to Sell 3,000,000 USD CIBC (8,648) 26/04/2019 Buy 50,000,000 JPY to Sell 402,080 EUR Goldman Sachs (6,845) 26/04/2019 Buy 306,178 EUR to Sell 3,000,000 NOK Goldman Sachs (1,496) 26/04/2019
Total unrealised loss on open forward foreign exchange contracts (2,434,544)
Total net unrealised loss on open forward foreign exchange contracts (2,201,678)
Notes to the Financial Statements (continued)
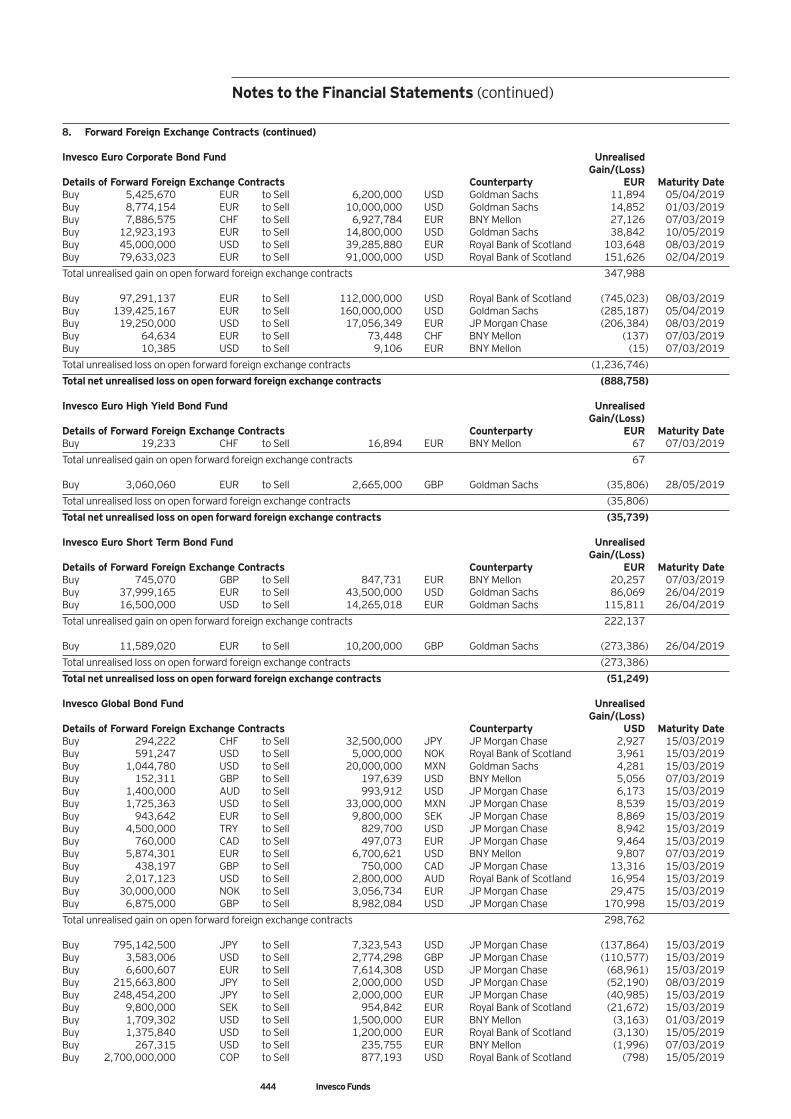
444 Invesco Funds
8. Forward Foreign Exchange Contracts (continued) Invesco Euro Corporate Bond Fund Unrealised Gain/(Loss) Details of Forward Foreign Exchange Contracts Counterparty EUR Maturity Date Buy 5,425,670 EUR to Sell 6,200,000 USD Goldman Sachs 11,894 05/04/2019 Buy 8,774,154 EUR to Sell 10,000,000 USD Goldman Sachs 14,852 01/03/2019 Buy 7,886,575 CHF to Sell 6,927,784 EUR BNY Mellon 27,126 07/03/2019 Buy 12,923,193 EUR to Sell 14,800,000 USD Goldman Sachs 38,842 10/05/2019 Buy 45,000,000 USD to Sell 39,285,880 EUR Royal Bank of Scotland 103,648 08/03/2019 Buy 79,633,023 EUR to Sell 91,000,000 USD Royal Bank of Scotland 151,626 02/04/2019
Total unrealised gain on open forward foreign exchange contracts 347,988 Buy 97,291,137 EUR to Sell 112,000,000 USD Royal Bank of Scotland (745,023) 08/03/2019 Buy 139,425,167 EUR to Sell 160,000,000 USD Goldman Sachs (285,187) 05/04/2019 Buy 19,250,000 USD to Sell 17,056,349 EUR JP Morgan Chase (206,384) 08/03/2019 Buy 64,634 EUR to Sell 73,448 CHF BNY Mellon (137) 07/03/2019 Buy 10,385 USD to Sell 9,106 EUR BNY Mellon (15) 07/03/2019
Total unrealised loss on open forward foreign exchange contracts (1,236,746)
Total net unrealised loss on open forward foreign exchange contracts (888,758) Invesco Euro High Yield Bond Fund Unrealised Gain/(Loss) Details of Forward Foreign Exchange Contracts Counterparty EUR Maturity Date Buy 19,233 CHF to Sell 16,894 EUR BNY Mellon 67 07/03/2019
Total unrealised gain on open forward foreign exchange contracts 67 Buy 3,060,060 EUR to Sell 2,665,000 GBP Goldman Sachs (35,806) 28/05/2019
Total unrealised loss on open forward foreign exchange contracts (35,806)
Total net unrealised loss on open forward foreign exchange contracts (35,739) Invesco Euro Short Term Bond Fund Unrealised Gain/(Loss) Details of Forward Foreign Exchange Contracts Counterparty EUR Maturity Date Buy 745,070 GBP to Sell 847,731 EUR BNY Mellon 20,257 07/03/2019 Buy 37,999,165 EUR to Sell 43,500,000 USD Goldman Sachs 86,069 26/04/2019 Buy 16,500,000 USD to Sell 14,265,018 EUR Goldman Sachs 115,811 26/04/2019
Total unrealised gain on open forward foreign exchange contracts 222,137 Buy 11,589,020 EUR to Sell 10,200,000 GBP Goldman Sachs (273,386) 26/04/2019
Total unrealised loss on open forward foreign exchange contracts (273,386)
Total net unrealised loss on open forward foreign exchange contracts (51,249) Invesco Global Bond Fund Unrealised Gain/(Loss) Details of Forward Foreign Exchange Contracts Counterparty USD Maturity Date Buy 294,222 CHF to Sell 32,500,000 JPY JP Morgan Chase 2,927 15/03/2019 Buy 591,247 USD to Sell 5,000,000 NOK Royal Bank of Scotland 3,961 15/03/2019 Buy 1,044,780 USD to Sell 20,000,000 MXN Goldman Sachs 4,281 15/03/2019 Buy 152,311 GBP to Sell 197,639 USD BNY Mellon 5,056 07/03/2019 Buy 1,400,000 AUD to Sell 993,912 USD JP Morgan Chase 6,173 15/03/2019 Buy 1,725,363 USD to Sell 33,000,000 MXN JP Morgan Chase 8,539 15/03/2019 Buy 943,642 EUR to Sell 9,800,000 SEK JP Morgan Chase 8,869 15/03/2019 Buy 4,500,000 TRY to Sell 829,700 USD JP Morgan Chase 8,942 15/03/2019 Buy 760,000 CAD to Sell 497,073 EUR JP Morgan Chase 9,464 15/03/2019 Buy 5,874,301 EUR to Sell 6,700,621 USD BNY Mellon 9,807 07/03/2019 Buy 438,197 GBP to Sell 750,000 CAD JP Morgan Chase 13,316 15/03/2019 Buy 2,017,123 USD to Sell 2,800,000 AUD Royal Bank of Scotland 16,954 15/03/2019 Buy 30,000,000 NOK to Sell 3,056,734 EUR JP Morgan Chase 29,475 15/03/2019 Buy 6,875,000 GBP to Sell 8,982,084 USD JP Morgan Chase 170,998 15/03/2019
Total unrealised gain on open forward foreign exchange contracts 298,762 Buy 795,142,500 JPY to Sell 7,323,543 USD JP Morgan Chase (137,864) 15/03/2019 Buy 3,583,006 USD to Sell 2,774,298 GBP JP Morgan Chase (110,577) 15/03/2019 Buy 6,600,607 EUR to Sell 7,614,308 USD JP Morgan Chase (68,961) 15/03/2019 Buy 215,663,800 JPY to Sell 2,000,000 USD JP Morgan Chase (52,190) 08/03/2019 Buy 248,454,200 JPY to Sell 2,000,000 EUR JP Morgan Chase (40,985) 15/03/2019 Buy 9,800,000 SEK to Sell 954,842 EUR Royal Bank of Scotland (21,672) 15/03/2019 Buy 1,709,302 USD to Sell 1,500,000 EUR BNY Mellon (3,163) 01/03/2019 Buy 1,375,840 USD to Sell 1,200,000 EUR Royal Bank of Scotland (3,130) 15/05/2019 Buy 267,315 USD to Sell 235,755 EUR BNY Mellon (1,996) 07/03/2019 Buy 2,700,000,000 COP to Sell 877,193 USD Royal Bank of Scotland (798) 15/05/2019
Notes to the Financial Statements (continued)
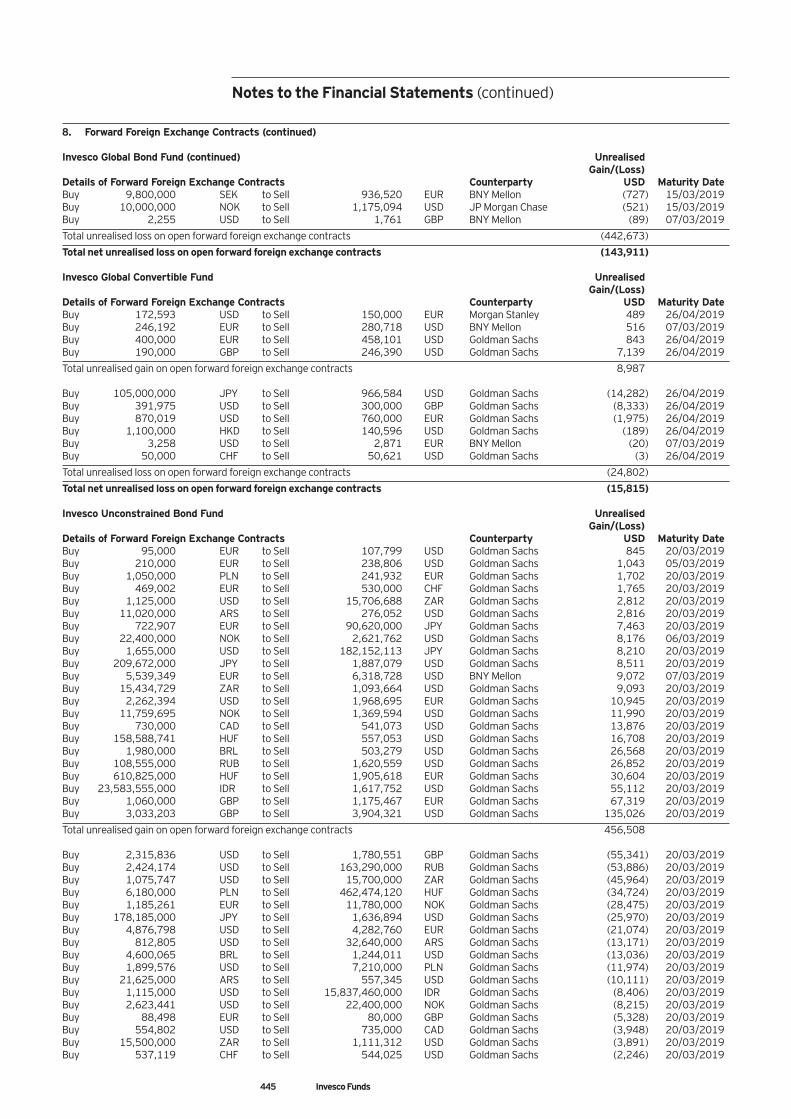
445 Invesco Funds
8. Forward Foreign Exchange Contracts (continued) Invesco Global Bond Fund (continued) Unrealised Gain/(Loss) Details of Forward Foreign Exchange Contracts Counterparty USD Maturity Date Buy 9,800,000 SEK to Sell 936,520 EUR BNY Mellon (727) 15/03/2019 Buy 10,000,000 NOK to Sell 1,175,094 USD JP Morgan Chase (521) 15/03/2019 Buy 2,255 USD to Sell 1,761 GBP BNY Mellon (89) 07/03/2019
Total unrealised loss on open forward foreign exchange contracts (442,673)
Total net unrealised loss on open forward foreign exchange contracts (143,911) Invesco Global Convertible Fund Unrealised Gain/(Loss) Details of Forward Foreign Exchange Contracts Counterparty USD Maturity Date Buy 172,593 USD to Sell 150,000 EUR Morgan Stanley 489 26/04/2019 Buy 246,192 EUR to Sell 280,718 USD BNY Mellon 516 07/03/2019 Buy 400,000 EUR to Sell 458,101 USD Goldman Sachs 843 26/04/2019 Buy 190,000 GBP to Sell 246,390 USD Goldman Sachs 7,139 26/04/2019
Total unrealised gain on open forward foreign exchange contracts 8,987 Buy 105,000,000 JPY to Sell 966,584 USD Goldman Sachs (14,282) 26/04/2019 Buy 391,975 USD to Sell 300,000 GBP Goldman Sachs (8,333) 26/04/2019 Buy 870,019 USD to Sell 760,000 EUR Goldman Sachs (1,975) 26/04/2019 Buy 1,100,000 HKD to Sell 140,596 USD Goldman Sachs (189) 26/04/2019 Buy 3,258 USD to Sell 2,871 EUR BNY Mellon (20) 07/03/2019 Buy 50,000 CHF to Sell 50,621 USD Goldman Sachs (3) 26/04/2019
Total unrealised loss on open forward foreign exchange contracts (24,802)
Total net unrealised loss on open forward foreign exchange contracts (15,815) Invesco Unconstrained Bond Fund Unrealised Gain/(Loss) Details of Forward Foreign Exchange Contracts Counterparty USD Maturity Date Buy 95,000 EUR to Sell 107,799 USD Goldman Sachs 845 20/03/2019 Buy 210,000 EUR to Sell 238,806 USD Goldman Sachs 1,043 05/03/2019 Buy 1,050,000 PLN to Sell 241,932 EUR Goldman Sachs 1,702 20/03/2019 Buy 469,002 EUR to Sell 530,000 CHF Goldman Sachs 1,765 20/03/2019 Buy 1,125,000 USD to Sell 15,706,688 ZAR Goldman Sachs 2,812 20/03/2019 Buy 11,020,000 ARS to Sell 276,052 USD Goldman Sachs 2,816 20/03/2019 Buy 722,907 EUR to Sell 90,620,000 JPY Goldman Sachs 7,463 20/03/2019 Buy 22,400,000 NOK to Sell 2,621,762 USD Goldman Sachs 8,176 06/03/2019 Buy 1,655,000 USD to Sell 182,152,113 JPY Goldman Sachs 8,210 20/03/2019 Buy 209,672,000 JPY to Sell 1,887,079 USD Goldman Sachs 8,511 20/03/2019 Buy 5,539,349 EUR to Sell 6,318,728 USD BNY Mellon 9,072 07/03/2019 Buy 15,434,729 ZAR to Sell 1,093,664 USD Goldman Sachs 9,093 20/03/2019 Buy 2,262,394 USD to Sell 1,968,695 EUR Goldman Sachs 10,945 20/03/2019 Buy 11,759,695 NOK to Sell 1,369,594 USD Goldman Sachs 11,990 20/03/2019 Buy 730,000 CAD to Sell 541,073 USD Goldman Sachs 13,876 20/03/2019 Buy 158,588,741 HUF to Sell 557,053 USD Goldman Sachs 16,708 20/03/2019 Buy 1,980,000 BRL to Sell 503,279 USD Goldman Sachs 26,568 20/03/2019 Buy 108,555,000 RUB to Sell 1,620,559 USD Goldman Sachs 26,852 20/03/2019 Buy 610,825,000 HUF to Sell 1,905,618 EUR Goldman Sachs 30,604 20/03/2019 Buy 23,583,555,000 IDR to Sell 1,617,752 USD Goldman Sachs 55,112 20/03/2019 Buy 1,060,000 GBP to Sell 1,175,467 EUR Goldman Sachs 67,319 20/03/2019 Buy 3,033,203 GBP to Sell 3,904,321 USD Goldman Sachs 135,026 20/03/2019
Total unrealised gain on open forward foreign exchange contracts 456,508 Buy 2,315,836 USD to Sell 1,780,551 GBP Goldman Sachs (55,341) 20/03/2019 Buy 2,424,174 USD to Sell 163,290,000 RUB Goldman Sachs (53,886) 20/03/2019 Buy 1,075,747 USD to Sell 15,700,000 ZAR Goldman Sachs (45,964) 20/03/2019 Buy 6,180,000 PLN to Sell 462,474,120 HUF Goldman Sachs (34,724) 20/03/2019 Buy 1,185,261 EUR to Sell 11,780,000 NOK Goldman Sachs (28,475) 20/03/2019 Buy 178,185,000 JPY to Sell 1,636,894 USD Goldman Sachs (25,970) 20/03/2019 Buy 4,876,798 USD to Sell 4,282,760 EUR Goldman Sachs (21,074) 20/03/2019 Buy 812,805 USD to Sell 32,640,000 ARS Goldman Sachs (13,171) 20/03/2019 Buy 4,600,065 BRL to Sell 1,244,011 USD Goldman Sachs (13,036) 20/03/2019 Buy 1,899,576 USD to Sell 7,210,000 PLN Goldman Sachs (11,974) 20/03/2019 Buy 21,625,000 ARS to Sell 557,345 USD Goldman Sachs (10,111) 20/03/2019 Buy 1,115,000 USD to Sell 15,837,460,000 IDR Goldman Sachs (8,406) 20/03/2019 Buy 2,623,441 USD to Sell 22,400,000 NOK Goldman Sachs (8,215) 20/03/2019 Buy 88,498 EUR to Sell 80,000 GBP Goldman Sachs (5,328) 20/03/2019 Buy 554,802 USD to Sell 735,000 CAD Goldman Sachs (3,948) 20/03/2019 Buy 15,500,000 ZAR to Sell 1,111,312 USD Goldman Sachs (3,891) 20/03/2019 Buy 537,119 CHF to Sell 544,025 USD Goldman Sachs (2,246) 20/03/2019
Notes to the Financial Statements (continued)
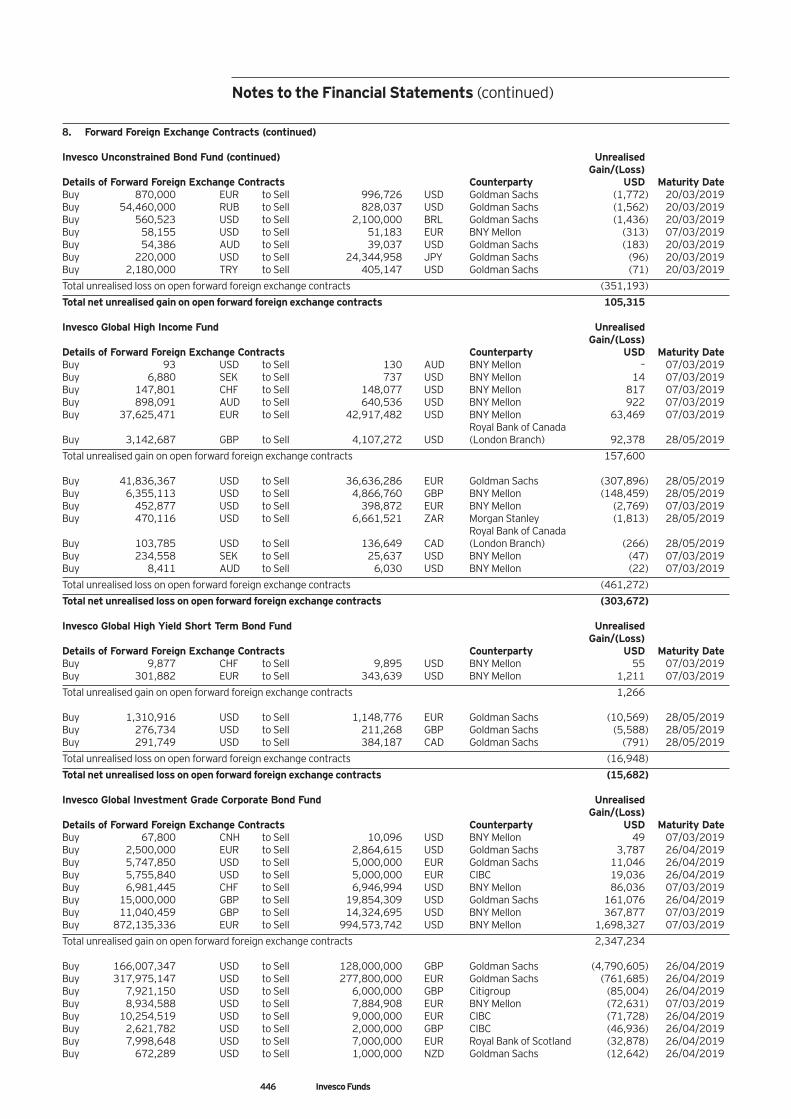
446 Invesco Funds
8. Forward Foreign Exchange Contracts (continued) Invesco Unconstrained Bond Fund (continued) Unrealised Gain/(Loss) Details of Forward Foreign Exchange Contracts Counterparty USD Maturity Date Buy 870,000 EUR to Sell 996,726 USD Goldman Sachs (1,772) 20/03/2019 Buy 54,460,000 RUB to Sell 828,037 USD Goldman Sachs (1,562) 20/03/2019 Buy 560,523 USD to Sell 2,100,000 BRL Goldman Sachs (1,436) 20/03/2019 Buy 58,155 USD to Sell 51,183 EUR BNY Mellon (313) 07/03/2019 Buy 54,386 AUD to Sell 39,037 USD Goldman Sachs (183) 20/03/2019 Buy 220,000 USD to Sell 24,344,958 JPY Goldman Sachs (96) 20/03/2019 Buy 2,180,000 TRY to Sell 405,147 USD Goldman Sachs (71) 20/03/2019
Total unrealised loss on open forward foreign exchange contracts (351,193)
Total net unrealised gain on open forward foreign exchange contracts 105,315 Invesco Global High Income Fund Unrealised Gain/(Loss) Details of Forward Foreign Exchange Contracts Counterparty USD Maturity Date Buy 93 USD to Sell 130 AUD BNY Mellon – 07/03/2019 Buy 6,880 SEK to Sell 737 USD BNY Mellon 14 07/03/2019 Buy 147,801 CHF to Sell 148,077 USD BNY Mellon 817 07/03/2019 Buy 898,091 AUD to Sell 640,536 USD BNY Mellon 922 07/03/2019 Buy 37,625,471 EUR to Sell 42,917,482 USD BNY Mellon 63,469 07/03/2019 Royal Bank of Canada Buy 3,142,687 GBP to Sell 4,107,272 USD (London Branch) 92,378 28/05/2019
Total unrealised gain on open forward foreign exchange contracts 157,600 Buy 41,836,367 USD to Sell 36,636,286 EUR Goldman Sachs (307,896) 28/05/2019 Buy 6,355,113 USD to Sell 4,866,760 GBP BNY Mellon (148,459) 28/05/2019 Buy 452,877 USD to Sell 398,872 EUR BNY Mellon (2,769) 07/03/2019 Buy 470,116 USD to Sell 6,661,521 ZAR Morgan Stanley (1,813) 28/05/2019 Royal Bank of Canada Buy 103,785 USD to Sell 136,649 CAD (London Branch) (266) 28/05/2019 Buy 234,558 SEK to Sell 25,637 USD BNY Mellon (47) 07/03/2019 Buy 8,411 AUD to Sell 6,030 USD BNY Mellon (22) 07/03/2019
Total unrealised loss on open forward foreign exchange contracts (461,272)
Total net unrealised loss on open forward foreign exchange contracts (303,672) Invesco Global High Yield Short Term Bond Fund Unrealised Gain/(Loss) Details of Forward Foreign Exchange Contracts Counterparty USD Maturity Date Buy 9,877 CHF to Sell 9,895 USD BNY Mellon 55 07/03/2019 Buy 301,882 EUR to Sell 343,639 USD BNY Mellon 1,211 07/03/2019
Total unrealised gain on open forward foreign exchange contracts 1,266 Buy 1,310,916 USD to Sell 1,148,776 EUR Goldman Sachs (10,569) 28/05/2019 Buy 276,734 USD to Sell 211,268 GBP Goldman Sachs (5,588) 28/05/2019 Buy 291,749 USD to Sell 384,187 CAD Goldman Sachs (791) 28/05/2019
Total unrealised loss on open forward foreign exchange contracts (16,948)
Total net unrealised loss on open forward foreign exchange contracts (15,682) Invesco Global Investment Grade Corporate Bond Fund Unrealised Gain/(Loss) Details of Forward Foreign Exchange Contracts Counterparty USD Maturity Date Buy 67,800 CNH to Sell 10,096 USD BNY Mellon 49 07/03/2019 Buy 2,500,000 EUR to Sell 2,864,615 USD Goldman Sachs 3,787 26/04/2019 Buy 5,747,850 USD to Sell 5,000,000 EUR Goldman Sachs 11,046 26/04/2019 Buy 5,755,840 USD to Sell 5,000,000 EUR CIBC 19,036 26/04/2019 Buy 6,981,445 CHF to Sell 6,946,994 USD BNY Mellon 86,036 07/03/2019 Buy 15,000,000 GBP to Sell 19,854,309 USD Goldman Sachs 161,076 26/04/2019 Buy 11,040,459 GBP to Sell 14,324,695 USD BNY Mellon 367,877 07/03/2019 Buy 872,135,336 EUR to Sell 994,573,742 USD BNY Mellon 1,698,327 07/03/2019
Total unrealised gain on open forward foreign exchange contracts 2,347,234 Buy 166,007,347 USD to Sell 128,000,000 GBP Goldman Sachs (4,790,605) 26/04/2019 Buy 317,975,147 USD to Sell 277,800,000 EUR Goldman Sachs (761,685) 26/04/2019 Buy 7,921,150 USD to Sell 6,000,000 GBP Citigroup (85,004) 26/04/2019 Buy 8,934,588 USD to Sell 7,884,908 EUR BNY Mellon (72,631) 07/03/2019 Buy 10,254,519 USD to Sell 9,000,000 EUR CIBC (71,728) 26/04/2019 Buy 2,621,782 USD to Sell 2,000,000 GBP CIBC (46,936) 26/04/2019 Buy 7,998,648 USD to Sell 7,000,000 EUR Royal Bank of Scotland (32,878) 26/04/2019 Buy 672,289 USD to Sell 1,000,000 NZD Goldman Sachs (12,642) 26/04/2019
Notes to the Financial Statements (continued)
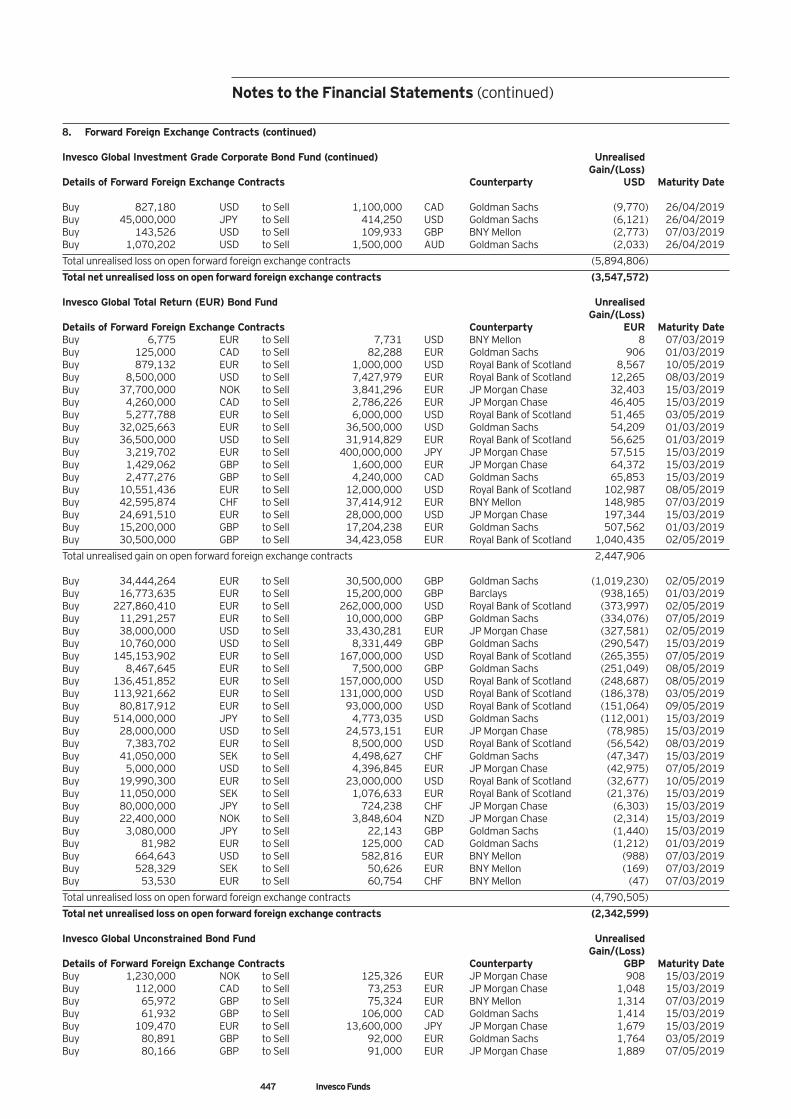
447 Invesco Funds
8. Forward Foreign Exchange Contracts (continued) Invesco Global Investment Grade Corporate Bond Fund (continued) Unrealised Gain/(Loss) Details of Forward Foreign Exchange Contracts Counterparty USD Maturity Date Buy 827,180 USD to Sell 1,100,000 CAD Goldman Sachs (9,770) 26/04/2019 Buy 45,000,000 JPY to Sell 414,250 USD Goldman Sachs (6,121) 26/04/2019 Buy 143,526 USD to Sell 109,933 GBP BNY Mellon (2,773) 07/03/2019 Buy 1,070,202 USD to Sell 1,500,000 AUD Goldman Sachs (2,033) 26/04/2019
Total unrealised loss on open forward foreign exchange contracts (5,894,806)
Total net unrealised loss on open forward foreign exchange contracts (3,547,572) Invesco Global Total Return (EUR) Bond Fund Unrealised Gain/(Loss) Details of Forward Foreign Exchange Contracts Counterparty EUR Maturity Date Buy 6,775 EUR to Sell 7,731 USD BNY Mellon 8 07/03/2019 Buy 125,000 CAD to Sell 82,288 EUR Goldman Sachs 906 01/03/2019 Buy 879,132 EUR to Sell 1,000,000 USD Royal Bank of Scotland 8,567 10/05/2019 Buy 8,500,000 USD to Sell 7,427,979 EUR Royal Bank of Scotland 12,265 08/03/2019 Buy 37,700,000 NOK to Sell 3,841,296 EUR JP Morgan Chase 32,403 15/03/2019 Buy 4,260,000 CAD to Sell 2,786,226 EUR JP Morgan Chase 46,405 15/03/2019 Buy 5,277,788 EUR to Sell 6,000,000 USD Royal Bank of Scotland 51,465 03/05/2019 Buy 32,025,663 EUR to Sell 36,500,000 USD Goldman Sachs 54,209 01/03/2019 Buy 36,500,000 USD to Sell 31,914,829 EUR Royal Bank of Scotland 56,625 01/03/2019 Buy 3,219,702 EUR to Sell 400,000,000 JPY JP Morgan Chase 57,515 15/03/2019 Buy 1,429,062 GBP to Sell 1,600,000 EUR JP Morgan Chase 64,372 15/03/2019 Buy 2,477,276 GBP to Sell 4,240,000 CAD Goldman Sachs 65,853 15/03/2019 Buy 10,551,436 EUR to Sell 12,000,000 USD Royal Bank of Scotland 102,987 08/05/2019 Buy 42,595,874 CHF to Sell 37,414,912 EUR BNY Mellon 148,985 07/03/2019 Buy 24,691,510 EUR to Sell 28,000,000 USD JP Morgan Chase 197,344 15/03/2019 Buy 15,200,000 GBP to Sell 17,204,238 EUR Goldman Sachs 507,562 01/03/2019 Buy 30,500,000 GBP to Sell 34,423,058 EUR Royal Bank of Scotland 1,040,435 02/05/2019
Total unrealised gain on open forward foreign exchange contracts 2,447,906 Buy 34,444,264 EUR to Sell 30,500,000 GBP Goldman Sachs (1,019,230) 02/05/2019 Buy 16,773,635 EUR to Sell 15,200,000 GBP Barclays (938,165) 01/03/2019 Buy 227,860,410 EUR to Sell 262,000,000 USD Royal Bank of Scotland (373,997) 02/05/2019 Buy 11,291,257 EUR to Sell 10,000,000 GBP Goldman Sachs (334,076) 07/05/2019 Buy 38,000,000 USD to Sell 33,430,281 EUR JP Morgan Chase (327,581) 02/05/2019 Buy 10,760,000 USD to Sell 8,331,449 GBP Goldman Sachs (290,547) 15/03/2019 Buy 145,153,902 EUR to Sell 167,000,000 USD Royal Bank of Scotland (265,355) 07/05/2019 Buy 8,467,645 EUR to Sell 7,500,000 GBP Goldman Sachs (251,049) 08/05/2019 Buy 136,451,852 EUR to Sell 157,000,000 USD Royal Bank of Scotland (248,687) 08/05/2019 Buy 113,921,662 EUR to Sell 131,000,000 USD Royal Bank of Scotland (186,378) 03/05/2019 Buy 80,817,912 EUR to Sell 93,000,000 USD Royal Bank of Scotland (151,064) 09/05/2019 Buy 514,000,000 JPY to Sell 4,773,035 USD Goldman Sachs (112,001) 15/03/2019 Buy 28,000,000 USD to Sell 24,573,151 EUR JP Morgan Chase (78,985) 15/03/2019 Buy 7,383,702 EUR to Sell 8,500,000 USD Royal Bank of Scotland (56,542) 08/03/2019 Buy 41,050,000 SEK to Sell 4,498,627 CHF Goldman Sachs (47,347) 15/03/2019 Buy 5,000,000 USD to Sell 4,396,845 EUR JP Morgan Chase (42,975) 07/05/2019 Buy 19,990,300 EUR to Sell 23,000,000 USD Royal Bank of Scotland (32,677) 10/05/2019 Buy 11,050,000 SEK to Sell 1,076,633 EUR Royal Bank of Scotland (21,376) 15/03/2019 Buy 80,000,000 JPY to Sell 724,238 CHF JP Morgan Chase (6,303) 15/03/2019 Buy 22,400,000 NOK to Sell 3,848,604 NZD JP Morgan Chase (2,314) 15/03/2019 Buy 3,080,000 JPY to Sell 22,143 GBP Goldman Sachs (1,440) 15/03/2019 Buy 81,982 EUR to Sell 125,000 CAD Goldman Sachs (1,212) 01/03/2019 Buy 664,643 USD to Sell 582,816 EUR BNY Mellon (988) 07/03/2019 Buy 528,329 SEK to Sell 50,626 EUR BNY Mellon (169) 07/03/2019 Buy 53,530 EUR to Sell 60,754 CHF BNY Mellon (47) 07/03/2019
Total unrealised loss on open forward foreign exchange contracts (4,790,505)
Total net unrealised loss on open forward foreign exchange contracts (2,342,599) Invesco Global Unconstrained Bond Fund Unrealised Gain/(Loss) Details of Forward Foreign Exchange Contracts Counterparty GBP Maturity Date Buy 1,230,000 NOK to Sell 125,326 EUR JP Morgan Chase 908 15/03/2019 Buy 112,000 CAD to Sell 73,253 EUR JP Morgan Chase 1,048 15/03/2019 Buy 65,972 GBP to Sell 75,324 EUR BNY Mellon 1,314 07/03/2019 Buy 61,932 GBP to Sell 106,000 CAD Goldman Sachs 1,414 15/03/2019 Buy 109,470 EUR to Sell 13,600,000 JPY JP Morgan Chase 1,679 15/03/2019 Buy 80,891 GBP to Sell 92,000 EUR Goldman Sachs 1,764 03/05/2019 Buy 80,166 GBP to Sell 91,000 EUR JP Morgan Chase 1,889 07/05/2019
Notes to the Financial Statements (continued)
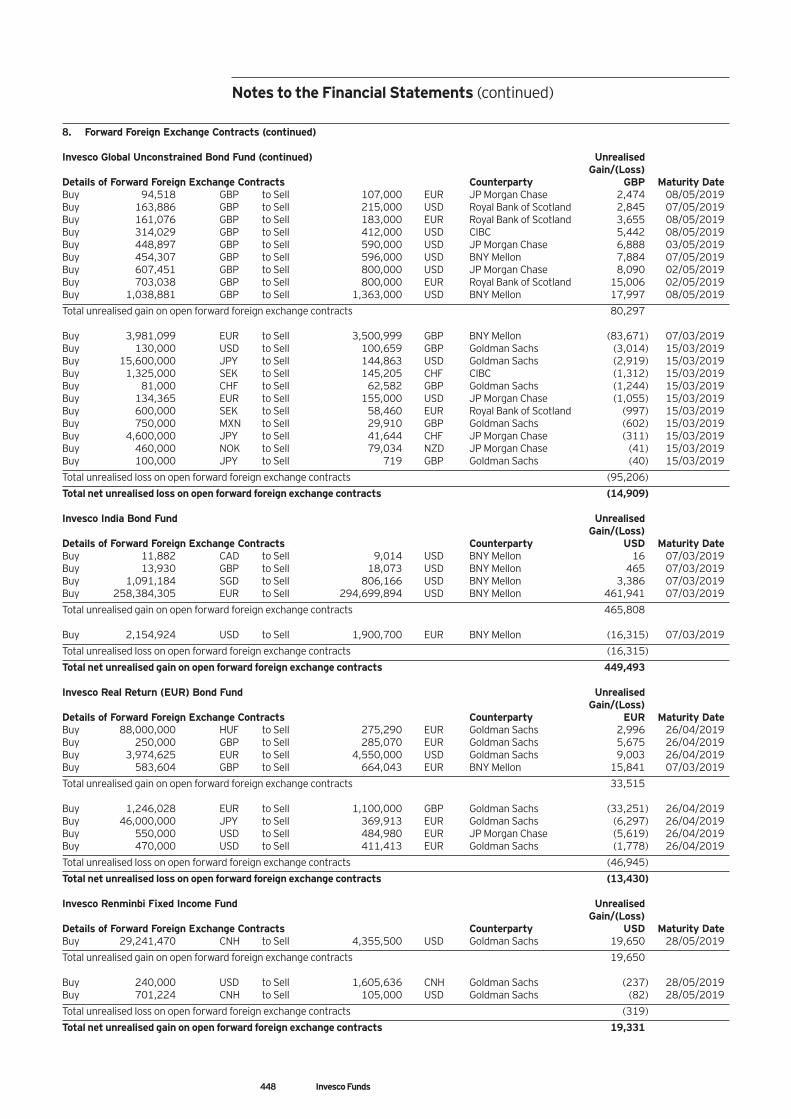
448 Invesco Funds
8. Forward Foreign Exchange Contracts (continued) Invesco Global Unconstrained Bond Fund (continued) Unrealised Gain/(Loss) Details of Forward Foreign Exchange Contracts Counterparty GBP Maturity Date Buy 94,518 GBP to Sell 107,000 EUR JP Morgan Chase 2,474 08/05/2019 Buy 163,886 GBP to Sell 215,000 USD Royal Bank of Scotland 2,845 07/05/2019 Buy 161,076 GBP to Sell 183,000 EUR Royal Bank of Scotland 3,655 08/05/2019 Buy 314,029 GBP to Sell 412,000 USD CIBC 5,442 08/05/2019 Buy 448,897 GBP to Sell 590,000 USD JP Morgan Chase 6,888 03/05/2019 Buy 454,307 GBP to Sell 596,000 USD BNY Mellon 7,884 07/05/2019 Buy 607,451 GBP to Sell 800,000 USD JP Morgan Chase 8,090 02/05/2019 Buy 703,038 GBP to Sell 800,000 EUR Royal Bank of Scotland 15,006 02/05/2019 Buy 1,038,881 GBP to Sell 1,363,000 USD BNY Mellon 17,997 08/05/2019
Total unrealised gain on open forward foreign exchange contracts 80,297 Buy 3,981,099 EUR to Sell 3,500,999 GBP BNY Mellon (83,671) 07/03/2019 Buy 130,000 USD to Sell 100,659 GBP Goldman Sachs (3,014) 15/03/2019 Buy 15,600,000 JPY to Sell 144,863 USD Goldman Sachs (2,919) 15/03/2019 Buy 1,325,000 SEK to Sell 145,205 CHF CIBC (1,312) 15/03/2019 Buy 81,000 CHF to Sell 62,582 GBP Goldman Sachs (1,244) 15/03/2019 Buy 134,365 EUR to Sell 155,000 USD JP Morgan Chase (1,055) 15/03/2019 Buy 600,000 SEK to Sell 58,460 EUR Royal Bank of Scotland (997) 15/03/2019 Buy 750,000 MXN to Sell 29,910 GBP Goldman Sachs (602) 15/03/2019 Buy 4,600,000 JPY to Sell 41,644 CHF JP Morgan Chase (311) 15/03/2019 Buy 460,000 NOK to Sell 79,034 NZD JP Morgan Chase (41) 15/03/2019 Buy 100,000 JPY to Sell 719 GBP Goldman Sachs (40) 15/03/2019
Total unrealised loss on open forward foreign exchange contracts (95,206)
Total net unrealised loss on open forward foreign exchange contracts (14,909) Invesco India Bond Fund Unrealised Gain/(Loss) Details of Forward Foreign Exchange Contracts Counterparty USD Maturity Date Buy 11,882 CAD to Sell 9,014 USD BNY Mellon 16 07/03/2019 Buy 13,930 GBP to Sell 18,073 USD BNY Mellon 465 07/03/2019 Buy 1,091,184 SGD to Sell 806,166 USD BNY Mellon 3,386 07/03/2019 Buy 258,384,305 EUR to Sell 294,699,894 USD BNY Mellon 461,941 07/03/2019
Total unrealised gain on open forward foreign exchange contracts 465,808 Buy 2,154,924 USD to Sell 1,900,700 EUR BNY Mellon (16,315) 07/03/2019
Total unrealised loss on open forward foreign exchange contracts (16,315)
Total net unrealised gain on open forward foreign exchange contracts 449,493 Invesco Real Return (EUR) Bond Fund Unrealised Gain/(Loss) Details of Forward Foreign Exchange Contracts Counterparty EUR Maturity Date Buy 88,000,000 HUF to Sell 275,290 EUR Goldman Sachs 2,996 26/04/2019 Buy 250,000 GBP to Sell 285,070 EUR Goldman Sachs 5,675 26/04/2019 Buy 3,974,625 EUR to Sell 4,550,000 USD Goldman Sachs 9,003 26/04/2019 Buy 583,604 GBP to Sell 664,043 EUR BNY Mellon 15,841 07/03/2019
Total unrealised gain on open forward foreign exchange contracts 33,515 Buy 1,246,028 EUR to Sell 1,100,000 GBP Goldman Sachs (33,251) 26/04/2019 Buy 46,000,000 JPY to Sell 369,913 EUR Goldman Sachs (6,297) 26/04/2019 Buy 550,000 USD to Sell 484,980 EUR JP Morgan Chase (5,619) 26/04/2019 Buy 470,000 USD to Sell 411,413 EUR Goldman Sachs (1,778) 26/04/2019
Total unrealised loss on open forward foreign exchange contracts (46,945)
Total net unrealised loss on open forward foreign exchange contracts (13,430) Invesco Renminbi Fixed Income Fund Unrealised Gain/(Loss) Details of Forward Foreign Exchange Contracts Counterparty USD Maturity Date Buy 29,241,470 CNH to Sell 4,355,500 USD Goldman Sachs 19,650 28/05/2019
Total unrealised gain on open forward foreign exchange contracts 19,650 Buy 240,000 USD to Sell 1,605,636 CNH Goldman Sachs (237) 28/05/2019 Buy 701,224 CNH to Sell 105,000 USD Goldman Sachs (82) 28/05/2019
Total unrealised loss on open forward foreign exchange contracts (319)
Total net unrealised gain on open forward foreign exchange contracts 19,331
Notes to the Financial Statements (continued)
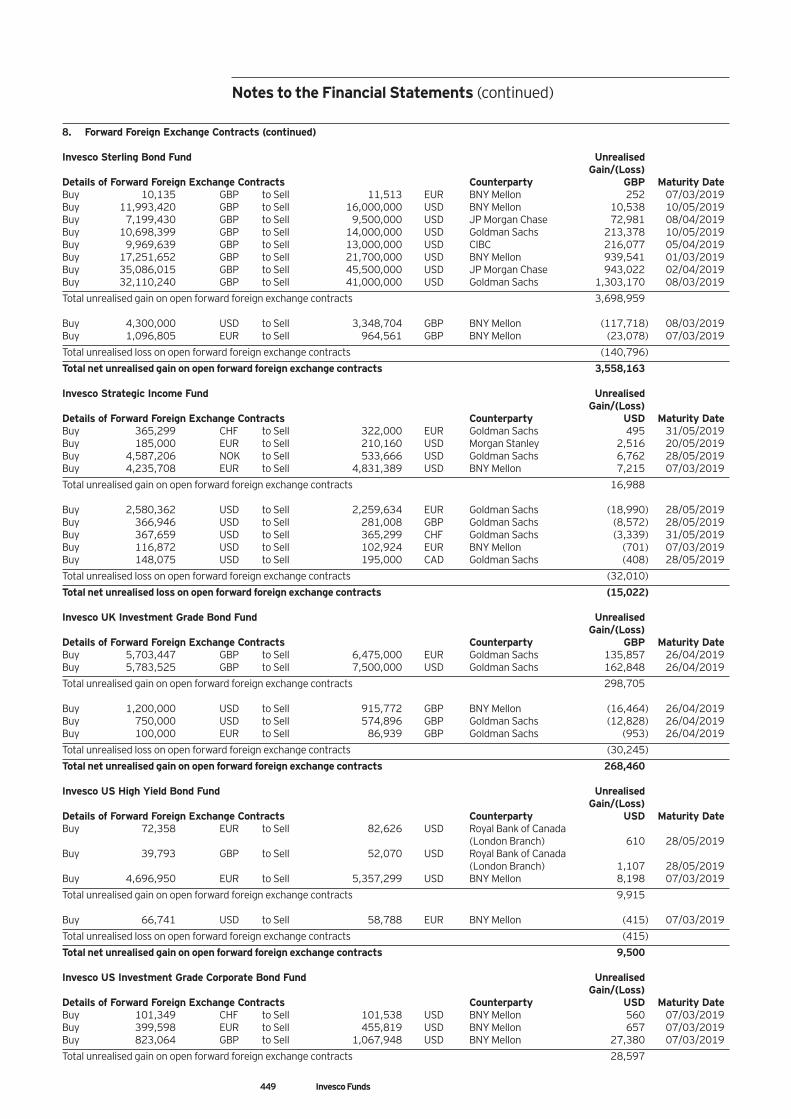
449 Invesco Funds
8. Forward Foreign Exchange Contracts (continued) Invesco Sterling Bond Fund Unrealised Gain/(Loss) Details of Forward Foreign Exchange Contracts Counterparty GBP Maturity Date Buy 10,135 GBP to Sell 11,513 EUR BNY Mellon 252 07/03/2019 Buy 11,993,420 GBP to Sell 16,000,000 USD BNY Mellon 10,538 10/05/2019 Buy 7,199,430 GBP to Sell 9,500,000 USD JP Morgan Chase 72,981 08/04/2019 Buy 10,698,399 GBP to Sell 14,000,000 USD Goldman Sachs 213,378 10/05/2019 Buy 9,969,639 GBP to Sell 13,000,000 USD CIBC 216,077 05/04/2019 Buy 17,251,652 GBP to Sell 21,700,000 USD BNY Mellon 939,541 01/03/2019 Buy 35,086,015 GBP to Sell 45,500,000 USD JP Morgan Chase 943,022 02/04/2019 Buy 32,110,240 GBP to Sell 41,000,000 USD Goldman Sachs 1,303,170 08/03/2019
Total unrealised gain on open forward foreign exchange contracts 3,698,959 Buy 4,300,000 USD to Sell 3,348,704 GBP BNY Mellon (117,718) 08/03/2019 Buy 1,096,805 EUR to Sell 964,561 GBP BNY Mellon (23,078) 07/03/2019
Total unrealised loss on open forward foreign exchange contracts (140,796)
Total net unrealised gain on open forward foreign exchange contracts 3,558,163 Invesco Strategic Income Fund Unrealised Gain/(Loss) Details of Forward Foreign Exchange Contracts Counterparty USD Maturity Date Buy 365,299 CHF to Sell 322,000 EUR Goldman Sachs 495 31/05/2019 Buy 185,000 EUR to Sell 210,160 USD Morgan Stanley 2,516 20/05/2019 Buy 4,587,206 NOK to Sell 533,666 USD Goldman Sachs 6,762 28/05/2019 Buy 4,235,708 EUR to Sell 4,831,389 USD BNY Mellon 7,215 07/03/2019
Total unrealised gain on open forward foreign exchange contracts 16,988 Buy 2,580,362 USD to Sell 2,259,634 EUR Goldman Sachs (18,990) 28/05/2019 Buy 366,946 USD to Sell 281,008 GBP Goldman Sachs (8,572) 28/05/2019 Buy 367,659 USD to Sell 365,299 CHF Goldman Sachs (3,339) 31/05/2019 Buy 116,872 USD to Sell 102,924 EUR BNY Mellon (701) 07/03/2019 Buy 148,075 USD to Sell 195,000 CAD Goldman Sachs (408) 28/05/2019
Total unrealised loss on open forward foreign exchange contracts (32,010)
Total net unrealised loss on open forward foreign exchange contracts (15,022) Invesco UK Investment Grade Bond Fund Unrealised Gain/(Loss) Details of Forward Foreign Exchange Contracts Counterparty GBP Maturity Date Buy 5,703,447 GBP to Sell 6,475,000 EUR Goldman Sachs 135,857 26/04/2019 Buy 5,783,525 GBP to Sell 7,500,000 USD Goldman Sachs 162,848 26/04/2019
Total unrealised gain on open forward foreign exchange contracts 298,705 Buy 1,200,000 USD to Sell 915,772 GBP BNY Mellon (16,464) 26/04/2019 Buy 750,000 USD to Sell 574,896 GBP Goldman Sachs (12,828) 26/04/2019 Buy 100,000 EUR to Sell 86,939 GBP Goldman Sachs (953) 26/04/2019
Total unrealised loss on open forward foreign exchange contracts (30,245)
Total net unrealised gain on open forward foreign exchange contracts 268,460 Invesco US High Yield Bond Fund Unrealised Gain/(Loss) Details of Forward Foreign Exchange Contracts Counterparty USD Maturity Date Buy 72,358 EUR to Sell 82,626 USD Royal Bank of Canada (London Branch) 610 28/05/2019 Buy 39,793 GBP to Sell 52,070 USD Royal Bank of Canada (London Branch) 1,107 28/05/2019 Buy 4,696,950 EUR to Sell 5,357,299 USD BNY Mellon 8,198 07/03/2019
Total unrealised gain on open forward foreign exchange contracts 9,915 Buy 66,741 USD to Sell 58,788 EUR BNY Mellon (415) 07/03/2019
Total unrealised loss on open forward foreign exchange contracts (415)
Total net unrealised gain on open forward foreign exchange contracts 9,500 Invesco US Investment Grade Corporate Bond Fund Unrealised Gain/(Loss) Details of Forward Foreign Exchange Contracts Counterparty USD Maturity Date Buy 101,349 CHF to Sell 101,538 USD BNY Mellon 560 07/03/2019 Buy 399,598 EUR to Sell 455,819 USD BNY Mellon 657 07/03/2019 Buy 823,064 GBP to Sell 1,067,948 USD BNY Mellon 27,380 07/03/2019
Total unrealised gain on open forward foreign exchange contracts 28,597
Notes to the Financial Statements (continued)
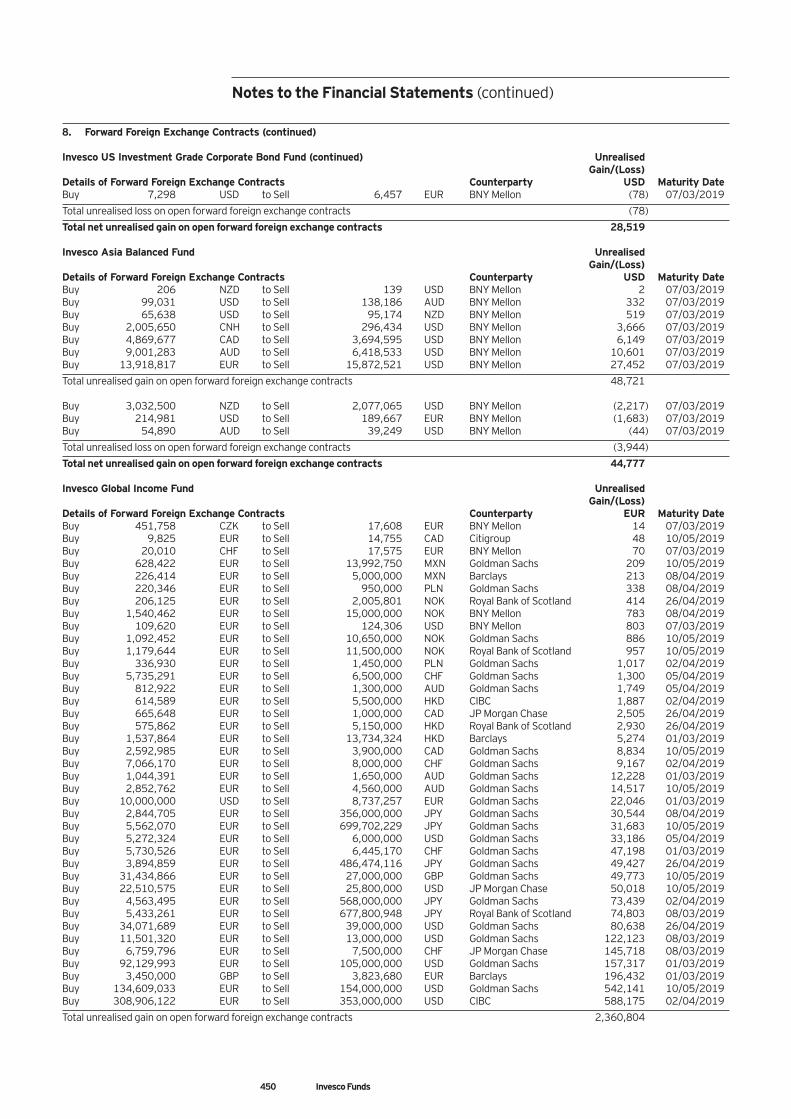
450 Invesco Funds
8. Forward Foreign Exchange Contracts (continued) Invesco US Investment Grade Corporate Bond Fund (continued) Unrealised Gain/(Loss) Details of Forward Foreign Exchange Contracts Counterparty USD Maturity Date Buy 7,298 USD to Sell 6,457 EUR BNY Mellon (78) 07/03/2019
Total unrealised loss on open forward foreign exchange contracts (78)
Total net unrealised gain on open forward foreign exchange contracts 28,519 Invesco Asia Balanced Fund Unrealised Gain/(Loss) Details of Forward Foreign Exchange Contracts Counterparty USD Maturity Date Buy 206 NZD to Sell 139 USD BNY Mellon 2 07/03/2019 Buy 99,031 USD to Sell 138,186 AUD BNY Mellon 332 07/03/2019 Buy 65,638 USD to Sell 95,174 NZD BNY Mellon 519 07/03/2019 Buy 2,005,650 CNH to Sell 296,434 USD BNY Mellon 3,666 07/03/2019 Buy 4,869,677 CAD to Sell 3,694,595 USD BNY Mellon 6,149 07/03/2019 Buy 9,001,283 AUD to Sell 6,418,533 USD BNY Mellon 10,601 07/03/2019 Buy 13,918,817 EUR to Sell 15,872,521 USD BNY Mellon 27,452 07/03/2019
Total unrealised gain on open forward foreign exchange contracts 48,721 Buy 3,032,500 NZD to Sell 2,077,065 USD BNY Mellon (2,217) 07/03/2019 Buy 214,981 USD to Sell 189,667 EUR BNY Mellon (1,683) 07/03/2019 Buy 54,890 AUD to Sell 39,249 USD BNY Mellon (44) 07/03/2019
Total unrealised loss on open forward foreign exchange contracts (3,944)
Total net unrealised gain on open forward foreign exchange contracts 44,777 Invesco Global Income Fund Unrealised Gain/(Loss) Details of Forward Foreign Exchange Contracts Counterparty EUR Maturity Date Buy 451,758 CZK to Sell 17,608 EUR BNY Mellon 14 07/03/2019 Buy 9,825 EUR to Sell 14,755 CAD Citigroup 48 10/05/2019 Buy 20,010 CHF to Sell 17,575 EUR BNY Mellon 70 07/03/2019 Buy 628,422 EUR to Sell 13,992,750 MXN Goldman Sachs 209 10/05/2019 Buy 226,414 EUR to Sell 5,000,000 MXN Barclays 213 08/04/2019 Buy 220,346 EUR to Sell 950,000 PLN Goldman Sachs 338 08/04/2019 Buy 206,125 EUR to Sell 2,005,801 NOK Royal Bank of Scotland 414 26/04/2019 Buy 1,540,462 EUR to Sell 15,000,000 NOK BNY Mellon 783 08/04/2019 Buy 109,620 EUR to Sell 124,306 USD BNY Mellon 803 07/03/2019 Buy 1,092,452 EUR to Sell 10,650,000 NOK Goldman Sachs 886 10/05/2019 Buy 1,179,644 EUR to Sell 11,500,000 NOK Royal Bank of Scotland 957 10/05/2019 Buy 336,930 EUR to Sell 1,450,000 PLN Goldman Sachs 1,017 02/04/2019 Buy 5,735,291 EUR to Sell 6,500,000 CHF Goldman Sachs 1,300 05/04/2019 Buy 812,922 EUR to Sell 1,300,000 AUD Goldman Sachs 1,749 05/04/2019 Buy 614,589 EUR to Sell 5,500,000 HKD CIBC 1,887 02/04/2019 Buy 665,648 EUR to Sell 1,000,000 CAD JP Morgan Chase 2,505 26/04/2019 Buy 575,862 EUR to Sell 5,150,000 HKD Royal Bank of Scotland 2,930 26/04/2019 Buy 1,537,864 EUR to Sell 13,734,324 HKD Barclays 5,274 01/03/2019 Buy 2,592,985 EUR to Sell 3,900,000 CAD Goldman Sachs 8,834 10/05/2019 Buy 7,066,170 EUR to Sell 8,000,000 CHF Goldman Sachs 9,167 02/04/2019 Buy 1,044,391 EUR to Sell 1,650,000 AUD Goldman Sachs 12,228 01/03/2019 Buy 2,852,762 EUR to Sell 4,560,000 AUD Goldman Sachs 14,517 10/05/2019 Buy 10,000,000 USD to Sell 8,737,257 EUR Goldman Sachs 22,046 01/03/2019 Buy 2,844,705 EUR to Sell 356,000,000 JPY Goldman Sachs 30,544 08/04/2019 Buy 5,562,070 EUR to Sell 699,702,229 JPY Goldman Sachs 31,683 10/05/2019 Buy 5,272,324 EUR to Sell 6,000,000 USD Goldman Sachs 33,186 05/04/2019 Buy 5,730,526 EUR to Sell 6,445,170 CHF Goldman Sachs 47,198 01/03/2019 Buy 3,894,859 EUR to Sell 486,474,116 JPY Goldman Sachs 49,427 26/04/2019 Buy 31,434,866 EUR to Sell 27,000,000 GBP Goldman Sachs 49,773 10/05/2019 Buy 22,510,575 EUR to Sell 25,800,000 USD JP Morgan Chase 50,018 10/05/2019 Buy 4,563,495 EUR to Sell 568,000,000 JPY Goldman Sachs 73,439 02/04/2019 Buy 5,433,261 EUR to Sell 677,800,948 JPY Royal Bank of Scotland 74,803 08/03/2019 Buy 34,071,689 EUR to Sell 39,000,000 USD Goldman Sachs 80,638 26/04/2019 Buy 11,501,320 EUR to Sell 13,000,000 USD Goldman Sachs 122,123 08/03/2019 Buy 6,759,796 EUR to Sell 7,500,000 CHF JP Morgan Chase 145,718 08/03/2019 Buy 92,129,993 EUR to Sell 105,000,000 USD Goldman Sachs 157,317 01/03/2019 Buy 3,450,000 GBP to Sell 3,823,680 EUR Barclays 196,432 01/03/2019 Buy 134,609,033 EUR to Sell 154,000,000 USD Goldman Sachs 542,141 10/05/2019 Buy 308,906,122 EUR to Sell 353,000,000 USD CIBC 588,175 02/04/2019
Total unrealised gain on open forward foreign exchange contracts 2,360,804
Notes to the Financial Statements (continued)
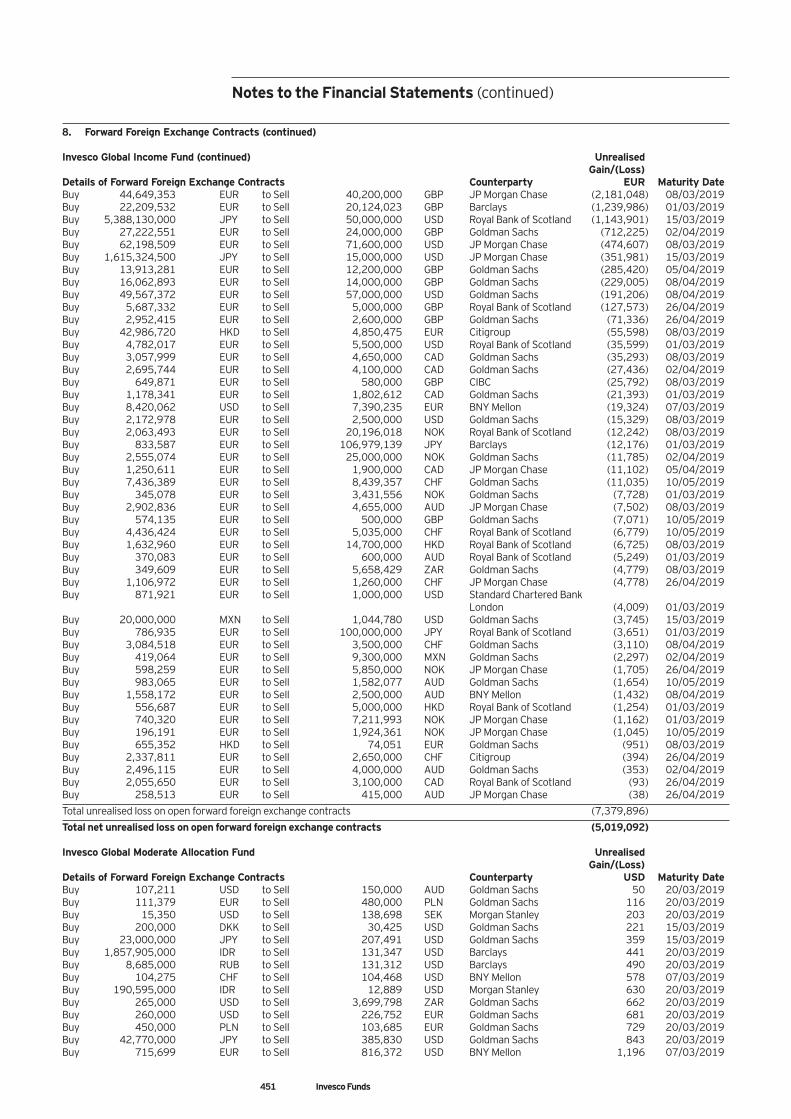
451 Invesco Funds
8. Forward Foreign Exchange Contracts (continued) Invesco Global Income Fund (continued) Unrealised Gain/(Loss) Details of Forward Foreign Exchange Contracts Counterparty EUR Maturity Date Buy 44,649,353 EUR to Sell 40,200,000 GBP JP Morgan Chase (2,181,048) 08/03/2019 Buy 22,209,532 EUR to Sell 20,124,023 GBP Barclays (1,239,986) 01/03/2019 Buy 5,388,130,000 JPY to Sell 50,000,000 USD Royal Bank of Scotland (1,143,901) 15/03/2019 Buy 27,222,551 EUR to Sell 24,000,000 GBP Goldman Sachs (712,225) 02/04/2019 Buy 62,198,509 EUR to Sell 71,600,000 USD JP Morgan Chase (474,607) 08/03/2019 Buy 1,615,324,500 JPY to Sell 15,000,000 USD JP Morgan Chase (351,981) 15/03/2019 Buy 13,913,281 EUR to Sell 12,200,000 GBP Goldman Sachs (285,420) 05/04/2019 Buy 16,062,893 EUR to Sell 14,000,000 GBP Goldman Sachs (229,005) 08/04/2019 Buy 49,567,372 EUR to Sell 57,000,000 USD Goldman Sachs (191,206) 08/04/2019 Buy 5,687,332 EUR to Sell 5,000,000 GBP Royal Bank of Scotland (127,573) 26/04/2019 Buy 2,952,415 EUR to Sell 2,600,000 GBP Goldman Sachs (71,336) 26/04/2019 Buy 42,986,720 HKD to Sell 4,850,475 EUR Citigroup (55,598) 08/03/2019 Buy 4,782,017 EUR to Sell 5,500,000 USD Royal Bank of Scotland (35,599) 01/03/2019 Buy 3,057,999 EUR to Sell 4,650,000 CAD Goldman Sachs (35,293) 08/03/2019 Buy 2,695,744 EUR to Sell 4,100,000 CAD Goldman Sachs (27,436) 02/04/2019 Buy 649,871 EUR to Sell 580,000 GBP CIBC (25,792) 08/03/2019 Buy 1,178,341 EUR to Sell 1,802,612 CAD Goldman Sachs (21,393) 01/03/2019 Buy 8,420,062 USD to Sell 7,390,235 EUR BNY Mellon (19,324) 07/03/2019 Buy 2,172,978 EUR to Sell 2,500,000 USD Goldman Sachs (15,329) 08/03/2019 Buy 2,063,493 EUR to Sell 20,196,018 NOK Royal Bank of Scotland (12,242) 08/03/2019 Buy 833,587 EUR to Sell 106,979,139 JPY Barclays (12,176) 01/03/2019 Buy 2,555,074 EUR to Sell 25,000,000 NOK Goldman Sachs (11,785) 02/04/2019 Buy 1,250,611 EUR to Sell 1,900,000 CAD JP Morgan Chase (11,102) 05/04/2019 Buy 7,436,389 EUR to Sell 8,439,357 CHF Goldman Sachs (11,035) 10/05/2019 Buy 345,078 EUR to Sell 3,431,556 NOK Goldman Sachs (7,728) 01/03/2019 Buy 2,902,836 EUR to Sell 4,655,000 AUD JP Morgan Chase (7,502) 08/03/2019 Buy 574,135 EUR to Sell 500,000 GBP Goldman Sachs (7,071) 10/05/2019 Buy 4,436,424 EUR to Sell 5,035,000 CHF Royal Bank of Scotland (6,779) 10/05/2019 Buy 1,632,960 EUR to Sell 14,700,000 HKD Royal Bank of Scotland (6,725) 08/03/2019 Buy 370,083 EUR to Sell 600,000 AUD Royal Bank of Scotland (5,249) 01/03/2019 Buy 349,609 EUR to Sell 5,658,429 ZAR Goldman Sachs (4,779) 08/03/2019 Buy 1,106,972 EUR to Sell 1,260,000 CHF JP Morgan Chase (4,778) 26/04/2019 Buy 871,921 EUR to Sell 1,000,000 USD Standard Chartered Bank London (4,009) 01/03/2019 Buy 20,000,000 MXN to Sell 1,044,780 USD Goldman Sachs (3,745) 15/03/2019 Buy 786,935 EUR to Sell 100,000,000 JPY Royal Bank of Scotland (3,651) 01/03/2019 Buy 3,084,518 EUR to Sell 3,500,000 CHF Goldman Sachs (3,110) 08/04/2019 Buy 419,064 EUR to Sell 9,300,000 MXN Goldman Sachs (2,297) 02/04/2019 Buy 598,259 EUR to Sell 5,850,000 NOK JP Morgan Chase (1,705) 26/04/2019 Buy 983,065 EUR to Sell 1,582,077 AUD Goldman Sachs (1,654) 10/05/2019 Buy 1,558,172 EUR to Sell 2,500,000 AUD BNY Mellon (1,432) 08/04/2019 Buy 556,687 EUR to Sell 5,000,000 HKD Royal Bank of Scotland (1,254) 01/03/2019 Buy 740,320 EUR to Sell 7,211,993 NOK JP Morgan Chase (1,162) 01/03/2019 Buy 196,191 EUR to Sell 1,924,361 NOK JP Morgan Chase (1,045) 10/05/2019 Buy 655,352 HKD to Sell 74,051 EUR Goldman Sachs (951) 08/03/2019 Buy 2,337,811 EUR to Sell 2,650,000 CHF Citigroup (394) 26/04/2019 Buy 2,496,115 EUR to Sell 4,000,000 AUD Goldman Sachs (353) 02/04/2019 Buy 2,055,650 EUR to Sell 3,100,000 CAD Royal Bank of Scotland (93) 26/04/2019 Buy 258,513 EUR to Sell 415,000 AUD JP Morgan Chase (38) 26/04/2019
Total unrealised loss on open forward foreign exchange contracts (7,379,896)
Total net unrealised loss on open forward foreign exchange contracts (5,019,092) Invesco Global Moderate Allocation Fund Unrealised Gain/(Loss) Details of Forward Foreign Exchange Contracts Counterparty USD Maturity Date Buy 107,211 USD to Sell 150,000 AUD Goldman Sachs 50 20/03/2019 Buy 111,379 EUR to Sell 480,000 PLN Goldman Sachs 116 20/03/2019 Buy 15,350 USD to Sell 138,698 SEK Morgan Stanley 203 20/03/2019 Buy 200,000 DKK to Sell 30,425 USD Goldman Sachs 221 15/03/2019 Buy 23,000,000 JPY to Sell 207,491 USD Goldman Sachs 359 15/03/2019 Buy 1,857,905,000 IDR to Sell 131,347 USD Barclays 441 20/03/2019 Buy 8,685,000 RUB to Sell 131,312 USD Barclays 490 20/03/2019 Buy 104,275 CHF to Sell 104,468 USD BNY Mellon 578 07/03/2019 Buy 190,595,000 IDR to Sell 12,889 USD Morgan Stanley 630 20/03/2019 Buy 265,000 USD to Sell 3,699,798 ZAR Goldman Sachs 662 20/03/2019 Buy 260,000 USD to Sell 226,752 EUR Goldman Sachs 681 20/03/2019 Buy 450,000 PLN to Sell 103,685 EUR Goldman Sachs 729 20/03/2019 Buy 42,770,000 JPY to Sell 385,830 USD Goldman Sachs 843 20/03/2019 Buy 715,699 EUR to Sell 816,372 USD BNY Mellon 1,196 07/03/2019
Notes to the Financial Statements (continued)
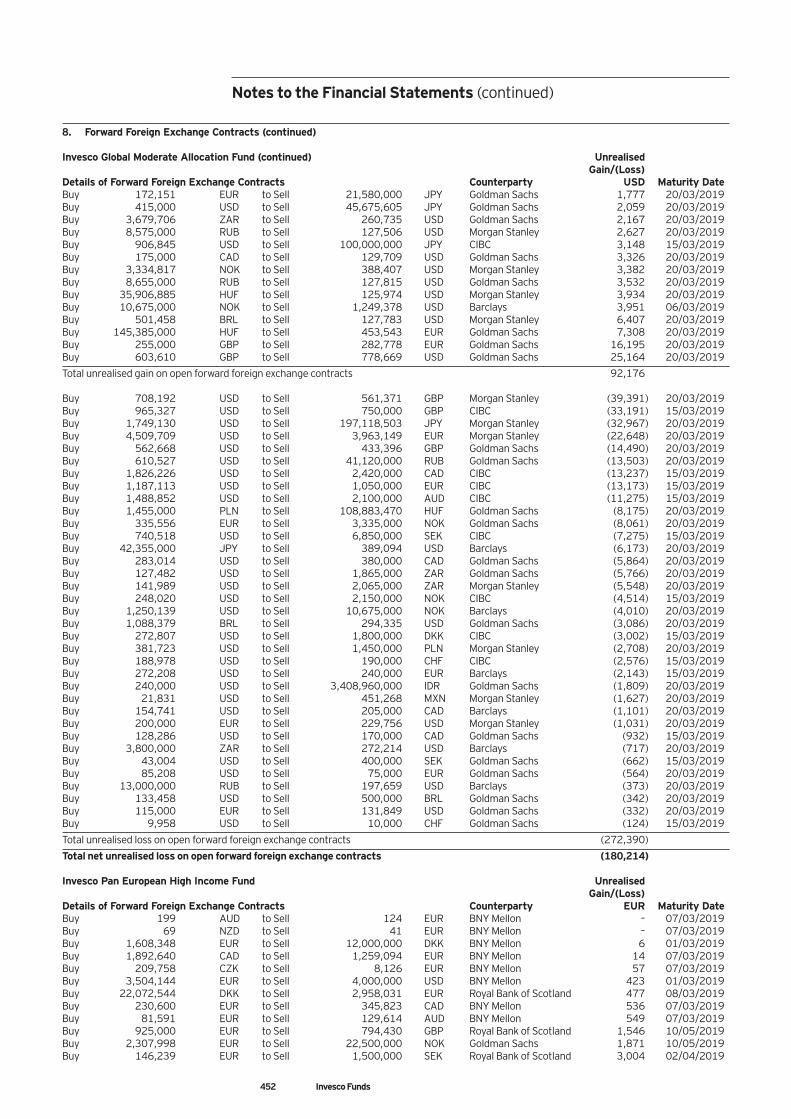
452 Invesco Funds
8. Forward Foreign Exchange Contracts (continued) Invesco Global Moderate Allocation Fund (continued) Unrealised Gain/(Loss) Details of Forward Foreign Exchange Contracts Counterparty USD Maturity Date Buy 172,151 EUR to Sell 21,580,000 JPY Goldman Sachs 1,777 20/03/2019 Buy 415,000 USD to Sell 45,675,605 JPY Goldman Sachs 2,059 20/03/2019 Buy 3,679,706 ZAR to Sell 260,735 USD Goldman Sachs 2,167 20/03/2019 Buy 8,575,000 RUB to Sell 127,506 USD Morgan Stanley 2,627 20/03/2019 Buy 906,845 USD to Sell 100,000,000 JPY CIBC 3,148 15/03/2019 Buy 175,000 CAD to Sell 129,709 USD Goldman Sachs 3,326 20/03/2019 Buy 3,334,817 NOK to Sell 388,407 USD Morgan Stanley 3,382 20/03/2019 Buy 8,655,000 RUB to Sell 127,815 USD Goldman Sachs 3,532 20/03/2019 Buy 35,906,885 HUF to Sell 125,974 USD Morgan Stanley 3,934 20/03/2019 Buy 10,675,000 NOK to Sell 1,249,378 USD Barclays 3,951 06/03/2019 Buy 501,458 BRL to Sell 127,783 USD Morgan Stanley 6,407 20/03/2019 Buy 145,385,000 HUF to Sell 453,543 EUR Goldman Sachs 7,308 20/03/2019 Buy 255,000 GBP to Sell 282,778 EUR Goldman Sachs 16,195 20/03/2019 Buy 603,610 GBP to Sell 778,669 USD Goldman Sachs 25,164 20/03/2019
Total unrealised gain on open forward foreign exchange contracts 92,176 Buy 708,192 USD to Sell 561,371 GBP Morgan Stanley (39,391) 20/03/2019 Buy 965,327 USD to Sell 750,000 GBP CIBC (33,191) 15/03/2019 Buy 1,749,130 USD to Sell 197,118,503 JPY Morgan Stanley (32,967) 20/03/2019 Buy 4,509,709 USD to Sell 3,963,149 EUR Morgan Stanley (22,648) 20/03/2019 Buy 562,668 USD to Sell 433,396 GBP Goldman Sachs (14,490) 20/03/2019 Buy 610,527 USD to Sell 41,120,000 RUB Goldman Sachs (13,503) 20/03/2019 Buy 1,826,226 USD to Sell 2,420,000 CAD CIBC (13,237) 15/03/2019 Buy 1,187,113 USD to Sell 1,050,000 EUR CIBC (13,173) 15/03/2019 Buy 1,488,852 USD to Sell 2,100,000 AUD CIBC (11,275) 15/03/2019 Buy 1,455,000 PLN to Sell 108,883,470 HUF Goldman Sachs (8,175) 20/03/2019 Buy 335,556 EUR to Sell 3,335,000 NOK Goldman Sachs (8,061) 20/03/2019 Buy 740,518 USD to Sell 6,850,000 SEK CIBC (7,275) 15/03/2019 Buy 42,355,000 JPY to Sell 389,094 USD Barclays (6,173) 20/03/2019 Buy 283,014 USD to Sell 380,000 CAD Goldman Sachs (5,864) 20/03/2019 Buy 127,482 USD to Sell 1,865,000 ZAR Goldman Sachs (5,766) 20/03/2019 Buy 141,989 USD to Sell 2,065,000 ZAR Morgan Stanley (5,548) 20/03/2019 Buy 248,020 USD to Sell 2,150,000 NOK CIBC (4,514) 15/03/2019 Buy 1,250,139 USD to Sell 10,675,000 NOK Barclays (4,010) 20/03/2019 Buy 1,088,379 BRL to Sell 294,335 USD Goldman Sachs (3,086) 20/03/2019 Buy 272,807 USD to Sell 1,800,000 DKK CIBC (3,002) 15/03/2019 Buy 381,723 USD to Sell 1,450,000 PLN Morgan Stanley (2,708) 20/03/2019 Buy 188,978 USD to Sell 190,000 CHF CIBC (2,576) 15/03/2019 Buy 272,208 USD to Sell 240,000 EUR Barclays (2,143) 15/03/2019 Buy 240,000 USD to Sell 3,408,960,000 IDR Goldman Sachs (1,809) 20/03/2019 Buy 21,831 USD to Sell 451,268 MXN Morgan Stanley (1,627) 20/03/2019 Buy 154,741 USD to Sell 205,000 CAD Barclays (1,101) 20/03/2019 Buy 200,000 EUR to Sell 229,756 USD Morgan Stanley (1,031) 20/03/2019 Buy 128,286 USD to Sell 170,000 CAD Goldman Sachs (932) 15/03/2019 Buy 3,800,000 ZAR to Sell 272,214 USD Barclays (717) 20/03/2019 Buy 43,004 USD to Sell 400,000 SEK Goldman Sachs (662) 15/03/2019 Buy 85,208 USD to Sell 75,000 EUR Goldman Sachs (564) 20/03/2019 Buy 13,000,000 RUB to Sell 197,659 USD Barclays (373) 20/03/2019 Buy 133,458 USD to Sell 500,000 BRL Goldman Sachs (342) 20/03/2019 Buy 115,000 EUR to Sell 131,849 USD Goldman Sachs (332) 20/03/2019 Buy 9,958 USD to Sell 10,000 CHF Goldman Sachs (124) 15/03/2019
Total unrealised loss on open forward foreign exchange contracts (272,390)
Total net unrealised loss on open forward foreign exchange contracts (180,214) Invesco Pan European High Income Fund Unrealised Gain/(Loss) Details of Forward Foreign Exchange Contracts Counterparty EUR Maturity Date Buy 199 AUD to Sell 124 EUR BNY Mellon – 07/03/2019 Buy 69 NZD to Sell 41 EUR BNY Mellon – 07/03/2019 Buy 1,608,348 EUR to Sell 12,000,000 DKK BNY Mellon 6 01/03/2019 Buy 1,892,640 CAD to Sell 1,259,094 EUR BNY Mellon 14 07/03/2019 Buy 209,758 CZK to Sell 8,126 EUR BNY Mellon 57 07/03/2019 Buy 3,504,144 EUR to Sell 4,000,000 USD BNY Mellon 423 01/03/2019 Buy 22,072,544 DKK to Sell 2,958,031 EUR Royal Bank of Scotland 477 08/03/2019 Buy 230,600 EUR to Sell 345,823 CAD BNY Mellon 536 07/03/2019 Buy 81,591 EUR to Sell 129,614 AUD BNY Mellon 549 07/03/2019 Buy 925,000 EUR to Sell 794,430 GBP Royal Bank of Scotland 1,546 10/05/2019 Buy 2,307,998 EUR to Sell 22,500,000 NOK Goldman Sachs 1,871 10/05/2019 Buy 146,239 EUR to Sell 1,500,000 SEK Royal Bank of Scotland 3,004 02/04/2019
Notes to the Financial Statements (continued)
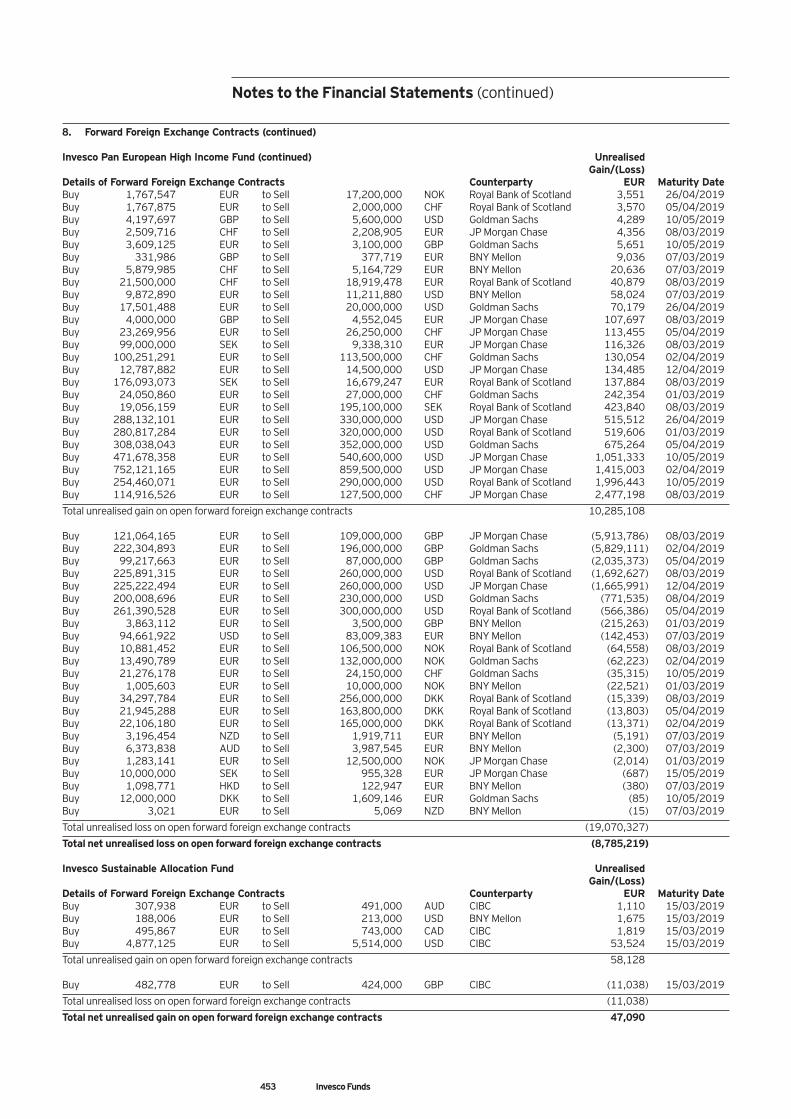
Notes to the Financial Statements (continued)
8. Forward Foreign Exchange Contracts (continued) Invesco Pan European High Income Fund (continued) Unrealised Gain/(Loss) Details of Forward Foreign Exchange Contracts Counterparty EUR Maturity Date Buy 1,767,547 EUR to Sell 17,200,000 NOK Royal Bank of Scotland 3,551 26/04/2019 Buy 1,767,875 EUR to Sell 2,000,000 CHF Royal Bank of Scotland 3,570 05/04/2019 Buy 4,197,697 GBP to Sell 5,600,000 USD Goldman Sachs 4,289 10/05/2019 Buy 2,509,716 CHF to Sell 2,208,905 EUR JP Morgan Chase 4,356 08/03/2019 Buy 3,609,125 EUR to Sell 3,100,000 GBP Goldman Sachs 5,651 10/05/2019 Buy 331,986 GBP to Sell 377,719 EUR BNY Mellon 9,036 07/03/2019 Buy 5,879,985 CHF to Sell 5,164,729 EUR BNY Mellon 20,636 07/03/2019 Buy 21,500,000 CHF to Sell 18,919,478 EUR Royal Bank of Scotland 40,879 08/03/2019 Buy 9,872,890 EUR to Sell 11,211,880 USD BNY Mellon 58,024 07/03/2019 Buy 17,501,488 EUR to Sell 20,000,000 USD Goldman Sachs 70,179 26/04/2019 Buy 4,000,000 GBP to Sell 4,552,045 EUR JP Morgan Chase 107,697 08/03/2019 Buy 23,269,956 EUR to Sell 26,250,000 CHF JP Morgan Chase 113,455 05/04/2019 Buy 99,000,000 SEK to Sell 9,338,310 EUR JP Morgan Chase 116,326 08/03/2019 Buy 100,251,291 EUR to Sell 113,500,000 CHF Goldman Sachs 130,054 02/04/2019 Buy 12,787,882 EUR to Sell 14,500,000 USD JP Morgan Chase 134,485 12/04/2019 Buy 176,093,073 SEK to Sell 16,679,247 EUR Royal Bank of Scotland 137,884 08/03/2019 Buy 24,050,860 EUR to Sell 27,000,000 CHF Goldman Sachs 242,354 01/03/2019 Buy 19,056,159 EUR to Sell 195,100,000 SEK Royal Bank of Scotland 423,840 08/03/2019 Buy 288,132,101 EUR to Sell 330,000,000 USD JP Morgan Chase 515,512 26/04/2019 Buy 280,817,284 EUR to Sell 320,000,000 USD Royal Bank of Scotland 519,606 01/03/2019 Buy 308,038,043 EUR to Sell 352,000,000 USD Goldman Sachs 675,264 05/04/2019 Buy 471,678,358 EUR to Sell 540,600,000 USD JP Morgan Chase 1,051,333 10/05/2019 Buy 752,121,165 EUR to Sell 859,500,000 USD JP Morgan Chase 1,415,003 02/04/2019 Buy 254,460,071 EUR to Sell 290,000,000 USD Royal Bank of Scotland 1,996,443 10/05/2019 Buy 114,916,526 EUR to Sell 127,500,000 CHF JP Morgan Chase 2,477,198 08/03/2019
Total unrealised gain on open forward foreign exchange contracts 10,285,108 Buy 121,064,165 EUR to Sell 109,000,000 GBP JP Morgan Chase (5,913,786) 08/03/2019 Buy 222,304,893 EUR to Sell 196,000,000 GBP Goldman Sachs (5,829,111) 02/04/2019 Buy 99,217,663 EUR to Sell 87,000,000 GBP Goldman Sachs (2,035,373) 05/04/2019 Buy 225,891,315 EUR to Sell 260,000,000 USD Royal Bank of Scotland (1,692,627) 08/03/2019 Buy 225,222,494 EUR to Sell 260,000,000 USD JP Morgan Chase (1,665,991) 12/04/2019 Buy 200,008,696 EUR to Sell 230,000,000 USD Goldman Sachs (771,535) 08/04/2019 Buy 261,390,528 EUR to Sell 300,000,000 USD Royal Bank of Scotland (566,386) 05/04/2019 Buy 3,863,112 EUR to Sell 3,500,000 GBP BNY Mellon (215,263) 01/03/2019 Buy 94,661,922 USD to Sell 83,009,383 EUR BNY Mellon (142,453) 07/03/2019 Buy 10,881,452 EUR to Sell 106,500,000 NOK Royal Bank of Scotland (64,558) 08/03/2019 Buy 13,490,789 EUR to Sell 132,000,000 NOK Goldman Sachs (62,223) 02/04/2019 Buy 21,276,178 EUR to Sell 24,150,000 CHF Goldman Sachs (35,315) 10/05/2019 Buy 1,005,603 EUR to Sell 10,000,000 NOK BNY Mellon (22,521) 01/03/2019 Buy 34,297,784 EUR to Sell 256,000,000 DKK Royal Bank of Scotland (15,339) 08/03/2019 Buy 21,945,288 EUR to Sell 163,800,000 DKK Royal Bank of Scotland (13,803) 05/04/2019 Buy 22,106,180 EUR to Sell 165,000,000 DKK Royal Bank of Scotland (13,371) 02/04/2019 Buy 3,196,454 NZD to Sell 1,919,711 EUR BNY Mellon (5,191) 07/03/2019 Buy 6,373,838 AUD to Sell 3,987,545 EUR BNY Mellon (2,300) 07/03/2019 Buy 1,283,141 EUR to Sell 12,500,000 NOK JP Morgan Chase (2,014) 01/03/2019 Buy 10,000,000 SEK to Sell 955,328 EUR JP Morgan Chase (687) 15/05/2019 Buy 1,098,771 HKD to Sell 122,947 EUR BNY Mellon (380) 07/03/2019 Buy 12,000,000 DKK to Sell 1,609,146 EUR Goldman Sachs (85) 10/05/2019 Buy 3,021 EUR to Sell 5,069 NZD BNY Mellon (15) 07/03/2019
Total unrealised loss on open forward foreign exchange contracts (19,070,327)
Total net unrealised loss on open forward foreign exchange contracts (8,785,219) Invesco Sustainable Allocation Fund Unrealised Gain/(Loss) Details of Forward Foreign Exchange Contracts Counterparty EUR Maturity Date Buy 307,938 EUR to Sell 491,000 AUD CIBC 1,110 15/03/2019 Buy 188,006 EUR to Sell 213,000 USD BNY Mellon 1,675 15/03/2019 Buy 495,867 EUR to Sell 743,000 CAD CIBC 1,819 15/03/2019 Buy 4,877,125 EUR to Sell 5,514,000 USD CIBC 53,524 15/03/2019
Total unrealised gain on open forward foreign exchange contracts 58,128 Buy 482,778 EUR to Sell 424,000 GBP CIBC (11,038) 15/03/2019
Total unrealised loss on open forward foreign exchange contracts (11,038)
Total net unrealised gain on open forward foreign exchange contracts 47,090
453 Invesco Funds
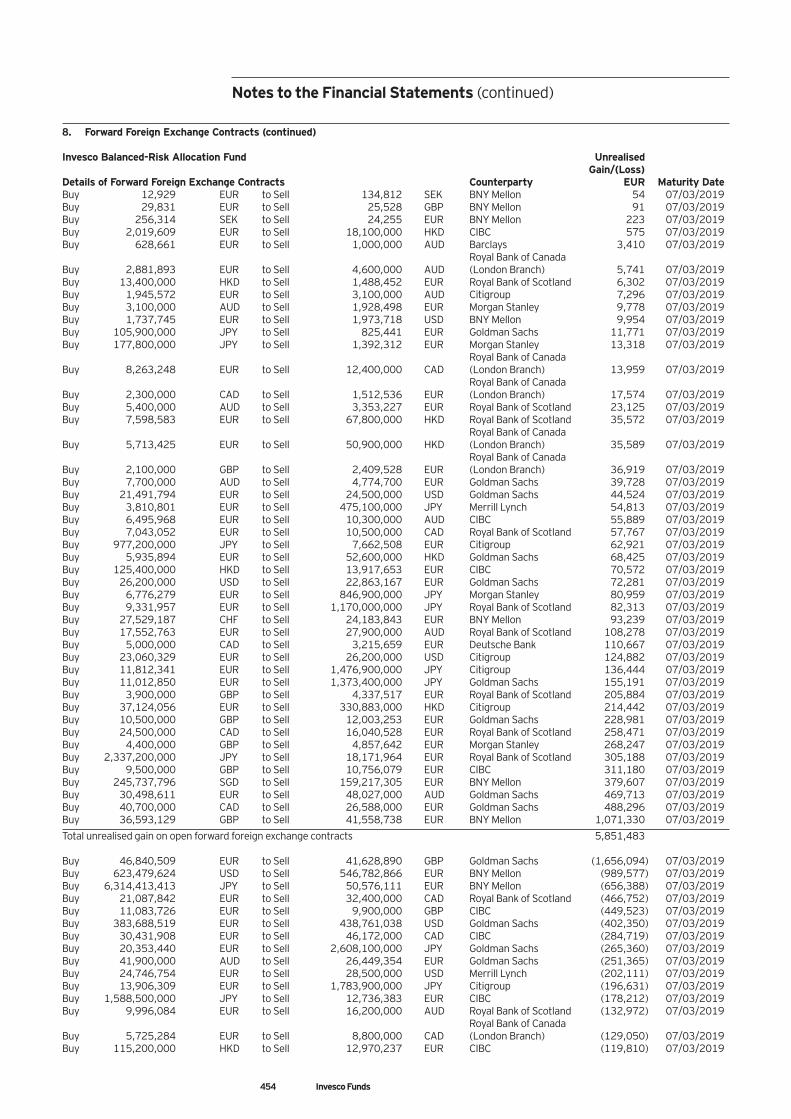
8. Forward Foreign Exchange Contracts (continued) Invesco Balanced-Risk Allocation Fund Unrealised Gain/(Loss) Details of Forward Foreign Exchange Contracts Counterparty EUR Maturity Date Buy 12,929 EUR to Sell 134,812 SEK BNY Mellon 54 07/03/2019 Buy 29,831 EUR to Sell 25,528 GBP BNY Mellon 91 07/03/2019 Buy 256,314 SEK to Sell 24,255 EUR BNY Mellon 223 07/03/2019 Buy 2,019,609 EUR to Sell 18,100,000 HKD CIBC 575 07/03/2019 Buy 628,661 EUR to Sell 1,000,000 AUD Barclays 3,410 07/03/2019 Royal Bank of Canada Buy 2,881,893 EUR to Sell 4,600,000 AUD (London Branch) 5,741 07/03/2019 Buy 13,400,000 HKD to Sell 1,488,452 EUR Royal Bank of Scotland 6,302 07/03/2019 Buy 1,945,572 EUR to Sell 3,100,000 AUD Citigroup 7,296 07/03/2019 Buy 3,100,000 AUD to Sell 1,928,498 EUR Morgan Stanley 9,778 07/03/2019 Buy 1,737,745 EUR to Sell 1,973,718 USD BNY Mellon 9,954 07/03/2019 Buy 105,900,000 JPY to Sell 825,441 EUR Goldman Sachs 11,771 07/03/2019 Buy 177,800,000 JPY to Sell 1,392,312 EUR Morgan Stanley 13,318 07/03/2019 Royal Bank of Canada Buy 8,263,248 EUR to Sell 12,400,000 CAD (London Branch) 13,959 07/03/2019 Royal Bank of Canada Buy 2,300,000 CAD to Sell 1,512,536 EUR (London Branch) 17,574 07/03/2019 Buy 5,400,000 AUD to Sell 3,353,227 EUR Royal Bank of Scotland 23,125 07/03/2019 Buy 7,598,583 EUR to Sell 67,800,000 HKD Royal Bank of Scotland 35,572 07/03/2019 Royal Bank of Canada Buy 5,713,425 EUR to Sell 50,900,000 HKD (London Branch) 35,589 07/03/2019 Royal Bank of Canada Buy 2,100,000 GBP to Sell 2,409,528 EUR (London Branch) 36,919 07/03/2019 Buy 7,700,000 AUD to Sell 4,774,700 EUR Goldman Sachs 39,728 07/03/2019 Buy 21,491,794 EUR to Sell 24,500,000 USD Goldman Sachs 44,524 07/03/2019 Buy 3,810,801 EUR to Sell 475,100,000 JPY Merrill Lynch 54,813 07/03/2019 Buy 6,495,968 EUR to Sell 10,300,000 AUD CIBC 55,889 07/03/2019 Buy 7,043,052 EUR to Sell 10,500,000 CAD Royal Bank of Scotland 57,767 07/03/2019 Buy 977,200,000 JPY to Sell 7,662,508 EUR Citigroup 62,921 07/03/2019 Buy 5,935,894 EUR to Sell 52,600,000 HKD Goldman Sachs 68,425 07/03/2019 Buy 125,400,000 HKD to Sell 13,917,653 EUR CIBC 70,572 07/03/2019 Buy 26,200,000 USD to Sell 22,863,167 EUR Goldman Sachs 72,281 07/03/2019 Buy 6,776,279 EUR to Sell 846,900,000 JPY Morgan Stanley 80,959 07/03/2019 Buy 9,331,957 EUR to Sell 1,170,000,000 JPY Royal Bank of Scotland 82,313 07/03/2019 Buy 27,529,187 CHF to Sell 24,183,843 EUR BNY Mellon 93,239 07/03/2019 Buy 17,552,763 EUR to Sell 27,900,000 AUD Royal Bank of Scotland 108,278 07/03/2019 Buy 5,000,000 CAD to Sell 3,215,659 EUR Deutsche Bank 110,667 07/03/2019 Buy 23,060,329 EUR to Sell 26,200,000 USD Citigroup 124,882 07/03/2019 Buy 11,812,341 EUR to Sell 1,476,900,000 JPY Citigroup 136,444 07/03/2019 Buy 11,012,850 EUR to Sell 1,373,400,000 JPY Goldman Sachs 155,191 07/03/2019 Buy 3,900,000 GBP to Sell 4,337,517 EUR Royal Bank of Scotland 205,884 07/03/2019 Buy 37,124,056 EUR to Sell 330,883,000 HKD Citigroup 214,442 07/03/2019 Buy 10,500,000 GBP to Sell 12,003,253 EUR Goldman Sachs 228,981 07/03/2019 Buy 24,500,000 CAD to Sell 16,040,528 EUR Royal Bank of Scotland 258,471 07/03/2019 Buy 4,400,000 GBP to Sell 4,857,642 EUR Morgan Stanley 268,247 07/03/2019 Buy 2,337,200,000 JPY to Sell 18,171,964 EUR Royal Bank of Scotland 305,188 07/03/2019 Buy 9,500,000 GBP to Sell 10,756,079 EUR CIBC 311,180 07/03/2019 Buy 245,737,796 SGD to Sell 159,217,305 EUR BNY Mellon 379,607 07/03/2019 Buy 30,498,611 EUR to Sell 48,027,000 AUD Goldman Sachs 469,713 07/03/2019 Buy 40,700,000 CAD to Sell 26,588,000 EUR Goldman Sachs 488,296 07/03/2019 Buy 36,593,129 GBP to Sell 41,558,738 EUR BNY Mellon 1,071,330 07/03/2019
Total unrealised gain on open forward foreign exchange contracts 5,851,483 Buy 46,840,509 EUR to Sell 41,628,890 GBP Goldman Sachs (1,656,094) 07/03/2019 Buy 623,479,624 USD to Sell 546,782,866 EUR BNY Mellon (989,577) 07/03/2019 Buy 6,314,413,413 JPY to Sell 50,576,111 EUR BNY Mellon (656,388) 07/03/2019 Buy 21,087,842 EUR to Sell 32,400,000 CAD Royal Bank of Scotland (466,752) 07/03/2019 Buy 11,083,726 EUR to Sell 9,900,000 GBP CIBC (449,523) 07/03/2019 Buy 383,688,519 EUR to Sell 438,761,038 USD Goldman Sachs (402,350) 07/03/2019 Buy 30,431,908 EUR to Sell 46,172,000 CAD CIBC (284,719) 07/03/2019 Buy 20,353,440 EUR to Sell 2,608,100,000 JPY Goldman Sachs (265,360) 07/03/2019 Buy 41,900,000 AUD to Sell 26,449,354 EUR Goldman Sachs (251,365) 07/03/2019 Buy 24,746,754 EUR to Sell 28,500,000 USD Merrill Lynch (202,111) 07/03/2019 Buy 13,906,309 EUR to Sell 1,783,900,000 JPY Citigroup (196,631) 07/03/2019 Buy 1,588,500,000 JPY to Sell 12,736,383 EUR CIBC (178,212) 07/03/2019 Buy 9,996,084 EUR to Sell 16,200,000 AUD Royal Bank of Scotland (132,972) 07/03/2019 Royal Bank of Canada Buy 5,725,284 EUR to Sell 8,800,000 CAD (London Branch) (129,050) 07/03/2019 Buy 115,200,000 HKD to Sell 12,970,237 EUR CIBC (119,810) 07/03/2019
454 Invesco Funds
Notes to the Financial Statements (continued)
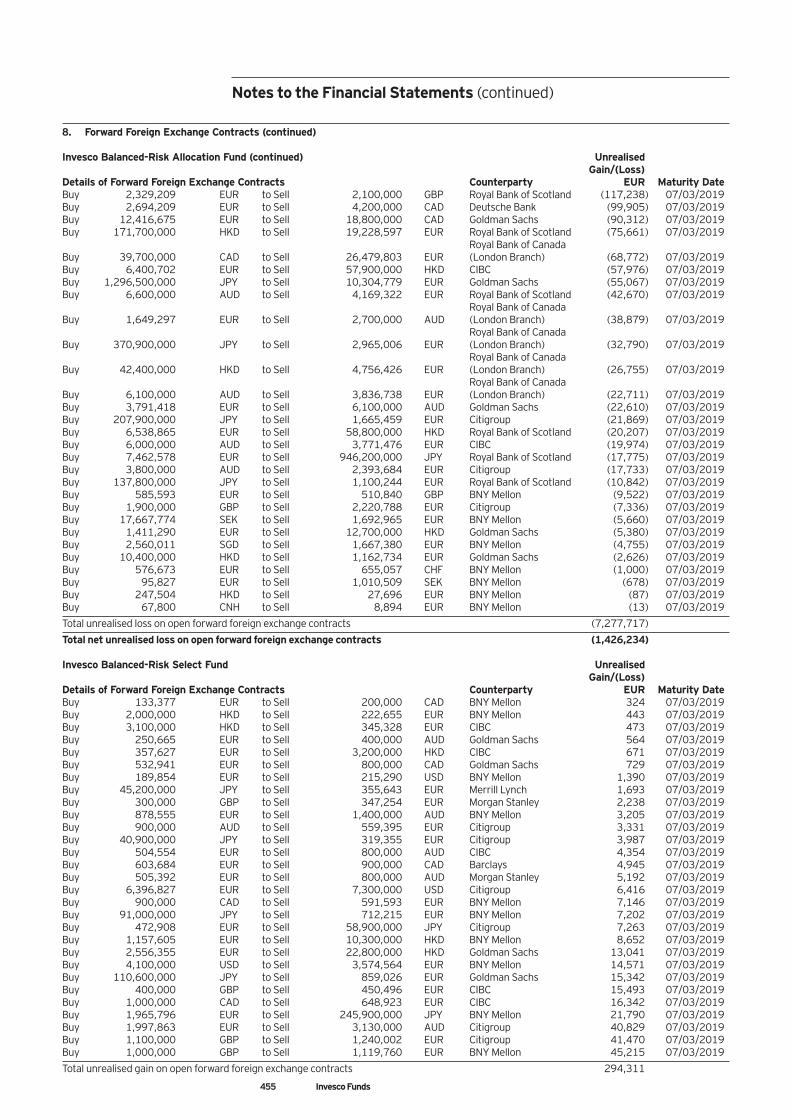
Notes to the Financial Statements (continued)
8. Forward Foreign Exchange Contracts (continued) Invesco Balanced-Risk Allocation Fund (continued) Unrealised Gain/(Loss) Details of Forward Foreign Exchange Contracts Counterparty EUR Maturity Date Buy 2,329,209 EUR to Sell 2,100,000 GBP Royal Bank of Scotland (117,238) 07/03/2019 Buy 2,694,209 EUR to Sell 4,200,000 CAD Deutsche Bank (99,905) 07/03/2019 Buy 12,416,675 EUR to Sell 18,800,000 CAD Goldman Sachs (90,312) 07/03/2019 Buy 171,700,000 HKD to Sell 19,228,597 EUR Royal Bank of Scotland (75,661) 07/03/2019 Royal Bank of Canada Buy 39,700,000 CAD to Sell 26,479,803 EUR (London Branch) (68,772) 07/03/2019 Buy 6,400,702 EUR to Sell 57,900,000 HKD CIBC (57,976) 07/03/2019 Buy 1,296,500,000 JPY to Sell 10,304,779 EUR Goldman Sachs (55,067) 07/03/2019 Buy 6,600,000 AUD to Sell 4,169,322 EUR Royal Bank of Scotland (42,670) 07/03/2019 Royal Bank of Canada Buy 1,649,297 EUR to Sell 2,700,000 AUD (London Branch) (38,879) 07/03/2019 Royal Bank of Canada Buy 370,900,000 JPY to Sell 2,965,006 EUR (London Branch) (32,790) 07/03/2019 Royal Bank of Canada Buy 42,400,000 HKD to Sell 4,756,426 EUR (London Branch) (26,755) 07/03/2019 Royal Bank of Canada Buy 6,100,000 AUD to Sell 3,836,738 EUR (London Branch) (22,711) 07/03/2019 Buy 3,791,418 EUR to Sell 6,100,000 AUD Goldman Sachs (22,610) 07/03/2019 Buy 207,900,000 JPY to Sell 1,665,459 EUR Citigroup (21,869) 07/03/2019 Buy 6,538,865 EUR to Sell 58,800,000 HKD Royal Bank of Scotland (20,207) 07/03/2019 Buy 6,000,000 AUD to Sell 3,771,476 EUR CIBC (19,974) 07/03/2019 Buy 7,462,578 EUR to Sell 946,200,000 JPY Royal Bank of Scotland (17,775) 07/03/2019 Buy 3,800,000 AUD to Sell 2,393,684 EUR Citigroup (17,733) 07/03/2019 Buy 137,800,000 JPY to Sell 1,100,244 EUR Royal Bank of Scotland (10,842) 07/03/2019 Buy 585,593 EUR to Sell 510,840 GBP BNY Mellon (9,522) 07/03/2019 Buy 1,900,000 GBP to Sell 2,220,788 EUR Citigroup (7,336) 07/03/2019 Buy 17,667,774 SEK to Sell 1,692,965 EUR BNY Mellon (5,660) 07/03/2019 Buy 1,411,290 EUR to Sell 12,700,000 HKD Goldman Sachs (5,380) 07/03/2019 Buy 2,560,011 SGD to Sell 1,667,380 EUR BNY Mellon (4,755) 07/03/2019 Buy 10,400,000 HKD to Sell 1,162,734 EUR Goldman Sachs (2,626) 07/03/2019 Buy 576,673 EUR to Sell 655,057 CHF BNY Mellon (1,000) 07/03/2019 Buy 95,827 EUR to Sell 1,010,509 SEK BNY Mellon (678) 07/03/2019 Buy 247,504 HKD to Sell 27,696 EUR BNY Mellon (87) 07/03/2019 Buy 67,800 CNH to Sell 8,894 EUR BNY Mellon (13) 07/03/2019
Total unrealised loss on open forward foreign exchange contracts (7,277,717)
Total net unrealised loss on open forward foreign exchange contracts (1,426,234) Invesco Balanced-Risk Select Fund Unrealised Gain/(Loss) Details of Forward Foreign Exchange Contracts Counterparty EUR Maturity Date Buy 133,377 EUR to Sell 200,000 CAD BNY Mellon 324 07/03/2019 Buy 2,000,000 HKD to Sell 222,655 EUR BNY Mellon 443 07/03/2019 Buy 3,100,000 HKD to Sell 345,328 EUR CIBC 473 07/03/2019 Buy 250,665 EUR to Sell 400,000 AUD Goldman Sachs 564 07/03/2019 Buy 357,627 EUR to Sell 3,200,000 HKD CIBC 671 07/03/2019 Buy 532,941 EUR to Sell 800,000 CAD Goldman Sachs 729 07/03/2019 Buy 189,854 EUR to Sell 215,290 USD BNY Mellon 1,390 07/03/2019 Buy 45,200,000 JPY to Sell 355,643 EUR Merrill Lynch 1,693 07/03/2019 Buy 300,000 GBP to Sell 347,254 EUR Morgan Stanley 2,238 07/03/2019 Buy 878,555 EUR to Sell 1,400,000 AUD BNY Mellon 3,205 07/03/2019 Buy 900,000 AUD to Sell 559,395 EUR Citigroup 3,331 07/03/2019 Buy 40,900,000 JPY to Sell 319,355 EUR Citigroup 3,987 07/03/2019 Buy 504,554 EUR to Sell 800,000 AUD CIBC 4,354 07/03/2019 Buy 603,684 EUR to Sell 900,000 CAD Barclays 4,945 07/03/2019 Buy 505,392 EUR to Sell 800,000 AUD Morgan Stanley 5,192 07/03/2019 Buy 6,396,827 EUR to Sell 7,300,000 USD Citigroup 6,416 07/03/2019 Buy 900,000 CAD to Sell 591,593 EUR BNY Mellon 7,146 07/03/2019 Buy 91,000,000 JPY to Sell 712,215 EUR BNY Mellon 7,202 07/03/2019 Buy 472,908 EUR to Sell 58,900,000 JPY Citigroup 7,263 07/03/2019 Buy 1,157,605 EUR to Sell 10,300,000 HKD BNY Mellon 8,652 07/03/2019 Buy 2,556,355 EUR to Sell 22,800,000 HKD Goldman Sachs 13,041 07/03/2019 Buy 4,100,000 USD to Sell 3,574,564 EUR BNY Mellon 14,571 07/03/2019 Buy 110,600,000 JPY to Sell 859,026 EUR Goldman Sachs 15,342 07/03/2019 Buy 400,000 GBP to Sell 450,496 EUR CIBC 15,493 07/03/2019 Buy 1,000,000 CAD to Sell 648,923 EUR CIBC 16,342 07/03/2019 Buy 1,965,796 EUR to Sell 245,900,000 JPY BNY Mellon 21,790 07/03/2019 Buy 1,997,863 EUR to Sell 3,130,000 AUD Citigroup 40,829 07/03/2019 Buy 1,100,000 GBP to Sell 1,240,002 EUR Citigroup 41,470 07/03/2019 Buy 1,000,000 GBP to Sell 1,119,760 EUR BNY Mellon 45,215 07/03/2019
Total unrealised gain on open forward foreign exchange contracts 294,311
455 Invesco Funds
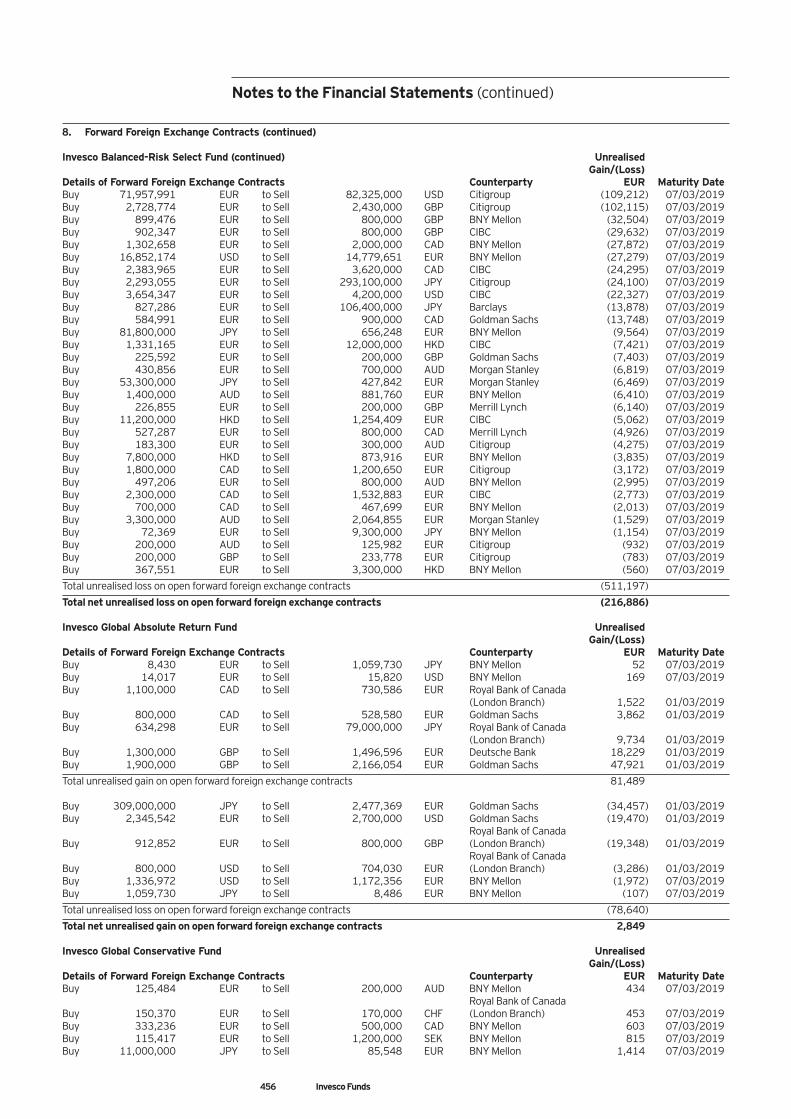
Notes to the Financial Statements (continued)
8. Forward Foreign Exchange Contracts (continued) Invesco Balanced-Risk Select Fund (continued) Unrealised Gain/(Loss) Details of Forward Foreign Exchange Contracts Counterparty EUR Maturity Date Buy 71,957,991 EUR to Sell 82,325,000 USD Citigroup (109,212) 07/03/2019 Buy 2,728,774 EUR to Sell 2,430,000 GBP Citigroup (102,115) 07/03/2019 Buy 899,476 EUR to Sell 800,000 GBP BNY Mellon (32,504) 07/03/2019 Buy 902,347 EUR to Sell 800,000 GBP CIBC (29,632) 07/03/2019 Buy 1,302,658 EUR to Sell 2,000,000 CAD BNY Mellon (27,872) 07/03/2019 Buy 16,852,174 USD to Sell 14,779,651 EUR BNY Mellon (27,279) 07/03/2019 Buy 2,383,965 EUR to Sell 3,620,000 CAD CIBC (24,295) 07/03/2019 Buy 2,293,055 EUR to Sell 293,100,000 JPY Citigroup (24,100) 07/03/2019 Buy 3,654,347 EUR to Sell 4,200,000 USD CIBC (22,327) 07/03/2019 Buy 827,286 EUR to Sell 106,400,000 JPY Barclays (13,878) 07/03/2019 Buy 584,991 EUR to Sell 900,000 CAD Goldman Sachs (13,748) 07/03/2019 Buy 81,800,000 JPY to Sell 656,248 EUR BNY Mellon (9,564) 07/03/2019 Buy 1,331,165 EUR to Sell 12,000,000 HKD CIBC (7,421) 07/03/2019 Buy 225,592 EUR to Sell 200,000 GBP Goldman Sachs (7,403) 07/03/2019 Buy 430,856 EUR to Sell 700,000 AUD Morgan Stanley (6,819) 07/03/2019 Buy 53,300,000 JPY to Sell 427,842 EUR Morgan Stanley (6,469) 07/03/2019 Buy 1,400,000 AUD to Sell 881,760 EUR BNY Mellon (6,410) 07/03/2019 Buy 226,855 EUR to Sell 200,000 GBP Merrill Lynch (6,140) 07/03/2019 Buy 11,200,000 HKD to Sell 1,254,409 EUR CIBC (5,062) 07/03/2019 Buy 527,287 EUR to Sell 800,000 CAD Merrill Lynch (4,926) 07/03/2019 Buy 183,300 EUR to Sell 300,000 AUD Citigroup (4,275) 07/03/2019 Buy 7,800,000 HKD to Sell 873,916 EUR BNY Mellon (3,835) 07/03/2019 Buy 1,800,000 CAD to Sell 1,200,650 EUR Citigroup (3,172) 07/03/2019 Buy 497,206 EUR to Sell 800,000 AUD BNY Mellon (2,995) 07/03/2019 Buy 2,300,000 CAD to Sell 1,532,883 EUR CIBC (2,773) 07/03/2019 Buy 700,000 CAD to Sell 467,699 EUR BNY Mellon (2,013) 07/03/2019 Buy 3,300,000 AUD to Sell 2,064,855 EUR Morgan Stanley (1,529) 07/03/2019 Buy 72,369 EUR to Sell 9,300,000 JPY BNY Mellon (1,154) 07/03/2019 Buy 200,000 AUD to Sell 125,982 EUR Citigroup (932) 07/03/2019 Buy 200,000 GBP to Sell 233,778 EUR Citigroup (783) 07/03/2019 Buy 367,551 EUR to Sell 3,300,000 HKD BNY Mellon (560) 07/03/2019
Total unrealised loss on open forward foreign exchange contracts (511,197)
Total net unrealised loss on open forward foreign exchange contracts (216,886) Invesco Global Absolute Return Fund Unrealised Gain/(Loss) Details of Forward Foreign Exchange Contracts Counterparty EUR Maturity Date Buy 8,430 EUR to Sell 1,059,730 JPY BNY Mellon 52 07/03/2019 Buy 14,017 EUR to Sell 15,820 USD BNY Mellon 169 07/03/2019 Buy 1,100,000 CAD to Sell 730,586 EUR Royal Bank of Canada (London Branch) 1,522 01/03/2019 Buy 800,000 CAD to Sell 528,580 EUR Goldman Sachs 3,862 01/03/2019 Buy 634,298 EUR to Sell 79,000,000 JPY Royal Bank of Canada (London Branch) 9,734 01/03/2019 Buy 1,300,000 GBP to Sell 1,496,596 EUR Deutsche Bank 18,229 01/03/2019 Buy 1,900,000 GBP to Sell 2,166,054 EUR Goldman Sachs 47,921 01/03/2019
Total unrealised gain on open forward foreign exchange contracts 81,489 Buy 309,000,000 JPY to Sell 2,477,369 EUR Goldman Sachs (34,457) 01/03/2019 Buy 2,345,542 EUR to Sell 2,700,000 USD Goldman Sachs (19,470) 01/03/2019 Royal Bank of Canada Buy 912,852 EUR to Sell 800,000 GBP (London Branch) (19,348) 01/03/2019 Royal Bank of Canada Buy 800,000 USD to Sell 704,030 EUR (London Branch) (3,286) 01/03/2019 Buy 1,336,972 USD to Sell 1,172,356 EUR BNY Mellon (1,972) 07/03/2019 Buy 1,059,730 JPY to Sell 8,486 EUR BNY Mellon (107) 07/03/2019
Total unrealised loss on open forward foreign exchange contracts (78,640)
Total net unrealised gain on open forward foreign exchange contracts 2,849 Invesco Global Conservative Fund Unrealised Gain/(Loss) Details of Forward Foreign Exchange Contracts Counterparty EUR Maturity Date Buy 125,484 EUR to Sell 200,000 AUD BNY Mellon 434 07/03/2019 Royal Bank of Canada Buy 150,370 EUR to Sell 170,000 CHF (London Branch) 453 07/03/2019 Buy 333,236 EUR to Sell 500,000 CAD BNY Mellon 603 07/03/2019 Buy 115,417 EUR to Sell 1,200,000 SEK BNY Mellon 815 07/03/2019 Buy 11,000,000 JPY to Sell 85,548 EUR BNY Mellon 1,414 07/03/2019
456 Invesco Funds
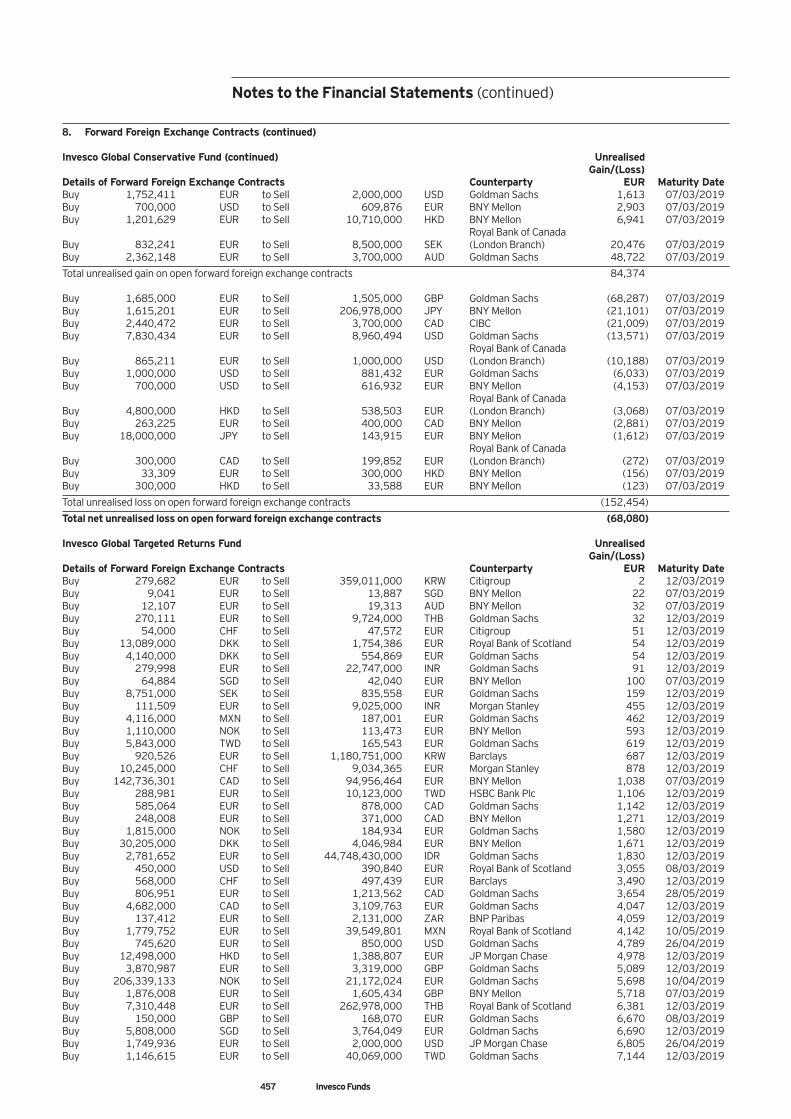
Notes to the Financial Statements (continued)
8. Forward Foreign Exchange Contracts (continued) Invesco Global Conservative Fund (continued) Unrealised Gain/(Loss) Details of Forward Foreign Exchange Contracts Counterparty EUR Maturity Date Buy 1,752,411 EUR to Sell 2,000,000 USD Goldman Sachs 1,613 07/03/2019 Buy 700,000 USD to Sell 609,876 EUR BNY Mellon 2,903 07/03/2019 Buy 1,201,629 EUR to Sell 10,710,000 HKD BNY Mellon 6,941 07/03/2019 Royal Bank of Canada Buy 832,241 EUR to Sell 8,500,000 SEK (London Branch) 20,476 07/03/2019 Buy 2,362,148 EUR to Sell 3,700,000 AUD Goldman Sachs 48,722 07/03/2019
Total unrealised gain on open forward foreign exchange contracts 84,374 Buy 1,685,000 EUR to Sell 1,505,000 GBP Goldman Sachs (68,287) 07/03/2019 Buy 1,615,201 EUR to Sell 206,978,000 JPY BNY Mellon (21,101) 07/03/2019 Buy 2,440,472 EUR to Sell 3,700,000 CAD CIBC (21,009) 07/03/2019 Buy 7,830,434 EUR to Sell 8,960,494 USD Goldman Sachs (13,571) 07/03/2019 Royal Bank of Canada Buy 865,211 EUR to Sell 1,000,000 USD (London Branch) (10,188) 07/03/2019 Buy 1,000,000 USD to Sell 881,432 EUR Goldman Sachs (6,033) 07/03/2019 Buy 700,000 USD to Sell 616,932 EUR BNY Mellon (4,153) 07/03/2019 Royal Bank of Canada Buy 4,800,000 HKD to Sell 538,503 EUR (London Branch) (3,068) 07/03/2019 Buy 263,225 EUR to Sell 400,000 CAD BNY Mellon (2,881) 07/03/2019 Buy 18,000,000 JPY to Sell 143,915 EUR BNY Mellon (1,612) 07/03/2019 Royal Bank of Canada Buy 300,000 CAD to Sell 199,852 EUR (London Branch) (272) 07/03/2019 Buy 33,309 EUR to Sell 300,000 HKD BNY Mellon (156) 07/03/2019 Buy 300,000 HKD to Sell 33,588 EUR BNY Mellon (123) 07/03/2019
Total unrealised loss on open forward foreign exchange contracts (152,454)
Total net unrealised loss on open forward foreign exchange contracts (68,080) Invesco Global Targeted Returns Fund Unrealised Gain/(Loss) Details of Forward Foreign Exchange Contracts Counterparty EUR Maturity Date Buy 279,682 EUR to Sell 359,011,000 KRW Citigroup 2 12/03/2019 Buy 9,041 EUR to Sell 13,887 SGD BNY Mellon 22 07/03/2019 Buy 12,107 EUR to Sell 19,313 AUD BNY Mellon 32 07/03/2019 Buy 270,111 EUR to Sell 9,724,000 THB Goldman Sachs 32 12/03/2019 Buy 54,000 CHF to Sell 47,572 EUR Citigroup 51 12/03/2019 Buy 13,089,000 DKK to Sell 1,754,386 EUR Royal Bank of Scotland 54 12/03/2019 Buy 4,140,000 DKK to Sell 554,869 EUR Goldman Sachs 54 12/03/2019 Buy 279,998 EUR to Sell 22,747,000 INR Goldman Sachs 91 12/03/2019 Buy 64,884 SGD to Sell 42,040 EUR BNY Mellon 100 07/03/2019 Buy 8,751,000 SEK to Sell 835,558 EUR Goldman Sachs 159 12/03/2019 Buy 111,509 EUR to Sell 9,025,000 INR Morgan Stanley 455 12/03/2019 Buy 4,116,000 MXN to Sell 187,001 EUR Goldman Sachs 462 12/03/2019 Buy 1,110,000 NOK to Sell 113,473 EUR BNY Mellon 593 12/03/2019 Buy 5,843,000 TWD to Sell 165,543 EUR Goldman Sachs 619 12/03/2019 Buy 920,526 EUR to Sell 1,180,751,000 KRW Barclays 687 12/03/2019 Buy 10,245,000 CHF to Sell 9,034,365 EUR Morgan Stanley 878 12/03/2019 Buy 142,736,301 CAD to Sell 94,956,464 EUR BNY Mellon 1,038 07/03/2019 Buy 288,981 EUR to Sell 10,123,000 TWD HSBC Bank Plc 1,106 12/03/2019 Buy 585,064 EUR to Sell 878,000 CAD Goldman Sachs 1,142 12/03/2019 Buy 248,008 EUR to Sell 371,000 CAD BNY Mellon 1,271 12/03/2019 Buy 1,815,000 NOK to Sell 184,934 EUR Goldman Sachs 1,580 12/03/2019 Buy 30,205,000 DKK to Sell 4,046,984 EUR BNY Mellon 1,671 12/03/2019 Buy 2,781,652 EUR to Sell 44,748,430,000 IDR Goldman Sachs 1,830 12/03/2019 Buy 450,000 USD to Sell 390,840 EUR Royal Bank of Scotland 3,055 08/03/2019 Buy 568,000 CHF to Sell 497,439 EUR Barclays 3,490 12/03/2019 Buy 806,951 EUR to Sell 1,213,562 CAD Goldman Sachs 3,654 28/05/2019 Buy 4,682,000 CAD to Sell 3,109,763 EUR Goldman Sachs 4,047 12/03/2019 Buy 137,412 EUR to Sell 2,131,000 ZAR BNP Paribas 4,059 12/03/2019 Buy 1,779,752 EUR to Sell 39,549,801 MXN Royal Bank of Scotland 4,142 10/05/2019 Buy 745,620 EUR to Sell 850,000 USD Goldman Sachs 4,789 26/04/2019 Buy 12,498,000 HKD to Sell 1,388,807 EUR JP Morgan Chase 4,978 12/03/2019 Buy 3,870,987 EUR to Sell 3,319,000 GBP Goldman Sachs 5,089 12/03/2019 Buy 206,339,133 NOK to Sell 21,172,024 EUR Goldman Sachs 5,698 10/04/2019 Buy 1,876,008 EUR to Sell 1,605,434 GBP BNY Mellon 5,718 07/03/2019 Buy 7,310,448 EUR to Sell 262,978,000 THB Royal Bank of Scotland 6,381 12/03/2019 Buy 150,000 GBP to Sell 168,070 EUR Goldman Sachs 6,670 08/03/2019 Buy 5,808,000 SGD to Sell 3,764,049 EUR Goldman Sachs 6,690 12/03/2019 Buy 1,749,936 EUR to Sell 2,000,000 USD JP Morgan Chase 6,805 26/04/2019 Buy 1,146,615 EUR to Sell 40,069,000 TWD Goldman Sachs 7,144 12/03/2019
457 Invesco Funds
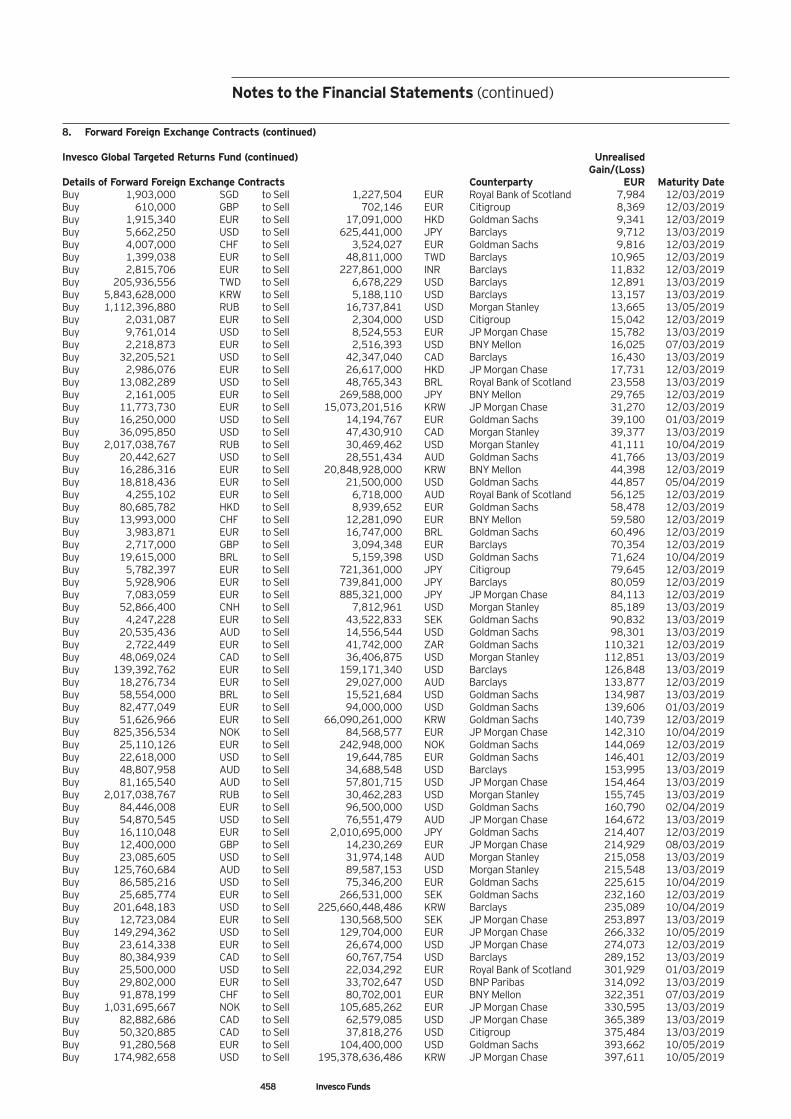
Notes to the Financial Statements (continued)
458 Invesco Funds
8. Forward Foreign Exchange Contracts (continued) Invesco Global Targeted Returns Fund (continued) Unrealised Gain/(Loss) Details of Forward Foreign Exchange Contracts Counterparty EUR Maturity Date Buy 1,903,000 SGD to Sell 1,227,504 EUR Royal Bank of Scotland 7,984 12/03/2019 Buy 610,000 GBP to Sell 702,146 EUR Citigroup 8,369 12/03/2019 Buy 1,915,340 EUR to Sell 17,091,000 HKD Goldman Sachs 9,341 12/03/2019 Buy 5,662,250 USD to Sell 625,441,000 JPY Barclays 9,712 13/03/2019 Buy 4,007,000 CHF to Sell 3,524,027 EUR Goldman Sachs 9,816 12/03/2019 Buy 1,399,038 EUR to Sell 48,811,000 TWD Barclays 10,965 12/03/2019 Buy 2,815,706 EUR to Sell 227,861,000 INR Barclays 11,832 12/03/2019 Buy 205,936,556 TWD to Sell 6,678,229 USD Barclays 12,891 13/03/2019 Buy 5,843,628,000 KRW to Sell 5,188,110 USD Barclays 13,157 13/03/2019 Buy 1,112,396,880 RUB to Sell 16,737,841 USD Morgan Stanley 13,665 13/05/2019 Buy 2,031,087 EUR to Sell 2,304,000 USD Citigroup 15,042 12/03/2019 Buy 9,761,014 USD to Sell 8,524,553 EUR JP Morgan Chase 15,782 13/03/2019 Buy 2,218,873 EUR to Sell 2,516,393 USD BNY Mellon 16,025 07/03/2019 Buy 32,205,521 USD to Sell 42,347,040 CAD Barclays 16,430 13/03/2019 Buy 2,986,076 EUR to Sell 26,617,000 HKD JP Morgan Chase 17,731 12/03/2019 Buy 13,082,289 USD to Sell 48,765,343 BRL Royal Bank of Scotland 23,558 13/03/2019 Buy 2,161,005 EUR to Sell 269,588,000 JPY BNY Mellon 29,765 12/03/2019 Buy 11,773,730 EUR to Sell 15,073,201,516 KRW JP Morgan Chase 31,270 12/03/2019 Buy 16,250,000 USD to Sell 14,194,767 EUR Goldman Sachs 39,100 01/03/2019 Buy 36,095,850 USD to Sell 47,430,910 CAD Morgan Stanley 39,377 13/03/2019 Buy 2,017,038,767 RUB to Sell 30,469,462 USD Morgan Stanley 41,111 10/04/2019 Buy 20,442,627 USD to Sell 28,551,434 AUD Goldman Sachs 41,766 13/03/2019 Buy 16,286,316 EUR to Sell 20,848,928,000 KRW BNY Mellon 44,398 12/03/2019 Buy 18,818,436 EUR to Sell 21,500,000 USD Goldman Sachs 44,857 05/04/2019 Buy 4,255,102 EUR to Sell 6,718,000 AUD Royal Bank of Scotland 56,125 12/03/2019 Buy 80,685,782 HKD to Sell 8,939,652 EUR Goldman Sachs 58,478 12/03/2019 Buy 13,993,000 CHF to Sell 12,281,090 EUR BNY Mellon 59,580 12/03/2019 Buy 3,983,871 EUR to Sell 16,747,000 BRL Goldman Sachs 60,496 12/03/2019 Buy 2,717,000 GBP to Sell 3,094,348 EUR Barclays 70,354 12/03/2019 Buy 19,615,000 BRL to Sell 5,159,398 USD Goldman Sachs 71,624 10/04/2019 Buy 5,782,397 EUR to Sell 721,361,000 JPY Citigroup 79,645 12/03/2019 Buy 5,928,906 EUR to Sell 739,841,000 JPY Barclays 80,059 12/03/2019 Buy 7,083,059 EUR to Sell 885,321,000 JPY JP Morgan Chase 84,113 12/03/2019 Buy 52,866,400 CNH to Sell 7,812,961 USD Morgan Stanley 85,189 13/03/2019 Buy 4,247,228 EUR to Sell 43,522,833 SEK Goldman Sachs 90,832 13/03/2019 Buy 20,535,436 AUD to Sell 14,556,544 USD Goldman Sachs 98,301 13/03/2019 Buy 2,722,449 EUR to Sell 41,742,000 ZAR Goldman Sachs 110,321 12/03/2019 Buy 48,069,024 CAD to Sell 36,406,875 USD Morgan Stanley 112,851 13/03/2019 Buy 139,392,762 EUR to Sell 159,171,340 USD Barclays 126,848 13/03/2019 Buy 18,276,734 EUR to Sell 29,027,000 AUD Barclays 133,877 12/03/2019 Buy 58,554,000 BRL to Sell 15,521,684 USD Goldman Sachs 134,987 13/03/2019 Buy 82,477,049 EUR to Sell 94,000,000 USD Goldman Sachs 139,606 01/03/2019 Buy 51,626,966 EUR to Sell 66,090,261,000 KRW Goldman Sachs 140,739 12/03/2019 Buy 825,356,534 NOK to Sell 84,568,577 EUR JP Morgan Chase 142,310 10/04/2019 Buy 25,110,126 EUR to Sell 242,948,000 NOK Goldman Sachs 144,069 12/03/2019 Buy 22,618,000 USD to Sell 19,644,785 EUR Goldman Sachs 146,401 12/03/2019 Buy 48,807,958 AUD to Sell 34,688,548 USD Barclays 153,995 13/03/2019 Buy 81,165,540 AUD to Sell 57,801,715 USD JP Morgan Chase 154,464 13/03/2019 Buy 2,017,038,767 RUB to Sell 30,462,283 USD Morgan Stanley 155,745 13/03/2019 Buy 84,446,008 EUR to Sell 96,500,000 USD Goldman Sachs 160,790 02/04/2019 Buy 54,870,545 USD to Sell 76,551,479 AUD JP Morgan Chase 164,672 13/03/2019 Buy 16,110,048 EUR to Sell 2,010,695,000 JPY Goldman Sachs 214,407 12/03/2019 Buy 12,400,000 GBP to Sell 14,230,269 EUR JP Morgan Chase 214,929 08/03/2019 Buy 23,085,605 USD to Sell 31,974,148 AUD Morgan Stanley 215,058 13/03/2019 Buy 125,760,684 AUD to Sell 89,587,153 USD Morgan Stanley 215,548 13/03/2019 Buy 86,585,216 USD to Sell 75,346,200 EUR Goldman Sachs 225,615 10/04/2019 Buy 25,685,774 EUR to Sell 266,531,000 SEK Goldman Sachs 232,160 12/03/2019 Buy 201,648,183 USD to Sell 225,660,448,486 KRW Barclays 235,089 10/04/2019 Buy 12,723,084 EUR to Sell 130,568,500 SEK JP Morgan Chase 253,897 13/03/2019 Buy 149,294,362 USD to Sell 129,704,000 EUR JP Morgan Chase 266,332 10/05/2019 Buy 23,614,338 EUR to Sell 26,674,000 USD JP Morgan Chase 274,073 12/03/2019 Buy 80,384,939 CAD to Sell 60,767,754 USD Barclays 289,152 13/03/2019 Buy 25,500,000 USD to Sell 22,034,292 EUR Royal Bank of Scotland 301,929 01/03/2019 Buy 29,802,000 EUR to Sell 33,702,647 USD BNP Paribas 314,092 13/03/2019 Buy 91,878,199 CHF to Sell 80,702,001 EUR BNY Mellon 322,351 07/03/2019 Buy 1,031,695,667 NOK to Sell 105,685,262 EUR JP Morgan Chase 330,595 13/03/2019 Buy 82,882,686 CAD to Sell 62,579,085 USD JP Morgan Chase 365,389 13/03/2019 Buy 50,320,885 CAD to Sell 37,818,276 USD Citigroup 375,484 13/03/2019 Buy 91,280,568 EUR to Sell 104,400,000 USD Goldman Sachs 393,662 10/05/2019 Buy 174,982,658 USD to Sell 195,378,636,486 KRW JP Morgan Chase 397,611 10/05/2019
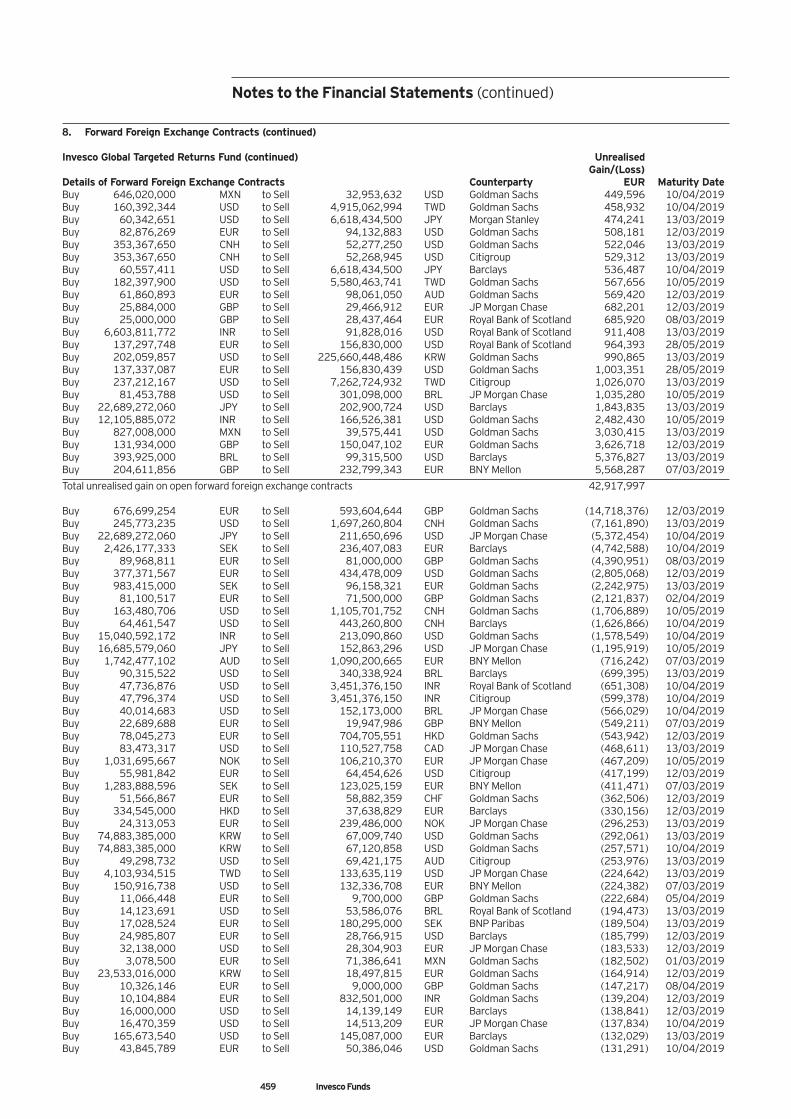
Notes to the Financial Statements (continued)
459 Invesco Funds
8. Forward Foreign Exchange Contracts (continued) Invesco Global Targeted Returns Fund (continued) Unrealised Gain/(Loss) Details of Forward Foreign Exchange Contracts Counterparty EUR Maturity Date Buy 646,020,000 MXN to Sell 32,953,632 USD Goldman Sachs 449,596 10/04/2019 Buy 160,392,344 USD to Sell 4,915,062,994 TWD Goldman Sachs 458,932 10/04/2019 Buy 60,342,651 USD to Sell 6,618,434,500 JPY Morgan Stanley 474,241 13/03/2019 Buy 82,876,269 EUR to Sell 94,132,883 USD Goldman Sachs 508,181 12/03/2019 Buy 353,367,650 CNH to Sell 52,277,250 USD Goldman Sachs 522,046 13/03/2019 Buy 353,367,650 CNH to Sell 52,268,945 USD Citigroup 529,312 13/03/2019 Buy 60,557,411 USD to Sell 6,618,434,500 JPY Barclays 536,487 10/04/2019 Buy 182,397,900 USD to Sell 5,580,463,741 TWD Goldman Sachs 567,656 10/05/2019 Buy 61,860,893 EUR to Sell 98,061,050 AUD Goldman Sachs 569,420 12/03/2019 Buy 25,884,000 GBP to Sell 29,466,912 EUR JP Morgan Chase 682,201 12/03/2019 Buy 25,000,000 GBP to Sell 28,437,464 EUR Royal Bank of Scotland 685,920 08/03/2019 Buy 6,603,811,772 INR to Sell 91,828,016 USD Royal Bank of Scotland 911,408 13/03/2019 Buy 137,297,748 EUR to Sell 156,830,000 USD Royal Bank of Scotland 964,393 28/05/2019 Buy 202,059,857 USD to Sell 225,660,448,486 KRW Goldman Sachs 990,865 13/03/2019 Buy 137,337,087 EUR to Sell 156,830,439 USD Goldman Sachs 1,003,351 28/05/2019 Buy 237,212,167 USD to Sell 7,262,724,932 TWD Citigroup 1,026,070 13/03/2019 Buy 81,453,788 USD to Sell 301,098,000 BRL JP Morgan Chase 1,035,280 10/05/2019 Buy 22,689,272,060 JPY to Sell 202,900,724 USD Barclays 1,843,835 13/03/2019 Buy 12,105,885,072 INR to Sell 166,526,381 USD Goldman Sachs 2,482,430 10/05/2019 Buy 827,008,000 MXN to Sell 39,575,441 USD Goldman Sachs 3,030,415 13/03/2019 Buy 131,934,000 GBP to Sell 150,047,102 EUR Goldman Sachs 3,626,718 12/03/2019 Buy 393,925,000 BRL to Sell 99,315,500 USD Barclays 5,376,827 13/03/2019 Buy 204,611,856 GBP to Sell 232,799,343 EUR BNY Mellon 5,568,287 07/03/2019
Total unrealised gain on open forward foreign exchange contracts 42,917,997 Buy 676,699,254 EUR to Sell 593,604,644 GBP Goldman Sachs (14,718,376) 12/03/2019 Buy 245,773,235 USD to Sell 1,697,260,804 CNH Goldman Sachs (7,161,890) 13/03/2019 Buy 22,689,272,060 JPY to Sell 211,650,696 USD JP Morgan Chase (5,372,454) 10/04/2019 Buy 2,426,177,333 SEK to Sell 236,407,083 EUR Barclays (4,742,588) 10/04/2019 Buy 89,968,811 EUR to Sell 81,000,000 GBP Goldman Sachs (4,390,951) 08/03/2019 Buy 377,371,567 EUR to Sell 434,478,009 USD Goldman Sachs (2,805,068) 12/03/2019 Buy 983,415,000 SEK to Sell 96,158,321 EUR Goldman Sachs (2,242,975) 13/03/2019 Buy 81,100,517 EUR to Sell 71,500,000 GBP Goldman Sachs (2,121,837) 02/04/2019 Buy 163,480,706 USD to Sell 1,105,701,752 CNH Goldman Sachs (1,706,889) 10/05/2019 Buy 64,461,547 USD to Sell 443,260,800 CNH Barclays (1,626,866) 10/04/2019 Buy 15,040,592,172 INR to Sell 213,090,860 USD Goldman Sachs (1,578,549) 10/04/2019 Buy 16,685,579,060 JPY to Sell 152,863,296 USD JP Morgan Chase (1,195,919) 10/05/2019 Buy 1,742,477,102 AUD to Sell 1,090,200,665 EUR BNY Mellon (716,242) 07/03/2019 Buy 90,315,522 USD to Sell 340,338,924 BRL Barclays (699,395) 13/03/2019 Buy 47,736,876 USD to Sell 3,451,376,150 INR Royal Bank of Scotland (651,308) 10/04/2019 Buy 47,796,374 USD to Sell 3,451,376,150 INR Citigroup (599,378) 10/04/2019 Buy 40,014,683 USD to Sell 152,173,000 BRL JP Morgan Chase (566,029) 10/04/2019 Buy 22,689,688 EUR to Sell 19,947,986 GBP BNY Mellon (549,211) 07/03/2019 Buy 78,045,273 EUR to Sell 704,705,551 HKD Goldman Sachs (543,942) 12/03/2019 Buy 83,473,317 USD to Sell 110,527,758 CAD JP Morgan Chase (468,611) 13/03/2019 Buy 1,031,695,667 NOK to Sell 106,210,370 EUR JP Morgan Chase (467,209) 10/05/2019 Buy 55,981,842 EUR to Sell 64,454,626 USD Citigroup (417,199) 12/03/2019 Buy 1,283,888,596 SEK to Sell 123,025,159 EUR BNY Mellon (411,471) 07/03/2019 Buy 51,566,867 EUR to Sell 58,882,359 CHF Goldman Sachs (362,506) 12/03/2019 Buy 334,545,000 HKD to Sell 37,638,829 EUR Barclays (330,156) 12/03/2019 Buy 24,313,053 EUR to Sell 239,486,000 NOK JP Morgan Chase (296,253) 13/03/2019 Buy 74,883,385,000 KRW to Sell 67,009,740 USD Goldman Sachs (292,061) 13/03/2019 Buy 74,883,385,000 KRW to Sell 67,120,858 USD Goldman Sachs (257,571) 10/04/2019 Buy 49,298,732 USD to Sell 69,421,175 AUD Citigroup (253,976) 13/03/2019 Buy 4,103,934,515 TWD to Sell 133,635,119 USD JP Morgan Chase (224,642) 13/03/2019 Buy 150,916,738 USD to Sell 132,336,708 EUR BNY Mellon (224,382) 07/03/2019 Buy 11,066,448 EUR to Sell 9,700,000 GBP Goldman Sachs (222,684) 05/04/2019 Buy 14,123,691 USD to Sell 53,586,076 BRL Royal Bank of Scotland (194,473) 13/03/2019 Buy 17,028,524 EUR to Sell 180,295,000 SEK BNP Paribas (189,504) 13/03/2019 Buy 24,985,807 EUR to Sell 28,766,915 USD Barclays (185,799) 12/03/2019 Buy 32,138,000 USD to Sell 28,304,903 EUR JP Morgan Chase (183,533) 12/03/2019 Buy 3,078,500 EUR to Sell 71,386,641 MXN Goldman Sachs (182,502) 01/03/2019 Buy 23,533,016,000 KRW to Sell 18,497,815 EUR Goldman Sachs (164,914) 12/03/2019 Buy 10,326,146 EUR to Sell 9,000,000 GBP Goldman Sachs (147,217) 08/04/2019 Buy 10,104,884 EUR to Sell 832,501,000 INR Goldman Sachs (139,204) 12/03/2019 Buy 16,000,000 USD to Sell 14,139,149 EUR Barclays (138,841) 12/03/2019 Buy 16,470,359 USD to Sell 14,513,209 EUR JP Morgan Chase (137,834) 10/04/2019 Buy 165,673,540 USD to Sell 145,087,000 EUR Barclays (132,029) 13/03/2019 Buy 43,845,789 EUR to Sell 50,386,046 USD Goldman Sachs (131,291) 10/04/2019
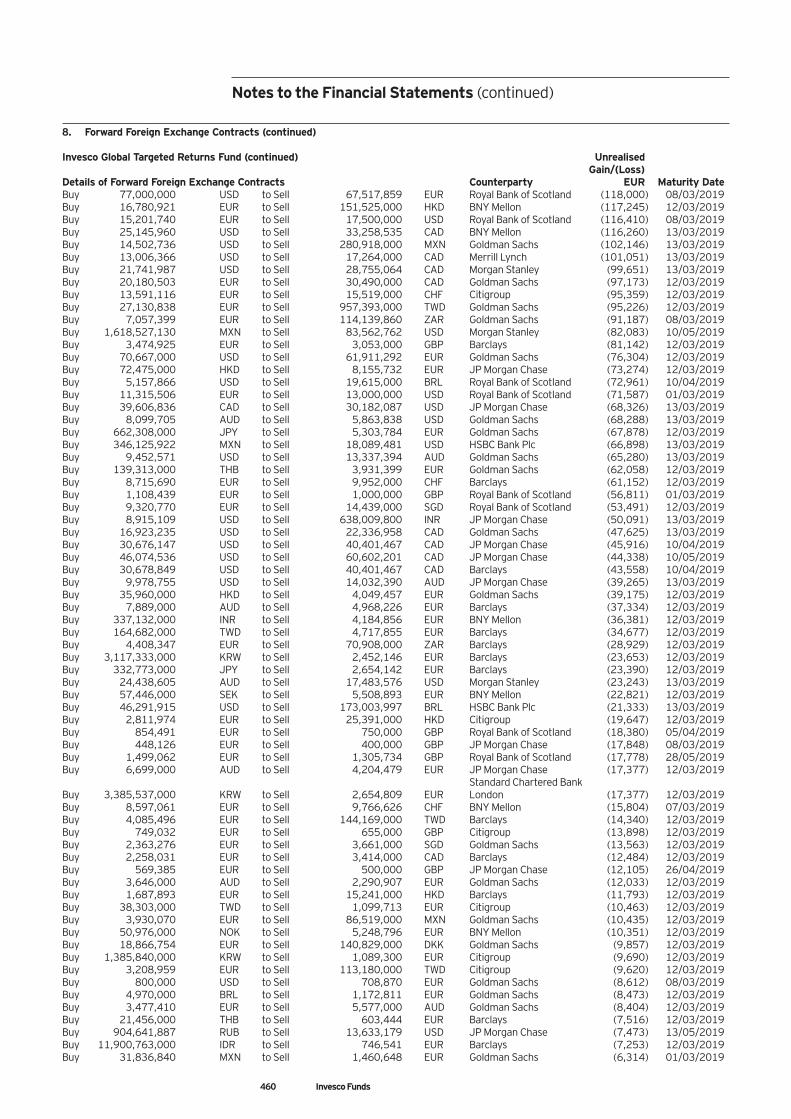
Notes to the Financial Statements (continued)
460 Invesco Funds
8. Forward Foreign Exchange Contracts (continued) Invesco Global Targeted Returns Fund (continued) Unrealised Gain/(Loss) Details of Forward Foreign Exchange Contracts Counterparty EUR Maturity Date Buy 77,000,000 USD to Sell 67,517,859 EUR Royal Bank of Scotland (118,000) 08/03/2019 Buy 16,780,921 EUR to Sell 151,525,000 HKD BNY Mellon (117,245) 12/03/2019 Buy 15,201,740 EUR to Sell 17,500,000 USD Royal Bank of Scotland (116,410) 08/03/2019 Buy 25,145,960 USD to Sell 33,258,535 CAD BNY Mellon (116,260) 13/03/2019 Buy 14,502,736 USD to Sell 280,918,000 MXN Goldman Sachs (102,146) 13/03/2019 Buy 13,006,366 USD to Sell 17,264,000 CAD Merrill Lynch (101,051) 13/03/2019 Buy 21,741,987 USD to Sell 28,755,064 CAD Morgan Stanley (99,651) 13/03/2019 Buy 20,180,503 EUR to Sell 30,490,000 CAD Goldman Sachs (97,173) 12/03/2019 Buy 13,591,116 EUR to Sell 15,519,000 CHF Citigroup (95,359) 12/03/2019 Buy 27,130,838 EUR to Sell 957,393,000 TWD Goldman Sachs (95,226) 12/03/2019 Buy 7,057,399 EUR to Sell 114,139,860 ZAR Goldman Sachs (91,187) 08/03/2019 Buy 1,618,527,130 MXN to Sell 83,562,762 USD Morgan Stanley (82,083) 10/05/2019 Buy 3,474,925 EUR to Sell 3,053,000 GBP Barclays (81,142) 12/03/2019 Buy 70,667,000 USD to Sell 61,911,292 EUR Goldman Sachs (76,304) 12/03/2019 Buy 72,475,000 HKD to Sell 8,155,732 EUR JP Morgan Chase (73,274) 12/03/2019 Buy 5,157,866 USD to Sell 19,615,000 BRL Royal Bank of Scotland (72,961) 10/04/2019 Buy 11,315,506 EUR to Sell 13,000,000 USD Royal Bank of Scotland (71,587) 01/03/2019 Buy 39,606,836 CAD to Sell 30,182,087 USD JP Morgan Chase (68,326) 13/03/2019 Buy 8,099,705 AUD to Sell 5,863,838 USD Goldman Sachs (68,288) 13/03/2019 Buy 662,308,000 JPY to Sell 5,303,784 EUR Goldman Sachs (67,878) 12/03/2019 Buy 346,125,922 MXN to Sell 18,089,481 USD HSBC Bank Plc (66,898) 13/03/2019 Buy 9,452,571 USD to Sell 13,337,394 AUD Goldman Sachs (65,280) 13/03/2019 Buy 139,313,000 THB to Sell 3,931,399 EUR Goldman Sachs (62,058) 12/03/2019 Buy 8,715,690 EUR to Sell 9,952,000 CHF Barclays (61,152) 12/03/2019 Buy 1,108,439 EUR to Sell 1,000,000 GBP Royal Bank of Scotland (56,811) 01/03/2019 Buy 9,320,770 EUR to Sell 14,439,000 SGD Royal Bank of Scotland (53,491) 12/03/2019 Buy 8,915,109 USD to Sell 638,009,800 INR JP Morgan Chase (50,091) 13/03/2019 Buy 16,923,235 USD to Sell 22,336,958 CAD Goldman Sachs (47,625) 13/03/2019 Buy 30,676,147 USD to Sell 40,401,467 CAD JP Morgan Chase (45,916) 10/04/2019 Buy 46,074,536 USD to Sell 60,602,201 CAD JP Morgan Chase (44,338) 10/05/2019 Buy 30,678,849 USD to Sell 40,401,467 CAD Barclays (43,558) 10/04/2019 Buy 9,978,755 USD to Sell 14,032,390 AUD JP Morgan Chase (39,265) 13/03/2019 Buy 35,960,000 HKD to Sell 4,049,457 EUR Goldman Sachs (39,175) 12/03/2019 Buy 7,889,000 AUD to Sell 4,968,226 EUR Barclays (37,334) 12/03/2019 Buy 337,132,000 INR to Sell 4,184,856 EUR BNY Mellon (36,381) 12/03/2019 Buy 164,682,000 TWD to Sell 4,717,855 EUR Barclays (34,677) 12/03/2019 Buy 4,408,347 EUR to Sell 70,908,000 ZAR Barclays (28,929) 12/03/2019 Buy 3,117,333,000 KRW to Sell 2,452,146 EUR Barclays (23,653) 12/03/2019 Buy 332,773,000 JPY to Sell 2,654,142 EUR Barclays (23,390) 12/03/2019 Buy 24,438,605 AUD to Sell 17,483,576 USD Morgan Stanley (23,243) 13/03/2019 Buy 57,446,000 SEK to Sell 5,508,893 EUR BNY Mellon (22,821) 12/03/2019 Buy 46,291,915 USD to Sell 173,003,997 BRL HSBC Bank Plc (21,333) 13/03/2019 Buy 2,811,974 EUR to Sell 25,391,000 HKD Citigroup (19,647) 12/03/2019 Buy 854,491 EUR to Sell 750,000 GBP Royal Bank of Scotland (18,380) 05/04/2019 Buy 448,126 EUR to Sell 400,000 GBP JP Morgan Chase (17,848) 08/03/2019 Buy 1,499,062 EUR to Sell 1,305,734 GBP Royal Bank of Scotland (17,778) 28/05/2019 Buy 6,699,000 AUD to Sell 4,204,479 EUR JP Morgan Chase (17,377) 12/03/2019 Standard Chartered Bank Buy 3,385,537,000 KRW to Sell 2,654,809 EUR London (17,377) 12/03/2019 Buy 8,597,061 EUR to Sell 9,766,626 CHF BNY Mellon (15,804) 07/03/2019 Buy 4,085,496 EUR to Sell 144,169,000 TWD Barclays (14,340) 12/03/2019 Buy 749,032 EUR to Sell 655,000 GBP Citigroup (13,898) 12/03/2019 Buy 2,363,276 EUR to Sell 3,661,000 SGD Goldman Sachs (13,563) 12/03/2019 Buy 2,258,031 EUR to Sell 3,414,000 CAD Barclays (12,484) 12/03/2019 Buy 569,385 EUR to Sell 500,000 GBP JP Morgan Chase (12,105) 26/04/2019 Buy 3,646,000 AUD to Sell 2,290,907 EUR Goldman Sachs (12,033) 12/03/2019 Buy 1,687,893 EUR to Sell 15,241,000 HKD Barclays (11,793) 12/03/2019 Buy 38,303,000 TWD to Sell 1,099,713 EUR Citigroup (10,463) 12/03/2019 Buy 3,930,070 EUR to Sell 86,519,000 MXN Goldman Sachs (10,435) 12/03/2019 Buy 50,976,000 NOK to Sell 5,248,796 EUR BNY Mellon (10,351) 12/03/2019 Buy 18,866,754 EUR to Sell 140,829,000 DKK Goldman Sachs (9,857) 12/03/2019 Buy 1,385,840,000 KRW to Sell 1,089,300 EUR Citigroup (9,690) 12/03/2019 Buy 3,208,959 EUR to Sell 113,180,000 TWD Citigroup (9,620) 12/03/2019 Buy 800,000 USD to Sell 708,870 EUR Goldman Sachs (8,612) 08/03/2019 Buy 4,970,000 BRL to Sell 1,172,811 EUR Goldman Sachs (8,473) 12/03/2019 Buy 3,477,410 EUR to Sell 5,577,000 AUD Goldman Sachs (8,404) 12/03/2019 Buy 21,456,000 THB to Sell 603,444 EUR Barclays (7,516) 12/03/2019 Buy 904,641,887 RUB to Sell 13,633,179 USD JP Morgan Chase (7,473) 13/05/2019 Buy 11,900,763,000 IDR to Sell 746,541 EUR Barclays (7,253) 12/03/2019 Buy 31,836,840 MXN to Sell 1,460,648 EUR Goldman Sachs (6,314) 01/03/2019
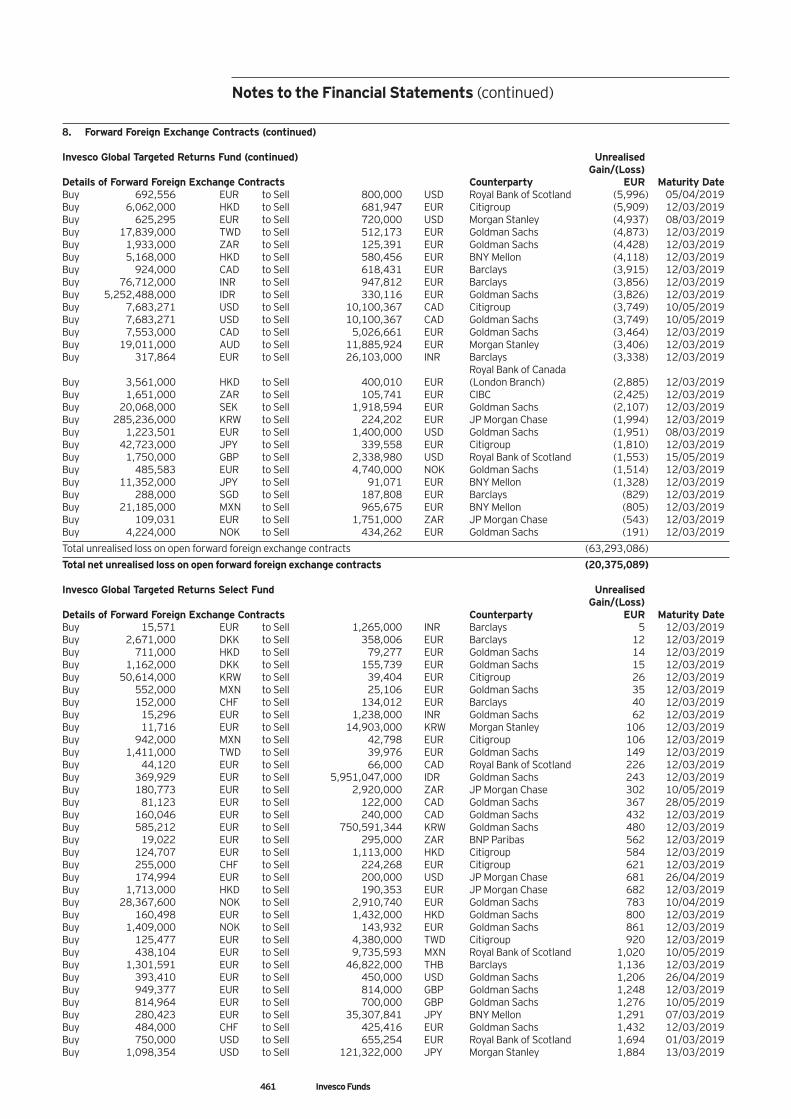
Notes to the Financial Statements (continued)
461 Invesco Funds
8. Forward Foreign Exchange Contracts (continued) Invesco Global Targeted Returns Fund (continued) Unrealised Gain/(Loss) Details of Forward Foreign Exchange Contracts Counterparty EUR Maturity Date Buy 692,556 EUR to Sell 800,000 USD Royal Bank of Scotland (5,996) 05/04/2019 Buy 6,062,000 HKD to Sell 681,947 EUR Citigroup (5,909) 12/03/2019 Buy 625,295 EUR to Sell 720,000 USD Morgan Stanley (4,937) 08/03/2019 Buy 17,839,000 TWD to Sell 512,173 EUR Goldman Sachs (4,873) 12/03/2019 Buy 1,933,000 ZAR to Sell 125,391 EUR Goldman Sachs (4,428) 12/03/2019 Buy 5,168,000 HKD to Sell 580,456 EUR BNY Mellon (4,118) 12/03/2019 Buy 924,000 CAD to Sell 618,431 EUR Barclays (3,915) 12/03/2019 Buy 76,712,000 INR to Sell 947,812 EUR Barclays (3,856) 12/03/2019 Buy 5,252,488,000 IDR to Sell 330,116 EUR Goldman Sachs (3,826) 12/03/2019 Buy 7,683,271 USD to Sell 10,100,367 CAD Citigroup (3,749) 10/05/2019 Buy 7,683,271 USD to Sell 10,100,367 CAD Goldman Sachs (3,749) 10/05/2019 Buy 7,553,000 CAD to Sell 5,026,661 EUR Goldman Sachs (3,464) 12/03/2019 Buy 19,011,000 AUD to Sell 11,885,924 EUR Morgan Stanley (3,406) 12/03/2019 Buy 317,864 EUR to Sell 26,103,000 INR Barclays (3,338) 12/03/2019 Royal Bank of Canada Buy 3,561,000 HKD to Sell 400,010 EUR (London Branch) (2,885) 12/03/2019 Buy 1,651,000 ZAR to Sell 105,741 EUR CIBC (2,425) 12/03/2019 Buy 20,068,000 SEK to Sell 1,918,594 EUR Goldman Sachs (2,107) 12/03/2019 Buy 285,236,000 KRW to Sell 224,202 EUR JP Morgan Chase (1,994) 12/03/2019 Buy 1,223,501 EUR to Sell 1,400,000 USD Goldman Sachs (1,951) 08/03/2019 Buy 42,723,000 JPY to Sell 339,558 EUR Citigroup (1,810) 12/03/2019 Buy 1,750,000 GBP to Sell 2,338,980 USD Royal Bank of Scotland (1,553) 15/05/2019 Buy 485,583 EUR to Sell 4,740,000 NOK Goldman Sachs (1,514) 12/03/2019 Buy 11,352,000 JPY to Sell 91,071 EUR BNY Mellon (1,328) 12/03/2019 Buy 288,000 SGD to Sell 187,808 EUR Barclays (829) 12/03/2019 Buy 21,185,000 MXN to Sell 965,675 EUR BNY Mellon (805) 12/03/2019 Buy 109,031 EUR to Sell 1,751,000 ZAR JP Morgan Chase (543) 12/03/2019 Buy 4,224,000 NOK to Sell 434,262 EUR Goldman Sachs (191) 12/03/2019
Total unrealised loss on open forward foreign exchange contracts (63,293,086)
Total net unrealised loss on open forward foreign exchange contracts (20,375,089) Invesco Global Targeted Returns Select Fund Unrealised Gain/(Loss) Details of Forward Foreign Exchange Contracts Counterparty EUR Maturity Date Buy 15,571 EUR to Sell 1,265,000 INR Barclays 5 12/03/2019 Buy 2,671,000 DKK to Sell 358,006 EUR Barclays 12 12/03/2019 Buy 711,000 HKD to Sell 79,277 EUR Goldman Sachs 14 12/03/2019 Buy 1,162,000 DKK to Sell 155,739 EUR Goldman Sachs 15 12/03/2019 Buy 50,614,000 KRW to Sell 39,404 EUR Citigroup 26 12/03/2019 Buy 552,000 MXN to Sell 25,106 EUR Goldman Sachs 35 12/03/2019 Buy 152,000 CHF to Sell 134,012 EUR Barclays 40 12/03/2019 Buy 15,296 EUR to Sell 1,238,000 INR Goldman Sachs 62 12/03/2019 Buy 11,716 EUR to Sell 14,903,000 KRW Morgan Stanley 106 12/03/2019 Buy 942,000 MXN to Sell 42,798 EUR Citigroup 106 12/03/2019 Buy 1,411,000 TWD to Sell 39,976 EUR Goldman Sachs 149 12/03/2019 Buy 44,120 EUR to Sell 66,000 CAD Royal Bank of Scotland 226 12/03/2019 Buy 369,929 EUR to Sell 5,951,047,000 IDR Goldman Sachs 243 12/03/2019 Buy 180,773 EUR to Sell 2,920,000 ZAR JP Morgan Chase 302 10/05/2019 Buy 81,123 EUR to Sell 122,000 CAD Goldman Sachs 367 28/05/2019 Buy 160,046 EUR to Sell 240,000 CAD Goldman Sachs 432 12/03/2019 Buy 585,212 EUR to Sell 750,591,344 KRW Goldman Sachs 480 12/03/2019 Buy 19,022 EUR to Sell 295,000 ZAR BNP Paribas 562 12/03/2019 Buy 124,707 EUR to Sell 1,113,000 HKD Citigroup 584 12/03/2019 Buy 255,000 CHF to Sell 224,268 EUR Citigroup 621 12/03/2019 Buy 174,994 EUR to Sell 200,000 USD JP Morgan Chase 681 26/04/2019 Buy 1,713,000 HKD to Sell 190,353 EUR JP Morgan Chase 682 12/03/2019 Buy 28,367,600 NOK to Sell 2,910,740 EUR Goldman Sachs 783 10/04/2019 Buy 160,498 EUR to Sell 1,432,000 HKD Goldman Sachs 800 12/03/2019 Buy 1,409,000 NOK to Sell 143,932 EUR Goldman Sachs 861 12/03/2019 Buy 125,477 EUR to Sell 4,380,000 TWD Citigroup 920 12/03/2019 Buy 438,104 EUR to Sell 9,735,593 MXN Royal Bank of Scotland 1,020 10/05/2019 Buy 1,301,591 EUR to Sell 46,822,000 THB Barclays 1,136 12/03/2019 Buy 393,410 EUR to Sell 450,000 USD Goldman Sachs 1,206 26/04/2019 Buy 949,377 EUR to Sell 814,000 GBP Goldman Sachs 1,248 12/03/2019 Buy 814,964 EUR to Sell 700,000 GBP Goldman Sachs 1,276 10/05/2019 Buy 280,423 EUR to Sell 35,307,841 JPY BNY Mellon 1,291 07/03/2019 Buy 484,000 CHF to Sell 425,416 EUR Goldman Sachs 1,432 12/03/2019 Buy 750,000 USD to Sell 655,254 EUR Royal Bank of Scotland 1,694 01/03/2019 Buy 1,098,354 USD to Sell 121,322,000 JPY Morgan Stanley 1,884 13/03/2019
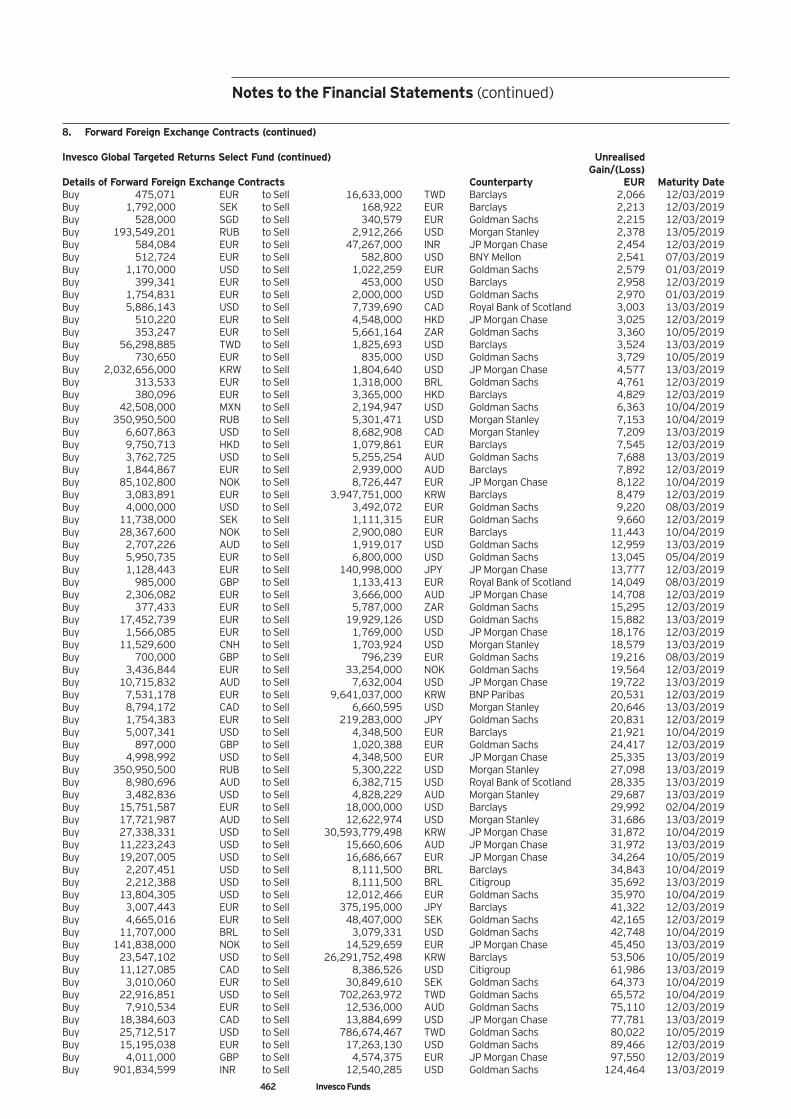
462 Invesco Funds
Notes to the Financial Statements (continued)
8. Forward Foreign Exchange Contracts (continued) Invesco Global Targeted Returns Select Fund (continued) Unrealised Gain/(Loss) Details of Forward Foreign Exchange Contracts Counterparty EUR Maturity Date Buy 475,071 EUR to Sell 16,633,000 TWD Barclays 2,066 12/03/2019 Buy 1,792,000 SEK to Sell 168,922 EUR Barclays 2,213 12/03/2019 Buy 528,000 SGD to Sell 340,579 EUR Goldman Sachs 2,215 12/03/2019 Buy 193,549,201 RUB to Sell 2,912,266 USD Morgan Stanley 2,378 13/05/2019 Buy 584,084 EUR to Sell 47,267,000 INR JP Morgan Chase 2,454 12/03/2019 Buy 512,724 EUR to Sell 582,800 USD BNY Mellon 2,541 07/03/2019 Buy 1,170,000 USD to Sell 1,022,259 EUR Goldman Sachs 2,579 01/03/2019 Buy 399,341 EUR to Sell 453,000 USD Barclays 2,958 12/03/2019 Buy 1,754,831 EUR to Sell 2,000,000 USD Goldman Sachs 2,970 01/03/2019 Buy 5,886,143 USD to Sell 7,739,690 CAD Royal Bank of Scotland 3,003 13/03/2019 Buy 510,220 EUR to Sell 4,548,000 HKD JP Morgan Chase 3,025 12/03/2019 Buy 353,247 EUR to Sell 5,661,164 ZAR Goldman Sachs 3,360 10/05/2019 Buy 56,298,885 TWD to Sell 1,825,693 USD Barclays 3,524 13/03/2019 Buy 730,650 EUR to Sell 835,000 USD Goldman Sachs 3,729 10/05/2019 Buy 2,032,656,000 KRW to Sell 1,804,640 USD JP Morgan Chase 4,577 13/03/2019 Buy 313,533 EUR to Sell 1,318,000 BRL Goldman Sachs 4,761 12/03/2019 Buy 380,096 EUR to Sell 3,365,000 HKD Barclays 4,829 12/03/2019 Buy 42,508,000 MXN to Sell 2,194,947 USD Goldman Sachs 6,363 10/04/2019 Buy 350,950,500 RUB to Sell 5,301,471 USD Morgan Stanley 7,153 10/04/2019 Buy 6,607,863 USD to Sell 8,682,908 CAD Morgan Stanley 7,209 13/03/2019 Buy 9,750,713 HKD to Sell 1,079,861 EUR Barclays 7,545 12/03/2019 Buy 3,762,725 USD to Sell 5,255,254 AUD Goldman Sachs 7,688 13/03/2019 Buy 1,844,867 EUR to Sell 2,939,000 AUD Barclays 7,892 12/03/2019 Buy 85,102,800 NOK to Sell 8,726,447 EUR JP Morgan Chase 8,122 10/04/2019 Buy 3,083,891 EUR to Sell 3,947,751,000 KRW Barclays 8,479 12/03/2019 Buy 4,000,000 USD to Sell 3,492,072 EUR Goldman Sachs 9,220 08/03/2019 Buy 11,738,000 SEK to Sell 1,111,315 EUR Goldman Sachs 9,660 12/03/2019 Buy 28,367,600 NOK to Sell 2,900,080 EUR Barclays 11,443 10/04/2019 Buy 2,707,226 AUD to Sell 1,919,017 USD Goldman Sachs 12,959 13/03/2019 Buy 5,950,735 EUR to Sell 6,800,000 USD Goldman Sachs 13,045 05/04/2019 Buy 1,128,443 EUR to Sell 140,998,000 JPY JP Morgan Chase 13,777 12/03/2019 Buy 985,000 GBP to Sell 1,133,413 EUR Royal Bank of Scotland 14,049 08/03/2019 Buy 2,306,082 EUR to Sell 3,666,000 AUD JP Morgan Chase 14,708 12/03/2019 Buy 377,433 EUR to Sell 5,787,000 ZAR Goldman Sachs 15,295 12/03/2019 Buy 17,452,739 EUR to Sell 19,929,126 USD Goldman Sachs 15,882 13/03/2019 Buy 1,566,085 EUR to Sell 1,769,000 USD JP Morgan Chase 18,176 12/03/2019 Buy 11,529,600 CNH to Sell 1,703,924 USD Morgan Stanley 18,579 13/03/2019 Buy 700,000 GBP to Sell 796,239 EUR Goldman Sachs 19,216 08/03/2019 Buy 3,436,844 EUR to Sell 33,254,000 NOK Goldman Sachs 19,564 12/03/2019 Buy 10,715,832 AUD to Sell 7,632,004 USD JP Morgan Chase 19,722 13/03/2019 Buy 7,531,178 EUR to Sell 9,641,037,000 KRW BNP Paribas 20,531 12/03/2019 Buy 8,794,172 CAD to Sell 6,660,595 USD Morgan Stanley 20,646 13/03/2019 Buy 1,754,383 EUR to Sell 219,283,000 JPY Goldman Sachs 20,831 12/03/2019 Buy 5,007,341 USD to Sell 4,348,500 EUR Barclays 21,921 10/04/2019 Buy 897,000 GBP to Sell 1,020,388 EUR Goldman Sachs 24,417 12/03/2019 Buy 4,998,992 USD to Sell 4,348,500 EUR JP Morgan Chase 25,335 13/03/2019 Buy 350,950,500 RUB to Sell 5,300,222 USD Morgan Stanley 27,098 13/03/2019 Buy 8,980,696 AUD to Sell 6,382,715 USD Royal Bank of Scotland 28,335 13/03/2019 Buy 3,482,836 USD to Sell 4,828,229 AUD Morgan Stanley 29,687 13/03/2019 Buy 15,751,587 EUR to Sell 18,000,000 USD Barclays 29,992 02/04/2019 Buy 17,721,987 AUD to Sell 12,622,974 USD Morgan Stanley 31,686 13/03/2019 Buy 27,338,331 USD to Sell 30,593,779,498 KRW JP Morgan Chase 31,872 10/04/2019 Buy 11,223,243 USD to Sell 15,660,606 AUD JP Morgan Chase 31,972 13/03/2019 Buy 19,207,005 USD to Sell 16,686,667 EUR JP Morgan Chase 34,264 10/05/2019 Buy 2,207,451 USD to Sell 8,111,500 BRL Barclays 34,843 10/04/2019 Buy 2,212,388 USD to Sell 8,111,500 BRL Citigroup 35,692 13/03/2019 Buy 13,804,305 USD to Sell 12,012,466 EUR Goldman Sachs 35,970 10/04/2019 Buy 3,007,443 EUR to Sell 375,195,000 JPY Barclays 41,322 12/03/2019 Buy 4,665,016 EUR to Sell 48,407,000 SEK Goldman Sachs 42,165 12/03/2019 Buy 11,707,000 BRL to Sell 3,079,331 USD Goldman Sachs 42,748 10/04/2019 Buy 141,838,000 NOK to Sell 14,529,659 EUR JP Morgan Chase 45,450 13/03/2019 Buy 23,547,102 USD to Sell 26,291,752,498 KRW Barclays 53,506 10/05/2019 Buy 11,127,085 CAD to Sell 8,386,526 USD Citigroup 61,986 13/03/2019 Buy 3,010,060 EUR to Sell 30,849,610 SEK Goldman Sachs 64,373 10/04/2019 Buy 22,916,851 USD to Sell 702,263,972 TWD Goldman Sachs 65,572 10/04/2019 Buy 7,910,534 EUR to Sell 12,536,000 AUD Goldman Sachs 75,110 12/03/2019 Buy 18,384,603 CAD to Sell 13,884,699 USD JP Morgan Chase 77,781 13/03/2019 Buy 25,712,517 USD to Sell 786,674,467 TWD Goldman Sachs 80,022 10/05/2019 Buy 15,195,038 EUR to Sell 17,263,130 USD Goldman Sachs 89,466 12/03/2019 Buy 4,011,000 GBP to Sell 4,574,375 EUR JP Morgan Chase 97,550 12/03/2019 Buy 901,834,599 INR to Sell 12,540,285 USD Goldman Sachs 124,464 13/03/2019
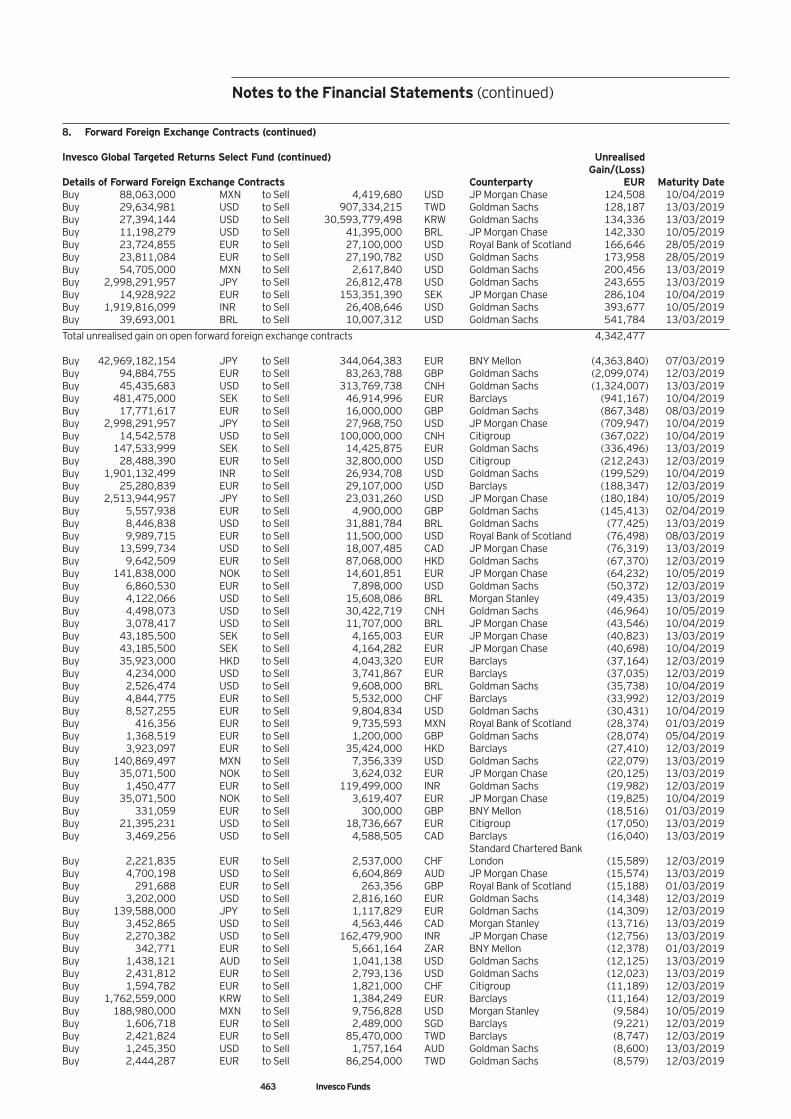
Notes to the Financial Statements (continued)
463 Invesco Funds
8. Forward Foreign Exchange Contracts (continued) Invesco Global Targeted Returns Select Fund (continued) Unrealised Gain/(Loss) Details of Forward Foreign Exchange Contracts Counterparty EUR Maturity Date Buy 88,063,000 MXN to Sell 4,419,680 USD JP Morgan Chase 124,508 10/04/2019 Buy 29,634,981 USD to Sell 907,334,215 TWD Goldman Sachs 128,187 13/03/2019 Buy 27,394,144 USD to Sell 30,593,779,498 KRW Goldman Sachs 134,336 13/03/2019 Buy 11,198,279 USD to Sell 41,395,000 BRL JP Morgan Chase 142,330 10/05/2019 Buy 23,724,855 EUR to Sell 27,100,000 USD Royal Bank of Scotland 166,646 28/05/2019 Buy 23,811,084 EUR to Sell 27,190,782 USD Goldman Sachs 173,958 28/05/2019 Buy 54,705,000 MXN to Sell 2,617,840 USD Goldman Sachs 200,456 13/03/2019 Buy 2,998,291,957 JPY to Sell 26,812,478 USD Goldman Sachs 243,655 13/03/2019 Buy 14,928,922 EUR to Sell 153,351,390 SEK JP Morgan Chase 286,104 10/04/2019 Buy 1,919,816,099 INR to Sell 26,408,646 USD Goldman Sachs 393,677 10/05/2019 Buy 39,693,001 BRL to Sell 10,007,312 USD Goldman Sachs 541,784 13/03/2019
Total unrealised gain on open forward foreign exchange contracts 4,342,477 Buy 42,969,182,154 JPY to Sell 344,064,383 EUR BNY Mellon (4,363,840) 07/03/2019 Buy 94,884,755 EUR to Sell 83,263,788 GBP Goldman Sachs (2,099,074) 12/03/2019 Buy 45,435,683 USD to Sell 313,769,738 CNH Goldman Sachs (1,324,007) 13/03/2019 Buy 481,475,000 SEK to Sell 46,914,996 EUR Barclays (941,167) 10/04/2019 Buy 17,771,617 EUR to Sell 16,000,000 GBP Goldman Sachs (867,348) 08/03/2019 Buy 2,998,291,957 JPY to Sell 27,968,750 USD JP Morgan Chase (709,947) 10/04/2019 Buy 14,542,578 USD to Sell 100,000,000 CNH Citigroup (367,022) 10/04/2019 Buy 147,533,999 SEK to Sell 14,425,875 EUR Goldman Sachs (336,496) 13/03/2019 Buy 28,488,390 EUR to Sell 32,800,000 USD Citigroup (212,243) 12/03/2019 Buy 1,901,132,499 INR to Sell 26,934,708 USD Goldman Sachs (199,529) 10/04/2019 Buy 25,280,839 EUR to Sell 29,107,000 USD Barclays (188,347) 12/03/2019 Buy 2,513,944,957 JPY to Sell 23,031,260 USD JP Morgan Chase (180,184) 10/05/2019 Buy 5,557,938 EUR to Sell 4,900,000 GBP Goldman Sachs (145,413) 02/04/2019 Buy 8,446,838 USD to Sell 31,881,784 BRL Goldman Sachs (77,425) 13/03/2019 Buy 9,989,715 EUR to Sell 11,500,000 USD Royal Bank of Scotland (76,498) 08/03/2019 Buy 13,599,734 USD to Sell 18,007,485 CAD JP Morgan Chase (76,319) 13/03/2019 Buy 9,642,509 EUR to Sell 87,068,000 HKD Goldman Sachs (67,370) 12/03/2019 Buy 141,838,000 NOK to Sell 14,601,851 EUR JP Morgan Chase (64,232) 10/05/2019 Buy 6,860,530 EUR to Sell 7,898,000 USD Goldman Sachs (50,372) 12/03/2019 Buy 4,122,066 USD to Sell 15,608,086 BRL Morgan Stanley (49,435) 13/03/2019 Buy 4,498,073 USD to Sell 30,422,719 CNH Goldman Sachs (46,964) 10/05/2019 Buy 3,078,417 USD to Sell 11,707,000 BRL JP Morgan Chase (43,546) 10/04/2019 Buy 43,185,500 SEK to Sell 4,165,003 EUR JP Morgan Chase (40,823) 13/03/2019 Buy 43,185,500 SEK to Sell 4,164,282 EUR JP Morgan Chase (40,698) 10/04/2019 Buy 35,923,000 HKD to Sell 4,043,320 EUR Barclays (37,164) 12/03/2019 Buy 4,234,000 USD to Sell 3,741,867 EUR Barclays (37,035) 12/03/2019 Buy 2,526,474 USD to Sell 9,608,000 BRL Goldman Sachs (35,738) 10/04/2019 Buy 4,844,775 EUR to Sell 5,532,000 CHF Barclays (33,992) 12/03/2019 Buy 8,527,255 EUR to Sell 9,804,834 USD Goldman Sachs (30,431) 10/04/2019 Buy 416,356 EUR to Sell 9,735,593 MXN Royal Bank of Scotland (28,374) 01/03/2019 Buy 1,368,519 EUR to Sell 1,200,000 GBP Goldman Sachs (28,074) 05/04/2019 Buy 3,923,097 EUR to Sell 35,424,000 HKD Barclays (27,410) 12/03/2019 Buy 140,869,497 MXN to Sell 7,356,339 USD Goldman Sachs (22,079) 13/03/2019 Buy 35,071,500 NOK to Sell 3,624,032 EUR JP Morgan Chase (20,125) 13/03/2019 Buy 1,450,477 EUR to Sell 119,499,000 INR Goldman Sachs (19,982) 12/03/2019 Buy 35,071,500 NOK to Sell 3,619,407 EUR JP Morgan Chase (19,825) 10/04/2019 Buy 331,059 EUR to Sell 300,000 GBP BNY Mellon (18,516) 01/03/2019 Buy 21,395,231 USD to Sell 18,736,667 EUR Citigroup (17,050) 13/03/2019 Buy 3,469,256 USD to Sell 4,588,505 CAD Barclays (16,040) 13/03/2019 Standard Chartered Bank Buy 2,221,835 EUR to Sell 2,537,000 CHF London (15,589) 12/03/2019 Buy 4,700,198 USD to Sell 6,604,869 AUD JP Morgan Chase (15,574) 13/03/2019 Buy 291,688 EUR to Sell 263,356 GBP Royal Bank of Scotland (15,188) 01/03/2019 Buy 3,202,000 USD to Sell 2,816,160 EUR Goldman Sachs (14,348) 12/03/2019 Buy 139,588,000 JPY to Sell 1,117,829 EUR Goldman Sachs (14,309) 12/03/2019 Buy 3,452,865 USD to Sell 4,563,446 CAD Morgan Stanley (13,716) 13/03/2019 Buy 2,270,382 USD to Sell 162,479,900 INR JP Morgan Chase (12,756) 13/03/2019 Buy 342,771 EUR to Sell 5,661,164 ZAR BNY Mellon (12,378) 01/03/2019 Buy 1,438,121 AUD to Sell 1,041,138 USD Goldman Sachs (12,125) 13/03/2019 Buy 2,431,812 EUR to Sell 2,793,136 USD Goldman Sachs (12,023) 13/03/2019 Buy 1,594,782 EUR to Sell 1,821,000 CHF Citigroup (11,189) 12/03/2019 Buy 1,762,559,000 KRW to Sell 1,384,249 EUR Barclays (11,164) 12/03/2019 Buy 188,980,000 MXN to Sell 9,756,828 USD Morgan Stanley (9,584) 10/05/2019 Buy 1,606,718 EUR to Sell 2,489,000 SGD Barclays (9,221) 12/03/2019 Buy 2,421,824 EUR to Sell 85,470,000 TWD Barclays (8,747) 12/03/2019 Buy 1,245,350 USD to Sell 1,757,164 AUD Goldman Sachs (8,600) 13/03/2019 Buy 2,444,287 EUR to Sell 86,254,000 TWD Goldman Sachs (8,579) 12/03/2019
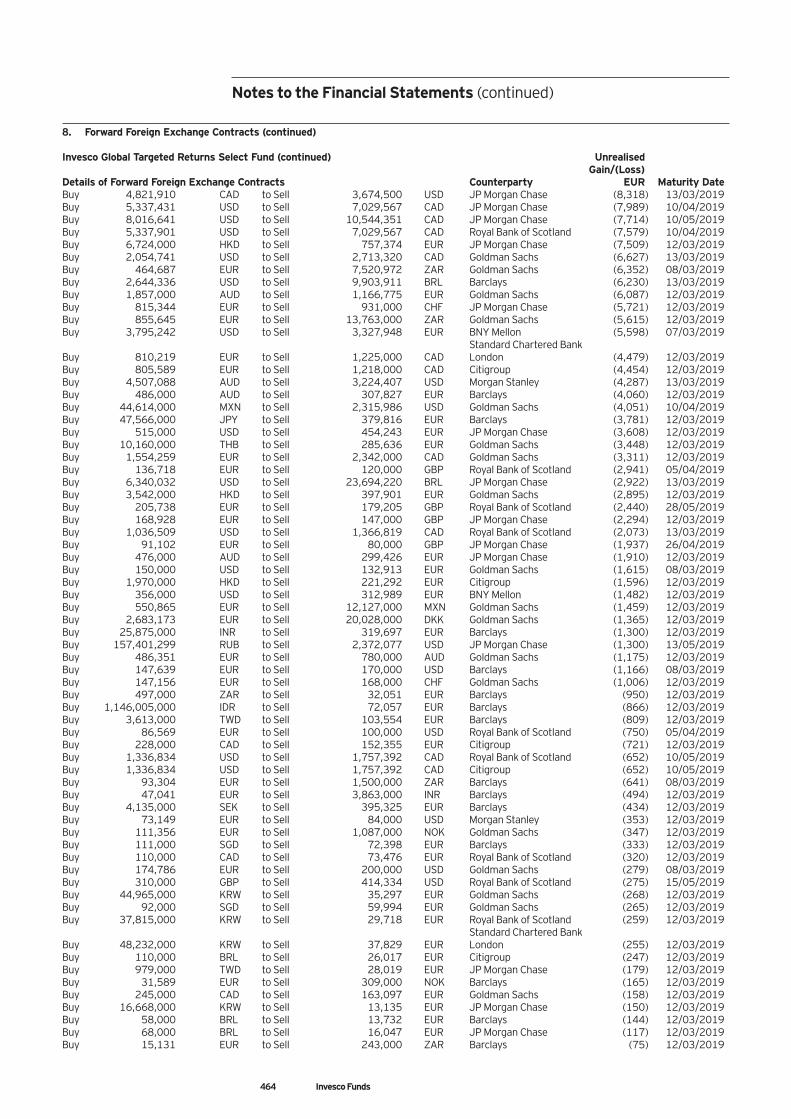
464 Invesco Funds
Notes to the Financial Statements (continued)
8. Forward Foreign Exchange Contracts (continued) Invesco Global Targeted Returns Select Fund (continued) Unrealised Gain/(Loss) Details of Forward Foreign Exchange Contracts Counterparty EUR Maturity Date Buy 4,821,910 CAD to Sell 3,674,500 USD JP Morgan Chase (8,318) 13/03/2019 Buy 5,337,431 USD to Sell 7,029,567 CAD JP Morgan Chase (7,989) 10/04/2019 Buy 8,016,641 USD to Sell 10,544,351 CAD JP Morgan Chase (7,714) 10/05/2019 Buy 5,337,901 USD to Sell 7,029,567 CAD Royal Bank of Scotland (7,579) 10/04/2019 Buy 6,724,000 HKD to Sell 757,374 EUR JP Morgan Chase (7,509) 12/03/2019 Buy 2,054,741 USD to Sell 2,713,320 CAD Goldman Sachs (6,627) 13/03/2019 Buy 464,687 EUR to Sell 7,520,972 ZAR Goldman Sachs (6,352) 08/03/2019 Buy 2,644,336 USD to Sell 9,903,911 BRL Barclays (6,230) 13/03/2019 Buy 1,857,000 AUD to Sell 1,166,775 EUR Goldman Sachs (6,087) 12/03/2019 Buy 815,344 EUR to Sell 931,000 CHF JP Morgan Chase (5,721) 12/03/2019 Buy 855,645 EUR to Sell 13,763,000 ZAR Goldman Sachs (5,615) 12/03/2019 Buy 3,795,242 USD to Sell 3,327,948 EUR BNY Mellon (5,598) 07/03/2019 Standard Chartered Bank Buy 810,219 EUR to Sell 1,225,000 CAD London (4,479) 12/03/2019 Buy 805,589 EUR to Sell 1,218,000 CAD Citigroup (4,454) 12/03/2019 Buy 4,507,088 AUD to Sell 3,224,407 USD Morgan Stanley (4,287) 13/03/2019 Buy 486,000 AUD to Sell 307,827 EUR Barclays (4,060) 12/03/2019 Buy 44,614,000 MXN to Sell 2,315,986 USD Goldman Sachs (4,051) 10/04/2019 Buy 47,566,000 JPY to Sell 379,816 EUR Barclays (3,781) 12/03/2019 Buy 515,000 USD to Sell 454,243 EUR JP Morgan Chase (3,608) 12/03/2019 Buy 10,160,000 THB to Sell 285,636 EUR Goldman Sachs (3,448) 12/03/2019 Buy 1,554,259 EUR to Sell 2,342,000 CAD Goldman Sachs (3,311) 12/03/2019 Buy 136,718 EUR to Sell 120,000 GBP Royal Bank of Scotland (2,941) 05/04/2019 Buy 6,340,032 USD to Sell 23,694,220 BRL JP Morgan Chase (2,922) 13/03/2019 Buy 3,542,000 HKD to Sell 397,901 EUR Goldman Sachs (2,895) 12/03/2019 Buy 205,738 EUR to Sell 179,205 GBP Royal Bank of Scotland (2,440) 28/05/2019 Buy 168,928 EUR to Sell 147,000 GBP JP Morgan Chase (2,294) 12/03/2019 Buy 1,036,509 USD to Sell 1,366,819 CAD Royal Bank of Scotland (2,073) 13/03/2019 Buy 91,102 EUR to Sell 80,000 GBP JP Morgan Chase (1,937) 26/04/2019 Buy 476,000 AUD to Sell 299,426 EUR JP Morgan Chase (1,910) 12/03/2019 Buy 150,000 USD to Sell 132,913 EUR Goldman Sachs (1,615) 08/03/2019 Buy 1,970,000 HKD to Sell 221,292 EUR Citigroup (1,596) 12/03/2019 Buy 356,000 USD to Sell 312,989 EUR BNY Mellon (1,482) 12/03/2019 Buy 550,865 EUR to Sell 12,127,000 MXN Goldman Sachs (1,459) 12/03/2019 Buy 2,683,173 EUR to Sell 20,028,000 DKK Goldman Sachs (1,365) 12/03/2019 Buy 25,875,000 INR to Sell 319,697 EUR Barclays (1,300) 12/03/2019 Buy 157,401,299 RUB to Sell 2,372,077 USD JP Morgan Chase (1,300) 13/05/2019 Buy 486,351 EUR to Sell 780,000 AUD Goldman Sachs (1,175) 12/03/2019 Buy 147,639 EUR to Sell 170,000 USD Barclays (1,166) 08/03/2019 Buy 147,156 EUR to Sell 168,000 CHF Goldman Sachs (1,006) 12/03/2019 Buy 497,000 ZAR to Sell 32,051 EUR Barclays (950) 12/03/2019 Buy 1,146,005,000 IDR to Sell 72,057 EUR Barclays (866) 12/03/2019 Buy 3,613,000 TWD to Sell 103,554 EUR Barclays (809) 12/03/2019 Buy 86,569 EUR to Sell 100,000 USD Royal Bank of Scotland (750) 05/04/2019 Buy 228,000 CAD to Sell 152,355 EUR Citigroup (721) 12/03/2019 Buy 1,336,834 USD to Sell 1,757,392 CAD Royal Bank of Scotland (652) 10/05/2019 Buy 1,336,834 USD to Sell 1,757,392 CAD Citigroup (652) 10/05/2019 Buy 93,304 EUR to Sell 1,500,000 ZAR Barclays (641) 08/03/2019 Buy 47,041 EUR to Sell 3,863,000 INR Barclays (494) 12/03/2019 Buy 4,135,000 SEK to Sell 395,325 EUR Barclays (434) 12/03/2019 Buy 73,149 EUR to Sell 84,000 USD Morgan Stanley (353) 12/03/2019 Buy 111,356 EUR to Sell 1,087,000 NOK Goldman Sachs (347) 12/03/2019 Buy 111,000 SGD to Sell 72,398 EUR Barclays (333) 12/03/2019 Buy 110,000 CAD to Sell 73,476 EUR Royal Bank of Scotland (320) 12/03/2019 Buy 174,786 EUR to Sell 200,000 USD Goldman Sachs (279) 08/03/2019 Buy 310,000 GBP to Sell 414,334 USD Royal Bank of Scotland (275) 15/05/2019 Buy 44,965,000 KRW to Sell 35,297 EUR Goldman Sachs (268) 12/03/2019 Buy 92,000 SGD to Sell 59,994 EUR Goldman Sachs (265) 12/03/2019 Buy 37,815,000 KRW to Sell 29,718 EUR Royal Bank of Scotland (259) 12/03/2019 Standard Chartered Bank Buy 48,232,000 KRW to Sell 37,829 EUR London (255) 12/03/2019 Buy 110,000 BRL to Sell 26,017 EUR Citigroup (247) 12/03/2019 Buy 979,000 TWD to Sell 28,019 EUR JP Morgan Chase (179) 12/03/2019 Buy 31,589 EUR to Sell 309,000 NOK Barclays (165) 12/03/2019 Buy 245,000 CAD to Sell 163,097 EUR Goldman Sachs (158) 12/03/2019 Buy 16,668,000 KRW to Sell 13,135 EUR JP Morgan Chase (150) 12/03/2019 Buy 58,000 BRL to Sell 13,732 EUR Barclays (144) 12/03/2019 Buy 68,000 BRL to Sell 16,047 EUR JP Morgan Chase (117) 12/03/2019 Buy 15,131 EUR to Sell 243,000 ZAR Barclays (75) 12/03/2019
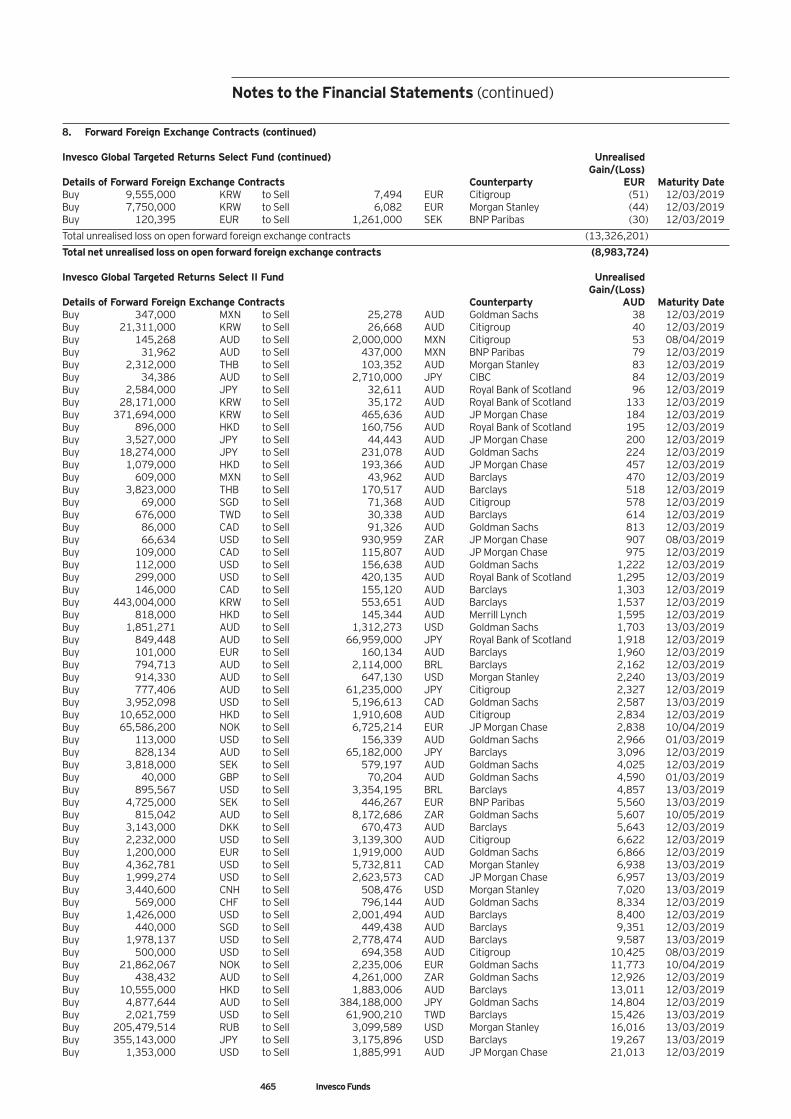
Notes to the Financial Statements (continued)
465 Invesco Funds
8. Forward Foreign Exchange Contracts (continued) Invesco Global Targeted Returns Select Fund (continued) Unrealised Gain/(Loss) Details of Forward Foreign Exchange Contracts Counterparty EUR Maturity Date Buy 9,555,000 KRW to Sell 7,494 EUR Citigroup (51) 12/03/2019 Buy 7,750,000 KRW to Sell 6,082 EUR Morgan Stanley (44) 12/03/2019 Buy 120,395 EUR to Sell 1,261,000 SEK BNP Paribas (30) 12/03/2019
Total unrealised loss on open forward foreign exchange contracts (13,326,201)
Total net unrealised loss on open forward foreign exchange contracts (8,983,724) Invesco Global Targeted Returns Select II Fund Unrealised Gain/(Loss) Details of Forward Foreign Exchange Contracts Counterparty AUD Maturity Date Buy 347,000 MXN to Sell 25,278 AUD Goldman Sachs 38 12/03/2019 Buy 21,311,000 KRW to Sell 26,668 AUD Citigroup 40 12/03/2019 Buy 145,268 AUD to Sell 2,000,000 MXN Citigroup 53 08/04/2019 Buy 31,962 AUD to Sell 437,000 MXN BNP Paribas 79 12/03/2019 Buy 2,312,000 THB to Sell 103,352 AUD Morgan Stanley 83 12/03/2019 Buy 34,386 AUD to Sell 2,710,000 JPY CIBC 84 12/03/2019 Buy 2,584,000 JPY to Sell 32,611 AUD Royal Bank of Scotland 96 12/03/2019 Buy 28,171,000 KRW to Sell 35,172 AUD Royal Bank of Scotland 133 12/03/2019 Buy 371,694,000 KRW to Sell 465,636 AUD JP Morgan Chase 184 12/03/2019 Buy 896,000 HKD to Sell 160,756 AUD Royal Bank of Scotland 195 12/03/2019 Buy 3,527,000 JPY to Sell 44,443 AUD JP Morgan Chase 200 12/03/2019 Buy 18,274,000 JPY to Sell 231,078 AUD Goldman Sachs 224 12/03/2019 Buy 1,079,000 HKD to Sell 193,366 AUD JP Morgan Chase 457 12/03/2019 Buy 609,000 MXN to Sell 43,962 AUD Barclays 470 12/03/2019 Buy 3,823,000 THB to Sell 170,517 AUD Barclays 518 12/03/2019 Buy 69,000 SGD to Sell 71,368 AUD Citigroup 578 12/03/2019 Buy 676,000 TWD to Sell 30,338 AUD Barclays 614 12/03/2019 Buy 86,000 CAD to Sell 91,326 AUD Goldman Sachs 813 12/03/2019 Buy 66,634 USD to Sell 930,959 ZAR JP Morgan Chase 907 08/03/2019 Buy 109,000 CAD to Sell 115,807 AUD JP Morgan Chase 975 12/03/2019 Buy 112,000 USD to Sell 156,638 AUD Goldman Sachs 1,222 12/03/2019 Buy 299,000 USD to Sell 420,135 AUD Royal Bank of Scotland 1,295 12/03/2019 Buy 146,000 CAD to Sell 155,120 AUD Barclays 1,303 12/03/2019 Buy 443,004,000 KRW to Sell 553,651 AUD Barclays 1,537 12/03/2019 Buy 818,000 HKD to Sell 145,344 AUD Merrill Lynch 1,595 12/03/2019 Buy 1,851,271 AUD to Sell 1,312,273 USD Goldman Sachs 1,703 13/03/2019 Buy 849,448 AUD to Sell 66,959,000 JPY Royal Bank of Scotland 1,918 12/03/2019 Buy 101,000 EUR to Sell 160,134 AUD Barclays 1,960 12/03/2019 Buy 794,713 AUD to Sell 2,114,000 BRL Barclays 2,162 12/03/2019 Buy 914,330 AUD to Sell 647,130 USD Morgan Stanley 2,240 13/03/2019 Buy 777,406 AUD to Sell 61,235,000 JPY Citigroup 2,327 12/03/2019 Buy 3,952,098 USD to Sell 5,196,613 CAD Goldman Sachs 2,587 13/03/2019 Buy 10,652,000 HKD to Sell 1,910,608 AUD Citigroup 2,834 12/03/2019 Buy 65,586,200 NOK to Sell 6,725,214 EUR JP Morgan Chase 2,838 10/04/2019 Buy 113,000 USD to Sell 156,339 AUD Goldman Sachs 2,966 01/03/2019 Buy 828,134 AUD to Sell 65,182,000 JPY Barclays 3,096 12/03/2019 Buy 3,818,000 SEK to Sell 579,197 AUD Goldman Sachs 4,025 12/03/2019 Buy 40,000 GBP to Sell 70,204 AUD Goldman Sachs 4,590 01/03/2019 Buy 895,567 USD to Sell 3,354,195 BRL Barclays 4,857 13/03/2019 Buy 4,725,000 SEK to Sell 446,267 EUR BNP Paribas 5,560 13/03/2019 Buy 815,042 AUD to Sell 8,172,686 ZAR Goldman Sachs 5,607 10/05/2019 Buy 3,143,000 DKK to Sell 670,473 AUD Barclays 5,643 12/03/2019 Buy 2,232,000 USD to Sell 3,139,300 AUD Citigroup 6,622 12/03/2019 Buy 1,200,000 EUR to Sell 1,919,000 AUD Goldman Sachs 6,866 12/03/2019 Buy 4,362,781 USD to Sell 5,732,811 CAD Morgan Stanley 6,938 13/03/2019 Buy 1,999,274 USD to Sell 2,623,573 CAD JP Morgan Chase 6,957 13/03/2019 Buy 3,440,600 CNH to Sell 508,476 USD Morgan Stanley 7,020 13/03/2019 Buy 569,000 CHF to Sell 796,144 AUD Goldman Sachs 8,334 12/03/2019 Buy 1,426,000 USD to Sell 2,001,494 AUD Barclays 8,400 12/03/2019 Buy 440,000 SGD to Sell 449,438 AUD Barclays 9,351 12/03/2019 Buy 1,978,137 USD to Sell 2,778,474 AUD Barclays 9,587 13/03/2019 Buy 500,000 USD to Sell 694,358 AUD Citigroup 10,425 08/03/2019 Buy 21,862,067 NOK to Sell 2,235,006 EUR Goldman Sachs 11,773 10/04/2019 Buy 438,432 AUD to Sell 4,261,000 ZAR Goldman Sachs 12,926 12/03/2019 Buy 10,555,000 HKD to Sell 1,883,006 AUD Barclays 13,011 12/03/2019 Buy 4,877,644 AUD to Sell 384,188,000 JPY Goldman Sachs 14,804 12/03/2019 Buy 2,021,759 USD to Sell 61,900,210 TWD Barclays 15,426 13/03/2019 Buy 205,479,514 RUB to Sell 3,099,589 USD Morgan Stanley 16,016 13/03/2019 Buy 355,143,000 JPY to Sell 3,175,896 USD Barclays 19,267 13/03/2019 Buy 1,353,000 USD to Sell 1,885,991 AUD JP Morgan Chase 21,013 12/03/2019
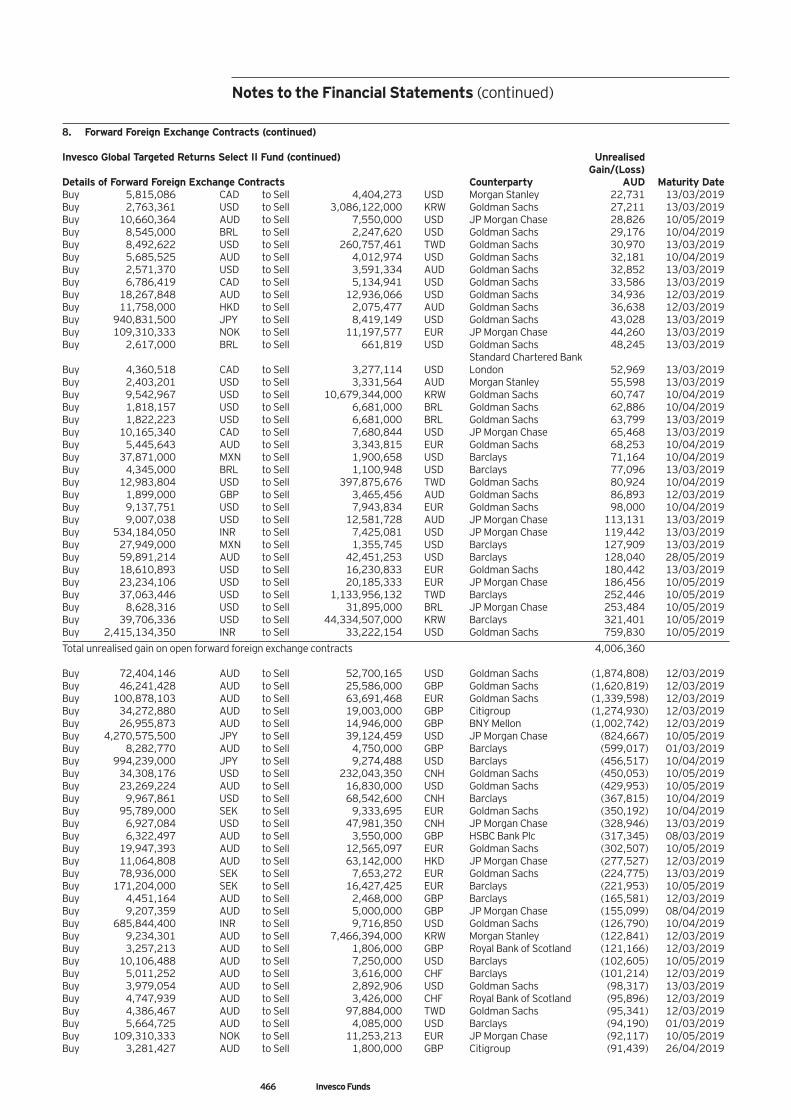
466 Invesco Funds
Notes to the Financial Statements (continued)
8. Forward Foreign Exchange Contracts (continued) Invesco Global Targeted Returns Select II Fund (continued) Unrealised Gain/(Loss) Details of Forward Foreign Exchange Contracts Counterparty AUD Maturity Date Buy 5,815,086 CAD to Sell 4,404,273 USD Morgan Stanley 22,731 13/03/2019 Buy 2,763,361 USD to Sell 3,086,122,000 KRW Goldman Sachs 27,211 13/03/2019 Buy 10,660,364 AUD to Sell 7,550,000 USD JP Morgan Chase 28,826 10/05/2019 Buy 8,545,000 BRL to Sell 2,247,620 USD Goldman Sachs 29,176 10/04/2019 Buy 8,492,622 USD to Sell 260,757,461 TWD Goldman Sachs 30,970 13/03/2019 Buy 5,685,525 AUD to Sell 4,012,974 USD Goldman Sachs 32,181 10/04/2019 Buy 2,571,370 USD to Sell 3,591,334 AUD Goldman Sachs 32,852 13/03/2019 Buy 6,786,419 CAD to Sell 5,134,941 USD Goldman Sachs 33,586 13/03/2019 Buy 18,267,848 AUD to Sell 12,936,066 USD Goldman Sachs 34,936 12/03/2019 Buy 11,758,000 HKD to Sell 2,075,477 AUD Goldman Sachs 36,638 12/03/2019 Buy 940,831,500 JPY to Sell 8,419,149 USD Goldman Sachs 43,028 13/03/2019 Buy 109,310,333 NOK to Sell 11,197,577 EUR JP Morgan Chase 44,260 13/03/2019 Buy 2,617,000 BRL to Sell 661,819 USD Goldman Sachs 48,245 13/03/2019 Standard Chartered Bank Buy 4,360,518 CAD to Sell 3,277,114 USD London 52,969 13/03/2019 Buy 2,403,201 USD to Sell 3,331,564 AUD Morgan Stanley 55,598 13/03/2019 Buy 9,542,967 USD to Sell 10,679,344,000 KRW Goldman Sachs 60,747 10/04/2019 Buy 1,818,157 USD to Sell 6,681,000 BRL Goldman Sachs 62,886 10/04/2019 Buy 1,822,223 USD to Sell 6,681,000 BRL Goldman Sachs 63,799 13/03/2019 Buy 10,165,340 CAD to Sell 7,680,844 USD JP Morgan Chase 65,468 13/03/2019 Buy 5,445,643 AUD to Sell 3,343,815 EUR Goldman Sachs 68,253 10/04/2019 Buy 37,871,000 MXN to Sell 1,900,658 USD Barclays 71,164 10/04/2019 Buy 4,345,000 BRL to Sell 1,100,948 USD Barclays 77,096 13/03/2019 Buy 12,983,804 USD to Sell 397,875,676 TWD Goldman Sachs 80,924 10/04/2019 Buy 1,899,000 GBP to Sell 3,465,456 AUD Goldman Sachs 86,893 12/03/2019 Buy 9,137,751 USD to Sell 7,943,834 EUR Goldman Sachs 98,000 10/04/2019 Buy 9,007,038 USD to Sell 12,581,728 AUD JP Morgan Chase 113,131 13/03/2019 Buy 534,184,050 INR to Sell 7,425,081 USD JP Morgan Chase 119,442 13/03/2019 Buy 27,949,000 MXN to Sell 1,355,745 USD Barclays 127,909 13/03/2019 Buy 59,891,214 AUD to Sell 42,451,253 USD Barclays 128,040 28/05/2019 Buy 18,610,893 USD to Sell 16,230,833 EUR Goldman Sachs 180,442 13/03/2019 Buy 23,234,106 USD to Sell 20,185,333 EUR JP Morgan Chase 186,456 10/05/2019 Buy 37,063,446 USD to Sell 1,133,956,132 TWD Barclays 252,446 10/05/2019 Buy 8,628,316 USD to Sell 31,895,000 BRL JP Morgan Chase 253,484 10/05/2019 Buy 39,706,336 USD to Sell 44,334,507,000 KRW Barclays 321,401 10/05/2019 Buy 2,415,134,350 INR to Sell 33,222,154 USD Goldman Sachs 759,830 10/05/2019
Total unrealised gain on open forward foreign exchange contracts 4,006,360 Buy 72,404,146 AUD to Sell 52,700,165 USD Goldman Sachs (1,874,808) 12/03/2019 Buy 46,241,428 AUD to Sell 25,586,000 GBP Goldman Sachs (1,620,819) 12/03/2019 Buy 100,878,103 AUD to Sell 63,691,468 EUR Goldman Sachs (1,339,598) 12/03/2019 Buy 34,272,880 AUD to Sell 19,003,000 GBP Citigroup (1,274,930) 12/03/2019 Buy 26,955,873 AUD to Sell 14,946,000 GBP BNY Mellon (1,002,742) 12/03/2019 Buy 4,270,575,500 JPY to Sell 39,124,459 USD JP Morgan Chase (824,667) 10/05/2019 Buy 8,282,770 AUD to Sell 4,750,000 GBP Barclays (599,017) 01/03/2019 Buy 994,239,000 JPY to Sell 9,274,488 USD Barclays (456,517) 10/04/2019 Buy 34,308,176 USD to Sell 232,043,350 CNH Goldman Sachs (450,053) 10/05/2019 Buy 23,269,224 AUD to Sell 16,830,000 USD Goldman Sachs (429,953) 10/05/2019 Buy 9,967,861 USD to Sell 68,542,600 CNH Barclays (367,815) 10/04/2019 Buy 95,789,000 SEK to Sell 9,333,695 EUR Goldman Sachs (350,192) 10/04/2019 Buy 6,927,084 USD to Sell 47,981,350 CNH JP Morgan Chase (328,946) 13/03/2019 Buy 6,322,497 AUD to Sell 3,550,000 GBP HSBC Bank Plc (317,345) 08/03/2019 Buy 19,947,393 AUD to Sell 12,565,097 EUR Goldman Sachs (302,507) 10/05/2019 Buy 11,064,808 AUD to Sell 63,142,000 HKD JP Morgan Chase (277,527) 12/03/2019 Buy 78,936,000 SEK to Sell 7,653,272 EUR Goldman Sachs (224,775) 13/03/2019 Buy 171,204,000 SEK to Sell 16,427,425 EUR Barclays (221,953) 10/05/2019 Buy 4,451,164 AUD to Sell 2,468,000 GBP Barclays (165,581) 12/03/2019 Buy 9,207,359 AUD to Sell 5,000,000 GBP JP Morgan Chase (155,099) 08/04/2019 Buy 685,844,400 INR to Sell 9,716,850 USD Goldman Sachs (126,790) 10/04/2019 Buy 9,234,301 AUD to Sell 7,466,394,000 KRW Morgan Stanley (122,841) 12/03/2019 Buy 3,257,213 AUD to Sell 1,806,000 GBP Royal Bank of Scotland (121,166) 12/03/2019 Buy 10,106,488 AUD to Sell 7,250,000 USD Barclays (102,605) 10/05/2019 Buy 5,011,252 AUD to Sell 3,616,000 CHF Barclays (101,214) 12/03/2019 Buy 3,979,054 AUD to Sell 2,892,906 USD Goldman Sachs (98,317) 13/03/2019 Buy 4,747,939 AUD to Sell 3,426,000 CHF Royal Bank of Scotland (95,896) 12/03/2019 Buy 4,386,467 AUD to Sell 97,884,000 TWD Goldman Sachs (95,341) 12/03/2019 Buy 5,664,725 AUD to Sell 4,085,000 USD Barclays (94,190) 01/03/2019 Buy 109,310,333 NOK to Sell 11,253,213 EUR JP Morgan Chase (92,117) 10/05/2019 Buy 3,281,427 AUD to Sell 1,800,000 GBP Citigroup (91,439) 26/04/2019
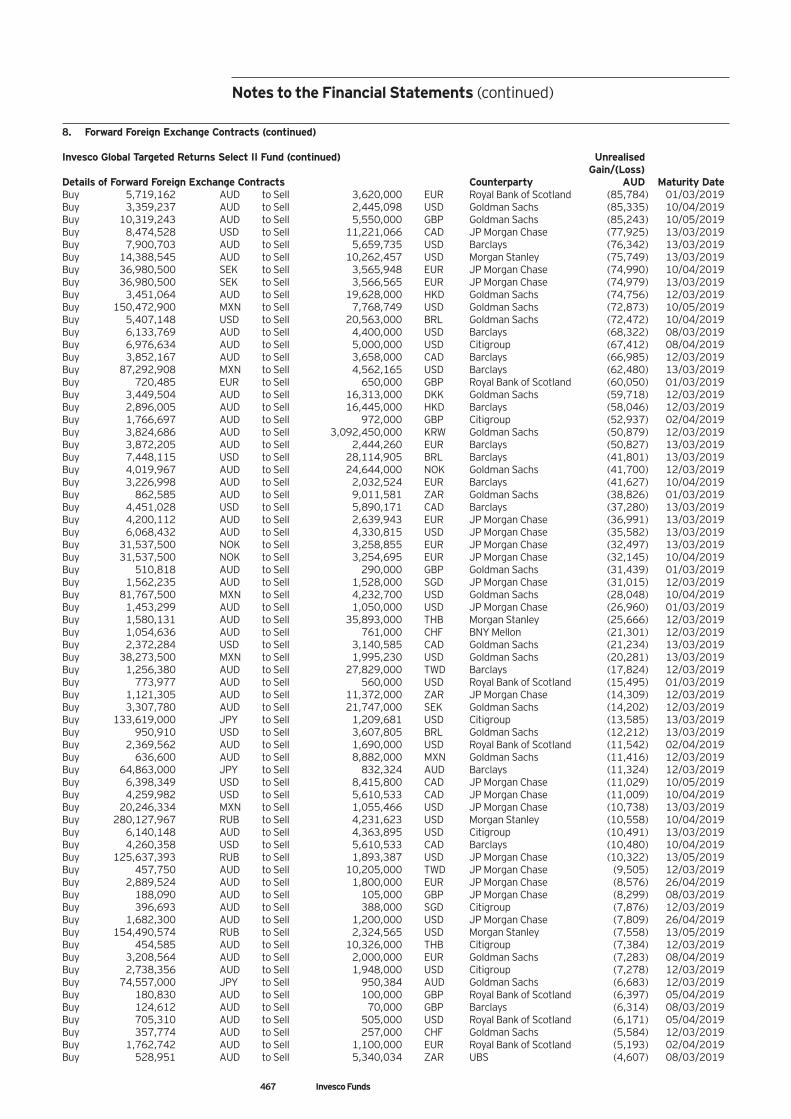
Notes to the Financial Statements (continued)
8. Forward Foreign Exchange Contracts (continued) Invesco Global Targeted Returns Select II Fund (continued) Unrealised Gain/(Loss) Details of Forward Foreign Exchange Contracts Counterparty AUD Maturity Date Buy 5,719,162 AUD to Sell 3,620,000 EUR Royal Bank of Scotland (85,784) 01/03/2019 Buy 3,359,237 AUD to Sell 2,445,098 USD Goldman Sachs (85,335) 10/04/2019 Buy 10,319,243 AUD to Sell 5,550,000 GBP Goldman Sachs (85,243) 10/05/2019 Buy 8,474,528 USD to Sell 11,221,066 CAD JP Morgan Chase (77,925) 13/03/2019 Buy 7,900,703 AUD to Sell 5,659,735 USD Barclays (76,342) 13/03/2019 Buy 14,388,545 AUD to Sell 10,262,457 USD Morgan Stanley (75,749) 13/03/2019 Buy 36,980,500 SEK to Sell 3,565,948 EUR JP Morgan Chase (74,990) 10/04/2019 Buy 36,980,500 SEK to Sell 3,566,565 EUR JP Morgan Chase (74,979) 13/03/2019 Buy 3,451,064 AUD to Sell 19,628,000 HKD Goldman Sachs (74,756) 12/03/2019 Buy 150,472,900 MXN to Sell 7,768,749 USD Goldman Sachs (72,873) 10/05/2019 Buy 5,407,148 USD to Sell 20,563,000 BRL Goldman Sachs (72,472) 10/04/2019 Buy 6,133,769 AUD to Sell 4,400,000 USD Barclays (68,322) 08/03/2019 Buy 6,976,634 AUD to Sell 5,000,000 USD Citigroup (67,412) 08/04/2019 Buy 3,852,167 AUD to Sell 3,658,000 CAD Barclays (66,985) 12/03/2019 Buy 87,292,908 MXN to Sell 4,562,165 USD Barclays (62,480) 13/03/2019 Buy 720,485 EUR to Sell 650,000 GBP Royal Bank of Scotland (60,050) 01/03/2019 Buy 3,449,504 AUD to Sell 16,313,000 DKK Goldman Sachs (59,718) 12/03/2019 Buy 2,896,005 AUD to Sell 16,445,000 HKD Barclays (58,046) 12/03/2019 Buy 1,766,697 AUD to Sell 972,000 GBP Citigroup (52,937) 02/04/2019 Buy 3,824,686 AUD to Sell 3,092,450,000 KRW Goldman Sachs (50,879) 12/03/2019 Buy 3,872,205 AUD to Sell 2,444,260 EUR Barclays (50,827) 13/03/2019 Buy 7,448,115 USD to Sell 28,114,905 BRL Barclays (41,801) 13/03/2019 Buy 4,019,967 AUD to Sell 24,644,000 NOK Goldman Sachs (41,700) 12/03/2019 Buy 3,226,998 AUD to Sell 2,032,524 EUR Barclays (41,627) 10/04/2019 Buy 862,585 AUD to Sell 9,011,581 ZAR Goldman Sachs (38,826) 01/03/2019 Buy 4,451,028 USD to Sell 5,890,171 CAD Barclays (37,280) 13/03/2019 Buy 4,200,112 AUD to Sell 2,639,943 EUR JP Morgan Chase (36,991) 13/03/2019 Buy 6,068,432 AUD to Sell 4,330,815 USD JP Morgan Chase (35,582) 13/03/2019 Buy 31,537,500 NOK to Sell 3,258,855 EUR JP Morgan Chase (32,497) 13/03/2019 Buy 31,537,500 NOK to Sell 3,254,695 EUR JP Morgan Chase (32,145) 10/04/2019 Buy 510,818 AUD to Sell 290,000 GBP Goldman Sachs (31,439) 01/03/2019 Buy 1,562,235 AUD to Sell 1,528,000 SGD JP Morgan Chase (31,015) 12/03/2019 Buy 81,767,500 MXN to Sell 4,232,700 USD Goldman Sachs (28,048) 10/04/2019 Buy 1,453,299 AUD to Sell 1,050,000 USD JP Morgan Chase (26,960) 01/03/2019 Buy 1,580,131 AUD to Sell 35,893,000 THB Morgan Stanley (25,666) 12/03/2019 Buy 1,054,636 AUD to Sell 761,000 CHF BNY Mellon (21,301) 12/03/2019 Buy 2,372,284 USD to Sell 3,140,585 CAD Goldman Sachs (21,234) 13/03/2019 Buy 38,273,500 MXN to Sell 1,995,230 USD Goldman Sachs (20,281) 13/03/2019 Buy 1,256,380 AUD to Sell 27,829,000 TWD Barclays (17,824) 12/03/2019 Buy 773,977 AUD to Sell 560,000 USD Royal Bank of Scotland (15,495) 01/03/2019 Buy 1,121,305 AUD to Sell 11,372,000 ZAR JP Morgan Chase (14,309) 12/03/2019 Buy 3,307,780 AUD to Sell 21,747,000 SEK Goldman Sachs (14,202) 12/03/2019 Buy 133,619,000 JPY to Sell 1,209,681 USD Citigroup (13,585) 13/03/2019 Buy 950,910 USD to Sell 3,607,805 BRL Goldman Sachs (12,212) 13/03/2019 Buy 2,369,562 AUD to Sell 1,690,000 USD Royal Bank of Scotland (11,542) 02/04/2019 Buy 636,600 AUD to Sell 8,882,000 MXN Goldman Sachs (11,416) 12/03/2019 Buy 64,863,000 JPY to Sell 832,324 AUD Barclays (11,324) 12/03/2019 Buy 6,398,349 USD to Sell 8,415,800 CAD JP Morgan Chase (11,029) 10/05/2019 Buy 4,259,982 USD to Sell 5,610,533 CAD JP Morgan Chase (11,009) 10/04/2019 Buy 20,246,334 MXN to Sell 1,055,466 USD JP Morgan Chase (10,738) 13/03/2019 Buy 280,127,967 RUB to Sell 4,231,623 USD Morgan Stanley (10,558) 10/04/2019 Buy 6,140,148 AUD to Sell 4,363,895 USD Citigroup (10,491) 13/03/2019 Buy 4,260,358 USD to Sell 5,610,533 CAD Barclays (10,480) 10/04/2019 Buy 125,637,393 RUB to Sell 1,893,387 USD JP Morgan Chase (10,322) 13/05/2019 Buy 457,750 AUD to Sell 10,205,000 TWD JP Morgan Chase (9,505) 12/03/2019 Buy 2,889,524 AUD to Sell 1,800,000 EUR JP Morgan Chase (8,576) 26/04/2019 Buy 188,090 AUD to Sell 105,000 GBP JP Morgan Chase (8,299) 08/03/2019 Buy 396,693 AUD to Sell 388,000 SGD Citigroup (7,876) 12/03/2019 Buy 1,682,300 AUD to Sell 1,200,000 USD JP Morgan Chase (7,809) 26/04/2019 Buy 154,490,574 RUB to Sell 2,324,565 USD Morgan Stanley (7,558) 13/05/2019 Buy 454,585 AUD to Sell 10,326,000 THB Citigroup (7,384) 12/03/2019 Buy 3,208,564 AUD to Sell 2,000,000 EUR Goldman Sachs (7,283) 08/04/2019 Buy 2,738,356 AUD to Sell 1,948,000 USD Citigroup (7,278) 12/03/2019 Buy 74,557,000 JPY to Sell 950,384 AUD Goldman Sachs (6,683) 12/03/2019 Buy 180,830 AUD to Sell 100,000 GBP Royal Bank of Scotland (6,397) 05/04/2019 Buy 124,612 AUD to Sell 70,000 GBP Barclays (6,314) 08/03/2019 Buy 705,310 AUD to Sell 505,000 USD Royal Bank of Scotland (6,171) 05/04/2019 Buy 357,774 AUD to Sell 257,000 CHF Goldman Sachs (5,584) 12/03/2019 Buy 1,762,742 AUD to Sell 1,100,000 EUR Royal Bank of Scotland (5,193) 02/04/2019 Buy 528,951 AUD to Sell 5,340,034 ZAR UBS (4,607) 08/03/2019
467 Invesco Funds
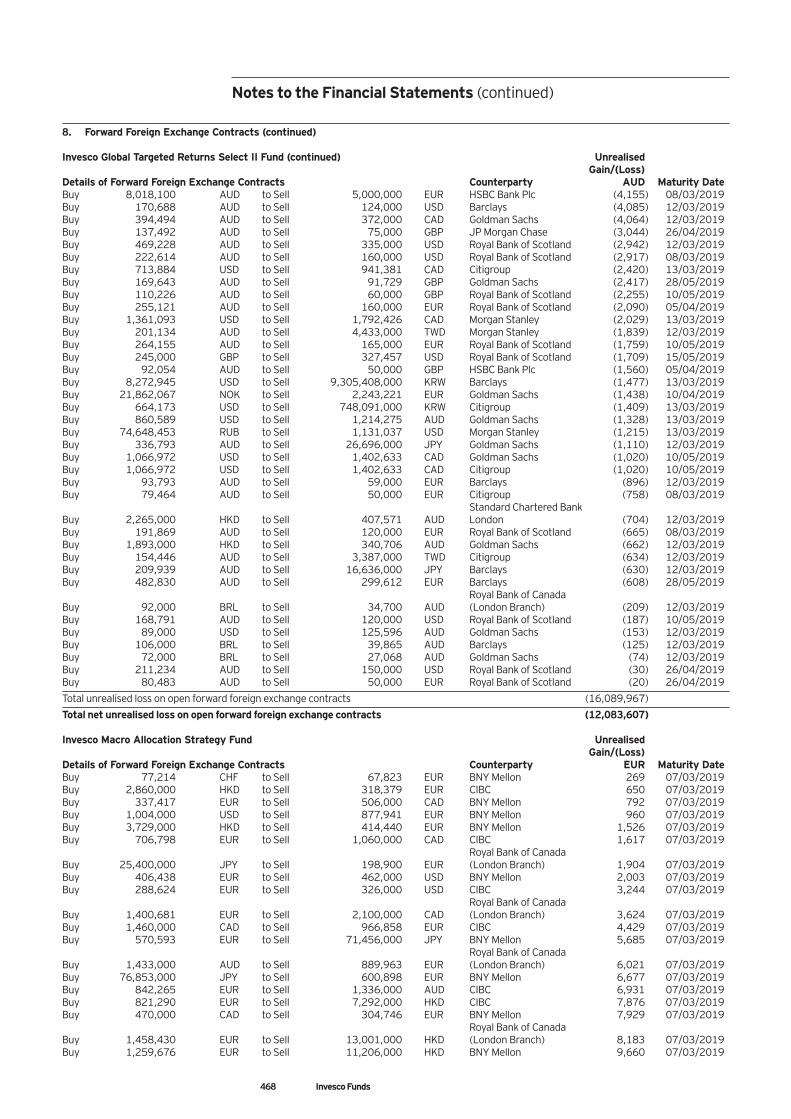
Notes to the Financial Statements (continued)
8. Forward Foreign Exchange Contracts (continued) Invesco Global Targeted Returns Select II Fund (continued) Unrealised Gain/(Loss) Details of Forward Foreign Exchange Contracts Counterparty AUD Maturity Date Buy 8,018,100 AUD to Sell 5,000,000 EUR HSBC Bank Plc (4,155) 08/03/2019 Buy 170,688 AUD to Sell 124,000 USD Barclays (4,085) 12/03/2019 Buy 394,494 AUD to Sell 372,000 CAD Goldman Sachs (4,064) 12/03/2019 Buy 137,492 AUD to Sell 75,000 GBP JP Morgan Chase (3,044) 26/04/2019 Buy 469,228 AUD to Sell 335,000 USD Royal Bank of Scotland (2,942) 12/03/2019 Buy 222,614 AUD to Sell 160,000 USD Royal Bank of Scotland (2,917) 08/03/2019 Buy 713,884 USD to Sell 941,381 CAD Citigroup (2,420) 13/03/2019 Buy 169,643 AUD to Sell 91,729 GBP Goldman Sachs (2,417) 28/05/2019 Buy 110,226 AUD to Sell 60,000 GBP Royal Bank of Scotland (2,255) 10/05/2019 Buy 255,121 AUD to Sell 160,000 EUR Royal Bank of Scotland (2,090) 05/04/2019 Buy 1,361,093 USD to Sell 1,792,426 CAD Morgan Stanley (2,029) 13/03/2019 Buy 201,134 AUD to Sell 4,433,000 TWD Morgan Stanley (1,839) 12/03/2019 Buy 264,155 AUD to Sell 165,000 EUR Royal Bank of Scotland (1,759) 10/05/2019 Buy 245,000 GBP to Sell 327,457 USD Royal Bank of Scotland (1,709) 15/05/2019 Buy 92,054 AUD to Sell 50,000 GBP HSBC Bank Plc (1,560) 05/04/2019 Buy 8,272,945 USD to Sell 9,305,408,000 KRW Barclays (1,477) 13/03/2019 Buy 21,862,067 NOK to Sell 2,243,221 EUR Goldman Sachs (1,438) 10/04/2019 Buy 664,173 USD to Sell 748,091,000 KRW Citigroup (1,409) 13/03/2019 Buy 860,589 USD to Sell 1,214,275 AUD Goldman Sachs (1,328) 13/03/2019 Buy 74,648,453 RUB to Sell 1,131,037 USD Morgan Stanley (1,215) 13/03/2019 Buy 336,793 AUD to Sell 26,696,000 JPY Goldman Sachs (1,110) 12/03/2019 Buy 1,066,972 USD to Sell 1,402,633 CAD Goldman Sachs (1,020) 10/05/2019 Buy 1,066,972 USD to Sell 1,402,633 CAD Citigroup (1,020) 10/05/2019 Buy 93,793 AUD to Sell 59,000 EUR Barclays (896) 12/03/2019 Buy 79,464 AUD to Sell 50,000 EUR Citigroup (758) 08/03/2019 Standard Chartered Bank Buy 2,265,000 HKD to Sell 407,571 AUD London (704) 12/03/2019 Buy 191,869 AUD to Sell 120,000 EUR Royal Bank of Scotland (665) 08/03/2019 Buy 1,893,000 HKD to Sell 340,706 AUD Goldman Sachs (662) 12/03/2019 Buy 154,446 AUD to Sell 3,387,000 TWD Citigroup (634) 12/03/2019 Buy 209,939 AUD to Sell 16,636,000 JPY Barclays (630) 12/03/2019 Buy 482,830 AUD to Sell 299,612 EUR Barclays (608) 28/05/2019 Royal Bank of Canada Buy 92,000 BRL to Sell 34,700 AUD (London Branch) (209) 12/03/2019 Buy 168,791 AUD to Sell 120,000 USD Royal Bank of Scotland (187) 10/05/2019 Buy 89,000 USD to Sell 125,596 AUD Goldman Sachs (153) 12/03/2019 Buy 106,000 BRL to Sell 39,865 AUD Barclays (125) 12/03/2019 Buy 72,000 BRL to Sell 27,068 AUD Goldman Sachs (74) 12/03/2019 Buy 211,234 AUD to Sell 150,000 USD Royal Bank of Scotland (30) 26/04/2019 Buy 80,483 AUD to Sell 50,000 EUR Royal Bank of Scotland (20) 26/04/2019
Total unrealised loss on open forward foreign exchange contracts (16,089,967)
Total net unrealised loss on open forward foreign exchange contracts (12,083,607) Invesco Macro Allocation Strategy Fund Unrealised Gain/(Loss) Details of Forward Foreign Exchange Contracts Counterparty EUR Maturity Date Buy 77,214 CHF to Sell 67,823 EUR BNY Mellon 269 07/03/2019 Buy 2,860,000 HKD to Sell 318,379 EUR CIBC 650 07/03/2019 Buy 337,417 EUR to Sell 506,000 CAD BNY Mellon 792 07/03/2019 Buy 1,004,000 USD to Sell 877,941 EUR BNY Mellon 960 07/03/2019 Buy 3,729,000 HKD to Sell 414,440 EUR BNY Mellon 1,526 07/03/2019 Buy 706,798 EUR to Sell 1,060,000 CAD CIBC 1,617 07/03/2019 Royal Bank of Canada Buy 25,400,000 JPY to Sell 198,900 EUR (London Branch) 1,904 07/03/2019 Buy 406,438 EUR to Sell 462,000 USD BNY Mellon 2,003 07/03/2019 Buy 288,624 EUR to Sell 326,000 USD CIBC 3,244 07/03/2019 Royal Bank of Canada Buy 1,400,681 EUR to Sell 2,100,000 CAD (London Branch) 3,624 07/03/2019 Buy 1,460,000 CAD to Sell 966,858 EUR CIBC 4,429 07/03/2019 Buy 570,593 EUR to Sell 71,456,000 JPY BNY Mellon 5,685 07/03/2019 Royal Bank of Canada Buy 1,433,000 AUD to Sell 889,963 EUR (London Branch) 6,021 07/03/2019 Buy 76,853,000 JPY to Sell 600,898 EUR BNY Mellon 6,677 07/03/2019 Buy 842,265 EUR to Sell 1,336,000 AUD CIBC 6,931 07/03/2019 Buy 821,290 EUR to Sell 7,292,000 HKD CIBC 7,876 07/03/2019 Buy 470,000 CAD to Sell 304,746 EUR BNY Mellon 7,929 07/03/2019 Royal Bank of Canada Buy 1,458,430 EUR to Sell 13,001,000 HKD (London Branch) 8,183 07/03/2019 Buy 1,259,676 EUR to Sell 11,206,000 HKD BNY Mellon 9,660 07/03/2019
468 Invesco Funds
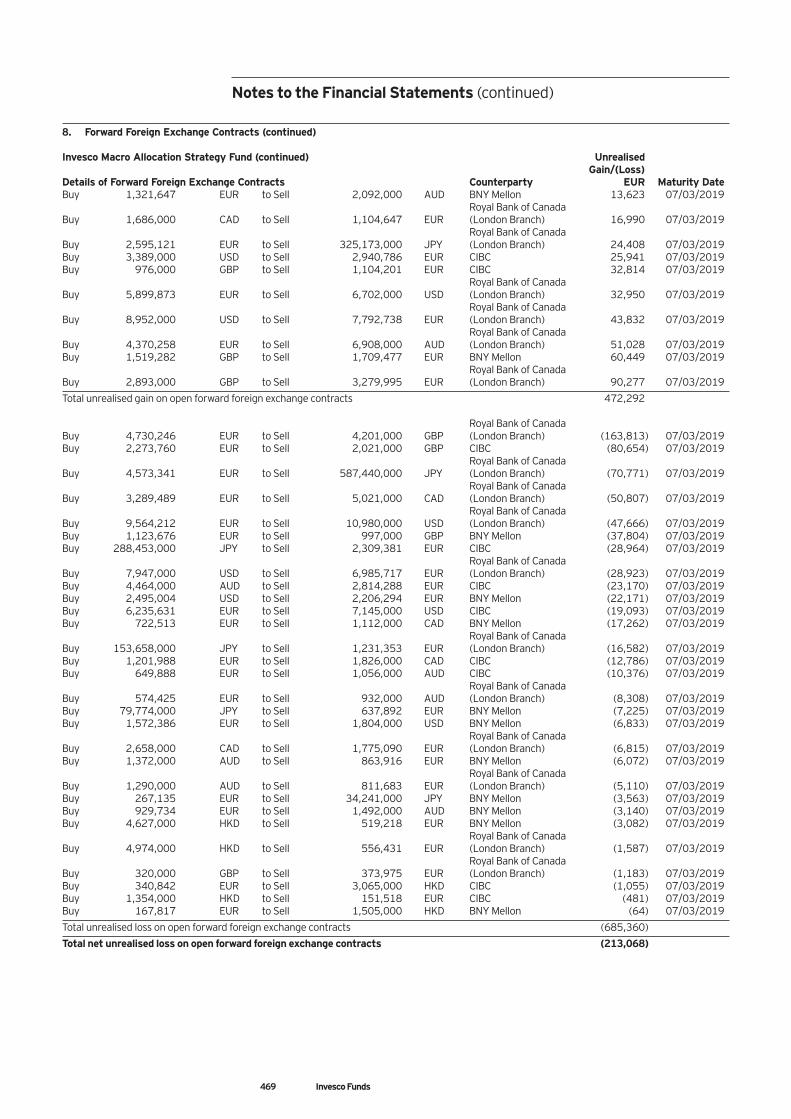
Notes to the Financial Statements (continued)
469 Invesco Funds
8. Forward Foreign Exchange Contracts (continued) Invesco Macro Allocation Strategy Fund (continued) Unrealised Gain/(Loss) Details of Forward Foreign Exchange Contracts Counterparty EUR Maturity Date Buy 1,321,647 EUR to Sell 2,092,000 AUD BNY Mellon 13,623 07/03/2019 Royal Bank of Canada Buy 1,686,000 CAD to Sell 1,104,647 EUR (London Branch) 16,990 07/03/2019 Royal Bank of Canada Buy 2,595,121 EUR to Sell 325,173,000 JPY (London Branch) 24,408 07/03/2019 Buy 3,389,000 USD to Sell 2,940,786 EUR CIBC 25,941 07/03/2019 Buy 976,000 GBP to Sell 1,104,201 EUR CIBC 32,814 07/03/2019 Royal Bank of Canada Buy 5,899,873 EUR to Sell 6,702,000 USD (London Branch) 32,950 07/03/2019 Royal Bank of Canada Buy 8,952,000 USD to Sell 7,792,738 EUR (London Branch) 43,832 07/03/2019 Royal Bank of Canada Buy 4,370,258 EUR to Sell 6,908,000 AUD (London Branch) 51,028 07/03/2019 Buy 1,519,282 GBP to Sell 1,709,477 EUR BNY Mellon 60,449 07/03/2019 Royal Bank of Canada Buy 2,893,000 GBP to Sell 3,279,995 EUR (London Branch) 90,277 07/03/2019
Total unrealised gain on open forward foreign exchange contracts 472,292 Royal Bank of Canada Buy 4,730,246 EUR to Sell 4,201,000 GBP (London Branch) (163,813) 07/03/2019 Buy 2,273,760 EUR to Sell 2,021,000 GBP CIBC (80,654) 07/03/2019 Royal Bank of Canada Buy 4,573,341 EUR to Sell 587,440,000 JPY (London Branch) (70,771) 07/03/2019 Royal Bank of Canada Buy 3,289,489 EUR to Sell 5,021,000 CAD (London Branch) (50,807) 07/03/2019 Royal Bank of Canada Buy 9,564,212 EUR to Sell 10,980,000 USD (London Branch) (47,666) 07/03/2019 Buy 1,123,676 EUR to Sell 997,000 GBP BNY Mellon (37,804) 07/03/2019 Buy 288,453,000 JPY to Sell 2,309,381 EUR CIBC (28,964) 07/03/2019 Royal Bank of Canada Buy 7,947,000 USD to Sell 6,985,717 EUR (London Branch) (28,923) 07/03/2019 Buy 4,464,000 AUD to Sell 2,814,288 EUR CIBC (23,170) 07/03/2019 Buy 2,495,004 USD to Sell 2,206,294 EUR BNY Mellon (22,171) 07/03/2019 Buy 6,235,631 EUR to Sell 7,145,000 USD CIBC (19,093) 07/03/2019 Buy 722,513 EUR to Sell 1,112,000 CAD BNY Mellon (17,262) 07/03/2019 Royal Bank of Canada Buy 153,658,000 JPY to Sell 1,231,353 EUR (London Branch) (16,582) 07/03/2019 Buy 1,201,988 EUR to Sell 1,826,000 CAD CIBC (12,786) 07/03/2019 Buy 649,888 EUR to Sell 1,056,000 AUD CIBC (10,376) 07/03/2019 Royal Bank of Canada Buy 574,425 EUR to Sell 932,000 AUD (London Branch) (8,308) 07/03/2019 Buy 79,774,000 JPY to Sell 637,892 EUR BNY Mellon (7,225) 07/03/2019 Buy 1,572,386 EUR to Sell 1,804,000 USD BNY Mellon (6,833) 07/03/2019 Royal Bank of Canada Buy 2,658,000 CAD to Sell 1,775,090 EUR (London Branch) (6,815) 07/03/2019 Buy 1,372,000 AUD to Sell 863,916 EUR BNY Mellon (6,072) 07/03/2019 Royal Bank of Canada Buy 1,290,000 AUD to Sell 811,683 EUR (London Branch) (5,110) 07/03/2019 Buy 267,135 EUR to Sell 34,241,000 JPY BNY Mellon (3,563) 07/03/2019 Buy 929,734 EUR to Sell 1,492,000 AUD BNY Mellon (3,140) 07/03/2019 Buy 4,627,000 HKD to Sell 519,218 EUR BNY Mellon (3,082) 07/03/2019 Royal Bank of Canada Buy 4,974,000 HKD to Sell 556,431 EUR (London Branch) (1,587) 07/03/2019 Royal Bank of Canada Buy 320,000 GBP to Sell 373,975 EUR (London Branch) (1,183) 07/03/2019 Buy 340,842 EUR to Sell 3,065,000 HKD CIBC (1,055) 07/03/2019 Buy 1,354,000 HKD to Sell 151,518 EUR CIBC (481) 07/03/2019 Buy 167,817 EUR to Sell 1,505,000 HKD BNY Mellon (64) 07/03/2019
Total unrealised loss on open forward foreign exchange contracts (685,360)
Total net unrealised loss on open forward foreign exchange contracts (213,068)
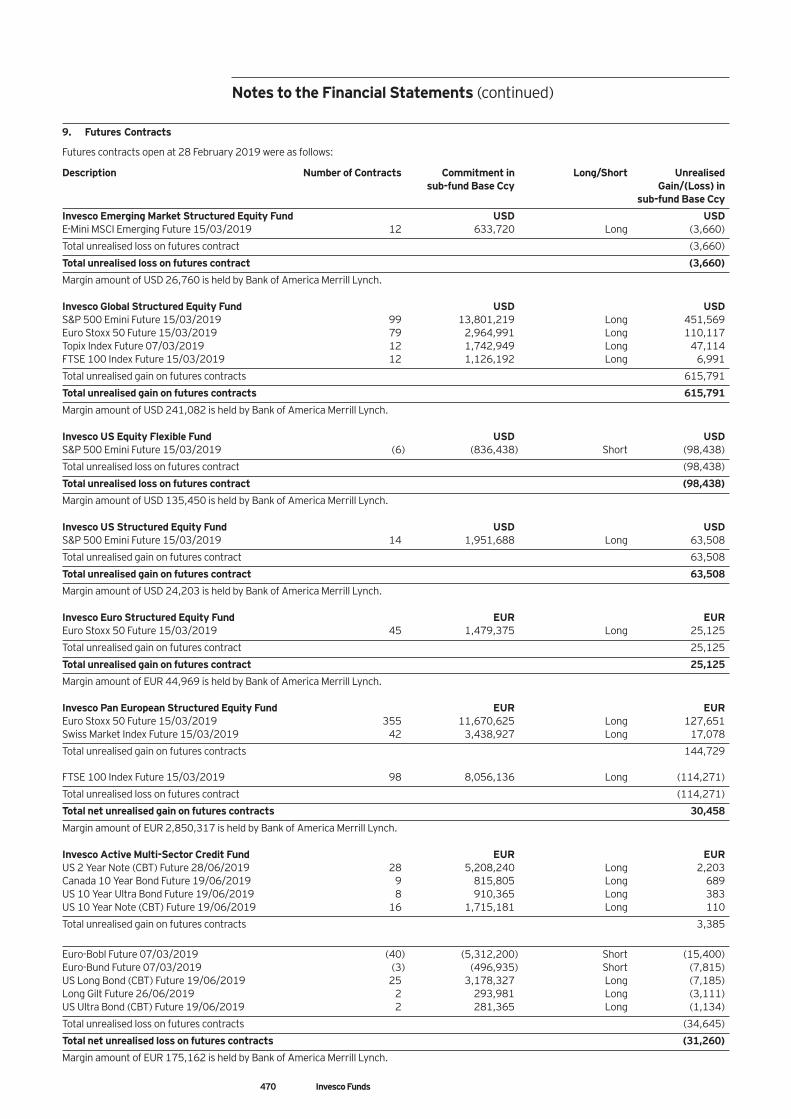
470 Invesco Funds
9. Futures Contracts Futures contracts open at 28 February 2019 were as follows:
Description Number of Contracts Commitment in Long/Short Unrealised sub-fund Base Ccy Gain/(Loss) in sub-fund Base Ccy
Invesco Emerging Market Structured Equity Fund USD USD E-Mini MSCI Emerging Future 15/03/2019 12 633,720 Long (3,660)
Total unrealised loss on futures contract (3,660)
Total unrealised loss on futures contract (3,660)
Margin amount of USD 26,760 is held by Bank of America Merrill Lynch. Invesco Global Structured Equity Fund USD USD S&P 500 Emini Future 15/03/2019 99 13,801,219 Long 451,569 Euro Stoxx 50 Future 15/03/2019 79 2,964,991 Long 110,117 Topix Index Future 07/03/2019 12 1,742,949 Long 47,114 FTSE 100 Index Future 15/03/2019 12 1,126,192 Long 6,991
Total unrealised gain on futures contracts 615,791
Total unrealised gain on futures contracts 615,791
Margin amount of USD 241,082 is held by Bank of America Merrill Lynch. Invesco US Equity Flexible Fund USD USD S&P 500 Emini Future 15/03/2019 (6) (836,438) Short (98,438)
Total unrealised loss on futures contract (98,438)
Total unrealised loss on futures contract (98,438)
Margin amount of USD 135,450 is held by Bank of America Merrill Lynch. Invesco US Structured Equity Fund USD USD S&P 500 Emini Future 15/03/2019 14 1,951,688 Long 63,508
Total unrealised gain on futures contract 63,508
Total unrealised gain on futures contract 63,508
Margin amount of USD 24,203 is held by Bank of America Merrill Lynch. Invesco Euro Structured Equity Fund EUR EUR Euro Stoxx 50 Future 15/03/2019 45 1,479,375 Long 25,125
Total unrealised gain on futures contract 25,125
Total unrealised gain on futures contract 25,125
Margin amount of EUR 44,969 is held by Bank of America Merrill Lynch. Invesco Pan European Structured Equity Fund EUR EUR Euro Stoxx 50 Future 15/03/2019 355 11,670,625 Long 127,651 Swiss Market Index Future 15/03/2019 42 3,438,927 Long 17,078
Total unrealised gain on futures contracts 144,729 FTSE 100 Index Future 15/03/2019 98 8,056,136 Long (114,271)
Total unrealised loss on futures contract (114,271)
Total net unrealised gain on futures contracts 30,458
Margin amount of EUR 2,850,317 is held by Bank of America Merrill Lynch. Invesco Active Multi-Sector Credit Fund EUR EUR US 2 Year Note (CBT) Future 28/06/2019 28 5,208,240 Long 2,203 Canada 10 Year Bond Future 19/06/2019 9 815,805 Long 689 US 10 Year Ultra Bond Future 19/06/2019 8 910,365 Long 383 US 10 Year Note (CBT) Future 19/06/2019 16 1,715,181 Long 110
Total unrealised gain on futures contracts 3,385
Euro-Bobl Future 07/03/2019 (40) (5,312,200) Short (15,400) Euro-Bund Future 07/03/2019 (3) (496,935) Short (7,815) US Long Bond (CBT) Future 19/06/2019 25 3,178,327 Long (7,185) Long Gilt Future 26/06/2019 2 293,981 Long (3,111) US Ultra Bond (CBT) Future 19/06/2019 2 281,365 Long (1,134)
Total unrealised loss on futures contracts (34,645)
Total net unrealised loss on futures contracts (31,260)
Margin amount of EUR 175,162 is held by Bank of America Merrill Lynch.
Notes to the Financial Statements (continued)
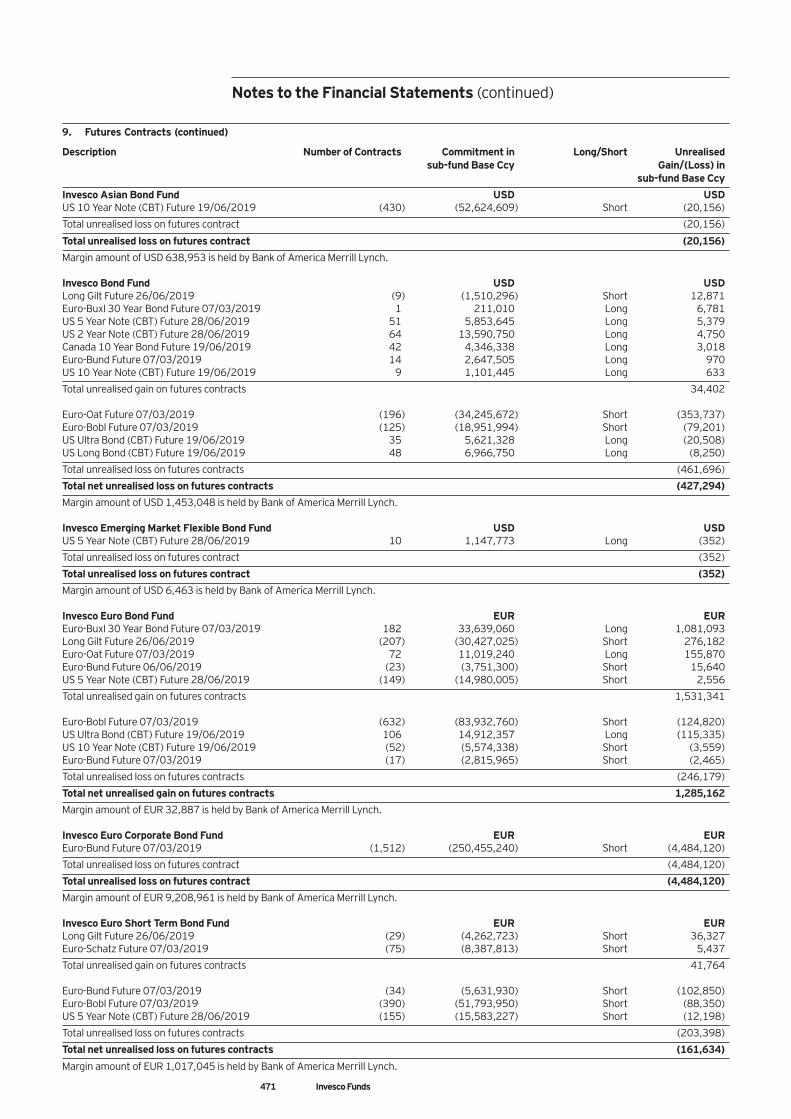
471 Invesco Funds
9. Futures Contracts (continued) Description Number of Contracts Commitment in Long/Short Unrealised sub-fund Base Ccy Gain/(Loss) in sub-fund Base Ccy
Invesco Asian Bond Fund USD USD US 10 Year Note (CBT) Future 19/06/2019 (430) (52,624,609) Short (20,156)
Total unrealised loss on futures contract (20,156)
Total unrealised loss on futures contract (20,156)
Margin amount of USD 638,953 is held by Bank of America Merrill Lynch. Invesco Bond Fund USD USD Long Gilt Future 26/06/2019 (9) (1,510,296) Short 12,871 Euro-Buxl 30 Year Bond Future 07/03/2019 1 211,010 Long 6,781 US 5 Year Note (CBT) Future 28/06/2019 51 5,853,645 Long 5,379 US 2 Year Note (CBT) Future 28/06/2019 64 13,590,750 Long 4,750 Canada 10 Year Bond Future 19/06/2019 42 4,346,338 Long 3,018 Euro-Bund Future 07/03/2019 14 2,647,505 Long 970 US 10 Year Note (CBT) Future 19/06/2019 9 1,101,445 Long 633
Total unrealised gain on futures contracts 34,402 Euro-Oat Future 07/03/2019 (196) (34,245,672) Short (353,737) Euro-Bobl Future 07/03/2019 (125) (18,951,994) Short (79,201) US Ultra Bond (CBT) Future 19/06/2019 35 5,621,328 Long (20,508) US Long Bond (CBT) Future 19/06/2019 48 6,966,750 Long (8,250)
Total unrealised loss on futures contracts (461,696)
Total net unrealised loss on futures contracts (427,294)
Margin amount of USD 1,453,048 is held by Bank of America Merrill Lynch. Invesco Emerging Market Flexible Bond Fund USD USD US 5 Year Note (CBT) Future 28/06/2019 10 1,147,773 Long (352)
Total unrealised loss on futures contract (352)
Total unrealised loss on futures contract (352)
Margin amount of USD 6,463 is held by Bank of America Merrill Lynch. Invesco Euro Bond Fund EUR EUR Euro-Buxl 30 Year Bond Future 07/03/2019 182 33,639,060 Long 1,081,093 Long Gilt Future 26/06/2019 (207) (30,427,025) Short 276,182 Euro-Oat Future 07/03/2019 72 11,019,240 Long 155,870 Euro-Bund Future 06/06/2019 (23) (3,751,300) Short 15,640 US 5 Year Note (CBT) Future 28/06/2019 (149) (14,980,005) Short 2,556
Total unrealised gain on futures contracts 1,531,341 Euro-Bobl Future 07/03/2019 (632) (83,932,760) Short (124,820) US Ultra Bond (CBT) Future 19/06/2019 106 14,912,357 Long (115,335) US 10 Year Note (CBT) Future 19/06/2019 (52) (5,574,338) Short (3,559) Euro-Bund Future 07/03/2019 (17) (2,815,965) Short (2,465)
Total unrealised loss on futures contracts (246,179)
Total net unrealised gain on futures contracts 1,285,162
Margin amount of EUR 32,887 is held by Bank of America Merrill Lynch. Invesco Euro Corporate Bond Fund EUR EUR Euro-Bund Future 07/03/2019 (1,512) (250,455,240) Short (4,484,120)
Total unrealised loss on futures contract (4,484,120)
Total unrealised loss on futures contract (4,484,120)
Margin amount of EUR 9,208,961 is held by Bank of America Merrill Lynch. Invesco Euro Short Term Bond Fund EUR EUR Long Gilt Future 26/06/2019 (29) (4,262,723) Short 36,327 Euro-Schatz Future 07/03/2019 (75) (8,387,813) Short 5,437
Total unrealised gain on futures contracts 41,764 Euro-Bund Future 07/03/2019 (34) (5,631,930) Short (102,850) Euro-Bobl Future 07/03/2019 (390) (51,793,950) Short (88,350) US 5 Year Note (CBT) Future 28/06/2019 (155) (15,583,227) Short (12,198)
Total unrealised loss on futures contracts (203,398)
Total net unrealised loss on futures contracts (161,634)
Margin amount of EUR 1,017,045 is held by Bank of America Merrill Lynch.
Notes to the Financial Statements (continued)
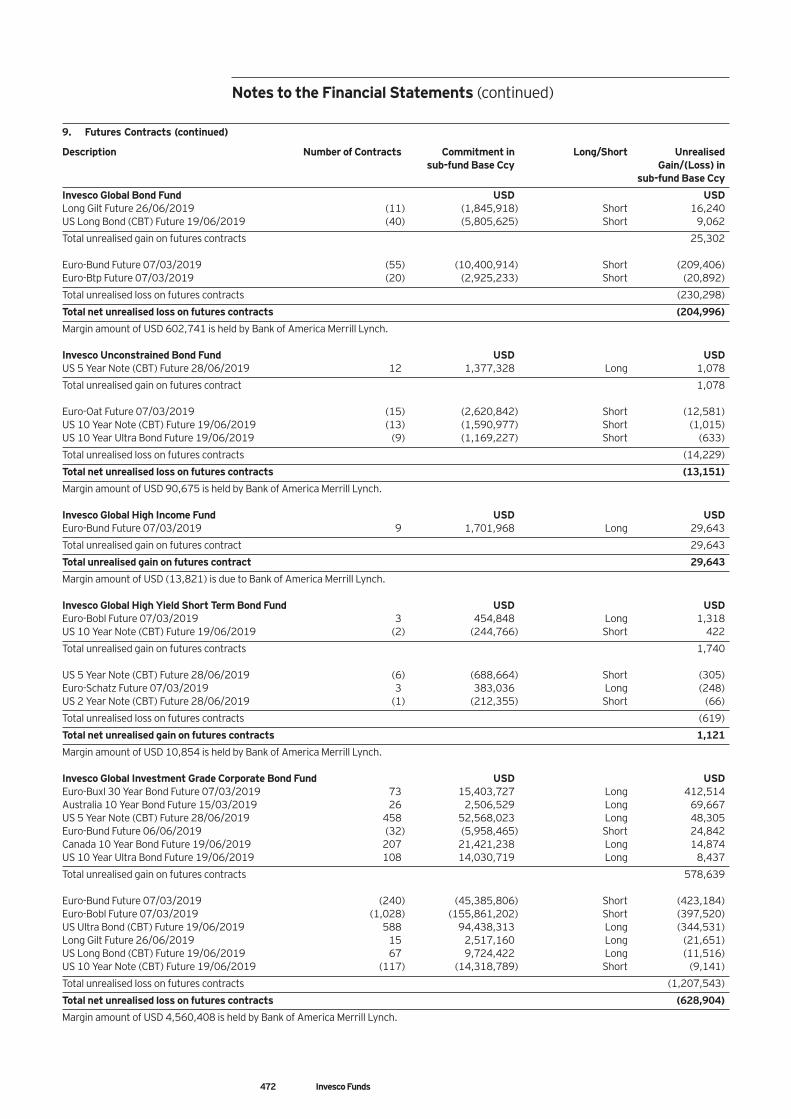
472 Invesco Funds
9. Futures Contracts (continued) Description Number of Contracts Commitment in Long/Short Unrealised sub-fund Base Ccy Gain/(Loss) in sub-fund Base Ccy
Invesco Global Bond Fund USD USD Long Gilt Future 26/06/2019 (11) (1,845,918) Short 16,240 US Long Bond (CBT) Future 19/06/2019 (40) (5,805,625) Short 9,062
Total unrealised gain on futures contracts 25,302 Euro-Bund Future 07/03/2019 (55) (10,400,914) Short (209,406) Euro-Btp Future 07/03/2019 (20) (2,925,233) Short (20,892)
Total unrealised loss on futures contracts (230,298)
Total net unrealised loss on futures contracts (204,996)
Margin amount of USD 602,741 is held by Bank of America Merrill Lynch. Invesco Unconstrained Bond Fund USD USD US 5 Year Note (CBT) Future 28/06/2019 12 1,377,328 Long 1,078
Total unrealised gain on futures contract 1,078 Euro-Oat Future 07/03/2019 (15) (2,620,842) Short (12,581) US 10 Year Note (CBT) Future 19/06/2019 (13) (1,590,977) Short (1,015) US 10 Year Ultra Bond Future 19/06/2019 (9) (1,169,227) Short (633)
Total unrealised loss on futures contracts (14,229)
Total net unrealised loss on futures contracts (13,151)
Margin amount of USD 90,675 is held by Bank of America Merrill Lynch. Invesco Global High Income Fund USD USD Euro-Bund Future 07/03/2019 9 1,701,968 Long 29,643
Total unrealised gain on futures contract 29,643
Total unrealised gain on futures contract 29,643
Margin amount of USD (13,821) is due to Bank of America Merrill Lynch. Invesco Global High Yield Short Term Bond Fund USD USD Euro-Bobl Future 07/03/2019 3 454,848 Long 1,318 US 10 Year Note (CBT) Future 19/06/2019 (2) (244,766) Short 422
Total unrealised gain on futures contracts 1,740 US 5 Year Note (CBT) Future 28/06/2019 (6) (688,664) Short (305) Euro-Schatz Future 07/03/2019 3 383,036 Long (248) US 2 Year Note (CBT) Future 28/06/2019 (1) (212,355) Short (66)
Total unrealised loss on futures contracts (619)
Total net unrealised gain on futures contracts 1,121
Margin amount of USD 10,854 is held by Bank of America Merrill Lynch. Invesco Global Investment Grade Corporate Bond Fund USD USD Euro-Buxl 30 Year Bond Future 07/03/2019 73 15,403,727 Long 412,514 Australia 10 Year Bond Future 15/03/2019 26 2,506,529 Long 69,667 US 5 Year Note (CBT) Future 28/06/2019 458 52,568,023 Long 48,305 Euro-Bund Future 06/06/2019 (32) (5,958,465) Short 24,842 Canada 10 Year Bond Future 19/06/2019 207 21,421,238 Long 14,874 US 10 Year Ultra Bond Future 19/06/2019 108 14,030,719 Long 8,437
Total unrealised gain on futures contracts 578,639 Euro-Bund Future 07/03/2019 (240) (45,385,806) Short (423,184) Euro-Bobl Future 07/03/2019 (1,028) (155,861,202) Short (397,520) US Ultra Bond (CBT) Future 19/06/2019 588 94,438,313 Long (344,531) Long Gilt Future 26/06/2019 15 2,517,160 Long (21,651) US Long Bond (CBT) Future 19/06/2019 67 9,724,422 Long (11,516) US 10 Year Note (CBT) Future 19/06/2019 (117) (14,318,789) Short (9,141)
Total unrealised loss on futures contracts (1,207,543)
Total net unrealised loss on futures contracts (628,904)
Margin amount of USD 4,560,408 is held by Bank of America Merrill Lynch.
Notes to the Financial Statements (continued)
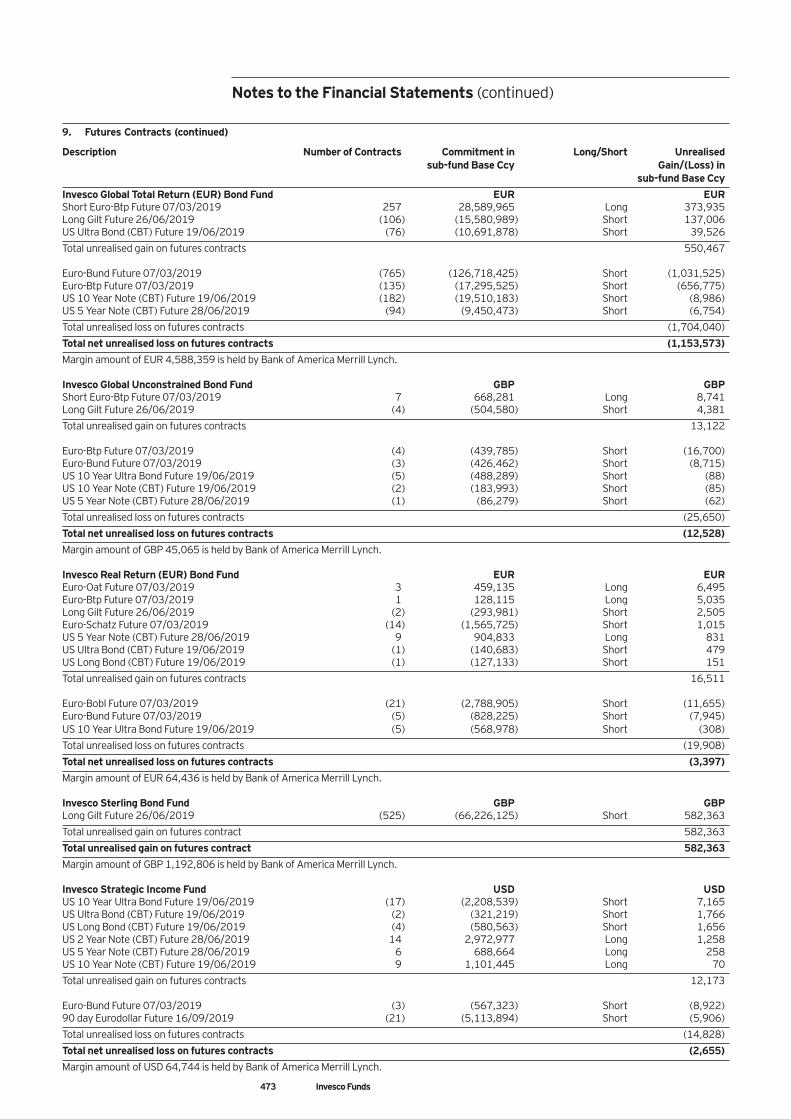
473 Invesco Funds
9. Futures Contracts (continued) Description Number of Contracts Commitment in Long/Short Unrealised sub-fund Base Ccy Gain/(Loss) in sub-fund Base Ccy
Invesco Global Total Return (EUR) Bond Fund EUR EUR Short Euro-Btp Future 07/03/2019 257 28,589,965 Long 373,935 Long Gilt Future 26/06/2019 (106) (15,580,989) Short 137,006 US Ultra Bond (CBT) Future 19/06/2019 (76) (10,691,878) Short 39,526
Total unrealised gain on futures contracts 550,467 Euro-Bund Future 07/03/2019 (765) (126,718,425) Short (1,031,525) Euro-Btp Future 07/03/2019 (135) (17,295,525) Short (656,775) US 10 Year Note (CBT) Future 19/06/2019 (182) (19,510,183) Short (8,986) US 5 Year Note (CBT) Future 28/06/2019 (94) (9,450,473) Short (6,754)
Total unrealised loss on futures contracts (1,704,040)
Total net unrealised loss on futures contracts (1,153,573)
Margin amount of EUR 4,588,359 is held by Bank of America Merrill Lynch. Invesco Global Unconstrained Bond Fund GBP GBP Short Euro-Btp Future 07/03/2019 7 668,281 Long 8,741 Long Gilt Future 26/06/2019 (4) (504,580) Short 4,381
Total unrealised gain on futures contracts 13,122 Euro-Btp Future 07/03/2019 (4) (439,785) Short (16,700) Euro-Bund Future 07/03/2019 (3) (426,462) Short (8,715) US 10 Year Ultra Bond Future 19/06/2019 (5) (488,289) Short (88) US 10 Year Note (CBT) Future 19/06/2019 (2) (183,993) Short (85) US 5 Year Note (CBT) Future 28/06/2019 (1) (86,279) Short (62)
Total unrealised loss on futures contracts (25,650)
Total net unrealised loss on futures contracts (12,528)
Margin amount of GBP 45,065 is held by Bank of America Merrill Lynch. Invesco Real Return (EUR) Bond Fund EUR EUR Euro-Oat Future 07/03/2019 3 459,135 Long 6,495 Euro-Btp Future 07/03/2019 1 128,115 Long 5,035 Long Gilt Future 26/06/2019 (2) (293,981) Short 2,505 Euro-Schatz Future 07/03/2019 (14) (1,565,725) Short 1,015 US 5 Year Note (CBT) Future 28/06/2019 9 904,833 Long 831 US Ultra Bond (CBT) Future 19/06/2019 (1) (140,683) Short 479 US Long Bond (CBT) Future 19/06/2019 (1) (127,133) Short 151
Total unrealised gain on futures contracts 16,511 Euro-Bobl Future 07/03/2019 (21) (2,788,905) Short (11,655) Euro-Bund Future 07/03/2019 (5) (828,225) Short (7,945) US 10 Year Ultra Bond Future 19/06/2019 (5) (568,978) Short (308)
Total unrealised loss on futures contracts (19,908)
Total net unrealised loss on futures contracts (3,397)
Margin amount of EUR 64,436 is held by Bank of America Merrill Lynch. Invesco Sterling Bond Fund GBP GBP Long Gilt Future 26/06/2019 (525) (66,226,125) Short 582,363
Total unrealised gain on futures contract 582,363
Total unrealised gain on futures contract 582,363
Margin amount of GBP 1,192,806 is held by Bank of America Merrill Lynch. Invesco Strategic Income Fund USD USD US 10 Year Ultra Bond Future 19/06/2019 (17) (2,208,539) Short 7,165 US Ultra Bond (CBT) Future 19/06/2019 (2) (321,219) Short 1,766 US Long Bond (CBT) Future 19/06/2019 (4) (580,563) Short 1,656 US 2 Year Note (CBT) Future 28/06/2019 14 2,972,977 Long 1,258 US 5 Year Note (CBT) Future 28/06/2019 6 688,664 Long 258 US 10 Year Note (CBT) Future 19/06/2019 9 1,101,445 Long 70
Total unrealised gain on futures contracts 12,173 Euro-Bund Future 07/03/2019 (3) (567,323) Short (8,922) 90 day Eurodollar Future 16/09/2019 (21) (5,113,894) Short (5,906)
Total unrealised loss on futures contracts (14,828)
Total net unrealised loss on futures contracts (2,655)
Margin amount of USD 64,744 is held by Bank of America Merrill Lynch.
Notes to the Financial Statements (continued)
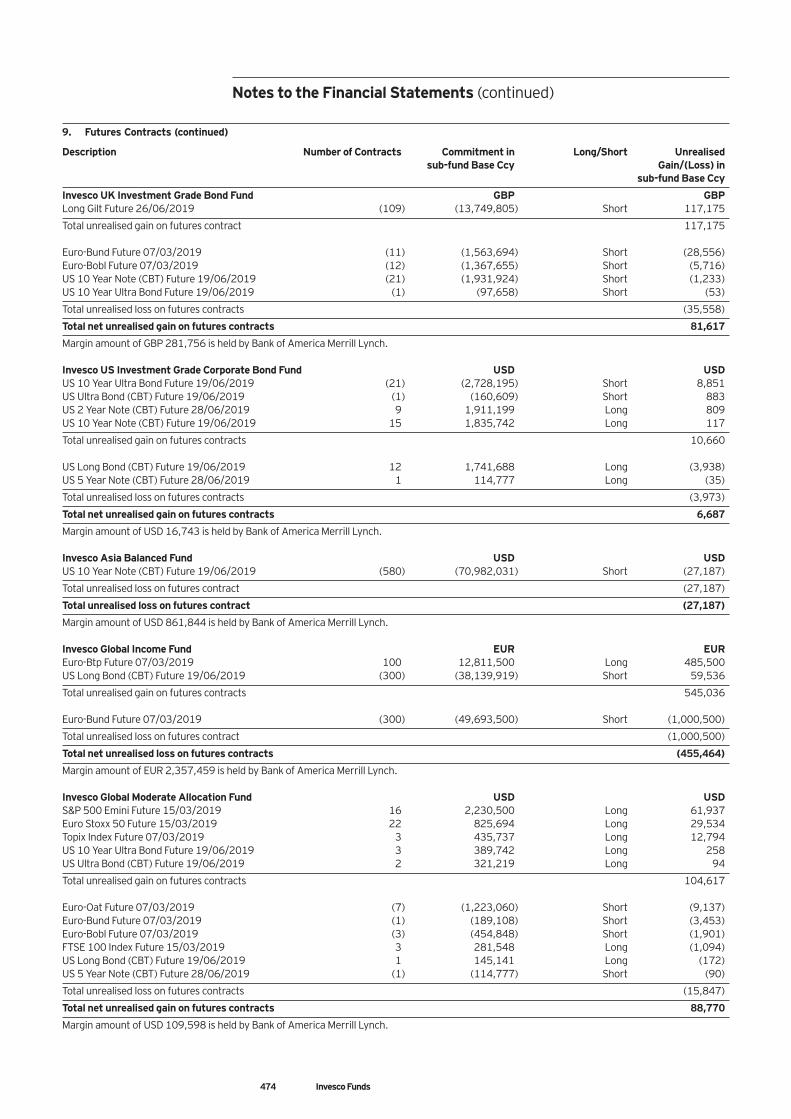
474 Invesco Funds
9. Futures Contracts (continued) Description Number of Contracts Commitment in Long/Short Unrealised sub-fund Base Ccy Gain/(Loss) in sub-fund Base Ccy
Invesco UK Investment Grade Bond Fund GBP GBP Long Gilt Future 26/06/2019 (109) (13,749,805) Short 117,175
Total unrealised gain on futures contract 117,175 Euro-Bund Future 07/03/2019 (11) (1,563,694) Short (28,556) Euro-Bobl Future 07/03/2019 (12) (1,367,655) Short (5,716) US 10 Year Note (CBT) Future 19/06/2019 (21) (1,931,924) Short (1,233) US 10 Year Ultra Bond Future 19/06/2019 (1) (97,658) Short (53)
Total unrealised loss on futures contracts (35,558)
Total net unrealised gain on futures contracts 81,617
Margin amount of GBP 281,756 is held by Bank of America Merrill Lynch. Invesco US Investment Grade Corporate Bond Fund USD USD US 10 Year Ultra Bond Future 19/06/2019 (21) (2,728,195) Short 8,851 US Ultra Bond (CBT) Future 19/06/2019 (1) (160,609) Short 883 US 2 Year Note (CBT) Future 28/06/2019 9 1,911,199 Long 809 US 10 Year Note (CBT) Future 19/06/2019 15 1,835,742 Long 117
Total unrealised gain on futures contracts 10,660 US Long Bond (CBT) Future 19/06/2019 12 1,741,688 Long (3,938) US 5 Year Note (CBT) Future 28/06/2019 1 114,777 Long (35)
Total unrealised loss on futures contracts (3,973)
Total net unrealised gain on futures contracts 6,687
Margin amount of USD 16,743 is held by Bank of America Merrill Lynch. Invesco Asia Balanced Fund USD USD US 10 Year Note (CBT) Future 19/06/2019 (580) (70,982,031) Short (27,187)
Total unrealised loss on futures contract (27,187)
Total unrealised loss on futures contract (27,187)
Margin amount of USD 861,844 is held by Bank of America Merrill Lynch. Invesco Global Income Fund EUR EUR Euro-Btp Future 07/03/2019 100 12,811,500 Long 485,500 US Long Bond (CBT) Future 19/06/2019 (300) (38,139,919) Short 59,536
Total unrealised gain on futures contracts 545,036 Euro-Bund Future 07/03/2019 (300) (49,693,500) Short (1,000,500)
Total unrealised loss on futures contract (1,000,500)
Total net unrealised loss on futures contracts (455,464)
Margin amount of EUR 2,357,459 is held by Bank of America Merrill Lynch. Invesco Global Moderate Allocation Fund USD USD S&P 500 Emini Future 15/03/2019 16 2,230,500 Long 61,937 Euro Stoxx 50 Future 15/03/2019 22 825,694 Long 29,534 Topix Index Future 07/03/2019 3 435,737 Long 12,794 US 10 Year Ultra Bond Future 19/06/2019 3 389,742 Long 258 US Ultra Bond (CBT) Future 19/06/2019 2 321,219 Long 94
Total unrealised gain on futures contracts 104,617 Euro-Oat Future 07/03/2019 (7) (1,223,060) Short (9,137) Euro-Bund Future 07/03/2019 (1) (189,108) Short (3,453) Euro-Bobl Future 07/03/2019 (3) (454,848) Short (1,901) FTSE 100 Index Future 15/03/2019 3 281,548 Long (1,094) US Long Bond (CBT) Future 19/06/2019 1 145,141 Long (172) US 5 Year Note (CBT) Future 28/06/2019 (1) (114,777) Short (90)
Total unrealised loss on futures contracts (15,847)
Total net unrealised gain on futures contracts 88,770
Margin amount of USD 109,598 is held by Bank of America Merrill Lynch.
Notes to the Financial Statements (continued)
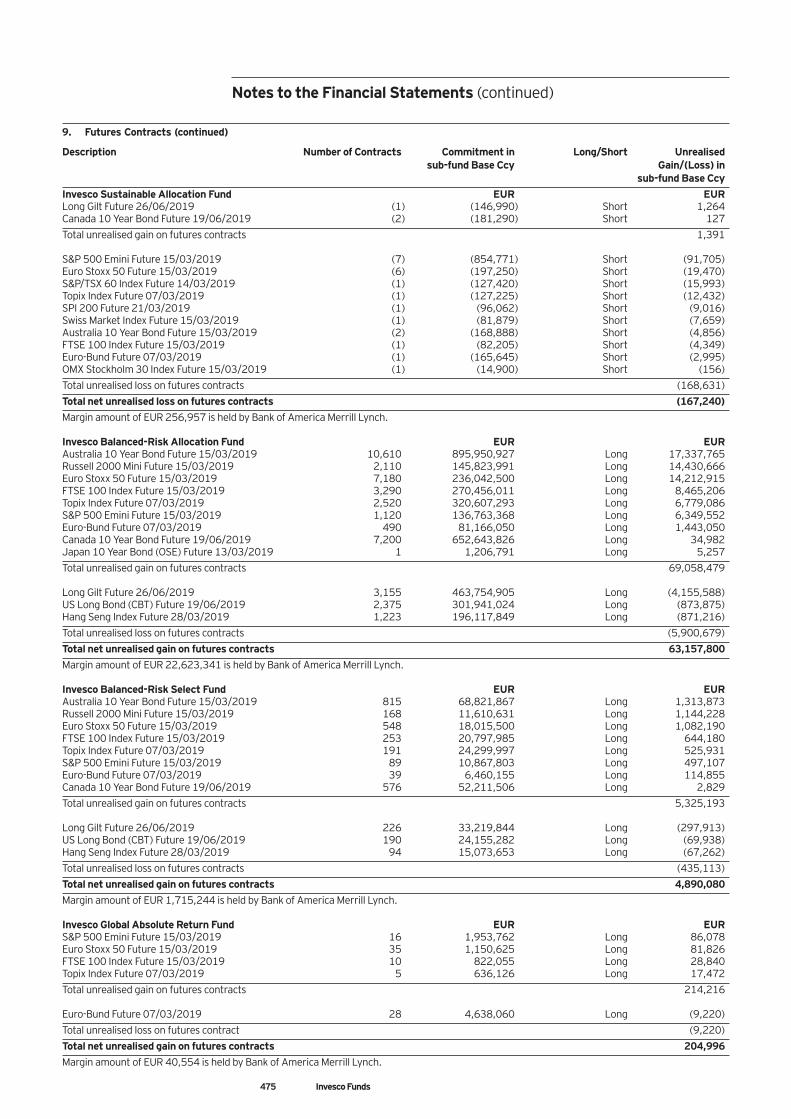
475 Invesco Funds
9. Futures Contracts (continued) Description Number of Contracts Commitment in Long/Short Unrealised sub-fund Base Ccy Gain/(Loss) in sub-fund Base Ccy
Invesco Sustainable Allocation Fund EUR EUR Long Gilt Future 26/06/2019 (1) (146,990) Short 1,264 Canada 10 Year Bond Future 19/06/2019 (2) (181,290) Short 127
Total unrealised gain on futures contracts 1,391 S&P 500 Emini Future 15/03/2019 (7) (854,771) Short (91,705) Euro Stoxx 50 Future 15/03/2019 (6) (197,250) Short (19,470) S&P/TSX 60 Index Future 14/03/2019 (1) (127,420) Short (15,993) Topix Index Future 07/03/2019 (1) (127,225) Short (12,432) SPI 200 Future 21/03/2019 (1) (96,062) Short (9,016) Swiss Market Index Future 15/03/2019 (1) (81,879) Short (7,659) Australia 10 Year Bond Future 15/03/2019 (2) (168,888) Short (4,856) FTSE 100 Index Future 15/03/2019 (1) (82,205) Short (4,349) Euro-Bund Future 07/03/2019 (1) (165,645) Short (2,995) OMX Stockholm 30 Index Future 15/03/2019 (1) (14,900) Short (156)
Total unrealised loss on futures contracts (168,631)
Total net unrealised loss on futures contracts (167,240)
Margin amount of EUR 256,957 is held by Bank of America Merrill Lynch. Invesco Balanced-Risk Allocation Fund EUR EUR Australia 10 Year Bond Future 15/03/2019 10,610 895,950,927 Long 17,337,765 Russell 2000 Mini Future 15/03/2019 2,110 145,823,991 Long 14,430,666 Euro Stoxx 50 Future 15/03/2019 7,180 236,042,500 Long 14,212,915 FTSE 100 Index Future 15/03/2019 3,290 270,456,011 Long 8,465,206 Topix Index Future 07/03/2019 2,520 320,607,293 Long 6,779,086 S&P 500 Emini Future 15/03/2019 1,120 136,763,368 Long 6,349,552 Euro-Bund Future 07/03/2019 490 81,166,050 Long 1,443,050 Canada 10 Year Bond Future 19/06/2019 7,200 652,643,826 Long 34,982 Japan 10 Year Bond (OSE) Future 13/03/2019 1 1,206,791 Long 5,257
Total unrealised gain on futures contracts 69,058,479 Long Gilt Future 26/06/2019 3,155 463,754,905 Long (4,155,588) US Long Bond (CBT) Future 19/06/2019 2,375 301,941,024 Long (873,875) Hang Seng Index Future 28/03/2019 1,223 196,117,849 Long (871,216)
Total unrealised loss on futures contracts (5,900,679)
Total net unrealised gain on futures contracts 63,157,800
Margin amount of EUR 22,623,341 is held by Bank of America Merrill Lynch. Invesco Balanced-Risk Select Fund EUR EUR Australia 10 Year Bond Future 15/03/2019 815 68,821,867 Long 1,313,873 Russell 2000 Mini Future 15/03/2019 168 11,610,631 Long 1,144,228 Euro Stoxx 50 Future 15/03/2019 548 18,015,500 Long 1,082,190 FTSE 100 Index Future 15/03/2019 253 20,797,985 Long 644,180 Topix Index Future 07/03/2019 191 24,299,997 Long 525,931 S&P 500 Emini Future 15/03/2019 89 10,867,803 Long 497,107 Euro-Bund Future 07/03/2019 39 6,460,155 Long 114,855 Canada 10 Year Bond Future 19/06/2019 576 52,211,506 Long 2,829
Total unrealised gain on futures contracts 5,325,193 Long Gilt Future 26/06/2019 226 33,219,844 Long (297,913) US Long Bond (CBT) Future 19/06/2019 190 24,155,282 Long (69,938) Hang Seng Index Future 28/03/2019 94 15,073,653 Long (67,262)
Total unrealised loss on futures contracts (435,113)
Total net unrealised gain on futures contracts 4,890,080
Margin amount of EUR 1,715,244 is held by Bank of America Merrill Lynch. Invesco Global Absolute Return Fund EUR EUR S&P 500 Emini Future 15/03/2019 16 1,953,762 Long 86,078 Euro Stoxx 50 Future 15/03/2019 35 1,150,625 Long 81,826 FTSE 100 Index Future 15/03/2019 10 822,055 Long 28,840 Topix Index Future 07/03/2019 5 636,126 Long 17,472
Total unrealised gain on futures contracts 214,216 Euro-Bund Future 07/03/2019 28 4,638,060 Long (9,220)
Total unrealised loss on futures contract (9,220)
Total net unrealised gain on futures contracts 204,996
Margin amount of EUR 40,554 is held by Bank of America Merrill Lynch.
Notes to the Financial Statements (continued)
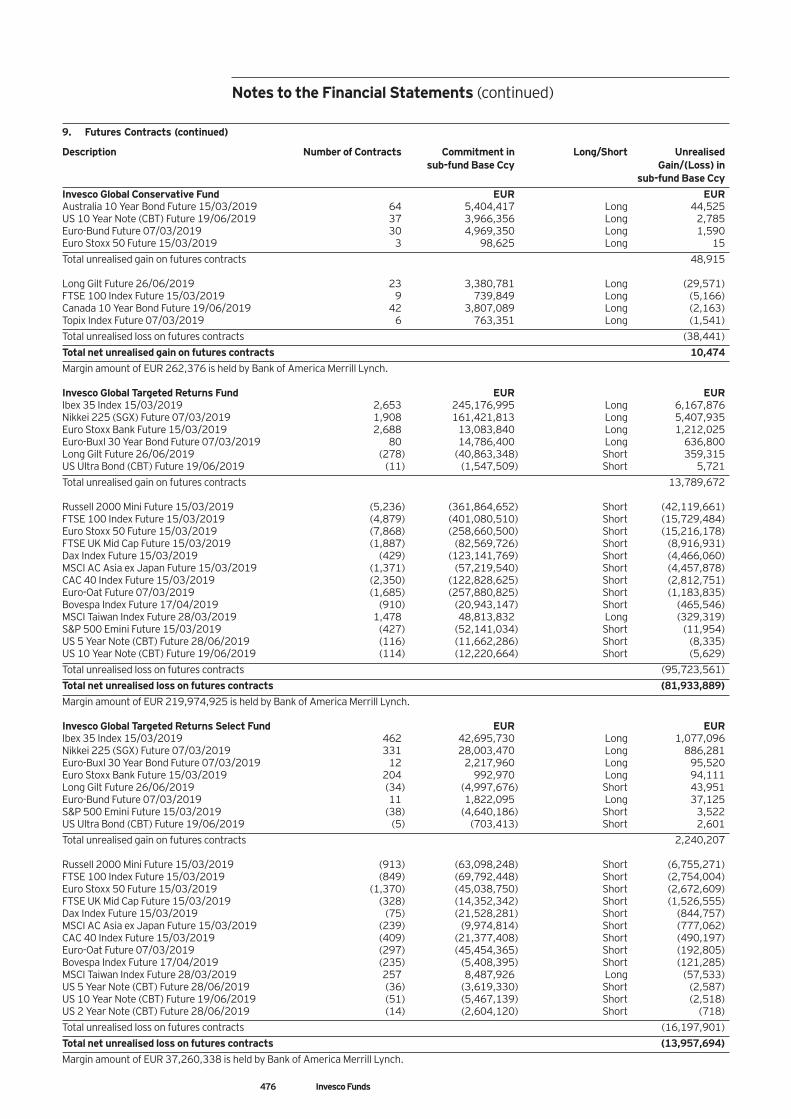
476 Invesco Funds
9. Futures Contracts (continued) Description Number of Contracts Commitment in Long/Short Unrealised sub-fund Base Ccy Gain/(Loss) in sub-fund Base Ccy
Invesco Global Conservative Fund EUR EUR Australia 10 Year Bond Future 15/03/2019 64 5,404,417 Long 44,525 US 10 Year Note (CBT) Future 19/06/2019 37 3,966,356 Long 2,785 Euro-Bund Future 07/03/2019 30 4,969,350 Long 1,590 Euro Stoxx 50 Future 15/03/2019 3 98,625 Long 15
Total unrealised gain on futures contracts 48,915 Long Gilt Future 26/06/2019 23 3,380,781 Long (29,571) FTSE 100 Index Future 15/03/2019 9 739,849 Long (5,166) Canada 10 Year Bond Future 19/06/2019 42 3,807,089 Long (2,163) Topix Index Future 07/03/2019 6 763,351 Long (1,541)
Total unrealised loss on futures contracts (38,441)
Total net unrealised gain on futures contracts 10,474
Margin amount of EUR 262,376 is held by Bank of America Merrill Lynch. Invesco Global Targeted Returns Fund EUR EUR Ibex 35 Index 15/03/2019 2,653 245,176,995 Long 6,167,876 Nikkei 225 (SGX) Future 07/03/2019 1,908 161,421,813 Long 5,407,935 Euro Stoxx Bank Future 15/03/2019 2,688 13,083,840 Long 1,212,025 Euro-Buxl 30 Year Bond Future 07/03/2019 80 14,786,400 Long 636,800 Long Gilt Future 26/06/2019 (278) (40,863,348) Short 359,315 US Ultra Bond (CBT) Future 19/06/2019 (11) (1,547,509) Short 5,721
Total unrealised gain on futures contracts 13,789,672 Russell 2000 Mini Future 15/03/2019 (5,236) (361,864,652) Short (42,119,661) FTSE 100 Index Future 15/03/2019 (4,879) (401,080,510) Short (15,729,484) Euro Stoxx 50 Future 15/03/2019 (7,868) (258,660,500) Short (15,216,178) FTSE UK Mid Cap Future 15/03/2019 (1,887) (82,569,726) Short (8,916,931) Dax Index Future 15/03/2019 (429) (123,141,769) Short (4,466,060) MSCI AC Asia ex Japan Future 15/03/2019 (1,371) (57,219,540) Short (4,457,878) CAC 40 Index Future 15/03/2019 (2,350) (122,828,625) Short (2,812,751) Euro-Oat Future 07/03/2019 (1,685) (257,880,825) Short (1,183,835) Bovespa Index Future 17/04/2019 (910) (20,943,147) Short (465,546) MSCI Taiwan Index Future 28/03/2019 1,478 48,813,832 Long (329,319) S&P 500 Emini Future 15/03/2019 (427) (52,141,034) Short (11,954) US 5 Year Note (CBT) Future 28/06/2019 (116) (11,662,286) Short (8,335) US 10 Year Note (CBT) Future 19/06/2019 (114) (12,220,664) Short (5,629)
Total unrealised loss on futures contracts (95,723,561)
Total net unrealised loss on futures contracts (81,933,889)
Margin amount of EUR 219,974,925 is held by Bank of America Merrill Lynch. Invesco Global Targeted Returns Select Fund EUR EUR Ibex 35 Index 15/03/2019 462 42,695,730 Long 1,077,096 Nikkei 225 (SGX) Future 07/03/2019 331 28,003,470 Long 886,281 Euro-Buxl 30 Year Bond Future 07/03/2019 12 2,217,960 Long 95,520 Euro Stoxx Bank Future 15/03/2019 204 992,970 Long 94,111 Long Gilt Future 26/06/2019 (34) (4,997,676) Short 43,951 Euro-Bund Future 07/03/2019 11 1,822,095 Long 37,125 S&P 500 Emini Future 15/03/2019 (38) (4,640,186) Short 3,522 US Ultra Bond (CBT) Future 19/06/2019 (5) (703,413) Short 2,601
Total unrealised gain on futures contracts 2,240,207 Russell 2000 Mini Future 15/03/2019 (913) (63,098,248) Short (6,755,271) FTSE 100 Index Future 15/03/2019 (849) (69,792,448) Short (2,754,004) Euro Stoxx 50 Future 15/03/2019 (1,370) (45,038,750) Short (2,672,609) FTSE UK Mid Cap Future 15/03/2019 (328) (14,352,342) Short (1,526,555) Dax Index Future 15/03/2019 (75) (21,528,281) Short (844,757) MSCI AC Asia ex Japan Future 15/03/2019 (239) (9,974,814) Short (777,062) CAC 40 Index Future 15/03/2019 (409) (21,377,408) Short (490,197) Euro-Oat Future 07/03/2019 (297) (45,454,365) Short (192,805) Bovespa Index Future 17/04/2019 (235) (5,408,395) Short (121,285) MSCI Taiwan Index Future 28/03/2019 257 8,487,926 Long (57,533) US 5 Year Note (CBT) Future 28/06/2019 (36) (3,619,330) Short (2,587) US 10 Year Note (CBT) Future 19/06/2019 (51) (5,467,139) Short (2,518) US 2 Year Note (CBT) Future 28/06/2019 (14) (2,604,120) Short (718)
Total unrealised loss on futures contracts (16,197,901)
Total net unrealised loss on futures contracts (13,957,694)
Margin amount of EUR 37,260,338 is held by Bank of America Merrill Lynch.
Notes to the Financial Statements (continued)
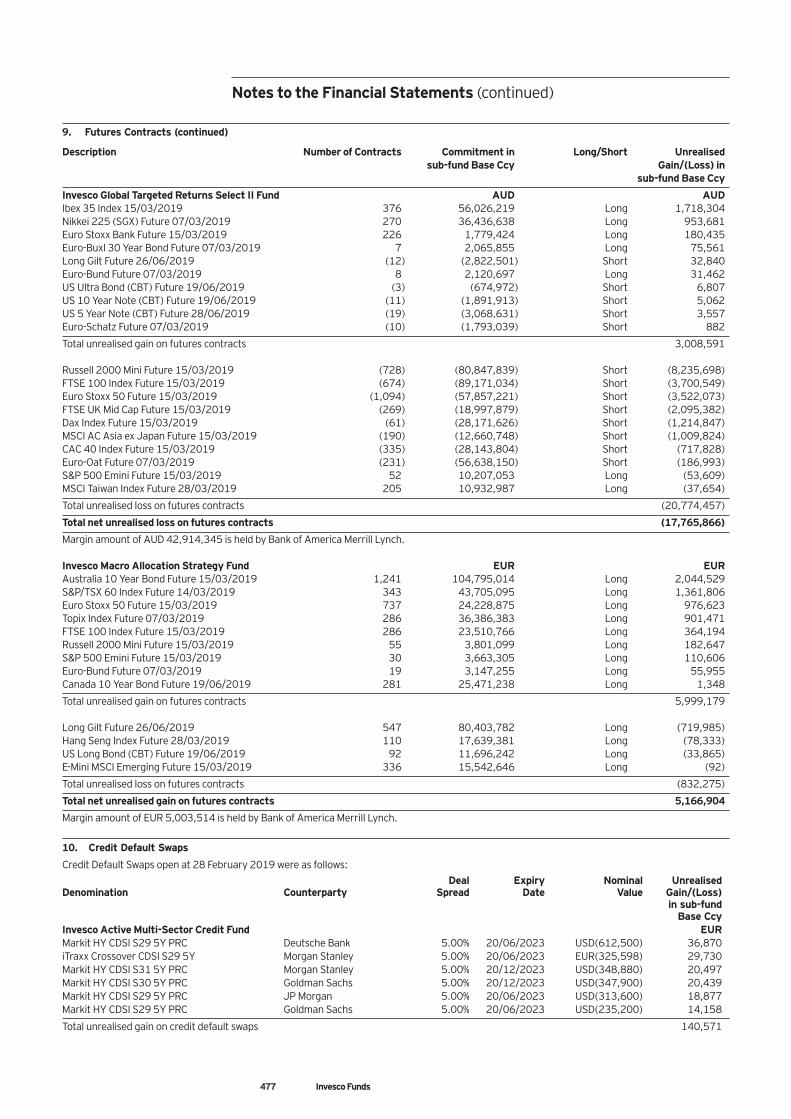
477 Invesco Funds
9. Futures Contracts (continued) Description Number of Contracts Commitment in Long/Short Unrealised sub-fund Base Ccy Gain/(Loss) in sub-fund Base Ccy
Invesco Global Targeted Returns Select II Fund AUD AUD Ibex 35 Index 15/03/2019 376 56,026,219 Long 1,718,304 Nikkei 225 (SGX) Future 07/03/2019 270 36,436,638 Long 953,681 Euro Stoxx Bank Future 15/03/2019 226 1,779,424 Long 180,435 Euro-Buxl 30 Year Bond Future 07/03/2019 7 2,065,855 Long 75,561 Long Gilt Future 26/06/2019 (12) (2,822,501) Short 32,840 Euro-Bund Future 07/03/2019 8 2,120,697 Long 31,462 US Ultra Bond (CBT) Future 19/06/2019 (3) (674,972) Short 6,807 US 10 Year Note (CBT) Future 19/06/2019 (11) (1,891,913) Short 5,062 US 5 Year Note (CBT) Future 28/06/2019 (19) (3,068,631) Short 3,557 Euro-Schatz Future 07/03/2019 (10) (1,793,039) Short 882
Total unrealised gain on futures contracts 3,008,591 Russell 2000 Mini Future 15/03/2019 (728) (80,847,839) Short (8,235,698) FTSE 100 Index Future 15/03/2019 (674) (89,171,034) Short (3,700,549) Euro Stoxx 50 Future 15/03/2019 (1,094) (57,857,221) Short (3,522,073) FTSE UK Mid Cap Future 15/03/2019 (269) (18,997,879) Short (2,095,382) Dax Index Future 15/03/2019 (61) (28,171,626) Short (1,214,847) MSCI AC Asia ex Japan Future 15/03/2019 (190) (12,660,748) Short (1,009,824) CAC 40 Index Future 15/03/2019 (335) (28,143,804) Short (717,828) Euro-Oat Future 07/03/2019 (231) (56,638,150) Short (186,993) S&P 500 Emini Future 15/03/2019 52 10,207,053 Long (53,609) MSCI Taiwan Index Future 28/03/2019 205 10,932,987 Long (37,654)
Total unrealised loss on futures contracts (20,774,457)
Total net unrealised loss on futures contracts (17,765,866)
Margin amount of AUD 42,914,345 is held by Bank of America Merrill Lynch. Invesco Macro Allocation Strategy Fund EUR EUR Australia 10 Year Bond Future 15/03/2019 1,241 104,795,014 Long 2,044,529 S&P/TSX 60 Index Future 14/03/2019 343 43,705,095 Long 1,361,806 Euro Stoxx 50 Future 15/03/2019 737 24,228,875 Long 976,623 Topix Index Future 07/03/2019 286 36,386,383 Long 901,471 FTSE 100 Index Future 15/03/2019 286 23,510,766 Long 364,194 Russell 2000 Mini Future 15/03/2019 55 3,801,099 Long 182,647 S&P 500 Emini Future 15/03/2019 30 3,663,305 Long 110,606 Euro-Bund Future 07/03/2019 19 3,147,255 Long 55,955 Canada 10 Year Bond Future 19/06/2019 281 25,471,238 Long 1,348
Total unrealised gain on futures contracts 5,999,179 Long Gilt Future 26/06/2019 547 80,403,782 Long (719,985) Hang Seng Index Future 28/03/2019 110 17,639,381 Long (78,333) US Long Bond (CBT) Future 19/06/2019 92 11,696,242 Long (33,865) E-Mini MSCI Emerging Future 15/03/2019 336 15,542,646 Long (92)
Total unrealised loss on futures contracts (832,275)
Total net unrealised gain on futures contracts 5,166,904
Margin amount of EUR 5,003,514 is held by Bank of America Merrill Lynch.
10. Credit Default Swaps
Credit Default Swaps open at 28 February 2019 were as follows: Deal Expiry Nominal Unrealised Denomination Counterparty Spread Date Value Gain/(Loss) in sub-fund Base Ccy Invesco Active Multi-Sector Credit Fund EUR Markit HY CDSI S29 5Y PRC Deutsche Bank 5.00% 20/06/2023 USD(612,500) 36,870 iTraxx Crossover CDSI S29 5Y Morgan Stanley 5.00% 20/06/2023 EUR(325,598) 29,730 Markit HY CDSI S31 5Y PRC Morgan Stanley 5.00% 20/12/2023 USD(348,880) 20,497 Markit HY CDSI S30 5Y PRC Goldman Sachs 5.00% 20/12/2023 USD(347,900) 20,439 Markit HY CDSI S29 5Y PRC JP Morgan 5.00% 20/06/2023 USD(313,600) 18,877 Markit HY CDSI S29 5Y PRC Goldman Sachs 5.00% 20/06/2023 USD(235,200) 14,158
Total unrealised gain on credit default swaps 140,571
Notes to the Financial Statements (continued)
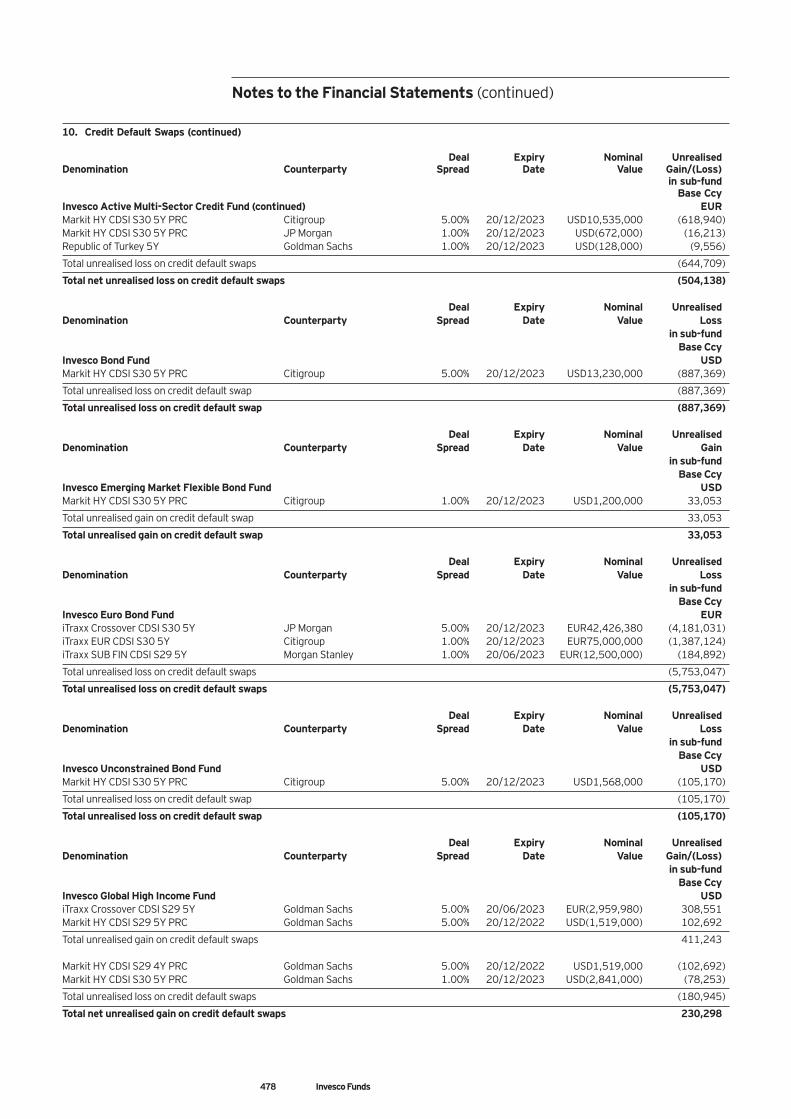
478 Invesco Funds
10. Credit Default Swaps (continued) Deal Expiry Nominal Unrealised Denomination Counterparty Spread Date Value Gain/(Loss) in sub-fund Base Ccy Invesco Active Multi-Sector Credit Fund (continued) EUR Markit HY CDSI S30 5Y PRC Citigroup 5.00% 20/12/2023 USD10,535,000 (618,940) Markit HY CDSI S30 5Y PRC JP Morgan 1.00% 20/12/2023 USD(672,000) (16,213) Republic of Turkey 5Y Goldman Sachs 1.00% 20/12/2023 USD(128,000) (9,556)
Total unrealised loss on credit default swaps (644,709)
Total net unrealised loss on credit default swaps (504,138) Deal Expiry Nominal Unrealised Denomination Counterparty Spread Date Value Loss in sub-fund Base Ccy Invesco Bond Fund USD Markit HY CDSI S30 5Y PRC Citigroup 5.00% 20/12/2023 USD13,230,000 (887,369)
Total unrealised loss on credit default swap (887,369)
Total unrealised loss on credit default swap (887,369) Deal Expiry Nominal Unrealised Denomination Counterparty Spread Date Value Gain in sub-fund Base Ccy Invesco Emerging Market Flexible Bond Fund USD Markit HY CDSI S30 5Y PRC Citigroup 1.00% 20/12/2023 USD1,200,000 33,053
Total unrealised gain on credit default swap 33,053
Total unrealised gain on credit default swap 33,053 Deal Expiry Nominal Unrealised Denomination Counterparty Spread Date Value Loss in sub-fund Base Ccy Invesco Euro Bond Fund EUR iTraxx Crossover CDSI S30 5Y JP Morgan 5.00% 20/12/2023 EUR42,426,380 (4,181,031) iTraxx EUR CDSI S30 5Y Citigroup 1.00% 20/12/2023 EUR75,000,000 (1,387,124) iTraxx SUB FIN CDSI S29 5Y Morgan Stanley 1.00% 20/06/2023 EUR(12,500,000) (184,892)
Total unrealised loss on credit default swaps (5,753,047)
Total unrealised loss on credit default swaps (5,753,047) Deal Expiry Nominal Unrealised Denomination Counterparty Spread Date Value Loss in sub-fund Base Ccy Invesco Unconstrained Bond Fund USD Markit HY CDSI S30 5Y PRC Citigroup 5.00% 20/12/2023 USD1,568,000 (105,170)
Total unrealised loss on credit default swap (105,170)
Total unrealised loss on credit default swap (105,170) Deal Expiry Nominal Unrealised Denomination Counterparty Spread Date Value Gain/(Loss) in sub-fund Base Ccy Invesco Global High Income Fund USD iTraxx Crossover CDSI S29 5Y Goldman Sachs 5.00% 20/06/2023 EUR(2,959,980) 308,551 Markit HY CDSI S29 5Y PRC Goldman Sachs 5.00% 20/12/2022 USD(1,519,000) 102,692
Total unrealised gain on credit default swaps 411,243 Markit HY CDSI S29 4Y PRC Goldman Sachs 5.00% 20/12/2022 USD1,519,000 (102,692) Markit HY CDSI S30 5Y PRC Goldman Sachs 1.00% 20/12/2023 USD(2,841,000) (78,253)
Total unrealised loss on credit default swaps (180,945)
Total net unrealised gain on credit default swaps 230,298
Notes to the Financial Statements (continued)
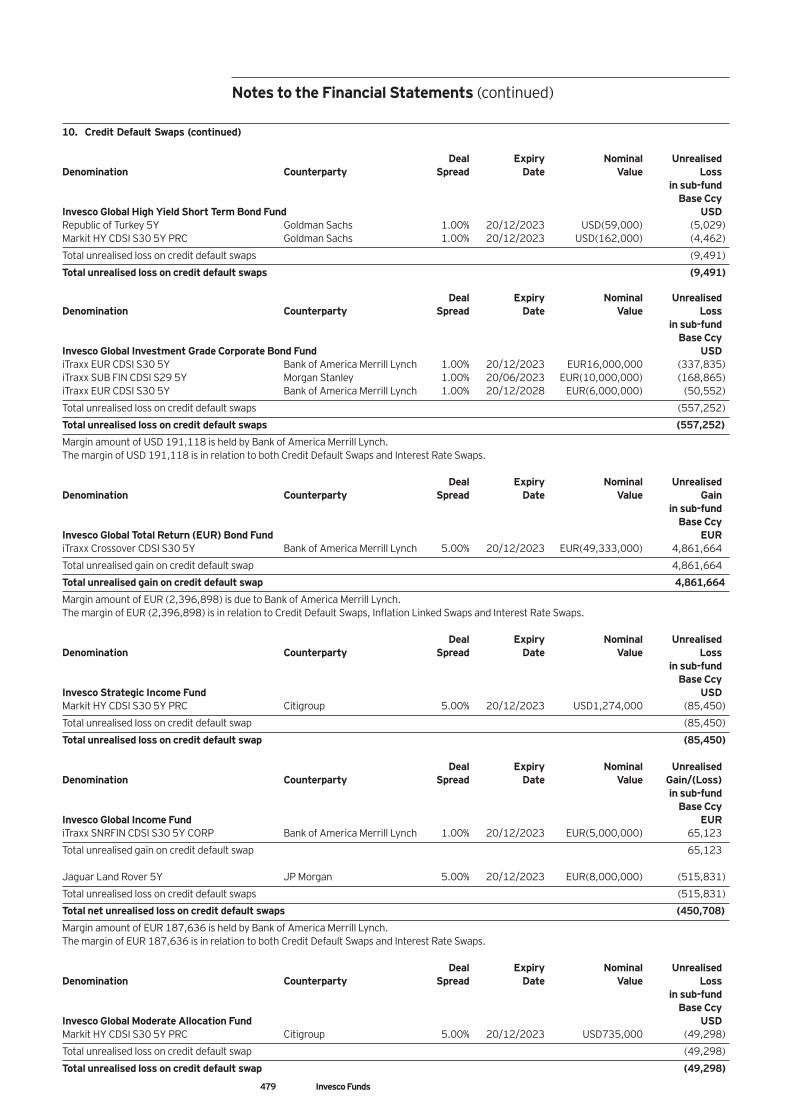
479 Invesco Funds
10. Credit Default Swaps (continued) Deal Expiry Nominal Unrealised Denomination Counterparty Spread Date Value Loss in sub-fund Base Ccy Invesco Global High Yield Short Term Bond Fund USD Republic of Turkey 5Y Goldman Sachs 1.00% 20/12/2023 USD(59,000) (5,029) Markit HY CDSI S30 5Y PRC Goldman Sachs 1.00% 20/12/2023 USD(162,000) (4,462)
Total unrealised loss on credit default swaps (9,491)
Total unrealised loss on credit default swaps (9,491) Deal Expiry Nominal Unrealised Denomination Counterparty Spread Date Value Loss in sub-fund Base Ccy Invesco Global Investment Grade Corporate Bond Fund USD iTraxx EUR CDSI S30 5Y Bank of America Merrill Lynch 1.00% 20/12/2023 EUR16,000,000 (337,835) iTraxx SUB FIN CDSI S29 5Y Morgan Stanley 1.00% 20/06/2023 EUR(10,000,000) (168,865) iTraxx EUR CDSI S30 5Y Bank of America Merrill Lynch 1.00% 20/12/2028 EUR(6,000,000) (50,552)
Total unrealised loss on credit default swaps (557,252)
Total unrealised loss on credit default swaps (557,252)
Margin amount of USD 191,118 is held by Bank of America Merrill Lynch. The margin of USD 191,118 is in relation to both Credit Default Swaps and Interest Rate Swaps. Deal Expiry Nominal Unrealised Denomination Counterparty Spread Date Value Gain in sub-fund Base Ccy Invesco Global Total Return (EUR) Bond Fund EUR iTraxx Crossover CDSI S30 5Y Bank of America Merrill Lynch 5.00% 20/12/2023 EUR(49,333,000) 4,861,664
Total unrealised gain on credit default swap 4,861,664
Total unrealised gain on credit default swap 4,861,664
Margin amount of EUR (2,396,898) is due to Bank of America Merrill Lynch. The margin of EUR (2,396,898) is in relation to Credit Default Swaps, Inflation Linked Swaps and Interest Rate Swaps. Deal Expiry Nominal Unrealised Denomination Counterparty Spread Date Value Loss in sub-fund Base Ccy Invesco Strategic Income Fund USD Markit HY CDSI S30 5Y PRC Citigroup 5.00% 20/12/2023 USD1,274,000 (85,450)
Total unrealised loss on credit default swap (85,450)
Total unrealised loss on credit default swap (85,450) Deal Expiry Nominal Unrealised Denomination Counterparty Spread Date Value Gain/(Loss) in sub-fund Base Ccy Invesco Global Income Fund EUR iTraxx SNRFIN CDSI S30 5Y CORP Bank of America Merrill Lynch 1.00% 20/12/2023 EUR(5,000,000) 65,123
Total unrealised gain on credit default swap 65,123 Jaguar Land Rover 5Y JP Morgan 5.00% 20/12/2023 EUR(8,000,000) (515,831)
Total unrealised loss on credit default swaps (515,831)
Total net unrealised loss on credit default swaps (450,708)
Margin amount of EUR 187,636 is held by Bank of America Merrill Lynch. The margin of EUR 187,636 is in relation to both Credit Default Swaps and Interest Rate Swaps. Deal Expiry Nominal Unrealised Denomination Counterparty Spread Date Value Loss in sub-fund Base Ccy Invesco Global Moderate Allocation Fund USD Markit HY CDSI S30 5Y PRC Citigroup 5.00% 20/12/2023 USD735,000 (49,298)
Total unrealised loss on credit default swap (49,298)
Total unrealised loss on credit default swap (49,298)
Notes to the Financial Statements (continued)
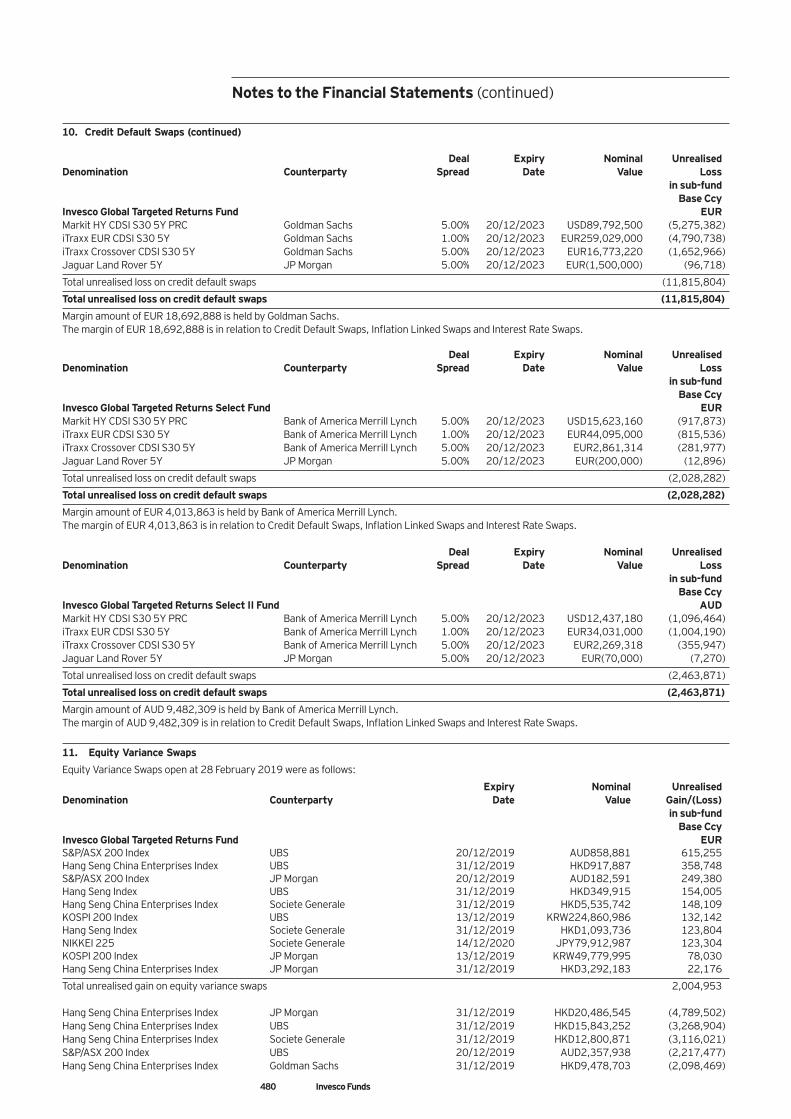
480 Invesco Funds
10. Credit Default Swaps (continued) Deal Expiry Nominal Unrealised Denomination Counterparty Spread Date Value Loss in sub-fund Base Ccy Invesco Global Targeted Returns Fund EUR Markit HY CDSI S30 5Y PRC Goldman Sachs 5.00% 20/12/2023 USD89,792,500 (5,275,382) iTraxx EUR CDSI S30 5Y Goldman Sachs 1.00% 20/12/2023 EUR259,029,000 (4,790,738) iTraxx Crossover CDSI S30 5Y Goldman Sachs 5.00% 20/12/2023 EUR16,773,220 (1,652,966) Jaguar Land Rover 5Y JP Morgan 5.00% 20/12/2023 EUR(1,500,000) (96,718)
Total unrealised loss on credit default swaps (11,815,804)
Total unrealised loss on credit default swaps (11,815,804)
Margin amount of EUR 18,692,888 is held by Goldman Sachs. The margin of EUR 18,692,888 is in relation to Credit Default Swaps, Inflation Linked Swaps and Interest Rate Swaps. Deal Expiry Nominal Unrealised Denomination Counterparty Spread Date Value Loss in sub-fund Base Ccy Invesco Global Targeted Returns Select Fund EUR Markit HY CDSI S30 5Y PRC Bank of America Merrill Lynch 5.00% 20/12/2023 USD15,623,160 (917,873) iTraxx EUR CDSI S30 5Y Bank of America Merrill Lynch 1.00% 20/12/2023 EUR44,095,000 (815,536) iTraxx Crossover CDSI S30 5Y Bank of America Merrill Lynch 5.00% 20/12/2023 EUR2,861,314 (281,977) Jaguar Land Rover 5Y JP Morgan 5.00% 20/12/2023 EUR(200,000) (12,896)
Total unrealised loss on credit default swaps (2,028,282)
Total unrealised loss on credit default swaps (2,028,282)
Margin amount of EUR 4,013,863 is held by Bank of America Merrill Lynch. The margin of EUR 4,013,863 is in relation to Credit Default Swaps, Inflation Linked Swaps and Interest Rate Swaps. Deal Expiry Nominal Unrealised Denomination Counterparty Spread Date Value Loss in sub-fund Base Ccy Invesco Global Targeted Returns Select II Fund AUD Markit HY CDSI S30 5Y PRC Bank of America Merrill Lynch 5.00% 20/12/2023 USD12,437,180 (1,096,464) iTraxx EUR CDSI S30 5Y Bank of America Merrill Lynch 1.00% 20/12/2023 EUR34,031,000 (1,004,190) iTraxx Crossover CDSI S30 5Y Bank of America Merrill Lynch 5.00% 20/12/2023 EUR2,269,318 (355,947) Jaguar Land Rover 5Y JP Morgan 5.00% 20/12/2023 EUR(70,000) (7,270)
Total unrealised loss on credit default swaps (2,463,871)
Total unrealised loss on credit default swaps (2,463,871)
Margin amount of AUD 9,482,309 is held by Bank of America Merrill Lynch. The margin of AUD 9,482,309 is in relation to Credit Default Swaps, Inflation Linked Swaps and Interest Rate Swaps.
11. Equity Variance Swaps
Equity Variance Swaps open at 28 February 2019 were as follows:
Expiry Nominal Unrealised Denomination Counterparty Date Value Gain/(Loss) in sub-fund Base Ccy Invesco Global Targeted Returns Fund EUR S&P/ASX 200 Index UBS 20/12/2019 AUD858,881 615,255 Hang Seng China Enterprises Index UBS 31/12/2019 HKD917,887 358,748 S&P/ASX 200 Index JP Morgan 20/12/2019 AUD182,591 249,380 Hang Seng Index UBS 31/12/2019 HKD349,915 154,005 Hang Seng China Enterprises Index Societe Generale 31/12/2019 HKD5,535,742 148,109 KOSPI 200 Index UBS 13/12/2019 KRW224,860,986 132,142 Hang Seng Index Societe Generale 31/12/2019 HKD1,093,736 123,804 NIKKEI 225 Societe Generale 14/12/2020 JPY79,912,987 123,304 KOSPI 200 Index JP Morgan 13/12/2019 KRW49,779,995 78,030 Hang Seng China Enterprises Index JP Morgan 31/12/2019 HKD3,292,183 22,176
Total unrealised gain on equity variance swaps 2,004,953 Hang Seng China Enterprises Index JP Morgan 31/12/2019 HKD20,486,545 (4,789,502) Hang Seng China Enterprises Index UBS 31/12/2019 HKD15,843,252 (3,268,904) Hang Seng China Enterprises Index Societe Generale 31/12/2019 HKD12,800,871 (3,116,021) S&P/ASX 200 Index UBS 20/12/2019 AUD2,357,938 (2,217,477) Hang Seng China Enterprises Index Goldman Sachs 31/12/2019 HKD9,478,703 (2,098,469)
Notes to the Financial Statements (continued)
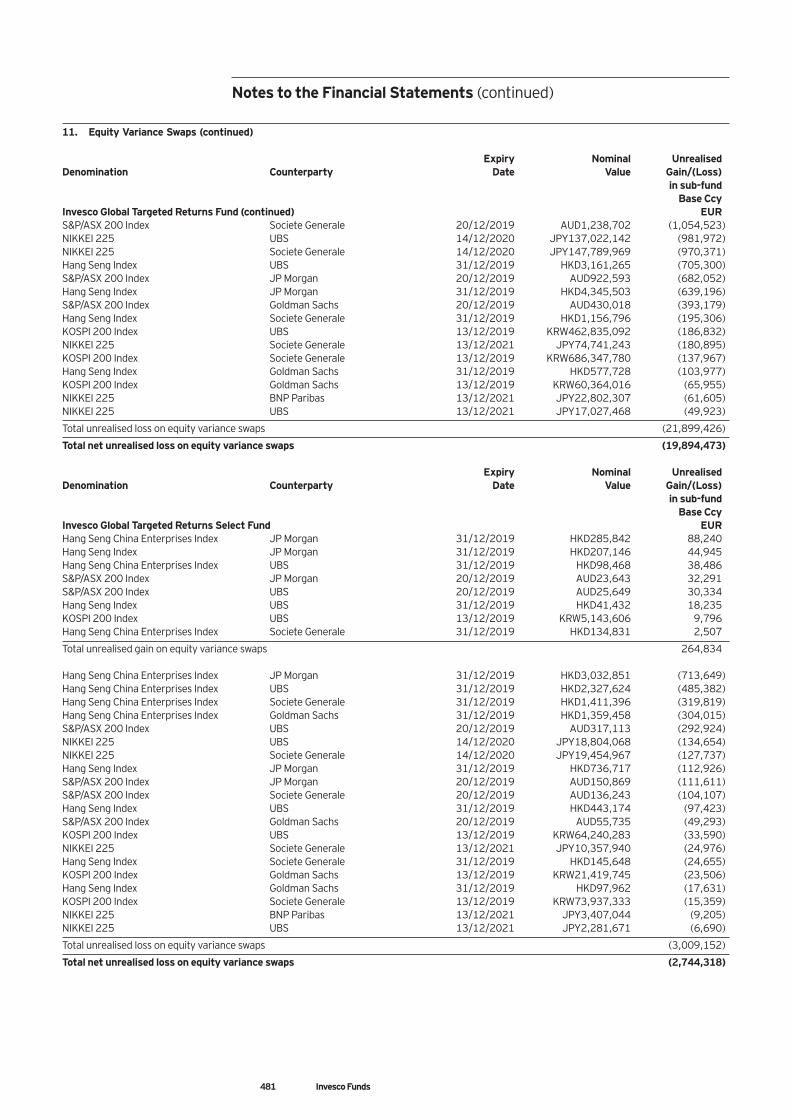
481 Invesco Funds
11. Equity Variance Swaps (continued) Expiry Nominal Unrealised Denomination Counterparty Date Value Gain/(Loss) in sub-fund Base Ccy Invesco Global Targeted Returns Fund (continued) EUR S&P/ASX 200 Index Societe Generale 20/12/2019 AUD1,238,702 (1,054,523) NIKKEI 225 UBS 14/12/2020 JPY137,022,142 (981,972) NIKKEI 225 Societe Generale 14/12/2020 JPY147,789,969 (970,371) Hang Seng Index UBS 31/12/2019 HKD3,161,265 (705,300) S&P/ASX 200 Index JP Morgan 20/12/2019 AUD922,593 (682,052) Hang Seng Index JP Morgan 31/12/2019 HKD4,345,503 (639,196) S&P/ASX 200 Index Goldman Sachs 20/12/2019 AUD430,018 (393,179) Hang Seng Index Societe Generale 31/12/2019 HKD1,156,796 (195,306) KOSPI 200 Index UBS 13/12/2019 KRW462,835,092 (186,832) NIKKEI 225 Societe Generale 13/12/2021 JPY74,741,243 (180,895) KOSPI 200 Index Societe Generale 13/12/2019 KRW686,347,780 (137,967) Hang Seng Index Goldman Sachs 31/12/2019 HKD577,728 (103,977) KOSPI 200 Index Goldman Sachs 13/12/2019 KRW60,364,016 (65,955) NIKKEI 225 BNP Paribas 13/12/2021 JPY22,802,307 (61,605) NIKKEI 225 UBS 13/12/2021 JPY17,027,468 (49,923)
Total unrealised loss on equity variance swaps (21,899,426)
Total net unrealised loss on equity variance swaps (19,894,473) Expiry Nominal Unrealised Denomination Counterparty Date Value Gain/(Loss) in sub-fund Base Ccy Invesco Global Targeted Returns Select Fund EUR Hang Seng China Enterprises Index JP Morgan 31/12/2019 HKD285,842 88,240 Hang Seng Index JP Morgan 31/12/2019 HKD207,146 44,945 Hang Seng China Enterprises Index UBS 31/12/2019 HKD98,468 38,486 S&P/ASX 200 Index JP Morgan 20/12/2019 AUD23,643 32,291 S&P/ASX 200 Index UBS 20/12/2019 AUD25,649 30,334 Hang Seng Index UBS 31/12/2019 HKD41,432 18,235 KOSPI 200 Index UBS 13/12/2019 KRW5,143,606 9,796 Hang Seng China Enterprises Index Societe Generale 31/12/2019 HKD134,831 2,507
Total unrealised gain on equity variance swaps 264,834 Hang Seng China Enterprises Index JP Morgan 31/12/2019 HKD3,032,851 (713,649) Hang Seng China Enterprises Index UBS 31/12/2019 HKD2,327,624 (485,382) Hang Seng China Enterprises Index Societe Generale 31/12/2019 HKD1,411,396 (319,819) Hang Seng China Enterprises Index Goldman Sachs 31/12/2019 HKD1,359,458 (304,015) S&P/ASX 200 Index UBS 20/12/2019 AUD317,113 (292,924) NIKKEI 225 UBS 14/12/2020 JPY18,804,068 (134,654) NIKKEI 225 Societe Generale 14/12/2020 JPY19,454,967 (127,737) Hang Seng Index JP Morgan 31/12/2019 HKD736,717 (112,926) S&P/ASX 200 Index JP Morgan 20/12/2019 AUD150,869 (111,611) S&P/ASX 200 Index Societe Generale 20/12/2019 AUD136,243 (104,107) Hang Seng Index UBS 31/12/2019 HKD443,174 (97,423) S&P/ASX 200 Index Goldman Sachs 20/12/2019 AUD55,735 (49,293) KOSPI 200 Index UBS 13/12/2019 KRW64,240,283 (33,590) NIKKEI 225 Societe Generale 13/12/2021 JPY10,357,940 (24,976) Hang Seng Index Societe Generale 31/12/2019 HKD145,648 (24,655) KOSPI 200 Index Goldman Sachs 13/12/2019 KRW21,419,745 (23,506) Hang Seng Index Goldman Sachs 31/12/2019 HKD97,962 (17,631) KOSPI 200 Index Societe Generale 13/12/2019 KRW73,937,333 (15,359) NIKKEI 225 BNP Paribas 13/12/2021 JPY3,407,044 (9,205) NIKKEI 225 UBS 13/12/2021 JPY2,281,671 (6,690)
Total unrealised loss on equity variance swaps (3,009,152)
Total net unrealised loss on equity variance swaps (2,744,318)
Notes to the Financial Statements (continued)
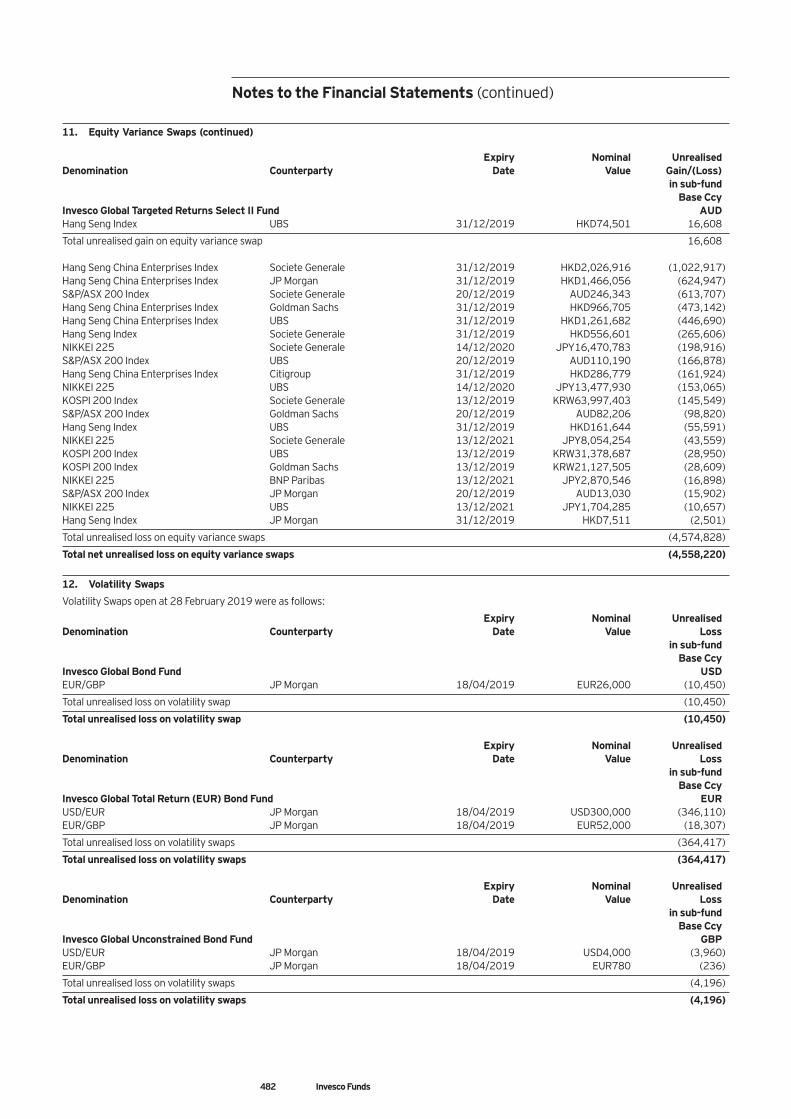
482 Invesco Funds
11. Equity Variance Swaps (continued) Expiry Nominal Unrealised Denomination Counterparty Date Value Gain/(Loss) in sub-fund Base Ccy Invesco Global Targeted Returns Select II Fund AUD Hang Seng Index UBS 31/12/2019 HKD74,501 16,608
Total unrealised gain on equity variance swap 16,608 Hang Seng China Enterprises Index Societe Generale 31/12/2019 HKD2,026,916 (1,022,917) Hang Seng China Enterprises Index JP Morgan 31/12/2019 HKD1,466,056 (624,947) S&P/ASX 200 Index Societe Generale 20/12/2019 AUD246,343 (613,707) Hang Seng China Enterprises Index Goldman Sachs 31/12/2019 HKD966,705 (473,142) Hang Seng China Enterprises Index UBS 31/12/2019 HKD1,261,682 (446,690) Hang Seng Index Societe Generale 31/12/2019 HKD556,601 (265,606) NIKKEI 225 Societe Generale 14/12/2020 JPY16,470,783 (198,916) S&P/ASX 200 Index UBS 20/12/2019 AUD110,190 (166,878) Hang Seng China Enterprises Index Citigroup 31/12/2019 HKD286,779 (161,924) NIKKEI 225 UBS 14/12/2020 JPY13,477,930 (153,065) KOSPI 200 Index Societe Generale 13/12/2019 KRW63,997,403 (145,549) S&P/ASX 200 Index Goldman Sachs 20/12/2019 AUD82,206 (98,820) Hang Seng Index UBS 31/12/2019 HKD161,644 (55,591) NIKKEI 225 Societe Generale 13/12/2021 JPY8,054,254 (43,559) KOSPI 200 Index UBS 13/12/2019 KRW31,378,687 (28,950) KOSPI 200 Index Goldman Sachs 13/12/2019 KRW21,127,505 (28,609) NIKKEI 225 BNP Paribas 13/12/2021 JPY2,870,546 (16,898) S&P/ASX 200 Index JP Morgan 20/12/2019 AUD13,030 (15,902) NIKKEI 225 UBS 13/12/2021 JPY1,704,285 (10,657) Hang Seng Index JP Morgan 31/12/2019 HKD7,511 (2,501)
Total unrealised loss on equity variance swaps (4,574,828)
Total net unrealised loss on equity variance swaps (4,558,220)
12. Volatility Swaps
Volatility Swaps open at 28 February 2019 were as follows:
Expiry Nominal Unrealised Denomination Counterparty Date Value Loss in sub-fund Base Ccy Invesco Global Bond Fund USD EUR/GBP JP Morgan 18/04/2019 EUR26,000 (10,450)
Total unrealised loss on volatility swap (10,450)
Total unrealised loss on volatility swap (10,450) Expiry Nominal Unrealised Denomination Counterparty Date Value Loss in sub-fund Base Ccy Invesco Global Total Return (EUR) Bond Fund EUR USD/EUR JP Morgan 18/04/2019 USD300,000 (346,110) EUR/GBP JP Morgan 18/04/2019 EUR52,000 (18,307)
Total unrealised loss on volatility swaps (364,417)
Total unrealised loss on volatility swaps (364,417) Expiry Nominal Unrealised Denomination Counterparty Date Value Loss in sub-fund Base Ccy Invesco Global Unconstrained Bond Fund GBP USD/EUR JP Morgan 18/04/2019 USD4,000 (3,960) EUR/GBP JP Morgan 18/04/2019 EUR780 (236)
Total unrealised loss on volatility swaps (4,196)
Total unrealised loss on volatility swaps (4,196)
Notes to the Financial Statements (continued)
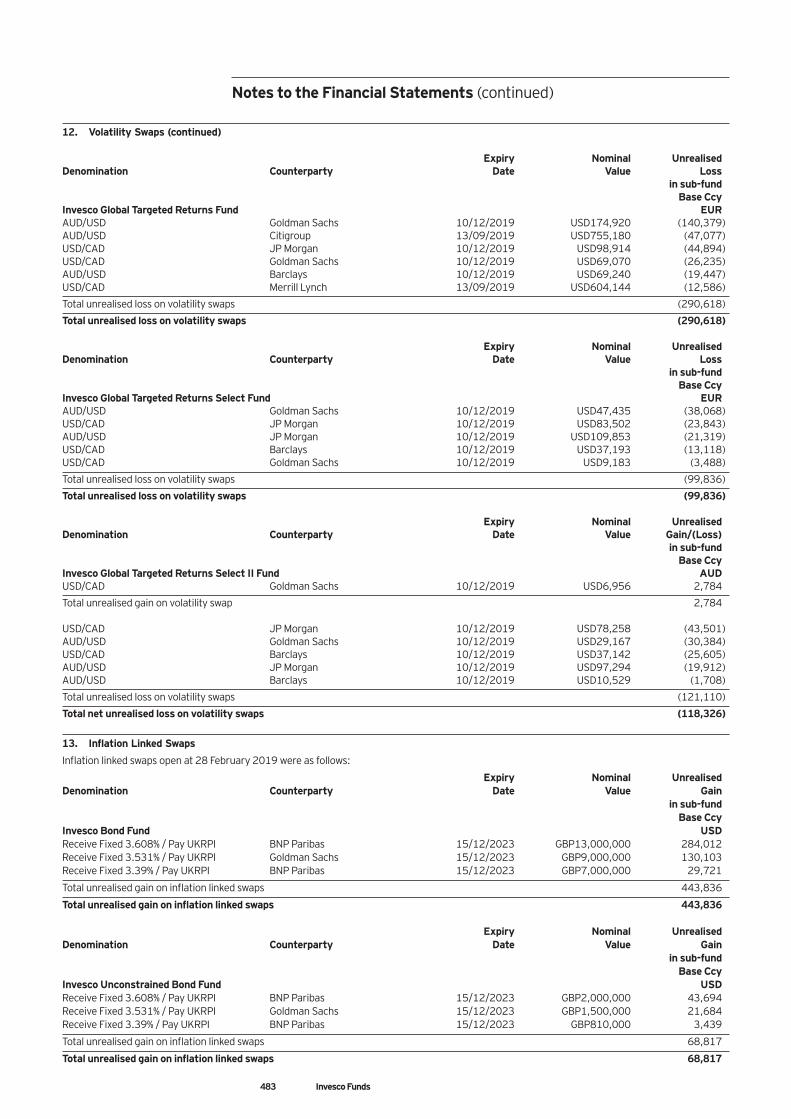
483 Invesco Funds
12. Volatility Swaps (continued) Expiry Nominal Unrealised Denomination Counterparty Date Value Loss in sub-fund Base Ccy Invesco Global Targeted Returns Fund EUR AUD/USD Goldman Sachs 10/12/2019 USD174,920 (140,379) AUD/USD Citigroup 13/09/2019 USD755,180 (47,077) USD/CAD JP Morgan 10/12/2019 USD98,914 (44,894) USD/CAD Goldman Sachs 10/12/2019 USD69,070 (26,235) AUD/USD Barclays 10/12/2019 USD69,240 (19,447) USD/CAD Merrill Lynch 13/09/2019 USD604,144 (12,586)
Total unrealised loss on volatility swaps (290,618)
Total unrealised loss on volatility swaps (290,618) Expiry Nominal Unrealised Denomination Counterparty Date Value Loss in sub-fund Base Ccy Invesco Global Targeted Returns Select Fund EUR AUD/USD Goldman Sachs 10/12/2019 USD47,435 (38,068) USD/CAD JP Morgan 10/12/2019 USD83,502 (23,843) AUD/USD JP Morgan 10/12/2019 USD109,853 (21,319) USD/CAD Barclays 10/12/2019 USD37,193 (13,118) USD/CAD Goldman Sachs 10/12/2019 USD9,183 (3,488)
Total unrealised loss on volatility swaps (99,836)
Total unrealised loss on volatility swaps (99,836) Expiry Nominal Unrealised Denomination Counterparty Date Value Gain/(Loss) in sub-fund Base Ccy Invesco Global Targeted Returns Select II Fund AUD USD/CAD Goldman Sachs 10/12/2019 USD6,956 2,784
Total unrealised gain on volatility swap 2,784 USD/CAD JP Morgan 10/12/2019 USD78,258 (43,501) AUD/USD Goldman Sachs 10/12/2019 USD29,167 (30,384) USD/CAD Barclays 10/12/2019 USD37,142 (25,605) AUD/USD JP Morgan 10/12/2019 USD97,294 (19,912) AUD/USD Barclays 10/12/2019 USD10,529 (1,708)
Total unrealised loss on volatility swaps (121,110)
Total net unrealised loss on volatility swaps (118,326)
13. Inflation Linked Swaps
Inflation linked swaps open at 28 February 2019 were as follows:
Expiry Nominal Unrealised Denomination Counterparty Date Value Gain in sub-fund Base Ccy Invesco Bond Fund USD Receive Fixed 3.608% / Pay UKRPI BNP Paribas 15/12/2023 GBP13,000,000 284,012 Receive Fixed 3.531% / Pay UKRPI Goldman Sachs 15/12/2023 GBP9,000,000 130,103 Receive Fixed 3.39% / Pay UKRPI BNP Paribas 15/12/2023 GBP7,000,000 29,721
Total unrealised gain on inflation linked swaps 443,836
Total unrealised gain on inflation linked swaps 443,836 Expiry Nominal Unrealised Denomination Counterparty Date Value Gain in sub-fund Base Ccy Invesco Unconstrained Bond Fund USD Receive Fixed 3.608% / Pay UKRPI BNP Paribas 15/12/2023 GBP2,000,000 43,694 Receive Fixed 3.531% / Pay UKRPI Goldman Sachs 15/12/2023 GBP1,500,000 21,684 Receive Fixed 3.39% / Pay UKRPI BNP Paribas 15/12/2023 GBP810,000 3,439
Total unrealised gain on inflation linked swaps 68,817
Total unrealised gain on inflation linked swaps 68,817
Notes to the Financial Statements (continued)
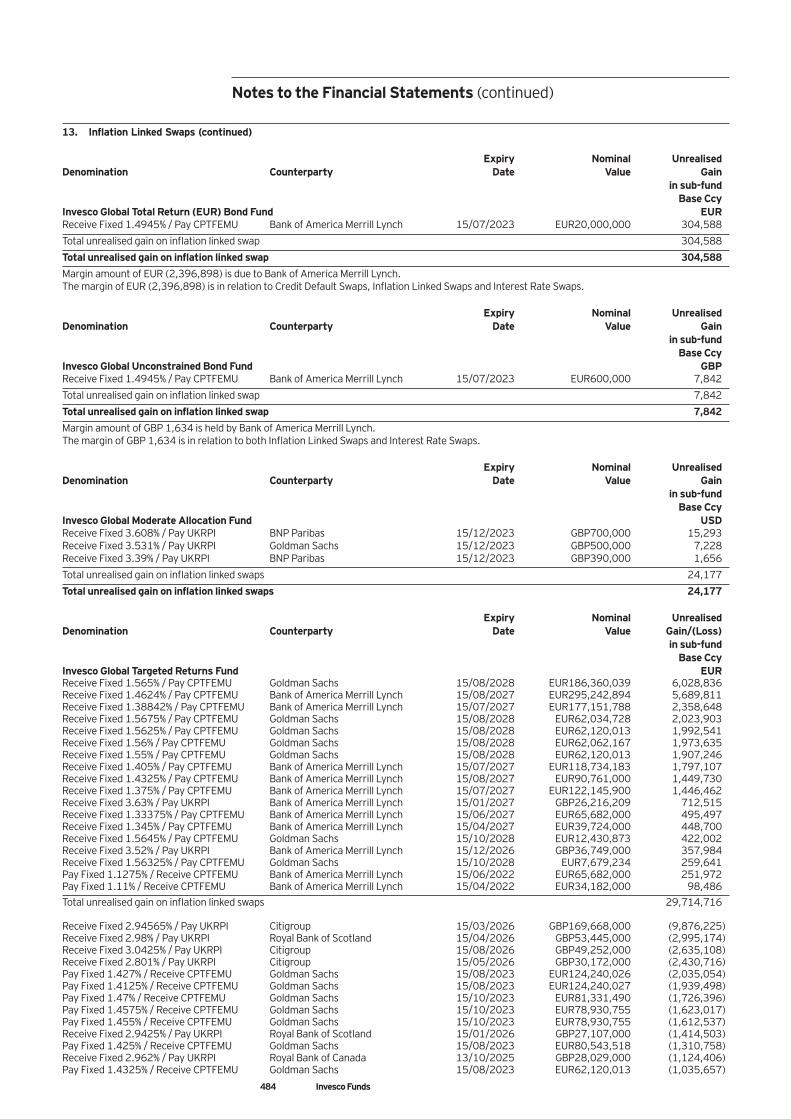
484 Invesco Funds
13. Inflation Linked Swaps (continued) Expiry Nominal Unrealised Denomination Counterparty Date Value Gain in sub-fund Base Ccy Invesco Global Total Return (EUR) Bond Fund EUR Receive Fixed 1.4945% / Pay CPTFEMU Bank of America Merrill Lynch 15/07/2023 EUR20,000,000 304,588
Total unrealised gain on inflation linked swap 304,588
Total unrealised gain on inflation linked swap 304,588
Margin amount of EUR (2,396,898) is due to Bank of America Merrill Lynch. The margin of EUR (2,396,898) is in relation to Credit Default Swaps, Inflation Linked Swaps and Interest Rate Swaps. Expiry Nominal Unrealised Denomination Counterparty Date Value Gain in sub-fund Base Ccy Invesco Global Unconstrained Bond Fund GBP Receive Fixed 1.4945% / Pay CPTFEMU Bank of America Merrill Lynch 15/07/2023 EUR600,000 7,842
Total unrealised gain on inflation linked swap 7,842
Total unrealised gain on inflation linked swap 7,842
Margin amount of GBP 1,634 is held by Bank of America Merrill Lynch. The margin of GBP 1,634 is in relation to both Inflation Linked Swaps and Interest Rate Swaps. Expiry Nominal Unrealised Denomination Counterparty Date Value Gain in sub-fund Base Ccy Invesco Global Moderate Allocation Fund USD Receive Fixed 3.608% / Pay UKRPI BNP Paribas 15/12/2023 GBP700,000 15,293 Receive Fixed 3.531% / Pay UKRPI Goldman Sachs 15/12/2023 GBP500,000 7,228 Receive Fixed 3.39% / Pay UKRPI BNP Paribas 15/12/2023 GBP390,000 1,656
Total unrealised gain on inflation linked swaps 24,177
Total unrealised gain on inflation linked swaps 24,177 Expiry Nominal Unrealised Denomination Counterparty Date Value Gain/(Loss) in sub-fund Base Ccy Invesco Global Targeted Returns Fund EUR Receive Fixed 1.565% / Pay CPTFEMU Goldman Sachs 15/08/2028 EUR186,360,039 6,028,836 Receive Fixed 1.4624% / Pay CPTFEMU Bank of America Merrill Lynch 15/08/2027 EUR295,242,894 5,689,811 Receive Fixed 1.38842% / Pay CPTFEMU Bank of America Merrill Lynch 15/07/2027 EUR177,151,788 2,358,648 Receive Fixed 1.5675% / Pay CPTFEMU Goldman Sachs 15/08/2028 EUR62,034,728 2,023,903 Receive Fixed 1.5625% / Pay CPTFEMU Goldman Sachs 15/08/2028 EUR62,120,013 1,992,541 Receive Fixed 1.56% / Pay CPTFEMU Goldman Sachs 15/08/2028 EUR62,062,167 1,973,635 Receive Fixed 1.55% / Pay CPTFEMU Goldman Sachs 15/08/2028 EUR62,120,013 1,907,246 Receive Fixed 1.405% / Pay CPTFEMU Bank of America Merrill Lynch 15/07/2027 EUR118,734,183 1,797,107 Receive Fixed 1.4325% / Pay CPTFEMU Bank of America Merrill Lynch 15/08/2027 EUR90,761,000 1,449,730 Receive Fixed 1.375% / Pay CPTFEMU Bank of America Merrill Lynch 15/07/2027 EUR122,145,900 1,446,462 Receive Fixed 3.63% / Pay UKRPI Bank of America Merrill Lynch 15/01/2027 GBP26,216,209 712,515 Receive Fixed 1.33375% / Pay CPTFEMU Bank of America Merrill Lynch 15/06/2027 EUR65,682,000 495,497 Receive Fixed 1.345% / Pay CPTFEMU Bank of America Merrill Lynch 15/04/2027 EUR39,724,000 448,700 Receive Fixed 1.5645% / Pay CPTFEMU Goldman Sachs 15/10/2028 EUR12,430,873 422,002 Receive Fixed 3.52% / Pay UKRPI Bank of America Merrill Lynch 15/12/2026 GBP36,749,000 357,984 Receive Fixed 1.56325% / Pay CPTFEMU Goldman Sachs 15/10/2028 EUR7,679,234 259,641 Pay Fixed 1.1275% / Receive CPTFEMU Bank of America Merrill Lynch 15/06/2022 EUR65,682,000 251,972 Pay Fixed 1.11% / Receive CPTFEMU Bank of America Merrill Lynch 15/04/2022 EUR34,182,000 98,486 Total unrealised gain on inflation linked swaps 29,714,716 Receive Fixed 2.94565% / Pay UKRPI Citigroup 15/03/2026 GBP169,668,000 (9,876,225) Receive Fixed 2.98% / Pay UKRPI Royal Bank of Scotland 15/04/2026 GBP53,445,000 (2,995,174) Receive Fixed 3.0425% / Pay UKRPI Citigroup 15/08/2026 GBP49,252,000 (2,635,108) Receive Fixed 2.801% / Pay UKRPI Citigroup 15/05/2026 GBP30,172,000 (2,430,716) Pay Fixed 1.427% / Receive CPTFEMU Goldman Sachs 15/08/2023 EUR124,240,026 (2,035,054) Pay Fixed 1.4125% / Receive CPTFEMU Goldman Sachs 15/08/2023 EUR124,240,027 (1,939,498) Pay Fixed 1.47% / Receive CPTFEMU Goldman Sachs 15/10/2023 EUR81,331,490 (1,726,396) Pay Fixed 1.4575% / Receive CPTFEMU Goldman Sachs 15/10/2023 EUR78,930,755 (1,623,017) Pay Fixed 1.455% / Receive CPTFEMU Goldman Sachs 15/10/2023 EUR78,930,755 (1,612,537) Receive Fixed 2.9425% / Pay UKRPI Royal Bank of Scotland 15/01/2026 GBP27,107,000 (1,414,503) Pay Fixed 1.425% / Receive CPTFEMU Goldman Sachs 15/08/2023 EUR80,543,518 (1,310,758) Receive Fixed 2.962% / Pay UKRPI Royal Bank of Canada 13/10/2025 GBP28,029,000 (1,124,406) Pay Fixed 1.4325% / Receive CPTFEMU Goldman Sachs 15/08/2023 EUR62,120,013 (1,035,657)
Notes to the Financial Statements (continued)
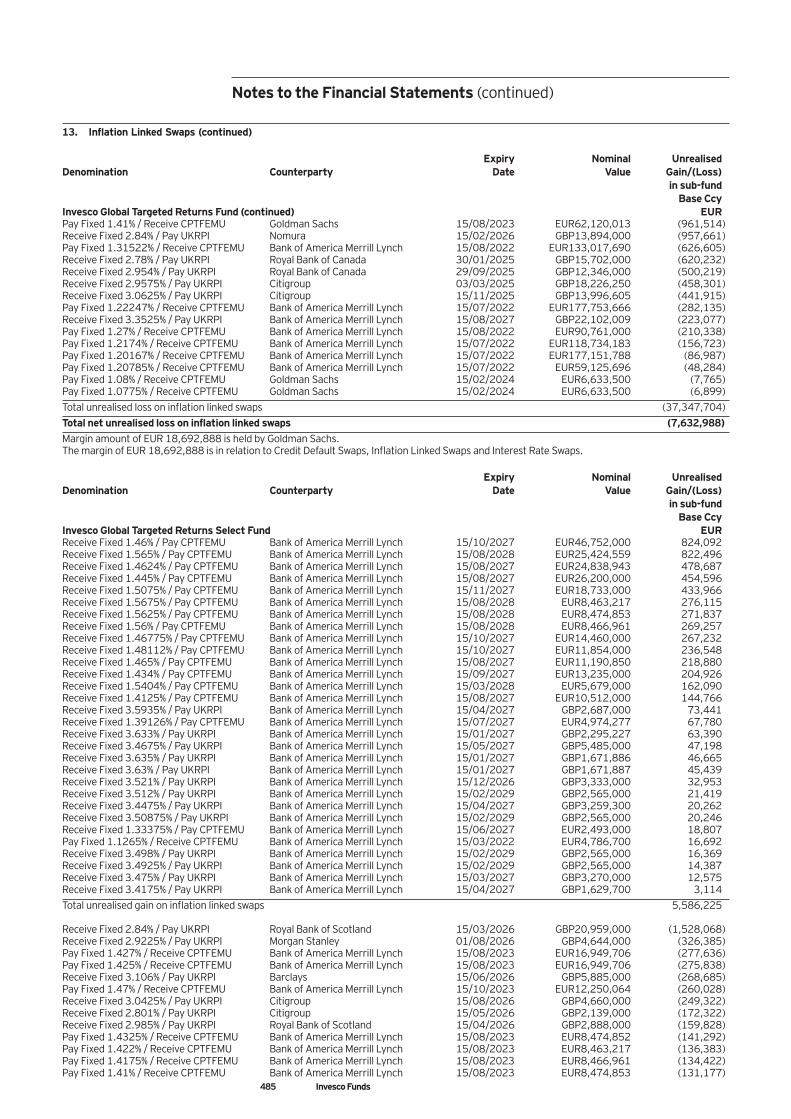
485 Invesco Funds
13. Inflation Linked Swaps (continued) Expiry Nominal Unrealised Denomination Counterparty Date Value Gain/(Loss) in sub-fund Base Ccy Invesco Global Targeted Returns Fund (continued) EUR Pay Fixed 1.41% / Receive CPTFEMU Goldman Sachs 15/08/2023 EUR62,120,013 (961,514) Receive Fixed 2.84% / Pay UKRPI Nomura 15/02/2026 GBP13,894,000 (957,661) Pay Fixed 1.31522% / Receive CPTFEMU Bank of America Merrill Lynch 15/08/2022 EUR133,017,690 (626,605) Receive Fixed 2.78% / Pay UKRPI Royal Bank of Canada 30/01/2025 GBP15,702,000 (620,232) Receive Fixed 2.954% / Pay UKRPI Royal Bank of Canada 29/09/2025 GBP12,346,000 (500,219) Receive Fixed 2.9575% / Pay UKRPI Citigroup 03/03/2025 GBP18,226,250 (458,301) Receive Fixed 3.0625% / Pay UKRPI Citigroup 15/11/2025 GBP13,996,605 (441,915) Pay Fixed 1.22247% / Receive CPTFEMU Bank of America Merrill Lynch 15/07/2022 EUR177,753,666 (282,135) Receive Fixed 3.3525% / Pay UKRPI Bank of America Merrill Lynch 15/08/2027 GBP22,102,009 (223,077) Pay Fixed 1.27% / Receive CPTFEMU Bank of America Merrill Lynch 15/08/2022 EUR90,761,000 (210,338) Pay Fixed 1.2174% / Receive CPTFEMU Bank of America Merrill Lynch 15/07/2022 EUR118,734,183 (156,723) Pay Fixed 1.20167% / Receive CPTFEMU Bank of America Merrill Lynch 15/07/2022 EUR177,151,788 (86,987) Pay Fixed 1.20785% / Receive CPTFEMU Bank of America Merrill Lynch 15/07/2022 EUR59,125,696 (48,284) Pay Fixed 1.08% / Receive CPTFEMU Goldman Sachs 15/02/2024 EUR6,633,500 (7,765) Pay Fixed 1.0775% / Receive CPTFEMU Goldman Sachs 15/02/2024 EUR6,633,500 (6,899) Total unrealised loss on inflation linked swaps (37,347,704) Total net unrealised loss on inflation linked swaps (7,632,988) Margin amount of EUR 18,692,888 is held by Goldman Sachs. The margin of EUR 18,692,888 is in relation to Credit Default Swaps, Inflation Linked Swaps and Interest Rate Swaps. Expiry Nominal Unrealised Denomination Counterparty Date Value Gain/(Loss) in sub-fund Base Ccy Invesco Global Targeted Returns Select Fund EUR Receive Fixed 1.46% / Pay CPTFEMU Bank of America Merrill Lynch 15/10/2027 EUR46,752,000 824,092 Receive Fixed 1.565% / Pay CPTFEMU Bank of America Merrill Lynch 15/08/2028 EUR25,424,559 822,496 Receive Fixed 1.4624% / Pay CPTFEMU Bank of America Merrill Lynch 15/08/2027 EUR24,838,943 478,687 Receive Fixed 1.445% / Pay CPTFEMU Bank of America Merrill Lynch 15/08/2027 EUR26,200,000 454,596 Receive Fixed 1.5075% / Pay CPTFEMU Bank of America Merrill Lynch 15/11/2027 EUR18,733,000 433,966 Receive Fixed 1.5675% / Pay CPTFEMU Bank of America Merrill Lynch 15/08/2028 EUR8,463,217 276,115 Receive Fixed 1.5625% / Pay CPTFEMU Bank of America Merrill Lynch 15/08/2028 EUR8,474,853 271,837 Receive Fixed 1.56% / Pay CPTFEMU Bank of America Merrill Lynch 15/08/2028 EUR8,466,961 269,257 Receive Fixed 1.46775% / Pay CPTFEMU Bank of America Merrill Lynch 15/10/2027 EUR14,460,000 267,232 Receive Fixed 1.48112% / Pay CPTFEMU Bank of America Merrill Lynch 15/10/2027 EUR11,854,000 236,548 Receive Fixed 1.465% / Pay CPTFEMU Bank of America Merrill Lynch 15/08/2027 EUR11,190,850 218,880 Receive Fixed 1.434% / Pay CPTFEMU Bank of America Merrill Lynch 15/09/2027 EUR13,235,000 204,926 Receive Fixed 1.5404% / Pay CPTFEMU Bank of America Merrill Lynch 15/03/2028 EUR5,679,000 162,090 Receive Fixed 1.4125% / Pay CPTFEMU Bank of America Merrill Lynch 15/08/2027 EUR10,512,000 144,766 Receive Fixed 3.5935% / Pay UKRPI Bank of America Merrill Lynch 15/04/2027 GBP2,687,000 73,441 Receive Fixed 1.39126% / Pay CPTFEMU Bank of America Merrill Lynch 15/07/2027 EUR4,974,277 67,780 Receive Fixed 3.633% / Pay UKRPI Bank of America Merrill Lynch 15/01/2027 GBP2,295,227 63,390 Receive Fixed 3.4675% / Pay UKRPI Bank of America Merrill Lynch 15/05/2027 GBP5,485,000 47,198 Receive Fixed 3.635% / Pay UKRPI Bank of America Merrill Lynch 15/01/2027 GBP1,671,886 46,665 Receive Fixed 3.63% / Pay UKRPI Bank of America Merrill Lynch 15/01/2027 GBP1,671,887 45,439 Receive Fixed 3.521% / Pay UKRPI Bank of America Merrill Lynch 15/12/2026 GBP3,333,000 32,953 Receive Fixed 3.512% / Pay UKRPI Bank of America Merrill Lynch 15/02/2029 GBP2,565,000 21,419 Receive Fixed 3.4475% / Pay UKRPI Bank of America Merrill Lynch 15/04/2027 GBP3,259,300 20,262 Receive Fixed 3.50875% / Pay UKRPI Bank of America Merrill Lynch 15/02/2029 GBP2,565,000 20,246 Receive Fixed 1.33375% / Pay CPTFEMU Bank of America Merrill Lynch 15/06/2027 EUR2,493,000 18,807 Pay Fixed 1.1265% / Receive CPTFEMU Bank of America Merrill Lynch 15/03/2022 EUR4,786,700 16,692 Receive Fixed 3.498% / Pay UKRPI Bank of America Merrill Lynch 15/02/2029 GBP2,565,000 16,369 Receive Fixed 3.4925% / Pay UKRPI Bank of America Merrill Lynch 15/02/2029 GBP2,565,000 14,387 Receive Fixed 3.475% / Pay UKRPI Bank of America Merrill Lynch 15/03/2027 GBP3,270,000 12,575 Receive Fixed 3.4175% / Pay UKRPI Bank of America Merrill Lynch 15/04/2027 GBP1,629,700 3,114 Total unrealised gain on inflation linked swaps 5,586,225 Receive Fixed 2.84% / Pay UKRPI Royal Bank of Scotland 15/03/2026 GBP20,959,000 (1,528,068) Receive Fixed 2.9225% / Pay UKRPI Morgan Stanley 01/08/2026 GBP4,644,000 (326,385) Pay Fixed 1.427% / Receive CPTFEMU Bank of America Merrill Lynch 15/08/2023 EUR16,949,706 (277,636) Pay Fixed 1.425% / Receive CPTFEMU Bank of America Merrill Lynch 15/08/2023 EUR16,949,706 (275,838) Receive Fixed 3.106% / Pay UKRPI Barclays 15/06/2026 GBP5,885,000 (268,685) Pay Fixed 1.47% / Receive CPTFEMU Bank of America Merrill Lynch 15/10/2023 EUR12,250,064 (260,028) Receive Fixed 3.0425% / Pay UKRPI Citigroup 15/08/2026 GBP4,660,000 (249,322) Receive Fixed 2.801% / Pay UKRPI Citigroup 15/05/2026 GBP2,139,000 (172,322) Receive Fixed 2.985% / Pay UKRPI Royal Bank of Scotland 15/04/2026 GBP2,888,000 (159,828) Pay Fixed 1.4325% / Receive CPTFEMU Bank of America Merrill Lynch 15/08/2023 EUR8,474,852 (141,292) Pay Fixed 1.422% / Receive CPTFEMU Bank of America Merrill Lynch 15/08/2023 EUR8,463,217 (136,383) Pay Fixed 1.4175% / Receive CPTFEMU Bank of America Merrill Lynch 15/08/2023 EUR8,466,961 (134,422) Pay Fixed 1.41% / Receive CPTFEMU Bank of America Merrill Lynch 15/08/2023 EUR8,474,853 (131,177)
Notes to the Financial Statements (continued)
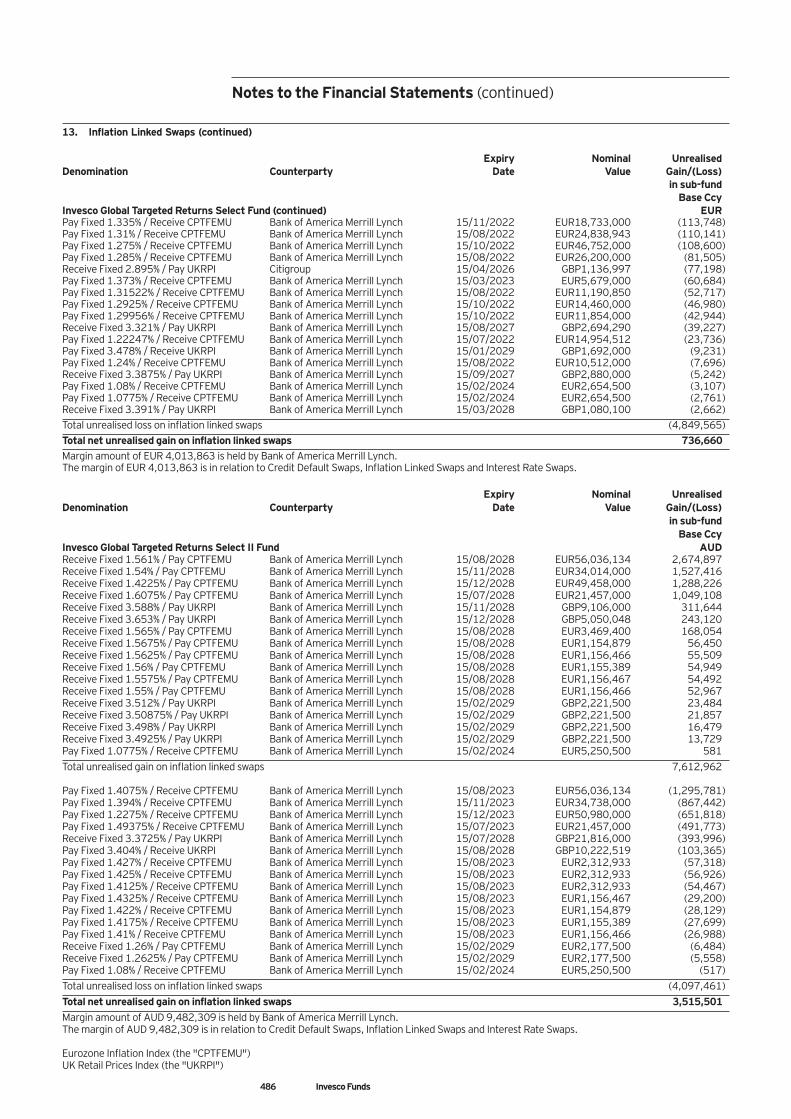
486 Invesco Funds
13. Inflation Linked Swaps (continued) Expiry Nominal Unrealised Denomination Counterparty Date Value Gain/(Loss) in sub-fund Base Ccy Invesco Global Targeted Returns Select Fund (continued) EUR Pay Fixed 1.335% / Receive CPTFEMU Bank of America Merrill Lynch 15/11/2022 EUR18,733,000 (113,748) Pay Fixed 1.31% / Receive CPTFEMU Bank of America Merrill Lynch 15/08/2022 EUR24,838,943 (110,141) Pay Fixed 1.275% / Receive CPTFEMU Bank of America Merrill Lynch 15/10/2022 EUR46,752,000 (108,600) Pay Fixed 1.285% / Receive CPTFEMU Bank of America Merrill Lynch 15/08/2022 EUR26,200,000 (81,505) Receive Fixed 2.895% / Pay UKRPI Citigroup 15/04/2026 GBP1,136,997 (77,198) Pay Fixed 1.373% / Receive CPTFEMU Bank of America Merrill Lynch 15/03/2023 EUR5,679,000 (60,684) Pay Fixed 1.31522% / Receive CPTFEMU Bank of America Merrill Lynch 15/08/2022 EUR11,190,850 (52,717) Pay Fixed 1.2925% / Receive CPTFEMU Bank of America Merrill Lynch 15/10/2022 EUR14,460,000 (46,980) Pay Fixed 1.29956% / Receive CPTFEMU Bank of America Merrill Lynch 15/10/2022 EUR11,854,000 (42,944) Receive Fixed 3.321% / Pay UKRPI Bank of America Merrill Lynch 15/08/2027 GBP2,694,290 (39,227) Pay Fixed 1.22247% / Receive CPTFEMU Bank of America Merrill Lynch 15/07/2022 EUR14,954,512 (23,736) Pay Fixed 3.478% / Receive UKRPI Bank of America Merrill Lynch 15/01/2029 GBP1,692,000 (9,231) Pay Fixed 1.24% / Receive CPTFEMU Bank of America Merrill Lynch 15/08/2022 EUR10,512,000 (7,696) Receive Fixed 3.3875% / Pay UKRPI Bank of America Merrill Lynch 15/09/2027 GBP2,880,000 (5,242) Pay Fixed 1.08% / Receive CPTFEMU Bank of America Merrill Lynch 15/02/2024 EUR2,654,500 (3,107) Pay Fixed 1.0775% / Receive CPTFEMU Bank of America Merrill Lynch 15/02/2024 EUR2,654,500 (2,761) Receive Fixed 3.391% / Pay UKRPI Bank of America Merrill Lynch 15/03/2028 GBP1,080,100 (2,662) Total unrealised loss on inflation linked swaps (4,849,565) Total net unrealised gain on inflation linked swaps 736,660 Margin amount of EUR 4,013,863 is held by Bank of America Merrill Lynch. The margin of EUR 4,013,863 is in relation to Credit Default Swaps, Inflation Linked Swaps and Interest Rate Swaps. Expiry Nominal Unrealised Denomination Counterparty Date Value Gain/(Loss) in sub-fund Base Ccy Invesco Global Targeted Returns Select II Fund AUD Receive Fixed 1.561% / Pay CPTFEMU Bank of America Merrill Lynch 15/08/2028 EUR56,036,134 2,674,897 Receive Fixed 1.54% / Pay CPTFEMU Bank of America Merrill Lynch 15/11/2028 EUR34,014,000 1,527,416 Receive Fixed 1.4225% / Pay CPTFEMU Bank of America Merrill Lynch 15/12/2028 EUR49,458,000 1,288,226 Receive Fixed 1.6075% / Pay CPTFEMU Bank of America Merrill Lynch 15/07/2028 EUR21,457,000 1,049,108 Receive Fixed 3.588% / Pay UKRPI Bank of America Merrill Lynch 15/11/2028 GBP9,106,000 311,644 Receive Fixed 3.653% / Pay UKRPI Bank of America Merrill Lynch 15/12/2028 GBP5,050,048 243,120 Receive Fixed 1.565% / Pay CPTFEMU Bank of America Merrill Lynch 15/08/2028 EUR3,469,400 168,054 Receive Fixed 1.5675% / Pay CPTFEMU Bank of America Merrill Lynch 15/08/2028 EUR1,154,879 56,450 Receive Fixed 1.5625% / Pay CPTFEMU Bank of America Merrill Lynch 15/08/2028 EUR1,156,466 55,509 Receive Fixed 1.56% / Pay CPTFEMU Bank of America Merrill Lynch 15/08/2028 EUR1,155,389 54,949 Receive Fixed 1.5575% / Pay CPTFEMU Bank of America Merrill Lynch 15/08/2028 EUR1,156,467 54,492 Receive Fixed 1.55% / Pay CPTFEMU Bank of America Merrill Lynch 15/08/2028 EUR1,156,466 52,967 Receive Fixed 3.512% / Pay UKRPI Bank of America Merrill Lynch 15/02/2029 GBP2,221,500 23,484 Receive Fixed 3.50875% / Pay UKRPI Bank of America Merrill Lynch 15/02/2029 GBP2,221,500 21,857 Receive Fixed 3.498% / Pay UKRPI Bank of America Merrill Lynch 15/02/2029 GBP2,221,500 16,479 Receive Fixed 3.4925% / Pay UKRPI Bank of America Merrill Lynch 15/02/2029 GBP2,221,500 13,729 Pay Fixed 1.0775% / Receive CPTFEMU Bank of America Merrill Lynch 15/02/2024 EUR5,250,500 581 Total unrealised gain on inflation linked swaps 7,612,962 Pay Fixed 1.4075% / Receive CPTFEMU Bank of America Merrill Lynch 15/08/2023 EUR56,036,134 (1,295,781) Pay Fixed 1.394% / Receive CPTFEMU Bank of America Merrill Lynch 15/11/2023 EUR34,738,000 (867,442) Pay Fixed 1.2275% / Receive CPTFEMU Bank of America Merrill Lynch 15/12/2023 EUR50,980,000 (651,818) Pay Fixed 1.49375% / Receive CPTFEMU Bank of America Merrill Lynch 15/07/2023 EUR21,457,000 (491,773) Receive Fixed 3.3725% / Pay UKRPI Bank of America Merrill Lynch 15/07/2028 GBP21,816,000 (393,996) Pay Fixed 3.404% / Receive UKRPI Bank of America Merrill Lynch 15/08/2028 GBP10,222,519 (103,365) Pay Fixed 1.427% / Receive CPTFEMU Bank of America Merrill Lynch 15/08/2023 EUR2,312,933 (57,318) Pay Fixed 1.425% / Receive CPTFEMU Bank of America Merrill Lynch 15/08/2023 EUR2,312,933 (56,926) Pay Fixed 1.4125% / Receive CPTFEMU Bank of America Merrill Lynch 15/08/2023 EUR2,312,933 (54,467) Pay Fixed 1.4325% / Receive CPTFEMU Bank of America Merrill Lynch 15/08/2023 EUR1,156,467 (29,200) Pay Fixed 1.422% / Receive CPTFEMU Bank of America Merrill Lynch 15/08/2023 EUR1,154,879 (28,129) Pay Fixed 1.4175% / Receive CPTFEMU Bank of America Merrill Lynch 15/08/2023 EUR1,155,389 (27,699) Pay Fixed 1.41% / Receive CPTFEMU Bank of America Merrill Lynch 15/08/2023 EUR1,156,466 (26,988) Receive Fixed 1.26% / Pay CPTFEMU Bank of America Merrill Lynch 15/02/2029 EUR2,177,500 (6,484) Receive Fixed 1.2625% / Pay CPTFEMU Bank of America Merrill Lynch 15/02/2029 EUR2,177,500 (5,558) Pay Fixed 1.08% / Receive CPTFEMU Bank of America Merrill Lynch 15/02/2024 EUR5,250,500 (517) Total unrealised loss on inflation linked swaps (4,097,461) Total net unrealised gain on inflation linked swaps 3,515,501 Margin amount of AUD 9,482,309 is held by Bank of America Merrill Lynch. The margin of AUD 9,482,309 is in relation to Credit Default Swaps, Inflation Linked Swaps and Interest Rate Swaps. Eurozone Inflation Index (the "CPTFEMU") UK Retail Prices Index (the "UKRPI")
Notes to the Financial Statements (continued)
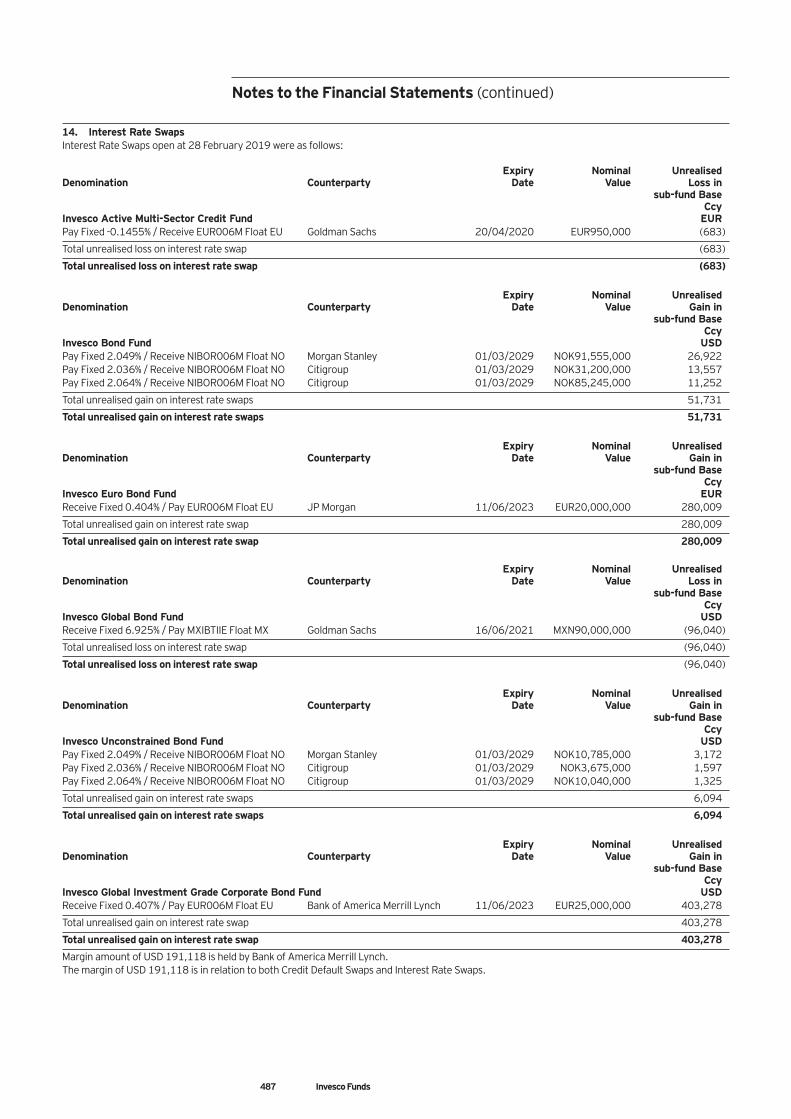
487 Invesco Funds
14. Interest Rate Swaps Interest Rate Swaps open at 28 February 2019 were as follows: Expiry Nominal Unrealised Denomination Counterparty Date Value Loss in sub-fund Base Ccy Invesco Active Multi-Sector Credit Fund EUR Pay Fixed -0.1455% / Receive EUR006M Float EU Goldman Sachs 20/04/2020 EUR950,000 (683)
Total unrealised loss on interest rate swap (683)
Total unrealised loss on interest rate swap (683)
Expiry Nominal Unrealised Denomination Counterparty Date Value Gain in sub-fund Base Ccy Invesco Bond Fund USD Pay Fixed 2.049% / Receive NIBOR006M Float NO Morgan Stanley 01/03/2029 NOK91,555,000 26,922 Pay Fixed 2.036% / Receive NIBOR006M Float NO Citigroup 01/03/2029 NOK31,200,000 13,557 Pay Fixed 2.064% / Receive NIBOR006M Float NO Citigroup 01/03/2029 NOK85,245,000 11,252
Total unrealised gain on interest rate swaps 51,731
Total unrealised gain on interest rate swaps 51,731
Expiry Nominal Unrealised Denomination Counterparty Date Value Gain in sub-fund Base Ccy Invesco Euro Bond Fund EUR Receive Fixed 0.404% / Pay EUR006M Float EU JP Morgan 11/06/2023 EUR20,000,000 280,009
Total unrealised gain on interest rate swap 280,009
Total unrealised gain on interest rate swap 280,009 Expiry Nominal Unrealised Denomination Counterparty Date Value Loss in sub-fund Base Ccy Invesco Global Bond Fund USD Receive Fixed 6.925% / Pay MXIBTIIE Float MX Goldman Sachs 16/06/2021 MXN90,000,000 (96,040)
Total unrealised loss on interest rate swap (96,040)
Total unrealised loss on interest rate swap (96,040)
Expiry Nominal Unrealised Denomination Counterparty Date Value Gain in sub-fund Base Ccy Invesco Unconstrained Bond Fund USD Pay Fixed 2.049% / Receive NIBOR006M Float NO Morgan Stanley 01/03/2029 NOK10,785,000 3,172 Pay Fixed 2.036% / Receive NIBOR006M Float NO Citigroup 01/03/2029 NOK3,675,000 1,597 Pay Fixed 2.064% / Receive NIBOR006M Float NO Citigroup 01/03/2029 NOK10,040,000 1,325
Total unrealised gain on interest rate swaps 6,094
Total unrealised gain on interest rate swaps 6,094
Expiry Nominal Unrealised Denomination Counterparty Date Value Gain in sub-fund Base Ccy Invesco Global Investment Grade Corporate Bond Fund USD Receive Fixed 0.407% / Pay EUR006M Float EU Bank of America Merrill Lynch 11/06/2023 EUR25,000,000 403,278
Total unrealised gain on interest rate swap 403,278
Total unrealised gain on interest rate swap 403,278
Margin amount of USD 191,118 is held by Bank of America Merrill Lynch. The margin of USD 191,118 is in relation to both Credit Default Swaps and Interest Rate Swaps.
Notes to the Financial Statements (continued)
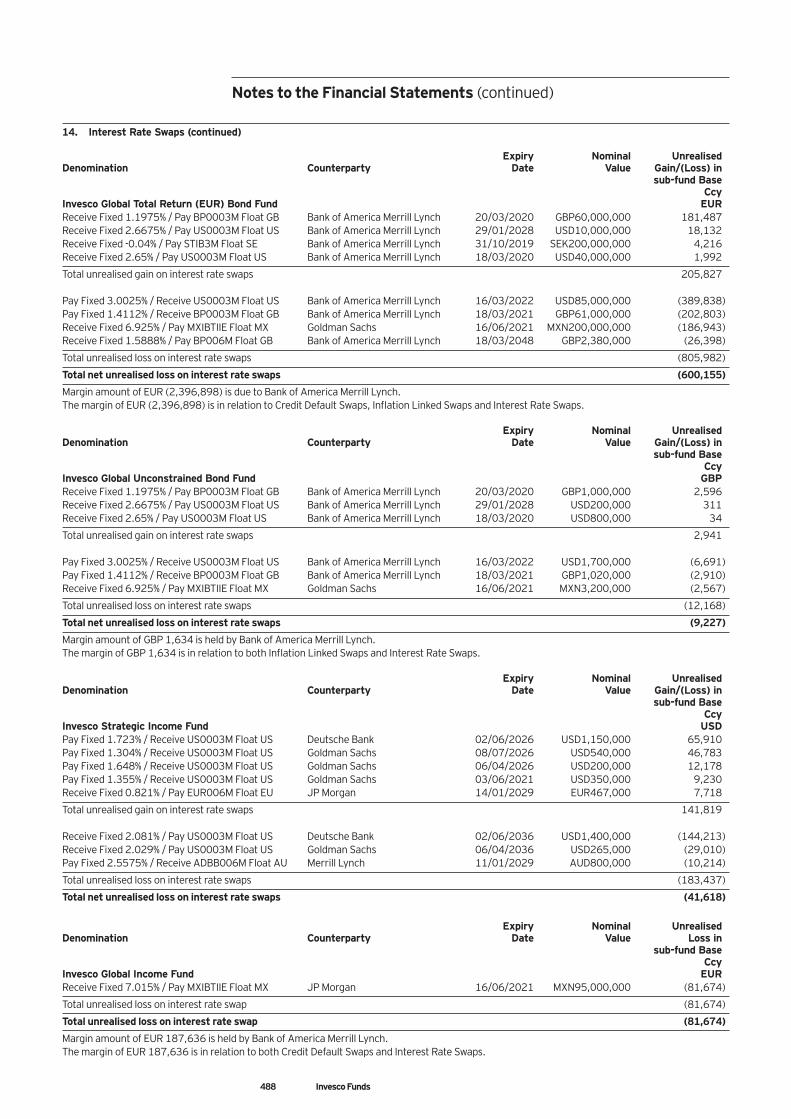
488 Invesco Funds
14. Interest Rate Swaps (continued) Expiry Nominal Unrealised Denomination Counterparty Date Value Gain/(Loss) in sub-fund Base Ccy Invesco Global Total Return (EUR) Bond Fund EUR Receive Fixed 1.1975% / Pay BP0003M Float GB Bank of America Merrill Lynch 20/03/2020 GBP60,000,000 181,487 Receive Fixed 2.6675% / Pay US0003M Float US Bank of America Merrill Lynch 29/01/2028 USD10,000,000 18,132 Receive Fixed -0.04% / Pay STIB3M Float SE Bank of America Merrill Lynch 31/10/2019 SEK200,000,000 4,216 Receive Fixed 2.65% / Pay US0003M Float US Bank of America Merrill Lynch 18/03/2020 USD40,000,000 1,992
Total unrealised gain on interest rate swaps 205,827 Pay Fixed 3.0025% / Receive US0003M Float US Bank of America Merrill Lynch 16/03/2022 USD85,000,000 (389,838) Pay Fixed 1.4112% / Receive BP0003M Float GB Bank of America Merrill Lynch 18/03/2021 GBP61,000,000 (202,803) Receive Fixed 6.925% / Pay MXIBTIIE Float MX Goldman Sachs 16/06/2021 MXN200,000,000 (186,943) Receive Fixed 1.5888% / Pay BP006M Float GB Bank of America Merrill Lynch 18/03/2048 GBP2,380,000 (26,398)
Total unrealised loss on interest rate swaps (805,982)
Total net unrealised loss on interest rate swaps (600,155)
Margin amount of EUR (2,396,898) is due to Bank of America Merrill Lynch. The margin of EUR (2,396,898) is in relation to Credit Default Swaps, Inflation Linked Swaps and Interest Rate Swaps. Expiry Nominal Unrealised Denomination Counterparty Date Value Gain/(Loss) in sub-fund Base Ccy Invesco Global Unconstrained Bond Fund GBP Receive Fixed 1.1975% / Pay BP0003M Float GB Bank of America Merrill Lynch 20/03/2020 GBP1,000,000 2,596 Receive Fixed 2.6675% / Pay US0003M Float US Bank of America Merrill Lynch 29/01/2028 USD200,000 311 Receive Fixed 2.65% / Pay US0003M Float US Bank of America Merrill Lynch 18/03/2020 USD800,000 34
Total unrealised gain on interest rate swaps 2,941 Pay Fixed 3.0025% / Receive US0003M Float US Bank of America Merrill Lynch 16/03/2022 USD1,700,000 (6,691) Pay Fixed 1.4112% / Receive BP0003M Float GB Bank of America Merrill Lynch 18/03/2021 GBP1,020,000 (2,910) Receive Fixed 6.925% / Pay MXIBTIIE Float MX Goldman Sachs 16/06/2021 MXN3,200,000 (2,567)
Total unrealised loss on interest rate swaps (12,168)
Total net unrealised loss on interest rate swaps (9,227)
Margin amount of GBP 1,634 is held by Bank of America Merrill Lynch. The margin of GBP 1,634 is in relation to both Inflation Linked Swaps and Interest Rate Swaps. Expiry Nominal Unrealised Denomination Counterparty Date Value Gain/(Loss) in sub-fund Base Ccy Invesco Strategic Income Fund USD Pay Fixed 1.723% / Receive US0003M Float US Deutsche Bank 02/06/2026 USD1,150,000 65,910 Pay Fixed 1.304% / Receive US0003M Float US Goldman Sachs 08/07/2026 USD540,000 46,783 Pay Fixed 1.648% / Receive US0003M Float US Goldman Sachs 06/04/2026 USD200,000 12,178 Pay Fixed 1.355% / Receive US0003M Float US Goldman Sachs 03/06/2021 USD350,000 9,230 Receive Fixed 0.821% / Pay EUR006M Float EU JP Morgan 14/01/2029 EUR467,000 7,718
Total unrealised gain on interest rate swaps 141,819 Receive Fixed 2.081% / Pay US0003M Float US Deutsche Bank 02/06/2036 USD1,400,000 (144,213) Receive Fixed 2.029% / Pay US0003M Float US Goldman Sachs 06/04/2036 USD265,000 (29,010) Pay Fixed 2.5575% / Receive ADBB006M Float AU Merrill Lynch 11/01/2029 AUD800,000 (10,214)
Total unrealised loss on interest rate swaps (183,437)
Total net unrealised loss on interest rate swaps (41,618)
Expiry Nominal Unrealised Denomination Counterparty Date Value Loss in sub-fund Base Ccy Invesco Global Income Fund EUR Receive Fixed 7.015% / Pay MXIBTIIE Float MX JP Morgan 16/06/2021 MXN95,000,000 (81,674)
Total unrealised loss on interest rate swap (81,674)
Total unrealised loss on interest rate swap (81,674)
Margin amount of EUR 187,636 is held by Bank of America Merrill Lynch. The margin of EUR 187,636 is in relation to both Credit Default Swaps and Interest Rate Swaps.
Notes to the Financial Statements (continued)
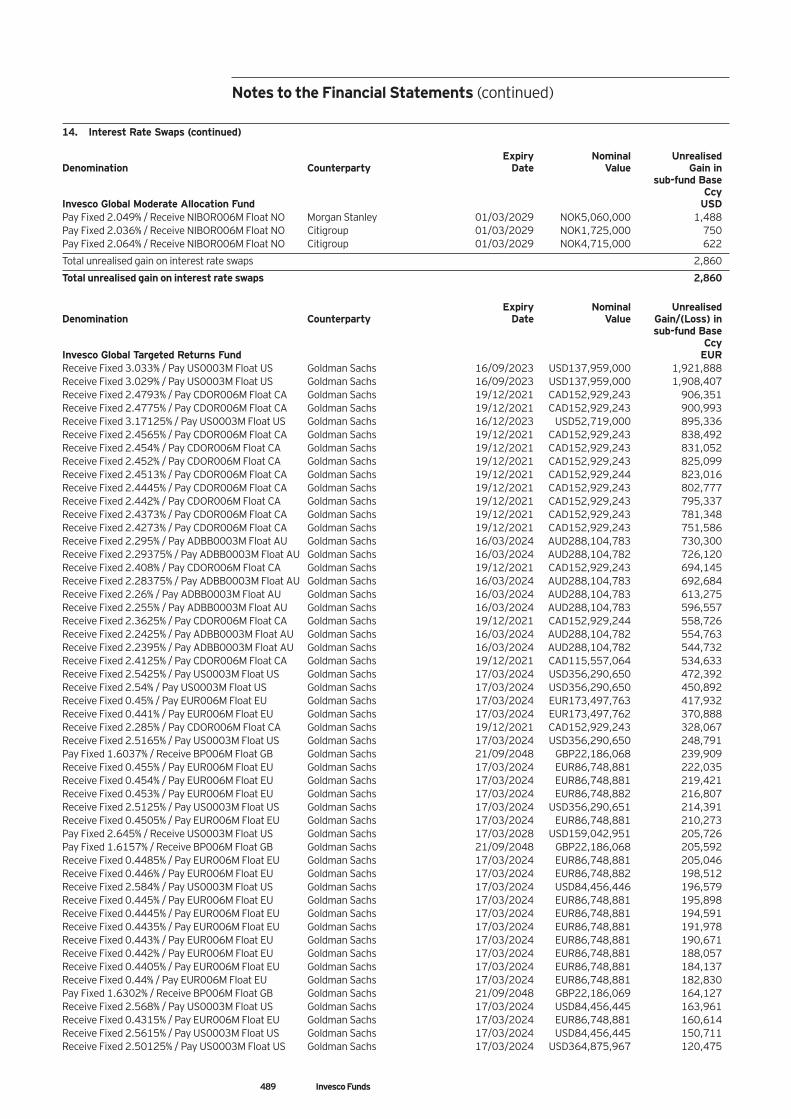
489 Invesco Funds
14. Interest Rate Swaps (continued) Expiry Nominal Unrealised Denomination Counterparty Date Value Gain in sub-fund Base Ccy Invesco Global Moderate Allocation Fund USD Pay Fixed 2.049% / Receive NIBOR006M Float NO Morgan Stanley 01/03/2029 NOK5,060,000 1,488 Pay Fixed 2.036% / Receive NIBOR006M Float NO Citigroup 01/03/2029 NOK1,725,000 750 Pay Fixed 2.064% / Receive NIBOR006M Float NO Citigroup 01/03/2029 NOK4,715,000 622
Total unrealised gain on interest rate swaps 2,860
Total unrealised gain on interest rate swaps 2,860
Expiry Nominal Unrealised Denomination Counterparty Date Value Gain/(Loss) in sub-fund Base Ccy Invesco Global Targeted Returns Fund EUR Receive Fixed 3.033% / Pay US0003M Float US Goldman Sachs 16/09/2023 USD137,959,000 1,921,888 Receive Fixed 3.029% / Pay US0003M Float US Goldman Sachs 16/09/2023 USD137,959,000 1,908,407 Receive Fixed 2.4793% / Pay CDOR006M Float CA Goldman Sachs 19/12/2021 CAD152,929,243 906,351 Receive Fixed 2.4775% / Pay CDOR006M Float CA Goldman Sachs 19/12/2021 CAD152,929,243 900,993 Receive Fixed 3.17125% / Pay US0003M Float US Goldman Sachs 16/12/2023 USD52,719,000 895,336 Receive Fixed 2.4565% / Pay CDOR006M Float CA Goldman Sachs 19/12/2021 CAD152,929,243 838,492 Receive Fixed 2.454% / Pay CDOR006M Float CA Goldman Sachs 19/12/2021 CAD152,929,243 831,052 Receive Fixed 2.452% / Pay CDOR006M Float CA Goldman Sachs 19/12/2021 CAD152,929,243 825,099 Receive Fixed 2.4513% / Pay CDOR006M Float CA Goldman Sachs 19/12/2021 CAD152,929,244 823,016 Receive Fixed 2.4445% / Pay CDOR006M Float CA Goldman Sachs 19/12/2021 CAD152,929,243 802,777 Receive Fixed 2.442% / Pay CDOR006M Float CA Goldman Sachs 19/12/2021 CAD152,929,243 795,337 Receive Fixed 2.4373% / Pay CDOR006M Float CA Goldman Sachs 19/12/2021 CAD152,929,243 781,348 Receive Fixed 2.4273% / Pay CDOR006M Float CA Goldman Sachs 19/12/2021 CAD152,929,243 751,586 Receive Fixed 2.295% / Pay ADBB0003M Float AU Goldman Sachs 16/03/2024 AUD288,104,783 730,300 Receive Fixed 2.29375% / Pay ADBB0003M Float AU Goldman Sachs 16/03/2024 AUD288,104,782 726,120 Receive Fixed 2.408% / Pay CDOR006M Float CA Goldman Sachs 19/12/2021 CAD152,929,243 694,145 Receive Fixed 2.28375% / Pay ADBB0003M Float AU Goldman Sachs 16/03/2024 AUD288,104,783 692,684 Receive Fixed 2.26% / Pay ADBB0003M Float AU Goldman Sachs 16/03/2024 AUD288,104,783 613,275 Receive Fixed 2.255% / Pay ADBB0003M Float AU Goldman Sachs 16/03/2024 AUD288,104,783 596,557 Receive Fixed 2.3625% / Pay CDOR006M Float CA Goldman Sachs 19/12/2021 CAD152,929,244 558,726 Receive Fixed 2.2425% / Pay ADBB0003M Float AU Goldman Sachs 16/03/2024 AUD288,104,782 554,763 Receive Fixed 2.2395% / Pay ADBB0003M Float AU Goldman Sachs 16/03/2024 AUD288,104,782 544,732 Receive Fixed 2.4125% / Pay CDOR006M Float CA Goldman Sachs 19/12/2021 CAD115,557,064 534,633 Receive Fixed 2.5425% / Pay US0003M Float US Goldman Sachs 17/03/2024 USD356,290,650 472,392 Receive Fixed 2.54% / Pay US0003M Float US Goldman Sachs 17/03/2024 USD356,290,650 450,892 Receive Fixed 0.45% / Pay EUR006M Float EU Goldman Sachs 17/03/2024 EUR173,497,763 417,932 Receive Fixed 0.441% / Pay EUR006M Float EU Goldman Sachs 17/03/2024 EUR173,497,762 370,888 Receive Fixed 2.285% / Pay CDOR006M Float CA Goldman Sachs 19/12/2021 CAD152,929,243 328,067 Receive Fixed 2.5165% / Pay US0003M Float US Goldman Sachs 17/03/2024 USD356,290,650 248,791 Pay Fixed 1.6037% / Receive BP006M Float GB Goldman Sachs 21/09/2048 GBP22,186,068 239,909 Receive Fixed 0.455% / Pay EUR006M Float EU Goldman Sachs 17/03/2024 EUR86,748,881 222,035 Receive Fixed 0.454% / Pay EUR006M Float EU Goldman Sachs 17/03/2024 EUR86,748,881 219,421 Receive Fixed 0.453% / Pay EUR006M Float EU Goldman Sachs 17/03/2024 EUR86,748,882 216,807 Receive Fixed 2.5125% / Pay US0003M Float US Goldman Sachs 17/03/2024 USD356,290,651 214,391 Receive Fixed 0.4505% / Pay EUR006M Float EU Goldman Sachs 17/03/2024 EUR86,748,881 210,273 Pay Fixed 2.645% / Receive US0003M Float US Goldman Sachs 17/03/2028 USD159,042,951 205,726 Pay Fixed 1.6157% / Receive BP006M Float GB Goldman Sachs 21/09/2048 GBP22,186,068 205,592 Receive Fixed 0.4485% / Pay EUR006M Float EU Goldman Sachs 17/03/2024 EUR86,748,881 205,046 Receive Fixed 0.446% / Pay EUR006M Float EU Goldman Sachs 17/03/2024 EUR86,748,882 198,512 Receive Fixed 2.584% / Pay US0003M Float US Goldman Sachs 17/03/2024 USD84,456,446 196,579 Receive Fixed 0.445% / Pay EUR006M Float EU Goldman Sachs 17/03/2024 EUR86,748,881 195,898 Receive Fixed 0.4445% / Pay EUR006M Float EU Goldman Sachs 17/03/2024 EUR86,748,881 194,591 Receive Fixed 0.4435% / Pay EUR006M Float EU Goldman Sachs 17/03/2024 EUR86,748,881 191,978 Receive Fixed 0.443% / Pay EUR006M Float EU Goldman Sachs 17/03/2024 EUR86,748,881 190,671 Receive Fixed 0.442% / Pay EUR006M Float EU Goldman Sachs 17/03/2024 EUR86,748,881 188,057 Receive Fixed 0.4405% / Pay EUR006M Float EU Goldman Sachs 17/03/2024 EUR86,748,881 184,137 Receive Fixed 0.44% / Pay EUR006M Float EU Goldman Sachs 17/03/2024 EUR86,748,881 182,830 Pay Fixed 1.6302% / Receive BP006M Float GB Goldman Sachs 21/09/2048 GBP22,186,069 164,127 Receive Fixed 2.568% / Pay US0003M Float US Goldman Sachs 17/03/2024 USD84,456,445 163,961 Receive Fixed 0.4315% / Pay EUR006M Float EU Goldman Sachs 17/03/2024 EUR86,748,881 160,614 Receive Fixed 2.5615% / Pay US0003M Float US Goldman Sachs 17/03/2024 USD84,456,445 150,711 Receive Fixed 2.50125% / Pay US0003M Float US Goldman Sachs 17/03/2024 USD364,875,967 120,475
Notes to the Financial Statements (continued)
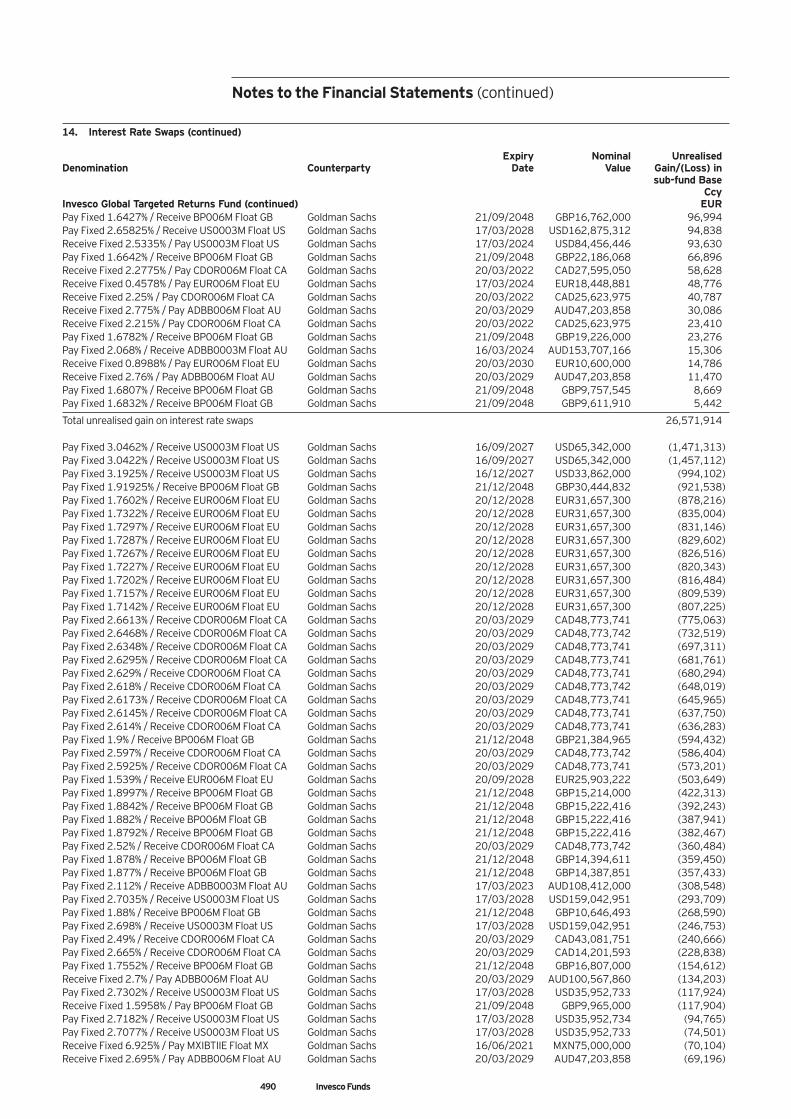
490 Invesco Funds
14. Interest Rate Swaps (continued) Expiry Nominal Unrealised Denomination Counterparty Date Value Gain/(Loss) in sub-fund Base Ccy Invesco Global Targeted Returns Fund (continued) EUR Pay Fixed 1.6427% / Receive BP006M Float GB Goldman Sachs 21/09/2048 GBP16,762,000 96,994 Pay Fixed 2.65825% / Receive US0003M Float US Goldman Sachs 17/03/2028 USD162,875,312 94,838 Receive Fixed 2.5335% / Pay US0003M Float US Goldman Sachs 17/03/2024 USD84,456,446 93,630 Pay Fixed 1.6642% / Receive BP006M Float GB Goldman Sachs 21/09/2048 GBP22,186,068 66,896 Receive Fixed 2.2775% / Pay CDOR006M Float CA Goldman Sachs 20/03/2022 CAD27,595,050 58,628 Receive Fixed 0.4578% / Pay EUR006M Float EU Goldman Sachs 17/03/2024 EUR18,448,881 48,776 Receive Fixed 2.25% / Pay CDOR006M Float CA Goldman Sachs 20/03/2022 CAD25,623,975 40,787 Receive Fixed 2.775% / Pay ADBB006M Float AU Goldman Sachs 20/03/2029 AUD47,203,858 30,086 Receive Fixed 2.215% / Pay CDOR006M Float CA Goldman Sachs 20/03/2022 CAD25,623,975 23,410 Pay Fixed 1.6782% / Receive BP006M Float GB Goldman Sachs 21/09/2048 GBP19,226,000 23,276 Pay Fixed 2.068% / Receive ADBB0003M Float AU Goldman Sachs 16/03/2024 AUD153,707,166 15,306 Receive Fixed 0.8988% / Pay EUR006M Float EU Goldman Sachs 20/03/2030 EUR10,600,000 14,786 Receive Fixed 2.76% / Pay ADBB006M Float AU Goldman Sachs 20/03/2029 AUD47,203,858 11,470 Pay Fixed 1.6807% / Receive BP006M Float GB Goldman Sachs 21/09/2048 GBP9,757,545 8,669 Pay Fixed 1.6832% / Receive BP006M Float GB Goldman Sachs 21/09/2048 GBP9,611,910 5,442
Total unrealised gain on interest rate swaps 26,571,914 Pay Fixed 3.0462% / Receive US0003M Float US Goldman Sachs 16/09/2027 USD65,342,000 (1,471,313) Pay Fixed 3.0422% / Receive US0003M Float US Goldman Sachs 16/09/2027 USD65,342,000 (1,457,112) Pay Fixed 3.1925% / Receive US0003M Float US Goldman Sachs 16/12/2027 USD33,862,000 (994,102) Pay Fixed 1.91925% / Receive BP006M Float GB Goldman Sachs 21/12/2048 GBP30,444,832 (921,538) Pay Fixed 1.7602% / Receive EUR006M Float EU Goldman Sachs 20/12/2028 EUR31,657,300 (878,216) Pay Fixed 1.7322% / Receive EUR006M Float EU Goldman Sachs 20/12/2028 EUR31,657,300 (835,004) Pay Fixed 1.7297% / Receive EUR006M Float EU Goldman Sachs 20/12/2028 EUR31,657,300 (831,146) Pay Fixed 1.7287% / Receive EUR006M Float EU Goldman Sachs 20/12/2028 EUR31,657,300 (829,602) Pay Fixed 1.7267% / Receive EUR006M Float EU Goldman Sachs 20/12/2028 EUR31,657,300 (826,516) Pay Fixed 1.7227% / Receive EUR006M Float EU Goldman Sachs 20/12/2028 EUR31,657,300 (820,343) Pay Fixed 1.7202% / Receive EUR006M Float EU Goldman Sachs 20/12/2028 EUR31,657,300 (816,484) Pay Fixed 1.7157% / Receive EUR006M Float EU Goldman Sachs 20/12/2028 EUR31,657,300 (809,539) Pay Fixed 1.7142% / Receive EUR006M Float EU Goldman Sachs 20/12/2028 EUR31,657,300 (807,225) Pay Fixed 2.6613% / Receive CDOR006M Float CA Goldman Sachs 20/03/2029 CAD48,773,741 (775,063) Pay Fixed 2.6468% / Receive CDOR006M Float CA Goldman Sachs 20/03/2029 CAD48,773,742 (732,519) Pay Fixed 2.6348% / Receive CDOR006M Float CA Goldman Sachs 20/03/2029 CAD48,773,741 (697,311) Pay Fixed 2.6295% / Receive CDOR006M Float CA Goldman Sachs 20/03/2029 CAD48,773,741 (681,761) Pay Fixed 2.629% / Receive CDOR006M Float CA Goldman Sachs 20/03/2029 CAD48,773,741 (680,294) Pay Fixed 2.618% / Receive CDOR006M Float CA Goldman Sachs 20/03/2029 CAD48,773,742 (648,019) Pay Fixed 2.6173% / Receive CDOR006M Float CA Goldman Sachs 20/03/2029 CAD48,773,741 (645,965) Pay Fixed 2.6145% / Receive CDOR006M Float CA Goldman Sachs 20/03/2029 CAD48,773,741 (637,750) Pay Fixed 2.614% / Receive CDOR006M Float CA Goldman Sachs 20/03/2029 CAD48,773,741 (636,283) Pay Fixed 1.9% / Receive BP006M Float GB Goldman Sachs 21/12/2048 GBP21,384,965 (594,432) Pay Fixed 2.597% / Receive CDOR006M Float CA Goldman Sachs 20/03/2029 CAD48,773,742 (586,404) Pay Fixed 2.5925% / Receive CDOR006M Float CA Goldman Sachs 20/03/2029 CAD48,773,741 (573,201) Pay Fixed 1.539% / Receive EUR006M Float EU Goldman Sachs 20/09/2028 EUR25,903,222 (503,649) Pay Fixed 1.8997% / Receive BP006M Float GB Goldman Sachs 21/12/2048 GBP15,214,000 (422,313) Pay Fixed 1.8842% / Receive BP006M Float GB Goldman Sachs 21/12/2048 GBP15,222,416 (392,243) Pay Fixed 1.882% / Receive BP006M Float GB Goldman Sachs 21/12/2048 GBP15,222,416 (387,941) Pay Fixed 1.8792% / Receive BP006M Float GB Goldman Sachs 21/12/2048 GBP15,222,416 (382,467) Pay Fixed 2.52% / Receive CDOR006M Float CA Goldman Sachs 20/03/2029 CAD48,773,742 (360,484) Pay Fixed 1.878% / Receive BP006M Float GB Goldman Sachs 21/12/2048 GBP14,394,611 (359,450) Pay Fixed 1.877% / Receive BP006M Float GB Goldman Sachs 21/12/2048 GBP14,387,851 (357,433) Pay Fixed 2.112% / Receive ADBB0003M Float AU Goldman Sachs 17/03/2023 AUD108,412,000 (308,548) Pay Fixed 2.7035% / Receive US0003M Float US Goldman Sachs 17/03/2028 USD159,042,951 (293,709) Pay Fixed 1.88% / Receive BP006M Float GB Goldman Sachs 21/12/2048 GBP10,646,493 (268,590) Pay Fixed 2.698% / Receive US0003M Float US Goldman Sachs 17/03/2028 USD159,042,951 (246,753) Pay Fixed 2.49% / Receive CDOR006M Float CA Goldman Sachs 20/03/2029 CAD43,081,751 (240,666) Pay Fixed 2.665% / Receive CDOR006M Float CA Goldman Sachs 20/03/2029 CAD14,201,593 (228,838) Pay Fixed 1.7552% / Receive BP006M Float GB Goldman Sachs 21/12/2048 GBP16,807,000 (154,612) Receive Fixed 2.7% / Pay ADBB006M Float AU Goldman Sachs 20/03/2029 AUD100,567,860 (134,203) Pay Fixed 2.7302% / Receive US0003M Float US Goldman Sachs 17/03/2028 USD35,952,733 (117,924) Receive Fixed 1.5958% / Pay BP006M Float GB Goldman Sachs 21/09/2048 GBP9,965,000 (117,904) Pay Fixed 2.7182% / Receive US0003M Float US Goldman Sachs 17/03/2028 USD35,952,734 (94,765) Pay Fixed 2.7077% / Receive US0003M Float US Goldman Sachs 17/03/2028 USD35,952,733 (74,501) Receive Fixed 6.925% / Pay MXIBTIIE Float MX Goldman Sachs 16/06/2021 MXN75,000,000 (70,104) Receive Fixed 2.695% / Pay ADBB006M Float AU Goldman Sachs 20/03/2029 AUD47,203,858 (69,196)
Notes to the Financial Statements (continued)
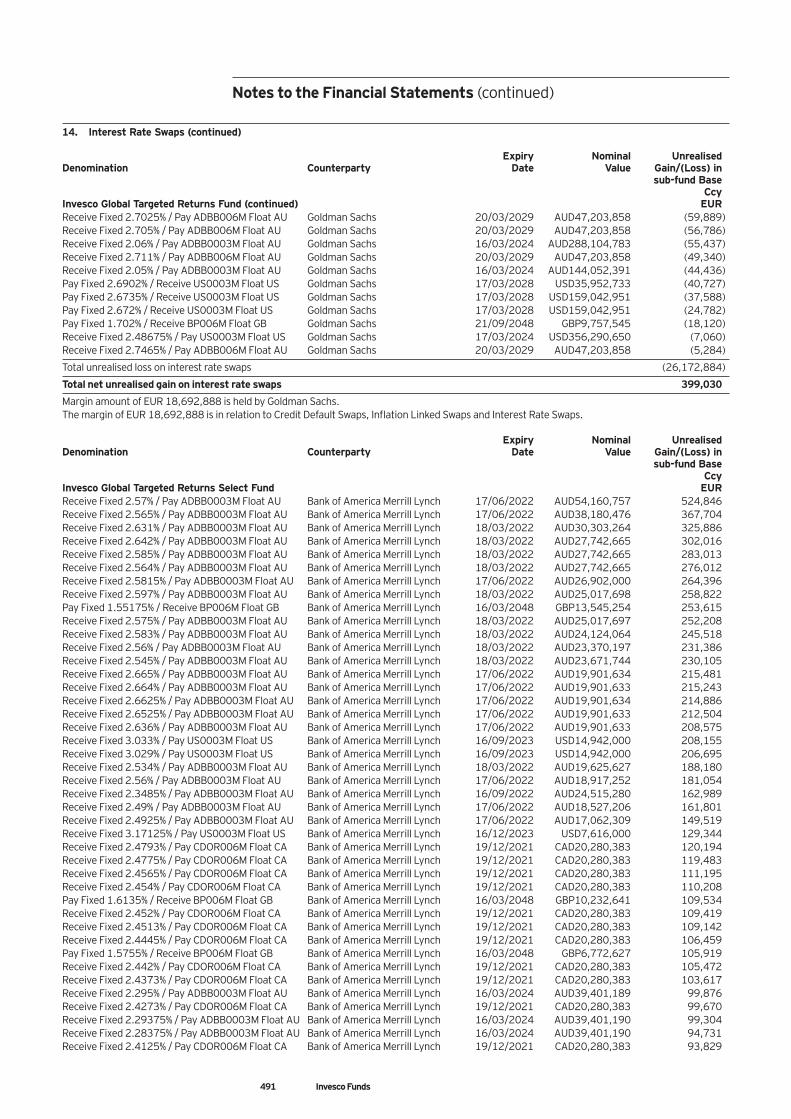
491 Invesco Funds
14. Interest Rate Swaps (continued) Expiry Nominal Unrealised Denomination Counterparty Date Value Gain/(Loss) in sub-fund Base Ccy Invesco Global Targeted Returns Fund (continued) EUR Receive Fixed 2.7025% / Pay ADBB006M Float AU Goldman Sachs 20/03/2029 AUD47,203,858 (59,889) Receive Fixed 2.705% / Pay ADBB006M Float AU Goldman Sachs 20/03/2029 AUD47,203,858 (56,786) Receive Fixed 2.06% / Pay ADBB0003M Float AU Goldman Sachs 16/03/2024 AUD288,104,783 (55,437) Receive Fixed 2.711% / Pay ADBB006M Float AU Goldman Sachs 20/03/2029 AUD47,203,858 (49,340) Receive Fixed 2.05% / Pay ADBB0003M Float AU Goldman Sachs 16/03/2024 AUD144,052,391 (44,436) Pay Fixed 2.6902% / Receive US0003M Float US Goldman Sachs 17/03/2028 USD35,952,733 (40,727) Pay Fixed 2.6735% / Receive US0003M Float US Goldman Sachs 17/03/2028 USD159,042,951 (37,588) Pay Fixed 2.672% / Receive US0003M Float US Goldman Sachs 17/03/2028 USD159,042,951 (24,782) Pay Fixed 1.702% / Receive BP006M Float GB Goldman Sachs 21/09/2048 GBP9,757,545 (18,120) Receive Fixed 2.48675% / Pay US0003M Float US Goldman Sachs 17/03/2024 USD356,290,650 (7,060) Receive Fixed 2.7465% / Pay ADBB006M Float AU Goldman Sachs 20/03/2029 AUD47,203,858 (5,284)
Total unrealised loss on interest rate swaps (26,172,884)
Total net unrealised gain on interest rate swaps 399,030
Margin amount of EUR 18,692,888 is held by Goldman Sachs. The margin of EUR 18,692,888 is in relation to Credit Default Swaps, Inflation Linked Swaps and Interest Rate Swaps. Expiry Nominal Unrealised Denomination Counterparty Date Value Gain/(Loss) in sub-fund Base Ccy Invesco Global Targeted Returns Select Fund EUR Receive Fixed 2.57% / Pay ADBB0003M Float AU Bank of America Merrill Lynch 17/06/2022 AUD54,160,757 524,846 Receive Fixed 2.565% / Pay ADBB0003M Float AU Bank of America Merrill Lynch 17/06/2022 AUD38,180,476 367,704 Receive Fixed 2.631% / Pay ADBB0003M Float AU Bank of America Merrill Lynch 18/03/2022 AUD30,303,264 325,886 Receive Fixed 2.642% / Pay ADBB0003M Float AU Bank of America Merrill Lynch 18/03/2022 AUD27,742,665 302,016 Receive Fixed 2.585% / Pay ADBB0003M Float AU Bank of America Merrill Lynch 18/03/2022 AUD27,742,665 283,013 Receive Fixed 2.564% / Pay ADBB0003M Float AU Bank of America Merrill Lynch 18/03/2022 AUD27,742,665 276,012 Receive Fixed 2.5815% / Pay ADBB0003M Float AU Bank of America Merrill Lynch 17/06/2022 AUD26,902,000 264,396 Receive Fixed 2.597% / Pay ADBB0003M Float AU Bank of America Merrill Lynch 18/03/2022 AUD25,017,698 258,822 Pay Fixed 1.55175% / Receive BP006M Float GB Bank of America Merrill Lynch 16/03/2048 GBP13,545,254 253,615 Receive Fixed 2.575% / Pay ADBB0003M Float AU Bank of America Merrill Lynch 18/03/2022 AUD25,017,697 252,208 Receive Fixed 2.583% / Pay ADBB0003M Float AU Bank of America Merrill Lynch 18/03/2022 AUD24,124,064 245,518 Receive Fixed 2.56% / Pay ADBB0003M Float AU Bank of America Merrill Lynch 18/03/2022 AUD23,370,197 231,386 Receive Fixed 2.545% / Pay ADBB0003M Float AU Bank of America Merrill Lynch 18/03/2022 AUD23,671,744 230,105 Receive Fixed 2.665% / Pay ADBB0003M Float AU Bank of America Merrill Lynch 17/06/2022 AUD19,901,634 215,481 Receive Fixed 2.664% / Pay ADBB0003M Float AU Bank of America Merrill Lynch 17/06/2022 AUD19,901,633 215,243 Receive Fixed 2.6625% / Pay ADBB0003M Float AU Bank of America Merrill Lynch 17/06/2022 AUD19,901,634 214,886 Receive Fixed 2.6525% / Pay ADBB0003M Float AU Bank of America Merrill Lynch 17/06/2022 AUD19,901,633 212,504 Receive Fixed 2.636% / Pay ADBB0003M Float AU Bank of America Merrill Lynch 17/06/2022 AUD19,901,633 208,575 Receive Fixed 3.033% / Pay US0003M Float US Bank of America Merrill Lynch 16/09/2023 USD14,942,000 208,155 Receive Fixed 3.029% / Pay US0003M Float US Bank of America Merrill Lynch 16/09/2023 USD14,942,000 206,695 Receive Fixed 2.534% / Pay ADBB0003M Float AU Bank of America Merrill Lynch 18/03/2022 AUD19,625,627 188,180 Receive Fixed 2.56% / Pay ADBB0003M Float AU Bank of America Merrill Lynch 17/06/2022 AUD18,917,252 181,054 Receive Fixed 2.3485% / Pay ADBB0003M Float AU Bank of America Merrill Lynch 16/09/2022 AUD24,515,280 162,989 Receive Fixed 2.49% / Pay ADBB0003M Float AU Bank of America Merrill Lynch 17/06/2022 AUD18,527,206 161,801 Receive Fixed 2.4925% / Pay ADBB0003M Float AU Bank of America Merrill Lynch 17/06/2022 AUD17,062,309 149,519 Receive Fixed 3.17125% / Pay US0003M Float US Bank of America Merrill Lynch 16/12/2023 USD7,616,000 129,344 Receive Fixed 2.4793% / Pay CDOR006M Float CA Bank of America Merrill Lynch 19/12/2021 CAD20,280,383 120,194 Receive Fixed 2.4775% / Pay CDOR006M Float CA Bank of America Merrill Lynch 19/12/2021 CAD20,280,383 119,483 Receive Fixed 2.4565% / Pay CDOR006M Float CA Bank of America Merrill Lynch 19/12/2021 CAD20,280,383 111,195 Receive Fixed 2.454% / Pay CDOR006M Float CA Bank of America Merrill Lynch 19/12/2021 CAD20,280,383 110,208 Pay Fixed 1.6135% / Receive BP006M Float GB Bank of America Merrill Lynch 16/03/2048 GBP10,232,641 109,534 Receive Fixed 2.452% / Pay CDOR006M Float CA Bank of America Merrill Lynch 19/12/2021 CAD20,280,383 109,419 Receive Fixed 2.4513% / Pay CDOR006M Float CA Bank of America Merrill Lynch 19/12/2021 CAD20,280,383 109,142 Receive Fixed 2.4445% / Pay CDOR006M Float CA Bank of America Merrill Lynch 19/12/2021 CAD20,280,383 106,459 Pay Fixed 1.5755% / Receive BP006M Float GB Bank of America Merrill Lynch 16/03/2048 GBP6,772,627 105,919 Receive Fixed 2.442% / Pay CDOR006M Float CA Bank of America Merrill Lynch 19/12/2021 CAD20,280,383 105,472 Receive Fixed 2.4373% / Pay CDOR006M Float CA Bank of America Merrill Lynch 19/12/2021 CAD20,280,383 103,617 Receive Fixed 2.295% / Pay ADBB0003M Float AU Bank of America Merrill Lynch 16/03/2024 AUD39,401,189 99,876 Receive Fixed 2.4273% / Pay CDOR006M Float CA Bank of America Merrill Lynch 19/12/2021 CAD20,280,383 99,670 Receive Fixed 2.29375% / Pay ADBB0003M Float AU Bank of America Merrill Lynch 16/03/2024 AUD39,401,190 99,304 Receive Fixed 2.28375% / Pay ADBB0003M Float AU Bank of America Merrill Lynch 16/03/2024 AUD39,401,190 94,731 Receive Fixed 2.4125% / Pay CDOR006M Float CA Bank of America Merrill Lynch 19/12/2021 CAD20,280,383 93,829
Notes to the Financial Statements (continued)
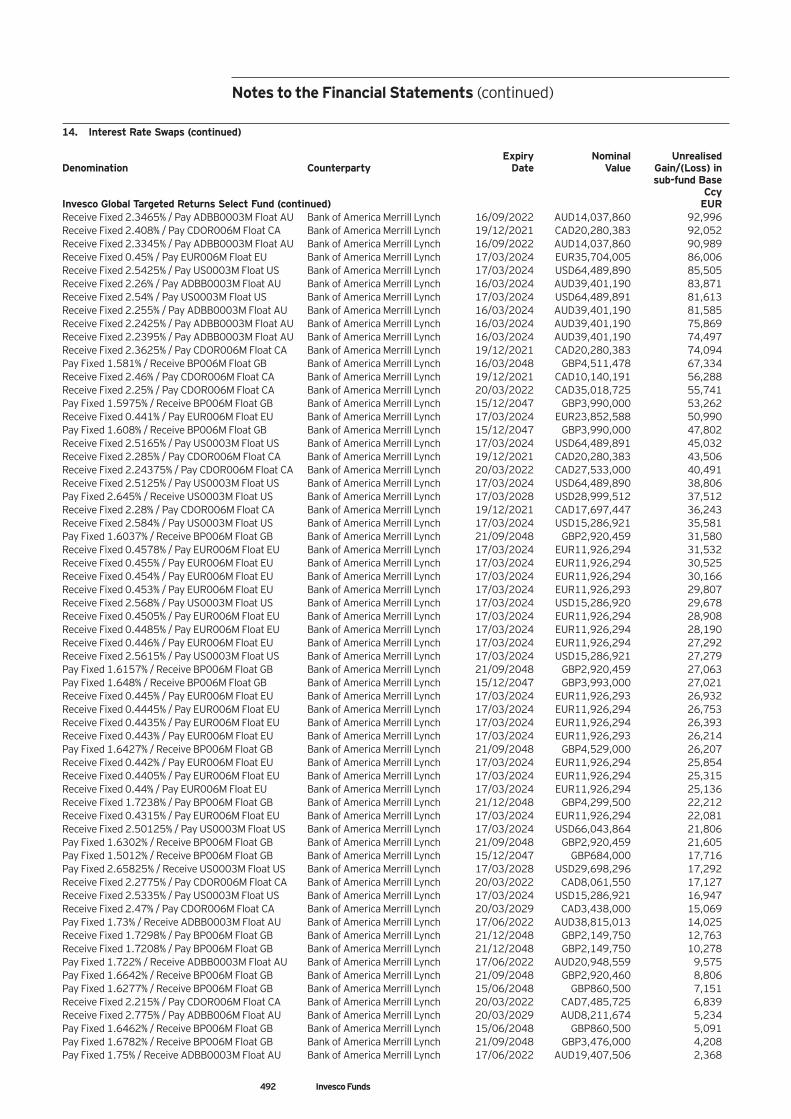
492 Invesco Funds
14. Interest Rate Swaps (continued) Expiry Nominal Unrealised Denomination Counterparty Date Value Gain/(Loss) in sub-fund Base Ccy Invesco Global Targeted Returns Select Fund (continued) EUR Receive Fixed 2.3465% / Pay ADBB0003M Float AU Bank of America Merrill Lynch 16/09/2022 AUD14,037,860 92,996 Receive Fixed 2.408% / Pay CDOR006M Float CA Bank of America Merrill Lynch 19/12/2021 CAD20,280,383 92,052 Receive Fixed 2.3345% / Pay ADBB0003M Float AU Bank of America Merrill Lynch 16/09/2022 AUD14,037,860 90,989 Receive Fixed 0.45% / Pay EUR006M Float EU Bank of America Merrill Lynch 17/03/2024 EUR35,704,005 86,006 Receive Fixed 2.5425% / Pay US0003M Float US Bank of America Merrill Lynch 17/03/2024 USD64,489,890 85,505 Receive Fixed 2.26% / Pay ADBB0003M Float AU Bank of America Merrill Lynch 16/03/2024 AUD39,401,190 83,871 Receive Fixed 2.54% / Pay US0003M Float US Bank of America Merrill Lynch 17/03/2024 USD64,489,891 81,613 Receive Fixed 2.255% / Pay ADBB0003M Float AU Bank of America Merrill Lynch 16/03/2024 AUD39,401,190 81,585 Receive Fixed 2.2425% / Pay ADBB0003M Float AU Bank of America Merrill Lynch 16/03/2024 AUD39,401,190 75,869 Receive Fixed 2.2395% / Pay ADBB0003M Float AU Bank of America Merrill Lynch 16/03/2024 AUD39,401,190 74,497 Receive Fixed 2.3625% / Pay CDOR006M Float CA Bank of America Merrill Lynch 19/12/2021 CAD20,280,383 74,094 Pay Fixed 1.581% / Receive BP006M Float GB Bank of America Merrill Lynch 16/03/2048 GBP4,511,478 67,334 Receive Fixed 2.46% / Pay CDOR006M Float CA Bank of America Merrill Lynch 19/12/2021 CAD10,140,191 56,288 Receive Fixed 2.25% / Pay CDOR006M Float CA Bank of America Merrill Lynch 20/03/2022 CAD35,018,725 55,741 Pay Fixed 1.5975% / Receive BP006M Float GB Bank of America Merrill Lynch 15/12/2047 GBP3,990,000 53,262 Receive Fixed 0.441% / Pay EUR006M Float EU Bank of America Merrill Lynch 17/03/2024 EUR23,852,588 50,990 Pay Fixed 1.608% / Receive BP006M Float GB Bank of America Merrill Lynch 15/12/2047 GBP3,990,000 47,802 Receive Fixed 2.5165% / Pay US0003M Float US Bank of America Merrill Lynch 17/03/2024 USD64,489,891 45,032 Receive Fixed 2.285% / Pay CDOR006M Float CA Bank of America Merrill Lynch 19/12/2021 CAD20,280,383 43,506 Receive Fixed 2.24375% / Pay CDOR006M Float CA Bank of America Merrill Lynch 20/03/2022 CAD27,533,000 40,491 Receive Fixed 2.5125% / Pay US0003M Float US Bank of America Merrill Lynch 17/03/2024 USD64,489,890 38,806 Pay Fixed 2.645% / Receive US0003M Float US Bank of America Merrill Lynch 17/03/2028 USD28,999,512 37,512 Receive Fixed 2.28% / Pay CDOR006M Float CA Bank of America Merrill Lynch 19/12/2021 CAD17,697,447 36,243 Receive Fixed 2.584% / Pay US0003M Float US Bank of America Merrill Lynch 17/03/2024 USD15,286,921 35,581 Pay Fixed 1.6037% / Receive BP006M Float GB Bank of America Merrill Lynch 21/09/2048 GBP2,920,459 31,580 Receive Fixed 0.4578% / Pay EUR006M Float EU Bank of America Merrill Lynch 17/03/2024 EUR11,926,294 31,532 Receive Fixed 0.455% / Pay EUR006M Float EU Bank of America Merrill Lynch 17/03/2024 EUR11,926,294 30,525 Receive Fixed 0.454% / Pay EUR006M Float EU Bank of America Merrill Lynch 17/03/2024 EUR11,926,294 30,166 Receive Fixed 0.453% / Pay EUR006M Float EU Bank of America Merrill Lynch 17/03/2024 EUR11,926,293 29,807 Receive Fixed 2.568% / Pay US0003M Float US Bank of America Merrill Lynch 17/03/2024 USD15,286,920 29,678 Receive Fixed 0.4505% / Pay EUR006M Float EU Bank of America Merrill Lynch 17/03/2024 EUR11,926,294 28,908 Receive Fixed 0.4485% / Pay EUR006M Float EU Bank of America Merrill Lynch 17/03/2024 EUR11,926,294 28,190 Receive Fixed 0.446% / Pay EUR006M Float EU Bank of America Merrill Lynch 17/03/2024 EUR11,926,294 27,292 Receive Fixed 2.5615% / Pay US0003M Float US Bank of America Merrill Lynch 17/03/2024 USD15,286,921 27,279 Pay Fixed 1.6157% / Receive BP006M Float GB Bank of America Merrill Lynch 21/09/2048 GBP2,920,459 27,063 Pay Fixed 1.648% / Receive BP006M Float GB Bank of America Merrill Lynch 15/12/2047 GBP3,993,000 27,021 Receive Fixed 0.445% / Pay EUR006M Float EU Bank of America Merrill Lynch 17/03/2024 EUR11,926,293 26,932 Receive Fixed 0.4445% / Pay EUR006M Float EU Bank of America Merrill Lynch 17/03/2024 EUR11,926,294 26,753 Receive Fixed 0.4435% / Pay EUR006M Float EU Bank of America Merrill Lynch 17/03/2024 EUR11,926,294 26,393 Receive Fixed 0.443% / Pay EUR006M Float EU Bank of America Merrill Lynch 17/03/2024 EUR11,926,293 26,214 Pay Fixed 1.6427% / Receive BP006M Float GB Bank of America Merrill Lynch 21/09/2048 GBP4,529,000 26,207 Receive Fixed 0.442% / Pay EUR006M Float EU Bank of America Merrill Lynch 17/03/2024 EUR11,926,294 25,854 Receive Fixed 0.4405% / Pay EUR006M Float EU Bank of America Merrill Lynch 17/03/2024 EUR11,926,294 25,315 Receive Fixed 0.44% / Pay EUR006M Float EU Bank of America Merrill Lynch 17/03/2024 EUR11,926,294 25,136 Receive Fixed 1.7238% / Pay BP006M Float GB Bank of America Merrill Lynch 21/12/2048 GBP4,299,500 22,212 Receive Fixed 0.4315% / Pay EUR006M Float EU Bank of America Merrill Lynch 17/03/2024 EUR11,926,294 22,081 Receive Fixed 2.50125% / Pay US0003M Float US Bank of America Merrill Lynch 17/03/2024 USD66,043,864 21,806 Pay Fixed 1.6302% / Receive BP006M Float GB Bank of America Merrill Lynch 21/09/2048 GBP2,920,459 21,605 Pay Fixed 1.5012% / Receive BP006M Float GB Bank of America Merrill Lynch 15/12/2047 GBP684,000 17,716 Pay Fixed 2.65825% / Receive US0003M Float US Bank of America Merrill Lynch 17/03/2028 USD29,698,296 17,292 Receive Fixed 2.2775% / Pay CDOR006M Float CA Bank of America Merrill Lynch 20/03/2022 CAD8,061,550 17,127 Receive Fixed 2.5335% / Pay US0003M Float US Bank of America Merrill Lynch 17/03/2024 USD15,286,921 16,947 Receive Fixed 2.47% / Pay CDOR006M Float CA Bank of America Merrill Lynch 20/03/2029 CAD3,438,000 15,069 Pay Fixed 1.73% / Receive ADBB0003M Float AU Bank of America Merrill Lynch 17/06/2022 AUD38,815,013 14,025 Receive Fixed 1.7298% / Pay BP006M Float GB Bank of America Merrill Lynch 21/12/2048 GBP2,149,750 12,763 Receive Fixed 1.7208% / Pay BP006M Float GB Bank of America Merrill Lynch 21/12/2048 GBP2,149,750 10,278 Pay Fixed 1.722% / Receive ADBB0003M Float AU Bank of America Merrill Lynch 17/06/2022 AUD20,948,559 9,575 Pay Fixed 1.6642% / Receive BP006M Float GB Bank of America Merrill Lynch 21/09/2048 GBP2,920,460 8,806 Pay Fixed 1.6277% / Receive BP006M Float GB Bank of America Merrill Lynch 15/06/2048 GBP860,500 7,151 Receive Fixed 2.215% / Pay CDOR006M Float CA Bank of America Merrill Lynch 20/03/2022 CAD7,485,725 6,839 Receive Fixed 2.775% / Pay ADBB006M Float AU Bank of America Merrill Lynch 20/03/2029 AUD8,211,674 5,234 Pay Fixed 1.6462% / Receive BP006M Float GB Bank of America Merrill Lynch 15/06/2048 GBP860,500 5,091 Pay Fixed 1.6782% / Receive BP006M Float GB Bank of America Merrill Lynch 21/09/2048 GBP3,476,000 4,208 Pay Fixed 1.75% / Receive ADBB0003M Float AU Bank of America Merrill Lynch 17/06/2022 AUD19,407,506 2,368
Notes to the Financial Statements (continued)
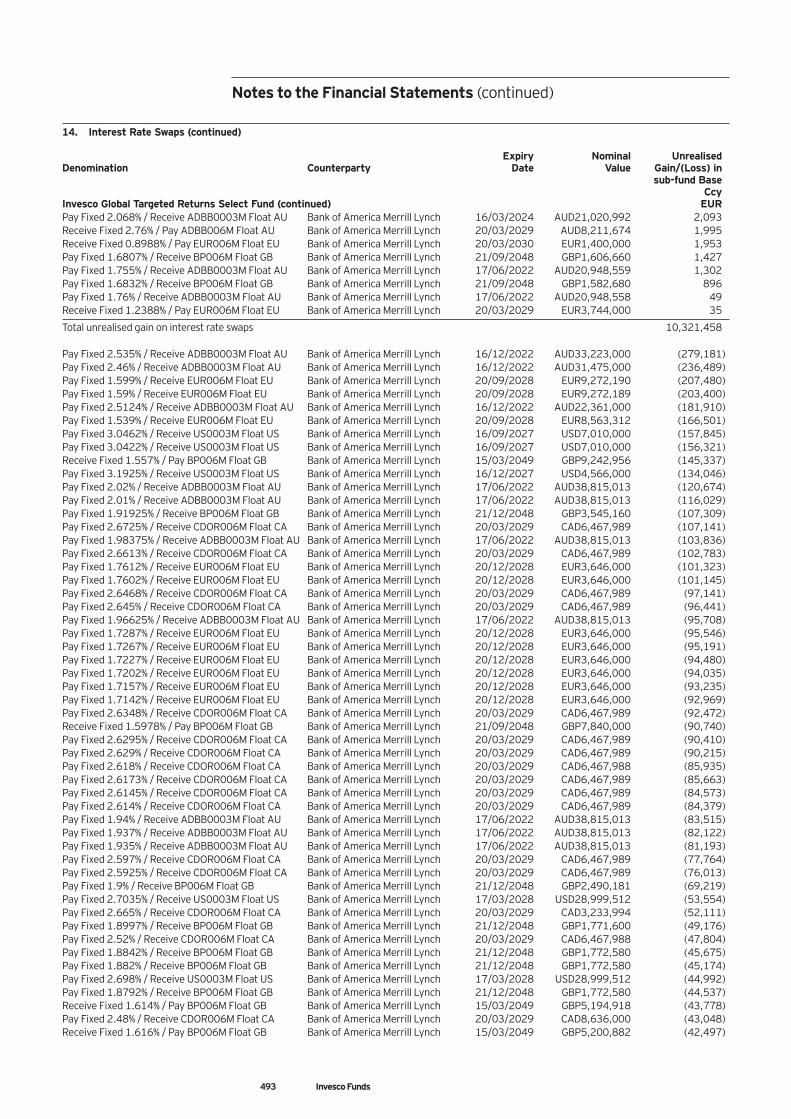
493 Invesco Funds
14. Interest Rate Swaps (continued) Expiry Nominal Unrealised Denomination Counterparty Date Value Gain/(Loss) in sub-fund Base Ccy Invesco Global Targeted Returns Select Fund (continued) EUR Pay Fixed 2.068% / Receive ADBB0003M Float AU Bank of America Merrill Lynch 16/03/2024 AUD21,020,992 2,093 Receive Fixed 2.76% / Pay ADBB006M Float AU Bank of America Merrill Lynch 20/03/2029 AUD8,211,674 1,995 Receive Fixed 0.8988% / Pay EUR006M Float EU Bank of America Merrill Lynch 20/03/2030 EUR1,400,000 1,953 Pay Fixed 1.6807% / Receive BP006M Float GB Bank of America Merrill Lynch 21/09/2048 GBP1,606,660 1,427 Pay Fixed 1.755% / Receive ADBB0003M Float AU Bank of America Merrill Lynch 17/06/2022 AUD20,948,559 1,302 Pay Fixed 1.6832% / Receive BP006M Float GB Bank of America Merrill Lynch 21/09/2048 GBP1,582,680 896 Pay Fixed 1.76% / Receive ADBB0003M Float AU Bank of America Merrill Lynch 17/06/2022 AUD20,948,558 49 Receive Fixed 1.2388% / Pay EUR006M Float EU Bank of America Merrill Lynch 20/03/2029 EUR3,744,000 35
Total unrealised gain on interest rate swaps 10,321,458 Pay Fixed 2.535% / Receive ADBB0003M Float AU Bank of America Merrill Lynch 16/12/2022 AUD33,223,000 (279,181) Pay Fixed 2.46% / Receive ADBB0003M Float AU Bank of America Merrill Lynch 16/12/2022 AUD31,475,000 (236,489) Pay Fixed 1.599% / Receive EUR006M Float EU Bank of America Merrill Lynch 20/09/2028 EUR9,272,190 (207,480) Pay Fixed 1.59% / Receive EUR006M Float EU Bank of America Merrill Lynch 20/09/2028 EUR9,272,189 (203,400) Pay Fixed 2.5124% / Receive ADBB0003M Float AU Bank of America Merrill Lynch 16/12/2022 AUD22,361,000 (181,910) Pay Fixed 1.539% / Receive EUR006M Float EU Bank of America Merrill Lynch 20/09/2028 EUR8,563,312 (166,501) Pay Fixed 3.0462% / Receive US0003M Float US Bank of America Merrill Lynch 16/09/2027 USD7,010,000 (157,845) Pay Fixed 3.0422% / Receive US0003M Float US Bank of America Merrill Lynch 16/09/2027 USD7,010,000 (156,321) Receive Fixed 1.557% / Pay BP006M Float GB Bank of America Merrill Lynch 15/03/2049 GBP9,242,956 (145,337) Pay Fixed 3.1925% / Receive US0003M Float US Bank of America Merrill Lynch 16/12/2027 USD4,566,000 (134,046) Pay Fixed 2.02% / Receive ADBB0003M Float AU Bank of America Merrill Lynch 17/06/2022 AUD38,815,013 (120,674) Pay Fixed 2.01% / Receive ADBB0003M Float AU Bank of America Merrill Lynch 17/06/2022 AUD38,815,013 (116,029) Pay Fixed 1.91925% / Receive BP006M Float GB Bank of America Merrill Lynch 21/12/2048 GBP3,545,160 (107,309) Pay Fixed 2.6725% / Receive CDOR006M Float CA Bank of America Merrill Lynch 20/03/2029 CAD6,467,989 (107,141) Pay Fixed 1.98375% / Receive ADBB0003M Float AU Bank of America Merrill Lynch 17/06/2022 AUD38,815,013 (103,836) Pay Fixed 2.6613% / Receive CDOR006M Float CA Bank of America Merrill Lynch 20/03/2029 CAD6,467,989 (102,783) Pay Fixed 1.7612% / Receive EUR006M Float EU Bank of America Merrill Lynch 20/12/2028 EUR3,646,000 (101,323) Pay Fixed 1.7602% / Receive EUR006M Float EU Bank of America Merrill Lynch 20/12/2028 EUR3,646,000 (101,145) Pay Fixed 2.6468% / Receive CDOR006M Float CA Bank of America Merrill Lynch 20/03/2029 CAD6,467,989 (97,141) Pay Fixed 2.645% / Receive CDOR006M Float CA Bank of America Merrill Lynch 20/03/2029 CAD6,467,989 (96,441) Pay Fixed 1.96625% / Receive ADBB0003M Float AU Bank of America Merrill Lynch 17/06/2022 AUD38,815,013 (95,708) Pay Fixed 1.7287% / Receive EUR006M Float EU Bank of America Merrill Lynch 20/12/2028 EUR3,646,000 (95,546) Pay Fixed 1.7267% / Receive EUR006M Float EU Bank of America Merrill Lynch 20/12/2028 EUR3,646,000 (95,191) Pay Fixed 1.7227% / Receive EUR006M Float EU Bank of America Merrill Lynch 20/12/2028 EUR3,646,000 (94,480) Pay Fixed 1.7202% / Receive EUR006M Float EU Bank of America Merrill Lynch 20/12/2028 EUR3,646,000 (94,035) Pay Fixed 1.7157% / Receive EUR006M Float EU Bank of America Merrill Lynch 20/12/2028 EUR3,646,000 (93,235) Pay Fixed 1.7142% / Receive EUR006M Float EU Bank of America Merrill Lynch 20/12/2028 EUR3,646,000 (92,969) Pay Fixed 2.6348% / Receive CDOR006M Float CA Bank of America Merrill Lynch 20/03/2029 CAD6,467,989 (92,472) Receive Fixed 1.5978% / Pay BP006M Float GB Bank of America Merrill Lynch 21/09/2048 GBP7,840,000 (90,740) Pay Fixed 2.6295% / Receive CDOR006M Float CA Bank of America Merrill Lynch 20/03/2029 CAD6,467,989 (90,410) Pay Fixed 2.629% / Receive CDOR006M Float CA Bank of America Merrill Lynch 20/03/2029 CAD6,467,989 (90,215) Pay Fixed 2.618% / Receive CDOR006M Float CA Bank of America Merrill Lynch 20/03/2029 CAD6,467,988 (85,935) Pay Fixed 2.6173% / Receive CDOR006M Float CA Bank of America Merrill Lynch 20/03/2029 CAD6,467,989 (85,663) Pay Fixed 2.6145% / Receive CDOR006M Float CA Bank of America Merrill Lynch 20/03/2029 CAD6,467,989 (84,573) Pay Fixed 2.614% / Receive CDOR006M Float CA Bank of America Merrill Lynch 20/03/2029 CAD6,467,989 (84,379) Pay Fixed 1.94% / Receive ADBB0003M Float AU Bank of America Merrill Lynch 17/06/2022 AUD38,815,013 (83,515) Pay Fixed 1.937% / Receive ADBB0003M Float AU Bank of America Merrill Lynch 17/06/2022 AUD38,815,013 (82,122) Pay Fixed 1.935% / Receive ADBB0003M Float AU Bank of America Merrill Lynch 17/06/2022 AUD38,815,013 (81,193) Pay Fixed 2.597% / Receive CDOR006M Float CA Bank of America Merrill Lynch 20/03/2029 CAD6,467,989 (77,764) Pay Fixed 2.5925% / Receive CDOR006M Float CA Bank of America Merrill Lynch 20/03/2029 CAD6,467,989 (76,013) Pay Fixed 1.9% / Receive BP006M Float GB Bank of America Merrill Lynch 21/12/2048 GBP2,490,181 (69,219) Pay Fixed 2.7035% / Receive US0003M Float US Bank of America Merrill Lynch 17/03/2028 USD28,999,512 (53,554) Pay Fixed 2.665% / Receive CDOR006M Float CA Bank of America Merrill Lynch 20/03/2029 CAD3,233,994 (52,111) Pay Fixed 1.8997% / Receive BP006M Float GB Bank of America Merrill Lynch 21/12/2048 GBP1,771,600 (49,176) Pay Fixed 2.52% / Receive CDOR006M Float CA Bank of America Merrill Lynch 20/03/2029 CAD6,467,988 (47,804) Pay Fixed 1.8842% / Receive BP006M Float GB Bank of America Merrill Lynch 21/12/2048 GBP1,772,580 (45,675) Pay Fixed 1.882% / Receive BP006M Float GB Bank of America Merrill Lynch 21/12/2048 GBP1,772,580 (45,174) Pay Fixed 2.698% / Receive US0003M Float US Bank of America Merrill Lynch 17/03/2028 USD28,999,512 (44,992) Pay Fixed 1.8792% / Receive BP006M Float GB Bank of America Merrill Lynch 21/12/2048 GBP1,772,580 (44,537) Receive Fixed 1.614% / Pay BP006M Float GB Bank of America Merrill Lynch 15/03/2049 GBP5,194,918 (43,778) Pay Fixed 2.48% / Receive CDOR006M Float CA Bank of America Merrill Lynch 20/03/2029 CAD8,636,000 (43,048) Receive Fixed 1.616% / Pay BP006M Float GB Bank of America Merrill Lynch 15/03/2049 GBP5,200,882 (42,497)
Notes to the Financial Statements (continued)
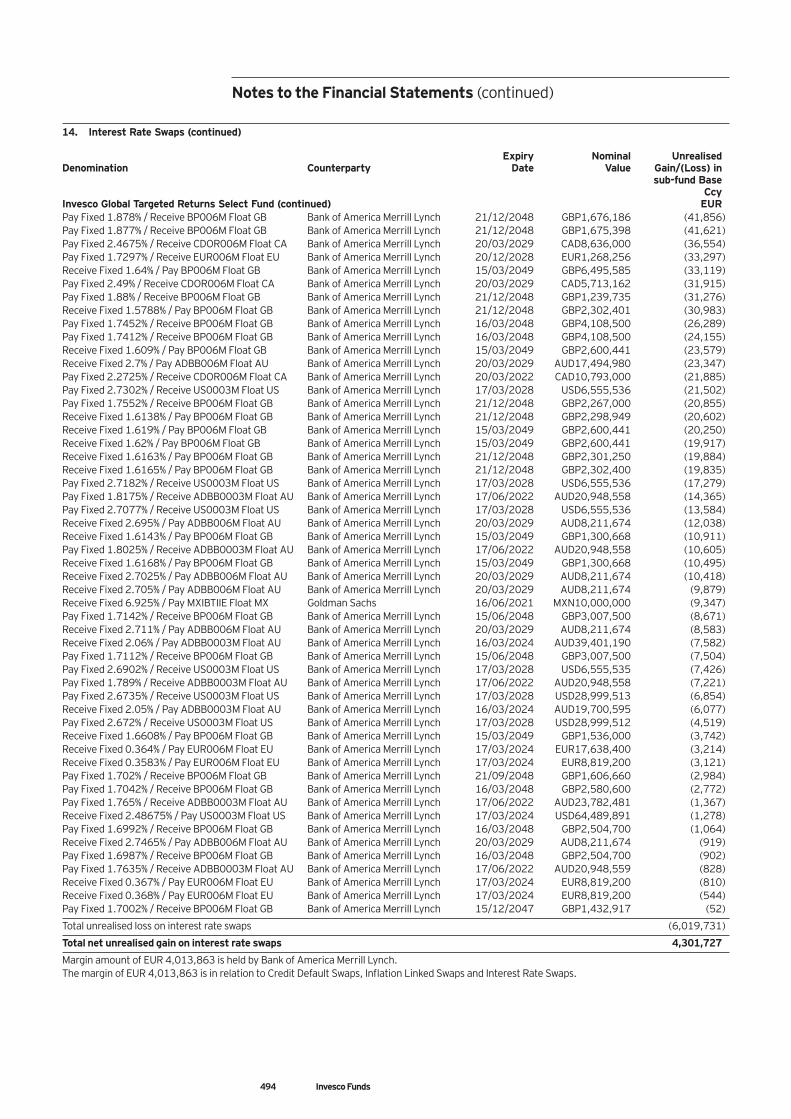
494 Invesco Funds
14. Interest Rate Swaps (continued) Expiry Nominal Unrealised Denomination Counterparty Date Value Gain/(Loss) in sub-fund Base Ccy Invesco Global Targeted Returns Select Fund (continued) EUR Pay Fixed 1.878% / Receive BP006M Float GB Bank of America Merrill Lynch 21/12/2048 GBP1,676,186 (41,856) Pay Fixed 1.877% / Receive BP006M Float GB Bank of America Merrill Lynch 21/12/2048 GBP1,675,398 (41,621) Pay Fixed 2.4675% / Receive CDOR006M Float CA Bank of America Merrill Lynch 20/03/2029 CAD8,636,000 (36,554) Pay Fixed 1.7297% / Receive EUR006M Float EU Bank of America Merrill Lynch 20/12/2028 EUR1,268,256 (33,297) Receive Fixed 1.64% / Pay BP006M Float GB Bank of America Merrill Lynch 15/03/2049 GBP6,495,585 (33,119) Pay Fixed 2.49% / Receive CDOR006M Float CA Bank of America Merrill Lynch 20/03/2029 CAD5,713,162 (31,915) Pay Fixed 1.88% / Receive BP006M Float GB Bank of America Merrill Lynch 21/12/2048 GBP1,239,735 (31,276) Receive Fixed 1.5788% / Pay BP006M Float GB Bank of America Merrill Lynch 21/12/2048 GBP2,302,401 (30,983) Pay Fixed 1.7452% / Receive BP006M Float GB Bank of America Merrill Lynch 16/03/2048 GBP4,108,500 (26,289) Pay Fixed 1.7412% / Receive BP006M Float GB Bank of America Merrill Lynch 16/03/2048 GBP4,108,500 (24,155) Receive Fixed 1.609% / Pay BP006M Float GB Bank of America Merrill Lynch 15/03/2049 GBP2,600,441 (23,579) Receive Fixed 2.7% / Pay ADBB006M Float AU Bank of America Merrill Lynch 20/03/2029 AUD17,494,980 (23,347) Pay Fixed 2.2725% / Receive CDOR006M Float CA Bank of America Merrill Lynch 20/03/2022 CAD10,793,000 (21,885) Pay Fixed 2.7302% / Receive US0003M Float US Bank of America Merrill Lynch 17/03/2028 USD6,555,536 (21,502) Pay Fixed 1.7552% / Receive BP006M Float GB Bank of America Merrill Lynch 21/12/2048 GBP2,267,000 (20,855) Receive Fixed 1.6138% / Pay BP006M Float GB Bank of America Merrill Lynch 21/12/2048 GBP2,298,949 (20,602) Receive Fixed 1.619% / Pay BP006M Float GB Bank of America Merrill Lynch 15/03/2049 GBP2,600,441 (20,250) Receive Fixed 1.62% / Pay BP006M Float GB Bank of America Merrill Lynch 15/03/2049 GBP2,600,441 (19,917) Receive Fixed 1.6163% / Pay BP006M Float GB Bank of America Merrill Lynch 21/12/2048 GBP2,301,250 (19,884) Receive Fixed 1.6165% / Pay BP006M Float GB Bank of America Merrill Lynch 21/12/2048 GBP2,302,400 (19,835) Pay Fixed 2.7182% / Receive US0003M Float US Bank of America Merrill Lynch 17/03/2028 USD6,555,536 (17,279) Pay Fixed 1.8175% / Receive ADBB0003M Float AU Bank of America Merrill Lynch 17/06/2022 AUD20,948,558 (14,365) Pay Fixed 2.7077% / Receive US0003M Float US Bank of America Merrill Lynch 17/03/2028 USD6,555,536 (13,584) Receive Fixed 2.695% / Pay ADBB006M Float AU Bank of America Merrill Lynch 20/03/2029 AUD8,211,674 (12,038) Receive Fixed 1.6143% / Pay BP006M Float GB Bank of America Merrill Lynch 15/03/2049 GBP1,300,668 (10,911) Pay Fixed 1.8025% / Receive ADBB0003M Float AU Bank of America Merrill Lynch 17/06/2022 AUD20,948,558 (10,605) Receive Fixed 1.6168% / Pay BP006M Float GB Bank of America Merrill Lynch 15/03/2049 GBP1,300,668 (10,495) Receive Fixed 2.7025% / Pay ADBB006M Float AU Bank of America Merrill Lynch 20/03/2029 AUD8,211,674 (10,418) Receive Fixed 2.705% / Pay ADBB006M Float AU Bank of America Merrill Lynch 20/03/2029 AUD8,211,674 (9,879) Receive Fixed 6.925% / Pay MXIBTIIE Float MX Goldman Sachs 16/06/2021 MXN10,000,000 (9,347) Pay Fixed 1.7142% / Receive BP006M Float GB Bank of America Merrill Lynch 15/06/2048 GBP3,007,500 (8,671) Receive Fixed 2.711% / Pay ADBB006M Float AU Bank of America Merrill Lynch 20/03/2029 AUD8,211,674 (8,583) Receive Fixed 2.06% / Pay ADBB0003M Float AU Bank of America Merrill Lynch 16/03/2024 AUD39,401,190 (7,582) Pay Fixed 1.7112% / Receive BP006M Float GB Bank of America Merrill Lynch 15/06/2048 GBP3,007,500 (7,504) Pay Fixed 2.6902% / Receive US0003M Float US Bank of America Merrill Lynch 17/03/2028 USD6,555,535 (7,426) Pay Fixed 1.789% / Receive ADBB0003M Float AU Bank of America Merrill Lynch 17/06/2022 AUD20,948,558 (7,221) Pay Fixed 2.6735% / Receive US0003M Float US Bank of America Merrill Lynch 17/03/2028 USD28,999,513 (6,854) Receive Fixed 2.05% / Pay ADBB0003M Float AU Bank of America Merrill Lynch 16/03/2024 AUD19,700,595 (6,077) Pay Fixed 2.672% / Receive US0003M Float US Bank of America Merrill Lynch 17/03/2028 USD28,999,512 (4,519) Receive Fixed 1.6608% / Pay BP006M Float GB Bank of America Merrill Lynch 15/03/2049 GBP1,536,000 (3,742) Receive Fixed 0.364% / Pay EUR006M Float EU Bank of America Merrill Lynch 17/03/2024 EUR17,638,400 (3,214) Receive Fixed 0.3583% / Pay EUR006M Float EU Bank of America Merrill Lynch 17/03/2024 EUR8,819,200 (3,121) Pay Fixed 1.702% / Receive BP006M Float GB Bank of America Merrill Lynch 21/09/2048 GBP1,606,660 (2,984) Pay Fixed 1.7042% / Receive BP006M Float GB Bank of America Merrill Lynch 16/03/2048 GBP2,580,600 (2,772) Pay Fixed 1.765% / Receive ADBB0003M Float AU Bank of America Merrill Lynch 17/06/2022 AUD23,782,481 (1,367) Receive Fixed 2.48675% / Pay US0003M Float US Bank of America Merrill Lynch 17/03/2024 USD64,489,891 (1,278) Pay Fixed 1.6992% / Receive BP006M Float GB Bank of America Merrill Lynch 16/03/2048 GBP2,504,700 (1,064) Receive Fixed 2.7465% / Pay ADBB006M Float AU Bank of America Merrill Lynch 20/03/2029 AUD8,211,674 (919) Pay Fixed 1.6987% / Receive BP006M Float GB Bank of America Merrill Lynch 16/03/2048 GBP2,504,700 (902) Pay Fixed 1.7635% / Receive ADBB0003M Float AU Bank of America Merrill Lynch 17/06/2022 AUD20,948,559 (828) Receive Fixed 0.367% / Pay EUR006M Float EU Bank of America Merrill Lynch 17/03/2024 EUR8,819,200 (810) Receive Fixed 0.368% / Pay EUR006M Float EU Bank of America Merrill Lynch 17/03/2024 EUR8,819,200 (544) Pay Fixed 1.7002% / Receive BP006M Float GB Bank of America Merrill Lynch 15/12/2047 GBP1,432,917 (52)
Total unrealised loss on interest rate swaps (6,019,731)
Total net unrealised gain on interest rate swaps 4,301,727
Margin amount of EUR 4,013,863 is held by Bank of America Merrill Lynch. The margin of EUR 4,013,863 is in relation to Credit Default Swaps, Inflation Linked Swaps and Interest Rate Swaps.
Notes to the Financial Statements (continued)
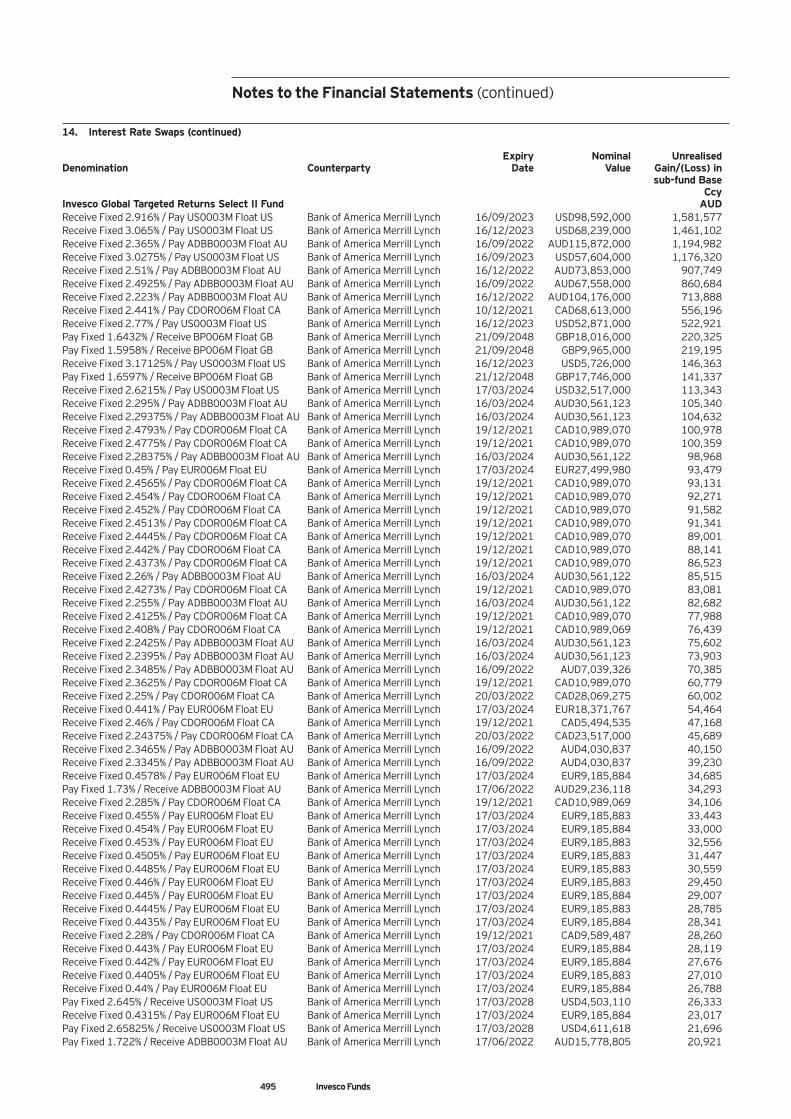
495 Invesco Funds
14. Interest Rate Swaps (continued) Expiry Nominal Unrealised Denomination Counterparty Date Value Gain/(Loss) in sub-fund Base Ccy Invesco Global Targeted Returns Select II Fund AUD Receive Fixed 2.916% / Pay US0003M Float US Bank of America Merrill Lynch 16/09/2023 USD98,592,000 1,581,577 Receive Fixed 3.065% / Pay US0003M Float US Bank of America Merrill Lynch 16/12/2023 USD68,239,000 1,461,102 Receive Fixed 2.365% / Pay ADBB0003M Float AU Bank of America Merrill Lynch 16/09/2022 AUD115,872,000 1,194,982 Receive Fixed 3.0275% / Pay US0003M Float US Bank of America Merrill Lynch 16/09/2023 USD57,604,000 1,176,320 Receive Fixed 2.51% / Pay ADBB0003M Float AU Bank of America Merrill Lynch 16/12/2022 AUD73,853,000 907,749 Receive Fixed 2.4925% / Pay ADBB0003M Float AU Bank of America Merrill Lynch 16/09/2022 AUD67,558,000 860,684 Receive Fixed 2.223% / Pay ADBB0003M Float AU Bank of America Merrill Lynch 16/12/2022 AUD104,176,000 713,888 Receive Fixed 2.441% / Pay CDOR006M Float CA Bank of America Merrill Lynch 10/12/2021 CAD68,613,000 556,196 Receive Fixed 2.77% / Pay US0003M Float US Bank of America Merrill Lynch 16/12/2023 USD52,871,000 522,921 Pay Fixed 1.6432% / Receive BP006M Float GB Bank of America Merrill Lynch 21/09/2048 GBP18,016,000 220,325 Pay Fixed 1.5958% / Receive BP006M Float GB Bank of America Merrill Lynch 21/09/2048 GBP9,965,000 219,195 Receive Fixed 3.17125% / Pay US0003M Float US Bank of America Merrill Lynch 16/12/2023 USD5,726,000 146,363 Pay Fixed 1.6597% / Receive BP006M Float GB Bank of America Merrill Lynch 21/12/2048 GBP17,746,000 141,337 Receive Fixed 2.6215% / Pay US0003M Float US Bank of America Merrill Lynch 17/03/2024 USD32,517,000 113,343 Receive Fixed 2.295% / Pay ADBB0003M Float AU Bank of America Merrill Lynch 16/03/2024 AUD30,561,123 105,340 Receive Fixed 2.29375% / Pay ADBB0003M Float AU Bank of America Merrill Lynch 16/03/2024 AUD30,561,123 104,632 Receive Fixed 2.4793% / Pay CDOR006M Float CA Bank of America Merrill Lynch 19/12/2021 CAD10,989,070 100,978 Receive Fixed 2.4775% / Pay CDOR006M Float CA Bank of America Merrill Lynch 19/12/2021 CAD10,989,070 100,359 Receive Fixed 2.28375% / Pay ADBB0003M Float AU Bank of America Merrill Lynch 16/03/2024 AUD30,561,122 98,968 Receive Fixed 0.45% / Pay EUR006M Float EU Bank of America Merrill Lynch 17/03/2024 EUR27,499,980 93,479 Receive Fixed 2.4565% / Pay CDOR006M Float CA Bank of America Merrill Lynch 19/12/2021 CAD10,989,070 93,131 Receive Fixed 2.454% / Pay CDOR006M Float CA Bank of America Merrill Lynch 19/12/2021 CAD10,989,070 92,271 Receive Fixed 2.452% / Pay CDOR006M Float CA Bank of America Merrill Lynch 19/12/2021 CAD10,989,070 91,582 Receive Fixed 2.4513% / Pay CDOR006M Float CA Bank of America Merrill Lynch 19/12/2021 CAD10,989,070 91,341 Receive Fixed 2.4445% / Pay CDOR006M Float CA Bank of America Merrill Lynch 19/12/2021 CAD10,989,070 89,001 Receive Fixed 2.442% / Pay CDOR006M Float CA Bank of America Merrill Lynch 19/12/2021 CAD10,989,070 88,141 Receive Fixed 2.4373% / Pay CDOR006M Float CA Bank of America Merrill Lynch 19/12/2021 CAD10,989,070 86,523 Receive Fixed 2.26% / Pay ADBB0003M Float AU Bank of America Merrill Lynch 16/03/2024 AUD30,561,122 85,515 Receive Fixed 2.4273% / Pay CDOR006M Float CA Bank of America Merrill Lynch 19/12/2021 CAD10,989,070 83,081 Receive Fixed 2.255% / Pay ADBB0003M Float AU Bank of America Merrill Lynch 16/03/2024 AUD30,561,122 82,682 Receive Fixed 2.4125% / Pay CDOR006M Float CA Bank of America Merrill Lynch 19/12/2021 CAD10,989,070 77,988 Receive Fixed 2.408% / Pay CDOR006M Float CA Bank of America Merrill Lynch 19/12/2021 CAD10,989,069 76,439 Receive Fixed 2.2425% / Pay ADBB0003M Float AU Bank of America Merrill Lynch 16/03/2024 AUD30,561,123 75,602 Receive Fixed 2.2395% / Pay ADBB0003M Float AU Bank of America Merrill Lynch 16/03/2024 AUD30,561,123 73,903 Receive Fixed 2.3485% / Pay ADBB0003M Float AU Bank of America Merrill Lynch 16/09/2022 AUD7,039,326 70,385 Receive Fixed 2.3625% / Pay CDOR006M Float CA Bank of America Merrill Lynch 19/12/2021 CAD10,989,070 60,779 Receive Fixed 2.25% / Pay CDOR006M Float CA Bank of America Merrill Lynch 20/03/2022 CAD28,069,275 60,002 Receive Fixed 0.441% / Pay EUR006M Float EU Bank of America Merrill Lynch 17/03/2024 EUR18,371,767 54,464 Receive Fixed 2.46% / Pay CDOR006M Float CA Bank of America Merrill Lynch 19/12/2021 CAD5,494,535 47,168 Receive Fixed 2.24375% / Pay CDOR006M Float CA Bank of America Merrill Lynch 20/03/2022 CAD23,517,000 45,689 Receive Fixed 2.3465% / Pay ADBB0003M Float AU Bank of America Merrill Lynch 16/09/2022 AUD4,030,837 40,150 Receive Fixed 2.3345% / Pay ADBB0003M Float AU Bank of America Merrill Lynch 16/09/2022 AUD4,030,837 39,230 Receive Fixed 0.4578% / Pay EUR006M Float EU Bank of America Merrill Lynch 17/03/2024 EUR9,185,884 34,685 Pay Fixed 1.73% / Receive ADBB0003M Float AU Bank of America Merrill Lynch 17/06/2022 AUD29,236,118 34,293 Receive Fixed 2.285% / Pay CDOR006M Float CA Bank of America Merrill Lynch 19/12/2021 CAD10,989,069 34,106 Receive Fixed 0.455% / Pay EUR006M Float EU Bank of America Merrill Lynch 17/03/2024 EUR9,185,883 33,443 Receive Fixed 0.454% / Pay EUR006M Float EU Bank of America Merrill Lynch 17/03/2024 EUR9,185,884 33,000 Receive Fixed 0.453% / Pay EUR006M Float EU Bank of America Merrill Lynch 17/03/2024 EUR9,185,883 32,556 Receive Fixed 0.4505% / Pay EUR006M Float EU Bank of America Merrill Lynch 17/03/2024 EUR9,185,883 31,447 Receive Fixed 0.4485% / Pay EUR006M Float EU Bank of America Merrill Lynch 17/03/2024 EUR9,185,883 30,559 Receive Fixed 0.446% / Pay EUR006M Float EU Bank of America Merrill Lynch 17/03/2024 EUR9,185,883 29,450 Receive Fixed 0.445% / Pay EUR006M Float EU Bank of America Merrill Lynch 17/03/2024 EUR9,185,884 29,007 Receive Fixed 0.4445% / Pay EUR006M Float EU Bank of America Merrill Lynch 17/03/2024 EUR9,185,883 28,785 Receive Fixed 0.4435% / Pay EUR006M Float EU Bank of America Merrill Lynch 17/03/2024 EUR9,185,884 28,341 Receive Fixed 2.28% / Pay CDOR006M Float CA Bank of America Merrill Lynch 19/12/2021 CAD9,589,487 28,260 Receive Fixed 0.443% / Pay EUR006M Float EU Bank of America Merrill Lynch 17/03/2024 EUR9,185,884 28,119 Receive Fixed 0.442% / Pay EUR006M Float EU Bank of America Merrill Lynch 17/03/2024 EUR9,185,884 27,676 Receive Fixed 0.4405% / Pay EUR006M Float EU Bank of America Merrill Lynch 17/03/2024 EUR9,185,883 27,010 Receive Fixed 0.44% / Pay EUR006M Float EU Bank of America Merrill Lynch 17/03/2024 EUR9,185,884 26,788 Pay Fixed 2.645% / Receive US0003M Float US Bank of America Merrill Lynch 17/03/2028 USD4,503,110 26,333 Receive Fixed 0.4315% / Pay EUR006M Float EU Bank of America Merrill Lynch 17/03/2024 EUR9,185,884 23,017 Pay Fixed 2.65825% / Receive US0003M Float US Bank of America Merrill Lynch 17/03/2028 USD4,611,618 21,696 Pay Fixed 1.722% / Receive ADBB0003M Float AU Bank of America Merrill Lynch 17/06/2022 AUD15,778,805 20,921
Notes to the Financial Statements (continued)
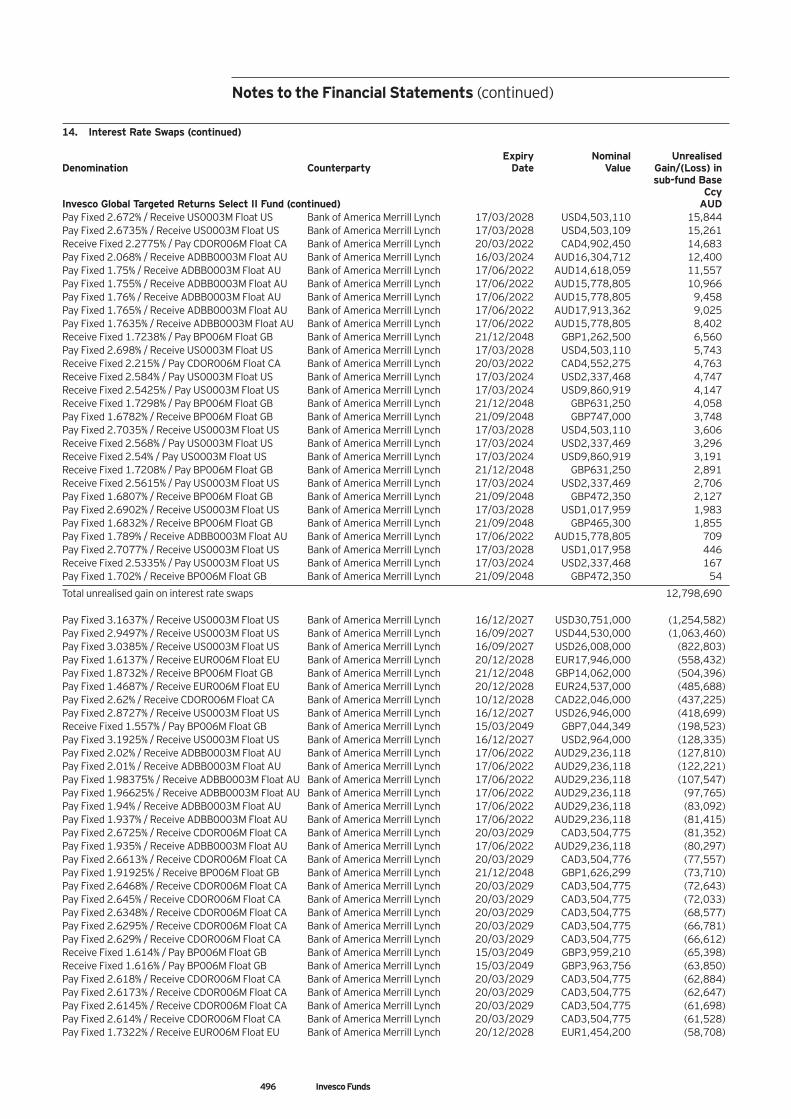
496 Invesco Funds
14. Interest Rate Swaps (continued) Expiry Nominal Unrealised Denomination Counterparty Date Value Gain/(Loss) in sub-fund Base Ccy Invesco Global Targeted Returns Select II Fund (continued) AUD Pay Fixed 2.672% / Receive US0003M Float US Bank of America Merrill Lynch 17/03/2028 USD4,503,110 15,844 Pay Fixed 2.6735% / Receive US0003M Float US Bank of America Merrill Lynch 17/03/2028 USD4,503,109 15,261 Receive Fixed 2.2775% / Pay CDOR006M Float CA Bank of America Merrill Lynch 20/03/2022 CAD4,902,450 14,683 Pay Fixed 2.068% / Receive ADBB0003M Float AU Bank of America Merrill Lynch 16/03/2024 AUD16,304,712 12,400 Pay Fixed 1.75% / Receive ADBB0003M Float AU Bank of America Merrill Lynch 17/06/2022 AUD14,618,059 11,557 Pay Fixed 1.755% / Receive ADBB0003M Float AU Bank of America Merrill Lynch 17/06/2022 AUD15,778,805 10,966 Pay Fixed 1.76% / Receive ADBB0003M Float AU Bank of America Merrill Lynch 17/06/2022 AUD15,778,805 9,458 Pay Fixed 1.765% / Receive ADBB0003M Float AU Bank of America Merrill Lynch 17/06/2022 AUD17,913,362 9,025 Pay Fixed 1.7635% / Receive ADBB0003M Float AU Bank of America Merrill Lynch 17/06/2022 AUD15,778,805 8,402 Receive Fixed 1.7238% / Pay BP006M Float GB Bank of America Merrill Lynch 21/12/2048 GBP1,262,500 6,560 Pay Fixed 2.698% / Receive US0003M Float US Bank of America Merrill Lynch 17/03/2028 USD4,503,110 5,743 Receive Fixed 2.215% / Pay CDOR006M Float CA Bank of America Merrill Lynch 20/03/2022 CAD4,552,275 4,763 Receive Fixed 2.584% / Pay US0003M Float US Bank of America Merrill Lynch 17/03/2024 USD2,337,468 4,747 Receive Fixed 2.5425% / Pay US0003M Float US Bank of America Merrill Lynch 17/03/2024 USD9,860,919 4,147 Receive Fixed 1.7298% / Pay BP006M Float GB Bank of America Merrill Lynch 21/12/2048 GBP631,250 4,058 Pay Fixed 1.6782% / Receive BP006M Float GB Bank of America Merrill Lynch 21/09/2048 GBP747,000 3,748 Pay Fixed 2.7035% / Receive US0003M Float US Bank of America Merrill Lynch 17/03/2028 USD4,503,110 3,606 Receive Fixed 2.568% / Pay US0003M Float US Bank of America Merrill Lynch 17/03/2024 USD2,337,469 3,296 Receive Fixed 2.54% / Pay US0003M Float US Bank of America Merrill Lynch 17/03/2024 USD9,860,919 3,191 Receive Fixed 1.7208% / Pay BP006M Float GB Bank of America Merrill Lynch 21/12/2048 GBP631,250 2,891 Receive Fixed 2.5615% / Pay US0003M Float US Bank of America Merrill Lynch 17/03/2024 USD2,337,469 2,706 Pay Fixed 1.6807% / Receive BP006M Float GB Bank of America Merrill Lynch 21/09/2048 GBP472,350 2,127 Pay Fixed 2.6902% / Receive US0003M Float US Bank of America Merrill Lynch 17/03/2028 USD1,017,959 1,983 Pay Fixed 1.6832% / Receive BP006M Float GB Bank of America Merrill Lynch 21/09/2048 GBP465,300 1,855 Pay Fixed 1.789% / Receive ADBB0003M Float AU Bank of America Merrill Lynch 17/06/2022 AUD15,778,805 709 Pay Fixed 2.7077% / Receive US0003M Float US Bank of America Merrill Lynch 17/03/2028 USD1,017,958 446 Receive Fixed 2.5335% / Pay US0003M Float US Bank of America Merrill Lynch 17/03/2024 USD2,337,468 167 Pay Fixed 1.702% / Receive BP006M Float GB Bank of America Merrill Lynch 21/09/2048 GBP472,350 54
Total unrealised gain on interest rate swaps 12,798,690 Pay Fixed 3.1637% / Receive US0003M Float US Bank of America Merrill Lynch 16/12/2027 USD30,751,000 (1,254,582) Pay Fixed 2.9497% / Receive US0003M Float US Bank of America Merrill Lynch 16/09/2027 USD44,530,000 (1,063,460) Pay Fixed 3.0385% / Receive US0003M Float US Bank of America Merrill Lynch 16/09/2027 USD26,008,000 (822,803) Pay Fixed 1.6137% / Receive EUR006M Float EU Bank of America Merrill Lynch 20/12/2028 EUR17,946,000 (558,432) Pay Fixed 1.8732% / Receive BP006M Float GB Bank of America Merrill Lynch 21/12/2048 GBP14,062,000 (504,396) Pay Fixed 1.4687% / Receive EUR006M Float EU Bank of America Merrill Lynch 20/12/2028 EUR24,537,000 (485,688) Pay Fixed 2.62% / Receive CDOR006M Float CA Bank of America Merrill Lynch 10/12/2028 CAD22,046,000 (437,225) Pay Fixed 2.8727% / Receive US0003M Float US Bank of America Merrill Lynch 16/12/2027 USD26,946,000 (418,699) Receive Fixed 1.557% / Pay BP006M Float GB Bank of America Merrill Lynch 15/03/2049 GBP7,044,349 (198,523) Pay Fixed 3.1925% / Receive US0003M Float US Bank of America Merrill Lynch 16/12/2027 USD2,964,000 (128,335) Pay Fixed 2.02% / Receive ADBB0003M Float AU Bank of America Merrill Lynch 17/06/2022 AUD29,236,118 (127,810) Pay Fixed 2.01% / Receive ADBB0003M Float AU Bank of America Merrill Lynch 17/06/2022 AUD29,236,118 (122,221) Pay Fixed 1.98375% / Receive ADBB0003M Float AU Bank of America Merrill Lynch 17/06/2022 AUD29,236,118 (107,547) Pay Fixed 1.96625% / Receive ADBB0003M Float AU Bank of America Merrill Lynch 17/06/2022 AUD29,236,118 (97,765) Pay Fixed 1.94% / Receive ADBB0003M Float AU Bank of America Merrill Lynch 17/06/2022 AUD29,236,118 (83,092) Pay Fixed 1.937% / Receive ADBB0003M Float AU Bank of America Merrill Lynch 17/06/2022 AUD29,236,118 (81,415) Pay Fixed 2.6725% / Receive CDOR006M Float CA Bank of America Merrill Lynch 20/03/2029 CAD3,504,775 (81,352) Pay Fixed 1.935% / Receive ADBB0003M Float AU Bank of America Merrill Lynch 17/06/2022 AUD29,236,118 (80,297) Pay Fixed 2.6613% / Receive CDOR006M Float CA Bank of America Merrill Lynch 20/03/2029 CAD3,504,776 (77,557) Pay Fixed 1.91925% / Receive BP006M Float GB Bank of America Merrill Lynch 21/12/2048 GBP1,626,299 (73,710) Pay Fixed 2.6468% / Receive CDOR006M Float CA Bank of America Merrill Lynch 20/03/2029 CAD3,504,775 (72,643) Pay Fixed 2.645% / Receive CDOR006M Float CA Bank of America Merrill Lynch 20/03/2029 CAD3,504,775 (72,033) Pay Fixed 2.6348% / Receive CDOR006M Float CA Bank of America Merrill Lynch 20/03/2029 CAD3,504,775 (68,577) Pay Fixed 2.6295% / Receive CDOR006M Float CA Bank of America Merrill Lynch 20/03/2029 CAD3,504,775 (66,781) Pay Fixed 2.629% / Receive CDOR006M Float CA Bank of America Merrill Lynch 20/03/2029 CAD3,504,775 (66,612) Receive Fixed 1.614% / Pay BP006M Float GB Bank of America Merrill Lynch 15/03/2049 GBP3,959,210 (65,398) Receive Fixed 1.616% / Pay BP006M Float GB Bank of America Merrill Lynch 15/03/2049 GBP3,963,756 (63,850) Pay Fixed 2.618% / Receive CDOR006M Float CA Bank of America Merrill Lynch 20/03/2029 CAD3,504,775 (62,884) Pay Fixed 2.6173% / Receive CDOR006M Float CA Bank of America Merrill Lynch 20/03/2029 CAD3,504,775 (62,647) Pay Fixed 2.6145% / Receive CDOR006M Float CA Bank of America Merrill Lynch 20/03/2029 CAD3,504,775 (61,698) Pay Fixed 2.614% / Receive CDOR006M Float CA Bank of America Merrill Lynch 20/03/2029 CAD3,504,775 (61,528) Pay Fixed 1.7322% / Receive EUR006M Float EU Bank of America Merrill Lynch 20/12/2028 EUR1,454,200 (58,708)
Notes to the Financial Statements (continued)
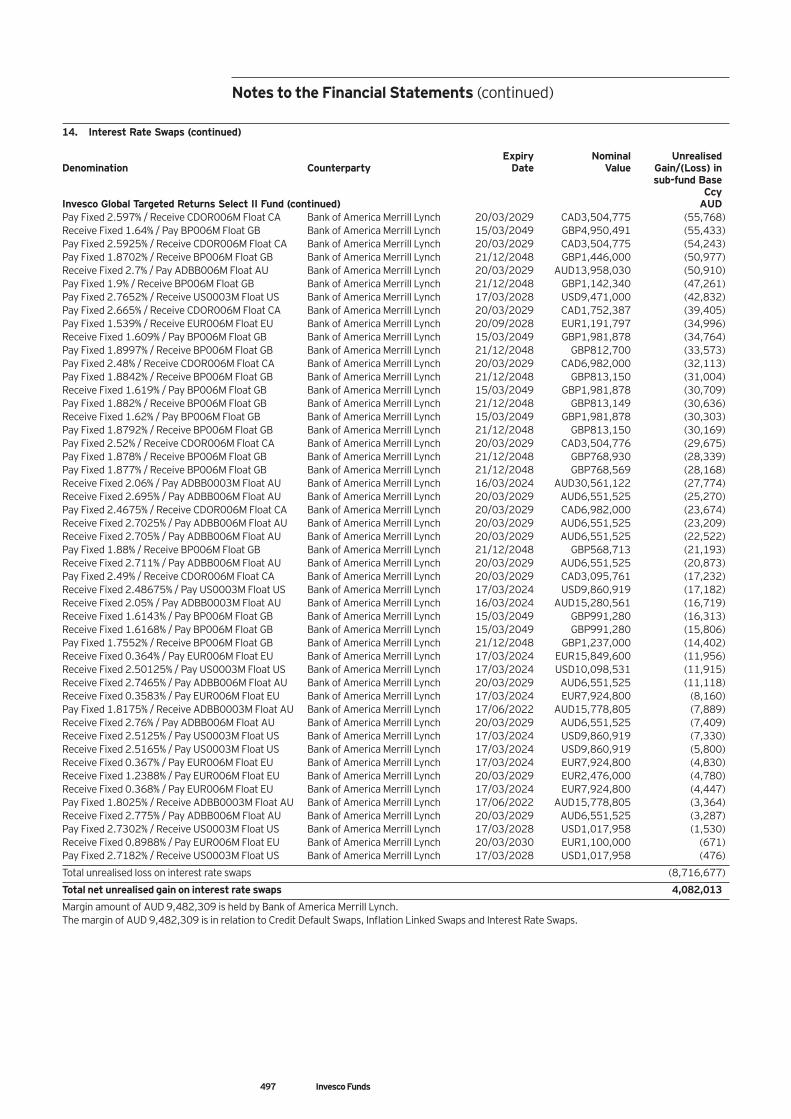
497 Invesco Funds
14. Interest Rate Swaps (continued) Expiry Nominal Unrealised Denomination Counterparty Date Value Gain/(Loss) in sub-fund Base Ccy Invesco Global Targeted Returns Select II Fund (continued) AUD Pay Fixed 2.597% / Receive CDOR006M Float CA Bank of America Merrill Lynch 20/03/2029 CAD3,504,775 (55,768) Receive Fixed 1.64% / Pay BP006M Float GB Bank of America Merrill Lynch 15/03/2049 GBP4,950,491 (55,433) Pay Fixed 2.5925% / Receive CDOR006M Float CA Bank of America Merrill Lynch 20/03/2029 CAD3,504,775 (54,243) Pay Fixed 1.8702% / Receive BP006M Float GB Bank of America Merrill Lynch 21/12/2048 GBP1,446,000 (50,977) Receive Fixed 2.7% / Pay ADBB006M Float AU Bank of America Merrill Lynch 20/03/2029 AUD13,958,030 (50,910) Pay Fixed 1.9% / Receive BP006M Float GB Bank of America Merrill Lynch 21/12/2048 GBP1,142,340 (47,261) Pay Fixed 2.7652% / Receive US0003M Float US Bank of America Merrill Lynch 17/03/2028 USD9,471,000 (42,832) Pay Fixed 2.665% / Receive CDOR006M Float CA Bank of America Merrill Lynch 20/03/2029 CAD1,752,387 (39,405) Pay Fixed 1.539% / Receive EUR006M Float EU Bank of America Merrill Lynch 20/09/2028 EUR1,191,797 (34,996) Receive Fixed 1.609% / Pay BP006M Float GB Bank of America Merrill Lynch 15/03/2049 GBP1,981,878 (34,764) Pay Fixed 1.8997% / Receive BP006M Float GB Bank of America Merrill Lynch 21/12/2048 GBP812,700 (33,573) Pay Fixed 2.48% / Receive CDOR006M Float CA Bank of America Merrill Lynch 20/03/2029 CAD6,982,000 (32,113) Pay Fixed 1.8842% / Receive BP006M Float GB Bank of America Merrill Lynch 21/12/2048 GBP813,150 (31,004) Receive Fixed 1.619% / Pay BP006M Float GB Bank of America Merrill Lynch 15/03/2049 GBP1,981,878 (30,709) Pay Fixed 1.882% / Receive BP006M Float GB Bank of America Merrill Lynch 21/12/2048 GBP813,149 (30,636) Receive Fixed 1.62% / Pay BP006M Float GB Bank of America Merrill Lynch 15/03/2049 GBP1,981,878 (30,303) Pay Fixed 1.8792% / Receive BP006M Float GB Bank of America Merrill Lynch 21/12/2048 GBP813,150 (30,169) Pay Fixed 2.52% / Receive CDOR006M Float CA Bank of America Merrill Lynch 20/03/2029 CAD3,504,776 (29,675) Pay Fixed 1.878% / Receive BP006M Float GB Bank of America Merrill Lynch 21/12/2048 GBP768,930 (28,339) Pay Fixed 1.877% / Receive BP006M Float GB Bank of America Merrill Lynch 21/12/2048 GBP768,569 (28,168) Receive Fixed 2.06% / Pay ADBB0003M Float AU Bank of America Merrill Lynch 16/03/2024 AUD30,561,122 (27,774) Receive Fixed 2.695% / Pay ADBB006M Float AU Bank of America Merrill Lynch 20/03/2029 AUD6,551,525 (25,270) Pay Fixed 2.4675% / Receive CDOR006M Float CA Bank of America Merrill Lynch 20/03/2029 CAD6,982,000 (23,674) Receive Fixed 2.7025% / Pay ADBB006M Float AU Bank of America Merrill Lynch 20/03/2029 AUD6,551,525 (23,209) Receive Fixed 2.705% / Pay ADBB006M Float AU Bank of America Merrill Lynch 20/03/2029 AUD6,551,525 (22,522) Pay Fixed 1.88% / Receive BP006M Float GB Bank of America Merrill Lynch 21/12/2048 GBP568,713 (21,193) Receive Fixed 2.711% / Pay ADBB006M Float AU Bank of America Merrill Lynch 20/03/2029 AUD6,551,525 (20,873) Pay Fixed 2.49% / Receive CDOR006M Float CA Bank of America Merrill Lynch 20/03/2029 CAD3,095,761 (17,232) Receive Fixed 2.48675% / Pay US0003M Float US Bank of America Merrill Lynch 17/03/2024 USD9,860,919 (17,182) Receive Fixed 2.05% / Pay ADBB0003M Float AU Bank of America Merrill Lynch 16/03/2024 AUD15,280,561 (16,719) Receive Fixed 1.6143% / Pay BP006M Float GB Bank of America Merrill Lynch 15/03/2049 GBP991,280 (16,313) Receive Fixed 1.6168% / Pay BP006M Float GB Bank of America Merrill Lynch 15/03/2049 GBP991,280 (15,806) Pay Fixed 1.7552% / Receive BP006M Float GB Bank of America Merrill Lynch 21/12/2048 GBP1,237,000 (14,402) Receive Fixed 0.364% / Pay EUR006M Float EU Bank of America Merrill Lynch 17/03/2024 EUR15,849,600 (11,956) Receive Fixed 2.50125% / Pay US0003M Float US Bank of America Merrill Lynch 17/03/2024 USD10,098,531 (11,915) Receive Fixed 2.7465% / Pay ADBB006M Float AU Bank of America Merrill Lynch 20/03/2029 AUD6,551,525 (11,118) Receive Fixed 0.3583% / Pay EUR006M Float EU Bank of America Merrill Lynch 17/03/2024 EUR7,924,800 (8,160) Pay Fixed 1.8175% / Receive ADBB0003M Float AU Bank of America Merrill Lynch 17/06/2022 AUD15,778,805 (7,889) Receive Fixed 2.76% / Pay ADBB006M Float AU Bank of America Merrill Lynch 20/03/2029 AUD6,551,525 (7,409) Receive Fixed 2.5125% / Pay US0003M Float US Bank of America Merrill Lynch 17/03/2024 USD9,860,919 (7,330) Receive Fixed 2.5165% / Pay US0003M Float US Bank of America Merrill Lynch 17/03/2024 USD9,860,919 (5,800) Receive Fixed 0.367% / Pay EUR006M Float EU Bank of America Merrill Lynch 17/03/2024 EUR7,924,800 (4,830) Receive Fixed 1.2388% / Pay EUR006M Float EU Bank of America Merrill Lynch 20/03/2029 EUR2,476,000 (4,780) Receive Fixed 0.368% / Pay EUR006M Float EU Bank of America Merrill Lynch 17/03/2024 EUR7,924,800 (4,447) Pay Fixed 1.8025% / Receive ADBB0003M Float AU Bank of America Merrill Lynch 17/06/2022 AUD15,778,805 (3,364) Receive Fixed 2.775% / Pay ADBB006M Float AU Bank of America Merrill Lynch 20/03/2029 AUD6,551,525 (3,287) Pay Fixed 2.7302% / Receive US0003M Float US Bank of America Merrill Lynch 17/03/2028 USD1,017,958 (1,530) Receive Fixed 0.8988% / Pay EUR006M Float EU Bank of America Merrill Lynch 20/03/2030 EUR1,100,000 (671) Pay Fixed 2.7182% / Receive US0003M Float US Bank of America Merrill Lynch 17/03/2028 USD1,017,958 (476)
Total unrealised loss on interest rate swaps (8,716,677)
Total net unrealised gain on interest rate swaps 4,082,013
Margin amount of AUD 9,482,309 is held by Bank of America Merrill Lynch. The margin of AUD 9,482,309 is in relation to Credit Default Swaps, Inflation Linked Swaps and Interest Rate Swaps.
Notes to the Financial Statements (continued)
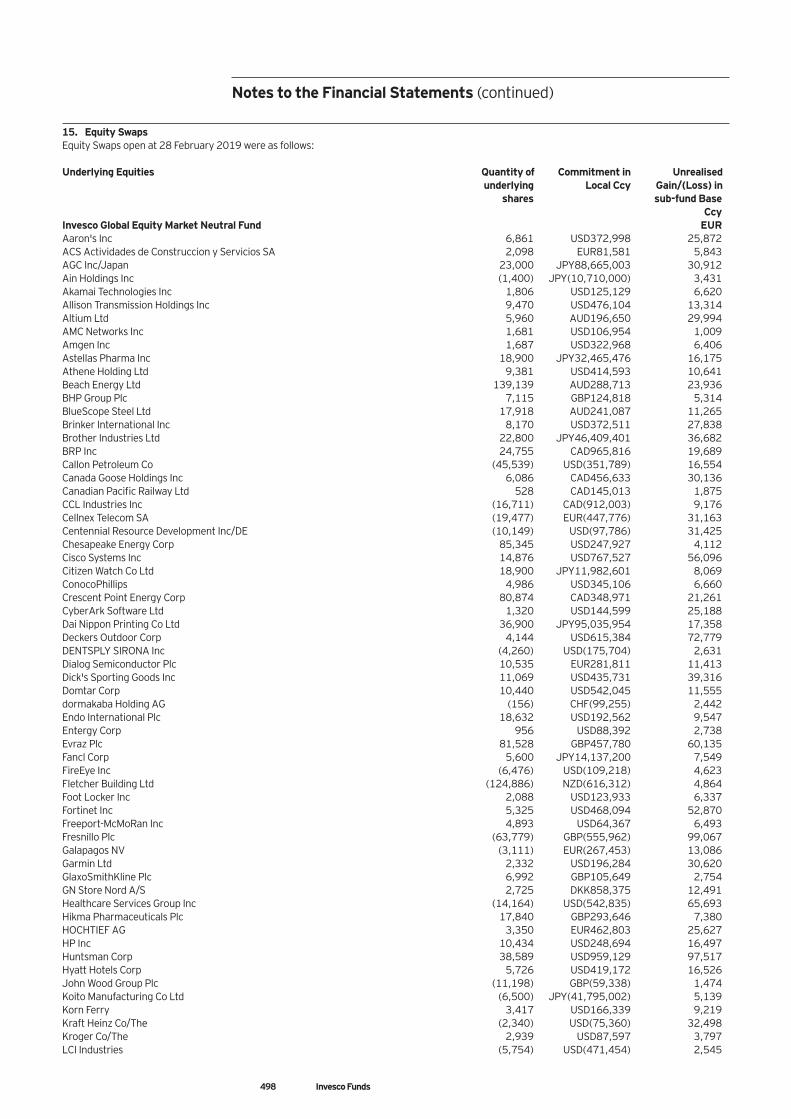
498 Invesco Funds
15. Equity Swaps Equity Swaps open at 28 February 2019 were as follows: Underlying Equities Quantity of Commitment in Unrealised underlying Local Ccy Gain/(Loss) in shares sub-fund Base Ccy Invesco Global Equity Market Neutral Fund EUR Aaron's Inc 6,861 USD372,998 25,872 ACS Actividades de Construccion y Servicios SA 2,098 EUR81,581 5,843 AGC Inc/Japan 23,000 JPY88,665,003 30,912 Ain Holdings Inc (1,400) JPY(10,710,000) 3,431 Akamai Technologies Inc 1,806 USD125,129 6,620 Allison Transmission Holdings Inc 9,470 USD476,104 13,314 Altium Ltd 5,960 AUD196,650 29,994 AMC Networks Inc 1,681 USD106,954 1,009 Amgen Inc 1,687 USD322,968 6,406 Astellas Pharma Inc 18,900 JPY32,465,476 16,175 Athene Holding Ltd 9,381 USD414,593 10,641 Beach Energy Ltd 139,139 AUD288,713 23,936 BHP Group Plc 7,115 GBP124,818 5,314 BlueScope Steel Ltd 17,918 AUD241,087 11,265 Brinker International Inc 8,170 USD372,511 27,838 Brother Industries Ltd 22,800 JPY46,409,401 36,682 BRP Inc 24,755 CAD965,816 19,689 Callon Petroleum Co (45,539) USD(351,789) 16,554 Canada Goose Holdings Inc 6,086 CAD456,633 30,136 Canadian Pacific Railway Ltd 528 CAD145,013 1,875 CCL Industries Inc (16,711) CAD(912,003) 9,176 Cellnex Telecom SA (19,477) EUR(447,776) 31,163 Centennial Resource Development Inc/DE (10,149) USD(97,786) 31,425 Chesapeake Energy Corp 85,345 USD247,927 4,112 Cisco Systems Inc 14,876 USD767,527 56,096 Citizen Watch Co Ltd 18,900 JPY11,982,601 8,069 ConocoPhillips 4,986 USD345,106 6,660 Crescent Point Energy Corp 80,874 CAD348,971 21,261 CyberArk Software Ltd 1,320 USD144,599 25,188 Dai Nippon Printing Co Ltd 36,900 JPY95,035,954 17,358 Deckers Outdoor Corp 4,144 USD615,384 72,779 DENTSPLY SIRONA Inc (4,260) USD(175,704) 2,631 Dialog Semiconductor Plc 10,535 EUR281,811 11,413 Dick's Sporting Goods Inc 11,069 USD435,731 39,316 Domtar Corp 10,440 USD542,045 11,555 dormakaba Holding AG (156) CHF(99,255) 2,442 Endo International Plc 18,632 USD192,562 9,547 Entergy Corp 956 USD88,392 2,738 Evraz Plc 81,528 GBP457,780 60,135 Fancl Corp 5,600 JPY14,137,200 7,549 FireEye Inc (6,476) USD(109,218) 4,623 Fletcher Building Ltd (124,886) NZD(616,312) 4,864 Foot Locker Inc 2,088 USD123,933 6,337 Fortinet Inc 5,325 USD468,094 52,870 Freeport-McMoRan Inc 4,893 USD64,367 6,493 Fresnillo Plc (63,779) GBP(555,962) 99,067 Galapagos NV (3,111) EUR(267,453) 13,086 Garmin Ltd 2,332 USD196,284 30,620 GlaxoSmithKline Plc 6,992 GBP105,649 2,754 GN Store Nord A/S 2,725 DKK858,375 12,491 Healthcare Services Group Inc (14,164) USD(542,835) 65,693 Hikma Pharmaceuticals Plc 17,840 GBP293,646 7,380 HOCHTIEF AG 3,350 EUR462,803 25,627 HP Inc 10,434 USD248,694 16,497 Huntsman Corp 38,589 USD959,129 97,517 Hyatt Hotels Corp 5,726 USD419,172 16,526 John Wood Group Plc (11,198) GBP(59,338) 1,474 Koito Manufacturing Co Ltd (6,500) JPY(41,795,002) 5,139 Korn Ferry 3,417 USD166,339 9,219 Kraft Heinz Co/The (2,340) USD(75,360) 32,498 Kroger Co/The 2,939 USD87,597 3,797 LCI Industries (5,754) USD(471,454) 2,545
Notes to the Financial Statements (continued)
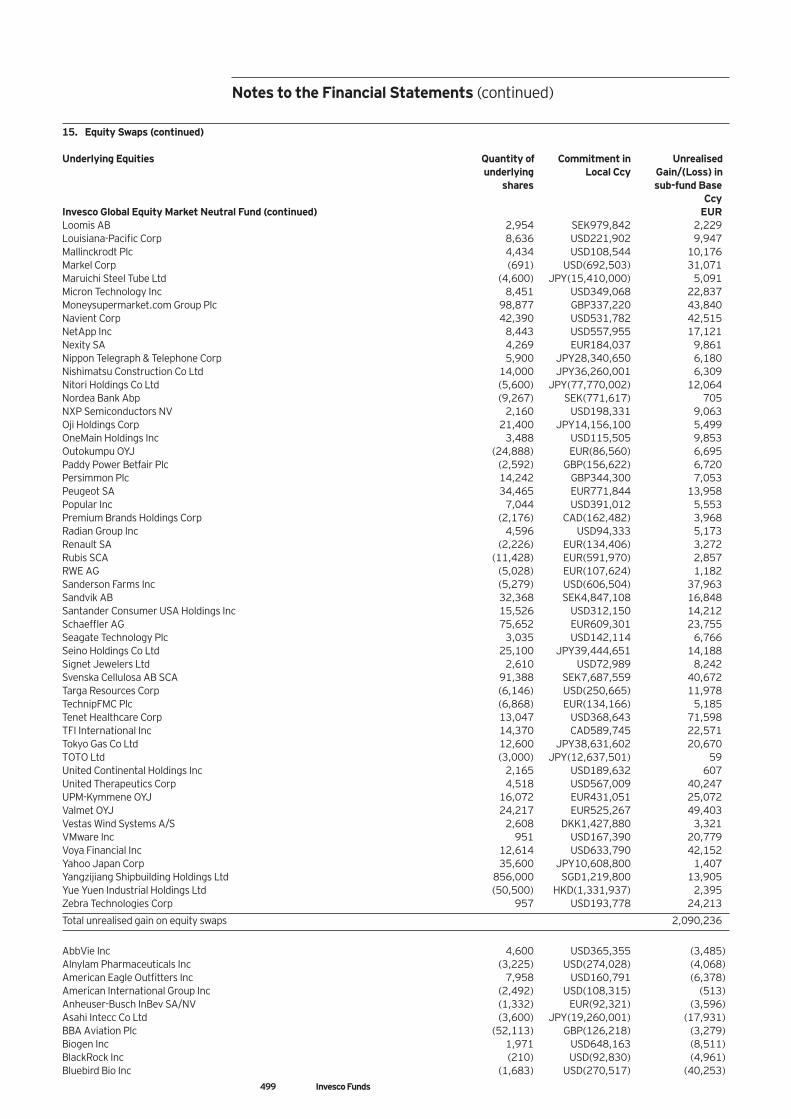
499 Invesco Funds
15. Equity Swaps (continued) Underlying Equities Quantity of Commitment in Unrealised underlying Local Ccy Gain/(Loss) in shares sub-fund Base Ccy Invesco Global Equity Market Neutral Fund (continued) EUR Loomis AB 2,954 SEK979,842 2,229 Louisiana-Pacific Corp 8,636 USD221,902 9,947 Mallinckrodt Plc 4,434 USD108,544 10,176 Markel Corp (691) USD(692,503) 31,071 Maruichi Steel Tube Ltd (4,600) JPY(15,410,000) 5,091 Micron Technology Inc 8,451 USD349,068 22,837 Moneysupermarket.com Group Plc 98,877 GBP337,220 43,840 Navient Corp 42,390 USD531,782 42,515 NetApp Inc 8,443 USD557,955 17,121 Nexity SA 4,269 EUR184,037 9,861 Nippon Telegraph & Telephone Corp 5,900 JPY28,340,650 6,180 Nishimatsu Construction Co Ltd 14,000 JPY36,260,001 6,309 Nitori Holdings Co Ltd (5,600) JPY(77,770,002) 12,064 Nordea Bank Abp (9,267) SEK(771,617) 705 NXP Semiconductors NV 2,160 USD198,331 9,063 Oji Holdings Corp 21,400 JPY14,156,100 5,499 OneMain Holdings Inc 3,488 USD115,505 9,853 Outokumpu OYJ (24,888) EUR(86,560) 6,695 Paddy Power Betfair Plc (2,592) GBP(156,622) 6,720 Persimmon Plc 14,242 GBP344,300 7,053 Peugeot SA 34,465 EUR771,844 13,958 Popular Inc 7,044 USD391,012 5,553 Premium Brands Holdings Corp (2,176) CAD(162,482) 3,968 Radian Group Inc 4,596 USD94,333 5,173 Renault SA (2,226) EUR(134,406) 3,272 Rubis SCA (11,428) EUR(591,970) 2,857 RWE AG (5,028) EUR(107,624) 1,182 Sanderson Farms Inc (5,279) USD(606,504) 37,963 Sandvik AB 32,368 SEK4,847,108 16,848 Santander Consumer USA Holdings Inc 15,526 USD312,150 14,212 Schaeffler AG 75,652 EUR609,301 23,755 Seagate Technology Plc 3,035 USD142,114 6,766 Seino Holdings Co Ltd 25,100 JPY39,444,651 14,188 Signet Jewelers Ltd 2,610 USD72,989 8,242 Svenska Cellulosa AB SCA 91,388 SEK7,687,559 40,672 Targa Resources Corp (6,146) USD(250,665) 11,978 TechnipFMC Plc (6,868) EUR(134,166) 5,185 Tenet Healthcare Corp 13,047 USD368,643 71,598 TFI International Inc 14,370 CAD589,745 22,571 Tokyo Gas Co Ltd 12,600 JPY38,631,602 20,670 TOTO Ltd (3,000) JPY(12,637,501) 59 United Continental Holdings Inc 2,165 USD189,632 607 United Therapeutics Corp 4,518 USD567,009 40,247 UPM-Kymmene OYJ 16,072 EUR431,051 25,072 Valmet OYJ 24,217 EUR525,267 49,403 Vestas Wind Systems A/S 2,608 DKK1,427,880 3,321 VMware Inc 951 USD167,390 20,779 Voya Financial Inc 12,614 USD633,790 42,152 Yahoo Japan Corp 35,600 JPY10,608,800 1,407 Yangzijiang Shipbuilding Holdings Ltd 856,000 SGD1,219,800 13,905 Yue Yuen Industrial Holdings Ltd (50,500) HKD(1,331,937) 2,395 Zebra Technologies Corp 957 USD193,778 24,213
Total unrealised gain on equity swaps 2,090,236
AbbVie Inc 4,600 USD365,355 (3,485) Alnylam Pharmaceuticals Inc (3,225) USD(274,028) (4,068) American Eagle Outfitters Inc 7,958 USD160,791 (6,378) American International Group Inc (2,492) USD(108,315) (513) Anheuser-Busch InBev SA/NV (1,332) EUR(92,321) (3,596) Asahi Intecc Co Ltd (3,600) JPY(19,260,001) (17,931) BBA Aviation Plc (52,113) GBP(126,218) (3,279) Biogen Inc 1,971 USD648,163 (8,511) BlackRock Inc (210) USD(92,830) (4,961) Bluebird Bio Inc (1,683) USD(270,517) (40,253)
Notes to the Financial Statements (continued)
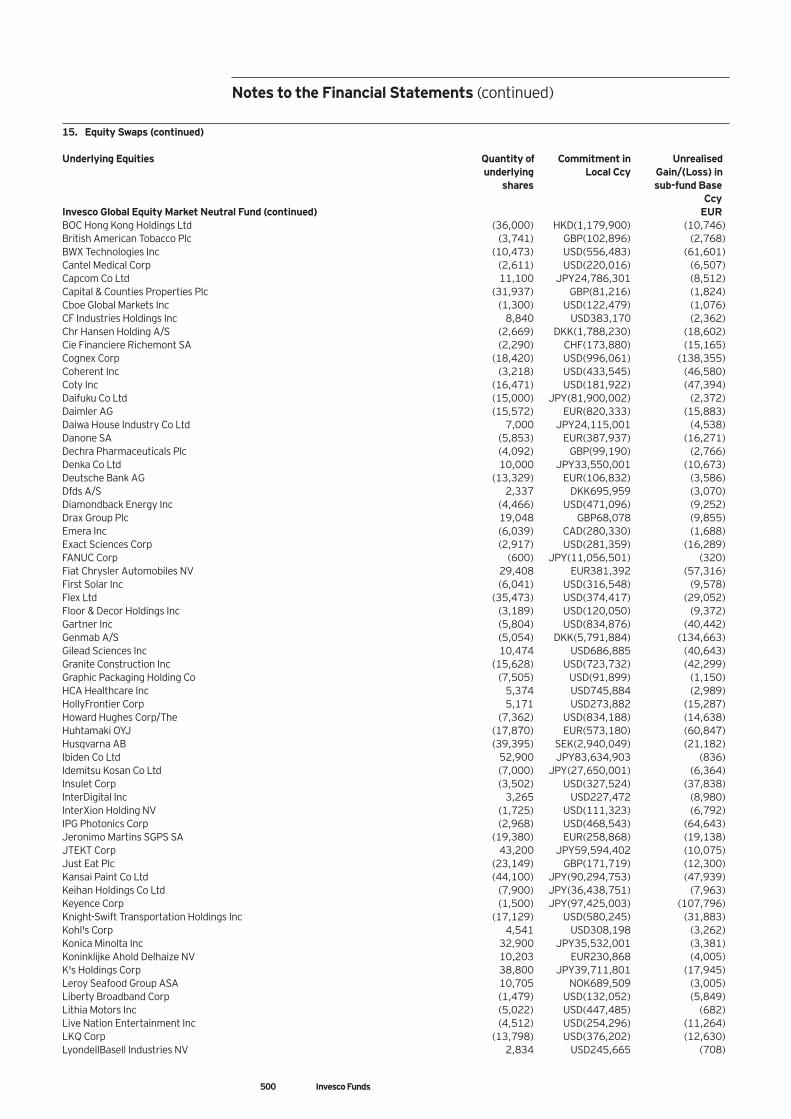
500 Invesco Funds
15. Equity Swaps (continued) Underlying Equities Quantity of Commitment in Unrealised underlying Local Ccy Gain/(Loss) in shares sub-fund Base Ccy Invesco Global Equity Market Neutral Fund (continued) EUR BOC Hong Kong Holdings Ltd (36,000) HKD(1,179,900) (10,746) British American Tobacco Plc (3,741) GBP(102,896) (2,768) BWX Technologies Inc (10,473) USD(556,483) (61,601) Cantel Medical Corp (2,611) USD(220,016) (6,507) Capcom Co Ltd 11,100 JPY24,786,301 (8,512) Capital & Counties Properties Plc (31,937) GBP(81,216) (1,824) Cboe Global Markets Inc (1,300) USD(122,479) (1,076) CF Industries Holdings Inc 8,840 USD383,170 (2,362) Chr Hansen Holding A/S (2,669) DKK(1,788,230) (18,602) Cie Financiere Richemont SA (2,290) CHF(173,880) (15,165) Cognex Corp (18,420) USD(996,061) (138,355) Coherent Inc (3,218) USD(433,545) (46,580) Coty Inc (16,471) USD(181,922) (47,394) Daifuku Co Ltd (15,000) JPY(81,900,002) (2,372) Daimler AG (15,572) EUR(820,333) (15,883) Daiwa House Industry Co Ltd 7,000 JPY24,115,001 (4,538) Danone SA (5,853) EUR(387,937) (16,271) Dechra Pharmaceuticals Plc (4,092) GBP(99,190) (2,766) Denka Co Ltd 10,000 JPY33,550,001 (10,673) Deutsche Bank AG (13,329) EUR(106,832) (3,586) Dfds A/S 2,337 DKK695,959 (3,070) Diamondback Energy Inc (4,466) USD(471,096) (9,252) Drax Group Plc 19,048 GBP68,078 (9,855) Emera Inc (6,039) CAD(280,330) (1,688) Exact Sciences Corp (2,917) USD(281,359) (16,289) FANUC Corp (600) JPY(11,056,501) (320) Fiat Chrysler Automobiles NV 29,408 EUR381,392 (57,316) First Solar Inc (6,041) USD(316,548) (9,578) Flex Ltd (35,473) USD(374,417) (29,052) Floor & Decor Holdings Inc (3,189) USD(120,050) (9,372) Gartner Inc (5,804) USD(834,876) (40,442) Genmab A/S (5,054) DKK(5,791,884) (134,663) Gilead Sciences Inc 10,474 USD686,885 (40,643) Granite Construction Inc (15,628) USD(723,732) (42,299) Graphic Packaging Holding Co (7,505) USD(91,899) (1,150) HCA Healthcare Inc 5,374 USD745,884 (2,989) HollyFrontier Corp 5,171 USD273,882 (15,287) Howard Hughes Corp/The (7,362) USD(834,188) (14,638) Huhtamaki OYJ (17,870) EUR(573,180) (60,847) Husqvarna AB (39,395) SEK(2,940,049) (21,182) Ibiden Co Ltd 52,900 JPY83,634,903 (836) Idemitsu Kosan Co Ltd (7,000) JPY(27,650,001) (6,364) Insulet Corp (3,502) USD(327,524) (37,838) InterDigital Inc 3,265 USD227,472 (8,980) InterXion Holding NV (1,725) USD(111,323) (6,792) IPG Photonics Corp (2,968) USD(468,543) (64,643) Jeronimo Martins SGPS SA (19,380) EUR(258,868) (19,138) JTEKT Corp 43,200 JPY59,594,402 (10,075) Just Eat Plc (23,149) GBP(171,719) (12,300) Kansai Paint Co Ltd (44,100) JPY(90,294,753) (47,939) Keihan Holdings Co Ltd (7,900) JPY(36,438,751) (7,963) Keyence Corp (1,500) JPY(97,425,003) (107,796) Knight-Swift Transportation Holdings Inc (17,129) USD(580,245) (31,883) Kohl's Corp 4,541 USD308,198 (3,262) Konica Minolta Inc 32,900 JPY35,532,001 (3,381) Koninklijke Ahold Delhaize NV 10,203 EUR230,868 (4,005) K's Holdings Corp 38,800 JPY39,711,801 (17,945) Leroy Seafood Group ASA 10,705 NOK689,509 (3,005) Liberty Broadband Corp (1,479) USD(132,052) (5,849) Lithia Motors Inc (5,022) USD(447,485) (682) Live Nation Entertainment Inc (4,512) USD(254,296) (11,264) LKQ Corp (13,798) USD(376,202) (12,630) LyondellBasell Industries NV 2,834 USD245,665 (708)
Notes to the Financial Statements (continued)
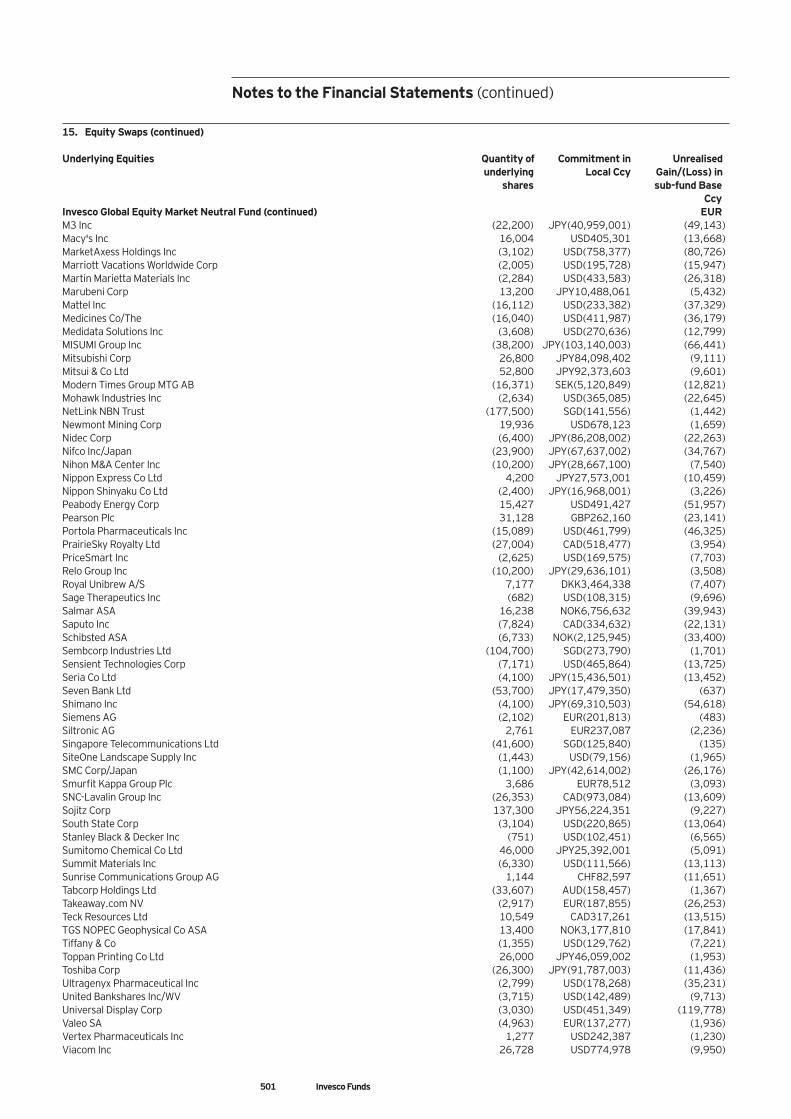
501 Invesco Funds
15. Equity Swaps (continued) Underlying Equities Quantity of Commitment in Unrealised underlying Local Ccy Gain/(Loss) in shares sub-fund Base Ccy Invesco Global Equity Market Neutral Fund (continued) EUR M3 Inc (22,200) JPY(40,959,001) (49,143) Macy's Inc 16,004 USD405,301 (13,668) MarketAxess Holdings Inc (3,102) USD(758,377) (80,726) Marriott Vacations Worldwide Corp (2,005) USD(195,728) (15,947) Martin Marietta Materials Inc (2,284) USD(433,583) (26,318) Marubeni Corp 13,200 JPY10,488,061 (5,432) Mattel Inc (16,112) USD(233,382) (37,329) Medicines Co/The (16,040) USD(411,987) (36,179) Medidata Solutions Inc (3,608) USD(270,636) (12,799) MISUMI Group Inc (38,200) JPY(103,140,003) (66,441) Mitsubishi Corp 26,800 JPY84,098,402 (9,111) Mitsui & Co Ltd 52,800 JPY92,373,603 (9,601) Modern Times Group MTG AB (16,371) SEK(5,120,849) (12,821) Mohawk Industries Inc (2,634) USD(365,085) (22,645) NetLink NBN Trust (177,500) SGD(141,556) (1,442) Newmont Mining Corp 19,936 USD678,123 (1,659) Nidec Corp (6,400) JPY(86,208,002) (22,263) Nifco Inc/Japan (23,900) JPY(67,637,002) (34,767) Nihon M&A Center Inc (10,200) JPY(28,667,100) (7,540) Nippon Express Co Ltd 4,200 JPY27,573,001 (10,459) Nippon Shinyaku Co Ltd (2,400) JPY(16,968,001) (3,226) Peabody Energy Corp 15,427 USD491,427 (51,957) Pearson Plc 31,128 GBP262,160 (23,141) Portola Pharmaceuticals Inc (15,089) USD(461,799) (46,325) PrairieSky Royalty Ltd (27,004) CAD(518,477) (3,954) PriceSmart Inc (2,625) USD(169,575) (7,703) Relo Group Inc (10,200) JPY(29,636,101) (3,508) Royal Unibrew A/S 7,177 DKK3,464,338 (7,407) Sage Therapeutics Inc (682) USD(108,315) (9,696) Salmar ASA 16,238 NOK6,756,632 (39,943) Saputo Inc (7,824) CAD(334,632) (22,131) Schibsted ASA (6,733) NOK(2,125,945) (33,400) Sembcorp Industries Ltd (104,700) SGD(273,790) (1,701) Sensient Technologies Corp (7,171) USD(465,864) (13,725) Seria Co Ltd (4,100) JPY(15,436,501) (13,452) Seven Bank Ltd (53,700) JPY(17,479,350) (637) Shimano Inc (4,100) JPY(69,310,503) (54,618) Siemens AG (2,102) EUR(201,813) (483) Siltronic AG 2,761 EUR237,087 (2,236) Singapore Telecommunications Ltd (41,600) SGD(125,840) (135) SiteOne Landscape Supply Inc (1,443) USD(79,156) (1,965) SMC Corp/Japan (1,100) JPY(42,614,002) (26,176) Smurfit Kappa Group Plc 3,686 EUR78,512 (3,093) SNC-Lavalin Group Inc (26,353) CAD(973,084) (13,609) Sojitz Corp 137,300 JPY56,224,351 (9,227) South State Corp (3,104) USD(220,865) (13,064) Stanley Black & Decker Inc (751) USD(102,451) (6,565) Sumitomo Chemical Co Ltd 46,000 JPY25,392,001 (5,091) Summit Materials Inc (6,330) USD(111,566) (13,113) Sunrise Communications Group AG 1,144 CHF82,597 (11,651) Tabcorp Holdings Ltd (33,607) AUD(158,457) (1,367) Takeaway.com NV (2,917) EUR(187,855) (26,253) Teck Resources Ltd 10,549 CAD317,261 (13,515) TGS NOPEC Geophysical Co ASA 13,400 NOK3,177,810 (17,841) Tiffany & Co (1,355) USD(129,762) (7,221) Toppan Printing Co Ltd 26,000 JPY46,059,002 (1,953) Toshiba Corp (26,300) JPY(91,787,003) (11,436) Ultragenyx Pharmaceutical Inc (2,799) USD(178,268) (35,231) United Bankshares Inc/WV (3,715) USD(142,489) (9,713) Universal Display Corp (3,030) USD(451,349) (119,778) Valeo SA (4,963) EUR(137,277) (1,936) Vertex Pharmaceuticals Inc 1,277 USD242,387 (1,230) Viacom Inc 26,728 USD774,978 (9,950)
Notes to the Financial Statements (continued)
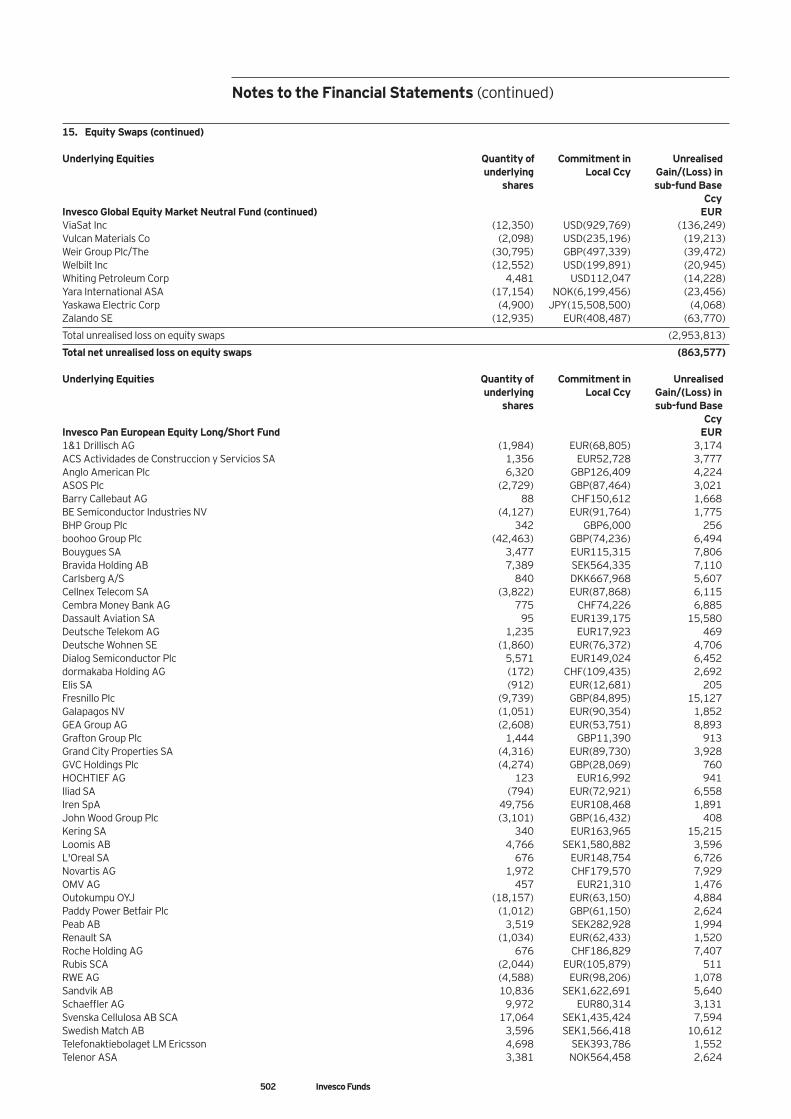
502 Invesco Funds
15. Equity Swaps (continued) Underlying Equities Quantity of Commitment in Unrealised underlying Local Ccy Gain/(Loss) in shares sub-fund Base Ccy Invesco Global Equity Market Neutral Fund (continued) EUR ViaSat Inc (12,350) USD(929,769) (136,249) Vulcan Materials Co (2,098) USD(235,196) (19,213) Weir Group Plc/The (30,795) GBP(497,339) (39,472) Welbilt Inc (12,552) USD(199,891) (20,945) Whiting Petroleum Corp 4,481 USD112,047 (14,228) Yara International ASA (17,154) NOK(6,199,456) (23,456) Yaskawa Electric Corp (4,900) JPY(15,508,500) (4,068) Zalando SE (12,935) EUR(408,487) (63,770)
Total unrealised loss on equity swaps (2,953,813)
Total net unrealised loss on equity swaps (863,577) Underlying Equities Quantity of Commitment in Unrealised underlying Local Ccy Gain/(Loss) in shares sub-fund Base Ccy Invesco Pan European Equity Long/Short Fund EUR 1&1 Drillisch AG (1,984) EUR(68,805) 3,174 ACS Actividades de Construccion y Servicios SA 1,356 EUR52,728 3,777 Anglo American Plc 6,320 GBP126,409 4,224 ASOS Plc (2,729) GBP(87,464) 3,021 Barry Callebaut AG 88 CHF150,612 1,668 BE Semiconductor Industries NV (4,127) EUR(91,764) 1,775 BHP Group Plc 342 GBP6,000 256 boohoo Group Plc (42,463) GBP(74,236) 6,494 Bouygues SA 3,477 EUR115,315 7,806 Bravida Holding AB 7,389 SEK564,335 7,110 Carlsberg A/S 840 DKK667,968 5,607 Cellnex Telecom SA (3,822) EUR(87,868) 6,115 Cembra Money Bank AG 775 CHF74,226 6,885 Dassault Aviation SA 95 EUR139,175 15,580 Deutsche Telekom AG 1,235 EUR17,923 469 Deutsche Wohnen SE (1,860) EUR(76,372) 4,706 Dialog Semiconductor Plc 5,571 EUR149,024 6,452 dormakaba Holding AG (172) CHF(109,435) 2,692 Elis SA (912) EUR(12,681) 205 Fresnillo Plc (9,739) GBP(84,895) 15,127 Galapagos NV (1,051) EUR(90,354) 1,852 GEA Group AG (2,608) EUR(53,751) 8,893 Grafton Group Plc 1,444 GBP11,390 913 Grand City Properties SA (4,316) EUR(89,730) 3,928 GVC Holdings Plc (4,274) GBP(28,069) 760 HOCHTIEF AG 123 EUR16,992 941 Iliad SA (794) EUR(72,921) 6,558 Iren SpA 49,756 EUR108,468 1,891 John Wood Group Plc (3,101) GBP(16,432) 408 Kering SA 340 EUR163,965 15,215 Loomis AB 4,766 SEK1,580,882 3,596 L'Oreal SA 676 EUR148,754 6,726 Novartis AG 1,972 CHF179,570 7,929 OMV AG 457 EUR21,310 1,476 Outokumpu OYJ (18,157) EUR(63,150) 4,884 Paddy Power Betfair Plc (1,012) GBP(61,150) 2,624 Peab AB 3,519 SEK282,928 1,994 Renault SA (1,034) EUR(62,433) 1,520 Roche Holding AG 676 CHF186,829 7,407 Rubis SCA (2,044) EUR(105,879) 511 RWE AG (4,588) EUR(98,206) 1,078 Sandvik AB 10,836 SEK1,622,691 5,640 Schaeffler AG 9,972 EUR80,314 3,131 Svenska Cellulosa AB SCA 17,064 SEK1,435,424 7,594 Swedish Match AB 3,596 SEK1,566,418 10,612 Telefonaktiebolaget LM Ericsson 4,698 SEK393,786 1,552 Telenor ASA 3,381 NOK564,458 2,624
Notes to the Financial Statements (continued)
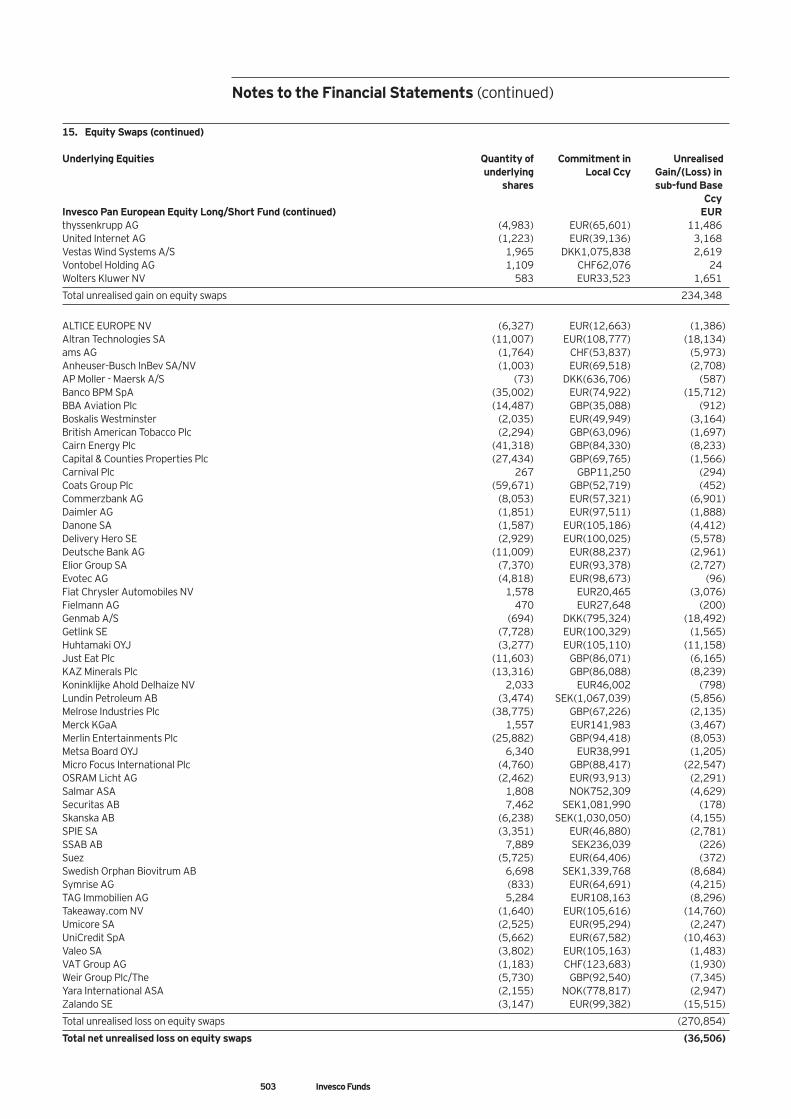
503 Invesco Funds
15. Equity Swaps (continued) Underlying Equities Quantity of Commitment in Unrealised underlying Local Ccy Gain/(Loss) in shares sub-fund Base Ccy Invesco Pan European Equity Long/Short Fund (continued) EUR thyssenkrupp AG (4,983) EUR(65,601) 11,486 United Internet AG (1,223) EUR(39,136) 3,168 Vestas Wind Systems A/S 1,965 DKK1,075,838 2,619 Vontobel Holding AG 1,109 CHF62,076 24 Wolters Kluwer NV 583 EUR33,523 1,651
Total unrealised gain on equity swaps 234,348
ALTICE EUROPE NV (6,327) EUR(12,663) (1,386) Altran Technologies SA (11,007) EUR(108,777) (18,134) ams AG (1,764) CHF(53,837) (5,973) Anheuser-Busch InBev SA/NV (1,003) EUR(69,518) (2,708) AP Moller - Maersk A/S (73) DKK(636,706) (587) Banco BPM SpA (35,002) EUR(74,922) (15,712) BBA Aviation Plc (14,487) GBP(35,088) (912) Boskalis Westminster (2,035) EUR(49,949) (3,164) British American Tobacco Plc (2,294) GBP(63,096) (1,697) Cairn Energy Plc (41,318) GBP(84,330) (8,233) Capital & Counties Properties Plc (27,434) GBP(69,765) (1,566) Carnival Plc 267 GBP11,250 (294) Coats Group Plc (59,671) GBP(52,719) (452) Commerzbank AG (8,053) EUR(57,321) (6,901) Daimler AG (1,851) EUR(97,511) (1,888) Danone SA (1,587) EUR(105,186) (4,412) Delivery Hero SE (2,929) EUR(100,025) (5,578) Deutsche Bank AG (11,009) EUR(88,237) (2,961) Elior Group SA (7,370) EUR(93,378) (2,727) Evotec AG (4,818) EUR(98,673) (96) Fiat Chrysler Automobiles NV 1,578 EUR20,465 (3,076) Fielmann AG 470 EUR27,648 (200) Genmab A/S (694) DKK(795,324) (18,492) Getlink SE (7,728) EUR(100,329) (1,565) Huhtamaki OYJ (3,277) EUR(105,110) (11,158) Just Eat Plc (11,603) GBP(86,071) (6,165) KAZ Minerals Plc (13,316) GBP(86,088) (8,239) Koninklijke Ahold Delhaize NV 2,033 EUR46,002 (798) Lundin Petroleum AB (3,474) SEK(1,067,039) (5,856) Melrose Industries Plc (38,775) GBP(67,226) (2,135) Merck KGaA 1,557 EUR141,983 (3,467) Merlin Entertainments Plc (25,882) GBP(94,418) (8,053) Metsa Board OYJ 6,340 EUR38,991 (1,205) Micro Focus International Plc (4,760) GBP(88,417) (22,547) OSRAM Licht AG (2,462) EUR(93,913) (2,291) Salmar ASA 1,808 NOK752,309 (4,629) Securitas AB 7,462 SEK1,081,990 (178) Skanska AB (6,238) SEK(1,030,050) (4,155) SPIE SA (3,351) EUR(46,880) (2,781) SSAB AB 7,889 SEK236,039 (226) Suez (5,725) EUR(64,406) (372) Swedish Orphan Biovitrum AB 6,698 SEK1,339,768 (8,684) Symrise AG (833) EUR(64,691) (4,215) TAG Immobilien AG 5,284 EUR108,163 (8,296) Takeaway.com NV (1,640) EUR(105,616) (14,760) Umicore SA (2,525) EUR(95,294) (2,247) UniCredit SpA (5,662) EUR(67,582) (10,463) Valeo SA (3,802) EUR(105,163) (1,483) VAT Group AG (1,183) CHF(123,683) (1,930) Weir Group Plc/The (5,730) GBP(92,540) (7,345) Yara International ASA (2,155) NOK(778,817) (2,947) Zalando SE (3,147) EUR(99,382) (15,515)
Total unrealised loss on equity swaps (270,854)
Total net unrealised loss on equity swaps (36,506)
Notes to the Financial Statements (continued)
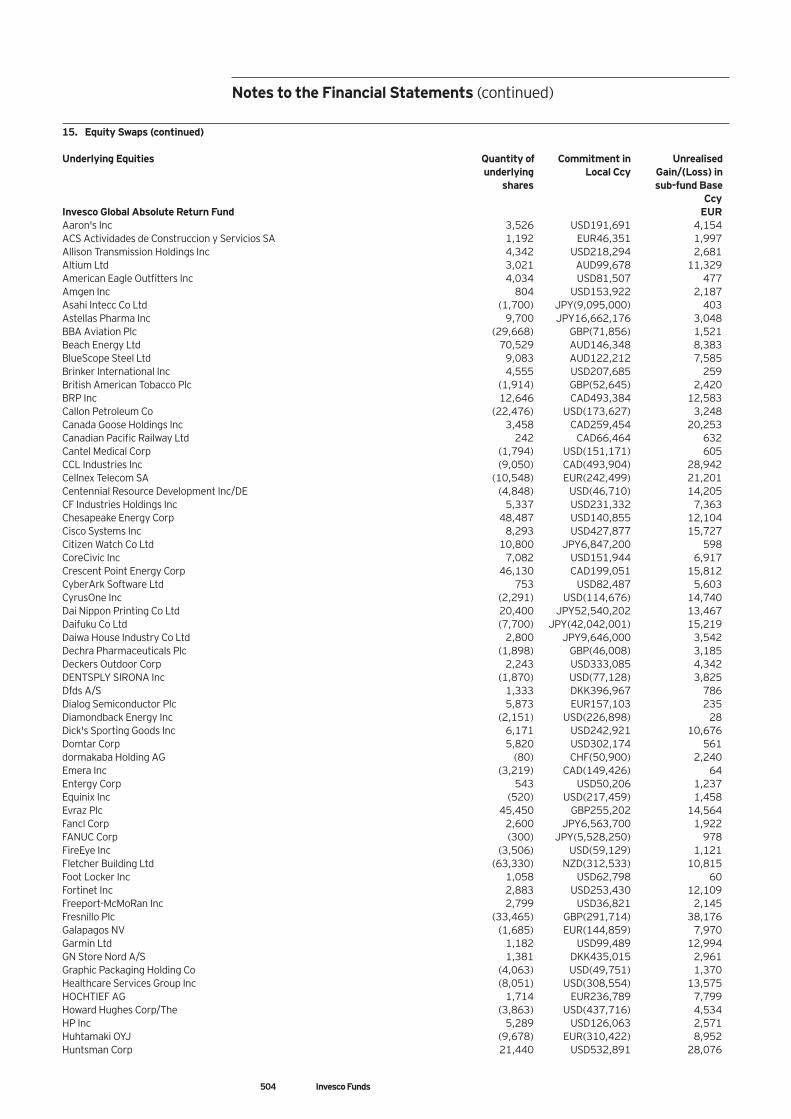
504 Invesco Funds
15. Equity Swaps (continued) Underlying Equities Quantity of Commitment in Unrealised underlying Local Ccy Gain/(Loss) in shares sub-fund Base Ccy Invesco Global Absolute Return Fund EUR Aaron's Inc 3,526 USD191,691 4,154 ACS Actividades de Construccion y Servicios SA 1,192 EUR46,351 1,997 Allison Transmission Holdings Inc 4,342 USD218,294 2,681 Altium Ltd 3,021 AUD99,678 11,329 American Eagle Outfitters Inc 4,034 USD81,507 477 Amgen Inc 804 USD153,922 2,187 Asahi Intecc Co Ltd (1,700) JPY(9,095,000) 403 Astellas Pharma Inc 9,700 JPY16,662,176 3,048 BBA Aviation Plc (29,668) GBP(71,856) 1,521 Beach Energy Ltd 70,529 AUD146,348 8,383 BlueScope Steel Ltd 9,083 AUD122,212 7,585 Brinker International Inc 4,555 USD207,685 259 British American Tobacco Plc (1,914) GBP(52,645) 2,420 BRP Inc 12,646 CAD493,384 12,583 Callon Petroleum Co (22,476) USD(173,627) 3,248 Canada Goose Holdings Inc 3,458 CAD259,454 20,253 Canadian Pacific Railway Ltd 242 CAD66,464 632 Cantel Medical Corp (1,794) USD(151,171) 605 CCL Industries Inc (9,050) CAD(493,904) 28,942 Cellnex Telecom SA (10,548) EUR(242,499) 21,201 Centennial Resource Development Inc/DE (4,848) USD(46,710) 14,205 CF Industries Holdings Inc 5,337 USD231,332 7,363 Chesapeake Energy Corp 48,487 USD140,855 12,104 Cisco Systems Inc 8,293 USD427,877 15,727 Citizen Watch Co Ltd 10,800 JPY6,847,200 598 CoreCivic Inc 7,082 USD151,944 6,917 Crescent Point Energy Corp 46,130 CAD199,051 15,812 CyberArk Software Ltd 753 USD82,487 5,603 CyrusOne Inc (2,291) USD(114,676) 14,740 Dai Nippon Printing Co Ltd 20,400 JPY52,540,202 13,467 Daifuku Co Ltd (7,700) JPY(42,042,001) 15,219 Daiwa House Industry Co Ltd 2,800 JPY9,646,000 3,542 Dechra Pharmaceuticals Plc (1,898) GBP(46,008) 3,185 Deckers Outdoor Corp 2,243 USD333,085 4,342 DENTSPLY SIRONA Inc (1,870) USD(77,128) 3,825 Dfds A/S 1,333 DKK396,967 786 Dialog Semiconductor Plc 5,873 EUR157,103 235 Diamondback Energy Inc (2,151) USD(226,898) 28 Dick's Sporting Goods Inc 6,171 USD242,921 10,676 Domtar Corp 5,820 USD302,174 561 dormakaba Holding AG (80) CHF(50,900) 2,240 Emera Inc (3,219) CAD(149,426) 64 Entergy Corp 543 USD50,206 1,237 Equinix Inc (520) USD(217,459) 1,458 Evraz Plc 45,450 GBP255,202 14,564 Fancl Corp 2,600 JPY6,563,700 1,922 FANUC Corp (300) JPY(5,528,250) 978 FireEye Inc (3,506) USD(59,129) 1,121 Fletcher Building Ltd (63,330) NZD(312,533) 10,815 Foot Locker Inc 1,058 USD62,798 60 Fortinet Inc 2,883 USD253,430 12,109 Freeport-McMoRan Inc 2,799 USD36,821 2,145 Fresnillo Plc (33,465) GBP(291,714) 38,176 Galapagos NV (1,685) EUR(144,859) 7,970 Garmin Ltd 1,182 USD99,489 12,994 GN Store Nord A/S 1,381 DKK435,015 2,961 Graphic Packaging Holding Co (4,063) USD(49,751) 1,370 Healthcare Services Group Inc (8,051) USD(308,554) 13,575 HOCHTIEF AG 1,714 EUR236,789 7,799 Howard Hughes Corp/The (3,863) USD(437,716) 4,534 HP Inc 5,289 USD126,063 2,571 Huhtamaki OYJ (9,678) EUR(310,422) 8,952 Huntsman Corp 21,440 USD532,891 28,076
Notes to the Financial Statements (continued)
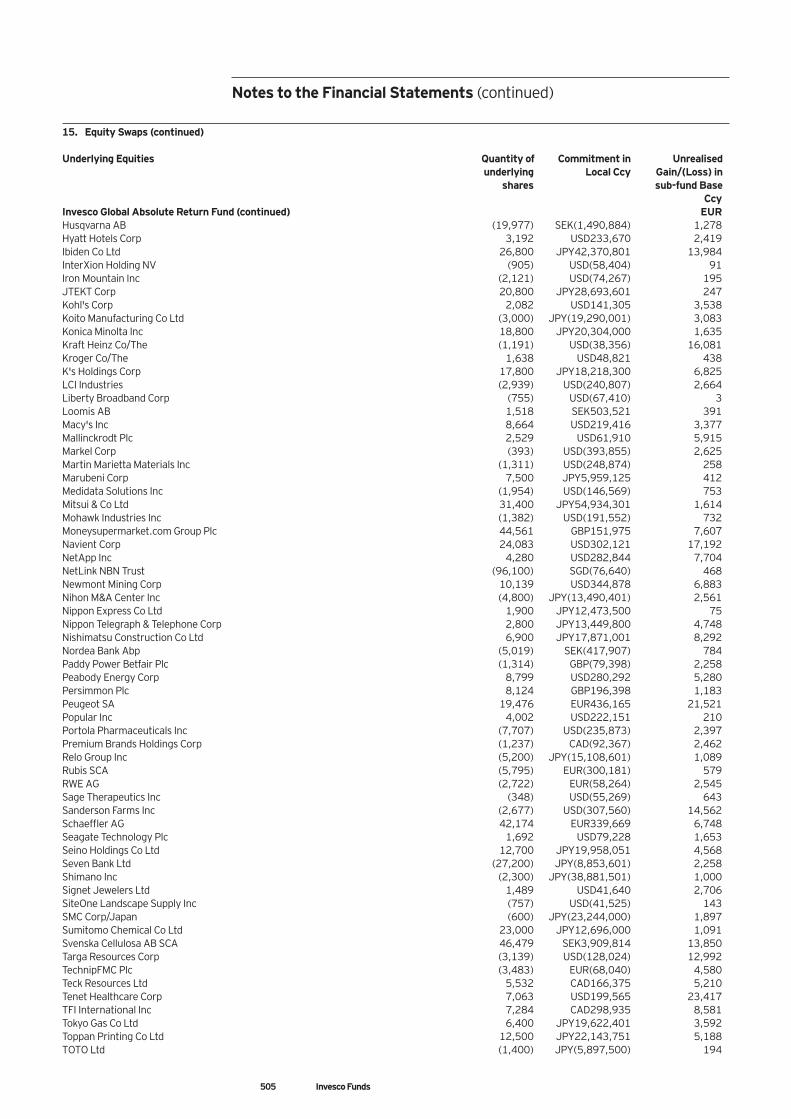
505 Invesco Funds
15. Equity Swaps (continued) Underlying Equities Quantity of Commitment in Unrealised underlying Local Ccy Gain/(Loss) in shares sub-fund Base Ccy Invesco Global Absolute Return Fund (continued) EUR Husqvarna AB (19,977) SEK(1,490,884) 1,278 Hyatt Hotels Corp 3,192 USD233,670 2,419 Ibiden Co Ltd 26,800 JPY42,370,801 13,984 InterXion Holding NV (905) USD(58,404) 91 Iron Mountain Inc (2,121) USD(74,267) 195 JTEKT Corp 20,800 JPY28,693,601 247 Kohl's Corp 2,082 USD141,305 3,538 Koito Manufacturing Co Ltd (3,000) JPY(19,290,001) 3,083 Konica Minolta Inc 18,800 JPY20,304,000 1,635 Kraft Heinz Co/The (1,191) USD(38,356) 16,081 Kroger Co/The 1,638 USD48,821 438 K's Holdings Corp 17,800 JPY18,218,300 6,825 LCI Industries (2,939) USD(240,807) 2,664 Liberty Broadband Corp (755) USD(67,410) 3 Loomis AB 1,518 SEK503,521 391 Macy's Inc 8,664 USD219,416 3,377 Mallinckrodt Plc 2,529 USD61,910 5,915 Markel Corp (393) USD(393,855) 2,625 Martin Marietta Materials Inc (1,311) USD(248,874) 258 Marubeni Corp 7,500 JPY5,959,125 412 Medidata Solutions Inc (1,954) USD(146,569) 753 Mitsui & Co Ltd 31,400 JPY54,934,301 1,614 Mohawk Industries Inc (1,382) USD(191,552) 732 Moneysupermarket.com Group Plc 44,561 GBP151,975 7,607 Navient Corp 24,083 USD302,121 17,192 NetApp Inc 4,280 USD282,844 7,704 NetLink NBN Trust (96,100) SGD(76,640) 468 Newmont Mining Corp 10,139 USD344,878 6,883 Nihon M&A Center Inc (4,800) JPY(13,490,401) 2,561 Nippon Express Co Ltd 1,900 JPY12,473,500 75 Nippon Telegraph & Telephone Corp 2,800 JPY13,449,800 4,748 Nishimatsu Construction Co Ltd 6,900 JPY17,871,001 8,292 Nordea Bank Abp (5,019) SEK(417,907) 784 Paddy Power Betfair Plc (1,314) GBP(79,398) 2,258 Peabody Energy Corp 8,799 USD280,292 5,280 Persimmon Plc 8,124 GBP196,398 1,183 Peugeot SA 19,476 EUR436,165 21,521 Popular Inc 4,002 USD222,151 210 Portola Pharmaceuticals Inc (7,707) USD(235,873) 2,397 Premium Brands Holdings Corp (1,237) CAD(92,367) 2,462 Relo Group Inc (5,200) JPY(15,108,601) 1,089 Rubis SCA (5,795) EUR(300,181) 579 RWE AG (2,722) EUR(58,264) 2,545 Sage Therapeutics Inc (348) USD(55,269) 643 Sanderson Farms Inc (2,677) USD(307,560) 14,562 Schaeffler AG 42,174 EUR339,669 6,748 Seagate Technology Plc 1,692 USD79,228 1,653 Seino Holdings Co Ltd 12,700 JPY19,958,051 4,568 Seven Bank Ltd (27,200) JPY(8,853,601) 2,258 Shimano Inc (2,300) JPY(38,881,501) 1,000 Signet Jewelers Ltd 1,489 USD41,640 2,706 SiteOne Landscape Supply Inc (757) USD(41,525) 143 SMC Corp/Japan (600) JPY(23,244,000) 1,897 Sumitomo Chemical Co Ltd 23,000 JPY12,696,000 1,091 Svenska Cellulosa AB SCA 46,479 SEK3,909,814 13,850 Targa Resources Corp (3,139) USD(128,024) 12,992 TechnipFMC Plc (3,483) EUR(68,040) 4,580 Teck Resources Ltd 5,532 CAD166,375 5,210 Tenet Healthcare Corp 7,063 USD199,565 23,417 TFI International Inc 7,284 CAD298,935 8,581 Tokyo Gas Co Ltd 6,400 JPY19,622,401 3,592 Toppan Printing Co Ltd 12,500 JPY22,143,751 5,188 TOTO Ltd (1,400) JPY(5,897,500) 194
Notes to the Financial Statements (continued)
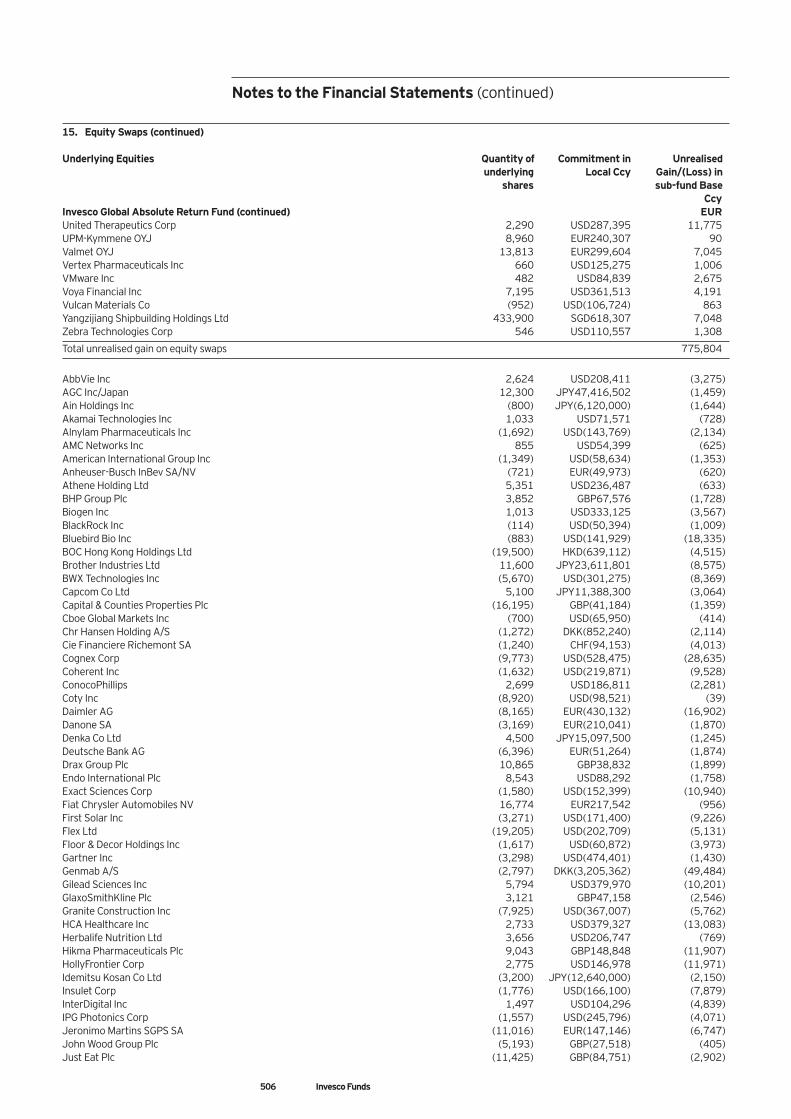
506 Invesco Funds
15. Equity Swaps (continued) Underlying Equities Quantity of Commitment in Unrealised underlying Local Ccy Gain/(Loss) in shares sub-fund Base Ccy Invesco Global Absolute Return Fund (continued) EUR United Therapeutics Corp 2,290 USD287,395 11,775 UPM-Kymmene OYJ 8,960 EUR240,307 90 Valmet OYJ 13,813 EUR299,604 7,045 Vertex Pharmaceuticals Inc 660 USD125,275 1,006 VMware Inc 482 USD84,839 2,675 Voya Financial Inc 7,195 USD361,513 4,191 Vulcan Materials Co (952) USD(106,724) 863 Yangzijiang Shipbuilding Holdings Ltd 433,900 SGD618,307 7,048 Zebra Technologies Corp 546 USD110,557 1,308
Total unrealised gain on equity swaps 775,804
AbbVie Inc 2,624 USD208,411 (3,275) AGC Inc/Japan 12,300 JPY47,416,502 (1,459) Ain Holdings Inc (800) JPY(6,120,000) (1,644) Akamai Technologies Inc 1,033 USD71,571 (728) Alnylam Pharmaceuticals Inc (1,692) USD(143,769) (2,134) AMC Networks Inc 855 USD54,399 (625) American International Group Inc (1,349) USD(58,634) (1,353) Anheuser-Busch InBev SA/NV (721) EUR(49,973) (620) Athene Holding Ltd 5,351 USD236,487 (633) BHP Group Plc 3,852 GBP67,576 (1,728) Biogen Inc 1,013 USD333,125 (3,567) BlackRock Inc (114) USD(50,394) (1,009) Bluebird Bio Inc (883) USD(141,929) (18,335) BOC Hong Kong Holdings Ltd (19,500) HKD(639,112) (4,515) Brother Industries Ltd 11,600 JPY23,611,801 (8,575) BWX Technologies Inc (5,670) USD(301,275) (8,369) Capcom Co Ltd 5,100 JPY11,388,300 (3,064) Capital & Counties Properties Plc (16,195) GBP(41,184) (1,359) Cboe Global Markets Inc (700) USD(65,950) (414) Chr Hansen Holding A/S (1,272) DKK(852,240) (2,114) Cie Financiere Richemont SA (1,240) CHF(94,153) (4,013) Cognex Corp (9,773) USD(528,475) (28,635) Coherent Inc (1,632) USD(219,871) (9,528) ConocoPhillips 2,699 USD186,811 (2,281) Coty Inc (8,920) USD(98,521) (39) Daimler AG (8,165) EUR(430,132) (16,902) Danone SA (3,169) EUR(210,041) (1,870) Denka Co Ltd 4,500 JPY15,097,500 (1,245) Deutsche Bank AG (6,396) EUR(51,264) (1,874) Drax Group Plc 10,865 GBP38,832 (1,899) Endo International Plc 8,543 USD88,292 (1,758) Exact Sciences Corp (1,580) USD(152,399) (10,940) Fiat Chrysler Automobiles NV 16,774 EUR217,542 (956) First Solar Inc (3,271) USD(171,400) (9,226) Flex Ltd (19,205) USD(202,709) (5,131) Floor & Decor Holdings Inc (1,617) USD(60,872) (3,973) Gartner Inc (3,298) USD(474,401) (1,430) Genmab A/S (2,797) DKK(3,205,362) (49,484) Gilead Sciences Inc 5,794 USD379,970 (10,201) GlaxoSmithKline Plc 3,121 GBP47,158 (2,546) Granite Construction Inc (7,925) USD(367,007) (5,762) HCA Healthcare Inc 2,733 USD379,327 (13,083) Herbalife Nutrition Ltd 3,656 USD206,747 (769) Hikma Pharmaceuticals Plc 9,043 GBP148,848 (11,907) HollyFrontier Corp 2,775 USD146,978 (11,971) Idemitsu Kosan Co Ltd (3,200) JPY(12,640,000) (2,150) Insulet Corp (1,776) USD(166,100) (7,879) InterDigital Inc 1,497 USD104,296 (4,839) IPG Photonics Corp (1,557) USD(245,796) (4,071) Jeronimo Martins SGPS SA (11,016) EUR(147,146) (6,747) John Wood Group Plc (5,193) GBP(27,518) (405) Just Eat Plc (11,425) GBP(84,751) (2,902)
Notes to the Financial Statements (continued)
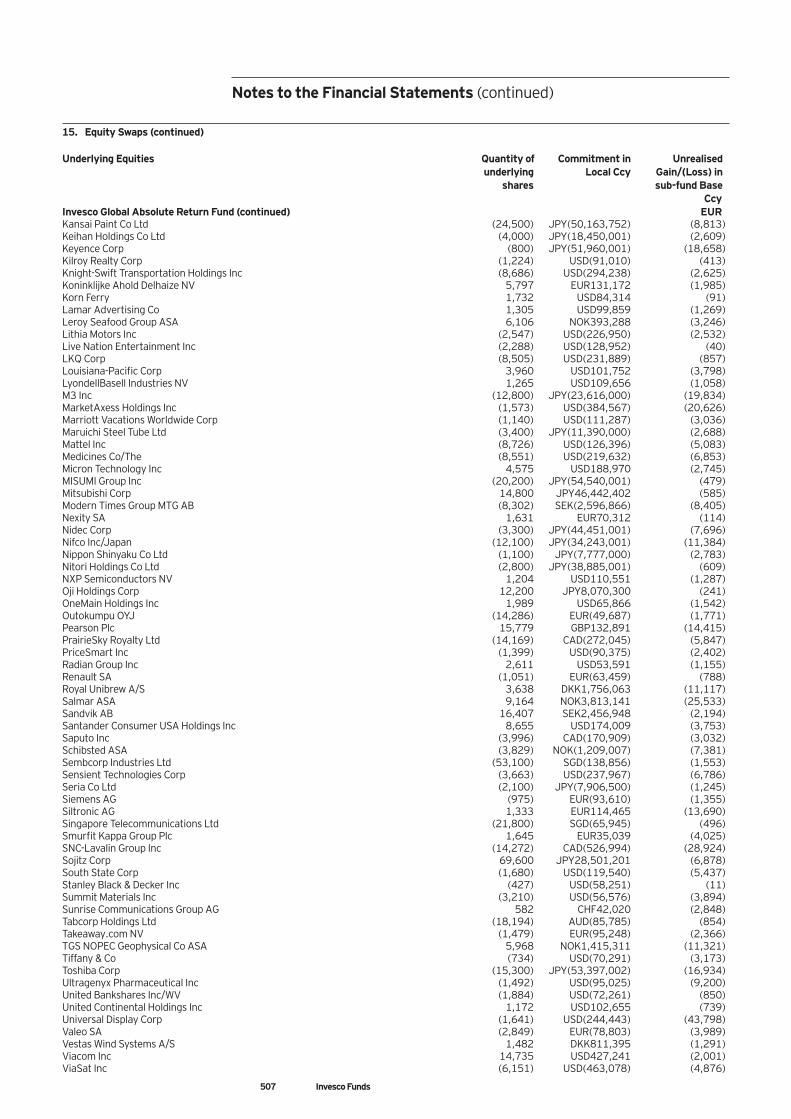
507 Invesco Funds
15. Equity Swaps (continued) Underlying Equities Quantity of Commitment in Unrealised underlying Local Ccy Gain/(Loss) in shares sub-fund Base Ccy Invesco Global Absolute Return Fund (continued) EUR Kansai Paint Co Ltd (24,500) JPY(50,163,752) (8,813) Keihan Holdings Co Ltd (4,000) JPY(18,450,001) (2,609) Keyence Corp (800) JPY(51,960,001) (18,658) Kilroy Realty Corp (1,224) USD(91,010) (413) Knight-Swift Transportation Holdings Inc (8,686) USD(294,238) (2,625) Koninklijke Ahold Delhaize NV 5,797 EUR131,172 (1,985) Korn Ferry 1,732 USD84,314 (91) Lamar Advertising Co 1,305 USD99,859 (1,269) Leroy Seafood Group ASA 6,106 NOK393,288 (3,246) Lithia Motors Inc (2,547) USD(226,950) (2,532) Live Nation Entertainment Inc (2,288) USD(128,952) (40) LKQ Corp (8,505) USD(231,889) (857) Louisiana-Pacific Corp 3,960 USD101,752 (3,798) LyondellBasell Industries NV 1,265 USD109,656 (1,058) M3 Inc (12,800) JPY(23,616,000) (19,834) MarketAxess Holdings Inc (1,573) USD(384,567) (20,626) Marriott Vacations Worldwide Corp (1,140) USD(111,287) (3,036) Maruichi Steel Tube Ltd (3,400) JPY(11,390,000) (2,688) Mattel Inc (8,726) USD(126,396) (5,083) Medicines Co/The (8,551) USD(219,632) (6,853) Micron Technology Inc 4,575 USD188,970 (2,745) MISUMI Group Inc (20,200) JPY(54,540,001) (479) Mitsubishi Corp 14,800 JPY46,442,402 (585) Modern Times Group MTG AB (8,302) SEK(2,596,866) (8,405) Nexity SA 1,631 EUR70,312 (114) Nidec Corp (3,300) JPY(44,451,001) (7,696) Nifco Inc/Japan (12,100) JPY(34,243,001) (11,384) Nippon Shinyaku Co Ltd (1,100) JPY(7,777,000) (2,783) Nitori Holdings Co Ltd (2,800) JPY(38,885,001) (609) NXP Semiconductors NV 1,204 USD110,551 (1,287) Oji Holdings Corp 12,200 JPY8,070,300 (241) OneMain Holdings Inc 1,989 USD65,866 (1,542) Outokumpu OYJ (14,286) EUR(49,687) (1,771) Pearson Plc 15,779 GBP132,891 (14,415) PrairieSky Royalty Ltd (14,169) CAD(272,045) (5,847) PriceSmart Inc (1,399) USD(90,375) (2,402) Radian Group Inc 2,611 USD53,591 (1,155) Renault SA (1,051) EUR(63,459) (788) Royal Unibrew A/S 3,638 DKK1,756,063 (11,117) Salmar ASA 9,164 NOK3,813,141 (25,533) Sandvik AB 16,407 SEK2,456,948 (2,194) Santander Consumer USA Holdings Inc 8,655 USD174,009 (3,753) Saputo Inc (3,996) CAD(170,909) (3,032) Schibsted ASA (3,829) NOK(1,209,007) (7,381) Sembcorp Industries Ltd (53,100) SGD(138,856) (1,553) Sensient Technologies Corp (3,663) USD(237,967) (6,786) Seria Co Ltd (2,100) JPY(7,906,500) (1,245) Siemens AG (975) EUR(93,610) (1,355) Siltronic AG 1,333 EUR114,465 (13,690) Singapore Telecommunications Ltd (21,800) SGD(65,945) (496) Smurfit Kappa Group Plc 1,645 EUR35,039 (4,025) SNC-Lavalin Group Inc (14,272) CAD(526,994) (28,924) Sojitz Corp 69,600 JPY28,501,201 (6,878) South State Corp (1,680) USD(119,540) (5,437) Stanley Black & Decker Inc (427) USD(58,251) (11) Summit Materials Inc (3,210) USD(56,576) (3,894) Sunrise Communications Group AG 582 CHF42,020 (2,848) Tabcorp Holdings Ltd (18,194) AUD(85,785) (854) Takeaway.com NV (1,479) EUR(95,248) (2,366) TGS NOPEC Geophysical Co ASA 5,968 NOK1,415,311 (11,321) Tiffany & Co (734) USD(70,291) (3,173) Toshiba Corp (15,300) JPY(53,397,002) (16,934) Ultragenyx Pharmaceutical Inc (1,492) USD(95,025) (9,200) United Bankshares Inc/WV (1,884) USD(72,261) (850) United Continental Holdings Inc 1,172 USD102,655 (739) Universal Display Corp (1,641) USD(244,443) (43,798) Valeo SA (2,849) EUR(78,803) (3,989) Vestas Wind Systems A/S 1,482 DKK811,395 (1,291) Viacom Inc 14,735 USD427,241 (2,001) ViaSat Inc (6,151) USD(463,078) (4,876)
Notes to the Financial Statements (continued)
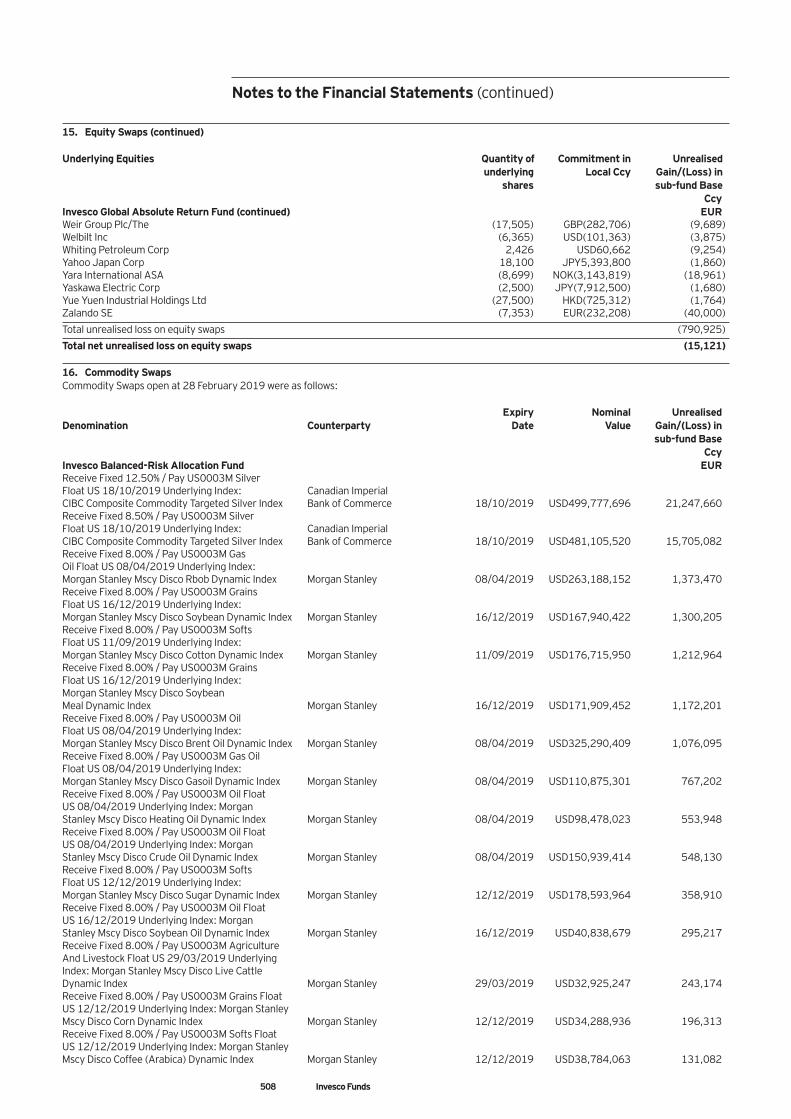
Notes to the Financial Statements (continued)
15. Equity Swaps (continued) Underlying Equities Quantity of Commitment in Unrealised underlying Local Ccy Gain/(Loss) in shares sub-fund Base Ccy Invesco Global Absolute Return Fund (continued) EUR Weir Group Plc/The (17,505) GBP(282,706) (9,689) Welbilt Inc (6,365) USD(101,363) (3,875) Whiting Petroleum Corp 2,426 USD60,662 (9,254) Yahoo Japan Corp 18,100 JPY5,393,800 (1,860) Yara International ASA (8,699) NOK(3,143,819) (18,961) Yaskawa Electric Corp (2,500) JPY(7,912,500) (1,680) Yue Yuen Industrial Holdings Ltd (27,500) HKD(725,312) (1,764) Zalando SE (7,353) EUR(232,208) (40,000)
Total unrealised loss on equity swaps (790,925)
Total net unrealised loss on equity swaps (15,121) 16. Commodity Swaps Commodity Swaps open at 28 February 2019 were as follows: Expiry Nominal Unrealised Denomination Counterparty Date Value Gain/(Loss) in sub-fund Base Ccy Invesco Balanced-Risk Allocation Fund EUR Receive Fixed 12.50% / Pay US0003M Silver Float US 18/10/2019 Underlying Index: Canadian Imperial CIBC Composite Commodity Targeted Silver Index Bank of Commerce 18/10/2019 USD499,777,696 21,247,660 Receive Fixed 8.50% / Pay US0003M Silver Float US 18/10/2019 Underlying Index: Canadian Imperial CIBC Composite Commodity Targeted Silver Index Bank of Commerce 18/10/2019 USD481,105,520 15,705,082 Receive Fixed 8.00% / Pay US0003M Gas Oil Float US 08/04/2019 Underlying Index: Morgan Stanley Mscy Disco Rbob Dynamic Index Morgan Stanley 08/04/2019 USD263,188,152 1,373,470 Receive Fixed 8.00% / Pay US0003M Grains Float US 16/12/2019 Underlying Index: Morgan Stanley Mscy Disco Soybean Dynamic Index Morgan Stanley 16/12/2019 USD167,940,422 1,300,205 Receive Fixed 8.00% / Pay US0003M Softs Float US 11/09/2019 Underlying Index: Morgan Stanley Mscy Disco Cotton Dynamic Index Morgan Stanley 11/09/2019 USD176,715,950 1,212,964 Receive Fixed 8.00% / Pay US0003M Grains Float US 16/12/2019 Underlying Index: Morgan Stanley Mscy Disco Soybean Meal Dynamic Index Morgan Stanley 16/12/2019 USD171,909,452 1,172,201 Receive Fixed 8.00% / Pay US0003M Oil Float US 08/04/2019 Underlying Index: Morgan Stanley Mscy Disco Brent Oil Dynamic Index Morgan Stanley 08/04/2019 USD325,290,409 1,076,095 Receive Fixed 8.00% / Pay US0003M Gas Oil Float US 08/04/2019 Underlying Index: Morgan Stanley Mscy Disco Gasoil Dynamic Index Morgan Stanley 08/04/2019 USD110,875,301 767,202 Receive Fixed 8.00% / Pay US0003M Oil Float US 08/04/2019 Underlying Index: Morgan Stanley Mscy Disco Heating Oil Dynamic Index Morgan Stanley 08/04/2019 USD98,478,023 553,948 Receive Fixed 8.00% / Pay US0003M Oil Float US 08/04/2019 Underlying Index: Morgan Stanley Mscy Disco Crude Oil Dynamic Index Morgan Stanley 08/04/2019 USD150,939,414 548,130 Receive Fixed 8.00% / Pay US0003M Softs Float US 12/12/2019 Underlying Index: Morgan Stanley Mscy Disco Sugar Dynamic Index Morgan Stanley 12/12/2019 USD178,593,964 358,910 Receive Fixed 8.00% / Pay US0003M Oil Float US 16/12/2019 Underlying Index: Morgan Stanley Mscy Disco Soybean Oil Dynamic Index Morgan Stanley 16/12/2019 USD40,838,679 295,217 Receive Fixed 8.00% / Pay US0003M Agriculture And Livestock Float US 29/03/2019 Underlying Index: Morgan Stanley Mscy Disco Live Cattle Dynamic Index Morgan Stanley 29/03/2019 USD32,925,247 243,174 Receive Fixed 8.00% / Pay US0003M Grains Float US 12/12/2019 Underlying Index: Morgan Stanley Mscy Disco Corn Dynamic Index Morgan Stanley 12/12/2019 USD34,288,936 196,313 Receive Fixed 8.00% / Pay US0003M Softs Float US 12/12/2019 Underlying Index: Morgan Stanley Mscy Disco Coffee (Arabica) Dynamic Index Morgan Stanley 12/12/2019 USD38,784,063 131,082
508 Invesco Funds
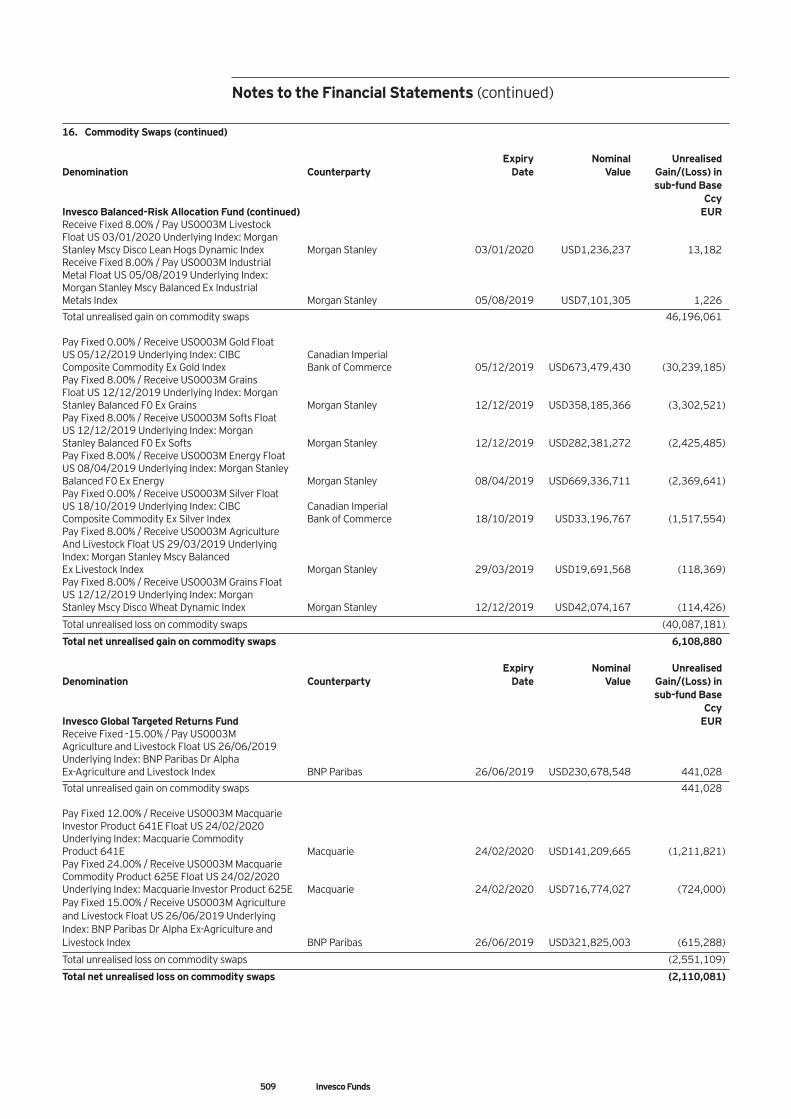
16. Commodity Swaps (continued) Expiry Nominal Unrealised Denomination Counterparty Date Value Gain/(Loss) in sub-fund Base Ccy Invesco Balanced-Risk Allocation Fund (continued) EUR Receive Fixed 8.00% / Pay US0003M Livestock Float US 03/01/2020 Underlying Index: Morgan Stanley Mscy Disco Lean Hogs Dynamic Index Morgan Stanley 03/01/2020 USD1,236,237 13,182 Receive Fixed 8.00% / Pay US0003M Industrial Metal Float US 05/08/2019 Underlying Index: Morgan Stanley Mscy Balanced Ex Industrial Metals Index Morgan Stanley 05/08/2019 USD7,101,305 1,226
Total unrealised gain on commodity swaps 46,196,061 Pay Fixed 0.00% / Receive US0003M Gold Float US 05/12/2019 Underlying Index: CIBC Canadian Imperial Composite Commodity Ex Gold Index Bank of Commerce 05/12/2019 USD673,479,430 (30,239,185) Pay Fixed 8.00% / Receive US0003M Grains Float US 12/12/2019 Underlying Index: Morgan Stanley Balanced F0 Ex Grains Morgan Stanley 12/12/2019 USD358,185,366 (3,302,521) Pay Fixed 8.00% / Receive US0003M Softs Float US 12/12/2019 Underlying Index: Morgan Stanley Balanced F0 Ex Softs Morgan Stanley 12/12/2019 USD282,381,272 (2,425,485) Pay Fixed 8.00% / Receive US0003M Energy Float US 08/04/2019 Underlying Index: Morgan Stanley Balanced F0 Ex Energy Morgan Stanley 08/04/2019 USD669,336,711 (2,369,641) Pay Fixed 0.00% / Receive US0003M Silver Float US 18/10/2019 Underlying Index: CIBC Canadian Imperial Composite Commodity Ex Silver Index Bank of Commerce 18/10/2019 USD33,196,767 (1,517,554) Pay Fixed 8.00% / Receive US0003M Agriculture And Livestock Float US 29/03/2019 Underlying Index: Morgan Stanley Mscy Balanced Ex Livestock Index Morgan Stanley 29/03/2019 USD19,691,568 (118,369) Pay Fixed 8.00% / Receive US0003M Grains Float US 12/12/2019 Underlying Index: Morgan Stanley Mscy Disco Wheat Dynamic Index Morgan Stanley 12/12/2019 USD42,074,167 (114,426)
Total unrealised loss on commodity swaps (40,087,181)
Total net unrealised gain on commodity swaps 6,108,880 Expiry Nominal Unrealised Denomination Counterparty Date Value Gain/(Loss) in sub-fund Base Ccy Invesco Global Targeted Returns Fund EUR Receive Fixed -15.00% / Pay US0003M Agriculture and Livestock Float US 26/06/2019 Underlying Index: BNP Paribas Dr Alpha Ex-Agriculture and Livestock Index BNP Paribas 26/06/2019 USD230,678,548 441,028
Total unrealised gain on commodity swaps 441,028 Pay Fixed 12.00% / Receive US0003M Macquarie Investor Product 641E Float US 24/02/2020 Underlying Index: Macquarie Commodity Product 641E Macquarie 24/02/2020 USD141,209,665 (1,211,821) Pay Fixed 24.00% / Receive US0003M Macquarie Commodity Product 625E Float US 24/02/2020 Underlying Index: Macquarie Investor Product 625E Macquarie 24/02/2020 USD716,774,027 (724,000) Pay Fixed 15.00% / Receive US0003M Agriculture and Livestock Float US 26/06/2019 Underlying Index: BNP Paribas Dr Alpha Ex-Agriculture and Livestock Index BNP Paribas 26/06/2019 USD321,825,003 (615,288)
Total unrealised loss on commodity swaps (2,551,109)
Total net unrealised loss on commodity swaps (2,110,081)
509 Invesco Funds
Notes to the Financial Statements (continued)
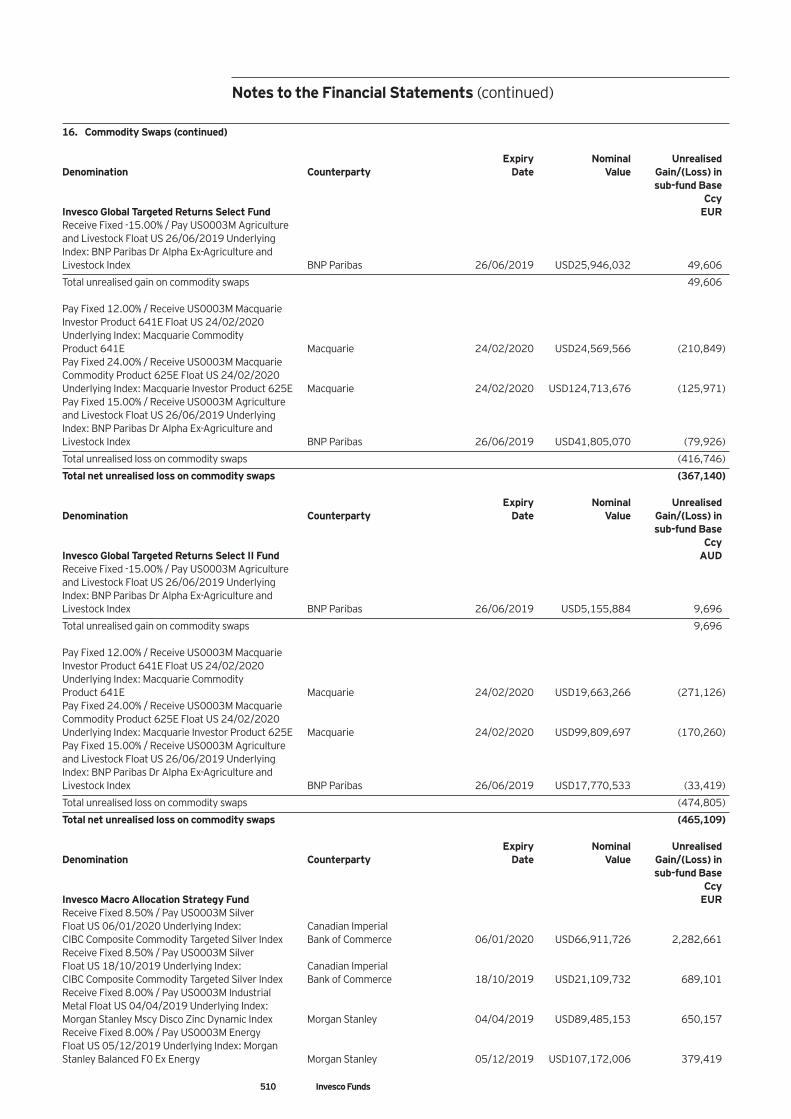
Notes to the Financial Statements (continued)
16. Commodity Swaps (continued) Expiry Nominal Unrealised Denomination Counterparty Date Value Gain/(Loss) in sub-fund Base Ccy Invesco Global Targeted Returns Select Fund EUR Receive Fixed -15.00% / Pay US0003M Agriculture and Livestock Float US 26/06/2019 Underlying Index: BNP Paribas Dr Alpha Ex-Agriculture and Livestock Index BNP Paribas 26/06/2019 USD25,946,032 49,606
Total unrealised gain on commodity swaps 49,606 Pay Fixed 12.00% / Receive US0003M Macquarie Investor Product 641E Float US 24/02/2020 Underlying Index: Macquarie Commodity Product 641E Macquarie 24/02/2020 USD24,569,566 (210,849) Pay Fixed 24.00% / Receive US0003M Macquarie Commodity Product 625E Float US 24/02/2020 Underlying Index: Macquarie Investor Product 625E Macquarie 24/02/2020 USD124,713,676 (125,971) Pay Fixed 15.00% / Receive US0003M Agriculture and Livestock Float US 26/06/2019 Underlying Index: BNP Paribas Dr Alpha Ex-Agriculture and Livestock Index BNP Paribas 26/06/2019 USD41,805,070 (79,926)
Total unrealised loss on commodity swaps (416,746)
Total net unrealised loss on commodity swaps (367,140) Expiry Nominal Unrealised Denomination Counterparty Date Value Gain/(Loss) in sub-fund Base Ccy Invesco Global Targeted Returns Select II Fund AUD Receive Fixed -15.00% / Pay US0003M Agriculture and Livestock Float US 26/06/2019 Underlying Index: BNP Paribas Dr Alpha Ex-Agriculture and Livestock Index BNP Paribas 26/06/2019 USD5,155,884 9,696
Total unrealised gain on commodity swaps 9,696 Pay Fixed 12.00% / Receive US0003M Macquarie Investor Product 641E Float US 24/02/2020 Underlying Index: Macquarie Commodity Product 641E Macquarie 24/02/2020 USD19,663,266 (271,126) Pay Fixed 24.00% / Receive US0003M Macquarie Commodity Product 625E Float US 24/02/2020 Underlying Index: Macquarie Investor Product 625E Macquarie 24/02/2020 USD99,809,697 (170,260) Pay Fixed 15.00% / Receive US0003M Agriculture and Livestock Float US 26/06/2019 Underlying Index: BNP Paribas Dr Alpha Ex-Agriculture and Livestock Index BNP Paribas 26/06/2019 USD17,770,533 (33,419)
Total unrealised loss on commodity swaps (474,805)
Total net unrealised loss on commodity swaps (465,109) Expiry Nominal Unrealised Denomination Counterparty Date Value Gain/(Loss) in sub-fund Base Ccy Invesco Macro Allocation Strategy Fund EUR Receive Fixed 8.50% / Pay US0003M Silver Float US 06/01/2020 Underlying Index: Canadian Imperial CIBC Composite Commodity Targeted Silver Index Bank of Commerce 06/01/2020 USD66,911,726 2,282,661 Receive Fixed 8.50% / Pay US0003M Silver Float US 18/10/2019 Underlying Index: Canadian Imperial CIBC Composite Commodity Targeted Silver Index Bank of Commerce 18/10/2019 USD21,109,732 689,101 Receive Fixed 8.00% / Pay US0003M Industrial Metal Float US 04/04/2019 Underlying Index: Morgan Stanley Mscy Disco Zinc Dynamic Index Morgan Stanley 04/04/2019 USD89,485,153 650,157 Receive Fixed 8.00% / Pay US0003M Energy Float US 05/12/2019 Underlying Index: Morgan Stanley Balanced F0 Ex Energy Morgan Stanley 05/12/2019 USD107,172,006 379,419
510 Invesco Funds
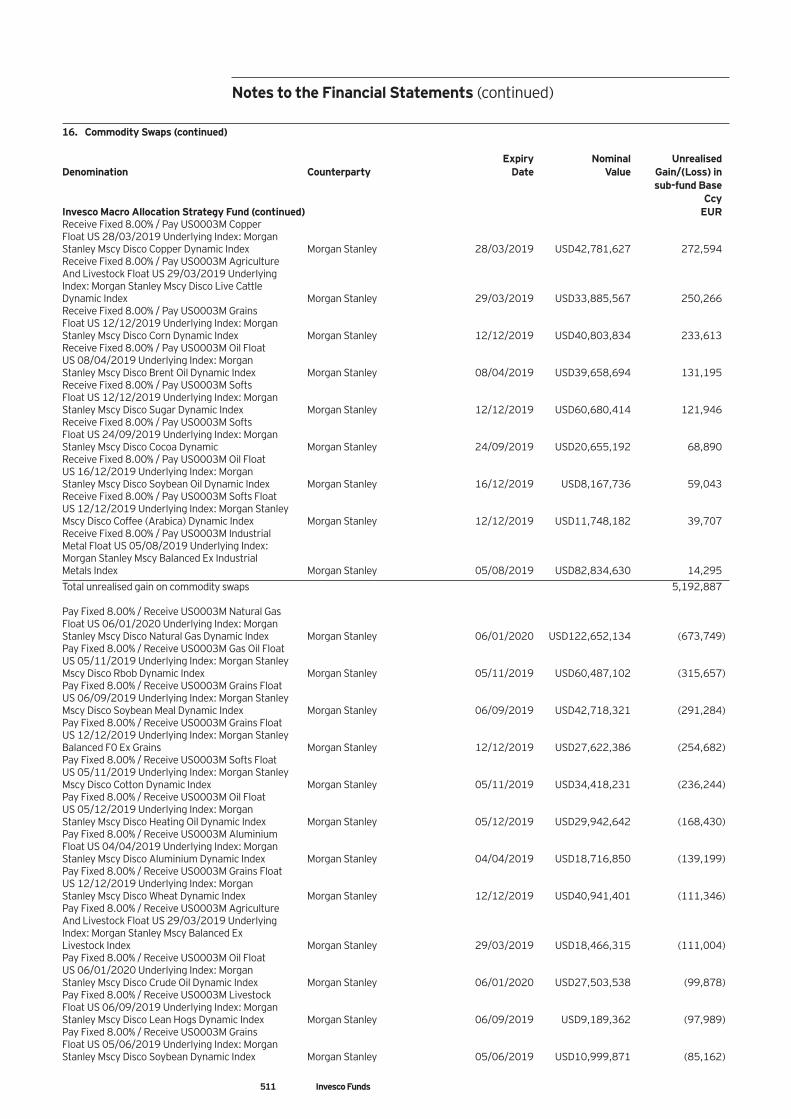
Notes to the Financial Statements (continued)
16. Commodity Swaps (continued) Expiry Nominal Unrealised Denomination Counterparty Date Value Gain/(Loss) in sub-fund Base Ccy Invesco Macro Allocation Strategy Fund (continued) EUR Receive Fixed 8.00% / Pay US0003M Copper Float US 28/03/2019 Underlying Index: Morgan Stanley Mscy Disco Copper Dynamic Index Morgan Stanley 28/03/2019 USD42,781,627 272,594 Receive Fixed 8.00% / Pay US0003M Agriculture And Livestock Float US 29/03/2019 Underlying Index: Morgan Stanley Mscy Disco Live Cattle Dynamic Index Morgan Stanley 29/03/2019 USD33,885,567 250,266 Receive Fixed 8.00% / Pay US0003M Grains Float US 12/12/2019 Underlying Index: Morgan Stanley Mscy Disco Corn Dynamic Index Morgan Stanley 12/12/2019 USD40,803,834 233,613 Receive Fixed 8.00% / Pay US0003M Oil Float US 08/04/2019 Underlying Index: Morgan Stanley Mscy Disco Brent Oil Dynamic Index Morgan Stanley 08/04/2019 USD39,658,694 131,195 Receive Fixed 8.00% / Pay US0003M Softs Float US 12/12/2019 Underlying Index: Morgan Stanley Mscy Disco Sugar Dynamic Index Morgan Stanley 12/12/2019 USD60,680,414 121,946 Receive Fixed 8.00% / Pay US0003M Softs Float US 24/09/2019 Underlying Index: Morgan Stanley Mscy Disco Cocoa Dynamic Morgan Stanley 24/09/2019 USD20,655,192 68,890 Receive Fixed 8.00% / Pay US0003M Oil Float US 16/12/2019 Underlying Index: Morgan Stanley Mscy Disco Soybean Oil Dynamic Index Morgan Stanley 16/12/2019 USD8,167,736 59,043 Receive Fixed 8.00% / Pay US0003M Softs Float US 12/12/2019 Underlying Index: Morgan Stanley Mscy Disco Coffee (Arabica) Dynamic Index Morgan Stanley 12/12/2019 USD11,748,182 39,707 Receive Fixed 8.00% / Pay US0003M Industrial Metal Float US 05/08/2019 Underlying Index: Morgan Stanley Mscy Balanced Ex Industrial Metals Index Morgan Stanley 05/08/2019 USD82,834,630 14,295
Total unrealised gain on commodity swaps 5,192,887 Pay Fixed 8.00% / Receive US0003M Natural Gas Float US 06/01/2020 Underlying Index: Morgan Stanley Mscy Disco Natural Gas Dynamic Index Morgan Stanley 06/01/2020 USD122,652,134 (673,749) Pay Fixed 8.00% / Receive US0003M Gas Oil Float US 05/11/2019 Underlying Index: Morgan Stanley Mscy Disco Rbob Dynamic Index Morgan Stanley 05/11/2019 USD60,487,102 (315,657) Pay Fixed 8.00% / Receive US0003M Grains Float US 06/09/2019 Underlying Index: Morgan Stanley Mscy Disco Soybean Meal Dynamic Index Morgan Stanley 06/09/2019 USD42,718,321 (291,284) Pay Fixed 8.00% / Receive US0003M Grains Float US 12/12/2019 Underlying Index: Morgan Stanley Balanced F0 Ex Grains Morgan Stanley 12/12/2019 USD27,622,386 (254,682) Pay Fixed 8.00% / Receive US0003M Softs Float US 05/11/2019 Underlying Index: Morgan Stanley Mscy Disco Cotton Dynamic Index Morgan Stanley 05/11/2019 USD34,418,231 (236,244) Pay Fixed 8.00% / Receive US0003M Oil Float US 05/12/2019 Underlying Index: Morgan Stanley Mscy Disco Heating Oil Dynamic Index Morgan Stanley 05/12/2019 USD29,942,642 (168,430) Pay Fixed 8.00% / Receive US0003M Aluminium Float US 04/04/2019 Underlying Index: Morgan Stanley Mscy Disco Aluminium Dynamic Index Morgan Stanley 04/04/2019 USD18,716,850 (139,199) Pay Fixed 8.00% / Receive US0003M Grains Float US 12/12/2019 Underlying Index: Morgan Stanley Mscy Disco Wheat Dynamic Index Morgan Stanley 12/12/2019 USD40,941,401 (111,346) Pay Fixed 8.00% / Receive US0003M Agriculture And Livestock Float US 29/03/2019 Underlying Index: Morgan Stanley Mscy Balanced Ex Livestock Index Morgan Stanley 29/03/2019 USD18,466,315 (111,004) Pay Fixed 8.00% / Receive US0003M Oil Float US 06/01/2020 Underlying Index: Morgan Stanley Mscy Disco Crude Oil Dynamic Index Morgan Stanley 06/01/2020 USD27,503,538 (99,878) Pay Fixed 8.00% / Receive US0003M Livestock Float US 06/09/2019 Underlying Index: Morgan Stanley Mscy Disco Lean Hogs Dynamic Index Morgan Stanley 06/09/2019 USD9,189,362 (97,989) Pay Fixed 8.00% / Receive US0003M Grains Float US 05/06/2019 Underlying Index: Morgan Stanley Mscy Disco Soybean Dynamic Index Morgan Stanley 05/06/2019 USD10,999,871 (85,162)
511 Invesco Funds
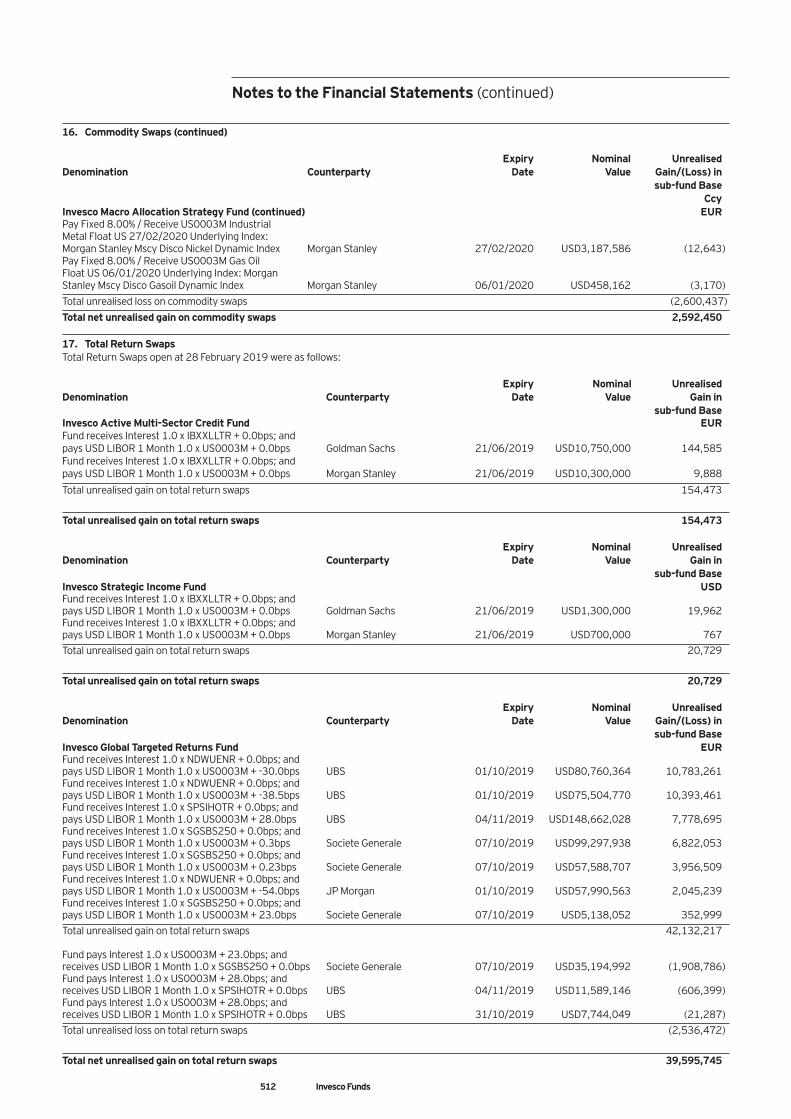
Notes to the Financial Statements (continued)
16. Commodity Swaps (continued) Expiry Nominal Unrealised Denomination Counterparty Date Value Gain/(Loss) in sub-fund Base Ccy Invesco Macro Allocation Strategy Fund (continued) EUR Pay Fixed 8.00% / Receive US0003M Industrial Metal Float US 27/02/2020 Underlying Index: Morgan Stanley Mscy Disco Nickel Dynamic Index Morgan Stanley 27/02/2020 USD3,187,586 (12,643) Pay Fixed 8.00% / Receive US0003M Gas Oil Float US 06/01/2020 Underlying Index: Morgan Stanley Mscy Disco Gasoil Dynamic Index Morgan Stanley 06/01/2020 USD458,162 (3,170)
Total unrealised loss on commodity swaps (2,600,437)
Total net unrealised gain on commodity swaps 2,592,450 17. Total Return Swaps Total Return Swaps open at 28 February 2019 were as follows: Expiry Nominal Unrealised Denomination Counterparty Date Value Gain in sub-fund Base Invesco Active Multi-Sector Credit Fund EUR Fund receives Interest 1.0 x IBXXLLTR + 0.0bps; and pays USD LIBOR 1 Month 1.0 x US0003M + 0.0bps Goldman Sachs 21/06/2019 USD10,750,000 144,585 Fund receives Interest 1.0 x IBXXLLTR + 0.0bps; and pays USD LIBOR 1 Month 1.0 x US0003M + 0.0bps Morgan Stanley 21/06/2019 USD10,300,000 9,888
Total unrealised gain on total return swaps 154,473
Total unrealised gain on total return swaps 154,473 Expiry Nominal Unrealised Denomination Counterparty Date Value Gain in sub-fund Base Invesco Strategic Income Fund USD Fund receives Interest 1.0 x IBXXLLTR + 0.0bps; and pays USD LIBOR 1 Month 1.0 x US0003M + 0.0bps Goldman Sachs 21/06/2019 USD1,300,000 19,962 Fund receives Interest 1.0 x IBXXLLTR + 0.0bps; and pays USD LIBOR 1 Month 1.0 x US0003M + 0.0bps Morgan Stanley 21/06/2019 USD700,000 767 Total unrealised gain on total return swaps 20,729
Total unrealised gain on total return swaps 20,729 Expiry Nominal Unrealised Denomination Counterparty Date Value Gain/(Loss) in sub-fund Base Invesco Global Targeted Returns Fund EUR Fund receives Interest 1.0 x NDWUENR + 0.0bps; and pays USD LIBOR 1 Month 1.0 x US0003M + -30.0bps UBS 01/10/2019 USD80,760,364 10,783,261 Fund receives Interest 1.0 x NDWUENR + 0.0bps; and pays USD LIBOR 1 Month 1.0 x US0003M + -38.5bps UBS 01/10/2019 USD75,504,770 10,393,461 Fund receives Interest 1.0 x SPSIHOTR + 0.0bps; and pays USD LIBOR 1 Month 1.0 x US0003M + 28.0bps UBS 04/11/2019 USD148,662,028 7,778,695 Fund receives Interest 1.0 x SGSBS250 + 0.0bps; and pays USD LIBOR 1 Month 1.0 x US0003M + 0.3bps Societe Generale 07/10/2019 USD99,297,938 6,822,053 Fund receives Interest 1.0 x SGSBS250 + 0.0bps; and pays USD LIBOR 1 Month 1.0 x US0003M + 0.23bps Societe Generale 07/10/2019 USD57,588,707 3,956,509 Fund receives Interest 1.0 x NDWUENR + 0.0bps; and pays USD LIBOR 1 Month 1.0 x US0003M + -54.0bps JP Morgan 01/10/2019 USD57,990,563 2,045,239 Fund receives Interest 1.0 x SGSBS250 + 0.0bps; and pays USD LIBOR 1 Month 1.0 x US0003M + 23.0bps Societe Generale 07/10/2019 USD5,138,052 352,999 Total unrealised gain on total return swaps 42,132,217 Fund pays Interest 1.0 x US0003M + 23.0bps; and receives USD LIBOR 1 Month 1.0 x SGSBS250 + 0.0bps Societe Generale 07/10/2019 USD35,194,992 (1,908,786) Fund pays Interest 1.0 x US0003M + 28.0bps; and receives USD LIBOR 1 Month 1.0 x SPSIHOTR + 0.0bps UBS 04/11/2019 USD11,589,146 (606,399) Fund pays Interest 1.0 x US0003M + 28.0bps; and receives USD LIBOR 1 Month 1.0 x SPSIHOTR + 0.0bps UBS 31/10/2019 USD7,744,049 (21,287) Total unrealised loss on total return swaps (2,536,472)
Total net unrealised gain on total return swaps 39,595,745
512 Invesco Funds
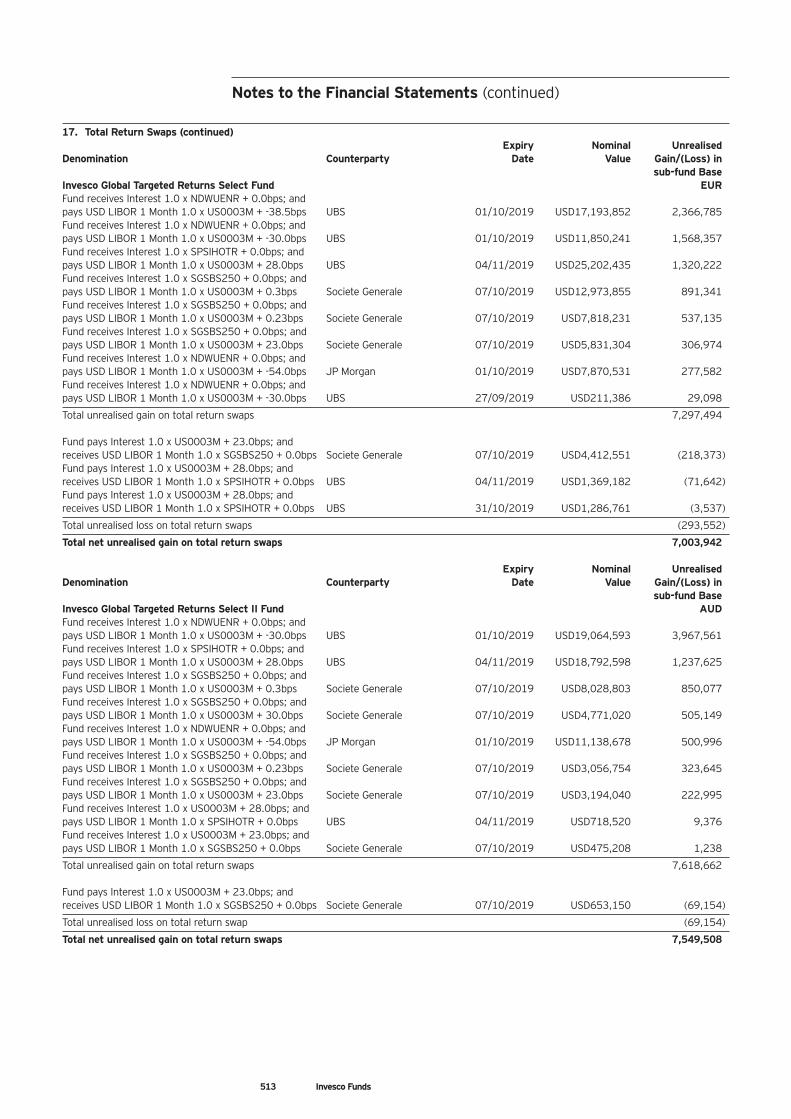
513 Invesco Funds
17. Total Return Swaps (continued) Expiry Nominal Unrealised Denomination Counterparty Date Value Gain/(Loss) in sub-fund Base Invesco Global Targeted Returns Select Fund EUR Fund receives Interest 1.0 x NDWUENR + 0.0bps; and pays USD LIBOR 1 Month 1.0 x US0003M + -38.5bps UBS 01/10/2019 USD17,193,852 2,366,785 Fund receives Interest 1.0 x NDWUENR + 0.0bps; and pays USD LIBOR 1 Month 1.0 x US0003M + -30.0bps UBS 01/10/2019 USD11,850,241 1,568,357 Fund receives Interest 1.0 x SPSIHOTR + 0.0bps; and pays USD LIBOR 1 Month 1.0 x US0003M + 28.0bps UBS 04/11/2019 USD25,202,435 1,320,222 Fund receives Interest 1.0 x SGSBS250 + 0.0bps; and pays USD LIBOR 1 Month 1.0 x US0003M + 0.3bps Societe Generale 07/10/2019 USD12,973,855 891,341 Fund receives Interest 1.0 x SGSBS250 + 0.0bps; and pays USD LIBOR 1 Month 1.0 x US0003M + 0.23bps Societe Generale 07/10/2019 USD7,818,231 537,135 Fund receives Interest 1.0 x SGSBS250 + 0.0bps; and pays USD LIBOR 1 Month 1.0 x US0003M + 23.0bps Societe Generale 07/10/2019 USD5,831,304 306,974 Fund receives Interest 1.0 x NDWUENR + 0.0bps; and pays USD LIBOR 1 Month 1.0 x US0003M + -54.0bps JP Morgan 01/10/2019 USD7,870,531 277,582 Fund receives Interest 1.0 x NDWUENR + 0.0bps; and pays USD LIBOR 1 Month 1.0 x US0003M + -30.0bps UBS 27/09/2019 USD211,386 29,098
Total unrealised gain on total return swaps 7,297,494 Fund pays Interest 1.0 x US0003M + 23.0bps; and receives USD LIBOR 1 Month 1.0 x SGSBS250 + 0.0bps Societe Generale 07/10/2019 USD4,412,551 (218,373) Fund pays Interest 1.0 x US0003M + 28.0bps; and receives USD LIBOR 1 Month 1.0 x SPSIHOTR + 0.0bps UBS 04/11/2019 USD1,369,182 (71,642) Fund pays Interest 1.0 x US0003M + 28.0bps; and receives USD LIBOR 1 Month 1.0 x SPSIHOTR + 0.0bps UBS 31/10/2019 USD1,286,761 (3,537)
Total unrealised loss on total return swaps (293,552)
Total net unrealised gain on total return swaps 7,003,942 Expiry Nominal Unrealised Denomination Counterparty Date Value Gain/(Loss) in sub-fund Base Invesco Global Targeted Returns Select II Fund AUD Fund receives Interest 1.0 x NDWUENR + 0.0bps; and pays USD LIBOR 1 Month 1.0 x US0003M + -30.0bps UBS 01/10/2019 USD19,064,593 3,967,561 Fund receives Interest 1.0 x SPSIHOTR + 0.0bps; and pays USD LIBOR 1 Month 1.0 x US0003M + 28.0bps UBS 04/11/2019 USD18,792,598 1,237,625 Fund receives Interest 1.0 x SGSBS250 + 0.0bps; and pays USD LIBOR 1 Month 1.0 x US0003M + 0.3bps Societe Generale 07/10/2019 USD8,028,803 850,077 Fund receives Interest 1.0 x SGSBS250 + 0.0bps; and pays USD LIBOR 1 Month 1.0 x US0003M + 30.0bps Societe Generale 07/10/2019 USD4,771,020 505,149 Fund receives Interest 1.0 x NDWUENR + 0.0bps; and pays USD LIBOR 1 Month 1.0 x US0003M + -54.0bps JP Morgan 01/10/2019 USD11,138,678 500,996 Fund receives Interest 1.0 x SGSBS250 + 0.0bps; and pays USD LIBOR 1 Month 1.0 x US0003M + 0.23bps Societe Generale 07/10/2019 USD3,056,754 323,645 Fund receives Interest 1.0 x SGSBS250 + 0.0bps; and pays USD LIBOR 1 Month 1.0 x US0003M + 23.0bps Societe Generale 07/10/2019 USD3,194,040 222,995 Fund receives Interest 1.0 x US0003M + 28.0bps; and pays USD LIBOR 1 Month 1.0 x SPSIHOTR + 0.0bps UBS 04/11/2019 USD718,520 9,376 Fund receives Interest 1.0 x US0003M + 23.0bps; and pays USD LIBOR 1 Month 1.0 x SGSBS250 + 0.0bps Societe Generale 07/10/2019 USD475,208 1,238
Total unrealised gain on total return swaps 7,618,662 Fund pays Interest 1.0 x US0003M + 23.0bps; and receives USD LIBOR 1 Month 1.0 x SGSBS250 + 0.0bps Societe Generale 07/10/2019 USD653,150 (69,154)
Total unrealised loss on total return swap (69,154)
Total net unrealised gain on total return swaps 7,549,508
Notes to the Financial Statements (continued)
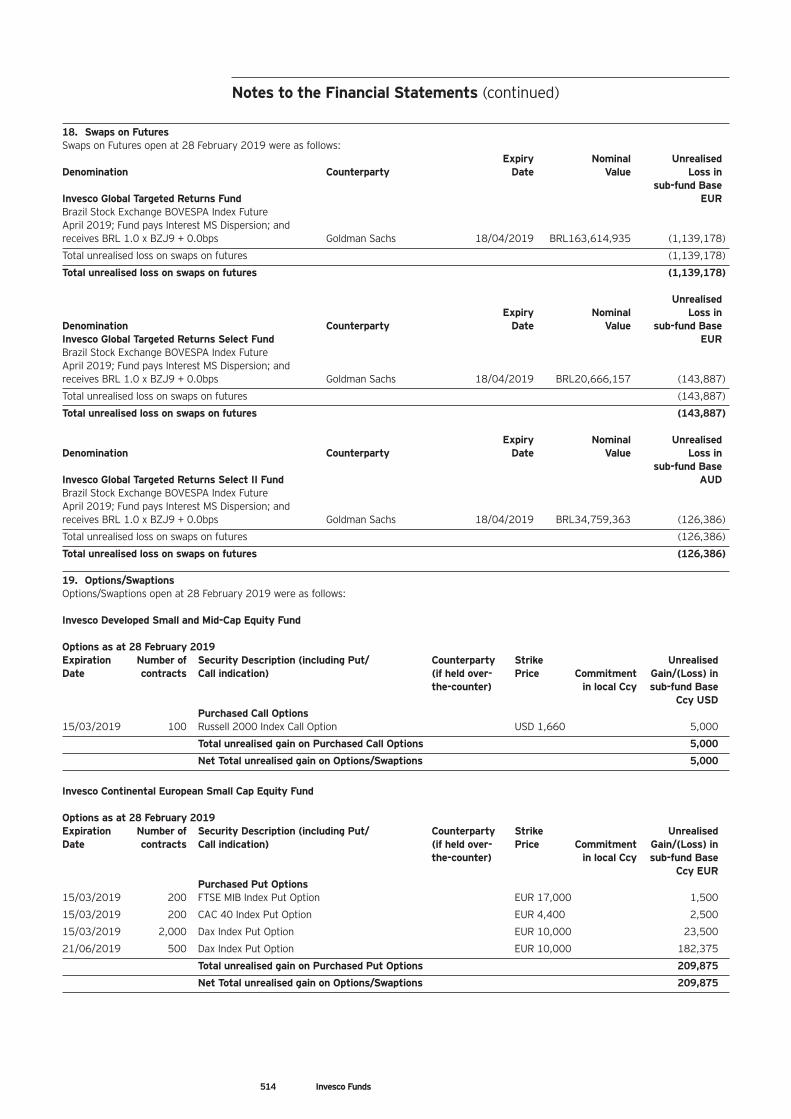
514 Invesco Funds
18. Swaps on Futures Swaps on Futures open at 28 February 2019 were as follows: Expiry Nominal Unrealised Denomination Counterparty Date Value Loss in sub-fund Base Invesco Global Targeted Returns Fund EUR Brazil Stock Exchange BOVESPA Index Future April 2019; Fund pays Interest MS Dispersion; and receives BRL 1.0 x BZJ9 + 0.0bps Goldman Sachs 18/04/2019 BRL163,614,935 (1,139,178)
Total unrealised loss on swaps on futures (1,139,178)
Total unrealised loss on swaps on futures (1,139,178) Unrealised Expiry Nominal Loss in Denomination Counterparty Date Value sub-fund Base Invesco Global Targeted Returns Select Fund EUR Brazil Stock Exchange BOVESPA Index Future April 2019; Fund pays Interest MS Dispersion; and receives BRL 1.0 x BZJ9 + 0.0bps Goldman Sachs 18/04/2019 BRL20,666,157 (143,887)
Total unrealised loss on swaps on futures (143,887)
Total unrealised loss on swaps on futures (143,887) Expiry Nominal Unrealised Denomination Counterparty Date Value Loss in sub-fund Base Invesco Global Targeted Returns Select II Fund AUD Brazil Stock Exchange BOVESPA Index Future April 2019; Fund pays Interest MS Dispersion; and receives BRL 1.0 x BZJ9 + 0.0bps Goldman Sachs 18/04/2019 BRL34,759,363 (126,386)
Total unrealised loss on swaps on futures (126,386)
Total unrealised loss on swaps on futures (126,386) 19. Options/Swaptions Options/Swaptions open at 28 February 2019 were as follows: Invesco Developed Small and Mid-Cap Equity Fund Options as at 28 February 2019 Expiration Number of Security Description (including Put/ Counterparty Strike Unrealised Date contracts Call indication) (if held over- Price Commitment Gain/(Loss) in
the-counter) in local Ccy sub-fund Base Ccy USD Purchased Call Options
15/03/2019 100 Russell 2000 Index Call Option USD 1,660 5,000
Total unrealised gain on Purchased Call Options 5,000
Net Total unrealised gain on Options/Swaptions 5,000
Invesco Continental European Small Cap Equity Fund Options as at 28 February 2019 Expiration Number of Security Description (including Put/ Counterparty Strike Unrealised Date contracts Call indication) (if held over- Price Commitment Gain/(Loss) in
the-counter) in local Ccy sub-fund Base Ccy EUR Purchased Put Options
15/03/2019 200 FTSE MIB Index Put Option EUR 17,000 1,500
15/03/2019 200 CAC 40 Index Put Option EUR 4,400 2,500
15/03/2019 2,000 Dax Index Put Option EUR 10,000 23,500
21/06/2019 500 Dax Index Put Option EUR 10,000 182,375
Total unrealised gain on Purchased Put Options 209,875
Net Total unrealised gain on Options/Swaptions 209,875
Notes to the Financial Statements (continued)
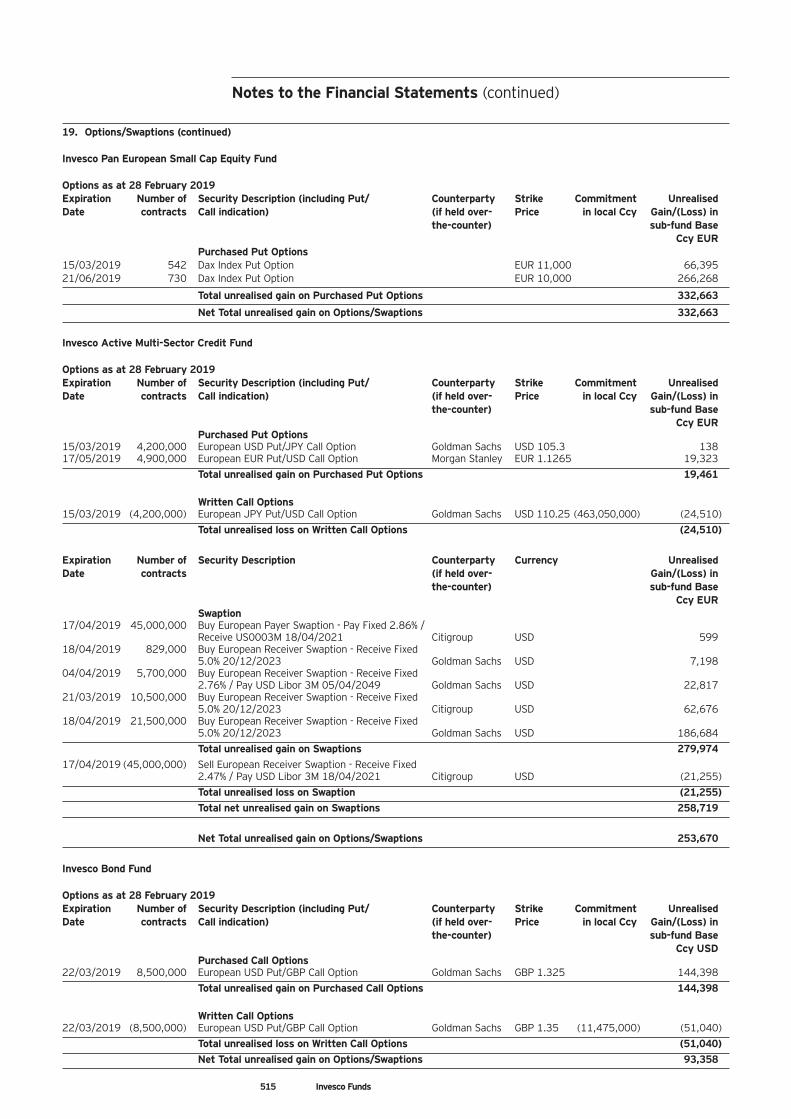
515 Invesco Funds
19. Options/Swaptions (continued) Invesco Pan European Small Cap Equity Fund Options as at 28 February 2019 Expiration Number of Security Description (including Put/ Counterparty Strike Commitment Unrealised Date contracts Call indication) (if held over- Price in local Ccy Gain/(Loss) in
the-counter) sub-fund Base Ccy EUR Purchased Put Options
15/03/2019 542 Dax Index Put Option EUR 11,000 66,395 21/06/2019 730 Dax Index Put Option EUR 10,000 266,268
Total unrealised gain on Purchased Put Options 332,663
Net Total unrealised gain on Options/Swaptions 332,663
Invesco Active Multi-Sector Credit Fund Options as at 28 February 2019 Expiration Number of Security Description (including Put/ Counterparty Strike Commitment Unrealised Date contracts Call indication) (if held over- Price in local Ccy Gain/(Loss) in
the-counter) sub-fund Base Ccy EUR Purchased Put Options
15/03/2019 4,200,000 European USD Put/JPY Call Option Goldman Sachs USD 105.3 138 17/05/2019 4,900,000 European EUR Put/USD Call Option Morgan Stanley EUR 1.1265 19,323
Total unrealised gain on Purchased Put Options 19,461 Written Call Options
15/03/2019 (4,200,000) European JPY Put/USD Call Option Goldman Sachs USD 110.25 (463,050,000) (24,510) Total unrealised loss on Written Call Options (24,510)
Expiration Number of Security Description Counterparty Currency Unrealised Date contracts (if held over- Gain/(Loss) in
the-counter) sub-fund Base Ccy EUR Swaption
17/04/2019 45,000,000 Buy European Payer Swaption - Pay Fixed 2.86% / Receive US0003M 18/04/2021 Citigroup USD 599
18/04/2019 829,000 Buy European Receiver Swaption - Receive Fixed 5.0% 20/12/2023 Goldman Sachs USD 7,198
04/04/2019 5,700,000 Buy European Receiver Swaption - Receive Fixed 2.76% / Pay USD Libor 3M 05/04/2049 Goldman Sachs USD 22,817
21/03/2019 10,500,000 Buy European Receiver Swaption - Receive Fixed 5.0% 20/12/2023 Citigroup USD 62,676
18/04/2019 21,500,000 Buy European Receiver Swaption - Receive Fixed 5.0% 20/12/2023 Goldman Sachs USD 186,684 Total unrealised gain on Swaptions 279,974
17/04/2019 (45,000,000) Sell European Receiver Swaption - Receive Fixed 2.47% / Pay USD Libor 3M 18/04/2021 Citigroup USD (21,255) Total unrealised loss on Swaption (21,255) Total net unrealised gain on Swaptions 258,719
Net Total unrealised gain on Options/Swaptions 253,670
Invesco Bond Fund Options as at 28 February 2019 Expiration Number of Security Description (including Put/ Counterparty Strike Commitment Unrealised Date contracts Call indication) (if held over- Price in local Ccy Gain/(Loss) in
the-counter) sub-fund Base Ccy USD Purchased Call Options
22/03/2019 8,500,000 European USD Put/GBP Call Option Goldman Sachs GBP 1.325 144,398 Total unrealised gain on Purchased Call Options 144,398
Written Call Options
22/03/2019 (8,500,000) European USD Put/GBP Call Option Goldman Sachs GBP 1.35 (11,475,000) (51,040) Total unrealised loss on Written Call Options (51,040)
Net Total unrealised gain on Options/Swaptions 93,358
Notes to the Financial Statements (continued)
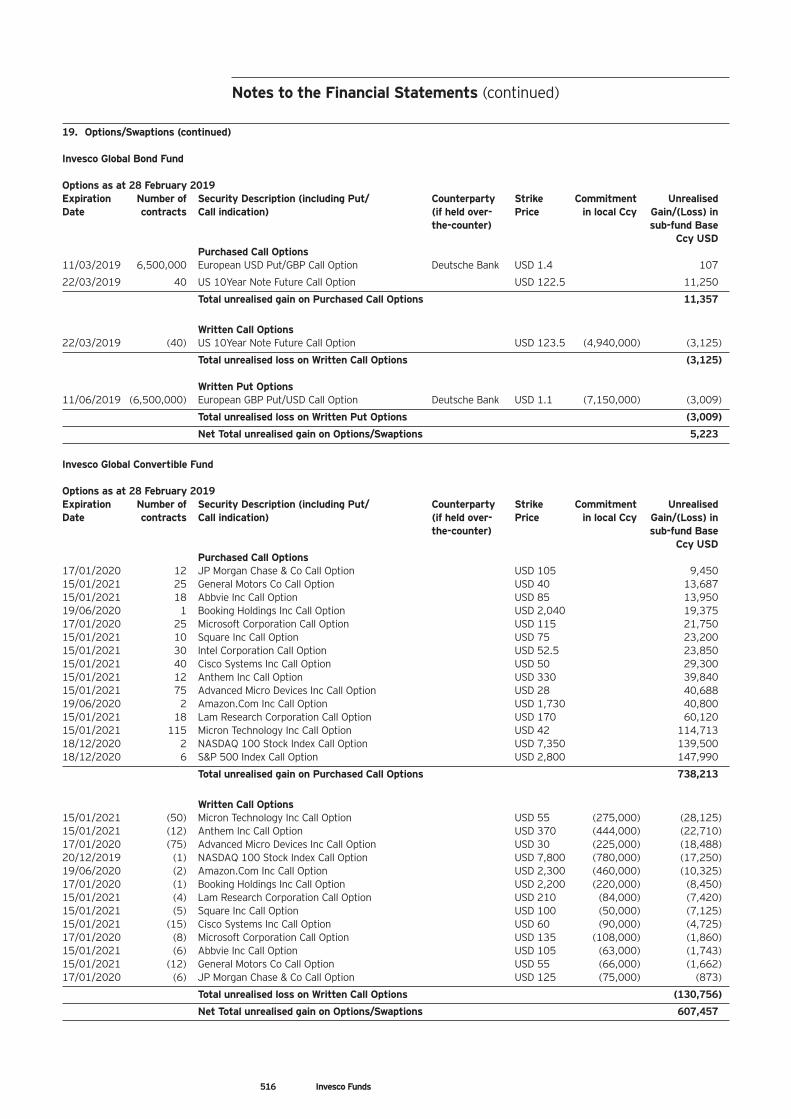
516 Invesco Funds
19. Options/Swaptions (continued) Invesco Global Bond Fund Options as at 28 February 2019 Expiration Number of Security Description (including Put/ Counterparty Strike Commitment Unrealised Date contracts Call indication) (if held over- Price in local Ccy Gain/(Loss) in
the-counter) sub-fund Base Ccy USD Purchased Call Options
11/03/2019 6,500,000 European USD Put/GBP Call Option Deutsche Bank USD 1.4 107
22/03/2019 40 US 10Year Note Future Call Option USD 122.5 11,250
Total unrealised gain on Purchased Call Options 11,357
Written Call Options
22/03/2019 (40) US 10Year Note Future Call Option USD 123.5 (4,940,000) (3,125)
Total unrealised loss on Written Call Options (3,125)
Written Put Options 11/06/2019 (6,500,000) European GBP Put/USD Call Option Deutsche Bank USD 1.1 (7,150,000) (3,009)
Total unrealised loss on Written Put Options (3,009)
Net Total unrealised gain on Options/Swaptions 5,223
Invesco Global Convertible Fund Options as at 28 February 2019 Expiration Number of Security Description (including Put/ Counterparty Strike Commitment Unrealised Date contracts Call indication) (if held over- Price in local Ccy Gain/(Loss) in
the-counter) sub-fund Base Ccy USD Purchased Call Options
17/01/2020 12 JP Morgan Chase & Co Call Option USD 105 9,450 15/01/2021 25 General Motors Co Call Option USD 40 13,687 15/01/2021 18 Abbvie Inc Call Option USD 85 13,950 19/06/2020 1 Booking Holdings Inc Call Option USD 2,040 19,375 17/01/2020 25 Microsoft Corporation Call Option USD 115 21,750 15/01/2021 10 Square Inc Call Option USD 75 23,200 15/01/2021 30 Intel Corporation Call Option USD 52.5 23,850 15/01/2021 40 Cisco Systems Inc Call Option USD 50 29,300 15/01/2021 12 Anthem Inc Call Option USD 330 39,840 15/01/2021 75 Advanced Micro Devices Inc Call Option USD 28 40,688 19/06/2020 2 Amazon.Com Inc Call Option USD 1,730 40,800 15/01/2021 18 Lam Research Corporation Call Option USD 170 60,120 15/01/2021 115 Micron Technology Inc Call Option USD 42 114,713 18/12/2020 2 NASDAQ 100 Stock Index Call Option USD 7,350 139,500 18/12/2020 6 S&P 500 Index Call Option USD 2,800 147,990
Total unrealised gain on Purchased Call Options 738,213
Written Call Options
15/01/2021 (50) Micron Technology Inc Call Option USD 55 (275,000) (28,125) 15/01/2021 (12) Anthem Inc Call Option USD 370 (444,000) (22,710) 17/01/2020 (75) Advanced Micro Devices Inc Call Option USD 30 (225,000) (18,488) 20/12/2019 (1) NASDAQ 100 Stock Index Call Option USD 7,800 (780,000) (17,250) 19/06/2020 (2) Amazon.Com Inc Call Option USD 2,300 (460,000) (10,325) 17/01/2020 (1) Booking Holdings Inc Call Option USD 2,200 (220,000) (8,450) 15/01/2021 (4) Lam Research Corporation Call Option USD 210 (84,000) (7,420) 15/01/2021 (5) Square Inc Call Option USD 100 (50,000) (7,125) 15/01/2021 (15) Cisco Systems Inc Call Option USD 60 (90,000) (4,725) 17/01/2020 (8) Microsoft Corporation Call Option USD 135 (108,000) (1,860) 15/01/2021 (6) Abbvie Inc Call Option USD 105 (63,000) (1,743) 15/01/2021 (12) General Motors Co Call Option USD 55 (66,000) (1,662) 17/01/2020 (6) JP Morgan Chase & Co Call Option USD 125 (75,000) (873)
Total unrealised loss on Written Call Options (130,756)
Net Total unrealised gain on Options/Swaptions 607,457
Notes to the Financial Statements (continued)

517 Invesco Funds
19. Options/Swaptions (continued) Invesco Unconstrained Bond Fund Options as at 28 February 2019 Expiration Number of Security Description (including Put/ Counterparty Strike Commitment Unrealised Date contracts Call indication) (if held over- Price in local Ccy Gain/(Loss) in
the-counter) sub-fund Base Ccy USD Purchased Call Options
22/03/2019 1,600,000 European USD Put/GBP Call Option Goldman Sachs GBP 1.325 27,181
Total unrealised gain on Purchased Call Options 27,181 Written Call Options
22/03/2019 (1,600,000) European USD Put/GBP Call Option Goldman Sachs GBP 1.35 (2,160,000) (9,608) Total unrealised loss on Written Call Options (9,608)
Net Total unrealised gain on Options/Swaptions 17,573
Invesco Global High Yield Short Term Bond Fund Expiration Number of Security Description Counterparty Unrealised Date contracts (if held over- Currency Gain/(Loss) in
the-counter) sub-fund Base Ccy USD Swaption Buy European Receiver Swaption - Receive Fixed
18/04/2019 400,000 5.0% 20/12/2023 Goldman Sachs USD 3,965
Total unrealised gain on Swaption 3,965 Total unrealised gain on Swaption 3,965
Net Total unrealised gain on Options/Swaptions 3,965
Invesco Global Total Return (EUR) Bond Fund Options as at 28 February 2019 Expiration Number of Security Description (including Put/ Counterparty Strike Commitment Unrealised Date contracts Call indication) (if held over- Price in local Ccy Gain/(Loss) in
the-counter) sub-fund Base Ccy EUR Purchased Call Options
22/03/2019 978 US 10Year Note Future Call Option USD 122.5 240,936
Total unrealised gain on Purchased Call Options 240,936
Written Call Options 22/03/2019 (978) US 10Year Note Future Call Option USD 123.5 (120,783,000) (66,927)
Total unrealised loss on Written Call Options (66,927)
Net Total unrealised gain on Options/Swaptions 174,009
Invesco Global Unconstrained Bond Fund Options as at 28 February 2019 Expiration Number of Security Description (including Put/ Counterparty Strike Commitment Unrealised Date contracts Call indication) (if held over- Price in local Ccy Gain/(Loss) in
the-counter) sub-fund Base Ccy GBP Purchased Call Options
22/03/2019 12 US 10Year Note Future Call Option USD 122.5 2,537
Total unrealised gain on Purchased Call Options 2,537 Written Call Options
22/03/2019 (12) US 10Year Note Future Call Option USD 123.5 (1,482,000) (705)
Total unrealised loss on Written Call Options (705)
Net Total unrealised gain on Options/Swaptions 1,832
Notes to the Financial Statements (continued)
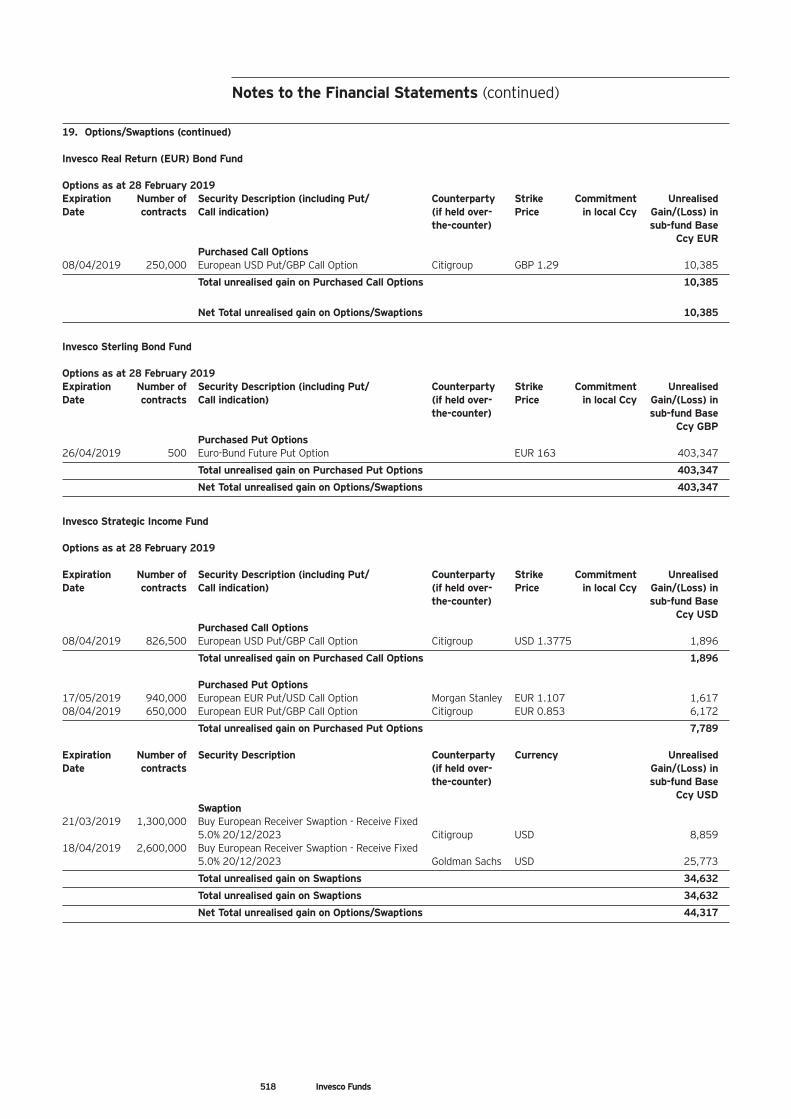
518 Invesco Funds
19. Options/Swaptions (continued) Invesco Real Return (EUR) Bond Fund Options as at 28 February 2019 Expiration Number of Security Description (including Put/ Counterparty Strike Commitment Unrealised Date contracts Call indication) (if held over- Price in local Ccy Gain/(Loss) in
the-counter) sub-fund Base Ccy EUR Purchased Call Options
08/04/2019 250,000 European USD Put/GBP Call Option Citigroup GBP 1.29 10,385
Total unrealised gain on Purchased Call Options 10,385
Net Total unrealised gain on Options/Swaptions 10,385
Invesco Sterling Bond Fund Options as at 28 February 2019 Expiration Number of Security Description (including Put/ Counterparty Strike Commitment Unrealised Date contracts Call indication) (if held over- Price in local Ccy Gain/(Loss) in
the-counter) sub-fund Base Ccy GBP Purchased Put Options
26/04/2019 500 Euro-Bund Future Put Option EUR 163 403,347
Total unrealised gain on Purchased Put Options 403,347
Net Total unrealised gain on Options/Swaptions 403,347
Invesco Strategic Income Fund Options as at 28 February 2019 Expiration Number of Security Description (including Put/ Counterparty Strike Commitment Unrealised Date contracts Call indication) (if held over- Price in local Ccy Gain/(Loss) in
the-counter) sub-fund Base Ccy USD Purchased Call Options
08/04/2019 826,500 European USD Put/GBP Call Option Citigroup USD 1.3775 1,896
Total unrealised gain on Purchased Call Options 1,896 Purchased Put Options
17/05/2019 940,000 European EUR Put/USD Call Option Morgan Stanley EUR 1.107 1,617 08/04/2019 650,000 European EUR Put/GBP Call Option Citigroup EUR 0.853 6,172
Total unrealised gain on Purchased Put Options 7,789 Expiration Number of Security Description Counterparty Currency Unrealised Date contracts (if held over- Gain/(Loss) in
the-counter) sub-fund Base Ccy USD Swaption
21/03/2019 1,300,000 Buy European Receiver Swaption - Receive Fixed 5.0% 20/12/2023 Citigroup USD 8,859
18/04/2019 2,600,000 Buy European Receiver Swaption - Receive Fixed 5.0% 20/12/2023 Goldman Sachs USD 25,773
Total unrealised gain on Swaptions 34,632
Total unrealised gain on Swaptions 34,632
Net Total unrealised gain on Options/Swaptions 44,317
Notes to the Financial Statements (continued)
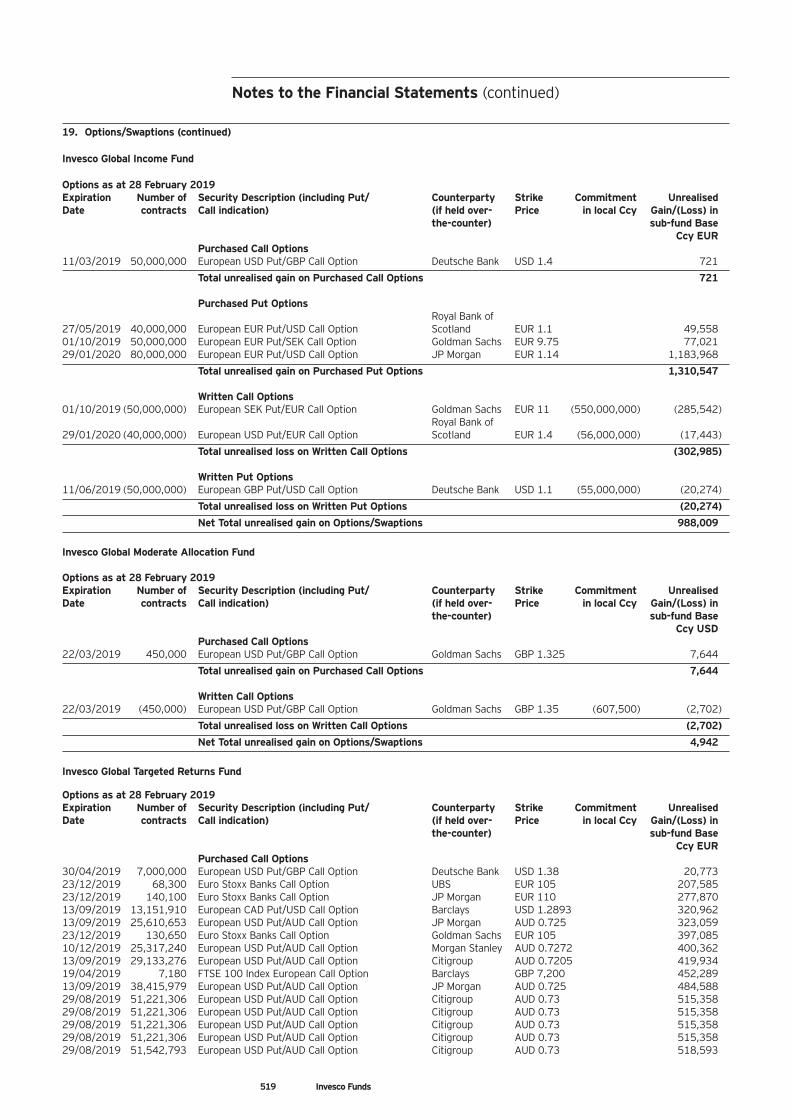
519 Invesco Funds
19. Options/Swaptions (continued) Invesco Global Income Fund Options as at 28 February 2019 Expiration Number of Security Description (including Put/ Counterparty Strike Commitment Unrealised Date contracts Call indication) (if held over- Price in local Ccy Gain/(Loss) in
the-counter) sub-fund Base Ccy EUR Purchased Call Options
11/03/2019 50,000,000 European USD Put/GBP Call Option Deutsche Bank USD 1.4 721
Total unrealised gain on Purchased Call Options 721
Purchased Put Options Royal Bank of
27/05/2019 40,000,000 European EUR Put/USD Call Option Scotland EUR 1.1 49,558 01/10/2019 50,000,000 European EUR Put/SEK Call Option Goldman Sachs EUR 9.75 77,021 29/01/2020 80,000,000 European EUR Put/USD Call Option JP Morgan EUR 1.14 1,183,968
Total unrealised gain on Purchased Put Options 1,310,547
Written Call Options 01/10/2019 (50,000,000) European SEK Put/EUR Call Option Goldman Sachs EUR 11 (550,000,000) (285,542)
Royal Bank of 29/01/2020 (40,000,000) European USD Put/EUR Call Option Scotland EUR 1.4 (56,000,000) (17,443)
Total unrealised loss on Written Call Options (302,985)
Written Put Options 11/06/2019 (50,000,000) European GBP Put/USD Call Option Deutsche Bank USD 1.1 (55,000,000) (20,274)
Total unrealised loss on Written Put Options (20,274)
Net Total unrealised gain on Options/Swaptions 988,009
Invesco Global Moderate Allocation Fund Options as at 28 February 2019 Expiration Number of Security Description (including Put/ Counterparty Strike Commitment Unrealised Date contracts Call indication) (if held over- Price in local Ccy Gain/(Loss) in
the-counter) sub-fund Base Ccy USD Purchased Call Options
22/03/2019 450,000 European USD Put/GBP Call Option Goldman Sachs GBP 1.325 7,644
Total unrealised gain on Purchased Call Options 7,644 Written Call Options
22/03/2019 (450,000) European USD Put/GBP Call Option Goldman Sachs GBP 1.35 (607,500) (2,702)
Total unrealised loss on Written Call Options (2,702)
Net Total unrealised gain on Options/Swaptions 4,942
Invesco Global Targeted Returns Fund Options as at 28 February 2019 Expiration Number of Security Description (including Put/ Counterparty Strike Commitment Unrealised Date contracts Call indication) (if held over- Price in local Ccy Gain/(Loss) in
the-counter) sub-fund Base Ccy EUR Purchased Call Options
30/04/2019 7,000,000 European USD Put/GBP Call Option Deutsche Bank USD 1.38 20,773 23/12/2019 68,300 Euro Stoxx Banks Call Option UBS EUR 105 207,585 23/12/2019 140,100 Euro Stoxx Banks Call Option JP Morgan EUR 110 277,870 13/09/2019 13,151,910 European CAD Put/USD Call Option Barclays USD 1.2893 320,962 13/09/2019 25,610,653 European USD Put/AUD Call Option JP Morgan AUD 0.725 323,059 23/12/2019 130,650 Euro Stoxx Banks Call Option Goldman Sachs EUR 105 397,085 10/12/2019 25,317,240 European USD Put/AUD Call Option Morgan Stanley AUD 0.7272 400,362 13/09/2019 29,133,276 European USD Put/AUD Call Option Citigroup AUD 0.7205 419,934 19/04/2019 7,180 FTSE 100 Index European Call Option Barclays GBP 7,200 452,289 13/09/2019 38,415,979 European USD Put/AUD Call Option JP Morgan AUD 0.725 484,588 29/08/2019 51,221,306 European USD Put/AUD Call Option Citigroup AUD 0.73 515,358 29/08/2019 51,221,306 European USD Put/AUD Call Option Citigroup AUD 0.73 515,358 29/08/2019 51,221,306 European USD Put/AUD Call Option Citigroup AUD 0.73 515,358 29/08/2019 51,221,306 European USD Put/AUD Call Option Citigroup AUD 0.73 515,358 29/08/2019 51,542,793 European USD Put/AUD Call Option Citigroup AUD 0.73 518,593
Notes to the Financial Statements (continued)
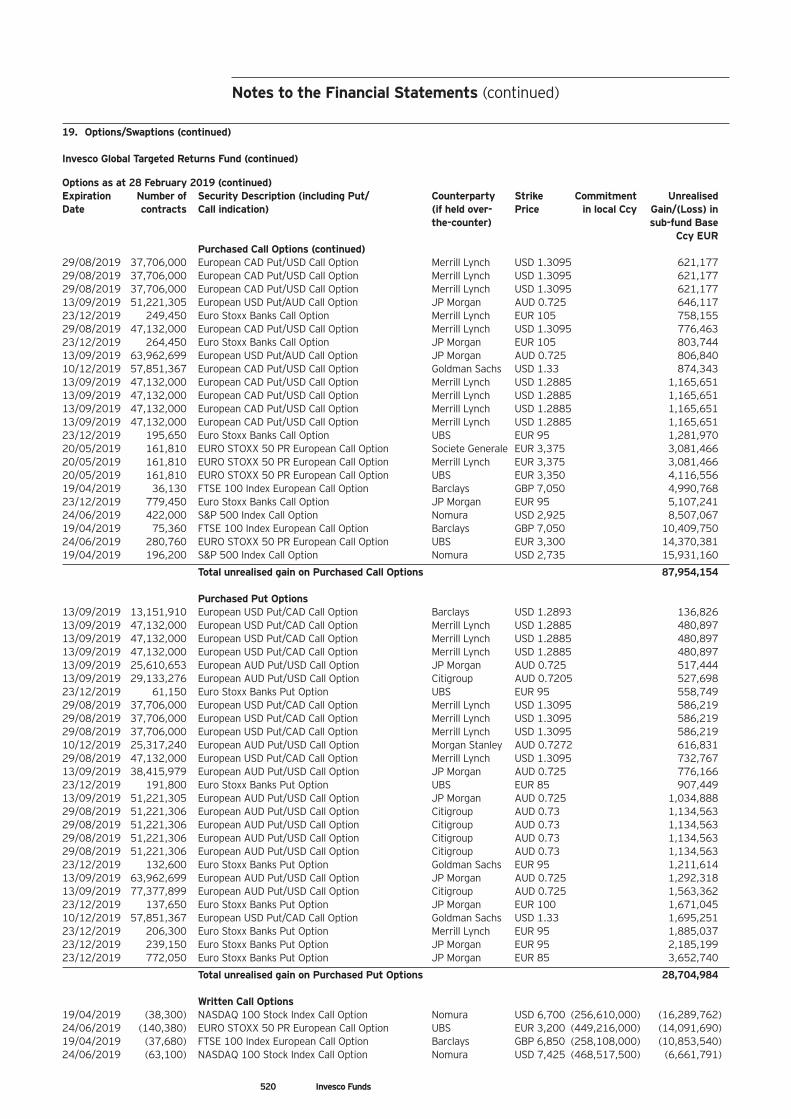
520 Invesco Funds
19. Options/Swaptions (continued) Invesco Global Targeted Returns Fund (continued) Options as at 28 February 2019 (continued) Expiration Number of Security Description (including Put/ Counterparty Strike Commitment Unrealised Date contracts Call indication) (if held over- Price in local Ccy Gain/(Loss) in
the-counter) sub-fund Base Ccy EUR Purchased Call Options (continued)
29/08/2019 37,706,000 European CAD Put/USD Call Option Merrill Lynch USD 1.3095 621,177 29/08/2019 37,706,000 European CAD Put/USD Call Option Merrill Lynch USD 1.3095 621,177 29/08/2019 37,706,000 European CAD Put/USD Call Option Merrill Lynch USD 1.3095 621,177 13/09/2019 51,221,305 European USD Put/AUD Call Option JP Morgan AUD 0.725 646,117 23/12/2019 249,450 Euro Stoxx Banks Call Option Merrill Lynch EUR 105 758,155 29/08/2019 47,132,000 European CAD Put/USD Call Option Merrill Lynch USD 1.3095 776,463 23/12/2019 264,450 Euro Stoxx Banks Call Option JP Morgan EUR 105 803,744 13/09/2019 63,962,699 European USD Put/AUD Call Option JP Morgan AUD 0.725 806,840 10/12/2019 57,851,367 European CAD Put/USD Call Option Goldman Sachs USD 1.33 874,343 13/09/2019 47,132,000 European CAD Put/USD Call Option Merrill Lynch USD 1.2885 1,165,651 13/09/2019 47,132,000 European CAD Put/USD Call Option Merrill Lynch USD 1.2885 1,165,651 13/09/2019 47,132,000 European CAD Put/USD Call Option Merrill Lynch USD 1.2885 1,165,651 13/09/2019 47,132,000 European CAD Put/USD Call Option Merrill Lynch USD 1.2885 1,165,651 23/12/2019 195,650 Euro Stoxx Banks Call Option UBS EUR 95 1,281,970 20/05/2019 161,810 EURO STOXX 50 PR European Call Option Societe Generale EUR 3,375 3,081,466 20/05/2019 161,810 EURO STOXX 50 PR European Call Option Merrill Lynch EUR 3,375 3,081,466 20/05/2019 161,810 EURO STOXX 50 PR European Call Option UBS EUR 3,350 4,116,556 19/04/2019 36,130 FTSE 100 Index European Call Option Barclays GBP 7,050 4,990,768 23/12/2019 779,450 Euro Stoxx Banks Call Option JP Morgan EUR 95 5,107,241 24/06/2019 422,000 S&P 500 Index Call Option Nomura USD 2,925 8,507,067 19/04/2019 75,360 FTSE 100 Index European Call Option Barclays GBP 7,050 10,409,750 24/06/2019 280,760 EURO STOXX 50 PR European Call Option UBS EUR 3,300 14,370,381 19/04/2019 196,200 S&P 500 Index Call Option Nomura USD 2,735 15,931,160
Total unrealised gain on Purchased Call Options 87,954,154 Purchased Put Options
13/09/2019 13,151,910 European USD Put/CAD Call Option Barclays USD 1.2893 136,826 13/09/2019 47,132,000 European USD Put/CAD Call Option Merrill Lynch USD 1.2885 480,897 13/09/2019 47,132,000 European USD Put/CAD Call Option Merrill Lynch USD 1.2885 480,897 13/09/2019 47,132,000 European USD Put/CAD Call Option Merrill Lynch USD 1.2885 480,897 13/09/2019 25,610,653 European AUD Put/USD Call Option JP Morgan AUD 0.725 517,444 13/09/2019 29,133,276 European AUD Put/USD Call Option Citigroup AUD 0.7205 527,698 23/12/2019 61,150 Euro Stoxx Banks Put Option UBS EUR 95 558,749 29/08/2019 37,706,000 European USD Put/CAD Call Option Merrill Lynch USD 1.3095 586,219 29/08/2019 37,706,000 European USD Put/CAD Call Option Merrill Lynch USD 1.3095 586,219 29/08/2019 37,706,000 European USD Put/CAD Call Option Merrill Lynch USD 1.3095 586,219 10/12/2019 25,317,240 European AUD Put/USD Call Option Morgan Stanley AUD 0.7272 616,831 29/08/2019 47,132,000 European USD Put/CAD Call Option Merrill Lynch USD 1.3095 732,767 13/09/2019 38,415,979 European AUD Put/USD Call Option JP Morgan AUD 0.725 776,166 23/12/2019 191,800 Euro Stoxx Banks Put Option UBS EUR 85 907,449 13/09/2019 51,221,305 European AUD Put/USD Call Option JP Morgan AUD 0.725 1,034,888 29/08/2019 51,221,306 European AUD Put/USD Call Option Citigroup AUD 0.73 1,134,563 29/08/2019 51,221,306 European AUD Put/USD Call Option Citigroup AUD 0.73 1,134,563 29/08/2019 51,221,306 European AUD Put/USD Call Option Citigroup AUD 0.73 1,134,563 29/08/2019 51,221,306 European AUD Put/USD Call Option Citigroup AUD 0.73 1,134,563 23/12/2019 132,600 Euro Stoxx Banks Put Option Goldman Sachs EUR 95 1,211,614 13/09/2019 63,962,699 European AUD Put/USD Call Option JP Morgan AUD 0.725 1,292,318 13/09/2019 77,377,899 European AUD Put/USD Call Option Citigroup AUD 0.725 1,563,362 23/12/2019 137,650 Euro Stoxx Banks Put Option JP Morgan EUR 100 1,671,045 10/12/2019 57,851,367 European USD Put/CAD Call Option Goldman Sachs USD 1.33 1,695,251 23/12/2019 206,300 Euro Stoxx Banks Put Option Merrill Lynch EUR 95 1,885,037 23/12/2019 239,150 Euro Stoxx Banks Put Option JP Morgan EUR 95 2,185,199 23/12/2019 772,050 Euro Stoxx Banks Put Option JP Morgan EUR 85 3,652,740
Total unrealised gain on Purchased Put Options 28,704,984 Written Call Options
19/04/2019 (38,300) NASDAQ 100 Stock Index Call Option Nomura USD 6,700 (256,610,000) (16,289,762) 24/06/2019 (140,380) EURO STOXX 50 PR European Call Option UBS EUR 3,200 (449,216,000) (14,091,690) 19/04/2019 (37,680) FTSE 100 Index European Call Option Barclays GBP 6,850 (258,108,000) (10,853,540) 24/06/2019 (63,100) NASDAQ 100 Stock Index Call Option Nomura USD 7,425 (468,517,500) (6,661,791)
Notes to the Financial Statements (continued)
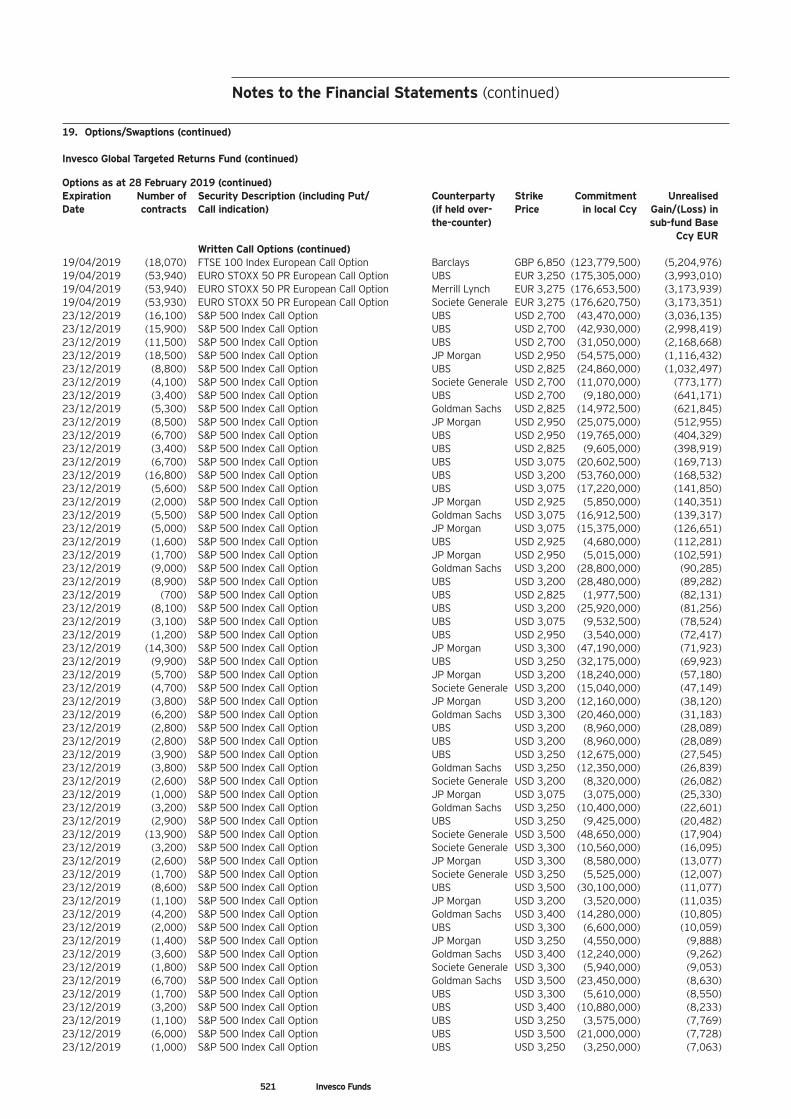
521 Invesco Funds
19. Options/Swaptions (continued) Invesco Global Targeted Returns Fund (continued) Options as at 28 February 2019 (continued) Expiration Number of Security Description (including Put/ Counterparty Strike Commitment Unrealised Date contracts Call indication) (if held over- Price in local Ccy Gain/(Loss) in
the-counter) sub-fund Base Ccy EUR Written Call Options (continued)
19/04/2019 (18,070) FTSE 100 Index European Call Option Barclays GBP 6,850 (123,779,500) (5,204,976) 19/04/2019 (53,940) EURO STOXX 50 PR European Call Option UBS EUR 3,250 (175,305,000) (3,993,010) 19/04/2019 (53,940) EURO STOXX 50 PR European Call Option Merrill Lynch EUR 3,275 (176,653,500) (3,173,939) 19/04/2019 (53,930) EURO STOXX 50 PR European Call Option Societe Generale EUR 3,275 (176,620,750) (3,173,351) 23/12/2019 (16,100) S&P 500 Index Call Option UBS USD 2,700 (43,470,000) (3,036,135) 23/12/2019 (15,900) S&P 500 Index Call Option UBS USD 2,700 (42,930,000) (2,998,419) 23/12/2019 (11,500) S&P 500 Index Call Option UBS USD 2,700 (31,050,000) (2,168,668) 23/12/2019 (18,500) S&P 500 Index Call Option JP Morgan USD 2,950 (54,575,000) (1,116,432) 23/12/2019 (8,800) S&P 500 Index Call Option UBS USD 2,825 (24,860,000) (1,032,497) 23/12/2019 (4,100) S&P 500 Index Call Option Societe Generale USD 2,700 (11,070,000) (773,177) 23/12/2019 (3,400) S&P 500 Index Call Option UBS USD 2,700 (9,180,000) (641,171) 23/12/2019 (5,300) S&P 500 Index Call Option Goldman Sachs USD 2,825 (14,972,500) (621,845) 23/12/2019 (8,500) S&P 500 Index Call Option JP Morgan USD 2,950 (25,075,000) (512,955) 23/12/2019 (6,700) S&P 500 Index Call Option UBS USD 2,950 (19,765,000) (404,329) 23/12/2019 (3,400) S&P 500 Index Call Option UBS USD 2,825 (9,605,000) (398,919) 23/12/2019 (6,700) S&P 500 Index Call Option UBS USD 3,075 (20,602,500) (169,713) 23/12/2019 (16,800) S&P 500 Index Call Option UBS USD 3,200 (53,760,000) (168,532) 23/12/2019 (5,600) S&P 500 Index Call Option UBS USD 3,075 (17,220,000) (141,850) 23/12/2019 (2,000) S&P 500 Index Call Option JP Morgan USD 2,925 (5,850,000) (140,351) 23/12/2019 (5,500) S&P 500 Index Call Option Goldman Sachs USD 3,075 (16,912,500) (139,317) 23/12/2019 (5,000) S&P 500 Index Call Option JP Morgan USD 3,075 (15,375,000) (126,651) 23/12/2019 (1,600) S&P 500 Index Call Option UBS USD 2,925 (4,680,000) (112,281) 23/12/2019 (1,700) S&P 500 Index Call Option JP Morgan USD 2,950 (5,015,000) (102,591) 23/12/2019 (9,000) S&P 500 Index Call Option Goldman Sachs USD 3,200 (28,800,000) (90,285) 23/12/2019 (8,900) S&P 500 Index Call Option UBS USD 3,200 (28,480,000) (89,282) 23/12/2019 (700) S&P 500 Index Call Option UBS USD 2,825 (1,977,500) (82,131) 23/12/2019 (8,100) S&P 500 Index Call Option UBS USD 3,200 (25,920,000) (81,256) 23/12/2019 (3,100) S&P 500 Index Call Option UBS USD 3,075 (9,532,500) (78,524) 23/12/2019 (1,200) S&P 500 Index Call Option UBS USD 2,950 (3,540,000) (72,417) 23/12/2019 (14,300) S&P 500 Index Call Option JP Morgan USD 3,300 (47,190,000) (71,923) 23/12/2019 (9,900) S&P 500 Index Call Option UBS USD 3,250 (32,175,000) (69,923) 23/12/2019 (5,700) S&P 500 Index Call Option JP Morgan USD 3,200 (18,240,000) (57,180) 23/12/2019 (4,700) S&P 500 Index Call Option Societe Generale USD 3,200 (15,040,000) (47,149) 23/12/2019 (3,800) S&P 500 Index Call Option JP Morgan USD 3,200 (12,160,000) (38,120) 23/12/2019 (6,200) S&P 500 Index Call Option Goldman Sachs USD 3,300 (20,460,000) (31,183) 23/12/2019 (2,800) S&P 500 Index Call Option UBS USD 3,200 (8,960,000) (28,089) 23/12/2019 (2,800) S&P 500 Index Call Option UBS USD 3,200 (8,960,000) (28,089) 23/12/2019 (3,900) S&P 500 Index Call Option UBS USD 3,250 (12,675,000) (27,545) 23/12/2019 (3,800) S&P 500 Index Call Option Goldman Sachs USD 3,250 (12,350,000) (26,839) 23/12/2019 (2,600) S&P 500 Index Call Option Societe Generale USD 3,200 (8,320,000) (26,082) 23/12/2019 (1,000) S&P 500 Index Call Option JP Morgan USD 3,075 (3,075,000) (25,330) 23/12/2019 (3,200) S&P 500 Index Call Option Goldman Sachs USD 3,250 (10,400,000) (22,601) 23/12/2019 (2,900) S&P 500 Index Call Option UBS USD 3,250 (9,425,000) (20,482) 23/12/2019 (13,900) S&P 500 Index Call Option Societe Generale USD 3,500 (48,650,000) (17,904) 23/12/2019 (3,200) S&P 500 Index Call Option Societe Generale USD 3,300 (10,560,000) (16,095) 23/12/2019 (2,600) S&P 500 Index Call Option JP Morgan USD 3,300 (8,580,000) (13,077) 23/12/2019 (1,700) S&P 500 Index Call Option Societe Generale USD 3,250 (5,525,000) (12,007) 23/12/2019 (8,600) S&P 500 Index Call Option UBS USD 3,500 (30,100,000) (11,077) 23/12/2019 (1,100) S&P 500 Index Call Option JP Morgan USD 3,200 (3,520,000) (11,035) 23/12/2019 (4,200) S&P 500 Index Call Option Goldman Sachs USD 3,400 (14,280,000) (10,805) 23/12/2019 (2,000) S&P 500 Index Call Option UBS USD 3,300 (6,600,000) (10,059) 23/12/2019 (1,400) S&P 500 Index Call Option JP Morgan USD 3,250 (4,550,000) (9,888) 23/12/2019 (3,600) S&P 500 Index Call Option Goldman Sachs USD 3,400 (12,240,000) (9,262) 23/12/2019 (1,800) S&P 500 Index Call Option Societe Generale USD 3,300 (5,940,000) (9,053) 23/12/2019 (6,700) S&P 500 Index Call Option Goldman Sachs USD 3,500 (23,450,000) (8,630) 23/12/2019 (1,700) S&P 500 Index Call Option UBS USD 3,300 (5,610,000) (8,550) 23/12/2019 (3,200) S&P 500 Index Call Option UBS USD 3,400 (10,880,000) (8,233) 23/12/2019 (1,100) S&P 500 Index Call Option UBS USD 3,250 (3,575,000) (7,769) 23/12/2019 (6,000) S&P 500 Index Call Option UBS USD 3,500 (21,000,000) (7,728) 23/12/2019 (1,000) S&P 500 Index Call Option UBS USD 3,250 (3,250,000) (7,063)
Notes to the Financial Statements (continued)
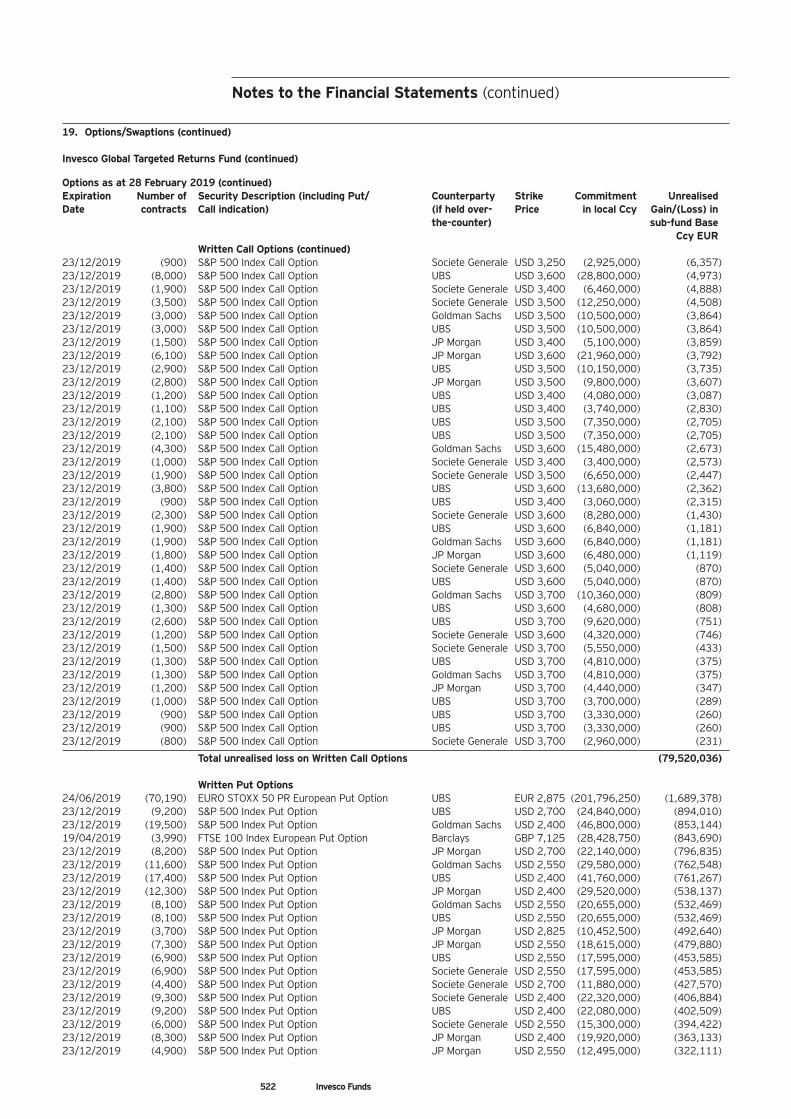
522 Invesco Funds
19. Options/Swaptions (continued) Invesco Global Targeted Returns Fund (continued) Options as at 28 February 2019 (continued) Expiration Number of Security Description (including Put/ Counterparty Strike Commitment Unrealised Date contracts Call indication) (if held over- Price in local Ccy Gain/(Loss) in
the-counter) sub-fund Base Ccy EUR Written Call Options (continued)
23/12/2019 (900) S&P 500 Index Call Option Societe Generale USD 3,250 (2,925,000) (6,357) 23/12/2019 (8,000) S&P 500 Index Call Option UBS USD 3,600 (28,800,000) (4,973) 23/12/2019 (1,900) S&P 500 Index Call Option Societe Generale USD 3,400 (6,460,000) (4,888) 23/12/2019 (3,500) S&P 500 Index Call Option Societe Generale USD 3,500 (12,250,000) (4,508) 23/12/2019 (3,000) S&P 500 Index Call Option Goldman Sachs USD 3,500 (10,500,000) (3,864) 23/12/2019 (3,000) S&P 500 Index Call Option UBS USD 3,500 (10,500,000) (3,864) 23/12/2019 (1,500) S&P 500 Index Call Option JP Morgan USD 3,400 (5,100,000) (3,859) 23/12/2019 (6,100) S&P 500 Index Call Option JP Morgan USD 3,600 (21,960,000) (3,792) 23/12/2019 (2,900) S&P 500 Index Call Option UBS USD 3,500 (10,150,000) (3,735) 23/12/2019 (2,800) S&P 500 Index Call Option JP Morgan USD 3,500 (9,800,000) (3,607) 23/12/2019 (1,200) S&P 500 Index Call Option UBS USD 3,400 (4,080,000) (3,087) 23/12/2019 (1,100) S&P 500 Index Call Option UBS USD 3,400 (3,740,000) (2,830) 23/12/2019 (2,100) S&P 500 Index Call Option UBS USD 3,500 (7,350,000) (2,705) 23/12/2019 (2,100) S&P 500 Index Call Option UBS USD 3,500 (7,350,000) (2,705) 23/12/2019 (4,300) S&P 500 Index Call Option Goldman Sachs USD 3,600 (15,480,000) (2,673) 23/12/2019 (1,000) S&P 500 Index Call Option Societe Generale USD 3,400 (3,400,000) (2,573) 23/12/2019 (1,900) S&P 500 Index Call Option Societe Generale USD 3,500 (6,650,000) (2,447) 23/12/2019 (3,800) S&P 500 Index Call Option UBS USD 3,600 (13,680,000) (2,362) 23/12/2019 (900) S&P 500 Index Call Option UBS USD 3,400 (3,060,000) (2,315) 23/12/2019 (2,300) S&P 500 Index Call Option Societe Generale USD 3,600 (8,280,000) (1,430) 23/12/2019 (1,900) S&P 500 Index Call Option UBS USD 3,600 (6,840,000) (1,181) 23/12/2019 (1,900) S&P 500 Index Call Option Goldman Sachs USD 3,600 (6,840,000) (1,181) 23/12/2019 (1,800) S&P 500 Index Call Option JP Morgan USD 3,600 (6,480,000) (1,119) 23/12/2019 (1,400) S&P 500 Index Call Option Societe Generale USD 3,600 (5,040,000) (870) 23/12/2019 (1,400) S&P 500 Index Call Option UBS USD 3,600 (5,040,000) (870) 23/12/2019 (2,800) S&P 500 Index Call Option Goldman Sachs USD 3,700 (10,360,000) (809) 23/12/2019 (1,300) S&P 500 Index Call Option UBS USD 3,600 (4,680,000) (808) 23/12/2019 (2,600) S&P 500 Index Call Option UBS USD 3,700 (9,620,000) (751) 23/12/2019 (1,200) S&P 500 Index Call Option Societe Generale USD 3,600 (4,320,000) (746) 23/12/2019 (1,500) S&P 500 Index Call Option Societe Generale USD 3,700 (5,550,000) (433) 23/12/2019 (1,300) S&P 500 Index Call Option UBS USD 3,700 (4,810,000) (375) 23/12/2019 (1,300) S&P 500 Index Call Option Goldman Sachs USD 3,700 (4,810,000) (375) 23/12/2019 (1,200) S&P 500 Index Call Option JP Morgan USD 3,700 (4,440,000) (347) 23/12/2019 (1,000) S&P 500 Index Call Option UBS USD 3,700 (3,700,000) (289) 23/12/2019 (900) S&P 500 Index Call Option UBS USD 3,700 (3,330,000) (260) 23/12/2019 (900) S&P 500 Index Call Option UBS USD 3,700 (3,330,000) (260) 23/12/2019 (800) S&P 500 Index Call Option Societe Generale USD 3,700 (2,960,000) (231)
Total unrealised loss on Written Call Options (79,520,036)
Written Put Options 24/06/2019 (70,190) EURO STOXX 50 PR European Put Option UBS EUR 2,875 (201,796,250) (1,689,378) 23/12/2019 (9,200) S&P 500 Index Put Option UBS USD 2,700 (24,840,000) (894,010) 23/12/2019 (19,500) S&P 500 Index Put Option Goldman Sachs USD 2,400 (46,800,000) (853,144) 19/04/2019 (3,990) FTSE 100 Index European Put Option Barclays GBP 7,125 (28,428,750) (843,690) 23/12/2019 (8,200) S&P 500 Index Put Option JP Morgan USD 2,700 (22,140,000) (796,835) 23/12/2019 (11,600) S&P 500 Index Put Option Goldman Sachs USD 2,550 (29,580,000) (762,548) 23/12/2019 (17,400) S&P 500 Index Put Option UBS USD 2,400 (41,760,000) (761,267) 23/12/2019 (12,300) S&P 500 Index Put Option JP Morgan USD 2,400 (29,520,000) (538,137) 23/12/2019 (8,100) S&P 500 Index Put Option Goldman Sachs USD 2,550 (20,655,000) (532,469) 23/12/2019 (8,100) S&P 500 Index Put Option UBS USD 2,550 (20,655,000) (532,469) 23/12/2019 (3,700) S&P 500 Index Put Option JP Morgan USD 2,825 (10,452,500) (492,640) 23/12/2019 (7,300) S&P 500 Index Put Option JP Morgan USD 2,550 (18,615,000) (479,880) 23/12/2019 (6,900) S&P 500 Index Put Option UBS USD 2,550 (17,595,000) (453,585) 23/12/2019 (6,900) S&P 500 Index Put Option Societe Generale USD 2,550 (17,595,000) (453,585) 23/12/2019 (4,400) S&P 500 Index Put Option Societe Generale USD 2,700 (11,880,000) (427,570) 23/12/2019 (9,300) S&P 500 Index Put Option Societe Generale USD 2,400 (22,320,000) (406,884) 23/12/2019 (9,200) S&P 500 Index Put Option UBS USD 2,400 (22,080,000) (402,509) 23/12/2019 (6,000) S&P 500 Index Put Option Societe Generale USD 2,550 (15,300,000) (394,422) 23/12/2019 (8,300) S&P 500 Index Put Option JP Morgan USD 2,400 (19,920,000) (363,133) 23/12/2019 (4,900) S&P 500 Index Put Option JP Morgan USD 2,550 (12,495,000) (322,111)
Notes to the Financial Statements (continued)
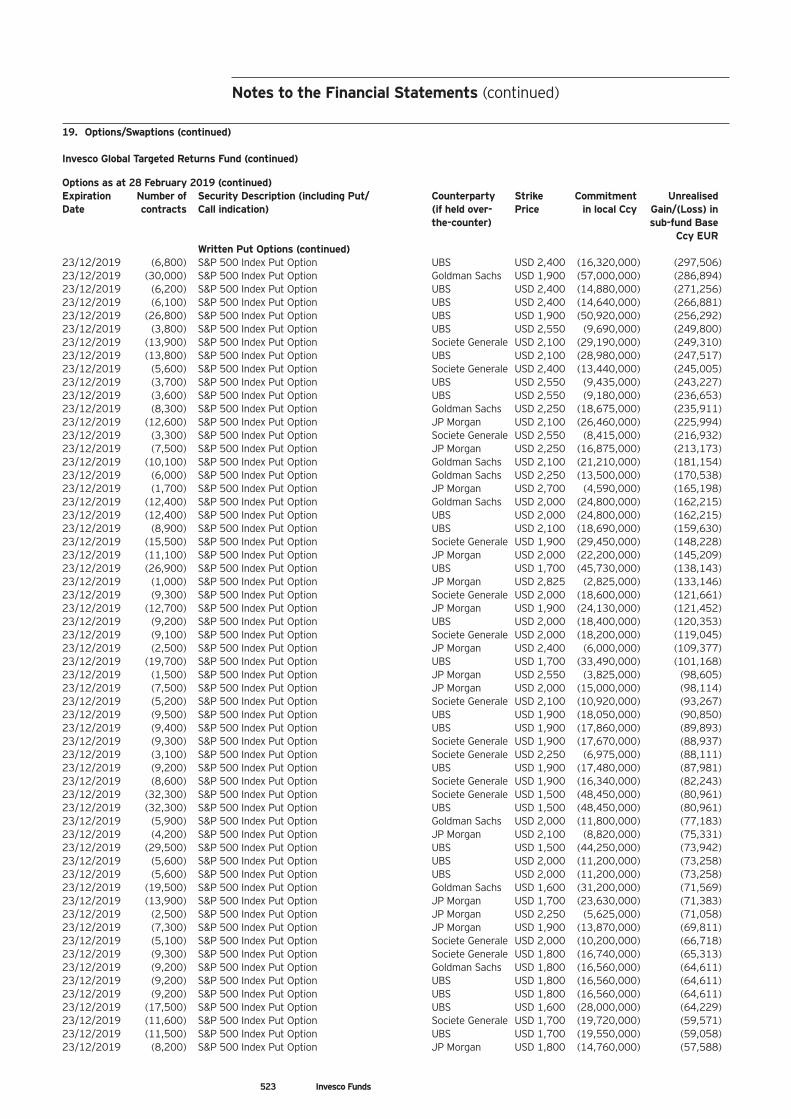
523 Invesco Funds
19. Options/Swaptions (continued) Invesco Global Targeted Returns Fund (continued) Options as at 28 February 2019 (continued) Expiration Number of Security Description (including Put/ Counterparty Strike Commitment Unrealised Date contracts Call indication) (if held over- Price in local Ccy Gain/(Loss) in
the-counter) sub-fund Base Ccy EUR Written Put Options (continued)
23/12/2019 (6,800) S&P 500 Index Put Option UBS USD 2,400 (16,320,000) (297,506) 23/12/2019 (30,000) S&P 500 Index Put Option Goldman Sachs USD 1,900 (57,000,000) (286,894) 23/12/2019 (6,200) S&P 500 Index Put Option UBS USD 2,400 (14,880,000) (271,256) 23/12/2019 (6,100) S&P 500 Index Put Option UBS USD 2,400 (14,640,000) (266,881) 23/12/2019 (26,800) S&P 500 Index Put Option UBS USD 1,900 (50,920,000) (256,292) 23/12/2019 (3,800) S&P 500 Index Put Option UBS USD 2,550 (9,690,000) (249,800) 23/12/2019 (13,900) S&P 500 Index Put Option Societe Generale USD 2,100 (29,190,000) (249,310) 23/12/2019 (13,800) S&P 500 Index Put Option UBS USD 2,100 (28,980,000) (247,517) 23/12/2019 (5,600) S&P 500 Index Put Option Societe Generale USD 2,400 (13,440,000) (245,005) 23/12/2019 (3,700) S&P 500 Index Put Option UBS USD 2,550 (9,435,000) (243,227) 23/12/2019 (3,600) S&P 500 Index Put Option UBS USD 2,550 (9,180,000) (236,653) 23/12/2019 (8,300) S&P 500 Index Put Option Goldman Sachs USD 2,250 (18,675,000) (235,911) 23/12/2019 (12,600) S&P 500 Index Put Option JP Morgan USD 2,100 (26,460,000) (225,994) 23/12/2019 (3,300) S&P 500 Index Put Option Societe Generale USD 2,550 (8,415,000) (216,932) 23/12/2019 (7,500) S&P 500 Index Put Option JP Morgan USD 2,250 (16,875,000) (213,173) 23/12/2019 (10,100) S&P 500 Index Put Option Goldman Sachs USD 2,100 (21,210,000) (181,154) 23/12/2019 (6,000) S&P 500 Index Put Option Goldman Sachs USD 2,250 (13,500,000) (170,538) 23/12/2019 (1,700) S&P 500 Index Put Option JP Morgan USD 2,700 (4,590,000) (165,198) 23/12/2019 (12,400) S&P 500 Index Put Option Goldman Sachs USD 2,000 (24,800,000) (162,215) 23/12/2019 (12,400) S&P 500 Index Put Option UBS USD 2,000 (24,800,000) (162,215) 23/12/2019 (8,900) S&P 500 Index Put Option UBS USD 2,100 (18,690,000) (159,630) 23/12/2019 (15,500) S&P 500 Index Put Option Societe Generale USD 1,900 (29,450,000) (148,228) 23/12/2019 (11,100) S&P 500 Index Put Option JP Morgan USD 2,000 (22,200,000) (145,209) 23/12/2019 (26,900) S&P 500 Index Put Option UBS USD 1,700 (45,730,000) (138,143) 23/12/2019 (1,000) S&P 500 Index Put Option JP Morgan USD 2,825 (2,825,000) (133,146) 23/12/2019 (9,300) S&P 500 Index Put Option Societe Generale USD 2,000 (18,600,000) (121,661) 23/12/2019 (12,700) S&P 500 Index Put Option JP Morgan USD 1,900 (24,130,000) (121,452) 23/12/2019 (9,200) S&P 500 Index Put Option UBS USD 2,000 (18,400,000) (120,353) 23/12/2019 (9,100) S&P 500 Index Put Option Societe Generale USD 2,000 (18,200,000) (119,045) 23/12/2019 (2,500) S&P 500 Index Put Option JP Morgan USD 2,400 (6,000,000) (109,377) 23/12/2019 (19,700) S&P 500 Index Put Option UBS USD 1,700 (33,490,000) (101,168) 23/12/2019 (1,500) S&P 500 Index Put Option JP Morgan USD 2,550 (3,825,000) (98,605) 23/12/2019 (7,500) S&P 500 Index Put Option JP Morgan USD 2,000 (15,000,000) (98,114) 23/12/2019 (5,200) S&P 500 Index Put Option Societe Generale USD 2,100 (10,920,000) (93,267) 23/12/2019 (9,500) S&P 500 Index Put Option UBS USD 1,900 (18,050,000) (90,850) 23/12/2019 (9,400) S&P 500 Index Put Option UBS USD 1,900 (17,860,000) (89,893) 23/12/2019 (9,300) S&P 500 Index Put Option Societe Generale USD 1,900 (17,670,000) (88,937) 23/12/2019 (3,100) S&P 500 Index Put Option Societe Generale USD 2,250 (6,975,000) (88,111) 23/12/2019 (9,200) S&P 500 Index Put Option UBS USD 1,900 (17,480,000) (87,981) 23/12/2019 (8,600) S&P 500 Index Put Option Societe Generale USD 1,900 (16,340,000) (82,243) 23/12/2019 (32,300) S&P 500 Index Put Option Societe Generale USD 1,500 (48,450,000) (80,961) 23/12/2019 (32,300) S&P 500 Index Put Option UBS USD 1,500 (48,450,000) (80,961) 23/12/2019 (5,900) S&P 500 Index Put Option Goldman Sachs USD 2,000 (11,800,000) (77,183) 23/12/2019 (4,200) S&P 500 Index Put Option JP Morgan USD 2,100 (8,820,000) (75,331) 23/12/2019 (29,500) S&P 500 Index Put Option UBS USD 1,500 (44,250,000) (73,942) 23/12/2019 (5,600) S&P 500 Index Put Option UBS USD 2,000 (11,200,000) (73,258) 23/12/2019 (5,600) S&P 500 Index Put Option UBS USD 2,000 (11,200,000) (73,258) 23/12/2019 (19,500) S&P 500 Index Put Option Goldman Sachs USD 1,600 (31,200,000) (71,569) 23/12/2019 (13,900) S&P 500 Index Put Option JP Morgan USD 1,700 (23,630,000) (71,383) 23/12/2019 (2,500) S&P 500 Index Put Option JP Morgan USD 2,250 (5,625,000) (71,058) 23/12/2019 (7,300) S&P 500 Index Put Option JP Morgan USD 1,900 (13,870,000) (69,811) 23/12/2019 (5,100) S&P 500 Index Put Option Societe Generale USD 2,000 (10,200,000) (66,718) 23/12/2019 (9,300) S&P 500 Index Put Option Societe Generale USD 1,800 (16,740,000) (65,313) 23/12/2019 (9,200) S&P 500 Index Put Option Goldman Sachs USD 1,800 (16,560,000) (64,611) 23/12/2019 (9,200) S&P 500 Index Put Option UBS USD 1,800 (16,560,000) (64,611) 23/12/2019 (9,200) S&P 500 Index Put Option UBS USD 1,800 (16,560,000) (64,611) 23/12/2019 (17,500) S&P 500 Index Put Option UBS USD 1,600 (28,000,000) (64,229) 23/12/2019 (11,600) S&P 500 Index Put Option Societe Generale USD 1,700 (19,720,000) (59,571) 23/12/2019 (11,500) S&P 500 Index Put Option UBS USD 1,700 (19,550,000) (59,058) 23/12/2019 (8,200) S&P 500 Index Put Option JP Morgan USD 1,800 (14,760,000) (57,588)
Notes to the Financial Statements (continued)
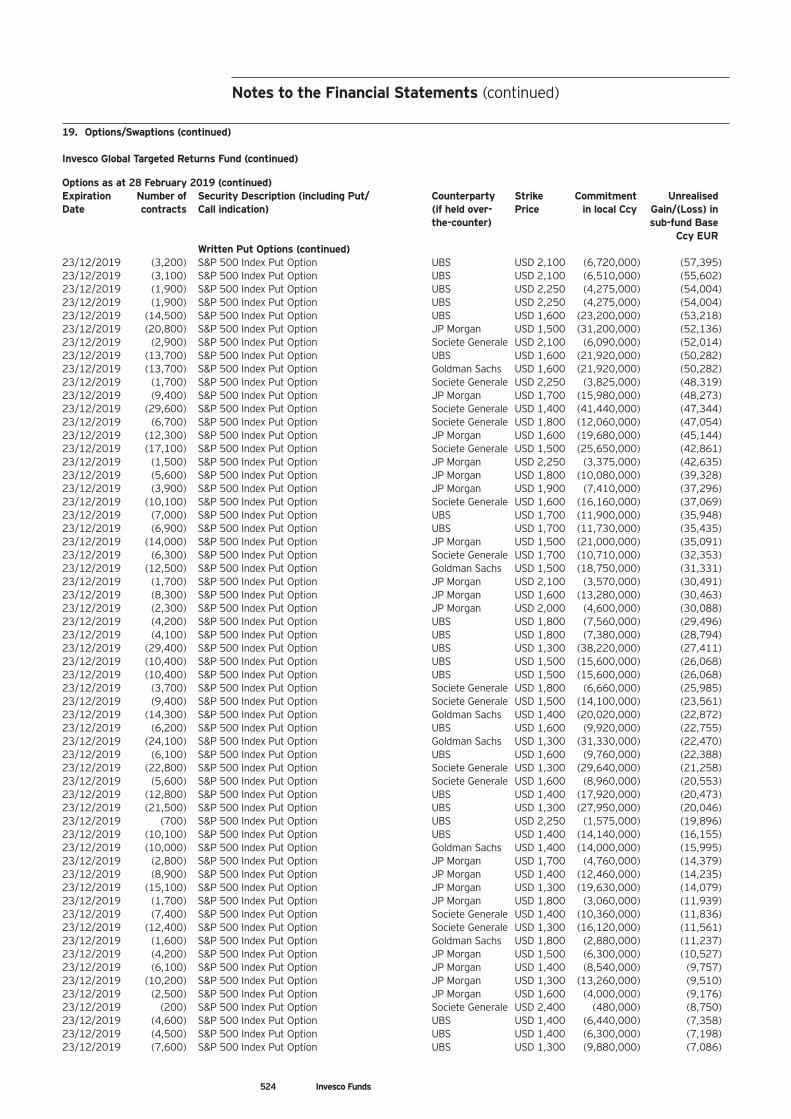
524 Invesco Funds
19. Options/Swaptions (continued) Invesco Global Targeted Returns Fund (continued) Options as at 28 February 2019 (continued) Expiration Number of Security Description (including Put/ Counterparty Strike Commitment Unrealised Date contracts Call indication) (if held over- Price in local Ccy Gain/(Loss) in
the-counter) sub-fund Base Ccy EUR Written Put Options (continued)
23/12/2019 (3,200) S&P 500 Index Put Option UBS USD 2,100 (6,720,000) (57,395) 23/12/2019 (3,100) S&P 500 Index Put Option UBS USD 2,100 (6,510,000) (55,602) 23/12/2019 (1,900) S&P 500 Index Put Option UBS USD 2,250 (4,275,000) (54,004) 23/12/2019 (1,900) S&P 500 Index Put Option UBS USD 2,250 (4,275,000) (54,004) 23/12/2019 (14,500) S&P 500 Index Put Option UBS USD 1,600 (23,200,000) (53,218) 23/12/2019 (20,800) S&P 500 Index Put Option JP Morgan USD 1,500 (31,200,000) (52,136) 23/12/2019 (2,900) S&P 500 Index Put Option Societe Generale USD 2,100 (6,090,000) (52,014) 23/12/2019 (13,700) S&P 500 Index Put Option UBS USD 1,600 (21,920,000) (50,282) 23/12/2019 (13,700) S&P 500 Index Put Option Goldman Sachs USD 1,600 (21,920,000) (50,282) 23/12/2019 (1,700) S&P 500 Index Put Option Societe Generale USD 2,250 (3,825,000) (48,319) 23/12/2019 (9,400) S&P 500 Index Put Option JP Morgan USD 1,700 (15,980,000) (48,273) 23/12/2019 (29,600) S&P 500 Index Put Option Societe Generale USD 1,400 (41,440,000) (47,344) 23/12/2019 (6,700) S&P 500 Index Put Option Societe Generale USD 1,800 (12,060,000) (47,054) 23/12/2019 (12,300) S&P 500 Index Put Option JP Morgan USD 1,600 (19,680,000) (45,144) 23/12/2019 (17,100) S&P 500 Index Put Option Societe Generale USD 1,500 (25,650,000) (42,861) 23/12/2019 (1,500) S&P 500 Index Put Option JP Morgan USD 2,250 (3,375,000) (42,635) 23/12/2019 (5,600) S&P 500 Index Put Option JP Morgan USD 1,800 (10,080,000) (39,328) 23/12/2019 (3,900) S&P 500 Index Put Option JP Morgan USD 1,900 (7,410,000) (37,296) 23/12/2019 (10,100) S&P 500 Index Put Option Societe Generale USD 1,600 (16,160,000) (37,069) 23/12/2019 (7,000) S&P 500 Index Put Option UBS USD 1,700 (11,900,000) (35,948) 23/12/2019 (6,900) S&P 500 Index Put Option UBS USD 1,700 (11,730,000) (35,435) 23/12/2019 (14,000) S&P 500 Index Put Option JP Morgan USD 1,500 (21,000,000) (35,091) 23/12/2019 (6,300) S&P 500 Index Put Option Societe Generale USD 1,700 (10,710,000) (32,353) 23/12/2019 (12,500) S&P 500 Index Put Option Goldman Sachs USD 1,500 (18,750,000) (31,331) 23/12/2019 (1,700) S&P 500 Index Put Option JP Morgan USD 2,100 (3,570,000) (30,491) 23/12/2019 (8,300) S&P 500 Index Put Option JP Morgan USD 1,600 (13,280,000) (30,463) 23/12/2019 (2,300) S&P 500 Index Put Option JP Morgan USD 2,000 (4,600,000) (30,088) 23/12/2019 (4,200) S&P 500 Index Put Option UBS USD 1,800 (7,560,000) (29,496) 23/12/2019 (4,100) S&P 500 Index Put Option UBS USD 1,800 (7,380,000) (28,794) 23/12/2019 (29,400) S&P 500 Index Put Option UBS USD 1,300 (38,220,000) (27,411) 23/12/2019 (10,400) S&P 500 Index Put Option UBS USD 1,500 (15,600,000) (26,068) 23/12/2019 (10,400) S&P 500 Index Put Option UBS USD 1,500 (15,600,000) (26,068) 23/12/2019 (3,700) S&P 500 Index Put Option Societe Generale USD 1,800 (6,660,000) (25,985) 23/12/2019 (9,400) S&P 500 Index Put Option Societe Generale USD 1,500 (14,100,000) (23,561) 23/12/2019 (14,300) S&P 500 Index Put Option Goldman Sachs USD 1,400 (20,020,000) (22,872) 23/12/2019 (6,200) S&P 500 Index Put Option UBS USD 1,600 (9,920,000) (22,755) 23/12/2019 (24,100) S&P 500 Index Put Option Goldman Sachs USD 1,300 (31,330,000) (22,470) 23/12/2019 (6,100) S&P 500 Index Put Option UBS USD 1,600 (9,760,000) (22,388) 23/12/2019 (22,800) S&P 500 Index Put Option Societe Generale USD 1,300 (29,640,000) (21,258) 23/12/2019 (5,600) S&P 500 Index Put Option Societe Generale USD 1,600 (8,960,000) (20,553) 23/12/2019 (12,800) S&P 500 Index Put Option UBS USD 1,400 (17,920,000) (20,473) 23/12/2019 (21,500) S&P 500 Index Put Option UBS USD 1,300 (27,950,000) (20,046) 23/12/2019 (700) S&P 500 Index Put Option UBS USD 2,250 (1,575,000) (19,896) 23/12/2019 (10,100) S&P 500 Index Put Option UBS USD 1,400 (14,140,000) (16,155) 23/12/2019 (10,000) S&P 500 Index Put Option Goldman Sachs USD 1,400 (14,000,000) (15,995) 23/12/2019 (2,800) S&P 500 Index Put Option JP Morgan USD 1,700 (4,760,000) (14,379) 23/12/2019 (8,900) S&P 500 Index Put Option JP Morgan USD 1,400 (12,460,000) (14,235) 23/12/2019 (15,100) S&P 500 Index Put Option JP Morgan USD 1,300 (19,630,000) (14,079) 23/12/2019 (1,700) S&P 500 Index Put Option JP Morgan USD 1,800 (3,060,000) (11,939) 23/12/2019 (7,400) S&P 500 Index Put Option Societe Generale USD 1,400 (10,360,000) (11,836) 23/12/2019 (12,400) S&P 500 Index Put Option Societe Generale USD 1,300 (16,120,000) (11,561) 23/12/2019 (1,600) S&P 500 Index Put Option Goldman Sachs USD 1,800 (2,880,000) (11,237) 23/12/2019 (4,200) S&P 500 Index Put Option JP Morgan USD 1,500 (6,300,000) (10,527) 23/12/2019 (6,100) S&P 500 Index Put Option JP Morgan USD 1,400 (8,540,000) (9,757) 23/12/2019 (10,200) S&P 500 Index Put Option JP Morgan USD 1,300 (13,260,000) (9,510) 23/12/2019 (2,500) S&P 500 Index Put Option JP Morgan USD 1,600 (4,000,000) (9,176) 23/12/2019 (200) S&P 500 Index Put Option Societe Generale USD 2,400 (480,000) (8,750) 23/12/2019 (4,600) S&P 500 Index Put Option UBS USD 1,400 (6,440,000) (7,358) 23/12/2019 (4,500) S&P 500 Index Put Option UBS USD 1,400 (6,300,000) (7,198) 23/12/2019 (7,600) S&P 500 Index Put Option UBS USD 1,300 (9,880,000) (7,086)
Notes to the Financial Statements (continued)
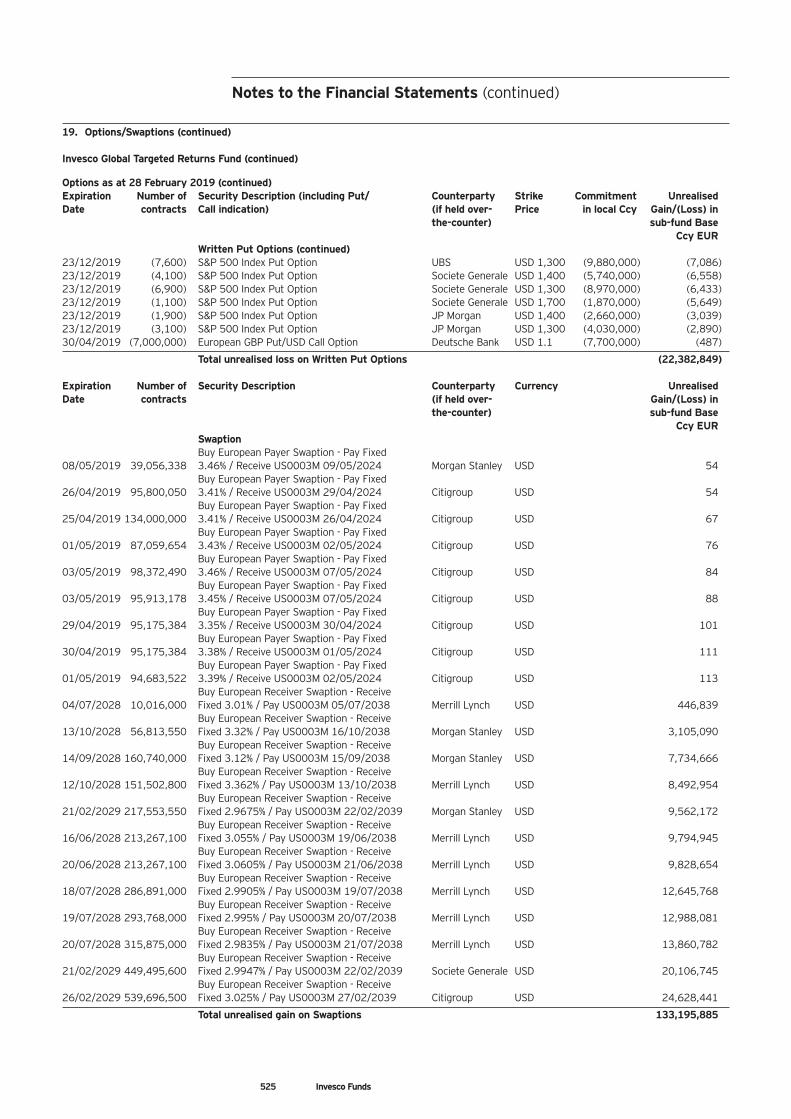
525 Invesco Funds
19. Options/Swaptions (continued) Invesco Global Targeted Returns Fund (continued) Options as at 28 February 2019 (continued) Expiration Number of Security Description (including Put/ Counterparty Strike Commitment Unrealised Date contracts Call indication) (if held over- Price in local Ccy Gain/(Loss) in
the-counter) sub-fund Base Ccy EUR Written Put Options (continued)
23/12/2019 (7,600) S&P 500 Index Put Option UBS USD 1,300 (9,880,000) (7,086) 23/12/2019 (4,100) S&P 500 Index Put Option Societe Generale USD 1,400 (5,740,000) (6,558) 23/12/2019 (6,900) S&P 500 Index Put Option Societe Generale USD 1,300 (8,970,000) (6,433) 23/12/2019 (1,100) S&P 500 Index Put Option Societe Generale USD 1,700 (1,870,000) (5,649) 23/12/2019 (1,900) S&P 500 Index Put Option JP Morgan USD 1,400 (2,660,000) (3,039) 23/12/2019 (3,100) S&P 500 Index Put Option JP Morgan USD 1,300 (4,030,000) (2,890) 30/04/2019 (7,000,000) European GBP Put/USD Call Option Deutsche Bank USD 1.1 (7,700,000) (487)
Total unrealised loss on Written Put Options (22,382,849) Expiration Number of Security Description Counterparty Currency Unrealised Date contracts (if held over- Gain/(Loss) in
the-counter) sub-fund Base Ccy EUR Swaption Buy European Payer Swaption - Pay Fixed
08/05/2019 39,056,338 3.46% / Receive US0003M 09/05/2024 Morgan Stanley USD 54 Buy European Payer Swaption - Pay Fixed
26/04/2019 95,800,050 3.41% / Receive US0003M 29/04/2024 Citigroup USD 54 Buy European Payer Swaption - Pay Fixed
25/04/2019 134,000,000 3.41% / Receive US0003M 26/04/2024 Citigroup USD 67 Buy European Payer Swaption - Pay Fixed
01/05/2019 87,059,654 3.43% / Receive US0003M 02/05/2024 Citigroup USD 76 Buy European Payer Swaption - Pay Fixed
03/05/2019 98,372,490 3.46% / Receive US0003M 07/05/2024 Citigroup USD 84 Buy European Payer Swaption - Pay Fixed
03/05/2019 95,913,178 3.45% / Receive US0003M 07/05/2024 Citigroup USD 88 Buy European Payer Swaption - Pay Fixed
29/04/2019 95,175,384 3.35% / Receive US0003M 30/04/2024 Citigroup USD 101 Buy European Payer Swaption - Pay Fixed
30/04/2019 95,175,384 3.38% / Receive US0003M 01/05/2024 Citigroup USD 111 Buy European Payer Swaption - Pay Fixed
01/05/2019 94,683,522 3.39% / Receive US0003M 02/05/2024 Citigroup USD 113 Buy European Receiver Swaption - Receive
04/07/2028 10,016,000 Fixed 3.01% / Pay US0003M 05/07/2038 Merrill Lynch USD 446,839 Buy European Receiver Swaption - Receive
13/10/2028 56,813,550 Fixed 3.32% / Pay US0003M 16/10/2038 Morgan Stanley USD 3,105,090 Buy European Receiver Swaption - Receive
14/09/2028 160,740,000 Fixed 3.12% / Pay US0003M 15/09/2038 Morgan Stanley USD 7,734,666 Buy European Receiver Swaption - Receive
12/10/2028 151,502,800 Fixed 3.362% / Pay US0003M 13/10/2038 Merrill Lynch USD 8,492,954 Buy European Receiver Swaption - Receive
21/02/2029 217,553,550 Fixed 2.9675% / Pay US0003M 22/02/2039 Morgan Stanley USD 9,562,172 Buy European Receiver Swaption - Receive
16/06/2028 213,267,100 Fixed 3.055% / Pay US0003M 19/06/2038 Merrill Lynch USD 9,794,945 Buy European Receiver Swaption - Receive
20/06/2028 213,267,100 Fixed 3.0605% / Pay US0003M 21/06/2038 Merrill Lynch USD 9,828,654 Buy European Receiver Swaption - Receive
18/07/2028 286,891,000 Fixed 2.9905% / Pay US0003M 19/07/2038 Merrill Lynch USD 12,645,768 Buy European Receiver Swaption - Receive
19/07/2028 293,768,000 Fixed 2.995% / Pay US0003M 20/07/2038 Merrill Lynch USD 12,988,081 Buy European Receiver Swaption - Receive
20/07/2028 315,875,000 Fixed 2.9835% / Pay US0003M 21/07/2038 Merrill Lynch USD 13,860,782 Buy European Receiver Swaption - Receive
21/02/2029 449,495,600 Fixed 2.9947% / Pay US0003M 22/02/2039 Societe Generale USD 20,106,745 Buy European Receiver Swaption - Receive
26/02/2029 539,696,500 Fixed 3.025% / Pay US0003M 27/02/2039 Citigroup USD 24,628,441
Total unrealised gain on Swaptions 133,195,885
Notes to the Financial Statements (continued)
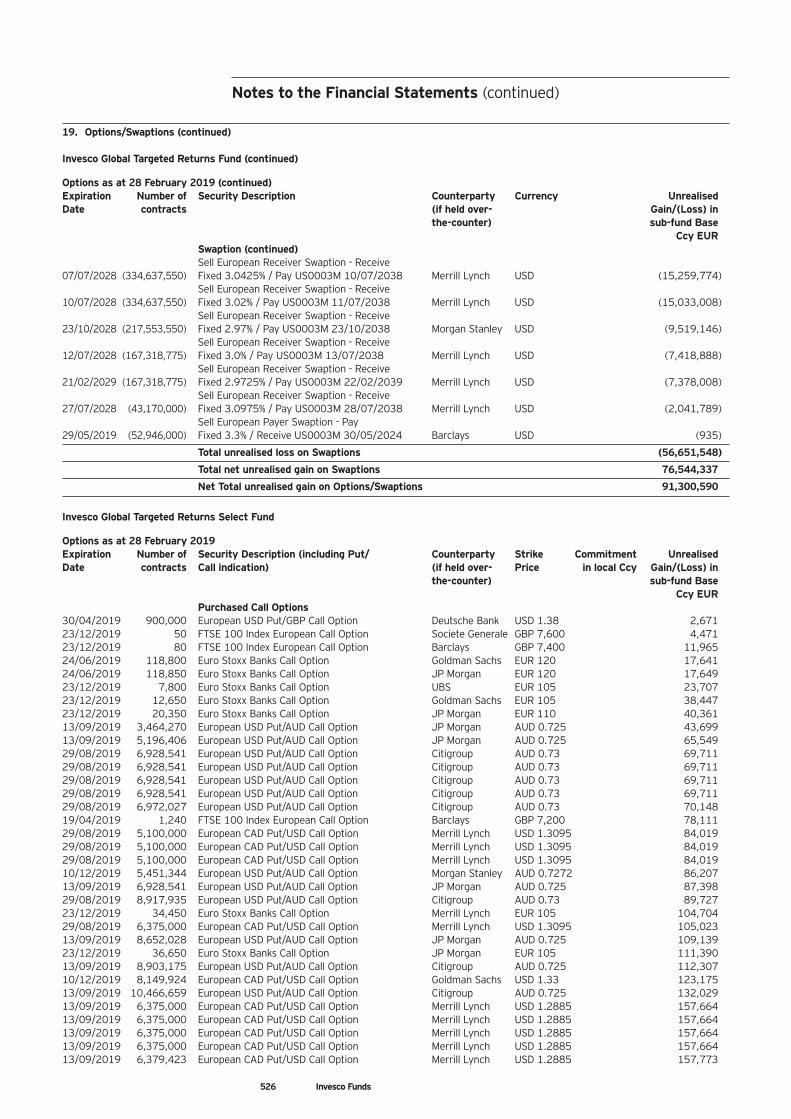
526 Invesco Funds
19. Options/Swaptions (continued) Invesco Global Targeted Returns Fund (continued) Options as at 28 February 2019 (continued) Expiration Number of Security Description Counterparty Currency Unrealised Date contracts (if held over- Gain/(Loss) in
the-counter) sub-fund Base Ccy EUR Swaption (continued) Sell European Receiver Swaption - Receive
07/07/2028 (334,637,550) Fixed 3.0425% / Pay US0003M 10/07/2038 Merrill Lynch USD (15,259,774) Sell European Receiver Swaption - Receive
10/07/2028 (334,637,550) Fixed 3.02% / Pay US0003M 11/07/2038 Merrill Lynch USD (15,033,008) Sell European Receiver Swaption - Receive
23/10/2028 (217,553,550) Fixed 2.97% / Pay US0003M 23/10/2038 Morgan Stanley USD (9,519,146) Sell European Receiver Swaption - Receive
12/07/2028 (167,318,775) Fixed 3.0% / Pay US0003M 13/07/2038 Merrill Lynch USD (7,418,888) Sell European Receiver Swaption - Receive
21/02/2029 (167,318,775) Fixed 2.9725% / Pay US0003M 22/02/2039 Merrill Lynch USD (7,378,008) Sell European Receiver Swaption - Receive
27/07/2028 (43,170,000) Fixed 3.0975% / Pay US0003M 28/07/2038 Merrill Lynch USD (2,041,789) Sell European Payer Swaption - Pay
29/05/2019 (52,946,000) Fixed 3.3% / Receive US0003M 30/05/2024 Barclays USD (935)
Total unrealised loss on Swaptions (56,651,548)
Total net unrealised gain on Swaptions 76,544,337
Net Total unrealised gain on Options/Swaptions 91,300,590
Invesco Global Targeted Returns Select Fund Options as at 28 February 2019 Expiration Number of Security Description (including Put/ Counterparty Strike Commitment Unrealised Date contracts Call indication) (if held over- Price in local Ccy Gain/(Loss) in
the-counter) sub-fund Base Ccy EUR Purchased Call Options
30/04/2019 900,000 European USD Put/GBP Call Option Deutsche Bank USD 1.38 2,671 23/12/2019 50 FTSE 100 Index European Call Option Societe Generale GBP 7,600 4,471 23/12/2019 80 FTSE 100 Index European Call Option Barclays GBP 7,400 11,965 24/06/2019 118,800 Euro Stoxx Banks Call Option Goldman Sachs EUR 120 17,641 24/06/2019 118,850 Euro Stoxx Banks Call Option JP Morgan EUR 120 17,649 23/12/2019 7,800 Euro Stoxx Banks Call Option UBS EUR 105 23,707 23/12/2019 12,650 Euro Stoxx Banks Call Option Goldman Sachs EUR 105 38,447 23/12/2019 20,350 Euro Stoxx Banks Call Option JP Morgan EUR 110 40,361 13/09/2019 3,464,270 European USD Put/AUD Call Option JP Morgan AUD 0.725 43,699 13/09/2019 5,196,406 European USD Put/AUD Call Option JP Morgan AUD 0.725 65,549 29/08/2019 6,928,541 European USD Put/AUD Call Option Citigroup AUD 0.73 69,711 29/08/2019 6,928,541 European USD Put/AUD Call Option Citigroup AUD 0.73 69,711 29/08/2019 6,928,541 European USD Put/AUD Call Option Citigroup AUD 0.73 69,711 29/08/2019 6,928,541 European USD Put/AUD Call Option Citigroup AUD 0.73 69,711 29/08/2019 6,972,027 European USD Put/AUD Call Option Citigroup AUD 0.73 70,148 19/04/2019 1,240 FTSE 100 Index European Call Option Barclays GBP 7,200 78,111 29/08/2019 5,100,000 European CAD Put/USD Call Option Merrill Lynch USD 1.3095 84,019 29/08/2019 5,100,000 European CAD Put/USD Call Option Merrill Lynch USD 1.3095 84,019 29/08/2019 5,100,000 European CAD Put/USD Call Option Merrill Lynch USD 1.3095 84,019 10/12/2019 5,451,344 European USD Put/AUD Call Option Morgan Stanley AUD 0.7272 86,207 13/09/2019 6,928,541 European USD Put/AUD Call Option JP Morgan AUD 0.725 87,398 29/08/2019 8,917,935 European USD Put/AUD Call Option Citigroup AUD 0.73 89,727 23/12/2019 34,450 Euro Stoxx Banks Call Option Merrill Lynch EUR 105 104,704 29/08/2019 6,375,000 European CAD Put/USD Call Option Merrill Lynch USD 1.3095 105,023 13/09/2019 8,652,028 European USD Put/AUD Call Option JP Morgan AUD 0.725 109,139 23/12/2019 36,650 Euro Stoxx Banks Call Option JP Morgan EUR 105 111,390 13/09/2019 8,903,175 European USD Put/AUD Call Option Citigroup AUD 0.725 112,307 10/12/2019 8,149,924 European CAD Put/USD Call Option Goldman Sachs USD 1.33 123,175 13/09/2019 10,466,659 European USD Put/AUD Call Option Citigroup AUD 0.725 132,029 13/09/2019 6,375,000 European CAD Put/USD Call Option Merrill Lynch USD 1.2885 157,664 13/09/2019 6,375,000 European CAD Put/USD Call Option Merrill Lynch USD 1.2885 157,664 13/09/2019 6,375,000 European CAD Put/USD Call Option Merrill Lynch USD 1.2885 157,664 13/09/2019 6,375,000 European CAD Put/USD Call Option Merrill Lynch USD 1.2885 157,664 13/09/2019 6,379,423 European CAD Put/USD Call Option Merrill Lynch USD 1.2885 157,773
Notes to the Financial Statements (continued)
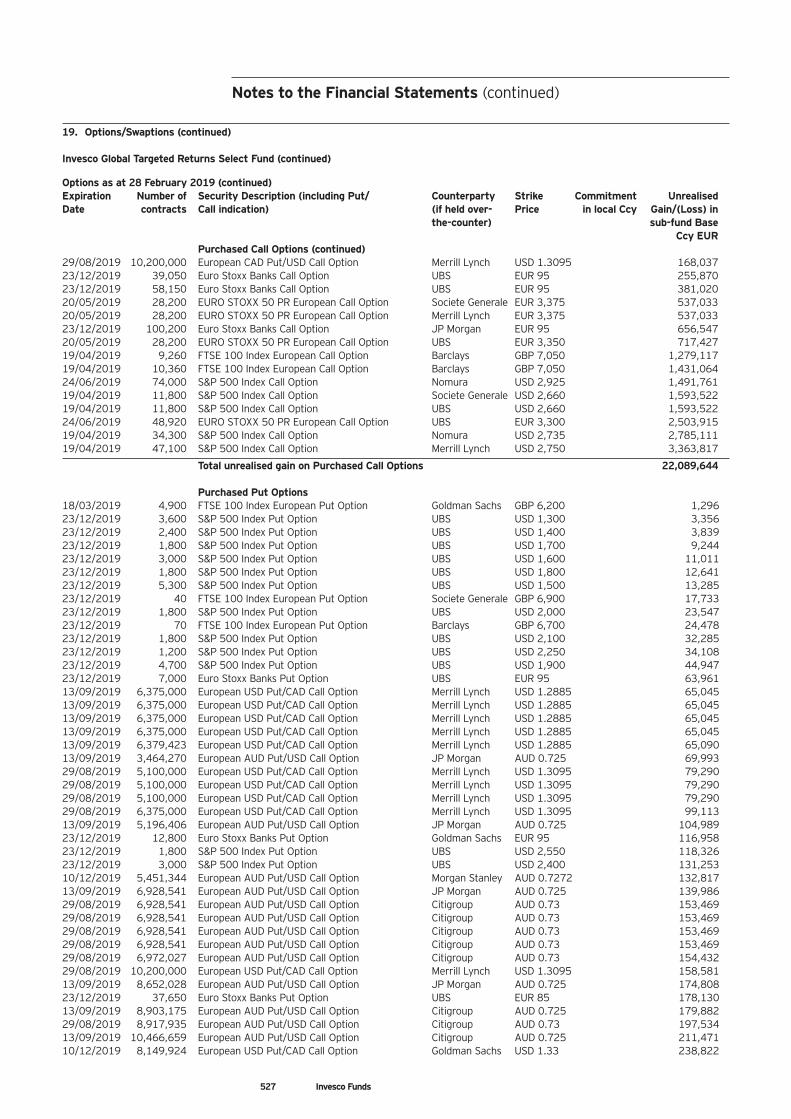
527 Invesco Funds
19. Options/Swaptions (continued) Invesco Global Targeted Returns Select Fund (continued) Options as at 28 February 2019 (continued) Expiration Number of Security Description (including Put/ Counterparty Strike Commitment Unrealised Date contracts Call indication) (if held over- Price in local Ccy Gain/(Loss) in
the-counter) sub-fund Base Ccy EUR Purchased Call Options (continued)
29/08/2019 10,200,000 European CAD Put/USD Call Option Merrill Lynch USD 1.3095 168,037 23/12/2019 39,050 Euro Stoxx Banks Call Option UBS EUR 95 255,870 23/12/2019 58,150 Euro Stoxx Banks Call Option UBS EUR 95 381,020 20/05/2019 28,200 EURO STOXX 50 PR European Call Option Societe Generale EUR 3,375 537,033 20/05/2019 28,200 EURO STOXX 50 PR European Call Option Merrill Lynch EUR 3,375 537,033 23/12/2019 100,200 Euro Stoxx Banks Call Option JP Morgan EUR 95 656,547 20/05/2019 28,200 EURO STOXX 50 PR European Call Option UBS EUR 3,350 717,427 19/04/2019 9,260 FTSE 100 Index European Call Option Barclays GBP 7,050 1,279,117 19/04/2019 10,360 FTSE 100 Index European Call Option Barclays GBP 7,050 1,431,064 24/06/2019 74,000 S&P 500 Index Call Option Nomura USD 2,925 1,491,761 19/04/2019 11,800 S&P 500 Index Call Option Societe Generale USD 2,660 1,593,522 19/04/2019 11,800 S&P 500 Index Call Option UBS USD 2,660 1,593,522 24/06/2019 48,920 EURO STOXX 50 PR European Call Option UBS EUR 3,300 2,503,915 19/04/2019 34,300 S&P 500 Index Call Option Nomura USD 2,735 2,785,111 19/04/2019 47,100 S&P 500 Index Call Option Merrill Lynch USD 2,750 3,363,817
Total unrealised gain on Purchased Call Options 22,089,644 Purchased Put Options
18/03/2019 4,900 FTSE 100 Index European Put Option Goldman Sachs GBP 6,200 1,296 23/12/2019 3,600 S&P 500 Index Put Option UBS USD 1,300 3,356 23/12/2019 2,400 S&P 500 Index Put Option UBS USD 1,400 3,839 23/12/2019 1,800 S&P 500 Index Put Option UBS USD 1,700 9,244 23/12/2019 3,000 S&P 500 Index Put Option UBS USD 1,600 11,011 23/12/2019 1,800 S&P 500 Index Put Option UBS USD 1,800 12,641 23/12/2019 5,300 S&P 500 Index Put Option UBS USD 1,500 13,285 23/12/2019 40 FTSE 100 Index European Put Option Societe Generale GBP 6,900 17,733 23/12/2019 1,800 S&P 500 Index Put Option UBS USD 2,000 23,547 23/12/2019 70 FTSE 100 Index European Put Option Barclays GBP 6,700 24,478 23/12/2019 1,800 S&P 500 Index Put Option UBS USD 2,100 32,285 23/12/2019 1,200 S&P 500 Index Put Option UBS USD 2,250 34,108 23/12/2019 4,700 S&P 500 Index Put Option UBS USD 1,900 44,947 23/12/2019 7,000 Euro Stoxx Banks Put Option UBS EUR 95 63,961 13/09/2019 6,375,000 European USD Put/CAD Call Option Merrill Lynch USD 1.2885 65,045 13/09/2019 6,375,000 European USD Put/CAD Call Option Merrill Lynch USD 1.2885 65,045 13/09/2019 6,375,000 European USD Put/CAD Call Option Merrill Lynch USD 1.2885 65,045 13/09/2019 6,375,000 European USD Put/CAD Call Option Merrill Lynch USD 1.2885 65,045 13/09/2019 6,379,423 European USD Put/CAD Call Option Merrill Lynch USD 1.2885 65,090 13/09/2019 3,464,270 European AUD Put/USD Call Option JP Morgan AUD 0.725 69,993 29/08/2019 5,100,000 European USD Put/CAD Call Option Merrill Lynch USD 1.3095 79,290 29/08/2019 5,100,000 European USD Put/CAD Call Option Merrill Lynch USD 1.3095 79,290 29/08/2019 5,100,000 European USD Put/CAD Call Option Merrill Lynch USD 1.3095 79,290 29/08/2019 6,375,000 European USD Put/CAD Call Option Merrill Lynch USD 1.3095 99,113 13/09/2019 5,196,406 European AUD Put/USD Call Option JP Morgan AUD 0.725 104,989 23/12/2019 12,800 Euro Stoxx Banks Put Option Goldman Sachs EUR 95 116,958 23/12/2019 1,800 S&P 500 Index Put Option UBS USD 2,550 118,326 23/12/2019 3,000 S&P 500 Index Put Option UBS USD 2,400 131,253 10/12/2019 5,451,344 European AUD Put/USD Call Option Morgan Stanley AUD 0.7272 132,817 13/09/2019 6,928,541 European AUD Put/USD Call Option JP Morgan AUD 0.725 139,986 29/08/2019 6,928,541 European AUD Put/USD Call Option Citigroup AUD 0.73 153,469 29/08/2019 6,928,541 European AUD Put/USD Call Option Citigroup AUD 0.73 153,469 29/08/2019 6,928,541 European AUD Put/USD Call Option Citigroup AUD 0.73 153,469 29/08/2019 6,928,541 European AUD Put/USD Call Option Citigroup AUD 0.73 153,469 29/08/2019 6,972,027 European AUD Put/USD Call Option Citigroup AUD 0.73 154,432 29/08/2019 10,200,000 European USD Put/CAD Call Option Merrill Lynch USD 1.3095 158,581 13/09/2019 8,652,028 European AUD Put/USD Call Option JP Morgan AUD 0.725 174,808 23/12/2019 37,650 Euro Stoxx Banks Put Option UBS EUR 85 178,130 13/09/2019 8,903,175 European AUD Put/USD Call Option Citigroup AUD 0.725 179,882 29/08/2019 8,917,935 European AUD Put/USD Call Option Citigroup AUD 0.73 197,534 13/09/2019 10,466,659 European AUD Put/USD Call Option Citigroup AUD 0.725 211,471 10/12/2019 8,149,924 European USD Put/CAD Call Option Goldman Sachs USD 1.33 238,822
Notes to the Financial Statements (continued)
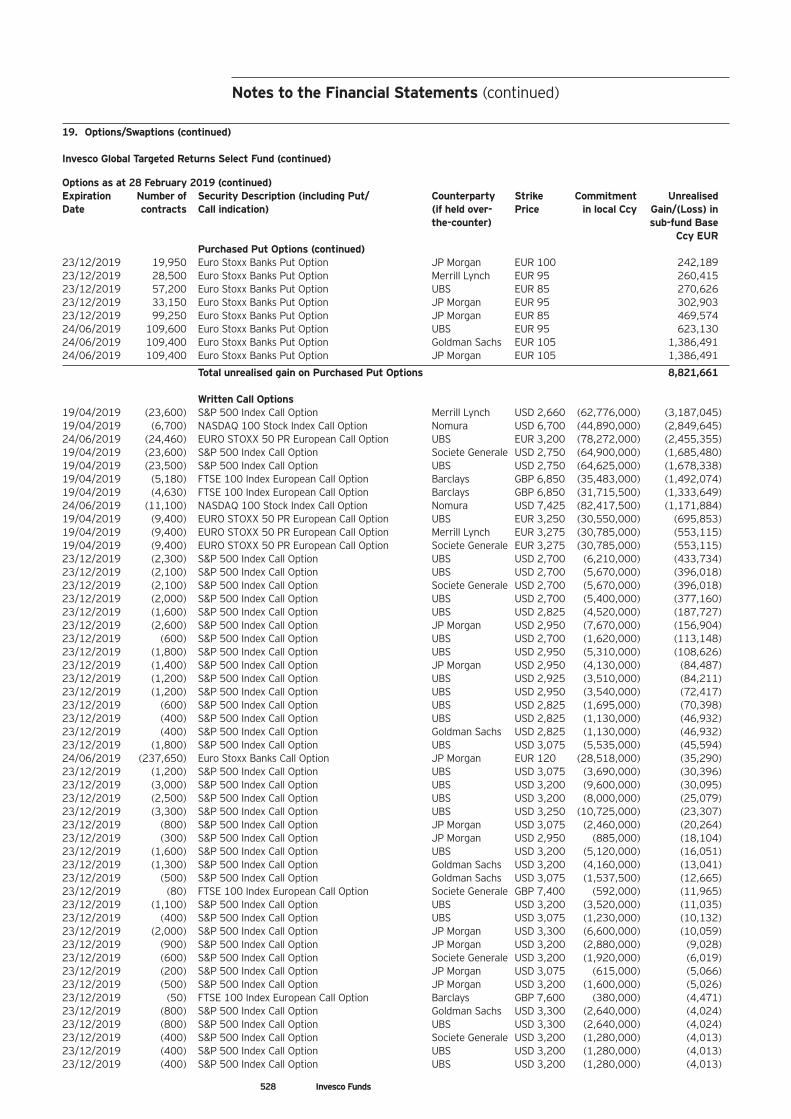
528 Invesco Funds
19. Options/Swaptions (continued) Invesco Global Targeted Returns Select Fund (continued) Options as at 28 February 2019 (continued) Expiration Number of Security Description (including Put/ Counterparty Strike Commitment Unrealised Date contracts Call indication) (if held over- Price in local Ccy Gain/(Loss) in
the-counter) sub-fund Base Ccy EUR Purchased Put Options (continued)
23/12/2019 19,950 Euro Stoxx Banks Put Option JP Morgan EUR 100 242,189 23/12/2019 28,500 Euro Stoxx Banks Put Option Merrill Lynch EUR 95 260,415 23/12/2019 57,200 Euro Stoxx Banks Put Option UBS EUR 85 270,626 23/12/2019 33,150 Euro Stoxx Banks Put Option JP Morgan EUR 95 302,903 23/12/2019 99,250 Euro Stoxx Banks Put Option JP Morgan EUR 85 469,574 24/06/2019 109,600 Euro Stoxx Banks Put Option UBS EUR 95 623,130 24/06/2019 109,400 Euro Stoxx Banks Put Option Goldman Sachs EUR 105 1,386,491 24/06/2019 109,400 Euro Stoxx Banks Put Option JP Morgan EUR 105 1,386,491
Total unrealised gain on Purchased Put Options 8,821,661
Written Call Options 19/04/2019 (23,600) S&P 500 Index Call Option Merrill Lynch USD 2,660 (62,776,000) (3,187,045) 19/04/2019 (6,700) NASDAQ 100 Stock Index Call Option Nomura USD 6,700 (44,890,000) (2,849,645) 24/06/2019 (24,460) EURO STOXX 50 PR European Call Option UBS EUR 3,200 (78,272,000) (2,455,355) 19/04/2019 (23,600) S&P 500 Index Call Option Societe Generale USD 2,750 (64,900,000) (1,685,480) 19/04/2019 (23,500) S&P 500 Index Call Option UBS USD 2,750 (64,625,000) (1,678,338) 19/04/2019 (5,180) FTSE 100 Index European Call Option Barclays GBP 6,850 (35,483,000) (1,492,074) 19/04/2019 (4,630) FTSE 100 Index European Call Option Barclays GBP 6,850 (31,715,500) (1,333,649) 24/06/2019 (11,100) NASDAQ 100 Stock Index Call Option Nomura USD 7,425 (82,417,500) (1,171,884) 19/04/2019 (9,400) EURO STOXX 50 PR European Call Option UBS EUR 3,250 (30,550,000) (695,853) 19/04/2019 (9,400) EURO STOXX 50 PR European Call Option Merrill Lynch EUR 3,275 (30,785,000) (553,115) 19/04/2019 (9,400) EURO STOXX 50 PR European Call Option Societe Generale EUR 3,275 (30,785,000) (553,115) 23/12/2019 (2,300) S&P 500 Index Call Option UBS USD 2,700 (6,210,000) (433,734) 23/12/2019 (2,100) S&P 500 Index Call Option UBS USD 2,700 (5,670,000) (396,018) 23/12/2019 (2,100) S&P 500 Index Call Option Societe Generale USD 2,700 (5,670,000) (396,018) 23/12/2019 (2,000) S&P 500 Index Call Option UBS USD 2,700 (5,400,000) (377,160) 23/12/2019 (1,600) S&P 500 Index Call Option UBS USD 2,825 (4,520,000) (187,727) 23/12/2019 (2,600) S&P 500 Index Call Option JP Morgan USD 2,950 (7,670,000) (156,904) 23/12/2019 (600) S&P 500 Index Call Option UBS USD 2,700 (1,620,000) (113,148) 23/12/2019 (1,800) S&P 500 Index Call Option UBS USD 2,950 (5,310,000) (108,626) 23/12/2019 (1,400) S&P 500 Index Call Option JP Morgan USD 2,950 (4,130,000) (84,487) 23/12/2019 (1,200) S&P 500 Index Call Option UBS USD 2,925 (3,510,000) (84,211) 23/12/2019 (1,200) S&P 500 Index Call Option UBS USD 2,950 (3,540,000) (72,417) 23/12/2019 (600) S&P 500 Index Call Option UBS USD 2,825 (1,695,000) (70,398) 23/12/2019 (400) S&P 500 Index Call Option UBS USD 2,825 (1,130,000) (46,932) 23/12/2019 (400) S&P 500 Index Call Option Goldman Sachs USD 2,825 (1,130,000) (46,932) 23/12/2019 (1,800) S&P 500 Index Call Option UBS USD 3,075 (5,535,000) (45,594) 24/06/2019 (237,650) Euro Stoxx Banks Call Option JP Morgan EUR 120 (28,518,000) (35,290) 23/12/2019 (1,200) S&P 500 Index Call Option UBS USD 3,075 (3,690,000) (30,396) 23/12/2019 (3,000) S&P 500 Index Call Option UBS USD 3,200 (9,600,000) (30,095) 23/12/2019 (2,500) S&P 500 Index Call Option UBS USD 3,200 (8,000,000) (25,079) 23/12/2019 (3,300) S&P 500 Index Call Option UBS USD 3,250 (10,725,000) (23,307) 23/12/2019 (800) S&P 500 Index Call Option JP Morgan USD 3,075 (2,460,000) (20,264) 23/12/2019 (300) S&P 500 Index Call Option JP Morgan USD 2,950 (885,000) (18,104) 23/12/2019 (1,600) S&P 500 Index Call Option UBS USD 3,200 (5,120,000) (16,051) 23/12/2019 (1,300) S&P 500 Index Call Option Goldman Sachs USD 3,200 (4,160,000) (13,041) 23/12/2019 (500) S&P 500 Index Call Option Goldman Sachs USD 3,075 (1,537,500) (12,665) 23/12/2019 (80) FTSE 100 Index European Call Option Societe Generale GBP 7,400 (592,000) (11,965) 23/12/2019 (1,100) S&P 500 Index Call Option UBS USD 3,200 (3,520,000) (11,035) 23/12/2019 (400) S&P 500 Index Call Option UBS USD 3,075 (1,230,000) (10,132) 23/12/2019 (2,000) S&P 500 Index Call Option JP Morgan USD 3,300 (6,600,000) (10,059) 23/12/2019 (900) S&P 500 Index Call Option JP Morgan USD 3,200 (2,880,000) (9,028) 23/12/2019 (600) S&P 500 Index Call Option Societe Generale USD 3,200 (1,920,000) (6,019) 23/12/2019 (200) S&P 500 Index Call Option JP Morgan USD 3,075 (615,000) (5,066) 23/12/2019 (500) S&P 500 Index Call Option JP Morgan USD 3,200 (1,600,000) (5,026) 23/12/2019 (50) FTSE 100 Index European Call Option Barclays GBP 7,600 (380,000) (4,471) 23/12/2019 (800) S&P 500 Index Call Option Goldman Sachs USD 3,300 (2,640,000) (4,024) 23/12/2019 (800) S&P 500 Index Call Option UBS USD 3,300 (2,640,000) (4,024) 23/12/2019 (400) S&P 500 Index Call Option Societe Generale USD 3,200 (1,280,000) (4,013) 23/12/2019 (400) S&P 500 Index Call Option UBS USD 3,200 (1,280,000) (4,013) 23/12/2019 (400) S&P 500 Index Call Option UBS USD 3,200 (1,280,000) (4,013)
Notes to the Financial Statements (continued)
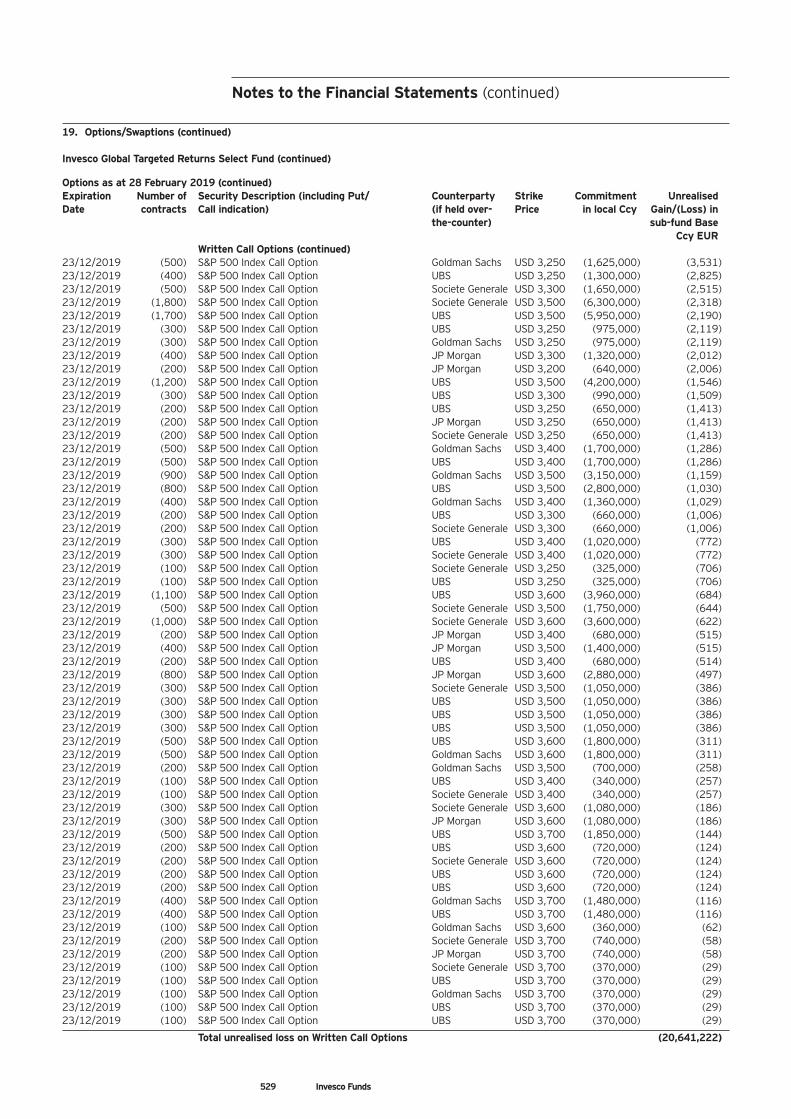
529 Invesco Funds
19. Options/Swaptions (continued) Invesco Global Targeted Returns Select Fund (continued) Options as at 28 February 2019 (continued) Expiration Number of Security Description (including Put/ Counterparty Strike Commitment Unrealised Date contracts Call indication) (if held over- Price in local Ccy Gain/(Loss) in
the-counter) sub-fund Base Ccy EUR Written Call Options (continued)
23/12/2019 (500) S&P 500 Index Call Option Goldman Sachs USD 3,250 (1,625,000) (3,531) 23/12/2019 (400) S&P 500 Index Call Option UBS USD 3,250 (1,300,000) (2,825) 23/12/2019 (500) S&P 500 Index Call Option Societe Generale USD 3,300 (1,650,000) (2,515) 23/12/2019 (1,800) S&P 500 Index Call Option Societe Generale USD 3,500 (6,300,000) (2,318) 23/12/2019 (1,700) S&P 500 Index Call Option UBS USD 3,500 (5,950,000) (2,190) 23/12/2019 (300) S&P 500 Index Call Option UBS USD 3,250 (975,000) (2,119) 23/12/2019 (300) S&P 500 Index Call Option Goldman Sachs USD 3,250 (975,000) (2,119) 23/12/2019 (400) S&P 500 Index Call Option JP Morgan USD 3,300 (1,320,000) (2,012) 23/12/2019 (200) S&P 500 Index Call Option JP Morgan USD 3,200 (640,000) (2,006) 23/12/2019 (1,200) S&P 500 Index Call Option UBS USD 3,500 (4,200,000) (1,546) 23/12/2019 (300) S&P 500 Index Call Option UBS USD 3,300 (990,000) (1,509) 23/12/2019 (200) S&P 500 Index Call Option UBS USD 3,250 (650,000) (1,413) 23/12/2019 (200) S&P 500 Index Call Option JP Morgan USD 3,250 (650,000) (1,413) 23/12/2019 (200) S&P 500 Index Call Option Societe Generale USD 3,250 (650,000) (1,413) 23/12/2019 (500) S&P 500 Index Call Option Goldman Sachs USD 3,400 (1,700,000) (1,286) 23/12/2019 (500) S&P 500 Index Call Option UBS USD 3,400 (1,700,000) (1,286) 23/12/2019 (900) S&P 500 Index Call Option Goldman Sachs USD 3,500 (3,150,000) (1,159) 23/12/2019 (800) S&P 500 Index Call Option UBS USD 3,500 (2,800,000) (1,030) 23/12/2019 (400) S&P 500 Index Call Option Goldman Sachs USD 3,400 (1,360,000) (1,029) 23/12/2019 (200) S&P 500 Index Call Option UBS USD 3,300 (660,000) (1,006) 23/12/2019 (200) S&P 500 Index Call Option Societe Generale USD 3,300 (660,000) (1,006) 23/12/2019 (300) S&P 500 Index Call Option UBS USD 3,400 (1,020,000) (772) 23/12/2019 (300) S&P 500 Index Call Option Societe Generale USD 3,400 (1,020,000) (772) 23/12/2019 (100) S&P 500 Index Call Option Societe Generale USD 3,250 (325,000) (706) 23/12/2019 (100) S&P 500 Index Call Option UBS USD 3,250 (325,000) (706) 23/12/2019 (1,100) S&P 500 Index Call Option UBS USD 3,600 (3,960,000) (684) 23/12/2019 (500) S&P 500 Index Call Option Societe Generale USD 3,500 (1,750,000) (644) 23/12/2019 (1,000) S&P 500 Index Call Option Societe Generale USD 3,600 (3,600,000) (622) 23/12/2019 (200) S&P 500 Index Call Option JP Morgan USD 3,400 (680,000) (515) 23/12/2019 (400) S&P 500 Index Call Option JP Morgan USD 3,500 (1,400,000) (515) 23/12/2019 (200) S&P 500 Index Call Option UBS USD 3,400 (680,000) (514) 23/12/2019 (800) S&P 500 Index Call Option JP Morgan USD 3,600 (2,880,000) (497) 23/12/2019 (300) S&P 500 Index Call Option Societe Generale USD 3,500 (1,050,000) (386) 23/12/2019 (300) S&P 500 Index Call Option UBS USD 3,500 (1,050,000) (386) 23/12/2019 (300) S&P 500 Index Call Option UBS USD 3,500 (1,050,000) (386) 23/12/2019 (300) S&P 500 Index Call Option UBS USD 3,500 (1,050,000) (386) 23/12/2019 (500) S&P 500 Index Call Option UBS USD 3,600 (1,800,000) (311) 23/12/2019 (500) S&P 500 Index Call Option Goldman Sachs USD 3,600 (1,800,000) (311) 23/12/2019 (200) S&P 500 Index Call Option Goldman Sachs USD 3,500 (700,000) (258) 23/12/2019 (100) S&P 500 Index Call Option UBS USD 3,400 (340,000) (257) 23/12/2019 (100) S&P 500 Index Call Option Societe Generale USD 3,400 (340,000) (257) 23/12/2019 (300) S&P 500 Index Call Option Societe Generale USD 3,600 (1,080,000) (186) 23/12/2019 (300) S&P 500 Index Call Option JP Morgan USD 3,600 (1,080,000) (186) 23/12/2019 (500) S&P 500 Index Call Option UBS USD 3,700 (1,850,000) (144) 23/12/2019 (200) S&P 500 Index Call Option UBS USD 3,600 (720,000) (124) 23/12/2019 (200) S&P 500 Index Call Option Societe Generale USD 3,600 (720,000) (124) 23/12/2019 (200) S&P 500 Index Call Option UBS USD 3,600 (720,000) (124) 23/12/2019 (200) S&P 500 Index Call Option UBS USD 3,600 (720,000) (124) 23/12/2019 (400) S&P 500 Index Call Option Goldman Sachs USD 3,700 (1,480,000) (116) 23/12/2019 (400) S&P 500 Index Call Option UBS USD 3,700 (1,480,000) (116) 23/12/2019 (100) S&P 500 Index Call Option Goldman Sachs USD 3,600 (360,000) (62) 23/12/2019 (200) S&P 500 Index Call Option Societe Generale USD 3,700 (740,000) (58) 23/12/2019 (200) S&P 500 Index Call Option JP Morgan USD 3,700 (740,000) (58) 23/12/2019 (100) S&P 500 Index Call Option Societe Generale USD 3,700 (370,000) (29) 23/12/2019 (100) S&P 500 Index Call Option UBS USD 3,700 (370,000) (29) 23/12/2019 (100) S&P 500 Index Call Option Goldman Sachs USD 3,700 (370,000) (29) 23/12/2019 (100) S&P 500 Index Call Option UBS USD 3,700 (370,000) (29) 23/12/2019 (100) S&P 500 Index Call Option UBS USD 3,700 (370,000) (29)
Total unrealised loss on Written Call Options (20,641,222)
Notes to the Financial Statements (continued)
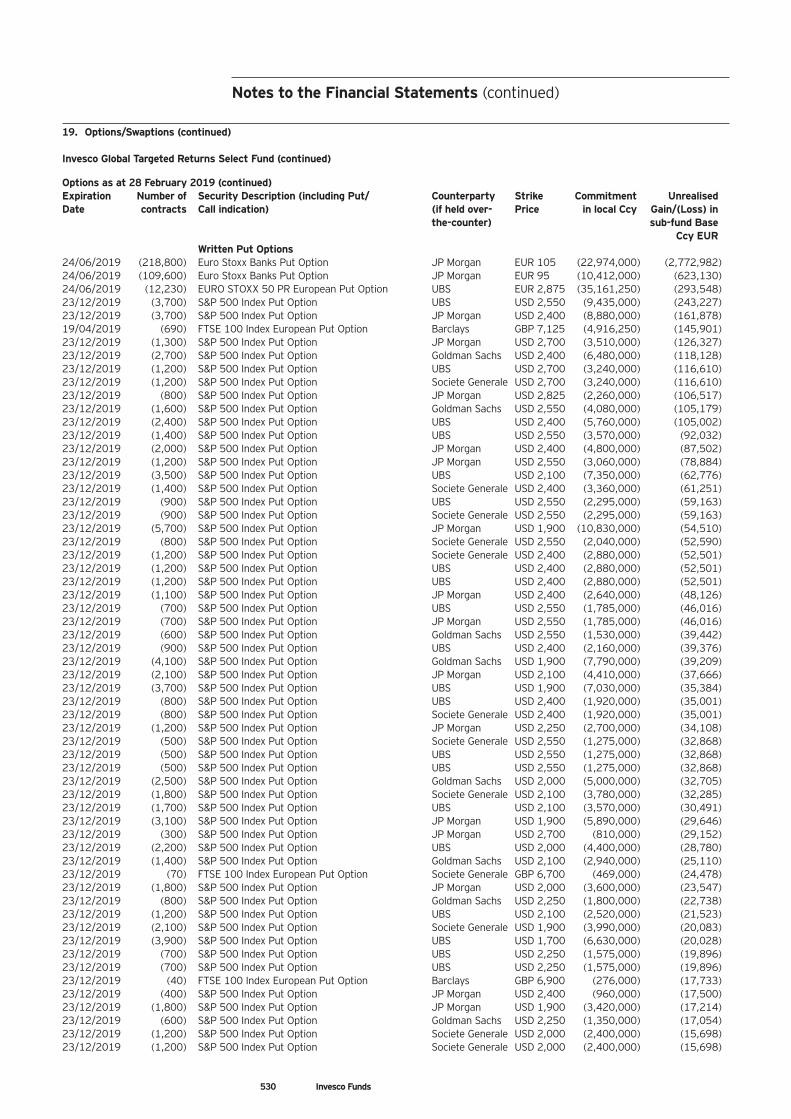
530 Invesco Funds
19. Options/Swaptions (continued) Invesco Global Targeted Returns Select Fund (continued) Options as at 28 February 2019 (continued) Expiration Number of Security Description (including Put/ Counterparty Strike Commitment Unrealised Date contracts Call indication) (if held over- Price in local Ccy Gain/(Loss) in
the-counter) sub-fund Base Ccy EUR Written Put Options
24/06/2019 (218,800) Euro Stoxx Banks Put Option JP Morgan EUR 105 (22,974,000) (2,772,982) 24/06/2019 (109,600) Euro Stoxx Banks Put Option JP Morgan EUR 95 (10,412,000) (623,130) 24/06/2019 (12,230) EURO STOXX 50 PR European Put Option UBS EUR 2,875 (35,161,250) (293,548) 23/12/2019 (3,700) S&P 500 Index Put Option UBS USD 2,550 (9,435,000) (243,227) 23/12/2019 (3,700) S&P 500 Index Put Option JP Morgan USD 2,400 (8,880,000) (161,878) 19/04/2019 (690) FTSE 100 Index European Put Option Barclays GBP 7,125 (4,916,250) (145,901) 23/12/2019 (1,300) S&P 500 Index Put Option JP Morgan USD 2,700 (3,510,000) (126,327) 23/12/2019 (2,700) S&P 500 Index Put Option Goldman Sachs USD 2,400 (6,480,000) (118,128) 23/12/2019 (1,200) S&P 500 Index Put Option UBS USD 2,700 (3,240,000) (116,610) 23/12/2019 (1,200) S&P 500 Index Put Option Societe Generale USD 2,700 (3,240,000) (116,610) 23/12/2019 (800) S&P 500 Index Put Option JP Morgan USD 2,825 (2,260,000) (106,517) 23/12/2019 (1,600) S&P 500 Index Put Option Goldman Sachs USD 2,550 (4,080,000) (105,179) 23/12/2019 (2,400) S&P 500 Index Put Option UBS USD 2,400 (5,760,000) (105,002) 23/12/2019 (1,400) S&P 500 Index Put Option UBS USD 2,550 (3,570,000) (92,032) 23/12/2019 (2,000) S&P 500 Index Put Option JP Morgan USD 2,400 (4,800,000) (87,502) 23/12/2019 (1,200) S&P 500 Index Put Option JP Morgan USD 2,550 (3,060,000) (78,884) 23/12/2019 (3,500) S&P 500 Index Put Option UBS USD 2,100 (7,350,000) (62,776) 23/12/2019 (1,400) S&P 500 Index Put Option Societe Generale USD 2,400 (3,360,000) (61,251) 23/12/2019 (900) S&P 500 Index Put Option UBS USD 2,550 (2,295,000) (59,163) 23/12/2019 (900) S&P 500 Index Put Option Societe Generale USD 2,550 (2,295,000) (59,163) 23/12/2019 (5,700) S&P 500 Index Put Option JP Morgan USD 1,900 (10,830,000) (54,510) 23/12/2019 (800) S&P 500 Index Put Option Societe Generale USD 2,550 (2,040,000) (52,590) 23/12/2019 (1,200) S&P 500 Index Put Option Societe Generale USD 2,400 (2,880,000) (52,501) 23/12/2019 (1,200) S&P 500 Index Put Option UBS USD 2,400 (2,880,000) (52,501) 23/12/2019 (1,200) S&P 500 Index Put Option UBS USD 2,400 (2,880,000) (52,501) 23/12/2019 (1,100) S&P 500 Index Put Option JP Morgan USD 2,400 (2,640,000) (48,126) 23/12/2019 (700) S&P 500 Index Put Option UBS USD 2,550 (1,785,000) (46,016) 23/12/2019 (700) S&P 500 Index Put Option JP Morgan USD 2,550 (1,785,000) (46,016) 23/12/2019 (600) S&P 500 Index Put Option Goldman Sachs USD 2,550 (1,530,000) (39,442) 23/12/2019 (900) S&P 500 Index Put Option UBS USD 2,400 (2,160,000) (39,376) 23/12/2019 (4,100) S&P 500 Index Put Option Goldman Sachs USD 1,900 (7,790,000) (39,209) 23/12/2019 (2,100) S&P 500 Index Put Option JP Morgan USD 2,100 (4,410,000) (37,666) 23/12/2019 (3,700) S&P 500 Index Put Option UBS USD 1,900 (7,030,000) (35,384) 23/12/2019 (800) S&P 500 Index Put Option UBS USD 2,400 (1,920,000) (35,001) 23/12/2019 (800) S&P 500 Index Put Option Societe Generale USD 2,400 (1,920,000) (35,001) 23/12/2019 (1,200) S&P 500 Index Put Option JP Morgan USD 2,250 (2,700,000) (34,108) 23/12/2019 (500) S&P 500 Index Put Option Societe Generale USD 2,550 (1,275,000) (32,868) 23/12/2019 (500) S&P 500 Index Put Option UBS USD 2,550 (1,275,000) (32,868) 23/12/2019 (500) S&P 500 Index Put Option UBS USD 2,550 (1,275,000) (32,868) 23/12/2019 (2,500) S&P 500 Index Put Option Goldman Sachs USD 2,000 (5,000,000) (32,705) 23/12/2019 (1,800) S&P 500 Index Put Option Societe Generale USD 2,100 (3,780,000) (32,285) 23/12/2019 (1,700) S&P 500 Index Put Option UBS USD 2,100 (3,570,000) (30,491) 23/12/2019 (3,100) S&P 500 Index Put Option JP Morgan USD 1,900 (5,890,000) (29,646) 23/12/2019 (300) S&P 500 Index Put Option JP Morgan USD 2,700 (810,000) (29,152) 23/12/2019 (2,200) S&P 500 Index Put Option UBS USD 2,000 (4,400,000) (28,780) 23/12/2019 (1,400) S&P 500 Index Put Option Goldman Sachs USD 2,100 (2,940,000) (25,110) 23/12/2019 (70) FTSE 100 Index European Put Option Societe Generale GBP 6,700 (469,000) (24,478) 23/12/2019 (1,800) S&P 500 Index Put Option JP Morgan USD 2,000 (3,600,000) (23,547) 23/12/2019 (800) S&P 500 Index Put Option Goldman Sachs USD 2,250 (1,800,000) (22,738) 23/12/2019 (1,200) S&P 500 Index Put Option UBS USD 2,100 (2,520,000) (21,523) 23/12/2019 (2,100) S&P 500 Index Put Option Societe Generale USD 1,900 (3,990,000) (20,083) 23/12/2019 (3,900) S&P 500 Index Put Option UBS USD 1,700 (6,630,000) (20,028) 23/12/2019 (700) S&P 500 Index Put Option UBS USD 2,250 (1,575,000) (19,896) 23/12/2019 (700) S&P 500 Index Put Option UBS USD 2,250 (1,575,000) (19,896) 23/12/2019 (40) FTSE 100 Index European Put Option Barclays GBP 6,900 (276,000) (17,733) 23/12/2019 (400) S&P 500 Index Put Option JP Morgan USD 2,400 (960,000) (17,500) 23/12/2019 (1,800) S&P 500 Index Put Option JP Morgan USD 1,900 (3,420,000) (17,214) 23/12/2019 (600) S&P 500 Index Put Option Goldman Sachs USD 2,250 (1,350,000) (17,054) 23/12/2019 (1,200) S&P 500 Index Put Option Societe Generale USD 2,000 (2,400,000) (15,698) 23/12/2019 (1,200) S&P 500 Index Put Option Societe Generale USD 2,000 (2,400,000) (15,698)
Notes to the Financial Statements (continued)
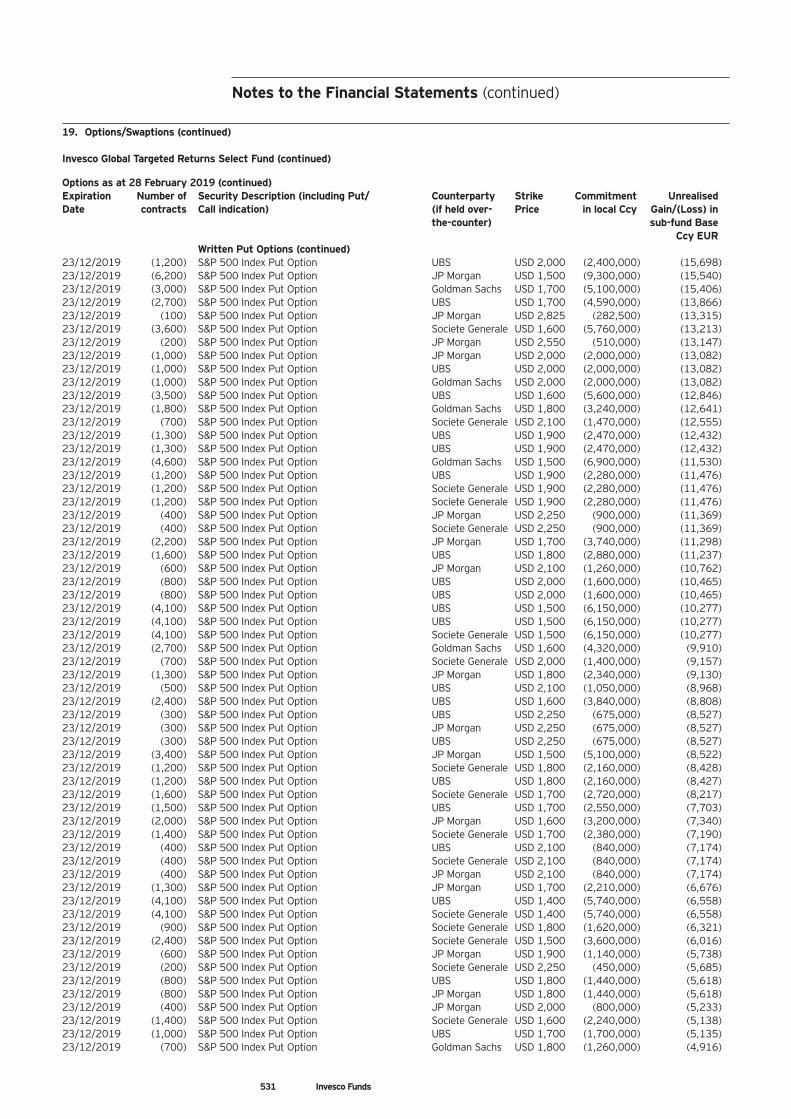
531 Invesco Funds
19. Options/Swaptions (continued) Invesco Global Targeted Returns Select Fund (continued) Options as at 28 February 2019 (continued) Expiration Number of Security Description (including Put/ Counterparty Strike Commitment Unrealised Date contracts Call indication) (if held over- Price in local Ccy Gain/(Loss) in
the-counter) sub-fund Base Ccy EUR Written Put Options (continued)
23/12/2019 (1,200) S&P 500 Index Put Option UBS USD 2,000 (2,400,000) (15,698) 23/12/2019 (6,200) S&P 500 Index Put Option JP Morgan USD 1,500 (9,300,000) (15,540) 23/12/2019 (3,000) S&P 500 Index Put Option Goldman Sachs USD 1,700 (5,100,000) (15,406) 23/12/2019 (2,700) S&P 500 Index Put Option UBS USD 1,700 (4,590,000) (13,866) 23/12/2019 (100) S&P 500 Index Put Option JP Morgan USD 2,825 (282,500) (13,315) 23/12/2019 (3,600) S&P 500 Index Put Option Societe Generale USD 1,600 (5,760,000) (13,213) 23/12/2019 (200) S&P 500 Index Put Option JP Morgan USD 2,550 (510,000) (13,147) 23/12/2019 (1,000) S&P 500 Index Put Option JP Morgan USD 2,000 (2,000,000) (13,082) 23/12/2019 (1,000) S&P 500 Index Put Option UBS USD 2,000 (2,000,000) (13,082) 23/12/2019 (1,000) S&P 500 Index Put Option Goldman Sachs USD 2,000 (2,000,000) (13,082) 23/12/2019 (3,500) S&P 500 Index Put Option UBS USD 1,600 (5,600,000) (12,846) 23/12/2019 (1,800) S&P 500 Index Put Option Goldman Sachs USD 1,800 (3,240,000) (12,641) 23/12/2019 (700) S&P 500 Index Put Option Societe Generale USD 2,100 (1,470,000) (12,555) 23/12/2019 (1,300) S&P 500 Index Put Option UBS USD 1,900 (2,470,000) (12,432) 23/12/2019 (1,300) S&P 500 Index Put Option UBS USD 1,900 (2,470,000) (12,432) 23/12/2019 (4,600) S&P 500 Index Put Option Goldman Sachs USD 1,500 (6,900,000) (11,530) 23/12/2019 (1,200) S&P 500 Index Put Option UBS USD 1,900 (2,280,000) (11,476) 23/12/2019 (1,200) S&P 500 Index Put Option Societe Generale USD 1,900 (2,280,000) (11,476) 23/12/2019 (1,200) S&P 500 Index Put Option Societe Generale USD 1,900 (2,280,000) (11,476) 23/12/2019 (400) S&P 500 Index Put Option JP Morgan USD 2,250 (900,000) (11,369) 23/12/2019 (400) S&P 500 Index Put Option Societe Generale USD 2,250 (900,000) (11,369) 23/12/2019 (2,200) S&P 500 Index Put Option JP Morgan USD 1,700 (3,740,000) (11,298) 23/12/2019 (1,600) S&P 500 Index Put Option UBS USD 1,800 (2,880,000) (11,237) 23/12/2019 (600) S&P 500 Index Put Option JP Morgan USD 2,100 (1,260,000) (10,762) 23/12/2019 (800) S&P 500 Index Put Option UBS USD 2,000 (1,600,000) (10,465) 23/12/2019 (800) S&P 500 Index Put Option UBS USD 2,000 (1,600,000) (10,465) 23/12/2019 (4,100) S&P 500 Index Put Option UBS USD 1,500 (6,150,000) (10,277) 23/12/2019 (4,100) S&P 500 Index Put Option UBS USD 1,500 (6,150,000) (10,277) 23/12/2019 (4,100) S&P 500 Index Put Option Societe Generale USD 1,500 (6,150,000) (10,277) 23/12/2019 (2,700) S&P 500 Index Put Option Goldman Sachs USD 1,600 (4,320,000) (9,910) 23/12/2019 (700) S&P 500 Index Put Option Societe Generale USD 2,000 (1,400,000) (9,157) 23/12/2019 (1,300) S&P 500 Index Put Option JP Morgan USD 1,800 (2,340,000) (9,130) 23/12/2019 (500) S&P 500 Index Put Option UBS USD 2,100 (1,050,000) (8,968) 23/12/2019 (2,400) S&P 500 Index Put Option UBS USD 1,600 (3,840,000) (8,808) 23/12/2019 (300) S&P 500 Index Put Option UBS USD 2,250 (675,000) (8,527) 23/12/2019 (300) S&P 500 Index Put Option JP Morgan USD 2,250 (675,000) (8,527) 23/12/2019 (300) S&P 500 Index Put Option UBS USD 2,250 (675,000) (8,527) 23/12/2019 (3,400) S&P 500 Index Put Option JP Morgan USD 1,500 (5,100,000) (8,522) 23/12/2019 (1,200) S&P 500 Index Put Option Societe Generale USD 1,800 (2,160,000) (8,428) 23/12/2019 (1,200) S&P 500 Index Put Option UBS USD 1,800 (2,160,000) (8,427) 23/12/2019 (1,600) S&P 500 Index Put Option Societe Generale USD 1,700 (2,720,000) (8,217) 23/12/2019 (1,500) S&P 500 Index Put Option UBS USD 1,700 (2,550,000) (7,703) 23/12/2019 (2,000) S&P 500 Index Put Option JP Morgan USD 1,600 (3,200,000) (7,340) 23/12/2019 (1,400) S&P 500 Index Put Option Societe Generale USD 1,700 (2,380,000) (7,190) 23/12/2019 (400) S&P 500 Index Put Option UBS USD 2,100 (840,000) (7,174) 23/12/2019 (400) S&P 500 Index Put Option Societe Generale USD 2,100 (840,000) (7,174) 23/12/2019 (400) S&P 500 Index Put Option JP Morgan USD 2,100 (840,000) (7,174) 23/12/2019 (1,300) S&P 500 Index Put Option JP Morgan USD 1,700 (2,210,000) (6,676) 23/12/2019 (4,100) S&P 500 Index Put Option UBS USD 1,400 (5,740,000) (6,558) 23/12/2019 (4,100) S&P 500 Index Put Option Societe Generale USD 1,400 (5,740,000) (6,558) 23/12/2019 (900) S&P 500 Index Put Option Societe Generale USD 1,800 (1,620,000) (6,321) 23/12/2019 (2,400) S&P 500 Index Put Option Societe Generale USD 1,500 (3,600,000) (6,016) 23/12/2019 (600) S&P 500 Index Put Option JP Morgan USD 1,900 (1,140,000) (5,738) 23/12/2019 (200) S&P 500 Index Put Option Societe Generale USD 2,250 (450,000) (5,685) 23/12/2019 (800) S&P 500 Index Put Option UBS USD 1,800 (1,440,000) (5,618) 23/12/2019 (800) S&P 500 Index Put Option JP Morgan USD 1,800 (1,440,000) (5,618) 23/12/2019 (400) S&P 500 Index Put Option JP Morgan USD 2,000 (800,000) (5,233) 23/12/2019 (1,400) S&P 500 Index Put Option Societe Generale USD 1,600 (2,240,000) (5,138) 23/12/2019 (1,000) S&P 500 Index Put Option UBS USD 1,700 (1,700,000) (5,135) 23/12/2019 (700) S&P 500 Index Put Option Goldman Sachs USD 1,800 (1,260,000) (4,916)
Notes to the Financial Statements (continued)
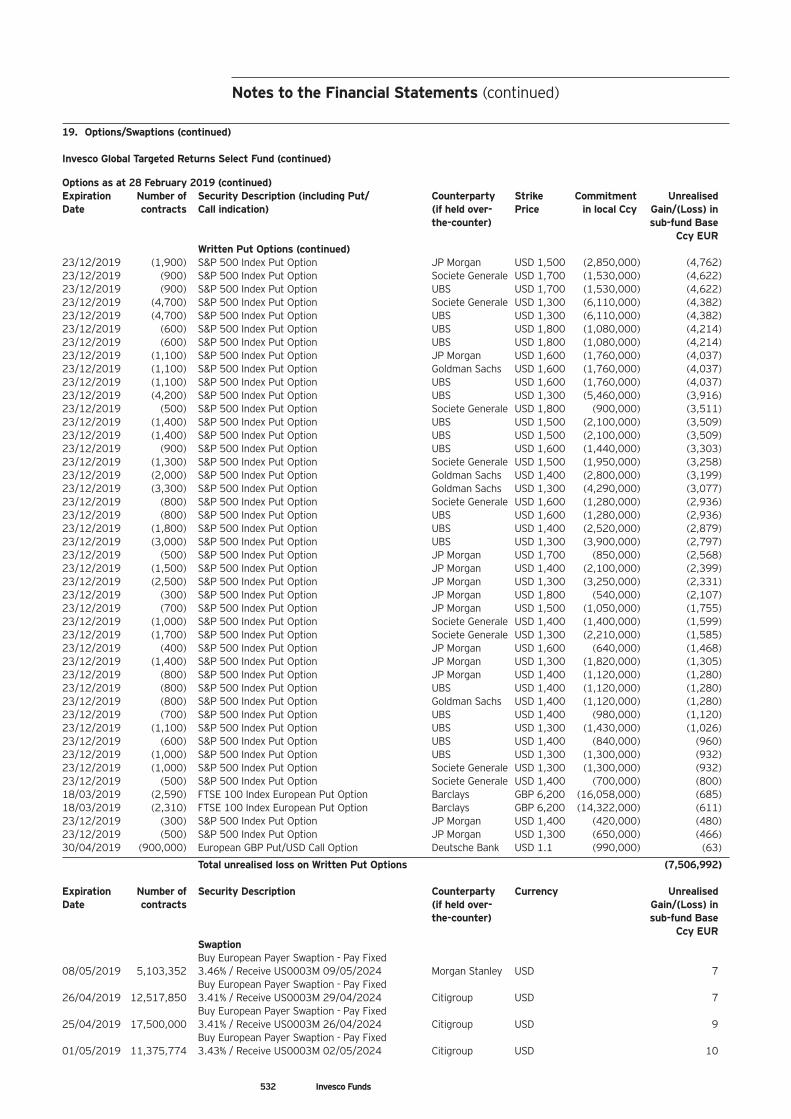
532 Invesco Funds
19. Options/Swaptions (continued) Invesco Global Targeted Returns Select Fund (continued) Options as at 28 February 2019 (continued) Expiration Number of Security Description (including Put/ Counterparty Strike Commitment Unrealised Date contracts Call indication) (if held over- Price in local Ccy Gain/(Loss) in
the-counter) sub-fund Base Ccy EUR Written Put Options (continued)
23/12/2019 (1,900) S&P 500 Index Put Option JP Morgan USD 1,500 (2,850,000) (4,762) 23/12/2019 (900) S&P 500 Index Put Option Societe Generale USD 1,700 (1,530,000) (4,622) 23/12/2019 (900) S&P 500 Index Put Option UBS USD 1,700 (1,530,000) (4,622) 23/12/2019 (4,700) S&P 500 Index Put Option Societe Generale USD 1,300 (6,110,000) (4,382) 23/12/2019 (4,700) S&P 500 Index Put Option UBS USD 1,300 (6,110,000) (4,382) 23/12/2019 (600) S&P 500 Index Put Option UBS USD 1,800 (1,080,000) (4,214) 23/12/2019 (600) S&P 500 Index Put Option UBS USD 1,800 (1,080,000) (4,214) 23/12/2019 (1,100) S&P 500 Index Put Option JP Morgan USD 1,600 (1,760,000) (4,037) 23/12/2019 (1,100) S&P 500 Index Put Option Goldman Sachs USD 1,600 (1,760,000) (4,037) 23/12/2019 (1,100) S&P 500 Index Put Option UBS USD 1,600 (1,760,000) (4,037) 23/12/2019 (4,200) S&P 500 Index Put Option UBS USD 1,300 (5,460,000) (3,916) 23/12/2019 (500) S&P 500 Index Put Option Societe Generale USD 1,800 (900,000) (3,511) 23/12/2019 (1,400) S&P 500 Index Put Option UBS USD 1,500 (2,100,000) (3,509) 23/12/2019 (1,400) S&P 500 Index Put Option UBS USD 1,500 (2,100,000) (3,509) 23/12/2019 (900) S&P 500 Index Put Option UBS USD 1,600 (1,440,000) (3,303) 23/12/2019 (1,300) S&P 500 Index Put Option Societe Generale USD 1,500 (1,950,000) (3,258) 23/12/2019 (2,000) S&P 500 Index Put Option Goldman Sachs USD 1,400 (2,800,000) (3,199) 23/12/2019 (3,300) S&P 500 Index Put Option Goldman Sachs USD 1,300 (4,290,000) (3,077) 23/12/2019 (800) S&P 500 Index Put Option Societe Generale USD 1,600 (1,280,000) (2,936) 23/12/2019 (800) S&P 500 Index Put Option UBS USD 1,600 (1,280,000) (2,936) 23/12/2019 (1,800) S&P 500 Index Put Option UBS USD 1,400 (2,520,000) (2,879) 23/12/2019 (3,000) S&P 500 Index Put Option UBS USD 1,300 (3,900,000) (2,797) 23/12/2019 (500) S&P 500 Index Put Option JP Morgan USD 1,700 (850,000) (2,568) 23/12/2019 (1,500) S&P 500 Index Put Option JP Morgan USD 1,400 (2,100,000) (2,399) 23/12/2019 (2,500) S&P 500 Index Put Option JP Morgan USD 1,300 (3,250,000) (2,331) 23/12/2019 (300) S&P 500 Index Put Option JP Morgan USD 1,800 (540,000) (2,107) 23/12/2019 (700) S&P 500 Index Put Option JP Morgan USD 1,500 (1,050,000) (1,755) 23/12/2019 (1,000) S&P 500 Index Put Option Societe Generale USD 1,400 (1,400,000) (1,599) 23/12/2019 (1,700) S&P 500 Index Put Option Societe Generale USD 1,300 (2,210,000) (1,585) 23/12/2019 (400) S&P 500 Index Put Option JP Morgan USD 1,600 (640,000) (1,468) 23/12/2019 (1,400) S&P 500 Index Put Option JP Morgan USD 1,300 (1,820,000) (1,305) 23/12/2019 (800) S&P 500 Index Put Option JP Morgan USD 1,400 (1,120,000) (1,280) 23/12/2019 (800) S&P 500 Index Put Option UBS USD 1,400 (1,120,000) (1,280) 23/12/2019 (800) S&P 500 Index Put Option Goldman Sachs USD 1,400 (1,120,000) (1,280) 23/12/2019 (700) S&P 500 Index Put Option UBS USD 1,400 (980,000) (1,120) 23/12/2019 (1,100) S&P 500 Index Put Option UBS USD 1,300 (1,430,000) (1,026) 23/12/2019 (600) S&P 500 Index Put Option UBS USD 1,400 (840,000) (960) 23/12/2019 (1,000) S&P 500 Index Put Option UBS USD 1,300 (1,300,000) (932) 23/12/2019 (1,000) S&P 500 Index Put Option Societe Generale USD 1,300 (1,300,000) (932) 23/12/2019 (500) S&P 500 Index Put Option Societe Generale USD 1,400 (700,000) (800) 18/03/2019 (2,590) FTSE 100 Index European Put Option Barclays GBP 6,200 (16,058,000) (685) 18/03/2019 (2,310) FTSE 100 Index European Put Option Barclays GBP 6,200 (14,322,000) (611) 23/12/2019 (300) S&P 500 Index Put Option JP Morgan USD 1,400 (420,000) (480) 23/12/2019 (500) S&P 500 Index Put Option JP Morgan USD 1,300 (650,000) (466) 30/04/2019 (900,000) European GBP Put/USD Call Option Deutsche Bank USD 1.1 (990,000) (63)
Total unrealised loss on Written Put Options (7,506,992) Expiration Number of Security Description Counterparty Currency Unrealised Date contracts (if held over- Gain/(Loss) in
the-counter) sub-fund Base Ccy EUR Swaption Buy European Payer Swaption - Pay Fixed
08/05/2019 5,103,352 3.46% / Receive US0003M 09/05/2024 Morgan Stanley USD 7 Buy European Payer Swaption - Pay Fixed
26/04/2019 12,517,850 3.41% / Receive US0003M 29/04/2024 Citigroup USD 7 Buy European Payer Swaption - Pay Fixed
25/04/2019 17,500,000 3.41% / Receive US0003M 26/04/2024 Citigroup USD 9 Buy European Payer Swaption - Pay Fixed
01/05/2019 11,375,774 3.43% / Receive US0003M 02/05/2024 Citigroup USD 10
Notes to the Financial Statements (continued)
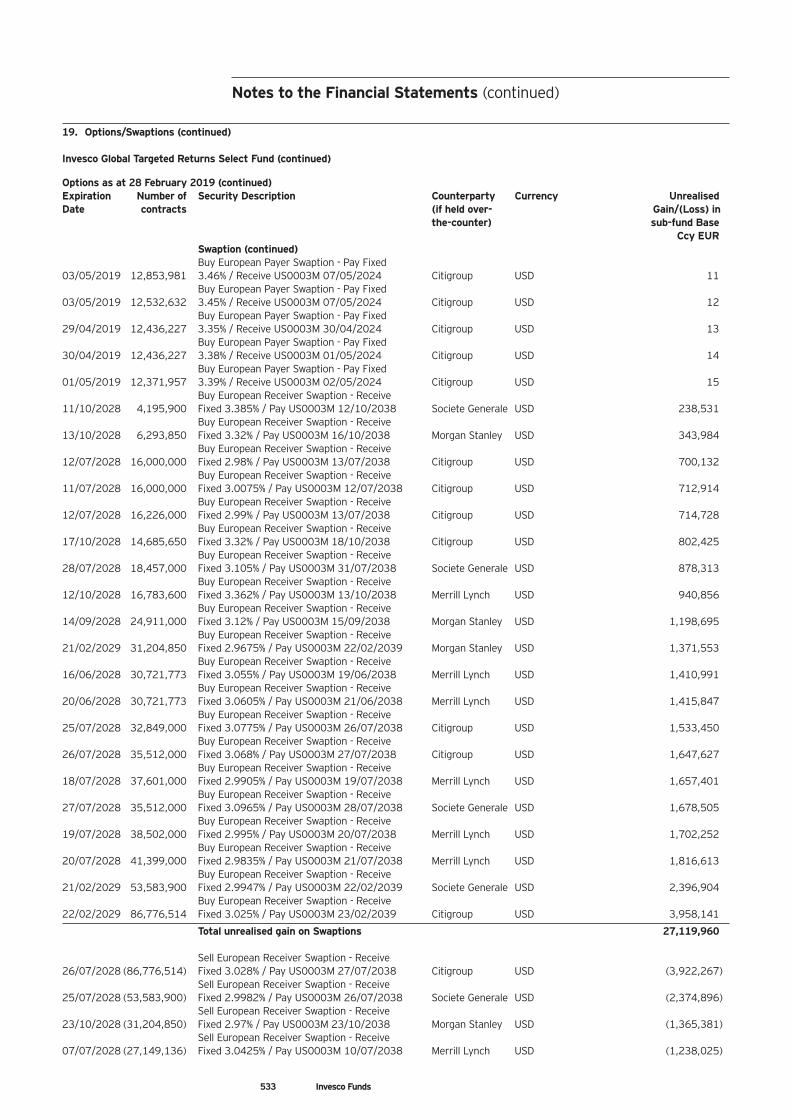
533 Invesco Funds
19. Options/Swaptions (continued) Invesco Global Targeted Returns Select Fund (continued) Options as at 28 February 2019 (continued) Expiration Number of Security Description Counterparty Currency Unrealised Date contracts (if held over- Gain/(Loss) in
the-counter) sub-fund Base Ccy EUR Swaption (continued) Buy European Payer Swaption - Pay Fixed
03/05/2019 12,853,981 3.46% / Receive US0003M 07/05/2024 Citigroup USD 11 Buy European Payer Swaption - Pay Fixed
03/05/2019 12,532,632 3.45% / Receive US0003M 07/05/2024 Citigroup USD 12 Buy European Payer Swaption - Pay Fixed
29/04/2019 12,436,227 3.35% / Receive US0003M 30/04/2024 Citigroup USD 13 Buy European Payer Swaption - Pay Fixed
30/04/2019 12,436,227 3.38% / Receive US0003M 01/05/2024 Citigroup USD 14 Buy European Payer Swaption - Pay Fixed
01/05/2019 12,371,957 3.39% / Receive US0003M 02/05/2024 Citigroup USD 15 Buy European Receiver Swaption - Receive
11/10/2028 4,195,900 Fixed 3.385% / Pay US0003M 12/10/2038 Societe Generale USD 238,531 Buy European Receiver Swaption - Receive
13/10/2028 6,293,850 Fixed 3.32% / Pay US0003M 16/10/2038 Morgan Stanley USD 343,984 Buy European Receiver Swaption - Receive
12/07/2028 16,000,000 Fixed 2.98% / Pay US0003M 13/07/2038 Citigroup USD 700,132 Buy European Receiver Swaption - Receive
11/07/2028 16,000,000 Fixed 3.0075% / Pay US0003M 12/07/2038 Citigroup USD 712,914 Buy European Receiver Swaption - Receive
12/07/2028 16,226,000 Fixed 2.99% / Pay US0003M 13/07/2038 Citigroup USD 714,728 Buy European Receiver Swaption - Receive
17/10/2028 14,685,650 Fixed 3.32% / Pay US0003M 18/10/2038 Citigroup USD 802,425 Buy European Receiver Swaption - Receive
28/07/2028 18,457,000 Fixed 3.105% / Pay US0003M 31/07/2038 Societe Generale USD 878,313 Buy European Receiver Swaption - Receive
12/10/2028 16,783,600 Fixed 3.362% / Pay US0003M 13/10/2038 Merrill Lynch USD 940,856 Buy European Receiver Swaption - Receive
14/09/2028 24,911,000 Fixed 3.12% / Pay US0003M 15/09/2038 Morgan Stanley USD 1,198,695 Buy European Receiver Swaption - Receive
21/02/2029 31,204,850 Fixed 2.9675% / Pay US0003M 22/02/2039 Morgan Stanley USD 1,371,553 Buy European Receiver Swaption - Receive
16/06/2028 30,721,773 Fixed 3.055% / Pay US0003M 19/06/2038 Merrill Lynch USD 1,410,991 Buy European Receiver Swaption - Receive
20/06/2028 30,721,773 Fixed 3.0605% / Pay US0003M 21/06/2038 Merrill Lynch USD 1,415,847 Buy European Receiver Swaption - Receive
25/07/2028 32,849,000 Fixed 3.0775% / Pay US0003M 26/07/2038 Citigroup USD 1,533,450 Buy European Receiver Swaption - Receive
26/07/2028 35,512,000 Fixed 3.068% / Pay US0003M 27/07/2038 Citigroup USD 1,647,627 Buy European Receiver Swaption - Receive
18/07/2028 37,601,000 Fixed 2.9905% / Pay US0003M 19/07/2038 Merrill Lynch USD 1,657,401 Buy European Receiver Swaption - Receive
27/07/2028 35,512,000 Fixed 3.0965% / Pay US0003M 28/07/2038 Societe Generale USD 1,678,505 Buy European Receiver Swaption - Receive
19/07/2028 38,502,000 Fixed 2.995% / Pay US0003M 20/07/2038 Merrill Lynch USD 1,702,252 Buy European Receiver Swaption - Receive
20/07/2028 41,399,000 Fixed 2.9835% / Pay US0003M 21/07/2038 Merrill Lynch USD 1,816,613 Buy European Receiver Swaption - Receive
21/02/2029 53,583,900 Fixed 2.9947% / Pay US0003M 22/02/2039 Societe Generale USD 2,396,904 Buy European Receiver Swaption - Receive
22/02/2029 86,776,514 Fixed 3.025% / Pay US0003M 23/02/2039 Citigroup USD 3,958,141
Total unrealised gain on Swaptions 27,119,960 Sell European Receiver Swaption - Receive
26/07/2028 (86,776,514) Fixed 3.028% / Pay US0003M 27/07/2038 Citigroup USD (3,922,267) Sell European Receiver Swaption - Receive
25/07/2028 (53,583,900) Fixed 2.9982% / Pay US0003M 26/07/2038 Societe Generale USD (2,374,896) Sell European Receiver Swaption - Receive
23/10/2028 (31,204,850) Fixed 2.97% / Pay US0003M 23/10/2038 Morgan Stanley USD (1,365,381) Sell European Receiver Swaption - Receive
07/07/2028 (27,149,136) Fixed 3.0425% / Pay US0003M 10/07/2038 Merrill Lynch USD (1,238,025)
Notes to the Financial Statements (continued)
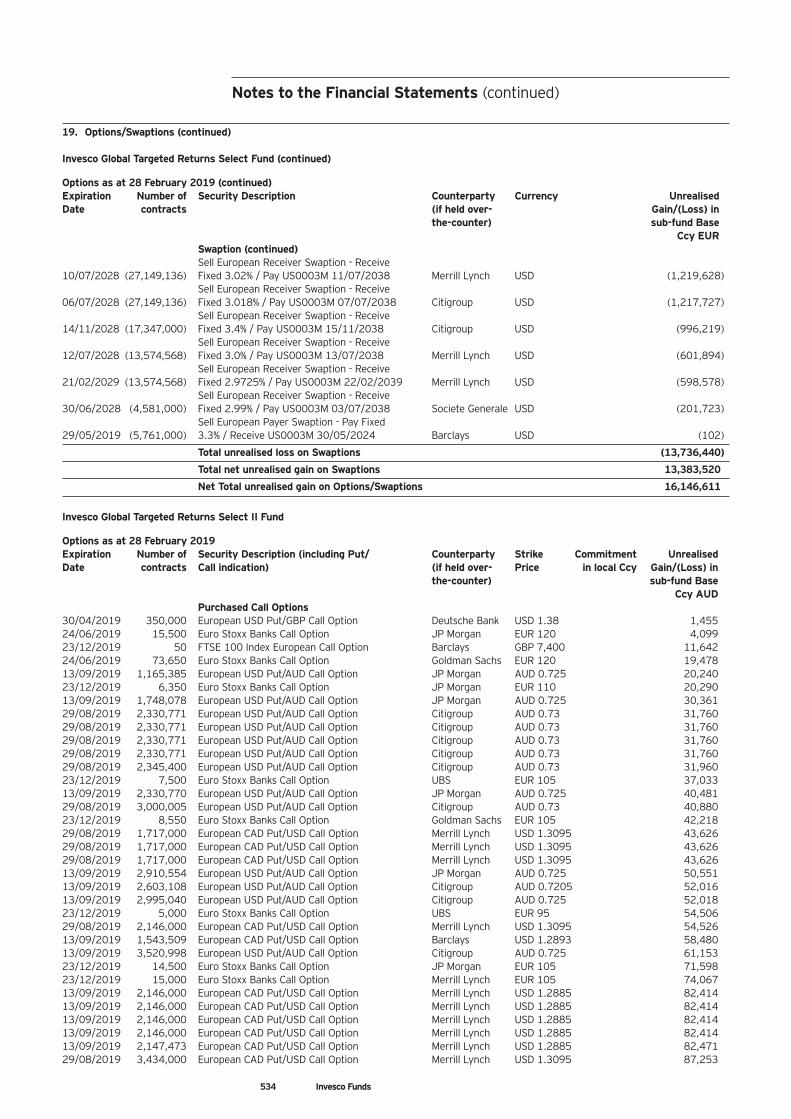
Notes to the Financial Statements (continued)
19. Options/Swaptions (continued) Invesco Global Targeted Returns Select Fund (continued) Options as at 28 February 2019 (continued) Expiration Number of Security Description Counterparty Currency Unrealised Date contracts (if held over- Gain/(Loss) in
the-counter) sub-fund Base Ccy EUR Swaption (continued) Sell European Receiver Swaption - Receive
10/07/2028 (27,149,136) Fixed 3.02% / Pay US0003M 11/07/2038 Merrill Lynch USD (1,219,628) Sell European Receiver Swaption - Receive
06/07/2028 (27,149,136) Fixed 3.018% / Pay US0003M 07/07/2038 Citigroup USD (1,217,727) Sell European Receiver Swaption - Receive
14/11/2028 (17,347,000) Fixed 3.4% / Pay US0003M 15/11/2038 Citigroup USD (996,219) Sell European Receiver Swaption - Receive
12/07/2028 (13,574,568) Fixed 3.0% / Pay US0003M 13/07/2038 Merrill Lynch USD (601,894) Sell European Receiver Swaption - Receive
21/02/2029 (13,574,568) Fixed 2.9725% / Pay US0003M 22/02/2039 Merrill Lynch USD (598,578) Sell European Receiver Swaption - Receive
30/06/2028 (4,581,000) Fixed 2.99% / Pay US0003M 03/07/2038 Societe Generale USD (201,723) Sell European Payer Swaption - Pay Fixed
29/05/2019 (5,761,000) 3.3% / Receive US0003M 30/05/2024 Barclays USD (102)
Total unrealised loss on Swaptions (13,736,440)
Total net unrealised gain on Swaptions 13,383,520
Net Total unrealised gain on Options/Swaptions 16,146,611
Invesco Global Targeted Returns Select II Fund Options as at 28 February 2019 Expiration Number of Security Description (including Put/ Counterparty Strike Commitment Unrealised Date contracts Call indication) (if held over- Price in local Ccy Gain/(Loss) in
the-counter) sub-fund Base Ccy AUD Purchased Call Options
30/04/2019 350,000 European USD Put/GBP Call Option Deutsche Bank USD 1.38 1,455 24/06/2019 15,500 Euro Stoxx Banks Call Option JP Morgan EUR 120 4,099 23/12/2019 50 FTSE 100 Index European Call Option Barclays GBP 7,400 11,642 24/06/2019 73,650 Euro Stoxx Banks Call Option Goldman Sachs EUR 120 19,478 13/09/2019 1,165,385 European USD Put/AUD Call Option JP Morgan AUD 0.725 20,240 23/12/2019 6,350 Euro Stoxx Banks Call Option JP Morgan EUR 110 20,290 13/09/2019 1,748,078 European USD Put/AUD Call Option JP Morgan AUD 0.725 30,361 29/08/2019 2,330,771 European USD Put/AUD Call Option Citigroup AUD 0.73 31,760 29/08/2019 2,330,771 European USD Put/AUD Call Option Citigroup AUD 0.73 31,760 29/08/2019 2,330,771 European USD Put/AUD Call Option Citigroup AUD 0.73 31,760 29/08/2019 2,330,771 European USD Put/AUD Call Option Citigroup AUD 0.73 31,760 29/08/2019 2,345,400 European USD Put/AUD Call Option Citigroup AUD 0.73 31,960 23/12/2019 7,500 Euro Stoxx Banks Call Option UBS EUR 105 37,033 13/09/2019 2,330,770 European USD Put/AUD Call Option JP Morgan AUD 0.725 40,481 29/08/2019 3,000,005 European USD Put/AUD Call Option Citigroup AUD 0.73 40,880 23/12/2019 8,550 Euro Stoxx Banks Call Option Goldman Sachs EUR 105 42,218 29/08/2019 1,717,000 European CAD Put/USD Call Option Merrill Lynch USD 1.3095 43,626 29/08/2019 1,717,000 European CAD Put/USD Call Option Merrill Lynch USD 1.3095 43,626 29/08/2019 1,717,000 European CAD Put/USD Call Option Merrill Lynch USD 1.3095 43,626 13/09/2019 2,910,554 European USD Put/AUD Call Option JP Morgan AUD 0.725 50,551 13/09/2019 2,603,108 European USD Put/AUD Call Option Citigroup AUD 0.7205 52,016 13/09/2019 2,995,040 European USD Put/AUD Call Option Citigroup AUD 0.725 52,018 23/12/2019 5,000 Euro Stoxx Banks Call Option UBS EUR 95 54,506 29/08/2019 2,146,000 European CAD Put/USD Call Option Merrill Lynch USD 1.3095 54,526 13/09/2019 1,543,509 European CAD Put/USD Call Option Barclays USD 1.2893 58,480 13/09/2019 3,520,998 European USD Put/AUD Call Option Citigroup AUD 0.725 61,153 23/12/2019 14,500 Euro Stoxx Banks Call Option JP Morgan EUR 105 71,598 23/12/2019 15,000 Euro Stoxx Banks Call Option Merrill Lynch EUR 105 74,067 13/09/2019 2,146,000 European CAD Put/USD Call Option Merrill Lynch USD 1.2885 82,414 13/09/2019 2,146,000 European CAD Put/USD Call Option Merrill Lynch USD 1.2885 82,414 13/09/2019 2,146,000 European CAD Put/USD Call Option Merrill Lynch USD 1.2885 82,414 13/09/2019 2,146,000 European CAD Put/USD Call Option Merrill Lynch USD 1.2885 82,414 13/09/2019 2,147,473 European CAD Put/USD Call Option Merrill Lynch USD 1.2885 82,471 29/08/2019 3,434,000 European CAD Put/USD Call Option Merrill Lynch USD 1.3095 87,253
534 Invesco Funds
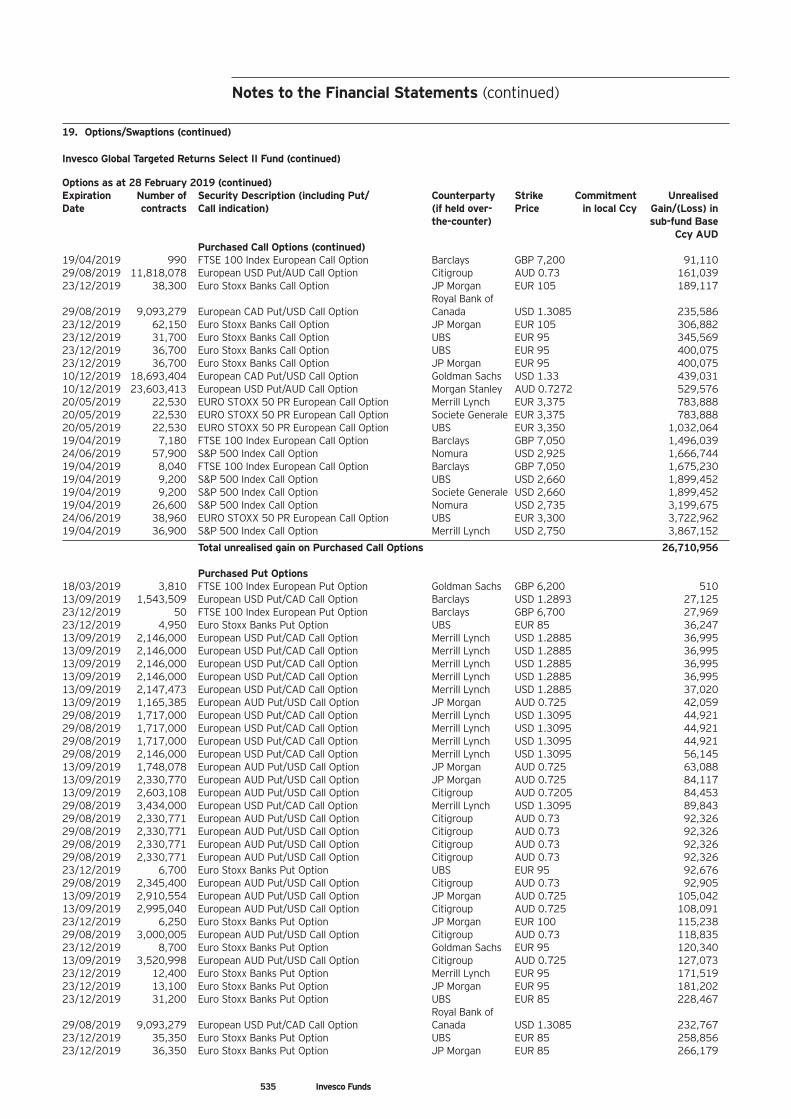
19. Options/Swaptions (continued) Invesco Global Targeted Returns Select II Fund (continued) Options as at 28 February 2019 (continued) Expiration Number of Security Description (including Put/ Counterparty Strike Commitment Unrealised Date contracts Call indication) (if held over- Price in local Ccy Gain/(Loss) in
the-counter) sub-fund Base Ccy AUD Purchased Call Options (continued)
19/04/2019 990 FTSE 100 Index European Call Option Barclays GBP 7,200 91,110 29/08/2019 11,818,078 European USD Put/AUD Call Option Citigroup AUD 0.73 161,039 23/12/2019 38,300 Euro Stoxx Banks Call Option JP Morgan EUR 105 189,117
Royal Bank of 29/08/2019 9,093,279 European CAD Put/USD Call Option Canada USD 1.3085 235,586 23/12/2019 62,150 Euro Stoxx Banks Call Option JP Morgan EUR 105 306,882 23/12/2019 31,700 Euro Stoxx Banks Call Option UBS EUR 95 345,569 23/12/2019 36,700 Euro Stoxx Banks Call Option UBS EUR 95 400,075 23/12/2019 36,700 Euro Stoxx Banks Call Option JP Morgan EUR 95 400,075 10/12/2019 18,693,404 European CAD Put/USD Call Option Goldman Sachs USD 1.33 439,031 10/12/2019 23,603,413 European USD Put/AUD Call Option Morgan Stanley AUD 0.7272 529,576 20/05/2019 22,530 EURO STOXX 50 PR European Call Option Merrill Lynch EUR 3,375 783,888 20/05/2019 22,530 EURO STOXX 50 PR European Call Option Societe Generale EUR 3,375 783,888 20/05/2019 22,530 EURO STOXX 50 PR European Call Option UBS EUR 3,350 1,032,064 19/04/2019 7,180 FTSE 100 Index European Call Option Barclays GBP 7,050 1,496,039 24/06/2019 57,900 S&P 500 Index Call Option Nomura USD 2,925 1,666,744 19/04/2019 8,040 FTSE 100 Index European Call Option Barclays GBP 7,050 1,675,230 19/04/2019 9,200 S&P 500 Index Call Option UBS USD 2,660 1,899,452 19/04/2019 9,200 S&P 500 Index Call Option Societe Generale USD 2,660 1,899,452 19/04/2019 26,600 S&P 500 Index Call Option Nomura USD 2,735 3,199,675 24/06/2019 38,960 EURO STOXX 50 PR European Call Option UBS EUR 3,300 3,722,962 19/04/2019 36,900 S&P 500 Index Call Option Merrill Lynch USD 2,750 3,867,152
Total unrealised gain on Purchased Call Options 26,710,956 Purchased Put Options
18/03/2019 3,810 FTSE 100 Index European Put Option Goldman Sachs GBP 6,200 510 13/09/2019 1,543,509 European USD Put/CAD Call Option Barclays USD 1.2893 27,125 23/12/2019 50 FTSE 100 Index European Put Option Barclays GBP 6,700 27,969 23/12/2019 4,950 Euro Stoxx Banks Put Option UBS EUR 85 36,247 13/09/2019 2,146,000 European USD Put/CAD Call Option Merrill Lynch USD 1.2885 36,995 13/09/2019 2,146,000 European USD Put/CAD Call Option Merrill Lynch USD 1.2885 36,995 13/09/2019 2,146,000 European USD Put/CAD Call Option Merrill Lynch USD 1.2885 36,995 13/09/2019 2,146,000 European USD Put/CAD Call Option Merrill Lynch USD 1.2885 36,995 13/09/2019 2,147,473 European USD Put/CAD Call Option Merrill Lynch USD 1.2885 37,020 13/09/2019 1,165,385 European AUD Put/USD Call Option JP Morgan AUD 0.725 42,059 29/08/2019 1,717,000 European USD Put/CAD Call Option Merrill Lynch USD 1.3095 44,921 29/08/2019 1,717,000 European USD Put/CAD Call Option Merrill Lynch USD 1.3095 44,921 29/08/2019 1,717,000 European USD Put/CAD Call Option Merrill Lynch USD 1.3095 44,921 29/08/2019 2,146,000 European USD Put/CAD Call Option Merrill Lynch USD 1.3095 56,145 13/09/2019 1,748,078 European AUD Put/USD Call Option JP Morgan AUD 0.725 63,088 13/09/2019 2,330,770 European AUD Put/USD Call Option JP Morgan AUD 0.725 84,117 13/09/2019 2,603,108 European AUD Put/USD Call Option Citigroup AUD 0.7205 84,453 29/08/2019 3,434,000 European USD Put/CAD Call Option Merrill Lynch USD 1.3095 89,843 29/08/2019 2,330,771 European AUD Put/USD Call Option Citigroup AUD 0.73 92,326 29/08/2019 2,330,771 European AUD Put/USD Call Option Citigroup AUD 0.73 92,326 29/08/2019 2,330,771 European AUD Put/USD Call Option Citigroup AUD 0.73 92,326 29/08/2019 2,330,771 European AUD Put/USD Call Option Citigroup AUD 0.73 92,326 23/12/2019 6,700 Euro Stoxx Banks Put Option UBS EUR 95 92,676 29/08/2019 2,345,400 European AUD Put/USD Call Option Citigroup AUD 0.73 92,905 13/09/2019 2,910,554 European AUD Put/USD Call Option JP Morgan AUD 0.725 105,042 13/09/2019 2,995,040 European AUD Put/USD Call Option Citigroup AUD 0.725 108,091 23/12/2019 6,250 Euro Stoxx Banks Put Option JP Morgan EUR 100 115,238 29/08/2019 3,000,005 European AUD Put/USD Call Option Citigroup AUD 0.73 118,835 23/12/2019 8,700 Euro Stoxx Banks Put Option Goldman Sachs EUR 95 120,340 13/09/2019 3,520,998 European AUD Put/USD Call Option Citigroup AUD 0.725 127,073 23/12/2019 12,400 Euro Stoxx Banks Put Option Merrill Lynch EUR 95 171,519 23/12/2019 13,100 Euro Stoxx Banks Put Option JP Morgan EUR 95 181,202 23/12/2019 31,200 Euro Stoxx Banks Put Option UBS EUR 85 228,467
Royal Bank of 29/08/2019 9,093,279 European USD Put/CAD Call Option Canada USD 1.3085 232,767 23/12/2019 35,350 Euro Stoxx Banks Put Option UBS EUR 85 258,856 23/12/2019 36,350 Euro Stoxx Banks Put Option JP Morgan EUR 85 266,179
535 Invesco Funds
Notes to the Financial Statements (continued)
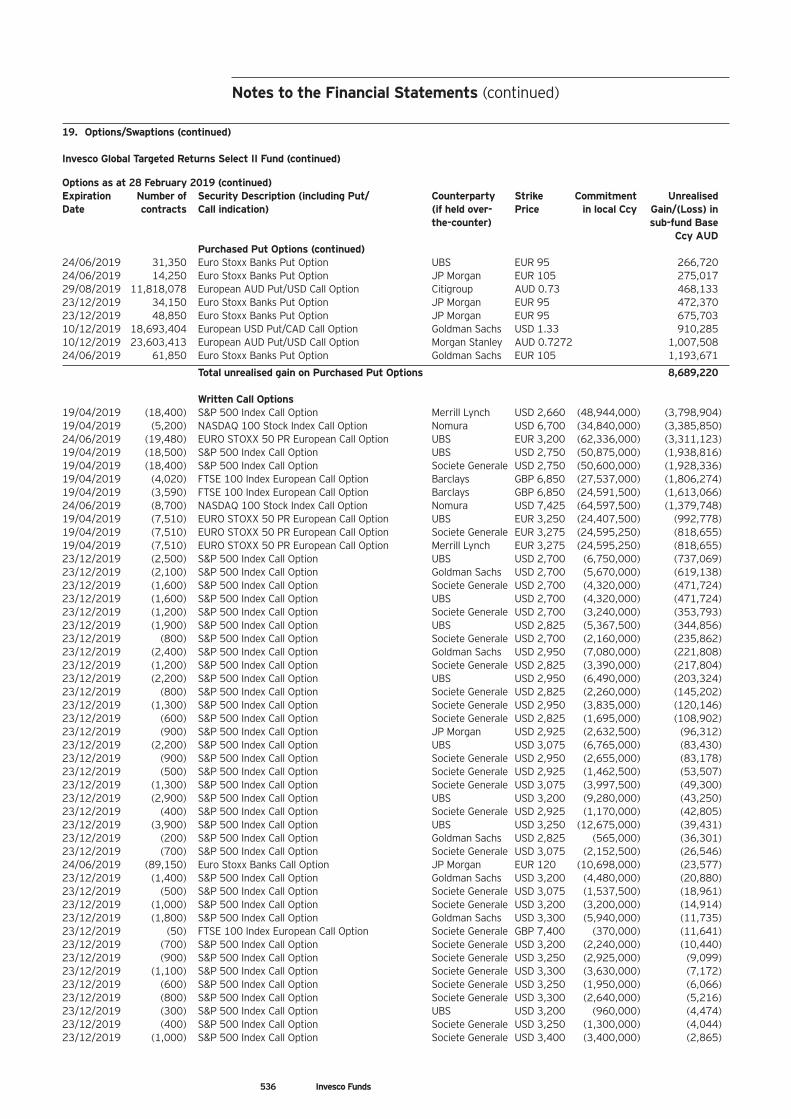
Notes to the Financial Statements (continued)
19. Options/Swaptions (continued) Invesco Global Targeted Returns Select II Fund (continued) Options as at 28 February 2019 (continued) Expiration Number of Security Description (including Put/ Counterparty Strike Commitment Unrealised Date contracts Call indication) (if held over- Price in local Ccy Gain/(Loss) in
the-counter) sub-fund Base Ccy AUD Purchased Put Options (continued)
24/06/2019 31,350 Euro Stoxx Banks Put Option UBS EUR 95 266,720 24/06/2019 14,250 Euro Stoxx Banks Put Option JP Morgan EUR 105 275,017 29/08/2019 11,818,078 European AUD Put/USD Call Option Citigroup AUD 0.73 468,133 23/12/2019 34,150 Euro Stoxx Banks Put Option JP Morgan EUR 95 472,370 23/12/2019 48,850 Euro Stoxx Banks Put Option JP Morgan EUR 95 675,703 10/12/2019 18,693,404 European USD Put/CAD Call Option Goldman Sachs USD 1.33 910,285 10/12/2019 23,603,413 European AUD Put/USD Call Option Morgan Stanley AUD 0.7272 1,007,508 24/06/2019 61,850 Euro Stoxx Banks Put Option Goldman Sachs EUR 105 1,193,671
Total unrealised gain on Purchased Put Options 8,689,220
Written Call Options 19/04/2019 (18,400) S&P 500 Index Call Option Merrill Lynch USD 2,660 (48,944,000) (3,798,904) 19/04/2019 (5,200) NASDAQ 100 Stock Index Call Option Nomura USD 6,700 (34,840,000) (3,385,850) 24/06/2019 (19,480) EURO STOXX 50 PR European Call Option UBS EUR 3,200 (62,336,000) (3,311,123) 19/04/2019 (18,500) S&P 500 Index Call Option UBS USD 2,750 (50,875,000) (1,938,816) 19/04/2019 (18,400) S&P 500 Index Call Option Societe Generale USD 2,750 (50,600,000) (1,928,336) 19/04/2019 (4,020) FTSE 100 Index European Call Option Barclays GBP 6,850 (27,537,000) (1,806,274) 19/04/2019 (3,590) FTSE 100 Index European Call Option Barclays GBP 6,850 (24,591,500) (1,613,066) 24/06/2019 (8,700) NASDAQ 100 Stock Index Call Option Nomura USD 7,425 (64,597,500) (1,379,748) 19/04/2019 (7,510) EURO STOXX 50 PR European Call Option UBS EUR 3,250 (24,407,500) (992,778) 19/04/2019 (7,510) EURO STOXX 50 PR European Call Option Societe Generale EUR 3,275 (24,595,250) (818,655) 19/04/2019 (7,510) EURO STOXX 50 PR European Call Option Merrill Lynch EUR 3,275 (24,595,250) (818,655) 23/12/2019 (2,500) S&P 500 Index Call Option UBS USD 2,700 (6,750,000) (737,069) 23/12/2019 (2,100) S&P 500 Index Call Option Goldman Sachs USD 2,700 (5,670,000) (619,138) 23/12/2019 (1,600) S&P 500 Index Call Option Societe Generale USD 2,700 (4,320,000) (471,724) 23/12/2019 (1,600) S&P 500 Index Call Option UBS USD 2,700 (4,320,000) (471,724) 23/12/2019 (1,200) S&P 500 Index Call Option Societe Generale USD 2,700 (3,240,000) (353,793) 23/12/2019 (1,900) S&P 500 Index Call Option UBS USD 2,825 (5,367,500) (344,856) 23/12/2019 (800) S&P 500 Index Call Option Societe Generale USD 2,700 (2,160,000) (235,862) 23/12/2019 (2,400) S&P 500 Index Call Option Goldman Sachs USD 2,950 (7,080,000) (221,808) 23/12/2019 (1,200) S&P 500 Index Call Option Societe Generale USD 2,825 (3,390,000) (217,804) 23/12/2019 (2,200) S&P 500 Index Call Option UBS USD 2,950 (6,490,000) (203,324) 23/12/2019 (800) S&P 500 Index Call Option Societe Generale USD 2,825 (2,260,000) (145,202) 23/12/2019 (1,300) S&P 500 Index Call Option Societe Generale USD 2,950 (3,835,000) (120,146) 23/12/2019 (600) S&P 500 Index Call Option Societe Generale USD 2,825 (1,695,000) (108,902) 23/12/2019 (900) S&P 500 Index Call Option JP Morgan USD 2,925 (2,632,500) (96,312) 23/12/2019 (2,200) S&P 500 Index Call Option UBS USD 3,075 (6,765,000) (83,430) 23/12/2019 (900) S&P 500 Index Call Option Societe Generale USD 2,950 (2,655,000) (83,178) 23/12/2019 (500) S&P 500 Index Call Option Societe Generale USD 2,925 (1,462,500) (53,507) 23/12/2019 (1,300) S&P 500 Index Call Option Societe Generale USD 3,075 (3,997,500) (49,300) 23/12/2019 (2,900) S&P 500 Index Call Option UBS USD 3,200 (9,280,000) (43,250) 23/12/2019 (400) S&P 500 Index Call Option Societe Generale USD 2,925 (1,170,000) (42,805) 23/12/2019 (3,900) S&P 500 Index Call Option UBS USD 3,250 (12,675,000) (39,431) 23/12/2019 (200) S&P 500 Index Call Option Goldman Sachs USD 2,825 (565,000) (36,301) 23/12/2019 (700) S&P 500 Index Call Option Societe Generale USD 3,075 (2,152,500) (26,546) 24/06/2019 (89,150) Euro Stoxx Banks Call Option JP Morgan EUR 120 (10,698,000) (23,577) 23/12/2019 (1,400) S&P 500 Index Call Option Goldman Sachs USD 3,200 (4,480,000) (20,880) 23/12/2019 (500) S&P 500 Index Call Option Societe Generale USD 3,075 (1,537,500) (18,961) 23/12/2019 (1,000) S&P 500 Index Call Option Societe Generale USD 3,200 (3,200,000) (14,914) 23/12/2019 (1,800) S&P 500 Index Call Option Goldman Sachs USD 3,300 (5,940,000) (11,735) 23/12/2019 (50) FTSE 100 Index European Call Option Societe Generale GBP 7,400 (370,000) (11,641) 23/12/2019 (700) S&P 500 Index Call Option Societe Generale USD 3,200 (2,240,000) (10,440) 23/12/2019 (900) S&P 500 Index Call Option Societe Generale USD 3,250 (2,925,000) (9,099) 23/12/2019 (1,100) S&P 500 Index Call Option Societe Generale USD 3,300 (3,630,000) (7,172) 23/12/2019 (600) S&P 500 Index Call Option Societe Generale USD 3,250 (1,950,000) (6,066) 23/12/2019 (800) S&P 500 Index Call Option Societe Generale USD 3,300 (2,640,000) (5,216) 23/12/2019 (300) S&P 500 Index Call Option UBS USD 3,200 (960,000) (4,474) 23/12/2019 (400) S&P 500 Index Call Option Societe Generale USD 3,250 (1,300,000) (4,044) 23/12/2019 (1,000) S&P 500 Index Call Option Societe Generale USD 3,400 (3,400,000) (2,865)
536 Invesco Funds
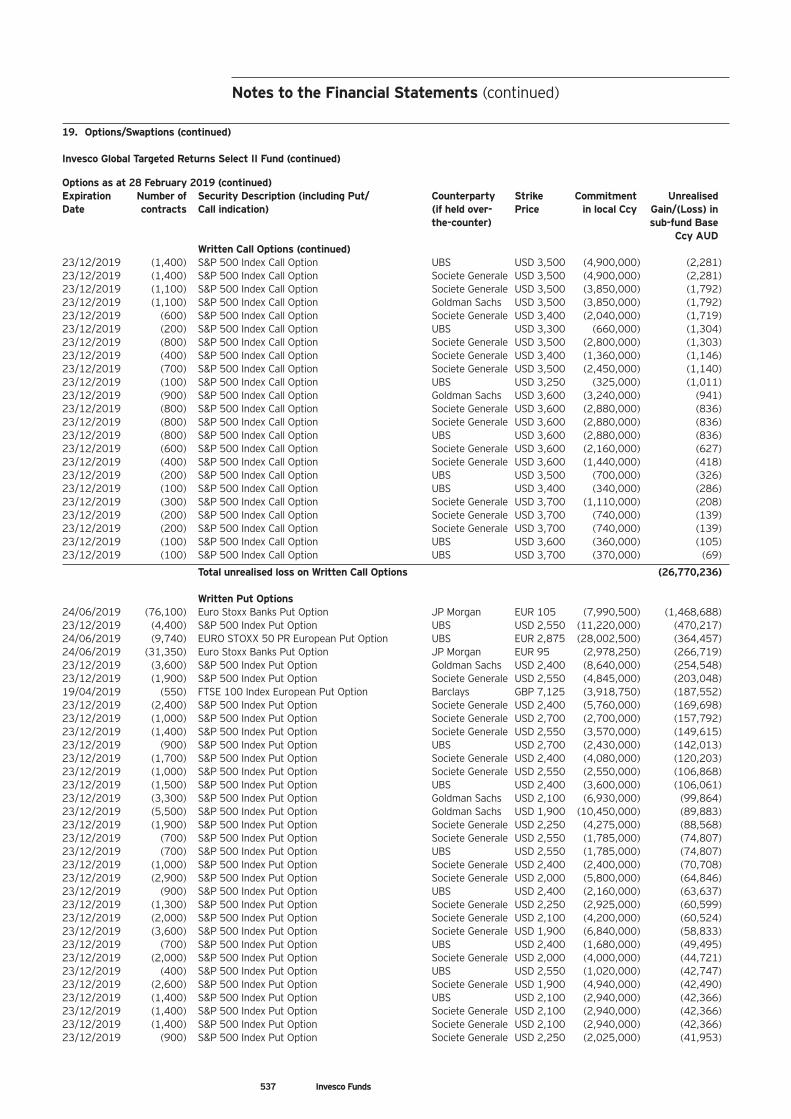
Notes to the Financial Statements (continued)
19. Options/Swaptions (continued) Invesco Global Targeted Returns Select II Fund (continued) Options as at 28 February 2019 (continued) Expiration Number of Security Description (including Put/ Counterparty Strike Commitment Unrealised Date contracts Call indication) (if held over- Price in local Ccy Gain/(Loss) in
the-counter) sub-fund Base Ccy AUD Written Call Options (continued)
23/12/2019 (1,400) S&P 500 Index Call Option UBS USD 3,500 (4,900,000) (2,281) 23/12/2019 (1,400) S&P 500 Index Call Option Societe Generale USD 3,500 (4,900,000) (2,281) 23/12/2019 (1,100) S&P 500 Index Call Option Societe Generale USD 3,500 (3,850,000) (1,792) 23/12/2019 (1,100) S&P 500 Index Call Option Goldman Sachs USD 3,500 (3,850,000) (1,792) 23/12/2019 (600) S&P 500 Index Call Option Societe Generale USD 3,400 (2,040,000) (1,719) 23/12/2019 (200) S&P 500 Index Call Option UBS USD 3,300 (660,000) (1,304) 23/12/2019 (800) S&P 500 Index Call Option Societe Generale USD 3,500 (2,800,000) (1,303) 23/12/2019 (400) S&P 500 Index Call Option Societe Generale USD 3,400 (1,360,000) (1,146) 23/12/2019 (700) S&P 500 Index Call Option Societe Generale USD 3,500 (2,450,000) (1,140) 23/12/2019 (100) S&P 500 Index Call Option UBS USD 3,250 (325,000) (1,011) 23/12/2019 (900) S&P 500 Index Call Option Goldman Sachs USD 3,600 (3,240,000) (941) 23/12/2019 (800) S&P 500 Index Call Option Societe Generale USD 3,600 (2,880,000) (836) 23/12/2019 (800) S&P 500 Index Call Option Societe Generale USD 3,600 (2,880,000) (836) 23/12/2019 (800) S&P 500 Index Call Option UBS USD 3,600 (2,880,000) (836) 23/12/2019 (600) S&P 500 Index Call Option Societe Generale USD 3,600 (2,160,000) (627) 23/12/2019 (400) S&P 500 Index Call Option Societe Generale USD 3,600 (1,440,000) (418) 23/12/2019 (200) S&P 500 Index Call Option UBS USD 3,500 (700,000) (326) 23/12/2019 (100) S&P 500 Index Call Option UBS USD 3,400 (340,000) (286) 23/12/2019 (300) S&P 500 Index Call Option Societe Generale USD 3,700 (1,110,000) (208) 23/12/2019 (200) S&P 500 Index Call Option Societe Generale USD 3,700 (740,000) (139) 23/12/2019 (200) S&P 500 Index Call Option Societe Generale USD 3,700 (740,000) (139) 23/12/2019 (100) S&P 500 Index Call Option UBS USD 3,600 (360,000) (105) 23/12/2019 (100) S&P 500 Index Call Option UBS USD 3,700 (370,000) (69)
Total unrealised loss on Written Call Options (26,770,236) Written Put Options
24/06/2019 (76,100) Euro Stoxx Banks Put Option JP Morgan EUR 105 (7,990,500) (1,468,688) 23/12/2019 (4,400) S&P 500 Index Put Option UBS USD 2,550 (11,220,000) (470,217) 24/06/2019 (9,740) EURO STOXX 50 PR European Put Option UBS EUR 2,875 (28,002,500) (364,457) 24/06/2019 (31,350) Euro Stoxx Banks Put Option JP Morgan EUR 95 (2,978,250) (266,719) 23/12/2019 (3,600) S&P 500 Index Put Option Goldman Sachs USD 2,400 (8,640,000) (254,548) 23/12/2019 (1,900) S&P 500 Index Put Option Societe Generale USD 2,550 (4,845,000) (203,048) 19/04/2019 (550) FTSE 100 Index European Put Option Barclays GBP 7,125 (3,918,750) (187,552) 23/12/2019 (2,400) S&P 500 Index Put Option Societe Generale USD 2,400 (5,760,000) (169,698) 23/12/2019 (1,000) S&P 500 Index Put Option Societe Generale USD 2,700 (2,700,000) (157,792) 23/12/2019 (1,400) S&P 500 Index Put Option Societe Generale USD 2,550 (3,570,000) (149,615) 23/12/2019 (900) S&P 500 Index Put Option UBS USD 2,700 (2,430,000) (142,013) 23/12/2019 (1,700) S&P 500 Index Put Option Societe Generale USD 2,400 (4,080,000) (120,203) 23/12/2019 (1,000) S&P 500 Index Put Option Societe Generale USD 2,550 (2,550,000) (106,868) 23/12/2019 (1,500) S&P 500 Index Put Option UBS USD 2,400 (3,600,000) (106,061) 23/12/2019 (3,300) S&P 500 Index Put Option Goldman Sachs USD 2,100 (6,930,000) (99,864) 23/12/2019 (5,500) S&P 500 Index Put Option Goldman Sachs USD 1,900 (10,450,000) (89,883) 23/12/2019 (1,900) S&P 500 Index Put Option Societe Generale USD 2,250 (4,275,000) (88,568) 23/12/2019 (700) S&P 500 Index Put Option Societe Generale USD 2,550 (1,785,000) (74,807) 23/12/2019 (700) S&P 500 Index Put Option UBS USD 2,550 (1,785,000) (74,807) 23/12/2019 (1,000) S&P 500 Index Put Option Societe Generale USD 2,400 (2,400,000) (70,708) 23/12/2019 (2,900) S&P 500 Index Put Option Societe Generale USD 2,000 (5,800,000) (64,846) 23/12/2019 (900) S&P 500 Index Put Option UBS USD 2,400 (2,160,000) (63,637) 23/12/2019 (1,300) S&P 500 Index Put Option Societe Generale USD 2,250 (2,925,000) (60,599) 23/12/2019 (2,000) S&P 500 Index Put Option Societe Generale USD 2,100 (4,200,000) (60,524) 23/12/2019 (3,600) S&P 500 Index Put Option Societe Generale USD 1,900 (6,840,000) (58,833) 23/12/2019 (700) S&P 500 Index Put Option UBS USD 2,400 (1,680,000) (49,495) 23/12/2019 (2,000) S&P 500 Index Put Option Societe Generale USD 2,000 (4,000,000) (44,721) 23/12/2019 (400) S&P 500 Index Put Option UBS USD 2,550 (1,020,000) (42,747) 23/12/2019 (2,600) S&P 500 Index Put Option Societe Generale USD 1,900 (4,940,000) (42,490) 23/12/2019 (1,400) S&P 500 Index Put Option UBS USD 2,100 (2,940,000) (42,366) 23/12/2019 (1,400) S&P 500 Index Put Option Societe Generale USD 2,100 (2,940,000) (42,366) 23/12/2019 (1,400) S&P 500 Index Put Option Societe Generale USD 2,100 (2,940,000) (42,366) 23/12/2019 (900) S&P 500 Index Put Option Societe Generale USD 2,250 (2,025,000) (41,953)
537 Invesco Funds
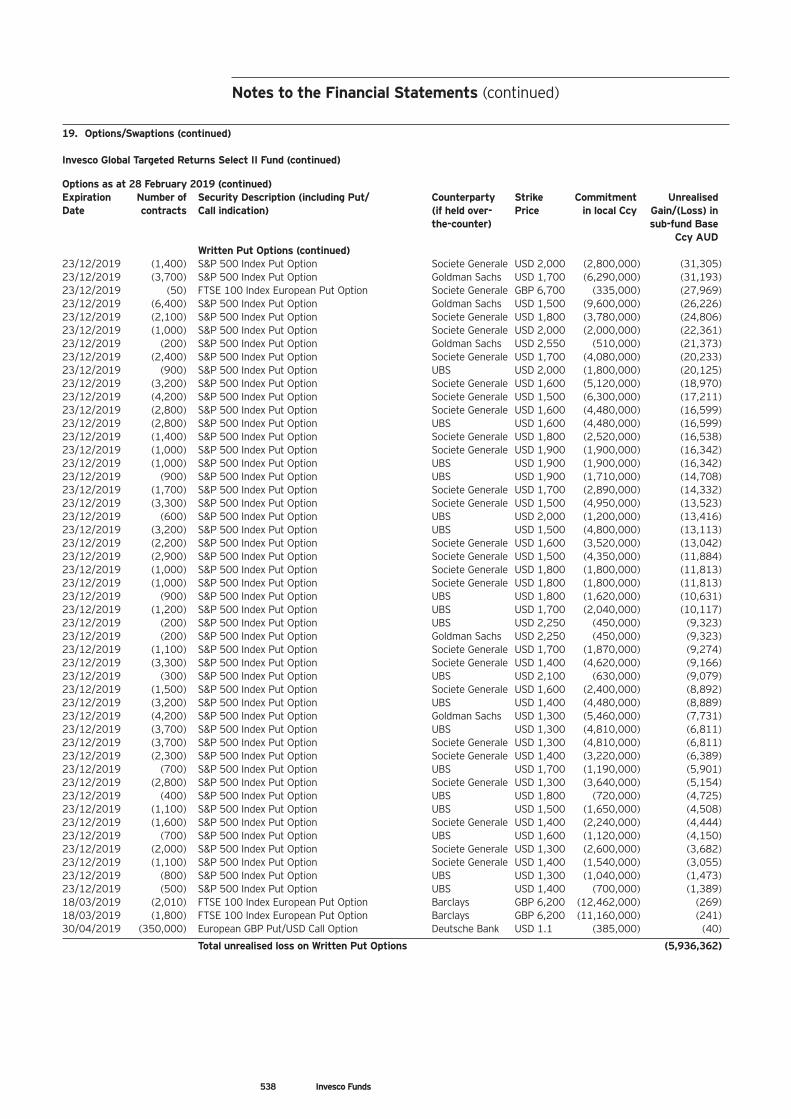
Notes to the Financial Statements (continued)
19. Options/Swaptions (continued) Invesco Global Targeted Returns Select II Fund (continued) Options as at 28 February 2019 (continued) Expiration Number of Security Description (including Put/ Counterparty Strike Commitment Unrealised Date contracts Call indication) (if held over- Price in local Ccy Gain/(Loss) in
the-counter) sub-fund Base Ccy AUD Written Put Options (continued)
23/12/2019 (1,400) S&P 500 Index Put Option Societe Generale USD 2,000 (2,800,000) (31,305) 23/12/2019 (3,700) S&P 500 Index Put Option Goldman Sachs USD 1,700 (6,290,000) (31,193) 23/12/2019 (50) FTSE 100 Index European Put Option Societe Generale GBP 6,700 (335,000) (27,969) 23/12/2019 (6,400) S&P 500 Index Put Option Goldman Sachs USD 1,500 (9,600,000) (26,226) 23/12/2019 (2,100) S&P 500 Index Put Option Societe Generale USD 1,800 (3,780,000) (24,806) 23/12/2019 (1,000) S&P 500 Index Put Option Societe Generale USD 2,000 (2,000,000) (22,361) 23/12/2019 (200) S&P 500 Index Put Option Goldman Sachs USD 2,550 (510,000) (21,373) 23/12/2019 (2,400) S&P 500 Index Put Option Societe Generale USD 1,700 (4,080,000) (20,233) 23/12/2019 (900) S&P 500 Index Put Option UBS USD 2,000 (1,800,000) (20,125) 23/12/2019 (3,200) S&P 500 Index Put Option Societe Generale USD 1,600 (5,120,000) (18,970) 23/12/2019 (4,200) S&P 500 Index Put Option Societe Generale USD 1,500 (6,300,000) (17,211) 23/12/2019 (2,800) S&P 500 Index Put Option Societe Generale USD 1,600 (4,480,000) (16,599) 23/12/2019 (2,800) S&P 500 Index Put Option UBS USD 1,600 (4,480,000) (16,599) 23/12/2019 (1,400) S&P 500 Index Put Option Societe Generale USD 1,800 (2,520,000) (16,538) 23/12/2019 (1,000) S&P 500 Index Put Option Societe Generale USD 1,900 (1,900,000) (16,342) 23/12/2019 (1,000) S&P 500 Index Put Option UBS USD 1,900 (1,900,000) (16,342) 23/12/2019 (900) S&P 500 Index Put Option UBS USD 1,900 (1,710,000) (14,708) 23/12/2019 (1,700) S&P 500 Index Put Option Societe Generale USD 1,700 (2,890,000) (14,332) 23/12/2019 (3,300) S&P 500 Index Put Option Societe Generale USD 1,500 (4,950,000) (13,523) 23/12/2019 (600) S&P 500 Index Put Option UBS USD 2,000 (1,200,000) (13,416) 23/12/2019 (3,200) S&P 500 Index Put Option UBS USD 1,500 (4,800,000) (13,113) 23/12/2019 (2,200) S&P 500 Index Put Option Societe Generale USD 1,600 (3,520,000) (13,042) 23/12/2019 (2,900) S&P 500 Index Put Option Societe Generale USD 1,500 (4,350,000) (11,884) 23/12/2019 (1,000) S&P 500 Index Put Option Societe Generale USD 1,800 (1,800,000) (11,813) 23/12/2019 (1,000) S&P 500 Index Put Option Societe Generale USD 1,800 (1,800,000) (11,813) 23/12/2019 (900) S&P 500 Index Put Option UBS USD 1,800 (1,620,000) (10,631) 23/12/2019 (1,200) S&P 500 Index Put Option UBS USD 1,700 (2,040,000) (10,117) 23/12/2019 (200) S&P 500 Index Put Option UBS USD 2,250 (450,000) (9,323) 23/12/2019 (200) S&P 500 Index Put Option Goldman Sachs USD 2,250 (450,000) (9,323) 23/12/2019 (1,100) S&P 500 Index Put Option Societe Generale USD 1,700 (1,870,000) (9,274) 23/12/2019 (3,300) S&P 500 Index Put Option Societe Generale USD 1,400 (4,620,000) (9,166) 23/12/2019 (300) S&P 500 Index Put Option UBS USD 2,100 (630,000) (9,079) 23/12/2019 (1,500) S&P 500 Index Put Option Societe Generale USD 1,600 (2,400,000) (8,892) 23/12/2019 (3,200) S&P 500 Index Put Option UBS USD 1,400 (4,480,000) (8,889) 23/12/2019 (4,200) S&P 500 Index Put Option Goldman Sachs USD 1,300 (5,460,000) (7,731) 23/12/2019 (3,700) S&P 500 Index Put Option UBS USD 1,300 (4,810,000) (6,811) 23/12/2019 (3,700) S&P 500 Index Put Option Societe Generale USD 1,300 (4,810,000) (6,811) 23/12/2019 (2,300) S&P 500 Index Put Option Societe Generale USD 1,400 (3,220,000) (6,389) 23/12/2019 (700) S&P 500 Index Put Option UBS USD 1,700 (1,190,000) (5,901) 23/12/2019 (2,800) S&P 500 Index Put Option Societe Generale USD 1,300 (3,640,000) (5,154) 23/12/2019 (400) S&P 500 Index Put Option UBS USD 1,800 (720,000) (4,725) 23/12/2019 (1,100) S&P 500 Index Put Option UBS USD 1,500 (1,650,000) (4,508) 23/12/2019 (1,600) S&P 500 Index Put Option Societe Generale USD 1,400 (2,240,000) (4,444) 23/12/2019 (700) S&P 500 Index Put Option UBS USD 1,600 (1,120,000) (4,150) 23/12/2019 (2,000) S&P 500 Index Put Option Societe Generale USD 1,300 (2,600,000) (3,682) 23/12/2019 (1,100) S&P 500 Index Put Option Societe Generale USD 1,400 (1,540,000) (3,055) 23/12/2019 (800) S&P 500 Index Put Option UBS USD 1,300 (1,040,000) (1,473) 23/12/2019 (500) S&P 500 Index Put Option UBS USD 1,400 (700,000) (1,389) 18/03/2019 (2,010) FTSE 100 Index European Put Option Barclays GBP 6,200 (12,462,000) (269) 18/03/2019 (1,800) FTSE 100 Index European Put Option Barclays GBP 6,200 (11,160,000) (241) 30/04/2019 (350,000) European GBP Put/USD Call Option Deutsche Bank USD 1.1 (385,000) (40)
Total unrealised loss on Written Put Options (5,936,362)
538 Invesco Funds
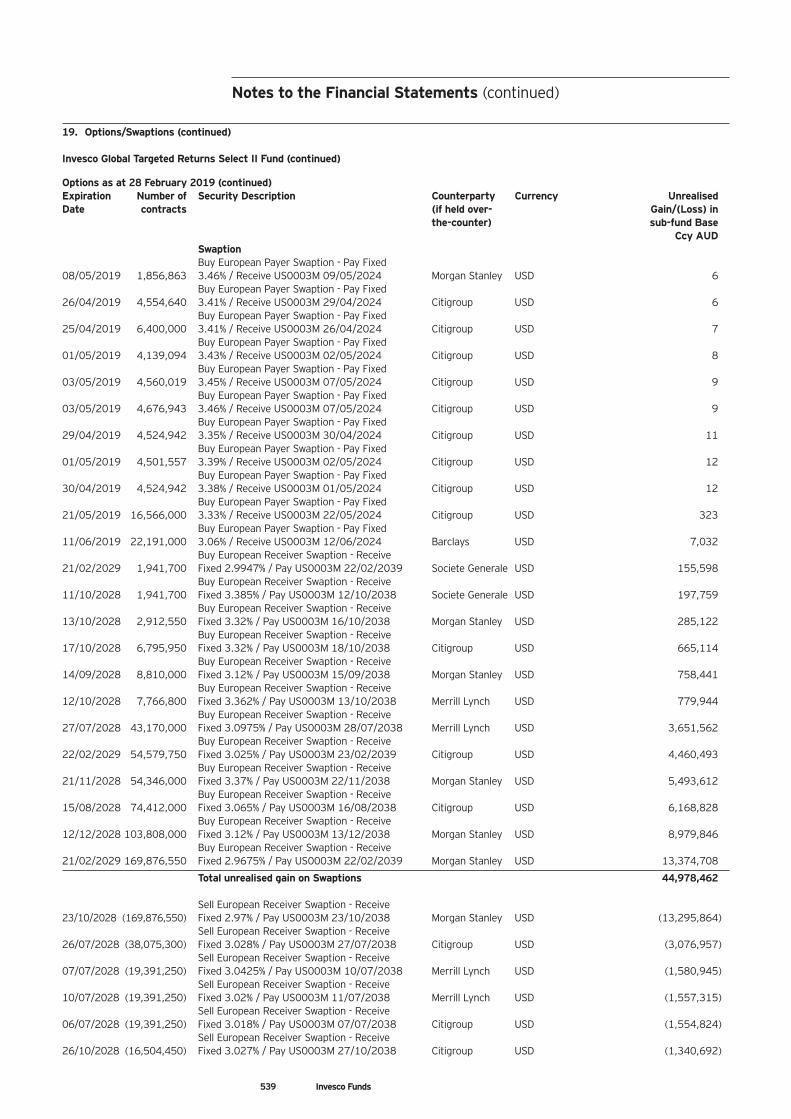
Notes to the Financial Statements (continued)
539 Invesco Funds
19. Options/Swaptions (continued) Invesco Global Targeted Returns Select II Fund (continued) Options as at 28 February 2019 (continued) Expiration Number of Security Description Counterparty Currency Unrealised Date contracts (if held over- Gain/(Loss) in
the-counter) sub-fund Base Ccy AUD Swaption Buy European Payer Swaption - Pay Fixed
08/05/2019 1,856,863 3.46% / Receive US0003M 09/05/2024 Morgan Stanley USD 6 Buy European Payer Swaption - Pay Fixed
26/04/2019 4,554,640 3.41% / Receive US0003M 29/04/2024 Citigroup USD 6 Buy European Payer Swaption - Pay Fixed
25/04/2019 6,400,000 3.41% / Receive US0003M 26/04/2024 Citigroup USD 7 Buy European Payer Swaption - Pay Fixed
01/05/2019 4,139,094 3.43% / Receive US0003M 02/05/2024 Citigroup USD 8 Buy European Payer Swaption - Pay Fixed
03/05/2019 4,560,019 3.45% / Receive US0003M 07/05/2024 Citigroup USD 9 Buy European Payer Swaption - Pay Fixed
03/05/2019 4,676,943 3.46% / Receive US0003M 07/05/2024 Citigroup USD 9 Buy European Payer Swaption - Pay Fixed
29/04/2019 4,524,942 3.35% / Receive US0003M 30/04/2024 Citigroup USD 11 Buy European Payer Swaption - Pay Fixed
01/05/2019 4,501,557 3.39% / Receive US0003M 02/05/2024 Citigroup USD 12 Buy European Payer Swaption - Pay Fixed
30/04/2019 4,524,942 3.38% / Receive US0003M 01/05/2024 Citigroup USD 12 Buy European Payer Swaption - Pay Fixed
21/05/2019 16,566,000 3.33% / Receive US0003M 22/05/2024 Citigroup USD 323 Buy European Payer Swaption - Pay Fixed
11/06/2019 22,191,000 3.06% / Receive US0003M 12/06/2024 Barclays USD 7,032 Buy European Receiver Swaption - Receive
21/02/2029 1,941,700 Fixed 2.9947% / Pay US0003M 22/02/2039 Societe Generale USD 155,598 Buy European Receiver Swaption - Receive
11/10/2028 1,941,700 Fixed 3.385% / Pay US0003M 12/10/2038 Societe Generale USD 197,759 Buy European Receiver Swaption - Receive
13/10/2028 2,912,550 Fixed 3.32% / Pay US0003M 16/10/2038 Morgan Stanley USD 285,122 Buy European Receiver Swaption - Receive
17/10/2028 6,795,950 Fixed 3.32% / Pay US0003M 18/10/2038 Citigroup USD 665,114 Buy European Receiver Swaption - Receive
14/09/2028 8,810,000 Fixed 3.12% / Pay US0003M 15/09/2038 Morgan Stanley USD 758,441 Buy European Receiver Swaption - Receive
12/10/2028 7,766,800 Fixed 3.362% / Pay US0003M 13/10/2038 Merrill Lynch USD 779,944 Buy European Receiver Swaption - Receive
27/07/2028 43,170,000 Fixed 3.0975% / Pay US0003M 28/07/2038 Merrill Lynch USD 3,651,562 Buy European Receiver Swaption - Receive
22/02/2029 54,579,750 Fixed 3.025% / Pay US0003M 23/02/2039 Citigroup USD 4,460,493 Buy European Receiver Swaption - Receive
21/11/2028 54,346,000 Fixed 3.37% / Pay US0003M 22/11/2038 Morgan Stanley USD 5,493,612 Buy European Receiver Swaption - Receive
15/08/2028 74,412,000 Fixed 3.065% / Pay US0003M 16/08/2038 Citigroup USD 6,168,828 Buy European Receiver Swaption - Receive
12/12/2028 103,808,000 Fixed 3.12% / Pay US0003M 13/12/2038 Morgan Stanley USD 8,979,846 Buy European Receiver Swaption - Receive
21/02/2029 169,876,550 Fixed 2.9675% / Pay US0003M 22/02/2039 Morgan Stanley USD 13,374,708
Total unrealised gain on Swaptions 44,978,462 Sell European Receiver Swaption - Receive
23/10/2028 (169,876,550) Fixed 2.97% / Pay US0003M 23/10/2038 Morgan Stanley USD (13,295,864) Sell European Receiver Swaption - Receive
26/07/2028 (38,075,300) Fixed 3.028% / Pay US0003M 27/07/2038 Citigroup USD (3,076,957) Sell European Receiver Swaption - Receive
07/07/2028 (19,391,250) Fixed 3.0425% / Pay US0003M 10/07/2038 Merrill Lynch USD (1,580,945) Sell European Receiver Swaption - Receive
10/07/2028 (19,391,250) Fixed 3.02% / Pay US0003M 11/07/2038 Merrill Lynch USD (1,557,315) Sell European Receiver Swaption - Receive
06/07/2028 (19,391,250) Fixed 3.018% / Pay US0003M 07/07/2038 Citigroup USD (1,554,824) Sell European Receiver Swaption - Receive
26/10/2028 (16,504,450) Fixed 3.027% / Pay US0003M 27/10/2038 Citigroup USD (1,340,692)
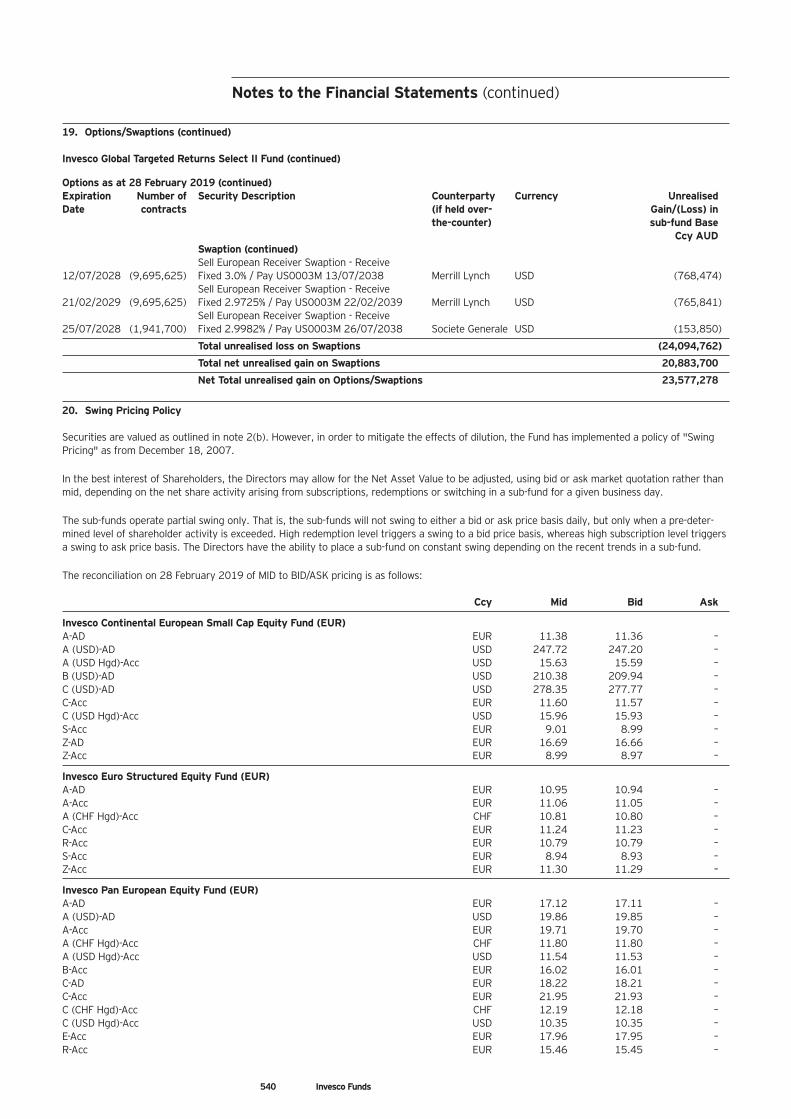
Notes to the Financial Statements (continued)
540 Invesco Funds
19. Options/Swaptions (continued) Invesco Global Targeted Returns Select II Fund (continued) Options as at 28 February 2019 (continued) Expiration Number of Security Description Counterparty Currency Unrealised Date contracts (if held over- Gain/(Loss) in
the-counter) sub-fund Base Ccy AUD Swaption (continued) Sell European Receiver Swaption - Receive
12/07/2028 (9,695,625) Fixed 3.0% / Pay US0003M 13/07/2038 Merrill Lynch USD (768,474) Sell European Receiver Swaption - Receive
21/02/2029 (9,695,625) Fixed 2.9725% / Pay US0003M 22/02/2039 Merrill Lynch USD (765,841) Sell European Receiver Swaption - Receive
25/07/2028 (1,941,700) Fixed 2.9982% / Pay US0003M 26/07/2038 Societe Generale USD (153,850)
Total unrealised loss on Swaptions (24,094,762)
Total net unrealised gain on Swaptions 20,883,700
Net Total unrealised gain on Options/Swaptions 23,577,278
20. Swing Pricing Policy Securities are valued as outlined in note 2(b). However, in order to mitigate the effects of dilution, the Fund has implemented a policy of "Swing Pricing" as from December 18, 2007.
In the best interest of Shareholders, the Directors may allow for the Net Asset Value to be adjusted, using bid or ask market quotation rather than mid, depending on the net share activity arising from subscriptions, redemptions or switching in a sub-fund for a given business day.
The sub-funds operate partial swing only. That is, the sub-funds will not swing to either a bid or ask price basis daily, but only when a pre-deter-mined level of shareholder activity is exceeded. High redemption level triggers a swing to a bid price basis, whereas high subscription level triggers a swing to ask price basis. The Directors have the ability to place a sub-fund on constant swing depending on the recent trends in a sub-fund.
The reconciliation on 28 February 2019 of MID to BID/ASK pricing is as follows: Ccy Mid Bid Ask
Invesco Continental European Small Cap Equity Fund (EUR) A-AD EUR 11.38 11.36 – A (USD)-AD USD 247.72 247.20 – A (USD Hgd)-Acc USD 15.63 15.59 – B (USD)-AD USD 210.38 209.94 – C (USD)-AD USD 278.35 277.77 – C-Acc EUR 11.60 11.57 – C (USD Hgd)-Acc USD 15.96 15.93 – S-Acc EUR 9.01 8.99 – Z-AD EUR 16.69 16.66 – Z-Acc EUR 8.99 8.97 –
Invesco Euro Structured Equity Fund (EUR) A-AD EUR 10.95 10.94 – A-Acc EUR 11.06 11.05 – A (CHF Hgd)-Acc CHF 10.81 10.80 – C-Acc EUR 11.24 11.23 – R-Acc EUR 10.79 10.79 – S-Acc EUR 8.94 8.93 – Z-Acc EUR 11.30 11.29 –
Invesco Pan European Equity Fund (EUR) A-AD EUR 17.12 17.11 – A (USD)-AD USD 19.86 19.85 – A-Acc EUR 19.71 19.70 – A (CHF Hgd)-Acc CHF 11.80 11.80 – A (USD Hgd)-Acc USD 11.54 11.53 – B-Acc EUR 16.02 16.01 – C-AD EUR 18.22 18.21 – C-Acc EUR 21.95 21.93 – C (CHF Hgd)-Acc CHF 12.19 12.18 – C (USD Hgd)-Acc USD 10.35 10.35 – E-Acc EUR 17.96 17.95 – R-Acc EUR 15.46 15.45 –
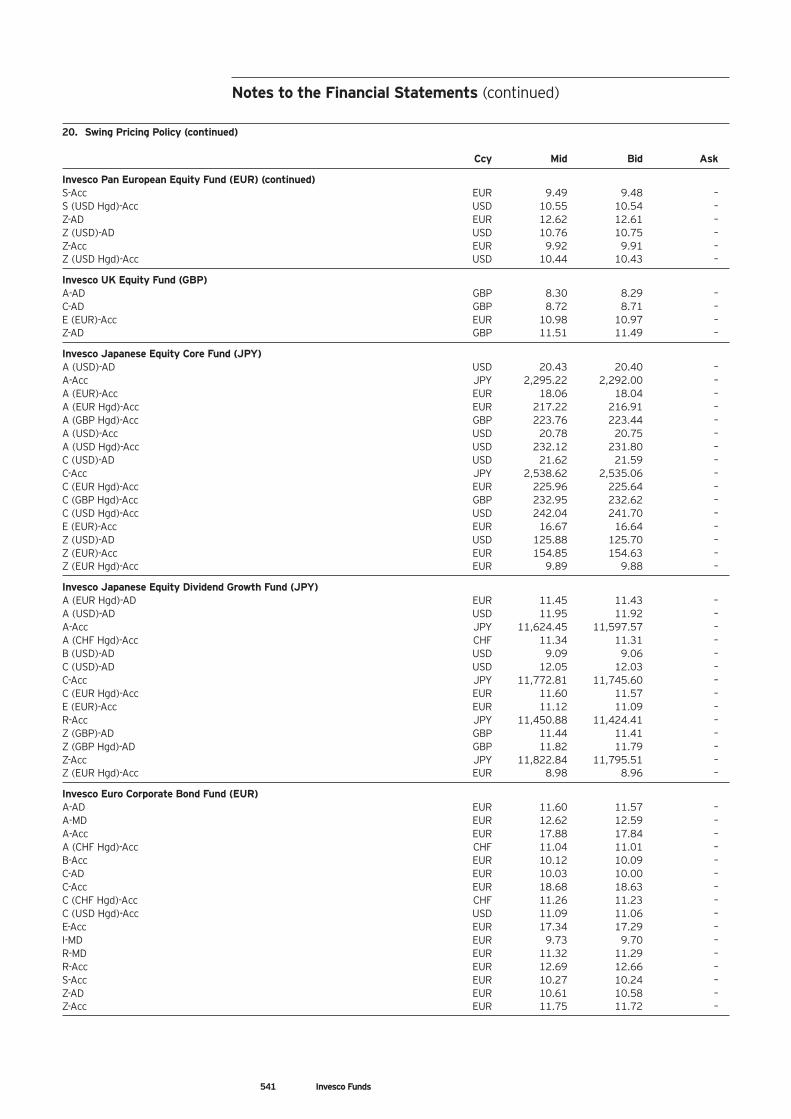
Notes to the Financial Statements (continued)
541 Invesco Funds
20. Swing Pricing Policy (continued) Ccy Mid Bid Ask
Invesco Pan European Equity Fund (EUR) (continued) S-Acc EUR 9.49 9.48 – S (USD Hgd)-Acc USD 10.55 10.54 – Z-AD EUR 12.62 12.61 – Z (USD)-AD USD 10.76 10.75 – Z-Acc EUR 9.92 9.91 – Z (USD Hgd)-Acc USD 10.44 10.43 –
Invesco UK Equity Fund (GBP) A-AD GBP 8.30 8.29 – C-AD GBP 8.72 8.71 – E (EUR)-Acc EUR 10.98 10.97 – Z-AD GBP 11.51 11.49 –
Invesco Japanese Equity Core Fund (JPY) A (USD)-AD USD 20.43 20.40 – A-Acc JPY 2,295.22 2,292.00 – A (EUR)-Acc EUR 18.06 18.04 – A (EUR Hgd)-Acc EUR 217.22 216.91 – A (GBP Hgd)-Acc GBP 223.76 223.44 – A (USD)-Acc USD 20.78 20.75 – A (USD Hgd)-Acc USD 232.12 231.80 – C (USD)-AD USD 21.62 21.59 – C-Acc JPY 2,538.62 2,535.06 – C (EUR Hgd)-Acc EUR 225.96 225.64 – C (GBP Hgd)-Acc GBP 232.95 232.62 – C (USD Hgd)-Acc USD 242.04 241.70 – E (EUR)-Acc EUR 16.67 16.64 – Z (USD)-AD USD 125.88 125.70 – Z (EUR)-Acc EUR 154.85 154.63 – Z (EUR Hgd)-Acc EUR 9.89 9.88 –
Invesco Japanese Equity Dividend Growth Fund (JPY) A (EUR Hgd)-AD EUR 11.45 11.43 – A (USD)-AD USD 11.95 11.92 – A-Acc JPY 11,624.45 11,597.57 – A (CHF Hgd)-Acc CHF 11.34 11.31 – B (USD)-AD USD 9.09 9.06 – C (USD)-AD USD 12.05 12.03 – C-Acc JPY 11,772.81 11,745.60 – C (EUR Hgd)-Acc EUR 11.60 11.57 – E (EUR)-Acc EUR 11.12 11.09 – R-Acc JPY 11,450.88 11,424.41 – Z (GBP)-AD GBP 11.44 11.41 – Z (GBP Hgd)-AD GBP 11.82 11.79 – Z-Acc JPY 11,822.84 11,795.51 – Z (EUR Hgd)-Acc EUR 8.98 8.96 –
Invesco Euro Corporate Bond Fund (EUR) A-AD EUR 11.60 11.57 – A-MD EUR 12.62 12.59 – A-Acc EUR 17.88 17.84 – A (CHF Hgd)-Acc CHF 11.04 11.01 – B-Acc EUR 10.12 10.09 – C-AD EUR 10.03 10.00 – C-Acc EUR 18.68 18.63 – C (CHF Hgd)-Acc CHF 11.26 11.23 – C (USD Hgd)-Acc USD 11.09 11.06 – E-Acc EUR 17.34 17.29 – I-MD EUR 9.73 9.70 – R-MD EUR 11.32 11.29 – R-Acc EUR 12.69 12.66 – S-Acc EUR 10.27 10.24 – Z-AD EUR 10.61 10.58 – Z-Acc EUR 11.75 11.72 –
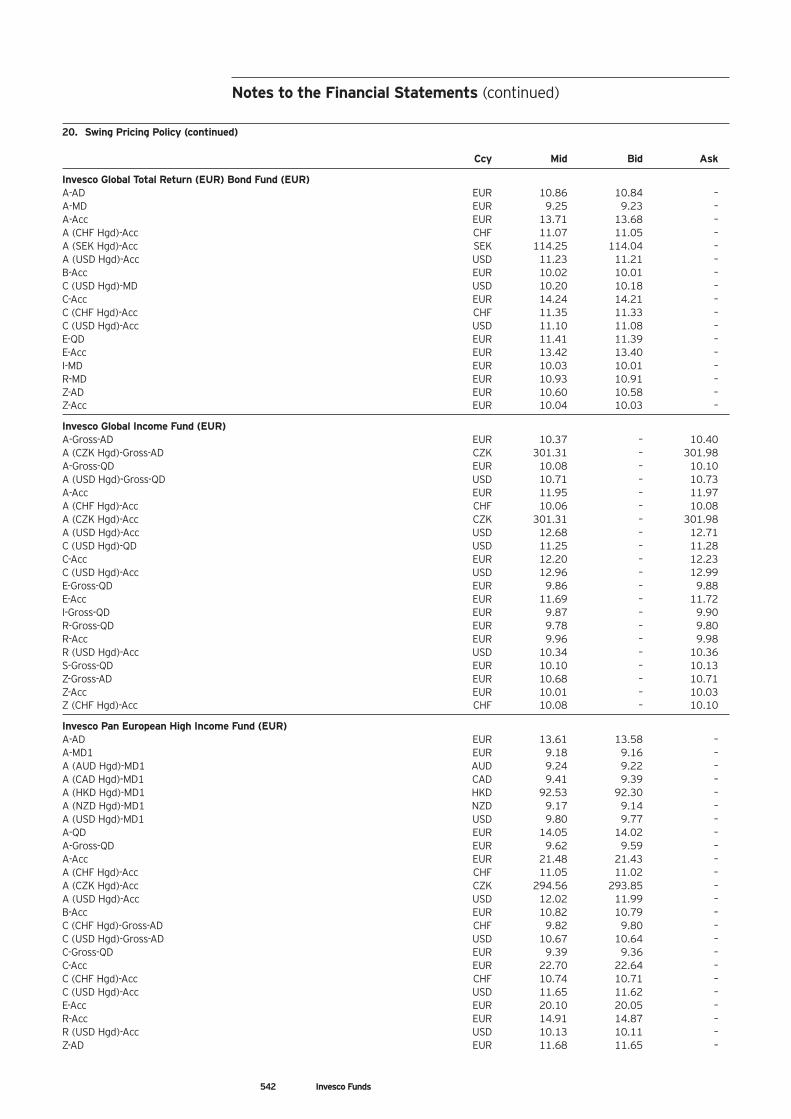
Notes to the Financial Statements (continued)
542 Invesco Funds
20. Swing Pricing Policy (continued) Ccy Mid Bid Ask
Invesco Global Total Return (EUR) Bond Fund (EUR) A-AD EUR 10.86 10.84 – A-MD EUR 9.25 9.23 – A-Acc EUR 13.71 13.68 – A (CHF Hgd)-Acc CHF 11.07 11.05 – A (SEK Hgd)-Acc SEK 114.25 114.04 – A (USD Hgd)-Acc USD 11.23 11.21 – B-Acc EUR 10.02 10.01 – C (USD Hgd)-MD USD 10.20 10.18 – C-Acc EUR 14.24 14.21 – C (CHF Hgd)-Acc CHF 11.35 11.33 – C (USD Hgd)-Acc USD 11.10 11.08 – E-QD EUR 11.41 11.39 – E-Acc EUR 13.42 13.40 – I-MD EUR 10.03 10.01 – R-MD EUR 10.93 10.91 – Z-AD EUR 10.60 10.58 – Z-Acc EUR 10.04 10.03 –
Invesco Global Income Fund (EUR) A-Gross-AD EUR 10.37 – 10.40 A (CZK Hgd)-Gross-AD CZK 301.31 – 301.98 A-Gross-QD EUR 10.08 – 10.10 A (USD Hgd)-Gross-QD USD 10.71 – 10.73 A-Acc EUR 11.95 – 11.97 A (CHF Hgd)-Acc CHF 10.06 – 10.08 A (CZK Hgd)-Acc CZK 301.31 – 301.98 A (USD Hgd)-Acc USD 12.68 – 12.71 C (USD Hgd)-QD USD 11.25 – 11.28 C-Acc EUR 12.20 – 12.23 C (USD Hgd)-Acc USD 12.96 – 12.99 E-Gross-QD EUR 9.86 – 9.88 E-Acc EUR 11.69 – 11.72 I-Gross-QD EUR 9.87 – 9.90 R-Gross-QD EUR 9.78 – 9.80 R-Acc EUR 9.96 – 9.98 R (USD Hgd)-Acc USD 10.34 – 10.36 S-Gross-QD EUR 10.10 – 10.13 Z-Gross-AD EUR 10.68 – 10.71 Z-Acc EUR 10.01 – 10.03 Z (CHF Hgd)-Acc CHF 10.08 – 10.10
Invesco Pan European High Income Fund (EUR) A-AD EUR 13.61 13.58 – A-MD1 EUR 9.18 9.16 – A (AUD Hgd)-MD1 AUD 9.24 9.22 – A (CAD Hgd)-MD1 CAD 9.41 9.39 – A (HKD Hgd)-MD1 HKD 92.53 92.30 – A (NZD Hgd)-MD1 NZD 9.17 9.14 – A (USD Hgd)-MD1 USD 9.80 9.77 – A-QD EUR 14.05 14.02 – A-Gross-QD EUR 9.62 9.59 – A-Acc EUR 21.48 21.43 – A (CHF Hgd)-Acc CHF 11.05 11.02 – A (CZK Hgd)-Acc CZK 294.56 293.85 – A (USD Hgd)-Acc USD 12.02 11.99 – B-Acc EUR 10.82 10.79 – C (CHF Hgd)-Gross-AD CHF 9.82 9.80 – C (USD Hgd)-Gross-AD USD 10.67 10.64 – C-Gross-QD EUR 9.39 9.36 – C-Acc EUR 22.70 22.64 – C (CHF Hgd)-Acc CHF 10.74 10.71 – C (USD Hgd)-Acc USD 11.65 11.62 – E-Acc EUR 20.10 20.05 – R-Acc EUR 14.91 14.87 – R (USD Hgd)-Acc USD 10.13 10.11 – Z-AD EUR 11.68 11.65 –
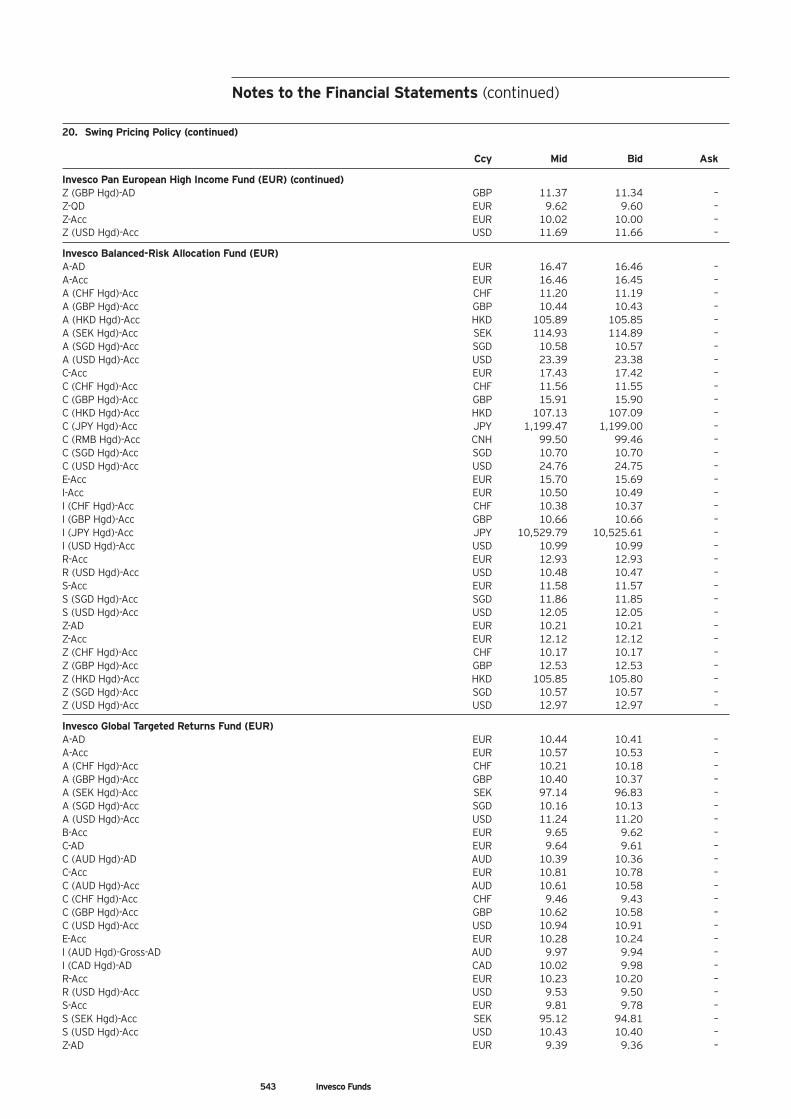
543 Invesco Funds
Notes to the Financial Statements (continued)
20. Swing Pricing Policy (continued) Ccy Mid Bid Ask
Invesco Pan European High Income Fund (EUR) (continued) Z (GBP Hgd)-AD GBP 11.37 11.34 – Z-QD EUR 9.62 9.60 – Z-Acc EUR 10.02 10.00 – Z (USD Hgd)-Acc USD 11.69 11.66 –
Invesco Balanced-Risk Allocation Fund (EUR) A-AD EUR 16.47 16.46 – A-Acc EUR 16.46 16.45 – A (CHF Hgd)-Acc CHF 11.20 11.19 – A (GBP Hgd)-Acc GBP 10.44 10.43 – A (HKD Hgd)-Acc HKD 105.89 105.85 – A (SEK Hgd)-Acc SEK 114.93 114.89 – A (SGD Hgd)-Acc SGD 10.58 10.57 – A (USD Hgd)-Acc USD 23.39 23.38 – C-Acc EUR 17.43 17.42 – C (CHF Hgd)-Acc CHF 11.56 11.55 – C (GBP Hgd)-Acc GBP 15.91 15.90 – C (HKD Hgd)-Acc HKD 107.13 107.09 – C (JPY Hgd)-Acc JPY 1,199.47 1,199.00 – C (RMB Hgd)-Acc CNH 99.50 99.46 – C (SGD Hgd)-Acc SGD 10.70 10.70 – C (USD Hgd)-Acc USD 24.76 24.75 – E-Acc EUR 15.70 15.69 – I-Acc EUR 10.50 10.49 – I (CHF Hgd)-Acc CHF 10.38 10.37 – I (GBP Hgd)-Acc GBP 10.66 10.66 – I (JPY Hgd)-Acc JPY 10,529.79 10,525.61 – I (USD Hgd)-Acc USD 10.99 10.99 – R-Acc EUR 12.93 12.93 – R (USD Hgd)-Acc USD 10.48 10.47 – S-Acc EUR 11.58 11.57 – S (SGD Hgd)-Acc SGD 11.86 11.85 – S (USD Hgd)-Acc USD 12.05 12.05 – Z-AD EUR 10.21 10.21 – Z-Acc EUR 12.12 12.12 – Z (CHF Hgd)-Acc CHF 10.17 10.17 – Z (GBP Hgd)-Acc GBP 12.53 12.53 – Z (HKD Hgd)-Acc HKD 105.85 105.80 – Z (SGD Hgd)-Acc SGD 10.57 10.57 – Z (USD Hgd)-Acc USD 12.97 12.97 –
Invesco Global Targeted Returns Fund (EUR) A-AD EUR 10.44 10.41 – A-Acc EUR 10.57 10.53 – A (CHF Hgd)-Acc CHF 10.21 10.18 – A (GBP Hgd)-Acc GBP 10.40 10.37 – A (SEK Hgd)-Acc SEK 97.14 96.83 – A (SGD Hgd)-Acc SGD 10.16 10.13 – A (USD Hgd)-Acc USD 11.24 11.20 – B-Acc EUR 9.65 9.62 – C-AD EUR 9.64 9.61 – C (AUD Hgd)-AD AUD 10.39 10.36 – C-Acc EUR 10.81 10.78 – C (AUD Hgd)-Acc AUD 10.61 10.58 – C (CHF Hgd)-Acc CHF 9.46 9.43 – C (GBP Hgd)-Acc GBP 10.62 10.58 – C (USD Hgd)-Acc USD 10.94 10.91 – E-Acc EUR 10.28 10.24 – I (AUD Hgd)-Gross-AD AUD 9.97 9.94 – I (CAD Hgd)-AD CAD 10.02 9.98 – R-Acc EUR 10.23 10.20 – R (USD Hgd)-Acc USD 9.53 9.50 – S-Acc EUR 9.81 9.78 – S (SEK Hgd)-Acc SEK 95.12 94.81 – S (USD Hgd)-Acc USD 10.43 10.40 – Z-AD EUR 9.39 9.36 –
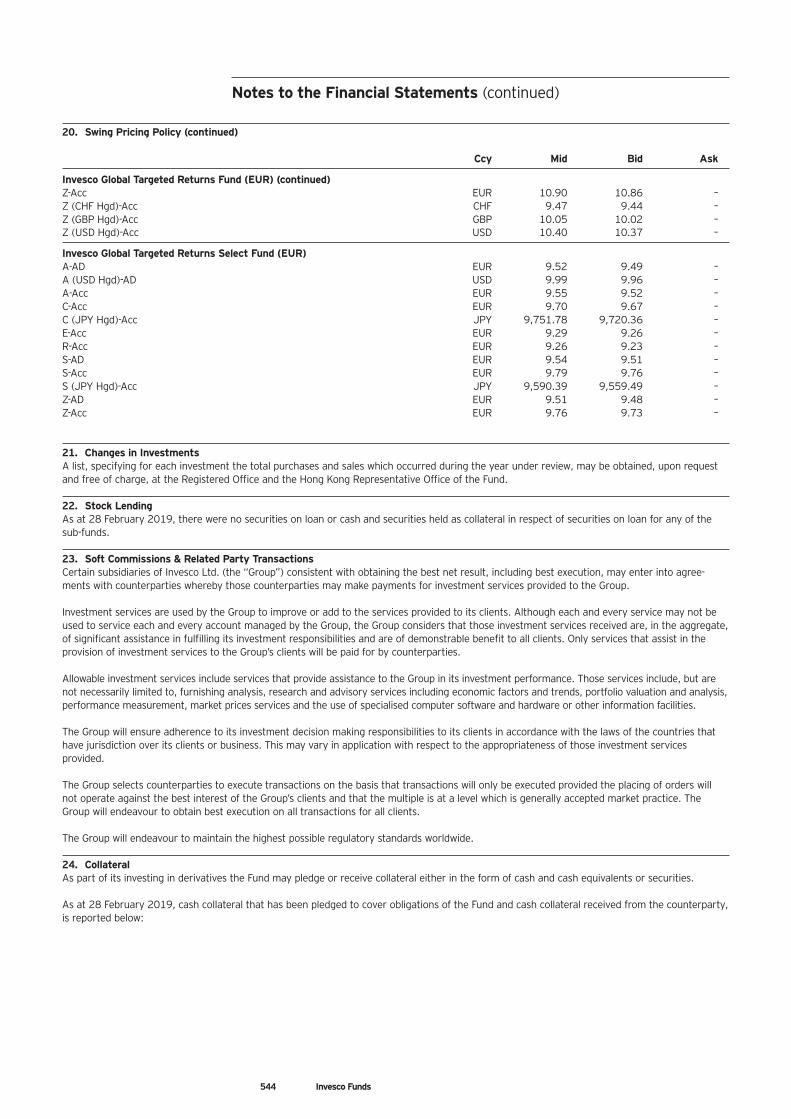
Notes to the Financial Statements (continued)
544 Invesco Funds
20. Swing Pricing Policy (continued) Ccy Mid Bid Ask
Invesco Global Targeted Returns Fund (EUR) (continued) Z-Acc EUR 10.90 10.86 – Z (CHF Hgd)-Acc CHF 9.47 9.44 – Z (GBP Hgd)-Acc GBP 10.05 10.02 – Z (USD Hgd)-Acc USD 10.40 10.37 –
Invesco Global Targeted Returns Select Fund (EUR) A-AD EUR 9.52 9.49 – A (USD Hgd)-AD USD 9.99 9.96 – A-Acc EUR 9.55 9.52 – C-Acc EUR 9.70 9.67 – C (JPY Hgd)-Acc JPY 9,751.78 9,720.36 – E-Acc EUR 9.29 9.26 – R-Acc EUR 9.26 9.23 – S-AD EUR 9.54 9.51 – S-Acc EUR 9.79 9.76 – S (JPY Hgd)-Acc JPY 9,590.39 9,559.49 – Z-AD EUR 9.51 9.48 – Z-Acc EUR 9.76 9.73 – 21. Changes in Investments A list, specifying for each investment the total purchases and sales which occurred during the year under review, may be obtained, upon request and free of charge, at the Registered Office and the Hong Kong Representative Office of the Fund. 22. Stock Lending As at 28 February 2019, there were no securities on loan or cash and securities held as collateral in respect of securities on loan for any of the sub-funds. 23. Soft Commissions & Related Party Transactions Certain subsidiaries of Invesco Ltd. (the “Group”) consistent with obtaining the best net result, including best execution, may enter into agree-ments with counterparties whereby those counterparties may make payments for investment services provided to the Group. Investment services are used by the Group to improve or add to the services provided to its clients. Although each and every service may not be used to service each and every account managed by the Group, the Group considers that those investment services received are, in the aggregate, of significant assistance in fulfilling its investment responsibilities and are of demonstrable benefit to all clients. Only services that assist in the provision of investment services to the Group’s clients will be paid for by counterparties. Allowable investment services include services that provide assistance to the Group in its investment performance. Those services include, but are not necessarily limited to, furnishing analysis, research and advisory services including economic factors and trends, portfolio valuation and analysis, performance measurement, market prices services and the use of specialised computer software and hardware or other information facilities. The Group will ensure adherence to its investment decision making responsibilities to its clients in accordance with the laws of the countries that have jurisdiction over its clients or business. This may vary in application with respect to the appropriateness of those investment services provided. The Group selects counterparties to execute transactions on the basis that transactions will only be executed provided the placing of orders will not operate against the best interest of the Group’s clients and that the multiple is at a level which is generally accepted market practice. The Group will endeavour to obtain best execution on all transactions for all clients. The Group will endeavour to maintain the highest possible regulatory standards worldwide. 24. Collateral As part of its investing in derivatives the Fund may pledge or receive collateral either in the form of cash and cash equivalents or securities. As at 28 February 2019, cash collateral that has been pledged to cover obligations of the Fund and cash collateral received from the counterparty, is reported below:
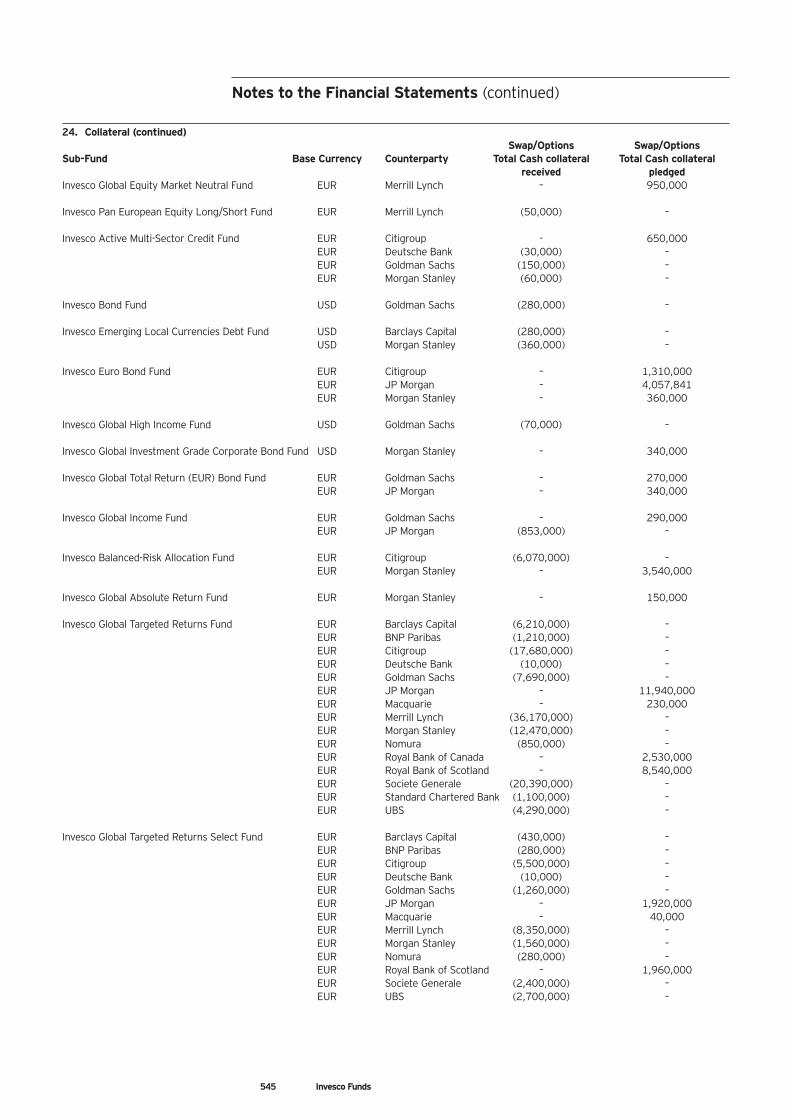
545 Invesco Funds
Notes to the Financial Statements (continued)
24. Collateral (continued) Swap/Options Swap/Options
Sub-Fund Base Currency Counterparty Total Cash collateral Total Cash collateral received pledged
Invesco Global Equity Market Neutral Fund EUR Merrill Lynch – 950,000 Invesco Pan European Equity Long/Short Fund EUR Merrill Lynch (50,000) – Invesco Active Multi-Sector Credit Fund EUR Citigroup - 650,000
EUR Deutsche Bank (30,000) – EUR Goldman Sachs (150,000) – EUR Morgan Stanley (60,000) –
Invesco Bond Fund USD Goldman Sachs (280,000) – Invesco Emerging Local Currencies Debt Fund USD Barclays Capital (280,000) –
USD Morgan Stanley (360,000) – Invesco Euro Bond Fund EUR Citigroup – 1,310,000
EUR JP Morgan – 4,057,841 EUR Morgan Stanley – 360,000
Invesco Global High Income Fund USD Goldman Sachs (70,000) – Invesco Global Investment Grade Corporate Bond Fund USD Morgan Stanley – 340,000 Invesco Global Total Return (EUR) Bond Fund EUR Goldman Sachs – 270,000
EUR JP Morgan – 340,000 Invesco Global Income Fund EUR Goldman Sachs – 290,000
EUR JP Morgan (853,000) – Invesco Balanced-Risk Allocation Fund EUR Citigroup (6,070,000) –
EUR Morgan Stanley – 3,540,000 Invesco Global Absolute Return Fund EUR Morgan Stanley – 150,000 Invesco Global Targeted Returns Fund EUR Barclays Capital (6,210,000) –
EUR BNP Paribas (1,210,000) – EUR Citigroup (17,680,000) – EUR Deutsche Bank (10,000) – EUR Goldman Sachs (7,690,000) – EUR JP Morgan – 11,940,000 EUR Macquarie – 230,000 EUR Merrill Lynch (36,170,000) – EUR Morgan Stanley (12,470,000) – EUR Nomura (850,000) – EUR Royal Bank of Canada – 2,530,000 EUR Royal Bank of Scotland – 8,540,000 EUR Societe Generale (20,390,000) – EUR Standard Chartered Bank (1,100,000) – EUR UBS (4,290,000) –
Invesco Global Targeted Returns Select Fund EUR Barclays Capital (430,000) –
EUR BNP Paribas (280,000) – EUR Citigroup (5,500,000) – EUR Deutsche Bank (10,000) – EUR Goldman Sachs (1,260,000) – EUR JP Morgan – 1,920,000 EUR Macquarie – 40,000 EUR Merrill Lynch (8,350,000) – EUR Morgan Stanley (1,560,000) – EUR Nomura (280,000) – EUR Royal Bank of Scotland – 1,960,000 EUR Societe Generale (2,400,000) – EUR UBS (2,700,000) –
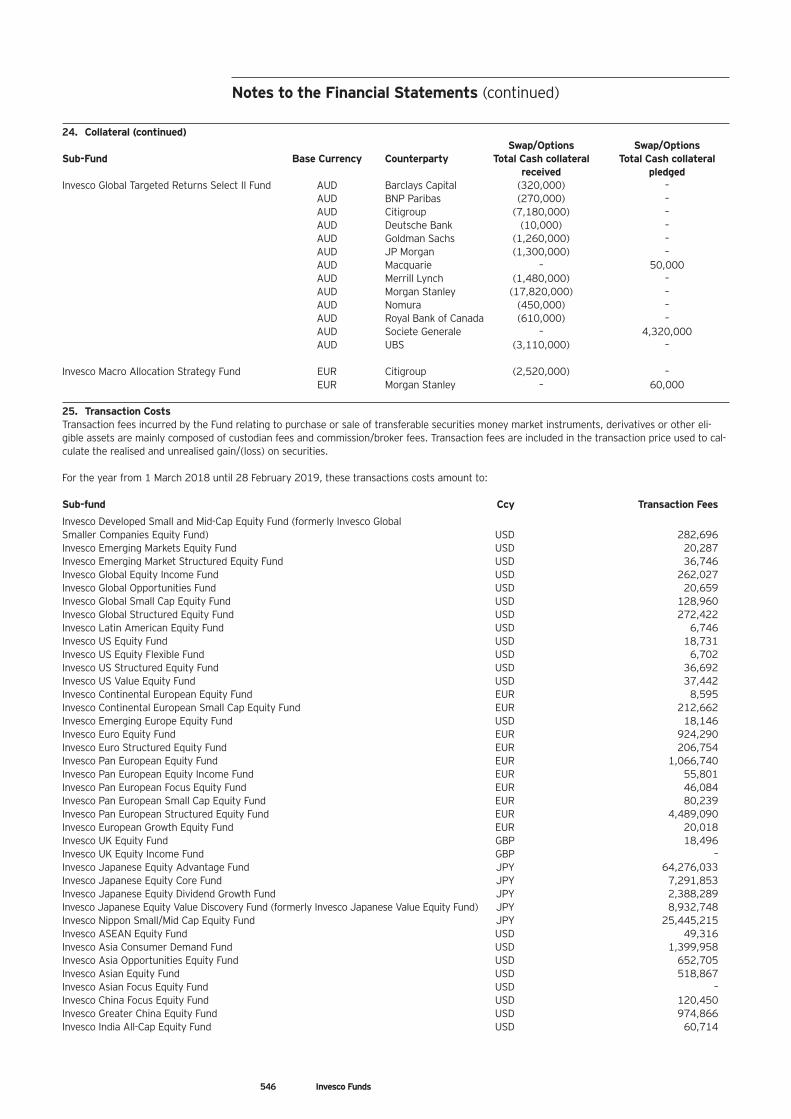
Notes to the Financial Statements (continued)
546 Invesco Funds
24. Collateral (continued) Swap/Options Swap/Options
Sub-Fund Base Currency Counterparty Total Cash collateral Total Cash collateral received pledged
Invesco Global Targeted Returns Select II Fund AUD Barclays Capital (320,000) – AUD BNP Paribas (270,000) – AUD Citigroup (7,180,000) – AUD Deutsche Bank (10,000) – AUD Goldman Sachs (1,260,000) – AUD JP Morgan (1,300,000) – AUD Macquarie – 50,000 AUD Merrill Lynch (1,480,000) – AUD Morgan Stanley (17,820,000) – AUD Nomura (450,000) – AUD Royal Bank of Canada (610,000) – AUD Societe Generale – 4,320,000 AUD UBS (3,110,000) –
Invesco Macro Allocation Strategy Fund EUR Citigroup (2,520,000) –
EUR Morgan Stanley – 60,000 25. Transaction Costs Transaction fees incurred by the Fund relating to purchase or sale of transferable securities money market instruments, derivatives or other eli-gible assets are mainly composed of custodian fees and commission/broker fees. Transaction fees are included in the transaction price used to cal-culate the realised and unrealised gain/(loss) on securities. For the year from 1 March 2018 until 28 February 2019, these transactions costs amount to: Sub-fund Ccy Transaction Fees
Invesco Developed Small and Mid-Cap Equity Fund (formerly Invesco Global Smaller Companies Equity Fund) USD 282,696 Invesco Emerging Markets Equity Fund USD 20,287 Invesco Emerging Market Structured Equity Fund USD 36,746 Invesco Global Equity Income Fund USD 262,027 Invesco Global Opportunities Fund USD 20,659 Invesco Global Small Cap Equity Fund USD 128,960 Invesco Global Structured Equity Fund USD 272,422 Invesco Latin American Equity Fund USD 6,746 Invesco US Equity Fund USD 18,731 Invesco US Equity Flexible Fund USD 6,702 Invesco US Structured Equity Fund USD 36,692 Invesco US Value Equity Fund USD 37,442 Invesco Continental European Equity Fund EUR 8,595 Invesco Continental European Small Cap Equity Fund EUR 212,662 Invesco Emerging Europe Equity Fund USD 18,146 Invesco Euro Equity Fund EUR 924,290 Invesco Euro Structured Equity Fund EUR 206,754 Invesco Pan European Equity Fund EUR 1,066,740 Invesco Pan European Equity Income Fund EUR 55,801 Invesco Pan European Focus Equity Fund EUR 46,084 Invesco Pan European Small Cap Equity Fund EUR 80,239 Invesco Pan European Structured Equity Fund EUR 4,489,090 Invesco European Growth Equity Fund EUR 20,018 Invesco UK Equity Fund GBP 18,496 Invesco UK Equity Income Fund GBP – Invesco Japanese Equity Advantage Fund JPY 64,276,033 Invesco Japanese Equity Core Fund JPY 7,291,853 Invesco Japanese Equity Dividend Growth Fund JPY 2,388,289 Invesco Japanese Equity Value Discovery Fund (formerly Invesco Japanese Value Equity Fund) JPY 8,932,748 Invesco Nippon Small/Mid Cap Equity Fund JPY 25,445,215 Invesco ASEAN Equity Fund USD 49,316 Invesco Asia Consumer Demand Fund USD 1,399,958 Invesco Asia Opportunities Equity Fund USD 652,705 Invesco Asian Equity Fund USD 518,867 Invesco Asian Focus Equity Fund USD – Invesco China Focus Equity Fund USD 120,450 Invesco Greater China Equity Fund USD 974,866 Invesco India All-Cap Equity Fund USD 60,714
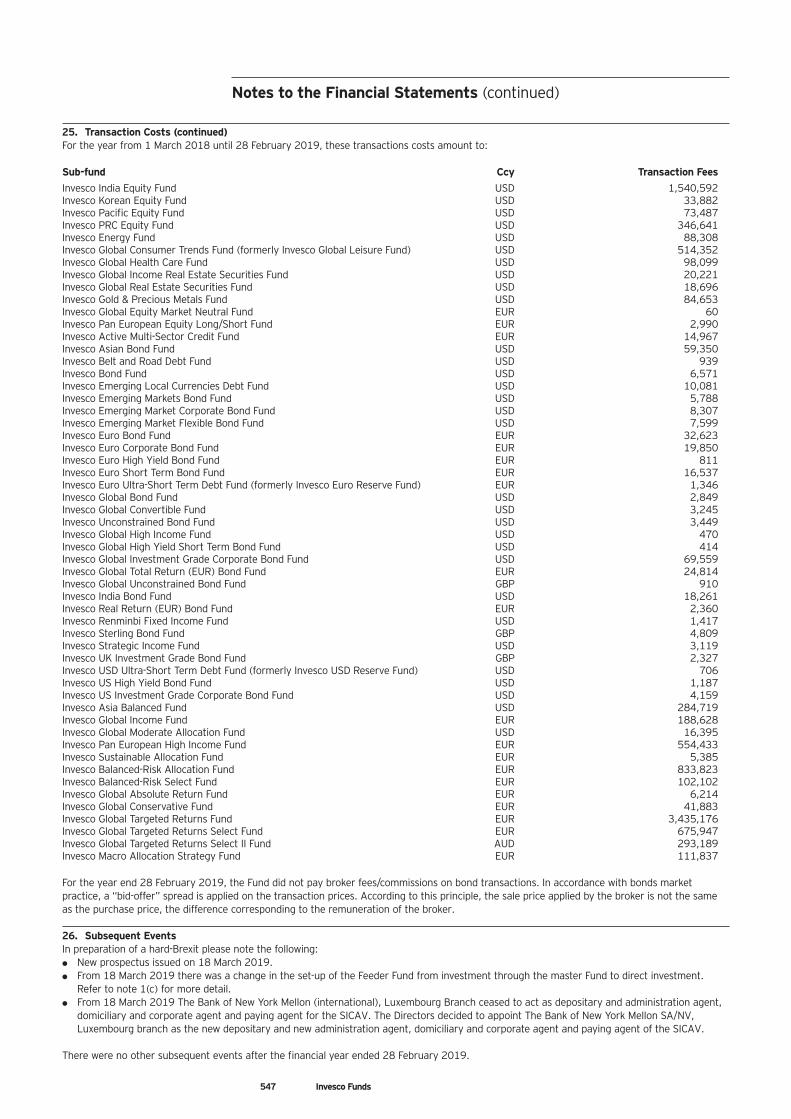
547 Invesco Funds
Notes to the Financial Statements (continued)
25. Transaction Costs (continued) For the year from 1 March 2018 until 28 February 2019, these transactions costs amount to: Sub-fund Ccy Transaction Fees
Invesco India Equity Fund USD 1,540,592 Invesco Korean Equity Fund USD 33,882 Invesco Pacific Equity Fund USD 73,487 Invesco PRC Equity Fund USD 346,641 Invesco Energy Fund USD 88,308 Invesco Global Consumer Trends Fund (formerly Invesco Global Leisure Fund) USD 514,352 Invesco Global Health Care Fund USD 98,099 Invesco Global Income Real Estate Securities Fund USD 20,221 Invesco Global Real Estate Securities Fund USD 18,696 Invesco Gold & Precious Metals Fund USD 84,653 Invesco Global Equity Market Neutral Fund EUR 60 Invesco Pan European Equity Long/Short Fund EUR 2,990 Invesco Active Multi-Sector Credit Fund EUR 14,967 Invesco Asian Bond Fund USD 59,350 Invesco Belt and Road Debt Fund USD 939 Invesco Bond Fund USD 6,571 Invesco Emerging Local Currencies Debt Fund USD 10,081 Invesco Emerging Markets Bond Fund USD 5,788 Invesco Emerging Market Corporate Bond Fund USD 8,307 Invesco Emerging Market Flexible Bond Fund USD 7,599 Invesco Euro Bond Fund EUR 32,623 Invesco Euro Corporate Bond Fund EUR 19,850 Invesco Euro High Yield Bond Fund EUR 811 Invesco Euro Short Term Bond Fund EUR 16,537 Invesco Euro Ultra-Short Term Debt Fund (formerly Invesco Euro Reserve Fund) EUR 1,346 Invesco Global Bond Fund USD 2,849 Invesco Global Convertible Fund USD 3,245 Invesco Unconstrained Bond Fund USD 3,449 Invesco Global High Income Fund USD 470 Invesco Global High Yield Short Term Bond Fund USD 414 Invesco Global Investment Grade Corporate Bond Fund USD 69,559 Invesco Global Total Return (EUR) Bond Fund EUR 24,814 Invesco Global Unconstrained Bond Fund GBP 910 Invesco India Bond Fund USD 18,261 Invesco Real Return (EUR) Bond Fund EUR 2,360 Invesco Renminbi Fixed Income Fund USD 1,417 Invesco Sterling Bond Fund GBP 4,809 Invesco Strategic Income Fund USD 3,119 Invesco UK Investment Grade Bond Fund GBP 2,327 Invesco USD Ultra-Short Term Debt Fund (formerly Invesco USD Reserve Fund) USD 706 Invesco US High Yield Bond Fund USD 1,187 Invesco US Investment Grade Corporate Bond Fund USD 4,159 Invesco Asia Balanced Fund USD 284,719 Invesco Global Income Fund EUR 188,628 Invesco Global Moderate Allocation Fund USD 16,395 Invesco Pan European High Income Fund EUR 554,433 Invesco Sustainable Allocation Fund EUR 5,385 Invesco Balanced-Risk Allocation Fund EUR 833,823 Invesco Balanced-Risk Select Fund EUR 102,102 Invesco Global Absolute Return Fund EUR 6,214 Invesco Global Conservative Fund EUR 41,883 Invesco Global Targeted Returns Fund EUR 3,435,176 Invesco Global Targeted Returns Select Fund EUR 675,947 Invesco Global Targeted Returns Select II Fund AUD 293,189 Invesco Macro Allocation Strategy Fund EUR 111,837 For the year end 28 February 2019, the Fund did not pay broker fees/commissions on bond transactions. In accordance with bonds market practice, a “bid-offer” spread is applied on the transaction prices. According to this principle, the sale price applied by the broker is not the same as the purchase price, the difference corresponding to the remuneration of the broker. 26. Subsequent Events In preparation of a hard-Brexit please note the following: l New prospectus issued on 18 March 2019. l From 18 March 2019 there was a change in the set-up of the Feeder Fund from investment through the master Fund to direct investment.
Refer to note 1(c) for more detail. l From 18 March 2019 The Bank of New York Mellon (international), Luxembourg Branch ceased to act as depositary and administration agent,
domiciliary and corporate agent and paying agent for the SICAV. The Directors decided to appoint The Bank of New York Mellon SA/NV, Luxembourg branch as the new depositary and new administration agent, domiciliary and corporate agent and paying agent of the SICAV.
There were no other subsequent events after the financial year ended 28 February 2019.
548 Invesco Funds
Audit Report To the Shareholders of Invesco Funds Our opinion In our opinion, the accompanying financial statements give a true and fair view of the financial position of Invesco Funds and of each of its sub-funds (the “Fund”) as at 28 February 2019, and of the results of their operations and changes in their net assets for the year then ended in accordance with Luxembourg legal and regulatory requirements relating to the preparation and presentation of the financial statements. What we have audited The Fund’s financial statements comprise: l the Statement of Net Assets as at 28 February 2019; l the Statement of Investments as at 28 February 2019; l the Statement of Operations and Changes in Net Assets for the year then ended; and l the notes to the financial statements, which include a summary of significant accounting policies. Basis for opinion We conducted our audit in accordance with the Law of 23 July 2016 on the audit profession (Law of 23 July 2016) and with International Standards on Auditing (ISAs) as adopted for Luxembourg by the “Commission de Surveillance du Secteur Financier” (CSSF). Our responsibilities under the Law of 23 July 2016 and ISAs as adopted for Luxembourg by the CSSF are further described in the “Responsibilities of the “Réviseur d’entreprises agréé” for the audit of the financial statements” section of our report. We believe that the audit evidence we have obtained is sufficient and appropriate to provide a basis for our opinion. We are independent of the Fund in accordance with the International Ethics Standards Board for Accountants’ Code of Ethics for Professional Accountants (IESBA Code) as adopted for Luxembourg by the CSSF together with the ethical requirements that are relevant to our audit of the financial statements. We have fulfilled our other ethical responsibilities under those ethical requirements. Other information The Board of Directors of the Fund is responsible for the other information. The other information comprises the information stated in the annual report but does not include the financial statements and our audit report thereon. Our opinion on the financial statements does not cover the other information and we do not express any form of assurance conclusion thereon. In connection with our audit of the financial statements, our responsibility is to read the other information identified above and, in doing so, consider whether the other information is materially inconsistent with the financial statements or our knowledge obtained in the audit, or otherwise appears to be materially misstated. If, based on the work we have performed, we conclude that there is a material misstatement of this other information, we are required to report that fact. We have nothing to report in this regard. Responsibilities of the Board of Directors of the Fund for the financial statements The Board of Directors of the Fund is responsible for the preparation and fair presentation of the financial statements in accordance with Luxembourg legal and regulatory requirements relating to the preparation and presentation of the financial statements, and for such internal control as the Board of Directors of the Fund determines is necessary to enable the preparation of financial statements that are free from material misstatement, whether due to fraud or error. In preparing the financial statements, the Board of Directors of the Fund is responsible for assessing the Fund’s ability to continue as a going concern, disclosing, as applicable, matters related to going concern and using the going concern basis of accounting unless the Board of Directors of the Fund either intends to liquidate the Fund or to cease operations, or has no realistic alternative but to do so.
PricewaterhouseCoopers, Société coopérative, 2 rue Gerhard Mercator, B.P. 1443, L-1014 Luxembourg T : +352 494848 1, F : +352 494848 2900, www.pwc.lu Cabinet de révision agréé. Expert-comptable (autorisation gouvernementale n°10028256) R.C.S. Luxembourg B 65 477 - TVA LU25482518
Responsibilities of the “Réviseur d’entreprises agréé” for the audit of the financial statements The objectives of our audit are to obtain reasonable assurance about whether the financial statements as a whole are free from material misstatement, whether due to fraud or error, and to issue an audit report that includes our opinion. Reasonable assurance is a high level of assurance, but is not a guarantee that an audit conducted in accordance with the Law of 23 July 2016 and with ISAs as adopted for Luxembourg by the CSSF will always detect a material misstatement when it exists. Misstatements can arise from fraud or error and are considered material if, individually or in the aggregate, they could reasonably be expected to influence the economic decisions of users taken on the basis of these financial statements. As part of an audit in accordance with the Law of 23 July 2016 and with ISAs as adopted for Luxembourg by the CSSF, we exercise professional judgment and maintain professional scepticism throughout the audit. We also: l identify and assess the risks of material misstatement of the financial statements, whether due to fraud or error, design and perform audit
procedures responsive to those risks, and obtain audit evidence that is sufficient and appropriate to provide a basis for our opinion. The risk of not detecting a material misstatement resulting from fraud is higher than for one resulting from error, as fraud may involve collusion, forgery, intentional omissions, misrepresentations, or the override of internal control;
l obtain an understanding of internal control relevant to the audit in order to design audit procedures that are appropriate in the circumstances, but not for the purpose of expressing an opinion on the effectiveness of the Fund’s internal control;
l evaluate the appropriateness of accounting policies used and the reasonableness of accounting estimates and related disclosures made by the
Board of Directors of the Fund;
l conclude on the appropriateness of the Board of Directors of the Fund’s use of the going concern basis of accounting and, based on the audit evidence obtained, whether a material uncertainty exists related to events or conditions that may cast significant doubt on the Fund’s ability to continue as a going concern. If we conclude that a material uncertainty exists, we are required to draw attention in our audit report to the related disclosures in the financial statements or, if such disclosures are inadequate, to modify our opinion. Our conclusions are based on the audit evidence obtained up to the date of our audit report. However, future events or conditions may cause the Fund to cease to continue as a going concern;
l evaluate the overall presentation, structure and content of the financial statements, including the disclosures, and whether the financial statements represent the underlying transactions and events in a manner that achieves fair presentation.
We communicate with those charged with governance regarding, among other matters, the planned scope and timing of the audit and significant audit findings, including any significant deficiencies in internal control that we identify during our audit. PricewaterhouseCoopers, Société coopérative Luxembourg, 25 June 2019 Represented by Christelle Crépin
549 Invesco Funds
550 Invesco Funds
UK Reporting Regime The following share classes currently have approval from HM Revenue & Customs for the purposes of UK taxation. Sub-fund Classes Invesco Developed Small and Mid-Cap Equity Fund (formerly Invesco Global Smaller Companies Equity Fund) A-SD Invesco Developed Small and Mid-Cap Equity Fund (formerly Invesco Global Smaller Companies Equity Fund) C-Acc Invesco Developed Small and Mid-Cap Equity Fund (formerly Invesco Global Smaller Companies Equity Fund) Z-Acc Invesco Emerging Markets Equity Fund A-AD Invesco Emerging Markets Equity Fund C-AD Invesco Emerging Markets Equity Fund C (EUR)-Gross-AD Invesco Emerging Markets Equity Fund Z-AD Invesco Emerging Market Structured Equity Fund A-Acc Invesco Emerging Market Structured Equity Fund C-Acc Invesco Emerging Market Structured Equity Fund C (GBP Hgd)-Acc Invesco Global Equity Income Fund A-SD Invesco Global Equity Income Fund A-Acc Invesco Global Equity Income Fund C-Acc Invesco Global Equity Income Fund Z-SD Invesco Global Equity Income Fund Z-Acc Invesco Global Opportunities Fund A-AD Invesco Global Opportunities Fund C-AD Invesco Global Opportunities Fund C-Acc Invesco Global Opportunities Fund E (EUR)-Acc Invesco Global Opportunities Fund Z-AD Invesco Global Opportunities Fund Z-Acc Invesco Global Small Cap Equity Fund A-AD Invesco Global Small Cap Equity Fund C-AD Invesco Global Small Cap Equity Fund Z-AD Invesco Global Structured Equity Fund A-AD Invesco Global Structured Equity Fund C-AD Invesco Global Structured Equity Fund C (GBP Hgd)-Acc Invesco Global Structured Equity Fund Z (EUR Hgd)-Acc Invesco Latin American Equity Fund Z-Acc Invesco US Equity Fund A (USD)-AD Invesco US Equity Fund B-AD Invesco US Equity Fund C-AD Invesco US Equity Fund C-Acc Invesco US Equity Fund Z-AD Invesco US Equity Flexible Fund Z (EUR Hgd)-Acc Invesco US Structured Equity Fund A-Acc Invesco US Structured Equity Fund C-Acc Invesco US Structured Equity Fund Z-Acc Invesco US Value Equity Fund A-SD Invesco US Value Equity Fund C-SD Invesco US Value Equity Fund C-Acc Invesco Continental European Equity Fund A-AD Invesco Continental European Equity Fund C-AD Invesco Continental European Equity Fund Z-Gross-AD Invesco Continental European Small Cap Equity Fund A (USD)-AD Invesco Continental European Small Cap Equity Fund C (USD)-AD Invesco Continental European Small Cap Equity Fund C-Acc Invesco Continental European Small Cap Equity Fund Z-AD Invesco Emerging Europe Equity Fund A-Acc Invesco Emerging Europe Equity Fund C-Acc Invesco Euro Equity Fund A-Acc Invesco Euro Equity Fund A (CHF Hgd)-Acc Invesco Euro Equity Fund A (GBP Hgd)-Acc Invesco Euro Equity Fund A (USD Hgd)-Acc Invesco Euro Equity Fund C-Gross-AD Invesco Euro Equity Fund C-Acc Invesco Euro Equity Fund C (CHF Hgd)-Acc Invesco Euro Equity Fund C (GBP Hgd)-Acc Invesco Euro Equity Fund C (USD Hgd)-Acc Invesco Euro Equity Fund Z-Gross-AD Invesco Euro Equity Fund Z-Acc Invesco Euro Equity Fund Z (CHF Hgd)-Acc Invesco Euro Equity Fund Z (USD Hgd)-Acc Invesco Euro Structured Equity Fund C-Acc Invesco Euro Structured Equity Fund Z-Acc Invesco Pan European Equity Fund A-AD Invesco Pan European Equity Fund A (USD)-AD
Other Information (unaudited)
UK Reporting Regime (continued) The following share classes currently have approval from HM Revenue & Customs for the purposes of UK taxation. Sub-fund Classes Invesco Pan European Equity Fund A-Acc Invesco Pan European Equity Fund C-AD Invesco Pan European Equity Fund Z (EUR)-AD Invesco Pan European Equity Fund Z (USD)-AD Invesco Pan European Equity Fund Z (USD Hgd)-Acc Invesco Pan European Equity Income Fund A-SD Invesco Pan European Equity Income Fund Z-SD Invesco Pan European Small Cap Equity Fund A (USD)-AD Invesco Pan European Small Cap Equity Fund C-Acc Invesco Pan European Small Cap Equity Fund Z-Acc Invesco Pan European Structured Equity Fund A-AD Invesco Pan European Structured Equity Fund C-Acc Invesco Pan European Structured Equity Fund Z-AD Invesco Pan European Structured Equity Fund Z (EUR)-Gross-QD Invesco Pan European Structured Equity Fund Z-Acc Invesco European Growth Equity Fund A-Acc Invesco European Growth Equity Fund C-Acc Invesco UK Equity Fund A-AD Invesco UK Equity Fund C-AD Invesco UK Equity Fund Z-AD Invesco UK Equity Income Fund A-SD Invesco UK Equity Income Fund A-Acc Invesco UK Equity Income Fund C-SD Invesco UK Equity Income Fund C-Acc Invesco UK Equity Income Fund Z-SD Invesco UK Equity Income Fund Z-Acc Invesco Japanese Equity Advantage Fund A-Acc Invesco Japanese Equity Advantage Fund C-Acc Invesco Japanese Equity Advantage Fund Z (GBP)-Acc Invesco Japanese Equity Advantage Fund Z (USD Hgd)-Acc Invesco Japanese Equity Core Fund A (USD)-AD Invesco Japanese Equity Core Fund A (GBP Hgd)-Acc Invesco Japanese Equity Core Fund C (USD)-AD Invesco Japanese Equity Core Fund C (GBP Hgd)-Acc Invesco Japanese Equity Core Fund Z (USD)-AD Invesco Japanese Equity Dividend Growth Fund A (USD)-AD Invesco Japanese Equity Dividend Growth Fund B (USD)-AD Invesco Japanese Equity Dividend Growth Fund C (USD)-AD Invesco Japanese Equity Dividend Growth Fund Z (GBP)-AD Invesco Japanese Equity Dividend Growth Fund Z (GBP Hgd)-AD Invesco Japanese Equity Value Discovery Fund (formerly Invesco Japanese Value Equity Fund) A-SD Invesco Japanese Equity Value Discovery Fund (formerly Invesco Japanese Value Equity Fund) C (USD)-AD Invesco Japanese Equity Value Discovery Fund (formerly Invesco Japanese Value Equity Fund) C-Acc Invesco Nippon Small/Mid Cap Equity Fund A-Acc Invesco Nippon Small/Mid Cap Equity Fund C-Acc Invesco Nippon Small/Mid Cap Equity Fund Z-Acc Invesco ASEAN Equity Fund A-AD Invesco ASEAN Equity Fund C-AD Invesco ASEAN Equity Fund Z-AD Invesco Asia Consumer Demand Fund A-SD Invesco Asia Consumer Demand Fund C-Acc Invesco Asia Consumer Demand Fund Z-Acc Invesco Asia Opportunities Equity Fund A-SD Invesco Asia Opportunities Equity Fund A-Acc Invesco Asia Opportunities Equity Fund A (EUR Hgd)-Acc Invesco Asia Opportunities Equity Fund C-Acc Invesco Asia Opportunities Equity Fund C (EUR Hgd)-Acc Invesco Asia Opportunities Equity Fund R-Acc Invesco Asia Opportunities Equity Fund Z-Acc Invesco Asian Equity Fund A-AD Invesco Asian Equity Fund C-AD Invesco Asian Equity Fund C-Acc Invesco Asian Equity Fund Z-AD Invesco Asian Focus Equity Fund C-Acc Invesco Greater China Equity Fund A-Acc Invesco Greater China Equity Fund C-Acc Invesco Greater China Equity Fund Z-Acc Invesco India All-Cap Equity Fund C-Acc Invesco India All-Cap Equity Fund Z-Acc Invesco India Equity Fund A-AD
551 Invesco Funds
Other Information (unaudited) (continued)
UK Reporting Regime (continued) The following share classes currently have approval from HM Revenue & Customs for the purposes of UK taxation. Sub-fund Classes Invesco India Equity Fund C-AD Invesco Korean Equity Fund A-AD Invesco Korean Equity Fund C-AD Invesco Pacific Equity Fund A-AD Invesco Pacific Equity Fund C-AD Invesco Pacific Equity Fund Z-AD Invesco Pacific Equity Fund Z-Acc Invesco PRC Equity Fund A-AD Invesco PRC Equity Fund C-AD Invesco PRC Equity Fund Z-AD Invesco Energy Fund A-AD Invesco Energy Fund C-Acc Invesco Global Consumer Trends Fund (formerly Invesco Global Leisure Fund) A (EUR)-AD Invesco Global Consumer Trends Fund (formerly Invesco Global Leisure Fund) A-Acc Invesco Global Consumer Trends Fund (formerly Invesco Global Leisure Fund) A (CHF Hgd)-Acc Invesco Global Consumer Trends Fund (formerly Invesco Global Leisure Fund) A (EUR Hgd)-Acc Invesco Global Consumer Trends Fund (formerly Invesco Global Leisure Fund) C-Acc Invesco Global Consumer Trends Fund (formerly Invesco Global Leisure Fund) C (CHF Hgd)-Acc Invesco Global Consumer Trends Fund (formerly Invesco Global Leisure Fund) Z-Acc Invesco Global Consumer Trends Fund (formerly Invesco Global Leisure Fund) Z (GBP)-Acc Invesco Global Health Care Fund A-AD Invesco Global Health Care Fund C-AD Invesco Global Health Care Fund Z-AD Invesco Global Income Real Estate Securities Fund C-Acc Invesco Global Income Real Estate Securities Fund C (GBP Hgd)-Acc Invesco Global Real Estate Securities Fund A-AD Invesco Global Real Estate Securities Fund A (GBP)-AD Invesco Global Real Estate Securities Fund C-Acc Invesco Global Real Estate Securities Fund Z-AD Invesco Gold & Precious Metals Fund A-Acc Invesco Gold & Precious Metals Fund C-Acc Invesco Global Equity Market Neutral Fund C-Acc Invesco Global Equity Market Neutral Fund C (GBP Hgd)-Acc Invesco Global Equity Market Neutral Fund Z-Acc Invesco Global Equity Market Neutral Fund Z (GBP Hgd)-Acc Invesco Active Multi-Sector Credit Fund A-Acc Invesco Active Multi-Sector Credit Fund C (GBP Hgd)-Acc Invesco Active Multi-Sector Credit Fund S (GBP Hgd)-Acc Invesco Asian Bond Fund Z-Acc Invesco Belt and Road Debt Fund Z-Gross-QD Invesco Belt and Road Debt Fund Z-Acc Invesco Bond Fund A-SD Invesco Bond Fund C-SD Invesco Bond Fund C (GBP)-Acc Invesco Bond Fund Z-SD Invesco Emerging Local Currencies Debt Fund A-MD Invesco Emerging Local Currencies Debt Fund C-Acc Invesco Emerging Markets Bond Fund A-SD Invesco Emerging Markets Bond Fund C-SD Invesco Emerging Markets Bond Fund C (GBP Hgd)-Acc Invesco Emerging Market Corporate Bond Fund C-MD Invesco Euro Bond Fund C (GBP Hgd)-Acc Invesco Euro Corporate Bond Fund A-MD Invesco Euro Corporate Bond Fund A-Acc Invesco Euro Corporate Bond Fund C-Acc Invesco Euro Corporate Bond Fund Z-AD Invesco Euro Corporate Bond Fund Z-Acc Invesco Euro High Yield Bond Fund Z-Acc Invesco Euro Short Term Bond Fund C-Acc Invesco Euro Short Term Bond Fund C (GBP Hgd)-Acc Invesco Euro Short Term Bond Fund Z-Acc Invesco Euro Ultra-Short Term Debt Fund (formerly Invesco Euro Reserve Fund) A-AD Invesco Euro Ultra-Short Term Debt Fund (formerly Invesco Euro Reserve Fund) C-Acc Invesco Euro Ultra-Short Term Debt Fund (formerly Invesco Euro Reserve Fund) Z-Acc Invesco Global Bond Fund A-SD Invesco Global Bond Fund C-Acc
Other Information (unaudited) (continued)
552 Invesco Funds
553 Invesco Funds
UK Reporting Regime (continued) The following share classes currently have approval from HM Revenue & Customs for the purposes of UK taxation. Sub-fund Classes Invesco Global Bond Fund C (GBP Hgd)-Acc Invesco Global Bond Fund Z-SD Invesco Global Convertible Fund Z (EUR Hgd)-Acc Invesco Unconstrained Bond Fund C-Acc Invesco Unconstrained Bond Fund Z-Acc Invesco Global High Income Fund A-SD Invesco Global High Income Fund C-SD Invesco Global High Income Fund Z-SD Invesco Global Investment Grade Corporate Bond Fund A-AD Invesco Global Investment Grade Corporate Bond Fund A (CHF Hgd)-Acc Invesco Global Investment Grade Corporate Bond Fund C-AD Invesco Global Investment Grade Corporate Bond Fund C (GBP Hgd)-Gross-AD Invesco Global Investment Grade Corporate Bond Fund C (CHF Hgd)-Acc Invesco Global Investment Grade Corporate Bond Fund C (GBP Hgd)-Acc Invesco Global Investment Grade Corporate Bond Fund Z (EUR)-Gross-AD Invesco Global Investment Grade Corporate Bond Fund Z (GBP Hgd)-Gross-QD Invesco Global Investment Grade Corporate Bond Fund Z (CHF Hgd)-Acc Invesco Global Total Return (EUR) Bond Fund A-Acc Invesco Global Total Return (EUR) Bond Fund C-Acc Invesco Global Unconstrained Bond Fund C-Acc Invesco India Bond Fund C-Acc Invesco India Bond Fund Z-Gross-MD Invesco India Bond Fund Z (GBP Hgd)-Gross-QD Invesco India Bond Fund Z-Acc Invesco India Bond Fund Z (GBP Hgd)-Acc Invesco Real Return (EUR) Bond Fund A-Acc Invesco Real Return (EUR) Bond Fund C-Acc Invesco Real Return (EUR) Bond Fund C (GBP Hgd)-Acc Invesco Sterling Bond Fund A-QD Invesco Sterling Bond Fund A (EUR Hgd)-QD Invesco Sterling Bond Fund A-Acc Invesco Sterling Bond Fund C-QD Invesco Sterling Bond Fund C-Acc Invesco Sterling Bond Fund Z-QD Invesco Sterling Bond Fund Z-Acc Invesco Strategic Income Fund C-Acc Invesco Strategic Income Fund Z-Acc Invesco UK Investment Grade Bond Fund A-QD Invesco UK Investment Grade Bond Fund C-QD Invesco UK Investment Grade Bond Fund C-Acc Invesco UK Investment Grade Bond Fund Z-QD Invesco USD Ultra-Short Term Debt Fund (formerly Invesco USD Reserve Fund) A-Acc Invesco USD Ultra-Short Term Debt Fund (formerly Invesco USD Reserve Fund) C-Acc Invesco US Investment Grade Corporate Bond Fund C (GBP Hgd)-Acc Invesco US Investment Grade Corporate Bond Fund Z-Acc Invesco Asia Balanced Fund A-QD Invesco Asia Balanced Fund C-Acc Invesco Global Income Fund C-Acc Invesco Pan European High Income Fund A (EUR)-AD Invesco Pan European High Income Fund A-Acc Invesco Pan European High Income Fund C-Acc Invesco Pan European High Income Fund Z (GBP Hgd)-AD Invesco Pan European High Income Fund Z (USD Hgd)-Acc Invesco Balanced-Risk Allocation Fund A-AD Invesco Balanced-Risk Allocation Fund A-Acc Invesco Balanced-Risk Allocation Fund A (CHF Hgd)-Acc Invesco Balanced-Risk Allocation Fund A (GBP Hgd)-Acc Invesco Balanced-Risk Allocation Fund A (HKD Hgd)-Acc Invesco Balanced-Risk Allocation Fund A (SGD Hgd)-Acc Invesco Balanced-Risk Allocation Fund A (USD Hgd)-Acc Invesco Balanced-Risk Allocation Fund C-Acc Invesco Balanced-Risk Allocation Fund C (CHF Hgd)-Acc Invesco Balanced-Risk Allocation Fund C (GBP Hgd)-Acc Invesco Balanced-Risk Allocation Fund C (HKD Hgd)-Acc Invesco Balanced-Risk Allocation Fund C (SGD Hgd)-Acc Invesco Balanced-Risk Allocation Fund C (USD Hgd)-Acc
Other Information (unaudited) (continued)
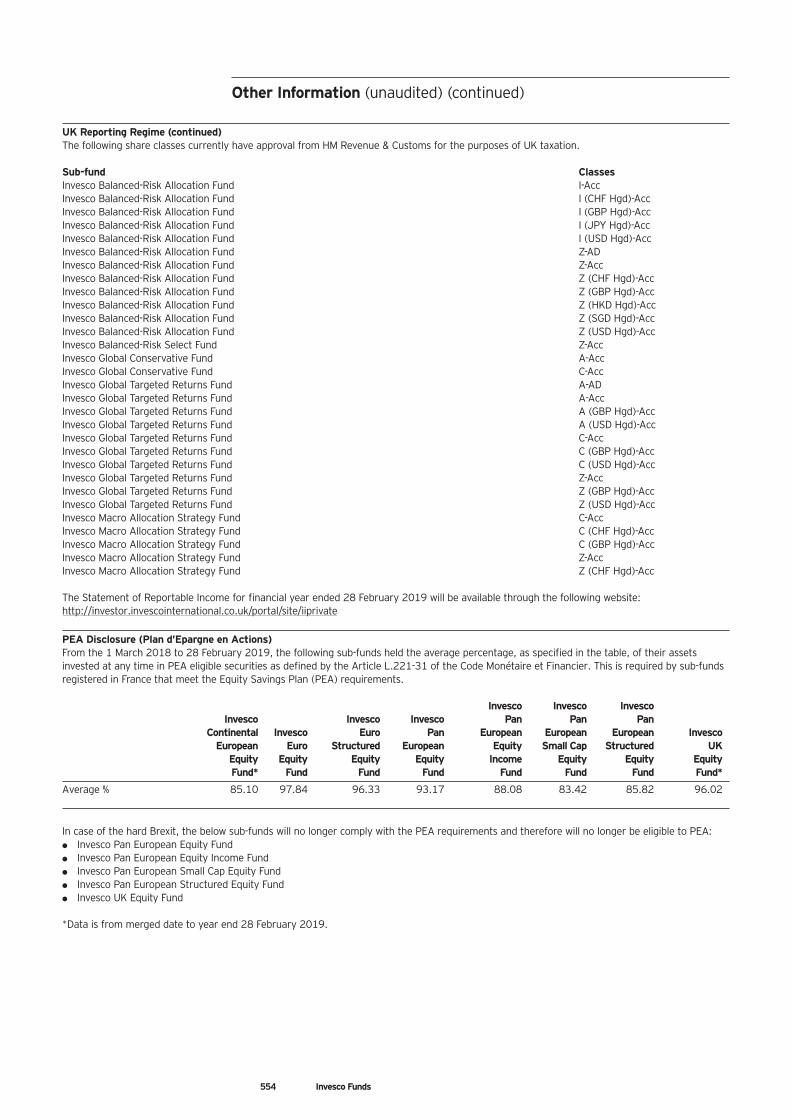
UK Reporting Regime (continued) The following share classes currently have approval from HM Revenue & Customs for the purposes of UK taxation. Sub-fund Classes Invesco Balanced-Risk Allocation Fund I-Acc Invesco Balanced-Risk Allocation Fund I (CHF Hgd)-Acc Invesco Balanced-Risk Allocation Fund I (GBP Hgd)-Acc Invesco Balanced-Risk Allocation Fund I (JPY Hgd)-Acc Invesco Balanced-Risk Allocation Fund I (USD Hgd)-Acc Invesco Balanced-Risk Allocation Fund Z-AD Invesco Balanced-Risk Allocation Fund Z-Acc Invesco Balanced-Risk Allocation Fund Z (CHF Hgd)-Acc Invesco Balanced-Risk Allocation Fund Z (GBP Hgd)-Acc Invesco Balanced-Risk Allocation Fund Z (HKD Hgd)-Acc Invesco Balanced-Risk Allocation Fund Z (SGD Hgd)-Acc Invesco Balanced-Risk Allocation Fund Z (USD Hgd)-Acc Invesco Balanced-Risk Select Fund Z-Acc Invesco Global Conservative Fund A-Acc Invesco Global Conservative Fund C-Acc Invesco Global Targeted Returns Fund A-AD Invesco Global Targeted Returns Fund A-Acc Invesco Global Targeted Returns Fund A (GBP Hgd)-Acc Invesco Global Targeted Returns Fund A (USD Hgd)-Acc Invesco Global Targeted Returns Fund C-Acc Invesco Global Targeted Returns Fund C (GBP Hgd)-Acc Invesco Global Targeted Returns Fund C (USD Hgd)-Acc Invesco Global Targeted Returns Fund Z-Acc Invesco Global Targeted Returns Fund Z (GBP Hgd)-Acc Invesco Global Targeted Returns Fund Z (USD Hgd)-Acc Invesco Macro Allocation Strategy Fund C-Acc Invesco Macro Allocation Strategy Fund C (CHF Hgd)-Acc Invesco Macro Allocation Strategy Fund C (GBP Hgd)-Acc Invesco Macro Allocation Strategy Fund Z-Acc Invesco Macro Allocation Strategy Fund Z (CHF Hgd)-Acc The Statement of Reportable Income for financial year ended 28 February 2019 will be available through the following website: http://investor.invescointernational.co.uk/portal/site/iiprivate PEA Disclosure (Plan d’Epargne en Actions) From the 1 March 2018 to 28 February 2019, the following sub-funds held the average percentage, as specified in the table, of their assets invested at any time in PEA eligible securities as defined by the Article L.221-31 of the Code Monétaire et Financier. This is required by sub-funds registered in France that meet the Equity Savings Plan (PEA) requirements.
Invesco Invesco Invesco Invesco Invesco Invesco Pan Pan Pan
Continental Invesco Euro Pan European European European Invesco European Euro Structured European Equity Small Cap Structured UK
Equity Equity Equity Equity Income Equity Equity Equity Fund* Fund Fund Fund Fund Fund Fund Fund*
Average % 85.10 97.84 96.33 93.17 88.08 83.42 85.82 96.02 In case of the hard Brexit, the below sub-funds will no longer comply with the PEA requirements and therefore will no longer be eligible to PEA: l Invesco Pan European Equity Fund l Invesco Pan European Equity Income Fund l Invesco Pan European Small Cap Equity Fund l Invesco Pan European Structured Equity Fund l Invesco UK Equity Fund *Data is from merged date to year end 28 February 2019.
Other Information (unaudited) (continued)
554 Invesco Funds
Other Information (unaudited) (continued)
555 Invesco Funds
Additional note for Hong Kong Residents The following funds are not authorised in Hong Kong and not available to Hong Kong residents: Invesco Emerging Market Structured Equity Fund Invesco Emerging Market Flexible Bond Fund Invesco Strategic Income Fund Invesco Global Opportunities Fund Invesco Euro Bond Fund Invesco US Investment Grade Corporate Bond Fund Invesco US Equity Flexible Fund Invesco Euro High Yield Bond Fund Invesco Global Income Fund Invesco Euro Structured Equity Fund Invesco Euro Short Term Bond Fund Invesco Global Moderate Allocation Fund Invesco Pan European Focus Equity Fund Invesco Global Bond Fund Invesco Sustainable Allocation Fund Invesco European Growth Equity Fund Invesco Global Convertible Fund Invesco Balanced-Risk Allocation Fund Invesco UK Equity Income Fund Invesco Unconstrained Bond Fund Invesco Balanced-Risk Select Fund Invesco Asian Focus Equity Fund Invesco Global High Yield Short Term Bond Fund Invesco Global Absolute Return Fund Invesco India All-Cap Equity Fund Invesco Global Investment Grade Corporate Bond Fund Invesco Global Conservative Fund Invesco Global Equity Market Neutral Fund Invesco Global Total Return (EUR) Bond Fund Invesco Global Targeted Returns Fund Invesco Pan European Equity Long/Short Fund Invesco Global Unconstrained Bond Fund Invesco Global Targeted Returns Select Fund Invesco Active Multi-Sector Credit Fund Invesco Real Return (EUR) Bond Fund Invesco Global Targeted Returns Select II Fund Invesco Belt and Road Debt Fund Invesco Renminbi Fixed Income Fund Invesco Macro Allocation Strategy Fund Invesco Bond Fund Invesco Sterling Bond Fund Calculation Methods of the Risk Exposure Following the assessment of the investment policy of each sub-fund of Invesco Funds (the sub-fund), Invesco Management S.A. has decided to use (Value-at-Risk) (VaR) for the assessment of the global exposure of each sub-fund. Value-at-Risk (VaR) is a statistical measurement. It intends to measure the maximum potential loss at a given confidence level (probability) over a specific time period under normal market conditions. All of the positions within the portfolio are taken into account for the VaR calculation, not just derivatives. Absolute and Relative VaR are calculated daily using a VaR risk model based on a two years historical simulation methodology. This method for calculating VaR contains no standard distribution assumption and assumes that history repeats itself. The calculation standards used for the VaR model are in compliance with the provisions in box 15 of ESMA Guidelines on Risk Measurement and the calculation of Global Exposure and Counterparty Risk for UCITS (Ref:10-788) (“ESMA Guidelines”). The Absolute VaR of a UCITS cannot be greater than 20% of its NAV. The Relative VaR of a UCITS cannot be more than 2 times the VaR of the reference portfolio. Invesco Management S.A .monitors that the VaR of the UCITS / 2* VaR of the reference portfolio is not greater than 100%. The calculation of the Absolute and Relative VaR is carried out in accordance with the following parameters: l one-tailed confidence interval of 99%; l holding period equivalent to 1 month (i.e. 20 business days); l effective observation period (history) of risk factors of 2 years; l daily calculation. In line with box 25 of ESMA Guidelines, as the sub-funds use the VaR approach to monitor the global exposure, Invesco Management S.A. calculates the leverage for each sub-fund on a daily basis, as the sum of the absolute value of the notionals of the derivatives used. With respect to financial derivative instruments which do not have a notional value attached to them, the calculation of the value is based upon the market value of the equivalent position of the underlying asset that is attached to the financial derivative instrument and applied consistently and appropriately. The average level of leverage figures provided below does not take into account any netting and hedging arrangements that the sub-funds may have in place at any time even though these netting and hedging arrangements are used for risk reduction purpose. The overleaf table details the VaR approach for each sub-fund and for those sub-funds utilising the relative VaR methodology, it details the reference portfolio. The table also details the minimum, maximum and average daily VaR utilisation that occurred during the one year period ending 28 February 2019, as well as the daily average level of leverage for each sub-fund during the one year period ending 28 February 2019.
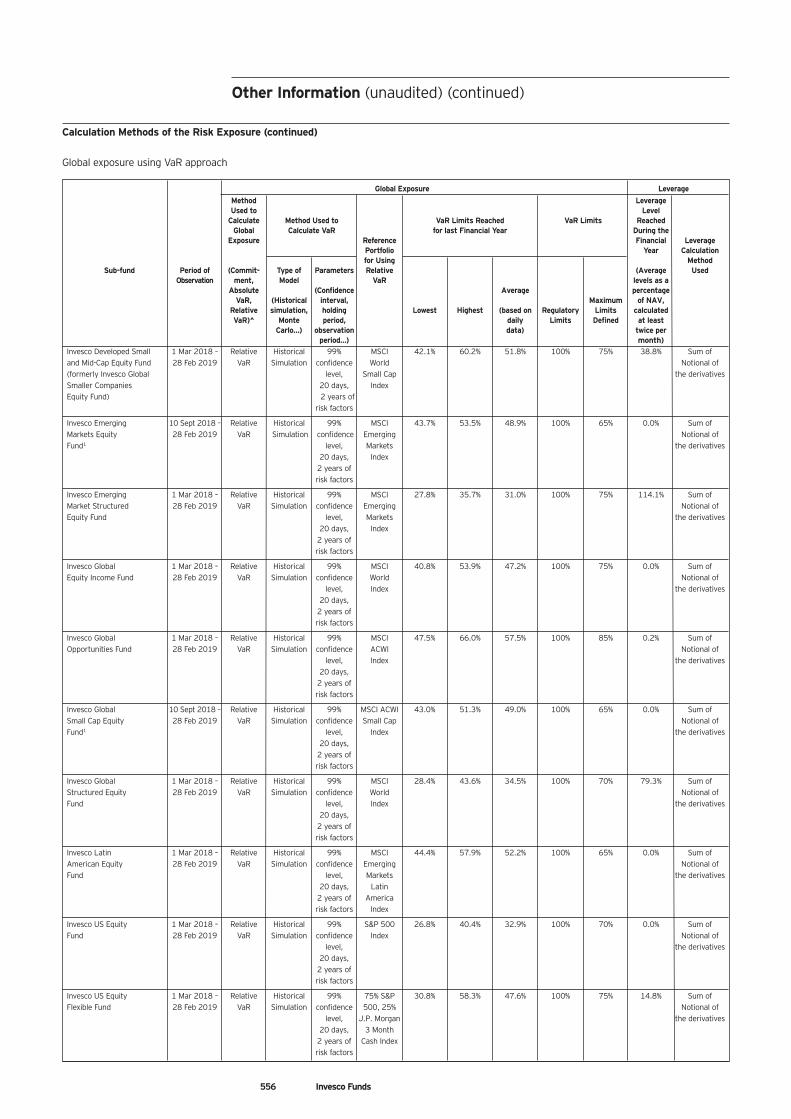
Global Exposure Leverage Method Leverage Used to Level
Calculate Method Used to VaR Limits Reached VaR Limits Reached Global Calculate VaR for last Financial Year During the
Exposure Reference Financial Leverage Portfolio Year Calculation for Using Method
Sub-fund Period of (Commit- Type of Parameters Relative (Average Used Observation ment, Model VaR levels as a
Absolute (Confidence Average percentage VaR, (Historical interval, Maximum of NAV, Relative simulation, holding Lowest Highest (based on Regulatory Limits calculated VaR)^ Monte period, daily Limits Defined at least Carlo…) observation data) twice per period…) month) Invesco Developed Small 1 Mar 2018 – Relative Historical 99% MSCI 42.1% 60.2% 51.8% 100% 75% 38.8% Sum of and Mid-Cap Equity Fund 28 Feb 2019 VaR Simulation confidence World Notional of (formerly Invesco Global level, Small Cap the derivatives Smaller Companies 20 days, Index Equity Fund) 2 years of risk factors
Invesco Emerging 10 Sept 2018 – Relative Historical 99% MSCI 43.7% 53.5% 48.9% 100% 65% 0.0% Sum of Markets Equity 28 Feb 2019 VaR Simulation confidence Emerging Notional of Fund1 level, Markets the derivatives 20 days, Index 2 years of risk factors
Invesco Emerging 1 Mar 2018 – Relative Historical 99% MSCI 27.8% 35.7% 31.0% 100% 75% 114.1% Sum of Market Structured 28 Feb 2019 VaR Simulation confidence Emerging Notional of Equity Fund level, Markets the derivatives 20 days, Index 2 years of risk factors
Invesco Global 1 Mar 2018 – Relative Historical 99% MSCI 40.8% 53.9% 47.2% 100% 75% 0.0% Sum of Equity Income Fund 28 Feb 2019 VaR Simulation confidence World Notional of level, Index the derivatives 20 days, 2 years of risk factors
Invesco Global 1 Mar 2018 – Relative Historical 99% MSCI 47.5% 66.0% 57.5% 100% 85% 0.2% Sum of Opportunities Fund 28 Feb 2019 VaR Simulation confidence ACWI Notional of level, Index the derivatives 20 days, 2 years of risk factors
Invesco Global 10 Sept 2018 – Relative Historical 99% MSCI ACWI 43.0% 51.3% 49.0% 100% 65% 0.0% Sum of Small Cap Equity 28 Feb 2019 VaR Simulation confidence Small Cap Notional of Fund1 level, Index the derivatives 20 days, 2 years of risk factors
Invesco Global 1 Mar 2018 – Relative Historical 99% MSCI 28.4% 43.6% 34.5% 100% 70% 79.3% Sum of Structured Equity 28 Feb 2019 VaR Simulation confidence World Notional of Fund level, Index the derivatives 20 days, 2 years of risk factors
Invesco Latin 1 Mar 2018 – Relative Historical 99% MSCI 44.4% 57.9% 52.2% 100% 65% 0.0% Sum of American Equity 28 Feb 2019 VaR Simulation confidence Emerging Notional of Fund level, Markets the derivatives 20 days, Latin 2 years of America risk factors Index
Invesco US Equity 1 Mar 2018 – Relative Historical 99% S&P 500 26.8% 40.4% 32.9% 100% 70% 0.0% Sum of Fund 28 Feb 2019 VaR Simulation confidence Index Notional of level, the derivatives 20 days, 2 years of risk factors
Invesco US Equity 1 Mar 2018 – Relative Historical 99% 75% S&P 30.8% 58.3% 47.6% 100% 75% 14.8% Sum of Flexible Fund 28 Feb 2019 VaR Simulation confidence 500, 25% Notional of level, J.P. Morgan the derivatives 20 days, 3 Month 2 years of Cash Index risk factors
556 Invesco Funds
Other Information (unaudited) (continued)
Calculation Methods of the Risk Exposure (continued) Global exposure using VaR approach
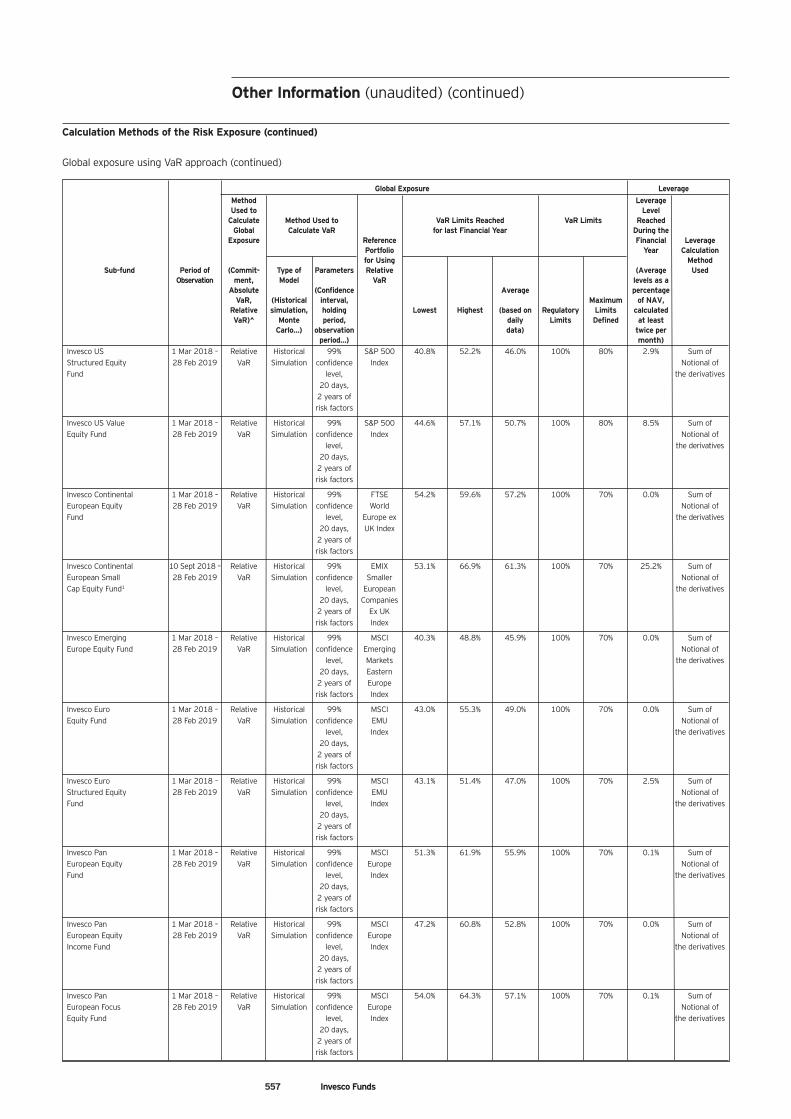
Global Exposure Leverage Method Leverage Used to Level
Calculate Method Used to VaR Limits Reached VaR Limits Reached Global Calculate VaR for last Financial Year During the
Exposure Reference Financial Leverage Portfolio Year Calculation for Using Method
Sub-fund Period of (Commit- Type of Parameters Relative (Average Used Observation ment, Model VaR levels as a
Absolute (Confidence Average percentage VaR, (Historical interval, Maximum of NAV, Relative simulation, holding Lowest Highest (based on Regulatory Limits calculated VaR)^ Monte period, daily Limits Defined at least Carlo…) observation data) twice per period…) month) Invesco US 1 Mar 2018 – Relative Historical 99% S&P 500 40.8% 52.2% 46.0% 100% 80% 2.9% Sum of Structured Equity 28 Feb 2019 VaR Simulation confidence Index Notional of Fund level, the derivatives 20 days, 2 years of risk factors
Invesco US Value 1 Mar 2018 – Relative Historical 99% S&P 500 44.6% 57.1% 50.7% 100% 80% 8.5% Sum of Equity Fund 28 Feb 2019 VaR Simulation confidence Index Notional of level, the derivatives 20 days, 2 years of risk factors
Invesco Continental 1 Mar 2018 – Relative Historical 99% FTSE 54.2% 59.6% 57.2% 100% 70% 0.0% Sum of European Equity 28 Feb 2019 VaR Simulation confidence World Notional of Fund level, Europe ex the derivatives 20 days, UK Index 2 years of risk factors
Invesco Continental 10 Sept 2018 – Relative Historical 99% EMIX 53.1% 66.9% 61.3% 100% 70% 25.2% Sum of European Small 28 Feb 2019 VaR Simulation confidence Smaller Notional of Cap Equity Fund1 level, European the derivatives 20 days, Companies 2 years of Ex UK risk factors Index
Invesco Emerging 1 Mar 2018 – Relative Historical 99% MSCI 40.3% 48.8% 45.9% 100% 70% 0.0% Sum of Europe Equity Fund 28 Feb 2019 VaR Simulation confidence Emerging Notional of level, Markets the derivatives 20 days, Eastern 2 years of Europe risk factors Index
Invesco Euro 1 Mar 2018 – Relative Historical 99% MSCI 43.0% 55.3% 49.0% 100% 70% 0.0% Sum of Equity Fund 28 Feb 2019 VaR Simulation confidence EMU Notional of level, Index the derivatives 20 days, 2 years of risk factors
Invesco Euro 1 Mar 2018 – Relative Historical 99% MSCI 43.1% 51.4% 47.0% 100% 70% 2.5% Sum of Structured Equity 28 Feb 2019 VaR Simulation confidence EMU Notional of Fund level, Index the derivatives 20 days, 2 years of risk factors
Invesco Pan 1 Mar 2018 – Relative Historical 99% MSCI 51.3% 61.9% 55.9% 100% 70% 0.1% Sum of European Equity 28 Feb 2019 VaR Simulation confidence Europe Notional of Fund level, Index the derivatives 20 days, 2 years of risk factors
Invesco Pan 1 Mar 2018 – Relative Historical 99% MSCI 47.2% 60.8% 52.8% 100% 70% 0.0% Sum of European Equity 28 Feb 2019 VaR Simulation confidence Europe Notional of Income Fund level, Index the derivatives 20 days, 2 years of risk factors
Invesco Pan 1 Mar 2018 – Relative Historical 99% MSCI 54.0% 64.3% 57.1% 100% 70% 0.1% Sum of European Focus 28 Feb 2019 VaR Simulation confidence Europe Notional of Equity Fund level, Index the derivatives 20 days, 2 years of risk factors
557 Invesco Funds
Other Information (unaudited) (continued)
Calculation Methods of the Risk Exposure (continued) Global exposure using VaR approach (continued)
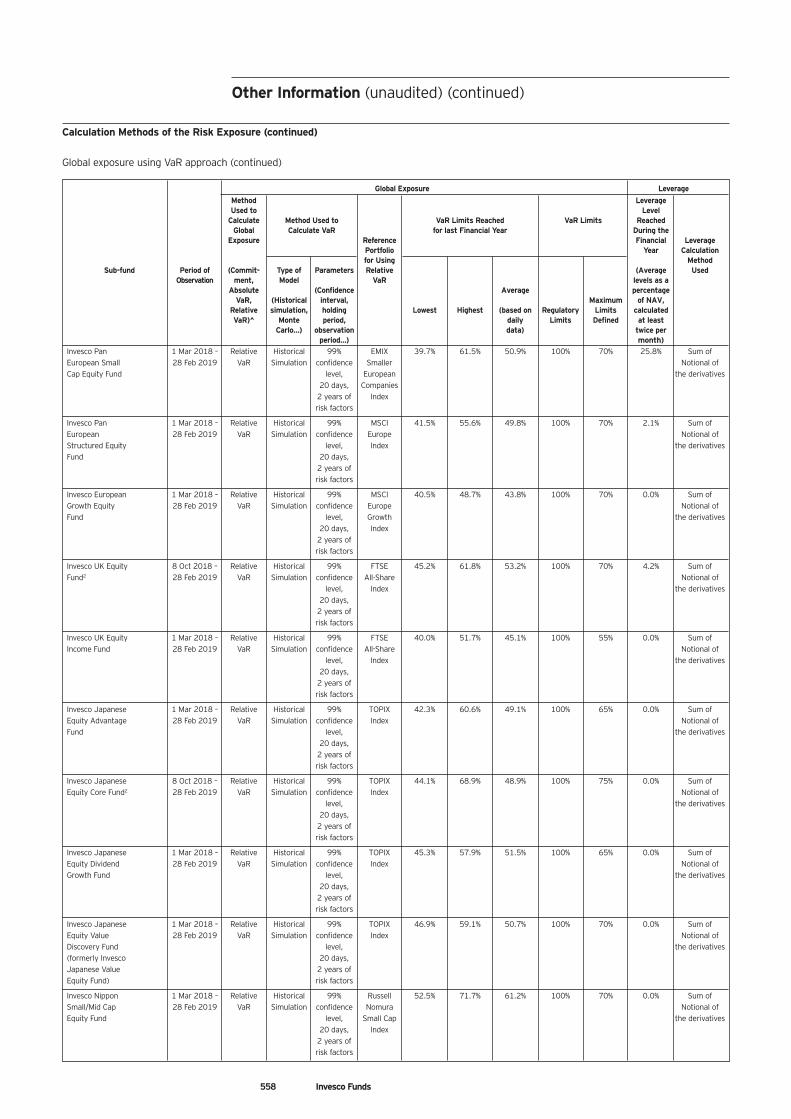
558 Invesco Funds
Global Exposure Leverage Method Leverage Used to Level
Calculate Method Used to VaR Limits Reached VaR Limits Reached Global Calculate VaR for last Financial Year During the
Exposure Reference Financial Leverage Portfolio Year Calculation for Using Method
Sub-fund Period of (Commit- Type of Parameters Relative (Average Used Observation ment, Model VaR levels as a
Absolute (Confidence Average percentage VaR, (Historical interval, Maximum of NAV, Relative simulation, holding Lowest Highest (based on Regulatory Limits calculated VaR)^ Monte period, daily Limits Defined at least Carlo…) observation data) twice per period…) month) Invesco Pan 1 Mar 2018 – Relative Historical 99% EMIX 39.7% 61.5% 50.9% 100% 70% 25.8% Sum of European Small 28 Feb 2019 VaR Simulation confidence Smaller Notional of Cap Equity Fund level, European the derivatives 20 days, Companies 2 years of Index risk factors
Invesco Pan 1 Mar 2018 – Relative Historical 99% MSCI 41.5% 55.6% 49.8% 100% 70% 2.1% Sum of European 28 Feb 2019 VaR Simulation confidence Europe Notional of Structured Equity level, Index the derivatives Fund 20 days, 2 years of risk factors
Invesco European 1 Mar 2018 – Relative Historical 99% MSCI 40.5% 48.7% 43.8% 100% 70% 0.0% Sum of Growth Equity 28 Feb 2019 VaR Simulation confidence Europe Notional of Fund level, Growth the derivatives 20 days, Index 2 years of risk factors
Invesco UK Equity 8 Oct 2018 – Relative Historical 99% FTSE 45.2% 61.8% 53.2% 100% 70% 4.2% Sum of Fund2 28 Feb 2019 VaR Simulation confidence All-Share Notional of level, Index the derivatives 20 days, 2 years of risk factors
Invesco UK Equity 1 Mar 2018 – Relative Historical 99% FTSE 40.0% 51.7% 45.1% 100% 55% 0.0% Sum of Income Fund 28 Feb 2019 VaR Simulation confidence All-Share Notional of level, Index the derivatives 20 days, 2 years of risk factors
Invesco Japanese 1 Mar 2018 – Relative Historical 99% TOPIX 42.3% 60.6% 49.1% 100% 65% 0.0% Sum of Equity Advantage 28 Feb 2019 VaR Simulation confidence Index Notional of Fund level, the derivatives 20 days, 2 years of risk factors
Invesco Japanese 8 Oct 2018 – Relative Historical 99% TOPIX 44.1% 68.9% 48.9% 100% 75% 0.0% Sum of Equity Core Fund2 28 Feb 2019 VaR Simulation confidence Index Notional of level, the derivatives 20 days, 2 years of risk factors
Invesco Japanese 1 Mar 2018 – Relative Historical 99% TOPIX 45.3% 57.9% 51.5% 100% 65% 0.0% Sum of Equity Dividend 28 Feb 2019 VaR Simulation confidence Index Notional of Growth Fund level, the derivatives 20 days, 2 years of risk factors
Invesco Japanese 1 Mar 2018 – Relative Historical 99% TOPIX 46.9% 59.1% 50.7% 100% 70% 0.0% Sum of Equity Value 28 Feb 2019 VaR Simulation confidence Index Notional of Discovery Fund level, the derivatives (formerly Invesco 20 days, Japanese Value 2 years of Equity Fund) risk factors
Invesco Nippon 1 Mar 2018 – Relative Historical 99% Russell 52.5% 71.7% 61.2% 100% 70% 0.0% Sum of Small/Mid Cap 28 Feb 2019 VaR Simulation confidence Nomura Notional of Equity Fund level, Small Cap the derivatives 20 days, Index 2 years of risk factors
Other Information (unaudited) (continued)
Calculation Methods of the Risk Exposure (continued) Global exposure using VaR approach (continued)
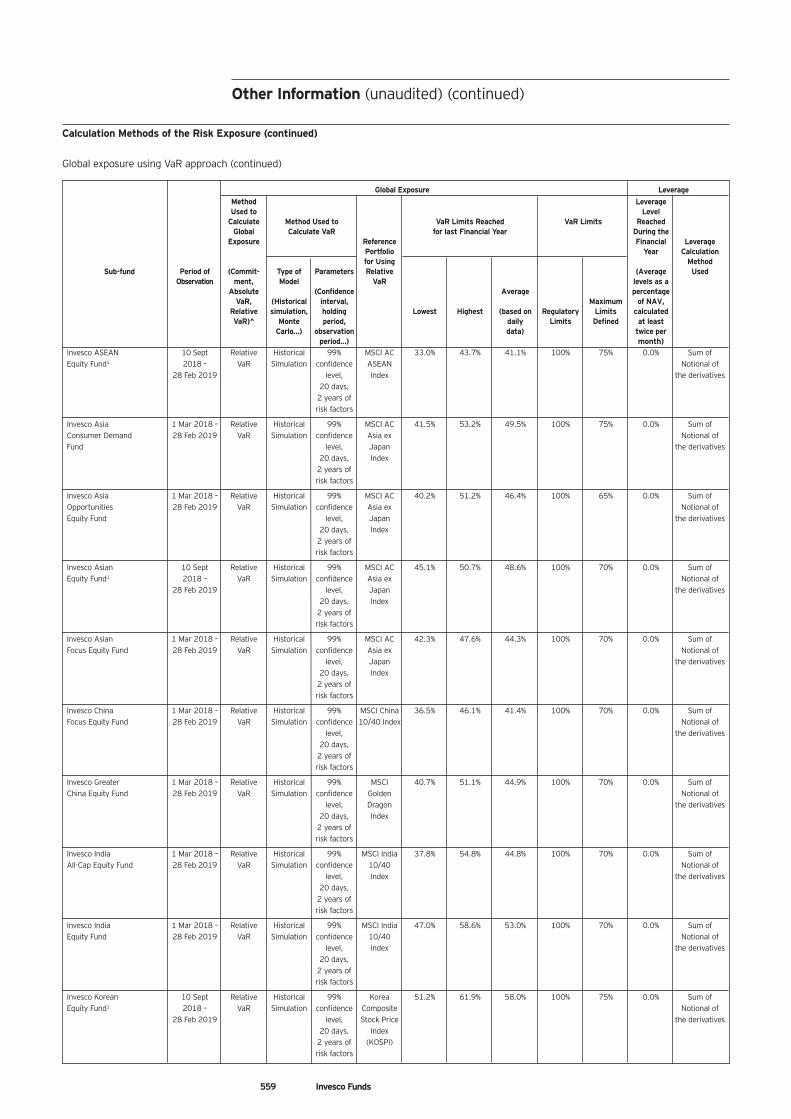
Global Exposure Leverage Method Leverage Used to Level
Calculate Method Used to VaR Limits Reached VaR Limits Reached Global Calculate VaR for last Financial Year During the
Exposure Reference Financial Leverage Portfolio Year Calculation for Using Method
Sub-fund Period of (Commit- Type of Parameters Relative (Average Used Observation ment, Model VaR levels as a
Absolute (Confidence Average percentage VaR, (Historical interval, Maximum of NAV, Relative simulation, holding Lowest Highest (based on Regulatory Limits calculated VaR)^ Monte period, daily Limits Defined at least Carlo…) observation data) twice per period…) month) Invesco ASEAN 10 Sept Relative Historical 99% MSCI AC 33.0% 43.7% 41.1% 100% 75% 0.0% Sum of Equity Fund1 2018 – VaR Simulation confidence ASEAN Notional of 28 Feb 2019 level, Index the derivatives 20 days, 2 years of risk factors
Invesco Asia 1 Mar 2018 – Relative Historical 99% MSCI AC 41.5% 53.2% 49.5% 100% 75% 0.0% Sum of Consumer Demand 28 Feb 2019 VaR Simulation confidence Asia ex Notional of Fund level, Japan the derivatives 20 days, Index 2 years of risk factors
Invesco Asia 1 Mar 2018 – Relative Historical 99% MSCI AC 40.2% 51.2% 46.4% 100% 65% 0.0% Sum of Opportunities 28 Feb 2019 VaR Simulation confidence Asia ex Notional of Equity Fund level, Japan the derivatives 20 days, Index 2 years of risk factors
Invesco Asian 10 Sept Relative Historical 99% MSCI AC 45.1% 50.7% 48.6% 100% 70% 0.0% Sum of Equity Fund1 2018 – VaR Simulation confidence Asia ex Notional of 28 Feb 2019 level, Japan the derivatives 20 days, Index 2 years of risk factors
Invesco Asian 1 Mar 2018 – Relative Historical 99% MSCI AC 42.3% 47.6% 44.3% 100% 70% 0.0% Sum of Focus Equity Fund 28 Feb 2019 VaR Simulation confidence Asia ex Notional of level, Japan the derivatives 20 days, Index 2 years of risk factors
Invesco China 1 Mar 2018 – Relative Historical 99% MSCI China 36.5% 46.1% 41.4% 100% 70% 0.0% Sum of Focus Equity Fund 28 Feb 2019 VaR Simulation confidence 10/40 Index Notional of level, the derivatives 20 days, 2 years of risk factors
Invesco Greater 1 Mar 2018 – Relative Historical 99% MSCI 40.7% 51.1% 44.9% 100% 70% 0.0% Sum of China Equity Fund 28 Feb 2019 VaR Simulation confidence Golden Notional of level, Dragon the derivatives 20 days, Index 2 years of risk factors
Invesco India 1 Mar 2018 – Relative Historical 99% MSCI India 37.8% 54.8% 44.8% 100% 70% 0.0% Sum of All-Cap Equity Fund 28 Feb 2019 VaR Simulation confidence 10/40 Notional of level, Index the derivatives 20 days, 2 years of risk factors
Invesco India 1 Mar 2018 – Relative Historical 99% MSCI India 47.0% 58.6% 53.0% 100% 70% 0.0% Sum of Equity Fund 28 Feb 2019 VaR Simulation confidence 10/40 Notional of level, Index the derivatives 20 days, 2 years of risk factors
Invesco Korean 10 Sept Relative Historical 99% Korea 51.2% 61.9% 58.0% 100% 75% 0.0% Sum of Equity Fund1 2018 – VaR Simulation confidence Composite Notional of 28 Feb 2019 level, Stock Price the derivatives 20 days, Index 2 years of (KOSPI) risk factors
559 Invesco Funds
Other Information (unaudited) (continued)
Calculation Methods of the Risk Exposure (continued) Global exposure using VaR approach (continued)
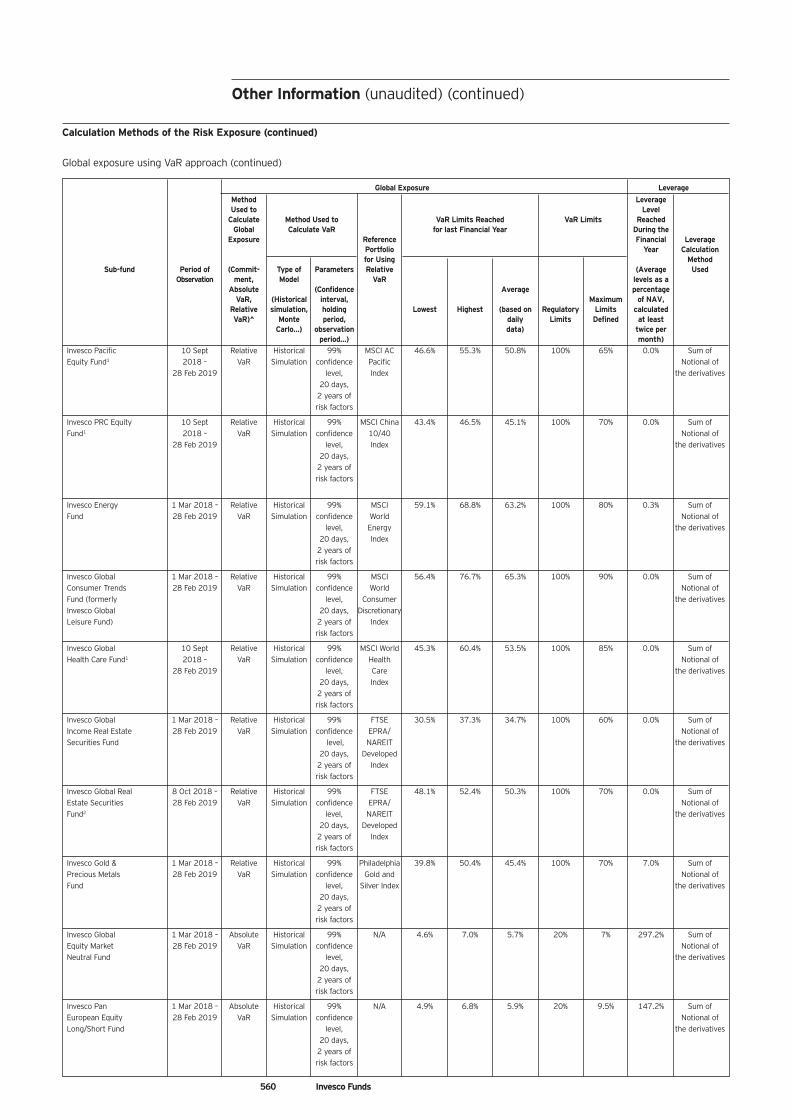
Global Exposure Leverage Method Leverage Used to Level
Calculate Method Used to VaR Limits Reached VaR Limits Reached Global Calculate VaR for last Financial Year During the
Exposure Reference Financial Leverage Portfolio Year Calculation for Using Method
Sub-fund Period of (Commit- Type of Parameters Relative (Average Used Observation ment, Model VaR levels as a
Absolute (Confidence Average percentage VaR, (Historical interval, Maximum of NAV, Relative simulation, holding Lowest Highest (based on Regulatory Limits calculated VaR)^ Monte period, daily Limits Defined at least Carlo…) observation data) twice per period…) month) Invesco Pacific 10 Sept Relative Historical 99% MSCI AC 46.6% 55.3% 50.8% 100% 65% 0.0% Sum of Equity Fund1 2018 – VaR Simulation confidence Pacific Notional of 28 Feb 2019 level, Index the derivatives 20 days, 2 years of risk factors
Invesco PRC Equity 10 Sept Relative Historical 99% MSCI China 43.4% 46.5% 45.1% 100% 70% 0.0% Sum of Fund1 2018 – VaR Simulation confidence 10/40 Notional of 28 Feb 2019 level, Index the derivatives 20 days, 2 years of risk factors
Invesco Energy 1 Mar 2018 – Relative Historical 99% MSCI 59.1% 68.8% 63.2% 100% 80% 0.3% Sum of Fund 28 Feb 2019 VaR Simulation confidence World Notional of level, Energy the derivatives 20 days, Index 2 years of risk factors
Invesco Global 1 Mar 2018 – Relative Historical 99% MSCI 56.4% 76.7% 65.3% 100% 90% 0.0% Sum of Consumer Trends 28 Feb 2019 VaR Simulation confidence World Notional of Fund (formerly level, Consumer the derivatives Invesco Global 20 days, Discretionary Leisure Fund) 2 years of Index risk factors
Invesco Global 10 Sept Relative Historical 99% MSCI World 45.3% 60.4% 53.5% 100% 85% 0.0% Sum of Health Care Fund1 2018 – VaR Simulation confidence Health Notional of 28 Feb 2019 level, Care the derivatives 20 days, Index 2 years of risk factors
Invesco Global 1 Mar 2018 – Relative Historical 99% FTSE 30.5% 37.3% 34.7% 100% 60% 0.0% Sum of Income Real Estate 28 Feb 2019 VaR Simulation confidence EPRA/ Notional of Securities Fund level, NAREIT the derivatives 20 days, Developed 2 years of Index risk factors
Invesco Global Real 8 Oct 2018 – Relative Historical 99% FTSE 48.1% 52.4% 50.3% 100% 70% 0.0% Sum of Estate Securities 28 Feb 2019 VaR Simulation confidence EPRA/ Notional of Fund2 level, NAREIT the derivatives 20 days, Developed 2 years of Index risk factors
Invesco Gold & 1 Mar 2018 – Relative Historical 99% Philadelphia 39.8% 50.4% 45.4% 100% 70% 7.0% Sum of Precious Metals 28 Feb 2019 VaR Simulation confidence Gold and Notional of Fund level, Silver Index the derivatives 20 days, 2 years of risk factors
Invesco Global 1 Mar 2018 – Absolute Historical 99% N/A 4.6% 7.0% 5.7% 20% 7% 297.2% Sum of Equity Market 28 Feb 2019 VaR Simulation confidence Notional of Neutral Fund level, the derivatives 20 days, 2 years of risk factors
Invesco Pan 1 Mar 2018 – Absolute Historical 99% N/A 4.9% 6.8% 5.9% 20% 9.5% 147.2% Sum of European Equity 28 Feb 2019 VaR Simulation confidence Notional of Long/Short Fund level, the derivatives 20 days, 2 years of risk factors
560 Invesco Funds
Calculation Methods of the Risk Exposure (continued) Global exposure using VaR approach (continued)
Other Information (unaudited) (continued)
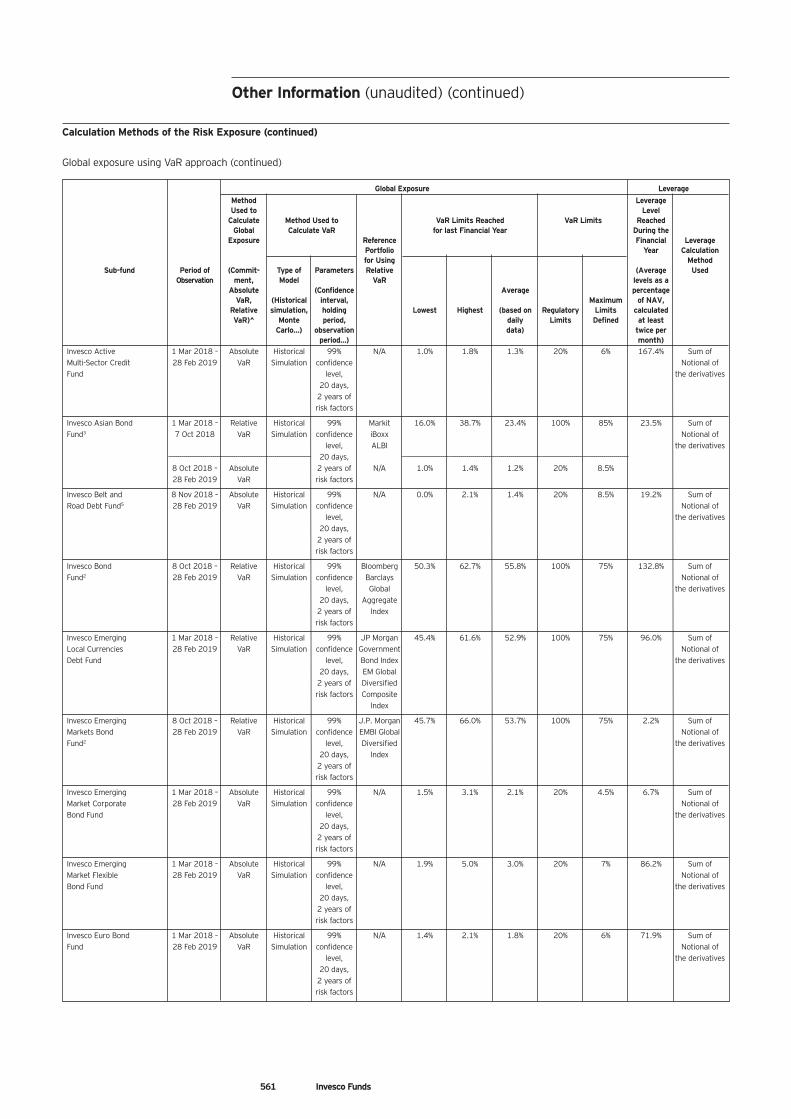
Global Exposure Leverage Method Leverage Used to Level
Calculate Method Used to VaR Limits Reached VaR Limits Reached Global Calculate VaR for last Financial Year During the
Exposure Reference Financial Leverage Portfolio Year Calculation for Using Method
Sub-fund Period of (Commit- Type of Parameters Relative (Average Used Observation ment, Model VaR levels as a
Absolute (Confidence Average percentage VaR, (Historical interval, Maximum of NAV, Relative simulation, holding Lowest Highest (based on Regulatory Limits calculated VaR)^ Monte period, daily Limits Defined at least Carlo…) observation data) twice per period…) month) Invesco Active 1 Mar 2018 – Absolute Historical 99% N/A 1.0% 1.8% 1.3% 20% 6% 167.4% Sum of Multi-Sector Credit 28 Feb 2019 VaR Simulation confidence Notional of Fund level, the derivatives 20 days, 2 years of risk factors
Invesco Asian Bond 1 Mar 2018 – Relative Historical 99% Markit 16.0% 38.7% 23.4% 100% 85% 23.5% Sum of Fund3 7 Oct 2018 VaR Simulation confidence iBoxx Notional of level, ALBI the derivatives ––––––––––––––––––––––––––––––––––––––––––––––––––––––––––––––––––––––––– 20 days, –––––––––––––––––––––––––––––––––––––––––––––––––––––––––––––––––––––––––––––––––––––––––––––––––––––––––––––––––– 8 Oct 2018 – Absolute 2 years of N/A 1.0% 1.4% 1.2% 20% 8.5% 28 Feb 2019 VaR risk factors
Invesco Belt and 8 Nov 2018 – Absolute Historical 99% N/A 0.0% 2.1% 1.4% 20% 8.5% 19.2% Sum of Road Debt Fund5 28 Feb 2019 VaR Simulation confidence Notional of level, the derivatives 20 days, 2 years of risk factors
Invesco Bond 8 Oct 2018 – Relative Historical 99% Bloomberg 50.3% 62.7% 55.8% 100% 75% 132.8% Sum of Fund2 28 Feb 2019 VaR Simulation confidence Barclays Notional of level, Global the derivatives 20 days, Aggregate 2 years of Index risk factors
Invesco Emerging 1 Mar 2018 – Relative Historical 99% JP Morgan 45.4% 61.6% 52.9% 100% 75% 96.0% Sum of Local Currencies 28 Feb 2019 VaR Simulation confidence Government Notional of Debt Fund level, Bond Index the derivatives 20 days, EM Global 2 years of Diversified risk factors Composite Index
Invesco Emerging 8 Oct 2018 – Relative Historical 99% J.P. Morgan 45.7% 66.0% 53.7% 100% 75% 2.2% Sum of Markets Bond 28 Feb 2019 VaR Simulation confidence EMBI Global Notional of Fund2 level, Diversified the derivatives 20 days, Index 2 years of risk factors
Invesco Emerging 1 Mar 2018 – Absolute Historical 99% N/A 1.5% 3.1% 2.1% 20% 4.5% 6.7% Sum of Market Corporate 28 Feb 2019 VaR Simulation confidence Notional of Bond Fund level, the derivatives 20 days, 2 years of risk factors
Invesco Emerging 1 Mar 2018 – Absolute Historical 99% N/A 1.9% 5.0% 3.0% 20% 7% 86.2% Sum of Market Flexible 28 Feb 2019 VaR Simulation confidence Notional of Bond Fund level, the derivatives 20 days, 2 years of risk factors
Invesco Euro Bond 1 Mar 2018 – Absolute Historical 99% N/A 1.4% 2.1% 1.8% 20% 6% 71.9% Sum of Fund 28 Feb 2019 VaR Simulation confidence Notional of level, the derivatives 20 days, 2 years of risk factors
Other Information (unaudited) (continued)
Calculation Methods of the Risk Exposure (continued) Global exposure using VaR approach (continued)
561 Invesco Funds
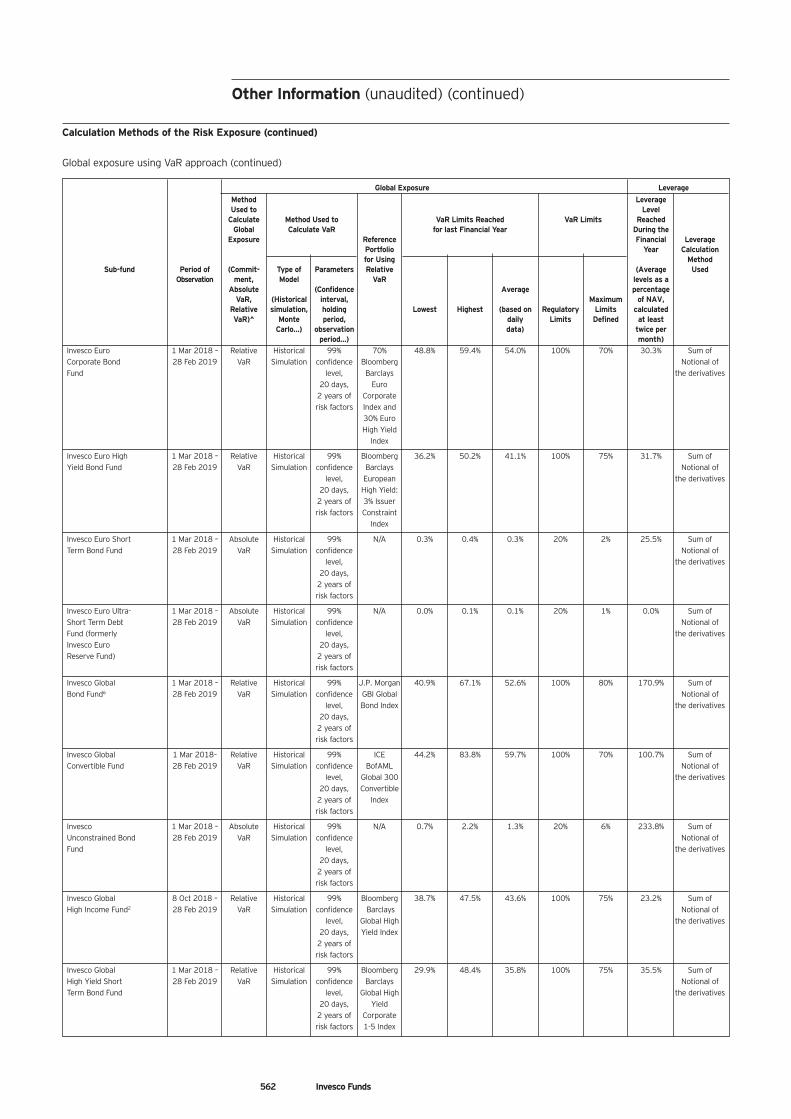
Global Exposure Leverage Method Leverage Used to Level
Calculate Method Used to VaR Limits Reached VaR Limits Reached Global Calculate VaR for last Financial Year During the
Exposure Reference Financial Leverage Portfolio Year Calculation for Using Method
Sub-fund Period of (Commit- Type of Parameters Relative (Average Used Observation ment, Model VaR levels as a
Absolute (Confidence Average percentage VaR, (Historical interval, Maximum of NAV, Relative simulation, holding Lowest Highest (based on Regulatory Limits calculated VaR)^ Monte period, daily Limits Defined at least Carlo…) observation data) twice per period…) month) Invesco Euro 1 Mar 2018 – Relative Historical 99% 70% 48.8% 59.4% 54.0% 100% 70% 30.3% Sum of Corporate Bond 28 Feb 2019 VaR Simulation confidence Bloomberg Notional of Fund level, Barclays the derivatives 20 days, Euro 2 years of Corporate risk factors Index and 30% Euro High Yield Index
Invesco Euro High 1 Mar 2018 – Relative Historical 99% Bloomberg 36.2% 50.2% 41.1% 100% 75% 31.7% Sum of Yield Bond Fund 28 Feb 2019 VaR Simulation confidence Barclays Notional of level, European the derivatives 20 days, High Yield: 2 years of 3% Issuer risk factors Constraint Index
Invesco Euro Short 1 Mar 2018 – Absolute Historical 99% N/A 0.3% 0.4% 0.3% 20% 2% 25.5% Sum of Term Bond Fund 28 Feb 2019 VaR Simulation confidence Notional of level, the derivatives 20 days, 2 years of risk factors
Invesco Euro Ultra- 1 Mar 2018 – Absolute Historical 99% N/A 0.0% 0.1% 0.1% 20% 1% 0.0% Sum of Short Term Debt 28 Feb 2019 VaR Simulation confidence Notional of Fund (formerly level, the derivatives Invesco Euro 20 days, Reserve Fund) 2 years of risk factors
Invesco Global 1 Mar 2018 – Relative Historical 99% J.P. Morgan 40.9% 67.1% 52.6% 100% 80% 170.9% Sum of Bond Fund6 28 Feb 2019 VaR Simulation confidence GBI Global Notional of level, Bond Index the derivatives 20 days, 2 years of risk factors
Invesco Global 1 Mar 2018– Relative Historical 99% ICE 44.2% 83.8% 59.7% 100% 70% 100.7% Sum of Convertible Fund 28 Feb 2019 VaR Simulation confidence BofAML Notional of level, Global 300 the derivatives 20 days, Convertible 2 years of Index risk factors
Invesco 1 Mar 2018 – Absolute Historical 99% N/A 0.7% 2.2% 1.3% 20% 6% 233.8% Sum of Unconstrained Bond 28 Feb 2019 VaR Simulation confidence Notional of Fund level, the derivatives 20 days, 2 years of risk factors
Invesco Global 8 Oct 2018 – Relative Historical 99% Bloomberg 38.7% 47.5% 43.6% 100% 75% 23.2% Sum of High Income Fund2 28 Feb 2019 VaR Simulation confidence Barclays Notional of level, Global High the derivatives 20 days, Yield Index 2 years of risk factors
Invesco Global 1 Mar 2018 – Relative Historical 99% Bloomberg 29.9% 48.4% 35.8% 100% 75% 35.5% Sum of High Yield Short 28 Feb 2019 VaR Simulation confidence Barclays Notional of Term Bond Fund level, Global High the derivatives 20 days, Yield 2 years of Corporate risk factors 1-5 Index
562 Invesco Funds
Calculation Methods of the Risk Exposure (continued) Global exposure using VaR approach (continued)
Other Information (unaudited) (continued)
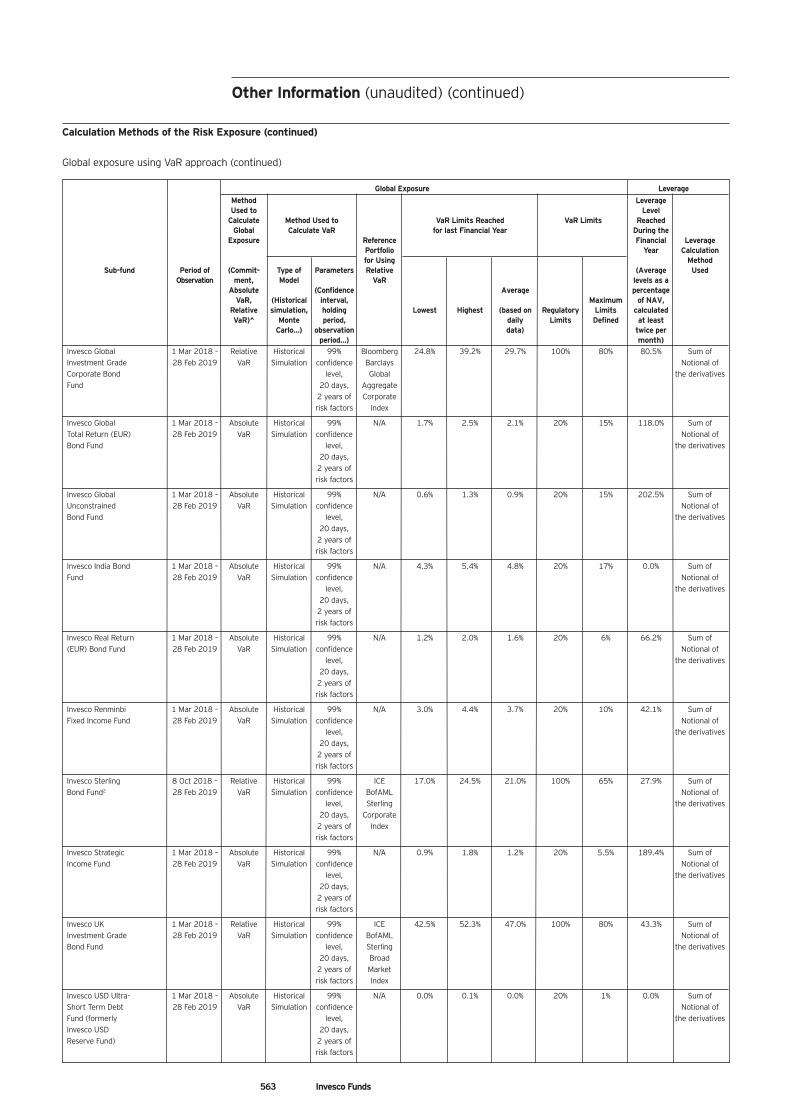
Global Exposure Leverage Method Leverage Used to Level
Calculate Method Used to VaR Limits Reached VaR Limits Reached Global Calculate VaR for last Financial Year During the
Exposure Reference Financial Leverage Portfolio Year Calculation for Using Method
Sub-fund Period of (Commit- Type of Parameters Relative (Average Used Observation ment, Model VaR levels as a
Absolute (Confidence Average percentage VaR, (Historical interval, Maximum of NAV, Relative simulation, holding Lowest Highest (based on Regulatory Limits calculated VaR)^ Monte period, daily Limits Defined at least Carlo…) observation data) twice per period…) month) Invesco Global 1 Mar 2018 – Relative Historical 99% Bloomberg 24.8% 39.2% 29.7% 100% 80% 80.5% Sum of Investment Grade 28 Feb 2019 VaR Simulation confidence Barclays Notional of Corporate Bond level, Global the derivatives Fund 20 days, Aggregate 2 years of Corporate risk factors Index
Invesco Global 1 Mar 2018 – Absolute Historical 99% N/A 1.7% 2.5% 2.1% 20% 15% 118.0% Sum of Total Return (EUR) 28 Feb 2019 VaR Simulation confidence Notional of Bond Fund level, the derivatives 20 days, 2 years of risk factors
Invesco Global 1 Mar 2018 – Absolute Historical 99% N/A 0.6% 1.3% 0.9% 20% 15% 202.5% Sum of Unconstrained 28 Feb 2019 VaR Simulation confidence Notional of Bond Fund level, the derivatives 20 days, 2 years of risk factors
Invesco India Bond 1 Mar 2018 – Absolute Historical 99% N/A 4.3% 5.4% 4.8% 20% 17% 0.0% Sum of Fund 28 Feb 2019 VaR Simulation confidence Notional of level, the derivatives 20 days, 2 years of risk factors
Invesco Real Return 1 Mar 2018 – Absolute Historical 99% N/A 1.2% 2.0% 1.6% 20% 6% 66.2% Sum of (EUR) Bond Fund 28 Feb 2019 VaR Simulation confidence Notional of level, the derivatives 20 days, 2 years of risk factors
Invesco Renminbi 1 Mar 2018 – Absolute Historical 99% N/A 3.0% 4.4% 3.7% 20% 10% 42.1% Sum of Fixed Income Fund 28 Feb 2019 VaR Simulation confidence Notional of level, the derivatives 20 days, 2 years of risk factors
Invesco Sterling 8 Oct 2018 – Relative Historical 99% ICE 17.0% 24.5% 21.0% 100% 65% 27.9% Sum of Bond Fund2 28 Feb 2019 VaR Simulation confidence BofAML Notional of level, Sterling the derivatives 20 days, Corporate 2 years of Index risk factors
Invesco Strategic 1 Mar 2018 – Absolute Historical 99% N/A 0.9% 1.8% 1.2% 20% 5.5% 189.4% Sum of Income Fund 28 Feb 2019 VaR Simulation confidence Notional of level, the derivatives 20 days, 2 years of risk factors
Invesco UK 1 Mar 2018 – Relative Historical 99% ICE 42.5% 52.3% 47.0% 100% 80% 43.3% Sum of Investment Grade 28 Feb 2019 VaR Simulation confidence BofAML Notional of Bond Fund level, Sterling the derivatives 20 days, Broad 2 years of Market risk factors Index
Invesco USD Ultra- 1 Mar 2018 – Absolute Historical 99% N/A 0.0% 0.1% 0.0% 20% 1% 0.0% Sum of Short Term Debt 28 Feb 2019 VaR Simulation confidence Notional of Fund (formerly level, the derivatives Invesco USD 20 days, Reserve Fund) 2 years of risk factors
Other Information (unaudited) (continued)
Calculation Methods of the Risk Exposure (continued) Global exposure using VaR approach (continued)
563 Invesco Funds
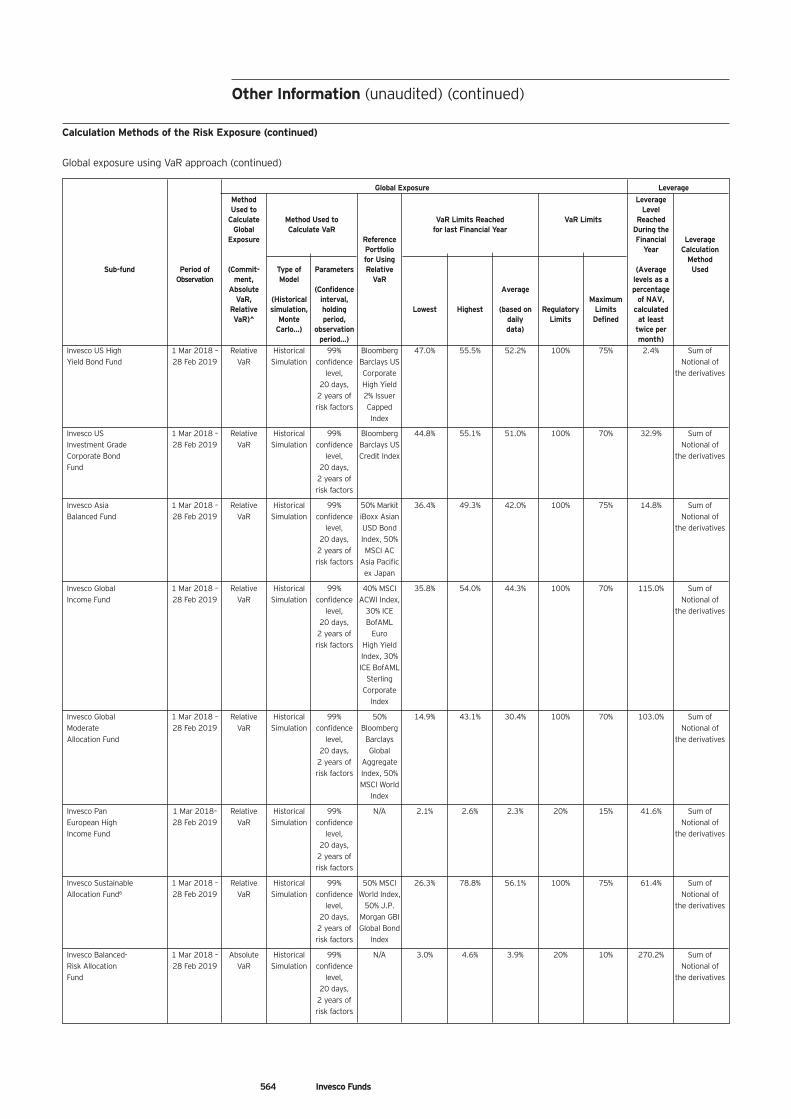
Global Exposure Leverage Method Leverage Used to Level
Calculate Method Used to VaR Limits Reached VaR Limits Reached Global Calculate VaR for last Financial Year During the
Exposure Reference Financial Leverage Portfolio Year Calculation for Using Method
Sub-fund Period of (Commit- Type of Parameters Relative (Average Used Observation ment, Model VaR levels as a
Absolute (Confidence Average percentage VaR, (Historical interval, Maximum of NAV, Relative simulation, holding Lowest Highest (based on Regulatory Limits calculated VaR)^ Monte period, daily Limits Defined at least Carlo…) observation data) twice per period…) month) Invesco US High 1 Mar 2018 – Relative Historical 99% Bloomberg 47.0% 55.5% 52.2% 100% 75% 2.4% Sum of Yield Bond Fund 28 Feb 2019 VaR Simulation confidence Barclays US Notional of level, Corporate the derivatives 20 days, High Yield 2 years of 2% Issuer risk factors Capped Index
Invesco US 1 Mar 2018 – Relative Historical 99% Bloomberg 44.8% 55.1% 51.0% 100% 70% 32.9% Sum of Investment Grade 28 Feb 2019 VaR Simulation confidence Barclays US Notional of Corporate Bond level, Credit Index the derivatives Fund 20 days, 2 years of risk factors
Invesco Asia 1 Mar 2018 – Relative Historical 99% 50% Markit 36.4% 49.3% 42.0% 100% 75% 14.8% Sum of Balanced Fund 28 Feb 2019 VaR Simulation confidence iBoxx Asian Notional of level, USD Bond the derivatives 20 days, Index, 50% 2 years of MSCI AC risk factors Asia Pacific ex Japan
Invesco Global 1 Mar 2018 – Relative Historical 99% 40% MSCI 35.8% 54.0% 44.3% 100% 70% 115.0% Sum of Income Fund 28 Feb 2019 VaR Simulation confidence ACWI Index, Notional of level, 30% ICE the derivatives 20 days, BofAML 2 years of Euro risk factors High Yield Index, 30% ICE BofAML Sterling Corporate Index
Invesco Global 1 Mar 2018 – Relative Historical 99% 50% 14.9% 43.1% 30.4% 100% 70% 103.0% Sum of Moderate 28 Feb 2019 VaR Simulation confidence Bloomberg Notional of Allocation Fund level, Barclays the derivatives 20 days, Global 2 years of Aggregate risk factors Index, 50% MSCI World Index
Invesco Pan 1 Mar 2018– Relative Historical 99% N/A 2.1% 2.6% 2.3% 20% 15% 41.6% Sum of European High 28 Feb 2019 VaR Simulation confidence Notional of Income Fund level, the derivatives 20 days, 2 years of risk factors
Invesco Sustainable 1 Mar 2018 – Relative Historical 99% 50% MSCI 26.3% 78.8% 56.1% 100% 75% 61.4% Sum of Allocation Fund6 28 Feb 2019 VaR Simulation confidence World Index, Notional of level, 50% J.P. the derivatives 20 days, Morgan GBI 2 years of Global Bond risk factors Index
Invesco Balanced- 1 Mar 2018 – Absolute Historical 99% N/A 3.0% 4.6% 3.9% 20% 10% 270.2% Sum of Risk Allocation 28 Feb 2019 VaR Simulation confidence Notional of Fund level, the derivatives 20 days, 2 years of risk factors
564 Invesco Funds
Calculation Methods of the Risk Exposure (continued) Global exposure using VaR approach (continued)
Other Information (unaudited) (continued)
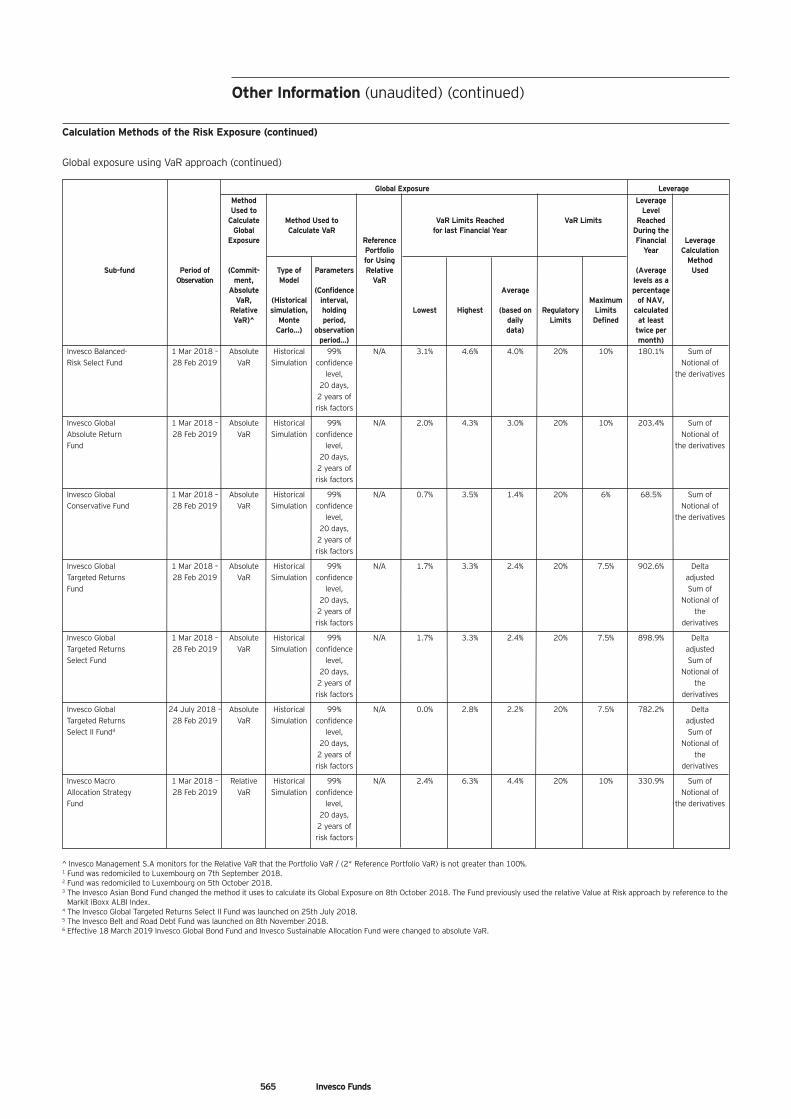
Global Exposure Leverage Method Leverage Used to Level
Calculate Method Used to VaR Limits Reached VaR Limits Reached Global Calculate VaR for last Financial Year During the
Exposure Reference Financial Leverage Portfolio Year Calculation for Using Method
Sub-fund Period of (Commit- Type of Parameters Relative (Average Used Observation ment, Model VaR levels as a
Absolute (Confidence Average percentage VaR, (Historical interval, Maximum of NAV, Relative simulation, holding Lowest Highest (based on Regulatory Limits calculated VaR)^ Monte period, daily Limits Defined at least Carlo…) observation data) twice per period…) month) Invesco Balanced- 1 Mar 2018 – Absolute Historical 99% N/A 3.1% 4.6% 4.0% 20% 10% 180.1% Sum of Risk Select Fund 28 Feb 2019 VaR Simulation confidence Notional of level, the derivatives 20 days, 2 years of risk factors
Invesco Global 1 Mar 2018 – Absolute Historical 99% N/A 2.0% 4.3% 3.0% 20% 10% 203.4% Sum of Absolute Return 28 Feb 2019 VaR Simulation confidence Notional of Fund level, the derivatives 20 days, 2 years of risk factors
Invesco Global 1 Mar 2018 – Absolute Historical 99% N/A 0.7% 3.5% 1.4% 20% 6% 68.5% Sum of Conservative Fund 28 Feb 2019 VaR Simulation confidence Notional of level, the derivatives 20 days, 2 years of risk factors
Invesco Global 1 Mar 2018 – Absolute Historical 99% N/A 1.7% 3.3% 2.4% 20% 7.5% 902.6% Delta Targeted Returns 28 Feb 2019 VaR Simulation confidence adjusted Fund level, Sum of 20 days, Notional of 2 years of the risk factors derivatives
Invesco Global 1 Mar 2018 – Absolute Historical 99% N/A 1.7% 3.3% 2.4% 20% 7.5% 898.9% Delta Targeted Returns 28 Feb 2019 VaR Simulation confidence adjusted Select Fund level, Sum of 20 days, Notional of 2 years of the risk factors derivatives
Invesco Global 24 July 2018 – Absolute Historical 99% N/A 0.0% 2.8% 2.2% 20% 7.5% 782.2% Delta Targeted Returns 28 Feb 2019 VaR Simulation confidence adjusted Select II Fund4 level, Sum of 20 days, Notional of 2 years of the risk factors derivatives
Invesco Macro 1 Mar 2018 – Relative Historical 99% N/A 2.4% 6.3% 4.4% 20% 10% 330.9% Sum of Allocation Strategy 28 Feb 2019 VaR Simulation confidence Notional of Fund level, the derivatives 20 days, 2 years of risk factors
Other Information (unaudited) (continued)
Calculation Methods of the Risk Exposure (continued) Global exposure using VaR approach (continued)
565 Invesco Funds
^ Invesco Management S.A monitors for the Relative VaR that the Portfolio VaR / (2* Reference Portfolio VaR) is not greater than 100%. 1 Fund was redomiciled to Luxembourg on 7th September 2018. 2 Fund was redomiciled to Luxembourg on 5th October 2018. 3 The Invesco Asian Bond Fund changed the method it uses to calculate its Global Exposure on 8th October 2018. The Fund previously used the relative Value at Risk approach by reference to the
Markit iBoxx ALBI Index. 4 The Invesco Global Targeted Returns Select II Fund was launched on 25th July 2018. 5 The Invesco Belt and Road Debt Fund was launched on 8th November 2018. 6 Effective 18 March 2019 Invesco Global Bond Fund and Invesco Sustainable Allocation Fund were changed to absolute VaR.
Remuneration Policy Invesco Management S.A. (the “Management Company”) has adopted a remuneration policy which is consistent with the principles outlined in the European Securities and Markets Authority (ESMA) Guidelines on sound remuneration policies under the UCITS Directive. The policy was revised in 2018, to include specificities for some Invesco EU regulated Management Companies. The Management Company was not materially impacted by the changes. The purpose of the remuneration policy is to ensure the remuneration of the staff of the Management Company is consistent with and promotes sound and effective risk management, does not encourage risk-taking which is inconsistent with the risk profiles, rules or instruments of incorporation of the Manager and of the UCITS it manages and does not impair the Management Company’s compliance with its duty to act in the best interests of the UCITS it manages. The Management Company’s summary remuneration policy is available on our website (www.invescomanagementcompany.lu) The Management Company’s full remuneration policy is available for free from the registered office (see address page 2) upon request. The remuneration policy is reviewed annually by the Compliance, Human Resources and Risk Management functions who recommend any adjustments to ensure continued alignment of the policy with sound risk management. The board of directors of the Management Company is responsible for the oversight of remuneration and for ensuring adherence to this policy through the Human Resources function. The Internal Audit function conducts regular testing of administration of the remuneration policy to assess its ongoing compliance with the Invesco Group’s remuneration policies and procedures. The aggregate total remuneration for the staff of the Management Company during performance year 2018 (1st January to 31st December 2018) is EUR 2.44m of which EUR 2.05m is fixed remuneration and EUR 0.39m is variable remuneration. The number of beneficiaries is 17. The Management Company has identified individuals considered to have a material impact on the risk profile of the Management Company or the UCITS it manages (Identified Staff), who include board members of the Management Company, senior management, heads of control functions, other risk takers and any employees receiving total remuneration that takes them into the same remuneration bracket as senior management and risk takers. The aggregate total remuneration paid to the Identified Staff of the Management Company for UCITS related activities for the performance year 2018 (1st January to 31st December 2018) is EUR 21.39m of which EUR 6.67m is paid to Senior Management and EUR 14.72m is paid to other Identified Staff. Please note the total remuneration for Identified Staff of the Management Company for UCITS related activities includes remuneration for staff employed by delegates.
Other Information (unaudited) (continued)
566 Invesco Funds
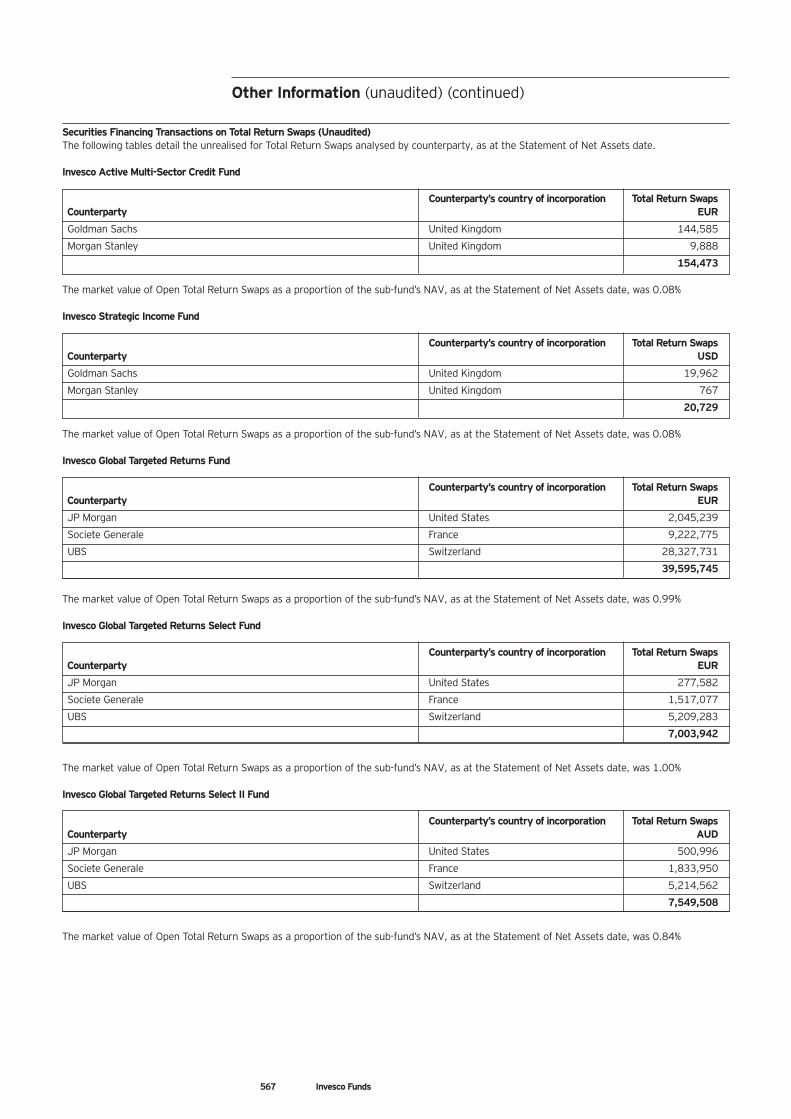
Securities Financing Transactions on Total Return Swaps (Unaudited) The following tables detail the unrealised for Total Return Swaps analysed by counterparty, as at the Statement of Net Assets date. Invesco Active Multi-Sector Credit Fund
Counterparty’s country of incorporation Total Return Swaps Counterparty EUR
Goldman Sachs United Kingdom 144,585
Morgan Stanley United Kingdom 9,888
154,473 The market value of Open Total Return Swaps as a proportion of the sub-fund’s NAV, as at the Statement of Net Assets date, was 0.08% Invesco Strategic Income Fund
Counterparty’s country of incorporation Total Return Swaps Counterparty USD
Goldman Sachs United Kingdom 19,962
Morgan Stanley United Kingdom 767
20,729 The market value of Open Total Return Swaps as a proportion of the sub-fund’s NAV, as at the Statement of Net Assets date, was 0.08% Invesco Global Targeted Returns Fund
Counterparty’s country of incorporation Total Return Swaps Counterparty EUR
JP Morgan United States 2,045,239
Societe Generale France 9,222,775
UBS Switzerland 28,327,731
39,595,745
The market value of Open Total Return Swaps as a proportion of the sub-fund’s NAV, as at the Statement of Net Assets date, was 0.99% Invesco Global Targeted Returns Select Fund
Counterparty’s country of incorporation Total Return Swaps Counterparty EUR
JP Morgan United States 277,582
Societe Generale France 1,517,077
UBS Switzerland 5,209,283
7,003,942
The market value of Open Total Return Swaps as a proportion of the sub-fund’s NAV, as at the Statement of Net Assets date, was 1.00% Invesco Global Targeted Returns Select II Fund
Counterparty’s country of incorporation Total Return Swaps Counterparty AUD
JP Morgan United States 500,996
Societe Generale France 1,833,950
UBS Switzerland 5,214,562
7,549,508
The market value of Open Total Return Swaps as a proportion of the sub-fund’s NAV, as at the Statement of Net Assets date, was 0.84%
Other Information (unaudited) (continued)
567 Invesco Funds
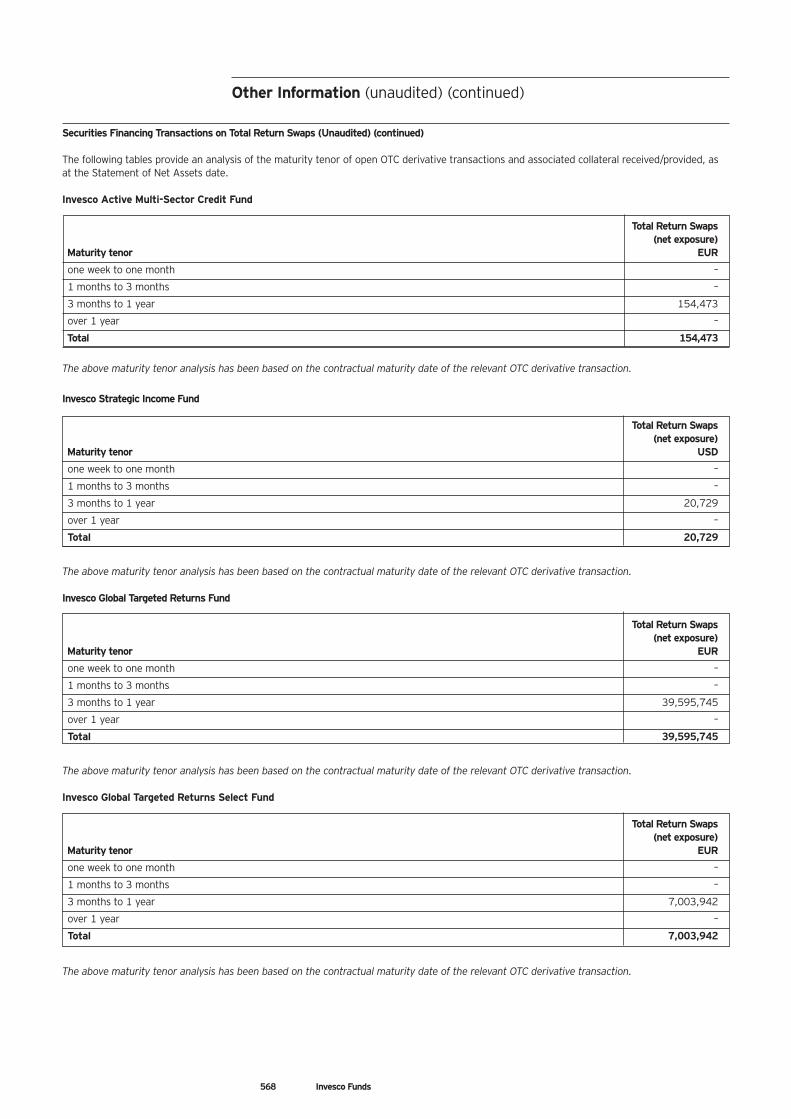
Securities Financing Transactions on Total Return Swaps (Unaudited) (continued) The following tables provide an analysis of the maturity tenor of open OTC derivative transactions and associated collateral received/provided, as at the Statement of Net Assets date. Invesco Active Multi-Sector Credit Fund
Total Return Swaps (net exposure)
Maturity tenor EUR
one week to one month –
1 months to 3 months –
3 months to 1 year 154,473
over 1 year –
Total 154,473
The above maturity tenor analysis has been based on the contractual maturity date of the relevant OTC derivative transaction.
Invesco Strategic Income Fund
Total Return Swaps (net exposure)
Maturity tenor USD
one week to one month –
1 months to 3 months –
3 months to 1 year 20,729
over 1 year –
Total 20,729
The above maturity tenor analysis has been based on the contractual maturity date of the relevant OTC derivative transaction. Invesco Global Targeted Returns Fund
Total Return Swaps (net exposure)
Maturity tenor EUR
one week to one month –
1 months to 3 months –
3 months to 1 year 39,595,745
over 1 year –
Total 39,595,745
The above maturity tenor analysis has been based on the contractual maturity date of the relevant OTC derivative transaction. Invesco Global Targeted Returns Select Fund
Total Return Swaps (net exposure)
Maturity tenor EUR
one week to one month –
1 months to 3 months –
3 months to 1 year 7,003,942
over 1 year –
Total 7,003,942
The above maturity tenor analysis has been based on the contractual maturity date of the relevant OTC derivative transaction.
Other Information (unaudited) (continued)
568 Invesco Funds
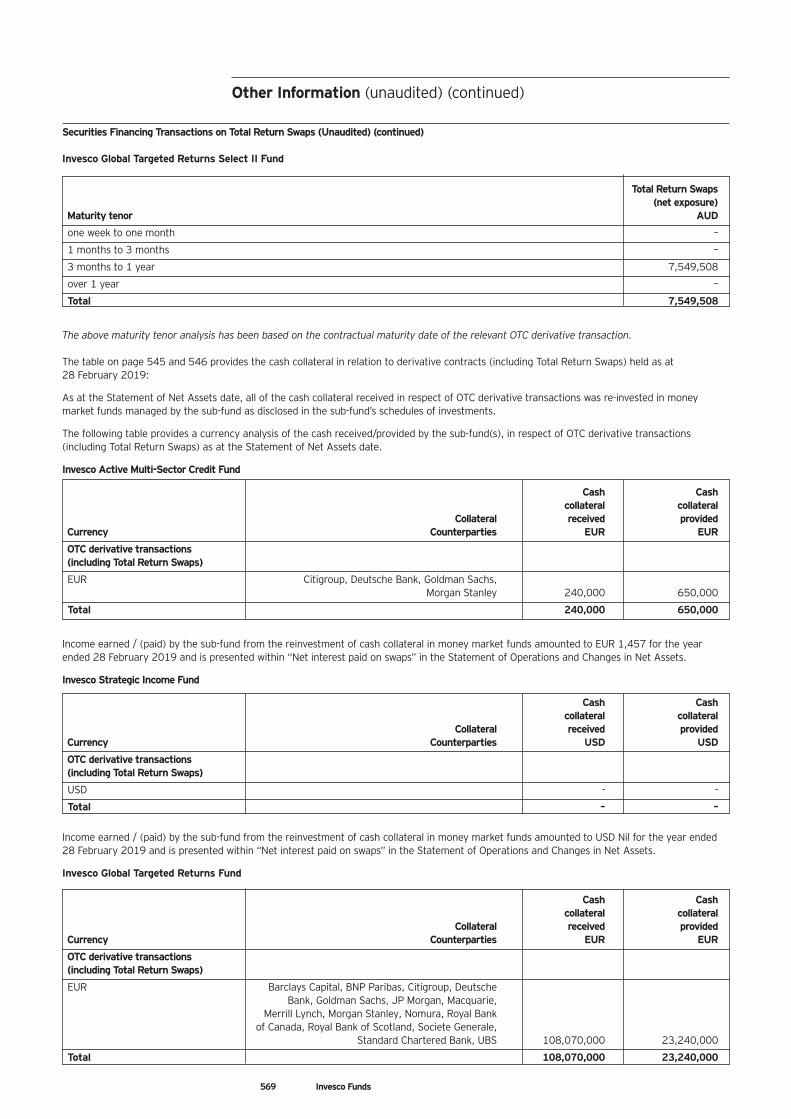
Securities Financing Transactions on Total Return Swaps (Unaudited) (continued) Invesco Global Targeted Returns Select II Fund
Total Return Swaps (net exposure)
Maturity tenor AUD
one week to one month –
1 months to 3 months –
3 months to 1 year 7,549,508
over 1 year –
Total 7,549,508
The above maturity tenor analysis has been based on the contractual maturity date of the relevant OTC derivative transaction. The table on page 545 and 546 provides the cash collateral in relation to derivative contracts (including Total Return Swaps) held as at 28 February 2019: As at the Statement of Net Assets date, all of the cash collateral received in respect of OTC derivative transactions was re-invested in money market funds managed by the sub-fund as disclosed in the sub-fund’s schedules of investments. The following table provides a currency analysis of the cash received/provided by the sub-fund(s), in respect of OTC derivative transactions (including Total Return Swaps) as at the Statement of Net Assets date. Invesco Active Multi-Sector Credit Fund Cash Cash collateral collateral Collateral received provided Currency Counterparties EUR EUR
OTC derivative transactions (including Total Return Swaps)
EUR Citigroup, Deutsche Bank, Goldman Sachs, Morgan Stanley 240,000 650,000
Total 240,000 650,000
Income earned / (paid) by the sub-fund from the reinvestment of cash collateral in money market funds amounted to EUR 1,457 for the year ended 28 February 2019 and is presented within “Net interest paid on swaps” in the Statement of Operations and Changes in Net Assets. Invesco Strategic Income Fund Cash Cash collateral collateral Collateral received provided Currency Counterparties USD USD
OTC derivative transactions (including Total Return Swaps)
USD - -
Total – –
Income earned / (paid) by the sub-fund from the reinvestment of cash collateral in money market funds amounted to USD Nil for the year ended 28 February 2019 and is presented within “Net interest paid on swaps” in the Statement of Operations and Changes in Net Assets. Invesco Global Targeted Returns Fund Cash Cash collateral collateral Collateral received provided Currency Counterparties EUR EUR
OTC derivative transactions (including Total Return Swaps)
EUR Barclays Capital, BNP Paribas, Citigroup, Deutsche Bank, Goldman Sachs, JP Morgan, Macquarie, Merrill Lynch, Morgan Stanley, Nomura, Royal Bank of Canada, Royal Bank of Scotland, Societe Generale, Standard Chartered Bank, UBS 108,070,000 23,240,000
Total 108,070,000 23,240,000
569 Invesco Funds
Other Information (unaudited) (continued)
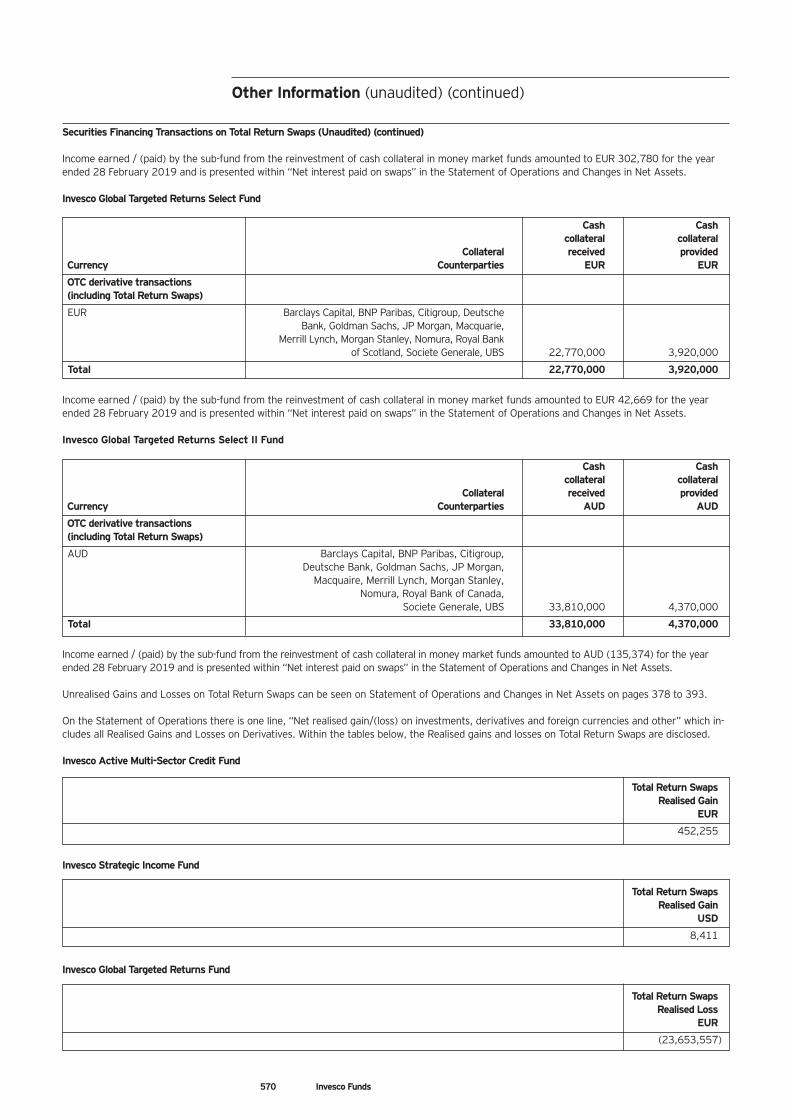
Other Information (unaudited) (continued)
570 Invesco Funds
Securities Financing Transactions on Total Return Swaps (Unaudited) (continued) Income earned / (paid) by the sub-fund from the reinvestment of cash collateral in money market funds amounted to EUR 302,780 for the year ended 28 February 2019 and is presented within “Net interest paid on swaps” in the Statement of Operations and Changes in Net Assets. Invesco Global Targeted Returns Select Fund Cash Cash collateral collateral Collateral received provided Currency Counterparties EUR EUR
OTC derivative transactions (including Total Return Swaps)
EUR Barclays Capital, BNP Paribas, Citigroup, Deutsche Bank, Goldman Sachs, JP Morgan, Macquarie, Merrill Lynch, Morgan Stanley, Nomura, Royal Bank of Scotland, Societe Generale, UBS 22,770,000 3,920,000
Total 22,770,000 3,920,000
Income earned / (paid) by the sub-fund from the reinvestment of cash collateral in money market funds amounted to EUR 42,669 for the year ended 28 February 2019 and is presented within “Net interest paid on swaps” in the Statement of Operations and Changes in Net Assets. Invesco Global Targeted Returns Select II Fund Cash Cash collateral collateral Collateral received provided Currency Counterparties AUD AUD
OTC derivative transactions (including Total Return Swaps)
AUD Barclays Capital, BNP Paribas, Citigroup, Deutsche Bank, Goldman Sachs, JP Morgan, Macquaire, Merrill Lynch, Morgan Stanley, Nomura, Royal Bank of Canada, Societe Generale, UBS 33,810,000 4,370,000
Total 33,810,000 4,370,000
Income earned / (paid) by the sub-fund from the reinvestment of cash collateral in money market funds amounted to AUD (135,374) for the year ended 28 February 2019 and is presented within “Net interest paid on swaps” in the Statement of Operations and Changes in Net Assets. Unrealised Gains and Losses on Total Return Swaps can be seen on Statement of Operations and Changes in Net Assets on pages 378 to 393. On the Statement of Operations there is one line, “Net realised gain/(loss) on investments, derivatives and foreign currencies and other” which in-cludes all Realised Gains and Losses on Derivatives. Within the tables below, the Realised gains and losses on Total Return Swaps are disclosed. Invesco Active Multi-Sector Credit Fund
Total Return Swaps Realised Gain
EUR
452,255
Invesco Strategic Income Fund
Total Return Swaps Realised Gain
USD
8,411
Invesco Global Targeted Returns Fund
Total Return Swaps Realised Loss
EUR
(23,653,557)
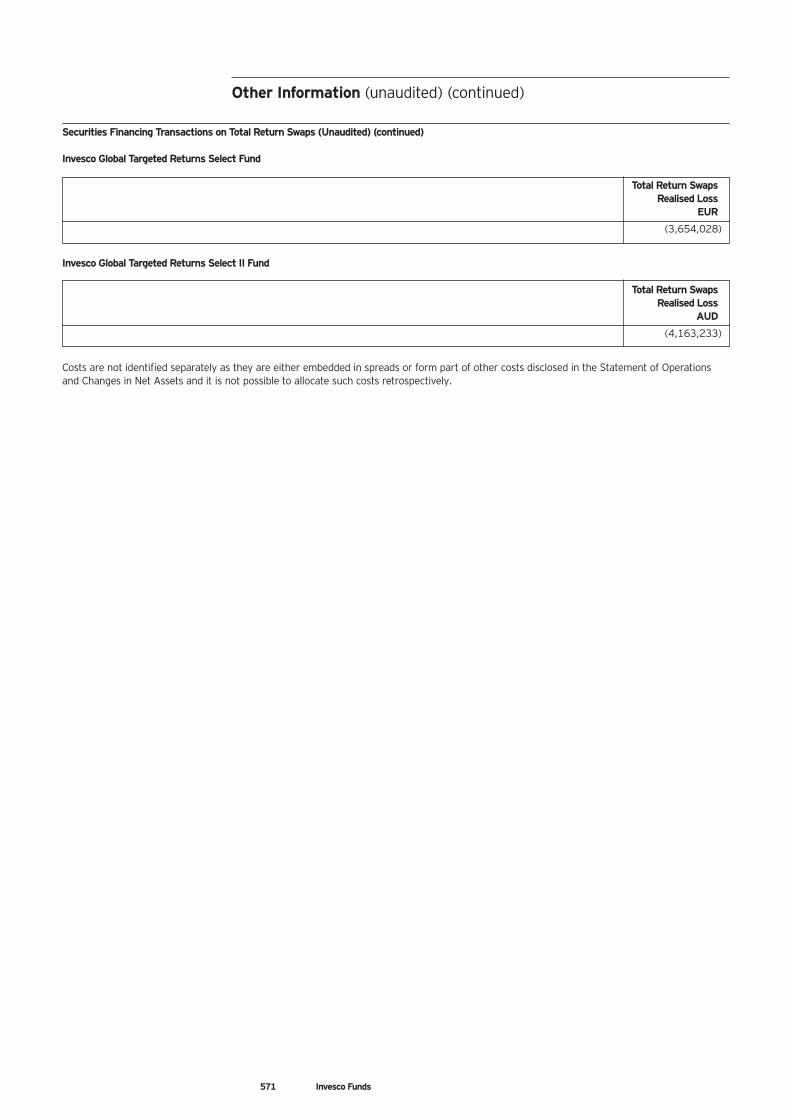
571 Invesco Funds
Securities Financing Transactions on Total Return Swaps (Unaudited) (continued) Invesco Global Targeted Returns Select Fund
Total Return Swaps Realised Loss
EUR
(3,654,028)
Invesco Global Targeted Returns Select II Fund
Total Return Swaps Realised Loss
AUD
(4,163,233)
Costs are not identified separately as they are either embedded in spreads or form part of other costs disclosed in the Statement of Operations and Changes in Net Assets and it is not possible to allocate such costs retrospectively.
Other Information (unaudited) (continued)
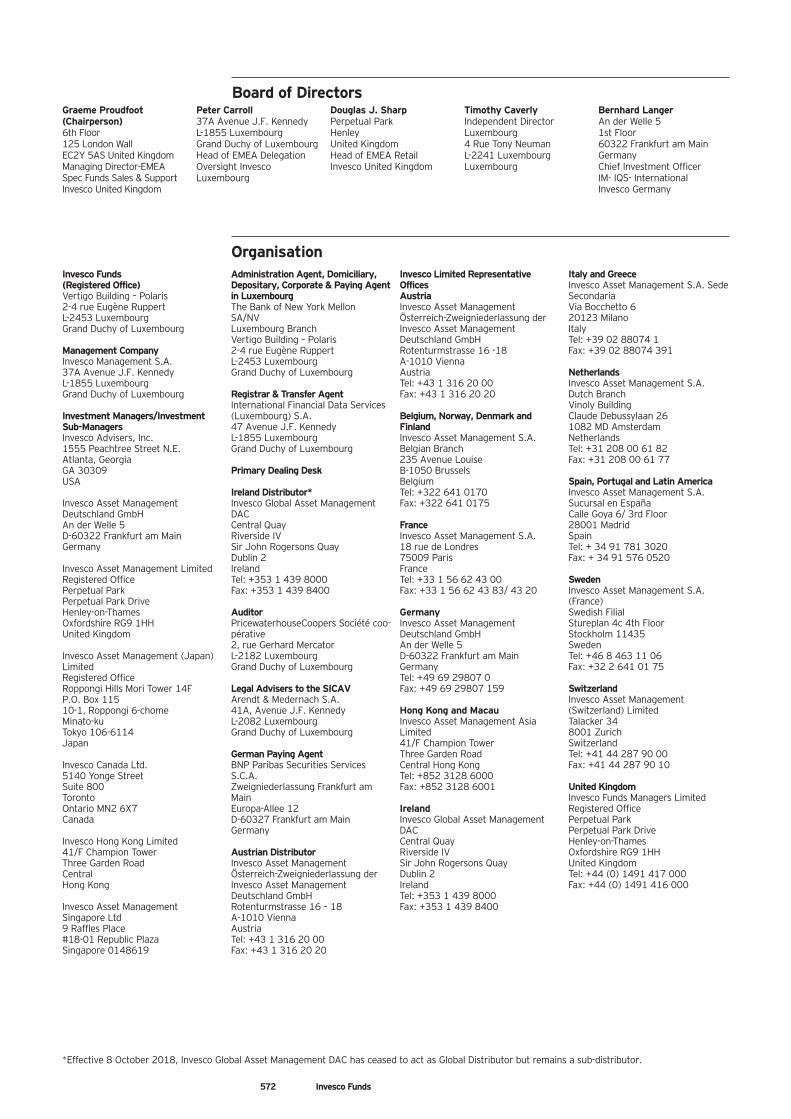
Organisation
Graeme Proudfoot (Chairperson) 6th Floor 125 London Wall EC2Y 5AS United Kingdom Managing Director-EMEA Spec Funds Sales & Support Invesco United Kingdom
Peter Carroll 37A Avenue J.F. Kennedy L-1855 Luxembourg Grand Duchy of Luxembourg Head of EMEA Delegation Oversight Invesco Luxembourg
Douglas J. Sharp Perpetual Park Henley United Kingdom Head of EMEA Retail Invesco United Kingdom
Timothy Caverly Independent Director Luxembourg 4 Rue Tony Neuman L-2241 Luxembourg Luxembourg
Bernhard Langer An der Welle 5 1st Floor 60322 Frankfurt am Main Germany Chief Investment Officer IM- IQS- International Invesco Germany
Invesco Funds (Registered Office) Vertigo Building – Polaris 2-4 rue Eugène Ruppert L-2453 Luxembourg Grand Duchy of Luxembourg Management Company Invesco Management S.A. 37A Avenue J.F. Kennedy L-1855 Luxembourg Grand Duchy of Luxembourg Investment Managers/Investment Sub-Managers Invesco Advisers, Inc. 1555 Peachtree Street N.E. Atlanta, Georgia GA 30309 USA Invesco Asset Management Deutschland GmbH An der Welle 5 D-60322 Frankfurt am Main Germany Invesco Asset Management Limited Registered Office Perpetual Park Perpetual Park Drive Henley-on-Thames Oxfordshire RG9 1HH United Kingdom Invesco Asset Management (Japan) Limited Registered Office Roppongi Hills Mori Tower 14F P.O. Box 115 10-1, Roppongi 6-chome Minato-ku Tokyo 106-6114 Japan Invesco Canada Ltd. 5140 Yonge Street Suite 800 Toronto Ontario MN2 6X7 Canada Invesco Hong Kong Limited 41/F Champion Tower Three Garden Road Central Hong Kong Invesco Asset Management Singapore Ltd 9 Raffles Place #18-01 Republic Plaza Singapore 0148619
Administration Agent, Domiciliary, Depositary, Corporate & Paying Agent in Luxembourg The Bank of New York Mellon SA/NV Luxembourg Branch Vertigo Building – Polaris 2-4 rue Eugène Ruppert L-2453 Luxembourg Grand Duchy of Luxembourg Registrar & Transfer Agent International Financial Data Services (Luxembourg) S.A. 47 Avenue J.F. Kennedy L-1855 Luxembourg Grand Duchy of Luxembourg Primary Dealing Desk Ireland Distributor* Invesco Global Asset Management DAC Central Quay Riverside IV Sir John Rogersons Quay Dublin 2 Ireland Tel: +353 1 439 8000 Fax: +353 1 439 8400 Auditor PricewaterhouseCoopers Société coo-pérative 2, rue Gerhard Mercator L-2182 Luxembourg Grand Duchy of Luxembourg Legal Advisers to the SICAV Arendt & Medernach S.A. 41A, Avenue J.F. Kennedy L-2082 Luxembourg Grand Duchy of Luxembourg German Paying Agent BNP Paribas Securities Services S.C.A. Zweigniederlassung Frankfurt am Main Europa-Allee 12 D-60327 Frankfurt am Main Germany Austrian Distributor Invesco Asset Management Österreich-Zweigniederlassung der Invesco Asset Management Deutschland GmbH Rotenturmstrasse 16 – 18 A-1010 Vienna Austria Tel: +43 1 316 20 00 Fax: +43 1 316 20 20
Invesco Limited Representative Offices Austria Invesco Asset Management Österreich-Zweigniederlassung der Invesco Asset Management Deutschland GmbH Rotenturmstrasse 16 -18 A-1010 Vienna Austria Tel: +43 1 316 20 00 Fax: +43 1 316 20 20 Belgium, Norway, Denmark and Finland Invesco Asset Management S.A. Belgian Branch 235 Avenue Louise B-1050 Brussels Belgium Tel: +322 641 0170 Fax: +322 641 0175 France Invesco Asset Management S.A. 18 rue de Londres 75009 Paris France Tel: +33 1 56 62 43 00 Fax: +33 1 56 62 43 83/ 43 20 Germany Invesco Asset Management Deutschland GmbH An der Welle 5 D-60322 Frankfurt am Main Germany Tel: +49 69 29807 0 Fax: +49 69 29807 159 Hong Kong and Macau Invesco Asset Management Asia Limited 41/F Champion Tower Three Garden Road Central Hong Kong Tel: +852 3128 6000 Fax: +852 3128 6001 Ireland Invesco Global Asset Management DAC Central Quay Riverside IV Sir John Rogersons Quay Dublin 2 Ireland Tel: +353 1 439 8000 Fax: +353 1 439 8400
Italy and Greece Invesco Asset Management S.A. Sede Secondaria Via Bocchetto 6 20123 Milano Italy Tel: +39 02 88074 1 Fax: +39 02 88074 391 Netherlands Invesco Asset Management S.A. Dutch Branch Vinoly Building Claude Debussylaan 26 1082 MD Amsterdam Netherlands Tel: +31 208 00 61 82 Fax: +31 208 00 61 77 Spain, Portugal and Latin America Invesco Asset Management S.A. Sucursal en España Calle Goya 6/ 3rd Floor 28001 Madrid Spain Tel: + 34 91 781 3020 Fax: + 34 91 576 0520 Sweden Invesco Asset Management S.A. (France) Swedish Filial Stureplan 4c 4th Floor Stockholm 11435 Sweden Tel: +46 8 463 11 06 Fax: +32 2 641 01 75 Switzerland Invesco Asset Management (Switzerland) Limited Talacker 34 8001 Zurich Switzerland Tel: +41 44 287 90 00 Fax: +41 44 287 90 10 United Kingdom Invesco Funds Managers Limited Registered Office Perpetual Park Perpetual Park Drive Henley-on-Thames Oxfordshire RG9 1HH United Kingdom Tel: +44 (0) 1491 417 000 Fax: +44 (0) 1491 416 000
Board of Directors
*Effective 8 October 2018, Invesco Global Asset Management DAC has ceased to act as Global Distributor but remains a sub-distributor.
572 Invesco Funds
Invesco Funds Audited Annual Report Société d’Investissement à Capital Variable For the year ended 28 February 2019 (R.C.S. Luxembourg B34457)
Contact us
Invesco Global Asset Management DAC Central Quay, Riverside IV Sir John Rogersons Quay, Dublin 2, Ireland Telephone: +353 1 439 8000 Website: www.invesco.com
Perivan Financial Print 254788
254788 Invesco SICAV English cover spread 30mm spine.qxp_254788 Invesco SICAV English cover spread 25mm spine 26/06/2019 15:31 Page 1