art as an investment: risk, return and portfolio diversification in major painting markets
TRANSCRIPT
Accounting and Finance 44 (2004) 257–271
© AFAANZ, 2004. Published by Blackwell Publishing.
Blackwell Publishing, Ltd.Oxford, UKACFIAccounting and Finance0810-5391AFAANZ, 2003. Published by Blackwell Publishing442
ORIGINAL ARTICLE
A. C. Worthington
et al.
/ Accounting and Finance 44 (2004) 00–00
Art as an investment: risk, return and portfolio diversification in major painting markets
Andrew C. Worthington, Helen Higgs
School of Economics and Finance, Queensland University of Technology, Brisbane, 4001, Australia
Abstract
The present paper examines risk, return and the prospects for portfoliodiversification among major painting and financial markets over the period1976–2001. The art markets examined are Contemporary Masters, FrenchImpressionists, Modern European, 19th Century European, Old Masters,Surrealists, 20th Century English and Modern US paintings. The financialmarkets comprise US Treasury bills, corporate and government bonds andsmall and large company stocks. In common with the published literature inthis area, the present study finds that the returns on paintings are much lowerand the risks much higher than conventional investment markets. Moreover,while low correlations of returns suggest that opportunities for portfoliodiversification in art works alone and in conjunction with equity markets exist,the construction of Markowitz mean-variance efficient portfolios indicatesthat no diversification gains are provided by art in financial asset portfolios.However, diversification benefits in portfolios comprised solely of art works arepossible, with Contemporary Masters, 19th Century European, Old Masters and20th Century English paintings dominating the efficient frontier during theperiod in question.
Key words
: Art and collectibles; Markowitz efficient frontier; Portfolio diversification; Risk and return
JEL classification
: C61 D81; G11
The authors would like to thank seminar participants at the Queensland University ofTechnology and Massey University, Bruce Grundy (Associate Editor) and two anonymousreferees for helpful comments on an earlier version of this paper. The financial support ofan Australian Technology Network Research Grant is also gratefully acknowledged.
Received 28 June 2001; accepted 16 July 2003 by Robert Faff (Editor).

258 A. C. Worthington
et al.
/ Accounting and Finance 44 (2004) 257–271
© AFAANZ, 2004
1. Introduction
In March 1987 Vincent Van Gogh’s (1853–1890)
Sunflowers
sold at auctionfor $US39.9 million, followed in November by the sale of
Irises
for $US53.9million. Additional record-breaking sales in art markets followed closely. InMay 1989, Pablo Picasso’s (1881–1973)
Yo Picasso
sold for $US47.8 million,far exceeding the $US5.8 million that it last commanded in May 1981; his
Noces de Pierette
later sold for $US60.0 million. In May 1990, Van Gogh’s
Portrait of Docteur Gachet
sold for $US82.5 million and Pierre-AugusteRenoir’s (1841–1919)
At the Moulin de la Galette
for $US78.1 million, becom-ing the two most expensive pictures ever sold at auction (Pesando and Shum,1999). Indeed, even demand for Modern and contemporary paintings in the1980s was so strong that works by (often still-living) artists such as RoyLichtenstein, Jackson Pollock, Jasper Johns, Robert Rauschenberg, Willem deKooning and Andy Warhol were frequently attracting prices in excess of $US10million (Anonymous, 2000). As a result, the international market for auctionedart grew dramatically during this time, from less than $US150 million in 1970to more than $US1.8 billion in 1997 (Renneboog and Van Houtte, 2000).
Obviously, these examples and others indicate that at least some paintingshave increased significantly in value and thereby generated large rates of returnfor their owners. For instance,
Irises
had last been bought in 1948 for$US84,000 (some $US0.5 million at 1989 prices), such that the record 1987 saleprovided a 12 per cent annual real rate of return (De la Barre
et al
., 1994) anddespite the well publicised bear market in art during the period 1989–1992, therehas been a sustained revival in picture prices over much of the last decade,especially in areas outside the sky-high prices of Impressionist, Modern andcontemporary works a decade earlier (Curry, 1998). For example, Old Mastersale prices have been rising strongly, with many paintings selling for morethan their high estimates. A rediscovered El Greco (1541–1614) work,
TheCrucifixion
, recently sold for more than six times its estimate at £3.6 millionand a tiny flower painting by Ambrosius Bosschaert the Elder (1573–1621)realized five times expectations at £1.92 million (Anonymous, 2000).
In response to the commonly held belief that the art market yields hugeprofits in comparison to other more prosaic investment markets, a small butgrowing published literature has examined the financial characteristics of themarket in paintings, and art markets in general (paintings, sculpture, ceramicsand prints, along with collectibles such as coins, stamps, antiques and furni-ture). This invariably accompanies a revival of interest in art investment by thebusiness world (see Oleck and Dunkin, 1999; Peers and Jeffrey, 1999). Startingwith the seminal work of Baumol (1986) much of this has been concernedwith measuring the rate of return of paintings (see, e.g., Frey and Pommerehne,1989; Buelens and Ginsburgh, 1993; Goetzmann, 1993; Pesando, 1993; Chanel
et al
., 1994; Frey and Eichenberger, 1995a, 1995b; Guerzoni, 1995; Candelaand Scorcu, 1997; Pesando and Shum, 1999); however, in recent years there has
A. C. Worthington
et al.
/ Accounting and Finance 44 (2004) 257–271 259
© AFAANZ, 2004
been an emerging emphasis on other analytical dimensions of art investment(Felton, 1998).
Importantly, if art is to be regarded as a valid (albeit imperfect) addition totraditional investments such as stocks and bonds amongst others, there is therequirement of examining the prospects for diversification in such portfolios(Flores
et al
., 1998). Moreover, it is also desirous to examine the prospectsfor diversification in portfolios composed primarily of art held by investors,collectors, dealers and museums, amongst others. If low correlations of returnsexist between various art markets, diversifying across these markets may allowinvestors to reduce portfolio risk while holding expected return constant.Unfortunately, little empirical evidence currently exists concerning correlationamong the differing art markets and the concomitant prospects for portfoliodiversification, both among art works alone and in combination with financialassets.
Of course, it goes without saying that art markets differ substantially fromfinancial markets, and this potentially limits the strict applicability of well-known financial techniques. Art works are not very liquid assets, almost neverdivisible, transaction costs are high, and there are lengthy delays between thedecision to sell and actual sale. Investing in art typically requires extensiveknowledge of art and the art world, and a large amount of capital to acquire thework of well-known artists. The market is highly segmented and dominated bya few large auction houses, and only a small number of works are presented forsale throughout the year. Risk is also pervasive, deriving from both the physicalrisks of fire and theft and the possibility of reattribution to a different artist, andthe cost of insurance as a result can be prohibitive. And while auction pricesrepresent, in part, a consensus opinion on the value of art works, values in turnare determined by a complex and subjective set of beliefs based on past, presentand future prices, individual tastes and changing fashion.
Nevertheless, in recent years it has been widely accepted that most art mar-kets have moved closer to the ideals set by financial markets. Turnover, forexample, has increased dramatically among the auction houses and the largerproportion of transactions are pursued in these as against traditional dealers.Information on alternative art investments is now more accessible through theattention of the media, and the publishing and dissemination of catalogues andprice index series has increased the amount of information available to bothbuyers and sellers. Likewise, art markets are increasingly globalized, and thewidening of the asset pool to include collectibles, furniture, jewellery and wine,amongst others, has seen substantially greater participation in most art markets.Of course, caution must play its part when applying the tools of financial analysisto these scenarios, but such cross-disciplinary research can still offer valuableinsights, even with qualification.
The purpose of the present paper is to examine risk, return and portfoliodiversification in major painting markets. Such information will provide import-ant information to both holders of exclusively art portfolios and investors

260 A. C. Worthington
et al.
/ Accounting and Finance 44 (2004) 257–271
© AFAANZ, 2004
desiring to include art within mixed asset portfolios comprising stocks andbonds, amongst others. The present paper itself is divided into four main areas.Section 2 explains the data and empirical methodology employed in the presentanalysis. Section 3 discusses risk and return in art markets while Section 4presents an analysis of portfolio diversification. The paper ends with some briefconcluding remarks in the final section.
2. Data and methodology
The data employed in the present study is composed of indices for nine majorcategories of paintings and five financial markets. All art index data is obtainedfrom UK-based Art Market Research (AMR) 2003 and encompasses the periodJanuary 1976 to December 2001. AMR art indexes are widely used by a varietyof leading institutions concerned with prices in the arts, including Christie’s,Sotheby’s, the British Inland Revenue Service and the New York FederalReserve, along with the
Financial Times
,
Wall Street Journal
,
The Economist
,
Business Week
,
The Art Newspaper
and
Handelsblatt
(AMR, 2003) (e.g.,Anonymous (2000) ). In brief, the indices are calculated by collecting all world-wide sales in each month by artist, converting these values to US dollars(USD), trimming by 10 per cent to eliminate extreme values and calculating theratio to the January 1976-base period. For schools, movements and periods, theindividual artists are combined together to form an equal-weighted portfolio.
The nine major art indexes are as follows: (i) Contemporary Masters (
CM
),covering 5,106 sales of current masters including Basquiat, Clemente andPolke; (ii) 20th Century English (
TE
) encompassing 10,603 sales by artists suchas Dawson, Flint, Moore and Munnings; (iii) 19th Century European (
NE
) with50,510 sales by artists including Maris, Troyon, Constable and Corot; (iv)French Impressionist (
FI
) with sales of 6,242 works by painters includingDegas, Monet and Renoir; (v) Modern European (ME) with 17,538 sales byartists like Bonnard, Picasso and Utrillo; (vi) Modern US Paintings (
US
) with10,607 sales of works by painters such as Kooning, Rivers and Warhol; (vii)Old Masters (
OM
) with 6,412 sales by artists including Gainsborough, Reynoldsand Storck; (viii) Surrealists (
SR
) with 10,395 sales by artists including Dali,Magritte and Picabia; and a general painting (
ART
) index with 94,514 salesby a selection of one hundred artists across all schools and periods includingartists such as Boyd, Foster and Rivera. All data is monthly and specified inUSD terms.
The indexes selected are consistent with studies in the area of art investmentreturns and risk and represent some of the most closely followed paintingsub-sectors. It is also important to note that the aggregation of these art indicesacross schools, movements and periods produces a portfolio diversificationeffect when compared to artists in much the same manner as the aggregationof companies in industries and markets. This effect varies from index to index.For example, French Impressionists (
FI
) are drawn from a small number of
A. C. Worthington
et al.
/ Accounting and Finance 44 (2004) 257–271 261
© AFAANZ, 2004
artists from a single movement and a relatively narrow period (mostlyDegas, Monet, Renoir and Pissarro from the 1860s until Post-Impressionism),whereas Old Masters (
OM
) comprises a larger number of artists drawn fromseveral movements and periods (Renaissance, Mannerist and Baroque, espe-cially Italian, Dutch and Flemish artists, largely pre 1700) (see AMR (2003) fordetails).
The five financial market indices represent major asset classes and aredefined as: large company stocks (
LCS
), small company stocks (
SCS
), long-term corporate bonds (
LCB
), long-term government bonds (
LGB
) and treasurybills (
TBL
). All Ibbotson Associates (2002) indices are constructed using USequity and bond markets and this maintains consistency with the art dataas defined in USD terms and with the position of the US as the world’s lead-ing art market (some 44 per cent of the global art market followed by theUK with 29 per cent (Renneboog and Van Houtte, 2002) ). The series employedare total monthly returns, and where applicable, include capital appreciationand income. For both the art and financial indices the monthly returns arecalculated such that the monthly return in market
i
is represented by thecontinuously compounded return or log return of the price index at time
t
such that
∆
p
it
=
log(
p
it
/
p
it
−
1
)
×
100. (1)
where
∆
p
it
denotes the rate of change of
p
it
.The analysis of art risk, return and portfolio diversification in the present
paper is made as follows. To start with, two different data sets are examined.The first set of data is returns for the eight individual schools or periods ofpaintings and is examined in the context of an exclusively art portfolio. That is,
CM
,
FI
,
ME
,
NE
,
OM
,
SR
,
TE
and
US
. The second set of data relates to a broadart asset included in a multiasset class portfolio with other financial assets;namely,
ART
,
LCS
,
SCS
,
LCB
,
LGB
and
TBL
. Two stages of analysis are fol-lowed in each case. First, the central tendency, dispersion and shape of allseries are examined, along with their time series properties. Second, followingMarkowitz’s (1952) well-known portfolio theory, combinations of these assetswith different risk-return characteristics are constructed. Within this set of allpossible combinations, the set of portfolio strategies with the least variance fora given mean return produces the mean-variance frontier (also known as themean-variance set). The mean-variance frontier is then further identified as anefficient frontier (efficient set) representing portfolios where portfolio returnis maximized for a given level of portfolio risk. Portfolios are constructedemploying both optimizing (mean-variance efficient investment) and naïve(single market and equally spread investment) strategies. One constraint placed onasset allocation within the portfolios is that negative (or short) positions are notallowable in order to correctly reflect the realities of investment in art markets.For simplification, cash is assumed to be zero.
262A
. C. W
orthington
et al.
/ Accounting and F
inance 44 (2004) 257–271
© A
FAA
NZ
, 2004
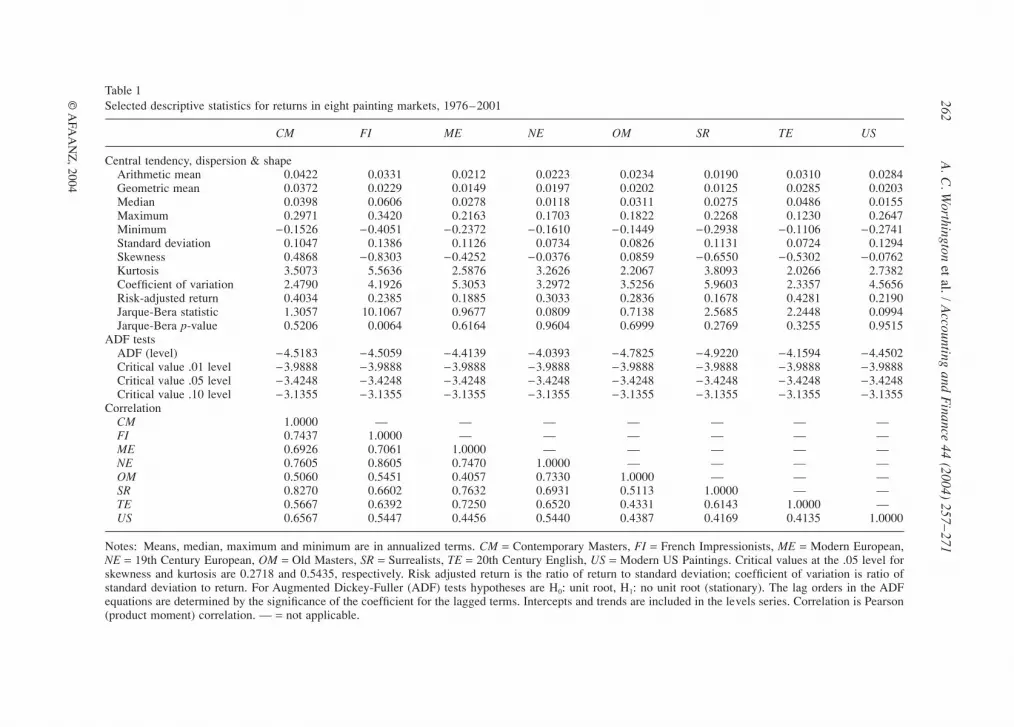
Table 1Selected descriptive statistics for returns in eight painting markets, 1976–2001
CM FI ME NE OM SR TE US
Central tendency, dispersion & shapeArithmetic mean 0.0422 0.0331 0.0212 0.0223 0.0234 0.0190 0.0310 0.0284Geometric mean 0.0372 0.0229 0.0149 0.0197 0.0202 0.0125 0.0285 0.0203Median 0.0398 0.0606 0.0278 0.0118 0.0311 0.0275 0.0486 0.0155Maximum 0.2971 0.3420 0.2163 0.1703 0.1822 0.2268 0.1230 0.2647Minimum
−
0.1526
−
0.4051
−
0.2372
−
0.1610
−
0.1449
−
0.2938
−
0.1106
−
0.2741Standard deviation 0.1047 0.1386 0.1126 0.0734 0.0826 0.1131 0.0724 0.1294Skewness 0.4868
−
0.8303
−
0.4252
−
0.0376 0.0859
−
0.6550
−
0.5302
−
0.0762Kurtosis 3.5073 5.5636 2.5876 3.2626 2.2067 3.8093 2.0266 2.7382Coefficient of variation 2.4790 4.1926 5.3053 3.2972 3.5256 5.9603 2.3357 4.5656Risk-adjusted return 0.4034 0.2385 0.1885 0.3033 0.2836 0.1678 0.4281 0.2190Jarque-Bera statistic 1.3057 10.1067 0.9677 0.0809 0.7138 2.5685 2.2448 0.0994Jarque-Bera
p
-value 0.5206 0.0064 0.6164 0.9604 0.6999 0.2769 0.3255 0.9515ADF tests
ADF (level)
−
4.5183
−
4.5059
−
4.4139
−
4.0393
−
4.7825
−
4.9220
−
4.1594 −4.4502Critical value .01 level −3.9888 −3.9888 −3.9888 −3.9888 −3.9888 −3.9888 −3.9888 −3.9888Critical value .05 level −3.4248 −3.4248 −3.4248 −3.4248 −3.4248 −3.4248 −3.4248 −3.4248Critical value .10 level −3.1355 −3.1355 −3.1355 −3.1355 −3.1355 −3.1355 −3.1355 −3.1355
CorrelationCM 1.0000 — — — — — — —FI 0.7437 1.0000 — — — — — —ME 0.6926 0.7061 1.0000 — — — — —NE 0.7605 0.8605 0.7470 1.0000 — — — —OM 0.5060 0.5451 0.4057 0.7330 1.0000 — — —SR 0.8270 0.6602 0.7632 0.6931 0.5113 1.0000 — —TE 0.5667 0.6392 0.7250 0.6520 0.4331 0.6143 1.0000 —US 0.6567 0.5447 0.4456 0.5440 0.4387 0.4169 0.4135 1.0000
Notes: Means, median, maximum and minimum are in annualized terms. CM = Contemporary Masters, FI = French Impressionists, ME = Modern European,NE = 19th Century European, OM = Old Masters, SR = Surrealists, TE = 20th Century English, US = Modern US Paintings. Critical values at the .05 level forskewness and kurtosis are 0.2718 and 0.5435, respectively. Risk adjusted return is the ratio of return to standard deviation; coefficient of variation is ratio ofstandard deviation to return. For Augmented Dickey-Fuller (ADF) tests hypotheses are H0: unit root, H1: no unit root (stationary). The lag orders in the ADFequations are determined by the significance of the coefficient for the lagged terms. Intercepts and trends are included in the levels series. Correlation is Pearson(product moment) correlation. — = not applicable.
A. C. Worthington et al. / Accounting and Finance 44 (2004) 257–271 263
© AFAANZ, 2004
3. Risk and return
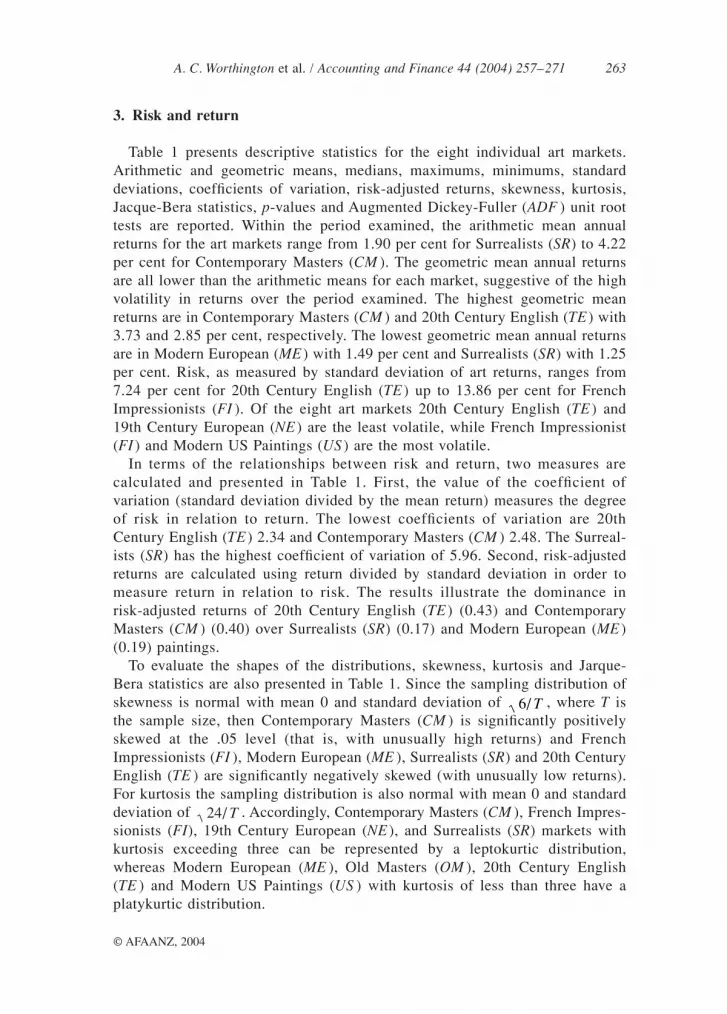
Table 1 presents descriptive statistics for the eight individual art markets.Arithmetic and geometric means, medians, maximums, minimums, standarddeviations, coefficients of variation, risk-adjusted returns, skewness, kurtosis,Jacque-Bera statistics, p-values and Augmented Dickey-Fuller (ADF ) unit roottests are reported. Within the period examined, the arithmetic mean annualreturns for the art markets range from 1.90 per cent for Surrealists (SR) to 4.22per cent for Contemporary Masters (CM ). The geometric mean annual returnsare all lower than the arithmetic means for each market, suggestive of the highvolatility in returns over the period examined. The highest geometric meanreturns are in Contemporary Masters (CM ) and 20th Century English (TE) with3.73 and 2.85 per cent, respectively. The lowest geometric mean annual returnsare in Modern European (ME) with 1.49 per cent and Surrealists (SR) with 1.25per cent. Risk, as measured by standard deviation of art returns, ranges from7.24 per cent for 20th Century English (TE) up to 13.86 per cent for FrenchImpressionists (FI ). Of the eight art markets 20th Century English (TE) and19th Century European (NE) are the least volatile, while French Impressionist(FI) and Modern US Paintings (US) are the most volatile.
In terms of the relationships between risk and return, two measures arecalculated and presented in Table 1. First, the value of the coefficient ofvariation (standard deviation divided by the mean return) measures the degreeof risk in relation to return. The lowest coefficients of variation are 20thCentury English (TE) 2.34 and Contemporary Masters (CM ) 2.48. The Surreal-ists (SR) has the highest coefficient of variation of 5.96. Second, risk-adjustedreturns are calculated using return divided by standard deviation in order tomeasure return in relation to risk. The results illustrate the dominance inrisk-adjusted returns of 20th Century English (TE) (0.43) and ContemporaryMasters (CM ) (0.40) over Surrealists (SR) (0.17) and Modern European (ME)(0.19) paintings.
To evaluate the shapes of the distributions, skewness, kurtosis and Jarque-Bera statistics are also presented in Table 1. Since the sampling distribution ofskewness is normal with mean 0 and standard deviation of , where T isthe sample size, then Contemporary Masters (CM ) is significantly positivelyskewed at the .05 level (that is, with unusually high returns) and FrenchImpressionists (FI ), Modern European (ME ), Surrealists (SR) and 20th CenturyEnglish (TE ) are significantly negatively skewed (with unusually low returns).For kurtosis the sampling distribution is also normal with mean 0 and standarddeviation of . Accordingly, Contemporary Masters (CM ), French Impres-sionists (FI), 19th Century European (NE), and Surrealists (SR) markets withkurtosis exceeding three can be represented by a leptokurtic distribution,whereas Modern European (ME ), Old Masters (OM ), 20th Century English(TE ) and Modern US Paintings (US ) with kurtosis of less than three have aplatykurtic distribution.
6/ T
24/ T
264 A. C. Worthington et al. / Accounting and Finance 44 (2004) 257–271
© AFAANZ, 2004
The Jarque-Bera statistic and p-values in Table 1 are used to test the null hypo-thesis that the distribution for the art market returns is normally distributed.All p-values are greater than the 0.01 level of significance indicating that artreturns can be approximated by a normal distribution with the exception ofFrench Impressionists (FI). Finally, ADF unit root tests are calculated for theeight series of painting returns. In all instances, the null hypothesis of non-stationarity is tested. The analyses of the art market returns at levels indicateall painting markets are stationary at the 0.01 level of significance.
The correlation matrix for the eight art markets is included in the lower portionof Table 1. All pairwise correlations are positive and range from 0.41 to 0.86.French Impressionists (FI ) shows a high correlation with 19th Century European(NE) (0.86), while there is also a high positive correlation of 0.83 between Con-temporary Masters (CM ) and Surrealists (SR). The lowest positive correlationsare 0.41 between Modern European (ME) and Old Masters (OM ) and 0.41between 20th Century English (TE) and Modern US Paintings (US). The findingthat the art markets are not perfectly positively correlated is suggestive ofthe potential benefits of portfolio diversification in exclusively art portfolios.
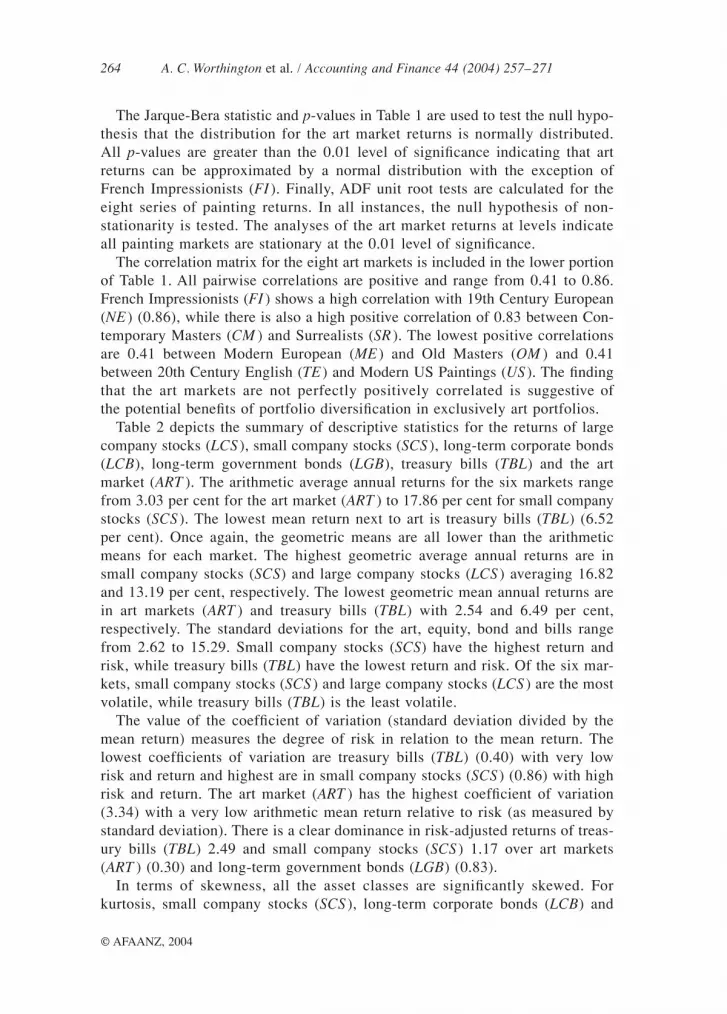
Table 2 depicts the summary of descriptive statistics for the returns of largecompany stocks (LCS), small company stocks (SCS), long-term corporate bonds(LCB), long-term government bonds (LGB), treasury bills (TBL) and the artmarket (ART ). The arithmetic average annual returns for the six markets rangefrom 3.03 per cent for the art market (ART ) to 17.86 per cent for small companystocks (SCS ). The lowest mean return next to art is treasury bills (TBL) (6.52per cent). Once again, the geometric means are all lower than the arithmeticmeans for each market. The highest geometric average annual returns are insmall company stocks (SCS) and large company stocks (LCS) averaging 16.82and 13.19 per cent, respectively. The lowest geometric mean annual returns arein art markets (ART ) and treasury bills (TBL) with 2.54 and 6.49 per cent,respectively. The standard deviations for the art, equity, bond and bills rangefrom 2.62 to 15.29. Small company stocks (SCS) have the highest return andrisk, while treasury bills (TBL) have the lowest return and risk. Of the six mar-kets, small company stocks (SCS) and large company stocks (LCS) are the mostvolatile, while treasury bills (TBL) is the least volatile.
The value of the coefficient of variation (standard deviation divided by themean return) measures the degree of risk in relation to the mean return. Thelowest coefficients of variation are treasury bills (TBL) (0.40) with very lowrisk and return and highest are in small company stocks (SCS) (0.86) with highrisk and return. The art market (ART ) has the highest coefficient of variation(3.34) with a very low arithmetic mean return relative to risk (as measured bystandard deviation). There is a clear dominance in risk-adjusted returns of treas-ury bills (TBL) 2.49 and small company stocks (SCS ) 1.17 over art markets(ART ) (0.30) and long-term government bonds (LGB) (0.83).
In terms of skewness, all the asset classes are significantly skewed. Forkurtosis, small company stocks (SCS ), long-term corporate bonds (LCB) and
A. C. Worthington et al. / Accounting and Finance 44 (2004) 257–271 265
© AFAANZ, 2004
treasury bills (TBL) can be represented by a leptokurtic distribution whereas art(ART ), large company stocks (LCS) and long-term government bonds (LGB)with kurtosis of less than three can be represented by a platykurtic distribution.The Jarque-Bera statistic and corresponding p-values in Table 2 fail to rejectthe null hypothesis that the distributions are normally distributed. The ADF unitroot tests are presented for the six markets in the returns series. The analyses of
Table 2Selected descriptive statistics for annualized returns in painting and financial markets, 1976–2001
ART LCS SCS LCB LGB TBL
Central tendency, dispersion and shapeArithmetic mean 0.0303 0.1395 0.1786 0.0963 0.0975 0.0652Geometric mean 0.0254 0.1319 0.1682 0.0915 0.0916 0.0649Median 0.0305 0.1698 0.2234 0.1040 0.0886 0.0560Maximum 0.2281 0.3234 0.3928 0.3672 0.3487 0.1381Minimum −0.2115 −0.1076 −0.2205 −0.0761 −0.0923 0.0286Standard deviation 0.1012 0.1321 0.1529 0.1051 0.1168 0.0262Skewness −0.3145 −0.3538 −0.7648 0.5256 0.3250 0.9758Kurtosis 2.8978 1.9600 3.0898 3.1103 2.2580 3.5077Coefficient of variation 3.3417 0.9463 0.8562 1.0912 1.1971 0.4011Risk-adjusted return 0.2993 1.0567 1.1680 0.9165 0.8354 2.4929Jarque-Bera statistic 0.4399 1.7142 2.5432 1.2101 1.0542 4.4056Jarque-Bera p-value 0.8026 0.4244 0.2804 0.5460 0.5903 0.1105ADF tests ADF (Level) −3.9616 −4.9445 −5.9095 −4.8880 −5.1064 −2.8936Critical value .01 level −3.9888 −3.9888 −3.9888 −3.9888 −3.9888 −3.9888Critical value .05 level −3.4248 −3.4248 −3.4248 −3.4248 −3.4248 −3.4248Critical value .10 level −3.1355 −3.1355 −3.1355 −3.1355 −3.1355 −3.1355ADF (Difference) −6.0253 — — — — −5.7827Critical value .01 level −3.4520 — — — — −3.4520Critical value .05 level −2.8710 — — — — −2.8710Critical value .10 level −2.5719 — — — — −2.5719
CorrelationART 1.0000 — — — — —LCS 0.1618 1.0000 — — — —SCS −0.3058 0.3800 1.0000 — — —LCB −0.0724 0.3234 0.0175 1.0000 — —LGB 0.0220 0.3297 −0.0247 0.9629 1.0000 —TBL 0.3009 0.0871 0.0808 0.0261 0.0485 1.0000
Notes: Means, median, maximum and minimum are in annualized terms. ART = art market, LCS =large company stocks, SCS = small company stocks, LCB = long-term corporate bonds, LGB = long-term government bonds, TBL = Treasury bills. Critical values at the .05 level for skewness and kurtosisare 0.1387 and 0.2773, respectively. Risk adjusted return is the ratio of return to standard deviation;coefficient of variation is ratio of standard deviation to return. For Augmented Dickey-Fuller (ADF)tests hypotheses are H0: unit root, H1: no unit root (stationary). The lag orders in the ADF equations aredetermined by the significance of the coefficient for the lagged terms. Intercepts and trends areincluded in the levels series, intercepts only in the first-differenced series. Correlation is Pearson(product moment) correlation. — = not applicable.
266 A. C. Worthington et al. / Accounting and Finance 44 (2004) 257–271
© AFAANZ, 2004
the art, equity and bond market returns at levels indicate that returns in allmarkets are stationary with the exception of art (ART ) and treasury bills (TBL),which are stationary in differences.
Finally, Table 2 also presents the correlation matrix for the six markets. Thepairwise correlations range from −0.3058 to 0.9629 and are generally positive.The exceptions are that art markets (ART ) are negatively correlated with smallcompany stocks (SCS) and long-term corporate bonds (LCB) while long-termgovernment bonds (LGB) and small company stocks (SCS ) are also negativelycorrelated. The low correlations between art markets and most of the financialmarkets are once again suggestive of the potential gains for portfolio diversi-fication involving art investment.
4. Portfolio diversification
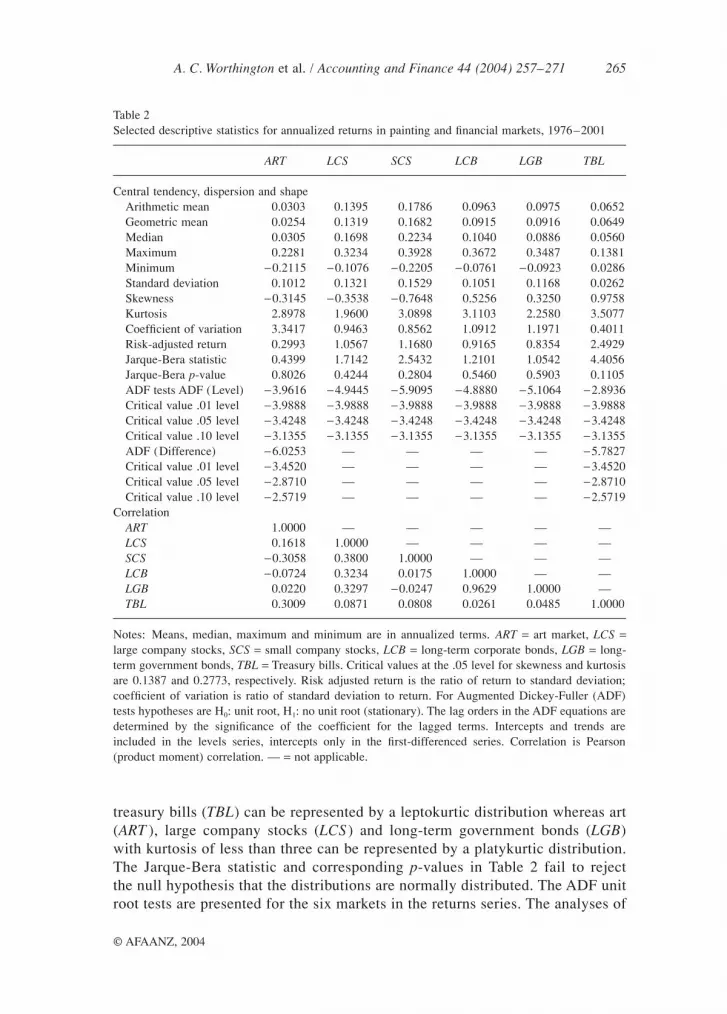
In the second part of the analysis, Markowitz portfolio theory is used to con-struct the efficient frontier for the exclusively art portfolio and the mixed assetportfolio where art is included alongside short and long-term government debtand corporate debt and equity. Mean-variance portfolio optimization is madeusing the Microsoft Excel-based program M-V Optimiser (Wagner Associates,2003). Figure 1 depicts the efficient frontier derived from the various combina-tions of the eight art markets. The efficient set includes 104 portfolios. Also
Figure 1 Efficient frontier for art investments. CM = Contemporary Masters, FI = French Impressionists, ME = Modern European, NE = 19th Century European,
OM = Old Masters, SR = Surrealists, TE = 20th Century English, US = Modern US Paintings, EQW = equally weighted portfolio.
A. C. Worthington et al. / Accounting and Finance 44 (2004) 257–271 267
© AFAANZ, 2004
included with the mean-variance frontier are several naïve portfolios that areeither art investments made in a single market (CM, FI, ME, NE, OM, SR, TEand US) or an equally weighted portfolio across all markets (EQW ).
The returns (risks) for the efficient frontier range from 2.71 per cent (6.44per cent) at the minimum variance point to 4.22 per cent (10.47 per cent) at itsuppermost. All other things being equal, naïve strategies, where investment ismade solely in one art market or equally in all markets, are dominated bythe efficient set. Only Contemporary Masters (CM ), with the highest risk andreturn, lies on the efficient frontier. However, as a result of the relatively narrowrange of returns in the feasible set of mean-variance portfolios, even the dom-inance of the efficient frontier over the naïve strategies is small, such thatthe return of the equal weighting strategy is only 0.015 per cent less than thehighest return in the efficient set.
As often as not, it is expected that individual assets that are plotted farthestfrom the efficient frontier are excluded from the set of efficient portfolios andthis is indeed the case with the naïve strategies of investing in French Impres-sionists (FI) and Modern US Paintings (US) alone. In fact, the efficient frontieris mostly comprised of just two or three of the eight art assets included in thecalculations. For example, when return is equal to 2.71 per cent (Point A) theonly assets included (with their portfolio weight) are 19th Century European(NE ) 21.12 per cent, Old Masters (OM ) 27.45 per cent and 20th Century Eng-lish (TE ) (51.43 per cent). At Point B (3.16 per cent return) the frontier pointis composed of Contemporary Masters (CM ) 19.27 per cent, Old Masters (OM )20.38 per cent and 20th Century English (TE ) (60.35 per cent). At Point CContemporary Masters (CM ) (52.74 per cent) and 20th Century English (TE )(47.26 per cent) form the efficient portfolio, changing to 68.94 and 31.06 per centat Point D. Finally, at Point E the efficient portfolio is composed solely ofContemporary Masters (CM ).
While the parameters used in constructing the efficient frontier for art invest-ment are historical, there are a number of points to make regarding portfoliodiversification. To start with, over the period 1976–2001 a relatively smallnumber of separate art markets dominate the efficient set, mainly 19th CenturyEuropean (NE ), Old Masters (OM ), 20th Century English (TE) and Contem-porary Masters (CM ). Moreover, Contemporary Masters (CM ) with its relativelyhigh returns over the period generally dominates portfolios with high risk-return characteristics, while 20th Century English (TE) dominates portfolioswith low risk-return characteristics. Accordingly, taking as given an art investor’ssubjective risk preferences, less risk averse investors would tend to favourContemporary Masters (CM ) in their diversified portfolios, while more riskaverse investors would tend to weight heavily in favour of 20th Century English(TE ) works. Of the remaining painting markets, French Impressionists (FI ),Surrealists (SR), Modern US Paintings (US ) and Modern European (ME ) paint-ing are generally not included in the efficient set through their high risk-lowreturn characteristics over the period in question. In general, it would appear
268 A. C. Worthington et al. / Accounting and Finance 44 (2004) 257–271
© AFAANZ, 2004
that most of the gains from diversification achievable in art can be made with asmall number of individual painting markets, though of course the performanceof individual artists and schools within these markets could vary markedly fromthe market as a whole.
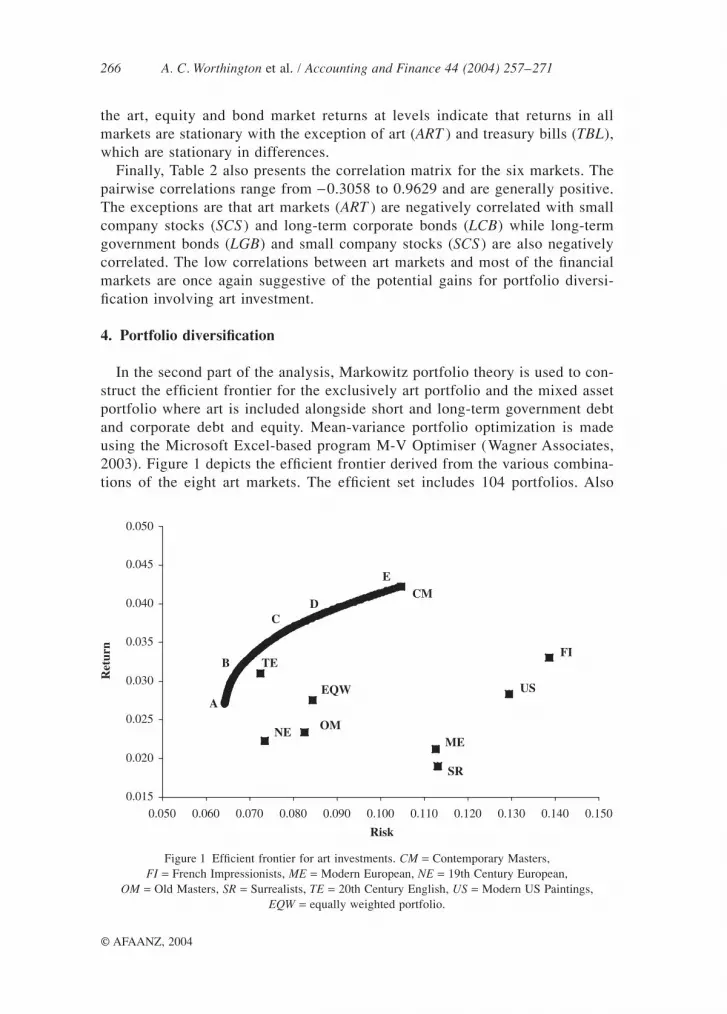
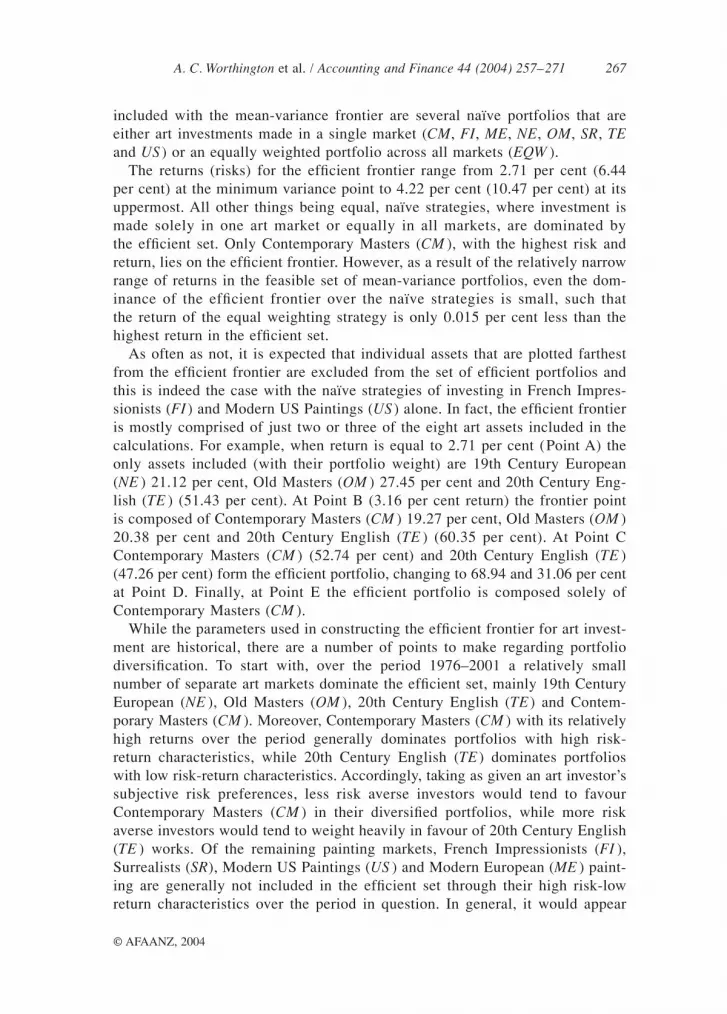
To construct the efficient frontier in Table 2 (see also Figure 2), a general artasset class (ART ) is included alongside short and long-term government debt(TBL and LGB) and corporate debt (LCB) and equity (SCS and LCS). Six port-folios employing a naïve strategy are again plotted, being investment in a singleart, bond or equity market or in an equally weighted portfolio (EQW ), alongwith one hundred and five portfolios that form the efficient frontier. The returns(risks) for the efficient frontier of the art and equity markets vary from 6.87 percent (2.54) to 17.86 per cent (15.29). Importantly, and unlike the experiencewith the exclusively art portfolio, most of the assets in the mixed-asset portfolioare included in some way in the efficient set. For instance, treasury bills (TBL)average 34.54 per cent weighting across all efficient portfolios, small companystocks (SCS) 44.69 per cent, large company stocks (LCS) 10.43 per cent and long-term corporate (LCB) and government (LGB) bonds 5.04 and 5.29 per cent,respectively. Nonetheless, at points A and B (low risk-return) the portfolio isdominated by treasury bills (TBL) and at C, D and E (high risk-return) by smallcompany stocks (SCS). In most cases, the mean-variance efficient portfolios outperform the naïve strategies, and in some the gains are quite substantial.
Figure 2 Efficient frontier for art and financial investments. ART = art market, LCS = large company stocks, SCS = small company stocks, LCB = long-term corporate bonds, LGB = long-term government
bonds, TBL = Treasury bills, EQW = equally weighted portfolio.
A. C. Worthington et al. / Accounting and Finance 44 (2004) 257–271 269
© AFAANZ, 2004
However, in none of the risk-return optimal portfolios that define the efficientfrontier is the art market included. It is clear that even though art markets havevery low and even negative correlations with financial market assets, their risk-return characteristics are so inferior to equity and debt markets that they arenever included in the efficient set. This would suggest, for the most part, thatthe diversification benefits of art in a multi-financial asset portfolio are close tozero. Renneboog and Van Houtte, 2002, p. 349) likewise concluded that ‘theMarkowitz efficient frontier of an investment opportunity set consisting of bothequity and art investment does not shift upwards . . . suggesting that thediversification potential of art in an equity setting is limited’. However, it is thecase that as the number of assets increases the risk of the portfolio collapses tothe individual covariances, such that the creation of a portfolio with much finerdetail than the broad asset classes used here should illustrate at least somediversification benefits.
5. Summary and conclusions
The present paper investigates risk, return and portfolio diversification inmajor painting markets during the period 1976–2001. The art markets examinedare Contemporary Masters, French Impressionists, Modern European, 19thCentury European, Old Masters, Surrealists, 20th Century English and ModernUS paintings. Comparison is also made between art and financial assets, includ-ing US government debt and corporate debt and equity. In common with mostother work in this area, the results indicate that the returns to art investment areless, and the risks much higher, than in more conventional investment markets.However, there is also much variation across the different art markets, withContemporary Masters, 19th Century European, 20th Century English and OldMasters offering superior risk-adjusted returns (at least among painting mar-kets) during the period question.
At first impression, the low correlations of returns among art works andbetween art works and financial assets are suggestive of the benefits of portfoliodiversification. Certainly, gains to portfolio diversification exist in the firstrespect, and this offers potential guidance for portfolios composed primarily ofart held by investors, collectors, dealers and museums, amongst others. How-ever, it is also the case that the risk-return attributes of art are so inferior tofinancial assets such as stocks and bonds during the period in question thatinclusion of these assets for diversification purposes in financial asset portfolioscannot be supported, at least in a portfolio composed of the broad asset classesas used here. Renneboog and Van Houtte (2000, 2002) also concluded thatMarkowitz efficient frontiers showed limited diversification potential for art,though just in the context of equity investment. Of course, the art returns ascalculated do not reflect the fact that a substantial component of the return fromart investment can be derived not from financial returns, rather its intrinsicaesthetic qualities. Equally, they also do not include the many and sizeable
270 A. C. Worthington et al. / Accounting and Finance 44 (2004) 257–271
© AFAANZ, 2004
transaction and holding costs associated with art portfolios, the absence ofwhich may serve to inflate financial returns.
There are many interesting opportunities to expand upon this work by apply-ing some of the well-used tools of financial analysis to art markets. One possib-ility is to follow the work of Ginsburg and Jeanfils, 1995), Chanel (1995) andCzujack et al. (1996) and more closely examine the short and long run relation-ships between art and financial markets. A few studies have already investigatedthe wealth effect link between stock and art markets and concluded that boomsin stock markets create booms in art markets (see, for instance, Goetzmann,1993; Chanel, 1995), However, the exact strength and persistence of this causalrelationship is less well known. Another avenue for research would be toexamine the opportunities for arbitrage that exists between different geographicalmarkets (say, New York, London and Paris). This would permit greater empiricalcertainty on the global efficiency of art markets. Asset-pricing models couldalso be applied to artworks in order to gain a greater awareness of price forma-tion in these markets. A hedonic pricing equation as followed in Renneboog andVan Houtte (2002) is one option; another is Zanola and Locatelli Biey’s (1998)short-run capital asset pricing model approach. Finally, there may be potentialto examine art markets along the lines of the momentum-investing literature.Investor over and under reaction may go far in explaining the sustained bullmarket in art up to 1989 and the bear market in the following 3 years.
References
Anonymous, 2000, New century, old masters, The Economist 356, 84.Art Market Research, 2003. [Online]. URL: http://www.artmarketresearch.com/, Accessed
March 2003.Baumol, W. J., 1986, Unnatural value. Or art investment as a floating crap game, American
Economic Review 76, 10–14.Buelens, N., and V. Ginsburgh, 1993, Revisiting Baumol’s ‘Art as a floating crap game’,
European Economic Review 37, 1351–1371.Candela, G., and A. E. Scorcu, 1997, A price index for art market auctions, Journal of
Cultural Economics 21, 175–196.Chanel, O., 1995, Is art market behaviour predictable? European Economic Review 39,
519–527.Chanel, O., L. A. Gerard-Varet, and V. Ginsburgh, 1994, Prices and returns on paintings: an
exercise on how to price the priceless, Geneva Papers on Risk and Insurance Theory 19,7–21.
Curry, J., 1998, Art as an alternative investment, Trust and Estates 137, 25–26.Czujack, C., R. Flores, and V. Ginsburgh, 1996, On long-run price comovements between
paintings and prints, in: V. A. Ginsburgh and P. M. Menger, ed., Economics of the Arts:Selected Essays (Elsevier North-Holland, Amsterdam), 85–112.
De la Barre, M., S. Docclo, and V. Ginsburgh, 1994, Returns of impressionist, modern andcontemporary European paintings, 1962–91, Annales d’Economie et de Statistique 35,143–181.
Felton, M. V., 1998, Review of: economics of the arts: selected essays, Journal of Eco-nomic Literature 36, 286–287.

A. C. Worthington et al. / Accounting and Finance 44 (2004) 257–271 271
© AFAANZ, 2004
Flores, R. G., V. Ginsburgh, and P. Jeanfils, 1998, Long and short term portfolio choices ofpaintings, Journal of Cultural Economics 23, 193–201.
Frey, B. S., and R. Eichenberger, 1995a, On the return of art investment return analyses,Journal of Cultural Economics 19, 207–220.
Frey, B. S., and R. Eichenberger, 1995b, On the rate of return in the art market: survey andevaluation, European Economic Review 39, 528–537.
Frey, B. S., and W. W. Pommerehne, 1989, Art investment: an empirical inquiry, SouthernEconomic Journal 56, 396–409.
Ginsburg, V., and P. Jeanfils, 1995, Long term comovements in international markets forpaintings, European Economic Review 39, 538–548.
Goetzmann, W. N., 1993, Accounting for taste: art and the finance markets over three cen-turies, American Economic Review 83, 1370–1376.
Guerzoni, G., 1995, Reflections on historical series of art prices: Reitlinger’s data revisited,Journal of Cultural Economics 19, 251–260.
Ibbotson Associates, 2002, Stocks, bonds, bills and inflation, 2001 yearbook (IbbotsonAssociates, Chicago).
Markowitz, H. M., 1952, Portfolio selection, Journal of Finance 2, 184–199.Oleck, J., and A. Dunkin, 1999, The art of collecting art, Business Week, May 17.Peers, A., and N. A. Jeffrey, 1999, Art and money, Wall Street Journal, November 12.Pesando, J. E., 1993, Arts as an investment: the market for modern prints, American Eco-
nomic Review 83, 1075–1089.Pesando, J. E., and P. M. Shum, 1999, The returns to Picasso’s prints and to traditional
financial assets, 1977–96, Journal of Cultural Economics 23, 183–192.Renneboog, L., and T. Van Houtte, 2000, From realism to surrealism: investing in Belgian
art, Cahiers Economiques de Bruxelles 165, 69–106.Renneboog, L., and T. Van Houtte, 2002, The monetary appreciation of paintings: from
realism to Magritte, Cambridge Journal of Economics 26, 331–357.Wagner Associates., 2003. [Online]. URL: http://www.wagner.com, Accessed March 2003.Zanola, R., and M. Locatelli Biey, 1998, Speculative Investment in Painting: A Short Run
Capital Asset Price Index, Working paper (Department of Economics, University of York).