portfolio maagement
TRANSCRIPT

SUMMARY
Working capital management refers to the administration of all
aspects of current assets, namely cash, marketable securities, debtors
and stock (inventories) and current liabilities. The financial manager
must determine levels and composition of current assets. He must see
that right sources are tapped to finance current assets, and that
current liabilities are paid in time. He must see that right sources
are tapped to finance current assets, and that current liabilities are
paid in time.
There are many aspects of working capital management, which
make it an important function of the financial manager:
Time: working capital management requires much of the
financial manager’s time.
Investment: working capital represents a large portion of
the total investments in assets.
Significance: working capital management has great
significance for all firms but it is very critical for small
firms.
Growth: the need for working capital is directly related to
the firm’s growth.
Investment in current assets represents a very significant portion of
the total investment in assets. Working capital management is critical
for all firms. A small firm may not have much investment in fixed
1
assets, but it has to invest to in current assets. Small firms in
India face a severe problem of collecting their debtors.
Companies have their own policies to assess the working capital
of the firm to finance them with the shortage.
Maddi Lakshmaiah Company adopts certain method for financing
their customer’s working capital requirements. There are certain
recommendations from the committees for the companies to finance the
working capital.
It may, thus, be concluded that all precautions should be taken
for the effective and efficient management of working capital. The
finance manager should pay regular attention to the levels of current
assets and the financing of current assets.
2
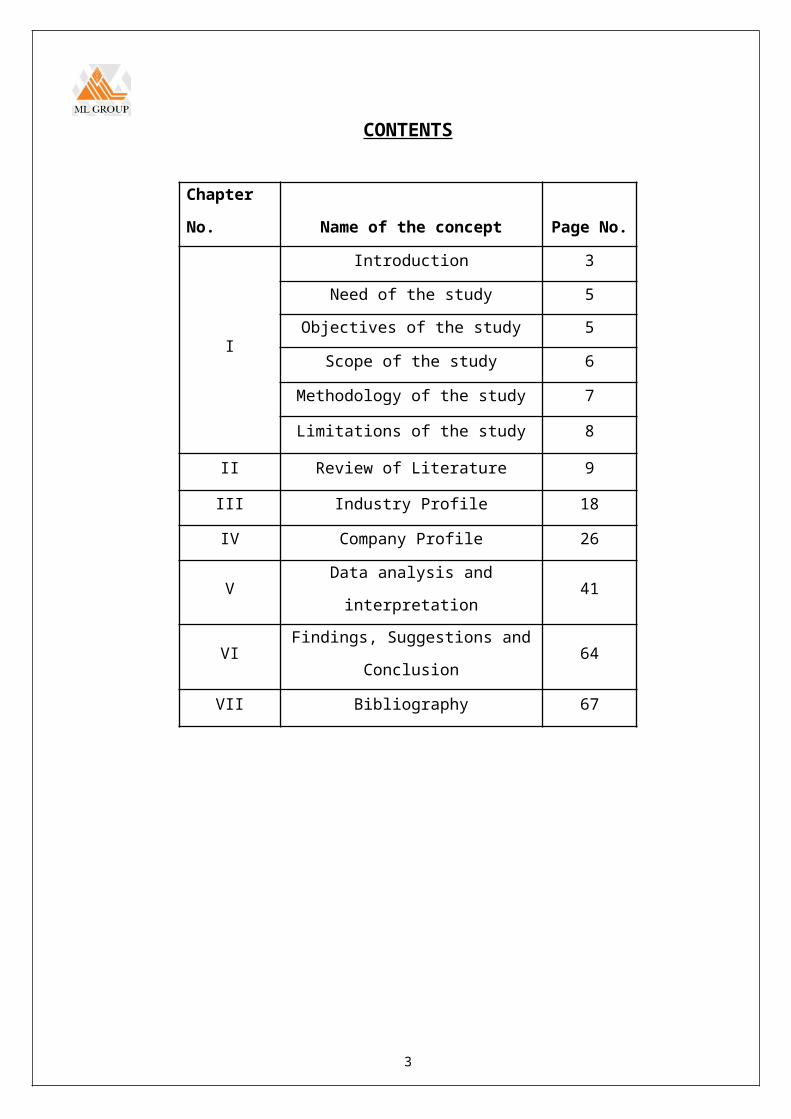
CONTENTS
Chapter
No. Name of the concept Page No.
I
Introduction 3
Need of the study 5
Objectives of the study 5
Scope of the study 6
Methodology of the study 7
Limitations of the study 8
II Review of Literature 9
III Industry Profile 18
IV Company Profile 26
VData analysis and
interpretation41
VIFindings, Suggestions and
Conclusion64
VII Bibliography 67
3

CHAPTER I – INTRODUCTION
4
INTRODUCTION
Working capital may be regarded as the life blood of a business. A
study of working capital is a major importance to internal and
external analysis because of its close relationship with the current
day to day operations of a business.
The goal of a working capital management is to manage
the firm’s public undertaking which has been selected for the study.
The topic selected is “A study on working capital management with
reference to M.L & Company Ltd.,
Working capital has become the most important task of
top executive to this increasing troubleshoot in the environment of
the business. This project work provides a conceptual frame work for
the study of various aspects of working capital in M.L. & Company
Ltd.,
The goal of working capital management is to manage
the firm’s current assets and current liabilities in such a way that a
satisfactory level of working capital is maintained.
The most important activities of a business firm are
finance, Production, marketing and human’s resources. Among them
financial management is the very important. Finance management
involves the application of a general management principal is a
particular financial operation. The management of a working capital is
one of the most important aspects of the firm’s overall finance
management.
5

OBJECTIVES OF THE STUDY
To study the existing system of working capital management in
M.L. & Company Ltd.,
To examine the feasibility of present system of Managing cash,
Debtors and Inventory in M.L. Company Ltd.,
Suggesting a better way if any improving management of working
capital.
To analyze the financial performance of the company with
reference to its working capital components.
SOURCES OF DATA
6
The Data is collected from the following sources.
Six years annual reports of M.L. & Company Ltd., from 2009 to
2014.
Interaction with the related finance department.
Ten years financial data of M.L. & Company Ltd., and
consolidation statements.
Past six year’s operating results and Balance sheet of M.L. &
Company Ltd.,
METHODOLOGY AND TECHINIQUES
The working capital management mechanism is studied in detail.
The various factors of working capital management are studied in
detail.
7
The existing scenario of Debt’s management collection period,
cash system, Inventory. Procurement was studied to correlate
with the working capital management components.
Activities regional operating divisions as well as power sector,
industrial sector and international operational division were
studied in depth to analyze the bills receivable system, sales
and debts.
Considering all these factors, we have designed analysis
techniques for determination of ideal working capital management
in M.L. & Company Ltd.,
SCOPE AND PERIOD OF STUDY
The scope and period of study is restricted to the following:
The scope is limited to the operations of M.L. & Company Ltd.,
The information obtained from the Primary and Secondary sources
were limited to M.L. & Company Ltd.,
The key performance indications were taken from 2009-2014.
The operating results, the Balance sheet was of last six years.
Comparison analysis was done in comparison of its sister units.
8
DESIGN OF STUDY
Working capital management is a vital importance in
an organization like M.L. Company Ltd., which deals with its customers
like State tobacco boards, Private industries and public sectors. Even
though it’s internal resources for diversifications and for expansion
projects supported most of its working capital requirements. They
have designed working capital management by keeping the nature of the
industry and its product lifecycle.
The design of the study is as follows:
Streamlining of Cash inputs.
Forecasting of Material requirements.
Keeping the track of system of centralize cash collections.
Computerized bill passing system and customer payment schedule.
Existing Inventory procurements system for both Indigenous nature
and import consignment.
9
NEED FOR THE STUDY
The Study is continued for the following needs:
To know various procedure and patterns followed for computation
of working capital in the organization
To have a personal exposure by visiting the organization for
many times
To study the role of working capital and application in the
organization
To know more information about working capital management both
theoretically and practically
LIMITATION OF THE STUDY
Some aspects of financial information were not available because
of the confidentiality
Information provided is mostly of secondary nature so the
accuracy of the study is limited
Current year’s information is not available
The period of study is limited to only Eight weeks
10

The data and analysis given in the report is applicable to
similar purpose of study
11

CHAPTER II - REVIEW OF LITERATURE
12
WORKING CAPITAL MANAGEMENT
Working capital management involves the relationship between a
firm’s short-term assets and its short-term liabilities. The goal of
working capital management is to ensure that a firm is able to
continue its operations and this it has sufficient ability to satisfy
both maturing short-term debt and upcoming operational expenses. The
management of working capital involves managing inventories, accounts
receivable and payable and cash to pay current liabilities as they
fall due. This implies a clearly designed risk policy to determine
the required liquidity level.
Why Firms Hold Cash
The finance profession recognizes the three
primary reasons offered by economist John Maynard Keynes to explain
why firms hold cash. The three reasons are for the purpose of
speculation, for the purpose of precaution, and for the purpose of
making transactions. All three of these reasons stem from the need
for companies to possess liquidity.
SPECULATION Economist Keynes described this reason for holding
cash as creating the ability for a firm to take advantage of special
opportunities that if acted upon quickly will favour the firm. An
example of this would be purchasing extra inventory at a discount that
is greater than the carrying costs of holding the inventory.
PRECAUTION
13
Holding cash as a precaution serves as an
emergency fund for a firm. If expected cash inflows are not received
as expected cash held on a precautionary basis could be used to
satisfy short-term obligations that the cash inflow may have been
bench marked for.TRANSACTION Firms are in existence to create products or
provide services. The providing of services and creating of products
results in the need for cash inflows and outflows. Firms hold cash in
order to satisfy the cash inflow and cash outflow needs that they
have.
CONCEPTS OF WORKING CAPITALThere are two concepts of working capital
Gross Working Capital
Net working Capital
In the broad sense, the term working capitalrefers to the gross working capital and represents the amount of funds
invested in current assets. Current assets are those assets, which in
the ordinary course of business can be converted into cash within a
short period of normally one accounting year.
14
In a narrow sense, the term working capital refers
to the net working capital. Net working capital is the excess of
current assets over current liabilities.
Net working capital may be positive or negative.
When the current assets exceed the current liabilities, the working
capital is positive and the negative working capital results when the
current liabilities are more than the current assets. Current
liabilities are those liabilities which are intend to be paid in the
ordinary course of business within a short period or normally one
accounting year out of the current assets or the income of the
business.
The gross working capital concept is financial
or going concern concept whereas net working capital is an accounting
concept of working capital. These two concepts of working capital are
not exclusive; rather both have their own merits.
Gross concept is very suitable to the company
form of organization where there is divorce between ownership,
management and control. The net concept of working capital may be
suitable only for proprietary from of organizations such as sole-
trader or partnership firms. However, it may be made clear that as
15
Working Capital = Current Assets –Current Liabilities

per the general practice net working capital is referred to simply as
working capital.
TYPES OF WORKING CAPITALWorking capital may be classified in two ways
1. On the basis of concept
2. On the basis of time
On the basis of concept, working capital Gross working capital
Net working capital
Based on time, working capital can be further classified
into Permanent or fixed working capital.
Temporary or variable working capital.
PERMANENT WORKING CAPITAL: Permanent or fixed working capital isthe minimum amount, which is required to ensure effective utilization
of fixed facilities and for maintaining the circulation of current
assets. There is always a minimum level of current assets, which is
continuously required by the enterprise to carry out its normal
business operations. For example, every firm has to maintain a
16
minimum levels of raw materials, work-in-process, finished goods and
cash balance. This minimum level of current assets is called fixed
working capital.
TEMPORARY WORKING CAPITAL: Any amount over and above the permanent level
of working capital is temporary, fluctuating or variable working
capital. This portion of the required working capital is needed to
meet fluctuations in demand consequent upon changes in production and
sales as a result of seasonal changes
WORKING CAPITAL CYCLE: Cash flows in a cycle into, around and out of
a business. It is the business’s lifeblood and every manager’s
primary task is to help keep it flowing and to use the cash flow to
generate profits. If a business is operating profitably, then it
should, in theory, generate cash surpluses. If it doesn’t generate
surpluses, the business will eventually run out of cash and expire.
The faster a business expands the more cash
it will need for working capital and investment. The cheapest and
best sources of cash exist as working capital right within business.
Good management of working capital will generate cash will help
improve profits and reduce risks. Bear in mind that the cost of
providing credit customers and holding stocks can represent a
substantial proportion of a firm’s total profits.
There are two elements in the business
cycle that absorb cash – inventory (stocks and work-in-progress) and
17

receivables (debtors owing you money). The main sources of cash are
payables (your creditors) and equity and loans.
Each component of working capital (namely
inventory, receivables and payables) has two dimensions … TIME. and
MONEY. When it comes to managing working capital – TIME IS MONEY. If
you can get money to move faster around the cycle (e.g. collect money
due from debtors more quickly) or reduce the amount of money tied up.
(e.g. reduce inventory levels relative to sales), the business will
generate more cash or it will need to borrow less money to fund
working capital. Consequently, you could reduce the cost of bank
interest or you’ll have additional free money available to support
additional sales growth or investment. Similarly, if you can
negotiate, improved terms with suppliers e.g. get longer credit or an
increased credit limit; you effectively create free finance to help
find future sales.
ADVANTAGES OF ADEQUATE WORKING CAPITAL Working capital is the lifeblood and nerve
center of business. Just as circulation of blood is essential in the
human body for maintaining life, working capital is very essential to
maintain the smooth running of a business. No business can run
successfully without an adequate amount of working capital. The main
advantages of maintaining adequate amount of working capital are as
follows:
Solvency of the business: Adequate working capital helps in maintaining
solvency of the business by providing uninterrupted flow of
production.
18
Goodwill: Sufficient working capital enables abusiness concern to make prompt payments and hence helps in creating
and maintaining goodwill.
Easy loans: A concern hacking adequate working capital,high solvency and good credit standing can arrange loans from banks
and others on easy and favorable terms.
Cash Discounts: Adequate working capital also enables aconcern to avail cash discounts on the purchases and hence it reduces
costs. Regular payment of salaries, wages and other day-to-day
commitments company which has ample working capital can make regular
payment of salaries, wages and other day-to-day commitments which
raises the morale of its employees, increases their efficiency,
reduces wastage’s and costs and enhances production and profits.
Regular supply of raw materials: Sufficient working capital ensures regular
supply of raw materials and continuous production.Ability to face Crisis: Adequate working capital enables a concern to
face business crisis in emergencies such as Ability to face Crisis:
Adequate working capital enables a concern to face business crisis in
19

emergencies such as depression because during such periods, generally,
there is much pressure on working capital.Quick and regular return on Investments: Every Investor wants a quick and regularreturn on investments. Sufficient of working capital enables a
concern to pay quick and regular dividends to its investors, as there
may not be much pressure to plough back profits. This gains the
confidence of its investors and creates a favorable market to raise
additional funds in the future.
High morale: Adequacy of working capital creates anenvironment of security, confidence, and high morale and creates
overall efficiency in a business.
DISADVANTAGES OF EXCESSIVE WORKING CAPITAL Every business concern should have adequate
working capital to run its business operations. It should have
neither redundant or excessive working capital nor inadequate nor
shortage of working capital. Both excessive as well as short working
capital positions are bad for any business.
Excessive working capital means idle funds which earn no profits
for the business and hence the business cannot earn a proper rate
of return on its investments.
When there is redundant working capital, it may lead to
unnecessary purchasing and accumulation of inventories causing
more chances of theft, waste and losses.
20
Excessive working capital implies excessive debtors and defective
credit policy, which may cause higher incidence of bad debts.
It may result into overall inefficiency in the organization.
When there is an excessive working capital relation with the
banks and other financial institutions may not be maintained.
Due to low rate of return on investments the value of shares may
also fall.
DETERMINANTS OF WORKING CAPITAL
Nature or character of business: The working capital requirements of a firm
basically depend upon the nature of its business. Public utility
undertakings like electricity, water and railway need very limited
working capital because they offer cash sales only and supply
services.
Size of business, Scale of operations: The working capital requirements of a concern are
directly influenced by the size of its business which may be measured
in terms of scale of operations. Greater the size of business units,
generally larger will be the requirements of working capital.
Production policy: In certain industries the wide fluctuations may
be due to seasonal variations. The requirements of working capital in
such a case depend upon the production policy.
21

Seasonal variations: In certain industries the raw material maynot be available throughout the year. They have to buy raw materials
in bulk during the season to ensure an uninterrupted flow of
production.
Working capital cycle: In a manufacturing concern the working capital
starts with the purchase of raw materials and ends with realization of
cash from the sales of finished products. The speed with which the
working capital completes one cycle determines the requirements of
working capital. Longer the period of cycle larger is the requirement
of working capital.
Credit policy: The credit policy of a concern in itsdealings with debtors and creditors considerably influence the
requirements of working capital. A concern that purchases its
requirements on credit and sells its products on cash requires less
amount of working capital.
Business cycles: Business cycle refers to alternativeexpansion and contraction in general business activity. In a period
of boom i.e., when the business is prosperous, there is a need for
22
larger amount of working capital due to increase in sales, rise in
prices, optimistic expansion of business, etc.
On the contrary in the times of depression i.e.,
when there is a down swing of the cycle, the business contracts, sales
decline, difficulties are faced in collections from debtors and firms
may have large amount of working capital lying idle.
Rate of growth of Business: The working capital requirements of a concern
increases with the growth and expansion of its business activities.
Although, it is difficult to determine the relationship between the
growth in the volume of business and working capital of a business,
yet it may be concluded that for normal rate of expansion in the
volume of business, we may have retained profits to provide for more
working capital but in fast growing concern, we shall require large
working capital.
Earning capacity and dividend policy: Some firms have more earning capacity than other
due to quality of their products, monopoly conditions etc. such firms
with high earning capacity may generate cash profits from operations
and contribute to their working capital. The dividend policy of a
concern also influences the requirements of its working capital.
Price level changes: Changes in the price level also affectthe working capital requirements. Generally, the rising prices will
require the firm to maintain large amount of working capital as more
funds will be required to maintain the same current assets. The
23
effect of rising prices may be different for different firms. Some
firms may be affected much while some others may not be affected at
all by the rise in prices.
Other factors: Certain other factors such as operatingefficiency, management ability, irregularities of supply, import
policy, asset structure, importance of labor, banking facilities, etc,
also influence the requirements of working capital.
MANAGEMENT OF CASH Cash management is one of the key areasof working capital management. Cash, the most liquid asset is of
vital importance to the daily operations of business firms need cash
to meet the needs of daily transactions, to take advantage of
unexpected investment opportunities. While cash serves these
functions, it is an idle resource with an opportunity cost. The
liquidity provided by the holding cash is at the expense of profits
that could from alternative investment opportunities. Hence the firm
should plan and control cash carefully.
Cash management details with the following
Cash inflows and out flows
Cash flows within the firm
Cash balances held by a firm at a point of time
24
Cash management need strategies to deal with following various
facts of cash.
INVESTMENT OF SURPLUS FUNDS There are sometimes, surplus funds with thecompanies, which are required after sometime. These funds can be
employed in liquid and risk free securities to earn some income.
There are number of avenues where these funds can be invested
Unit 1964 scheme
Ready forwards
Investment in marketable securities
Bald financing
Negotiable certificate of deposit.
25

CHAPTER III - INDUSTRY PROFILE
26
HISTORY:Tobacco is a plant that grows natively in north and South
America. It is in the same family as the potato, pepper and the
poisonous nightshade, a very dead plant. The seed of a tobacco plant
is very small. A ‘1’ ounce sample contains about 300,000 seeds.
It is believed that tobacco began growing in the America about
6,000 B.C. As early as ‘1’ B.C., American Indians began using tobacco
in many different ways, such as in religious and medicinal practices.
Tobacco was believed to be a cure-all, and was used to dress wounds,
as well as a pain killer. Chewing tobacco was believed to relieve the
pain of a toothache.
Soon after, sailors brought tobacco back to Europe, and the plant
was being grown all over Europe. The major reason for tobacco’s
growing popularity in Europe was its supposed healing properties.
Europeans believed that tobacco could cure almost anything, from bad
breath to cancer.
In 1571, a Spanish doctor named Nicolas Monardes wrote a book
about the history of medicinal plants of the new world. In this he
claimed that tobacco could cure 36 health problems.
In 1588, a Virginian named Thomas Harriet promoted smoking
tobacco as a viable way to get one’s daily dose of tobacco.
Unfortunately, he died of nose cancer (because it was popular then to
breathe the smoke out through the nose).
During the 1600’s, tobacco was so popular that it was frequently
used as money! Tobacco was literally “as good as gold!” This was also
a time when some of the dangerous effects of smoking tobacco were
27
being realised by some individuals. In 1610 sir Francis Bacon noted
that trying to quit the bad habit was really hard.
In 1632, 12 years after the mayflower arrived on Plymoth Rock, it
was illegal to smoke publicly in Massachusetts! This had more to do
with moral beliefs of the day, than health concerns about smoking
tobacco.
In 1760, Pierre Lorilliard establishes a company in New York City
to process tobacco, cigar, and snuff. Today, P. Lorillard is the
oldest tobacco company in the U.S.
GROWTH:In 1776, during the American revolutionary war, tobacco helped
finance the revolution by serving as collateral for loans the
Americans borrowed from France! Over the years, more and more
scientists began to understand the chemical in tobacco, as well as the
dangerous health effects smoking produces.
In 1826, the pure form of nicotine was finally discovered. Soon
after, scientists concluded that nicotine was dangerous poison.
In 1836, New Englander Samuel Green stated that tobacco was an
insecticide, a poison, and can kill a man.
In 1847, the famous Phillip Morris was established, selling hand
rolled Turkish cigarettes. Soon after in 1849, J. E. Liggett and
Brother was established in St. Louis, Mo. (the company that has
settled out of the big lawsuits recently). Cigarettes became popular
around this time when soldiers brought it back to England from the
Russian and Turkish soldiers.
Cigarettes in the U.S. were mainly made from scraps left over
after the production of other tobacco products, especially chewing
28
tobacco. Chewing tobacco became quite popular at this time with the
“cowboys” of the American West.
In 1875, R. J. Reynolds Tobacco Company (better known for its
Reynolds wrap aluminium foil) was established to produce chewing
tobacco. It wasn’t until the 1900’s that the cigarette became the
major tobacco product made and sold. Still, in 1901 3.5 billion
cigarettes were sold, while 6 billion cigars were sold. Along with the
popularity of cigarettes however, was a small but growing anti-tobacco
campaign, with some states proposing a total ban on tobacco?
In 1902, the British Phillip Morris set up a New York
headquarters to market its cigarettes, including a now famous Marlboro
brand. The demand for cigarettes grew however, and in 1913 R.J.
Reynolds began to market a cigarette brand called Camel.
WAR & CIGARETTES: A DEADLY COMBO:The cigarette exploded during world war (1914-1918), where
cigarettes were called the “soldier’s smoke”. By 1923, Camel controls
45% of the U.S. market! In 1924, Phillip Morris began to market
Marlboro as a woman’s cigarette that is a “Mild as May”!
To battle this, American Tobacco Company, maker of the lucky
strike brand, began to market its cigarettes to women and gains 38% of
the market. Smoking rates among female teenagers soon tripled during
the years between 1925-1935. In 1939, American Tobacco Company
introduced a new brand, Pall Mall, which allowed American to become
the largest tobacco company in the U.S.
During World War II (1939-1945), cigarette rates were at an all
time high. Cigarettes were included in a soldier’s C-Rations (like
food). Tobacco companies sent millions of cigarettes to the soldiers
29
for free, and when these soldiers came home, the companies had a
steady stream of loyal customers. During the 1950’s, more and more
evidence was surfacing that smoking was linked to lung cancer.
In 1952 P. Lorillard markets its Kent brand with the ’Micronite’
filter, which contained asbestos! This was fortunately discontinued in
1956. In 1953, Dr. Ernst L. Wynders find that putting cigarette tar on
the backs of mice causes tumors! In 1954, RJ Reynolds introduced the
salem brand, which was the first filter-tipped menthol cigarette.
HEALTH HAZARDS REVEALED:In 1964, the Surgeon General’s Report on “Smoking and Health”
came out. This report assisted in allowing the government to regulate
the advertisement and sales of cigarettes. The 1960’s in general was a
time when much of health hazards of smoking were reported.
In 1965, television cigarette ads were taken off the air in Great
Britain. In 1966, those health warnings on cigarette packs began
propping up. In 1968, Bravo, a non-tobacco cigarette brand was
marketed made primarily of Lettuce, it failed miserably!
Because of the negative press about tobacco, the major tobacco
companies began to diversify their products. Phillip Morris began to
buy into the Miller Brewing company, makers of Miller Beer, Miller
Lite, and Red Dog Beer. RJ Reynolds Tobacco Company drops the “Tobacco
Company” in its name, and becomes RJ Reynolds industries.
It also began to buy into other products, such as aluminium.
American Tobacco Company also drops “Tobacco” from its name, becoming
American Brands, Inc. In 1971, television ads for cigarettes are
finally taken off the air in the U.S. cigarettes, however, were still
30
the most heavily advertised product second to automobiles. In 1977,
the first national great American Smoke out took place.
In 1979, the surgeon general reported on the health consequences
of smoking for women. This is in light to the increasing number of
women who were taking up the bad habit. Some attribute is to slick and
campaign of the Virginia Slims brand, “you’ve come a long way baby”.
THE RECENT PAST:During the 1980’s there were many lawsuits filed against the
tobacco industry because of the harmful effects of its products.
Smoking became politically incorrect, with more public places
forbidding smoking. In 1982, the surgeon general reported that second
hand smoke may cause lung cancer. Smoking in pubic areas was soon
restricted, especially at the work place. In 1985, lung cancer became
the No.1 killer of women, beating out breast cancer! Phillip Morris
continued to diversify into other products, buying into General Foods
Corporation and Kraft Inc in 1985. R. Reynolds also diversified,
buying Nabisco and becoming RJR / Nabisco.
In 1987, congress banned smoking on all domestic flights lasting
less than 2 hours. In 1990, smoking is banned, except to Alaska and
Hawaii. In 1990, Ben & Jeery’s (of ice cream fame) boycotts RJR /
Nabisco, and dropped Oreos from its ice cream products.
During the 80’s and 90’s, the tobacco started marketing heavily
in areas outside the U.S., especially developing countries in Asia.
Marlboro is considered the world’s no.1 most valuable brand of any
product with a value over $30 billion! Over this period, there is a
battle between Coca Cola and Marlboro as the No.1 brand in the world.
31

In the recent years there is growing evidence that the tobacco
industry has known all along that cigarettes are harmful, but continue
to market and sell them. There is also evidence that they know that
nicotine was addictive and exploited this hidden knowledge to get
millions of people hooked on this dangerous habit!
Tobacco industry is an agro based industry. Tobacco is cultivated
mainly in the states of Andhra Pradesh and Karnataka most of the
tobacco is used for the manufacture of cigarettes and for exports.
Tobacco is also grown in Tamilnadu, West Bengal, Uttar Pradesh,
Gujarat, Madhya Pradesh, Maharashtra and Orissa also.
However the tobacco grown in these states is of very less quality
and is not used for manufacture of cigarettes and exports. Several
varieties of tobacco such as Virginia flue cured ,Virginia air cured
light soil burley, sun cured Virginia ,nature, chewing. Tobacco,
HDBRG, wrapper tobacco, beedi tobacco and hookah tobacco etc. are
grown in India. Virginia flue cured is a major variety grown in India.
More than 80% of Indian tobacco crop belongs to this variety.
In Virginia flue cured variety the tobacco leaves are separated
from the plant and are cured in tobacco barns. Tobacco barns are
like a furnace where the fumes are used to cure the green leaves of
tobacco plant. tobacco barns appear like small go downs with firing
chambers at the bottom fixed to the walls .the green tobacco leaves
of the plant will be arranged in the form of rows inside the
barns .the temperature inside the barn will be regulated by means of
flow of hot air through the firing chambers .
The tobacco cultivation exports and some other industrial
activities are regulated by central government (ministry of
commerce) through Tobacco board. Tobacco board is headed by I.A.S
32
officer of senior category generally from the central government.
The board consists of several central government officers, state
government officers, political leaders, representatives of farmers
and reputed industrialists. One of the directors of ML group is
always representing the industrialists in the tobacco board.
Tobacco board issues licenses to the farmers who are permitted to
grow tobacco. The licenses regulate the cultivations area the
farmers have to restrict the cultivation to the given area and must
sell the grown tobacco through tobacco board auctions only any
violation is an offence and is punishable.
This is simple technical process by which the green leaf exposed
to hot air at high temperature and cooled slowly over a period of
time. After the curing process, the primary leaf tobacco turns into
lemon yellow color, gold color, brownish yellow color, brown color and
dark brown color. This tobacco is called katcha tobacco leaf and is
ready for sale. The formers pack different colors as a separate grade
which has a separate price in the market.
Tobacco must be sold only through tobacco board auction platforms
under strict rules and regulations. Farmer or buyer is permitted to
transact in tobacco board auction platforms. Central government has
also established several tobacco research institutes for betterment of
quality of tobacco in India. The other varieties of tobacco are not
regulated by tobacco board.
The tobacco purchased from the tobacco board auction platforms
will be graded further wherever required. Grading is a process of
manual separation of one variety of leaf from the other and is done
mainly on the basis if color. Each grade will generally have unique
quality parameters.
33
The graded tobacco is further processed either manually or on
machines; this processing is called DEBUTTING and STRIPPING. Workers
separate the butt of the tobacco leaf from the leaf. This process
can also be done on machines .The machines processing is called
THRESHING.
After stripping/threshing, the tobacco will be further processed
for stabilization of moisture. And this process is called
“REDRYING”. In this process the tobacco first of all will be dried
completely then it will be given steam at the required temperature.
After redrying process the tobacco will be packed in the required
packing say bale packing /case packing etc. The packed tobacco is
ready for export. In India, the first threshing plant which is
working uninterruptedly for the last 25/30 years an imported one by
Maddi Lakshmaiah &co ltd. This was installed at Ganapavaram and the
plant is still running at high efficiency levels in the country with
98% average efficiency level for the last 3 years. There are two
plants owned by ITC which can be compared with this plant in the
country. ITC uses their threshing plants for their own consumption.
Tobacco industry is fetching more than Rs 9000 crores of revenue
to the Central Government. It is providing employment to lakh of
people directly and millions of people indirectly and is also
contributing RS 1000 corers of forex reserves to the country. The
Central Government is announcing several restrictions on
advertisement and consumption of cigarettes in the country.
Encouraging the farmers by providing subsidized fertilizers and by
supporting through tobacco board.
34
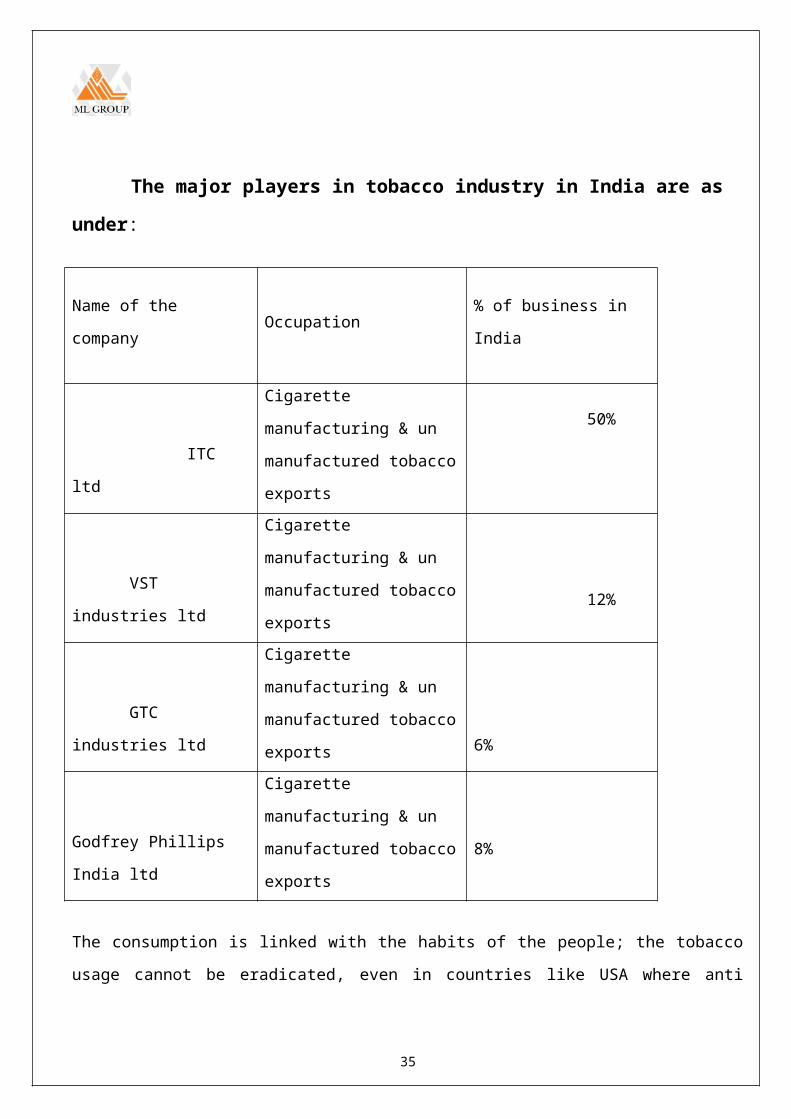
The major players in tobacco industry in India are as
under:
Name of the
companyOccupation
% of business in
India
ITC
ltd
Cigarette
manufacturing & un
manufactured tobacco
exports
50%
VST
industries ltd
Cigarette
manufacturing & un
manufactured tobacco
exports12%
GTC
industries ltd
Cigarette
manufacturing & un
manufactured tobacco
exports
6%
Godfrey Phillips
India ltd
Cigarette
manufacturing & un
manufactured tobacco
exports
8%
The consumption is linked with the habits of the people; the tobacco
usage cannot be eradicated, even in countries like USA where anti
35
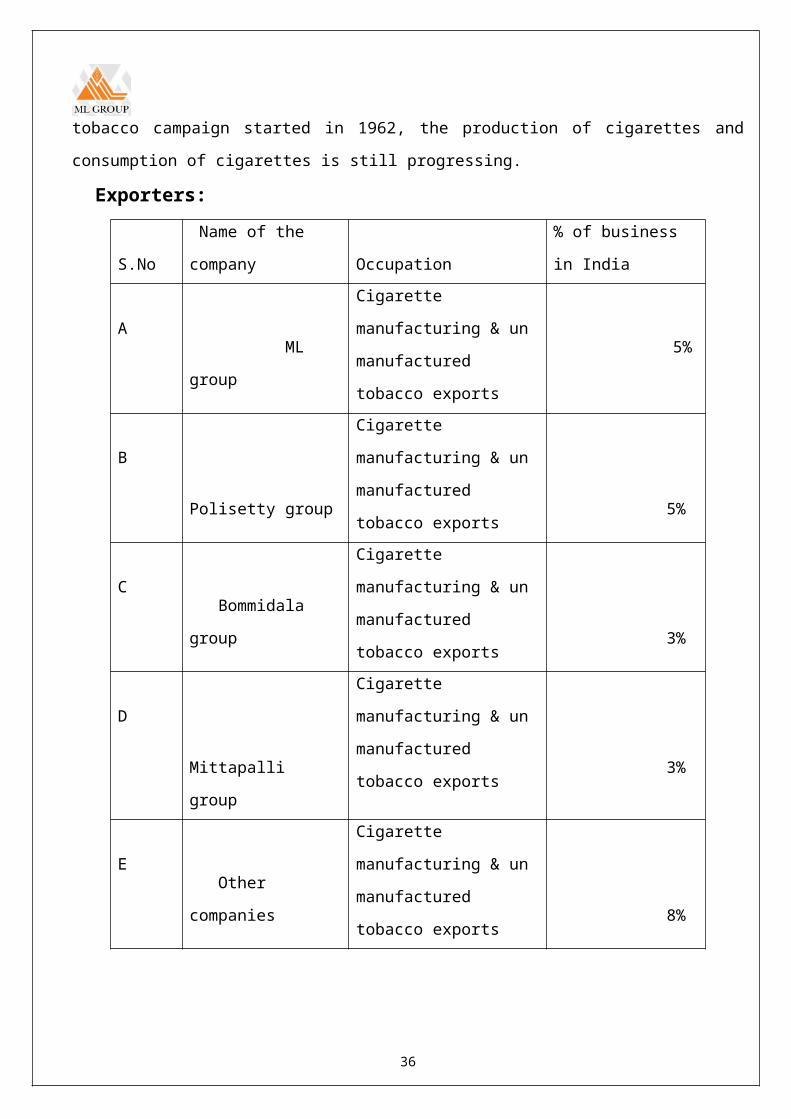
tobacco campaign started in 1962, the production of cigarettes and
consumption of cigarettes is still progressing.
Exporters:
S.No
Name of the
company
Occupation
% of business
in India
A ML
group
Cigarette
manufacturing & un
manufactured
tobacco exports
5%
B
Polisetty group
Cigarette
manufacturing & un
manufactured
tobacco exports5%
C Bommidala
group
Cigarette
manufacturing & un
manufactured
tobacco exports3%
D
Mittapalli
group
Cigarette
manufacturing & un
manufactured
tobacco exports3%
E Other
companies
Cigarette
manufacturing & un
manufactured
tobacco exports8%
36

Our ML company has developed strong relationship with overseas
manufacturing in Europe, Russia and Middle East though there is very
good demand from Russian market. Our company is not exporting much
because of poor economic conditions of the country.
ML Company is now exporting cigarettes to Middle East and U.S.A
by manufacturing the cigarettes on job work basis. The company
foresees a very bright future for this company in tobacco in the
coming years.
ML group is the first tobacco company who exported tobacco to
China and is the first company who imported tobacco also from China.
There was imported tobacco in Indian tobacco history before this and
after till now. The group maintains good relationship with the Chinese
tobacco monopoly.
One of the trade delegates that accompanied our honorable Prime
Minister during his recent visit to China is from ML Company. Three
ambassadors of China have visited our company in the past as our
guests and expressed their satisfaction on our infrastructure
facilities.
Production of different varieties of tobacco in India: VFC Tobacco Traditional/NCOs/My
sore
200 million
VFC Tobacco HDBRG 12 millionISB Tobacco ISB
(Releswaram/Warangal)
10 million
IAS Tobacco 25 million
37

CHAPTER IV - COMPANY PROFILE
38

HISTORY:The highly competitive tobacco market represented tremendous
growth potential to Mr. Maddi Lakshmaiah. Foreseeing the and for
quality Indian tobacco a long term strategy was formulated. Right from
its inception, the company adhered to international standards and made
rapid in roads to global tobacco markets.
A sophisticated threshing plant of international standards was
commissioned in 1976 first in Andhra Pradesh. It created a revolution
in tobacco processing and led to a huge upsurge in demand. This led to
the commissioning of two modern plants with threshers, redryers and
other sophisticated equipment for the processing of quality tobacco.
ML Group has taken its credo of total quality to the furthest,
whether in the quality of process, products or working conditions for
the vast workforce. The foresighted innovation of Sri Maddi Lakshmaiah
has given the group strong edge. The personal involvement of the
directors in all aspects of the business has resulted in high quality
operational parameters.
The company can proudly claim some of the most skilled work force
and a highly efficient management people who have contributed
significantly to the prominent position the company. The company has
earned recognition from apex institutions and is a recognized leader
in tobacco markets the world over.
The quantum growth in ML Co: Spread of investment in infra
structure and diversification into other business.
“ML GROUP” under its umbrella, various companies have an annul
turnover of Rs 1550 million and an asset base of Rs 2000 million. A
real estate development wing was setup to develop and lease commercial
39
properties with working environment that rival the best
internationally.
The information about the establishment of the group which
consists of five concerns as displayed on the preceding pages, let us
have a look on the various concerns of ML Group individually:
ML group of companies (ML group) was founded by Mr.Maddi
Lakshmaiah in 1970. He joined in his family business in 1952 after
completing his engineering degree. The joint family business started
payback in 1943 dealing with tobacco exports, well before India.
ML group of companies (ML group), a pioneer in Indian un
manufactured tobacco industry has been exporting tobacco to all over
the world for the past three decades. It has solidified its
relationship with overseas tobacco merchants& manufactures.
Maddi Lakshmaiah & Co Ltd, was set up at Chilakaluripet, a
village in Andhra Pradesh that produces some of the best tobacco in
the country. Today it has evolved into a diversified, multi products
conglomerate known as ML Group that is recognised world over for its
excellence. The company processes tobacco and another agro based
products that are used both in the country and exported to the most
quality conscious world markets.
An emphasis on total quality and dedication to the interests of
its client’s world wide is a hallmark of ML group. The group is
performing excellently well from the date of its incorporation and
has been exporting large volume of tobacco to Russia, CIS countries,
U.K, Europe, African countries, China, Latin American countries,
Middle East countries, Bangladesh & Nepal etc. The group established
its branches in Russia & European countries and has strong tie up
40
with African and Latin American countries and especially with the
neighbour giant China.
The group is founded by Sri Maddi Lakshmaiah, a mechanical
engineer after 15 years of versatile experience in tobacco industry
in 1970 at Chilakaluripet , Günter dist, A.P .the group has 5 major
concern namely;
Maddi Lakshmaiah & Co Ltd (MLCO)
ML Agro Products (MLAP)
K.S Subbaiah Pillai & co ltd (KSSP)
ML Exports (MLE)
Coromandal Agro Products & Oils Ltd (CAPOL)
Expecting CAPOL which is engaged in edible oils all are engaged
in tobacco industry. MLCO & MLAP have concentrated on processing
activities where as KSSP&MLE are leading exporters and are
recognised by government of India as export house.
Vision: Descriptions of some thing can organization corporate culture,
business technology an activity in the future.
The company is trying to develop world class information
technology building in Bangalore, china and Hyderabad in the
coming 5 years time.
The company is going for sheet tobacco plant in joint venture
with on of the Indian best tobacco cigarette manufacturer.
The company is also contemplating for 100% tobacco joint venture
association with one of the best cigarette manufacturer.
The company exports with second strongest country china, Russia
and Germany.
41
The ambassadors are coming to Maddi Lakshmaiah Company limited in
August.
The ambassadors of South Africa are hold up and the company is
having top joint venture with U.K.
Mission:A mission statement is an enduring statement of purpose that
distinguishes one business from others similar firms. This statement
identifies the scope of firms operations in product and market terms.
M.L & company limited mission is to produce good quality of
tobacco and get number one position in India in producing and
exporting tobacco.
Policies:Policies can be considered a guide to action it is desirable that
persons responsible for implementation of policies use discretion and
judgment in appraising and deciding among alternative courses of
action.
The company has well defined policies for exports the quality
tobacco.
To conduct its operation with honesty integrity and
transpoarency.
Employment policy is formulation and adoption.
This company shall maintain quality leadership by providing
products and services that completely and consistently meet the
agreed.
Requirements of all customs and unsure fitness for use of all
products there by ensuring total confidence to every customer.
42
Employment policy formulation and adoption.
Canteen, cleaning, security maintenance of good industrial
relation.
Future plans:- The company (Maddi Lakshmaiah) for an ECB for 50 million
dollars and development of regular trade and also
infrastructure projects in India.
Maddi Lakshmaiah Company is also working on joint venture basis
with UK based Commodities Company for supply of agri products
to South Asian countries.
The company already entered into joint venture with an US based
company by name CARGIL for the south Indian needs.
They have worked for joint venture arrangements with
Yugoslavian government for their requirement for India.
This for above five million dollars of investment in supply of
5000 tonnes every year.
Achievements / awards:- Maddi Lakshmaiah Company has no particular achievements/ awards.
Maddi Lakshmaiah group (CAPOL Chirala, Prakasam Dist ) got
several achievement awards .
All India Cotton Feed Crushers Association, Mumbai awarded CAPOL
as III highest exporter and II highest domestic seller of cotton
seed extraction for the year 1992-93.
43

CAPOL is the highest exporter and III highest domestic set of
cotton seed extraction for the year 1993-94.
CAPOL is the III highest domestic seller of cotton seed
extraction in the year 1994-95.
CAPOL is the II highest domestic seller of cotton seed extraction
in the year 1995-96.
CAPOL is the II highest domestic seller of cotton seed extraction
in the year 1997-98
CAPOL is the III highest domestic seller of cotton seed
extraction for the year 1999-2000.
CAPOL is the II highest extraction of cotton linter for the year
2000-01.
CAPOL is the III highest exporter of cotton linter and III
highest domestic seller of cotton seed extraction for the year
2001-02.
The company (CAPOL) has been awarded may commendation led by
government of AP for its continuous harmonious relations with its
employees in the years 1994,95,96,97.
Track record:- The company has 30 years of performance.
It never failed in meeting the scheduled repayments of loans with
the bank. Rather it postponed most of the loans with the lenders.
LAND MARKS:- Maddi Lakshmaiah Company was the first Indian company to join
with China to do business.
It was the first company to import tobacco and export tobacco.
44
Ambassadors have already come here and 4th one is coming in this
august.
NEGOTIATIONS:- The company is trying to develop world class information
technology building in Bangalore, Chennai and Hyderabad in the
coming five years time
The company is going for sheet tobacco plant in joint venture
with one of the Indian best tobacco cigarette manufacture.
The company is also contemplating for 100% tobacco joint venture
in association with one of the best cigarette manufacture.
The company exports with the second strongest country china,
Russia and India.
The finance manager is assisted by a team of experienced
management and non management staff who takes care of finance &
accounts activities of the organisation.
The export manager (ML Company) deals all the matters regarding
the exports department and directly reports to the managing
director.
ML group was a multifaceted corporate leader of which the
group consists of five concerns namely.
Maddi Lakshmaiah and Co Ltd - Tobacco threshers, packers &
exporters, real estate &leasing.
ML Agro Products - Tobacco threshers, packers &exporters.
KS Subbaiah Pillai & Co (India) ltd - Tobacco export.
ML Exports. - Exports house.
45
Coromandal Agro Products & Oils ltd. - Bulk producers of oils.
Maddi Lakshmaiah & Co Ltd:-ML & company Limited, the fore runner of all the companies of ML
group, the company enjoys a pre eminent standing in the world of
tobacco, exporting to China, Russia, Western Europe, Africa and
Bangladesh among others.
Supported by a team of experts, technicians, engineering and a
skilled world –force, the company has forged a head setting standards
that have become benchmarks in the industry. Today Chilakaluripet is a
well known name in the global tobacco business in no little measure
due to the pioneering efforts of the intrepid founder, Sri Maddi
Lakshmaiah.
ML AGRO PRODUCTS LTD:-ML agro products ltd was born of a increase in demand for quality
tobacco in both the domestic and foreign markets. Building on the rich
experience of running a profitable operation, a new plant was set up
in 1976 at Martur, Prakasam district.
It is fully self sufficient with modern threshers, lamina
redryers, automatic double ram press, sophisticated quality control
laboratory and mammoth ware houses. It ranks among the largest
threshing units in the country apart from its export commitments.
KS Subbiah Pillai & Co (India) ltd:
46
K.S.S.P & Co Ltd was acquired in 1982 with all its
assets K.S Subbaiah Pillai & Co (India) Ltd is the group with leading
tobacco exporting unit. In a field that is extremely competitive, the
excellent performance of the company is an indicator of the trust that
it enjoys across the globe.
COROMANDAL AGRO PRODUCTS & OILS LTD (CAPOL):CAPOL started in 1976, extracts and refines cotton seed oil.
Today it is a multi products company with equipment to process all
kinds of oil seeds. The plant has a storage capacity of 2100 tones for
different types of oil.
Extreme care is taken to ensure that at every stage in the
process of production right from selection of the raw material to
packing the products, only the best is passed.
Minimum human intervention and rigorous application of quality
control process ensures the final product conform to all appropriate
standards. The by-products, hulls and de-oil cakes are in high demand
in many parts of the world.
ML EXPORTS: ML exports is a totally export oriented unit, with clients in a
variety of markets around the world. The company enjoys a reputation
for excellent delivery schedules and transparent business practice in
global markets.
SHARE HOLDING PATTERN & MANAGEMENT OF GROUP:The group has been successfully improving its business in all of
its activities such as domestic sales, export sales, tobacco
processing & other tobacco development activities, warehousing
47

facilities etc. The group has two tobacco processing plants and one
solvent extraction plant in South India. The group owns around 1,
00,000 sq. mts of warehousing complexes in south India.
INCORPORTATION:ML Company is a limited company (m/s Maddi Lakshmaiah and Company
Limited) which was originally incorporated on 8th day of October 1970
under the name, Maddi Lakshmaiah and Company Private Limited having
passed the necessary special resolution on the 23rd day of March 2002,
in terms of Sec 31(1)/44 of the Companies Act 1956 the name of the
company changed to Maddi Lakshmaiah and Company Limited.
NATURE OF ACTIVITY:o This factory produces good quality tobacco.
o The production capacity per each day is 1 lakh 20 tones
FINANCIAL STRUCTURE;The initial investment of ML Company is 10, 00,000.
TURN OVER OF THE GROUP:The turn over of the group for the financial year 1989-99
standards is at around Rs 800 million. The net earnings after taxes of
the group have been maintained at Rs 150/200 million per annum.
The group has sound assets base having assets spread in most of
the prime centres & ports of South India.
The group has developed excellent infrastructure during the
past 30 years which has been yielding a promising regular income of
more than Rs 225 million every year.
The products of the M.L Company &their main uses:
48
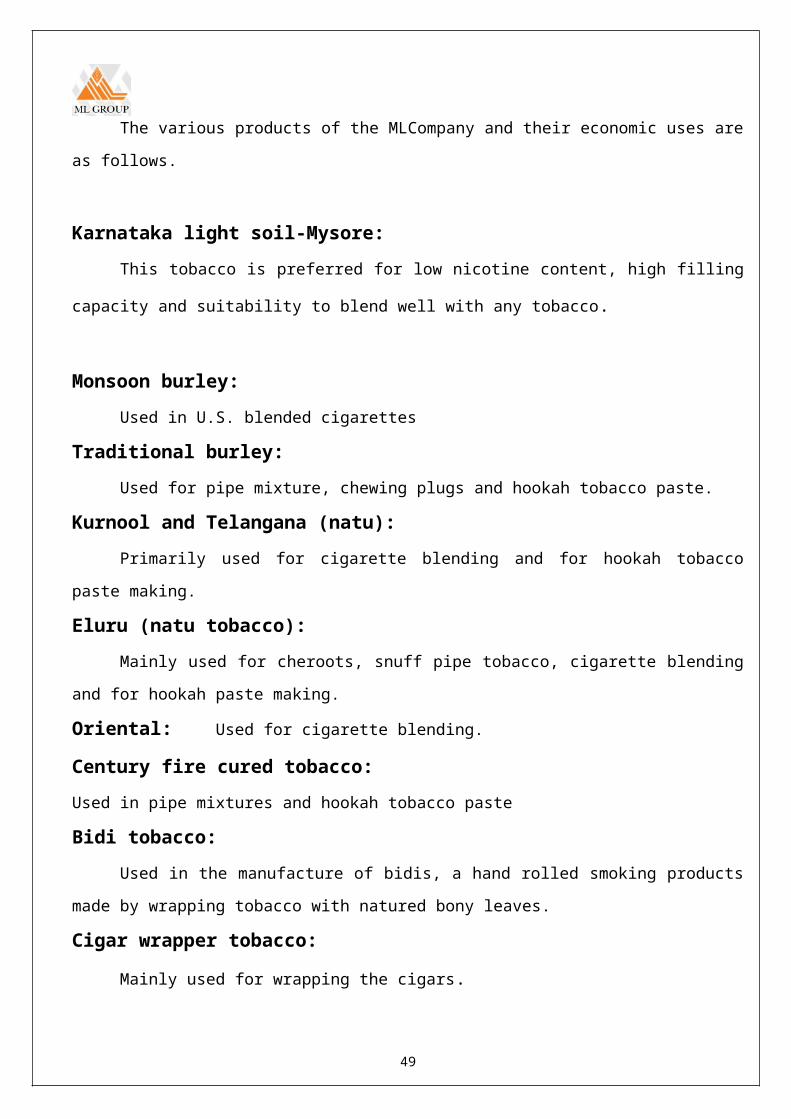
The various products of the MLCompany and their economic uses are
as follows.
Karnataka light soil-Mysore:This tobacco is preferred for low nicotine content, high filling
capacity and suitability to blend well with any tobacco.
Monsoon burley:Used in U.S. blended cigarettes
Traditional burley:Used for pipe mixture, chewing plugs and hookah tobacco paste.
Kurnool and Telangana (natu):Primarily used for cigarette blending and for hookah tobacco
paste making.
Eluru (natu tobacco):Mainly used for cheroots, snuff pipe tobacco, cigarette blending
and for hookah paste making.
Oriental: Used for cigarette blending.
Century fire cured tobacco:Used in pipe mixtures and hookah tobacco paste
Bidi tobacco:Used in the manufacture of bidis, a hand rolled smoking products
made by wrapping tobacco with natured bony leaves.
Cigar wrapper tobacco:
Mainly used for wrapping the cigars.
49
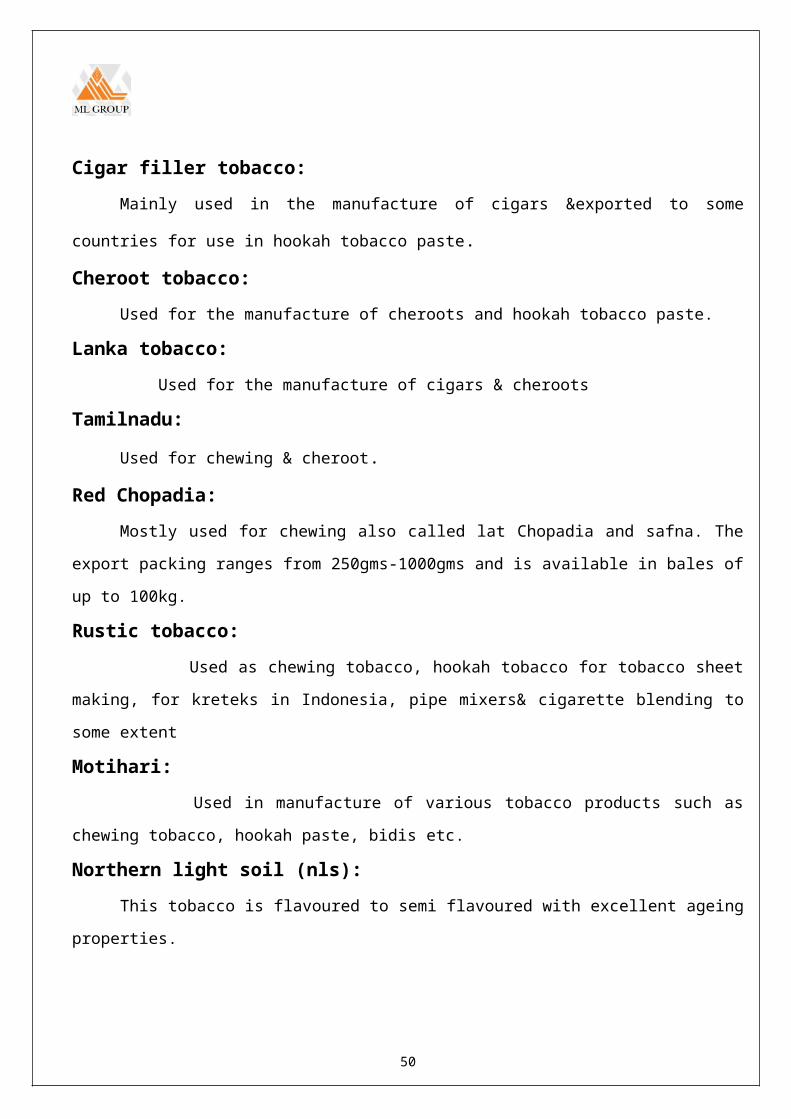
Cigar filler tobacco:Mainly used in the manufacture of cigars &exported to some
countries for use in hookah tobacco paste.
Cheroot tobacco:Used for the manufacture of cheroots and hookah tobacco paste.
Lanka tobacco: Used for the manufacture of cigars & cheroots
Tamilnadu:
Used for chewing & cheroot.
Red Chopadia:Mostly used for chewing also called lat Chopadia and safna. The
export packing ranges from 250gms-1000gms and is available in bales of
up to 100kg.
Rustic tobacco: Used as chewing tobacco, hookah tobacco for tobacco sheet
making, for kreteks in Indonesia, pipe mixers& cigarette blending to
some extent
Motihari: Used in manufacture of various tobacco products such aschewing tobacco, hookah paste, bidis etc.
Northern light soil (nls):This tobacco is flavoured to semi flavoured with excellent ageing
properties.
50
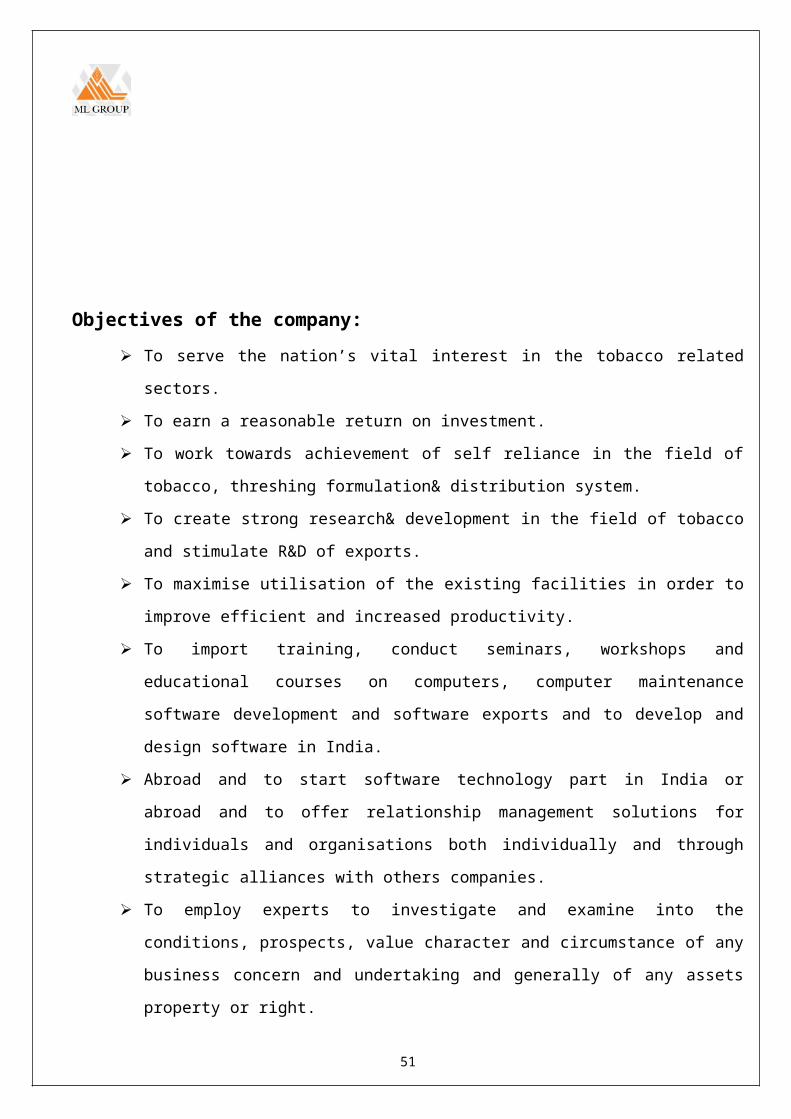
Objectives of the company: To serve the nation’s vital interest in the tobacco related
sectors.
To earn a reasonable return on investment.
To work towards achievement of self reliance in the field of
tobacco, threshing formulation& distribution system.
To create strong research& development in the field of tobacco
and stimulate R&D of exports.
To maximise utilisation of the existing facilities in order to
improve efficient and increased productivity.
To import training, conduct seminars, workshops and
educational courses on computers, computer maintenance
software development and software exports and to develop and
design software in India.
Abroad and to start software technology part in India or
abroad and to offer relationship management solutions for
individuals and organisations both individually and through
strategic alliances with others companies.
To employ experts to investigate and examine into the
conditions, prospects, value character and circumstance of any
business concern and undertaking and generally of any assets
property or right.
51
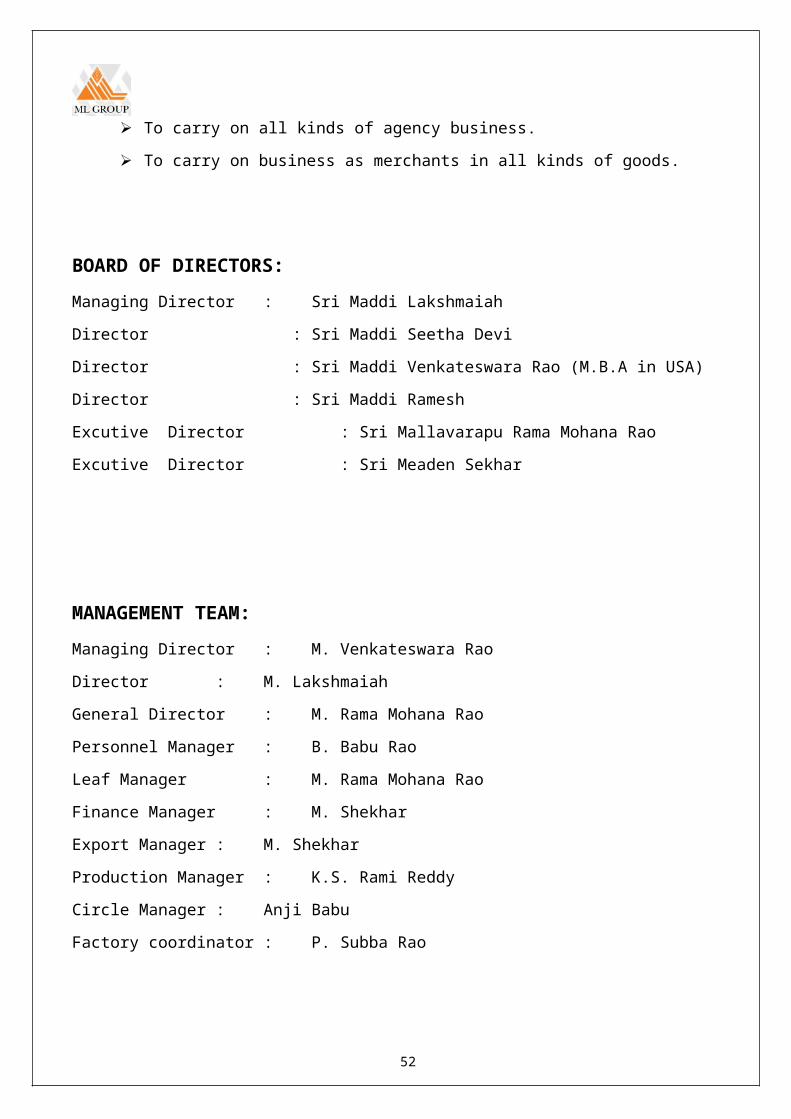
To carry on all kinds of agency business.
To carry on business as merchants in all kinds of goods.
BOARD OF DIRECTORS:Managing Director : Sri Maddi Lakshmaiah
Director : Sri Maddi Seetha Devi
Director : Sri Maddi Venkateswara Rao (M.B.A in USA)
Director : Sri Maddi Ramesh
Excutive Director : Sri Mallavarapu Rama Mohana Rao
Excutive Director : Sri Meaden Sekhar
MANAGEMENT TEAM:Managing Director : M. Venkateswara Rao
Director : M. Lakshmaiah
General Director : M. Rama Mohana Rao
Personnel Manager : B. Babu Rao
Leaf Manager : M. Rama Mohana Rao
Finance Manager : M. Shekhar
Export Manager : M. Shekhar
Production Manager : K.S. Rami Reddy
Circle Manager : Anji Babu
Factory coordinator : P. Subba Rao
52
ORGANIZATION STRUCTURE: The company (ML Company) is under the complete administrative control
of the managing director and he is reported by the director and he is
reported by general manager.
The General Manager (ML Company) is assisted by five
General Managers.
o Manager personnel.
o Manager leaf department.
o Manger finance.
o Manager exports.
o Manager production.
53

54
Managing DirectorDeputy Managing DirectorGeneral Managing DirectorPersonnel ManagerPersonnel officerWelfare officerSafty officerStaffLeaf ManagerFinancial ManagerAccouns OfficerStaffExport ManagerExport OfficerProduction ManagerPlant EngineerAssist. EngineerStaff workers

Responsibilities:The M.L Company managing director M.Venkateswara Rao is under the
complete administrative control of the managing direction and he is
reported by the director and he is reported by general manager
The general manager of ML Company is M. Ram Mohan Rao assisted by
fine general manager i.e., personal manager, leaf manager or
department manager, finance manager, exports manager and production
manager.
The personal department manager B. Babu Rao is headed by who
reports directly to G.M. he looks after the areas of personnel &
administration under there may be a personal offices welfare officer
and a safely officer.
The finance manager M.Shekhar is assisted by a team of
experienced management and non management staff who tekes care of the
finance is accounts activities of the organization.
The export manager M.Shakhar deals all the matters regarding the
export departments and directly reports to managing director.
The production manager K.S.Rami Reddy is headed by the G.M. is
assisted by a plant engineer and staff of the production department.
FUNCTIONS OF THE COMPANY: The group has the following different departments.
PERSONNEL DEPARTMENT:This department deals with the matters of industrial relations,
HRD, welfare activities, labour legislations, recruitment and issues
of wages etc. which is the main department in the organisation.
LEAF DEPARTMENT:
55
This department deals with the matters of tobacco leaf. It looks
after buying tobacco from the farmers for the processing of tobacco.
EXPORT DEPARTMENT:It looks after the export matters of the organisation. This
organisation exports tobacco leaf to China, Bangladesh & UK.
PRODUCTION DEPARTMENT: This department takes care to produce quality tobacco to
customers.
MARKETING DEPARTMENT:This department takes care of marketing the company tobacco to
other countries such as Russia, Europe, Middle East, Bangladesh,
African countries etc. They sell varieties of tobacco in market and maintain goodrelationship with the customers. This is one of the main/important
departments in this organization.
M.L group was concentrating on domestic market.
It ties up with Indian strongest cigarette manufacturing company,
ITC.
Methods:-In ML Company the methods of purchasing tobacco is of various types
i.e.
With tenders raised in market, documents will be filled up by
various companies or merchants can purchase them.
They have good contacts with various merchants (mediators between
manufacture & exporters) in reputed companies at Guntur.
56
Every year they are procuring 1000 tonnes of various varieties
/grades of tobacco.
They usually do their business with the international reputed
companies like.
o Universal
o Dimon
o Standard commercial
The company have some direct contacts with other
countries and they directly ask them at the time of requirement.
Marketing channels:- Normally they send samples/verities.
At the time of requirement, they send samples through couriers.
Participating in exhibitions- every year ML Company was taking
participation in 5-6 exhibitions.
The people who have connection in tobacco visit tobacco stalls
usually, even from Europe, Russia & china.
People like manufactures, dealers, bankers, merchants of tobacco
may visit the tobacco exhibitions.
They display the samples of the company and sell the samples.
Another mode:-The other mode of marketing (channel) is through business
delegations of Tobacco Board of Central government, Ministry of
Commerce. Government. of India, Guntur. The tobacco board usually:
Regularize crop.
Register of foreigners. Fixing the crop size.
57
The board explore marketing possibilities with the help of
exporters.
Another type of business mode is tobacco trade delegations from
different countries (usually every year 5-6 delegations may takes
place).
The tobacco delegations meet exporters and inspect all the
tobacco.
They get the business through reputation.
Customers usually approach them because of the good will of
the company.
Mode of payment:- Exporters normally receive payment from their buyers through
L.C’S (letters of credit).
Some time through advance payment ion terms of D.A&D.P.
o Document against payment
o Document against acceptance.
After customers checkers in the Madras port it may send to
abroad.
Shipment of tobacco is through Chennai port only.
At the same time shipment of tobacco the pay/buyers send payment
to bank in the company’s account.
Credit:- Some parties ask/need some time for payment with in certain
period from the date of bill of payment (up to 180 days).
In India there is a rule that on credit basis, the payment must
be done with in 180 days from the date.
Market range:-
58
ML Company was marketing 7-10 million kilos of tobacco every year.
But the market range is not fixed. The market range depends on supply
&demand forces.
When there is demand, the company produces more.
In the tobacco field, the marketing/market range may be flexible
based on international supply -demand.
FINANCE DEPARTMENT: In this department
Cash payments will be checked by cashiers.
Cash bills and credit bills may be received from trashing factory
and engineering department.
Concerned accounts may be generalized by the accountants and may
be sent to concerned heads.
Credit bills payment will be given in the form of cheque’s or DD’s
CHAPTER V
DATA ANALYSIS & INTERPRETATIONS
59

TABLE No. :1 PROFIT & LOSS ACCOUNTS
SL.No
DESCRIPTIONACTUALS
2008-09 2009-10 20010-11 2011-12 2012-13 2013-14
A Income Sales 13177274
5 96695127 255762587
257993866 280678564 588655944
Threshing & Re-drying Charges
64895977 122756852
121348304
102639420 147816539 126595125
Exchange Fluctuation Gain
……. ……. ……. 14388067 30583174 …….
Profit on Forward Contacts
……. ……. ……. ……. ……. 12986303
Other Income 41145403 54219836 45775357 60206090 143913688 52984780Licence fee &Amenities fromIT Park
……. ……. 65001628 90007058 136987132 145331345
Closing Stock 158548517
177827787
227917226
221660415 315463618 327075443
Total (A) 396362642
451499602
715805102
746894916 1055442716 1253628940
B Expenditure
Opening Stock 124793176
158548517
177827787
227917226 221660415 315463618
Purchases 155880478
111121750
280314175
211640666 336888367 441026464
Manufacturing& TradingExpenses
47914280 74069521 92767953 100518972 85887573 97948079
AdministrativeExp. 20353905 25796364 32312207 34106300 42886670 46204417
SellingExpenses 1073226 1676574 2533525 1045901 2069214 3941191
Rent onBuilding &Machinery
4608518 3762398 8217482 5450732 6928277 6692952
Repairs toBuilding 2449847 6772217 8774221 13061646 17310485 38314867
Interest &Bank Charges 14233479 34469107 40357291 49132743 36690054 46543858
60
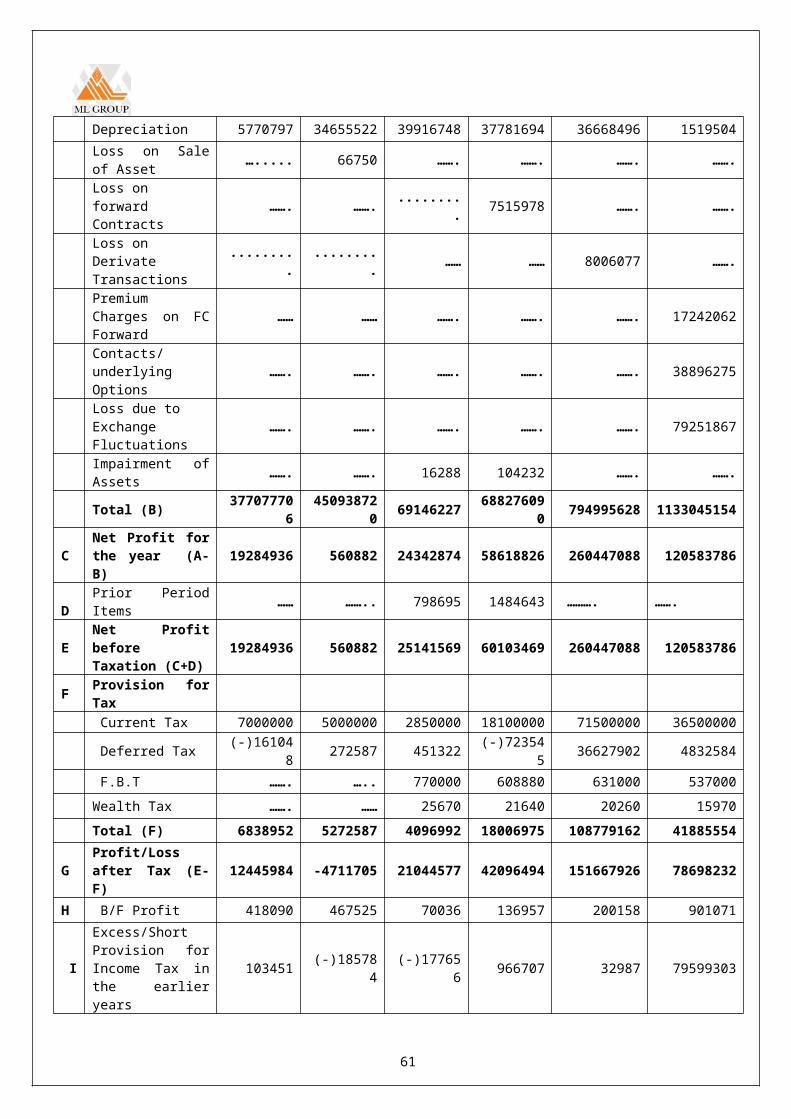
Depreciation 5770797 34655522 39916748 37781694 36668496 1519504Loss on Saleof Asset …..... 66750 ……. ……. ……. …….
Loss on forward Contracts
……. ……. ......... 7515978 ……. …….
Loss on Derivate Transactions
.........
......... …… …… 8006077 …….
PremiumCharges on FCForward
…… …… ……. ……. ……. 17242062
Contacts/underlyingOptions
……. ……. ……. ……. ……. 38896275
Loss due to ExchangeFluctuations
……. ……. ……. ……. ……. 79251867
Impairment ofAssets ……. ……. 16288 104232 ……. …….
Total (B) 377077706
450938720 69146227 68827609
0 794995628 1133045154
CNet Profit forthe year (A-B)
19284936 560882 24342874 58618826 260447088 120583786
DPrior PeriodItems …… …….. 798695 1484643 ………. …….
ENet ProfitbeforeTaxation (C+D)
19284936 560882 25141569 60103469 260447088 120583786
F Provision forTax Current Tax 7000000 5000000 2850000 18100000 71500000 36500000
Deferred Tax (-)161048 272587 451322 (-)72354
5 36627902 4832584
F.B.T ……. ….. 770000 608880 631000 537000Wealth Tax ……. …… 25670 21640 20260 15970Total (F) 6838952 5272587 4096992 18006975 108779162 41885554
GProfit/Lossafter Tax (E-F)
12445984 -4711705 21044577 42096494 151667926 78698232
H B/F Profit 418090 467525 70036 136957 200158 901071
I
Excess/ShortProvision forIncome Tax inthe earlieryears
103451 (-)185784
(-)177656 966707 32987 79599303
61

JTransferred toGeneralReserve
12500000 ……. 20800000 43000000 151000000 79000000
KTransferred from General Reserve
…… 4500000 ……. …… ….. ……
L
Balance ProfitCarried toBalance Sheet(G+H+I-J+K)
467525 70036 136957 200158 901071 599303
62
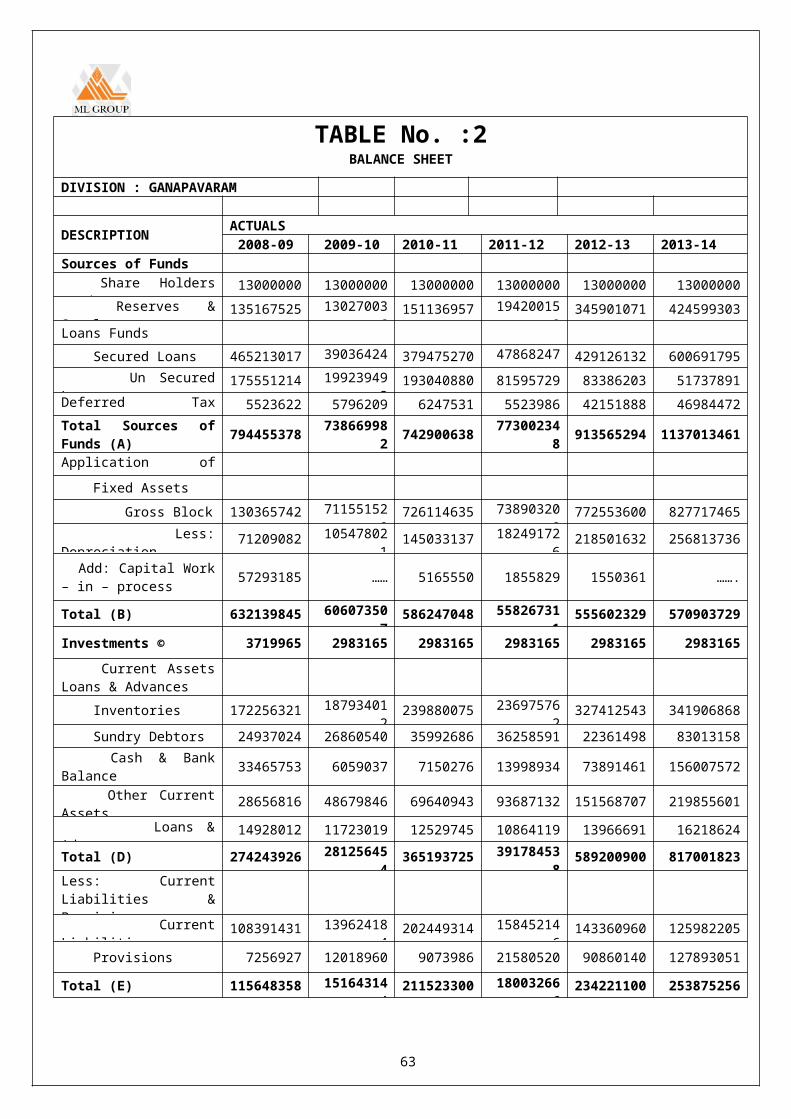
TABLE No. :2BALANCE SHEET
DIVISION : GANAPAVARAM
DESCRIPTION ACTUALS2008-09 2009-10 2010-11 2011-12 2012-13 2013-14
Sources of Funds Share HoldersFunds
13000000 13000000 13000000 13000000 13000000 13000000 Reserves &Surplus
135167525 130270036
151136957 194200158
345901071 424599303Loans Funds Secured Loans 465213017 39036424
4379475270 47868247
5429126132 600691795
Un SecuredLoans
175551214 199239493
193040880 81595729 83386203 51737891Deferred TaxLiability
5523622 5796209 6247531 5523986 42151888 46984472Total Sources ofFunds (A) 794455378 73866998
2 742900638 773002348 913565294 1137013461
Application ofFunds Fixed Assets Gross Block 130365742 71155152
8726114635 73890320
8772553600 827717465
Less:Depreciation
71209082 105478021
145033137 182491726
218501632 256813736
Add: Capital Work– in – process 57293185 …… 5165550 1855829 1550361 …….
Total (B) 632139845 606073507
586247048 558267311
555602329 570903729
Investments © 3719965 2983165 2983165 2983165 2983165 2983165 Current AssetsLoans & Advances Inventories 172256321 18793401
2239880075 23697576
2327412543 341906868
Sundry Debtors 24937024 26860540 35992686 36258591 22361498 83013158 Cash & BankBalance 33465753 6059037 7150276 13998934 73891461 156007572
Other CurrentAssets
28656816 48679846 69640943 93687132 151568707 219855601 Loans &Advances
14928012 11723019 12529745 10864119 13966691 16218624
Total (D) 274243926 281256454
365193725 391784538
589200900 817001823Less: CurrentLiabilities &Provisions CurrentLiabilities
108391431 139624184
202449314 158452146
143360960 125982205
Provisions 7256927 12018960 9073986 21580520 90860140 127893051
Total (E) 115648358 151643144
211523300 180032666
234221100 253875256
63

Total Applicationof Funds (B+C+D-E) 794455378 73866998
2 742900638 773002348 913565294 1137013461
64
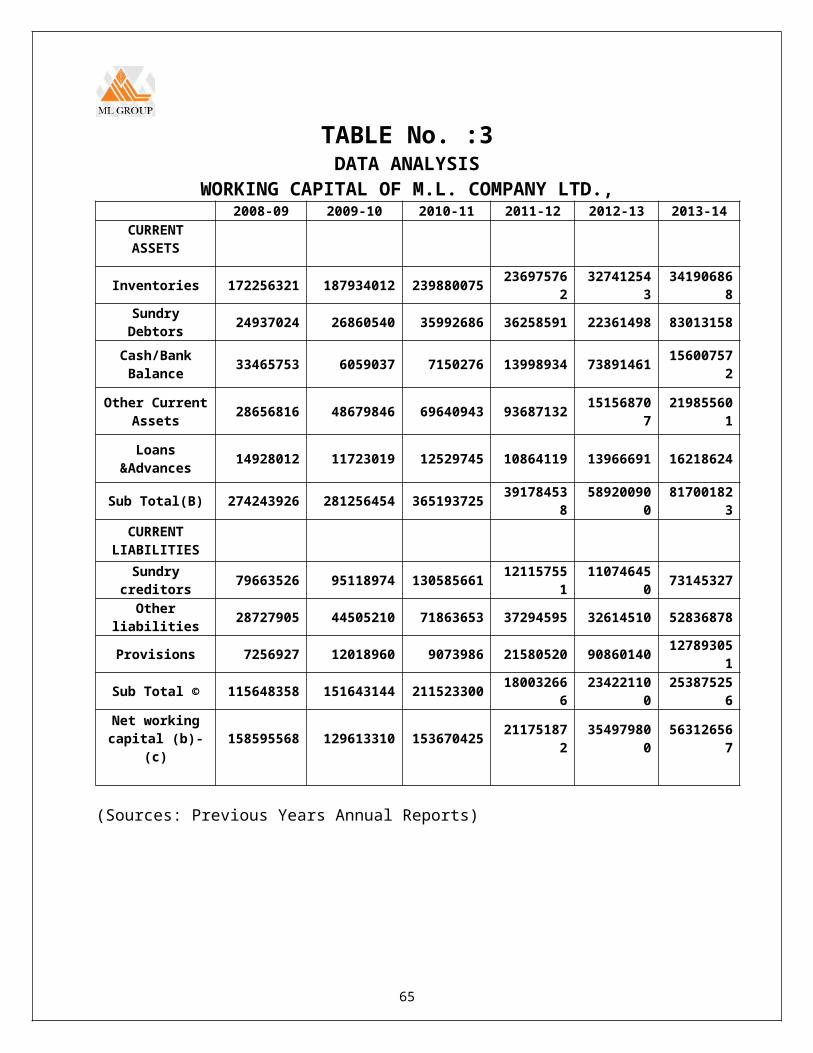
TABLE No. :3DATA ANALYSIS
WORKING CAPITAL OF M.L. COMPANY LTD.,2008-09 2009-10 2010-11 2011-12 2012-13 2013-14
CURRENTASSETS
Inventories 172256321 187934012 239880075 236975762
327412543
341906868
SundryDebtors 24937024 26860540 35992686 36258591 22361498 83013158
Cash/BankBalance 33465753 6059037 7150276 13998934 73891461 15600757
2
Other CurrentAssets 28656816 48679846 69640943 93687132 15156870
721985560
1
Loans&Advances 14928012 11723019 12529745 10864119 13966691 16218624
Sub Total(B) 274243926 281256454 365193725 391784538
589200900
817001823
CURRENTLIABILITIES
Sundrycreditors 79663526 95118974 130585661 12115755
111074645
0 73145327
Otherliabilities 28727905 44505210 71863653 37294595 32614510 52836878
Provisions 7256927 12018960 9073986 21580520 90860140 127893051
Sub Total © 115648358 151643144 211523300 180032666
234221100
253875256
Net workingcapital (b)-
(c)158595568 129613310 153670425 21175187
235497980
056312656
7
(Sources: Previous Years Annual Reports)
65

RATIO ANALYSISTABLE No. : 4CURRENT RATIO
Year Currentassets
Currentliabilities Ratio
2008-09 274243926 115648358 2.37
2009-10 281256454 151643144 1.86
2010-11 365193725 211523300 1.73
2011-12 391784538 180032666 2.18
2012-13 589200900 234221100 2.52
2013-14 817001823 253875256 3.22
(Sources: Previous years Annual Reports)
66
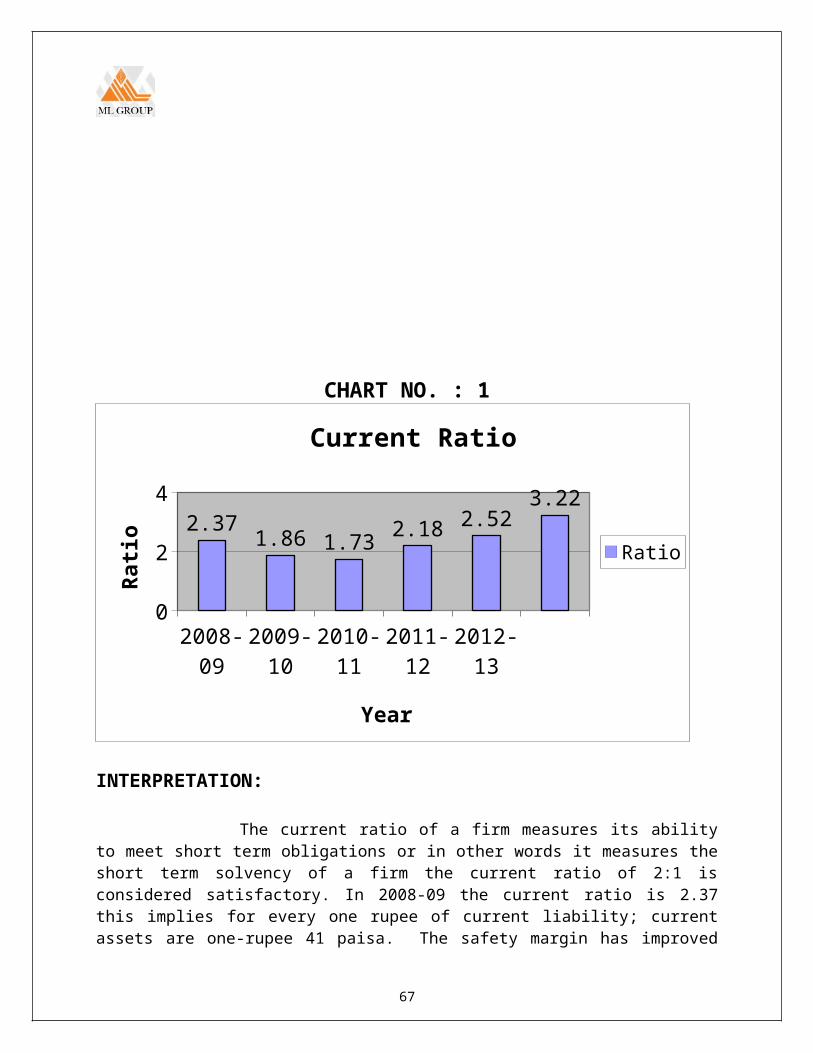
CHART NO. : 1
2008-09
2009-10
2010-11
2011-12
2012-13
0
2
42.37 1.86 1.73 2.18 2.52
3.22
Current Ratio
Ratio
Year
Rati
o
INTERPRETATION:
The current ratio of a firm measures its abilityto meet short term obligations or in other words it measures theshort term solvency of a firm the current ratio of 2:1 isconsidered satisfactory. In 2008-09 the current ratio is 2.37this implies for every one rupee of current liability; currentassets are one-rupee 41 paisa. The safety margin has improved
67
over the previous years. In 2009-10 the current ratio decreedover 2008; the current ratio is less than the standard i.e 1.86this implies that for every one rupee of current liability and isless than the previous year
In 2010-11 the current ratio is less than thestandard i.e 1.73; this implies that for every one rupee ofcurrent liability and is less than the previous year. In 2011-12the current ratio is more than the standard i.e 2.18; thisimplies that for every one rupee of current liability and is morethan the previous year. It is a good sing of the company that itis more then the safe margin of solvency.
It is a good sign of the company in 2012-13 thecurrent ratio is more than the standard i.e 2.52; this impliesthat for every one rupee of current liability and is more thanthe previous year. It is a good sign of the company in 2013-14the current ratio is more than the standard i.e 3.22; thisimplies that for every one rupee of current liability and is morethan the previous year it is a good sing of the company that itis more then the safe margin of solvency.
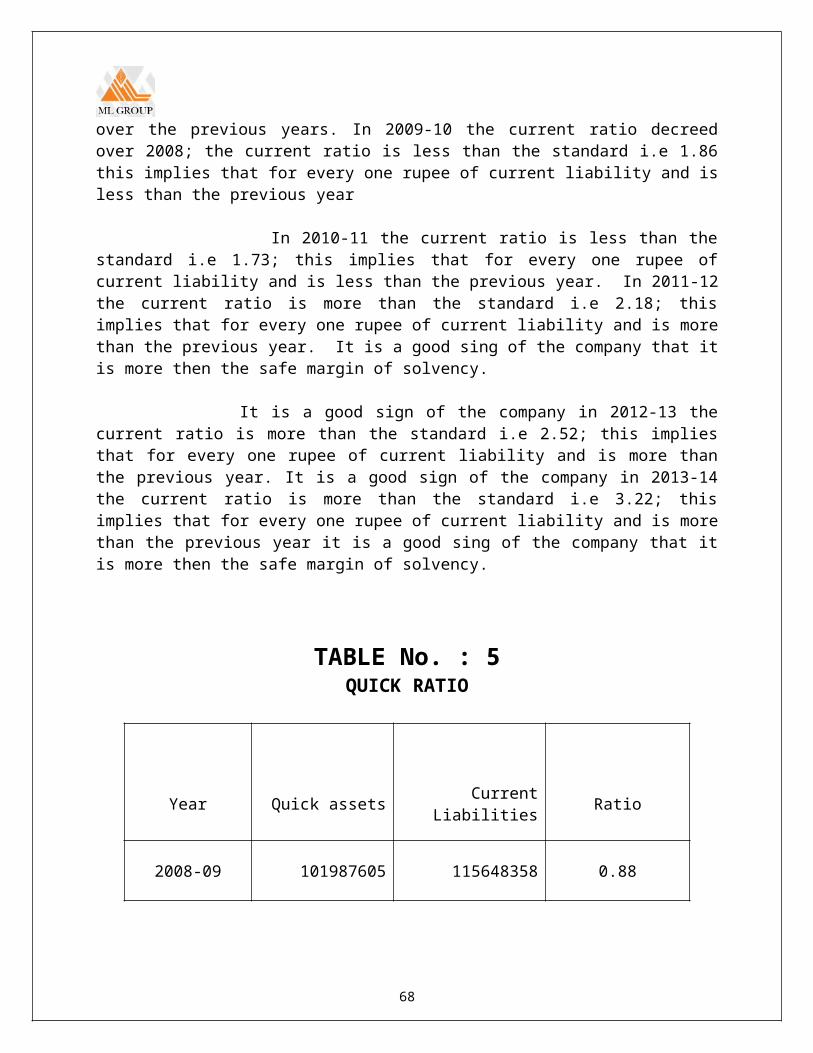
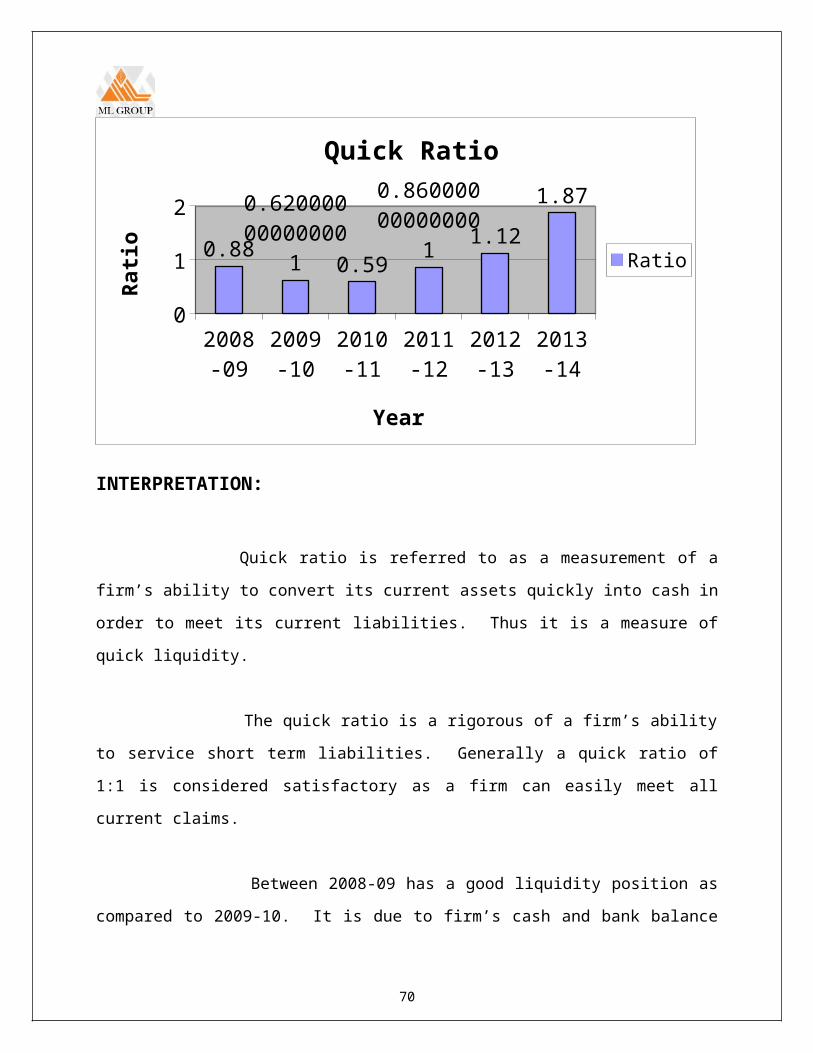
TABLE No. : 5QUICK RATIO
Year Quick assets CurrentLiabilities Ratio
2008-09 101987605 115648358 0.88
68
2009-10 93322442 151643144 0.62
2010-11 125313650 211523300 0.59
2011-12 154808776 180032666 0.86
2012-13 261788357 234221100 1.12
2013-14 475094955 253875256 1.87
(Sources : Previous Years Annual Reports)
CHART NO. : 2
69
2008-09
2009-10
2010-11
2011-12
2012-13
2013-14
0
1
20.88
0.62000000000000
1 0.59
0.86000000000000
1 1.121.87
Quick Ratio
Ratio
Year
Rati
o
INTERPRETATION:
Quick ratio is referred to as a measurement of a
firm’s ability to convert its current assets quickly into cash in
order to meet its current liabilities. Thus it is a measure of
quick liquidity.
The quick ratio is a rigorous of a firm’s ability
to service short term liabilities. Generally a quick ratio of
1:1 is considered satisfactory as a firm can easily meet all
current claims.
Between 2008-09 has a good liquidity position as
compared to 2009-10. It is due to firm’s cash and bank balance
70

and good receivables management. In 2009-10, company allowed
credit sales in order to expand its sales volume and also the
purchase of the inventory is more as compared to previous year.
It is effect fell on successive year. In 2010-11 the liquidity
position is decreased when compared to 2008-00. In 2011-12 the
liquidity position is increased when compared to 2010-11. In
2012-13, and 2013-14 the quick ratio of the company is
satisfactory i.e. 1.1 which is nearer to the standard.
TURNOVER RATIOTABLE No. : 6
INVENTORY TURNOVER RATIO
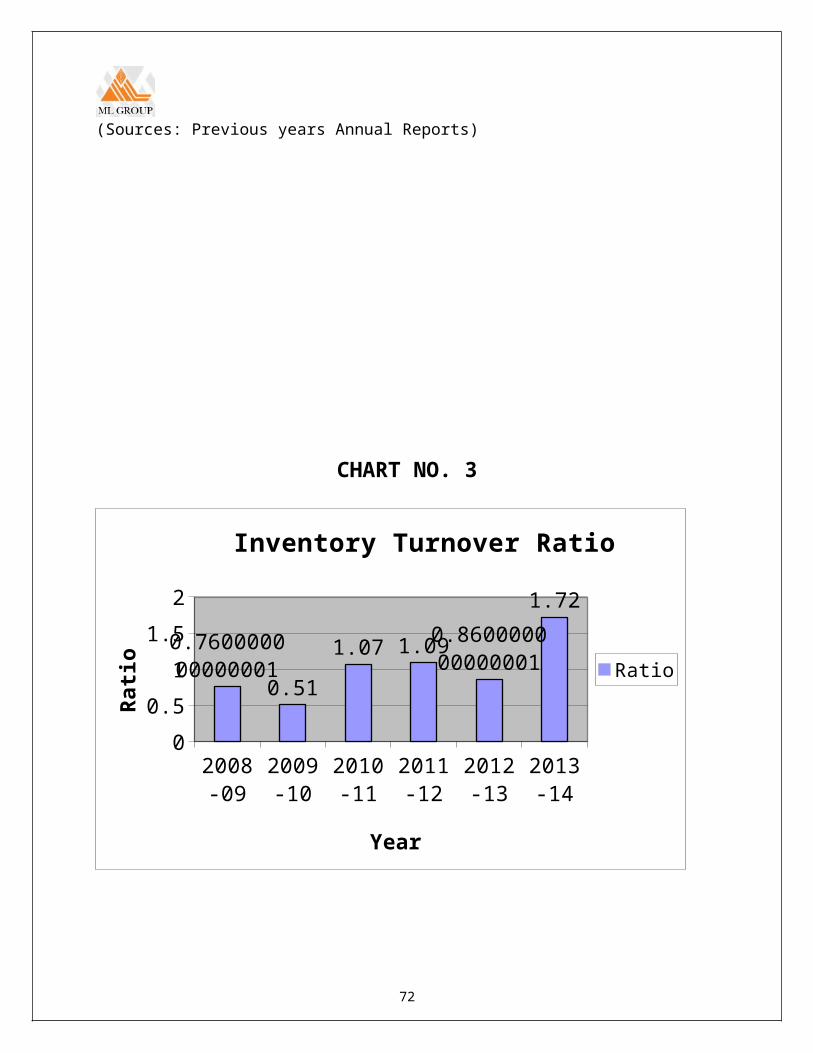
Year Turnover Inventory Ratio
2008-09 131772745 172256321 0.76
2009-10 96695127 187934012 0.51
2010-11 255762587 239880075 1.07
2011-12 257993866 236975762 1.09
2012-13 280678564 327412543 0.86
2013-14 588655944 341906868 1.72
71
(Sources: Previous years Annual Reports)
CHART NO. 3
2008-09
2009-10
2010-11
2011-12
2012-13
2013-14
00.5
11.5
2
0.760000000000001
0.511.07 1.090.860000000000001
1.72
Inventory Turnover Ratio
Ratio
Year
Rati
o
72
INTERPRETATION:
The inventory turnover ratio measures how quickly the
inventory is sold. It is a test of efficient inventory
management. In general, a high inventory is better than a low
ratio. A high ratio implies good inventory management.
In 2014 stock are converted into liquid more fatly when
compared to the successive years 2008, 2009, 2010, 2011, 2012,
2013. It shows effective inventory management. In the year
2008-09 there has been decreased in the inventory turnover ratio.
In these year inventory has not been told sold fast. In 2012 the
inventory turnover ratio is high when compared to 2010-11. Here
the inventory value is reduced in 2008-09 inventory turnover
ratio decreased when compared of 2009-10. In 2013-14 the company
maintain high inventory turnover ratio.
TABLE No. : 7
WORKING CAPITAL TURNOVER RATIO
Year TurnoverWorking
CapitalRatio
73

2008-09 131772745 158595568 0.83
2009-10 96695127 129613310 0.75
2010-11 255762587 153670425 1.66
2011-12 257993866 211751872 1.22
2012-13 280678564 354979800 0.79
2013-14 588655944 563126567 1.05
(Sources: Pervious Years Annual Report)
CHART NO. 4
74
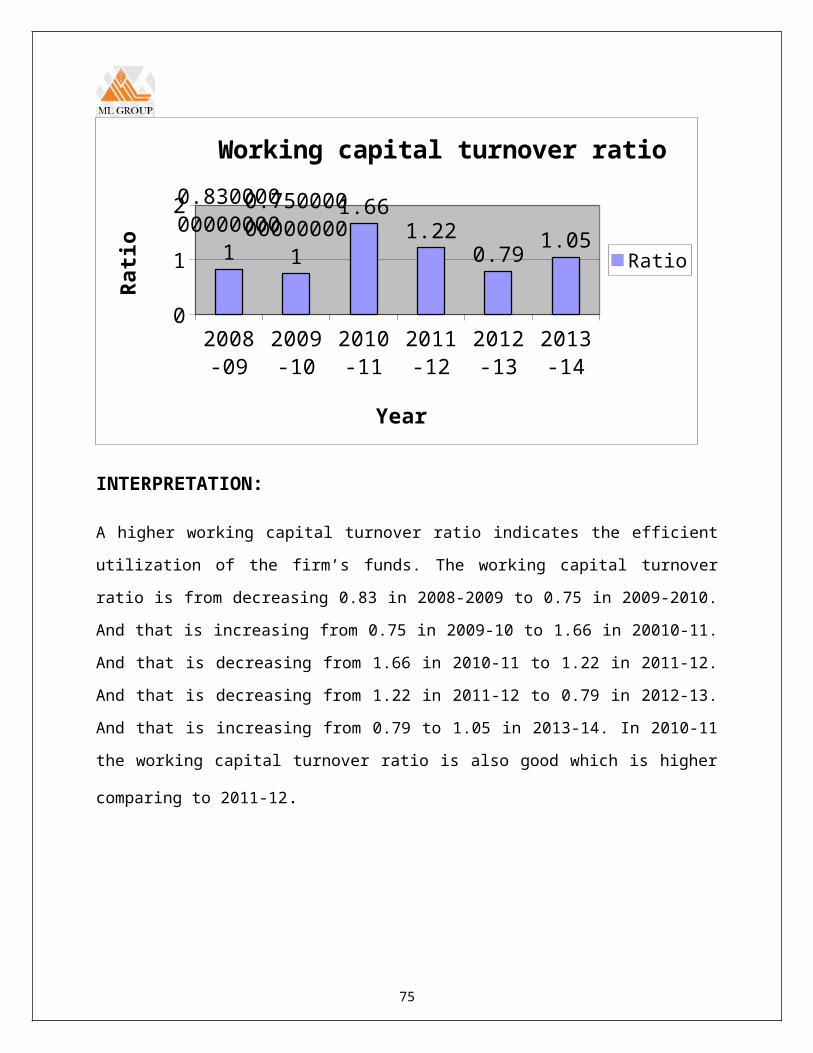
2008-09
2009-10
2010-11
2011-12
2012-13
2013-14
0
1
20.83000000000000
1
0.75000000000000
1
1.661.22
0.79 1.05
Working capital turnover ratio
Ratio
Year
Rati
o
INTERPRETATION:
A higher working capital turnover ratio indicates the efficient
utilization of the firm’s funds. The working capital turnover
ratio is from decreasing 0.83 in 2008-2009 to 0.75 in 2009-2010.
And that is increasing from 0.75 in 2009-10 to 1.66 in 20010-11.
And that is decreasing from 1.66 in 2010-11 to 1.22 in 2011-12.
And that is decreasing from 1.22 in 2011-12 to 0.79 in 2012-13.
And that is increasing from 0.79 to 1.05 in 2013-14. In 2010-11
the working capital turnover ratio is also good which is higher
comparing to 2011-12.
75

TABLE No. : 8
CURRENT ASSETS TURNOVER RATIO
Year Turnover Current Assets Ratio
2008-09 131772745 274243926 0.48
2009-10 96695127 281256454 0.34
2010-11 255762587 365193725 0.70
2011-12 257993866 391784538 0.66
2012-13 280678564 589200900 0.48
2013-14 588655944 817001823 0.72
76
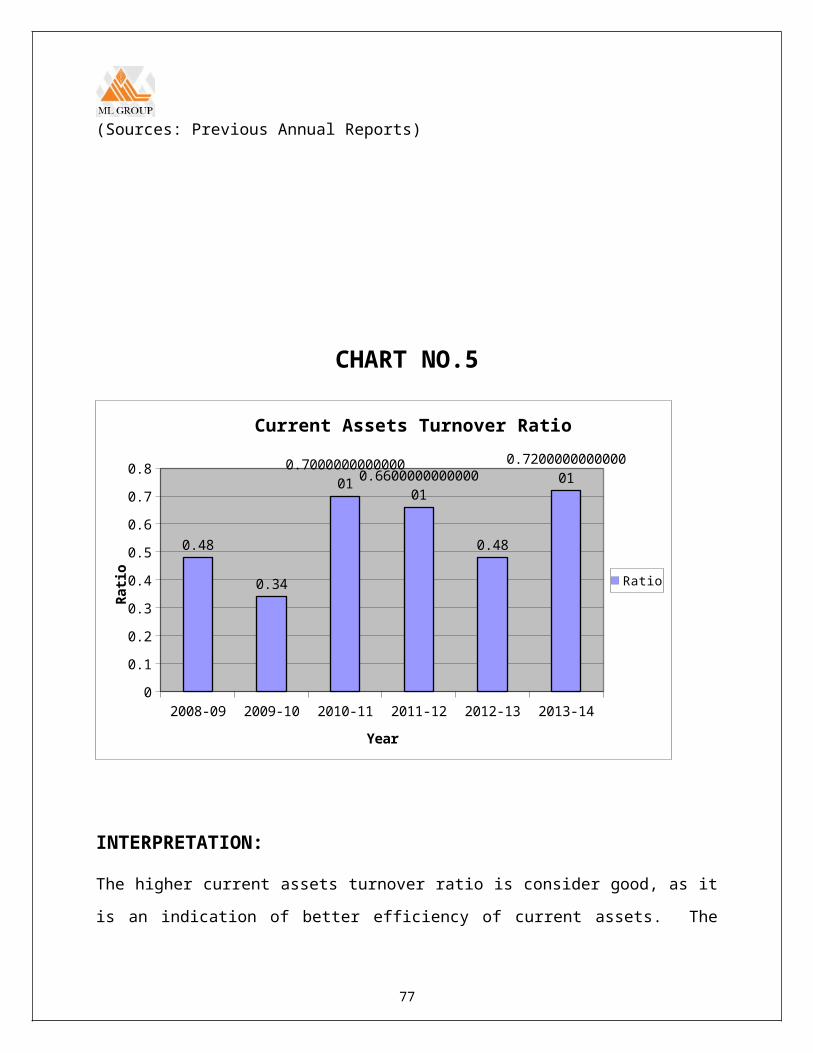
(Sources: Previous Annual Reports)
CHART NO.5
2008-09 2009-10 2010-11 2011-12 2012-13 2013-140
0.10.20.30.40.50.60.70.8
0.48
0.34
0.700000000000001 0.6600000000000
01
0.48
0.720000000000001
Current Assets Turnover Ratio
Ratio
Year
Ratio
INTERPRETATION:
The higher current assets turnover ratio is consider good, as it
is an indication of better efficiency of current assets. The
77
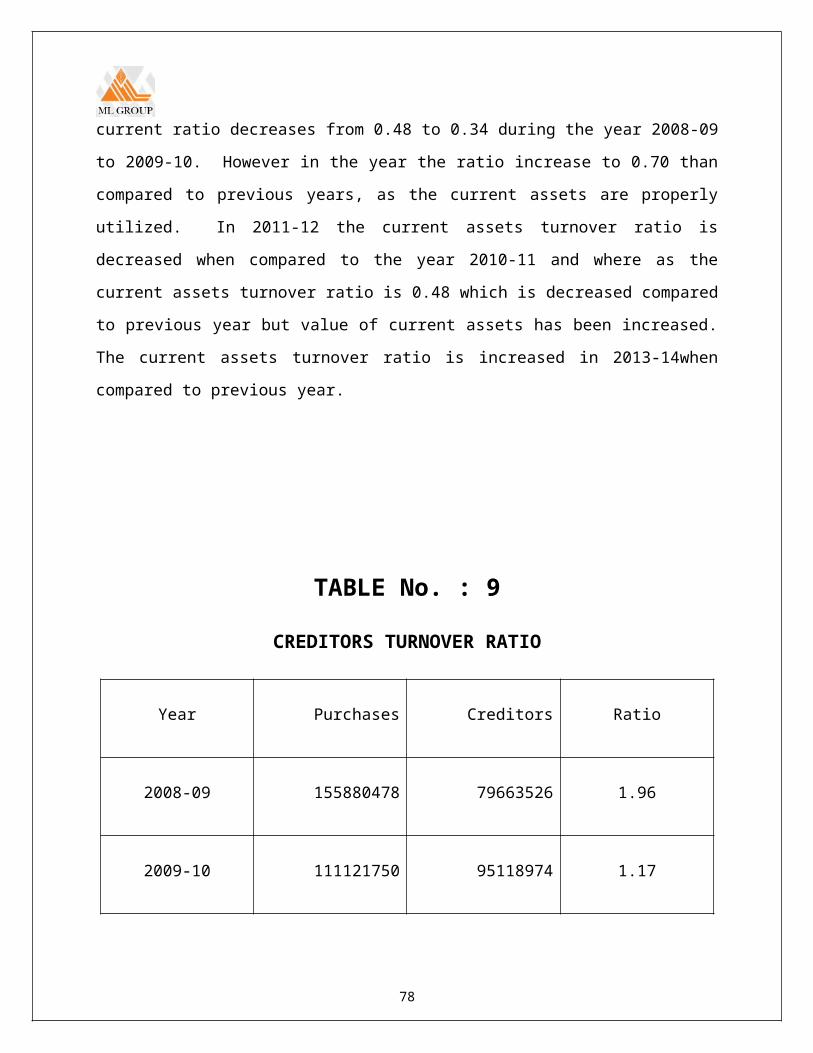
current ratio decreases from 0.48 to 0.34 during the year 2008-09
to 2009-10. However in the year the ratio increase to 0.70 than
compared to previous years, as the current assets are properly
utilized. In 2011-12 the current assets turnover ratio is
decreased when compared to the year 2010-11 and where as the
current assets turnover ratio is 0.48 which is decreased compared
to previous year but value of current assets has been increased.
The current assets turnover ratio is increased in 2013-14when
compared to previous year.
TABLE No. : 9
CREDITORS TURNOVER RATIO
Year Purchases Creditors Ratio
2008-09 155880478 79663526 1.96
2009-10 111121750 95118974 1.17
78

2010-11 280314175 130585661 2.15
2011-12 211640666 121157551 1.75
2012-13 336888367 110746450 3.04
2013-14 441026464 73145327 6.03
(Sources: Previous years Annual Reports)
CHART NO. 6
79
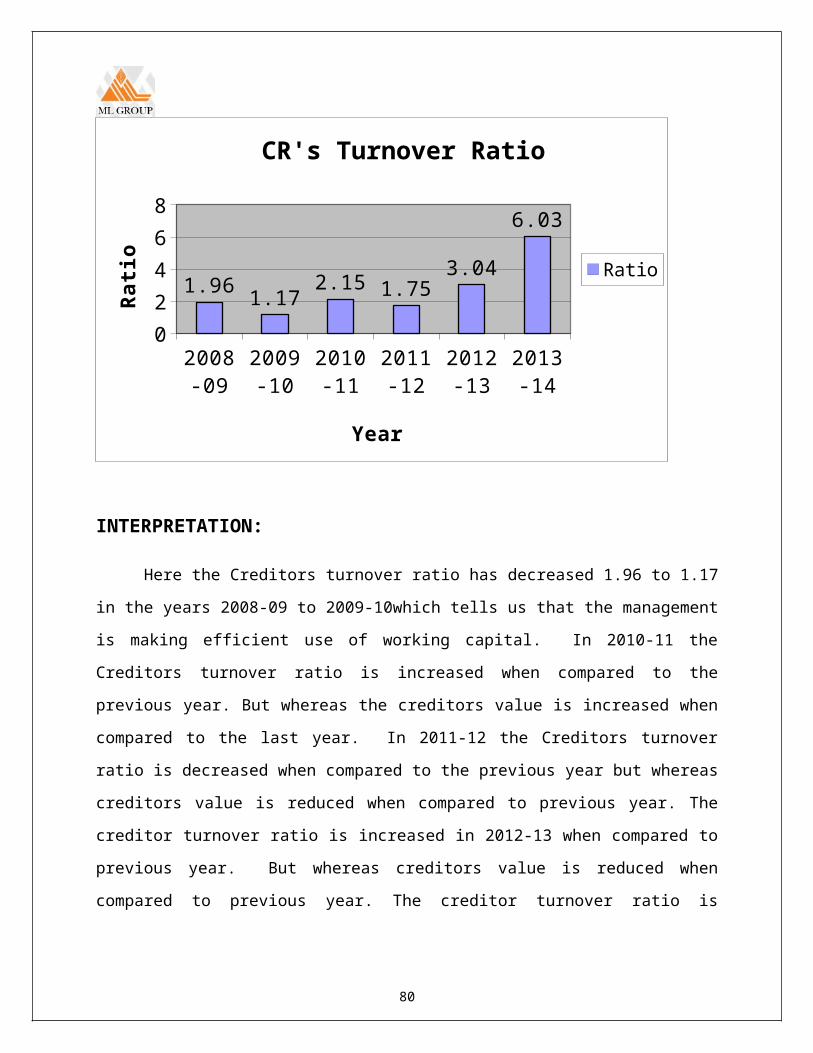
2008-09
2009-10
2010-11
2011-12
2012-13
2013-14
02468
1.96 1.17 2.15 1.753.04
6.03
CR's Turnover Ratio
Ratio
Year
Rati
o
INTERPRETATION:
Here the Creditors turnover ratio has decreased 1.96 to 1.17
in the years 2008-09 to 2009-10which tells us that the management
is making efficient use of working capital. In 2010-11 the
Creditors turnover ratio is increased when compared to the
previous year. But whereas the creditors value is increased when
compared to the last year. In 2011-12 the Creditors turnover
ratio is decreased when compared to the previous year but whereas
creditors value is reduced when compared to previous year. The
creditor turnover ratio is increased in 2012-13 when compared to
previous year. But whereas creditors value is reduced when
compared to previous year. The creditor turnover ratio is
80

increased in 2013–14 when compared to previous year. But whereas
creditors value is reduced when compared to previous year.
TABLE No. : 10
DEBTORS TURNOVER RATIO
Year Turnover Average Ratio
2008-09 131772745 24937024 5.28
2009-10 96695127 25898782 3.73
2010-11 255762587 31426613 8.13
2011-12 257993866 36125639 7.14
2012-13 280678564 29310044 9.58
81
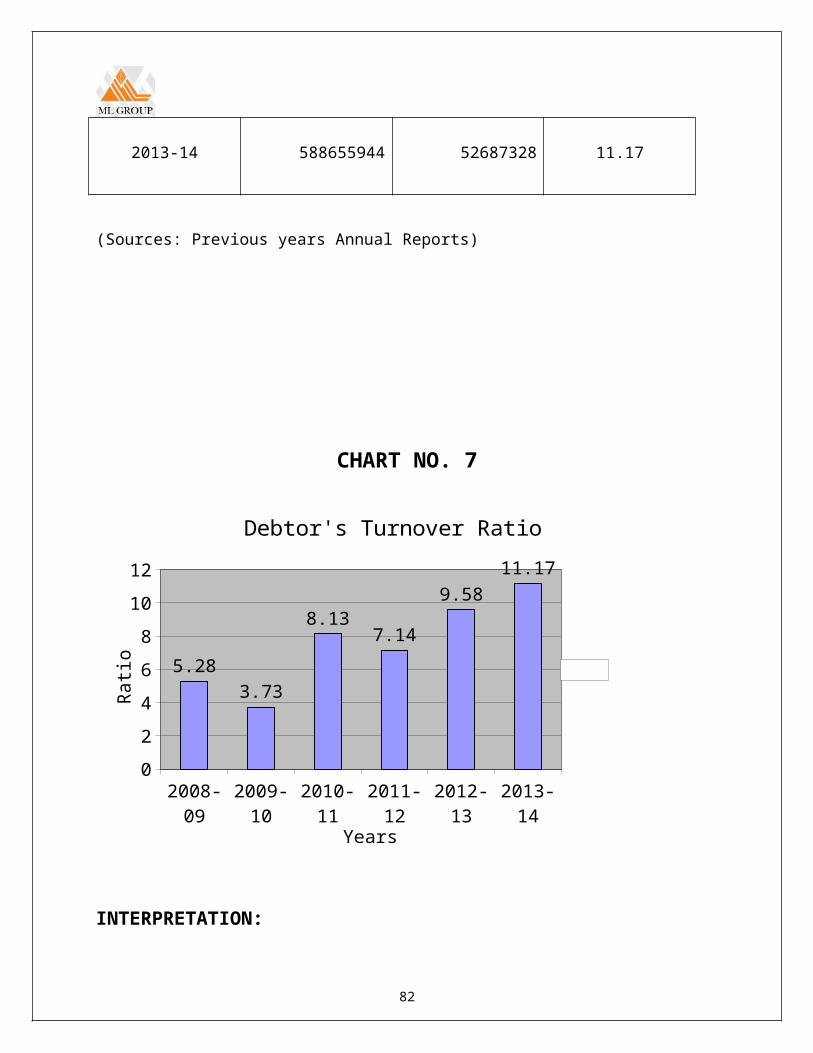
2013-14 588655944 52687328 11.17
(Sources: Previous years Annual Reports)
CHART NO. 7
2008-09
2009-10
2010-11
2011-12
2012-13
2013-14
024681012
5.283.73
8.137.14
9.5811.17
Debtor's Turnover Ratio
Years
Rati
o
INTERPRETATION:
82
Debtor’s turnover ratio measures how quickly the
accounts receivable are being collected. The higher the turnover
ratio and shorter the average collection period, the better the
trade credit management and the better the liquidity of debtors,
as short collection period and high turnover ratio imply prompt
payment on the part of debtors.
Debtors turnover ratio of M.L & Company is
decreasing from 2008-09 to 2009-10debtors turnovers ratio was
decreased from 5.28 to 3.73.Later it was increased to 8.13 due to
increase in sales.
In 2011-12 the debtors turnover ratio is reduced
when compared to the year 2010-11. In 2010-11 the debtors
turnover ratio is 8.13 which is higher then 7.14 in 2011-12. In
2013-14 the debtors turnover ratio is 11.17 which is higher than
9.58 in 2012-13.
TABLE No. : 11STATEMENT OF CHANGES IN THE WORKING CAPITAL THE YEAR
2008-09 &2009-10
Particulars2008-09 2009-10 Increase (+)
Decrease
(-)CURRENT
ASSETS
83

Inventories 172256321 187934012 15677691Sundry Debtors 24937024 26860540 1923516
Cash/Bank
Balance33465753 6059037 27406716
Other Current
Assets28656816 48679846 20023030
Loans
&Advances14928012 11723019 3204993
Total(A) 274243926 281256454CURRENT
LIABILITIESSundry creditors 79663526 95118974 15455448Other liabilities 28727905 44505210 15777305
Provisions 7256927 12018960 4762033Total (B) 115648358 151643144
Net working
capital (A)-(B)158595568 129613310
Net increasing
working capital28982258 28982258
Total 158595568 158595568 66606495 66606495
(Sources: Previous years Annual Reports)
INTERPRETATION:In this year there is a decrease in working capital as compare tothe previous year, it is due to increase in sundry creditors and
84
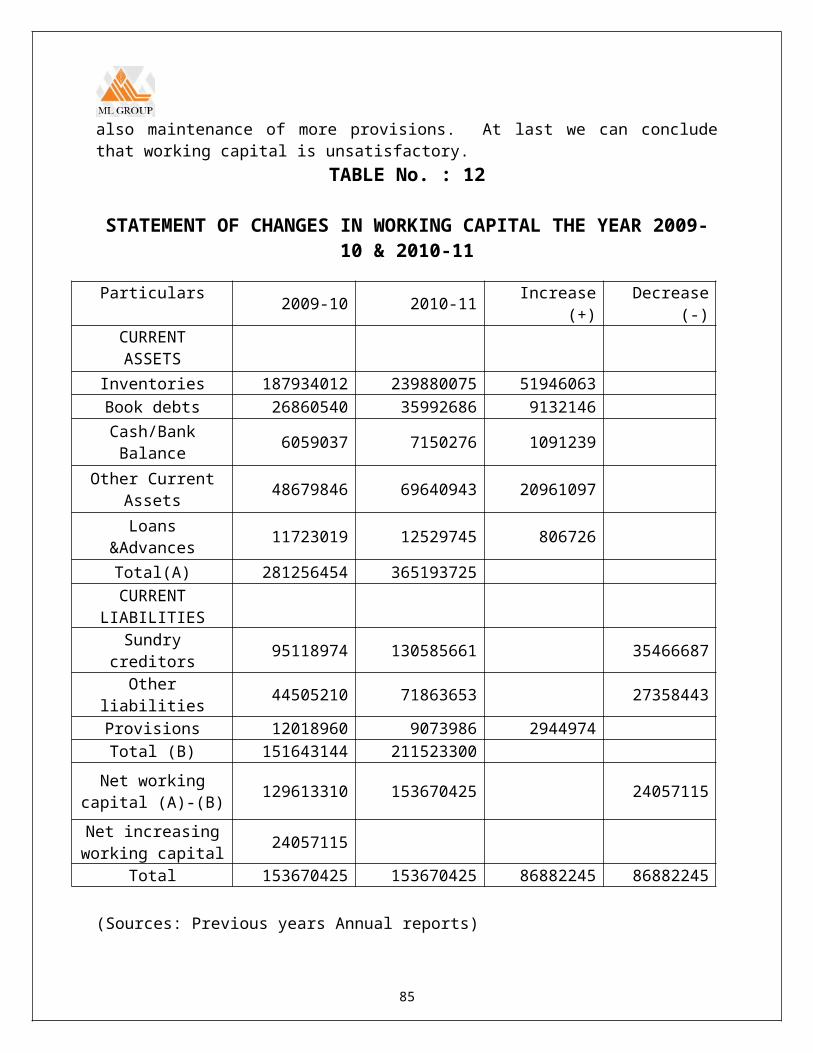
also maintenance of more provisions. At last we can concludethat working capital is unsatisfactory.
TABLE No. : 12
STATEMENT OF CHANGES IN WORKING CAPITAL THE YEAR 2009-10 & 2010-11
Particulars 2009-10 2010-11 Increase(+)
Decrease(-)
CURRENTASSETS
Inventories 187934012 239880075 51946063Book debts 26860540 35992686 9132146Cash/BankBalance 6059037 7150276 1091239
Other CurrentAssets 48679846 69640943 20961097
Loans&Advances 11723019 12529745 806726
Total(A) 281256454 365193725CURRENT
LIABILITIESSundry
creditors 95118974 130585661 35466687
Otherliabilities 44505210 71863653 27358443
Provisions 12018960 9073986 2944974Total (B) 151643144 211523300
Net workingcapital (A)-(B) 129613310 153670425 24057115
Net increasingworking capital 24057115
Total 153670425 153670425 86882245 86882245
(Sources: Previous years Annual reports)
85
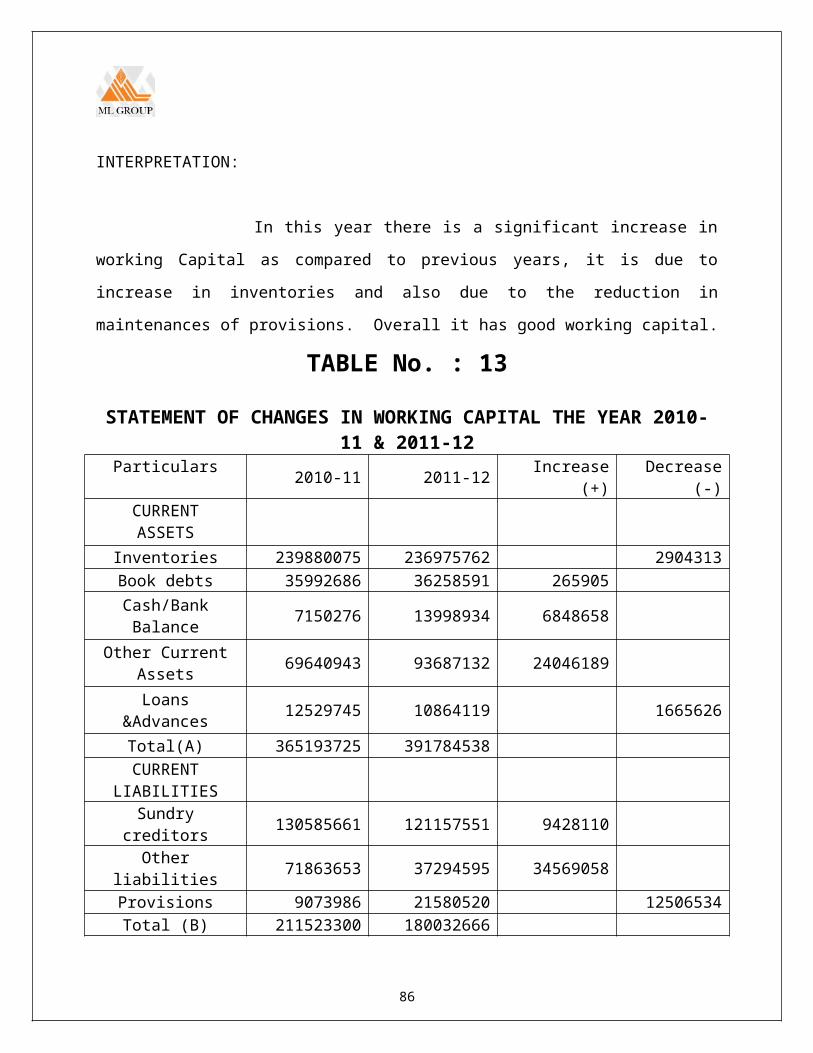
INTERPRETATION:
In this year there is a significant increase in
working Capital as compared to previous years, it is due to
increase in inventories and also due to the reduction in
maintenances of provisions. Overall it has good working capital.
TABLE No. : 13
STATEMENT OF CHANGES IN WORKING CAPITAL THE YEAR 2010-11 & 2011-12
Particulars 2010-11 2011-12 Increase(+)
Decrease(-)
CURRENTASSETS
Inventories 239880075 236975762 2904313Book debts 35992686 36258591 265905Cash/BankBalance 7150276 13998934 6848658
Other CurrentAssets 69640943 93687132 24046189
Loans&Advances 12529745 10864119 1665626
Total(A) 365193725 391784538CURRENT
LIABILITIESSundry
creditors 130585661 121157551 9428110
Otherliabilities 71863653 37294595 34569058
Provisions 9073986 21580520 12506534Total (B) 211523300 180032666
86

Net workingcapital (A)-(B) 153670425 211751872 58081447
Net increasingworking capital 58081447
Total 211751872 211751872 75157920 75157920
(Sources: Previous years Annual Reports)
INTERPRETATION:
There is an increase in working capital in this year as
compared to previous year. It is because of increase in cash &
Bank balances and Other Current assets which has increased
current assets to current liabilities. Overall we can conclude
that working Capital is satisfactory.
TABLE No. : 14
STATEMENT OF CHANGES IN WORKING CAPITAL THE YEAR 2011-12& 2012-13
Particulars 2011-12 2012-13 Increase(+)
Decrease(-)
CURRENTASSETS
Inventories 236975762 327412543 90436781Book debts 36258591 22361498 13897093Cash/BankBalance 13998934 73891461 59892527
Other Currentassets 93687132 151568707 57881575
Loans&Advances 10864119 13966691 3102572
87

Total(A) 391784538 589200900CURRENT
LIABILITIESSundry
creditors 121157551 110746450 10411101
Otherliabilities 37294595 32614510 4680085
Provisions 21580520 90860140 69279620Total (B) 180032666 234221100
Net workingcapital (A)-(B) 211751872 354979800
Net increasingworking capital 143227928 143227928
Total 354979800 354979800 226404641 226404641
(sources: Previous years Annual Reports)
INTERPRETATION:There is an increase in working capital in this year as
compared to previous year. It is because of increase in
Inventories cash & Bank balances and Other Current assets which
has increased current assets to current liabilities. Overall we
can conclude that working Capital is satisfactory.
TABLE No. : 15
STATEMENT OF CHANGES IN WORKING CAPITAL THE YEAR 2012-13 & 2013-14
Particulars 2012-2013 2013-2014 Increase(+)
Decrease(-)
88
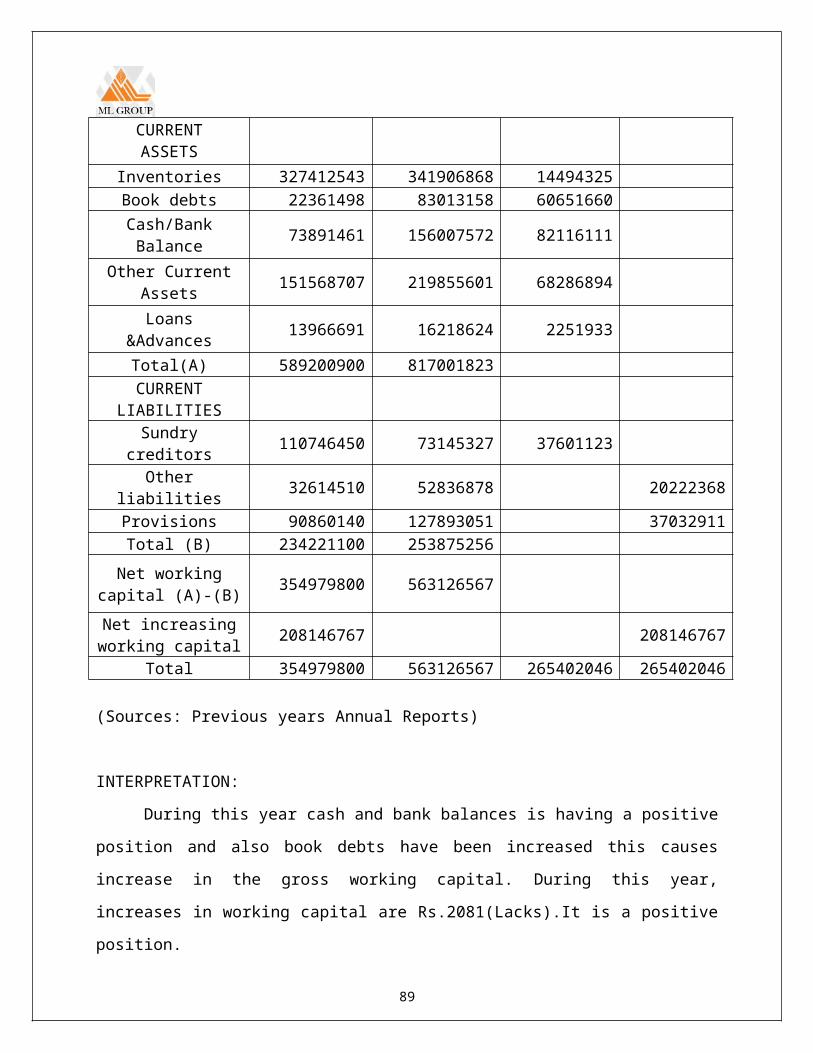
CURRENTASSETS
Inventories 327412543 341906868 14494325Book debts 22361498 83013158 60651660Cash/BankBalance 73891461 156007572 82116111
Other CurrentAssets 151568707 219855601 68286894
Loans&Advances 13966691 16218624 2251933
Total(A) 589200900 817001823CURRENT
LIABILITIESSundry
creditors 110746450 73145327 37601123
Otherliabilities 32614510 52836878 20222368
Provisions 90860140 127893051 37032911Total (B) 234221100 253875256
Net workingcapital (A)-(B) 354979800 563126567
Net increasingworking capital 208146767 208146767
Total 354979800 563126567 265402046 265402046
(Sources: Previous years Annual Reports)
INTERPRETATION:
During this year cash and bank balances is having a positive
position and also book debts have been increased this causes
increase in the gross working capital. During this year,
increases in working capital are Rs.2081(Lacks).It is a positive
position.
89
FINDINGS
On observing the changes in Working Capital from the year
2008 to 2014 it has been noticed that except for the year
2008-09 remaining all years the working capital of the
company was increasing year by year.
The current ratio reveals that the company can meet its
short term obligations at any given point of time. Though
the ratio of 2:1 is considered satisfactory, the survey
reveals that the company’s current ratio is above the
standard.
It has been observed from the survey that quick ratio had
been above the standard in the years 2009-10 and 2010-11.
The inventory turnover ratio indicates that conversion of
inventory into cash is very fast throughout the study. It
is an increasing trend.
It has been observed that the creditors are paid rapidly in
the year 2010-2011. In other preceding years the creditors
are maintained a steady payment period.
90
CONCLUSIONS
The net working capital of M.L. Company & Limited is good.
But the company’s working capital turnover ratio shows the
utilization of working capital is not satisfactory. It is
suggested that the company should concentrate on the
management of current assets and current liabilities more
effectively.
The liquidity position of the company is satisfactory. Even
though the Company current ratio is not equally standard
form; if the sales orders increased the liquidity positions
also improve.
91
The Increase in the inventory is a progressive change and
thus it can be recommended to the company.
Step should also be taken to reduce the scrap, which has
been increasing over the year. Necessary measure should be
taken for the disposal of the scrap as soon as possible.
The Turnover has been increased as compared to previous
years it shows the operating efficiency of the company.
There are more orders for the company products.
92
BIBLIOGRAPHY
1. Author: Dr. S N Maheshwari
Name of the book: Financial Management
Edition 2004
Publisher name: SULTAN CHAND &SONS
Pages no.: D.290 onwards
2. Author: I .M. Pandey
Name of the book: Financial Management
8th Edition 2004
Publisher name: VIKAS PUBLISHING HOUSE PVT. LTD
Page no.: 820
3. Maddi lakshmaiah companies journals and website
93