expansion and diversification - tadawul
TRANSCRIPT
AnnualReport 2017
Expansion and Diversification

Annual Report 2017
Annual Report 2017 32
King Salman bin Abdulaziz Al SaudCustodian of the Two Holy Mosques
HRH Prince Mohammad bin Salman Al SaudCrown Prince, Deputy Prime Minister
and Minister of Defense
Annual Report 2017
Annual Report 2017 54
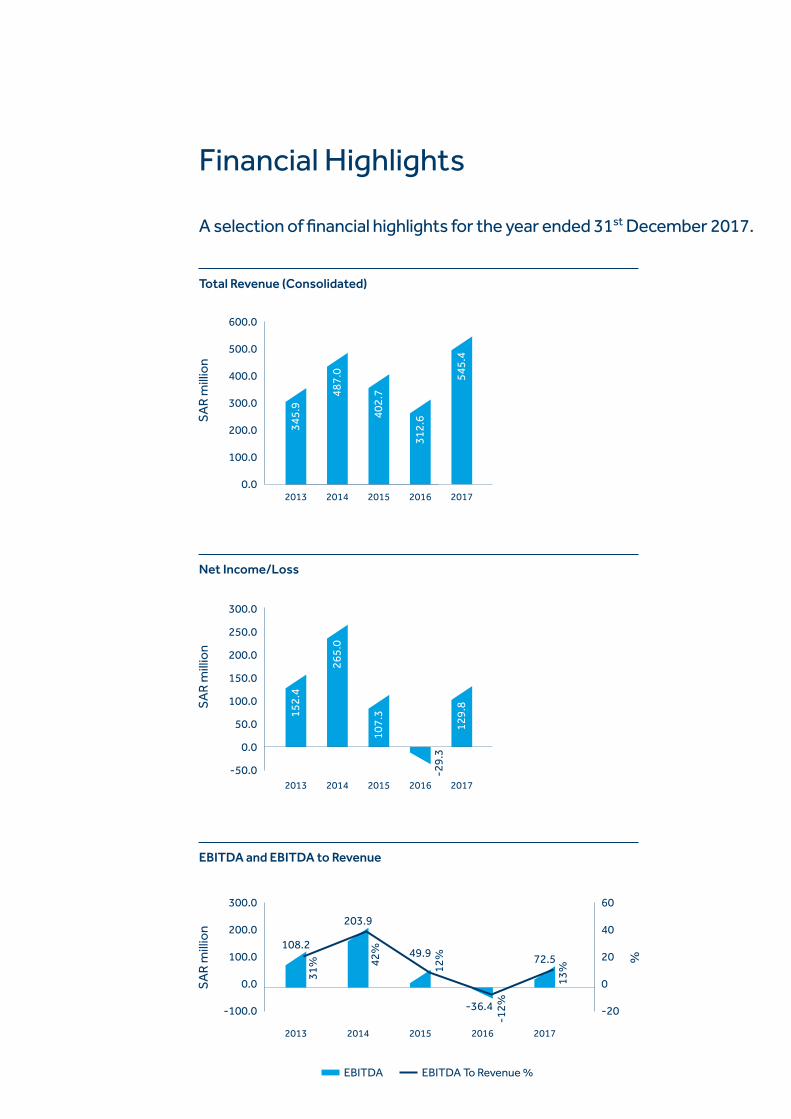
Financial Highlights
A selection of financial highlights for the year ended 31st December 2017.
Total Revenue (Consolidated)34
5.9
SAR
milli
on
600.0
500.0
400.0
300.0
200.0
100.0
0.0
487.
0
402.
7
312.
6
545.
4
2013 2015 2016 20172014
2013 2015 2016
-29.
3
2017
Net Income/Loss
152.
4
SAR
milli
on
2014
300.0
250.0
200.0
150.0
100.0
50.0
0.0
-50.0
265.
0
107.
3
129.
8
2013
108.2
2015
49.9
2016 2017
72.5
EBITDA and EBITDA to Revenue
%
SAR
milli
on
2014
300.0
200.0
100.0
0.0
-100.0
60
40
20
0
-20-36.4
13%
-12%
12%42
%
31%
203.9
EBITDA EBITDA To Revenue %
Annual Report 2017
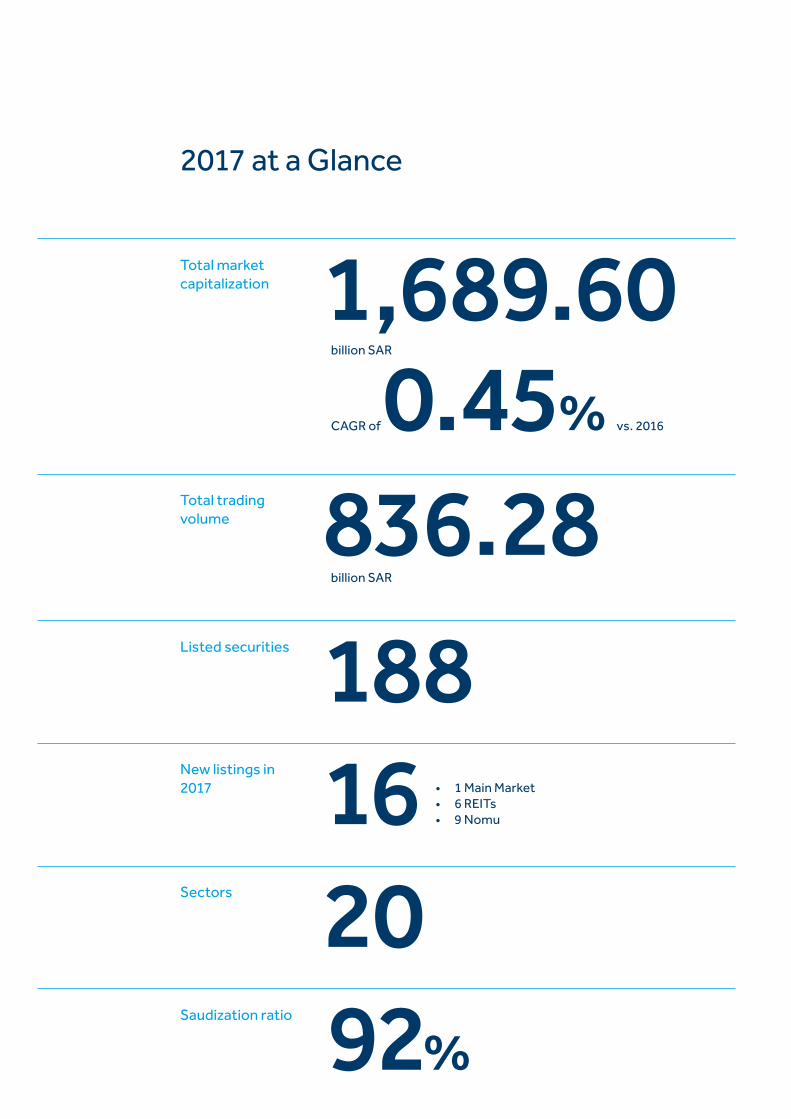
2017 at a Glance
billion SAR
Total market capitalization 1,689.60
CAGR of 0.45% vs. 2016
billion SAR
836.28 Total trading volume
• 1 Main Market• 6 REITs• 9 Nomu16 New listings in
2017
188 Listed securities
20Sectors
92% Saudization ratio
Annual Report 2017 76
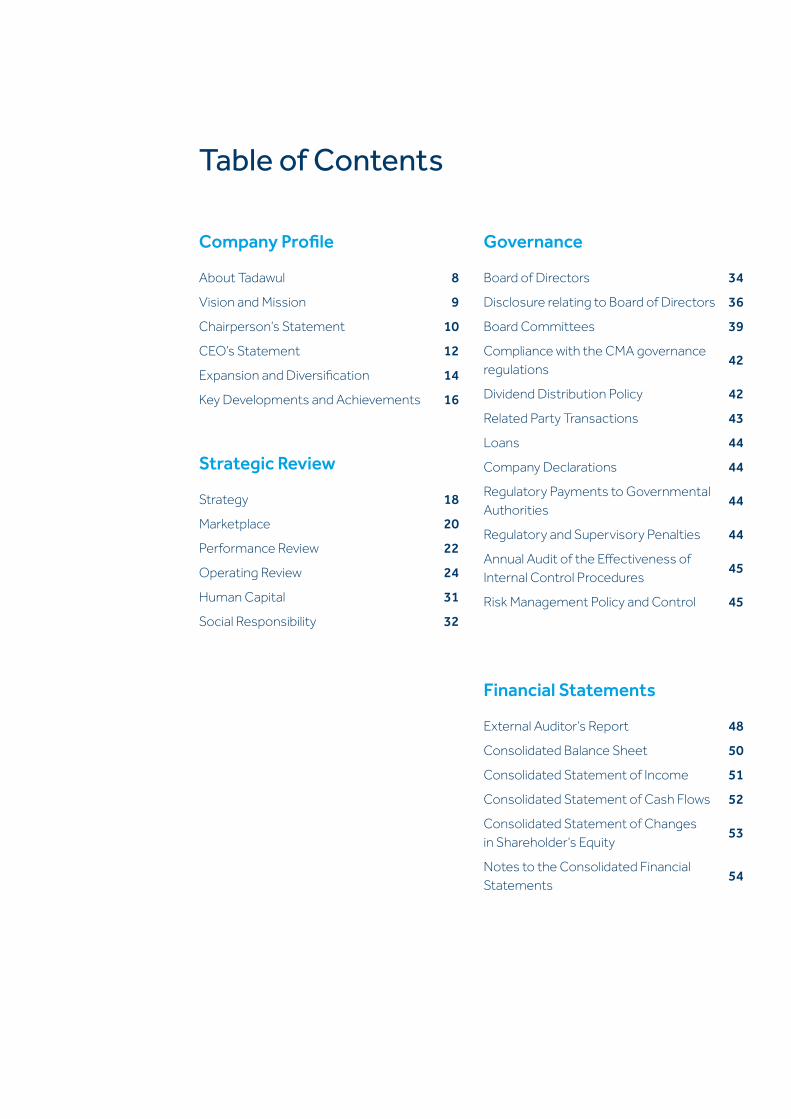
Company Profile
About Tadawul 8
Vision and Mission 9
Chairperson’s Statement 10
CEO’s Statement 12
Expansion and Diversification 14
Key Developments and Achievements 16
Strategic Review
Strategy 18
Marketplace 20
Performance Review 22
Operating Review 24
Human Capital 31
Social Responsibility 32
Governance
Board of Directors 34
Disclosure relating to Board of Directors 36
Board Committees 39
Compliance with the CMA governance regulations 42
Dividend Distribution Policy 42
Related Party Transactions 43
Loans 44
Company Declarations 44
Regulatory Payments to Governmental Authorities 44
Regulatory and Supervisory Penalties 44
Annual Audit of the Effectiveness of Internal Control Procedures 45
Risk Management Policy and Control 45
Financial Statements
External Auditor’s Report 48
Consolidated Balance Sheet 50
Consolidated Statement of Income 51
Consolidated Statement of Cash Flows 52
Consolidated Statement of Changes in Shareholder’s Equity
53
Notes to the Consolidated Financial Statements 54
Table of Contents
8 Annual Report 2017
About "Tadawul"
On the 19th March 2007, Saudi Arabia’s Council of Ministers approved the formation of the Saudi Stock Exchange (“Tadawul”). This was in accordance with Article 20 of the Capital Market Law (“CML”), establishing Tadawul as a joint stock company. Tadawul is the sole entity authorized in the Kingdom of Saudi Arabia to act as a securities exchange (the “Exchange”).
Tadawul mainly carries out listing and trading in securities. The deposit, transfer, clearing, settlement, and registry of ownership of securities traded on the Exchange is performed by the recently incorporated Securities Depository Center Company (Edaa). The legal status, duties, and responsibilities of both the Exchange and "Edaa" are
explicitly defined in the Capital Market Law issued by Royal Decree Number (M/30), dated 16th June 2003. The Exchange is also the official source of all market information.
The capital of Tadawul is SAR 1,200,000,000, divided into 120,000,000 shares of equal value of SAR 10.00, all of which are cash shares held by the Public Investment Fund (“PIF”). Tadawul is an affiliate member of the International Organization of Securities Commissions (“IOSCO”) . Tadawul’s CEO was recently elected as one of the 8 Board of Directors for the World Federation of Exchanges (WFE) for 3 years.
Tadawul is the sole entity authorized in the Kingdom of Saudi Arabia to act as a securities exchange (the “Exchange”). The Exchange is also the official source of all market information.
Company Profile 9
Vision and Mission
MissionTo offer sound, efficient and attractive capital market products and services that deliver superior value to our market participants and stakeholders
VisionTo be an integrated financial exchange that fosters the development of a diverse Saudi capital market and competes internationally
10 Annual Report 2017
Chairperson’s Statement
As the Saudi Stock Exchange is the central pillar in Saudi Economy, which aims to create a thriving economy through investing for the long-term, with diversification of income vital for its sustainability. The fast pace of reform under Vision 2030 is both inspiring and challenging, and we are committed to its successful delivery.
It is my pleasure to introduce Tadawul’s Annual Report and consolidated financial statements for the year ended 31st December 2017. This was a year in which the "Tadawul" made important strides towards the achievement of its strategy for growth, and cemented its role at the heart of Saudi Arabia’s economy. The overall strategic aim of Tadawul is to become a widely recognized global exchange. To support this goal, we embarked on a comprehensive program to raise standards and achieve parity with our emerging market peers.
Tadawul’s core objectives stem from its role in the Kingdom’s Vision 2030 reform agenda. The Exchange is central to the ‘economy’ pillar of the Vision, which aims to create a thriving economy through investing
for the long-term, with diversification of income vital for its sustainability. The fast pace of reform under Vision 2030 is both inspiring and challenging, and we are committed to its successful delivery.
Expansion and DiversificationAs the pages that follow will show, in
2017 Tadawul undertook a broad range of projects and programs to enable the business to expand and diversify. The ‘expansion and diversification’ theme is a wide-reaching concept. As such, it applies not only to the growing size of the stock market, in terms of capitalisation, liquidity and participants, but to the increasingly prominent role that Tadawul plays in supporting the growth of the Saudi economy – particularly its capital market. When
“The fast pace of reform under Vision 2030 is both inspiring and challenging, and we are committed to its successful delivery.“
Company Profile 11
it comes to diversification, we have achieved a great deal in widening our range of products and services, and offering a more holistic set of opportunities to market participants, while building an infrastructure to support the weighty requirements of a global offer.
Milestones2017 was a pivotal year for Tadawul, which
experienced great progress made by the Exchange as it successfully reached a number of crucial milestones. The Exchange carried out a careful and considered strategy for attracting and accommodating QFIs, as their participation in the capital market increases, including preliminary measures for a Central Counterparty Company (CCP) establishment, facilitating a wider access to the market. Investor roadshows took place in 9 countries and reached out to over 500 investors. Tadawul was recognized in the MSCI , FTSE Russell, and (S&P) Emerging Market Index watch lists, with a strong possibility of inclusion in the main emerging market indices, which will positively impact the activity of QFIs in the Kingdom’s capital market.
The Path to 2022To achieve the Exchange’s core objectives,
the Board approved an updated plan built on 7 strategic pillars: Asset Classes, Issuers, Investors, Post-Trade, Market Information & Analytics, Technology & Operations and Organization Enablers. This strategic framework forms the launch pad for Tadawul’s future development, creating opportunities for growth and engaging fully with vision 2030. Tadawul’s five-year plan identifies 3 key value drivers that will deliver superior shareholder returns while stimulating the upward trajectory of our growth.
As a first step, we are focused on developing a diversified and integrated exchange, benefitting from diverse asset classes, revenue and product mix, investors and issuers. Therein, Tadawul will operate a
market infrastructure that covers the entire capital market value chain. The second value driver is to enable and capitalize on Saudi Arabia’s macro-economic growth. This will be achieved by facilitating a marketplace that will help fund Vision 2030 and that would support the ambitions of Vision 2030 and fulfill the needs of both the public and private sectors, ultimately enabling the opening of the market to international participants. One of Tadawul’s key aims is to propel Saudi Arabia towards a globalised economy, and to support the Kingdom’s status as the world’s 20th largest economy. The final driver, and in many ways the result of our current efforts, will be to maintain and grow Tadawul’s status as the largest and most liquid market in MENA, which will monetize investment by offering the seamless and industry-leading Tadawul infrastructure and capabilities to other exchanges in the MENA region.
With ThanksMost importantly, it remains for me to
thank our colleagues and stakeholders. I would, firstly, like to place on record my gratitude to the Board of Directors, for their wise counsel and the support they have shown in the journey on which we have embarked. I would like to thank the executive management, for their tireless efforts to develop and deliver a strategic path for the future; our employees, who work so hard to make our vision and mission a reality; the Capital Market Authority (CMA), for their ongoing support; and the Exchange’s participants, whose activities and ambitions are at the heart of our future aims. We have exciting years ahead, and I personally look forward to working alongside our stakeholders to deliver on the ambitious goals that we have set for ourselves.
— Ms. Sarah Al-SuhaimiChairperson of the Board of Directors
12 Annual Report 2017
CEO’s Message
Tadawul’s status as the leading regional exchange is demonstrated by the fact that 72% of the value traded across MENA is carried out in Saudi Arabia.
The year 2017 experienced "Tadawul" build on a position of strength, to consolidate its place as the Middle East’s leading stock exchange, while creating a platform to grow, diversify and globalize in tandem with Saudi Arabia’s economy. Guided by Vision 2030, we are steadfast in our commitment to reform, so that we may continue to grow international investor confidence and strengthen the Saudi capital market. A series of projects and initiatives were at the heart of that process, and I am pleased to report another year of robust and positive performance.
Strategic Highlights Important strategic milestones in
2017 included introducing Nomu, our parallel market for growth companies, which hosted 9 listings in 2017. "Tadawul" developed a comprehensive suite of information and analytics services,
including the E-Reference Data Project, which enables the user to view issuer information, securities identifiers, reports, historical data and financial statements. Ultimately, "Tadawul" was successful in its efforts to cover the full capital market value chain, as it built an agile and digitized service offering.
Performance HighlightsAs of 31st December 2017, "Tadawul"
ranked 25th of WFE Exchanges with a market capitalization of USD 451bn. Financial performance for the year was mostly strong, with consolidated revenues of SAR 545.4m increasing by 74% on the previous year. Income streams were dominated by Trading, Post-Trade, Listing, Market Information and others, which delivered 28%, 52%, 8%, 12% and 0.2% of total revenues respectively. EBITDA in 2017 reached a total of SAR 72.5m improving by
“Tadawul is the leading exchange in the GCC, with a market capitalization that is three times greater than its closest peer.“
Company Profile 13
nearly 299% over 2016, with an EBITDA margin of 13% compared to -12% in the previous year. From a loss of SAR -29m, this year consolidated net income reached SAR 129.8m, with a margin of 24%, compared to -9% in 2016. This was primarily the result of an increase in revenue due to the activation of core fees starting from January 2017.
Operational HighlightsOperational highlights in 2017
included the completion of our tradable rights optimization projects, the implementation of the Global Industry Classification Standard (GICS), segregating and implementing a new set of post-trade, listing and membership fees, the roll-out of the T+2 settlement cycle, the introduction of securities borrowing and lending and covered short-selling frameworks, the formal incorporation of the Securities Depository Center Company "Edaa" as a standalone subsidiary, and completion of a post-trade technology transformation agreement with Nasdaq.
These core developments have played a pivotal role in enabling "Tadawul" to achieve its goal, which would not have been possible without the dedication of our staff and the management's keenness to devote expertise to providing insight and efforts to fulfill its responsibilities. Through this approach, we have continued to develop and operationalize the most important and influential strategic programs to drive future growth.Looking Ahead
An important springboard for the range of growth opportunities available to us is our already strong competitive position. "Tadawul" is the leading exchange in the GCC, with a market capitalization that is three times greater
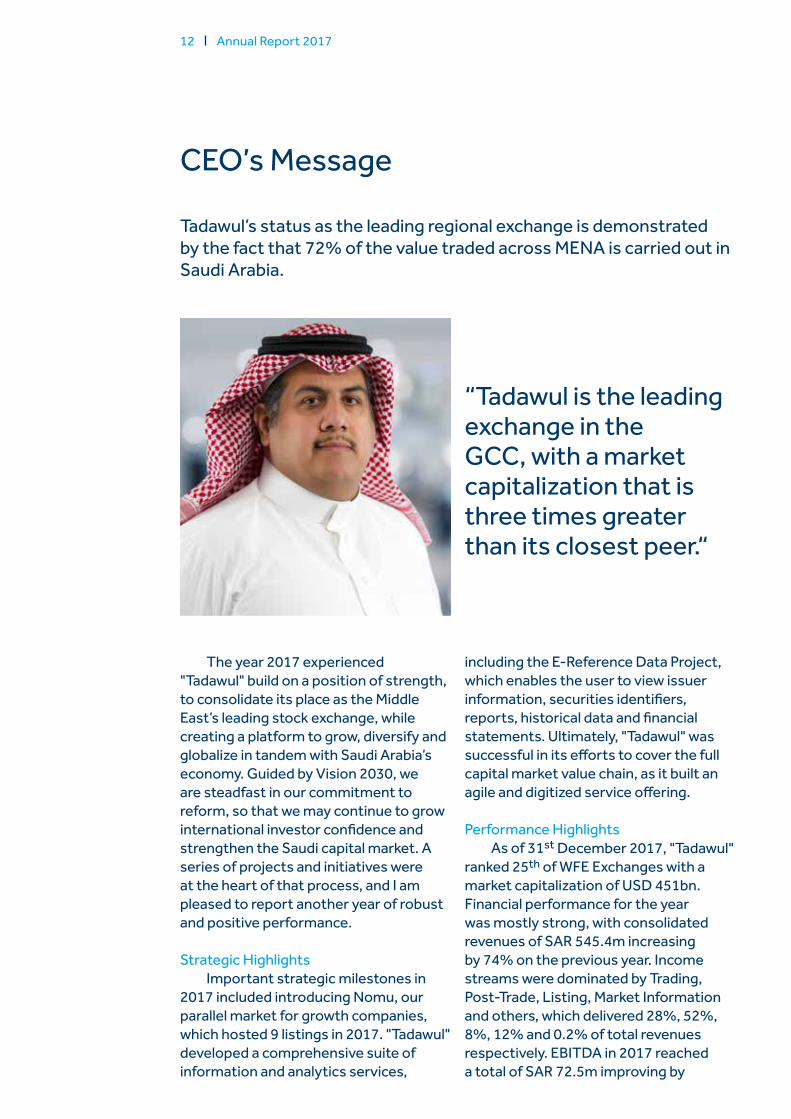
than its closest peer. The Saudi stock market is the largest and most liquid in MENA, accounting for 53% of total GCC market capitalization. Tadawul’s status as the leading regional exchange is demonstrated by the fact that 72% of the value traded across the region is carried out in Saudi Arabia.
With this strong competitive position, our most important avenue for growth is globalization: "Tadawul" aims to become the first choice for investors seeking exposure to the assets of a rapidly growing region. This will be achieved by the exploitation of 3 key value drivers: the development of a diversified and integrated exchange; enabling and capitalizing on Saudi social and economic growth; and the delivery of a truly regional exchange platform.
— Eng. Khalid A. Al Hussan Chief Executive Officer
*Saudi Arabia has the largest stock market (USD 451bn) in the Arab world.
Saudi market as compared to GCC markets (USD Billions)
%
*Mar
ket C
ap -
GD
P (U
SD) 500
400
300
200
100
0
100
80
60
40
20
0
Qat
ar
131
UAE
132
Kuw
ait
93O
man
21
Bahr
ain
22
78%
36%
Saud
iAr
abia
451
70%82%
69%
33%
14 Annual Report 2017
Expansion and Diversification
With a role at the heart of Saudi Arabia’s growth story, Tadawul is focused on becoming a driver of the Kingdom’s economy. As such, the Exchange plays a key role in opening the country’s capital market to the world. In order to achieve this objective, the business has broadened the spectrum of its work to become a stronger, more agile and more comprehensive stock exchange. Diversification of the Saudi economy is an important part of Vision 2030, and Tadawul is an important platform for a wide range of industries and sectors, with a place at the heart of Saudi economy.
This year, Tadawul along with the Capital Market Authority (CMA) of Saudi Arabia have taken bold steps to make the capital market a destination of foreign investments. Nemours roadshows and meeting with international investors, invest banks and asset managers to highlight the changes currently implemented to open the market.
The QFI program has seen over 100 international financial institutions enter the market, with more than 100 more at various stages in the qualifying process
QFI ProgramIn our continued effort to develop
the local financial market, Tadawul prioritized the easing of Qualified Foreign Investors (QFIs) qualifying criteria, achieved by streamlining foreign ownership limits (FOLs) and access for foreign inflows to Saudi IPOs, with QFIs participating in domestic offers from the first trading day of 2017. The QFI program has seen over 100 international financial institutions enter the market, with an additional 100 more at various stages in the qualifying process. Acceleration of the QFI program is a clear indicator of the progress Tadawul has made in reforming the market to attract foreign capital.
Inclusion in International IndicesIn 2017, Tadawul was added to the
watch lists for potential inclusion on the MSCI, the FTSE Russell, and the S&P. These achievements are significant for the Exchange, as well as the wider Saudi economy. In terms of delivery and change, 2017 may well be regarded as the most successful year in Tadawul’s history. With a high chance of upgrades to Emerging Market status by some of the world’s most recognized indices, these future accomplishments will be the by-product of Tadawul’s tireless commitment to delivering initiatives and projects that align with international best practice standards.
Tadawul was added to the watch lists for potential inclusion on the MSCI, the FTSE Russell, and the S&P
Tadawul prioritized the easing of Qualified Foreign Investors (QFIs) qualifying criteria, along side with CMA we have achieved the streamlining of foreign ownership limits (FOLs) and access for foreign inflows to Saudi IPOs
Company Profile 15
Diversification of the Saudi economy is an important part of Vision 2030
16 Annual Report 2017
Spin off the Security and Depository Centre (Edaa)
Tadawul spun off the SDC to develop the depository, register and settlement business as part of transforming the Saudi Financial Market Infrastructure (FMI). "Edaa" will usher in new services that will grow the eco system around assets and allow Tadawul to strengthen post trade.
Launch of first Tadawul parallel equity market (Nomu)As the Saudi economy grows and
becomes more diversified, Attention is required to the Small and Medium Enterprises (SME). Tadawul launched Nomu as means of providing an avenue for SMEs way to raise capital and benefit from listing for future financial transactions. The market was open to institutional investors, QFI and qualified retail investors.
Adoption of new classification system: Global Industry Classification Standard (GICS)
The classification aligns Tadawul to major indicia developers to allow the exchange to offer more indices that meet the need of both local and international investors. Researchers will also be able to easily integrate Saudi firms in sector specific reports that follow GICS giving them more exposure especially to international investors.
Key Developments and Achievements
This year saw Tadawul make great strides towards achieving its overall vision of becoming an integrated exchange that fosters the development of a diverse Saudi capital market and competes internationally. Such a status will be achieved not just by market size and liquidity, but also through international recognition, accessibility and macro-economic importance. At all times, Tadawul keeps a close eye on its mission: to offer sound, efficient and attractive capital market products and services that deliver superior value to market participants and stakeholders.
Activation of post-trade, listing, and membership fees
The company activated these fees in 2017 as ways to reflect the changes made to both the listing services and post trade developments. The fees are based on benchmarks with exchanges in frontier, emerging and frontier markets and close collaboration with the CMA.
Successful transition to T+2 standard settlement cycle for all listed securities
Tadauwl has transitioned to a new settlement and clearing cycle that is aligned with international best practice and demand of both local and international investors. The change puts Tadawul in league of the G20 countries in which it is a member. The change has also allowed for the optimization of tradeable rights and enhancing the Independent Custody Model.
Completing registration of government debt instrumentsThe Saudi government has chosen
Tadawul to register its bonds allowing for further development in the debt market. The registration will lead to the option of trading the bonds and developing a yield curve that the market has been in need for.
Company Profile 17
18 Annual Report 2017
Strategy
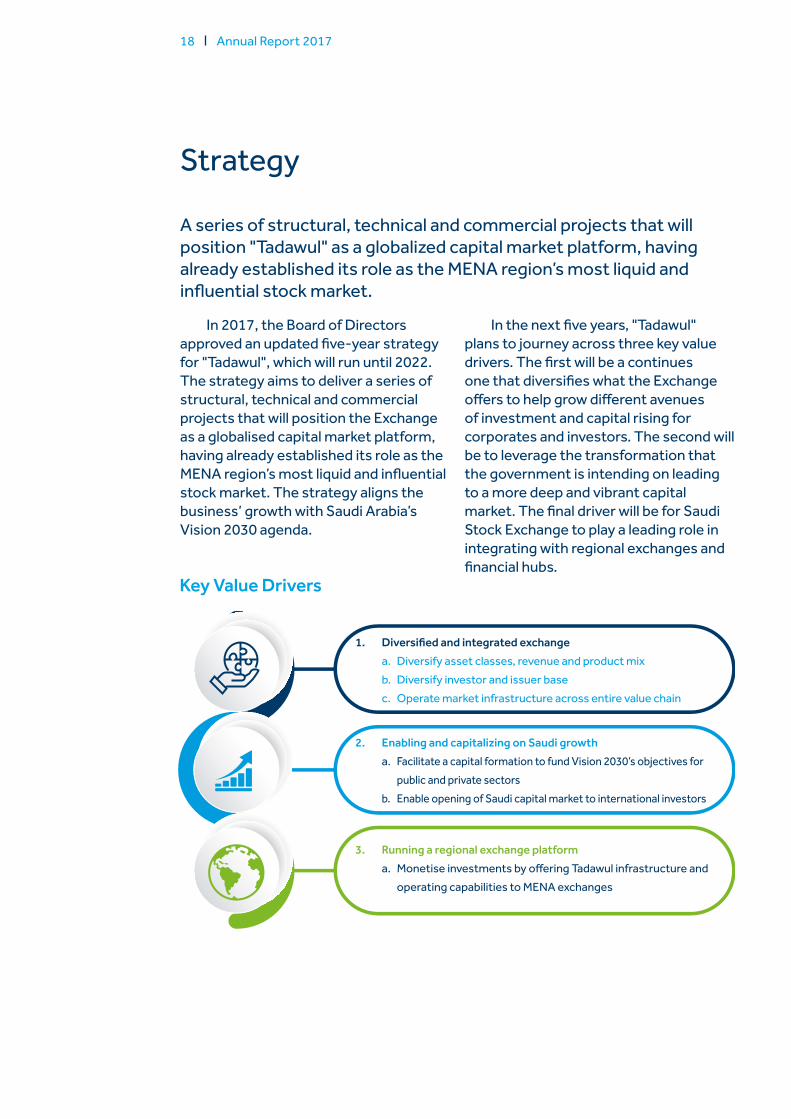
A series of structural, technical and commercial projects that will position "Tadawul" as a globalized capital market platform, having already established its role as the MENA region’s most liquid and influential stock market.
In 2017, the Board of Directors approved an updated five-year strategy for "Tadawul", which will run until 2022. The strategy aims to deliver a series of structural, technical and commercial projects that will position the Exchange as a globalised capital market platform, having already established its role as the MENA region’s most liquid and influential stock market. The strategy aligns the business’ growth with Saudi Arabia’s Vision 2030 agenda.
In the next five years, "Tadawul" plans to journey across three key value drivers. The first will be a continues one that diversifies what the Exchange offers to help grow different avenues of investment and capital rising for corporates and investors. The second will be to leverage the transformation that the government is intending on leading to a more deep and vibrant capital market. The final driver will be for Saudi Stock Exchange to play a leading role in integrating with regional exchanges and financial hubs.
Key Value Drivers
1. Diversified and integrated exchangea. Diversify asset classes, revenue and product mixb. Diversify investor and issuer basec. Operate market infrastructure across entire value chain
2. Enabling and capitalizing on Saudi growtha. Facilitate a capital formation to fund Vision 2030’s objectives for
public and private sectors b. Enable opening of Saudi capital market to international investors
3. Running a regional exchange platforma. Monetise investments by offering Tadawul infrastructure and
operating capabilities to MENA exchanges
Strategic Review 19
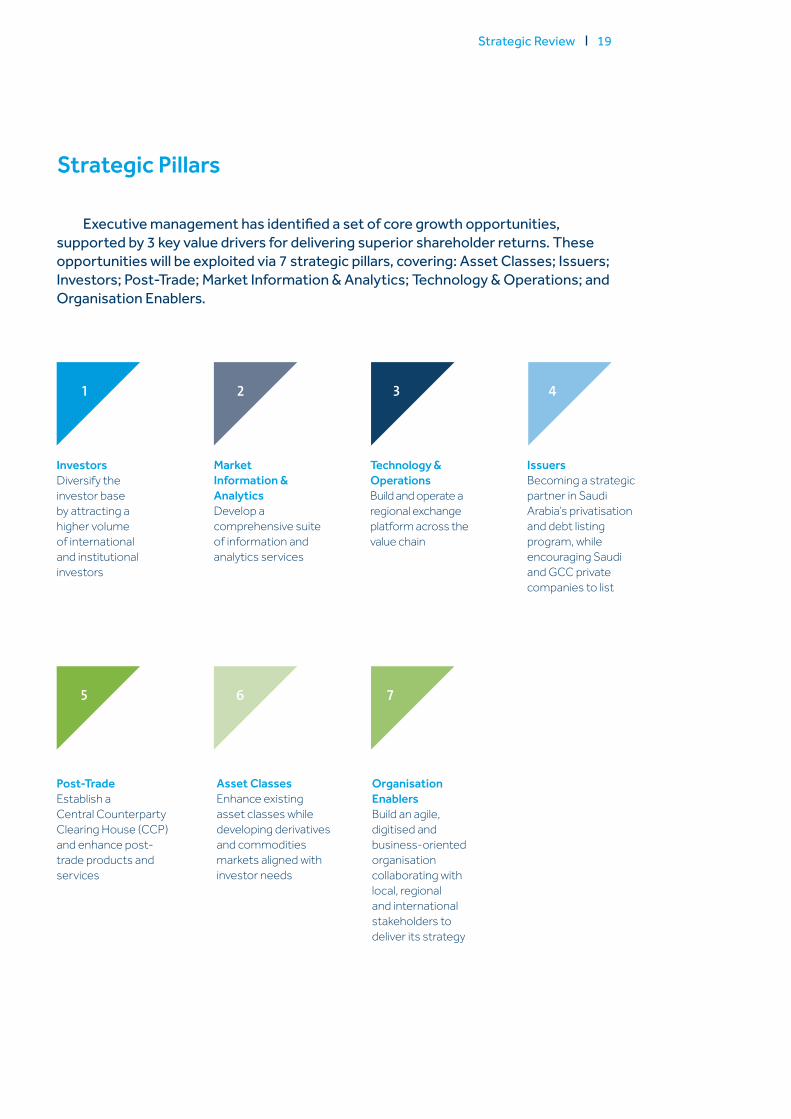
Executive management has identified a set of core growth opportunities, supported by 3 key value drivers for delivering superior shareholder returns. These opportunities will be exploited via 7 strategic pillars, covering: Asset Classes; Issuers; Investors; Post-Trade; Market Information & Analytics; Technology & Operations; and Organisation Enablers.
Strategic Pillars
4321
765
InvestorsDiversify the investor base by attracting a higher volume of international and institutional investors
Technology & OperationsBuild and operate a regional exchange platform across the value chain
Post-TradeEstablish a Central Counterparty Clearing House (CCP) and enhance post-trade products and services
Organisation EnablersBuild an agile, digitised and business-oriented organisation collaborating with local, regional and international stakeholders to deliver its strategy
Market Information & AnalyticsDevelop a comprehensive suite of information and analytics services
Issuers Becoming a strategic partner in Saudi Arabia’s privatisation and debt listing program, while encouraging Saudi and GCC private companies to list
Asset ClassesEnhance existing asset classes while developing derivatives and commodities markets aligned with investor needs
20 Annual Report 2017
Marketplace
As the Kingdom’s economic reform program gathers momentum in its aim to diversify the economy away from a reliance on oil-based revenues, "Tadawul" plays an important role in promoting and developing an active and accessible capital market.
The relatively high level of liquidity, and the volume of investible assets that exists within the Saudi market – particularly as compared to its regional peers – has historically proved rewarding for both "Tadawul" and the Exchange’s participants. Moreover, as the Kingdom’s economic reform program gathers momentum in its aim to diversify the economy away from a reliance on oil-based revenues, "Tadawul" plays an important role in promoting and developing an active and accessible capital market.
Among Tadawul’s key drivers for delivering its strategic objectives for 2022 is its ambition to both enable and capitalise on Saudi Arabia’s economic growth. This includes facilitating a capital formation to fund Vision 2030’s ambitions for public and private sectors, as well as its role in opening up the Exchange to international investors, thereby attracting a more diverse array of capital to local listed companies. This in turn would lead them to rely less on state budget funding and more on market led demand.
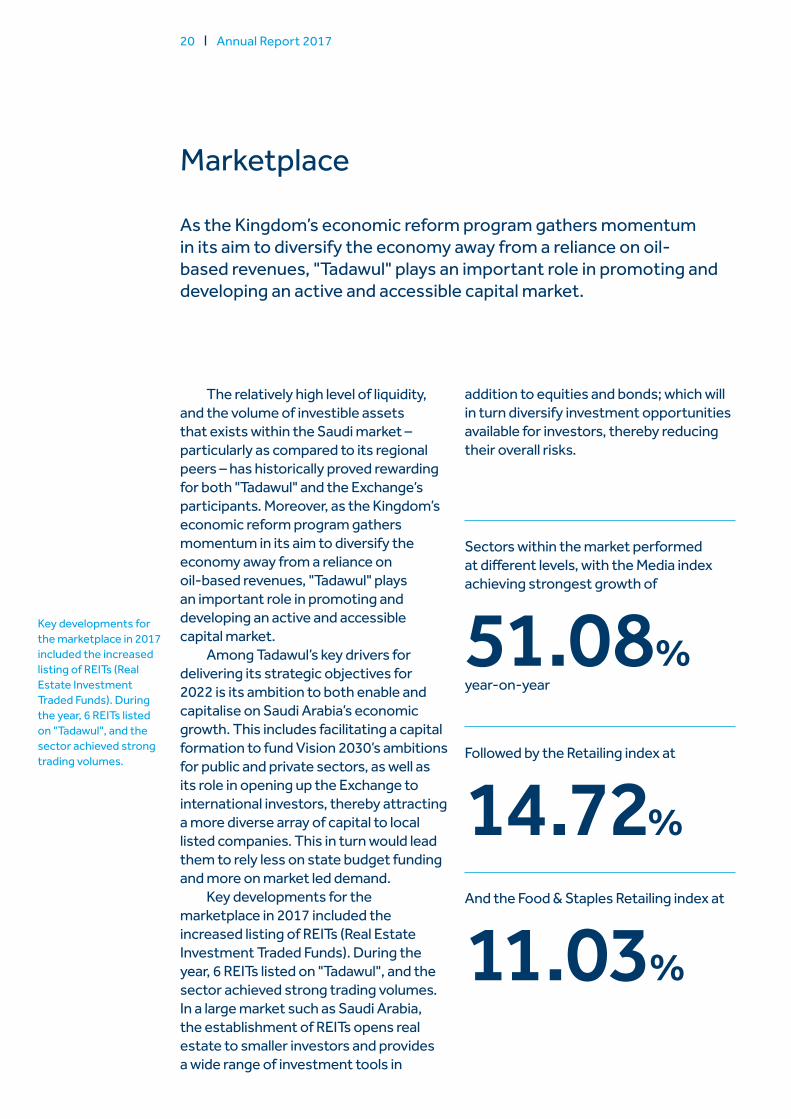
Key developments for the marketplace in 2017 included the increased listing of REITs (Real Estate Investment Traded Funds). During the year, 6 REITs listed on "Tadawul", and the sector achieved strong trading volumes. In a large market such as Saudi Arabia, the establishment of REITs opens real estate to smaller investors and provides a wide range of investment tools in
addition to equities and bonds; which will in turn diversify investment opportunities available for investors, thereby reducing their overall risks.
Key developments for the marketplace in 2017 included the increased listing of REITs (Real Estate Investment Traded Funds). During the year, 6 REITs listed on "Tadawul", and the sector achieved strong trading volumes.
Sectors within the market performed at different levels, with the Media index achieving strongest growth of
51.08%year-on-year
Followed by the Retailing index at
14.72%
And the Food & Staples Retailing index at
11.03%
Strategic Review 21
Another important marketplace initiative was the introduction of Tadawul’s first parallel market – Nomu. Nomu gives small-cap issuers – of which 9 listed in 2017 – the opportunity to raise capital in the local market.
With regards to the performance of the market itself, the "Tadawul" All Shares Index (“TASI”) reached 7,226.32 points as at 31st December 2017, as compared to 7,210.43 points in full year 2016, increasing by 0.22%.
Tadawul’s total market capitalisation at year-end was SAR 1,689.60bn, as compared with SAR 1,681.95bn increased by in 0.46% 2016. The value of shares traded on the Exchange decreased by 27.72% to SAR 836.28bn at year end. Trading volume decreased to 43.30bn shares, by 32.85% compared to the previous year. In total, 16 new securities
were listed on "Tadawul", with one on the main market, 9 on the Nomu parallel market, and 6 REITs listed on the Exchange. Market capitalisation remained at the same level thanks to the newly listed securities.
22 Annual Report 2017
Performance Review
As encouragement for current and future participation by Qualified Foreign Investors (QFIs) gained traction, the Exchange succeeded in diversifying the products and services it offers to market participants, and thereby its sources of revenue.
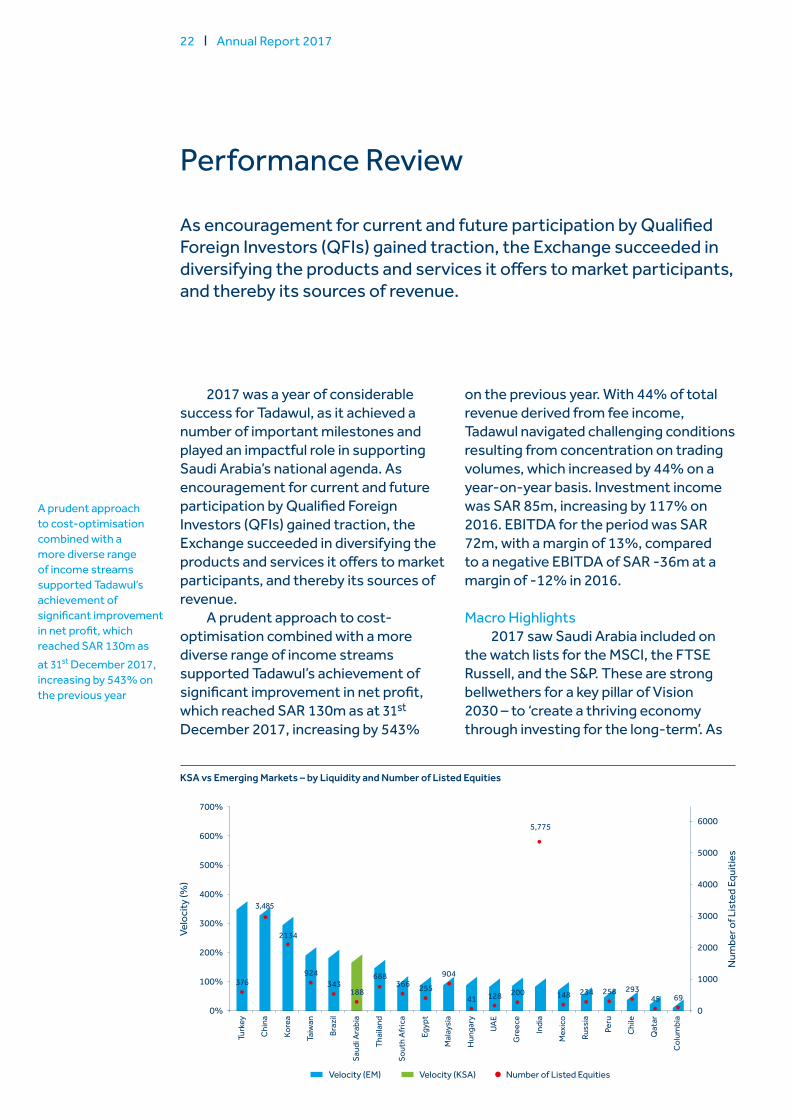
2017 was a year of considerable success for Tadawul, as it achieved a number of important milestones and played an impactful role in supporting Saudi Arabia’s national agenda. As encouragement for current and future participation by Qualified Foreign Investors (QFIs) gained traction, the Exchange succeeded in diversifying the products and services it offers to market participants, and thereby its sources of revenue.
A prudent approach to cost-optimisation combined with a more diverse range of income streams supported Tadawul’s achievement of significant improvement in net profit, which reached SAR 130m as at 31st December 2017, increasing by 543%
on the previous year. With 44% of total revenue derived from fee income, Tadawul navigated challenging conditions resulting from concentration on trading volumes, which increased by 44% on a year-on-year basis. Investment income was SAR 85m, increasing by 117% on 2016. EBITDA for the period was SAR 72m, with a margin of 13%, compared to a negative EBITDA of SAR -36m at a margin of -12% in 2016.
Macro Highlights2017 saw Saudi Arabia included on
the watch lists for the MSCI, the FTSE Russell, and the S&P. These are strong bellwethers for a key pillar of Vision 2030 – to ‘create a thriving economy through investing for the long-term’. As
A prudent approach to cost-optimisation combined with a more diverse range of income streams supported Tadawul’s achievement of significant improvement in net profit, which reached SAR 130m as at 31st December 2017, increasing by 543% on the previous year
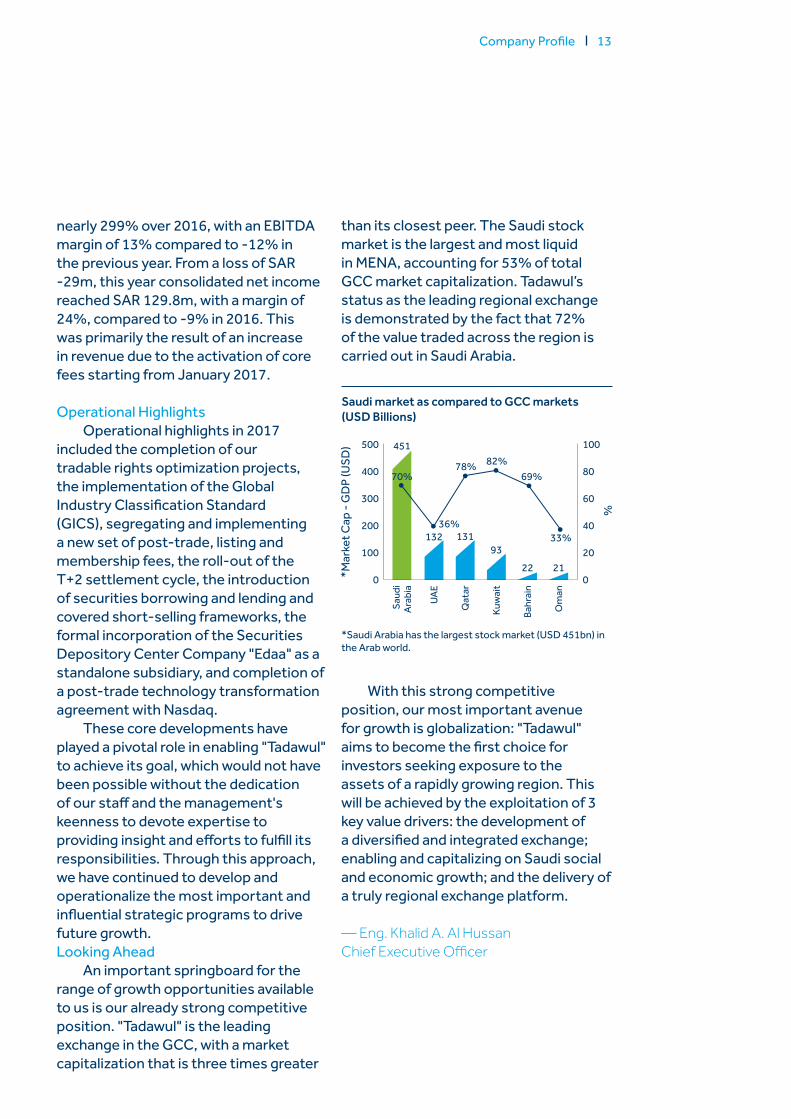
KSA vs Emerging Markets – by Liquidity and Number of Listed Equities
Num
ber o
f Lis
ted
Equi
ties
Velo
city
(%)
6000
5000
4000
3000
2000
1000
0
700%
600%
500%
400%
300%
200%
100%
0%
Turk
ey
Chi
na
Kore
a
Taiw
an
Braz
il
Saud
i Ara
bia
Thai
land
Sout
h Af
rica
Egyp
t
Mal
aysi
a
Hun
gary
UAE
Gre
ece
Indi
a
Mex
ico
Russ
ia
Peru
Chi
le
Qat
ar
Colu
mbi
a
Velocity (EM) Velocity (KSA) Number of Listed Equities
376
2134
924343 366 255 20012841 148 234
45 69293258
904688
188
3,485
5,775
Strategic Review 23
far as the local capital market – and by association the Exchange – is concerned, this development was a crucial step towards an expected upgrade to Emerging Market status, and a clear indication that Tadawul will soon be attracting significant levels of foreign
capital inflows. By directly supporting the diversification and growth of the Saudi economy, Tadawul facilitates its own development, as privatisation and investment in non-oil sectors gathers pace.
24 Annual Report 2017
Operating Review
The Focus value guides "Tadawul" in its efforts to achieve parity with world-leading stock markets, as the Exchange carries out its mission to offer sound, efficient and attractive capital market products and services that deliver superior value to market participants and shareholders.
Issuer Products and Services–––––––––––––
Investor Products and Services–––––––––––––
Supervision and Regulation–––––––––––––
Information Technology (IT)–––––––––––––
Information Security (IS)–––––––––––––
Corporate Restructuring –––––––––––––
Awareness and Education
Strategic Review 25
Operating highlights in 2017 included the completion of tradable rights optimisation projects, implementation of the Global Industry Classification Standard (GICS) and the incorporation of the Securities Depository Center Company (Edaa) as a standalone subsidiary
One of Tadawul’s core values is Focus. The company is a keen observer of the dynamics of the market, allowing it to make sound and forward-thinking decisions for the future. The Focus value guides "Tadawul" in its efforts to achieve parity with world-leading stock markets, as the Exchange carries out its mission to offer sound, efficient and attractive capital market products and services that deliver superior value to market participants and shareholders.
Operating highlights in 2017 included the completion of tradable rights optimisation projects, implementation of the Global Industry Classification Standard (GICS) and the incorporation of the Securities Depository Center Company (Edaa) as a standalone subsidiary. Other important achievements included identification and activation of post-trade, listing and membership fees, the launch of the parallel market (Nomu), which enables small-cap issuers to tap into the capital market and gain access to an additional source of funding, implementation of the T+2 settlement cycle to enhance security and align with best practice, and an agreement with Nasdaq to transform "Tadawul"’s post-trade technology.
Issuer Products and ServicesTadawul’s products and services are
at the heart of its success in providing a best-in-class exchange environment to issuers. The Exchange’s philosophy is to make continual improvements to its product and service offering, to ensure that issuers’ needs are catered for to the very best of its ability.
Through the launch of Nomu, "Tadawul" has empowered small-cap issuers with the opportunity to tap Saudi Arabia’s capital market. In this regard, "Tadawul" directly supports
growth-stage companies, and thereby the diversification of the Kingdom’s capital market landscape. The launch of Nomu also prompted fundamental updates to the Exchange’s front-end systems, including e-services channels such as the website, IFSAH, mobile app, Tadawulaty and e-reference data.
Real Estate Investment Traded Funds (REITs) were introduced as an asset class for the first time, with 6 REITs listed on the Stock Exchange in 2017. This initiative has provided improved and welcome access for the real estate sector to investors on "Tadawul". Equally, it provided an easy and reputable exit for real estate owners. With REITs growing in number across the GCC, and attracting investors seeking stable income generating opportunities, "Tadawul" expects them to be a popular asset class going forward.
Industrial classification for the main market was re-aligned with international standards, with listed companies re-classified in line with the Global Industry Classification Standard (GICS). This industry classification has seen the previous 16 "Tadawul" market sectors reclassified to 20 market sectors, more fitting for developments in the Saudi economy. This sector classification is necessary when it comes to international investors comparing companies in the same sectors. Adopting an international standard provides issuers with the required visibility on sectorial investors, and sheds light on available listed companies in different sectors.
GICS was successfully rolled out across all systems, including e-services channels such as the market’s website, IFSAH, mobile app, Tadawulaty and e-reference data. This delivered another important win for Tadawul’s ongoing ambition to achieve equivalence to the world’s best-regarded stock exchanges.
26 Annual Report 2017
Core technology systems, SAMA integration and e-services channels such as "Tadawul" website and Tadawulaty were all upgraded to support the T+2 settlement cycle.
Supervision and Regulation2017 saw the launch of
the Transition & Activation of Responsibilities Project (TAR). This initiative is in line with the National Agenda and the Saudi Vision 2030, which together aims to improve the Saudi business environment through the strict application of regulations conducive to long-term investment. This essential project aims to activate Tadawul’s responsibilities under the Capital Market Law, under which "Tadawul" will progress towards full responsibility for regulating and approving the listing of all securities. The TAR project has resulted in the issuance of two sets of rules: Tadawul’s listing rules and the CMA’s Rules on the Offer of Securities and Continuing Obligations. These regulations serve to monitor and standardize the offering and listing of securities on the market as well as obligations for issuers and shareholders. As part of the efforts of the Capital Market Authority (CMA) and the Saudi Stock Exchange (Tadawul) have encouraged all stakeholders and investors in the Saudi capital market to participate in reflecting their views regarding the draft rules for CMA &"Tadawul". The CMA Board has issued its resolution approving the Rules in December 2017 which will be effective from 15/7/1439H corresponding to 1/4/2018G. in addition, a media plan and a dedicated system for issuers and authorized persons were approved and the information is available on the Tadawul’s website.
Investor Products and Services A second essential delivery strand
for developing a world-class exchange is to provide first-rate investor services. During 2017, considerable progress was made in upgrading technologies and processes, to the ultimate benefit of Tadawul’s operating model. This included the launch of a suite of market information products and services, covering e-reference, analytics, tick data and non-display.
Among the most important strategic projects in 2017 was the Post-Trade Program – to enable "Tadawul" to execute its business growth and strategic direction, which includes full replacement of the current clearing and settlement system (Equator) with the state-of-the-art CSD system.
A change from a T+0 to a T+2 settlement cycle was successfully implemented, enabling a two-business day settlement cycle, which will provide the following benefits:
1. Allow foreign investors to access the Saudi capital market without being obliged to immobilise cash before buying securities. This change increases the level of asset safety for investors, and provides enough time to verify transactions and deal with errors should they occur.
2. Align "Tadawul" with leading global settlement practices, opening up new listing opportunities as well as participation in global market indices.
3. Develop an environment that promotes institutional-level investment and meets the necessary requirements for coping with future change.
Among the most important strategic projects in 2017 was the Post-Trade Program – to enable Tadawul to execute its business growth and strategic direction, which includes full replacement of the current clearing and settlement system (Equator) with the state-of-the-art CSD system
Strategic Review 27
Information Technology (IT)In order to deliver a stock exchange
with infrastructure on par with the best in the world, "Tadawul" applies international best practice standards to its IT operations. "Tadawul" is widely recognized for the quality and reliability of its systems, with 3 core pillars feeding directly into the IT strategy. These are: Technology Operations; Corporate Strategy and Business Initiative Support; and Technology Governance and Efficiency.
Technology OperationsAs technology is the enabler for the
Exchange’s services, a top priority for "Tadawul" is to secure the availability of its systems and services. In 2017, 100% systems availability was achieved without any interruption to services or impact on the market. A major network upgrade was also completed, as part of Tadawul’s infrastructure roadmap. The upgrade mitigates risks related to future network devices’ end-of-life, as well as meeting Tadawul’s business continuity requirements with a better performing and secure network that serves as a backbone for the IT infrastructure. Major planned technology infrastructure maintenance was delivered in the course of the year, with the successful roll-out of changes and upgrades a testament to the maturity of the IT infrastructure. This maturity is a foundation block for quality, flexibility to change, and readiness to transition processes and frameworks.
Corporate Strategy and Business Initiative Support
With Tadawul’s corporate strategy comprising highly ambitious projects for increasing openness to international investors, initiatives in 2017 had considerable requirement for IT support
The Post-Trade Program, for example, required full technology replacement of the current registry, depository and settlement solution (Equator). In addition to introducing a new central counter party clearing solution, developed by the world’s leading exchange technology provider Nasdaq
and enablement. The Post-Trade Program, for example, required full technology replacement of the current registry, depository and settlement solution (Equator). In addition to introducing a new central counter party clearing solution, developed by the world’s leading exchange technology provider Nasdaq. Further technology changes were successfully introduced to support the launch of the Nomu parallel market, the T+2 settlement cycle, industry re-classification, and the "Tadawul" Virtual Trading Platform (VTP). More than 40 regulation initiatives and requirements were supported, fulfilling successful integration with both regulatory and government entities.
Technology Governance and EfficiencyIT governance is a major part of
Tadawul’s technology operating model, guiding standards and policies, quality, IT process optimization, cost optimization, change management, risk mitigation, and reporting on IT performance in a timely manner. "Tadawul" adheres to ITIL standards, which include a list of integrated processes to ensure IT operation integration, quality and efficiency. In 2017, IT successfully completed annual surveillance audits for two renowned international standards – ISO 9001 Quality Management Systems, and ISO 20000 IT Services Management Systems.
Information Security (IS)As the Middle East’s leading stock
exchange, "Tadawul" has a considerable level of responsibility when it comes to information security – particularly in the protection and management of information concerning market participants, from issuers to investors and all those who operate in between.
28 Annual Report 2017
Tadawul’s security objectives are in line with the organization’s overall goals and strategic plans. These include effective incident planning and management, development and maintenance of the Security Management Framework, maintaining updated and fine-tuned security monitoring tools, successful security awareness, training and education for all employees, and access management optimisation. The security strategy is primarily designed to protect critical information and physical assets, and the continually changing security landscape ensures that objectives address the increasing sophistication of online and network challenges.
To this end, the overall maturity of the cyber and physical security functions increased significantly in 2017, addressing the dramatic increase in the volume and strength of cyber-attacks, malware and ransomware observed globally throughout the year. The security team continues to use innovative technologies and best practice to keep up with this ever-evolving environment, and is certified by its successful completion of the Information Security Management System ISO 27001:2013 surveillance audit.
Corporate Restructuring Among the structural enhancement
made at "Tadawul" in 2017, the process of establishing the Central Counterparty (CCP) company started and it is expected to be fully operational by the second half of 2019.
The full incorporation of the Securities Depository Center Company (Edaa) at the beginning of the year was a highly significant project for improving the range of post-trade products and
services offered by "Tadawul". "Edaa" is now a standalone (wholly-owned) subsidiary, with its own management and governance, and will play a central role in Tadawul’s efforts to develop a more sophisticated exchange, aligned with the highest international standards.
Since its inception at the start of the year, "Edaa" has successfully completed key transition milestones. Essential technology delivery has now been made both on Oracle ERP implementation and Edaa’s portal implementation, as well as the development and launch of the business’ new website. Furthermore, a separate "Edaa" branding and identity has been launched. Enjoying a successful first year, "Edaa" achieved 90% of its target net income.
Edaa’s aim is to emulate the Exchange’s objectives in relation to developing infrastructures and procedures to execute transactions in alignment with international standards. The Center is servicing 2 types of customers: issuers – listed and unlisted – and investors. It performs the settlement of trades made on the Exchange Platform and delivers added value services to its main customers. One of its additional objectives is to enhance the efficiency of securities deposit and registration services, in alignment with Saudi Vision 2030, through the development of a more resourceful environment that fosters excellence within all sectors related to the capital market.
The Center has positioned itself as a ‘regional gateway’ into foreign markets, with a long-term view to becoming the regional securities depositary hub. "Edaa" also provides a range of services tailored to Saudi Arabia’s domestic market and current capital market model. The Center has worked alongside
The Centre has positioned itself as a ‘regional gateway’ into foreign markets, with a long-term view to becoming the regional securities depositary hub. "Edaa" also provides a range of services tailored to Saudi Arabia’s domestic market and current capital market model
Strategic Review 29
"Tadawul" in extending and enhancing its service portfolio, towards the needs of international investors.
Awareness and EducationAs part of the ‘Invest Wisely’
awareness programme, additional technology enhancements included the launch of "Tadawul" Virtual Trading Platform, to create awareness of trading and investing to existing and prospective investors. The Invest Wisely programme conducted 10 workshops, carried out as part of Tadawul’s ongoing efforts to increase financial literacy and raise investor’s awareness and confidence, achieved through cooperation with leading financial experts.
As part of Tadawul's ongoing efforts, a memorandum of understanding was signed with the Ministry of Education aimed at promoting cooperation between the two entities to raise
investment awareness in all fields among university students in the Kingdom.
30 Annual Report 2017
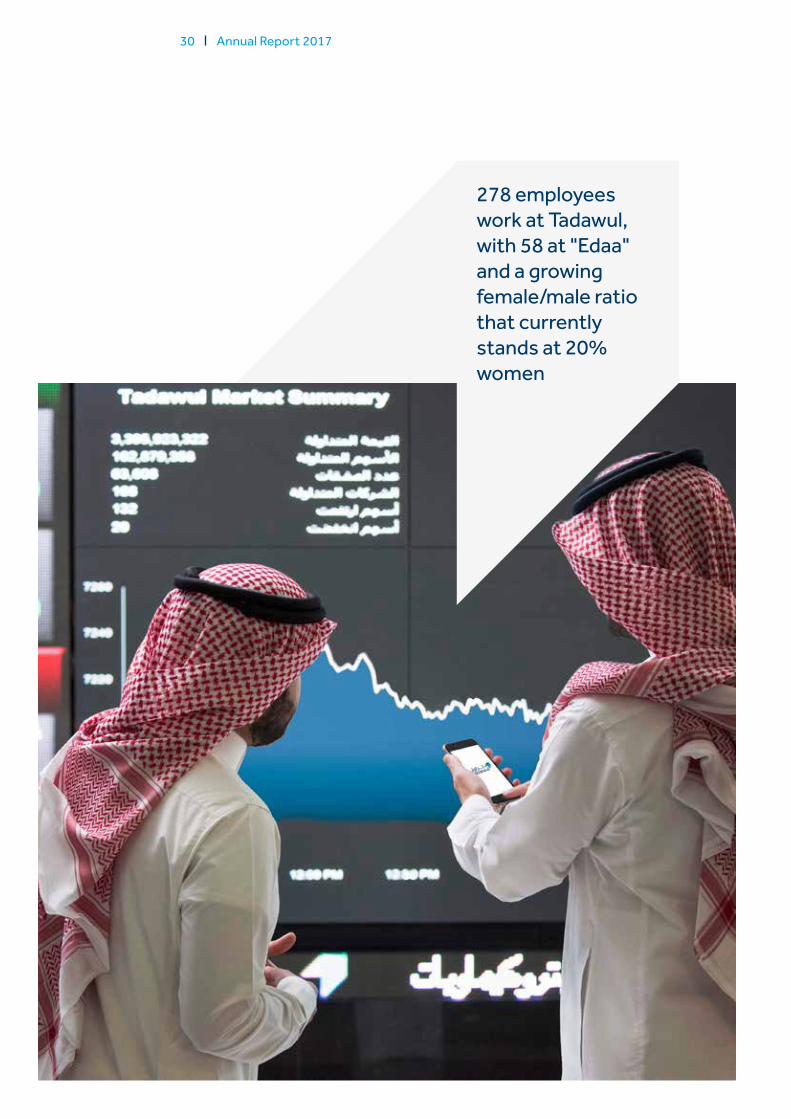
278 employees work at Tadawul, with 58 at "Edaa" and a growing female/male ratio that currently stands at 20% women
Strategic Review 31
Human Capital
Tadawul aims to implement its HR Roadmap continuously, which has the principal goal of enhancing organisational capability by attracting and retaining talent.
Tadawul’s success rests on the efforts of its employees, and Tadawul’s Human Resources (HR) is focused on supporting the wider corporate strategy. HR is geared towards Tadawul and "Edaa" building and sustaining organisational capability through engaged, empowered, and enabled talent, not only to meet, but outperform strategic objectives. Tadawul aims to implement its HR Roadmap continuously, which has the principal goal of enhancing organisational capability by attracting and retaining talent.
HR is the custodian of Tadawul’s values of Focus, Fairness and Transparency, and each is at the core of its activities. In order to deliver on these values, HR scrutinises and measures progress through 17 different KPIs including, manpower cost and internal promotion rates. Both Tadawul and "Edaa" performed well against the targets assigned to them in 2017.
One of the core values of Tadawul is Fairness, with the organisation applying self-imposed filters in its dealings with different parties to ensure fair treatment of all stakeholders. "Tadawul" applies objectivity in evaluating its employees and provides equal opportunities to all staff. As well as its commercial responsibility, Tadawul abides by the highest ethical standards in its daily work.
Close to 278 employees work at Tadawul, with 58 at "Edaa" and a growing female/male ratio that currently stands at 20% women, ensuring direct support
for Vision 2030’s objective of significantly increasing female participation in the workplace, and promoting professional competencies and skills among Saudi women. Tadawul also maintains a strong commitment to promoting the role of Saudi professionals within the economy, and is proud of its Platinum-level 92% Saudization rate.
As part of its 2017 Total Reward Strategy review, Tadawul introduced a unique employee savings plan, aimed at supporting its talented staff in saving and investing for their future. While the plan management cost is fully subsidised, Tadawul has also offered an employer contribution that is linked to length of service. The seven-year programme has been built in line with Tadawul’s 2022 strategy delivery.
As well as on the job training, Tadawul promotes cross-functional training, which in 2017 witnessed collaboration between Regulatory Policy and Oversight, Sales and Marketing, and Listing – enabling staff to gain exposure to new practices and disciplines during a three-month scheme. In the course of the year, Tadawul’s employees collectively benefitted from 1,094 days of external training, 27 seats of customised visits to reputable international exchanges, 36 individual leadership programs, 89 accredited global certifications – including CIPD, CME CISSP – and 99 advanced technical courses such as Oracle database management, VAT seminars and derivatives courses.
Tadawul also maintains a strong commitment to promoting the role of Saudi professionals within the economy, and is proud of its Platinum-level 92% Saudization rate
32 Annual Report 2017
Social Responsibility
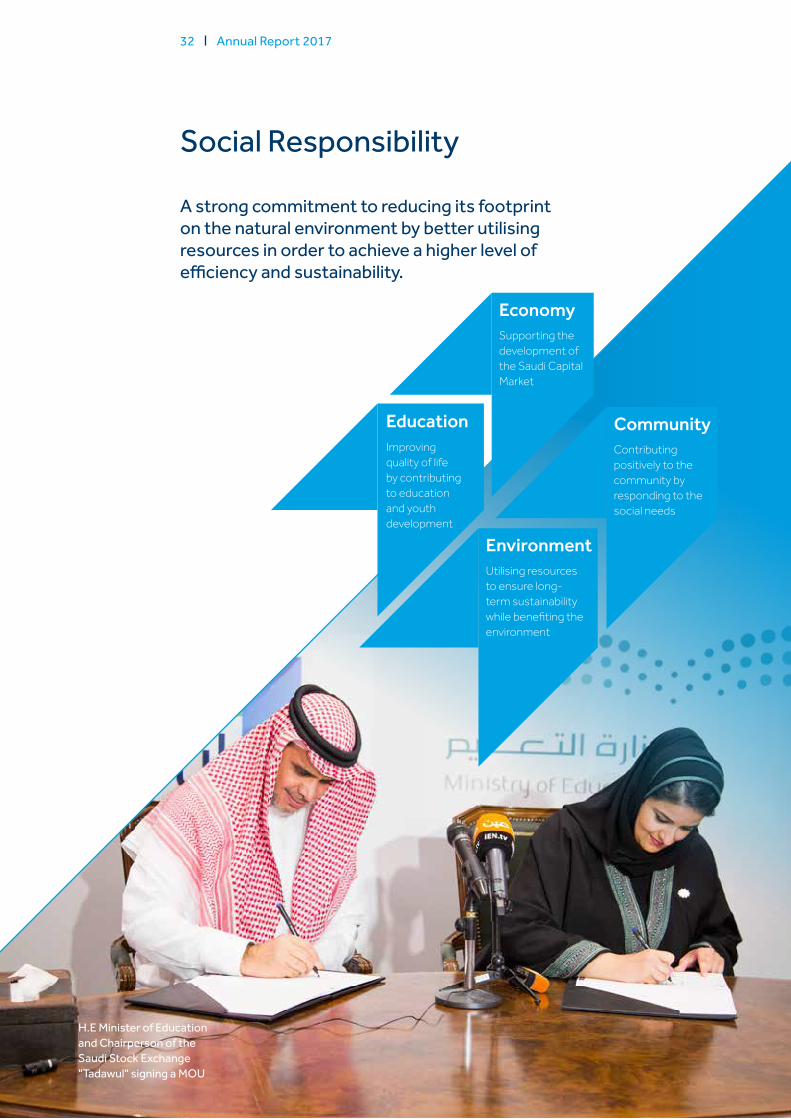
A strong commitment to reducing its footprint on the natural environment by better utilising resources in order to achieve a higher level of efficiency and sustainability.
EnvironmentUtilising resources to ensure long-term sustainability while benefiting the environment
CommunityContributing positively to the community by responding to the social needs
EconomySupporting the development of the Saudi Capital Market
EducationImproving quality of life by contributing to education and youth development
H.E Minister of Education and Chairperson of the Saudi Stock Exchange "Tadawul" signing a MOU
Strategic Review 33
Tadawul’s commitment to supporting the local community and contributing to the sustainable development of Saudi Arabia rests on the following areas of focus: Economy, Education, Environment, and Community.Economy
Tadawul’s 2022 strategy is focused on alignment and direct support for the process of building a robust and diverse capital market environment that will, in turn, directly contribute to Saudi economic growth and the aims of Vision 2030. Moreover, by nurturing and improving its workforce, the Exchange is investing for the long-term. This is particularly evident in its high level of Saudization (92%).Education
Tadawul supports enhanced quality of life in the Kingdom by carrying out a series of initiatives that made a valuable contribution to education and youth development. The Injaz programme provided high-school and university students with hands-on work experience, allowing them to learn the basics of starting a business. Over the course of 10 weeks, 10 Tadawul volunteers carried out this programme at 5 schools.
The Global Money Week (GMW) initiative is an annual programme that raises financial awareness in the community and aids people in making better financial decisions.
A MOU has been signed between “Tadawul” and the Ministry of Education to contribute to University’s Students in various fields of investment and to provide the necessary materials and tools to enable them to invest skilfully and consciously.
The MOU includes workshops organization at the universities and the launch of competitions at the university level through simulation system. Environment
Tadawul has a strong commitment to reducing its footprint on the natural environment by better utilising resources in order to achieve a higher level of efficiency
and sustainability. A key environmental initiative in 2017 was the development of a formal Recycling & Waste Management programme, which will be fully activated in 2018.Community
Considerable headway was made towards contributing positively to the community. An initiative with the Disabled Children’s Association saw Tadawul’s CEO distribute gifts to children and sign an MoU with the charity, while "Tadawul" supported the charity’s Greeting Cards programme whereby funds are raised by companies purchasing cards made by disabled children.
Tadawul supported the Donate for Life initiative, which carried out an awareness campaign for blood donation, with employees encouraged to donate blood to the KFSH Blood Mobile Car. Further employee initiatives included a Breast Cancer Awareness seminar, held for all female employees, and a Stress Management Workshop, which was open to all staff.
During the Holy Month of Ramadan, Tadawul’s "Aman" campaign was initiated in response to the increased number of car accidents during last hour of day, as drivers tend to speed before Maghreb prayer to arrive in time for Iftar. The campaign distributed 200,000 Iftar meals to drivers on the roads and at traffic intersections in Riyadh, Dammam and Jeddah. In addition, Tadawul employees had the opportunity to serve as active volunteers distributing and preparing the meals throughout the Holy Month.
All of Tadawul’s sustainability work is underpinned by honoring its national responsibilities of adopting regulatory and market best practices, fostering market literacy and investor protection and delivering on its socio-economic responsibilities.
34 Annual Report 2017
Board of Directors
Governance 35
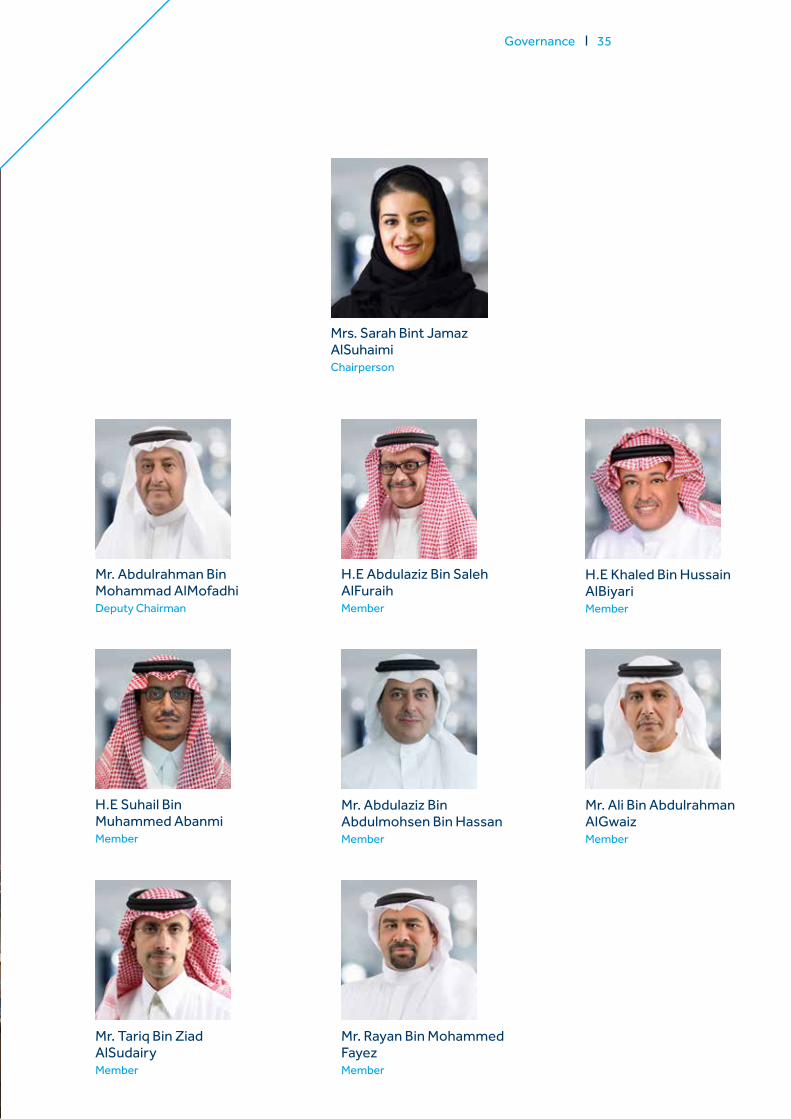
Mrs. Sarah Bint Jamaz AlSuhaimiChairperson
Mr. Abdulrahman Bin Mohammad AlMofadhiDeputy Chairman
H.E Abdulaziz Bin Saleh AlFuraihMember
H.E Suhail Bin Muhammed AbanmiMember
Mr. Abdulaziz Bin Abdulmohsen Bin HassanMember
Mr. Tariq Bin Ziad AlSudairyMember
H.E Khaled Bin Hussain AlBiyariMember
Mr. Ali Bin Abdulrahman AlGwaizMember
Mr. Rayan Bin Mohammed FayezMember
36 Annual Report 2017
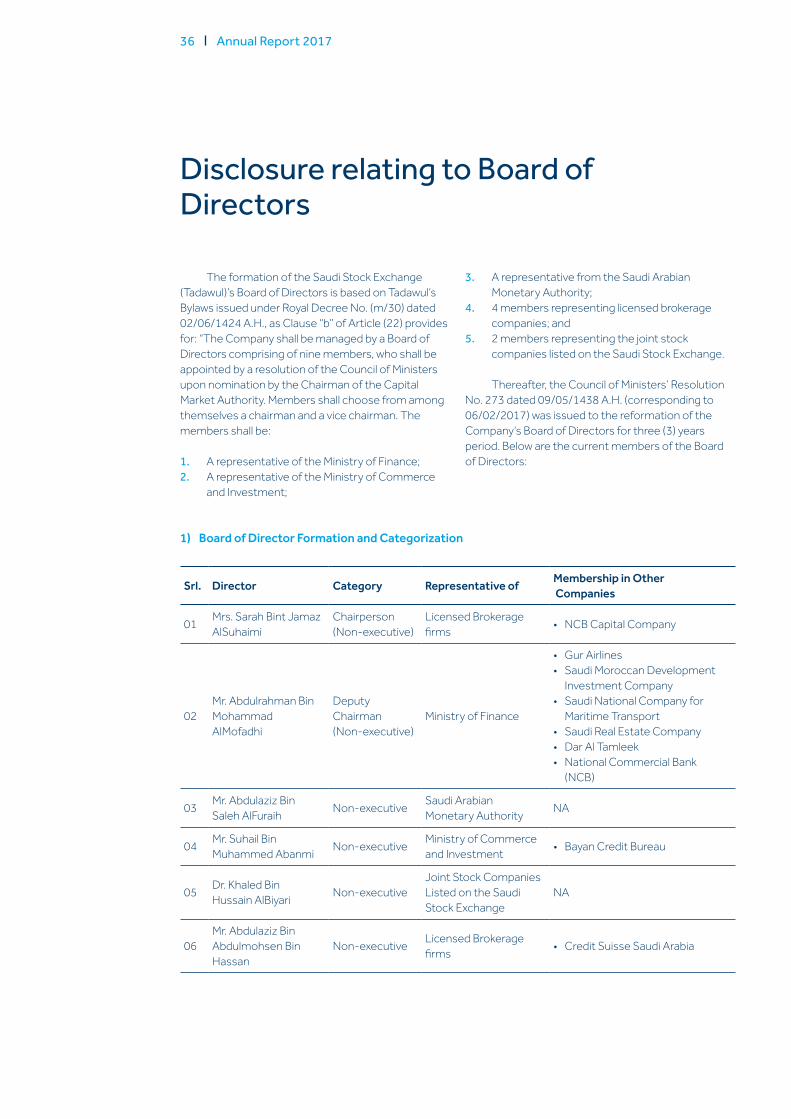
The formation of the Saudi Stock Exchange (Tadawul)’s Board of Directors is based on Tadawul’s Bylaws issued under Royal Decree No. (m/30) dated 02/06/1424 A.H., as Clause “b” of Article (22) provides for: “The Company shall be managed by a Board of Directors comprising of nine members, who shall be appointed by a resolution of the Council of Ministers upon nomination by the Chairman of the Capital Market Authority. Members shall choose from among themselves a chairman and a vice chairman. The members shall be:
1. A representative of the Ministry of Finance;2. A representative of the Ministry of Commerce
and Investment;
3. A representative from the Saudi Arabian Monetary Authority;
4. 4 members representing licensed brokerage companies; and
5. 2 members representing the joint stock companies listed on the Saudi Stock Exchange.
Thereafter, the Council of Ministers’ Resolution No. 273 dated 09/05/1438 A.H. (corresponding to 06/02/2017) was issued to the reformation of the Company’s Board of Directors for three (3) years period. Below are the current members of the Board of Directors:
1) Board of Director Formation and Categorization
Srl. Director Category Representative of Membership in Other Companies
01 Mrs. Sarah Bint Jamaz AlSuhaimi
Chairperson (Non-executive)
Licensed Brokerage firms • NCB Capital Company
02Mr. Abdulrahman Bin Mohammad AlMofadhi
Deputy Chairman (Non-executive)
Ministry of Finance
• Gur Airlines• Saudi Moroccan Development
Investment Company• Saudi National Company for
Maritime Transport• Saudi Real Estate Company• Dar Al Tamleek• National Commercial Bank
(NCB)
03 Mr. Abdulaziz Bin Saleh AlFuraih Non-executive Saudi Arabian
Monetary Authority NA
04 Mr. Suhail Bin Muhammed Abanmi Non-executive Ministry of Commerce
and Investment • Bayan Credit Bureau
05 Dr. Khaled Bin Hussain AlBiyari Non-executive
Joint Stock Companies Listed on the Saudi Stock Exchange
NA
06Mr. Abdulaziz Bin Abdulmohsen Bin Hassan
Non-executive Licensed Brokerage firms • Credit Suisse Saudi Arabia
Disclosure relating to Board of Directors
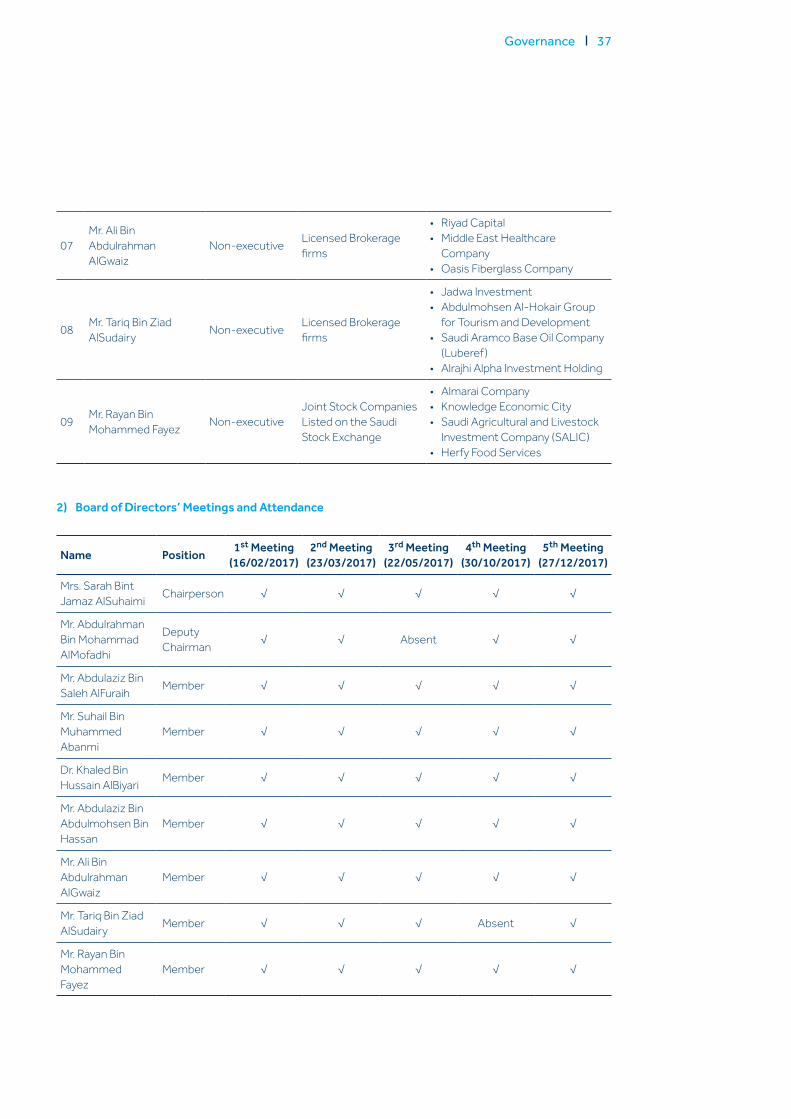
Governance 37
07Mr. Ali Bin Abdulrahman AlGwaiz
Non-executive Licensed Brokerage firms
• Riyad Capital• Middle East Healthcare
Company• Oasis Fiberglass Company
08 Mr. Tariq Bin Ziad AlSudairy Non-executive Licensed Brokerage
firms
• Jadwa Investment• Abdulmohsen Al-Hokair Group
for Tourism and Development• Saudi Aramco Base Oil Company
(Luberef)• Alrajhi Alpha Investment Holding
09 Mr. Rayan Bin Mohammed Fayez Non-executive
Joint Stock Companies Listed on the Saudi Stock Exchange
• Almarai Company• Knowledge Economic City• Saudi Agricultural and Livestock
Investment Company (SALIC)• Herfy Food Services
2) Board of Directors’ Meetings and Attendance
Name Position 1st Meeting (16/02/2017)
2nd Meeting (23/03/2017)
3rd Meeting (22/05/2017)
4th Meeting (30/10/2017)
5th Meeting (27/12/2017)
Mrs. Sarah Bint Jamaz AlSuhaimi Chairperson √ √ √ √ √
Mr. Abdulrahman Bin Mohammad AlMofadhi
Deputy Chairman √ √ Absent √ √
Mr. Abdulaziz Bin Saleh AlFuraih Member √ √ √ √ √
Mr. Suhail Bin Muhammed Abanmi
Member √ √ √ √ √
Dr. Khaled Bin Hussain AlBiyari Member √ √ √ √ √
Mr. Abdulaziz Bin Abdulmohsen Bin Hassan
Member √ √ √ √ √
Mr. Ali Bin Abdulrahman AlGwaiz
Member √ √ √ √ √
Mr. Tariq Bin Ziad AlSudairy Member √ √ √ Absent √
Mr. Rayan Bin Mohammed Fayez
Member √ √ √ √ √
38 Annual Report 2017
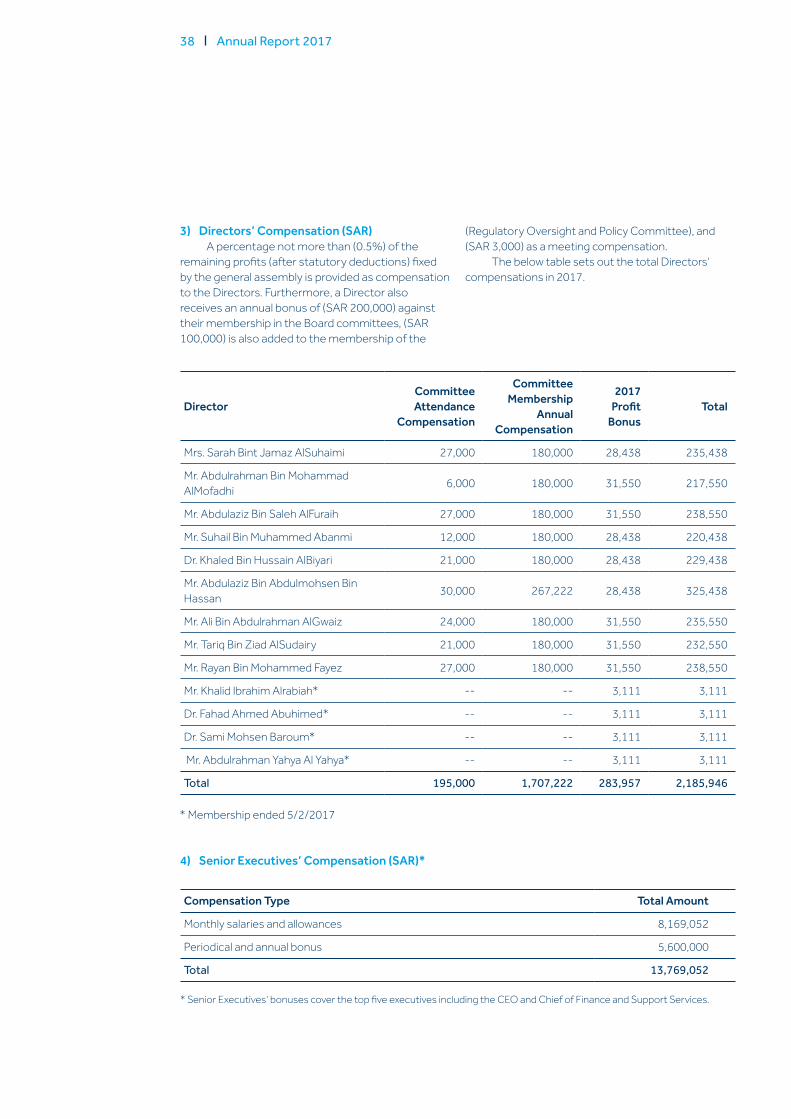
3) Directors’ Compensation (SAR)A percentage not more than (0.5%) of the
remaining profits (after statutory deductions) fixed by the general assembly is provided as compensation to the Directors. Furthermore, a Director also receives an annual bonus of (SAR 200,000) against their membership in the Board committees, (SAR 100,000) is also added to the membership of the
(Regulatory Oversight and Policy Committee), and (SAR 3,000) as a meeting compensation.
The below table sets out the total Directors‘ compensations in 2017.
* Senior Executives‘ bonuses cover the top five executives including the CEO and Chief of Finance and Support Services.
DirectorCommittee Attendance
Compensation
Committee Membership
Annual Compensation
2017 Profit
BonusTotal
Mrs. Sarah Bint Jamaz AlSuhaimi 27,000 180,000 28,438 235,438
Mr. Abdulrahman Bin Mohammad AlMofadhi 6,000 180,000 31,550 217,550
Mr. Abdulaziz Bin Saleh AlFuraih 27,000 180,000 31,550 238,550
Mr. Suhail Bin Muhammed Abanmi 12,000 180,000 28,438 220,438
Dr. Khaled Bin Hussain AlBiyari 21,000 180,000 28,438 229,438
Mr. Abdulaziz Bin Abdulmohsen Bin Hassan 30,000 267,222 28,438 325,438
Mr. Ali Bin Abdulrahman AlGwaiz 24,000 180,000 31,550 235,550
Mr. Tariq Bin Ziad AlSudairy 21,000 180,000 31,550 232,550
Mr. Rayan Bin Mohammed Fayez 27,000 180,000 31,550 238,550
Mr. Khalid Ibrahim Alrabiah* -- -- 3,111 3,111
Dr. Fahad Ahmed Abuhimed* -- -- 3,111 3,111
Dr. Sami Mohsen Baroum* -- -- 3,111 3,111
Mr. Abdulrahman Yahya Al Yahya* -- -- 3,111 3,111
Total 195,000 1,707,222 283,957 2,185,946
4) Senior Executives’ Compensation (SAR)*
Compensation Type Total Amount
Monthly salaries and allowances 8,169,052
Periodical and annual bonus 5,600,000
Total 13,769,052
* Membership ended 5/2/2017
Governance 39
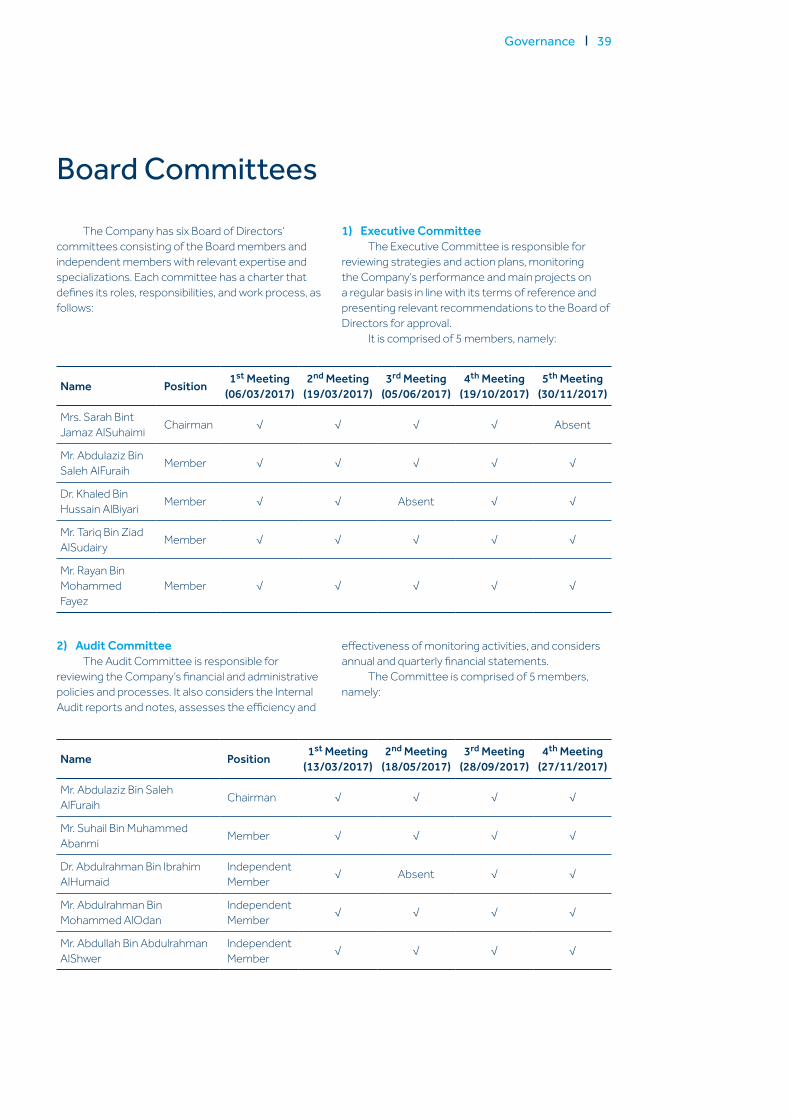
2) Audit Committee The Audit Committee is responsible for
reviewing the Company‘s financial and administrative policies and processes. It also considers the Internal Audit reports and notes, assesses the efficiency and
effectiveness of monitoring activities, and considers annual and quarterly financial statements.
The Committee is comprised of 5 members, namely:
Name Position 1st Meeting (06/03/2017)
2nd Meeting (19/03/2017)
3rd Meeting (05/06/2017)
4th Meeting (19/10/2017)
5th Meeting (30/11/2017)
Mrs. Sarah Bint Jamaz AlSuhaimi Chairman √ √ √ √ Absent
Mr. Abdulaziz Bin Saleh AlFuraih Member √ √ √ √ √
Dr. Khaled Bin Hussain AlBiyari Member √ √ Absent √ √
Mr. Tariq Bin Ziad AlSudairy Member √ √ √ √ √
Mr. Rayan Bin Mohammed Fayez
Member √ √ √ √ √
Name Position 1st Meeting (13/03/2017)
2nd Meeting (18/05/2017)
3rd Meeting (28/09/2017)
4th Meeting (27/11/2017)
Mr. Abdulaziz Bin Saleh AlFuraih Chairman √ √ √ √
Mr. Suhail Bin Muhammed Abanmi Member √ √ √ √
Dr. Abdulrahman Bin Ibrahim AlHumaid
Independent Member √ Absent √ √
Mr. Abdulrahman Bin Mohammed AlOdan
Independent Member √ √ √ √
Mr. Abdullah Bin Abdulrahman AlShwer
Independent Member √ √ √ √
The Company has six Board of Directors‘ committees consisting of the Board members and independent members with relevant expertise and specializations. Each committee has a charter that defines its roles, responsibilities, and work process, as follows:
1) Executive Committee The Executive Committee is responsible for
reviewing strategies and action plans, monitoring the Company‘s performance and main projects on a regular basis in line with its terms of reference and presenting relevant recommendations to the Board of Directors for approval.
It is comprised of 5 members, namely:
Board Committees
40 Annual Report 2017
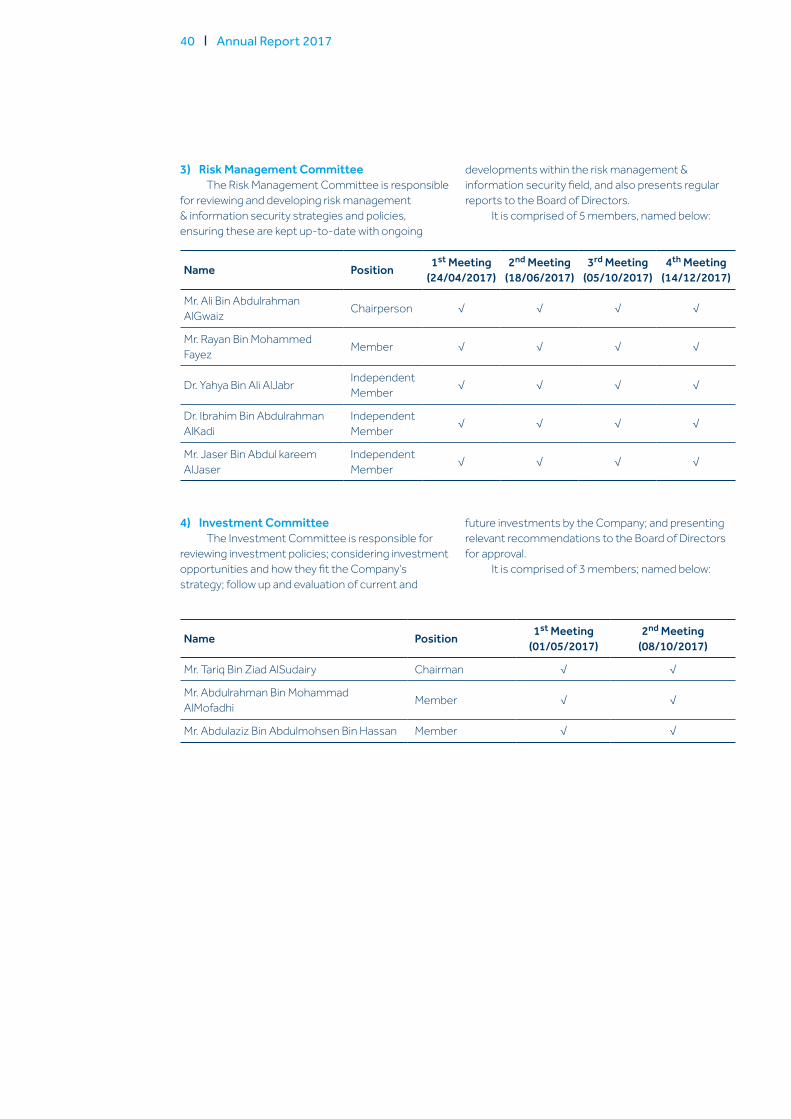
3) Risk Management Committee The Risk Management Committee is responsible
for reviewing and developing risk management & information security strategies and policies, ensuring these are kept up-to-date with ongoing
developments within the risk management & information security field, and also presents regular reports to the Board of Directors.
It is comprised of 5 members, named below:
4) Investment Committee The Investment Committee is responsible for
reviewing investment policies; considering investment opportunities and how they fit the Company‘s strategy; follow up and evaluation of current and
future investments by the Company; and presenting relevant recommendations to the Board of Directors for approval.
It is comprised of 3 members; named below:
Name Position 1st Meeting (24/04/2017)
2nd Meeting (18/06/2017)
3rd Meeting (05/10/2017)
4th Meeting (14/12/2017)
Mr. Ali Bin Abdulrahman AlGwaiz Chairperson √ √ √ √
Mr. Rayan Bin Mohammed Fayez Member √ √ √ √
Dr. Yahya Bin Ali AlJabr Independent Member √ √ √ √
Dr. Ibrahim Bin Abdulrahman AlKadi
Independent Member √ √ √ √
Mr. Jaser Bin Abdul kareem AlJaser
Independent Member √ √ √ √
Name Position 1st Meeting (01/05/2017)
2nd Meeting (08/10/2017)
Mr. Tariq Bin Ziad AlSudairy Chairman √ √
Mr. Abdulrahman Bin Mohammad AlMofadhi Member √ √
Mr. Abdulaziz Bin Abdulmohsen Bin Hassan Member √ √
Governance 41
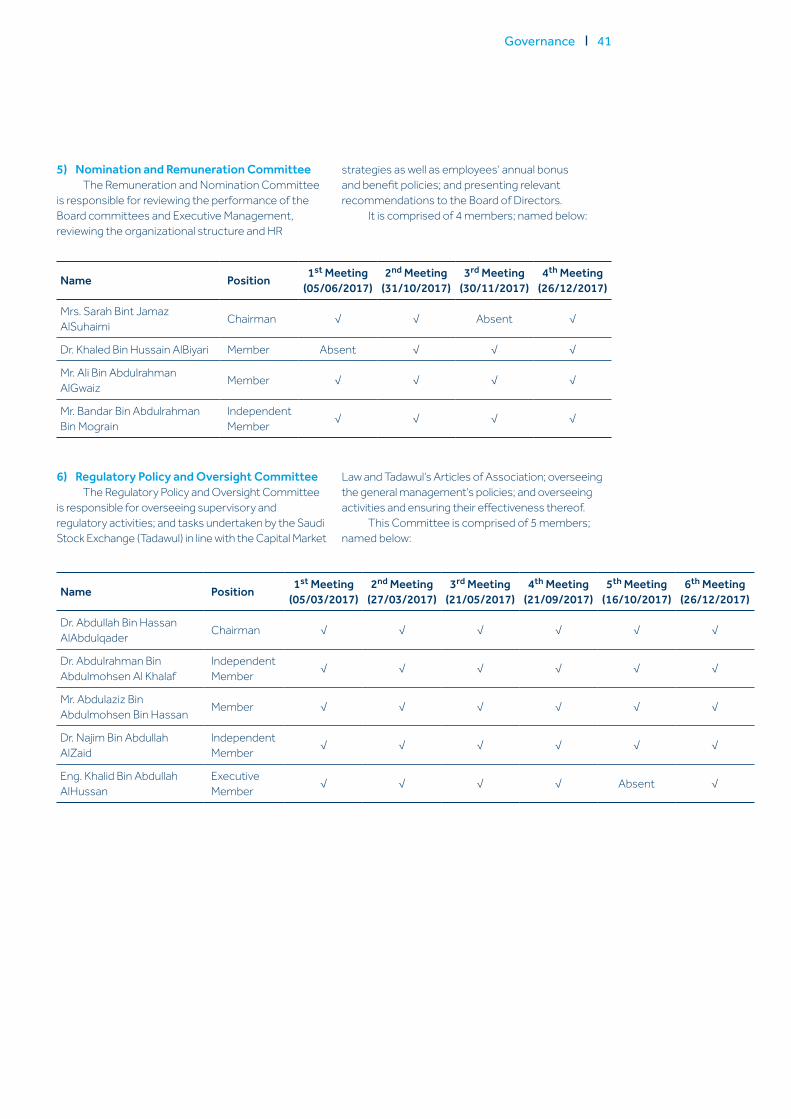
5) Nomination and Remuneration Committee The Remuneration and Nomination Committee
is responsible for reviewing the performance of the Board committees and Executive Management, reviewing the organizational structure and HR
strategies as well as employees‘ annual bonus and benefit policies; and presenting relevant recommendations to the Board of Directors.
It is comprised of 4 members; named below:
Name Position 1st Meeting (05/06/2017)
2nd Meeting (31/10/2017)
3rd Meeting (30/11/2017)
4th Meeting (26/12/2017)
Mrs. Sarah Bint Jamaz AlSuhaimi Chairman √ √ Absent √
Dr. Khaled Bin Hussain AlBiyari Member Absent √ √ √
Mr. Ali Bin Abdulrahman AlGwaiz Member √ √ √ √
Mr. Bandar Bin Abdulrahman Bin Mograin
Independent Member √ √ √ √
6) Regulatory Policy and Oversight Committee The Regulatory Policy and Oversight Committee
is responsible for overseeing supervisory and regulatory activities; and tasks undertaken by the Saudi Stock Exchange (Tadawul) in line with the Capital Market
Law and Tadawul’s Articles of Association; overseeing the general management‘s policies; and overseeing activities and ensuring their effectiveness thereof.
This Committee is comprised of 5 members; named below:
Name Position 1st Meeting (05/03/2017)
2nd Meeting (27/03/2017)
3rd Meeting (21/05/2017)
4th Meeting (21/09/2017)
5th Meeting (16/10/2017)
6th Meeting (26/12/2017)
Dr. Abdullah Bin Hassan AlAbdulqader Chairman √ √ √ √ √ √
Dr. Abdulrahman Bin Abdulmohsen Al Khalaf
Independent Member √ √ √ √ √ √
Mr. Abdulaziz Bin Abdulmohsen Bin Hassan Member √ √ √ √ √ √
Dr. Najim Bin Abdullah AlZaid
Independent Member √ √ √ √ √ √
Eng. Khalid Bin Abdullah AlHussan
Executive Member √ √ √ √ Absent √
42 Annual Report 2017
The Company‘s policy for distribution of annual net income is based on the provisions of its Articles of Association and the availability of liquidity to meet liabilities and strategic projects. Annual net profits (after deduction of all overheads and expenses) shall be distributed as follows:
1. 10% of net profits are allocated to the statutory reserve. The Ordinary General Assembly may suspend this allocation once this reserve equals half the Company‘s paid-up capital.
2. The Ordinary General Assembly – at the Board of Directors‘ recommendation – may allocate a percentage of net profits for other special reserves.
3. Of the remainder, a first payment equaling 5% of paid-up capital is allocated to the shareholders.
4. After these allocations, a percentage of the remainder (to be determined by the Ordinary General Assembly, provided that such percentage does not exceed 0.5% of the net profit) is allocated as a bonus for the Board of Directors. The remainder will be distributed to the shareholders as an additional dividend.
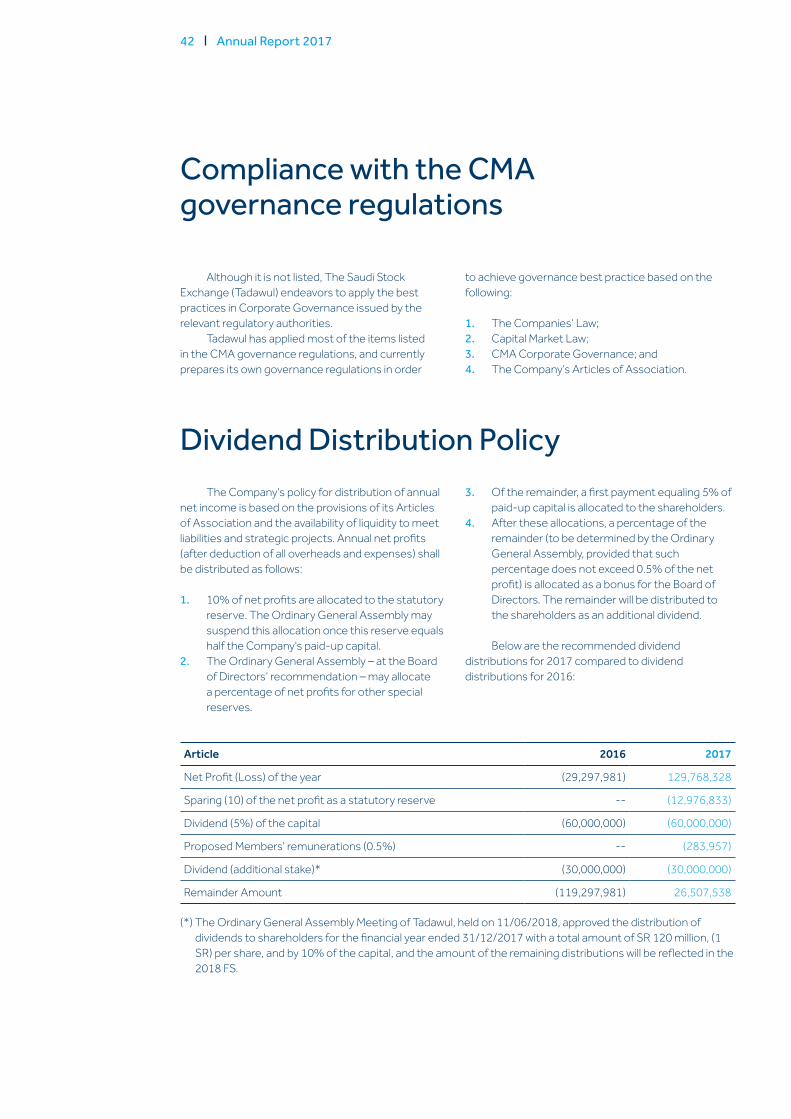
Below are the recommended dividend distributions for 2017 compared to dividend distributions for 2016:
Dividend Distribution Policy
Compliance with the CMA governance regulations
Although it is not listed, The Saudi Stock Exchange (Tadawul) endeavors to apply the best practices in Corporate Governance issued by the relevant regulatory authorities.
Tadawul has applied most of the items listed in the CMA governance regulations, and currently prepares its own governance regulations in order
to achieve governance best practice based on the following:
1. The Companies‘ Law; 2. Capital Market Law; 3. CMA Corporate Governance; and4. The Company‘s Articles of Association.
Article 2016 2017
Net Profit (Loss) of the year (29,297,981) 129,768,328
Sparing (10) of the net profit as a statutory reserve -- (12,976,833)
Dividend (5%) of the capital (60,000,000) (60,000,000)
Proposed Members' remunerations (0.5%) -- (283,957)
Dividend (additional stake)* (30,000,000) (30,000,000)
Remainder Amount (119,297,981) 26,507,538
(*) The Ordinary General Assembly Meeting of Tadawul, held on 11/06/2018, approved the distribution of dividends to shareholders for the financial year ended 31/12/2017 with a total amount of SR 120 million, (1 SR) per share, and by 10% of the capital, and the amount of the remaining distributions will be reflected in the 2018 FS.
Governance 43
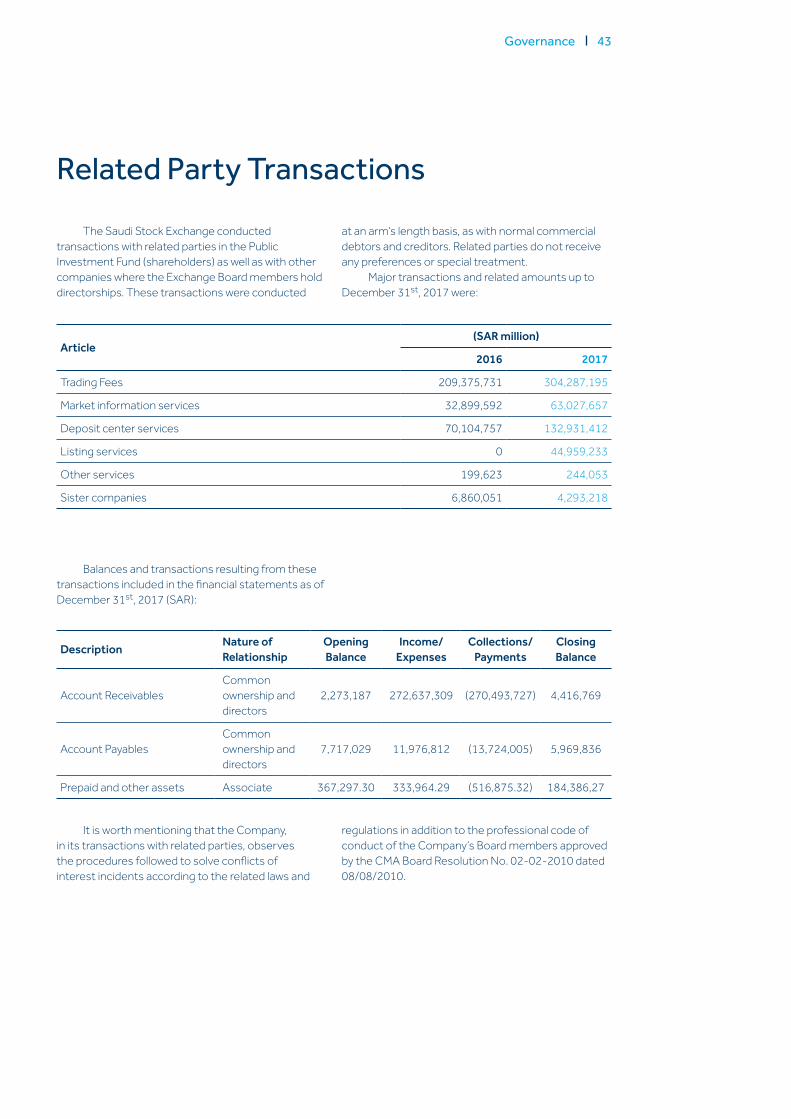
The Saudi Stock Exchange conducted transactions with related parties in the Public Investment Fund (shareholders) as well as with other companies where the Exchange Board members hold directorships. These transactions were conducted
at an arm‘s length basis, as with normal commercial debtors and creditors. Related parties do not receive any preferences or special treatment.
Major transactions and related amounts up to December 31st, 2017 were:
Article(SAR million)
2016 2017
Trading Fees 209,375,731 304,287,195
Market information services 32,899,592 63,027,657
Deposit center services 70,104,757 132,931,412
Listing services 0 44,959,233
Other services 199,623 244,053
Sister companies 6,860,051 4,293,218
Balances and transactions resulting from these transactions included in the financial statements as of December 31st, 2017 (SAR):
It is worth mentioning that the Company, in its transactions with related parties, observes the procedures followed to solve conflicts of interest incidents according to the related laws and
regulations in addition to the professional code of conduct of the Company’s Board members approved by the CMA Board Resolution No. 02-02-2010 dated 08/08/2010.
Description Nature of Relationship
Opening Balance
Income/ Expenses
Collections/ Payments
Closing Balance
Account ReceivablesCommon ownership and directors
2,273,187 272,637,309 (270,493,727) 4,416,769
Account PayablesCommon ownership and directors
7,717,029 11,976,812 (13,724,005) 5,969,836
Prepaid and other assets Associate 367,297.30 333,964.29 (516,875.32) 184,386,27
Related Party Transactions
44 Annual Report 2017
The Saudi Stock Exchange (Tadawul) has no loans.
Loans
The Saudi Exchange Company declares that:
• The financial statements were properly prepared and maintained;
• The internal control system was prepared on a sound basis and is reviewed annually to ensure its effectiveness;
• There are no substantive doubts concerning the Company’s ability to continue its operations;
• There was no deviation from the Accounting Standards issued by the Saudi Organization for Certified Public Accountants (SOCPA), and there were no material comments by the auditors on the Company’s 2017 financial statements.
Company Declarations
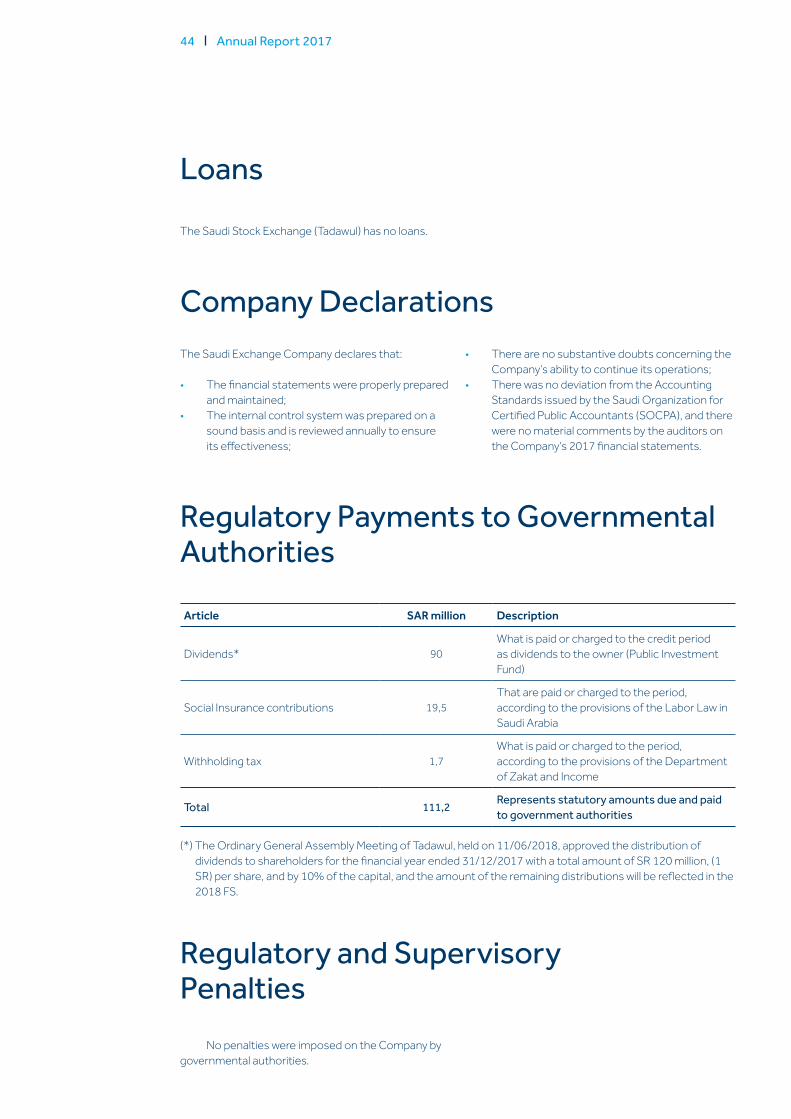
Regulatory Payments to Governmental Authorities
Article SAR million Description
Dividends* 90What is paid or charged to the credit period as dividends to the owner (Public Investment Fund)
Social Insurance contributions 19,5That are paid or charged to the period, according to the provisions of the Labor Law in Saudi Arabia
Withholding tax 1,7What is paid or charged to the period, according to the provisions of the Department of Zakat and Income
Total 111,2 Represents statutory amounts due and paid to government authorities
No penalties were imposed on the Company by governmental authorities.
Regulatory and Supervisory Penalties
(*) The Ordinary General Assembly Meeting of Tadawul, held on 11/06/2018, approved the distribution of dividends to shareholders for the financial year ended 31/12/2017 with a total amount of SR 120 million, (1 SR) per share, and by 10% of the capital, and the amount of the remaining distributions will be reflected in the 2018 FS.
Governance 45
The Risk and Security Management Division in the Saudi Stock Exchange (Tadawul) implements the “Three-Lines of Defense” method, which is considered the best according to international standards. It also helps to define the responsibilities of the Company’s Division, Executive Management and Board Committees effectively and accurately in connection with the risks. The Division’s fundamental roles include the approval and development of special standards and requirements for the information security and business continuity for all the Exchange members and data suppliers in line with the developments surrounding and affecting the Exchange, in addition to leveraging the level of awareness in the risk management and business continuity in line with the market developments and the Company’s vision.
Below are categories of risks that are defined and approved by Tadawul:
1. Operational RiskOperational Risks are those of the losses
resulting from inadequacy or failure of internal and external operations, personnel, external systems and events and change initiatives. These include risks related to issuances, clearing companies’ transactions, market transactions, asset and deposit transactions, market development, market regulation, HR, and material assets. The Risk and Security Management Division carries out a revision of all the sources related to the operational risks and creates the suitable policies to mitigate such risks.
2. Regulatory RisksRegulatory Risks are those resulting from the
Board taking improper decisions or implementing the regulatory decisions improperly, or non-taking any decision in due course, resulting in the Company incurring losses or losing alternative opportunities. These risks are manifested as a result of non-observance of the Laws, regulations and regulatory instructions. These risks also exist as a result of the Company violating the Laws and Standards issued by the supervisory authorities and include the risks that may result from the non-existence of a suitable strategy of the Company, by which the must-followed path is defined in order to achieve its goals on the short term and long term. Due consideration is provided in light of the general market circumstances and those of the competitors, in addition to the risks connected to project implementation, governance and compliance.
3. IT RisksIT Risks are those related to the systems
resulting from the probability of a failure in the system functions of failures in IT infrastructure and telecommunications. IT Risk Management is concerned with understanding the ongoing operations and processes, evaluating and measuring the factors that may cause damages or adverse effects thereto or to the information derived therefrom. Analysis takes into account whether such factors are accidental or intentional from those who have the intent to adversely affect the company, as well as developing strategies to control the same. Such strategies also include transferring the risks to another party, avoiding them, mitigating their adverse effects, or accommodating all or any of their consequences.
Risk Management Policy and Control
The Internal Audit Division submits its periodic reports to the Audit Committee on operational, administrative and financial review processes that are intended to verify the effectiveness of the internal control system with respect to protecting the Company’s assets, evaluating its business risks and measuring efficiency and performance. This
review has not shown any material weakness in the Company’s internal control system. The Internal Control System is also reviewed by the external auditor when they audit the annual financial statements of the Company. They are empowered to access all records and internal control reports for the fiscal period under review.
Annual Audit of the Effectiveness of Internal Control Procedures
46 Annual Report 2017
4. Information Security RisksInformation Security Risks are those resulting
from vulnerabilities in, and threats to, information assets used by the Exchange in such a manner that would affect business objectives. They include risks related to internal and external information security, information privacy and information validity and availability. The Risk and Security Management Division defines the level of data classification in order to recognize the tools and processes required to grant the access to it. The Division also evaluates the Company’s ability to protect the confidentiality of the classified data, considering that disclosing the same would reflect a negative image of the Company and adversely affect it.
5. Business Continuity RisksBusiness Continuity Risks are risks that cause
disastrous and harmful stoppage of the Company operations, leading to huge losses in technical infrastructure and level of services provided. They include risks related to infrastructure breakdown, logistic support providers, personnel safety and natural disasters. The Risk and Security Management Division defines the requirements of recovering the services and ensuring the Company’s ability to keep and protect the services provided promptly after major crises. The Division also sets controls and plans to mitigate the risks of system and public facilities breakdowns to ensure business continuity in line with the Exchange Effectiveness requirements.
6. Financial RisksFinancial Risks are current and future risks that
may affect the Company’s revenues such as trading commissions comprise a huge percentage of the Company’s revenues, which is variable in its nature. Other risks include those resulting from variations in the interest rate, exchange rate, securities rate and developments of the market value of stocks that may affect the return on investment. These are taken into account in addition to the, liquidity, investment, insurance and financial analysis risks. The Company’s strategy is to increase the other operational income that is not connected to trading, in order to mitigate the financial effect of the market variations. Procurement and supporting services risks are also within the financial risks for which an approved strategy was set to not being affected by such risks.
7. External RisksExternal Risks are potential losses or risks
resulting from a number of factors such as economic, political and environmental conditions, and they include the risks surrounding the Company such as market members and economic conditions that include economic downturn, inflation and retreat and loss of investors’ trust in the Exchange.
Governance 47
48 Annual Report 2017
Financial Statements 49
50 Annual Report 2017
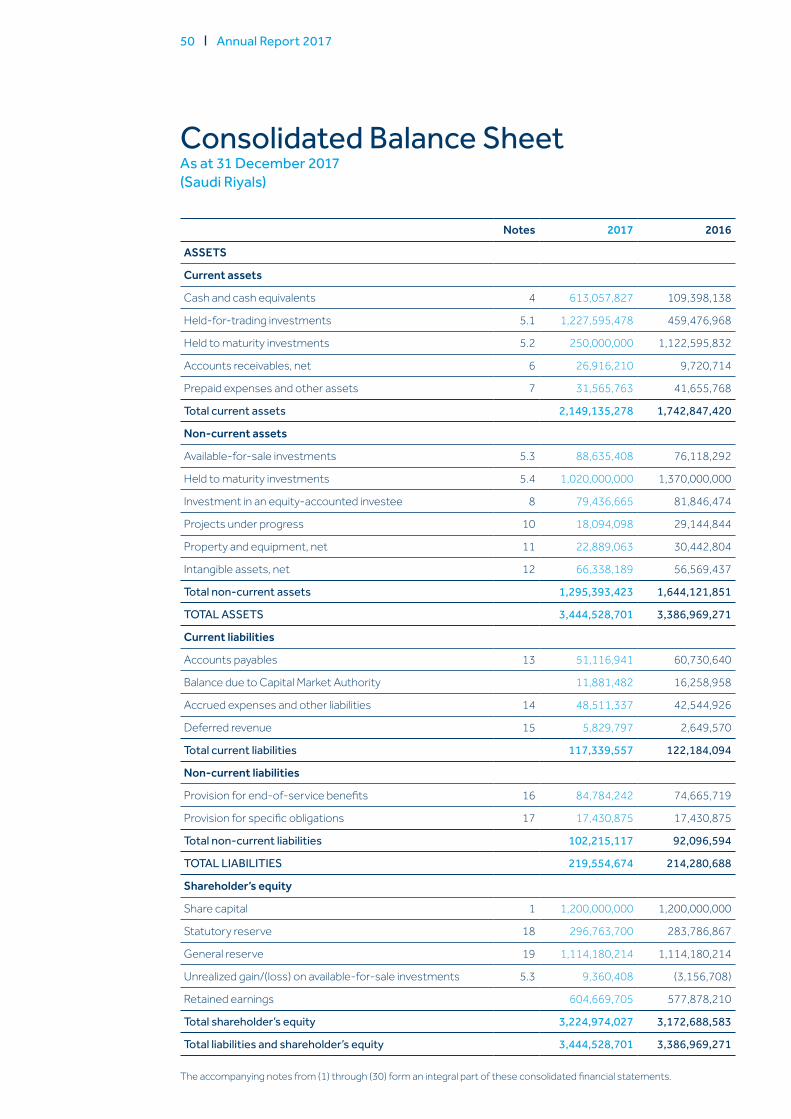
Consolidated Balance SheetAs at 31 December 2017(Saudi Riyals)
Notes 2017 2016
ASSETS
Current assets
Cash and cash equivalents 4 613,057,827 109,398,138
Held-for-trading investments 5.1 1,227,595,478 459,476,968
Held to maturity investments 5.2 250,000,000 1,122,595,832
Accounts receivables, net 6 26,916,210 9,720,714
Prepaid expenses and other assets 7 31,565,763 41,655,768
Total current assets 2,149,135,278 1,742,847,420
Non-current assets
Available-for-sale investments 5.3 88,635,408 76,118,292
Held to maturity investments 5.4 1,020,000,000 1,370,000,000
Investment in an equity-accounted investee 8 79,436,665 81,846,474
Projects under progress 10 18,094,098 29,144,844
Property and equipment, net 11 22,889,063 30,442,804
Intangible assets, net 12 66,338,189 56,569,437
Total non-current assets 1,295,393,423 1,644,121,851
TOTAL ASSETS 3,444,528,701 3,386,969,271
Current liabilities
Accounts payables 13 51,116,941 60,730,640
Balance due to Capital Market Authority 11,881,482 16,258,958
Accrued expenses and other liabilities 14 48,511,337 42,544,926
Deferred revenue 15 5,829,797 2,649,570
Total current liabilities 117,339,557 122,184,094
Non-current liabilities
Provision for end-of-service benefits 16 84,784,242 74,665,719
Provision for specific obligations 17 17,430,875 17,430,875
Total non-current liabilities 102,215,117 92,096,594
TOTAL LIABILITIES 219,554,674 214,280,688
Shareholder’s equity
Share capital 1 1,200,000,000 1,200,000,000
Statutory reserve 18 296,763,700 283,786,867
General reserve 19 1,114,180,214 1,114,180,214
Unrealized gain/(loss) on available-for-sale investments 5.3 9,360,408 (3,156,708)
Retained earnings 604,669,705 577,878,210
Total shareholder’s equity 3,224,974,027 3,172,688,583
Total liabilities and shareholder’s equity 3,444,528,701 3,386,969,271
The accompanying notes from (1) through (30) form an integral part of these consolidated financial statements.
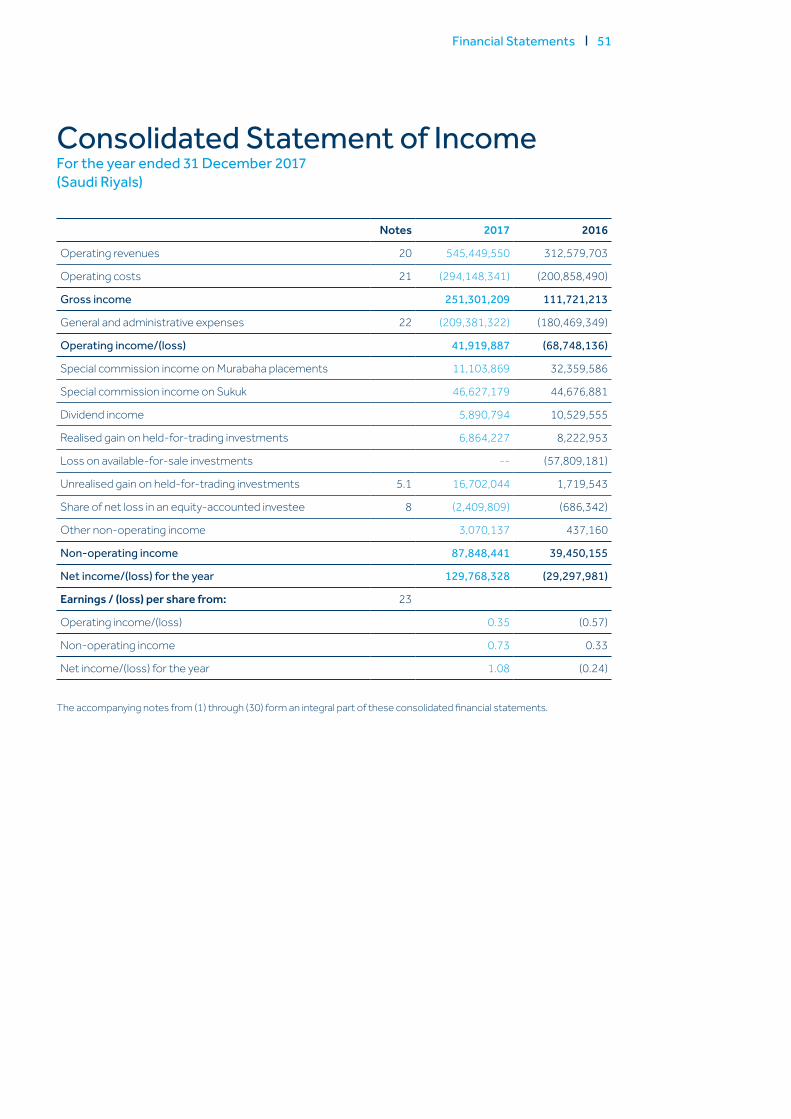
Financial Statements 51
Consolidated Statement of IncomeFor the year ended 31 December 2017(Saudi Riyals)
Notes 2017 2016
Operating revenues 20 545,449,550 312,579,703
Operating costs 21 (294,148,341) (200,858,490)
Gross income 251,301,209 111,721,213
General and administrative expenses 22 (209,381,322) (180,469,349)
Operating income/(loss) 41,919,887 (68,748,136)
Special commission income on Murabaha placements 11,103,869 32,359,586
Special commission income on Sukuk 46,627,179 44,676,881
Dividend income 5,890,794 10,529,555
Realised gain on held-for-trading investments 6,864,227 8,222,953
Loss on available-for-sale investments -- (57,809,181)
Unrealised gain on held-for-trading investments 5.1 16,702,044 1,719,543
Share of net loss in an equity-accounted investee 8 (2,409,809) (686,342)
Other non-operating income 3,070,137 437,160
Non-operating income 87,848,441 39,450,155
Net income/(loss) for the year 129,768,328 (29,297,981)
Earnings / (loss) per share from: 23
Operating income/(loss) 0.35 (0.57)
Non-operating income 0.73 0.33
Net income/(loss) for the year 1.08 (0.24)
The accompanying notes from (1) through (30) form an integral part of these consolidated financial statements.
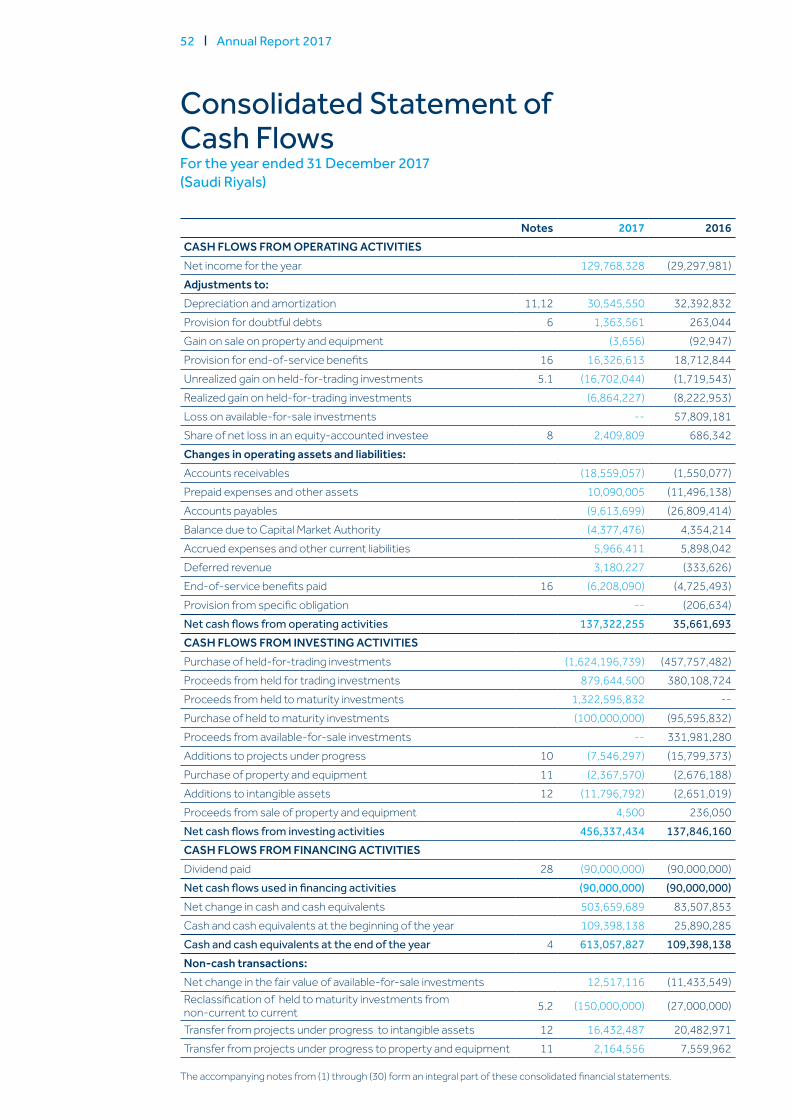
52 Annual Report 2017
Consolidated Statement of Cash FlowsFor the year ended 31 December 2017(Saudi Riyals)
Notes 2017 2016CASH FLOWS FROM OPERATING ACTIVITIESNet income for the year 129,768,328 (29,297,981)Adjustments to:Depreciation and amortization 11,12 30,545,550 32,392,832Provision for doubtful debts 6 1,363,561 263,044Gain on sale on property and equipment (3,656) (92,947)Provision for end-of-service benefits 16 16,326,613 18,712,844Unrealized gain on held-for-trading investments 5.1 (16,702,044) (1,719,543)Realized gain on held-for-trading investments (6,864,227) (8,222,953)Loss on available-for-sale investments -- 57,809,181Share of net loss in an equity-accounted investee 8 2,409,809 686,342Changes in operating assets and liabilities:Accounts receivables (18,559,057) (1,550,077)Prepaid expenses and other assets 10,090,005 (11,496,138)Accounts payables (9,613,699) (26,809,414)Balance due to Capital Market Authority (4,377,476) 4,354,214Accrued expenses and other current liabilities 5,966,411 5,898,042Deferred revenue 3,180,227 (333,626)End-of-service benefits paid 16 (6,208,090) (4,725,493)Provision from specific obligation -- (206,634)Net cash flows from operating activities 137,322,255 35,661,693CASH FLOWS FROM INVESTING ACTIVITIES Purchase of held-for-trading investments (1,624,196,739) (457,757,482)Proceeds from held for trading investments 879,644,500 380,108,724Proceeds from held to maturity investments 1,322,595,832 --Purchase of held to maturity investments (100,000,000) (95,595,832)Proceeds from available-for-sale investments -- 331,981,280Additions to projects under progress 10 (7,546,297) (15,799,373)Purchase of property and equipment 11 (2,367,570) (2,676,188)Additions to intangible assets 12 (11,796,792) (2,651,019)Proceeds from sale of property and equipment 4,500 236,050Net cash flows from investing activities 456,337,434 137,846,160CASH FLOWS FROM FINANCING ACTIVITIESDividend paid 28 (90,000,000) (90,000,000)Net cash flows used in financing activities (90,000,000) (90,000,000)Net change in cash and cash equivalents 503,659,689 83,507,853Cash and cash equivalents at the beginning of the year 109,398,138 25,890,285Cash and cash equivalents at the end of the year 4 613,057,827 109,398,138Non-cash transactions:Net change in the fair value of available-for-sale investments 12,517,116 (11,433,549)Reclassification of held to maturity investments from non-current to current 5.2 (150,000,000) (27,000,000)
Transfer from projects under progress to intangible assets 12 16,432,487 20,482,971Transfer from projects under progress to property and equipment 11 2,164,556 7,559,962
The accompanying notes from (1) through (30) form an integral part of these consolidated financial statements.
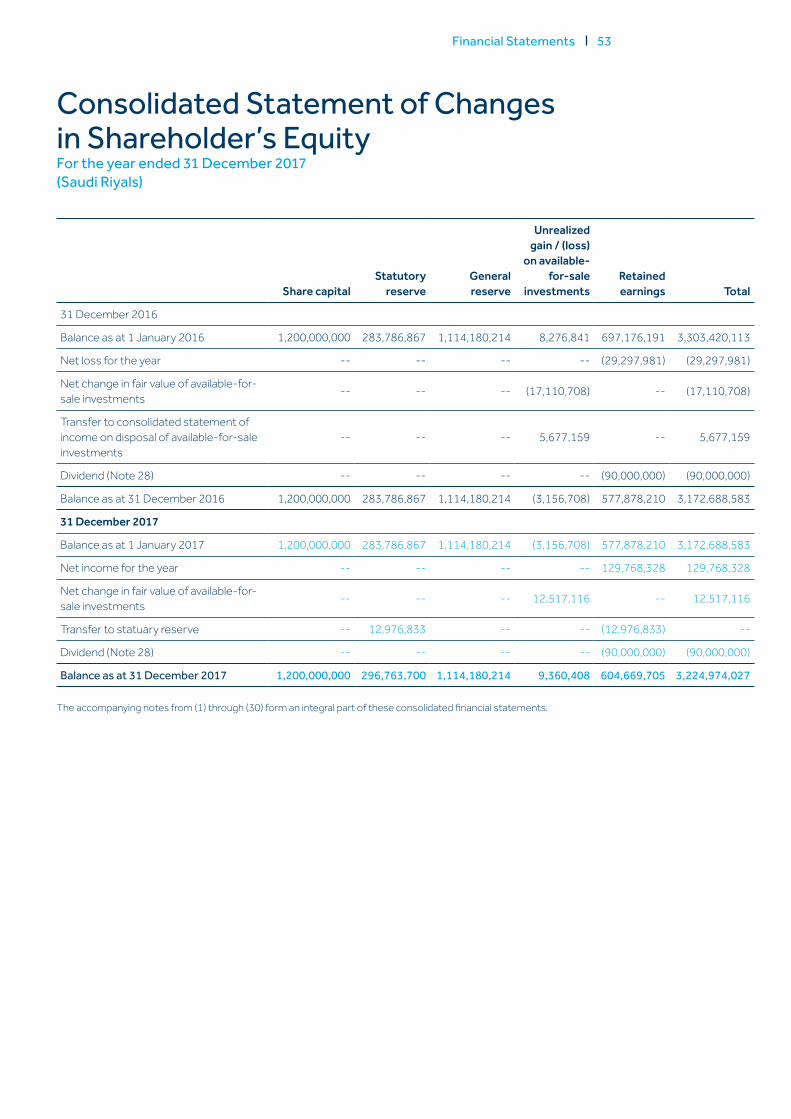
Financial Statements 53
Consolidated Statement of Changes in Shareholder’s EquityFor the year ended 31 December 2017(Saudi Riyals)
Share capital Statutory
reserve General reserve
Unrealized gain / (loss)
on available-for-sale
investmentsRetained earnings Total
31 December 2016
Balance as at 1 January 2016 1,200,000,000 283,786,867 1,114,180,214 8,276,841 697,176,191 3,303,420,113
Net loss for the year -- -- -- -- (29,297,981) (29,297,981)
Net change in fair value of available-for-sale investments -- -- -- (17,110,708) -- (17,110,708)
Transfer to consolidated statement of income on disposal of available-for-sale investments
-- -- -- 5,677,159 -- 5,677,159
Dividend (Note 28) -- -- -- -- (90,000,000) (90,000,000)
Balance as at 31 December 2016 1,200,000,000 283,786,867 1,114,180,214 (3,156,708) 577,878,210 3,172,688,583
31 December 2017
Balance as at 1 January 2017 1,200,000,000 283,786,867 1,114,180,214 (3,156,708) 577,878,210 3,172,688,583
Net income for the year -- -- -- -- 129,768,328 129,768,328
Net change in fair value of available-for-sale investments -- -- -- 12,517,116 -- 12,517,116
Transfer to statuary reserve -- 12,976,833 -- -- (12,976,833) --
Dividend (Note 28) -- -- -- -- (90,000,000) (90,000,000)
Balance as at 31 December 2017 1,200,000,000 296,763,700 1,114,180,214 9,360,408 604,669,705 3,224,974,027
The accompanying notes from (1) through (30) form an integral part of these consolidated financial statements.
54 Annual Report 2017
1. GENERALThe Royal Decree No. M/15 dated 01/03/1428
H (corresponding to 20 March 2007) was issued approving the license to establish the Saudi Stock Exchange Company (Tadawul) (“the Company”) as a Saudi joint stock company with a share capital of SAR 1,200 million divided into 120 million shares of SAR 10 each fully subscribed by the Public Investment Fund (“PIF”).
The Ministry of Commerce and Industry resolution no. 320/k dated 1/12/1428 H (corresponding to 11 December 2007) was issued approving the license to establish the Company as a Saudi joint stock company. The Company was registered as a closed joint stock company in Riyadh under Commercial Registration number 1010241733 dated 2/12/1428 H (corresponding to 12 December 2007). All rights, assets, liabilities, obligations and records were transferred from the Saudi Share Registration Company (a company which existed before the establishment of Tadawul) to the Company as at 30/11/1428 H (corresponding to 10 December 2007).
The Company’s main activity is to provide, create and manage the mechanisms of trading of securities, providing settlement and clearing services of securities, depository and registration of securities ownership, dissemination of securities information and engage in any other related activity to achieve the objectives as defined in the Capital Market Law.
These consolidated financial statements comprise the financial statements of Tadawul and its subsidiary (collectively referred to as “the Group”).
SubsidiariesCapital Market Authority (“CMA”) Board approved
the formation of Securities Depository Centre Company (Edaa) as a new Saudi joint stock company in the Kingdom of Saudi Arabia in accordance with the Capital Market Law issued by the Royal Decree no. M/30 dated 06/02/1424 H (corresponding to 22 march 2003). "Edaa" was registered as a Saudi joint stock company in Riyadh under Commercial Registration no. 1010463866 dated 27/11/1437 H (corresponding to 30 August 2016) with an authorized share capital of SAR 400 million divided into 40 million shares of SAR 10 each.
As at 31 December 2017, the Company owns 100 percent of the issued share capital of the "Edaa". The main objective of "Edaa" is to provide depository and registration of securities ownership, and clearing services of securities.
During the year ended 31 December 2017, the Company’s Board of Directors in their meeting dated 30 October 2017 under a decision number
03-04-2017/04-04-2017 approved the formation of a new company, Central Counter-Party Clearing House Company (“CCP”). As at 31 December 2017, CCP was under formation, however, subsequent to 31 December 2017, CCP was registered as a closed joint stock company in Riyadh under Commercial Registration number 1010935131 dated 02/06/1439 (corresponding to 18 February 2018) with an authorized share capital of SAR 600 million divided into 60 million shares of SR 10 each.
As at 31 December 2017, an amount of SR 150 million was deposited by the Company with a local bank under the name of CCP (a company under formation) on account of share capital.
The main objective of CCP is clearing of financial securities.
2. BASIS OF PREPARATION
Statement of compliance The accompanying consolidated financial
statements have been prepared in conformity with the Accounting Standards Generally Accepted in the Kingdom of Saudi Arabia issued by the Saudi Organization for Certified Public Accountants (“SOCPA”).
The new Regulation for Companies issued through Royal Decree M/3 on 11 November 2015 (hereinafter referred as “The Law”) came into force on 25/07/1437H (corresponding to 2 May 2016). The Company has to amend its By-laws for any changes to align those with provisions of the Law. Consequently, the Company shall present its amended By-laws to stockholders in their Extraordinary General Assembly meeting for their ratification. The legal proceedings to amend the Company’s By-laws are still under process.
Basis of measurement The consolidated financial statements have
been prepared on historical cost basis, except for available-for-sale and held-for-trading investments which are stated at fair value, using the accrual basis of accounting and the going concern concept.
Basis of consolidationThe consolidated financial statements comprise
the financial statements of Tadawul and its wholly owned subsidiary, "Edaa", and collectively referred to as “the Group”.
Subsidiaries are entities controlled by the Group. Control exists when the Group has the power to govern the financial and operating policies of an entity so as to obtain benefits from its activities. In assessing control, potential voting rights that presently are exercisable are taken into account. Subsidiaries are
Notes to the Consolidated Financial StatementsFor the year ended 31 December 2017(Saudi Riyals)
Financial Statements 55
fully consolidated from the date of acquisition, being the date on which the Company obtains control, and continue to be consolidated until the date that such control ceases.
All intra-group balances, transactions, income and expenses and profits and losses resulting from intra-group transactions that are recognized in assets, are eliminated in full. Also, any unrealized gains and losses arising from intra-group transactions are eliminated on consolidation.
Functional and presentation currencyThese consolidated financial statements are
presented in Saudi Riyals (SAR) which is the functional and reporting currency of the Group. All amounts have been rounded to the nearest Riyal, unless otherwise stated.
Use of estimates and judgmentsThe preparation of consolidated financial
statements in conformity with generally accepted accounting standards requires the use of estimates and judgments that affect the reported amounts of assets and liabilities and disclosure of contingent assets and liabilities at the date of the consolidated financial statements and the reported amounts of revenues and expenses during the reporting period. Although these estimates and judgments are based on management‘s best knowledge of current events and actions, actual results might differ from those estimates.
Estimates and underlying assumptions are reviewed on an ongoing basis. Revisions to accounting estimates are recognized in the period in which the estimates are revised and in future periods affected.
3. SUMMARY OF SIGNIFICANT ACCOUNTING POLICIES
The principal accounting policies adopted in the preparation of these consolidated financial statements are set out below) except the change in the useful lives of intangible assets from 4 to 6 years) over all periods presented in these consolidated financial statements.
Cash and cash equivalentsCash and cash equivalents include cash in hand,
cash at bank and short-term liquid investments with original maturities of three months or less and which is available to the Group with no restrictions to use.
Held for trading investmentsInvestment in trade securities which are
purchased for trading purposes are initially recorded at cost and then re-measured and stated in the balance sheet at market value and included under current assets. Realized gain or loss on sale of trading securities and changes in market value at balance sheet date are credited or charged to consolidated statement of income.
Available-for-sale investmentsAvailable-for-sale investments consist of
quoted and unquoted equity investments including mutual funds investments, which are not held for trading purposes and where the Group does not have any significant influence or control. These are initially recognized and subsequently re-measured at fair value. Any changes in fair value are recognized in equity as fair value reserve until the investment is disposed. On de-recognition, any cumulative gain or loss previously recognized in equity is included in the consolidated statement of income. Any significant and prolonged decline in fair value of the available-for-sale, if any, is charged to the statement of income. The fair value of investments that are actively traded in organized financial markets is determined by reference to quoted market bid prices at the close of business on the balance sheet date. For investments where there is no active market, including investments in unquoted private equity, fair value is determined using valuation techniques. Such techniques include using recent arm‘s length market transactions; reference to the current market value of another instrument, which is substantially the same, otherwise the cost is considered to be the fair value for these investments.
Held to maturity investmentsInvestments having fixed or determinable
payments and fixed maturity for which the management has a positive intention and ability to hold to maturity are classified as held to maturity. Held to maturity investments are initially recognized at fair value including direct and incremental transaction costs and subsequently measured at amortized cost, less provision for impairment in their value. Amortized cost is calculated by taking into account any discount or premium on acquisition using the effective yield method. Any gain or loss on such investments is recognized in the consolidated statement of income when the investment is derecognized or impaired. These investments are classified in current assets if their maturity falls within twelve months from the balance sheet date and in non-current assets if their maturity after twelve months from the balance sheet date.
Investments in equity accounted investeesEquity-accounted investees (“the Associates”)
are those entities in which the Group has significant influence, but not control, over the financial and operating policies, generally accompanying a shareholding between 20% and 50% of the voting rights. The associates are accounted for using the equity method which are initially recognized at cost including goodwill identified on acquisition. The Group‘s share in its investees‘ post-acquisition income and losses is recognized in the consolidated statement of income and its share in post-acquisition movements in reserves is recognized in the Group‘s equity.
56 Annual Report 2017
Accounts receivablesAccount receivables are stated at original invoice
amount less provisions made for doubtful debts. A provision against doubtful debts is established when there is an objective evidence that the Group will not be able to collect the amounts due according to the original terms of receivables. Bad debts are written off when identified, against its related provisions. The provisions are charged to consolidated statement of income and any subsequent recovery of receivable amounts previously written off are credited to income.
Impairment of financial assetsAn assessment is made at each balance sheet
date to determine whether there is objective evidence that a specific financial asset may be impaired. If such evidence exists, any impairment loss is recognized in the consolidated statement of income. Impairment is determined as follows:
a) For asset carried at fair value, impairment is the difference between cost and fair value, less any impairment loss previously recognized in the consolidated statement of income.
b) For asset carried at cost, impairment is the difference between carrying amount and the present value cash flows discounted at the current market rate of return for a similar financial asset.
c) For assets carried at amortized cost, impairment is the difference between carrying amount and the present value of future cash flows discounted at the original effective profit rate.
For equity investments held as available-for-sale, a significant and prolonged decline in fair value below its cost represents objective evidence of impairment. The impairment loss can not be reversed through consolidated statement of income as long as the asset continues to be recognized i.e. any increase in fair value after impairment can only be recognized in equity. On de-recognition, any cumulative gain or loss previously recognized in equity is included in the consolidated statement of income for the period.
Property and equipmentProperty and equipment are stated at cost
less accumulated depreciation. Expenditure on maintenance and repairs is charged to consolidated statement of income, while expenditure for betterment is capitalized. Depreciation is charged over the estimated useful lives of the applicable assets using the straight line method. The estimated lives of the principal classes of assets are as follows:
Years
Computer hardware 4Decorations, improvements, furniture and fixtures 10Electrical supplies, equipment and office tools 6Vehicles 4Buildings 30
Intangible assetsAll costs paid to acquire the intangible assets are
capitalized. Intangible assets are stated at cost less accumulated amortization. The intangible assets of the Company are amortized over an estimated useful life 6 years using the straight-line method.
Impairment of non-financial of assetsThe Group reviews on a regular basis the
carrying amount of its non-financial assets to determine whether there is any indication that those assets have suffered impairment in value. In case such indication exists, the recoverable amount of the asset is estimated in order to determine the extent of the impairment, if any. Where it is not possible to estimate the recoverable amount of an individual asset, the Group estimates the recoverable amount of the cash generating unit to which the asset belongs.
In circumstances where the recoverable amounts for the assets or the cash generating unit is estimated below its net book value, then the net book value for that asset or cash generating unit will be impaired to the recoverable amounts. Impairment losses are recognized immediately as expenses in the consolidated statement of income.
ProvisionsA provision is recognized if, as a result of past
events, the Group has a present legal or constructive obligation that can be estimated reliably, and it is probable that an outflow of economic benefits will be required to settle the obligation.
Provision for end-of-service benefitsEmployees‘ end-of-service benefits is calculated
based on Group‘s internal policy of a month‘s salary for the first five years of employment, and one and a half month salary starting from the sixth year of the employees‘ service at the Group.
Revenue recognitionThe trading commission revenue is recognized
upon the completion of the trade transaction whereas revenue on other services is recognized upon delivery of the services. Part of total commissions and services provided by the Group are deducted in favor of CMA.
Financial Statements 57
The annual services fees collected at the beginning of the contract are recorded as unearned revenues (Deferred) and is recognized in the consolidated statement of income over the term of the contract.
ExpensesOperating costs are those arising from the
Company‘s efforts underlying the core activities. All other expenses, excluding operating costs are classified as general and administrative expenses. Allocations between general and administrative expenses and operating costs, when required, are made on a constant basis.
ZakatBased on the GAZT letter number 2999/12
dated 5/6/1429 H, the Group will be subject to Zakat after the initial public offering and the participation of private sector in its share capital in accordance with the approval of the Minister of Finance on GAZT’s study regarding this matter dated 24/5/1429 H. In addition, based on the GAZT letter number 16/33008 dated 28/12/1438H, the Group is not subject to Zakat as it is fully owned by the Public Investment Fund (a governmental agency) and hence no provision is calculated in these consolidated financial statements.
Foreign currency transactionsForeign currency transactions are translated
into Saudi Riyals at the rates of exchange prevailing at the time of the transactions. Monetary assets and liabilities denominated in foreign currencies at the balance sheet date are translated at the exchange rates prevailing at that date. Gains and losses from settlement and translation of foreign currency transactions are included in the consolidated statement of income.
Contingent liabilitiesAll possible obligations arising from past
events whose existence will be confirmed only by the occurrence or non-occurrence of one or more uncertain future events not wholly with the control of the Group; or all present obligations arising from past events but not recognized because: (i) it is not probable that an outflow of resources embodying economic benefits will be required to settle the obligation, or (ii) the amount of the obligation cannot be measured with sufficient reliability; all are assessed at each consolidated balance sheet date and disclosed in the Group‘s consolidated financial statements under contingent liabilities.
4. CASH AND CASH EQUIVALENTS
2017 2016
Cash at bank (4.1) 169,057,827 9,398,138
Short-term Murabaha placements (4.2) 444,000,000 100,000,000
613,057,827 109,398,138
4.1 This includes SR 150 million held with a local bank on account of share capital paid by the Company in relation to CCP (a company under formation) – (note 1).
4.2 Short-term Murabaha placements are with counterparties having good credit ratings. These placements have an original maturity period of three months or less. These placements carry an annual average special commission rate of 2.1% per annum (31 December 2016: 2.7% per annum).
5. INVESTMENTSInvestment securities portfolio is summarized as
follows:
2017 2016
Held-for-trading investments (5.1) 1,227,595,478 459,476,968
Held to maturity investments – current (5.2) 250,000,000 1,122,595,832
Available-for-sale investments (5.3) 88,635,408 76,118,292
Held to maturity investments – non-current (5.4) 1,020,000,000 1,370,000,000
2,586,230,886 3,028,191,092
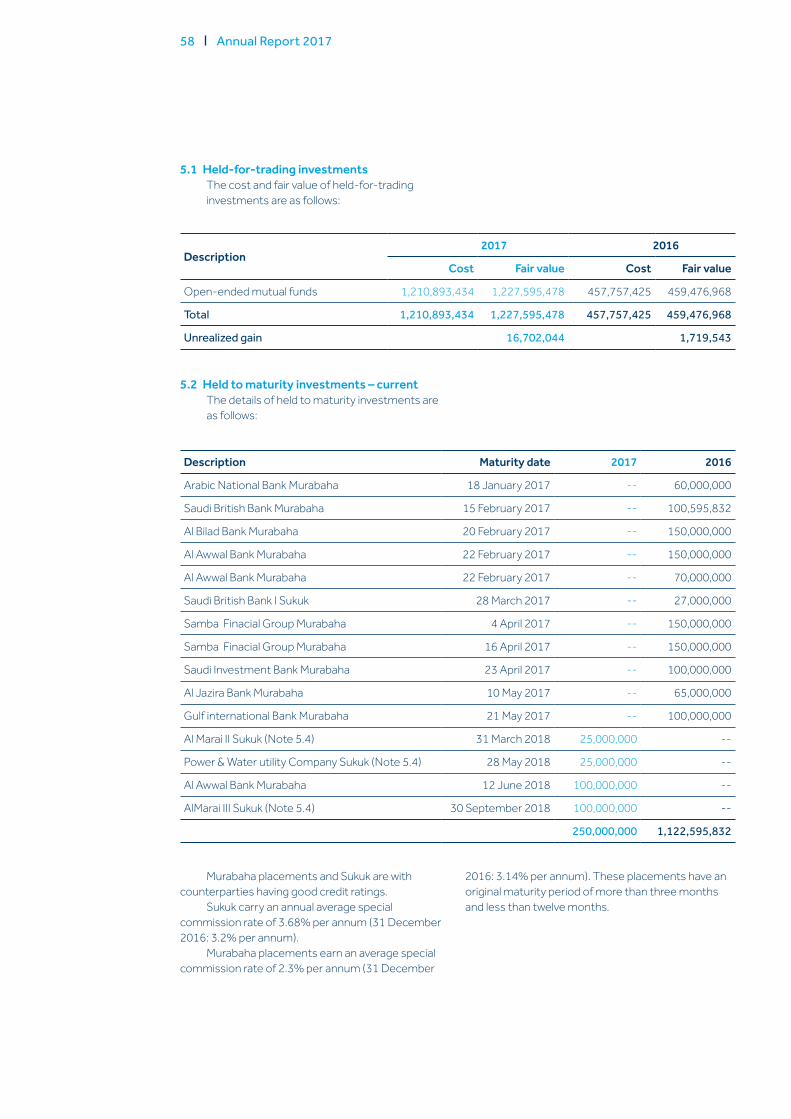
58 Annual Report 2017
5.1 Held-for-trading investmentsThe cost and fair value of held-for-trading investments are as follows:
5.2 Held to maturity investments – currentThe details of held to maturity investments are as follows:
Murabaha placements and Sukuk are with counterparties having good credit ratings.
Sukuk carry an annual average special commission rate of 3.68% per annum (31 December 2016: 3.2% per annum).
Murabaha placements earn an average special commission rate of 2.3% per annum (31 December
2016: 3.14% per annum). These placements have an original maturity period of more than three months and less than twelve months.
Description 2017 2016
Cost Fair value Cost Fair value
Open-ended mutual funds 1,210,893,434 1,227,595,478 457,757,425 459,476,968
Total 1,210,893,434 1,227,595,478 457,757,425 459,476,968
Unrealized gain 16,702,044 1,719,543
Description Maturity date 2017 2016
Arabic National Bank Murabaha 18 January 2017 -- 60,000,000
Saudi British Bank Murabaha 15 February 2017 -- 100,595,832
Al Bilad Bank Murabaha 20 February 2017 -- 150,000,000
Al Awwal Bank Murabaha 22 February 2017 -- 150,000,000
Al Awwal Bank Murabaha 22 February 2017 -- 70,000,000
Saudi British Bank I Sukuk 28 March 2017 -- 27,000,000
Samba Finacial Group Murabaha 4 April 2017 -- 150,000,000
Samba Finacial Group Murabaha 16 April 2017 -- 150,000,000
Saudi Investment Bank Murabaha 23 April 2017 -- 100,000,000
Al Jazira Bank Murabaha 10 May 2017 -- 65,000,000
Gulf international Bank Murabaha 21 May 2017 -- 100,000,000
Al Marai II Sukuk (Note 5.4) 31 March 2018 25,000,000 --
Power & Water utility Company Sukuk (Note 5.4) 28 May 2018 25,000,000 --
Al Awwal Bank Murabaha 12 June 2018 100,000,000 --
AlMarai III Sukuk (Note 5.4) 30 September 2018 100,000,000 --
250,000,000 1,122,595,832
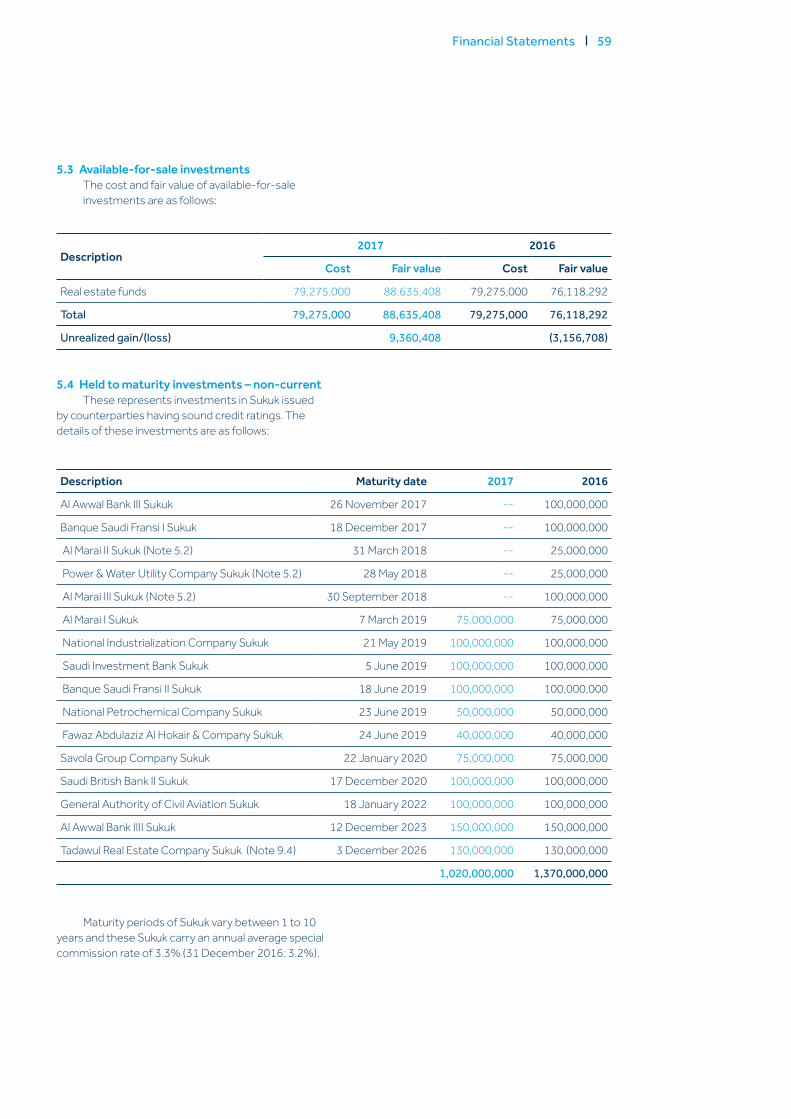
Financial Statements 59
5.3 Available-for-sale investmentsThe cost and fair value of available-for-sale investments are as follows:
5.4 Held to maturity investments – non-currentThese represents investments in Sukuk issued
by counterparties having sound credit ratings. The details of these investments are as follows:
Maturity periods of Sukuk vary between 1 to 10 years and these Sukuk carry an annual average special commission rate of 3.3% (31 December 2016: 3.2%).
Description 2017 2016
Cost Fair value Cost Fair value
Real estate funds 79,275,000 88,635,408 79,275,000 76,118,292
Total 79,275,000 88,635,408 79,275,000 76,118,292
Unrealized gain/(loss) 9,360,408 (3,156,708)
Description Maturity date 2017 2016
Al Awwal Bank III Sukuk 26 November 2017 -- 100,000,000
Banque Saudi Fransi I Sukuk 18 December 2017 -- 100,000,000
Al Marai II Sukuk (Note 5.2) 31 March 2018 -- 25,000,000
Power & Water Utility Company Sukuk (Note 5.2) 28 May 2018 -- 25,000,000
Al Marai III Sukuk (Note 5.2) 30 September 2018 -- 100,000,000
Al Marai I Sukuk 7 March 2019 75,000,000 75,000,000
National Industrialization Company Sukuk 21 May 2019 100,000,000 100,000,000
Saudi Investment Bank Sukuk 5 June 2019 100,000,000 100,000,000
Banque Saudi Fransi II Sukuk 18 June 2019 100,000,000 100,000,000
National Petrochemical Company Sukuk 23 June 2019 50,000,000 50,000,000
Fawaz Abdulaziz Al Hokair & Company Sukuk 24 June 2019 40,000,000 40,000,000
Savola Group Company Sukuk 22 January 2020 75,000,000 75,000,000
Saudi British Bank II Sukuk 17 December 2020 100,000,000 100,000,000
General Authority of Civil Aviation Sukuk 18 January 2022 100,000,000 100,000,000
Al Awwal Bank IIII Sukuk 12 December 2023 150,000,000 150,000,000
Tadawul Real Estate Company Sukuk (Note 9.4) 3 December 2026 130,000,000 130,000,000
1,020,000,000 1,370,000,000
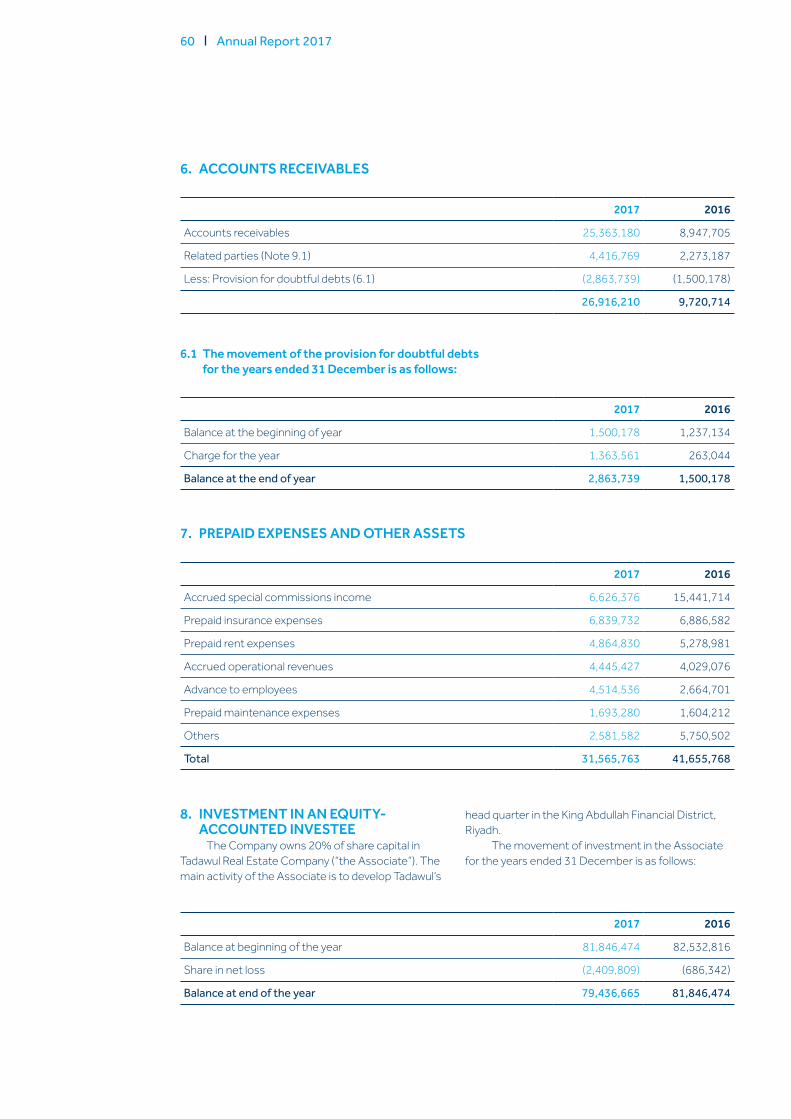
60 Annual Report 2017
6. ACCOUNTS RECEIVABLES
2017 2016
Accounts receivables 25,363,180 8,947,705
Related parties (Note 9.1) 4,416,769 2,273,187
Less: Provision for doubtful debts (6.1) (2,863,739) (1,500,178)
26,916,210 9,720,714
7. PREPAID EXPENSES AND OTHER ASSETS
2017 2016
Accrued special commissions income 6,626,376 15,441,714
Prepaid insurance expenses 6,839,732 6,886,582
Prepaid rent expenses 4,864,830 5,278,981
Accrued operational revenues 4,445,427 4,029,076
Advance to employees 4,514,536 2,664,701
Prepaid maintenance expenses 1,693,280 1,604,212
Others 2,581,582 5,750,502
Total 31,565,763 41,655,768
6.1 The movement of the provision for doubtful debts for the years ended 31 December is as follows:
2017 2016
Balance at the beginning of year 1,500,178 1,237,134
Charge for the year 1,363,561 263,044
Balance at the end of year 2,863,739 1,500,178
8. INVESTMENT IN AN EQUITY-ACCOUNTED INVESTEE
The Company owns 20% of share capital in Tadawul Real Estate Company (“the Associate”). The main activity of the Associate is to develop Tadawul’s
head quarter in the King Abdullah Financial District, Riyadh.
The movement of investment in the Associate for the years ended 31 December is as follows:
2017 2016
Balance at beginning of the year 81,846,474 82,532,816
Share in net loss (2,409,809) (686,342)
Balance at end of the year 79,436,665 81,846,474
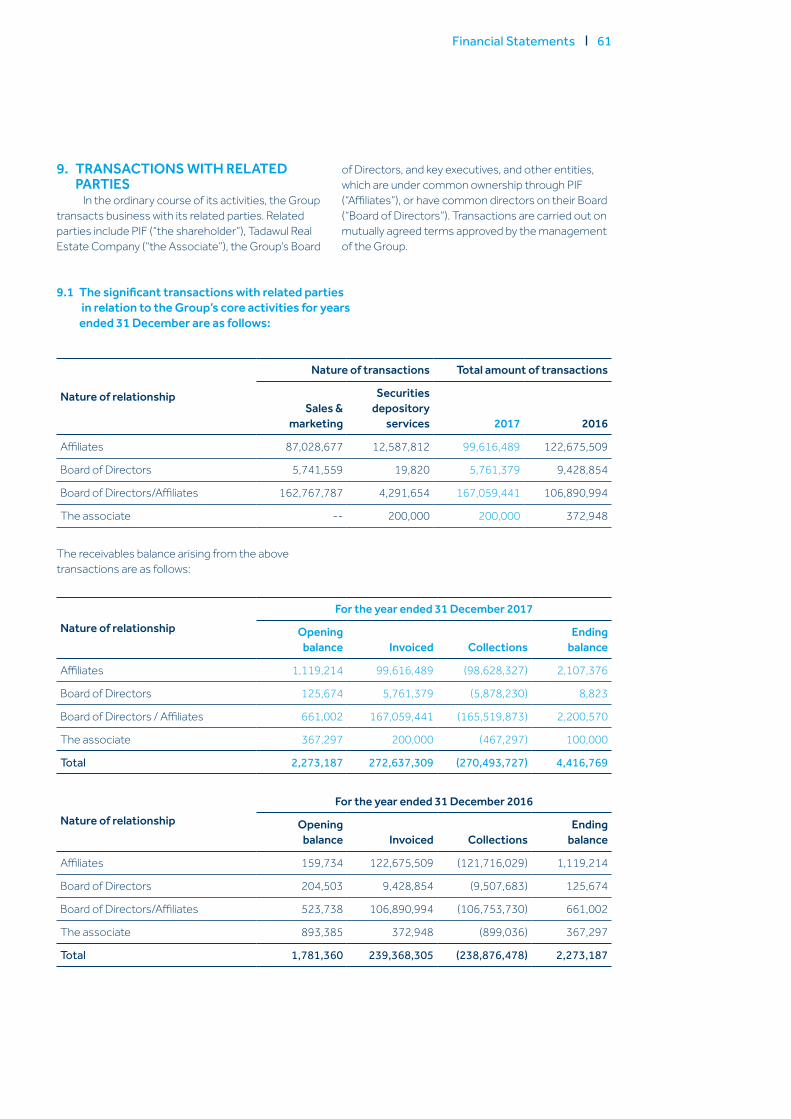
Financial Statements 61
9.1 The significant transactions with related parties in relation to the Group’s core activities for years ended 31 December are as follows:
9. TRANSACTIONS WITH RELATED PARTIES
In the ordinary course of its activities, the Group transacts business with its related parties. Related parties include PIF (“the shareholder”), Tadawul Real Estate Company (“the Associate”), the Group’s Board
of Directors, and key executives, and other entities, which are under common ownership through PIF (“Affiliates”), or have common directors on their Board (“Board of Directors”). Transactions are carried out on mutually agreed terms approved by the management of the Group.
Nature of relationship
Nature of transactions Total amount of transactions
Sales &marketing
Securities depository
services 2017 2016
Affiliates 87,028,677 12,587,812 99,616,489 122,675,509
Board of Directors 5,741,559 19,820 5,761,379 9,428,854
Board of Directors/Affiliates 162,767,787 4,291,654 167,059,441 106,890,994
The associate -- 200,000 200,000 372,948
The receivables balance arising from the above transactions are as follows:
Nature of relationshipFor the year ended 31 December 2017
Opening balance Invoiced Collections
Ending balance
Affiliates 1,119,214 99,616,489 (98,628,327) 2,107,376
Board of Directors 125,674 5,761,379 (5,878,230) 8,823
Board of Directors / Affiliates 661,002 167,059,441 (165,519,873) 2,200,570
The associate 367,297 200,000 (467,297) 100,000
Total 2,273,187 272,637,309 (270,493,727) 4,416,769
Nature of relationshipFor the year ended 31 December 2016
Opening balance Invoiced Collections
Ending balance
Affiliates 159,734 122,675,509 (121,716,029) 1,119,214
Board of Directors 204,503 9,428,854 (9,507,683) 125,674
Board of Directors/Affiliates 523,738 106,890,994 (106,753,730) 661,002
The associate 893,385 372,948 (899,036) 367,297
Total 1,781,360 239,368,305 (238,876,478) 2,273,187
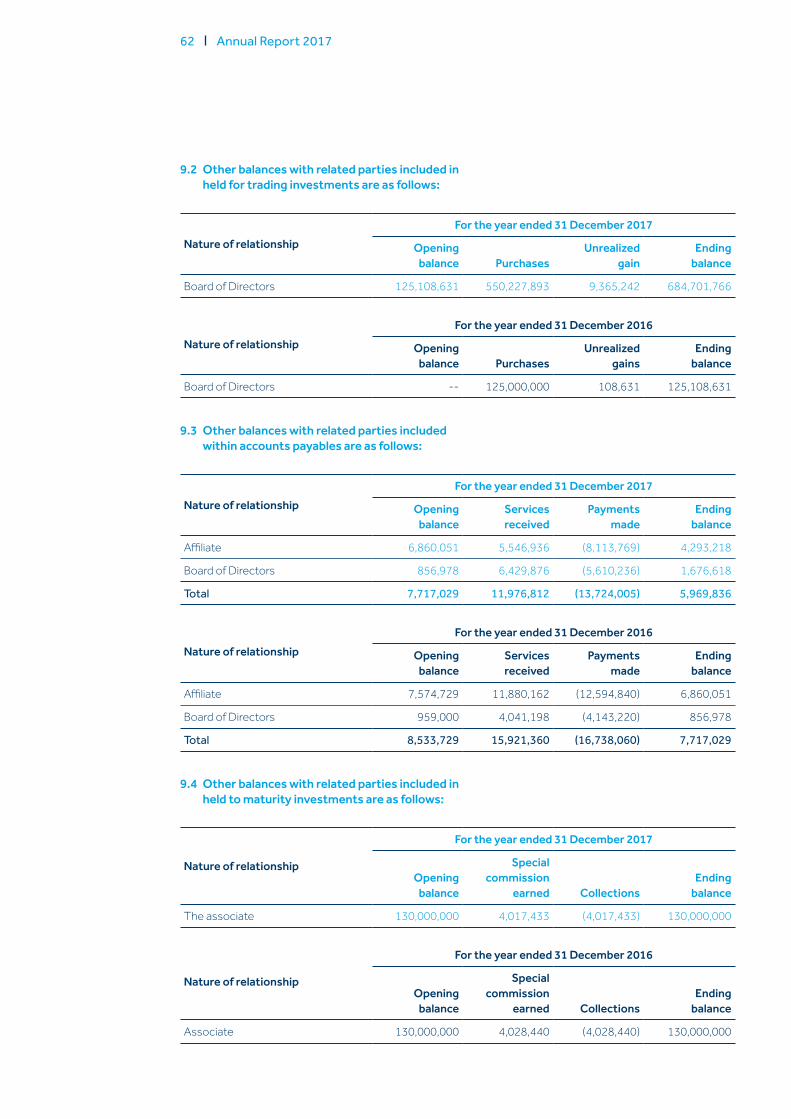
62 Annual Report 2017
9.3 Other balances with related parties included within accounts payables are as follows:
Nature of relationshipFor the year ended 31 December 2017
Opening balance
Servicesreceived
Payments made
Ending balance
Affiliate 6,860,051 5,546,936 (8,113,769) 4,293,218
Board of Directors 856,978 6,429,876 (5,610,236) 1,676,618
Total 7,717,029 11,976,812 (13,724,005) 5,969,836
Nature of relationshipFor the year ended 31 December 2016
Opening balance
Servicesreceived
Payments made
Ending balance
Affiliate 7,574,729 11,880,162 (12,594,840) 6,860,051
Board of Directors 959,000 4,041,198 (4,143,220) 856,978
Total 8,533,729 15,921,360 (16,738,060) 7,717,029
9.4 Other balances with related parties included in held to maturity investments are as follows:
Nature of relationship
For the year ended 31 December 2017
Opening balance
Special commission
earned CollectionsEnding
balance
The associate 130,000,000 4,017,433 (4,017,433) 130,000,000
Nature of relationship
For the year ended 31 December 2016
Opening balance
Specialcommission
earned CollectionsEnding
balance
Associate 130,000,000 4,028,440 (4,028,440) 130,000,000
9.2 Other balances with related parties included in held for trading investments are as follows:
Nature of relationshipFor the year ended 31 December 2017
Opening balance Purchases
Unrealized gain
Ending balance
Board of Directors 125,108,631 550,227,893 9,365,242 684,701,766
Nature of relationshipFor the year ended 31 December 2016
Opening balance Purchases
Unrealized gains
Ending balance
Board of Directors -- 125,000,000 108,631 125,108,631
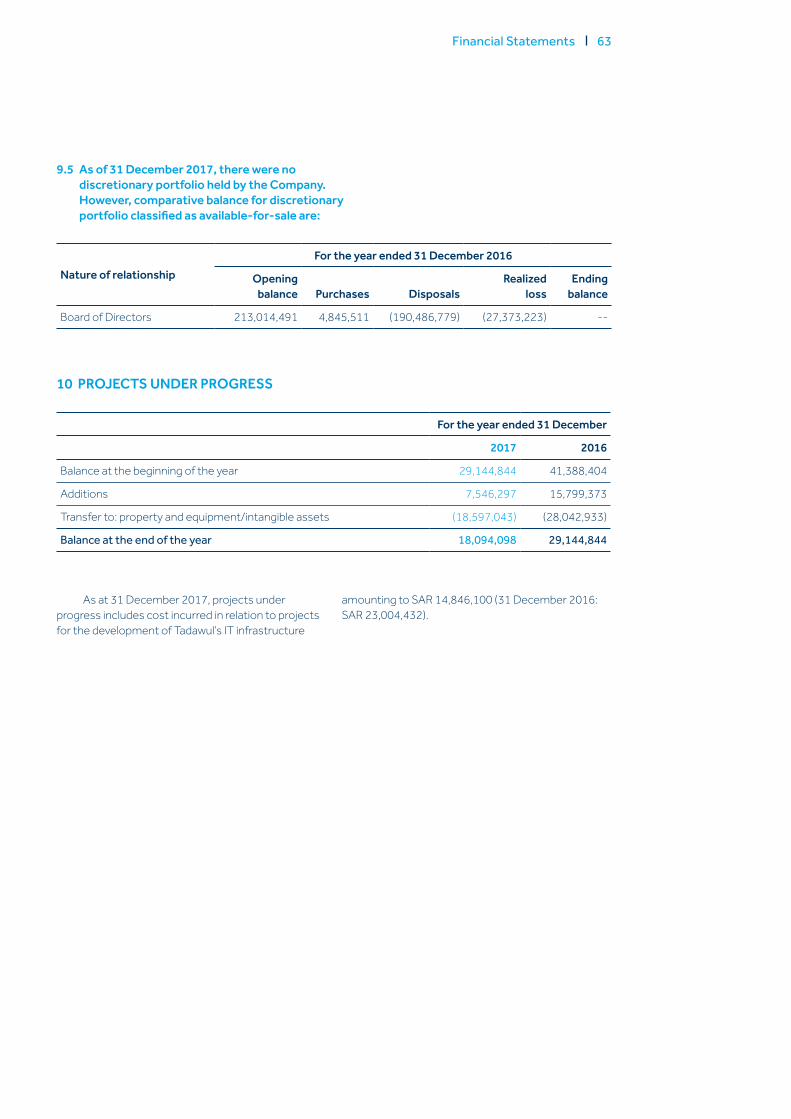
Financial Statements 63
9.5 As of 31 December 2017, there were no discretionary portfolio held by the Company. However, comparative balance for discretionary portfolio classified as available-for-sale are:
Nature of relationshipFor the year ended 31 December 2016
Opening balance Purchases Disposals
Realized loss
Ending balance
Board of Directors 213,014,491 4,845,511 (190,486,779) (27,373,223) --
10 PROJECTS UNDER PROGRESS
For the year ended 31 December
2017 2016
Balance at the beginning of the year 29,144,844 41,388,404
Additions 7,546,297 15,799,373
Transfer to: property and equipment/intangible assets (18,597,043) (28,042,933)
Balance at the end of the year 18,094,098 29,144,844
As at 31 December 2017, projects under progress includes cost incurred in relation to projects for the development of Tadawul’s IT infrastructure
amounting to SAR 14,846,100 (31 December 2016: SAR 23,004,432).
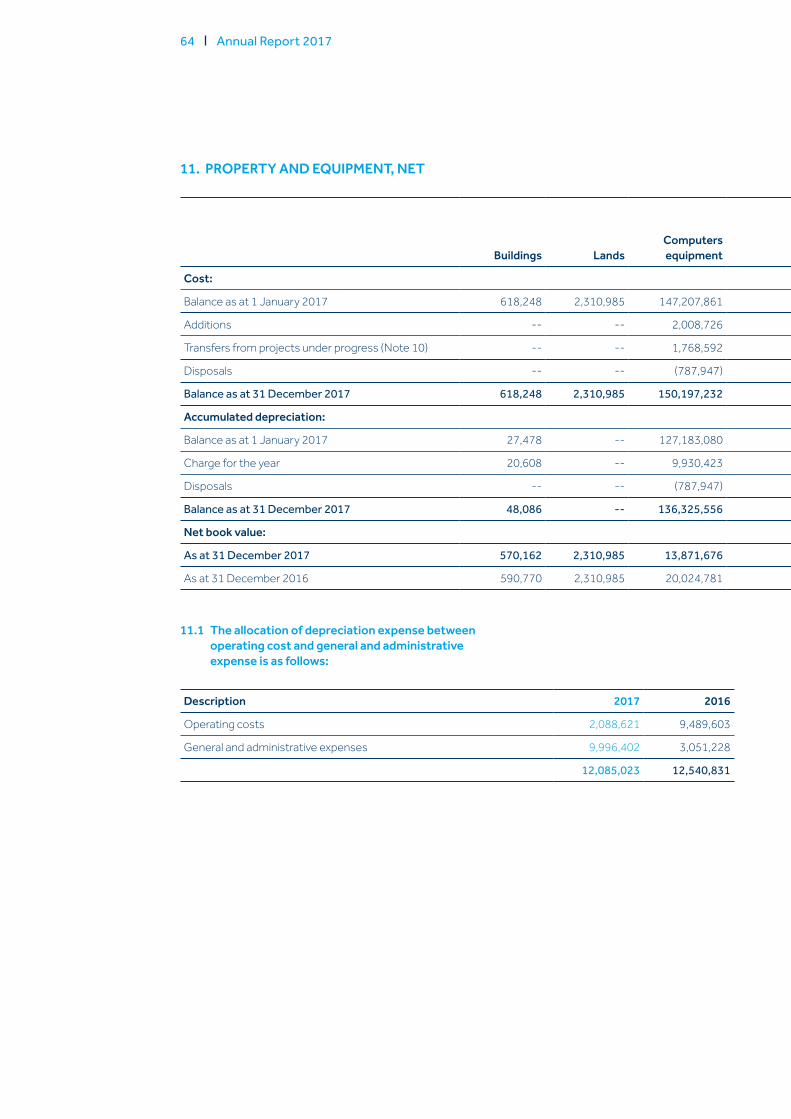
64 Annual Report 2017
11. PROPERTY AND EQUIPMENT, NET
Buildings LandsComputers equipment
Decoration and
fixtures
Furniture and
fixtures
Electrical machines
and equipment Tools Vehicles Total
Cost:
Balance as at 1 January 2017 618,248 2,310,985 147,207,861 11,160,192 9,533,405 11,653,139 6,554,407 1,656,350 190,694,587
Additions -- -- 2,008,726 164,304 67,754 88,390 38,396 -- 2,367,570
Transfers from projects under progress (Note 10) -- -- 1,768,592 -- 276,384 105,000 14,580 -- 2,164,556
Disposals -- -- (787,947) -- (382,390) (46,920) (381,260) -- (1,598,517)
Balance as at 31 December 2017 618,248 2,310,985 150,197,232 11,324,496 9,495,153 11,799,609 6,226,123 1,656,350 193,628,196
Accumulated depreciation:
Balance as at 1 January 2017 27,478 -- 127,183,080 9,264,104 7,154,779 10,047,059 5,667,821 907,462 160,251,783
Charge for the year 20,608 -- 9,930,423 583,493 452,007 560,949 254,776 282,767 12,085,023
Disposals -- -- (787,947) -- (381,546) (46,920) (381,260) -- (1,597,673)
Balance as at 31 December 2017 48,086 -- 136,325,556 9,847,597 7,225,240 10,561,088 5,541,337 1,190,229 170,739,133
Net book value:
As at 31 December 2017 570,162 2,310,985 13,871,676 1,476,899 2,269,913 1,238,521 684,786 466,121 22,889,063
As at 31 December 2016 590,770 2,310,985 20,024,781 1,896,088 2,378,626 1,606,080 886,586 748,888 30,442,804
11.1 The allocation of depreciation expense between operating cost and general and administrative expense is as follows:
Description 2017 2016
Operating costs 2,088,621 9,489,603
General and administrative expenses 9,996,402 3,051,228
12,085,023 12,540,831
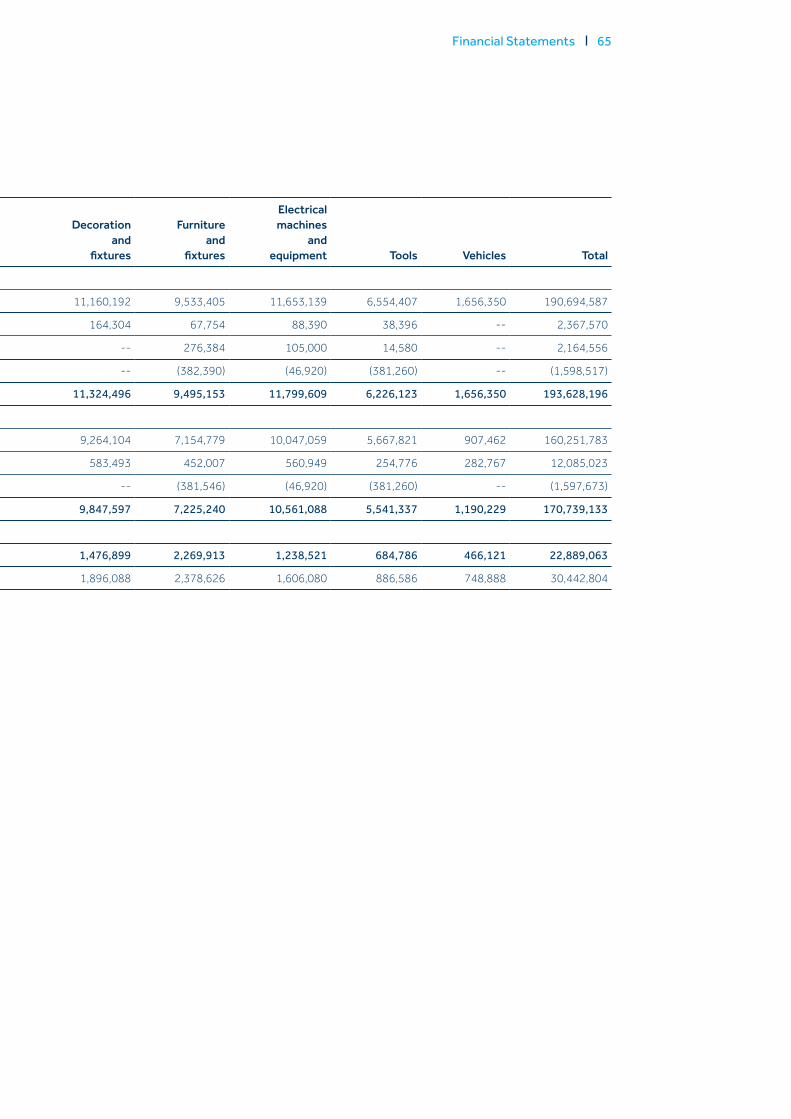
Financial Statements 65
11. PROPERTY AND EQUIPMENT, NET
Buildings LandsComputers equipment
Decoration and
fixtures
Furniture and
fixtures
Electrical machines
and equipment Tools Vehicles Total
Cost:
Balance as at 1 January 2017 618,248 2,310,985 147,207,861 11,160,192 9,533,405 11,653,139 6,554,407 1,656,350 190,694,587
Additions -- -- 2,008,726 164,304 67,754 88,390 38,396 -- 2,367,570
Transfers from projects under progress (Note 10) -- -- 1,768,592 -- 276,384 105,000 14,580 -- 2,164,556
Disposals -- -- (787,947) -- (382,390) (46,920) (381,260) -- (1,598,517)
Balance as at 31 December 2017 618,248 2,310,985 150,197,232 11,324,496 9,495,153 11,799,609 6,226,123 1,656,350 193,628,196
Accumulated depreciation:
Balance as at 1 January 2017 27,478 -- 127,183,080 9,264,104 7,154,779 10,047,059 5,667,821 907,462 160,251,783
Charge for the year 20,608 -- 9,930,423 583,493 452,007 560,949 254,776 282,767 12,085,023
Disposals -- -- (787,947) -- (381,546) (46,920) (381,260) -- (1,597,673)
Balance as at 31 December 2017 48,086 -- 136,325,556 9,847,597 7,225,240 10,561,088 5,541,337 1,190,229 170,739,133
Net book value:
As at 31 December 2017 570,162 2,310,985 13,871,676 1,476,899 2,269,913 1,238,521 684,786 466,121 22,889,063
As at 31 December 2016 590,770 2,310,985 20,024,781 1,896,088 2,378,626 1,606,080 886,586 748,888 30,442,804
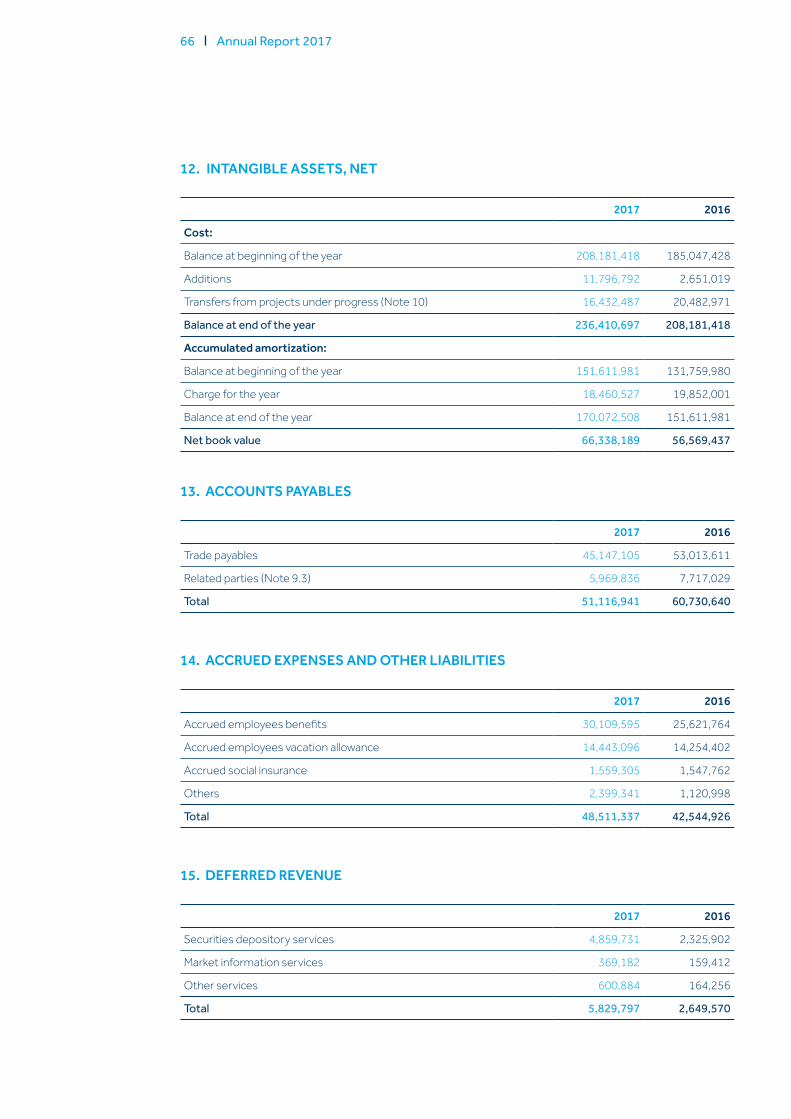
66 Annual Report 2017
12. INTANGIBLE ASSETS, NET
2017 2016
Cost:
Balance at beginning of the year 208,181,418 185,047,428
Additions 11,796,792 2,651,019
Transfers from projects under progress (Note 10) 16,432,487 20,482,971
Balance at end of the year 236,410,697 208,181,418
Accumulated amortization:
Balance at beginning of the year 151,611,981 131,759,980
Charge for the year 18,460,527 19,852,001
Balance at end of the year 170,072,508 151,611,981
Net book value 66,338,189 56,569,437
14. ACCRUED EXPENSES AND OTHER LIABILITIES
2017 2016
Accrued employees benefits 30,109,595 25,621,764
Accrued employees vacation allowance 14,443,096 14,254,402
Accrued social insurance 1,559,305 1,547,762
Others 2,399,341 1,120,998
Total 48,511,337 42,544,926
15. DEFERRED REVENUE
2017 2016
Securities depository services 4,859,731 2,325,902
Market information services 369,182 159,412
Other services 600,884 164,256
Total 5,829,797 2,649,570
13. ACCOUNTS PAYABLES
2017 2016
Trade payables 45,147,105 53,013,611
Related parties (Note 9.3) 5,969,836 7,717,029
Total 51,116,941 60,730,640
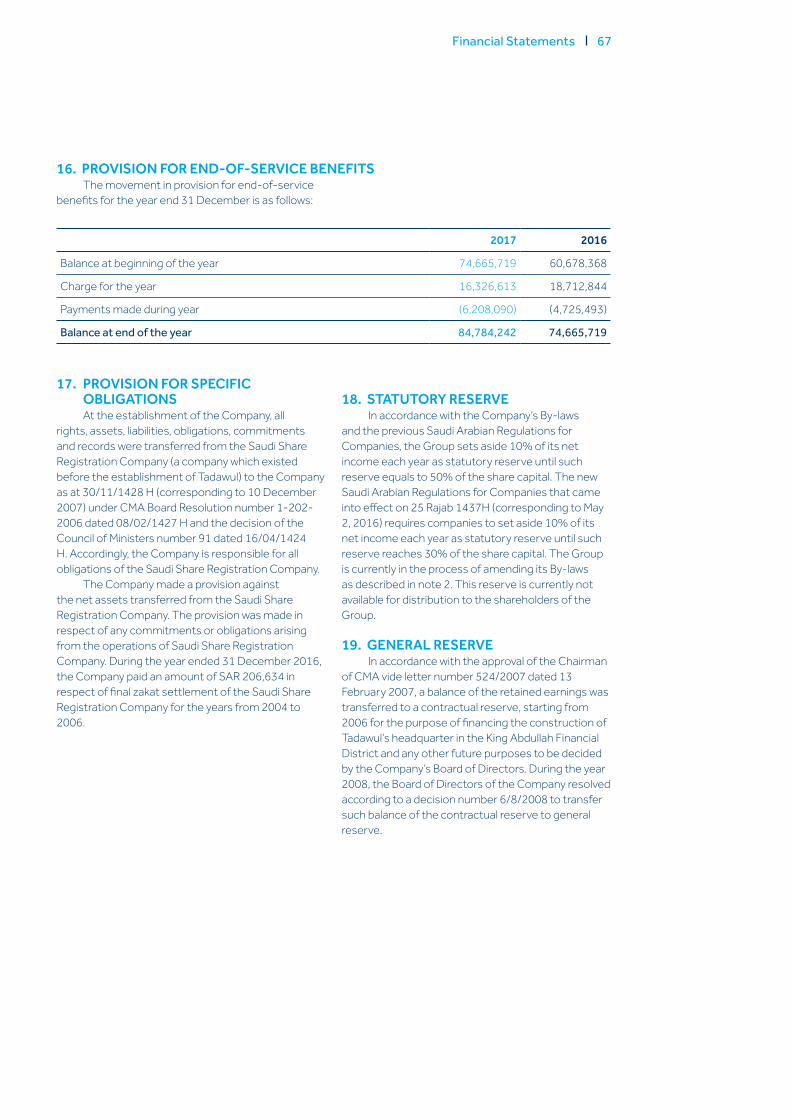
Financial Statements 67
16. PROVISION FOR END-OF-SERVICE BENEFITSThe movement in provision for end-of-service
benefits for the year end 31 December is as follows:
2017 2016
Balance at beginning of the year 74,665,719 60,678,368
Charge for the year 16,326,613 18,712,844
Payments made during year (6,208,090) (4,725,493)
Balance at end of the year 84,784,242 74,665,719
17. PROVISION FOR SPECIFIC OBLIGATIONSAt the establishment of the Company, all
rights, assets, liabilities, obligations, commitments and records were transferred from the Saudi Share Registration Company (a company which existed before the establishment of Tadawul) to the Company as at 30/11/1428 H (corresponding to 10 December 2007) under CMA Board Resolution number 1-202-2006 dated 08/02/1427 H and the decision of the Council of Ministers number 91 dated 16/04/1424 H. Accordingly, the Company is responsible for all obligations of the Saudi Share Registration Company.
The Company made a provision against the net assets transferred from the Saudi Share Registration Company. The provision was made in respect of any commitments or obligations arising from the operations of Saudi Share Registration Company. During the year ended 31 December 2016, the Company paid an amount of SAR 206,634 in respect of final zakat settlement of the Saudi Share Registration Company for the years from 2004 to 2006.
18. STATUTORY RESERVEIn accordance with the Company’s By-laws
and the previous Saudi Arabian Regulations for Companies, the Group sets aside 10% of its net income each year as statutory reserve until such reserve equals to 50% of the share capital. The new Saudi Arabian Regulations for Companies that came into effect on 25 Rajab 1437H (corresponding to May 2, 2016) requires companies to set aside 10% of its net income each year as statutory reserve until such reserve reaches 30% of the share capital. The Group is currently in the process of amending its By-laws as described in note 2. This reserve is currently not available for distribution to the shareholders of the Group.
19. GENERAL RESERVEIn accordance with the approval of the Chairman
of CMA vide letter number 524/2007 dated 13 February 2007, a balance of the retained earnings was transferred to a contractual reserve, starting from 2006 for the purpose of financing the construction of Tadawul’s headquarter in the King Abdullah Financial District and any other future purposes to be decided by the Company’s Board of Directors. During the year 2008, the Board of Directors of the Company resolved according to a decision number 6/8/2008 to transfer such balance of the contractual reserve to general reserve.
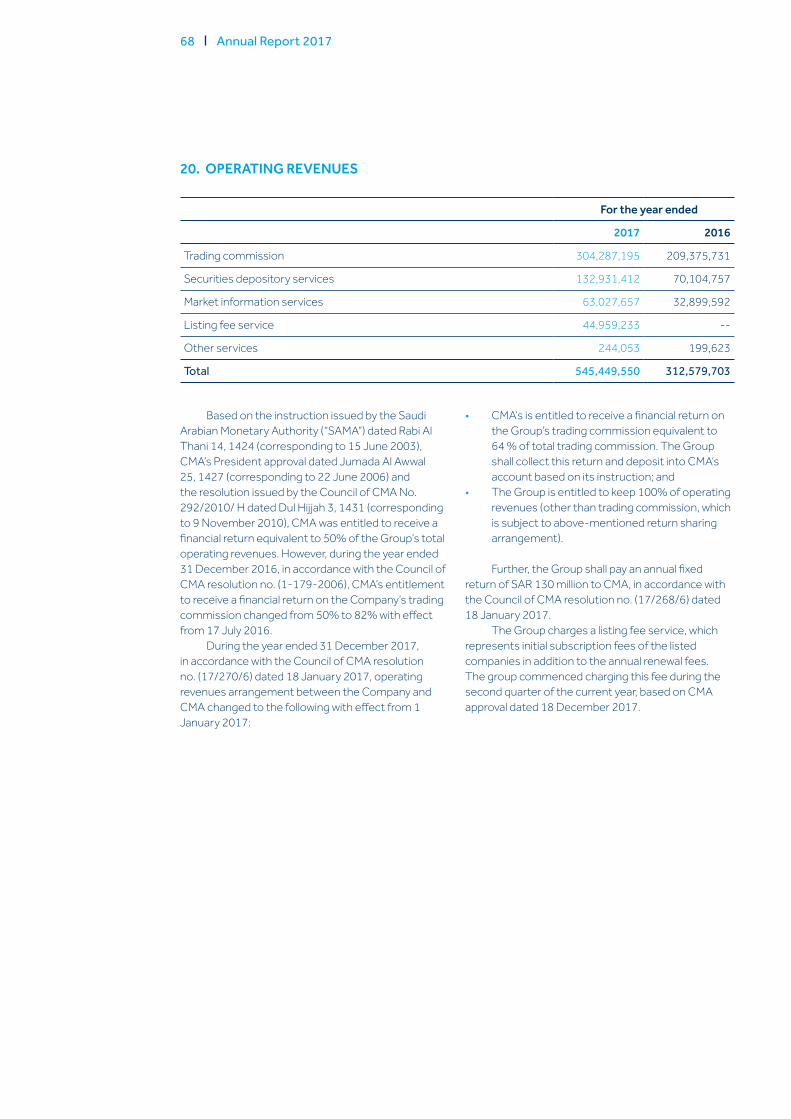
68 Annual Report 2017
20. OPERATING REVENUES
For the year ended
2017 2016
Trading commission 304,287,195 209,375,731
Securities depository services 132,931,412 70,104,757
Market information services 63,027,657 32,899,592
Listing fee service 44,959,233 --
Other services 244,053 199,623
Total 545,449,550 312,579,703
Based on the instruction issued by the Saudi Arabian Monetary Authority (“SAMA”) dated Rabi Al Thani 14, 1424 (corresponding to 15 June 2003), CMA’s President approval dated Jumada Al Awwal 25, 1427 (corresponding to 22 June 2006) and the resolution issued by the Council of CMA No. 292/2010/ H dated Dul Hijjah 3, 1431 (corresponding to 9 November 2010), CMA was entitled to receive a financial return equivalent to 50% of the Group’s total operating revenues. However, during the year ended 31 December 2016, in accordance with the Council of CMA resolution no. (1-179-2006), CMA’s entitlement to receive a financial return on the Company’s trading commission changed from 50% to 82% with effect from 17 July 2016.
During the year ended 31 December 2017, in accordance with the Council of CMA resolution no. (17/270/6) dated 18 January 2017, operating revenues arrangement between the Company and CMA changed to the following with effect from 1 January 2017:
• CMA’s is entitled to receive a financial return on the Group’s trading commission equivalent to 64 % of total trading commission. The Group shall collect this return and deposit into CMA’s account based on its instruction; and
• The Group is entitled to keep 100% of operating revenues (other than trading commission, which is subject to above-mentioned return sharing arrangement).
Further, the Group shall pay an annual fixed return of SAR 130 million to CMA, in accordance with the Council of CMA resolution no. (17/268/6) dated 18 January 2017.
The Group charges a listing fee service, which represents initial subscription fees of the listed companies in addition to the annual renewal fees. The group commenced charging this fee during the second quarter of the current year, based on CMA approval dated 18 December 2017.
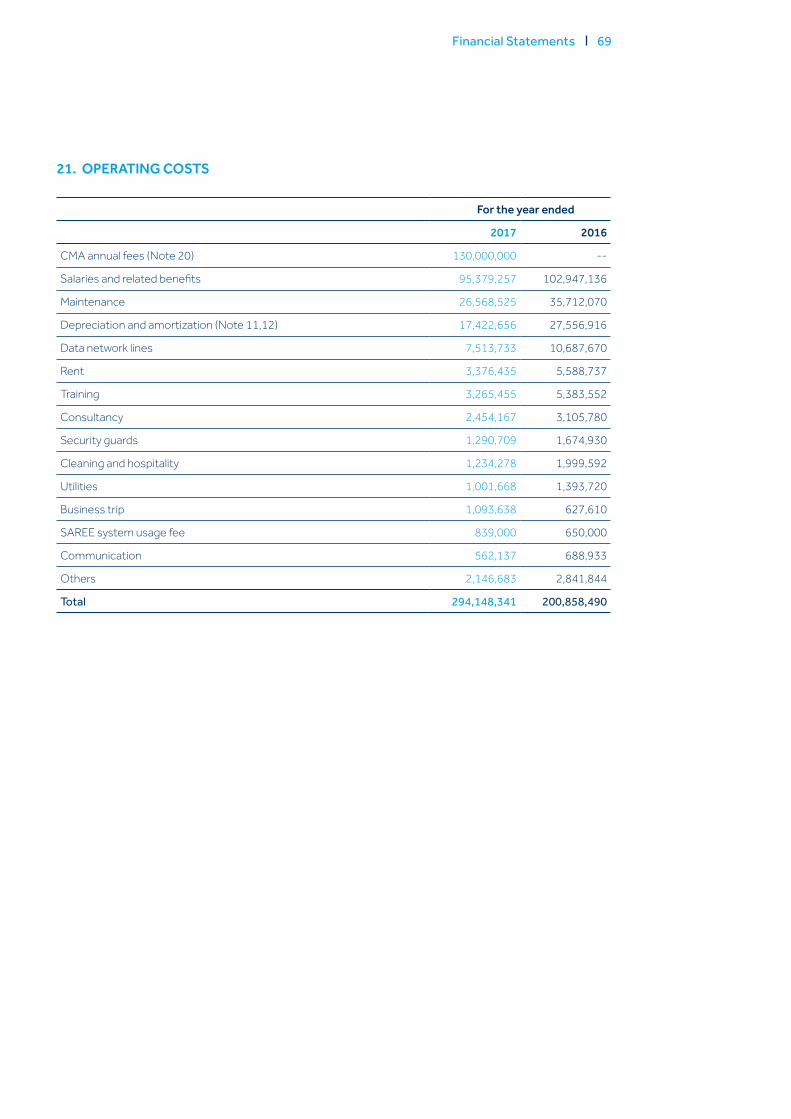
Financial Statements 69
21. OPERATING COSTS
For the year ended
2017 2016
CMA annual fees (Note 20) 130,000,000 --
Salaries and related benefits 95,379,257 102,947,136
Maintenance 26,568,525 35,712,070
Depreciation and amortization (Note 11,12) 17,422,656 27,556,916
Data network lines 7,513,733 10,687,670
Rent 3,376,435 5,588,737
Training 3,265,455 5,383,552
Consultancy 2,454,167 3,105,780
Security guards 1,290,709 1,674,930
Cleaning and hospitality 1,234,278 1,999,592
Utilities 1,001,668 1,393,720
Business trip 1,093,638 627,610
SAREE system usage fee 839,000 650,000
Communication 562,137 688,933
Others 2,146,683 2,841,844
Total 294,148,341 200,858,490
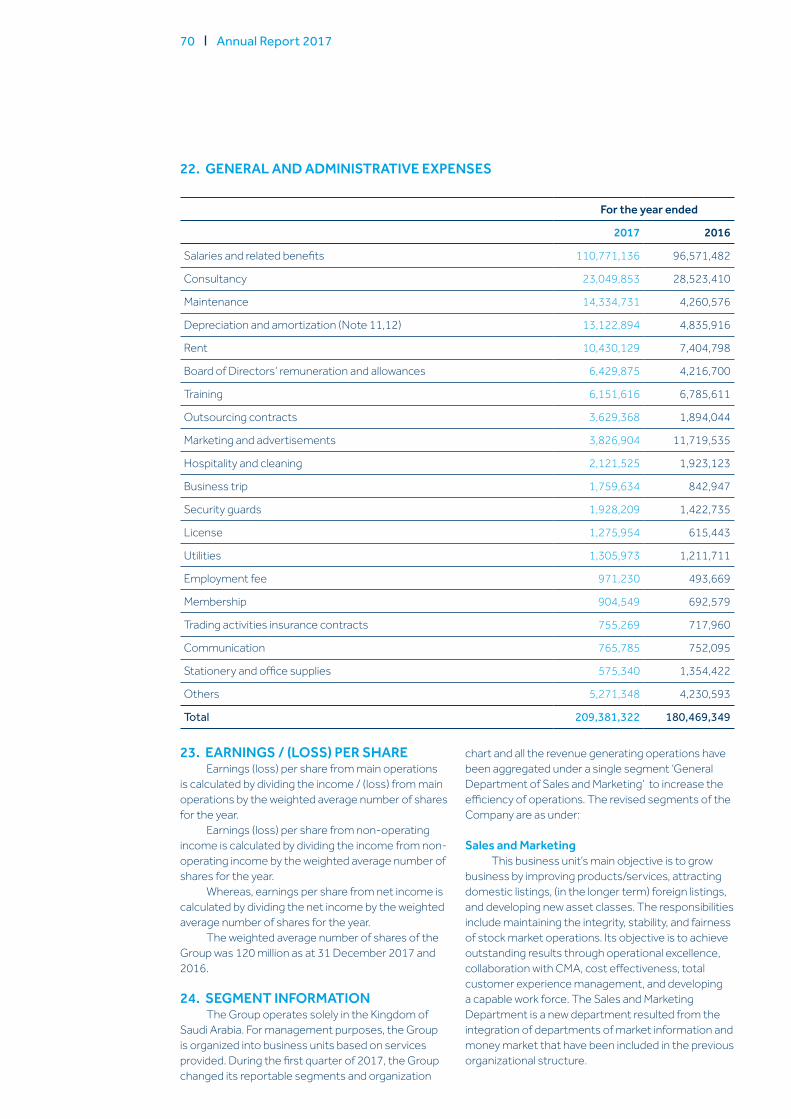
70 Annual Report 2017
22. GENERAL AND ADMINISTRATIVE EXPENSES
For the year ended
2017 2016
Salaries and related benefits 110,771,136 96,571,482
Consultancy 23,049,853 28,523,410
Maintenance 14,334,731 4,260,576
Depreciation and amortization (Note 11,12) 13,122,894 4,835,916
Rent 10,430,129 7,404,798
Board of Directors’ remuneration and allowances 6,429,875 4,216,700
Training 6,151,616 6,785,611
Outsourcing contracts 3,629,368 1,894,044
Marketing and advertisements 3,826,904 11,719,535
Hospitality and cleaning 2,121,525 1,923,123
Business trip 1,759,634 842,947
Security guards 1,928,209 1,422,735
License 1,275,954 615,443
Utilities 1,305,973 1,211,711
Employment fee 971,230 493,669
Membership 904,549 692,579
Trading activities insurance contracts 755,269 717,960
Communication 765,785 752,095
Stationery and office supplies 575,340 1,354,422
Others 5,271,348 4,230,593
Total 209,381,322 180,469,349
23. EARNINGS / (LOSS) PER SHAREEarnings (loss) per share from main operations
is calculated by dividing the income / (loss) from main operations by the weighted average number of shares for the year.
Earnings (loss) per share from non-operating income is calculated by dividing the income from non-operating income by the weighted average number of shares for the year.
Whereas, earnings per share from net income is calculated by dividing the net income by the weighted average number of shares for the year.
The weighted average number of shares of the Group was 120 million as at 31 December 2017 and 2016.
24. SEGMENT INFORMATIONThe Group operates solely in the Kingdom of
Saudi Arabia. For management purposes, the Group is organized into business units based on services provided. During the first quarter of 2017, the Group changed its reportable segments and organization
chart and all the revenue generating operations have been aggregated under a single segment ‘General Department of Sales and Marketing’ to increase the efficiency of operations. The revised segments of the Company are as under:
Sales and MarketingThis business unit’s main objective is to grow
business by improving products/services, attracting domestic listings, (in the longer term) foreign listings, and developing new asset classes. The responsibilities include maintaining the integrity, stability, and fairness of stock market operations. Its objective is to achieve outstanding results through operational excellence, collaboration with CMA, cost effectiveness, total customer experience management, and developing a capable work force. The Sales and Marketing Department is a new department resulted from the integration of departments of market information and money market that have been included in the previous organizational structure.
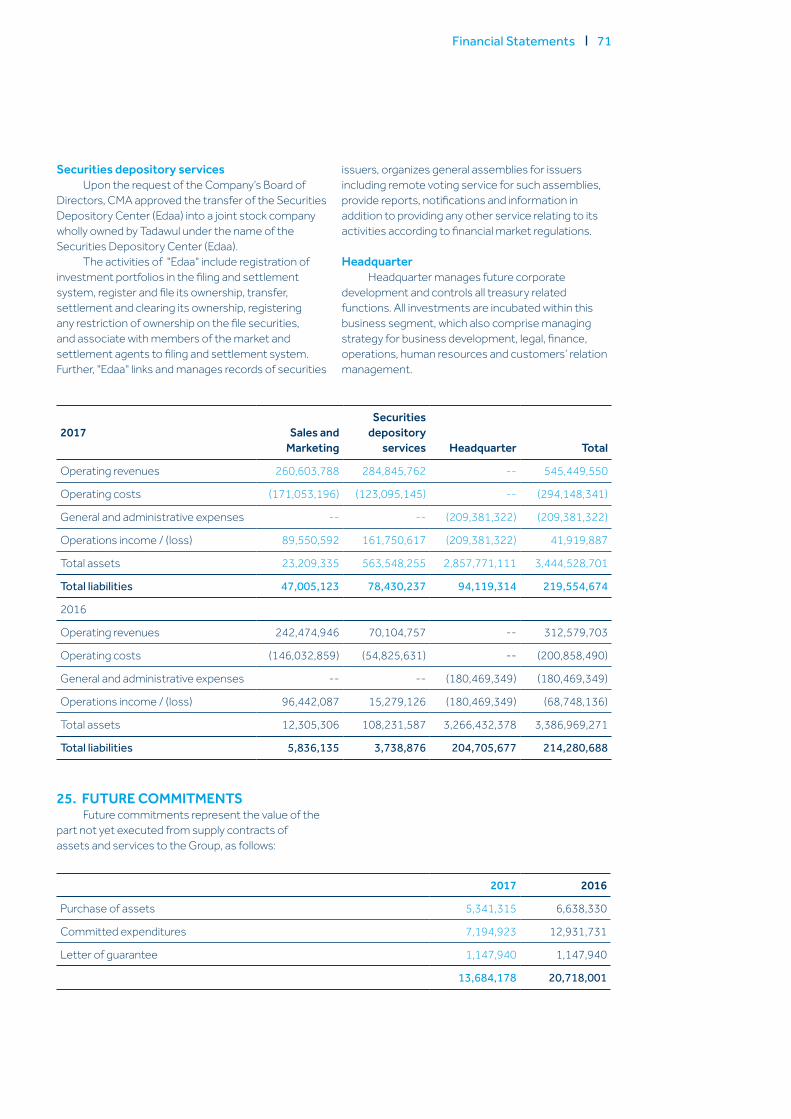
Financial Statements 71
Securities depository servicesUpon the request of the Company’s Board of
Directors, CMA approved the transfer of the Securities Depository Center (Edaa) into a joint stock company wholly owned by Tadawul under the name of the Securities Depository Center (Edaa).
The activities of "Edaa" include registration of investment portfolios in the filing and settlement system, register and file its ownership, transfer, settlement and clearing its ownership, registering any restriction of ownership on the file securities, and associate with members of the market and settlement agents to filing and settlement system. Further, "Edaa" links and manages records of securities
issuers, organizes general assemblies for issuers including remote voting service for such assemblies, provide reports, notifications and information in addition to providing any other service relating to its activities according to financial market regulations.
HeadquarterHeadquarter manages future corporate
development and controls all treasury related functions. All investments are incubated within this business segment, which also comprise managing strategy for business development, legal, finance, operations, human resources and customers’ relation management.
2017 Sales and Marketing
Securities depository
services Headquarter Total
Operating revenues 260,603,788 284,845,762 -- 545,449,550
Operating costs (171,053,196) (123,095,145) -- (294,148,341)
General and administrative expenses -- -- (209,381,322) (209,381,322)
Operations income / (loss) 89,550,592 161,750,617 (209,381,322) 41,919,887
Total assets 23,209,335 563,548,255 2,857,771,111 3,444,528,701
Total liabilities 47,005,123 78,430,237 94,119,314 219,554,674
2016
Operating revenues 242,474,946 70,104,757 -- 312,579,703
Operating costs (146,032,859) (54,825,631) -- (200,858,490)
General and administrative expenses -- -- (180,469,349) (180,469,349)
Operations income / (loss) 96,442,087 15,279,126 (180,469,349) (68,748,136)
Total assets 12,305,306 108,231,587 3,266,432,378 3,386,969,271
Total liabilities 5,836,135 3,738,876 204,705,677 214,280,688
25. FUTURE COMMITMENTSFuture commitments represent the value of the
part not yet executed from supply contracts of assets and services to the Group, as follows:
2017 2016
Purchase of assets 5,341,315 6,638,330
Committed expenditures 7,194,923 12,931,731
Letter of guarantee 1,147,940 1,147,940
13,684,178 20,718,001
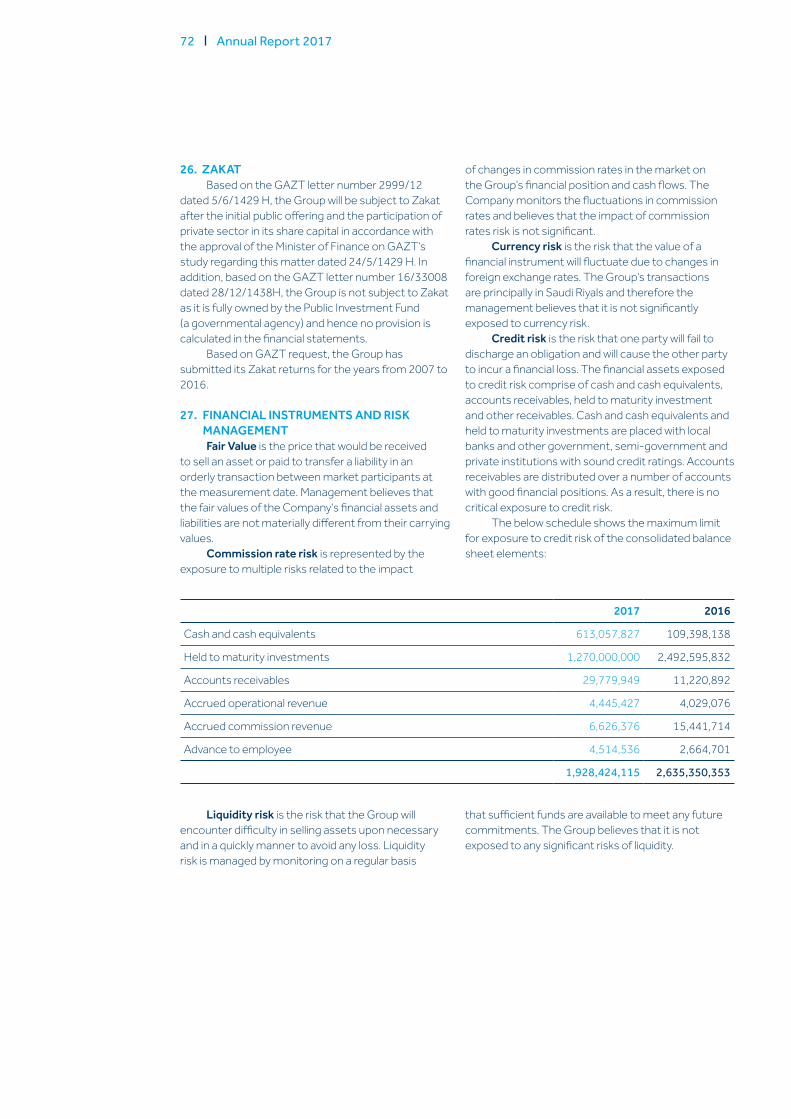
72 Annual Report 2017
26. ZAKATBased on the GAZT letter number 2999/12
dated 5/6/1429 H, the Group will be subject to Zakat after the initial public offering and the participation of private sector in its share capital in accordance with the approval of the Minister of Finance on GAZT’s study regarding this matter dated 24/5/1429 H. In addition, based on the GAZT letter number 16/33008 dated 28/12/1438H, the Group is not subject to Zakat as it is fully owned by the Public Investment Fund (a governmental agency) and hence no provision is calculated in the financial statements.
Based on GAZT request, the Group has submitted its Zakat returns for the years from 2007 to 2016.
27. FINANCIAL INSTRUMENTS AND RISK MANAGEMENTFair Value is the price that would be received
to sell an asset or paid to transfer a liability in an orderly transaction between market participants at the measurement date. Management believes that the fair values of the Company‘s financial assets and liabilities are not materially different from their carrying values.
Commission rate risk is represented by the exposure to multiple risks related to the impact
of changes in commission rates in the market on the Group’s financial position and cash flows. The Company monitors the fluctuations in commission rates and believes that the impact of commission rates risk is not significant.
Currency risk is the risk that the value of a financial instrument will fluctuate due to changes in foreign exchange rates. The Group‘s transactions are principally in Saudi Riyals and therefore the management believes that it is not significantly exposed to currency risk.
Credit risk is the risk that one party will fail to discharge an obligation and will cause the other party to incur a financial loss. The financial assets exposed to credit risk comprise of cash and cash equivalents, accounts receivables, held to maturity investment and other receivables. Cash and cash equivalents and held to maturity investments are placed with local banks and other government, semi-government and private institutions with sound credit ratings. Accounts receivables are distributed over a number of accounts with good financial positions. As a result, there is no critical exposure to credit risk.
The below schedule shows the maximum limit for exposure to credit risk of the consolidated balance sheet elements:
Liquidity risk is the risk that the Group will encounter difficulty in selling assets upon necessary and in a quickly manner to avoid any loss. Liquidity risk is managed by monitoring on a regular basis
that sufficient funds are available to meet any future commitments. The Group believes that it is not exposed to any significant risks of liquidity.
2017 2016
Cash and cash equivalents 613,057,827 109,398,138
Held to maturity investments 1,270,000,000 2,492,595,832
Accounts receivables 29,779,949 11,220,892
Accrued operational revenue 4,445,427 4,029,076
Accrued commission revenue 6,626,376 15,441,714
Advance to employee 4,514,536 2,664,701
1,928,424,115 2,635,350,353
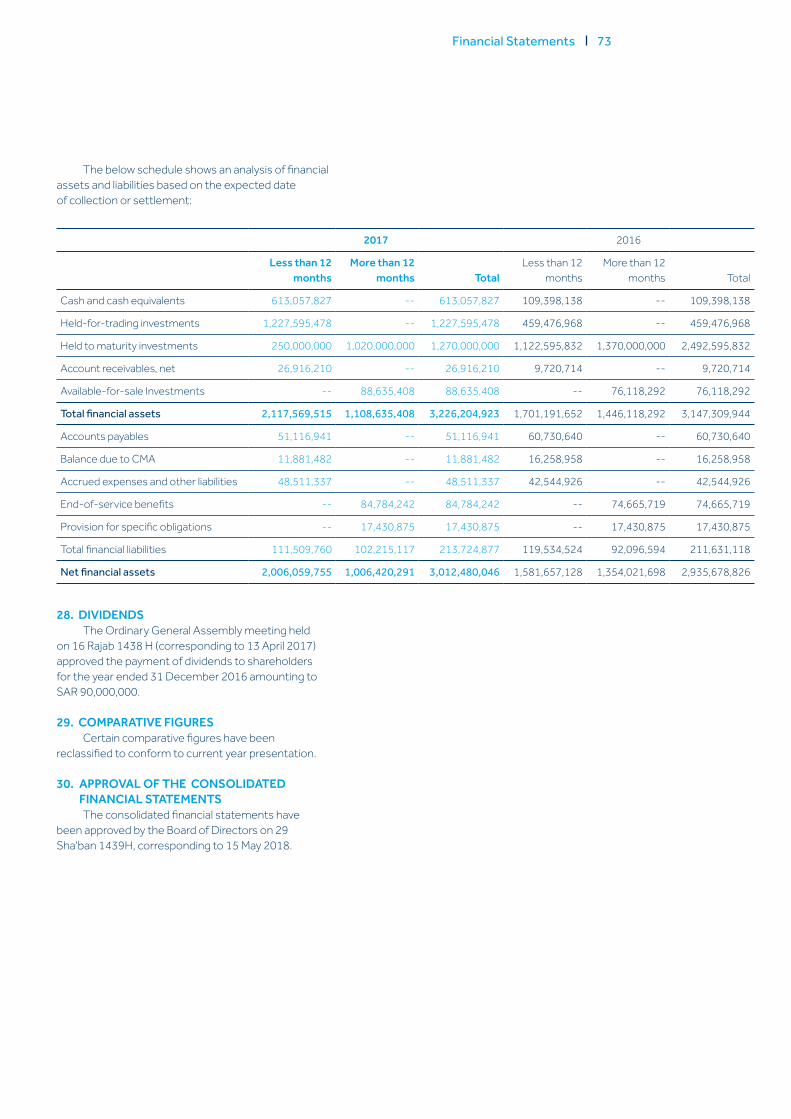
Financial Statements 73
28. DIVIDENDSThe Ordinary General Assembly meeting held
on 16 Rajab 1438 H (corresponding to 13 April 2017) approved the payment of dividends to shareholders for the year ended 31 December 2016 amounting to SAR 90,000,000.
29. COMPARATIVE FIGURESCertain comparative figures have been
reclassified to conform to current year presentation.
30. APPROVAL OF THE CONSOLIDATED FINANCIAL STATEMENTSThe consolidated financial statements have
been approved by the Board of Directors on 29 Sha'ban 1439H, corresponding to 15 May 2018.
The below schedule shows an analysis of financial assets and liabilities based on the expected date of collection or settlement:
2017 2016
Less than 12 months
More than 12 months Total
Less than 12 months
More than 12 months Total
Cash and cash equivalents 613,057,827 -- 613,057,827 109,398,138 -- 109,398,138
Held-for-trading investments 1,227,595,478 -- 1,227,595,478 459,476,968 -- 459,476,968
Held to maturity investments 250,000,000 1,020,000,000 1,270,000,000 1,122,595,832 1,370,000,000 2,492,595,832
Account receivables, net 26,916,210 -- 26,916,210 9,720,714 -- 9,720,714
Available-for-sale Investments -- 88,635,408 88,635,408 -- 76,118,292 76,118,292
Total financial assets 2,117,569,515 1,108,635,408 3,226,204,923 1,701,191,652 1,446,118,292 3,147,309,944
Accounts payables 51,116,941 -- 51,116,941 60,730,640 -- 60,730,640
Balance due to CMA 11,881,482 -- 11,881,482 16,258,958 -- 16,258,958
Accrued expenses and other liabilities 48,511,337 -- 48,511,337 42,544,926 -- 42,544,926
End-of-service benefits -- 84,784,242 84,784,242 -- 74,665,719 74,665,719
Provision for specific obligations -- 17,430,875 17,430,875 -- 17,430,875 17,430,875
Total financial liabilities 111,509,760 102,215,117 213,724,877 119,534,524 92,096,594 211,631,118
Net financial assets 2,006,059,755 1,006,420,291 3,012,480,046 1,581,657,128 1,354,021,698 2,935,678,826

Annual Report 2017

Annual Report 2017 7574
Saudi Stock Exchange (Tadawul)
6897 King Fahd Road - Al UlayaUnit Number: 15Riyadh 12211-3388Kingdom of Saudi Arabia
Customer Service: (+966) 92000 1919Fax: +966 (0)11 218 9133
Email: [email protected]: www.tadawul.com.sa
Annual Report 2017
92000 1919 @tadawul
www.tadawul.com.sa