theoretical foundation of diversification decisions: - virtus
TRANSCRIPT

Corporate Ownership & Control / Volume 13, Issue 1, Autumn 2015
3
CORPORATE
OWNERSHIP & CONTROL
Postal Address:
Postal Box 36
Sumy 40014
Ukraine
Tel: +380-542-698125
Fax: +380-542-698125
e-mail: [email protected]
www.virtusinterpress.org
Journal Corporate Ownership & Control is published four times a year, in September-November, December-
February, March-May and June-August, by Publishing House “Virtus Interpress”, Kirova Str. 146/1, office 20,
Sumy, 40021, Ukraine.
Information for subscribers: New orders requests should be addressed to the Editor by e-mail. See the section
"Subscription details".
Back issues: Single issues are available from the Editor. Details, including prices, are available upon request.
Advertising: For details, please, contact the Editor of the journal.
Copyright: All rights reserved. No part of this publication may be reproduced, stored or transmitted in any form
or by any means without the prior permission in writing of the Publisher.
Corporate Ownership & Control
ISSN 1727-9232 (printed version)
1810-0368 (CD version)
1810-3057 (online version)
Certificate № 7881
Virtus Interpress. All rights reserved.
Corporate Ownership & Control / Volume 13, Issue 1, Autumn 2015
4
EDITORIAL
Dear readers!
The recent issue of the journal Corporate Ownership and Control pays attention to issues of corporate
social responsibility, risks management, audit issues, corporate codes etc. More detailed issues are
given below.
Sujani Thrikawala, Stuart Locke, Krishna Reddy examine the impact of corporate governance
practices of microfinance institutions (MFIs) on outreach to the poor people in Sri Lanka by using
three outreach variables. Ziad Mohammad. Zurigat, Nadia Jawdat aim at testing the partial adjustment
model of cash holdings to investigate whether Jordanian industrial firms have a target cash holdings
and how fast they move toward that target when any target deviation exists. The results of the research
of Turki Al-Sabah signify a negative relationship between the firm’s financial leverage and dividend
payout ratio. Samer Khalil, Assem Safieddine examines governance-related issues within Middle East
family businesses. They construct a governance index and use a probit model to examine whether
family-related variables can explain the level of corporate governance.
Graziella Sicoli, Paolo Tenuta analyse the concept of going concern on the one hand, through a case
study of three companies which have recently come under observation of the CONSOB and have been
inserted in the so-called “black list” and, on the other, the consequences that the removal of the
presumption of continuity can have on the kind of assessment the auditors make. Rajni Mala, Parmod
Chand examine whether the accuracy of judgments made by accountants varies as a consequence of
their level of confidence, and whether their confidence in exercising judgments could be enhanced by
greater familiarity with IFRS. Sutaryo Sutaryo, Yediel Lase
investigate the effects of auditor
characteristics on local governments’ audit delay by studying 127 Indonesian local governments.
Agung Nur Probohudono, Eko Arief Sudaryono, Nurmadi Harsa Sumarta, Yonatan Ardilas examine
the impact of ownership, corporate governance and mandatory tax disclosure on voluntary financial
disclosure in Indonesia using 102 Indonesian listed companies in the period of 2009 to 2012.
Hayat M. Awan, M. Ishaq Bhatti, Zahid Razaq investigate the financial management performance
involved in increasing the firms’ profitability. Reem Khamis, Wajeeh Al-Ali, Allam Hamdan examine
the relation between ownership structure and corporate performance; the sample of the study included
42 out of 48 companies (resembling 87.5% of the population) of all sectors in Bahrain Stock Exchange
in five years from 2007-2011. Mahlomola Khumalo, Andries Masenge investigate the relationship
between CEO remuneration and firm performance. Roderick Bugador views the network of control in
a corporate business group as its source of competitive advantages.
We hope that you will enjoy reading the journal and in future we will receive new papers, outlining
the most important issues and best practices of corporate governance!
Corporate Ownership & Control / Volume 13, Issue 1, Autumn 2015
5
CORPORATE OWNERSHIP & CONTROL VOLUME 13, ISSUE 1, AUTUMN 2015
CONTENTS
EDITORIAL 4
ACADEMIC NVESTIGATIONS & CONCEPTS AN EMPIRICAL ANALYSIS OF CORPORATE GOVERNANCE IMPACT ON OUTREACH OF MICROFINANCE INSTITUTIONS (MFIS) 8 Sujani Thrikawala, Stuart Locke, Krishna Reddy This study examines the impact of corporate governance practices of microfinance institutions on outreach to the poor people in Sri Lanka. The findings of this study revealed several significant relationships: Breadth of outreach in Sri Lankan MFIs improve when they have a female chair on the board but decreases when they have more female directors and client representation on the board, and female borrowers get more loans when the firm has women representation and international/donor directors on the board, but less loans if they have a female chair. TESTING THE PARTIAL ADJUSTMENT MODEL OF OPTIMAL CASH HOLDING: EVIDENCE FROM AMMAN STOCK EXCHANGE 15 Ziad Mohammad. Zurigat, Nadia Jawdat This study aims at testing the partial adjustment model of cash holdings to investigate whether Jordanian industrial firms have a target cash holdings and how fast they move toward that target when any target deviation exists. The study uses the estimated fitted values from the conventional cash equation as a proxy for the target cash holding. The study provides evidence suggesting that cash flows, net working capital, leverage and firm size significantly affect the cash holdings of Jordanian firms. THE EFFECT OF THE FIRM’S AGE AND FINANCIAL LEVERAGE ON ITS DIVIDEND POLICY – EVIDENCE FROM KUWAIT STOCK EXCHANGE MARKET (KSE) 24 Turki Al-Sabah In this research, the effect of the firms’ financial leverage and age on their dividend policy has been explored. Two hypotheses were formulated, where the first focused on examining the effect of the firms’ financial leverage and the second concentrated on investigating the effect of the firms’ age on their dividend policy. The hypotheses were tested using ordinary least square and fixed-effect panel regression. The results signify a negative relationship between the firm’s financial leverage and dividend payout ratio. CORPORATE GOVERNANCE IN MIDDLE EAST FAMILY BUSINESSES 32 Samer Khalil, Assem Safieddine This study examines governance-related issues within Middle East family businesses. The absence of proper external monitoring mechanisms – governmental or other – to protect shareholder rights, and
Corporate Ownership & Control / Volume 13, Issue 1, Autumn 2015
6
the absence of any pre-existing literature on the Middle East market provides the motivation to evaluate the corporate governance practices of Middle East family businesses. Authors construct a governance index and use a probit model to examine whether family-related variables can explain the level of corporate governance. It is found that the majority of boards had a prevalence of family members and a low proportion of independent directors.
AUDIT, ACCOUNTING & REPORTING THE IMPACT OF THE “GOING CONCERN” ON AUDITORS’ JUDGEMENT. ANALYSIS OF THE ITALIAN CONTEXT FROM AN INTERNATIONAL PERSPECTIVE 44 Graziella Sicoli, Paolo Tenuta The present work aims to analyse the concept of going concern on the one hand, through a case study of three companies which have recently come under observation of the CONSOB and have been inserted in the so-called “black list” and, on the other, the consequences that the removal of the presumption of continuity can have on the kind of assessment the auditors make. The aim of the present work is twofold: the first part analyses the principle of going concern from a business and economic perspective. Once this has been completed, the work will go on to offer an overview of the dynamics that can bring a company to a crisis point, and how these affect the judgments expressed by the auditors. CONFIDENCE OF ACCOUNTANTS IN APPLYING INTERNATIONAL FINANCIAL REPORTING STANDARDS 56 Rajni Mala, Parmod Chand Research on how accountants could increase their confidence in interpreting and applying IFRS is lacking. This study examines whether the accuracy of judgments made by accountants varies as a consequence of their level of confidence, and whether their confidence in exercising judgments could be enhanced by greater familiarity with IFRS. The results of the study support that accountants who are more confident make judgments that better reflect the economic substance of a transaction than accountants who are less confident. The results further indicate that familiarity with IFRS enhances the confidence of accountants and the most accurate judgments are made by those accountants who are not only familiar with IFRS but also have confidence in their judgments. AUDITORS CHARACTERISTICS AND AUDIT DELAY: EVIDENCE FROM INDONESIAN REGIONAL GOVERNMENTS 66 Sutaryo Sutaryo, Yediel Lase
Overdue financial statements reporting, more specifically audit delay, can cause losses in its capacity in decision making. We investigate the effects of auditor characteristics on local governments’ audit delay. We find that auditor professional proficiency and auditor educational background have significant effect on the audit delay of local government financial statements. Our results also indicate the intersection of some auditor characteristics in affecting audit delay. Our findings mainly suggest that the auditor professional proficiency should be improved to shrink audit delay. OWNERSHIP, CORPORATE GOVERNANCE AND MANDATORY TAX DISCLOSURE INFLUENCING VOLUNTARY FINANCIAL DISCLOSURE IN INDONESIA 74 Agung Nur Probohudono, Eko Arief Sudaryono, Nurmadi Harsa Sumarta, Yonatan Ardilas This study examines the impact of ownership, corporate governance and mandatory tax disclosure on voluntary financial disclosure in Indonesia. The results show that proportion of independent director, managerial ownership, institutional ownership, foreign ownership and mandatory tax disclosure are assosiated with voluntary financial disclosure. Analysis reveals a moderate level of 59,90% score of disclosure in the period of 2009 to 2012 in Indonesian listed companies.
Corporate Ownership & Control / Volume 13, Issue 1, Autumn 2015
7
CORPORATE GOVERNANCE & PERFORMANCE FINANCIAL MANAGEMENT: THE IMPACT OF PERFORMANCE INDICATORS ON THE ORGANIZATIONAL PROFITABILITY 84 Hayat M. Awan, M. Ishaq Bhatti, Zahid Razaq This paper investigates the financial management performance involved in increasing the firms’ profitability. Stratified random sampling technique was used to select a sample of 200 manufacturing firms with process performance management system (PPMS) criteria to check the impact of performance indicators on the overall business performance index using ROE, ROA. The results of AHP analysis show that the “Supportive Culture” and “PPMS facilitate the competitive advantage” are the major facilitators for those organizations who have implemented the PPMS whereas firms without implementation of PPMS have major inhibitors as “ Non supportive culture” and ”Have another Performance System”. THE RELATIONS BETWEEN OWNERSHIP STRUCTURE AND CORPORATE PERFORMANCE: EVIDENCE FROM BAHRAIN STOCK EXCHANGE 97 Reem Khamis, Wajeeh Al-Ali, Allam Hamdan In this article we examine the relation between ownership structure and corporate performance; the sample of the study included 42 out of 48 companies of all sectors in Bahrain Stock Exchange in five years from 2007-2011. Several dimensions of ownership structure were studied and two different measurements of performance were used to capture the different results from using each one of them and to assess the relevance of each measurement to performance and to justify the conflicting results found by previous studies. Another objective of this study was to explore the patterns of ownership structure found in Bahraini market. EXAMINING THE RELATIONSHIP BETWEEN CEO REMUNERATION AND PERFORMANCE OF MAJOR COMMERCIAL BANKS IN SOUTH AFRICA 115 Mahlomola Khumalo, Andries Masenge The relationship between CEO remuneration and firm performance continues to receive much attention. Although the focus of most of the studies is across sectors, attention is increasingly being directed towards the banking industry. At the same time, controversy around what is deemed excessive remuneration of CEOs in the light of not so impressive firm performance across sectors continues. The 2008 global financial crisis and subsequent problems in the banking industry have increased interest in the dynamics of CEO remuneration and bank performance. This study, which examines the relationship between CEO remuneration and bank performance in South Africa, aims to bring a new perspective to the on-going research and debate. THE EFFECTS OF BUSINESS GROUP CONTROL ADVANTAGES AND AFFILIATE LEVEL ADVANTAGES ON AFFILIATE PERFORMANCE 125 Roderick Bugador This study views the network of control in a corporate business group as its source of competitive advantages. These control advantages are distributed among the business group affiliates and eventually influence their performance. This paper examines this by providing a reconceptualization of both the nature of business group and affiliate level advantages using the data of the top 20 Philippine corporate groups. The study found out that the group level control advantage affects the affiliate performance more than their individual level advantages. This result confirms the capability of business groups to influence and control their group internal market. This also implies that the business group affiliates have not yet developed significant capabilities which are independent to that of their business group. SUBSCRIPTION DETAILS 136
Corporate Ownership & Control / Volume 13, Issue 1, Autumn 2015
8
ACADEMIC INVESTIGATIONS
& CONCEPTS
SECTION 1
AN EMPIRICAL ANALYSIS OF CORPORATE GOVERNANCE IMPACT ON OUTREACH OF MICROFINANCE
INSTITUTIONS (MFIS)
Sujani Thrikawala*, Stuart Locke**, Krishna Reddy**
Abstract This study examines the impact of corporate governance practices of microfinance institutions (MFIs) on outreach to the poor people in Sri Lanka by using three outreach variables: Breadth of outreach, percentage of women borrowers and depth of outreach. Data for 54 MFIs are analysed using regression analysis of unbalanced panel data from 2007 to 2012. The findings of this study revealed several significant relationships: Breadth of outreach in Sri Lankan MFIs improve when they have a female chair on the board but decreases when they have more female directors and client representation on the board, and female borrowers get more loans when the firm has women representation and international/donor directors on the board, but less loans if they have a female chair. This study provides a direction for future researchers to explore more, and recommend good corporate governance practices for MFIs to reach more poor clients. Keywords: Microfinance Institutions (MFIs), Corporate Governance, Outreach, Sri Lanka, Panel Data *Corresponding author. Department of Finance, Waikato management School, University of Waikato, Private Bag 3105, Hamilton 3240, New Zealand Tel: +647 838 8182 **Department of Finance, Waikato Management School, University of Waikato
1 Introduction
Microfinance institutions (MFIs) emerge as an
important provider of microcredit to under-served
people and an instrument to combat extreme poverty
in developing nations (Hermes & Lensink 2007).
Widespread public enthusiasm for microcredit has
generated a dramatic increase in the number of MFIs
operating in developing countries. It is estimated that
in 2007 there was a total of around 10,000 MFIs in the
world (Ming-Yee 2007), serving over 113 million
clients. Due to the high profits and public perception
of social responsible investment, this sector has grown
commercially and now concerns itself only with
profitability. Unlike other firms, MFI performance
encompasses both financial profitability and outreach.
However, many MFIs are now drifting from their
original mission of alleviating poverty. Accordingly,
among policy makers there is a hefty debate on the
compatibility or trade-off between financial
sustainability and outreach of microfinance sector
(Hermes et al. 2011). Muhammad Yunus, the
foremost pioneer of the microfinance movement, also
expressed the opinion that MFIs must protect the poor
from loan sharks and not give rise to their own breed
of loan sharks. As a result, extant studies have
identified that good corporate governance practices
can improve the MFIs’ outreach to poor people
because sound corporate governance practices can
help MFIs to operate effectively and efficiently.
However, currently available measurements of MFIs
indicate an overriding concern with the profitability of
Corporate Ownership & Control / Volume 13, Issue 1, Autumn 2015
9
MFI activities and less with outreach. Therefore, it is
important to identify which corporate governance
practices are helping MFIs to reach more clients.
The motivation to examine the impact of
corporate governance on outreach of MFIs in Sri
Lanka is based on the following: First Sri Lanka has
been recovering after 30 years of war and terrorism
and enjoying peace and harmony for about four years
since the war. It is imperative to boost the economic
development of such a suffered country. As a result,
enhancement of microfinance activities became one of
the major economic development goals in Sri Lanka
(Central Bank of Sri Lanka 2012). However, there is
lack of formal governance guidelines for Sri Lankan
MFIs to improve their service in a broader context
(Modoran & Grashof 2009), particularly code of best
practice on corporate governance is not mandatory for
MFIs in Sri Lanka. Therefore, the findings of this
study will contribute to the existing literature relating
to corporate governance practices in MFIs in the Sri
Lankan context and boost the economic development
of a recovering country. From a policy perspective,
Kumar and Zattoni (2013, p. 199) stated that “firm-
level corporate governance performance affects the
development of national governance institutions”.
The remainder of this paper is structured as
follows: Section 2 provides a brief review of the
literature relating to corporate governance. Data
collection and research methods used are described in
section 3. Section 4 discusses the empirical research
results. Finally, the paper concludes with implications
of the study.
2 Literature review
Only a handful of studies have been done to test the
impact of corporate governance on outreach of MFIs.
The empirical analysis of good corporate governance
practices in relation to MFIs is still at an immature
stage and it is important to conduct more studies in
this field to enhance MFIs’ development (Hartarska
2005; Cull et al. 2007; Hartarska & Nadolnyak 2007;
Bassem 2009; Hartarska 2009; Mersland 2009;
Mersland & Strøm 2009). However, there is plenty of
empirical evidence in the financial literature that
supports the view that good corporate governance
enhances the performance of a firm. The same
rationale recommends that good governance practices
of MFIs would enhance their performance and reduce
risk. Therefore, it is important to examine the
empirical evidence of corporate governance
mechanisms in for-profit firms that improve firm
performance.
Previous studies undertaken by different scholars
have recognised certain aspects, such as board
composition and characteristics, and their impact on
firm performance (Lorsch & MacIver 1989; Daily &
Dalton 1997; Muth & Donaldson 1998; Bhagat &
Black 1999; Kula 2005; Roberts et al. 2005). They
revealed many factors to measure the corporate
governance practices of a firm, such as board size,
proportion of non-executive directors, stakeholder
representation on board, gender diversity,
CEO/chairman duality, education qualifications of
board members and number of board meetings
(Lorsch & MacIver 1989; Daily & Dalton 1997;
Bhagat & Black 1999; Roberts et al. 2005; Huse &
Solberg 2006; Kyereboah-Coleman & Biekpe 2006;
Solomon 2007).
However, the researchers that have tested the
relationship between corporate governance practices
and firm performance in the for-profit companies have
reported inconclusive evidence (Bhagat & Black
1999; Weir et al. 2002; Bathula 2008). Some have
reported evidence of a positive relationship between
corporate governance and firm performance (Gompers
et al. 2003; Kyereboah-Coleman & Biekpe 2006),
while others have reported evidence of a negative
relationship between governance and performance
(Hambrick et al. 1996; Sheridan & Milgate 2005;
Rose 2007). In addition, some studies found no
evidence to support the link between corporate
governance and firm performance (Baliga et al. 1996;
Dalton et al. 1998; Abdullah 2004), whereas Dalton
et al. (1998) and Weir et al. (2002) reported that there
is little evidence to support the view that board
characteristics have an impact on firm performance.
The appropriate corporate governance practices
have been a matter of continuing debate and
researches give mixed results. Inconsistent findings of
prior studies and lack of empirical results for the
microfinance industry have led to unclear ideas about
corporate governance influence on firm performance.
However, based on the indication given by many
empirical studies in developed and developing
countries around the world, it is important to further
explore the impact of corporate governance on
outreach of MFIs, as it leads to better service to the
poor people in these countries. Therefore, this study
argues that MFI boards need to have a high standard
of governance practices to deliver better outreach to
the poor.
3 Research methodology
Sample and sample period were constrained by the
data availability, accessibility and validity. Therefore,
our panel was comprised of 300 firm-year
observations over the period of 2007 to 2012. This
study collected data from the MFIs that are registered
with MIX market and Lanka Microfinance
Practitioners' Association (LMFPA), the Sri Lankan
microfinance network. Recent studies (Bassem 2009;
Cull et al. 2011; Lin & Ahlin 2011; Shahzad et al.
2012) have used MIX market database for their
empirical studies as MIX collects its data mainly
through the contracted consultants and the country
level networks that are based in each country
(Lafourcade et al. 2006). The director information has
been collected from the individual institutions by
going through their websites and by individually
contacting them.

Corporate Ownership & Control / Volume 13, Issue 1, Autumn 2015
10
Table 1. Dependent and independent variable definitions
Variables Acronym Definition
Dependent Variable
Breadth of outreach Breadth The natural logarithm of the number of active borrowers
in the MFI
Percentage of female borrowers FemBorr The ratio of female borrowers to total number of active
borrowers
Depth of outreach Depth
The natural logarithm of average loan balance per
borrower/adjusted gross national income (GNI) per
capita
Independent Variables
Percentage of female directors FemDir The ratio of female directors to total number of
directors on the board
Female CEO FemCEO Dummy variable that takes a value of 1 if the CEO of
the firm in a female
Female chairperson FemChair Dummy variable that takes a value of 1 if the
chairperson of the firm in a female
Duality Duality Dummy variable that takes a value of 1 if the firm’s
CEO and chairperson are same
Board of directors who represent
international/donors agencies of the
firm
IntdorDir
Dummy explanatory variable that takes a value of 1 if
the firm has at least one international/donor agency
representative on board.
Board of directors who represent
clients of the firm Clientdir
Dummy variable that takes a value of 1 if the firm has at
least one director representing clients of the firm.
Independent directors on board IndDir Dummy variable that takes a value of 1 if the firm has at
least one independent director on board.
Board size Bsize The natural logarithm of the total number of directors
on the board
Internal auditor IntAudit Dummy variable that takes a value of 1 if the firm has
an internal auditor reporting to the board
Control Variables
Regulated by banking authority Regbank Dummy variable that takes a value of 1 if the firm
regulated by banking authority in the country
Firm Age Fage The natural logarithm of the number of years from the
date of establishment
Firm size Fsize The natural logarithm of the firm’s total assets
Leverage Lev The ratio of the firm's total debt to its total assets
Year dummy variables year Six year dummies for each of the years from 2007 to
2012
Organisation type dummy variables otype
Dummy variables for each of the organisation type:
NGO, Company, NBFI, Specialised Licenced Bank,
Cooperatives and Credit Unions
Table 1 depicts the definitions of dependent and
independent variables in the study. Breadth of
outreach is measured by the number of clients that
MFIs has provided loans to, or the number of
borrowers over a specific period of time who currently
have an outstanding loan balance with the MFI
(Microfinance Consensus Guidelines 2003; Quayes
2012). Since the inception of the Grameen bank
concept, outreach to women has been a priority
because compared with men, women face greater
problems in accessing loans. According to Quayes
(2012), outreach to female borrowers (FemBorr) is
measured by the number of women borrowers as a
fraction of the total number of borrowers. With the
development of the microfinance sector, Depth of
outreach has become an important measure that
concerns with the overall social outreach of the
microfinance sector. It measures the access of credit
disbursement to poor people; that is, poorer borrowers
will lead to greater depth of outreach (Quayes 2012).
In other words, it indicates how well MFIs have
reached the very poor clients, and focuses on poverty
lending. It can be measured by comparing the loan
size to the Gross National Income (GNI) per capita of
a country.
Percentage of female directors on the board,
female CEO, female chairperson, duality,
international/ donor representation on boards, client
representation on boards, outside/independent
directors on board, board size and internal auditor are
Corporate Ownership & Control / Volume 13, Issue 1, Autumn 2015
11
employed as the proxies for corporate governance
variables. Regulated by central bank of Sri Lanka,
firm age, firm size, leverage, year dummy variables
and organisation type dummy variables are treated as
control variables in line with previous studies
(Hartarska 2005; Kyereboah-Coleman 2006;
Hartarska & Nadolnyak 2007; Kyereboah-Coleman &
Osei 2008; Reddy et al. 2008; Bassem 2009;
Hartarska 2009; Hartarska & Mersland 2009;
Mersland & Strøm 2009; Mersland et al. 2011;
Galema et al. 2012; Hewa-Wellalage et al. 2012;
Strøm et al. 2014).
This study employed different statistical methods
to analyse panel data. Under univariate analysis,
descriptive statistics including mean, standard
deviation, minimum and maximum values were
computed to identify the overall behaviour of the data.
In particular, the data was normally distributed so that
parametric form of statistical modeling could be
employed. Pearson’s correlation matrix and variance
inflation factor (VIF) were used to determine whether
there were multicollinearity issues in our dataset. The
strength of correlation between dependent variables
and explanatory variables suggests that independent
variables should be included in our regression. Our
results show that the correlation coefficients among
the regressors are below the threshold of 0.80
suggested by Gujarati and Porter (2009). Even though
the multicollinearity is not a serious problem, VIF was
used to do a further test for multicollinearity.
According to Myers (1990), VIF value of 10 or above
is a good indicator that multicollinearity is present
among independent variables and therefore, is a cause
for concern. The results of this study indicate that all
the independent variables had VIF values of less than
3. Therefore, the above evidence leads us to conclude
that there is no multicollinearity issue in our
estimations, as all the values are well below the
thresholds.
Under inferential statistics, we have used a
multiple linear regression model to estimate the
unknown parameters of corporate governance and
outreach of MFIs in Sri Lanka. The two methods,
fixed-effect and random-effect, were used to diagnose
the unobserved factors in the panel regression model.
The main difference between these two methods lies
with the treatment of the dummy variables. Both
fixed-effect and random-effect have their own strength
and weakness. According to Greene (2012), in both
models the explanatory variables tend to be
uncorrelated to the observed firm heterogeneity term
ui and suggest using the Hausman test to choose
between fixed-effect and random-effect model
(Hausman 1978). The test examines whether the
individual effects are uncorrelated with other
regressors in the model. The null hypothesis of the
Hausman test assumes that individual effects are
random, therefore estimators for both models should
be consistent (Cameron & Trivedi 2010, p. 266). The
Hausman test result suggests that it is important to
employ a fixed effect model for Depth variable, due to
the rejection of the null hypotheses where p-values are
significantly lower than the 0.05 level but employed a
random effect model for Breadth and FemBorr
variables due to the acceptance of the null hypotheses.
4 Discussion of empirical findings
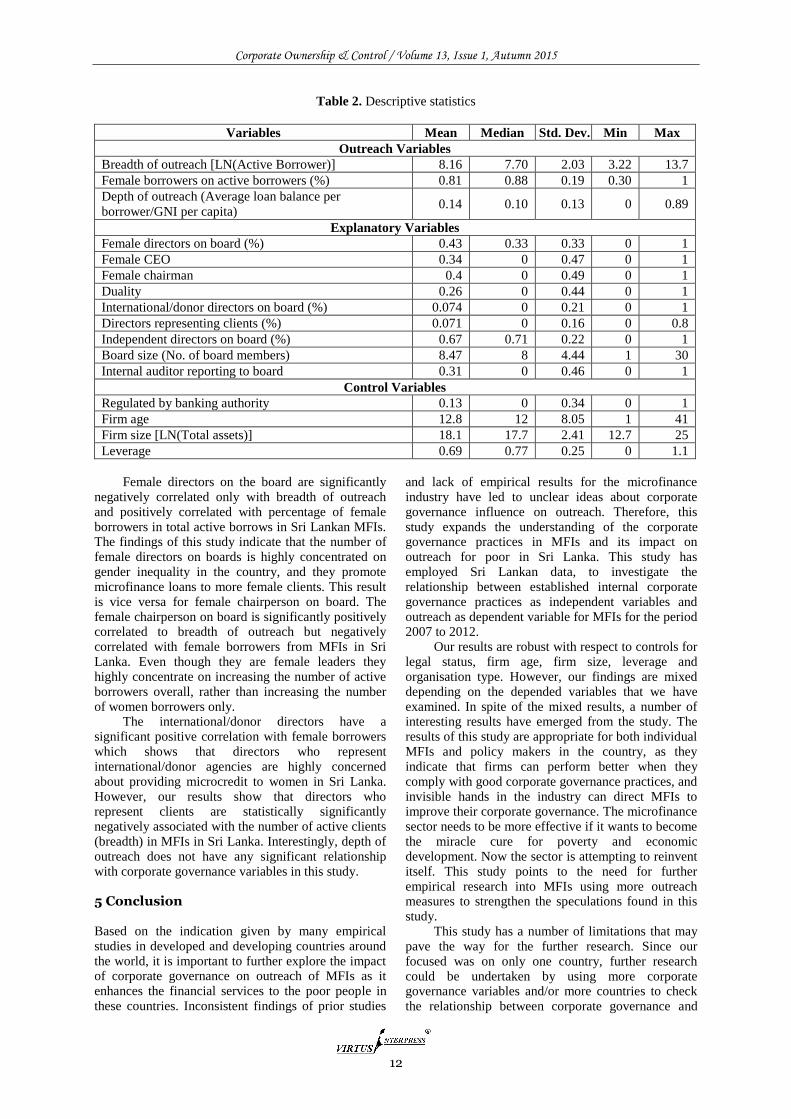
Table 2 provides descriptive statistics for major
variables in the study. Due to the huge dispersion in
the number of active clients in the sample, this study
used natural logarithm transformation to condense the
dispersion, as a result the mean and the median values
are 8.16, 7.70 respectively. In Sri Lanka, the average
number of female borrowers represents 81% of the
total number of credit clients. The median value of
88% indicates that fifty percent of the MFIs have less
than 12% of male clients. Average depth of outreach
in Sri Lankan MFIs is Rs.0.14 where the median is
Rs.0.10. This is a relatively weak value when
compared with other studies, and these lower values
indicate that the poor borrowers are very well served
in Sri Lanka, because a higher value would mean that
fewer poor clients are being served (Hartarska 2005;
Bassem 2009). The percentage of women directors on
the board is approximately 43%, which is higher than
the value obtained by Hewa-Wellalage et al. (2012)
for listed companies in Sri Lanka (7.4%). MFIs with
female CEOs are 34% in Sri Lanka, while on the other
hand, 66% of the MFIs have male counterparts as their
CEOs. Findings of this study show that in Sri Lanka,
40% of MFIs have female chairpersons which is a
fairly high figure when compared with a global study.
Out of the total MFIs in the sample, 26% of them have
a CEO who is doubling the role as chairperson of the
board, and this value is relatively high when compared
with the global sample (12%-15%) but low with
Ghana (50%). Sri Lankan MFI boards have around
7.4% of directors who represent international/donor
directors which is a very insignificant representation
when compared with literature (Mersland & Strøm
2009; Galema et al. 2012). As found by Hartarska
(2005) and Mersland and Strøm (2009), Sri Lankan
MFIs also have very small numbers of directors (7%)
on their boards who represent the clients. Around 67%
of the board members in Sri Lankan MFIs are
independent directors. The number of board members
in Sri Lankan MFIs is around 9. On average, 31% of
MFIs have an internal auditor reporting to the board.
Table 3 illustrates the empirical results of
multivariate analysis of outreach variables in this
study. The study comments on the regression result as
a whole by controlling the unobserved heterogeneity
in the panel model. Even though most of the expected
signs of the coefficients are generated from the
regression, only very few of them are significant for
Sri Lankan MFIs. However, interesting results appear
in both of these significant and non-significant
regression results.
Corporate Ownership & Control / Volume 13, Issue 1, Autumn 2015
12
Table 2. Descriptive statistics
Variables Mean Median Std. Dev. Min Max
Outreach Variables
Breadth of outreach [LN(Active Borrower)] 8.16 7.70 2.03 3.22 13.7
Female borrowers on active borrowers (%) 0.81 0.88 0.19 0.30 1
Depth of outreach (Average loan balance per
borrower/GNI per capita) 0.14 0.10 0.13 0 0.89
Explanatory Variables
Female directors on board (%) 0.43 0.33 0.33 0 1
Female CEO 0.34 0 0.47 0 1
Female chairman 0.4 0 0.49 0 1
Duality 0.26 0 0.44 0 1
International/donor directors on board (%) 0.074 0 0.21 0 1
Directors representing clients (%) 0.071 0 0.16 0 0.8
Independent directors on board (%) 0.67 0.71 0.22 0 1
Board size (No. of board members) 8.47 8 4.44 1 30
Internal auditor reporting to board 0.31 0 0.46 0 1
Control Variables
Regulated by banking authority 0.13 0 0.34 0 1
Firm age 12.8 12 8.05 1 41
Firm size [LN(Total assets)] 18.1 17.7 2.41 12.7 25
Leverage 0.69 0.77 0.25 0 1.1
Female directors on the board are significantly
negatively correlated only with breadth of outreach and positively correlated with percentage of female borrowers in total active borrows in Sri Lankan MFIs. The findings of this study indicate that the number of female directors on boards is highly concentrated on gender inequality in the country, and they promote microfinance loans to more female clients. This result is vice versa for female chairperson on board. The female chairperson on board is significantly positively correlated to breadth of outreach but negatively correlated with female borrowers from MFIs in Sri Lanka. Even though they are female leaders they highly concentrate on increasing the number of active borrowers overall, rather than increasing the number of women borrowers only.
The international/donor directors have a significant positive correlation with female borrowers which shows that directors who represent international/donor agencies are highly concerned about providing microcredit to women in Sri Lanka. However, our results show that directors who represent clients are statistically significantly negatively associated with the number of active clients (breadth) in MFIs in Sri Lanka. Interestingly, depth of outreach does not have any significant relationship with corporate governance variables in this study. 5 Conclusion Based on the indication given by many empirical studies in developed and developing countries around the world, it is important to further explore the impact of corporate governance on outreach of MFIs as it enhances the financial services to the poor people in these countries. Inconsistent findings of prior studies
and lack of empirical results for the microfinance industry have led to unclear ideas about corporate governance influence on outreach. Therefore, this study expands the understanding of the corporate governance practices in MFIs and its impact on outreach for poor in Sri Lanka. This study has employed Sri Lankan data, to investigate the relationship between established internal corporate governance practices as independent variables and outreach as dependent variable for MFIs for the period 2007 to 2012.
Our results are robust with respect to controls for legal status, firm age, firm size, leverage and organisation type. However, our findings are mixed depending on the depended variables that we have examined. In spite of the mixed results, a number of interesting results have emerged from the study. The results of this study are appropriate for both individual MFIs and policy makers in the country, as they indicate that firms can perform better when they comply with good corporate governance practices, and invisible hands in the industry can direct MFIs to improve their corporate governance. The microfinance sector needs to be more effective if it wants to become the miracle cure for poverty and economic development. Now the sector is attempting to reinvent itself. This study points to the need for further empirical research into MFIs using more outreach measures to strengthen the speculations found in this study.
This study has a number of limitations that may pave the way for the further research. Since our focused was on only one country, further research could be undertaken by using more corporate governance variables and/or more countries to check the relationship between corporate governance and
Corporate Ownership & Control / Volume 13, Issue 1, Autumn 2015
13
outreach of MFIs. In addition, this study has considered only the fixed-effects and random-effects models to examine the relationship. Thus, further analysis can be done with a large dataset by
considering the endogeneity of the variable which is another aspect of the research that could be lead to the better understand of the industry and strengthen the speculations found in this study.
Table 3. Fixed-effect and random-effects regression results
Variables
Breadth FemBorr Depth
Random Effect Model Random Effect Model Fixed Effect Model
b/p t b/p t b/p t
FemDir -0.376* [-1.800] 0.086** [2.094] 0.043 [1.383]
(0.072) (0.036) (0.172)
FemCEO -0.003 [-0.028] 0.010 [0.495] 0.015 [1.211]
(0.977) (0.621) (0.231)
FemChair 0.253*** [2.813] -0.032* [-1.795] -0.010 [-0.777]
(0.005) (0.073) (0.441)
Duality 0.034 [0.352] -0.026 [-1.363] -0.022 [-1.647]
(0.725) (0.173) (0.106)
IntdorDir -0.009 [-0.093] 0.047** [2.394] -0.006 [-0.600]
(0.926) (0.017) (0.551)
ClientDir -0.201* [-1.886] 0.034 [1.643] 0.021 [1.374]
(0.059) (0.100) (0.175)
IndDir -0.052 [-0.191] -0.028 [-0.524] 0.013 [0.347]
(0.848) (0.601) (0.730)
Bsize -0.099 [-0.874] -0.007 [-0.292] 0.003 [0.234]
(0.382) (0.770) (0.816)
IntAudit -0.051 [-0.581] 0.023 [1.302] 0.006 [0.701]
(0.562) (0.193) (0.487)
Regbank -0.201 [-0.287] -0.018 [-0.121]
(0.774) (0.903)
Fage -0.001 [-0.100] 0.005* [1.719] -0.013*** [-4.189]
(0.921) (0.086) (0.000)
Fsize 0.802*** [15.980] 0.024** [2.321] 0.015 [1.065]
(0.000) (0.020) (0.292)
Lev 0.237 [1.179] 0.037 [0.930] -0.022 [-1.012]
(0.238) (0.352) (0.316)
Constant -6.062*** [-7.281] 0.306* [1.786] -0.000 [-0.002]
(0.000) (0.074) (0.998)
Note: Asterisks indicate significance at 10% (*), 5% (**), and 1% (***). Variables are defined in Table 1. Number of clusters are 54. Year dummy 2007 and Organisation Type dummy NGO are treated as the benchmark categories to avoid dummy variable trap
References 1. Abdullah, S. N. 2004, 'Board composition, CEO
duality and performance among Malaysian listed companies', Corporate Governance, vol. 4, no. 4, pp. 47-61.
2. Baliga, B. R., et al. 1996, 'CEO duality and firm performance: What's the fuss?', Strategic Management Journal, vol. 17, no. 1, pp. 41-53.
3. Bassem, B. S. 2009, 'Governance and performance of microfinance institutions in Mediterranean countries', Journal of Business Economics and Management, vol. 10, no. 1, pp. 31-43.
4. Bathula, H. 2008, Board characteristics and firm performance: evidence from New Zealand, Thesis, AUT University.
5. Bhagat, S. & Black, B. 1999, 'The uncertain relationship between board composition and firm performance', Business Lawyer, vol. 54, no. 3, pp. 921-921.
6. Cameron, A. C. & Trivedi, P. K. 2010, Microeconometrics using Stata: Revised Edition, Stata
Press, College Station, Texas. 7. Central Bank of Sri Lanka 2012, Annual Report 2012,
Central Bank of Sri Lanka, Sri Lanka. 8. Cull, R., et al. 2007, 'Financial performance and
outreach: A global analysis of leading microbanks', The Economic Journal, vol. 117, no. 517, pp. F107-F133.
9. Cull, R., et al. 2011, 'Does regulatory supervision curtail microfinance profitability and outreach?', World Development, vol. 39, no. 6, pp. 949-965.
10. Daily, C. M. & Dalton, D. R. 1997, 'Separate, but not independent: Board leadership structure in large corporations', Corporate Governance: An International Review, vol. 5, no. 3, pp. 126-136.
11. Dalton, D. R., et al. 1998, 'Meta-analytic reviews of board composition, leadership structure, and financial performance', Strategic Management Journal, vol. 19, no. 3, pp. 269-290.
Corporate Ownership & Control / Volume 13, Issue 1, Autumn 2015
14
12. Galema, R., et al. 2012, 'Do powerful CEOs determine microfinance performance?', Journal of Management Studies, vol. 49, no. 4, pp. 718-742.
13. Gompers, P., et al. 2003, 'Corporate governance and equity prices', The Quarterly Journal of Economics, vol. 118, no. 1, pp. 107-156.
14. Greene, W. H. 2012, Econometric Analysis, Pearson Prentice Hall, Upper Saddle River, NJ.
15. Gujarati, D. N. & Porter, D. C. 2009, Basic econometrics, McGraw-Hill, Boston.
16. Hambrick, D. C., et al. 1996, 'The influence of top management team heterogeneity on firms' competitive moves', Administrative Science Quarterly, vol. 41, no. 4, pp. 659-684.
17. Hartarska, V. 2005, 'Governance and performance of microfinance institutions in Central and Eastern Europe and the newly independent states', World Development, vol. 33, no. 10, pp. 1627-1643.
18. Hartarska, V. 2009, 'The impact of outside control in microfinance', Managerial Finance, vol. 35, no. 12, pp. 975-989.
19. Hartarska, V. & Mersland, R. 2009, 'Which governance mechanisms promote efficiency in reaching poor clients? Evidence from rated microfinance institutions', European Financial Management, vol. 18, no. 2, pp. 218-239.
20. Hartarska, V. & Nadolnyak, D. 2007, 'Do regulated microfinance institutions achieve better sustainability and outreach? Cross-country evidence', Applied Economics, vol. 39, no. 10, pp. 1207-1222.
21. Hausman, J. A. 1978, 'Specification tests in econometrics', Econometrica, vol. 46, no. 6, pp. 1251-1271.
22. Hermes, N. & Lensink, R. 2007, 'The empirics of microfinance: What do we know?', The Economic Journal, vol. 117, no. 517, pp. F1-F10.
23. Hermes, N., et al. 2011, 'Outreach and efficiency of microfinance institutions', World Development, vol. 39, no. 6, pp. 938-948.
24. Hewa-Wellalage, N., et al. 2012, 'Does one size fit all? An empirical investigation of board structure on family firms' financial performance', Afro-Asian Journal of Finance and Accounting, vol. 3, no. 2, pp. 182-194.
25. Huse, M. & Solberg, A. G. 2006, 'Gender-related boardroom dynamics: How Scandinavian women make and can make contributions on corporate boards', Women in Management Review, vol. 21, no. 2, pp. 113-130.
26. Kula, V. 2005, 'The impact of the roles, structure and process of boards on firm performance: Evidence from turkey', Corporate Governance: An International Review, vol. 13, no. 2, pp. 265-276.
27. Kumar, P. & Zattoni, A. 2013, 'Editorial: How much do country-level or firm-level variables matter in corporate governance studies?', Corporate Governance: An International Review, vol. 21 no. 3, pp. 199–200.
28. Kyereboah-Coleman, A. 2006, 'Corporate board diversity and performance of microfinance institutions: The effect of gender', Journal for Studies in Economics and Econometrics, vol. 30, no. 3, pp. 19-33.
29. Kyereboah-Coleman, A. & Biekpe, N. 2006, 'The relationship between board size board composition, CEO duality, and firm performance: experience from Ghana', Corporate Ownership and Control, vol. 4, no. 2, pp. 114-122.
30. Kyereboah-Coleman, A. & Osei, K. A. 2008, 'Outreach and profitability of microfinance institutions: the role of governance', Journal of Economic Studies, vol. 35, no. 3/4, pp. 236-248.
31. Lafourcade, A. L., et al. 2006, Overview of the outreach and financial performance of microfinance institutions in Africa, Feature Articles, Microbanking Bulletin, Washington, DC.
32. Lin, J. & Ahlin, C. 2011, 'Where does microfinance flourish?: Microfinance institution performance in macroeconomic context', Journal of Development Economics, vol. 95, no. 2, pp. 105-120.
33. Lorsch, J. W. & MacIver, E. 1989, Pawns or Potentates: The Reality of America's Corporate Boards, Harvard Business School Press, Boston, Mass.
34. Mersland, R. 2009, Corporate governance and ownership in microfinance organizations, Thesis, University of Agder.
35. Mersland, R., et al. 2011, 'The impact of international influence on microbanks’ performance: A global survey', International Business Review, vol. 20, no. 2, pp. 163-176.
36. Mersland, R. & Strøm, R. Ø. 2009, 'Performance and governance in microfinance institutions', Journal of Banking and Finance, vol. 33, no. pp. 662-669.
37. Microfinance Consensus Guidelines 2003, Definitions of Selected Financial Terms, Ratios, and Adjustments for Microfinance, CGAP, The World Bank Group, Washington, DC.
38. Ming-Yee, H. 2007, The International Funding of Microfinance Institutions: An Overview, LuxFLAG,
39. Modoran, C. & Grashof, L. 2009, Microfinance Institutions in Sri Lanka, Ministry of Finance & Planning with GTZ-ProMiS, Colombo, Sri Lanka.
40. Muth, M. & Donaldson, L. 1998, 'Stewardship theory and board structure: a contingency approach', Corporate Governance: An International Review, vol. 6, no. 1, pp. 5-28.
41. Myers, R. H. 1990, Classical and Modern Regression with Applications, PWS-Kent, Boston.
42. Quayes, S. 2012, 'Depth of outreach and financial sustainability of microfinance institutions', Applied Economics, vol. 44, no. 26, pp. 3421-3433.
43. Reddy, K., et al. 2008, 'Corporate governance practices of small cap companies and their financial performance: An empirical study in New Zealand', International Journal of Business, Governance and Ethics, vol. 4, no. 1, pp. 51-78.
44. Roberts, J., et al. 2005, 'Beyond agency conceptions of the work of the non-executive director: Creating accountability in the boardroom', British Journal of Management, vol. 16, no. s1, pp. S5-S26.
45. Rose, C. 2007, 'Does female board representation influence firm performance? The Danish evidence', Corporate Governance: An International Review, vol. 15, no. 2, pp. 404-413.
46. Sheridan, A. & Milgate, G. 2005, 'Accessing board positions: A comparison of female and male board members’ views', Corporate Governance: An International Review, vol. 13, no. 6, pp. 847-855.
47. Solomon, J. 2007, Corporate Governance and Accountability, John Wiley & Sons Ltd, England.
48. Weir, C., et al. 2002, 'Internal and external governance mechanisms: Their impact on the performance of large UK public companies', Journal of Business Finance & Accounting, vol. 29, no. 5-6, pp. 579-611.
Corporate Ownership & Control / Volume 13, Issue 1, Autumn 2015
15
TESTING THE PARTIAL ADJUSTMENT MODEL OF OPTIMAL CASH HOLDING: EVIDENCE FROM AMMAN
STOCK EXCHANGE
Ziad Mohammad. Zurigat*, Nadia Jawdat**
Abstract This study aims at testing the partial adjustment model of cash holdings to investigate whether Jordanian industrial firms have a target cash holdings and how fast they move toward that target when any target deviation exists. A sample of 57 industrial firms listed in the Amman Stock Exchange (ASE) over the period 2001-2013 is used. The study uses the estimated fitted values from the conventional cash equation as a proxy for the target cash holding. Using pooled and panel data analysis, the study provides evidence suggesting that cash flows, net working capital, leverage and firm size significantly affect the cash holdings of Jordanian firms. Moreover, it reveals that Jordanian industrial firms have a target cash level and make a target reversion whenever needed. However, Jordanian industrial firms adjust their actual cash holdings to its target level too slowly. Keywords: Cash Holdings, Trade-off Theory, Pecking Order Theory, Agency Theory of Free Cash Flow, Partial Adjustment Model *Department of Banking and Finance, Yarmouk University **Department of Islamic economy, Yarmouk University
1 Introduction The perfection assumption of capital market suggests
that firms should not show any preferences of internal
over external financing. Both internal and external
financing are perfectly substitute for each other.
Consequently, there is no need for holding cash to
meet any shortage in external financing as long as
external funds can be raised at any time needed. On
the other hand, when frictions exist, capital markets
are no longer perfect. This may restrict the firm's
ability to generate funds externally. Hence, external
and internal financing are not perfect substitutes for
each other. Consequently the need for holding cash
increases in order to avoid under investment problem
that might arise because of the presence of agency and
bankruptcy costs of using external financing (Jensen
& Meckling 1976). Consistent with this argument,
Acharya et al. (2005) argue that, in the presence of
financing frictions, cash plays a separate role and
should therefore be managed and studied in its own
right. The main problem in developing countries in
general is the lack of sources of funds and the reliance
on internal financing to take the advantages of
investment opportunities. In Jordan, the capital market
has been described as imperfect, less developed and
all frictions are relevant and may affect the firm's
investment, financing and dividend policy decisions.
This, along with the fact that banks credit policy is
largely affected by the uncertainty condition in the
world and the region. Such conditions make Jordanian
firms show a preference of internal over external
financing and increase the need for holding cash.
The most relevant theoretical models that can
explain determinants of the cash holding level are the
trade-off theory, the pecking order theory and the
agency theory. According to the trade off theory, firms
trade off the costs and benefits of cash holdings to
maximize the value, implying that the presence of
cash holding costs may outweigh its benefits.1 This
suggests that there is some threshold level of cash
holdings under which the firm’s value is maximized.
This threshold of cash is generally called the optimal
(target) level of cash holdings. Hence, the observed
cash holding is not always the optimal level which
increases the necessity of target adjustment when
deviation from that target exists.
With respect of pecking order theory, issuing
new equity is very costly for firms because of
information asymmetries. Therefore, firms finance
their new investment opportunities primarily with
internal funds, then with debt and finally with equities
as the last resort. Extending the pecking order theory
of Myers & Majluf (1984) and Myers (1984) to
explain what determine cash holdings leads to the
conclusion that there is no optimal cash level but cash
is used as a buffer between retained earnings and
1 The benefits of holding cash are the reduction of transaction
cost for precautionary needs and the cash allowance for speculation, while, the costs are the opportunity cost and liquidity premium.
Corporate Ownership & Control / Volume 13, Issue 1, Autumn 2015
16
investment needs, implying that cash level would just
be the result of financing and investment decisions.
Few studies provide evidence supporting the
prediction of pecking order theory such as Kalcheva &
Lins (2003) who conclude that cash is positively
related to the growth opportunities of the company, its
size and cash flow. Whilst, negatively related to the
level of debt and capital expenditures.
The agency theory of Jensen & Meckling (1976)
provides another explanation as to why firms hold
cash. It states that managers hold cash and other liquid
assets in order to minimize the cost of external
finance. Dittmar et al. (2003) find evidence suggesting
that firms hold more cash in countries with greater
agency problems. Dittmar & Mahrt-Smith (2007) and
Pinkowitz et al. (2006) find that cash is worth less,
when agency problems between insiders and outside
shareholders are greater.
According to Alles et al. (2012), tradeoff model,
pecking order theory and agency theory of free cash
flow complement each other and work together to
explain the existence of target cash level. Although a
cash holding is considered as one of the most
important topics of corporate finance, there are few
studies that focus on the partial adjustment of
corporate cash holding. Most of the studies focused on
investigating the determinants of firms' cash level,
mainly of large public and private firms in developed
economies (i.e. Ozkan & Ozkan, 2004 and Alles et al.,
2012) with less attention is paid to this topic in less
developed countries including Jordan.
In Jordan, where the capital market is imperfect,
market frictions such as information asymmetry
agency and bankruptcy costs are applicable and
influence a firm's investment and financial decisions
and thereby its value. Moreover, it is a thin and a
small market, making the cost of raising external
funds in primary market relatively high which
increases the reliance on internally generated funds.
However, information asymmetries and agency costs
restrict the firms’ ability not only to raise funds
externally, but also to raise funds internally,
supporting the information content of dividend
payment ( see, Baskin, 1989). This makes cash
management decisions too important for Jordanian
listed companies in Amman Stock Exchange(ASE).
Therefore, this study tries to investigate whether
Jordanian industrial companies have target cash
holdings and how fast do they move towards that
target if any deviations exist by testing the partial
adjustment model of cash holding using a sample of
57 Jordanian Industrial firms listed in the ASE over
the period of (2001- 2013). For this purpose, the
current study uses fitted values estimated by using the
conventional cash equation as a proxy for target cash
holdings level.
This paper is organized as follows. Section 2
presents theoretical framework and a related literature
review. Section 3 discusses the research methodology.
Section 4 presents the estimation results with some
conclusions and recommendations.
2 Theoretical framework and literature review
The theoretical background of cash holdings refers to
Modigliani & Miller (1958) who stated that, under the
perfection assumption of capital market, holding large
amounts of cash is irrelevant because all companies
can borrow and lend at the same rate and can easily
finance their profitable investment projects at
negligible transaction costs. The absence of market
frictions such as transaction, bankruptcy, agency and
information costs makes firms show no preferences of
internal financing over external financing. Hence, the
firm's decision to hold cash is not related to, or
affected by other financial decisions.
However, when transaction costs, agency costs
and information asymmetries are considered, firms'
investment decisions become highly sensitive to the
cash holdings. This suggests that the firm's decision to
hold cash is largely affected by capital market
frictions. More precisely, it is largely affected by the
costs and benefits of cash holding when firms are
restricted to raise funds externally, implying that there
is an optimal cash level that balances costs and
benefits and thus maximizes the firm's value (Garcia-
Teruel & Martinez-Solano, 2008). Moreover,
empirical evidence shows that any deviations from the
optimal level reduce firm value. This implies that
firms can increase their market value merely by being
around the optimal level of cash, which seems
consistent according to the trade-off between benefits
and cost of cash holdings.
In the absence of adjustment cost and the costs of
liquidating assets, firms would always have and
maintain their target cash ratio by changing its
existing ratio to equal its target cash ratio. On the
other word, each firm’s observed cash ratio should be
its optimal ratio. However, the presence of adjustment
costs may restrict the firm’s ability to back
immediately to its target level. Thus, when the
observed level of cash deviates from its optimal level,
firms will gradually adjust that level to the optimal
level in a process referred to as the partial adjustment
process (Jalilvand & Harris, 1984; Taggart, 1977).
The partial adjustment mechanism allows for firms’
observed cash ratio not always to be equal to their
optimal level. Hence, the dynamic trade-off theories,
not the static trade-off theory, will be able to capture
the dynamic change in firms cash holdings. Dynamic
behavior exists because the presence of market
frictions may limit the firm's ability to manage their
cash level, causing them to deviate from optimal
levels and consequently increasing the need for target
reversion to maximize value (Kim et al., 2011).
Moreover, it may not be appropriate for firms to
immediately adjust their target deviations when the
cost of moving toward target level is higher than that
Corporate Ownership & Control / Volume 13, Issue 1, Autumn 2015
17
of being away from the target (Alles et al., 2012). This
suggests that firms will make target-reversion when
the benefit of moving toward the target level is higher
than the cost of being away from the target. In
addition, Bruinshoofd (2009) found that firms increase
their level of cash holdings from an insufficient level
to a target level more rapidly than they decrease their
level from an excessive level to a target level.
Therefore, firms are very concerned about the speed
by which they move toward their target cash levels
because of high adjustment costs. Few studies
recognize and incorporate the dynamic nature of cash
holdings.
Therefore another trend of research appears to
examine the existence of partial adjustment model of
cash holding. Whether adjustment frictions, such as
those that affect capital structure decisions, influence
cash holding decisions is an important research
question because of their consequences on the
shareholder wealth which associated with deviating
from optimal levels of liquid assets, especially for
financially constrained firms (Denis & Sibilkov,
2010).
Bruinshoofd and Kool (2004) collect data from
Dutch firms and investigate the existence of long-run
liquidity targets. Depending on the empirical
methodology, they document that the rates of annual
target convergence range from 20 percent to over 60
percent which supports the dynamic nature of the
cash-holding decision, which is characterized by a
trade-off between the costs of deviation from the
target and the costs of adjustment. Slow adjustment
process is attributed to adjustment cost and therefore a
firm’s actual cash level is not necessarily identical to
the desired cash holding level.
Ozkan and Ozkan (2004) estimate a partial
adjustment model of cash holdings for a sample of
U.K. firms and find that a dynamic model of cash
holding behavior is better suited than the static models
employed in the extant literature. They find that the
estimated target-adjustment coefficient has a positive
value of 0.54, implying that UK companies adjust
their target deviation too quickly and supporting the
view that firms always adjust towards a target cash
ratio. Drobetz and Grüninger (2006) analyze Swiss
firms’ speed of adjustment towards an endogenous
target cash ratio, using dynamic panel estimation.
They find that the speed of target adjustment of Swiss
firms is between 0.35 and 0.5, indicating that Swiss
firms adjust their liquidity holdings more slowly
towards an endogenous target cash ratio than firms in
other countries. They suspect that the most reasonable
explanations are based on the strong influence of
banks in Switzerland and/or the unfavorable economic
conditions during the sample period that entail low
costs of deviation from the target.
Guney et al.(2006) investigate corporate cash
holding behavior in Japan, France, Germany, and the
UK using data for 3,989 companies over the period
1983-2000. Their findings reveal that the dynamic
cash holding analysis indicates that firms tend to
adjust their cash levels towards a target cash structure.
The speed of adjustment of cash holdings for France,
Germany and Japan is found to be similar (adjustment
coefficient is approximately 0.5),while firms in the
UK seem to adjust to the target cash level more
quickly. This possibly, may suggest that when
adjustment costs are higher, resulting in lower speeds
of adjustment. According to their study, the lower
speed of adjustment for Japan and Germany can be
explained by the fact that German firms and Japanese
firms have close ties with their banks and depend on
them for external financing. It is feasible for them to
adjust slowly towards their target level without
incurring a high level of agency cost. Overall, the
results lend strong support to the dynamic nature of
the cash holding decision of firms. Firms tend to
trade-off between costs of speedy adjustment and
costs of delay in achieving the target cash structure.
Empirical studies also indicate that the speed of
adjustment towards target levels varied among
different samples with different firm characteristics
and at different cash positions. For example, using a
dynamic adjustment model to analyze the cash-
holding behavior of small and medium-sized firms
(SMEs) in Spain, Garcia-Teruel and Martinez-Solano
(2008) find that SMEs aim to achieve a target level of
cash holdings and that they adjust their actual level
towards the target level more rapidly than large firms
do in developed countries.
Another related study by Jiang and Lie (2010)
estimates that firms close about 36% of the gap
between actual and target cash ratios each year. They
further document that across all sample firms, the
adjustment speed is slower if the cash level is above
the target than if it is below. They interpret this as
evidence that self-interested managers are reluctant to
disburse excess cash, and will allow cash levels to
remain high unless they are subject to external
pressure and this is consistent with the argument of
Opler et al. (1999).
Using a sample of U.S. manufacturing firms,
Venkiteshwaran (2011) estimates a dynamic model
that allows firms to adjust their cash holding levels
over time and find evidence consistent with trade-off
type behavior in cash holding levels. He finds a very
strong mean reversion in cash holding levels to
optimal levels and that any deviations from optimal
cash levels are rapidly corrected, typically within two
years for the average firm in the sample. He also finds
that this adjustment rate is faster for small, financially
constrained firms than for larger firm consistent with
the expectation that constrained firms may find it
more costly to operate at sub-optimal levels of cash.
Further, he finds that firms with excess cash are
slower to return to optimal levels than firms that have
cash deficiencies. His findings are similar to those
reported in Ozkan and Ozkan (2004) for a sample of
U.K. firms, but inconsistent with the finding reported
by Dittmar and Duchin(2011) for U.S. firms who
Corporate Ownership & Control / Volume 13, Issue 1, Autumn 2015
18
report a slower adjustment rates for a broader sample
of firms; firms need three to six years to correct any
deviations from optimal levels. They also find that, on
average, cash deficient firms are slower to adjust to
optimal levels compared to firms with surpluses and
attribute this finding to asymmetric adjustment costs
associated with building versus spending cash
reserves.
3 Research methodology
The study uses pooled and panel data analysis which
is usually estimated by either fixed effect or random
effects technique.
As the current study aims at investigating the
target adjustment path of Jordanian firms, the
conventional cash equation is used to estimate the
target cash holding. This is because the target cash
holding itself is unobservable. Previous studies have
analyzed determinants of cash holdings assuming
implicitly the existence of optimal cash holding (Opler
et al., 1999; Kim et al., 1998).In addition, Opler et
al.(1999) estimate the optimal cash holding as a
moving average of past cash holding levels.
Consistent with the majority of previous studies
(e.g. Opler et al., 1999, Dittmar et al., 2003, Kalcheva
& Lins, 2003, Ferreira & Vilela, 2004 and Bates et al.,
2009) which have identified a set of firm specific
characteristics that influence the target level of cash
holdings of firms, the current study uses firm specific
characteristics as predictors for target cash holdings of
listed Jordanian firms.
It is worth noting that the selection of
explanatory variables in the current study is based on
alternative theories that might be responsible for the
corporate cash holdings and can be found in the
literature. However, the choice is sometimes limited,
due to lack of relevant data. Following Opler et al.,
(1999) and Bates et al., (2009) in the selection of
independent variables, the following variables are
selected; firm size, growth opportunity (the market to
book ratio), cash flow, net working capital, capital
expenditure, leverage ratio and profitability.
The current study employs the following static
model to investigate the determinants of optimal cash
holding of listed Jordanian industrial firms in the
Amman Stock Exchange. In this model, the observed
cash holding is modeled as a function of the various
firm-specific factors has been discussed above.
ititit
itititititit
CExpCflow
LevprofNWCFSizGrthCash
1716
15141312110 (1)
Where Cash: is the dependent variable and measured by the ratio of cash and cash equivalent to total assets (e.g.
Kim et al., 1998; Opler et al., 1999; Ozkan and Ozkan, 2004; Bruinshoofd and Kool, 2004).
Grth is the Growth opportunity and measured by market to book ratio.
FSiz is the Firm size, and measured by the natural logarithm of total assets.
NWC is Net working capital and measured by current assets minus current liabilities minus cash.
Prof is the firm's profitability and measured as the ratio of earnings before interest and tax (EBIT)
divided by total assets.
Lev is the leverage ratio and measured by the ratio of total liabilities to total assets.
Cflow is the cash flows. Operating cash flows are calculated by EBIT+ Depreciation- Taxes.
CExp is the firm's capital expenditure is measured as the yearly change in fixed assets added to
depreciation.
ε is the error term which represents all random variables that are not included in the model.
3.1 Target adjustment model of cash holding
To investigate whether Jordanian listed industrial
firms have targeted cash ratio and move gradually
toward their target ratio when any deviations exist, the
static-partial adjustment models are adopted. Prior
studies have used several methods to estimate the
adjustment speed for cash levels. This study will
follow the theoretical framework developed by Opler
et al. (1999), who argue that firms' optimal cash
holdings are determined by the tradeoff between the
marginal costs and benefits of holding liquid assets.
They emphasize the persistence of cash holdings and
the existence of implicit target cash levels. They test
the validity of the static trade-off theory, using a
partial adjustment model to provide evidence for the
presence of target level of cash holdings. The
underlying assumption of this model is that, firms
optimally balance the costs and benefits of cash
holdings to maintain their target level of cash reserves.
Moreover, firms may not be always in equilibrium at
their target level of cash holdings. A delay in target
adjustment exists because of its adjustment costs
(Nicolusc, 2005). The presence of adjustment costs
may restrict the firms’ ability to make target reversion
immediately, suggesting the occurrence of partial
adjustment toward the target level (Opler et al., 1999;
Kim et al., 1998).
Hence, the firms’ observed cash ratio will be at
their target level only if no adjustment costs exist.
The speed of target adjustment, when target reversion
exists, depends on the adjustment cost as well as on
the cost of being away from the target level (the
Corporate Ownership & Control / Volume 13, Issue 1, Autumn 2015
19
benefits of moving back towards the target level). In
reality firms may not completely close the gap
between their actual and target levels of cash holdings
because it may not be effective to do due to the
existence of market friction (Alles et al., 2012). More
precisely, firms may keep the gap between their
observed cash holding and target level if the cost of
being away from the target is lower than that of
moving toward the target and vice versa (Dittmar &
Duchin, 2011).
Following Ozkan & Ozkan (2004) and Garcia-
Teruel & Martinez-Solano (2008), the partial
adjustment model of cash holding can be formalized
as follows:
11
itititit CBCBCBCB (2)
Where, *
ititandCBCB denote the actual cash
holding and the target cash holdings for firm i at time
t. 1 itit CBCB is the difference between a firm's
actual or observed cash holdings between year t and
year t-1. The expression 1
*
itit CBCB is the
deviation of a firm’s cash holdings from its target
level of cash holdings indicating that the target
adjustment is required to reach the optimal level.
Finally, estimating dynamic panel data model of
cash holdings taking into account the dynamic nature
of cash level, will help to analyze the speed of
adjustment of Jordanian firms towards an endogenous
target cash ratio. Unlike the static model that
implicitly assumes that firms can instantaneously
adjust their cash holdings toward the target levels, the
dynamic model recognizes that an adjustment process
may take place and there are some lags for firms to
adjust their cash holdings to their target levels (Gao et
al., 2012). By extending the static model, the study
estimates the speed of adjustment towards an
endogenous target cash ratio in a dynamic panel
model.
For the purpose of target adjustment estimation,
model 2 will be re-formalized as follows:
ititit TRDCBCB 10 (3)
Where itCB is 1 itit CBCB , itTRDCB
is 1
*
itit CBCB and used to measure how far the
actual cash ratio deviates from the target cash ratio.
it is the error term and assumed to be independently
distributed with zero mean.
In this study, 1 is used to capture a firm’s
ability to adjust to its target cash holdings, 1 should
be statistically significant and between zero and one,
not zero nor one (0 < < 1) implying that the
movement toward the target is not a costless process.
At one extreme, when 1 = 1, the model implies that
firms can immediately adjust to their target levels.
Such immediate adjustment is possible only in
frictionless perfect capital markets that impose no
adjustment costs. At the other extreme, when 1 = 0,
the model implies that adjustment costs are so large
that firms cannot adjust their actual level of cash
reserves (Alles et al.,2012).
In general, this class of model is used to describe
the adjustment process toward target levels of
corporate cash holdings taking in to account that the
deviations from target cash ratio are not necessarily
offset quickly. This implies that value-maximizing
firms will gradually adjust their actual cash holding
toward their target level (Garcia-Teruel & Martinez-
Solano, 2008). The reason for this is that cash holding
decisions may be affected by the existence of market
imperfections such as information asymmetry, agency
conflicts or the existence of transaction costs incurred
by accessing the capital markets (Garcia-Teruel &
Martinez-Solano, 2008).
It worth's noting that the conventional cash
equation will be used to estimate the target cash
holdings level that will be used to calculate the target
deviation and then estimating the target adjustment
rate. The following section presents the estimation
results of partial adjustment model.
4 Regression results
This section consists of two sub-sections. The first one
presents the estimation results of conventional cash
holding equation; the equation that has been used in
the current study to estimate the fitted values of cash
holdings as a proxy for the target cash level. The
second one presents the estimation results of partial
adjustment model.
4.1 Estimation results of conventional cash equation
The result presented in table (4-1) suggests that the
fixed effect model is found to be the best specification
of the study's data set. The significant Lagrange
Multiplier (LM) test implies that the panel data
analysis is better than pooled OLS analysis,
suggesting the presence of firm and time specific
effect, and hence, OLS regression will not be efficient
to estimate study empirical model. The Ch2 value of
LM test is estimated to be 138.09 with p-value of
0.000. However, Hausman test suggests that the fixed
effects regressors will be better than random effect
regressors to greater efficient estimation results. This
finding is confirmed by the insignificant value of
Hausman CH2. It is found to be 18.5 with a p-value of
0.000. Moreover, the results of diagnostic tests for
Multicolinearity and Heteroskedasticity indicate that
the empirical models have no Multicolinearity and
Heteroskedasticity problems. The results of VIF show
that the mean value of VIF for all variables included
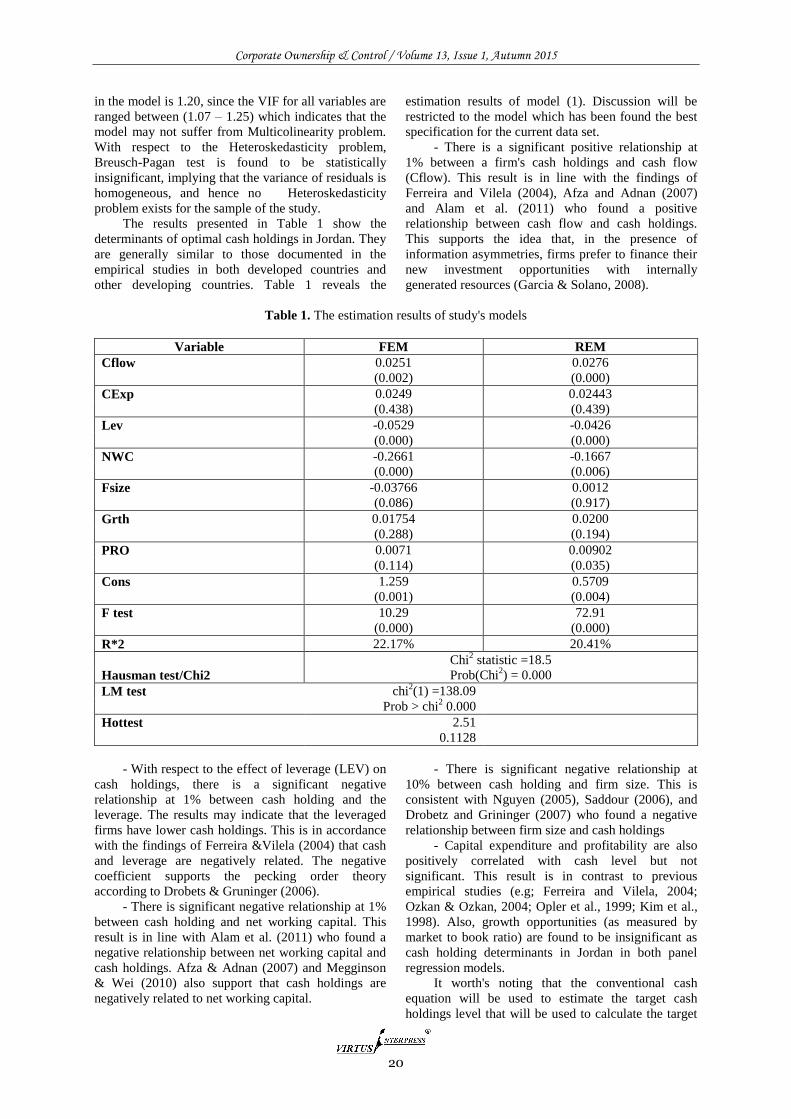
Corporate Ownership & Control / Volume 13, Issue 1, Autumn 2015
20
in the model is 1.20, since the VIF for all variables are
ranged between (1.07 – 1.25) which indicates that the
model may not suffer from Multicolinearity problem.
With respect to the Heteroskedasticity problem,
Breusch-Pagan test is found to be statistically
insignificant, implying that the variance of residuals is
homogeneous, and hence no Heteroskedasticity
problem exists for the sample of the study.
The results presented in Table 1 show the
determinants of optimal cash holdings in Jordan. They
are generally similar to those documented in the
empirical studies in both developed countries and
other developing countries. Table 1 reveals the
estimation results of model (1). Discussion will be
restricted to the model which has been found the best
specification for the current data set.
- There is a significant positive relationship at
1% between a firm's cash holdings and cash flow
(Cflow). This result is in line with the findings of
Ferreira and Vilela (2004), Afza and Adnan (2007)
and Alam et al. (2011) who found a positive
relationship between cash flow and cash holdings.
This supports the idea that, in the presence of
information asymmetries, firms prefer to finance their
new investment opportunities with internally
generated resources (Garcia & Solano, 2008).
Table 1. The estimation results of study's models
REM FEM Variable
0.0276 0.0251 Cflow
(0.000) (0.002)
0.02443 0.0249 CExp
(0.439) (0.438)
-0.0426 -0.0529 Lev
(0.000) (0.000)
-0.1667 -0.2661 NWC
(0.006) (0.000)
0.0012 -0.03766 Fsize
(0.917) (0.086)
0.0200 0.01754 Grth
(0.194) (0.288)
0.00902 0.0071 PRO
(0.035) (0.114)
0.5709 1.259 Cons
(0.004) (0.001)
72.91 10.29 F test
(0.000) (0.000)
20.41% 22.17% R*2
Chi2 statistic =18.5
Prob(Chi2) = 0.000 Hausman test/Chi2
chi2(1) =138.09 LM test
Prob > chi2 0.000
2.51 Hottest
0.1128
- With respect to the effect of leverage (LEV) on
cash holdings, there is a significant negative
relationship at 1% between cash holding and the
leverage. The results may indicate that the leveraged
firms have lower cash holdings. This is in accordance
with the findings of Ferreira &Vilela (2004) that cash
and leverage are negatively related. The negative
coefficient supports the pecking order theory
according to Drobets & Gruninger (2006).
- There is significant negative relationship at 1%
between cash holding and net working capital. This
result is in line with Alam et al. (2011) who found a
negative relationship between net working capital and
cash holdings. Afza & Adnan (2007) and Megginson
& Wei (2010) also support that cash holdings are
negatively related to net working capital.
- There is significant negative relationship at
10% between cash holding and firm size. This is
consistent with Nguyen (2005), Saddour (2006), and
Drobetz and Grininger (2007) who found a negative
relationship between firm size and cash holdings
- Capital expenditure and profitability are also
positively correlated with cash level but not
significant. This result is in contrast to previous
empirical studies (e.g; Ferreira and Vilela, 2004;
Ozkan & Ozkan, 2004; Opler et al., 1999; Kim et al.,
1998). Also, growth opportunities (as measured by
market to book ratio) are found to be insignificant as
cash holding determinants in Jordan in both panel
regression models.
It worth's noting that the conventional cash
equation will be used to estimate the target cash
holdings level that will be used to calculate the target
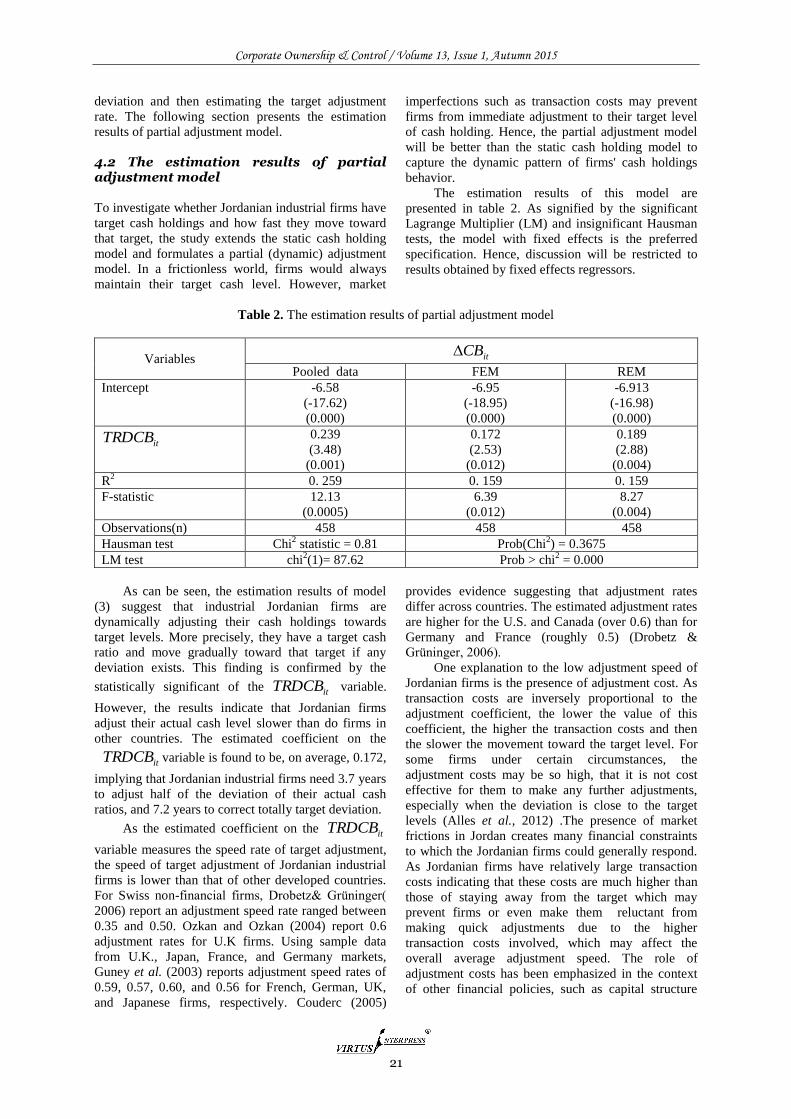
Corporate Ownership & Control / Volume 13, Issue 1, Autumn 2015
21
deviation and then estimating the target adjustment
rate. The following section presents the estimation
results of partial adjustment model.
4.2 The estimation results of partial adjustment model
To investigate whether Jordanian industrial firms have
target cash holdings and how fast they move toward
that target, the study extends the static cash holding
model and formulates a partial (dynamic) adjustment
model. In a frictionless world, firms would always
maintain their target cash level. However, market
imperfections such as transaction costs may prevent
firms from immediate adjustment to their target level
of cash holding. Hence, the partial adjustment model
will be better than the static cash holding model to
capture the dynamic pattern of firms' cash holdings
behavior.
The estimation results of this model are
presented in table 2. As signified by the significant
Lagrange Multiplier (LM) and insignificant Hausman
tests, the model with fixed effects is the preferred
specification. Hence, discussion will be restricted to
results obtained by fixed effects regressors.
Table 2. The estimation results of partial adjustment model
Variables itCB
Pooled data FEM REM
Intercept -6.58
(-17.62)
(0.000)
-6.95
(-18.95)
(0.000)
-6.913
(-16.98)
(0.000)
itTRDCB 0.239
(3.48)
(0.001)
0.172
(2.53)
(0.012)
0.189
(2.88)
(0.004)
R2 0. 259 0. 159 0. 159
F-statistic 12.13
(0.0005)
6.39
(0.012)
8.27
(0.004)
Observations(n) 458 458 458
Hausman test Chi2 statistic = 0.81 Prob(Chi
2) = 0.3675
LM test chi2(1)= 87.62 Prob > chi
2 = 0.000
As can be seen, the estimation results of model
(3) suggest that industrial Jordanian firms are
dynamically adjusting their cash holdings towards
target levels. More precisely, they have a target cash
ratio and move gradually toward that target if any
deviation exists. This finding is confirmed by the
statistically significant of the itTRDCB variable.
However, the results indicate that Jordanian firms
adjust their actual cash level slower than do firms in
other countries. The estimated coefficient on the
itTRDCB variable is found to be, on average, 0.172,
implying that Jordanian industrial firms need 3.7 years
to adjust half of the deviation of their actual cash
ratios, and 7.2 years to correct totally target deviation.
As the estimated coefficient on the itTRDCB
variable measures the speed rate of target adjustment,
the speed of target adjustment of Jordanian industrial
firms is lower than that of other developed countries.
For Swiss non-financial firms, Drobetz& Grüninger(
2006) report an adjustment speed rate ranged between
0.35 and 0.50. Ozkan and Ozkan (2004) report 0.6
adjustment rates for U.K firms. Using sample data
from U.K., Japan, France, and Germany markets,
Guney et al. (2003) reports adjustment speed rates of
0.59, 0.57, 0.60, and 0.56 for French, German, UK,
and Japanese firms, respectively. Couderc (2005)
provides evidence suggesting that adjustment rates
differ across countries. The estimated adjustment rates
are higher for the U.S. and Canada (over 0.6) than for
Germany and France (roughly 0.5) (Drobetz &
Grüninger, 2006).
One explanation to the low adjustment speed of
Jordanian firms is the presence of adjustment cost. As
transaction costs are inversely proportional to the
adjustment coefficient, the lower the value of this
coefficient, the higher the transaction costs and then
the slower the movement toward the target level. For
some firms under certain circumstances, the
adjustment costs may be so high, that it is not cost
effective for them to make any further adjustments,
especially when the deviation is close to the target
levels (Alles et al., 2012) .The presence of market
frictions in Jordan creates many financial constraints
to which the Jordanian firms could generally respond.
As Jordanian firms have relatively large transaction
costs indicating that these costs are much higher than
those of staying away from the target which may
prevent firms or even make them reluctant from
making quick adjustments due to the higher
transaction costs involved, which may affect the
overall average adjustment speed. The role of
adjustment costs has been emphasized in the context
of other financial policies, such as capital structure
Corporate Ownership & Control / Volume 13, Issue 1, Autumn 2015
22
and investment but has not received attention in the
cash literature (Dittmer & Duhin, 2011).
Another explanation for the delay in adjustment
process is the access to bank credit. According to
Zeitun et al. (2007), Jordan is a bank-based system
and the cost of borrowing is quite high, which makes
retained earnings an important source of funds. Thus,
a limited source of funding that is available for
Jordanian firms would have an impact on their cash
adjustment ability, and this means that the
mechanisms for Jordanian firms to make their cash
adjustments are limited. These findings are consistent
with the finding of Dittmer and Duhin (2011) that
firms with access to bank credit have significantly
higher speed of adjustment of cash. These results are
supportive of the “trade-off theory” of cash holdings,
under which firms have an optimal cash level, as
opposed to the "financial hierarchy hypothesis" of
cash holdings.
5 Conclusion and recommendations
The aim of this study is to investigate the speed by
which a sample of Jordanian industrial firms adjust
cash ratios toward their target levels, using a dynamic
adjustment model. A panel data for a sample of 57
Jordanian firms over the 2001-2010 is used and
estimated using fixed and random effects model. The
findings of this study suggest that Jordanian industrial
companies retain an average 6.5% of their assets in the
form of cash. This implies that Jordanian firms keep
their cash holdings low for the purpose of reducing the
agency costs of holding cash. Furthermore, Cash flow,
net working capital, leverage and firm size
significantly influence the cash holdings of Jordanian
firms with no impact of growth opportunities,
profitability and capital expenditures. The negative
impact of leverage on cash holdings suggests that
Industrial Jordanian firms can use borrowing as a
substitute for holding high levels of cash and
marketable securities. This explains how severe the
agency problem in Jordanian industrial firms is as
listed in ASE.
The study also reveals that Jordanian industrial
firms identify a target level for their cash holdings and
their decisions are taken in the aim of achieving this
objective. However, target adjustment occurs too
slowly, indicating that Jordanian firms have a large
transaction, asymmetric information and agency costs,
increasing the cost of moving toward the target ratio
and consequently, reducing the impetus of these firms
to back quickly to their target.
In the light of above conclusions, the study
recommends that Jordanian firms should increase their
cash holdings in an attempt to lower the probability of
financial distress and bankruptcy because the
insufficient balance of cash holdings may force firms
to give up some of the profitable investment
opportunities. Moreover, it recommends that the
policy makers in Jordan should develop the capital
market, increase its efficiency, competition and
transparency to increase the firm's ability to generate
funds externally.
References 1. Acharya, V. Almeida, H. and Campello M.(2005) "Is
cash negative debt? A hedging perspective on
corporate financial policies."London Business School.
Working Paper.
2. Afza, T., & Adnan, S.M. (2007)." Determinants of
corporate cash holdings: A case study of Pakistan".
Proceedings of Singapore Economic Review
Conference (SERC) 2007, August 01-04, Organized
by Singapore Economics Review and The University
of Manchester (Brooks World Poverty Institute),
Singapore 164-165 Available on
[https://editorialexpress.com/cgibin/conference/downl
oad.cgi?db_name=SERC2007&paper_id=166].
3. Alam H.M., Ali, L., Rehman C.A. & Akram M,
(2011). “The impact of working capital management
on profitability and market valuation of Pakistani
firms”: European Journal of Economics, Finance
&Administrative Sciences, vol. 32, 2011. viewed on
17 October, 2011,http://www.eurojournals.com
4. Alles, L ., Lian, Y. and Xu, C.Y. (2012) "The
Determinants of Target Cash Holdings and
Adjustment Speeds: An Empirical analysis of Chinese
Firms". Financial Markets & Corporate Governance
Conference Available at [SSRN:
http://ssrn.com/abstracr=1981818 or
http;//dx.doi.org/10.2139/ssrn.1981818]
5. Bates, T.W., Khale, K.M., Stulz, R.M. (2009). "Why
do US firms hold so much more cash than they used
to?" Journal of Finance, 64, 1985–2022.
6. Bruinshoofd, W. A., Kool, C., (2004)." Dutch
Corporate Liquidity Management: New Evidence on
Aggregation." Journal of Applied Economics 7, 195-
230
7. Bruinshoofd, W.(2009)."Nonlinear target adjustment
in corporate liquidity management: an endogenous
thresholds approach." Applied Economics,
forthcoming.
8. Couderc, N. (2005)."Corporate cash holdings:
financial determinants and consequences". Working
Paper.
9. Denis, D. J., V. Sibilkov. (2010)." Financial
Constraints, Investment, and the Value of Cash
Holdings." The Review of Financial Studies, 23: 247–
269.
10. Dittmar, A., J. Mahrt-Smith and H. Servaes (2003).
"International corporate governance and corporate
cash holdings. Journal of Financial and Quantitative
Analysis 38, 111-133 .
11. Dittmar, A. and J. Mahrt-Smith (2007). "Corporate
governance and the value of cash Holdings." Journal
of Financial Economics 83, 599-634.
12. Dittmar, Amy, and Ran Duchin, 2011. "The dynamics
of cash". University of Michigan. working paper.
13. Drobetz, W. and Grüninger M. (2006).“Corporate
Cash Holdings: Evidence from a Different
Institutional Setting.” presented at 9th SGF
conference.
14. Drobetz, W., and Grüninger, M.C. (2007). "Corporate
cash holdings: Evidence from Switzerland. Financial
markets Portfolio." 21, 293–324,
http://dx.doi.org/10.1007/s11408-007-0052-8.
Corporate Ownership & Control / Volume 13, Issue 1, Autumn 2015
23
15. Ferreira M.A. and Vilela A., (2004). "Why do firms
hold cash? Evidence from EMU countries." European
Financial Management, 10, 295-319.
16. Gao, H., J. Harford, and K. Li, 2012, “Determinants of
Corporate Cash Policy: A Comparison of Public and
Private Firms,” Working Paper.
17. García-Teruel, P.J., Martínez-Solano, P. (2008). “On
the Determinants of SMEs Cash Holdings: Evidence
from Spain.” Journal of Business Finance &
Accounting, 35 (1) & (2), 127-149.
18. Guney, Y., Ozkan, A. and Ozkan, N., 2003.
Additional international evidence on corporate
cash holdings. Working paper.
Guney, Y., Ozkan, A., and Ozkan, N. (2006).
“International evidence on the non-linear impact of
leverage on corporate cash holdings.” Journal of
Multinational Financial Management, 17, 45-60.
19. Jalilvand, A., & Harris, R.(1984). "Corporate
behavior in adjusting to capital structure and dividend
targets: An Econometric Study". Journal of Finance
39, 127-145.
20. Jensen MC, Meckling WH, (1976). "Theory of the
Firm: Managerial Behavior, Agency Costs and
Ownership Structure". J. Finance. Econ.,3: 305-360.
21. Jiang, Z. and Lie, L. (2010) . "Cash Holding
Adjustments and Firm Entrenchment" Working paper.
22. Kalcheva, I. and Lins, K.V. (2003). "International
Evidence on Cash Holdings and Expected Managerial
Agency Problems." Working Paper, ssrn.
23. Kim, C., Mauer, D., Sherman, A.(1998). "The
determinants of corporate liquidity: Theory and
evidence." Journal of Financial and Quantitative
Analysis 33, 335–359.
24. Kim, J., Kim, H., & Woods, D. (2011). "Determinants
of corporate cash-holding levels: An empirical
examination of the restaurant industry". International
Journal of Hospitality management, 30(3), 568-574,
http://dx.doi.org/10.1016/j.ijhm.2010.10.004.
25. Megginson, W.L., and Wei, Z. (2010). "Determinants
and value of cash holdings: Evidence from China's
privatized firms". SSRN Working Paper Series, 1-37.
26. Modigliani, F., and Miller, M.H. (1958). "The Cost of
Capital, Corporation Finance and the Theory of
Investment". American Economic Review Vol. 48,
261-297.
27. Myers C.S., (1984) .“The capital structure puzzle”,
The Journal of Finance, Vol. 39, No. 3, pp. 1-33.
28. Myers, S.C., Majluf, N. (1984). “Corporate financing
and investment decisions when firms have information
that investors do not have.” Journal of Financial
Economics, 13, 187-22.
29. Nguyen (2005) “How Sensitive are Japanese Firms to
Earnings Risk? Evidence from Cash Holdings”.
Working paper.
30. Nicolas Couderc ( 2005). "Corporate cash holdings:
financial determinants and consequences." Working
paper.
31. Opler, T., Pinkowitz, L., Stulz, R., and Williamson, R.
(1999). "The determinants and implications of
corporate cash holdings." Journal of financial
economics, 52(1), 3-46,
http://dx.doi.org/10.1016/S0304-405X(99)00003-3.
32. Ozkan, A., Ozkan, N. (2004). “Corporate cash
holdings: An empirical investigation of UK
companies.” Journal of Banking & Finance, 28(9),
pp. 2103-2134.
33. Pinkowitz, L., Stulz R., and Williamson R. (2006).
"Does the contribution of corporate cash holdings and
dividends to firm value depend on governance? A
cross-country analysis." Journal of Finance 61, 2725–
2751.
34. Saddour, K. (2006). "The determinants and the value
of cash holdings: Evidence from French firms ."
CEREG, 1-33. [Online]
Available:http://www.dauphine.fr/cereg/cahiers_rech/c
ereg200606.pdf
35. Taggart, R.(1977). "A model of corporate financing
decisions." Journal of Finance 32, 1467-1484.
36. Venkiteshwaran,V. (2011) ."Partial adjustment
toward optimal cash holding levels" . The Review of
Financial Economics 20(2011) 113-121 .
37. Zeitun, R, Tian, G and Keen, K.(2007). "Default
probability for the Jordanian companies: a test of
cash flow theory." International Research Journal of
Finance and Economics, 8, 147-62,2007.
Corporate Ownership & Control / Volume 13, Issue 1, Autumn 2015
24
THE EFFECT OF THE FIRM’S AGE AND FINANCIAL LEVERAGE ON ITS DIVIDEND POLICY – EVIDENCE FROM
KUWAIT STOCK EXCHANGE MARKET (KSE)
Turki Al-Sabah*
Abstract Identifying the major determinants of companies’ dividend policy has been the pith of various researchers and industry practitioners as well. In this research, the effect of the firms’ financial leverage and age on their dividend policy has been explored. Two hypotheses were formulated, where the first focused on examining the effect of the firms’ financial leverage and the second concentrated on investigating the effect of the firms’ age on their dividend policy. The sample assimilated in this study comprises of 38 Kuwait Stock Exchange listed companies from different industries. The period of investigation was five years, from 2009 to 2013. The hypotheses were tested using ordinary least square and fixed-effect panel regression. The results signify a negative relationship between the firm’s financial leverage and dividend payout ratio. Moreover, the results indicate a negative relationship between the firm’s age and dividend payout ratio. Keywords: Financial Leverage, Dividend Policy, Stock Exchange Market
*B.S. Finance & Financial Institutions-Kuwait University, College of Business Administration
1 Introduction
The monitoring of companies dividend policy is
requisite and integral for many investors and industrial
practitioners. Dividends distributed in the form of cash
to shareholders serves as a gauge of the financial
soundness, strength, and future prospects of
companies. Dividends are used to calculate a wide
range of ratios (e.g. dividend yield, dividend coverage
ratio, firm value via the dividend discount model) that
are essential for the valuation of companies.
Furthermore, there are investors who are dividend
seekers and who target companies with high cash
dividend payout ratios. In that perspective, these
investors are analogous to John D. Rockefeller who
quoted: “The only thing that gives me pleasure is to
see my dividend coming in”.
Due to the importance of companies’ dividend
policies to investors and practitioners, numerous
researchers focused on determining the dominant
factors that affected such policies and sought to
explain it in a quantifiable relationship.
2 Literature review
When companies generate profits, management must
decide whether to distribute these profits in the form
of dividends or else reinvest these funds in the form of
retained earnings within the company. Dividends are
categorized into two main classes: 1) Cash Dividend
2) Stock Dividend. Usually, it is more common for
companies to distribute dividends in the form of cash
as opposed to stocks, however stock market
characteristics and investor behavior vary substantially
with regards to different countries, opting many
companies to allocate stock dividends in certain
circumstances. Moreover, regulations in certain
countries can delimit the company’s dividend policies
and restrain their flexibilities.
Financial leverage refers to the total amount of
debt expressed as a percentage of total assets for a
specific company (debt ratio). Financial leverage
includes all fixed-income securities and preferred
stock included in the company’s capital structure. The
impetus behind the use of financial leverage is
inherent from the tax shield offered by several
governments, including the United States.
Furthermore, raising external debt adds economical
value to a company that earns higher returns on the
assets acquired by debt than the cost of debt itself.
Nevertheless, financial leverage has its negative
implications, which was salient during the financial
crisis in 2008, where many financial companies
collapsed due mainly to exorbitantly leveraged capital
structures (e.g. Lehmann Brothers). On the other hand,
Modigliani and Miller (1958) published the Nobel
Prize winning paper regarding the optimal capital
structure and theory of investment, where they
claimed that financial leverage has no effect on the
firms’ value in the absence of corporate income taxes
and distress costs (i.e. ex ante (related to increased
borrowing) and ex post costs (related to filing for
bankruptcy)).
Corporate Ownership & Control / Volume 13, Issue 1, Autumn 2015
25
All living organisms have a finite age, where
they go through various stages in their lives and
eventually end at some point in time. The life cycle
theory (Adizes, 1989) claims that firms experience
commensurate life cycles as living organisms on the
premise that they initiate, stabilize, and ultimately
perish. Copious researchers have concluded that the
firms operating and financial activities, including the
payout of dividends, are affected by the company’s
stage in its life cycle (Anthony and Ramesh, 1992).
The four stages of a firms life cycle are as follows: 1)
Introduction 2) Growth 3) Maturity 4) Decline.
Research regarding the determinants of dividend
policies traces back to the 1950’s, when Lintner
(1956) surveyed several chief executive officers
(CEO’s) and chief financial officers (CFO’s). Lintner
proposed several factors affecting firms’ dividend
policy including the corporation’s ownership
structure, investing expenditures, size, and proclivity
to employ external debt. Nonetheless, Lintner’s
dividend policy model was based on two main
parameters: 1) target payout level 2) the time it takes
for current dividends to adjust to the target. During his
research on determinants of dividend policy, Lintner
observed that managers tend to establish long-term
dividend to earning targets based on the total amount
of projected positive net present value (NPV) of
available projects. Further, he concluded that firms
would not alter the dividend policy, unless managers
are confident of sustaining earnings at a specific level.
Fama and Babiak (1968) further extended Lintner’s
model. Al-Kuwari (2007) researched the main
determinants of dividend policies for firms listed in
the Gulf Cooperation Council (GCC) stock exchange
markets. She tested several variables including
financial leverage, where she found a negative
relationship between a firm’s debt and it’s dividend
payout ratio. Nevertheless, she concludes that the
effect of leverage on dividend payout is not as
profound as other research cases suggest. Hafeez and
Attiya (2008) applied Lintner’s model along with its
extension in order to determine the main factors
affecting dividend policies for non-financial firms in
Pakistan’s stock exchange market. Their sample
included 320 listed non-financial firms from the
period 2001 to 2006. They tested several variables
including the company’s earnings, ownership
structure, liquidity, and market capitalization. More
importantly, they concluded that financial leverage has
negative impact on dividend policy. Thus, their
research suggests that highly leveraged firms listed in
Pakistan’s stock exchange market are more loath to
payout dividends. Furthermore, Talat and Hammad
(2010) analyzed 100 companies listed in Pakistan’s
stock exchange market. Although they also concluded
that financial leverage is negatively related to dividend
payout, however based on their sensitivity analysis,
they suggested that leverage is not a major factor in
determining the firm’s dividend level for companies
incorporated in the sample study. Azhagaiah and
Veeramuthu (2010) examined 73 stock exchange
listed companies across different sectors in India.
Their research manifested that the dividend payout
ratio for small-sized, medium-sized, and large-sized
companies is dependent on the level of debt reflected
in the capital structure. Wang et al. (2011) assessed
the main determinants of dividend policy and the
application of the life-cycle theory with regards to
Taiwanese companies. Their sample included various
listed companies in Taiwan’s stock exchange market,
from the period 1992 to 2007. Their results were
coherent with the life-cycle theory, where they found
out that younger firms with high growth trajectories
and limited profitability have a higher propensity to
distribute stock dividends as opposed to cash
dividends, whereas older firms with lower growth
potential and high profitability prefer to dispense cash
dividends as opposed to stock dividends. Ihejirika and
Nwakanma (2012) compiled a similar study on 62
stock exchange listed companies in Nigeria from the
period 2000 to 2008. Their results indicated that firms’
dividend payout ratio is affected mainly by the return
on equity (ROE), life-cycle stage, and size.
Surprisingly, their results suggested a negative
relationship between the firms’ life cycle stage and the
dividend payout ratio, demonstrating that younger
aged Nigerian firms have a higher predilection to pay
dividends than older firms, which is inconsistent with
Deangelo et al. (2006) study findings. Maladjian and
El Khoury (2014) conducted a study on several
Lebanese banks listed in the stock exchange market
from 2005 to 2011 to find out the main determinants
of dividend policies for banks in Lebanon. Similarly to
some previous studies, the results signified that
financial leverage is not a major variable affecting
dividend payout, however it was surprising that there
was a positive relationship between debt and dividend
policy. Lastly, Tamimi et al. (2014) evaluated the
effect of financial leverage and age on the dividend
policy of listed manufacturing companies in Tehran
stock exchange from 2005 to 2011. Their results
suggest a negative relationship between leverage and
dividend policy, while in the mean time indicate a
positive relationship between the firm’s age and it’s
dividend policy.
3 Objective of the study
The goal of this paper is to assess whether the firm’s
age and financial leverage have a significant effect on
its dividend payout ratio with regards to companies
listed in the Kuwaiti Stock Exchange (KSE).
Moreover, the study aims to quantify the magnitude of
the effect of financial leverage and age of the firm on
its dividend policy, if such relationship exists.
4 Hypotheses development
Consistent with the goals of this research paper, the
primary objective is to investigate the following
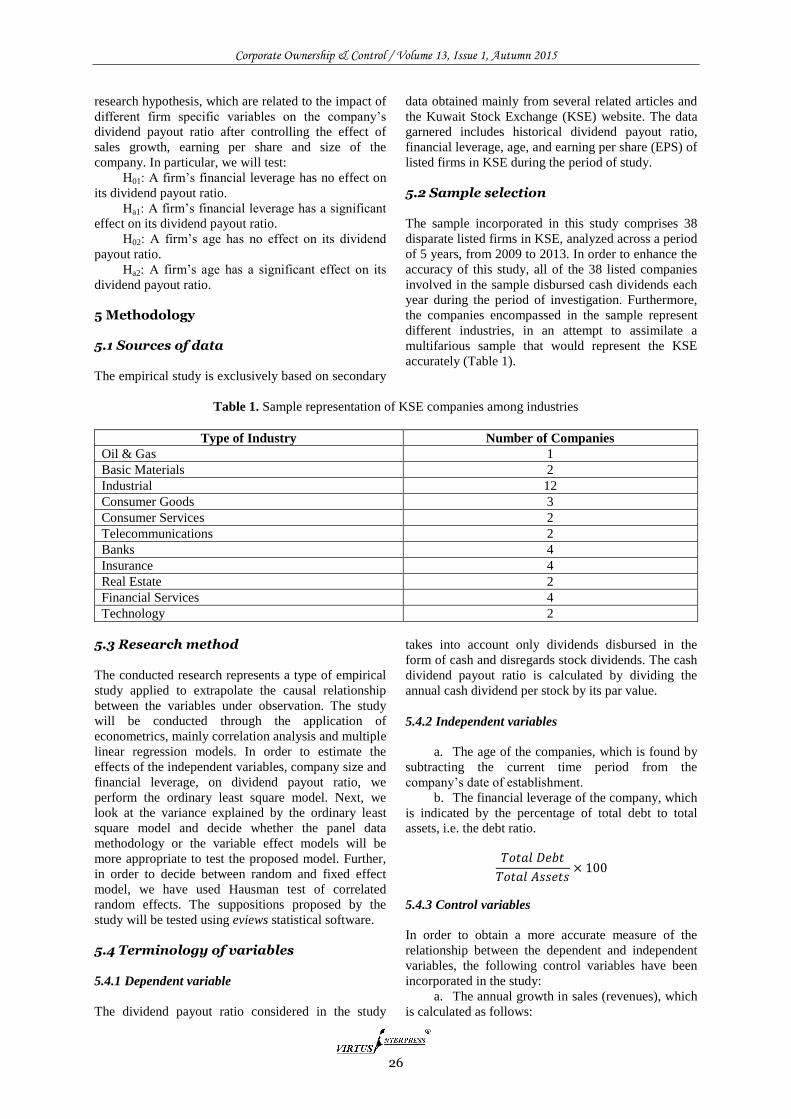
Corporate Ownership & Control / Volume 13, Issue 1, Autumn 2015
26
research hypothesis, which are related to the impact of
different firm specific variables on the company’s
dividend payout ratio after controlling the effect of
sales growth, earning per share and size of the
company. In particular, we will test:
H01: A firm’s financial leverage has no effect on
its dividend payout ratio.
Ha1: A firm’s financial leverage has a significant
effect on its dividend payout ratio.
H02: A firm’s age has no effect on its dividend
payout ratio.
Ha2: A firm’s age has a significant effect on its
dividend payout ratio.
5 Methodology 5.1 Sources of data
The empirical study is exclusively based on secondary
data obtained mainly from several related articles and
the Kuwait Stock Exchange (KSE) website. The data
garnered includes historical dividend payout ratio,
financial leverage, age, and earning per share (EPS) of
listed firms in KSE during the period of study.
5.2 Sample selection
The sample incorporated in this study comprises 38
disparate listed firms in KSE, analyzed across a period
of 5 years, from 2009 to 2013. In order to enhance the
accuracy of this study, all of the 38 listed companies
involved in the sample disbursed cash dividends each
year during the period of investigation. Furthermore,
the companies encompassed in the sample represent
different industries, in an attempt to assimilate a
multifarious sample that would represent the KSE
accurately (Table 1).
Table 1. Sample representation of KSE companies among industries
Type of Industry Number of Companies
Oil & Gas 1
Basic Materials 2
Industrial 12
Consumer Goods 3
Consumer Services 2
Telecommunications 2
Banks 4
Insurance 4
Real Estate 2
Financial Services 4
Technology 2
5.3 Research method
The conducted research represents a type of empirical
study applied to extrapolate the causal relationship
between the variables under observation. The study
will be conducted through the application of
econometrics, mainly correlation analysis and multiple
linear regression models. In order to estimate the
effects of the independent variables, company size and
financial leverage, on dividend payout ratio, we
perform the ordinary least square model. Next, we
look at the variance explained by the ordinary least
square model and decide whether the panel data
methodology or the variable effect models will be
more appropriate to test the proposed model. Further,
in order to decide between random and fixed effect
model, we have used Hausman test of correlated
random effects. The suppositions proposed by the
study will be tested using eviews statistical software.
5.4 Terminology of variables
5.4.1 Dependent variable
The dividend payout ratio considered in the study
takes into account only dividends disbursed in the
form of cash and disregards stock dividends. The cash
dividend payout ratio is calculated by dividing the
annual cash dividend per stock by its par value.
5.4.2 Independent variables
a. The age of the companies, which is found by
subtracting the current time period from the
company’s date of establishment.
b. The financial leverage of the company, which
is indicated by the percentage of total debt to total
assets, i.e. the debt ratio.
5.4.3 Control variables
In order to obtain a more accurate measure of the
relationship between the dependent and independent
variables, the following control variables have been
incorporated in the study:
a. The annual growth in sales (revenues), which
is calculated as follows:
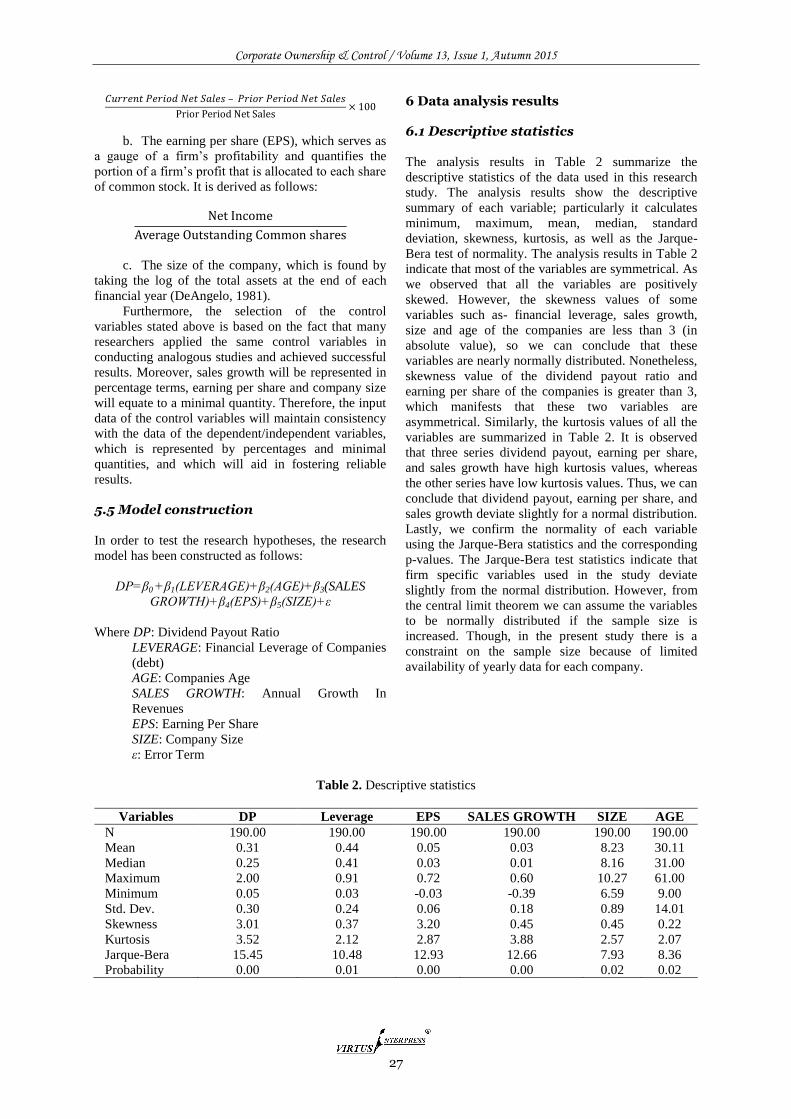
Corporate Ownership & Control / Volume 13, Issue 1, Autumn 2015
27
b. The earning per share (EPS), which serves as
a gauge of a firm’s profitability and quantifies the
portion of a firm’s profit that is allocated to each share
of common stock. It is derived as follows:
c. The size of the company, which is found by
taking the log of the total assets at the end of each
financial year (DeAngelo, 1981).
Furthermore, the selection of the control
variables stated above is based on the fact that many
researchers applied the same control variables in
conducting analogous studies and achieved successful
results. Moreover, sales growth will be represented in
percentage terms, earning per share and company size
will equate to a minimal quantity. Therefore, the input
data of the control variables will maintain consistency
with the data of the dependent/independent variables,
which is represented by percentages and minimal
quantities, and which will aid in fostering reliable
results.
5.5 Model construction
In order to test the research hypotheses, the research
model has been constructed as follows:
DP=β0 +β1(LEVERAGE)+β2(AGE)+β3(SALES
GROWTH)+β4(EPS)+β5(SIZE)+ε
Where DP: Dividend Payout Ratio
LEVERAGE: Financial Leverage of Companies
(debt)
AGE: Companies Age
SALES GROWTH: Annual Growth In
Revenues
EPS: Earning Per Share
SIZE: Company Size
ε: Error Term
6 Data analysis results 6.1 Descriptive statistics
The analysis results in Table 2 summarize the
descriptive statistics of the data used in this research
study. The analysis results show the descriptive
summary of each variable; particularly it calculates
minimum, maximum, mean, median, standard
deviation, skewness, kurtosis, as well as the Jarque-
Bera test of normality. The analysis results in Table 2
indicate that most of the variables are symmetrical. As
we observed that all the variables are positively
skewed. However, the skewness values of some
variables such as- financial leverage, sales growth,
size and age of the companies are less than 3 (in
absolute value), so we can conclude that these
variables are nearly normally distributed. Nonetheless,
skewness value of the dividend payout ratio and
earning per share of the companies is greater than 3,
which manifests that these two variables are
asymmetrical. Similarly, the kurtosis values of all the
variables are summarized in Table 2. It is observed
that three series dividend payout, earning per share,
and sales growth have high kurtosis values, whereas
the other series have low kurtosis values. Thus, we can
conclude that dividend payout, earning per share, and
sales growth deviate slightly for a normal distribution.
Lastly, we confirm the normality of each variable
using the Jarque-Bera statistics and the corresponding
p-values. The Jarque-Bera test statistics indicate that
firm specific variables used in the study deviate
slightly from the normal distribution. However, from
the central limit theorem we can assume the variables
to be normally distributed if the sample size is
increased. Though, in the present study there is a
constraint on the sample size because of limited
availability of yearly data for each company.
Table 2. Descriptive statistics
Variables DP Leverage EPS SALES GROWTH SIZE AGE
N 190.00 190.00 190.00 190.00 190.00 190.00
Mean 0.31 0.44 0.05 0.03 8.23 30.11
Median 0.25 0.41 0.03 0.01 8.16 31.00
Maximum 2.00 0.91 0.72 0.60 10.27 61.00
Minimum 0.05 0.03 -0.03 -0.39 6.59 9.00
Std. Dev. 0.30 0.24 0.06 0.18 0.89 14.01
Skewness 3.01 0.37 3.20 0.45 0.45 0.22
Kurtosis 3.52 2.12 2.87 3.88 2.57 2.07
Jarque-Bera 15.45 10.48 12.93 12.66 7.93 8.36
Probability 0.00 0.01 0.00 0.00 0.02 0.02
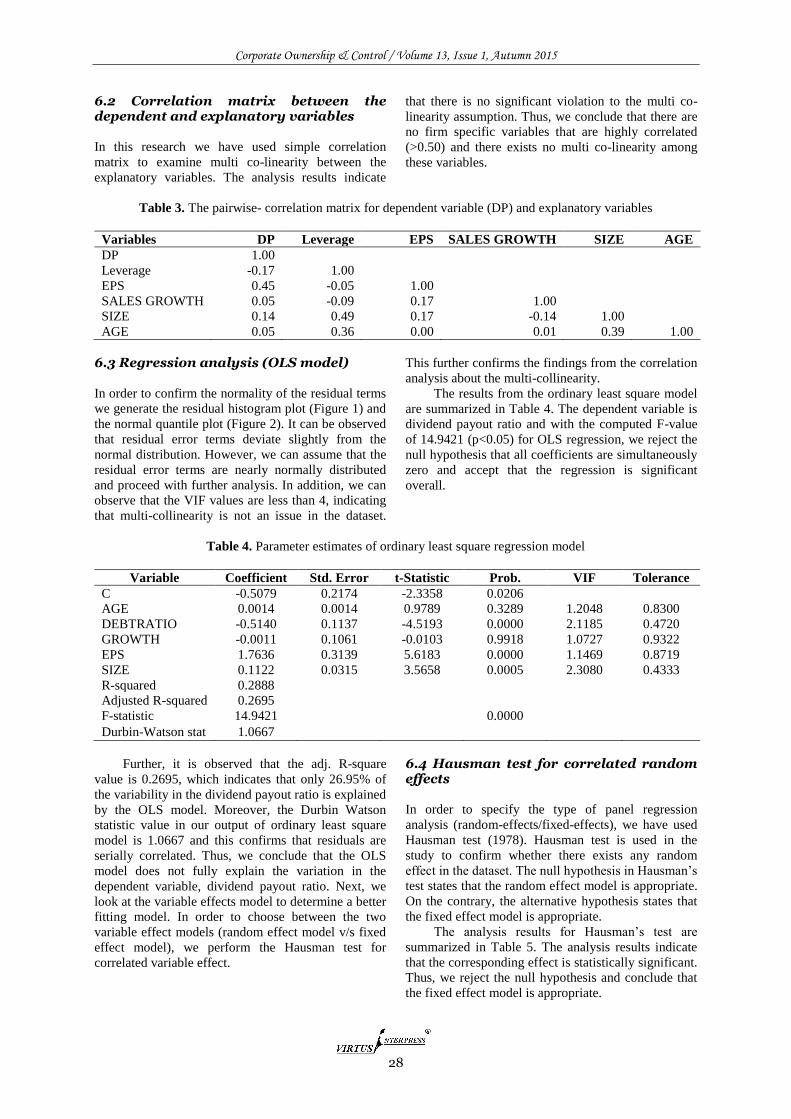
Corporate Ownership & Control / Volume 13, Issue 1, Autumn 2015
28
6.2 Correlation matrix between the dependent and explanatory variables
In this research we have used simple correlation
matrix to examine multi co-linearity between the
explanatory variables. The analysis results indicate
that there is no significant violation to the multi co-
linearity assumption. Thus, we conclude that there are
no firm specific variables that are highly correlated
(>0.50) and there exists no multi co-linearity among
these variables.
Table 3. The pairwise- correlation matrix for dependent variable (DP) and explanatory variables
Variables DP Leverage EPS SALES GROWTH SIZE AGE
DP 1.00
Leverage -0.17 1.00
EPS 0.45 -0.05 1.00
SALES GROWTH 0.05 -0.09 0.17 1.00
SIZE 0.14 0.49 0.17 -0.14 1.00
AGE 0.05 0.36 0.00 0.01 0.39 1.00
6.3 Regression analysis (OLS model)
In order to confirm the normality of the residual terms
we generate the residual histogram plot (Figure 1) and
the normal quantile plot (Figure 2). It can be observed
that residual error terms deviate slightly from the
normal distribution. However, we can assume that the
residual error terms are nearly normally distributed
and proceed with further analysis. In addition, we can
observe that the VIF values are less than 4, indicating
that multi-collinearity is not an issue in the dataset.
This further confirms the findings from the correlation
analysis about the multi-collinearity.
The results from the ordinary least square model
are summarized in Table 4. The dependent variable is
dividend payout ratio and with the computed F-value
of 14.9421 (p<0.05) for OLS regression, we reject the
null hypothesis that all coefficients are simultaneously
zero and accept that the regression is significant
overall.
Table 4. Parameter estimates of ordinary least square regression model
Variable Coefficient Std. Error t-Statistic Prob. VIF Tolerance
C -0.5079 0.2174 -2.3358 0.0206
AGE 0.0014 0.0014 0.9789 0.3289 1.2048 0.8300
DEBTRATIO -0.5140 0.1137 -4.5193 0.0000 2.1185 0.4720
GROWTH -0.0011 0.1061 -0.0103 0.9918 1.0727 0.9322
EPS 1.7636 0.3139 5.6183 0.0000 1.1469 0.8719
SIZE 0.1122 0.0315 3.5658 0.0005 2.3080 0.4333
R-squared 0.2888
Adjusted R-squared 0.2695
F-statistic 14.9421
0.0000
Durbin-Watson stat 1.0667
Further, it is observed that the adj. R-square
value is 0.2695, which indicates that only 26.95% of
the variability in the dividend payout ratio is explained
by the OLS model. Moreover, the Durbin Watson
statistic value in our output of ordinary least square
model is 1.0667 and this confirms that residuals are
serially correlated. Thus, we conclude that the OLS
model does not fully explain the variation in the
dependent variable, dividend payout ratio. Next, we
look at the variable effects model to determine a better
fitting model. In order to choose between the two
variable effect models (random effect model v/s fixed
effect model), we perform the Hausman test for
correlated variable effect.
6.4 Hausman test for correlated random effects
In order to specify the type of panel regression
analysis (random-effects/fixed-effects), we have used
Hausman test (1978). Hausman test is used in the
study to confirm whether there exists any random
effect in the dataset. The null hypothesis in Hausman’s
test states that the random effect model is appropriate.
On the contrary, the alternative hypothesis states that
the fixed effect model is appropriate.
The analysis results for Hausman’s test are
summarized in Table 5. The analysis results indicate
that the corresponding effect is statistically significant.
Thus, we reject the null hypothesis and conclude that
the fixed effect model is appropriate.
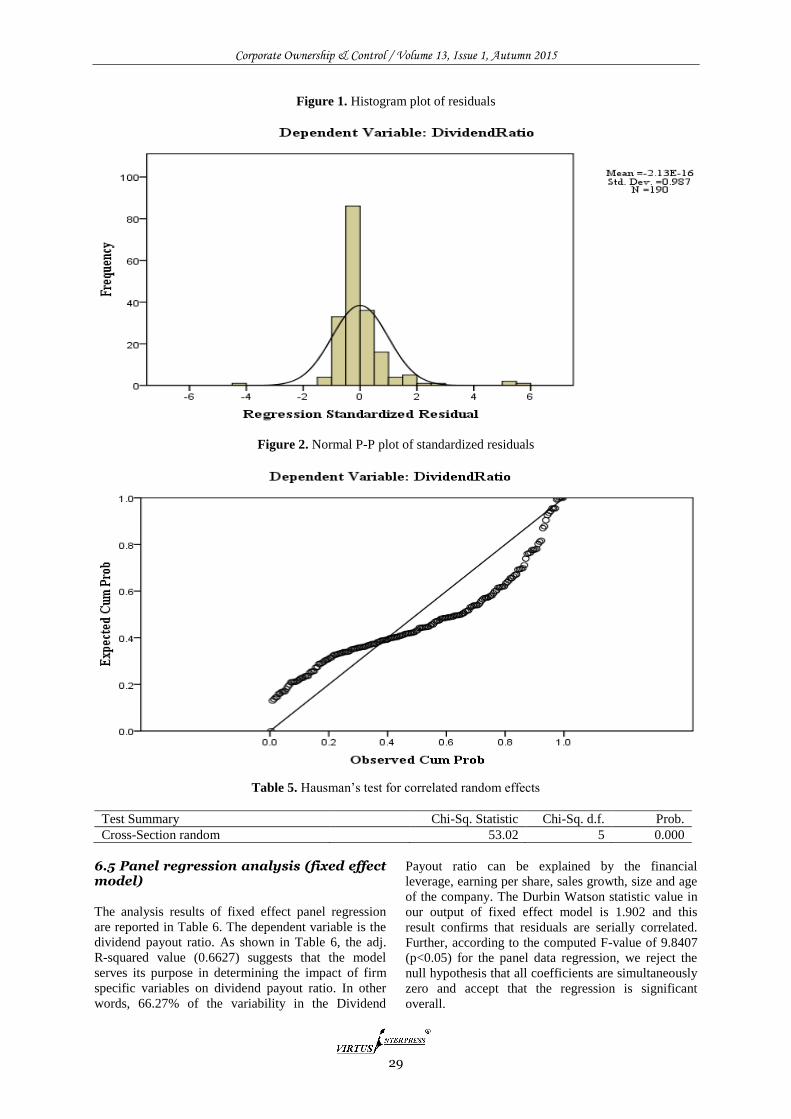
Corporate Ownership & Control / Volume 13, Issue 1, Autumn 2015
29
Figure 1. Histogram plot of residuals
Figure 2. Normal P-P plot of standardized residuals
Table 5. Hausman’s test for correlated random effects
Test Summary Chi-Sq. Statistic Chi-Sq. d.f. Prob.
Cross-Section random 53.02 5 0.000
6.5 Panel regression analysis (fixed effect model)
The analysis results of fixed effect panel regression
are reported in Table 6. The dependent variable is the
dividend payout ratio. As shown in Table 6, the adj.
R-squared value (0.6627) suggests that the model
serves its purpose in determining the impact of firm
specific variables on dividend payout ratio. In other
words, 66.27% of the variability in the Dividend
Payout ratio can be explained by the financial
leverage, earning per share, sales growth, size and age
of the company. The Durbin Watson statistic value in
our output of fixed effect model is 1.902 and this
result confirms that residuals are serially correlated.
Further, according to the computed F-value of 9.8407
(p<0.05) for the panel data regression, we reject the
null hypothesis that all coefficients are simultaneously
zero and accept that the regression is significant
overall.
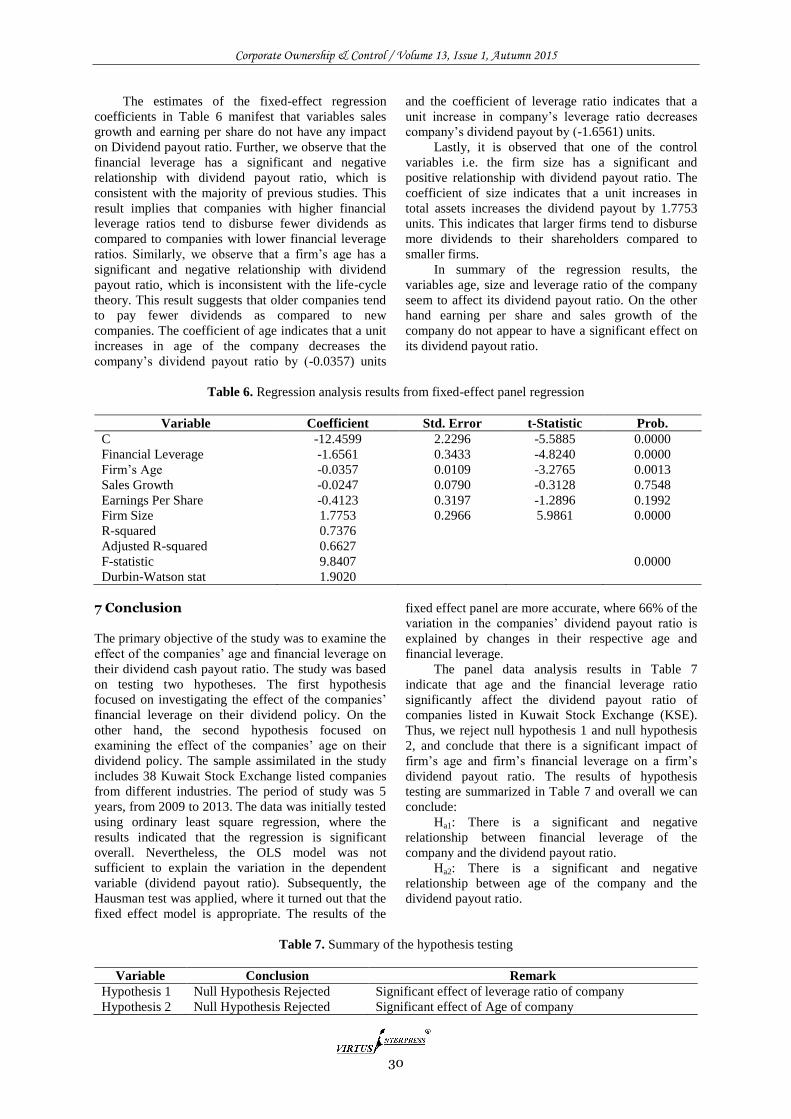
Corporate Ownership & Control / Volume 13, Issue 1, Autumn 2015
30
The estimates of the fixed-effect regression
coefficients in Table 6 manifest that variables sales
growth and earning per share do not have any impact
on Dividend payout ratio. Further, we observe that the
financial leverage has a significant and negative
relationship with dividend payout ratio, which is
consistent with the majority of previous studies. This
result implies that companies with higher financial
leverage ratios tend to disburse fewer dividends as
compared to companies with lower financial leverage
ratios. Similarly, we observe that a firm’s age has a
significant and negative relationship with dividend
payout ratio, which is inconsistent with the life-cycle
theory. This result suggests that older companies tend
to pay fewer dividends as compared to new
companies. The coefficient of age indicates that a unit
increases in age of the company decreases the
company’s dividend payout ratio by (-0.0357) units
and the coefficient of leverage ratio indicates that a
unit increase in company’s leverage ratio decreases
company’s dividend payout by (-1.6561) units.
Lastly, it is observed that one of the control
variables i.e. the firm size has a significant and
positive relationship with dividend payout ratio. The
coefficient of size indicates that a unit increases in
total assets increases the dividend payout by 1.7753
units. This indicates that larger firms tend to disburse
more dividends to their shareholders compared to
smaller firms.
In summary of the regression results, the
variables age, size and leverage ratio of the company
seem to affect its dividend payout ratio. On the other
hand earning per share and sales growth of the
company do not appear to have a significant effect on
its dividend payout ratio.
Table 6. Regression analysis results from fixed-effect panel regression
Variable Coefficient Std. Error t-Statistic Prob.
C -12.4599 2.2296 -5.5885 0.0000
Financial Leverage -1.6561 0.3433 -4.8240 0.0000
Firm’s Age -0.0357 0.0109 -3.2765 0.0013
Sales Growth -0.0247 0.0790 -0.3128 0.7548
Earnings Per Share -0.4123 0.3197 -1.2896 0.1992
Firm Size 1.7753 0.2966 5.9861 0.0000
R-squared 0.7376
Adjusted R-squared 0.6627
F-statistic 9.8407
0.0000
Durbin-Watson stat 1.9020
7 Conclusion
The primary objective of the study was to examine the
effect of the companies’ age and financial leverage on
their dividend cash payout ratio. The study was based
on testing two hypotheses. The first hypothesis
focused on investigating the effect of the companies’
financial leverage on their dividend policy. On the
other hand, the second hypothesis focused on
examining the effect of the companies’ age on their
dividend policy. The sample assimilated in the study
includes 38 Kuwait Stock Exchange listed companies
from different industries. The period of study was 5
years, from 2009 to 2013. The data was initially tested
using ordinary least square regression, where the
results indicated that the regression is significant
overall. Nevertheless, the OLS model was not
sufficient to explain the variation in the dependent
variable (dividend payout ratio). Subsequently, the
Hausman test was applied, where it turned out that the
fixed effect model is appropriate. The results of the
fixed effect panel are more accurate, where 66% of the
variation in the companies’ dividend payout ratio is
explained by changes in their respective age and
financial leverage.
The panel data analysis results in Table 7
indicate that age and the financial leverage ratio
significantly affect the dividend payout ratio of
companies listed in Kuwait Stock Exchange (KSE).
Thus, we reject null hypothesis 1 and null hypothesis
2, and conclude that there is a significant impact of
firm’s age and firm’s financial leverage on a firm’s
dividend payout ratio. The results of hypothesis
testing are summarized in Table 7 and overall we can
conclude:
Ha1: There is a significant and negative
relationship between financial leverage of the
company and the dividend payout ratio.
Ha2: There is a significant and negative
relationship between age of the company and the
dividend payout ratio.
Table 7. Summary of the hypothesis testing
Variable Conclusion Remark
Hypothesis 1 Null Hypothesis Rejected Significant effect of leverage ratio of company
Hypothesis 2 Null Hypothesis Rejected Significant effect of Age of company

Corporate Ownership & Control / Volume 13, Issue 1, Autumn 2015
31
References 1. Franco Modigliani & Merton H. Miller. (1958). The
Cost of Capital, Corporation Finance, and the Theory
of Investment. The American Economic Review,
VOLUME XLVIII, (3).
2. Anthony, Joseph H., & Ramesh, K. (1992).
Association between accounting Performance
Measures and Stock Prices: A Test of the Life Cycle
Hypothesis. Journal of Accounting and Economics,
15(2-3), 203-227.
3. Lintner, John. (1956). Distribution of Incomes of
Corporations among Dividends, Retained Earnings,
and Taxes. American economic review, 46(2), 97-113.
4. Duha Al-Kuwari. (2009). Determinants of the
Dividend Policy in Emerging Stock Exchanges: The
Case of GCC Countries. Global Economy & Finance
Journal, Vol.2 No.2, 38-63.
5. Hafeez Ahmed and Attiya Yasmin Javid. (2008).
Dynamics and determinants of dividend policy in
Pakistan (evidence from Karachi stock exchange non-
financial listed firms). MPRA Paper No. 37342,
http://mpra.ub.uni-muenchen.de/37342/.
6. Afza, Talat, & Mirza, Hammad Hassan. (2010).
Ownership Structure and Cash Flows As Determinants
of Corporate Dividend Policy in Pakistan.
International Business Research, 3(3).
7. Azhagaiah Ramachandran & Veeramuthu
Packkirisamy. (2010). The Impact of Firm Size on
Dividend Behaviour: A Study With Reference to
Corporate Firms across Industries in India. Managing
Global Transitions 8 (1): 49–78.
8. Wang, Ming-Hui, Ke, Mei-Chu, Liu, Day-Yang, &
Huang, Yen-Sheng. (2011). Dividend Policy and the
Life Cycle Hypothesis: Evidence from Taiwan. The
International Journal of Business and Finance
Research, 5(1), 33-52.
9. Ihejirika and Nwakanma. (2012). An empirical
analysis of the propensity to pay or not to pay
dividends: a test of the life cycle theory with Nigerian
data. Arabian Journal of Business and Management
Review (OMAN Chapter) Vol. 1, No.12.
10. DeAngelo, Linda Elizabeth. (1981). Auditor Size and
Audit Quality. Journal of Accounting and Economics,
3(3)
11. Christopher Maladjian
& Rim El Khoury. (2014).
Determinants of the Dividend Policy: An Empirical
Study on the Lebanese Listed Banks. International
Journal of Economics and Finance; Vol. 6, No. 4
12. Jenkins, David S, Kane, Gregory D., & Velury, Uma.
(2004). The Impact of the Corporate Life-Cycle on the
Value-Relevance of disaggregated Earnings
Components. Review of Accounting and Finance, 3(4),
5-20.
13. Almazan, Andres, De Motta, Adolfo, Titman,
Sheridan, & Uysal, Vahap. (2010). Financial
Structure, Acquisition Opportunities, and Firm
Locations. The Journal of Finance, 65(2).
14. Mohammad Tamimi & Nasrollah Takhtaei. (2014).
Relationship between Firm Age and Financial
Leverage with Dividend Policy. Asian Journal of
Finance & Accounting, Vol. 6, No. 2.
15. Stepanyan, Gohar G. (2011). Firm Life Cycle and the
Choice of the form of Payout. Available at SSRN
1632834.
Corporate Ownership & Control / Volume 13, Issue 1, Autumn 2015
32
CORPORATE GOVERNANCE IN MIDDLE EAST FAMILY BUSINESSES
Samer Khalil*, Assem Safieddine**
Abstract
This study examines governance-related issues within Middle East family businesses. The absence of proper external monitoring mechanisms – governmental or other – to protect shareholder rights, and the absence of any pre-existing literature on the Middle East market provides the motivation to evaluate the corporate governance practices of Middle East family businesses. Using a sample of 124 family businesses, we construct a governance index and use a probit model to examine whether family-related variables can explain the level of corporate governance. It is found that the majority of boards had a prevalence of family members and a low proportion of independent directors. Family businesses, still being run by the first generation, have a limited number of independent members on their boards and tend to adopt poorer governance practices than other firms where the third or fourth generations are involved. Instituting a family council has a positive governance impact, however, much work is needed, especially that it seems to lack clear vision as it is rendering the involvement of new generations ineffective. Keywords: Corporate Governance, Governance Score, Family Business, Middle East *Olayan School of Business, American University of Beirut, Bliss Street, P. O. Box 11-0236, Beirut, Lebanon Tel: +961 11350000 x 3769 **Corresponding author. The School of Business, American University of Beirut, Bliss Street, Beirut, Lebanon, P.O. Box: 11-0236 Tel: 961-1-350000 x 3949 Fax: 961-1-750214
1 Introduction
Corporate governance has been a subject for academic
research over the past decades (Adams, Hermalin, &
Weisbach, 2010; Gillan, 2006). Using data pertaining
to large, publicly traded firms, existing research
primarily investigates governance practices and their
implications on corporate policies, decision-making,
and performance in the Americas, Europe, East Asia,
and Latin America (Agrawal and Knoeber, 2012;
Kaplan, 2012; Carney, 2010; Claessens, Djankov, &
Lang, 2000). The existing literature, however, falls
short from documenting corporate governance
practices for family businesses operating in emerging
markets having stark differences in economic
environments, capital markets’ depth and breadth,
governance bodies and authorities, ownership
structure, financial markets participants, in addition to
cultural dissimilarities and differences in the ways of
doing business (Center For International Private
Enterprise (CIPE) 2011; PriceWaterhouseCoopers
(PWC) 2013).
We attempt to fill the void in the literature by
investigating the governance practices of privately-
held enterprises operating in the Middle East and
examining issues family businesses deal with in terms
of governance structures. Is there a link between
increased generational participation in the corporate
decision-making and corporate governance
enhancements? Does the presence of independent
directors on the Board of Directors (BOD) have an
effect on the corporate governance? Does the
governance of family businesses improve with the
presence of a family council? What are the effects of
the Chairman/CEO duality on the governance of the
family business?
The focus on family businesses in the Middle
East stems from various reasons. First, the Middle
East region is striving to improve governance
standards with significant achievements in a relatively
short period of time (Koldertsova, 2010; Nadal, 2013).
The past few years witnessed the establishment of at
least four new institutes of corporate governance or
institutes of directors that provide corporate
governance information, training, and guidance for
companies to improve their practices. Codes for
national corporate governance rules have also been
issued by most Middle Eastern countries (14 out of the
17 countries) over the past ten years. The Egyptian
Institute of Directors also introduced a governance
code targeted specifically at state-owned entities. The
Jordanian, Palestinian and Emirati regulators
introduced codes for banks, while the Lebanese,
Yemeni and Egyptian Central Banks are currently
Corporate Ownership & Control / Volume 13, Issue 1, Autumn 2015
33
working on developing guidelines on corporate
governance of banks. Moreover, the Lebanese
Transparency Association introduced specialized
guidelines for family-owned enterprises.
Second, family businesses play a key economic
role in their local and regional markets (PWC 2013)2.
They play a critical role in their respective sectors and
account for a large fraction of employment in various
economic sectors including retail, automotive,
construction, import/export, shipping, insurance,
agriculture, financial services, real estate and
manufacturing. Ninety percent of companies are
family-owned businesses, contributing up to 80% to
GDP as well as capturing 70% of the total
employment market. A large percentage of firms start
their operations as small trading entities that grow into
large, diversified conglomerates over two or three
generations by capitalizing on dominant positions
within their own markets, robust trading networks
within individual markets, and strong relationships
with banks. Until the recent financial crisis, the latter
has made access to finance far easier than it is for
family businesses elsewhere in the world.
Third, a relatively large number of family
businesses in the Middle East are first - or second-
generation businesses that were originally established
50 or 60 years ago and that currently face a transition
to the next generation in the next 5-10 years (PWC
2013; CIPE 2013). In Western countries, a large
number of family businesses have moved to the
ownership of the third and fourth generation. In the
MENA region however, the majority of family firms
are still under the second generation ownership with
only around 20% starting to have involvement from
members of the third generation. Succession planning
can be a sensitive topic since the founder or the
patriarch of the family may not feel completely secure
about training a successor and ceding his/her own
position to an heir. This process may also be intricate
due to family members’ hesitance to relinquish control
to outside managers - even in the absence of qualified
family members - especially that putting a succession
plan in place would require a management team
capable of growing the business independently of the
shareholders as well as having highly qualified board
members. Finally, succession planning, especially in
the MENA region, may be further complicated by a
strong cultural tradition of respect for older
generations which affects the manner in which a
change in management and control is handled.
In order to further evaluate the 124 family
businesses across the Middle East, we obtain results
using a 20-factor governance score developed along
the lines of Gompers, Ishii & Metrick (2003) and
Brown and Caylor (2006). We document the
following: First, corporate governance is still a topic
that is significantly under-studied and misunderstood
2 In the Gulf region, 80% of gross domestic product (GDP)
outside the oil sector is generated by family businesses (PWC 2013)
given that one-third of the respondents reported that
they were not well-enough informed about corporate
governance. Second, having an effective and well-
structured family council can enhance corporate
governance since it represents a forum for
communicating and voicing concerns and constitutes a
venue for identifying the way of dealing with family
and business issues.
Findings also show that, at the onset of family
firms, chairman/CEO duality is prevalent across
sample firms (close to 85 percent of the sample), and
board structures significantly contest best governance
practices. The majority of the firms in our sample had
a prevalence of family members on board and a
significantly low proportion of independent directors.
Interestingly, sample firms still being run by the
founding member or the first generation, have a
limited number of independent members on their
board and tend to adopt fewer governance practices
than other firms where the third or fourth generations
are involved.
Results further show that succession planning,
one of the key challenges in family firms and one of
the key pillars in sound governance practices, are
substantially ignored within our sample, whereby few
of the family businesses have any succession planning
arrangements in place; even those businesses with
established family councils report that family
succession is not an area of focus on their agenda.
While 51% of the firms in the sample with a family
council are dealing with succession planning, 10%
with no family council do have a succession plan.
Finally, findings reveal that family firms adapting and
abiding by corporate governance practices are less
likely to have family members with higher
compensation than the market salary.
The paper is structured as follows: following this
introduction, we present in a second section the
theoretical framework for the governance score and
develop the hypotheses. The third section describes our
sample and methodology, which includes a discussion
of the data collection process as well as the calculation
of the governance score, ME-Gov. A presentation of
our results follows in the fourth section to conclude
with a discussion of the findings and their practical
and research implications.
2 Theoretical perspectives and hypothesis
There is scant empirical evidence that investigates
corporate governance practices and their implications
in the Middle East. For instance, Hussainey and Aljifri
(2012) examine the degree to which internal and
external corporate governance mechanisms affect
UAE firms’ capital structure. Chahine and Safieddine
(2011) examine the effect of board size and its
composition on banks’ performance. Their findings
document that bank performance is positively related
to board size. Hussain and Mallin (2007) analyze the
state of corporate governance in Bahrain and find that
Corporate Ownership & Control / Volume 13, Issue 1, Autumn 2015
34
companies have boards dominated by non-executive
directors and that there is a separation of the Chair and
CEO position. El Sayyed (2007) examines the extent
to which corporate leadership structure affects
Egyptian publicly listed firms. Results indicate that
CEO duality has no impact on corporate performance.
Family firms have a number of characteristics
that distinguish them from typical listed firms. Amit
and Villalonga (2004) find that family and non-family
firms differ significantly in age, growth, performance,
and corporate governance and control. Daily and
Dollinger (1992) find that the principal common
characteristic among the majority of family firms is
that the main owner (family) is usually involved in the
key-decision-making of the firm. Similarly, Ali, Chen,
& Radhakrishnan (2007) report that in the U.S.,
families own 18% of their firms voting rights, hold top
executive and board director positions in respectively
63% and 99% of their firms.
In order to examine the issues related to the BOD
structure and role, family continuity and succession
planning, we develop four hypotheses and base our
findings on a sample of 124 firms. Anderson and
Reeb (2003), using a sample of S&P 500 firms, find
that boards in family firms contain significantly fewer
independent directors, and more inside directors than
boards in non-family firms. Lorsch and Maclver
(1989) indicate that objective evaluation and
monitoring of firm activity is one of the most critical
functions of independent directors. Byrd and Hickman
(1992) observe that independent directors are
responsible for protection and promotion of minority
shareholders’ interests.
Hypothesis I: Presence of independent directors
on the BOD has a significant influence on the firm’s
corporate governance.
Succession planning and family continuity is a
critical concern for family members, practitioners, and
family firm researchers. Prior studies have put forth
that continuity of businesses from one generation to
the next depends in significant part on succession
planning. Gersick, Davis, Hampton and Landsberg
(1997) indicate that proper succession planning is
critical to take the business from one generation to the
next. Beckard and Dyer (1983) find that only 30
percent of family businesses survive the transition to
second generation and only 10 percent go on to a third
generation. Statistics show that family businesses face
continuity issues in the transition process from one
generation to the next with 80% of firms not surviving
the third generation. Morck, Strangeland, &Yeung
(2000) report that heir-controlled firms exhibit lower
levels of industry-adjusted performance and technical
innovation, and conclude that inherited control is a
strong impediment to organizational growth.
In addition to succession planning, the presence,
or lack thereof, of a family charter and council may
serve as a good indicator of the strength of a family
business’s governance structure.
Hypothesis II: The presence of an effective
family council or assembly, taking into account family
continuity and succession planning, results in a better
governance at the business level.
Bartholomeusz and Tanewski (2006) find that it
is substantially more common for the Chairman of the
Board and CEO to hold the same position in family
firms compared to non-family ones.
Hillier and McColgan (2004) sample UK firms
and note that stock prices react favorably when
companies announce the departure of a family CEO,
but only when these directors are replaced by a non-
family successor. Shleifer and Vishny (1997), show
that CEO duality is linked with ineffective governance.
Family firms are more likely to have CEO
duality since such structure provides the family with
the opportunity of getting benefits that are not shared
with the minority shareholders. However, According
to Lam and Lee (2007), CEO duality has a negative
impact on family-owned businesses. Thus, segregation
of CEO and chairman duties is more appropriate for
family firms.
Hypothesis III: Having the Chairman of the
Board act as the CEO of the firm results in weaker
governance for the business.
Gompers et al. (2003) constructed a governance
index to proxy for the level of shareholder rights. GIM
classify 24 governance factors into five groups: tactics
for delaying hostile takeover, voting rights,
director/officer protection, other takeover defenses,
and state laws. They found that firms with stronger
shareholder rights had higher firm value, higher
profits, higher sales growth, lower capital expenditures,
and made fewer corporate acquisitions.
Brown and Caylor (2006) also created a measure
of corporate governance, Gov-Score, which constitutes
a measure of 51 factors encompassing eight corporate
governance categories: audit, BOD, charter/bylaws,
director evaluation, executive and director
compensation,
ownership, progressive practices, and state of
incorporation. They note that better-governed firms
are relatively more profitable, more valuable, and pay
out more cash to their shareholders.
Hypothesis IV: The higher the ME-GOV, the
more likely family members are to be compensated in
line with the market.
2.1.Estimating corporate governance quantitatively: the governance score
We derive the ME-GOV using the following twenty
parameters.
2.1.1 Presence of well-defined written strategy
Firms having a well-defined and written strategy are
scored 1, otherwise 0. A well-defined strategy helps in
shaping the corporation performance and the way the
strategy is being implemented.
Corporate Ownership & Control / Volume 13, Issue 1, Autumn 2015
35
2.1.2 BOD written and documented charter Firms having a written and documented charter specifying the BOD’s composition and responsibilities are assigned a score of 1, otherwise 0.
2.1.3 Financial expertise of board members Firms having at least one board member with expertise in financial matters are scored 1, otherwise 0. Ismail and Kamarudin (2012) examine whether the presence of financial experts reduces the perceived inherent risk of auditors. Results show that financial experts on the audit committee reduce the auditors' perception of the risk inherent in family firms.
2.1.4 Audit and accounting expertise of board
members Firms with an audit and accounting expert sitting on their board are assigned a score of 1, otherwise 0. Felo, Krishnamurthy, and Solieri (2003) found that the percentage of audit committee members having expertise in accounting is positively related to financial reporting quality.
2.1.5 Human resources expertise of board members A score of 1 is allocated for firms with at least one Human Resources expert sitting on the board, otherwise 0. Huselid, Jackson & Schuler (1997) found positive relationships between HR management effectiveness and productivity, cash flow, and market value.
2.1.6 Industry expertise of board members Firms with at least one board member being an industry expert are assigned a score of 1, otherwise 0. Faleye, Hoitash and Hoitash (2013) that board industry expertise is robustly associated with an increase in firm value since their presence has a positive effect on innovation.
2.1.7 Strategy expertise of board members
Firms having at least one member with expertise in strategy are given a score of 1, otherwise 0. The presence of a strategy expert on the board is very important in enhancing the ability of the latter in overseeing corporate strategy development and implementation which is considered to be one of the most important duties of the board.
2.1.8 Representation of non-family minority
shareholders on the board
Firms having at least one non-family minority shareholder on the board are scored 1, otherwise 0. Many studies show a positive relationship between the fraction of minorities on the board and firm value.
2.1.9 Establishment of Audit Committee
Firms having an Audit Committee are scored 1, otherwise 0. In his findings, Swamy (2012) shows a positive relationship between audit committee and performance.
2.1.10 Establishment of Nomination committee
Firms with an established Nomination Committee are scored 1, otherwise 0. Vafeas (1999) examines the association between the employment and composition of nominating committees with board and ownership characteristics. The results of the study are consistent with nominating committees substituting inside ownership in controlling management, mostly improving board quality, and being staffed with independent, experienced, and knowledgeable members.
2.1.11 Establishment of Remuneration Committee
Firms having Remuneration Committee are scored 1, otherwise 0. Câmara (2012) found that the presence of a remuneration committee promotes the rigor and transparency of the remuneration setting process.
2.1.12 Establishment of Risk Committee
Firms with an established Risk Committee are scored 1, otherwise 0. Tonello (2012) suggests that risk committee of the board is not a one-size fits-all solution, and it may be a better fit for companies with special circumstances. Organizations with complex market, credit, liquidity, commodity pricing, regulatory and other risks that require special attention may find a risk committee useful.
2.1.13 Establishment of Human Resources
Committee
Firms having a Human Resources Committee are scored 1, otherwise 0. Huselid (1995) indicates that Human Resource management practices have an economically and statistically significant impact on a firm’s turnover and productivity as well as on short and long term measures of corporate financial performance.
2.1.14 Establishment of Governance Committee
Firms having an established Governance Committee are scored 1, otherwise 0.
2.1.15 Presence of CEO/Chairman Duality
Firms with CEO duality are scored 0, otherwise 1. Klai and Omri (2011) emphasize the need of separating the positions of CEO and Board chairman in order to guarantee the board independence and improve the firm transparency, thus avoiding conflict of interest.
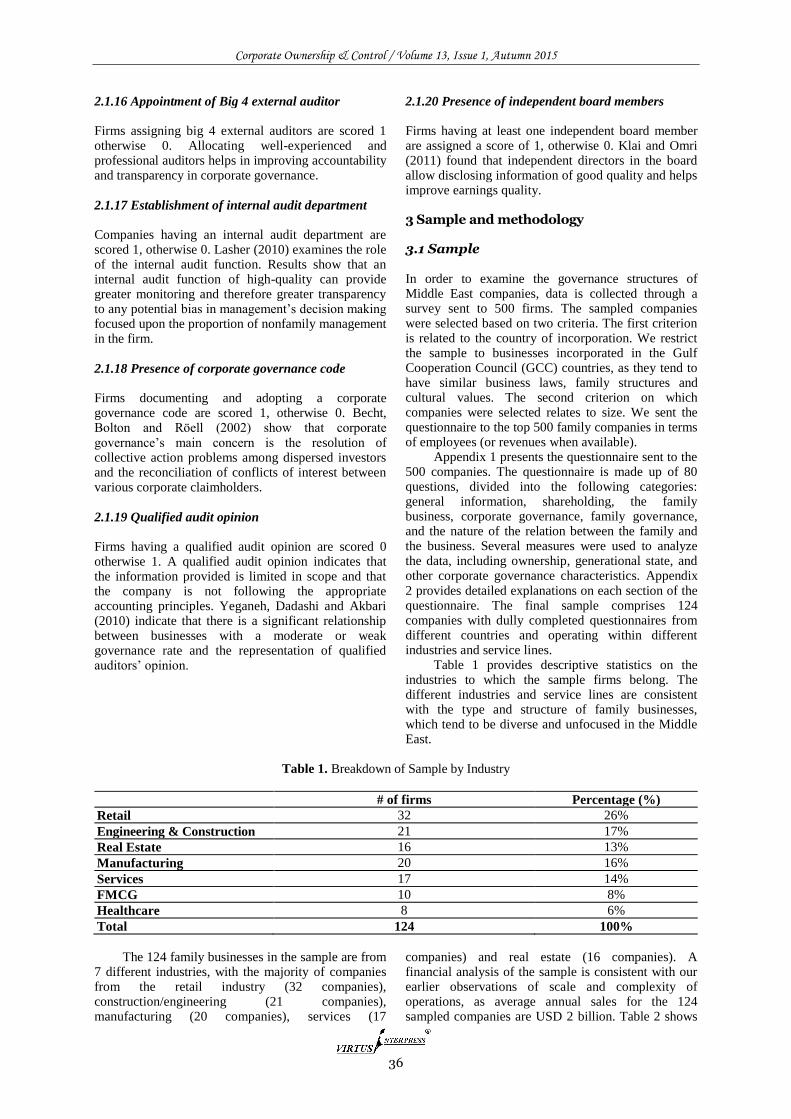
Corporate Ownership & Control / Volume 13, Issue 1, Autumn 2015
36
2.1.16 Appointment of Big 4 external auditor
Firms assigning big 4 external auditors are scored 1 otherwise 0. Allocating well-experienced and professional auditors helps in improving accountability and transparency in corporate governance.
2.1.17 Establishment of internal audit department
Companies having an internal audit department are scored 1, otherwise 0. Lasher (2010) examines the role of the internal audit function. Results show that an internal audit function of high-quality can provide greater monitoring and therefore greater transparency to any potential bias in management’s decision making focused upon the proportion of nonfamily management in the firm.
2.1.18 Presence of corporate governance code Firms documenting and adopting a corporate governance code are scored 1, otherwise 0. Becht, Bolton and Röell (2002) show that corporate governance’s main concern is the resolution of collective action problems among dispersed investors and the reconciliation of conflicts of interest between various corporate claimholders.
2.1.19 Qualified audit opinion Firms having a qualified audit opinion are scored 0 otherwise 1. A qualified audit opinion indicates that the information provided is limited in scope and that the company is not following the appropriate accounting principles. Yeganeh, Dadashi and Akbari (2010) indicate that there is a significant relationship between businesses with a moderate or weak governance rate and the representation of qualified auditors’ opinion.
2.1.20 Presence of independent board members Firms having at least one independent board member are assigned a score of 1, otherwise 0. Klai and Omri (2011) found that independent directors in the board allow disclosing information of good quality and helps improve earnings quality.
3 Sample and methodology 3.1 Sample In order to examine the governance structures of Middle East companies, data is collected through a survey sent to 500 firms. The sampled companies were selected based on two criteria. The first criterion is related to the country of incorporation. We restrict the sample to businesses incorporated in the Gulf Cooperation Council (GCC) countries, as they tend to have similar business laws, family structures and cultural values. The second criterion on which companies were selected relates to size. We sent the questionnaire to the top 500 family companies in terms of employees (or revenues when available).
Appendix 1 presents the questionnaire sent to the 500 companies. The questionnaire is made up of 80 questions, divided into the following categories: general information, shareholding, the family business, corporate governance, family governance, and the nature of the relation between the family and the business. Several measures were used to analyze the data, including ownership, generational state, and other corporate governance characteristics. Appendix 2 provides detailed explanations on each section of the questionnaire. The final sample comprises 124 companies with dully completed questionnaires from different countries and operating within different industries and service lines.
Table 1 provides descriptive statistics on the industries to which the sample firms belong. The different industries and service lines are consistent with the type and structure of family businesses, which tend to be diverse and unfocused in the Middle East.
Table 1. Breakdown of Sample by Industry
# of firms Percentage (%)
Retail 32 26%
Engineering & Construction 21 17%
Real Estate 16 13%
Manufacturing 20 16%
Services 17 14%
FMCG 10 8%
Healthcare 8 6%
Total 124 100%
The 124 family businesses in the sample are from
7 different industries, with the majority of companies from the retail industry (32 companies), construction/engineering (21 companies), manufacturing (20 companies), services (17
companies) and real estate (16 companies). A financial analysis of the sample is consistent with our earlier observations of scale and complexity of operations, as average annual sales for the 124 sampled companies are USD 2 billion. Table 2 shows
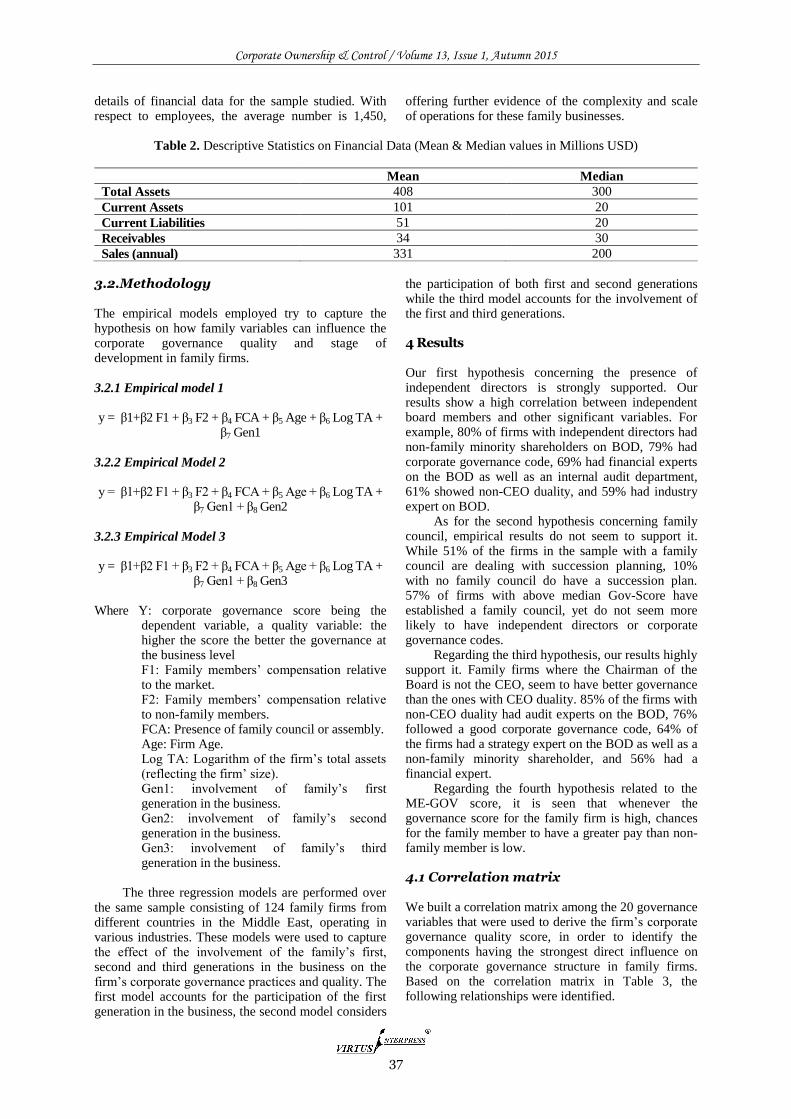
Corporate Ownership & Control / Volume 13, Issue 1, Autumn 2015
37
details of financial data for the sample studied. With respect to employees, the average number is 1,450,
offering further evidence of the complexity and scale of operations for these family businesses.
Table 2. Descriptive Statistics on Financial Data (Mean & Median values in Millions USD)
Mean Median
Total Assets 408 300
Current Assets 101 20
Current Liabilities 51 20
Receivables 34 30
Sales (annual) 331 200
3.2.Methodology The empirical models employed try to capture the hypothesis on how family variables can influence the corporate governance quality and stage of development in family firms.
3.2.1 Empirical model 1 y = β1+β2 F1 + β3 F2 + β4 FCA + β5 Age + β6 Log TA +
β7 Gen1
3.2.2 Empirical Model 2
y = β1+β2 F1 + β3 F2 + β4 FCA + β5 Age + β6 Log TA + β7 Gen1 + β8 Gen2
3.2.3 Empirical Model 3 y = β1+β2 F1 + β3 F2 + β4 FCA + β5 Age + β6 Log TA +
β7 Gen1 + β8 Gen3
Where Y: corporate governance score being the dependent variable, a quality variable: the higher the score the better the governance at the business level F1: Family members’ compensation relative to the market. F2: Family members’ compensation relative to non-family members. FCA: Presence of family council or assembly. Age: Firm Age. Log TA: Logarithm of the firm’s total assets (reflecting the firm’ size). Gen1: involvement of family’s first generation in the business. Gen2: involvement of family’s second generation in the business. Gen3: involvement of family’s third generation in the business.
The three regression models are performed over
the same sample consisting of 124 family firms from different countries in the Middle East, operating in various industries. These models were used to capture the effect of the involvement of the family’s first, second and third generations in the business on the firm’s corporate governance practices and quality. The first model accounts for the participation of the first generation in the business, the second model considers
the participation of both first and second generations while the third model accounts for the involvement of the first and third generations. 4 Results Our first hypothesis concerning the presence of independent directors is strongly supported. Our results show a high correlation between independent board members and other significant variables. For example, 80% of firms with independent directors had non-family minority shareholders on BOD, 79% had corporate governance code, 69% had financial experts on the BOD as well as an internal audit department, 61% showed non-CEO duality, and 59% had industry expert on BOD.
As for the second hypothesis concerning family council, empirical results do not seem to support it. While 51% of the firms in the sample with a family council are dealing with succession planning, 10% with no family council do have a succession plan. 57% of firms with above median Gov-Score have established a family council, yet do not seem more likely to have independent directors or corporate governance codes.
Regarding the third hypothesis, our results highly support it. Family firms where the Chairman of the Board is not the CEO, seem to have better governance than the ones with CEO duality. 85% of the firms with non-CEO duality had audit experts on the BOD, 76% followed a good corporate governance code, 64% of the firms had a strategy expert on the BOD as well as a non-family minority shareholder, and 56% had a financial expert.
Regarding the fourth hypothesis related to the ME-GOV score, it is seen that whenever the governance score for the family firm is high, chances for the family member to have a greater pay than non-family member is low.
4.1 Correlation matrix We built a correlation matrix among the 20 governance variables that were used to derive the firm’s corporate governance quality score, in order to identify the components having the strongest direct influence on the corporate governance structure in family firms. Based on the correlation matrix in Table 3, the following relationships were identified.
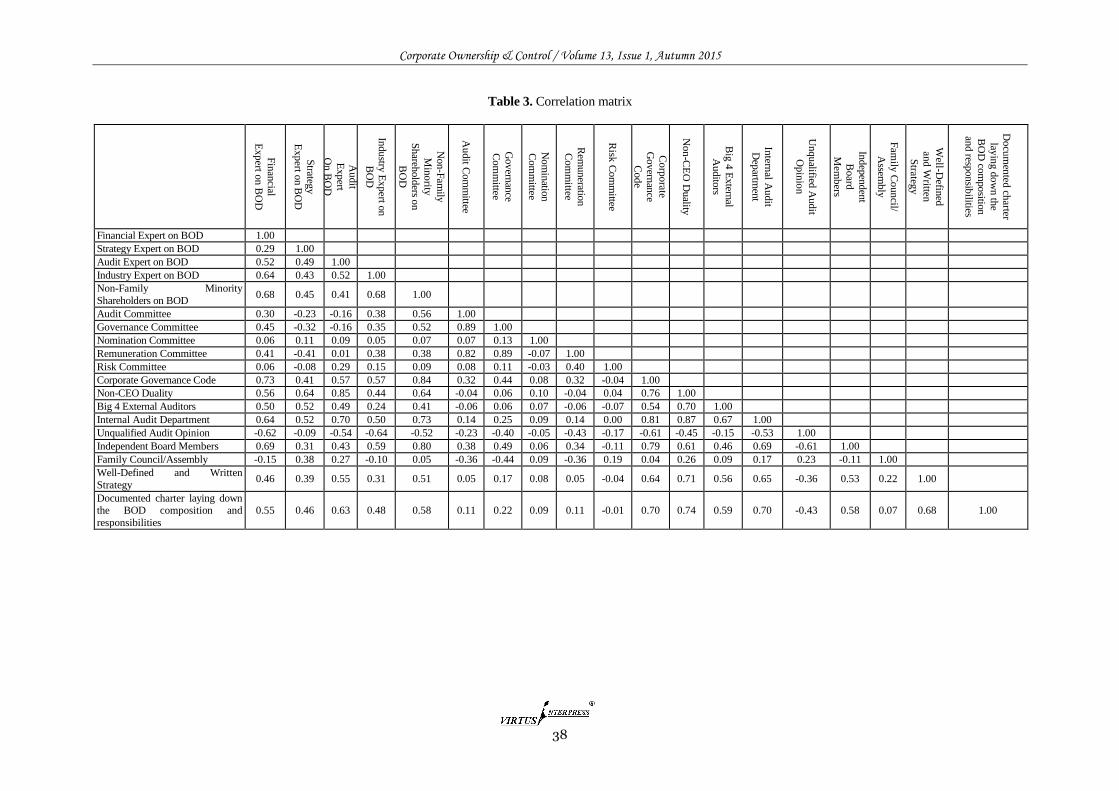
Corporate Ownership & Control / Volume 13, Issue 1, Autumn 2015
38
Table 3. Correlation matrix
Fin
ancial
Exp
ert on
BO
D
Strateg
y
Exp
ert on B
OD
Au
dit
Expert
On
BO
D
Industry
Ex
pert o
n
BO
D
Non-F
amily
Min
ority
Shareh
old
ers on
BO
D
Au
dit C
om
mittee
Govern
ance
Com
mittee
Nom
inatio
n
Com
mittee
Rem
uneratio
n
Co
mm
ittee
Risk
Com
mittee
Co
rpo
rate
Govern
ance
Cod
e
No
n-C
EO
Duality
Big
4 E
xtern
al
Audito
rs
Intern
al Au
dit
Dep
artmen
t
Unqualified
Audit
Op
inio
n
Indep
enden
t
Board
Mem
bers
Fam
ily C
oun
cil/
Assem
bly
Well-D
efined
and
Written
Strateg
y
Do
cum
ented
charter
layin
g d
ow
n th
e
BO
D co
mpositio
n
and resp
onsib
ilities
Financial Expert on BOD 1.00
Strategy Expert on BOD 0.29 1.00
Audit Expert on BOD 0.52 0.49 1.00
Industry Expert on BOD 0.64 0.43 0.52 1.00
Non-Family Minority
Shareholders on BOD 0.68 0.45 0.41 0.68 1.00
Audit Committee 0.30 -0.23 -0.16 0.38 0.56 1.00
Governance Committee 0.45 -0.32 -0.16 0.35 0.52 0.89 1.00
Nomination Committee 0.06 0.11 0.09 0.05 0.07 0.07 0.13 1.00
Remuneration Committee 0.41 -0.41 0.01 0.38 0.38 0.82 0.89 -0.07 1.00
Risk Committee 0.06 -0.08 0.29 0.15 0.09 0.08 0.11 -0.03 0.40 1.00
Corporate Governance Code 0.73 0.41 0.57 0.57 0.84 0.32 0.44 0.08 0.32 -0.04 1.00
Non-CEO Duality 0.56 0.64 0.85 0.44 0.64 -0.04 0.06 0.10 -0.04 0.04 0.76 1.00
Big 4 External Auditors 0.50 0.52 0.49 0.24 0.41 -0.06 0.06 0.07 -0.06 -0.07 0.54 0.70 1.00
Internal Audit Department 0.64 0.52 0.70 0.50 0.73 0.14 0.25 0.09 0.14 0.00 0.81 0.87 0.67 1.00
Unqualified Audit Opinion -0.62 -0.09 -0.54 -0.64 -0.52 -0.23 -0.40 -0.05 -0.43 -0.17 -0.61 -0.45 -0.15 -0.53 1.00
Independent Board Members 0.69 0.31 0.43 0.59 0.80 0.38 0.49 0.06 0.34 -0.11 0.79 0.61 0.46 0.69 -0.61 1.00
Family Council/Assembly -0.15 0.38 0.27 -0.10 0.05 -0.36 -0.44 0.09 -0.36 0.19 0.04 0.26 0.09 0.17 0.23 -0.11 1.00
Well-Defined and Written
Strategy 0.46 0.39 0.55 0.31 0.51 0.05 0.17 0.08 0.05 -0.04 0.64 0.71 0.56 0.65 -0.36 0.53 0.22 1.00
Documented charter laying down the BOD composition and
responsibilities
0.55 0.46 0.63 0.48 0.58 0.11 0.22 0.09 0.11 -0.01 0.70 0.74 0.59 0.70 -0.43 0.58 0.07 0.68 1.00
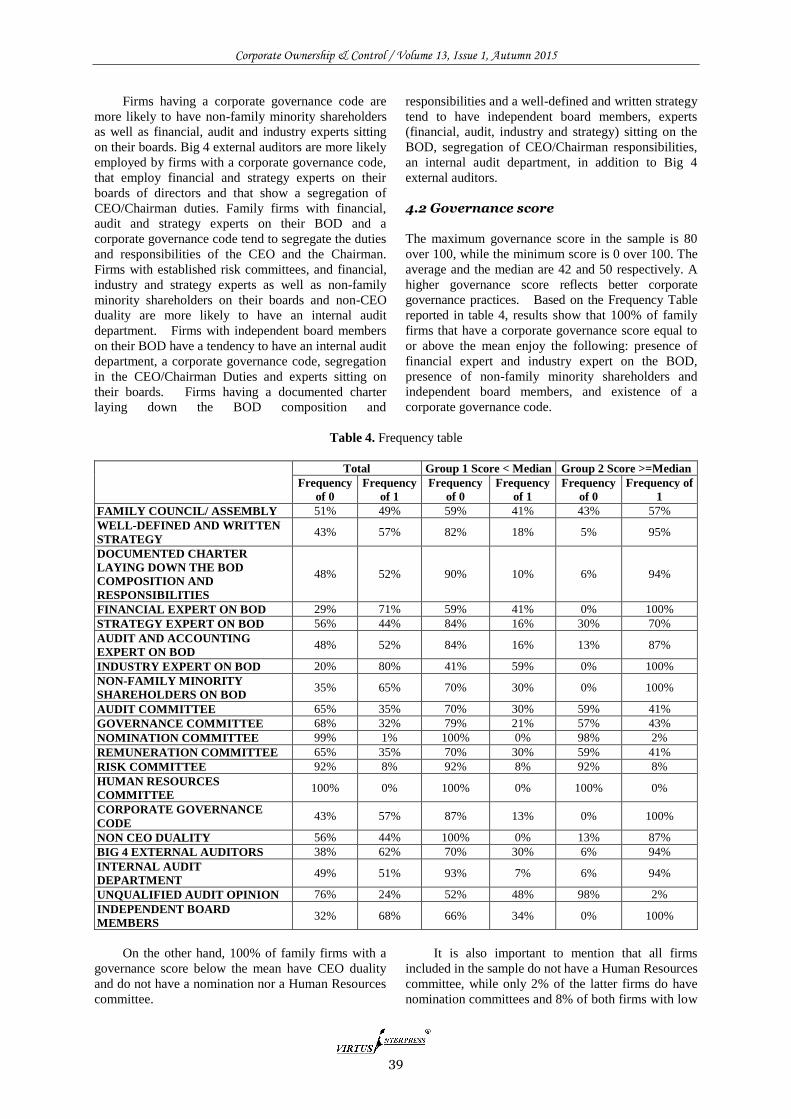
Corporate Ownership & Control / Volume 13, Issue 1, Autumn 2015
39
Firms having a corporate governance code are
more likely to have non-family minority shareholders
as well as financial, audit and industry experts sitting
on their boards. Big 4 external auditors are more likely
employed by firms with a corporate governance code,
that employ financial and strategy experts on their
boards of directors and that show a segregation of
CEO/Chairman duties. Family firms with financial,
audit and strategy experts on their BOD and a
corporate governance code tend to segregate the duties
and responsibilities of the CEO and the Chairman.
Firms with established risk committees, and financial,
industry and strategy experts as well as non-family
minority shareholders on their boards and non-CEO
duality are more likely to have an internal audit
department. Firms with independent board members
on their BOD have a tendency to have an internal audit
department, a corporate governance code, segregation
in the CEO/Chairman Duties and experts sitting on
their boards. Firms having a documented charter
laying down the BOD composition and
responsibilities and a well-defined and written strategy
tend to have independent board members, experts
(financial, audit, industry and strategy) sitting on the
BOD, segregation of CEO/Chairman responsibilities,
an internal audit department, in addition to Big 4
external auditors.
4.2 Governance score
The maximum governance score in the sample is 80
over 100, while the minimum score is 0 over 100. The
average and the median are 42 and 50 respectively. A
higher governance score reflects better corporate
governance practices. Based on the Frequency Table
reported in table 4, results show that 100% of family
firms that have a corporate governance score equal to
or above the mean enjoy the following: presence of
financial expert and industry expert on the BOD,
presence of non-family minority shareholders and
independent board members, and existence of a
corporate governance code.
Table 4. Frequency table
Total Group 1 Score < Median Group 2 Score >=Median Frequency
of 0 Frequency
of 1 Frequency
of 0 Frequency
of 1 Frequency
of 0 Frequency of
1 FAMILY COUNCIL/ ASSEMBLY 51% 49% 59% 41% 43% 57% WELL-DEFINED AND WRITTEN
STRATEGY 43% 57% 82% 18% 5% 95%
DOCUMENTED CHARTER
LAYING DOWN THE BOD
COMPOSITION AND
RESPONSIBILITIES
48% 52% 90% 10% 6% 94%
FINANCIAL EXPERT ON BOD 29% 71% 59% 41% 0% 100% STRATEGY EXPERT ON BOD 56% 44% 84% 16% 30% 70% AUDIT AND ACCOUNTING
EXPERT ON BOD 48% 52% 84% 16% 13% 87%
INDUSTRY EXPERT ON BOD 20% 80% 41% 59% 0% 100% NON-FAMILY MINORITY
SHAREHOLDERS ON BOD 35% 65% 70% 30% 0% 100%
AUDIT COMMITTEE 65% 35% 70% 30% 59% 41% GOVERNANCE COMMITTEE 68% 32% 79% 21% 57% 43% NOMINATION COMMITTEE 99% 1% 100% 0% 98% 2% REMUNERATION COMMITTEE 65% 35% 70% 30% 59% 41% RISK COMMITTEE 92% 8% 92% 8% 92% 8% HUMAN RESOURCES
COMMITTEE 100% 0% 100% 0% 100% 0%
CORPORATE GOVERNANCE
CODE 43% 57% 87% 13% 0% 100%
NON CEO DUALITY 56% 44% 100% 0% 13% 87% BIG 4 EXTERNAL AUDITORS 38% 62% 70% 30% 6% 94% INTERNAL AUDIT
DEPARTMENT 49% 51% 93% 7% 6% 94%
UNQUALIFIED AUDIT OPINION 76% 24% 52% 48% 98% 2% INDEPENDENT BOARD
MEMBERS 32% 68% 66% 34% 0% 100%
On the other hand, 100% of family firms with a
governance score below the mean have CEO duality
and do not have a nomination nor a Human Resources
committee.
It is also important to mention that all firms
included in the sample do not have a Human Resources
committee, while only 2% of the latter firms do have
nomination committees and 8% of both firms with low
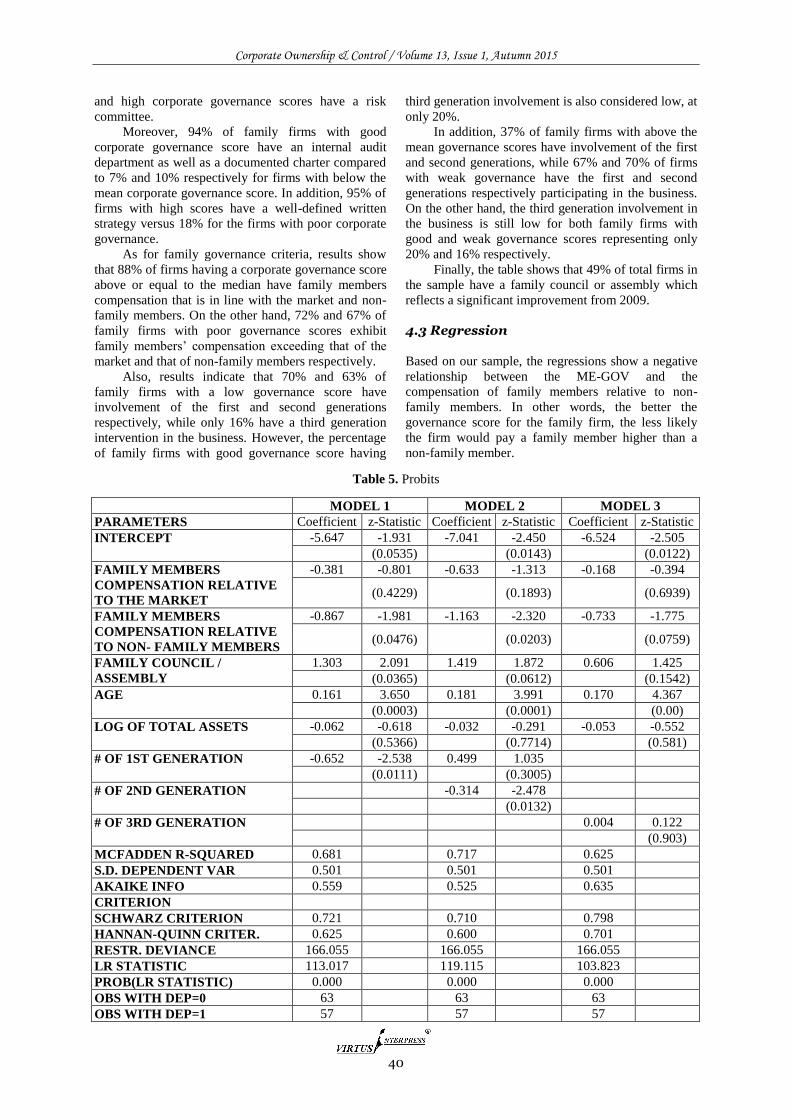
Corporate Ownership & Control / Volume 13, Issue 1, Autumn 2015
40
and high corporate governance scores have a risk
committee.
Moreover, 94% of family firms with good
corporate governance score have an internal audit
department as well as a documented charter compared
to 7% and 10% respectively for firms with below the
mean corporate governance score. In addition, 95% of
firms with high scores have a well-defined written
strategy versus 18% for the firms with poor corporate
governance.
As for family governance criteria, results show
that 88% of firms having a corporate governance score
above or equal to the median have family members
compensation that is in line with the market and non-
family members. On the other hand, 72% and 67% of
family firms with poor governance scores exhibit
family members’ compensation exceeding that of the
market and that of non-family members respectively.
Also, results indicate that 70% and 63% of
family firms with a low governance score have
involvement of the first and second generations
respectively, while only 16% have a third generation
intervention in the business. However, the percentage
of family firms with good governance score having
third generation involvement is also considered low, at
only 20%.
In addition, 37% of family firms with above the
mean governance scores have involvement of the first
and second generations, while 67% and 70% of firms
with weak governance have the first and second
generations respectively participating in the business.
On the other hand, the third generation involvement in
the business is still low for both family firms with
good and weak governance scores representing only
20% and 16% respectively.
Finally, the table shows that 49% of total firms in
the sample have a family council or assembly which
reflects a significant improvement from 2009.
4.3 Regression
Based on our sample, the regressions show a negative
relationship between the ME-GOV and the
compensation of family members relative to non-
family members. In other words, the better the
governance score for the family firm, the less likely
the firm would pay a family member higher than a
non-family member.
Table 5. Probits
MODEL 1 MODEL 2 MODEL 3
PARAMETERS Coefficient z-Statistic Coefficient z-Statistic Coefficient z-Statistic
INTERCEPT -5.647 -1.931 -7.041 -2.450 -6.524 -2.505
(0.0535) (0.0143) (0.0122)
FAMILY MEMBERS
COMPENSATION RELATIVE
TO THE MARKET
-0.381 -0.801 -0.633 -1.313 -0.168 -0.394
(0.4229) (0.1893) (0.6939)
FAMILY MEMBERS
COMPENSATION RELATIVE
TO NON- FAMILY MEMBERS
-0.867 -1.981 -1.163 -2.320 -0.733 -1.775
(0.0476) (0.0203) (0.0759)
FAMILY COUNCIL /
ASSEMBLY
1.303 2.091 1.419 1.872 0.606 1.425
(0.0365) (0.0612) (0.1542)
AGE 0.161 3.650 0.181 3.991 0.170 4.367
(0.0003) (0.0001) (0.00)
LOG OF TOTAL ASSETS -0.062 -0.618 -0.032 -0.291 -0.053 -0.552
(0.5366) (0.7714) (0.581)
# OF 1ST GENERATION -0.652 -2.538 0.499 1.035
(0.0111) (0.3005)
# OF 2ND GENERATION -0.314 -2.478
(0.0132)
# OF 3RD GENERATION 0.004 0.122
(0.903)
MCFADDEN R-SQUARED 0.681 0.717 0.625
S.D. DEPENDENT VAR 0.501 0.501 0.501
AKAIKE INFO 0.559 0.525 0.635
CRITERION
SCHWARZ CRITERION 0.721 0.710 0.798
HANNAN-QUINN CRITER. 0.625 0.600 0.701
RESTR. DEVIANCE 166.055 166.055 166.055
LR STATISTIC 113.017 119.115 103.823
PROB(LR STATISTIC) 0.000 0.000 0.000
OBS WITH DEP=0 63 63 63
OBS WITH DEP=1 57 57 57
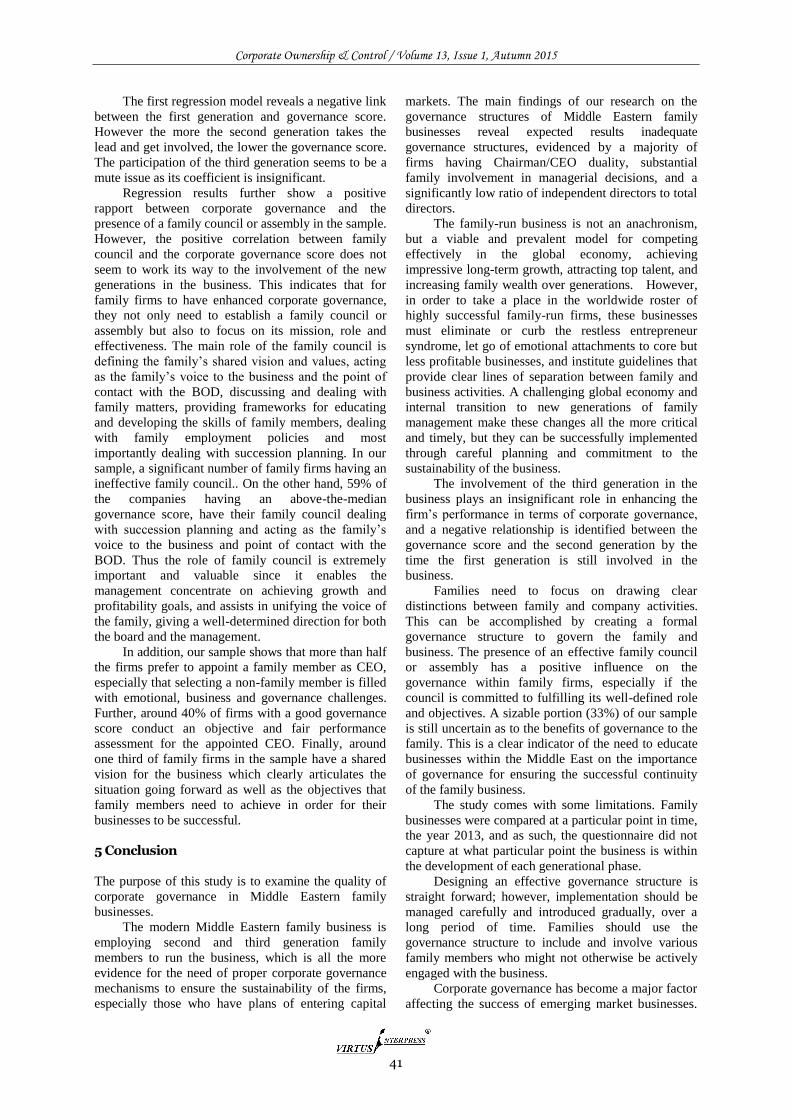
Corporate Ownership & Control / Volume 13, Issue 1, Autumn 2015
41
The first regression model reveals a negative link
between the first generation and governance score.
However the more the second generation takes the
lead and get involved, the lower the governance score.
The participation of the third generation seems to be a
mute issue as its coefficient is insignificant.
Regression results further show a positive
rapport between corporate governance and the
presence of a family council or assembly in the sample.
However, the positive correlation between family
council and the corporate governance score does not
seem to work its way to the involvement of the new
generations in the business. This indicates that for
family firms to have enhanced corporate governance,
they not only need to establish a family council or
assembly but also to focus on its mission, role and
effectiveness. The main role of the family council is
defining the family’s shared vision and values, acting
as the family’s voice to the business and the point of
contact with the BOD, discussing and dealing with
family matters, providing frameworks for educating
and developing the skills of family members, dealing
with family employment policies and most
importantly dealing with succession planning. In our
sample, a significant number of family firms having an
ineffective family council.. On the other hand, 59% of
the companies having an above-the-median
governance score, have their family council dealing
with succession planning and acting as the family’s
voice to the business and point of contact with the
BOD. Thus the role of family council is extremely
important and valuable since it enables the
management concentrate on achieving growth and
profitability goals, and assists in unifying the voice of
the family, giving a well-determined direction for both
the board and the management.
In addition, our sample shows that more than half
the firms prefer to appoint a family member as CEO,
especially that selecting a non-family member is filled
with emotional, business and governance challenges.
Further, around 40% of firms with a good governance
score conduct an objective and fair performance
assessment for the appointed CEO. Finally, around
one third of family firms in the sample have a shared
vision for the business which clearly articulates the
situation going forward as well as the objectives that
family members need to achieve in order for their
businesses to be successful.
5 Conclusion
The purpose of this study is to examine the quality of
corporate governance in Middle Eastern family
businesses.
The modern Middle Eastern family business is
employing second and third generation family
members to run the business, which is all the more
evidence for the need of proper corporate governance
mechanisms to ensure the sustainability of the firms,
especially those who have plans of entering capital
markets. The main findings of our research on the
governance structures of Middle Eastern family
businesses reveal expected results inadequate
governance structures, evidenced by a majority of
firms having Chairman/CEO duality, substantial
family involvement in managerial decisions, and a
significantly low ratio of independent directors to total
directors.
The family-run business is not an anachronism,
but a viable and prevalent model for competing
effectively in the global economy, achieving
impressive long-term growth, attracting top talent, and
increasing family wealth over generations. However,
in order to take a place in the worldwide roster of
highly successful family-run firms, these businesses
must eliminate or curb the restless entrepreneur
syndrome, let go of emotional attachments to core but
less profitable businesses, and institute guidelines that
provide clear lines of separation between family and
business activities. A challenging global economy and
internal transition to new generations of family
management make these changes all the more critical
and timely, but they can be successfully implemented
through careful planning and commitment to the
sustainability of the business.
The involvement of the third generation in the
business plays an insignificant role in enhancing the
firm’s performance in terms of corporate governance,
and a negative relationship is identified between the
governance score and the second generation by the
time the first generation is still involved in the
business.
Families need to focus on drawing clear
distinctions between family and company activities.
This can be accomplished by creating a formal
governance structure to govern the family and
business. The presence of an effective family council
or assembly has a positive influence on the
governance within family firms, especially if the
council is committed to fulfilling its well-defined role
and objectives. A sizable portion (33%) of our sample
is still uncertain as to the benefits of governance to the
family. This is a clear indicator of the need to educate
businesses within the Middle East on the importance
of governance for ensuring the successful continuity
of the family business.
The study comes with some limitations. Family
businesses were compared at a particular point in time,
the year 2013, and as such, the questionnaire did not
capture at what particular point the business is within
the development of each generational phase.
Designing an effective governance structure is
straight forward; however, implementation should be
managed carefully and introduced gradually, over a
long period of time. Families should use the
governance structure to include and involve various
family members who might not otherwise be actively
engaged with the business.
Corporate governance has become a major factor
affecting the success of emerging market businesses.

Corporate Ownership & Control / Volume 13, Issue 1, Autumn 2015
42
At a time when the increasingly global economy
creates opportunities, but also competitive threats,
instituting good corporate governance practices is an
important part of any strategy to prosper. For small,
medium-sized and family owned companies, which
comprise the majority of companies in the Middle East
and North Africa (MENA) region, corporate
governance procedures can help facilitate a smooth
intergeneration and transfer of wealth and reduce
conflicts within families. Good governance is an
essential component for ensuring the integrity of
financial reporting and effective business
management.
References
1. Adams, R., Hermalin, B.E., & Weisbach, M. 2010.
“The role of boards of directors in corporate
governance: A conceptual framework and survey”,
Journal of Economic Literature, 48(1): 58-107.
2. Agrawal, A. & Knoeber, 2012. C. Corporate
governance and firm performance. “Oxford Handbook
in Managerial Economics”, Oxford University Press,
New York, NY.
3. Ali, A., Chen, T.Y., & Radhakrishnan, S. 2007.
“Corporate disclosures by family firms”, Journal of
Accounting & Economics, 44: 238-286.
4. Amit R., & Villalonga, B. 2004. “How do family
ownership, management and control affect firm
value?”, Journal of Financial Economics, 80: 385-
417.
5. Anderson, R. & Reeb, D. 2003. “Founding-family
ownership and firm performance: Evidence from the
S&P 500”, Journal of Finance, 58: 1301–1327.
6. Bartholomeusz, S. & Tanewski, G. 2006. Journal of
Small Business Management, 44(2): 245– 267.
7. Becht, M., Bolton, P., & Röell, A. 2002. Corporate
governance and control. ECGI - Finance Working
Paper No. 02/2002.
8. Beckhard, R. and Dyer Jr, W. G. 1983. “Managing
Continuity in the Family-Owned Business”,
Organizational Dynamics, 12: 5–12.
9. Brown, L., & Caylor, M. 2006. “Corporate governance
and firm valuation”, Journal of Accounting and public
Policy, 25: 409 – 434.
10. Byrd, J. & Hickman, K. 1992, “Do outside directors
monitor managers? Evidence from tender offer bids”,
Journal of Financial Economics, 32: 195-222.
11. Câmara, P. 2012. The governance role of the
remuneration committee. Governance Lab Working
paper No. 01/2012. http://ssrn.com/abstract=2178497.
12. Carney, R. 2010. Financial regulatory harmonization
in East Asia: balancing domestic and international
pressures for corporate governance reforms. ADBI
Working paper series.
13. Center For International Private Enterprise (CIPE).
Advancing Corporate Governance in the Middle East
and North Africa: Stories and Solutions, Global
Corporate Governance Forum, February 2011.
14. Chahine, S. & Safieddine, A. 2011. “Is corporate
governance different for the Lebanese banking
system?”, Journal of Management & Governance,
15(2): 207-226.
15. Claessens, S., Djankov, S., & Lang, L. 2000. “The
separation of ownership and control in East Asian
corporations”, Journal of Financial Economics, 58:
81–112.
16. Daily, C. M. and Dollinger, M. J. 1992, “An empirical
examination of ownership structure in family and
professionally managed firms”, Family Business
Review, 5(2): 117-136.
17. El Sayyed, K. 2007. “Does CEO duality really affect
corporate performance?”, Corporate Governance: An
International Review, 15 (6): 1203- 1214.
18. Faleye, O., Hoitash, R. & Hoitash, U., 2013. Industry
expertise on corporate boards. Northeastern U.
D’Amore-McKim School of Business Research Paper
No. 2013-04. http://ssrn.com/abstract=2117104.
19. Felo, Andrewz J., Krishnamurthy, Srinivasan and
Solieri, Steven A., 2003. Audit Committee
Characteristics and the Perceived Quality of
Financial Reporting: An Empirical Analysis.
http://ssrn.com/abstract=401240.
20. Gersick, K.E., Davis, J.A., Hampton, M.M.,
Landsberg, I., 1997. ”Generation to Generation: Life
Cycles of the Family Business”, Harvard Business
School Press, Boston, MA.
21. Gillan, S. 2006. “Recent developments in corporate
governance: An overview”, Journal of Corporate
Finance, 12 (3): 381-402.
22. Gompers, P., Ishii, J., & Metrick, A. 2003. “Corporate
governance and equity prices”, The Quarterly Journal
of Economics, MIT Press, 118(1):107-155.
23. Hillier, D.J. & McColgan, P.M.L. 2004. An analysis of
majority owner-managed companies in the UK.
University of Aberdeen, Working Paper.
24. Huselid, M. 1995. “The impact of human resource
management practices on turnover, productivity, and
corporate financial performance”, Academy of
Management Journal, 38 (3): 635 – 672.
25. Huselid, M., Jackson, S., & Schuler, R. 1997.
“Technical and strategic human resource management
effectiveness as determinants of firm performance”,
Academy of Management Journal, 40(1): 171 – 188.
26. Hussain, S.H. & Mallin, C. 2007. “Corporate
governance in Bahrain”, Corporate Governance: An
International Review, 10 (3): 197- 210.
27. Hussainey, K. & AlJifri, K. 2012. “Corporate
governance mechanisms and capital structure in
UAE”, Journal of Applied Accounting Research, 13
(2): 145-160.
28. Ismail, W., & Kamarudin, K. 2012. “Family firms and
audit risks: The role of audit committee financial
expertise”, Business, Engineering and Industrial
Applications (ISBEIA), 263 – 267.
29. Kaplan, S. 2012. Executive Compensation and
Corporate Governance in the U.S.: Perceptions, Facts
and Challenges. Working paper, University of
Chicago Booth School of Business and National
Bureau of Economic Research (NBER).
30. Klai N., & Omri, A. 2011. “Corporate governance and
financial reporting quality: The case of Tunisian
firms”. International Business Research, 4(1): 158 –
166.
31. Koldertsova, A. 2010. The second corporate
governance wave in the Middle East and North Africa.
Organization for Economic Cooperation and
Development, 2010 (2): 1-8.
32. Lam, T. and Lee, S. 2008. “CEO duality and firm
performance: evidence from Hong Kong”, Journal of
Corporate Governance, 8(3): 299 – 316.

Corporate Ownership & Control / Volume 13, Issue 1, Autumn 2015
43
33. Lasher, D. 2010. Firm characteristics associated with
the investment in internal auditing in family
businesses, EDAMBA Summer Academy, working
paper.
34. Lorsch, J.W. & MacIver, E. 1989. Pawns and
potentates: The reality of America’s corporate boards.
Boston: Harvard University Press.
35. Morck, R., Strangeland, D., & Yeung, B. 2000.
“Inherited wealth, corporate control, and economic
growth: The Canadian disease?”, R. Morck (Ed.),
Concentrated corporate ownership. Chicago:
University of Chicago Press.
36. Nadal, N. 2013. “Corporate governance post “Arab
spring” in the Middle East and North Africa”, Law in
Transition, 52-61.
37. PriceWaterhouseCoopers. “Family matters: Governance
practices in GCC family firms, The Pearl Initiative”,
2013.
38. Shleifer, A. & Vishny, R. W. 1997. “A survey of
corporate governance”, Journal of Finance, 52: 737–
783.
39. Swamy, V. 2012. Corporate governance in family
owned small firms, working paper.
http://ssrn.com/abstract=2126756
40. Tonello, M. “Should your Board have a separate
risk committee?”, The Conference Board,
February 2012.
41. Vafeas, N.1999. “Board meeting frequency and
firm performance”, Journal of Financial
Economics, 53: 113-142.
42. Yeganeh, H., Dadashi, I., & Akbari, M
2010. The Impact of non-mandatory
corporate governance on auditor’s judgment. SSRN:
http://ssrn.com/abstract=1618110
Corporate Ownership & Control / Volume 13, Issue 1, Autumn 2015
44
AUDIT, ACCOUNTING & REPORTING
SECTION 2
THE IMPACT OF THE “GOING CONCERN” ON AUDITORS’ JUDGEMENT. ANALYSIS OF THE ITALIAN CONTEXT FROM
AN INTERNATIONAL PERSPECTIVE
Graziella Sicoli*, Paolo Tenuta**
Abstract The present work aims to analyse the concept of going concern on the one hand, through a case study of three companies which have recently come under observation of the CONSOB and have been inserted in the so-called “black list” and, on the other, the consequences that the removal of the presumption of continuity can have on the kind of assessment the auditors make. The aim of the present work is twofold: the first part analyses the principle of going concern from a business and economic perspective. Once this has been completed, the work will go on to offer an overview of the dynamics that can bring a company to a crisis point, and how these affect the judgments expressed by the auditors***. Keywords: Going Concern, Continuity, Black List, Audit *Department of Business Science and Law, University of Calabria - Ponte P. Bucci 87036 Arcavacata Rende CS (Italy) Tel: +39 0984492255 **Department of Business Science and Law, University of Calabria - Ponte P. Bucci 87036 Arcavacata Rende CS (Italy) Tel: +39 0984492191 ***For academic reasons Sections 2, 5, 5.2, 5.2.1 and 6 are to be attributed to Graziella Sicoli and Sections 1, 3, 4 5.1 and 5.1.1 are to be attributed to Paolo Tenuta
1 Introduction
The economic situation in Italy, being heavily
influenced by the global financial crisis, threatens the
ability of companies to maintain and consolidate their
business activities over time. The fact of uncertainties,
often nothing to do with the company itself, can cast
doubt on the presumption of continuity. This context
is a threat to a company’s future, and thus demands
greater attention on the part of administrators and
auditors, whose role it is to verify all the facts
carefully, so as to be in a position to decide what
criteria and procedures to adopt when drawing up the
company accounts and expressing their professional
judgement. All this falls within the current debate on
the analysis of the “going concern”, reiterated in
article 2423 of the Civil Code, the first item of which
states, “the evaluation of the accounts is to be carried
out in line with the criterion of prudence, and with a
view to the future prospects of the company
concerned.” One can also find the same concept in
international accounting regulations, in particular in
the IAS (items 23 and 24).
If, after making a thorough assessment, the
management of a company believes that a number of
factors put at risk the company’s ability to continue
operating, explicit reference to this must be included
in the company balance sheets.
The drafting of a budget on the assumption of the
company’s certain market future in a context in which
such an assumption is untenable, implies considerable
risks both for the administrators and for the organs of
control, above all in the case of default. The person
whose job it is to inspect the company accounts must
Corporate Ownership & Control / Volume 13, Issue 1, Autumn 2015
45
carry out certain procedures so as to be in a position to
ascertain the correctness of the work of the
administrators. In brief, the auditor must verify
whether the conclusions reached by the administrators
are valid and/or whether there are grounds to suspect
that that there are serious doubts as regards the
company’s future, which should be included in the
company financial statements. For all aspects linked to
the work of auditing we refer specifically to the
auditing rule no. 570 “ going concern”.
At this point it is important to mention that in
December 2014 the ISA Italia auditing rules were
adopted, under the aegis of the Ministry of Finance;
this was the result of a collaboration between a
number of the professional associations and orders:
ASSIREVI (Italian auditors), CNDCEC (National
Council of Chartered Accountants), INRL (National
Institute of Statutory Auditors) and CONSOB (Italian
Securities and Exchange Commission) with reference
to articles 11 and 12 of the Italian law (D. lgs.
39/2010).
What emerges clearly from all this is the
presumption of going concern is by no means to be
taken for granted; indeed, it is reasonable to doubt
whether such an assumption holds for a number of
companies, and whether it will continue to hold for
many others in the foreseeable future.
Talking these considerations as a starting point,
the present work aims to analyse the concept of going
concern on the one hand, though a case study of three
companies which have recently come under
observation of the CONSOB and inserted in the so-
called “black list” and, on the other, the consequences
that the removal of the presumption of continuity can
have on the kind of assessment the auditors make.
Recently, in fact, we have witnessed a progressive
reduction of the issuing of clean bill of health by
auditors at the expense of an increase in assessments
with reservations or, indeed, declarations withholding
any judgement at all.
The aim of the present work is twofold: the first
part analyses the principle of going concern from a
business and economic perspective, underlining the
diverse factors involved, as well as the variety of
strategies that can be adopted to overcome business
crises and, hopefully, to return to normal conditions.
Once this has been completed, the work will go on to
offer an overview of the dynamics that can bring a
company to a crisis point, and how these affect the
judgements expressed by auditors, in particular the
correctness and truthfulness of the information
contained in company financial statements.
2 Going concern and auditor: literature review
The concept of going concern was first regulated with
the approval in 1995 of Document 21 by the Joint
Commission for the drawing up of Auditing
regulations by the National Council of Chartered
Accountants and the National Council of Accountants
and Commercial Inspectors (Cndcr, 1995). Although,
given the somewhat one-sided view of the matter, this
document has certain limitations, it clarified how the
work of the auditor should help assess the reliability of
the account (Marasco, 2004), even though this is no
absolute guarantee of the company’s ability to operate
in the future. Following a process of harmonization of
the rules governing international auditing, Document
no. 21 was integrated in Auditing Regulation 570,
which was issued in October 2007 by the Joint
Auditing Commission. This principle deals with the
responsibilities of the auditor when reviewing a
company’s books, in particular how the company
management use the presumption of going concern in
their reports (Aspes, Campedelli, 1999; Marasco,
1995; Bava et. al., 2012).
The presumption of going concern has been the
object of numerous studies both by academics and
accountants and they all agree on the need for this
condition to be periodically reviewed by the
administrators when drawing up company financial
statements (Caratozzolo, 2006; Quatraro,1992; Quagli,
2003; A.Av.v., 2007; Superti Furga, 2004). In the case
where this presumption cannot be made all other
auditing principles (competence, consistency in
applying assessment criteria and so on) will no longer
be deemed tenable (Pontami, 2011).
The following elements undermine the
presumption of going concern (Carrieri, 2008;
Braidotti et. al., 2009; Soprani, 2009; Cndcr, 1995):
1. negative equity and lack of working capital;
2. negative structural margins;
3. difficulties in obtaining new credit lines or
finance for investment;
4. negative cash flow;
5. impossibility of meeting debt repayment
deadlines;
6. the fact of heavy losses from running costs;
7. violation of covenants contained in loan
contracts;
8. sizeable reductions of market share;
9. the presence of legal battles the outcome of
which could have serious consequences for the
company’s future viability and many others.
The first paragraph of Article 2423 and the
accounting principle OIC 11 state that, when drafting
a financial statement, the different items must be
carefully evaluated with a view to the company’s
prospects as a going concern, in other words the assets
and liabilities must be accounted for on the
assumption that the company is in a position to carry
on operating and capable of dealing with its liabilities
as part of its normal economic activity (Carrieri 2008;
Oic, 2005).
Further normative regulations in relation to the
presumption of going concern are contained in the
first paragraph of Article 24238 of the Civil Code, as
well as in the modification of Article 1 of 2/2/2007 (D.
Lgs 2/2/2007, no. 32 ), which - with reference to the
Corporate Ownership & Control / Volume 13, Issue 1, Autumn 2015
46
minimum content of the financial assessment of the
business management - required the administrators to
describe the current and future risks their company
may be exposed to3.
On the subject of going concern, for companies
who resort to markets for risk capital, in February
2009 the supervisory authorities - the CONSOB, the
Bank of Italy, and the IVASS (formerly ISVAP) -
issued a unitary document which, inspired by the
recommendations of a number of international
professional bodies, supplied further clarifications not
only on the behaviour that administrators and auditors
are obliged to adopt with regard to the drawing up
compulsory financial statements, but also on the
control systems that companies must put in place in
order to ensure that the potential risks, current or
future, are stated publically in a clear and transparent
manner, as well as the uncertainties that the company
may have to face in the future running of the
business4. In brief, the document of the
aforementioned three agencies recommends that, with
a view to improving the transparency of financial
statements and the grounds on which assessment of
whether a company is a going concern is based, the
information must be clearly set out, preferably the
section concerning accounting policies. In the event
that this is not possible, publication of the financial
statement must be postponed until such time as this
has been made available.
The OIC has also devoted considerable time and
attention to the going concern concept; in the
accounting principle devoted to general considerations
on the theme of issuing financial statements document
11 issued by the OIC makes it clear that: “the issuing
of a financial statement understood as a tool for
providing information on the equity, financial and
economic situation of a working company, that is to
say a company characterised by going concern, is
based on accounting principles”. This means that in
the event of lack of evidence to support the
assumption of continuity, the normal principles of
accounting used when drawing up financial statements
cannot be applied. The assumption of continuity has
been further clarified with the publication of document
OIC 295.
The auditing principle no. 570 supplies a series
of indicators whose function is to set the alarm bells
3 Still on the subject of the aforementioned document, for the
companies who have to draft consolidated balance sheet, since the year 2008 they have been obliged to provide in their statement a reliable and thorough analysis of the company’s situation and the trend and result of the company’s performance, as well as a description of the major risks and uncertainties to which the company is exposed. 4 Banca D’Italia- CONSOB- ISVAP: Document 2. information
to be supplied on the financial relations of the going concern, on the financial risks, on the control of the reduction in value of the company’s activities and on the uncertainties regarding the use of estimates. 5 For further information see “OIC, Principi contabili dei CNDC
dei CNR” modified by the OIC in relation to the reform of company law, op. cit. from page 19 onwards.
ringing (Bava et al, 2012), by summarising the major
existence-threatening dangers that can place the future
prospects of a company at risk.
Among the ones listed by the aforementioned
document we find those financial and economic
factors which can involve, for example, negative
equity or deficit of operating capital, fixed term loans
nearing their repayment deadlines with no or little sign
of the money available to repay the debt or extend the
loan. Another warning signal is an overdependence on
short-term loans to finance long-term activities,
previous financial statements or forecasts that express
negative cash flow, the inability to honour loan
repayments and so on.
With regards to the going concern debate overall,
one has to observe capital in its dynamic form, i.e. its
ability to generate future income. In this context,
therefore, the economic value of capital can be given a
specific definition: it is the present value of the
prospect of future gains, evaluated on the basis of the
risks to which such gains are exposed.
Company indicators used by managers, however,
can often be influenced by situations that are difficult
to quantify in monetary terms, such unforeseen events
as, for instance, the loss of administrators, or key
managers without any prospect of finding adequate
replacements, the sudden loss of important markets,
distribution contracts, concessions or suppliers. Many
of these aspects are observed by the auditor during
their periodic visits, and point to problems that can
often lead to business crises.
Other indicators that can have an impact on the
running of a company are, for example, a reduction of
capital below the legal limit, or irregularities
concerning other legal norms, legal or tax disputes
which in the event of an adverse ruling could lead to
financial penalties that the company could ill afford to
meet; the same applies to fines incurred for polluting
or the extra money required for the recycling of waste
produced by the company and so on.
From an international perspective we find that
the going concern concept underpins accountancy
rules and practice (Braidotti et al, 2009).
Moreover, in paragraphs 23 and 24 it is affirmed
that the statement must be drawn up on the
understanding that the company’s future prospects are
sound, apart from the situation where the ownership
intends to go into liquidation or cease operating
(Soprani, 2009; Forgione, 2008).
3 Planning for the future, professional judgement and the auditor’s report
Faced with the uncertainties that can make the going
concern requirement problematic, the company
management could set out their future plans, planning
a series of direct actions aimed at recovering
economic and financial equilibrium thereby
maintaining and reinforcing the company’s advantages
vis-à-vis their competitors. Such plans are usually
Corporate Ownership & Control / Volume 13, Issue 1, Autumn 2015
47
elaborated by the management with the help of
qualified advisors. Carrying out these plans is
entrusted to a figure within the company or an outsider
with special competence in the specific case. The
usefulness of such strategies, however, tends to
diminish over time, given that if the difficulties are not
overcome straight away, the problems within the
company can be accentuated as a result of further
unfavourable events or conditions, in this way
exacerbating the company’s problems.
Through such plans the economic and financial
results are forecast on the basis of the decisions the
company intends to put into future operation (Carboni,
2009), or with the elaboration of a business plan
through which the would-be entrepreneur will be in a
position to respond to a variety of demands,
concerning the products on offer, the markets targeted,
the nature of the competitive advantage that the
company believes it can achieve, the economic
potential of the business plan and the number of
resources required.
After identifying all the probative elements
collected, the task of the auditor is to carry out a
comprehensive examination of the financial statement
and its reliability (Pisoni et al, 2012), through final
analytical procedures, or analysis of the indices, trends
or key elements in order to ascertain whether the
account overall is in line with the evidence the auditor
has uncovered, his/her knowledge of the business
sector and the type of business involved. The legal
role of the auditor is to express, through a final report,
a professional opinion on whether the accounts
conform to legal standards and whether they give a
truthful and reliable picture of the company’s situation
as regards its assets, its economic and financial
position and so on. This opinion, contained in the
report, is expressed in the terms stipulated by Article
14 (D. lgs 39/2010); it can be positive without
reservation, positive with reservations, negative, or the
auditor may feel unable to express an opinion.
Furthermore, the auditor can draw attention to certain
aspects requiring elucidation.
The auditor’s report should contain:
a) the legal grounds on which the auditor’s
opinion is based;
b) the recipient of the report, i.e. the person who
has appointed the auditor to carry out the work of
drafting the report;
c) an introductory section containing the
account in question and the different responsibilities
undertaken by the auditors;
d) the nature and import of the budget, detailing
the purpose of the inspection, the work carried out and
whether there is sufficient information provided;
e) the auditor’s professional opinion;
f) requests for further information if required;
g) an opinion on the reliability and clarity of the
budget statement;
h) the date and place of issue as well as the
signature of the auditor who has carried out the
inspection.
If, after having gone through all the necessary
procedures, the auditor considers that the assumption
of going concern is based on solid foundations and the
management has supplied a clear plan of the future
direction of the company in question, the auditor will
express a positive opinion without reservations; if the
information is not entirely satisfactory, the auditor will
express a positive opinion with certain reservations
and in the case where information is lacking a
negative opinion (Manzana, 2009). Where the
administrators provide a feasible and well-reasoned
strategy for overcoming the crisis, the auditor can give
a clean bill of health, even when doubts about the
company’s future remain. Otherwise the auditor may
approve the budget statement, but add a note
underlining the on going problems.
Recent clarification on the different types of
judgement on the verification of the concept of going
concern, in particular on the use of the disclaimer, i.e.
the impossibility of expressing an opinion, has been
supplied in a research paper by Assirevi6. This paper
makes it clear that the auditor should abstain from
forming an opinion only in extreme cases, for example
where details of numerous serious problems and
uncertainties are provided in the company accounts.
When, on the other hand, such problems are not fully
addressed in the company accounts, the auditors are
advised to express reservations or give a negative
opinion, if they consider that such omissions have the
effect of making the company accounts as a whole
unreliable.
4 Ideas, aims and research methods
The lack of evidence for considering a company a
going concern, or where serious doubts remain as to
its future can be traced to events and/or conditions
prior to the effective default of the company. This
being the case, the duty of administrators, auditors and
inspectors is to analyse, demonstrate and verify that
the future prospects are such that the company can be
considered a going concern, and thus in a position to
draft financial statements and accounts in line with
regulations governing them.
In the light of all this, the present work proposes
to start by analysing the concept of the going concern
with reference to three public companies quoted on
the Milan Stock Exchange whose situations were so
6 ASSIREVI is a private non profit association of auditing
companies started in 1980, and successively recognised. Its aim is to analyse various issues connected with the work of auditing in order to support a technical and professional support to members and spread the word about the role of the auditors. The professionals involved in the work of the association number roughly 6,000 spread throughout the country. The association numbers 14 consultancy firms among its members, that currently make up the majority of firms that carry out audits for public authorities (Enti di Interesse Pubblico).
Corporate Ownership & Control / Volume 13, Issue 1, Autumn 2015
48
critical that they came under review of the CONSOB
and were inserted in the black list7. The paper will
then go on to examine what are the consequences for a
company when it fails to be considered a going
concern, according to the different types of opinion
expressed by the auditor.
The three case studies concern the following
companies: Meridiana Fly (formerly Eurofly), Viaggi
del Ventaglio and EEMS. The study has a dual aim.
To start with, we analyse the grounds for which each
company was no longer
considered a going concern (financial, economic
problems etc.). We then go on to focus on the effects
that the uncertainties and problems have on the
opinions expressed by the auditors, regarding the
truthful and reliable representation of their
predicament in the company accounts.
The choice to consider Meridiana Fly, Viaggi al
Ventaglio and EEMS was based on the fact that they
represent widely different spheres of activity, but also
because of the different ways they responded to their
crisis. The outcomes differ: some succeed in
overcoming their difficulties, while others, try as they
might, are unable to break free from their
predicament. Moreover, each company experiences a
different sort of difficulty, and adopts a wide range of
strategies in the hope of returning to normal
operational conditions.
The aim of our work, the results of which are
reported in detail in the final section, is to represent
the different factors that can culminate in a loss of
going concern status, and the strategies that can help a
company overcome a crisis. The paper then provides
an overview of the dynamics that can lead to a crisis
and the repercussions of this on the opinions
expressed by the auditors with reference to the correct
and truthful representation of the company’s situation
in budget statements.
5 Methodology
The research was carried out in a series of phases:
1. in the first phase after analysing the
compulsory documentation available on-line we
extracted the risks and danger signals brought to light
by the administrators. We analysed the budget
statements, consolidated accounts, the work of
7 The CONSOB has among its roles “the protection of
investors and the transparency of the property market”. It decides when a company should go on the blacklist, which was set up in 2002. The companies on the list find themselves “ in a situation of multiple losses”. The reasons which trigger the Consob’s decision to put a company on the black list and thereby put it under surveillance are generally backed by the firms whose task it is to carry out the auditing of these companies financial statements. The companies on the black list are obliged to supply monthly updates on their situation to the capital markets, The number of companies on the black list has varied over the years from 15 at the end of 2006 and 17 in 2007 up to 23 in March 2015. This confirms a sharp increase in the number of companies in difficulty over the past few years.
statutory auditors, the minutes of board meetings on
company performance, the documents of corporate
governance and the auditors reports;
2. in the second phase we studied the
restructuring plans proposed by the administrators;
3. in the third and final phase we analysed the
opinions expressed by the auditors on the uncertainties
regarding the company’s future, and hence their
judgement on whether the company was a going
concern.
As regards Viaggi del Ventaglio, this company
was inserted in the black list in February 2005. At the
time it was struggling with numerous problems,
including notable losses which had led to a reduction
of working capital by over a third. Given this
situation, the CONSOB deemed it necessary to keep
the market updated on the company’s financial and
economic situation, so that potential investors would
be in a position to make an informed choice. The
information on the company’s situation runs from
October 2005 until May 2010, after which on 15 July
2010 the company officially went into receivership
(Tribunale Civile e Penale di Milano- Sectione
Falimentare Fasc. No. 517/10).
Regarding Meridiana Fly, it was included in the
black list in 2007. The data available revealed
considerable operating losses of over 11 million euros.
As a consequence the CONSOB requested the
disclosure of data in order to keep the market up to
date with the developments of the economic and
financial situation of the company with the aim of
notifying potential investors. Compulsory notification
of the situation followed and from 2007 every request
was respected (transparency regime) until June 2013
when the company was delisted. Thereafter, the
company withdrew from the Stock Market in the hope
of facilitating rescue operations with other subjects
working in the same sector. Today the company
continues to operate in the air travel business.
Since June 2013, when the company was
delisted, Meridiana Fly has been under no obligation
to disclose its net financial position8.
The third company analysed is EEMS. This
company was included in the black list relatively
recently, on 30 September, 2012. It was given special
attention by the CONSOB on account of its 51 million
euro losses. Upon joining the black list EEMS was
obliged provide monthly data on its business and debt
situation. The table below provides information on the
company’s net financial position up till March 2015.
8 In June 2013 Meridian Fly left the Milan Stock Exchange.
After delisting the company hoped to undertake extraordinary measures including agreements with other companies operating in the same sector. According to the CEO the company left the Stock Market to concentrate on recovering profitability,
Corporate Ownership & Control / Volume 13, Issue 1, Autumn 2015
49
Table 1. Viaggi del Ventaglio blacklisted in October 2005
Company
NFP 31
October
2005
NFP 31
October
2006
NFP 31
October
2007
NFP 31
October
2008
NFP 31
October
2009
NFP 31
October
2010
NFP 31
October
2011
NFP 31
October
2012
NFP 30
Giugno
2013
I Viaggi del
Ventaglio -105,5 -55 -10,4 -20,7 -15,3 -17,1 nd nd nd
Note: NFP= Net financial position
Source: http://www.soldionline.it
Table 2. Eurofly blacklisted August 2007
Company NFP 31
August 2007
NFP 31
August 2008
NFP 31
August 2009
NFP 31
August 2010
NFP 31
August 2011
NFP 31
August 2012
NFP 30
June 2013
Eurofly
(Meridiana Fly) -11,402 -11,263 -4,07 -12,16 -6,72 -68,22 nd
Source: “Black list Consob”, document retrieved from www.marketmovers.it
Table 3. EEMS Italia blacklisted September 2012
Source: “Black list Consob”, document retrieved from www.marketmovers.it
5.1 The Eurofly group
Eurofly s.p.a. was set up in Turin in 1989, focusing
mainly on air passenger transport and other activities
related to the use, repair and maintenance of aircraft.
There have been many changes both as regards the
company management, and its modus operandi in the
constant research for a better product to meet the
demands of its customers.
In 2006 Eurofly was forced to face difficulties
that were not only cyclical, i.e. linked to the increasing
level of competition in the business, especially the
growth of low cost airlines (Carboni, 2009), but also
structural, i.e. linked to the company’s commercial
and industrial internal processes. These negative
factors led to a serious fall in profitability. Nor was the
situation helped by other factors, such as climatic and
political instability in certain key areas of the globe
where the company operated, for instance in Egypt
and the Caribbean. Moreover, profit margins in the air
charter operations declined as a result of difficulties in
the tour operator sector, which was dependent, in its
turn, on changes in the purchasing habits of its
clientele; another problem to contend with was an
increase in the cost of fuel, as well as in the repair and
maintenance of the company’s fleet. Interest rates in
the USA and Europe rose at the time, thereby
worsening the credit situation; to make matters worse,
certain travel companies were unable to repay what
they owed, a sign of the general deterioration in the
credit worthiness of the tour operator sector as a
whole. Finally, the company suffered further losses
from the fact that their reserves were held in dollars at
a time when the dollar lost value vis-à-vis the euro.
The company closed its operations in the year
2006 with losses of over 29 million euros (compared
with losses of just 2.8 million euro in 2005)9.
Gross earnings (EBITDA) were minus 9.5
million euro, compared with plus 4.7 million in 2005.
As we can see the net financial position suffered
a deterioration in 2006, compared with the previous
year, by over 23 million euro, as a result of the
company’s worsening performance. In particular,
operating activities absorbed up to 28.8 million euro;
investment and disinvestment generated a profit of 2.7
million euro, financing and capital operations
generated an overall financial flow of 7.9 million euro.
When the company closed its doors it presented a net
financial position of minus 27.9 million, 7.9 million of
which was current net debt.
5.1.1 The auditor’s ruling on the Eurofly balance
sheet, the industrial plan 2007-2009 and the group’s
recovery
The consultancy firm Deloitte & Touche concluded
that it was impossible to express an opinion on the
company’s balance sheet of 31 December 2006, on
account of a number of uncertainties relating basically
to the lack of information about the rescue plan
launched by the board in an attempt to overcome the
serious difficulties that had led to the heavy losses10
.
9 “Bilancio d’esercizio al 31 dicembre 2006”, document found
on www.meridiana.it 10
“Bilancio d’esercizio al 31 dicembre 2006”, document found on www.meridiana.it
Company NFP
30 September 2012
NFP
30 June 2013
NFP
31 December 2014
NFP
31 March 2015
EEMS Italia - 51,21 - 28,62 - 30,80 - 35,06
Corporate Ownership & Control / Volume 13, Issue 1, Autumn 2015
50
Table 4. Previous losses 2005/2006. Amounts in Euro/000
2006 2005 Difference
Revenue from sales and services 289.835 271.474 18.360
Other revenue 6.858 6.512 346
Total revenue 296.693 277.986 18.706
Direct commercial costs 8.163 3.200 4.962
Revenue net of direct comm. costs 288.530 274.786 13.744
Fuel 88.947 72.472 16.475
Staff costs 43.390 39.143 4.247
Maintenance services and materials 40.347 33.137 7.209
Other operating costs and wet lease 71.077 84.156 (13.079)
Other buYESness costs and overheads 19.125 14.160 4.965
Costs subtotal 262.886 243.068 19.818
EBITDAR 25.644 31.718 (6.074)
Operating leases 35.120 27.034 8.086
EBITDA (9.476) 4.684 (14.160)
Amortization 6.260 4.836 1.424
Impairment of non-current assets 2.465 0 2.465
Other adjustment provisions 5.649 2.000 3.649
Allocation of provision and charge funds 2.090 559 1.531
Amotization and provisions 16.464 7.396 9.068
EBIT (25.940) (2.712) (23.228)
Financial income/costs (5.322) 42 (5.364)
Profit before tax (31.263) (2.671) (28.592)
Taxes (2.123) 1.685 (3.809)
Result of the divestiture of activities 0 1.581 (1.581)
Profit for the year (29.139) (2.775) (26.364)
Source: “Concise Profit and Loss/Revenue account of Financial Statements 2006”, retrieved from www.meridiana.it
Table 5. Net financial position
Amounts in Euro/000 2006 2005
Funds 5.149 32.272
Derivatives included in included in cash - 8.477
Cash 5.149 40.749
Current financial claims 3.000 -
Current bank debt 9.273 18.529
Banking contracts included in banking debts - 8.142
Current part of non-current debt 2.312 2.203
Other current financial debts 4.500 -
Current financial debt 16.085 28.874
Current net financial debt 7.936 (11.875)
Non-current financial credits 8.000 18.906
Non-current bank debts 3.783 4.270
Debt securities - -
Other non-current debts 24.138 30.604
Non-current financial debt 27.921 34.874
Net financial debt 27.857 4.093
Source: “Financial Statements 2006”, retrieved from www.meridiana.it
Given the company’s serious predicament, the board set out a three year recovery plan for the period 2007-2009. The project envisaged an upturn in activity through the intervention of and close collaboration with the shareholder Meridiana spa, a focus on short haul domestic flights on a limited number of routes with the aim of increasing income,
improving efficiency and reducing unit costs, as well as obtaining better conditions as regards the purchasing of supplies and external services, through the setting up of a computerised platform covering
Corporate Ownership & Control / Volume 13, Issue 1, Autumn 2015
51
organisation and competences11
, research and the protection of niche markets in order to secure a competitive advantage over business rivals. The plan envisaged the reconversion of the company from one involved exclusively with charter flights, to a commercial airline. Moreover, the plan entailed debt restructuring, in other words a renegotiation with its creditors-the three main banks, which together held 80% of the debt
12- and two injections of capital, one in
kind, i.e. through the conferring of goods from the main shareholder Meridiana, and the other in cash through capital markets.
On 28 June 2007 the board approved the industrial plan for 2007-2009. The fulfilment of the provisions contributed to the financial and economic recovery of the group. The problems concerning the future development of the company were considered overcome, thereby ensuring a healthy balance sheet for the year up to 31 December 2007.
Even though some uncertainty still remains as regards the company’s future, the administrators claim that the company is a going concern. After the delisting from the Milan Stock Exchange the company continued to operate and on 31/12/2012, thanks to the backing of the parent company AKFED it became possible to obtain credit. In particular, AKFED undertook to: release added financial resources, underwrite new shares following an injection of capital, and reconvert loans into net assets. Despite the uncertainty surrounding future scenarios and the doubts concerning the company’s ability to continue operating, thanks to the considerable support of the holding company, Eurofly had sufficient resources to continue operating. On 18/03/2014 AKFED formally committed itself in writing to continued support of the company through a series of financial undertakings, not unlike those given formerly, thereby ensuring enough equity and financial resources to justify the assumption of going concern. Nevertheless, the auditing firm declared itself unable to express any opinion as regards the financial statement of 31/12/2013. 5.2 Viaggi del Ventaglio and EEM Italia We decided it would be illuminating to compare the case of Eurofly with the other two companies, whose difficulties led to their respective auditors feeling unable to express any opinion on their financial statements. These two company are Viaggi del Ventaglio, which began operating in1976 in the tourist and package holiday sector, and EEM Italia which made semi-conductors from 1969 until 2012, when it ceded certain activities and now operates in the photovoltaic sector.
From an analysis of the economic and financial situation of the Viaggi del Ventaglio group in 2009,
11
“Piano industriale 2007/2009 press conference 28 June 2007”, document found on www.meridiana.it 12
“Press conference 28 December 2007”, document found on www.meridiana.it.
we find a reduction of their debt situation, which can be attributed, in part, to a reduction of their debt to factoring companies, owing to a suspension of credit by the latter, and partly to a reduction of debts to banks, both in current accounts and loans.
One worrying factor, however, was the money owed to suppliers in terms of unpaid credit lines.
As a result in 2009 the company management attempted to set up a series of negotiations for the relinquishing of different assets as well as for the cession of control of the company and the recapitalisation through new partners. For a number of reasons, summarised in the company report, these negotiations did not produce a positive result and the shareholders assembly, in July 2009 after approving the financial situation in which capital had descended below the legal minimum on account of a loss of 15m euro, decided to fully cover the loss through a reduction of capital to 120m euros and a new increase in capital of up to 77m euros, with the undertaking to raise 6m euros by 30 November. The assembly also nominated commissioners to liquidate the company if by 1 December the above-mentioned sum had not been paid into the company accounts.
In December 2009, having recognised that the 6m euro had not arrived and that the three liquidators had not accepted the mission, the board decided to wind up the company, delegating to the chair the task of applying to the courts to be taken into receivership. The chair was also mandated to call a new assembly to nominate other liquidators who, on acceptance, would present the request for receivership to the Court in Milan. On 18 February 2010 the company’s request was accepted by the Court (former article 166 bankruptcy law) on the basis of a plan proposed by the company. In order to extinguish its debt the idea was to sell off the assets, and to realize the value of trademarks, specialised personnel and so on. Next, the plan entailed the cession of operating branches of the group to a new company (Newco) and, finally, the conversion of the credit held by third parties into shares of the group leader. However, in July 2010 the receivership was revoked by the commissioner appointed by the Court on the grounds that the party concerned had proposed an increase in capital, whereas Article 2447c.c. requires a reduction of capital to cover the losses. Moreover, the party had not given a deposit to cover the costs in line with Article 163, no. 4. Furthermore, the new proposal also contained other unacceptable elements: on the one hand it entailed the repayment of privileged creditors through the issue of shares without any prior demonstration of the likelihood of a worse outcome though the bankruptcy courts, thereby violating Article 160, para. 2 of the Bankruptcy Law, and on the other the profiles presented concerning future decisions regarding capital were far too vague, all of which rendered the new proposal uncertain and unacceptable. Owing to the liquidators’ inability to formulate a credible rescue package, therefore, the Court had no alternative but to declare the company bankrupt.
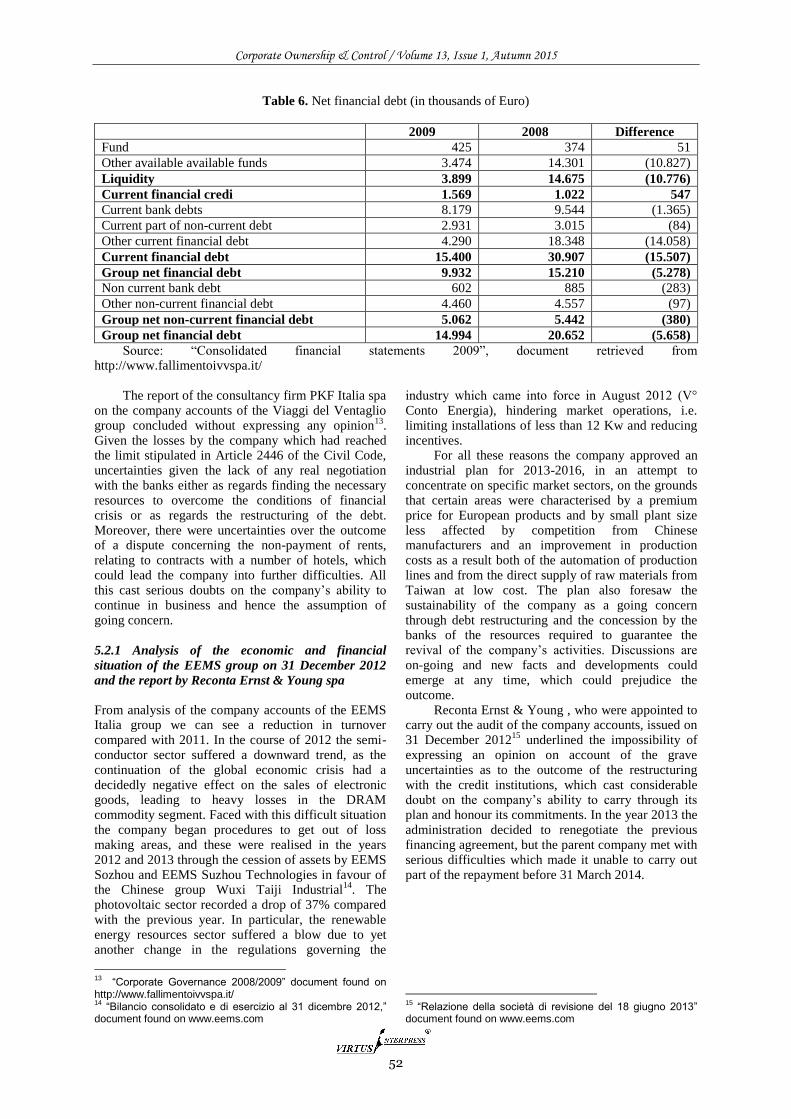
Corporate Ownership & Control / Volume 13, Issue 1, Autumn 2015
52
Table 6. Net financial debt (in thousands of Euro)
2009 2008 Difference
Fund 425 374 51
Other available available funds 3.474 14.301 (10.827)
Liquidity 3.899 14.675 (10.776)
Current financial credi 1.569 1.022 547
Current bank debts 8.179 9.544 (1.365)
Current part of non-current debt 2.931 3.015 (84)
Other current financial debt 4.290 18.348 (14.058)
Current financial debt 15.400 30.907 (15.507)
Group net financial debt 9.932 15.210 (5.278)
Non current bank debt 602 885 (283)
Other non-current financial debt 4.460 4.557 (97)
Group net non-current financial debt 5.062 5.442 (380)
Group net financial debt 14.994 20.652 (5.658)
Source: “Consolidated financial statements 2009”, document retrieved from http://www.fallimentoivvspa.it/
The report of the consultancy firm PKF Italia spa
on the company accounts of the Viaggi del Ventaglio group concluded without expressing any opinion
13.
Given the losses by the company which had reached the limit stipulated in Article 2446 of the Civil Code, uncertainties given the lack of any real negotiation with the banks either as regards finding the necessary resources to overcome the conditions of financial crisis or as regards the restructuring of the debt. Moreover, there were uncertainties over the outcome of a dispute concerning the non-payment of rents, relating to contracts with a number of hotels, which could lead the company into further difficulties. All this cast serious doubts on the company’s ability to continue in business and hence the assumption of going concern.
5.2.1 Analysis of the economic and financial
situation of the EEMS group on 31 December 2012
and the report by Reconta Ernst & Young spa
From analysis of the company accounts of the EEMS Italia group we can see a reduction in turnover compared with 2011. In the course of 2012 the semi-conductor sector suffered a downward trend, as the continuation of the global economic crisis had a decidedly negative effect on the sales of electronic goods, leading to heavy losses in the DRAM commodity segment. Faced with this difficult situation the company began procedures to get out of loss making areas, and these were realised in the years 2012 and 2013 through the cession of assets by EEMS Sozhou and EEMS Suzhou Technologies in favour of the Chinese group Wuxi Taiji Industrial
14. The
photovoltaic sector recorded a drop of 37% compared with the previous year. In particular, the renewable energy resources sector suffered a blow due to yet another change in the regulations governing the
13
“Corporate Governance 2008/2009” document found on http://www.fallimentoivvspa.it/ 14
“Bilancio consolidato e di esercizio al 31 dicembre 2012,” document found on www.eems.com
industry which came into force in August 2012 (V° Conto Energia), hindering market operations, i.e. limiting installations of less than 12 Kw and reducing incentives.
For all these reasons the company approved an industrial plan for 2013-2016, in an attempt to concentrate on specific market sectors, on the grounds that certain areas were characterised by a premium price for European products and by small plant size less affected by competition from Chinese manufacturers and an improvement in production costs as a result both of the automation of production lines and from the direct supply of raw materials from Taiwan at low cost. The plan also foresaw the sustainability of the company as a going concern through debt restructuring and the concession by the banks of the resources required to guarantee the revival of the company’s activities. Discussions are on-going and new facts and developments could emerge at any time, which could prejudice the outcome.
Reconta Ernst & Young , who were appointed to carry out the audit of the company accounts, issued on 31 December 2012
15 underlined the impossibility of
expressing an opinion on account of the grave uncertainties as to the outcome of the restructuring with the credit institutions, which cast considerable doubt on the company’s ability to carry through its plan and honour its commitments. In the year 2013 the administration decided to renegotiate the previous financing agreement, but the parent company met with serious difficulties which made it unable to carry out part of the repayment before 31 March 2014.
15
“Relazione della società di revisione del 18 giugno 2013” document found on www.eems.com
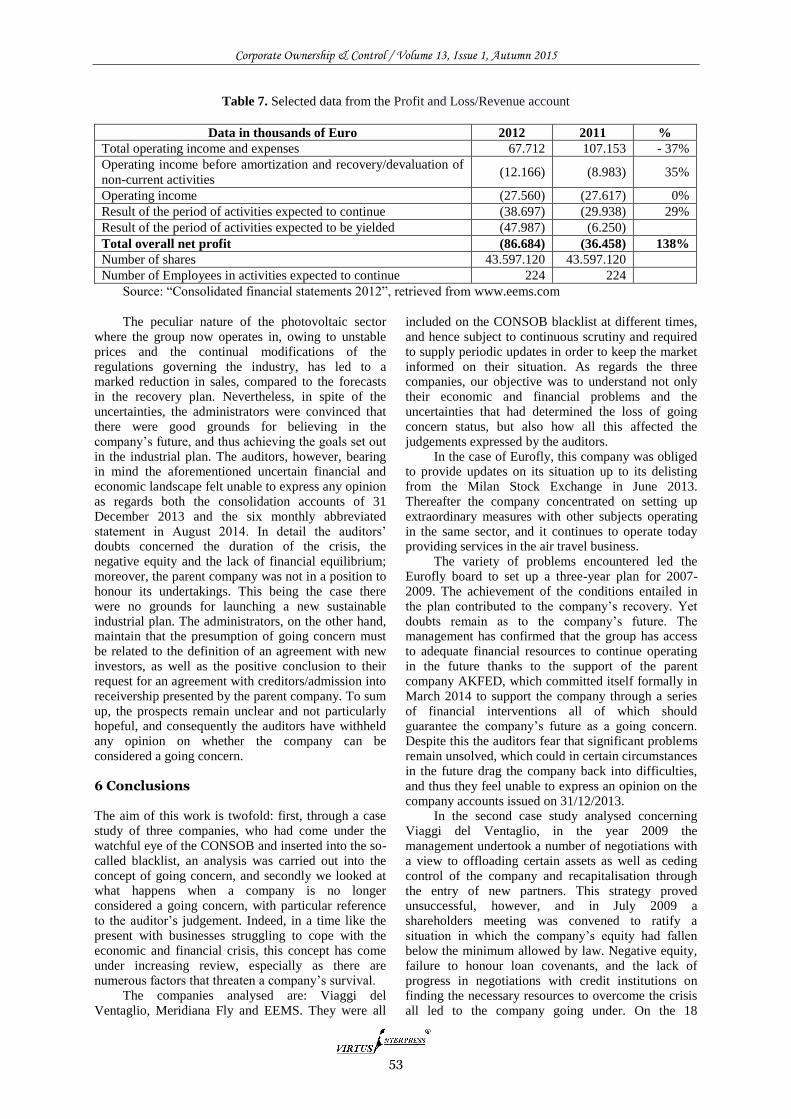
Corporate Ownership & Control / Volume 13, Issue 1, Autumn 2015
53
Table 7. Selected data from the Profit and Loss/Revenue account
Data in thousands of Euro 2012 2011 %
Total operating income and expenses 67.712 107.153 - 37%
Operating income before amortization and recovery/devaluation of
non-current activities (12.166) (8.983) 35%
Operating income (27.560) (27.617) 0%
Result of the period of activities expected to continue (38.697) (29.938) 29%
Result of the period of activities expected to be yielded (47.987) (6.250)
Total overall net profit (86.684) (36.458) 138%
Number of shares 43.597.120 43.597.120
Number of Employees in activities expected to continue 224 224
Source: “Consolidated financial statements 2012”, retrieved from www.eems.com
The peculiar nature of the photovoltaic sector
where the group now operates in, owing to unstable prices and the continual modifications of the regulations governing the industry, has led to a marked reduction in sales, compared to the forecasts in the recovery plan. Nevertheless, in spite of the uncertainties, the administrators were convinced that there were good grounds for believing in the company’s future, and thus achieving the goals set out in the industrial plan. The auditors, however, bearing in mind the aforementioned uncertain financial and economic landscape felt unable to express any opinion as regards both the consolidation accounts of 31 December 2013 and the six monthly abbreviated statement in August 2014. In detail the auditors’ doubts concerned the duration of the crisis, the negative equity and the lack of financial equilibrium; moreover, the parent company was not in a position to honour its undertakings. This being the case there were no grounds for launching a new sustainable industrial plan. The administrators, on the other hand, maintain that the presumption of going concern must be related to the definition of an agreement with new investors, as well as the positive conclusion to their request for an agreement with creditors/admission into receivership presented by the parent company. To sum up, the prospects remain unclear and not particularly hopeful, and consequently the auditors have withheld any opinion on whether the company can be considered a going concern. 6 Conclusions The aim of this work is twofold: first, through a case study of three companies, who had come under the watchful eye of the CONSOB and inserted into the so-called blacklist, an analysis was carried out into the concept of going concern, and secondly we looked at what happens when a company is no longer considered a going concern, with particular reference to the auditor’s judgement. Indeed, in a time like the present with businesses struggling to cope with the economic and financial crisis, this concept has come under increasing review, especially as there are numerous factors that threaten a company’s survival.
The companies analysed are: Viaggi del Ventaglio, Meridiana Fly and EEMS. They were all
included on the CONSOB blacklist at different times, and hence subject to continuous scrutiny and required to supply periodic updates in order to keep the market informed on their situation. As regards the three companies, our objective was to understand not only their economic and financial problems and the uncertainties that had determined the loss of going concern status, but also how all this affected the judgements expressed by the auditors.
In the case of Eurofly, this company was obliged to provide updates on its situation up to its delisting from the Milan Stock Exchange in June 2013. Thereafter the company concentrated on setting up extraordinary measures with other subjects operating in the same sector, and it continues to operate today providing services in the air travel business.
The variety of problems encountered led the Eurofly board to set up a three-year plan for 2007-2009. The achievement of the conditions entailed in the plan contributed to the company’s recovery. Yet doubts remain as to the company’s future. The management has confirmed that the group has access to adequate financial resources to continue operating in the future thanks to the support of the parent company AKFED, which committed itself formally in March 2014 to support the company through a series of financial interventions all of which should guarantee the company’s future as a going concern. Despite this the auditors fear that significant problems remain unsolved, which could in certain circumstances in the future drag the company back into difficulties, and thus they feel unable to express an opinion on the company accounts issued on 31/12/2013.
In the second case study analysed concerning Viaggi del Ventaglio, in the year 2009 the management undertook a number of negotiations with a view to offloading certain assets as well as ceding control of the company and recapitalisation through the entry of new partners. This strategy proved unsuccessful, however, and in July 2009 a shareholders meeting was convened to ratify a situation in which the company’s equity had fallen below the minimum allowed by law. Negative equity, failure to honour loan covenants, and the lack of progress in negotiations with credit institutions on finding the necessary resources to overcome the crisis all led to the company going under. On the 18
Corporate Ownership & Control / Volume 13, Issue 1, Autumn 2015
54
February 2010 the company entered into receivership. Given the liquidators’ inability to come up with a credible rescue plan, the Court declared the company bankrupt. In the light of all this and in particular of the company’s heavy losses, on the same date the report of the consultancy firm PKF Italia on the company accounts of the group concluded that it was not in a position to express any opinion.
In the final case study on EEMS Italia the various negative results on the running of the company led to the drafting of an industrial plan for the 2013-2015 period. Whether the plan has been a success is still a matter of debate and the recovery is still uncertain, also because future events may occur linked to the sectorial difficulties in general which are impossible to predict and therefore assess. Nevertheless, EEMS continues to operate, despite still being included in the black list, and despite a series of negative financial results, which have led the auditors, today as in the past, to declare themselves unable to express an opinion on the company’s prospects.
From the results of the three case studies it emerges that the three companies have numerous common elements as regards the circumstances that have triggered the loss of going concern status. Obviously this work does not pretend to be exhaustive in its reach, yet it does help to focus attention on certain situations which if not adequately dealt with can trigger crises and therefore put the company’s future at risk. Some companies do everything possible to tackle their predicament, by making strategic decisions, restructuring plans, renegotiating the debt burden and searching for new inputs of capital, yet all these efforts are no guarantee that they will overcome their difficulties.
Turning now to the opinions expressed by the auditors in the case studies, we can see that, notwithstanding the work of the administrators in supplying all the financial information required, the auditors still feel unable to express an opinion given the uncertainties and the possibility of negative developments in the economy at large which could impinge on the companies involved and put their survival at risk.
In conclusion, when things go well everything is much simpler and any financial problems can be dealt with within the company, but when the company’s future is threatened maximum professionalism is required. The key issue is not merely a drop in profits but the company’s survival, and also involves the financial and legal responsibilities of the administrators as well as the wellbeing of creditors and everyone else involved. References 1. A.A.V.V., (2007), Basic Financial Accounting.
Rilevazioni per il bilancio di esercizio e il bilancio
consolidato, McGraw – Hill, Milano.
2. Aspes, G, Campedelli, B. (1999), Principi di revisione
internazionali: il processo di revisione, Giappichelli,
Torino, 1999.
3. Assirevi - Associazione Italiana Revisori Contabili,
Documento di ricerca n. 176, Delibera IX/3856 del 25
luglio 2012 Regione Lombardia – Chiarimenti sulla
continuità aziendale, Milano, 2013.
4. Bauer, R. (2010), “La continuità aziendale nelle
relazioni del revisore”, Amministrazione & Finanza,
Milano.
5. Bauer, R. (1990), Introduzione allo studio della
revisione aziendale, Pirola, Milano.
6. Bauer, R. (2009), “Il giudizio di coerenza sulla
relazione sulla gestione”, Rivista Italiana di
Ragioneria ed Economia Aziendale, Milano.
7. Bava, F. and Devalle, A. (2012), “Il principio di
revisione n. 570 : la continuità aziendale”, Bilancio e
Reddito d’Impresa, Torino.
8. Benigno, P. (1999), Manuale di finanza aziendale, il
Mulino, Bologna.
9. Bianchi, G. (2003), Manuale di revisione aziendale,
Ipsoa, Milano.
10. Borello, A. (1999), Il business plan, Mc Graw-Hill,
Milano.
11. Borghi, A. (2006), Guida pratica alla revisione
contabile, Ipsoa, Milano.
12. Braidotti, S. and Fantini, G. (2009), “Il principio della
continuità aziendale (Going Concern)”, Contabilità
Finanza e Controllo, Udine.
13. Bruni, G. (1973), La revisione aziendale, principi-
metodi-procedure”, Isedi, Milano.
14. Bruni, G. (1996), Revisione aziendale, Utet, Torino.
15. Cadeddu, L. and Portalupi, A. (2009), “Il processo di
revisione contabile”, il Sole 24 Ore, Milano.
16. Camaren, M. (2001), La domanda di revisione
contabile volontaria in Italia: evoluzione, determinanti
e prospettive future, Egea, Milano.
17. Campra, M. and Cantino, V. (1995), Revisione
aziendale e tecnica professionale, casi ed esercizi,
Giappichelli, Torino.
18. Capiaghi, G. and Sabbatini, M. (2011), “Le procedure
di valutazione del rischio”, il Revisore Legale, il Sole
24 Ore, Milano.
19. Capodaglio, G. (1997), La revisione aziendale: verso
una nuova professionalità, Clueb, Bologna.
20. Caratozzolo M., (2006), Il bilancio d’esercizio, 2° Ed.,
Giuffrè, Milano.
21. Carboni, C. “Crescere al futuro. Leadership e
continuità d’impresa oltre la crisi”, il Sole 24 Ore,
Milano, 2009.
22. Carrieri, R. (2008), “La valutazione del presupposto
della continuità aziendale”, Controllo di gestione,
Ipsoa, Milano.
23. Cassandro, P.E. (1980), “Revisione aziendale e
certificazione di bilanci: l’esperienza americana e i
suoi insegnamenti”, Rivista dei Dottori
Commercialisti, Giuffrè, Milano.
24. Chiarini, A. (2009), La conduzione degli audit, Franco
Angeli, Milano.
25. CNDCR, (1995), “Continuità aziendale, documento n.
21 della Commissione per la Statuizione dei Principi
di Revisione”, Giuffrè, Milano.
26. CNDCR, (2007), “Continuità aziendale, documento n.
570”, Giuffrè, Milano.
27. CNDCR, (2007), Commissione paritetica per i principi
di revisione. Documento n. 570. La continuità
aziendale, Milano, Giuffrè.
28. Colombo, G.E. (1997), “La disciplina italiana della
revisione”, Rivista dei Dottori Commercialisti,
Milano.
Corporate Ownership & Control / Volume 13, Issue 1, Autumn 2015
55
29. CONSOB, (2009), “Documento Banca
d’Italia/Consob/Isvap”, in www.consob.it.
30. Cortesi, A. Tettamanzi, P. Fossati, S. and Spertini, I.
(2009), Revisione contabile e Internal Auditing, Ipsoa,
Milano.
31. Cossu, F. and Vairano, L. (2007), “Il revisore
contabile”, il Sole 24 Ore, Milano.
32. Cotto, A. Fornero, L. and Odetto, G. (2009).
Contabilità e bilancio, Ipsoa, Milano.
33. De Angelis, L. (2209), “Continuità aziendale sotto la
lente”, Italia Oggi, Roma.
34. Dezzani, F. (2004), “O.I.C Organismo Italiano di
Contabilità: IAS e principi contabili nazionali, le
principali differenze”, in Impresa Commerciale e
Industriale, Roma.
35. Dezzani, F. (2004), “Principi civilistici e principi
IAS/IFRS, gli organismi contabili internazionali ed
italiani”, Impresa Commerciale e Industriale, Roma.
36. Di Meo, W. (2005), Teoria unificata e modulare della
contabilità. Primi sviluppi: il rendiconto finanziario
delle imprese, Giappichelli, Torino.
37. Di Pietra, R. (2005), “La revisione contabile in Italia e
nella prospettiva internazionale”, Cedam, Padova.
38. Forgione, G. (2008), “OIC 5- Bilanci di liquidazione”,
www.fiscoetasse.it.
39. Frizzera, B. (2008), “Guida alla revisione contabile”, il
Sole 24 Ore, Milano.
40. Fusa, E. and GUATRI, G. (1990), “La valutazione del
capitale economico d’impresa, metodi tradizionali,
innovativi ed empirici. Casi pratici”, il Sole 24 Ore,
Milano.
41. Golinelli, G.M. (2000), “L’approccio sistemico al
governo dell’impresa”, Cedam, Padova.
42. Magnano San Lio, L. (2011), “La relazione del
revisore quando la continuità aziendale è venuta
meno”, il Revisore Legale, il Sole 24 Ore, Milano.
43. Mainardi, M. (1998), Introduzione alla revisione
contabile di bilancio, Cedam, Padova.
44. Manzana, G. (2009), “Relazione del revisore:
esistenza della continuità aziendale”, Guida alla
Contabilità e Bilancio, il Sole 24 Ore, Milano.
45. Marasco, V. (1995), “La continuità aziendale nei
principi di revisione”, Amministrazione & Finanza,
Milano, 1995.
46. Marchi, L. (1991), Principi di revisione aziendale,
Clueb, Bologna.
47. Marchi, L. (2005), Principi di revisione contabile,
Giuffrè, Milano.
48. Marchi, L. (2012), Revisione aziendale e sistemi di
controllo interno, Giuffrè, Milano.
49. Marinelli, U. and Troina, G. (1994), Revisione
contabile: note metodologiche, Giappichelli, Torino.
50. Mazzi, F. Pellegrini, C. and Roncher, A. (2005), Il
nuovo revisore e il controllo contabile, Seac Editore
SpA, Trento, 2005.
51. Montrone, A. and Musaio, A. (2010), Capitale e
operazioni straordinarie, McGraw-Hill, Milano.
52. NASINI, A. (2001), “La revisione contabile”,
Giappichelli, Torino.
53. Paolone, G. D’Amico, L. and Consorti, A. (2000), La
revisione aziendale: fondamenti, principi e procedure,
Giappichelli, Torino.
54. Pesenato, A. (2008), Manuale di revisione contabile
per le imprese industriali, commerciali e PMI.
Verifiche sindacali, controlli del revisore e relativi
verbali, Ipsoa, Milano.
55. Pisoni, P. Busso, D. Devalle, A. and Bava, F. (2012),
“Giudizio del revisore sul bilancio”, Contabilità
Finanza e Controllo, il Sole 24 Ore, Milano.
56. Pogliani, L.P. (2007), “Principi e metodologie di
auditing”, Egea, Milano.
57. Pontani, F. (2011), Il bilancio di esercizio delle società
di capitali. Accounting philosophy e conceptual
framework , Cedam, Padova.
58. Pozzoli, M. and Vitali, F.R. (2005), “Guida operativa
ai principi contabili internazionali: il processo di
transazione, criteri di valutazione, schemi e prospetti”,
il Sole 24 Ore, Milano.
59. Quagli, A. (2003), Bilancio di esercizio e principi
contabili, Giappichelli, Torino.
60. Quatraro, B. (1992), “La clausola generale ed i
principi di redazione del bilancio di esercizio”, Rivista
dei dottori commercialisti, Milano.
61. Recchia, G. (2008), Revisione contabile e due
diligenze in imprese ed enti minori, Cacucci, Bari.
62. Rossi, C. and Gervasio, D. (2008), La revisione
aziendale. Teoria e procedure, Giuffrè, Milano.
63. Ruggieri, A. (2005), Manuale di revisione aziendale,
Giuffrè, Milano.
64. Rusticali, G. (2006), Auditing e servizi di assurance,
Pearson Education Italia, Milano.
65. Salvadeo, S. and Tedeschi, G. (2010), Valutazione
delle voci di bilancio secondo il principio di continuità
aziendale, Bilancio e Reddito d’Impresa, Torino.
66. Sciarelli, S. (2003), Economia e gestione dell’impresa,
Cedam, Padova.
67. Soprani, A. (2009), “La continuità aziendale in periodi
di crisi. Riflessi sul bilancio e sul lavoro di revisione
legale dei conti”, Bilancio Vigilanza e Controlli,
Milano.
68. Sorrentino, M. (2003), Le nuove imprese, Cedam,
Padova.
69. Superti Furga F., (1994), Il bilancio di esercizio
italiano secondo la normativa europea, 2° Ed., Giuffrè,
Milano.
70. Zambon, S. (1997), Alle origini della revisione
contabile, Il Mulino, Bologna.
71. www.bancad’italia.it
72. www.borsaitaliana.it
73. www.cndc.it
74. www.consob.it
75. www.consob.it, 2009
76. www.eems.com
77. www.fiscoetasse.it
78. www.iviaggidelventaglioinliquidazione.it
79. www.marketmovers.it
80. www.meridiana.it
Corporate Ownership & Control / Volume 13, Issue 1, Autumn 2015
56
CONFIDENCE OF ACCOUNTANTS IN APPLYING INTERNATIONAL FINANCIAL REPORTING STANDARDS
Rajni Mala*, Parmod Chand**
Abstract
Research on how accountants could increase their confidence in interpreting and applying International Financial Reporting Standards (IFRS) is lacking. This study examines whether the accuracy of judgments made by accountants varies as a consequence of their level of confidence, and whether their confidence in exercising judgments could be enhanced by greater familiarity with IFRS. The results of the study support that accountants who are more confident make judgments that better reflect the economic substance of a transaction than accountants who are less confident. The results further indicate that familiarity with IFRS enhances the confidence of accountants and the most accurate judgments are made by those accountants who are not only familiar with IFRS but also have confidence in their judgments. Keywords: IFRS, Professional Judgments, Confidence, Familiarity *Corresponding author. Department of Accounting and Corporate Governance, Macquarie University, North Ryde, NSW 2109, Australia Tel: (612) 9850 8530 Fax: (612) 9850 8497 **Department of Accounting and Corporate Governance, Macquarie University, North Ryde, NSW 2109, Australia Tel: (612) 9850 6137 Fax: (612) 9850 8497
1 Introduction
The fact that International Financial Reporting
Standards (IFRS) promulgated by the International
Accounting Standards Board (IASB) embody a
principles-based or ‘substance over form’ regime
(Chambers & Wolnizer, 1991; Doupnik & Richter,
2003) means that many decisions concerning the
accounting treatment of a transaction are based on the
professional judgments of accountants. This study
examines whether accountants are confident in using
IFRS, and if they are, whether these confident
accountants are more likely to choose accounting
treatments that reflect the economic substance of a
transaction than accountants who are less confident.
The study also examines whether accountants’
confidence in exercising judgments could be enhanced
by greater familiarity with IFRS.
Approximately 128 countries have adopted or
intend to adopt IFRS for all their domestically listed
companies. The implicit assumption in accounting
convergence is that this will lead to high quality and
comparable financial reporting. However, even though
the adoption of IFRS is widely promoted, there are
still many inherent challenges in implementing and
applying IFRS within and across countries (see
Doupnik & Richter, 2003; Verschoor, 2010;
Wustemann & Wustemann, 2010; Hodgdon et al.,
2011). Owing to the significance of the role played by
judgment in the application of IFRS, it is extremely
important to examine how accountants’ choice of
accounting treatments could be enhanced when
judgments are made that reflect the economic
substance of a transaction, because an inappropriate
judgment can lead to serious economic consequences
for users of accounting information, as well as for
firms.
Accountants’ confidence in using IFRS to
exercise their judgment to determine the appropriate
form of financial disclosure is crucial. Confidence is
the belief of the decision maker in the quality of the
decision made (Sniezek, 1992). It can be perceived as
a process variable that is considered a determinant of
performance or an outcome variable that reflects an
individual’s confidence in the performance of a task
(Bonner, 2007). Confidence in this study is
conceptualised as an outcome variable, where
confidence is described as the degree of belief in the
accuracy of judgments made (see Einhorn & Hogarth,
1978; Lichtenstein et al., 1982; Reber, 1995). In
psychology, a number of studies which examined the
effects of confidence on judgment accuracy have
reported that higher confidence in one’s judgments
leads to more accurate judgments being made
(Woodman & Hardy, 2003; Kebbell, 2009; Lee et al.,
2011). Hence, it becomes crucial to investigate
Corporate Ownership & Control / Volume 13, Issue 1, Autumn 2015
57
whether accountants are confident in their judgments
that require the use of IFRS and whether this
confidence leads to choosing the accounting
treatments that best reflect the economic substance of
a transaction.
Research on judgment and decision making
suggests that familiarity has a positive effect on
judgments. Familiarity has been defined as “specific
knowledge a person has about the aspects of work”
(Goodman & Leyden, 1991, p. 578). Familiarity in our
conceptualization is a knowledge-based variable
which facilitates greater confidence in accountants and
hence improves the quality of their judgments. The
positive effects of familiarity on task performance
have also been confirmed in experimental problem-
solving tasks (Littlepage et al., 1997), studies of team
familiarity in medical teams (Reagans et al., 2005),
and in software development studies (Boehm, 1981;
Curtis et al., 1988; Walz et al., 1993; Banker &
Slaughter, 2000; Brooks, 1995). While the general
benefits of task familiarity are apparent from these
studies, it is still not clear whether familiarity with
IFRS will enhance accountants’ confidence and
support them to choose the accounting treatments that
best reflect the economic substance of a transaction
when applying principles-based accounting standards.
This research therefore is timely and relevant.
Three hypotheses are used as a basis for the
examination of the effects of confidence on the
reporting judgments of accountants and to examine
whether familiarity with IFRS as a confidence
enhancing factor will assist them in selecting an
accounting treatment that best reflects the economic
substance of a transaction. A lease task was chosen
and accountants were required to exercise their
judgment on whether a leased item should be
recognised as an operating lease or a finance lease.
International Accounting Standard (IAS) 17 Leases is
a conventional principles-based standard which
emphasizes the substance of a lease transaction in
making a classification as a finance lease or an
operating lease (Jamal & Tan, 2010; Agoglia,
Doupnik, & Tsakumis, 2011).
The first hypothesis posits that there will be
differences in the judgments based on the degree of
confidence accountants have in exercising their
judgment. Specifically, the first hypothesis implies
that accountants who have greater confidence in their
judgments are more likely to choose accounting
treatments that best reflect the economic substance of
a transaction than accountants who are not confident.
As expected, the results of the study provide strong
support for the notion that accountants who are more
confident make judgments which better reflect the
economic substance of a transaction than accountants
who are less confident.
The second and third hypotheses examine the
potential role that familiarity plays in enhancing the
confidence of accountants. The second hypothesis
presumes that accountants who are familiar with IFRS
are able to use specific knowledge that links the
principles of the accounting standards with business
transactions, will spend less time referring to the
contents of the standards and will focus more attention
on exercising their professional judgment; hence, they
will choose the accounting treatment that best reflects
the economic substance of a transaction. The results
indicate that accountants’ familiarity with IFRS have a
significant positive influence on their judgments.
Further, the study examines the impacts of both
familiarity with IFRS and confidence on the
judgments of accountants. The results indicate that
familiarity with IFRS enhances the confidence of
accountants and the most accurate judgment is made
by those accountants who are familiar with IFRS as
well as confident in their judgments.
Our findings have practical implications that are
important for both accountants and standard setters
because they show that accountants’ confidence in
their judgments is crucial for choosing accounting
treatments that best reflect the economic substance of
a transaction. This study has implications for the
convergence of accounting standards which advocates
for high quality financial reports. The results of this
study imply that countries adopting IFRS can only
realize gains if the necessary investment in accounting
education and training has been made so that
accountants feel familiar with IFRS and their
confidence is consequently enhanced.
The remainder of the paper is organized as
follows. Section 2 outlines the relevant literature and
develops our hypotheses. Sections 3 and 4 describe the
experiment used to test the hypotheses and present the
results. Section 5 provides a summary and offers the
conclusions and implications of our study.
2 Theory and hypotheses development 2.1 Confidence in judgment and decision making Confidence is a crucial factor in the judgment and
decision making process because it reflects the degree
of “assuredness” in one’s judgment or decision (Reber,
1995). According to Peterson and Pitz (1988),
confidence can be assessed by obtaining the decision
makers’ self-review on their belief in the possibility
that the decision they have made is correct. The higher
the probability stated by the decision makers, the
higher the level of confidence they have in their
judgments. Sniezek (1992) argued that confidence in
judgments may be as important as the quality of the
judgments themselves, because confidence will
determine whether and how those judgments or
decisions are used by decision makers, or even by
others. Bonner (2007) pointed out that, although some
prior studies in accounting have examined confidence
as a process variable in individuals’ judgment and
decision making (JDM), most studies tend not to
examine the effects of confidence on subsequent JDM,
Corporate Ownership & Control / Volume 13, Issue 1, Autumn 2015
58
hence, the relationship between the two variables is
still not well understood.
According to Lee and Dry (2006) people are
sensitive to the accuracy of information when
evaluating how accurately they perform. They
observed that the type of decision made by individuals
is linked to the kind of information presented to them,
and that their confidence is affected by the frequency
and accuracy of the advice. They also showed that
people are less confident in their estimated decisions
when they have to make many decisions.
A number of studies in psychology which
examined the effects of confidence on judgment
accuracy have reported that higher confidence in
judgments leads to higher accuracy in judgments
(Woodman & Hardy, 2003; Kebbell, 2009; Lee et al.,
2011). For example, Kebbell (2009) conducted an
experiment with 100 undergraduate participants to
examine witnesses’ confidence in their level of recall
accuracy in relation to film footage of criminal
behaviour. The study reported a significant positive
relationship between witnesses’ confidence and the
recall accuracy of their answers. Similarly, Lee et al.
(2011) explored the interaction between students’
confidence in their judgment, their actual accuracy
and time taken in answering 100 general knowledge
questions. The results support their prediction that
accuracy increases with higher confidence ratings. In a
meta-analysis of 48 studies on competitive
performance, Woodman and Hardy (2003)
documented a significant positive relationship
between individuals’ confidence and their
performance. The result is consistent with the
proposition of motivation theory which suggests that a
higher level of confidence may lead to increased
performance by increasing individuals’ motivation to
succeed in a given task (Benabou & Tirole, 2002).
In accounting, findings regarding the effects of
confidence on judgment accuracy have been mixed.
For example, Pincus (1991) examined the
relationships between individual auditor
characteristics, decision accuracy and audit judgment
confidence. The study reported that confidence and
accuracy were not significantly related and suggested
that confidence may be a process variable rather than
an output variable. Weber (1978) tested 40 auditors’
decision processes in assessing the overall reliability
of internal control for a manufacturing company's
inventory system, and even though the study failed to
provide a test of the significance of the confidence-
accuracy relationship, they reported that those subjects
who used decision aid were significantly more
confident in their judgments and made significantly
more accurate decisions than those who did not,
therefore supporting the existence of a positive
relationship between confidence and accuracy.
Similarly, Hageman (2010) conducted an experiment
with 114 participants to examine the role of
confidence in tax return preparation. The results
indicate that tax preparers with higher levels of
confidence in their ability to accurately prepare a tax
return demonstrated higher levels of accuracy in their
performance of the task using a tax decision support
system.
A number of studies in auditing that have
investigated the appropriateness of auditors’
confidence in the judgments they make have also
reported mixed findings that auditors sometimes
display overconfidence and sometimes
underconfidence in the decisions they have made
(Hunton et al., 2004). For example, Solomon et al.
(1985) found that auditors' judgments in general-
knowledge (almanac) questions were miscalibrated
and significantly overconfident. Similarly, Hunton et
al. (2004) reported that financial auditors may be
overconfident in their ability to recognize heightened
risks associated with an enterprise resource planning
(ERP) system. Overconfidence in a decision is
regarded as having a greater degree of perceived
accuracy on a given task than is reflected in the actual
accuracy of the performance (Lichtenstein et al., 1982;
Paese & Sniezek, 1991). According to Bonner (2007),
overconfidence is one of the most problematic biases
in judgment and decision making; the outcome can
have serious consequences if individuals fail to
recognise the inaccuracy of their task performance,
and this may lead to inaccurate resource allocation.
Generally, studies have shown that overconfidence in
task performance is negatively associated with
judgment accuracy (Sniezek et al., 1990; Hageman,
2010; See et al., 2011).
Underconfidence in decision making occurs
when there is greater accuracy in the decisions made
than the self-assessed judgment accuracy of those
decisions (Lichtenstein et al., 1982). Underconfidence
may result in a good judgment being discarded,
resulting in failure to benefit from a good decision
(Staw, 1976). In the study by Tomassini et al. (1982),
auditors were required to establish probability density
functions on account balance for 6 real world cases.
The results show substantial underconfidence in all
areas of the distribution. Similarly, the study by
Solomon et al. (1985) found that auditors’ judgments
in assessing the accuracy of particular account
balances in financial statements were predominantly
underconfident.
Both overconfidence and underconfidence can
lead to inaccurate resource allocation, thus an
appropriate level of decision confidence is as vital as
decision accuracy in its effect on the ultimate outcome
of a decision (Sniezek & Henry, 1989). While studies
have been conducted in psychology, auditing and
taxation contexts, research investigating the
confidence in the context of IFRS reporting is missing.
Our study fills this void by examining whether
accountants who are more confident in their
judgments are likely to choose the accounting
treatments that best reflect the economic substance of
a transaction than accountants who are not confident.
Corporate Ownership & Control / Volume 13, Issue 1, Autumn 2015
59
2.1.1 Effect of confidence on reporting judgments of
accountants when interpreting and applying
IFRS (H1)
To examine the confidence effect on judgment
accuracy, a lease decision context for the classification
of the proposed leasing arrangements between a lessor
and a wholly-owned financing subsidiary who then
subleases to an airline company as either financing
lease or operating lease is selected. Under IAS 17,
paragraphs 10 to 12 include the general principles for
the lease treatment, primarily based on the criterion of
whether the lessee has transferred to the lessor the
‘significant’ risks and rewards of ownership of the
asset.
Grounded in prior research, mixed directions of
judgment accuracy may be expected due to an
individual’s confidence. Confidence in a certain range
may be associated with more accurate judgments,
while overconfidence may be associated with less
accurate judgments. In this study, it is expected that
accountants who are confident will potentially
evaluate the business transactions more thoroughly,
process the given information more carefully, and not
make judgments based on estimations (Lee & Dry,
2006). Additionally, accountants who are confident
are expected to analyse the transactions more
vigilantly and to be motivated to be successful in
performing the task (Benabou & Tirole, 2002).
Therefore, this study predicts that accountants who are
thorough and vigilant, as well as being motivated to be
successful in the task, will feel confident in their
judgments. It is further predicted that those
accountants who are more confident that their
judgments are accurate are likely to make more
accurate judgments. Accordingly, the following
hypothesis is formulated.
H1: Accountants who are more confident in their
judgments are likely to choose the accounting
treatment that best reflects the economic substance of
a transaction when applying IFRS than accountants
who are less confident.
2.2 Effect of familiarity on judgment and decision making
Another major factor that has been found to affect an
individual’s performance and decision making is
familiarity. A person who is familiar with a certain
task may perceive the task to be less complex than
those who are unfamiliar or have fewer relevant
experiences (Campbell, 1988). To develop an
understanding of the effects of familiarity on
individuals’ judgments and decision making, Schank
(1999) provided a theoretical basis to indicate how
training and prior exposure to a task help decision
makers to make better judgments. In his theory,
human information processing relies on memory
processes and the categorical structures that organize
the information stored in memory. Schank (1999)
pointed out that human memory is organized by
categories, with a memory index to store new
information, retrieve existing knowledge, and create
new indices for novel information. When people
process information, the mind consults the memory
index to establish links between related categories and
assemble the relevant knowledge needed to
understand and interpret the information. In this
process, how the categories are structured significantly
influences the outcome of a decision task. The
categorical knowledge structures can be developed
through training and prior exposure/experience to a
decision task, which in turn leads to improvements in
the judgment and decision making process (Kopp &
O’Donnell, 2005).
In psychology, a number of studies provide
evidence that a person’s familiarity with a task or
situation has a positive influence on judgments and
performance. For example, the studies of Goodman
and Leyden (1992), Littlepage et al. (1997) and
Espinosa et al. (2007) in group settings have
consistently reported that familiarity with tasks
positively affects group members’ performance in the
areas of mining, problem solving and software
development. Littlepage et al. (1997) concluded that
the positive effect is the result of improvement in
individual ability through a transfer of specific
knowledge or strategies between prior and current
tasks. Similarly, Reinhard et al. (2011 and 2013)
showed that those participants who have high
familiarity have greater accuracy in making judgments
of truth and deception. The authors explained that
participants with high familiarity are less likely to
direct attention away from valid cues and rely on
invalid cues to make judgments. Reinhard et al. (2013)
also reported that participants in the high-familiarity
category were also more confident in their decision
making and better calibrated than participants in the
low-familiarity category.
In auditing, extant studies have reached similar
conclusions that familiarity with a particular judgment
task influence the judgment and decision making of
auditors. Anderson and Maletta (1994) reviewed prior
studies and concluded that auditors who are less
familiar with a particular judgment task are more
cautious and risk averse than those with greater task
familiarity. Further, a small number of studies in
accounting substantiate that familiarity in accounting
standards improves the judgments of analysts and
accountants. For example, Bae et al. (2008) reported
that foreign analysts whose home-country accounting
standards do not differ greatly from the firm’s home-
country accounting standards, i.e., they are more
familiar with the accounting standards used by the
firm, tend to be more accurate in earnings forecasting.
Byard et al. (2011) examined whether the European-
wide mandatory adoption of IFRS had improved the
forecast accuracy of foreign analysts relative to
domestic analysts. The findings indicate that only
those foreign analysts familiar with IFRS experience
Corporate Ownership & Control / Volume 13, Issue 1, Autumn 2015
60
an improvement in forecast accuracy because they are
better able to analyse IFRS-based financial statements.
Similarly, Chand et al. (2010) found that the
complexity of the accounting standard and the
professional accountant's familiarity with the standard
affected the accountant’s ability to interpret and apply
the standard in a consistent manner. In their study,
professional accountants demonstrated more
consistency in their judgments when they were
required to interpret accounting standards which they
were familiar with. Therefore, in the accounting
context, professional accountants would be required to
have appropriate training and exposure before being
able to proficiently interpret and apply accounting
standards. The level of familiarity of professional
accountants with an accounting standard largely
depends on the extent to which they are trained and
exposed to the standard (Chand et al., 2010). Overall,
it can be seen from prior studies that familiarity
positively affects the judgments and decision making
of professionals.
2.2.1 Effect of familiarity with IFRS on the reporting
judgments of accountants when interpreting and
applying IFRS (H2)
Existing research in psychology and accounting has
suggested that familiarity has an impact on judgment
and decision making, particularly when the task is
complex. It is argued that the interpretation of
principles-based standards is a complex task due to the
high cognitive demands placed on accountants to
interpret and apply the accounting standards (Devi,
2003). Accountants need to interpret uncertainty
expressions, evaluate a number of broad principles,
and exercise their own judgments to determine the
appropriate form of financial disclosure. Therefore,
professional accountants need to be well-trained and
extensively exposed to principles-based standards
before they are sufficiently familiar with the standards
to accurately interpret and apply them.
In the context of this study, it is expected that
accountants who are familiar with the accounting
standards will be able to use specific knowledge that
links the principles of the accounting standards with
business transactions, will spend less time referring to
the contents of the standards, and will focus more
attention on exercising their professional judgment.
Moreover, they are likely to rely on more relevant
information to make judgments and will be able to
interpret and apply accounting standards in an
accurate manner compared to those accountants who
are less familiar with the standards. Therefore, this
study predicts that accountants who are familiar with
the accounting standards will more accurately
interpret and apply accounting standards and will
therefore choose the accounting treatments that best
reflect the economic substance of a transaction than
those accountants who are less familiar with the
standards. Accordingly, the following hypothesis is
formulated:
H2: Accountants who are more familiar with
IFRS are more likely to choose the accounting
treatment that best reflects the economic substance of
a transaction when interpreting and applying IFRS
than accountants who are less familiar with IFRS.
2.3 Influence of familiarity with IFRS and accountants’ confidence on their judgments (H3)
The psychology and auditing literature shows that
confidence on the judgments has a positive effect on
judgment. The findings show that a higher level of
confidence leads to greater accuracy in the judgments
made. Similarly, findings in psychology literature
show that when individuals are familiar with the tasks
being undertaken, they are able to establish links
between related categories and assemble the relevant
knowledge needed to understand and interpret the
information, leading to accurate judgments.
This study expects that those accountants who
are more familiar with IFRS as a result of possessing
well-developed knowledge structures will be more
confident in their judgments and hence will make
more accurate judgments. Accordingly, the following
hypothesis is formulated:
H3: Familiarity with IFRS is likely to enhance
the accountant’s confidence in their judgment and
accuracy when they interpret and apply IFRS.
3 Research method 3.1 Participants and design It was necessary for the research setting of this study
to represent a country that has harmonised with IFRS.
Malaysian Accounting Standards (MAS) are generally
harmonised with IFRS. Hence, Malaysia provides an
appropriate research setting for undertaking the
current study.
The participants in our experiment were 82
Malaysian Certified Practising Accountants (CPA)
with an average of five years’ professional work
experience. The respondents had relevant education,
training and experience in dealing with MAS which,
as noted above, is well harmonised with IFRS.
Because our experiment asks participants to choose
the accounting treatment that best reflects the
underlying economics of transactions for a company
faced with the treatment of a lease transaction, it was
important for us to feature Malaysian-based
accountants who had experience in making financial
reporting decisions in this context. To preserve internal validity and to enable
differences in the reporting judgments of accountants to be attributable to the two variables of interest (confidence with the judgment and familiarity with IFRS), particular care was taken in designing the scenario. Potentially confounding variables that could also affect the reporting judgments of accountants
Corporate Ownership & Control / Volume 13, Issue 1, Autumn 2015
61
were controlled. For the given scenario, participants were simply instructed to choose the accounting treatment that best reflected the underlying economics of transaction for a company faced with lease treatment decision.
3.2 Procedures The participants were provided with a research instrument containing two sections. The first section required respondents to provide demographic data such as gender, age, level of formal education, employer details and years of work experience. Respondents were asked to identify their familiarity level with IFRS with the options ranging from very familiar to not familiar (where 1 denoted ‘very familiar’ and 4 denoted ‘not familiar’). In order to group the participants as familiar with IFRS or not familiar with IFRS, the median split technique was employed to split the accountants into two groups according to their level of familiarity. Fifty accountants (61% of the sample) were familiar with IFRS while thirty two accountants (39% of the sample) were not familiar with IFRS.
The respondents were also asked to indicate how confident they were that their judgment was correct on a seven-point Likert scale (where 1 denoted ‘extremely confident’ and 7 denoted ‘not confident at all’). Again, the median split technique was employed to group the participants who were confident with their judgment and those who were not confident with their judgment. Twenty-eight accountants (34% of the sample) were confident that their judgment was accurate, while fifty four accountants (66% of the sample) were not confident that their judgment was accurate.
The second section includes the case scenario based on a hypothetical airline company. The participants were provided with the proposed leasing arrangements between a lessor and a wholly-owned financing subsidiary who then subleases to an airline company. The sublease is for 12 years, which is 60% of the aircraft’s economic useful life of 20 years. The airline company has no purchase option at the end of the lease term; however, the wholly-owned financing subsidiary has an option to purchase the aircraft at the end of the lease. The present net value of the lease payments is 64% of the aircraft’s fair market value. In the alternative other scenario, the lessee enters into a guarantee agreement with the lessor regarding the payment in favour of the wholly-owned financing subsidiary.
3.3 Pre-test To obtain an indication of the accounting treatment that best reflects the underlying economics of transaction and event in the financial statements (i.e., the most accurate judgment) on the scenario, a pre-test was conducted. The research instrument was pre-tested with fifteen senior accounting academics from Macquarie University in Australia and five senior
professional accountants in Sydney, Australia. To determine whether to “treat the lease arrangement as an operating lease”, the mean score of the judgments made by all the participants in the pre-test was used.
A lease can only be recognised as a financing lease by an entity when any one of the conditions under IAS 17 paragraphs 10 – 12 has been satisfied. The sublease is for 60% of the aircraft’s economic useful which does not meet the criterion that the “lease term is for the major part of the economic life of the asset”. Additionally, the airline company has no purchase option at the end of the lease term. The Net Present Value of the Minimum Lease Payment (MLP) is 80% of the fair value of the asset, which also does not meet the criterion that “the present value of the minimum lease payments amounts to at least substantially all of the fair value of the leased asset”. Moreover, the lessee has an option to renew the lease for a further 5 years at the prevailing market rental rate at the end of this lease term, which does not meet the criterion of a financing lease. Therefore, none of the conditions of IAS paragraphs 10 – 12 had been satisfied. Consequently, the most accurate judgment in this scenario is that the lease should be treated as an operating lease.
The pre-test mean score for the accountants’ judgment was 6.5 (non-tabulated), which indicates that the lease should be treated as an operating lease. Since accuracy is unobservable for many accounting tasks, the mean judgment is an indication of judgment consensus amongst the respondents (Libby, 1981; Ashton, 1985; Abdolmohammadi & Wright, 1987). Research has shown that consensus is a fairly good surrogate for accuracy in accounting tasks (Solomon & Shields, 1995). Therefore, in this study the consensus in the judgment of experts is used as a proxy for judgment accuracy.
4 Results and discussions 4.1 Demographic details of respondents
85 accountants participated in the research, but there were only 82 valid responses (i.e. a usable response rate of 96%).
16 As shown in Table 1 of the usable
responses, 28 accountants were confident that their judgment was correct while 54 accountants were not confident that their judgment was correct. Additionally, of the usable responses, 32 accountants were not very familiar with IFRS while 50 accountants were familiar with IFRS. The mean age category of the respondents in the confident group was 35 years and in the familiarity group was 36 years. The average number of years in formal education was 17 years for the respondents in the confident group and 17.5 years for the respondents in the familiarity group. The average level of professional experience was 5 years for the confident group and 7.7 years for the familiarity group.
16
Three responses were not included in the analysis of the results because they were incomplete.
Corporate Ownership & Control / Volume 13, Issue 1, Autumn 2015
62
Table 1. Demographic data of respondents
Demographic Data Confident that the
Judgment is correct
Familiarity with
IFRS
Sample Size Confident Not Confident
28 54
Familiar Not Familiar
50 32
Level of Experience in years
(Mean)
5
7.7
Level of Formal Education in years
(Mean)
17
17.5
Age (Mean) 35 36
4.2 Effect of confidence on the reporting judgments of accountants (H1)
H1 is tested using a 2 x 2 ANOVA where “confidence
in judgment” is the between-subject independent
variable with the accountant’s lease treatment decision
serving as the dependent variable. The participants are
dichotomized into a confident group and a less
confident group using the median split.
The ANOVA results with dichotomized variable
reveal that participants who are in the confidence
group are significantly more likely to make a lease
treatment decision which best reflects the economic
substance of a transaction (mean = 5.25) than the less
confident group (mean = 4.28, F = 14.216, p = 0.000).
These results in Table 2 provide support for H1.
Table 2. Descriptive statistics and Univariate analysis of effect of confidence on the judgments of respondents
Source of Variance Mean Standard Deviation F Significance Level
Confident
with judgment
n=28
5.25 1.236 14.216 0.000*
Not Confident
with judgment
n=54
4.28 1.036
Note: *Significant at p < 0.01
4.3 Effect of familiarity on the reporting judgments of accountants (H2)
H2 is tested using a 2 x 2 ANOVA where “familiarity
with IFRS” is the between-subject independent
variable with the accountant’s lease treatment decision
serving as the dependent variable. The participants are
dichotomized into a familiar group and a less familiar
group using the median split.
The ANOVA results with dichotomized variable
reveal that participants who are in the familiar group
are significantly more likely to make a lease treatment
decision which best reflects the economic substance of
a transaction (mean = 4.84) than the less familiar
group (mean = 4.25, F = 4.998, p = 0.028). These
results in Table 3 provide support for H2.
4.4 Influence of familiarity and accountants’ confidence on their judgments (H3)
It was expected that the accountants’ confidence in
their judgments would be enhanced when they were
familiar with IFRS, hence they would choose the lease
treatment decision which best reflected the economic
substance of the transaction. Therefore, a positive
correlation between the confidence of individual
accountants with their judgments (i.e. a lower value on
the seven-point Likert scale) and the familiarity level
of accountants (i.e. a lower value on the seven-point
Likert scale) will be shown.
The results show that the correlation between the
two variables is positively correlated (non-tabulated
Pearson correlation coefficient is 0.057). The follow-
up nonparametric correlation tests also show that the
correlation between the two variables is positively
correlated (non-tabulated Kendall’s correlation
coefficient is 0.057 and Spearman’s correlation
coefficient is 0.057).
Between-subjects ANOVA tests show that, as
expected, the most accurate decision was made by the
accountants who were confident in their judgment as
well as familiar with IFRS (mean = 5.62) than the
accountants who were less familiar and confident,
familiar and less confident and less familiar and less
confident in their judgment (mean 4.36, F = 17.250, p
= 0.000).17
17
For the purpose of showing the difference in judgments, the familiar and confident accountants were placed in one group, while the less familiar and confident, familiar and less confident, less familiar and less confident were placed in another.
Corporate Ownership & Control / Volume 13, Issue 1, Autumn 2015
63
Table 3. Descriptive statistics and Univariate analysis of effect of familiarity
with IFRS on the judgments of respondents
Source of Variance Mean Standard Deviation F Significance Level
Not familiar with IFRS
N=32 4.25 1.218 4.998 0.028*
Familiar with IFRS
N=50 4.84 1.131
Note: *Significant at p < 0.05
Table 4a. Descriptive statistics of effects of familiarity with IFRS and confidence on judgments of respondents
Confidence with judgment Familiar with IFRS Mean Standard Deviation N
Confident with judgment
Less Familiar with IFRS
Familiar with IFRS
Total
4.75
5.62
5.25
1.422
0.957
1.236
12
16
28
Not confident with judgment Less Familiar with IFRS
Familiar with IFRS
Total
3.95
4.47
4.28
0.999
1.022
1.036
20
34
54
Total Less Familiar with IFRS
Familiar with IFRS
Total
4.25
4.84
4.61
1.218
1.131
1.194
32
50
82
Table 4b. Descriptive statistics and Univariate analysis of effect of familiarity
with IFRS and confidence on judgments of respondents
Source of Variance Mean Standard Deviation F Significance Level
Familiar and Confident
N=16 5.62 0.957 17.250 0.000*
Less familiar and confident,
familiar and less confident and
less familiar and less confident
N=66
4.36 1.118
Note: *Significant at p < 0.01
5 Conclusion and implications
Using a sample of professional accountants from
Malaysia, we examined whether the accuracy in the
judgments of accountants varies as a function of their
confidence and whether their confidence in exercising
judgments could be enhanced with greater familiarity
with IFRS. The results provide strong support for the
claim that accountants who are more confident about
their judgments make more accurate judgment.
The results further demonstrate that familiarity
with IFRS enhances the confidence of accountants,
which has a positive influence on the accuracy of the
accounting judgment. A possible explanation for this
positive relationship between familiarity with IFRS
and judgment would be that the accountants who are
familiar with IFRS are likely to base their judgments
on relevant cues or heuristics and thus will pay much
attention to the relevant aspects of the accounting
transaction, therefore making the appropriate
judgment. Overall, the findings show that the most
accurate judgment is made by those accountants who
are familiar with IFRS as well as being confident in
their judgments.
An important implication of the results is that it
would be premature for the IASB and standard setters
of countries adopting IFRS to assume that adopting
IFRS will automatically lead to high quality financial
reports. The results of this study imply that
accountants, the preparers of the financial reports,
need to acquire relevant interpersonal skills such as
confidence in the outcomes of tasks being undertaken
to produce high quality financial reports. To help
accountants acquire such interpersonal skills, it is
imperative for organizations to mount in-house
training on the interpretation and application of IFRS,
which will assist accountants to familiarize themselves
with IFRS. This will certainly facilitate the
improvement of accountants’ judgments which will
also enhance the decision usefulness of accounting
information.
This study contributes to the wide and still
growing literature on factors that are important tools
for improving judgment. Prior research in psychology
and accounting generally indicates that confidence and
familiarity improve the judgments of individuals,
which is strongly supported by our findings. This
study provides the motivation for future research to

Corporate Ownership & Control / Volume 13, Issue 1, Autumn 2015
64
learn what other judgment improvement tools are
important for accountants.
References
1. Agoglia, C. P., Doupnik, T. S. and Tsakumis, G. T.
(2011). Principles-based versus rules-based accounting
standards: the influence of standard precision and
audit committee strength on financial reporting
decisions. The Accounting Review, 86 (3), 747–767.
2. Anderson, B. H. and Maletta, M. (1994). Auditor
attendance to negative and positive information: the
effect of experience-related differences. Behavioral
Research in Accounting, 6, 1-20.
3. Asare, S. K. and McDaniel, L. S. (1996). The effects
of familiarity with the preparer and task complexity on
the effectiveness of the audit review process. The
Accounting Review, 71, 139-159.
4. Bae, K, Tan, H. and Welker, M. (2008). International
GAAP differences: the impact on foreign analysts. The
Accounting Review, 83(3), 593-628.
5. Banker, R. D., S. A. Slaughter. (2000). The moderating
effects of structure on volatility and complexity in
software enhancement. Information Systems Research,
11(3), 219–240.
6. Benabou, R. and Tirole, J. (2002). Self-confidence and
personal motivation. Quarterly Journal of Economics,
117(3), 871–915.
7. Boehm, B. R. (1981). Software Engineering
Economics. Prentice-Hall, Englewood Cliffs, NJ.
8. Bonner, S. E. (2007). Judgment and Decision Making
in Accounting. Pearson/Prentice Hall, Upper Saddle
River, NJ
9. Byard, D., Li, Y. and Yu, Y. (2011) Does mandatory
IFRS adoption level the informational playing field
between foreign and domestic analysts? Working
paper. Available at:
http://capana.net/download/2011papers/Byard_Li_and
_Yu_2011.pdf
10. Campbell, D. (1988). Task complexity: a review and
analysis. Academy of Management Review,
13(January), 40-52.
11. Chambers, R. J. and Wolnizer, P. (1991). A true and
fair view of position and results: the historical
background. Accounting, Business and Financial
History, 1 (2), 197–214.
12. Chand, P., Patel, C. and Patel, A. (2010). Interpretation
and application of “new” and “complex” international
financial reporting standards in Fiji: implications for
convergence of accounting standards. Advances in
Accounting, 26 (2), 280–289.
13. Devi, S. (2003). A framework for differential
reporting: A response to ISAR’s accounting and
financial reporting guidelines for small and medium
enterprises. Study undertaken for Confederation of
Asian and Pacific Accountants.
14. Doupnik, T. S. and Richter, M. (2003). Interpretation
of uncertainty expressions: a cross-national study.
Accounting, Organizations and Society, 28, 15–35.
15. Einhorn, H. J. and Hogarth, R. M. (1978). Confidence
in judgment: persistence of the illusion of validity.
Psychological Review, 85, 395– 416.
16. Espinosa, J. A., Slaughter, S.A., Kraut, R. E. and
Herbsleb, J. D. (2007). Familiarity, complexity, and
team performance in geographically distributed
software development. Organization Science, 18(4),
613-630.
17. Goodman, P. S. and Leyden, D. P. (1991). Familiarity
and group productivity. Journal of Applied
Psychology, 76(4), 578-586.
18. Goodman, P. S. and Shah, S. (1992). Familiarity and
work group outcomes. In Worchel, S. & Wood, W. &
Simpson, J. A. (Eds.), Group Processes and
Productivity: 578-586. Sage Publications, Newbury
Park, CA.
19. Hageman, A. M. (2010). The role of confidence in tax
return preparation using tax software. Advances in
Accounting Behavioural Research, 13, 3–57.
20. Hodgdon, C., Hughes, S. B. and Street, D. L. (2011).
Framework based teaching Based Teaching of IFRS
Judgments. Accounting Education, 20 (4), 415–439.
21. Hunton, J. E, Wright, A. M.and Wright S. (2004). Are
financial auditors overconfident in their ability to
assess risks associated with enterprise resource
planning systems? Journal of Information Systms, 18,
72–8.
22. Jamal, K. and Tan, H-T. (2010). Effect of principles-
based versus rules-based standards and auditor type on
financial managers’ reporting judgments. The
Accounting Review, 85 (4), 1325–1346.
23. Kebbell, M. R. (2009). Witness confidence and
accuracy: is a positive relationship maintained for
recall under interview conditions? Journal of
Investigative Psychology and Offender Profiling, 6,
11–23.
24. Kopp, L. S. and O’Donnell, E. (2005). The influence
of a business-process focus on category knowledge
and internal control evaluation. Accounting,
Organizations and Society, 30, 423–434.
25. Lee, J., Kim, H. J. & Ahn, M. J. (2011). The
willingness of e-government service adoption by
business users: the role of offline service quality and
trust in technology. Government Information
Quarterly, 28(2), 222–230.
26. Lee, M. D., and Dry, M. J. (2006). Decision-making
and confidence given uncertain advice. Cognitive
Science, 30, 1081–1095
27. Lichtenstein, S., Fischhoff, B. and Phillips, L. D.
(1982). Calibration of probabilities: the state of the art
to 1980. In D. Kahneman, P. Slovic, and A. Tversky
(Eds). Judgment Under Uncertainty: Heuristics and
Biases. Cambridge University Press. 306–334.
28. Littlepage, G., Robison, W. and Reddington, K.
(1997). Effects of task experience and group
experience on group performance, member ability, and
recognition of expertise. Organizational Behavior and
Human Decision Processes, 69(2), 133–147.
29. Metcalfe, J. and Finn, B. (2008). Familiarity and
retrieval processes in delayed judgments of learning.
Journal of Experimental Psychology: Learning,
Memory, and Cognition, 34(5), 1084–1097.
30. Peterson, D., and Pitz, G. (1988). Confidence,
uncertainty and the use of information. Journal of
Experimental Psychology: Human, Learning &
Memory, 14, 85–92.
31. Pincus, K. (1991). Audit judgment confidence.
Behavioral Research in Accounting, 3, 39–65.
32. Reagans, R., Argote, L. and Brooks, D. (2005).
Individual experience and experience working
together: Predicting learning rates from knowing who
knows what and knowing how to work together.
Management Science, 51(6) 869–881.
33. Reber, A. (1995). The Penguin Dictionary of
Psychology, 2nd ed. Penguin Books, New York.

Corporate Ownership & Control / Volume 13, Issue 1, Autumn 2015
65
34. Reinhard, M. A., Sporer, S. L. and Scharmach, M.
(2013). Perceived familiarity with a judgmental
situation improves lie detection ability. Swiss Journal
of Psychology, 72(1), 43–52.
35. Reinhard, M. A., Sporer, S. L., Scharmach, M. and
Marksteiner T (2011). Listening, not watching:
situational familiarity and the ability to detect
deception. Journal of Personality and Social
Psychology, 101(3), 467–84.
36. Schank, R. (1999). Dynamic memory revisited.
Cambridge University Press, New York.
37. See, K. E., Morrison, E. W., Rothman, N. B. and Soll,
J. B. (2011). The detrimental effects of power on
confidence, advice taking, and accuracy.
Organizational Behavior and Human Decision
Processes, 116 (2), 272–285.
38. Sniezek, J. (1992). Groups under certainty: an
example of confidence in group decision – making.
Organisational Behaviour and Human Decision
Processes, 52, 124–155.
39. Sniezek, J. A. and Henry, R. A. (1989). Accuracy and
confidence in group judgment. Organizational
Behavior and Human Decision Processes, 43 (l), 1–
28.
40. Sniezek, J. A., Paese, P. W. and Switzer, F. S. (1990).
The effect of choosing on confidence in choice.
Organizational Behavior and Human Decision
Processes, 46, 264–282.
41. Solomon, I. Artyo, A. and Tomassini, L. A. (1985).
Contextual effects on the calibration of probablistic
judgments, Journal of Applied Psychology, 70(3),
528–532.
42. Staw, B. M. (1976). Knee-deep in the big muddy: a
study of escalating commitment to a chosen course of
action. Organizational Behavior and Human Decision
Processes, 16 (1), 27–44.
43. Tomassini, L. A., Solomon, I. Romney, M. B. and
Krogstad. J. L. (1982). Calibration of auditors'
probabilistic judgments: some empirical evidence.
Organizational Behavior and Human Performance,
30(3): 391–407.
44. Verschoor, C. C. (2010). IFRS would escalate ethical
challenges for accountants. Strategic Finance, 92 (1),
13–16.
45. Weber, R. (1978). Auditor decision making on overall
system reliability: accuracy, consensus and the
usefulness of a simulation aid. Journal of Accounting
Research, Autumn, 368–388.
46. Walz, D. B., Elam, J. J. and Curtis, B. (1993). Inside a
software design team: knowledge acquisition, sharing,
and integration. Communications of the ACM, 36(10)
63–77.
47. Woodman, T., and Hardy, L. (2003). The relative
impact of cognitive anxiety and self-confidence upon
sport performance: a meta-analysis. Journal of Sports
Sciences, 21, 443 –457.
48. Wright, W. F. and Anderson, U. (1989). Effects of
situation familiarity and financial incentives on use of
the anchoring and adjustment heuristic for probability
assessment. Organizational Behavior and Human
Decision Processes, 44, 68–82.
49. Wustemann, J. and Wustemann, S. (2010). Why
consistency of accounting standards matters: a
contribution to the rules-versus-principles debate in
financial reporting. Abacus, 46 (1), 1–27.
Corporate Ownership & Control / Volume 13, Issue 1, Autumn 2015
66
AUDITORS CHARACTERISTICS AND AUDIT DELAY: EVIDENCE FROM INDONESIAN REGIONAL GOVERNMENTS
Sutaryo Sutaryo*, Yediel Lase**
Abstract
Overdue financial statements reporting, more specifically audit delay, can cause losses in its capacity in decision making. We investigate the effects of auditor characteristics on local governments’ audit delay by studying 127 Indonesian local governments. We find that auditor professional proficiency and auditor educational background have significant effect on the audit delay of local government financial statements. Our results also indicate the intersection of some auditor characteristics in affecting audit delay. Our findings mainly suggest that the auditor professional proficiency should be improved to shrink audit delay. Keywords: Audit Delay, Local Governments, Auditor Characteristics, Auditor Professional Proficiency, Auditor Educational Background, Auditor Tenure *Corresponding author. Faculty of Economics and Business, Universitas Sebelas Maret. Jl. Ir. Sutami 36A, Surakarta 57126, Indonesia Tel: +62271647481 Fax: +62271638143 **Indonesia Supreme Audit Council
1 Introduction
It has been widely known that timeliness of financial
reporting is crucial especially with regard to its impact
on decision making. Financial reports are useful if
they provide information to decision maker before that
information could not be able to influence the decision
(Kieso, 2012). Timeliness of financial reporting
depends on the audit period as financial report must be
released after the audit has been done (Johnson, 1998).
Auditors, therefore, are expected to work without
delay, at least within the professionally and ethically
limit (Carcello et al, 1992; DeAngelo, 1981). Audit
delay refers to the distance between the end of
financial period and the date of audit reporting (Payne
dan Jensen, 2002; Johnson et al, 2002). ```
Studies on the audit delay for local governments
have been done in the US and Europe. Payne and
Jensen (2002) document that managerial incentive is
associated with timeliness of reporting and quality of
financial reporting. Moreover, experience and
reputation of auditors reduce the audit delay. Cohen
and Leventis (2012), in the context of regional
governments in Greece, find that strong opposition,
size of local government, incumbent status,
population, internal audit team as well as remarks are
the determinants of audit delay.
The present paper investigates the determinants
of audit delay especially with regard to auditor’s
characteristics which are measured by educational
background, tenure, and professional capability. We
study in the context of public sector organizations,
more specifically Indonesian local governments. Little
is found on the determinants of audit delay for public
sector in Indonesia as most of papers discuss the audit
delay for profit organizations (Merdekawati dan
Arsjah, 2011; Rahmawati, 2008). According to the
Indonesian Public Accounting Standard (SAP),
financial report of government must deal with four
principles which are relevant, reliable, comparable and
understandable. To be reliable, financial report have to
provide information which have predictive ability,
complete and on time.
The Indonesian government has regulated the
timeliness of financial report of local government18
.
Financial reports have to be submitted 3 months after
the end of fiscal period to the Supreme Audit Council.
Then, the council has to exam those reports and
releases the audit report within 2 months to the local
parliament. Based on the summary of exam report for
the second semester of 2012, it could be seen that 94
financial reports (18.08%) were delayed reported.
This paper could be considered as the first paper
discussing the determinants of audit delay of local
government in Indonesia. This paper also adds to the
literature by taking into account the role of
characteristics of auditor.
18
Decree of Ministry of Internal Affairs No. 13/2006 and Act No. 15/ 2004.
Corporate Ownership & Control / Volume 13, Issue 1, Autumn 2015
67
2 Literature review 2.1 Agency theory
Agency theory deals with the contract between
principal and agent to perform on behalf of principal
with some authorities to agent to make decisions
(Jensen and Meckling, 1976). This theory emphasizes
on the separation between principal and agent.
However, this separation could lead to a conflict
between principal and agent (agency problem/ agency
conflict) which rises because manager may pursue
private benefits (Ugurlu, 2000; Jensen dan Meckling,
1976). It is assumed that agent has more information
than principal (information assymmetry) which then
could lead to the capability of principal to effectively
monitor the agent to ensure that agent behaves for the
interests of principal. The other assumption is that
principal and agent behave rationally in which they
will maximize their wealth. It means that agent might
have private interests which is contradictory with the
interest of principal. It is generally known as moral
hazard problem (Adams, 1994; Mustapha dan Ahmad,
2011). The last issue is adverse selection bias in which
the principal might not select the appropriate agent in
terms of expertise (Gilardi, 2001). The principal has to
allocate agency cost to minimize agency problem such
as the monitoring cost to audit the financial report
(Adams, 1994; Primadita dan Fitriany, 2012).
2.2 Agency theory in public organization
Halim and Abdullah (2006) argue that agency theory
can be applied in the public organization. In such
institution, the agency relationship is in the form of
society to parliament, parliament to executives
(government), government to minister, and
government to bureaucracy (Gilardi, 2001). In
Indonesia, based on the Government Rule (PP) No. 6/
2005, regional head which can be governor, mayor
and regent are directly elected by public in a general
election. In such mechanism, public delegate their
governmental authority to the regional head. It means
that the regional heads serve as agent while public is
the principal (Sutaryo and Winarna, 2013).
2.3 Examination of local government financial report as a monitoring mechanism
Adams (1994) explains that audit (examination) on
financial reports by external auditor is an example of
monitoring mechanism to ensure that agent behave in
line with the interest of principal. In the context of
Indonesian local governments, since 2006, it has been
implemented that local government financial reports
have to be audited yearly. Based on the Indonesian
Law No. 15/2004, it is clearly defined that audit is the
process of problem identification, analysis, and
evaluation which is conducted independently,
objective, and professional based on standards to
assess the truth, accuracy, credibility, and reliability of
information regarding the managing and responsibility
of state budget.
Audit to local government financial reports is
conducted by the Supreme Audit Council (BPK), an
independent state institution which is assigned to
examine the management and responsibility of state
budget according to the Indonesian constitution of
1945. BPK has authority to conduct three kinds of
examination which are financial examination,
performance examination and special purpose
examination. Financial examination is aimed at
providing reasonable assurance whether financial
reports have been presented properly in all materials
based on accounting principles applied in Indonesia or
comprehensive accounting basis which are not
generally applied in Indonesia. Following the
examination, BPK releases opinion which is a
professional statement as an auditor conclusion
regarding the fairness of information presented in the
financial reports.
The Law also regulates the duration of financial
reporting as well as the examination of the reports.
The Regulation of Ministry of Home Affairs No.
13/2006 mandates that regional heads (governor,
mayor and regent) have to submit the financial reports
to the BPK three months after the end of fiscal year.
According to the Law No. 15/2004, it is mentioned
that the BPK has to complete the examination within
two months and provide the reports to regional
parliament.
2.4 Audit delay
A number of studies measure audit delay as the time
difference between end of fiscal year and the audit
report (Payne dan Jensen, 2002; Johnson et al, 2002;
McLelland dan Giroux, 2000; Carslaw dan Kaplan
1991). The longer the audit delay could be considered
that the timeliness of financial report becomes
dwindle. The timelines of financial report is associated
with the quality of information to make decision
(Kieso et al., 2012). In this study, we measure audit
delay as the difference between the receiving of
financial report until the providing the report to local
parliament. It is more appropriate in the context of
Indonesia as the regulations have clearly divided the
period of financial reporting from local government to
the BPK and the period of audit of BPK. As explained
earlier,
2.5 Auditor characteristics
The process of examination/ audit is supposed to be
affected by auditor characteristic. Auditor
characteristic is generally identified based on the
characteristic of audit institution such as public
accountant office (KAP). Cohen and Leventis (2012)
and Carslaw and Kaplan (1991) disentangle auditor
Corporate Ownership & Control / Volume 13, Issue 1, Autumn 2015
68
characteristic to international KAP and local KAP.
Lowensohn et al (2007) categorize auditor
characteristic to big five KAP and non-big five.
Primadita dan Fitriany (2012) study the effect of audit
tenure and specialization on asymmetry information.
They divide tenure and specialization based on the
level of KAP. In this paper, we identify auditor
characteristics at the individual level. In an
examination, the team consists of person in charge,
technical control, team leader and team members.
Therefore, we employ education background, repeat
assignment (tenure), and professional capability to
proxy auditor characteristics.
Education background could be identified based
on the discipline at the university level, more
specifically accounting discipline. Setyaningrum
(2012) explains that accounting education is a
mandatory requirement to examine financial report.
Moreover, she documents that the higher the
education levels the more comprehensive accounting
knowledge that auditors have. In addition, she argues
that education quality of examiner should be higher
than executive, so that the examiner would be able to
assess the conformity of executive to the applied
standards. Setiawan dan Fitriany (2011) also explain
that accounting expertise, proxied by accounting
education background, is strongly needed for an
auditor to examine financial reports to provide
accurate and suitable information and to reduce the
probability of fraud in the reporting process.
Auditor tenure refers to the number of repeat
assignment in the same object. Almutairi et al (2009)
explains that the longer the tenure would reduce the
independency of auditor and reduce the auditor
objectivity. On the other side, one might also argue
that the audit quality would be improved with the
longer the tenure as the auditors have more
experiences and familiarity with the client especially
with regard to financial reporting. Almutairi et al
(2009) measure tenure as the consecutive years of the
relations between auditor and client. Payne and Jensen
(2002) argue that the longer the auditor tenure would
improve the capability to facilitate the preparation of
financial reports.
Auditor professional proficiency could be
measured based on the professional certification in
accounting. The standard of SPKN requires that
auditors should collectively have appropriate
professional capability. Moreover, it is also mentioned
in the standard that auditors should collectively have
expertise certification. Hutchison dan Fleischman
(2003) point out that accounting expertise certification
indicates the extent to which accountants are
competent in accounting and compliance with the
professional standards. Hutchison dan Fleischman
(2003) explains various expertise certifications for
accountant and auditors such as Certified Public
Accountant (CPA), Certified Fraud Examiner (CFE),
Certified Government Auditing Professional (CGAP),
Certified Information Systems Auditor (CISA),
Certified Internal Auditor (CIA) and others.
2.6 Hypotheses
LKPD (Local government financial report) is prepared
based on the accounting principles regulated in the
Indonesian Government Accounting Standard. To
examine this report, it is regulated that auditors must
have capability in auditing and accounting as well as
having good understanding on accounting principle
for local government. In general, BPK’s auditors have
education background in accounting. However,
complexity in examination process requires them to
equip them with some other competencies such as
information technology, law and engineering. In
addition, BPK also recruits auditors with non-
accounting education. However, they are massively
educated and trained with accounting and auditing
before assigned to audit. As the financial reports are
highly associated with accounting discipline, it is
expected that those having accounting background
should complete the audit on time. Therefore, we
hypothesize as follows:
H1: Education background in accounting is
negatively associated with audit delay
Auditors with repeat assignments in the same
local governments are expected to have more
experiences and familiarity with the client so that it
will ease them to complete the audit on time and
appropriate. However, on the contrary, Li (2007) finds
that auditor tenure is negatively associated with audit
conservatism due to the over trust behavior. Such
attitude could lead to negative behaviors for instance
reducing audit samples and neglecting audit
procedures. As there is a conflicting argument,
therefore, we hypothesize as follows:
H2: Auditor repeat assignments affect the audit
delay
With regard to the audit expertise, it is widely
known that professional certification is offered for
example public accountant, Certified Public
Accountant (CPA), Certified Information System
Auditor (CISA), Certified Fraud Examiners (CFE)
dan others. Those certifications are recognition to the
professionalism of an accountant in that field. Those
having such expertise are expected to have more
competences.
Better capability is considered to positively
correlate with timelines of audit. Schelker (2010)
empirically reveals that states in the US which require
auditors to have at least CPA have less spending and
liabilities and have higher bond rating compare to
those do not regulate such requirement. Therefore, we
hypothesize as follows:
H3: Auditor professional proficiency is
negatively associated with audit delay
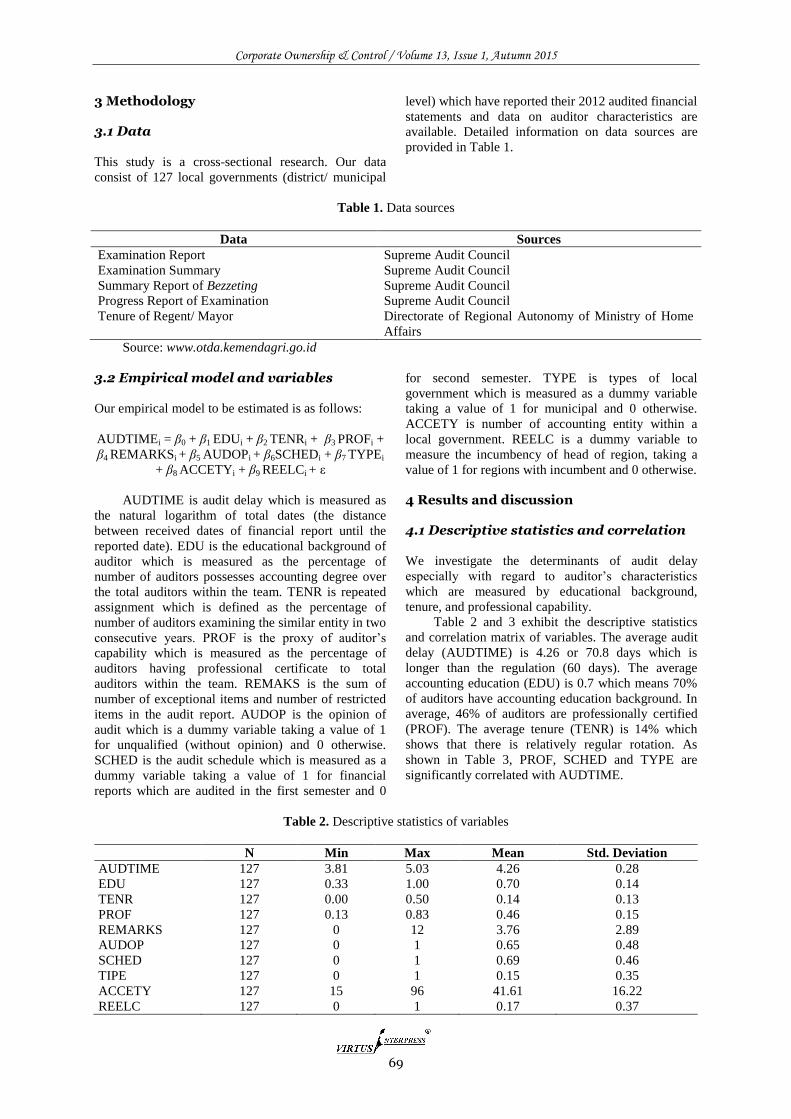
Corporate Ownership & Control / Volume 13, Issue 1, Autumn 2015
69
3 Methodology 3.1 Data
This study is a cross-sectional research. Our data
consist of 127 local governments (district/ municipal
level) which have reported their 2012 audited financial
statements and data on auditor characteristics are
available. Detailed information on data sources are
provided in Table 1.
Table 1. Data sources
Data Sources
Examination Report Supreme Audit Council
Examination Summary Supreme Audit Council
Summary Report of Bezzeting Supreme Audit Council
Progress Report of Examination Supreme Audit Council
Tenure of Regent/ Mayor Directorate of Regional Autonomy of Ministry of Home
Affairs
Source: www.otda.kemendagri.go.id
3.2 Empirical model and variables
Our empirical model to be estimated is as follows:
AUDTIMEi = β0 + β1 EDUi + β2 TENRi + β3 PROFi +
β4 REMARKSi + β5 AUDOPi + β6SCHEDi + β7 TYPEi
+ β8 ACCETYi + β9 REELCi + ε
AUDTIME is audit delay which is measured as
the natural logarithm of total dates (the distance
between received dates of financial report until the
reported date). EDU is the educational background of
auditor which is measured as the percentage of
number of auditors possesses accounting degree over
the total auditors within the team. TENR is repeated
assignment which is defined as the percentage of
number of auditors examining the similar entity in two
consecutive years. PROF is the proxy of auditor’s
capability which is measured as the percentage of
auditors having professional certificate to total
auditors within the team. REMAKS is the sum of
number of exceptional items and number of restricted
items in the audit report. AUDOP is the opinion of
audit which is a dummy variable taking a value of 1
for unqualified (without opinion) and 0 otherwise.
SCHED is the audit schedule which is measured as a
dummy variable taking a value of 1 for financial
reports which are audited in the first semester and 0
for second semester. TYPE is types of local
government which is measured as a dummy variable
taking a value of 1 for municipal and 0 otherwise.
ACCETY is number of accounting entity within a
local government. REELC is a dummy variable to
measure the incumbency of head of region, taking a
value of 1 for regions with incumbent and 0 otherwise.
4 Results and discussion 4.1 Descriptive statistics and correlation
We investigate the determinants of audit delay
especially with regard to auditor’s characteristics
which are measured by educational background,
tenure, and professional capability.
Table 2 and 3 exhibit the descriptive statistics
and correlation matrix of variables. The average audit
delay (AUDTIME) is 4.26 or 70.8 days which is
longer than the regulation (60 days). The average
accounting education (EDU) is 0.7 which means 70%
of auditors have accounting education background. In
average, 46% of auditors are professionally certified
(PROF). The average tenure (TENR) is 14% which
shows that there is relatively regular rotation. As
shown in Table 3, PROF, SCHED and TYPE are
significantly correlated with AUDTIME.
Table 2. Descriptive statistics of variables
N Min Max Mean Std. Deviation
AUDTIME 127 3.81 5.03 4.26 0.28
EDU 127 0.33 1.00 0.70 0.14
TENR 127 0.00 0.50 0.14 0.13
PROF 127 0.13 0.83 0.46 0.15
REMARKS 127 0 12 3.76 2.89
AUDOP 127 0 1 0.65 0.48
SCHED 127 0 1 0.69 0.46
TIPE 127 0 1 0.15 0.35
ACCETY 127 15 96 41.61 16.22
REELC 127 0 1 0.17 0.37
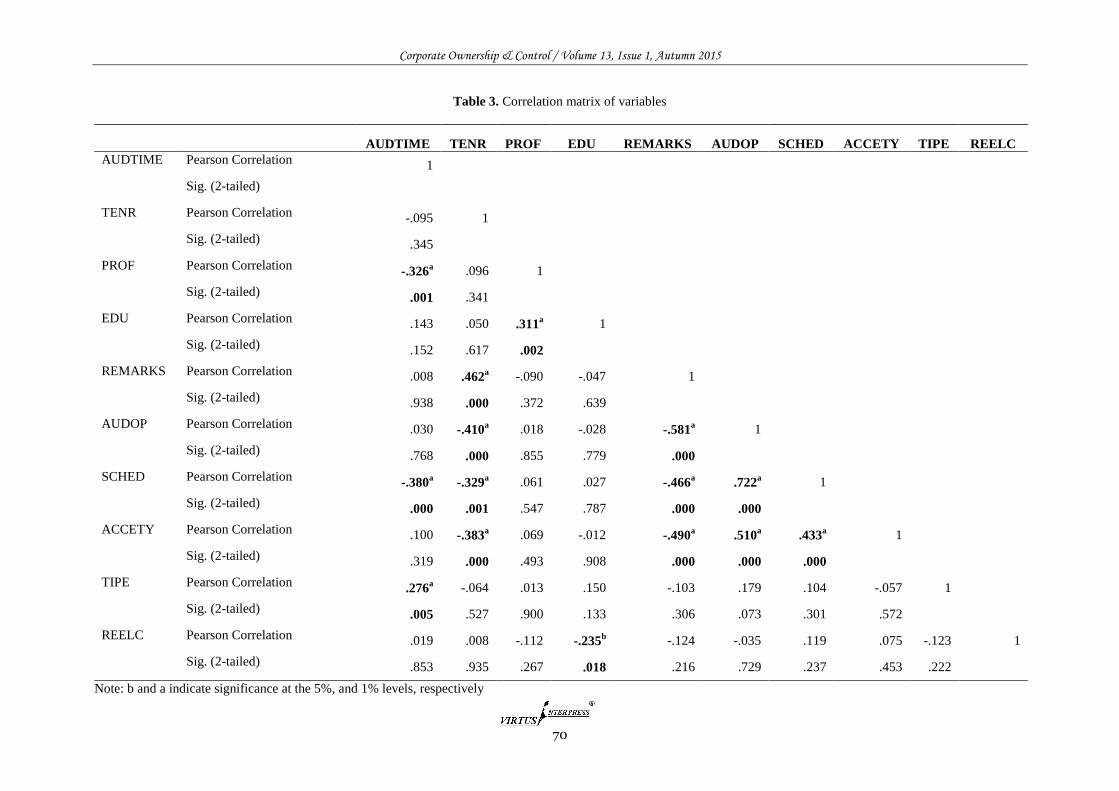
Corporate Ownership & Control / Volume 13, Issue 1, Autumn 2015
70
Table 3. Correlation matrix of variables
AUDTIME TENR PROF EDU REMARKS AUDOP SCHED ACCETY TIPE REELC
AUDTIME Pearson Correlation 1
Sig. (2-tailed)
TENR Pearson Correlation -.095 1
Sig. (2-tailed) .345
PROF Pearson Correlation -.326a .096 1
Sig. (2-tailed) .001 .341
EDU Pearson Correlation .143 .050 .311a 1
Sig. (2-tailed) .152 .617 .002
REMARKS Pearson Correlation .008 .462a -.090 -.047 1
Sig. (2-tailed) .938 .000 .372 .639
AUDOP Pearson Correlation .030 -.410a .018 -.028 -.581
a 1
Sig. (2-tailed) .768 .000 .855 .779 .000
SCHED Pearson Correlation -.380a -.329
a .061 .027 -.466
a .722
a 1
Sig. (2-tailed) .000 .001 .547 .787 .000 .000
ACCETY Pearson Correlation .100 -.383a .069 -.012 -.490
a .510
a .433
a 1
Sig. (2-tailed) .319 .000 .493 .908 .000 .000 .000
TIPE Pearson Correlation .276
a -.064 .013 .150 -.103 .179 .104 -.057 1
Sig. (2-tailed) .005 .527 .900 .133 .306 .073 .301 .572
REELC Pearson Correlation .019 .008 -.112 -.235b -.124 -.035 .119 .075 -.123 1
Sig. (2-tailed) .853 .935 .267 .018 .216 .729 .237 .453 .222
Note: b and a indicate significance at the 5%, and 1% levels, respectively
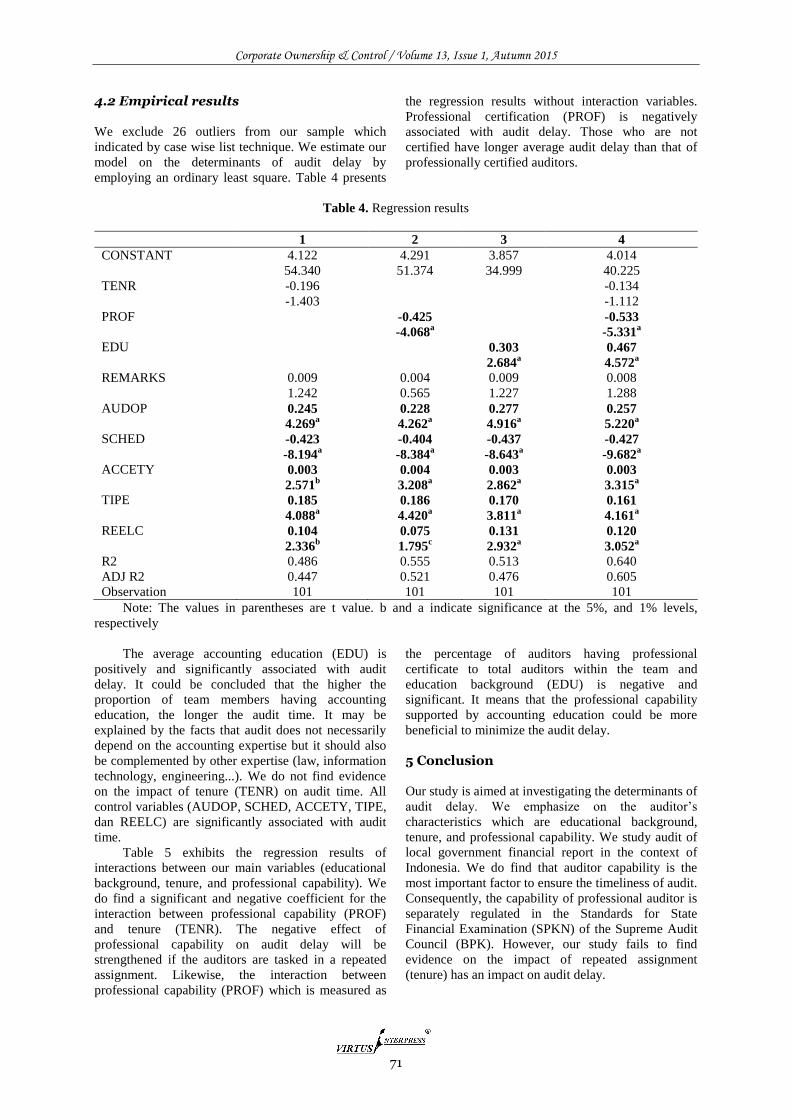
Corporate Ownership & Control / Volume 13, Issue 1, Autumn 2015
71
4.2 Empirical results
We exclude 26 outliers from our sample which
indicated by case wise list technique. We estimate our
model on the determinants of audit delay by
employing an ordinary least square. Table 4 presents
the regression results without interaction variables.
Professional certification (PROF) is negatively
associated with audit delay. Those who are not
certified have longer average audit delay than that of
professionally certified auditors.
Table 4. Regression results
1 2 3 4
CONSTANT 4.122 4.291 3.857 4.014
54.340 51.374 34.999 40.225
TENR -0.196
-0.134
-1.403
-1.112
PROF
-0.425
-0.533
-4.068
a
-5.331
a
EDU
0.303 0.467
2.684
a 4.572
a
REMARKS 0.009 0.004 0.009 0.008
1.242 0.565 1.227 1.288
AUDOP 0.245 0.228 0.277 0.257
4.269
a 4.262
a 4.916
a 5.220
a
SCHED -0.423 -0.404 -0.437 -0.427
-8.194
a -8.384
a -8.643
a -9.682
a
ACCETY 0.003 0.004 0.003 0.003
2.571
b 3.208
a 2.862
a 3.315
a
TIPE 0.185 0.186 0.170 0.161
4.088
a 4.420
a 3.811
a 4.161
a
REELC 0.104 0.075 0.131 0.120
2.336
b 1.795
c 2.932
a 3.052
a
R2 0.486 0.555 0.513 0.640
ADJ R2 0.447 0.521 0.476 0.605
Observation 101 101 101 101
Note: The values in parentheses are t value. b and a indicate significance at the 5%, and 1% levels,
respectively
The average accounting education (EDU) is
positively and significantly associated with audit
delay. It could be concluded that the higher the
proportion of team members having accounting
education, the longer the audit time. It may be
explained by the facts that audit does not necessarily
depend on the accounting expertise but it should also
be complemented by other expertise (law, information
technology, engineering...). We do not find evidence
on the impact of tenure (TENR) on audit time. All
control variables (AUDOP, SCHED, ACCETY, TIPE,
dan REELC) are significantly associated with audit
time.
Table 5 exhibits the regression results of
interactions between our main variables (educational
background, tenure, and professional capability). We
do find a significant and negative coefficient for the
interaction between professional capability (PROF)
and tenure (TENR). The negative effect of
professional capability on audit delay will be
strengthened if the auditors are tasked in a repeated
assignment. Likewise, the interaction between
professional capability (PROF) which is measured as
the percentage of auditors having professional
certificate to total auditors within the team and
education background (EDU) is negative and
significant. It means that the professional capability
supported by accounting education could be more
beneficial to minimize the audit delay.
5 Conclusion
Our study is aimed at investigating the determinants of
audit delay. We emphasize on the auditor’s
characteristics which are educational background,
tenure, and professional capability. We study audit of
local government financial report in the context of
Indonesia. We do find that auditor capability is the
most important factor to ensure the timeliness of audit.
Consequently, the capability of professional auditor is
separately regulated in the Standards for State
Financial Examination (SPKN) of the Supreme Audit
Council (BPK). However, our study fails to find
evidence on the impact of repeated assignment
(tenure) has an impact on audit delay.
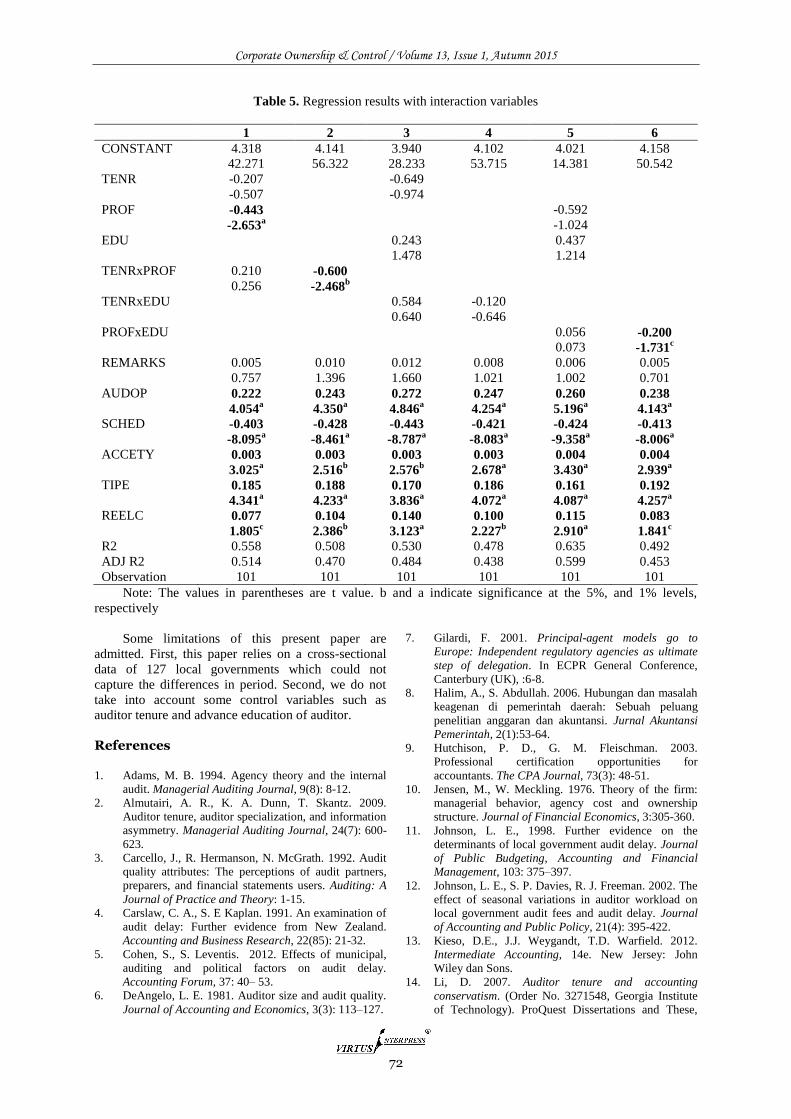
Corporate Ownership & Control / Volume 13, Issue 1, Autumn 2015
72
Table 5. Regression results with interaction variables
1 2 3 4 5 6
CONSTANT 4.318 4.141 3.940 4.102 4.021 4.158
42.271 56.322 28.233 53.715 14.381 50.542
TENR -0.207
-0.649
-0.507
-0.974
PROF -0.443
-0.592
-2.653
a
-1.024
EDU
0.243
0.437
1.478
1.214
TENRxPROF 0.210 -0.600
0.256 -2.468b
TENRxEDU
0.584 -0.120
0.640 -0.646
PROFxEDU
0.056 -0.200
0.073 -1.731c
REMARKS 0.005 0.010 0.012 0.008 0.006 0.005
0.757 1.396 1.660 1.021 1.002 0.701
AUDOP 0.222 0.243 0.272 0.247 0.260 0.238
4.054
a 4.350
a 4.846
a 4.254
a 5.196
a 4.143
a
SCHED -0.403 -0.428 -0.443 -0.421 -0.424 -0.413
-8.095
a -8.461
a -8.787
a -8.083
a -9.358
a -8.006
a
ACCETY 0.003 0.003 0.003 0.003 0.004 0.004
3.025
a 2.516
b 2.576
b 2.678
a 3.430
a 2.939
a
TIPE 0.185 0.188 0.170 0.186 0.161 0.192
4.341
a 4.233
a 3.836
a 4.072
a 4.087
a 4.257
a
REELC 0.077 0.104 0.140 0.100 0.115 0.083
1.805
c 2.386
b 3.123
a 2.227
b 2.910
a 1.841
c
R2 0.558 0.508 0.530 0.478 0.635 0.492
ADJ R2 0.514 0.470 0.484 0.438 0.599 0.453
Observation 101 101 101 101 101 101
Note: The values in parentheses are t value. b and a indicate significance at the 5%, and 1% levels,
respectively
Some limitations of this present paper are
admitted. First, this paper relies on a cross-sectional
data of 127 local governments which could not
capture the differences in period. Second, we do not
take into account some control variables such as
auditor tenure and advance education of auditor.
References 1. Adams, M. B. 1994. Agency theory and the internal
audit. Managerial Auditing Journal, 9(8): 8-12.
2. Almutairi, A. R., K. A. Dunn, T. Skantz. 2009.
Auditor tenure, auditor specialization, and information
asymmetry. Managerial Auditing Journal, 24(7): 600-
623.
3. Carcello, J., R. Hermanson, N. McGrath. 1992. Audit
quality attributes: The perceptions of audit partners,
preparers, and financial statements users. Auditing: A
Journal of Practice and Theory: 1-15.
4. Carslaw, C. A., S. E Kaplan. 1991. An examination of
audit delay: Further evidence from New Zealand.
Accounting and Business Research, 22(85): 21-32.
5. Cohen, S., S. Leventis. 2012. Effects of municipal,
auditing and political factors on audit delay.
Accounting Forum, 37: 40– 53.
6. DeAngelo, L. E. 1981. Auditor size and audit quality.
Journal of Accounting and Economics, 3(3): 113–127.
7. Gilardi, F. 2001. Principal-agent models go to
Europe: Independent regulatory agencies as ultimate
step of delegation. In ECPR General Conference,
Canterbury (UK), :6-8.
8. Halim, A., S. Abdullah. 2006. Hubungan dan masalah
keagenan di pemerintah daerah: Sebuah peluang
penelitian anggaran dan akuntansi. Jurnal Akuntansi
Pemerintah, 2(1):53-64.
9. Hutchison, P. D., G. M. Fleischman. 2003.
Professional certification opportunities for
accountants. The CPA Journal, 73(3): 48-51.
10. Jensen, M., W. Meckling. 1976. Theory of the firm:
managerial behavior, agency cost and ownership
structure. Journal of Financial Economics, 3:305-360.
11. Johnson, L. E., 1998. Further evidence on the
determinants of local government audit delay. Journal
of Public Budgeting, Accounting and Financial
Management, 103: 375–397.
12. Johnson, L. E., S. P. Davies, R. J. Freeman. 2002. The
effect of seasonal variations in auditor workload on
local government audit fees and audit delay. Journal
of Accounting and Public Policy, 21(4): 395-422.
13. Kieso, D.E., J.J. Weygandt, T.D. Warfield. 2012.
Intermediate Accounting, 14e. New Jersey: John
Wiley dan Sons.
14. Li, D. 2007. Auditor tenure and accounting
conservatism. (Order No. 3271548, Georgia Institute
of Technology). ProQuest Dissertations and These,

Corporate Ownership & Control / Volume 13, Issue 1, Autumn 2015
73
138-n/a.
http://search.proquest.com/docview/304871423?
accountid=86413.
15. Lowensohn, S., L.E. Johnson, R.J. Elder, S.P. Davies.
2007. Auditor specialization, perceived audit quality,
and audit fees in the local government audit market.
Journal of Accounting and Public Policy 26: 705–732.
16. McLelland, A. J., G. Giroux. 2000. An empirical
analysis of auditor report timing by large
municipalities. Journal of Accounting and Public
Policy, 19(3): 263-281.
17. Merdekawati I., R.J. Arsjah. 2001. Timeliness of
financial reporting analysis: an empirical study in
indonesia stock exchange. Simposium Nasional
Akuntansi (SNA) XIV.
18. Mustapha, M., A. C. Ahmad. 2011. Agency theory
and managerial ownership: evidence from Malaysia.
Managerial Auditing Journal, 26(5): 419-436.
19. Payne, J. L., dan K. L. Jensen. 2002. An examination
of municipal audit delay. Journal of Accounting and
Public Policy, 21: 1–29.
20. Primadita, I., Fitriany. 2012. Pengaruh tenure audit
dan auditor spesialis terhadap informasi asimetri.
Simposium Nasional Akuntansi XV.
21. Rachmawati, S. 2008. Pengaruh faktor internal dan
eksternal perusahaan terhadap audit delay dan
timeliness. Jurnal Akuntansi dan Keuangan, 10: 1-10.
22. Schelker, M. 2010. Auditor expertise: Evidence from
the public sector. Working paper.
http://papers.ssrn.com.
23. Setiawan, L., Fitriany. 2011. Pengaruh workload dan
spesialisasi auditor terhadap kualitas audit dengan
komite audit sebagai variabel pemoderasi. Simposium
Nasional Akuntansi XIV.
24. Setyaningrum, D. 2012. Analisis faktor-faktor yang
mempengaruhi kualitas audit BPK-RI. Simposium
Nasional Akuntansi XV.
25. Sutaryo, Winarna, J. 2013. Karakteristik DPRD dan
kinerja penyelenggaraan pemerintah daerah:
Dukungan empiris dari perspektif teori keagenan.
Simposium Nasional Akuntansi XVI.
26. Ugurlu, M. 2000. Agency costs and corporate control
devices in the Turkish manufacturing industry.
Journal of Economic Studies, 27(6) :566-599.
Corporate Ownership & Control / Volume 13, Issue 1, Autumn 2015
74
OWNERSHIP, CORPORATE GOVERNANCE AND MANDATORY TAX DISCLOSURE INFLUENCING
VOLUNTARY FINANCIAL DISCLOSURE IN INDONESIA
Agung Nur Probohudono*, Eko Arief Sudaryono*, Nurmadi Harsa Sumarta*, Yonatan Ardilas*
Abstract
This study examines the impact of ownership, corporate governance and mandatory tax disclosure on voluntary financial disclosure in Indonesia using 102 Indonesian listed companies in the period of 2009 to 2012, a total sample is 408 annual reports. The results show that proportion of independent director, managerial ownership, institutional ownership, foreign ownership and mandatory tax disclosure are assosiated with voluntary financial disclosure. Analysis reveals a moderate level of 59,90% score of disclosure in the period of 2009 to 2012 in Indonesian listed companies. Statistical analysis shows that the lowest disclosure score is in 2009 with the “Projected Information” as the subcategory of the disclosure. The highest voluntary financial disclosure is in 2012 with the “stock price information” as the subcategory of the disclosure. This study implies that ownership, corporate governance and mandatory tax disclosure are the key factors to explain communicating companies’ voluntary financial disclosures.
Keywords: Voluntary Financial Disclosure, Ownership, Corporate Governance, Mandatory Mandatory Tax Disclosure, Indonesia *Fakultas Ekonomi dan Bisnis Universitas Sebelas Maret, Surakarta Indonesia
1 Introduction
Indonesia is a country in Southeast Asia that lies on
the equator and is located in between Asia and
Australia continent. Furthermore, Indonesia is
surrounded by The Pacific Ocean and Indian Ocean.
With 17,508 islands scattered around, Indonesia has
become the greatest archipelago country in the world.
The economic growth that is 6.5% in the end of 2011
has led Indonesia to be a developing country with the
highest economic growth in Southeast Asia.
The recent disclosure has become the main focus
in many researches (Bamber and Mcmeeking 2010;
Gisbert and Navallas 2013; Wang, Ali and Al-Akra
2013). The objective of the disclosure is to reduce the
asymmetry information that is laid between the agent
and the principal, in accordance with the public doubt
that increased toward the financial statement and the
traumatic happened after the Enron issue in 2001
about the corporate governance and since then the
disclosure has become the main attention in the
developing country, especially in term of transparency
(Reed, 2002; Barth and Schipper, 2008).
The disclosure in the financial statement would
make the users understand the content easier, so the
users would accept all the information provided by the
management (Qu et al, 2013; schipper, 1991; Parker
2007).
Disclosure, the requirement in the capital market,
is used to gain interest from the investors or the
potential investors, and also used to gain a bigger
amount of analysis. (Gul and Leung, 2004; Lang and
Lundholm, 1996; Healy and Palepu, 2001; Hodge et
al., 2004).
Disclosure is one of the main foundations in the
Good Corporate Governance because the information
availability is very important to minimize the
asymmetric information that lay between the insider
and the outsider. (Cheung et al., 2010; Probohudono et
al., 2013a; Latridis dan Alexakis, 2012; Gisbert dan
Navallas, 2013). Better management of a company
would likely to increase the management’s incentive
to reveal the company’s information to the
shareholder. (Jensen, 2000; Chau and Gray, 2002).
Monitoring from the independent board would
likely to increase the value of the financial statement,
especially in raising the disclosure (Gul and Leung,
2004; Lang and Lundholm, 1996; Healy and Palepu,
2001; Hodge et al., 2004). Other research, how to
increase the Financial Instruments Disclosures by
Taylor et al. (2001), is influenced by several aspects,
such as Income tax; either income tax exposure or
income tax transparency. Disclosure is also influenced
by various policies, such as the tax elusion policy by
the management and the tax management. (Hasseldine
dan Morris, 2013; Huseynov dan Klamm, 2012;
Corporate Ownership & Control / Volume 13, Issue 1, Autumn 2015
75
Minnick dan Noga, 2010; Fischer et al., 1992; Watts,
1977)
The voluntary disclosure is also one of the
important aspects and used to add the value of the
financial statement (Bamber dan Mcmeeking, 2010;
Tsalavoutas, 2011; Lo, 2003; Einhorn, 2007). The
voluntary disclosure is the management’s free choice
in providing the financial statement and the
information that might be useful in the decision-
making by the financial statement users (Meek et al.,
1995; Probohudono et al., 2013b; Ntim, Lindop dan
Thomas, 2013).
The decision to reveal the information from a
company is likely depended on the individual
management’s consideration according to their
welfare level. The manager could use their wisdom
either to disclose or not to disclose the information to
facilitate their contribution in the opportunistic
attitude for their interest (Watts dan Zimmerman,
1990; Warfield et al, 1995).
Jensen and Meckling (1976) said that the
ownership separation and the control of the company
gave the agent (manager) support to service their self-
interest by sacrificing the principal (stockholder)
interest. The main problem with this company is the
asymmetric information between the manager and the
stockholder. The manager, the self-interested agent,
have information about the recent future performance
and the stockholders have less information about the
possibility that might happen in the future.
Shleifer and Vishny (1997) suggested that well
planned structure management could help to ensure
the company to achieve the optimal disclosure policy.
However, Taylor et al. (2010) also suggested that the
disclosure pattern of the financial risk management is
significantly and positively related to the strength of
the company structure management.
2 Literature review
This research used an agency theory because the
theory have been used in various researches,
(Probohudono et al., 2013; Taylor et al. 2010). Jensen
and Meckling (1976), have defined the agency theory
as the agency relationship under one contract or more
(principal) that have a deal with another side (agent) to
do some business and their members authority to take
some decisions.
Berle and Means (1932) argued that the
separation is not without risks; there are risks in the
separation, such as the different information that the
principal have got from the agent (manager) called
asymmetry information.
Asymmetric information have caused the loss
toward the principal side, because it isn’t likely to
have the entire and the real picture about the company
activity (Fama and Jensen, 1983; Herry and Hamin,
2005; Eisenhardt, 1989). The company management
issue, like the monitoring mechanism, have a great
connection to the agency theory (Mat Nor and Sulong,
2007; Maijoor, 2000)
2.1 Independent commissioner proportion
Xie et al, (2003) in his research have proved that the
independent board and the independent commissioner
board are effectively monitored the decisions and the
company managerial activities, while other researches
suggested that the independent committee board have
given advices and guidance to the management
(Dahya and McConnell, 2005). Chen and Jaggi (2000)
in their research suggested that the independent
commissioner proportion would stimulate the
management to raise the company voluntary
disclosure, the independent commissioner proportion
is expected to give a big effect to the management’s
decisions to widely give the information disclosure
(Forker, 1992; Fama and Jensen, 1983; Williams,
2002)
H1: The independent commissioner proportion
have a positive effect on the voluntary financial
disclosure to the listed companies in Indonesia Stock
Exchange (IDX).
2.2 Managerial ownership
High managerial ownership would likely to open a
management gap to manipulate the profit and to
monopolize the information. It happened because of
the lack of control of the stock market that caused the
manager to make an accountant option that matched to
his self-interest of the self-motivation than the
company interests (Sanchez-Ballesta and Garcia-
Meca, 2007).
Eng and Mak (2003) in their research argued that
the low managerial ownership would likely to increase
the needs and the supports of the disclosure from
outside. Morck et al., (1988) argued when the
managerial ownership increased, the market’s skills
controlling the company would be less effective in
supporting the manager to take decisions to maximize
the value of the company.
H2: Managerial Ownership have a negative
effect on the voluntary financial disclosure to the
listed company in IDX.
2.3 Institutional ownership
Institutional ownership, based on their great
shareholder, have a bigger interest to reduce the
agency cost because they could gain bigger benefit of
monitoring and could gain greater vote that made it
easy to take a corrective action if necessary. (Morck,
et.al., 1997; Bushe and Goodman, 2007). El-Gazzar
(1998) noted that the institutional ownership is
positively connected to the voluntary disclosure.
H3: Institutional ownership have a positive effect
on the voluntary financial disclosure to the listed
company in IDX.
Corporate Ownership & Control / Volume 13, Issue 1, Autumn 2015
76
2.4 Foreign ownership
Foreign ownership is an ownership where the
company have a number of percentages from the
foreign investors who invested in the domestic market.
The foreign investors would likely to have less
information that is more transparent, thus the foreign
investors demanded a higher disclosure in the
financial statement (Ananchoticul, 2007; Mangena
dan Tauringana, 2007).
Haniffa and Cooke (2002) in their research found
the significant interaction between the company
disclosure and the level of the foreign ownership.
Based on that explanation, there is a hypothesis:
H4: The foreign ownership have a positive effect
on the voluntary financial disclosure to the listed
company in IDX.
2.5 Public ownership
Public ownership is an ownership that have various
kinds of shareholders with low percentages. The
public ownership is studied first by Berle and Means
(1932) who suggested that big companies in the US
have been owned by small shareholders. Hardiningsih
(2008) in her research suggested that there are
differences in the public ownership proportion that
could affect the policy and the disclosure
comprehensiveness by the company.
H5: The public ownership have a positive effect
on the voluntary financial disclosure to the listed
company in IDX.
2.6 Mandatory tax disclosure
In his research, Bardertscher et al (2013) said that the
companies are trying to do tax management in their
business activity. Indeed, it is to reduce the loss risk in
the business, hence the tax regulation and the tax
payment are important for the investors.
Taylor et al. (2011) in his research suggested that
the withholding taxes, foreign sourced income and tax
haven affected and connected to the disclosure pattern.
So in conclusion the tax structure affected the
corporate disclosure pattern.
Indonesia rule mandatory about listed companies
(Bapepam-LK rules No.X.K.6) issued by Indonesia
Capital Market Supervisory Agency (Bapepam-LK)
explains about the disclosure of tax that supports the
quality from the financial statement. The items must
be disclosed in the financial statement are:
1. The explanation about the connection
between the tax income and accounting profit.
2. The fiscal reconciliation and the recent tax
accounting.
3. The statement that the Taxable Profit as the
result of the reconciliation has become the basis in
filling out the yearly tax.
4. The asset detail and the deferred tax liability
that is admitted in the financial position report for
each proposal period and the total differed tax load
(income) that is admitted in the income statement if
the total is not available from the total asset or the
deferred tax liability admitted in the financial position
statement.
5. There is tax dispute or not in the disclosure.
H6: The mandatory tax disclosure have a
positive effect on the voluntary financial disclosure to
the registered company in Indonesia Stock Exchange
(IDX)
3 Methodology
The subjects in this research are all companies listed
on the Indonesia Stock Exchange (IDX) in 2009,
2010, 2011, and 2012. There are 408 subject
companies in this research.
3.1 Dependent variable
In this research, the voluntary financial disclosure is
estimated with the voluntary financial disclosure index
(VFDI) that is adapted from the research Bruslerie and
Gabteni (2001), Ho and Taylor (2013), Chow and
Boren (1987), Akhtaruddin and Haron (2010), and
Meek et.al (1995). The voluntary financial disclosure
index is categorized based on qu et al. (2013) such as
indicators, financial review, projected information,
foreign currency information, stock price information,
and other useful financial information. There are 35
items in this index (see Apendix A).
3.2 Independent variable
The independent variable used in this research is the
independent commissioner proportion, managerial
ownership, institutional ownership, foreign ownership,
public ownership and mandatory tax disclosure .
3.3 Control variable
There are four variables in this research, such as
leverage, size, profitability. Those three variables are
controlled variables so there are no any outside factors
that affected the indicators being estimated.
4 Results 4.1 Descriptive result The SPSS output descriptive statistic result suggested
the total observation in the research (N) is 408
companies. Among the 408 companies the mean of the
Voluntary Financial Disclosure (VFD) variables is
0.599, the lowest disclosure value is 43% and the
highest disclosure value is 77%.
Corporate Ownership & Control / Volume 13, Issue 1, Autumn 2015
77
Table 1. Variables and variables measurement
Name Acronym Measuring
Dependent variables
Voluntary Financial
Disclosure
VFD Total disclosure items disclosed by companies / total
disclosure value indexs.
Independent variables
Independent Commissioner KOMIND The total independent commissioner / total commissioner
boards
Managerial Ownership MANOWN Total stocks managerial ownership/ total company stocks
Institutional Ownership INSTOWN Total stocks institutions ownership/ total companies stocks
Foreign Ownership FOROWN Total stocks foreigners ownership/ total companies stocks
Public Ownership PUBOWN Total Stock public ownership / total companies stock
Mandatory tax disclosure TAXDISC Mandatory tax disclosure score achieved / maximum
mandatory tax disclosure score
Control variables
The companies
measurement
SIZE Log total assets
Leverage Leverage Total liabilities / total assets
Profitability Profitability Netto / total assets
Table 2. Descriptive statistic
N Minimum Maximum Mean Std. Deviation
VFD 408 .4285714285715285 .7714285714286715 .599019607843237 .067498325044170
KOMIND 408 .2000 1.0000 .447500 .1347125
MANOWN 408 .0000 .7926 .024441 .0873720
INSTOWN 408 .0000 1.0000 .397893 .3400467
FOROWN 408 .0000 .9900 .244320 .3132506
PUBOWN 408 .0000 1.0000 .285333 .2051262
TAXDISC 408 .6000 1.0000 .762745 .0874667
Size 408 4.3273 8.8032 6.518225 .8797187
Leverage 408 .0057 27.1341 .696406 1.5281194
Profitability 408 -.4480 6.1628 .094852 .3439190
Valid N (list wise) .
Note: see Table 1 for acronym
The maximum KOMIND value is 1 and the
minimum is 0.2. The mean of the MANOWN
companies in the research is 2% with the deviation
standard is 9%. The lowest institutional ownership
value of the INSTOWN among the 408 samples is 0%
and the highest is 100%. The lowest foreigner
ownership of the FOROWN is 0% and the highest is
99% by the Bentoel International Investama Tbk. The
mean of the PUBOWN is 29% and the deviation
standard is 21%. The mean of the TAXDISC is 76%
and the standard deviation is 87%.
4.2 Descriptive result per item
Table 3. Descriptive voluntary financial disclosure item
Voluntary Financial Disclosure Item Pool 2009 2010 2011 2012
Total Voluntary Financial disclosure index 59.90% 57.73% 59.33% 60.78% 61.76%
Performance indicators 71.02% 70.22% 70.47% 71.20% 72.18%
Historical figures for last five years or more 92.40% 93.14% 92.16% 92.16% 92.16%
Profitability ratios 95.83% 95.10% 95.10% 96.08% 97.06%
Cash flow ratios 12.25% 8.82% 11.76% 13.73% 14.71%
Liquidity ratios 86.27% 85.29% 86.27% 86.27% 87.25%
Gearing ratios 86.76% 86.27% 86.27% 86.27% 88.24%
Net tangible assets per share. 12.75% 10.78% 10.78% 13.73% 15.69%
Explanation provided for change in sales. 96.81% 98.04% 97.06% 96.08% 96.08%
Explanation provided for change in operating
income/net income 85.05% 84.31% 84.31% 85.29% 86.27%
Financial review 52.80% 49.16% 52.38% 53.92% 55.74%
Disclosure of intangible valuations 16.67% 9.80% 16.67% 19.61% 20.59%
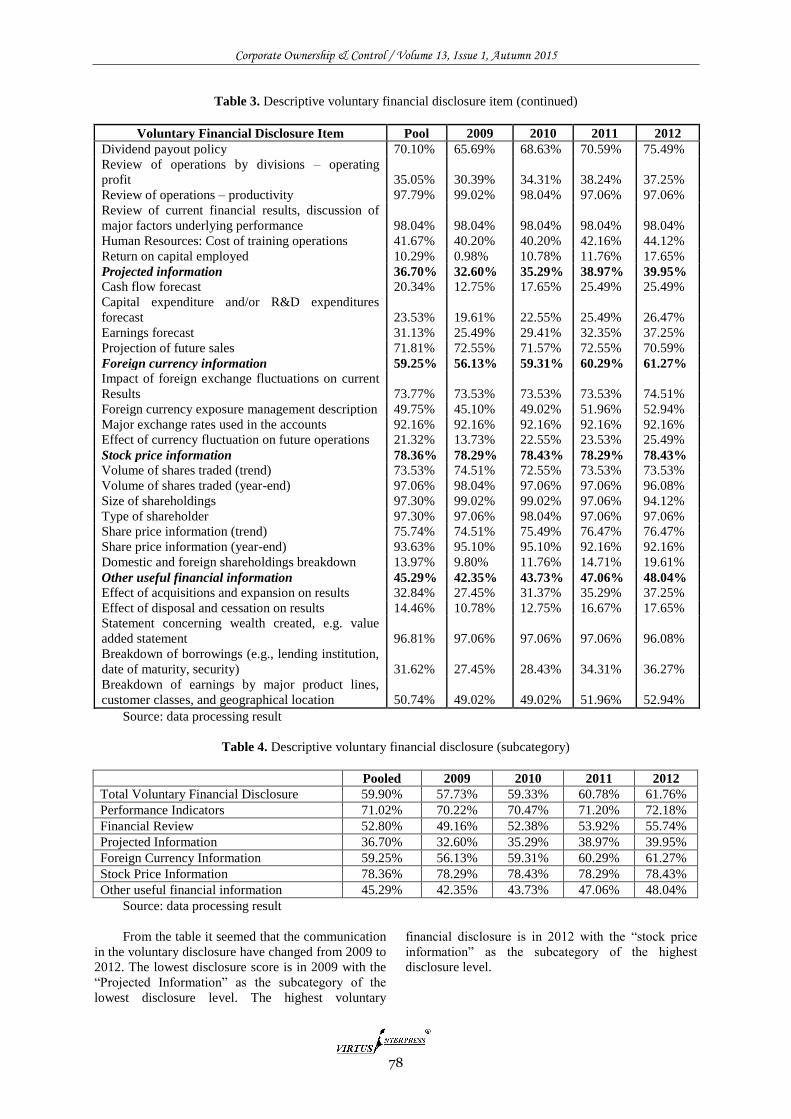
Corporate Ownership & Control / Volume 13, Issue 1, Autumn 2015
78
Table 3. Descriptive voluntary financial disclosure item (continued)
Voluntary Financial Disclosure Item Pool 2009 2010 2011 2012
Dividend payout policy 70.10% 65.69% 68.63% 70.59% 75.49%
Review of operations by divisions – operating
profit 35.05% 30.39% 34.31% 38.24% 37.25%
Review of operations – productivity 97.79% 99.02% 98.04% 97.06% 97.06%
Review of current financial results, discussion of
major factors underlying performance 98.04% 98.04% 98.04% 98.04% 98.04%
Human Resources: Cost of training operations 41.67% 40.20% 40.20% 42.16% 44.12%
Return on capital employed 10.29% 0.98% 10.78% 11.76% 17.65%
Projected information 36.70% 32.60% 35.29% 38.97% 39.95%
Cash flow forecast 20.34% 12.75% 17.65% 25.49% 25.49%
Capital expenditure and/or R&D expenditures
forecast 23.53% 19.61% 22.55% 25.49% 26.47%
Earnings forecast 31.13% 25.49% 29.41% 32.35% 37.25%
Projection of future sales 71.81% 72.55% 71.57% 72.55% 70.59%
Foreign currency information 59.25% 56.13% 59.31% 60.29% 61.27%
Impact of foreign exchange fluctuations on current
Results 73.77% 73.53% 73.53% 73.53% 74.51%
Foreign currency exposure management description 49.75% 45.10% 49.02% 51.96% 52.94%
Major exchange rates used in the accounts 92.16% 92.16% 92.16% 92.16% 92.16%
Effect of currency fluctuation on future operations 21.32% 13.73% 22.55% 23.53% 25.49%
Stock price information 78.36% 78.29% 78.43% 78.29% 78.43%
Volume of shares traded (trend) 73.53% 74.51% 72.55% 73.53% 73.53%
Volume of shares traded (year-end) 97.06% 98.04% 97.06% 97.06% 96.08%
Size of shareholdings 97.30% 99.02% 99.02% 97.06% 94.12%
Type of shareholder 97.30% 97.06% 98.04% 97.06% 97.06%
Share price information (trend) 75.74% 74.51% 75.49% 76.47% 76.47%
Share price information (year-end) 93.63% 95.10% 95.10% 92.16% 92.16%
Domestic and foreign shareholdings breakdown 13.97% 9.80% 11.76% 14.71% 19.61%
Other useful financial information 45.29% 42.35% 43.73% 47.06% 48.04%
Effect of acquisitions and expansion on results 32.84% 27.45% 31.37% 35.29% 37.25%
Effect of disposal and cessation on results 14.46% 10.78% 12.75% 16.67% 17.65%
Statement concerning wealth created, e.g. value
added statement 96.81% 97.06% 97.06% 97.06% 96.08%
Breakdown of borrowings (e.g., lending institution,
date of maturity, security) 31.62% 27.45% 28.43% 34.31% 36.27%
Breakdown of earnings by major product lines,
customer classes, and geographical location 50.74% 49.02% 49.02% 51.96% 52.94%
Source: data processing result
Table 4. Descriptive voluntary financial disclosure (subcategory)
Pooled 2009 2010 2011 2012
Total Voluntary Financial Disclosure 59.90% 57.73% 59.33% 60.78% 61.76%
Performance Indicators 71.02% 70.22% 70.47% 71.20% 72.18%
Financial Review 52.80% 49.16% 52.38% 53.92% 55.74%
Projected Information 36.70% 32.60% 35.29% 38.97% 39.95%
Foreign Currency Information 59.25% 56.13% 59.31% 60.29% 61.27%
Stock Price Information 78.36% 78.29% 78.43% 78.29% 78.43%
Other useful financial information 45.29% 42.35% 43.73% 47.06% 48.04%
Source: data processing result
From the table it seemed that the communication
in the voluntary disclosure have changed from 2009 to
2012. The lowest disclosure score is in 2009 with the
“Projected Information” as the subcategory of the
lowest disclosure level. The highest voluntary
financial disclosure is in 2012 with the “stock price
information” as the subcategory of the highest
disclosure level.
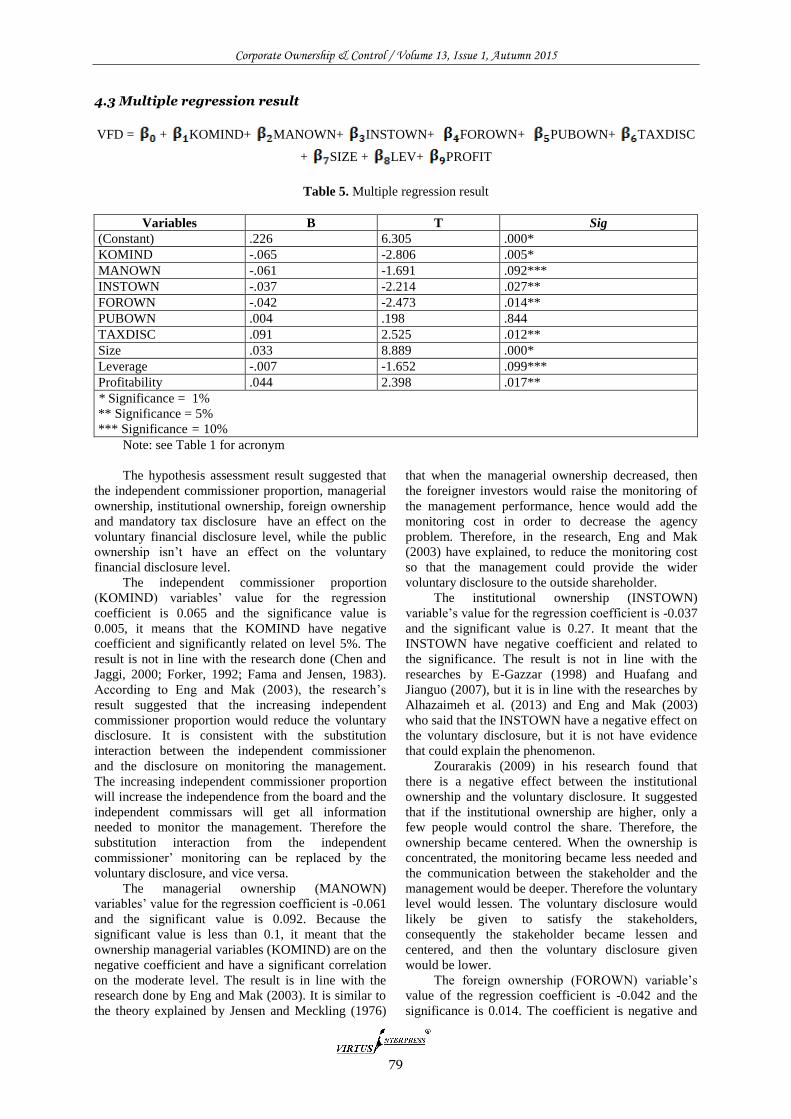
Corporate Ownership & Control / Volume 13, Issue 1, Autumn 2015
79
4.3 Multiple regression result
VFD = + KOMIND+ MANOWN+ INSTOWN+ FOROWN+ PUBOWN+ TAXDISC
+ SIZE + LEV+ PROFIT
Table 5. Multiple regression result
Variables B T Sig
(Constant) .226 6.305 .000*
KOMIND -.065 -2.806 .005*
MANOWN -.061 -1.691 .092***
INSTOWN -.037 -2.214 .027**
FOROWN -.042 -2.473 .014**
PUBOWN .004 .198 .844
TAXDISC .091 2.525 .012**
Size .033 8.889 .000*
Leverage -.007 -1.652 .099***
Profitability .044 2.398 .017**
* Significance = 1%
** Significance = 5%
*** Significance = 10%
Note: see Table 1 for acronym
The hypothesis assessment result suggested that
the independent commissioner proportion, managerial
ownership, institutional ownership, foreign ownership
and mandatory tax disclosure have an effect on the
voluntary financial disclosure level, while the public
ownership isn’t have an effect on the voluntary
financial disclosure level.
The independent commissioner proportion
(KOMIND) variables’ value for the regression
coefficient is 0.065 and the significance value is
0.005, it means that the KOMIND have negative
coefficient and significantly related on level 5%. The
result is not in line with the research done (Chen and
Jaggi, 2000; Forker, 1992; Fama and Jensen, 1983).
According to Eng and Mak (2003), the research’s
result suggested that the increasing independent
commissioner proportion would reduce the voluntary
disclosure. It is consistent with the substitution
interaction between the independent commissioner
and the disclosure on monitoring the management.
The increasing independent commissioner proportion
will increase the independence from the board and the
independent commissars will get all information
needed to monitor the management. Therefore the
substitution interaction from the independent
commissioner’ monitoring can be replaced by the
voluntary disclosure, and vice versa.
The managerial ownership (MANOWN)
variables’ value for the regression coefficient is -0.061
and the significant value is 0.092. Because the
significant value is less than 0.1, it meant that the
ownership managerial variables (KOMIND) are on the
negative coefficient and have a significant correlation
on the moderate level. The result is in line with the
research done by Eng and Mak (2003). It is similar to
the theory explained by Jensen and Meckling (1976)
that when the managerial ownership decreased, then
the foreigner investors would raise the monitoring of
the management performance, hence would add the
monitoring cost in order to decrease the agency
problem. Therefore, in the research, Eng and Mak
(2003) have explained, to reduce the monitoring cost
so that the management could provide the wider
voluntary disclosure to the outside shareholder.
The institutional ownership (INSTOWN)
variable’s value for the regression coefficient is -0.037
and the significant value is 0.27. It meant that the
INSTOWN have negative coefficient and related to
the significance. The result is not in line with the
researches by E-Gazzar (1998) and Huafang and
Jianguo (2007), but it is in line with the researches by
Alhazaimeh et al. (2013) and Eng and Mak (2003)
who said that the INSTOWN have a negative effect on
the voluntary disclosure, but it is not have evidence
that could explain the phenomenon.
Zourarakis (2009) in his research found that
there is a negative effect between the institutional
ownership and the voluntary disclosure. It suggested
that if the institutional ownership are higher, only a
few people would control the share. Therefore, the
ownership became centered. When the ownership is
concentrated, the monitoring became less needed and
the communication between the stakeholder and the
management would be deeper. Therefore the voluntary
level would lessen. The voluntary disclosure would
likely be given to satisfy the stakeholders,
consequently the stakeholder became lessen and
centered, and then the voluntary disclosure given
would be lower.
The foreign ownership (FOROWN) variable’s
value of the regression coefficient is -0.042 and the
significance is 0.014. The coefficient is negative and
Corporate Ownership & Control / Volume 13, Issue 1, Autumn 2015
80
significance. Putri and Diyanty (2014) explained that
the negative effect of the foreign ownership on the
voluntary disclosure have caused an assumption that
such result happened because many companies or
foreign institutions have stock ownership on the public
company in Indonesia, which not all of them are from
overseas. Many domestic businessmen purposely
created foreign certificates and names for the
companies to broaden the control access in a
company. As a consequence, the positive effect of the
foreign ownership would not show up in the company
information disclosure, in the other hand the negative
effect of the big control is owned by one block holder
that used foreign companies as a medium have a role.
The public ownership (PUBOWN) variables’
value of the regression coefficient is 0.004 and the
significance value is 0.844. PUBOWN isn’t have an
effect on the voluntary financial disclosure.
The result is in line with the researches’ research
from Mujiyono and Nany (2006), Susanto (1992), and
Na’im and Rakhman (2000) that suggested that the
public ownership is not affect the disclosure.
Generally the public ownership are the investors with
low ownership percentages that caused the investors is
not have authority to get the particular information,
which in this research is the company voluntary
financial disclosure. Besides, the public investors tend
to use technical analysis tools than fundamental
analysis in deciding its investment policy and in
monitoring the companies, thus it would not affect the
voluntary disclosure level.
The mandatory tax disclosure (TAXDISC)
variables are positively coefficient and significance,
because its regression coefficient’s value is 0.091 and
the significance is 0.012. The research is in line with
the research done by Taylor et al. (2011) that
suggested that the international tax exposure is
positively and correlated to the financial disclosure
level in Australia. The mandatory tax disclosure used
in the research is the mandatory disclosure that issued
by Indonesia Capital Market Supervisory Agency
(BAPEPAM-LK No. X.K.6). Taylor et al. (2011)
explained, if the management minimizes the
mandatory tax disclosure level in the company, the
management will get motivated to sort out the
information that will be given to the stakeholder,
where it will reduce the company voluntary disclosure
level. The selected information will affect the annual
report, as it is a source (in term of tax data) that needs
review and audit testing about the truth of the
mandatory tax disclosure , which is given by the
management (Bartelsman and Beetsman, 2003).
5 Conclusion
This research suggests that the voluntary financial
disclosure level in the companies in Indonesia
increases every year. It cannot be separated from the
management awareness about the importance of the
disclosure on how the companies will survive in the
future. This disclosure is used as a tool to reduce the
information gap between the principal and the agent
that is feared to be the agency problem where there is
a contract that cannot be done by one of the sides
and/or the loss side in the decision-making (Fama and
Jensen, 1983).
The research suggests a result that the voluntary
financial disclosure in Indonesia is in the moderate
level of the disclosure. The financial disclosure is a
disclosure to see a company’s state in a short time and
also to predict the financial condition of a company
for a few years, so the investors can use it as a
consideration to determine the investment.
References
1. Akhtarudin, M. and Haron, H. 2010. Board
Ownership, Audit Committees’ Effectiveness, and
Corporate Voluntary disclosures. Asian Review of
Accounting 18 (3): 245-259
2. Alhazaimeh, A., R. Palaniappan, and M. Almsafir.
2013. The Impact of Corporate Governance and
Ownership Structure on Voluntary Disclosure in
Annual Reports among Listed Jordanian Companies.
Procedia- Social and Behavioral Sciences 129: 341 –
348.
3. Ananchoticul, N. (2007) Does foreign direct
investment really improves corporate governance?
Evidence from Thailand. Working paper, University of
California.
4. Bamber, M. and Mcmeeking, K. 2010. An
Examination of Voluntary Financial Instruments
Disclosures in Excess of Mandatory requirements by
UK FTSE 100 Non-Financial Firms. Journal of
Applied Accounting Research. Vol. 11 No. 2. pp. 133-
153
5. Bardertscher, B.A. Katz, S.P, and Rego, S.O. The
Separation of Ownership and Control and Corporate
Tax Avoidance. Journal of Accounting and
Economiscs 56: 228-250.
6. Bartelsman, E. J., and Beetsma, R. M. (2003). Why
Pay More? Corporate Tax Avoidance Through
Transfer Pricing in OECD Countries. Journal of
Public Economics, 87: 2225–2252.
7. Barth, M.E. and Schipper, K. 2008. Financial
Reporting Transparency. Journal of Accounting
Auditing and Finance 23 (2): 73-19.
8. Berle, A.A.. Jr. and G.C. Means, 1932. The Modern
Corporation and Private Property (Macmillan, New
York).
9. Bruslerie, Hubert de La and Heger Gabteni. 2011.
Voluntary Disclosure The Introduction of IFRS and
Long-term Communication Policy: An Empirical Test
on French Firms. Halshs-00636602 versi 1.
10. Bushee, B. and Goodman, T., 2007. Which
Institutional Investors Trade Based on Private
Information About Earnings and Returns? Journal of
Accounting Research 45: 1–31.
11. Chau, G.K. and Gray, S.J. 2002. Ownership Structure
and Corporate Voluntary Disclosure in Hong Kong
and Singapore. The International Journal of
Accounting 37: 247-65.
12. Chen, C.J.P. and Jaggi, B., 2000. Association Between
Independent Non-executive Directors, Family Control
Corporate Ownership & Control / Volume 13, Issue 1, Autumn 2015
81
and Financial Disclosures in Hong Kong. Journal of
Accounting and Public Policy 19: 285–310.
13. Cheung. Y.L, Jiang. Ping, and Tan, W. 2010. A
Transparancy Disclosure Index Measuring
Disclosures: Chinese Listed Companies. Jurnal
Accounting and Public Policy: 259-280.
14. Chow, C.W. and Wong-Boren, A. 1987. Voluntary
Financial Disclosure by Mexican Corporations, The
Accounting Review 62 (3): 533-541.
15. Dahya, J., dan McConnell, J., 2005. Outside Directors
and Corporate Board Decision. J. Corp. Finance 11:
37–60.
16. Einhorn, E. 2007. Voluntary Disclosure Under
Uncertainty About the Reporting Objective. Journal of
Accounting and Economics 43: 245-274.
17. Eisenhardt, K.M. 1989. Agency Theory: An
Assessment and Review. The Academy of
Management Review 14 (1): 57–74.
18. El-Gazzar, S. M. 1998. Predisclosure Information and
Institutional Ownership: A Cross-Sectional
Examination of Market Revaluations During Earnings
Announcement Periods. The Accounting Review 73
(1): 119–129.
19. Eng, L.L. and Mak, Y.T. 2003. Corporate Governance
and Voluntary Disclosure. Journal of Accounting &
Public Policy 22: 325-45.
20. Fama, E., and Jensen, M. 1983. Separation of
Ownership and Control. Journal of Law and
Economics 26 (2): 301–325.
21. Fischer, C.M., Wartick, M. and Mark, M.M. 1992.
Detection Probability and Taxpayer Compliance: A
Review of The Literature. Journal of Accounting
Literature 11: 1-46.
22. Forker, J. 1992. Corporate Governance and
Disclosure. Accounting & Business Research 22: 111-
24.
23. Gisbert, A. and Navallas, B. 2013. The Association
Between Voluntary Disclosure and Corporate
Governance in The Presence of Severe Agency
Conflicts. Advances in Accounting,Incorporating
Advances in International Accounting.
24. Gul, F.A. and Leung, S. 2004. Board Leadership,
Outside Directors’ Expertise and Voluntary Corporate
Disclosures. Journal of Accounting & Public Policy
23: 351-79.
25. Haniffa, R. M., and Cooke, T. E. (2002). Culture,
Corporate Governance and Disclosure in Malaysian
Corporations. Abacus, 38 (3): 317–349.
26. Hardiningsih, P. 2008. Analisis Faktor-Faktor Yang
Mempengaruhi Voluntary Disclosure Laporan
Tahunan Perusahaan. Jurnal Bisnis dan Ekonomi
(JBE): 67 – 79.
27. Hasseldine, J. and Morris, G. 2013. Corporate Social
Responsibility and Tax Avoidance: A Comment and
Reflection. Accounting Forum 37: 1– 14.
28. Healy, P.M. and Palepu, K.G. 2001. Information
Asymmetry, Corporate Disclosure, and The Capital
Markets: A Review of The Empirical Disclosure
Literature. Journal of Accounting and Economics:
405–440
29. Herry dan Hamin. 2005. Tingkat Kepemilikan
Manajerial dan Nilai Perusahaan: Bukti Empiris pada
Perusahaan Publik di Indonesia. Surabaya: Simposium
Riset Ekonomi II
30. Ho, P.-L., and G. Taylor. 2013. Corporate Governance
and Different Types of Voluntary Disclosure Evidence
from Malaysian listed firms. Pacific Accounting
Review 25:. 4-29.
31. Hodge, F.D., Kennedy, J.J. and Maines, L.A. 2004.
Does Search-Facilitating Technology Improve The
Transparency of Financial Reporting?. The Accounting
Review 79 (3):. 687-703.
32. Huafang, X., and Jianguo, Y. (2007) Ownership
Structure, Board Composition and Corporate
Voluntary Disclosure: Evidence from Listed
Companies in China. Managerial Auditing Journal 22
(6): 604-619
33. Huseynov, F. and Klamm, B.K. 2012. Tax avoidance,
tax management and corporate social responsibility.
Journal of Corporate Finance 18: 804–827.
34. Jensen, M.C. and W. H. Meckling. 1976. Theory of
the Firm: Managerial Behavior, Agency Cost and
Ownership Structure. Journal of Financial Economics
3: 305 – 360
35. Jensen, M.C. 2000. A Theory of the Firm:
Governance, Residual Claims, and Organizational
Forms. Harvard University Press, Cambridge. MA.
36. Lang, M. and Lundholm, R. 1996. Corporate
Disclosure Policy and Analyst Behavior. The
Accounting Review 71 (4): 467-92.
37. Latridis, G. and Alexakis, P. 2012. Evidence of
Voluntary Accounting Disclosures in The Athens
Stock Market. Review of Accounting and Finance 11
(1): 73-92.
38. Lo, K. 2003. Economic Consequences of Regulated
Changes in Disclosure: The Case of Executive
Compensation. Journal of Accounting and Economics
35: 285-314.
39. Maijoor, S. 2000. The Internal Control Explosion.
International Journal of Auditing 4 (1): 101-9.
40. Mangena, M. and Tauringana, V. 2007. Disclosure,
Corporate Governance and Foreign Share Ownership
on The Zimbabwe Stock Exchange. Journal of
International Financial Management and Accounting
18 (2): 53-85.
41. Mat Nor, F. and Sulong, Z. 2007. The Interaction
Effect of Ownership Structure and Board Governance
on Dividends: Evidence from Malaysian Listed Firms.
Capital Market Review 15: 73-101.
42. Meek, G. K., C. B. Roberts, and S. J. Gray. 1995.
Factors Influencing Voluntary Annual Report
Disclosures by US, UK and Continental European
Multinational Corporations. Journal of International
Business Studies 26 (3), pp. 555-572.
43. Minnick, K. and Noga, T. 2010. Do Corporate
Governance Characteristics Influence Tax
Management?. Journal of Corporate Finance 16. pp.
703–718.
44. Morck, R., A. Shleifer and R. Vishny. 1988.
Management Ownership and Market Valuation: An
Empirical Analysis. Journal of Financial Economics
20: 293-315.
45. Mujiyono and Nany,M. 2006. Pengaruh Leverage,
Likuiditas, dan Saham Publik terhadap Luas
Pengungkapan Sukarela Dalam Laporan Tahunan.
Jurnal Akuntansi & Bisnis 6 (1): 23 – 28.
46. Na’im, A. and Rakhman, F. 2000. Analisis Hubungan
Antara Kelengkapan Pengungkapan Laporan
Keuangan Dengan Struktur Modal dan Tipe
Kepemilikan Perusahaan. Jurnal Ekonomi dan Bisnis
Indonesia 15 (1): 70-82.
47. Ntim, C.G., Lindop, S., and Thomas, D.A. 2013.
Corporate Governance and Risk Reporting in South
Corporate Ownership & Control / Volume 13, Issue 1, Autumn 2015
82
Africa: A Study of Corporate Risk Disclosures in The
Pre- and Post-2007/2008 Global Financial Crisis
Periods. International Review of Financial Analysis.
48. Parker, L.D. 2007. Financial and External Reporting
Research: The Broadening Corporate Governance
Challenge. Accounting & Business Research 37 (1):
39-54.
49. Probohudono, A. N., G. Tower, and R. Rusmin.
2013b. Risk Disclosure During The Global Financial
Crisis. Social Responsibility Journal 9 (1): 124-137.
50. Probohudono, A. N., G. Tower, and Rusmin. 2013a.
Diversity in Risk Communication. Australasian
Accounting Business & Finance Journal 7: 43-58.
51. Putri, M. and Diyanty, V. 2014. Pengaruh Struktur
Kepemilikan dan Mekanisme Corporate Governance
Terhadap Tingkat Pengungkapan Laporan
Keberlanjutan. Fakultas Ekonomi Universitas
Indonesia
52. Qu, W., Leung, P., and Cooper, B. 2013. A Study of
Voluntary Disclosure of Listed Chinese Firms – A
Stakeholder Perspective. Managerial Auditing Journal
28 (3): 261-294.
53. Reed, D. 2002. Corporate Governance in Developing
Countries. Journal of Business Ethics 37 (3): 223-47.
54. Sanchez-Ballesta, J., and B., Garcia-Meca. 2007.
Ownership Structure, Discretionary Accruals and The
Informativeness of Earnings. Corporate Governance
15:677-691
55. Schipper, K. 1991. Analysts’ Forecasts. Accounting
Horizons 5 (4): 105-21.
56. Shleifer, A. and Vishny, R. 1997. A Survey of
Corporate Governance. Journal of Finance 52 (2):
737-783.
57. Susanto, Djoko. 1992. An Empirical Investigation of
the Extent of Corporate Disclosure in Annual Report
Companies Listed on the Jakarta Stock Exchange.
PhD dissertation, University of Arkansas USA.
58. Taylor, G., Tower, G. and Neilson, J. 2010. Corporate
Communication of Financial Risk. Accounting and
Finance 50 (2): 417-446.
59. Taylor, Grantly, Tower. G, and Zahn. M.V.D. 2011.
The Influence of International Taxation Structures on
Corporate Financial Disclosure Patterns” Accounting
Forum 35: 32-46.
60. Tsalavoutas, Loannis. 2011. Transition to IFRS and
compliance with mandatory disclosure Requirements:
What Is The Signal?. Advances in Accounting,
Incorporating Advances in International Accounting
27: 390–405.
61. Wang, Z., M. J. Ali, dan M. Al-Akra. 2013. Value
Relevance of Voluntary Disclosure and The Global
Financial Crisis: Evidence from China. Managerial
Auditing Journal 28 (5): 444-468.
62. Warfield, T.D., Wild, J.J. and Wild, K.L. 1995.
Managerial Ownership, Accounting Choices, and
Informativeness of Earnings. Journal of Accounting
and Economics 20: 61-91.
63. Watts, R. L. 1977. Corporate Financial Statements, A
Product of The Market and Political Processes.
Australian of Journal Management, 2 (l): 53-75
64. Watts, R.L. and Zimmerman, J.L. 1990. Positive
Accounting Theory: A Ten-Year Perspective.
Accounting Review 65 (1): 131-156.
65. Williams, S. M. 2002. Board of Director Determinants
of Voluntary Audit Committee Disclosures: Evidence
from Singapore. Working paper, Singapore
Management University.
66. Xie, B., Davidson III, W., and Dadalt, P. 2003.
Earnings Management and Corporate Governance:
The Role of The Board and The Audit Committee. J.
Corp. Finance 9: 295–316.
67. Zourarakis, N. S. 2009. Voluntary Disclosure:
Evidence from UK. [Online] Available:
http://www.efinancialnews.com/story/2010-12-
15/walker-transparency-regulation-buyout
Corporate Ownership & Control / Volume 13, Issue 1, Autumn 2015
83
Apendix A. Checklist index voluntary financial disclosure
Performance Indicators
1. Historical figures for last five years or more (f)
2. Profitability ratios (f)
3. Cash flow ratios (f)
4. Liquidity ratios (f)
5. Gearing ratios (f)
6. Net tangible assets per share (d)
7. Explanation provided for change in sales (d)
8. Explanation provided for change in operating income/net income (d)
Financial Review
9. Disclosure of intangible valuations (f)
10. Dividend payout policy (f)
11. Review of operations by divisions – operating profit (b)
12. Review of operations – productivity (b)
13. Review of current financial results, discussion of major factors underlying performance (b)
14. Human Resources: Cost of training operations (a)
15. Return on capital employed (a)
Projected Information
16. Cash flow forecast (f)
17. Capital expenditure and/or R&D expenditures forecast (f)
18. Earnings forecast (f)
19. Projection of future sales (d)
Foreign Currency Information
20. Impact of foreign exchange fluctuations on current Results (f)
21. Foreign currency exposure management description (f)
22. Major exchange rates used in the accounts (f)
23. Effect of currency fluctuation on future operations (e)
Stock Price Information
24. Volume of shares traded (trend) (b)
25. Volume of shares traded (year-end) (b)
26. Size of shareholdings (f)
27. Type of shareholder (f)
28. Share price information (trend) (b)
29. Share price information (year-end) (b)
30. Domestic and foreign shareholdings breakdown (b)
Other Useful Financial Information
31. Effect of acquisitions and expansion on results (b)
32. Effect of disposal and cessation on results (b)
33. Statement concerning wealth created, e.g. value added statement (b)
34. Breakdown of borrowings (e.g., lending institution, date of maturity, security) (c)
35. Breakdown of earnings by major product lines, customer classes, and geographical location (c)
Note: a = Adapted from Bruslerie and Gabteni (2011)
b = Adapted from Ho and Taylor (2013)
c = Adapted from Chow and Boren (1987)
d = Adapted from Akhtaruddin and Haron (2010)
e = Adapted from Meek, et.al (1995)
f = Adapted from Qu, et al. (2013)
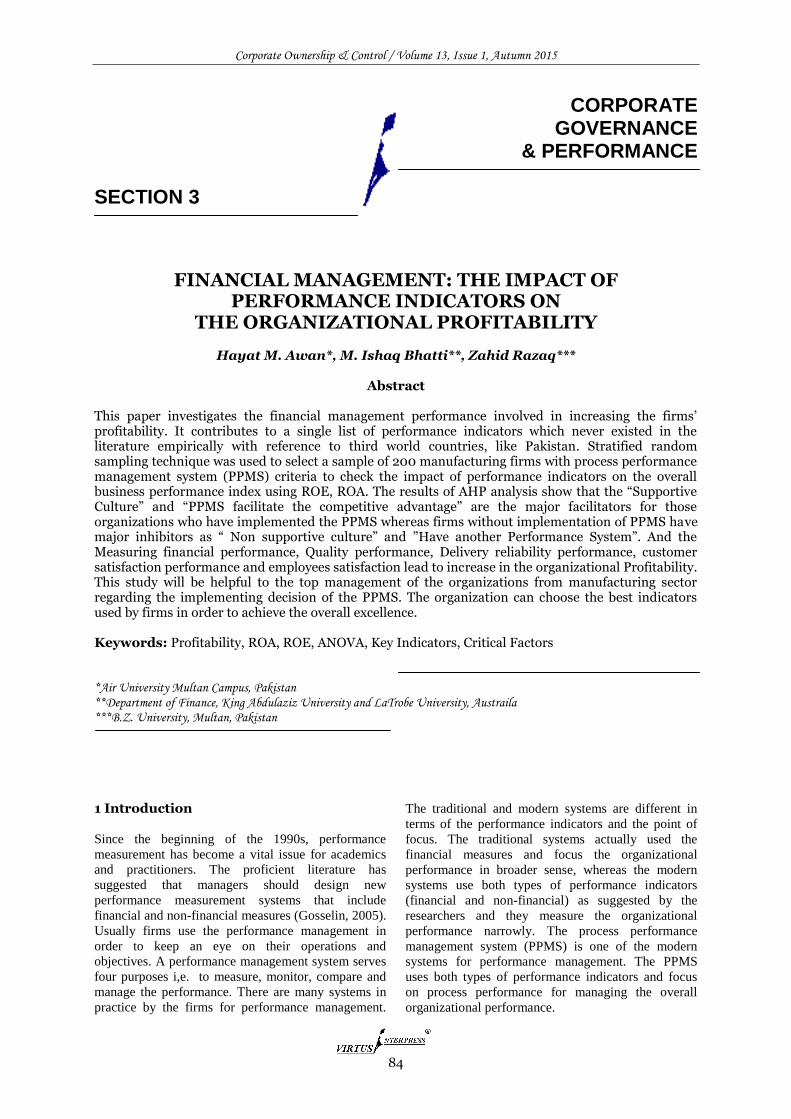
Corporate Ownership & Control / Volume 13, Issue 1, Autumn 2015
84
CORPORATE GOVERNANCE
& PERFORMANCE
SECTION 3
FINANCIAL MANAGEMENT: THE IMPACT OF PERFORMANCE INDICATORS ON
THE ORGANIZATIONAL PROFITABILITY
Hayat M. Awan*, M. Ishaq Bhatti**, Zahid Razaq***
Abstract This paper investigates the financial management performance involved in increasing the firms’ profitability. It contributes to a single list of performance indicators which never existed in the literature empirically with reference to third world countries, like Pakistan. Stratified random sampling technique was used to select a sample of 200 manufacturing firms with process performance management system (PPMS) criteria to check the impact of performance indicators on the overall business performance index using ROE, ROA. The results of AHP analysis show that the “Supportive Culture” and “PPMS facilitate the competitive advantage” are the major facilitators for those organizations who have implemented the PPMS whereas firms without implementation of PPMS have major inhibitors as “ Non supportive culture” and ”Have another Performance System”. And the Measuring financial performance, Quality performance, Delivery reliability performance, customer satisfaction performance and employees satisfaction lead to increase in the organizational Profitability. This study will be helpful to the top management of the organizations from manufacturing sector regarding the implementing decision of the PPMS. The organization can choose the best indicators used by firms in order to achieve the overall excellence. Keywords: Profitability, ROA, ROE, ANOVA, Key Indicators, Critical Factors *Air University Multan Campus, Pakistan **Department of Finance, King Abdulaziz University and LaTrobe University, Austraila ***B.Z. University, Multan, Pakistan
1 Introduction
Since the beginning of the 1990s, performance
measurement has become a vital issue for academics
and practitioners. The proficient literature has
suggested that managers should design new
performance measurement systems that include
financial and non-financial measures (Gosselin, 2005).
Usually firms use the performance management in
order to keep an eye on their operations and
objectives. A performance management system serves
four purposes i,e. to measure, monitor, compare and
manage the performance. There are many systems in
practice by the firms for performance management.
The traditional and modern systems are different in
terms of the performance indicators and the point of
focus. The traditional systems actually used the
financial measures and focus the organizational
performance in broader sense, whereas the modern
systems use both types of performance indicators
(financial and non-financial) as suggested by the
researchers and they measure the organizational
performance narrowly. The process performance
management system (PPMS) is one of the modern
systems for performance management. The PPMS
uses both types of performance indicators and focus
on process performance for managing the overall
organizational performance.
Corporate Ownership & Control / Volume 13, Issue 1, Autumn 2015
85
The main purpose of this study is to affirm the
steps involved in PPMS suggested by Oakland (2010)
in the manufacturing sector in Pakistan. The other
purpose of the study is to investigate either the
profitability of the firms which are using the PPMS for
performance management, is significantly different
from the others firms which are not using the PPMS.
The last purpose of the study is to know that what are
most important inhibitors and facilitators regarding the
implementation of PPMS. This study is the descriptive
research, which has used the survey research method
and some statistical techniques in order to find the
purpose of the study. The section 2 discusses the
literature review and section 3 deals with the research
methodology. Sections 4 and 5 describe data analysis
and conclusion respectively.
2 Literature review
The phenomenon performance measurement is used
by the organizations in order to ensure that they are
going on right direction, or achieving targets in terms
of organizational goals and objectives. The
performance measures are used to evaluate and control
the overall business operations. They are also used to
measure and compare the performance of different
organizations in the industry, plants, departments,
teams and individuals (Ghalayini and Noble, 1996;
Neely et al, 2000; 2005). The business performance
measurement is not an untapped topic. A large number
of researches have been conducted by the researchers
on this topic. According to Neely (2000), almost 3,615
researches on business performance measurement
were published in three years 1994 to 1996, which
means that for every five working hour one article on
the issue was published. The overall organizational
performance could be measured by using financial
indicators, operational indicators or by using both. The
financial indicators may include the sales growth,
profitability and Earning per share, which are
organization specific and if we consider the market
then the market to book and stock market returns and
its variants are taken as the financial indicators of the
organization’s overall financial performance. The
second types of indicators are operational indicators
which are also called the non-financial indicators of
the organization’s performance. They include the
market share, new product introduction, quality of the
products, marketing effectiveness, manufacturing
value-added and other measures of technological
efficiency (Venkatraman and Ramanujam 1986,De
Toni and Tonchia 2001 and Browne et al 1997).
2.1 Performance management systems
Heckl and Moormann (2010) have identified the
following systems for measurement of performance of
the organizations.
Balanced scorecard
Self-assessment,
Traditional controlling,
Activity based costing
Process performance measurement system.
Work flow based monitoring and
Statistical control system.
All above mentioned systems have different set
of objectives and characteristics but also have some
common set of elements with each other. Heckl and
Moormann (2010) have differentiated these
approaches on the basis of two dimensions; the first
one is the focus and the second is scope as shown in
figure 1 below.
Figure 1. Positioning of performance management systems
2.1.1 Balance scorecard
Kaplan and Norton (1992) have developed the
balanced scorecard instrument to clarify and
operationalize the organization vision with respect to
four perspectives (financial, customer, internal process
& learning and growth perspective). This system is
developed in order to describe the overall business
performance in terms of financial and non-financial
indicators on continuous basis. This framework is
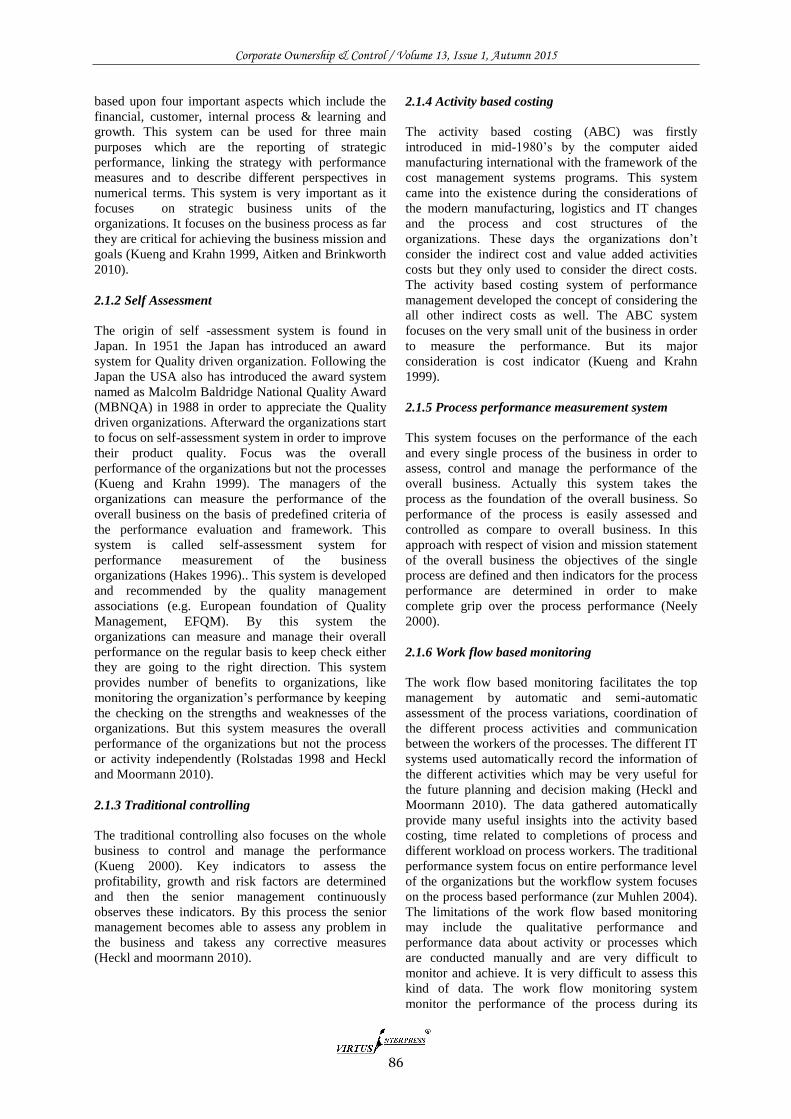
Corporate Ownership & Control / Volume 13, Issue 1, Autumn 2015
86
based upon four important aspects which include the
financial, customer, internal process & learning and
growth. This system can be used for three main
purposes which are the reporting of strategic
performance, linking the strategy with performance
measures and to describe different perspectives in
numerical terms. This system is very important as it
focuses on strategic business units of the
organizations. It focuses on the business process as far
they are critical for achieving the business mission and
goals (Kueng and Krahn 1999, Aitken and Brinkworth
2010).
2.1.2 Self Assessment
The origin of self -assessment system is found in
Japan. In 1951 the Japan has introduced an award
system for Quality driven organization. Following the
Japan the USA also has introduced the award system
named as Malcolm Baldridge National Quality Award
(MBNQA) in 1988 in order to appreciate the Quality
driven organizations. Afterward the organizations start
to focus on self-assessment system in order to improve
their product quality. Focus was the overall
performance of the organizations but not the processes
(Kueng and Krahn 1999). The managers of the
organizations can measure the performance of the
overall business on the basis of predefined criteria of
the performance evaluation and framework. This
system is called self-assessment system for
performance measurement of the business
organizations (Hakes 1996).. This system is developed
and recommended by the quality management
associations (e.g. European foundation of Quality
Management, EFQM). By this system the
organizations can measure and manage their overall
performance on the regular basis to keep check either
they are going to the right direction. This system
provides number of benefits to organizations, like
monitoring the organization’s performance by keeping
the checking on the strengths and weaknesses of the
organizations. But this system measures the overall
performance of the organizations but not the process
or activity independently (Rolstadas 1998 and Heckl
and Moormann 2010).
2.1.3 Traditional controlling
The traditional controlling also focuses on the whole
business to control and manage the performance
(Kueng 2000). Key indicators to assess the
profitability, growth and risk factors are determined
and then the senior management continuously
observes these indicators. By this process the senior
management becomes able to assess any problem in
the business and takess any corrective measures
(Heckl and moormann 2010).
2.1.4 Activity based costing
The activity based costing (ABC) was firstly
introduced in mid-1980’s by the computer aided
manufacturing international with the framework of the
cost management systems programs. This system
came into the existence during the considerations of
the modern manufacturing, logistics and IT changes
and the process and cost structures of the
organizations. These days the organizations don’t
consider the indirect cost and value added activities
costs but they only used to consider the direct costs.
The activity based costing system of performance
management developed the concept of considering the
all other indirect costs as well. The ABC system
focuses on the very small unit of the business in order
to measure the performance. But its major
consideration is cost indicator (Kueng and Krahn
1999).
2.1.5 Process performance measurement system
This system focuses on the performance of the each
and every single process of the business in order to
assess, control and manage the performance of the
overall business. Actually this system takes the
process as the foundation of the overall business. So
performance of the process is easily assessed and
controlled as compare to overall business. In this
approach with respect of vision and mission statement
of the overall business the objectives of the single
process are defined and then indicators for the process
performance are determined in order to make
complete grip over the process performance (Neely
2000).
2.1.6 Work flow based monitoring
The work flow based monitoring facilitates the top
management by automatic and semi-automatic
assessment of the process variations, coordination of
the different process activities and communication
between the workers of the processes. The different IT
systems used automatically record the information of
the different activities which may be very useful for
the future planning and decision making (Heckl and
Moormann 2010). The data gathered automatically
provide many useful insights into the activity based
costing, time related to completions of process and
different workload on process workers. The traditional
performance system focus on entire performance level
of the organizations but the workflow system focuses
on the process based performance (zur Muhlen 2004).
The limitations of the work flow based monitoring
may include the qualitative performance and
performance data about activity or processes which
are conducted manually and are very difficult to
monitor and achieve. It is very difficult to assess this
kind of data. The work flow monitoring system
monitor the performance of the process during its
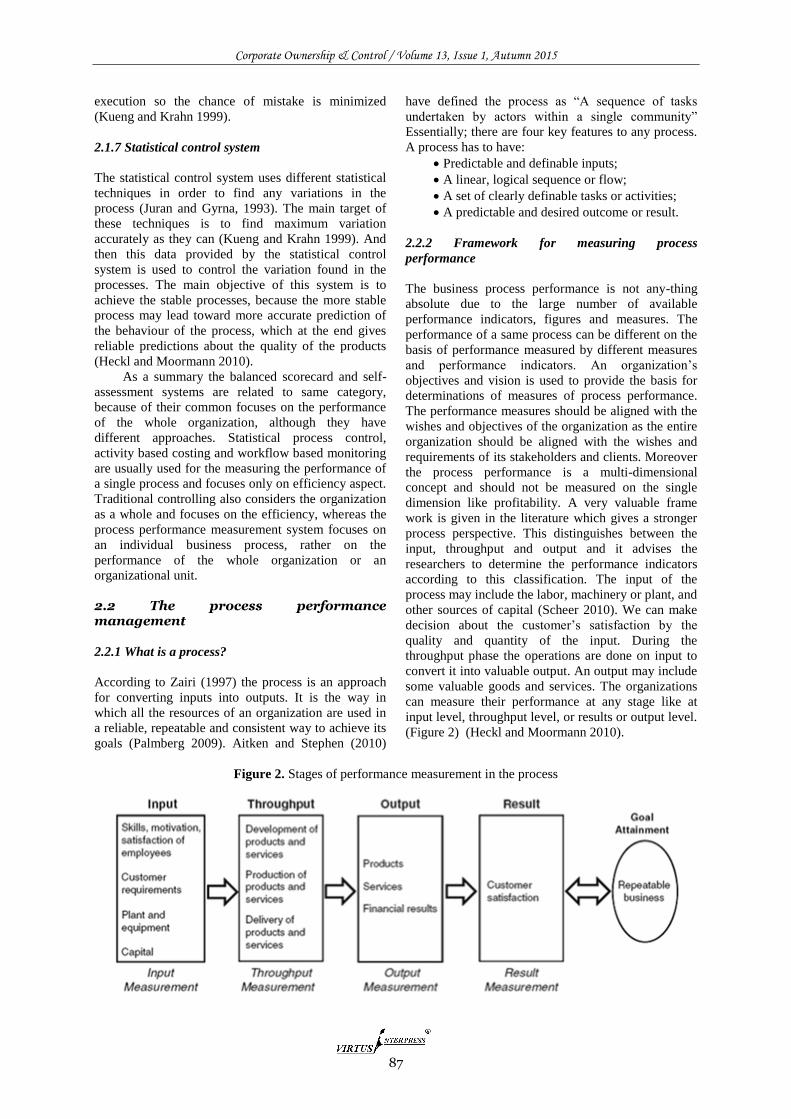
Corporate Ownership & Control / Volume 13, Issue 1, Autumn 2015
87
execution so the chance of mistake is minimized
(Kueng and Krahn 1999).
2.1.7 Statistical control system
The statistical control system uses different statistical
techniques in order to find any variations in the
process (Juran and Gyrna, 1993). The main target of
these techniques is to find maximum variation
accurately as they can (Kueng and Krahn 1999). And
then this data provided by the statistical control
system is used to control the variation found in the
processes. The main objective of this system is to
achieve the stable processes, because the more stable
process may lead toward more accurate prediction of
the behaviour of the process, which at the end gives
reliable predictions about the quality of the products
(Heckl and Moormann 2010).
As a summary the balanced scorecard and self-
assessment systems are related to same category,
because of their common focuses on the performance
of the whole organization, although they have
different approaches. Statistical process control,
activity based costing and workflow based monitoring
are usually used for the measuring the performance of
a single process and focuses only on efficiency aspect.
Traditional controlling also considers the organization
as a whole and focuses on the efficiency, whereas the
process performance measurement system focuses on
an individual business process, rather on the
performance of the whole organization or an
organizational unit.
2.2 The process performance management
2.2.1 What is a process?
According to Zairi (1997) the process is an approach
for converting inputs into outputs. It is the way in
which all the resources of an organization are used in
a reliable, repeatable and consistent way to achieve its
goals (Palmberg 2009). Aitken and Stephen (2010)
have defined the process as “A sequence of tasks
undertaken by actors within a single community”
Essentially; there are four key features to any process.
A process has to have:
Predictable and definable inputs;
A linear, logical sequence or flow;
A set of clearly definable tasks or activities;
A predictable and desired outcome or result.
2.2.2 Framework for measuring process
performance
The business process performance is not any-thing
absolute due to the large number of available
performance indicators, figures and measures. The
performance of a same process can be different on the
basis of performance measured by different measures
and performance indicators. An organization’s
objectives and vision is used to provide the basis for
determinations of measures of process performance.
The performance measures should be aligned with the
wishes and objectives of the organization as the entire
organization should be aligned with the wishes and
requirements of its stakeholders and clients. Moreover
the process performance is a multi-dimensional
concept and should not be measured on the single
dimension like profitability. A very valuable frame
work is given in the literature which gives a stronger
process perspective. This distinguishes between the
input, throughput and output and it advises the
researchers to determine the performance indicators
according to this classification. The input of the
process may include the labor, machinery or plant, and
other sources of capital (Scheer 2010). We can make
decision about the customer’s satisfaction by the
quality and quantity of the input. During the
throughput phase the operations are done on input to
convert it into valuable output. An output may include
some valuable goods and services. The organizations
can measure their performance at any stage like at
input level, throughput level, or results or output level.
(Figure 2) (Heckl and Moormann 2010).
Figure 2. Stages of performance measurement in the process
Corporate Ownership & Control / Volume 13, Issue 1, Autumn 2015
88
As previously stated that the organizations can
judge their performance at any stage of the process
(e.g. input, output, throughput), so the performance
indicators could be like input related, output related or
throughput related.
2.2.3 Steps for PPMS
In his book the total organizational excellence the
Oakland (2010) has identified the following steps in
measuring and managing a organization performance
which can be applied for business process
performance management.
2.2.3.1 Defining the organization vision, mission,
and goals and strategies
In the first step of the PPMS the organization’s vision,
mission, goals and strategies to achieve these goals are
defined. Almost over a thousand of the books and
articles about defining the organization’s vision have
appeared in the press but the technically vision is yet
hypothetical phenomenon. The vision is something
which could not be directly observable and apparently
carries meanings beyond any single and simple
description (Larwood 1995; Hui and Chuan 2002).
The organization vision, mission, goals and strategies
are very important to define because they set the
direction for the organization (Oakland and Gadd,
2002). The first step in the PPMS is to define the
organization’s vision, mission, goals and strategies.
The vision and missions are broad terms which carry
the futuristic desires of the organization’s top
management (Zairi and Sinclair 1995). But the
organizational goals are rather short-term objectives of
the organizations which are derived directly from the
mission statement of the organization and are stated in
terms of physical values. And this mission rather than
the organization’s objectives drives the organization’s
strategy (Leong and Ward, 1990; Kaplan 2001 and
Kellen 2003).
2.2.3.2 Business process documentation
This is the second step in the PPMS in which the
organizations points out all the processes involved in
the overall business of the organization and then draw
diagrams of these processes on the paper (Zairi and
Sinclair 1995). First of all the management define
their processes and the boundaries of the processes
and then they document all the processes. Without the
proper documentation of the process there are often
conflicting views about the process that what the
process exactly is? The main benefit of the process
documentation is that it includes the systematic
descriptions of the process which brings agreement
among all team members and managers that what
constitute a process (Elzinga et al, 1995).
2.2.3.3 Defining the Critical Success Factors (CSFs)
The third step of the PPMS is defining the critical
success factors (CSFs). These CSFs are defined on the
basis of organization’s vision, mission, goals and
strategy. The CSFs can be defined as the important
factors which organization must accomplish in order
to achieve the mission of the organization (Oakland
2001). Basic rule behind choosing the CSFs is that
they should be necessary and sufficient to achieve the
overall organization mission (Zairi and Sinclair 1995;
Oakland 2001).
2.2.3.4 Defining the core processes
In this fourth step of PPMS the organizations define
their core processes on the basis of their critical
success factors. Actually the core processes of the
organizations are the most important processes to
achieve the mission of the organizations. The core
processes and the CSFs of the organization should be
linked together (Zairi 1997; Oakland 2001).
2.2.3.5 Defining the Key performance Indicators
(KPIs)
The most important step of the PPMS is the defining
of the key performance indicators of the organization.
There are two categories of performance indicators;
the qualitative and quantitative. We can divide the
performance indicators as the internal and external
performance indicators also. The Costs / financial,
Quality, Time, Delivery reliability, Flexibility are
largely accepted indicators of organizational
performance (White 1996 and Koufteros and Doll,
1998, Cyrus et al 2013). But several authors have
defined other indicators as well on the basis of their
case study researches. Sinclair and Zairi (1995) have
found the customer satisfaction, quality, delivery,
employee factors, productivity, financial performance,
safety and environment / social performance as the
indicators of business performance used by many
organizations. Parmenter (2009) has identified the
customer’s satisfaction, employees’ satisfaction,
environment/community, financial, internal process
performance and learning and growth as the
performance measurement perspectives. The
performance indicators must be based upon the
competitive strategy of the organization (Sinclair and
Zairi 1995).
2.2.3.6 Benchmarking
The improvements can only be done if the
benchmarking is done for performance of any process,
activity, task or overall organization (Parmenter
2009). If the improvements have been made then these
improved results could be the new standards for that
particular process, activity, task or overall
organization. The benchmarks could be the previous
Corporate Ownership & Control / Volume 13, Issue 1, Autumn 2015
89
performance the company or performance of the
competitors company (Sinclair and Zairi 1995).
2.2.3.7 Process Analysis
This is the overall seventh step of the PPMS but it is
the start of second phase of PPMS. The evaluation of
the performance starts from this step. In this step the
organizations evaluate the performance of the each
and every process and compare it with standards or
benchmarks (Oakland 2002; Heckl and Moormann
2010 and Skrinjar et al, 2010).
2.2.3.8 Identifying the skill needed
This is the very next step after the process evaluation
stage. During this stage the skill needed to improve
the overall performance of the organizations are
identified. This step is not always done but when there
are some technological changes occurred in the market
or when company has adopted these changes then this
step become important to perform. During identifying
the skill needed to performance various task the HR
department of the organizations come into action in
order to identify the proper skills needed provide to
the employees of the organization (Oakland 2001;
2010).
2.2.3.9 Providing the skill needed
After identifying the list of skill needed the HR
department of the organizations provide the necessary
skills to respective employees, who lack these
necessary skills. In this process a necessary training
and education about the overall organizational
mission, vision, goals and strategies are provided to
employees (Oakland 2001; Neely 2005).
2.2.3.10 Managing the Process
On the basis of the processes performance data the
process managers try to manage the performance of
their processes. The process managers firstly clearly
understand the results of the process performance data
and then make positive and effective decisions about
the improvements in the process performance (R.
Skrinjar 2010). At first the performance of the
processes is measured and compared with the
benchmarks or standards and any improvements are
suggested for the processes. By this the performance
of the processes can be increased which contributes
towards the overall performance of the organization
(Oakland 2001).
2.2.3.11 Process improvements
This is the important step of the second phase of the
PPMS in which the organizations start improvements
in the processes by rearranging the process activities.
The flow charts are drawn in this stage and different
performance indicators are redefined by the managers.
The improvement programs are started and the skills
and knowledge of the employees is fully utilized. A
proposed framework of continuous improvements by
Oakland (2001) is that the managers should start by
defining the problem, review the information,
investigate the problem, verify the solutions, and
execute the change (Oakland 2002).
2.2.3.12 Feedback generation
Feedback is the primary source of continuous
improvement and the employees remain motivated
and work with full commitment from this feedback.
Managers try to provide the feedback of the
performance against organizational goals, new
opportunities, performance against internal standards
and external standards to their subordinates (Oakland
2001).
2.2.3.13 Assigning the responsible person
When there is not any responsible person for any
activity then who will take the responsibility of that
particular activity. In this step the responsibility of
process performance is delivered to any manager, who
keeps the check on the outcome of his assigned
process (Scheer 2010 and R. Skrinjar 2010). The
management then asks for any undesirable outcome of
the process directly to the responsible person. The
responsible person is then has an authority to make
any decision regarding the process. The other benefit
of the assigning the responsible person is that the
rewards and incentives could be delivered to right
person (Oakland 2002).
2.2.3.14 Upgrading the strategies and organizational
goals
This is the last step of PPMS where the whole cycle is
complete. In this step the feedback is used to update
the organizational strategies, objectives and goals by
the budgetary control team within the organization.
The whole process is revised on continuous basis in
order to manage the overall organizational
performance. This is also an important step and if this
step is not performed then the whole process is
useless. The feedback should be used to update the
benchmarks and strategic planning (Oakland 2001).
3 The methodology and model
This study explores the dimensions of organizational
performance in terms of performance indicators;
defines indices of overall performance indicators and
its dimensions; establishment of the relationship of
performance indicators to Pakistani manufacturing
sector’s companies from four different industries
which have applied the PPMS. The research questions
identified for this study are stated as:
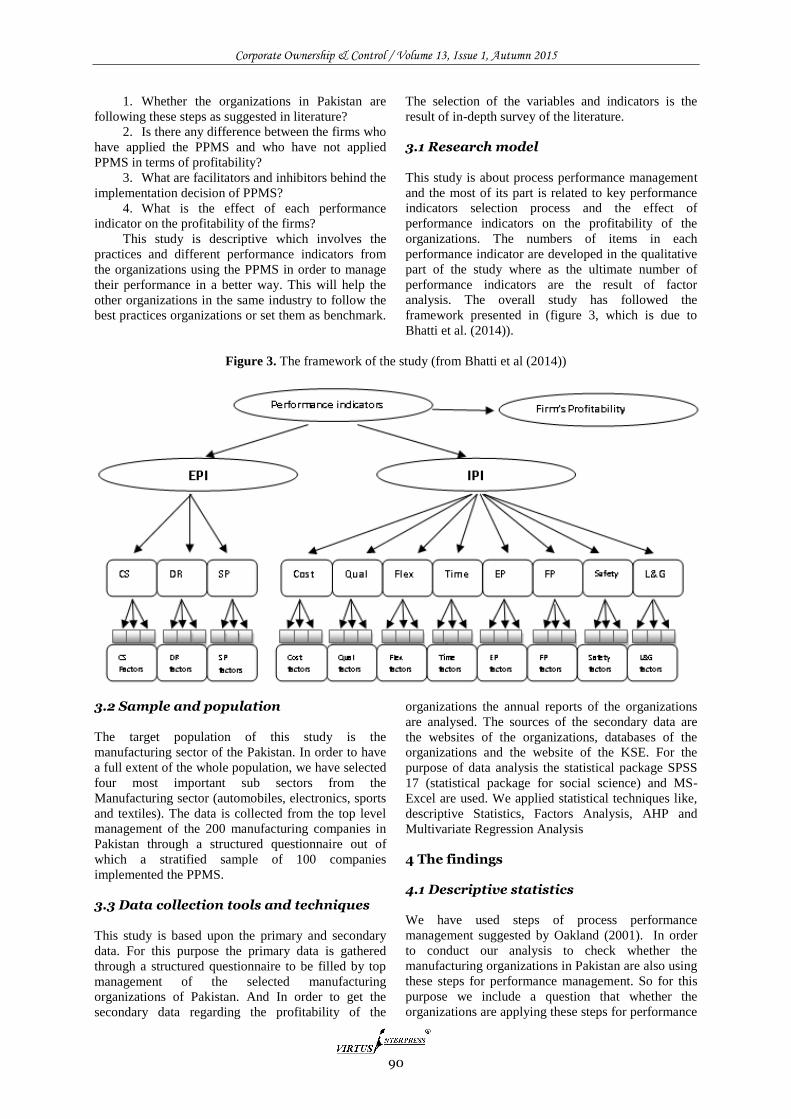
Corporate Ownership & Control / Volume 13, Issue 1, Autumn 2015
90
1. Whether the organizations in Pakistan are
following these steps as suggested in literature?
2. Is there any difference between the firms who
have applied the PPMS and who have not applied
PPMS in terms of profitability?
3. What are facilitators and inhibitors behind the
implementation decision of PPMS?
4. What is the effect of each performance
indicator on the profitability of the firms?
This study is descriptive which involves the
practices and different performance indicators from
the organizations using the PPMS in order to manage
their performance in a better way. This will help the
other organizations in the same industry to follow the
best practices organizations or set them as benchmark.
The selection of the variables and indicators is the
result of in-depth survey of the literature.
3.1 Research model
This study is about process performance management
and the most of its part is related to key performance
indicators selection process and the effect of
performance indicators on the profitability of the
organizations. The numbers of items in each
performance indicator are developed in the qualitative
part of the study where as the ultimate number of
performance indicators are the result of factor
analysis. The overall study has followed the
framework presented in (figure 3, which is due to
Bhatti et al. (2014)).
Figure 3. The framework of the study (from Bhatti et al (2014))
3.2 Sample and population
The target population of this study is the
manufacturing sector of the Pakistan. In order to have
a full extent of the whole population, we have selected
four most important sub sectors from the
Manufacturing sector (automobiles, electronics, sports
and textiles). The data is collected from the top level
management of the 200 manufacturing companies in
Pakistan through a structured questionnaire out of
which a stratified sample of 100 companies
implemented the PPMS.
3.3 Data collection tools and techniques
This study is based upon the primary and secondary
data. For this purpose the primary data is gathered
through a structured questionnaire to be filled by top
management of the selected manufacturing
organizations of Pakistan. And In order to get the
secondary data regarding the profitability of the
organizations the annual reports of the organizations
are analysed. The sources of the secondary data are
the websites of the organizations, databases of the
organizations and the website of the KSE. For the
purpose of data analysis the statistical package SPSS
17 (statistical package for social science) and MS-
Excel are used. We applied statistical techniques like,
descriptive Statistics, Factors Analysis, AHP and
Multivariate Regression Analysis
4 The findings
4.1 Descriptive statistics
We have used steps of process performance
management suggested by Oakland (2001). In order
to conduct our analysis to check whether the
manufacturing organizations in Pakistan are also using
these steps for performance management. So for this
purpose we include a question that whether the
organizations are applying these steps for performance
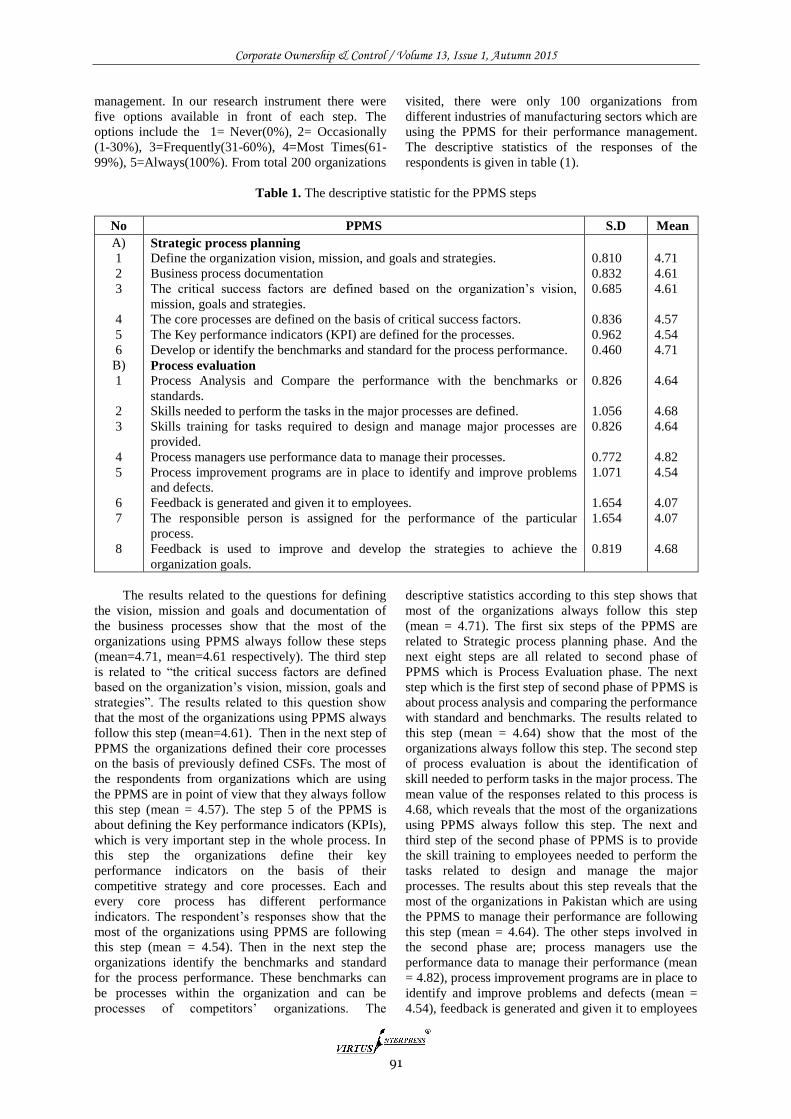
Corporate Ownership & Control / Volume 13, Issue 1, Autumn 2015
91
management. In our research instrument there were
five options available in front of each step. The
options include the 1= Never(0%), 2= Occasionally
(1-30%), 3=Frequently(31-60%), 4=Most Times(61-
99%), 5=Always(100%). From total 200 organizations
visited, there were only 100 organizations from
different industries of manufacturing sectors which are
using the PPMS for their performance management.
The descriptive statistics of the responses of the
respondents is given in table (1).
Table 1. The descriptive statistic for the PPMS steps
No PPMS S.D Mean
A)
1
2
3
4
5
6
B)
1
2
3
4
5
6
7
8
Strategic process planning
Define the organization vision, mission, and goals and strategies.
Business process documentation
The critical success factors are defined based on the organization’s vision,
mission, goals and strategies.
The core processes are defined on the basis of critical success factors.
The Key performance indicators (KPI) are defined for the processes.
Develop or identify the benchmarks and standard for the process performance.
Process evaluation
Process Analysis and Compare the performance with the benchmarks or
standards.
Skills needed to perform the tasks in the major processes are defined.
Skills training for tasks required to design and manage major processes are
provided.
Process managers use performance data to manage their processes.
Process improvement programs are in place to identify and improve problems
and defects.
Feedback is generated and given it to employees.
The responsible person is assigned for the performance of the particular
process.
Feedback is used to improve and develop the strategies to achieve the
organization goals.
0.810
0.832
0.685
0.836
0.962
0.460
0.826
1.056
0.826
0.772
1.071
1.654
1.654
0.819
4.71
4.61
4.61
4.57
4.54
4.71
4.64
4.68
4.64
4.82
4.54
4.07
4.07
4.68
The results related to the questions for defining
the vision, mission and goals and documentation of
the business processes show that the most of the
organizations using PPMS always follow these steps
(mean=4.71, mean=4.61 respectively). The third step
is related to “the critical success factors are defined
based on the organization’s vision, mission, goals and
strategies”. The results related to this question show
that the most of the organizations using PPMS always
follow this step (mean=4.61). Then in the next step of
PPMS the organizations defined their core processes
on the basis of previously defined CSFs. The most of
the respondents from organizations which are using
the PPMS are in point of view that they always follow
this step (mean = 4.57). The step 5 of the PPMS is
about defining the Key performance indicators (KPIs),
which is very important step in the whole process. In
this step the organizations define their key
performance indicators on the basis of their
competitive strategy and core processes. Each and
every core process has different performance
indicators. The respondent’s responses show that the
most of the organizations using PPMS are following
this step (mean = 4.54). Then in the next step the
organizations identify the benchmarks and standard
for the process performance. These benchmarks can
be processes within the organization and can be
processes of competitors’ organizations. The
descriptive statistics according to this step shows that
most of the organizations always follow this step
(mean = 4.71). The first six steps of the PPMS are
related to Strategic process planning phase. And the
next eight steps are all related to second phase of
PPMS which is Process Evaluation phase. The next
step which is the first step of second phase of PPMS is
about process analysis and comparing the performance
with standard and benchmarks. The results related to
this step (mean = 4.64) show that the most of the
organizations always follow this step. The second step
of process evaluation is about the identification of
skill needed to perform tasks in the major process. The
mean value of the responses related to this process is
4.68, which reveals that the most of the organizations
using PPMS always follow this step. The next and
third step of the second phase of PPMS is to provide
the skill training to employees needed to perform the
tasks related to design and manage the major
processes. The results about this step reveals that the
most of the organizations in Pakistan which are using
the PPMS to manage their performance are following
this step (mean = 4.64). The other steps involved in
the second phase are; process managers use the
performance data to manage their performance (mean
= 4.82), process improvement programs are in place to
identify and improve problems and defects (mean =
4.54), feedback is generated and given it to employees
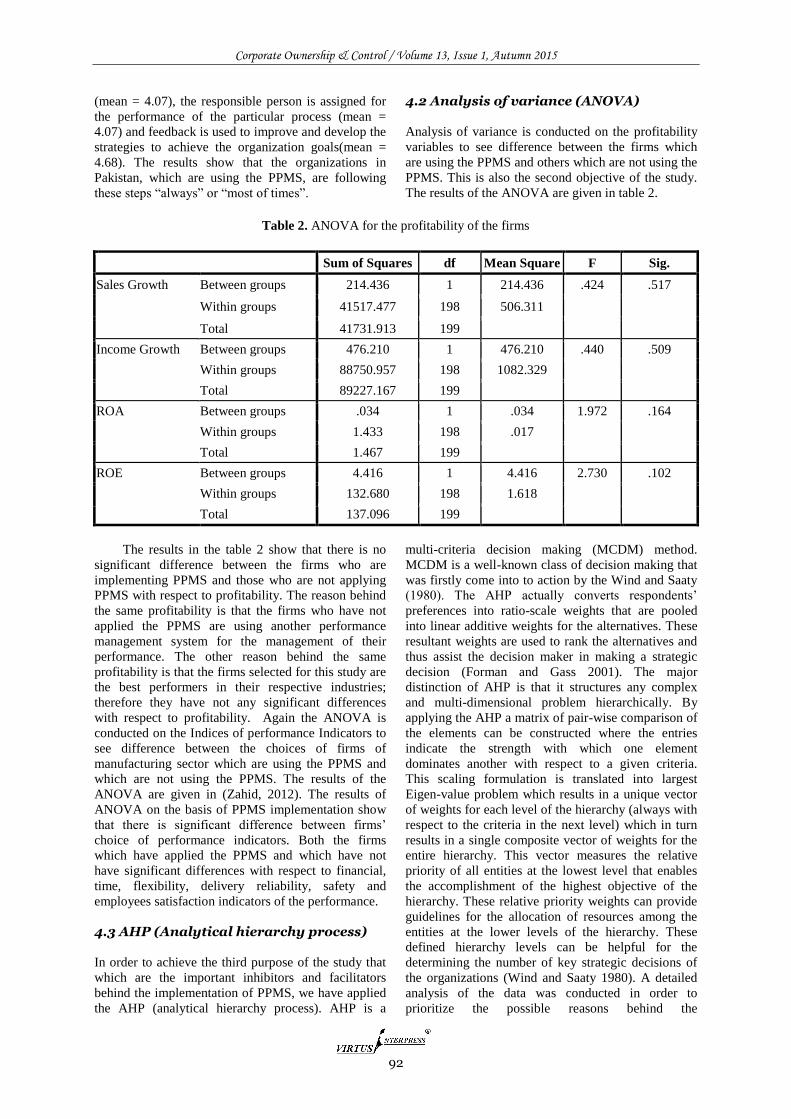
Corporate Ownership & Control / Volume 13, Issue 1, Autumn 2015
92
(mean = 4.07), the responsible person is assigned for
the performance of the particular process (mean =
4.07) and feedback is used to improve and develop the
strategies to achieve the organization goals(mean =
4.68). The results show that the organizations in
Pakistan, which are using the PPMS, are following
these steps “always” or “most of times”.
4.2 Analysis of variance (ANOVA)
Analysis of variance is conducted on the profitability
variables to see difference between the firms which
are using the PPMS and others which are not using the
PPMS. This is also the second objective of the study.
The results of the ANOVA are given in table 2.
Table 2. ANOVA for the profitability of the firms
Sum of Squares df Mean Square F Sig.
Sales Growth Between groups 214.436 1 214.436 .424 .517
Within groups 41517.477 198 506.311
Total 41731.913 199
Income Growth Between groups 476.210 1 476.210 .440 .509
Within groups 88750.957 198 1082.329
Total 89227.167 199
ROA Between groups .034 1 .034 1.972 .164
Within groups 1.433 198 .017
Total 1.467 199
ROE Between groups 4.416 1 4.416 2.730 .102
Within groups 132.680 198 1.618
Total 137.096 199
The results in the table 2 show that there is no
significant difference between the firms who are
implementing PPMS and those who are not applying
PPMS with respect to profitability. The reason behind
the same profitability is that the firms who have not
applied the PPMS are using another performance
management system for the management of their
performance. The other reason behind the same
profitability is that the firms selected for this study are
the best performers in their respective industries;
therefore they have not any significant differences
with respect to profitability. Again the ANOVA is
conducted on the Indices of performance Indicators to
see difference between the choices of firms of
manufacturing sector which are using the PPMS and
which are not using the PPMS. The results of the
ANOVA are given in (Zahid, 2012). The results of
ANOVA on the basis of PPMS implementation show
that there is significant difference between firms’
choice of performance indicators. Both the firms
which have applied the PPMS and which have not
have significant differences with respect to financial,
time, flexibility, delivery reliability, safety and
employees satisfaction indicators of the performance.
4.3 AHP (Analytical hierarchy process)
In order to achieve the third purpose of the study that
which are the important inhibitors and facilitators
behind the implementation of PPMS, we have applied
the AHP (analytical hierarchy process). AHP is a
multi-criteria decision making (MCDM) method.
MCDM is a well-known class of decision making that
was firstly come into to action by the Wind and Saaty
(1980). The AHP actually converts respondents’
preferences into ratio-scale weights that are pooled
into linear additive weights for the alternatives. These
resultant weights are used to rank the alternatives and
thus assist the decision maker in making a strategic
decision (Forman and Gass 2001). The major
distinction of AHP is that it structures any complex
and multi-dimensional problem hierarchically. By
applying the AHP a matrix of pair-wise comparison of
the elements can be constructed where the entries
indicate the strength with which one element
dominates another with respect to a given criteria.
This scaling formulation is translated into largest
Eigen-value problem which results in a unique vector
of weights for each level of the hierarchy (always with
respect to the criteria in the next level) which in turn
results in a single composite vector of weights for the
entire hierarchy. This vector measures the relative
priority of all entities at the lowest level that enables
the accomplishment of the highest objective of the
hierarchy. These relative priority weights can provide
guidelines for the allocation of resources among the
entities at the lower levels of the hierarchy. These
defined hierarchy levels can be helpful for the
determining the number of key strategic decisions of
the organizations (Wind and Saaty 1980). A detailed
analysis of the data was conducted in order to
prioritize the possible reasons behind the
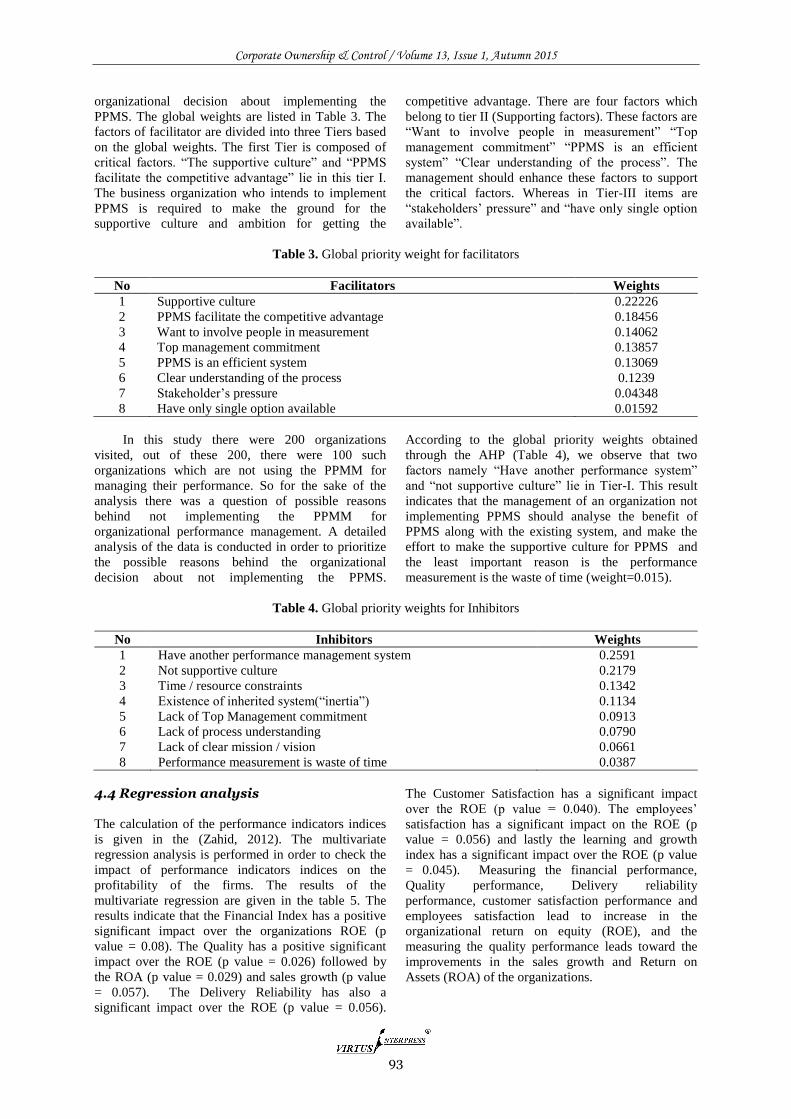
Corporate Ownership & Control / Volume 13, Issue 1, Autumn 2015
93
organizational decision about implementing the
PPMS. The global weights are listed in Table 3. The
factors of facilitator are divided into three Tiers based
on the global weights. The first Tier is composed of
critical factors. “The supportive culture” and “PPMS
facilitate the competitive advantage” lie in this tier I.
The business organization who intends to implement
PPMS is required to make the ground for the
supportive culture and ambition for getting the
competitive advantage. There are four factors which
belong to tier II (Supporting factors). These factors are
“Want to involve people in measurement” “Top
management commitment” “PPMS is an efficient
system” “Clear understanding of the process”. The
management should enhance these factors to support
the critical factors. Whereas in Tier-III items are
“stakeholders’ pressure” and “have only single option
available”.
Table 3. Global priority weight for facilitators
No Facilitators Weights
1 Supportive culture 0.22226
2 PPMS facilitate the competitive advantage 0.18456
3 Want to involve people in measurement 0.14062
4 Top management commitment 0.13857
5 PPMS is an efficient system 0.13069
6 Clear understanding of the process 0.1239
7 Stakeholder’s pressure 0.04348
8 Have only single option available 0.01592
In this study there were 200 organizations
visited, out of these 200, there were 100 such
organizations which are not using the PPMM for
managing their performance. So for the sake of the
analysis there was a question of possible reasons
behind not implementing the PPMM for
organizational performance management. A detailed
analysis of the data is conducted in order to prioritize
the possible reasons behind the organizational
decision about not implementing the PPMS.
According to the global priority weights obtained
through the AHP (Table 4), we observe that two
factors namely “Have another performance system”
and “not supportive culture” lie in Tier-I. This result
indicates that the management of an organization not
implementing PPMS should analyse the benefit of
PPMS along with the existing system, and make the
effort to make the supportive culture for PPMS and
the least important reason is the performance
measurement is the waste of time (weight=0.015).
Table 4. Global priority weights for Inhibitors
No Inhibitors Weights
1 Have another performance management system 0.2591
2 Not supportive culture 0.2179
3 Time / resource constraints 0.1342
4 Existence of inherited system(“inertia”) 0.1134
5 Lack of Top Management commitment 0.0913
6 Lack of process understanding 0.0790
7 Lack of clear mission / vision 0.0661
8 Performance measurement is waste of time 0.0387
4.4 Regression analysis
The calculation of the performance indicators indices
is given in the (Zahid, 2012). The multivariate
regression analysis is performed in order to check the
impact of performance indicators indices on the
profitability of the firms. The results of the
multivariate regression are given in the table 5. The
results indicate that the Financial Index has a positive
significant impact over the organizations ROE (p
value = 0.08). The Quality has a positive significant
impact over the ROE (p value = 0.026) followed by
the ROA (p value = 0.029) and sales growth (p value
= 0.057). The Delivery Reliability has also a
significant impact over the ROE (p value = 0.056).
The Customer Satisfaction has a significant impact
over the ROE (p value = 0.040). The employees’
satisfaction has a significant impact on the ROE (p
value = 0.056) and lastly the learning and growth
index has a significant impact over the ROE (p value
= 0.045). Measuring the financial performance,
Quality performance, Delivery reliability
performance, customer satisfaction performance and
employees satisfaction lead to increase in the
organizational return on equity (ROE), and the
measuring the quality performance leads toward the
improvements in the sales growth and Return on
Assets (ROA) of the organizations.
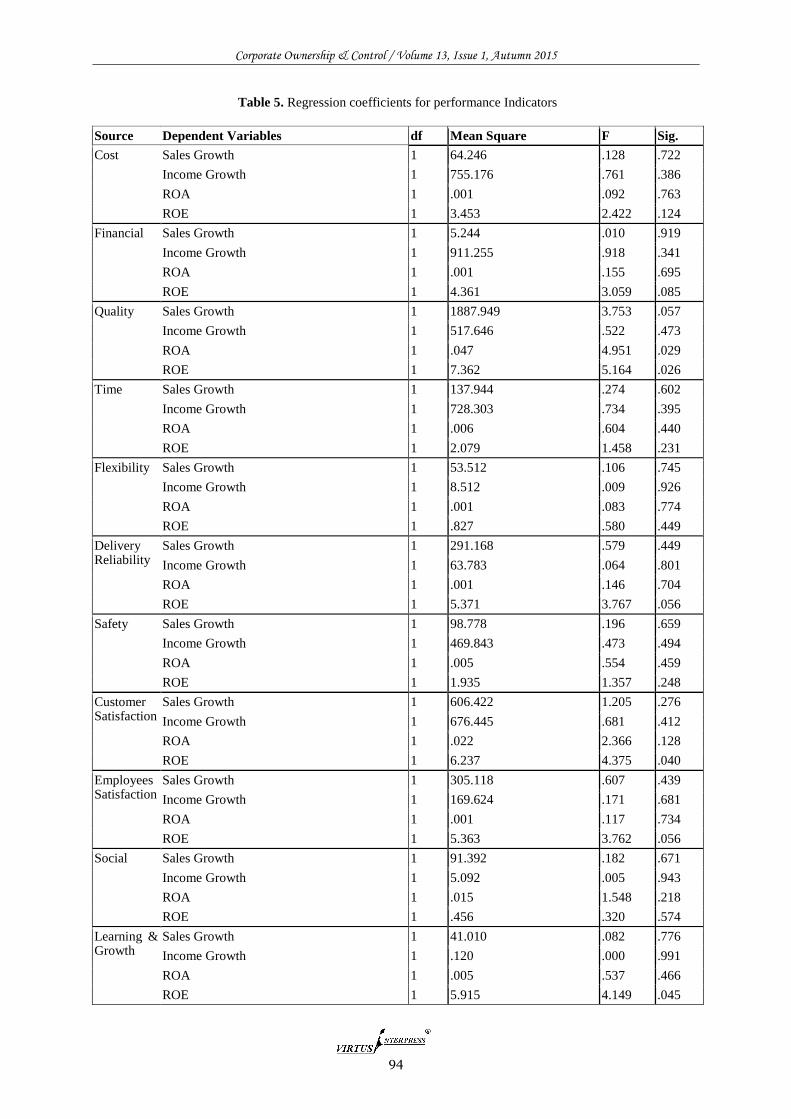
Corporate Ownership & Control / Volume 13, Issue 1, Autumn 2015
94
Table 5. Regression coefficients for performance Indicators
Source Dependent Variables df Mean Square F Sig.
Cost Sales Growth 1 64.246 .128 .722
Income Growth 1 755.176 .761 .386
ROA 1 .001 .092 .763
ROE 1 3.453 2.422 .124
Financial Sales Growth 1 5.244 .010 .919
Income Growth 1 911.255 .918 .341
ROA 1 .001 .155 .695
ROE 1 4.361 3.059 .085
Quality Sales Growth 1 1887.949 3.753 .057
Income Growth 1 517.646 .522 .473
ROA 1 .047 4.951 .029
ROE 1 7.362 5.164 .026
Time Sales Growth 1 137.944 .274 .602
Income Growth 1 728.303 .734 .395
ROA 1 .006 .604 .440
ROE 1 2.079 1.458 .231
Flexibility Sales Growth 1 53.512 .106 .745
Income Growth 1 8.512 .009 .926
ROA 1 .001 .083 .774
ROE 1 .827 .580 .449
Delivery Reliability
Sales Growth 1 291.168 .579 .449
Income Growth 1 63.783 .064 .801
ROA 1 .001 .146 .704
ROE 1 5.371 3.767 .056
Safety Sales Growth 1 98.778 .196 .659
Income Growth 1 469.843 .473 .494
ROA 1 .005 .554 .459
ROE 1 1.935 1.357 .248
Customer Satisfaction
Sales Growth 1 606.422 1.205 .276
Income Growth 1 676.445 .681 .412
ROA 1 .022 2.366 .128
ROE 1 6.237 4.375 .040
Employees Satisfaction
Sales Growth 1 305.118 .607 .439
Income Growth 1 169.624 .171 .681
ROA 1 .001 .117 .734
ROE 1 5.363 3.762 .056
Social Sales Growth 1 91.392 .182 .671
Income Growth 1 5.092 .005 .943
ROA 1 .015 1.548 .218
ROE 1 .456 .320 .574
Learning & Growth
Sales Growth 1 41.010 .082 .776
Income Growth 1 .120 .000 .991
ROA 1 .005 .537 .466
ROE 1 5.915 4.149 .045
Corporate Ownership & Control / Volume 13, Issue 1, Autumn 2015
95
5 Summary and conclusions
The phenomenon performance measurement is used
by the organizations in order to ensure that they are
going on right direction and achieving their preset
targets in terms of organizational goals and objectives.
For this purpose the performance measures are used to
evaluate and control the overall business operations.
They are also used to measure and compare the
performance of different organizations both within the
organization and outside of the organization. The
performance can be compared within the departments,
sub departments, teams and individual processes
(Ghalayini and Noble 1996). This study is an attempt
to know that whether the manufacturing organizations
of Pakistan are following all steps for PPMS as
suggested by Oakland (2001). What are the potential
inhibitors and facilitators regarding the implementing
and not implementing the PPMS and what is impact of
each performance indicator on the profitability of the
organizations.
On the basis of the results and data analysis we
can conclude that the manufacturing organizations in
Pakistan are following all steps involved in process
performance management system as suggested by the
researchers. The most important facilitators behind
implementing the PPMS are supportive culture and the
“PPMS facilitate the competitive advantage” and the
least important facilitator is stakeholder’s pressure on
the firms to implement the PPMS, which means that
the there is no pressure from any stakeholder on the
company to implement the PPMS. The most important
inhibitors behind not implementing the PPMS are that
the firms have another performance management
system and not supportive culture in the organization.
And least important inhibitor is “performance
management is the wastage of time”, which means
that organizations which have not applied the PPMS,
do not consider that the “performance management as
wastage of time” is the important inhibitor behind not
implementing the PPMS. And the companies which
have not applied the PPMS have another performance
management system or they do not have supportive
culture for implementing the PPMS.
The results of regression show that the
Measuring the financial performance, Quality
performance, Delivery reliability performance,
customer satisfaction performance and employees
satisfaction lead to increase in the organizational
return on equity (ROE), and measuring the quality
performance also leads toward the improvements in
the sales growth and Return on Assets (ROA) of the
organizations. In order to simplify our results we can
say that by measuring the overall organizational
performance has a significant impact over the
profitability of the organizations significantly. The
results of ANOVA show that the companies who have
applied the PPMS and who have not applied the
PPMS have the same profitability. There is not any
significant difference between the selected industries
regarding the using of performance indicators except
the textile and automobiles regarding the use of
learning & growth performance indicator.
From these results we conclude that KPI
performance measurement importance could also be
expressed by next statement: KPI tells you where
performance has been in the past, where it is now, and
perhaps more useful, where performance is likely to
be in the future“ (Smith, 2001).
References
1. Aitken, C. S., C. Brinkworth, R. (2010). "Process
Classification Frameworks." Handbook on Business
Process Management 2: pp.73-92.
2. Bhatti, M. I., Awan, H. M. and Razaq, Z. (2014). “The
key Performance indicators (KPI’s) and their imact on
overall organisational performance” Quality and
Quantity, Vol. 48, p. 3127-3143.
3. Browne, J. D., J. Rolstadas, A. Andersen, B. (1997).
"Performance measurement: the ENAPS approach."
International Journal of Business Transformation 1:
pp.73-84.
4. De Toni, A. and S. Tonchia (2001). "Performance
measurement systems-models, characteristics and
measures." International Journal of Operations &
Production Management 21(1/2): pp.46-71.
5. Elzinga, D. J. H., T.Lee, C.Y.Bruner, C. (1995).
"Business process management: survey and
methodology." Engineering Management, IEEE
Transactions on 42(2): pp.119-128
6. Forman, E. H. and S. I. Gass (2001). "The analytic
hierarchy process: An exposition." Operations
research: pp.469-486.
7. Ghalayini, A. M. and J. S. Noble (1996). "The
changing basis of performance measurement."
International Journal of Operations & Production
Management 16(8): pp.63-80.
8. Gosselin, M. 2005. "An empirical study of
performance measurement in manufacturing firms."
International journal of productivity and performance
management 54(5/6): pp.419-437
9. H. M. Awan, K. Bukhari and Z. Razaq (2012).
“Process performance management: case of
manufacturing companies in Pakistan”. A research
memo, BZ University, Multan.
10. Heckl, D. and J. Moormann (2010). "Process
performance management." Handbook on Business
Process Management 2: pp.115-135.
11. Hui, K. H. and T. K. Chuan (2002). "Nine approaches
to organizational excellence." Journal of
Organizational Excellence 22(1): pp.53-65.
12. Juran JM, Gryna FM (1993) Quality planning and
analysis: from product development through use.
McGraw-Hill, New York
13. Kaplan, R. S. (2001). "Strategic performance
measurement and management in nonprofit
organizations." Nonprofit management and Leadership
11(3): pp.353-370.
14. Kaplan RS, Norton DP (1993) Putting the balanced
scorecard to work. Harv Bus Rev 71(5): pp.134–147
15. Kellen, V. (2003). "Business Performance
Measurement At the Crossroads of Strategy, Decision-
Making, Learning and Information Visualization ".
Corporate Ownership & Control / Volume 13, Issue 1, Autumn 2015
96
16. Koufteros, X. A. V., M.A. Doll, W.J. (1998).
"Developing measures of time-based manufacturing."
Journal of Operations Management 16(1): pp.21-41.
17. Kueng, P. and A. J. W. Krahn (1999). "Building a
process performance measurement system: some early
experiences." Journal of Scientific and Industrial
Research 58:pp. 149-159.
18. Kueng P (2000) Process performance measurement
system – a tool to support process-based
organizations. Total Qual Manage 11(1):pp.67–86
19. Larwood, L. F., C.M. Kriger, M.P. Miesing, P. (1995).
"Structure and meaning of organizational vision."
Academy of management journal: pp.740-769.
20. Leong, G. K. S., DL, Ward, P.T. (1990). "Research in
the process and content of manufacturing strategy."
Omega 18(2):pp.109-122.
21. Neely, A. (1999). "The performance measurement
revolution: why now and what next?" International
Journal of Operations & Production Management
19(2): pp.205-228.
22. Neely, A. G., M. Platts, K. (2005). "Performance
measurement system design: a literature review and
research agenda." International Journal of Operations
& Production Management 25(12): pp.1228-1263.
23. Neely, A. M., J. Platts, K.Richards, H.Gregory,
M.Bourne, M. Kennerley, M. (2000). "Performance
measurement system design: developing and testing a
process-based approach." International Journal of
Operations & Production Management 20(10): pp.
1119-1145.
24. Oakland, J. S. (2001). Total organizational excellence,
Butterworth-Heinemann.
25. Oakland, J. T., S. Gadd, K. (2002). "Best practice in
business excellence." Total Quality Management
13(8): pp. 1125-1139.
26. Palmberg, K. (2009). "Exploring process management:
Are there any widespread models and definitions?"
The TQM Journal 21(2): pp.203-215.
27. Parmenter, D. (2009). Key performance indicators:
developing, implementing, and using winning KPIs,
Wiley.
28. Rok Škrinjar, V. B. V., Mojca Indihar Štemberger
(2010). "Adoption of Business Process Orientation
Practices:Slovenian and Croatian Survey." BUSINESS
SYSTEMS RESEARCH 01(1-2): pp.1-50.
29. Rolstadås, A. (1998). "Enterprise performance
measurement." International Journal of Operations &
Production Management 18(9/10):pp. 989-999.
30. Scheer, A. W. B., E. (2010). "The Process of Business
Process Management." Handbook on Business Process
Management 2: pp.239-265.
31. Sinclair, D. and M. Zairi (1995). "Effective process
management through performance measurement: Part
II–benchmarking total quality-based performance
measurement for best practice." Business Process
Management Journal 1(2): pp. 58-72.
32. Smith, J. (2001) THE K.P.I. Book, Insight
Training&Development, Stourbridge, England.
33. Venkatraman, N. and V. Ramanujam (1986).
"Measurement of business performance in strategy
research: A comparison of approaches." The Academy
of Management Review 11(4): pp. 801-814.
34. White, G. P. (1996). "A survey and taxonomy of
strategy-related performance measures for
manufacturing." International Journal of Operations &
Production Management Vol. 16(3): pp.42-61.
35. Wind, Y. and T. L. Saaty (1980). "Marketing
applications of the analytic hierarchy process."
Management Science: pp. 641-658.
36. Zairi, M. (1997). "Business process management: a
boundaryless approach to modern competitiveness."
Business Process Management Journal 3 (1): pp.64-
80.
37. Zairi, M. and D. Sinclair (1995). "Business process re-
engineering and process management: a survey of
current practice and future trends in integrated
management." Business Process Management Journal
1(1): pp.8-30.
38. Zur Muhlen M(2004) “Workflow-based process
controlling. Foundation, design, and application of
workflow-driven process information systems”.
Logos, Berlin
Corporate Ownership & Control / Volume 13, Issue 1, Autumn 2015
97
THE RELATIONS BETWEEN OWNERSHIP STRUCTURE AND CORPORATE PERFORMANCE: EVIDENCE
FROM BAHRAIN STOCK EXCHANGE
Reem Khamis*, Wajeeh Al-Ali**, Allam Hamdan**
Abstract
In this article we examine the relation between ownership structure and corporate performance; the sample of the study included 42 out of 48 companies (resembling 87.5% of the population) of all sectors in Bahrain Stock Exchange in five years from 2007-2011. Several dimensions of ownership structure were studied and two different measurements of performance were used (ROA and Tobin’s Q) to capture the different results from using each one of them and to assess the relevance of each measurement to performance and to justify the conflicting results found by previous studies. Another objective of this study was to explore the patterns of ownership structure found in Bahraini market. The results of the study revealed that institutional ownership is the most common pattern of ownership structure that exists in Bahraini market. The results of testing the effect of ownership structure on performance were conflicting as expected depending on the measurement of performance that was used. Several recommendations were given to investors depending on the results obtained from the study and several points were cleared out to be addressed by future studies.
Keywords: Ownership Structure, Ownership Concentration, Foreign Ownership, Institutional Ownership, Managerial Ownership, Company Performance
*Brunel University, UK **Ahlia University, Bahrain
1 Introduction
The relation between ownership structure and firm value and performance has been studied early since 1932, when researchers studied the conflict between owners and management and how it affects corporate value. Berle and Means (1932) indicated that an increase in professionalization of management, companies may operate for managers’ benefit not for the benefit of owners. This what was known later as agency problem, when there is a conflict between the owners of the firm and the people who manage that firm when they work to achieve their own benefits rather than the benefits of the owners. Managers often have the discretion and incentives to pursue strategies and practices that benefit themselves at the expense of shareholders (Fama and Jenson, 1983). Different ownership structures affects agency problem differently, so it is crucial to know the firm’s ownership structure to determine the nature of agency problem and costs associated with it and how corporate value and performance might be affected by that issue, for example , managers of publicly held firm has different objectives than a manager of a family business and so.
Knowing the firm’s ownership structure and determining its effect on corporate value and performance have concerned many researchers around the world from developed to developing countries but
few in the middle east and fewer in GCC countries and this study may be the first one to do so in Bahrain. This study provides empirical evidence from Bahrain on the effect of ownership structure on corporate performance, using different measures of corporate performance and different dimensions of ownership structure to justify the conflicting results found by different researchers. It also investigates the patterns of ownership structures in Bahraini financial market in addition to providing useful information to other interested parties that may benefit from it such as investors and researchers.
1.1 Problem statement and study questions
The study may provide answers to many questions that may be asked by any interested individual or institute. The first question that may arise, do ownership structure really matter? If yes; how do they affect corporate performance? What is the best ownership structure that maximizes the firm’s value? What are the patterns of ownership structure in Bahraini market? What are the other factors that may affect corporate performance?
1.2 Study objective
The study aims at exploring the effect of ownership structure on corporate performance in Bahrain using two different ways of measuring corporate
Corporate Ownership & Control / Volume 13, Issue 1, Autumn 2015
98
performance and different dimensions of ownership structure to know how exactly these factors affect corporate performance and how investors can benefit from this information to make the correct investment decision.
The paper is organized as follows: Section 2 background and literature review. Section 3 describes research design and methodology. Sections 4 present empirical results. Section 5 provides a brief summary and concluding remarks.
2 Background and literature review
Corporate performance and factors affecting it is an important topic in finance, as many researchers were concerned about the firm performance and what makes one firm more successful than another. There are two different lines of research in the business research world. The first one is concerned about factors in the external economic atmosphere that affects the firm’s successfulness, and the second one is concerned about the internal organizational characteristics. Both lines do not give proper attention to the competitive position of the firm itself (Hansen and Wernerfelt, 1989).
Evaluation of the firm performance is an important issue to management of the company, investors and researchers. For managers, evaluation of the firm performance is sometimes tied to their compensation to alleviate the agency problem. To investors, performance is an important indicator for successfulness of their investment or not. In the following section, we will take a look on some performance measure and later on, we will use some of them in measuring the variables of the study.
Ownership structure and its effect on performance of the firm is one of the most covered topics in the literature of corporate finance although the results of most studies are conflicting and that may be because of the difference between these studies in the measurement tools used to measure ownership structure or the dimensions of ownership structure that is studied.
The issue of ownership structure was studied as early as the property rights were known. Berle and Means (1932) were from the earliest ones to study this topic and indicated that there is a significant relationship between ownership structure and company value. Perhaps it is useful to indicate that researchers from different countries found different results. Some researchers found that there is significant relationship between these two variables others couldn’t find this relationship. That’s could be because they studied the issue from different perspectives. Thus we found it easier to classify ownership structures that were reviewed according to the dimension that was studied and then we will take a look on the previous studies that studied ownership structure in different countries from around the world.
Ownership structure is divided into two dimensions which are: degree of concentration and identity of the owner which is also divided into sub dimensions which are: family ownership, institutional
ownership, government ownership, foreign ownership, and insider or management ownership.
2.1 Concentration of ownership
This dimension is concerned with the degree of dispersion of ownership among certain shareholders. Ownership could be diluted among large number of shareholders or concentrated in small number of shareholders or block holders. The problem of diffuseness of ownership among large number of shareholders is that there will be weakness in monitoring management (Morck et al. 1988), but the advantage is that, there will not be a structure large enough to over control management. In some cases, management would exploit the resources of the firm affecting its value and performance negatively (Berle and Means, 1932).
Some studies such as (Demesetz and Lehn, 1985; Demesetz and Vilalonga, 2001; Kumar, 2003 and Rowe and Davidson, 2002) found that there is no significant relationship between concentrated ownership and company value.
Other studies such (Pivovarsky, 2003; Sanda, Mikailu and Garba, 2005; Joh, 2002 and Xu and Wang, 1997) found a significant relationship between the two variables. Some studies found a positive relationship but insignificant relationship between the two variables such as (McConnell and Servaes, 1990).
2.2 Foreign ownership
Usually foreign investors perform a detailed analysis before investing and they tend to invest in profitable companies. Foreign investors are expected to bring in the latest technologies which allow companies to perform better in an efficient manner thus performance is expected to improve (Caves, 1996; Kumar, 2003)
Again researchers found conflicting results as some found a relation between foreign ownership and company value such as (Bai et al., 2005; Sarkar and Sarkar, 2000 and Patibandle, 2002). Others found a negative relationship such as (Sarac, 2002 and Kumar, 2003)
2.3 Institutional ownership
This dimension of ownership is related to the total percentage of equity owned by institutional investors. Fama, 1980 claimed that institutional ownership is beneficial to the firm and leads to improving its performance and value. Shleifer and Vishny, 1986 explained that possible relation in two points: The first one is that outside block owners have the ability to overcome the problem of controlling managers. The second one is that large block shareholders may also improve the effectiveness of takeover mechanism by overcoming the problem of free rider which rises from the lack of control by shareholders. (Berger, 2003 and Sarac, 2002) found a positive relationship with a moderate statistic effect between institutional ownership and firm value. Others like Wan (1990) found a positive, statistical and significant correlation between the two variables.
Corporate Ownership & Control / Volume 13, Issue 1, Autumn 2015
99
2.4 Managerial ownership
This dimension with the concentration ownership dimension forms the agency problem which still a debate between researchers, as when the management controls the firm, it is expected to work in its own interest and if owners control managers, they are expected to work in the interest of the firm thus improving its performance and value and not wasting the firms resources or abuse them. As expected, researchers also found conflicting results regarding managerial ownership as some found a positive relationship such as (Severin, 2001 and Kumar, 2003). Others didn’t find that relationship such as (Demsetz and Villalonga, 1999; Rowe and Davidson, 2002 and long and So, 2002).
2.5 Family ownership
Family ownership is very common worldwide. Perhaps it’s one of the most presented types of ownership structures around the world. La Porta et al. (2003) mentioned that family ownership is the most common type of organizations in 27 countries worldwide. Some studies found a positive relationship between family ownership and corporate value and performance while others did not find this relationship. A study like Villalonga and Amit (2006) found that firm only makes value when the founder of the firm acts as the COE of the firm. The most important issues that were studied are the founding family owner effect and generation difference effect. In an overall perspective, it can be seen that when family owners are in the management there will be what called incentive alignment where the conflict between owners and management will be reduced thus agency costs will be reduced too. The other important issue which was discussed that other types of owners think only about profit maximization but family owners look at the long term commitment to the company and they try to create competitive advantages that requires large investments at the beginning. (Hsu and Chen, 2009).
Some researchers found a negative effect of family ownership as when the family acts as the block holder of shares, the minority owners will be affected negatively specially when protection laws are weak in certain countries thus a conflict will be created and the performance of the firm will deteriorate. The other issue is that family owners, usually are involved in management thus there may be a bias in choosing management to the family relations issue versus the efficiency issue and that will affect performance for sure, this argument is known as manager discouragement. (Smith and Amoako – Adu, 1999).
2.6 Governmental ownership
In the early years of last century governments played an important role in planning market economy to overcome problems arising from social monopoly (Meade 1948). But in 1970’s and 80’s huge amount of government owned companies went through privatization to reduce the government role in market
mechanisms. Few governments around the world are still owning and controlling its markets such as China, Russia and some Eastern Europe countries.
There is a debate about the advantages and disadvantages of governmental ownership and the positive and negative effects of it on firm performance.
In the positive side, the total effect of government ownership on society as a whole is considered but not the success of the individual firms. It is known that governmental ownership cures market failures as when the social cost of monopoly becomes high, governments interfere to restore the purchasing power of its citizens thus protecting them. The other issue is governmental ownership of some industries is considered of strategic importance to the whole nation such as natural resources, utilities and infrastructures. As some studies found positive effect of government ownership among private ownership in some industries such as utilities.
In the negative side, governmental ownership is considered to be inefficient and bureaucratic. (Stulz, 1988). As the control rights and cash flow rights of decision maker are interfered, there will not be significant cash flow as all profits are allocated to the firm or to the national budget. Thus, there will be lack of incentives to maximize firm’s profits.
Some studies concluded that government owned firms depends largely on the quality of the government itself which varies from one country to another. (La Porta et al., 1999).
The relation between ownership structure and performance has been investigated in many studies around the world. This part will review some of these studies that are related to our study in somehow from different countries.
Severin (2001) investigated the relationship between ownership structure, other variables and the economic performance in a sample of French companies. The results of his study indicated that there is a non-linear relation between ownership structure and performance. He also found that debt level has a negative effect on performance and a company size had a positive effect on performance.
Pinteris (2002) conducted a study on a panel data of 228 Argentine banks from 1997 to 1999. The study explored the relationship between ownership structure, board composition and performance. Results showed that there is statistically negative relation between the proportion of insider directors and performance.
In Turkey, Sarac (2002) conducted a study on a sample of 138 Turkish manufacturing companies. The results showed that a relation between ownership structure and net profit. It also proved that there is a positive relation between institutional ownership and profitability.
A study conducted by Reyana & Valdes (2012) in Mexico on a sample of 90 companies listed in Mexico Stock exchange over five years, explored the relationship between corporate governance, ownership structure and performance. Results indicated that there is a negative relation between CEO ownership and
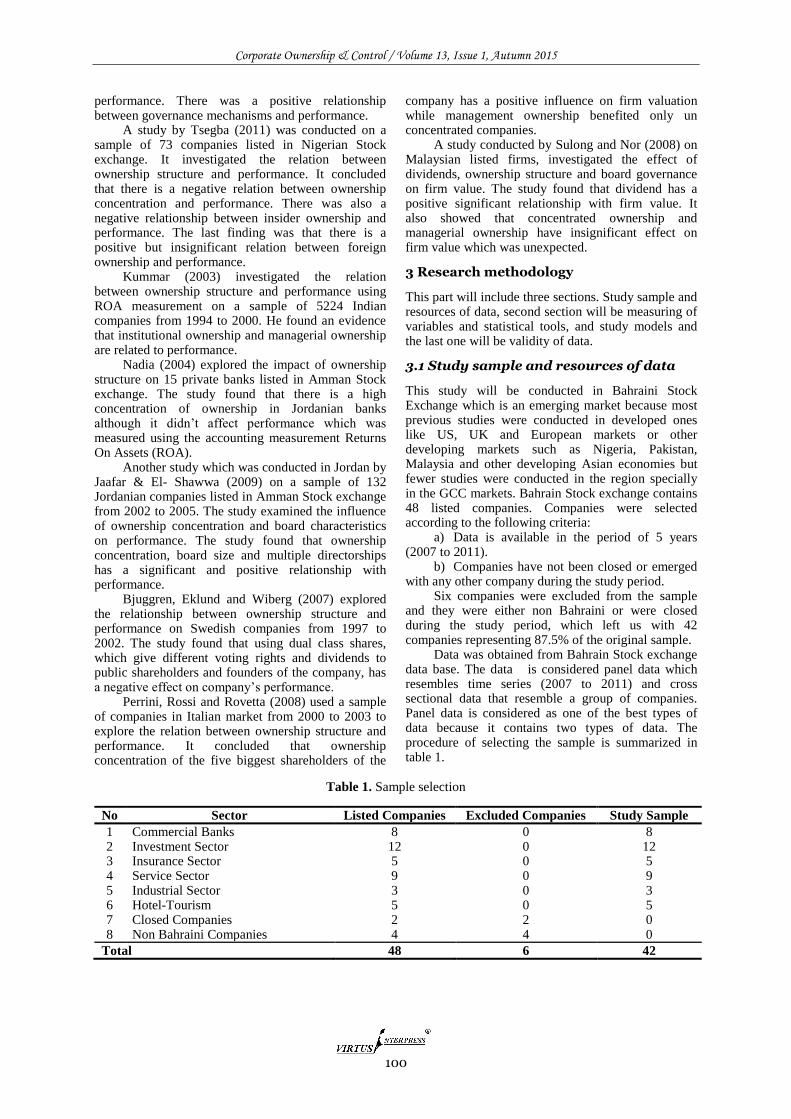
Corporate Ownership & Control / Volume 13, Issue 1, Autumn 2015
100
performance. There was a positive relationship between governance mechanisms and performance.
A study by Tsegba (2011) was conducted on a sample of 73 companies listed in Nigerian Stock exchange. It investigated the relation between ownership structure and performance. It concluded that there is a negative relation between ownership concentration and performance. There was also a negative relationship between insider ownership and performance. The last finding was that there is a positive but insignificant relation between foreign ownership and performance.
Kummar (2003) investigated the relation between ownership structure and performance using ROA measurement on a sample of 5224 Indian companies from 1994 to 2000. He found an evidence that institutional ownership and managerial ownership are related to performance.
Nadia (2004) explored the impact of ownership structure on 15 private banks listed in Amman Stock exchange. The study found that there is a high concentration of ownership in Jordanian banks although it didn’t affect performance which was measured using the accounting measurement Returns On Assets (ROA).
Another study which was conducted in Jordan by Jaafar & El- Shawwa (2009) on a sample of 132 Jordanian companies listed in Amman Stock exchange from 2002 to 2005. The study examined the influence of ownership concentration and board characteristics on performance. The study found that ownership concentration, board size and multiple directorships has a significant and positive relationship with performance.
Bjuggren, Eklund and Wiberg (2007) explored the relationship between ownership structure and performance on Swedish companies from 1997 to 2002. The study found that using dual class shares, which give different voting rights and dividends to public shareholders and founders of the company, has a negative effect on company’s performance.
Perrini, Rossi and Rovetta (2008) used a sample of companies in Italian market from 2000 to 2003 to explore the relation between ownership structure and performance. It concluded that ownership concentration of the five biggest shareholders of the
company has a positive influence on firm valuation while management ownership benefited only un concentrated companies.
A study conducted by Sulong and Nor (2008) on Malaysian listed firms, investigated the effect of dividends, ownership structure and board governance on firm value. The study found that dividend has a positive significant relationship with firm value. It also showed that concentrated ownership and managerial ownership have insignificant effect on firm value which was unexpected.
3 Research methodology
This part will include three sections. Study sample and resources of data, second section will be measuring of variables and statistical tools, and study models and the last one will be validity of data.
3.1 Study sample and resources of data
This study will be conducted in Bahraini Stock Exchange which is an emerging market because most previous studies were conducted in developed ones like US, UK and European markets or other developing markets such as Nigeria, Pakistan, Malaysia and other developing Asian economies but fewer studies were conducted in the region specially in the GCC markets. Bahrain Stock exchange contains 48 listed companies. Companies were selected according to the following criteria:
a) Data is available in the period of 5 years (2007 to 2011).
b) Companies have not been closed or emerged with any other company during the study period.
Six companies were excluded from the sample and they were either non Bahraini or were closed during the study period, which left us with 42 companies representing 87.5% of the original sample.
Data was obtained from Bahrain Stock exchange data base. The data is considered panel data which resembles time series (2007 to 2011) and cross sectional data that resemble a group of companies. Panel data is considered as one of the best types of data because it contains two types of data. The procedure of selecting the sample is summarized in table 1.
Table 1. Sample selection
No Sector Listed Companies Excluded Companies Study Sample
1 Commercial Banks 8 0 8 2 Investment Sector 12 0 12 3 Insurance Sector 5 0 5 4 Service Sector 9 0 9 5 Industrial Sector 3 0 3 6 Hotel-Tourism 5 0 5 7 Closed Companies 2 2 0 8 Non Bahraini Companies 4 4 0
Total 48 6 42
Corporate Ownership & Control / Volume 13, Issue 1, Autumn 2015
101
3.2 Hypothesis development This study will find the effect of ownership structure on one dependent variable which is company performance. The main hypothesis may be formed as follows:
Ha1: There is a significant relationship between ownership structure and performance among Bahraini companies.
Thus, the study hypothesis may be divided into one main hypothesis and four sub hypotheses according to the ownership dimension that will be studied: 3.2.1 Ownership concentration and performance The findings of previous studies are contradicted, as some of them like (Joh, 2002 ; Severin, 2001 ; Xu and Wang , 1997) found a positive effect of ownership concentration on performance as concentrated companies had a better performance. Other studies like (Kumar, 2003 ; Rowe and Davidson, 2002; Demsetz and Villalonga, 1999) couldn’t find that positive relationship. Thus the first sub hypothesis may be formed as follows:
Ha1.1: There is a significant relationship between ownership concentration and performance among Bahraini companies. 3.2.2 Institutional ownership and performance Reviewed previous studies concerning the relation between institutional ownership and company performance indicated a positive, significant statistical relationship between the two variables like (Wan, 1999). Other studies like (Berger, 2003 and Sarac, 2002) found a relationship between the two variables but in a moderate statistic effect. Thus the second sub hypothesis may be formed as follows:
Ha1.2: There is a significant relationship between institutional ownership and performance among Bahraini companies. 3.2.3 Foreign ownership and performance Previous studies that studied the effect of foreign ownership on performance found different results. Some like (Kummar, 2003 and Sarac, 2002) couldn’t find any relation between the two variables. Others, like (Sarkar and Sarkar, 2000 and Patibandle , 2002) found a positive relationship between foreign ownership and company performance. Thus, the third sub hypothesis may be formed as follows:
Ha1.3: There is a significant relationship between foreign ownership and performance among Bahraini companies. 3.2.4 Management ownership and performance Results obtained from previous studies concerning the relationship between managerial ownership and company performance, were also confusing. While some of them found a positive influence of managerial
ownership on performance.(Severin, 2001 and Kummar, 2003). Others like (Demsetz and Villalonga, 1999; Rowe and Davidson, 2002; Long and So, 2002) found like managerial ownership does not enhance performance. Thus the fourth sub hypothesis may be formed as follows:
Ha1.4: There is a significant relationship between management ownership and performance among Bahraini companies. 3.3 Study models This study tries to find the effect of ownership structure on company performance. Thus, ownerships are considered as independent variables and company performance is considered as the dependent variable. The study also uses two different measurement tools to measure the dependent variable (company performance). The first one is simple Tobin’s Q formula and the second one is Return on Assets (ROA) formula. Based on that two study models may be developed as follows: 3.3.1 First model The first model was developed using Tobin’s Q as measurement tool to measure the dependent variable (company performance). 3.3.2 Second model The second model was developed using Return On Equity (ROE) as a measurement tool of the independent variable (company performance). 3.4 Measuring of variables The selection of variables is based on an examination of previous empirical studies, table 2 shows the dependent variable, the independent variables, and the control variables employed for all estimated models of the study. 3.4.1 Dependent variables; corporate performance The main purpose of the study is to investigate the influence of ownership structure and other control variables on firm value in Bahrain stock exchange. Which means that firm performance will be considered as dependent variable. To measure firm performance three major ways were found in the literature:
a) Financial ratios which are obtained from balance sheet and income statement. Studies that were reviewed and used this method are (Long and So, 2002; Pinteris, 2002; Kumar, 2003; Shahid, 2003).
b) Tobin’s Q (e.g. Ruan et al., and Sevein, 2001).
c) Combined method which uses both measures combined together, financial ratios and Tobin’s Q (e.g. Abu Serdaneh et al., 2010 and Demset and Villalonga, 1999 and Wan, 1999).
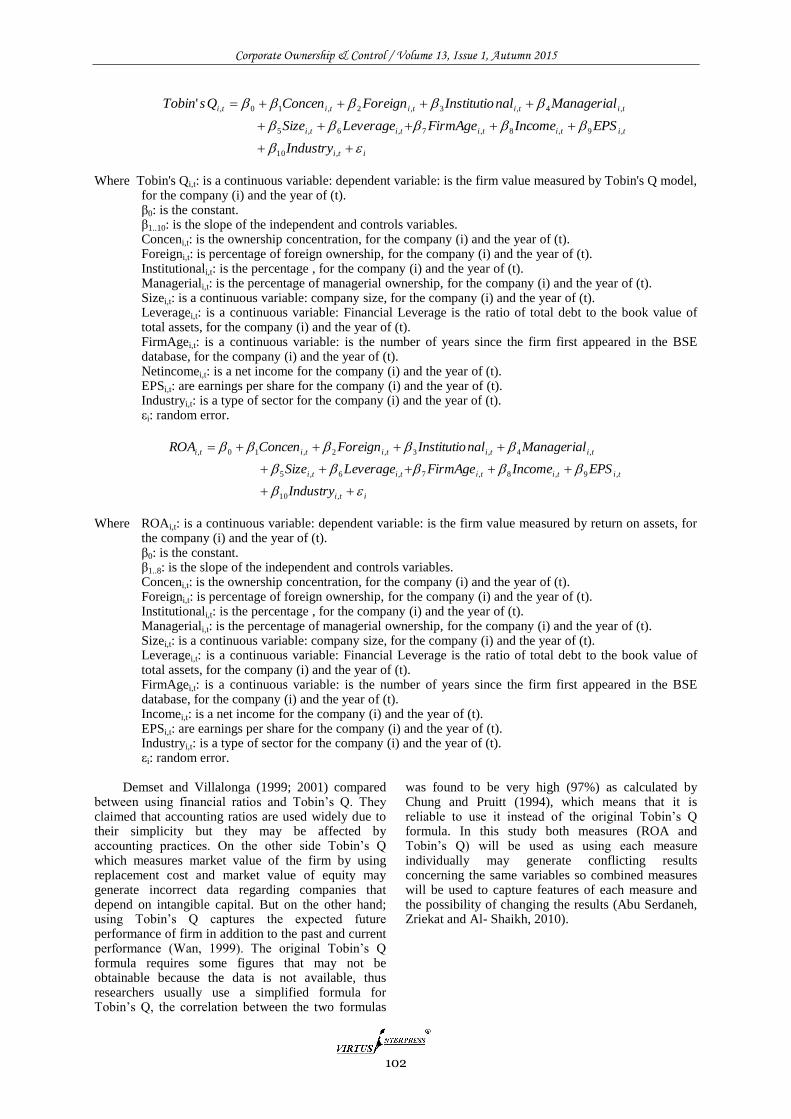
Corporate Ownership & Control / Volume 13, Issue 1, Autumn 2015
102
iti
tititititi
tititititi
Industry
EPSIncomeFirmAgeLeverageSize
ManagerialnalInstitutioForeignConcenQsTobin
,10
,9,8,7,6,5
,4,3,2,10,'
Where Tobin's Qi,t: is a continuous variable: dependent variable: is the firm value measured by Tobin's Q model,
for the company (i) and the year of (t). β0: is the constant. β1..10: is the slope of the independent and controls variables. Conceni,t: is the ownership concentration, for the company (i) and the year of (t). Foreigni,t: is percentage of foreign ownership, for the company (i) and the year of (t). Institutionali,t: is the percentage , for the company (i) and the year of (t). Manageriali,t: is the percentage of managerial ownership, for the company (i) and the year of (t). Sizei,t: is a continuous variable: company size, for the company (i) and the year of (t). Leveragei,t: is a continuous variable: Financial Leverage is the ratio of total debt to the book value of total assets, for the company (i) and the year of (t). FirmAgei,t: is a continuous variable: is the number of years since the firm first appeared in the BSE database, for the company (i) and the year of (t). Netincomei,t: is a net income for the company (i) and the year of (t). EPSi,t: are earnings per share for the company (i) and the year of (t). Industryi,t: is a type of sector for the company (i) and the year of (t). εi: random error.
iti
tititititi
tititititi
Industry
EPSIncomeFirmAgeLeverageSize
ManagerialnalInstitutioForeignConcenROA
,10
,9,8,7,6,5
,4,3,2,10,
Where ROAi,t: is a continuous variable: dependent variable: is the firm value measured by return on assets, for
the company (i) and the year of (t). β0: is the constant. β1..8: is the slope of the independent and controls variables. Conceni,t: is the ownership concentration, for the company (i) and the year of (t). Foreigni,t: is percentage of foreign ownership, for the company (i) and the year of (t). Institutionali,t: is the percentage , for the company (i) and the year of (t). Manageriali,t: is the percentage of managerial ownership, for the company (i) and the year of (t). Sizei,t: is a continuous variable: company size, for the company (i) and the year of (t). Leveragei,t: is a continuous variable: Financial Leverage is the ratio of total debt to the book value of total assets, for the company (i) and the year of (t). FirmAgei,t: is a continuous variable: is the number of years since the firm first appeared in the BSE database, for the company (i) and the year of (t). Incomei,t: is a net income for the company (i) and the year of (t). EPSi,t: are earnings per share for the company (i) and the year of (t). Industryi,t: is a type of sector for the company (i) and the year of (t). εi: random error.
Demset and Villalonga (1999; 2001) compared
between using financial ratios and Tobin’s Q. They claimed that accounting ratios are used widely due to their simplicity but they may be affected by accounting practices. On the other side Tobin’s Q which measures market value of the firm by using replacement cost and market value of equity may generate incorrect data regarding companies that depend on intangible capital. But on the other hand; using Tobin’s Q captures the expected future performance of firm in addition to the past and current performance (Wan, 1999). The original Tobin’s Q formula requires some figures that may not be obtainable because the data is not available, thus researchers usually use a simplified formula for Tobin’s Q, the correlation between the two formulas
was found to be very high (97%) as calculated by Chung and Pruitt (1994), which means that it is reliable to use it instead of the original Tobin’s Q formula. In this study both measures (ROA and Tobin’s Q) will be used as using each measure individually may generate conflicting results concerning the same variables so combined measures will be used to capture features of each measure and the possibility of changing the results (Abu Serdaneh, Zriekat and Al- Shaikh, 2010).
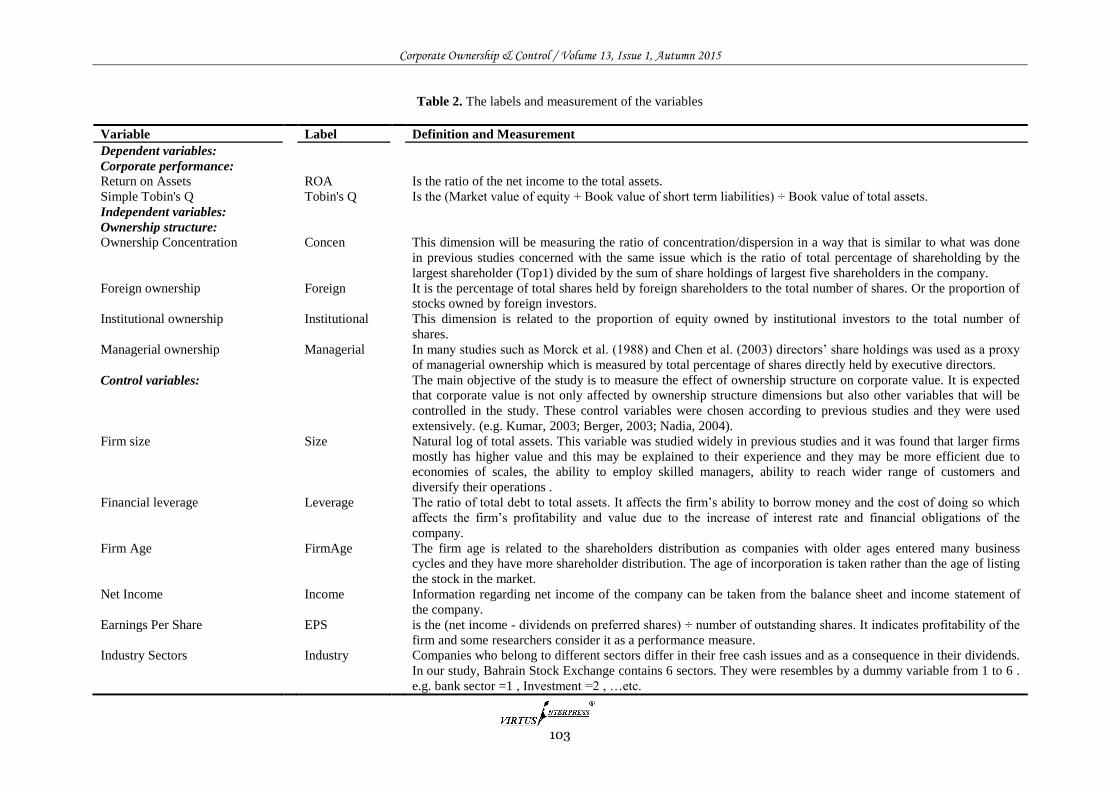
Corporate Ownership & Control / Volume 13, Issue 1, Autumn 2015
103
Table 2. The labels and measurement of the variables
Variable
Label
Definition and Measurement
Dependent variables:
Corporate performance:
Return on Assets ROA Is the ratio of the net income to the total assets.
Simple Tobin's Q Tobin's Q Is the (Market value of equity + Book value of short term liabilities) ÷ Book value of total assets.
Independent variables:
Ownership structure:
Ownership Concentration Concen This dimension will be measuring the ratio of concentration/dispersion in a way that is similar to what was done
in previous studies concerned with the same issue which is the ratio of total percentage of shareholding by the
largest shareholder (Top1) divided by the sum of share holdings of largest five shareholders in the company.
Foreign ownership Foreign It is the percentage of total shares held by foreign shareholders to the total number of shares. Or the proportion of
stocks owned by foreign investors.
Institutional ownership Institutional This dimension is related to the proportion of equity owned by institutional investors to the total number of
shares.
Managerial ownership Managerial In many studies such as Morck et al. (1988) and Chen et al. (2003) directors’ share holdings was used as a proxy
of managerial ownership which is measured by total percentage of shares directly held by executive directors.
Control variables: The main objective of the study is to measure the effect of ownership structure on corporate value. It is expected
that corporate value is not only affected by ownership structure dimensions but also other variables that will be
controlled in the study. These control variables were chosen according to previous studies and they were used
extensively. (e.g. Kumar, 2003; Berger, 2003; Nadia, 2004).
Firm size Size Natural log of total assets. This variable was studied widely in previous studies and it was found that larger firms
mostly has higher value and this may be explained to their experience and they may be more efficient due to
economies of scales, the ability to employ skilled managers, ability to reach wider range of customers and
diversify their operations .
Financial leverage Leverage The ratio of total debt to total assets. It affects the firm’s ability to borrow money and the cost of doing so which
affects the firm’s profitability and value due to the increase of interest rate and financial obligations of the
company.
Firm Age FirmAge The firm age is related to the shareholders distribution as companies with older ages entered many business
cycles and they have more shareholder distribution. The age of incorporation is taken rather than the age of listing
the stock in the market.
Net Income Income Information regarding net income of the company can be taken from the balance sheet and income statement of
the company.
Earnings Per Share EPS is the (net income - dividends on preferred shares) ÷ number of outstanding shares. It indicates profitability of the
firm and some researchers consider it as a performance measure.
Industry Sectors Industry Companies who belong to different sectors differ in their free cash issues and as a consequence in their dividends.
In our study, Bahrain Stock Exchange contains 6 sectors. They were resembles by a dummy variable from 1 to 6 .
e.g. bank sector =1 , Investment =2 , …etc.

Corporate Ownership & Control / Volume 13, Issue 1, Autumn 2015
104
3.5 Data validity tests
This study belongs to the General Linear Model
(GLM) which requires certain conditions before
applying it. Table (3) summarizes the tests that were
conducted to validate the date of the study.
3.5.1 Normal distribution test
To test normality of the data (Jarque-Bera) test was
conducted and results showed that all the data of the
study was normally distributed as p-value more than
5% except two variables which are ownership
concentration and, company age and earnings per
share where p-value less than 5%. To overcome this
problem, natural logarithm of these variables was
taken.
3.5.2 Time series stationarity test
Studies that use time series data as this study consider
these series to be stable otherwise there might be
autocorrelation because the time series are not stable.
To test the stationarity of the time series Unit Root
Test was used, which include: Augmented Dicky-
Fuller Test (ADF) and Phillips-Person Test (PP).
From table (1) we notice that the results of both tests
were more than the critical value at 1% which means
that the time series from 2007-2011 are stable.
3.5.3 Multicollinearity test
The strength of the general linear model depends on
the independency of each variable of the independent
variables used in the model. If this condition was not
met, then the linear model is not considered to be good
to be applied and used. To test the independency of
the independent variables, (Collinearity Diagnostics
Test) was used by measuring the tolerance of each
independent variable and then finding the (Variance
Inflation Factor (VIF)) as this test is used a measure of
the effect of correlation between the independent
variables .Gujarati (2003). If the value of (VIF) is
more than (10), that indicates that there is a problem
with the multicollinearity of the measured independent
variable. From table (4), we notice that VIF value is
less than (10) for all the independent variables, which
means that the study models do not suffer from
multicollinearity problem.
3.5.4 Autocorrelation test
Autocorrelation problem appears in the model when
two following observations are related which will
affect the validity of the model as the independent
variables will be affecting the dependent variables in a
high degree because of that correlation. To test the
presence of that correlation Durbin Watson (D-W) test
was used. Table (4) part (B) indicates that (D-W) for
the two models is not located in this range (d-statistic
dL 1.665 – dU 1.874) which means that there is a
positive correlation in the two study models (Gujrati,
2003) to overcome this problem Lag (-1) was used
when testing the study models.
3.5.5 Homoscedasticity test
When using linear regression models and Ordinary
Least Squares (OLS), variance of random error should
be constant and the average of it should equal zero,
that when it is said that the model has
homoscedasticity. And if the variance is not constant it
is said that the model has Heteroscedasticity then
some statistical methods are used to overcome this
problem, one of them is (White test) which is used
automatically when using programs like (E-views)
when detected by the program itself. From table (4)
part (B) p-value for white test is less than 0.05 for
both study models which means that the two study
models has homoscedasticity and the random error is
constant so the models are valid to be used.
4 Descriptive study
The first step in statistical analysis is descriptive
statistics for the study variables as mentioned in table
(5). After that in tables (6) and (7) we divided the firm
performance into firms with high performance and the
other with low performance based on the value of the
median to compare between firms according to
performance. In table (6) firms were divided to firms
with high T’Q (high performance) and firms with low
T’Q (low performance) which their T’Q value is less
than the median. When doing so we end up with two
samples and then we find the Mean and Standard
deviation for the characteristics of the firm (dividends,
ownership concentration, foreign ownership,
institutional ownership, managerial ownership) and
other control variables (company size, financial
leverage, company age, net income, EPS). To identify
the significance in the variance between the means of
the two samples t-statistic test and z-statistic tests
were used. The same can be said about table (7) where
performance was divided based on ROA
measurement.
In table (8), we looked at the other side, where
we divided the characteristics of the firm (ownership
concentration, foreign ownership, institutional
ownership, managerial ownership) into two parts
according to the median value and in each part the
mean and standard deviation was found to T’Q and
ROA values one at a time. Based on that we can
describe the study variables.
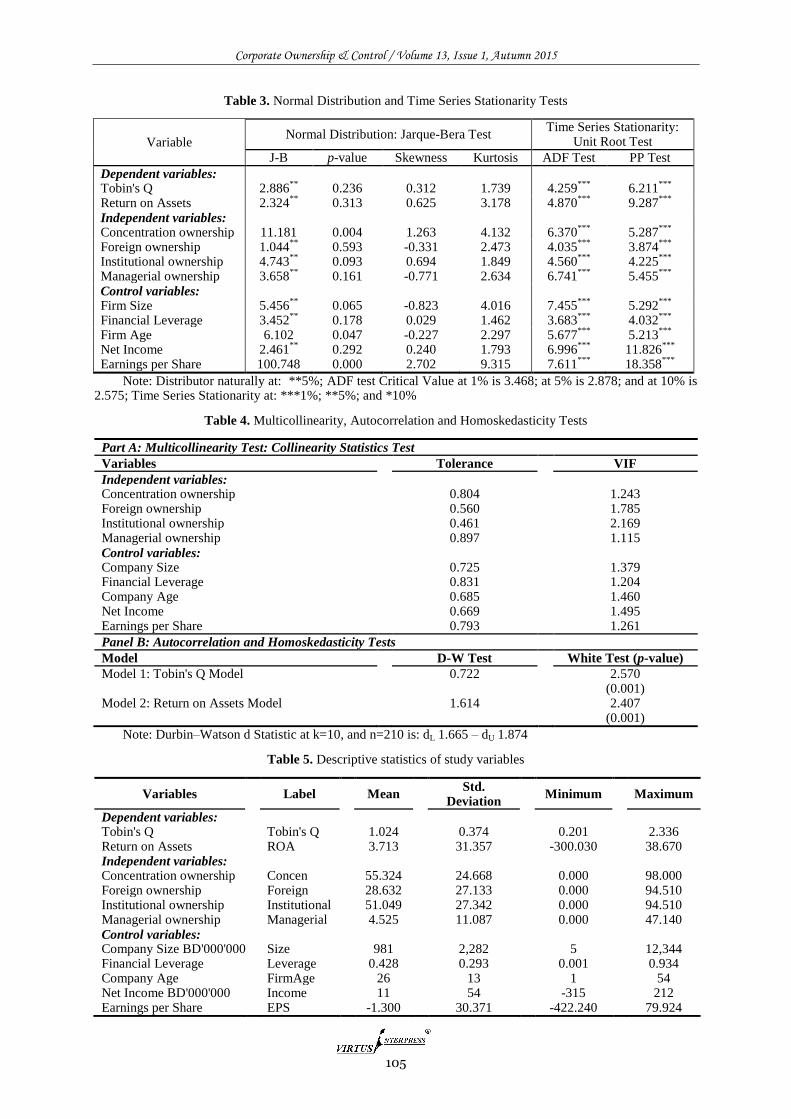
Corporate Ownership & Control / Volume 13, Issue 1, Autumn 2015
105
Table 3. Normal Distribution and Time Series Stationarity Tests
Variable Normal Distribution: Jarque-Bera Test
Time Series Stationarity: Unit Root Test
J-B p-value Skewness Kurtosis ADF Test PP Test
Dependent variables: Tobin's Q 2.886
** 0.236 0.312 1.739 4.259
*** 6.211
***
Return on Assets 2.324**
0.313 0.625 3.178 4.870***
9.287***
Independent variables:
Concentration ownership 11.181 0.004 1.263 4.132 6.370
*** 5.287
***
Foreign ownership 1.044**
0.593 -0.331 2.473 4.035***
3.874***
Institutional ownership 4.743
** 0.093 0.694 1.849 4.560
*** 4.225
***
Managerial ownership 3.658**
0.161 -0.771 2.634 6.741***
5.455***
Control variables:
Firm Size 5.456
** 0.065 -0.823 4.016 7.455
*** 5.292
***
Financial Leverage 3.452**
0.178 0.029 1.462 3.683***
4.032***
Firm Age 6.102 0.047 -0.227 2.297 5.677
*** 5.213
***
Net Income 2.461**
0.292 0.240 1.793 6.996***
11.826***
Earnings per Share 100.748 0.000 2.702 9.315 7.611
*** 18.358
***
Note: Distributor naturally at: **5%; ADF test Critical Value at 1% is 3.468; at 5% is 2.878; and at 10% is 2.575; Time Series Stationarity at: ***1%; **5%; and *10%
Table 4. Multicollinearity, Autocorrelation and Homoskedasticity Tests
Part A: Multicollinearity Test: Collinearity Statistics Test
Variables
Tolerance
VIF
Independent variables: Concentration ownership
0.804
1.243 Foreign ownership
0.560
1.785
Institutional ownership
0.461
2.169 Managerial ownership
0.897
1.115
Control variables: Company Size
0.725
1.379 Financial Leverage
0.831
1.204
Company Age
0.685
1.460 Net Income
0.669
1.495
Earnings per Share
0.793
1.261
Panel B: Autocorrelation and Homoskedasticity Tests
Model
D-W Test
White Test (p-value)
Model 1: Tobin's Q Model
0.722
2.570
(0.001)
Model 2: Return on Assets Model
1.614
2.407
(0.001)
Note: Durbin–Watson d Statistic at k=10, and n=210 is: dL 1.665 – dU 1.874
Table 5. Descriptive statistics of study variables
Variables
Label
Mean
Std. Deviation
Minimum
Maximum
Dependent variables: Tobin's Q
Tobin's Q
1.024
0.374
0.201
2.336 Return on Assets
ROA
3.713
31.357
-300.030
38.670
Independent variables: Concentration ownership
Concen
55.324
24.668
0.000
98.000 Foreign ownership
Foreign
28.632
27.133
0.000
94.510
Institutional ownership
Institutional
51.049
27.342
0.000
94.510 Managerial ownership
Managerial
4.525
11.087
0.000
47.140
Control variables: Company Size BD'000'000 Size
981
2,282
5
12,344
Financial Leverage
Leverage
0.428
0.293
0.001
0.934 Company Age
FirmAge
26
13
1
54
Net Income BD'000'000
Income
11
54
-315
212 Earnings per Share
EPS
-1.300
30.371
-422.240
79.924
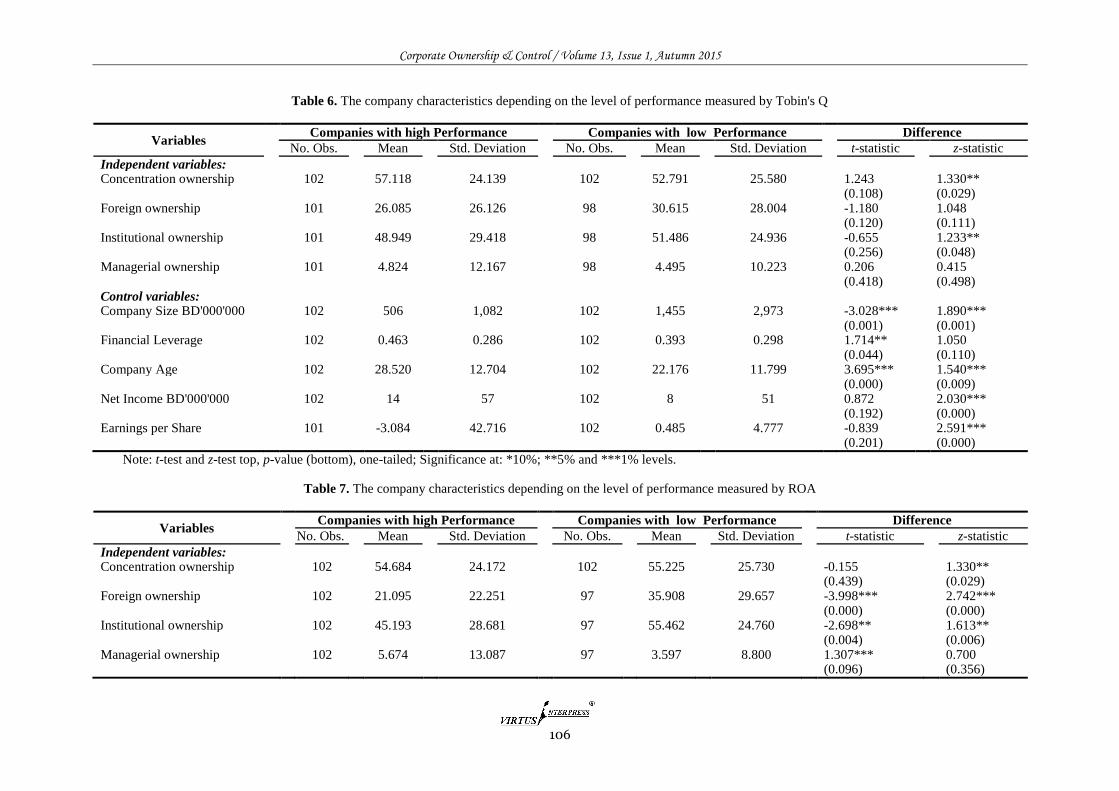
Corporate Ownership & Control / Volume 13, Issue 1, Autumn 2015
106
Table 6. The company characteristics depending on the level of performance measured by Tobin's Q
Variables
Companies with high Performance
Companies with low Performance
Difference
No. Obs.
Mean
Std. Deviation
No. Obs.
Mean
Std. Deviation
t-statistic
z-statistic
Independent variables: Concentration ownership
102
57.118
24.139
102
52.791
25.580
1.243
1.330**
(0.108)
(0.029)
Foreign ownership
101
26.085
26.126
98
30.615
28.004
-1.180
1.048
(0.120)
(0.111)
Institutional ownership
101
48.949
29.418
98
51.486
24.936
-0.655
1.233**
(0.256)
(0.048)
Managerial ownership
101
4.824
12.167
98
4.495
10.223
0.206
0.415
(0.418)
(0.498)
Control variables: Company Size BD'000'000 102
506
1,082
102
1,455
2,973
-3.028***
1.890***
(0.001)
(0.001)
Financial Leverage
102
0.463
0.286
102
0.393
0.298
1.714**
1.050
(0.044)
(0.110)
Company Age
102
28.520
12.704
102
22.176
11.799
3.695***
1.540***
(0.000)
(0.009)
Net Income BD'000'000
102
14
57
102
8
51
0.872
2.030***
(0.192)
(0.000)
Earnings per Share
101
-3.084
42.716
102
0.485
4.777
-0.839
2.591***
(0.201)
(0.000)
Note: t-test and z-test top, p-value (bottom), one-tailed; Significance at: *10%; **5% and ***1% levels.
Table 7. The company characteristics depending on the level of performance measured by ROA
Variables
Companies with high Performance
Companies with low Performance
Difference
No. Obs.
Mean
Std. Deviation
No. Obs.
Mean
Std. Deviation
t-statistic
z-statistic
Independent variables: Concentration ownership
102
54.684
24.172
102
55.225
25.730
-0.155
1.330**
(0.439)
(0.029)
Foreign ownership
102
21.095
22.251
97
35.908
29.657
-3.998***
2.742***
(0.000)
(0.000)
Institutional ownership
102
45.193
28.681
97
55.462
24.760
-2.698**
1.613**
(0.004)
(0.006)
Managerial ownership
102
5.674
13.087
97
3.597
8.800
1.307***
0.700
(0.096)
(0.356)
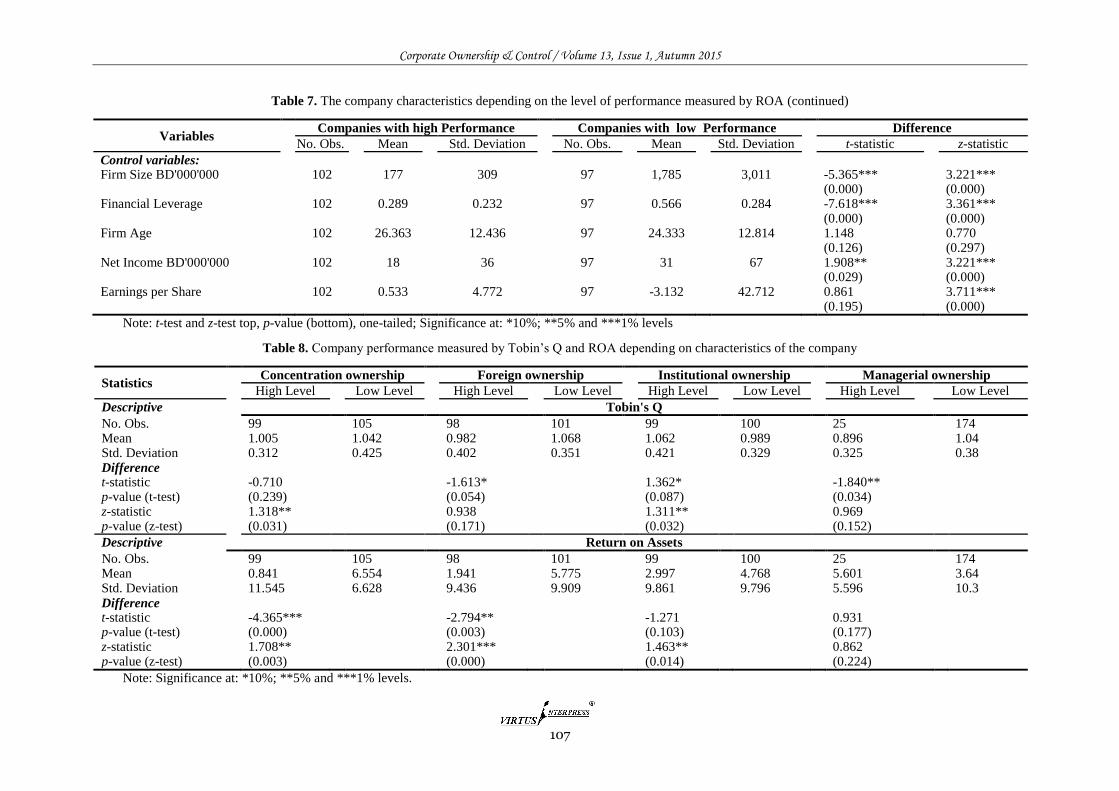
Corporate Ownership & Control / Volume 13, Issue 1, Autumn 2015
107
Table 7. The company characteristics depending on the level of performance measured by ROA (continued)
Variables
Companies with high Performance
Companies with low Performance
Difference
No. Obs.
Mean
Std. Deviation
No. Obs.
Mean
Std. Deviation
t-statistic
z-statistic
Control variables: Firm Size BD'000'000 102
177
309
97
1,785
3,011
-5.365***
3.221***
(0.000)
(0.000)
Financial Leverage
102
0.289
0.232
97
0.566
0.284
-7.618***
3.361***
(0.000)
(0.000)
Firm Age
102
26.363
12.436
97
24.333
12.814
1.148
0.770
(0.126)
(0.297)
Net Income BD'000'000
102
18
36
97
31
67
1.908**
3.221***
(0.029)
(0.000)
Earnings per Share
102
0.533
4.772
97
-3.132
42.712
0.861
3.711***
(0.195)
(0.000)
Note: t-test and z-test top, p-value (bottom), one-tailed; Significance at: *10%; **5% and ***1% levels
Table 8. Company performance measured by Tobin’s Q and ROA depending on characteristics of the company
Statistics
Concentration ownership
Foreign ownership
Institutional ownership
Managerial ownership
High Level
Low Level
High Level
Low Level
High Level
Low Level
High Level
Low Level
Descriptive
Tobin's Q
No. Obs.
99 105 98 101 99 100 25 174 Mean
1.005 1.042 0.982 1.068 1.062 0.989 0.896 1.04
Std. Deviation
0.312 0.425 0.402 0.351 0.421 0.329 0.325 0.38 Difference
t-statistic
-0.710 -1.613* 1.362* -1.840** p-value (t-test) (0.239) (0.054) (0.087) (0.034) z-statistic
1.318** 0.938 1.311** 0.969
p-value (z-test) (0.031) (0.171) (0.032) (0.152)
Descriptive
Return on Assets
No. Obs.
99 105 98 101 99 100 25 174 Mean
0.841 6.554 1.941 5.775 2.997 4.768 5.601 3.64
Std. Deviation
11.545 6.628 9.436 9.909 9.861 9.796 5.596 10.3 Difference
t-statistic
-4.365*** -2.794** -1.271 0.931 p-value (t-test) (0.000) (0.003) (0.103) (0.177) z-statistic
1.708** 2.301*** 1.463** 0.862
p-value (z-test) (0.003) (0.000) (0.014) (0.224)
Note: Significance at: *10%; **5% and ***1% levels.
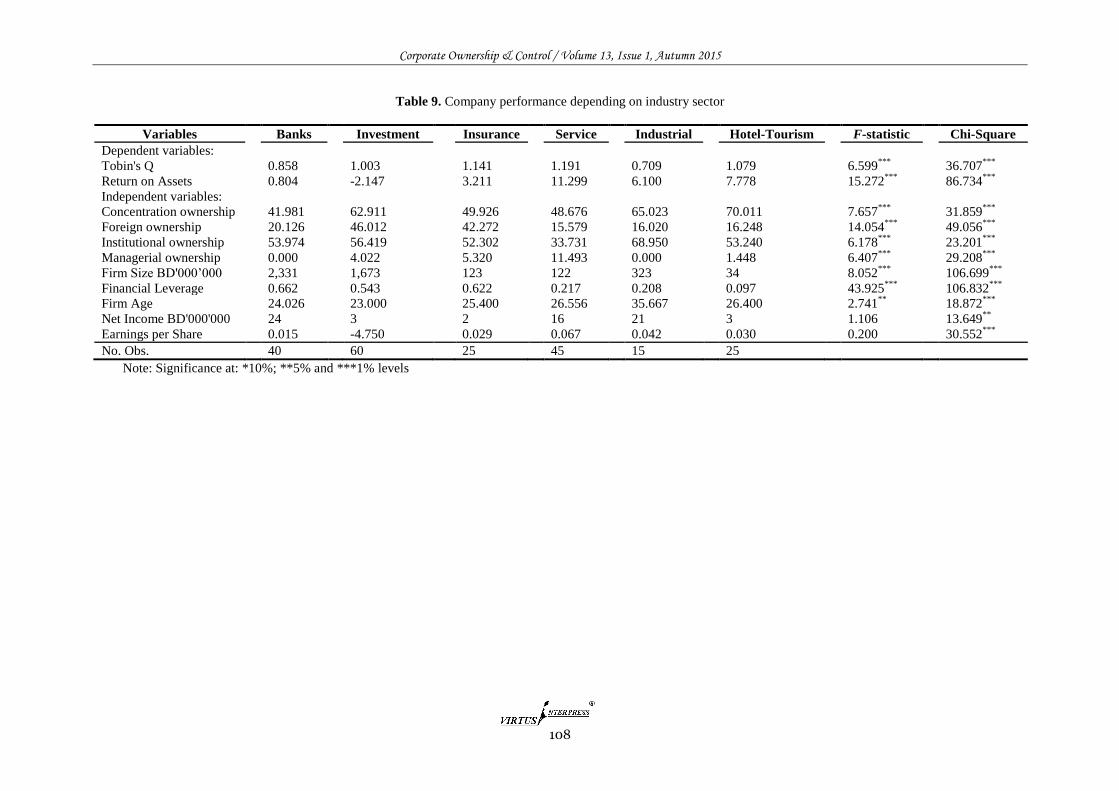
Corporate Ownership & Control / Volume 13, Issue 1, Autumn 2015
108
Table 9. Company performance depending on industry sector
Variables
Banks
Investment
Insurance
Service
Industrial
Hotel-Tourism
F-statistic
Chi-Square
Dependent variables:
Tobin's Q
0.858
1.003
1.141
1.191
0.709
1.079
6.599***
36.707***
Return on Assets
0.804
-2.147
3.211
11.299
6.100
7.778
15.272***
86.734***
Independent variables:
Concentration ownership
41.981 62.911 49.926
48.676
65.023
70.011
7.657***
31.859***
Foreign ownership
20.126 46.012 42.272
15.579
16.020
16.248
14.054***
49.056***
Institutional ownership
53.974
56.419
52.302
33.731
68.950
53.240
6.178***
23.201***
Managerial ownership
0.000 4.022 5.320
11.493
0.000
1.448
6.407***
29.208***
Firm Size BD'000’000 2,331 1,673 123 122 323 34 8.052***
106.699***
Financial Leverage 0.662 0.543 0.622 0.217 0.208 0.097 43.925***
106.832***
Firm Age 24.026 23.000 25.400 26.556 35.667 26.400 2.741**
18.872***
Net Income BD'000'000 24 3 2 16 21 3 1.106 13.649**
Earnings per Share 0.015 -4.750 0.029 0.067 0.042 0.030 0.200 30.552***
No. Obs.
40
60
25
45
15
25
Note: Significance at: *10%; **5% and ***1% levels
Corporate Ownership & Control / Volume 13, Issue 1, Autumn 2015
109
4.1 Company performance
Company performance was measured using T’Q and
ROA measurements. The Mean for T’Q was more
than (1) which gives a positive indication about the
value of companies listed in Bahrain Stock Exchange
as this means that it achieved a market value that is
higher than its book value. The lowest value of T’Q
was (0.201). The highest value was (2.336). The
highest T’Q was achieved by service sector while the
lowest value was achieved by industrial sector.
Regarding the second measurement (ROA), it had a
mean of 3.782% during the study period and the
standard deviation was very high which means there is
huge difference between companies in achieving
returns on their assets. Lowest (-45.4%) – highest
(24.34%). The highest ROA was achieved by service
sector and the lowest value was achieved by
investment sector. All these results may be found in
table (9).
4.2 Ownership concentration
In table (5) we notice that ownership concentration
“which was measured by dividing number of shares
owned by the largest investor by the total number of
shares owned by the largest five investors.” is 55.3%
with a very high standard deviation which means that
the sample is dispersed.
From table (6) we notice that ownership
concentration was higher in companies with high
performance as ownership concentration in companies
with higher performance (using T’Q measurement)
was 57% whereas ownership concentration in
companies with lower performance was 52.8%. This
difference was statistically significant at 5% according
to z-test while it was not according to t-test. This
means that whenever the performance of the company
increases, it attracts more investors who wish to
control the company to invest in it. Whereas if we
looked at table (8) where we divided concentration
into two parts according to the median value and then
we found the mean and standard deviation for the T’Q
values, we notice that T’Q values for companies with
low ownership concentration was higher than
companies with high ownership concentration. This is
an indication that ownership concentration does not
contribute in improving the company performance as
investors invest in companies with high performance
without working on improving and increasing the
company performance following their investment.
Industrial sector has the most concentrated ownership
and bank sector had the least as seen in table (9).
4.3 Foreign ownership
Foreign ownership was measured by the percentage of
shares owned by non - Bahraini investors in BSE.
From table (5) we notice that foreign ownership
percentage in BSE is 28.632% and the highest
percentage of foreign ownership was 94.51% that was
because Bahraini laws allow GCC citizens to invest
and own freely in the country while other companies
was with 0% foreign ownership. In table (6) we notice
that foreign ownership was less in companies with
higher performance using T’Q and ROA
measurements. And that difference was statistically
significant at less than 1% in performance using ROA
measurement but it wasn’t the same using T’Q. In
table (8) we notice that low percentage of foreign
ownership in companies is followed by lower
performance using both measures (ROA and T’Q) and
that was statistically significant using both measures.
Which indicates that foreign ownership and
performance has negative relationship in both
directions. Foreign ownership was the highest in
investment sector and the lowest in service and
industrial sector as seen in table (9).
4.4 Institutional ownership
Institutional ownership was the most form of
ownership presented in the Bahraini market. As 51%
of companies’ shares were owned by institutional
investors. In some companies, the percentage of
institutional ownership reached 94.5%. The relation
between institutional ownership and performance was
cleared out in table (6, 7) as we notice that
institutional ownership decreases in companies with
high performance and it increases in companies with
low performance and that difference was statistically
significant. Also it was found that companies with
high institutional ownership have lower dividend
yields with statistical significance while company
performance measured by T’Q increased when
institutional ownership increased. Institutional
ownership was the highest in industrial sector and the
lowest in service sector as seen in table (9).
4.5 Managerial ownership
Bahraini market may be characterized by the low
managerial ownership in its companies. The mean
percentage of this ownership dimension was 4.525%
meanwhile, the standard deviation was very high,
while in some companies, managers owned 47% of
the shares, and other companies presented 0%
managerial ownership according to the measurement
tool used in our study. Managerial ownership did not
differ in companies with high or low performance
using T’Q measurement while there was difference at
10% using ROA measurement as companies that
achieved high ROA was characterized by high
managerial ownership and vice versa, companies that
are characterized by high managerial ownership had
high ROA but that was not statistically significant.
Managerial ownership was the highest in service
sector and it reached 0% in bank and industrial sectors
as cleared out in table (9).
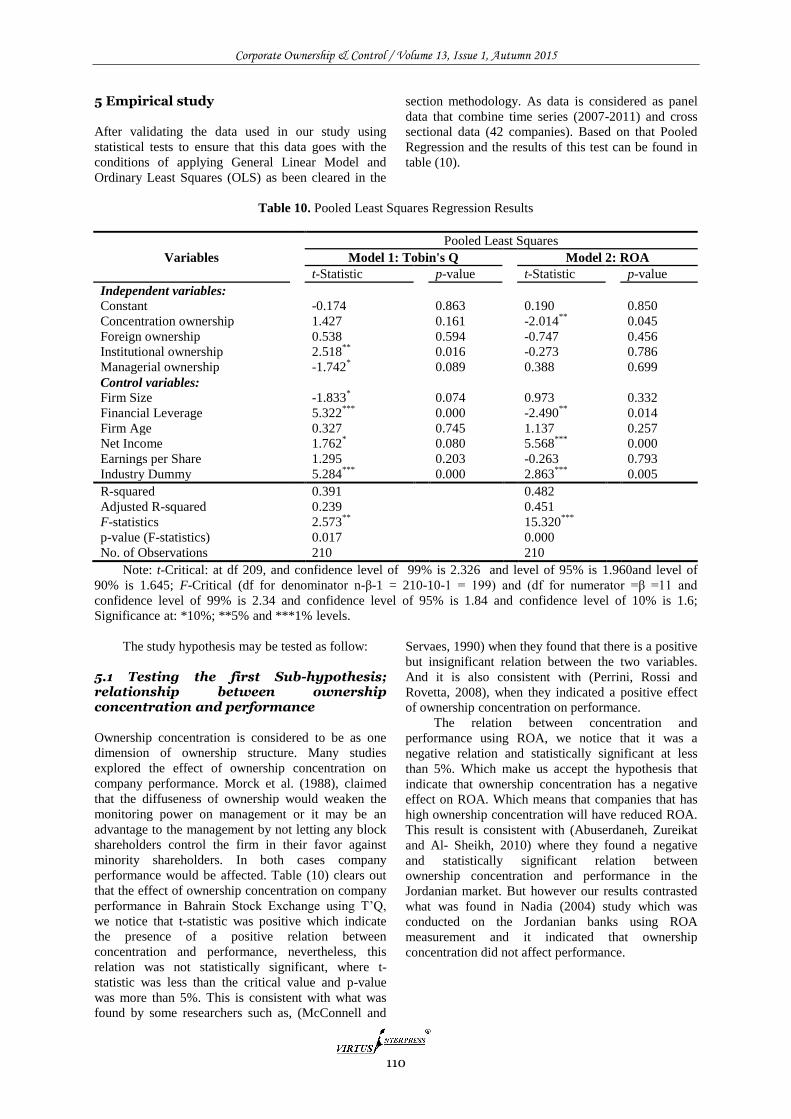
Corporate Ownership & Control / Volume 13, Issue 1, Autumn 2015
110
5 Empirical study
After validating the data used in our study using
statistical tests to ensure that this data goes with the
conditions of applying General Linear Model and
Ordinary Least Squares (OLS) as been cleared in the
section methodology. As data is considered as panel
data that combine time series (2007-2011) and cross
sectional data (42 companies). Based on that Pooled
Regression and the results of this test can be found in
table (10).
Table 10. Pooled Least Squares Regression Results
Variables
Pooled Least Squares
Model 1: Tobin's Q
Model 2: ROA
t-Statistic
p-value
t-Statistic
p-value
Independent variables:
Constant
-0.174
0.863
0.190
0.850
Concentration ownership
1.427
0.161
-2.014**
0.045
Foreign ownership
0.538
0.594
-0.747
0.456
Institutional ownership
2.518**
0.016
-0.273
0.786
Managerial ownership
-1.742*
0.089
0.388
0.699
Control variables:
Firm Size
-1.833*
0.074
0.973
0.332
Financial Leverage
5.322***
0.000
-2.490**
0.014
Firm Age
0.327
0.745
1.137
0.257
Net Income
1.762*
0.080
5.568***
0.000
Earnings per Share
1.295
0.203
-0.263
0.793
Industry Dummy
5.284***
0.000
2.863***
0.005
R-squared
0.391
0.482
Adjusted R-squared
0.239
0.451
F-statistics
2.573**
15.320***
p-value (F-statistics)
0.017
0.000
No. of Observations
210
210
Note: t-Critical: at df 209, and confidence level of 99% is 2.326 and level of 95% is 1.960and level of
90% is 1.645; F-Critical (df for denominator n-β-1 = 210-10-1 = 199) and (df for numerator =β =11 and
confidence level of 99% is 2.34 and confidence level of 95% is 1.84 and confidence level of 10% is 1.6;
Significance at: *10%; **5% and ***1% levels.
The study hypothesis may be tested as follow:
5.1 Testing the first Sub-hypothesis; relationship between ownership concentration and performance
Ownership concentration is considered to be as one
dimension of ownership structure. Many studies
explored the effect of ownership concentration on
company performance. Morck et al. (1988), claimed
that the diffuseness of ownership would weaken the
monitoring power on management or it may be an
advantage to the management by not letting any block
shareholders control the firm in their favor against
minority shareholders. In both cases company
performance would be affected. Table (10) clears out
that the effect of ownership concentration on company
performance in Bahrain Stock Exchange using T’Q,
we notice that t-statistic was positive which indicate
the presence of a positive relation between
concentration and performance, nevertheless, this
relation was not statistically significant, where t-
statistic was less than the critical value and p-value
was more than 5%. This is consistent with what was
found by some researchers such as, (McConnell and
Servaes, 1990) when they found that there is a positive
but insignificant relation between the two variables.
And it is also consistent with (Perrini, Rossi and
Rovetta, 2008), when they indicated a positive effect
of ownership concentration on performance.
The relation between concentration and
performance using ROA, we notice that it was a
negative relation and statistically significant at less
than 5%. Which make us accept the hypothesis that
indicate that ownership concentration has a negative
effect on ROA. Which means that companies that has
high ownership concentration will have reduced ROA.
This result is consistent with (Abuserdaneh, Zureikat
and Al- Sheikh, 2010) where they found a negative
and statistically significant relation between
ownership concentration and performance in the
Jordanian market. But however our results contrasted
what was found in Nadia (2004) study which was
conducted on the Jordanian banks using ROA
measurement and it indicated that ownership
concentration did not affect performance.
Corporate Ownership & Control / Volume 13, Issue 1, Autumn 2015
111
5.2 Testing the second Sub-hypothesis; relationship between foreign ownership and performance
The effect of foreign ownership was studied by many
researchers like (Caves, 1996 and Kummar, 2003)
where they mentioned in their studies that usually
foreign investors buy shares in successful companies
and in some how they are expected to bring in the
most recent technologies to the firm thus they play an
important role in improving the performance in the
firms they invest in. In table (10), we notice that the
effect of foreign ownership on performance using T’Q
was positive, which is consistent with studies like (Bai
et al., 2005 , Sarkar and Sarkar , 2000 and Patibandle,
2002) and a negative effect on performance using
ROA model which consistent with studies like
(Solung and Nor, 2008). But both models failed to
find a statistically significant effect neither positively
nor nigativelly.
5.3 Testing the third Sub-hypothesis; relationship between institutional ownership and performance
Fama (1980), indicated in his study that institutional
ownership improves firm performance, many studies
like (Shleifer and Vishny, 1986) that institutional
ownership would affect performance in two ways: the
first one that it makes outside block shareholders
overcome the controlling managers and the second
one is: that it would reduce the free rider problem
which arise from the lack of shareholders control.
Institutional ownership is the most common form of
ownership structure in Bahrain Stock Exchange as
mentioned in the descriptive statistics section as they
own over 51% of the companies’ shares, but the
question here is does this type of ownership affects
performance? In table (10), we may see the regression
results where we can see the effect of institutional
ownership on performance using T’Q model, we
notice that it was a positive effect and statistically
significant at less than 5%. This result is consistent
with what was found in some studies like (Wan,
1990) and partially with what was found by others like
(Berger, 2003 and Sarac, 2002) where they found a
positive relation but with moderate statistic effect
between the two variable. Using ROA model, the
effect was negative and without any statistical
significance between institutional ownership and
performance. This result contrast what was mentioned
in the study of (Abuserdaneh, Zureikat and Al-
Sheikh, 2010) where the effect of institutional
ownership on performance was positive when using
ROA model.
5.4 Testing the fourth Sub-hypothesis; relationship between management ownership and performance
This dimension is related to the agency theory, as
when management owns a large portion of the firm, it
is expected to work in its own favor and when it owns
less portion, it is expected to work in the favor of the
firm itself. In Bahrain, although management
ownership percentage is minimal, there was a negative
effect with statistical significance at less than 10% on
performance using T’Q model which is consistent
with what was found by researchers like (Demsetz and
Villalonga, 1990 and Rowe and Davidson, 2002) and
a positive insignificant effect using ROA model which
is consistent with studies like (Severin, 2001 and
Kummar, 2003).
5.5 Testing the effect of control variables on performance
The findings of the study were conflicting regarding
the effect of company size on performance. We can
see in table (10) that company size has a negative
effect that is statistically significant at less than 1% on
performance using T’Q model. We can see also in the
same table that it has a positive effect that is not
statistically significant on performance using ROA
model.
The results were conflicting again. We noticed
that financial leverage has a positive effect with
statistical significance at less than 1% on performance
using T’Q model and a negative effect with statistical
significance at less than 5% on performance using
ROA. Although company age has a positive relation
with performance as seen in table (10) but it was not a
statistical significant effect on performance. The study
proved that net income has a positive significant effect
on performance using T’Q and ROA models. In table
(10), we can see that EPS has a positive insignificant
effect on performance using T’Q model and a negative
insignificant effect on performance using ROA model.
Our results confirmed that the sector that the
company belong to has a positive significant effect at
less 1% on performance. This is consistent with what
was mentioned previously in the descriptive statistics
which indicated that the performance of the company
is different according to the sector it belongs to.
5.6 Comparing the study models
To know which of the study models represents the
relation between the study independent variables
(ownership structure & dividends) and the dependent
variable (company performance), Adjusted R-
Squared was measured, as seen in table (10), which is
used to compare between the models of the study.
Whenever Adj. R2 increases this means that the model
represents the relation more. From table (10), we
notice that Adj. R2 for ROA model equal 45.1% and
Corporate Ownership & Control / Volume 13, Issue 1, Autumn 2015
112
for T’Q equal 23.9%. Based on that we may consider
ROA model represents the relation between variables
more. This is consistent with what was found by
previous studies such as Abu Serdaneh et. al. (2010) ,
where they used both models to measure performance
and they found that ROA model represents the relation
more but they indicated that this needs to be
confirmed by other studies that follow the same
methodology.
6 Conclusion and recommendation
The main objective of the study was; knowing what
really affect company performance. Four factors of
ownership structure were chosen and believed to be
from the most important factors that affect
performance. ownership structure were from the
earliest factors to be studied as (Berle and Means,
1932) were from the first researchers to study the
effect of ownership structure on performance. Few
studies were conducted in the Middle East and very
few or no studies were conducted about this topic in
the GCC area. In Bahrain, this is the first time that this
topic has been studied. So, this study is considered to
be the first study to cover this gap.
It is beneficial to know what really affects
company performance in this area and whether
ownership structure really affect performance. The
study also aimed at investigating the most common
type of ownership structure that presents in Bahraini
market. It also consider giving investors some hints
about what may be the best choice of companies to
invest in that achieve the best performance according
to the statistical analysis conducted by the study.
To conduct this study, the sample was chosen to
be the whole Bahraini Bourse which includes all the
listed companies in Bahrain Stock Exchange during a
period of 5 years from 2007 to 2011. Six companies
were excluded because they were either non-Bahraini
or closed during the study period. The study after that
considered ownership structure dimensions as
independent variables and company performance as
the dependent variable. Ownership structure was
studied from different dimensions. The dimensions
that were chosen to represent ownership structure
were: ownership concentration, institutional
ownership, foreign ownership and managerial
ownership. Several control variables were chosen
based on previous studies and what was believed to be
affecting the variables of the study. The study built
two different regression models to study the effect of
ownership on performance. The first model used
simplified Tobin’s Q formula as an indicator of
performance and the second model used Return on
Assets as an indicator of performance. The two
models were used to capture the differences between
them and justify the conflicting results found by
different previous studies and then we compared
between them using statistical tools to determine
which indicator is better to be used as an indicator of
company performance.
Different validity tests were conducted on data
and the models to validate them before testing them.
The data and the models were valid and any errors that
were found were overcome using statistical tools. Four
hypotheses were developed regarding the relation
between each independent variable (ownership
concentration, institutional ownership, foreign
ownership and managerial ownership) and company
performance. The models after that were tested and
some descriptive statistics were defined, the following
results were obtained:
a) The results of testing regression models were
conflicting depending on the performance indicator
that was used (T’Q or ROA).
b) The most common type of ownership
structure found in Bahraini market was institutional
ownership.
c) The most profitable sector that achieved the
highest profits during the study period was the bank
sector and the least one was.
d) The best performance using T’Q indicator
was achieved by service sector and the lowest was by
industrial sector. Using ROA, the highest performance
was achieved by service sector and the lowest was by
investment sector.
e) Ownership concentration was found to be
having positive effect but not statistically significant
on performance using T’Q indicator. And it has a
negative statistically significant effect on performance
using ROA measurement.
f) Institutional ownership was found to be
having positive and statistically significant effect on
performance using T’Q indicator. And using ROA
indicator, the effect was negative with no statistical
significance.
g) Foreign ownership was found to be having
positive effect using T’Q indicator and negative effect
using ROA indicator with no statistical significance
using both indicators.
h) Managerial ownership was found to be
having negative statistically significant effect on
performance using T’Q and a positive insignificant
effect using ROA indicator.
i) The effect of company size on performance
was found to be negative with statistical significance
using T’Q and a positive effect that is not statistically
significant using ROA indicator.
j) The effect of financial leverage on
performance was found to be positive and statistically
significant using T’Q and a negative effect that is
statistically significant using ROA indicator.
k) Company age was found to be having
positive effect with no statistical significance on
performance.
l) Net income was found to be having positive
significant effect on performance using ROA and T’Q
indicators.
Corporate Ownership & Control / Volume 13, Issue 1, Autumn 2015
113
m) EPS was found to be having positive effect
on performance using T’Q and a negative effect on
performance using ROA. Both effects were not
statistically significant.
n) Company sector was found to be having a
positive statistically significant effect on performance.
o) The best indicator of performance that was
used by the study was ROA over T’Q. As it was found
to be more related and it reflects the truth about
performance more than the other indicator as was
proved by statistical tests when the hypothesis of the
study were tested.
Based on the study results; Investors are strongly
encouraged to look at low debt companies when they
expect high profits. The study found that ownership
concentration affects performance negatively when
applying ROA indicator so lows that protect minority
shareholders and their rights are surely welcome.
The study is considered to be limited because it
studies performance in companies in a period of five
years only 2007-2011. This time series may be un-
stable because the global financial crisis occurred
during this period. Future studies may take longer and
different time series. The study was conducted in
Bahraini market and it is considered to be a small
sample to be studied and it is considered to be an
emerging market. Further studies may be conducted
on the whole GCC market, because the GCC
economies are considered to be having a lot of
similarities in lows and nature of economy. The study
found that ROA indicator is more representative and
related to performance. This needs to be confirmed by
other studies following the same methodology to
confirm what was found in our study or other data
needed to be known when applying the T’Q indicator
to correctly assess its relevance to performance.
Family ownership was not studied in our research
although it exists in Bahrain because of lack of data;
Bahrain Stock Exchange is encouraged to announce
the data that is related to family ownership so that its
effect on performance may be studied in future.
References 1 Abu-Serdaneh, J., Zuriekat, M., & Al-Sheikh, I. (2010).
Ownership Structure and Corporate performance in the
Jordanian manufacturing companies. Jordan journal of
Business Administration, 6(3), 426-439.
2 Berger, A. (2003). Capital Structure and Firm
Performance: A New Approach to Testing Agency
Theory and an Application to the Banking Industry.
Working Paper, University of South Carolina
http://papers.ssrn.com.
3 Berle, A. & Means, G. (1932). The Modern
Corporation and Private Property. New York:
Larcourt, Brace and World Inc., (Republished:1968).
4 Bjuggren, P., Eklund, J. & Wiberg, D. (2007).
Ownership Structure, Control and Firm Performance:
The Effects of Vote-differentiated Shares. Applied
Financial Economics, 17 (16), 1323-1334.
5 Caves, E. (1996). Multinational Enterprises and
Economic Analysis. 2th edition, Cambridge: Cambridge
University Press.
6 Chang, R. & Rhee, S. (1990). The Impact of Personal
Taxes on Corporate Dividend Policy and Capital
Structure Decisions, Financial Management, 19(1), 21-
31.
7 Chen, C. Guo, W . & Mande, V . (2003). Managerial
Ownership and Firm Valuation: Evidence from
Japanese Firms. Pacific-Basin Finance Journal, 11(3),
267-283.
8 Chen, C., Guo, W. & Mande, V. (2003). Managerial
Ownership and Firm Valuation: Evidence from
Japanese Firms, Pacific-Basin Finance Journal, 11(1),
267-283.
9 Chung, K. & Pruitt, S. (1994). A Simple
Approximation of Tobin’s Q, Financial Management,
23, 3: 70-74.
10 Demsetz, H. & Lehn, K. (1985). The Structure of
Corporate Ownership: Causes and Consequences.
Journal of Political Economy, 93(6), 1155-1177.
11 Demsetz, H. & Villalonga, B. (1999). Ownership
Structure and Corporate Performance, Working Paper,
University of California.
12 Demsetz, H. & Villalonga, B. (2001). Ownership
Structure and Corporate Performance. Journal of
Corporate Finance, 7(3), 209-233.
13 Fama, E. (1980). Agency Problem and the Theory of
the Firm. Journal of Political Economy, 88(2), 288-
307.
14 Fama, E. & Jensen, M. (1983). Separation of
Ownership and Control. Journal of Law and
Economics, 26(June), 301–325.
15 Gordon, M. (1959). Dividends Earnings and Stock
Prices. Review of Economics and Statistics, 41(1), 99-
105.
16 Gujarati, D. (2003). Basic Econometrics. 4th Ed.
McGraw-Hill Higher Education: New York.
17 Han, C., Lee, S. & Suk, D. (1999). Institutional
Shareholders and Dividends, Journal of Financial and
Strategic Decisions, 12(1), 53-62.
18 Jaafar, A. & El Shawa, M. (2009). Ownership
Concentration, Board Characteristics and Performance:
Evidence from Jordan. SSRN:
http://ssrn.com/abstract=1392727
19 Jensen, M. (1986). Agency Costs of Free Cash Flow,
Corporate Finance and Takeovers. American Economic
Review Papers and Proceedings, 76(2), 323-329.
20 Jensen, M. & Meckling, W. (1976). Theory of the
Firm: Managerial Behavior, Agency Costs, and
Ownership Structure, Journal of Financial Economics,
3(1), 305-360.
21 Joh, S. (2002). Control, Ownership and Firm
Performance: The Case of Korea. Working Paper,
Corea Development Institute.
22 Kumar, J. (2003). Does Ownership Structure Influence
Firm Value? Evidence from India. Working Paper,
Indira Gandhi Institute of Development Research,
India.
23 La Porta, R., Lopez-de-Silanes, F., Shleiffer, A. &
Vishny, R. (1998). Law and Finance, Journal of
Political Economy, 106(6), 1113-1155.
24 La Porta, R., Lopez-de-Silanes, F., Shleiffer, A. &
Vishny, R. (2002). Investor Protection and Corporate
Valuation, Journal of Finance, 57(1), 1147-1170.
25 La Porta, R., Lopez-de-Silanes, F., Shleiffer, A. &
Vishny, R. (2000a). Agency Problems and Dividend
Policies Around the World, Journal of Finance, 55(1),
1-33.
Corporate Ownership & Control / Volume 13, Issue 1, Autumn 2015
114
26 La Porta, R., Lopez-de-Silanes, F., Shleiffer, A. &
Vishny, R. (2000b). Investor Protection and Corporate
Governance, Journal of Financial Economics, 58(1), 3-
28.
27 Lang, L. & So, R. (2002). Bank Ownership Structure
and Economic Performance. Working Paper, Chinese
University of Hong Kong.
28 McConnell, J. & Servaes, H. (1990). Additional
Evidence on Equity Ownership and Corporate Value.
The Journal of Financial Economics 27(1), 595-612.
29 McConnell, J. & Servaes, H. (1995). Equity Ownership
and the Two Faces of Debt. Journal of Financial
Economics, 39(1), 131-157.
30 Morck, R., Shleifer, A. & Vishny, R. (1988).
Management Ownership and Market Valuation: An
Empirical Analysis. Journal of Financial Economics,
20(1988), 293-315.
31 Morck, R., Shleifer, A. & Vishny, R. (1988).
Management Ownership and Market Valuation: An
Empirical Analysis, Journal of Financial Economics,
20(1-2), 293-315.
32 Nadia, T. (2004). Ownership Structure, Board
Characteristics and Firm Profitability, Master
Dissertation, Hashemite University, Jordan
33 Perrini, F., Rossi, G. & Rovetta, B. (2008). Does
Ownership Structure Affect Performance? Evidence
from the Italian Market. Corporate Governance, 16(4),
312-325.
34 Pinteris, G. (2002). Ownership Structure, Board
Characteristics and Performance of Argentine Banks.
Working Paper, University of Illinois.
35 Rowe, W. & Davidson, W. (2002). Endogeneity in
Financial Performance and Board Composition: The
Case of Closed-End Funds. Working Paper, University
of Nebraska.
36 Sarac, M. (2002). An Empirical Analysis of Corporate
Ownership Structure in Turkish Manufacturing Sector.
Working Paper, Bogazici University, Istanbul.
37 Sarkar, J. & Sarkar, S. (2000). Large Shareholder
Activism in Corporate Governance in Developing
Countries: Evidence from India. International Review
of Finance, 1(3), 161-194.
38 Severin, E. (2001). Ownership Structure and the
Performance of Firms: Evidence from France.
European Journal of Economic and Social Systems,
15(2), 85-107
39 Shleifer, A. & Vishny, R. (1986). Large Shareholders
and Corporate Control. Journal of Political Economy,
94(3), 461-488.
40 Sulong, Z., & Nor, F. (2008). Dividends, ownership
structure and board governance on firm value:
empirical evidence from Malaysian listed firms.
Malaysian Accounting Review, 7(2), 55-92.
41 University of Texas-Dallas. Xu, X. & Wang, Y. (1997).
Ownership Structure, Corporate Governance, and
Firm's Performance: The Case of Chinese Stock
Companies. Working Paper, Amherst College and the
World Bank.
42 Wan, K. (1999). Do Ownership and Firm Performance
Proxies Matter? An Empirical Study of the Relation of
Ownership Structure and Firm. Working paper.
Corporate Ownership & Control / Volume 13, Issue 1, Autumn 2015
115
EXAMINING THE RELATIONSHIP BETWEEN CEO REMUNERATION AND PERFORMANCE OF MAJOR
COMMERCIAL BANKS IN SOUTH AFRICA
Mahlomola Khumalo*, Andries Masenge**
Abstract The relationship between CEO remuneration and firm performance continues to receive much attention. Although the focus of most of the studies is across sectors, attention is increasingly being directed towards the banking industry. At the same time, controversy around what is deemed excessive remuneration of CEOs in the light of not so impressive firm performance across sectors continues. The 2008 global financial crisis and subsequent problems in the banking industry have increased interest in the dynamics of CEO remuneration and bank performance. This study, which examines the relationship between CEO remuneration and bank performance in South Africa, aims to bring a new perspective to the on-going research and debate. The data used is for the years 2008 – 2013, and a purposive sampling method was employed to select a sample frame that consists of five major commercial banks in South Africa. The results suggest that not all measurement instruments used confirmed that a relationship between CEO remuneration and bank performance existed. In the overall, the results of the study do show that the remuneration of the CEO in the banking industry is such that it does have a significant influence on the performance of a bank. Keywords: CEO Remuneration, Bank Performance, Regression, South Africa
*University of South Africa, South Africa **University of Pretoria, South Africa
1 Introduction
Concerns over incomes inequality and what is deemed
excessive - Chief Executive Officer (CEO)
remuneration - continues to feature prominently in the
executive remuneration discourse, and the 2008
financial crisis has made the situation in this respect
no better for the banking industry, in particular. The
controversy has escalated so badly that the assumed
excessive CEO remuneration is described as obscene
in some quarters (The Star, 2014:3). And CEO
remuneration in South Africa has not escaped
criticism. In fact, recently two CEOs from the banking
industry, in particular, caused a public outcry with
their pay which was for having been a mere nine
month in their top positions. This pay caused serious
discomfort amongst some industry role-players
because it could not be justified, more especially, from
a moral point of view, considering the situation in
South Africa where incomes inequality is such a major
talking point (Business Times, 2014:9).
Notably, the remuneration debate across
industries remains varied with a plethora of
viewpoints advanced within and outside of the
academic realm. Nonetheless, there has been
increased momentum to tackle this runaway problem
of CEO remuneration that is being partly blamed for
the global banking crisis of 2007 – 2008 (Gregg,
Jewell & Tonks, 2012). However, in South Africa,
where the payment gap between executives and
employees is the biggest in the world, efforts to arrest
the abnormal escalation have not been made due to the
absence of prescriptive measures by regulatory
authorities and lack of disclosure of sensitive but
essential information about key performance
indicators by the banks (Business Times, 2014), (The
Star, 2014:3). Unlike in South Africa, in the United
Kingdom (UK) and Australia, legislation imposes
binding shareholder votes when approving
remuneration policies, with the Australian model
demanding the removal of the board should its
remuneration policy be rejected by the shareholders
two years running (Business Times, 2014a:9 &
2014b:4).
Increased controversy surrounding and studies
on CEO remuneration and bank performance have
been approached from theoretical frameworks that
include but not limited to the examination of “agency
problem” by the likes of Barro and Barro (1990), Ely
(1991), Houston and James (1995), Hubbard and Palia
(1995), and Akhigbe, Madura and Ryan (1997).
“Managerial power” was found by Dorff (2005) to be
presenting a challenge to corporate governance
effectiveness in the determination of executive
remuneration (Crumley, 2008). A varied combination
of variables such as CEO compensation (plus long-
Corporate Ownership & Control / Volume 13, Issue 1, Autumn 2015
116
term incentive plans and CEO age) and size (total
assets and number of employees) of the organisation
(Gregoriou and Rouah, 2003); bonuses and attraction
and retention of executives (Beer and Katz, 2003);
executive equity (Daily and Dalton, 2002), and stock
based compensation and bonus (Hill & Stevens, 2001)
has also been used to build theoretical frameworks
used to examine CEO pay and organisational
performance. Crumley (2008) added to the discourse
with the use of firm-specific characteristics like
performance (stock market price and return on equity)
and size (sales, assets and number of employees)
together with CEO characteristics (age, tenure,
education and stock ownership). A search for related
South African studies has proven that not much
literature with these and other related approaches
existed.
The aim of this study, therefore, is to add to the
extant literature by means of examining the
performance of a sample of major commercial banks
in South Africa in relation to the pay plus bonus of
their CEOs. The significant distinguishing feature of
this study is the use of financial performance variables
that include profitability, efficiency and asset quality
measures relative to the CEO remuneration measures
such as basic pay plus bonus. Noticeably, CEO
characteristics have been deliberately excluded
because previous studies such as those by Crumley
(2008), Gregoriou and Rouah (2003), and Daily and
Dalton (2002) have significantly demonstrated that
they had weak or no association with CEO
remuneration.
The structure of the rest of this paper include
review of related literature, method used to conduct
the research, results drawn from the research, analysis
and discussion of the outcome of the research, and
conclusion and recommendations.
2 Review of related literature
It is imperative that the raging debate surrounding the
CEO pay and bank performance is clearly understood
lest the contribution of this paper is not fully
appreciated. The merits or the demerits of the
arguments advanced on the subject continue to evolve
over the years with the industry specific approach to
the debate proving to be more appropriate in helping
to identify the performance variables that are
important to the pay-performance relationship (Sigler
and Poterfield, 2001). In contrast, the approach that
pooled data from a cross-section of industries has the
shortcoming of using the same independent variables
for all companies regardless of industry uniqueness,
according to Sigler and Poterfield (2001).
Bank specific approach in various studies on
CEO remuneration and organisation performance have
commonly looked at the “agency problem”,
“managerial power”, firm-specific characteristics such
as performance (stock market price and return on
equity) and size (sales, assets and number of
employees), and CEO characteristics (age, tenure,
education and stock ownership). Accordingly,
Akhigbe, Madura and Ryan (1997), and Barro and
Barro (1990), among others, examined the difficulties
that were created by the goals of management which
were not aligned to those of shareholders and the
attempts of the banking industry at ameliorating those
difficulties (Crumley, 2008).
Dorff (2005), in his study of managerial power
as it relates to executive compensation, confirmed the
view that the power that the chief executive had over
the directors resulted in excessive compensation. This
scenario is certainly a poser to the independence and
effectiveness of the board. It is for this reason
therefore that the solution, as argued by Dorff (2005),
lies in part in the corporate governance reform that
curtails managerial power over directors through
competitive elections for directors (Crumley, 2008).
The study by Joyce (2001), which tested the
relationship between bank performance and CEO
compensation in publicly traded banks and savings
and loans institutions, gave mixed results. The study
found weak support for the agency theory as it relates
to the relationship between the performance of the
firm and CEO salary and bonus, and that there was a
small but positive relationship between the
performance of the firm and CEO salary and bonus
compensation. The generally weak correlation
between return on assets and CEO salary and bonus
compensation findings lend support to the findings of
other authors such as Murphy and Salter (1975) who
have not found a strong relationship between return on
assets and CEO salary and bonus compensation.
Furthermore, the study by Joyce (2001) was not able
to support the findings of Veliyath and Bishop (1995),
who found a strong relationship between stockholders
equity and executive compensation.
Gregoriou and Rouah (2003), besides finding
that CEO compensation increased with increasing
return on assets and no tenure effect on CEO
compensation, they found that CEO compensation
increased with the size of firm as well as with the
value of the long-term incentive plans and CEO age.
Studies by Gregg, Jewell and Tonks (2012), Aduda
(2011) and Crumley (2008), Hubbard and Palia (1995)
found that CEO compensation increased with the size
of the firm, and this supported the findings of
Gregoriou and Rouah (2003).
Studies that sought to examine the relationship
between firm performance and basic CEO pay plus
bonus have confirmed that in fact there was indeed a
relationship between bonuses and the motivation of
CEO. This hypothesis about bonuses and CEO
motivation is supported by Beer and Katz (2003)
where the use of bonuses is better explained as
possibly being the way to attract and retain executives
(Crumley, 2008). Furthermore, Hill and Stevens
(2001) found that in addition to stock based
compensation bonus plans contributed to a relative
increase in financial performance of the firm.
Corporate Ownership & Control / Volume 13, Issue 1, Autumn 2015
117
CEO remuneration package remain complex and
controversial. Evidence, at least in the context of
South Africa, does not exist that supports the view that
the bank CEO salary has been proven to be
appropriate let alone optimal. There must be other
considerations when structuring a bank CEO
remuneration package that are aimed at attracting,
retaining and motivating a talented CEO who would
work in the interests of the bank’s shareholders (Sigler
and Porterfield, 2001). The income inequalities that
exist in the country are making the determination of an
optimal remuneration package a challenge in the light
of competition for talent.
Most of the studies on bank CEO remuneration
seem to have taken little into account regarding how
the remuneration package of the CEO is initially
determined upon his entry into his current position. It
would not be farfetched to postulate that the
competition for talent or demand-supply
considerations do play a role in the determination of
the CEO remuneration package. However, it remains
to be seen if the remuneration package set at
recruitment or retention point is, in fact, optimal in
that it confirms the potential or actual contribution of
the CEO. Determining bonus payment may be
complicated but not as it is with the determination of
the entry-point basic salary of the bank CEO when
supply-demand for talent is taken into account.
Therefore, optimality assessment of the entry-point
basic salary ought to be considered in the subsequent
studies to counter the assertion, as advanced by Crotty
(Business Report, 2012), that the claim that the value
created by the company in the year under review
might not be attributable to extraordinary efforts and
talents of the CEO but the industry developments such
commodities boom, in case of a mining company;
consumption boom, in case of a retailer; or
government infrastructure spend in case of a
construction company. This then follows that the use
of the pre-existing remuneration package levels, as it
was the case with the previous studies, has the
potential to limit the methodological analysis of the
relationship between CEO remuneration and bank
performance. As Joyce (2001) hypothesised, the level
of CEO remuneration may be a function of such
factors as strategic concepts; industry characteristics
(e.g. barriers to entry and technological intensity), and
intra-organisational politics, and as such the level of
CEO remuneration may not be optimal as it is
assumed.
3 Methodology
The purpose of this paper was to examine the
relationship between CEO remuneration and financial
performance of the five major banks in South Africa.
Previously, various studies have advanced models that
examined the link between the two variables,
dependent (CEO remuneration) and independent (bank
performance). However, inconsistency prevails in
terms of both the CEO remuneration structure and
bank performance measurement methodologies. For
example, to mention a select few studies, Sigler and
Porterfield (2001) used CEO compensation as a
dependent variable and tenure, return on assets, beta
of the bank’s common stock and changes in revenue
as independent variables; Crumley (2008) used CEO
compensation (annual salary plus bonus) as a
dependent variable and independent variables that
include bank performance (stock market price return,
return on equity), size (sales, assets, number of
employees), and CEO characteristics (age, tenure in
present position, education, stock ownership by CEO);
Joyce (2001) used CEO compensation (annual salary
plus bonus) as a dependent variable with firm
performance characteristics (return on assets, CEO
tenure, CEO common stock ownership) as
independent variables, and Akhigbe, Madura and
Ryan (1997) used CEO compensation (annual salary,
bonus, stock options) as a dependent variable and
independent variables that include firm-specific
characteristics (size), bank performance (earnings per
share, return on assets, return on equity) and CEO-
specific characteristics (age, tenure, education, CEO
stock ownership).
The challenge of having consistency in the
choice and type of measures or indicators of both CEO
compensation and bank performance was also pointed
out by other authors like Lin and Zhang (2009), Choi
and Hasan (2005) and Berger et al (2005) who used
such measures as profitability [return on assets
(ROA) and return on equity (ROE)], efficiency [cost
to capital (COI)], and asset quality [ratio of impaired
loans to gross loans (also known as non-performing
loans or NPL)] in their works (that also looked at
governance in the banking sector, though). Barnes
(1987) and Al-Shammari and Salimi (1998) in their
related earlier works, according to Al-Hawari and
Ward (2006:136), raised similar concerns about the
problem of not having “generally accepted list of
ratios or standard methods to measure financial
performance”.
However, profitability, efficiency and asset
quality indicators are used in this study as measures of
bank performance. Other bank characteristic, size,
which includes sales, assets and number of employees,
is used contemporaneously with the aforementioned
bank performance measures.
In this study, the chosen CEO remuneration
measures or indicators deliberately excluded deferred
remuneration benefits such as retirement benefits
(pensions, provident funds and retirement annuities),
profit sharing and stock options. This was so because,
according to Joyce (2001), it was pointed out by Kerr
and Bettis (1987) and Finkelstein and Hambrick
(1989) that valuation of long-term incentives was
problematic in terms of practicability and
methodology considerations. This means that CEO
remuneration herein is defined as basic annual salary
plus bonus because this allows for comparability with
Corporate Ownership & Control / Volume 13, Issue 1, Autumn 2015
118
other studies of executive remuneration as the
majority of previous studies limited CEO
remuneration to cash payments (Agarwal, 1981 and
Joyce, 2001). Lewellen and Hunstman (1970),
according Joyce (2001), in their study of managerial
pay and company performance, indicated that salary
plus bonus that was used as a measure of executive
remuneration in a regression analysis was an
acceptable substitute for a more comprehensive
measure of remuneration which includes pension
benefits, stock options, stock bonus, profit sharing and
deferred pay.
Furthermore, to obviate the problem of
inconsistency and to ensure comparability, in this
study, CEO characteristics (age, tenure in present
position, education, stock ownership by CEO) have
been excluded. Gregoriou and Rouah (2003) pointed
out that tenure had no effect on bank performance.
Similarly, Crumley (2008), in his regression analysis,
found that bank CEOs in the US were not paid for
their tenure, age, educational level or stock ownership.
Furthermore, Daily and Dalton (2002), in their earlier
study, stated that equity ownership had no effect on
bank performance.
3.1 Data, variables and model
3.1.1 Data
A purposive sampling method was used to generate a
sampling frame that consist of the five largest
commercial banks in South Africa in terms of assets
and market share. These are the banks with the largest
geographic footprint coupled with the most
comprehensive financial services offerings in the
country, unlike the other banks which are largely
niche-based. The research design of this study makes
use of the data that comprises of bank specific
performance characteristics and bank CEO
remuneration schemes. The data collected is for a
period of five years from the year 2009 to 2013. This
is a period of the beginning of relative stability
immediately after the global financial crisis of 2008. A
five-year time-scale is consistent with cyclical reviews
usually carried out by banks as seen in their reports.
3.1.2 Variables
As previously alluded to the bank performance
measures of profitability, efficiency, size and asset
quality are used as independent variables. Return on
equity (ROE), defined as the rate of return to
shareholders or the percentage return on each Rand of
equity invested in the bank, and return on assets
(ROA), another measure of profitability, are used as
independent variables. The choice of ROE was
motivated by what Kumbirai and Webb (2010)
describe as “the most important indicator of a bank’s
profitability and growth potential”, where Cronje
(2007) asserts it could be regarded as the “ultimate
measurement of profitability”. Noting from previous
studies, Bradley (2013), wrote that ROE, has been
criticized for being open to manipulation by
management due to the fact that it was a mere
accounting figure although it logically remained the
most enduring and popular as its focus was on
shareholder returns - which happened to be of primary
importance to the investor.
ROA, on the other hand, was used
contemporaneously as a measure of profitability
because it was found, according to Sigler and
Porterfield (2001), to be the most comprehensive
standard in the determination of bank profitability. Lin
and Zhang (2009:23) and Ahmed (2009) in Kumbirai
and Webb (2010:39) defined ROA as profits relative
to total assets or the ability of management to acquire
deposits at a reasonable cost and invest them in
profitable investments. This additional profitability
measure was introduced with the view to making the
study more complete (Bradley, 2013).
Firm size is described by Crumley (2008) and
various other studies as having one of the most
important influences on remuneration. However, in
this study firm size is measured by the value of total
assets, level of sales or revenue and number of
employees. Total assets measure is used in order to
take into account the presumed contribution of the
CEO in the totality of the performance of the firm.
Cost to income (COI), defined as income
generated per Rand cost, was used as a measure of
efficiency as explained by Kumbirai and Webb (2010)
and asset quality measure, the ratio of impaired loans
to gross loans or non-performing loans (NPL, as
explained by Lin and Zhang (2009), were the other
independent variables used in this study.
The CEO remuneration comprising of annual
basic salary plus bonus was the dependent variable
being examined in relation to the bank performance
variables. As already pointed out basic salary and
bonus were selected as the only bank performance
measures to constitute the dependent variable in order
to obviate issues of complexity and calibration of
remuneration. Both salary and bonus are in cash.
3.1.3 Model
As already stated the study focuses on examining the
relationship between CEO remuneration and bank
performance and the attendant regression model
specification involving a dependant variable and
independent variables. The specified variables include
annual basic salary plus bonus, representing the
remuneration, and ROA, ROE, COI, NPL and size
constituting performance.
The basic regression model is formulated as
follows:
Dependent variable (Annual Basic Salary plus
Bonus) = Independent variables (ROA, ROE, COI,
NPL, Assets, Sales, Employees)
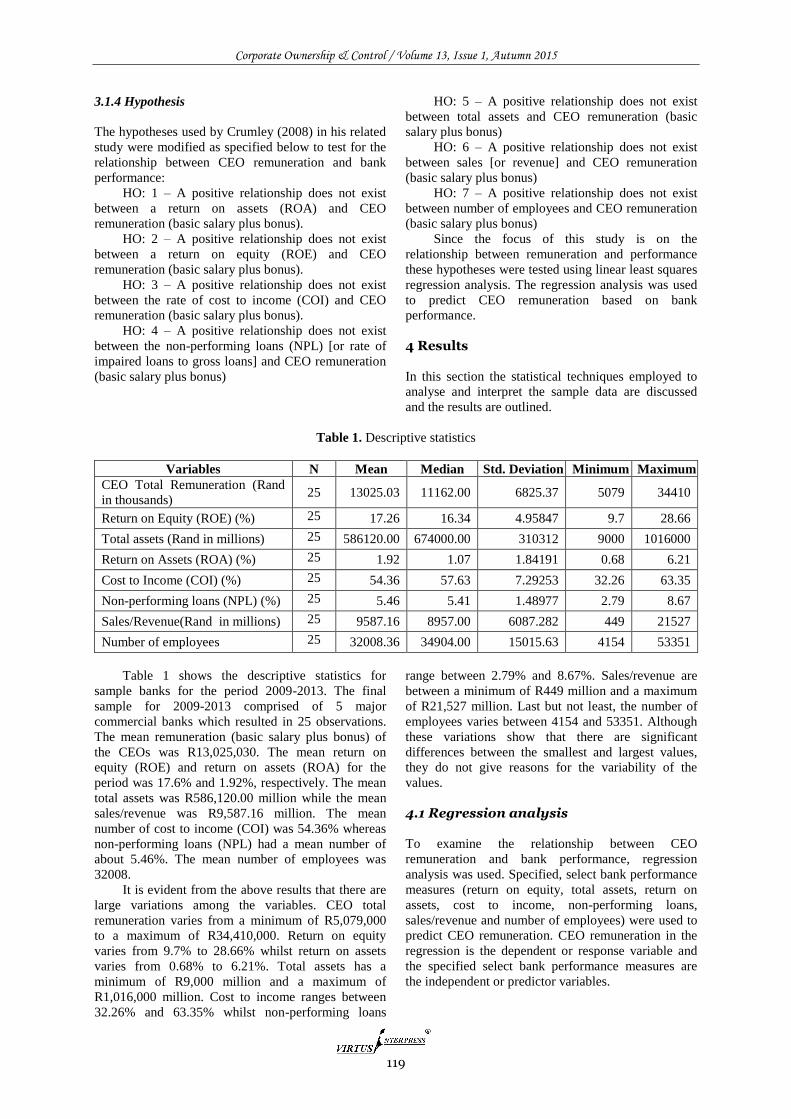
Corporate Ownership & Control / Volume 13, Issue 1, Autumn 2015
119
3.1.4 Hypothesis
The hypotheses used by Crumley (2008) in his related
study were modified as specified below to test for the
relationship between CEO remuneration and bank
performance:
HO: 1 – A positive relationship does not exist
between a return on assets (ROA) and CEO
remuneration (basic salary plus bonus).
HO: 2 – A positive relationship does not exist
between a return on equity (ROE) and CEO
remuneration (basic salary plus bonus).
HO: 3 – A positive relationship does not exist
between the rate of cost to income (COI) and CEO
remuneration (basic salary plus bonus).
HO: 4 – A positive relationship does not exist
between the non-performing loans (NPL) [or rate of
impaired loans to gross loans] and CEO remuneration
(basic salary plus bonus)
HO: 5 – A positive relationship does not exist
between total assets and CEO remuneration (basic
salary plus bonus)
HO: 6 – A positive relationship does not exist
between sales [or revenue] and CEO remuneration
(basic salary plus bonus)
HO: 7 – A positive relationship does not exist
between number of employees and CEO remuneration
(basic salary plus bonus)
Since the focus of this study is on the
relationship between remuneration and performance
these hypotheses were tested using linear least squares
regression analysis. The regression analysis was used
to predict CEO remuneration based on bank
performance.
4 Results
In this section the statistical techniques employed to
analyse and interpret the sample data are discussed
and the results are outlined.
Table 1. Descriptive statistics
Variables N Mean Median Std. Deviation Minimum Maximum
CEO Total Remuneration (Rand
in thousands) 25 13025.03 11162.00 6825.37 5079 34410
Return on Equity (ROE) (%) 25 17.26 16.34 4.95847 9.7 28.66
Total assets (Rand in millions) 25 586120.00 674000.00 310312 9000 1016000
Return on Assets (ROA) (%) 25 1.92 1.07 1.84191 0.68 6.21
Cost to Income (COI) (%) 25 54.36 57.63 7.29253 32.26 63.35
Non-performing loans (NPL) (%) 25 5.46 5.41 1.48977 2.79 8.67
Sales/Revenue(Rand in millions) 25 9587.16 8957.00 6087.282 449 21527
Number of employees 25 32008.36 34904.00 15015.63 4154 53351
Table 1 shows the descriptive statistics for
sample banks for the period 2009-2013. The final
sample for 2009-2013 comprised of 5 major
commercial banks which resulted in 25 observations.
The mean remuneration (basic salary plus bonus) of
the CEOs was R13,025,030. The mean return on
equity (ROE) and return on assets (ROA) for the
period was 17.6% and 1.92%, respectively. The mean
total assets was R586,120.00 million while the mean
sales/revenue was R9,587.16 million. The mean
number of cost to income (COI) was 54.36% whereas
non-performing loans (NPL) had a mean number of
about 5.46%. The mean number of employees was
32008.
It is evident from the above results that there are
large variations among the variables. CEO total
remuneration varies from a minimum of R5,079,000
to a maximum of R34,410,000. Return on equity
varies from 9.7% to 28.66% whilst return on assets
varies from 0.68% to 6.21%. Total assets has a
minimum of R9,000 million and a maximum of
R1,016,000 million. Cost to income ranges between
32.26% and 63.35% whilst non-performing loans
range between 2.79% and 8.67%. Sales/revenue are
between a minimum of R449 million and a maximum
of R21,527 million. Last but not least, the number of
employees varies between 4154 and 53351. Although
these variations show that there are significant
differences between the smallest and largest values,
they do not give reasons for the variability of the
values.
4.1 Regression analysis
To examine the relationship between CEO
remuneration and bank performance, regression
analysis was used. Specified, select bank performance
measures (return on equity, total assets, return on
assets, cost to income, non-performing loans,
sales/revenue and number of employees) were used to
predict CEO remuneration. CEO remuneration in the
regression is the dependent or response variable and
the specified select bank performance measures are
the independent or predictor variables.
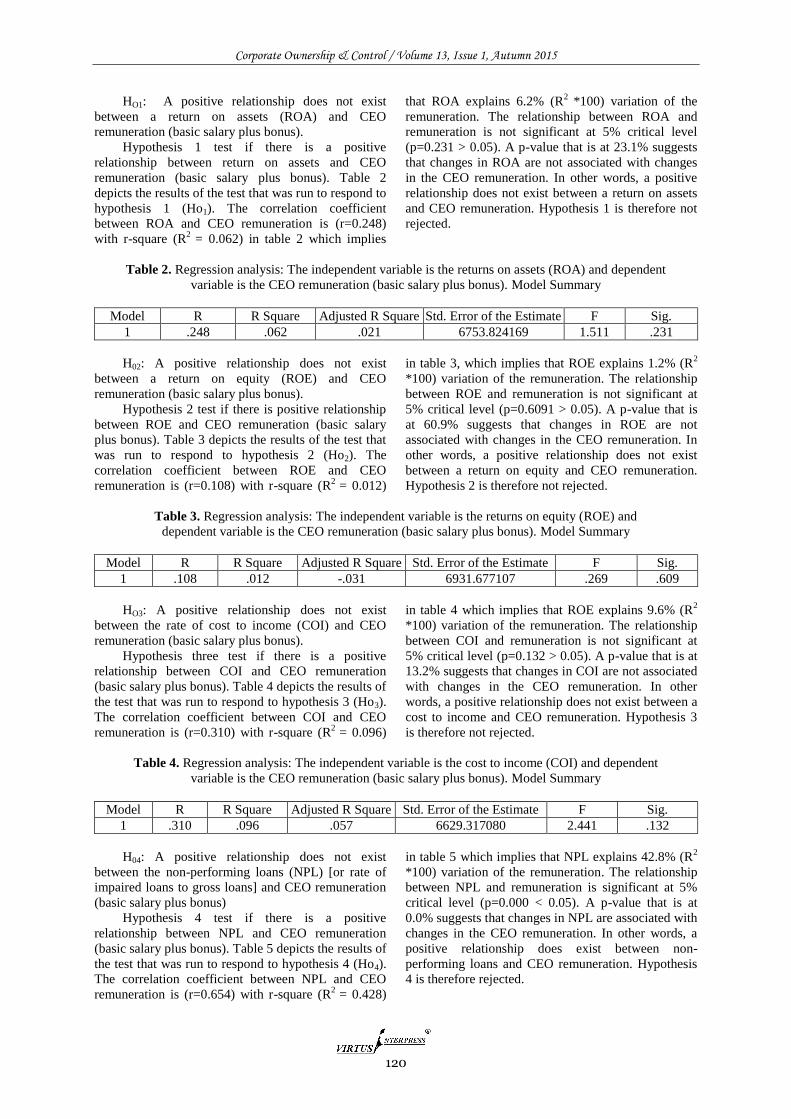
Corporate Ownership & Control / Volume 13, Issue 1, Autumn 2015
120
HO1: A positive relationship does not exist
between a return on assets (ROA) and CEO
remuneration (basic salary plus bonus).
Hypothesis 1 test if there is a positive
relationship between return on assets and CEO
remuneration (basic salary plus bonus). Table 2
depicts the results of the test that was run to respond to
hypothesis 1 (Ho1). The correlation coefficient
between ROA and CEO remuneration is (r=0.248)
with r-square (R2
= 0.062) in table 2 which implies
that ROA explains 6.2% (R2
*100) variation of the
remuneration. The relationship between ROA and
remuneration is not significant at 5% critical level
(p=0.231 > 0.05). A p-value that is at 23.1% suggests
that changes in ROA are not associated with changes
in the CEO remuneration. In other words, a positive
relationship does not exist between a return on assets
and CEO remuneration. Hypothesis 1 is therefore not
rejected.
Table 2. Regression analysis: The independent variable is the returns on assets (ROA) and dependent
variable is the CEO remuneration (basic salary plus bonus). Model Summary
Model R R Square Adjusted R Square Std. Error of the Estimate F Sig.
1 .248 .062 .021 6753.824169 1.511 .231
H02: A positive relationship does not exist
between a return on equity (ROE) and CEO
remuneration (basic salary plus bonus).
Hypothesis 2 test if there is positive relationship
between ROE and CEO remuneration (basic salary
plus bonus). Table 3 depicts the results of the test that
was run to respond to hypothesis 2 (Ho2). The
correlation coefficient between ROE and CEO
remuneration is (r=0.108) with r-square (R2
= 0.012)
in table 3, which implies that ROE explains 1.2% (R2
*100) variation of the remuneration. The relationship
between ROE and remuneration is not significant at
5% critical level (p=0.6091 > 0.05). A p-value that is
at 60.9% suggests that changes in ROE are not
associated with changes in the CEO remuneration. In
other words, a positive relationship does not exist
between a return on equity and CEO remuneration.
Hypothesis 2 is therefore not rejected.
Table 3. Regression analysis: The independent variable is the returns on equity (ROE) and
dependent variable is the CEO remuneration (basic salary plus bonus). Model Summary
Model R R Square Adjusted R Square Std. Error of the Estimate F Sig.
1 .108 .012 -.031 6931.677107 .269 .609
HO3: A positive relationship does not exist
between the rate of cost to income (COI) and CEO
remuneration (basic salary plus bonus).
Hypothesis three test if there is a positive
relationship between COI and CEO remuneration
(basic salary plus bonus). Table 4 depicts the results of
the test that was run to respond to hypothesis 3 (Ho3).
The correlation coefficient between COI and CEO
remuneration is (r=0.310) with r-square (R2
= 0.096)
in table 4 which implies that ROE explains 9.6% (R2
*100) variation of the remuneration. The relationship
between COI and remuneration is not significant at
5% critical level (p=0.132 > 0.05). A p-value that is at
13.2% suggests that changes in COI are not associated
with changes in the CEO remuneration. In other
words, a positive relationship does not exist between a
cost to income and CEO remuneration. Hypothesis 3
is therefore not rejected.
Table 4. Regression analysis: The independent variable is the cost to income (COI) and dependent
variable is the CEO remuneration (basic salary plus bonus). Model Summary
Model R R Square Adjusted R Square Std. Error of the Estimate F Sig.
1 .310 .096 .057 6629.317080 2.441 .132
H04: A positive relationship does not exist
between the non-performing loans (NPL) [or rate of
impaired loans to gross loans] and CEO remuneration
(basic salary plus bonus)
Hypothesis 4 test if there is a positive
relationship between NPL and CEO remuneration
(basic salary plus bonus). Table 5 depicts the results of
the test that was run to respond to hypothesis 4 (Ho4).
The correlation coefficient between NPL and CEO
remuneration is (r=0.654) with r-square (R2
= 0.428)
in table 5 which implies that NPL explains 42.8% (R2
*100) variation of the remuneration. The relationship
between NPL and remuneration is significant at 5%
critical level (p=0.000 < 0.05). A p-value that is at
0.0% suggests that changes in NPL are associated with
changes in the CEO remuneration. In other words, a
positive relationship does exist between non-
performing loans and CEO remuneration. Hypothesis
4 is therefore rejected.
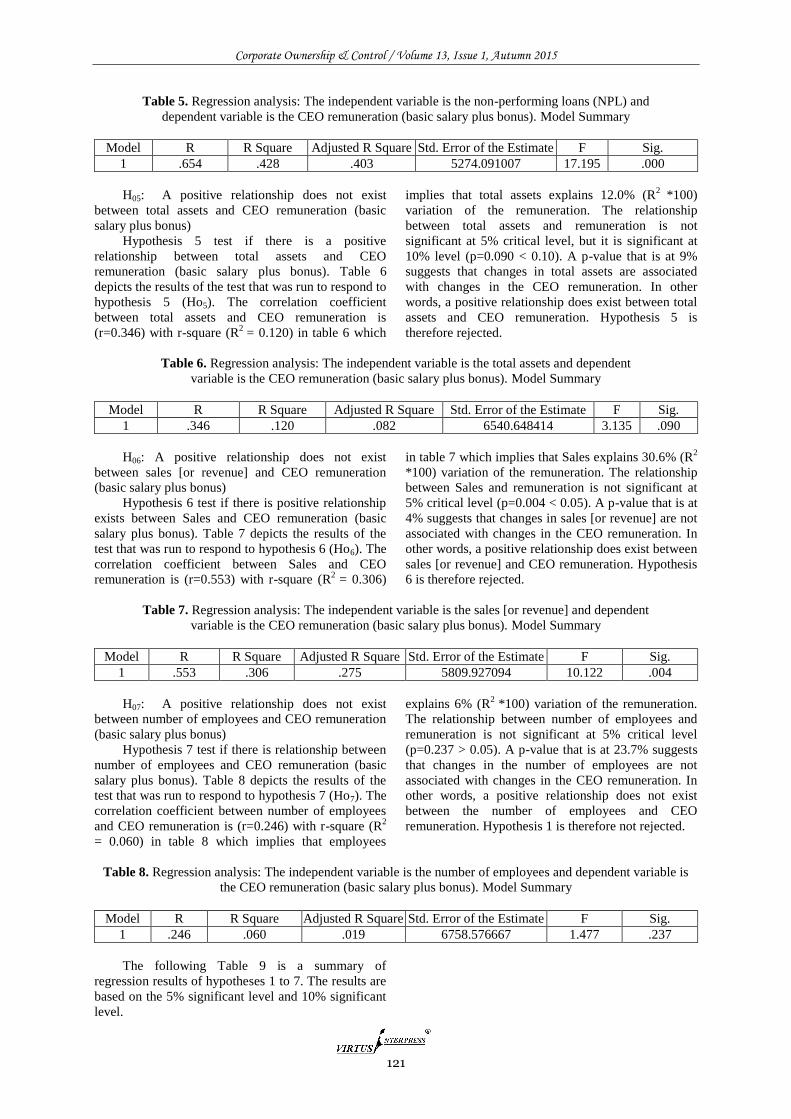
Corporate Ownership & Control / Volume 13, Issue 1, Autumn 2015
121
Table 5. Regression analysis: The independent variable is the non-performing loans (NPL) and
dependent variable is the CEO remuneration (basic salary plus bonus). Model Summary
Model R R Square Adjusted R Square Std. Error of the Estimate F Sig.
1 .654 .428 .403 5274.091007 17.195 .000
H05: A positive relationship does not exist
between total assets and CEO remuneration (basic
salary plus bonus)
Hypothesis 5 test if there is a positive
relationship between total assets and CEO
remuneration (basic salary plus bonus). Table 6
depicts the results of the test that was run to respond to
hypothesis 5 (Ho5). The correlation coefficient
between total assets and CEO remuneration is
(r=0.346) with r-square (R2
= 0.120) in table 6 which
implies that total assets explains 12.0% (R2
*100)
variation of the remuneration. The relationship
between total assets and remuneration is not
significant at 5% critical level, but it is significant at
10% level (p=0.090 < 0.10). A p-value that is at 9%
suggests that changes in total assets are associated
with changes in the CEO remuneration. In other
words, a positive relationship does exist between total
assets and CEO remuneration. Hypothesis 5 is
therefore rejected.
Table 6. Regression analysis: The independent variable is the total assets and dependent
variable is the CEO remuneration (basic salary plus bonus). Model Summary
Model R R Square Adjusted R Square Std. Error of the Estimate F Sig.
1 .346 .120 .082 6540.648414 3.135 .090
H06: A positive relationship does not exist
between sales [or revenue] and CEO remuneration
(basic salary plus bonus)
Hypothesis 6 test if there is positive relationship
exists between Sales and CEO remuneration (basic
salary plus bonus). Table 7 depicts the results of the
test that was run to respond to hypothesis 6 (Ho6). The
correlation coefficient between Sales and CEO
remuneration is (r=0.553) with r-square (R2
= 0.306)
in table 7 which implies that Sales explains 30.6% (R2
*100) variation of the remuneration. The relationship
between Sales and remuneration is not significant at
5% critical level (p=0.004 < 0.05). A p-value that is at
4% suggests that changes in sales [or revenue] are not
associated with changes in the CEO remuneration. In
other words, a positive relationship does exist between
sales [or revenue] and CEO remuneration. Hypothesis
6 is therefore rejected.
Table 7. Regression analysis: The independent variable is the sales [or revenue] and dependent
variable is the CEO remuneration (basic salary plus bonus). Model Summary
Model R R Square Adjusted R Square Std. Error of the Estimate F Sig.
1 .553 .306 .275 5809.927094 10.122 .004
H07: A positive relationship does not exist
between number of employees and CEO remuneration
(basic salary plus bonus)
Hypothesis 7 test if there is relationship between
number of employees and CEO remuneration (basic
salary plus bonus). Table 8 depicts the results of the
test that was run to respond to hypothesis 7 (Ho7). The
correlation coefficient between number of employees
and CEO remuneration is (r=0.246) with r-square (R2
= 0.060) in table 8 which implies that employees
explains 6% (R2
*100) variation of the remuneration.
The relationship between number of employees and
remuneration is not significant at 5% critical level
(p=0.237 > 0.05). A p-value that is at 23.7% suggests
that changes in the number of employees are not
associated with changes in the CEO remuneration. In
other words, a positive relationship does not exist
between the number of employees and CEO
remuneration. Hypothesis 1 is therefore not rejected.
Table 8. Regression analysis: The independent variable is the number of employees and dependent variable is
the CEO remuneration (basic salary plus bonus). Model Summary
Model R R Square Adjusted R Square Std. Error of the Estimate F Sig.
1 .246 .060 .019 6758.576667 1.477 .237
The following Table 9 is a summary of
regression results of hypotheses 1 to 7. The results are
based on the 5% significant level and 10% significant
level.
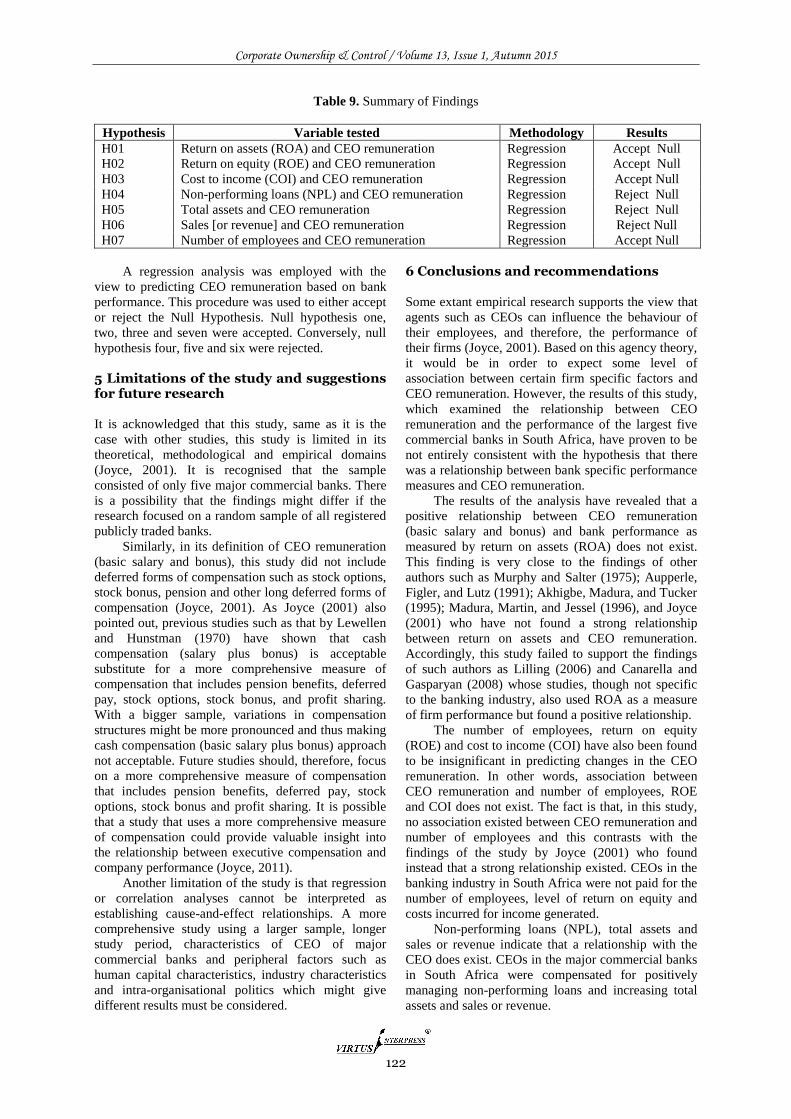
Corporate Ownership & Control / Volume 13, Issue 1, Autumn 2015
122
Table 9. Summary of Findings
Hypothesis Variable tested Methodology Results
H01 Return on assets (ROA) and CEO remuneration Regression Accept Null
H02 Return on equity (ROE) and CEO remuneration Regression Accept Null
H03 Cost to income (COI) and CEO remuneration Regression Accept Null
H04 Non-performing loans (NPL) and CEO remuneration Regression Reject Null
H05 Total assets and CEO remuneration Regression Reject Null
H06 Sales [or revenue] and CEO remuneration Regression Reject Null
H07 Number of employees and CEO remuneration Regression Accept Null
A regression analysis was employed with the
view to predicting CEO remuneration based on bank
performance. This procedure was used to either accept
or reject the Null Hypothesis. Null hypothesis one,
two, three and seven were accepted. Conversely, null
hypothesis four, five and six were rejected.
5 Limitations of the study and suggestions for future research
It is acknowledged that this study, same as it is the
case with other studies, this study is limited in its
theoretical, methodological and empirical domains
(Joyce, 2001). It is recognised that the sample
consisted of only five major commercial banks. There
is a possibility that the findings might differ if the
research focused on a random sample of all registered
publicly traded banks.
Similarly, in its definition of CEO remuneration
(basic salary and bonus), this study did not include
deferred forms of compensation such as stock options,
stock bonus, pension and other long deferred forms of
compensation (Joyce, 2001). As Joyce (2001) also
pointed out, previous studies such as that by Lewellen
and Hunstman (1970) have shown that cash
compensation (salary plus bonus) is acceptable
substitute for a more comprehensive measure of
compensation that includes pension benefits, deferred
pay, stock options, stock bonus, and profit sharing.
With a bigger sample, variations in compensation
structures might be more pronounced and thus making
cash compensation (basic salary plus bonus) approach
not acceptable. Future studies should, therefore, focus
on a more comprehensive measure of compensation
that includes pension benefits, deferred pay, stock
options, stock bonus and profit sharing. It is possible
that a study that uses a more comprehensive measure
of compensation could provide valuable insight into
the relationship between executive compensation and
company performance (Joyce, 2011).
Another limitation of the study is that regression
or correlation analyses cannot be interpreted as
establishing cause-and-effect relationships. A more
comprehensive study using a larger sample, longer
study period, characteristics of CEO of major
commercial banks and peripheral factors such as
human capital characteristics, industry characteristics
and intra-organisational politics which might give
different results must be considered.
6 Conclusions and recommendations
Some extant empirical research supports the view that
agents such as CEOs can influence the behaviour of
their employees, and therefore, the performance of
their firms (Joyce, 2001). Based on this agency theory,
it would be in order to expect some level of
association between certain firm specific factors and
CEO remuneration. However, the results of this study,
which examined the relationship between CEO
remuneration and the performance of the largest five
commercial banks in South Africa, have proven to be
not entirely consistent with the hypothesis that there
was a relationship between bank specific performance
measures and CEO remuneration.
The results of the analysis have revealed that a
positive relationship between CEO remuneration
(basic salary and bonus) and bank performance as
measured by return on assets (ROA) does not exist.
This finding is very close to the findings of other
authors such as Murphy and Salter (1975); Aupperle,
Figler, and Lutz (1991); Akhigbe, Madura, and Tucker
(1995); Madura, Martin, and Jessel (1996), and Joyce
(2001) who have not found a strong relationship
between return on assets and CEO remuneration.
Accordingly, this study failed to support the findings
of such authors as Lilling (2006) and Canarella and
Gasparyan (2008) whose studies, though not specific
to the banking industry, also used ROA as a measure
of firm performance but found a positive relationship.
The number of employees, return on equity
(ROE) and cost to income (COI) have also been found
to be insignificant in predicting changes in the CEO
remuneration. In other words, association between
CEO remuneration and number of employees, ROE
and COI does not exist. The fact is that, in this study,
no association existed between CEO remuneration and
number of employees and this contrasts with the
findings of the study by Joyce (2001) who found
instead that a strong relationship existed. CEOs in the
banking industry in South Africa were not paid for the
number of employees, level of return on equity and
costs incurred for income generated.
Non-performing loans (NPL), total assets and
sales or revenue indicate that a relationship with the
CEO does exist. CEOs in the major commercial banks
in South Africa were compensated for positively
managing non-performing loans and increasing total
assets and sales or revenue.
Corporate Ownership & Control / Volume 13, Issue 1, Autumn 2015
123
This study contributed to the literature in the area
of executive compensation by examining the
association between CEO remuneration and
performance for a select number of generally accepted
measures for major commercial banks, designated as
such in terms of size (assets and turnover/revenue). In
addition, the study has brought to the fore the
significance of non-performing loans (NPL) as
predictor variable of CEO remuneration which should
be included in future research.
Although no positive relationship was found
between CEO remuneration and bank performance as
measured by return on assets, return on equity and
cost to income, these variables remain important
factors in managerial and organisational performance
and investor relations. It remains important for
management to ensure that assets utilisation is
maximised in order to yield a good return for the
benefit of shareholders and other stakeholders such as
bank employees.
The variable, number of employees in the
organisation, as a predictor of CEO remuneration
remains contentious. Not enough research exist that
support the idea that CEOs in the commercial banking
industry were paid for the number employees in their
organisations.
Lastly, there continues to be a lot to learn about
the determinants of CEO remuneration, as indicated
by the above suggestions for future research.
However, it is hoped that other researchers will
address some of these issues in future research.
References 1. Aduda, J., (2011), “The relationship between
executive compensation and firm performance in the
Kenyan banking sector”, Journal of Accounting and
Taxation, Vol. 3 (6), pp. 130 – 139.
2. Agarwal, N., (1981), “Determinants of executive
compensation”, Industrial Relations, 20 (1), pp. 36 –
46.
3. Akhigbe, A., Madura, J. and Ryan, H. (1997), “CEO
compensation and performance of commercial banks”,
Managerial Finance, 23, (11), pp. 40 – 55.
4. Al-Hawari, M. and Ward, T., (2006), “The effect of
automated services quality on Australian banks’
financial performance and the mediation role of
customer satisfaction”, Marketing Intelligence &
Planning, Vol. 24, Issue: 2, pp. 127 – 147.
5. Barro, J.R., and Barro, R.J., (1990), “Pay,
performance, and turnover of bank CEOs”, Journal of
Labor Economics, 8 (4), pp. 448 – 481.
6. Barron, C., (2014), “Something’s got to give on CEO
pay”, Sunday Times (Business Times), May 18, p.9a.
7. Barron, C., (2014), “Something’s got to give on CEO
pay”, Sunday Times (Business Times), May 18, p.9b.
8. Beer, M. and Katz, N., (2003), “Do incentives work?
The perceptions of worldwide sample of senior
executives”, HR. Human Resource Planning, 26 (3),
99. 30 – 44.
9. Berger, A.N., Clarke, G.R.G, Cull, R., Klapper, L. and
Udell, G.F., (2005), “Corporate governance and bank
performance: A joint analysis of the static, selection
and dynamic effects of domestic, foreign, and state
ownership”, Journal of Banking and Finance, 29, pp.
2179 – 2221.
10. Bradley, S., (2013), “The relationship between CEO
compensation and company performance in a South
African context”, Journal of Economic and Financial
Sciences, 6 (3), pp. 539 – 564.
11. Business Monitor International, (2013), South African
Commercial Banking Report Q1 2013, London.
12. Canarella, G., and Gasparyan, A. (2008), “New
insights into executive compensation and firm
performance”, Managerial Finance, Vol. 13, No. 8, pp.
537 – 554.
13. Cronje, J.J.L., (2007), “Assessing the relative
efficiency management of South African banks”,
Management Dynamics, Vol. 16, No. 4, pp. 11 – 23.
14. Crotty, A., (2014), “SA’s corporate governance trails
world rivals”, Sunday Times (Business Times), April
13, p.4.
15. Crotty, A., (2014), “Protecting comfy CEOs from
activists”, Sunday Times (Business Times), May 18,
p.11.
16. Crumley, C.R., (2008), “A study of the relationship
between firm performance and CEO compensation in
the U.S. commercial industry”, Journal of Applied
Management and Entrepreneurship, Vol. 13, No. 2, 99.
26 – 45.
17. Daily, C.M. and Dalton, D.R., (2002), “The problem
with equity compensation”, The Journal of Business
Strategy, 23 (4), pp. 28 – 30.
18. Dorff, M.B., (2005), “Does one hand wash the other?
Testing the managerial power and optimal contracting
theories of executive compensation”, Journal of
Corporation Law, 30 (2), pp. 255 – 307.
19. Ely, K.M., (1991), “Interindustry differences in the
relation between compensation and firm performance
variables”, Journal of Accounting Research, 29, pp. 37
– 58.
20. Finkelstein, S., and D. Hambrick, (1989), “Chief
Executive Compensation: A study of the intersection
of markets and politic processes”, Strategic
Management Journal, pp. 121 – 134.
21. Gregg, P., Jewel, S., and Tonks, I., (2012), “Executive
pay and performance: Did bankers’ bonuses cause the
crisis?”, International Review of Finance, 12, 1, pp. 89
– 122.
22. Gregoriou, G.N. and Rouah, F., (2003), “An
examination of CEO compensation of U.S. banks and
thrifts using non-traditional performance measures:
1997 – 2001”, Journal of Financial Services
Marketing, 7 (3), pp. 246 – 257.
23. Hill, N.T., and Stevens, K.T., (2001), “Structuring
compensation to achieve better financial results”,
Strategic Finance, 82 (9), pp. 48 – 51.
24. Houston, J.F., and James, C., (1995), “CEO
compensation and bank risk: Is compensation in
banking structured to promote risk taking?”, Journal of
Monetary Economics, 36, 405 – 431.
25. Hubbard, R.G., and Palia, D., “Executive pay and
performance: Evidence from the U.S. banking
industry”, Journal of Financial Economics, 39, 105 –
130.
26. Joyce, W.B., (2001), “Return and reward: Bank
performance and CEO compensation”, American
Business Review, 19 (2), pp. 93 – 99.
27. Kerr, J., and Bettis, R., (1987), “Boards of directors,
top management compensation, and shareholder

Corporate Ownership & Control / Volume 13, Issue 1, Autumn 2015
124
returns”, Academy of management Journal, 30 (4), pp.
645 – 664.
28. Kumbirai, M. and Webb, R., (2010), “A financial ratio
analysis of commercial bank performance in South
Africa”, African Review of Economics and Finance,
Vol. 2, No. 1, pp. 30 – 53.
29. Lewellen, W.G., and Huntsman, B., (1970),
“Managerial pay and corporate performance”,
American Economic Review, 60, pp. 710 – 720.
30. Lilling, M.S. (2006), “The link between CEO
compensation and firm performance: Does
simultaneity matter?”, Atlantic Economic Journal,
Vol. 34, pp. 101 – 114.
31. Lin, X., and Zhang, Y., (2009), “Bank ownership
reform and bank performance in China”, Journal of
Banking and Finance, 33, pp. 20 – 29.
32. Merten, M., (2014), “Top chief executives take home
average of R49m”, The Star, May 1, p.3.
33. Murphy, K., and Salter, M.S., (1975), “Should CEO
pay be linked to results?”, Harvard Business Review,
53 (3), pp. 66 – 73.
34. Sigler, K.J. and Porterfield, R., (2001), “CEO
compensation: It slink to bank performance”,
American Business Review, 19, 2, pp. 110 – 114.
35. Vellyath, R., and Bishop, J.W., (1995), “CEO
compensation and firm performance: Empirical
evidence of labour market norms”, The International
Journal of Organisational Analysis, 3 (3), pp. 268 –
283.
Corporate Ownership & Control / Volume 13, Issue 1, Autumn 2015
125
THE EFFECTS OF BUSINESS GROUP CONTROL ADVANTAGES AND AFFILIATE LEVEL ADVANTAGES ON
AFFILIATE PERFORMANCE☆
Roderick Bugador*
Abstract
This study views the network of control in a corporate business group as its source of competitive advantages. These control advantages are distributed among the business group affiliates and eventually influence their performance. This paper examines this by providing a reconceptualization of both the nature of business group and affiliate level advantages using the data of the top 20 Philippine corporate groups. The study found out that the group level control advantage affects the affiliate performance more than their individual level advantages. This result confirms the capability of business groups to influence and control their group internal market. This also implies that the business group affiliates have not yet developed significant capabilities which are independent to that of their business group. Keywords: Corporate Groups, Business Group Advantages, Affiliate Level Advantages, Business Group Affiliation, Director Interlocks, Network Analysis *College of Economics and Business, Hankuk University of Foreign Studies, 81 Oedae-ro, Mohyeon-myeon, Cheoin-gu, Yongin-si, Geonggi-do, 449-791 Korea Tel: +82313304773 *This work was supported by Hankuk University of Foreign Studies Research Fund of 2015
1 Introduction
The empirical thrust in the existing business group
literature has been centered around confirming if
business group affiliation enables firms to perform
better than their non-business group counterparts with
the assumption that affiliation to business groups (here
also abbreviated as BG or BGs) confer advantages,
especially in developing or emerging economies
(Carney et al., 2011; Khanna, 2000; Khanna and
Palepu, 2000). In other words, the objective is to
explain whether the business group affiliation is more
efficient than non-business group affiliation thereby
alluding to the concept of business group advantages
in the outcome perspective. However, this traditional
approach offers a rather limited explanation in our
understanding on the question of how and when is
actually the nature of the competitive advantages of
business groups, let alone its performance and
characteristics, without comparing them to non-
business groups or standalone firms. The conventional
belief is that the business group advantages are easily
endowed as long as the firm is affiliated with the
business group.
This paper argues that business group affiliation
does not necessarily guarantee the premium of
business group advantages as affiliation and
advantages are not the same thing. The business group
affiliation provides legitimacy of an affiliate
belonging to a business group but may not function
towards the operationalization and creation of
business group advantages. This is because the
business group advantages are not always endowed
but also built by the affiliates owing to their specific
operational circumstances and individual firm-level
capabilities (Mahmood et al., 2011). In other words,
there is an interplay between the advantages that are
found at the group level and those that are derived
from the affiliate level (Birkinshaw and Hood, 1998).
Therefore, the previous literature fails to recognize the
extent to which the individual affiliates operationalize
the business group advantages by discounting the
contribution and heterogeneity of the affiliates within
the business group (Choo et al., 2009).
This paper contributes to the above discussion by
incorporating transaction cost economics, resource-
based view and social network, and reconsiders the
value of the prevailing assumptions between the
relationship of business group advantages and affiliate
performance. This paper also holds that the analysis of
the advantages of business groups is only valid if the
nature of these advantages is known and justly
measured empirically, especially when comparing to
non-business group firms. Thus far this has not been
fully reconciled in the existing literature (Carney,
2008; Delios and Ma, 2010). Hence, the previous
studies which compare BGs to non-BGs remain
problematic at this point.
Corporate Ownership & Control / Volume 13, Issue 1, Autumn 2015
126
In addressing the issues above the succeeding
sections are organized as follows. It begins with a
review on the theoretical underpinnings of business
groups and their competitive advantages, dubbed here
as the business group advantages or BGAs. This is
followed by a conceptual framework and hypotheses
which explains the performance at the affiliate level,
not through their mere affiliation with the business
group but by the extent to which they explore and
exploit the business group advantages of their business
group according to their network position. The
framework points to the role and heterogeneity of the
affiliates in combining the advantages that are specific
to the group and those individual strengths or the
affiliate level advantages which eventually lead to the
variation in their individual affiliate level
performance. This is examined using the case of the
top 20 business groups from the Philippines. Lastly,
the later sections provide the discussion and
theoretical implications of the study. Their
applications are related to the context of diversified
business groups in developing or emerging economies.
2 Theory and hypotheses 2.1 The nature of business group advantages
The dynamics of the advantage of the business group
structure are different from that of the typical single
firm or standalone firms. These are both in cognitive
and functional dimensions (Dyer and Singh, 1998;
Lavie, 2006; Prahalad and Bettis, 1986). Historically,
these advantages stem from the response to specific
country characteristics, such as market imperfections,
and the managerial capabilities of the affiliate firms.
They epitomize the capabilities to control or manage
multiple portfolios or a group internal market within a
complex environment such as the emerging economies
(Chang and Choi, 1988; Rugman, 1981). They are a
summation of knowledge that has been internalized,
owned and controlled by the business group over time
(Chang and Hong, 2000; Demsetz, 1988; Dierickx and
Cool, 1989). The resulting structure of business group
advantages are found and distributed among the
affiliates in the business group (Heugens and
Zyglidopoulos, 2008). As the sources of advantages,
such as knowledge and experience, are controlled as a
group, business group advantages accrue exclusively
to business group affiliated firms (Chang and Hong,
2000).
Within the literature, there are three generic
components when describing the control structure of
business group advantages. These advantages are:
Firstly, reduced transactions costs through the group
internal capital, labor, internal buying and selling and
market information search. The business group
advantages on transaction costs clearly explain the
incentive of reducing the risks and costs for searching
or developing information and advantages in the
external market (Hennart, 1982; Li et al., 2006;
Williamson, 1973). The business group structure
provides an array of internal resources which an
affiliate can exploit. For example, internal group
capital is a very good source of capitalization for
affiliates during investments, including foreign
investments, and expansion (Gonenc et al., 2007). In
the developing and emerging economies, capital
market functioning is not only inefficient but
oftentimes missing. Secondly, transferable group
managerial skills and experience in product and
geographical diversification, contacts and
intermediation capabilities, and state relations. The
business group advantage on group managerial skills
and experience provides a combination of context
specific and transferable skills among BG affiliates
(Kock and Guillén, 2001; Tan and Meyer, 2010).
Amsden and Hikino (1994)argue that the repeated
industry-entry patterns of business groups are realized
because of their ‘contact capabilities’ with the state
and foreign multinationals, followed by ‘project
execution capabilities’. According to them, these
project execution capabilities refer “to the skills
required to establish or expand operating and other
corporate facilities, including undertaking pre-
investment feasibility studies, project management,
project engineering, procurement, construction and
startup operations”. These capabilities are generic to
business groups and not industry-specific. They are
difficult to trade because they are embodied in the
organisation’s owners, managers, and routines (Amit
and Schoemaker, 1993; Penrose, 1959). Thirdly,
economies of scale and scope such as allocation and
co-development of resources in the area such as in
R&D/technology and marketing and distribution,
group brand and reputation. These are the generic
advantages of multi-unit organizations such as the
business groups, which can use leverage in their
multiple portfolio operations (Chandler, 1990; Colpan
and Hikino, 2010).
2.2 The affiliate level advantages
The concept of business group control advantage
explains the kinds of advantages which are found at
the group level but it does not explain all the potential
advantages that are found at the individual affiliate
level. Some research on interorganisational networks
have identified that individual nodes have very
specific qualities compared to the entire network
(Ahuja et al., 2012; Jones et al., 1997). These specific
qualities, such as capabilities, directly affect the
performance of the focal affiliates (Mahmood et al.,
2011). Hence, with regards to advantages, what
individual business groups affiliates have are both the
subset of the BGAs and affiliate level advantages
(here also abbreviated as ALAs). Both, or their
interactions, explain the outcome, such as
performance of business group affiliates and
eventually the whole business group. By building on
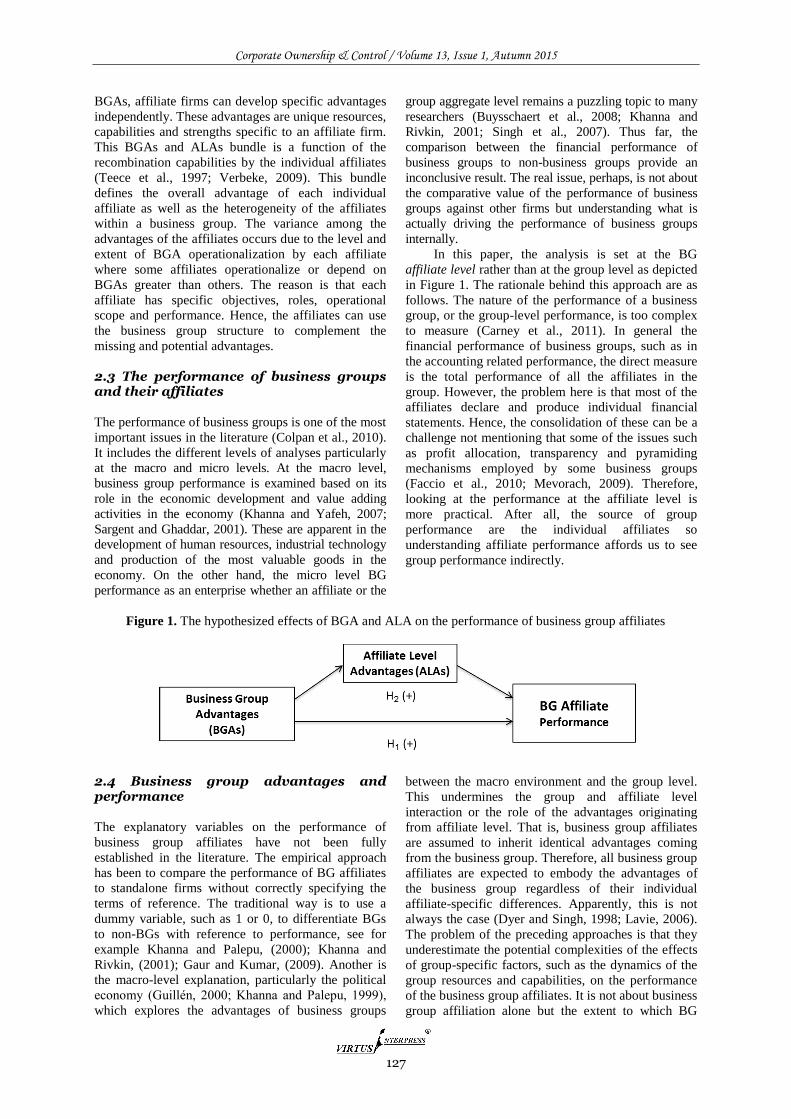
Corporate Ownership & Control / Volume 13, Issue 1, Autumn 2015
127
BGAs, affiliate firms can develop specific advantages
independently. These advantages are unique resources,
capabilities and strengths specific to an affiliate firm.
This BGAs and ALAs bundle is a function of the
recombination capabilities by the individual affiliates
(Teece et al., 1997; Verbeke, 2009). This bundle
defines the overall advantage of each individual
affiliate as well as the heterogeneity of the affiliates
within a business group. The variance among the
advantages of the affiliates occurs due to the level and
extent of BGA operationalization by each affiliate
where some affiliates operationalize or depend on
BGAs greater than others. The reason is that each
affiliate has specific objectives, roles, operational
scope and performance. Hence, the affiliates can use
the business group structure to complement the
missing and potential advantages.
2.3 The performance of business groups and their affiliates
The performance of business groups is one of the most
important issues in the literature (Colpan et al., 2010).
It includes the different levels of analyses particularly
at the macro and micro levels. At the macro level,
business group performance is examined based on its
role in the economic development and value adding
activities in the economy (Khanna and Yafeh, 2007;
Sargent and Ghaddar, 2001). These are apparent in the
development of human resources, industrial technology
and production of the most valuable goods in the
economy. On the other hand, the micro level BG
performance as an enterprise whether an affiliate or the
group aggregate level remains a puzzling topic to many
researchers (Buysschaert et al., 2008; Khanna and
Rivkin, 2001; Singh et al., 2007). Thus far, the
comparison between the financial performance of
business groups to non-business groups provide an
inconclusive result. The real issue, perhaps, is not about
the comparative value of the performance of business
groups against other firms but understanding what is
actually driving the performance of business groups
internally.
In this paper, the analysis is set at the BG
affiliate level rather than at the group level as depicted
in Figure 1. The rationale behind this approach are as
follows. The nature of the performance of a business
group, or the group-level performance, is too complex
to measure (Carney et al., 2011). In general the
financial performance of business groups, such as in
the accounting related performance, the direct measure
is the total performance of all the affiliates in the
group. However, the problem here is that most of the
affiliates declare and produce individual financial
statements. Hence, the consolidation of these can be a
challenge not mentioning that some of the issues such
as profit allocation, transparency and pyramiding
mechanisms employed by some business groups
(Faccio et al., 2010; Mevorach, 2009). Therefore,
looking at the performance at the affiliate level is
more practical. After all, the source of group
performance are the individual affiliates so
understanding affiliate performance affords us to see
group performance indirectly.
Figure 1. The hypothesized effects of BGA and ALA on the performance of business group affiliates
2.4 Business group advantages and performance
The explanatory variables on the performance of
business group affiliates have not been fully
established in the literature. The empirical approach
has been to compare the performance of BG affiliates
to standalone firms without correctly specifying the
terms of reference. The traditional way is to use a
dummy variable, such as 1 or 0, to differentiate BGs
to non-BGs with reference to performance, see for
example Khanna and Palepu, (2000); Khanna and
Rivkin, (2001); Gaur and Kumar, (2009). Another is
the macro-level explanation, particularly the political
economy (Guillén, 2000; Khanna and Palepu, 1999),
which explores the advantages of business groups
between the macro environment and the group level.
This undermines the group and affiliate level
interaction or the role of the advantages originating
from affiliate level. That is, business group affiliates
are assumed to inherit identical advantages coming
from the business group. Therefore, all business group
affiliates are expected to embody the advantages of
the business group regardless of their individual
affiliate-specific differences. Apparently, this is not
always the case (Dyer and Singh, 1998; Lavie, 2006).
The problem of the preceding approaches is that they
underestimate the potential complexities of the effects
of group-specific factors, such as the dynamics of the
group resources and capabilities, on the performance
of the business group affiliates. It is not about business
group affiliation alone but the extent to which BG
Corporate Ownership & Control / Volume 13, Issue 1, Autumn 2015
128
affiliates are endowed and positioned within the scope
of the business group advantages. Thus, this paper
hypothesizes that the performance of business group
affiliates can be best explained by capturing relevant
factors such as the business group control advantages.
H1. The stronger are the business group control
advantages of the business group the higher the
performance of their affiliates.
2.5 The mediating role of affiliate level advantages
In addition to resolving the complexities of the effects
of the business groups to the affiliates, and to their
performance, the issue of affiliate heterogeneity within
the business group has not been taken into
consideration by previous studies (Choo et al., 2009;
Mahmood et al., 2011). Thus far, the traditional
analysis of the effects of the business group to their
affiliates assumes a single focus, that is only at the
group level. There are two problems in the
unidirectional conceptualization. First, the business
group advantages are assumed to be transferred easily
to any affiliate as long as they are affiliated to the
business group, hence the traditional concept of ‘BG
affiliation’ or empirically, the “1, 0 flaw”. Second, the
affiliate firms are assumed to exclusively embody the
business group advantages and overlook their
individual development of advantages which would
arise from the interaction of their specific operational
circumstances and firm-level capabilities. In short, the
affiliates can bring new advantages to the group and in
turn make the BGAs dynamic. As discussed above,
business group affiliates also possess different kinds
and types of advantages which do not necessarily
represent that of the business group (Granovetter,
2005; Zaheer and McEvily, 1999). Therefore, the
advantages of business groups should be
conceptualized at two levels, i.e. at the group and the
affiliate levels, and both affect the affiliate
performance.
H2. The affiliate level advantages mediate the
positive relationship between business group
advantages and the performance of the business group
affiliate firms.
3 Methodology 3.1 Research design
There are three different units of analysis in a business
group: the subsidiary (domestic or foreign), the
affiliate firm (can be a division), and the group (all
firms). This paper focuses its analysis at the affiliate
firm level and its interaction with the group level. The
paper has adopted a quantitative analysis using various
secondary data. The objective is to provide a specific
explanation of the business group’s affiliate level
performance by using business group control
advantages and affiliate level advantages as the
explanatory variables. To do this, the main
observations were only consisted of BG affiliated
firms in one country’s setting that is the Philippines.
The reasons for this are the following. Firstly, the
BGA and ALA are new conceptual propositions,
hence, it is rational to apply them exclusively to BG
affiliated firms. Secondly, the existing literature
compares BGs to non-BGs but failed to recognise the
important variations within the BG population itself,
such as BGAs and ALAs, thus making the BG and
standalone comparisons invalid. And thirdly, using
one country study provides greater control in terms of
understanding the heterogeneity among the advantages
of both business groups and their affiliates in a
common location. As to the choice of country, the
Philippines is home to many business groups and
extensive analyses about them are scarce. In fact,
Sullivan and Unite (2001) pointed out that the thirteen
largest domestic Philippine BGs controlled 392
companies from 18 different industries in 1993. Their
study also found that out of 196 publicly listed
companies in 1997, seventy-five firms were fully
controlled by business groups in addition to thirty-
eight others with significant ownership. In addition,
the majority of the Philippine BGs fit with the type
and characteristics of business groups that are being
targeted by this study: (1) non-state owned; (2)
diversified (related and unrelated); and (3) have a
common controller (such as family or kinship related).
These types of business groups are geared towards
developing their unique business group advantages
without depending upon a strong state intervention
such as those business groups from China.
3.2 Data measurement and process
This study processed various secondary data in three
phases. These include literature analysis and data
preparation, business group sample confirmation and
measurement of group and affiliate network measures.
In the first phase, the study collected and reviewed
research articles, including books, on business groups
from different sources. The purpose of which was to
build the theoretical grounding of the study as well as
to establish an initial list of business groups from
previous studies. Specifically, this stage provided an
initial list of business groups particularly from the
Philippines. The second phase involved two stages:
these were the confirmation of the business group list
and business group affiliation analysis. To carry out
this phase the study utilized a combined data from two
primary databases namely OneSource and OSIRIS.
OneSource was used to obtain a list of 839 Philippine
companies including the names and positions of 5714
board of directors (which also include the highest
executive positions such as CEO or COO). On the
other hand, OSIRIS was used to confirm the
consistency of the data, specially the financial
sections, for the period of 2010-2012. Also, the data
Corporate Ownership & Control / Volume 13, Issue 1, Autumn 2015
129
was cleaned from name duplicates, particularly the
complete name of the board of directors.
Using the combined database, the first stage in
the second phase was to purposely identify the firms
which were included in the initial list of Philippine
business groups. This was to make sure that there are
references and validity in the selection of the final
business group sample for the study. Next, the study
conducted an affiliation analysis using both the data of
the companies and their board of directors (Borgatti
and Halgin, 2011; Carrington et al., 2005). The
objective of this analysis was to identify the firms
which were tied up with other firms byhaving the
same board of directors; that is, director interlocks.
This was done through social network analysis (SNA)
techniques using UCINET and NetDraw softwares
(Borgatti et al., 2002). The inclusion of firms in a
group was decided based on the strength of the
common ties among them and from the secondary
data, such as annual reports, which provided the
names of other affiliate firms and capital cross-
shareholdings within the business group. Therefore,
the selection of business group sample in this study
was done through a combination of subjective and
objective analyses. This process is definitely reliable
as compared to previous studies. Lastly, the third
phase moved from confirmation to measurement of
the business group network characteristics using the
UCINET program. This study utilizes these group
network measures to represent the structure of group
and affiliate level advantages on human resources,
particularly with regard to managerial skills and
experience, and power distribution. Therefore, the
analysis was done at two levels, one at the business
group level and one at the affiliate level respectively.
3.3 Variables
3.3.1 Measure for affiliate performance
In this paper the dependent variable is the business
group affiliate performance by return on sales (ROS),
averaged for the years 2010 - 2012. The ROS is one of
the accepted accounting based measures of firm
performance. The choice of ROS over other
performance measures is crucial as some of these
measures may not be affiliate specific but group
specific. An example of this is return on assets (ROA),
which is highly contingent on the overall assets and
control by the group rather than by the individual
affiliate.
3.3.2 Measure for business group control advantages
One of the explanatory variables of this study is a
group level measure to represent BGA, particularly
the centralization of the business group. The business
group centralization measures how a certain group
advantage is controlled or endowed by the group
within an affiliate. Hence, it is a valid measure of
business group advantages. However, for the overall
descriptive analysis of the sample groups, this study
presented all the five important group network level
measures that are commonly used in the literature
(Borgatti and Halgin, 2011; Mahmood et al., 2011).
The first three are descriptive measures and are
sample dependent, which means that their values are
influenced by the composition in the group such as the
number of firms (or nodes), directors (or actors) and
incidence (or event). The last two are the comparative
measures of a business group network. They are the
basic measures which compare the characteristics of a
certain networks to others.
The first of the five measures is the diameter,
which is the size of a network in geodesic sense, the
bigger the network the higher the values. The next one
is the average tie, which is measured by adding all the
actual ties in the group divided by all the ties that are
present (or edges). In the context of this study, the
value for this measure reflects the average number of
incidence that the same board of directors occupies sit
in certain affiliates at the same time. Next is the
average degree which is the measure of the average
number of ties (in and out connections) or
relationships which flow on each affiliate (or node) in
the network. This is the average amount of
information or power that is found in each affiliate.
The fourth one is density which is measured by adding
all the actual ties divided by the expected ties. The
value of one represents a fully connected group
network while zero is the opposite. It is the measure of
cohesion and integration in the group. Finally,
centralization is the measure of the degree to which
the group revolves around a single or few affiliates (or
nodes), the higher the value the more centralised the
group network.
3.3.3 Measure for affiliate level advantages
The other explanatory variable in this study is the
affiliate centrality which is an affiliate level measure
to proxy for ALA. The centrality defines the
importance of the position of a certain affiliate on a
particular ALA, such as in financial and human
resources, within the group. This measure is also
common in previous studies (Chung, 2006). Also, for
the purpose of descriptive analysis, this study
conducted all the centrality measures of each affiliate
across the groups. This was done by examining the
four basic network measures on the centrality of an
actor, in this case the affiliate, in a certain network
(Borgatti and Halgin, 2011). The measures reflect the
centrality of a certain position of an actor within a
contextual network, that is resources. Firstly is degree
centrality, which measures how central is the affiliate
in the group network with regard to power and
information; the higher the number the higher the
connection of an affiliate to the rest of the group.
Secondly, there is a 2-step reach or closeness to
others, which ascertains the reach of an affiliate to

Corporate Ownership & Control / Volume 13, Issue 1, Autumn 2015
130
every other affiliate in two steps or less. Thirdly, an
eigenvector which measures how connected is a
certain affiliate to other well-connected affiliates.
Fourthly and lastly, betweenness centrality, measures
the location of a certain affiliate in the brokerage and
flow of information, and influence within the group’s
network.
4 Results
4.1 Descriptive network analysis
Through the social network analysis, the study was
able to confirm the top 20 business groups with a total
of 257 affiliate firms and 2754 directors from the
original data (see Table 1). The top 20 business groups
are basically chosen based on their prominence in the
network mapping analysis in NetDraw (see Figure 2),
followed by in depth analysis of their annual reports
and other sources such as websites. The network
measures for the group are listed in Table 2a and
Table 2b, whilst the affiliate ones in Table 3.
Table 1. Combined data from OneSource and Osiris
Business Group firms/Affiliates Non-Business group firms Total
No. of Firms 257 582 839
No. of Board of Directors 2754 2960 5714
Figure 2. Network map of the top Philippine business groups and their affiliates
4.1.1 Group level
The details and network measures of the top 20
business groups are shown in Table 2a and Table 2b
below. The group size of the business groups varies
from 4 to 33. About twelve (or 60%) of them have less
than 10 affiliates. There are three of them with more
than 10 affiliates, while there are four with 20 and one
with more than 30 affiliates respectively. With regard
to diameter the values are influenced by the size of the
business group. Half or fifty percent (50%) of the
group have a diameter of 1, particularly those with
less than 10 affiliates, and the rest have 3, 2 and 5
respectively. The affiliate which is the biggest and
highest in diameter and seems to be an outlier is the
AYALA Business Group. This group is also the oldest
business group in the Philippines which started
operations in the late 19th
century.
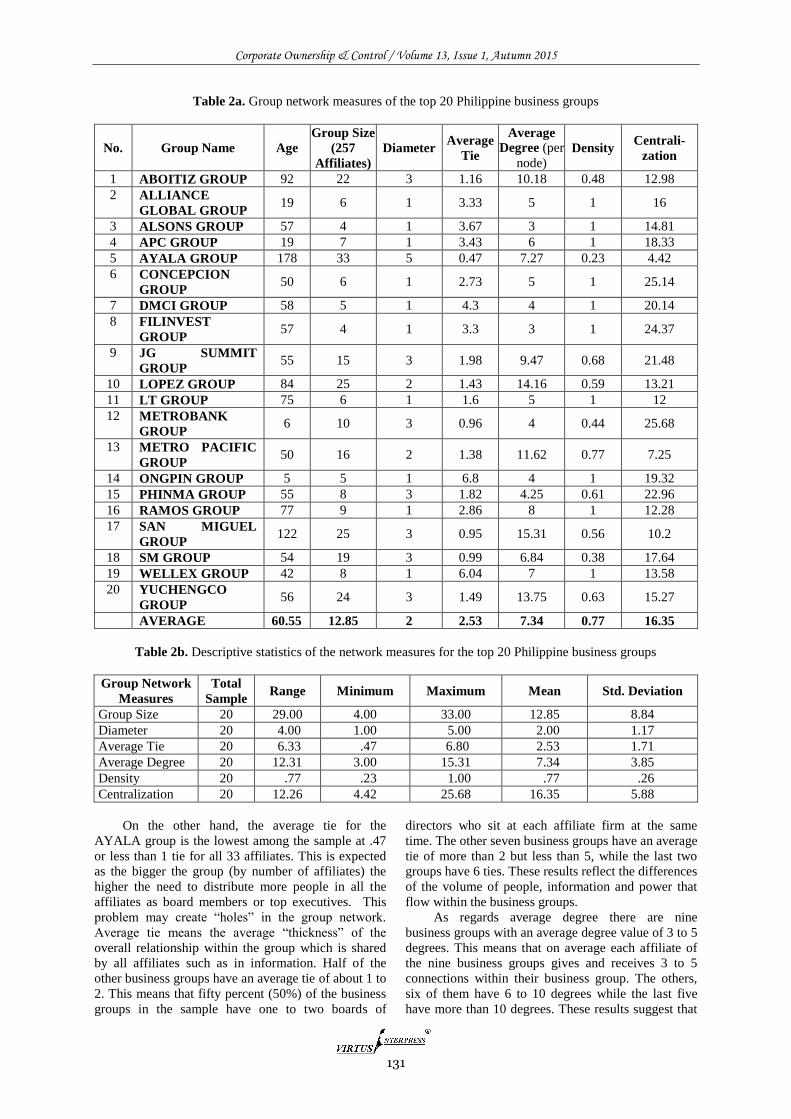
Corporate Ownership & Control / Volume 13, Issue 1, Autumn 2015
131
Table 2a. Group network measures of the top 20 Philippine business groups
No. Group Name Age
Group Size
(257
Affiliates)
Diameter Average
Tie
Average
Degree (per
node) Density
Centrali-
zation
1 ABOITIZ GROUP 92 22 3 1.16 10.18 0.48 12.98
2 ALLIANCE
GLOBAL GROUP 19 6 1 3.33 5 1 16
3 ALSONS GROUP 57 4 1 3.67 3 1 14.81
4 APC GROUP 19 7 1 3.43 6 1 18.33
5 AYALA GROUP 178 33 5 0.47 7.27 0.23 4.42
6 CONCEPCION
GROUP 50 6 1 2.73 5 1 25.14
7 DMCI GROUP 58 5 1 4.3 4 1 20.14
8 FILINVEST
GROUP 57 4 1 3.3 3 1 24.37
9 JG SUMMIT
GROUP 55 15 3 1.98 9.47 0.68 21.48
10 LOPEZ GROUP 84 25 2 1.43 14.16 0.59 13.21
11 LT GROUP 75 6 1 1.6 5 1 12
12 METROBANK
GROUP 6 10 3 0.96 4 0.44 25.68
13 METRO PACIFIC
GROUP 50 16 2 1.38 11.62 0.77 7.25
14 ONGPIN GROUP 5 5 1 6.8 4 1 19.32
15 PHINMA GROUP 55 8 3 1.82 4.25 0.61 22.96
16 RAMOS GROUP 77 9 1 2.86 8 1 12.28
17 SAN MIGUEL
GROUP 122 25 3 0.95 15.31 0.56 10.2
18 SM GROUP 54 19 3 0.99 6.84 0.38 17.64
19 WELLEX GROUP 42 8 1 6.04 7 1 13.58
20 YUCHENGCO
GROUP 56 24 3 1.49 13.75 0.63 15.27
AVERAGE 60.55 12.85 2 2.53 7.34 0.77 16.35
Table 2b. Descriptive statistics of the network measures for the top 20 Philippine business groups
Group Network
Measures
Total
Sample Range Minimum Maximum Mean Std. Deviation
Group Size 20 29.00 4.00 33.00 12.85 8.84
Diameter 20 4.00 1.00 5.00 2.00 1.17
Average Tie 20 6.33 .47 6.80 2.53 1.71
Average Degree 20 12.31 3.00 15.31 7.34 3.85
Density 20 .77 .23 1.00 .77 .26
Centralization 20 12.26 4.42 25.68 16.35 5.88
On the other hand, the average tie for the
AYALA group is the lowest among the sample at .47
or less than 1 tie for all 33 affiliates. This is expected
as the bigger the group (by number of affiliates) the
higher the need to distribute more people in all the
affiliates as board members or top executives. This
problem may create “holes” in the group network.
Average tie means the average “thickness” of the
overall relationship within the group which is shared
by all affiliates such as in information. Half of the
other business groups have an average tie of about 1 to
2. This means that fifty percent (50%) of the business
groups in the sample have one to two boards of
directors who sit at each affiliate firm at the same
time. The other seven business groups have an average
tie of more than 2 but less than 5, while the last two
groups have 6 ties. These results reflect the differences
of the volume of people, information and power that
flow within the business groups.
As regards average degree there are nine
business groups with an average degree value of 3 to 5
degrees. This means that on average each affiliate of
the nine business groups gives and receives 3 to 5
connections within their business group. The others,
six of them have 6 to 10 degrees while the last five
have more than 10 degrees. These results suggest that
Corporate Ownership & Control / Volume 13, Issue 1, Autumn 2015
132
the affiliates in each business group are very much
connected with one another since the higher the
number of degrees the highly connected the affiliates.
As to density, half of the sample has a full
measure of 1, which means that fifty percent (50%) of
the business groups in the sample have a one hundred
percent (100%) connection among their affiliates.
These business groups are connected by at least one
tie and do not contain any “hole” in the network, that
is a star network. However, all of these groups have
less than 10 affiliates, which in the context of human
resource deployment is easy to achieve. The others
with more than 10 affiliates have a density ranging
from .23 or twenty-three percent (23%) to .77 or
seventy-seven percent (77%) showing some holes that
exist within the network or containing some affiliates
which are not connected with other affiliates. This
means that there are broken points in the network
which may prevent the flow of information, such as
sharing of experiences, to and from other affiliates.
Finally, the measures of centralization for all the
business groups in the sample range from 4.42 to
25.68. Of that, only six groups have a centralization
measure of above 20 or twenty percent (20%). High
value means that the business group is highly
centralized and the information and power are
concentrated in one or few affiliates. In general, the
maximum value of 25.68 or twenty-six percent (26%)
centralisation is not very high, which means that most
of the business groups in the sample are moderately
centralized.
4.1.2 Affiliate level
The network measures of the 257 affiliates are
presented in Table 3 by their average value in
reference to their role in the business group. On
average the affiliates in the sample display a high level
of degree centrality. The average value for this is .62
or sixty-two percent (62%) which means that most of
the affiliates enjoy central position as regards to
information and power in their business group. In
terms of 2-Step reach or closeness, the affiliates score
for this is .95 or ninety-five (95%) which means that
most of the affiliates can reach other affiliates within
two steps or less. This means easy access for affiliates
when seeking information such as on managerial
experiences of other affiliates. The next one is
eigenvector of the affiliates which has an average
value of .35 or thirty-five percent (35%). This is
expected to be low for all given high degree centrality
and closeness. This means that many affiliates are not
especially well connected to others, as most of them
are well connected to one another in their group.
Lastly, betweenness has the lowest average value of
.02 or two percent (2%) which means most of the
affiliates in the group does not have the role as go-
between or brokers. Again this is expected as the
degree centrality and closeness values are high for
most of the affiliates. This simply means that most of
the information is not difficult to access within the
business group. On the other hand, the range and
standard deviation (SD) of the network measures
among the affiliates show considerable variation. This
reflects the heterogeneity of the affiliates across
different business groups.
Table 3. Descriptive statistics of the network measures for the 257 Philippine business group affiliates
Affiliate Network
Measures
Total
Sample Range Minimum Maximum Mean
Std.
Deviation
Degree 257 .97 .03 1.00 .6239 .33096
Closeness 257 .94 .06 1.00 .9520 .11319
Eigenvector 257 .73 .00 .73 .3502 .18281
Betweenness 257 .46 .00 .46 .0231 .06176
4.2 Mediation analysis
This study performed a simple mediation analysis
using the Baron and Kenny (1986) causal-steps
approach. In addition, a bootstrapped confidence
interval for the ab indirect effect was obtained using
procedures described by Preacher and Hayes (2004).
The initial explanatory variable was BGA
(centralization); measured in percentage, the outcome
variable was affiliate performance (return on sales-
ROS, in USD Mil.); and the proposed mediating
variable was ALA (degree centrality), measured in
percentage. This is depicted in Figure 3, which shows
the path diagram that corresponds to the mediation
hypothesis. Preliminary data screening suggested that
there were no serious violations of assumptions of
normality or linearity. All coefficients reported here
are unstandardized, unless otherwise noted; a = .05
two-tailed is the criterion for statistical significance.
The total effect of BGA on affiliate performance
was significant, c = .23, t= 2.06, p < .04; each 1-
percent increase in BGA in centralization predicted
approximately a .23 increase in affiliate’s ROS
performance in USD Mil. Hence, H1 is supported. The
BGA was significantly predictive of the hypothesized
mediating variable, ALA; a = .018 (unstandardized), t
= 5.41, p = .000. When controlling for BGA, ALA
was significantly predictive of performance, b = -
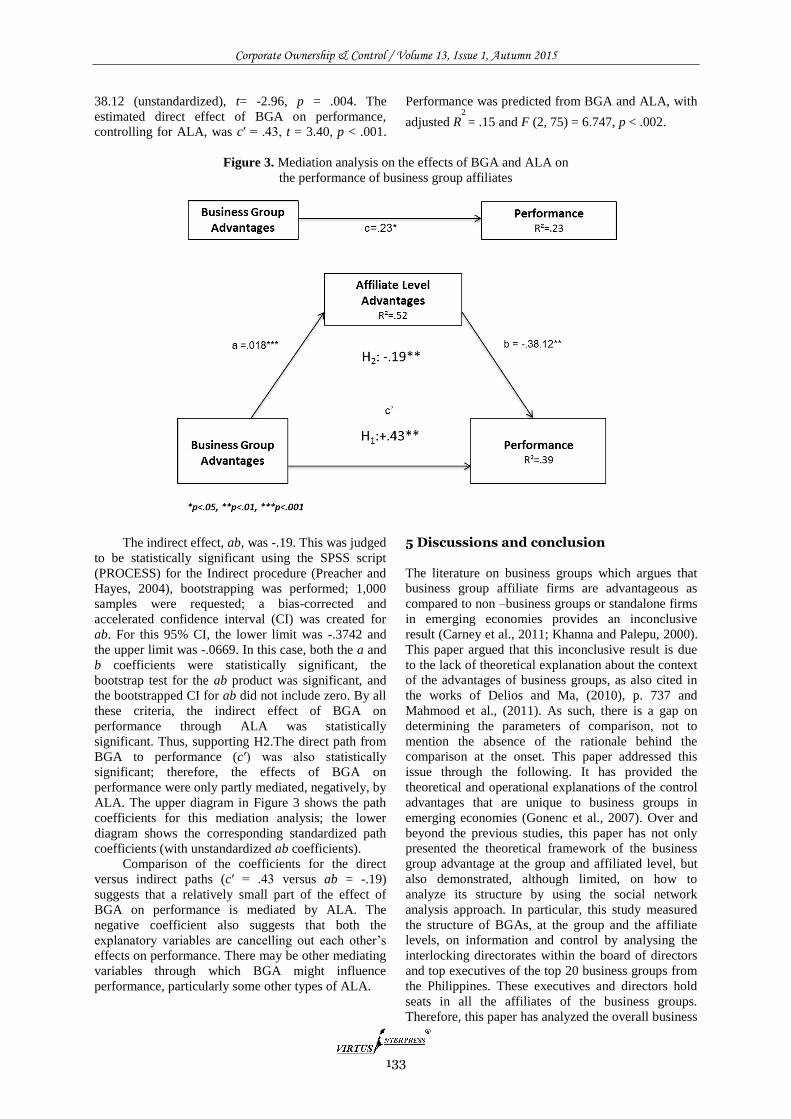
Corporate Ownership & Control / Volume 13, Issue 1, Autumn 2015
133
38.12 (unstandardized), t= -2.96, p = .004. The
estimated direct effect of BGA on performance,
controlling for ALA, was c′ = .43, t = 3.40, p < .001.
Performance was predicted from BGA and ALA, with
adjusted R2
= .15 and F (2, 75) = 6.747, p < .002.
Figure 3. Mediation analysis on the effects of BGA and ALA on
the performance of business group affiliates
The indirect effect, ab, was -.19. This was judged
to be statistically significant using the SPSS script
(PROCESS) for the Indirect procedure (Preacher and
Hayes, 2004), bootstrapping was performed; 1,000
samples were requested; a bias-corrected and
accelerated confidence interval (CI) was created for
ab. For this 95% CI, the lower limit was -.3742 and
the upper limit was -.0669. In this case, both the a and
b coefficients were statistically significant, the
bootstrap test for the ab product was significant, and
the bootstrapped CI for ab did not include zero. By all
these criteria, the indirect effect of BGA on
performance through ALA was statistically
significant. Thus, supporting H2.The direct path from
BGA to performance (c′) was also statistically
significant; therefore, the effects of BGA on
performance were only partly mediated, negatively, by
ALA. The upper diagram in Figure 3 shows the path
coefficients for this mediation analysis; the lower
diagram shows the corresponding standardized path
coefficients (with unstandardized ab coefficients).
Comparison of the coefficients for the direct
versus indirect paths (c′ = .43 versus ab = -.19)
suggests that a relatively small part of the effect of
BGA on performance is mediated by ALA. The
negative coefficient also suggests that both the
explanatory variables are cancelling out each other’s
effects on performance. There may be other mediating
variables through which BGA might influence
performance, particularly some other types of ALA.
5 Discussions and conclusion
The literature on business groups which argues that
business group affiliate firms are advantageous as
compared to non –business groups or standalone firms
in emerging economies provides an inconclusive
result (Carney et al., 2011; Khanna and Palepu, 2000).
This paper argued that this inconclusive result is due
to the lack of theoretical explanation about the context
of the advantages of business groups, as also cited in
the works of Delios and Ma, (2010), p. 737 and
Mahmood et al., (2011). As such, there is a gap on
determining the parameters of comparison, not to
mention the absence of the rationale behind the
comparison at the onset. This paper addressed this
issue through the following. It has provided the
theoretical and operational explanations of the control
advantages that are unique to business groups in
emerging economies (Gonenc et al., 2007). Over and
beyond the previous studies, this paper has not only
presented the theoretical framework of the business
group advantage at the group and affiliated level, but
also demonstrated, although limited, on how to
analyze its structure by using the social network
analysis approach. In particular, this study measured
the structure of BGAs, at the group and the affiliate
levels, on information and control by analysing the
interlocking directorates within the board of directors
and top executives of the top 20 business groups from
the Philippines. These executives and directors hold
seats in all the affiliates of the business groups.
Therefore, this paper has analyzed the overall business
Corporate Ownership & Control / Volume 13, Issue 1, Autumn 2015
134
group advantages of the sampled business groups
which cover all the affiliates with both domestic and
international operations. The BGAs, then, are
applicable in both the domestic and international
contexts. The descriptive results of the study also
support the concept of group advantages at the
affiliate level. This is based on the significant
variation within the network measures of the sample
affiliates. This variation clearly reflects the
heterogeneity among the affiliates which is in this
context being argued as the specific advantages at the
affiliate level. Finally, the results of the mediation
analysis support the hypotheses of the study that the
performance of the affiliates is significantly
influenced by both BGAs and ALAs and not their
mere affiliation with the business group.
References 1. Ahuja, G., Soda, G. and Zaheer, A. (2012), "The
genesis and dynamics of organizational networks",
Organization Science, Vol. 23, no. 2, pp. 434-448.
2. Amit, R. and Schoemaker, P. J. (1993), "Strategic
assets and organizational rent", Strategic Management
Journal, Vol. 14, no. 1, pp. 33-46.
3. Amsden, A. H. and Hikino, T. (1994), "Project
execution capability, organizational know-how and
conglomerate corporate growth in late
industrialization", Industrial and Corporate Change,
Vol. 3, no. 1, p. 111.
4. Baron, R. M. and Kenny, D. A. (1986), "The
moderator–mediator variable distinction in social
psychological research: Conceptual, strategic, and
statistical considerations", Journal of personality and
social psychology, Vol. 51, no. 6, p. 1173.
5. Birkinshaw, J. and Hood, N. (1998), "Multinational
Subsidiary Evolution: Capability and Charter Change
in Foreign-Owned Subsidiary Companies", The
Academy of Management Review, Vol. 23, no. 4, pp.
773-795.
6. Borgatti, S. P., Everett, M. G. and Freeman, L. C.
(2002), "Ucinet for Windows: Software for social
network analysis", Harvard Analytic Technologies,
Vol. 2006.
7. Borgatti, S. P. and Halgin, D. S. (2011), "Analyzing
affiliation networks", The Sage handbook of social
network analysis, pp. 417-433.
8. Buysschaert, A., Deloof, M., Jegers, M. and
Rommens, A. (2008), "Is Group Affiliation Profitable
in Developed Countries? Belgian Evidence",
Corporate Governance: An International Review, Vol.
16, no. 6, pp. 504-518.
9. Carney, M. (2008), Asian business groups: context,
governance and performance, Chandos Oxford UK.
10. Carney, M., Gedajlovic, E. R., Heugens, P. P. M. A.
R., Van Essen, M. and Van Oosterhout, J. (2011),
"Business group affiliation, performance, context, and
strategy: a meta-analysis", Academy of Management
Journal, Vol. 54, no. 3, pp. 437-460.
11. Carrington, P. J., Scott, J. and Wasserman, S. (2005),
Models and methods in social network analysis,
Cambridge university press.
12. Chandler, A. D. (1990), Scale and scope, Cambridge
Univ Press.
13. Chang, S. J. and Choi, U. (1988), "Strategy, structure
and performance of Korean business groups: A
transactions cost approach", The Journal of Industrial
Economics, pp. 141-158.
14. Chang, S. J. and Hong, J. (2000), "Economic
performance of group-affiliated companies in Korea:
Intragroup resource sharing and internal business
transactions", Academy of Management Journal, pp.
429-448.
15. Choo, K., Lee, K., Ryu, K. and Yoon, J. (2009),
"Changing performance of business groups over two
decades: Technological capabilities and investment
inefficiency in Korean chaebols", Economic
development and cultural change, Vol. 57, no. 2, pp.
359-386.
16. Chung, H.-M. (2006), "Managerial ties, control and
deregulation: An investigation of business groups
entering the deregulated banking industry in Taiwan",
Asia Pacific Journal of Management, Vol. 23, no. 4,
pp. 505-520.
17. Colpan, A. M. and Hikino, T. (2010) Foundations of
Business Groups: Towards an Integrated Framework
In A. M. Colpan, J. R. Lincoln and T. Hikino (eds)
The Oxford handbook of business groups: Oxford
Univ Pr.
18. Colpan, A. M., Hikino, T. and Lincoln, J. R. (2010),
The Oxford handbook of business groups, Oxford
Univ Pr.
19. Delios, A. and Ma, X. (2010) Diversification strategy
and business groups. In A. M. Colpan, T. Hikino and
J. R. Lincoln (eds) The Oxford Handbook of Business
Groups, 718-742. Oxford: Oxford University Press.
20. Demsetz, H. (1988), "Theory of the Firm Revisisted,
The", Journal of Law, Economics & Organization,
Vol. 4, p. 141.
21. Dierickx, I. and Cool, K. (1989), "Asset stock
accumulation and sustainability of competitive
advantage", Management Science, Vol. 35, no. 12, pp.
1504-1511.
22. Dyer, J. H. and Singh, H. (1998), "The relational view:
Cooperative strategy and sources of
interorganizational competitive advantage", Academy
of Management Review, Vol. 23, no. 4, pp. 660-679.
23. Faccio, M., Lang, L. H. P. and Young, L. (2010),
"Pyramiding vs Leverage in Corporate Groups:
International Evidence", Journal of International
Business Studies, Vol. 41, no. 1, pp. 88-104.
24. Gaur, A. S. and Kumar, V. (2009), "International
Diversification, Business Group Affiliation and Firm
Performance: Empirical Evidence from India*",
British Journal of Management, Vol. 20, no. 2, pp.
172-186.
25. Gonenc, H., Kan, O. B. and Karadagli, E. C. (2007),
"Business Groups and Internal Capital Markets",
Emerging Markets Finance & Trade, Vol. 43, no. 2,
pp. 63-81.
26. Granovetter, M. (2005), "Business Groups and Social
Organization", The handbook of economic sociology,
p. 429.
27. Guillén, M. F. (2000), "Business groups in emerging
economies: a resource-based view", Academy of
Management Journal, Vol. 43, pp. 362-380.
28. Hennart, J. F. (1982), A Theory of Multinational
Enterprise, University of Michigan Press: Ann Arbor.
29. Heugens, P. and Zyglidopoulos, S. (2008), "From
social ties to embedded competencies: the case of
Corporate Ownership & Control / Volume 13, Issue 1, Autumn 2015
135
business groups", Journal of Management &
Governance, Vol. 12, no. 4, pp. 325-341.
30. Jones, C., Hesterly, W. S. and Borgatti, S. P. (1997),
"A general theory of network governance: Exchange
conditions and social mechanisms", Academy of
Management Review, pp. 911-945.
31. Khanna, T. (2000), "Business groups and social
welfare in emerging markets: Existing evidence and
unanswered questions", European Economic Review,
Vol. 44, no. 4-6, pp. 748-761.
32. Khanna, T. and Palepu, K. (2000), "Is group affiliation
profitable in emerging markets? An analysis of
diversified Indian business groups", The Journal of
Finance, Vol. 55, no. 2, pp. 867-891.
33. Khanna, T. and Palepu, K. (1999), "Policy shocks,
market intermediaries, and corporate strategy: The
evolution of business groups in Chile and India",
Journal of Economics & Management Strategy, Vol.
8, no. 2, pp. 271-310.
34. Khanna, T. and Rivkin, J. W. (2001), "Estimating the
performance effects of business groups in emerging
markets", Strategic Management Journal, Vol. 22, no.
1, pp. 45-74.
35. Khanna, T. and Yafeh, Y. (2007), "Business groups in
emerging markets: Paragons or parasites?", Journal of
Economic Literature, Vol. 45, no. 2, pp. 331-372.
36. Kock, C. J. and Guillén, M. F. (2001), "Strategy and
structure in developing countries: Business groups as
an evolutionary response to opportunities for unrelated
diversification", Industrial and Corporate Change,
Vol. 10, no. 1, pp. 77-113.
37. Lavie, D. (2006), "The competitive advantage of
interconnected firms: an extension of the resource-
based view", Academy of Management Review, Vol.
31, no. 3, pp. 638-658.
38. Li, M., Ramaswamy, K. and Pécherot Petitt, B. S.
(2006), "Business groups and market failures: A focus
on vertical and horizontal strategies", Asia Pacific
Journal of Management, Vol. 23, no. 4, pp. 439-452.
39. Mahmood, I., Zhu, H. and Zajac, E. J. (2011), "Where
can capabilities come from? network ties and
capability acquisition in business groups", Strategic
Management Journal, Vol. 32, no. 8, pp. 820-848.
40. Mevorach, I. (2009), "Insolvency within multinational
enterprise groups", OUP Catalogue.
41. Penrose, E. T. (1959) The theory of the growth of the
firm. In Editor (ed)^(eds) Book The theory of the
growth of the firm. City: Oxford.
42. Prahalad, C. and Bettis, R. A. (1986), "The dominant
logic: A new linkage between diversity and
performance", Strategic Management Journal, Vol. 7,
no. 6, pp. 485-501.
43. Preacher, K. J. and Hayes, A. F. (2004), "SPSS and
SAS procedures for estimating indirect effects in
simple mediation models", Behavior Research
Methods, Instruments, & Computers, Vol. 36, no. 4,
pp. 717-731.
44. Rugman, A. M. (1981) Inside the multinationals: the
economics of the multinational enterprise. In Editor
(ed)^(eds) Book Inside the multinationals: the
economics of the multinational enterprise. City:
Columbia University Press, New York.
45. Sargent, J. and Ghaddar, S. (2001), "International
Success of Business Groups as an Indicator of
National Competitiveness: The Mexican Example",
Latin American Business Review, Vol. 2, no. 3/4, p.
97.
46. Singh, M., Nejadmalayeri, A. and Mathur, I. (2007),
"Performance impact of business group affiliation: An
analysis of the diversification-performance link in a
developing economy", Journal of Business Research,
Vol. 60, no. 4, pp. 339-347.
47. Sullivan, M. J. and Unite, A. A. (2001), "The
influence of group affiliation and the underwriting
process on emerging market IPOs: The case of the
Philippines", Pacific-Basin Finance Journal, Vol. 9,
no. 5, pp. 487-512.
48. Tan, D. and Meyer, K. E. (2010), "Business groups'
outward FDI: A managerial resources perspective",
Journal of International Management, Vol. 16, no. 2,
pp. 154-164.
49. Teece, D. J., Pisano, G. and Shuen, A. (1997),
"Dynamic capabilities and strategic management",
Strategic Management Journal, Vol. 18, no. 7, pp.
509-533.
50. Verbeke, A. (2009), International business strategy:
Rethinking the foundations of global corporate
success, Cambridge University Press.
51. Williamson, O. E. (1973), "Markets and hierarchies:
some elementary considerations", American Economic
Review, Vol. 63, pp. 316-325.
52. Zaheer, A. and McEvily, B. (1999), "Bridging ties: A
source of firm heterogeneity in competitive
capabilities", Strategic Management Journal, Vol. 20,
no. 12, p. 1133.

Corporate Ownership & Control / Volume 13, Issue 1, Autumn 2015
136
SUBSCRIPTION FORM
TO "CORPORATE OWNERSHIP & CONTROL", "CORPORATE BOARD: ROLE, DUTIES &
COMPOSITION", “RISK GOVERNANCE & CONTROL: FINANCIAL MARKETS &
INSTITUTIONS”, “JOURNAL OF GOVERNANCE AND REGULATION”
Copy this form and follow guidelines to fill it up. I would like to buy (underline what you choose):
For individual subscribers:
1. Journal of Corporate Ownership & Control:
1.1. Printed version of the journal - US$260 / €220.
1.2. Electronic version - US$185 / €150.
2. Corporate Board: role, duties & composition:
2.1. Printed version of the journal - US$240 / €190.
2.2. Electronic version - US$180 / €145.
3. Risk Governance & Control journal: financial markets & institutions:
3.1. Printed version of the journal - US$240 / €190.
3.2. Electronic version - US$180 / €145.
4. Journal of Governance and Regulation:
3.1. Printed version of the journal - US$240 / €190.
3.2. Electronic version - US$180 / €145.
For institutional subscribers:
1. Journal of Corporate Ownership & Control:
1.1. Printed version of the journal and electronic subscription - US$1240 / €890.
1.2. Printed version of the journal - US$1080 / €790.
1.3. Electronic version - US$730 / €650.
2. Corporate Board: role, duties & composition:
2.1. Printed version of the journal and electronic subscription - US$820 / €760.
2.2. Printed version of the journal - US$960 / €720.
2.3. Electronic version - US$650 / €590.
3. Risk Governance & Control journal: financial markets & institutions:
3.1. Printed version of the journal and electronic subscription - US$920 / €790.
3.2. Printed version of the journal - US$860 / €620.
3.3. Electronic version - US$550 / €490.
3. Journal of Governance and Regulation:
3.1. Printed version of the journal and electronic subscription - US$920 / €790.
3.2. Printed version of the journal - US$860 / €620.
3.3. Electronic version - US$550 / €490.
Underline one of the payment methods you prefer, and write amount to pay (if you prefer, you can pay by one cheque/bank
transfer to subscribe to both journals):
1. I enclose a cheque for US$ / €_______;
2. Send me an invoice for US$ / €_______ (indicate currency correctly).
Write your contact details here:
Name_________________________________________________________________________
Position________________________________________________________________________
Institution_______________________________________________________________________
Address________________________________________________________________________
E-mail_______________________________Tel_____________________Fax________________
Please, send this form (with a cheque if you prefer to pay by cheque) at:
Dr. Alexander Kostyuk
Publishing house "Virtus Interpress"
Postal Box 36
Sumy
40014
Ukraine
Ask for invoice by fax at order[at]virtusinterpress.org