internationalization, product diversification and performance
TRANSCRIPT
UNRAVELING THE RELATIONSHIPS BETWEEN INTERNATIONALIZATION AND PRODUCT
DIVERSIFICATION AMONG THE WORLD’S LARGEST FOOD AND BEVERAGE ENTERPRISES
Niron Hashai
School of Business Administration The Hebrew University
Mount Scopus Jerusalem 91905
Israel E-mail: [email protected]
Tamar Almor School of Business Administration
College of Management – Academic Studies 7 Yitzhak Rabin Blvd., PO box 25073
Rishon LeZion 75910 Israel
E-mail: [email protected]
Marina Papanastassiou Department of International Economics and Management
Copenhagen Business School Porcelaenshaven 24
DK-2000 Frederiksberg Denmark
E-mail: [email protected]
Fragkiskos Filippaios Faculty of Business Kingston University
Kingston Hill, Kingston Upon Thames, Surrey, KT2 7LB
United Kingdom
E-mail: [email protected]
Ruth Rama
Institute of Economics and Geography - CSIC Spanish Council for Scientific Research
Albasanz, 28 28037 Madrid
Spain E-mail: [email protected]
In: Ravi Ramamurti & Niron Hashai (eds), “The future of Foreign Direct
Investment and the multinational enterprise”, Emerald Group, Bingley (UK), 271-299, 2011
ABSTRACT This chapter examines the interrelationships between internationalization and product diversification among the world's l35 largest food and beverage enterprises. Based on the argument that food and beverage enterprises enjoy economies of scope when moderately diversifying into new countries and product areas, but encounter resource constraints when extremely diversified and internationalized, we expect to find an inverted U-shaped relationship between the two strategies. Nevertheless, the authors find that the relationships between the two strategies show both an inverted U-shaped (when geographic diversification is the dependent variable and product diversification the independent one) and a U-shaped pattern (when product diversification is the dependent variable and geographic diversification the independent one). These results imply that the relationships between internationalization and product diversification among food and beverage enterprises are more complex than currently conceived. KEYWORDS Internationalization; product diversification; firm growth; food and beverage
2
At the beginning of the 21st century, Unilever, one of the leading food and beverage enterprises in the world, decided to launch the 'Path to Growth' program, a strategy to transform its business. As a result, Unilever cut its brands from 1,600 to 900 while at the same time extending its international operations and becoming a global company1.
Since the beginning of the 21st century, Strauss, an Israel based food leader and a dairy products company, has acquired a host of South American and East European coffee producers, while at that same period of time expanding its product portfolio by acquiring "Elite" an Israeli sweets and candy firm, as well as various biscuit and cookie bakeries, an apiary and a fresh vegetables company. Lately it has also begun investing in the drinking water business2.
Both Unilever and Strauss have made major strategic changes during the last ten years in their internationalization strategy and their product diversification strategy. Yet, while Unilever decided to prune the breadth of its product diversification while widening its geographical spread, Strauss simultaneously pursued product diversification and internationalization.
The challenges firms face when attempting to make strategic changes has been a recurrent theme in Yair Aharoni's work since his seminal 1966 book. Since both product diversification and internationalization make extensive use of the same resource base possessed by firms, it is very likely that the two strategies are interdependent. Yet, the behavior of Unilever and Strauss seem to contradict one another and question the interdependency of both strategies. The current study aims to unravel the nature of the relationships between internationalization and product diversification at the firm level, while focusing on food and beverage enterprises.
In this paper, we hypothesize that an inverted U-shape relationship exists between internationalization and product diversification. We argue in this paper that a local food and beverage enterprise which tries its hand initially at internationalization and product diversification will enjoy economies of scope. By expanding into foreign markets and in industries simultaneously, the enterprise attains economies of scope which allow it to develop concurrently in two directions. Yet when development along both paths is continued, the limited bundle of fairly fixed resources of such enterprises results in a situation where continued development of one strategy will be at the expense of the other.
In order to explore this preposition, we examine the relationships between internationalization and product diversification of the largest food and beverage enterprises in the world between the years 1996-2002 while taking into account their endogeneity (Kumar, 2009) and the level of expansion along each route3.
The paper proceeds as follows: in the next section background literature is presented followed by a conceptual framework which outlines the hypothesized relationship between internationalization and diversification. Subsequently we present
1http://www.unilever.co.uk/ourcompany/aboutunilever/History/?linkid=navigation accessed May 29, 2010. Unilever reported a turnover of € 39.8 Billion in 2009. 2 http://www.strauss-group.com/en/MenuItem-AboutUs/History/ accessed May 29, 2010. Strauss reported a turnover of NIS 6.3 Billion (approx.USD 1.5 B) in 2009. 3 It is noteworthy that the current study does not aim to analyze the joint impact of internationalization and product diversification on performance and is not concerned with the direct and moderating effects of either strategy on performance.
3
our sample, measures and methods and then the results of our analyses. We conclude with a discussion and implications of our findings.
BACKGROUND LITERATURE
Many studies suggest that firms have to make an either/or choice between internationalization and product diversification, at least in the short term. Substitution between internationalization and product diversification is assumed as both internationalization and product diversification make use of the same bundle of resources the firm possesses, thereby creating short run interdependencies between the strategies (Caves & Mehra, 1975; Kumar, 2009). Tallman and Li (1996), who focused on performance, implied in their study that firms with low levels of product diversification can enhance their performance by expanding internationally. Indeed, findings by Pearce (1993) as well as by Davies et al. (2001), showed a negative relationship between product diversification and internationalization. In a similar vein, Palich et al., (2000) argued that internationalization decreases the advantages of related product diversification due to international impediments to synergy formation in marketing, production, and technology. Likewise, Meyer (2006) argued that firm growth may be facilitated by "globalfocusing" – increasing internationalization in a narrow set of industries. Studying selected European food chains, Palpacuer and Tozanli (2008) draw a distinction between global strategies characterized by homogeneous market approaches and the search for economies of scale across world macro regions, on the one hand, and home region strategies by which firms concentrate a large proportion of their activities in the home region and operate a smaller range of activities in extra-regional locations, on the other hand.
This view seems to suggest that firms have a limited resource pool, which can be invested either in product diversification or in furthering internationalization. Indeed, Kumar (2009) recently showed that internationalization and product diversification were negatively associated in the short run, arguably due to limitations in replicating and transferring tacit, causally ambiguous competencies between the two strategies coupled with limitations in absorptive capacity. Kumar (2009) also argued that decisions concerning the extent of development along the two paths were likely to be made simultaneously and endogenously by firms after taking into consideration the availability of various resources and not independently as implicitly assumed in past research.
Yet, other studies reported a positive linear relationship between internationalization and product diversification indicating complementarity between the two strategies (Davis, et al., 2001; Delios and Beamish, 1999; Hitt et al., 1997). Davies et al. (2001) argued that for differentiated products, internationalization and product diversification were complementary strategies that enable a firm to maximize its utilization of firm specific proprietary assets. Their view assumes that specific proprietary assets may foster both internationalization and product diversification simultaneously. Likewise, Delios and Beamish (1999) noted that for highly diversified Japanese firms, internationalization and product diversification complement each other, as the need for assets to enter distant lines of business may be met by the opportunities found to generate or acquire new assets when expanding the firm's geographic scope. This is also supported by Kim et al. (1993) who argued that increased internationalization reduces risk and increased returns of product-diversified
4
firms, since additional opportunities are created for such firms. Finally, Hitt et al. (1997) argued that the combination of high levels of internationalization and product diversification create synergies that enable firms to differentiate their products while incurring lower costs than non-diversified firms.
These two streams of contradictory findings are consistent with the anecdotal evidence provided earlier for Unilever and Strauss. In this paper we seek to explore the endogenous relationship between internationalization and product diversification by building on the resource based view (RBV) of the firm. By creating an argument for the existence of non-linear relationships that allow for complementarity and substitution to co-exist at different levels of internationalization and product diversification we will attempt to shed light on the contradictory findings reported above.
CONCEPTUAL FRAMEWORK
The resource based view (RBV) of the firm views firms as sets of tangible,
intangible and human resources that create capabilities. These capabilities are unique, provided that a given firm's resources are durable and inimitable, hence enabling firms to compete successfully against their rivals (Barney, 1991; Collis, 1991; Peteraf, 1993; Wernerfelt, 1984). We will use the RBV in order to examine the relationship between internationalization and product diversification from different aspects. We will start out by examining the role resources play when arguing the existence of a positive relationship and when arguing the same for a negative relationship between the two strategies. Subsequently we will build upon these arguments to construct a hypothesis that proposes the existence of a non-linear relationship between the two strategies.
A positive relationship between internationalization and product diversification
Firms possessing unique and inimitable resources are expected to have a greater capability to grow, be it through internationalization through product diversification into different industries (Davis et al., 2001). Internationalization enables firms to develop more diverse resources as they operate in multiple foreign countries with different comparative advantages (Delios & Beamish, 1999) and are exposed to diverse market needs and consumer tastes (Bartlett & Ghoshal, 1989). These resources can be transferred between markets enabling the firm to continue its internationalization.
Diversification into new product areas enables the exploitation of economies of scope (Teece, 1982; Panzar and Willig, 1981). Tangible and intangible resources which are difficult to transfer in arms length transactions can be effectively transferred between product lines within the firm (Teece, 1982). Thus, it can be argued that if resources are transferable across product and international markets, simultaneous internationalization and product diversification will allow firms to benefit from the synergies created from the combination of greater internationalization and product diversification (Hitt et al., 1994, 1997; Kim et al., 1989).
A negative relationship between internationalization and product diversification
5
Firms usually posses fairly fixed bundles of resources that are costly to change in the short term (Barney, 1991; Penrose, 1959; Montgomery and Wernerfelt, 1988). Thus, firms that expand their international reach and product line breadth simultaneously, are likely to encounter problems of trade-offs at a certain point. Such a point is firm specific and reflects managerial and financial resource constraints. When such constraints appear, firms may find themselves dealing with the need to choose between the two strategies. The scarcity of physical and intangible assets such as finance and management time, is expected to constrain the number and variety of expansion activities a firm can pursue in a given time period (Penrose, 1959; Kumar, 2009). This is likely to lead firms to select the expansion route that matches their resources best (Montgomery & Wernerfelt, 1988) and focus their resources on further expansion along this route.
The costs of realizing synergies for product diversified firms (Palich et al,, 2000; Rumelt, 1974, 1982; Simmonds, 1990; Teece, 1982; Varadarajan & Ramanujam, 1987) are expected to be significant and increase rapidly as firms diversify. Such costs result from the need to invest in activity sharing which involves the management of cross-business relationships, sharing of technological development, production and distribution activities as well as retaining a certain level of reputation for different businesses (Davies, et al. 2001). All these may limit the ability to internationalize while diversifying into new product areas. Likewise, internationalization requires firms to direct a significant share of their resources towards their host countries as well as to effectively coordinate their foreign operations (Bartlett & Ghoshal, 1989). Since firms are limited in their managerial and financial resources, when reaching a certain level of internationalization firms will likely face the need to reduce product diversification in order to avoid the exhaustion of these resources. A non-linear relationship between internationalization and product diversification
Given the potential synergy-led economies of scope that simultaneous
internationalization and product diversification drive on the one hand and the exhaustion of managerial and financial resources they may lead to, on the other, one may expect their relationships to change at different levels of internationalization and product diversification.
At relatively low levels of internationalization firms are likely to have slack resources (Aharoni, 1966; Penrose, 1959; Teece, 1982) that can be used for diversification of their product range. Likewise, as long as firms have not diversified their product range too excessively they are likely to be able to use slack managerial resources and seek for synergies in foreign markets. For instance, as long as a given firm's internationalization is kept mostly within "home-region" markets (Rugman & Verbeke, 2004; Rugman, 2005) it may avoid having to deal with stark cultural and institutional variance between home and foreign markets (Barkema & Drogendijk, 2007; Cuervo-Cazurra et al., 2007) and employ its managerial resources for further expansion of its product range. Since regional consumer tastes and needs are relatively more homogeneous than global ones, internationalization at the regional level is likely to reduce the need of substantive resource investment in adaptation of products to specific local requirements and retain available resources for introducing a wider range of products while simultaneously internationalizing. Since food products
6
are relatively sensitive to differing consumer tastes (Bartlett & Ghoshal, 1989) food and beverage enterprises, may find this particularly appealing as they can leverage their product specific resources and competencies in relatively similar countries (Filippaios & Rama, 2008). Some authors argue that technology based durables would be the products least connected to local cultures while food products would be the most connected (Verlegh, 2007).
Thus, we expect internationalization and product diversification to be complementary as long as their managerial and financial resources are not exhausted.
Yet, achieving both high levels of internationalization and product diversification is likely to exhaust such resources and hence outstrip the returns to resources that are applied to a very broad scope, thereby leading to substitution between the two strategies. The combination of both internationalization and product diversification may require firms to possess diverse sets of resources and capabilities and confer upon them costly managerial time and efforts in complex coordination of such resources and capabilities hence promoting substitution between the two strategies. Taken together we therefore hypothesize that:
Hypothesis 1: An inverted U-shape relationship exists between internationalization and product diversification.
METHOD
The sample The hypotheses were tested on a sample of the world's top food and beverage
enterprises, which account for one third of production (Rastoin et al., 1998) and more than one half of the technological activities of the world food and beverage industry (Alfranca et al., 2001). Firms in this sample are based in all regions of the world and manufacture food and beverages but also non-food products such as detergents, soaps and other products. The database includes publicly traded as well as privately held firms which are world renowned from a wide variety of countries, including: Anheuser Busch, Coca-Cola Company, Danone, Heinz, Mars, Nestlé, PepsiCo, Procter & Gamble, Phillip Morris, Sara Lee and Unilever. The enterprises in the sample hold over 8,000 subsidiaries worldwide which employ over 3 million workers. These subsidiaries provide us with the industrial and geographical distribution of operations of the analyzed firms. This sample thus allows us to examine a very well established, internationalized and diversified industry while controlling for potential industry effects.
The list of firms analyzed was derived from the global AGRODATA database (Institut Mediterraneen de Montpellier, 1990; Padilla et al., 1983; Rastoin et al., 1998), a database produced by the Institut Agronomique Méditerranéen de Montpellier, France (I.A.M.M). The main sources for compiling the AGRODATA database are Moody’s Industrial Manual, the Fortune 500 directory, the “Dossier 5000” published by Le Nouvel Economiste and the annual reports of the firms.
Since the AGRODATA database requires extensive data collection at the subsidiary level it does not contain information for every year. The data used in this study pertains to three years: 1996, 2000 and 2002. For each of the three years we examined the 100 world's largest food and beverage enterprises (in terms of sales), 66
7
of which appeared in all three years. In total this created 265 usable observations45 pertaining to 135 firms, some of them included in all three years and some only in two of the years. The financial information at the corporate level was compiled from COMPUSTAT, AMADEUS, AGRODATA and in some cases directly from annual reports.
Food and beverage enterprises are considered precursors to other firms in both internationalization and product diversification (Anastassopoulos & Rama, 2005). On average, food and beverage enterprises are older and more internationally experienced (Stopford & Dunning, 1983; Tozanli, 1998) than other firms. The longevity of food and beverage enterprises is often associated with their growth strategies, as leading food and beverage enterprises have sometimes survived for more than a century, among other reasons, thanks to their expansion into a variety of industrial and geographical markets (Anastassopoulos & Rama, 2005; Ding & Caswell, 1995; Gopinath, et al., 1999). Food and beverage enterprises often strive to achieve growth since economies of scale and scope are prominent in this industry (Anastassopoulos & Rama, 2005). Growth is certainly not the only motive for internationalization. However, a large size is a very important issue for food and beverage firms since large companies have the opportunity to enter new, profitable markets for foodstuffs (e.g. sauces, precooked dishes, nutraceuticals) while keeping oligopolistic control over markets for basic foodstuffs (e.g. sugar, flour), where margins are thinner. Small companies often lack this possibility because they cannot balance thin margins with the enormous volumes of basic foodstuffs marketed by the largest firms (Anastassopoulos & Rama, 2005).
By focusing on the largest food and beverage enterprises in the world, we are able to examine a very well established, internationalized and diversified industry at a global level.
Measures of internationalization and product diversification
The absolute number and dispersion of subsidiaries operating in domestic and foreign countries are often used as proxies for internationalization (e.g. Carpenter & Sanders, 2004; Delios & Beamish, 1999, 2005; Lu & Beamish, 2004; Tihanyi et al., 2003). In this paper, we build on the geographical distribution of the 8000 domestic and foreign subsidiaries as measure of internationalization and on the industrial distribution of the subsidiaries as a measure of product diversification. Since both a detailed 4-digit level ISIC breakdown as well as a geographical location is provided for each subsidiary, we can derive proxies of the industrial and geographical distribution of operations of the enterprises.
While we would have liked to compare our subsidiary level measures with sales based measures, this data was not available for the firms in our sample as many of them are not publicly traded and do not divulge the data. However, prior research has shown that subsidiary level data are a reasonable substitute for sales-weighted segment data and they tend to have high correlations with measures based on sales (Sullivan, 1994). Furthermore, since our conceptual framework is rooted in RBV reasoning, referring to subsidiaries as rough proxies of the firm resources can be viewed appropriate in lieu of sales data.
4Due to missing data on other items.
8
In order to examine the dispersion of activities across markets and industries, we developed country and industry sector entropy measures of subsidiary networks as proxies for internationalization and product diversification respectively. Entropy measures enable researchers to capture both the depth and breadth of operations (Allen & Pantzalis, 1996) and provide a good indication of the dispersion of firm activities across countries and sectors. For instance, a firm that is operating in n countries, but has most of its subsidiaries concentrated in a single country, should be considered less internationalized than a firm operating in the same number of countries, but with a more uniform distribution of subsidiaries across countries. This is because the latter firm is likely to face higher coordination and control costs for its subsidiary network. Simple absolute number proxies (i.e. number of countries or subsidiaries) cannot fully capture the difference in international dispersion between two such firms, while entropy measures can. Previous studies (e.g. Hitt, et al., 1997; Kim et al., 1993; Raghunathan, 1995; Sambharya, 2000) have extensively used entropy measures to capture the degree of internationalization, product diversification or their combination.
The general formula for the entropy measure is:
])/1ln(*[_1∑=
=n
iii PPMeasureEntropy
such that , where Pi is the proportion of subsidiaries operating within segment i. Segment i can represent countries, thereby constructing a 'Country Entropy' measure (country_entropy), or industrial sectors, thereby constructing a 'Sector Entropy' measure (sector_entropy). 'Country Entropy' measures the dispersion of a network of subsidiaries with respect to the number of countries, whereas 'Sector Entropy' does the same with respect to the number of industries.
0≠iP
As previous research has highlighted several problems with entropy measures (e.g. Robins & Wiersema, 2003) we also used a set of "count" measures for internationalization and product diversification. Using multiple measures further enables us to strengthen the robustness of our results (Boyd et al., 2005). The level of internationalization (internationalization) was proxied by the percentage of foreign subsidiaries owned (wholly or partially) by each firm (out of the total number of subsidiaries) while the level of product diversification (diversification) was proxied by the percentage of non-core subsidiaries (i.e. subsidiaries not in the food and beverage industry) owned out of the total number of subsidiaries6.
Finally, an additional set of proxies for internationalization included regional level internationalization (Rugman & Verbeke, 2004; Rugman, 2005), measured as the percentage of foreign subsidiaries operating in the home region of the firm (region_subsidiaries) out of the total number of subsidiaries, and global internationalization, measured as the percentage of subsidiaries outside the home region (global_subsidiaries) out of the total number of subsidiaries7. The home region
6Affiliates which operate in, respectively, related industries and unrelated industries account for nearly 87% of the total number of affiliates. Most of the rest are primarily active in R&D and retailing; we also take into account such affiliates in our model (rd_subs, marketing subs). 7Unilever is Dutch/British. In this paper, however, we consider Unilever to be a Dutch company, following AGRODATA. The company, a conglomerate, has located it Food Division and its main R&D centre for food technology and nutrition in The Netherlands (www.unilever.com). When we calculate its level of regional internationalization we count the percentage of foreign subsidiaries operating in the home region of the firm, i.e. Europe (with the exception of The Netherlands, which is
9
of US firms is The Americas; that of European firms, Europe; and that of Japanese firms, Asia. Likewise, we introduced proxies for "related" vs. "unrelated" diversification (Rumelt, 1974, 1982). Related diversification (related_subsidiaries) was proxied by the percentage of subsidiaries in the food and beverage sector (ISIC 3100) out of the total number of subsidiaries and unrelated diversification (unrelated_subsidiaries) was proxied by the percentage of subsidiaries in non-food industries out of the total number of subsidiaries. In a similar fashion we have built entropy measures for global and regional internationalization (regional_subsidiaries_entropy and global_subsidiaries_entropy) and related and unrelated diversification (related_sector_entropy and unrelated_sector_entropy). Method of analysis
An important concern when testing our hypothesis is whether internationalization and product diversification are endogenous. The possibility of endogeneity arises from the fact that at any given point a given firm's decision on further product diversification is unlikely to be detached from this firm's level of internationalization and vice versa (Kumar, 2009) due to the fact that both paths make use of the same bundle of fairly fixed resources of the firm.
In order to test the possibility of an endogenous relationship between internationalization and product diversification we first ran Ordinary Least Squared (OLS) regressions (within firm fixed effects). The inclusion of within-firm fixed effects suggests that the reported models explain within-firm variation in internationalization or product diversification (i.e. change over time) rather than inter-firm variation. The analysis of within-firm variation seems to be the most appropriate to test our hypothesis, since the logic and reasoning underlying the hypothesis pertains to the impact of change in a given level of internationalization or product diversification on subsequent expansion (or contraction) in the alternate path. Fixed effects models further enable us to control for the impact of firm specific effects which do not change over time on internationalization or product diversification, as well as for industry specific effects (as industry is fixed per firm).
Subsequently, we employed a system of simultaneous equations taking into account reciprocal causal relationships (Zellner & Theil, 1962). The system employed the following structure:
Internationalization=f(diversification , diversification squared, control variables, year effects, firm effects) (1)
Product diversification =f(Internationalization, Internationalization squared, control variables, year effects, firm effects) (2)
Internationalization=f(related_subsidiaries, unrelated_subsidiariest, control variables, year effects, firm effects) (3)
Product diversification =f(region_subsidiariest, global_subsidiariest, control variables, year effects, firm effects) (4)
As specified in expressions (1) and (2) we used regular measures as well as
squared measures for product diversification and internationalization. Since we
considered the home-country). It should be noted, therefore, affiliates located in the UK are considered foreign regional affiliates of the company.
10
hypothesized a non-linear relationship between internationalization and product diversification, square terms should enable us to capture possible curvilinear effects (Geringer et al., 2000). In some of the regression models we replace these measures and their square values with measures for related and unrelated product diversification and regional and global internationalization, as specified in expressions (3) and (4). The reasoning here is that the related diversification and regional internationalization measures are proxies for relatively moderate levels of internationalization and product diversification (in which case correlation is expected to be positive) while unrelated diversification and global internationalization are proxies for relatively high levels of internationalization and product diversification (in which case correlation is expected to be negative).
The specific system of equations used to test the relationship between internationalization and product diversification was a within firm fixed effects Three-stage Least Squares (3SLS) regression analysis. This allowed us to avoid a possible bias as a result of correlation between the error term in one equation and the dependent variable in the other (Jaccard & Wan, 1996; Kmenta, 1986; Kumar, 2009). The system included the measures of internationalization and product diversification as dependent and independent variables which enabled us to capture the endogenous relationship in their respective change between different time periods and also included their square values in order to capture curvilinear effects in such changes. The within firm fixed effects models further enable us to control for year and firm (corporate) effects and hence compensate for possible firm specific biases stemming from the fact that we use multiple (up to three) observations per firm. Control and instrumental variables
The relationship between internationalization and product diversification was controlled by variables capturing managerial and financial resources (see Table 1 for a description):
------------------ Table 1
------------------ Ln_employees (LAN of the number of employees at the corporate level)
controlled for possible firm size effects8. This variable measures the company’s global number of employees (not its employees in the headquarters). A positive relationship was expected between a firm's size and its level of internationalization and product diversification (Aharoni, 1966; Chandler, 1990; Teece, 1982).
Leverage (measured as the ratio of liabilities to assets) controlled for possible financial leverage effects on internationalization and product diversification. We expected a positive effect of leverage on the ability of firms to combine of the two strategies as such leverage enables the use of external financial resources.
We further controlled for the impact of corporate level specific resources on internationalization and product diversification (Delios & Beamish, 1999; Silverman, 1999). For this purpose we used the percentage of different types of subsidiaries out of the total number of subsidiaries as our proxies for R&D and marketing competencies at the corporate level. The share of R&D subsidiaries (rd_subsidiaries) functioned as a proxy for corporate investments in knowledge creation activities and controlled for the possible effect of technological knowledge resources; the share of
8 An alternative measure of size, Ln_sales (Lan of total sales), was also used yielding similar results.
11
marketing subsidiaries (marketing_subsidiaries) out of the total number of subsidiaries was used as a proxy for corporate investments in marketing activities, and controlled for a possible effect of marketing resources9. We expected that higher values for rd_subsidiaries and marketing_subsidiaries would be positively correlated with the levels of internationalization and product diversification (Chatterjee & Wernerfelt, 1991; Silverman, 1999). EU, Japan and USA were dummy variables which were used to control for specific ‘country of origin’ effects10 such as institutional differences between the home regions of the corporate, domestic market size, regulatory regime and economic conditions (Delios & Henisz, 2003; Guillen, 2000; Khanna & Palepu, 2000; Luo, 2004; Rugman & Verbeke, 2004) which may affect internationalization and product diversification levels.
Finally, we included a different control variable in each equation in order to ensure adequate identification of our equation system. A necessary condition for obtaining meaningful parameter estimates in an equations system is that expression (1) includes at least one explanatory variable not included in expression (2) and vice versa11 (Kmenta, 1986). Such a measure is called "instrumental variable". When measuring internationalization and product diversification by means of the entropy measures (see models 1, 4, 5 and 8 in Table 4) we used home_subsidiaries, which measures the percentage of home country subsidiaries (as an instrumental variable for country_entropy) and core_sales which measures the percentage of food and beverage sales of each enterprise (as an instrumental variable for sector_entropy). These variables captured the size of the enterprise in its home market and its core sector and were expected to be negatively correlated with country_entropy and sector_entropy, respectively. For the count measures (see models 2, 3, 6 and 7 in Table 4) we used region_subsidiaries (percentage of foreign subsidiaries in the home region of the enterprise out of the total number of subsidiaries) and related_subsidiaries (percentage of foreign subsidiaries in the food and beverage industry out of the total number of subsidiaries) as different instrumental variables for internationalization and diversification, respectively. The first variable was expected to be negatively correlated with internationalization while the second one was expected to be negatively correlated with diversification.
A key issue when estimating systems of equations is the validity of instruments used. In our case all the available lags of exogenous variables in the system were used as potential instrumental variables. To further test the validity of our instrumental variables we followed Davidson and MacKinnon (1993, p.532) who have conducted a Hansen/Sargan (Sargan, 1988) test for over-identification of systems. Under the null hypothesis the instrumental variables used are the appropriate ones and are uncorrelated with the disturbances. In this paper, we reported the Hansen/Sargan test for each equation at the bottom of the respective tables (Hall & Peixe, 2003; Hall et al., 1996). An Akaike information criterion (Akaike, 1974) was used to evaluate the fit of the regression models12. The Akaike information criterion
9 Following Anastassopoulos & Rama (2005), R&D subsidiaries belong to the following industry classifications: 832020, 832021 and 832030. Marketing subsidiaries are those belonging to the 832011 classification. 10 Overall 93% of the firms in our sample originated from these three regions (30% from the US, 27% from Japan and 36% from the EU). 11 The same applies for expression (3) and (4). 12 This measure of fit reports the explanatory power of a model, where lower values of the Akaike information criterion indicate a better fit of the model.
12
complements the F-statistics which shows the overall explanatory power of the models.
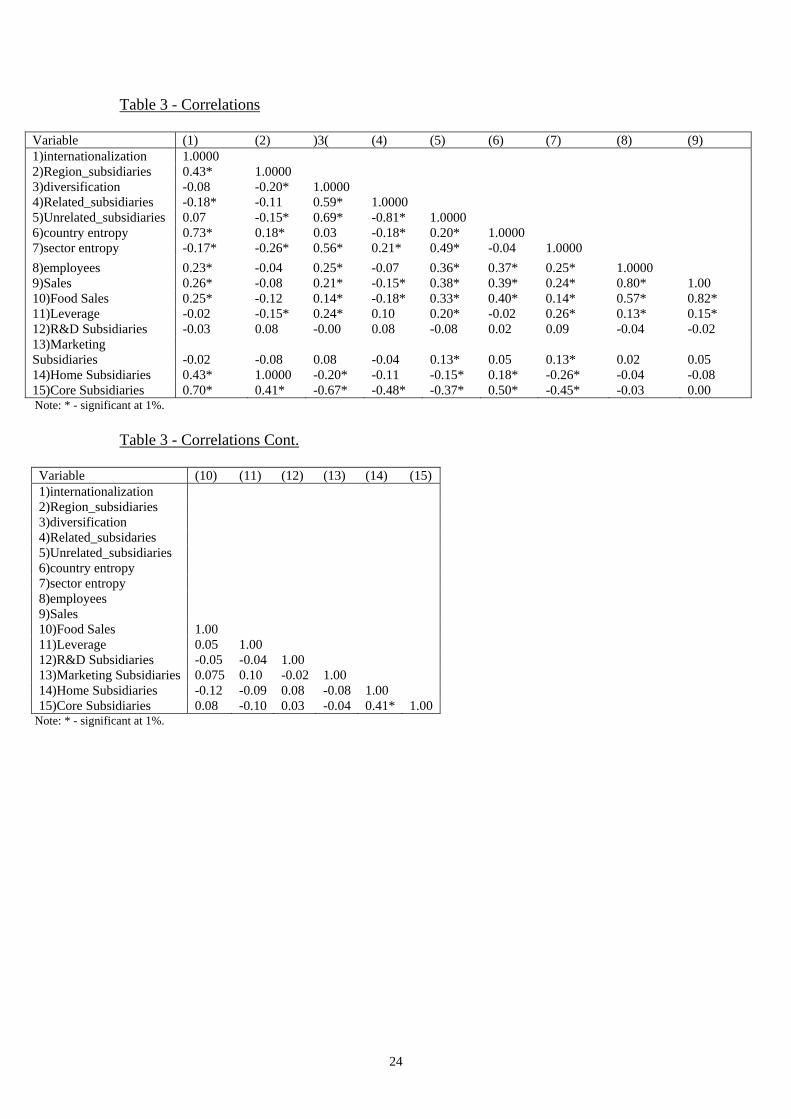
Descriptive statistics of all measures, depicting our sample characteristics, are presented in Table 2 which shows that the sample is dominated by relatively mature and large firms with sales close to US$7.5 billion and average number of employees approaching 34,000. A correlation table of the variables is also provided in Table 3. It is evident that the corporate size measures (sales and number of employees) are positively correlated. A positive correlation is also found between the percentage of food and beverage sales (out of total sales) and firm size. The table further indicates that the entropy and count measures for internationalization, product diversification and their combination are, respectively, positively correlated. Overall, the correlation table does not show any evidence of significant correlation between the variables used in the analysis.
------------------ Tables 2& 3 about here
------------------
RESULTS
We found no significant relationships between the different measures of internationalization and product diversification while using within firm fixed effects OLS regressions of the two strategies. However, the two strategies did show significant relationships when the within firm fixed effects system of equations was used, thus supporting the expectation that they are endogenous to each other. Results of the within firm fixed effects 3SLS regression analysis regarding the level of internationalization and product diversification are presented in Table 4.
------------------
Table 4 about here ------------------
Table 4 present several combinations of the explanatory variables in order to verify the robustness of our results. The table includes eight models with the count and entropy measures for internationalization and product diversification. In the first four models (model 1-4) the measures of product diversification serve as the dependent variables while in the next four models (models 5-8) the measures of internationalization serve as the dependent variables. Each system of equations is represented by the two models appearing in the same column (e.g. 1 and 5, 2 and 6 etc.).
Table 4 shows support for an inverted U-shaped relationship when product diversification is the dependent variable and internationalization serves as the independent one (models 1-4). Results show positive coefficients for the internationalization measures and negative coefficients for their squares (models 1 and 2). This result is further supported in models 3 and 4 where measures for regional and global diversification are used as the independent measures of internationalization. These models suggest that as long as firms internationalize in their home-region they also diversify their products (region_subsidiaries and regional_subsidiaries_entropy have a positive sign) and that internationalization beyond the home region reduces the level of product diversification
13
(global_subsidiaries and global_subsidiaries_entropy have a negative sign), thus supporting our hypothesis regarding non-linearity.
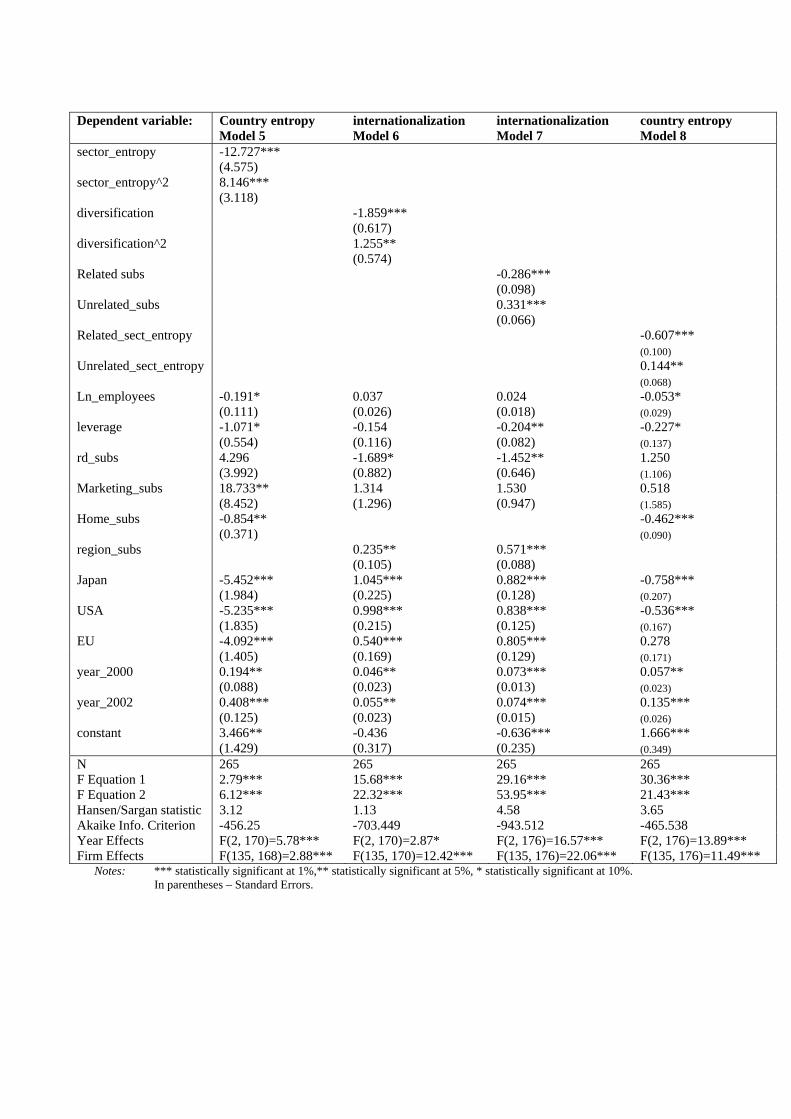
Table 4 further shows the existence of a U-shaped relationship between internationalization (as dependent variable) and product diversification. Results show negative coefficients for the product diversification measures and positive coefficients for their squares (models 5 and 6). This result is also supported in model 7 and 8 where proxies for related and unrelated diversification are used. The models imply that firms specializing in the production and sale of core-products (i.e. food and beverages) find it difficult to internationalize (see the negative signs of related_subsidiaries and related_sector_entropy) while there is a positive association between unrelated_subsidiaries as well as unrelated_sector_entropy and the level of internationalization.
Together these results indicate that the relationships between internationalization and product diversification are not only non-linear, as hypothesized, but also asymmetric. It is noteworthy that the revealed asymmetry in our results is feasible in econometric terms since, as noted above, our within firm fixed effects system of equations adds an additional explanatory variable (the instrumental variable) to either expression (1) or (2) that in not included in the other expression. This implies that the concerned relationships are not necessarily portrayed in identical landscapes. When the level of regional or home operations are used as identifying control variables (home_subsidiaries or region_subsidiaries) the inverted U-shaped between internationalization and product diversification is revealed. On the other hand when core or related operations (core_sales or related_subsidiaries) are used, the U-shaped relationship between product diversification and internationalization is revealed. We discuss the meaning of the inclusion of these identifying variables in the concluding section below.
The values of the F statistics are high and the Akaike Info Criteria are low, thus further supporting the significance of our results. Moreover, the inflection points in all models are within our sample range of internationalization and product diversification levels, hence also corroborating our findings. Finally, the Hansen/Sargan statistic verifies the null hypothesis of the test, i.e. that the instrumental variables used are valid and the model is not over-identified.
CONCLUDING REMARKS
The results of the analyses conducted in this paper shed a new light on results
presented in previous studies regarding the relationships between internationalization and product diversification as two important strategic decisions firms make (Aharoni, 1966). Building on the RBV reasoning and basing ourselves on contradictory findings in existing literature, we hypothesized an inverted U shaped relationship between the two endogenous strategies. Our results however, paint a more complex picture.
Our results show an inverted U-shaped relationship between product diversification and internationalization when the latter is the dependent variable (and the former the independent one) whereas a U-shaped relationship is found when internationalization is the dependent variable and product diversification is the independent one. The first relationship implies that moderate internationalization is likely to be associated with high levels of product diversification while the second implies that that non-diversified firms, as well as highly diversified ones are expected to be the most internationalized ones.
14
While the existence of a U shaped relationship (in addition to the inverted U shaped one) is feasible in econometric terms (as explained above) it is not easy to explain in theoretical terms. One compelling explanation to this finding might be the argument that either single business firms or firms with multiple unrelated businesses possess the managerial resources to internationalize their business units; however the complexity of managing multiple related businesses consumes a considerable amount of resources that prevent such firms from being also highly internationalized (Geringer et al., 2000; Jones & Hill, 1988).
On the other hand, the inverted U-shaped relationship implies that up to certain level, internationalization complements product diversification (e.g. due to synergy creation) but after a certain threshold it becomes a substitute (e.g. due to resource specificity and coordination complexities).
Essentially, the results may imply that food and beverage enterprises which are set to increase their internationalization behave differently than firms deciding to enlarge their product diversification. In the first case internationalization can be conceived as an "independent" variable affecting product diversification while in the second case product diversification is the "independent" variable affecting internationalization.
Our results may explain why a firm such as the Coca Cola Company, which was hardly diversified when it started to internationalize in the 1940s, has international sales contributing over 70% to its total sales volume13 but is still very focused on beverages in its product portfolio. The decision to internationalize when the firm was essentially a single business allowed the firm to continue with this strategy while it also started to diversify. However, at a certain point the firm narrowed its product range and continued internationalizing while maintaining a relatively limited level of product diversification. The results may also explain why Nestlé, which diversified beyond the food and beverage industry already in the 1970s, found it necessary in the 1980s and again in the 1990s to streamline its product portfolio and focus on water, pet food and ice cream in order to allow the firm to continue growing internationally14.
Similarly, our findings may predict that a firm like Strauss, which at first diversified its product line within its home country, and started internationalizing part of its product lines internationally within a few years after initial diversification, will at a certain point in the future need to consider the trade-off between diversification and internationalization. As our results imply, the resources required for coordinating multiple operations, conferred upon firms which become increasingly global in reach (Rugman & Verbeke, 2004; Rugman, 2005), may lead to reduction in ongoing product diversification as the firm decides to increase internationalization (Markides, 1995; Meyer, 2006).
In addition our results suggest that firms choosing to compete with related diversification of geographically bound products (i.e. products that differ substantially in their nature between different foreign regions due to sharply differing consumer tastes) are in need of many resources, which hampers internationalization. Increased diversification may impede the allocation of adequate resources that are required for
13 http://www.thecoca-colacompany.com/ourcompany/pdf/Company_Fact_Sheet.pdf. Accessed April, 24, 2010. 14 http://www.nestle.com/Resource.axd?Id=CA63136E-CAF5-484B-A97D-4543C6ACED65. Accessed April, 24, 2010.
15
internationalization of geographically bound products, hence leading to reduction in internationalization as product diversification increases.
In order to cope with this problem, enterprises may decide to focus on products that are likely to be less 'geographically bound', either by diversifying into more standardized product areas such as detergents, packing materials and so forth, or by creating global brands. In this case, internationalization becomes less resource consuming and allows firms to allocate their resources to manage multiple products and gain the organizational capacity to increase internationalization level, as is the case for Unilever for instance, which is actively strengthening its global brands both within and outside the food and beverage industry15.
It may further be that the different relationships that we observe are dependent upon the initial level of internationalization and product diversification of each firm. Thus, the findings of this study should be generalized with caution. For instance, smaller firms which are constrained by their size and by resources may face different obstacles when choosing to internationalize or to diversify than the firms analyzed in this paper. In addition there may be specific characteristics of the food and beverage industry (beyond the fact that it is considered relatively geographically bound) that may affect the amount of resources required for joint internationalization and product diversification. Nevertheless, if one accepts the notion that food and beverage firms are precursors to the internationalization and diversification patterns of other large firms producing geographically bound products, our findings might well serve as an indication that the nature of relationships between firms' level of internationalization and product diversification is complex and should be analyzed while taking into account the specific context in which it is conducted.
15 http://www.unilever.com/images/ir_ar08_annual-report_tcm13-163124.pdf. Accessed April, 24, 2010.
16
REFERENCES Aharoni, Y. (1966), The Foreign Investment Decision Process, Harvard University,
Graduate School of Business Administration, Division of Research. Akaike, H. (1974). A new look at the statistical model identification. IEEE Transactions on
Automatic Control, 19(6): 716–723. Allen, L., & Pantzalis C. (1996). Valuation of the Operating Flexibility of Multinational
Corporations. Journal of International Business Studies, 22(4): 633-653. Alfranca, O., Rama R., & von Tunzelmann N. (2001). A patent analysis of
global food and beverage firms: the persistence of innovation. Agribusiness, 18(3): 221-238.
Anastassopoulos, G., & Rama R. (2005). The performance of Multinational
Agribusiness: Effects of Product and Geographical Diversification. in Rama R. (Ed.), Multinational Agribusinesses, NY: Food Product Press.
Barkema, H.G., & Drogendijk, R. (2007). Internationalizing in small, incremental or larger
steps?' Journal of International Business Studies, 38(7): 1132-1148. Barney, J.B. 1991. Firms resources and sustained competitive advantage. Journal of
Management, 17: 99-120. Bartlett, C.A., & Ghoshal S. (1989). Managing Across Borders- The Transnational Solution.
Boston: Harvard Business School Press. Boyd, K.B., Gove S., & Hitt, M.A. (2005). Consequences of measurement problems in
strategic management research: the case of Amihud and Lev. Strategic Management Journal, 26: 367-375.
Carpenter, M.A, & Sanders, W.G. (2004). The effects of top management team pay and firm
internationalization on MNC performance. Journal of Management, 30: 509-519 Caves R.E., & Mehra S.K. (1986). Entry of foreign multinationals into U.S. manufacturing
industries. Pp. 449-481 in Porter M.E. (ed), Competition in Global Industries. Boston MA: Harvard Business School Press.
Chandler, A. (1990). Scale and Scope: The Dynamics of Industrial Capitalism. Boston:
Harvard University Press. Chatterjee, S., & Wernerfelt B. (1991). 'The link between resources and type of
diversification: Theory and evidence'. Strategic Management Journal, 12: 33-48. Collis D.J. 1991. A resource-based analysis of global competition: the case of the bearings
industry. Strategic Management Journal, 12: 49-68. Cuervo-Cazurra A., Maloney M.M., & Manrakhan S. (2007). Cause of the difficulties in
internationalization. Journal of International Business Studies 38: 709-725. Davidson, R., & J. G. MacKinnon (1993). Estimation and Inference in Econometrics. 2nd ed.
New York: Oxford University Press.
17
Davies, S.W., Rondi L., & Sembenelli A. (2001). Are multinationality and diversification
complementary or substitutive strategies? An empirical analysis on European leading firms. International Journal of Industrial Organization, 19: 1315-1346.
Delios, A., & Beamish P.W. (1999). Geographic scope, product diversification, and the
corporate performance of Japanese firms. Strategic Management Journal, 20: 711-727.
Delios, A., & Beamish P.W. (2005). Regional and Global Strategies of Japanese Firms.
Management International Review, 45(1): 19-36. Delios, A., & Henisz W.J. (2003). Policy uncertainty and the sequence of entry by Japanese
firms 1980-1998. Journal of International Business Studies, 34: 227-241. Ding, J.Y., & Caswell, J.A. (1995). Changes in diversification among very large food
manufacturing firms in the 1980s. Agribusiness, 11: 553-563. Filippaios F., & Rama R. (2008). Globalization or Regionalization? The strategies of the
world's largest food and beverages MNEs. European management Journal, 26: 59-72. Geringer, J.M., Tallman S., & Olsen D.M. (2000). Product and international diversification
among Japanese multinational firms. Strategic Management Journal, 21: 51-80. Gopinath, M., Pick, D., & Vasavada U. (1999). The economics of foreign direct investments
and trade with an application to the US food processing industry. American Journal of Agricultural Economics, 81: 442-452.
Guillen, M.F. (2000). Business groups in emerging economies: A resource based view. Academy of Management Journal, 43(3): 362-380.
Hall, A. R., & Peixe, F. P. M. (2003). A Consistent Method for the Selection of Relevant
Instruments. Econometric Reviews, 22(5): 269–287. Hall, A. R., G. D. Rudebusch, & Wilcox D. W. (1996). Judging instrument relevance in
instrumental variables estimation. International Economic Review, 37(2): 283–298. Hitt, M.A., Hoskisson R.E., & Ireland R.D. (1994). 'A mid-range theory of the interactive
effects of international and product diversification on innovation and Performance'. Journal of Management, 20(2), 297-326.
Hitt, M.A., Hoskisson R.E., & Kim H. (1997). International diversification, effects on
innovation and firm performance in product-diversified firms. Academy of Management Journal, 40: 767-798.
Institut Mediterraneen de Montpellier (I.A.M.M) (1990). Les 100 premiers groupes agro-
alimentaires mondiaux. Montpellier, France. Jaccard, J. & Wan CK. (1996). LISREL approaches to interaction effects in multiple
regression. Thousand Oaks, CA: Sage. Jones G.R. & Hill, C.W.L. (1988). Transaction Cost Analysis of Strategy-Structure Choice.
Strategic Management Journal, 9: 159-172.
18
Khanna, T. & Palepu K. (2000). The future of business groups in emerging markets: long run evidence from Chile. Academy of Management Journal, 43(3): 268-285.
Kim, W.C., Hwang P. & Burgers W.P. (1989). Global diversification strategy and corporate
profit performance. Strategic Management Journal, 10(1): 45-58. Kim, W.C., Hwang P. & Burgers W.P. (1993). Multinationals' Diversification and the Risk-
Return Trade-Off. Strategic Management Journal, 14(4): 275-286. Kmenta, J. (1986). Elements of Econometrics, 2nd Edition, New York: Maxwell Macmillan
International Editors. Kumar, S.M.V. (2009). The Relationship between product and geographic diversification:
The effects of short-run constraints and endogeneity. Strategic Management Journal, 30(1): 99-116.
Lu, J.W. & Beamish P.W. (2004). International diversification an firm performance: the S-
curve hypothesis. Academy of Management Journal, 47(4): 598-609. Luo, Y. (2004). Building a Strong Foothold in an Emerging Market: A Link Between
Resource Commitment and Environment Conditions. Journal of Management Studies, 41(5): 749-771.
Markides C.C. (1995). Diversification, Restructuring and Economic Performance. Strategic
Management Journal, 16(2): 101-118. Meyer, K.E. (2006). Globalfocusing: from domestic conglomerates to global specialists.
Journal of Management Studies, 43(5): 1109-1144. Montgomery C.A., & Wernerfelt, B. (1988). Diversification, Ricardian rents, and Tobin's q.
Rand Journal of Economics, 19: 623-632. Padilla, M., Laval G.G., Allaya M-C. & Allaya M. (1983). Les cent premiers groupes Agro-
Industriels Mondiaux, Montpellier, France. Palich, L.E., Carini, G.R. & Seaman S.L. (2000). The impact of internationalization on the
diversification-performance relationship: a replication and extension of prior research. Journal of Business Research, 48: 43-54.
Palpacuer, F., & Tozanli, S. (2008). Changing governance patterns in European food chains:
the rise of a new divide between global players and regional producers. Transnational Corporations, 17(1), 69-100.
Panzar, J.C. & Willig, R.D. Economies of scope. American Economic Review, 71: 268-272. Pearce, R.D. (1993). The Growth and Evolution of Multinational Enterprise. Patterns of
Geographical and Industrial Diversification, Aldershot: Edward Elgar. Penrose, E.T. (1959). The Theory of the Growth of the Firm. New York: John Wiley. Peteraf, M. 1993. The cornerstones of competitive advantage: a resource-based view.
Strategic Management Journal, 14(3): 179-191.
19
Raghunathan, S.R. (1995). A refinement of the entropy measure of firm diversification: toward definitional and computational accuracy. Journal of Management, 21(5): 989-1002.
Rastoin, J.L., Ghersi G., Pérez R. & Tozanli S. (1998). Structures, performances et stratégies
des groupes agro-alimentaires multinationaux. Montpellier, France: AGRODATA. Robins, J.A. & Wiersema, M. (2003). The measurement of corporate portfolio strategy:
analysis of the content validity of related diversification indexes. Strategic Management Journal, 24(1): 39-59.
Rugman, A. (2005). The Regional Multinationals: MNEs and “global” Strategic
Management. Cambridge: Cambridge University Press. Rugman, A. &Verbeke, A. (2004). A perspective on regional and global strategies of
multinational enterprises. Journal of International Business Studies, 35: 3-18. Rumelt, R.P. (1974). Strategy, Structure, and Economic Performance. Cambridge, MA:
Harvard Business Review Press. Rumelt, R.P. (1982). Diversification strategy and profitability. Strategic Management
Journal, 3: 359-369. Sambharya, R.S. (2000). Assessing the construct validity of strategic and SIC-based measures
of corporate diversification. British Journal of Management, 11: 163-173. Sargan, J. (1988). Testing for misspecification after estimation using instrumental variables.
In Sargan, J. D. & Maasoumi, E. (Eds.) Contributions to Econometrics. vol. 1. Cambridge University Press.
Silverman, B.S. (1999). 'Technological resources and the direction of corporate
diversification: toward an integration of the resource-based view and transaction cost economics'. Management Science, 45(8): 1109-1124.
Simmonds, P.G. 1990. The combined diversification breadth and mode dimensions and the
performance of large diversified firms. Strategic Management Journal, 11: 399-410. Stopford, J.M. & Dunning J.H. (1983). Multinationals: Company performance and global
trends .London: McMillan Publishers. Sullivan, D. (1994). Measuring the degree of internationalization of a firm. Journal of
International Business Studies, 25(2): 325-342. Tallman S., Li J.T. 1996. The effects of international diversity and product diversity on the
performance of multinational firms. Academy of Management Journal, 39(1), 179-196.
Teece, D.J. (1982). Towards an economic theory of the multiproduct firm. Journal of
Economic Behavior and Organization, 3: 39-63. Tihanyi, L. Johnson, R.A., Hoskisson R.E. & Hitt, M.A. (2003). Institutional ownership
differences and international diversification: The effects of board of directors and technological opportunity. Academy of Management Journal, 46: 195-205.
20
Tozanli, S. (1998). Capital concentration among the food multinational enterprises and development of the world's agro-food system. International Journal of Technology management, 16: 695-710.
Varadarajan, P.R. & Ramanujam V. (1987). Diversification and performance: a
reexamination using a new two-dimensional conceptualization of diversity in firms. Academy of Management Journal, 30: 380-393.
Verlegh, P. W. J. (2007). Home country bias in product evaluation: the complementary roles
of economic and socio-psychological motives. Journal of International Business Studies, 38, 361-373.
Wernerfelt, B. (1984). A resource-based view of the firm. Strategic Management Journal, 5(2): 171-181.
Zellner, A. & Theil H. (1962). Three-stage least squares: Simultaneous estimation of simultaneous equations. Econometrica, 30: 54-78.
21
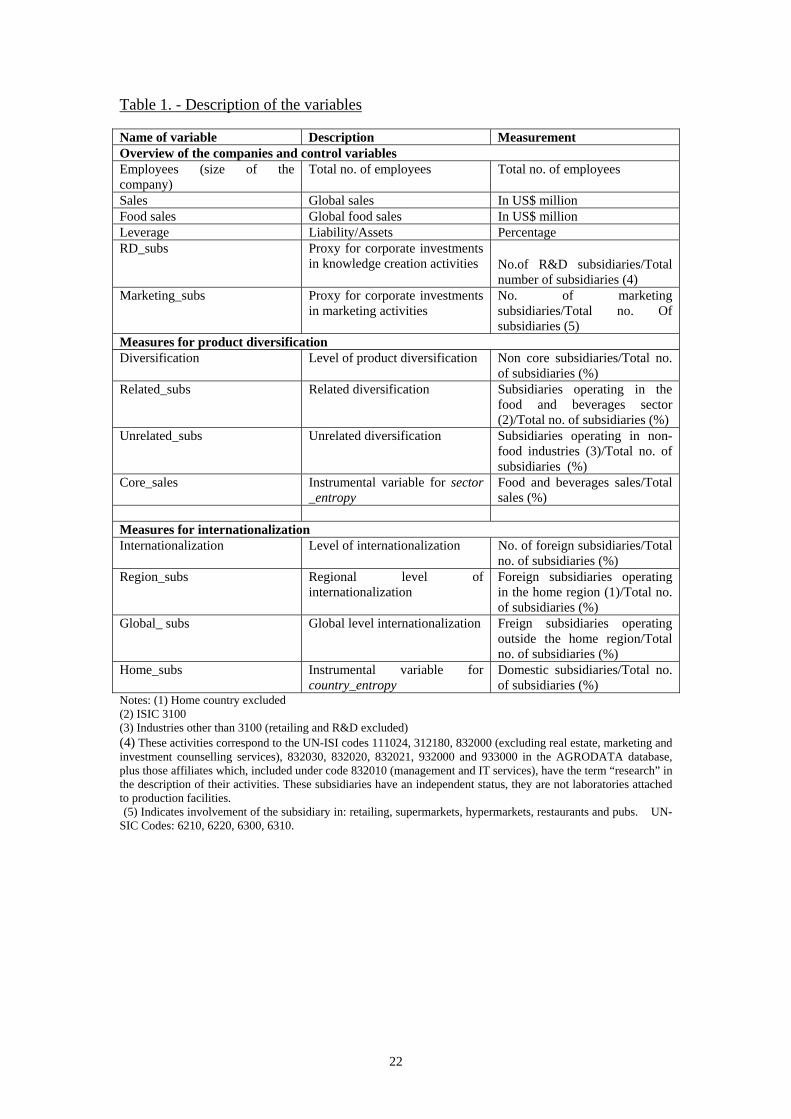
Table 1. - Description of the variables Name of variable Description Measurement Overview of the companies and control variables Employees (size of the company)
Total no. of employees Total no. of employees
Sales Global sales In US$ million Food sales Global food sales In US$ million Leverage Liability/Assets Percentage RD_subs Proxy for corporate investments
in knowledge creation activities No.of R&D subsidiaries/Total number of subsidiaries (4)
Marketing_subs Proxy for corporate investments in marketing activities
No. of marketing subsidiaries/Total no. Of subsidiaries (5)
Measures for product diversification Diversification Level of product diversification Non core subsidiaries/Total no.
of subsidiaries (%) Related_subs Related diversification Subsidiaries operating in the
food and beverages sector (2)/Total no. of subsidiaries (%)
Unrelated_subs Unrelated diversification Subsidiaries operating in non-food industries (3)/Total no. of subsidiaries (%)
Core_sales Instrumental variable for sector _entropy
Food and beverages sales/Total sales (%)
Measures for internationalization Internationalization Level of internationalization No. of foreign subsidiaries/Total
no. of subsidiaries (%) Region_subs Regional level of
internationalization Foreign subsidiaries operating in the home region (1)/Total no. of subsidiaries (%)
Global_ subs Global level internationalization Freign subsidiaries operating outside the home region/Total no. of subsidiaries (%)
Home_subs Instrumental variable for country_entropy
Domestic subsidiaries/Total no. of subsidiaries (%)
Notes: (1) Home country excluded (2) ISIC 3100 (3) Industries other than 3100 (retailing and R&D excluded) (4) These activities correspond to the UN-ISI codes 111024, 312180, 832000 (excluding real estate, marketing and investment counselling services), 832030, 832020, 832021, 932000 and 933000 in the AGRODATA database, plus those affiliates which, included under code 832010 (management and IT services), have the term “research” in the description of their activities. These subsidiaries have an independent status, they are not laboratories attached to production facilities. (5) Indicates involvement of the subsidiary in: retailing, supermarkets, hypermarkets, restaurants and pubs. UN-SIC Codes: 6210, 6220, 6300, 6310.
22
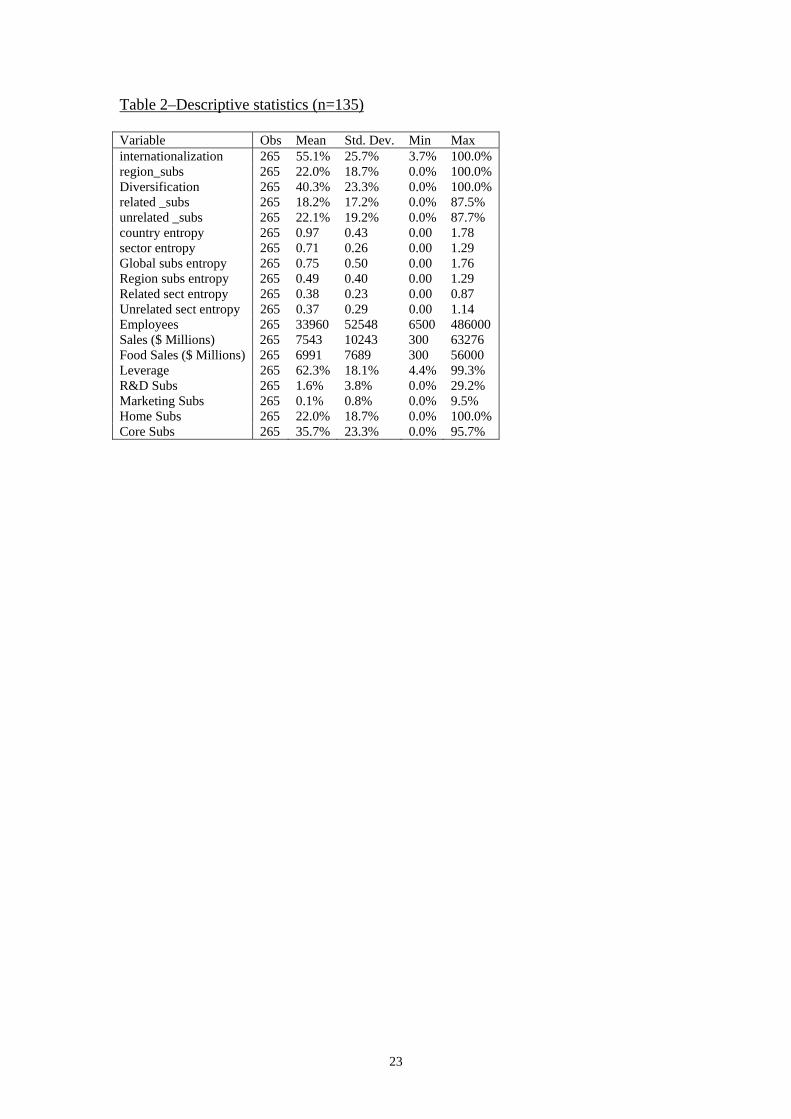
Table 2–Descriptive statistics (n=135) Variable Obs Mean Std. Dev. Min Max internationalization 265 55.1% 25.7% 3.7% 100.0% region_subs 265 22.0% 18.7% 0.0% 100.0% Diversification 265 40.3% 23.3% 0.0% 100.0% related _subs 265 18.2% 17.2% 0.0% 87.5% unrelated _subs 265 22.1% 19.2% 0.0% 87.7% country entropy 265 0.97 0.43 0.00 1.78 sector entropy 265 0.71 0.26 0.00 1.29 Global subs entropy 265 0.75 0.50 0.00 1.76 Region subs entropy 265 0.49 0.40 0.00 1.29 Related sect entropy 265 0.38 0.23 0.00 0.87 Unrelated sect entropy 265 0.37 0.29 0.00 1.14 Employees 265 33960 52548 6500 486000 Sales ($ Millions) 265 7543 10243 300 63276 Food Sales ($ Millions) 265 6991 7689 300 56000 Leverage 265 62.3% 18.1% 4.4% 99.3% R&D Subs 265 1.6% 3.8% 0.0% 29.2% Marketing Subs 265 0.1% 0.8% 0.0% 9.5% Home Subs 265 22.0% 18.7% 0.0% 100.0% Core Subs 265 35.7% 23.3% 0.0% 95.7%
23
24
Table 3 - Correlations
Variable (1) (2) )3( (4) (5) (6) (7) (8) (9) 1)internationalization 1.0000 2)Region_subsidiaries 0.43* 1.0000 3)diversification -0.08 -0.20* 1.0000 4)Related_subsidiaries -0.18* -0.11 0.59* 1.0000 5)Unrelated_subsidiaries 0.07 -0.15* 0.69* -0.81* 1.0000 6)country entropy 0.73* 0.18* 0.03 -0.18* 0.20* 1.0000 7)sector entropy -0.17* -0.26* 0.56* 0.21* 0.49* -0.04 1.0000 8)employees 0.23* -0.04 0.25* -0.07 0.36* 0.37* 0.25* 1.0000 9)Sales 0.26* -0.08 0.21* -0.15* 0.38* 0.39* 0.24* 0.80* 1.00 10)Food Sales 0.25* -0.12 0.14* -0.18* 0.33* 0.40* 0.14* 0.57* 0.82* 11)Leverage -0.02 -0.15* 0.24* 0.10 0.20* -0.02 0.26* 0.13* 0.15* 12)R&D Subsidiaries -0.03 0.08 -0.00 0.08 -0.08 0.02 0.09 -0.04 -0.02 13)Marketing Subsidiaries -0.02 -0.08 0.08 -0.04 0.13* 0.05 0.13* 0.02 0.05 14)Home Subsidiaries 0.43* 1.0000 -0.20* -0.11 -0.15* 0.18* -0.26* -0.04 -0.08 15)Core Subsidiaries 0.70* 0.41* -0.67* -0.48* -0.37* 0.50* -0.45* -0.03 0.00 Note: * - significant at 1%.
Table 3 - Correlations Cont.
Variable (10) (11) (12) (13) (14) (15)1)internationalization 2)Region_subsidiaries 3)diversification 4)Related_subsidaries 5)Unrelated_subsidiaries 6)country entropy 7)sector entropy 8)employees 9)Sales 10)Food Sales 1.00 11)Leverage 0.05 1.00 12)R&D Subsidiaries -0.05 -0.04 1.00 13)Marketing Subsidiaries 0.075 0.10 -0.02 1.00 14)Home Subsidiaries -0.12 -0.09 0.08 -0.08 1.00 15)Core Subsidiaries 0.08 -0.10 0.03 -0.04 0.41* 1.00
Note: * - significant at 1%.
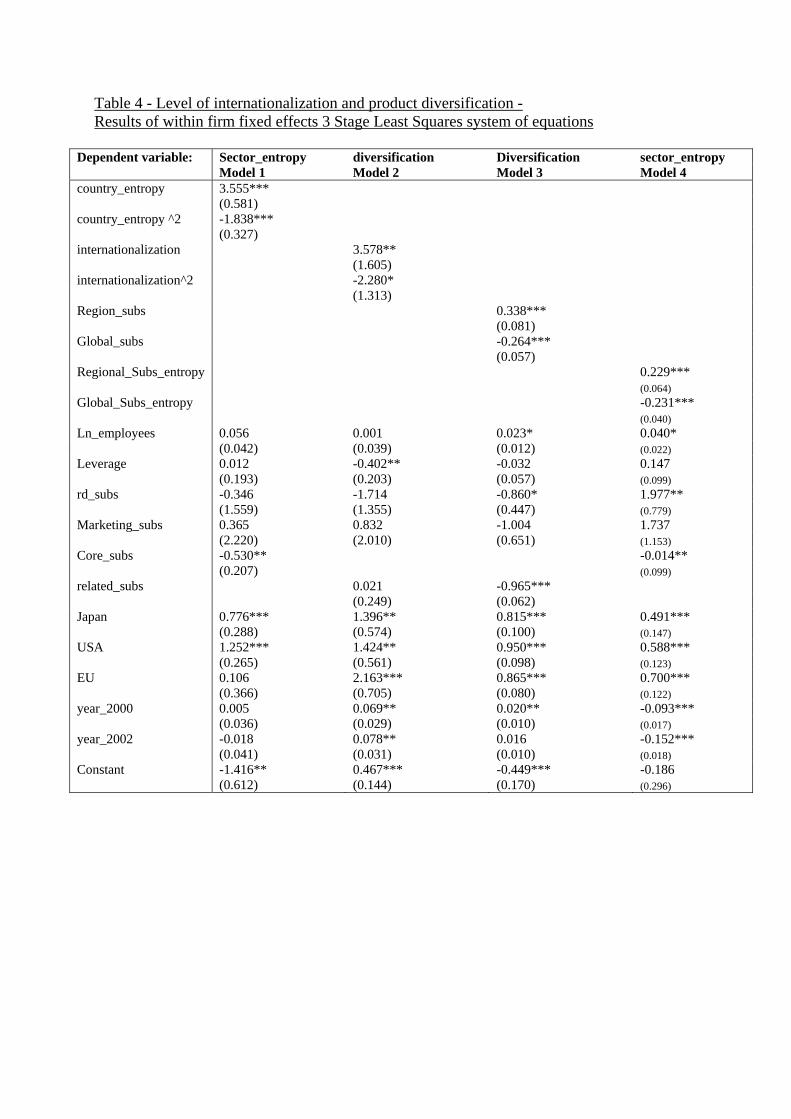
Table 4 - Level of internationalization and product diversification - Results of within firm fixed effects 3 Stage Least Squares system of equations
Dependent variable: Sector_entropy diversification Diversification sector_entropy Model 1 Model 2 Model 3 Model 4 country_entropy 3.555*** (0.581) country_entropy ^2 -1.838*** (0.327) internationalization 3.578** (1.605) internationalization^2 -2.280* (1.313) Region_subs 0.338*** (0.081) Global_subs -0.264*** (0.057) Regional_Subs_entropy 0.229*** (0.064) Global_Subs_entropy -0.231*** (0.040) Ln_employees 0.056 0.001 0.023* 0.040* (0.042) (0.039) (0.012) (0.022) Leverage 0.012 -0.402** -0.032 0.147 (0.193) (0.203) (0.057) (0.099) rd_subs -0.346 -1.714 -0.860* 1.977** (1.559) (1.355) (0.447) (0.779) Marketing_subs 0.365 0.832 -1.004 1.737 (2.220) (2.010) (0.651) (1.153) Core_subs -0.530** -0.014** (0.207) (0.099) related_subs 0.021 -0.965*** (0.249) (0.062) Japan 0.776*** 1.396** 0.815*** 0.491*** (0.288) (0.574) (0.100) (0.147) USA 1.252*** 1.424** 0.950*** 0.588*** (0.265) (0.561) (0.098) (0.123) EU 0.106 2.163*** 0.865*** 0.700*** (0.366) (0.705) (0.080) (0.122) year_2000 0.005 0.069** 0.020** -0.093*** (0.036) (0.029) (0.010) (0.017) year_2002 -0.018 0.078** 0.016 -0.152*** (0.041) (0.031) (0.010) (0.018) Constant -1.416** 0.467*** -0.449*** -0.186 (0.612) (0.144) (0.170) (0.296)
Dependent variable: Country entropy internationalization internationalization country entropy Model 5 Model 6 Model 7 Model 8 sector_entropy -12.727*** (4.575) sector_entropy^2 8.146*** (3.118) diversification -1.859*** (0.617) diversification^2 1.255** (0.574) Related subs -0.286*** (0.098) Unrelated_subs 0.331*** (0.066) Related_sect_entropy -0.607*** (0.100) Unrelated_sect_entropy 0.144** (0.068) Ln_employees -0.191* 0.037 0.024 -0.053* (0.111) (0.026) (0.018) (0.029) leverage -1.071* -0.154 -0.204** -0.227* (0.554) (0.116) (0.082) (0.137) rd_subs 4.296 -1.689* -1.452** 1.250 (3.992) (0.882) (0.646) (1.106) Marketing_subs 18.733** 1.314 1.530 0.518 (8.452) (1.296) (0.947) (1.585) Home_subs -0.854** -0.462*** (0.371) (0.090) region_subs 0.235** 0.571*** (0.105) (0.088) Japan -5.452*** 1.045*** 0.882*** -0.758*** (1.984) (0.225) (0.128) (0.207) USA -5.235*** 0.998*** 0.838*** -0.536*** (1.835) (0.215) (0.125) (0.167) EU -4.092*** 0.540*** 0.805*** 0.278 (1.405) (0.169) (0.129) (0.171) year_2000 0.194** 0.046** 0.073*** 0.057** (0.088) (0.023) (0.013) (0.023) year_2002 0.408*** 0.055** 0.074*** 0.135*** (0.125) (0.023) (0.015) (0.026) constant 3.466** -0.436 -0.636*** 1.666*** (1.429) (0.317) (0.235) (0.349) N 265 265 265 265 F Equation 1 2.79*** 15.68*** 29.16*** 30.36*** F Equation 2 6.12*** 22.32*** 53.95*** 21.43*** Hansen/Sargan statistic 3.12 1.13 4.58 3.65 Akaike Info. Criterion -456.25 -703.449 -943.512 -465.538 Year Effects F(2, 170)=5.78*** F(2, 170)=2.87* F(2, 176)=16.57*** F(2, 176)=13.89*** Firm Effects F(135, 168)=2.88*** F(135, 170)=12.42*** F(135, 176)=22.06*** F(135, 176)=11.49***
Notes: *** statistically significant at 1%,** statistically significant at 5%, * statistically significant at 10%. In parentheses – Standard Errors.