analysis of liquid-flooded expansion using a scroll expander
TRANSCRIPT
Purdue UniversityPurdue e-Pubs
International Compressor Engineering Conference School of Mechanical Engineering
2008
Analysis of Liquid-Flooded Expansion Using aScroll ExpanderVincent LemortUniversity of Liege
Ian BellPurdue University
Eckhard A. GrollPurdue University
Jim BraunPurdue University
Follow this and additional works at: http://docs.lib.purdue.edu/icec
This document has been made available through Purdue e-Pubs, a service of the Purdue University Libraries. Please contact [email protected] foradditional information.Complete proceedings may be acquired in print and on CD-ROM directly from the Ray W. Herrick Laboratories at https://engineering.purdue.edu/Herrick/Events/orderlit.html
Lemort, Vincent; Bell, Ian; Groll, Eckhard A.; and Braun, Jim, "Analysis of Liquid-Flooded Expansion Using a Scroll Expander"(2008). International Compressor Engineering Conference. Paper 1874.http://docs.lib.purdue.edu/icec/1874
1323, Page 1
International Compressor Engineering Conference at Purdue, July 14-17, 2008
Analysis of liquid-flooded expansion using a scroll expander
Vincent LEMORT1*, Ian BELL2, Eckhard GROLL3, Jim BRAUN4
1University of Liège, Aerospace and Mechanical Engineering, Liège, Belgium, [email protected]
2Purdue University, Mechanical Engineering, West Lafayette, IN, USA, [email protected] 3Purdue University, Mechanical Engineering, West Lafayette, IN, USA, [email protected]
4Purdue University, Mechanical Engineering, West Lafayette, IN, USA, [email protected]
* Corresponding Author
ABSTRACT This paper presents the development and the experimental validation of a model of a scroll expander integrated into a Liquid Flooded Ericsson Cooler (LFEC) as proposed by Hugenroth (2007). This system uses liquid flooding of the compressor and the expander to approach isothermal compression and expansion processes. A detailed model of the flooded scroll expander has been constructed which allows prediction of its performance over a wide range of operating conditions. This model is validated with experimental data collected on a prototype of a Liquid Flooded Ericsson Cooler. A parametric study is finally conducted for investigating the performances of the expander under different design changes, such as the shape of the tip of the scroll and the leakage gap size.
1. INTRODUCTION The purpose of the present work is to develop and validate a comprehensive model of a scroll expander integrated into a Liquid Flooded Ericsson Cooler (LFEC). This system uses liquid flooding of the compressor and the expander to approach isothermal compression and expansion processes. The model must be detailed enough to investigate the performances of the expander under different operating conditions and design changes and to point out the losses that occur in flooded expansion.
2. MODEL The development of this model is done in two steps. First, a model describing the geometry of the expander is built. This model determines the evolution of the volumes (and their derivatives) and the internal leakage paths with the crank angle. Results generated by the geometric model are then used in the expansion process model. This model describes the evolution of the temperature and the pressure in all the chambers of the expander with the crank angle. The primary equations governing the modeling of the flooded scroll compressor and expander are given by Bell et al. (2008). This paper focuses on the modeling features specific to the expander. The different working chambers are shown in Figure 1. At the beginning of the suction process, the suction chamber is chamber 6. The volume of this chamber increases with increasing the orbiting angle, up to a point where the gap area A12 between the chamber in communication with the suction port (chamber 1) and chamber 2 (or 3) is small enough to create a pressure differential between these chambers. In order to avoid any numerical instability, chamber 6 is arbitrarily divided into chamber 1, chamber 2 and chamber 3, when the gap area is equal to half of the suction port area. From this time, evolution of the pressure and the temperature in the three chambers are described independently. One can expect a large radial leakage flow between chamber 1 and chambers 2 and 3 due to the fact that the tip seal doesn’t extend to the end of the scrolls. This will attenuate the suction pressure drop. As the suction process proceeds, the volume of chamber 1 still increases to finally reach, at = 2 rad, the initial volume of the suction chamber (volume of chamber 6 at = 0 rad). The pressure and the temperature of the fluid in chamber 1 at the end of the suction process must be equal to the pressure and temperature in the chamber 6 at the beginning of the suction process. At exactly = 2 rad, chambers 2 and 3 cease to be in communication with chamber 1 and the expansion process starts.
1323, Page 2
International Compressor Engineering Conference at Purdue, July 14-17, 2008
Figure 1: Definition of various expander chambers at the end of the suction process (at position /2 = 0.9)
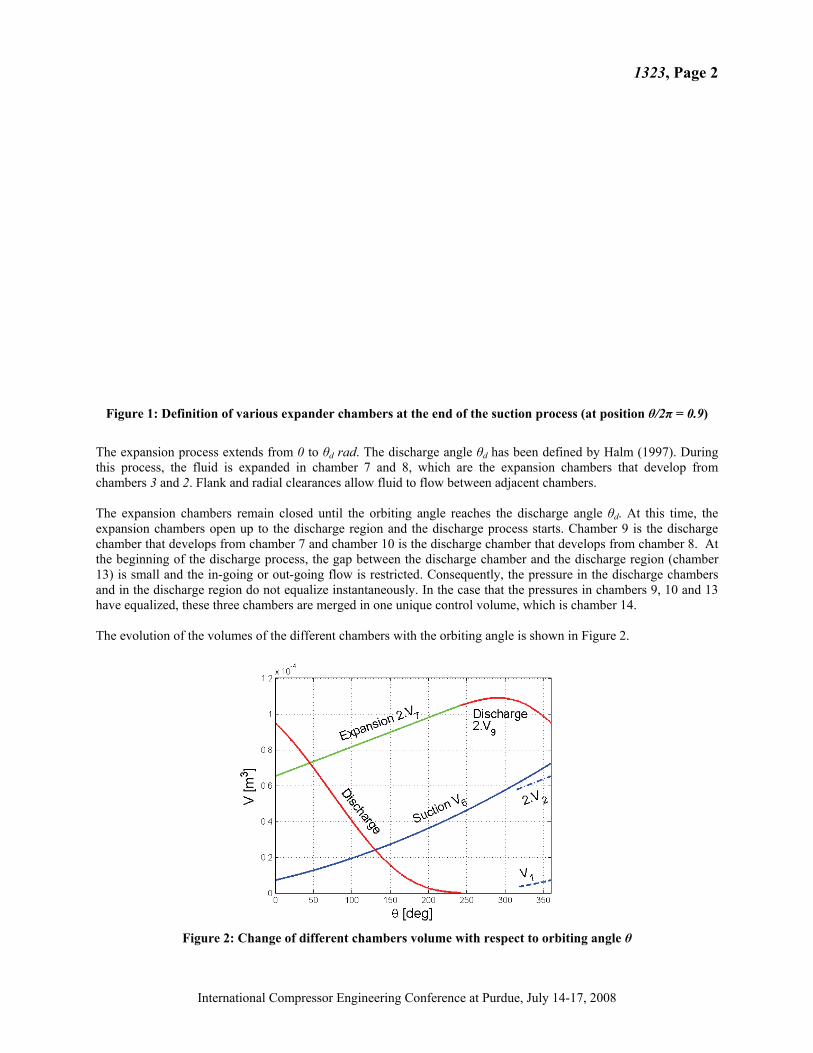
The expansion process extends from 0 to d rad. The discharge angle d has been defined by Halm (1997). During this process, the fluid is expanded in chamber 7 and 8, which are the expansion chambers that develop from chambers 3 and 2. Flank and radial clearances allow fluid to flow between adjacent chambers. The expansion chambers remain closed until the orbiting angle reaches the discharge angle d. At this time, the expansion chambers open up to the discharge region and the discharge process starts. Chamber 9 is the discharge chamber that develops from chamber 7 and chamber 10 is the discharge chamber that develops from chamber 8. At the beginning of the discharge process, the gap between the discharge chamber and the discharge region (chamber 13) is small and the in-going or out-going flow is restricted. Consequently, the pressure in the discharge chambers and in the discharge region do not equalize instantaneously. In the case that the pressures in chambers 9, 10 and 13 have equalized, these three chambers are merged in one unique control volume, which is chamber 14. The evolution of the volumes of the different chambers with the orbiting angle is shown in Figure 2.
Figure 2: Change of different chambers volume with respect to orbiting angle
1323, Page 3
International Compressor Engineering Conference at Purdue, July 14-17, 2008
3. VALIDATION
3.1. Experimental investigation An initial experimental data set comprising 27 tests is obtained. For the expander, these tests differ from each other by the expander speed (865, 1155 and 1751 rpm), the hydraulic pump speed (60, 120 and 240 rpm, leading to different oil flow rates through the expander) and the levels of pressure in the test rig (3 levels). Results related to additional tests are also reported in this paper.
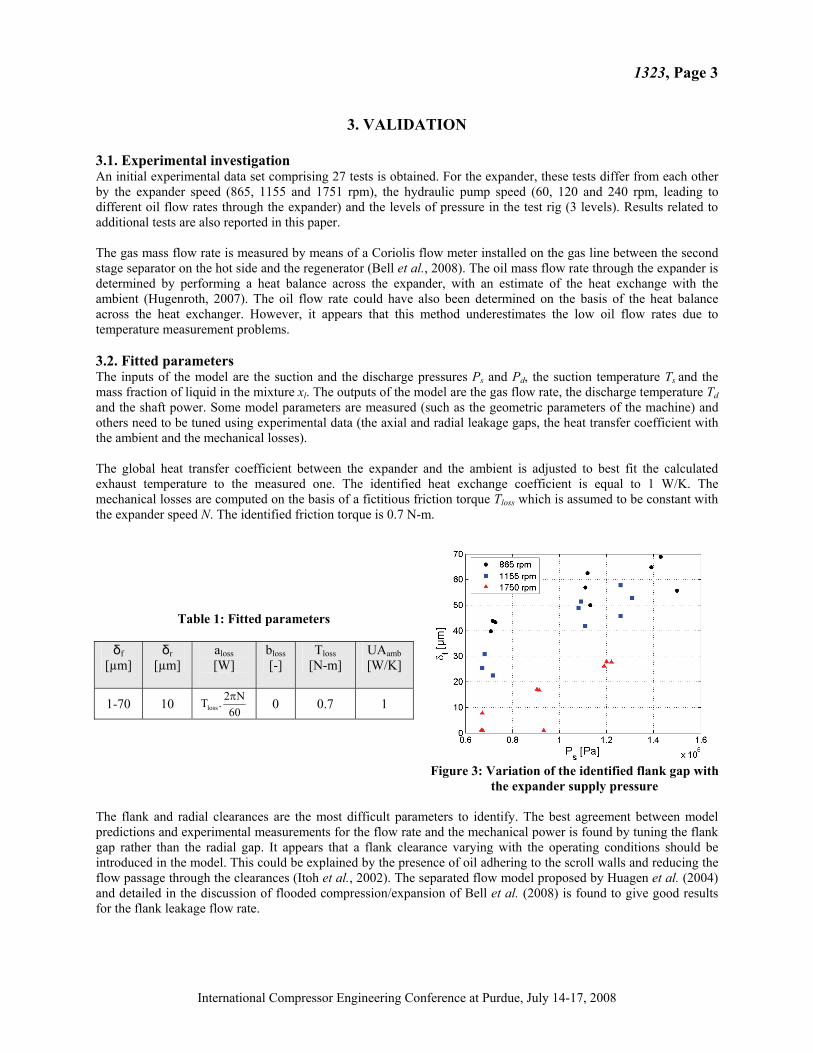
The gas mass flow rate is measured by means of a Coriolis flow meter installed on the gas line between the second stage separator on the hot side and the regenerator (Bell et al., 2008). The oil mass flow rate through the expander is determined by performing a heat balance across the expander, with an estimate of the heat exchange with the ambient (Hugenroth, 2007). The oil flow rate could have also been determined on the basis of the heat balance across the heat exchanger. However, it appears that this method underestimates the low oil flow rates due to temperature measurement problems. 3.2. Fitted parameters The inputs of the model are the suction and the discharge pressures Ps and Pd, the suction temperature Ts and the mass fraction of liquid in the mixture xl. The outputs of the model are the gas flow rate, the discharge temperature Td and the shaft power. Some model parameters are measured (such as the geometric parameters of the machine) and others need to be tuned using experimental data (the axial and radial leakage gaps, the heat transfer coefficient with the ambient and the mechanical losses). The global heat transfer coefficient between the expander and the ambient is adjusted to best fit the calculated exhaust temperature to the measured one. The identified heat exchange coefficient is equal to 1 W/K. The mechanical losses are computed on the basis of a fictitious friction torque Tloss which is assumed to be constant with the expander speed N. The identified friction torque is 0.7 N-m.
Table 1: Fitted parameters
f [μm]
r [μm]
aloss [W]
bloss [-]
Tloss [N-m]
UAamb [W/K]
1-70 10 60
N2.Tloss 0 0.7 1
Figure 3: Variation of the identified flank gap with the expander supply pressure
The flank and radial clearances are the most difficult parameters to identify. The best agreement between model predictions and experimental measurements for the flow rate and the mechanical power is found by tuning the flank gap rather than the radial gap. It appears that a flank clearance varying with the operating conditions should be introduced in the model. This could be explained by the presence of oil adhering to the scroll walls and reducing the flow passage through the clearances (Itoh et al., 2002). The separated flow model proposed by Huagen et al. (2004) and detailed in the discussion of flooded compression/expansion of Bell et al. (2008) is found to give good results for the flank leakage flow rate.
1323, Page 4
International Compressor Engineering Conference at Purdue, July 14-17, 2008
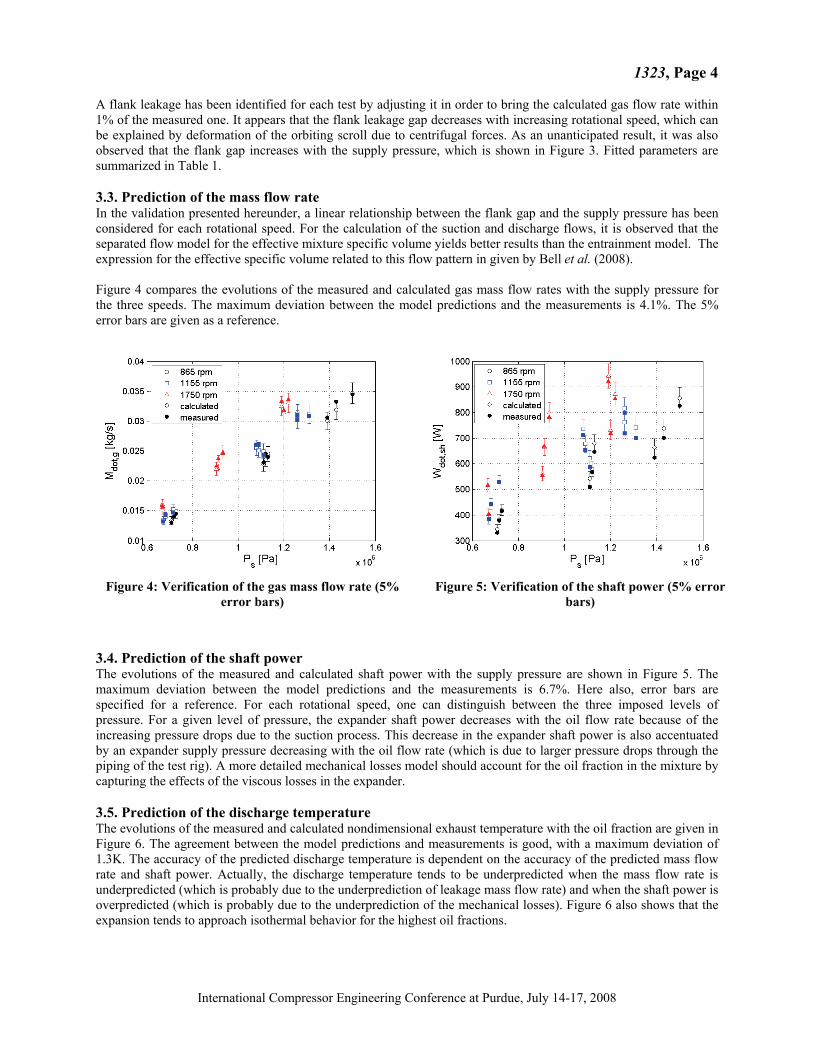
A flank leakage has been identified for each test by adjusting it in order to bring the calculated gas flow rate within 1% of the measured one. It appears that the flank leakage gap decreases with increasing rotational speed, which can be explained by deformation of the orbiting scroll due to centrifugal forces. As an unanticipated result, it was also observed that the flank gap increases with the supply pressure, which is shown in Figure 3. Fitted parameters are summarized in Table 1. 3.3. Prediction of the mass flow rate In the validation presented hereunder, a linear relationship between the flank gap and the supply pressure has been considered for each rotational speed. For the calculation of the suction and discharge flows, it is observed that the separated flow model for the effective mixture specific volume yields better results than the entrainment model. The expression for the effective specific volume related to this flow pattern in given by Bell et al. (2008).
Figure 4 compares the evolutions of the measured and calculated gas mass flow rates with the supply pressure for the three speeds. The maximum deviation between the model predictions and the measurements is 4.1%. The 5% error bars are given as a reference.
Figure 4: Verification of the gas mass flow rate (5%
error bars)
Figure 5: Verification of the shaft power (5% error
bars)
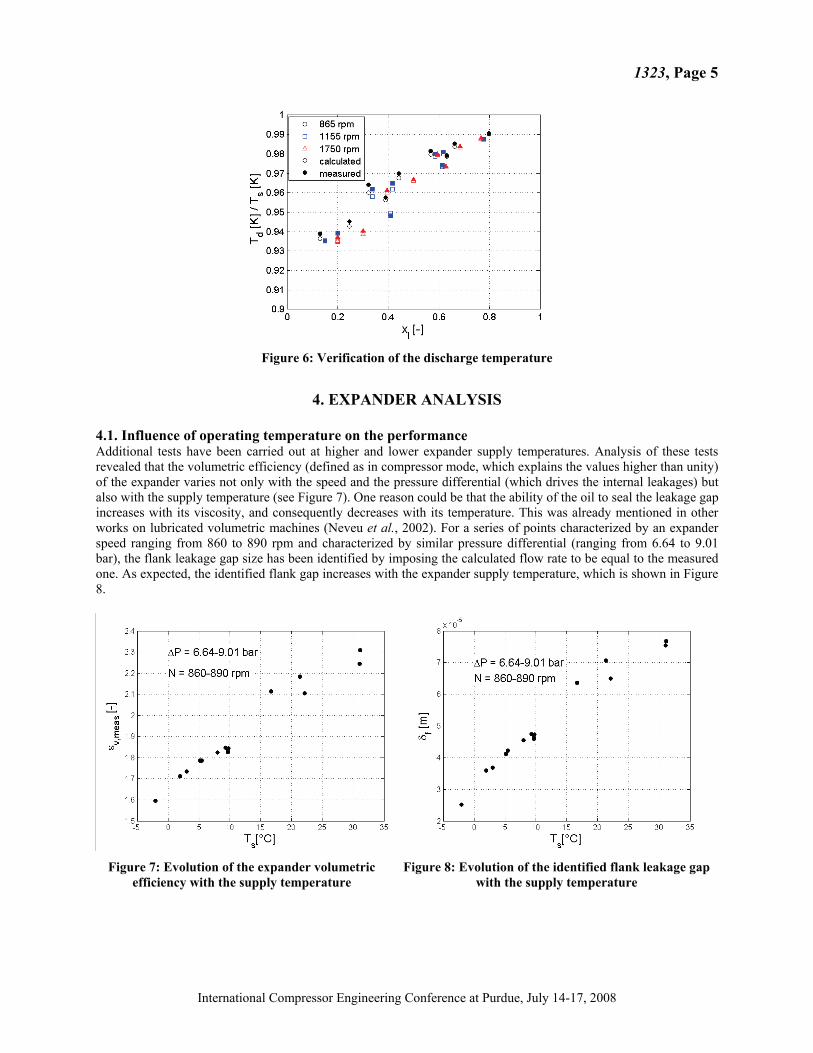
3.4. Prediction of the shaft power The evolutions of the measured and calculated shaft power with the supply pressure are shown in Figure 5. The maximum deviation between the model predictions and the measurements is 6.7%. Here also, error bars are specified for a reference. For each rotational speed, one can distinguish between the three imposed levels of pressure. For a given level of pressure, the expander shaft power decreases with the oil flow rate because of the increasing pressure drops due to the suction process. This decrease in the expander shaft power is also accentuated by an expander supply pressure decreasing with the oil flow rate (which is due to larger pressure drops through the piping of the test rig). A more detailed mechanical losses model should account for the oil fraction in the mixture by capturing the effects of the viscous losses in the expander. 3.5. Prediction of the discharge temperature The evolutions of the measured and calculated nondimensional exhaust temperature with the oil fraction are given in Figure 6. The agreement between the model predictions and measurements is good, with a maximum deviation of 1.3K. The accuracy of the predicted discharge temperature is dependent on the accuracy of the predicted mass flow rate and shaft power. Actually, the discharge temperature tends to be underpredicted when the mass flow rate is underpredicted (which is probably due to the underprediction of leakage mass flow rate) and when the shaft power is overpredicted (which is probably due to the underprediction of the mechanical losses). Figure 6 also shows that the expansion tends to approach isothermal behavior for the highest oil fractions.
1323, Page 5
International Compressor Engineering Conference at Purdue, July 14-17, 2008
Figure 6: Verification of the discharge temperature
4. EXPANDER ANALYSIS
4.1. Influence of operating temperature on the performance Additional tests have been carried out at higher and lower expander supply temperatures. Analysis of these tests revealed that the volumetric efficiency (defined as in compressor mode, which explains the values higher than unity) of the expander varies not only with the speed and the pressure differential (which drives the internal leakages) but also with the supply temperature (see Figure 7). One reason could be that the ability of the oil to seal the leakage gap increases with its viscosity, and consequently decreases with its temperature. This was already mentioned in other works on lubricated volumetric machines (Neveu et al., 2002). For a series of points characterized by an expander speed ranging from 860 to 890 rpm and characterized by similar pressure differential (ranging from 6.64 to 9.01 bar), the flank leakage gap size has been identified by imposing the calculated flow rate to be equal to the measured one. As expected, the identified flank gap increases with the expander supply temperature, which is shown in Figure 8.
Figure 7: Evolution of the expander volumetric efficiency with the supply temperature
Figure 8: Evolution of the identified flank leakage gap with the supply temperature
1323, Page 6
International Compressor Engineering Conference at Purdue, July 14-17, 2008
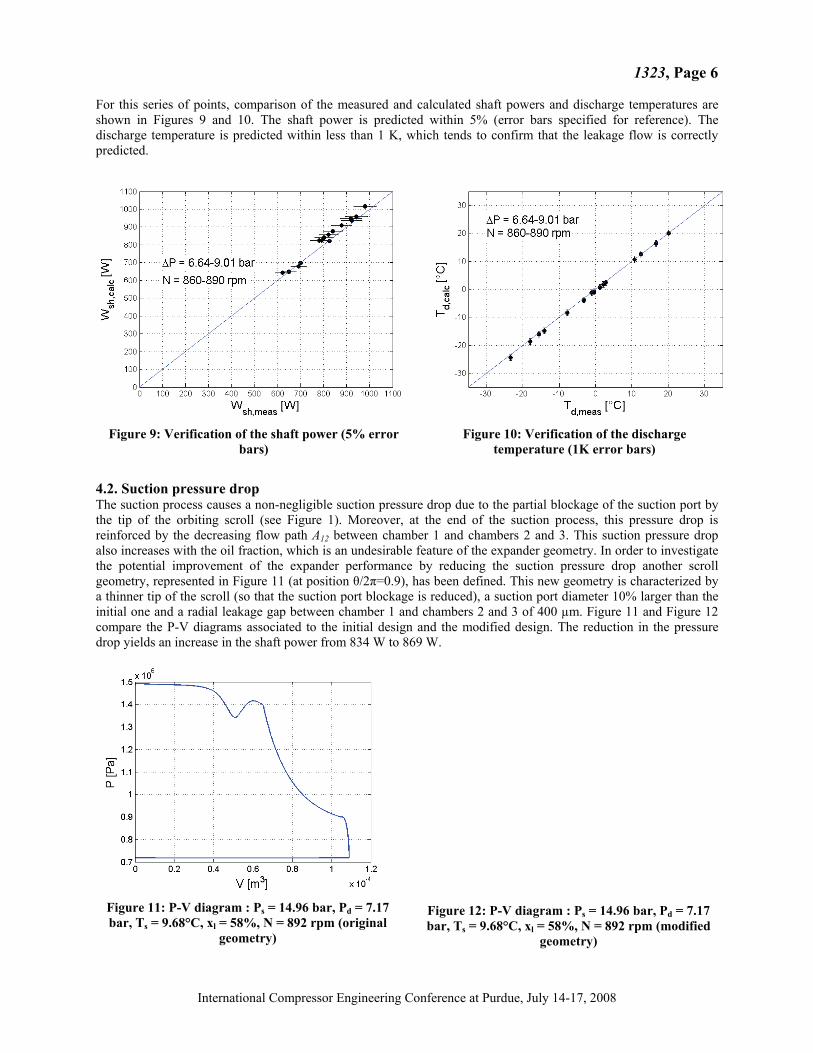
For this series of points, comparison of the measured and calculated shaft powers and discharge temperatures are shown in Figures 9 and 10. The shaft power is predicted within 5% (error bars specified for reference). The discharge temperature is predicted within less than 1 K, which tends to confirm that the leakage flow is correctly predicted.
Figure 9: Verification of the shaft power (5% error bars)
Figure 10: Verification of the discharge temperature (1K error bars)
4.2. Suction pressure drop The suction process causes a non-negligible suction pressure drop due to the partial blockage of the suction port by the tip of the orbiting scroll (see Figure 1). Moreover, at the end of the suction process, this pressure drop is reinforced by the decreasing flow path A12 between chamber 1 and chambers 2 and 3. This suction pressure drop also increases with the oil fraction, which is an undesirable feature of the expander geometry. In order to investigate the potential improvement of the expander performance by reducing the suction pressure drop another scroll geometry, represented in Figure 11 (at position /2 =0.9), has been defined. This new geometry is characterized by a thinner tip of the scroll (so that the suction port blockage is reduced), a suction port diameter 10% larger than the initial one and a radial leakage gap between chamber 1 and chambers 2 and 3 of 400 μm. Figure 11 and Figure 12 compare the P-V diagrams associated to the initial design and the modified design. The reduction in the pressure drop yields an increase in the shaft power from 834 W to 869 W.
Figure 11: P-V diagram : Ps = 14.96 bar, Pd = 7.17 bar, Ts = 9.68°C, xl = 58%, N = 892 rpm (original
geometry)
Figure 12: P-V diagram : Ps = 14.96 bar, Pd = 7.17 bar, Ts = 9.68°C, xl = 58%, N = 892 rpm (modified
geometry)
1323, Page 7
International Compressor Engineering Conference at Purdue, July 14-17, 2008
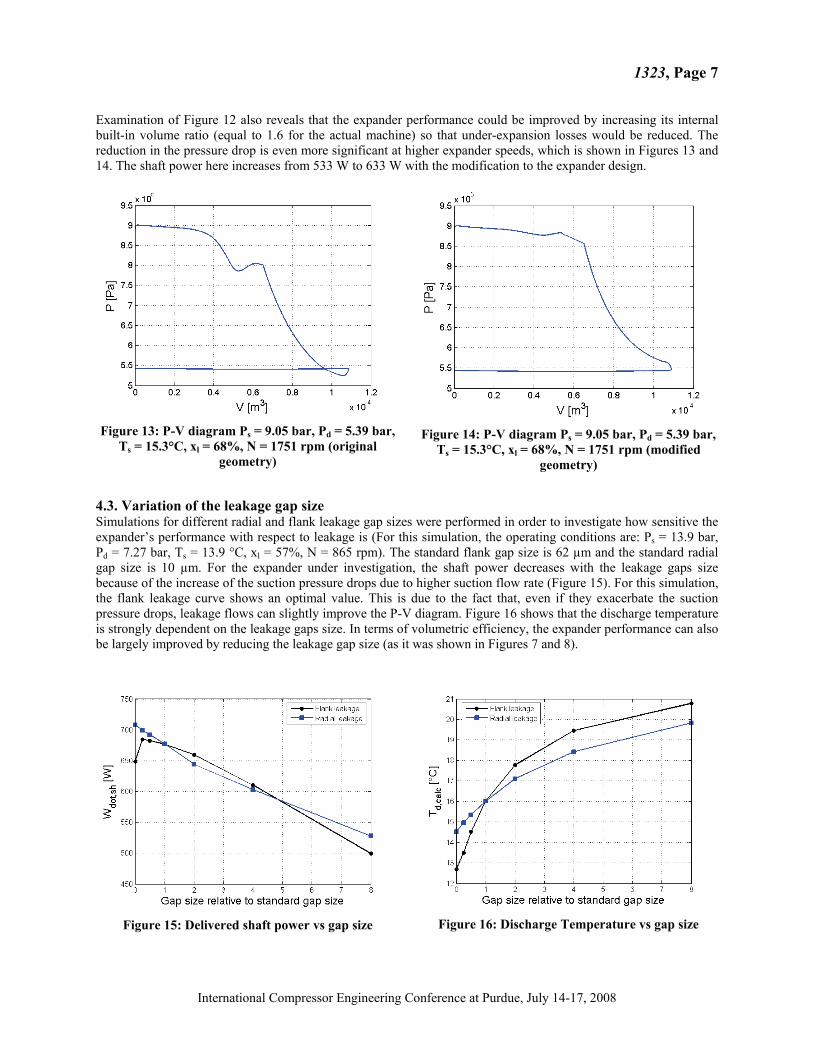
Examination of Figure 12 also reveals that the expander performance could be improved by increasing its internal built-in volume ratio (equal to 1.6 for the actual machine) so that under-expansion losses would be reduced. The reduction in the pressure drop is even more significant at higher expander speeds, which is shown in Figures 13 and 14. The shaft power here increases from 533 W to 633 W with the modification to the expander design.
Figure 13: P-V diagram Ps = 9.05 bar, Pd = 5.39 bar,
Ts = 15.3°C, xl = 68%, N = 1751 rpm (original geometry)
Figure 14: P-V diagram Ps = 9.05 bar, Pd = 5.39 bar,
Ts = 15.3°C, xl = 68%, N = 1751 rpm (modified geometry)
4.3. Variation of the leakage gap size Simulations for different radial and flank leakage gap sizes were performed in order to investigate how sensitive the expander’s performance with respect to leakage is (For this simulation, the operating conditions are: Ps = 13.9 bar, Pd = 7.27 bar, Ts = 13.9 °C, xl = 57%, N = 865 rpm). The standard flank gap size is 62 μm and the standard radial gap size is 10 μm. For the expander under investigation, the shaft power decreases with the leakage gaps size because of the increase of the suction pressure drops due to higher suction flow rate (Figure 15). For this simulation, the flank leakage curve shows an optimal value. This is due to the fact that, even if they exacerbate the suction pressure drops, leakage flows can slightly improve the P-V diagram. Figure 16 shows that the discharge temperature is strongly dependent on the leakage gaps size. In terms of volumetric efficiency, the expander performance can also be largely improved by reducing the leakage gap size (as it was shown in Figures 7 and 8).
Figure 15: Delivered shaft power vs gap size
Figure 16: Discharge Temperature vs gap size
1323, Page 8
International Compressor Engineering Conference at Purdue, July 14-17, 2008
8. CONCLUSIONS AND RECOMMENDATIONS A comprehensive model of a scroll expander integrated into a Liquid Flooded Ericsson Cycle Cooler has been developed. This model appears to be an appropriate tool for investigating the performance of the expander under different operating conditions and design changes. The model has been validated with experimental data. Only a few parameters had to be tuned (the external heat transfer coefficient, the mechanical losses and the flank and radial leakage gaps). It appears that the leakage gaps decrease with the expander speed, which can be explained by increased scroll deformation at higher rotational speed. It is also observed that the leakage gap increases with the supply pressure. Analysis of the measurements also revealed that the volumetric efficiency of the expander worsens with warmer expander suction temperatures. One reason could be that the sealing ability of oil decreases with its viscosity and hence with its temperature. The geometry of the scroll machine should be modified for a use in expander mode. More particularly, the suction pressure drop could be diminished by modifying the shape of the scroll tip. It is also shown that the performance of the expander can be improved by decreasing the leakage gap sizes.
NOMENCLATURE A area (m2) Subscripts gap (m) calc calculated efficiency (-) d discharge
h specific enthalpy (J/kg) f flank M mass flow rate (kg/s) g gas N rotation speed (rpm) l liquid P pressure (Pa) leak leakage T temperature or torque (°C or N-m) meas measured orbiting angle (rad) r radial
v specific volume (m3/kg) s isentropic, supply UA heat transfer coefficient (W/K) sh shaft V volume (m3) v volumetric x mass fraction (-)
REFERENCES Bell, I., Lemort, V., Braun, J., Groll, E., 2008, Development of Liquid-Flooded Scroll Compressor and Expander
Models. Proceedings of the 19th International Compressor Engineering Conference at Purdue University. Paper # 1283.
Chisholm, D., 1983, Two-Phase flow in pipelines and heat exchangers, George Goodwin, London: p. 207-214. Halm, N., 1997, Mathematical Modeling of Scroll Compressors, PhD Thesis, Purdue University. Huagen, W., Ziwen X., Pengcheng S., 2004, Theoretical and experimental study on indicator diagram of twin screw
refrigeration compressor, Int. J. Refrig. v. 207, p. 331-338. Hugenroth J., Braun J.E., Groll E.A., King G.B., 2007, Thermodynamic analysis of a liquid-flooded Ericsson cycle
cooler, Int. J. Refrig., Vol. 30, No. 7, p. 1176-1186. Itoh T., Fujitani M., Sakai. Y., 2002, Leakage Characteristics of Scroll Compressor by Two Phase Flow Model in
Consideration of Wall Oil Film Thickness, The Japan Society of Mechanical Engineers, no. 01-1391: p. 158-165.
Neveu C.D., Cocks R., Hutchinson P., 2002, A study of the dependence of the volumetric efficiency of a vane pump on pressure and viscosity. Proceedings Third Intl. Sym. Fuels & Lubricants.
ACKNOWLEDGEMENT
The authors would like to thank Tecumseh Products Company and the Herrick Foundation for their sponsorship of this project. In addition, the authors would like to thank Prof. Galen King, School of Mechanical Engineering, Purdue University, for his contribution to the paper and the shop at Herrick Labs for their help, as well as Bob Johns, an undergraduate student who worked on the project for a summer.