an abc method for whole-genome sequence data
TRANSCRIPT
An ABC Method for Whole-Genome Sequence Data: InferringPaleolithic and Neolithic Human Expansions
Flora Jay,*,1,2 Simon Boitard,3 and Fr�ed�eric Austerlitz1
1Laboratoire EcoAnthropologie et Ethnobiologie, CNRS/MNHN/Universit�e Paris Diderot, Paris, France2Laboratoire de Recherche en Informatique, CNRS/Universit�e Paris-Sud/Universit�e Paris-Saclay, Orsay, France3GenPhySE, Universit�e de Toulouse, INRA, INPT, INP-ENVT, Castanet Tolosan, France
*Corresponding author: E-mail: [email protected].
Associate editor: Ryan Hernandez
Abstract
Species generally undergo a complex demographic history consisting, in particular, of multiple changes in populationsize. Genome-wide sequencing data are potentially highly informative for reconstructing this demographic history.A crucial point is to extract the relevant information from these very large data sets. Here, we design an approachfor inferring past demographic events from a moderate number of fully sequenced genomes. Our new approach usesApproximate Bayesian Computation, a simulation-based statistical framework that allows 1) identifying the best demo-graphic scenario among several competing scenarios and 2) estimating the best-fitting parameters under the chosenscenario. Approximate Bayesian Computation relies on the computation of summary statistics. Using a cross-validationapproach, we show that statistics such as the lengths of haplotypes shared between individuals, or the decay of linkagedisequilibrium with distance, can be combined with classical statistics (e.g., heterozygosity and Tajima’s D) to accuratelyinfer complex demographic scenarios including bottlenecks and expansion periods. We also demonstrate the importanceof simultaneously estimating the genotyping error rate. Applying our method on genome-wide human-sequence data-bases, we finally show that a model consisting in a bottleneck followed by a Paleolithic and a Neolithic expansion is themost relevant for Eurasian populations.
Key words: demographic inference, Approximate Bayesian Computation, population genetics, whole-genomesequence data, human expansions.
IntroductionThe inference of demographic history from genetic polymor-phism data is a long-standing subject in population genetics(Veeramah and Hammer 2014; Schraiber and Akey 2015).Since high-throughput sequencing data are becoming in-creasingly available, it becomes imperative to develop novelmethods aiming at handling these large amounts of data ofvarying quality.
There are currently several kinds of methods available. Themost common ones are based either on the repartition ofpolymorphic sites along the genome or on the analysis of thesite frequency spectrum (SFS). The first class includes 1) hid-den Markov model methods based on the sequential Markovcoalescent (SMC and SMC0) (McVean and Cardin 2005;Marjoram and Wall 2006) such as PSMC (Li and Durbin2011), MSMC (Schiffels and Durbin 2014), diCal (Sheehanet al. 2013), and SMCþþ (Terhorst et al. 2017); and 2) meth-ods using the lengths of regions that are identical-by-state(IBS) or identical-by-descent (IBD) within pairs of haplotypes(Palamara et al. 2012; Harris and Nielsen 2013; MacLeod et al.2013; Browning and Browning 2015). These methods capturethe recombination process and at least partial knowledge onthe hidden genealogies, and therefore allow extractingsubstantial information even from a very low number of
individuals (as low as 1 for PSMC). A strong limitation ofhidden Markov model-based methods is that increasingthis number highly increases the complexity of analyticalresults and the amount of computational power required,making them unusable for larger samples (usually abovefive individuals). This impedes the inference of recent demo-graphic events (Schiffels and Durbin 2014; Boitard et al. 2016).Note, however, that the more recent SMCþþ scales to alarge number of individuals, and thus more recent time scales,by combining information from the times to the most recentcommon ancestor (TMRCAs) of each haplotype pair and theSFS (Terhorst et al. 2017). The IBD-based methods on theother hand retrieve efficiently recent events but cannot inferancient history (Browning and Browning 2015).
The second class of methods is based on the analyticalanalysis of the SFS and assumes independent segregating sites(e.g., Gutenkunst et al. 2009; Bhaskar et al. 2015; Liu and Fu2015). These methods, which do not take the recombinationprocess into account, are easily scalable to very large samplesize data sets, such as large single nucleotide polymorphism(SNP) chips or genome-wide sequences. Because these SNP-based approaches are blind to linkage information, and be-cause it might be hard in practice to distinguish two SFScomputed from limited amount of data, they contain little
Article
� The Author(s) 2019. Published by Oxford University Press on behalf of the Society for Molecular Biology and Evolution.All rights reserved. For permissions, please e-mail: [email protected]
Mol. Biol. Evol. 36(7):1565–1579 doi:10.1093/molbev/msz038 Advance Access publication February 20, 2019 1565
Dow
nloaded from https://academ
ic.oup.com/m
be/article/36/7/1565/5345566 by guest on 20 July 2022
information about recent history unless the sample size isquite large (in the order of hundreds, see Bhaskar and Song[2014] for results on identifiability).
Moreover, apart from dadi (Gutenkunst et al. 2009), all themethods previously mentioned (SMC, IBD or SFS based, etc.)do not propose a formal testing between competing demo-graphic models. For this purpose, Approximate BayesianComputation (ABC) offers a proper framework aiming atinvestigating several models and selecting the best-fittingone, along with inferring its parameters. ABC is a likelihood-free approach that consists in simulating a large number ofpseudo-data sets under several demographic scenarios; thebest scenario is then chosen by analyzing which pseudo-datasets are the closest to the observed data (Csill�ery et al. 2010;Sunnaker et al. 2013) The parameters of this scenario (e.g.,effective population sizes, migration rates, growth rates, andsplit times) are then estimated similarly. ABC has been shownto be a valuable method to infer population history and hasbeen applied widely to many kind of genetic polymorphismdata, including microsatellite data, SNP data, genotype-by-sequencing data, and short autosomal sequences (e.g.,Excoffier et al. 2005; Fontaine et al. 2012; Sjodin et al. 2012;Shafer et al. 2015; Palstra et al. 2015).
A few ABC methods or other kinds of simulation-basedapproaches have been proposed to tackle whole-genomedata and investigate complex demographic scenarios.Excoffier et al. (2013) developed a composite-likelihood ap-proach based on simulations, which relies exclusively on thejoint SFS. Although this method differs from the purely ana-lytical SFS-based methods (Bhaskar et al. 2015; Liu and Fu2015), it again requires a large sample size to counterbalancethe loss of linkage information. Wollstein et al. (2010) devel-oped an ABC approach that uses jointly the SFS and shorthaplotype diversity computed from DNA chips data. Li andJakobsson (2012) developed another ABC approach based onhaplotype information, short-distance linkage disequilibrium(LD) and a few traditional population genetics statistics, allcomputed on 100-kb genomic regions. However, extremelyfew simulation-based methods are specifically designed forwhole-genome sequence data and the practicability of ABCfor long-recombining sequences (�2 Mb) was investigatedonly in few studies (Theunert et al. 2012; Boitard et al. 2016).This scarcity is likely due to the computational burden ofsimulating long regions of the genome and computing com-plex summary statistics for each pseudo-data set. Theunertet al. (2012) developed two new statistics: allele frequency-identity by descent (AF-IBD) and allele frequency-identity bystate (AF-IBS), which was computed for simulated long-recombining regions and genome-wide SNP data. Boitardet al. (2016) also simulated long-recombining regions andcomputed both SFS and LD statistics. These two studies dem-onstrated that the approach is feasible, and that useful infor-mation can be extracted from dense data of intermediatesample size. Yet, Theunert et al. (2012) did not apply theirmethod to whole-genome sequencing but to SNP arrays,whereas Boitard et al. (2016) did not investigate model test-ing. Moreover, as these studies focused on specific categoriesof summary statistics, they did not specifically explore which
combinations of summary statistics would lead to the bestdemographic inference, among all the classical statistics pro-posed in the literature.
Improving existing inference methods is especially relevantfor understanding human evolutionary history. Even if somedemographic processes have been reconstructed repeatedly,such as a strong bottleneck in population size for non-Africanpopulations resulting from the out-of-Africa migration(Veeramah and Hammer 2014), many other parts of historyare still obscure or controversial. For instance, several studieshave shown that food-producing human populations in-creased in size since the Paleolithic, whereas this was notthe case for hunter-gatherer populations (Excoffier andSchneider 1999; Patin et al. 2009; Aim�e et al. 2013).However, the inferred effective sizes and timings of expan-sions vary widely across studies and seem sensitive to theinference method and sample size used. Although some stud-ies inferred an expansion starting in the upper Paleolithic(Cox et al. 2009; Patin et al. 2009; Batini et al. 2011), otherstudies using rapidly mutating microsatellite markers (Aim�eet al. 2014) or specific mitochondrial haplogroups (Soareset al. 2012) point toward a more recent Neolithic expansionwhich is consistent with the hypothesis of two subsequentexpansions (Tennessen et al. 2012). A recent simulation study(Aim�e and Austerlitz 2017) has shown, indeed, that in case ofa Paleolithic expansion followed by a Neolithic expansion,slowly mutating markers such as nuclear DNA sequenceswill detect only the ancient expansion, whereas rapidly mu-tating microsatellite markers will only detect the recent one.These studies provide thus an indirect evidence of this two-expansion process, however the question remains whetherwe can infer this process directly from whole-genome data.
Here, we developed a model-based ABC approach fornext-generation sequencing data and investigated the prac-ticability of using a very large number of summary statistics tomaximize the information that can be extracted from a smallor intermediate number of sequences. We also investigatedthe power of the method to infer recent history and especiallyto detect different phases of growth. We proposed a simplesolution to account for sequence data specificities, investigat-ing in particular the best way for handling the genotypingerror rate. We then applied our method to several humanpopulations of African, European, and Asian ancestries, basedon two published data sets (Complete Genomics [CG] and1000Genomes). These allowed us to investigate whetherthese populations were submitted to a bottleneck duringthe out-of-Africa period and whether they underwent oneor two-expansion phases during the Paleolithic and theNeolithic.
New ApproachesOur ABC approach leverages whole-genome sequence datato first select the best demographic model among severalproposals, and then coestimate demographic parametersand a genotyping error rate. It is based on realistic simulationsof long-recombining chromosomal segments encompassinggenotyping errors, and on a set of statistics that aims at
Jay et al. . doi:10.1093/molbev/msz038 MBE
1566
Dow
nloaded from https://academ
ic.oup.com/m
be/article/36/7/1565/5345566 by guest on 20 July 2022

summarizing most aspects of Next Generation Sequencing(NGS) data, by capturing dependencies between SNPs at dif-ferent scales along the chromosome. These summary statis-tics were divided into five categories (see table 1 and Materialsand Methods for details): 1) Classical statistics: Tajima’s D, 50-kb-haplotype heterozygosity, etc.; 2) the SFS and total num-ber of SNPs (SFS); 3) the decay of LD; 4) the length of IBSsegments across two or more chromosomes (IBS); and 5) theextended length of IBS around a SNP conditioned on its de-rived allele frequency (AFIBS; Theunert et al. 2012). Thesechoices were based on a great number of previous studieshighlighting that each of these summary statistics containsinformation about past demographic history (Gutenkunstet al. 2009; Theunert et al. 2012; for a review see Gattepailleet al. 2013; Harris and Nielsen 2013; Patin et al. 2014) Weevaluated the performance of each category of statistics aloneor combined with other categories, by considering first eachcategory alone in the ABC procedure, then all pairwise com-binations, and then all five categories simultaneously.
Results
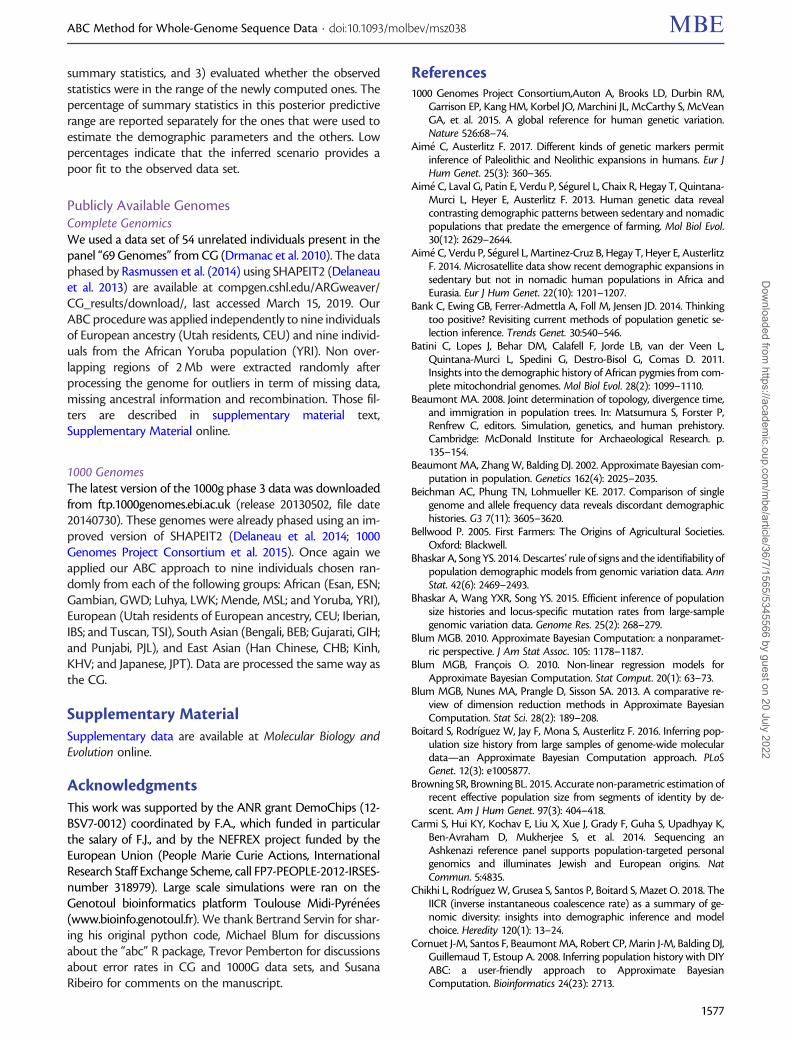
Benchmarking ABC RoutinesWe first benchmarked different ABC routines previously de-veloped for parameter estimation and model selection(Beaumont et al. 2002; Beaumont 2008; Blum and Francois2010; Blum et al. 2013; see Materials and Methods). We con-sidered a sample size of nine individuals per population, be-cause this is the number of sequences we could obtain fromhigh quality public data sets for a reasonably large number ofhuman populations. In a preliminary analysis, we consideredtwo demographic models that encompass either one or twoexponential expansions in the last 5,000 generations (fig. 1 topand supplementary table S1, Supplementary Material online),comparing the performances of three methods that estimatethe posterior model probabilities for model selection (rejec-tion, multinomial logistic, and neural network) and fourmethods that estimate the posterior distribution of parame-ters for the selected model (rejection, linear regression, ridgeregression, and neural network). The misclassification ratesfor model selection (i.e., the probability of selecting the wrongmodel among the two proposed) and prediction errors forparameter inference (i.e., a measure of estimation accuracy)were computed through cross-validation with 1,000 pseudo-observed data sets.
The misclassification rate when combining all categories ofstatistics, was 31% and 10% lower when using the neuralnetwork than when using the rejection algorithm and themultinomial regression, respectively (fig. 2A, tolerance rate0.01). Similarly, for parameter estimation, for both demo-graphic models and whatever the combination of summarystatistics, we found that using neural networks lead to thelowest prediction error: from 30% to 54% lower than whenusing the basic rejection algorithm (fig. 2B and supplementarytable S2, Supplementary Material online). This conclusion isconsistent with that of Boitard et al. (2016), who found thatneural network regression significantly improved ABC infer-ence of population size histories, when these were modeledby piecewise constant processes.
Given these preliminary results we used algorithms basedon neural networks both for parameter estimation and modelselection throughout the rest of the study.
In a second phase, we tested the effect of changing thetolerance rate on parameter inference, that is, the acceptancerate of pseudo-data sets for which the statistics were the clos-est from the observed values, from 0.001 (stringent) to 0.01and 0.1 (less stringent), for different combination of summarystatistics (supplementary fig. S1, Supplementary Material on-line). Changing the tolerance rate had only a slight impact onthe prediction error, with the rate 0.01 usually giving the mostaccurate estimations. However, it is striking that for somecombinations of summary statistics, the 90% credible intervalswere not well estimated for a tolerance of 0.001. The empiricalcoverages indicated that the interval lengths were underesti-mated, a nonconservative behavior meaning that they con-tained the true parameter values<90% of the time. The factor2 was overall slightly better for tolerance of 0.01 comparedwith 0.001, whereas the bias was not clearly impacted by thetolerance rate. For a tolerance of 0.1 the prediction error wasnot consistently lower than for 0.01, and because the runningtime was longer, we set the tolerance to 0.01 for all subsequentparameter estimation analyses.
Genotyping ErrorsThe main advantage of NGS data over SNP data is obviouslythe fact that a large number of positions are covered alongthe genome and that we have access to both short andlong haplotypic information. Moreover, whole-genomesequencing allows circumventing the well-known issue of
Table 1. Summary Statistics Used in Our Study, Grouped into Five Classes.
Abbrev. Full Details Nb Stat.a
Classical Several statistics widely used in ABC Expected heterozygosity (mean, sd), 50-kb-haplotype heterozy-gosity (mean, sd), Tajima D (mean, sd) [1], total number ofSNPs
7
SFS Site frequency spectrum Relative counts (mean, sd), total number of SNPs 35LD Linkage disequilibrium (decay) r2 for pairs of SNPs for bins of distance [2–4] 38IBS Identity-by-state Distribution of IBS lengths across 2, 4, or 8 chromosomes [5, 6] 44AFIBS Allele frequency identity-by-state IBS lengths conditional on the frequency of a focal SNP (binned
per AF) [7]32
aNumber of statistics for a data set of nine diploid individuals [1] Tajima (1989), [2] Hayes et al. (2003), [3] Patin et al. (2014), [4] Boitard et al. (2016), [5] Harris and Nielsen(2013), [6] MacLeod et al. (2013), and [7] Theunert et al. (2012).
ABC Method for Whole-Genome Sequence Data . doi:10.1093/molbev/msz038 MBE
1567
Dow
nloaded from https://academ
ic.oup.com/m
be/article/36/7/1565/5345566 by guest on 20 July 2022
SNP ascertainment bias. Nevertheless, the error rate is indis-putably higher for NGS than for SNP data and might blur, if notdistort, the picture. Ingenious genotype callers (Martin et al.2010; DePristo et al. 2011; Li 2011; Liao et al. 2017) aim at fillingthis gap but the difference is still noticeable.
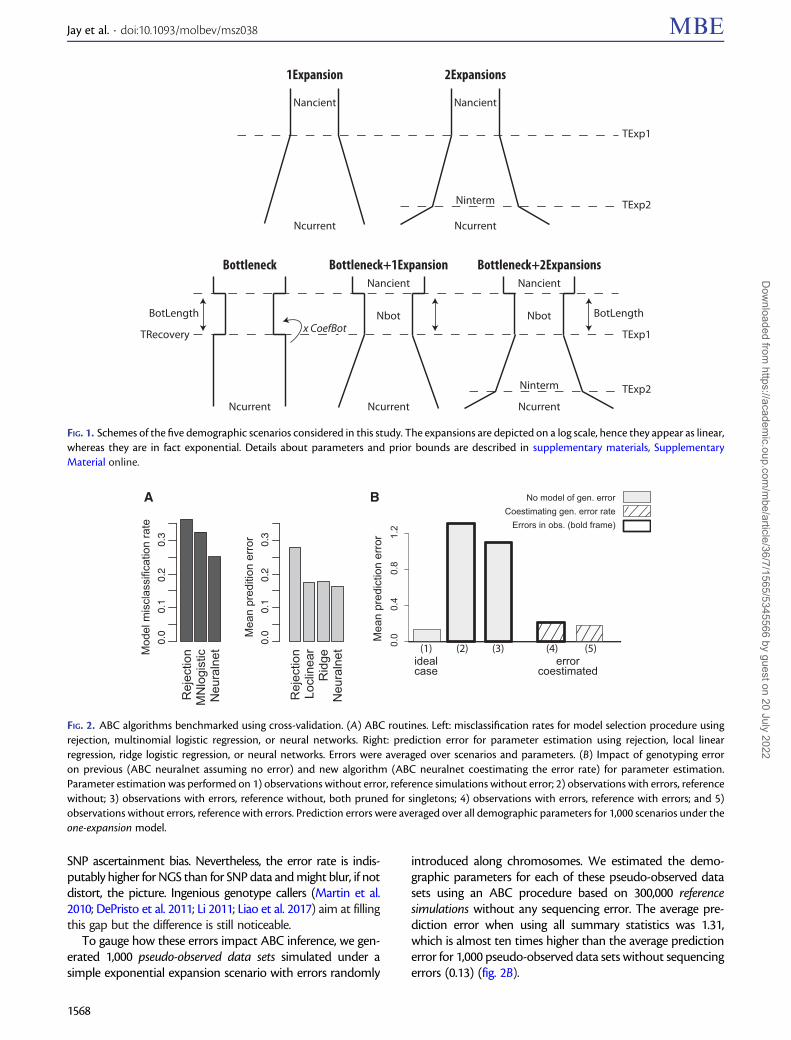
To gauge how these errors impact ABC inference, we gen-erated 1,000 pseudo-observed data sets simulated under asimple exponential expansion scenario with errors randomly
introduced along chromosomes. We estimated the demo-graphic parameters for each of these pseudo-observed datasets using an ABC procedure based on 300,000 referencesimulations without any sequencing error. The average pre-diction error when using all summary statistics was 1.31,which is almost ten times higher than the average predictionerror for 1,000 pseudo-observed data sets without sequencingerrors (0.13) (fig. 2B).
TExp1
TExp1
TExp2
TExp2
TRecovery
Nancient Nancient
Nancient Nancient
NbotNbot
NcurrentNcurrent Ncurrent
NcurrentNcurrent
Ninterm
x CoefBotBotLengthBotLength
Ninterm
1Expansion
Bottleneck Bottleneck+1Expansion Bottleneck+2Expansions
2Expansions
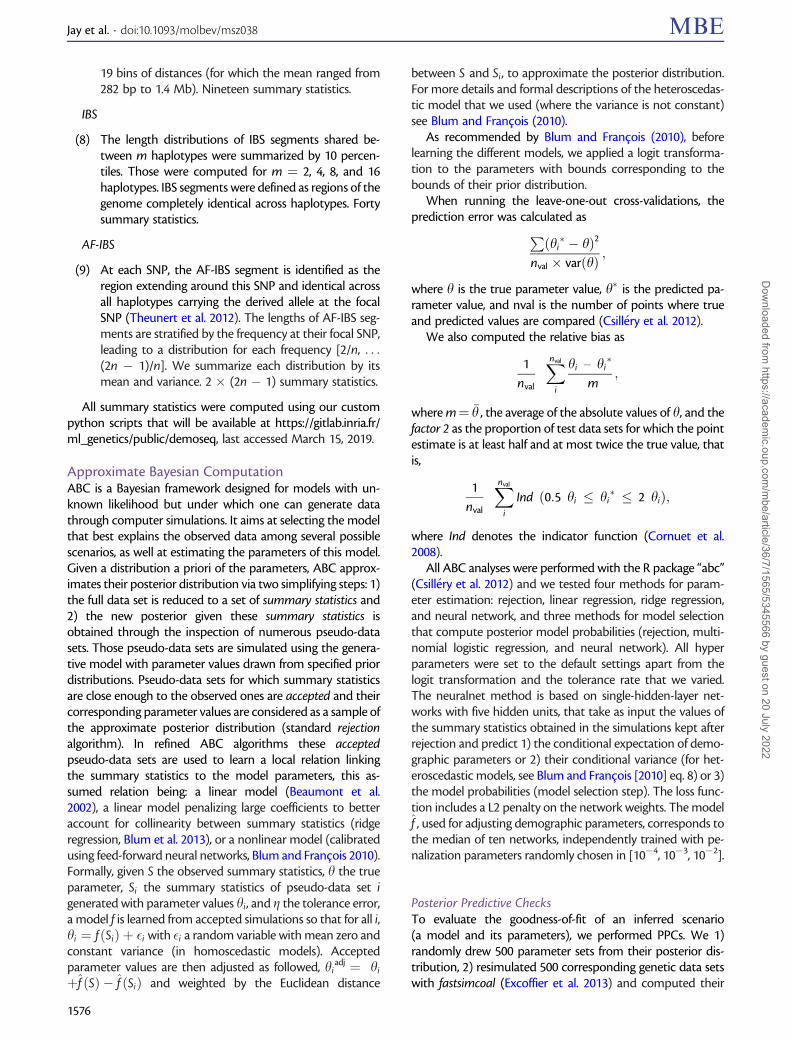
FIG. 1. Schemes of the five demographic scenarios considered in this study. The expansions are depicted on a log scale, hence they appear as linear,whereas they are in fact exponential. Details about parameters and prior bounds are described in supplementary materials, SupplementaryMaterial online.
Rej
ectio
nM
Nlo
gist
icN
eura
lnet
0.0
0.1
0.2
0.3
Mod
el m
iscl
assi
ficat
ion
rate
Rej
ectio
nLo
clin
ear
Rid
geN
eura
lnet
0.0
0.1
0.2
0.3
Mea
n pr
editi
on e
rror
A
0.0
0.4
0.8
1.2
Mea
n pr
edic
tion
erro
r
B
Errors in obs. (bold frame)Coestimating gen. error rate
No model of gen. error
idealcase
(1) (2) (3) (4) (5)error
coestimated
FIG. 2. ABC algorithms benchmarked using cross-validation. (A) ABC routines. Left: misclassification rates for model selection procedure usingrejection, multinomial logistic regression, or neural networks. Right: prediction error for parameter estimation using rejection, local linearregression, ridge logistic regression, or neural networks. Errors were averaged over scenarios and parameters. (B) Impact of genotyping erroron previous (ABC neuralnet assuming no error) and new algorithm (ABC neuralnet coestimating the error rate) for parameter estimation.Parameter estimation was performed on 1) observations without error, reference simulations without error; 2) observations with errors, referencewithout; 3) observations with errors, reference without, both pruned for singletons; 4) observations with errors, reference with errors; and 5)observations without errors, reference with errors. Prediction errors were averaged over all demographic parameters for 1,000 scenarios under theone-expansion model.
Jay et al. . doi:10.1093/molbev/msz038 MBE
1568
Dow
nloaded from https://academ
ic.oup.com/m
be/article/36/7/1565/5345566 by guest on 20 July 2022

A common practice to reduce the impact of sequencingand genotyping errors is to prune the data by ignoring single-tons, as they are indeed more likely to be the result of errorsthan alleles observed at higher frequencies. However, ignoringsingletons both in our pseudo-observed data sets and refer-ence simulations only decreased the prediction error to 1.10(fig. 2B).
We then approximated the imperfect sequencing, geno-typing and phasing processes by artificially introducing errorsin the reference simulations used in the ABC procedure (seeMaterials and Methods). Using these new reference simula-tions, we could infer simultaneously the error rate and thedemographic parameters. Doing so, we decreased the predic-tion error rate to 0.21, only 1.6 times higher than the ideal casewithout errors (fig. 2B). Moreover, when the pseudo-observeddata contained no error, but the reference simulations did,the average prediction error was relatively close to the idealcase (0.18).
Additionally, we checked the impact of this new frame-work on model selection. Under a tolerance rate of 0.01, inthe ideal case where both the pseudo-observed data sets andthe reference simulations contained no genotyping errors, themisclassification rate was of 0.207 (supplementary fig. S2,Supplementary Material online). However if the pseudo-observed data sets contained errors, using reference simula-tions without errors yielded a quite high misclassification rate:0.479. When discarding the singletons, this rate was still of0.338. When both the pseudo-data sets and the referencesimulations contained errors and the singleton were dis-carded, the misclassification rate was only of 0.278. Finally,we found that if the pseudo-observed data sets contained noerror, whereas the reference simulations did, the misclassifi-cation rate was higher (0.386 when the singletons were dis-carded). However, it is well known that whole-genomesequencing and genotype calling are prone to errors, hencethis last case is infrequent (Nielsen et al. 2011; Wall et al. 2014).
Five Demographic ScenariosWe defined five demographic scenarios of interest not onlyfor human populations but also for other species that mighthave experienced expansion processes in the past: One expan-sion, Two expansions, Bottleneck (þinstant recovery),Bottleneck and one expansion, and Bottleneck and two expan-sions (fig. 1). Prior distributions were either uniform or
log-uniform distributions (supplementary table S1,Supplementary Material online), with maximal values of5,000 generations before present for the expansion timesand of 500,000 for the population sizes. For the 16 differentcombinations of summary statistics and two pruning filters(“no pruning” or “singleton pruning”), we evaluated themodel misclassification rates and the prediction errors in pa-rameter estimation—as well as several quality criteria such asempirical coverages, estimation biases and factor 2 scores,through intensive cross-validation. For both pruning filters,the genotyping error was coestimated.
First, we established that the minimum misclassificationrate when comparing simultaneously the five models wasobtained for the combination of all categories of summarystatistics computed once the singletons were removed (sup-plementary fig. S3, Supplementary Material online, using neu-ral networks and a tolerance rate of 0.001). Themisclassification rate was of 0.335, much lower than the 0.8expected by chance. When trying an easier task, assigning toA: “One or Two expansions” or B: “Bottleneck” or C:“Bottleneck with one or two expansions,” this rate decreasedto 0.134. These values partly reflect the fact that some modelsare nested and that differences between scenarios under twodistinct models can be extremely subtle (see next section). Forall categories of summary statistics, the misclassification rateswere slightly higher for larger tolerance rates (0.355 and 0.362for rates of 0.01 and 0.004, respectively).
Second, we identified the combination of statistics leadingto the best parameter estimation for each of the five scenariosindependently. This was done by minimizing the predictionerror averaged over all demographic parameters (i.e., allparameters but the genotyping error rate). No combinationprovided systematically the most accurate estimations, al-though the AFIBS category was almost always part of thebest combination (table 2). Using the best subsets, the pre-diction error was on average 0.219 (across the five models).Chosen subsets performed well according to other perfor-mance criteria, such as empirical coverages, factor2, and esti-mation biases (supplementary fig. S4, Supplementary Materialonline).
Interestingly, the genotyping error rate could be estimatedquite accurately along with the demographic parameters. Foralmost all scenarios and tolerance rates, combining SFS andAFIBS provided the most accurate estimation of this errorrate. The only exception was the Bottleneck scenario for whichAFIBS þ IBS performed slightly better when the tolerancerate was 0.01. For this genotyping error rate parameter, theprediction error averaged across the five scenarios was of 0.11when the tolerance was set to 0.01.
Detecting Two Subsequent ExpansionsWhen trying to assign a pseudo-observed data set generatedunder a two-expansion scenario, to either the one-expansionor the two-expansion model, there is a risk of misclassificationinherent to the fact that these models are nested. As depictedon figure 3 (left), the probability of identifying the model Oneexpansion, whereas in fact Two expansions occurred increasedwhen the ancient and recent growth rates were very similar
Table 2. Best Combinations of Summary Statistics for FiveDemographic Models.
Model Tolerance 0.01
1Expansion SFS 1 AF-IBS (no singl) 0.0522Expansions ALL (no singl) 0.165Bottleneck IBS 1 AF-IBS (no singl) 0.428Bottleneck 1 1Expansion IBS 1 AF-IBS (no singl) 0.17Bottleneck 1 2Expansions IBS 1 AF-IBS (no singl) 0.28
NOTE.—For each model, prediction errors were evaluated on a validation set of 500pseudo-data sets and averaged over all demographic parameters. Best combina-tions were identified as the ones with the smallest prediction error. Minimal valuesare given in the right column. no singl ¼ singletons were pruned.
ABC Method for Whole-Genome Sequence Data . doi:10.1093/molbev/msz038 MBE
1569
Dow
nloaded from https://academ
ic.oup.com/m
be/article/36/7/1565/5345566 by guest on 20 July 2022
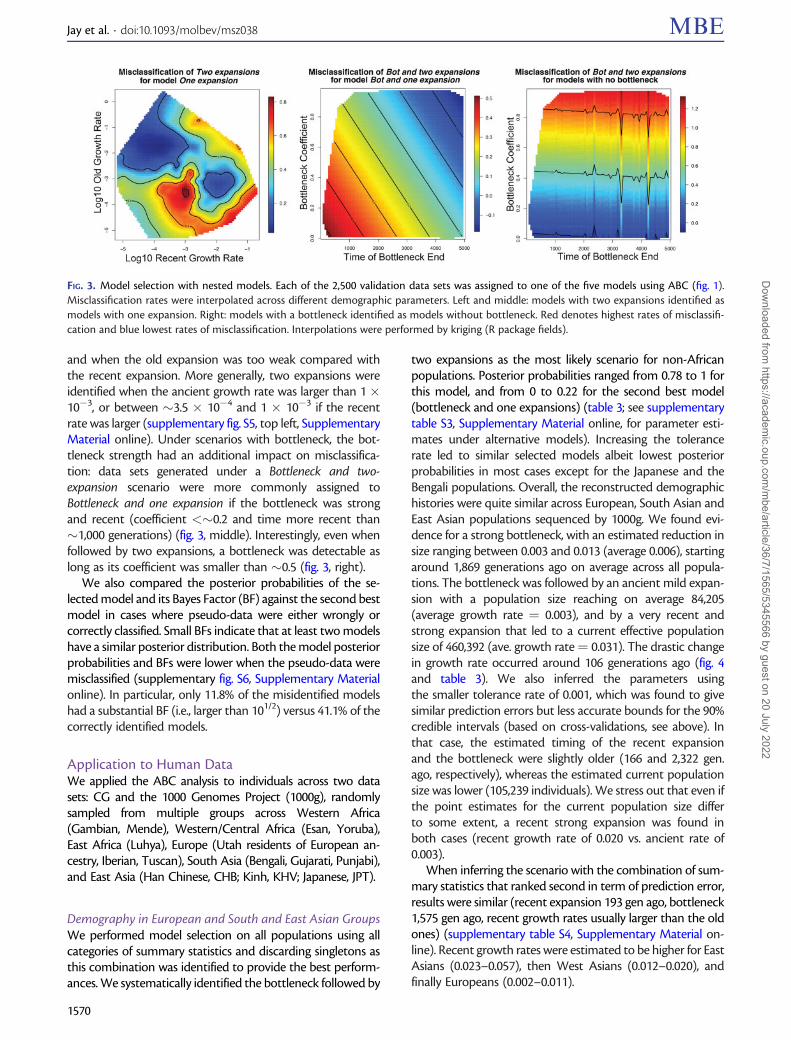
and when the old expansion was too weak compared withthe recent expansion. More generally, two expansions wereidentified when the ancient growth rate was larger than 1�10�3, or between �3.5 � 10�4 and 1 � 10�3 if the recentrate was larger (supplementary fig. S5, top left, SupplementaryMaterial online). Under scenarios with bottleneck, the bot-tleneck strength had an additional impact on misclassifica-tion: data sets generated under a Bottleneck and two-expansion scenario were more commonly assigned toBottleneck and one expansion if the bottleneck was strongand recent (coefficient <�0.2 and time more recent than�1,000 generations) (fig. 3, middle). Interestingly, even whenfollowed by two expansions, a bottleneck was detectable aslong as its coefficient was smaller than �0.5 (fig. 3, right).
We also compared the posterior probabilities of the se-lected model and its Bayes Factor (BF) against the second bestmodel in cases where pseudo-data were either wrongly orcorrectly classified. Small BFs indicate that at least two modelshave a similar posterior distribution. Both the model posteriorprobabilities and BFs were lower when the pseudo-data weremisclassified (supplementary fig. S6, Supplementary Materialonline). In particular, only 11.8% of the misidentified modelshad a substantial BF (i.e., larger than 101/2) versus 41.1% of thecorrectly identified models.
Application to Human DataWe applied the ABC analysis to individuals across two datasets: CG and the 1000 Genomes Project (1000g), randomlysampled from multiple groups across Western Africa(Gambian, Mende), Western/Central Africa (Esan, Yoruba),East Africa (Luhya), Europe (Utah residents of European an-cestry, Iberian, Tuscan), South Asia (Bengali, Gujarati, Punjabi),and East Asia (Han Chinese, CHB; Kinh, KHV; Japanese, JPT).
Demography in European and South and East Asian GroupsWe performed model selection on all populations using allcategories of summary statistics and discarding singletons asthis combination was identified to provide the best perform-ances. We systematically identified the bottleneck followed by
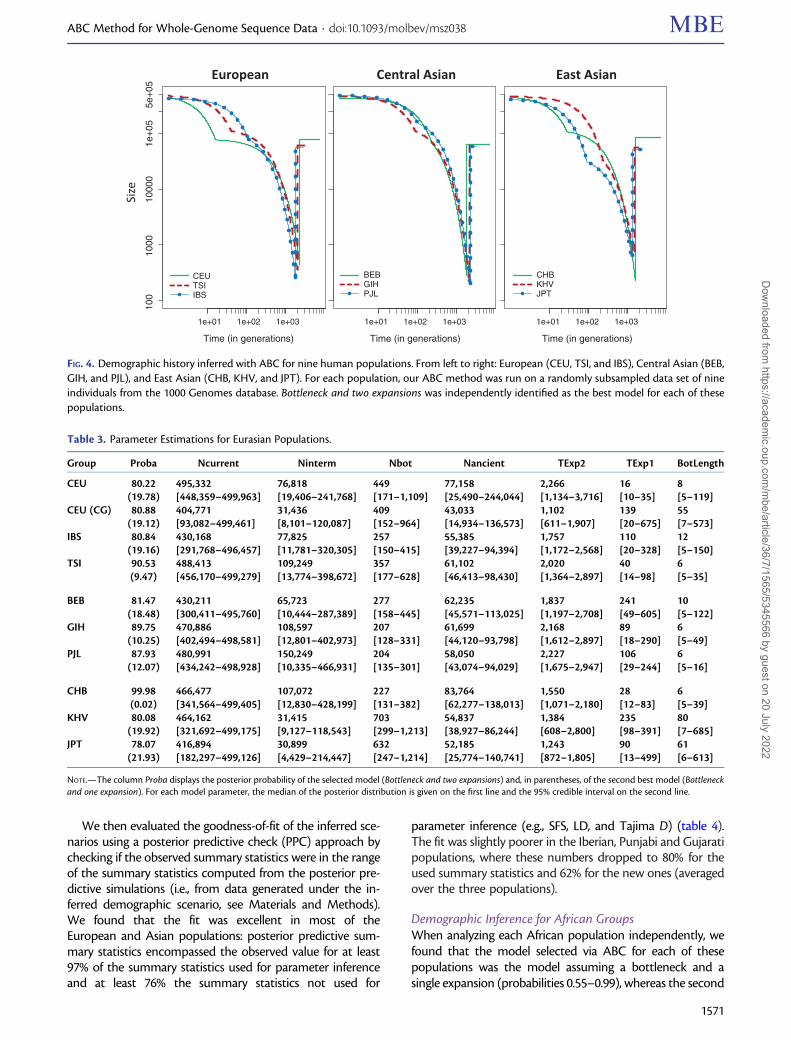
two expansions as the most likely scenario for non-Africanpopulations. Posterior probabilities ranged from 0.78 to 1 forthis model, and from 0 to 0.22 for the second best model(bottleneck and one expansions) (table 3; see supplementarytable S3, Supplementary Material online, for parameter esti-mates under alternative models). Increasing the tolerancerate led to similar selected models albeit lowest posteriorprobabilities in most cases except for the Japanese and theBengali populations. Overall, the reconstructed demographichistories were quite similar across European, South Asian andEast Asian populations sequenced by 1000g. We found evi-dence for a strong bottleneck, with an estimated reduction insize ranging between 0.003 and 0.013 (average 0.006), startingaround 1,869 generations ago on average across all popula-tions. The bottleneck was followed by an ancient mild expan-sion with a population size reaching on average 84,205(average growth rate ¼ 0.003), and by a very recent andstrong expansion that led to a current effective populationsize of 460,392 (ave. growth rate¼ 0.031). The drastic changein growth rate occurred around 106 generations ago (fig. 4and table 3). We also inferred the parameters usingthe smaller tolerance rate of 0.001, which was found to givesimilar prediction errors but less accurate bounds for the 90%credible intervals (based on cross-validations, see above). Inthat case, the estimated timing of the recent expansionand the bottleneck were slightly older (166 and 2,322 gen.ago, respectively), whereas the estimated current populationsize was lower (105,239 individuals). We stress out that even ifthe point estimates for the current population size differto some extent, a recent strong expansion was found inboth cases (recent growth rate of 0.020 vs. ancient rate of0.003).
When inferring the scenario with the combination of sum-mary statistics that ranked second in term of prediction error,results were similar (recent expansion 193 gen ago, bottleneck1,575 gen ago, recent growth rates usually larger than the oldones) (supplementary table S4, Supplementary Material on-line). Recent growth rates were estimated to be higher for EastAsians (0.023–0.057), then West Asians (0.012–0.020), andfinally Europeans (0.002–0.011).
FIG. 3. Model selection with nested models. Each of the 2,500 validation data sets was assigned to one of the five models using ABC (fig. 1).Misclassification rates were interpolated across different demographic parameters. Left and middle: models with two expansions identified asmodels with one expansion. Right: models with a bottleneck identified as models without bottleneck. Red denotes highest rates of misclassifi-cation and blue lowest rates of misclassification. Interpolations were performed by kriging (R package fields).
Jay et al. . doi:10.1093/molbev/msz038 MBE
1570
Dow
nloaded from https://academ
ic.oup.com/m
be/article/36/7/1565/5345566 by guest on 20 July 2022
We then evaluated the goodness-of-fit of the inferred sce-narios using a posterior predictive check (PPC) approach bychecking if the observed summary statistics were in the rangeof the summary statistics computed from the posterior pre-dictive simulations (i.e., from data generated under the in-ferred demographic scenario, see Materials and Methods).We found that the fit was excellent in most of theEuropean and Asian populations: posterior predictive sum-mary statistics encompassed the observed value for at least97% of the summary statistics used for parameter inferenceand at least 76% the summary statistics not used for
parameter inference (e.g., SFS, LD, and Tajima D) (table 4).The fit was slightly poorer in the Iberian, Punjabi and Gujaratipopulations, where these numbers dropped to 80% for theused summary statistics and 62% for the new ones (averagedover the three populations).
Demographic Inference for African GroupsWhen analyzing each African population independently, wefound that the model selected via ABC for each of thesepopulations was the model assuming a bottleneck and asingle expansion (probabilities 0.55–0.99), whereas the second
Time (in generations)
Size
100
1000
1000
01e
+05
5e+
05
1e+01 1e+02 1e+03
Central Asian East AsianEuropean
Time (in generations)
1e+01 1e+02 1e+03
Time (in generations)
1e+01 1e+02 1e+03
BEBGIHPJL
CEUTSIIBS
CHBKHVJPT
FIG. 4. Demographic history inferred with ABC for nine human populations. From left to right: European (CEU, TSI, and IBS), Central Asian (BEB,GIH, and PJL), and East Asian (CHB, KHV, and JPT). For each population, our ABC method was run on a randomly subsampled data set of nineindividuals from the 1000 Genomes database. Bottleneck and two expansions was independently identified as the best model for each of thesepopulations.
Table 3. Parameter Estimations for Eurasian Populations.
Group Proba Ncurrent Ninterm Nbot Nancient TExp2 TExp1 BotLength
CEU 80.22 495,332 76,818 449 77,158 2,266 16 8(19.78) [448,359–499,963] [19,406–241,768] [171–1,109] [25,490–244,044] [1,134–3,716] [10–35] [5–119]
CEU (CG) 80.88 404,771 31,436 409 43,033 1,102 139 55(19.12) [93,082–499,461] [8,101–120,087] [152–964] [14,934–136,573] [611–1,907] [20–675] [7–573]
IBS 80.84 430,168 77,825 257 55,385 1,757 110 12(19.16) [291,768–496,457] [11,781–320,305] [150–415] [39,227–94,394] [1,172–2,568] [20–328] [5–150]
TSI 90.53 488,413 109,249 357 61,102 2,020 40 6(9.47) [456,170–499,279] [13,774–398,672] [177–628] [46,413–98,430] [1,364–2,897] [14–98] [5–35]
BEB 81.47 430,211 65,723 277 62,235 1,837 241 10(18.48) [300,411–495,760] [10,444–287,389] [158–445] [45,571–113,025] [1,197–2,708] [49–605] [5–122]
GIH 89.75 470,886 108,597 207 61,699 2,168 89 6(10.25) [402,494–498,581] [12,801–402,973] [128–331] [44,120–93,798] [1,612–2,897] [18–290] [5–49]
PJL 87.93 480,991 150,249 204 58,050 2,227 106 6(12.07) [434,242–498,928] [10,335–466,931] [135–301] [43,074–94,029] [1,675–2,947] [29–244] [5–16]
CHB 99.98 466,477 107,072 227 83,764 1,550 28 6(0.02) [341,564–499,405] [12,830–428,199] [131–382] [62,277–138,013] [1,071–2,180] [12–83] [5–39]
KHV 80.08 464,162 31,415 703 54,837 1,384 235 80(19.92) [321,692–499,175] [9,127–118,543] [299–1,213] [38,927–86,244] [608–2,800] [98–391] [7–685]
JPT 78.07 416,894 30,899 632 52,185 1,243 90 61(21.93) [182,297–499,126] [4,429–214,447] [247–1,214] [25,774–140,741] [872–1,805] [13–499] [6–613]
NOTE.—The column Proba displays the posterior probability of the selected model (Bottleneck and two expansions) and, in parentheses, of the second best model (Bottleneckand one expansion). For each model parameter, the median of the posterior distribution is given on the first line and the 95% credible interval on the second line.
ABC Method for Whole-Genome Sequence Data . doi:10.1093/molbev/msz038 MBE
1571
Dow
nloaded from https://academ
ic.oup.com/m
be/article/36/7/1565/5345566 by guest on 20 July 2022
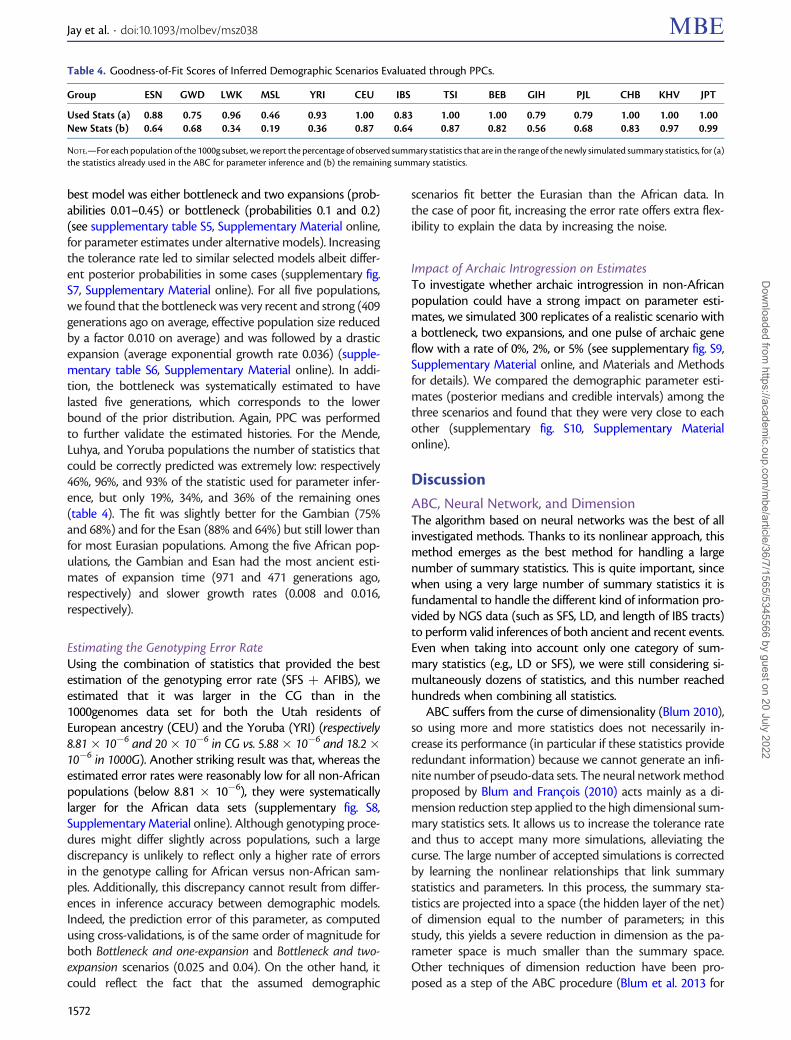
best model was either bottleneck and two expansions (prob-abilities 0.01–0.45) or bottleneck (probabilities 0.1 and 0.2)(see supplementary table S5, Supplementary Material online,for parameter estimates under alternative models). Increasingthe tolerance rate led to similar selected models albeit differ-ent posterior probabilities in some cases (supplementary fig.S7, Supplementary Material online). For all five populations,we found that the bottleneck was very recent and strong (409generations ago on average, effective population size reducedby a factor 0.010 on average) and was followed by a drasticexpansion (average exponential growth rate 0.036) (supple-mentary table S6, Supplementary Material online). In addi-tion, the bottleneck was systematically estimated to havelasted five generations, which corresponds to the lowerbound of the prior distribution. Again, PPC was performedto further validate the estimated histories. For the Mende,Luhya, and Yoruba populations the number of statistics thatcould be correctly predicted was extremely low: respectively46%, 96%, and 93% of the statistic used for parameter infer-ence, but only 19%, 34%, and 36% of the remaining ones(table 4). The fit was slightly better for the Gambian (75%and 68%) and for the Esan (88% and 64%) but still lower thanfor most Eurasian populations. Among the five African pop-ulations, the Gambian and Esan had the most ancient esti-mates of expansion time (971 and 471 generations ago,respectively) and slower growth rates (0.008 and 0.016,respectively).
Estimating the Genotyping Error RateUsing the combination of statistics that provided the bestestimation of the genotyping error rate (SFS þ AFIBS), weestimated that it was larger in the CG than in the1000genomes data set for both the Utah residents ofEuropean ancestry (CEU) and the Yoruba (YRI) (respectively8.81� 10�6 and 20� 10�6 in CG vs. 5.88� 10�6 and 18.2�10�6 in 1000G). Another striking result was that, whereas theestimated error rates were reasonably low for all non-Africanpopulations (below 8.81 � 10�6), they were systematicallylarger for the African data sets (supplementary fig. S8,Supplementary Material online). Although genotyping proce-dures might differ slightly across populations, such a largediscrepancy is unlikely to reflect only a higher rate of errorsin the genotype calling for African versus non-African sam-ples. Additionally, this discrepancy cannot result from differ-ences in inference accuracy between demographic models.Indeed, the prediction error of this parameter, as computedusing cross-validations, is of the same order of magnitude forboth Bottleneck and one-expansion and Bottleneck and two-expansion scenarios (0.025 and 0.04). On the other hand, itcould reflect the fact that the assumed demographic
scenarios fit better the Eurasian than the African data. Inthe case of poor fit, increasing the error rate offers extra flex-ibility to explain the data by increasing the noise.
Impact of Archaic Introgression on EstimatesTo investigate whether archaic introgression in non-Africanpopulation could have a strong impact on parameter esti-mates, we simulated 300 replicates of a realistic scenario witha bottleneck, two expansions, and one pulse of archaic geneflow with a rate of 0%, 2%, or 5% (see supplementary fig. S9,Supplementary Material online, and Materials and Methodsfor details). We compared the demographic parameter esti-mates (posterior medians and credible intervals) among thethree scenarios and found that they were very close to eachother (supplementary fig. S10, Supplementary Materialonline).
Discussion
ABC, Neural Network, and DimensionThe algorithm based on neural networks was the best of allinvestigated methods. Thanks to its nonlinear approach, thismethod emerges as the best method for handling a largenumber of summary statistics. This is quite important, sincewhen using a very large number of summary statistics it isfundamental to handle the different kind of information pro-vided by NGS data (such as SFS, LD, and length of IBS tracts)to perform valid inferences of both ancient and recent events.Even when taking into account only one category of sum-mary statistics (e.g., LD or SFS), we were still considering si-multaneously dozens of statistics, and this number reachedhundreds when combining all statistics.
ABC suffers from the curse of dimensionality (Blum 2010),so using more and more statistics does not necessarily in-crease its performance (in particular if these statistics provideredundant information) because we cannot generate an infi-nite number of pseudo-data sets. The neural network methodproposed by Blum and Francois (2010) acts mainly as a di-mension reduction step applied to the high dimensional sum-mary statistics sets. It allows us to increase the tolerance rateand thus to accept many more simulations, alleviating thecurse. The large number of accepted simulations is correctedby learning the nonlinear relationships that link summarystatistics and parameters. In this process, the summary sta-tistics are projected into a space (the hidden layer of the net)of dimension equal to the number of parameters; in thisstudy, this yields a severe reduction in dimension as the pa-rameter space is much smaller than the summary space.Other techniques of dimension reduction have been pro-posed as a step of the ABC procedure (Blum et al. 2013 for
Table 4. Goodness-of-Fit Scores of Inferred Demographic Scenarios Evaluated through PPCs.
Group ESN GWD LWK MSL YRI CEU IBS TSI BEB GIH PJL CHB KHV JPT
Used Stats (a) 0.88 0.75 0.96 0.46 0.93 1.00 0.83 1.00 1.00 0.79 0.79 1.00 1.00 1.00New Stats (b) 0.64 0.68 0.34 0.19 0.36 0.87 0.64 0.87 0.82 0.56 0.68 0.83 0.97 0.99
NOTE.—For each population of the 1000g subset, we report the percentage of observed summary statistics that are in the range of the newly simulated summary statistics, for (a)the statistics already used in the ABC for parameter inference and (b) the remaining summary statistics.
Jay et al. . doi:10.1093/molbev/msz038 MBE
1572
Dow
nloaded from https://academ
ic.oup.com/m
be/article/36/7/1565/5345566 by guest on 20 July 2022
review; Pudlo et al. 2016). Random forests and their exten-sions, within an ABC framework or not (Pudlo et al. 2016;Schrider et al. 2018), deep learning approaches that allow tolearn automatically a mapping from the initial summary sta-tistics to intermediate statistics treated as input of ABC (Jianget al. 2017), from the initial summary statistics to the demo-graphic parameters (Sheehan and Song 2016), or from theSNP data directly to the demographic parameters (Flagel et al.2018) are all promising approaches to dimension reduction.In particular, Sheehan and Song (2016) implemented a deepneural network that bypass the ABC rejection step and detectselective signals in 100-kb regions, which corresponds some-how to setting the tolerance rate to 1 in our method, al-though the neural network architecture, summary statistics,scenarios of interest and inference algorithms differ. In futureworks, it will be essential to compare these approaches as wellas other supervised learning methods (Schrider and Kern2018 for review), through careful examination of a large vari-ety of applications and scenarios considered as milestones bythe population genetics community as already done in somefields.
Sequencing, Genotyping, and Phasing ErrorsTo reduce the impact of sequencing and genotyping errorswe pruned the data by removing singletons but observed thatit was not a satisfying solution. This is consistent with findingsthat “minor-allele-frequency filters – usual practice forgenotype-by-sequencing data – negatively affected nearlyall estimates” (Shafer et al. 2015). On the other hand, ourstrategy of modeling genotyping errors via an extra parameterthat we estimated together with the demographic parame-ters provided enough flexibility to estimate correctly the de-mographic histories of populations, based on samples ofvariable and unknown quality.
Moreover, we found in our cross-validation study that theerror rate could be correctly estimated provided that appro-priate summary statistics were used, especially the SFS alongwith the AF-IBS statistics (Theunert et al. 2012). It is in agree-ment with Racimo et al. (2016) who found that demography,error, and contamination rates could be coestimated in an-cient genomes using MCMC. It is tempting to compare therates estimated for CG and 1000 genomes (1000g). Yet, theinterpretation is not trivial. CG data have a much highercoverage than the 1000g (�51–89� vs. �2–4�), howeverthis might not necessarily translate into a higher quality of CGdata for several reasons: 1) The genotypes are called based onlikelihoods that take into account other individuals in thedata set. Therefore, the large sample size of the 1000g shouldcounterbalance somehow its low coverage. 2) The same rea-soning holds for phasing, which will be more accurate forlarge data sets, such as 1000g, than for small ones, such asCG. 3) The sequencing platforms differ between data sets (CGvs. Illumina) and are known to have different error rates. Forall these reasons, predicting which data set would have thehigher estimated error rate might be dubious. Nevertheless,we found that error rates were generally low and that CG datahad higher error rates than 1000g, in concordance with Wallet al. (2014) that estimated the genotype error rates to be
higher for sequences obtained by the CG technology than byIllumina.
European and Asian Histories: Bottleneck and TwoSuccessive ExpansionsFor all populations of European and Asian ancestry wedetected the out-of-Africa bottleneck followed by two suc-cessive expansions, an ancient and mild one followed by arecent and stronger one. The ancient expansion was esti-mated to have started on average 1,190 generations ago(i.e., 35,700 ya assuming a generation length of 30 years,95% CI ave. upper bound: 81,728 ya), and the recent expan-sion 106 generations ago (i.e., 3,180 years ago, 95% CI ave.upper bound: 8,460 ya). The most ancient expansion appearsthus as a signal of a Paleolithic expansion, whereas the morerecent expansion is consistent with the Neolithic transitionsthat emerged from 11,500 to 3,500 years ago across the world(Bellwood 2005).
This is of interest as only few studies had been able todetect simultaneously both expansions. For example, Aim�eet al. (2013, 2014) and Aim�e and Austerlitz (2017) used in-dependent data sets (mitochondrial and autosomal shortsequences, Y-chromosome and autosomal microsatelliteloci) to capture two different time scales and show evidencefor expansions before and after the emergence of farming.Palamara et al. (2012) inferred several growth phases inAshkenazi Jews history using IBD tract lengths, howeverthey focused only on very recent history (<200 generations).Following on, Carmi et al. (2014) inferred separately ancient(Paleolithic) and recent (medieval) expansions by applyingindependently a method based on SFS for ancient timesand the one based on IBD tract lengths for recent times.Among the few model-based studies that infer simulta-neously both expansions, one relies on the SFS-based methoddadi (Gutenkunst et al. 2009) but uses>1,000 individuals andall the parameters linked to events preceding the expansions,such as ancient bottlenecks and sizes, were fixed (Tennessenet al. 2012). Similarly, Gazave et al. (2014) used a very largesample of high quality to estimate the very recent growth rateof human populations. Compared with these studies, ourapproach focuses on data sets with lower sample sizes andquality and enables reconstructing the broad picture of bot-tlenecks and growths from a limited amount of data.Remarkably, our estimate of the recent growth rate (0.031averaged across Eurasian populations) is similar to the onesinferred by Tennessen et al. (2012) and Gazave et al. (2014)(0.0307 and 0.0338).
Unlike in African populations, the PPCs performed well fora wide range of summary statistics observed for European andAsian populations. Although there is likely extra complexity inEurasian demographic histories, the out-of-Africa bottleneckwas probably so strong that it wiped out part of the ancientdemographic signals in non-African populations comparedwith African populations. The assumption of a single ances-tral population of constant size may thus have a smaller im-pact on non-African population demographic inference,although we expect some parameter estimates to be biased.But, for example, the inferred bottleneck could be a
ABC Method for Whole-Genome Sequence Data . doi:10.1093/molbev/msz038 MBE
1573
Dow
nloaded from https://academ
ic.oup.com/m
be/article/36/7/1565/5345566 by guest on 20 July 2022
compromise between two events identified previously ascausing bottlenecks: the out-of-Africa migration and the splitbetween European and Asian populations (Schaffner et al.2005; Keinan et al. 2007). This would lead to an underestima-tion of the out-of-Africa timing. Our simulation of archaicintrogression into non-African population showed that thisevent could only minimally impact the demographic esti-mates that this study focuses on.
Demographic Histories in Africa and Goodness-of-FitOur study highlighted that the simple demographic scenarios,still often used to depict African populations, were not able toexplain the observed data. Interestingly, it showed that thecoestimated genotyping error rate might provide a conve-nient flag to detect models with poor fit even before perform-ing the PPC, especially when several populations of the samespecies are available, or when the error rate, or at least anupper bound of this rate, is known. This rate was indeedconsistently larger for data sets that could not be fitted byany proposed model. Note that when we estimated theparameters of the Bottleneck and one-expansion scenariobased on classical statistics (heterozygosity, Tajima’s D, etc.)and the SFS, we identified a weak bottleneck (average coeffi-cient 0.75) around 3,714 generations ago followed by a mildexpansion (average growth rate ¼ 4.4 � 10�4) (supplemen-tary table S7, Supplementary Material online). This history ismore similar to what is usually inferred for African popula-tions, such as the Yoruba. Yet, this scenario is not favoredwhen exploiting numerous linkage-informed statistics. Wesuggest that although this scenario is useful to have a broadpicture of past African histories, there is an additional demo-graphic signal that can be picked when extending the sum-mary statistics sets. Part of this complexity was highlighted byvarious studies based on more comprehensive data (seeSchlebusch and Jakobsson 2018 for a recent review). Thiscomplexity might encompass additional bottlenecks in theancient past, complex fluctuations in size or admixture be-tween populations.
Our results advocate for checking thoroughly thegoodness-of-fit of inferred models based on posterior checks,and for investigating more complex scenarios that could fitmost summary statistics of African data. In particular ancientstructure in Africa might be one of the causes of the poor fit,and previous studies (e.g., Sjodin et al. 2012) could be revisitedwith these new summary statistics in future work.
More generally, the goodness-of-fit of the demographichistories inferred from SMC, IBD, or AFS based approachesis too rarely investigated, although the outcome of theseapproaches is known to be strongly affected by past popula-tion structure or complex admixture and migration scenarios(see Mazet et al. 2016 for the case of PSMC). Several recentstudies illustrated that a demographic scenario proposedbased on one specific subset of summary statistics, could beclearly rejected when considering another one (Beichmanet al. 2017; Lapierre et al. 2017; Chikhi et al. 2018). As dem-onstrated in this study, ABC is a promising approach in thiscontext, because it provides a natural framework to performsuch goodness-of-fit tests.
We acknowledge that cases where scenarios do fit theobserved data according to the PPC and have a very higherror rate should be taken with caution, as high noise couldfacilitate the fit. However, this was not observed in our study,where the fit was poor for African populations (see table 4),suggesting that the variance added by the error rate did notlead to the acceptance of a wrong model. On the contrary, wefound that taking the error into account increased modelselection performances. From a Bayesian perspective, it couldbe of high interest for ABC studies to reconsider what shouldbe the (prior) belief in terms of error, depending on species,data type and quality. Often, the prior is that there is no erroror that the summary statistics are robust enough. A questionone might ask is, for a similar level of posterior probabilitiesand posterior predictive fit: is it more reasonable to have avery complex demographic model with no error or to havea simpler model with a moderate error rate? ABC provides aperfect framework to address this by allowing researchers toincorporate their knowledge on demographic, genotypingand sequencing error models.
Possible Methodological ExtensionsMutation and RecombinationIn this study, we used fixed mutation and recombinationrates, set to values commonly assumed in human genetics(see S�egurel et al. 2014 for review). Although it would be hardto coestimate the mutation rate because mutational effectbalances out with the population size (but additional ancientDNA samples could help to disentangle both), the averagerecombination rate could be coestimated as done by Boitardet al. (2016). Pseudo-data sets could also be simulated withrecombination rates varying along the chromosome, sincesuch maps have been established for human populationswith some degree of uncertainty (Kong et al. 2002; Frazeret al. 2007; Hinch et al. 2011). The first solution should bebeneficial mostly for nonmodel species for which even arough average rate is unknown, whereas the second solutioncould be tested for humans. However, adjusting the recom-bination maps according to the population of interest andsimulating data tailored for each genomic region would leadto a substantial increase in the number of simulationsrequired.
NeutralityWhen studying human demography, given the currentknowledge of the genetic map composition, it is possible todiscard presumed nonneutral regions such as protein-codingregions, human accelerated regions, DNA hypersensitive sites,and others (see Schraiber and Akey 2015 for review).However, doing so would prevent us from extracting contin-uous 2-MB long regions from the real data. As it is assumed inmost demographic inference methods (PSMC, MSMC, IBS-based approaches, etc.), given that such nonneutral regionsare uncommon, we considered here that their impact on theoverall demographic signal would be limited. However, sev-eral studies have demonstrated the strong confoundingeffects of background selection (e.g. Ewing and Jensen
Jay et al. . doi:10.1093/molbev/msz038 MBE
1574
Dow
nloaded from https://academ
ic.oup.com/m
be/article/36/7/1565/5345566 by guest on 20 July 2022
2016). Future developments are needed to address the chal-lenging task of coestimating selection and demography(Hernandez et al. 2011; Bank et al. 2014; Sheehan and Song,2016).
ConclusionWe implemented an ABC method that infers populationdemography from sequencing data, whereas accounting forthe specificities of these data (correlation between close SNPs,genotyping errors, etc.). We demonstrated that this methodallows inferring demographic histories consisting of successivebottleneck and expansions from a limited number of individ-uals. We successfully applied this method to human popula-tions from Eurasia, inferring the out-of-Africa bottleneck andtwo successive expansions corresponding to the Paleolithicand Neolithic periods.
An additional goal of our study was to understand whatcommonly used population genetic summary statisticsshould an ABC for sequencing data framework rely on. Weconclude that it depends on the investigated demographicmodel, but that the AF-IBS (Theunert et al. 2012) is a keystatistic that consistently increased prediction accuracy.
Even though more and more sequences are available, it islikely that data set will remain of limited size in the comingyears for most nonmodel species. Therefore, methods thatmake the best of a sample of intermediate size are muchneeded, and our approach will be useful for studying popu-lations in many species.
Materials and Methods
Simulated DataWe simulated sequences of length 2 Mbp using fastsimcoal2.5 (Excoffier et al. 2013). This program generates quickly longneutral sequences with recombination based on the SMC(McVean and Cardin 2005; Marjoram and Wall 2006). Foreach parameter set, we simulated 100 independent tracts,with a constant mutation rate of 1.25 � 10�8 per site pergeneration, and a constant recombination rate of 1 � 10�8
per site per generation (Scally and Durbin 2012; Schiffels andDurbin 2014). We generated around 300,000 pseudo-datasets for each of the five demographic models displayed infigure 1. They consist in one optional bottleneck followedeither by an instant recovery or by one or two expansions.These exponential expansions happen in the last 5,000 gen-erations, and the population sizes can range from 100 to500,000 (see supplementary text and supplementary tableS1, Supplementary Material online, for detailed informationand description of parameters and priors).
For the preliminary analyses, simulations were generatedunder models of constant size followed by either one or twoexponential expansions with narrower priors (all populationsizes were constrained to be under 70,000, supplementarytable S1, Supplementary Material online). The remainingparameters (length and number of tracts, rates, and numberof simulations per model) were similar to the extendedanalyses.
When taking sequencing errors into account, we intro-duced an extra parameter, the error rate, associated with auniform prior distribution with bounds [0, 2� 10�5]. At eachposition in the initial sample (even monomorphic positions)and for each haplotype, the allele was switched from derivedto ancestral—or from ancestral to derived—with a probabil-ity equal to this error rate.
We simulated archaic introgression into Eurasians,with a model of a single pulse of gene flow from an archaicpopulation 1,900 generations ago with a rate of 2% or 5%,a divergence time between archaic and modern humanpopulations set to 20,000 generations and archaic popu-lation size set to 5,000 following previous studies(Sankararaman et al. 2012; Wall et al. 2013; Prufer et al.2014). The population size changes for the modern hu-man population were in the same range as the one in-ferred by (Gravel et al. 2011; Tennessen et al. 2012)(supplementary fig. S9, Supplementary Material online).We generated 100 genetic data sets and their summarystatistics for each of the assumed admixture rates (2% or5%) and also for the case with the same demographicmodel but without admixture.
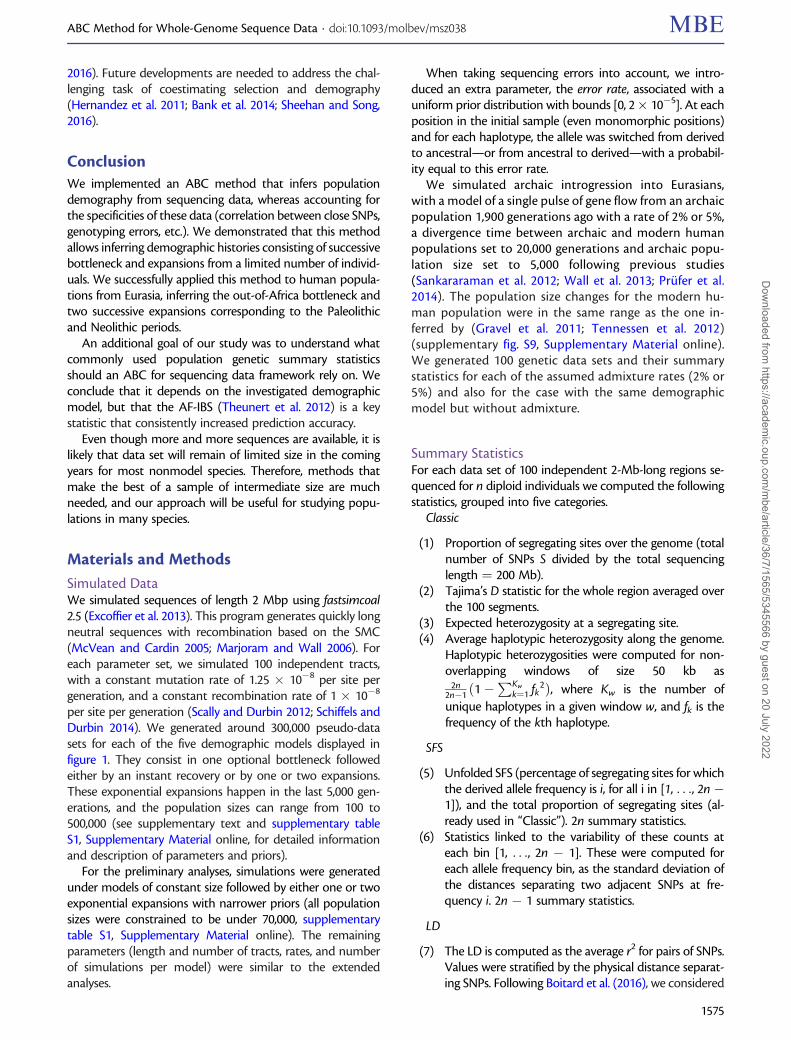
Summary StatisticsFor each data set of 100 independent 2-Mb-long regions se-quenced for n diploid individuals we computed the followingstatistics, grouped into five categories.
Classic
(1) Proportion of segregating sites over the genome (totalnumber of SNPs S divided by the total sequencinglength ¼ 200 Mb).
(2) Tajima’s D statistic for the whole region averaged overthe 100 segments.
(3) Expected heterozygosity at a segregating site.(4) Average haplotypic heterozygosity along the genome.
Haplotypic heterozygosities were computed for non-overlapping windows of size 50 kb as
2n2n�1 ð1�
PKw
k¼1 fk2Þ, where Kw is the number of
unique haplotypes in a given window w, and fk is thefrequency of the kth haplotype.
SFS
(5) Unfolded SFS (percentage of segregating sites for whichthe derived allele frequency is i, for all i in [1, . . ., 2n�1]), and the total proportion of segregating sites (al-ready used in “Classic”). 2n summary statistics.
(6) Statistics linked to the variability of these counts ateach bin [1, . . ., 2n � 1]. These were computed foreach allele frequency bin, as the standard deviation ofthe distances separating two adjacent SNPs at fre-quency i. 2n � 1 summary statistics.
LD
(7) The LD is computed as the average r2 for pairs of SNPs.Values were stratified by the physical distance separat-ing SNPs. Following Boitard et al. (2016), we considered
ABC Method for Whole-Genome Sequence Data . doi:10.1093/molbev/msz038 MBE
1575
Dow
nloaded from https://academ
ic.oup.com/m
be/article/36/7/1565/5345566 by guest on 20 July 2022
19 bins of distances (for which the mean ranged from282 bp to 1.4 Mb). Nineteen summary statistics.
IBS
(8) The length distributions of IBS segments shared be-tween m haplotypes were summarized by 10 percen-tiles. Those were computed for m ¼ 2, 4, 8, and 16haplotypes. IBS segments were defined as regions of thegenome completely identical across haplotypes. Fortysummary statistics.
AF-IBS
(9) At each SNP, the AF-IBS segment is identified as theregion extending around this SNP and identical acrossall haplotypes carrying the derived allele at the focalSNP (Theunert et al. 2012). The lengths of AF-IBS seg-ments are stratified by the frequency at their focal SNP,leading to a distribution for each frequency [2/n, . . .(2n � 1)/n]. We summarize each distribution by itsmean and variance. 2 � (2n � 1) summary statistics.
All summary statistics were computed using our custompython scripts that will be available at https://gitlab.inria.fr/ml_genetics/public/demoseq, last accessed March 15, 2019.
Approximate Bayesian ComputationABC is a Bayesian framework designed for models with un-known likelihood but under which one can generate datathrough computer simulations. It aims at selecting the modelthat best explains the observed data among several possiblescenarios, as well at estimating the parameters of this model.Given a distribution a priori of the parameters, ABC approx-imates their posterior distribution via two simplifying steps: 1)the full data set is reduced to a set of summary statistics and2) the new posterior given these summary statistics isobtained through the inspection of numerous pseudo-datasets. Those pseudo-data sets are simulated using the genera-tive model with parameter values drawn from specified priordistributions. Pseudo-data sets for which summary statisticsare close enough to the observed ones are accepted and theircorresponding parameter values are considered as a sample ofthe approximate posterior distribution (standard rejectionalgorithm). In refined ABC algorithms these acceptedpseudo-data sets are used to learn a local relation linkingthe summary statistics to the model parameters, this as-sumed relation being: a linear model (Beaumont et al.2002), a linear model penalizing large coefficients to betteraccount for collinearity between summary statistics (ridgeregression, Blum et al. 2013), or a nonlinear model (calibratedusing feed-forward neural networks, Blum and Francois 2010).Formally, given S the observed summary statistics, h the trueparameter, Si the summary statistics of pseudo-data set igenerated with parameter values hi, and g the tolerance error,a model f is learned from accepted simulations so that for all i,hi ¼ f Sið Þ þ �i with �i a random variable with mean zero andconstant variance (in homoscedastic models). Acceptedparameter values are then adjusted as followed, hi
adj ¼ hi
þf Sð Þ � f Sið Þ and weighted by the Euclidean distance
between S and Si, to approximate the posterior distribution.For more details and formal descriptions of the heteroscedas-tic model that we used (where the variance is not constant)see Blum and Francois (2010).
As recommended by Blum and Francois (2010), beforelearning the different models, we applied a logit transforma-tion to the parameters with bounds corresponding to thebounds of their prior distribution.
When running the leave-one-out cross-validations, theprediction error was calculated as
Pðhi� � hÞ2
nval � varðhÞ ;
where h is the true parameter value, h� is the predicted pa-rameter value, and nval is the number of points where trueand predicted values are compared (Csill�ery et al. 2012).
We also computed the relative bias as
1
nval
Xnval
i
hi – hi�
m;
where m¼ h�, the average of the absolute values of h, and thefactor 2 as the proportion of test data sets for which the pointestimate is at least half and at most twice the true value, thatis,
1
nval
Xnval
i
Ind ð0:5 hi � hi� � 2 hiÞ;
where Ind denotes the indicator function (Cornuet et al.2008).
All ABC analyses were performed with the R package “abc”(Csill�ery et al. 2012) and we tested four methods for param-eter estimation: rejection, linear regression, ridge regression,and neural network, and three methods for model selectionthat compute posterior model probabilities (rejection, multi-nomial logistic regression, and neural network). All hyperparameters were set to the default settings apart from thelogit transformation and the tolerance rate that we varied.The neuralnet method is based on single-hidden-layer net-works with five hidden units, that take as input the values ofthe summary statistics obtained in the simulations kept afterrejection and predict 1) the conditional expectation of demo-graphic parameters or 2) their conditional variance (for het-eroscedastic models, see Blum and Francois [2010] eq. 8) or 3)the model probabilities (model selection step). The loss func-tion includes a L2 penalty on the network weights. The modelf , used for adjusting demographic parameters, corresponds tothe median of ten networks, independently trained with pe-nalization parameters randomly chosen in [10�4, 10�3, 10�2].
Posterior Predictive ChecksTo evaluate the goodness-of-fit of an inferred scenario(a model and its parameters), we performed PPCs. We 1)randomly drew 500 parameter sets from their posterior dis-tribution, 2) resimulated 500 corresponding genetic data setswith fastsimcoal (Excoffier et al. 2013) and computed their
Jay et al. . doi:10.1093/molbev/msz038 MBE
1576
Dow
nloaded from https://academ
ic.oup.com/m
be/article/36/7/1565/5345566 by guest on 20 July 2022
summary statistics, and 3) evaluated whether the observedstatistics were in the range of the newly computed ones. Thepercentage of summary statistics in this posterior predictiverange are reported separately for the ones that were used toestimate the demographic parameters and the others. Lowpercentages indicate that the inferred scenario provides apoor fit to the observed data set.
Publicly Available GenomesComplete GenomicsWe used a data set of 54 unrelated individuals present in thepanel “69 Genomes” from CG (Drmanac et al. 2010). The dataphased by Rasmussen et al. (2014) using SHAPEIT2 (Delaneauet al. 2013) are available at compgen.cshl.edu/ARGweaver/CG_results/download/, last accessed March 15, 2019. OurABC procedure was applied independently to nine individualsof European ancestry (Utah residents, CEU) and nine individ-uals from the African Yoruba population (YRI). Non over-lapping regions of 2 Mb were extracted randomly afterprocessing the genome for outliers in term of missing data,missing ancestral information and recombination. Those fil-ters are described in supplementary material text,Supplementary Material online.
1000 GenomesThe latest version of the 1000g phase 3 data was downloadedfrom ftp.1000genomes.ebi.ac.uk (release 20130502, file date20140730). These genomes were already phased using an im-proved version of SHAPEIT2 (Delaneau et al. 2014; 1000Genomes Project Consortium et al. 2015). Once again weapplied our ABC approach to nine individuals chosen ran-domly from each of the following groups: African (Esan, ESN;Gambian, GWD; Luhya, LWK; Mende, MSL; and Yoruba, YRI),European (Utah residents of European ancestry, CEU; Iberian,IBS; and Tuscan, TSI), South Asian (Bengali, BEB; Gujarati, GIH;and Punjabi, PJL), and East Asian (Han Chinese, CHB; Kinh,KHV; and Japanese, JPT). Data are processed the same way asthe CG.
Supplementary MaterialSupplementary data are available at Molecular Biology andEvolution online.
AcknowledgmentsThis work was supported by the ANR grant DemoChips (12-BSV7-0012) coordinated by F.A., which funded in particularthe salary of F.J., and by the NEFREX project funded by theEuropean Union (People Marie Curie Actions, InternationalResearch Staff Exchange Scheme, call FP7-PEOPLE-2012-IRSES-number 318979). Large scale simulations were ran on theGenotoul bioinformatics platform Toulouse Midi-Pyr�en�ees(www.bioinfo.genotoul.fr). We thank Bertrand Servin for shar-ing his original python code, Michael Blum for discussionsabout the “abc” R package, Trevor Pemberton for discussionsabout error rates in CG and 1000G data sets, and SusanaRibeiro for comments on the manuscript.
References1000 Genomes Project Consortium,Auton A, Brooks LD, Durbin RM,
Garrison EP, Kang HM, Korbel JO, Marchini JL, McCarthy S, McVeanGA, et al. 2015. A global reference for human genetic variation.Nature 526:68–74.
Aim�e C, Austerlitz F. 2017. Different kinds of genetic markers permitinference of Paleolithic and Neolithic expansions in humans. Eur JHum Genet. 25(3): 360–365.
Aim�e C, Laval G, Patin E, Verdu P, S�egurel L, Chaix R, Hegay T, Quintana-Murci L, Heyer E, Austerlitz F. 2013. Human genetic data revealcontrasting demographic patterns between sedentary and nomadicpopulations that predate the emergence of farming. Mol Biol Evol.30(12): 2629–2644.
Aim�e C, Verdu P, S�egurel L, Martinez-Cruz B, Hegay T, Heyer E, AusterlitzF. 2014. Microsatellite data show recent demographic expansions insedentary but not in nomadic human populations in Africa andEurasia. Eur J Hum Genet. 22(10): 1201–1207.
Bank C, Ewing GB, Ferrer-Admettla A, Foll M, Jensen JD. 2014. Thinkingtoo positive? Revisiting current methods of population genetic se-lection inference. Trends Genet. 30:540–546.
Batini C, Lopes J, Behar DM, Calafell F, Jorde LB, van der Veen L,Quintana-Murci L, Spedini G, Destro-Bisol G, Comas D. 2011.Insights into the demographic history of African pygmies from com-plete mitochondrial genomes. Mol Biol Evol. 28(2): 1099–1110.
Beaumont MA. 2008. Joint determination of topology, divergence time,and immigration in population trees. In: Matsumura S, Forster P,Renfrew C, editors. Simulation, genetics, and human prehistory.Cambridge: McDonald Institute for Archaeological Research. p.135–154.
Beaumont MA, Zhang W, Balding DJ. 2002. Approximate Bayesian com-putation in population. Genetics 162(4): 2025–2035.
Beichman AC, Phung TN, Lohmueller KE. 2017. Comparison of singlegenome and allele frequency data reveals discordant demographichistories. G3 7(11): 3605–3620.
Bellwood P. 2005. First Farmers: The Origins of Agricultural Societies.Oxford: Blackwell.
Bhaskar A, Song YS. 2014. Descartes’ rule of signs and the identifiability ofpopulation demographic models from genomic variation data. AnnStat. 42(6): 2469–2493.
Bhaskar A, Wang YXR, Song YS. 2015. Efficient inference of populationsize histories and locus-specific mutation rates from large-samplegenomic variation data. Genome Res. 25(2): 268–279.
Blum MGB. 2010. Approximate Bayesian Computation: a nonparamet-ric perspective. J Am Stat Assoc. 105: 1178–1187.
Blum MGB, Francois O. 2010. Non-linear regression models forApproximate Bayesian Computation. Stat Comput. 20(1): 63–73.
Blum MGB, Nunes MA, Prangle D, Sisson SA. 2013. A comparative re-view of dimension reduction methods in Approximate BayesianComputation. Stat Sci. 28(2): 189–208.
Boitard S, Rodr�ıguez W, Jay F, Mona S, Austerlitz F. 2016. Inferring pop-ulation size history from large samples of genome-wide moleculardata—an Approximate Bayesian Computation approach. PLoSGenet. 12(3): e1005877.
Browning SR, Browning BL. 2015. Accurate non-parametric estimation ofrecent effective population size from segments of identity by de-scent. Am J Hum Genet. 97(3): 404–418.
Carmi S, Hui KY, Kochav E, Liu X, Xue J, Grady F, Guha S, Upadhyay K,Ben-Avraham D, Mukherjee S, et al. 2014. Sequencing anAshkenazi reference panel supports population-targeted personalgenomics and illuminates Jewish and European origins. NatCommun. 5:4835.
Chikhi L, Rodr�ıguez W, Grusea S, Santos P, Boitard S, Mazet O. 2018. TheIICR (inverse instantaneous coalescence rate) as a summary of ge-nomic diversity: insights into demographic inference and modelchoice. Heredity 120(1): 13–24.
Cornuet J-M, Santos F, Beaumont MA, Robert CP, Marin J-M, Balding DJ,Guillemaud T, Estoup A. 2008. Inferring population history with DIYABC: a user-friendly approach to Approximate BayesianComputation. Bioinformatics 24(23): 2713.
ABC Method for Whole-Genome Sequence Data . doi:10.1093/molbev/msz038 MBE
1577
Dow
nloaded from https://academ
ic.oup.com/m
be/article/36/7/1565/5345566 by guest on 20 July 2022

Cox MP, Morales DA, Woerner AE, Sozanski J, Wall JD, Hammer MF.2009. Autosomal resequence data reveal late stone age signals ofpopulation expansion in sub-Saharan African foraging and farmingpopulations. PLoS One 4(7): e6366.
Csill�ery K, Blum MGB, Gaggiotti OE, Francois O. 2010. ApproximateBayesian Computation (ABC) in practice. Trends Ecol Evol. 25(7):410–418.
Csill�ery K, Francois O, Blum MGB. 2012. abc: an R package forApproximate Bayesian Computation (ABC). Methods Ecol Evol.3(3): 475–479.
Delaneau O, Marchini J, 1000 Genomes Project Consortium. 2014.Integrating sequence and array data to create an improved1000 Genomes Project haplotype reference panel. Nat Commun.13:3934.
Delaneau O, Zagury J-F, Marchini J. 2013. Improved whole-chromosomephasing for disease and population genetic studies. Nat Methods.10(1): 5–6.
DePristo MA, Banks E, Poplin R, Garimella KV, Maguire JR, Hartl C,Philippakis AA, del Angel G, Rivas MA, Hanna M, et al. 2011. Aframework for variation discovery and genotyping using next-generation DNA sequencing data. Nat Genet. 43(5): 491–498.
Drmanac R, Sparks AB, Callow MJ, Halpern AL, Burns NL, Kermani BG,Carnevali P, Nazarenko I, Nilsen GB, Yeung G, et al. 2010. Humangenome sequencing using unchained base reads on self-assemblingDNA nanoarrays. Science 327(5961): 78–81.
Excoffier L, Dupanloup I, Huerta-Sanchez E, Sousa VC, Foll M. 2013.Robust demographic inference from genomic and SNP data. PLoSGenet. 9(10): e1003905.
Excoffier L, Estoup A, Cornuet J-M. 2005. Bayesian analysis of an admix-ture model with mutations and arbitrarily linked markers. Genetics169(3): 1727–1738.
Excoffier L, Schneider S. 1999. Why hunter-gatherer populations do notshow signs of Pleistocene demographic expansions. Proc Natl AcadSci U S A. 96(19): 10597–10602.
Ewing GB, Jensen JD. 2016. The consequences of not accounting forbackground selection in demographic inference. Mol. Ecol. 25:135–141.
Flagel L, Brandvain YJ, Schrider DR. 2018. The unreasonable effectivenessof convolutional neural networks in population genetic inference.Mol Biol Evol. 36(2): 220–238.
Fontaine MC, Snirc A, Frantzis A, Koutrakis E, €Ozturk B, €Ozturk AA,Austerlitz F. 2012. History of expansion and anthropogenic collapsein a top marine predator of the Black Sea estimated from geneticdata. Proc Natl Acad Sci U S A. 109(38): E2569–E2576.
Frazer KA, Ballinger DG, Cox DR, Hinds DA, Stuve LL, Gibbs RA, BelmontJW, Boudreau A, Hardenbol P, Leal SM, et al. 2007. A second gener-ation human haplotype map of over 3.1 million SNPs. Nature449(7164): 851–861.
Gattepaille LM, Jakobsson M, Blum MGB. 2013. Inferring population sizechanges with sequence and SNP data: lessons from human bottle-necks. Heredity 110(5): 409–419.
Gazave E, Ma L, Chang D, Coventry A, Gao F, Muzny D, Boerwinkle E,Gibbs RA, Sing CF, Clark AG, et al. 2014. Neutral genomic regionsrefine models of recent rapid human population growth. Proc NatlAcad Sci U S A. 111(2): 757–762.
Gravel S, Henn BM, Gutenkunst RN, Indap AR, Marth GT, Clark AG, YuF, Gibbs RA, Bustamante CD, Altshuler DL, et al. 2011. Demographichistory and rare allele sharing among human populations. Proc NatlAcad Sci U S A. 108(29): 11983–11988.
Gutenkunst RN, Hernandez RD, Williamson SH, Bustamante CD. 2009.Inferring the joint demographic history of multiple populationsfrom multidimensional SNP frequency data. PLoS Genet. 5(10):e1000695.
Harris K, Nielsen R. 2013. Inferring demographic history from a spectrumof shared haplotype lengths. PLoS Genet. 9(6): e1003521.
Hayes BJ, Visscher PM, McPartlan HC, Goddard ME. 2003. Novel multi-locus measure of linkage disequilibrium to estimate past effectivepopulation size. Genome Res. 13(4): 635–643.
Hernandez RD, Kelley JL, Elyashiv E, Melton SC, Auton A, McVean G,Project 1000 Genomes, Sella G, Przeworski M. 2011. Classic SelectiveSweeps Were Rare in Recent Human Evolution. Science 331:920–924.
Hinch AG, Tandon A, Patterson N, Song Y, Rohland N, Palmer CD, ChenGK, Wang K, Buxbaum SG, Akylbekova EL, et al. 2011. The landscapeof recombination in African Americans. Nature 476(7359): 170–175.
Jiang B, Wu TY, Zheng C, Wong WH. 2017. Learning summary statisticfor Approximate Bayesian Computation via deep neural network.Stat Sin. 27(4): 1595–1618.
Keinan A, Mullikin JC, Patterson N, Reich D. 2007. Measurementof the human allele frequency spectrum demonstrates greater ge-netic drift in East Asians than in Europeans. Nat Genet. 39(10):1251–1255.
Kong A, Gudbjartsson DF, Sainz J, Jonsdottir GM, Gudjonsson SA,Richardsson B, Sigurdardottir S, Barnard J, Hallbeck B, Masson G,et al. 2002. A high-resolution recombination map of the humangenome. Nat Genet. 31(3): 241–247.
Lapierre M, Lambert A, Achaz G. 2017. Accuracy of demographic infer-ences from the site frequency spectrum: the case of the Yorubapopulation. Genetics 206(1): 439–449.
Li H. 2011. A statistical framework for SNP calling, mutation discovery,association mapping and population genetical parameter estimationfrom sequencing data. Bioinformatics 27(21): 2987–2993.
Li H, Durbin R. 2011. Inference of human population history from indi-vidual whole-genome sequences. Nature 475(7357): 493–496.
Li S, Jakobsson M. 2012. Estimating demographic parameters from large-scale population genomic data using Approximate BayesianComputation. BMC Genet. 13:22.
Liao P, Satten GA, Hu Y-J. 2017. PhredEM: a phred-score-informed ge-notype-calling approach for next-generation sequencing studies.Genet Epidemiol. 41(5): 375–387.
Liu X, Fu Y-X. 2015. Exploring population size changes using SNP fre-quency spectra. Nat Genet. 47(5): 555–559.
MacLeod IM, Larkin DM, Lewin HA, Hayes BJ, Goddard ME. 2013.Inferring demography from runs of homozygosity in whole-genome sequence, with correction for sequence errors. Mol BiolEvol. 30(9): 2209–2223.
Marjoram P, Wall JD. 2006. Fast “coalescent” simulation. BMC Genet. 7:1.Martin ER, Kinnamon DD, Schmidt MA, Powell EH, Zuchner S, Morris
RW. 2010. SeqEM: an adaptive genotype-calling approach for next-generation sequencing studies. Bioinformatics 26(22): 2803–2810.
Mazet O, Rodriguez W, Grusea S, Boitard S, Chikhi L. 2016. On theimportance of being structured: instantaneous coalescence ratesand human evolution—lessons for ancestral population size infer-ence? Heredity 116(4): 362–371.
McVean GAT, Cardin NJ. 2005. Approximating the coalescent with re-combination. Philos Trans R Soc Lond B Biol Sci. 360(1459):1387–1393.
Nielsen R, Paul JS, Albrechtsen A, Song YS. 2011. Genotype and SNPcalling from next-generation sequencing data. Nat Rev Genet. 12(6):443–451.
Palamara PF, Lencz T, Darvasi A, Pe’er I. 2012. Length distributions ofidentity by descent reveal fine-scale demographic history. Am J HumGenet. 91(5): 809–822.
Palstra FP, Heyer E, Austerlitz F. 2015. Statistical inference on genetic datareveals the complex demographic history of human populations inCentral Asia. Mol Biol Evol. 32(6): 1411–1424.
Patin E, Laval G, Barreiro LB, Salas A, Semino O, Santachiara-BenerecettiS, Kidd KK, Kidd JR, Veen LV, der Hombert J-M, et al. 2009. Inferringthe demographic history of African farmers and pygmy hunter–gatherers using a multilocus resequencing data set. PLoS Genet.5(4): e1000448.
Patin E, Siddle KJ, Laval G, Quach H, Harmant C, Becker N, Froment A,R�egnault B, Lem�ee L, Gravel S, et al. 2014. The impact of agriculturalemergence on the genetic history of African rainforest hunter-gatherers and agriculturalists. Nat Commun. 5:3163.
Prufer K, Racimo F, Patterson N, Jay F, Sankararaman S, Sawyer S, HeinzeA, Renaud G, Sudmant PH, de Filippo C, et al. 2014. The complete
Jay et al. . doi:10.1093/molbev/msz038 MBE
1578
Dow
nloaded from https://academ
ic.oup.com/m
be/article/36/7/1565/5345566 by guest on 20 July 2022
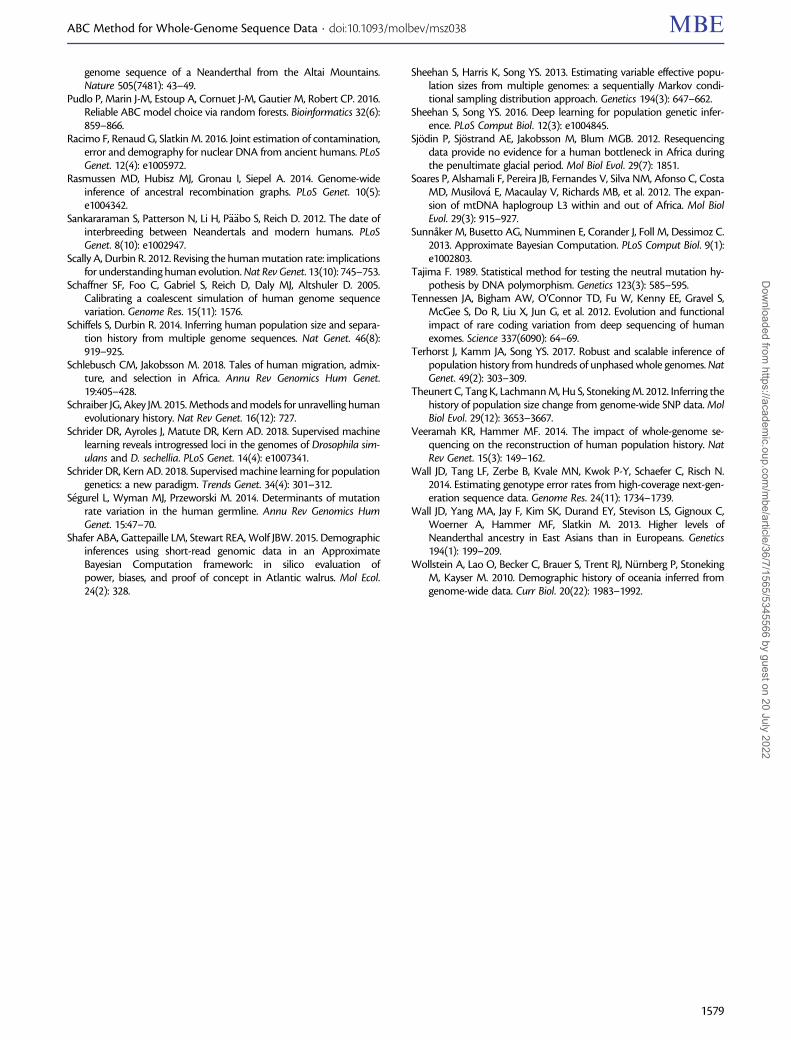
genome sequence of a Neanderthal from the Altai Mountains.Nature 505(7481): 43–49.
Pudlo P, Marin J-M, Estoup A, Cornuet J-M, Gautier M, Robert CP. 2016.Reliable ABC model choice via random forests. Bioinformatics 32(6):859–866.
Racimo F, Renaud G, Slatkin M. 2016. Joint estimation of contamination,error and demography for nuclear DNA from ancient humans. PLoSGenet. 12(4): e1005972.
Rasmussen MD, Hubisz MJ, Gronau I, Siepel A. 2014. Genome-wideinference of ancestral recombination graphs. PLoS Genet. 10(5):e1004342.
Sankararaman S, Patterson N, Li H, P€a€abo S, Reich D. 2012. The date ofinterbreeding between Neandertals and modern humans. PLoSGenet. 8(10): e1002947.
Scally A, Durbin R. 2012. Revising the human mutation rate: implicationsfor understanding human evolution. Nat Rev Genet. 13(10): 745–753.
Schaffner SF, Foo C, Gabriel S, Reich D, Daly MJ, Altshuler D. 2005.Calibrating a coalescent simulation of human genome sequencevariation. Genome Res. 15(11): 1576.
Schiffels S, Durbin R. 2014. Inferring human population size and separa-tion history from multiple genome sequences. Nat Genet. 46(8):919–925.
Schlebusch CM, Jakobsson M. 2018. Tales of human migration, admix-ture, and selection in Africa. Annu Rev Genomics Hum Genet.19:405–428.
Schraiber JG, Akey JM. 2015. Methods and models for unravelling humanevolutionary history. Nat Rev Genet. 16(12): 727.
Schrider DR, Ayroles J, Matute DR, Kern AD. 2018. Supervised machinelearning reveals introgressed loci in the genomes of Drosophila sim-ulans and D. sechellia. PLoS Genet. 14(4): e1007341.
Schrider DR, Kern AD. 2018. Supervised machine learning for populationgenetics: a new paradigm. Trends Genet. 34(4): 301–312.
S�egurel L, Wyman MJ, Przeworski M. 2014. Determinants of mutationrate variation in the human germline. Annu Rev Genomics HumGenet. 15:47–70.
Shafer ABA, Gattepaille LM, Stewart REA, Wolf JBW. 2015. Demographicinferences using short-read genomic data in an ApproximateBayesian Computation framework: in silico evaluation ofpower, biases, and proof of concept in Atlantic walrus. Mol Ecol.24(2): 328.
Sheehan S, Harris K, Song YS. 2013. Estimating variable effective popu-lation sizes from multiple genomes: a sequentially Markov condi-tional sampling distribution approach. Genetics 194(3): 647–662.
Sheehan S, Song YS. 2016. Deep learning for population genetic infer-ence. PLoS Comput Biol. 12(3): e1004845.
Sjodin P, Sjostrand AE, Jakobsson M, Blum MGB. 2012. Resequencingdata provide no evidence for a human bottleneck in Africa duringthe penultimate glacial period. Mol Biol Evol. 29(7): 1851.
Soares P, Alshamali F, Pereira JB, Fernandes V, Silva NM, Afonso C, CostaMD, Musilov�a E, Macaulay V, Richards MB, et al. 2012. The expan-sion of mtDNA haplogroup L3 within and out of Africa. Mol BiolEvol. 29(3): 915–927.
Sunnaker M, Busetto AG, Numminen E, Corander J, Foll M, Dessimoz C.2013. Approximate Bayesian Computation. PLoS Comput Biol. 9(1):e1002803.
Tajima F. 1989. Statistical method for testing the neutral mutation hy-pothesis by DNA polymorphism. Genetics 123(3): 585–595.
Tennessen JA, Bigham AW, O’Connor TD, Fu W, Kenny EE, Gravel S,McGee S, Do R, Liu X, Jun G, et al. 2012. Evolution and functionalimpact of rare coding variation from deep sequencing of humanexomes. Science 337(6090): 64–69.
Terhorst J, Kamm JA, Song YS. 2017. Robust and scalable inference ofpopulation history from hundreds of unphased whole genomes. NatGenet. 49(2): 303–309.
Theunert C, Tang K, Lachmann M, Hu S, Stoneking M. 2012. Inferring thehistory of population size change from genome-wide SNP data. MolBiol Evol. 29(12): 3653–3667.
Veeramah KR, Hammer MF. 2014. The impact of whole-genome se-quencing on the reconstruction of human population history. NatRev Genet. 15(3): 149–162.
Wall JD, Tang LF, Zerbe B, Kvale MN, Kwok P-Y, Schaefer C, Risch N.2014. Estimating genotype error rates from high-coverage next-gen-eration sequence data. Genome Res. 24(11): 1734–1739.
Wall JD, Yang MA, Jay F, Kim SK, Durand EY, Stevison LS, Gignoux C,Woerner A, Hammer MF, Slatkin M. 2013. Higher levels ofNeanderthal ancestry in East Asians than in Europeans. Genetics194(1): 199–209.
Wollstein A, Lao O, Becker C, Brauer S, Trent RJ, Nurnberg P, StonekingM, Kayser M. 2010. Demographic history of oceania inferred fromgenome-wide data. Curr Biol. 20(22): 1983–1992.
ABC Method for Whole-Genome Sequence Data . doi:10.1093/molbev/msz038 MBE
1579
Dow
nloaded from https://academ
ic.oup.com/m
be/article/36/7/1565/5345566 by guest on 20 July 2022