correction: whole-genome analysis of the short-root developmental pathway in arabidopsis
TRANSCRIPT

Whole-Genome Analysis of the SHORT-ROOTDevelopmental Pathway in ArabidopsisMitchell P. Levesque
1[¤a, Teva Vernoux
1[¤b, Wolfgang Busch
2, Hongchang Cui
1, Jean Y. Wang
1, Ikram Blilou
3,
Hala Hassan3
, Keiji Nakajima1¤c
, Noritaka Matsumoto1¤d
, Jan U. Lohmann2
, Ben Scheres3
, Philip N. Benfey1*
1 Department of Biology and Institute for Genome Sciences and Policy, Duke University, Durham, North Carolina, United States of America, 2 Max Planck Institute for
Developmental Biology, Tubingen, Germany, 3 Department of Molecular Cell Biology, Utrecht University, Utrecht, Netherlands
Stem cell function during organogenesis is a key issue in developmental biology. The transcription factor SHORT-ROOT(SHR) is a critical component in a developmental pathway regulating both the specification of the root stem cell nicheand the differentiation potential of a subset of stem cells in the Arabidopsis root. To obtain a comprehensive view ofthe SHR pathway, we used a statistical method called meta-analysis to combine the results of several microarrayexperiments measuring the changes in global expression profiles after modulating SHR activity. Meta-analysis was firstused to identify the direct targets of SHR by combining results from an inducible form of SHR driven by its endogenouspromoter, ectopic expression, followed by cell sorting and comparisons of mutant to wild-type roots. Eight putativedirect targets of SHR were identified, all with expression patterns encompassing subsets of the native SHR expressiondomain. Further evidence for direct regulation by SHR came from binding of SHR in vivo to the promoter regions offour of the eight putative targets. A new role for SHR in the vascular cylinder was predicted from the expressionpattern of several direct targets and confirmed with independent markers. The meta-analysis approach was then usedto perform a global survey of the SHR indirect targets. Our analysis suggests that the SHR pathway regulates rootdevelopment not only through a large transcription regulatory network but also through hormonal pathways andsignaling pathways using receptor-like kinases. Taken together, our results not only identify the first nodes in the SHRpathway and a new function for SHR in the development of the vascular tissue but also reveal the global architectureof this developmental pathway.
Citation: Levesque MP, Vernoux T, Busch W, Cui H, Wang JY, et al. (2006) Whole-genome analysis of the SHORT-ROOT developmental pathway in Arabidopsis. PLoS Biol 4(5):e143. DOI: 10.1371/journal.pbio.0040143
Introduction
How stem cell populations are maintained and how theirdifferentiation potential is regulated are key issues indevelopmental biology. In higher plants, stem cells arelocated in specialized structures called meristems [1]. In theroot meristem of Arabidopsis (Figure 1), the stem cells orinitials surround a group of slowly dividing cells named thequiescent center (QC), which acts as a signaling center thatpositions and maintains the stem cell niche (Figure 1A) [2,3].Stereotyped divisions of the initial cells generate the radialsymmetry of the root, where concentric layers of epidermis,cortex, endodermis, and pericycle surround a central vascularcylinder, with the latter two tissues forming the stele. Forexample, cortex and endodermis (collectively named groundtissue) originate from the asymmetric division of a singleinitial cell in the meristem: the cortex/endodermis initial(CEI) (Figure 1A and 1B) [4,5]. This initial is first cleavedtransversely, generating a new initial cell and a daughter cell.The CEI daughter cell then divides longitudinally, generatingthe first cells of the endodermal and cortical cell lineages.
SHORT-ROOT (SHR) is a putative transcription factor ofthe GRAS family and is a key component in a developmentalpathway regulating the specification of the root stem cellniche as well as the radial patterning of the root in Arabidopsis[6–8]. In shr mutants, a progressive disorganization of the QCis observed together with a loss of stem cell activity and acessation of root growth. Mutation of the SHR gene alsoaffects the development of the ground tissue and perturbs theradial pattern of the root. shr mutants do not undergo the
longitudinal cell division of the CEI daughter cell, resulting ina single layer with only cortex attributes (Figure 1D and 1E)[6,7]. SHR is thus implicated in specification of the root stemcell niche, asymmetric division of the CEI, and endodermisfate specification. SHR mRNA is exclusively found in the stele
Academic Editor: Daphne Preuss, Howard Hughes Medical Institute, United Statesof America
Received December 22, 2005; Accepted March 3, 2006; Published May 2, 2006
DOI: 10.1371/journal.pbio.0040143
Copyright: � 2006 Levesque et al. This is an open-access article distributed underthe terms of the Creative Commons Attribution License, which permits unrestricteduse, distribution, and reproduction in any medium, provided the original authorand source are credited.
Abbreviations: BR, brassinosteroid; CEI, cortex/endodermis initial; ChIP, chromatinimmunoprecipitation; Cyc, cycloheximide; Dex, dexamethasone; GFP, greenfluorescent protein; GO, Gene Ontology; GR, glucocorticoid receptor; LRC, lateralroot cap; PFR, predicted false-positive rate; QC, quiescent center; QRT, quantitativereal-time; RLK, receptor-like kinase; SHR, SHORT-ROOT; SOM, self-organized map;TE, translational enhancer element; TRI, tropinone reductase
* To whom correspondence should be addressed. E-mail: [email protected]
[ These authors contributed equally to this work.
¤a Current address: Max Planck Institute for Developmental Biology, Tubingen,Germany
¤b Current address: Reproduction et Developpement des Plantes, Ecole NormaleSuperieure de Lyon, Centre National de la Recherche Scientifique, Institut Nationalde la Recherche Agronomique, Universite Lyon I, Lyon Cedex, France
¤c Current address: Graduate School of Biological Sciences, Nara Institute ofScience and Technology, Nara, Japan
¤d Current address: Department of Botany, Graduate School of Science, KyotoUniversity, Kitashirakawa-Oiwake-cho, Sakyo-ku, Kyoto, Japan
PLoS Biology | www.plosbiology.org May 2006 | Volume 4 | Issue 5 | e1430739
PLoS BIOLOGY

but the SHR protein was shown to be present in all of the cellsadjacent to the stele (Figure 1C) [7,8], suggesting thatmovement from the stele could allow SHR to act as apositional signal in stem cell specification and radialpatterning.
Identification of the genes regulated by the SHR pathwayis essential to fully understand SHR function in rootdevelopment. However, our knowledge of this pathway isstill limited and SCARECROW (SCR) is the only gene that hasbeen demonstrated to be downstream of SHR [7,8]. SCRencodes another member of the GRAS family and isexpressed in all of the cells adjacent to the stele (Figure1C) [9]. In scr mutants, the asymmetric division of the CEIdaughter also does not occur (Figure 1D and 1F) and SCR wasshown to be cell-autonomously required for QC specificationand for the longitudinal cell division of the CEI daughter [9–11]. The expression of SCR is strongly reduced in the shrmutant background, suggesting that SHR activity is necessaryfor full SCR expression [7]. Taken together, these observa-tions show that SCR functions downstream of SHR in rootstem cell niche specification and asymmetric cell division.However, expression of SCR in the QC of shr mutants cannotrescue QC function and only partially rescues stem cellmaintenance [10], indicating that SHR function in stem cellspecification is not limited to its requirement for activating
SCR. Moreover, SCR is not involved in endodermis specifi-cation since the mutant ground tissue layer in scr plants has amixed cortex/endodermis identity. A number of unidentifiedgenes are thus expected to act downstream of SHR in parallelwith SCR.Genome-wide transcriptional analyses after modulation
of transcription factor activity provide a powerful way toidentify downstream genes. Although this allows for thescreening of most of the genes in the genome, the largedatasets require considerable effort to detect a signalamong the noise [12,13]. This is particularly true inmulticellular organisms where genes can be expressed insmall subsets of cells in an organ and transcriptionalprofiles are usually acquired from mixed tissue types [14–16]. A common solution to find transcription factor targetsin higher organisms is to generate several complementarydatasets from tissues overexpressing the transcriptionfactor of interest and from loss-of-function mutants or bydoing time series experiments using inducible overexpres-sion of the transcription factor [17–22]. Analysis ofconsistency across experiments, using notably Venn dia-grams, can then be used to minimize the rate of false-positives. The classical statistical method, called meta-analysis, combines the statistical information from severalindependent experiments and offers a way to maximize theuse of the information available from each experiment.Meta-analysis was recently used to identify cancer signa-tures from tumor profiling experiments and was shown todecrease the false-positive rate by diminishing the artifactsassociated with a single experiment [23–25]. Importantly,meta-analysis was also shown to increase the statisticalpower of detecting small changes in gene expression usingmicroarrays [23].In this report, we used meta-analysis to study the SHR
developmental pathway and implemented a new approachfor the combination of multiple independent experiments toanalyze developmental pathways in a multicellular organism.By borrowing strength from two other independent experi-ments, we were able to use an inducible form of SHR drivenby the native SHR promoter to identify the direct targets ofSHR. By doing so, we identified eight direct targets of SHR,one of which is the SCR gene. Binding of SHR to four of theeight promoter regions was confirmed in vivo using chroma-tin immunoprecipitation (ChIP) followed by quantitativereal-time PCR. The expression patterns of the direct targets,determined using either ‘‘digital in situ’’ [26] or RNA in situhybridization, show that the SHR protein regulates tran-scription in its entire domain, including the stele. Thissuggests that the SHR protein regulates the development ofall of the tissues where it is present and was confirmedthrough further analysis of stele development in the shrmutant. To initiate the construction of a meaningful geneticnetwork, we then used the meta-analysis approach to performa global survey of the indirect targets regulated by SHR. Ouranalysis shows that SHR regulates not only a large tran-scription factor network but also hormonal pathways as wellas signaling pathways using receptor-like kinases (RLKs).Taken together, our results thus not only identify the firstnodes in the SHR pathway and a new function for SHR in thestele but also reveal the global architecture of this devel-opmental pathway.
Figure 1. The SHR Pathway Is Essential for Stem Cell Specification and
Radial Patterning of the Root
(A) Schematic of a transverse section showing Arabidopsis root anatomy.Cei, cortex-endodermis initials; Ceid, cortex-endodermis initial daughters;Cor, cortex; Crc, columella root cap; Cri, columella root cap initials; End,endodermis; Epi, epidermis; Eri, epidermis-root cap initials; Lrc, lateralroot cap; Per, pericycle; QC, quiescent center; Ste, stele; Vas, vascularcylinder.(B) Diagram of the cell divisions that form endodermis and cortex. Thecolor code is as in (A). The two arrowheads indicate the transversedivision of the Cei and the longitudinal division of the Ceid.(C) The SHR and SCR domain. The SHR protein (left) is present in thestele, the endodermis, the QC, the Cei, and the Ceid. SCR (right) istranscribed specifically in the QC, the Cei, and the Ceid.(D–F) Confocal section of roots from 5-d-old wild-type (D), shr-2 (E),and scr-4 (F). Cor, cortex; End, endodermis; Mut, mutant layer. Scalebars: 25 lm.DOI: 10.1371/journal.pbio.0040143.g001
PLoS Biology | www.plosbiology.org May 2006 | Volume 4 | Issue 5 | e1430740
Global Analysis of SHORT-ROOT Pathway

Results
Expression of an Inducible Form of SHR in Its EndogenousDomain Rescues Root Growth and Radial PatterningDefects in the shr Mutant
To produce the first reagent for the identification of SHRdirect targets using meta-analysis, we generated a glucocorti-coid inducible form of SHR (Figure 2). Inducible versions oftranscription factors have been widely used in plants for theidentification of downstream targets [17,18,22,27–30]. How-ever, while previous studies have relied on the use of aconstitutive promoter, we sought to use a native promoter tominimize spurious effects linked to ectopic expression. TheSHR protein was fused to the ligand-binding domain of the ratglucocorticoid receptor (GR) and expressed under the controlof the 2.5-kilobase (kb) 59 upstream region of SHR(pSHR::SHR:GR construct: Figure 2A). The translationalenhancer element (TE) from tobacco etch virus was alsoincluded to compensate for possible functional attenuationdue to the protein fusion. The GR domain is expected toprevent a protein fused to it from entering the nucleus. Thisblock can be released by treating with the synthetic glucocorti-
coid dexamethasone (Dex), thereby allowing the translocationof the fusion protein into the nucleus (reviewed in [31].The pSHR::SHR:GR construct was introduced into the shr-2
mutant background, which is a presumed null allele (shr-2pSHR::SHR:GR plants) [7]. As expected, shr-2 pSHR::SHR:GRplants looked identical to shr-2 in the absence of Dex, interms of root length and radial pattern (Figure 2B and 2D).Upon germination of shr-2 pSHR::SHR:GR plants on amedium containing 10 lM Dex, we observed a completerescue of root length, indicating a restoration of stem cellactivity, and radial pattern (Figure 2C and 2E and unpub-lished data). Transverse sections of plants grown in thepresence of Dex were also used for immunostaining with theJIM13 antibody. The JIM13 antibody has been shown tospecifically bind an arabinogalactan epitope found inendodermal and stele cells [32]. The immunostaining showeda Dex-dependent restoration of endodermal attributes(Figure 2F and 2G).To determine the time-frame for Dex treatment, we
crossed the shr-2 pSHR::SHR:GR plants with a transgenic lineexpressing green fluorescent protein (GFP) under the controlof the 2-kb 59 upstream region of the SCR gene (pSCR::GFP
Figure 2. An Inducible Form of SHR Rescues Root Growth and Radial Patterning Defects in the shr Mutant
(A) Structure of the pSHR::SHR:GR gene construct. DNA fragments are not drawn to scale. SHR 59, 2.5-kb SHR 59 upstream sequence; TE, tobacco etchvirus translational enhancer sequence; SHR cds, SHR coding sequence; GR, steroid-binding domain sequence of the rat GR; 39, nopaline synthasepolyadenylation sequence.(B and C) Wild-type, shr-2, and shr-2 pSHR::SHR:GR 5-d-old seedlings germinated on a medium either without (B) or with (C) 10 lM Dex.(D and E) Confocal section of roots from 5-d-old shr-2 pSHR::SHR:GR plants germinated on a medium either without (D) or with (E) 10 lM Dex. Cor,cortex; End, endodermis; Mut, mutant.(F and G) JIM13 antibody staining of root transverse section from 5-d-old shr-2 pSHR::SHR:GR plants germinated on a medium either without (F) or with(G) 10 lM Dex. The stars indicate restoration of JIM13 staining in the ground tissue.(H–K) pSCR::GFP expression in roots of 5-d-old plants germinated on medium containing Dex and/or Cyc. (H) Root from untreated wild-type. (I)Root from untreated shr-2 pSHR::SHR:GR plants. (J) Root from shr-2 pSHR::SHR:GR plants treated with 10 lM Dex. The arrows indicate asymmetriccell divisions induced in response to the Dex treatment. (K) Root from shr-2 pSHR::SHR:GR plants treated with 10 lM Dex and 10 lM Cyc.Scale bars: 25 lm.DOI: 10.1371/journal.pbio.0040143.g002
PLoS Biology | www.plosbiology.org May 2006 | Volume 4 | Issue 5 | e1430741
Global Analysis of SHORT-ROOT Pathway

plants). As previously mentioned, SCR has been shown to bedownstream of SHR [6,7] and is expressed specifically in theendodermis, the CEI and daughter, and the QC (Figure 2H)[9]. In the absence of Dex, no GFP expression was detected in5-d-old shr-2 pSHR::SHR:GR pSCR::GFP plants (Figure 2I),confirming previous results showing a decrease in SCRexpression in shr mutants [7]. When these plants weretransferred to a medium containing 10 lM Dex, we observeda strong accumulation of GFP after 6 h as well as a fewasymmetric cell divisions (arrows in Figure 2J). Usingquantitative real-time PCR (QRT-PCR), we found SCR mRNAlevels to be similarly induced 6 and 24 h after Dex treatmentin shr-2 pSHR::SHR:GR plants (Figure S1). This suggests thatSCR is already induced at its higher level 6 h after treatment.These observations indicate that at least some of thedownstream targets of SHR are induced after 6 h of Dextreatment. They also confirm the results obtained with theJIM13 antibody and show that endodermal characteristics canbe rapidly restored after treatment with Dex.
Fusion of GR to transcription factors that control floralorgan development has been used to identify their directtargets through the concurrent short-term application of Dexwith the translational inhibitor cycloheximide (Cyc)[22,27,30]. This allows for the transcription of immediatetargets but presumably blocks those genes that are furtherdownstream in the pathway by preventing the translation ofintermediary factors. To demonstrate that such an approachcould be efficiently used to identify SHR direct targets, westudied the effect of a short-term Dex and Cyc treatment onthe translation of GFP in the shr-2 pSHR::SHR:GR pSCR::GFPplants. The induction of GFP fluorescence normally observedafter 6 h of Dex treatment was entirely inhibited byconcurrent treatment with 10 lM Cyc (Figure 2J and 2K).This indicates that translation was effectively inhibited by theCyc treatment. Using QRT-PCR, we also observed that SCRmRNA is induced in shr-2 pSHR::SHR:GR plants after 6 h ofDex treatment even in the presence of Cyc (Figure S1). This isa first demonstration that SCR is a direct target of SHR andsuggests that Cyc effectively inhibits translation withoutaffecting transcription of direct target genes.
Taken together, these results suggests that the SHR:GRfusion protein fully complements the shr-2 mutant whenexpressed under the SHR endogenous promoter and that theshr-2 pSHR::SHR:GR plants can be used to identify the directtargets of SHR.
A Microarray-Based Meta-Analysis Identifies DirectEndogenous SHR Targets
We next developed a whole-genome meta-analysis ap-proach in order to identify the direct targets of SHR usingthe inducible SHR protein driven from the SHR nativepromoter (i.e., the shr-2 pSHR::SHR:GR plants). We firstperformed three independent genome-wide transcriptionalanalyses after modulation of SHR activity. We obtainedtranscriptional profiles from root tips of 5-d-old shr-2pSHR::SHR:GR plants treated with Dex and Cyc or with Cycalone for 6 h using the Affymetrix ATH1 arrays (‘‘directinduction experiment’’). As described above, genes differ-entially expressed between these two treatments are expectedto be the direct targets of SHR.
The two other experiments were then chosen in order tominimize the impact of secondary effects and thus the
occurrence of false positives. The second experiment, the‘‘loss-of-function’’ experiment, was designed to identify genesdifferentially expressed between the shr mutant and the wild-type. Since the gross morphological effects of the shrmutation become readily apparent only after 5 d, we profiledRNA from the root tips of 5-d-old shr-2mutants and wild-typeplants. By doing so, we limited the secondary effects of the shrmutation on the root transcriptome.For the third experiment, we used plants expressing a
functional SHR:GFP fusion under the control of theregulatory sequences from the WEREWOLF (WER) gene(‘‘ectopic expression experiment’’). WER is transcribed inthe epidermis, the lateral root cap (LRC), and epidermal/LRCinitials (Figure 1A) [33], which together span a domain thatlacks native SHR protein and RNA. Expression of theSHR:GFP fusion has been shown to be sufficient to inducemarkers of endodermal fate in these cells and to activateasymmetric cell division in the initials [34]. To specificallyidentify the genes activated by SHR in this domain, we usedthe approach developed by Birnbaum et al. [23]. The roots ofplants expressing either SHR:GFP (pWER::SHR:GFP plants) orGFP (pWER::GFP plants) in the WER domain were dissociatedinto single cells by enzymatic digestion of their cell walls. TheGFP-expressing cells were then sorted with a fluorescence-activated cell sorter, and the RNA population of these cellswas analyzed on microarrays. By this approach, we could thusfocus specifically on the transcriptome of a single tissuewhere SHR ectopic expression was proved to activate SHRphysiological responses.The three microarray datasets were then analyzed for
differential expression using a mixed-model ANOVA, and theresulting p-values were combined in the classical meta-analytic technique of Fisher’s inverse v2 [35]. In this process,we selected genes for which at least two experiments showedthat SHR regulated their expression level (see Materials andMethods). One of these two experiments had to be the directinduction experiment, since it is the only one that allowed forthe inference of direct targets. Importantly, we also verifiedthat the identified genes were not induced by Dex in theabsence of the pSHR::SHR:GR construct by analyzing onATH1 microarrays the RNA profiles of roots of 5-d-old wild-type plants treated with Dex or a mock treatment for 6 h(unpublished data).Using this procedure, we identified with high statistical
confidence eight candidate direct targets that are positivelyregulated by SHR (Figure 3A). Four candidate genes encodeputative transcription factors. They are SCR, SCARECROW-like 3 (SCL-3), which is another GRAS family member shown tobe expressed in the endodermis [36], and two closely relatedC2H2 zinc finger transcription factors that we namedMAGPIE(MGP) and NUTCRACKER (NUC). It is noteworthy that SCRwas identified as a candidate direct target, given that wealready had strong evidence that it was downstream of SHR.The AT5G67280 candidate gene encodes an RLK that belongsto the LRRIII subfamily of RLKs [37] and will be referred to asRLK in this report. Two candidates encode metabolicenzymes: a tropinone reductase (TRI), which may regulatetropane alkaloid synthesis [38], and the BR6ox2/Cyp85A2cytochrome P450 (BR6ox2), which is potentially involved inbrassinosteroid (BR) biosynthesis [39]. The last candidateencodes the F-box protein SNEEZY/SLEEPY 2 (SNE) that isthought to play a role in gibberellin signaling [40,41].
PLoS Biology | www.plosbiology.org May 2006 | Volume 4 | Issue 5 | e1430742
Global Analysis of SHORT-ROOT Pathway

Candidate Direct Targets Are Regulated In Vivo by SHR,and Their Expression Patterns Overlap with the SHRDomain
As one means of confirming that the genes identified by themeta-analysis are direct targets of SHR, we examined bindingof SHR in vivo to the promoter region of the candidate genes.We conducted ChIP with a polyclonal antibody to the GFPprotein followed by quantitative real-time PCR (ChIP-QRT-PCR) to test for quantitative enrichment of the eightcandidate gene promoters (Figure 3B). Primers to the 59
upstream sequences of the putative target genes were usedfor PCR amplification from the immunoprecipitated DNAfrom wild-type plants compared to immunoprecipitatedDNA from transgenic plants expressing the SHR:GFP fusionunder control of the native 2.5-kb SHR promoter [8]. Usingthis method, we detected an enrichment of the signal in fourof the eight cases (Figure 3B), with very strong enrichment(227-fold and 43-fold) for two of the targets (SCR and MGP).For SCR, the target with the highest enrichment in the ChIP-QRT-PCR assay, we scanned the promoter with primers and
found two peaks of strongest enrichment. One peak wasbetween 209 and 528 bp from the start site of translation andthe other was at approximately 1 kb (Figure 3C). This resultindicates that SHR binds to the promoters of four of thedirect target candidate genes tested (SCR, MGP, TRI, andNUC) and suggests that there may be more than one bindingsite for SHR on the SCR promoter. The absence of enrich-ment for the other four candidates is not evidence for a lackof functional binding as it could be related to dilution due torestricted expression domains, lower binding constants, orsome combination of these factors. Together with the abilityof SHR to activate gene expression in the absence of proteinsynthesis, this demonstrates that SHR has transcription factoractivity and, most important, confirms that at least four of theeight direct targets identified by the meta-analysis are directlybound by SHR in vivo.As an alternative approach to confirming our results and a
means of gaining insight into the possible function of theputative direct targets of SHR, we asked if their expressionpatterns were compatible with direct regulation by SHR. We
Figure 3. Meta-Analysis Identifies Putative Direct Targets of SHR and Their Promoters Are Bound In Vivo by SHR
(A) Identification of SHR direct targets using meta-analysis. The putative direct targets of SHR were identified by combining the results from threeindependent experiments: the ‘‘direct induction,’’ ‘‘ectopic expression,’’ and ‘‘loss-of-function’’ (LOF) experiments. The fold change (FC) and p-valuesfor the direct targets in each experiment are shown. Using a meta-analysis approach, the p-values from the three independent approaches werecombined, a single meta-analysis p-value was calculated for each gene, and the false discovery rate was then estimated by calculating q-values (meta-analysis q-value). The FC and p-value obtained in the ‘‘induction experiment’’ (Ind) are also indicated.(B) Demonstration of SHR binding to the promoter regions of the candidate direct targets using ChIP-QRT-PCR (see Materials and Methods).(C) Tiling of the SCR promoter using ChIP-QRT-PCR. Overlapping primers specific to 200- to 350-bp regions along 1.8 kb of the SCR promoter were usedto identify the regions bound by SHR (see Materials and Methods).DOI: 10.1371/journal.pbio.0040143.g003
PLoS Biology | www.plosbiology.org May 2006 | Volume 4 | Issue 5 | e1430743
Global Analysis of SHORT-ROOT Pathway

first analyzed their expression patterns in the root using thedigital in situ approach [26], which measures gene expressionamong cell and tissue types (radial zones) and along thedevelopmental gradient (longitudinal zones) in the Arabidopsisroot. To determine specificity of the spatial expressionpattern of the putative direct targets, we obtained statisticalsignificance levels for differential expression between theseven previously published radial zone microarray datasets(atrichoblast, columella, LRC, stele, QC/initials, ground tissue,and endodermis: Figure 4A) [26,42] as well as one that we
generated from a pericycle-specific enhancer trap line (seeMaterials and Methods). We performed a similar statisticalanalysis of differential expression in the longitudinal zonedatasets (meristematic, elongation, and early differentiationzones: Figure 4B) [26]. The results from this data analysismatch precisely the known expression pattern for SCR andSCL-3 [7,36]. It shows that six of the eight putative directtargets of SHR are significantly enriched in a radial cell-typein which SHR protein is present versus all cell-types in whichSHR is absent (Figure 4A). The two exceptions are SNE andRLK, which both appear to be enriched at low levels in theQC/initials compared to two, but not all three, non-SHR cell-types (Figure S2). Only SNE was significantly enriched in alongitudinal zone, and it is in the meristem (Figure 4B). Thus,all of the putative direct targets of SHR are eithersignificantly enriched or have some component of theirexpression in an SHR cell-type, as expected from genesdirectly regulated by SHR.The two novel transcription factorsMGP and NUC have not
been described previously, and we decided to use RNA in situhybridization to further analyze their expression pattern inwild-type plants during embryogenesis and in the postem-bryonic root (Figure 4C–4J). MGP was first detected in thelower tier of the mid-globular stage embryos in theprocambium and the basal cells of the ground meristem(Figure 4C; embryo stages after [43]). This expression wasmaintained throughout embryogenesis and was progressivelyrestricted to the tip of the embryonic root (Figure 4D andunpublished data). After the heart stage, MGP was moststrongly expressed in the vascular stem cells and the basalcells of the ground tissue including the initials. Lowerexpression levels could also be detected higher in the steleand in the ground tissue. The same expression pattern wasseen in the postembryonic root (Figure 4E). The expressionpattern of NUC is essentially identical (Figure 4G–4I),confirming that MGP and NUC are expressed in a portionof the SHR expression domain. Moreover, expression of bothMGP and NUC is completely lost in the embryonic andpostembryonic root of shr-2 mutants (Figure 4F and 4J). SHRis thus necessary to activate and maintain the expression ofboth genes throughout development, in agreement with adirect regulation of MGP and NUC by SHR.In conclusion, we have shown that the promoters of four of
the eight putative direct targets we identified were bound invivo by SHR and that the RNA of the eight putative targets isfound in tissues with SHR protein. We have also confirmed byin situ hybridization that SHR is necessary to activate andmaintain the expression of two previously uncharacterizedtranscription factors, MGP and NUC, with the promoter ofthese two genes being bound by SHR. These results providevery strong evidence for direct regulation by SHR of four ofthe eight candidate genes (SCR, MGP, NUC, and TRI). Theexpression patterns of the other four targets (SCL3, SNE, RLK,and Br6Ox2) are consistent with direct regulation by SHR butfurther analysis will be necessary to confirm direct binding ofSHR to their regulatory regions.
A Role for SHR in the Development of the Stele IsIdentifiedSeveral putative direct targets of SHR were found to be
expressed in stele tissues (MGP, NUC, and Br6ox2) whichsuggested a role for SHR in the stele and prompted us to
Figure 4. The SHR Direct Targets Are Regulated In Planta by SHR and Are
Significantly Enriched in the SHR Domain
(A and B) Expression of SHR direct targets in the root using the digital insitu data. (A) Relative expression of the SHR direct targets in the radialzones. (B) Relative expression of the SHR direct targets in the longitudinalroot zones. A statistical analysis of the digital in situ data was performedto determine if the SHR direct targets are enriched in tissues in which theSHR protein is present (SHR domain, designated with a red arrow): thequiescent center and initials (QC/initials), endodermis, pericycle, andstele. A similar analysis was performed to determine significant enrich-ment in a specific longitudinal zone. The asterisk (*) marks the zone inwhich enrichment was found statistically significant in those analyses.See Materials and Methods for a description of the statistical analysis.(C–F) Whole-mount in situ hybridization of MGP in wild-type and shr-2embryonic and postembryonic tissues. (C) Wild-type globular embryo.(D) Root of wild-type torpedo embryo. (E) A 2-d-old wild-type root. Insetin (E): A 2-d-old wild-type root hybridized with MGP sense probe. (F) A 2-d-old shr-2 root.(G–J) Whole-mount in situ hybridization of NUC in wild-type and shr-2embryonic and postembryonic tissues. (G) Wild-type transition embryo.(H) Root of wild-type torpedo embryo. (I) A 2-d-old wild-type root. Insetin (I): A 2-d-old wild-type root hybridized with MGP sense probe. (J) A 2-d-old shr-2 root.DOI: 10.1371/journal.pbio.0040143.g004
PLoS Biology | www.plosbiology.org May 2006 | Volume 4 | Issue 5 | e1430744
Global Analysis of SHORT-ROOT Pathway
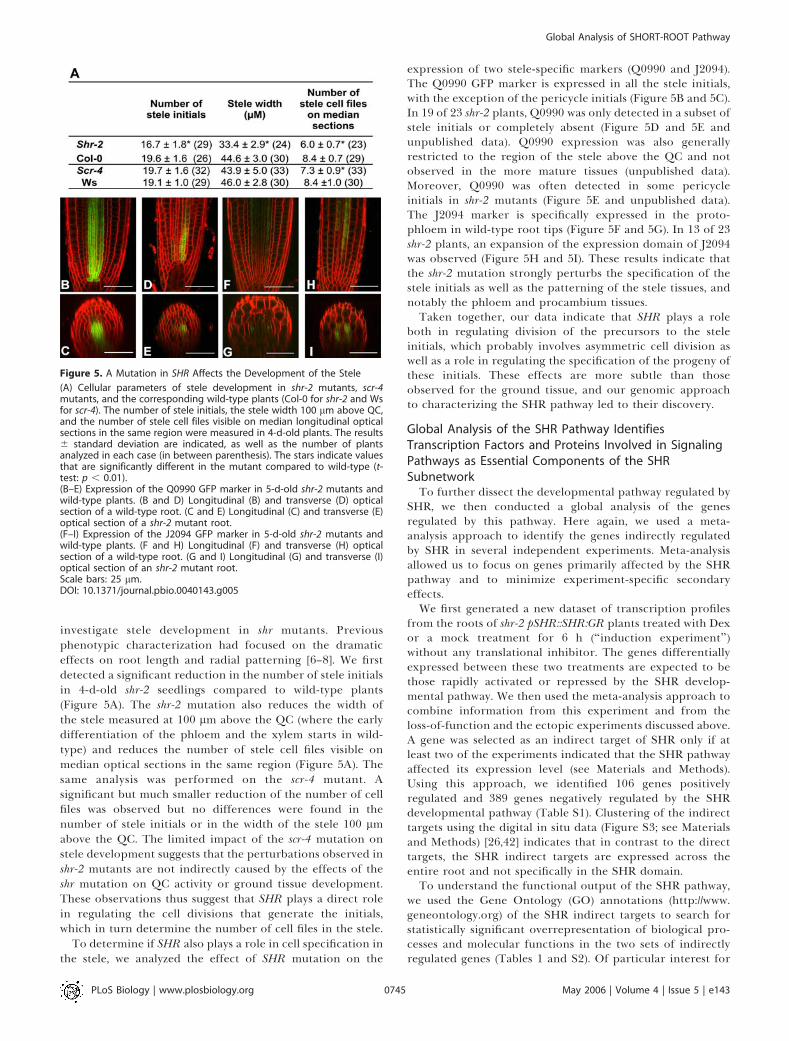
investigate stele development in shr mutants. Previousphenotypic characterization had focused on the dramaticeffects on root length and radial patterning [6–8]. We firstdetected a significant reduction in the number of stele initialsin 4-d-old shr-2 seedlings compared to wild-type plants(Figure 5A). The shr-2 mutation also reduces the width ofthe stele measured at 100 lm above the QC (where the earlydifferentiation of the phloem and the xylem starts in wild-type) and reduces the number of stele cell files visible onmedian optical sections in the same region (Figure 5A). Thesame analysis was performed on the scr-4 mutant. Asignificant but much smaller reduction of the number of cellfiles was observed but no differences were found in thenumber of stele initials or in the width of the stele 100 lmabove the QC. The limited impact of the scr-4 mutation onstele development suggests that the perturbations observed inshr-2 mutants are not indirectly caused by the effects of theshr mutation on QC activity or ground tissue development.These observations thus suggest that SHR plays a direct rolein regulating the cell divisions that generate the initials,which in turn determine the number of cell files in the stele.
To determine if SHR also plays a role in cell specification inthe stele, we analyzed the effect of SHR mutation on the
expression of two stele-specific markers (Q0990 and J2094).The Q0990 GFP marker is expressed in all the stele initials,with the exception of the pericycle initials (Figure 5B and 5C).In 19 of 23 shr-2 plants, Q0990 was only detected in a subset ofstele initials or completely absent (Figure 5D and 5E andunpublished data). Q0990 expression was also generallyrestricted to the region of the stele above the QC and notobserved in the more mature tissues (unpublished data).Moreover, Q0990 was often detected in some pericycleinitials in shr-2 mutants (Figure 5E and unpublished data).The J2094 marker is specifically expressed in the proto-phloem in wild-type root tips (Figure 5F and 5G). In 13 of 23shr-2 plants, an expansion of the expression domain of J2094was observed (Figure 5H and 5I). These results indicate thatthe shr-2 mutation strongly perturbs the specification of thestele initials as well as the patterning of the stele tissues, andnotably the phloem and procambium tissues.Taken together, our data indicate that SHR plays a role
both in regulating division of the precursors to the steleinitials, which probably involves asymmetric cell division aswell as a role in regulating the specification of the progeny ofthese initials. These effects are more subtle than thoseobserved for the ground tissue, and our genomic approachto characterizing the SHR pathway led to their discovery.
Global Analysis of the SHR Pathway IdentifiesTranscription Factors and Proteins Involved in SignalingPathways as Essential Components of the SHRSubnetworkTo further dissect the developmental pathway regulated by
SHR, we then conducted a global analysis of the genesregulated by this pathway. Here again, we used a meta-analysis approach to identify the genes indirectly regulatedby SHR in several independent experiments. Meta-analysisallowed us to focus on genes primarily affected by the SHRpathway and to minimize experiment-specific secondaryeffects.We first generated a new dataset of transcription profiles
from the roots of shr-2 pSHR::SHR:GR plants treated with Dexor a mock treatment for 6 h (‘‘induction experiment’’)without any translational inhibitor. The genes differentiallyexpressed between these two treatments are expected to bethose rapidly activated or repressed by the SHR develop-mental pathway. We then used the meta-analysis approach tocombine information from this experiment and from theloss-of-function and the ectopic experiments discussed above.A gene was selected as an indirect target of SHR only if atleast two of the experiments indicated that the SHR pathwayaffected its expression level (see Materials and Methods).Using this approach, we identified 106 genes positivelyregulated and 389 genes negatively regulated by the SHRdevelopmental pathway (Table S1). Clustering of the indirecttargets using the digital in situ data (Figure S3; see Materialsand Methods) [26,42] indicates that in contrast to the directtargets, the SHR indirect targets are expressed across theentire root and not specifically in the SHR domain.To understand the functional output of the SHR pathway,
we used the Gene Ontology (GO) annotations (http://www.geneontology.org) of the SHR indirect targets to search forstatistically significant overrepresentation of biological pro-cesses and molecular functions in the two sets of indirectlyregulated genes (Tables 1 and S2). Of particular interest for
Figure 5. A Mutation in SHR Affects the Development of the Stele
(A) Cellular parameters of stele development in shr-2 mutants, scr-4mutants, and the corresponding wild-type plants (Col-0 for shr-2 and Wsfor scr-4). The number of stele initials, the stele width 100 lm above QC,and the number of stele cell files visible on median longitudinal opticalsections in the same region were measured in 4-d-old plants. The results6 standard deviation are indicated, as well as the number of plantsanalyzed in each case (in between parenthesis). The stars indicate valuesthat are significantly different in the mutant compared to wild-type (t-test: p , 0.01).(B–E) Expression of the Q0990 GFP marker in 5-d-old shr-2 mutants andwild-type plants. (B and D) Longitudinal (B) and transverse (D) opticalsection of a wild-type root. (C and E) Longitudinal (C) and transverse (E)optical section of a shr-2 mutant root.(F–I) Expression of the J2094 GFP marker in 5-d-old shr-2 mutants andwild-type plants. (F and H) Longitudinal (F) and transverse (H) opticalsection of a wild-type root. (G and I) Longitudinal (G) and transverse (I)optical section of an shr-2 mutant root.Scale bars: 25 lm.DOI: 10.1371/journal.pbio.0040143.g005
PLoS Biology | www.plosbiology.org May 2006 | Volume 4 | Issue 5 | e1430745
Global Analysis of SHORT-ROOT Pathway

understanding how SHR information is relayed along itspathway, this analysis showed a significant overrepresentationin the repressed indirect targets of genes encoding proteinsinvolved in the regulation of transcription (molecularfunction ‘‘transcription factor activity’’) and in phosphor-ylation processes (biological process ‘‘protein amino acidphosphorylation’’ and molecular function ‘‘kinase activity’’and ‘‘serine/threonine kinase activity’’). This observationprompted us to look in more detail at SHR indirect targetswith predicted transcription factor and kinase activity (seeMaterials and Methods).
We identified 46 genes (11.8%) encoding putative tran-scription factors that are repressed and 10 (9%) that areactivated by the SHR pathway (Table S3), while only 6.3% ofthe genes expressed in the root are predicted to encodetranscription factors (see Materials and Methods). Confirmingthe results of the GO analysis, this overrepresentation ishighly significant for the repressed transcription factors (p ,
0.01) but not significant for the activated ones. The digital insitu data show that these transcription factors are expressedthroughout the root both radially and longitudinally (TableS3 and unpublished data). Several transcription factors withknown function in development are negatively regulated bythe SHR pathway (PHV, PHB, TNY, ANT, and BEL1). Ofparticular interest were also several transcription factorsencoding regulators of gibberellin and auxin signaling (seebelow). The SHR pathway thus regulates a large network oftranscriptional factors that are broadly expressed in the root.
Of the 389 indirect targets repressed by SHR, we found 37genes (9.5%) that encode proteins annotated as kinases
(Table S4). Most of these genes (29: 7.45% of the repressedindirect targets) belong to the RLK family [44,45]. The RLKsrepresent 2.17% of the genes expressed in the root, and theenrichment in the repressed SHR targets is highly significant(p , 0.01). Six of the 106 indirect targets activated by SHRencode proteins annotated as kinases, and three (2.8%) ofthose encode RLKs. These observations suggest that the SHRpathway also affects different signaling networks using RLKsduring root development.Finally, we focused our attention on genes regulated by
SHR and involved in responses to different hormones (TableS5). We have already described evidence indicating that SHRmight directly regulate SNE and BR6ox2, which suggests a linkto gibberellin and BR signaling, respectively. Several genesencoding components of the gibberellin and BR pathwaywere found downstream of SHR (Table S5). These observa-tions further support the idea that the SHR pathway interactswith gibberellin and BR signaling. Since auxin has beenshown to be an essential player in the root meristem [46–48],we next searched for genes involved in auxin responses. Wefound 12 genes implicated in auxin-related processes that arerepressed by SHR and none among the indirect targetsactivated by SHR (Table S5). Most of the repressed genes(seven of 12) are potentially involved in auxin signaling, andthe other ones have been implicated in auxin polar transport(PIN3 and PIN7) and auxin homeostasis (SPS, SUR2, andCyp79B2). Thus, the SHR pathway appears to also influenceauxin signaling, auxin transport, and auxin biosynthesisduring root development, but primarily in a negative fashion.In conclusion, these results show that the SHR pathway
regulates the expression of a large number of transcriptionfactors. It also affects the expression of genes involved insignaling such as those encoding RLKs and genes involved inhormonal responses.
Discussion
SHR is a putative transcription factor of the plant-specificGRAS family of proteins and plays a key role in rootdevelopment. In this report we have used a microarray-basedstrategy to identify the effectors of SHR function in rootdevelopment and provide evidence that SHR directlyregulates transcription in planta. Through a meta-analysisapproach, we combined statistical information from severalindependent experiments in which we analyzed transcrip-tional profiles after modulation of SHR activity. We predictedeight direct targets of SHR. One of the direct targets is SCR,which was previously shown to be downstream of SHR. Theother seven genes had not been previously implicated in theSHR pathway. We demonstrate that the expression patternsof all of these genes are consistent with direct regulation bySHR, and our data confirm that SHR binds in vivo to thepromoter regions of at least four of the putative directtargets. Taken together, our results strongly support a directregulation of SCR, MGP, NUC, and TRI by SHR during rootdevelopment, while further analysis will be necessary toconfirm binding of SHR to the regulatory regions of the otherfour putative direct targets. We also used the meta-analysisapproach to perform a global survey of the SHR pathway.Our data reveal the existence of a complex network oftranscriptional and signaling events downstream of SHR.
Table 1. Functional Characterization of SHR Indirect Targets
GO Main
Category
GO Term Number
of Genes
Annotated
to the Term
FDR
(False
Positives)
Indirect targets
activated by SHR
BP Alcohol metabolism 7 2% (0.06)
BP Carboxylic acid metabolism 10 1.6% (0.08)
MF Phosphoric monoester
hydrolase activity
4 3% (0.06)
MF Fatty-acid synthase activity 2 2.67% (0.08)
Indirect targets
repressed by SHR
BP Protein amino acid
phosphorylation
40 0% (0)
BP Response to biotic stimulus 20 0.75% (0.06)
BP Glucosinolate biosynthesis 3 0.67% (0.08)
BP Macromolecule metabolism 97 0.77% (0.1)
MF Kinase activity 42 0% (0)
MF Alpha-amylase activity 2 0.4% (0.02)
MF Protein serine/threonine
kinase activity
18 1% (0.06)
MF Peroxidase activity 0.86% (0.06)
MF 2-Isopropylmalate
synthase activity
3 0.67% (0.08)
MF Transcription factor activity 34 0.62% (0.08)
MF Monooxygenase activity 12 0.57% (0.08)
BP, biological process; MF, molecular function; FDR, false discovery rate.DOI: 10.1371/journal.pbio.0040143.t001
PLoS Biology | www.plosbiology.org May 2006 | Volume 4 | Issue 5 | e1430746
Global Analysis of SHORT-ROOT Pathway

Meta-Analysis of Microarray Data Provides a Reliable Toolfor the Analysis of Developmental Pathways
Consistency of changes in gene expression across severalmicroarray experiments has been widely used to identifygenes of potential biological interest, because it has thepotential to greatly increase the confidence in the identifiedgenes [25,49]. The meta-analysis approach formalizes theanalysis of consistency through the combination of statisticalinformation from multiple studies. Meta-analysis has beenused in many fields since the early 20th century, and recentlyon microarray data, to detect subtle but significant patternsin datasets [23,24,35,50–52]. To our knowledge, this approachhas not been previously used to map a developmentalpathway in a multicellular organism.
We applied meta-analytic techniques to the identificationof the targets of the SHR transcription factor to identify thenodes in the SHR subnetwork. The meta-analysis allowed usto identify the direct targets of SHR using an inducible SHRprotein driven from its native promoter (pSHR::SHR:GR),while previous studies relied on overexpression under astrong constitutive promoter [17,18,20,22]. The statisticaltests for significance across these experiments also allowed usto reliably detect targets with low expression in only a few celltypes of the root, such as seen for MGP and NUC (Figure 4).Our results are thus consistent with the idea that meta-analysis can be used both to ascertain consistency acrossexperiments and to increase the sensitivity of detectingdifferential expression using microarrays [23].
In an effort to identify the binding site for SHR, we usedvarious motif-finding programs, including Motif-Finder,Meme, and Gibbs sampler [53,54] on the four confirmedtargets as well as on all eight putative targets (unpublisheddata). No statistically significant putative binding site with highinformation content was identified. This may indicate that thetraining set is too small to predict binding sites withconfidence or that the binding site has relatively highdegeneracy. It is also possible that heterodimerization ofSHR with factors specific to expression subdomains results inbinding sites with different position weight matrices. By tilingacross the SCR promoter, we found two regions of enrichedSHR binding. Interestingly, these coincide with regions thatare conserved in phylogenetic footprints across several differ-ent Brassica species (J. Colinas and PNB, unpublished data). Acombination of promoter tiling with ChIP-QRT-PCR, phylo-genetic footprinting, and promoter expression analysis shouldallow us to narrow down the likely binding site(s) of SHR.
The meta-analysis approach was also used to ascertain theindirect targets of SHR, and the genes identified are thusexpected with a high level of confidence to be regulated bythe SHR pathway. By doing so, we have identified anensemble of genes constituting the SHR subnetwork and willbe able to use this list of candidate genes to explore the nextnodes in the SHR subnetwork, through iterative identifica-tion of transcription factor direct targets.
SHR Directly Activates SCRThe known functions of SHR are primarily in the QC and
endodermis where it regulates stem cell specification andradial patterning, and this function can be explained by themovement of SHR protein into the layer neighboring thestele [6–8]. SCR is specifically expressed in all the cellsneighboring the stele and was previously shown to act
downstream of SHR in the regulation of QC identity andasymmetric cell division [6,9,11]. We demonstrate in thisstudy that SHR directly regulates the transcription of SCRthrough binding to the chromatin upstream of the gene.Given the cell autonomous requirement of SCR in QCspecification and asymmetric cell division [10,11], our resultsshow that SHR functions in these two processes partlythrough direct regulation of the SCR gene.However, it was shown that expression of SCR in the QC of
shr mutants is not sufficient to rescue the division of theinitials [10]. In addition, when SHR is ectopically expressedunder the WER promoter, supernumerary layers are gener-ated through activation of SCR and asymmetric cell divisionin the epidermis initials [34]. In contrast, expression of SCRalone in theWER domain does not result in ectopic cell layers(Ji-Young Lee and PNB, unpublished data). SHR function instem cell specification and asymmetric cell division wouldthus appear to be mediated by other genes in addition to SCR.The spatial expression of the direct targets we identifiedsuggests that several of them might be implicated in QC andstem cell specification and/or radial patterning in parallelwith SCR. MGP and NUC are homologous genes expressed inthe CEI as well as in the first few cells of the endodermallineage and could thus redundantly regulate the fate of theCEI and radial patterning. The observation that SCL3 isenriched in the endodermis, QC, and initials [36] (Figure 4)indicates that it could have a similar function to SCR. Thedigital in situ data also suggest that TRI is mostly expressed inthe endodermis and may play a role in differentiation of theendodermis or in radial patterning.
Direct Targets in the Stele Reveal a Role for SHR inVascular DevelopmentOur data revealed that SHR also regulates transcription in
the stele and is thus active in its entire domain. In the absenceof SHR, two of the confirmed direct targets, MGP and NUC,fail to express in the stele (Figure 4), suggesting that theirexpression in this tissue is entirely dependent upon SHR(Figure 4). We also observed that mutation of SHR results in adiminution in the number of stele initials, perturbs theirspecification, and affects the differentiation of the phloem(Figure 5). Our results thus strongly support a role for SHR incell division and specification within the stele.A role for SHR in stele development is also suggested by the
putative direct target BR6Ox2. The encoded enzyme has beenimplicated in the biosynthesis of the brassinosteroid phyto-hormones (BRs) [39], which are important regulators ofvascular development [55]. Three other genes involved inregulation of BR response are also indirectly regulated by theSHR pathway (Table S5). One of these encodes the BRreceptor BRL3, which was shown to be involved in thedevelopment of the vasculature in synergy with two othergenes encoding BR receptors [56]. The SHR pathway alsoregulates the expression of the homologous HomeodomainLeucine-Zipper III (HD-Zip III) genes, PHB and PHV. The HD-Zip III proteins have been shown to be essential regulators ofthe patterning of vascular tissues in the stem [55,57,58]. TheSHR pathway thus modulates directly and indirectly theexpression of essential regulators of vascular development,further supporting a primary role of the SHR pathway in thedevelopment of the vascular tissue.Spatial expression of the confirmed and putative direct
PLoS Biology | www.plosbiology.org May 2006 | Volume 4 | Issue 5 | e1430747
Global Analysis of SHORT-ROOT Pathway

targets of SHR defines at least five subdomains in the SHRdomain: the QC, the early endodermis, the late endodermis,the early stele, and the late stele (Figure 6A). The fact thatseveral direct targets of SHR show very different expressionpatterns indicates that other genes probably act as coregu-lators with SHR in order to provide this spatial specificity. Wethus propose a model where the interaction of SHR withvarious coregulators allows for the activation of specificdirect targets. This defines functional subdomains (Figure 6A)allowing SHR to function in QC specification, CEI asymmet-ric cell division, and early and late endodermal specificationbut also early and late stele specification. The analysis of thefunction of the different direct targets will allow us to test thevalidity of this model.
Output and Global Architecture of the SHRDevelopmental Pathway
Our global analysis of the genes regulated by the SHRpathway suggests that the SHR pathway acts mostly in arepressive way, since 79% (389 of 495) of the SHR indirecttargets are repressed by SHR. Other studies of transcriptionfactor targets have generally found equivalent numbers ofindirectly activated and repressed genes in their assays orhigher numbers of upregulated genes [17,19,59,60].
Our data also begin to reveal the global architecture of theSHR subnetwork. We identified a large number of tran-scription factors downstream of SHR, with a significant
enrichment of transcription factors among the repressedgenes (Tables 1, S2, and S3). This suggests that SHR functionin root development is mediated notably through a largenetwork of transcription factors. However, signaling eventsmediated by posttranscriptional modifications and smallmolecules such as hormones may also contribute significantlyto SHR downstream function. We show that kinases areoverrepresented in the set of genes repressed by the SHRpathway and that their number is higher than the genomeaverage in the pool of activated genes as well (Tables 1, S2,and S4). Seventy-five percent of these genes encode RLKs,and we show that an RLK of unknown function is directlyregulated by SHR. This is strong evidence that signalingpathways involving RLKs may play a key role in mediatingthe SHR response. In addition to the modulation of BRsignaling discussed above, the SHR pathway affects theexpression of genes involved in both signaling and biosyn-thesis of two other hormones, gibberellin and auxin (TableS5). This global effect of the SHR pathway is likely to result inthe tuning of hormonal responses and is particularly relevantfor stem cell specification in the case of auxin. Auxin hasbeen shown to be essential for positioning the QC [2,47,48],and the transcriptional regulation of genes involved in auxinresponses by the SHR pathway could help to coordinate theaction of the two pathways in the specification of the stemcell niche.Taken together, our results suggest a global model of the
SHR pathway where SHR controls root development throughthe regulation of three interconnected modules: a tran-scription regulator module, a hormonal module, and asignaling module (Figure 6B). In this model, the interactionsbetween these three modules determine the developmentaloutput of the pathway on stem cell niche specification, radialpatterning, and stele development.
Materials and Methods
Plant lines and growth conditions. Arabidopsis thaliana lines in theColumbia (Col-0), C24, and Wassilewskaya (Ws) ecotypes were used.The pWER::SHR:GFP and pWER::GFP lines and the shr-2 mutants arein Col and are described in [7,34,61]. The scr-4 mutant is in the Wsecotype [61]. The J2261, J2094, and Q0990 enhancer traps (C24ecotype) are from the Jim Haselhof collection (http://www.plantsci.cam.ac.uk/Haseloff/Home.html) and were obtained through TAIR(http://www.arabidopsis.org). Seeds were surface-sterilized for 8 minin a 0.9% dichloroisocyanuric acid solution. The solution wasprepared by adding 440 mg of dichloroisocyanuric acid dissolved in5 ml of water to 45 ml of ethanol. The seeds were then washed twicein 95% ethanol and left to dry overnight. They were then germinatedon plates containing 13 Murashige and Skoog salt mixture, 8.9 mMthiamine, 40.6 mM nicotinic acid, 2.4 mM pyrridoxin, 0.56 mM myo-inositol, 1% (w/v) sucrose, and 2.3 mM 2-(N-morpholino)ethanesul-fonic acid (pH 5.8) in 1% agar. For the plants grown for themicroarray experiments, a layer of nylon mesh (Sefar, 03–100/47) wasadded on top of the agar to facilitate transfer onto treatment mediaand/or root dissection. For Dex treatments, a 10 mM stock solutionwas prepared in ethanol and added to the medium at a concentrationof 10 lM. For Cyc treatments, a 100 mM stock solution was preparedin DMSO and added to the medium at a concentration of 10 lM. Thesame amount of ethanol and/or DMSO was added to the control plateas necessary.
Plasmid construction and plant transformation. Standard molec-ular biology techniques were used for all cloning procedures [62]. Togenerate the pSHR::SHR:GR fusion gene cassette, a PCR-basedmegaprimer approach was used to modify the SHR coding sequenceand silently eliminate internal SpeI and SacI sites [63]. The SHRcoding region was amplified from a genomic subclone using two endprimers, CAGTCGACTAGTCATATGGATACTCTCTTTAGATTAand AAGAGCTCGGATCCGTTGGCCGCCACGCACT, and an inter-
Figure 6. Models for SHR Function in Root Development
(A) The interaction of SHR with various coregulators allows for theactivation of specific direct targets defining five functional subdomainsin the SHR domain: the QC, the early endodermis, the late endodermis,the early stele, and the late stele. The spatial specificity of the differentdirect targets allows SHR to function in QC specification, CEI asymmetriccell division, early and late endodermal specification, but also early andlate stele specification. The gene name was indicated in black or in graywhen the expression was inferred from RNA in situ hybridization ordigital in situ data, respectively. The stars indicate genes for whichbinding to the promoter region was demonstrated by ChIP-QRT-PCR.(B) Global model of the SHR developmental pathway. SHR controls rootdevelopment through the regulation of three interconnected modules: atranscription regulator module, a hormonal module, and a signalingmodule. The interactions between these three modules determine thedevelopmental output of the pathway on stem cell niche specification,radial patterning, and stele development.DOI: 10.1371/journal.pbio.0040143.g006
PLoS Biology | www.plosbiology.org May 2006 | Volume 4 | Issue 5 | e1430748
Global Analysis of SHORT-ROOT Pathway

nal primer CTCCGTACGGAGAAGATAGCTC. The resulting PCRfragment contained a SalI/SpeI/NdeI linker sequence at its 59 end anda BamHI/SacI linker at its 39 end. This fragment was digested with SalIand SacI and cloned into pBC SK(þ) (Stratagene, La Jolla, California,United States) to give pBC-SHR. The 140-bp tobacco etch virus TEwas amplified from the plasmid pAVA321 [64] with two end primers:CGACTAGTCTCAACACAACATAT and CCCATATGTATCGTTCG-TAAATG. This fragment was inserted before the SHR codingsequence in pBC-SHR using the SpeI and NdeI sites incorporatedby PCR and generated pBC-TE-SHR. The 0.9-kb GR fragment(corresponding to amino acids 508 to 795) was amplified from theplasmid pBI-DGR using the primers GCGGATCCTGGTGGT-GAAGCTCGAAAAACAAAG and GTGAGCTCGGGCCCTATTTTT-GATGAAACAG. The resulting PCR fragment contained a BamHI siteat its 59 end and an ApaI/SacI linker sequence at its 39 end, as well as a12-bp extension at the 59 end that encoded a short linker sequence(AspProGlyGly). This fragment was inserted after the SHR codingsequence using BamHI and SacI to give pBC-TE-SHR-GR. The TE-SHR-GR fragment was then excised and inserted after the 2.5-kb SHR59 sequence in the pBIH plant transformation vector. To generate thepSCR::GFP construct, a pBin vector obtained from J. Haselhoff wasused to amplify by PCR mGFP5-ER fused to the Nos terminator(NosT). The mGFP5-ER-NosT PCR fragment contained a XbaI/BamHI/XhoI linker at its 59 end and a KpnI site at its 39 end. It wasinserted in pBlueScript II SK using XbaI and KpnI to generatepSKmGFPL2Nt. The 2-kb region upstream of the ATG of SCR wasthen cloned by PCR from Col-0 genomic DNA. The resulting PCRfragment contained a BamHI linker at its 59 end and a XhoI at its39end. The promoter fragment was inserted as a BamHI-XhoIfragment upstream of mGFP5-NosT in SKmGFPL2Nt. ThepSCR::mGFP5-ER-NosT was then inserted in the pCGN1547 binaryvector using BamHI and KpnI. The plasmids were then transformedin the shr-2 mutant or Col-0 wild-type by the floral dip method [65].
Marker analysis and microscopy. The JIM13 immunolocalizationwas performed on roots from 5-d-old plants as previously described[7]. For confocal microscopy, the roots of 5-d-old plants were stainedwith 4 lg/ml FM 4–64 (Molecular Probes, Eugene, Oregon, UnitedStates) and then washed twice in water before observation with aZeiss LSM 410 confocal microscope. The number of initials in Col-0wild-type and shr-2 mutants was counted on transverse opticalsections just above the QC. Stele width was measured 100 lm abovethe QC using ImageJ (http://rsb.info.nih.gov/ij), and the number ofvisible stele files was counted in the same region on medianlongitudinal optical sections. Whole-mount RNA in situ hybridizationon embryos and roots from 2-d-old plants was performed manuallyusing a protocol described by [66]. Riboprobes were synthesized usingcloned cDNA. The riboprobe spanned the entire coding sequence forMGP and from nucleotide 945 to the end of the coding sequence forNUC. The images were processed in Photoshop 7.0 (Adobe Systems,San Jose, California, United States) to increase contrast.
Microarray data acquisition. The 5-d-old plants were used for allthe microarray experiments, and three biological replicates weredone for each experiment. For the direct induction, induction andloss-of-function experiments, root tips were dissected at approx-imately 0.5 cm from the apex and then immediately frozen in liquidnitrogen. For the ectopic experiment, GFP-expressing cells fromroots of pWER::SHR:GFP and pWER:::GFP plants were obtained afterprotoplasting using fluorescence-activated cell sorting according to[26]. The same approach was also used with the enhancer trap lineJ2661. GFP is specifically expressed in this line in the pericycle in theelongation and differentiation zones of the root (unpublished data).The sorted cells were subsequently frozen before use.
Total RNA was then isolated from the frozen material using theQiagen RNeasy kit (Valencia, California, United States). Probes forhybridization were then prepared from the total RNA according tostandard Affymetrix protocol and hybridized on Affymetrix ATH1microarray chip.
Mixed-model analysis. A mixed-model analysis of variance wasperformed to identify genes differentially expressed between thevarious treatments [67,68]. In this approach, a global normalizationstep was applied to minimize general array-level effects by centeringthe mean of the log2-transformed values to zero for each array [68].Outlier probes with values greater than two standard deviations fromthe probe-set mean were then removed. Next, a mixed-model ANOVAwas applied to the transformed and centered intensity values obtainedfrom the global normalization step. This gene model, which is basedon that developed by Chu et al. [68], can be formalized as:
log2ðPMjklÞ ¼ Tj þ Pk þ AlðjÞ þ ejkl ð1Þ
where the PM variable refers to the output of the global normal-ization procedure for each gene, as described above. The symbols T,P, and A represent treatment, probe, and array effects, respectively.The array effect Al(j) is assumed to be a normally distributed randomeffect [68]. A standard error term ejkl was also applied to this model.In addition, the indices j, k, and l represent the jth treatment, on thekth probe, and on the lth replicate [68]. The output of this model is themean expression value for every gene, based on the global model, aswell as a p-value from the gene model for the probability of falselyrejecting the null hypothesis of no-differential expression (a ¼ .05).The global and gene models were run on a Linux server with thestatistical software SAS (version 8.2).
Meta-analysis and selection of the candidate targets. The meta-analysis was done using Fisher’s inverse v2 method [35]. An S statisticwas calculated for each gene from the three original p-values fromeach test of differential expression:
S ¼ �2lnY3i¼1
pi
!ð2Þ
A v2 test with 6 degrees of freedom was then used to calculate a p-value for the likelihood that a gene could be falsely considered to bedifferentially expressed when all three experiments were combined,given the expected distribution [24,35]. The p-values were thenadjusted for multiple-hypothesis testing using the q-value falsediscover rate procedure [69]. The predicted false-positive rate (PFR)was set to less than or equal to 1 to reduce the reporting of falsepositives in the final candidate gene list. All computation for the meta-analysis was done using the statistical analysis software R (version 1.9.0alpha), which includes a module for performing the q-valuecalculation. All default parameters in the q-value module were used.
For the direct targets, the meta-analysis yielded 3,866 genes thatmet the conservative criteria of a q-value threshold ,0.0001 (PFR ¼0.38). However, the multiplicative nature of the Fisher combinationmay allow a single low p-value from any one of the three microarrayexperiments to overwhelm the other two in the meta-analysis [50].Thus, we added an additional requirement that candidates must havea statistically significant differential expression in at least twoexperiments (p , 0.01). One of these experiments had to be thedirect induction experiment, since it is the only one that demon-strates direct regulation. We also required the candidate directtargets to be identified as an indirect target in order to minimizeartifacts linked to the toxicity of Cyc and to further increase ourconfidence in the putative direct targets.
For the indirect targets, 3,745 genes met the conservative criteriaof a q-value threshold ,0.0001 (PFR¼ 0.37). A gene was then selectedas a candidate if the p-values for differential expression were below0.01 in at least two of the three experiments. The direct targets werethen removed from the list of candidate indirect targets beforefurther analysis.
Statistical analysis of the digital in situ data. The significance ofdifferential expression between all pairwise combinations of tissue-specific transcriptional profiles was obtained using the mixed-modelanalysis described above. For each pairwise comparison, thepredicted PFR was estimated by calculating q-values and the q-valuethreshold was set to a value between 0.75 and 1.5 (see Table S6 for thePFR used in each comparison). The different tissues compared were(1) SHR cell-types (i.e., stele, QC/initials, endodermis, pericycle) and(2) non-SHR cell-types (i.e., columella, LRC, and atrichoblast). A genewas considered to be enriched in a SHR cell-type if it had statisticallysignificant enrichment in the tissue versus all the non-SHR cell-types.
Clustering. The radial and longitudinal expression values for theindirectly induced and indirectly repressed candidates were sepa-rately clustered by principal component analysis using the Clusterprogram [70] after log transformation of the original absoluteexpression values from the mixed model. The number of clusterspresent in each of these four datasets was then used to set the y-dimension of the self-organized map (SOM) corresponding to thatdataset, also using Cluster. The SOMs with the principal componentanalysis�determined y-dimension were generated with 100,000 iter-ations of gene expression values for each radial or longitudinal zone.The program TreeView (version 1.6) was used to visualize the SOM.
GO analysis and biological theme representation analysis. The GOanalysis was performed using the Web-based generic GO TermFinder, which uses the hypergeometric distribution to look forsignificant GO terms (http://go.princeton.edu/cgi-bin/GOTermFinder;[71]). To limit redundancy in the same GO main category (BiologicalProcess, Molecular Function), we omitted parent categories synon-ymous with a child category when the gene content of the parent andchild category overlapped by more than two thirds. To identify genes
PLoS Biology | www.plosbiology.org May 2006 | Volume 4 | Issue 5 | e1430749
Global Analysis of SHORT-ROOT Pathway

with predicted kinase or transcription factor activity and genesinvolved in hormone response (auxin, gibberellin, BR), we usedMicrosoft Access to search the annotations of the SHR targets withthe corresponding keywords. For the transcription factors we alsoused several lists of transcription factors obtained from the AGRIS(http://arabidopsis.med.ohio-state.edu) [72] and DATF (http://datf.cbi.pku.edu.cn) [73] databases and from the Sheen lab Web site (http://genetics.mgh.harvard.edu/sheenweb). To identify the RLK in the SHRtargets, we used the list established by [44]. The lists of genes obtainedwere then manually curated. Statistical significance of enrichmentover the total number of transcription factors and RLKs expressed inthe root was tested using the hypergeometric distribution. To identifygenes expressed in the root, we used the expression values from themixed-model analysis and proceeded as described in [26]. Thethreshold was set at 1 for the mixed-model analysis values, which isequivalent to the threshold of 75 used by [26].
Chromatin immunoprecipitation followed by gene-specific quanti-tative real-time PCR (ChIP-QRT-PCR). ChIP was conducted as inLeibfried et al. [74] on roots of 5-d-old wild-type seedlings and 5-d-old seedlings expressing the SHR:GFP transgene expressed under thecontrol of the SHR 2.5-kb promoter [8]. Immunoprecipitation wasdone using a rabbit polyclonal antibody to GFP (ab290; Abcam Ltd.,Cambridge, United Kingdom). Enrichment of putative target pro-moter-region DNA was determined using QRT-PCR (as in Leibfriedet al. [74]). Precipitates from wild-type and SHR:GFP were comparedafter normalization to input DNA (i.e., sonicated, pre-ChIP DNA). APCR efficiency of 1.8-fold amplifications per cycle was assumed, andsequences from Heat-Shock Factor1 (HSF1) were used to normalize theresults between samples (Leibfried et al. [74]). Each experiment wasdone in triplicate with the mean fold enrichments shown in Figure3B. The following primers were used: SCR (At3g54220): pSCR-F (59AGAAACGAAATGGATCGGCAAACG 39) and pSCR-R (59 ATTTGGAAGGATGTGGGTTGGAGA 39); SCL3 (At1g50420): pSCL3-F (59TTTTGGGAGTGAGAGGGTTC 39) and pSCL3-R (59 AGATGGATGGGATTGGAAAA 39); MGP (At1g03840): pMGP-F (59 TCTTTGACCGCCTCAATTTACGGT 39) and pMGP-R (59 TTGATCTGTAAGAACTGTCGCAGC 39); RLK (At5g67280): pRLK-F (59 GCGTAATCTCACGTCACAATTTCCG 39) and pRLK-R (59 TGCTGACGTCGCTTTGTCGTTT 39); SNEEZY (at5g48170): pSNE-F (59 TTCTGAAAGTGGGCAAGGAC 39) and pSNE-R (59 AAGCGTGGAGGAGACAAAGA 39);TRI (At2g29330): pTRI-F (59 TTGGCCGTGTTGGAGAGC 39) andpTRI-R (59 GTTGGCGTAGCGGGTGTAA 39); NUC (At5g44160):pNUC-F (59 CTCGCTTCGAATTTGCAAGGCTAT 39) and pNUC-R(59 GCACCCTATGTTTGCAGTTTCACT 39); Br6ox2(At3g30180):pCYT-F (59 CGCGATCTCCACCGTAAT 39) and pCYT-R (59CGAAAATAAGTAAAGGCGAGAT 39); HSF1 (At4g17750): G-4680 (59GCTATCCACAGGTTAGATAAAGGAG 39) and G-4681 (59 GAGAAAGATTGTGTGAGAATGAAA 39).
Tiling and fold enrichment along the SCR promoter was doneusing the ChIP-QRT-PCR protocol as described above. The followingsets of adjacent or overlapping primers specific to 200- to 350-bpregions along 1.8 kb of the SCR promoter were used, in ascendingorder upstream from the SCR ATG: pSCR-F (59 AGAAACGAAATGGATCGGCAAACG 39) and pSCR-R (59 ATTTGGAAGGATGTGGGTTGGAGA 39); pSCR-F2 (59 CTAGTGGTGCAACCTGCTGA39); pSCR-R2 (59 TTCGTGGAACCGGTACAATA 39); pSCR-F3 (59AGTTGGTGCCCCATCTTAGT 39); pSCR-R3 (59 TCATTATGTGAAATGAATGGGTTT 39); pSCR-F4 (59 CGTCTTGTCCAATTCCTCTCA 39) pSCR-R4 (59 TCAAAGTGTGGTACGATGTGC 39); pSCR-F5(59 AGAAACAAAAGGGAAAAGATGAGG 39) pSCR-R5 (59 AAAGGCATTTTACTTGAGAGGAA 39); pSCR-F6 (59 ATCGTAGAAAGCGTGGATGG 39) pSCR-R6 (59 CCAACTGTGAAACCCCAGTT 39); pSCR-F7 (59 TGGATAAATTTTGGGAAAATCC 39) pSCR-R7 (59 AACACAAACACACGGCTCAA 39).
Supporting Information
Figure S1. Time-Course after Induction of SHR Demonstrates anIncrease in SCR Transcript after 6 h
Quantitative real-time PCR was used to measure the level of SCRtranscript when shr-2 pSHR::SHR:GR plants were treated with a mocktreatment, 10 lM Dex, 10 lM Dex plus 10 lM Cyc, or 10 lM Cyc.
Found at DOI: 10.1371/journal.pbio.0040143.sg001 (260 KB PDF).
Figure S2. The Statistical Analysis of the Digital In Situ Data Predictsan Enrichment of SHR Direct Targets in the Quiescent Center
A statistical analysis of the digital in situ data was performed todetermine if the SHR direct targets are enriched in the quiescent
center (QC) as compared to tissues where SHR is absent: LRC,columella, and atrichoblast. The stars indicate significant enrichment.See Materials and Methods for a description of the methods used inthis analysis.
Found at DOI: 10.1371/journal.pbio.0040143.sg002 (9.1 MB TIF).
Figure S3. Indirectly Induced SHR Targets Are Broadly Expressedthroughout the Root, and Indirectly Repressed SHR Targets AreEnriched in the Differentiation Zone
(A) Self-organizing map clusters of the SHR indirect targets in theroot radial zones. High expression of clusters in a tissue aredesignated in blue, moderate expression is in black, and low-to-absent expression is in red. See Materials and Methods for details onhow clusters were obtained. (B) Self-organizing map clusters of theSHR indirect targets in the root longitudinal zones, which includesthe meristematic zone (MZ), elongation zone (EZ), and youngdifferentiation zone (YDZ), as in [26]. Expression levels are designatedas in (A). (C) Statistical analysis of the digital in situ data for SHRindirect targets. The number of indirect targets enriched in thedifferent cell types of the SHR domain and in the longitudinal zonesis indicated. The total number of genes expressed in the root andenriched in the different zone is also indicated (total genes). SeeMaterials and Methods for a description of the statistical analysis. QC,quiescent center.
Found at DOI: 10.1371/journal.pbio.0040143.sg003 (579 KB PDF).
Table S1. SHR Indirect Targets
Found at DOI: 10.1371/journal.pbio.0040143.st001 (533 KB DOC).
Table S2. GO Analysis of SHR Indirect Targets
Found at DOI: 10.1371/journal.pbio.0040143.st002 (53 KB DOC).
Table S3. SHR Indirect Targets Encoding Transcription Factors
Found at DOI: 10.1371/journal.pbio.0040143.st003 (122 KB DOC).
Table S4. SHR Indirect Targets with Kinase Activity
Found at DOI: 10.1371/journal.pbio.0040143.st004 (83 KB DOC).
Table S5. SHR Indirect Targets Involved in Hormone-RelatedProcesses
Found at DOI: 10.1371/journal.pbio.0040143.st005 (93 KB DOC).
Table S6. Statistical Analysis of the Radial Zone Digital In Situ Data
Found at DOI: 10.1371/journal.pbio.0040143.st006 (44 KB DOC).
Accession Numbers
The Arabidopsis Genome Initiative (http://www.arabidopsis.org)accession numbers for the genes and gene products discussed in thispaper are WEREWOLF (WER) (AT5G14750), SHORT-ROOT (SHR)(AT4G37650), SCARECROW (SCR) (AT3G54220), SCARECROW-like 3(SCL-3) (AT1G50420), MAGPIE (MGP) (AT1G03840), NUTCRACKER(NUC) (AT5G44160), tropinone reductase (TRI) (AT2G29330), andBR6ox2/Cyp85A2 cytochrome P450 (BR6ox2) (AT3G30180).
Acknowledgments
We thank K. Roberts for the JIM13 antibody; A. Lloyd for the pBI-DGR vector; A. von Arnim for the pAVA321; J. Haseloff for the pBINmGFP5-ER vector; M. Aida for the pBIH vector; G. Sena for thepWER::SHR:GFP and pWER::GFP plants; J. Erickson and R. Wolfingerfor their invaluable help with the mixed-model analysis; A.Hartemink for advice on the data analysis; M. Cook for assistancein cell sorting; H. Dressman and the Duke Microarray Core Facilityfor assistance with microarrays; K. Gallagher, J. Colinas, J. Young, D.McClay, K. Birnbaum, and D. Weigel for helpful comments on themanuscript; and all the members of the Benfey lab for manydiscussions.
Author contributions. MPL, TV, JUL, BS, and PNB conceived anddesigned the experiments. MPL, TV, WB, HC, JUL, JYW, IB, and HHperformed the experiments. MPL, TV, WB, IB, and HH analyzed thedata. MPL, TV, KN, and NM contributed reagents/materials/analysistools. MPL, TV and PNB wrote the paper.
Funding. This work was funded by grants from the NationalInstitutes of Health (RO1GM-43778) and from the National ScienceFoundation (AT2010–0209704) to PNB. MPL was supported by afellowship from the National Science Foundation. KN and NM weresupported by postdoctoral fellowships from the Japan Society for the
PLoS Biology | www.plosbiology.org May 2006 | Volume 4 | Issue 5 | e1430750
Global Analysis of SHORT-ROOT Pathway

Promotion of Science. TV was supported by postdoctoral fellowshipsfrom the European Molecular Biology Organization (ALTF 478-2002)and the Human Frontier Science Program Organization (LT00113/2003). IB and BS were sponsored by an NWO-PIONIER grant. JUL
was supported by the Human Frontier Science Program CareerDevelopment Award.
Competing interests. The authors have declared that no competinginterests exist. &
References1. Weigel D, Jurgens G (2002) Stem cells that make stems. Nature 415: 751–
754.2. Aida M, Beis D, Heidstra R, Willemsen V, Blilou I, et al. (2004) The
PLETHORA genes mediate patterning of the Arabidopsis root stem cellniche. Cell 119: 109–120.
3. van den Berg C, Willemsen V, Hendriks G, Weisbeek P, Scheres B (1997)Short-range control of cell differentiation in the Arabidopsis root meristem.Nature 390: 287–289.
4. Scheres B, Benfey PN (1999) Asymmetric cell division in plants. Annu RevPlant Physiol Plant Mol Biol 50: 505–537.
5. Dolan L, Scheres B (1998) Root pattern: Shooting in the dark? Semin CellDev Biol 9: 201–206.
6. Benfey PN, Linstead PJ, Roberts K, Schiefelbein JW, Hauser MT, et al.(1993) Root development in Arabidopsis: Four mutants with dramaticallyaltered root morphogenesis. Development 119: 57–70.
7. Helariutta Y, Fukaki H, Wysocka-Diller J, Nakajima K, Jung J, et al. (2000)The SHORT-ROOT gene controls radial patterning of the Arabidopsis rootthrough radial signaling. Cell 101: 555–567.
8. Nakajima K, Sena G, Nawy T, Benfey PN (2001) Intercellular movement ofthe putative transcription factor SHR in root patterning. Nature 413: 307–311.
9. Di Laurenzio L, Wysocka-Diller J, Malamy JE, Pysh L, Helariutta Y, et al.(1996) The SCARECROW gene regulates an asymmetric cell division that isessential for generating the radial organization of the Arabidopsis root. Cell86: 423–433.
10. Sabatini S, Heidstra R, Wildwater M, Scheres B (2003) SCARECROW isinvolved in positioning the stem cell niche in the Arabidopsis root meristem.Genes Dev 17: 354–358.
11. Heidstra R, Welch D, Scheres B (2004) Mosaic analyses using markedactivation and deletion clones dissect Arabidopsis SCARECROW action inasymmetric cell division. Genes Dev 18: 1964–1969.
12. Tu Y, Stolovitzky G, Klein U (2002) Quantitative noise analysis for geneexpression microarray experiments. Proc Natl Acad Sci U S A 99: 14031–14036.
13. Slonim DK (2002) From patterns to pathways: Gene expression dataanalysis comes of age. Nat Genet 32 Suppl: 502–508.
14. Wray GA, Hahn MW, Abouheif E, Balhoff JP, Pizer M, et al. (2003) Theevolution of transcriptional regulation in eukaryotes. Mol Biol Evol 20:1377–1419.
15. Davidson EH (2001) Genomic regulatory systems: Development andevolution. San Diego: Academic Press. 261 p.
16. Livesey R (2002) Have microarrays failed to deliver for developmentalbiology? Genome Biol 3: comment2009.
17. Gomez-Mena C, de Folter S, Costa MM, Angenent GC, Sablowski R (2005)Transcriptional program controlled by the floral homeotic gene AGA-MOUS during early organogenesis. Development 132: 429–438.
18. Ito T, Wellmer F, Yu H, Das P, Ito N, et al. (2004) The homeotic proteinAGAMOUS controls microsporogenesis by regulation of SPOROCYTE-LESS. Nature 430: 356–360.
19. Furlong EE, Andersen EC, Null B, White KP, Scott MP (2001) Patterns ofgene expression during Drosophila mesoderm development. Science 293:1629–1633.
20. Zik M, Irish VF (2003) Global identification of target genes regulated byAPETALA3 and PISTILLATA floral homeotic gene action. Plant Cell 15:207–222.
21. Murphy CT, McCarroll SA, Bargmann CI, Fraser A, Kamath RS, et al. (2003)Genes that act downstream of DAF-16 to influence the lifespan ofCaenorhabditis elegans. Nature 424: 277–283.
22. William DA, Su Y, Smith MR, Lu M, Baldwin DA, et al. (2004) Genomicidentification of direct target genes of LEAFY. Proc Natl Acad Sci U S A101: 1775–1780.
23. Choi JK, Yu U, Kim S, Yoo OJ (2003) Combining multiple microarraystudies and modeling interstudy variation. Bioinformatics 19: 84–90.
24. Moreau Y, Aerts S, De Moor B, De Strooper B, Dabrowski M (2003)Comparison and meta-analysis of microarray data: From the bench to thecomputer desk. Trends Genet 19: 570–577.
25. Fraser AG, Marcotte EM (2004) Development through the eyes offunctional genomics. Curr Opin Genet Dev 14: 336–342.
26. Birnbaum K, Shasha DE, Wang JY, Jung JW, Lambert GM, et al. (2003) Agene expression map of the Arabidopsis root. Science 302: 1956–1960.
27. Samach A, Onouchi H, Gold SE, Ditta GS, Schwarz-Sommer Z, et al. (2000)Distinct roles of CONSTANS target genes in reproductive development ofArabidopsis. Science 288: 1613–1616.
28. Ohashi Y, Oka A, Rodrigues-Pousada R, Possenti M, Ruberti I, et al. (2003)Modulation of phospholipid signaling by GLABRA2 in root-hair patternformation. Science 300: 1427–1430.
29. Wagner D, Sablowski RW, Meyerowitz EM (1999) Transcriptional activationof APETALA1 by LEAFY. Science 285: 582–584.
30. Sablowski RW, Meyerowitz EM (1998) A homolog of NO APICALMERISTEM is an immediate target of the floral homeotic genesAPETALA3/PISTILLATA. Cell 92: 93–103.
31. Padidam M (2003) Chemically regulated gene expression in plants. CurrOpin Plant Biol 6: 169–177.
32. Knox JP, Linstead PJ, King J, Cooper C, Roberts K (1990) Pectinesterification is spatially regulated both within cell walls and betweendeveloping tissues of root apices. Planta 181: 512–521.
33. Lee MM, Schiefelbein J (1999) WEREWOLF, a MYB-related protein inArabidopsis, is a position-dependent regulator of epidermal cell patterning.Cell 99: 473–483.
34. Sena G, Jung JW, Benfey PN (2004) A broad competence to respond toSHORT ROOT revealed by tissue-specific ectopic expression. Development131: 2817–2826.
35. Fisher RA (1950) Statistical methods for research workers. New York:Hafner. xv, 354 p.
36. Pysh LD, Wysocka-Diller JW, Camilleri C, Bouchez D, Benfey PN (1999) TheGRAS gene family in Arabidopsis: Sequence characterization and basicexpression analysis of the SCARECROW-LIKE genes. Plant J 18: 111–119.
37. Shiu SH, Bleecker AB (2001) Receptor-like kinases from Arabidopsis form amonophyletic gene family related to animal receptor kinases. PNAS 98:10763–10768.
38. Facchini PJ, Bird DA, St-Pierre B (2004) Can Arabidopsis make complexalkaloids? Trends Plant Sci 9: 116–122.
39. Shimada Y, Goda H, Nakamura A, Takatsuto S, Fujioka S, et al. (2003)Organ-specific expression of brassinosteroid-biosynthetic genes and dis-tribution of endogenous brassinosteroids in Arabidopsis. Plant Physiol 131:287–297.
40. Strader LC, Ritchie S, Soule JD, McGinnis KM, Steber CM (2004) Recessive-interfering mutations in the gibberellin signaling gene SLEEPY1 arerescued by overexpression of its homologue, SNEEZY. Proc Natl Acad Sci US A 101: 12771–12776.
41. Fu X, Richards DE, Fleck B, Xie D, Burton N, et al. (2004) The Arabidopsismutant sleepy1gar2–1 protein promotes plant growth by increasing theaffinity of the SCFSLY1 E3 ubiquitin ligase for DELLA protein substrates.Plant Cell 16: 1406–1418.
42. Nawy T, Lee JY, Colinas J, Wang JY, Thongrod SC, et al. (2005)Transcriptional profile of the Arabidopsis root quiescent center. Plant Cell17: 1908–1925.
43. Jurgens G, Mayer U (1994) Arabidopsis. In: Bard J, editor. A colour atlas ofdeveloping embryos. London: Wolfe publishing. pp. 7–21.
44. Shiu SH, Bleecker AB (2003) Expansion of the receptor-like kinase/Pellegene family and receptor-like proteins in Arabidopsis. Plant Physiol 132:530–543.
45. Shiu SH, Bleecker AB (2001) Receptor-like kinases from Arabidopsis form amonophyletic gene family related to animal receptor kinases. Proc NatlAcad Sci U S A 98: 10763–10768.
46. Friml J, Vieten A, Sauer M, Weijers D, Schwarz H, et al. (2003) Efflux-dependent auxin gradients establish the apical-basal axis of Arabidopsis.Nature 426: 147–153.
47. Blilou I, Xu J, Wildwater M, Willemsen V, Paponov I, et al. (2005) The PINauxin efflux facilitator network controls growth and patterning inArabidopsis roots. Nature 433: 39–44.
48. Sabatini S, Beis D, Wolkenfelt H, Murfett J, Guilfoyle T, et al. (1999) Anauxin-dependent distal organizer of pattern and polarity in the Arabidopsisroot. Cell 99: 463–472.
49. Quackenbush J (2001) Computational analysis of microarray data. Nat RevGenet 2: 418–427.
50. Zaykin DV, Zhivotovsky LA, Westfall PH, Weir BS (2002) Truncatedproduct method for combining P-values. Genet Epidemiol 22: 170–185.
51. Rhodes DR, Barrette TR, Rubin MA, Ghosh D, Chinnaiyan AM (2002) Meta-analysis of microarrays: Interstudy validation of gene expression profilesreveals pathway dysregulation in prostate cancer. Cancer Res 62: 4427–4433.
52. Rhodes DR, Yu J, Shanker K, Deshpande N, Varambally R, et al. (2004)Large-scale meta-analysis of cancer microarray data identifies commontranscriptional profiles of neoplastic transformation and progression. ProcNatl Acad Sci U S A 101: 9309–9314.
53. Bailey TL, Elkan C (1994) Fitting a mixture model by expectationmaximization to discover motifs in biopolymers. Proc Int Conf Intell SystMol Biol 2: 28–36.
54. Thompson W, Rouchka EC, Lawrence CE (2003) Gibbs Recursive Sampler:Finding transcription factor binding sites. Nucleic Acids Res 31: 3580–3585.
55. Fukuda H (2004) Signals that control plant vascular cell differentiation. NatRev Mol Cell Biol 5: 379–391.
56. Cano-Delgado A, Yin YH, Yu C, Vafeados D, Mora-Garcia S, et al. (2004)
PLoS Biology | www.plosbiology.org May 2006 | Volume 4 | Issue 5 | e1430751
Global Analysis of SHORT-ROOT Pathway

BRL1 and BRL3 are novel brassinosteroid receptors that function invascular differentiation in Arabidopsis. Development 131: 5341–5351.
57. Bowman JL (2004) Class III HD-Zip gene regulation: The golden fleece ofARGONAUTE activity? Bioessays 26: 938–942.
58. McConnell JR, Emery J, Eshed Y, Bao N, Bowman J, et al. (2001) Role ofPHABULOSA and PHAVOLUTA in determining radial patterning inshoots. Nature 411: 709–713.
59. Lei H, Wang H, Juan AH, Ruddle FH (2005) The identification of Hoxc8target genes. Proc Natl Acad Sci U S A 102: 2420–2424.
60. Williams TM, Williams ME, Kuick R, Misek D, McDonagh K, et al. (2005)Candidate downstream regulated genes of HOX group 13 transcriptionfactors with and without monomeric DNA binding capability. Dev Biol 279:462–480.
61. Fukaki H, Wysocka-Diller J, Kato T, Fujisawa H, Benfey PN, et al. (1998)Genetic evidence that the endodermis is essential for shoot gravitropism inArabidopsis thaliana. Plant J 14: 425–430.
62. Sambrook J, Russel DW (2001) Molecular cloning: A laboratory manual.Cold Spring Harbor (New York): Cold Spring Harbor Laboratory Press.2344 p.
63. Burke E, Barik S (2003) Megaprimer PCR: Application in mutagenesis andgene fusion. Methods Mol Biol 226: 525–532.
64. von Arnim AG, Deng XW, Stacey MG (1998) Cloning vectors for theexpression of green fluorescent protein fusion proteins in transgenicplants. Gene 221: 35–43.
65. Clough SJ, Bent AF (1998) Floral dip: A simplified method for Agro-bacterium-mediated transformation of Arabidopsis thaliana. Plant J 16: 735–743.
66. Friml J, Benkova E, Mayer U, Palme K, Muster G (2003) Automated wholemount localisation techniques for plant seedlings. Plant J 34: 115–124.
67. Chu TM, Weir BS, Wolfinger RD (2004) Comparison of Li-Wong andloglinear mixed models for the statistical analysis of oligonucleotide arrays.Bioinformatics 20: 500–506.
68. Chu TM, Weir B, Wolfinger R (2002) A systematic statistical linear modelingapproach to oligonucleotide array experiments. Math Biosci 176: 35–51.
69. Storey JD, Tibshirani R (2003) Statistical methods for identifying differ-entially expressed genes in DNA microarrays. Methods Mol Biol 224: 149–157.
70. Eisen MB, Spellman PT, Brown PO, Botstein D (1998) Cluster analysis anddisplay of genome-wide expression patterns. Proc Natl Acad Sci U S A 95:14863–14868.
71. Boyle EI, Weng S, Gollub J, Jin H, Botstein D, et al. (2004) GO::Term-Finder—Open source software for accessing Gene Ontology informationand finding significantly enriched Gene Ontology terms associated with alist of genes. Bioinformatics 20: 3710–3715.
72. Davuluri R, Sun H, Palaniswamy S, Matthews N, Molina C, et al. (2003)AGRIS: Arabidopsis Gene Regulatory Information Server, an informationresource of Arabidopsis cis-regulatory elements and transcription factors.BMC Bioinformatics 4: 25.
73. Guo A, He K, Liu D, Bai S, Gu X, et al. (2005) DATF: A database ofArabidopsis transcription factors. Bioinformatics: bti334.
74. Leibfried A, To JPC, Busch W, Stehling S, Kehle A, et al. (2005) WUSCHELcontrols meristem function by direct regulation of cytokinin inducibleresponse regulators. Nature 438: 1172–1175.
PLoS Biology | www.plosbiology.org May 2006 | Volume 4 | Issue 5 | e1430752
Global Analysis of SHORT-ROOT Pathway