whole-genome analysis of human embryonic stem cells
TRANSCRIPT
Resource
Whole-genome analysis of
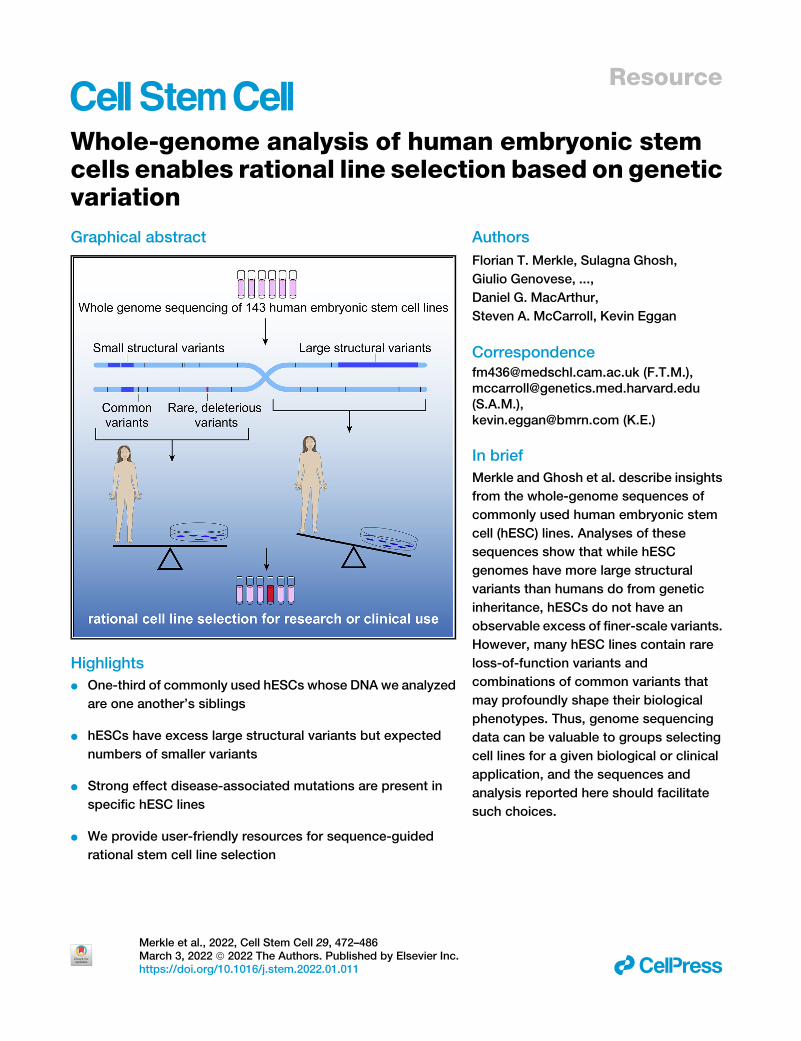
human embryonic stemcells enables rational line selection based on geneticvariationGraphical abstract
Highlights
d One-third of commonly used hESCs whose DNA we analyzed
are one another’s siblings
d hESCs have excess large structural variants but expected
numbers of smaller variants
d Strong effect disease-associated mutations are present in
specific hESC lines
d We provide user-friendly resources for sequence-guided
rational stem cell line selection
Merkle et al., 2022, Cell Stem Cell 29, 472–486March 3, 2022 ª 2022 The Authors. Published by Elsevier Inc.https://doi.org/10.1016/j.stem.2022.01.011
Authors
Florian T. Merkle, Sulagna Ghosh,
Giulio Genovese, ...,
Daniel G. MacArthur,
Steven A. McCarroll, Kevin Eggan
[email protected] (F.T.M.),[email protected](S.A.M.),[email protected] (K.E.)
In brief
Merkle and Ghosh et al. describe insights
from the whole-genome sequences of
commonly used human embryonic stem
cell (hESC) lines. Analyses of these
sequences show that while hESC
genomes have more large structural
variants than humans do from genetic
inheritance, hESCs do not have an
observable excess of finer-scale variants.
However, many hESC lines contain rare
loss-of-function variants and
combinations of common variants that
may profoundly shape their biological
phenotypes. Thus, genome sequencing
data can be valuable to groups selecting
cell lines for a given biological or clinical
application, and the sequences and
analysis reported here should facilitate
such choices.
ll
OPEN ACCESS
llResource
Whole-genome analysis of human embryonicstem cells enables rational line selectionbased on genetic variationFlorian T. Merkle,1,2,3,4,5,6,14,15,* Sulagna Ghosh,1,2,3,4,14 Giulio Genovese,4,7,8 Robert E. Handsaker,4,7,8 Seva Kashin,4,7,8
Daniel Meyer,4,8 Konrad J. Karczewski,8,9 Colm O’Dushlaine,4 Carlos Pato,10,11 Michele Pato,10,11
Daniel G. MacArthur,7,8,12,13 Steven A. McCarroll,4,7,8,* and Kevin Eggan1,2,3,4,*1Department of Stem Cell and Regenerative Biology, Harvard University, Cambridge, MA 02138, USA2Department of Molecular and Cellular Biology, Harvard University, Cambridge, MA 02138, USA3Harvard Stem Cell Institute, Cambridge, MA 02138, USA4Stanley Center for Psychiatric Research, Broad Institute of MIT and Harvard, Cambridge, MA 02142, USA5Wellcome – MRC Institute of Metabolic Science, University of Cambridge, Cambridge CB2 0QQ, UK6Wellcome – MRC Cambridge Stem Cell Institute, University of Cambridge, Cambridge CB2 0AW, UK7Department of Genetics, Harvard Medical School, Boston, MA 02115, USA8Program in Medical and Population Genetics, Broad Institute of MIT and Harvard, Cambridge, MA 02142, USA9Analytic and Translational Genetics Unit, Massachusetts General Hospital, Boston, MA 02114, USA10Department of Psychiatry, Robert Wood Johnson Medical School, Rutgers University, New Brunswick, NJ 08901, USA11Department of Psychiatry, New Jersey Medical School, Rutgers University, Newark, NJ 07103, USA12Centre for Population Genomics, Garvan Institute of Medical Research, and UNSW Sydney, Sydney, NSW, Australia13Centre for Population Genomics, Murdoch Children’s Research Institute, Melbourne, VIC, Australia14These authors contributed equally15Lead contact
*Correspondence: [email protected] (F.T.M.), [email protected] (S.A.M.), [email protected] (K.E.)
https://doi.org/10.1016/j.stem.2022.01.011
SUMMARY
Despite their widespread use in research, there has not yet been a systematic genomic analysis of humanembryonic stem cell (hESC) lines at a single-nucleotide resolution. We therefore performed whole-genomesequencing (WGS) of 143 hESC lines and annotated their single-nucleotide and structural genetic variants.We found that while a substantial fraction of hESC lines contained large deleterious structural variants,finer-scale structural and single-nucleotide variants (SNVs) that are ascertainable only throughWGS analyseswere present in hESC genomes and human blood-derived genomes at similar frequencies. Moreover, WGSallowed us to identify SNVs associated with cancer and other diseases that could alter cellular phenotypesand compromise the safety of hESC-derived cellular products transplanted into humans. As a resource toenable reproducible hESC research and safer translation, we provide a user-friendly WGS data portal anda data-driven scheme for cell line maintenance and selection.
INTRODUCTION
Human pluripotent stem cells (hPSCs) can self-renew indefinitely
while retaining the ability to differentiate into many cell types.
These properties make hPSCs a powerful resource for studying
early human development, disease modeling, and drug discov-
ery and increasingly for developing candidate cell therapies
(Avior et al., 2016; Merkle and Eggan, 2013; Trounson and DeW-
itt, 2016) (https://clinicaltrials.gov). However, the utility of human
embryonic stem cells (hESCs) and human induced pluripotent
stem cells (hiPSCs) for these applications can be compromised
by mutations that affect their differentiation potential, cellular
phenotypes, or clinical safety. The nature of such mutations
472 Cell Stem Cell 29, 472–486, March 3, 2022 ª 2022 The Authors.This is an open access article under the CC BY license (http://creative
has been studied using Giemsa-band karyotyping, fluorescent
in situ hybridization, comparative genome hybridization arrays,
and high-density single-nucleotide polymorphism (SNP) DNA
microarrays that have a spatial resolution of >100 kbp (Draper
et al., 2004; Laurent et al., 2011; Lefort et al., 2008; Maitra
et al., 2005; N€arv€a et al., 2010) These and subsequent studies
have revealed recurrent, culture-acquired structural genetic var-
iants, including a common duplication at Chr20q11.21 that has
been attributed to the gain of the anti-apoptotic gene BCL2L1
(Avery et al., 2013; Nguyen et al., 2014). However, the cause
and functional consequences of most mutations observed in
hPSCs remain poorly understood, and as much as 99% of the
genome of most hPSCs remains unexplored. Consequently,
Published by Elsevier Inc.commons.org/licenses/by/4.0/).
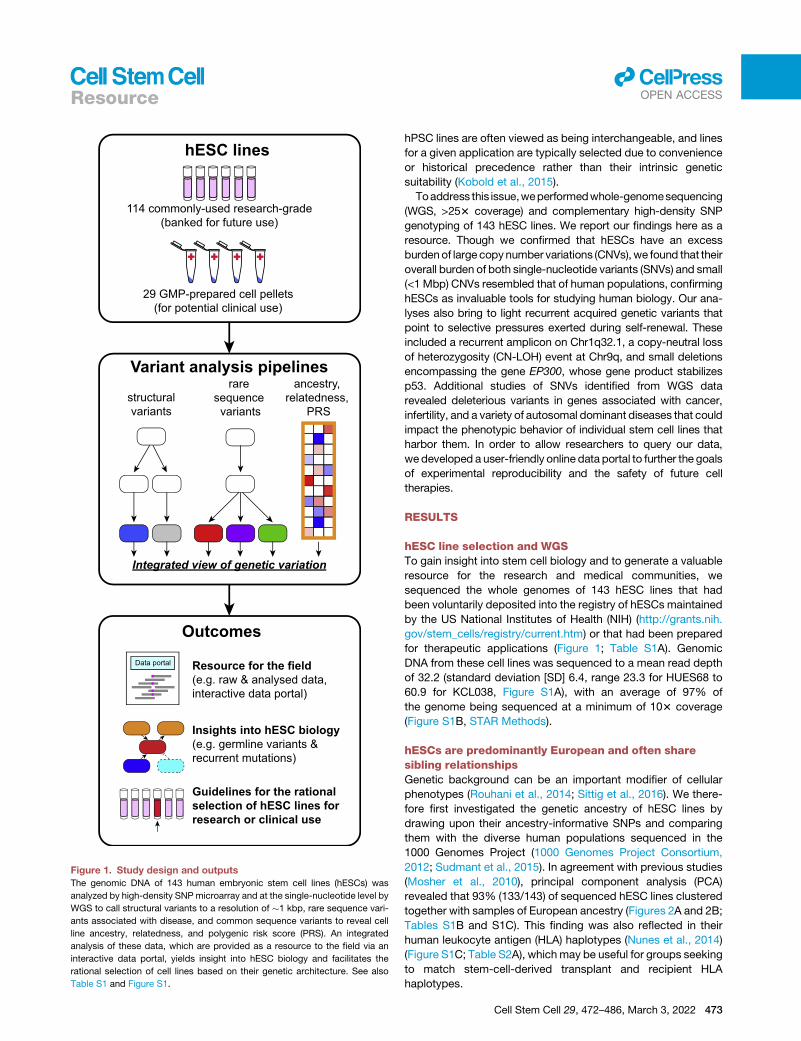
Figure 1. Study design and outputs
The genomic DNA of 143 human embryonic stem cell lines (hESCs) was
analyzed by high-density SNP microarray and at the single-nucleotide level by
WGS to call structural variants to a resolution of �1 kbp, rare sequence vari-
ants associated with disease, and common sequence variants to reveal cell
line ancestry, relatedness, and polygenic risk score (PRS). An integrated
analysis of these data, which are provided as a resource to the field via an
interactive data portal, yields insight into hESC biology and facilitates the
rational selection of cell lines based on their genetic architecture. See also
Table S1 and Figure S1.
llOPEN ACCESSResource
hPSC lines are often viewed as being interchangeable, and lines
for a given application are typically selected due to convenience
or historical precedence rather than their intrinsic genetic
suitability (Kobold et al., 2015).
Toaddress this issue,weperformedwhole-genomesequencing
(WGS, >253 coverage) and complementary high-density SNP
genotyping of 143 hESC lines. We report our findings here as a
resource. Though we confirmed that hESCs have an excess
burdenof large copynumber variations (CNVs),we found that their
overall burden of both single-nucleotide variants (SNVs) and small
(<1 Mbp) CNVs resembled that of human populations, confirming
hESCs as invaluable tools for studying human biology. Our ana-
lyses also bring to light recurrent acquired genetic variants that
point to selective pressures exerted during self-renewal. These
included a recurrent amplicon on Chr1q32.1, a copy-neutral loss
of heterozygosity (CN-LOH) event at Chr9q, and small deletions
encompassing the gene EP300, whose gene product stabilizes
p53. Additional studies of SNVs identified from WGS data
revealed deleterious variants in genes associated with cancer,
infertility, and a variety of autosomal dominant diseases that could
impact the phenotypic behavior of individual stem cell lines that
harbor them. In order to allow researchers to query our data,
wedeveloped a user-friendly online data portal to further the goals
of experimental reproducibility and the safety of future cell
therapies.
RESULTS
hESC line selection and WGSTo gain insight into stem cell biology and to generate a valuable
resource for the research and medical communities, we
sequenced the whole genomes of 143 hESC lines that had
been voluntarily deposited into the registry of hESCs maintained
by the US National Institutes of Health (NIH) (http://grants.nih.
gov/stem_cells/registry/current.htm) or that had been prepared
for therapeutic applications (Figure 1; Table S1A). Genomic
DNA from these cell lines was sequenced to a mean read depth
of 32.2 (standard deviation [SD] 6.4, range 23.3 for HUES68 to
60.9 for KCL038, Figure S1A), with an average of 97% of
the genome being sequenced at a minimum of 103 coverage
(Figure S1B, STAR Methods).
hESCs are predominantly European and often sharesibling relationshipsGenetic background can be an important modifier of cellular
phenotypes (Rouhani et al., 2014; Sittig et al., 2016). We there-
fore first investigated the genetic ancestry of hESC lines by
drawing upon their ancestry-informative SNPs and comparing
them with the diverse human populations sequenced in the
1000 Genomes Project (1000 Genomes Project Consortium,
2012; Sudmant et al., 2015). In agreement with previous studies
(Mosher et al., 2010), principal component analysis (PCA)
revealed that 93% (133/143) of sequenced hESC lines clustered
together with samples of European ancestry (Figures 2A and 2B;
Tables S1B and S1C). This finding was also reflected in their
human leukocyte antigen (HLA) haplotypes (Nunes et al., 2014)
(Figure S1C; Table S2A), whichmay be useful for groups seeking
to match stem-cell-derived transplant and recipient HLA
haplotypes.
Cell Stem Cell 29, 472–486, March 3, 2022 473
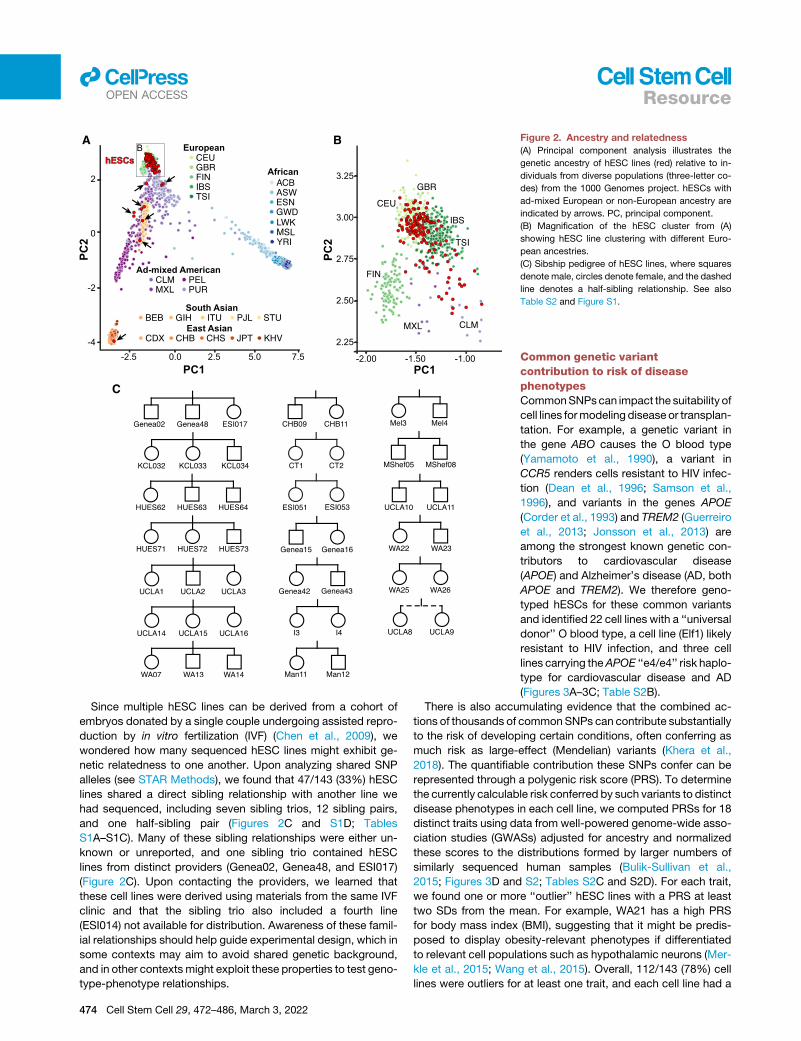
A B
C
Figure 2. Ancestry and relatedness
(A) Principal component analysis illustrates the
genetic ancestry of hESC lines (red) relative to in-
dividuals from diverse populations (three-letter co-
des) from the 1000 Genomes project. hESCs with
ad-mixed European or non-European ancestry are
indicated by arrows. PC, principal component.
(B) Magnification of the hESC cluster from (A)
showing hESC line clustering with different Euro-
pean ancestries.
(C) Sibship pedigree of hESC lines, where squares
denote male, circles denote female, and the dashed
line denotes a half-sibling relationship. See also
Table S2 and Figure S1.
llOPEN ACCESS Resource
Since multiple hESC lines can be derived from a cohort of
embryos donated by a single couple undergoing assisted repro-
duction by in vitro fertilization (IVF) (Chen et al., 2009), we
wondered how many sequenced hESC lines might exhibit ge-
netic relatedness to one another. Upon analyzing shared SNP
alleles (see STAR Methods), we found that 47/143 (33%) hESC
lines shared a direct sibling relationship with another line we
had sequenced, including seven sibling trios, 12 sibling pairs,
and one half-sibling pair (Figures 2C and S1D; Tables
S1A–S1C). Many of these sibling relationships were either un-
known or unreported, and one sibling trio contained hESC
lines from distinct providers (Genea02, Genea48, and ESI017)
(Figure 2C). Upon contacting the providers, we learned that
these cell lines were derived using materials from the same IVF
clinic and that the sibling trio also included a fourth line
(ESI014) not available for distribution. Awareness of these famil-
ial relationships should help guide experimental design, which in
some contexts may aim to avoid shared genetic background,
and in other contexts might exploit these properties to test geno-
type-phenotype relationships.
474 Cell Stem Cell 29, 472–486, March 3, 2022
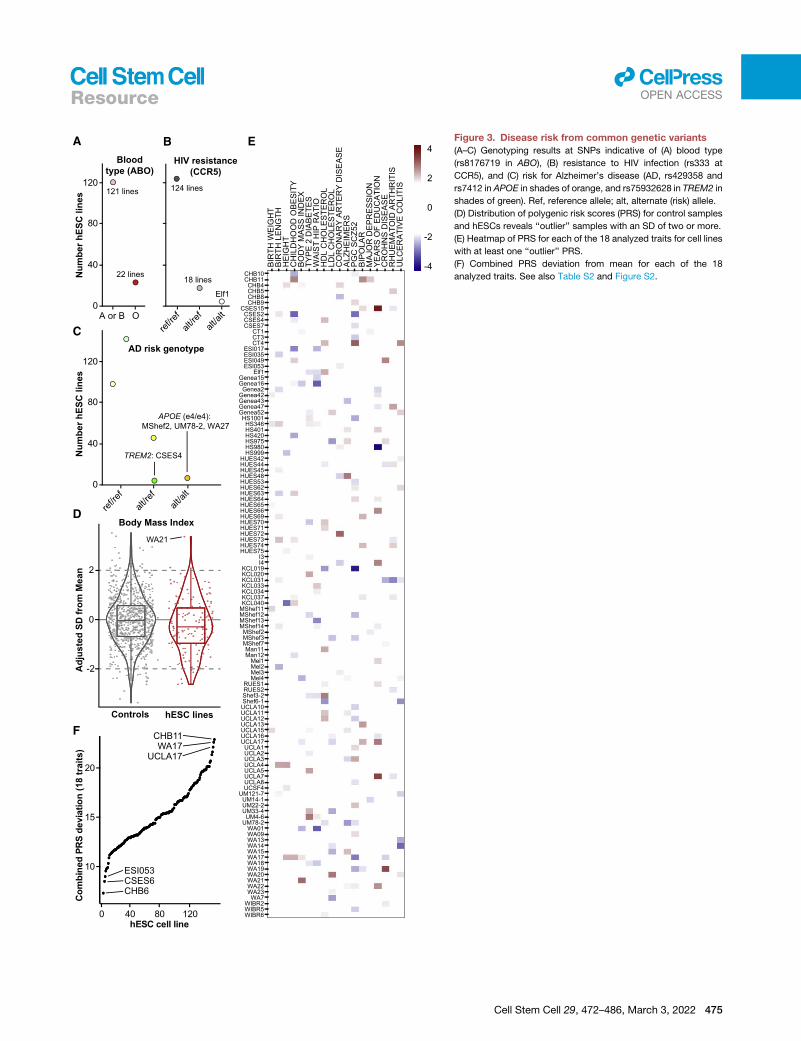
Common genetic variantcontribution to risk of diseasephenotypesCommonSNPscan impact the suitability of
cell lines formodeling disease or transplan-
tation. For example, a genetic variant in
the gene ABO causes the O blood type
(Yamamoto et al., 1990), a variant in
CCR5 renders cells resistant to HIV infec-
tion (Dean et al., 1996; Samson et al.,
1996), and variants in the genes APOE
(Corder et al., 1993) and TREM2 (Guerreiro
et al., 2013; Jonsson et al., 2013) are
among the strongest known genetic con-
tributors to cardiovascular disease
(APOE) and Alzheimer’s disease (AD, both
APOE and TREM2). We therefore geno-
typed hESCs for these common variants
and identified 22 cell lines with a ‘‘universal
donor’’ O blood type, a cell line (Elf1) likely
resistant to HIV infection, and three cell
lines carrying theAPOE ‘‘e4/e4’’ risk haplo-
type for cardiovascular disease and AD
(Figures 3A–3C; Table S2B).
There is also accumulating evidence that the combined ac-
tions of thousands of commonSNPs can contribute substantially
to the risk of developing certain conditions, often conferring as
much risk as large-effect (Mendelian) variants (Khera et al.,
2018). The quantifiable contribution these SNPs confer can be
represented through a polygenic risk score (PRS). To determine
the currently calculable risk conferred by such variants to distinct
disease phenotypes in each cell line, we computed PRSs for 18
distinct traits using data from well-powered genome-wide asso-
ciation studies (GWASs) adjusted for ancestry and normalized
these scores to the distributions formed by larger numbers of
similarly sequenced human samples (Bulik-Sullivan et al.,
2015; Figures 3D and S2; Tables S2C and S2D). For each trait,
we found one or more ‘‘outlier’’ hESC lines with a PRS at least
two SDs from the mean. For example, WA21 has a high PRS
for body mass index (BMI), suggesting that it might be predis-
posed to display obesity-relevant phenotypes if differentiated
to relevant cell populations such as hypothalamic neurons (Mer-
kle et al., 2015; Wang et al., 2015). Overall, 112/143 (78%) cell
lines were outliers for at least one trait, and each cell line had a
A B E
C
D
F
Figure 3. Disease risk from common genetic variants
(A–C) Genotyping results at SNPs indicative of (A) blood type
(rs8176719 in ABO), (B) resistance to HIV infection (rs333 at
CCR5), and (C) risk for Alzheimer’s disease (AD, rs429358 and
rs7412 in APOE in shades of orange, and rs75932628 in TREM2 in
shades of green). Ref, reference allele; alt, alternate (risk) allele.
(D) Distribution of polygenic risk scores (PRS) for control samples
and hESCs reveals ‘‘outlier’’ samples with an SD of two or more.
(E) Heatmap of PRS for each of the 18 analyzed traits for cell lines
with at least one ‘‘outlier’’ PRS.
(F) Combined PRS deviation from mean for each of the 18
analyzed traits. See also Table S2 and Figure S2.
llOPEN ACCESSResource
Cell Stem Cell 29, 472–486, March 3, 2022 475
A B C
D E F
G
H
I J K
L
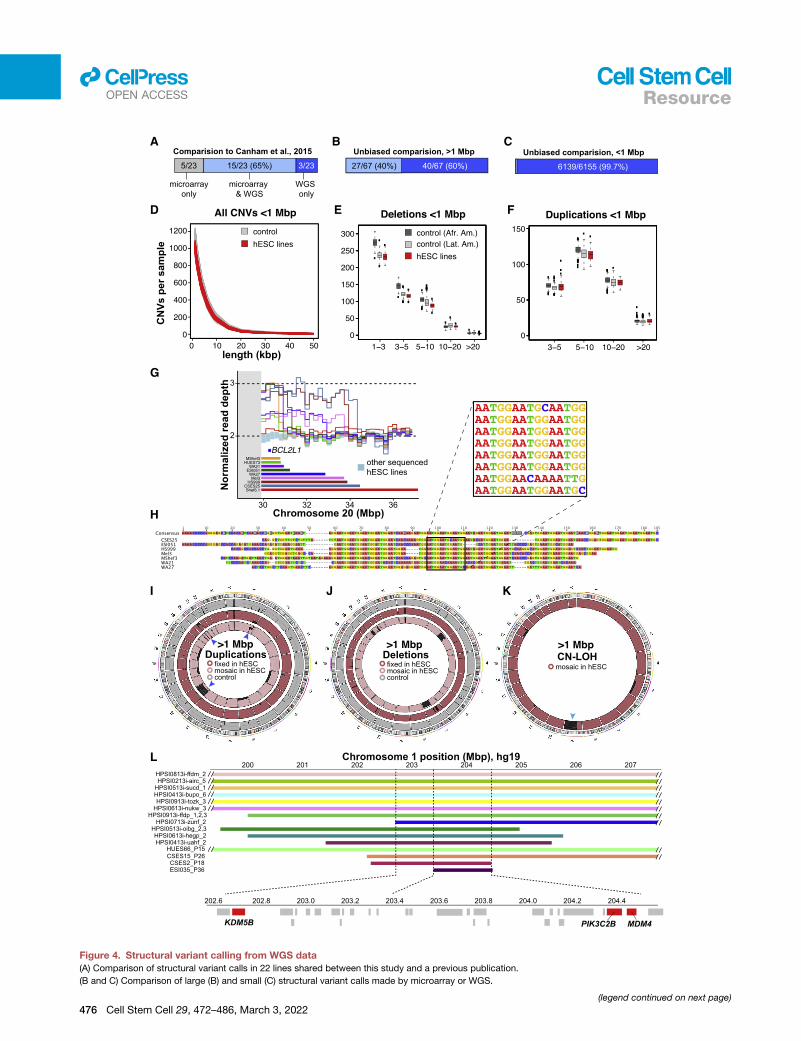
Figure 4. Structural variant calling from WGS data
(A) Comparison of structural variant calls in 22 lines shared between this study and a previous publication.
(B and C) Comparison of large (B) and small (C) structural variant calls made by microarray or WGS.
(legend continued on next page)
llOPEN ACCESS Resource
476 Cell Stem Cell 29, 472–486, March 3, 2022
llOPEN ACCESSResource
unique PRS fingerprint (Figure 3E). To identify hESCs that might
make good ‘‘all-purpose control’’ cell lines, we ranked hESC
lines by their combined absolute PRS across the 18 traits
and identified cell lines with PRSs close to the population
mean (Figure 3F; Table S2E).
Calling structural genetic variation from WGS dataHaving established the genetic background of hESCs using
common SNPs, we next analyzed their structural variants, which
can affect the expression of tens to thousands of genes and
significantly alter cellular phenotypes (Chiang et al., 2017). In
particular, aneuploidy and large CNVs often contribute to
disease (Henrichsen et al., 2009), and copy-neutral loss of
heterozygosity (CN-LOH) events are frequently associated
with cancer and can potently alter gene expression by affecting
imprinted genes and unmasking disease-associated recessive
mutations or risk alleles (Nicholls et al., 1989).
We reasoned that our WGS data with at least 253 mean
sequencing depth of coverage should provide both superior
spatial resolution and sensitivity for detecting small or mosaic
CNVs in hESCs, compared with data from SNPDNAmicroarrays
that sample only a small fraction of nucleotides. Indeed, we
found that normalized read depth of coverage (DOC) analysis
of WGS from 121 cell lines permitted the identification of dele-
tions as small as �1.1 kbp and duplications as small as �2.8
kbp (Figure S3A). To complement this analysis, we identified het-
erozygous SNPs across the genome from WGS data and
compared the sequencing depth of both alleles in all 143 hESC
lines to call CNVs and CN-LOH events using the B allele
frequency (BAF). We next split structural variants into ‘‘large’’
(>1 Mbp) and ‘‘small’’ (<1 Mbp) categories, revealing 66 distinct
fixed and mosaic large structural variants affecting nearly a third
of hESC lines (46/143, 32%; Figures S3B and S3C; Tables S3A
and S3B).
To test the accuracy and sensitivity of our approach, we
compared our WGS structural variant calls with a published
SNPmicroarray-based study (Canham et al., 2015) that included
22 of the cell lines we subsequently sequenced. We found that
WGS confirmed most of these variants, allowed CNV borders
to be more accurately mapped, and revealed previously unas-
certained structural variants (Figure 4A; Tables S3C and S3D).
To broaden this comparison, we analyzed identical genomic
DNA samples from 121 hESC lines by both DOC and BAF
analysis of WGS data and high-density SNP microarrays
(Infinium PsychArray, > 500,000 probes). Of the large variants
(>1 Mbp) observed by analyzing WGS data in these 121 lines,
41/58 (71%) were also called by PsychArray (Figure 4B; Table
S3B). Together, these results suggest that analysis of WGS
data has substantially improved the utility for calling large struc-
(D) Length distribution of small CNVs in hESCs and controls.
(E and F) At length scales of �1.1 kbp to 1 Mbp, the frequency of deletions (E) a
American (Afr. Amer.) and Latin American (Lat. Amer.) ancestries. Values on the
(G) Recurrent duplications of Chr20q11.21 encompassing the anti-apoptotic ge
(colored bars and lines) having distinct distal breakpoints.
(H) Alignment of sequencing reads flanking the distal Chr20q11.21 duplication b
(I–K) Circular ideograms of fixed (darker shades) and mosaic (lighter shades) dupl
and 500 similarly sequenced controls (gray). Genomic regions with at least four
duplicated region on Chr1q32.1 harbors candidate genes (red) among other cod
tural variants relative to microarrays and confirms and extends
previous reports (International Stem Cell Initiative et al., 2011;
Baker et al., 2016; Draper et al., 2004; Laurent et al., 2011; Lefort
et al., 2008; N€arv€a et al., 2010) that hESCs carry an excess
burden of large structural variants compared with somatic
human cells (Figure S3C; Tables S3A and S3B).
Frequency of small CNVs in hESCsSince large structural variants were relatively common in hESCs,
we wondered whether the hESCs we sequenced might also
carry an excess burden of small CNVs, which have not yet
been comprehensively examined. To address this question, we
filtered out genomic regions containing CNVs >1 Mbp from
affected samples and studied the residual whole genomes of
121 hESCs alongside 234 comparably prepared control whole-
genome sequences from human blood samples (Pato et al.,
2013) for CNVs between 1.1 kbp and 1 Mbp. We did not classify
small CNVs as fixed or mosaic due to the difficulty of distinguish-
ing between integer and fractional changes in copy number
at these length scales. We observed 6,155 unique CNVs (Table
S3E), many of which were shared across cell lines, leading to
an average of 999 ± 66 small CNVs per hESC sample (Table
S3F). The number of small CNVs called from WGS data vastly
exceeded the number of CNVs that could be called from
PsychArray DNA microarray data from these same 121 hESC
lines (16/6155, 0.3%, Figure 4C). To validate CNV calls, we iden-
tified those that contained two or more PsychArray probes
(1024/6155, 17%) and compared probe intensities across all
samples using an intensity ranked sum (IRS) test previously
used to establish CNV false discovery rates (FDRs) (Handsaker
et al., 2015; Mills et al., 2011). We observed an overall FDR of
5.7% (Table S3G), indicating that the vast majority of tested
CNVs were independently validated.
Since hPSCs are highly proliferative and rates of DNA replica-
tion are uneven across the genome, WGS data can be used to
gain insight into the biology of human DNA replication timing
(Ding et al., 2021). If the small CNVs we identified corresponded
to replication forks, we would expect them to be found in regions
of high guanine-cytosine (GC) content—and to be found in
excess in hESCs relative to more slowly proliferating samples.
We therefore jointly called CNVs in hESC genomes and similarly
sequenced primary human blood samples and found that CNVs
called in both hESC and control samples had a similar CG con-
tent (Figure S3D), genomic distribution, and frequency at all
length scales tested (Figures 4D–4F). Next, we asked whether
any small CNVs might be culture acquired and restricted our
analysis to CNVs present just once in the combined dataset of
hESCs and somatic cell control samples. We found that both
hESC and control samples harbored an average of 21 ± 11 of
nd duplications (F) in hESCs resembles that seen in control cells from African
x axis of 1–3 and 3–5 refer to 1.117–2.75 kbp and 2.75–5 kbp, respectively.
ne BCL2L1 extend from the pericentromeric (gray) region, with each cell line
reakpoint reveals a shared (AATGG)n motif.
ications (I), deletions (J), and CN-LOH events (K) in 121 hESC lines (red shades)
recurrent events in hESCs are indicated by blue arrowheads. (L) A minimally
ing genes (light gray). See also Table S3 and Figures S3 and S4.
Cell Stem Cell 29, 472–486, March 3, 2022 477
llOPEN ACCESS Resource
such singleton CNVs (Figures S3E–S3G), suggesting that hESCs
and human populations have a comparable burden of these
structural variants.
Location and potential roles of structural variantsin hESCsSome structural variants recur in hESCs, and to gain insight into
the underlying mechanisms we examined the well-studied
Chr20q11.21 region in which duplications extend from a centro-
meric region out to the long arm of Chr20 (International Stem Cell
Initiative et al., 2011).Weobservedduplications in 11/143 (8%)cell
lines (Figure4G), includingoneadditional likely instanceof isochro-
mosome 20 (Figure S4A). This duplication probably confers a se-
lective advantage since it contains the anti-apoptotic gene
BLC2L1 (Avery et al., 2013; Nguyen et al., 2014), although it re-
mains unclear as to why this duplication recurs more often than
other regions that harbor similar anti-apoptotic genes or proto-on-
cogenes. We mapped the Chr20q11.21 CNV breakpoints and
found that distal breakpoints were unique for each cell line and
that most of them shared a common centromere-like HSAT3
(GGAAT)n microsatellite repeat motif (Figure 4H). This motif is
commonlyseenonChr20q11 (Altemoseetal., 2014).Asdescribed
elsewhere (Halliwell et al., 2021), this result suggests that
Chr20q11.21 is prone to homology-based structural instability,
which might explain its frequent recurrence in hPSCs.
To better understand the potential functional consequences of
other large structural variants, we mapped them to the genome
(Figures 4I–4K). We found that 15/143 (10%) hESC cultures
contained aneuploid cells, all but one of which involved
chromosomal gain, andwere predicted to be present at a cellular
fraction of 4%–66% (Table S3B). We also observed eight large,
fixed duplications and 19 more that were mosaic or present in
a fraction of cells (see STAR Methods), as well as six large
fixed deletions and six large mosaic deletions (Table S3B). We
also found that 12/143 (8%) hESC lines carried CN-LOH events
in a subset of cells, of which five involved the entire q arm of
chromosome 9 (Figure 4K). Since we had previously observed
this structural variant arising de novo upon gene editing (Kiskinis
et al., 2014), it is likely to be recurrently culture acquired (Fig-
ure 6B). To map the genetic elements that might be responsible
for the recurrent duplication at Chr1q (Figures 4I and 4L), we
identified 11 hiPSC lines with duplications over this interval in
the HipSci resource (Kilpinen et al., 2017) (data accession:
EGAD00010001147), that when combined with our hESC lines
revealed a minimally duplicated sub-region spanning approxi-
mately chromosome 1 position 203,408,100 to 204,572,300
(hg19 assembly), corresponding to the cytogenetic location
Chr1q32.1 (Figure 4L). This region contains candidate genes
worthy of future investigation that may confer selective advan-
tage when duplicated, including the p53 regulator MDM4
(Francoz et al., 2006; Figure 6B; Table S3H).
We were surprised to observe two cell lines displaying pat-
terns of mosaic CNV calls consistent with ‘‘trisomy rescue’’ of
chromosomes 5 (Genea48) or 16 (HUES71) (Figure S4B). These
trisomies must have resulted from meiotic nondisjunction, since
they have three distinct haplotypes on segments of these
chromosomes, as opposed to two imbalanced haplotypes that
might arise from mitotic errors. These findings indicate that at
least some structural variants we observed were present in
478 Cell Stem Cell 29, 472–486, March 3, 2022
human embryos at the time of hESC derivation, which is consis-
tent with their relatively high prevalence in oocytes from older
mothers (Hassold et al., 1995). Trisomic cells may be ‘‘rescued’’
to a diploid state by losing one of the excess chromosomes to
either restore chromosomal balance or cause uniparental
disomy. Our findings suggest that meiotic trisomy rescue may
also occur in vitro, providing a unique opportunity to explore
the biology of a process that cannot be readily studied in primary
human tissue or hiPSCs.
Finally, we wondered whether small (<1 Mbp) CNVs might
wholly or partially affect genes of likely functional relevance for
hESC biology (Tables S3I and S3J). We did not see clear
evidence of recurrent small CNVs in hESCs (Figures S4C and
S4D) but found that one cell line (WIBR2) carried a small hetero-
zygous deletion encompassing TP53 and two unrelated cell lines
(CSES6 and CSES25), as well as distinct heterozygous deletions
encompassing EP300 that were not observed in human controls
(Table S3J). Similar heterozygous deletions at Chr17p13.1 that
include TP53 have been shown to confer growth advantage to
hPSCs (Amir et al., 2017). Moreover, the EP300 gene product
acetylates and stabilizes p53 (Gayther et al., 2000), suggesting
that its reduced dosage could contribute to reduced p53 activity.
Overall, our results suggest that certain small-culture-acquired
CNVs may functionally impact hPSC biology.
Frequency of SNVs in hESCsTo take advantage of the single-nucleotide resolution that WGS
enables, we tested formissense and loss-of-function (LoF) SNVs
that can profoundly alter cellular function by affecting both
coding regions and functionally important non-coding regions
of the genome. Although individual SNVs sufficient to cause
human disease are rare in a given individual, in aggregate they
affect over 300 million people worldwide (Nguengang Wakap
et al., 2020). We considered SNV calls from the autosomes
and X chromosomes that were supported by high confidence
and high quality (HC-HQ) sequence data using filters similar to
those used to analyze whole-genome sequences in the gnomAD
v2.1 database (Karczewski et al., 2020; Figure 5A). We observed
an average SNV burden per hESC line of 244 LoF variants and
11,483 missense variants, which was indistinguishable with
that described in gnomAD whole-genome sequences from
humans of diverse ancestries (Figure 5B).
Given that deleterious variants are rare in the general popula-
tion due to negative selective pressure, we restricted our anal-
ysis to variants present at an allele frequency (AF) of less than
0.001 (0.1%) among 60,706 exomes represented in the ExAC
database (Lek et al., 2016), which are non-overlappingwith these
gnomAD whole genomes. To conservatively enrich for likely
deleterious variants among these rare SNVs, we used the
bioinformatic prediction tools ‘‘combined annotation dependent
depletion’’ (CADD; Kircher et al., 2014) and ‘‘deleterious
annotation of genetic variants using neural networks’’ (DANN;
Quang et al., 2015) to identify the variants predicted to be among
the top 1%most deleterious in the human genome (CADD phred
>20 and DANN >0.99). When we compared the 9,982 SNVs
meeting these criteria in hESC lines with similarly filtered SNVs
from whole genomes from gnomAD, we again did not observe
an enriched burden of deleterious SNVs in hESCs (Figure 5C).
Together, these findings are consistent with the null hypothesis
B C
A
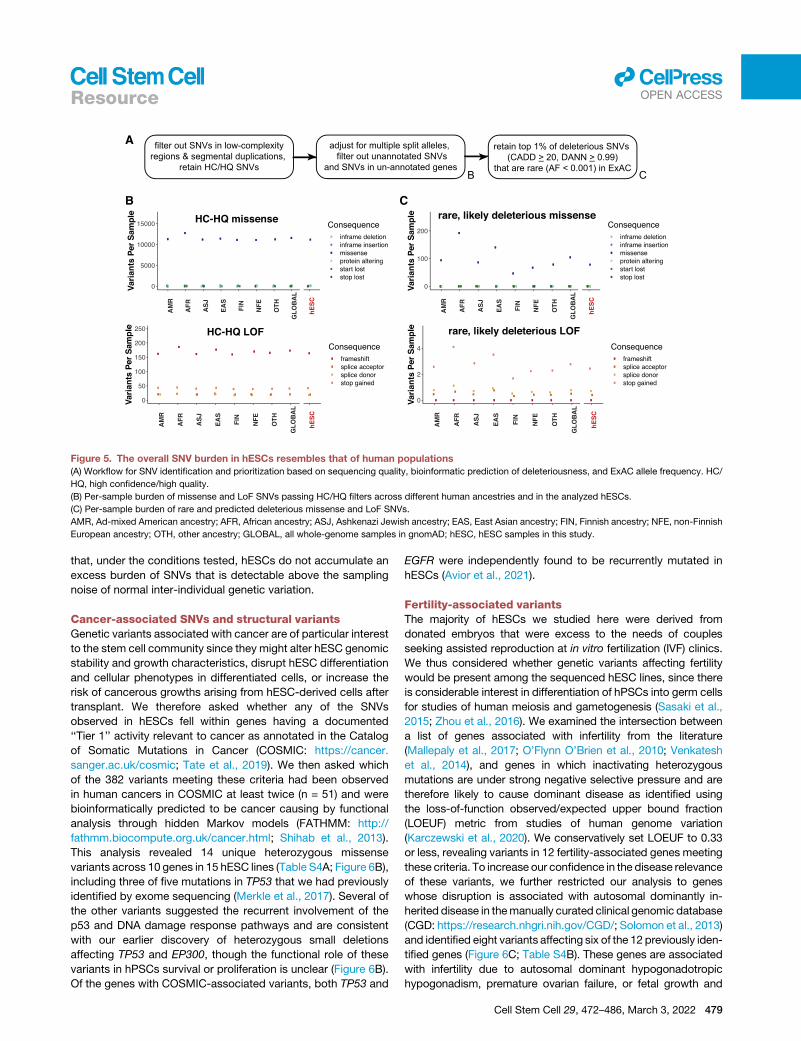
Figure 5. The overall SNV burden in hESCs resembles that of human populations
(A) Workflow for SNV identification and prioritization based on sequencing quality, bioinformatic prediction of deleteriousness, and ExAC allele frequency. HC/
HQ, high confidence/high quality.
(B) Per-sample burden of missense and LoF SNVs passing HC/HQ filters across different human ancestries and in the analyzed hESCs.
(C) Per-sample burden of rare and predicted deleterious missense and LoF SNVs.
AMR, Ad-mixed American ancestry; AFR, African ancestry; ASJ, Ashkenazi Jewish ancestry; EAS, East Asian ancestry; FIN, Finnish ancestry; NFE, non-Finnish
European ancestry; OTH, other ancestry; GLOBAL, all whole-genome samples in gnomAD; hESC, hESC samples in this study.
llOPEN ACCESSResource
that, under the conditions tested, hESCs do not accumulate an
excess burden of SNVs that is detectable above the sampling
noise of normal inter-individual genetic variation.
Cancer-associated SNVs and structural variantsGenetic variants associated with cancer are of particular interest
to the stem cell community since they might alter hESC genomic
stability and growth characteristics, disrupt hESC differentiation
and cellular phenotypes in differentiated cells, or increase the
risk of cancerous growths arising from hESC-derived cells after
transplant. We therefore asked whether any of the SNVs
observed in hESCs fell within genes having a documented
‘‘Tier 1’’ activity relevant to cancer as annotated in the Catalog
of Somatic Mutations in Cancer (COSMIC: https://cancer.
sanger.ac.uk/cosmic; Tate et al., 2019). We then asked which
of the 382 variants meeting these criteria had been observed
in human cancers in COSMIC at least twice (n = 51) and were
bioinformatically predicted to be cancer causing by functional
analysis through hidden Markov models (FATHMM: http://
fathmm.biocompute.org.uk/cancer.html; Shihab et al., 2013).
This analysis revealed 14 unique heterozygous missense
variants across 10 genes in 15 hESC lines (Table S4A; Figure 6B),
including three of five mutations in TP53 that we had previously
identified by exome sequencing (Merkle et al., 2017). Several of
the other variants suggested the recurrent involvement of the
p53 and DNA damage response pathways and are consistent
with our earlier discovery of heterozygous small deletions
affecting TP53 and EP300, though the functional role of these
variants in hPSCs survival or proliferation is unclear (Figure 6B).
Of the genes with COSMIC-associated variants, both TP53 and
EGFR were independently found to be recurrently mutated in
hESCs (Avior et al., 2021).
Fertility-associated variantsThe majority of hESCs we studied here were derived from
donated embryos that were excess to the needs of couples
seeking assisted reproduction at in vitro fertilization (IVF) clinics.
We thus considered whether genetic variants affecting fertility
would be present among the sequenced hESC lines, since there
is considerable interest in differentiation of hPSCs into germ cells
for studies of human meiosis and gametogenesis (Sasaki et al.,
2015; Zhou et al., 2016). We examined the intersection between
a list of genes associated with infertility from the literature
(Mallepaly et al., 2017; O’Flynn O’Brien et al., 2010; Venkatesh
et al., 2014), and genes in which inactivating heterozygous
mutations are under strong negative selective pressure and are
therefore likely to cause dominant disease as identified using
the loss-of-function observed/expected upper bound fraction
(LOEUF) metric from studies of human genome variation
(Karczewski et al., 2020). We conservatively set LOEUF to 0.33
or less, revealing variants in 12 fertility-associated genes meeting
these criteria. To increase our confidence in the disease relevance
of these variants, we further restricted our analysis to genes
whose disruption is associated with autosomal dominantly in-
herited disease in themanually curated clinical genomic database
(CGD: https://research.nhgri.nih.gov/CGD/; Solomon et al., 2013)
and identified eight variants affecting six of the 12 previously iden-
tified genes (Figure 6C; Table S4B). These genes are associated
with infertility due to autosomal dominant hypogonadotropic
hypogonadism, premature ovarian failure, or fetal growth and
Cell Stem Cell 29, 472–486, March 3, 2022 479
A C
D
B
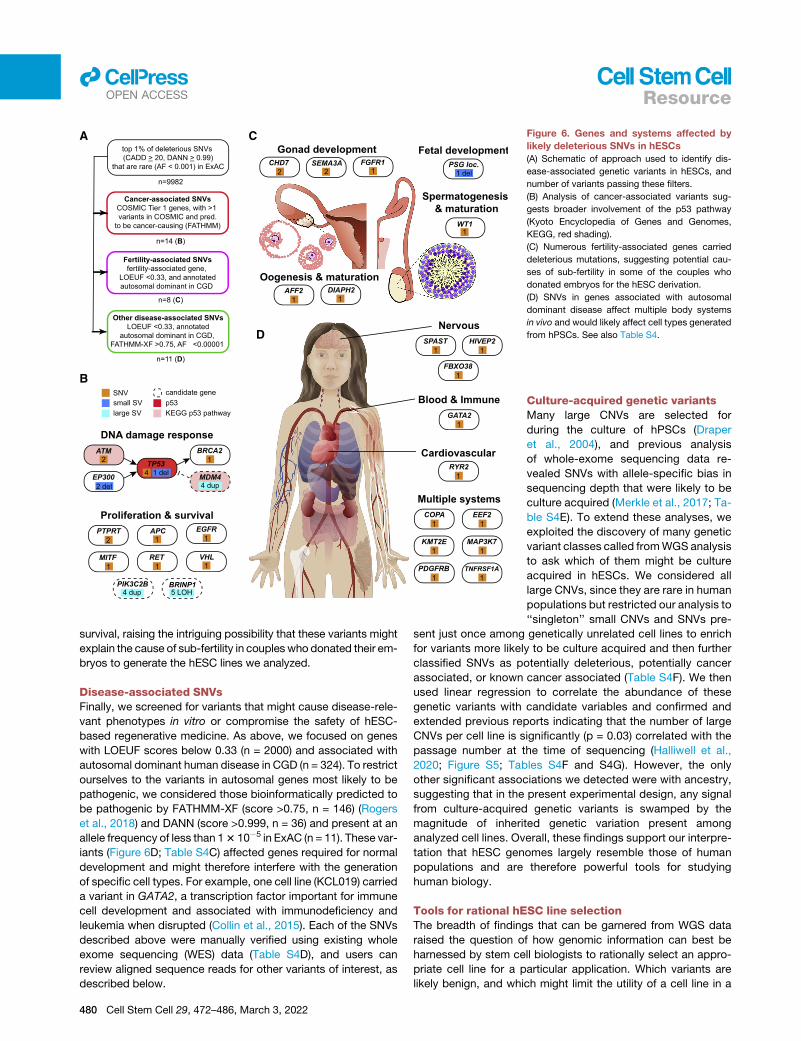
Figure 6. Genes and systems affected by
likely deleterious SNVs in hESCs
(A) Schematic of approach used to identify dis-
ease-associated genetic variants in hESCs, and
number of variants passing these filters.
(B) Analysis of cancer-associated variants sug-
gests broader involvement of the p53 pathway
(Kyoto Encyclopedia of Genes and Genomes,
KEGG, red shading).
(C) Numerous fertility-associated genes carried
deleterious mutations, suggesting potential cau-
ses of sub-fertility in some of the couples who
donated embryos for the hESC derivation.
(D) SNVs in genes associated with autosomal
dominant disease affect multiple body systems
in vivo and would likely affect cell types generated
from hPSCs. See also Table S4.
llOPEN ACCESS Resource
survival, raising the intriguing possibility that these variants might
explain the cause of sub-fertility in couples who donated their em-
bryos to generate the hESC lines we analyzed.
Disease-associated SNVsFinally, we screened for variants that might cause disease-rele-
vant phenotypes in vitro or compromise the safety of hESC-
based regenerative medicine. As above, we focused on genes
with LOEUF scores below 0.33 (n = 2000) and associated with
autosomal dominant human disease in CGD (n = 324). To restrict
ourselves to the variants in autosomal genes most likely to be
pathogenic, we considered those bioinformatically predicted to
be pathogenic by FATHMM-XF (score >0.75, n = 146) (Rogers
et al., 2018) and DANN (score >0.999, n = 36) and present at an
allele frequency of less than 13 10�5 in ExAC (n = 11). These var-
iants (Figure 6D; Table S4C) affected genes required for normal
development and might therefore interfere with the generation
of specific cell types. For example, one cell line (KCL019) carried
a variant in GATA2, a transcription factor important for immune
cell development and associated with immunodeficiency and
leukemia when disrupted (Collin et al., 2015). Each of the SNVs
described above were manually verified using existing whole
exome sequencing (WES) data (Table S4D), and users can
review aligned sequence reads for other variants of interest, as
described below.
480 Cell Stem Cell 29, 472–486, March 3, 2022
Culture-acquired genetic variantsMany large CNVs are selected for
during the culture of hPSCs (Draper
et al., 2004), and previous analysis
of whole-exome sequencing data re-
vealed SNVs with allele-specific bias in
sequencing depth that were likely to be
culture acquired (Merkle et al., 2017; Ta-
ble S4E). To extend these analyses, we
exploited the discovery of many genetic
variant classes called fromWGS analysis
to ask which of them might be culture
acquired in hESCs. We considered all
large CNVs, since they are rare in human
populations but restricted our analysis to
‘‘singleton’’ small CNVs and SNVs pre-
sent just once among genetically unrelated cell lines to enrich
for variants more likely to be culture acquired and then further
classified SNVs as potentially deleterious, potentially cancer
associated, or known cancer associated (Table S4F). We then
used linear regression to correlate the abundance of these
genetic variants with candidate variables and confirmed and
extended previous reports indicating that the number of large
CNVs per cell line is significantly (p = 0.03) correlated with the
passage number at the time of sequencing (Halliwell et al.,
2020; Figure S5; Tables S4F and S4G). However, the only
other significant associations we detected were with ancestry,
suggesting that in the present experimental design, any signal
from culture-acquired genetic variants is swamped by the
magnitude of inherited genetic variation present among
analyzed cell lines. Overall, these findings support our interpre-
tation that hESC genomes largely resemble those of human
populations and are therefore powerful tools for studying
human biology.
Tools for rational hESC line selectionThe breadth of findings that can be garnered from WGS data
raised the question of how genomic information can best be
harnessed by stem cell biologists to rationally select an appro-
priate cell line for a particular application. Which variants are
likely benign, and which might limit the utility of a cell line in a
A
B
C
(legend on next page)
llOPEN ACCESSResource
Cell Stem Cell 29, 472–486, March 3, 2022 481
llOPEN ACCESS Resource
given application? To help the community address these ques-
tions, we generated three complementary resources. First, we
summarize some of the most relevant results presented in this
study in the form of a convenient lookup table (Figure 7A)
and provide annotated tables of the variants we identified (Ta-
bles S1–S4). Second, the raw sequencing data are freely
available to interested groups via a controlled-access data-
base (DUOS: https://duos.broadinstitute.org/, dataset DUOS-
000121). Finally, we have created a user-friendly online data
portal (https://hscgp.broadinstitute.org/hscgp) (Figure 7B) that
enables users with more limited computational expertise to
readily search for sequence variants of interest among
sequenced hESC lines. For example, a search for TP53 reveals
all variants in the gene that were detected in the sequenced
cell lines, the names of those cell lines, as well as bioinformatic
predictions about the likely consequences of these variants.
Search results can be graphically visualized and exported for
further analysis in a variety of formats. Specific cell lines can
also be interrogated for the presence of variants of interest,
and raw sequencing alignments can be visualized via the inte-
grative genomics viewer IGV (Robinson et al., 2011).
DISCUSSION
Techniques commonly used to evaluate the genetic integrity of
hESCs, including high-density SNPmicroarrays and karyotyping
by G-banding, have limited spatial resolution and limited power
to detect mosaic events (Baker et al., 2016). Here, we show
that high-coverage (>253) WGS enables the robust identifica-
tion of potentially relevant structural and SNVs, including thou-
sands of small CNVs that are not detectable using traditional
methods and several of which are likely of functional relevance.
As the price of WGS is steadily dropping and provides consider-
ably more information on genetic variation than many other
methods, our experience suggests that WGS may gradually
become the tool of choice for the genetic analysis of both hESCs
and hiPSCs. In particular, WGS may prove valuable in the selec-
tion of hPSCs for use in disease modeling and gene editing ex-
periments, as well as in the interpretation of data arising from
these models and retrospective multimodal analysis, as many
of these cell lines included in this study have also been used to
generate complementary datasets such as RNA-seq and DNA
methylation.
The origin and impact of structural genetic variantsWe found that almost a third of hESC lines in this study carried
large structural variants, of which approximately half were
mosaic (Figures 4J, 4K, and 7A; Table S3B). Mosaic variants
might arise in culture and confer selective advantage to affected
cells, leading to the expansion and eventual fixation of the
variant. Indeed, of the nine hESC lines carrying advantageous
duplications at Chr20q11.21, six were mosaic and three were
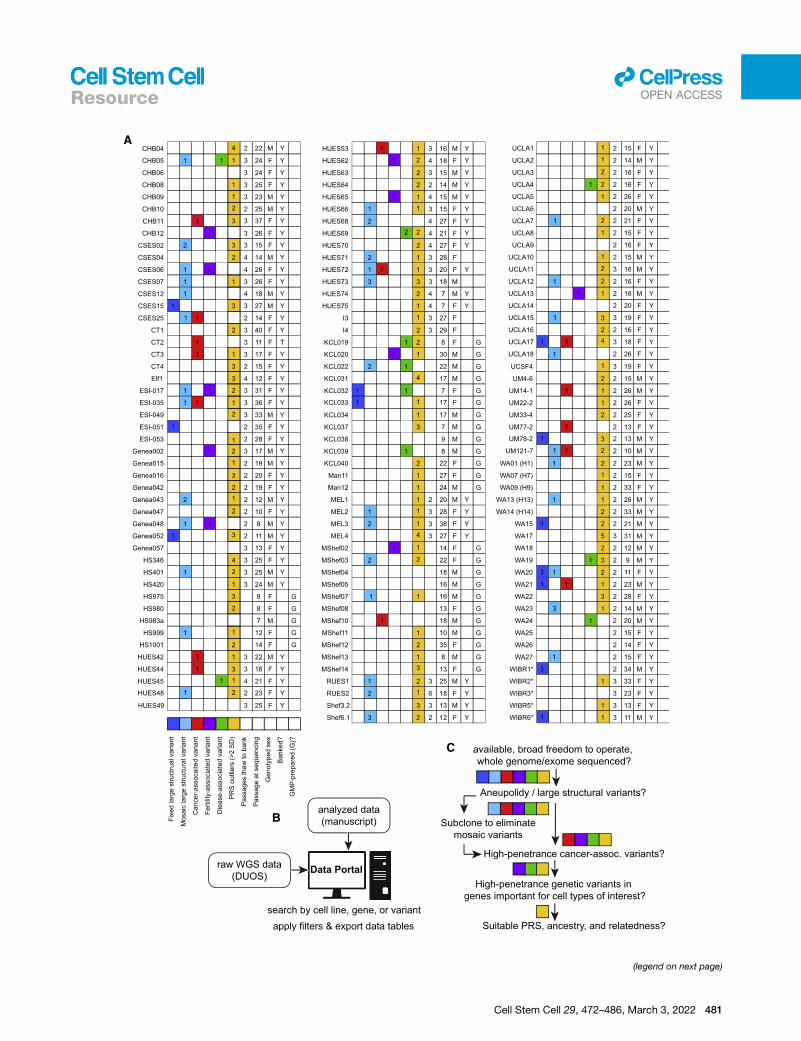
Figure 7. Genetically informed rational cell line selection
(A) Graphical summary of the number of large fixed and mosaic structural varian
fertility (magenta), or other diseases (green), ‘‘outlier’’ PRS, and summary data for
S3, and S4 for details about variants.
(B) Types of data availability for this resource.
(C) Suggested workflow for rational hPSC line selection based on genetic inform
482 Cell Stem Cell 29, 472–486, March 3, 2022
fixed (Figure 4B). Alternatively, mosaicism could arise from
negative selective pressures, since approximately half of all
preimplantation human embryos carry large structural genetic
variants (Fragouli et al., 2019), and we observed at least two
instances of apparent trisomy rescue (Figure S3H). Fixed
structural and sequence variants might have arisen in culture
and reached fixation or might be inherited, as seen in the sibling
cell lines KCL032 and KCL033 that carried identical large
duplications on Chr5 (Table S3B), or cell lines carrying SNVs
associated with disease or sub-fertility (Figure 6).
In addition to suggesting mechanisms explaining the frequent
recurrence of known duplications at Chr20q11.21 (Figure 4H)
and Chr1q32.1 (Figure 4L), we discovered a recurrent CN-LOH
event on Chr9q (Figure 4L) that would alter the expression levels
of imprinted or differentially methylated genes that regulate sur-
vival or proliferation. Indeed, Chr9q LOH is frequently observed
in certain types of cancer (Hirao et al., 2005; Yizhak et al.,
2019; Jakubek et al., 2020), and the gene BRINP1 (a.k.a.
DBCCR1 or DBC1) at Chr9q33.1 as well as the microRNA
miR-181a2/181b2 at Chr9q33.3 are frequently deleted or hyper-
methylated in cancer (Izumi et al., 2005; Mei et al., 2017). Future
transcriptional and epigenetic profiling studies of hPSCs may
reveal specific genetic variants associated with the recurrence
of this recurrent CN-LOH variant.
Suggestions for rational hPSC selectionThe unique constellation of inherited and acquired genetic
variants present across the studied cell lines raises the question
of how knowledge of these variants can rationally inform which
lines should be selected. For the purpose of regenerative
medicine, where safety should be considered, polyploid cells
have been knowingly transplanted into humanswithout apparent
ill effect (Nelson et al., 2002), and while we feel that most groups
would agree that a cell line carrying a TP53mutation conferring a
lifetime cancer risk of nearly 100% should not be transplanted
into patients if a suitable alternative exists, other variants should
be considered on a case-by-case basis depending on research
needs. In contrast, for the purpose of basic research, the pres-
ence of potentially damaging variants associated with fertility
or other disease may be of interest to groups studying human
development and modeling the associated diseases. Further-
more, since many genes are expressed in a cell-type-dependent
manner, even genetic variants predicted to be highly deleterious
in one cell type may be unproblematic for applications that focus
on another cell type. We therefore suggest a scheme (Figure 7C)
that can be adapted to achieve the appropriate balance of risk
and benefit for a particular application. First, we reason that
most groups would prefer to work with cell lines having minimal
restrictions on the freedom to use or share the lines and their
derivatives, and whose genomic structure has been extensively
characterized. Second, we suggest avoiding lines with aneu-
ploidy or large structural variants, although it might be possible
ts (dark and light blue, respectively), SNVs likely associated with cancer (red),
each analyzed hESC line. *please see note about WIBR lines in Tables S1A, S2,
ation.
llOPEN ACCESSResource
to ‘‘rescue’’ lines with mosaic variants by sub-cloning or by
requesting an earlier passage line that may lack the variant.
Third, most groups would avoid cell lines carrying cancer- and
disease-associated variants, though we note that other groups
may choose to exploit these variants. Fourth, the PRS for a trait
of interest, ancestry, and relatedness of the cell line may reveal
cell lines are most likely to display desired traits.
PerspectiveTogether, our analysis demonstrates that the overall numbers of
small CNVs and SNVs identified in hESCs resemble those of
somatic cells from a similarly scaled population of donors,
demonstrating the relative stability of their genomes and vali-
dating hESCs as a powerful tool to study human development
and disease and as a useful source of clinically important cell
populations. Indeed, the vast majority of variants we observed
are of unknown significance, and even variants that have
been associated with disease rarely have strong evidence
demonstrating that they play a causal role. We anticipate that
the data provided here will become increasingly valuable as
our understanding of genotype-phenotype relationships steadily
improves. By providing a searchable online data portal enabling
individuals with any level of computational expertise tomake use
of the resource we report here, we hope that the reproducibility
of research findings from hPSC studies and their ultimate use in
clinical applications will be improved.
Limitations of the studyWhile we strove to identify the most relevant genetic variants
present in hESC lines, our analyses were not exhaustive. We
did not consider inversions, translocations, repetitive genomic
regions, mitochondrial DNA sequences, epigenetic differences,
or variants on the Y chromosome. While the WGS data used in
this study provides an unprecedented view of stem cell ge-
nomes, its short read length (150-base-paired-end reads),
coupled with the inherent variation in sequencing read depth
due to DNA replication, does have some limitations that might
be mitigated in part by future studies using long-read
sequencing technologies. For instance, our analysis was limited
to variants (50 bp or T1.1 kbp, and our analysis of structural
variant mosaicism was limited to variants T1 Mbp. Though the
tagmentation-based methods, we used in library preparation
did not appear to result in any sequence bias in CNV calls
made by DOC analysis (Figure S3D), we cannot formally exclude
this possibility. Similarly, it is possible that variable sequencing
depth due to replication timing and sequencing bias might result
in erroneous CNV calls. While IRS testing validated the vast ma-
jority of these small variants, error rates were highest among
duplications under 20 kbp. We encourage groups to indepen-
dently verify variants of potential biological significance, such
as deletions affecting haploinsufficient or cancer-associated
genes (Table S3J). All 33 SNVs highlighted in this text were
manually confirmed by reviewing WES data from these same
cell lines as well as IGV traces accessible via the data portal
(https://hscgp.broadinstitute.org/hscgp). However, the accu-
racy of HLA haplotype estimation is constrained by the limited
number of informative SNPs (De Bakker et al., 2006), and haplo-
types should be verified prior to use in any downstream applica-
tion. We sought to identify sequence variants likely to affect the
function of hPSCs or their derivatives using a combination of
gene-level and variant-level filters based on manually curated
databases and bioinformatic prediction algorithms and note
that databases are not comprehensive and prediction algorithms
are imperfect, making it difficult to predict which variants are suf-
ficient to cause disease. Conversely, our stringent bioinformatic
selection criteria likely exclude some functionally relevant
variants. For example, filtering on LOEUF excluded all variants
in TP53 and a D90A variant in SOD1 associated with incom-
pletely penetrant amyotrophic lateral sclerosis (Al-Chalabi
et al., 1998) that may be relevant to groups modeling neurode-
generative disease, and our sequencing quality filters removed
two of the five variants previously identified in TP53 since they
were present at low allelic fractions. We therefore encourage
groups to interrogate the full dataset for relevant variants in their
cell line(s) of interest, using the web resource provided or by re-
analyzing the raw data (DUOS: https://duos.broadinstitute.org/,
dataset DUOS-000121). We also anticipate that groups may
wish to utilize the datasets presented here in combination with
transcriptomic data to map expression quantitative trait loci
(eQTL) in hESCs or their differentiated progeny.
STAR+METHODS
Detailed methods are provided in the online version of this paper
and include the following:
d KEY RESOURCES TABLE
d RESOURCE AVAILABILITY
B Lead contact
B Materials availability
B Data and code availability
d EXPERIMENTAL MODEL AND SUBJECT DETAILS
d METHOD DETAILS
B Whole genome sequencing and genotyping
B Ancestry, relatedness, and HLA analysis
B Polygenic risk score (PRS) computations
B CNV calling from read depth variation
B Identification of large structural variants
B Validation of large structural variants
B Detection and interpretation of small CNVs
B Identification of SNVs in hESCs
B Data portal architecture and implementation
B SNV characterization and prioritization
d QUANTIFICATION AND STATISTICAL ANALYSIS
SUPPLEMENTAL INFORMATION
Supplemental information can be found online at https://doi.org/10.1016/j.
stem.2022.01.011.
ACKNOWLEDGMENTS
We thank Maura Charlton, Genevieve Saphier, Diane Santos, Melissa Smith,
Kristen Elwell, Mary Anna Yram, Stacey Ellender, Liz Bevilacqua, Diane
Gage, and Anna Neumann for their assistancewith acquiring hESC lines, coor-
dinating the sequencing and genotyping workflows, and preparing data for
submission to data repositories. At the Broad Institute of MIT and Harvard,
the Genomics Platform performed sample preparation, sequencing, and
data storage; and Jonathan Bistline, Andrew Zimmer, and the KDUX team of
the Data Sciences Platform helped develop web tools. We are also grateful
Cell Stem Cell 29, 472–486, March 3, 2022 483
llOPEN ACCESS Resource
for the many institutions from around the world who generously provided their
cell lines and supported the publication of the results, who are listed in full in
Table S1. Costs associated with acquiring and sequencing hESC lines were
supported by the Howard Hughes Medical Institute and the Stanley Center
for Psychiatric Research at the Broad Institute of MIT and Harvard. F.T.M. is
a New York Stem Cell Foundation, Robertson Investigator (NYSCF-R-156)
and was supported by the Medical Research Council (MR/P501967/1), Acad-
emy of Medical Sciences (SBF001\1016), Wellcome Trust and Royal Society
(211221/Z/18/Z), the Chan Zuckerberg Initiative (191942), and the NIH
(5K99NS083713).
AUTHOR CONTRIBUTIONS
F.T.M., S.G., S.A.M., and K.E. conceptualized, supervised, and jointly admin-
istered the project. Formal analysis, curation, and visualization of data was
performed by F.T.M. as well as S.G., G.G., R.E.H., S.K., D.M., and C.O. Devel-
opment of methodologies to analyze and validate data was carried out by
G.G., R.E.H., S.K., and K.J.K., under the supervision of S.A.M. and D.G.M.
D.M. helped to develop software and organize resources for hosting and visu-
alizing WGS data. C.P. and M.P. provided access to unpublished WGS data
from individuals of Latin American and African American ancestry unaffected
by schizophrenia for CNV analysis. Funding for the study was acquired by
S.A.M. and K.E. The original draft of the manuscript was written by F.T.M.,
with contributions from S.G., G.G., R.E.H., S.K., and D.M. The manuscript
was reviewed and edited by F.T.M., S.G., S.A.M., and K.E., and all authors
read and approved the manuscript.
DECLARATION OF INTERESTS
K.E. is a founder of Q-State Biosciences, Quralis, and Enclear Therapies; an
employee and shareholder of BioMarin; and amember ofCell StemCell’s advi-
sory board. K.J.K. is a consultant for Vor Biopharma, and C.O. is now an
employee of 54gene.
INCLUSION AND DIVERSITY
We worked to ensure diversity in experimental samples through the selection
of the cell lines. We worked to ensure diversity in experimental samples
through the selection of the genomic datasets. One or more of the authors
of this paper self-identifies as an underrepresented ethnic minority in science.
While citing references scientifically relevant for this work, we also actively
worked to promote gender balance in our reference list.
Received: April 10, 2020
Revised: October 29, 2021
Accepted: January 24, 2022
Published: February 16, 2022
REFERENCES
1000 Genomes Project Consortium, Abecasis, G.R., Auton, A., Brooks, L.D.,
DePristo, M.A., Durbin, R.M., Handsaker, R.E., Kang, H.M., Marth, G.T., and
McVean, G.A. (2012). An integratedmap of genetic variation from 1,092 human
genomes. Nature 491, 56–65.
Al-Chalabi, A., Andersen, P.M., Chioza, B., Shaw, C., Sham, P.C., Robberecht,
W., Matthijs, G., Camu, W., Marklund, S.L., Forsgren, L., et al. (1998).
Recessive amyotrophic lateral sclerosis families with the D90A SOD1mutation
share a common founder: evidence for a linked protective factor. Hum. Mol.
Genet. 7, 2045–2050.
Altemose, N., Miga, K.H., Maggioni, M., and Willard, H.F. (2014). Genomic
characterization of large heterochromatic gaps in the human genome assem-
bly. PLoS Comput. Biol. 10, e1003628.
Amir, H., Touboul, T., Sabatini, K., Chhabra, D., Garitaonandia, I., Loring, J.F.,
Morey, R., and Laurent, L.C. (2017). Spontaneous single-copy loss of TP53 in
human embryonic stem cells markedly increases cell proliferation and survival.
Stem Cells 35, 872–885.
Avery, S., Hirst, A.J., Baker, D., Lim, C.Y., Alagaratnam, S., Skotheim, R.I.,
Lothe, R.A., Pera,M.F., Colman, A., Robson, P., et al. (2013). BCL-XLmediates
484 Cell Stem Cell 29, 472–486, March 3, 2022
the strong selective advantage of a 20q11.21 amplification commonly found in
human embryonic stem cell cultures. Stem Cell Rep. 1, 379–386.
Avior, Y., Lezmi, E., Eggan, K., and Benvenisty, N. (2021). Cancer-related mu-
tations identified in primed human pluripotent stem cells. Cell Stem Cell
28, 10–11.
Avior, Y., Sagi, I., and Benvenisty, N. (2016). Pluripotent stem cells in disease
modelling and drug discovery. Nat. Rev. Mol. Cell Biol. 17, 170–182.
Baker, D., Hirst, A.J., Gokhale, P.J., Juarez, M.A., Williams, S., Wheeler, M.,
Bean, K., Allison, T.F., Moore, H.D., Andrews, P.W., and Barbaric, I. (2016).
Detecting genetic mosaicism in cultures of human pluripotent stem cells.
Stem Cell Rep. 7, 998–1012.
Bulik-Sullivan, B., Finucane, H.K., Anttila, V., Gusev, A., Day, F.R., Loh, P.-R.,
Duncan, L., et al.; ReproGen Consortium; Psychiatric Genomics Consortium;
Genetic Consortium for Anorexia Nervosa of the Wellcome Trust Case
Control Consortium 3 (2015). An atlas of genetic correlations across human
diseases and traits. Nat. Genet. 47, 1236–1241.
Canham, M.A., Van Deusen, A., Brison, D.R., De Sousa, P.A., Downie, J.,
Devito, L., Hewitt, Z.A., Ilic, D., Kimber, S.J., Moore, H.D., et al. (2015). Themo-
lecular karyotype of 25 clinical-grade human embryonic stem cell lines. Sci.
Rep. 5, 17258.
Chang, C.C., Chow, C.C., Tellier, L.C.A.M., Vattikuti, S., Purcell, S.M., and Lee,
J.J. (2015). Second-generation PLINK: rising to the challenge of larger and
richer datasets. GigaScience 4, 7.
Chen, A.E., Egli, D., Niakan, K., Deng, J., Akutsu, H., Yamaki, M., Cowan, C.,
Fitz-Gerald, C., Zhang, K., Melton, D.A., and Eggan, K. (2009). Optimal timing
of inner cell mass isolation increases the efficiency of human embryonic stem
cell derivation and allows generation of sibling cell lines. Cell Stem Cell 4,
103–106.
Chiang, C., Scott, A.J., Davis, J.R., Tsang, E.K., Li, X., Kim, Y., Hadzic, T.,
Damani, F.N., Ganel, L., et al.; GTEx Consortium (2017). The impact of struc-
tural variation on human gene expression. Nat. Genet. 49, 692–699.
Collin, M., Dickinson, R., and Bigley, V. (2015). Haematopoietic and immune
defects associated with GATA2 mutation. Br. J. Haematol. 169, 173–187.
Corder, E.H., Saunders, A.M., Strittmatter, W.J., Schmechel, D.E., Gaskell,
P.C., Small, G.W., Roses, A.D., Haines, J.L., and Pericak-Vance, M.A.
(1993). Gene dose of apolipoprotein E type 4 allele and the risk of
Alzheimer’s disease in late onset families. Science 261, 921–923.
De Bakker, P.I.W., McVean, G., Sabeti, P.C., Miretti, M.M., Green, T., Marchini,
J., Ke, X., Monsuur, A.J., Whittaker, P., Delgado, M., et al. (2006). A high-res-
olution HLA and SNP haplotype map for disease association studies in the
extended human MHC. Nat. Genet. 38, 1166–1172.
Dean, M., Carrington, M., Winkler, C., Huttley, G.A., Smith, M.W., Allikmets, R.,
Goedert, J.J., Buchbinder, S.P., Vittinghoff, E., Gomperts, E., et al. (1996).
Genetic restriction of HIV-1 infection and progression to AIDS by a deletion
allele of the CKR5 structural gene. Science 273, 1856–1862.
Ding, Q., Edwards, M.M., Wang, N., Zhu, X., Bracci, A.N., Hulke, M.L., Hu, Y.,
Tong, Y., Hsiao, J., Charvet, C.J., et al. (2021). The genetic architecture of DNA
replication timing in human pluripotent stem cells. Nat. Commun. 12, 6746.
Draper, J.S., Smith, K., Gokhale, P., Moore, H.D., Maltby, E., Johnson, J.,
Meisner, L., Zwaka, T.P., Thomson, J.A., and Andrews, P.W. (2004).
Recurrent gain of chromosomes 17q and 12 in cultured human embryonic
stem cells. Nat. Biotechnol. 22, 53–54.
Fragouli, E., Munne, S., and Wells, D. (2019). The cytogenetic constitution of
human blastocysts: insights from comprehensive chromosome screening
strategies. Hum. Reprod. Update 25, 15–33.
Francoz, S., Froment, P., Bogaerts, S., De Clercq, S., Maetens, M., Doumont,
G., Bellefroid, E., and Marine, J.C. (2006). Mdm4 and Mdm2 cooperate to
inhibit p53 activity in proliferating and quiescent cells in vivo. Proc. Natl.
Acad. Sci. USA 103, 3232–3237.
Gayther, S.A., Batley, S.J., Linger, L., Bannister, A., Thorpe, K., Chin, S.F.,
Daigo, Y., Russell, P., Wilson, A., Sowter, H.M., et al. (2000). Mutations trun-
cating the EP300 acetylase in human cancers. Nat. Genet. 24, 300–303.
llOPEN ACCESSResource
Guerreiro, R., Wojtas, A., Bras, J., Carrasquillo, M., Rogaeva, E., Majounie, E.,
Cruchaga, C., Sassi, C., Kauwe, J.S.K., Younkin, S., et al. (2013). TREM2 var-
iants in Alzheimer’s disease. N. Engl. J. Med. 368, 117–127.
Halliwell, J., Barbaric, I., and Andrews, P.W. (2020). Acquired genetic changes
in human pluripotent stem cells: origins and consequences. Nat. Rev. Mol. Cell
Biol. 21, 715–728.
Halliwell, J.A., Baker, D., Judge, K., Quail, M.A., Oliver, K., Betteridge, E.,
Skelton, J., Andrews, P.W., and Barbaric, I. (2021). Nanopore sequencing in-
dicates that tandem amplification of chromosome 20q11.21 in human plurip-
otent stem cells is driven by break-induced replication. Stem Cells Dev. 30,
578–586.
Handsaker, R.E., Van Doren, V., Berman, J.R., Genovese, G., Kashin, S.,
Boettger, L.M., andMcCarroll, S.A. (2015). Large multiallelic copy number var-
iations in humans. Nat. Genet. 47, 296–303.
Hassold, T., Merrill, M., Adkins, K., Freeman, S., and Sherman, S. (1995).
Recombination and maternal age-dependent nondisjunction: molecular
studies of trisomy 16. Am. J. Hum. Genet. 57, 867–874.
Henrichsen, C.N., Chaignat, E., and Reymond, A. (2009). Copy number vari-
ants, diseases and gene expression. Hum. Mol. Genet. 18, R1–R8.
Hirao, S., Hirao, T., Marsit, C.J., Hirao, Y., Schned, A., Devi-Ashok, T., Nelson,
H.H., Andrew, A., Karagas,M.R., and Kelsey, K.T. (2005). Loss of heterozygos-
ity on chromosome 9q and p53 alterations in human bladder cancer. Cancer
104, 1918–1923.
International Schizophrenia Consortium, Purcell, S.M., Wray, N.R., Stone, J.L.,
Visscher, P.M., O’Donovan, M.C., Sullivan, P.F., and Sklar, P. (2009). Common
polygenic variation contributes to risk of schizophrenia and bipolar disorder.
Nature 460, 748–752.
International Stem Cell Initiative, Amps, K., Andrews, P.W., Anyfantis, G.,
Armstrong, L., Avery, S., Baharvand, H., Baker, J., Baker, D., Munoz, M.B.,
et al. (2011). Screening ethnically diverse human embryonic stem cells iden-
tifies a chromosome 20 minimal amplicon conferring growth advantage. Nat.
Biotechnol. 29, 1132–1144.
Izumi, H., Inoue, J., Yokoi, S., Hosoda, H., Shibata, T., Sunamori, M.,
Hirohashi, S., Inazawa, J., and Imoto, I. (2005). Frequent silencing of DBC1
is by genetic or epigenetic mechanisms in non-small cell lung cancers. Hum.
Mol. Genet. 14, 997–1007.
Jakubek, Y.A., Chang, K., Sivakumar, S., Yu, Y., Giordano, M.R., Fowler, J.,
Huff, C.D., Kadara, H., Vilar, E., and Scheet, P. (2020). Large-scale analysis
of acquired chromosomal alterations in non-tumor samples from patients
with cancer. Nat. Biotechnol. 38, 90–96.
Jonsson, T., Stefansson, H., Steinberg, S., Jonsdottir, I., Jonsson, P.V.,
Snaedal, J., Bjornsson, S., Huttenlocher, J., Levey, A.I., Lah, J.J., et al.
(2013). Variant of TREM2 associated with the risk of Alzheimer’s disease.
N. Engl. J. Med. 368, 107–116.
Kanehisa, M., and Goto, S. (2000). KEGG: kyoto encyclopedia of genes and
genomes. Nucleic Acids Res. 28, 27–30.
Karczewski, K.J., Francioli, L.C., Tiao, G., Cummings, B.B., Alfoldi, J., Wang,
Q., Collins, R.L., Laricchia, K.M., Ganna, A., Birnbaum, D.P., et al. (2020).
The mutational constraint spectrum quantified from variation in 141,456 hu-
mans. Nature 581, 434–443.
Khera, A.V., Chaffin, M., Aragam, K.G., Haas, M.E., Roselli, C., Choi, S.H.,
Natarajan, P., Lander, E.S., Lubitz, S.A., Ellinor, P.T., and Kathiresan, S.
(2018). Genome-wide polygenic scores for common diseases identify individ-
uals with risk equivalent to monogenic mutations. Nat. Genet. 50, 1219–1224.
Kilpinen, H., Goncalves, A., Leha, A., Afzal, V., Alasoo, K., Ashford, S., Bala, S.,
Bensaddek, D., Casale, F.P., Culley, O.J., et al. (2017). Common genetic vari-
ation drives molecular heterogeneity in human iPSCs. Nature 546, 370–375.
Kircher, M., Witten, D.M., Jain, P., O’roak, B.J., Cooper, G.M., and Shendure,
J. (2014). A general framework for estimating the relative pathogenicity of hu-
man genetic variants. Nat. Genet. 46, 310–315.
Kiskinis, E., Sandoe, J., Williams, L.A., Boulting, G.L., Moccia, R., Wainger,
B.J., Han, S., Peng, T., Thams, S., Mikkilineni, S., et al. (2014). Pathways dis-
rupted in human ALS motor neurons identified through genetic correction of
mutant SOD1. Cell Stem Cell 14, 781–795.
Kobold, S., Guhr, A., Kurtz, A., and Loser, P. (2015). Human embryonic and
induced pluripotent stem cell research trends: complementation and diversifi-
cation of the field. Stem Cell Rep. 4, 914–925.
Landrum, M.J., Lee, J.M., Riley, G.R., Jang, W., Rubinstein, W.S., Church,
D.M., and Maglott, D.R. (2014). ClinVar: public archive of relationships among
sequence variation and human phenotype. Nucleic Acids Res. 42,
D980–D985.
Laurent, L.C., Ulitsky, I., Slavin, I., Tran, H., Schork, A., Morey, R., Lynch, C.,
Harness, J.V., Lee, S., Barrero, M.J., et al. (2011). Dynamic changes in the
copy number of pluripotency and cell proliferation genes in human ESCs
and iPSCs during reprogramming and time in culture. Cell Stem Cell 8,
106–118.
Lefort, N., Feyeux, M., Bas, C., Feraud, O., Bennaceur-Griscelli, A., Tachdjian,
G., Peschanski, M., and Perrier, A.L. (2008). Human embryonic stem cells reveal
recurrent genomic instability at 20q11.21. Nat. Biotechnol. 26, 1364–1366.
Lek, M., Karczewski, K.J., Minikel, E.V., Samocha, K.E., Banks, E., Fennell, T.,
O’Donnell-Luria, A.H., Ware, J.S., Hill, A.J., Cummings, B.B., et al. (2016).
Analysis of protein-coding genetic variation in 60,706 humans. Nature 536,
285–291.
Loh, P.-R., Danecek, P., Palamara, P.F., Fuchsberger, C., A Reshef, Y., K
Finucane, H., Schoenherr, S., Forer, L., McCarthy, S., Abecasis, G.R., et al.
(2016). Reference-based phasing using the Haplotype Reference
Consortium panel. Nat. Genet. 48, 1443–1448.
Maitra, A., Arking, D.E., Shivapurkar, N., Ikeda, M., Stastny, V., Kassauei, K.,
Sui, G., Cutler, D.J., Liu, Y., Brimble, S.N., et al. (2005). Genomic alterations
in cultured human embryonic stem cells. Nat. Genet. 37, 1099–1103.
Mallepaly, R., Butler, P.R., Herati, A.S., and Lamb, D.J. (2017). Genetic basis of
male and female infertility. Monogr. Hum. Genet. 21, 1–16.
Maples, B.K., Gravel, S., Kenny, E.E., and Bustamante, C.D. (2013). RFMix: A
discriminative modeling approach for rapid and robust local-ancestry infer-
ence. Am. J. Hum. Genet. 93, 278–288.
McKenna, A., Hanna, M., Banks, E., Sivachenko, A., Cibulskis, K., Kernytsky,
A., Garimella, K., Altshuler, D., Gabriel, S., Daly, M., and DePristo, M.A. (2010).
The genome analysis toolkit: a MapReduce framework for analyzing next-gen-
eration DNA sequencing data. Genome Res. 20, 1297–1303.
McLaren, W., Gil, L., Hunt, S.E., Riat, H.S., Ritchie, G.R.S., Thormann, A.,
Flicek, P., and Cunningham, F. (2016). The Ensembl variant effect predictor.
Genome Biol. 17, 122.
Mei, Q., Li, X., Zhang, K., Wu, Z., Li, X., Meng, Y., Guo, M., Luo, G., Fu, X., and
Han, W. (2017). Genetic and methylation-induced loss of miR-181a2/181b2
within chr9q33.3 facilitates tumor growth of cervical cancer through the
PIK3R3/Akt/FoxO signaling pathway. Clin. Cancer Res. 23, 575–586.
Merkle, F.T., and Eggan, K. (2013). Modeling human disease with pluripotent
stem cells: From genome association to function. Cell Stem Cell 12, 656–668.
Merkle, F.T., Ghosh, S., Kamitaki, N., Mitchell, J., Avior, Y., Mello, C., Kashin,
S., Mekhoubad, S., Ilic, D., Charlton, M., et al. (2017). Human pluripotent stem
cells recurrently acquire and expand dominant negative P53mutations. Nature
545, 229–233.
Merkle, F.T., Maroof, A., Wataya, T., Sasai, Y., Studer, L., Eggan, K., and
Schier, A.F. (2015). Generation of neuropeptidergic hypothalamic neurons
from human pluripotent stem cells. Development 142, 633–643.
Mills, R.E., Walter, K., Stewart, C., Handsaker, R.E., Chen, K., Alkan, C.,
Abyzov, A., Yoon, S.C., Ye, K.K., Cheetham, R.K., et al. (2011). Mapping
copy number variation by population-scale genome sequencing. Nature
470, 59–65.
Mosher, J.T., Pemberton, T.J., Harter, K., Wang, C., Buzbas, E.O., Dvorak, P.,
Simon, C., Morrison, S.J., and Rosenberg, N.A. (2010). Lack of population di-
versity in commonly used human embryonic stem-cell lines. N. Engl. J. Med.
362, 183–185.
N€arv€a, E., Autio, R., Rahkonen, N., Kong, L., Harrison, N., Kitsberg, D.,
Borghese, L., Itskovitz-Eldor, J., Rasool, O., Dvorak, P., et al. (2010). High-res-
olution DNA analysis of human embryonic stem cell lines reveals culture-
induced copy number changes and loss of heterozygosity. Nat. Biotechnol.
28, 371–377.
Cell Stem Cell 29, 472–486, March 3, 2022 485
llOPEN ACCESS Resource
Nelson, P.T., Kondziolka, D., Wechsler, L., Goldstein, S., Gebel, J., DeCesare,
S., Elder, E.M., Zhang, P.J., Jacobs, A., McGrogan, M., et al. (2002). Clonal hu-
man (hNT) neuron grafts for stroke therapy: neuropathology in a patient
27 months after implantation. Am. J. Pathol. 160, 1201–1206.
Nguengang Wakap, S., Lambert, D.M., Olry, A., Rodwell, C., Gueydan, C.,
Lanneau, V., Murphy, D., Le Cam, Y., and Rath, A. (2020). Estimating cumula-
tive point prevalence of rare diseases: analysis of the Orphanet database. Eur.
J. Hum. Genet. 28, 165–173.
Nguyen, H.T., Geens, M., Mertzanidou, A., Jacobs, K., Heirman, C., Breckpot,
K., and Spits, C. (2014). Gain of 20q11.21 in human embryonic stem cells im-
proves cell survival by increased expression of Bcl-xL. Mol. Hum. Reprod. 20,
168–177.
Nicholls, R.D., Knoll, J.H.M., Butler, M.G., Karam, S., and Lalande, M. (1989).
Genetic imprinting suggested by maternal heterodisomy in nondeletion
Prader-Willi syndrome. Nature 342, 281–285.
Nunes, J.M., Buhler, S., Roessli, D., Sanchez-Mazas, A., Andreani, M.,
Benhamamouch, S., Boldyreva, M., Canossi, A., Chiaroni, J., Darke, C.,
et al. (2014). The HLA-net GENE[RATE] pipeline for effective HLA data analysis
and its application to 145 population samples from Europe and neighbouring
areas. Tissue Antigens 83, 307–323.
O’Flynn O’Brien, K.L., Varghese, A.C., and Agarwal, A. (2010). The genetic
causes of male factor infertility: a review. Fertil. Steril. 93, 1–12.
Pato, M.T., Sobell, J.L., Medeiros, H., Abbott, C., Sklar, B.M., Buckley, P.F.,
Bromet, E.J., Escamilla, M.A., Fanous, A.H., Lehrer, D.S., et al. (2013). The
genomic psychiatry cohort: partners in discovery. Am. J. Med. Genet. 162,
306–312.
Quang, D., Chen, Y., and Xie, X. (2015). DANN: a deep learning approach for
annotating the pathogenicity of genetic variants. Bioinformatics 31, 761–763.
Rehm, H.L., Berg, J.S., Brooks, L.D., Bustamante, C.D., Evans, J.P., Landrum,
M.J., Ledbetter, D.H., Maglott, D.R., Martin, C.L., Nussbaum, R.L., et al.
(2015). ClinGen – the clinical genome resource. N. Engl. J. Med. 372,
2235–2242.
Ripke, S., Neale, B.M., Corvin, A., Walters, J.T.R., Farh, K.H., Holmans, P.A.,
Lee, P., Bulik-Sullivan, B., Collier, D.A., Huang, H., et al. (2014). Biological in-
sights from 108 schizophrenia-associated genetic loci. Nature 511, 421–427.
Robinson, J.T., Thorvaldsdottir, H., Winckler, W., Guttman, M., Lander, E.S.,
Getz, G., and Mesirov, J.P. (2011). Integrative genomics viewer. Nat.
Biotechnol. 29, 24–26.
Rogers, M.F., Shihab, H.A., Mort, M., Cooper, D.N., Gaunt, T.R., and
Campbell, C. (2018). FATHMM-XF: accurate prediction of pathogenic point
mutations via extended features. Bioinformatics 34, 511–513.
Rouhani, F., Kumasaka, N., de Brito, M.C., Bradley, A., Vallier, L., and Gaffney,
D. (2014). Genetic background drives transcriptional variation in human
induced pluripotent stem cells. PLoS Genet. 10, e1004432.
Samson, M., Libert, F., Doranz, B.J., Rucker, J., Liesnard, C., Farber, C.M.,
Saragosti, S., Lapoumeroulie, C., Cognaux, J., Forceille, C., et al. (1996).
Resistance to HIV-1 infection in caucasian individuals bearing mutant alleles
of the CCR-5 chemokine receptor gene. Nature 382, 722–725.
486 Cell Stem Cell 29, 472–486, March 3, 2022
Sasaki, K., Yokobayashi, S., Nakamura, T., Okamoto, I., Yabuta, Y., Kurimoto,
K., Ohta, H., Moritoki, Y., Iwatani, C., Tsuchiya, H., et al. (2015). Robust in vitro
induction of human germ cell fate from pluripotent stem cells. Cell Stem Cell
17, 178–194.
Shihab, H.A., Gough, J., Cooper, D.N., Day, I.N.M., and Gaunt, T.R. (2013).
Predicting the functional consequences of cancer-associated amino acid sub-
stitutions. Bioinformatics 29, 1504–1510.
Sittig, L.J., Carbonetto, P., Engel, K.A., Krauss, K.S., Barrios-Camacho, C.M.,
and Palmer, A.A. (2016). Genetic background limits generalizability of geno-
type-phenotype relationships. Neuron 91, 1253–1259.
Solomon, B.D., Nguyen, A.-D., Bear, K.A., and Wolfsberg, T.G. (2013). Clinical
genomic database. Proc. Natl. Acad. Sci. USA 110, 9851–9855.
Sudmant, P.H., Rausch, T., Gardner, E.J., Handsaker, R.E., Abyzov, A.,
Huddleston, J., Zhang, Y., Ye, K., Jun, G., Fritz, M.H.Y., et al. (2015). An inte-
grated map of structural variation in 2,504 human genomes. Nature
526, 75–81.
Tate, J.G., Bamford, S., Jubb, H.C., Sondka, Z., Beare, D.M., Bindal, N.,
Boutselakis, H., Cole, C.G., Creatore, C., Dawson, E., et al. (2019). COSMIC:
the catalogue of somatic mutations in cancer. Nucleic Acids Res. 47,
D941–D947.
Trounson, A., and DeWitt, N.D. (2016). Pluripotent stem cells progressing to
the clinic. Nat. Rev. Mol. Cell Biol. 17, 194–200.
Venkatesh, T., Suresh, P.S., and Tsutsumi, R. (2014). New insights into the ge-
netic basis of infertility. Appl. Clin. Genet. 7, 235–243.
Wang, L., Meece, K., Williams, D.J., Lo, K.A., Zimmer, M., Heinrich, G., Martin
Carli, J., Leduc, C.A., Sun, L., Zeltser, L.M., et al. (2015). Differentiation of hy-
pothalamic-like neurons from human pluripotent stem cells. J. Clin. Invest.
125, 796–808.
Yamamoto, F.I., Clausen, H., White, T., Marken, J., and Hakomori, S.I. (1990).
Molecular genetic basis of the histo-blood group ABO system. Nature 345,
229–233.
Yang, J., Lee, S.H., Goddard, M.E., and Visscher, P.M. (2011). GCTA: a tool for
genome-wide complex trait analysis. Am. J. Hum. Genet. 88, 76–82.
Yilmaz, A., Peretz, M., Aharony, A., Sagi, I., and Benvenisty, N. (2018). Defining
essential genes for human pluripotent stem cells by CRISPR-Cas9 screening
in haploid cells. Nat. Cell Biol. 20, 610–619.
Yizhak, K., Aguet, F., Kim, J., Hess, J.M., K€ubler, K., Grimsby, J., Frazer, R.,
Zhang, H., Haradhvala, N.J., Rosebrock, D., et al. (2019). RNA sequence anal-
ysis reveals macroscopic somatic clonal expansion across normal tissues.
Science 364, eaaw0726.
Zhao, M., Kim, P., Mitra, R., Zhao, J., and Zhao, Z. (2016). TSGene 2.0: an up-
dated literature-based knowledgebase for Tumor Suppressor Genes. Nucleic
Acids Res. 44, D1023–D1031.
Zhou, Q.Q., Wang, M., Yuan, Y., Wang, X., Fu, R., Wan, H., Xie, M., Liu, M.,
Guo, X., Zheng, Y., et al. (2016). Complete meiosis from embryonic stem
cell-derived germ cells in vitro. Cell Stem Cell 18, 330–340.
llOPEN ACCESSResource
STAR+METHODS
KEY RESOURCES TABLE
REAGENT or RESOURCE SOURCE IDENTIFIER
Critical commercial assays
Nextera DNA Flex Library Prep Kit
(96 samples) for whole genome
sequence library preparation by
tagmentation
Illumina, Inc Cat# 20018705
Nextera DNA CD Indexes
(96 indexes, 96 samples)
Illumina, Inc Cat# 20018708
Deposited data
Whole genome sequencing data
of all cell lines included
in the study, except those
from UCLA which cannot be
shared due to legal restrictions
This paper https://duos.broadinstitute.org/,
dataset DUOS-000121
Experimental models: Cell lines
Details of human embryonic stem
cell lines from multiple
institutions used in this
study are provided in Table S1
This paper This paper
Software and algorithms
Picard Open-source, developed at the Broad
Institute of MIT and Harvard
https://broadinstitute.github.io/picard/
GATK McKenna et al. (2010) GATK nightly-2015-07-31-g3c929b0
PLINK 2.0 Chang et al. (2015) https://www.cog-genomics.org/plink2
GCTA Yang et al. (2011) https://yanglab.westlake.edu.cn/software/gcta
Genome STRiP version 2.0, r2.00.1587 Handsaker et al. (2015) http://www.broadinstitute.org/software/genomestrip/
Eagle v2.4.1 Loh et al. (2016) https://alkesgroup.broadinstitute.org/Eagle/
MoChA v2020-09-01 Open-source, developed at the
Broad Institute of MIT and Harvard
by Giulio Genovese under the
supervision of Steven McCarroll.
https://github.com/freeseek/mocha
https://github.com/freeseek/mocha
VEP version 85 McLaren et al. (2016) https://www.ensembl.org/info/docs/tools/
vep/index.html
Hail Open-source, developed at the
Broad Institute of MIT and
Harvard
https://hail.is
LOFTEE (plugin to VEP) Karczewski et al. (2020) https://github.com/konradjk/loftee
ClinVar Landrum et al. (2014) www.ncbi.nlm.nih.gov/clinvar/
CADD Kircher et al. (2014) https://cadd.gs.washington.edu/
DANN Quang et al. (2015) https://cbcl.ics.uci.edu/public_data/DANN/
COSMIC Tate et al. (2019) https://cancer.sanger.ac.uk/cosmic/
HSCGP data portal implementation
code
and documentation
This paper https://github.com/broadinstitute/hscgp
(https://doi.org/10.5281/zenodo.5794210)
FATHMM-XF Rogers et al. (2018) https://fathmm.biocompute.org.uk/
FATHMM cancer Shihab et al. (2013) https://fathmm.biocompute.org.uk/
OMIM database of genes and variants
associated with Mendelian disorders
Online Mendelian Inheritance
in Man, OMIM�. McKusick-
Nathans Institute of Genetic
Medicine, Johns Hopkins
University (Baltimore, MD), 2019
http://www.omim.org
(Continued on next page)
Cell Stem Cell 29, 472–486.e1–e7, March 3, 2022 e1
Continued
REAGENT or RESOURCE SOURCE IDENTIFIER
ClinGen curated database of
genes and variants
associated with human disease
Rehm et al. (2015) http://www.ncbi.nlm.nih.gov/projects/
dbvar/clingen/
Curated dosage-sensitive genes
from the American College of
Medical Genetics (ACMG)
Rehm et al. (2015) https://www.ncbi.nlm.nih.gov/projects/
dbvar/clingen/acmg.shtml
Genimprint database of imprinted genes http://www.geneimprint.com/s
TSgene database of tumor suppressor genes Zhao et al. (2016) https://bioinfo.uth.edu/TSGene/
KEGG p53 pathway Kanehisa and Goto (2000) https://www.genome.jp/dbget-bin/www_
bget?pathway+hsa04115
Clinical Genomic Database (CGD) Solomon et al. (2013) https://research.nhgri.nih.gov/CGD/
ExAC Lek et al. (2016) https://gnomad.broadinstitute.org/
gnomAD v2.1 Karczewski et al. (2020) https://gnomad.broadinstitute.org/
Other
Human stem cell genome project
(HSCGP) data portal developed
to allow users to browse whole genome
sequencing data from hESC lines included
in this study
This paper https://hscgp.broadinstitute.org/hscgp
llOPEN ACCESS Resource
RESOURCE AVAILABILITY
Lead contactFurther information and requests for resources should be directed to and will be fulfilled by lead contact, Florian T. Merkle (fm436@
medschl.cam.ac.uk).
Materials availabilityThis study did not generate new unique reagents.
Data and code availabilityWhole genome sequencing data (in CRAM format) from cell lines included in this study have been deposited at https://duos.
broadinstitute.org/, and are available as of the date of publication if access is granted. The accession number (dataset DUOS-
000121) is also listed in the key resources table. Access to this dataset is managed to ensure the preservation of donor anonymity,
and data from cell lines obtained from the University of California, Los Angeles cannot be shared by us due to legal restrictions. To
request access, follow the instructions of the DUOS website or in case of difficulties contact Anna Neumann (neumann@
broadinstitute.org). All original code is publicly available as of the date of publication (10.5281/zenodo.5794210, please see also
key resources table).
EXPERIMENTAL MODEL AND SUBJECT DETAILS
Human embryonic stem cell lines included in this study were all derived under informed consent as confirmed by Harvard University
at the time of import, and either deposited on theNIH registry of embryonic stem cell lines or registeredwith theUKStemCell Steering
Committee. Details of cell lines in this study, including their Research Resource Identifiers (RRIDs), are listed in Table S1. We took
care to authenticate cell lines wherever data were available fromproviding institutions, and noticed that samplesMShef5 andMShef7
were swapped (this has been corrected in our files), and that the XX genotypes of WIBR1 andWIBR6 in this study did not match their
reported XY genotype. We were unable to ascertain the source of this discrepancy due to the lack of ground truth data and have
included a flag in TableS1 to caution users accordingly.
Cell lines that had not been prepared for potential clinical use were acquired and cultured as previously described (Merkle et al.,
2017). Briefly, all cultures were tested for the presence of mycoplasma and cultured in a humidified 37�C tissue culture incubator in
the presence of 5%CO2 and 20%O2. Cell lines were adapted to a common set of culture media by being thawed in the presence of
10 mM Rock inhibitor (Y-27632 DNSK International) into either a 1:1 mixture of DMEM-based medium supplemented with knockout
serum replacement (KSR), and mTeSR1 (Stemcell Technologies) on a substrate of Matrigel (Corning), or KOSR medium on a
irradiated mouse embryonic fibroblasts (MEFs). Cultures were fed daily in the absence of antibiotics or Rock inhibitor, and once
homogeneous cultures with pluripotent stem cell morphology and lacking spontaneous differentiation had been established, they
were maintained in KSR–mTeSR1, passaged with 0.5 mM EDTA in calcium- and magnesium-free PBS followed by gentle trituration
e2 Cell Stem Cell 29, 472–486.e1–e7, March 3, 2022
llOPEN ACCESSResource
in KSR–mTeSR1 medium containing 10 m M Y-27632 and re-plating onto Matrigel-coated plates. Cell lines were frozen down in
KSR–mTeSR1 medium containing a final concentration of 10% DMSO and 40% sterile heat-inactivated fetal bovine serum.
METHOD DETAILS
Whole genome sequencing and genotypingCell pellets of approximately 1-5 million cells were digested overnight at 50�C in 500 ml lysis buffer containing 100 mg/ml proteinase K
(Roche), 10mMTris pH 8.0, 200mMNaCl, 5%w/v SDS, 10mMEDTA, followed by Phenol:Chloroform precipitation, ethanol washes,
and resuspension in 10 mM Tris buffer (pH 8.0). Genomic DNA from hESCs was processed into ‘‘tagmented’’ Illumina Nextera Flex
libraries. Control whole genomes used to set the FDR for CNV calling were sequenced from libraries prepared by shearing 100 ng
input genomic DNA in 50 mL of solution. For adapter ligation, Illumina paired end adapters were replaced with palindromic forked
adapters with unique 8 base index sequences embedded within the adapter. Size selection was performed using Sage’s Pippin
Prep, with a target insert size of 370bp +/- 10%. Both hESC and control samples were sequenced at the Genomics Platform at
the Broad Institute of MIT and Harvard. All sample information tracking was performed by automated LIMS messaging. Libraries
were quantified using quantitative PCR (KAPA biosystems) with probes specific to the ends of the adapters. This assay was auto-
mated using Agilent’s Bravo liquid handling platform. Based on qPCR quantification, libraries were normalized to 1 nM. Samples
were then combined with HiSeq X Cluster Amp Mix 1, 2, and 3 into single wells on a strip tube using the Hamilton Starlet Liquid
Handling system. Cluster amplification of the templates was performed according to the manufacturer’s protocol (Illumina) using
the Illumina cBot. Flowcells were sequenced on HiSeqX, then analyzed using RTA2. The target sequencing depth had a
median >25x coverage with paired-end 151 base reads. Sequence data were processed using the Picard pipeline to yield BAM files
aligned to the hg19 reference genome using best practices from GATK software (McKenna et al., 2010). Data from each cell line was
independently processed with the HaplotypeCaller walker and further aggregated with the CombineGVCFs and GenotypeGVCFs
walkers. Genotyped sites were filtered using the ApplyRecalibration walker.
Ancestry, relatedness, and HLA analysisGenotypes from the cell lines at sites in common with sites genotyped in the 1000 Genomes Project Phase 1 (1000 Genomes Project
Consortium, 2012) and with a minor allele frequency (MA) of at least 1% were selected for relatedness and ancestry analysis. For
relatedness analysis, selected sites were pruned using PLINK 2.0 software (Chang et al., 2015, ‘‘–indep 50 5 2’’ command option)
and estimates for the amount of IBD1 and IBD2 regions were computed (‘‘–genome gz’’ command option). Sample pairs were
considered directly related (parent-child or full sibling) when estimates were between 35% and 70%. For the sibling pairs we iden-
tified, IBS0 values ranged from 0.0019 to 0.0061 and Kinship values ranged from 0.2058 to 0.2845 (Table S1B) with the exception of
the likely half-sibling lines UCLA8 and UCLA9 (Figure 2C).
For ancestry analysis, selected sites were extracted from the dataset, merged with 1000 Genomes Project genotypes, and pruned
using PLINK 2.0 software (‘‘–indep 50 5 2’’ command option). Principal component analysis was then performed for this combined
dataset by computing the pairwise relationship matrix across all subjects (using the plink command ‘‘–make-grm-bin’’), and
computing the principal components using GCTA software (Yang et al., 2011). Global ancestral components for European, African,
Native American, and Asian ancestry were estimated from the first three principal components using a linear model trained by as-
signing full European, African, and Asian ancestry to the appropriate 1000 Genomes population samples, and assigning estimated
ancestry proportions to Latino samples using available published estimates (1000 Genomes Project Consortium, 2012; Maples et al.,
2013). Human Leukocyte Antigen (HLA) genotypewas ascertained by genotyping hESCs for SNPs associatedwith HLA haplotypes in
the CEU ethnic group (De Bakker et al., 2006).
Polygenic risk score (PRS) computationsTo compute PRSs, we used summary statistics from studies performed on individuals predominantly of European ancestry. For each
phenotypewith available summary statistics, we computed the score for all availablemarkers with association p-values in the original
study (Bulik-Sullivan et al., 2015) that were less than 0.5 (e.g. 1,218,732 for BMI). PRS’s were computed with established method-
ologies (Purcell et al., 2009) and PLINK 2.0 software (Chang et al., 2015) using genotypes from WGS data. To control for potential
methodological biases, we also calculated PRSs using high-coverage WGS data from unrelated human samples including 383
schizophrenia (SCZ) cases and 489 SCZ controls (Ripke et al., 2014) and adjusted raw PRSs by regressing the first 12 principal
component values to correct for slight biases introduced in the computation of the summary statistics. Principal components beyond
the first 12 did not show significant correlation with raw PRS. Raw PRS values were normalized such that the distribution of PRS
scores from SCZ control subjects had zero mean and unitary standard deviation (SD).
CNV calling from read depth variationCopy number variants were ascertained and genotyped using Genome STRiP version 2.0 (r2.00.1587, http://www.broadinstitute.
org/software/genomestrip/), using the CNVDiscoveryPipeline with default settings (Handsaker et al., 2015). This software examines
average depth of coverage (DOC) genome-wide to identify chromosomes and genomic regions whose normalized DOC deviated
from the expected copy number of 2 for autosomes, and 2 or 1 for the X and Y chromosomes. After initial CNV calling, quality
was assessed using signal intensity data from Omni 2.5 Microarrays run on 500 individuals from a control cohort (Pato et al.,
Cell Stem Cell 29, 472–486.e1–e7, March 3, 2022 e3
llOPEN ACCESS Resource
2013). Using the IRS method (Handsaker et al., 2015) we established separate length thresholds for deletions (length threshold =
1117) and duplications (length threshold = 2750) that achieved a false discovery rate under 3% for both categories of CNV in these
control data (Figure S3A). By comparing the number of CNVs called in the cell lines to CNVs called in the control cohort, stratified by
CNV type, length and ancestry, we reasoned that the false discovery rate in the cell lines should be comparable to the estimated
false discovery rate of 3% in the control cohort. To test this assumption, we sequenced 121 hESC lines using the InfiniumPsychArray
(> 500,000 probes), filtered out probes with high intrinsic variability in intensity, and asked which small CNV calls made by DOCwere
supported by probe intensity data from CNVs that contained >1 or >2 DNA microarray probes.
To increase CNV calling power and to enhance quality control, CNV analysis was performed on a combined cohort of 130
sequenced hESC lines and a control cohort consisting of 234 human samples from primary blood that had undergone WGS on
the same platform (Illumina HiSeqX) and to similar depth as the hESC lines. These control samples were selected from the larger
cohort of 500 samples based on their absence of a psychiatric diagnosis (i.e. controls) and their origin from blood as opposed to
lymphoblastoid cell lines to avoid any potential confounds from disease- or somatic mutation-associated CNVs (Pato et al.,
2013). We then separated CNVs into small (1117 bp - 1 Mbp) and large (> 1 Mbp) categories since large variants were uncommon
among similarly-sequenced human samples and therefore more likely to be culture-acquired and potentially deleterious, and manu-
ally confirmed all large CNV calls from hESCs and human control samples.
Identification of large structural variantsTo detect large-scale copy number alterations (> 1 Mbp) by sequencing depth of coverage (DOC), we scanned the genome for
segments where one sample was enriched or depleted in depth of sequencing coverage compared to the other cell line samples.
We divided the genome into non-overlapping 100 kbp bins of uniquely-alignable sequence (based on 101bp k-mers) and computed
the normalized depth of coverage using Genome STRiP (Handsaker et al., 2015). For each contiguous range of bins, a Z-score was
computed for each sample over the genomic interval as:
ZðS; IÞ = absðcoverageðS; IÞ�medianðIÞ =MADðIÞÞwhere coverage(S,I) is the normalized depth of coverage for sample S over the interval, median(I) is the median coverage over all
samples and MAD is the median-absolute-deviation. We performed a heuristic search to identify candidate CNV intervals with a
Z-score > 3 that were local maxima for sample S. We required that candidate CNV intervals have sharp boundaries, such that the
depth of coverage for sample S in the next adjacent bin (on both ends of the interval) was more than halfway from the coverage
for S inside the interval to the median coverage of the adjacent bin outside the interval. The final set of large CNVs reported were
selected to span at least 10 bins (minimum length 1 Mbp) and have a Z-score > 5. The boundaries of each CNV were manually
reviewed and adjusted as needed near centromeres or telomeres or to merge adjacent calls. Contiguous but compound variants
were considered as one unique event.
To determine if CNVs detected in hESCs were present in all sequenced cells or in a subset of them, we calculated the likelihood
that the divergence from an integer copy number could have arisen by chance. We set the P value threshold for detecting mosaicism
at 1 x 10⁻³ since human blood samples had only 2/243 (< 1%) samples with smaller P values (Figure S3B), and otherwise classified
CNVs as fixed. CNV calls made from sequencing depth of coverage analysis were supported by allelic coverage at heterozygous
sites. This was measured at all heterozygous SNPs observed at least five times across the whole dataset and falling outside of
regions exhibiting excessive heterozygosity in the 1000 Genomes project dataset, as these regions might be more prone to mis-
mapping. Each remaining heterozygous allele was then phased using Eagle v2.4.1 +htslib-1.9 (Loh et al., 2016). Phased genotypes
and allelic coverages were then analyzed for allelic imbalances with MoChA version 2020-09-01. Highly confident calls (LOD>20) of
large structural variations (> 1 Mbp) were reported (Table S3). To distinguish acquired CN-LOH events from fixed runs of homozy-
gosity arising from inbreeding or complex chromosomal rearrangement, we considered only events that were mosaic and extended
to the telomere, consistent with CN-LOH formation in culture by a single mitotic crossover event.
Validation of large structural variantsAll structural variant calls made by SNP DNA microarray in a published dataset (Canham et al., 2015) were compared to those
500 kbp or larger that were called in this study by DOC analysis. Calls made by SNP DNA microarray had been mapped to the
hg38 reference genome, so variant calls were converted to hg19 coordinates to enable comparison to WGS data. We considered
the 20 variants detected by Canham and colleagues regardless of their size, and found that 15 of them were confirmed by WGS
data. Manual inspection of the five calls made only by SNP DNA microarray showed that three of these calls were likely not true
CNVs, and two were likely explained by the divergent culture histories of cell lines that were sequenced at different passages.
Detection and interpretation of small CNVsRegions containing large fixed or mosaic CNVs were excluded from small-scale CNV analysis in affected samples to reduce the
potential ‘‘fragmentation’’ of large CNVs into smaller calls. Singleton events were defined as being present only once in any of the
other hESC lines, human samples, or in previously described databases such as the 1000 Genomes Project (1000 Genomes Project
Consortium, 2012).
To ask whether hESCs might be enriched for specific smaller CNVs, we examined the genome-wide distribution of CNVs < 1 Mbp
in hESCs and removed all but one cell line from the sib-ships we identified to control for CNVs shared between first-degree relatives.
e4 Cell Stem Cell 29, 472–486.e1–e7, March 3, 2022
llOPEN ACCESSResource
We measured the frequency of each CNV found in the hESCs in two control cohorts: 212 human samples of European ancestry
(GPC1) and 250 human samples of Latino or African American ancestry (CPG2). We identified events that were present in at least
5 hESC lines but that were absent from the European control samples and found in less than 10% of the other control samples.
This analysis identified the known region onChr20q11.21 aswell as four other potentially differentiated CNVs.Manual review of these
four additional regions revealed that they are all in small regions of extreme GC-content with excessive sequencing coverage and not
likely to be real CNVs.
For each cell line, genes overlapping with 5997 CNVs were identified and annotated using the GeneOverlap module in Genome-
Strip 2.0 and GENCODE. The region of overlap (coding vs. exonic vs. intronic) and the type of CNV (deletion or duplication) were also
recorded. 2185 CNVs contained at least some part of an annotated gene (Table S3). Limiting CNV overlaps to coding regions and
UTRs reduced these numbers to 357 deleted (CN < 2) and 321 duplicated (CN > 2) genes, respectively.
Identification of SNVs in hESCsTo ensure reliable assignment of variant function and to confidently identify potentially high impact variants, genotypes were called
jointly in all hESC lines and genotype data were annotated using Variant Effect Predictor version 85 (VEP, McLaren et al., 2016) in Hail
(https://hail.is) with the Loss-of-function Transcript Effect Estimator plugin (LOFTEE, Karczewski et al., 2020). Candidate variants
called by VEP were advanced for further analysis and false positive calls were removed from the VEP variant call set by applying
similar filters used by gnomAD to identify ‘‘high confidence and high quality’’ (HC-HQ) variant calls (Karczewski et al., 2020).
Specifically, we split multiallelic sites and discarded all calls without a ‘‘PASS’’ filter tag as determined by the Variant Quality Score
Recalibration tool (GATK). We also excluded variant sites where not a single sample had high genotyping quality as defined by (Depth
of Coverage >= 10, Genotype Quality >= 20 and Minor allele fraction >= 0.2). Variants in low complexity regions and segmental
duplications were filtered out and only variants that met the gnomAD ‘‘PASS’’ filter criteria or were missing were retained. These
filtering steps resulted in a total of 15.5M high quality variants corresponding to approximately 70% of all variants in the data.
Since VEP annotates individual transcripts, only variants on canonical transcripts as defined by Gencode/Ensembl were included
in downstream analyses. Variants were binned into synonymous, missense and lofs using the following criteria:
LOFS: "frameshift_variant", "splice_acceptor_variant", "splice_donor_variant", "stop_gained"
Missense: "inframe_deletion", "inframe_insertion", "missense_variant", "start_lost", "stop_lost", "protein_altering_variant"
Synonymous: "synonymous_variant", "stop_retained_variant", "incomplete_terminal_codon_variant"
To exclude common variants and to limit our analyses to biologically variant categories, the remaining calls were restricted to
missense and LOF variants with an allele frequency less than 0.001 in ExAC that were bioinformatically predicted to be deleterious
by both CADD (CADD-phred >20) and DANN (>0.99). ClinVar (Landrum et al., 2014) and COSMIC codingmutations (Tate et al., 2019)
were used to further refine the call set to disease relevant variants. Variant interpretation and prioritization was performed using a
series of variant-level and gene level filters described below (‘SNV characterization and prioritization’).
Data portal architecture and implementationThe interactive data portal will run onmost operating systems, andwas implemented using software freely available at https://github.
com/broadinstitute/hscgp. We hope this platform will lay a foundation for interested users to readily produce similar portals to host
their own data. The portal is implemented using Ruby on Rails and usesmongodb for object storage. Docker images are provided for
the Ruby on Rails application and for the mongodb database and these can both be run on any machine or cluster that supports
running docker containers and networking between thems. We utilize the firecloud API to allow sensitive genomic data to be ac-
cessed securely from its storage location on a protected Google Cloud bucket. This architecture ensures that authenticated users
of the application can access loci of interest across genomes of different cell lines without exposing a complete BAM file or passing
unencrypted genomic data between machines.
SNV characterization and prioritizationWe used a series of gene-level and variant-level filters to identify SNVs of particular interest to human disease, as described in the
main manuscript text. These filters are derived from publicly-available databases and bioinformatic prediction algorithms and rep-
resented in the columns of Table S4 and detailed below:
Variant details
gene, HUGO gene nomenclature committee (HGNC) official human gene symbol (https://www.genenames.org/);
transcript, Ensembl transcript identifier (https://www.ensembl.org/);
locus, genomic coordinates from hg19 reference, and base of the reference and alternate allele;
chr, human chromosome on which the variant is located;
pos, chromosomal position of the variant in hg19 coordinates;
ref, reference base at this chromosomal position;
alt, alternate base at this chromosomal position;
duplicated_locus, TRUE if the site is multiallelic and has been split.
rsid, reference SNP identifier from dbSNP (https://www.ncbi.nlm.nih.gov/snp/);
worst_csq, worst consequence predicted by VEP
consequence, consequence predicted by VEP
Cell Stem Cell 29, 472–486.e1–e7, March 3, 2022 e5
llOPEN ACCESS Resource
hgvsp, Ensembl identifier of the affected protein and most likely amino acid change;
hgvsc, Ensembl identifier of the affected transcript and coding change;
homs, file name(s) of hESC line(s) in which the variant was identified in a homozygous state;
hom_count, number of homozygous variant among the 143 analyzed hESC lines;
hets, file name(s) of hESC line(s) in which the variant was identified in a heterozygous state;
het_count, number of heterozygous variant among the 143 analyzed hESC lines;
AC, total number of variant alleles genotyped among the 143 analyzed hESC lines;
AN, total number of alleles at that genomic location genotyped among the 143 analyzed hESC lines;
AF, ratio of variant to total alleles in hESCs;
Variant-level filters
gnomad_global_AC, number of times this variant was present in 15,708 whole genome sequences currently represented in the gno-
mAD database (Karczewski et al., 2020, https://gnomad.broadinstitute.org/);
gnomad_global_AF, ratio of variant to total alleles among the 15,708 whole genome sequences in gnomAD;
exome_global_AC, number of times this variant was present in the ExAC database in 60,706 exomes that are non-overlapping
with the whole genomes represented in gnomAD (Lek et al., 2016, https://gnomad.broadinstitute.org/)
exome_global_AF, ratio of variant to total alleles at this genomic location in ExAC;
cadd_raw, raw score from the Combined Annotation Dependent Depletion (CADD) predictor of variant deleteriousness (Kircher
et al., 2014, https://cadd.gs.washington.edu/);
cadd_phred, scaled phred-like CADD score where the bottom 90% of deleterious variants have a score of 0-10, the next 9% have
scores of 10-20, and so on;
dann, score of variant deleteriousness from the Deleterious Annotation of genetic variants using Neural Networks (DANN) with
scores ranging from 0 to 1 for neutral to most deleterious (Quang et al., 2015, https://cbcl.ics.uci.edu/public_data/DANN/);
fathmm_xf_cod_score, score of likely coding variant pathogenicity from the Functional Analysis Through Hidden Markov Models
(FATHMM-XF) predictor (Rogers et al., 2018, https://fathmm.biocompute.org.uk/);
fathmm_xf_nc_score, FATHMM prediction for non-coding (e.g. splice donor) variants;
fathmm_warn, variant annotation from FATHMM at default sensitivity and specificity thresholds (https://fathmm.biocompute.
org.uk/);
fathmm_cancer, FATHMM prediction of cancer-associated coding variants with annotations at default sensitivity and specificity
thresholds (Shihab et al., 2013, http://fathmm.biocompute.org.uk/cancer.html);
cosmic_id, Catalogue Of Somatic Mutations in Cancer (COSMIC) numerical internal database identifier (Tate et al., 2019, http://
cancer.sanger.ac.uk/);
cosmic_count, number of times the specific variant was reported in COSMIC, where multiple entries denote multiple splice
isoforms;
cosmic_cds, base changes for each of the major splice isoforms of the protein in COSMIC,
cosmic_aa, amino acid changes for each of the major splice isoforms of the protein in COSMIC,
Gene-level filters
clin_def, clinical syndrome(s) associated with defects in the affected gene as reported in the manually-curated ClinVar database
(Landrum et al., 2014, www.ncbi.nlm.nih.gov/clinvar/);
clin_sig, likely clinical significance of the variant based on manual curation of the strength of supporting data in the literature;
clin_vc, variant type;
clin_db, links to databases describing clinical syndrome(s) in greater detail;
MIM, identifier for the clinical syndrome(s) associated with defects the affected gene as reported in the manually-curated Online
Mendelian Inheritance in Man database (http://www.omim.org/downloads, 2019);
Genomic.Location, genomic location of the gene associated with the clinical syndrome(s) described in OMIM;
Haploinsufficiency.Description, annotation of the gene as dosage-sensitive in the manually-curated ClinGen database (Rehm
et al., 2015, http://www.ncbi.nlm.nih.gov/projects/dbvar/clingen/);
Loss.phenotype.OMIM.ID, OMIM entries for genes in which gene loss of function is associated with a clinical phenotype;
Dosage, annotation of haploinsufficiency among the 59 genes designated by the American College of Medical Genetics (ACMG)
manual (https://www.ncbi.nlm.nih.gov/projects/dbvar/clingen/acmg.shtml),
Fertility_Related, genes described in the literature to be related to fertility (Mallepaly et al., 2017; O’Flynn O’Brien et al., 2010;
Venkatesh et al., 2014);
Imprinted, inclusion of the gene in amanually-curated list of imprinted human genes (http://www.geneimprint.com/site/genes-by-
species);
X-linked dominant, OMIM disease genes that show X-linked dominant inheritance;
Tumor Suppressors, inclusion of the gene in a curated list of tumor suppressors (Zhao et al., 2016, https://bioinfo.uth.edu/
TSGene/);
COSMIC_tier, inclusion of the gene as a COSMIC Tier 1 gene that has an established association to cancer (Tate et al., 2019,
http://cancer.sanger.ac.uk/census/);
e6 Cell Stem Cell 29, 472–486.e1–e7, March 3, 2022
llOPEN ACCESSResource
P53_Pathway, inclusion of the gene in the KEGG p53 pathway (Kanehisa and Goto, 2000, https://www.genome.jp/dbget-bin/
www_bget?pathway+hsa04115);
Growth restricting, Top 50 growth restricting genes in hESCs identified by (Yilmaz et al., 2018);
CONDITION, clinical syndrome associated with the gene in the Clinical Genomic Database (CGD: Solomon et al., 2013, https://
research.nhgri.nih.gov/CGD/);
INHERITANCE, reported inheritance of the clinical syndrome associated with the gene in CGD;
COMMENTS, comments associated with the clinical syndrome associated with the gene in CGD;
INTERVENTION.RATIONALE, clinical intervention rationale for the clinical syndrome associated with the gene in CGD;
REFERENCES, references associated with the clinical syndrome associated with the gene in CGD;
Autosomal Dominant, OMIM disease genes that show dominant inheritance;
obs_mis, observed number of missense variants in this gene in gnomAD;
exp_mis, expected number of missense variants in this gene in gnomAD;
mis_z, ExAC score of gene constraint to missense variants where positive scores indicated increased constraint;
oe_mis_lower, 90% confidence interval for the lower bound of observed to expected missense variants in this gene in gnomAD;
oe_mis_upper, 90% confidence interval for the upper bound of observed to expected missense variants in this gene in gnomAD;
obs_lof, observed number of loss-of-function variants in a gene in gnomAD;
exp_lof, expected number of loss-of-function variants in a gene in gnomAD;
pLI, probability of loss intolerance from a LoF mutation from the ExAC database based on expected versus observed LoF
mutations;
oe_lof, mean fraction of observed to expected loss-of-function variants in a given gene;
oe_lof_lower, 90% confidence interval for the lower bound of observed to expected loss-of-function variants in this gene in
gnomAD;
oe_lof_upper, 90%confidence interval for the upper bound of observed to expected loss-of-function variants (LOEUF) in this gene
in gnomAD;
constraint_flag, Flags assigned to constrained genes as defined in gnomad v2.1 (see https://gnomad.broadinstitute.org/faq)
gene_type, Type of constrained gene as per gnomad v2.1 (see https://gnomad.broadinstitute.org/faq)
QUANTIFICATION AND STATISTICAL ANALYSIS
Statistical analysis used is described in the main text or Methods Details above.
Cell Stem Cell 29, 472–486.e1–e7, March 3, 2022 e7