whole-genome linkage disequilibrium screening for complex traits in horses
TRANSCRIPT
Mol Genet Genomics (2007) 277:663–672
DOI 10.1007/s00438-007-0216-2ORIGINAL PAPER
Whole-genome linkage disequilibrium screening for complex traits in horses
Teruaki Tozaki · Kei-ichi Hirota · Telhisa Hasegawa · Nobushige Ishida · Takashi Tobe
Received: 11 December 2006 / Accepted: 25 January 2007 / Published online: 22 February 2007© Springer-Verlag 2007
Abstract The identiWcation of candidate genes forsigniWcant traits is crucial. In this study, we developedand tested eVective and systematic methods based onlinkage disequilibrium (LD) for the identiWcation ofcandidate regions for genes with Mendelian inheri-tance and those associated with complex traits. Ourapproach entailed the combination of primary screen-ing using pooled DNA samples based on �TAC, sec-ondary screening using an individual typing methodand tertiary screening using a permutation test basedon the diVerences in the haplotype frequency betweentwo neighbouring microsatellites. This series of meth-ods was evaluated using horse coat colour traits (chest-nut/non-chestnut) as a simple Mendelian inheritancemodel. In addition, the methods were evaluated using acomplex trait model constructed by mixing samplesfrom chestnut and non-chestnut horses. Using both
models, the methods could detect the expected regionsfor the horse coat colour trait. The results revealed thatLD extends up to several centimorgans in horses, indi-cating that whole-genome LD screening in horsescould be performed systematically and eYciently bycombining the above-mentioned methods. Sincegenetic maps based on microsatellites have been con-structed for many other species, the approaches pres-ent here could have wide applicability.
Keywords Horse · Linkage disequilibrium (LD) · �TAC · Pooled DNA · Microsatellite · Haplotype
Introduction
At present, whole-genome sequence information andmany annotated genes are available for many species,including humans and mice, while many signiWcanttraits and diseases are also clinically observed. How-ever, because of complex mechanisms such as gene–gene interactions, the relationship between traits andgenes is not well established. In this study, we devel-oped eYcient and systematic approaches designed toisolate genes with Mendelian inheritance and complextraits using linkage disequilibrium (LD) screening.
Parametric linkage analysis is an extremely eYcientmethod for the identiWcation of genetic factors exhibit-ing Mendelian inheritance. Many genes from thehuman genome have been isolated and identiWed asgenetic factors that underlie diseases (Funayama et al.2002; Cader et al. 2003). However, this approach can-not be used for the detection and identiWcation ofgenetic factors underlying complex diseases thatinvolve several genes and environmental factors.
Communicated by S. Hohmann.
T. Tozaki (&) · K. HirotaDepartment of Molecular Genetics, Laboratory of Racing Chemistry (LRC), 1731-2 Tsurutamachi, Utsunomiya, Tochigi 320-0851, Japane-mail: [email protected]; [email protected]
T. Hasegawa · N. IshidaEquine Research Institute, Japan Racing Association (JRA), 321-4 Tokami-cho, Utsunomiya, Tochigi 320-0856, Japan
T. TobeDepartment of Medicinal Information, School of Pharmaceutical Sciences, Showa University, 1-5-8, Hatanodai, Shinagawa, Tokyo 142-8555, Japan
123
664 Mol Genet Genomics (2007) 277:663–672
LD screening has been used as a genome scanningmethod to isolate genes that govern signiWcant traitsand diseases. This method has the following twospeciWc potential uses: (1) to Wnely map genes thatgovern those traits that have been previously mappedon chromosomes by using parametric linkage studies,and (2) to map novel genes that govern these traits byusing whole-genome LD screening. The use of LD forWne mapping has received considerable attention andhas several useful applications (Ahmed et al. 2003;Rahman et al. 2003; van Swieten et al. 2003). How-ever, the initial use of LD mapping to isolate thegenes that govern these traits is limited (Goedde et al.2002; Toda et al. 2003; Tamiya et al. 2005) becausethe extent of LD must be small in a large population,such as humans, and because, generally, many poly-morphic markers are required for whole-genome LDscreening.
Horses are aVected by several common diseases thatinvolve a heritable component; these include rhabd-omyolysis (tying-up), laryngeal hemiplegia (roaring),osteochondrosis dissecans, and recurrent airwayobstruction. These diseases are considered to be com-plex and involve several genetic and/or environmentalfactors. Therefore, it is diYcult to identify candidategenes for these diseases by using parametric linkagemapping. However, candidate regions for horse coatcolour traits have been easily assigned on the horsegenome by using this method (Locke et al. 2001, 2002;Henner et al. 2002; Swinburne et al. 2002; Terry et al.2004). Recently, we studied the extent of LD in a Thor-oughbred population by using microsatellites andrevealed the existence of LD extending to several cen-timorgans (cM) (Tozaki et al. 2005). The present studypromotes the use of the LD mapping method for theisolation of candidate genes exhibiting Mendelianinheritance, and it suggests the use of this method forthe detection of complex traits in horses; however, asuitable LD method for identifying candidate genes forcomplex traits in horses has yet to be developed.
Genetic maps are extremely important tools fortracing the genes that govern economically signiWcanttraits. Recent years have witnessed signiWcant advancesin horse genome mapping. The current status of thehorse gene map includes two linkage maps constructedfrom diVerent family resources (Penedo et al. 2005;Swinburne et al. 2006) and a radiation hybrid map(Chowdhary et al. 2003). In addition, a human–horsecomparative map based on BAC end sequences wasrecently reported (Leeb et al. 2006). The isolation ofnew microsatellites and mapping them by using theseresources will be critical for the Wne mapping of eco-nomically signiWcant traits in horses (Tozaki et al.
2004). This will enable the identiWcation and analysis ofthe genes that govern these traits.
In the present study, we aimed to conWrm the extentof LD in the horse genome and to determine the num-ber of markers required for whole-genome LD screen-ing for the identiWcation of the candidate regions forgenes with Mendelian inheritance and those associatedwith complex traits. In addition, we aimed to present astrategy for whole-genome LD screening for complextraits in horses. For this, we used the chestnut coat col-our phenotype in order to assess the eYciency of whole-genome LD mapping in a Thoroughbred population.The chestnut phenotype in horses is attributed to themelanocortin 1 receptor (MC1R), and its single nucleo-tide polymorphisms have previously been isolated andmapped onto horse chromosome 3 (ECA3) (Wagneret al. 2000; Rieder et al. 2001). The microsatellites onthe third phase international horse linkage map (Pen-edo et al. 2005) were used to assess the diVerencebetween chestnut (case) and non-chestnut (control)populations by using the chi-square test of associationfor detecting Mendelian inheritance. In addition, sev-eral case sample compositions (9:1–1:9, case:controlratio in the case samples) were constructed in order tosimulate and evaluate the complex traits aVected bygenetic and environmental factors. We evaluated thepossibility of performing whole-genome LD screeningby using microsatellites that have previously beenmapped on the available horse linkage maps.
Materials and methods
Thoroughbreds and DNA puriWcation
All the racehorses in Japan are registered in the Japa-nese Stud Book by the Japan Race Horse Registry(JRHR). The coat colour information in this study wasobtained from this book. For the LD analysis, Thor-oughbreds having chestnut coat colour (case popula-tion) and those having non-chestnut coat colour(control population) were selected randomly from theRitto and Miho Training Centre of the Japan RacingAssociation (JRA). Of these, we selected 144 horsesthat had no full- or half-sibling relationship as case andcontrol populations. Genomic DNAs were isolatedfrom whole blood by using the MagExtractor SystemMFX-2000 (Toyobo, Osaka, Japan) according to themanufacturer’s protocol. For individual genotyping,each sample was diluted to a concentration of 25 ng/�l.
For the analysis using pooled DNA samples, all thesamples were measured twice and diluted to a concen-tration of 25 ng/�l. The samples were measured again
123
Mol Genet Genomics (2007) 277:663–672 665
before being grouped under case or control samplepopulations and the samples were randomly selected toconstruct the mixed pools. We simulated complextraits for each case sample population by mixing caseand control samples in the following 10 case:controlratios: 10 (144):0 (0), 9 (130):1 (14), 8 (115):2 (29), 7(101):3 (43), 6 (86):4 (58), 5 (72):5 (72), 4 (58):6 (86), 3(43):7 (101), 2 (29):8 (115), 1 (14):9 (130). It is generallyknown that many genes (e.g. complex gene–gene inter-action) and environmental factors are involved in com-plex traits. If one population were to be classiWed intotwo populations based on random sampling, the allelefrequency distributions of all the markers would be thesame. However, if one population were to be classiWedinto two populations as the result of biased sampling,as for example in classiWcation based on phenotypes,the allele frequency distributions around the biasedloci would in many cases be diVerent between the twopopulations. Thus, the detection of a diVerent allelefrequency distribution leads to the identiWcation ofcandidate regions for complex traits. In the presentstudy, we used the constructed models in order toinvestigate whether our method could detect smalldiVerences in allele frequency distribution.
Microsatellites
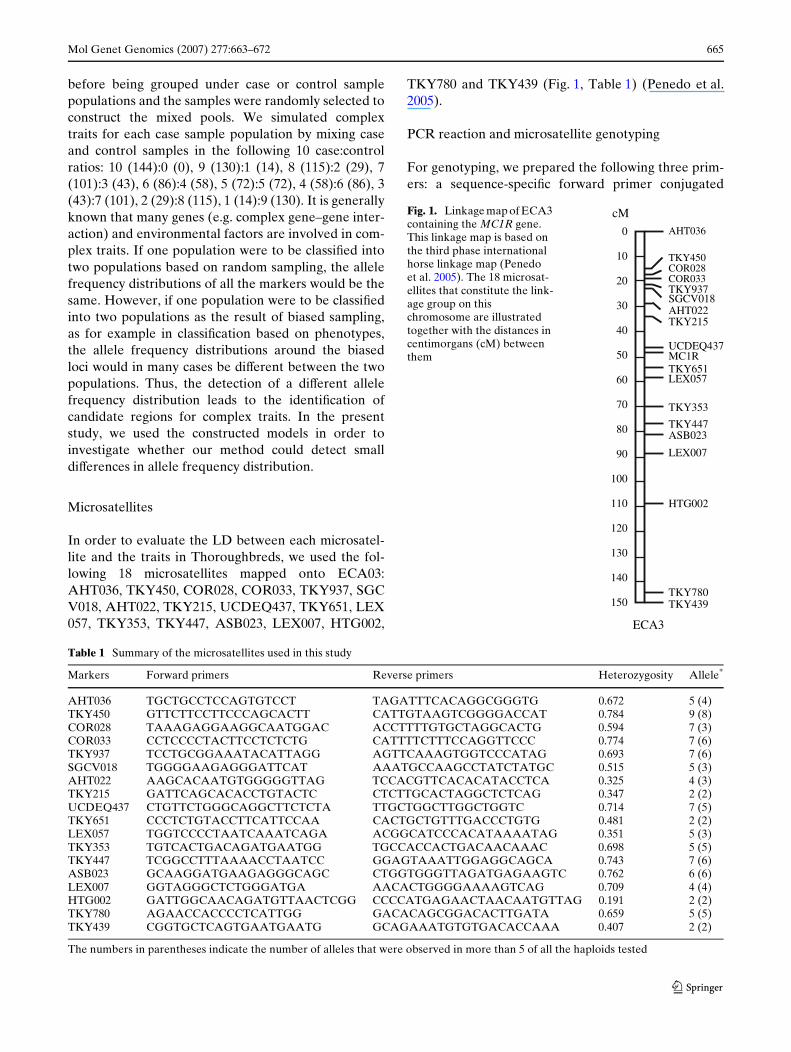
In order to evaluate the LD between each microsatel-lite and the traits in Thoroughbreds, we used the fol-lowing 18 microsatellites mapped onto ECA03:AHT036, TKY450, COR028, COR033, TKY937, SGCV018, AHT022, TKY215, UCDEQ437, TKY651, LEX057, TKY353, TKY447, ASB023, LEX007, HTG002,
TKY780 and TKY439 (Fig. 1, Table 1) (Penedo et al.2005).
PCR reaction and microsatellite genotyping
For genotyping, we prepared the following three prim-ers: a sequence-speciWc forward primer conjugated
Fig. 1. Linkage map of ECA3 containing the MC1R gene. This linkage map is based on the third phase international horse linkage map (Penedo et al. 2005). The 18 microsat-ellites that constitute the link-age group on this chromosome are illustrated together with the distances in centimorgans (cM) between them
AHT036
TKY450COR028COR033TKY937SGCV018AHT022TKY215
UCDEQ437
TKY651LEX057
TKY353
TKY447ASB023
LEX007
HTG002
TKY780TKY439
MC1R
0
10
20
30
40
50
60
70
80
90
100
110
120
130
140
150
cM
ECA3
Table 1 Summary of the microsatellites used in this study
The numbers in parentheses indicate the number of alleles that were observed in more than 5 of all the haploids tested
Markers Forward primers Reverse primers Heterozygosity Allele*
AHT036 TGCTGCCTCCAGTGTCCT TAGATTTCACAGGCGGGTG 0.672 5 (4)TKY450 GTTCTTCCTTCCCAGCACTT CATTGTAAGTCGGGGACCAT 0.784 9 (8)COR028 TAAAGAGGAAGGCAATGGAC ACCTTTTGTGCTAGGCACTG 0.594 7 (3)COR033 CCTCCCCTACTTCCTCTCTG CATTTTCTTTCCAGGTTCCC 0.774 7 (6)TKY937 TCCTGCGGAAATACATTAGG AGTTCAAAGTGGTCCCATAG 0.693 7 (6)SGCV018 TGGGGAAGAGGGATTCAT AAATGCCAAGCCTATCTATGC 0.515 5 (3)AHT022 AAGCACAATGTGGGGGTTAG TCCACGTTCACACATACCTCA 0.325 4 (3)TKY215 GATTCAGCACACCTGTACTC CTCTTGCACTAGGCTCTCAG 0.347 2 (2)UCDEQ437 CTGTTCTGGGCAGGCTTCTCTA TTGCTGGCTTGGCTGGTC 0.714 7 (5)TKY651 CCCTCTGTACCTTCATTCCAA CACTGCTGTTTGACCCTGTG 0.481 2 (2)LEX057 TGGTCCCCTAATCAAATCAGA ACGGCATCCCACATAAAATAG 0.351 5 (3)TKY353 TGTCACTGACAGATGAATGG TGCCACCACTGACAACAAAC 0.698 5 (5)TKY447 TCGGCCTTTAAAACCTAATCC GGAGTAAATTGGAGGCAGCA 0.743 7 (6)ASB023 GCAAGGATGAAGAGGGCAGC CTGGTGGGTTAGATGAGAAGTC 0.762 6 (6)LEX007 GGTAGGGCTCTGGGATGA AACACTGGGGAAAAGTCAG 0.709 4 (4)HTG002 GATTGGCAACAGATGTTAACTCGG CCCCATGAGAACTAACAATGTTAG 0.191 2 (2)TKY780 AGAACCACCCCTCATTGG GACACAGCGGACACTTGATA 0.659 5 (5)TKY439 CGGTGCTCAGTGAATGAATG GCAGAAATGTGTGACACCAAA 0.407 2 (2)
123
666 Mol Genet Genomics (2007) 277:663–672
with a 5�-TGA CCG GCA GCA AAA TTG-3� tail atits 5� end; a sequence-speciWc reverse primer; and anFAM-, VIC- or NED-labelled 5�-TGA CCG GCAGCA AAA TTG-3� primer (Applied Biosystems, Fos-ter City, USA). The underlined sequences (18 mer)were used for Xuorescence detection. PCR was per-formed in a total volume of 12.5 �l that had the follow-ing composition: 50 ng of genomic DNA, 0.6 pmol ofthe sequence-speciWc forward primer conjugated with a5�-TGA CCG GCA GCA AAA TTG-3� tail at its 5�
end, 6 pmol of the sequence-speciWc reverse primer,2 pmol of each of the Xuorescent-labelled 5�-TGACCG GCA GCA AAA TTG-3� primer, 200 �M ofdNTPs, 2.5 mM of MgCl2, 1.25 �l of 10£ reactionbuVer and 0.1 U of AmpliTaq Gold DNA polymerase(Applied Biosystems). PCR ampliWcation was per-formed using a GeneAmp PCR System 9700 andinvolved initial denaturation at 94°C for 4 min, fol-lowed by 15 cycles of 30 s each at 94, 55 and 72°C and25 cycles of 30 s each at 94, 50 and 72°C; Wnal extensionwas performed for 7 min at 72°C.
The reaction products were analyzed using anABI3100 automated sequencer (Applied Biosystems)according to the manufacturer’s instructions and aWlter set G. Genotyping data were collected and ini-tially analyzed using Genescan software (Applied Bio-systems). Genotyper (Applied Biosystems) was thenused, and the alleles were scored manually with eachallele being assigned an appropriate integer value.
Statistical analysis
LD analysis was performed using four approaches. Inthe Wrst approach, a chi-square test of association wasused by employing single markers to compare the fre-quency of alleles between the chestnut (case) and non-chestnut (control) coat colour populations. The calcu-lations were carried out by using the computer pro-gram Ekuseru-Toukei 2006 (SSRI, Tokyo, Japan).
In the second approach, the microsatellite totalallele content (TAC) diVerences between diVerentDNA pools were evaluated by calculating the �TAC(Collins et al. 2000). The peak height of each allele in apool was obtained from an electrophoretogram, andthe sum of all the peak heights in the pool was calcu-lated. The height of each allele was then divided by thesum of all allele heights and multiplied by 100 in orderto obtain the percentage of the allele in the pool. Thetwo pools were then compared and for each allele theabsolute value of the diVerence of the allele percent-ages of the two pools was calculated. This number wasdivided by 2 and, Wnally, the �TAC was obtained bysumming all values.
In the third approach, the haplotype frequencies ofneighbouring two-marker pairs were compared betweenthe case and control populations. The signiWcance of theLD between the pairs of loci was tested using a permuta-tion test with 10,000 permutations for each locus pair.This method is based on the theoretical results obtainedby Valdes and Thomson (1997). The test values werecalculated using the computer program SNPAlyze ver.5.1 Standard (Dynacom, Yokohama, Japan).
In the fourth approach, the LD scores of two-marker pairs were evaluated using the D� score, whichhas a range from 0 (linkage equilibrium) to 1 (completeLD) (Lewontin 1964; Hedrick 1987). LD was calcu-lated using the computer program SNPAlyze ver. 5.1Standard (Dynacom).
Results
Microsatellites
All the 18 microsatellites were well ampliWed andgenotyped using multiplex PCR sets for each microsat-ellite (data not shown). All the microsatellites in theThoroughbred population were polymorphic, andtherefore provided information on the mapping of thechestnut locus in this population.
P value
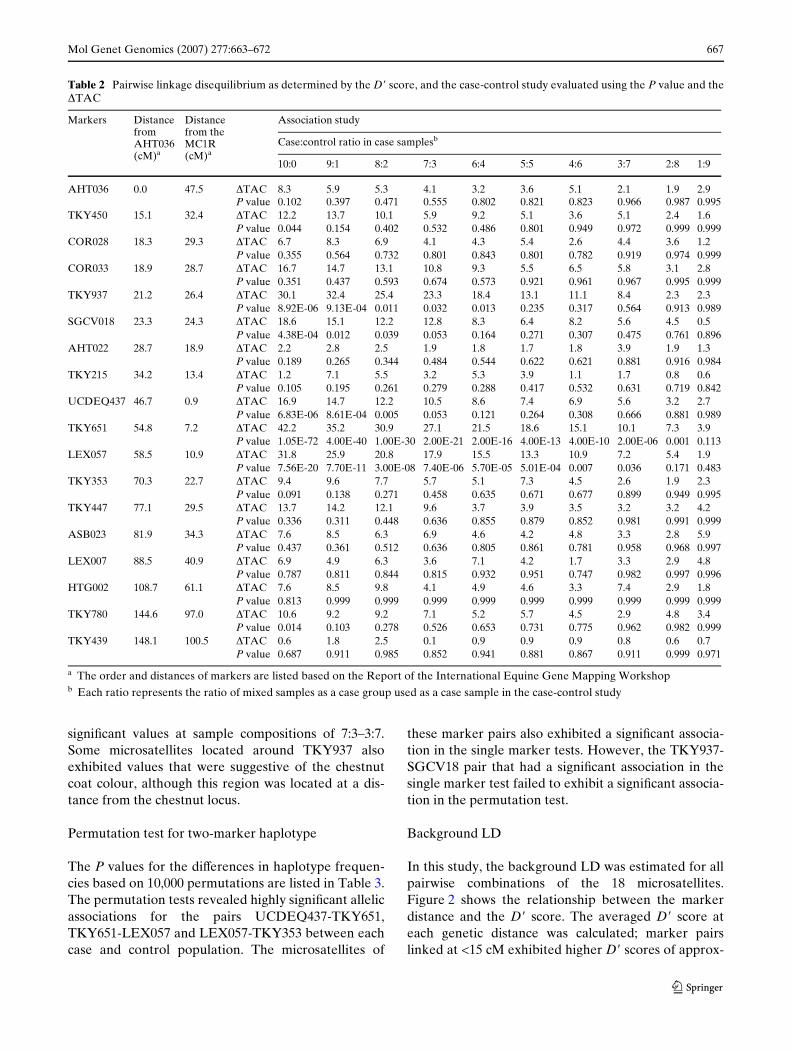
The association chi-square probabilities for each markerare shown in Table 2. SigniWcant allelic associations weredetected for the markers UCDEQ437 (P = 6.83E-06),TKY651 (P = 1.05E-72), LEX057 (P = 7.56E-20),TKY937 (P = 8.92E-06) and SGCV18 (P = 4.38E-04) ata sample composition of 10:0. In particular, TKY651exhibited the most signiWcant value for the chestnut phe-notype. Based on the LD analysis, we determined that ofall the markers studied, TKY651 was the closest toMC1R. Similar to the sample composition of 10:0,UCDEQ437, TKY651 and LEX057 exhibited signiWcantvalues at sample compositions of 9:1–2:8. In particular, asigniWcant allelic association was detected for the markerTKY651 (P = 0.001), even at a sample composition of2:8, implying a 20% contribution of genetic factors.
�TAC
The �TAC between each case and control populationwas calculated (Table 2). Three microsatellites,namely, UCDEQ437, TKY651 and LEX057, exhibitedsigniWcant values for the chestnut coat colour at a sam-ple composition of 10:0. These three loci also exhibited
123
Mol Genet Genomics (2007) 277:663–672 667
signiWcant values at sample compositions of 7:3–3:7.Some microsatellites located around TKY937 alsoexhibited values that were suggestive of the chestnutcoat colour, although this region was located at a dis-tance from the chestnut locus.
Permutation test for two-marker haplotype
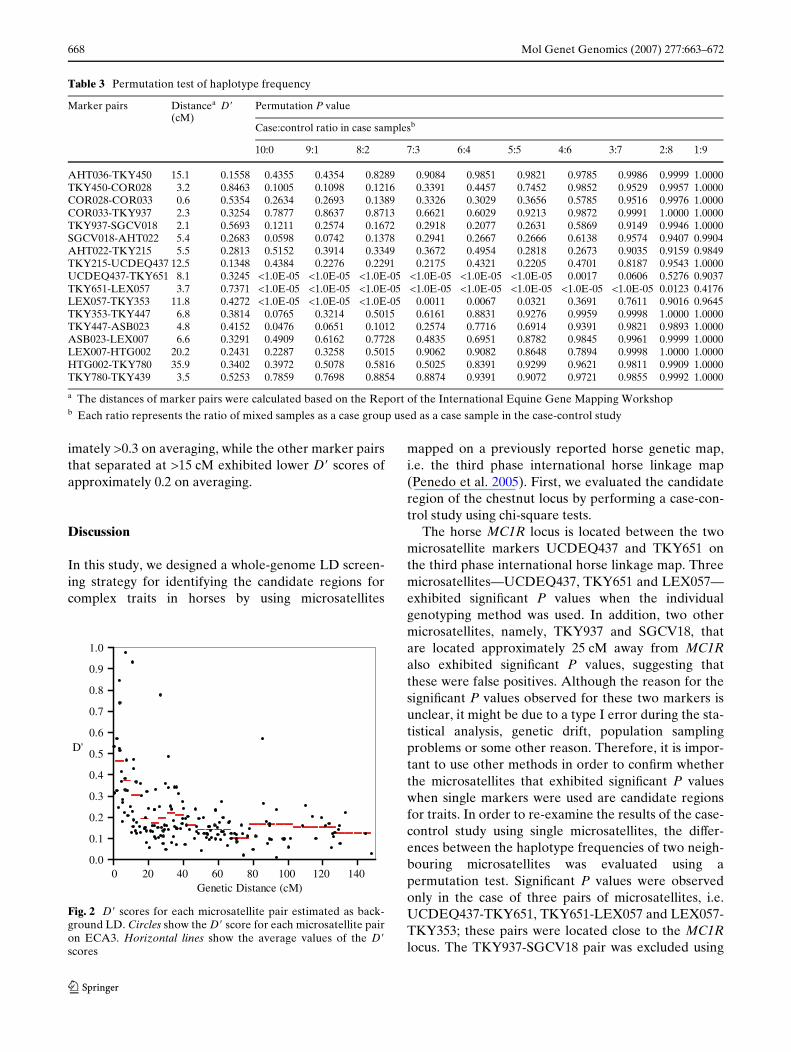
The P values for the diVerences in haplotype frequen-cies based on 10,000 permutations are listed in Table 3.The permutation tests revealed highly signiWcant allelicassociations for the pairs UCDEQ437-TKY651,TKY651-LEX057 and LEX057-TKY353 between eachcase and control population. The microsatellites of
these marker pairs also exhibited a signiWcant associa-tion in the single marker tests. However, the TKY937-SGCV18 pair that had a signiWcant association in thesingle marker test failed to exhibit a signiWcant associa-tion in the permutation test.
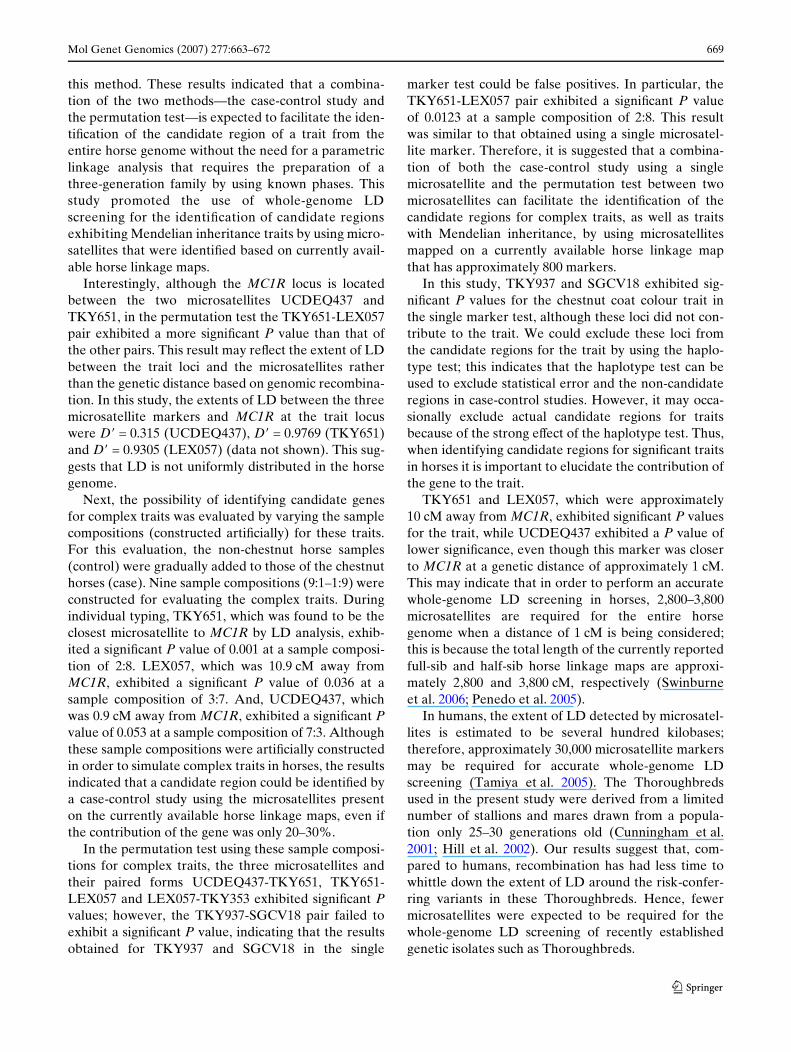
Background LD
In this study, the background LD was estimated for allpairwise combinations of the 18 microsatellites.Figure 2 shows the relationship between the markerdistance and the D� score. The averaged D� score ateach genetic distance was calculated; marker pairslinked at <15 cM exhibited higher D� scores of approx-
Table 2 Pairwise linkage disequilibrium as determined by the D� score, and the case-control study evaluated using the P value and the�TAC
a The order and distances of markers are listed based on the Report of the International Equine Gene Mapping Workshopb Each ratio represents the ratio of mixed samples as a case group used as a case sample in the case-control study
Markers Distance from AHT036(cM)a
Distance from the MC1R (cM)a
Association study
Case:control ratio in case samplesb
10:0 9:1 8:2 7:3 6:4 5:5 4:6 3:7 2:8 1:9
AHT036 0.0 47.5 �TAC 8.3 5.9 5.3 4.1 3.2 3.6 5.1 2.1 1.9 2.9P value 0.102 0.397 0.471 0.555 0.802 0.821 0.823 0.966 0.987 0.995
TKY450 15.1 32.4 �TAC 12.2 13.7 10.1 5.9 9.2 5.1 3.6 5.1 2.4 1.6P value 0.044 0.154 0.402 0.532 0.486 0.801 0.949 0.972 0.999 0.999
COR028 18.3 29.3 �TAC 6.7 8.3 6.9 4.1 4.3 5.4 2.6 4.4 3.6 1.2P value 0.355 0.564 0.732 0.801 0.843 0.801 0.782 0.919 0.974 0.999
COR033 18.9 28.7 �TAC 16.7 14.7 13.1 10.8 9.3 5.5 6.5 5.8 3.1 2.8P value 0.351 0.437 0.593 0.674 0.573 0.921 0.961 0.967 0.995 0.999
TKY937 21.2 26.4 �TAC 30.1 32.4 25.4 23.3 18.4 13.1 11.1 8.4 2.3 2.3P value 8.92E-06 9.13E-04 0.011 0.032 0.013 0.235 0.317 0.564 0.913 0.989
SGCV018 23.3 24.3 �TAC 18.6 15.1 12.2 12.8 8.3 6.4 8.2 5.6 4.5 0.5P value 4.38E-04 0.012 0.039 0.053 0.164 0.271 0.307 0.475 0.761 0.896
AHT022 28.7 18.9 �TAC 2.2 2.8 2.5 1.9 1.8 1.7 1.8 3.9 1.9 1.3P value 0.189 0.265 0.344 0.484 0.544 0.622 0.621 0.881 0.916 0.984
TKY215 34.2 13.4 �TAC 1.2 7.1 5.5 3.2 5.3 3.9 1.1 1.7 0.8 0.6P value 0.105 0.195 0.261 0.279 0.288 0.417 0.532 0.631 0.719 0.842
UCDEQ437 46.7 0.9 �TAC 16.9 14.7 12.2 10.5 8.6 7.4 6.9 5.6 3.2 2.7P value 6.83E-06 8.61E-04 0.005 0.053 0.121 0.264 0.308 0.666 0.881 0.989
TKY651 54.8 7.2 �TAC 42.2 35.2 30.9 27.1 21.5 18.6 15.1 10.1 7.3 3.9P value 1.05E-72 4.00E-40 1.00E-30 2.00E-21 2.00E-16 4.00E-13 4.00E-10 2.00E-06 0.001 0.113
LEX057 58.5 10.9 �TAC 31.8 25.9 20.8 17.9 15.5 13.3 10.9 7.2 5.4 1.9P value 7.56E-20 7.70E-11 3.00E-08 7.40E-06 5.70E-05 5.01E-04 0.007 0.036 0.171 0.483
TKY353 70.3 22.7 �TAC 9.4 9.6 7.7 5.7 5.1 7.3 4.5 2.6 1.9 2.3P value 0.091 0.138 0.271 0.458 0.635 0.671 0.677 0.899 0.949 0.995
TKY447 77.1 29.5 �TAC 13.7 14.2 12.1 9.6 3.7 3.9 3.5 3.2 3.2 4.2P value 0.336 0.311 0.448 0.636 0.855 0.879 0.852 0.981 0.991 0.999
ASB023 81.9 34.3 �TAC 7.6 8.5 6.3 6.9 4.6 4.2 4.8 3.3 2.8 5.9P value 0.437 0.361 0.512 0.636 0.805 0.861 0.781 0.958 0.968 0.997
LEX007 88.5 40.9 �TAC 6.9 4.9 6.3 3.6 7.1 4.2 1.7 3.3 2.9 4.8P value 0.787 0.811 0.844 0.815 0.932 0.951 0.747 0.982 0.997 0.996
HTG002 108.7 61.1 �TAC 7.6 8.5 9.8 4.1 4.9 4.6 3.3 7.4 2.9 1.8P value 0.813 0.999 0.999 0.999 0.999 0.999 0.999 0.999 0.999 0.999
TKY780 144.6 97.0 �TAC 10.6 9.2 9.2 7.1 5.2 5.7 4.5 2.9 4.8 3.4P value 0.014 0.103 0.278 0.526 0.653 0.731 0.775 0.962 0.982 0.999
TKY439 148.1 100.5 �TAC 0.6 1.8 2.5 0.1 0.9 0.9 0.9 0.8 0.6 0.7P value 0.687 0.911 0.985 0.852 0.941 0.881 0.867 0.911 0.999 0.971
123
668 Mol Genet Genomics (2007) 277:663–672
imately >0.3 on averaging, while the other marker pairsthat separated at >15 cM exhibited lower D� scores ofapproximately 0.2 on averaging.
Discussion
In this study, we designed a whole-genome LD screen-ing strategy for identifying the candidate regions forcomplex traits in horses by using microsatellites
mapped on a previously reported horse genetic map,i.e. the third phase international horse linkage map(Penedo et al. 2005). First, we evaluated the candidateregion of the chestnut locus by performing a case-con-trol study using chi-square tests.
The horse MC1R locus is located between the twomicrosatellite markers UCDEQ437 and TKY651 onthe third phase international horse linkage map. Threemicrosatellites—UCDEQ437, TKY651 and LEX057—exhibited signiWcant P values when the individualgenotyping method was used. In addition, two othermicrosatellites, namely, TKY937 and SGCV18, thatare located approximately 25 cM away from MC1Ralso exhibited signiWcant P values, suggesting thatthese were false positives. Although the reason for thesigniWcant P values observed for these two markers isunclear, it might be due to a type I error during the sta-tistical analysis, genetic drift, population samplingproblems or some other reason. Therefore, it is impor-tant to use other methods in order to conWrm whetherthe microsatellites that exhibited signiWcant P valueswhen single markers were used are candidate regionsfor traits. In order to re-examine the results of the case-control study using single microsatellites, the diVer-ences between the haplotype frequencies of two neigh-bouring microsatellites was evaluated using apermutation test. SigniWcant P values were observedonly in the case of three pairs of microsatellites, i.e.UCDEQ437-TKY651, TKY651-LEX057 and LEX057-TKY353; these pairs were located close to the MC1Rlocus. The TKY937-SGCV18 pair was excluded using
Table 3 Permutation test of haplotype frequency
a The distances of marker pairs were calculated based on the Report of the International Equine Gene Mapping Workshopb Each ratio represents the ratio of mixed samples as a case group used as a case sample in the case-control study
Marker pairs Distancea (cM)
D� Permutation P value
Case:control ratio in case samplesb
10:0 9:1 8:2 7:3 6:4 5:5 4:6 3:7 2:8 1:9
AHT036-TKY450 15.1 0.1558 0.4355 0.4354 0.8289 0.9084 0.9851 0.9821 0.9785 0.9986 0.9999 1.0000TKY450-COR028 3.2 0.8463 0.1005 0.1098 0.1216 0.3391 0.4457 0.7452 0.9852 0.9529 0.9957 1.0000COR028-COR033 0.6 0.5354 0.2634 0.2693 0.1389 0.3326 0.3029 0.3656 0.5785 0.9516 0.9976 1.0000COR033-TKY937 2.3 0.3254 0.7877 0.8637 0.8713 0.6621 0.6029 0.9213 0.9872 0.9991 1.0000 1.0000TKY937-SGCV018 2.1 0.5693 0.1211 0.2574 0.1672 0.2918 0.2077 0.2631 0.5869 0.9149 0.9946 1.0000SGCV018-AHT022 5.4 0.2683 0.0598 0.0742 0.1378 0.2941 0.2667 0.2666 0.6138 0.9574 0.9407 0.9904AHT022-TKY215 5.5 0.2813 0.5152 0.3914 0.3349 0.3672 0.4954 0.2818 0.2673 0.9035 0.9159 0.9849TKY215-UCDEQ437 12.5 0.1348 0.4384 0.2276 0.2291 0.2175 0.4321 0.2205 0.4701 0.8187 0.9543 1.0000UCDEQ437-TKY651 8.1 0.3245 <1.0E-05 <1.0E-05 <1.0E-05 <1.0E-05 <1.0E-05 <1.0E-05 0.0017 0.0606 0.5276 0.9037TKY651-LEX057 3.7 0.7371 <1.0E-05 <1.0E-05 <1.0E-05 <1.0E-05 <1.0E-05 <1.0E-05 <1.0E-05 <1.0E-05 0.0123 0.4176LEX057-TKY353 11.8 0.4272 <1.0E-05 <1.0E-05 <1.0E-05 0.0011 0.0067 0.0321 0.3691 0.7611 0.9016 0.9645TKY353-TKY447 6.8 0.3814 0.0765 0.3214 0.5015 0.6161 0.8831 0.9276 0.9959 0.9998 1.0000 1.0000TKY447-ASB023 4.8 0.4152 0.0476 0.0651 0.1012 0.2574 0.7716 0.6914 0.9391 0.9821 0.9893 1.0000ASB023-LEX007 6.6 0.3291 0.4909 0.6162 0.7728 0.4835 0.6951 0.8782 0.9845 0.9961 0.9999 1.0000LEX007-HTG002 20.2 0.2431 0.2287 0.3258 0.5015 0.9062 0.9082 0.8648 0.7894 0.9998 1.0000 1.0000HTG002-TKY780 35.9 0.3402 0.3972 0.5078 0.5816 0.5025 0.8391 0.9299 0.9621 0.9811 0.9909 1.0000TKY780-TKY439 3.5 0.5253 0.7859 0.7698 0.8854 0.8874 0.9391 0.9072 0.9721 0.9855 0.9992 1.0000
Fig. 2 D� scores for each microsatellite pair estimated as back-ground LD. Circles show the D� score for each microsatellite pairon ECA3. Horizontal lines show the average values of the D�scores
0.0
0.1
0.2
0.3
0.4
0.5
0.6
0.7
0.8
0.9
1.0
0 20 40 60 80 100 120 140Genetic Distance (cM)
D'
123
Mol Genet Genomics (2007) 277:663–672 669
this method. These results indicated that a combina-tion of the two methods—the case-control study andthe permutation test—is expected to facilitate the iden-tiWcation of the candidate region of a trait from theentire horse genome without the need for a parametriclinkage analysis that requires the preparation of athree-generation family by using known phases. Thisstudy promoted the use of whole-genome LDscreening for the identiWcation of candidate regionsexhibiting Mendelian inheritance traits by using micro-satellites that were identiWed based on currently avail-able horse linkage maps.
Interestingly, although the MC1R locus is locatedbetween the two microsatellites UCDEQ437 andTKY651, in the permutation test the TKY651-LEX057pair exhibited a more signiWcant P value than that ofthe other pairs. This result may reXect the extent of LDbetween the trait loci and the microsatellites ratherthan the genetic distance based on genomic recombina-tion. In this study, the extents of LD between the threemicrosatellite markers and MC1R at the trait locuswere D� = 0.315 (UCDEQ437), D� = 0.9769 (TKY651)and D� = 0.9305 (LEX057) (data not shown). This sug-gests that LD is not uniformly distributed in the horsegenome.
Next, the possibility of identifying candidate genesfor complex traits was evaluated by varying the samplecompositions (constructed artiWcially) for these traits.For this evaluation, the non-chestnut horse samples(control) were gradually added to those of the chestnuthorses (case). Nine sample compositions (9:1–1:9) wereconstructed for evaluating the complex traits. Duringindividual typing, TKY651, which was found to be theclosest microsatellite to MC1R by LD analysis, exhib-ited a signiWcant P value of 0.001 at a sample composi-tion of 2:8. LEX057, which was 10.9 cM away fromMC1R, exhibited a signiWcant P value of 0.036 at asample composition of 3:7. And, UCDEQ437, whichwas 0.9 cM away from MC1R, exhibited a signiWcant Pvalue of 0.053 at a sample composition of 7:3. Althoughthese sample compositions were artiWcially constructedin order to simulate complex traits in horses, the resultsindicated that a candidate region could be identiWed bya case-control study using the microsatellites presenton the currently available horse linkage maps, even ifthe contribution of the gene was only 20–30%.
In the permutation test using these sample composi-tions for complex traits, the three microsatellites andtheir paired forms UCDEQ437-TKY651, TKY651-LEX057 and LEX057-TKY353 exhibited signiWcant Pvalues; however, the TKY937-SGCV18 pair failed toexhibit a signiWcant P value, indicating that the resultsobtained for TKY937 and SGCV18 in the single
marker test could be false positives. In particular, theTKY651-LEX057 pair exhibited a signiWcant P valueof 0.0123 at a sample composition of 2:8. This resultwas similar to that obtained using a single microsatel-lite marker. Therefore, it is suggested that a combina-tion of both the case-control study using a singlemicrosatellite and the permutation test between twomicrosatellites can facilitate the identiWcation of thecandidate regions for complex traits, as well as traitswith Mendelian inheritance, by using microsatellitesmapped on a currently available horse linkage mapthat has approximately 800 markers.
In this study, TKY937 and SGCV18 exhibited sig-niWcant P values for the chestnut coat colour trait inthe single marker test, although these loci did not con-tribute to the trait. We could exclude these loci fromthe candidate regions for the trait by using the haplo-type test; this indicates that the haplotype test can beused to exclude statistical error and the non-candidateregions in case-control studies. However, it may occa-sionally exclude actual candidate regions for traitsbecause of the strong eVect of the haplotype test. Thus,when identifying candidate regions for signiWcant traitsin horses it is important to elucidate the contribution ofthe gene to the trait.
TKY651 and LEX057, which were approximately10 cM away from MC1R, exhibited signiWcant P valuesfor the trait, while UCDEQ437 exhibited a P value oflower signiWcance, even though this marker was closerto MC1R at a genetic distance of approximately 1 cM.This may indicate that in order to perform an accuratewhole-genome LD screening in horses, 2,800–3,800microsatellites are required for the entire horsegenome when a distance of 1 cM is being considered;this is because the total length of the currently reportedfull-sib and half-sib horse linkage maps are approxi-mately 2,800 and 3,800 cM, respectively (Swinburneet al. 2006; Penedo et al. 2005).
In humans, the extent of LD detected by microsatel-lites is estimated to be several hundred kilobases;therefore, approximately 30,000 microsatellite markersmay be required for accurate whole-genome LDscreening (Tamiya et al. 2005). The Thoroughbredsused in the present study were derived from a limitednumber of stallions and mares drawn from a popula-tion only 25–30 generations old (Cunningham et al.2001; Hill et al. 2002). Our results suggest that, com-pared to humans, recombination has had less time towhittle down the extent of LD around the risk-confer-ring variants in these Thoroughbreds. Hence, fewermicrosatellites were expected to be required for thewhole-genome LD screening of recently establishedgenetic isolates such as Thoroughbreds.
123
670 Mol Genet Genomics (2007) 277:663–672
Even if a few thousand microsatellites is suYcientcover the entire horse genome, it is laborious andexpensive to genotype all the samples of several hun-dred individuals. Therefore, a method based on �TACusing pooled DNA samples (Collins et al. 2000) wasdesigned for whole-genome LD screening in horses.Three neighbouring microsatellites of MC1R and twomicrosatellites that were at a distance of approximately25 cM from this gene exhibited signiWcant �TAC val-ues using this method. These results were similar tothose obtained using the individual genotypingmethod. Moreover, similar signiWcant values wereobserved by varying the sample compositions for thecomplex traits. These results suggested that in horses,the eYciency of the method using the pooled DNA wassimilar to that of the individual typing method.
However, although some studies have recentlyreported the use of this method (Goedde et al. 2002;Toda et al. 2003; Tamiya et al. 2005), it is generallyacknowledged that DNA pooling is not technicallyacceptable since this method is severely aVected by thequality of the puriWed DNA. Therefore, we collectedall the blood samples for the isolation of DNA simulta-neously, maintained them under identical conditions,and puriWed DNA from the blood samples by using anautomatic DNA isolation machine. The quality of thepuriWed DNA samples was conWrmed by electrophore-sis. All the samples used in this study were analyzedtwice and diluted. Although these DNA isolation andpuriWcation procedures for DNA pooling are consider-ably more time-consuming than the individual geno-typing method, it was concluded that these proceduresare a key step in the DNA pooling method. In fact, the�TAC values decreased proportionally with the num-ber of case samples, indicating that the DNA puriWca-tion processes used in this study were suitable for usein the DNA pooling method. However, deviation ofthe �TAC values was also observed based on thediVerences among the markers used, although it couldbe diYcult to compare the �TAC values among diVer-ent markers; this suggests that the �TAC valuesincrease slightly in proportion to the number of alleles.This may be due to the method used to calculate�TAC because the diVerences for each allele areWnally summed to obtain a �TAC value. It was pre-dicted that if a marker has many alleles and the qualityof the DNA samples is not suitable for pooling, the�TAC value is strongly aVected. Therefore, only quali-Wed techniques for the preparation of DNA for poolingor a more stringent �TAC threshold (i.e. 15 or 20) maybe required in order to isolate candidate genes of sig-niWcant traits in horses.
In addition to the pooled DNA method, we usedXuorescent labeling of PCR products for genotyping,and this enabled the economic genotyping of manymicrosatellites (Tozaki et al. 2001). This method isadvantageous because it merely requires a commonXuorescent-labelled primer for all the microsatellitesand for the ampliWcation and labelling of PCR prod-ucts. Furthermore, labelling is accomplished in a singlePCR reaction. This method has previously been usedfor the genotyping of individual samples; further, thepooled DNA samples could be clearly genotyped inthis study, indicating that the method used for the Xuo-rescent labelling of PCR products is also useful for thegenotyping of pooled DNA.
It is often diYcult to determine the threshold of LDfor tracing genes that govern signiWcant traits and dis-eases, even though chi-square probabilities can be cal-culated for the estimated and observed frequencies.Thus, it is crucial to measure the background LD in thepopulation. In this study, the background LD wasexamined using all the marker pairs on ECA3 (Fig. 2).High D� scores (D� > 0.3 on average) were observed atdistances of <15 cM, while low D� scores (approxi-mately, D� = 0.2) were observed at distances of>15 cM. The D� scores are expected to decline as afunction of the distance between markers. The lowervalue (D� = 0.2) was similar to the D� score betweennon-synthetic marker pairs on other chromosomes(data not shown). Therefore, for the Thoroughbredsused in this study, it is suggested that the LD extendsover several cM segments, and that the lower value(D� = 0.2) is the background LD. A strong LD such asthat shown in the Thoroughbreds has also beenobserved in other livestock, such as sheep and cattle, aswell as in dogs (McRae et al. 2002; Hyun et al. 2003;Odani et al. 2006).
It is important to measure the extent of LD betweenneighbouring microsatellites on the horse genomebecause it is unclear whether the total number ofmicrosatellites is suYcient to cover the entire genome.Table 3 lists the extent of LD between two neighbour-ing microsatellites on ECA3 by using the D� score. Sig-niWcant D� scores were observed for all themicrosatellite pairs, with the exception of AHT036-TKY450 and TKY215-UCDEQ437. Since these twopairs had a distance of more than 10 cM, they were notexpected to exhibit LD. However, a signiWcant D�
score was observed for the HTG002-TKY780 pair,even though the microsatellites were separated bya genetic distance of approximately 40 cM on thehorse linkage map; this suggested LD between thesetwo microsatellites. These observations indicated that
123
Mol Genet Genomics (2007) 277:663–672 671
similar to other mammals, haplotype blocks or recom-bination hotspots also occur in the horse genome.
For whole-genome LD screening in horses, it isimportant to consider the extent of LD and the densityof microsatellites required for eVective association. Inour recent study, we isolated approximately 2,400novel microsatellites and have registered these in pub-lic DNA databases (Tozaki et al. 2007). Since the totalnumber of previously registered horse microsatelliteswas approximately 1,900, the currently available num-ber for the investigation of candidate regions for sig-niWcant traits and diseases in horses is approximately4,300. This number is suYcient to cover the entirehorse genome even if the traits to be investigated arecomplex.
In the present study, we presented eYcientapproaches for the identiWcation of candidate regionsof signiWcant traits by using a combination of primaryscreening using pooled DNA samples based on �TAC,secondary screening using an individual typing methodand tertiary screening using a permutation test basedon the diVerences in the haplotype frequency betweentwo neighbouring microsatellites. This serial approachwas systematically and eYciently performed in order toidentify candidate regions of coat colour in horses, sug-gesting that the marker density of the reported geneticmap was suYcient for whole-genome LD screening inhorses. This study can be considered as the Wrst todescribe the process of whole-genome LD screening inhorses. Since genetic maps based on microsatelliteshave been constructed for many other species, theapproaches present here could have wide applicability.
Acknowledgments We thank Keiko Tanaka (Laboratory ofRacing Chemistry) for expert technical assistance. We would alsolike to thank the Japan Racing Association, which provided sam-ples from horses for this study and supported it with a grant-in-aid(2005–2006).
References
Ahmed ZM, Morell RJ, Riazuddin S, Gropman A, Shaukat S,Ahmad MM, Mohiddin SA, Fananapazir L, Caruso RC,Husnain T, Khan SN, Riazuddin S, GriYth AJ, FriedmanTB, Wilcox ER (2003) Mutations of MYO6 are associatedwith recessive deafness, DFNB37. Am J Hum Genet72:1315–1322
Cader ZM, Noble-Topham S, Dyment DA, Cherny SS, BrownJD, Rice GP, Ebers GC (2003) SigniWcant linkage tomigraine with aura on chromosome 11q24. Hum Mol Genet12:2511–2517
Chowdhary BP, Raudsepp T, Kata SR, Goh G, Millon LV, AllanV, Piumi F, Guérin G, Swinburne J, Binns M, Lear TL,Mickelson J, Murray J, Antczak DF, Womack JE, Skow LC(2003) The Wrst-generation wgole-genome radiation hybrid
map in the horse identiWes conserved segments in human andmouse genomes. Genome Res 13:742–751
Collins HE, Li H, Inda SE, Anderson J, Laiho K, Tuomilehto J,Seldin MF (2000) A simple and accurate method for deter-mination of microsatellite total allele content diVerences be-tween DNA pools. Hum Genet 106:218–226
Cunningham EP, Dooley JJ, Splan RK, Bradley DG (2001)Microsatellite diversity, pedigree relatedness and the contri-butions of founder lineages to Thoroughbred horses. AnimGenet 32:360–364
Funayama M, Hasegawa K, Kowa H, Saito M Tsuji S, Obata F(2002) A new locus for Parkinson’s disease (PARK8) mapsto chromosome 12p11.2-q13.1. Ann Neurol 51:296–301
Goedde R, Sawcer S, Boehringer S, Miterski B, Sindern E,Haupts M, Schimrigk S, Compston A, Epplen JT (2002) Agenome screen for linkage disequilibrium in HLA-DRB1*15-positive Germans with multiple sclerosis based on4666 microsatellite markers. Hum Genet 111:270–277
Hedrick PW (1987) Gametic disequilibrium measures, proceedwith caution. Genetics 117:331–341
Henner J, Poncet P-A, Guérin G, Hagger C, Stranzinger G,Rieder S (2002) Genetic mapping of the (G)-locus, responsi-ble for the coat color phenotype “progressive greying withage” in horses (Equus caballus). Mamm Genome 13:535–537
Hill EW, Bradley DG, Al-Barody M, Ertugrul O, Splan RK,Zakharov I, Cunningham EP (2002) History and integrity ofThoroughbred dam lines revealed in equine mtDNA varia-tion. Anim Genet 33:287–294
Hyun C, Filippich LJ, Lea RA, Shepherd G, Hughes IP, GriYthsLR (2003) Prospects for whole genome linkage disequilib-rium mapping in domestic dog breeds. Mamm Genome14:640–649
Leeb T, Vogl C, Zhu B, de Jong PJ, Binns MM, Chowdhary BP,Scharfe M, Jarek M, Nordsiek G, Schrader F, Blocker H(2006) A human–horse comparative map based on equineBAC end sequences. Genomics 87:772–776
Lewontin RC (1964) The interaction of selection and linkage II,Optimal model. Genetics 50:757–782
Locke MM, Ruth LS, Millon LV, Penedo MC, Murray JD,Bowling AT (2001) The cream dilution gene, responsible forthe palomino and buckskin coat colours, maps to horse chro-mosome 21. Anim Genet 32:340–243
Locke MM, Penedo MCT, SJ Bricker SJ, Millon LV, Murray JD(2002) Linkage of the grey coat colour locus to microsatel-lites on horse chromosome 25. Anim Genet 33:329–337
McRae AF, McEwan JC, Dodds KG, Wilson T, Crawford AM,Slate J (2002) Linkage disequilibrium in domestic sheep.Genetics 160:1113–1122
Odani M, Narita A, Watanabe T, Yokouchi K, Sugimoto Y,Fujita T, Oguni T, Matsumoto M, Sasaki Y (2006) Genome-wide linkage disequilibrium in two Japanese beef cattlebreeds. Anim Genet 37:139–144
Penedo MC, Millon LV, Bernoco D, Bailey E, Binns M, Chole-winski G, Ellis N, Flynn J, Gralak B, Guthrie A, HasegawaT, Lindgren G, Lyons LA, Roed KH, Swinburne JE, TozakiT (2005) International equine gene mapping workshop re-port: a comprehensive linkage map constructed with datafrom new markers and by merging four mapping resources.Cytogenet Genome Res 111:5–15
Rahman N, Dunstan M, Teare MD, Hank S, Douglas J, ColemanK, Bottomly WE, Campbell ME, Berglund B, NordenskjoldM, Forssell B, Burrows N, Lunt P, Young I, Williams N,Bignell GR, Futreal PA, Pope FM (2003) Ehlers-Danlossyndrome with severe early-onset periodontal disease (EDS-VIII) is a distinct, heterogeneous disorder with one predis-
123

672 Mol Genet Genomics (2007) 277:663–672
position gene at chromosome 12p13. Am J Hum Genet73:198–204
Rieder S, Taourit S, Mariat D, Langlois B, Guérin G (2001)Mutations in the agouti (ASIP), the extention (MC1R), andthe brown (TYRP1) loci and their association to coat pheno-types in horses (Equus caballus). Mamm Genome 12:450–455
Swinburne JE, Hopkins A, Binns M (2002) Assignment of thehorse grey coat colour gene to ECA25 using whole genomescanning. Anim Genet 33:338–342
Swinburne JE, Boursnell M, Hill G, Pettitt L, Allen T, Chowdh-ary B, Hasegawa T, Kurosawa M Leeb T, Mashima S,Mickelson JR, Raudsepp T, Tozaki T, Binns M (2006) Singlelinkage group per chromosome genetic linkage map for thehorse, based on two three-generation, full-sibling, crossbredhorse reference families. Genomics 87:1–29
Tamiya G, Shinya M, Imanishi T, Ikuta T, Makino S, Okamoto K,Furugaki K, Matsumoto T, Mano S, Ando S, Nozaki Y,Yukawa W, Nakashige R, Yamaguchi D, Ishibashi H,Yonekura M, Nakami Y, Takayama S, Endo T, SaruwatariT, Yagura M, Yoshikawa Y, Fujimoto K, Oka A, Chiku S,Linsen SE, Giphart MJ, Kulski JK, Fukazawa T, HashimotoH, Kimura M, Hoshina Y, Suzuki Y, Hotta T, Mochida J,Minezaki T, Komai K, Shiozawa S, Taniguchi A, YamanakaH, Kamatani N, Gojobori T, Bahram S, Inoko H (2005)Whole genome association study of rheumatoid arthritisusing 27039 microsatellites. Hum Mol Genet 14:2305–2321
Terry RB, Archer S, Brooks S, Bernoco D, Bailey E (2004)Assignment of the appaloosa coat colour gene (LP) toequine chromosome 1. Anim Genet 35:134–137
Toda T, Momose Y, Murata M, Tamiya G, Yamamoto M, HattoriN, Inoko H (2003) Toward identiWcation of susceptibilitygenes for sporadic Parkinson’s disease. J Neurol 250(Suppl3):III40–III43
Tozaki T, Mashima S, Hirota K, Miura N, Choi-Miura N, TomitaM (2001) Characterization of equine microsatellites andmicrosatellite-linked repetitive elements (eMLREs) byeYcient cloning and genotyping methods. DNA Res 8:33–45
Tozaki T, Penedo MC, Oliveira RP, Katz JP, Millon LV, Ward T,Pettigrew DC, Brault LS, Tomita M, Kurosawa M, Hasega-wa T, Hirota K (2004) Isolation, characterization and chro-mosome assignment of 341 newly isolated equine TKYmicrosatellite markers. Anim Genet 35:487–496
Tozaki T, Hirota K, Hasegawa T, Tomita M, Kurosawa M (2005)Prospects for whole genome linkage disequilibrium mappingin Thoroughbreds. Gene 14:127–132
Tozaki T, Swinburne J, Hirota K, Hasegawa T, Ishida N, Tobe T(2007) Improved resolution of the comparative horse–hu-man map: investigating markers with in silico and linkagemapping approaches. Gene (in press)
Valdes AM, Thomson G (1997) Detecting disease-predisposingvariants: the haplotype method. Am J Hum Genet 60:703–716
van Swieten JC, Brusse E, de Graaf BM, Krieger E, van de GraafR, de Koning I, Maat-Kievit A, Leegwater P, Dooijes D,Oostra BA, Heutink P (2003) A mutation in the Wbroblastgrowth factor 14 gene is associated with autosomal dominantcerebellar ataxia. Am J Hum Genet 72:191–199
Wagner H-J, Reissmann M (2000) New polymorphism detectedin the horse MC1R gene. Anim Genet 31:289–290
123