comparative high-resolution analysis of linkage disequilibrium and tag single nucleotide...
TRANSCRIPT

1
Comparative high-resolution analysis of linkage disequilibrium and
tag single nucleotide polymorphisms between populations in the
vitamin D receptor gene.
Sergey Nejentsev1, Lisa Godfrey1, Hywel Snook1, Helen Rance1, Sarah Nutland1, Neil
M. Walker1, Alex C. Lam1, Cristian Guja2, Constantin Ionescu-Tirgoviste2, Dag E.
Undlien3, Kjersti S. Rønningen4, Eva Tuomilehto-Wolf5, Jaakko Tuomilehto5,6,
Melanie J. Newport7, David G. Clayton1 and John A. Todd1.
1Juvenile Diabetes Research Foundation / Wellcome Trust Diabetes and Inflammation Laboratory, Cambridge Institute for Medical Research, University of Cambridge, Cambridge, UK 2Clinic of Diabetes, Institute of Diabetes, Nutrition and Metabolic Diseases “N. Paulescu”, Bucharest, Romania 3Institute of Medical Genetics, Ulleval University Hospital, University of Oslo, Oslo, Norway 4Laboratory of Molecular Epidemiology, Division of Epidemiology, Norwegian Institute of Public Health, Oslo, Norway 5Diabetes and Genetic Epidemiology Unit, National Public Health Institute, Helsinki, Finland 6Department of Public Health, University of Helsinki, Helsinki, Finland 7Department of Medicine, Cambridge Institute for Medical Research, University of Cambridge, Cambridge, UK Correspondence to: Sergey Nejentsev MD, PhD, JDRF/WT Diabetes and Inflammation Laboratory, Cambridge Institute for Medical Research, University of Cambridge, Wellcome Trust/MRC building, Addenbrooke's Hospital, Cambridge, CB2 2XY, UK. Tel: +44 (0) 1223 762106, Fax: +44 (0) 1223 762102, E-mail: [email protected]
Copyright © 2004 Oxford University Press
HMG Advance Access published June 2, 2004 by guest on June 2, 2013
http://hmg.oxfordjournals.org/
Dow
nloaded from

2
Abstract
A genome-wide map of single nucleotide polymorphisms (SNPs) and a pattern of
linkage disequilibrium (LD) between their alleles is being established in three main
ethnic groups. An important question is the applicability of such maps to different
populations within a main ethnic group. Therefore, we have developed high-
resolution SNP, haplotype and LD maps of the vitamin D receptor gene region in
large samples from five populations. Comparative analysis reveals that LD patterns
are identical in all four European populations tested with two small regions of 1.3 kb
and 5.7 kb at which LD is completely disrupted resulting in three block-like regions
over which there is significant and extensive LD. In an African population the pattern
is similar, but two additional LD-breaking spots are also apparent. This LD pattern
suggests combined action of recombination hotspots and founder effects, but cannot
be explained by random recombination and genetic drift only. Direct comparison
indicates that tag SNPs selected in one European population effectively predict non-
tag SNPs in other Europeans, but not in the Gambians, for this region.
by guest on June 2, 2013http://hm
g.oxfordjournals.org/D
ownloaded from
3
Introduction
Genetic association studies aim to identify human genome sequence variants that
cause complex diseases. The human genome contains regions in which single
nucleotide polymorphism (SNP) alleles are distributed non-randomly, i.e. are in
linkage disequilibrium (LD). These regions, known as LD or haplotype blocks, have
elevated local LD and limited haplotype diversity (1, 2). Because of the underlying
LD structure all common sequence variation in a given genome region may be
captured by a limited number of tag SNPs that are used to scan genomic regions for
disease association and reduce redundancy and costs of association studies (3, 4).
Recently, the HapMap project was launched to establish LD patterns and to catalogue
tag SNPs in the entire human genome in three main ethnic groups (5).
The origin of the LD blocks in the human genome is not completely understood.
Using direct studies of recombination in sperm Jeffreys and colleagues have shown
that boundaries of the LD blocks co-localise with recombination hotspots at least in
some areas of the genome (6, 7). Recent evidence suggests the presence of
recombination hotspots across the human genome every ~200 kb on average (8).
Recombination hotspots should determine similar LD block structure in different
human populations, unless recombination rates vary between populations. However,
computer simulations suggest that the block-like structure of the human genome may
have been generated by uniform recombination and random genetic drift (9-11). This
model implies that LD block boundaries may vary significantly between populations
that will complicate genetic association studies. Therefore, it is not clear how
informative LD block structure and tag SNPs established by the HapMap project,
would be in various human populations, particularly those not represented in the
HapMap panel (5). Studies of genomic regions in different populations featuring large
by guest on June 2, 2013http://hm
g.oxfordjournals.org/D
ownloaded from

4
sample size and dense SNP maps may provide answers to these questions. Moreover,
comparative inter-population analysis of LD blocks will help to understand their
evolutionary origin.
Here we have developed and studied a high-resolution SNP map of the vitamin D
receptor (VDR) gene region on chromosome 12q12-q14. VDR is a protein that
mediates the effects of vitamin D3 in bone and mineral metabolism, regulation of
growth and differentiation in many target tissues and acts as a modulator of the
immune system (12). The VDR gene contains eight protein-coding exons 2 – 9, six
untranslated exons 1a – 1f, which are alternatively spliced, and several promoter
regions (13, 14). Four common VDR SNPs were intensively studied for association
with various human traits and were reported to affect risk of osteoporosis, breast and
prostate cancers, and immune-mediated disorders (15). However, the association
observed is inconsistent in different studies suggesting that the SNPs tested may
merely be markers in LD with true causal variant(s), which remain unknown.
Construction of comprehensive SNP, haplotype and LD maps of the VDR gene will
facilitate association studies and fine mapping of the causal sequence variants for a
range of diseases.
Results
In total we sequenced 94 kb in a 164 kb region on chromosome 12q12-q14 around the
VDR gene and found 245 SNPs, of which 128 were not present in the dbSNP
database build 119 (Supplementary Table 1). We then genotyped 98 SNPs, i.e. one
SNP per 1.7 kb on average, in 458 families from Great Britain. We calculated allele
frequency in 916 parents and noticed 68 common SNPs with minor allele frequency
(MAF) >10% (Figure 1a). For these SNPs we calculated pairwise |D’| (Figure 1b), r2,
by guest on June 2, 2013http://hm
g.oxfordjournals.org/D
ownloaded from

5
and P values. A large sample of 916 subjects allowed us high confidence in estimating
LD. Three separate regions could be distinguished in the VDR gene and were
designated LD blocks A, B and C; SNPs in each of these blocks are in LD with SNPs
located inside a block, but show very little, if any, LD with SNPs located in other
blocks (Figure 1). Within blocks B and C, regions of markedly higher LD can be also
distinguished; we refer to them as B1, B2, C1, C2 and C3. However, their boundaries
cannot be established unambiguously, because considerable LD exists between SNPs
in these regions (Figure 1).
Block A localises 3’ to the VDR exon 9 and spans at least 10.5 kb. VDR exons 3 - 9
localise in the block B, which spans 40.8 kb. A 5.7 kb LD-breaking spot, located 3’ of
the VDR gene separates blocks A and B. Blocks B and C are separated by another 1.3
kb LD-breaking spot; it includes VDR exon 2 and a commonly studied FokI SNP,
which is the only SNP out of the 68 that has no detectable LD with any other SNP and
cannot be assigned to any block. All non-coding VDR exons localise in at least 92.9
kb block C. Both blocks A and C have one of their boundaries outside the region
studied.
In order to compare LD block structure in different populations we tested all 68 VDR
SNPs, which are common in Britons, in four other population samples, three
European and one African. We found 13 SNPs with MAF < 10% in, at least one,
usually Gambian, population sample. We restricted comparative analysis to 55 SNPs
common in all five populations. This provides consistency and avoids bias in the
conclusions due to the analysis of SNPs underrepresented in some populations. The
location of the two LD-breaking spots, which separate blocks A, B and C, was
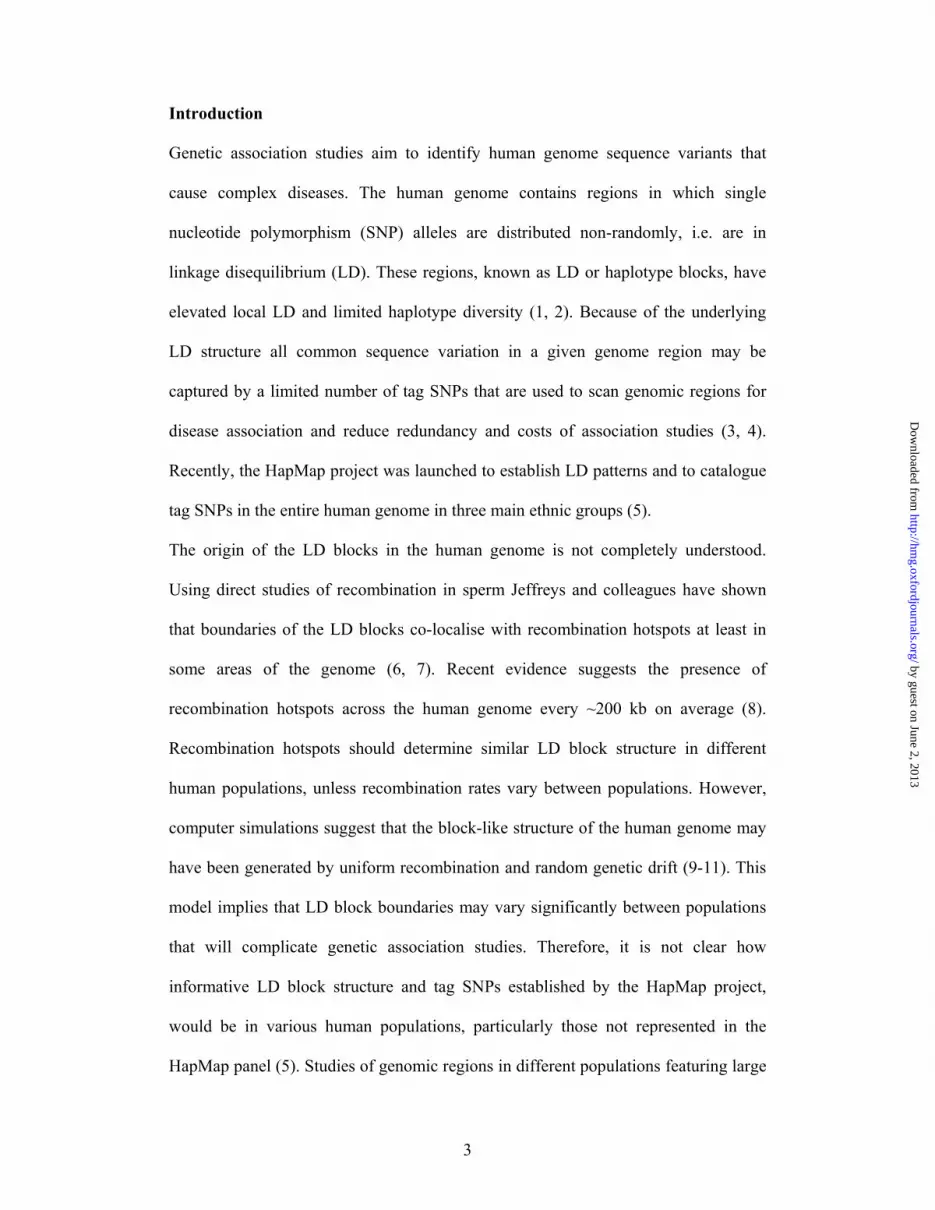
identical in all five populations studied (Figure 2). However, in the Gambians we
additionally found separate blocks C1, C2 and C3, which correspond to the regions of
by guest on June 2, 2013http://hm
g.oxfordjournals.org/D
ownloaded from

6
higher LD within block C in Europeans. Accordingly, LD-breaking spots in the
Gambians co-localise with spots of decreased LD within block C in Europeans, but
clearly more LD extends over these spots in Europeans (Figure 2). In contrast, block
structure in all four European populations is remarkably similar.
We then reconstructed haplotypes from the 55 SNPs in each population separately and
found similar haplotype diversity in Europeans, which is a fraction of haplotype
diversity in the Gambians (full list of haplotypes is available in the Supplementary
Table 2). In each of the five populations we then selected a minimal set of tag SNPs,
which have r2 ≥ 0.8 with all non-tag SNPs (tag SNPs for each population are
highlighted in the Supplementary Table 2). As predicted by a higher haplotype
diversity, we found that notably more tag SNPs are required to capture common
variation in the Gambians compared to Europeans: 42 versus 24-26, respectively.
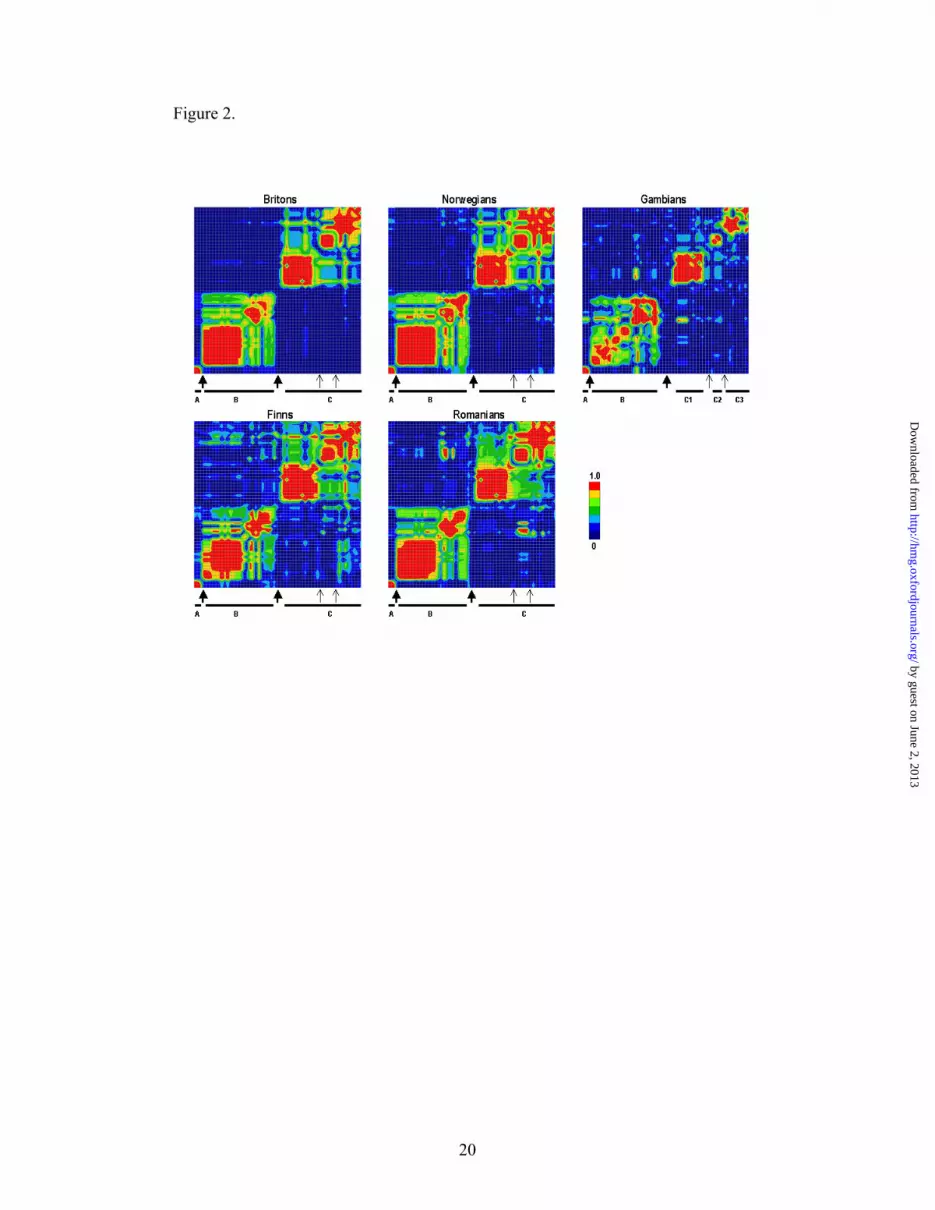
Then we tested how efficiently tag SNPs selected in one population sample predict
non-tag SNPs in the four other populations. We found that tag SNPs selected in each
of the European population samples usually effectively predict non-tag SNPs in all
other Europeans, but not in the Gambians (Figure 3). Conversely, tag SNPs selected
in the Gambian population predict non-tag SNPs in Europeans rather well. However,
this is achieved at a cost of a larger number of tag SNPs in the Gambians.
Similarly, in the four European population samples we have analysed tag SNPs
selected from all 68 VDR SNPs that were common in Britons (MAF > 10%). All these
68 SNPs were also common in other Europeans (MAF > 8 %). We found a similar
pattern: tag SNPs selected in each of the four European population samples
effectively predict non-tag SNPs in the other samples (Supplementary Figure). Tag
SNPs selected among 68 SNPs were more efficient than tag SNPs selected among 55
by guest on June 2, 2013http://hm
g.oxfordjournals.org/D
ownloaded from

7
SNPs, because extra tag SNPs capture additional information about some of the non-
tag SNPs.
We then investigated how informative was the analysis of the four classically typed
SNPs FokI, ApaI, TaqI and BsmI in previous studies of the VDR gene region aimed to
discover disease association. FokI is not in LD with any other common SNP and,
therefore, was not informative for capturing information from those SNPs. The three
other SNPs localised to block B and do not capture any information about SNPs in
other blocks. We then tested ApaI, TaqI and BsmI as tag SNPs for other block B SNPs
and found that out of the 29 SNPs in block B, which are common in Britons, these
three SNPs predict only 11 with r2 > 0.8 and 15 SNPs with r2 ranging between 0.05
and 0.43. Therefore, in various disease association studies that genotyped FokI, ApaI,
TaqI and BsmI only, information about a large fraction of common SNPs in the VDR
region was not captured.
Discussion
Here we constructed a dense SNP, haplotype and LD maps of the VDR gene region in
five populations. Given multiple association studies and high interest in the VDR gene
these maps provide a basis for future research of the VDR sequence polymorphism in
human diseases.
Structural analysis of LD blocks in the VDR gene region in various populations
allows insight in the mechanism of their origin and in the history of the populations
tested. Identical boundaries of blocks A and B in all five populations indicate general
mechanism that acted in both African and European populations. Potentially it may be
explained either by recombination hotspots or by random crossovers and drift, which
led to a block structure in the common ancestors that was fixed ever since. However,
by guest on June 2, 2013http://hm
g.oxfordjournals.org/D
ownloaded from

8
additional LD appeared in the history of all European populations. Such LD may have
been created by a bottleneck or a founder effect after divergence of the ancestors of all
modern Europeans from the ancestors of the Gambians (16, 17). This LD pattern is
not ubiquitous in the region but is restricted to the LD blocks, does not extend across
major LD-breaking spots between them, and, therefore, argues in favour of localised
recombination.
The mechanism that may have led to the observed LD block structure is suggested by
the observation that recombination hotspots vary dramatically in recombination
intensity and both highly and weakly active hotspots exist (6, 8, 18). Thus, highly
active recombination hotspots probably manifest by breaking LD in all populations
(e.g. LD-breaking spots between blocks A, B and C, Figure 2). In contrast, weakly
active recombination hotspots occasionally may manifest only in ancient and diverse
African populations, such as Gambian, that have accumulated and retained enough
recombinant chromosomes (18), while in the Europeans residual LD may still be
present over a weakly active recombination hotspot (e.g. LD breaking spots within
block C, Figure 2). Such a model is consistent with a well-known shorter average LD
in African populations in comparison to European populations (19, 20). Direct
recombination analysis is required to test it in the VDR gene region. Nevertheless,
highly structured pattern of the VDR LD blocks in different populations can be
explained by combined action of recombination hotspots of varying intensity and
demographic history events, but argues against the hypothesis that LD blocks may
have been generated by randomly distributed crossovers and genetic drift only (9-11).
Weakly active recombination hotspots localised inside LD blocks, rather than random
recombination, may explain a phenomenon of decreasing LD with distance within a
block (21).
by guest on June 2, 2013http://hm
g.oxfordjournals.org/D
ownloaded from

9
The remarkable similarity of LD patterns in all European populations tested is in line
with the model assuming that no major founder effects occurred at the origin of
specific farming communities in Europe (22). A bottleneck suggested at the founding
of the Finnish population (23) left no significant trace of additional LD in the VDR
gene. Consequently, studies of the Finnish population provide no major advantage of
stronger LD between SNPs compared to other Europeans (24).
Our direct inter-population comparison shows that tag SNPs selected in one European
population sample usually effectively predict non-tag SNPs in other Europeans, but
not in the Gambians (Figure 3), at least for this chromosome region. This observation
implies that tag SNPs selected in the CEPH families of European origin in the
HapMap project (5) may be applied in other Europeans with only moderate loss of
power. However, comparative analysis of multiple genomic regions in various
populations is required to answer this question confidently. As expected, our data
show that tag SNPs should be established separately for populations of the European
and African origin.
This study of the VDR region illustrates the relative advantages of various populations
for genetic associating mapping. Initial disease association is easier to detect in
Europeans than in Africans, because fewer tag SNPs are required to characterise
common variation (Figure 3). However, should association be detected, subsequent
fine mapping experiments will require testing of SNPs in an LD block region that
often will be smaller in Africans than in Europeans (Figure 2). Provided that Africans
have higher haplotype diversity, analysis of additional haplotypes may further help
fine mapping of a causal variant. Therefore, genetic analysis in populations of
different origin potentiates studies of complex diseases.
by guest on June 2, 2013http://hm
g.oxfordjournals.org/D
ownloaded from

10
Materials and Methods
Subjects. We searched for SNPs by sequencing eight unrelated Britons and also
sequenced coding VDR exons 2 – 9 in 40 individuals from the same population to find
additional rarer variants. We genotyped 285 new-borns from The Gambia, 458 British
families (916 parents), 90 Norwegian families (180 parents), 63 Finnish families (126
parents), and 64 Romanian families (128 parents). The Gambian population sample
comprises 285 unrelated new-borns collected in five centres across the country. All
European subjects were Caucasian. All families have type 1 diabetes offspring. LD
and haplotypes are similar for the chromosomes transmitted and non-transmitted to
the affected offspring and, therefore, their combined analysis is shown. We obtained
permission from the relevant ethical committees and informed consent from all
participating subjects.
Sequencing. We designed primers using Primer3 (http://www.broad.mit.edu/cgi-
bin/primer/primer3_www.cgi), amplified genomic DNA using protocol described
elsewhere (25) and sequenced 500-700 base pair PCR fragments with an ABI Big Dye
Terminator v2 kit and an ABI 3700 capillary sequencer (ABI, Foster City, CA). We
sequenced 94 kb in a 164 kb region on chromosome 12q12-q14 around the VDR
structural gene, between –34,045 bp upstream of the exon 1f and 27,338 bp
downstream exon 9, allowing for the possibility of uncharacterised long range
regulatory elements. We found 245 VDR SNPs using the Staden sequence analysis
package (26). Of these 128 SNPs were not present in the dbSNP build 119. All 245
SNPs are listed in the Supplementary Table 1 with the position corresponding to
Human Genome build 34.
Genotyping. We selected a total of 98 out of 245 SNPs distributed evenly to avoid
large gaps in the SNP map, one SNP per 1.7 kb on average. The density was higher
by guest on June 2, 2013http://hm
g.oxfordjournals.org/D
ownloaded from

11
around exons and lower in the 5’ and 3’ UTRs. Four commonly studied SNPs, FokI,
ApaI, TaqI and BsmI were also included. We genotyped 98 SNPs using Invader (Third
Wave Technologies, Madison, WI), TaqMan (Perkin Elmer Applied Biosystems,
Foster City, CA) or BeadArray (Illumina Inc, San Diego, CA) assays. We tested
genotype frequency for each SNP in each population with Arlequin version 2.000
(http://lgb.unige.ch/arlequin/) and found no deviation from the Hardy-Weinberg
equilibrium (P > 0.01).
Statistical analysis. We calculated pairwise r2 (27), |D’| (28), P values and generated
graphical images with GOLD (29) and edited images using GIMP version 1.2.3
(http://www.gimp.org). We reconstructed haplotypes using expectation-maximization
algorithm within SNPHAP version 0.2.1 (http://www-
gene.cimr.cam.ac.uk/clayton/software/) and then selected a minimal set of tag SNPs
that have r2 ≥ 0.8 with all non-tag SNPs in each of the five populations using ‘htstep’
and ‘htsearch’ programs within STATA version 8.1 (http://www.stata.com). Then we
calculated r2 between tag SNPs and non-tag SNPs, which they predict, in other four
population samples using ‘lpredict’ program written by David Clayton for STATA
version 8.1.
by guest on June 2, 2013http://hm
g.oxfordjournals.org/D
ownloaded from

12
ACKNOWLEDGEMENTS
We thank William Wang and Jason Cooper for interesting and productive discussions.
This work was funded by the Wellcome Trust, the Juvenile Diabetes Research
Foundation International, the Academy of Finland, the Sigrid Juselius Foundation and
the Novo Nordisk Foundation. Genotypic data will be available on request to
researchers on the basis of a Data Access Agreement. Please refer to our web site
(https://www-gene.cimr.cam.ac.uk/todd/access-agreement.html) and contact Neil
Walker ([email protected]).
by guest on June 2, 2013http://hm
g.oxfordjournals.org/D
ownloaded from

13
References
1. Daly, M.J., Rioux, J.D., Schaffner, S.F., Hudson, T.J. and Lander, E.S. (2001)
High-resolution haplotype structure in the human genome. Nat. Genet., 29,
229-232.
2. Goldstein, D.B. (2001) Islands of linkage disequilibrium. Nat. Genet., 29, 109-
111.
3. Johnson, G.C., Esposito, L., Barratt, B.J., Smith, A.N., Heward, J., Di Genova,
G., Ueda, H., Cordell, H.J., Eaves, I.A., Dudbridge, F. et al. (2001) Haplotype
tagging for the identification of common disease genes. Nat. Genet., 29, 233-
237.
4. Chapman, J.M., Cooper, J.D., Todd, J.A. and Clayton, D.G. (2003) Detecting
disease associations due to linkage disequilibrium using haplotype tags: a class
of tests and the determinants of statistical power. Hum. Hered., 56, 18-31.
5. The International HapMap Consortium (2003) The International HapMap
Project. Nature, 426, 789-796.
6. Jeffreys, A.J., Kauppi, L. and Neumann, R. (2001) Intensely punctate meiotic
recombination in the class II region of the major histocompatibility complex.
Nat. Genet., 29, 217-222.
7. May, C.A., Shone, A.C., Kalaydjieva, L., Sajantila, A. and Jeffreys, A.J.
(2002) Crossover clustering and rapid decay of linkage disequilibrium in the
Xp/Yp pseudoautosomal gene SHOX. Nat. Genet., 31, 272-275.
8. McVean, G.A., Myers, S.R., Hunt, S., Deloukas, P., Bentley, D.R. and
Donnelly, P. (2004) The fine-scale structure of recombination rate variation in
the human genome. Science, 304, 581-4.
by guest on June 2, 2013http://hm
g.oxfordjournals.org/D
ownloaded from

14
9. Wang, N., Akey, J.M., Zhang, K., Chakraborty, R. and Jin, L. (2002)
Distribution of recombination crossovers and the origin of haplotype blocks:
the interplay of population history, recombination, and mutation. Am. J. Hum.
Genet., 71, 1227-1234.
10. Zhang, K., Akey, J.M., Wang, N., Xiong, M., Chakraborty, R. and Jin, L.
(2003) Randomly distributed crossovers may generate block-like patterns of
linkage disequilibrium: an act of genetic drift. Hum. Genet., 113, 51-59.
11. Phillips, M.S., Lawrence, R., Sachidanandam, R., Morris, A.P., Balding, D.J.,
Donaldson, M.A., Studebaker, J.F., Ankener, W.M., Alfisi, S.V., Kuo, F.S. et
al. (2003) Chromosome-wide distribution of haplotype blocks and the role of
recombination hot spots. Nat. Genet., 33, 382-387.
12. Jones, G., Strugnell, S.A. and DeLuca, H.F. (1998) Current understanding of
the molecular actions of vitamin D. Physiol. Rev., 78, 1193-1231.
13. Baker, A.R., McDonnell, D.P., Hughes, M., Crisp, T.M., Mangelsdorf, D.J.,
Haussler, M.R., Pike, J.W., Shine, J. and O'Malley, B.W. (1988) Cloning and
expression of full-length cDNA encoding human vitamin D receptor. Proc.
Natl. Acad. Sci. U S A, 85, 3294-3298.
14. Crofts, L.A., Hancock, M.S., Morrison, N.A. and Eisman, J.A. (1998)
Multiple promoters direct the tissue-specific expression of novel N-terminal
variant human vitamin D receptor gene transcripts. Proc. Natl. Acad. Sci. U S
A, 95, 10529-10534.
15. Zmuda, J.M., Cauley, J.A. and Ferrell, R.E. (2000) Molecular epidemiology of
vitamin D receptor gene variants. Epidemiol. Rev., 22, 203-217.
16. Cann, R.L., Stoneking, M. and Wilson, A.C. (1987) Mitochondrial DNA and
human evolution. Nature, 325, 31-36.
by guest on June 2, 2013http://hm
g.oxfordjournals.org/D
ownloaded from

15
17. Stringer, C.B. and Andrews, P. (1988) Genetic and fossil evidence for the
origin of modern humans. Science, 239, 1263-1268.
18. Kauppi, L., Sajantila, A. and Jeffreys, A.J. (2003) Recombination hotspots
rather than population history dominate linkage disequilibrium in the MHC
class II region. Hum. Mol. Genet., 12, 33-40.
19. Reich, D.E., Cargill, M., Bolk, S., Ireland, J., Sabeti, P.C., Richter, D.J.,
Lavery, T., Kouyoumjian, R., Farhadian, S.F., Ward, R. et al. (2001) Linkage
disequilibrium in the human genome. Nature, 411, 199-204.
20. Gabriel, S.B., Schaffner, S.F., Nguyen, H., Moore, J.M., Roy, J., Blumenstiel,
B., Higgins, J., DeFelice, M., Lochner, A., Faggart, M. et al. (2002) The
structure of haplotype blocks in the human genome. Science, 296, 2225-2229.
21. Shifman, S., Kuypers, J., Kokoris, M., Yakir, B. and Darvasi, A. (2003)
Linkage disequilibrium patterns of the human genome across populations.
Hum. Mol. Genet., 12, 771-776.
22. Barbujani, G. and Bertorelle, G. (2001) Genetics and the population history of
Europe. Proc. Natl. Acad. Sci. U S A, 98, 22-25.
23. Sajantila, A., Salem, A.H., Savolainen, P., Bauer, K., Gierig, C. and Paabo, S.
(1996) Paternal and maternal DNA lineages reveal a bottleneck in the
founding of the Finnish population. Proc. Natl. Acad. Sci. U S A, 93, 12035-
12039.
24. Eaves, I.A., Merriman, T.R., Barber, R.A., Nutland, S., Tuomilehto Wolf, E.,
Tuomilehto, J., Cucca, F. and Todd, J.A. (2000) The genetically isolated
populations of Finland and sardinia may not be a panacea for linkage
disequilibrium mapping of common disease genes. Nat. Genet., 25, 320-323.
by guest on June 2, 2013http://hm
g.oxfordjournals.org/D
ownloaded from

16
25. Ueda, H., Howson, J.M., Esposito, L., Heward, J., Snook, H., Chamberlain,
G., Rainbow, D.B., Hunter, K.M., Smith, A.N., Di Genova, G. et al. (2003)
Association of the T-cell regulatory gene CTLA4 with susceptibility to
autoimmune disease. Nature, 423, 506-511.
26. Staden, R., Beal, K.F. and Bonfield, J.K. (2000) The Staden package, 1998.
Methods. Mol. Biol., 132, 115-130.
27. Pritchard, J.K. and Przeworski, M. (2001) Linkage disequilibrium in humans:
models and data. Am. J. Hum. Genet., 69, 1-14.
28. Lewontin, R.C. (1964) The Interaction of Selection and Linkage. I. General
considerations: heterotic models. Genetics, 49, 49-67.
29. Abecasis, G.R. and Cookson, W.O. (2000) GOLD--graphical overview of
linkage disequilibrium. Bioinformatics, 16, 182-183.
by guest on June 2, 2013http://hm
g.oxfordjournals.org/D
ownloaded from

17
Figure 1. High-resolution linkage disequilibrium analysis of the VDR gene
region.
a – Exons (black boxes) and SNPs (black lines).
b – Pairwise |D’|. SNP numbers correspond to numbers in the Supplementary Table 1
SNPs with MAF > 10% are shown.
c – LD blocks (black bars), unassigned FokI SNP (red dot) located in an LD-breaking
spot between blocks and the size of the LD-breaking spots (in kb) are shown.
Figure 2. Linkage disequilibrium structure in the VDR region in five
populations.
Pair-wise |D’|, LD blocks (black bars), location of the LD-breaking spots seen in all
five populations (thick arrows) and LD-breaking spots apparent in the Gambians only
(thin arrows) are shown.
Figure 3. Inter-population comparison of the tag SNPs.
Among 55 VDR SNPs a set of tag SNPs was selected in one of the five populations (X
axis) so that tag SNPs capture all non-tag SNPs with r2 ≥ 0.8. Then r2 between tag
SNPs and non-tag SNPs (Y axis) was calculated in the four other populations (British
– red, Finnish – blue, Norwegian – green, Romanian – yellow, Gambian – black).
by guest on June 2, 2013http://hm
g.oxfordjournals.org/D
ownloaded from

18
Supplementary Figure. Inter-population comparison of the tag SNPs selected
among 68 VDR SNPs.
Among 68 VDR SNPs a set of tag SNPs was selected in one of the five populations (X
axis) so that tag SNPs capture all non-tag SNPs with r2 ≥ 0.8. Then r2 between tag
SNPs and non-tag SNPs (Y axis) was calculated in the four other populations (British
– red, Finnish – blue, Norwegian – green, Romanian – yellow).
by guest on June 2, 2013http://hm
g.oxfordjournals.org/D
ownloaded from

19
Figure 1.
by guest on June 2, 2013http://hm
g.oxfordjournals.org/D
ownloaded from
20
Figure 2.
by guest on June 2, 2013http://hm
g.oxfordjournals.org/D
ownloaded from
21
Figure 3.
by guest on June 2, 2013http://hm
g.oxfordjournals.org/D
ownloaded from

22
Supplementary Figure.
by guest on June 2, 2013http://hm
g.oxfordjournals.org/D
ownloaded from

23
Abbreviations
LD, linkage disequilibrium
MAF, minor allele frequency
SNP, single nucleotide polymorphism
VDR, vitamin D receptor
by guest on June 2, 2013http://hm
g.oxfordjournals.org/D
ownloaded from