whole genome association study of rheumatoid arthritis using 27 039 microsatellites
TRANSCRIPT

Whole genome association study of rheumatoidarthritis using 27 039 microsatellites
Gen Tamiya1,2, Minori Shinya1,2, Tadashi Imanishi3, Tomoki Ikuta1,2, Satoshi Makino1,
Koichi Okamoto1,2,4, Koh Furugaki1,2,4, Toshiko Matsumoto5, Shuhei Mano1, Satoshi Ando1,
Yasuyuki Nozaki5, Wataru Yukawa2,5, Ryo Nakashige5, Daisuke Yamaguchi5, Hideo Ishibashi2,6,
Manabu Yonekura2,7, Yuu Nakami2,5, Seiken Takayama7, Takaho Endo1, Takuya Saruwatari2,8,
Masaru Yagura1, Yoko Yoshikawa9, Kei Fujimoto1, Akira Oka1, Suenori Chiku10,
Samuel E.V. Linsen11, Marius J. Giphart11, Jerzy K Kulski1,12, Toru Fukazawa13,
Hiroshi Hashimoto13, Minoru Kimura1, Yuuichi Hoshina14, Yasuo Suzuki14, Tomomitsu Hotta14,
Joji Mochida15, Takatoshi Minezaki15, Koichiro Komai16, Shunichi Shiozawa16,
Atsuo Taniguchi17, Hisashi Yamanaka17, Naoyuki Kamatani2,17, Takashi Gojobori2,18,
Seiamak Bahram19 and Hidetoshi Inoko1,2,3,*
1Department of Molecular Life Science, Course of Basic Medical Science and Molecular Medicine, Tokai University
School of Medicine, Bohseidai, Isehara, Kanagawa 259-1193, Japan, 2Japan Biological Information Research Center,
Japan Biological Informatics Consortium, Tokyo 135-0064, Japan, 3Biological Information Research Center, National
Institute of Advanced Industrial Science and Technology, Tokyo 135-0064, Japan, 4Chugai Pharmaceutical
Corporation Ltd., Gotemba, Shizuoka 412-8513, Japan, 5Hitachi Software Engineering Corporation, Ltd., Tokyo
140-002, Japan, 6Applied Biosystems Japan Ltd., Tokyo 104-0032, Japan, 7Mitsui Knowledge Industry Corporation
Ltd., Tokyo 164-8555, Japan, 8NTT DATA Corporation Ltd., Tokyo 135-6033, Japan, 9Nisshinbo Industries Inc.,
Chiba, Chiba 267-0056, Japan, 10Fuji Research Institute Corporation Ltd., Tokyo 101-0054, Japan, 11Department of
ImmunoHaematology and Blood Transfusion, Leiden University Medical Center, 2300RC Leiden, The Netherlands,12Centre for Bioinformatics and Biological Computing, School of Information Technology, Murdoch University,
Murdoch, Weatern Australia 6150, Australia, 13Department of Rheumatology and Internal Medicine, Juntendo
University, Tokyo 113-8421, Japan, 14Department of Hematology, Rheumatology and Endocrinology, Course of
Medical Science, and 15Department of Orthopedics Surgery, Course of Surgical Science, Tokai University School of
Medicine, Isehara, Kanagawa 259-1193, Japan, 16Department of Rheumatology, Faculty of Health Science, School of
Medicine, Kobe University, Kobe, Hyougo 654-0142, Japan, 17Institute of Rheumatology, Tokyo Women’s Medical
University, Tokyo 162-8666, Japan, 18Center for Information Biology and DNA Data Bank of Japan, National Institute
of Genetics, Mishima, Shizuoka 411-8540, Japan and 19INSERM-CReS, Immunogenetique Moleculaire Humaine,
Centre de Recherche d’Immunologie et d’Hematologie, 67085 Strasbourg, France
Received April 29, 2005; Revised June 15, 2005; Accepted June 28, 2005
A major goal of current human genome-wide studies is to identify the genetic basis of complex disorders.However, the availability of an unbiased, reliable, cost efficient and comprehensive methodology to analyzethe entire genome for complex disease association is still largely lacking or problematic. Therefore, we havedeveloped a practical and efficient strategy for whole genome association studies of complex diseases bycharting the human genome at 100 kb intervals using a collection of 27 039 microsatellites and the DNA pool-
# The Author 2005. Published by Oxford University Press. All rights reserved.The online version of this article has been published under an open access model. Users are entitled to use, reproduce, disseminate, or display the open access version ofthis article for non-commercial purposes provided that: the original authorship is properly and fully attributed; the Journal and Oxford University Press are attributed as theoriginal place of publication with the correct citation details given; if an article is subsequently reproduced or disseminated not in its entirety but only in part or as aderivative work this must be clearly indicated. For commercial re-use, please contact: [email protected]
*To whom correspondence should be addressed. Tel: þ81 463-93-1121, ext. 2312; Fax: þ81 463-94-8884; E.mail: [email protected]
Human Molecular Genetics, 2005, Vol. 14, No. 16 2305–2321doi:10.1093/hmg/ddi234Advance Access published on July 6, 2005
by guest on Novem
ber 9, 2015http://hm
g.oxfordjournals.org/D
ownloaded from

ing method in three successive genomic screens of independent case–control populations. The final step inour methodology consists of fine mapping of the candidate susceptible DNA regions by single nucleotidepolymorphisms (SNPs) analysis. This approach was validated upon application to rheumatoid arthritis, adestructive joint disease affecting up to 1% of the population. A total of 47 candidate regions were identified.The top seven loci, withstanding the most stringent statistical tests, were dissected down to individual genesand/or SNPs on four chromosomes, including the previously known 6p21.3-encoded MajorHistocompatibility Complex gene, HLA-DRB1. Hence, microsatellite-based genome-wide associationanalysis complemented by end stage SNP typing provides a new tool for genetic dissection of multifactorialpathologies including common diseases.
INTRODUCTION
With the ongoing success at unraveling the molecular basis ofMendelian disorders, the genomic community is now poisedto tackle the genetics of the inherently more sophisticated‘complex disorders’, so-called because they are the fruit ofnumerous interactions between the individual’s complexgenetic background (a few or multiple alleles at multiplegene loci) and the environment (1). Mendelian disorders arecomparatively rare, whereas complex diseases affect largersections of the population and have become, especially inindustrialized nations, of major public health concern. In con-trast to Mendelian diseases, where the path to successfulidentification of the causative mutation—autosomal domi-nant, autosomal recessive or X-linked—is well defined withmany examples, the search for underlying mutations/polymorphisms in complex diseases have enjoyed only afew clear-cut successes. In fact, linkage studies in multiplexfamilies followed by positional cloning, which is the standardprocedure for tracking monogenic diseases, have proved to beinadequate once applied to complex diseases. Among themany broadly defined segments of the human genome thathave been linked to such diseases as rheumatoid arthritis(RA), asthma, schizophrenia and so on, only a few havebeen replicated in independent studies (2). Associationstudies on the other hand do not require a large number ofsib-pairs for analysis, as they are based on genotypingspecific markers or sets of anonymous markers in indepen-dent cohorts of affected and healthy individuals, althoughthe main bottleneck is a combination of marker density andsample size.
Genetic association studies can be performed in two ways.The candidate gene approach is hypothesis-driven and directlybound by the systemic knowledge of a biological process,whereas whole genome association studies can theoreticallytackle the entire genome at once in an unbiased fashion. Themain bottleneck for the feasibility of the latter approach isthe scarcity of dense polymorphic markers across the wholegenome. In principle, two types of markers are at hand fordisease association studies, the microsatellites and singlenucleotide polymorphisms (SNPs), with each type ofmarkers presenting advantages as well as inconveniences. Incomparison with microsatellites, SNPs are thought to begenetically more stable, due to a lower mutation rate, theyare bi-allelic in nature and show a rather low degree of hetero-zygosity (on average, �20%) as well as a comparatively muchshorter range of linkage disequilibrium (LD). This means that
for an efficient pan-genome analysis, millions of SNP mayneed to be simultaneously analyzed. However, completion ofthe human ‘Haplotype Map’ (HapMap) project will bringdown this number of testable SNPs to several hundred thou-sands so-called haplotype tag SNPs (3). Further, recent deve-lopments, such as DNA chip-based technology, have attainedhigh-throughput and cost-effective SNP typing.
Microsatellites, if carefully chosen, are highly polymorphic,show a high degree of heterozygosity (on average, �70%) andLD lengths in the 100 kb range (4–12) when compared withthe shorter, �30 kb, range for SNPs, probably due to theirolder age (8,13–17). Therefore, the advantage of microsatel-lite is that a collection of a relatively small number of poly-morphic markers (e.g. tens of thousands of microsatellitemarkers versus hundreds of thousands or millions of SNPs)could make whole genome association analyses an immediatereality (18). Namely, a genome scan is first performed usingmicrosatellite markers at orders of magnitude fewer thanSNP markers for identification of the incriminated region(s)within the 100 kb range, followed by high-density SNPtyping (kilobase range) in order to ultimately find the respon-sible base mutation(s) or polymorphism(s). We have pre-viously tested this combined approach to narrow downdisease critical regions to 100 kb by microsatellite typing(4–7,9–11) and then identify susceptible loci by SNP typing(19) within 100 kb segments of the 3.6 Mb Major Histo-compatibility Complex (MHC, also called the HLA) regionnotorious for its strong association with a large number ofso-called ‘HLA-associated diseases’. The pertinence of thisextension from the HLA region to the entire genome wascorroborated by the recent finding that LD and variation inthe HLA region were essentially not different from those inthe rest of the genome (20).
Here, we report on our use of 27 037 microsatellites in thefirst human whole genome case–control association study ofRA, a chronic multifactorial debilitating systemic inflamma-tory disease presumably of autoimmune etiology. Our metho-dology relies on four main components: (i) the identification ofenough microsatellites in order to chart the genome at 100 kbintervals, (ii) a three-phased genomic screen, i.e. replication ofthe data in three independent case–control populations, inorder to reduce the type I error rate (21,22), (iii) the confir-mation of the ‘pool association’ by separate (unpooled) geno-typing of individual DNAs for the positive microsatellitemarkers (23) and (iv) fine dissection to susceptible generegions, again by genotyping individual DNAs with a set ofSNPs surrounding the target area.
2306 Human Molecular Genetics, 2005, Vol. 14, No. 16
by guest on Novem
ber 9, 2015http://hm
g.oxfordjournals.org/D
ownloaded from

RESULTS
Charting the genome with a high-density setof microsatellites
Extending our investigation from the HLA region of chromo-some 6 to encompass the entire genome required a level of reso-lution that was unavailable at the onset of our enterprise toundertake whole genome-wide association analysis. On thebasis of the knowledge accumulated from a large number ofrecent data that the average length of LD between disease sus-ceptible SNPs and nearby microsatellite alleles is �100 kb(4–12), a microsatellite-based map of the genome at a100 kb density will therefore make a whole genome associ-ation analysis a reality. Although the LD pattern is variablebetween different regions of the human genome dependingon several factors such as allele frequency, mutation andrecombination, the use of average spacing of genetic markersacross the entire genome is a practical solution in genome-wide association analysis prior to the availability of agenome-wide LD map. Therefore, our first step for genome-wide analysis was to collect enough microsatellite markers(.27 000 microsatellites, one microsatellite for every 100 kb)to cover the euchromatic area (�90%) of the human genome(3 Gb) (3 � 109 kb � 0.90 4 100 kb ¼ 27 000). The remainingpart of the genome was mostly heterochromatin restrictedmainly to centromeres and telomeres, rich in repetitivesequences and believed to lack any expressed genes. This100 kb spacing would enable us to doubly screen a 100 kbgenomic interval for the presence of a disease susceptible lociby two neighboring microsatellites across the whole genome.Indeed, we believe that the screening and detection of twoneighboring microsatellites on both sides of the susceptiblelocus, when the intervening genomic sequence of �100 kb isin LD, is the most logical, reliable and practical step to wholegenome-wide analysis. When LD happens to be ,100 kb,but .50 kb around the susceptible locus, a microsatellite oneither side can detect it in association mapping. This meansthat the maximum length of LD by which microsatellitemarkers should detect susceptible locus in this method canbe 50 kb.
Microsatellite sequences were computationally detectedfrom all the chromosomes except for the Y chromosomewhich is known to contain few expressed genes in the humangenome sequence (NCBI build 35), and polymerase chainreaction (PCR) primers were designed for the uniform amplifi-cation of selected repeats. Among the 66 089 microsatellitesinvestigated, 27 158 polymorphic markers that correspondedto our selection criteria were selected (see Materials andMethods) and localized on the human genome draft sequence(Fig. 1). The great majority of microsatellite markers, 20 755are reported here for the first time, whereas 6403 werepreviously known (the CEPH Genotype database: http://www.cephb.fr/cephdb and the CHLC Genetic Mapping data-base: http://lpgws.nci.nih.gov/html-chlc/ChlcMarkers.html).We eliminated 119 from our total list of markers because wefound them to be located on the Y chromosome rather thanon autosomes as initially reported. The remaining 27 039microsatellites that we finally accepted for our associationstudies had an average heterozygosity of 0.67 + 0.16, anaverage of 6.4 + 3.1 alleles and an average spacing of
108.1 kb (SD ¼ 64.5 kb; max ¼ 930.1 kb) (SupplementaryMaterial, Table S1). Among these 27 039 microsatellites, 77markers have intervals of over 400 kb mainly due to theabsence of any identifiable polymorphic markers with shorterintervals (see Supplementary Material, Table S1 and data notshown). However, only �5% of the entire human genomeregion (150 Mb) was limited to a resolution of .200 kb inLD due to the distance intervals between the polymorphicmicrosatellite markers of .200 kb (interval genomic segmentsof .200 kb between two neighboring microsatellites wheremicrosatellites on both sides cannot detect the presence of adisease susceptible locus in the middle part away from bothends because of the 100 kb length of LD). If susceptibilitygenes are located in these intervals, we may have thereforemomentarily lost the opportunity to find them.
Phased genomic screens using DNA pools
In order to bring down substantially the cost and the technicalburden linked to genotyping thousands of microsatelliteswithout losing any significant amounts of data, the DNApooling method was implemented. Because the absoluteequality of individual DNA quantities is the key factor inthis methodology, we employed a highly accurate quantitativeprocedure to construct a pooled DNA template for PCR ampli-fications (11,24). This pool was composed of strictly measuredDNA concentrations, extracted from 125 Japanese individuals.Given that multiple peak patterns representing marker poly-morphisms (21) showed distinct patterns in our Japanesepool when compared with that in two European pools (dueto different allelic distributions between two populations)(data not shown), we concluded that the multiple peaks reflectedoriginal length polymorphisms and not experimental artifacts.Therefore, the DNA pooling method enabled us to obtain theallele frequencies of microsatellites in 125 individuals at oncejust by the measurement of the heights of multiple peaks, anapproach directly applicable to association analysis. Theaccuracy of the pooling method was confirmed by the absenceof any significant difference (P . 0.05) in the allele frequenciesobtained by pooling against individual typing (21) (Supplemen-tary Material, Fig. S1). Because the measurement error of ourpooling method is ,2% (11) (Supplementary Material,Fig. S1), we calculated that the expected difference in theallele frequency between cases and controls of ,4%, whichcorresponds to 1.5-fold, 1.2-fold and 1.1-fold genotype relativerisk if the allele frequency is 10, 30 and 60%, respectively, maybe missed in a genome-wide scan (23).
An initial set of 375 RA patients and an identical number ofcontrol samples, all of Japanese descent, were equally dividedinto three pairs of 125 cases and 125 controls each, in order toinitiate the three-step genomic screen. In the first screening,125 cases and 125 controls were subjected to associationanalysis using all of the 27 039 microsatellites. Amongthem, microsatellites showing statistical significance ofP , 0.05 were subjected to a second screening phase with aseparate 125 cases and 125 controls. The microsatellitesshowing statistical significance of P , 0.05 in the secondscreening were then subjected to a third and final screeningstep with another distinct 125 cases and 125 controls. Thepower estimates of association testing that we calculated for
Human Molecular Genetics, 2005, Vol. 14, No. 16 2307
by guest on Novem
ber 9, 2015http://hm
g.oxfordjournals.org/D
ownloaded from

each of the three screenings were �0.9 and 0.5 to detect agenotype relative risk of 1.8 and 1.5, respectively, when D0
(degree of LD between the marker and disease-responsibleallele) is 0.8 and the frequency of the microsatellite markerand disease-responsible allele is 0.25 (18,22). This meansthat, in three successive screens, the powers to detect a geno-type relative risk of 1.8 and 1.5 are 0.73 (0.93) and 0.13 (0.53),respectively. Therefore, if a genotype relative risk is lowerthan 1.5 and/or frequency of disease-associated allele ismuch lower than 0.25, a considerable number of disease-associated microsatellites may be missed in this screeningstrategy.
Microsatellites that had remained statistically significant inall three screening steps were ultimately confirmed by individ-ual genotyping using the same set of 375 patients and 375controls. Such phased screens intended to sequentially repli-cate the results in the three independent sample populationsare an essential step to eliminate many of the pseudo-positivesresulting from type I errors (21,22). To calculate P-values, twotypes of the Fisher’s exact test for the 2�2 contingency tablesfor each individual allele and the 2 � m contingency tables foreach locus were used, where m refers to the number of markeralleles observed in a population. The number of multiplecomparisons in this mapping is nþ 1, where n refers to thenumber of multiple comparisons in the 2�2 Fisher’s exacttest. Supposing that microsatellites are only bi-allelic, thefirst screening phase would theoretically include more than1352 significantly associated pseudo-positive microsatellites(27 039 � a0 ¼ 2636; a0 ¼ 1 2 (1 2 0.05)nþ1, P , 0.05 inthe Fisher’s exact test). Further, this number will drop to257 (2636 � a0 ¼ 257) and 25 (257 � a0 ¼ 25) microsatellitesin the second and third screenings, respectively. Because thismicrosatellite-based association analysis was followed by SNPassociation analysis using a DNA sample set including afurther 565 cases and 565 controls (Table 2), the final list of
markers would be expected to be free of the pseudo-positives.However, as the average allele number of 27 039 microsatel-lites used here is 6.4, multiple comparisons for each of themicrosatellite alleles should be made in the P-value tests foreach of the three screenings. The detection of more pseudo-positive markers might be expected with increased allelicnumbers, although multiple comparisons for microsatellitealleles are not completely independent of each other whenevaluating statistical independence. This issue will be dis-cussed later (n ¼ 1.4 for microsatellites used in this study,see Discussion). Prior to embarking on these screens,however, we verified through the Pritchard’s method (25),using 69 randomly selected microsatellites from each of one�22 and X chromosomes (enough to successfully performsuch analysis), the absence of any significant stratification ineither case or control populations (Supplementary Material,Table S2) (discussed subsequently). The accomplishment ofthis test is important in order to prevent the so-called ‘spuriousassociations’ generated by population stratifications, especiallyfor late-onset diseases such as RA (26), where it is ratherdifficult to collect adequate internal controls.
In the first screen using all 27 039 microsatellites, we foundsignificant association (P , 0.05) for 2847 markers asassessed by the Fisher’s exact test, for the either 2�2 or2 � m contingency tables. In the second screen, 372 of these2847 markers continued to show significant association,whereas after the third screen, the significant association wasreduced to the 133 positive markers (Supplementary Material,Table S3 and Fig. S2) (Fig. 2). The relatively higher number ofpositive markers compared with what would be statisticallyexpected might be partly due to the experimental artifactsinherent to the DNA pooling method, as this has been pre-viously reported in analyses other than multiple testing(23,27). As the final step, we aimed to confirm each singlepositive marker by individually genotyping each and every
Figure 1. Distribution of 27 039 polymorphic microsatellite markers across the human genome. First column indicates status of draft sequence (green: finished,pink: draft and dark blue: predraft); black bars in second columns indicate sequence gaps, whereas red bars on right side of each chromosome represent thenumber of polymorphic marker per every 500 kb. These markers were mapped in silico on the NCBI build 35.
2308 Human Molecular Genetics, 2005, Vol. 14, No. 16
by guest on Novem
ber 9, 2015http://hm
g.oxfordjournals.org/D
ownloaded from

DNA sample within the screened populations. Only 47markers passed this ultimate test. Most of the other 86 failedmarkers possibly represented experimental artifacts associatedwith the DNA pooling method, such as PCR run to run vari-ations in PCR conditions and in peak height in electrophoresis,PCR ghost peaks due to dissociation of labeled fluorescencereagent from a primer oligonucleotide, complications resultingfrom stutter and A addition bands which might be inherent toparticular microsatellites and the effect of sample size in theassociation test (125 versus 375). Overall, the error or unsuc-cessful rate in our DNA pooling method was calculated as lessthan 3.2 � 1023 (87/27 039). As a result, as many as 26 992microsatellites (27 039 2 47 ¼ 26 992) used as geneticmarkers showed no significant difference in allele frequenciesbetween the patient and control groups. Among the 47 markerswhich survived three screenings by the DNA poolingtechnique followed by individual genotyping, the genomicsegments around 11 markers were found to coincide withthe ones previously suggested to be the RA gene candidateregions by genome-wide mapping based on linkage analysis,whereas the remaining 36 markers represented new RA-candidate regions defined for the first time by microsatellite-based association mapping in this study (data not shown).
As disease-responsible alleles with low frequency are sup-posed to explain a smaller fraction of the genetic susceptibilityto disease when compared with those with high frequency, 24of 47 positive markers were reserved for future analysisbecause of their low (,0.05) frequency, therefore leaving23 positive markers for subsequent analysis (Table 1).Among the latter group, the seven microsatellites that revealedseven distinct genomic regions with the highest significance inassociation with RA were then subjected to fine mapping usingSNPs.
Fine mapping by SNP and haplotype analysis
Among the seven most significant markers, four—the first(D6S0588i), the second (D6S0483i), the third (D6S1061)and the fifth (D6S0025i)—were located in the HLA regionon chromosome 6p21.3, whereas the fourth (D11S0497i),the sixth (D10S0168i) and the seventh (D14S0452i) werelocated on chromosomes 11q13.4, 10p13 and 14q23.1,respectively (cytobands refer to the NCBI build 35) (Table 1and Fig. 3). In order to further dissect each genomic region,we selected a collection of evenly spaced SNPs (coding andnon-coding) within a several hundred kilobase perimeter
Figure 2. Genome-wide mapping of rheumatoid arthritis (RA) susceptibility loci using 27 039 microsatellites. One hundred and thirty three microsatellitesshowing significant association (P , 0.05) in the first, second and third screens by the DNA pooling method are indicated by yellow circles. Small dots (redand blue) pinpoint microsatellites failing to show significant association in the first, second or third screen with P-values. Red and blue confer to P-valuesobtained by the Fisher’s exact test for the 2�2 and 2 � m contingency tables, respectively. Dots in parenthesis on right side of each chromosome indicate micro-satellites which could not be precisely mapped for their location on chromosomes.
Human Molecular Genetics, 2005, Vol. 14, No. 16 2309
by guest on Novem
ber 9, 2015http://hm
g.oxfordjournals.org/D
ownloaded from

surrounding each candidate region from the dbSNP (http://www.ncbi.nlm.nih.gov/projects/SNP/) and JSNP (http://snp.ims.u-tokyo.ac.jp) databases. In the HLA region, we selectedadditional SNPs from the IkBL to C4B genes to confirmpreviously reported associations around the centromeric endof the HLA class III region. These SNPs were selected fromthe Applied Biosystems SNP database (http://www.appliedbiosystems.com/).
We genotyped 165 SNPs after expanding our sample size(the combined population consisting of the previously tested375 cases and 375 controls, and an additional population setcomposed of 565 cases and an equal number of controls, i.e.940 patients and 940 healthy individuals) (SupplementaryMaterial, Table S4). Among these 165 SNPs, 45 displayed astatistically significant (P , 0.05) association in the combinedpopulation (Table 2 and Fig. 3). Essentially the same resultswere obtained when statistical significance was assessedusing only the newly recruited 565 cases and 565 controls(data not shown), indicating that these SNPs representedreal-positive markers and not pseudo-positive ones. Of thesepositive SNPs, 25 remained significant (Pc , 0.05) evenafter Bonferroni’s correction (Table 2). We then inferred theLD block structures for these 165 SNPs within the populationusing the EM algorithm (28) (Fig. 3) and carried out thecase–control association study using the newly constructedhaplotypes in each block (Table 3).
6p21.3
In the 6p21.3-located HLA region, 29 SNPs were statisticallysignificant (P , 0.05) after the SNP association test of the
combined (n ¼ 2 � 940) population (Table 2). Two previouslyknown MHC associations were replicated. In the firstinstance, genotyping HLA-DRB1 unveiled the HLA-DRB1�0405 allele as the most significant RA-associatedlocus (P ¼ 9.7 � 10220; Pc ¼ 5.1 � 10218) in the combined(n ¼ 2 � 940) population (Table 2) as this allele is widelyknown to be associated with RA Japanese as well as otherpopulations (29,30). Thus, the first and the fifth most stronglyassociated microsatellites, D6S0588i and D6S0025i, respec-tively, were in strong LD with the HLA-DRB1 gene. In additionto HLA-DRB1, we were also able to confirm the association ofthe IkBL (MIM�601022) promoter SNP, rs3219185, with thedisease (P ¼ 3.8 � 1026; Pc ¼ 2.0 � 1024) in the combinedpopulation (19), although the frequency of the minor allelein this SNP is relatively low. The association between IkBLand RA was not detected by microsatellites in our screeningsteps because no microsatellite near the IkBL gene wasincluded in our marker set. Importantly, we also detected bySNP analysis two new candidate loci within the HLA regionthat were strongly associated with RA. These were SNPsaround the NOTCH4 (MIM�164951) and Tenascin-XB(TNXB) (MIM�600985) genes, which are located �250 and300 kb from HLA-DRB1, respectively (Fig. 3).
NOTCH4, a member of NOTCH transmembrane receptorsfamily, is a proto-oncogene which contains epidermalgrowth factor (EGF) repeats. It is believed to be involved insignal transduction in a host of basic biological processessuch as cell proliferation, cell differentiation as well asangiogenesis (31). Within NOTCH4, nine SNPs, amongwhich two were non-synonymous, were significantly associ-ated with RA. The strongest association (P ¼ 1.1 � 10211;
Table 1. Twenty-three positive microsatellite markers from individual genotyping
Markers Cytobands Number of allele Positive allele Allele frequencies Fisher’s exact P-values Odds ratio 95% Cl
Control Case 2 � 2 Pc 2 � 2 Pc
D6S0588i 6p21.3 10 5 0.430 0.572 0.000000055 0.000014 0 0 1.78 1.45–2.18D6S0483i 6p21.3 18 7 0.089 0.176 0.00000092 0.00024 0 0 2.18 1.59–2.98D6S1061 6p21.3 24 16 0.095 0.183 0.000001 0.00026 0 0 2.14 1.57–2.90D11S0497i 11q13.4 5 2 0.513 0.613 0.000031 0.008 0.00052 0.012 1.55 1.26–1.91D6S0025i 6p21.3 6 2 0.125 0.185 0.002 0.51 0.0005 0.012 1.59 1.20–2.11D10S0168i 10p13 4 2 0.408 0.499 0.0005 0.13 0.001 0.024 1.44 1.18–1.77D14S0452i 14q23.1 9 4 0.370 0.452 0.001 0.26 0.0006 0.014 1.40 1.14–1.72D8S0127i 8q13.3 16 3 0.116 0.069 0.002 1 0.009 0.25 0.57 0.40–0.81D7S0086i 7p21.1 11 4 0.095 0.053 0.002 1 0.03 0.75 0.54 0.36–0.80D10S0607i 10q26.13 5 1 0.827 0.882 0.003 1 0.02 0.5 1.59 1.19–2.14D13S0561i 13q31.1 10 8 0.130 0.183 0.005 1 0.16 1 1.50 1.13–2.00G08462 5q14.1 9 4 0.190 0.136 0.005 1 0.09 1 0.67 0.51–0.89D16S0496i 16q12.2 10 7 0.204 0.267 0.005 1 0.07 1 1.41 1.11–1.79D5S0228i 5q12.1 11 7 0.305 0.371 0.004 1 0.02 0.5 1.35 1.09–1.67D5S400 5q34 18 2 0.063 0.101 0.008 1 0.03 0.75 1.69 1.15–2.46D6S0811i 6q22.33 6 3 0.445 0.515 0.008 1 0.01 0.25 1.31 1.07–1.61D20S910 20p12.1 14 7 0.301 0.365 0.009 1 0.18 1 1.34 1.08–1.66D4S0017i 4q25 22 5 0.071 0.111 0.009 1 0.12 1 1.64 1.14–2.35D16S0232i 16q24.1 4 2 0.444 0.380 0.01 1 0.06 1 0.77 0.63–0.95D3S1500i 3p24.3 4 1 0.781 0.725 0.01 1 0.005 0.13 0.74 0.58–0.94D20S470 20p12.1 14 7 0.111 0.073 0.02 1 0.59 1 0.64 0.45–0.91DXS0486i Xq25 8 1 0.118 0.090 0.09 1 0.19 1 0.68 0.51–1.04D18S0090i 18q12.1 20 13 0.193 0.153 0.05 1 0.54 1 0.76 0.58–0.99
Pc means corrected P-values by Bonferroni’s correction. The Fisher’s exact test was carried out in the case and control populations (n ¼ 375 each).This means allele frequency of which has the lowest P-value in the locus.
2310 Human Molecular Genetics, 2005, Vol. 14, No. 16
by guest on Novem
ber 9, 2015http://hm
g.oxfordjournals.org/D
ownloaded from
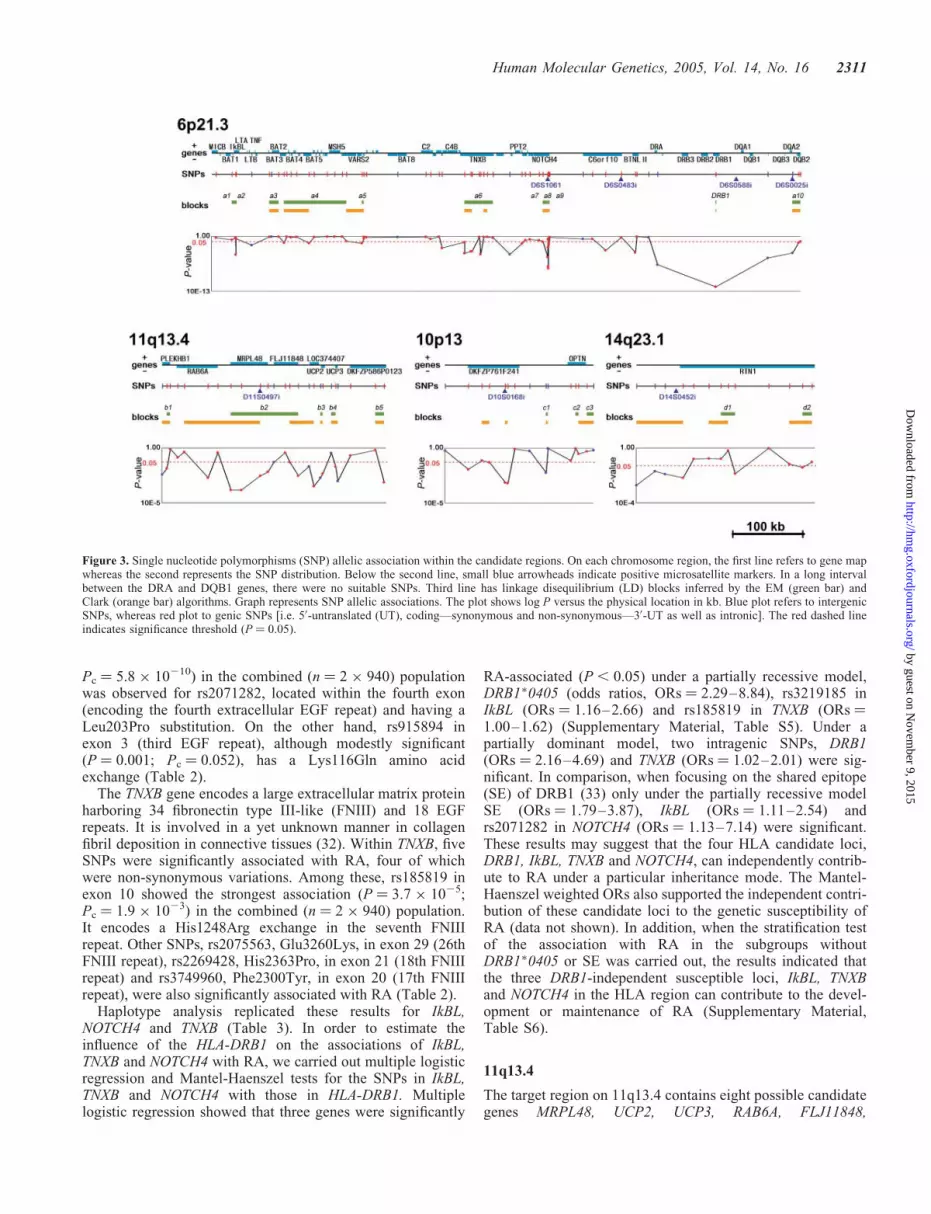
Pc ¼ 5.8 � 10210) in the combined (n ¼ 2 � 940) populationwas observed for rs2071282, located within the fourth exon(encoding the fourth extracellular EGF repeat) and having aLeu203Pro substitution. On the other hand, rs915894 inexon 3 (third EGF repeat), although modestly significant(P ¼ 0.001; Pc ¼ 0.052), has a Lys116Gln amino acidexchange (Table 2).
The TNXB gene encodes a large extracellular matrix proteinharboring 34 fibronectin type III-like (FNIII) and 18 EGFrepeats. It is involved in a yet unknown manner in collagenfibril deposition in connective tissues (32). Within TNXB, fiveSNPs were significantly associated with RA, four of whichwere non-synonymous variations. Among these, rs185819 inexon 10 showed the strongest association (P ¼ 3.7 � 1025;Pc ¼ 1.9 � 1023) in the combined (n ¼ 2 � 940) population.It encodes a His1248Arg exchange in the seventh FNIIIrepeat. Other SNPs, rs2075563, Glu3260Lys, in exon 29 (26thFNIII repeat), rs2269428, His2363Pro, in exon 21 (18th FNIIIrepeat) and rs3749960, Phe2300Tyr, in exon 20 (17th FNIIIrepeat), were also significantly associated with RA (Table 2).
Haplotype analysis replicated these results for IkBL,NOTCH4 and TNXB (Table 3). In order to estimate theinfluence of the HLA-DRB1 on the associations of IkBL,TNXB and NOTCH4 with RA, we carried out multiple logisticregression and Mantel-Haenszel tests for the SNPs in IkBL,TNXB and NOTCH4 with those in HLA-DRB1. Multiplelogistic regression showed that three genes were significantly
RA-associated (P , 0.05) under a partially recessive model,DRB1�0405 (odds ratios, ORs ¼ 2.29–8.84), rs3219185 inIkBL (ORs ¼ 1.16–2.66) and rs185819 in TNXB (ORs ¼1.00–1.62) (Supplementary Material, Table S5). Under apartially dominant model, two intragenic SNPs, DRB1(ORs ¼ 2.16–4.69) and TNXB (ORs ¼ 1.02–2.01) were sig-nificant. In comparison, when focusing on the shared epitope(SE) of DRB1 (33) only under the partially recessive modelSE (ORs ¼ 1.79–3.87), IkBL (ORs ¼ 1.11–2.54) andrs2071282 in NOTCH4 (ORs ¼ 1.13–7.14) were significant.These results may suggest that the four HLA candidate loci,DRB1, IkBL, TNXB and NOTCH4, can independently contrib-ute to RA under a particular inheritance mode. The Mantel-Haenszel weighted ORs also supported the independent contri-bution of these candidate loci to the genetic susceptibility ofRA (data not shown). In addition, when the stratification testof the association with RA in the subgroups withoutDRB1�0405 or SE was carried out, the results indicated thatthe three DRB1-independent susceptible loci, IkBL, TNXBand NOTCH4 in the HLA region can contribute to the devel-opment or maintenance of RA (Supplementary Material,Table S6).
11q13.4
The target region on 11q13.4 contains eight possible candidategenes MRPL48, UCP2, UCP3, RAB6A, FLJ11848,
Figure 3. Single nucleotide polymorphisms (SNP) allelic association within the candidate regions. On each chromosome region, the first line refers to gene mapwhereas the second represents the SNP distribution. Below the second line, small blue arrowheads indicate positive microsatellite markers. In a long intervalbetween the DRA and DQB1 genes, there were no suitable SNPs. Third line has linkage disequilibrium (LD) blocks inferred by the EM (green bar) andClark (orange bar) algorithms. Graph represents SNP allelic associations. The plot shows log P versus the physical location in kb. Blue plot refers to intergenicSNPs, whereas red plot to genic SNPs [i.e. 50-untranslated (UT), coding—synonymous and non-synonymous—30-UT as well as intronic]. The red dashed lineindicates significance threshold (P ¼ 0.05).
Human Molecular Genetics, 2005, Vol. 14, No. 16 2311
by guest on Novem
ber 9, 2015http://hm
g.oxfordjournals.org/D
ownloaded from

Table 2. SNP allelic association
Cytobands SNPs Genes Case:control ¼ 940:940 Pc Odds ratio 95% Cl
Allele Frequencies P-value�2
Name Portion Amino acid Control Case
6p21.3 rs3219185 IkBL promoter G 0.929 0.964 0.0000038 0.00020 2.01 1.49–2.71rs769178 – A 0.186 0.227 0.002 0.10 1.29 1.10–1.51rs2242656 BAT3 intron8 A 0.866 0.886 0.07 1 1.20 0.99–1.46rs805273 BAT5 intron4 C 0.866 0.886 0.07 1 1.20 0.99–1.46rs2242668 LSM2 intron2 A 0.882 0.901 0.08 1 1.21 0.99–1.49rs74534 DOM3Z intron5 T 0.912 0.935 0.008 0.42 1.39 1.09–1.78rs2242569 TNXB exon29 G 0.073 0.093 0.03 1 1.30 1.03–1.64rs2075563 TNXB exon29þ�1 Glu3260Lys G 0.106 0.162 0.00000076 0.00004 1.62 1.34–1.96rs2269428 TNXB exon21þ His2363Pro A 0.107 0.159 0.000003 0.00016 1.58 1.30–1.91rs3749960 TNXB exon20þ Phe2300Tyr T 0.107 0.160 0.0000024 0.00013 1.59 1.31–1.92rs185819 TNXB exon10þ His1248Arg A 0.647 0.711 0.000037 0.0019 1.34 1.17–1.53rs204999 – G 0.936 0.965 0.000042 0.0022 1.90 1.40–2.59rs2071289 EGFL8 exon6þ Glu204Ala A 0.019 0.036 0.002 0.10 1.92 1.28–2.89rs2849012 NOTCH4 intron7 G 0.692 0.762 0.0000016 0.000082 1.43 1.23–1.65rs520688 NOTCH4 exon5 G 0.326 0.408 0.00000022 0.000011 1.42 1.25–1.63rs2071284 NOTCH4 intron4 A 0.113 0.189 0.000000000080 0.0000000042 1.83 1.52–2.20rs2071283 NOTCH4 exon4 A 0.112 0.189 0.000000000057 0.000000003 1.84 1.53–2.21rs2071282 NOTCH4 exon4þ Leu203Pro T 0.113 0.193 0.000000000011 0.00000000058 1.87 1.56–2.25rs2071281 NOTCH4 exon4 T 0.113 0.189 0.00000000011 0.0000000058 1.82 1.52–2.19rs415929 NOTCH4 exon4 G 0.329 0.408 0.00000055 0.000029 1.41 1.23–1.61rs915894 NOTCH4 exon3þ Lys116Gln A 0.503 0.556 0.001 0.052 1.24 1.09–1.41rs443198 NOTCH4 exon3 T 0.504 0.569 0.000076 0.0039 1.30 1.14–1.47rs2273019 C6orf10 intron11 A 0.406 0.470 0.000091 0.0047 1.30 1.14–1.48rs2294878 BTNL2 intron2 C 0.644 0.733 0.0000000039 0.0000002 1.52 1.3–21.75rs2227139 – A 0.607 0.718 0.00000000000087 0.000000000045 1.65 1.44–1.89
HLA-DRB1 �0405 0.147 0.267 0.000000000000000000097 0.0000000000000000051 2.11 1.79–2.49rs2647012 – A 0.827 0.887 0.00000013 0.0000067 1.65 1.37–1.98rs2071798 – T 0.713 0.768 0.00015 0.0076 1.33 1.15–1.54rs1049110 HLA-DQB2 exon5þ Gln 161Arg A 0.778 0.802 0.07 1 1.16 0.99–1.36
11q13.4 rs3781909 – C 0.428 0.480 0.001 0.052 1.24 1.09–1.41rs2008734 PLEKHB1 intron5 T 0.425 0.476 0.002 0.10 1.22 1.08–1.39rs2140893 RAB6A intron1 C 0.509 0.564 0.00076 0.039 1.25 1.10–1.42rs17922174 MPRL48 50-UTR A 0.522 0.580 0.00045 0.023 1.26 1.11–1.44rs1792160 MPRL48 intron3 A 0.522 0.580 0.00035 0.018 1.27 1.11–1.44rs1792193 MPRL48 intron5 T 0.551 0.606 0.00075 0.039 1.25 1.10–1.43rs1061090 MPRL48 30-UTR C 0.971 0.976 0.4 1 1.21 0.81–1.80rs3741138 FLJ11848 exon7þ Ala209Gly C 0.833 0.862 0.01 0.73 1.25 1.05–1.50rs935985 FLJ11848 intron11 C 0.804 0.838 0.007 0.36 1.26 1.07–1.49rs637028 – T 0.831 0.867 0.003 0.16 1.32 1.10–1.58rs653263 LOC374407 exon3 A 0.428 0.471 0.008 0.42 1.19 1.05–1.35rs655717 – T 0.483 0.526 0.009 0.47 1.19 1.05–1.35rs660339 UCP2 exon4þ Ala55Val G 0.487 0.528 0.01 0.68 1.18 1.04–1.34
2312
HumanMolecu
larGenetics,
2005,Vol.14,No.16
by guest on November 9, 2015 http://hmg.oxfordjournals.org/ Downloaded from

Table 3. LD blocks and haplotype association with RA
Cytobands Block� SNPS Included genes Numberof SNPs
Number ofhaplotype
Positivehaplotype
Haplotype frequencies Fisher’s exact P-values Odd ratio 95% Cl
Name Size (kb) End Start Name Control 95% Cl Case 95% Cl 2 � 2 Pc
6p21.3 a1 8.26 rs2071595 rs2071592 BAT1-IkBL 5 5 4 0.074 0.055–0.093 0.028 0.018–0.040 0.000033 0.0037 0.35 0.21–0.59a2 0.04 rs2239708 rs2071591 IkBL 2 3 1 0.451 0.415–0.485 0.495 0.459–0.0531 0.10 1 1.19 0.97–1.46a3 19.03 rs2269475 rs1046089 BAT2 3 4 4 0.008 0.0003–0.015 0.012 0.005–0.020 0.45 1 1.51 0.53–4.26a4 127.97 rs2242656 rs707929 BAT3-C6orf27 10 11 4 0.072 0.056–0.090 0.030 0.019–0.041 0.00014 0.016 0.39 0.23–0.64a5 4.13 rs2242668 rs2075800 LSM2-HSPA1L 2 3 3 0.126 0.102–0.150 0.089 0.070–0.109 0.024 1 0.68 0.49–0.94a6 58.45 rs2242569 rs429150 TNXB 9 9 2 0.362 0.326–0.399 0.264 0.232–0.296 0.000046 0.0051 0.63 0.50–0.78a7 9.75 rs206018 rs2849012 NOTCH4 2 3 1 0.673 0.640–0.706 0.774 0.745–0.805 0.000015 0.0017 1.66 1.32–2.09a8 0.65 rs422951 rs415929 NOTCH4 8 3 3 0.103 0.083–0.126 0.203 0.175–0.231 0.00000010 0.000011 2.20 1.64–2.95a9 0.02 rs915894 rs443198 NOTCH4 2 4 2 0.493 0.460–0.531 0.432 0.400–0.465 0.020 1 0.78 0.64–0.96DRB1 0.26 rs2308754 rs1141742 DRB1 64 29 �405 0.129 0.276 0.0000000000013 0.00000000014 2.67 2.04–3.49a10 16.35 rs2071798 rs2071550 DQB2 3 4 4 0.069 0.052–0.089 0.025 0.014–0.037 0.000077 0.0086 0.35 0.20–0.60
11q13.4 b1 6.86 rs2008734 rs6590 PLEKHB1 2 3 2 0.412 0.376–0.447 0.479 0.445–0.513 0.011 1 1.31 0.07–1.61b2 139.37 rs1792174 rs93.5985 MRPL48-FLJ11848 8 6 1 0.500 0.461–0.533 0.595 0.565–0.629 0.00019 0.021 1.48 1.21–1.82b3 4.89 rs655717 rs660339 UCP2 2 2 2 0.454 0.417–0.489 0.535 0.501–0.569 0.0027 0.31 1.38 1.12–1.69b4 9.02 rs668514 rs2075577 UCP3 2 3 2 0.352 0.320–0.387 0.273 0.240–0.306 0.0010 0.11 0.69 0.55–0.86b5 17.81 rs866650 rs1527302 DKFZP586P0123 2 3 2 0.353 0.320–0.386 0.267 0.238–0.297 0.00044 0.049 0.67 0.54–0.84
10p13 c1 3.89 rs1347979 rs571066 2 4 3 0.175 0.150–0.203 0.120 0.097–0.145 0.0035 0.39 0.64 0.48–0.86c2 6.07 rs2244380 rs765884 OPTN 2 3 3 0.101 0.079–0.123 0.121 0.100–0.145 0.25 1 1.22 0.89–1.69c3 13.64 rs999999 rs1324252 OPTN 2 3 3 0.039 0.027–0.052 0.047 0.032–0.063 0.52 1 1.22 0.74–2.01
14q23.1 d1 28.86 rs1952043 rs2182138 RTN1 3 5 3 0.207 0.180–0.238 0.158 0.133–0.185 0.014 1 0.72 0.55–0.93d2 19.22 rs927326 rs2064992 RTN1 2 4 2 0.457 0.423–0.493 0.509 0.472–0.545 0.050 1 1.23 1.01–1.51
�LD blocks were inferred by the EM algorithm.
rs2075577 UCP3 exon5 G 0.445 0.477 0.05 1 1.14 1.00–1.29rs1800849 – G 0.667 0.711 0.004 0.21 1.23 1.07–1.41rs1527302 DKFZP586P0123 intron2 T 0.657 0.703 0.003 0.16 1.24 1.08–1.42
10p13 rs2280076 DKFZP761F241 30-UTR A 0.768 0.768 1 1 1.00 0.86–1.16rs2668907 DKFZP761F241 intron2 A 0.438 0.453 0.4 1 1.06 0.93–1.21rs662141 DKFZP761F241 intron2 T 0.481 0.499 0.3 1 1.08 0.95–1.22rs1347979 – G 0.828 0.858 0.01 0.73 1.25 1.05–1.50
14q23.1 rs725951 – T 0.787 0.823 0.006 0.31 1.26 1.07–1.48rs2073318 – G 0.784 0.823 0.002 0.10 1.29 1.10–1.51rs1980579 – T 0.782 0.822 0.002 0.10 1.29 1.10–1.51rs1950789 RTN1 intron8 C 0.810 0.848 0.002 0.10 1.31 1.11–1.56rs182138 RTN1 intron3 C 0.788 0.835 0.0002 0.012 1.36 1.16–1.61rs927326 RTN1 intron1 A 0.462 0.502 0.02 0.83 1.17 1.03–1.33
�1 Nonsynonymous SNPs.�2 Fisher’s exact test P-value in 2 � 2table of alleles.
HumanMolecu
larGenetics,
2005,Vol.14,No.16
2313
by guest on November 9, 2015 http://hmg.oxfordjournals.org/ Downloaded from

LOC374407, DKFZP586P0123 and PLEKHB1. Three of thesegenes, MRPL48, UCP2 and UCP3, are mitochondrial-relatedgenes (Fig. 3). MRPL48 was recently identified on the basisof homology to mammalian mitochondrial ribosomalproteins (MRPs) (34). UCP2 (MIM�601693) and UCP3(MIM�602044) encode transporter proteins on the inner mito-chondrial membrane, which are related to energy expenditure.UCP2 has been implicated in the genetics of obesity and dia-betes (35). The RAB6A gene encodes a RAS-associatedprotein (MIM�179513) and it is centromerically located withrespect to MRPL48. Of the other genes, FLJ11848 hasWD40 repeats that are related to a wide variety of functionsincluding cell–cell interactions (36). LOC374407 appears tohave protein homology to heat shock protein 40 homolog(HSP40 homolog) and a structural similarity to spermatogen-esis apoptosis-related protein. DKFZP586P0123 has oneprotein kinase C conserved region. Finally, PLEKHB1(MIM�607651) encodes a conserved protein (94% mouse–human amino acid identity) containing a pleckstrin homologydomain as well as several casein kinase II (see MIM�115440)phosphorylation sites and a potential protein kinase Cphosphorylation site.
Within this group of possible candidate genes, 15 of 25polymorphic SNPs were statistically significant after theSNP association test in the combined population. Althoughthe positive SNPs were scattered throughout the candidateregion, the first and second most significant associationswere observed for two SNPs, rs1792174 (P ¼ 0.00045) in50-UTR and rs1792160 (P ¼ 0.00035) in intron 3 of theMRPL48 gene. MRPL48 also had two other positive SNPs,rs1792193 (P ¼ 0.0076) in intron 5 and rs1051090(P ¼ 0.0075) in the 30-UTR region. Positive SNPs were alsoobserved in UCP2, UCP3, RAB38 and FLJ11848. However,only one common haplotype in the block b2, includingMRPL48 and FLJ11848, showed a significant associationthat was as strong as the single SNP in MRPL48 (Fig. 3).The positive SNPs in MRPL48 were also confirmed afterBonferroni’s correction in the combined population(Table 2), indicating that MRPL48 is the strongest candidatelocus for RA in this region.
10q13, 14q23.1 and PADI4
The candidate region at chromosomal position 10p13 containstwo genes of interest, DKFZP761F241 of yet unknownfunction and optineurin (OPTN) which encodes an opticneuropathy inducing protein involved in the developmentof primary open-angle glaucoma (37) (Fig. 3). Only oneSNP (rs1347979) in DKFZP761F241 remained significant inthe combined population. Although this SNP association wasnot confirmed after correction in the combined population,DKFZP761F241 still remains the RA-susceptibility locus inthe region most likely via a yet-to-be identified SNP(s). Thecandidate region on 14q23.1 contained a single locus, reticu-lon 1 (MIM�600865), a member of a group of neuroendo-crine-specific proteins. Even after Bonferroni’s correctionin the combined samples, rs2182138 in the third intron ofreticulon 1 remained statistically significant (P ¼ 0.0002).
Finally, LD-mapping using SNPs in a previously reportedlinkage group for RA identified peptidylarginine deiminases
4 (PADI4 ) as an RA-susceptibility locus (38). We replicatedfour positive SNPs, padi89 (P ¼ 0.002), padi90 (P ¼ 0.004),rs874881 (P ¼ 0.002) and rs2240340 (P ¼ 0.002) in our popu-lation study of PADI4. Moreover, we confirmed that themicrosatellite, D1S1144i, in intron 6 of the PADI4 gene wasincluded in the 47 microsatellite set that passed as a positivemarker with a marginally significant RA-association(P ¼ 0.008) in the three-phased pooling DNA screeningsand in the individual genotyping test, although the associatedallele frequency was low (3.7%) in the control population(data not shown).
Expression analysis
We performed a comprehensive human expression tissue-scanon ten of the identified RA-associated genes using quantitativereverse transcription–PCR (RT–PCR). The target tissuesincluded synovial cell lines obtained from patients with RAand osteoarthritis (OA). Those from OA patients wereemployed as a control. We observed consistently highexpression of NOTCH4 in the lung and of TNXB in a numberof tissues including the adrenal gland (Fig. 4). Our resultsalso showed that all genes were expressed in the RA synovialcells, with TNXB and NOTCH4 showing the highest level ofexpression in contrast to RTN1 which displayed the lowestlevel. We also compared expression levels of these genesbetween RA and OA synovial cells where the latter wasemployed as a control (Table 4). By the Student’s t-test,expression levels of MRPL48 (P¼ 0.049) and DKFZP761F241(P ¼ 0.027) genes showed a relatively significant differencebetween RA and OA synovial tissues, which may supportour preliminary association data that MRPL48 andDKFZP761F241 are involved in the pathogenesis of RA. Theexpression of MRPL48 in the RA synovial tissues was abouttwice the levels of the OA tissues. Three-quarters of the RAtissue donors were homozygous for a positive haplotype inthe block b2 of the MRPL48 locus.
DISCUSSION
The strategy we report here for genome-wide associationmapping of complex disease relies on a sequential case–control analysis starting with three separate screens of DNApools and ending with individual genotyping of positivemarkers that had successfully passed a stringent selectionprocess (23). Incriminated regions were then geneticallydissected down to candidate susceptible loci using SNP andhaplotype analysis. More than 99% of the 27 039 microsatel-lites collected as polymorphic markers in the Japanesepopulation in this study were found to be also polymorphicin the Caucasian population and so probably can be appliedto genome-wide association mapping of complex disease inmost of the world-wide populations. In order to improve thepower of the DNA pooling method, multiple measurementsof pools and multiple moderately sized pools such as 50may be incorporated in future studies to take advantage ofthe allele-frequency estimates from them (23).
The numbers of cases and controls (N ¼ 125) employed inour screening system were possibly not high enough to
2314 Human Molecular Genetics, 2005, Vol. 14, No. 16
by guest on Novem
ber 9, 2015http://hm
g.oxfordjournals.org/D
ownloaded from

detect disease-responsible loci with low genetic contributionto the disease susceptibility because of the limited numberof samples used for each of the three independent associationscreenings, as described in Results section. A considerablenumber of other disease-associated microsatellites, for whicha genotype relative risk was lower than 1.5 and/or frequencyof disease-associated alleles was low, may have been missedin our present screening system. Although we confirmed theHLA-DRB1 and PADI4 genes as RA-susceptible loci in thisstudy, the recently identified RA loci, RUNX1 (39),SLC22A4 (39) and PTPN22 (40), were not included in the
47 positive microsatellite RA-candidate regions that we ident-ified by the three-phased screening method. Consequently,more cases and controls may need to be employed for eachof the three screenings in order to increase the statisticalpower in future association analyses.
Employment of 300 cases and 300 patients in each of threescreenings is considered to be large enough to detect suscep-tible loci with a genotype relative risk of 1.5 with 95% prob-ability and with a power of association testing at more than 0.9in a genome-wide LD-mapping system (18). The large diffe-rence between the predicted and observed positives at eachof the first, second and third screenings was detected byassuming that the microsatellites are only bi-allelic (n ¼ 1;n: number of times of multiple comparisons). This differencemight be explained by independent multiple comparisons ofmore than two alleles of microsatellites in P-value testsbecause the average allele number of 27 039 microsatellitesused here was 6.4. Of 47 microsatellites that survived allthree screenings by the DNA pooling technique and individualgenotyping, only seven most statistically significant markerswere used to finally identify and examine the seven candidatesusceptible loci by SNP analysis. Therefore, on the basis ofdifferential selective screening, we reached a statistical confi-dence level where we believed that the top seven markers rep-resented the real-positive markers in our association mappingstudy of RA. We also applied the 27 039 microsatellites togenome-wide association mapping of several other complexdiseases such as psoriasis vulgaris, hypertension, diabetes mel-litus, Parkinson disease, etc. and found that a similar numberof microsatellites were significant in each of the first, secondand third screenings, and individual typing as in the case ofthe RA study. On the basis of these observations and also
Figure 4. Gene expression analyses by quantitative reverse transcription–polymerase chain reaction (RT–PCR). The BLT2 (leukotriene B4 receptor subtype 2)gene was employed as a positive control, which has been known to have strong expression in the RA synovial tissues (65). Each cell indicates average expressionlevel of the standardized quantity data after rejection by the Smirnov’s test.
Table 4. Expression levels of RA candidate genes in OA and RA synovial cells
OA synovial cell RA synovial cell
Gene Average SD Average SD
IkBL 3.1 2.4 1.0 0.8TNXB 339.3 349.7 80.7 35.1NOTCH4 36.7 0.4 39.7 30.8MRPL48 2.5� 0.2 4.4 1.6FLJ11848 0.9 0 1.3 0.7UCP2 1.5 0.9 2.8 2.1DKFZP761 F241 17.5� 8.1 7.1 0.8OPTN 7.4 2.4 12.7 3.4RTN1 0.8 0.1 0.9 0.6BLT2�� 51.2 70.7 11.1 6.9
�Expression levels of MRPL48 (P ¼ 0.049) and DKFZP761F241(P ¼ 0.027) genes showed relatively significant difference between RAand OA synovial tissues.��The BLT2 (leukotriene B4 receptor subtype 2) gene was employed as apositive control, which has been known to have strong expression in theRA synovial tissues (65).
Human Molecular Genetics, 2005, Vol. 14, No. 16 2315
by guest on Novem
ber 9, 2015http://hm
g.oxfordjournals.org/D
ownloaded from

on the assumption that all of the 47 microsatellites remainingafter a three-phased screen represent pseudo-positive markersin association mapping, then ‘n’ (n refers to the number ofmultiple comparisons in the 2�2 Fisher’s exact test) in ourmicrosatellite mapping system was calculated to be 1.4. Thisis very low, when compared with the average number ofalleles of 27 039 microsatellites used in this study, 6.4. Evenif dozens of microsatellites still survive as pseudo-positivemarkers after a three-phased screen, most of them can beexcluded theoretically in the following SNP association analy-sis by incorporating additional cases and controls. That meansthat SNPs identified by a three-phased screen followed by anassociation SNP test represent real-positive markers for dis-eases. More strictly, however, a second SNP association testemploying another set of cases and controls might be preferredto completely eliminate pseudo-positive markers, although thepower of detection may be decreased by an increase in thenumber of association tests.
The large difference between the predicted and observedpositives at each of the first, second and third screeningsmight also be explained in part by experimental artifactslinked to the DNA pooling method (23,27). Microsatellitesvulnerable to artifact formation by DNA pooling need to beidentified and removed from those used in genome-wideassociation mapping. In addition, a more accurate and reliableDNA pooling typing technique may need to be developed tocarry out microsatellite-based genome-wide associationmapping of complex diseases more efficiently.
The technical aspects of our association study began withthe analysis of microsatellite markers that were previouslyused in linkage analysis and in the development of a seriesof initial human genetic maps (41–43). However, thesemicrosatellite markers were not previously applied consist-ently to whole genome association analyses possibly becausetheir overall number was insufficient for efficient wholegenome analysis and there was a lack of an adequatesupport technology. On this basis, our first step for genome-wide analysis was to collect 27 037 polymorphic microsatel-lite markers estimated to be of sufficient number to coverthe euchromatic area (�90%) of the human genome (3 Gb)at �100 kb intervals. Therefore, we developed and tested20 755 new polymorphic microsatellite markers that rep-resented the great majority used in our study of RA and arereported here for the first time. The new microsatellitemarkers, presented here, should be useful for future wholegenome association studies of the many other humanchronic and infectious diseases that have yet to be investigatedsystematically. As the LD pattern is variable between differentregions of the human genome and so the LD length is ,50 kbin some regions of the human genome, it may be better tocollect more polymorphic microsatellite markers on the basisof LD map, namely genetic distance but not physical distancelike this work, on the whole human genome. The number ofpolymorphic microsatellites on the human genome that canbe used as genetic markers in association mapping was esti-mated to be approximately 200 000 according to our recentin silico screening of the entire human genome sequences.Therefore, it will be possible to collect much more poly-morphic microsatellites and employ them in our genome-wide association method with a higher density in order to
increase the statistical power of the detection of susceptibleloci.
Advantages inherent in the use of microsatellites overdimorphic SNP markers in genetic association studies havebeen repeatedly emphasized (14,15,44–46). Disadvantage ofmicrosatellite may be their high mutation rates, 1023 to1024/site/generation (one mutation/20 000 �200 000 years)when compared with the lower mutation rates, 1028/site/gen-eration, of SNPs (47). Mutation of microsatellites that wereassociated originally with a disease susceptibility allele(s)may subsequently result in a loss of disease associationbetween the mutated microsatellites and such susceptibilityallele(s) in association analysis. Thus, if a susceptible SNPis contained on a haplotype which has multiple microsatellitealleles, no single microsatellite allele may have strong corre-lation with the susceptible SNP, especially with low allelic fre-quency (,10%) (18). In that case, it will be necessary toassess associations of microsatellite with respect to everypossible combination of each allele of microsatellite todetect such a susceptible SNP in association mapping.However, a new mutated allele in the population mightserve as a new informative genetic marker showing a longerLD due to its young age (15,18). This issue can only be satis-factorily addressed through more extensive microsatellite-based association mapping of a significant number of diseases.Nevertheless, it should be noted that the presence of a strongLD between HLA-DRB1 and its nearby microsatellite allelesreported in this study as well as between HLA-DQB1, HLA-A, HLA-B or HLA-C and their nearby microsatellite alleles(48) were consistently recognized despite the fact that theage of HLA alleles are considered to be ancient (althoughspecies-specific), having been traced back to around the emer-gence of Homo Sapiens 200 000 �1 000 000 years ago (49).These facts suggest that microsatellites are genetically stableenough to be applied to large-scale association mapping if ahigh-density marker set is used, and even if mutated, thenewly generated allele might serve as a new genetic marker.
We successfully detected and confirmed the already well-known susceptibility gene for RA, HLA-DRB1. In addition tothis gene, through a combination of microsatellite and SNPanalysis, we identified two new candidate RA loci, TNXB andNOTCH4, in the HLA candidate region marked by the micro-satellite marker located 250 kb away from HLA-DRB1. Thesefindings are not only consistent with the previous data thatsuggested the existence of distinct LD blocks containingthese loci (20,50) but also hint to the existence of an additionalMHC-linked loci for RA (51). Importantly, analyses using themultiple logistic regression and Mantel-Haenszel tests showedthat the positive SNPs in TNXB and NOTCH4 were indepen-dent of HLA-DRB1�0405 or SE, under both partially dominantas well as partially recessive models (Supplementary Material,Tables S5 and S6). Mutations in TNXB have been identified in anumber of patients suffering from the Ehlers–Danlossyndrome (MIM�600985), a disorder of connective tissue dueto defects in fibrillar collagen structure, deposition and/ormetabolism, where TNXB has been shown to be involved(33). Amino acid exchanges of the TNXB product may there-fore functionally predispose to RA through a yet-to-be ident-ified pathway in collagen metabolism. Given that the murinetype II collagen-induced arthritis mimics human RA (52), a
2316 Human Molecular Genetics, 2005, Vol. 14, No. 16
by guest on Novem
ber 9, 2015http://hm
g.oxfordjournals.org/D
ownloaded from

similar involvement of collagen might be in play in human.Further, it must be noted that expression changes in TNXBwere observed in synovial samples from RA (53). NOTCH4was the other MHC-linked RA-associated candidate geneidentified in our study. As invasive hyperplastic synoviocytesare often linked with cartilage and joint destruction, it is nothard to envision how NOTCH4 might be involved in this patho-logical activity. Accordingly, it was recently reported thattumor necrosis factor (TNF), a pivotal cytokine in RA patho-genesis, upregulates NOTCH4 in rheumatoid synovial fibro-blasts in contrast to normal synovial fibroblasts. Hence, itwas suggested that the NOTCH4 product might be involvedin hyperproliferation of RA synovial cells, a prerequisite tojoint destruction (54). We also found candidate RA loci on11q13.4, 10q13 and 14q23.1. On 11q13.4 and 10q13, althoughMRPL48 and DKFZP761F241 functions are still unknown, sig-nificant differences in their mRNA expression levels betweenaffected and unaffected synovial tissues tend to corroboratetheir involvement in RA pathogenesis. How the 14q23.1-located reticulon 1 gene which encodes a member of a groupof neuroendocrine-specific proteins is involved in the develop-ment of RA remains to be investigated. Nevertheless, to provethat the new candidate RA genes identified in this associationstudy are true susceptible loci, additional evidence willdepend on the identification of all SNPs in the candidateregions followed by additional SNP association studies andsupporting data from functional analysis by directed assays incell or animal model systems.
What is the ultimate extent of the genetic contribution toRA pathogenesis? It is noteworthy that the seven loci dis-sected by genetic mapping here might represent only aminor fraction of the total genetic component to RA as wehave detected up to 47 markers that were significantlylinked to RA. It will be, therefore, important to identify theother RA-susceptibility loci that are hidden in the remaining40 uncharacterized candidate regions, although some ofthem might represent pseudo-positive markers. Because thestrength of statistical significance depends largely on thegenetic distance between microsatellite and disease suscepti-bility locus, the comparatively lesser significance for these40 candidate regions, when compared with the top sevenmicrosatellites investigated here, does not necessarily meanlesser contribution to disease pathogenesis per se.
Finally and in regard to the detailed analysis of the topseven microsatellite markers, it is clear that they were posi-tioned on particular LD blocks (Fig. 3), related to the ‘Clarkblocks’ rather than the ‘EM blocks’. In many cases, positivemicrosatellite alleles were also apparently associated withpositive SNP haplotypes in these blocks. Such associationbetween them is likely because the combination betweenthem roughly depends on each frequency in the randommating population. This observed relationship between micro-satellite alleles and SNP haplotypes indicates a possible com-patibility between our microsatellite set and the HapMapconsortium data (55), as recently suggested (56,57). In thisregard, our whole genome case–control association study sup-ports the practical synergism between these two seeminglydistinct approaches to not only use successfully in complexdiseases gene mapping but also in human evolutionaryinvestigations.
In conclusion, we have performed the first genome-wideassociation analysis of a complex human disease using thedensest set of polymorphic microsatellite markers availableto date with an original and multi-step methodology. Theoutcome is a rapid and efficient path for the detection of sus-ceptibility genes for complex disorders. The successfulaccomplishment of our analysis for RA-susceptibility genesopens the door for parallel investigations into a host of othermultifactorial disorders including the relatively frequentcommon diseases such as asthma, type II diabetes, obesity,atherosclerosis, schizophrenia and psoriasis. The wholegenome association study of common diseases using ourapproach as outlined here may ultimately lead to the identifi-cation of hitherto untapped biological pathways, multiplyingthe number of molecular targets for the development ofspecific therapeutic agents.
MATERIALS AND METHODS
Subjects
A total of 940 individuals affected with RA and an equalnumber of healthy unrelated individuals of Japanese originparticipated in this study. Upon the approval of our exper-imental procedures by the relevant ethical committee in eachparticipating center, we obtained informed consent from allaffected and healthy individuals whose DNA samples wereused in the analyses. The RA diagnosis was made accordingto the American College of Rheumatology diagnostic criteria(58). All personal identifiers associated with medical infor-mation and blood samples were carefully eliminated andreplaced with anonymous identities in each recruiting insti-tution. The average age of onset for the disease was47.7 + 13.1 years in the case population and the genderratio was 1:4 (male:female). The healthy control populationwas also optimally matched for age and gender. For allinvolved samples, we reconfirmed gender assignment by ame-logenin genotyping (59). HLA-DRB1 was genotyped by directPCR sequencing according to previous protocols (60). Finally,the quality of DNA from each individual was PCR-checkedprior to further analysis.
Microsatellite detection and PCR primer design
A number of high-speed programs (Apollo: detection of micro-satellites from genomic sequence; Discovery: design of PCRprimers by batch treatment; gPCR: localization of PCRprimer on the human genome sequence; MSMK: microsatel-lites database in human; MICOS: viewer of microsatellitemap on the human chromosomes) were developed in our labo-ratory in order to efficiently process the massive genomicsequences contained within each human chromosome. Micro-satellite sequences displaying two to six repetitive units weredetected using the Apollo program, which is also compatiblewith Sputnik, in four versions of the human genome draftsequence: Golden Path June 2004 to the NCBI build 35.Microsatellites were investigated for repeat polymorphismsusing 200 healthy Japanese with the DNA pooling method(discussed subsequently). Our criteria for the selection of
Human Molecular Genetics, 2005, Vol. 14, No. 16 2317
by guest on Novem
ber 9, 2015http://hm
g.oxfordjournals.org/D
ownloaded from

microsatellites were (i) di-nucleotide repeats with more thanten times repeat and tri-, tetra- and penta-nucleotide repeatswith more than five times repeat and (ii) polymorphicmicrosatellites with heterozygosity of .30%, but not thosewith heterozygosity of .85% to eliminate unstable andhighly mutated microsatellites. The discovery program, com-patible with PrimerExpress, automatically designed the PCRprimers for a uniform reaction condition. We also chosePCR primers which contained no SNPs in the sequences inorder to prevent differential amplification (23). Finally,using the gPCR program, compatible with e-PCR, we certifiedeach primer set to amplify a single copy on the NCBI build 35.Detailed information on 27 039 microsatellites is available atthe JBIRC (Japan Biological Information Research Center)homepage (http://www.jbirc.aist.go.jp/gdbs/).
DNA pool construction and typing
The DNA pooling method for microsatellite typing was per-formed according to the protocol of Collins et al. (24) afterslight modification (11). DNA was extracted using theQIAamp DNA blood kit (QIAGEN) under standardized con-ditions to prevent variation of DNA quality. This was followedby a 0.8% agarose gel electrophoresis in order to check forDNA degradation and/or RNA contamination. Followingmeasurement of optical density in order to check for proteincontamination, the DNA concentration was determinedthrough three successive measurements using the PicoGreenfluorescence assay (Molecular Probes) as previously described(24). The standardized pipetting and aliquoting of the DNAsamples were robotically performed using Biomek 2000 andMultimek 96 (Beckman). The pooled DNA template for2 � 27 039 microsatellite typing was prepared immediatelyafter the DNA quantification. The quality of the pooledDNA was ascertained by comparing allelic distributionsbetween individual and pooled typing results using 96 micro-satellite markers (Supplementary Material, Fig. S1). Measure-ment error of our pooling methods is ,2% (11). Stuttering ofpeak heights did not introduce appreciable artifacts in allelefrequency estimations. After the initial tests, the 27 039 PCRreaction mixtures containing all components except primerswere prepared and then aliquotted into the 96-well reactionplates and stored until use. The microsatellite pooled typingand individual genotyping procedures after the PCR reactionwere carried out according to standard protocols using theABI3700 DNA analyzer (Applied Biosystems). The standar-dized preparations allowed reproducibility and accuracy tobe maintained for the pooled DNA typing throughout theexperiment. Various kinds of information such as peak pos-itions and heights were automatically extracted by the Pick-Peak and MultiPeaks programs, developed by AppliedBiosystems Japan, from the multipeak pattern in the chroma-togram ABI fas files. Because peaks including those withstutter and shadow were automatically extracted and com-pared for their height between cases and controls by these pro-grams in association studies, most of the positive markerswhich remained statistically significant could be confirmedby individual genotyping using the same set of patients andcontrols.
SNP genotyping
SNPs were selected around candidate regions from the dbSNPat the NCBI homepage (http://www.ncbi.nlm.nih.gov/projects/SNP/) from the JSNP database at the homepage of the Instituteof Medical Science of Tokyo University (http://snp.ims.u-tokyo.ac.jp) as well as from the SNP database of Applied Bio-systems (http://www.appliedbiosystems.com/). The SNPswere genotyped using the TaqMan assays or direct sequencingand all the information regarding these SNPs is listed in Sup-plementary Material, Table S4. The TaqMan assays werecarried out using standard protocols for the ABI PRISM7900HT Sequence Detection System using a 384-well blockmodule and automation accessory (Applied Biosystems).The direct sequencing of PCR products was carried outaccording to standard procedures using the ABI3700 DNAanalyzer (Applied Biosystems).
Statistical analyses
The Pritchard’s method (25) was employed for the detectionof stratification in case and control populations. To calculateP-values, we used two types of the Fisher’s exact test forthe 2�2 contingency tables for each individual allele andthe 2 � m contingency tables for each locus, where m refersto the number of marker alleles observed in a population.The Markov chain/Monte Carlo simulation method wasemployed to execute the Fisher’s exact test for the 2 � m con-tingency table. The simple ‘allelic’ but not ‘genotypic’ associ-ation was presented for the 2�2 contingency tables formicrosatellites, SNPs and haplotypes. We corrected these P-values (Pc) by the Bonferroni’s correction where the coeffi-cient was the total number of the contingency tables tested.These analyses were carried out using the software package,MCFishman. Other basic statistical analyses, including themultiple logistic regression and Mantel-Haenszel tests, werecarried out using the SPSS program package as well as Micro-soft Excel. We inferred LD block structures for these SNPsusing confidence intervals of the D0 value as a LD measure(61,62). We also estimated haplotypes in each block andtheir frequencies by both the EM (28) and Clark (63) algor-ithms. Finally, to assess reliability of each block haplotype,we calculated the 95% confidence interval from each haplo-type frequency distribution given by bootstrap resampling ofup to 2000 times based on the estimated haplotype frequen-cies, which is implemented in the Right program (64).
Expression analysis
Total RNA was isolated by ISOGEN (Nippon Gene) from sur-gically obtained synovial membranes from eight RA and fourOA patients, and from a synovial cell line (SW982) obtainedfrom the American Type Culture Collection. RNAs fromvarious other tissues were obtained commercially from Clon-tech, Invitrogen, Origene and Stratagene. The quality and quan-tity of these RNAs were assessed using Agilent 2100Bioanalyzer (Agilent) and their quantity confirmed by theRiboGreen RNA fluorescence assay (Molecular Probes).Using these total RNAs as templates, complimentary DNAswere synthesized using random hexamers and TaqMan
2318 Human Molecular Genetics, 2005, Vol. 14, No. 16
by guest on Novem
ber 9, 2015http://hm
g.oxfordjournals.org/D
ownloaded from

Reverse Transcription Reagents kit (Applied Biosystems).cDNA specific primers and probes were obtained by the‘Assay-by-Design (AbD)’ for the ten genes tested and by the‘Assay-on-Demand (AoD)’ for GAPD (glyceraldehyde-3-phosphate dehydrogenase), used as a housekeeping controlgene, all provided by Applied Biosystems. After preliminaryexperiments, we used a final concentration of 210 nM of probe,756 nM of primers and 0.48 ng/ml cDNA in 50 ml reactionvolume in 96-well reaction plates on ABI PRISM 7900, allaccording to standard procedures recommended by AppliedBiosystems. We processed each plate three times and calculatedthe average and SD (standard deviation) for each sample.Quantity estimates were calculated each time using a standardcurve in each well. All standardized quantity data were adjustedtoGAPD and tested by the Smirnov’s test with a 5% significancelevel. The BLT2 (leukotriene B4 receptor subtype 2) gene wasemployed as a positive control, which has been known to havestrong expression in RA synovial tissues (65). After the recipro-cal transformation for all standardized quantity data, we carriedout the Student’s t-test for the expression levels betweenaverages of the RA and OA synovial tissues.
SUPPLEMENTARY MATERIALS
Supplementary material is available at HMG Online.
ELECTRONIC DATABASE INFORMATION
Information on the physical map of microsatellites and primersequences used for their amplification in this study have beendeposited in Genbank and given the accession numbers pro-vided in Supplementary Material Table 7 (Fig. 1) and alsoavailable at the JBIRC (Japan Biological Information ResearchCenter) homepage (http://www.jbirc.aist.go.jp/gdbs/).
ACKNOWLEDGEMENTS
We would like to thank M. Tomizawa, E. Tokubo, A. Takaki,H. Ando, S. Adachi, K. Yoshida, Y. Makino, K. Kobayashi,T. Shinomiya, S. Harada, M. Matsuzawa and S. Yamamotofor technical assistance, T. Ichihara (Nisshinbo Research andDevelopment Center), N. Yasuda and T. Tamura (JBIRC),S. Hashimoto and H. Sano (JBiC), Y. Eguchi (MKI),M. Morikawa (GenoDive Pharm) for suggestions or help inthis work and finally J.-L. Mandel, M. Koenig (both atIGBMC) and J. Sibilia (Strasbourg University Hospital) forcritical reading of the manuscript. This work was performedunder the management of Japan Biological InformaticsConsortium (JBIC) and supported by grants from the NewEnergy and Industrial Technology Development Organization(NEDO). This research was also supported by ‘Special Coordi-nation Funds for Promoting Science and Technology’ from theJapan Science and Technology Agency and ‘Research for theFuture Program’ from the Japan Society for the PromotionScience. S.B. and H.I. wish to thank an INSERM-JSPS colla-borative grant. Funding to pay the Open Access publicationcharges for this article was provided by the grant from NEDO.
Conflict of Interest Statement. None declared.
REFERENCES
1. Reich, D.E. and Lander, E.S. (2001) On the allelic spectrum of humandisease.Trends Genet., 17, 502–510.
2. Risch, N. and Merikangas, K. (1996) The future of genetic studies ofcomplex human diseases. Science, 273, 1516–1517.
3. The International HapMap Consortium. (2003) The International HapMapProject. Nature, 426, 789–796.
4. Oka, A., Tamiya, G., Tomizawa, M., Ota, M., Katsuyama, Y., Makino, S.,Shiina, T., Yoshitome, M., Iizuka, M., Sasao, Y. et al. (1999) Associationanalysis using refined microsatellite markers localizes a susceptible locusfor psoriasis vulgaris within a 111 kb segment telomeric of the HLA-C
gene. Hum. Mol. Genet., 8, 2165–2170.5. Ota, M., Mizuki N., Katsuyama, Y., Tamiya, G., Shiina, T., Oka, A.,
Ando, H., Kimura, M., Goto, K., Ohno, S. et al. (1999) The critical regionfor Behcet’s disease in the human major histocompatibility complex isreduced to a 46 kb segment centromeric of HLA-B by association analysisusing refined microsatellite mapping. Am. J. Hum. Genet., 64, 1406–1410.
6. Keicho, N., Ohashi, J., Tamiya, G., Nakata, K., Taguchi, Y., Azuma, A.,Ohishi, N., Emi, M., Park, M.H., Inoko, H. et al. (2000) Fine localizationof a major disease-susceptibility locus for diffuse panbronchiolitis.Am. J. Hum. Genet., 66, 501–507.
7. Mizuki, N., Ota, M., Yabuki, K., Katsuyama, Y., Ando, H., Palimeris,G.D., Kaklamani, E., Accorinti, M., Pivetti-Pezzi, P., Ohno, S. et al.(2000) Localization of the pathogenic gene of Behcet’s disease bymicrosatellite analysis of three different populations. Invest. Ophthalmol.Vis. Sci., 41, 3702–3708.
8. Abecasis, D.R., Noguchi, E., Heinzmann, A., Traherne, J.A.,Bhattacharyya, S., Leaves, N.I., Anderson, G.G., Zhang, Y., Lench, N.J.,Carey, A. et al. (2001) Extent and distribution of linkage disequilibrium inthree genomic regions. Am. J. Hum. Genet., 68, 191–197.
9. Ota, M., Katsuyama, Y., Kimura, A., Tsuchiya, K., Kondo, M.,Naruse, T., Mizuki, N., Itoh, K., Sasazuki, T. and Inoko, H. (2001) Asecond susceptibility gene for developing rheumatoid arthritis in thehuman MHC is localized within a 70 kb interval telomeric of the TNF
genes in the HLA class III region. Genomics, 71, 263–270.
10. Matsuzaka, Y., Makino, S., Okamoto, K., Oka, A., Tsujimura, A.,Matsumiya, K., Takahara, S., Okuyama, A., Sada, M., Gotoh, R. et al.(2002) Susceptibility locus for non-obstructive azoospermia is localizedwithin the HLA-DR/DQ subregion: primary role of DQB1�0604. TissueAntigens, 60, 53–63.
11. Oka, A., Hayashi, H., Tomizawa, M., Okamoto, K., Suyun, L., Hui, J.,Kulski, J.K., Beilby, J., Tamiya, G. and Inoko, H. (2003) Localization of anon-melanoma skin cancer susceptibility region within the majorhistocompatibility complex by association analysis using microsatellitemarkers. Tissue Antigens, 61, 203–210.
12. Zhang, Y., Leaves, N.I., Anderson, G.G., Ponting, C.P., Broxholme, J.,Holt, R., Edser, P., Bhattacharyya, S., Dunham, A., Adcock, I.M. et al.(2003) Positional cloning of a quantitative trait locus on chromosome13q14 that influences immunoglobulin E levels and asthma. Nat. Genet.,34, 181–186.
13. Koch, H.G., McClay, J., Loh, E.W., Higuchi, S., Zhao., J.H., Sham, P.,Ball, D. and Craig, I.W. (2000) Allele association studies with SSR andSNP markers at known physical distances within a 1 Mb regionembracing the ALDH2 locus in the Japanese, demonstrates linkagedisequilibrium extending up to 400 kb. Hum. Mol. Genet., 9,2993–2999.
14. Mohlke, K.L., Lange, E.M., Valle, T.T., Ghosh, S., Magnuson, V.L.,Silander, K., Watanabe, R.M., Chines, P.S., Bergman, R.N., Tuomilehto, J.et al. (2001) Linkage disequilibrium between microsatellite markersextends beyond 1 cM on chromosome 20 in Finns. Genome Res., 11,1221–1226.
15. Terwilliger, J.D., Haghighi, F., Hiekkalinna, T.S. and Goring, H.H. (2002)A biased assessment of the use of SNPs in human complex traits. Curr.Opin. Genet. Dev., 12, 726–734.
16. Shifman, S., Kuypers, J., Kokoris, M., Yakir, B. and Darvasi, A. (2003).Linkage disequilibrium patterns of the human genome across populations.Hum. Mol. Genet., 12, 771–776.
17. Varilo, T., Paunio, T., Parker, A., Perola, M., Meyer, J., Terwilliger. J.D.and Peltonen, L. (2003) The interval of linkage disequilibrium (LD)detected with microsatellite and SNP markers in chromosomes of Finnishpopulations with different histories. Hum. Mol. Genet., 12, 51–59.
Human Molecular Genetics, 2005, Vol. 14, No. 16 2319
by guest on Novem
ber 9, 2015http://hm
g.oxfordjournals.org/D
ownloaded from

18. Ohashi, J. and Tokunaga, K. (2003) Power of genome-wide linkagedisequilibrium testing by using microsatellite markers. J. Hum. Genet., 48,487–491.
19. Okamoto, K., Makino, S., Yoshikawa, Y., Takaki, A., Nagatsuka, Y.,Ota, M., Tamiya, G., Kimura, A., Bahram, S. and Inoko, H. (2003)Identification of I kappa BL as the second major histocompatibilitycomplex-linked susceptibility locus for rheumatoid arthritis. Am. J. Hum.Genet., 72, 303–312.
20. Walsh, E.C., Mather, K.A., Schaffner, S.F., Farwell, L., Daly, M.J.,Patterson, N., Cullen, M., Carrington, M., Bugawan, T.L., Erlich, H. et al.(2003) An integrated haplotype map of the human majorhistocompatibility complex. Am. J. Hum. Genet., 73, 580–590.
21. Barcellos, L.F., Klitz, W., Field, L.L., Tobias, R., Bowcock, A.M.,Wilson, R., Nelson, M.P., Nagatomi, J. and Thomson, G. (1997)Association mapping of disease loci, by use of a pooled DNA genomicscreen. Am. J. Hum. Genet., 61, 734–747.
22. Saito, A. and Kamatani, N. (2002) Strategies for genome-wide associationstudies: optimization of study designs by the stepwise focusing method.J. Hum. Genet., 47, 360–365.
23. Sham, P.C., Bader, J.S., Craig, I., O’Donovan, M. and Owen, M. (2002)DNA pooling: a tool for large-scale association studies. Nat. Rev. Genet.,3, 862–871.
24. Collins, H.E., Li, H., Inda, S.E., Anderson, J., Laiho, K., Tuomilehto, J.and Seldin, M.F. (2000) A simple and accurate method for determinationof microsatellite total allele content differences between DNA pools.Hum. Genet., 106, 218–226.
25. Pritchard, J.K. and Rosenberg, N.A. (1999) Use of unlinked geneticmarkers to detect population stratification in association studies.Am. J. Hum. Genet., 65, 220–228.
26. Risch, N.J. (2000) Searching for genetic determinants in the newmillennium. Nature, 405, 847–856.
27. Shaw, S.H., Carrasquillo, M.M., Kashuk, C., Puffenberger, E.G. andChakravarti, A. (1998) Allele frequency distributions in pooled DNAsamples: applications to mapping complex disease genes. Genome Res., 8,111–123.
28. Daly, M.J., Rioux, J.D., Schaffner, S.F., Hudson, T.J. and Lander, E.S.(2001) High-resolution haplotype structure in the human genome. Nat.Genet., 29, 229–232.
29. Wakitani, S., Murata, N., Toda, Y., Ogawa, R., Kaneshige, T.,Nishimura, Y. and Ochi, T. (1997) The relationship between HLA-DRB1alleles and disease subsets of rheumatoid arthritis in Japanese.Br. J. Rheumatol., 36, 630–636.
30. Shibue, T., Tsuchiya, N., Komata, T., Matsushita, M., Shiota, M.,Ohashi, J., Wakui, M., Matsuta, K. and Tokunaga, K. (2000) Tumornecrosis factor alpha 50-flanking region, tumor necrosis factor receptor II,and HLA-DRB1 polymorphisms in Japanese patients with rheumatoidarthritis. Arthritis Rheum., 43, 753–757.
31. Yung, Yu.C., Yang, Z., Blanchong, C.A. and Miller, W. (2000) Thehuman and mouse MHC class III region: a parade of 21 genes at thecentromeric segment. Immunol. Today, 21, 320–328.
32. Mao, J.R., Taylor, G., Dean, W.B., Wagner, D.R., Afzal, V., Lotz, J.C.,Rubin, E.M. and Bristow, J. (2002) Tenascin-X deficiency mimicsEhlers–Danlos syndrome in mice through alteration of collagendeposition. Nat. Genet., 30, 421–425.
33. Gonzalez-Gay, M.A., Garcia-Porrua, C. and Hajeer, A.H. (2002) Influenceof human leukocyte antigen-DRB1 on the susceptibility and severity ofrheumatoid arthritis. Semin. Arthritis Rheum., 31, 355–360.
34. Zhang, Z. and Gerstein, M. (2003) Identification and characterization ofover 100 mitochondrial ribosomal protein pseudogenes in the humangenome. Genomics, 81, 468–480.
35. Hesselink, M.K., Mensink, M. and Schrauwen, P. (2003) Humanuncoupling protein-3 and obesity: an update. Obes. Res., 11, 1429–1443.
36. Smith, T.F, Gaitatzes, C., Saxena, K. and Neer, E.J. (1999) The WDrepeat: a common architecture f or diverse functions. Trends Biochem.Sci., 24, 181–185.
37. Rezaie, T., Child, A., Hitchings, R., Brice, G., Miller, L.,Coca-Prados, M., Heon, E., Krupin, T., Ritch, R., Kreutzer, D. et al.(2002) Adult-onset primary open-angle glaucoma caused by mutations inoptineurin. Science, 295, 1077–1079.
38. Suzuki, A., Yamada, R., Chang, X., Tokuhiro, S., Sawada, T., Suzuki, M.,Nagasaki, M, Nakayama-Hamada, M., Kawaida, R., Ono, M. et al. (2003)Functional haplotypes of PADI4, encoding citrullinating enzyme
peptidylarginine deiminase 4, are associated with rheumatoid arthritis.Nat. Genet., 34, 395–402.
39. Tokuhiro, S., Yamada, R., Chang, X., Suzuki, A., Kochi, Y., Sawada, T.,Suzuki, M., Nagasaki, M., Ohtsuki, M., Ono, M. et al. (2003) An intronicSNP in RUNX1 binding site of SLC22A4, encoding an organic cationtransporter, is associated with rheumatoid arthritis. Nat. Genet., 35,341–348.
40. Begovich, A.B., Carlton, V.E., Honigberg, L.A., Schrodi, S.J.,Chokkalingam, A.P., Alexander, H.C., Ardlie, K.G., Huang, Q.,Smith, A.M., Spoerke, J.M. et al. (2004) A missense single-nucleotidepolymorphism in a gene encoding a protein tyrosine phosphatase(PTPN22) is associated with rheumatoid arthritis. Am. J. Hum. Genet., 75,330–337.
41. Murray, J.C., Buetow, K.H., Weber, J.L., Ludwigsen, S.,Scherpbier-Heddema, T., Manion, F., Quillen, J., Sheffield, V.C.,Sunden, S., Duyk, G.M. et al. (1994) A comprehensive human linkagemap with centimorgan density. Cooperative Human Linkage Center(CHLC). Science, 265, 2049–2054.
42. Dib, C., Faure, S., Fizames, C., Samson, D., Drouot, N., Vignal, A.,Millasseau, P., Marc, S., Hazan, J., Seboun, E., et al. (1996) Acomprehensive genetic map of the human genome based on 5264microsatellites. Nature, 380, 152–154.
43. Kong, A., Gudbjartsson, D.F., Sainz, J., Jonsdottir, G.M.,Gudjonsson, S.A., Richardsson, B., Sigurdardottir, S., Barnard, J.,Hallbeck, B., Masson, G., et al. (2002) A high-resolution recombinationmap of the human genome. Nat. Genet., 31, 241–247.
44. Ott, J. and Rabinowitz, D. (1997) The effect of marker heterozygosityon the power to detect linkage disequilibrium. Genetics, 147, 927–930.
45. Chapman, N.H. and Wijsman, E.M. (1998) Genome screens using linkagedisequilibrium tests: optimal marker characteristics and feasibility.Am. J. Hum. Genet., 63, 1872–1885.
46. Sham, P.C., Zhao, J.H. and Curtis, D. (2000) The effect of markercharacteristics on the power to detect linkage disequilibrium due to singleor multiple ancestral mutations. Ann. Hum. Genet., 64, 161–169.
47. Gray, I.C., Campbell, D.A. and Spurr, N.K. (2000) Single nucleotidepolymorphisms as tools in human genetics.Hum.Mol. Genet., 9, 2403–2408.
48. Li, S., Kawata, H., Katsuyama, Y., Ota, M., Morishima, Y., Mano, S.,Kulski, J.K., Naruse, T. and Inoko, H. (2004) Association of polymorphicMHC microsatellites with GDVH, survival and leukemia relapse intranslated hematopoietic stem cell transplant donor/recipient matched at5 HLA loci. Tissue Antigens, 63, 362–368.
49. Bergstrom, T.F., Josefsson, A., Erlich, H.A. and Gyllensten, U. (1998)Recent origin of HLA-DRB1 alleles and implications for humanevolution. Nat. Genet., 18, 237–242.
50. Cullen, M., Perfetto, S.P., Klitz, W., Nelson, G. and Carrington, M.(2002) High-resolution patterns of meiotic recombination across thehuman major histocompatibility complex. Am. J. Hum.Genet., 71,759–776.
51. Jawaheer, D., Li, W., Graham, R.R., Chen, W., Damle, A., Xiao, X.,Monteiro, J., Khalili, H., Lee, A., Lundsten, R., et al. (2002) Dissectingthe genetic complexity of the association between human leukocyteantigens and rheumatoid arthritis. Am. J. Hum. Genet., 71, 585–594.
52. Moore, A.R. (2003) Collagen-induced arthritis. Methods Mol. Biol., 225,175–179 (2003).
53. Li, T., Warris, V., Ma, J., Lassus, J., Yoshida, T., Santavirta, S.,Virtanen, I. and Konttinen, Y.T. (2000) Distribution of tenascin-X indifferent synovial samples and synovial membrane-like interface tissue fromaseptic loosening of total hip replacement. Rheumatol. Int., 19, 177–183.
54. Ando, K., Kanazawa, S., Tetsuka, T., Ohta, S., Jiang, X., Tada, T.,Kobayashi, M., Matsui, N. and Okamoto, T. (2003) Induction of Notchsignaling by tumor necrosis factor in rheumatoid synovial fibroblasts.Oncogene, 22, 7796–7803.
55. Cardon, L.R. and Abecasis, G.R. (2003) Using haplotype blocks to maphuman complex trait loci. Trends Genet., 19, 135–140.
56. Mateu, E., Perez-Lezaun, A., Martinez-Arias, R., Andres, A., Valles, M.,Bertranpetit, J. and Calafell, F. (2002) PKLR—GBA region shows almostcomplete linkage disequilibrium over 70 kb in a set of worldwidepopulations. Hum. Genet. 110, 532–544.
57. Gianfrancesco, F., Esposito, T., Ombra, M.N., Forabosco, P.,Maninchedda, G., Fattorini, M., Casula, S., Vaccargiu, S., Casu, G.,Cardia, F., et al. (2003) Identification of a novel gene and a commonvariant associated with uric acid nephrolithiasis in a Sardinian geneticisolate. Am. J. Hum. Genet., 72, 1479–1491.
2320 Human Molecular Genetics, 2005, Vol. 14, No. 16
by guest on Novem
ber 9, 2015http://hm
g.oxfordjournals.org/D
ownloaded from

58. Smith, C.A. and Arnett, F.C. Jr. (1991) Diagnosing rheumatoid arthritis:current criteria. Am. Fam. Physician, 44, 863–870.
59. Akane, A., Shiono, H., Matsubara, K., Nakahori, Y., Seki, S.,Nagafuchi, S., Yamada, M. and Nakagome, Y. (2001) Sexidentification of forensic specimens by polymerase chainreaction (PCR): two alternative methods. Forensic Sci. Int.,49, 81–88.
60. Voorter, C.E., Rozemuller, E.H., de Bruyn-Geraets, D.,van der Zwan, A.W., Tilanus, M.G. and van den Berg-Loonen, E.M.(1997) Comparison of DRB sequence-based typing using differentstrategies. Tissue Antigens, 49, 471–476.
61. Dawson, E., Abecasis, G.R., Bumpstead, S., Chen, Y., Hunt, S.,Beare, D.M., Pabial, J., Dibling, T., Tinsley, E., Kirby, S. et al. (2002) Afirst-generation linkage disequilibrium map of human chromosome 22.Nature, 418, 544–548.
62. Gabriel, S.B., Schaffner, S.F., Nguyen, H., Moore, J.M., Roy, J.,Blumenstiel, B., Higgins, J., DeFelice, M., Lochner, A., Faggart, M. et al.(2002) The structure of haplotype blocks in the human genome. Science,296, 2225–2229.
63. Clark, A.G. (1990) Inference of haplotypes from PCR-amplified samplesof diploid populations. Mol. Biol. Evol. 7, 111–122.
64. Mano, S., Yasuda, N., Katoh, T., Tounai, K., Inoko, H., Imanishi, T.,Tamiya, G. and Gojobori, T. (2004) Notes on the maximumlikelihood estimation of haplotype frequencies. Ann. Hum. Genet., 68,257–264.
65. Hashimoto, A., Endo, H., Hayashi, I., Murakami, Y., Kitasato, H.,Kono, S., Matsui, T., Tanaka, S., Nishimura, A., Urabe, K. et al. (2003)Differential expression of leukotriene B4 receptor subtypes (BLT1 andBLT2) in human synovial tissues and synovial fluid leukocytes of patientswith rheumatoid arthritis. J. Rheumatol., 30, 1712–1718.
Human Molecular Genetics, 2005, Vol. 14, No. 16 2321
by guest on Novem
ber 9, 2015http://hm
g.oxfordjournals.org/D
ownloaded from