optimized whole-genome amplification strategy for extremely at-biased template
TRANSCRIPT

Optimized Whole-Genome Amplification Strategy for ExtremelyAT-Biased Template
SAMUEL O. Oyola1,*, MAGNUS Manske1, SUSANA Campino1, ANTOINE Claessens1, WILLIAM L. Hamilton1,MIHIR Kekre1, ELEANOR Drury1, DANIEL Mead1, YONG Gu1, ALISTAIR Miles2,3, BRONWYN MacInnis1,2,CHRIS Newbold1,4, MATTHEW Berriman1, and DOMINIC P. Kwiatkowski1,2,3
Wellcome Trust Sanger Institute, Hinxton, UK1; MRC Centre for Genomics and Global Health, University of Oxford,Oxford OX3 7BN, UK2; Wellcome Trust Centre for Human Genetics, University of Oxford, Oxford OX3 7BN, UK3 andWeatherall Institute of Molecular Medicine, University of Oxford, Oxford OX3 9DS, UK4
*To whom correspondence should be addressed. Tel. þ44 1223-494-994. Fax. þ44 1223-494-919.Email: [email protected]
Edited by Dr Yuji Kohara(Received 9 June 2014; accepted 22 August 2014)
AbstractPathogen genome sequencing directly from clinical samples is quickly gaining importance in genetic
and medical research studies. However, low DNA yield from blood-borne pathogens is often a limitingfactor. The problem worsens in extremely base-biased genomes such as the AT-rich Plasmodium falciparum.We present a strategy for whole-genome amplification (WGA) of low-yield samples from P. falciparum prior toshort-read sequencing. We have developed WGA conditions that incorporate tetramethylammoniumchloride for improved amplification and coverage of AT-rich regions of the genome. We show that thismethod reduces amplification bias and chimera formation. Our data show that this method is suitable foras low as 10 pg input DNA, and offers the possibility of sequencing the parasite genome from small bloodsamples.Key words: whole-genome amplification; AT-rich; malaria; tetramethylammonium chloride
1. Introduction
Timely detection of emerging genetic variants andother evolutionary features associated with importantclinical phenotypes such as increased virulence anddrug resistance are central to malaria control strategies.Genome sequencing of parasite populations has beenidentified as an effective tool for detecting geneticchanges.1,2 Despite the current success in the sequen-cing technology, there remain significant challengesinachievingglobal genetic surveillance ofparasite popu-lations in the field. Most genome-scale analyses, such aswhole-genome sequencing, require large amounts ofclean genetic material that is often difficult to obtain,3
and therefore a serious impediment to genetic analysison many clinical samples. A large number of valuableclinical specimens are collected in the form of smallsamples that yield low quantity and quality of genetic
material.4–7 A common method for collecting clinicalsamples in the field is through heel/finger-pricks.5,7–10
However, the quantityand qualityof parasite genetic ma-terial that can be extracted from these small bloodsamples usually fall below the threshold required bygenome sequencing platforms.
To alleviate the problem of low DNA quantities,whole-genome amplification (WGA) is now routinelyapplied in many applications,3,11 but has yet to be opti-mized for use in genomes of extreme base compositionsuch as Plasmodium falciparum. Two major forms of WGAhavebeendescribed:multipledisplacementamplification(MDA)12,13 and PCR-based amplification methods.14,15
MDA has been the method of choice for a wider rangeof genome amplification studies, because it produceslonger DNA products with extensive genome coverage.16
MDA is based on w29 polymerase, which, in thepresence of random hexamers annealed to denatured
# The Author 2014. Published by Oxford University Press on behalf of Kazusa DNA Research Institute.This is an Open Access article distributed under the terms of the Creative Commons Attribution License (http://creativecommons.org/licenses/by/4.0/),which permits unrestricted reuse, distribution, and reproduction in any medium, provided the original work is properly cited.
DNA RESEARCH pp. 1–11, (2014) doi:10.1093/dnares/dsu028
DNA Research Advance Access published September 19, 2014 at W
ellcome T
rust Genom
e Cam
pus on September 30, 2014
http://dnaresearch.oxfordjournals.org/D
ownloaded from

DNA, uses an MDA mechanism to synthesize high-mo-lecular-weight DNA from very minute amountsof inputmaterial under isothermal conditions.17,18 The bestresults, however, have been obtained from genomeswith relatively balanced base composition.11,19,20
Amplification of genomes with imbalanced base com-position, such as the AT-rich P. falciparum, has remaineda challenge.21,22
In this study, we sought to identify and optimize aWGA system suitable for an AT-base-biased genome ofP. falciparum. Using standard conditions as outlinedfor each system, we tested the efficiency of non-MDA-and MDA-based methods. Initial findings showed thatMDA-based systems produced a more uniform genomecoverage than non-MDA methods (data not shown).We have optimized an identified MDA system to pro-duce an improved genome coverage and a reducedbase-bias with more accurate genome representation.We show that our optimized WGA conditions aresuitable for as low as 10 picograms (pg) P. falciparuminput DNA, producing high-sequence concordancewith unamplified genomic DNA. This developmentpromises a significant tool to aid implementation ofthe global genetic surveillance of parasite populationsthrough small blood sample sequencing.
2. Materials and methods
2.1. DNA samplesPlasmodium falciparum 3D7 genomic DNA was a gift
fromProf.ChrisNewbold (Universityof Oxford). Theclin-ical isolates were obtained from the Malaria GeneticsGroup’s Sequencing Sample Repository at the WellcomeTrust Sanger Institute.Other genomic DNAwas extractedfrom 17 progeny clones of P. falciparum strains derivedfrom genetic cross between 7G8xGB423 and a 3D7 strain(3D7_glasgow).
2.2. Whole-genome amplificationAll non-MDAWGAwere performed following individ-
ual kit manufacturer’s instructions. MDA-based WGAwas performed using either REPLI-g Mini kit (Qiagen)or Genomiphi kit (GE Healthcare). For Genomiphi, thekit manufacturer’s instructions were followed withoutmodification. For the REPLI-g Mini kit, manufacturer’sinstructions were followed during preliminary tests.The following modifications were performed in devel-oping optimized conditions for the REPLI-g Mini kit: nu-clease-free water and all tubes were UV-treated beforeuse. WGA reactions were performed in 0.2 ml PCRtubes. Buffer D1 stock solution (Qiagen) was reconsti-tuted by adding 500 ml of nuclease-free water, and aworking solution was prepared by mixing the stock so-lution and nuclease-free water in the ratio of 1 : 3.5, re-spectively. Unmodified Buffer N1 was reconstituted by
mixing Stop solution (Qiagen) and nuclease-freewater in the ratio of 1 : 5.7. Modified buffer N1 was pre-pared by including tetramethylammonium chloride(TMAC) at a concentration of 300 mM. To denatureDNA templates, 5 ml of the DNA solution was mixedwith 5 ml of buffer D1 (working solution prepared asdescribed above). The mixture was vortexed and centri-fuged briefly before incubating at room temperaturefor 3 min. Denatured DNA was neutralized by adding10 ml of either unmodified or modified buffer N1.Neutralized DNA was mixed by vortexing and centri-fuged briefly. To amplify the DNA template, denaturedand neutralized samplewasmixed with 29 ml of REPLI-gMini Reaction Buffer and 1 ml of REPLI-g Mini DNA poly-merase to obtain a final reaction volume of 50 ml. Thereaction mixture was incubated at 308C for 16 h usingan MJ Research PTC-225 thermal cycling system (GMI,Inc., USA) with the heating lid set to track at þ58C.Amplified DNA was cleaned using Agencourt AmpureXP beads (Beckman Coulter) using sample to beadsratio of 1 : 1 and eluted with 50 ml of EB (Qiagen).
2.3. Illumina library preparation and sequencingAll sequencing libraries were prepared as PCR-free.
Whole-genome amplified or unamplified genomicDNA (1.5 mg in 75 ml of TE buffer) was sheared using aCovaris S2 (Covaris, Inc., Woburn, MA, USA) to obtaina fragment-size distribution of �300 to �600 bp.The sheared DNA fragments were end-repaired and A-tailed using the NEBNext DNA sample preparation kit(NEB), following an Illumina sample preparation proto-col. Pre-annealed paired-end Illumina PCR-free adap-ters were ligated to the A-tailed fragments in a 50-mlreaction containing 10 ml of DNA sample, 1� QuickT4 DNA ligase buffer, 10 ml of PCR-free PE-adaptermixture, 5 ml of Quick T4 DNA ligase (NEB) and incu-bated at 208C for 30 min. The ligation reaction wascleaned twice using Agencourt Ampure XP beads(Beckman Coulter). Cleaned DNA was eluted with20 ml of buffer EB. Aliquots were analysed using anAgilent 2100 Bioanalyzer (Agilent Technologies) todetermine the size distribution and to check foradapter contamination. Samples were sequencedusing either IlluminaHiseq 2500 orMiseq technologies(San Diego, CA, USA) with 75 bp read length andthe paired-end read options. Corresponding WGA andnon-WGA samples were run in the same lanes, using dif-ferent multiplex tags. This strategy reduces potentialconfounding artefacts relating to sequencing chemistry.
2.4. Read mapping and genotype concordance analysisReadsweremappedagainsttheP. falciparumreference
sequence (http://plasmodb.org/common/downloads/release-10.0/Pfalciparum3D7/fasta/data/), using BWA(V0.6.2). We analysed the genotype calls from 17
Page 2 of 11 Whole-Genome Amplification for AT-Rich Templates
at Wellcom
e Trust G
enome C
ampus on Septem
ber 30, 2014http://dnaresearch.oxfordjournals.org/
Dow
nloaded from
samples derived from the progeny clones of geneticcrosses of 7G8xGB4 laboratory strains,23 including oneparent reference strain 3D7 as a control. For genotypeconcordance analysis, we generated de novo variationcalls using samtools (V0.1.1.19) mpileup and bfctools(V0.1.17), calling on both WGA and non-WGA samples.For in silico genotyping, we used a list of 20 737 high-quality single-nucleotide polymorphism (SNP) positionsand alleles generated from the sequence of geneticcrosses (unpublished data). We performed in silico geno-typing of both the WGA and non-WGA samples usingsamtools mpileup and counting alleles present in atleast five reads.
3. Results
3.1. WGA using standard methodsWeperformedtestsonvariousWGA systemsto identify
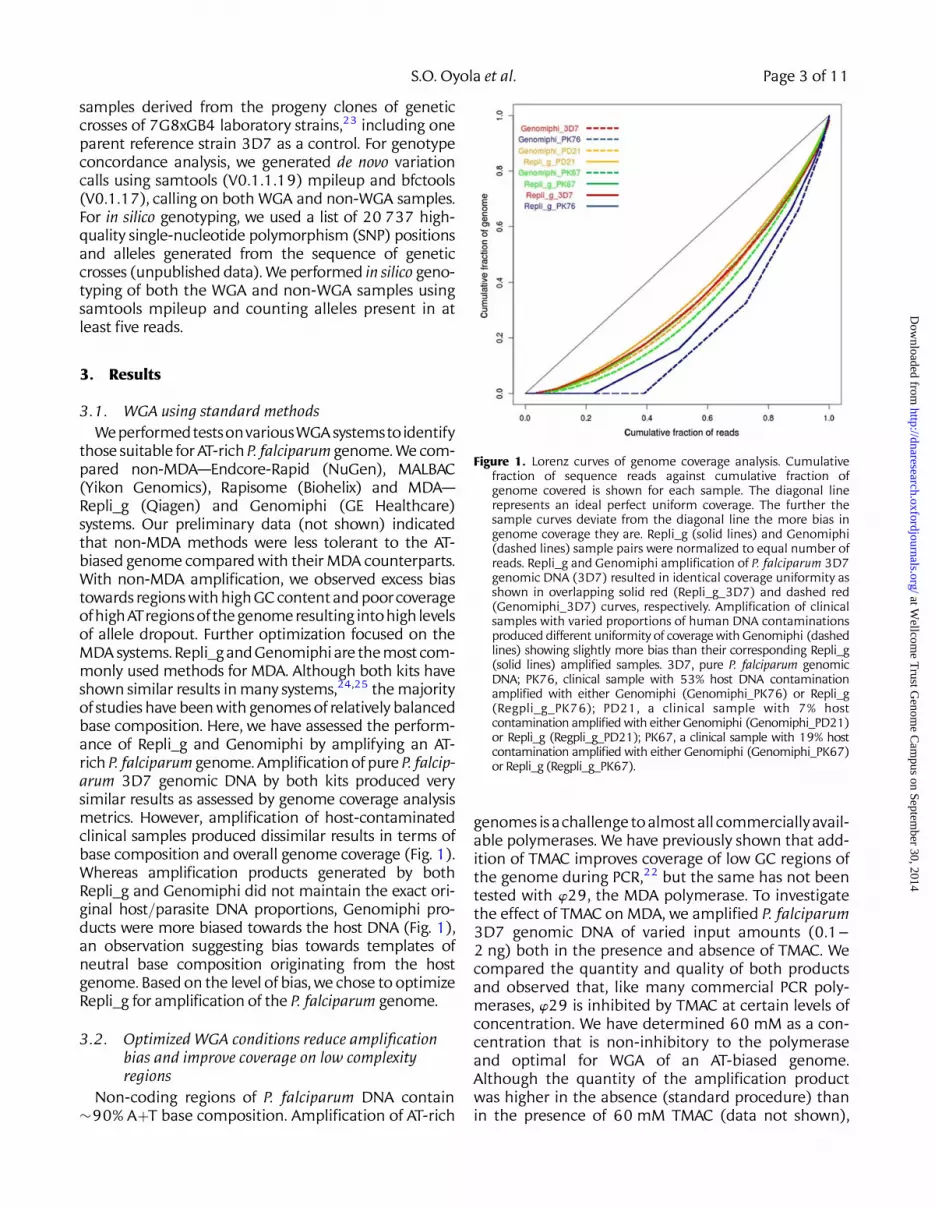
those suitable for AT-rich P. falciparum genome. We com-pared non-MDA—Endcore-Rapid (NuGen), MALBAC(Yikon Genomics), Rapisome (Biohelix) and MDA—Repli_g (Qiagen) and Genomiphi (GE Healthcare)systems. Our preliminary data (not shown) indicatedthat non-MDA methods were less tolerant to the AT-biased genome compared with their MDA counterparts.With non-MDA amplification, we observed excess biastowards regions with high GC contentand poorcoverageofhighATregionsof thegenomeresulting intohigh levelsof allele dropout. Further optimization focused on theMDA systems. Repli_g and Genomiphi are themost com-monly used methods for MDA. Although both kits haveshown similar results in many systems,24,25 the majorityof studies have been with genomes of relatively balancedbase composition. Here, we have assessed the perform-ance of Repli_g and Genomiphi by amplifying an AT-rich P. falciparum genome. Amplification of pure P. falcip-arum 3D7 genomic DNA by both kits produced verysimilar results as assessed by genome coverage analysismetrics. However, amplification of host-contaminatedclinical samples produced dissimilar results in terms ofbase composition and overall genome coverage (Fig. 1).Whereas amplification products generated by bothRepli_g and Genomiphi did not maintain the exact ori-ginal host/parasite DNA proportions, Genomiphi pro-ducts were more biased towards the host DNA (Fig. 1),an observation suggesting bias towards templates ofneutral base composition originating from the hostgenome. Based on the level of bias, we chose to optimizeRepli_g for amplification of the P. falciparum genome.
3.2. Optimized WGA conditions reduce amplificationbias and improve coverage on low complexityregions
Non-coding regions of P. falciparum DNA contain�90% AþT base composition. Amplification of AT-rich
genomes is achallenge to almostall commerciallyavail-able polymerases. We have previously shown that add-ition of TMAC improves coverage of low GC regions ofthe genome during PCR,22 but the same has not beentested with w29, the MDA polymerase. To investigatethe effect of TMAC on MDA, we amplified P. falciparum3D7 genomic DNA of varied input amounts (0.1–2 ng) both in the presence and absence of TMAC. Wecompared the quantity and quality of both productsand observed that, like many commercial PCR poly-merases, w29 is inhibited by TMAC at certain levels ofconcentration. We have determined 60 mM as a con-centration that is non-inhibitory to the polymeraseand optimal for WGA of an AT-biased genome.Although the quantity of the amplification productwas higher in the absence (standard procedure) thanin the presence of 60 mM TMAC (data not shown),
Figure 1. Lorenz curves of genome coverage analysis. Cumulativefraction of sequence reads against cumulative fraction ofgenome covered is shown for each sample. The diagonal linerepresents an ideal perfect uniform coverage. The further thesample curves deviate from the diagonal line the more bias ingenome coverage they are. Repli_g (solid lines) and Genomiphi(dashed lines) sample pairs were normalized to equal number ofreads. Repli_g and Genomiphi amplification of P. falciparum 3D7genomic DNA (3D7) resulted in identical coverage uniformity asshown in overlapping solid red (Repli_g_3D7) and dashed red(Genomiphi_3D7) curves, respectively. Amplification of clinicalsamples with varied proportions of human DNA contaminationsproduced different uniformity of coverage with Genomiphi (dashedlines) showing slightly more bias than their corresponding Repli_g(solid lines) amplified samples. 3D7, pure P. falciparum genomicDNA; PK76, clinical sample with 53% host DNA contaminationamplified with either Genomiphi (Genomiphi_PK76) or Repli_g(Regpli_g_PK76); PD21, a clinical sample with 7% hostcontamination amplified with either Genomiphi (Genomiphi_PD21)or Repli_g (Regpli_g_PD21); PK67, a clinical sample with 19% hostcontamination amplified with either Genomiphi (Genomiphi_PK67)or Repli_g (Regpli_g_PK67).
S.O. Oyola et al. Page 3 of 11
at Wellcom
e Trust G
enome C
ampus on Septem
ber 30, 2014http://dnaresearch.oxfordjournals.org/
Dow
nloaded from
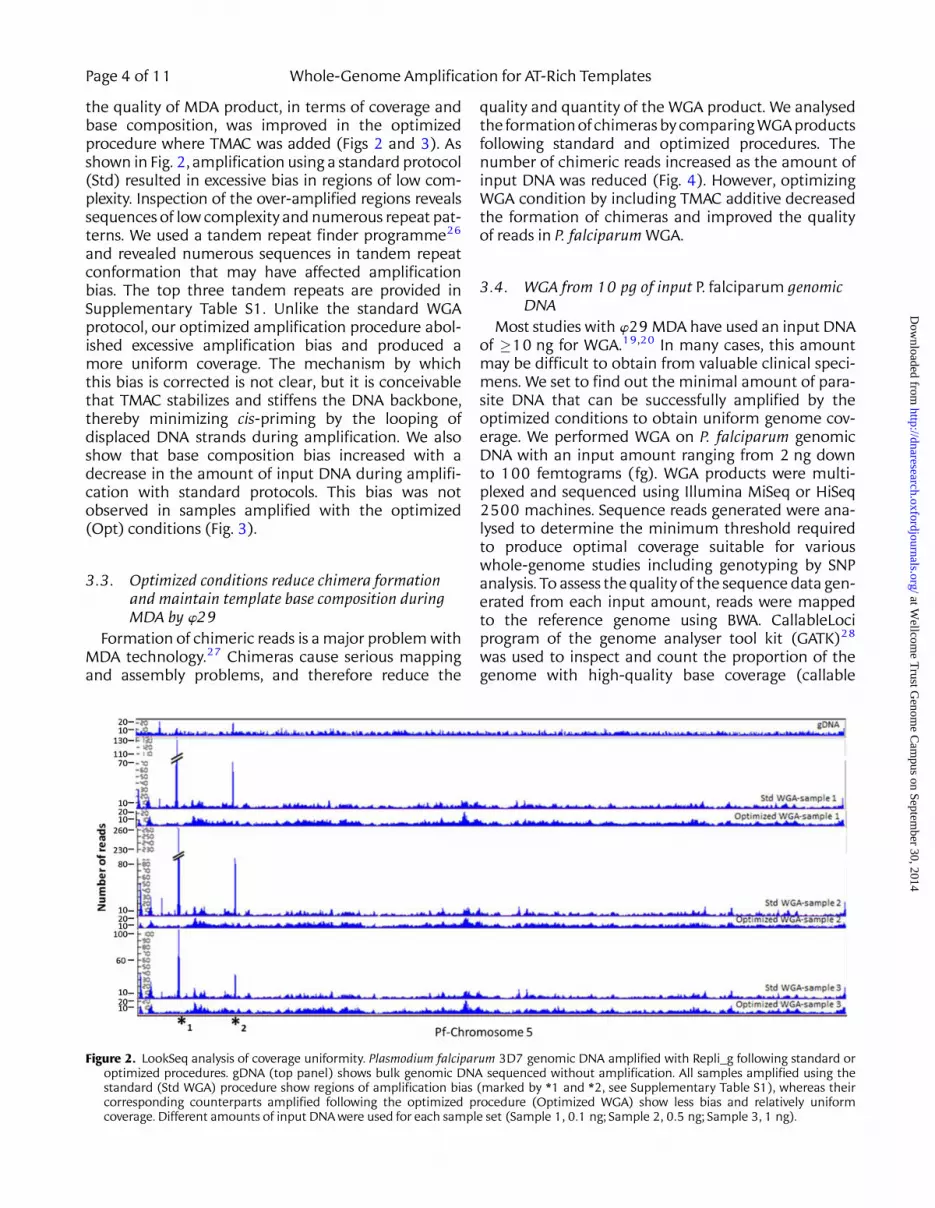
the quality of MDA product, in terms of coverage andbase composition, was improved in the optimizedprocedure where TMAC was added (Figs 2 and 3). Asshown in Fig. 2, amplification using a standard protocol(Std) resulted in excessive bias in regions of low com-plexity. Inspection of the over-amplified regions revealssequences of low complexity and numerous repeat pat-terns. We used a tandem repeat finder programme26
and revealed numerous sequences in tandem repeatconformation that may have affected amplificationbias. The top three tandem repeats are provided inSupplementary Table S1. Unlike the standard WGAprotocol, our optimized amplification procedure abol-ished excessive amplification bias and produced amore uniform coverage. The mechanism by whichthis bias is corrected is not clear, but it is conceivablethat TMAC stabilizes and stiffens the DNA backbone,thereby minimizing cis-priming by the looping ofdisplaced DNA strands during amplification. We alsoshow that base composition bias increased with adecrease in the amount of input DNA during amplifi-cation with standard protocols. This bias was notobserved in samples amplified with the optimized(Opt) conditions (Fig. 3).
3.3. Optimized conditions reduce chimera formationand maintain template base composition duringMDA by w29
Formation of chimeric reads is a major problem withMDA technology.27 Chimeras cause serious mappingand assembly problems, and therefore reduce the
quality and quantity of the WGA product. We analysedthe formation of chimeras by comparing WGA productsfollowing standard and optimized procedures. Thenumber of chimeric reads increased as the amount ofinput DNA was reduced (Fig. 4). However, optimizingWGA condition by including TMAC additive decreasedthe formation of chimeras and improved the qualityof reads in P. falciparum WGA.
3.4. WGA from 10 pg of input P. falciparum genomicDNA
Most studies with w29 MDA have used an input DNAof �10 ng for WGA.19,20 In many cases, this amountmay be difficult to obtain from valuable clinical speci-mens. We set to find out the minimal amount of para-site DNA that can be successfully amplified by theoptimized conditions to obtain uniform genome cov-erage. We performed WGA on P. falciparum genomicDNA with an input amount ranging from 2 ng downto 100 femtograms (fg). WGA products were multi-plexed and sequenced using Illumina MiSeq or HiSeq2500 machines. Sequence reads generated were ana-lysed to determine the minimum threshold requiredto produce optimal coverage suitable for variouswhole-genome studies including genotyping by SNPanalysis. To assess the quality of the sequence data gen-erated from each input amount, reads were mappedto the reference genome using BWA. CallableLociprogram of the genome analyser tool kit (GATK)28
was used to inspect and count the proportion of thegenome with high-quality base coverage (callable
Figure 2. LookSeq analysis of coverage uniformity. Plasmodium falciparum 3D7 genomic DNA amplified with Repli_g following standard oroptimized procedures. gDNA (top panel) shows bulk genomic DNA sequenced without amplification. All samples amplified using thestandard (Std WGA) procedure show regions of amplification bias (marked by *1 and *2, see Supplementary Table S1), whereas theircorresponding counterparts amplified following the optimized procedure (Optimized WGA) show less bias and relatively uniformcoverage. Different amounts of input DNA were used for each sample set (Sample 1, 0.1 ng; Sample 2, 0.5 ng; Sample 3, 1 ng).
Page 4 of 11 Whole-Genome Amplification for AT-Rich Templates
at Wellcom
e Trust G
enome C
ampus on Septem
ber 30, 2014http://dnaresearch.oxfordjournals.org/
Dow
nloaded from

bases), positions of the genome with zero coverage(uncovered bases) and the size of coverage gaps. Usingthese metrics, we show that the number of callableloci (high-quality bases) remained relatively high forsamples with input DNA ranging from 2 ng to 10 pg.However, the quality of sequence data droppedsharply for samples with input DNA ,10 pg (Fig. 5). Asimilar trend was observed with the proportion of gapsizes (length of uncovered bases, Fig. 5 bottom panel)and chimeric reads (Fig. 4), where a sharp increase inthese values was observed for samples with input DNA,10 pg. From these observations, we concluded that10 pg is the minimal amount of P. falciparum inputDNA that produces quality genome coverage under theoptimized MDA conditions described. This amount ofDNA is equivalent to only �380 parasite genomes.
3.5. Detailed analysis of WGA products from a10-pg input template DNA
Standard WGA methods produce products that showsequence representation bias, allelic dropout and amp-lification artefacts. These problems tend to increase asthe amount of input template decreases. To adequately
Figure3. GCcontentanalysis.DifferentamountsofP. falciparum3D7genomic DNA (ranging from 0.1 to 2 ng as shown in samplenames) were used as an input template for amplification byRepli_g following the standard or optimized procedure.Amplification products were sequenced as PCR-free and readsobtained were analysed for GþC content profile. A non-WGAsample (gDNA) shows a GC content of �19.4%, a profile thatwas closely matched by products amplified using the optimizedprocedure (Opt). Samples amplified following the standardprocedure (Std) showed biased GC content shown as a shifttowards the neutral base composition.
Figure 4. Bar graph of chimeric read analysis. Different amounts of P.falciparum 3D7 genomic DNA (ranging from 2 ng to 100 fg asshown in sample labels) were used as an input template foramplification by Repli_g following the standard or optimizedprocedure. Amplification products were sequenced as PCR-free,and reads obtained were normalized and analysed for thepresence of chimeric reads. A non-WGA sample (control)showed the least number of chimers. Using the standardprocedure, the number of chimers increased with a decrease inthe amount of input DNA. Samples amplified using theoptimized procedure showed a decrease in chimer formationthat remained low and steady from 2 ng to 100 pg of input DNA.
Figure 5. Determining the lowest threshold of input DNA mass forWGA. Different amounts of P. falciparum 3D7 genomic DNA(ranging from 2 ng to 100 fg, as shown in sample names) wereused as an input template for amplification by Repli_g followingthe standard or optimized procedure. Samples were multiplexedand sequenced using a fast turn-around Illumina Miseq machine.Sequence reads mapped to the reference were normalized andanalysed for coverage and base quality using the ‘CallableLoci’program of GATK. A non-WGA sample was used as anunamplified control. Input quantities ranging from 2 ng down to10 pg produced reads with high-quality ‘callable’ bases coveringover 60% of the genome. Input DNA below the10-pg thresholdproduced poor base quality with only ,30% of genome coveredwith ‘callable’ bases. Input DNA ,10 pg showed a sharp increasein positions with zero coverage (bases uncovered) and anincrease in gap sizes in genome coverage.
S.O. Oyola et al. Page 5 of 11
at Wellcom
e Trust G
enome C
ampus on Septem
ber 30, 2014http://dnaresearch.oxfordjournals.org/
Dow
nloaded from

evaluate the quality of the WGA products producedfrom an input of 10 pg—1,000-fold smaller thanthe standard input amounts—we performed analysison genomic DNA extracted from P. falciparum strainsderived from the progeny clones of genetic crossbetween 7G8xGB4 laboratory strains, as well as the3D7 Strain. Genomic DNA extracted from 17 progenyclones was sequenced both as WGA and as bulkgenomic DNA (non-WGA). We performed detailed ana-lysis by comparing sequence data generated from WGAand their matching unamplified genomic DNA (non-WGA). WGA and non-WGA samples yielded a medianof 3.5 and 3.4 billion base sequences, respectively,with 94.8 and 95.3% of the read mapping to the refer-ence sequence (Table 1). WGA samples showed cover-age between 180� and 500�, whereas non-WGAsamples showed coverage between 90� and 250�. Amedian of 1.5 and 1.2% of genome bases was notcovered in WGA and non-WGA samples, respectively(Table 1).
3.6. Genotype concordance analysisTo evaluate the fidelityof sequence representation by
WGA, we analysed the genotype calls from 17 crosssamples and the parent reference strain. We performed
de novo and in silico genotype calls on sequence gener-ated from both the WGA and non-WGA samples.Genotype concordance was determined by comparingSNP and InDel calls from matched pairs of both non-WGA and WGA samples.
3.6.1. Concordance of de novo SNPs and InDelcalls For each pair of WGA and non-WGA
sample, we generated de novo variation calls simultan-eously. A median of 20,338 biallelic de novo SNPs witha quality score of �250 were called for each sample.For the 3D7 reference strain (3D7_Glasgow), only185 de novo SNPs were called (Supplementary TableS2). Both of these numbers arewell within the expectedrange for this method.1 As given in Table 2, call pairswere grouped into ‘Perfect Concordance’, ‘WGA NewAlleles’ and ‘Undetermined’. Identical calls in bothnon-WGA and WGA samples had a median of 97.3%and a mean of 96.7%+1.2 that are in perfect concord-ance, and new alleles present only in the WGA samples(considered as WGA-introduced alleles) had a medianof 1.2% and a mean of 1.8+1.1%. Most of the WGA-introduced alleles were due to a mixed call in WGA,where the non-WGA counterpart only showed thereference allele. Discordant single-allele calls wereextremely rare with a median of zero SNPs and a total
Table 1. Sequence coverage and mapping analysis
Sample Total reads (million) Total base (Gb) Mapped reads (%) Uncovered bases (%)
WGA Non-WGA WGA Non-WGA WGA/non-WGA WGA Non-WGA WGA Non-WGA3D7_Glasgow 30.8 43.5 2.3 3.3 0.7 98.8 98.6 0.2 0.0
DEV_18_05_11 74.5 50.7 5.6 3.8 1.5 94.6 95.0 1.1 1.2
D2_18_05_11 41.7 41.4 3.1 3.1 1.0 94.2 95.2 1.2 1.0
WE2 69.7 35.2 5.2 2.6 2.0 95.1 95.1 1.2 1.3
GB4_NIH 45.2 37.9 3.4 2.8 1.2 94.2 94.5 1.3 1.1
JC3 45.1 47.6 3.4 3.6 0.9 94.3 95.1 1.3 1.1
JF6 49.1 57.3 3.7 4.3 0.9 94.3 95.5 1.4 1.1
QF5 46.5 66.6 3.5 5.0 0.7 95.2 95.9 1.4 1.2
NIC_18_05_11 59.1 36.9 4.4 2.8 1.6 95.5 90.6 1.5 1.3
NF10 48.4 35.0 3.6 2.6 1.4 95.5 95.0 1.5 1.4
XF12_18_05_11 39.2 58.6 2.9 4.4 0.7 94.7 95.6 1.5 1.2
AL2_13_05_11 38.3 40.1 2.9 3.0 1.0 94.8 95.4 1.5 1.3
XD8 46.9 45.0 3.5 3.4 1.0 93.6 95.5 1.6 1.2
7G8_NIH 61.1 40.5 4.6 3.0 1.5 94.2 94.9 1.6 1.5
JON 51.3 71.8 3.8 5.4 0.7 94.0 95.4 1.6 1.1
TF1 57.7 65.2 4.3 4.9 0.9 95.5 95.7 1.8 1.4
JC9 34.0 61.3 2.5 4.6 0.6 95.0 95.6 2.5 1.2
Median 46.9 45.0 3.5 3.4 1.0 94.7 95.4 1.5 1.2
Mean+ SD 49.3+12 49.1+12 3.7+0.9 3.7+0.9 1.0+0.4 94.9+1.2 95.2+1.5 1.4+0.4 1.1+0.3
Sequence reads obtained from WGA and non-WGA samples were analysed forcoverage and mapping statistics. Nearly identicalaverage number of sequence reads, mapping and coverage statistics were obtained for both WGA and non-WGA datasets.However, coverage distribution was less uniform in WGA compared with non-WGA datasets.
Page 6 of 11 Whole-Genome Amplification for AT-Rich Templates
at Wellcom
e Trust G
enome C
ampus on Septem
ber 30, 2014http://dnaresearch.oxfordjournals.org/
Dow
nloaded from

of 10 occurrences across all the samples (SupplementaryTable S2a). Additionally, de novo SNP calls in 5,075,789well-covered coding positions (Table 2) producedperfect concordance with a median of 98.5% and amean of 98.0+1.4%, while the occurrence of WGA-introduced alleles dropped to a median of 0.7% and amean of 0.8+0.4%. In this subset, no discordant calls(alt/ref or ref/alt) were observed (SupplementaryTable S2b). Calls that were grouped as ‘Undetermined’represent alleles that were missing or wrong alleles(present in the non-WGA samples but are neither thereference nor the alternative allele).
As with SNPs, we also performed biallelic de novoInDel calls with a quality score of �250 for both WGAand non-WGA samples. As given in Table 3, InDel callsfrom the whole genome with perfect concordancebetween WGA and non-WGA samples had a medianof 97.6% and a mean of 96.8+1.7%, and WGA-intro-duced InDels had a median of 1.5% and a mean of2.4+1.8%. Similarly, de novo InDel calls in the codingregions only produced near-perfect concordance witha median of 98.7% and a mean of 98.2+1.4%. WGA-
introduced InDels in these regions dropped to amedian of 0.4% and a mean of 1.4+1.3%.
3.6.2. Concordance of in silico genotyping Using alist of high-quality SNP positions and alleles fromthe genetic crosses, we performed in silico genotypingof both the WGA and non-WGA samples on 20,737positions, counting alleles present in at least fivereads. Call comparisons between the WGA and non-WGA from same samples were grouped into ‘PerfectConcordance (identical)’, ‘WGA Missing Alleles’, ‘WGANew Alleles’ and ‘Undetermined’ (missing allele).Identical alleles with perfect concordance betweenWGA and non-WGA samples had a median of 97.95%(Fig. 6). A median of 0.48% calls represent alleles thatwere called in the WGA, but not in the non-WGA,samples. These reflect cases where the WGA samplehad a mixed call and the non-WGA sample had asingle-allele call. A median of 0.94% represent allelesthat were missing in WGA, but were called in non-WGA samples. Discordant single-allele calls wereextremely rare, with a median of zero and a mean of
Table 2. WGA and non-WGA SNP concordance analysis
Sample De novo SNP calls in all regions De novo SNP calls in good quality regions
Perfectconcordance (%)
WGA new allele(%)
Undetermined(%)
Perfectconcordance (%)
WGA new allele(%)
Undetermined(%)
JON 93.8 4.4 1.8 97.2 1.6 1.2
JF6 94.4 4.3 1.3 94.2 5.0 0.8
D2_18_05_11 95.0 2.6 2.4 96.9 2.2 0.9
QF5 95.7 2.5 1.8 99.0 0.5 0.5
QF5 96.3 2.6 1.1 98.5 0.8 0.7
JC9 96.5 1.6 1.9 98.2 1.3 0.5
XF12_18_05_11 97.3 1.4 1.4 98.4 0.3 1.2
NIC_18_05_11 97.3 0.8 2.0 95.6 2.4 2.0
NF10 97.3 1.5 1.3 98.7 0.5 0.7
DEV_18_05_11 97.3 1.1 1.6 98.9 0.5 0.5
JC3 97.4 1.1 1.6 98.6 0.6 0.8
GB4_NIH 97.4 1.1 1.5 98.5 0.5 0.9
AL2_13_05_11 97.4 1.2 1.4 99.0 0.6 0.5
WE2 97.5 1.0 1.6 97.9 1.6 0.5
7G8_NIH 97.5 1.1 1.4 97.1 2.4 0.5
TF1 97.6 1.0 1.3 98.8 0.5 0.7
3D7_Glasgow 97.8 1.1 1.1 100.0 0.0 0.0
Median 97.3 1.2 1.5 98.5 0.6 0.7
Mean+ SD 96.7+1.2 1.8+1.1 1.6+0.3 98.0+1.4 1.3+1.2 0.8+0.4
WGA and non-WGA data were analysed for de novo SNP calling concordance. Matching sequence data from cross samples werepaired and the SNP calling was performed simultaneously. Concordance rates were generated by comparing WGA and relatednon-WGA calls. Columns on the left show comparison of all calls covering the entire genome, whereas columns on the rightshow a subset of all calls covering only the high-quality coding regions of the genome. Values in the perfect concordancecolumns represent the proportion of calls that were identical in both WGA and non-WGA samples. WGA new allele columnsshow the proportion of SNPs that were present only in the WGA and not in their matching non-WGA alleles. Undeterminedcolumn shows the proportion of SNPs that were called in wrong or missing alleles (Supplementary Table S2).
S.O. Oyola et al. Page 7 of 11
at Wellcom
e Trust G
enome C
ampus on Septem
ber 30, 2014http://dnaresearch.oxfordjournals.org/
Dow
nloaded from

2.9 SNPs per sample. Four of the 17 samples showedsuch discordant calls, and only three samples hadmore than one such call. The 3D7 (3D7_Glasgow) ref-erence sample showed 99.58% identical calls, and onlyone new allele in WGA sample was returned as a mixedcall (Supplementary Table S4).
4. Discussion
High-throughputDNA sequencing technologieshavegained awide range of applications in infectious diseaseresearch, including global surveillance of the emergenceand spread of drug resistance, detection of regions of thegenome under selection and identification of geneticdeterminants of clinical phenotypes through genome-wide association studies. The P. falciparum genome pre-sents inherent technical challenges to next-generationDNA sequencing, such as its extreme AT-richness.Whole-genome sequencing of P. falciparum field iso-lates poses additional difficulties due to the small quan-tity of DNA often retrieved from patients in the clinicalsetting and the high degree of host DNA contamination
from leucocytes. This study addressed the first of thesekey problems by developing a method for WGA capableof producing high-quality sequence data from just10 pg of input P. falciparum DNA.
AlthoughPCR-based WGA techniques, such asprimerextension PCR, ligation-mediated PCR and degenerateoligonucleotide-primed PCR, have been successfullyused in some studies such as single-cell amplification,29
their wider application has been limited. PCR-basedWGA methods produce relatively shorter products, non-specific amplification artefacts and incomplete genomecoverage.19,20,30 MDA has been associated with base-biasand generation of chimeric products.29 Nonetheless,MDA has been the method of choice for a wider rangeof genome amplification studies, because it produceslonger DNA products with extensive genome coverage.MDA also produces higher DNA yields with relativelyless amplification bias.3,11,19
Here, we have assessed MDA on an AT-rich genomeusing a range of input DNA quantities. We describe anoptimized WGA method incorporating TMAC reagentthat improves amplification coverage of the difficultAT-rich loci of the genome. We establish 10 pg of input
Table 3. WGA and non-WGA InDel concordance analysis
Sample De novo InDel calls in whole genome De novo InDel calls in good quality regions
Perfect concordance(%)
WGA NewInDels (%)
Undetermined Perfect concordance(%)
WGA NewInDels (%)
Undetermined(%)
3D7_Glasgow 95.2 4.8 0.0 100.0 0.0 0.0
JC3 97.6 1.5 0.9 98.8 0.8 0.4
QF5 97.2 2.1 0.6 96.1 3.6 0.3
JF6 91.5 7.8 0.7 96.5 3.4 0.2
TF1 98.2 1.2 0.5 99.4 0.5 0.1
DEV_18_05_11 98.1 1.0 0.8 99.2 0.3 0.5
7G8_NIH 97.9 1.2 0.8 98.7 0.6 0.8
GB4_NIH 97.9 1.2 0.9 98.6 0.7 0.7
WE2 98.0 1.1 0.9 99.0 0.7 0.3
D2_18_05_11 95.8 2.5 1.7 97.1 1.6 1.3
NIC_18_05_11 97.8 1.0 1.2 99.1 0.3 0.6
NF10 97.4 1.8 0.8 98.3 1.1 0.6
XF12_18_05_11 98.0 1.4 0.6 99.0 0.6 0.4
AL2_13_05_11 97.7 1.5 0.8 99.3 0.3 0.3
XD8 95.5 3.9 0.7 95.7 3.6 0.7
JON 95.2 4.2 0.6 96.1 3.7 0.3
JC9 96.4 2.9 0.7 98.4 1.5 0.1
Median 97.6 1.5 0.8 98.7 0.7 0.4
Mean+ SD 96.8+1.7 2.4+1.8 0.8+0.3 98.2+1.4 1.4+1.3 0.4+0.3
WGA and non-WGA data were analysed for de novo InDel calling concordance. Calls were performed simultaneously on bothWGA and related non-WGA. Columns on the left show comparison of all calls covering the entire genome, whereas columnson the right show a subset of all calls covering only the high-quality coding regions of the genome. Values in the perfect con-cordance columns represent the proportion of calls that were identical in both WGA and non-WGA samples. WGA new allelecolumns show the proportion of InDels that were present only in the WGA and not in their matching non-WGA alleles.Undetermined column shows the proportion of InDels that were called in wrong or missing alleles (Supplementary Table S3).
Page 8 of 11 Whole-Genome Amplification for AT-Rich Templates
at Wellcom
e Trust G
enome C
ampus on Septem
ber 30, 2014http://dnaresearch.oxfordjournals.org/
Dow
nloaded from

DNA as the lowest threshold from which our optimizedWGA protocol generates an amplification productwith optimal P. falciparum genome coverage for mostgenome sequencing analysis. This amount equates to�380 parasite genomes, equivalent to �1 ml of bloodin a patient with 0.01% parasitemia. Furthermore, weshow that the optimized conditions significantly reducethe formation of chimeric reads, thereby improving theoverall quality of the amplified product.
Standard WGA from such small quantities of inputmaterial is often associated with bias and incompletegenome coverage. A single-cell genomic approach thatuses infected red blood cell sorting technology has re-cently been reported that achieved a genome coverageof �50% with a standard WGA method.31 Althoughgenome coverage in single-cell approach is still low, thistechnology has opened avenues for single-cell genomicsstudies in malaria and offers great opportunities for dis-secting multiple genotype infection. Our optimizedWGA method described here will be useful for optimiz-ing genome coverage in such single-cell genome ampli-fications, as well as direct field applications for smallsample sequencing. For improved malaria clinical se-quencing, we routinely employ the combination ofhost depletion methods32,33 and the current optimizedWGA procedure to generate high-quality whole genomesequencing data.
We have assessed the quality of the amplified productsgenerated from 10 pg input DNA using high-throughputsequencing of DNA extracted from 17 progeny clonesderived from genetic crosses between two laboratorystrains. We performed a comparative analysis betweenthe WGA data and their corresponding non-WGA coun-terparts. We show that coverage was sufficient for allelecalling and other whole-genome analyses. Althoughthe number of uncovered bases was slightly higher inWGA (median, 1.5%) than non-WGA (median, 1.2%)samples (Table 1), the difference was insignificant(t-test,P¼ 0.053,95%CI).Thesameappliestopreference
for mitochondria DNA amplification, which showed amedian of 2.6% in WGA against 0.6% in the non-WGAsamples.
Another key aspect of P. falciparum whole-genomesequencing from clinical specimens is removing hostDNA contamination. This can be achieved either atthe blood sample processing stage through leucocytedepletion or through selective enrichment of parasiteDNA after extraction.32–34 The combination of an ef-fective method for removing human DNA that is applic-able to the field setting, and the ability to performwhole-genome sequencing from very low quantitiesof inputDNA asdescribed in this study,hasthepotentialto greatly increase the scope and scale of P. falciparumgenomic research. This, in turn, would contribute sig-nificantly to malaria genetic surveillance and controlstrategies.
5. Conclusion
The optimized amplification conditions describedhere have generated high-quality whole-genome se-quence data (99.8% genome coverage) from a minuteamount of inputDNA, equivalent to ,400 P. falciparumgenomes. This work shows for the first time that accur-ate in silico genotyping and de novo calling of geneticvariants is achievable on a WGA sample using ,1 ngof inputDNAfromanextremelyAT-richgenome.Wean-ticipate that sequencing from small quantities of inputDNA (,1 ng) will become a significant aid to geneticand genomic studies of P. falciparum in the field, par-ticularly when combined with effective methods forremoval of host DNA contamination.
Acknowledgements: We are grateful to Jean-BoscoOuedraogo (Institut de Recherche en Sciences de laSante, Burkina Faso) and Francois Nosten (NuffieldDepartment of Medicine, University of Oxford) for
Figure 6. Boxplot of in silico genotyping concordance analysing. A total of 20,737 high-quality SNP positions were genotyped in both WGA andnon-WGA samples. Call comparison was performed between matched pairs of corresponding WGA and non-WGA datasets and results weregrouped into ‘Perfect Concordance’, ‘WGA Missing Alleles’, ‘WGA New Alleles’ and ‘Undetermined’. Perfect_Concordance (identical alleles)had a medianof 97.95%(range 83.11–99.58%;n ¼ 17). A medianof 0.48%calls represent alleles that were called in the WGA samples, butnot in the non-WGA samples (WGA_New_Alleles). A median of 0.94% calls were present in non-WGA, but absent in WGA, samples(WGA_Missing_Alleles). The proportion of calls that were missing (Undetermined) had a median of 0.96% (Supplementary Table S4).
S.O. Oyola et al. Page 9 of 11
at Wellcom
e Trust G
enome C
ampus on Septem
ber 30, 2014http://dnaresearch.oxfordjournals.org/
Dow
nloaded from

providing field samples for analysis. We thank RichardPearson and Thomas Otto for useful discussions onsequence analysis.: Conflict of Interest statement. Nonedeclared.
Supplementary Data: Supplementary Data areavailable at www.dnaresearch.oxfordjournals.org.
Funding
This research was supported by the Wellcome Trustthrough the Wellcome Trust Sanger Institute (098051),the Resource Centre for Genomic Epidemiology ofMalaria (090770/Z/09/Z) and the Wellcome TrustCentre for Human Genetics (090532/Z/09/Z). TheCentre for Genomics and Global Health is supported bythe Medical Research Council (G0600718). Funding topay the Open Access publication charges for this articlewas provided by the Wellcome Trust Sanger Institute.
References
1. Manske, M., Miotto, O., Campino, S., et al. 2012, Analysisof Plasmodium falciparum diversity in natural infectionsby deep sequencing, Nature, 487, 375–9.
2. Miotto, O., Almagro-Garcia, J., Manske, M., et al. 2013,Multiple populations of artemisinin-resistant Plasmodiumfalciparum in Cambodia, Nat. Genet., 45, 648–55.
3. Lasken, R.S. and Egholm, M. 2003, Whole genome ampli-fication: abundant suppliesofDNAfromprecious samplesor clinical specimens, Trends Biotechnol., 21, 531–5.
4. Coombs, N.J., Gough, A.C. and Primrose, J.N. 1999,Optimisation of DNA and RNA extraction from archivalformalin-fixed tissue, Nucleic Acids Res., 27, e12.
5. Farnert, A., Arez, A.P., Correia, A.T., Bjorkman, A.,Snounou, G. and do Rosario, V. 1999, Sampling andstorage of blood and the detection of malaria parasitesby polymerase chain reaction, Trans. R. Soc. Trop. Med.Hyg., 93, 50–3.
6. Jackson, J., Laikre, L., Baker, C.S. and Kendall, K. 2012,Guidelines for collecting and maintaining archives forgeneticmonitoring,ConservationGenet.Resour.,4,527–36.
7. Shi, S.R., Cote, R.J., Wu, L., et al. 2002, DNA extraction fromarchival formalin-fixed, paraffin-embedded tissue sectionsbased on the antigen retrieval principle: heating under theinfluence of pH, J. Histochem. Cytochem., 50, 1005–11.
8. Bereczky, S., Martensson, A., Gil, J.P. and Farnert, A. 2005,Short report: rapid DNA extraction from archive bloodspots on filter paper for genotyping of Plasmodium falcip-arum, Am. J. Trop. Med. Hyg., 72, 249–51.
9. Hwang, J., Jaroensuk, J., Leimanis, M.L., et al. 2012, Long-term storage limits PCR-based analyses of malaria para-sites in archival dried blood spots, Malar. J., 11, 339.
10. Kain, K.C. and Lanar, D.E. 1991, Determination of geneticvariationwithinPlasmodiumfalciparumbyusingenzyma-ticallyamplified DNA from filter paper disks impregnatedwith whole blood, J. Clin. Microbiol., 29, 1171–4.
11. Spits, C., Le Caignec, C., De Rycke, M., et al. 2006, Whole-genomemultiple displacementamplification from singlecells, Nat. Protoc., 1, 1965–70.
12. Dean, F.B., Hosono, S., Fang, L., et al. 2002, Comprehensivehuman genome amplification using multiple displace-mentamplification,Proc.Natl. Acad. Sci.USA,99, 5261–6.
13. Dean, F.B., Nelson, J.R., Giesler, T.L. and Lasken, R.S. 2001,Rapid amplification of plasmid and phage DNA using Phi29 DNA polymerase and multiply-primed rolling circleamplification, Genome Res., 11, 1095–9.
14. Telenius, H., Carter, N.P., Bebb, C.E., Nordenskjold, M.,Ponder, B.A. and Tunnacliffe, A. 1992, Degenerate oligo-nucleotide-primed PCR: general amplification of targetDNAbyasingledegenerateprimer,Genomics,13,718–25.
15. Zhang, L., Cui, X., Schmitt, K., Hubert, R., Navidi, W. andArnheim, N. 1992, Whole genome amplification from asingle cell: implications for genetic analysis, Proc. Natl.Acad. Sci. USA, 89, 5847–51.
16. Lasken, R.S. 2009, Genomic DNA amplification by themultiple displacement amplification (MDA) method,Biochem. Soc. Trans., 37, 450–3.
17. Morin, J.A., Cao, F.J., Lazaro, J.M., et al. 2012, Active DNAunwinding dynamics during processive DNA replication,Proc. Natl. Acad. Sci. USA, 109, 8115–20.
18. Zhang, D.Y., Brandwein, M., Hsuih, T. and Li, H.B. 2001,Ramificationamplification:anovel isothermalDNA amp-lification method, Mol. Diagn., 6, 141–50.
19. Pinard, R., de Winter, A., Sarkis, G.J., et al. 2006,Assessment of whole genome amplification-inducedbias through high-throughput, massively parallel wholegenome sequencing, BMC Genomics, 7, 216.
20. Pugh,T.J.,Delaney,A.D., Farnoud,N., et al. 2008, Impactofwhole genome amplification on analysis of copy numbervariants, Nucleic Acids Res., 36, e80.
21. Kozarewa, I., Ning, Z., Quail, M.A., Sanders, M.J.,Berriman, M. and Turner, D.J. 2009, Amplification-freeIllumina sequencing-library preparation facilitatesimproved mapping and assembly of (GþC)-biasedgenomes, Nat. Methods, 6, 291–5.
22. Oyola, S.O., Otto, T.D., Gu, Y., et al. 2012, OptimizingIllumina next-generation sequencing library preparationfor extremely AT-biased genomes, BMC Genomics, 13, 1.
23. Hayton, K., Gaur, D., Liu, A., et al. 2008, Erythrocytebinding protein PfRH5 polymorphisms determinespecies-specific pathways of Plasmodium falciparum inva-sion, Cell Host Microbe, 4, 40–51.
24. Han, T., Chang, C.-W., Kwekel, J., et al. 2012,Characterization of whole genome amplified (WGA) DNAfor use in genotyping assay development, BMC Genomics,13, 217.
25. Spits, C., Le Caignec, C., De Rycke, M., et al. 2006,Optimization and evaluation of single-cell whole-genomemultiple displacement amplification, Hum. Mutat., 27,496–503.
26. Benson, G. 1999, Tandem repeats finder: a program toanalyze DNA sequences, Nucleic Acids Res., 27, 573–80.
27. Lasken, R. and Stockwell, T. 2007, Mechanism of chimeraformation during the multiple displacement amplifica-tion reaction, BMC Biotechnol., 7, 19.
28. McKenna, A., Hanna, M., Banks, E., et al. 2010, TheGenome Analysis Toolkit: a MapReduce framework for
Page 10 of 11 Whole-Genome Amplification for AT-Rich Templates
at Wellcom
e Trust G
enome C
ampus on Septem
ber 30, 2014http://dnaresearch.oxfordjournals.org/
Dow
nloaded from

analyzing next-generation DNA sequencing data, GenomeRes., 20, 1297–303.
29. Zong, C., Lu, S., Chapman, A.R. and Xie, X.S. 2012,Genome-wide detection of single-nucleotide and copy-number variations of a single human cell, Science, 338,1622–6.
30. Schneider, P., Balogh, K., Naveran, N., et al. 2004, Wholegenome amplification—the solution for a commonprobleminforensiccasework? Int.Congr.Ser.,12,61,24–6.
31. Nair, S., Nkhoma, S.C., Serre, D., et al. 2014, Single-cellgenomics for dissection of complex malaria infections,Genome Res., 24, 1028–38.
32. Oyola, S.O., Gu, Y., Manske, M., et al. 2013, Efficient deple-tion of host DNA contamination in malaria clinicalsequencing, J. Clin. Microbiol., 51, 745–51.
33. Feehery, G.R., Yigit, E., Oyola, S.O., et al. 2013, Amethod for selectively enriching microbial DNA fromcontaminating vertebrate host DNA, PLoS ONE, 8,e76096.
34. Venkatesan, M., Amaratunga, C., Campino, S., et al. 2012,Using CF11 cellulose columns to inexpensivelyand effectively remove human DNA from Plasmodiumfalciparum-infected whole blood samples, Malar. J.,11, 41.
S.O. Oyola et al. Page 11 of 11
at Wellcom
e Trust G
enome C
ampus on Septem
ber 30, 2014http://dnaresearch.oxfordjournals.org/
Dow
nloaded from