airborne laser altimetry survey of glaciar tyndall, patagonia
TRANSCRIPT
Available online at www.sciencedirect.com
e 59 (2007) 101–109www.elsevier.com/locate/gloplacha
Global and Planetary Chang
Airborne laser altimetry survey of Glaciar Tyndall, Patagonia
Kristian Keller a,⁎, Gino Casassa b,c, Andrés Rivera b,d,Rene Forsberg a, Niels Gundestrup ✠
a Geodynamics Department, Danish National Space Center, Juliane Mariesvej 30, DK-2100 Copenhagen, Denmarkb Centro de Estudios Científicos, Maipú 60, Valdivia, Chile
c Centro de Estudos del Cuaternario (CEQUA), Avenida Bulnes 01890, Punta Arenas, Chiled Departamento de Geografía, Universidad de Chile, Marcoleta 250, Santiago, Chile
Available online 30 January 2007
Abstract
The first airborne laser altimetry measurements of a glacier in South America are presented. Data were collected in Novemberof 2001 over Glaciar Tyndall, Torres del Paine National Park, Chilean Patagonia, onboard a Twin Otter airplane of the Chilean AirForce. A laser scanner with a rotating polygon-mirror system together with an Inertial Navigation System (INS) were fixed to thefloor of the aircraft, and used in combination with two dual-frequency GPS receivers. Together, the laser–INS–GPS system had anominal accuracy of 30 cm after data processing. On November 23rd, a total of 235 km were flown over the ablation area ofGlaciar Tyndall, with 5 longitudinal tracks with a mean swath width of 300 m, which results in a point spacing of approximately2 m both along and across track. A digital elevation model (DEM) generated using the laser altimetry data was compared with aDEM produced from a 1975 map (1:50,000 scale — Instituto Geográfico Militar (IGM), Chile). A mean thinning of −3.1±1.0 ma−1 was calculated for the ablation area of Glaciar Tyndall, with a maximum value of −7.7±1.0 m a−1 at the calving front at 50 ma.s.l. and minimum values of between −1.0 and −2.0±1.0 m a−1 at altitudes close to the equilibrium line altitude (900 m a.s.l.).The thinning rates derived from the airborne survey were similar to the results obtained by means of ground survey carried out at∼600 m of altitude on Glaciar Tyndall between 1975 and 2002, yielding a mean thinning of −3.2 m a−1 [Raymond, C., Neumann,T.A., Rignot, E., Echelmeyer, K.A., Rivera, A., Casassa, G., 2005. Retreat of Tyndall Glacier, Patagonia, over the last half century.Journal of Glaciology 173 (51), 239–247.]. A good agreement was also found between ice elevation changes measured with laserdata and previous results obtained with Shuttle Radar Topography Mission (SRTM) data. We conclude that airborne laser altimetryis an effective means for accurately detecting glacier elevation changes in Patagonia, where an ice thinning acceleration trend hasbeen observed during recent years, presumably in response to warming and possibly also drier conditions.© 2007 Elsevier B.V. All rights reserved.
Keywords: laser altimetry; glacier; mass balance; Patagonia; South America
⁎ Corresponding author. Tel.: +45 3587 5251; fax: +45 3587 5251.E-mail address: [email protected] (K. Keller).
✠ Deceased.
0921-8181/$ - see front matter © 2007 Elsevier B.V. All rights reserved.doi:10.1016/j.gloplacha.2006.11.039
1. Introduction
Understanding the physics of glaciers and their massbalance is a key component for assessing the impact ofclimate change (Oerlemans, 1994). Southern SouthAmerica (Fig. 1) provides a unique mid-latitude envi-ronment for the study of glaciers, with the Patagonian
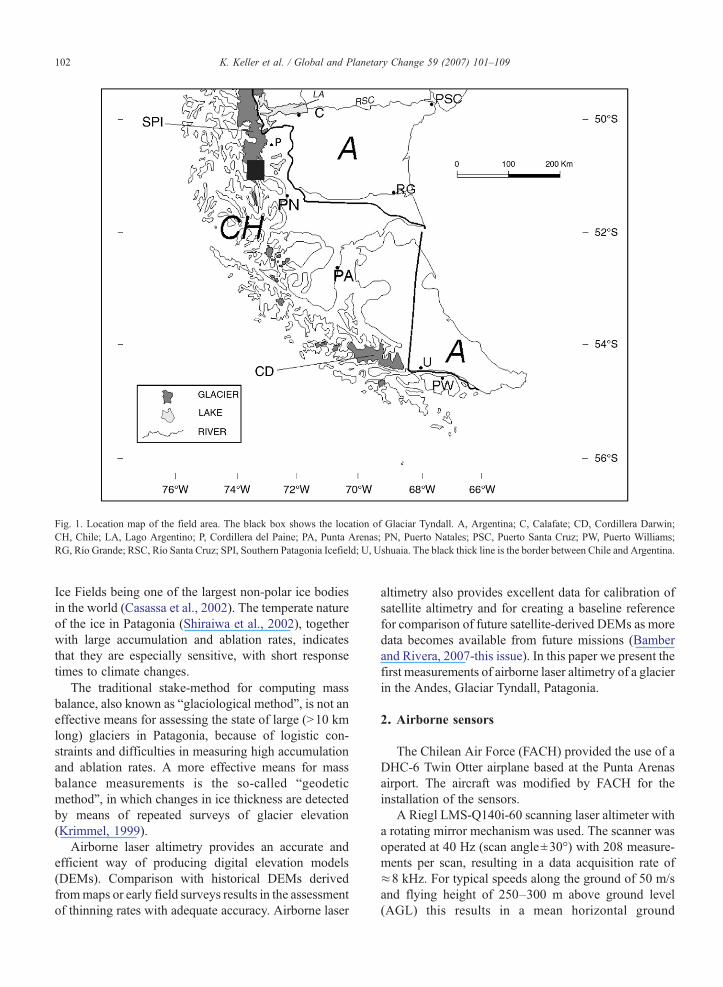
Fig. 1. Location map of the field area. The black box shows the location of Glaciar Tyndall. A, Argentina; C, Calafate; CD, Cordillera Darwin;CH, Chile; LA, Lago Argentino; P, Cordillera del Paine; PA, Punta Arenas; PN, Puerto Natales; PSC, Puerto Santa Cruz; PW, Puerto Williams;RG, Río Grande; RSC, Río Santa Cruz; SPI, Southern Patagonia Icefield; U, Ushuaia. The black thick line is the border between Chile and Argentina.
102 K. Keller et al. / Global and Planetary Change 59 (2007) 101–109
Ice Fields being one of the largest non-polar ice bodiesin the world (Casassa et al., 2002). The temperate natureof the ice in Patagonia (Shiraiwa et al., 2002), togetherwith large accumulation and ablation rates, indicatesthat they are especially sensitive, with short responsetimes to climate changes.
The traditional stake-method for computing massbalance, also known as “glaciological method”, is not aneffective means for assessing the state of large (N10 kmlong) glaciers in Patagonia, because of logistic con-straints and difficulties in measuring high accumulationand ablation rates. A more effective means for massbalance measurements is the so-called “geodeticmethod”, in which changes in ice thickness are detectedby means of repeated surveys of glacier elevation(Krimmel, 1999).
Airborne laser altimetry provides an accurate andefficient way of producing digital elevation models(DEMs). Comparison with historical DEMs derivedfrommaps or early field surveys results in the assessmentof thinning rates with adequate accuracy. Airborne laser
altimetry also provides excellent data for calibration ofsatellite altimetry and for creating a baseline referencefor comparison of future satellite-derived DEMs as moredata becomes available from future missions (Bamberand Rivera, 2007-this issue). In this paper we present thefirst measurements of airborne laser altimetry of a glacierin the Andes, Glaciar Tyndall, Patagonia.
2. Airborne sensors
The Chilean Air Force (FACH) provided the use of aDHC-6 Twin Otter airplane based at the Punta Arenasairport. The aircraft was modified by FACH for theinstallation of the sensors.
A Riegl LMS-Q140i-60 scanning laser altimeter witha rotating mirror mechanism was used. The scanner wasoperated at 40 Hz (scan angle±30°) with 208 measure-ments per scan, resulting in a data acquisition rate of≈8 kHz. For typical speeds along the ground of 50 m/sand flying height of 250–300 m above ground level(AGL) this results in a mean horizontal ground
103K. Keller et al. / Global and Planetary Change 59 (2007) 101–109
resolution close to 1 m. The laser captures the lastreflected pulse minimizing disturbances from atmo-spheric ice crystals and aerosols that might partly reflectthe laser beam and cause data errors (Riegl, 2001).Aircraft attitude (pitch, roll and heading) were recordedwith a Honeywell H-764G INS with a data capture rateof 50 Hz and a precision of 0.01 to 0.05°.
Two dual-frequency GPS receivers, one Trimble4000 SSI and one Javad Legacy, both operating at 1 Hzwere used onboard for positioning of the aircraft. Twobase stations were installed on the ground, whichallowed for carrier phase differential GPS correctionsduring post-processing. The GPS data also providedtime synchronization of the different sensors.
The scanning laser–INS–GPS system describedabove has been previously used with much success inthe Arctic and Greenland on both sea ice and ice caps,for a technical description see Forsberg et al. (2003) andKeller et al. (2004). Nominal accuracy of the systemused in Greenland was approximately 30 cm, mainly
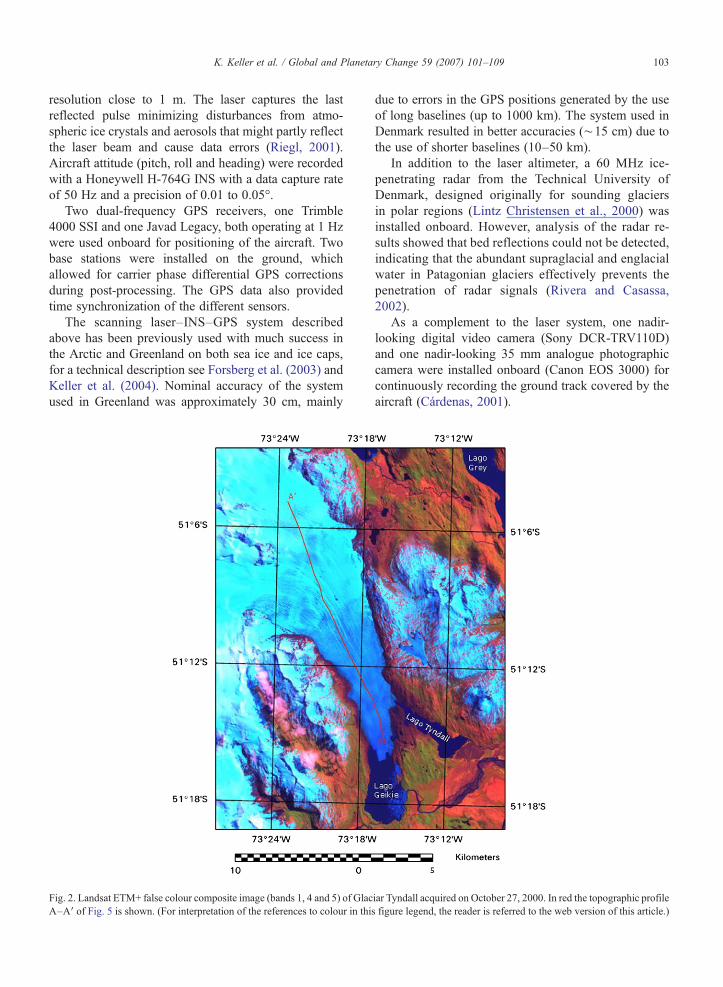
Fig. 2. Landsat ETM+ false colour composite image (bands 1, 4 and 5) of GlacA–A′ of Fig. 5 is shown. (For interpretation of the references to colour in thi
due to errors in the GPS positions generated by the useof long baselines (up to 1000 km). The system used inDenmark resulted in better accuracies (∼15 cm) due tothe use of shorter baselines (10–50 km).
In addition to the laser altimeter, a 60 MHz ice-penetrating radar from the Technical University ofDenmark, designed originally for sounding glaciersin polar regions (Lintz Christensen et al., 2000) wasinstalled onboard. However, analysis of the radar re-sults showed that bed reflections could not be detected,indicating that the abundant supraglacial and englacialwater in Patagonian glaciers effectively prevents thepenetration of radar signals (Rivera and Casassa,2002).
As a complement to the laser system, one nadir-looking digital video camera (Sony DCR-TRV110D)and one nadir-looking 35 mm analogue photographiccamera were installed onboard (Canon EOS 3000) forcontinuously recording the ground track covered by theaircraft (Cárdenas, 2001).
iar Tyndall acquired on October 27, 2000. In red the topographic profiles figure legend, the reader is referred to the web version of this article.)
104 K. Keller et al. / Global and Planetary Change 59 (2007) 101–109
3. Field survey and precision
A test flight was performed on November 19, 2001over the campus of Universidad deMagallanes (UMAG)in Punta Arenas for the calibration of the laser altimeter.The main 110 m-long building of the Faculty ofEngineering was used as a calibration target, surveyingthe vertices of the building by GPS to 1 cm accuracy.
During the test flight a four-leaf-clover track wasflown over the campus area targeting the surveyedbuilding. During the analysis of data resulting from thetest, a calibration of the misalignment angles betweenthe INS and the laser scanner allowed correction of thebuilding position in order that data collected in all fourpasses co-incided with the coordinates surveyed bytraditional static GPS. This process was done manually,yielding an estimated precision of 0.05°. After calibra-tion, the resulting airborne laser data were compared tokinematic GPS data obtained after surveying a field atUMAG campus, yielding a mean elevation difference of5 cm and a RMS error smaller than 10 cm.
On 23rd November 2001 a flight was performed overGlaciares Grey and Tyndall, Torres del Paine NationalPark, Southern Patagonia Icefield (SPI). Here we reportthe elevation results over the ablation area of GlaciarTyndall, covering an altitude range between 946 and∼50 m at the calving front of the glacier into LagosGeikie and Tyndall (Fig. 2). The altitude above groundlevel (AGL) of the aircraft varied from 150 m to 500 mduring the survey, with an average AGL of about 300 m,which results in a mean swath of 300 m.
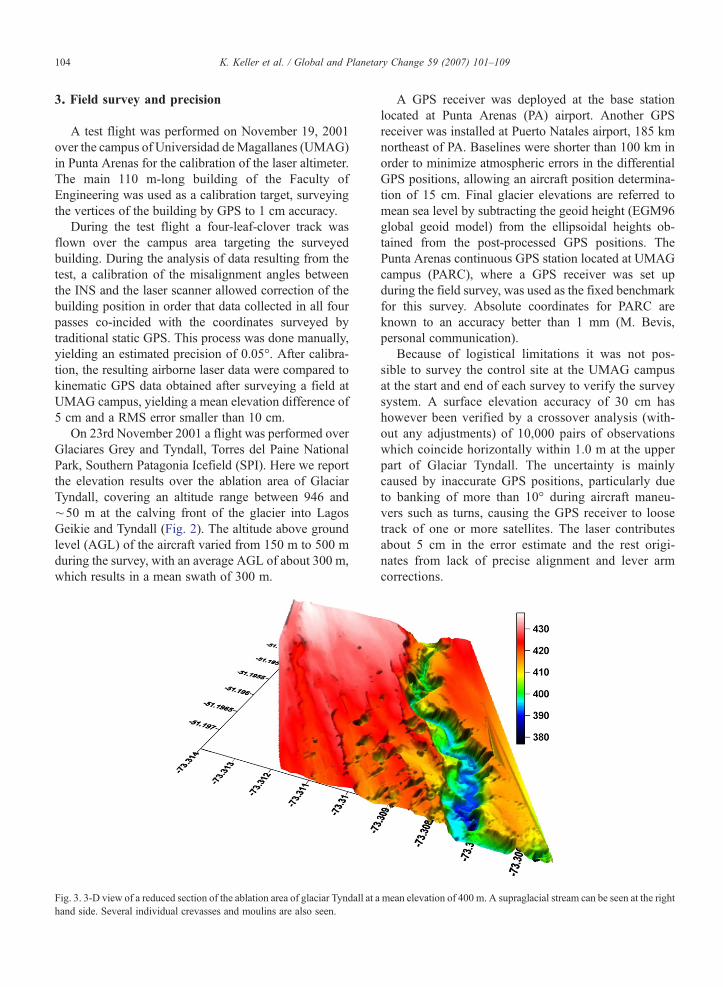
Fig. 3. 3-D view of a reduced section of the ablation area of glaciar Tyndall at ahand side. Several individual crevasses and moulins are also seen.
A GPS receiver was deployed at the base stationlocated at Punta Arenas (PA) airport. Another GPSreceiver was installed at Puerto Natales airport, 185 kmnortheast of PA. Baselines were shorter than 100 km inorder to minimize atmospheric errors in the differentialGPS positions, allowing an aircraft position determina-tion of 15 cm. Final glacier elevations are referred tomean sea level by subtracting the geoid height (EGM96global geoid model) from the ellipsoidal heights ob-tained from the post-processed GPS positions. ThePunta Arenas continuous GPS station located at UMAGcampus (PARC), where a GPS receiver was set upduring the field survey, was used as the fixed benchmarkfor this survey. Absolute coordinates for PARC areknown to an accuracy better than 1 mm (M. Bevis,personal communication).
Because of logistical limitations it was not pos-sible to survey the control site at the UMAG campusat the start and end of each survey to verify the surveysystem. A surface elevation accuracy of 30 cm hashowever been verified by a crossover analysis (with-out any adjustments) of 10,000 pairs of observationswhich coincide horizontally within 1.0 m at the upperpart of Glaciar Tyndall. The uncertainty is mainlycaused by inaccurate GPS positions, particularly dueto banking of more than 10° during aircraft maneu-vers such as turns, causing the GPS receiver to loosetrack of one or more satellites. The laser contributesabout 5 cm in the error estimate and the rest origi-nates from lack of precise alignment and lever armcorrections.
mean elevation of 400 m. A supraglacial stream can be seen at the right
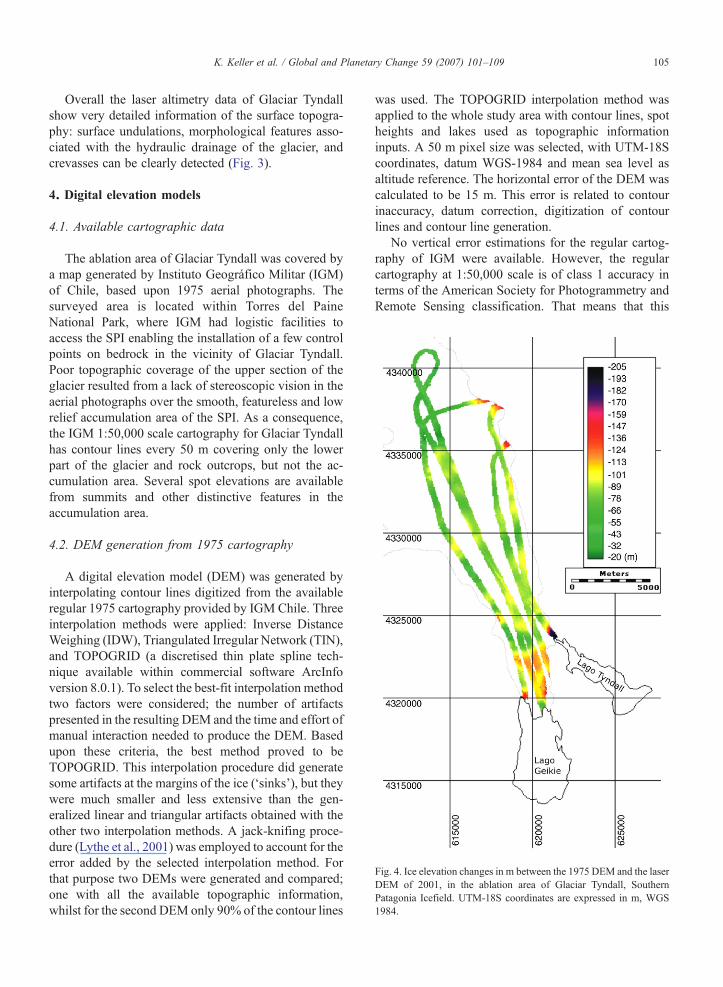
Fig. 4. Ice elevation changes in m between the 1975 DEM and the laserDEM of 2001, in the ablation area of Glaciar Tyndall, SouthernPatagonia Icefield. UTM-18S coordinates are expressed in m, WGS1984.
105K. Keller et al. / Global and Planetary Change 59 (2007) 101–109
Overall the laser altimetry data of Glaciar Tyndallshow very detailed information of the surface topogra-phy: surface undulations, morphological features asso-ciated with the hydraulic drainage of the glacier, andcrevasses can be clearly detected (Fig. 3).
4. Digital elevation models
4.1. Available cartographic data
The ablation area of Glaciar Tyndall was covered bya map generated by Instituto Geográfico Militar (IGM)of Chile, based upon 1975 aerial photographs. Thesurveyed area is located within Torres del PaineNational Park, where IGM had logistic facilities toaccess the SPI enabling the installation of a few controlpoints on bedrock in the vicinity of Glaciar Tyndall.Poor topographic coverage of the upper section of theglacier resulted from a lack of stereoscopic vision in theaerial photographs over the smooth, featureless and lowrelief accumulation area of the SPI. As a consequence,the IGM 1:50,000 scale cartography for Glaciar Tyndallhas contour lines every 50 m covering only the lowerpart of the glacier and rock outcrops, but not the ac-cumulation area. Several spot elevations are availablefrom summits and other distinctive features in theaccumulation area.
4.2. DEM generation from 1975 cartography
A digital elevation model (DEM) was generated byinterpolating contour lines digitized from the availableregular 1975 cartography provided by IGM Chile. Threeinterpolation methods were applied: Inverse DistanceWeighing (IDW), Triangulated Irregular Network (TIN),and TOPOGRID (a discretised thin plate spline tech-nique available within commercial software ArcInfoversion 8.0.1). To select the best-fit interpolation methodtwo factors were considered; the number of artifactspresented in the resulting DEM and the time and effort ofmanual interaction needed to produce the DEM. Basedupon these criteria, the best method proved to beTOPOGRID. This interpolation procedure did generatesome artifacts at the margins of the ice (‘sinks’), but theywere much smaller and less extensive than the gen-eralized linear and triangular artifacts obtained with theother two interpolation methods. A jack-knifing proce-dure (Lythe et al., 2001) was employed to account for theerror added by the selected interpolation method. Forthat purpose two DEMs were generated and compared;one with all the available topographic information,whilst for the second DEM only 90% of the contour lines
was used. The TOPOGRID interpolation method wasapplied to the whole study area with contour lines, spotheights and lakes used as topographic informationinputs. A 50 m pixel size was selected, with UTM-18Scoordinates, datum WGS-1984 and mean sea level asaltitude reference. The horizontal error of the DEM wascalculated to be 15 m. This error is related to contourinaccuracy, datum correction, digitization of contourlines and contour line generation.
No vertical error estimations for the regular cartog-raphy of IGM were available. However, the regularcartography at 1:50,000 scale is of class 1 accuracy interms of the American Society for Photogrammetry andRemote Sensing classification. That means that this
106 K. Keller et al. / Global and Planetary Change 59 (2007) 101–109
cartography is the most stringent, with vertical inaccu-racies related to the contour interval possessing avertical error of 17 m. After applying the jack-knifingprocedure, it was estimated that the vertical error addedby the interpolation procedure yielded 9 m. Therefore,the combined vertical error of the DEM is 19 m.
4.3. DEM from laser altimetry data
By plotting and analyzing the raw laser altimetry datapoints with ArcView 3.2 commercial software, outliersand spurious data points were filtered. The resulting datawere rasterized in a 50 m grid size in order to comparethe ice elevation changes with respect to the previouscartography. All data points located within a 50 m pixelsize were averaged (equally weighted mean) in order toobtain a single altitude value per pixel. Some pixelscontain thousands of laser data, especially at the centerof the flight line swaths, whilst at the margins a mini-mum of about ten points was available for some pixels.
4.4. Elevation control of the DEMs over bedrock
Mean sea level elevations from the laser DEM and the1975 DEM were compared along two profiles coveringonly rock areas at the eastern side of Lago Geikie andbetween the eastern front of Glaciar Tyndall and LagoGrey, resulting in a mean average difference of 1.0 m anda standard deviation of 24.8 m. Considering that theaccuracy of the laser DEM is 30 cm, the random error
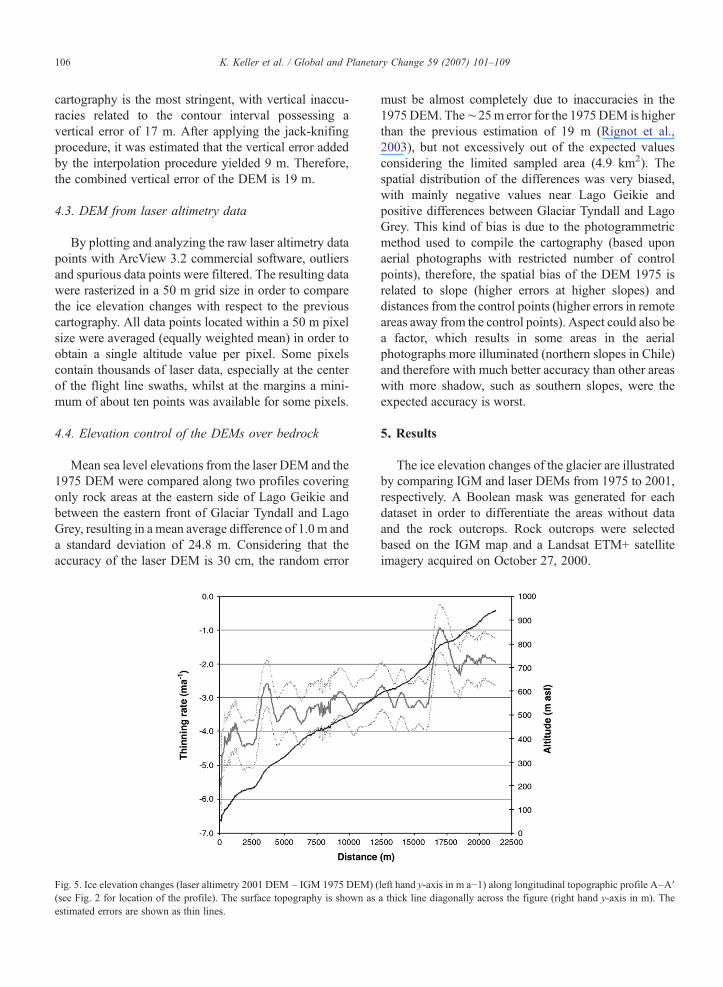
Fig. 5. Ice elevation changes (laser altimetry 2001 DEM – IGM 1975 DEM) ((see Fig. 2 for location of the profile). The surface topography is shown asestimated errors are shown as thin lines.
must be almost completely due to inaccuracies in the1975DEM. The∼25m error for the 1975DEM is higherthan the previous estimation of 19 m (Rignot et al.,2003), but not excessively out of the expected valuesconsidering the limited sampled area (4.9 km2). Thespatial distribution of the differences was very biased,with mainly negative values near Lago Geikie andpositive differences between Glaciar Tyndall and LagoGrey. This kind of bias is due to the photogrammetricmethod used to compile the cartography (based uponaerial photographs with restricted number of controlpoints), therefore, the spatial bias of the DEM 1975 isrelated to slope (higher errors at higher slopes) anddistances from the control points (higher errors in remoteareas away from the control points). Aspect could also bea factor, which results in some areas in the aerialphotographs more illuminated (northern slopes in Chile)and therefore with much better accuracy than other areaswith more shadow, such as southern slopes, were theexpected accuracy is worst.
5. Results
The ice elevation changes of the glacier are illustratedby comparing IGM and laser DEMs from 1975 to 2001,respectively. A Boolean mask was generated for eachdataset in order to differentiate the areas without dataand the rock outcrops. Rock outcrops were selectedbased on the IGM map and a Landsat ETM+ satelliteimagery acquired on October 27, 2000.
left hand y-axis in m a−1) along longitudinal topographic profile A–A′a thick line diagonally across the figure (right hand y-axis in m). The
107K. Keller et al. / Global and Planetary Change 59 (2007) 101–109
The laser data were located between the lower end ofGlaciar Tyndall (∼50 m a.s.l.) and a maximum altitudeof 946 m a.s.l., just above the equilibrium line altitude,located approximately at 900 m (Aniya et al., 1996). Ageneralized thinning trend was observed throughout theglacier. The average ice elevation change rate for all datayielded a thinning of −3.1±1.0 m a−1, with maximumvalue of −7.7±1.0 m a−1 at the freshwater calving frontof the glacier into Lago Tyndall. The non-calving easterntongue (Zapata), also experienced high thinning rates,up to −5.6±1.0 m a−1, whilst the freshwater calvingfront into Lago Geikie showed values between −3.7 and−5.7±1.0 m a−1. Fig. 4 shows the distribution of icethinning along the flight tracks.
To analyze in more detail the ice elevation changesversus altitude, a topographic profile was generated.This profile approximately follows the central flow lineof the glacier, from the frontal tongue of Lago Geikie upto 938 m a.s.l. (Fig. 2). Fig. 5 shows the resulting iceelevation changes along the profile, with maximum iceelevation change rates in areas close to the calving front,and a reduction of thinning rates at higher altitude,where minimum thinning values between −1.0 and−2.0±1.0 m a−1 were observed.
6. Discussion
Glaciar Tyndall has been retreating and shrinkingsince the end of the Little Ice Age (Rivera and Casassa,2004), with an acceleration of this trend being observedduring recent decades — presumably in response towarming and drier conditions prevailing in Patagoniaduring the second half of the 20th century (Casassaet al., 2002).
Ice elevation changes of the glacier have been re-peatedly measured along a topographic transverse pro-file first established in 1985 by Naruse et al. (1987) atapproximately 700 m of altitude. The same profile wasre-surveyed in 1990 by Kadota et al. (1992); in 1993 byNishida et al. (1995); and in 2001 by Raymond et al.(2005). Based on these values, and considering long-term comparison with previous estimations based uponaerial photographs acquired in 1945 and the IGMregular cartography of 1975, it was possible to confirman acceleration of the thinning trend at the transverseprofile from −2.3 m a−1 between 1945 and 2002, to−3.2 m a−1 between 1975 and 2002 (Raymond et al.,2005).
The results obtained here are coincident with theseestimations, as the mean average ice elevation changealong the transverse profile resulted in a thinning rate of−3.1 m a− 1 between 1975 and 2001. A similar
conclusion was obtained by comparing Shuttle RadarTopography Mission (SRTM) data obtained in 2000with IGM 1975 data (Rignot et al., 2003), confirmingthat the glacier is undergoing an accelerated thinning.
Based upon the warming trends recorded in severalPatagonian meteorological stations between 1961 and1990 (Rosenblüth et al., 1997; Carrasco et al., 2002) itwas possible to characterize the area as suffering recentrapid regional warming, similar to the observed changesexperienced on the Antarctic Peninsula (Vaughan et al.,2003). Villalba et al. (2003) described the surface tem-perature changes experienced during recent decades bythe Patagonian region between 46° and 55°S as “re-markable, more intensive during the summer seasonsand affecting predominantly minimum temperatures”. Inthis context, and considering all the dendrochronolog-ical evidence obtained in Patagonia by Villalba et al.(2001), it can be concluded that the warming trendsobserved from instrumental data in Patagonia duringrecent decades represent an unprecedented warming inthe long-term climatic variation since the end of theLittle Ice Age (LIA) during the mid-19th century.
This warming trend is presumably the main factorbehind Glaciar Tyndall variations, however, a dynamiccomponent could be playing an important role, as theglacier is calving into freshwater lakes where the ice isthinning at high rates which are not completely ex-plained by the warming experienced by the region.Raymond et al. (2005) as well as Rignot et al. (2003)considered that some enhanced basal sliding andcreeping due to higher amounts of melt water atprogressively higher altitudes, could explain the highthinning at the glacier front, where the glacier could bestretching longitudinally and thinning dynamically. Totest this hypothesis, laser data have proved to bereasonably accurate (0.3 m) for mapping the glacier anddetect ice elevation changes of relatively small magni-tudes, however, new data will be necessary to calculateeffects of possible ice flow acceleration and otherdynamic components on the glacier variations.
7. Conclusions
We report the first airborne laser altimetry survey for aSouth American glacier, Glaciar Tyndall of the SPI.Mostof the ablation area of the glacier between 50 and 948 mof altitude was surveyed. Results showed extensivethinning throughout the ablation area, with a mean valueof −3.1±1.0 m a−1. Thinning increases with decreasingaltitude, with a maximum value of −7.7± 1.0 m a−1 atthe freshwater calving front into Lago Tyndall andminimum values of −1.0 to −2.0±1.0 m a−1 close to the
108 K. Keller et al. / Global and Planetary Change 59 (2007) 101–109
equilibrium line altitude at ca. 900 m a.s.l. We see thesame trend of increased thinning at lower altitudes as inGreenland (Krabill et al., 2000) and Alaska (Arendtet al., 2002). Ice thinning at Glaciar Tyndall is atleast partly driven by enhanced melting due towarmer atmospheric temperatures. In the near future itwill be of great importance to continue monitoringchanges in glacier thickness in Patagonia by means ofairborne laser altimetry, which has proved to be anefficient method for mapping large glaciers which arenormally difficult to survey extensively using in-situfield methods. The high accuracy of the airborne lasermeasurements should provide information, over shortsurvey periods, that would assist in characterizing themass balance of the upper accumulation area, which ispresently unknown.
Acknowledgements
The valuable support of Fuerza Aérea de Chile isacknowledged, particularly the collaboration of officersand personnel at the Punta Arenas airport who made theproject possible. Universidad de Magallanes (UMAG)at Punta Arenas provided office space, the calibrationtest site and general support, through collaboration ofacademic authorities, and the relevant work of studentsMr. Ramón Cárdenas and Mr. Nivaldo Lucero. Thesupport of the Glaciology Group, Niels Bohr Institutefor Astronomy, Physics and Geophysics (NBIfAFG),University of Copenhagen, and of Kort & Matrikelstyr-elsen (KMS), Copenhagen, Denmark, is appreciated. Dr.Lintz Christensen at Technical University of Denmarkkindly provided the ice-penetrating radar. FernandoOrdenes collaborated with the figures at CECS. Theauthors wish to thank the reviewers for many helpfulcomments. Institutional support to the Centro deEstudios Científicos (CECS) from Empresas CMPC isgratefully acknowledged. CECS is a MillenniumScience Institute and is funded in part by grants fromFundación Andes and the Tinker Foundation.
References
Aniya, M., Sato, R., Naruse, R., Skvarca, P., Casassa, G., 1996. Theuse of satellite and airborne imagery to inventory outlet glaciers ofthe Southern Patagonia Icefield, South America. PhotogrammetricEngineering & Remote Sensing 62 (12), 1361–1369.
Arendt, K.A., Echelmeyer, W.D., Harrison, W.D., Lingle, C.,Valentine, V., 2002. Rapid wastage of Alaska glaciers and theircontribution to rising sea level. Science 297, 382–386.
Bamber, J., Rivera, A., 2007. A review of remote sensing methods forglacier mass balance determination. Global and Planetary Change59, 138–148 (this issue). doi:10.1016/j.gloplacha.2006.11.031.
Cárdenas, R., 2001. Sistema digital de adquisición de imágenes:aplicación de sensores aéreos. Unpublished thesis, Faculty ofEngineering, University of Magallanes.
Carrasco, J., Casassa, G., Rivera, A., 2002. Meteorological andclimatological aspects of the Southern Patagonia ice cap,Patagonia. In: Casassa, G., Sepúlveda, F., Sinclair, R. (Eds.), ThePatagonian Icefields: A Unique Natural Laboratory for Environ-mental and Climate Change Studies. Series of the Centro deEstudios Científicos. Kluwer Academic/Plenum Publishers, NewCork, pp. 29–41.
Casassa, G., Rivera, A., Aniya, M., Naruse, R., 2002. Currentknowledge of the Southern Patagonia Icefield. In: Casassa, G.,Sepúlveda, F., Sinclair, R. (Eds.), The Patagonian Icefields: AUnique Natural Laboratory for Environmental and Climate ChangeStudies. Series of the Centro de Estudios Científicos. KluwerAcademic/Plenum Publishers, New York, pp. 67–83.
Forsberg, R., Keller, K., Hvidegaard, S., Olesen, A., 2003. ESAG-2002: European Airborne Gravity and Lidar Survey in the ArcticOcean. Technical Report No. 21. National Survey and Cadastre,Denmark. ftp://ftp.kms.dk/pub/ESAG.
Keller, K., Hvidegaard, S.M., Forsberg, R., Dalå, N.S., Skourup, H.,Stenseng, L., 2004. Airborne lidar and radar measurements oversea ice and inland ice for cryosat validation: CRYOVEX 2003 —final report. Technical Report No. 25. National Survey andCadastre, Denmark.
Kadota, T., Naruse, R., Skvarca, P., Aniya, M., 1992. Ice flow andsurface lowering of Tyndall Glaciar, southern Patagonia. Bulletinof Glacier Research 10, 63–68.
Krabill, W., Abdalati, W., Frederick, E., Manizade, S., Martin, C.,Sonntag, J., Swift, R., Thomas, R., Wright, W., Yungel, J., 2000.Greenland ice sheet: high-elevation balance and peripheralthinning. Science 289, 428–430.
Krimmel, R., 1999. Analysis of difference between direct and geodeticmass balance measurements at South Cascade Glacier, Washing-ton. Geografiska Annaler 81A (4), 653–658.
Lintz Christensen, E., Reeh, N., Forsberg, R., Jørgensen, J.H., Skou,N., Woelders, K., 2000. A low-cost glacier-mapping system.Journal of Glaciology 46 (154), 531–537.
Lythe, M., Vaughan, D., BEDMAP consortium, 2001. BEDMAP: anew ice thickness and subglacial topographic model of Antarctica.Journal of Geophysical Research 106 (b6), 11335–11351.
Naruse, R., Peña, H., Aniya, M., Inoue, J., 1987. Flow and surfacestructure of Tyndall Glacier, Southern Patagonia Icefield. Bulletinof Glacier Research 4, 133–140.
Nishida, K., Satow, K., Aniya, M., Casassa, G., Kadota, T., 1995.Thickness change and flow of Tyndall Glacier, Patagonia. Bulletinof Glacier Research (Data Center for Glacier Research, JapaneseSociety of Snow and Ice) 13, 29–34.
Oerlemans, J., 1994. Quantifying global warming from the retreat ofglaciers. Science 264 (5156), 243–245.
Raymond, C., Neumann, T.A., Rignot, E., Echelmeyer, K.A., Rivera,A., Casassa, G., 2005. Retreat of Tyndall Glacier, Patagonia, overthe last half century. Journal of Glaciology 173 (51), 239–247.
Riegl, 2001. Laser mirror scanner, LMS-Q140i-60. TechnicalDocumentation and Users Instructions, Rev. 19–08–2001(V4.3), Riegl, Laser Measurements Systems GmbH, Horn,Austria. http://www.riegl.co.at/principles/e_gi009.htm.
Rignot, E., Rivera, A., Casassa, G., 2003. Contribution of the PatagoniaIcefields of South America to sea level rise. Science 302, 434–437.
Rivera, A., Casassa, G., 2002. Detection of ice thickness using radio-echo sounding on the Southern Patagonia Icefield. In: Casassa, G.,Sepúlveda, F., Sinclair, R. (Eds.), The Patagonian Icefields: A
109K. Keller et al. / Global and Planetary Change 59 (2007) 101–109
Unique Natural Laboratory for Environmental and Climate ChangeStudies. Series of the Centro de Estudios Científicos. KluwerAcademic/Plenum Publishers, New York, pp. 101–115.
Rivera, A., Casassa, G., 2004. Ice elevation, areal and frontal changesof glaciers from Torres del Paine National Park, SouthernPatagonia Icefield. Arctic, Alpine and Antarctic Research 4 (36),379–389.
Rosenblüth, B., Fuenzalida, H., Aceituno, P., 1997. Recent temper-ature variations in southern South America. International Journalof Climatology 17, 67–85.
Shiraiwa, T., Kohshima, S., Uemura, R., Yoshida, N., Matoba, S.,Uetake, J., Godoi, M., 2002. High net accumulation rates at Campode Hielo Patagónico Sur, South America, revealed by analysis of a45.97 m long ice core. Annals of Glaciology 35, 8490.
Vaughan, D., Marshall, G., Connolley, W., Parkinson, C., Mulvaney,R., Hodgson, D., King, J., Pudsey, C., Turner, J., 2003. Recentrapid regional climate warming on the Antarctic Peninsula.Climatic Change 60 (3), 243–274.
Villalba, V., D'Arrigo, R., Cook, E., Wiles, G., Jacoby, G., 2001.Decadal-scale climatic variability along the extratropical westerncoast of the Americas: evidences from tree-ring records. In:Markgraf, V. (Ed.), Inter-Hemispheric Climate Linkages. Aca-demic Press, San Diego, California, U.S.A., pp. 155–172.
Villalba, R., Lara, A., Boninsegna, J., Masiokas, M., Delgado, S.,Aravena, J., Roig, F., Schmelter, A., Wolodarsky, A., Ripalta, A.,2003. Large-scale temperature changes across the southern Andes:20th-century variations in the context of the past 400 years.Climatic Change 59 (1–2), 177–232.