wind characteristics in neuquen, north patagonia, argentina
TRANSCRIPT
Journal of Wind Engineeringand Industrial Aerodynamics 79 (1999) 183—199
Wind characteristics in Neuquen, North Patagonia,Argentina
J.L. Lassig*, M.G. Cogliati, M.A. Bastanski, C. PaleseUniversidad Nacional del Comahue, Facultad Ingenierı&a, Buenos Aires 1400, 8300 Neuque&n, Argentina
Received 10 December 1995; received in revised form 5 December 1996; accepted 11 March 1998
Abstract
Extreme wind episodes influence most economic and social regional activities. Wind and duststorms produce local troubles and discomfort. This paper describes climatological windcharacteristics and a surface layer wind profile following a power-law profile approach for laterwind tunnel studies. An adequate building plan could improve general life conditions. Statist-ical results concerning yearly and seasonal mean values were obtained. Two proper series ofwind speed measurements were made and analyzed. ( 1999 Elsevier Science Ltd. All rightsreserved.
1. Introduction
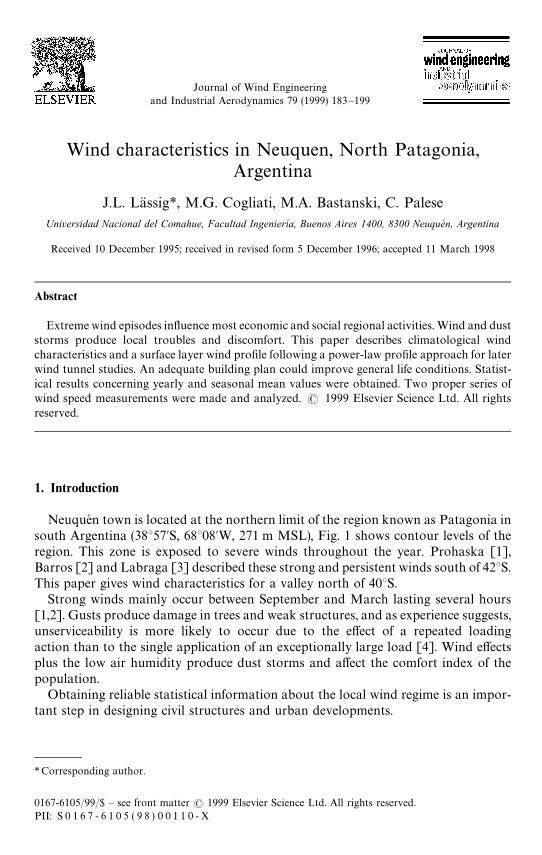
Neuquen town is located at the northern limit of the region known as Patagonia insouth Argentina (38°57@S, 68°08@W, 271 m MSL), Fig. 1 shows contour levels of theregion. This zone is exposed to severe winds throughout the year. Prohaska [1],Barros [2] and Labraga [3] described these strong and persistent winds south of 42°S.This paper gives wind characteristics for a valley north of 40°S.
Strong winds mainly occur between September and March lasting several hours[1,2]. Gusts produce damage in trees and weak structures, and as experience suggests,unserviceability is more likely to occur due to the effect of a repeated loadingaction than to the single application of an exceptionally large load [4]. Wind effectsplus the low air humidity produce dust storms and affect the comfort index of thepopulation.
Obtaining reliable statistical information about the local wind regime is an impor-tant step in designing civil structures and urban developments.
*Corresponding author.
0167-6105/99/$ — see front matter ( 1999 Elsevier Science Ltd. All rights reserved.PII: S 0 1 6 7 - 6 1 0 5 ( 9 8 ) 0 0 1 1 0 - X
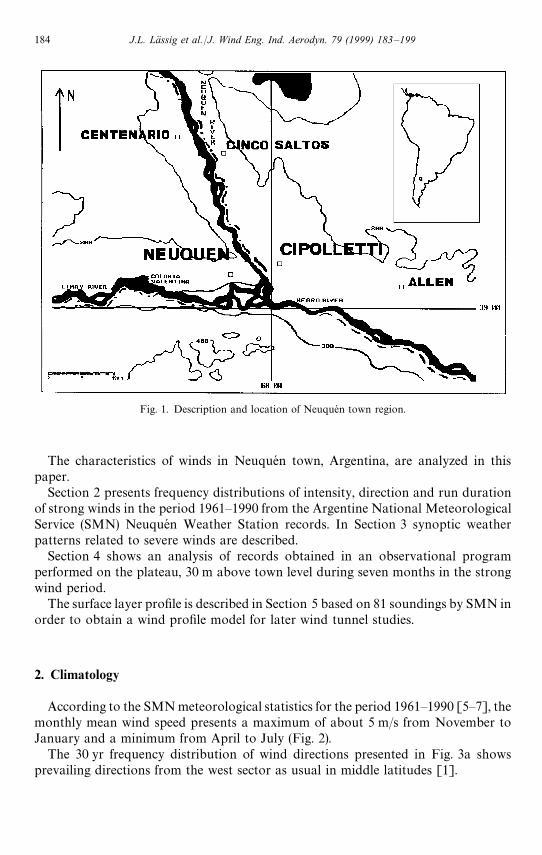
Fig. 1. Description and location of Neuquen town region.
The characteristics of winds in Neuquen town, Argentina, are analyzed in thispaper.
Section 2 presents frequency distributions of intensity, direction and run durationof strong winds in the period 1961—1990 from the Argentine National MeteorologicalService (SMN) Neuquen Weather Station records. In Section 3 synoptic weatherpatterns related to severe winds are described.
Section 4 shows an analysis of records obtained in an observational programperformed on the plateau, 30 m above town level during seven months in the strongwind period.
The surface layer profile is described in Section 5 based on 81 soundings by SMN inorder to obtain a wind profile model for later wind tunnel studies.
2. Climatology
According to the SMN meteorological statistics for the period 1961—1990 [5—7], themonthly mean wind speed presents a maximum of about 5 m/s from November toJanuary and a minimum from April to July (Fig. 2).
The 30 yr frequency distribution of wind directions presented in Fig. 3a showsprevailing directions from the west sector as usual in middle latitudes [1].
184 J.L. La( ssig et al./J. Wind Eng. Ind. Aerodyn. 79 (1999) 183–199
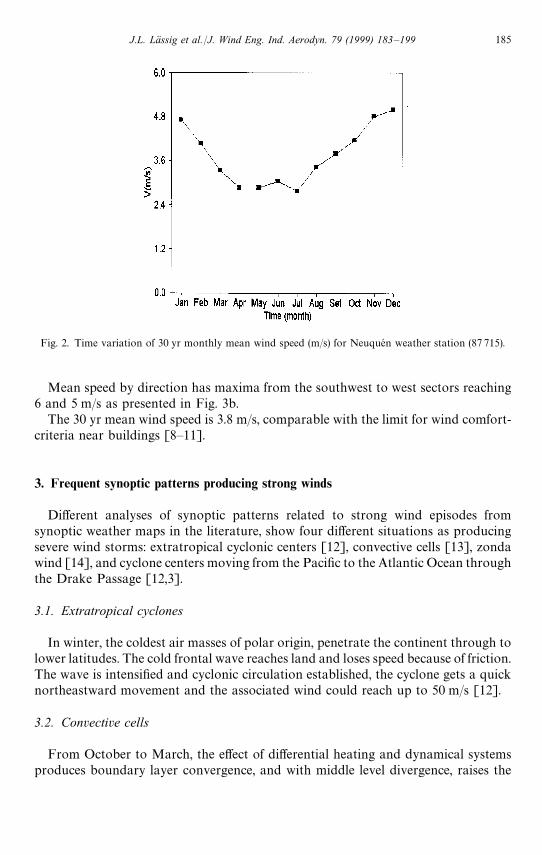
Fig. 2. Time variation of 30 yr monthly mean wind speed (m/s) for Neuquen weather station (87 715).
Mean speed by direction has maxima from the southwest to west sectors reaching6 and 5 m/s as presented in Fig. 3b.
The 30 yr mean wind speed is 3.8 m/s, comparable with the limit for wind comfort-criteria near buildings [8—11].
3. Frequent synoptic patterns producing strong winds
Different analyses of synoptic patterns related to strong wind episodes fromsynoptic weather maps in the literature, show four different situations as producingsevere wind storms: extratropical cyclonic centers [12], convective cells [13], zondawind [14], and cyclone centers moving from the Pacific to the Atlantic Ocean throughthe Drake Passage [12,3].
3.1. Extratropical cyclones
In winter, the coldest air masses of polar origin, penetrate the continent through tolower latitudes. The cold frontal wave reaches land and loses speed because of friction.The wave is intensified and cyclonic circulation established, the cyclone gets a quicknortheastward movement and the associated wind could reach up to 50 m/s [12].
3.2. Convective cells
From October to March, the effect of differential heating and dynamical systemsproduces boundary layer convergence, and with middle level divergence, raises the
J.L. La( ssig et al./J. Wind Eng. Ind. Aerodyn. 79 (1999) 183–199 185
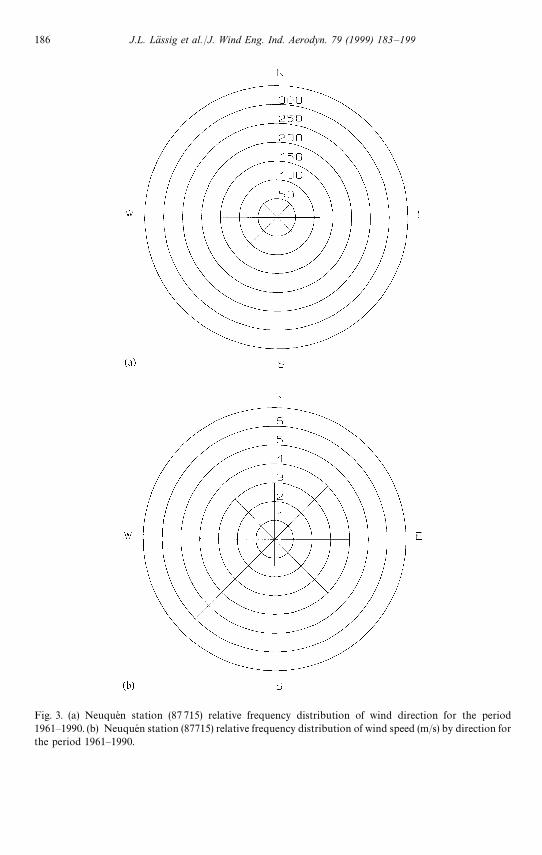
Fig. 3. (a) Neuquen station (87 715) relative frequency distribution of wind direction for the period1961—1990. (b) Neuquen station (87715) relative frequency distribution of wind speed (m/s) by direction forthe period 1961—1990.
186 J.L. La( ssig et al./J. Wind Eng. Ind. Aerodyn. 79 (1999) 183–199
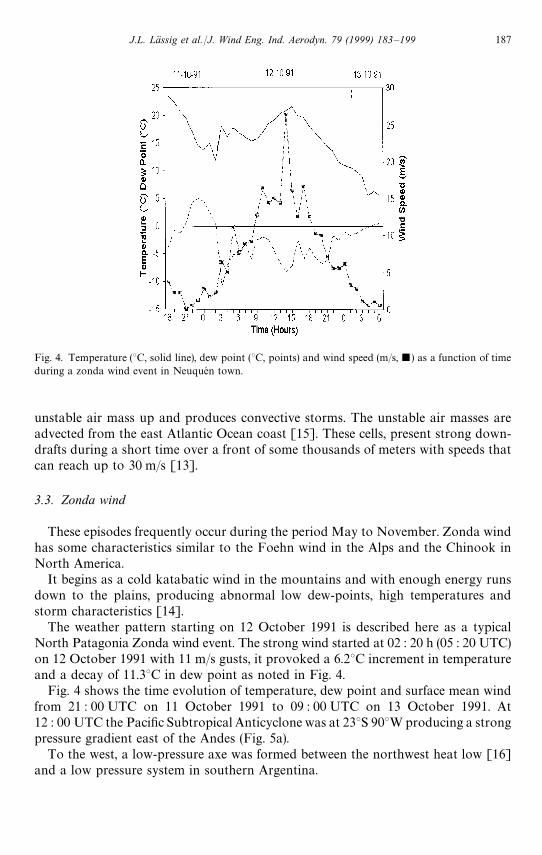
Fig. 4. Temperature (°C, solid line), dew point (°C, points) and wind speed (m/s, j ) as a function of timeduring a zonda wind event in Neuquen town.
unstable air mass up and produces convective storms. The unstable air masses areadvected from the east Atlantic Ocean coast [15]. These cells, present strong down-drafts during a short time over a front of some thousands of meters with speeds thatcan reach up to 30 m/s [13].
3.3. Zonda wind
These episodes frequently occur during the period May to November. Zonda windhas some characteristics similar to the Foehn wind in the Alps and the Chinook inNorth America.
It begins as a cold katabatic wind in the mountains and with enough energy runsdown to the plains, producing abnormal low dew-points, high temperatures andstorm characteristics [14].
The weather pattern starting on 12 October 1991 is described here as a typicalNorth Patagonia Zonda wind event. The strong wind started at 02 : 20 h (05 : 20 UTC)on 12 October 1991 with 11 m/s gusts, it provoked a 6.2°C increment in temperatureand a decay of 11.3°C in dew point as noted in Fig. 4.
Fig. 4 shows the time evolution of temperature, dew point and surface mean windfrom 21 : 00 UTC on 11 October 1991 to 09 : 00 UTC on 13 October 1991. At12 : 00 UTC the Pacific Subtropical Anticyclone was at 23°S 90°W producing a strongpressure gradient east of the Andes (Fig. 5a).
To the west, a low-pressure axe was formed between the northwest heat low [16]and a low pressure system in southern Argentina.
J.L. La( ssig et al./J. Wind Eng. Ind. Aerodyn. 79 (1999) 183–199 187
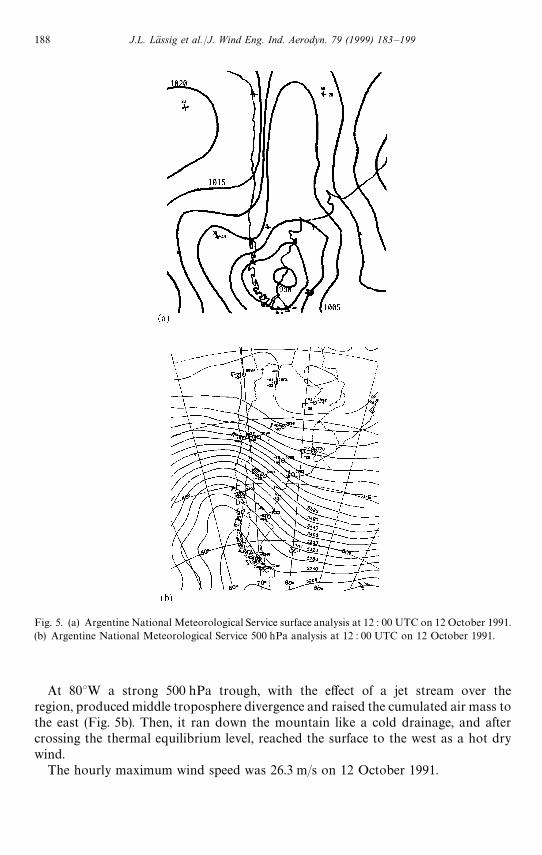
Fig. 5. (a) Argentine National Meteorological Service surface analysis at 12 : 00 UTC on 12 October 1991.(b) Argentine National Meteorological Service 500 hPa analysis at 12 : 00 UTC on 12 October 1991.
At 80°W a strong 500 hPa trough, with the effect of a jet stream over theregion, produced middle troposphere divergence and raised the cumulated air mass tothe east (Fig. 5b). Then, it ran down the mountain like a cold drainage, and aftercrossing the thermal equilibrium level, reached the surface to the west as a hot drywind.
The hourly maximum wind speed was 26.3 m/s on 12 October 1991.
188 J.L. La( ssig et al./J. Wind Eng. Ind. Aerodyn. 79 (1999) 183–199
3.4. Cyclones passing through the Drake Passage
The movement of cyclonic centers through the Drake Passage, provokes an in-crease in horizontal pressure gradients over the Neuquen region and strong windspeeds.
Schmitt [17] while studying the frequency of cyclones in the South Pacific Ocean,pointed out that the main passage for cyclones passing from the pacific to the AtlanticOcean is the Drake Passage. Labraga [3] pointed out that this is the main cause ofsevere wind episodes on the Pampa del Castillo Plateau (46°S, 68°W). The Neuquenregion, located to the northwest, is under the influence of the Pacific subtropical ridgeand the Andes chain, and this effect is decreased as shown in Table 1.
One example is a strong wind event lasting from 13 October to 16 October 1992with maximum wind speed values reaching 21.4 m/s on 14 October 1992. A low-pressure center passing through the Drake Passage on 13 October (Fig. 6a) produceda strong pressure gradient in Patagonia, reaching its maximum on 14 October; whichcombined with the effect of transport of momentum from a jet stream located south ofthe Neuquen latitude (Fig. 6b), produced intensification of the surface wind speed.
This case is a combined case. The strong wind was produced by a joint effect ofa cyclone passing through the Drake Passage and wind running down the Andeschain (Zonda wind).
Fig. 7a and Fig. 7b show the vertical distribution of temperature and dew pointbefore and after the wind event and show the dry out of the air mass between 900 and500 hPa because of dynamical and orographical subsidence.
4. Strong wind series analysis
In 1983 and 1984, two series of wind speed measurements were performed. The datawere obtained in the north part of the town, over the plateau, from a 10 m towerlocated in a place 30 m above town level (Limay River valley level).
This experiment included measurements of wind speed and direction with a SIAPAG-10 anemograph that were 10 min averages with 1 h interval.
The two periods were from 1 September 1983 to 31 January 1984 and from 1 May1984 to 30 June 1984.
Fig. 8 shows the frequency distribution of wind direction. 70% of the data is fromthe west to southwest sectors.
Fig. 9 presents the frequency distribution of the wind speed; the average wind speedis 4.4 m/s and the maximum value is 19.6 m/s; and the maximum frequencies are in the2.5 and 3 m/s classes.
The wind speed frequency distribution can be reasonably approximated bya Weibull II distribution [2],
f (u)"k
c Au
cBk~1
e~(u@c)k, (1)
where k is a shape parameter and c is a scale parameter of f (u).
J.L. La( ssig et al./J. Wind Eng. Ind. Aerodyn. 79 (1999) 183–199 189
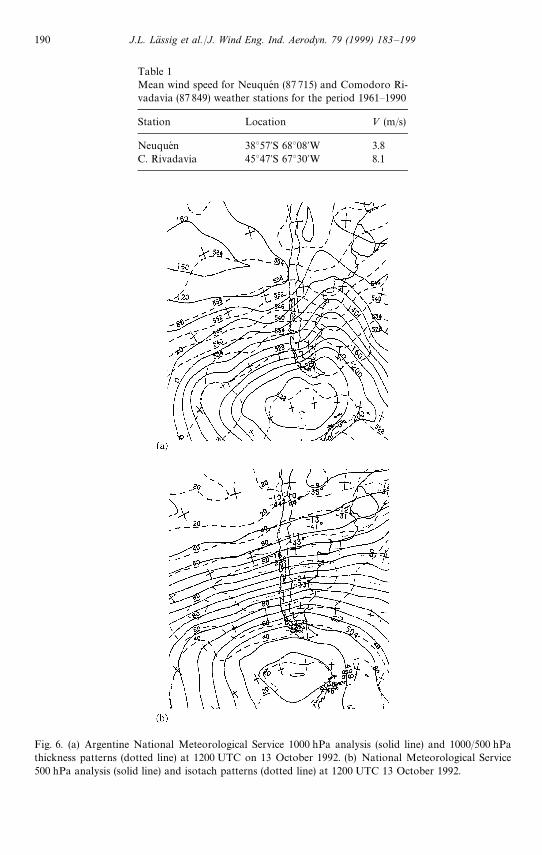
Table 1Mean wind speed for Neuquen (87 715) and Comodoro Ri-vadavia (87 849) weather stations for the period 1961—1990
Station Location » (m/s)
Neuquen 38°57@S 68°08@W 3.8C. Rivadavia 45°47@S 67°30@W 8.1
Fig. 6. (a) Argentine National Meteorological Service 1000 hPa analysis (solid line) and 1000/500 hPathickness patterns (dotted line) at 1200 UTC on 13 October 1992. (b) National Meteorological Service500 hPa analysis (solid line) and isotach patterns (dotted line) at 1200 UTC 13 October 1992.
190 J.L. La( ssig et al./J. Wind Eng. Ind. Aerodyn. 79 (1999) 183–199
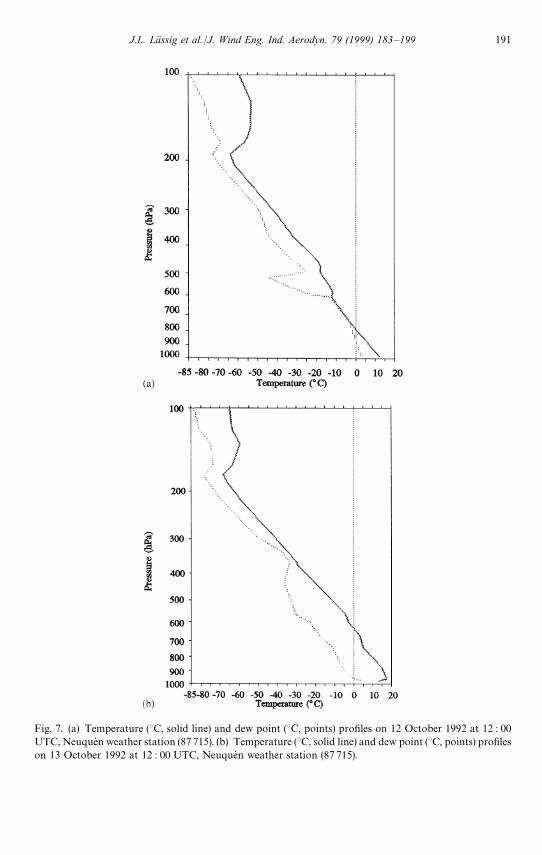
Fig. 7. (a) Temperature (°C, solid line) and dew point (°C, points) profiles on 12 October 1992 at 12 : 00UTC, Neuquen weather station (87 715). (b) Temperature (°C, solid line) and dew point (°C, points) profileson 13 October 1992 at 12 : 00 UTC, Neuquen weather station (87 715).
J.L. La( ssig et al./J. Wind Eng. Ind. Aerodyn. 79 (1999) 183–199 191
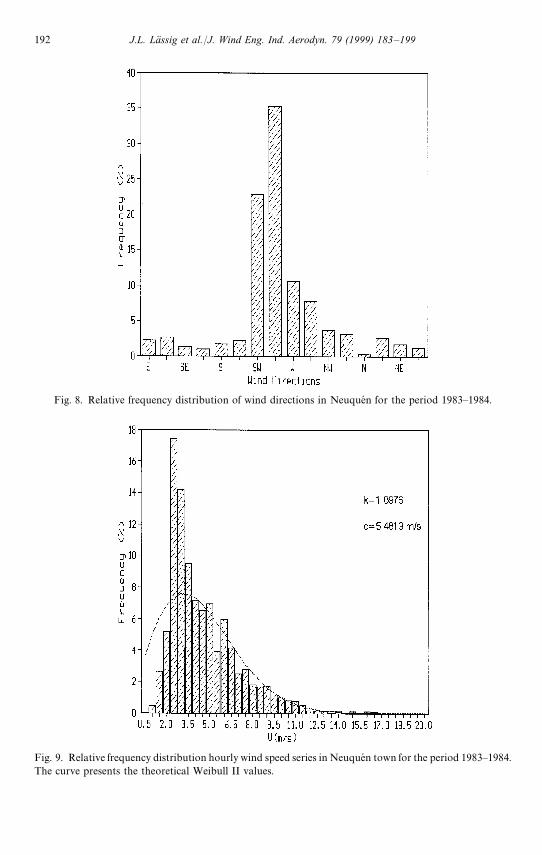
Fig. 8. Relative frequency distribution of wind directions in Neuquen for the period 1983—1984.
Fig. 9. Relative frequency distribution hourly wind speed series in Neuquen town for the period 1983—1984.The curve presents the theoretical Weibull II values.
192 J.L. La( ssig et al./J. Wind Eng. Ind. Aerodyn. 79 (1999) 183–199
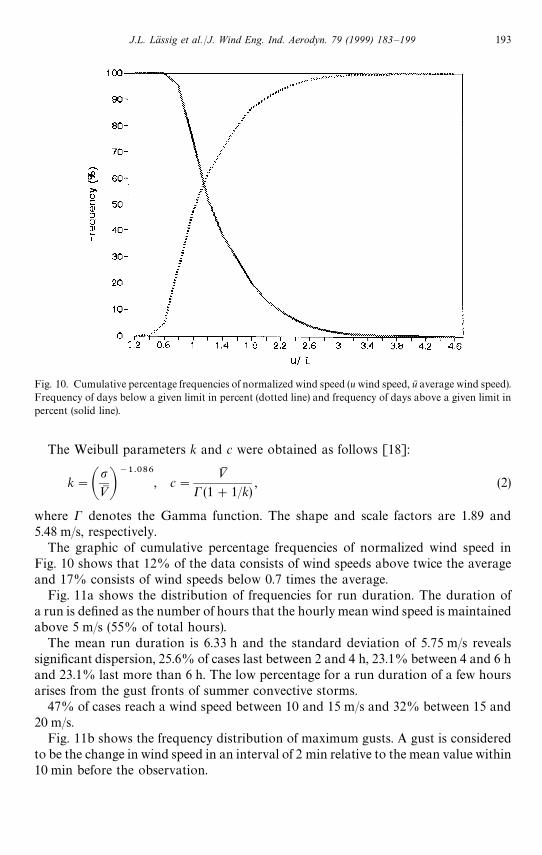
Fig. 10. Cumulative percentage frequencies of normalized wind speed (u wind speed, uN average wind speed).Frequency of days below a given limit in percent (dotted line) and frequency of days above a given limit inpercent (solid line).
The Weibull parameters k and c were obtained as follows [18]:
k"Ap»M B
~1.086, c"
»MC (1#1/k)
, (2)
where C denotes the Gamma function. The shape and scale factors are 1.89 and5.48 m/s, respectively.
The graphic of cumulative percentage frequencies of normalized wind speed inFig. 10 shows that 12% of the data consists of wind speeds above twice the averageand 17% consists of wind speeds below 0.7 times the average.
Fig. 11a shows the distribution of frequencies for run duration. The duration ofa run is defined as the number of hours that the hourly mean wind speed is maintainedabove 5 m/s (55% of total hours).
The mean run duration is 6.33 h and the standard deviation of 5.75 m/s revealssignificant dispersion, 25.6% of cases last between 2 and 4 h, 23.1% between 4 and 6 hand 23.1% last more than 6 h. The low percentage for a run duration of a few hoursarises from the gust fronts of summer convective storms.
47% of cases reach a wind speed between 10 and 15 m/s and 32% between 15 and20 m/s.
Fig. 11b shows the frequency distribution of maximum gusts. A gust is consideredto be the change in wind speed in an interval of 2 min relative to the mean value within10 min before the observation.
J.L. La( ssig et al./J. Wind Eng. Ind. Aerodyn. 79 (1999) 183–199 193
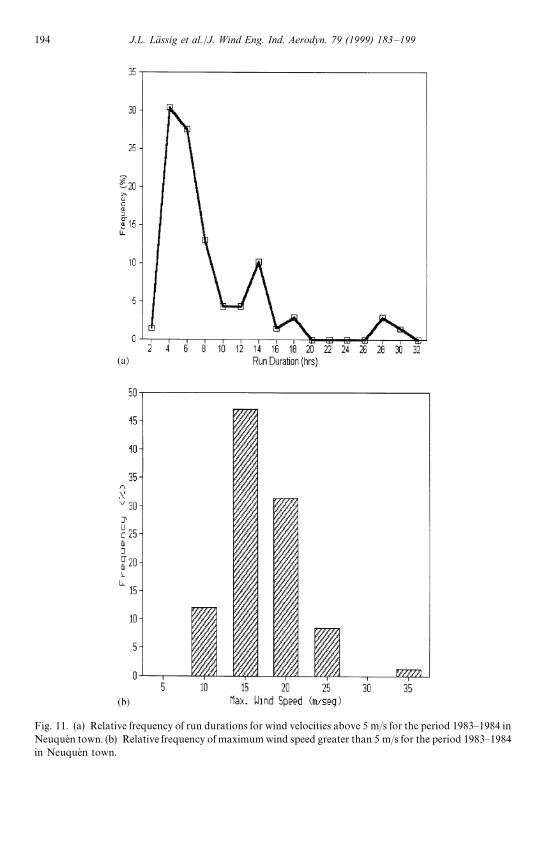
Fig. 11. (a) Relative frequency of run durations for wind velocities above 5 m/s for the period 1983—1984 inNeuquen town. (b) Relative frequency of maximum wind speed greater than 5 m/s for the period 1983—1984in Neuquen town.
194 J.L. La( ssig et al./J. Wind Eng. Ind. Aerodyn. 79 (1999) 183–199
The mean wind speed for events with a wind speed greater than 5 m/s is 7.38 m/s(p"1.67 m/s), the mean gust is 14.69 m/s (p"4.25 m/s) and the maximum gust is33.33 m/s.
5. Analysis of wind profile
Routine daily soundings from the Neuquen weather station (SMN) from 1 Septem-ber 1991 to 28 February 1992 were considered.
Measurements with wind speed at 10 m AGL (above ground level) greater than5 m/s were first selected, but because of the lack of cases it was decided to choose casesgreater than 4 m/s.
The zonal wind component (u) was calculated in the prevailing surface winddirection and v in the perpendicular direction.
According to Sutton [19], a power-law velocity profile is usually expressed as
u(z)/u(z2)"(z/z
2)p, (3)
where u(z2) is the wind speed at a height z
2, u(z) the wind speed at a height z and p the
power-law exponent. As a reference level, z"200 m is taken.The usual 10 m value produces agreement mainly at lower levels, then the approxi-
mation becomes less precise. In some wind tunnel experiments, there is a need tomodel higher levels, and with a higher reference level, a good profile is obtained forheights above 200 m AGL.
The power-law profile was considered for z(350 m AGL, with u(z)"u350 .
ifz*350 m AGL.
The power-law exponent was obtained from the slope of a linear regressionequation by taking the logarithm of both sides of Eq. (3).
The error was calculated as
e"(u
0!u
#)
u0
]100, (4)
where u#is the calculated wind speed, and u
0the observed value.
The power p is taken to be constant with height. When convective turbulencemakes important contributions, p will have to be adjusted further. The value ofp increases with increasing stability.
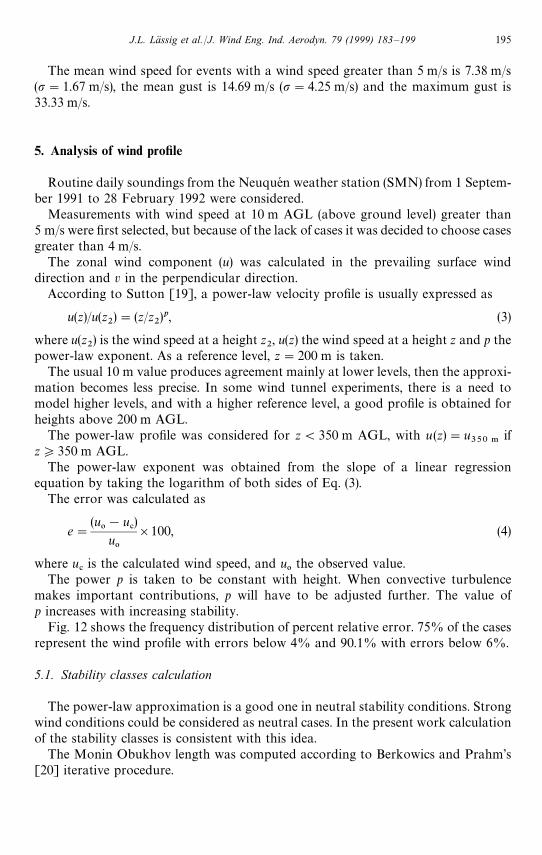
Fig. 12 shows the frequency distribution of percent relative error. 75% of the casesrepresent the wind profile with errors below 4% and 90.1% with errors below 6%.
5.1. Stability classes calculation
The power-law approximation is a good one in neutral stability conditions. Strongwind conditions could be considered as neutral cases. In the present work calculationof the stability classes is consistent with this idea.
The Monin Obukhov length was computed according to Berkowics and Prahm’s[20] iterative procedure.
J.L. La( ssig et al./J. Wind Eng. Ind. Aerodyn. 79 (1999) 183–199 195
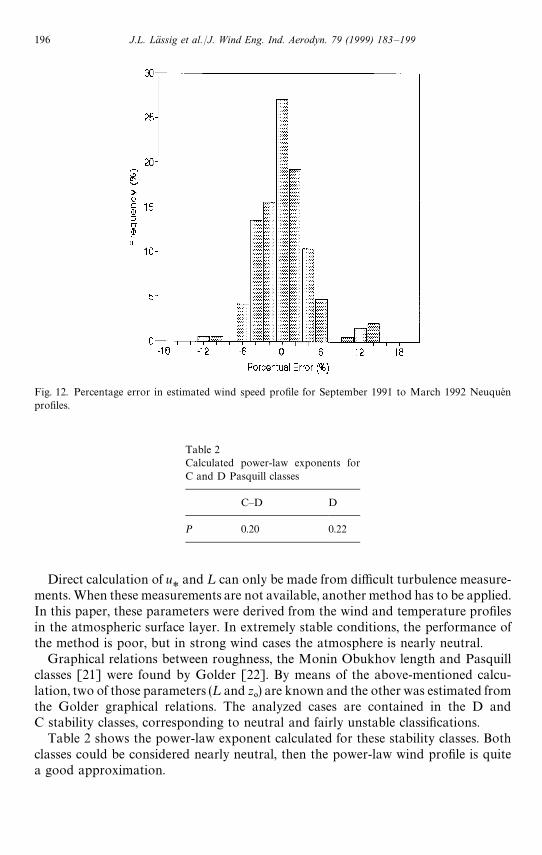
Fig. 12. Percentage error in estimated wind speed profile for September 1991 to March 1992 Neuquenprofiles.
Table 2Calculated power-law exponents forC and D Pasquill classes
C—D D
P 0.20 0.22
Direct calculation of u*
and ¸ can only be made from difficult turbulence measure-ments. When these measurements are not available, another method has to be applied.In this paper, these parameters were derived from the wind and temperature profilesin the atmospheric surface layer. In extremely stable conditions, the performance ofthe method is poor, but in strong wind cases the atmosphere is nearly neutral.
Graphical relations between roughness, the Monin Obukhov length and Pasquillclasses [21] were found by Golder [22]. By means of the above-mentioned calcu-lation, two of those parameters (¸ and z
0) are known and the other was estimated from
the Golder graphical relations. The analyzed cases are contained in the D andC stability classes, corresponding to neutral and fairly unstable classifications.
Table 2 shows the power-law exponent calculated for these stability classes. Bothclasses could be considered nearly neutral, then the power-law wind profile is quitea good approximation.
196 J.L. La( ssig et al./J. Wind Eng. Ind. Aerodyn. 79 (1999) 183–199
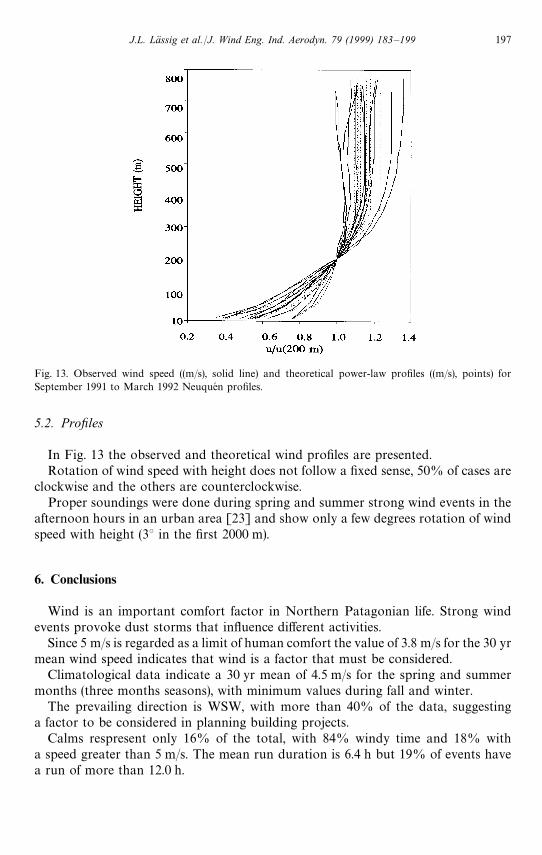
Fig. 13. Observed wind speed ((m/s), solid line) and theoretical power-law profiles ((m/s), points) forSeptember 1991 to March 1992 Neuquen profiles.
5.2. Profiles
In Fig. 13 the observed and theoretical wind profiles are presented.Rotation of wind speed with height does not follow a fixed sense, 50% of cases are
clockwise and the others are counterclockwise.Proper soundings were done during spring and summer strong wind events in the
afternoon hours in an urban area [23] and show only a few degrees rotation of windspeed with height (3° in the first 2000 m).
6. Conclusions
Wind is an important comfort factor in Northern Patagonian life. Strong windevents provoke dust storms that influence different activities.
Since 5 m/s is regarded as a limit of human comfort the value of 3.8 m/s for the 30 yrmean wind speed indicates that wind is a factor that must be considered.
Climatological data indicate a 30 yr mean of 4.5 m/s for the spring and summermonths (three months seasons), with minimum values during fall and winter.
The prevailing direction is WSW, with more than 40% of the data, suggestinga factor to be considered in planning building projects.
Calms respresent only 16% of the total, with 84% windy time and 18% witha speed greater than 5 m/s. The mean run duration is 6.4 h but 19% of events havea run of more than 12.0 h.
J.L. La( ssig et al./J. Wind Eng. Ind. Aerodyn. 79 (1999) 183–199 197
Maximum gusts are as high as 15 m/s in 41% of the total data and examplesreaching 39 m/s in the 1981—1990 decade.
An important tool in the study of wind effects is the use of the wind tunnel. Thispaper tries to characterize the wind profile for use in such experiments.
By considering routine SMN soundings from the Neuquen weather stationand special ones done during dust storms in the Neuquen town area, it is con-cluded that a power law represents, with errors less than 5%, the surface layerprofile up to the 350 m level and for a wind speed greater than 4 m/s, in the casesstudied.
The soundings considered are contained in the Pasquill C and D stability classes.The power-law exponent for the D class data is 0.2, very near to the value found byIrwin for D class data in an urban area.
From consideration of the few points included in the first 150 m, a power-lawexponent is suggested for near-neutral conditions and low Richardson number values,because of the behavior of the temperature profile, and dominance of pure mechanicalturbulence during strong wind episodes.
Over nonuniform terrain, even with purely mechanical turbulence, the real profilesare very complex, but to assume a power-law profile in a range is an acceptableapproximation.
Considering wind vertical rotation, the behavior is not clear, and in the specialurban soundings a clear rotation was not observed.
Thus, a power-law profile is suggested for Neuquen town in wind tunnel experi-ments. The power-law exponent should be chosen considering stability class butwithout considering any vertical rotation.
Acknowledgements
This study was realized thanks to a Universidad Nacional del Comahue (UNC)grant. Meteorological data was proportioned by SMN through an SMN-UNCagreement and Agua y Energıa, Neuquen province government and UNC agreement.The authors would like to thank Professor Alberto Flores for lending us the soundingequipment.
References
[1] F. Prohaska, The Climate of Argentina, Paraguay and Uruguay, in: H. Landsberg (Ed.), WorldSurvey of Climatology, vol. 2, Elsevier, Amsterdam, 1976, 532 pp.
[2] V.R. Barros, Atlas del Potencial Eolico del Sur Argentino, Centro Nacional Patagonico, PuertoMadryn, 1986, 293 pp.
[3] J. Labraga, Extreme winds in the pampa del Castillo Plateau, Patagonia, Argentina, with reference towind farm settlement, J. Appl. Meteorol. 33 (1) (1994) 85—95.
[4] A.G. Davenport, The dependence of wind loads on meteorological parameters, in: Proc. Int. Seminaron Wind Effects on Buildings and Structures, Ottawa, National Science Foundation, 1967, pp. 19—82.
[5] Servicio Meteorologico Nacional, Argentina, 1981, Estadıstica climatologica 1961—70, B ServicioMeteorologico Nacional, 35, 188 pp.
198 J.L. La( ssig et al./J. Wind Eng. Ind. Aerodyn. 79 (1999) 183–199
[6] Servicio Meteorologico Nacional, Argentina, 1986, Estadıstica climatologica 1971—80, B ServicioMeteorologico Nacional, 36, 169 pp.
[7] Servicio Meteorologico Nacional, Argentina, 1992, Estadıstica climatologica 1981—90, B ServicioMeteorologico Nacional, 37, 709 pp.
[8] A.G. Davenport, An approach to the human comfort criteria for environmental wind conditions,Activities of the boundary layer wind tunnel laboratory, Report, November 1965—March 1969,Faculty of Engineering Science, University of Western Ontario, London, Canada, 1969, 120 pp.
[9] J. Gandemer, Etudes des Champs de vitesse dans les ensmables batis, Cahiers du Centre Scientifiqueet Technique du Batiment, CSTB 179/1442, 1976, pp. 85—94.
[10] W. Melbourne, Criteria for environmental wind conditions, J. Ind. Aerodyn. 3 (2—3) (1978) 240—248.[11] M. Glaumann, Vindmatning i sorback, En vindforhallanden i ett hoghusomrade. Byggforsknin-
gsradet, Rapport R91, Stockholm, 1982.[12] J. Taljaard, Development, distribution and movement of cyclones in the southern Hemisphere during
the IGY, J. Appl. Meteorol. 6 (1967) 973—987.[13] M.L. Altinger, Estudio de Tornados en la Argentina, Revista de publicacion anual, UBA, 1994.[14] F. Norte, Vertical structure of the atmosphere when zonda wind occurs, 3rd Int. Conf. on Southern
Hemisphere Meteorology and Oceanography, preprint, Buenos Aires, 1989, pp. 178, 179.[15] L. Levi, L. Lubart, J.L. Lassig, Study of a convective storm series and precipitated hail in south
Argentina, Atmos. Res. 33 (1—4) (1994) 75—92.[16] E. Lichtenstein, Consideraciones preliminares sobre el mecanismo de la baja termica del noroeste
argentino, Meteorologica, Buenos Aires II (1—3) (1971) 355—383.[17] W. Schmitt, in: M.P. van Roy (Ed.), Synoptic meteorology of the antartic, meteorology of the antartic,
Editorial Pretoria Weather Bureau, Pretoria, South Africa, 1957, pp. 209—231.[18] C.G. Justus, W.R. Hargraves, A.S. Mikhail, D. Graver, Methods for estimating the wind speed
frequency distributions, J. Appl. Meteorol. 17 (1977) 673—678.[19] O.G. Sutton, Micrometeorology, McGraw-Hill, New York, 1953, 333 pp.[20] R. Berkowicz, L.P. Prahm, Evaluation of the profile method for estimation of surface fluxes of
momentum and heat, Atmos. Environ. 16 (12) (1982) 2809—2819.[21] F. Pasquill, Some aspects of boundary layer description, Q. J. R. Meteorol. Soc. 98 (1972) 469—494.[22] D. Golder, Relations among Stability parameters in the surface layer, Bound.-Layer Meteorol.
3 (1972) 56.[23] J.L. Lassig, C. Palese, M.G. Cogliati, Estudio de eventos meteorologicos en el Alto Valle del Rıo
Negro; Actas I Congreso Iberoamericano de Meteorologıa, Espan8 a, Parte 2, 1992, pp. 237—242.
J.L. La( ssig et al./J. Wind Eng. Ind. Aerodyn. 79 (1999) 183–199 199