atmospheric circulation over patagonia from the jurassic to
TRANSCRIPT
Atmospheric circulation over Patagonia from theJurassic to present: a review through proxy data andclimatic modelling scenarios
ROSA HILDA COMPAGNUCCI*
Departamento de Ciencias de la Atmósfera y los Océanos, Universidad de Buenos Aires, FCEyN,DCAO/CONICET, Ciudad Universitaria, Pabellón 2 Piso 2, (1428) Ciudad Autónoma de BuenosAires
Received 26 February 2011; accepted for publication 26 February 2011bij_1655 229..249
This paper discusses the general atmospheric circulation over Patagonia on the basis of the principal palaeoclimateforcings: continental drift, orography, variations in the greenhouse gases in the Earth’s atmosphere, evolution ofthe atmosphere and the oceans, changes in the orbit of the Earth, albedo feedbacks, and the land surface. Theseprocesses affect climate on time scales of millions to hundreds of thousands of years. Additionally, orbital forcinghas had a major influence on climate during the Quaternary. The palaeo-atmospheric circulation of Patagonia isanalyzed for the Early to Late Jurassic, the Cretaceous, the Late Palaeocene–Eocene Thermal Maximum, theTortonian–Oligocene cooling, the Pliocene, the Quaternary including the Last Glacial Maximum, the HoloceneOptimum, and the last millennium changes. Alternative palaeo-atmospheric circulations from climatic modellingscenarios through the ages are reviewed and compared with proxy data. Detailed and updated referenceinformation on the topics analyzed is also provided. © 2011 The Linnean Society of London, Biological Journalof the Linnean Society, 2011, 103, 229–249.
ADDITIONAL KEYWORDS: palaeoclimate – palaeoclimate forcings – palaeo-winds – westerlies.
Este trabajo discute la circulación general de la atmósfera en la Patagonia. Se han explicado los principalesforzantes del palaeoclima: deriva continental, orografía, variaciones en los gases de invernadero de la atmósferaterrestre, evolución de la atmósfera y los océanos, cambios orbitales, retroalimentación debida al albedo y lascondiciones generales de la superficie terrestre. Estos parámetros afectan el clima en escalas temporales demillones a cientos de miles de años, así como los forzantes orbitales dominaron los cambios climáticos durante elCuaternario. Las palaeo-circulaciones de la atmósfera sobre Patagonia son analizadas para el Jurásico Tempranoy Tardío, el Cretácico, el Máximo Termal del Palaeoceno Tardío- Eoceno, el enfriamiento del Tortoniano- Oligoceno,el Plioceno, y el Cuaternario incluyendo el Último Máximo Glacial (UMG), el Óptimo del Holoceno y los cambiosdel último milenio. Las palaeo-circulaciones atmosféricas alternativas a través del tiempo a partir de escenarios demodelos climáticos son revisadas y comparadas con proxy datos. Una extensiva lista de referencias proveeinformación detallada y actualizada (Noviembre del 2010) sobre los tópicos analizados en esta publicación.
PALABRAS CLAVE: palaeoclima – forzantes palaeoclimáticos – palaeo-vientos – oestes.
INTRODUCTION
The climate of Patagonia is conditioned by the south-ern borders of the semipermanent anticyclons of the
southern Atlantic and Pacific Oceans, which extendsouthward to approximately 38°S to 40°S, or evenfarther south, as a result of the flux of the westerlies.Even without the presence of the continents, on ahomogeneous Earth orbiting around the sun underconditions that vary in accordance with the theory of*E-mail: [email protected]
Biological Journal of the Linnean Society, 2011, 103, 229–249. With 13 figures
© 2011 The Linnean Society of London, Biological Journal of the Linnean Society, 2011, 103, 229–249 229
Milankovitch, the flux of the westerlies would bemaintained at approximately the same latitude astoday.
Despite past enormous tectonic changes throughoutthe last 250 Ma, Patagonia has generally been situ-ated within the latitudes influenced by the westerlies(Kious et al., 1996). This explains the low frequency ofclimatic changes, which are conditioned principally bythe distribution of the continents. Glacial periodswith permanent ice characterize the times when partsof continental masses were located in or near a polarregion. During such periods, polar ice caps can main-tain themselves and grow through snow and ice accu-mulation during repeated annual cycles. Long periodswithout permanent ice caps resulted instead whenthe continental mass remained removed from thepolar regions. Forcing through atmospheric green-house gases is another important factor potentiallyresponsible for climatic change. Two hundred andfifty million years ago, CO2 concentrations wereapproximately 2000 p.p.m.v. (i.e. three- to eight-foldhigher than today; Royer, 2006), producing warmingand enhancing seasonal monsoon circulation, espe-cially during the Triassic and Jurassic. Later CO2
concentrations decreased, reaching present conditionsduring the last ice age. Starting during the Mid-Pleistocene transition, the glacial/interglacial cyclesof temperature were accompanied by variations ofCO2 from 200 to 300 p.p.m.v., between the glacial andinterglacial periods.
Starting in the latest Miocene, the Andean Cordil-lera reached elevations similar to those at present,causing important climatic changes in Patagonia. Theflux of the westerlies, which advected moist air fromthe Pacific Ocean and brought precipitations wasperturbed by the cordilleran ‘wall’, perpendicularto their flux. Through this effect, moisture began todischarge mainly on the western sector of the cordil-lera and precipitations diminished towards the east.
Clearly, marked climatic differences appearedbetween the glacial and interglacial periods duringthe last 900 000 years. This occurred mainly throughthe influence of the change of eccentricity of theterrestrial orbit and the nonlinear interaction of theclimatic system with albedo produced by the ice caps.The Patagonian westerlies flux variation during theseglacial maxima is still a matter of debate. During theinterglacial periods, the changes of inclination of theaxis of the Earth played an important role generatingclimatic changes like that of the mid-Holocene. Majorwarming at high latitudes during summer decreasedthe equator–pole temperature gradient and weakenedthe westerlies flux.
Climatic variations in time scales of hundreds andthousands of years were influenced by changes insolar radiation related to the number of sun spots and
volcanism. These were the principal forcings of theMedieval Warming and the Little Ice Age, during theLate Holocene. Higher frequency variations in atmo-spheric circulation occurring over decadal to annualtimescales are also responsible for large scale climaticvariability. Such large-scale variations as the El Niño/Southern Oscillation (Philander, 1990), the SouthAnnular Mode (Marshall, 2003) or the Antarctic Oscil-lation (Thompson & Wallace, 2000), and the Pacific-Southamerican modes of oscillation (Mo & Paegle,2001) influence the climate of Patagonia.
THE GENERAL ATMOSPHERICCIRCULATION AND THE CONDITIONS
OVER PATAGONIA
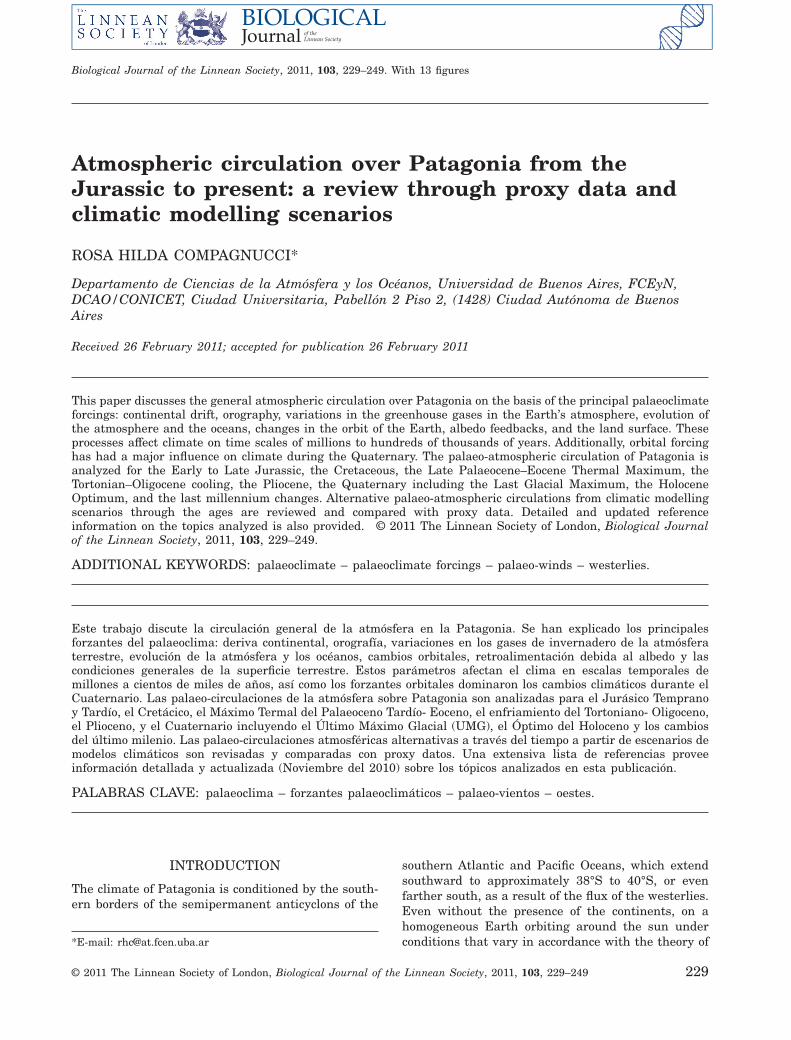
The tropics are characterized by a surplus of incomingradiation, whereas polar regions are characterized byan incoming radiation deficit. The intense incomingradiation in the equatorial region creates rising airmasses. On a global scale, however, Earth is in aradiative equilibrium and the atmospheric generalcirculation function is to transport heat poleward. Ona motionless Earth uniformly covered with water, thewind motion would be very simple (Fig. 1A). Aroundthe equator, air warmed from below rises and flowstoward the poles where it is cooled from below; it thensinks and to flows back towards the equator, formingan atmospheric convection cell for each hemisphere.
The Earth’s rotation gives rise to a ‘virtual force’known as the Coriolis effect responsible for deflectionof the air flow toward the right in the NorthernHemisphere and toward the left in the SouthernHemisphere. The pattern of atmospheric circulationis modified resulting in a triple cell, in part as aconsequence of the Coriolis effect (Fig. 1B). The twocells driven by the ascendance at the equator, calledthe Hadley cells, close with a downward branch atapproximately latitude 30°, forming the SubtropicalHigh belt. As the wind flow reaches the surface, itreturns to the equatorial zone to complete the cellmovement. The northern boundary of these cells ismarked by strong westerly winds in the upper tropo-sphere, which are called the tropospheric jets. Therotation of the Earth shifts ocean and land eastwardunder the air and the flow coming from the mid-latitudes moves toward the equator. This gives rise tothe easterly trade winds, characteristic of the tropicalregions. In the real atmosphere, the convergence ofsurface winds and the resulting ascendance does notoccur exactly at the equator, but in a band called theIntertropical Convergence Zone (ITCZ).
Between latitude 30° and 60° a second cell (calledthe Ferrel cell) exhibits a reversed flow pattern.Surface air in the Ferrel cells flows poleward and
230 R. H. COMPAGNUCCI
© 2011 The Linnean Society of London, Biological Journal of the Linnean Society, 2011, 103, 229–249
again is deflected eastward (to the right in the North-ern Hemisphere and to the left in the Southern Hemi-sphere). The net effect is for air in this zone in eachhemisphere to begin its flow from the west and moveeastward. These winds are known as the westerlies;they dominate the surface extra tropical circulation.At latitude 60°, the air is still warm and moist enoughto undergo convection, rising until it hits the tropo-pause. Then it moves toward the poles with signifi-cant cooling. It subsequently descends as a highpressure area, drifts away from the poles flowing inan easterly direction. These are the polar easterlies,which come into contact with the warmer air of thewesterlies forming the Polar Front. The polar air iscold and dense, causing the westerlies to rise and flowover the Arctic and Antarctic, forming a low-pressurearea. The outflow from the polar cell creates ultra-long waves, known as Rossby Waves, in the atmo-sphere, which are a key to determining the flow of thepolar Jet Stream (Barry & Chorley, 1992)
The atmospheric circulation as a whole is stronglydriven by the pole-to-equator temperature gradient(Lambeck, 1980). Wind strengths vary inverselywith this temperature gradient. A low meridionaltemperature gradient generally reduces the zonalaverage wind strengths and vice versa (Holton,1992). However, a Hadley circulation cannot pro-vide an adequate mechanism for transporting heatpolewards.
Consequently, when the meridional temperaturegradient increases, the flow becomes unstable inthe Hadley mode, breaking down into a number ofcyclonic and anticyclonic eddies (Barry & Chorley,1992). The strength of the westerlies is named as the
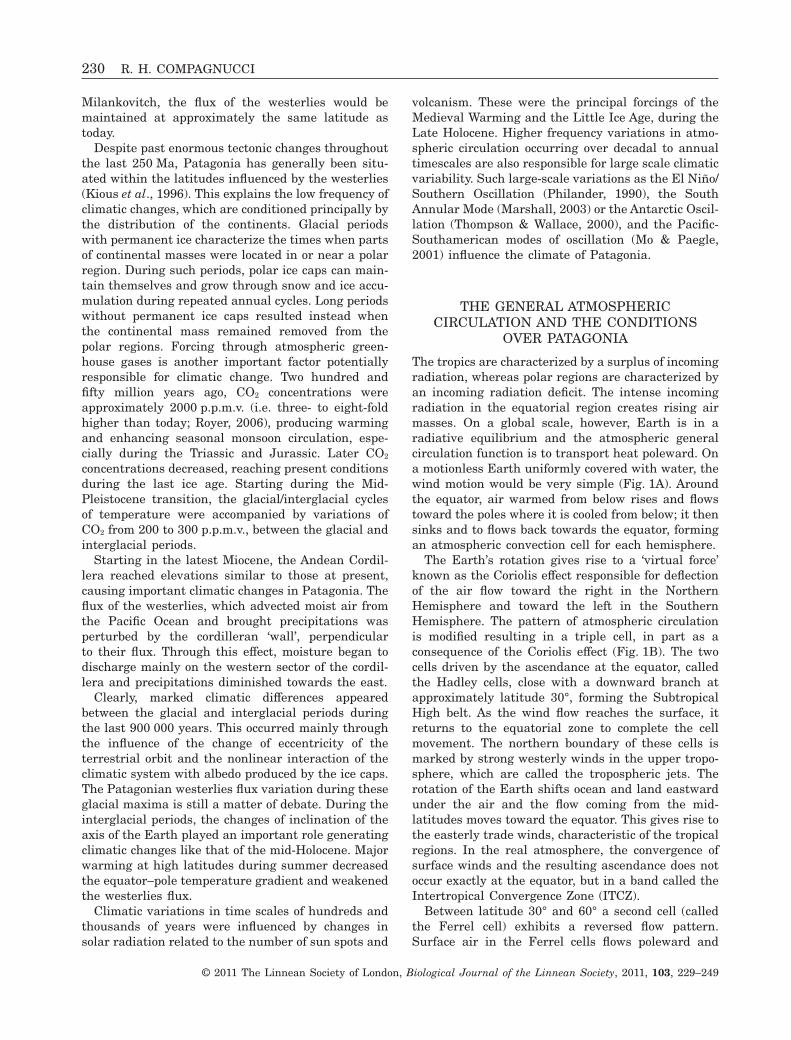
zonal index. The high index (Fig. 2A), is characterizedby increasing intensity of the zonal circulation at alllatitudes and poleward shift of the wind intensitymaxima with little north–south air mass exchange. Arelatively low index (Fig. 2B, C) may also occur if thewesterlies are, in the Southern Hemisphere, north oftheir usual latitudes. Paradoxically, such expansion ofthe zonal circulation pattern is associated with stron-ger than usual westerlies in lower latitudes. The jetexpands and increases in velocity, undulating withincreasingly larger oscillations. The low zonal index(Fig. 2D) is associated with a complete breakup andcellular fragmentation of the zonal westerlies, forma-tion of stationary deep occluding cold depressions inlower mid-latitudes and deep warm blocking anticy-clones at higher latitudes (Haltiner & Martin, 1957).
Figure 1. A, simple, single cell atmospheric convection in a nonrotating Earth. B, three cell atmospheric convection ina rotating Earth. The deflection of the winds within each cell is caused by the Coriolis force (sensu Lutgens & Tarbuck,2006).
Figure 2. Westerlies circulation. A, high zonal indexrelated strong westerlies south of their mean position. B,C, regular zonal index represents westerlies undulatingwith increasingly larger oscillations. D, low zonal index isassociated with a complete breakup and cellular fragmen-tation of the zonal westerlies (sensu Haltiner & Martin,1957).
PATAGONIAN PALAEO-ATMOSPHERIC CIRCULATION 231
© 2011 The Linnean Society of London, Biological Journal of the Linnean Society, 2011, 103, 229–249
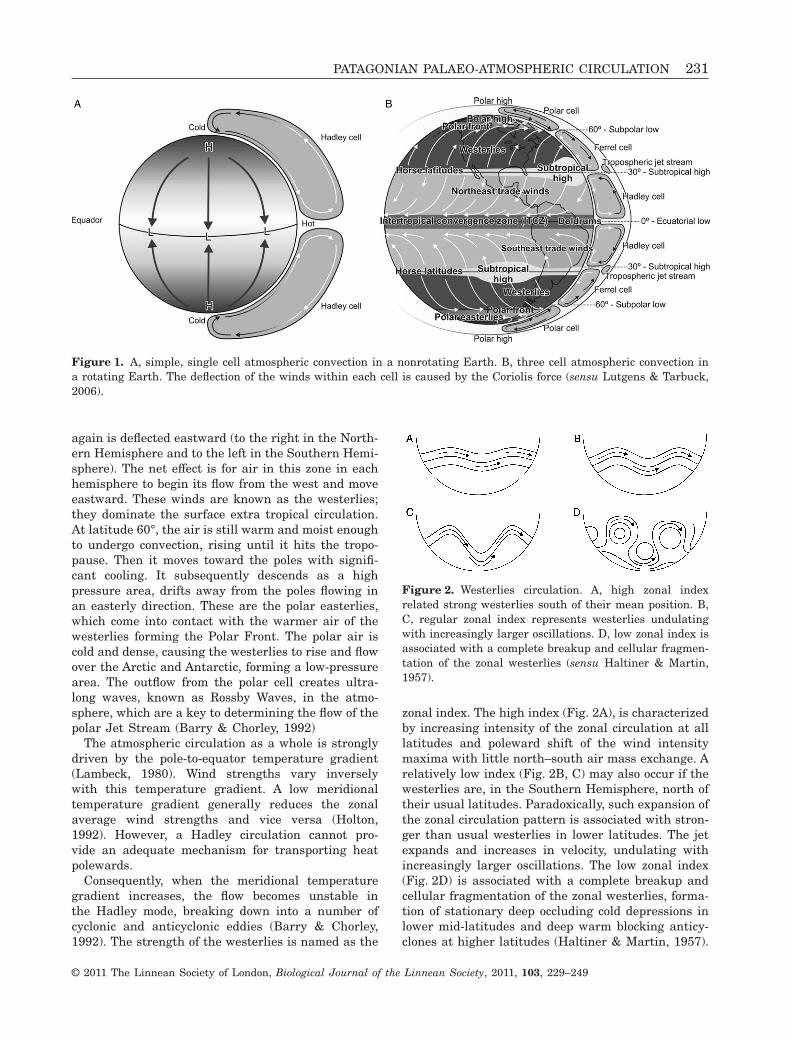
Patagonia extends from, approximately, 40° to 55°S.Its northern region is affected by the austral border ofthe semipermanent anticyclones of the Pacific andAtlantic oceans and its southern tip is under theeffect of the low pressure belt centered at approxi-mately 60°S (Prohaska, 1976). The climate is domi-nated by the westerlies, and the seasonal movementof the sun induced an atmospheric poleward circula-tion shift of approximately 5° during the summer(Fig. 3A, B). Furthermore, the greater annual tem-perature range in the subtropics and the polewardtemperature decrease, results in a steeper latitudinaltemperature gradient in summer than in winter.From 55°S to 65°S surface winds have maxima in thetransition season.
PALAEOCLIMATE FORCINGS
Different processes are responsible for climate andatmospheric circulation forcing, and their relevancedepends on the specific period analyzed and the fre-quency of climate change considered. Viewing theEarth’s climate as a global system, Frakes (1999)describes the evolution of climate throughout the past600 million years, from the Cambrian to the Quater-nary. This study highlights the complex interactionsbetween the carbon cycle, continental distribution,tectonics, sea level variation, ocean circulation, andtemperature change, as well as other processes.Valdes (2000) provides an overview of climatic forcingmechanisms and explores their possible role in Phan-erozoic climate variations.
Continental drift and orography are important forlow frequency processes (i.e. those involving changesover hundreds of millions of years). Glacial periodscharacterized times when continental masses werelocated at the pole as a result of the capacity of landto support and retain ice sheets. Warm climate withthe Earth free of permanent ice sheets characterized
the times when the oceans dominated the polar andsub-polar regions of the world and continental masseswere located in tropical and subtropical latitudes(Crowley & North, 1999).
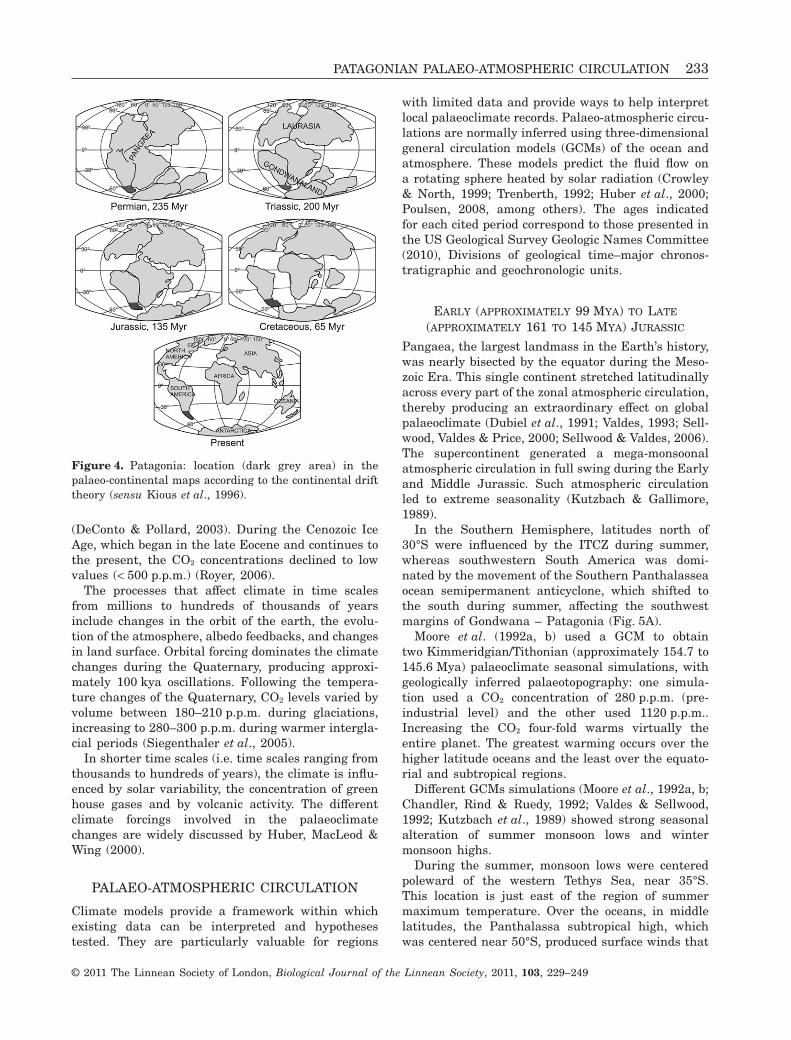
According to plate tectonics and continental drifttheory, the supercontinent Pangaea began breakingup approximately 225 to 200 Mya, eventually frag-menting into the continents as we know them today.Although the continents have not always been intheir present positions (Kious et al., 1996), Patagoniahas always been within in the westerlies belt area(Fig. 4). More recently Iglesia Llanos, Riccardi &Singer (2006) suggested that Patagonia shiftedbetween the earliest and the Late Jurassic fromapproximately 50°S to 30°S, affecting its climate(Volkheimer et al., 2008).
During the major Permo-Carboniferous glaciations(326 to 267 Mya), when Antarctica, South Americaand Australia drifted across or near the South Pole(Eyles, 1993; Crowell, 1999; Frakes, 1999), levels ofCO2 dropped to below 500 p.p.m. and remained atthese low levels for the duration of the cold phase(Crowley & Berner, 2001; Royer, 2006). After thetermination of this cold phase, CO2 increased to� 1000 p.p.m. and remained high until the EarlyTriassic.
The warm Mesozoic Era (230 to 65 Mya) was likelyassociated with high levels of CO2 of approximately2000 p.p.m. (Royer, 2006). The Early Jurassic to Cre-taceous at 184 to 66.5 Mya (Frakes, 1999), with coolpulses each lasting only < 3 Mya, was characterizedby very high CO2 levels (6000 p.p.m.). Thereafter, CO2
levels oscillated between very high (approximately2000 p.p.m.) and low (500 p.p.m.) values (Royer,2006).
A major expansion of Antarctic glaciations startingapproximately 40 to 35 Mya was likely a response,in part, to declining atmospheric CO2 levels fromtheir peak in the Cretaceous (approximately 100 Mya)
Figure 3. Middle fields surface pressure (in hPa) of the period 1961–90 for the months of (A) January (summer) and (B)July (winter) (sensu Lutgens & Tarbuck, 2006).
232 R. H. COMPAGNUCCI
© 2011 The Linnean Society of London, Biological Journal of the Linnean Society, 2011, 103, 229–249
(DeConto & Pollard, 2003). During the Cenozoic IceAge, which began in the late Eocene and continues tothe present, the CO2 concentrations declined to lowvalues (< 500 p.p.m.) (Royer, 2006).
The processes that affect climate in time scalesfrom millions to hundreds of thousands of yearsinclude changes in the orbit of the earth, the evolu-tion of the atmosphere, albedo feedbacks, and changesin land surface. Orbital forcing dominates the climatechanges during the Quaternary, producing approxi-mately 100 kya oscillations. Following the tempera-ture changes of the Quaternary, CO2 levels varied byvolume between 180–210 p.p.m. during glaciations,increasing to 280–300 p.p.m. during warmer intergla-cial periods (Siegenthaler et al., 2005).
In shorter time scales (i.e. time scales ranging fromthousands to hundreds of years), the climate is influ-enced by solar variability, the concentration of greenhouse gases and by volcanic activity. The differentclimate forcings involved in the palaeoclimatechanges are widely discussed by Huber, MacLeod &Wing (2000).
PALAEO-ATMOSPHERIC CIRCULATION
Climate models provide a framework within whichexisting data can be interpreted and hypothesestested. They are particularly valuable for regions
with limited data and provide ways to help interpretlocal palaeoclimate records. Palaeo-atmospheric circu-lations are normally inferred using three-dimensionalgeneral circulation models (GCMs) of the ocean andatmosphere. These models predict the fluid flow ona rotating sphere heated by solar radiation (Crowley& North, 1999; Trenberth, 1992; Huber et al., 2000;Poulsen, 2008, among others). The ages indicatedfor each cited period correspond to those presented inthe US Geological Survey Geologic Names Committee(2010), Divisions of geological time–major chronos-tratigraphic and geochronologic units.
EARLY (APPROXIMATELY 99 MYA) TO LATE
(APPROXIMATELY 161 TO 145 MYA) JURASSIC
Pangaea, the largest landmass in the Earth’s history,was nearly bisected by the equator during the Meso-zoic Era. This single continent stretched latitudinallyacross every part of the zonal atmospheric circulation,thereby producing an extraordinary effect on globalpalaeoclimate (Dubiel et al., 1991; Valdes, 1993; Sell-wood, Valdes & Price, 2000; Sellwood & Valdes, 2006).The supercontinent generated a mega-monsoonalatmospheric circulation in full swing during the Earlyand Middle Jurassic. Such atmospheric circulationled to extreme seasonality (Kutzbach & Gallimore,1989).
In the Southern Hemisphere, latitudes north of30°S were influenced by the ITCZ during summer,whereas southwestern South America was domi-nated by the movement of the Southern Panthalasseaocean semipermanent anticyclone, which shifted tothe south during summer, affecting the southwestmargins of Gondwana – Patagonia (Fig. 5A).
Moore et al. (1992a, b) used a GCM to obtaintwo Kimmeridgian/Tithonian (approximately 154.7 to145.6 Mya) palaeoclimate seasonal simulations, withgeologically inferred palaeotopography: one simula-tion used a CO2 concentration of 280 p.p.m. (pre-industrial level) and the other used 1120 p.p.m..Increasing the CO2 four-fold warms virtually theentire planet. The greatest warming occurs over thehigher latitude oceans and the least over the equato-rial and subtropical regions.
Different GCMs simulations (Moore et al., 1992a, b;Chandler, Rind & Ruedy, 1992; Valdes & Sellwood,1992; Kutzbach et al., 1989) showed strong seasonalalteration of summer monsoon lows and wintermonsoon highs.
During the summer, monsoon lows were centeredpoleward of the western Tethys Sea, near 35°S.This location is just east of the region of summermaximum temperature. Over the oceans, in middlelatitudes, the Panthalassa subtropical high, whichwas centered near 50°S, produced surface winds that
Figure 4. Patagonia: location (dark grey area) in thepalaeo-continental maps according to the continental drifttheory (sensu Kious et al., 1996).
PATAGONIAN PALAEO-ATMOSPHERIC CIRCULATION 233
© 2011 The Linnean Society of London, Biological Journal of the Linnean Society, 2011, 103, 229–249
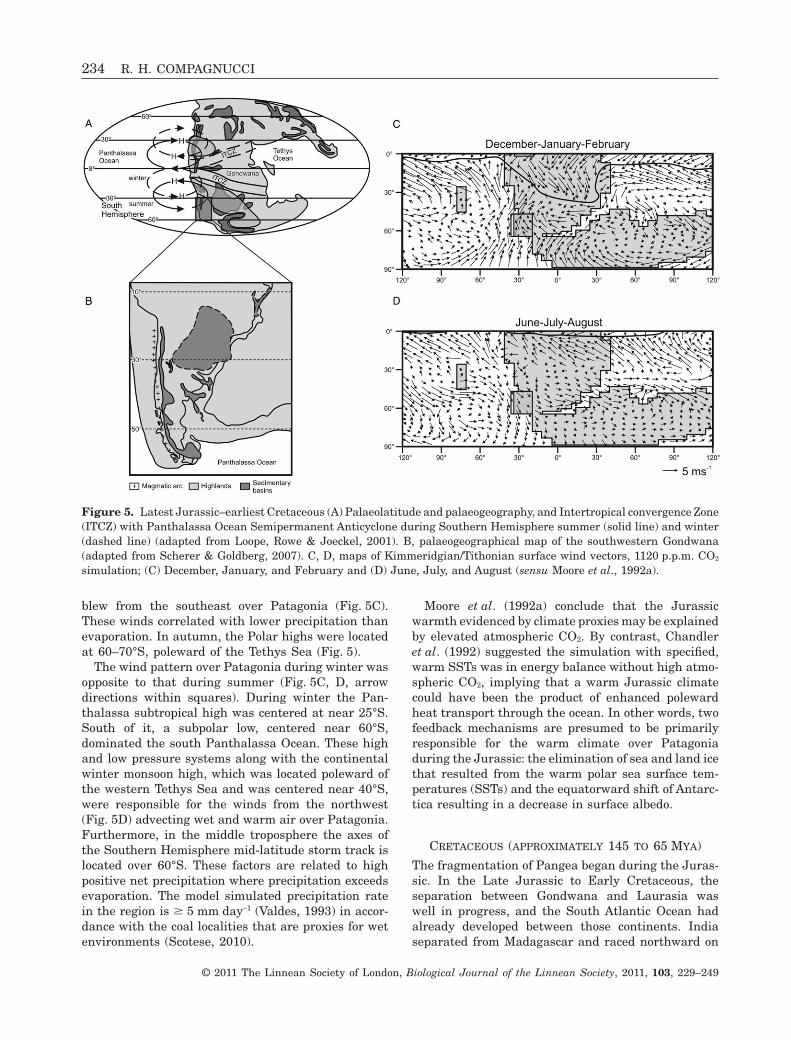
blew from the southeast over Patagonia (Fig. 5C).These winds correlated with lower precipitation thanevaporation. In autumn, the Polar highs were locatedat 60–70°S, poleward of the Tethys Sea (Fig. 5).
The wind pattern over Patagonia during winter wasopposite to that during summer (Fig. 5C, D, arrowdirections within squares). During winter the Pan-thalassa subtropical high was centered at near 25°S.South of it, a subpolar low, centered near 60°S,dominated the south Panthalassa Ocean. These highand low pressure systems along with the continentalwinter monsoon high, which was located poleward ofthe western Tethys Sea and was centered near 40°S,were responsible for the winds from the northwest(Fig. 5D) advecting wet and warm air over Patagonia.Furthermore, in the middle troposphere the axes ofthe Southern Hemisphere mid-latitude storm track islocated over 60°S. These factors are related to highpositive net precipitation where precipitation exceedsevaporation. The model simulated precipitation ratein the region is � 5 mm day-1 (Valdes, 1993) in accor-dance with the coal localities that are proxies for wetenvironments (Scotese, 2010).
Moore et al. (1992a) conclude that the Jurassicwarmth evidenced by climate proxies may be explainedby elevated atmospheric CO2. By contrast, Chandleret al. (1992) suggested the simulation with specified,warm SSTs was in energy balance without high atmo-spheric CO2, implying that a warm Jurassic climatecould have been the product of enhanced polewardheat transport through the ocean. In other words, twofeedback mechanisms are presumed to be primarilyresponsible for the warm climate over Patagoniaduring the Jurassic: the elimination of sea and land icethat resulted from the warm polar sea surface tem-peratures (SSTs) and the equatorward shift of Antarc-tica resulting in a decrease in surface albedo.
CRETACEOUS (APPROXIMATELY 145 TO 65 MYA)
The fragmentation of Pangea began during the Juras-sic. In the Late Jurassic to Early Cretaceous, theseparation between Gondwana and Laurasia waswell in progress, and the South Atlantic Ocean hadalready developed between those continents. Indiaseparated from Madagascar and raced northward on
Figure 5. Latest Jurassic–earliest Cretaceous (A) Palaeolatitude and palaeogeography, and Intertropical convergence Zone(ITCZ) with Panthalassa Ocean Semipermanent Anticyclone during Southern Hemisphere summer (solid line) and winter(dashed line) (adapted from Loope, Rowe & Joeckel, 2001). B, palaeogeographical map of the southwestern Gondwana(adapted from Scherer & Goldberg, 2007). C, D, maps of Kimmeridgian/Tithonian surface wind vectors, 1120 p.p.m. CO2
simulation; (C) December, January, and February and (D) June, July, and August (sensu Moore et al., 1992a).
234 R. H. COMPAGNUCCI
© 2011 The Linnean Society of London, Biological Journal of the Linnean Society, 2011, 103, 229–249
a collision course with Eurasia. North America wasconnected to Europe, and Australia was still joined toAntarctica. By the Late Cretaceous, the oceans hadwidened, and India approached the southern marginof Asia (Scotese, 2010).
The Early Cretaceous was a mild ‘Ice House’ world.There was snow and ice during the winter seasons,and cool temperate forests covered the Polar Regions.The Late Cretaceous was instead characterizedby super greenhouse intervals of global warmth withice-free continents. Globally averaged surface tem-peratures were 6–14 °C higher than at present(Barron, 1983) and the temperature gradient betweenthe poles and the equator was lower than today, thatis approximately 50 °C in the Northern Hemisphereand 90 °C in the Southern Hemisphere. The differ-ence is largely a result of adiabatic cooling reflectingthe elevation of Antarctica. Frakes (1999) summa-rized the data on estimates of Cretaceous sea surfaceand terrestrial temperatures.
There are four differing assumptions concerningCretaceous temperatures and meridional gradients:(1) tropical SSTs were the same as today, althoughpolar temperatures were warmer (5–8 °C) except whenice was present (0 to -5 °C); (2) the tropics weresignificantly cooler and mid-latitudes warmer thantoday; (3) tropical SSTs were 32–34 °C, with polarregions 10–18 °C; (4) tropical SSTs were approxi-mately 42 °C and polar temperatures > 18 °C. Further-more, different hypothesis can explain the drasticwarming and equable high latitudes during super-greenhouse intervals of the Cretaceous and earlyCenozoic. On the basis of coupled ocean–atmospheremodel simulations of the middle Cretaceous, Poulsen,Gendaszek & Jacob (2003) hypothesized that the for-mation of an Atlantic gateway could have contributedto the Cretaceous thermal maximum. Kump & Pollard(2008) GCM simulation of Middle Cretaceous using4 ¥ CO2, from preindustrial atmospheric level, failed toproduce the extreme high-latitude warmth implied bytemperature proxy data. However, simulations withthe combined increases in cloud droplet radii, whichmainly affect cloud optical depth, and precipitationefficiency, resulted in a reduction in global cloud coverfrom 64% to 55% with optically thinner clouds thatreduced planetary albedo from 0.30 to 0.24. Theensuing warming was dramatic, both in the tropics andin high latitudes, where warming was augmented bysurface albedo feedback of almost vanishing snow andsea-ice cover. Otto-Bliesner, Brady & Shields (2002)altered the models by the inclusion of high-latitudeforest thus changing the palaeogeography. These low-albedo forests warmed the high-latitude continents,which then transferred more heat to the high-latitudeoceans, impeding sea-ice formation and warmingcoastal regions.
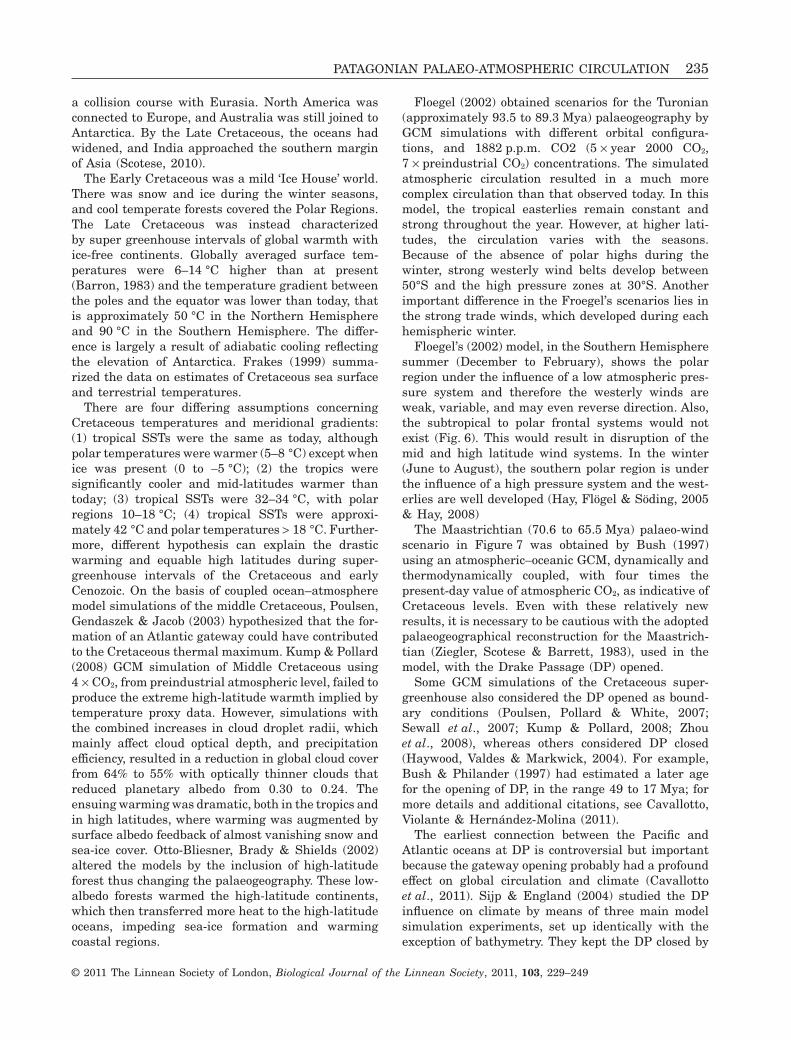
Floegel (2002) obtained scenarios for the Turonian(approximately 93.5 to 89.3 Mya) palaeogeography byGCM simulations with different orbital configura-tions, and 1882 p.p.m. CO2 (5 ¥ year 2000 CO2,7 ¥ preindustrial CO2) concentrations. The simulatedatmospheric circulation resulted in a much morecomplex circulation than that observed today. In thismodel, the tropical easterlies remain constant andstrong throughout the year. However, at higher lati-tudes, the circulation varies with the seasons.Because of the absence of polar highs during thewinter, strong westerly wind belts develop between50°S and the high pressure zones at 30°S. Anotherimportant difference in the Froegel’s scenarios lies inthe strong trade winds, which developed during eachhemispheric winter.
Floegel’s (2002) model, in the Southern Hemispheresummer (December to February), shows the polarregion under the influence of a low atmospheric pres-sure system and therefore the westerly winds areweak, variable, and may even reverse direction. Also,the subtropical to polar frontal systems would notexist (Fig. 6). This would result in disruption of themid and high latitude wind systems. In the winter(June to August), the southern polar region is underthe influence of a high pressure system and the west-erlies are well developed (Hay, Flögel & Söding, 2005& Hay, 2008)
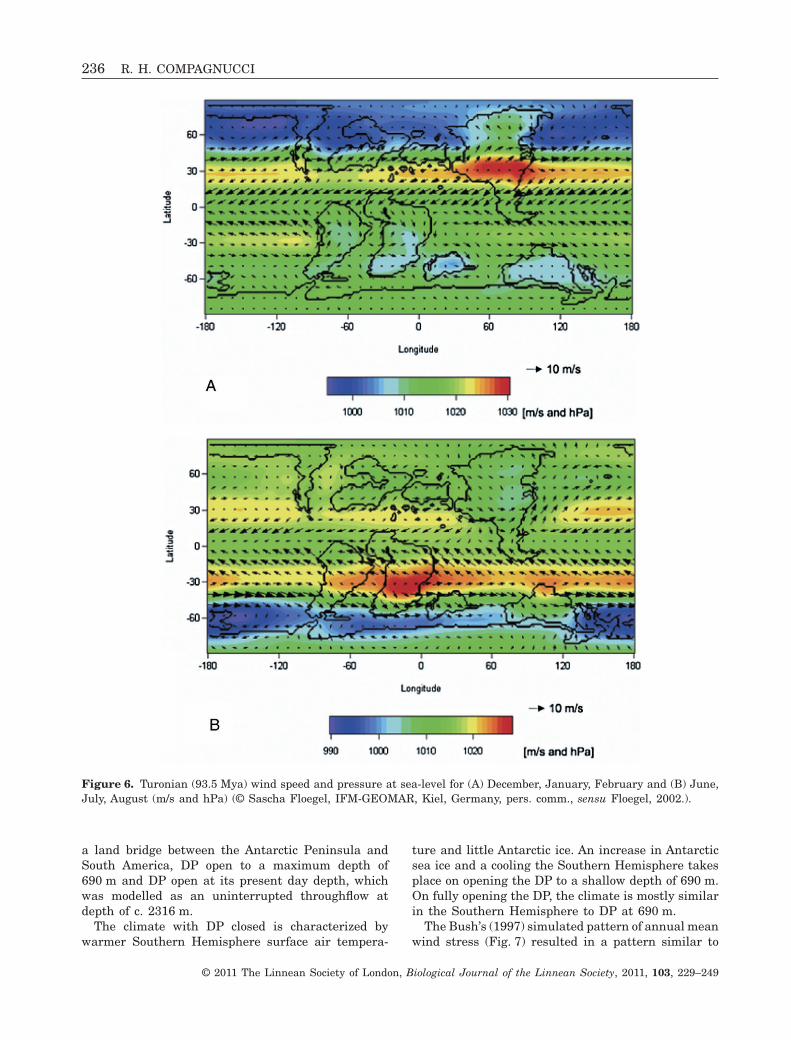
The Maastrichtian (70.6 to 65.5 Mya) palaeo-windscenario in Figure 7 was obtained by Bush (1997)using an atmospheric–oceanic GCM, dynamically andthermodynamically coupled, with four times thepresent-day value of atmospheric CO2, as indicative ofCretaceous levels. Even with these relatively newresults, it is necessary to be cautious with the adoptedpalaeogeographical reconstruction for the Maastrich-tian (Ziegler, Scotese & Barrett, 1983), used in themodel, with the Drake Passage (DP) opened.
Some GCM simulations of the Cretaceous super-greenhouse also considered the DP opened as bound-ary conditions (Poulsen, Pollard & White, 2007;Sewall et al., 2007; Kump & Pollard, 2008; Zhouet al., 2008), whereas others considered DP closed(Haywood, Valdes & Markwick, 2004). For example,Bush & Philander (1997) had estimated a later agefor the opening of DP, in the range 49 to 17 Mya; formore details and additional citations, see Cavallotto,Violante & Hernández-Molina (2011).
The earliest connection between the Pacific andAtlantic oceans at DP is controversial but importantbecause the gateway opening probably had a profoundeffect on global circulation and climate (Cavallottoet al., 2011). Sijp & England (2004) studied the DPinfluence on climate by means of three main modelsimulation experiments, set up identically with theexception of bathymetry. They kept the DP closed by
PATAGONIAN PALAEO-ATMOSPHERIC CIRCULATION 235
© 2011 The Linnean Society of London, Biological Journal of the Linnean Society, 2011, 103, 229–249
a land bridge between the Antarctic Peninsula andSouth America, DP open to a maximum depth of690 m and DP open at its present day depth, whichwas modelled as an uninterrupted throughflow atdepth of c. 2316 m.
The climate with DP closed is characterized bywarmer Southern Hemisphere surface air tempera-
ture and little Antarctic ice. An increase in Antarcticsea ice and a cooling the Southern Hemisphere takesplace on opening the DP to a shallow depth of 690 m.On fully opening the DP, the climate is mostly similarin the Southern Hemisphere to DP at 690 m.
The Bush’s (1997) simulated pattern of annual meanwind stress (Fig. 7) resulted in a pattern similar to
Figure 6. Turonian (93.5 Mya) wind speed and pressure at sea-level for (A) December, January, February and (B) June,July, August (m/s and hPa) (© Sascha Floegel, IFM-GEOMAR, Kiel, Germany, pers. comm., sensu Floegel, 2002.).
236 R. H. COMPAGNUCCI
© 2011 The Linnean Society of London, Biological Journal of the Linnean Society, 2011, 103, 229–249
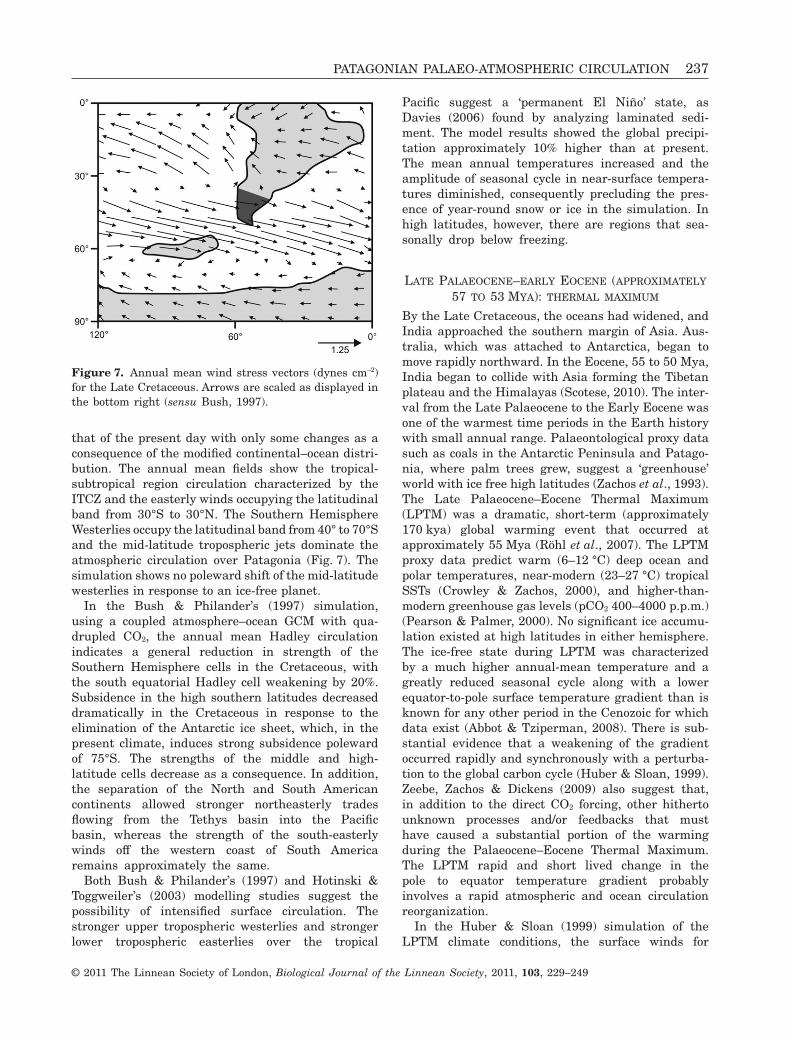
that of the present day with only some changes as aconsequence of the modified continental–ocean distri-bution. The annual mean fields show the tropical-subtropical region circulation characterized by theITCZ and the easterly winds occupying the latitudinalband from 30°S to 30°N. The Southern HemisphereWesterlies occupy the latitudinal band from 40° to 70°Sand the mid-latitude tropospheric jets dominate theatmospheric circulation over Patagonia (Fig. 7). Thesimulation shows no poleward shift of the mid-latitudewesterlies in response to an ice-free planet.
In the Bush & Philander’s (1997) simulation,using a coupled atmosphere–ocean GCM with qua-drupled CO2, the annual mean Hadley circulationindicates a general reduction in strength of theSouthern Hemisphere cells in the Cretaceous, withthe south equatorial Hadley cell weakening by 20%.Subsidence in the high southern latitudes decreaseddramatically in the Cretaceous in response to theelimination of the Antarctic ice sheet, which, in thepresent climate, induces strong subsidence polewardof 75°S. The strengths of the middle and high-latitude cells decrease as a consequence. In addition,the separation of the North and South Americancontinents allowed stronger northeasterly tradesflowing from the Tethys basin into the Pacificbasin, whereas the strength of the south-easterlywinds off the western coast of South Americaremains approximately the same.
Both Bush & Philander’s (1997) and Hotinski &Toggweiler’s (2003) modelling studies suggest thepossibility of intensified surface circulation. Thestronger upper tropospheric westerlies and strongerlower tropospheric easterlies over the tropical
Pacific suggest a ‘permanent El Niño’ state, asDavies (2006) found by analyzing laminated sedi-ment. The model results showed the global precipi-tation approximately 10% higher than at present.The mean annual temperatures increased and theamplitude of seasonal cycle in near-surface tempera-tures diminished, consequently precluding the pres-ence of year-round snow or ice in the simulation. Inhigh latitudes, however, there are regions that sea-sonally drop below freezing.
LATE PALAEOCENE–EARLY EOCENE (APPROXIMATELY
57 TO 53 MYA): THERMAL MAXIMUM
By the Late Cretaceous, the oceans had widened, andIndia approached the southern margin of Asia. Aus-tralia, which was attached to Antarctica, began tomove rapidly northward. In the Eocene, 55 to 50 Mya,India began to collide with Asia forming the Tibetanplateau and the Himalayas (Scotese, 2010). The inter-val from the Late Palaeocene to the Early Eocene wasone of the warmest time periods in the Earth historywith small annual range. Palaeontological proxy datasuch as coals in the Antarctic Peninsula and Patago-nia, where palm trees grew, suggest a ‘greenhouse’world with ice free high latitudes (Zachos et al., 1993).The Late Palaeocene–Eocene Thermal Maximum(LPTM) was a dramatic, short-term (approximately170 kya) global warming event that occurred atapproximately 55 Mya (Röhl et al., 2007). The LPTMproxy data predict warm (6–12 °C) deep ocean andpolar temperatures, near-modern (23–27 °C) tropicalSSTs (Crowley & Zachos, 2000), and higher-than-modern greenhouse gas levels (pCO2 400–4000 p.p.m.)(Pearson & Palmer, 2000). No significant ice accumu-lation existed at high latitudes in either hemisphere.The ice-free state during LPTM was characterizedby a much higher annual-mean temperature and agreatly reduced seasonal cycle along with a lowerequator-to-pole surface temperature gradient than isknown for any other period in the Cenozoic for whichdata exist (Abbot & Tziperman, 2008). There is sub-stantial evidence that a weakening of the gradientoccurred rapidly and synchronously with a perturba-tion to the global carbon cycle (Huber & Sloan, 1999).Zeebe, Zachos & Dickens (2009) also suggest that,in addition to the direct CO2 forcing, other hithertounknown processes and/or feedbacks that musthave caused a substantial portion of the warmingduring the Palaeocene–Eocene Thermal Maximum.The LPTM rapid and short lived change in thepole to equator temperature gradient probablyinvolves a rapid atmospheric and ocean circulationreorganization.
In the Huber & Sloan (1999) simulation of theLPTM climate conditions, the surface winds for
Figure 7. Annual mean wind stress vectors (dynes cm-2)for the Late Cretaceous. Arrows are scaled as displayed inthe bottom right (sensu Bush, 1997).
PATAGONIAN PALAEO-ATMOSPHERIC CIRCULATION 237
© 2011 The Linnean Society of London, Biological Journal of the Linnean Society, 2011, 103, 229–249
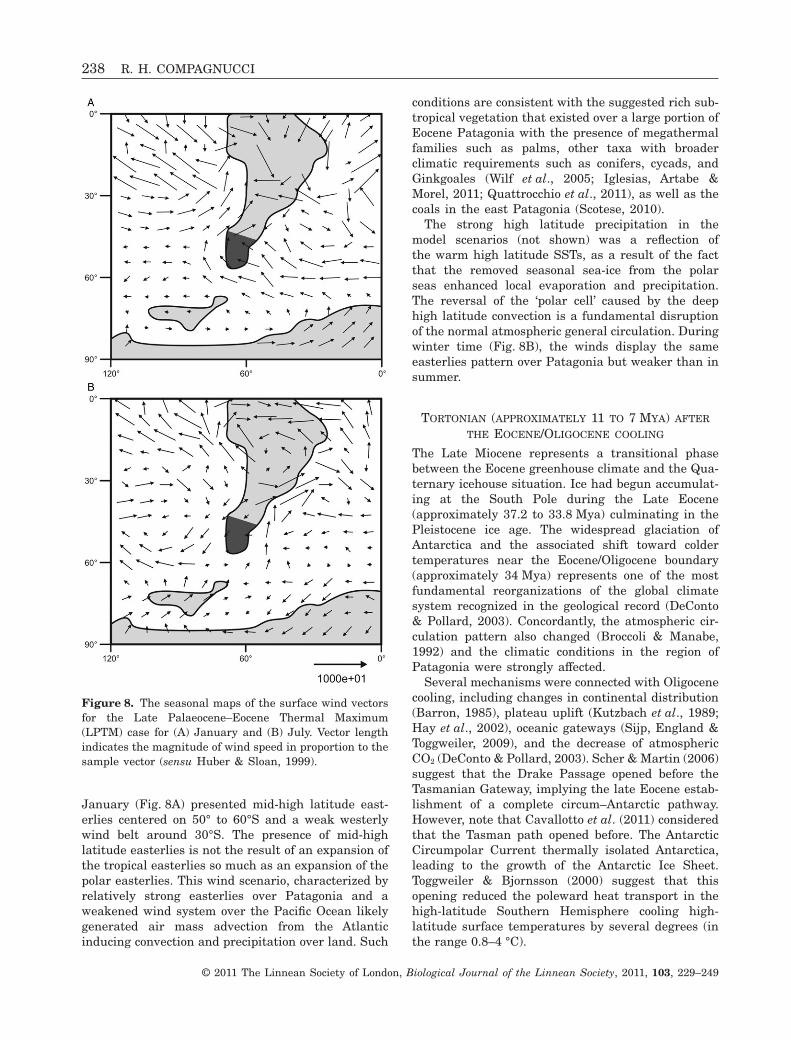
January (Fig. 8A) presented mid-high latitude east-erlies centered on 50° to 60°S and a weak westerlywind belt around 30°S. The presence of mid-highlatitude easterlies is not the result of an expansion ofthe tropical easterlies so much as an expansion of thepolar easterlies. This wind scenario, characterized byrelatively strong easterlies over Patagonia and aweakened wind system over the Pacific Ocean likelygenerated air mass advection from the Atlanticinducing convection and precipitation over land. Such
conditions are consistent with the suggested rich sub-tropical vegetation that existed over a large portion ofEocene Patagonia with the presence of megathermalfamilies such as palms, other taxa with broaderclimatic requirements such as conifers, cycads, andGinkgoales (Wilf et al., 2005; Iglesias, Artabe &Morel, 2011; Quattrocchio et al., 2011), as well as thecoals in the east Patagonia (Scotese, 2010).
The strong high latitude precipitation in themodel scenarios (not shown) was a reflection ofthe warm high latitude SSTs, as a result of the factthat the removed seasonal sea-ice from the polarseas enhanced local evaporation and precipitation.The reversal of the ‘polar cell’ caused by the deephigh latitude convection is a fundamental disruptionof the normal atmospheric general circulation. Duringwinter time (Fig. 8B), the winds display the sameeasterlies pattern over Patagonia but weaker than insummer.
TORTONIAN (APPROXIMATELY 11 TO 7 MYA) AFTER
THE EOCENE/OLIGOCENE COOLING
The Late Miocene represents a transitional phasebetween the Eocene greenhouse climate and the Qua-ternary icehouse situation. Ice had begun accumulat-ing at the South Pole during the Late Eocene(approximately 37.2 to 33.8 Mya) culminating in thePleistocene ice age. The widespread glaciation ofAntarctica and the associated shift toward coldertemperatures near the Eocene/Oligocene boundary(approximately 34 Mya) represents one of the mostfundamental reorganizations of the global climatesystem recognized in the geological record (DeConto& Pollard, 2003). Concordantly, the atmospheric cir-culation pattern also changed (Broccoli & Manabe,1992) and the climatic conditions in the region ofPatagonia were strongly affected.
Several mechanisms were connected with Oligocenecooling, including changes in continental distribution(Barron, 1985), plateau uplift (Kutzbach et al., 1989;Hay et al., 2002), oceanic gateways (Sijp, England &Toggweiler, 2009), and the decrease of atmosphericCO2 (DeConto & Pollard, 2003). Scher & Martin (2006)suggest that the Drake Passage opened before theTasmanian Gateway, implying the late Eocene estab-lishment of a complete circum–Antarctic pathway.However, note that Cavallotto et al. (2011) consideredthat the Tasman path opened before. The AntarcticCircumpolar Current thermally isolated Antarctica,leading to the growth of the Antarctic Ice Sheet.Toggweiler & Bjornsson (2000) suggest that thisopening reduced the poleward heat transport in thehigh-latitude Southern Hemisphere cooling high-latitude surface temperatures by several degrees (inthe range 0.8–4 °C).
Figure 8. The seasonal maps of the surface wind vectorsfor the Late Palaeocene–Eocene Thermal Maximum(LPTM) case for (A) January and (B) July. Vector lengthindicates the magnitude of wind speed in proportion to thesample vector (sensu Huber & Sloan, 1999).
238 R. H. COMPAGNUCCI
© 2011 The Linnean Society of London, Biological Journal of the Linnean Society, 2011, 103, 229–249
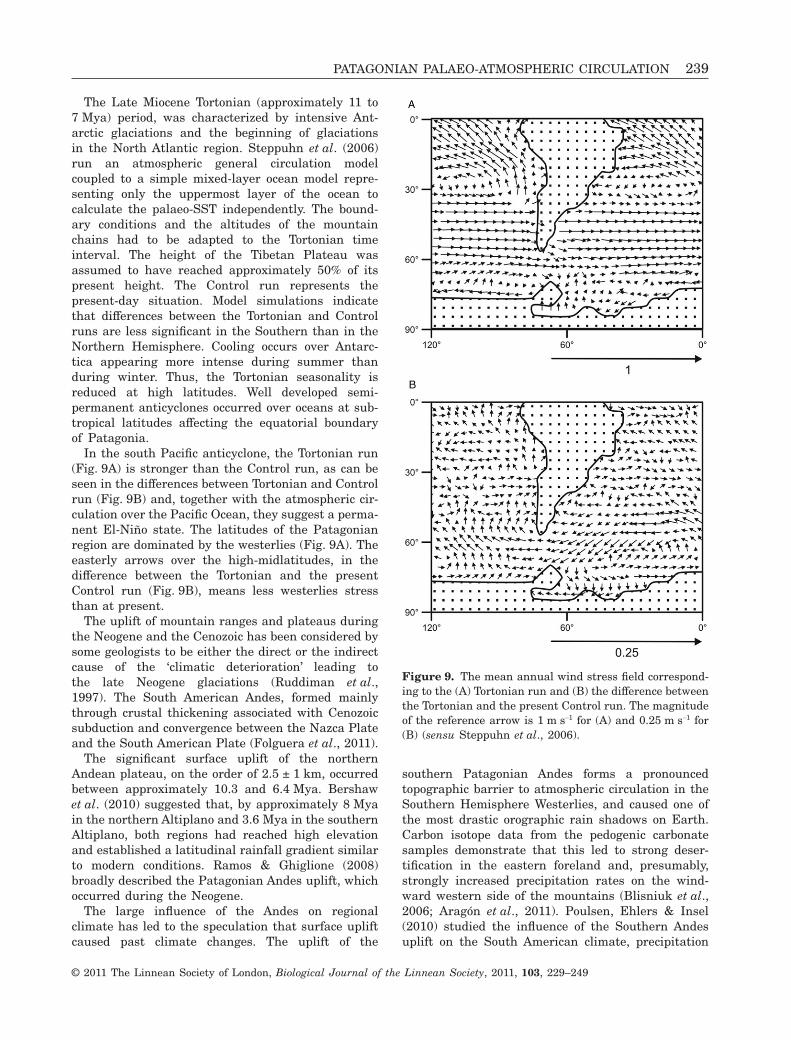
The Late Miocene Tortonian (approximately 11 to7 Mya) period, was characterized by intensive Ant-arctic glaciations and the beginning of glaciationsin the North Atlantic region. Steppuhn et al. (2006)run an atmospheric general circulation modelcoupled to a simple mixed-layer ocean model repre-senting only the uppermost layer of the ocean tocalculate the palaeo-SST independently. The bound-ary conditions and the altitudes of the mountainchains had to be adapted to the Tortonian timeinterval. The height of the Tibetan Plateau wasassumed to have reached approximately 50% of itspresent height. The Control run represents thepresent-day situation. Model simulations indicatethat differences between the Tortonian and Controlruns are less significant in the Southern than in theNorthern Hemisphere. Cooling occurs over Antarc-tica appearing more intense during summer thanduring winter. Thus, the Tortonian seasonality isreduced at high latitudes. Well developed semi-permanent anticyclones occurred over oceans at sub-tropical latitudes affecting the equatorial boundaryof Patagonia.
In the south Pacific anticyclone, the Tortonian run(Fig. 9A) is stronger than the Control run, as can beseen in the differences between Tortonian and Controlrun (Fig. 9B) and, together with the atmospheric cir-culation over the Pacific Ocean, they suggest a perma-nent El-Niño state. The latitudes of the Patagonianregion are dominated by the westerlies (Fig. 9A). Theeasterly arrows over the high-midlatitudes, in thedifference between the Tortonian and the presentControl run (Fig. 9B), means less westerlies stressthan at present.
The uplift of mountain ranges and plateaus duringthe Neogene and the Cenozoic has been considered bysome geologists to be either the direct or the indirectcause of the ‘climatic deterioration’ leading tothe late Neogene glaciations (Ruddiman et al.,1997). The South American Andes, formed mainlythrough crustal thickening associated with Cenozoicsubduction and convergence between the Nazca Plateand the South American Plate (Folguera et al., 2011).
The significant surface uplift of the northernAndean plateau, on the order of 2.5 ± 1 km, occurredbetween approximately 10.3 and 6.4 Mya. Bershawet al. (2010) suggested that, by approximately 8 Myain the northern Altiplano and 3.6 Mya in the southernAltiplano, both regions had reached high elevationand established a latitudinal rainfall gradient similarto modern conditions. Ramos & Ghiglione (2008)broadly described the Patagonian Andes uplift, whichoccurred during the Neogene.
The large influence of the Andes on regionalclimate has led to the speculation that surface upliftcaused past climate changes. The uplift of the
southern Patagonian Andes forms a pronouncedtopographic barrier to atmospheric circulation in theSouthern Hemisphere Westerlies, and caused one ofthe most drastic orographic rain shadows on Earth.Carbon isotope data from the pedogenic carbonatesamples demonstrate that this led to strong deser-tification in the eastern foreland and, presumably,strongly increased precipitation rates on the wind-ward western side of the mountains (Blisniuk et al.,2006; Aragón et al., 2011). Poulsen, Ehlers & Insel(2010) studied the influence of the Southern Andesuplift on the South American climate, precipitation
Figure 9. The mean annual wind stress field correspond-ing to the (A) Tortonian run and (B) the difference betweenthe Tortonian and the present Control run. The magnitudeof the reference arrow is 1 m s-1 for (A) and 0.25 m s-1 for(B) (sensu Steppuhn et al., 2006).
PATAGONIAN PALAEO-ATMOSPHERIC CIRCULATION 239
© 2011 The Linnean Society of London, Biological Journal of the Linnean Society, 2011, 103, 229–249
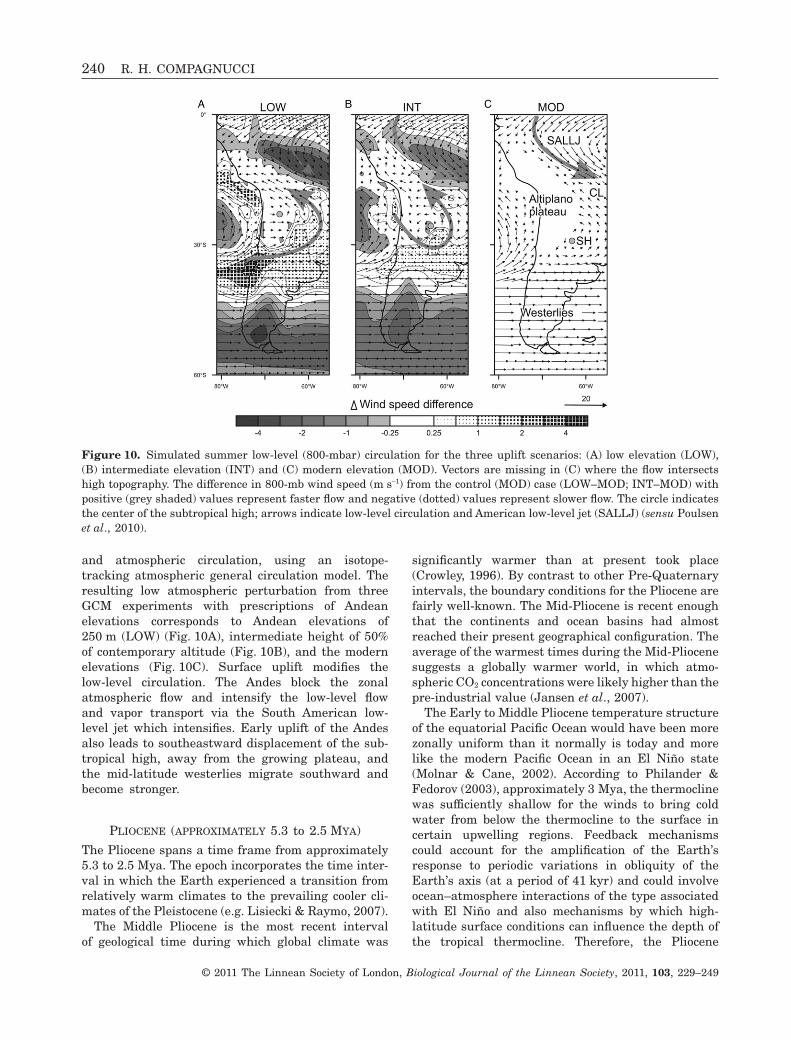
and atmospheric circulation, using an isotope-tracking atmospheric general circulation model. Theresulting low atmospheric perturbation from threeGCM experiments with prescriptions of Andeanelevations corresponds to Andean elevations of250 m (LOW) (Fig. 10A), intermediate height of 50%of contemporary altitude (Fig. 10B), and the modernelevations (Fig. 10C). Surface uplift modifies thelow-level circulation. The Andes block the zonalatmospheric flow and intensify the low-level flowand vapor transport via the South American low-level jet which intensifies. Early uplift of the Andesalso leads to southeastward displacement of the sub-tropical high, away from the growing plateau, andthe mid-latitude westerlies migrate southward andbecome stronger.
PLIOCENE (APPROXIMATELY 5.3 to 2.5 MYA)
The Pliocene spans a time frame from approximately5.3 to 2.5 Mya. The epoch incorporates the time inter-val in which the Earth experienced a transition fromrelatively warm climates to the prevailing cooler cli-mates of the Pleistocene (e.g. Lisiecki & Raymo, 2007).
The Middle Pliocene is the most recent intervalof geological time during which global climate was
significantly warmer than at present took place(Crowley, 1996). By contrast to other Pre-Quaternaryintervals, the boundary conditions for the Pliocene arefairly well-known. The Mid-Pliocene is recent enoughthat the continents and ocean basins had almostreached their present geographical configuration. Theaverage of the warmest times during the Mid-Pliocenesuggests a globally warmer world, in which atmo-spheric CO2 concentrations were likely higher than thepre-industrial value (Jansen et al., 2007).
The Early to Middle Pliocene temperature structureof the equatorial Pacific Ocean would have been morezonally uniform than it normally is today and morelike the modern Pacific Ocean in an El Niño state(Molnar & Cane, 2002). According to Philander &Fedorov (2003), approximately 3 Mya, the thermoclinewas sufficiently shallow for the winds to bring coldwater from below the thermocline to the surface incertain upwelling regions. Feedback mechanismscould account for the amplification of the Earth’sresponse to periodic variations in obliquity of theEarth’s axis (at a period of 41 kyr) and could involveocean–atmosphere interactions of the type associatedwith El Niño and also mechanisms by which high-latitude surface conditions can influence the depth ofthe tropical thermocline. Therefore, the Pliocene
Figure 10. Simulated summer low-level (800-mbar) circulation for the three uplift scenarios: (A) low elevation (LOW),(B) intermediate elevation (INT) and (C) modern elevation (MOD). Vectors are missing in (C) where the flow intersectshigh topography. The difference in 800-mb wind speed (m s-1) from the control (MOD) case (LOW–MOD; INT–MOD) withpositive (grey shaded) values represent faster flow and negative (dotted) values represent slower flow. The circle indicatesthe center of the subtropical high; arrows indicate low-level circulation and American low-level jet (SALLJ) (sensu Poulsenet al., 2010).
240 R. H. COMPAGNUCCI
© 2011 The Linnean Society of London, Biological Journal of the Linnean Society, 2011, 103, 229–249
paradox is the persistence of El Niño conditions, whichwas the major factor in the warmth of the EarlyPliocene. Fedorov et al. (2006) found that the ElNiño-like permanent conditions contributed to globalwarming, first by causing the disappearance ofstratus clouds from the eastern equatorial PacificOcean, thus lowering the planetary albedo, and secondby increasing the atmospheric concentration of watervapor, a powerful greenhouse gas. Brierley et al. (2009)reconstructed the latitudinal distribution of SSTapproximately 4 Mya, during the early Pliocene. Thereconstruction shows that the meridional temperaturegradient between the equator and subtropics wasgreatly reduced, implying a vast poleward expansion ofthe oceanic tropical warm pool with enormous impactson the Pliocene climate, including a slowdown of theatmospheric Hadley circulation.
Simulated 850 hPa wind fields (Jiang et al. (2005)show weakening Middle Pliocene Westerlies duringsummer, whereas, over the Atlantic and Pacificoceans, semi-permanent anticyclones appears to havebeen strengthened and poleward shifted. Duringwinter in the south Pacific Ocean, the westerlies arestrengthened and only slightly reinforced over Pat-agonia, compared with today.
THE QUATERNARY SINCE 2.5 MYA AND
THE LAST GLACIAL MAXIMUM
(LGM; APPROXIMATELY 20 KYR BP)
The warm equable climates were, after the Pliocene,replaced by recurring ice ages. Raymo et al. (1996)attempted to explain this replacement appealingto changes in CO2 in the atmosphere. Estimates ofpartial pressures of CO2 in the atmosphere of the past,however, show only modest changes during the past50 Mya (Pearson & Palmer, 2000). The additionalcause, suggested by Sloan, Crowley & Pollard (1996), isthe reduced heat transport by the Atlantic Ocean.Other forcing mechanisms included the fact that theobliquity cycle became more prominent approximately3 Mya. Haug & Tiedemann (1998) propose that theprogressive increase in obliquity amplitudes was thefinal trigger for amplification and continuation of thelong-term expansion of the Northern Hemisphere icesheets after the necessary preconditions were met 4.6to 3.6 Mya by formation of the Isthmus of Panama.Cane & Molnar (2001) instead, proposed that theclosing of the Indonesian Seaway, with New Guineaapproaching the equator and with much of Halmaheraemerging in the last 5 Myr, had more effect on theclimates of the Pacific and Indian Oceans than did theclosing of the Panamanian isthmus or changes inthermohaline circulation.
As a consequence of these forcing effects and thecyclic variations in eccentricity, axial tilt, and preces-
sion of the Earth’s orbit, mathematically theorized byMilankovitch (Crowley & North, 1999), an alternatingsequence of glacial and interglacial conditions inapproximately 100 kyr cycles characterized thesecond half of the Quaternary. The strongly affectedatmospheric circulation displayed patterns that dif-fered significantly between glacial and interglacialperiods. These differences may have been similar tothose that exist between the LGM at approximately20 kyr BP and interglacial warm periods representedby the extremely Holocene Optimum.
The LGM is conventionally defined from sea-levelrecords as the most recent interval in Earth historywhen global ice sheets reached their maximumintegrated volume (Mix, Bard & Schneider, 2001;Clark et al., 2009). Information on precipitationand surface temperature distributions over SouthAmerica during the LGM, as reconstructed frompollen, lake levels, ocean cores, speleothems, andplant microfossils, indicates levels of aridity thatmay be interpreted as plant available moisture, pre-cipitation minus evaporation, or some other relatedvariable (Cusminsky et al., 2011). Changes thatoccurred through the LGM and the Holocene overSouth America are widely described in Vimeux,Sylvestre & Khodri (2009).
Patagonia was evidently affected by changes in thewesterlies and in the position of the southern borderof the semi permanent Atlantic and Pacific anticy-clones. These changes, which took place duringthe LGM and the glacial-interglacial transition, arehowever still poorly understood. The hypothesis thatthe westerlies shifted north during the LGM hasbeen inferred from terrestrial palaeoecological andmarine records off Chile (Heusser, 1989; Stuut &Lamy, 2004). In response to Heusser (1989); Markgraf(1989) proposed that the westerlies shifted to highlatitude, giving rise to a long-standing controversyregarding the interpretation of pollen records in Pat-agonia and the westerlies behavior (Markgraf et al.,1992). However, most of the analyses by proxy datasuggest an equatorward shift and intensification ofthis atmospheric circulation system during the LGM(Lamy et al., 1998, 1999, 2001; Moreno & León, 2003;Valero-Garcés et al., 2005).
The climate modelling results are ambiguous andsomewhat contradictory. Although simulations byKitoh, Murakami & Kiode (2001) and Shin et al.(2003) indicate a poleward shift in the surface west-erlies, those by Kim, Flato & Boer (2003) indicate ashift towards the equator, and experiments by Otto-Bliesner et al. (2006) show no shift in the position ofthe maximum westerlies. Recently, Rojas et al. (2009)analyzed four coupled ocean-atmosphere simulationscarried out by the Palaeoclimate Modelling Intercom-parison Project Phase 2. They did not find a definite
PATAGONIAN PALAEO-ATMOSPHERIC CIRCULATION 241
© 2011 The Linnean Society of London, Biological Journal of the Linnean Society, 2011, 103, 229–249
‘shift’ in the westerly circulation, but suggesta general decrease in surface windspeeds in theSouthern Ocean and sub-Antarctic sectors. Thisdecline, in practice, could induce a similar effect asthe hypothesized equatorward shift of the southernmargin of the southern westerlies.
THE HOLOCENE: THE OPTIMUM APPROXIMATELY
9000 TO 6000 YEARS BP AND THE LAST MILLENNIUM
The Holocene climate probably resulted from predict-able changes in the Earth’s orbit and from thosewhich caused the end of the LGM. These orbitalchanges would have had a maximum heating effect inthe Northern Hemisphere climate at 9000 years BPwhen axial tilt was 24° and the nearest approach tothe Sun took place during the boreal summer. Thechanges in the climatic forcings affected the globalatmospheric circulation (Crowley & North, 1999;Issar, 2003). In Patagonia, the westerlies shifted pole-ward toward their modern position as the climatewarmed following the LGM (Toggweiler, Russell &Carson, 2006). This atmospheric change produceddried conditions (i.e. decreased precipitations andlake levels) in northern Patagonia and central Chile(Galloway, Markgraf & Bradbury, 1988; Heusser,1990; Villagrán & Varela, 1990; Villa-Martínez &Villagrán, 1997; Lamy et al., 2001; Jenny, Wilhelm &Valero-Garcés, 2003).
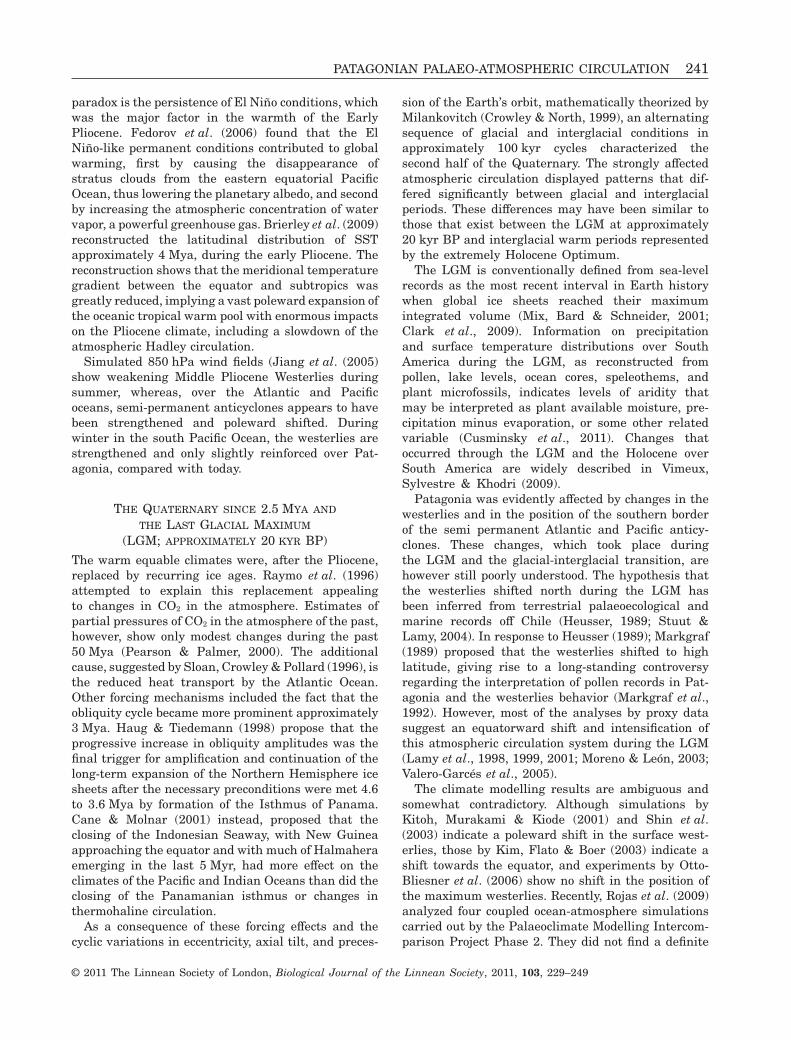
Wagner et al. (2007) model simulation for theMiddle-Holocene period between 7.0 and 4.5 kyr BPsuggest negative pressure anomalies increased withlatitude during summer leading to stronger wester-lies over Patagonia than the pre-industrial climate(Fig. 11, left). Winter conditions were very different
from those in the summer during this period (Fig. 11,right). These were characterized by a weakening ofthe zonal winds and reduced gradients in the polarfrontal jet as indicated by the positive pressureanomalies located at 60°S over the southwestern partof the South American southern tip.
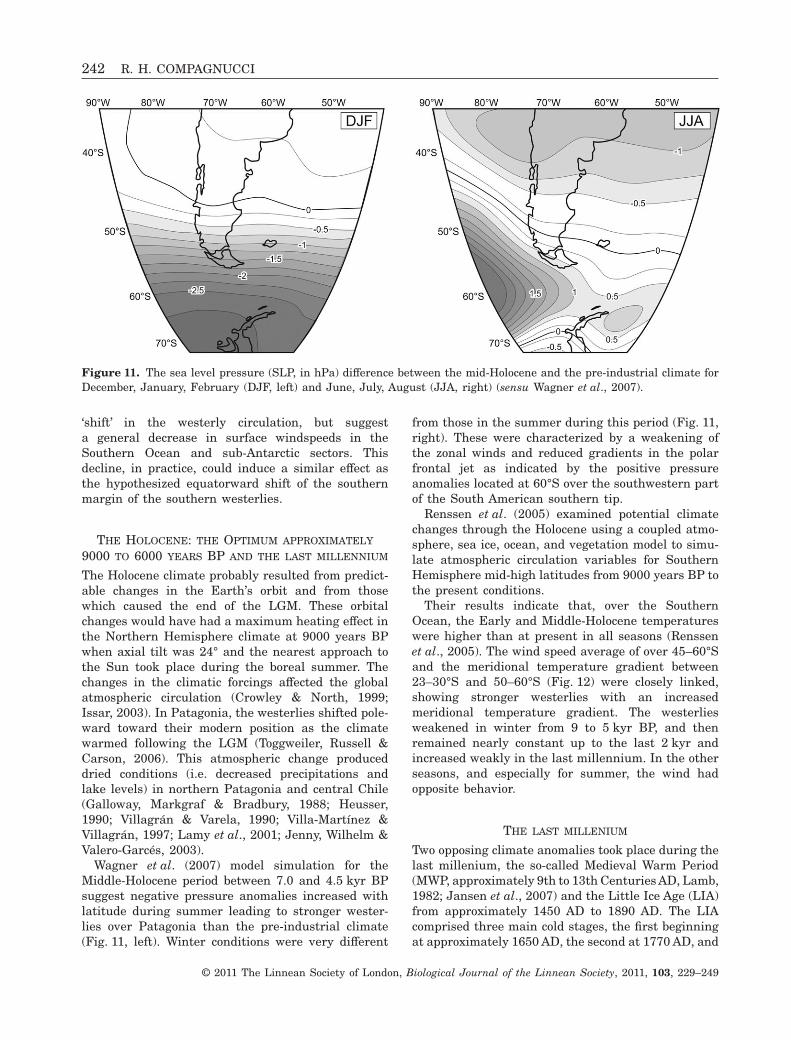
Renssen et al. (2005) examined potential climatechanges through the Holocene using a coupled atmo-sphere, sea ice, ocean, and vegetation model to simu-late atmospheric circulation variables for SouthernHemisphere mid-high latitudes from 9000 years BP tothe present conditions.
Their results indicate that, over the SouthernOcean, the Early and Middle-Holocene temperatureswere higher than at present in all seasons (Renssenet al., 2005). The wind speed average of over 45–60°Sand the meridional temperature gradient between23–30°S and 50–60°S (Fig. 12) were closely linked,showing stronger westerlies with an increasedmeridional temperature gradient. The westerliesweakened in winter from 9 to 5 kyr BP, and thenremained nearly constant up to the last 2 kyr andincreased weakly in the last millennium. In the otherseasons, and especially for summer, the wind hadopposite behavior.
THE LAST MILLENIUM
Two opposing climate anomalies took place during thelast millenium, the so-called Medieval Warm Period(MWP, approximately 9th to 13th Centuries AD, Lamb,1982; Jansen et al., 2007) and the Little Ice Age (LIA)from approximately 1450 AD to 1890 AD. The LIAcomprised three main cold stages, the first beginningat approximately 1650 AD, the second at 1770 AD, and
Figure 11. The sea level pressure (SLP, in hPa) difference between the mid-Holocene and the pre-industrial climate forDecember, January, February (DJF, left) and June, July, August (JJA, right) (sensu Wagner et al., 2007).
242 R. H. COMPAGNUCCI
© 2011 The Linnean Society of London, Biological Journal of the Linnean Society, 2011, 103, 229–249
the third at 1850 AD. They were separated by intervalsof slight warming. The cooler temperatures werecaused by a combination of large volcanic eruptions,less solar activity during the Spörer (1460–1550),Maunder (1645–1715), and Dalton (1790–1830)minima and the inherent climate variability (Crowley& North, 1999; Jansen et al., 2007).
Evidence of MWP and LIA effects over Patagoniahas been recovered from different localities, includ-ing Laguna Aculeo in Central Chile (Jenny et al.,2002; von Gunten et al., 2009); the Jacaf Channelof Chilean Northern Patagonia (Rebolledo et al.,2008; Sepulveda et al., 2009) Laguna Potrok Aike(Zolitschka et al., 2004; Haberzettl et al., 2005); andValle de Andorra, Ushuaia (Mauquoy et al., 2004).Glacier retractions following the LIA have beendocumented for the Laguna San Rafael and theglacier of the same name (Araneda et al., 2007), forthe North Patagonian Icefields (Hielo Patagonico
Norte; Harrison, Winchester & Glasser, 2007), forthe Proglacial Lago Frías at Monte Tronador innorthern Patagonia (Rabassa, Rubulis & Suárez,1979; Villalba et al., 1990), and for the Glaciar RíoManso, also at Monte Tronador (Masiokas et al.,2010), among others.
The atmospheric circulation at this time appears tohave been characterized by an increase of the meridi-onal component at high latitudes of the SouthernHemisphere (Kreutz et al., 1997) and by a cooling atthe South Pole, resulting in stronger zonal westerlies(Mosley-Thompson et al., 1990). Palaeoecologicalreconstruction and model simulation for LIA in south-ern Patagonia show that the precipitation fluctuationcan be attributed to latitudinal northward shift of thewesterlies (Mayr et al., 2007; Meyer & Wagner, 2008).Recently, Maenza & Compagnucci (2010) obtainedscenarios of the anomalies between the MaunderMinimum and the last two decades of the 20th
Figure 12. Simulated anomalies time series, through the last 9000 years, as deviations from the preindustrial mean(1000/250 years BP) for (A) wind speed (m s-1) over 45–60°S and (B) meridional gradient (°C), 20–30°S minus 50–60°S(sensu Renssen et al., 2005).
PATAGONIAN PALAEO-ATMOSPHERIC CIRCULATION 243
© 2011 The Linnean Society of London, Biological Journal of the Linnean Society, 2011, 103, 229–249
Century. The results show the zonal wind componentincreased over Central and Northern Patagonia anddecreased in the southern tip during the warm semes-ter, whereas, during the colder semester, the windincreased all over Patagonia, reaching a maximumover the southern tip. Varma et al. (2010) used aglobal climate model and proxies reflecting changesin the position of the westerlies, to infer that,centennial-scale periods of lower solar activity causedequatorward shifts of the westerlies during the past3000 years.
At present time, the climatic anomalies in northernPatagonia could be related to El Niño (Garreaudet al., 2009) and the whole region appears to beaffected by the Southern Annular Mode. This mode isthe most important pattern of the atmospheric circu-lation variability for the middle and high latitudes inthe Southern Hemisphere.
The atmospheric circulation at surface over thesouthern cone of South America corresponds to thebehavior synthetically described above (Fig. 3).Among the daily atmospheric circulation typesobtained by Compagnucci & Salles (1997) the meanfield or basic flow, with the westerlies prevailing overPatagonia, explains more than 50% of the total vari-ance. The remaining variance is explained by differ-ent synoptic features representing an increasedmeridional component (e.g. passage of low and highpressure systems) relative to the basic flow. The vari-ance explained by the basic flow during winters of ElNiño years is lower than during winters of La Niñayears (Compagnucci & Vargas, 1998).
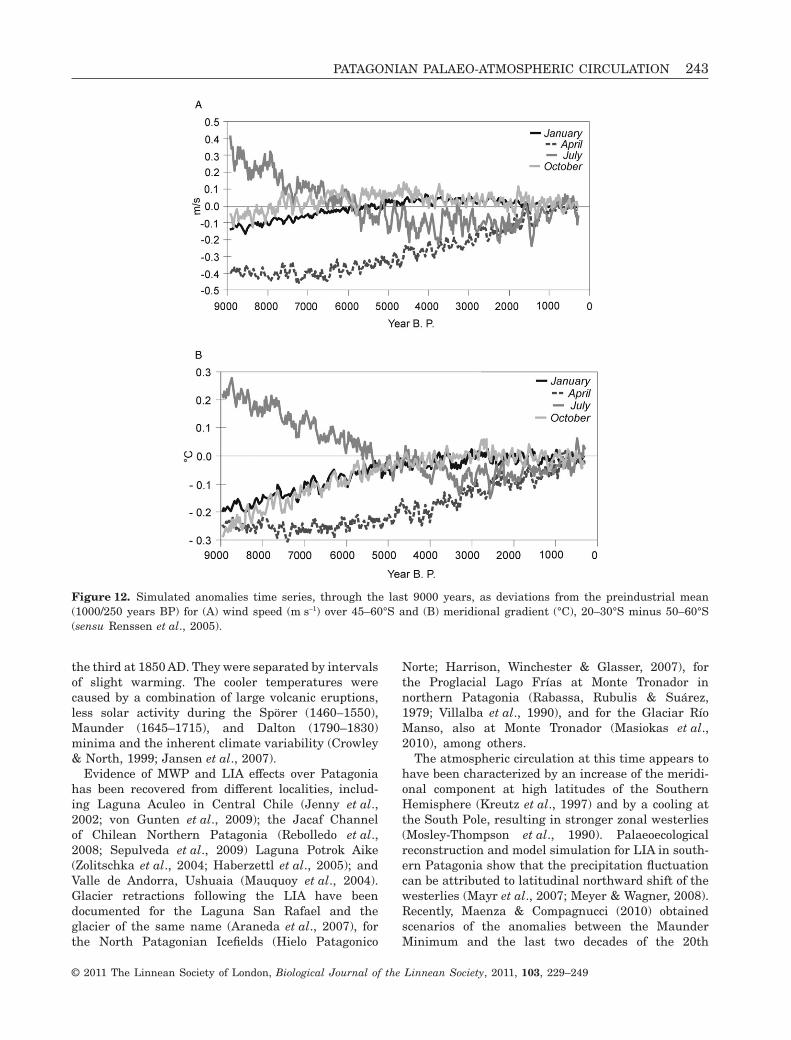
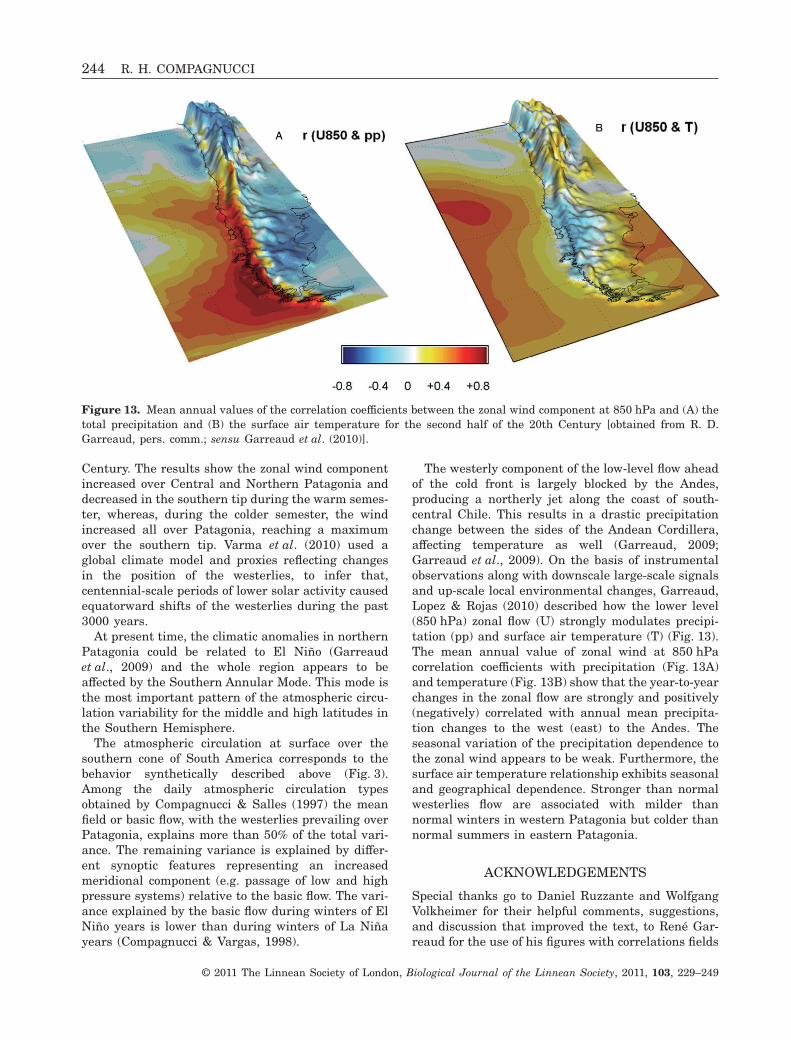
The westerly component of the low-level flow aheadof the cold front is largely blocked by the Andes,producing a northerly jet along the coast of south-central Chile. This results in a drastic precipitationchange between the sides of the Andean Cordillera,affecting temperature as well (Garreaud, 2009;Garreaud et al., 2009). On the basis of instrumentalobservations along with downscale large-scale signalsand up-scale local environmental changes, Garreaud,Lopez & Rojas (2010) described how the lower level(850 hPa) zonal flow (U) strongly modulates precipi-tation (pp) and surface air temperature (T) (Fig. 13).The mean annual value of zonal wind at 850 hPacorrelation coefficients with precipitation (Fig. 13A)and temperature (Fig. 13B) show that the year-to-yearchanges in the zonal flow are strongly and positively(negatively) correlated with annual mean precipita-tion changes to the west (east) to the Andes. Theseasonal variation of the precipitation dependence tothe zonal wind appears to be weak. Furthermore, thesurface air temperature relationship exhibits seasonaland geographical dependence. Stronger than normalwesterlies flow are associated with milder thannormal winters in western Patagonia but colder thannormal summers in eastern Patagonia.
ACKNOWLEDGEMENTS
Special thanks go to Daniel Ruzzante and WolfgangVolkheimer for their helpful comments, suggestions,and discussion that improved the text, to René Gar-reaud for the use of his figures with correlations fields
Figure 13. Mean annual values of the correlation coefficients between the zonal wind component at 850 hPa and (A) thetotal precipitation and (B) the surface air temperature for the second half of the 20th Century [obtained from R. D.Garreaud, pers. comm.; sensu Garreaud et al. (2010)].
244 R. H. COMPAGNUCCI
© 2011 The Linnean Society of London, Biological Journal of the Linnean Society, 2011, 103, 229–249
of the zonal wind component at 850 hPa with tem-perature and precipitation at the 20th Century and toSascha Floegel for the Turonian scenarios. This studywas supported by grants MINCYT-AGENCIA PICT2007-0438 and UBACYT X016. This contribution isbased on a presentation given at the Symposium on‘Palaeogeography and Palaeoclimatology of Patago-nia: Effects on Biodiversity’, held at the La PlataMuseum in Argentina in May 2009 and organized byJorge Rabassa, Eduardo Tonni, Alfredo Carlini andDaniel Ruzzante.
REFERENCES
Abbot DS, Tziperman E. 2008. Sea ice, high-latitude con-vection, and equable climates. Geophysical Research Letters35: L03702.
Aragón E, Goin FJ, Aguilera YE, Woodburne MO,Carlini AA, Roggiero MF. 2011. Paleogeography andpaleoenvironments of northern Patagonia from the LateCretaceous to the Miocene: the Paleogene Andean gap andthe rise of the Northern Patagonian High Plateau (NPHP).Biological Journal of the Linnean Society 103: 305–315.
Araneda A, Torrejon F, Aguayo M, Torres L, Cruces F,Cisternas M, Urrutia R. 2007. Historical records of SanRafael glacier advances (North Patagonian Icefield):another clue to ‘Little Ice Age’ timing in southern Chile?The Holocene 17: 987–998.
Barron EJ. 1983. A warm, equable Cretaceous: the nature ofthe problem. Earth Science Review 19: 305–338.
Barron EJ. 1985. Explanations of the tertiary global coolingtrend. Palaeogeography, Palaeoclimatology, Palaeoecology50: 45–61.
Barry RG, Chorley RJ. 1992. Atmosphere, weather &climate, 6th edn. London: Routledge, 392.
Bershaw J, Garzione CN, Higgins P, MacFadden BJ,Anaya F, Alvarenga H. 2010. Spatial-temporal changes inAndean plateau climate and elevation from stable isotopesof mammal teeth. Earth and Planetary Science Letters 289:530–538.
Blisniuk PM, Stern LA, Chamberlain CP, Zeitler PZ,Ramos VA, Haschke M, Sobel ER, Strecker MR,Warkus F. 2006. Links between mountain uplift, climate,and surface processes in the southern Patagonian Andes. In:Oncken O, Chong G, Franz G, Giese P, Götze H-J, Ramos V,Strecker M, Wigger P, eds. The Andes – active subductionorogeny: frontiers in earth sciences. Berlin: Springer Verlag,Vol. 1, 429–440.
Brierley C, Fedorov AV, Liu Z, Herbert T, Lawrence K,LaRiviere J. 2009. Greatly expanded tropical warm pooland weaker Hadley circulation in the early Pliocene. Science323: 1714–1718.
Broccoli AJ, Manabe S. 1992. The effects of orography onmiddle latitude northern hemisphere dry climates. Journalof Climate 5: 1181–1201.
Bush ABG. 1997. Numerical simulation of the CretaceousTethys circumglobal current. Science 275: 807–810.
Bush ABG, Philander SGH. 1997. The Late Cretaceous:simulation with a coupled atmosphere-ocean GCM. Pale-oceanography 21: 475–516.
Cane MA, Molnar P. 2001. Closing of the IndonesianSeaway as a precursor to East African aridification around3–4 million years ago. Nature 411: 157–162.
Cavallotto JL, Violante RA, Hernández-Molina FJ. 2011.Geological aspects and evolution of the Patagonian Conti-nental Margin. Biological Journal of the Linnean Society103: 346–362.
Chandler MA, Rind D, Ruedy R. 1992. Pangean climateduring the Early Jurassic: GCM simulations and the sedi-mentary record of paleoclimate. Geological Society ofAmerica Bulletin 104: 543–559.
Clark PU, Dyke AS, Shakun JD, Carlson AE, Clark J,Wohlfarth B, Mitrovica JX, Hostetler SW, McCabe AM.2009. The last glacial maximum. Science 325: 710–714.
Compagnucci RH, Salles M. 1997. Surface pressure pat-terns during the year over southern South America. Inter-national Journal of Climatology 17: 635–654.
Compagnucci RH, Vargas W. 1998. Interannual variabilityof Cuyo Rivers streamflow in Argentinean Andean Moun-tains and ENSO events. International Journal of Climatol-ogy 18: 1593–1609.
Crowell JC. 1999. Pre-Mesozoic ice ages: their bearing onunderstanding the climate system. Boulder, CO: GeologicalSociety of America Memoir, 192.
Crowley TJ. 1996. Pliocene climates: the nature of theproblem, Mar. Micropaleontology 27: 3–12.
Crowley TJ, Berner RA. 2001. CO2 and climate change.Science 292: 870–872.
Crowley TJ, North GR. 1999. Paleoclimatology. Oxford:Oxford University Press, 360.
Crowley TJ, Zachos JC. 2000. Comparison of zonaltemperature profiles for past warm time periods. In:Huber BT, MacLeod KG, Wing SL, eds. Warm climates inearth history. Cambridge: Cambridge University Press.
Cusminsky G, Schwalb A, Pérez AP, Pineda D, ViehbergF, Whatley R, Markgraf V, Gilli A, Ariztegui D, Ansel-metti FS. 2011. Late Quaternary environmental changesin Patagonia as inferred from lacustrine fossil and extantostracods. Biological Journal of the Linnean Society 103:397–408.
Davies A. 2006. High resolution palaeoceanography andpalaeoclimatology from mid and high latitude Late Creta-ceous laminated sediments. PhD Thesis, University ofSouthampton, Faculty of Engineering Science and Math-ematics, School of Ocean and Earth Science.
DeConto RM, Pollard D. 2003. Rapid Cenozoic glaciation ofAntarctica induced by declining atmospheric CO2. Nature421: 245–249.
Dubiel RF, Parrish JT, Parrish JM, Good SC. 1991.The pangaean megamonsoon – evidence from the uppertriassic chinle formation, Colorado Plateau. Palaios 6: 347–370.
Eyles N. 1993. Earth’s glacial record and its tectonic setting.Earth Science Review 35: 1–248.
Fedorov AV, Dekens PS, McCarthy M, Ravelo AC,
PATAGONIAN PALAEO-ATMOSPHERIC CIRCULATION 245
© 2011 The Linnean Society of London, Biological Journal of the Linnean Society, 2011, 103, 229–249
deMenocal PB, Barreiro M, Pacanowski RC, Philan-der SG. 2006. The Pliocene paradox (mechanisms for apermanent El Niño). Science 312: 1485–1489.
Floegel S. 2002. On the influence of precessional Milan-kovitch cycles on the Late Cretaceous climate system:Comparison of GCM-results, geochemical, and sedimentaryproxies for the Western Interior Seaway of North America.Universitätsbibliothek der Christian-Albrechts-UniversitätKiel, Doctoral Thesis, University of Kiel, Germany, 236 pp.
Folguera A, Orts D, Spagnuolo M, Rojas Vera E, LitvakV, Sagripanti L, Ramos ME, Ramos VA. 2011. A reviewof Late Cretaceous to Quaternary paleogeography of theSouthern Andes. Biological Journal of the Linnean Society103: 250–268.
Frakes LA. 1999. Estimating the global thermal statefrom Cretaceous sea surface and continental temperaturedata. In: Barrera E, Johnson CC, eds. Evolution of theCretaceous Ocean-Climate System. Boulder: GeologicalSociety of America Special Paper 332: 49–57.
Galloway RW, Markgraf V, Bradbury JP. 1988. Datingshorelines of lakes in Patagonia, Argentina. Journal ofSouth American Earth Sciences 1: 195–198.
Garreaud R, Lopez P, Rojas M. 2010. Large-scale controlon the climate of Patagonia. II International SymposiumReconstructing Climate Variations in South America and theAntarctic Peninsula over the last 2000 years. October 27–30,2010. Valdivia – Chile.
Garreaud R, Vuille M, Compagnucci R, Marengo J. 2009.Present-day South American climate. Paleo3 281: 180–195.
Garreaud RD. 2009. The Andes climate and weather.Advances in Geosciences 7: 1–9.
von Gunten L, Grosjean M, Rein B, Urrutia R, ApplebyP. 2009. A quantitative high-resolution summer tempera-ture reconstruction based on sedimentary pigments fromLaguna Aculeo, central Chile, back to AD 850. The Holocene19: 873–881.
Haberzettl T, Fey M, Lucke A, Maidana N, Mayr C,Ohlendorf C, Schabitz F, Schleser GH, Wille M,Zolitschka B. 2005. Climatically induced lake levelchanges during the last two millennia as reflected insediments of Laguna Potrok Aike, southern Patagonia(Santa Cruz, Argentina). Journal of Paleolimnology 33:283–302.
Haltiner GJ, Martin FL. 1957. Dynamical and physicalmeteorology. New York, NY: McGraw-Hill, 470.
Harrison S, Winchester V, Glasser N. 2007. The timingand nature of recession of outlet glaciers of Hielo PatagonicoNorte, Chile, from their Neoglacial IV (Little Ice Age)maximum positions. Global and Planetary Change 59:67–78.
Haug GH, Tiedemann R. 1998. Effect of the formation of theIsthmus of Panama on Atlantic Ocean thermohaline circu-lation. Nature 393: 673–676.
Hay WW. 2008. Evolving ideas about the Cretaceousclimate and ocean circulation. Cretaceous Research 29: 725–753.
Hay WW, Soeding E, DeConto RM, Wold CN. 2002. The
Late Cenozoic uplift–climate change paradox. InternationalJournal of Earth Sciences 91: 746–774.
Hay WW, Flögel S, Söding E. 2005. Is the initiation ofglaciation of the Cretaceous Ocean–Climate System onAntarctica related to a change in the structure of the ocean?Global and Planetary Change Geological Society of AmericaSpecial 45: 23–33.
Haywood AM, Valdes PJ, Markwick PJ. 2004. Cretaceous(Wealden) climates: a modelling perspective. CretaceousResearch 25: 303–311.
Heusser CJ. 1989. Southern westerlies during the lastglacial maximum. Quaternary Research 31: 423–425.
Heusser CJ. 1990. Late glacial and Holocene vegetation andclimate subantartic South America. Review of Paleobotanyand Palynology 65: 9–15.
Holton JR. 1992. An introduction to dynamic meteorology,3rd edn. San Diego, CA: Academic Press, 511.
Hotinski RM, Toggweiler JR. 2003. Impact of a Tethyancircumglobal passage on ocean heat transport and ‘equable’climates. Paleoceanography 18: 1007.
Huber BT, MacLeod KG, Wing SL, eds. 2000. Warm cli-mates in earth history. Cambridge: Cambridge UniversityPress, 462.
Huber M, Sloan LC. 1999. Warm climate transitions: ageneral circulation modeling study of the Late PaleoceneThermal Maximum (~56 Ma). Journal of Geophys Research104: 16633–16655.
Iglesia Llanos MP, Riccardi AC, Singer SE. 2006. Palaeo-magnetic study of Lower Jurassic marine strata from theNeuquén basin, Argentina: a new Jurassic apparent polarwander path for South America. Earth and PlanetaryScience Letters 252: 379–397.
Iglesias A, Artabe AE, Morel EM. 2011. The evolution ofPatagonian climate and vegetation, from the Mesozoic tothe present. Biological Journal of the Linnean Society 103:409–422.
Issar AS. 2003. Climate changes during the Holocene andtheir impact on hydrological systems. Cambridge: Cam-bridge University Press, 144.
Jansen E, Overpeck J, Briffa KR, Duplessy JC, Joos F,Masson-Delmotte V, Olago D, Otto-Bliesner B, PeltierWR, Rahmstorf S, Ramesh R, Raynaud D, Rind D,Solomina O, Villalba R, Zhang D. 2007. Palaeoclimate.In: Solomon S, Qin D, Manning M, Chen Z, Marquis M,Averyt KB, Tignor M, Miller HL, eds. Climate change 2007.The physical science basis. Contribution of working group Ito the fourth assessment report of the intergovernmentalpanel on climate change. Cambridge: Cambridge UniversityPress.
Jenny B, Valero-Garces BL, Urrutia R, Kelts K, Veit H,Appleby PG, Geyh M. 2002. Moisture changes andfluctuations of the westerlies in MediterraneanCentral Chile during the last 2000 years: the Laguna Aculeorecord (33°50′S). Quaternary International 87: 3–18.
Jenny B, Wilhelm D, Valero-Garcés BL. 2003. The South-ern Westerlies in Central Chile: Holocene precipitation esti-mates based on a water balance model for Laguna Aculeo(33°50′S). Climate Dynamics 20: 269–280.
246 R. H. COMPAGNUCCI
© 2011 The Linnean Society of London, Biological Journal of the Linnean Society, 2011, 103, 229–249
Jiang D, Wang H, Ding Z, Lang X, Drange H. 2005.Modeling the middle Pliocene climate with a global atmo-spheric general circulation model. Journal of GeophysicalResearch 110: D14107.
Kim SJ, Flato GM, Boer GJ. 2003. A coupled climatesimulation of the Last Glacial Maximum, part 2: approachto equilibrium. Climatic Dynamics 20: 635–661.
Kious WJ, Kious JW, Tilling RA, Geological Survey US.1996. This dynamic earth: the story of plate tectonics. U.S.Department of the Interior, U.S. Geological Survey (USGS),Washington: United States Government Printing, onlineedition. Available at: http://pubs.usgs.gov/gip/dynamic/dynamic.html#anchor19309449
Kitoh A, Murakami S, Kiode H. 2001. A simulation of thelast glacial maximum with a coupled atmosphere–oceanGCM. Geophysical Research Letters 28: 2221–2224.
Kreutz KJ, Mayewski PA, Meeker LD, Twickler MS,Whitlow SI, Pittalwala IP. 1997. Bipolar changes inatmospheric circulation during the Little Ice Age. Science277: 1294–1296.
Kump LR, Pollard D. 2008. Amplification of Cretaceouswarmth by biological cloud feedbacks. Science 320: 195.
Kutzbach JE, Gallimore RG. 1989. Pangaean climates:megamonsoons of the megacontinent. Journal of Geophysi-cal Research 94: 3341–3357.
Kutzbach JE, Guetter PJ, Ruddiman WF, Prell WL.1989. Sensitivity of climate to late Cenozoic uplift in South-ern Asia and the American West: numerical experiments.Journal of Geophysical Research 94: 18393–18407.
Lamb HH. 1982. Climate history and the modern world.London: Routledge, 433.
Lambeck K. 1980. The earth variable rotation. Cambridge:Cambridge University Press.
Lamy F, Hebbeln D, Wefer G. 1998. Late quaternary pre-cessional cycles of terrigenous sediment input off the NorteChico, Chile (27.5 degrees S) and palaeoclimatic implica-tions. Palaeogeography, Palaeoclimatology, Palaeoecology140: 233–244.
Lamy F, Hebbeln D, Wefer G. 1999. High-resolution marinerecord of climatic change in mid-latitude Chile during thelast 28 000 years based on terrigenous sediment param-eters. Quaternary Research 51: 83–93.
Lamy F, Hebbeln D, Röhl U, Wefer G. 2001. Holocenerainfall variability in southern Chile: a marine record oflatitudinal shifts of the Southern Westerlies. Earth andPlanetary Science Letters 185: 369–382.
Lisiecki LE, Raymo ME. 2007. Plio-Pleistocene climate evo-lution: trends and transitions in glacial cycle dynamics.Quaternary Science Review 26: 56–69.
Loope DB, Rowe CM, Joeckel RM. 2001. Annual monsoonrains recorded by Jurassic dunes. Nature 412: 64–66.
Lutgens FK, Tarbuck EJ. 2006. The atmosphere: an intro-duction to meteorology. New Jersey, USA: Prentice Hall,544.
Maenza RA, Compagnucci RH. 2010. Simulación de laPequeña Edad de Hielo usando el modelo EdGCM. Geoacta35: 2 (in press).
Markgraf V. 1989. Reply to C.J. Heusser’s ‘Southern
westerlies during the last glacial maximum’. QuaternaryResearch 31: 426–432.
Markgraf V, Dodson JR, Kershaw AP, McGlone MS,Nicholls N. 1992. Evolution of late pleistocene andholocene climates in the Circum–South Pacific land areas.Climate Dynamics 6: 193–211.
Marshall GJ. 2003. Trends in the Southern Annular Modefrom observations and reanalyses. Journal of Climate 16:4134–4143.
Masiokas MH, Luckman BH, Villalba R, Delgado S,Rabassa J. 2010. Little Ice Age fluctuations of Glaciar RíoManso in the north Patagonian Andes of Argentina. Qua-ternary Research 73: 96–106.
Mauquoy D, Blaauw M, van Geel B, Borromei A, Quat-trocchio M, Chambers FM, Possnert G. 2004. LateHolocene climatic changes in Tierra del Fuego based onmultiproxy analyses of peat deposits. Quaternary Research61: 148–158.
Mayr C, Wille M, Haberzettl T, Fey M, Janssen S, LückeA, Ohlendorf C, Oliva G, Schäbitz F, Schleser GH,Zolitschka B. 2007. Holocene variability of the SouthernHemisphere westerlies in Argentinean Patagonia (52°S).Quaternary Science Reviews 26: 579–584.
Meyer I, Wagner S. 2008. The Little Ice Age in southernPatagonia: comparison between paleoecological reconstruc-tions and downscaled model output of a GCM simulation.PAGES News 16: 12–13.
Mix AC, Bard E, Schneider RR. 2001. Environmental pro-cesses of the ice age: land, ocean, glaciers (EPILOG). Qua-ternary Science Review 20: 627–657.
Mo KC, Paegle JN. 2001. The Pacific–South American modesand their downstream effects. International Journal of Cli-matology 21: 1211–1229.
Molnar P, Cane M. 2002. El Nino’s tropical climate andteleconnections as a blueprint for pre- Ice-Age climates.Paleoceanography 17: 1021.
Moore GT, Hayashida DN, Ross CA, Jacobson SR. 1992a.Palaeoclimate of the Kimmeridgian/Tithonian (Late Juras-sic) world. I. Results using a general circulation model.Palaeogeography, Palaeoclimatology, Palaeoecology. 93: 113–150.
Moore GT, Sloan LC, Hayashida DN, Umrigar NP.1992b. Paleoclimate of the Kimmeridge/ Tithonian (LateJurassic) world. II. Sensitivity tests comparing three differ-ent paleotopographic settings. Palaeogeography, Palaeocli-matology, Palaeoecology 95: 229–252.
Moreno PI, León AL. 2003. Abrupt vegetation changesduring the Last Glacial to Holocene transition in mid-latitude South America. Journal of Quaternary Science 18:787–800.
Mosley-Thompson E, Thompson LG, Grootes PM, Gun-derstrup N. 1990. Little Ice Age (Neoglacial) paleoenviron-mental conditions at Siple Station, Antarctica. Annals ofGlaciology 14: 199–204.
Otto-Bliesner BL, Brady EC, Shields C. 2002. Late Cre-taceous ocean: coupled simulations with the NationalCenter for Atmospheric Research Climate System Model.Journal of Geophysical Research 332: 49–57.
PATAGONIAN PALAEO-ATMOSPHERIC CIRCULATION 247
© 2011 The Linnean Society of London, Biological Journal of the Linnean Society, 2011, 103, 229–249
Otto-Bliesner BL, Brady E, Clauzet G, Thomas R,Levis S, Kothavala Z. 2006. Last glacial maximum andHolocene climate in CCSM3. Journal of Climate 19: 2526–2544.
Pearson PN, Palmer MR. 2000. Atmospheric carbon dioxideconcentrations over the past 60 million years. Nature 406:695–699.
Philander SGH. 1990. El Niño, La Niña and the SouthernOscillation. San Diego, CA: Academic Press, 289.
Philander SG, Fedorov AV. 2003. The role of tropics inchanging the response to Milankovitch forcing some threemillion years ago. Paleoceanography 18: 1045.
Poulsen CJ. 2008. Paleoclimate modeling, Pre-Quaternary.In: Gornitz V, ed. Encyclopedia of paleoclimatology andancient environments. Springer, Dordrecht, The Nether-lands: Kluwer Academic Publishers, 700–709.
Poulsen CJ, Gendaszek AS, Jacob R. 2003. Did the riftingof the Atlantic Ocean cause the Cretaceous thermalmaximum? Geology 31: 115–118.
Poulsen CJ, Pollard D, White TS. 2007. General circula-tion model simulation of the d18O content of continentalprecipitation in the middle Cretaceous: a model-proxy com-parison. Geology 35: 199–202.
Poulsen CJ, Ehlers TA, Insel N. 2010. Onset of convectiverainfall during gradual Late Miocene rise of the CentralAndes. Science 328: 490–493.
Prohaska F. 1976. The climate of Argentina, Paraguay andUruguay. In: Schwertfeger W, ed. Climates of Central andSouth America. World Survey of Climatology. Amsterdam:Elsevier, Vol. 12, 13–112.
Quattrocchio ME, Volkheimer W, Borromei AM, Mar-tínez MA. 2011. Changes of the palynobiotas in the Meso-zoic and Cenozoic of Patagonia: a review. Biological Journalof the Linnean Society 103: 380–396.
Rabassa J, Rubulis S, Suárez J. 1979. Rate of formationand sedimentology of (1976–1978) push-moraines, FríasGlacier, Mount Tronador (41°10′S; 71°53′W), Argentina. In:Schlüchter C, ed. Moraines and varves. Rotterdam:Balkema, 65–79.
Ramos VA, Ghiglione MC. 2008. Tectonic evolution of thePatagonian Andes. In: Rabassa J, ed. The Late Cenozoic ofPatagonia and Tierra del Fuego. Elsevier, Amsterdam:Elsevier, 57–72.
Raymo ME, Grant B, Horowitz M, Rau GH. 1996. Mid-Pliocene warmth: stronger greenhouse and stronger con-veyor, Mar. Micropaleontology 27: 313–326.
Rebolledo L, Sepulveda J, Lange CB, Pantoja S, Ber-trand S, Hughen K, Figueroa D. 2008. Late Holocenemarine productivity changes in Northern Patagonia–Chileinferred from a multi-proxy analysis of Jacaf channelsediments. Estuarine, Coastal and Shelf. Science 80: 314–322.
Renssen H, Goosse H, Fichefet T, Masson-Delmotte V,Koç N. 2005. The Holocene climate evolution in the high-latitude Southern Hemisphere simulated by a coupledatmosphere-sea ice-ocean-vegetation model. The Holocene15: 951–964.
Röhl U, Westerhold T, Bralower TJ, Zachos JC. 2007. On
the duration of the Paleocene–Eocene thermal maximum(LPTM). Geochem Geophys Geosyst 8: Q12002.
Rojas M, Moreno P, Kageyama M, Crucifix M, Hewitt C,Abe-Ouchi A, Ohgaito R, Brady EC, Hope P. 2009.The Southern Westerlies during the Last Glacial Maxi-mum in PMIP2 simulations. Climate Dynamics 32: 525–548.
Royer DL. 2006. CO2-forced climate thresholds during thePhanerozoic. Geochim Cosmochim Acta 70: 5665–5675.
Ruddiman WF, Raymo ME, Prell W, Kutzbach JE. 1997.The uplift–climate connection: a synthesis. In: RuddimanWF, Prell W, eds. Global tectonics and climate change. NewYork, NY: Plenum Press, 471–515.
Scher HD, Martin EE. 2006. Timing and climatic conse-quences of the opening of Drake Passage. Science 312:428–430.
Scherer CMS, Goldberg K. 2007. Palaeowind patternsduring the latest Jurassic–earliest Cretaceous in Gond-wana: evidence from aeolian cross-strata of the BotucatuFormation, Brazil. Palaeogeography, Palaeoclimatology,Palaeoecology 250: 89–100.
Scotese CR. 2010. PALAEOMAP, earth history and climatehistory. Available at: http://www.scotese.com/ (November,2010).
Sellwood BW, Valdes PJ. 2006. Mesozoic climates: generalcirculation models and the rock record. SedimentaryGeology 190: 269–287.
Sellwood BW, Valdes PJ, Price GD. 2000. Geological evalu-ation of GCM simulations of Late Jurassic palaeoclimate.Palaeogeography, Palaeoclimatology, Palaeoecology 156:147–160.
Sepulveda J, Pantoja S, Hughen KA, Bertrand S,Figueroa D, Leon T, Drenzek NJ, Lange C. 2009. LateHolocene sea-surface temperature and precipitation vari-ability in northern Patagonia, Chile (Jacaf Fjord, 44°S).Quaternary Research 72: 400–409.
Sewall JO, van de Wal RSW, van der Zwan K, vanOoosterhout C, Dijkstra HA, Scotese CR. 2007. Climatemodel boundary conditions for four cretaceous time slices.Climate of the Past 3: 647–657.
Shin SI, Lui Z, Otto-Bliesner B, Brady EC, Kutzback JE,Harrison SP. 2003. A simulation of the last glacialmaximum climate using the NCAR-CCSM. Climate Dynam-ics 20: 127–151.
Siegenthaler U, Stocker TF, Monnin E, Luthi D,Schwander J, Stauffer B, Raynaud D, Barnola JM,Fischer H, Masson-Delmotte V, Jouzel J. 2005. Stablecarbon cycle–climate relationship during the late Pleis-tocene. Science 310: 1313–1317.
Sijp WP, England MH. 2004. Effect of the Drake Passagethroughflow on global climate. Journal of Physical Ocean-ography 34: 1254–1266.
Sijp WP, England MH, Toggweiler JR. 2009. Effect ofocean gaterway changes under greenhose warmth. Journalof Climate 22: 6639–6652.
Sloan LC, Crowley TJ, Pollard D. 1996. Modeling ofmiddle Pliocene climate with the NCAR GENESIS generalcirculation model. Mar Micropaleontol. 27: 51–61.
248 R. H. COMPAGNUCCI
© 2011 The Linnean Society of London, Biological Journal of the Linnean Society, 2011, 103, 229–249
Steppuhn A, Micheels A, Geiger G, Mosbrugger V. 2006.Reconstructing the Late Miocene climate and oceanicheat flux using the AGCM ECHAM4 coupled to a mixed-layer ocean model with adjusted flux correction. Palaeogeog-raphy, Palaeoclimatology, Palaeoecology 238: 399–423.
Stuut J-BW, Lamy F. 2004. Climate variability at the south-ern boundaries of the Namib (Southwestern Africa) andAtacama (Northern Chile) coastal deserts during the last120 000 yr. Quaternary Research 62: 301–309.
Thompson DWJ, Wallace JM. 2000. Annular modes in theextratropical circulation. Part I: month-to-month variabil-ity. Journal of Climate 13: 1000–1016.
Toggweiler JR, Bjornsson H. 2000. Drake Passage andpalaeoclimate. Journal of Quaternary Science 15: 319–328.
Toggweiler JR, Russell JL, Carson SR. 2006. Midlatitudewesterlies, atmospheric CO2, and climate change during theice ages. Paleoceanography 21: PA2005.
Trenberth KE. 1992. Climate system modeling. New York,NY: Cambridge University Press, 788.
US Geological Survey Geologic Names Committee. 2010.Divisions of geologic time – major chronostratigraphic andgeochronologic units. US Geological Survey Fact Sheet2010–3059, 2 p.
Valdes PJ. 1993. Atmospheric general circulation models ofthe Jurassic. Philosophical Transactions of the Royal Societyof London Series B, Biological Sciences 341: 317–326.
Valdes PJ. 2000. Warm climate forcing mechanisms. In: HuberBT, MacLeod KG, Wing SL, eds. Warm climates inEarth history. Cambridge: Cambridge University Press,3–20.
Valdes PJ, Sellwood BW. 1992. A palaeoclimate model forthe Kimmeridgian. Palaeogeography, Palaeoclimatology,Palaeoecology 95: 47–72.
Valero-Garcés BL, Rondanelli M, Delgado-Huertas A,Burns SJ, Veit H, Moreno A. 2005. Palaeohydrology ofLaguna de Tagua Tagua (34°30′S) and moisture fluctuationsin Central Chile for the last 46 000 yr. Jouranl of Quater-nary Science 20: 625–641.
Varma V, Prange M, Lamy F, Merkel U, Schulz M.2010. Solar-forced shifts of the Southern Hemisphere West-erlies during the late Holocene. Clim Past Discuss 6: 369–384.
Villagrán C, Varela J. 1990. Palynogical evidence forincreased aridity on the Central Chilean Coast during theHolocene. Quaternary Research 34: 198–207.
Villalba R, Leiva JC, Rubulis S, Suarez J, Lenzano L.
1990. Climate, tree-rings and glacial fluctuations in the RioFrías Valley, Rio Negro, Argentina. Arctic and AlpineResearch 22: 215–232.
Villa-Martínez R, Villagrán C. 1997. Historia de la veget-ación de la costa de Chile central durante el Holoceno medioy tardío. Revista Chilena de Historia Natural 70: 391–401.
Vimeux F, Sylvestre F, Khodri M, eds. 2009. Past climatevariability in South America and surrounding regions: fromthe Last Glacial Maximum to the Holocene. Developments inPaleoenvironmental Research Series (DPER). New York:Springer, 418.
Volkheimer W, Rauhut OWM, Quattrocchio ME, Mar-tinez MA. 2008. Jurassic Paleoclimates in Argentina, areview. Revista de la Asociación Geológica Argentina 63:549–556.
Wagner S, Widmann M, Jones J, Haberzettl T, Lücke A,Mayr C, Ohlendorf C, Schäbitz F, Zolitschka B. 2007.Transient simulations, empirical reconstructions and forcingmechanisms for the Mid-Holocene hydrological climate insouthern Patagonia. Climate Dynamics 29: 333–355.
Wilf P, Johnson KR, Cúneo NR, Smith ME, Singer BS,Gandolfo MA. 2005. Eocene plant diversity at Laguna delHunco and Río Pichileufú, Patagonia, Argentina. AmericanNaturalist 165: 634–650.
Zachos JC, Lohmann KC, Walker JCG, Wise SW. 1993.Abrupt climate change and transient climates in the Paleo-gene: a marine perspective. Journal of Geology 100: 191–213.
Zeebe RE, Zachos JC, Dickens GR. 2009. Carbon dioxideforcing alone insufficient to explain Palaeocene–EoceneThermal Maximum warming. Nature Geoscience 2: 576–580.
Zhou J, Poulsen CJ, Pollard D, White TS. 2008. Simula-tion of modern and middle Cretaceous marine d18O with anocean-atmosphere general circulation model. Paleoceanog-raphy 23: PA3223.
Ziegler AM, Scotese CR, Barrett SF. 1983. Mesozoic andCenozoic paleogeographic maps, In: Tidal Friction and theEarth’s Rotation II, edited by P. Brosche and J. Sunder-mann. Berlin: Springer Verlag, 240–252.
Zolitschka B, Schabitz F, Lucke A, Wille M, Mayr C,Ohlendorf C, Anselmetti F, Ariztegui D, Corbella H,Ercolano B, Fey M, Haberzettl T, Maidana N, Oliva G,Paez M, Schleser GH. 2004. Climate changes in southernPatagonia (Santa Cruz, Argentina) inferred from lake sedi-ments – the multi-proxy approach of SALSA. PAGES News12: 9–11.
PATAGONIAN PALAEO-ATMOSPHERIC CIRCULATION 249
© 2011 The Linnean Society of London, Biological Journal of the Linnean Society, 2011, 103, 229–249