a study on pricing of currency futures in indian currency market
TRANSCRIPT

IJRFM Volume 5, Issue 6 (June, 2015) (ISSN 2231-5985) International Journal of Research in Finance and Marketing (IMPACT FACTOR – 5.230)
International Journal of Research in Finance & Marketing Email id: [email protected] http://www.euroasiapub.org
1
A study on Pricing of currency futures in Indian currency market
Ms. Ankita Srivastava1
Research Scholar
ICFAI University
Central Hope Town, Bahadarpur
Dehradun, Uttarakhand
Dr. Manisha Singh2
IBS Business School
IDPL Complex
Gurgaon Haryana
Abstract
This paper attempts to study theoretically the pricing of currency futures and the scope of the available models for pricing. The purpose of this study is to investigate the available literature on pricing of currency futures and understand the empirical analysis employed by various researchers. The thorough review of literature and the study of futures data on National Stock Exchange conclude that in developing countries like India, Athens etc the markets are inefficient and thus the future or forward prices become equal to spot prices at the time of expiry i.e. convergence is there. This study has tested the cost of carry model and convergence empirically through VECM but seeing the pattern of trading and the study on market efficiency in India supports the dependency of two on each other i.e. there is a long run stable relationship between foreign currency spot and futures market. Keywords: pricing, convergence, National Stock Exchanges, future prices, spot prices etc. JEL Classification: G12, G14, G15.
I. Introduction Currencies have been recognized as new asset class and they follow distinctive fundamentals unlike other assets like equity or bond. Shapiro (2006) describes the emergence and growth of the market for derivative instruments back to the willingness of risk adverse economic agents to protect themselves against qualms arising out of fluctuations in asset prices. From 1867 to 1933, fixed exchange rate system was prevailing. During the period most of the economies of world used ‘Gold Standard’. This was a fixed exchange rate system in which the value of a currency was fixed relative to the value of gold which was used as the primary reserve asset during that time. Under this system the amount of money issued by a country was directly tied to the gold which in turn fixed the price of one currency to the other currencies. When a country suffered from deficit or surplus in balance of payments, gold flowed out or in. US dollar was the only currency which was strong enough at that time in order to withstand the increasing demand for international liquidity. But the great depression from 1929 to 1934, forced US to partially abandon the gold standard (were not allowed to exchange dollars for gold) and were given silver instead of gold. It gave rise to ‘Bretton Woods System’ that was an agreement of fixed exchange rates that ruled the international financial relationships. By 1971, US completely rejected the conversion of US dollar to gold. It was followed by ending up of Bretton Woods System and allowed the exchange rates of most western countries to follow in the world markets. These fluctuations in the currency exchange rates led to currency exposure risk which

IJRFM Volume 5, Issue 6 (June, 2015) (ISSN 2231-5985) International Journal of Research in Finance and Marketing (IMPACT FACTOR – 5.230)
International Journal of Research in Finance & Marketing Email id: [email protected] http://www.euroasiapub.org
2
is one of the major sources of overall risk in international trade and internationally diversified portfolios. Thus controlling this risk is very important for controlling and improving investment performance of international trade and investments as many individuals and firms find themselves helpless in the wake of drastic exchange rate movements. The price behaviour in the currencies market has become an important barometer for economic activity. The pattern in price discovery reveals suitable strategies that have to be taken in the trading/hedging decisions in currency market. There is a growing literature which explores the developments happening in currency market but Rendlemen and Carabini (1979) were the first researchers to study the pricing efficiency of an (interest rate futures) IRF contract. They studied the Treasury bill futures contract traded on the International Monetary Market (IMM) of the CME. It was found that if the transaction cost is less, the nearby futures contracts have been overpriced while longer-term futures contracts have been underpriced. Overall, there appears to be an affinity for the market to become less efficient over time. Jeng (1999) studied the strength of co-integration between future prices and their spot prices through cost of carry model and found that they are weakly associated .The study of Razak and Bacha (2009) on testing the pricing efficiency of 3-monthKLIBOR (Kaula Lumpur) futures contracts suggests that extent of mispricing is dependent on the trend and volatility of the underlying rate. The latest study by Tharavanij (2012) in Thailand on testing the efficiency through cost of carry model revealed that the cost-of-carry model explains SET 50 futures price properly. It was found that spot and futures prices form a co-integrating relationship. This fact can be explained by a negative correlation between the cost-of-carry and the spot price change, which make a futures price to be different from a forward price due to a future’s daily settlement. The cost of carry model though tested but still needs consideration for developing economies like India.
According to the report of NSE derivatives markets have been in existence in India in some form or other for a long time. In the area of commodities, the Bombay Cotton Trade Association started futures trading in 1875 and, by the early 1900s India had one of the world’s largest futures industries. In 1999, the Securities Contracts (Regulation) Act of 1956, or SC(R)A, was amended so that derivatives could be declared “securities.” This allowed the regulatory framework for trading securities to be extended to derivatives. In the Indian context the Securities Contracts (Regulation) Act, 1956 [SC(R) A] defines "derivative" to include-
1. A security derived from a debt instrument, share, loan whether secured or unsecured, risk instrument or contract for differences or any other form of security.
2. A contract which derives its value from the prices, or index of prices, of underlying securities.
The term derivative has been defined in section 45U (a) of the RBI act as follows:
‘An instrument, to be settled at a future date, whose value is derived from change in interest rate, foreign exchange rate, credit rating or credit index, price of securities (also called “underlying”), or a combination of more than one of them and includes interest rate swaps, forward rate agreements, foreign currency swaps, foreign currency-rupee swaps, foreign currency options, foreign currency-rupee options or such other instruments as may be specified by RBI from time to time.’
The economic liberalization of the early nineties facilitated the introduction of derivatives based on interest rates and foreign exchange. A system of market-determined exchange rates was adopted by India in March 1993. In August 1994, the rupee was made fully convertible on current account. These reforms allowed increased integration between domestic and international markets, and created a need to manage currency risk.

IJRFM Volume 5, Issue 6 (June, 2015) (ISSN 2231-5985) International Journal of Research in Finance and Marketing (IMPACT FACTOR – 5.230)
International Journal of Research in Finance & Marketing Email id: [email protected] http://www.euroasiapub.org
3
On October 1, 2008 BSE (Bombay Stock Exchange) launched its currency derivatives segment in dollar-rupee currency futures as the exchange traded currency futures contracts facilitate easy access, increased transparency, efficient price discovery, better counterparty credit risk management, wider participation and reduced transaction costs. A large variety of derivative contracts have been launched at exchanges across the world including India. Some of the factors driving the growth of financial derivatives are:
1. Increased volatility in asset prices in financial markets.
2. Increased integration of national financial markets with the international financial markets.
3. Marked improvement in communication facilities and sharp decline in their costs.
4. Development of more sophisticated risk management tools, providing a wider choice of risk management strategies.
5. Innovations in the derivatives markets, which optimally combine the risks and returns over a large number of financial assets, leading to higher returns, reduced risk and lower transactions costs as compared to individual financial assets.
Currently Indian currency derivatives market comprise of instruments like forward, futures and options where the terms have their usual definitions. For the first time in India, mini Futures and Options contracts are being offered. These are new products from BSE based on the leading Indian equity Index 'S&P BSE SENSEX '. These are primarily to enable retail investors to participate in the growing derivatives market. S&P BSE SENSEX is the barometer of the Indian capital market and is widely tracked in the global financial markets. As Indian derivatives markets grow more sophisticated, greater investor awareness will become essential
II. Literature Review Pradhan and Bhat (2009) investigated the causal relationship between spot and futures prices in Nifty futures markets, using Vector Error Correction Model (VECM). Their study compared the forecasting ability of futures prices on spot prices with three major forecasting techniques namely ARIMA, VAR and VECM model. The findings indicated the importance of taking into account the long-run relationship between the futures and the spot prices in forecasting future spot prices. Ozen et al. (2009) examined that the short-term and long-term causality between futures market and spot market for the period from February 2005 to February 2009. They used the analysis, unit root test, co-integration test and causality analysis depending on Vector Error Correction Model (VECM). Their findings indicated that the series derived from the futures prices and cash market prices were as stationary, as each other and co-integrated. It was also found that futures market leads spot market in the long term on the other hand spot market is the cause of futures market in the short term.
Floros (2009) examined the price discovery between futures and spot markets in South Africa over the period from 2002 to 2006. FTSE/JSE Top 40 stock index futures and spot markets were co-integrated and he found that futures and spot play a strong price discovery role, that was, FTSE/JSE Top 40 futures prices led to spot prices and vice versa. Rosenberg and Traub (2006) compared price discovery in the foreign exchange futures and spot markets. They developed a foreign exchange futures order flow measure that is a proxy for the order flow observed by Chicago Mercantile Exchange pit traders. They find that futures market has the major contribution to price discovery than the spot market.
Gupta and Belwinder (2006) examined the price discovery mechanism in the NSE spot and future market. The study used the daily closing values of index future Sand PCNX Nifty, from

IJRFM Volume 5, Issue 6 (June, 2015) (ISSN 2231-5985) International Journal of Research in Finance and Marketing (IMPACT FACTOR – 5.230)
International Journal of Research in Finance & Marketing Email id: [email protected] http://www.euroasiapub.org
4
June 2002 to February 2005. The techniques like Johansen and VECM were used and it was found that there exists stronger casual relation from Nifty futures to Nifty index.
Kenourgios (2004) investigated relationship between price movements of FTSE/ASE three-month futures index and the underlying spot market in Athens Stock Exchange over the period of August 1999 until June 2002 by using daily data. This study’s results show the presence of a bi-directional causality between stock index spot and futures markets, there is an informational linkage between two markets and the existence of such an informational linkage implies that investors using these markets can explore significant arbitrage profits and hedging opportunities
Kavussanos and Nomikos (2003) investigated the causal relationship between futures and spot prices in the freight futures market. They found that price discovery first takes position in the futures market and then it is transmitted to underlying cash market. Their findings indicate that futures prices tend to discover new information more rapidly than spot prices. They also reported that the information incorporated in futures prices, when formulated as a VECM, produces more accurate forecasts of spot prices than the VAR, ARIMA and random-walk models.
Lin and Stevenson (2001) employed the wavelet analysis to reconstruct data based on the information that differentiated the two fundamentally related time series: spot and futures indices. Wavelet analysis allowed signals to decompose into a parsimoniously countable set of basic functions at different time locations and resolution levels. Because of the compact support property of wavelets, wavelet analysis was capable of capturing short-lived, transient components of data in shorter time intervals, as well as capturing trends and patterns in longer time intervals. The analysis focused on examining the relationship between the two price series. Furthermore, it also enabled examination and comparison of reconstructed prices based on different levels of information detail. The result revealed that the lead-la g relationship described in the empirical literature still existed between the spot and the futures index prices. Such a relationship was more persistent when more detailed information was used for price reconstruction. This implied that, if market imperfection was to be blamed for thenon-contemporaneous relationship between the spot and the futures indices, one should concentrate solely on those imperfections that were likely to occur within very short time horizons.
Patnaik and Pauly (2000) developed a short run model of exchange rates to explain the behaviour of the rupee in foreign exchange markets in the nineties when India moved from a fixed to a floating exchange rate. In the model estimated the real exchange rate deviates from that determined by real interest parity due to risk and intervention. These, apart from the interest differential and the expected exchange rate, determine the current period’s exchange rate. The expected exchange rate was a curved combination of the rates derived from predictive behavior and the equilibrium exchange rate which was determined by a version of the purchasing power parity condition
Sarno and Valente (2000) examined empirically the dynamic relationship between spot and futures prices in stock index Futures markets employing a class of nonlinear, regime-switching-vector-equilibrium-correction models. Using data for S&P500and theFTSE-100overthepost-1987 crash period, it was shown that a long run relationship between spot and futures prices exists, which implied mean reversion of the basis. After providing strong evidence against the hypothesis of linear dynamics in the relationship under investigation, regime-switching-vector-equilibrium-correction models for spot and futures price movements were developed and shown to capture well the time-series properties of the data, consistent with a large theoretical and empirical literature.

IJRFM Volume 5, Issue 6 (June, 2015) (ISSN 2231-5985) International Journal of Research in Finance and Marketing (IMPACT FACTOR – 5.230)
International Journal of Research in Finance & Marketing Email id: [email protected] http://www.euroasiapub.org
5
Thomas, III (1986) examined the profitability of currency futures market trading rules that assume that spot exchange rates could be adequately modeled as drift less random walks for German mark, Japanese yen, Swiss franc, French franc and the British pound for 1974-1983. It compared the expected and actual rates of return realized by an investor who followed such a random walk hypothesis (RWH)-based strategy, using each of the five major currencies that typically sell at a significant discount or premium from spot. For four of the five currencies the regression estimates were not powerful enough to decisively reject either hypothesis—random walk or unbiasness—in favor of the other. However, it was fair to say that the weight of the evidence favors the RWH. All five estimates of the slope term from equation were positive and unbiasness could be rejected in favor of the RWH for one of the currencies, the pound. Zellner's seemingly unrelated regression (SUR) procedure yielded more precise estimates of the parameter values if the Utfrom equation were correlated across different currencies. It was likely that the error terms for various currencies were related. The SUR results showed that the case for the OLS estimates, the estimates of b were positive for all five currencies., and in no case could the RWH (b=1) be rejected. The estimated slope term was significantly positive for two of the five currencies, the British pound and the French franc. Unfortunately, even using SUR the estimates of b remained imprecise, so that for three of the five currencies neither the RWH nor the unbiasness hypothesis was rejected by the data. Levich (1979) studied that whether forward exchange rates were unbiased predictors of future spot rates. The article aimed to examine the accuracy of the forward rate as a predictor of the future spot rate. The relationship between today's forward exchange rate for delivery in n days (call it Ft, n) and the spot exchange rate n days in the future (St+n) along with the error term et,n (where et,n = : St + n - Ft,n ) had been studied. The results illustrated that the parameters a' and b'(regression equation coefficients) could take on a wide range of values. In several cases, individual parameters differed significantly from their expected values under the null hypothesis. The estimated regression line was significant for Italy (at the 1% level) and for Switzerland (at the 10% level) which stated that the forward premium was an unbiased forecast of the future exchange rate. It was equally true, however, that the predictive power of this relationship, as measured by R2 was very low and in most cases not significant.
III. Models: Fama (1991) defines an efficient market as one where prices reflect all available information. Price discovery is the function of the spot and the future rates. According to Tesler (1958) price insurance is only possible if spot and future price move exactly together. Kamara (1984) pronounced that future prices are biased predictors of spot prices. Various researchers have given many models for price discovery. They have been discussed below in detail. The relationship between spot and future price can be better understood by studying the basis behaviour. Basis is the difference between the cash/spot price and the future price Basis= Spot price – Future Price or Spot price= Basis+ Future price A. Pricing on the basis of Cost of Carry Model One of the most famous and simple model for explaining relationship between spot and future price is the cost of carry model. In the literature review also it has been found that various researchers have used this model for estimating the future prices. It states that under a perfect market situation the returns in the spot and the futures market should be perfectly correlated. It is an arbitrage-free pricing model and its central theme is that futures contract is so priced as to prevent arbitrage profit. In other words, investors will be indifferent to spot and futures market to execute their buying and selling of underlying asset because the prices they obtain are effectively the same. Expectations do influence the price, but they influence the spot price and, through it, the futures price. They do not directly influence the futures price.

IJRFM Volume 5, Issue 6 (June, 2015) (ISSN 2231-5985) International Journal of Research in Finance and Marketing (IMPACT FACTOR – 5.230)
International Journal of Research in Finance & Marketing Email id: [email protected] http://www.euroasiapub.org
6
According to the cost-of-carry model, the futures price is given by Futures price = Spot Price + (Carry Cost - Carry Return)
Carry cost (CC) is the interest cost of holding the underlying asset (purchased in spot market) until the maturity of futures contract. Carry return (CR) is the income (e.g., dividend) derived from underlying asset during holding period. Thus, the futures price (F) should be equal to spot price (S) plus carry cost minus carry return.
F(it,n)=(r-r*)+(S(t)) r=domestic interest rate r*=foreign interest rate F(it,n)=price of a futures with n periods at time t S(it)=spot rate B. Pricing on the basis of Samuelson Effect The net hedging hypothesis (which postulates that future prices are biased estimates of forthcoming cash prices because hedgers must compensate speculators for assuming the price risk of holding future contracts) says that the spot price and the future price will converge at the end of the future contract or at the time of expiration (Future price will be equal to spot price). The arbitrageurs make sure that convergence happens at the expiration. Samuelson (1965) proposed that future price varies less in comparison to spot prices and the variation of future prices reduces as maturity approaches. This effect is called Samuelson effect.
IV. Research Methodology
The pricing is the main issue raised in this paper so the pricing firstly through cost of carry model and then convergence has been verified. The cost of carry has been checked empirically in the form
Log F(t,n)=(r-r*)+Log(S(t)) (1) The rationale behind this is that spot exchange rates are assumed to be log normally distributed. This assumption excludes the possibility of negative spot or futures prices. As mentioned earlier, the convergence happens when spot price and future price become almost equal on the day of expiry. In other words when the basis moves towards zero as the expiration of a futures contract nears (Basis= Spot price – Future Price). Being the time series data, all the three series have been tested for stationary and autocorrelation through ADF statistics and Durbin Watson statistics respectively.
If the series found non stationary then the cointegration test will be performed. The Johansen co-integration procedure is a robust and powerful technique for testing efficient market hypothesis in the foreign exchange markets. The theory of co-integration was initially pioneered by Engle and Granger (1987) and improved by Johansen (1988; 1991). It helps in understanding the long run equilibrium relationship between multiple variables. The purpose of the cointegration test is to determine whether a group of non-stationary series is co integrated or not.
A vector error correction (VEC) model designed for use with non stationary series that are known to be co integrated will be used if co integration existed. The VEC has cointegration relations built into the specification so that it restricts the long-run behavior of the endogenous variables to converge to their cointegrating relationships while allowing for short-run adjustment dynamics. The cointegration term is known as the error correction term since the deviation from long-run equilibrium is corrected gradually through a series of partial short-run adjustments.
IJRFM Volume 5, Issue 6 (June, 2015) (ISSN 2231-5985) International Journal of Research in Finance and Marketing (IMPACT FACTOR – 5.230)
International Journal of Research in Finance & Marketing Email id: [email protected] http://www.euroasiapub.org
7
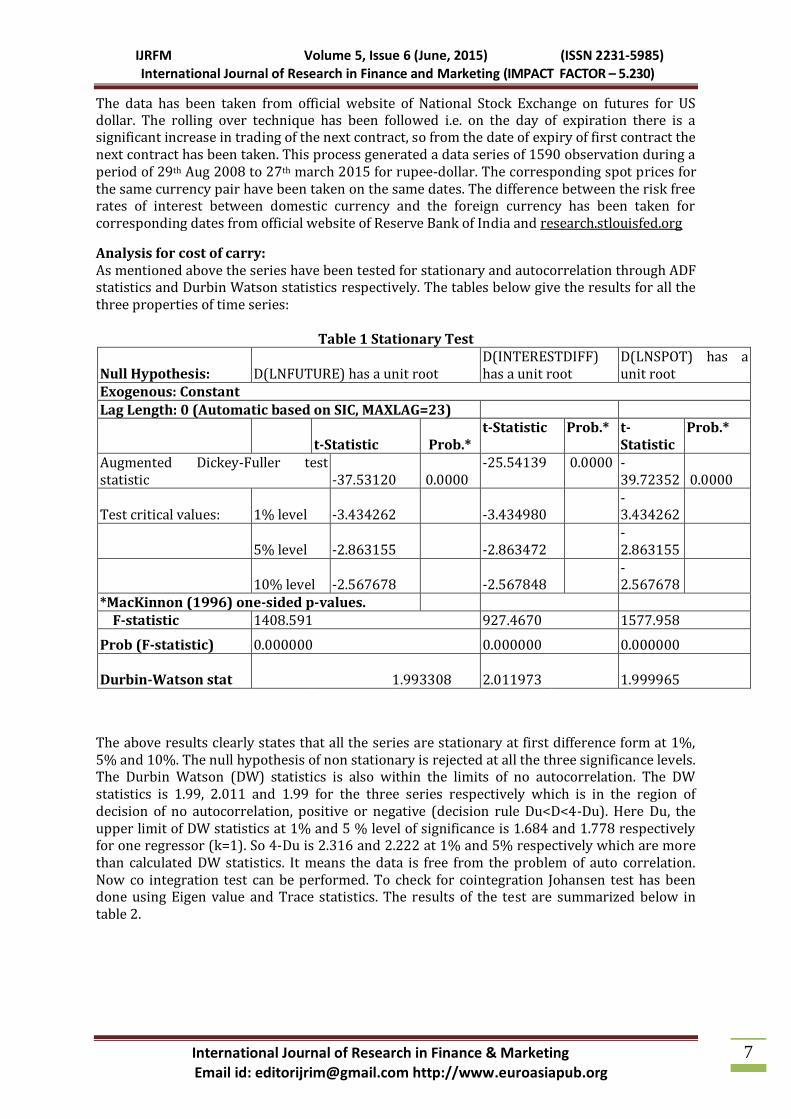
The data has been taken from official website of National Stock Exchange on futures for US dollar. The rolling over technique has been followed i.e. on the day of expiration there is a significant increase in trading of the next contract, so from the date of expiry of first contract the next contract has been taken. This process generated a data series of 1590 observation during a period of 29th Aug 2008 to 27th march 2015 for rupee-dollar. The corresponding spot prices for the same currency pair have been taken on the same dates. The difference between the risk free rates of interest between domestic currency and the foreign currency has been taken for corresponding dates from official website of Reserve Bank of India and research.stlouisfed.org
Analysis for cost of carry: As mentioned above the series have been tested for stationary and autocorrelation through ADF statistics and Durbin Watson statistics respectively. The tables below give the results for all the three properties of time series:
Table 1 Stationary Test
Null Hypothesis: D(LNFUTURE) has a unit root D(INTERESTDIFF) has a unit root
D(LNSPOT) has a unit root
Exogenous: Constant Lag Length: 0 (Automatic based on SIC, MAXLAG=23)
t-Statistic Prob.* t-Statistic Prob.* t-
Statistic Prob.*
Augmented Dickey-Fuller test statistic -37.53120 0.0000
-25.54139 0.0000 -39.72352 0.0000
Test critical values: 1% level -3.434262 -3.434980 -
3.434262
5% level -2.863155 -2.863472 -
2.863155
10% level -2.567678 -2.567848 -
2.567678
*MacKinnon (1996) one-sided p-values. F-statistic 1408.591 927.4670 1577.958
Prob (F-statistic) 0.000000 0.000000 0.000000
Durbin-Watson stat 1.993308
2.011973
1.999965
The above results clearly states that all the series are stationary at first difference form at 1%, 5% and 10%. The null hypothesis of non stationary is rejected at all the three significance levels. The Durbin Watson (DW) statistics is also within the limits of no autocorrelation. The DW statistics is 1.99, 2.011 and 1.99 for the three series respectively which is in the region of decision of no autocorrelation, positive or negative (decision rule Du<D<4-Du). Here Du, the upper limit of DW statistics at 1% and 5 % level of significance is 1.684 and 1.778 respectively for one regressor (k=1). So 4-Du is 2.316 and 2.222 at 1% and 5% respectively which are more than calculated DW statistics. It means the data is free from the problem of auto correlation. Now co integration test can be performed. To check for cointegration Johansen test has been done using Eigen value and Trace statistics. The results of the test are summarized below in table 2.

IJRFM Volume 5, Issue 6 (June, 2015) (ISSN 2231-5985) International Journal of Research in Finance and Marketing (IMPACT FACTOR – 5.230)
International Journal of Research in Finance & Marketing Email id: [email protected] http://www.euroasiapub.org
8
Table 2 -Co-Integration test
Included observations: 1381 after adjustments
Trend assumption: Linear deterministic trend
Series: LNFUTURE INTERESTDIFF LNSPOT
Lags interval (in first differences): 1 to 4
Unrestricted Cointegration Rank Test (Trace)
Hypothesized Trace 0.05
No. of CE(s) Eigen value Statistic Critical Value Prob.**
None * 0.093938 146.7700 29.79707 0.0001
At most 1 0.006700 10.53806 15.49471 0.2416
At most 2 0.000908 1.254124 3.841466 0.2628
Trace test indicates 1 cointegrating eqn(s) at the 0.05 level * denotes rejection of the hypothesis at the 0.05 level **MacKinnon-Haug-Michelis (1999) p-values
Unrestricted Cointegration Rank Test (Maximum Eigen value)
Hypothesized Max-Eigen 0.05
No. of CE(s) Eigen value Statistic Critical Value Prob.**
None * 0.093938 136.2320 21.13162 0.0001
At most 1 0.006700 9.283939 14.26460 0.2633
At most 2 0.000908 1.254124 3.841466 0.2628
Max-eigenvalue test indicates 1 cointegrating eqn(s) at the 0.05 level * denotes rejection of the hypothesis at the 0.05 level **MacKinnon-Haug-Michelis (1999) p-values
Table 3 Vector Error Correction Estimates Included observations: 1441 after adjustments Standard errors in ( ) & t-statistics in [ ]
Cointegrating Eq: CointEq1
LNFUTURE(-1) 1.000000
INTERESTDIFF(-1) -0.000214
(9.3E-05)
[-2.30381]
LNSPOT(-1) -1.002827
(0.00170)
[-588.581]
C 0.009733
Error Correction: D(LNFUTURE)
D(INTERESTDIFF) D(LNSPOT)
CointEq1 -0.262542 8.393590 0.327107
(0.05921) (8.28720) (0.04803)
[-4.43410] [ 1.01284] [ 6.81065]
D(LNFUTURE(-1)) 0.319890 -7.776765 0.650766
(0.05697) (7.97345) (0.04621)
[ 5.61526] [-0.97533] [ 14.0827]
D(LNFUTURE(-2)) 0.116672 -5.517971 0.241919
(0.04963) (6.94698) (0.04026)

IJRFM Volume 5, Issue 6 (June, 2015) (ISSN 2231-5985) International Journal of Research in Finance and Marketing (IMPACT FACTOR – 5.230)
International Journal of Research in Finance & Marketing Email id: [email protected] http://www.euroasiapub.org
9
[ 2.35063] [-0.79430] [ 6.00869]
D(INTERESTDIFF(-1)) 0.000438 -0.590851 0.000343
(0.00018) (0.02554) (0.00015)
[ 2.39914] [-23.1366] [ 2.31555]
D(INTERESTDIFF(-2)) 0.000326 -0.280101 0.000151
(0.00019) (0.02593) (0.00015)
[ 1.75811] [-10.8011] [ 1.00228]
D(LNSPOT(-1)) -0.260558 3.974740 -0.467897
(0.05638) (7.89177) (0.04574)
[-4.62109] [ 0.50366] [-10.2301]
D(LNSPOT(-2)) -0.095081 4.157735 -0.135842
(0.03887) (5.44088) (0.03153)
[-2.44590] [ 0.76417] [-4.30794]
C 0.000222 -0.004679 0.000191
(0.00015) (0.02108) (0.00012)
[ 1.47488] [-0.22194] [ 1.56636]
R-squared 0.274371 0.274477 0.407483
Adj. R-squared 0.226860 0.270933 0.404589
Sum sq. resids 0.046741 915.6519 0.030755
S.E. equation 0.005711 0.799359 0.004633
F-statistic 5.775246 77.44673 140.7851
Log likelihood 5402.556 -1717.975 5704.135
Akaike AIC -7.487240 2.395524 -7.905809
Schwarz SC -7.457965 2.424799 -7.876534
Mean dependent 0.000222 -0.005071 0.000213
S.D. dependent 0.005777 0.936178 0.006004 Determinant resid covariance (dof adj.) 2.06E-10
Determinant resid covariance 2.02E-10
Log likelihood 9948.170
Akaike information criterion -13.76984
Schwarz criterion -13.67104 The Johansen’s test for cointegration through trace test and Eigen value reveals that there is at least one co integrating equation which means that variable s have a long run relationship. Now to check if error correction is there and to estimate the coefficients VECM has been run. The VECM results clearly indicate that there is a long run relationship .The coefficient of error correction term is negative as well as significant which signifies convergence in the long run. The estimated equation is equation: D(LNFUTURE) = C(1)*(LN FUTURE(-1) - 0.0002137834104*INTERESTDIFF(-1) - 1.002826618*LNSPOT(-1) + 0.009733419713 ) + C(2)*D(LNFUTURE(-1)) + C(3)*D(LNFUTURE(-2)) + C(4)*D(INTERESTDIFF(-1)) + C(5)*D(INTERESTDIFF(-2)) + C(6)*D(LNSPOT(-1)) + C(7)*D(LNSPOT(-2)) + C(8) The equation tested here is having logarithm of futures price as dependent variable. So in order to confirm the significance of coefficients the p-values have been estimated through OLS.

IJRFM Volume 5, Issue 6 (June, 2015) (ISSN 2231-5985) International Journal of Research in Finance and Marketing (IMPACT FACTOR – 5.230)
International Journal of Research in Finance & Marketing Email id: [email protected] http://www.euroasiapub.org
10
Estimation Method: Least Squares Included observations: 1476 Total system (unbalanced) observations 4393
Coefficient Std. Error t-Statistic Prob.
C(1) -0.288492 0.058807 -4.905723 0.0000
C(2) 0.351599 0.056357 6.238839 0.0000
C(3) 0.134268 0.049482 2.713494 0.0067
C(4) 0.000419 0.000183 2.294028 0.0218
C(5) 0.000288 0.000181 1.595537 0.1107
C(6) -0.275132 0.056290 -4.887807 0.0000
C(7) -0.111884 0.038643 -2.895289 0.0038
C(8) 0.000266 0.000150 1.766693 0.0773 Determinant residual covariance 2.07E-10
Observations: 1476
R-squared 0.561137 Mean dependent var 0.000271 Adjusted R-squared 0.512517 S.D. dependent var 0.005848
S.E. of regression 0.005770 Sum squared resid 0.048874 Durbin-Watson stat 1.987705
V. Conclusion: This paper explores the relationship between spot and future prices of currencies through models and the importance of pricing. It has been tried to understand how the two prices (spot and future) depend on each other and help to explain the currency behaviour. This paper considered the empirical work because methods like Vector Error Correction Method (VECM) provides a sophisticated platform to study multiple time series. The empirical analysis of various researchers has got mixed results. Some found that future prices converge to spot price while others found no convergence. These variations might be due to difference in the data sets used by them. But if we go through the literature and theoretical concepts of pricing of currency futures they suggest that the spot prices are equivalent to future price at the time of expiry i.e. convergence is there as the markets found to be inefficient. The results of the present study are in line with a few researches for convergence in developing countries’. But if convergence is there it means that spot prices are predictable which ultimately leads to profits for the knowledgeable traders. The currency futures market has greater price transparency for the end-user by the introduction of exchange traded currency futures in India. It can now avoid the legal tangle and also bring the platform of foreign exchange in India same as developed countries. The upward trend of the open interest, number of contracts traded and average daily turnover since its inspection explain the whole story in detail. So, it can be thus concluded that the currency futures market will get more success in the coming future and the economy and the risk hedgers will definitely be benefited from this trade.
References Alan C. Shapiro. (2008). Multinational Financial Management.ed. 8th, pp. 246-279. Wiley Student
Edition, Wiley India (P.) Ltd., New Delhi. Fama, E.,& French. (1991). Efficient Capital Markets: II. Journal of Finance ,66, 1575-1617.

IJRFM Volume 5, Issue 6 (June, 2015) (ISSN 2231-5985) International Journal of Research in Finance and Marketing (IMPACT FACTOR – 5.230)
International Journal of Research in Finance & Marketing Email id: [email protected] http://www.euroasiapub.org
11
George M. Jabbour. (1994) Prediction of future currency exchange rates from Current currency future prices: The case of GM and JY. The Journal of Futures Markets, Vol. 14, No. 1, 25-36.
Gupta, K. and Balvinder, S. (2006).”Price discovery and causality in spot and future markets in India”, The ICFAI Journal of Derivatives, Vol.3, No. 1, pp.30-41.
Kamara, A. (1982). Issues in Futures Markets: A Survey. Journal of Futures Markets, 12, 261-94. Kawaller, I.G., Paul, D. and Koch, T.w.(1987). The temporal price relationship between S&P
500futures and S&P 500 index”. The Journal of finance, Vol. 42, No. 5, pp.1309-1329. Kenourgios, D.F. (2004). “Price discovery in the Atthens derivatives exchange:Evidences for the
ftse/ase-20futures market” ,Economic and Business Review, Vol. 6,No.3,pp.229-243. Kavussano, M.G. and Nomikos, N.K. (2003). “Price discovery, causality and forecasting in the
freight futures market”. Review of Derivative Research, Vol. 6, pp. 203-230. Lee R. Thomas, III.(1986).Random Walk Profits in Currency Futures Trading.The Journal of
Futures Markets, Vol. 6, No. 1, pp. 109-125 Lin, S.J. and Stevenson, M. (2001).Wavelet analysis of cost of carry model. Studies in Nonlinear
Dynamics and Econometrics , April , 5(1): 87–102. Ozen E., Bozdogan T. and Zugul M. (2009). “The relationship of causality between the price of
futures transactions underlying stock exchange and price of cash market: the case of Turkey”, Middle Eastern Finance and Economics, Vol, 4, pp, 28-37.
Patnaik., I. and Pauly.,(2000). P Fundamental determinants of the real exchange rate of the Indian rupee: http://openlib.org/home/ila/PDFDOCS/PatnaikPauly2000_wp.pdf
Pradhan, H. C., and Bhat, K.S. (2009). “An empirical analysis of price discovery, causality and forecasting in the nifty futures market”, International Reaserch Journal of Finance and Economics, Vol. 26, pp. 83-92.
Ranjan R. Chakravarty and D.G. Praveen. (2009) .Policy and Markets- Exchange traded currency derivatives markets in India: the road ahead. Macroeconomics and Finance in Emerging Market Economies. Vol. 3, No. 1, March 2010, 139–146
Razaka, M.A. and Bacha, O.I. (2009) Pricing efficiency of the 3-month KLIBOR futures contracts: an empirical analysis. Applied Financial Economics, 19, 445–462
Rendleman, R. J. and Carabini, C. E. (1979) The efficiency of the treasury bill futures market, Journal of Finance,34, 895–914.
Richard M. Levich. (1979). Are Forward Exchange Rates Unbiased Predictors of Future Spot Rates? Columbia Journal of World business, Winter.
Rosenberg, J. V., and Traub, L.G. (2006). “Price discovery in the foreign currency futures and spot market”. FRB of New York Staff Refort No. 262.
Sarno, L. and Valente, G.(2000). The cost of carry model and regime shifts in stock index futiures markets: An empirical investigation. The Journal of FuturesMarkets,Vol.20,No-7.603-624.
Tesler, L. G. (1958). Futures trading and the storage of cotton and wheat. Journal of Political Economy, 66, 233-255.
Tharavanij, P. (2012). Empirical Test of the Cost-of-Carry Model: A Case of Thai Stock Index Futures Contract. International Research Journal of Finance and Economics , Issue 101 November.
http://www.bseindia.com/markets/Derivatives/DeriReports/minisenx.aspx http://stockandmfs.blogspot.in/2011/02/derivatives-india.html http://www.newyorkfed.org/research/economists/sarkar/derivatives_in_india.pdf http://www.nseindia.com/content/us/ismr2011ch6.pdf