drug pricing investigation
TRANSCRIPT
Drug Pricing Investigation Majority Staff Report
Committee on Oversight and Reform
U.S. House of Representatives December 2021
oversight.house.gov
i
December 10, 2021 Dear Committee Members:
Today, I am releasing the final majority staff report in the Committee on Oversight and
Reform’s nearly three-year investigation of the pharmaceutical industry. In January 2019, under the leadership of our former Chairman, the late Elijah E. Cummings, the Committee launched a sweeping investigation into pricing and business practices in the pharmaceutical industry. The Committee focused on companies selling brand-name drugs that are especially costly to Medicare—which is currently prohibited by law from negotiating for lower prices. The goal of the investigation was to understand why drug companies have consistently raised prices, the strategies they use to protect their market power and keep prices high, and how Congress can reform the industry to make prescriptions more affordable for patients and taxpayers.
I have been honored to lead this investigation since becoming Chairwoman of the
Committee in October 2019. The Committee has obtained more than 1.5 million pages of internal company documents, held five hearings, and released eight interim staff reports. The investigation has provided a rare glimpse into the decision-making of many of the world’s most profitable drug companies.
What the Committee has learned should be troubling to lawmakers, taxpayers, and any American who has ever struggled to afford their prescriptions. Drug companies have raised prices relentlessly for decades while manipulating the patent system and other laws to delay competition from lower-priced generics. These companies have specifically targeted the U.S. market for higher prices, even while cutting prices in other countries, because weaknesses in our health care system have allowed them to get away with outrageous prices and anticompetitive conduct.
The drugs in our Committee’s investigation ranged from cancer therapies to insulin to treatments for chronic conditions and rare diseases. Although the markets for these products differ, the Committee uncovered common practices that cut across the industry.
First, drug companies have raised prices with abandon, especially when they succeed in
delaying or blocking competition. Internal documents reveal that companies have raised prices to meet ever-increasing revenue targets, which in some cases were tied to higher pay for executives.
Second, companies have manipulated the patent system and marketing exclusivities
granted by the Food and Drug Administration to extend their monopolies far longer than lawmakers envisioned when they created these systems.
ii
Third, all the companies the Committee investigated have employed anticompetitive strategies to suppress generic competition. Several companies have also used patient assistance programs and donations to third-party organizations—which were ostensibly intended to help patients afford expensive drugs—as tools to garner positive public relations, increase sales, and raise revenue.
These practices persist because the highly complex U.S. pharmaceutical market creates perverse incentives to raise prices, and unlike in other countries, drug companies can do so without limitation. Consumers will pay whatever they can afford—and often what they cannot—for lifesaving drugs.
Prescription drugs are increasingly unaffordable for Americans. The Committee heard firsthand accounts from patients who have been forced to make impossible sacrifices to afford their medications. High drug prices are also draining our federal health care programs. The Committee’s analysis found that from 2014 to 2018, taxpayers lost $25 billion in savings on just seven drugs because Medicare could not negotiate to lower prices. The Medicare Trust Fund is expected to run out in 2026.
The pharmaceutical industry plays an essential role in developing and producing lifesaving drugs. But the Committee’s investigation found that sky-high drug prices are not justified by the need to innovate. The largest drug companies spend more on payouts for investors and executives than on research and development. And many blockbuster drugs rely on scientific discoveries from research funded by taxpayers, while drug companies’ R&D spending often focuses on minor changes to extend patent protection and block lower-priced competitors.
This staff report is intended to help Congress, regulatory agencies, and the public understand rising drug prices and pursue effective reforms to make prescription drugs more affordable. The evidence overwhelmingly supports the need to pass the Build Back Better Act, which will empower Medicare to negotiate for lower prices, restrain price increases, and cap out-of-pocket patient costs for insulin and other drugs. Reforms are also needed to make pharmaceutical R&D spending more transparent and prevent anti-competitive practices that suppress generic competition and keep prices high.
I would like to extend my heartfelt gratitude to the majority staff of the Oversight Committee for their dedication and persistence in pursuing this investigation, despite many challenges. Their diligent efforts have helped shed light on the inner workings of an opaque industry and will be crucial to Congress’s pursuit of meaningful reforms to help Americans afford their prescription drugs.
Sincerely,
_________________________ Carolyn B. Maloney Chairwoman
iii
EXECUTIVE SUMMARY
As Congress considers provisions in the Build Back Better Act to lower prescription drug prices in the United States, this report presents the findings of the Oversight Committee’s nearly three-year investigation into pricing and business practices for branded prescription drugs. For years, prescription drug companies have aggressively raised prices on existing drugs and set higher launch prices for new drugs, all while reaping vast profits from American patients and taxpayers. In the five-year period from 2016 to 2020, pharmaceutical companies raised the prices of branded prescription drugs by 36%—almost four times the rate of inflation during that period.1 From 2012 to 2017, drug companies raised prices for the 20 most commonly prescribed brand-name drugs in the Medicare Part D program, which provides prescription drug benefits to seniors, by more than 12% annually—approximately ten times the average annual rate of inflation during those years.2 Patients in the United States pay more than twice as much for their prescription drugs as patients in 32 other developed nations.3
The pricing practices uncovered by the Committee’s investigation are unsustainable,
unjustified, and unfair to patients and taxpayers. In addition to straining the United States health care system, drug companies’ pricing practices have left millions of Americans unable to afford lifesaving medications. According to data from the Kaiser Family Foundation from October 2021, approximately one-quarter of Americans reported having difficulty affording their medications and three in ten American adults reported not taking their medicines as prescribed at some point in the previous year due to cost.4 Americans rely on the lifesaving drugs produced by pharmaceutical companies, but the Committee’s investigation shows that the industry’s excessive prices and anticompetitive practices are not justified by the need for innovation and have been used to enrich company executives and shareholders.
On January 14, 2019, at the direction of the late Chairman Elijah E. Cummings, the
Committee on Oversight and Reform launched a comprehensive investigation into pharmaceutical pricing and business practices. The Committee’s investigation focused on ten companies that sell 12 drugs that are among the costliest to the Medicare program.5 The
1 4 Recommendations to Guide the FDA in Its Analysis of the U.S. Patent System, Medium: I-MAK (July
30, 2021) (online at https://i-makglobal.medium.com/4-recommendations-to-guide-the-fda-in-its-analysis-of-the-u-s-patent-system-6f212b6d9d82).
2 Democratic Staff, Senate Committee on Homeland Security and Governmental Affairs, Manufactured Crisis: How Devastating Drug Price Increases Are Harming America’s Seniors (Mar. 26, 2018) (online at www.hsgac.senate.gov/imo/media/doc/Manufactured%20Crisis%20-%20How%20Devastating%20Drug%20Price%20Increases%20Are%20Harming%20America's%20Seniors%20-%20Report.pdf). Medicare Part D is the Medicare prescription drug benefit.
3 RAND Corporation, International Prescription Drug Price Comparisons: Current Empirical Estimates and Comparisons with Previous Studies (2021) (online at www.rand.org/pubs/research_reports/RR2956.html).
4 Kaiser Family Foundation, Public Opinion on Prescription Drugs and Their Prices (Oct. 18, 2021) (online at www.kff.org/slideshow/public-opinion-on-prescription-drugs-and-their-prices/).
5 This report focuses on the practices of the following ten companies: AbbVie Inc. (Humira and Imbruvica); Amgen Inc. (Enbrel and Sensipar); Celgene Corporation (Revlimid); Eli Lilly and Company (Humalog products); Mallinckrodt Pharmaceuticals (H.P. Acthar Gel); Novartis Pharmaceuticals Corporation (Gleevec); Novo
iv
Committee examined the justifications drug companies provide for raising prices in the United States, the tactics drug companies use to keep prices high and suppress competition, and the impact that high drug prices have on American patients and federal health care programs.
Over the course of the investigation, Committee staff reviewed more than 1.5 million
pages of documents—including internal strategy documents, communications among top executives, board materials, and non-public pricing data. These internal company documents provide significant new insights into the tactics drug companies use to raise prices and keep them high by suppressing competition.
As part of this investigation, the Committee held five hearings with drug company
executives, patients, policy experts, and stakeholders. The Committee also released six staff reports detailing the pricing and business practices of AbbVie, Amgen, Celgene, Mallinckrodt, Novartis, and Teva. In July 2021, the Committee released an analysis showing that the 14 largest drug companies in the world have spent more to enrich investors and executives than on research and development. In September 2021, the Committee released a report detailing the billions of dollars in lost taxpayer savings due to the prohibition on Medicare from negotiating for lower drug prices.
This final report builds on the Committee’s earlier reports and also presents new findings from the Committee’s investigation of insulin products manufactured by Eli Lilly, Novo Nordisk, and Sanofi. These three companies collectively control approximately 90% of the global insulin market. Over the past 20 years, they have repeatedly and dramatically raised the list prices of their rapid-acting and long-acting insulins and reaped billions of dollars in revenues. New documents reveal:
• The three insulin companies targeted the United States for price increases,
and Medicare lost out on more than $16 billion in savings. For years, these companies provided private Medicare Part D plans with significantly smaller rebates than those secured by other federal health care programs that are allowed to negotiate directly with drug companies. Information obtained by the Committee reveals that if Medicare Part D plans had secured the same discounts as other federal health care programs for three frequently used insulin products—Humalog, Lantus, and NovoLog—Medicare could have saved more than $16.7 billion from 2011 through 2017.
Nordisk Inc. (NovoLog products); Pfizer Inc. (Lyrica); Sanofi (Lantus products); and Teva Pharmaceutical Industries Ltd. (Copaxone). This report also examines the role of two other companies: Johnson & Johnson, which jointly markets the cancer drug Imbruvica with AbbVie, and Bristol Myers Squibb, which acquired Celgene as a subsidiary in 2019 and now markets Revlimid. According to publicly available information at the time the investigation was launched, these drugs were among the costliest per Medicare beneficiary, resulted in the highest aggregate spending by the Medicare Part D program, or had the largest price increases. See Centers for Medicare and Medicaid Services, Medicare Part D Drug Spending Dashboard & Data (online at www.cms.gov/Research-Statistics-Data-and-Systems/Statistics-Trends-and-Reports/Information-on-Prescription-Drugs/MedicarePartD) (accessed Nov. 9, 2021).
v
• The three insulin companies have engaged in strategies to maintain monopoly pricing and defend against competition from biosimilars. These strategies include manipulating the patent system and the marketing exclusivities granted by the Food and Drug Administration (FDA), pursuing tactics to switch patients to new formulations of their products before losing exclusivity, and engaging in “shadow pricing”—raising prices in lockstep with competitors—which keeps prices high.
This report also presents new findings from the Committee’s investigation of Pfizer’s
pain-management drug Lyrica. Internal documents obtained by the Committee reveal: • Pfizer targeted the U.S. market for price increases. A draft internal Pfizer
presentation from 2016 explicitly linked Pfizer’s global profitability to its ability to raise prices in the United States, noting that growth was driven by “price increases in the U.S.”
• Pfizer used patent protections, market exclusivities, and other tactics to delay generic competition and keep prices high. Pfizer filed for dozens of patents on Lyrica and obtained an FDA pediatric marketing exclusivity period that the company estimated would generate an additional $1.6 billion in revenue. Pfizer also sought to shift patients to a new controlled-release formulation of the drug before the old formulation faced generic competition, and aggressively marketed to patients and physicians to extend the Lyrica franchise and drive sales.
The Committee’s review of all ten companies’ practices confirms that the pharmaceutical
industry has targeted the United States for price increases for many years while maintaining or cutting prices in the rest of the world. This strategy has been driven in large part by the prohibition on Medicare negotiation, which would be lifted for certain drugs with the passage of the Build Back Better Act.6 The Committee’s investigation has also uncovered new evidence about pricing decisions, marketing strategies, patient assistance programs, and pharmaceutical companies’ spending on research and marketing.
The Committee’s three-year investigation revealed the following findings:
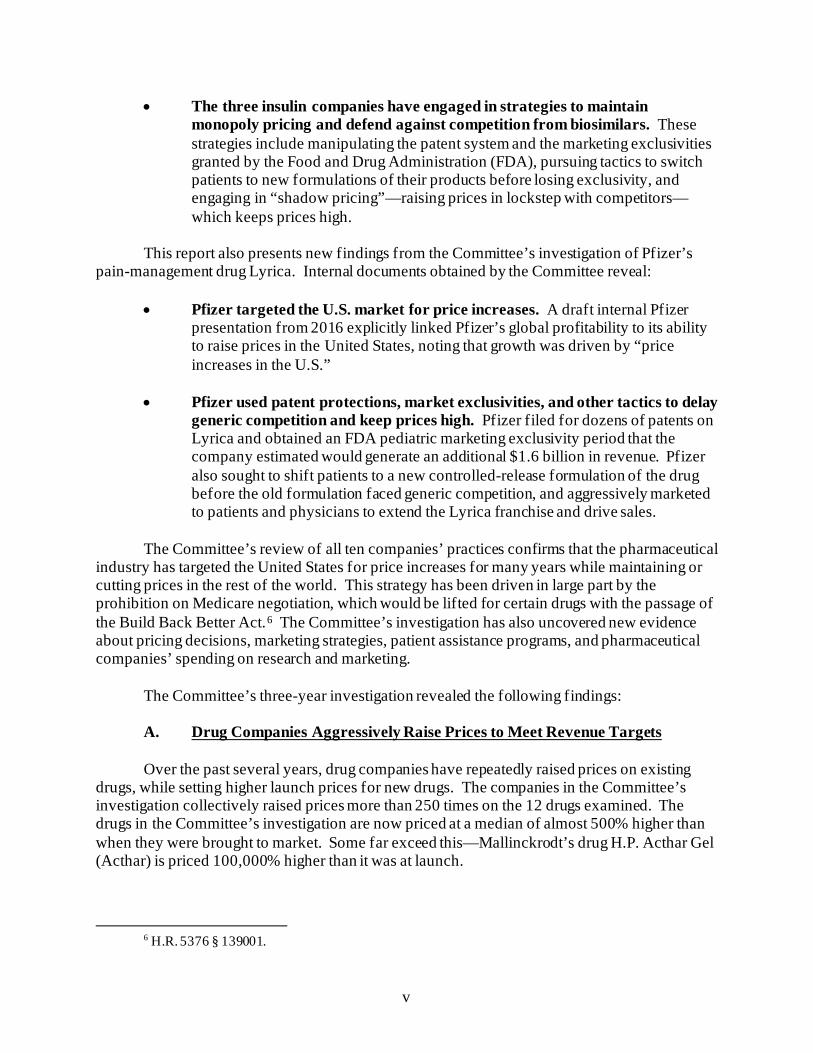
A. Drug Companies Aggressively Raise Prices to Meet Revenue Targets Over the past several years, drug companies have repeatedly raised prices on existing
drugs, while setting higher launch prices for new drugs. The companies in the Committee’s investigation collectively raised prices more than 250 times on the 12 drugs examined. The drugs in the Committee’s investigation are now priced at a median of almost 500% higher than when they were brought to market. Some far exceed this—Mallinckrodt’s drug H.P. Acthar Gel (Acthar) is priced 100,000% higher than it was at launch.
6 H.R. 5376 § 139001.
vi
Figure 1: Price Increases and Revenue
Drug Price Today No. of Price Increases*
Price Increase
Since Launch
2019 U.S. Net Revenue
Copaxone (Teva) $85,400/year 25+ 825% $950 Million Enbrel (Amgen) $72,200/year 25+ 486% $5.05 Billion Gleevec (Novartis) $123,000/year 20+ 395% $330 Million H.P. Acthar (Mallinckrodt) $39,864/vial 5 > 100,000% $953 Million Humalog (Eli Lilly) $274.70/vial 30+ 1219% $1.67 Billion Humira (AbbVie) $71,600/year 25+ 471% $14.9 Billion
Imbruvica (AbbVie) $181,500–
$242,000/year 5+ 82% $3.83 Billion
Lantus (Sanofi) $283.56/vial 20+ 715% $1.14 Billion Lyrica (Pfizer) $1,200/year 20+ 420% $2.01 Billion NovoLog (Novo Nordisk) $289.36/vial 25+ 627% $1.18 Billion Revlimid (Celgene/BMS) $192,000/year 20+ 255% $6.27 Billion Sensipar (Amgen) $9,800/year 20+ 232% $252 Million
* Number of price increases since launch or acquisition
Internal data obtained by the Committee reveals that the net prices—the prices
manufacturers collect after accounting for rebates, price concessions, and other discounts—of nearly all of the drugs in the investigation increased year over year.7 Net prices for all of the drugs examined are significantly higher today than at launch. This data, which has never before been shared with the public, undermines industry claims that price increases are primarily due to increasing rebates and discounts paid to pharmacy benefit managers (PBMs).
These price increases have fueled large corporate revenues. The ten companies in the
Committee’s investigation generated a combined $38.5 billion in U.S. net revenues from the sales of just 12 drugs in 2019 alone.8 The Committee’s investigation revealed evidence that
7 In the insulin market, net prices increased steadily from when the drugs entered the market (1996 for
Humalog and 2000 for NovoLog and Lantus) until the mid-2010s. Since the mid-2010s, competition over formulary placement has led to increasing pharmacy benefit manager rebates and stabilized net price growth.
8 AbbVie Inc., 2019 Form 10-K (Feb. 21, 2020) (online at https://investors.abbvie.com/sec-filings/sec-filing/10-k/0001551152-20-000007); Pfizer Inc., 2019 Form 10-K (Feb. 27, 2020) (online at https://investors.pfizer.com/financials/sec-filings/sec-filings-details/default.aspx?FilingId=13958533); Eli Lilly and Company, 2019 Form 10-K (Feb. 19, 2020) (online at https://investor.lilly.com/static-files/34d71960-241f-4160-bd20-86fb85df4def); Novartis Pharmaceuticals Corporation, 2019 Form 20-F (Jan. 29, 2020) (online at www.sec.gov/edgar/browse/?CIK=0001114448&owner=include); Mallinckrodt Pharmaceuticals, 2019 Form 10-K (Feb. 26, 2020) (online at www.mallinckrodt.com/investors/sec-filings/); Bristol Myers Squibb, 2019 Form 10-K (Feb. 24, 2020) (online at https://d18rn0p25nwr6d.cloudfront.net/CIK-0000014272/468bfaba-6810-4cec-80b5-94aa4c7a5a23.pdf); Sanofi, 2019 Form 20-F (Mar. 5, 2020) (online at www.sanofi.com/en/investors/reports-and-publications/financial-and-csr-reports); Novo Nordisk Inc., 2019 Form 20-F (Feb. 5, 2020) (online at www.sec.gov/edgar/browse/?CIK=0000353278); Amgen Inc., 2019 Form 10-K (Feb. 12, 2020) (online at
vii
company executives made pricing decisions to meet revenue targets and earnings goals, including executing more aggressive price increases than previously planned to reach ever increasing revenue goals. Documents also show how companies anticipating generic competition executed more frequent and higher price increases to maximize revenues as their drugs faced loss of patent protection or market exclusivity.
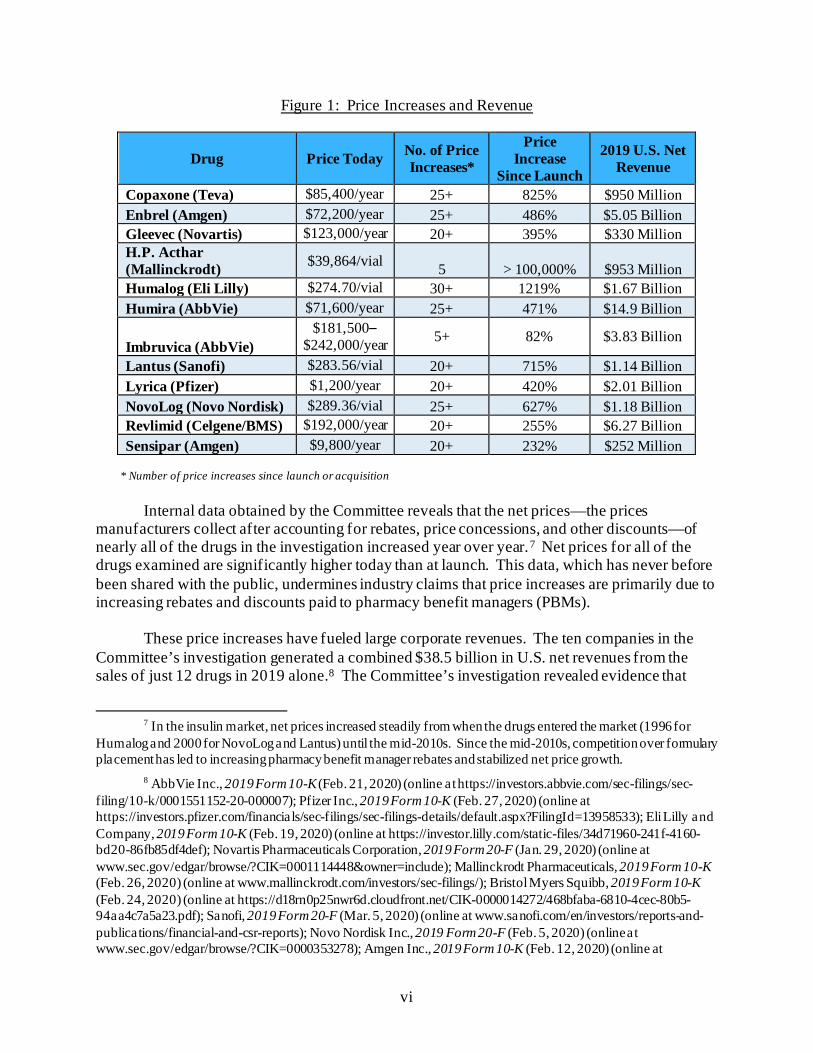
B. Executive Compensation Provides Incentives to Raise Prices
The ten companies in the Committee’s investigation paid their top executives more than $2.2 billion from 2016 to 2020, including $797 million in chief executive officer (CEO) compensation. All ten companies have compensation structures that tie incentive payments to revenue and other financial targets, and several companies directly tied incentive compensation to drug-specific revenue targets. The investigation showed that for at least two companies, the company would have missed its revenue targets and the executives would not have received bonuses had they not raised drug prices. Former Celgene CEO Mark Alles received more than $500,000 in bonus payments in 2016 and 2017 solely attributable to the company’s price increases for the cancer drug Revlimid.
Figure 2: Executive Committee Compensation, 2016–2020
* Reflects data from Celgene for 2016, 2017, and 2018 and data from Bristol Myers Squibb for 2019 and 2020. Bristol Myers Squibb acquired Celgene in 2019. Calculated using exchange rates from December 31, 2020.
C. Drug Companies Target the U.S. Market for Higher Prices and Use the Medicare Program to Boost Revenue
The Committee’s investigation uncovered new evidence showing how the pharmaceutical
industry has exploited the federal law that prohibits the Secretary of the Department of Health and Human Services (HHS) from engaging in direct negotiation with drug companies to lower
https://investors.amgen.com/financials/sec-filings); Teva Pharmaceutical Industries Ltd., 2019 Form 10-K (Feb. 21, 2020) (online at https://ir.tevapharm.com/financials/sec-filings/default.aspx). To calculate these figures for companies using foreign currencies, Committee staff used exchange rates current as of December 31, 2020.
Company Total AbbVie 347,697,413$ Amgen 240,436,746$
Celgene/BMS* 260,140,942$ Eli Lilly 234,015,759$
Mallinckrodt 160,784,443$ Novartis 320,585,194$
NovoNordisk 124,812,234$ Pfizer 287,751,046$ Sanofi 60,467,284$ Teva 195,881,480$ Total 2,232,572,540$
viii
drug prices in the Medicare Part D program. Internal strategy documents show that drug companies targeted the U.S. market for price increases—while maintaining or lowering prices in the rest of the world—in part because Medicare cannot negotiate directly. A draft internal Pfizer presentation from 2016 explicitly linked Pfizer’s profitability across the globe to its ability to raise prices in the United States, noting that growth was driven by “price increases in the U.S.” In a 2016 strategy presentation, executives from Teva, which sells the multiple sclerosis drug Copaxone, described one of the company’s key strengths as its ability to “increase prices successfully,” which was “influenced heavily by US [Teva’s U.S. Business] being allowed to hike prices.” A presentation prepared for Celgene’s pricing committee noted that a key strategy for Celgene to “win” in its cancer franchise Revlimid was to “[p]rotect free-market competition-based pricing for Medicare and commercial insurance” in the United States.
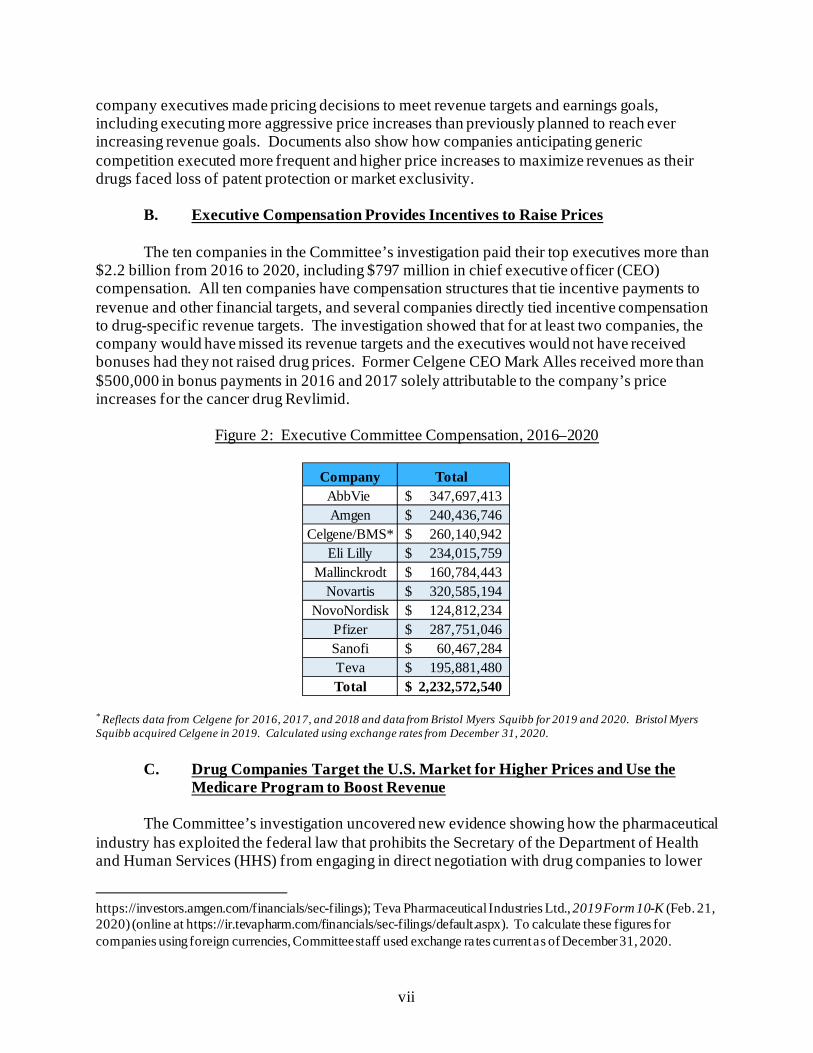
The Committee obtained non-public pricing data revealing how the Medicare program
has lost out on savings because Medicare Part D plans have failed to secure the same generous rebates or discounts as other federal health care programs that negotiate directly with drug companies. The Committee’s analysis found that taxpayers could have saved more than $25 billion over a five-year period for just seven of the drugs investigated—Humira, Imbruvica, Sensipar, Enbrel, Lantus, NovoLog, and Lyrica—if private Medicare Part D plans had obtained the same discounts as other federal health programs that are empowered to negotiate.9 If Medicare Part D plans had received the same discounts as other federal health care programs for the three frequently used insulin products investigated by the Committee—Humalog, Lantus, and NovoLog—Medicare could have saved more than $16.7 billion in the period from 2011 through 2017.10
Figure 3: Lost Medicare Savings for Seven Drugs, 2014–2018
Drug Medicare Part D Spending11 Lost Medicare Savings Lantus $ 11,583,098,197 $ 9,246,511,550 Humira $ 10,907,732,233 $ 6,136,305,246 NovoLog $ 3,627,264,339 $ 2,946,198,492 Enbrel $ 6,160,200,000 $ 2,353,170,600 Lyrica $ 7,254,607,375 $ 1,816,950,556 Imbruvica $ 5,071,975,613 $ 1,695,126,731 Sensipar $ 3,664,400,000 $ 948,124,100 Total $ 48,269,277,757 $ 25,142,387,275
9 These figures include comparisons of rebate data between Medicare and the Department of Defense
(DOD) and the Department of Veterans Affairs (VA). For some drugs, including Imbruvica, Gleevec, and Lyrica, these figures represent the average rebates or discounts offered to both DOD and the VA. For other drugs, these figures include only rebates or discounts offered to one agency. For an in-depth analysis, see Chapter 3.
10 Data from Novo Nordisk was provided for the “federal channel,” which primarily reflects sales to the VA but also include sales to DOD, the Indian Health Service, the Bureau of Prisons, and state homes for veterans.
11 For three drugs—Lantus, NovoLog, and Lyrica—this figure represents net Medicare Part D expenditures. For the other drugs—Humira, Enbrel, Imbruvica, and Sensipar—this figure represents gross Medicare Part D expenditures.
ix
Documents obtained by the Committee show that several of the companies in the Committee’s investigation targeted Medicare to boost revenues. An internal Novo Nordisk slide deck from October 2013 emphasized, “Part D is the most profitable market for the Novo Nordisk insulin portfolio,” and noted that insulin volume for the Part D market was growing three times faster than for the commercial market. A 2016 presentation prepared for Novartis by an outside consultant emphasized, “Medicare is critical to brand success, CMS spent ~$1 billion on Gleevec in 2014.”
D. Drug Companies Abuse the Patent System and FDA Market Exclusivity to Suppress Competition
Evidence uncovered by the Committee shows that companies use patent protections and
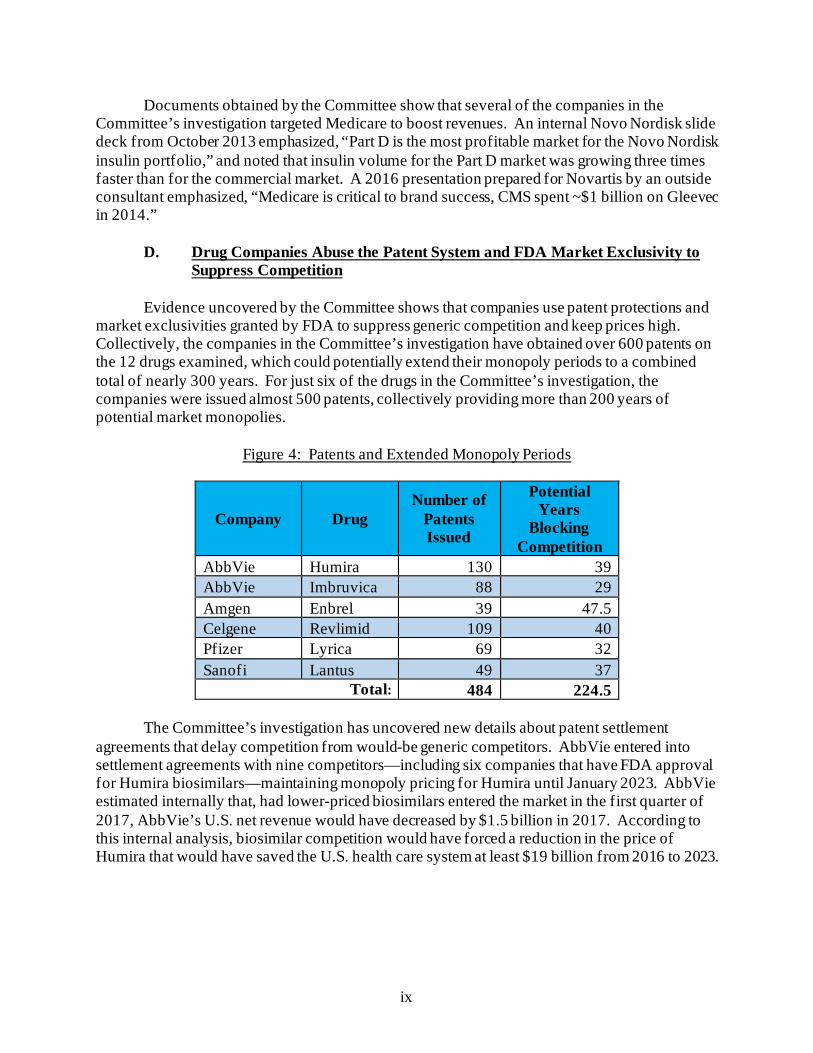
market exclusivities granted by FDA to suppress generic competition and keep prices high. Collectively, the companies in the Committee’s investigation have obtained over 600 patents on the 12 drugs examined, which could potentially extend their monopoly periods to a combined total of nearly 300 years. For just six of the drugs in the Committee’s investigation, the companies were issued almost 500 patents, collectively providing more than 200 years of potential market monopolies.
Figure 4: Patents and Extended Monopoly Periods
Company Drug Number of
Patents Issued
Potential Years
Blocking Competition
AbbVie Humira 130 39 AbbVie Imbruvica 88 29 Amgen Enbrel 39 47.5 Celgene Revlimid 109 40 Pfizer Lyrica 69 32 Sanofi Lantus 49 37
Total: 484 224.5
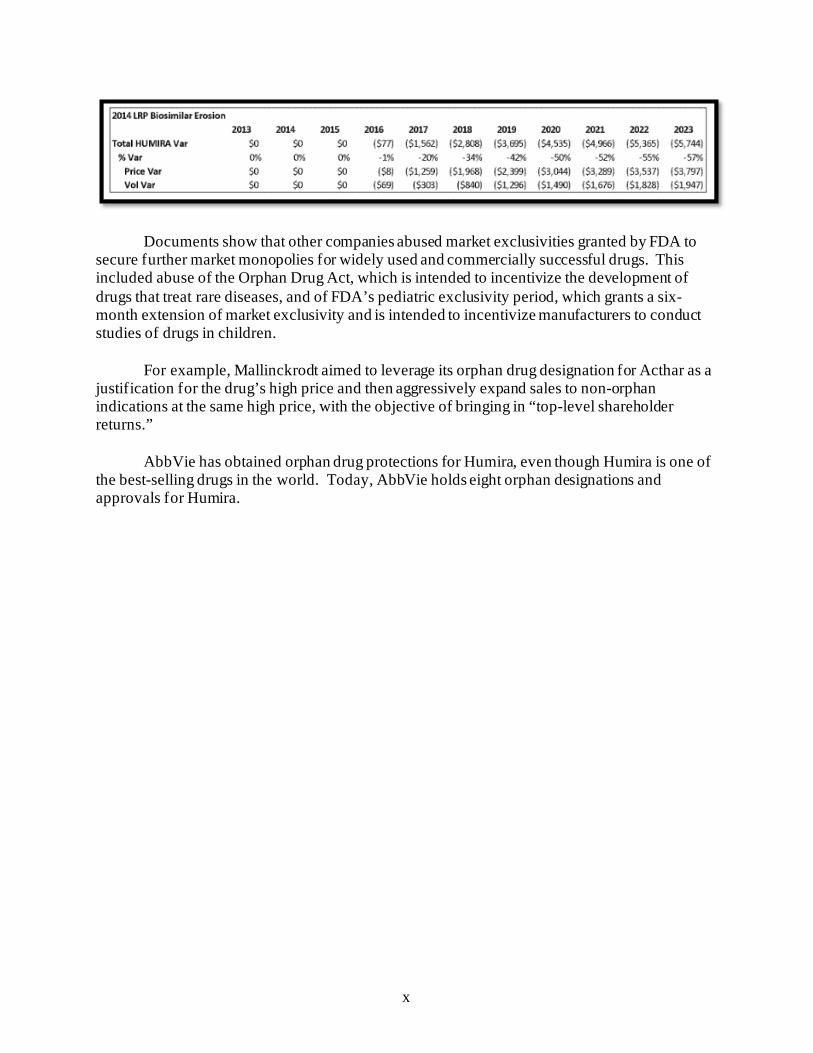
The Committee’s investigation has uncovered new details about patent settlement agreements that delay competition from would-be generic competitors. AbbVie entered into settlement agreements with nine competitors—including six companies that have FDA approval for Humira biosimilars—maintaining monopoly pricing for Humira until January 2023. AbbVie estimated internally that, had lower-priced biosimilars entered the market in the first quarter of 2017, AbbVie’s U.S. net revenue would have decreased by $1.5 billion in 2017. According to this internal analysis, biosimilar competition would have forced a reduction in the price of Humira that would have saved the U.S. health care system at least $19 billion from 2016 to 2023.
x
Documents show that other companies abused market exclusivities granted by FDA to secure further market monopolies for widely used and commercially successful drugs. This included abuse of the Orphan Drug Act, which is intended to incentivize the development of drugs that treat rare diseases, and of FDA’s pediatric exclusivity period, which grants a six-month extension of market exclusivity and is intended to incentivize manufacturers to conduct studies of drugs in children.
For example, Mallinckrodt aimed to leverage its orphan drug designation for Acthar as a
justification for the drug’s high price and then aggressively expand sales to non-orphan indications at the same high price, with the objective of bringing in “top-level shareholder returns.”
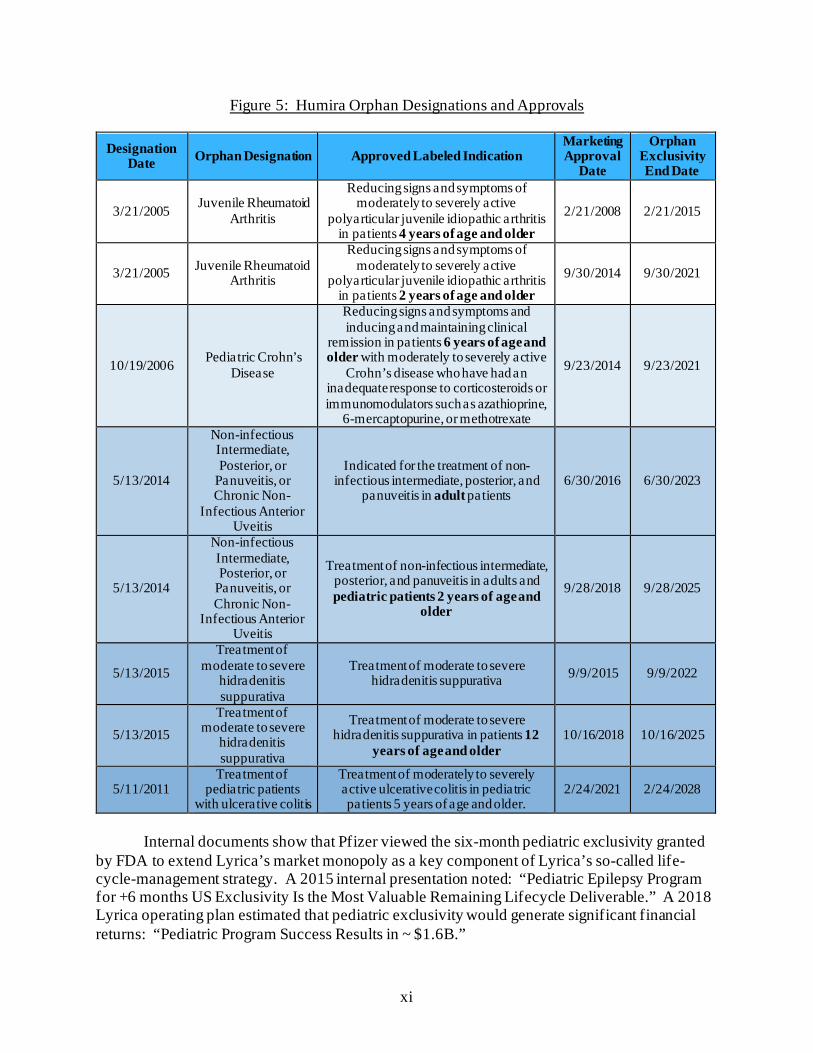
AbbVie has obtained orphan drug protections for Humira, even though Humira is one of the best-selling drugs in the world. Today, AbbVie holds eight orphan designations and approvals for Humira.
xi
Figure 5: Humira Orphan Designations and Approvals
Designation Date Orphan Designation Approved Labeled Indication
Marketing Approval
Date
Orphan Exclusivity End Date
3/21/2005 Juvenile Rheumatoid Arthritis
Reducing signs and symptoms of moderately to severely active
polyarticular juvenile idiopathic arthritis in patients 4 years of age and older
2/21/2008 2/21/2015
3/21/2005 Juvenile Rheumatoid Arthritis
Reducing signs and symptoms of moderately to severely active
polyarticular juvenile idiopathic arthritis in patients 2 years of age and older
9/30/2014 9/30/2021
10/19/2006 Pediatric Crohn’s Disease
Reducing signs and symptoms and inducing and maintaining clinical
remission in patients 6 years of age and older with moderately to severely active
Crohn’s disease who have had an inadequate response to corticosteroids or immunomodulators such as azathioprine,
6-mercaptopurine, or methotrexate
9/23/2014 9/23/2021
5/13/2014
Non-infectious Intermediate, Posterior, or
Panuveitis, or Chronic Non-
Infectious Anterior Uveitis
Indicated for the treatment of non-infectious intermediate, posterior, and
panuveitis in adult patients 6/30/2016 6/30/2023
5/13/2014
Non-infectious Intermediate, Posterior, or
Panuveitis, or Chronic Non-
Infectious Anterior Uveitis
Treatment of non-infectious intermediate, posterior, and panuveitis in adults and pediatric patients 2 years of age and
older
9/28/2018 9/28/2025
5/13/2015
Treatment of moderate to severe
hidradenitis suppurativa
Treatment of moderate to severe hidradenitis suppurativa 9/9/2015 9/9/2022
5/13/2015 Treatment of
moderate to severe hidradenitis suppurativa
Treatment of moderate to severe hidradenitis suppurativa in patients 12
years of age and older 10/16/2018 10/16/2025
5/11/2011 Treatment of
pediatric patients with ulcerative colitis
Treatment of moderately to severely active ulcerative colitis in pediatric patients 5 years of age and older.
2/24/2021 2/24/2028
Internal documents show that Pfizer viewed the six-month pediatric exclusivity granted
by FDA to extend Lyrica’s market monopoly as a key component of Lyrica’s so-called life-cycle-management strategy. A 2015 internal presentation noted: “Pediatric Epilepsy Program for +6 months US Exclusivity Is the Most Valuable Remaining Lifecycle Deliverable.” A 2018 Lyrica operating plan estimated that pediatric exclusivity would generate significant financial returns: “Pediatric Program Success Results in ~ $1.6B.”
xii
E. Companies Use Strategies to Suppress Competition and Maintain Monopoly Pricing
Every company in the Committee’s investigation engaged in one or more strategies to
suppress competition from generics or biosimilars, and keep prices high. These include what are often described as “life-cycle management” or “loss of exclusivity” strategies: (1) shifting patients to new products or formulations of a drug just before facing generic competition for the old formula (known as “product hopping” or “evergreening”); (2) pursuing contracts with PBMs and insurers that condition rebates and discounts on excluding competitor products; and (3) aggressively marketing directly to patients and physicians to drive sales, especially as drugs faced generic competition. These strategies are aimed at staving off generic competition and minimizing loss of revenue as older drugs lose their market protections. The Committee’s investigation also uncovered new evidence of “shadow pricing,” a practice in which would-be competitor companies follow each other’s price increases.
Teva, AbbVie, Sanofi, and Pfizer all engaged in product hopping and evergreening.
Independent experts estimate that Teva’s product-hopping strategy cost the U.S. health care system between $4.3 billion and $5.6 billion in additional health care expenditures from 2015 to 2017 due to delayed generic competition. In 2018, Pfizer launched a controlled-release version of its blockbuster pain management drug Lyrica. Although Pfizer asserted publicly that the controlled-release version was more convenient for patients than the prior formulation, internal company documents obtained by the Committee described it as an “anchor” to the company’s life-cycle management for Lyrica.
Novartis and Teva engaged in exclusionary tactics to block generics, using their market
power to obtain contract terms with payers or PBMs that limited or blocked generic competitors from being covered on a drug formulary.
Companies targeted doctors and patients to drive sales. In the aggregate, AbbVie,
Amgen, Novo Nordisk, and Pfizer spent more than $2.6 billion in direct-to-consumer advertising from 2015 to 2018 on just four drugs. AbbVie reported to the Committee that it spent over $1.5 billion in direct-to-consumer advertising for Humira over that period, and Pfizer disclosed over $750 million in marketing expenditures for Lyrica. Several companies also pursued “dispense as written” campaigns to encourage patients and physicians to request their brand-name drug and prevent lower-cost generic substitution.
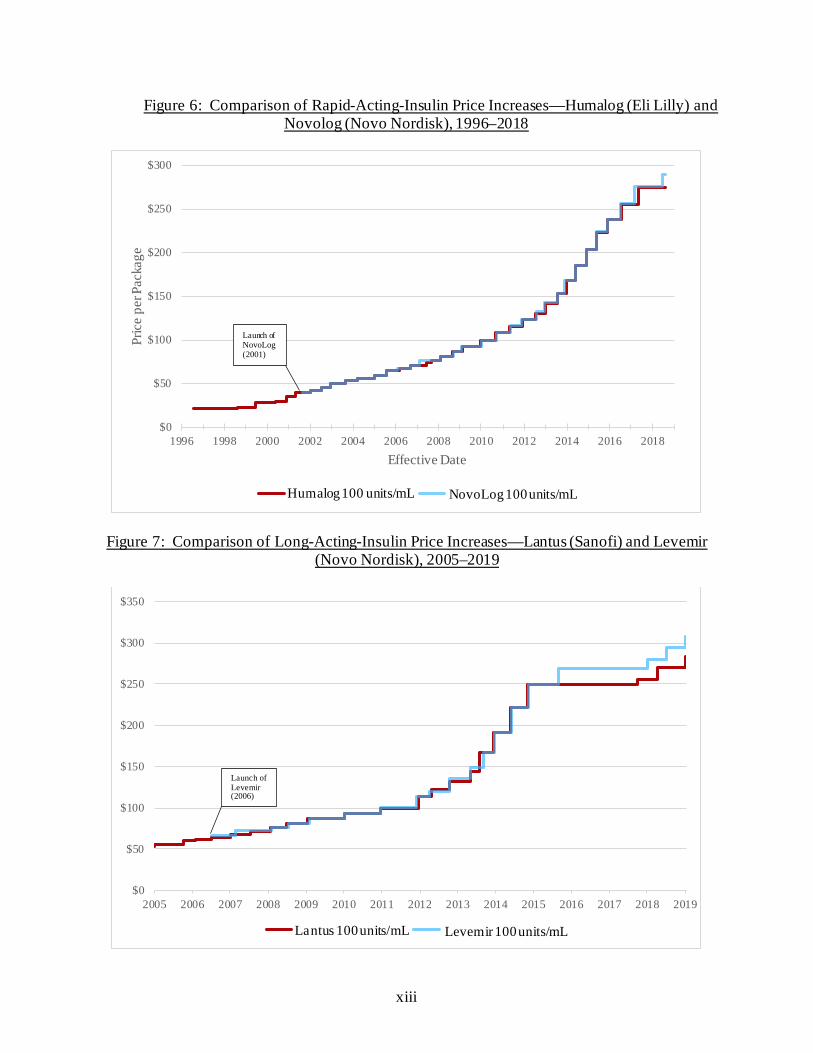
Companies also kept prices high by engaging in shadow pricing with would-be
competitors. Internal documents show that the three largest insulin manufacturers raised their prices in lockstep in order to maintain “pricing parity,” and that senior executives encouraged this practice. Eli Lilly and Novo Nordisk have raised prices in lockstep on their rapid-acting insulin products, Humalog and NovoLog, while Sanofi and Novo Nordisk have raised prices in lockstep on their long-acting insulin products, Lantus and Levemir. In a discussion among Novo Nordisk employees about an Eli Lilly price increase for a different diabetes product on December 24, 2015, a Novo Nordisk pricing analyst remarked, “[M]aybe Sanofi will wait until tomorrow morning to announce their price increase ... that’s all I want for Christmas.”
xiii
Figure 6: Comparison of Rapid-Acting-Insulin Price Increases—Humalog (Eli Lilly) and Novolog (Novo Nordisk), 1996–2018
Figure 7: Comparison of Long-Acting-Insulin Price Increases—Lantus (Sanofi) and Levemir (Novo Nordisk), 2005–2019
$0
$50
$100
$150
$200
$250
$300
1996 1998 2000 2002 2004 2006 2008 2010 2012 2014 2016 2018
Pric
e pe
r Pac
kage
Effective Date
Humalog 100 Unit/mL NovoLog 100 Unit/mL
$0
$50
$100
$150
$200
$250
$300
$350
2005 2006 2007 2008 2009 2010 2011 2012 2013 2014 2015 2016 2017 2018 2019
Lantus 100 Unit/mL Levemir 100 Unit/mL
Launch of Levemir (2006)
Launch of NovoLog (2001)
Humalog 100 units/mL NovoLog 100 units/mL
Lantus 100 units/mL Levemir 100 units/mL
xiv
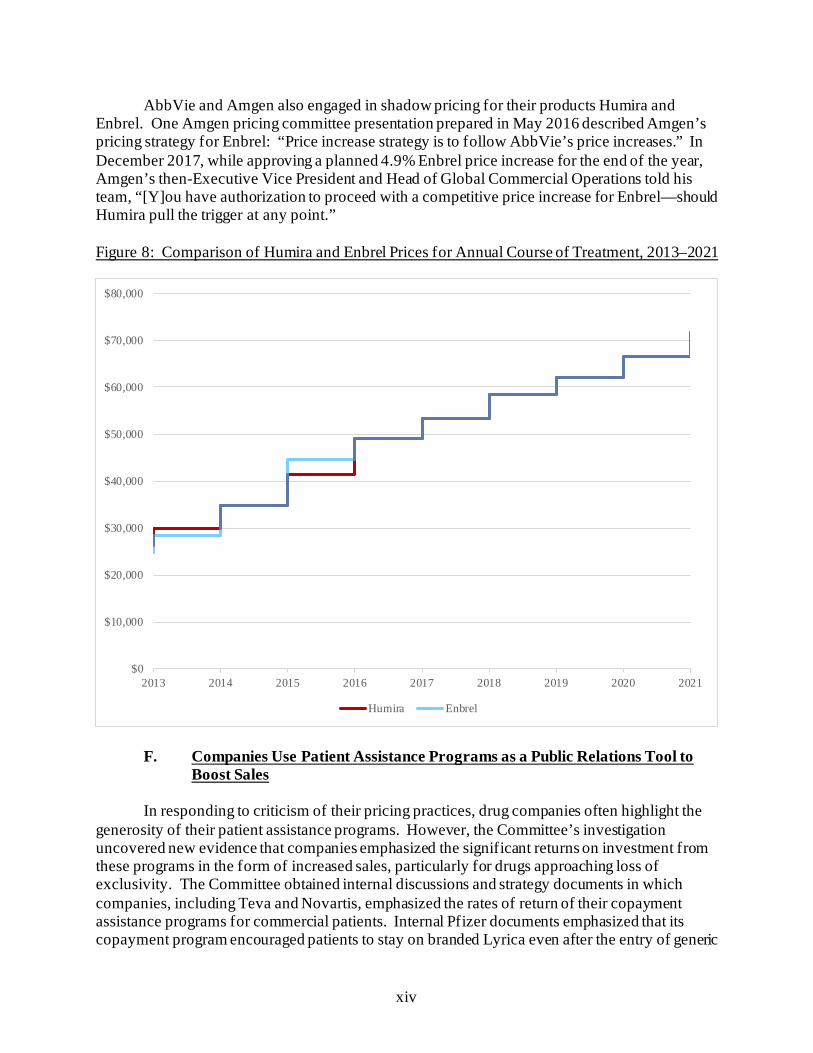
AbbVie and Amgen also engaged in shadow pricing for their products Humira and Enbrel. One Amgen pricing committee presentation prepared in May 2016 described Amgen’s pricing strategy for Enbrel: “Price increase strategy is to follow AbbVie’s price increases.” In December 2017, while approving a planned 4.9% Enbrel price increase for the end of the year, Amgen’s then-Executive Vice President and Head of Global Commercial Operations told his team, “[Y]ou have authorization to proceed with a competitive price increase for Enbrel—should Humira pull the trigger at any point.” Figure 8: Comparison of Humira and Enbrel Prices for Annual Course of Treatment, 2013–2021
F. Companies Use Patient Assistance Programs as a Public Relations Tool to
Boost Sales In responding to criticism of their pricing practices, drug companies often highlight the
generosity of their patient assistance programs. However, the Committee’s investigation uncovered new evidence that companies emphasized the significant returns on investment from these programs in the form of increased sales, particularly for drugs approaching loss of exclusivity. The Committee obtained internal discussions and strategy documents in which companies, including Teva and Novartis, emphasized the rates of return of their copayment assistance programs for commercial patients. Internal Pfizer documents emphasized that its copayment program encouraged patients to stay on branded Lyrica even after the entry of generic
$0
$10,000
$20,000
$30,000
$40,000
$50,000
$60,000
$70,000
$80,000
2013 2014 2015 2016 2017 2018 2019 2020 2021
Humira Enbrel

xv
competition. Internal documents suggest that companies also used donations to third-party foundations that subsidize copayment and other cost-sharing obligations for Medicare Part D patients as a way to generate sales. For example, internal documents from both Teva and AbbVie indicate that these donations were intended to drive sales or attract patients who otherwise might not have used the companies’ drugs.
Although internal documents show that companies view these programs as an important
public relations tool, internal data obtained by the Committee confirms that companies’ spending on patient assistance programs is minimal compared to the enormous amount of revenue brought in by these drugs. For example, the total cost of Pfizer’s patient assistance program expenditures related to Lyrica from 2015 to 2017 was equivalent to less than one-tenth of one percent of Pfizer’s net U.S. revenue from Lyrica over the same period. These programs often do not provide sustainable support for patients and do not address the burden that the company’s pricing practices have placed on the U.S. health care system. The Committee obtained hundreds of pages of patient complaints describing how high drug prices have harmed them and their loved ones.
G. Research and Manufacturing Costs Do Not Justify Price Increases The Committee’s investigation revealed that justifications frequently offered by the
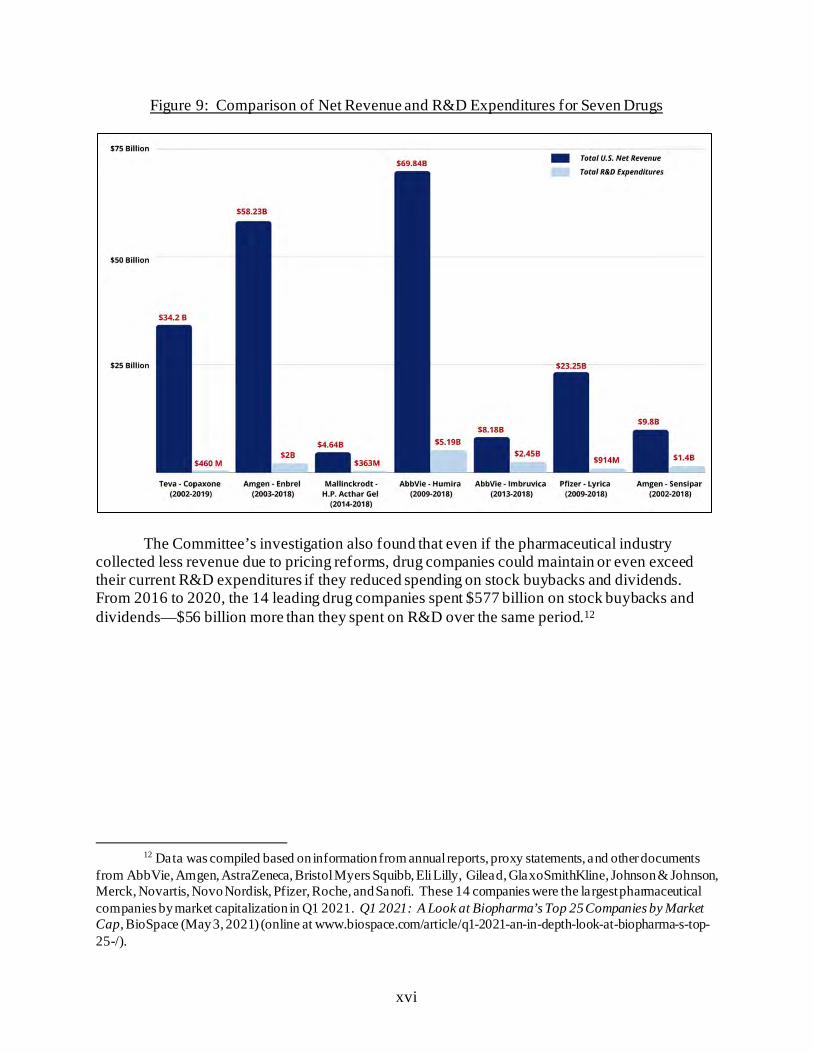
pharmaceutical industry for raising prices—including research and development (R&D), manufacturing, and other costs—are not supported. The Committee’s investigation found that companies’ investments in R&D are far outpaced by revenue gains. For example, in response to the Committee’s request, Pfizer identified a total of $914 million in R&D expenditures related to Lyrica from 2009 to 2018—equivalent to approximately 4% of the company’s $23 billion in net U.S. revenue from the drug for that period.
xvi
Figure 9: Comparison of Net Revenue and R&D Expenditures for Seven Drugs
The Committee’s investigation also found that even if the pharmaceutical industry
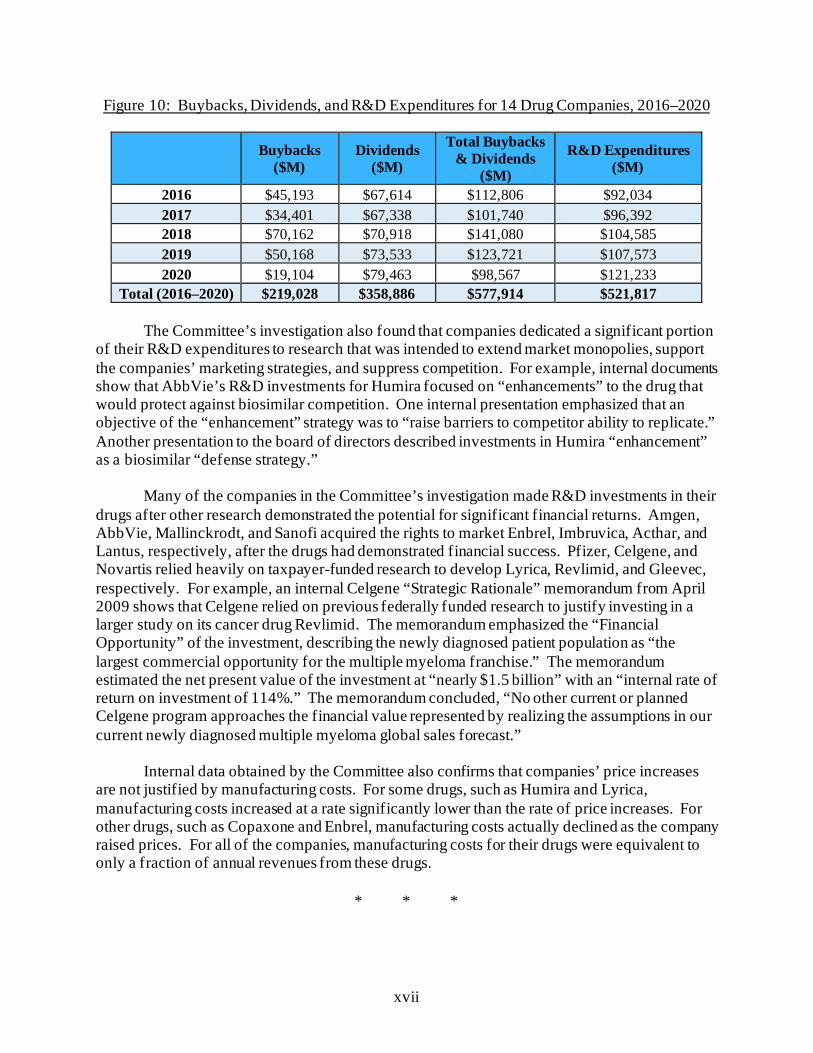
collected less revenue due to pricing reforms, drug companies could maintain or even exceed their current R&D expenditures if they reduced spending on stock buybacks and dividends. From 2016 to 2020, the 14 leading drug companies spent $577 billion on stock buybacks and dividends—$56 billion more than they spent on R&D over the same period.12
12 Data was compiled based on information from annual reports, proxy statements, and other documents
from AbbVie, Amgen, AstraZeneca, Bristol Myers Squibb, Eli Lilly, Gilead, GlaxoSmithKline, Johnson & Johnson, Merck, Novartis, Novo Nordisk, Pfizer, Roche, and Sanofi. These 14 companies were the largest pharmaceutical companies by market capitalization in Q1 2021. Q1 2021: A Look at Biopharma’s Top 25 Companies by Market Cap, BioSpace (May 3, 2021) (online at www.biospace.com/article/q1-2021-an-in-depth-look-at-biopharma-s-top-25-/).
xvii
Figure 10: Buybacks, Dividends, and R&D Expenditures for 14 Drug Companies, 2016–2020
Buybacks ($M)
Dividends ($M)
Total Buybacks & Dividends
($M)
R&D Expenditures ($M)
2016 $45,193 $67,614 $112,806 $92,034 2017 $34,401 $67,338 $101,740 $96,392 2018 $70,162 $70,918 $141,080 $104,585 2019 $50,168 $73,533 $123,721 $107,573 2020 $19,104 $79,463 $98,567 $121,233
Total (2016–2020) $219,028 $358,886 $577,914 $521,817
The Committee’s investigation also found that companies dedicated a significant portion of their R&D expenditures to research that was intended to extend market monopolies, support the companies’ marketing strategies, and suppress competition. For example, internal documents show that AbbVie’s R&D investments for Humira focused on “enhancements” to the drug that would protect against biosimilar competition. One internal presentation emphasized that an objective of the “enhancement” strategy was to “raise barriers to competitor ability to replicate.” Another presentation to the board of directors described investments in Humira “enhancement” as a biosimilar “defense strategy.”
Many of the companies in the Committee’s investigation made R&D investments in their
drugs after other research demonstrated the potential for significant financial returns. Amgen, AbbVie, Mallinckrodt, and Sanofi acquired the rights to market Enbrel, Imbruvica, Acthar, and Lantus, respectively, after the drugs had demonstrated financial success. Pfizer, Celgene, and Novartis relied heavily on taxpayer-funded research to develop Lyrica, Revlimid, and Gleevec, respectively. For example, an internal Celgene “Strategic Rationale” memorandum from April 2009 shows that Celgene relied on previous federally funded research to justify investing in a larger study on its cancer drug Revlimid. The memorandum emphasized the “Financial Opportunity” of the investment, describing the newly diagnosed patient population as “the largest commercial opportunity for the multiple myeloma franchise.” The memorandum estimated the net present value of the investment at “nearly $1.5 billion” with an “internal rate of return on investment of 114%.” The memorandum concluded, “No other current or planned Celgene program approaches the financial value represented by realizing the assumptions in our current newly diagnosed multiple myeloma global sales forecast.”
Internal data obtained by the Committee also confirms that companies’ price increases
are not justified by manufacturing costs. For some drugs, such as Humira and Lyrica, manufacturing costs increased at a rate significantly lower than the rate of price increases. For other drugs, such as Copaxone and Enbrel, manufacturing costs actually declined as the company raised prices. For all of the companies, manufacturing costs for their drugs were equivalent to only a fraction of annual revenues from these drugs.
* * *
xviii
The Committee’s investigation highlights the need for structural reform of the pharmaceutical industry. This report calls on Congress to take the following actions to achieve this reform:
• Allow Medicare Negotiation, Restrain Price Increases, and Cap Out-of-
Pocket Costs: Congress should enact reforms, like those in the Build Back Better Act, to enable Medicare to negotiate lower list prices, restrain excessive price increases through inflation rebates, and limit out-of-pocket costs for insulin and other drugs so American seniors and taxpayers are not exploited for pharmaceutical profits.
• Address Anticompetitive Practices That Keep Prices High: The Committee’s
investigation highlights the need for reforms that address anticompetitive practices, including product hopping and targeting doctors to prescribe branded drugs instead of lower-cost generics through dispense-as-written campaigns. Congress should pass legislation that targets these practices, such as the Affordable Prescriptions for Patients Through Promoting Competition Act.
• Address Anticompetitive Settlement Agreements: In light of the Committee’s
finding that companies engage in anticompetitive tactics to maintain monopoly pricing, including entering into settlement agreements that delay access to generics, Congress should consider reforms that address these issues, such as the Preserve Access to Affordable Generics and Biosimilars Act.
• Ensure Transparency of Research and Development Costs and Support
Innovative Research: Congress should consider reforms to increase transparency around pharmaceutical investment in R&D. Cost transparency would provide valuable data about companies’ investments in innovation and their claims that high costs of R&D justify the skyrocketing prices of their drugs. Transparency would also inform policies to help the government fund its own trials and incentivize innovation. Congress could also consider reforms to encourage innovative research by ensuring that eligible researchers have access to drugs at a discounted price.
xix
Table of Contents Chapter 1: Introduction ....................................................................................................... 1
I. Committee’s Investigation................................................................................................ 1
II. U.S. Prescription Drug Market ........................................................................................ 7
A. Pharmaceutical Supply Chain ...................................................................................... 7
B. Medicare Part D Program .......................................................................................... 10
Chapter 2: Price Increases and Soaring Corporate Revenue ............................................. 12
I. Uninhibited Price Increases Fueled Massive Corporate Revenues .................................... 13
II. Drug Companies Raised Prices to Meet Revenue Targets ............................................... 30
III. Executive Compensation Created Incentives for Price Increases.................................... 40
IV. Price Increases Exceeded Rebates ................................................................................ 46
V. Recommendations ........................................................................................................ 54
Chapter 3: Lost Medicare Savings and Targeting the U.S. for Higher Prices ................... 56
I. Lost Medicare Savings ................................................................................................... 59
II. Exploiting Medicare to Drive Revenues......................................................................... 62
III. Targeting the U.S. Market............................................................................................ 66
IV. Drug Companies Lobbied Against Reforms ................................................................. 71
V. Recommendations ........................................................................................................ 75
Chapter 4: Patent and Marketing Exclusivity Abuse ......................................................... 77
I. Patent Abuses ................................................................................................................ 78
A. Secondary Patents ..................................................................................................... 81
B. Patent Abuse Incentivizes Non-Innovative Research and Development ....................... 87
II. Patent Settlement Agreements ....................................................................................... 91
III. Exclusivity Abuses ...................................................................................................... 96
xx
A. Abuse of the Orphan Drug Act .................................................................................. 96
B. Pediatric Exclusivity Abuse ..................................................................................... 102
IV. Recommendations ..................................................................................................... 107
Chapter 5: Strategies to Suppress Competition and Maintain Monopoly Pricing ........... 108
I. Product Hopping .......................................................................................................... 109
II. Exclusionary Tactics to Block Generics ....................................................................... 119
III. Targeting Doctors and Patients................................................................................... 127
A. Direct-to-Consumer Advertising .............................................................................. 127
B. Physician Influence Campaigns ............................................................................... 130
IV. Shadow Pricing ......................................................................................................... 136
A. Shadow Pricing Among Insulin Manufacturers ........................................................ 137
B. Shadow Pricing Between Amgen and AbbVie .......................................................... 143
V. Recommendations ...................................................................................................... 148
Chapter 6: Patient Assistance Programs and Patient Impact .......................................... 149
I. Companies Leverage Patient Assistance Programs to Drive Revenue ............................. 150
II. Patient Impact............................................................................................................. 160
III. Recommendations ..................................................................................................... 163
Chapter 7: Research and Manufacturing Costs Do Not Justify Price Increases .............. 164
I. R&D Expenditures Compared to Buybacks and Dividends ............................................ 165
II. R&D Expenditures Compared to Revenue ................................................................... 168
III. Non-Innovative R&D Expenditures............................................................................ 172
IV. Reliance on Federally Funded Research and Investment Only After Other Research
Demonstrated Success................................................................................................ 175
V. Price Increases Not Justified by Manufacturing Costs .................................................. 182
VI. Recommendations ..................................................................................................... 185
xxi
Conclusion ......................................................................................................................... 186
Appendix ........................................................................................................................... 187
1
Chapter 1: Introduction
This staff report presents the findings of a nearly three-year investigation conducted by the majority staff of the House Committee on Oversight and Reform into pharmaceutical pricing and business practices. This report is intended to provide policymakers, regulatory and enforcement agencies, and the American public with a more complete understanding of how and why drug companies continue to raise prices and the impact of unrestrained prices on patients and the U.S. health care system. I. COMMITTEE’S INVESTIGATION
On January 14, 2019, the late Committee Chairman Elijah E. Cummings sent letters to some of the largest and most profitable drug companies in the world, requesting a broad range of non-public documents and information regarding the companies’ pricing practices; research and development (R&D) expenditures; manufacturing costs; executive compensation; patient assistance programs; and patent, contracting, and marketing strategies, among other topics.1 The Committee’s investigation focused on ten companies that sold 12 drugs that were among the costliest to the Medicare program, including the costliest per Medicare beneficiary, those that resulted in the highest spending by the Medicare Part D program, and those that had the largest price increases over a five-year period. The prescription drugs that are the subject of this report are:
• Copaxone, a drug marketed by Teva Pharmaceutical Industries Ltd. (Teva) to
treat multiple sclerosis, a disease of the central nervous system that affects nearly one million adults in the United States.2 Copaxone is priced between $70,000 and $85,000 for a standard annual course of treatment and generated $950 million in U.S. net revenue in 2019;3
• Enbrel, a biologic sold by Amgen Inc. (Amgen), as a long-term treatment to
induce the remission of rheumatoid arthritis, a chronic autoimmune disease that affects approximately 1.3 million Americans.4 Enbrel is priced at more than
1 House Committee on Oversight and Reform, Press Release: Oversight Committee Launches Sweeping
Drug Price Investigation (Jan. 14, 2019) (online at https://oversight.house.gov/news/press-releases/oversight-committee-launches-sweeping-drug-price-investigation).
2 Food and Drug Administration, Approved Label for Copaxone (Jan. 2018) (online at www.accessdata.fda.gov/drugsatfda_docs/label/2018/020622s102lbl.pdf); National Multiple Sclerosis Society, Landmark Study Estimates Nearly 1 Million in the U.S. Have Multiple Sclerosis (Feb. 15, 2019) (online at www.nationalmssociety.org/About-the-Society/News/Landmark-Study-Estimates-Nearly%C2%A01-Million-in-the-U).
3 IBM Micromedex Redbook, Wholesale Acquisition Cost and Average Wholesale Price History for Copaxone. This calculation is based on the wholesale acquisition cost of 12 monthly packages of Copaxone 40 mg/mL, each of which includes 12 syringes, and the wholesale acquisition cost of 12 monthly packages of Copaxone 20 mg/mL, each of which includes 30 syringes. Teva Pharmaceutical Industries Ltd., 2019 Form 10-K (Feb. 21, 2020) (online at https://ir.tevapharm.com/financials/sec-filings/default.aspx).
4 Food and Drug Administration, Approved Label for Enbrel (Mar. 2020) (online at www.accessdata.fda.gov/drugsatfda_docs/label/2020/103795s5574s5577lbl.pdf); Rheumatoid Arthritis Support
2
$77,000 for a standard annual course of treatment and generated $5.05 billion in U.S. net revenue in 2019;5
• Gleevec, an oral medication sold by Novartis Pharmaceuticals Corporation
(Novartis) that is most commonly used to treat chronic myeloid leukemia, a rare form of cancer of the blood and bone marrow, and gastrointestinal stromal tumors.6 Gleevec is priced at more than $123,000 for a standard annual course of treatment and generated $330 million in U.S. net revenue in 2019;7
• H.P. Acthar Gel (Acthar), a drug marketed by Mallinckrodt Pharmaceuticals (Mallinckrodt) for use in the treatment of infantile spasms, acute exacerbations in multiple sclerosis, and 17 other disorders and diseases.8 Acthar is priced between $119,592 and $199,320 for a full course of treatment and generated $953 million in U.S. net revenue in 2019;9
• Humalog, a rapid-acting form of insulin sold by Eli Lilly and Company (Eli Lilly) that is used to control high blood sugar in adults with type 1 and type 2 diabetes as well as type 1 diabetes in children who are at least three years old.10 Humalog is priced at $274.70 for a 100 units/mL vial of subcutaneous solution and generated $1.67 billion in U.S. net revenue in 2019;11
Network, RA Facts: What Are the Latest Statistics on Rheumatoid Arthritis? (online at www.rheumatoidarthritis.org/ra/facts-and-statistics/) (accessed Sept. 30, 2020).
5 IBM Micromedex Redbook, Wholesale Acquisition Cost and Average Wholesale Price History for Enbrel; Amgen Inc., 2019 Form 10-K (Feb. 12, 2020) (online at www.sec.gov/ix?doc=/Archives/edgar/data/318154/000031815420000017/amgn-12312019x10kq42019.htm).
6 Food and Drug Administration, Approved Label for Gleevec (Sept. 2008) (online at www.accessdata.fda.gov/drugsatfda_docs/label/2008/021588s024lbl.pdf).
7 IBM Micromedex Redbook, Wholesale Acquisition Cost and Average Wholesale Price History for Gleevec; see also Novartis, Gleevec (online at www.hcp.novartis.com/products/gleevec/gleevechcp/) (accessed Sept. 30, 2020); Novartis Pharmaceuticals Corporation, 2019 Form 20-F (Jan. 29, 2020) (online at www.sec.gov/Archives/edgar/data/1114448/000137036820000003/a20012920f.htm). To calculate this figure, Committee staff used the exchange rate as of December 2020.
8 Food and Drug Administration, Approved Label for H.P. Acthar Gel (Oct. 2010) (online at www.accessdata.fda.gov/drugsatfda_docs/label/2010/022432s000lbl.pdf). Mallinckrodt states in public materials that Acthar is “approved for 19 indications.” The FDA label is more precise: it states that it is indicated for two conditions and may be used in 17 other diseases or disorders.
9 Medispan Price Rx, Wholesale Acquisition Cost and Average Wholesale Price H.P. Acthar Gel; Mallinckrodt Pharmaceuticals, 2019 Form 10-K (Feb. 25, 2020) (online at www.mallinckrodt.com/investors/sec-filings/).
10 Food and Drug Administration, Approved Label for Humalog (Aug. 2019) (online at www.accessdata.fda.gov/drugsatfda_docs/label/2019/020563s195,205747s021lbl.pdf); Eli Lilly, Humalog (online at www.humalog.com) (accessed Jan. 11, 2020). The Committee’s review also touched on other insulin products manufactured by Eli Lilly.
11 IBM Micromedex Redbook, Wholesale Acquisition Cost and Average Wholesale Price History for Humalog; Eli Lilly and Company, 2019 Form 10-K (Feb. 19, 2020) (online at https://investor.lilly.com/static-files/34d71960-241f-4160-bd20-86fb85df4def).
3
• Humira, a biologic sold by AbbVie Inc. (AbbVie) for the treatment of rheumatoid arthritis and other painful inflammatory diseases.12 Humira is priced at $77,586 for a standard annual course of treatment and generated $14.9 billion in U.S. net revenue in 2019;13
• Imbruvica, a drug jointly marketed by AbbVie Inc. (AbbVie) and Johnson &
Johnson’s subsidiary, Janssen Biotech, Inc. (Janssen), for the treatment of mantle cell lymphoma and five other cancers or conditions.14 Imbruvica is priced between $181,529 and $242,039 for a standard annual course of treatment, depending on dosage, and generated $3.83 billion in U.S. net revenue in 2019;15
• Lantus, a long-acting insulin sold by Sanofi to treat adults with type 2 diabetes and adults and children six years of age and older with type 1 diabetes.16 Lantus is priced at $283.56 per 10 mL vial of subcutaneous solution and generated $1.14 billion in U.S. net revenue in 2019;17
• Lyrica, a pain-management drug marketed by Pfizer Inc. (Pfizer) that is used as a treatment for diabetic nerve pain, spinal cord injury, pain after shingles, and fibromyalgia, as well as an add-on treatment in various populations of epilepsy
12 Food and Drug Administration, Approved Label for Humira (Mar. 2020) (online at
www.accessdata.fda.gov/drugsatfda_docs/label/2020/125057s415lbl.pdf). 13 IBM Micromedex Redbook, Wholesale Acquisition Cost and Average Wholesale Price History for
Humira. The annual calculation is for a patient who injects Humira every other week. AbbVie Inc., 2019 Form 10-K (Feb. 21, 2020) (online at https://investors.abbvie.com/sec-filings/sec-filing/10-k/0001551152-20-000007).
14 ABV-HOR-3128 (Collaboration and License Agreement); Food and Drug Administration, Approved Label for Imbruvica (Feb. 2018) (online at www.accessdata.fda.gov/drugsatfda_docs/label/2018/210563s000lbl.pdf).
15 IBM Micromedex Redbook, Wholesale Acquisition Cost and Average Wholesale Price History for Imbruvica. AbbVie Inc., 2019 Form 10-K (Feb. 21, 2020) (online at https://investors.abbvie.com/sec-filings/sec-filing/10-k/0001551152-20-000007).
16 Food and Drug Administration, Approved Label for Lantus (June 2009) (online at www.accessdata.fda.gov/drugsatfda_docs/label/2009/021081s034lbl.pdf). Sanofi acquired Aventis Pharmaceuticals, Inc., in 2004. Lantus was part of the Aventis portfolio at the time of acquisition. See Letter from Arnold & Porter, on behalf of Sanofi, to Majority Staff, House Committee on Oversight and Reform (Feb. 19, 2019). The Committee’s review also touched on other core insulin products manufactured by Sanofi, such as Lantus SoloStar, a pen-type injector, which was approved by FDA in April 2007.
17 IBM Micromedex Redbook, Wholesale Acquisition Cost and Average Wholesale Price History for Lantus; Sanofi, 2019 Form 20-F (Mar. 16, 2020) (online at www.sec.gov/Archives/edgar/data/1121404/000119312518084834/d466787d20fa.htm). To calculate this figure, Committee staff used the exchange rate as of December 2020.
4
patients.18 Lyrica is priced at more than $6,480 for a standard annual course of treatment and generated $2.01 billion in U.S. net revenue in 2019;19
• NovoLog, Novo Nordisk Inc.’s (Novo Nordisk) rapid-acting form of insulin used
to control blood glucose levels in adults with type 1 or type 2 diabetes and children with type 1 diabetes who are at least two years old.20 NovoLog is priced at $289.36 per 100 units/mL vial of subcutaneous solution and generated $1.18 billion in U.S. net revenue in 2019;21
• Revlimid, a drug marketed by Celgene Corporation (Celgene) (now a subsidiary
of Bristol Myers Squibb) to treat multiple myeloma, a form of blood cancer diagnosed in approximately 30,000 Americans each year.22 Revlimid is priced at more than $200,000 for a standard annual course of treatment and generated $6.27 billion in U.S. net revenue in 2019;23 and
18 Food and Drug Administration, Approved Label for Lyrica (Apr. 2020) (online at
www.accessdata.fda.gov/drugsatfda_docs/label/2020/021446s040,%20022488s017lbl.pdf). Lyrica was approved by FDA in December 2004 for adjunctive therapy for adults with partial onset epileptic seizures and for the treatment of two forms of neuropathic pain: pain associated with diabetes and pain following shingles. In 2007, FDA approved Lyrica for management of pain from fibromyalgia, and in 2012, FDA approved Lyrica for management of pain associated with spinal cord injury. See Food and Drug Administration, FDA-Approved Drugs (online at www.accessdata.fda.gov/scripts/cder/daf/index.cfm?event=overview.process&ApplNo=021446) (accessed Nov. 10, 2021). The Centers for Disease Control and Prevention notes that fibromyalgia affects 4 million U.S. adults. See Centers for Disease Control and Prevention, Fibromyalgia (online at www.cdc.gov/arthritis/basics/fibromyalgia.htm) (accessed Dec. 1, 2021); see also Drugs.com, Lyrica FDA Approval History (online at www.drugs.com/history/lyrica.html) (accessed Nov. 16, 2020); Pfizer Inc., Frequently Asked Questions About Lyrica (online at www.lyrica.com/frequently-asked-questions#how-many-people-have-been-prescribed-lyrica) (accessed Oct. 19, 2020).
19 IBM Micromedex Redbook, Wholesale Acquisition Cost and Average Wholesale Price History for Lyrica. This calculation is based on the Wholesale Acquisition Cost of a 90-pill package of the 75 mg oral capsule and assumes a patient takes 150 mg per day for one year. Pfizer Inc., 2019 Form 10-K (Feb. 27, 2020) (online at https://s21.q4cdn.com/317678438/files/doc_financials/2018/ar/Pfizer-2019-Financial-Report.pdf)
20 Food and Drug Administration, Approved Label for NovoLog (Feb. 2015) (online at www.accessdata.fda.gov/drugsatfda_docs/label/2015/020986s082lbl.pdf). The Committee’s review also touched upon other core insulin products manufactured by Novo Nordisk.
21 IBM Micromedex Redbook, Wholesale Acquisition Cost and Average Wholesale Price History for NovoLog; Novo Nordisk, 2019 Form 10-K (Feb.5, 2020) (online at www.sec.gov/Archives/edgar/data/0000353278/000162828020001021/novo-b20xf12x31x19.htm).
22 Food and Drug Administration, Approved Label for Revlimid (Oct. 2019) (online at www.accessdata.fda.gov/drugsatfda_docs/label/2019/021880s060lbl.pdf).
23 IBM Micromedex Redbook, Wholesale Acquisition Cost and Average Wholesale Price History for Revlimid. Revlimid is a pill taken orally that comes in six different dosages, ranging from 2.5 milligrams to 20 milligrams. The price of Revlimid does not vary based on dosage. Although the number of pills taken per month varies from patient to patient, common treatment regimens require patients to take either 21 or 28 pills per month. This calculation reflects the wholesale acquisition cost of a 21-day monthly regimen of Revlimid, assuming a 5 mg pill. Celgene Corporation, Form 10-Q (Oct. 31, 2019) (online at https://sec.report/Document/0000816284-19-000046/); Bristol Myers Squibb, 2019 Form 10-K (Feb. 24, 2020) (online at https://sec.report/Document/0000014272-20-000082/).
5
• Sensipar, a drug marketed by Amgen, Inc. (Amgen), to treat overactive parathyroid glands in dialysis patients, a common complication of chronic kidney disease, as well as high levels of calcium in patients with parathyroid carcinoma.24 Sensipar is priced at approximately $9,800 for a standard annual course of treatment and generated $252 million in U.S. net revenue in 2019.25
Throughout the course of this investigation, Committee staff reviewed more than 1.5
million pages of documents, including internal corporate strategy documents, email communications sent among top corporate executives, and board materials. Committee staff also reviewed non-public data on R&D spending, manufacturing costs, and rebates and other discounts and price concessions by sales channel. The documents and information being made public by the Committee shed light on how and why drug companies continue to raise their prices and reveal new details about the specific tactics drug companies are using to keep prices high, maximize profits, and suppress competition.
To obtain these materials, the Committee overcame obstruction by some of the
pharmaceutical companies under investigation. For example, AbbVie refused to comply with the Committee’s requests for months, and finally produced documents voluntarily only after Chairwoman Maloney threatened to issue a subpoena.26 Each company was given an opportunity to explain the context and significance of documents and information and propose redactions prior to their public release.
As a part of this investigation, the Committee held five hearings with patients, drug company executives, health policy experts, and other stakeholders.
In hearings held on January 29, 2019, and July 26, 2019, Members heard firsthand from
patients and advocates about the wrenching personal, financial, and medical decisions they were forced to make based on the high prices of their medications.27 Witnesses testified about
24 Food and Drug Administration, Approved Label for Sensipar (Aug. 1, 2011) (online at
www.accessdata.fda.gov/drugsatfda_docs/label/2011/021688s017lbl.pdf); Letter from Robert Meyer, Director, Office of Drug Evaluation II, Food and Drug Administration, to Pamela Danagher, Manager, Regulatory Affairs, Amgen Inc. (Mar. 8, 2004) (online at www.accessdata.fda.gov/drugsatfda_docs/appletter/2004/21688ltr.pdf); Noah K. Yuen, Hyperparathyroidism of Renal Disease, Permanente Journal (July 22, 2016) (online at www.ncbi.nlm.nih.gov/pmc/articles/PMC4991918/).
25 IBM Micromedex Redbook, Wholesale Acquisition Cost History for Sensipar. To calculate the yearly course of Sensipar, staff multiplied the price of one 30 mg pill by 365. Amgen Inc., 2019 Form 10-K (Feb. 12, 2020) (online at www.sec.gov/ix?doc=/Archives/edgar/data/318154/000031815420000017/amgn-12312019x10kq42019.htm).
26 The Committee requested documents from AbbVie in January 2019. In September 2020, Chairwoman Carolyn B. Maloney notified Committee Members of her intent to issue a subpoena to AbbVie due to the company’s refusal to cooperate with the Committee’s investigation. Memorandum from Chairwoman Carolyn B. Maloney to Members, House Committee on Oversight and Reform, Notice of Intent to Issue a Subpoena to AbbVie Inc. (Sept. 1, 2020) (online at https://oversight.house.gov/sites/democrats.oversight.house.gov/files/documents/2020-09-01%20AbbVie%20Subpoena%20Memo.pdf). Other companies also sought to delay production of documents or initially produced documents in redacted form.
27 House Committee on Oversight and Reform, Hearing on Examining the Actions of Drug Companies in Raising Prescription Drug Prices, 116th Cong. (Jan. 29, 2019) (online at
6
rationing or forgoing necessary medications, delaying starting their families, refinancing their homes, taking on debt, and even losing a child because of prescription drug costs. Patient advocates and health policy experts underscored that these patients were representative of the millions of Americans who struggle to afford lifesaving treatments.28
The Committee held three hearings with pharmaceutical executives from seven
companies to directly address how and why these companies have continually raised prices. The CEOs of Celgene, Bristol Myers Squibb, and Teva testified before the Committee on September 30, 2020.29 The following day, on October 1, 2020, the Committee heard testimony from the CEOs of Amgen and Mallinckrodt, and the U.S. president of Novartis.30 On May 18, 2021, Richard Gonzalez, CEO of AbbVie, testified about his company’s pricing and anticompetitive practices.31 At this hearing, experts offered potential solutions to address the failures of existing legislative and regulatory regimes.
The Committee has also released eight staff reports describing the findings of its
investigation. These include six investigative reports of specific companies and products, one analysis of financial and research expenditure data of the 14 largest drug companies in the world, and one analysis of lost savings to taxpayers as a result of the prohibition on Medicare from negotiating directly for lower drug prices.32
This final report builds on the findings detailed in the Committee’s earlier reports. This
report also presents new findings from the Committee’s investigation of Pfizer’s marketing of the blockbuster pain drug Lyrica and its investigation of certain insulin products manufactured by Eli Lilly, Novo Nordisk, and Sanofi. This report sheds further light on companies’ pricing decisions, their marketing strategies, the financial impact of the Medicare program’s inability to negotiate drug prices, patient assistance programs, and pharmaceutical companies’ spending on
https://oversight.house.gov/legislation/hearings/examining-the-actions-of-drug-companies-in-raising-prescription-drug-prices); House Committee on Oversight and Reform, Hearing on The Patient Perspective: The Devastating Impact of Skyrocketing Drug Prices on American Families, 116th Cong. (July 26, 2019) (online at https://oversight.house.gov/legislation/hearings/the-patient-perspective-the-devastating-impacts-of-skyrocketing-drug-prices-on).
28 See, e.g., Kaiser Family Foundation, Public Opinion on Prescription Drugs and Their Prices (Oct. 18, 2021) (online at www.kff.org/slideshow/public-opinion-on-prescription-drugs-and-their-prices/).
29 House Committee on Oversight and Reform, Hearing on Unsustainable Drug Prices: Testimony from the CEOs (Part I), 116th Cong. (Sept. 30, 2020) (online at https://oversight.house.gov/legislation/hearings/unsustainable-drug-prices-testimony-from-the-ceos-part-i-and-part-ii).
30 House Committee on Oversight and Reform, Hearing on Unsustainable Drug Prices: Testimony from the CEOs (Part II), 116th Cong. (Oct. 1, 2020) (online at https://oversight.house.gov/legislation/hearings/unsustainable-drug-prices-testimony-from-the-ceos-part-ii).
31 House Committee on Oversight and Reform, Hearing on Unsustainable Drug Prices (Part III): Testimony from AbbVie CEO Richard Gonzalez (May 18, 2021) (online at https://oversight.house.gov/legislation/hearings/on-unsustainable-drug-prices-part-iii-testimony-from-abbvie-ceo-richard).
32 Majority Staff, House Committee on Oversight and Reform, Drug Pricing Reports (online at https://oversight.house.gov/drug-pricing-reports-0).
7
innovative research. The report also highlights industry-wide tactics used to maintain high prices and delay generic or biosimilar competition. Each chapter concludes with recommendations for legislative and policy reforms that address the report’s findings. II. U.S. PRESCRIPTION DRUG MARKET
The United States prescription drug market consists of a highly complex web of financial and other transactions among numerous supply chain actors. These relationships dictate how pharmaceutical products move from manufacturer to patient, and they impact the prices patients pay for prescription medications.
A. Pharmaceutical Supply Chain The supply chain includes several players: • Drug manufacturers, which produce, distribute, and set prices for drugs;
• Wholesale distributors, which purchase drugs in bulk and distribute them to
hospitals, doctors, pharmacies, and other entities that dispense drugs to patients;
• Payers and pharmacy benefit managers (PBMs), which contract with pharmacies and manufacturers to provide third-party payment for drugs on behalf of patients; and
• Patients, who pay some combination of insurance plan premiums, copayments, coinsurance fees, out-of-pocket costs, and other expenses to access their medications.
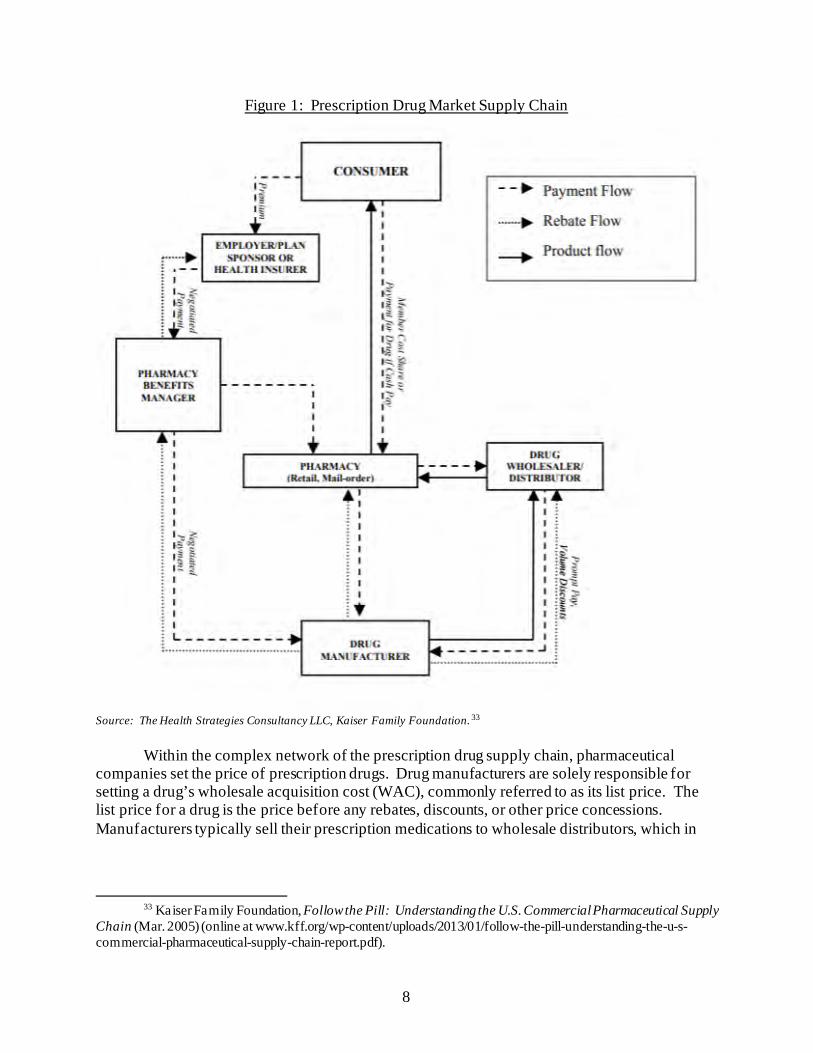
Figure 1 depicts the supply chain for prescription drugs.
8
Figure 1: Prescription Drug Market Supply Chain
Source: The Health Strategies Consultancy LLC, Kaiser Family Foundation. 33
Within the complex network of the prescription drug supply chain, pharmaceutical companies set the price of prescription drugs. Drug manufacturers are solely responsible for setting a drug’s wholesale acquisition cost (WAC), commonly referred to as its list price. The list price for a drug is the price before any rebates, discounts, or other price concessions. Manufacturers typically sell their prescription medications to wholesale distributors, which in
33 Kaiser Family Foundation, Follow the Pill: Understanding the U.S. Commercial Pharmaceutical Supply
Chain (Mar. 2005) (online at www.kff.org/wp-content/uploads/2013/01/follow-the-pill-understanding-the-u-s-commercial-pharmaceutical-supply-chain-report.pdf).
9
turn sell products to pharmacies, hospitals, doctors, and other entities that deliver medications to patients.34
For patients with health insurance coverage, insurers provide third-party payment for prescription drugs. Insurers often delegate the management of their prescription drug benefits to PBMs. PBMs aggregate demand by contracting with insurers and pharmacies to create consolidated markets of patients.35 PBMs leverage their aggregated demand to offer preferential access to patients through formularies, which function as lists of drugs covered by a plan, in exchange for discounts and rebates from the drug manufacturer that partially offset the drug’s list price.36 The cost of a drug after applying all of the manufacturer’s rebates and discounts is referred to as a drug’s net price.
PBMs contend that by securing substantial savings in the form of rebates, they limit
health care expenditures and pass savings on to patients. Because most discounts negotiated by PBMs are not disclosed publicly, the extent to which negotiated rebates are passed on to patients is typically unknown.37 The Pharmaceutical Care Management Association, a PBM trade association, estimates that PBMs save patients and payers an average of $962 per person per year.38
Drug companies assert that because rebates and discounts are provided to several actors
in the supply chain—including PBMs, pharmacies, and wholesale distributors—a drug’s list price is not an accurate indicator of cost to patients. Instead, drug companies argue that the net prices achieved through rebates present a better metric for evaluating drug affordability and a patient’s ability to access medication.39
34 Id. 35 Commonwealth Fund, Pharmacy Benefit Managers: Practices, Controversies, and What Lies Ahead
(Mar. 26, 2019) (online at www.commonwealthfund.org/sites/default/files/2019-03/Seeley_pharmacy_benefit_managers_ib_v2.pdf).
36 Commonwealth Fund, Pharmacy Benefit Managers and Their Role in Drug Spending (Apr. 22, 2019) (online at www.commonwealthfund.org/publications/explainer/2019/apr/pharmacy-benefit-managers-and-their-role-drug-spending#2).
37 Commonwealth Fund, Pharmacy Benefit Managers: Practices, Controversies, and What Lies Ahead (Mar. 26, 2019) (online at www.commonwealthfund.org/sites/default/files/2019-03/Seeley_pharmacy_benefit_managers_ib_v2.pdf).
38 Visante, Inc., on behalf of the Pharmaceutical Care Management Association, The Return on Investment (ROI) on PBM Services (Feb. 2020) (online at www.pcmanet.org/wp-content/uploads/2020/02/ROI-on-PBM-Services-FINAL_.pdf).
39 See, e.g., Sanofi., Sanofi 2020 Pricing Principles Report (Mar. 2020) (online at www.sanofi.us/en/corporate-responsibility/-/media/Project/One-Sanofi-Web/Websites/North-America/Sanofi-US/Home/corporateresponsibility/Prescription_Medicine_Pricing_March2020.pdf) (“Despite rhetoric about skyrocketing insulin prices, the net price of insulin has been falling for five consecutive years, making our insulins significantly less expensive for insurance companies.”); Letter from Joe Kelley, Vice President, Global Government Affairs, Eli Lilly, to Chairman Elijah E. Cummings, House Committee on Oversight and Reform (Feb. 4, 2019) (“By providing significant discounts off of the list price of Humalog, Lilly has been successful in keeping the cost of Humalog affordable for the vast majority of patients.”); TEVA_HCO_IC_005022375 (Teva talking points for PhRMA lobbying efforts, which stress that manufacturers “offer different levels of discounts and rebates to make the medications more affordable”).
10
However, a drug’s net price does not account for uninsured patients, who cannot access the benefits of rebates negotiated by payers and may pay the full list price for drugs. In addition, because certain out-of-pocket costs borne by patients are based on a drug’s list price, when drug companies raise the list price, patients may face higher out-of-pocket costs even as supply chain rebates lower the aggregate net prices of some drugs.40
B. Medicare Part D Program
Medicare administers prescription drug benefits through its Part D program, which was established by the Medicare Modernization Act of 2003 (MMA).41 Within the Department of Health and Human Services (HHS), the Centers for Medicare and Medicaid Services (CMS) contracts with private insurers—called sponsors—to offer prescription drug coverage in accordance with the Part D requirements specified by law.42 In 2020, approximately 47.4 million people were enrolled in Medicare Part D.43 The Congressional Budget Office (CBO) estimates that Medicare spending on Part D benefits will total $96 billion in 2021.44
Unlike other federal health care programs, including those managed by the Department of
Veterans Affairs (VA) and the Department of Defense (DOD), the MMA’s “noninterference clause” prohibited the Secretary of HHS from negotiating directly with drug manufacturers for lower drug prices on behalf of Medicare beneficiaries. Instead, Medicare Part D uses private insurers and PBMs to administer prescription drug benefits.45 This MMA provision was strongly supported by the pharmaceutical industry.46
40 Benjamin N. Rome et al., Correlation Between Changes in Brand-Name Drug Prices and Patient Out-of-
Pocket Costs, JAMA Network Open (May 4, 2021) (online at https://jamanetwork.com/journals/jamanetworkopen/fullarticle/2779442?utm_source=For_The_Media&utm_medium=referral&utm_campaign=ftm_links&utm_term=050421).
41 Pub. L. No. 108-173 (2003). 42 42 C.F.R. § 423 (2011). Federal law requires Medicare plans to offer a minimum specified set of terms
and benefits, referred to as qualified prescription drug coverage. Minimum requirements include categories of drugs that must be covered and spending thresholds for patient cost-sharing. See Congressional Research Service, Medicare Part D Prescription Drug Benefit (Dec. 18, 2020) (R40611) (online at https://crsreports.congress.gov/product/pdf/R/R40611). Beneficiaries may also obtain prescription drug coverage through Medicare Advantage plans, which offer prescription drug benefits as part of broader managed care plans. Kaiser Family Foundation, An Overview of the Medicare Part D Prescription Drug Benefit (Oct. 13, 2021) (online at www.kff.org/medicare/fact-sheet/an-overview-of-the-medicare-part-d-prescription-drug-benefit/).
43 Centers for Medicare and Medicaid Services, CMS Fast Facts (online at www.cms.gov/Research-Statistics-Data-and-Systems/Statistics-Trends-and-Reports/CMS-Fast-Facts) (accessed Nov. 30, 2021).
44 Congressional Budget Office, Medicare—CBO’s Baseline as of March 6, 2020 (online at www.cbo.gov/system/files/2020-03/51302-2020-03-medicare.pdf) (accessed Sept. 11, 2021).
45 “NONINTERFERENCE.—In order to promote competition under this part and in carrying out this part, the Secretary—(1) may not interfere with the negotiations between drug manufacturers and pharmacies and PDP sponsors; and (2) may not require a particular formulary or institute a price structure for the reimbursement of covered Part D drugs.” Sec. 1860D-11(i), 42 U.S.C. § 1395w-111(i).
46 See, e.g., Drug Industry and HMOs Deployed an Army of Nearly 1,000 Lobbyists to Push Medicare Bill, Report Finds, Public Citizen (June 23, 2004) (online at www.citizen.org/news/drug-industry-and-hmos-deployed-an-army-of-nearly-1000-lobbyists-to-push-medicare-bill-report-finds/).
11
CBO has determined that Medicare spends more for prescription drugs than other comparable government-run prescription drug programs like Medicaid and those run by DOD and the VA.47 The Committee’s investigation revealed that if private Part D plan sponsors had secured rebates and discounts similar to those offered to other federal health care programs that are empowered to negotiate drug prices, Medicare could have saved more than $25 billion between 2014 and 2018 on just seven of the 12 drugs investigated by the Committee.48
Drug companies’ increases in list prices also historically impacted beneficiaries in the
Medicare Part D coverage gap, the period after the initial coverage phase and before the catastrophic coverage phase. From the creation of Medicare Part D until the implementation of the Affordable Care Act reforms enacted in 2010, which phased out the coverage gap, patients in the coverage gap were responsible for 100% of out-of-pocket drug costs.49
Recent reforms have reduced the out-of-pocket obligations of Medicare beneficiaries, but
beneficiaries remain responsible for 25% of a drug’s list price until they reach the Medicare Part D program’s catastrophic coverage threshold.50 As a result, many seniors enrolled in Medicare Part D plans are directly impacted by the list price increases imposed by manufacturers, regardless of any rebates and discounts offered to insurance companies or PBMs. The Build Back Better Act would reduce beneficiaries’ share of costs for prescription drugs, set caps on out-of-pocket spending, and realign the cost distribution in the catastrophic coverage phase from the Medicare program to Part D plan sponsors and manufacturers.51
47 Congressional Budget Office, A Comparison of Brand-Name Drug Prices Among Selected Federal
Programs (Feb. 2021) (online at www.cbo.gov/system/files/2021-02/56978-Drug-Prices.pdf). 48 For more on the Committee’s calculations, see Majority Staff, Committee on Oversight and Reform,
Drug Pricing Investigation: Lost Savings: How Prohibiting Medicare Negotiation Has Cost Taxpayers (Sept. 2021) (online at https://oversight.house.gov/sites/democrats.oversight.house.gov/files/COR%20Staff%20Report--Lost%20Savings%20-%20How%20Prohibiting%20Medicare%20Negotiation%20Has%20Cost%20Taxpayers.pdf).
49 The Affordable Care Act included provisions to phase out the coverage gap by decreasing beneficiary share of drug costs to 25% by 2020. The Bipartisan Budget Act of 2018 accelerated the reduction in beneficiary cost sharing to 2019. See Kaiser Family Foundation, Closing the Medicare Part D Coverage Gap: Trends, Recent Changes, and What’s Ahead (Aug. 21, 2018) (online at https://files.kff.org/attachment/Data-Note-Closing-the-Medicare-Part-D-Coverage-Gap-Trends-Recent-Changes-and-Whats-Ahead).
50 The Bipartisan Budget Act of 2018, Pub. L. No. 115-123. 51 H.R. 5376 § 139201. By 2024, under changes proposed in the Build Back Better Act, Part D plans
would cover 60% of drug costs; Medicare would cover 20% of the costs for branded drugs, biologics, and biosimilars and 40% of the costs for generics; manufacturers would cover 20% of costs for branded drugs, biologics, and biosimilars; and manufacturers would bear no portion of the costs of generic drugs in the catastrophic phase. Id.
12
Chapter 2: Price Increases and Soaring Corporate Revenue
The drug companies in the Committee’s investigation significantly and repeatedly raised prices on top-selling drugs, with many companies hiking prices more than 20 times on a single drug. These price increases drove substantial increases in net revenues. AbbVie, for example, took 14 price increases on its blockbuster drug Humira over eight years—making it the highest-grossing drug in the United States and the world, and generating more than $16 billion in U.S. net revenue in 2020 alone. In 2020, just three drugs examined by the Committee—Humira, Enbrel, and Revlimid—comprised 8.2% of total prescription drug expenditures in the United States.52
The Committee’s investigation revealed that executives made decisions to raise prices in order to reach aggressive corporate revenue targets and earnings goals, taking more frequent and steeper price increases as drugs approached the loss of patent protection or market exclusivity. Information analyzed by the Committee shows that price increases taken on these drugs were integral to pharmaceutical companies achieving their annual revenue targets.
The investigation also showed that compensation structures created incentives for drug
company executives to raise prices in order to meet bonus targets. From 2016 to 2020, compensation for the top executives at the ten companies examined totaled more than $2.6 billion, with annual compensation increasing by more than 19% over that period. CEO pay accounted for $797 million—more than 30% of the total amount. Executive compensation structures at many drug companies link compensation to revenue targets for specific drugs, creating incentives for executives to raise prices in order to meet those targets. The Committee’s investigation revealed that, without price hikes on certain drugs, companies would have failed to meet revenue targets and top executives would have forgone millions of dollars in additional compensation.
The Committee’s investigation found:
• Uninhibited Price Increases Fueled Massive Corporate Revenues: Companies in the Committee’s investigation collectively raised prices more than 250 times on the drugs they sell. Eight of the ten companies took more than 20 price increases on a single drug. As a result, the median total price increase since launch of the drugs in the Committee’s investigation is almost 500%. For example, Pfizer increased the price of Lyrica by 10% or more in seven different years. In just the six years from 2013 and 2019, the company increased Lyrica’s price by a total of 155%—one of the largest price increases among top-grossing drugs in the U.S. market. Price increases have driven higher revenues for the companies in the Committee’s investigation. In 2019 alone, the ten companies generated a combined $38.5 billion in U.S. net revenues from the sales of just 12 drugs.
52 The Key to Lowering Drug Prices Is Improving Patent Quality, TechDirt (July 21, 2021) (online at
www.techdirt.com/articles/20210720/15144747208/key-to-lowering-drug-prices-is-improving-patent-quality.shtml).
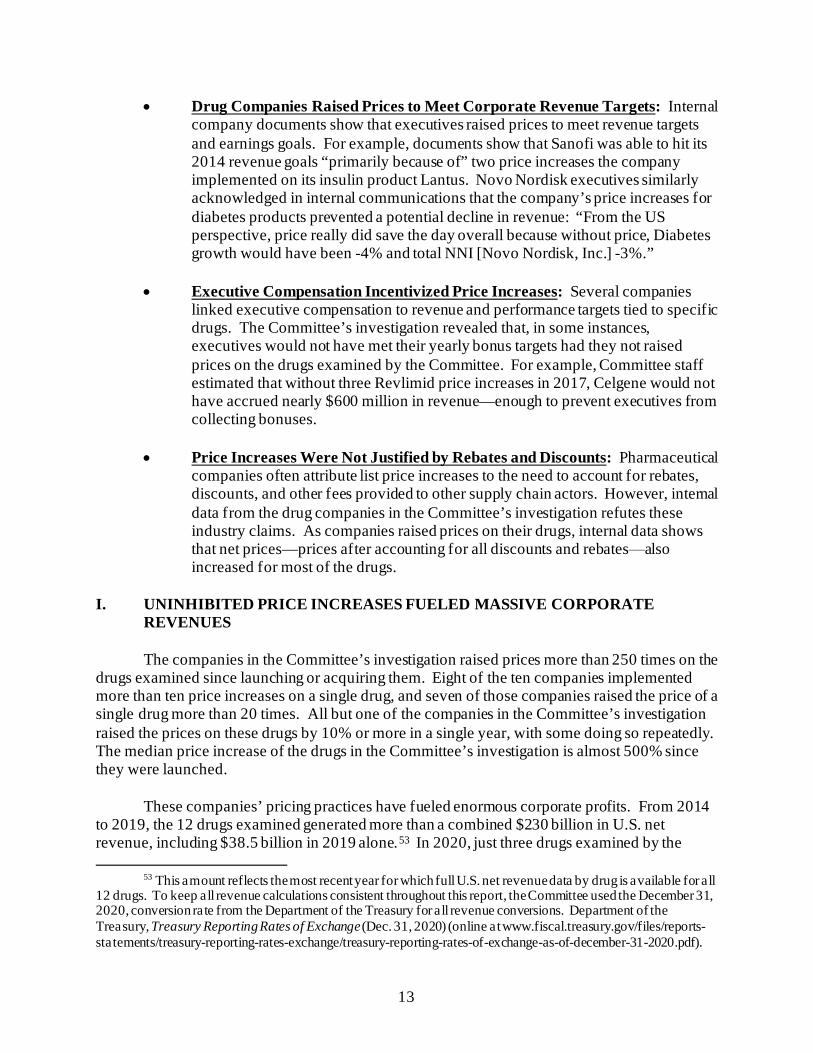
13
• Drug Companies Raised Prices to Meet Corporate Revenue Targets: Internal company documents show that executives raised prices to meet revenue targets and earnings goals. For example, documents show that Sanofi was able to hit its 2014 revenue goals “primarily because of” two price increases the company implemented on its insulin product Lantus. Novo Nordisk executives similarly acknowledged in internal communications that the company’s price increases for diabetes products prevented a potential decline in revenue: “From the US perspective, price really did save the day overall because without price, Diabetes growth would have been -4% and total NNI [Novo Nordisk, Inc.] -3%.”
• Executive Compensation Incentivized Price Increases: Several companies
linked executive compensation to revenue and performance targets tied to specific drugs. The Committee’s investigation revealed that, in some instances, executives would not have met their yearly bonus targets had they not raised prices on the drugs examined by the Committee. For example, Committee staff estimated that without three Revlimid price increases in 2017, Celgene would not have accrued nearly $600 million in revenue—enough to prevent executives from collecting bonuses.
• Price Increases Were Not Justified by Rebates and Discounts: Pharmaceutical
companies often attribute list price increases to the need to account for rebates, discounts, and other fees provided to other supply chain actors. However, internal data from the drug companies in the Committee’s investigation refutes these industry claims. As companies raised prices on their drugs, internal data shows that net prices—prices after accounting for all discounts and rebates⸺also increased for most of the drugs.
I. UNINHIBITED PRICE INCREASES FUELED MASSIVE CORPORATE
REVENUES
The companies in the Committee’s investigation raised prices more than 250 times on the drugs examined since launching or acquiring them. Eight of the ten companies implemented more than ten price increases on a single drug, and seven of those companies raised the price of a single drug more than 20 times. All but one of the companies in the Committee’s investigation raised the prices on these drugs by 10% or more in a single year, with some doing so repeatedly. The median price increase of the drugs in the Committee’s investigation is almost 500% since they were launched.
These companies’ pricing practices have fueled enormous corporate profits. From 2014
to 2019, the 12 drugs examined generated more than a combined $230 billion in U.S. net revenue, including $38.5 billion in 2019 alone.53 In 2020, just three drugs examined by the
53 This amount reflects the most recent year for which full U.S. net revenue data by drug is available for all
12 drugs. To keep all revenue calculations consistent throughout this report, the Committee used the December 31, 2020, conversion rate from the Department of the Treasury for all revenue conversions. Department of the Treasury, Treasury Reporting Rates of Exchange (Dec. 31, 2020) (online at www.fiscal.treasury.gov/files/reports-statements/treasury-reporting-rates-exchange/treasury-reporting-rates-of-exchange-as-of-december-31-2020.pdf).
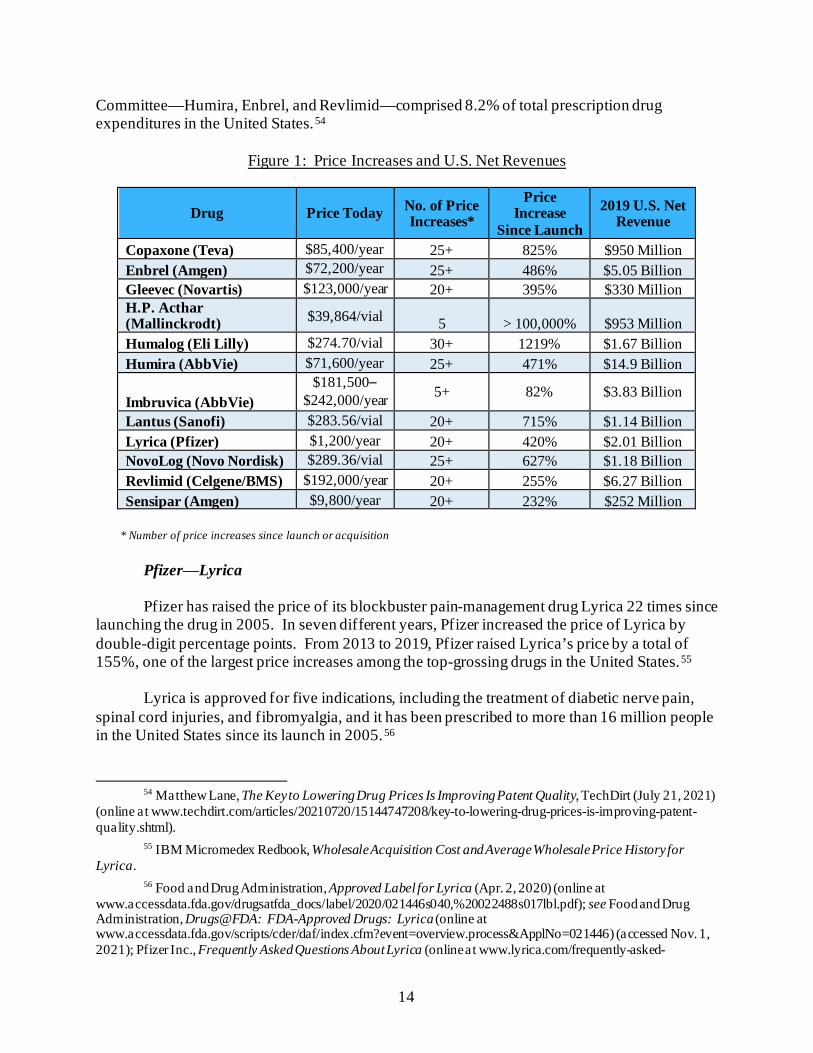
14
Committee—Humira, Enbrel, and Revlimid—comprised 8.2% of total prescription drug expenditures in the United States.54
Figure 1: Price Increases and U.S. Net Revenues
Drug Price Today No. of Price Increases*
Price Increase
Since Launch 2019 U.S. Net
Revenue
Copaxone (Teva) $85,400/year 25+ 825% $950 Million Enbrel (Amgen) $72,200/year 25+ 486% $5.05 Billion Gleevec (Novartis) $123,000/year 20+ 395% $330 Million H.P. Acthar (Mallinckrodt) $39,864/vial 5 > 100,000% $953 Million Humalog (Eli Lilly) $274.70/vial 30+ 1219% $1.67 Billion Humira (AbbVie) $71,600/year 25+ 471% $14.9 Billion
Imbruvica (AbbVie) $181,500–
$242,000/year 5+ 82% $3.83 Billion
Lantus (Sanofi) $283.56/vial 20+ 715% $1.14 Billion Lyrica (Pfizer) $1,200/year 20+ 420% $2.01 Billion NovoLog (Novo Nordisk) $289.36/vial 25+ 627% $1.18 Billion Revlimid (Celgene/BMS) $192,000/year 20+ 255% $6.27 Billion Sensipar (Amgen) $9,800/year 20+ 232% $252 Million
* Number of price increases since launch or acquisition
Pfizer⸺Lyrica
Pfizer has raised the price of its blockbuster pain-management drug Lyrica 22 times since
launching the drug in 2005. In seven different years, Pfizer increased the price of Lyrica by double-digit percentage points. From 2013 to 2019, Pfizer raised Lyrica’s price by a total of 155%, one of the largest price increases among the top-grossing drugs in the United States.55
Lyrica is approved for five indications, including the treatment of diabetic nerve pain,
spinal cord injuries, and fibromyalgia, and it has been prescribed to more than 16 million people in the United States since its launch in 2005.56
54 Matthew Lane, The Key to Lowering Drug Prices Is Improving Patent Quality, TechDirt (July 21, 2021)
(online at www.techdirt.com/articles/20210720/15144747208/key-to-lowering-drug-prices-is-improving-patent-quality.shtml).
55 IBM Micromedex Redbook, Wholesale Acquisition Cost and Average Wholesale Price History for Lyrica.
56 Food and Drug Administration, Approved Label for Lyrica (Apr. 2, 2020) (online at www.accessdata.fda.gov/drugsatfda_docs/label/2020/021446s040,%20022488s017lbl.pdf); see Food and Drug Administration, Drugs@FDA: FDA-Approved Drugs: Lyrica (online at www.accessdata.fda.gov/scripts/cder/daf/index.cfm?event=overview.process&ApplNo=021446) (accessed Nov. 1, 2021); Pfizer Inc., Frequently Asked Questions About Lyrica (online at www.lyrica.com/frequently-asked-
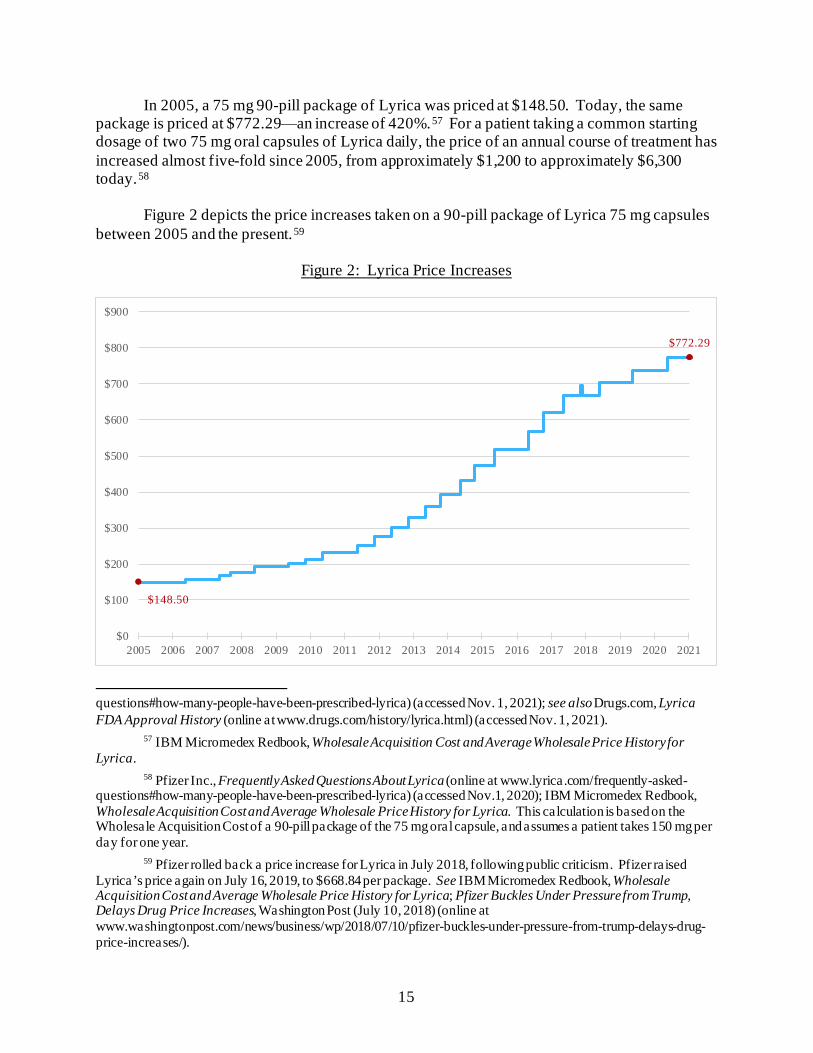
15
In 2005, a 75 mg 90-pill package of Lyrica was priced at $148.50. Today, the same package is priced at $772.29⸺an increase of 420%.57 For a patient taking a common starting dosage of two 75 mg oral capsules of Lyrica daily, the price of an annual course of treatment has increased almost five-fold since 2005, from approximately $1,200 to approximately $6,300 today.58
Figure 2 depicts the price increases taken on a 90-pill package of Lyrica 75 mg capsules
between 2005 and the present.59
Figure 2: Lyrica Price Increases
questions#how-many-people-have-been-prescribed-lyrica) (accessed Nov. 1, 2021); see also Drugs.com, Lyrica FDA Approval History (online at www.drugs.com/history/lyrica.html) (accessed Nov. 1, 2021).
57 IBM Micromedex Redbook, Wholesale Acquisition Cost and Average Wholesale Price History for Lyrica.
58 Pfizer Inc., Frequently Asked Questions About Lyrica (online at www.lyrica.com/frequently-asked-questions#how-many-people-have-been-prescribed-lyrica) (accessed Nov.1, 2020); IBM Micromedex Redbook, Wholesale Acquisition Cost and Average Wholesale Price History for Lyrica. This calculation is based on the Wholesale Acquisition Cost of a 90-pill package of the 75 mg oral capsule, and assumes a patient takes 150 mg per day for one year.
59 Pfizer rolled back a price increase for Lyrica in July 2018, following public criticism. Pfizer raised Lyrica’s price again on July 16, 2019, to $668.84 per package. See IBM Micromedex Redbook, Wholesale Acquisition Cost and Average Wholesale Price History for Lyrica; Pfizer Buckles Under Pressure from Trump, Delays Drug Price Increases, Washington Post (July 10, 2018) (online at www.washingtonpost.com/news/business/wp/2018/07/10/pfizer-buckles-under-pressure-from-trump-delays-drug-price-increases/).
$148.50
$772.29
$0
$100
$200
$300
$400
$500
$600
$700
$800
$900
2005 2006 2007 2008 2009 2010 2011 2012 2013 2014 2015 2016 2017 2018 2019 2020 2021
16
From 2009 to 2018, Pfizer generated more than $43 billion in global net revenue from Lyrica.60 More than half of that amount⸺$23.2 billion⸺came from the U.S. market, where annual net revenue more than doubled over this period.61 In 2018, the year before Lyrica lost market exclusivity, Pfizer raised the drug’s price by 7.9%.62 Lyrica accounted for more than 9% of the company’s total sales that year.63 Pfizer raised Lyrica’s price by a cumulative 13.3% in the approximately 18-month period leading up to Food and Drug Administration (FDA) approval of Lyrica’s first generic competitors in July 2019.64
Figure 3 below shows Lyrica’s net U.S. revenue over time.65
60 Pfizer Inc., 2009–2018 Form 10-K (online at https://investors.pfizer.com/financials/annual-
reports/default.aspx). 61 Letter from King & Spalding, on behalf of Pfizer Inc., to Chairman Elijah E. Cummings, House
Committee on Oversight and Reform, at Attachment A, Page 1 (June 6, 2019); Letter from King & Spalding, on behalf of Pfizer Inc., to Chairman Elijah E. Cummings, House Committee on Oversight and Reform, at Page 3 (Mar. 4, 2019).
62 IBM Micromedex Redbook, Wholesale Acquisition Cost and Average Wholesale Price History for Lyrica.
63 Pfizer’s Lyrica in the Anti-Epileptic Drugs Market, Forbes (Oct. 7, 2019) (online at www.forbes.com/sites/greatspeculations/2019/10/07/pfizers-lyrica-in-the-anti-epileptic-drugs-market/#4ad45ac12f7f); Pfizer Inc., 2018 Financial Report, Appendix A (online at https://s21.q4cdn.com/317678438/files/doc_financials/Annual/2018/2018-Financial-Report.pdf) (reporting Pfizer’s worldwide revenue from Lyrica for 2018 as $4.97 billion and Pfizer’s total 2018 revenue as $53.64 billion, and Pfizer’s 2017 worldwide revenue from Lyrica as $5.065 billion and overall Pfizer revenue as $52.54 billion).
64 IBM Micromedex Redbook, Wholesale Acquisition Cost and Average Wholesale Price History for Lyrica; Food and Drug Administration, Press Release: FDA Approves First Generics of Lyrica (July 22, 2019) (online at www.fda.gov/news-events/press-announcements/fda-approves-first-generics-lyrica).
65 Letter from King & Spalding, on behalf of Pfizer Inc., to Chairman Elijah E. Cummings, House Committee on Oversight and Reform, at Page 3 (Mar. 4, 2019); Pfizer Inc., 2019 Form 10-K (Feb. 27, 2020) (online at https://s21.q4cdn.com/317678438/files/doc_financials/2018/ar/Pfizer-2019-Financial-Report.pdf). This chart reflects the most recent available data for disaggregated U.S. revenue for Lyrica.
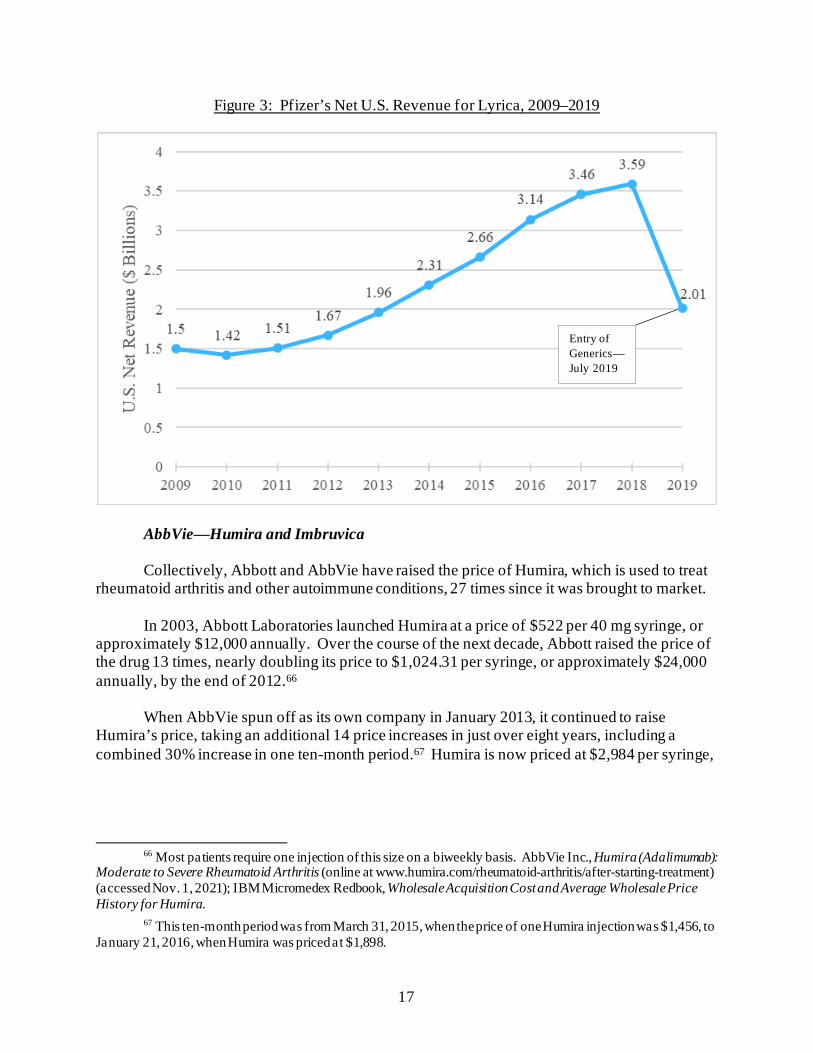
17
Figure 3: Pfizer’s Net U.S. Revenue for Lyrica, 2009–2019
AbbVie⸺Humira and Imbruvica
Collectively, Abbott and AbbVie have raised the price of Humira, which is used to treat rheumatoid arthritis and other autoimmune conditions, 27 times since it was brought to market.
In 2003, Abbott Laboratories launched Humira at a price of $522 per 40 mg syringe, or
approximately $12,000 annually. Over the course of the next decade, Abbott raised the price of the drug 13 times, nearly doubling its price to $1,024.31 per syringe, or approximately $24,000 annually, by the end of 2012.66
When AbbVie spun off as its own company in January 2013, it continued to raise
Humira’s price, taking an additional 14 price increases in just over eight years, including a combined 30% increase in one ten-month period.67 Humira is now priced at $2,984 per syringe,
66 Most patients require one injection of this size on a biweekly basis. AbbVie Inc., Humira (Adalimumab):
Moderate to Severe Rheumatoid Arthritis (online at www.humira.com/rheumatoid-arthritis/after-starting-treatment) (accessed Nov. 1, 2021); IBM Micromedex Redbook, Wholesale Acquisition Cost and Average Wholesale Price History for Humira.
67 This ten-month period was from March 31, 2015, when the price of one Humira injection was $1,456, to January 21, 2016, when Humira was priced at $1,898.
Entry of Generics— July 2019
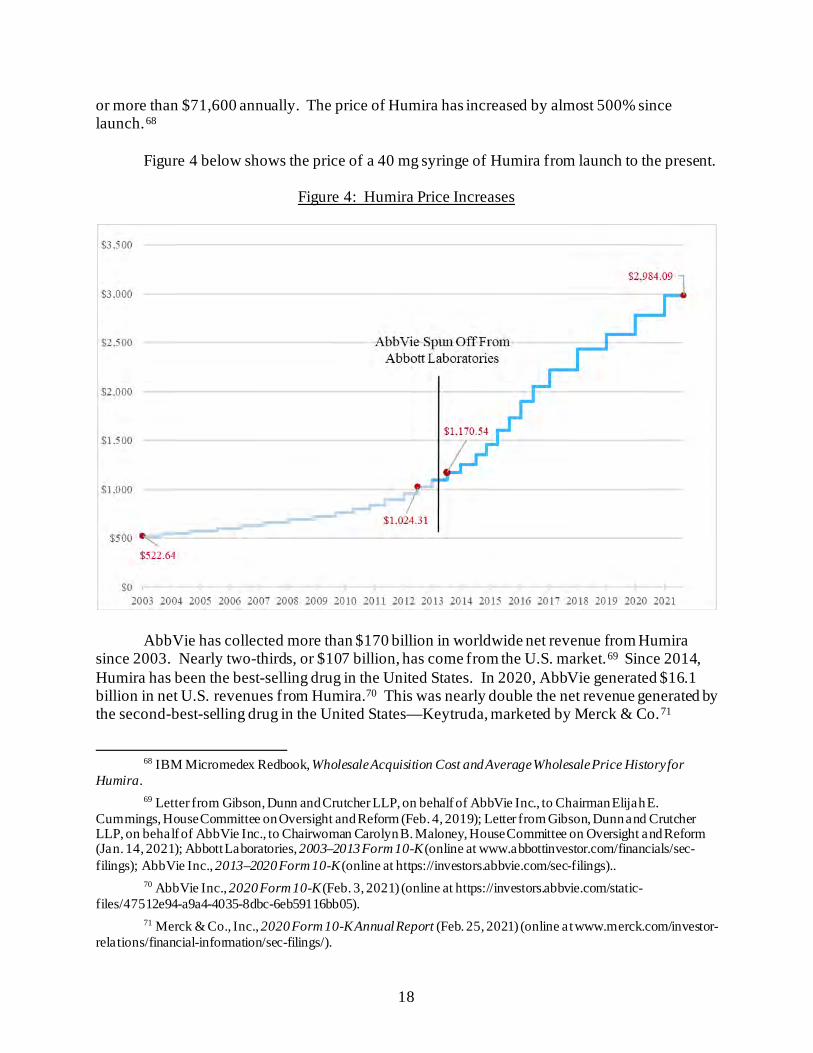
18
or more than $71,600 annually. The price of Humira has increased by almost 500% since launch.68
Figure 4 below shows the price of a 40 mg syringe of Humira from launch to the present.
Figure 4: Humira Price Increases
AbbVie has collected more than $170 billion in worldwide net revenue from Humira since 2003. Nearly two-thirds, or $107 billion, has come from the U.S. market.69 Since 2014, Humira has been the best-selling drug in the United States. In 2020, AbbVie generated $16.1 billion in net U.S. revenues from Humira.70 This was nearly double the net revenue generated by the second-best-selling drug in the United States—Keytruda, marketed by Merck & Co.71
68 IBM Micromedex Redbook, Wholesale Acquisition Cost and Average Wholesale Price History for
Humira. 69 Letter from Gibson, Dunn and Crutcher LLP, on behalf of AbbVie Inc., to Chairman Elijah E.
Cummings, House Committee on Oversight and Reform (Feb. 4, 2019); Letter from Gibson, Dunn and Crutcher LLP, on behalf of AbbVie Inc., to Chairwoman Carolyn B. Maloney, House Committee on Oversight and Reform (Jan. 14, 2021); Abbott Laboratories, 2003–2013 Form 10-K (online at www.abbottinvestor.com/financials/sec-filings); AbbVie Inc., 2013–2020 Form 10-K (online at https://investors.abbvie.com/sec-filings)..
70 AbbVie Inc., 2020 Form 10-K (Feb. 3, 2021) (online at https://investors.abbvie.com/static-files/47512e94-a9a4-4035-8dbc-6eb59116bb05).
71 Merck & Co., Inc., 2020 Form 10-K Annual Report (Feb. 25, 2021) (online at www.merck.com/investor-relations/financial-information/sec-filings/).
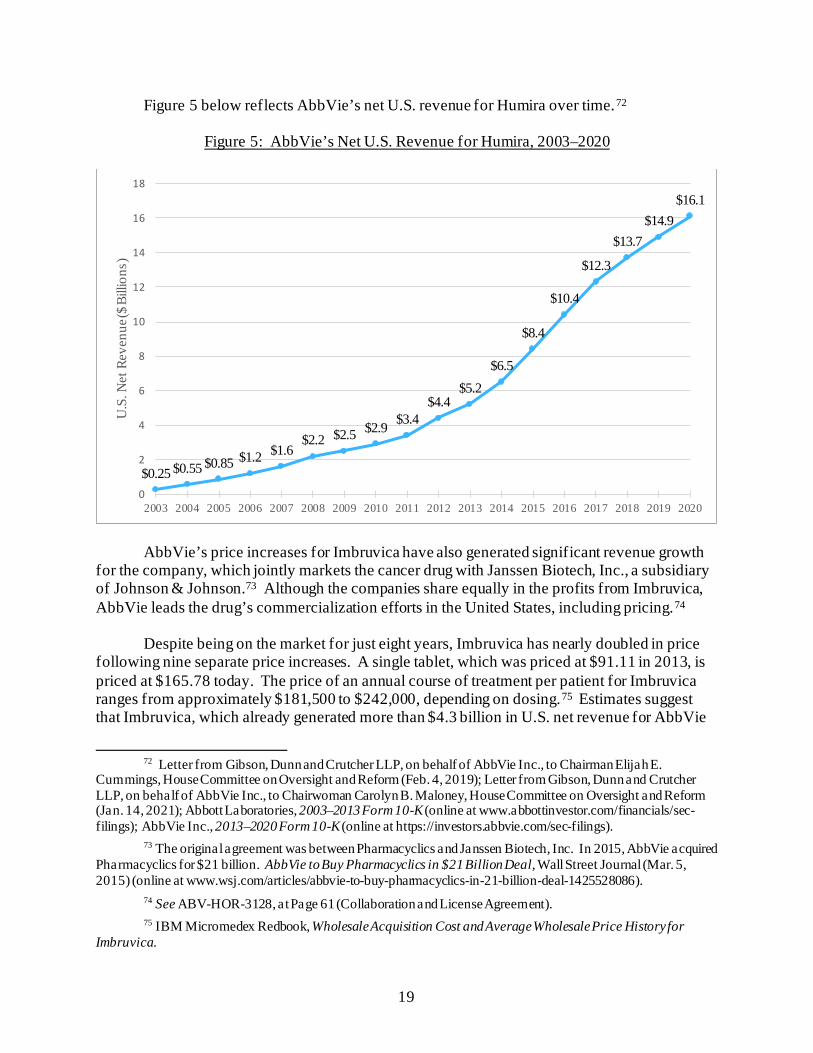
19
Figure 5 below reflects AbbVie’s net U.S. revenue for Humira over time.72
Figure 5: AbbVie’s Net U.S. Revenue for Humira, 2003–2020
AbbVie’s price increases for Imbruvica have also generated significant revenue growth for the company, which jointly markets the cancer drug with Janssen Biotech, Inc., a subsidiary of Johnson & Johnson.73 Although the companies share equally in the profits from Imbruvica, AbbVie leads the drug’s commercialization efforts in the United States, including pricing.74
Despite being on the market for just eight years, Imbruvica has nearly doubled in price
following nine separate price increases. A single tablet, which was priced at $91.11 in 2013, is priced at $165.78 today. The price of an annual course of treatment per patient for Imbruvica ranges from approximately $181,500 to $242,000, depending on dosing.75 Estimates suggest that Imbruvica, which already generated more than $4.3 billion in U.S. net revenue for AbbVie
72 Letter from Gibson, Dunn and Crutcher LLP, on behalf of AbbVie Inc., to Chairman Elijah E.
Cummings, House Committee on Oversight and Reform (Feb. 4, 2019); Letter from Gibson, Dunn and Crutcher LLP, on behalf of AbbVie Inc., to Chairwoman Carolyn B. Maloney, House Committee on Oversight and Reform (Jan. 14, 2021); Abbott Laboratories, 2003–2013 Form 10-K (online at www.abbottinvestor.com/financials/sec-filings); AbbVie Inc., 2013–2020 Form 10-K (online at https://investors.abbvie.com/sec-filings).
73 The original agreement was between Pharmacyclics and Janssen Biotech, Inc. In 2015, AbbVie acquired Pharmacyclics for $21 billion. AbbVie to Buy Pharmacyclics in $21 Billion Deal, Wall Street Journal (Mar. 5, 2015) (online at www.wsj.com/articles/abbvie-to-buy-pharmacyclics-in-21-billion-deal-1425528086).
74 See ABV-HOR-3128, at Page 61 (Collaboration and License Agreement). 75 IBM Micromedex Redbook, Wholesale Acquisition Cost and Average Wholesale Price History for
Imbruvica.
$0.25 $0.55 $0.85 $1.2 $1.6$2.2 $2.5 $2.9 $3.4
$4.4$5.2
$6.5
$8.4
$10.4
$12.3
$13.7$14.9
$16.1
0
2
4
6
8
10
12
14
16
18
2003 2004 2005 2006 2007 2008 2009 2010 2011 2012 2013 2014 2015 2016 2017 2018 2019 2020
U.S
. Net
Rev
enue
($ B
illio
ns)
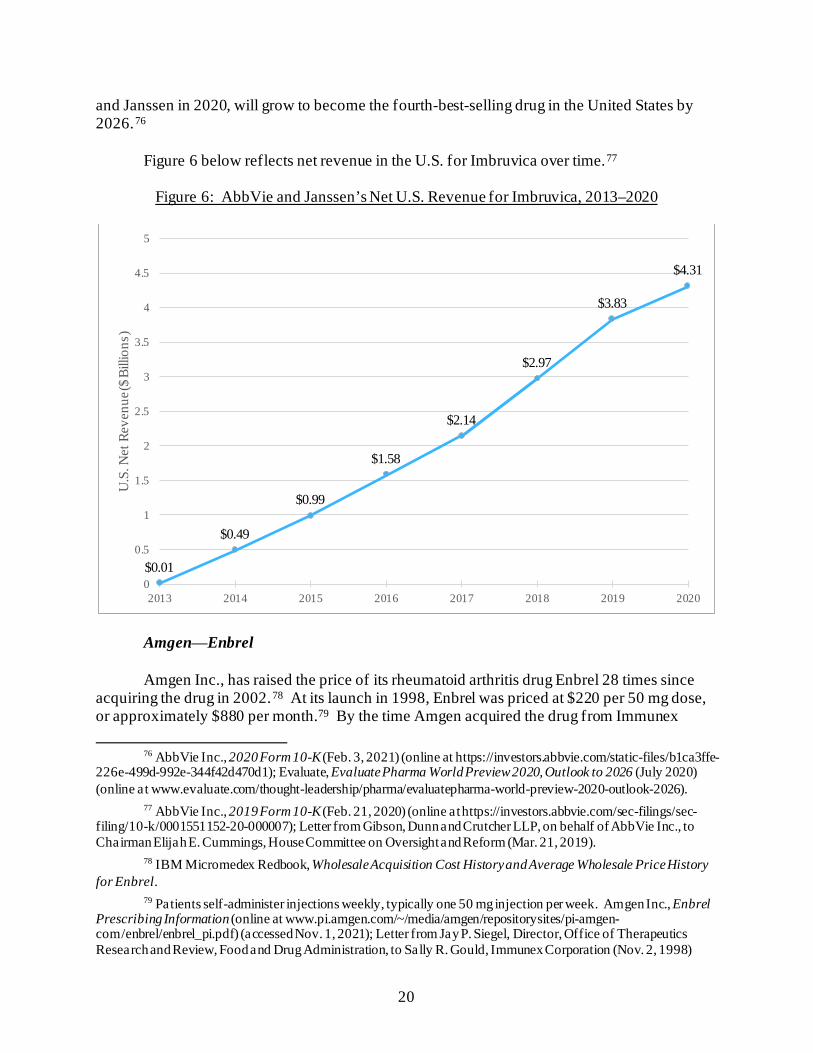
20
and Janssen in 2020, will grow to become the fourth-best-selling drug in the United States by 2026.76
Figure 6 below reflects net revenue in the U.S. for Imbruvica over time.77
Figure 6: AbbVie and Janssen’s Net U.S. Revenue for Imbruvica, 2013–2020
Amgen⸺Enbrel
Amgen Inc., has raised the price of its rheumatoid arthritis drug Enbrel 28 times since acquiring the drug in 2002.78 At its launch in 1998, Enbrel was priced at $220 per 50 mg dose, or approximately $880 per month.79 By the time Amgen acquired the drug from Immunex
76 AbbVie Inc., 2020 Form 10-K (Feb. 3, 2021) (online at https://investors.abbvie.com/static-files/b1ca3ffe-
226e-499d-992e-344f42d470d1); Evaluate, Evaluate Pharma World Preview 2020, Outlook to 2026 (July 2020) (online at www.evaluate.com/thought-leadership/pharma/evaluatepharma-world-preview-2020-outlook-2026).
77 AbbVie Inc., 2019 Form 10-K (Feb. 21, 2020) (online at https://investors.abbvie.com/sec-filings/sec-filing/10-k/0001551152-20-000007); Letter from Gibson, Dunn and Crutcher LLP, on behalf of AbbVie Inc., to Chairman Elijah E. Cummings, House Committee on Oversight and Reform (Mar. 21, 2019).
78 IBM Micromedex Redbook, Wholesale Acquisition Cost History and Average Wholesale Price History for Enbrel.
79 Patients self-administer injections weekly, typically one 50 mg injection per week. Amgen Inc., Enbrel Prescribing Information (online at www.pi.amgen.com/~/media/amgen/repositorysites/pi-amgen-com/enbrel/enbrel_pi.pdf) (accessed Nov. 1, 2021); Letter from Jay P. Siegel, Director, Office of Therapeutics Research and Review, Food and Drug Administration, to Sally R. Gould, Immunex Corporation (Nov. 2, 1998)
$0.01
$0.49
$0.99
$1.58
$2.14
$2.97
$3.83
$4.31
0
0.5
1
1.5
2
2.5
3
3.5
4
4.5
5
2013 2014 2015 2016 2017 2018 2019 2020
U.S
. Net
Rev
enue
($ B
illio
ns)
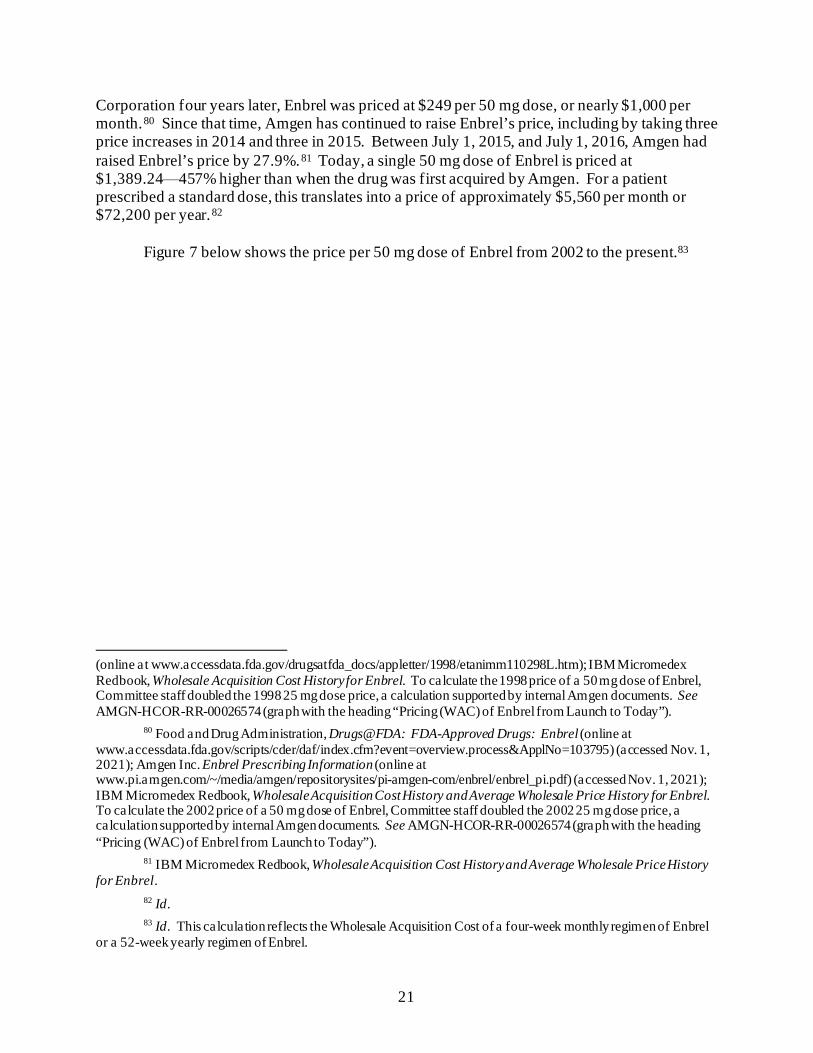
21
Corporation four years later, Enbrel was priced at $249 per 50 mg dose, or nearly $1,000 per month.80 Since that time, Amgen has continued to raise Enbrel’s price, including by taking three price increases in 2014 and three in 2015. Between July 1, 2015, and July 1, 2016, Amgen had raised Enbrel’s price by 27.9%.81 Today, a single 50 mg dose of Enbrel is priced at $1,389.24⸺457% higher than when the drug was first acquired by Amgen. For a patient prescribed a standard dose, this translates into a price of approximately $5,560 per month or $72,200 per year.82
Figure 7 below shows the price per 50 mg dose of Enbrel from 2002 to the present.83
(online at www.accessdata.fda.gov/drugsatfda_docs/appletter/1998/etanimm110298L.htm); IBM Micromedex Redbook, Wholesale Acquisition Cost History for Enbrel. To calculate the 1998 price of a 50 mg dose of Enbrel, Committee staff doubled the 1998 25 mg dose price, a calculation supported by internal Amgen documents. See AMGN-HCOR-RR-00026574 (graph with the heading “Pricing (WAC) of Enbrel from Launch to Today”).
80 Food and Drug Administration, Drugs@FDA: FDA-Approved Drugs: Enbrel (online at www.accessdata.fda.gov/scripts/cder/daf/index.cfm?event=overview.process&ApplNo=103795) (accessed Nov. 1, 2021); Amgen Inc. Enbrel Prescribing Information (online at www.pi.amgen.com/~/media/amgen/repositorysites/pi-amgen-com/enbrel/enbrel_pi.pdf) (accessed Nov. 1, 2021); IBM Micromedex Redbook, Wholesale Acquisition Cost History and Average Wholesale Price History for Enbrel. To calculate the 2002 price of a 50 mg dose of Enbrel, Committee staff doubled the 2002 25 mg dose price, a calculation supported by internal Amgen documents. See AMGN-HCOR-RR-00026574 (graph with the heading “Pricing (WAC) of Enbrel from Launch to Today”).
81 IBM Micromedex Redbook, Wholesale Acquisition Cost History and Average Wholesale Price History for Enbrel.
82 Id. 83 Id. This calculation reflects the Wholesale Acquisition Cost of a four-week monthly regimen of Enbrel
or a 52-week yearly regimen of Enbrel.
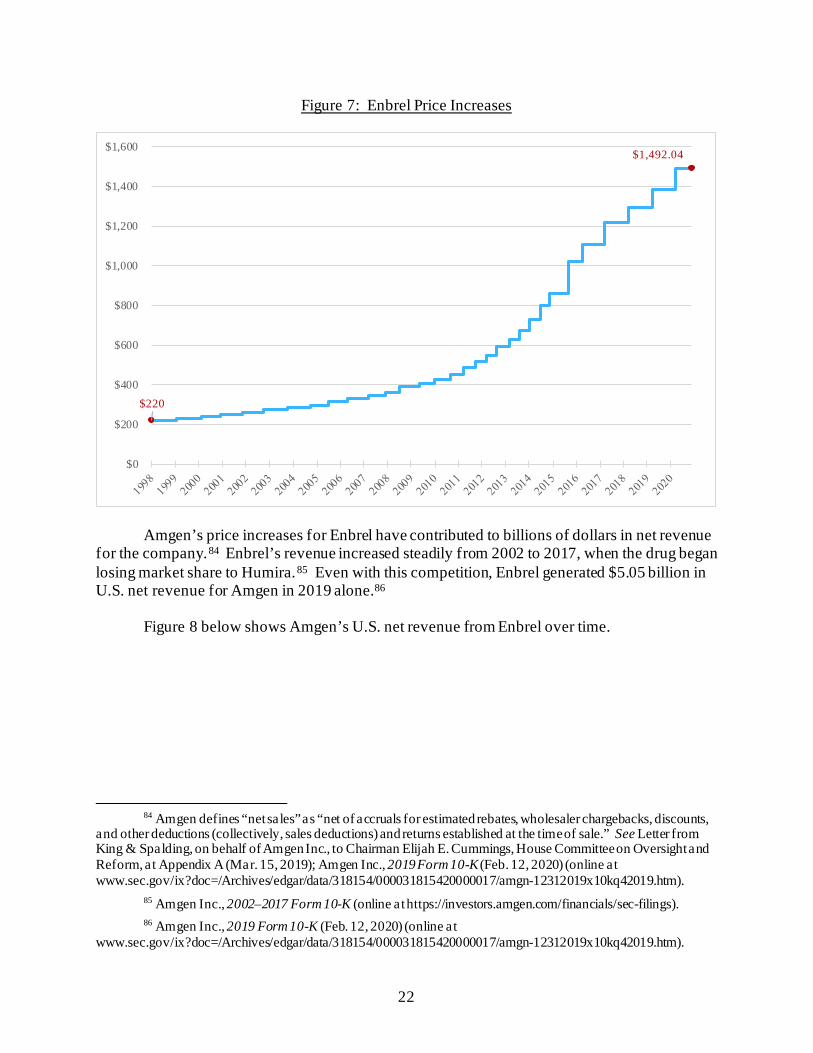
22
Figure 7: Enbrel Price Increases
Amgen’s price increases for Enbrel have contributed to billions of dollars in net revenue for the company.84 Enbrel’s revenue increased steadily from 2002 to 2017, when the drug began losing market share to Humira.85 Even with this competition, Enbrel generated $5.05 billion in U.S. net revenue for Amgen in 2019 alone.86
Figure 8 below shows Amgen’s U.S. net revenue from Enbrel over time.
84 Amgen defines “net sales” as “net of accruals for estimated rebates, wholesaler chargebacks, discounts,
and other deductions (collectively, sales deductions) and returns established at the time of sale.” See Letter from King & Spalding, on behalf of Amgen Inc., to Chairman Elijah E. Cummings, House Committee on Oversight and Reform, at Appendix A (Mar. 15, 2019); Amgen Inc., 2019 Form 10-K (Feb. 12, 2020) (online at www.sec.gov/ix?doc=/Archives/edgar/data/318154/000031815420000017/amgn-12312019x10kq42019.htm).
85 Amgen Inc., 2002–2017 Form 10-K (online at https://investors.amgen.com/financials/sec-filings). 86 Amgen Inc., 2019 Form 10-K (Feb. 12, 2020) (online at
www.sec.gov/ix?doc=/Archives/edgar/data/318154/000031815420000017/amgn-12312019x10kq42019.htm).
$220
$1,492.04
$0
$200
$400
$600
$800
$1,000
$1,200
$1,400
$1,600
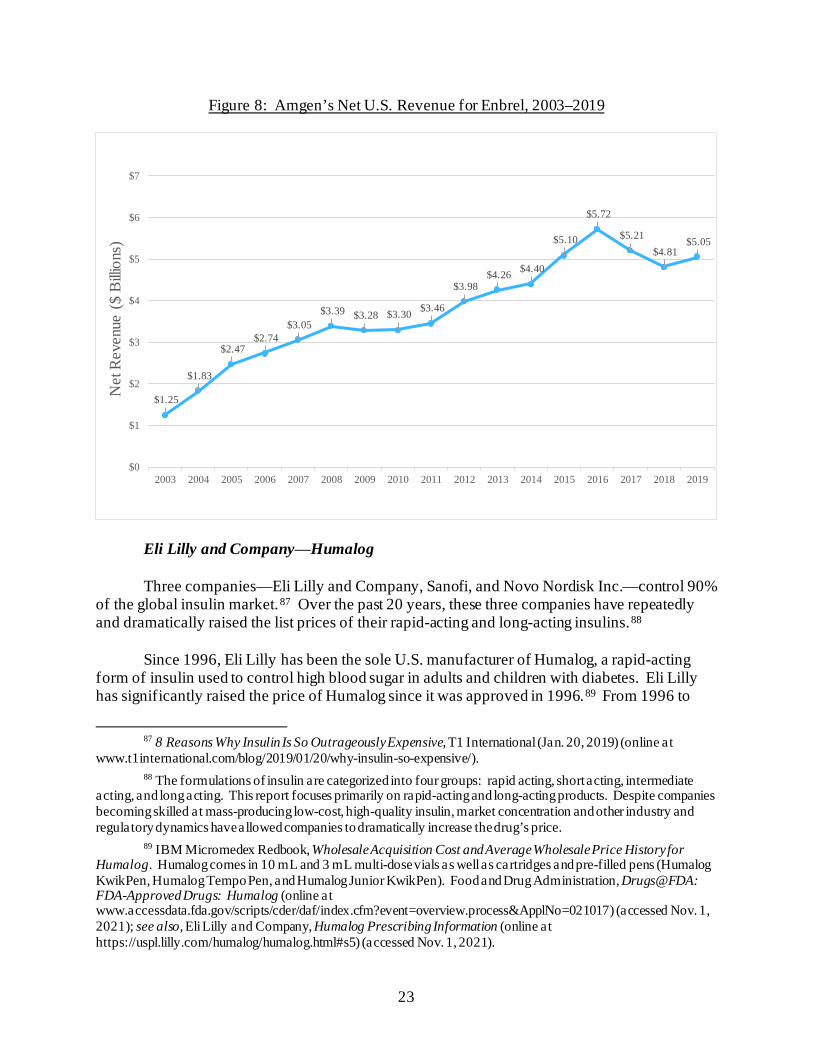
23
Figure 8: Amgen’s Net U.S. Revenue for Enbrel, 2003–2019
Eli Lilly and Company⸺Humalog Three companies—Eli Lilly and Company, Sanofi, and Novo Nordisk Inc.—control 90%
of the global insulin market.87 Over the past 20 years, these three companies have repeatedly and dramatically raised the list prices of their rapid-acting and long-acting insulins.88
Since 1996, Eli Lilly has been the sole U.S. manufacturer of Humalog, a rapid-acting
form of insulin used to control high blood sugar in adults and children with diabetes. Eli Lilly has significantly raised the price of Humalog since it was approved in 1996.89 From 1996 to
87 8 Reasons Why Insulin Is So Outrageously Expensive, T1 International (Jan. 20, 2019) (online at
www.t1international.com/blog/2019/01/20/why-insulin-so-expensive/). 88 The formulations of insulin are categorized into four groups: rapid acting, short acting, intermediate
acting, and long acting. This report focuses primarily on rapid-acting and long-acting products. Despite companies becoming skilled at mass-producing low-cost, high-quality insulin, market concentration and other industry and regulatory dynamics have allowed companies to dramatically increase the drug’s price.
89 IBM Micromedex Redbook, Wholesale Acquisition Cost and Average Wholesale Price History for Humalog. Humalog comes in 10 mL and 3 mL multi-dose vials as well as cartridges and pre-filled pens (Humalog KwikPen, Humalog Tempo Pen, and Humalog Junior KwikPen). Food and Drug Administration, Drugs@FDA: FDA-Approved Drugs: Humalog (online at www.accessdata.fda.gov/scripts/cder/daf/index.cfm?event=overview.process&ApplNo=021017) (accessed Nov. 1, 2021); see also, Eli Lilly and Company, Humalog Prescribing Information (online at https://uspl.lilly.com/humalog/humalog.html#s5) (accessed Nov. 1, 2021).
$1.25
$1.83
$2.47 $2.74
$3.05 $3.39 $3.28 $3.30 $3.46
$3.98 $4.26 $4.40
$5.10
$5.72
$5.21 $4.81
$5.05
$0
$1
$2
$3
$4
$5
$6
$7
2003 2004 2005 2006 2007 2008 2009 2010 2011 2012 2013 2014 2015 2016 2017 2018 2019
Net
Rev
enue
($
Billi
ons)
24
2017, Eli Lilly raised the price of its 10 mL vial of Humalog subcutaneous solution a total of 34 times for a cumulative price increase of more than 1,200%.90 In 12 of those years, Eli Lilly increased Humalog’s price at least two times. By 2017, a single 10 mL vial of Humalog subcutaneous solution was priced at $274.70, up from just $20.82 in 1996.91
Figure 9 shows the increase in price for the 10 mL vial of Humalog subcutaneous
solution and the Humalog Kwikpen from 1996 to the present.92
Figure 9: Humalog Price Increases
Eli Lilly has generated $38.94 billion in net revenue from its Humalog insulin products
since 2002, including $23.28 billion from the United States.93 As Eli Lilly raised the price of Humalog, from $39.75 in 2002 to $274.70 by 2018, annual U.S. net revenue for the drug
90 IBM Micromedex Redbook, Wholesale Acquisition Cost and Average Wholesale Price History for
Humalog; see also COR-BOX-00024053, at Pages 1–2. 91 IBM Micromedex Redbook, Wholesale Acquisition Cost and Average Wholesale Price History for
Humalog. 92 Id. 93 Eli Lilly, 2002–2020 Form 10-Ks, Notices of Annual Meeting, and Proxy Statements (online at
https://investor.lilly.com/financial-information/annual-reports). Committee staff calculated the total net revenue from Humalog products during this time based on the individual revenue numbers provided in each of Eli Lilly’s proxy statements from 2002 to 2020.
$20.82
$274.70
$29.58
$98.40
$0
$50
$100
$150
$200
$250
$300
1996
1997
1998
1999
2000
2001
2002
2003
2004
2005
2006
2007
2008
2009
2010
2011
2012
2013
2014
2015
2016
2017
2018
2019
2020
2021
Humalog subcutaneous solution 100 units/mL (10 mL) Humalog Kwikpen 100 unit/mL (10 mL)
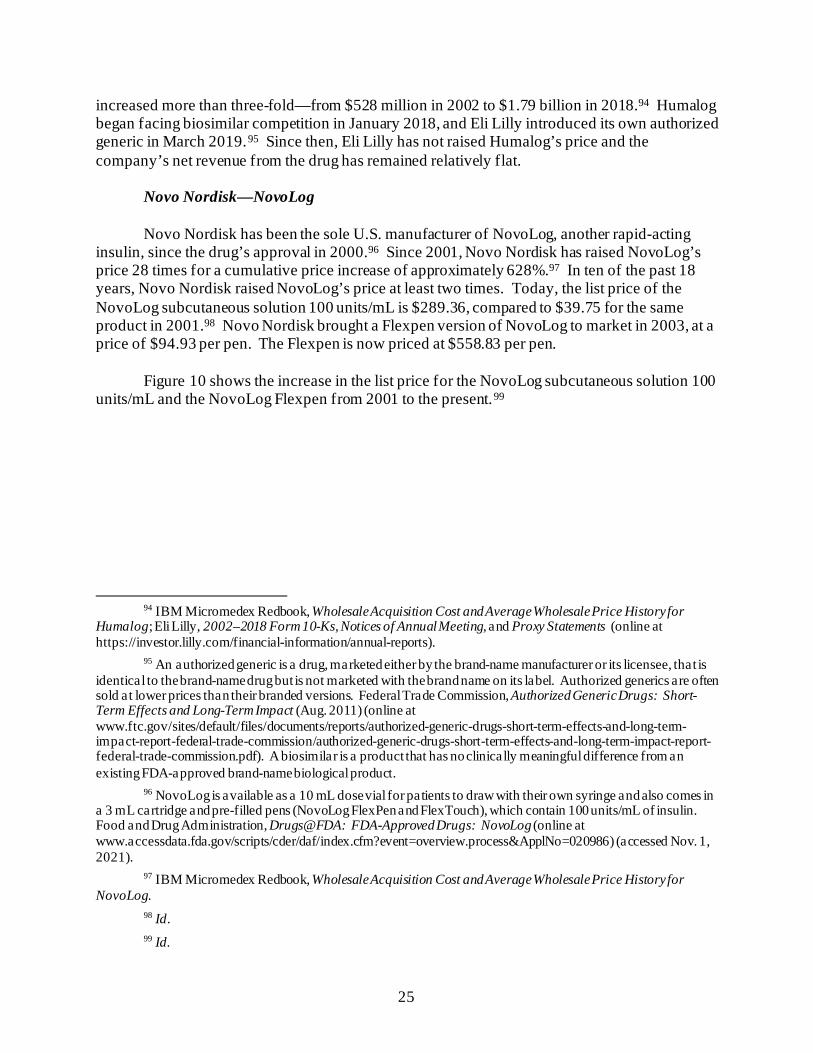
25
increased more than three-fold—from $528 million in 2002 to $1.79 billion in 2018.94 Humalog began facing biosimilar competition in January 2018, and Eli Lilly introduced its own authorized generic in March 2019.95 Since then, Eli Lilly has not raised Humalog’s price and the company’s net revenue from the drug has remained relatively flat.
Novo Nordisk—NovoLog
Novo Nordisk has been the sole U.S. manufacturer of NovoLog, another rapid-acting insulin, since the drug’s approval in 2000.96 Since 2001, Novo Nordisk has raised NovoLog’s price 28 times for a cumulative price increase of approximately 628%.97 In ten of the past 18 years, Novo Nordisk raised NovoLog’s price at least two times. Today, the list price of the NovoLog subcutaneous solution 100 units/mL is $289.36, compared to $39.75 for the same product in 2001.98 Novo Nordisk brought a Flexpen version of NovoLog to market in 2003, at a price of $94.93 per pen. The Flexpen is now priced at $558.83 per pen.
Figure 10 shows the increase in the list price for the NovoLog subcutaneous solution 100
units/mL and the NovoLog Flexpen from 2001 to the present.99
94 IBM Micromedex Redbook, Wholesale Acquisition Cost and Average Wholesale Price History for
Humalog; Eli Lilly, 2002–2018 Form 10-Ks, Notices of Annual Meeting, and Proxy Statements (online at https://investor.lilly.com/financial-information/annual-reports).
95 An authorized generic is a drug, marketed either by the brand-name manufacturer or its licensee, that is identical to the brand-name drug but is not marketed with the brand name on its label. Authorized generics are often sold at lower prices than their branded versions. Federal Trade Commission, Authorized Generic Drugs: Short-Term Effects and Long-Term Impact (Aug. 2011) (online at www.ftc.gov/sites/default/files/documents/reports/authorized-generic-drugs-short-term-effects-and-long-term-impact-report-federal-trade-commission/authorized-generic-drugs-short-term-effects-and-long-term-impact-report-federal-trade-commission.pdf). A biosimilar is a product that has no clinically meaningful difference from an existing FDA-approved brand-name biological product.
96 NovoLog is available as a 10 mL dose vial for patients to draw with their own syringe and also comes in a 3 mL cartridge and pre-filled pens (NovoLog FlexPen and FlexTouch), which contain 100 units/mL of insulin. Food and Drug Administration, Drugs@FDA: FDA-Approved Drugs: NovoLog (online at www.accessdata.fda.gov/scripts/cder/daf/index.cfm?event=overview.process&ApplNo=020986) (accessed Nov. 1, 2021).
97 IBM Micromedex Redbook, Wholesale Acquisition Cost and Average Wholesale Price History for NovoLog.
98 Id. 99 Id.
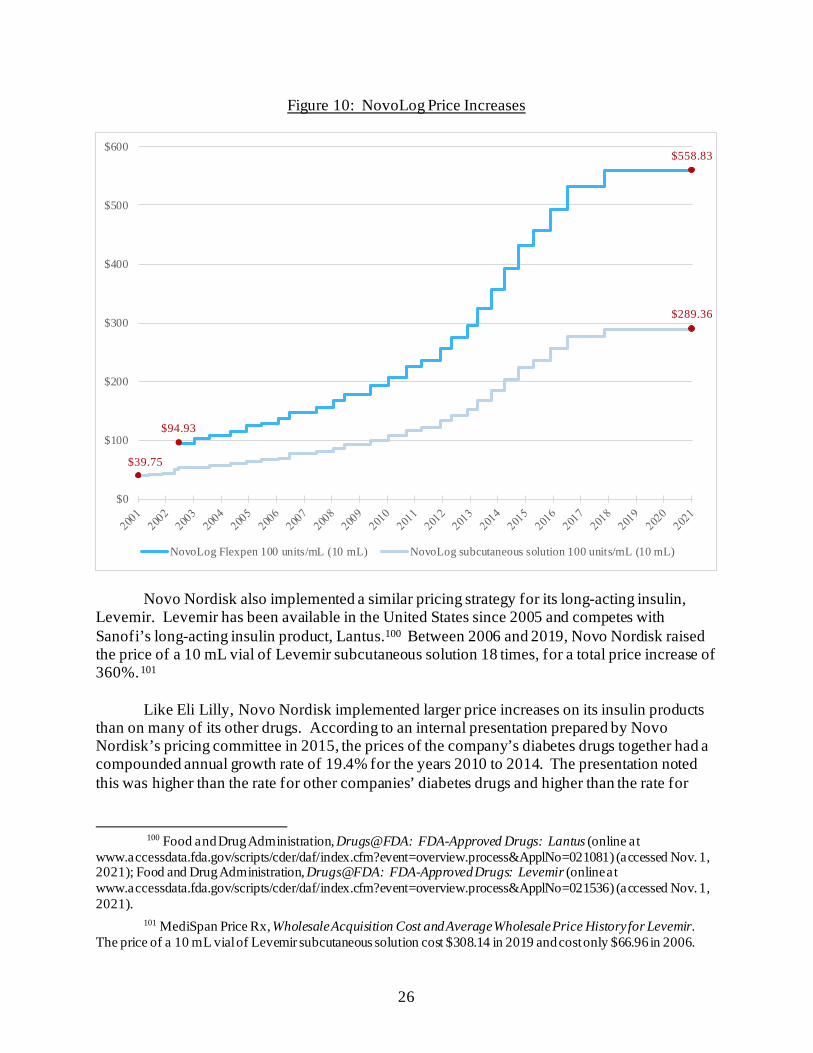
26
Figure 10: NovoLog Price Increases
Novo Nordisk also implemented a similar pricing strategy for its long-acting insulin, Levemir. Levemir has been available in the United States since 2005 and competes with Sanofi’s long-acting insulin product, Lantus.100 Between 2006 and 2019, Novo Nordisk raised the price of a 10 mL vial of Levemir subcutaneous solution 18 times, for a total price increase of 360%.101
Like Eli Lilly, Novo Nordisk implemented larger price increases on its insulin products
than on many of its other drugs. According to an internal presentation prepared by Novo Nordisk’s pricing committee in 2015, the prices of the company’s diabetes drugs together had a compounded annual growth rate of 19.4% for the years 2010 to 2014. The presentation noted this was higher than the rate for other companies’ diabetes drugs and higher than the rate for
100 Food and Drug Administration, Drugs@FDA: FDA-Approved Drugs: Lantus (online at
www.accessdata.fda.gov/scripts/cder/daf/index.cfm?event=overview.process&ApplNo=021081) (accessed Nov. 1, 2021); Food and Drug Administration, Drugs@FDA: FDA-Approved Drugs: Levemir (online at www.accessdata.fda.gov/scripts/cder/daf/index.cfm?event=overview.process&ApplNo=021536) (accessed Nov. 1, 2021).
101 MediSpan Price Rx, Wholesale Acquisition Cost and Average Wholesale Price History for Levemir. The price of a 10 mL vial of Levemir subcutaneous solution cost $308.14 in 2019 and cost only $66.96 in 2006.
$94.93
$558.83
$39.75
$289.36
$0
$100
$200
$300
$400
$500
$600
NovoLog Flexpen 100 units/mL (10 mL) NovoLog subcutaneous solution 100 units/mL (10 mL)
27
Novo Nordisk’s best-selling non-diabetes drugs, which had a list price compounded annual growth rate of 10.9%.102
From 2009 to 2019, Novo Nordisk generated $14.7 billion in net sales from NovoLog
products sold in the United States. Sales of NovoLog increased steadily year after year from 2009 to 2015, with $1.81 billion in net U.S. revenue from NovoLog products in 2015.103 Novo Nordisk’s price for NovoLog has remained flat since 2018, as has its revenue from the drug.
Sanofi—Lantus
Sanofi’s best-selling long-acting insulin, Lantus, was approved by FDA in 2000 and brought to market in 2001.104 Since acquiring the drug in 2004, Sanofi has raised the price of Lantus 23 times.105 In 2001, a 10 mL vial of Lantus was priced at $34.81. By 2004, a 10 mL vial was priced at $48.68.106 From 2004 to 2012, Sanofi raised the price of Lantus each year, including by as much as 15% in a single year.107 In 2013, Sanofi raised the price of Lantus in April, August, and December, resulting in a total increase of more than 45%.108 By 2019, a single 10 mL vial of Lantus was priced at $283.56⸺a 715% increase in price since launch.109 In 2007, Sanofi began selling Lantus in a disposable injector pen under the name Lantus SoloStar, and it quickly became a top-selling insulin pen product.110
Figure 11 shows the increase in price of a 10 mL vial of Lantus and the Lantus Solostar
Pen from 2001 to the present.111
102 NNI-ERR_0083044, at Slide 10. 103 NNI-ERR_0083954. 104 Sanofi acquired Aventis Pharmaceuticals, Inc., in 2004. Lantus was part of the Aventis portfolio at time
of acquisition. See Letter from Arnold & Porter, on behalf of Sanofi, to Majority Staff, House Committee on Oversight and Reform, at Page 4 (Feb. 19, 2019). Sanofi also markets Lantus SoloStar, a pen-type injector, which was approved by FDA in April 2007.
105 IBM Micromedex Redbook, Wholesale Acquisition Cost and Average Wholesale Price History for Lantus.
106 IBM Micromedex Redbook, Wholesale Acquisition Cost and Average Wholesale Price History for Lantus; Letter from Arnold & Porter, on behalf of Sanofi, to Majority Staff, House Committee on Oversight and Reform, at Page 2 (Mar. 25, 2019).
107 On December 16, 2011, Sanofi raised the price of Lantus to $114.15. By taking two price increases the following year—one on April 27, 2012, and one on October 5, 2012—Sanofi cumulatively raised the price of Lantus by approximately 15.45% in 2012.
108 IBM Micromedex Redbook, Wholesale Acquisition Cost and Average Wholesale Price History for Lantus.
109 Id. 110 See Food and Drug Administration, Drugs@FDA: FDA-Approved Drugs: Lantus (online at
www.accessdata.fda.gov/scripts/cder/daf/index.cfm?event=overview.process&ApplNo=021081) (accessed Nov. 1, 2021).
111 IBM Micromedex Redbook, Wholesale Acquisition Cost and Average Wholesale Price History for Lantus.
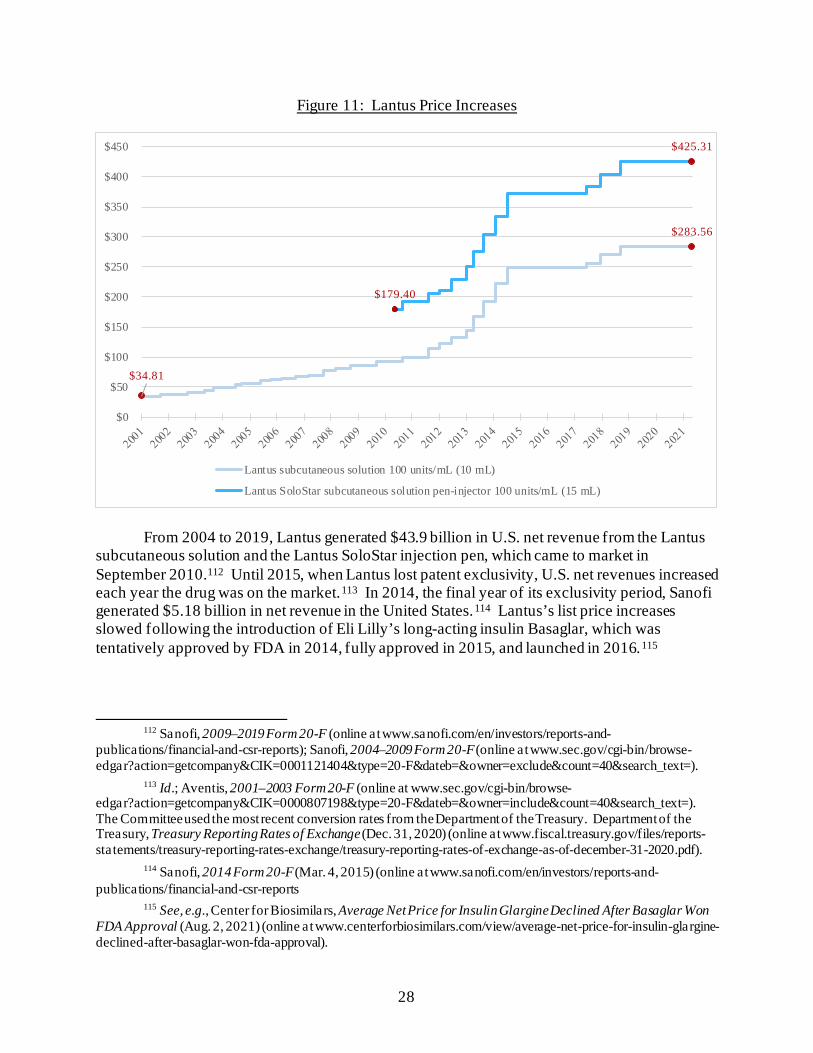
28
Figure 11: Lantus Price Increases
From 2004 to 2019, Lantus generated $43.9 billion in U.S. net revenue from the Lantus subcutaneous solution and the Lantus SoloStar injection pen, which came to market in September 2010.112 Until 2015, when Lantus lost patent exclusivity, U.S. net revenues increased each year the drug was on the market.113 In 2014, the final year of its exclusivity period, Sanofi generated $5.18 billion in net revenue in the United States.114 Lantus’s list price increases slowed following the introduction of Eli Lilly’s long-acting insulin Basaglar, which was tentatively approved by FDA in 2014, fully approved in 2015, and launched in 2016.115
112 Sanofi, 2009–2019 Form 20-F (online at www.sanofi.com/en/investors/reports-and-
publications/financial-and-csr-reports); Sanofi, 2004–2009 Form 20-F (online at www.sec.gov/cgi-bin/browse-edgar?action=getcompany&CIK=0001121404&type=20-F&dateb=&owner=exclude&count=40&search_text=).
113 Id.; Aventis, 2001–2003 Form 20-F (online at www.sec.gov/cgi-bin/browse-edgar?action=getcompany&CIK=0000807198&type=20-F&dateb=&owner=include&count=40&search_text=). The Committee used the most recent conversion rates from the Department of the Treasury. Department of the Treasury, Treasury Reporting Rates of Exchange (Dec. 31, 2020) (online at www.fiscal.treasury.gov/files/reports-statements/treasury-reporting-rates-exchange/treasury-reporting-rates-of-exchange-as-of-december-31-2020.pdf).
114 Sanofi, 2014 Form 20-F (Mar. 4, 2015) (online at www.sanofi.com/en/investors/reports-and-publications/financial-and-csr-reports
115 See, e.g., Center for Biosimilars, Average Net Price for Insulin Glargine Declined After Basaglar Won FDA Approval (Aug. 2, 2021) (online at www.centerforbiosimilars.com/view/average-net-price-for-insulin-glargine-declined-after-basaglar-won-fda-approval).
$34.81
$283.56
$179.40
$425.31
$0
$50
$100
$150
$200
$250
$300
$350
$400
$450
Lantus subcutaneous solution 100 units/mL (10 mL)
Lantus SoloStar subcutaneous solution pen-injector 100 units/mL (15 mL)
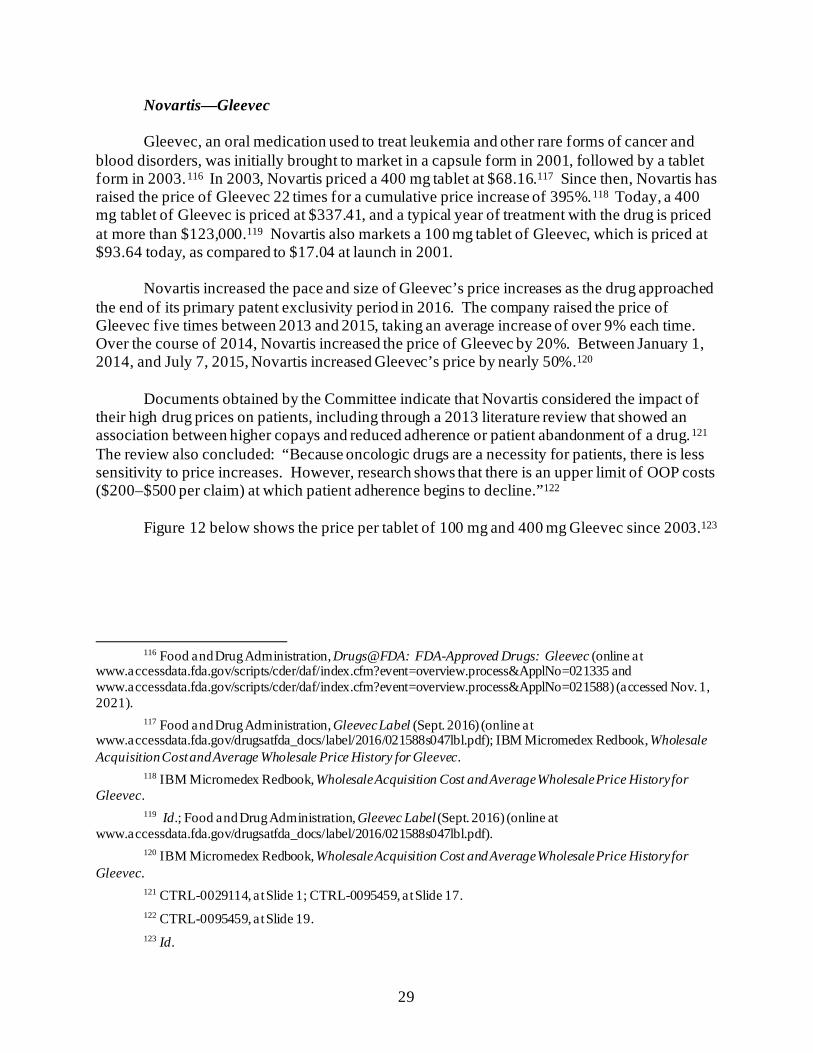
29
Novartis—Gleevec
Gleevec, an oral medication used to treat leukemia and other rare forms of cancer and blood disorders, was initially brought to market in a capsule form in 2001, followed by a tablet form in 2003.116 In 2003, Novartis priced a 400 mg tablet at $68.16.117 Since then, Novartis has raised the price of Gleevec 22 times for a cumulative price increase of 395%.118 Today, a 400 mg tablet of Gleevec is priced at $337.41, and a typical year of treatment with the drug is priced at more than $123,000.119 Novartis also markets a 100 mg tablet of Gleevec, which is priced at $93.64 today, as compared to $17.04 at launch in 2001.
Novartis increased the pace and size of Gleevec’s price increases as the drug approached
the end of its primary patent exclusivity period in 2016. The company raised the price of Gleevec five times between 2013 and 2015, taking an average increase of over 9% each time. Over the course of 2014, Novartis increased the price of Gleevec by 20%. Between January 1, 2014, and July 7, 2015, Novartis increased Gleevec’s price by nearly 50%.120
Documents obtained by the Committee indicate that Novartis considered the impact of
their high drug prices on patients, including through a 2013 literature review that showed an association between higher copays and reduced adherence or patient abandonment of a drug.121 The review also concluded: “Because oncologic drugs are a necessity for patients, there is less sensitivity to price increases. However, research shows that there is an upper limit of OOP costs ($200–$500 per claim) at which patient adherence begins to decline.”122
Figure 12 below shows the price per tablet of 100 mg and 400 mg Gleevec since 2003.123
116 Food and Drug Administration, Drugs@FDA: FDA-Approved Drugs: Gleevec (online at
www.accessdata.fda.gov/scripts/cder/daf/index.cfm?event=overview.process&ApplNo=021335 and www.accessdata.fda.gov/scripts/cder/daf/index.cfm?event=overview.process&ApplNo=021588) (accessed Nov. 1, 2021).
117 Food and Drug Administration, Gleevec Label (Sept. 2016) (online at www.accessdata.fda.gov/drugsatfda_docs/label/2016/021588s047lbl.pdf); IBM Micromedex Redbook, Wholesale Acquisition Cost and Average Wholesale Price History for Gleevec.
118 IBM Micromedex Redbook, Wholesale Acquisition Cost and Average Wholesale Price History for Gleevec.
119 Id.; Food and Drug Administration, Gleevec Label (Sept. 2016) (online at www.accessdata.fda.gov/drugsatfda_docs/label/2016/021588s047lbl.pdf).
120 IBM Micromedex Redbook, Wholesale Acquisition Cost and Average Wholesale Price History for Gleevec.
121 CTRL-0029114, at Slide 1; CTRL-0095459, at Slide 17. 122 CTRL-0095459, at Slide 19. 123 Id.
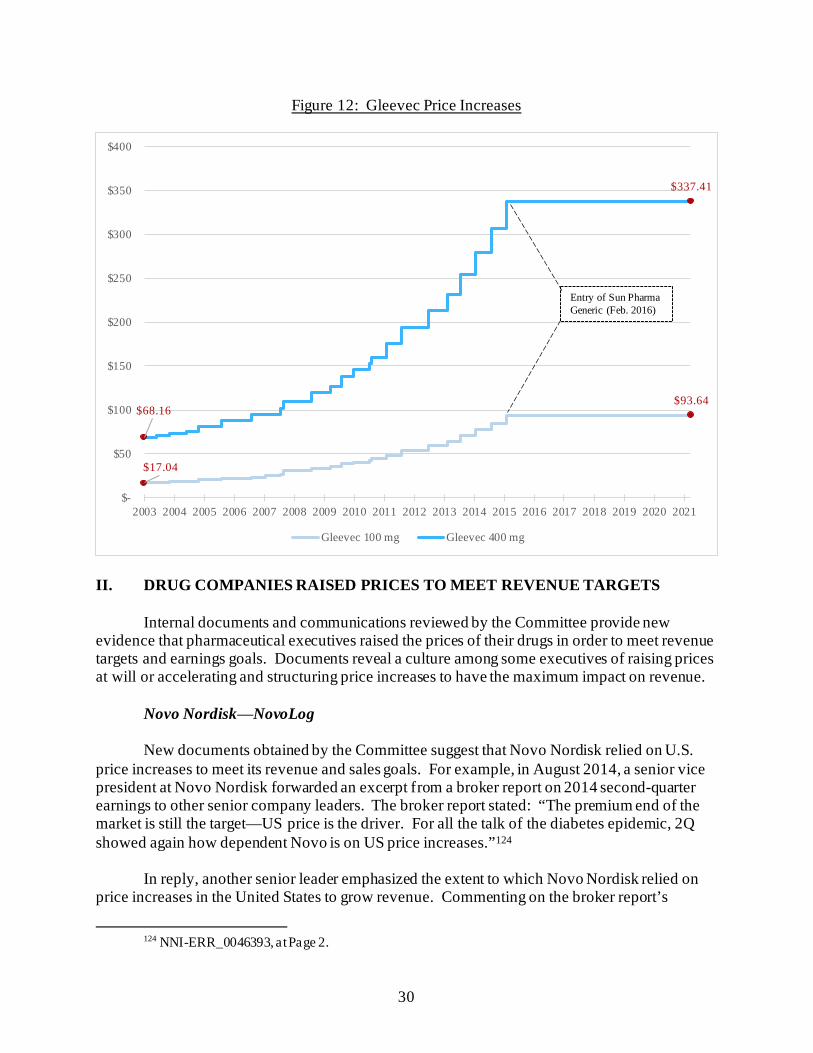
30
Figure 12: Gleevec Price Increases
II. DRUG COMPANIES RAISED PRICES TO MEET REVENUE TARGETS
Internal documents and communications reviewed by the Committee provide new evidence that pharmaceutical executives raised the prices of their drugs in order to meet revenue targets and earnings goals. Documents reveal a culture among some executives of raising prices at will or accelerating and structuring price increases to have the maximum impact on revenue.
Novo Nordisk⸺NovoLog
New documents obtained by the Committee suggest that Novo Nordisk relied on U.S. price increases to meet its revenue and sales goals. For example, in August 2014, a senior vice president at Novo Nordisk forwarded an excerpt from a broker report on 2014 second-quarter earnings to other senior company leaders. The broker report stated: “The premium end of the market is still the target—US price is the driver. For all the talk of the diabetes epidemic, 2Q showed again how dependent Novo is on US price increases.”124
In reply, another senior leader emphasized the extent to which Novo Nordisk relied on price increases in the United States to grow revenue. Commenting on the broker report’s
124 NNI-ERR_0046393, at Page 2.
$17.04
$93.64 $68.16
$337.41
$-
$50
$100
$150
$200
$250
$300
$350
$400
2003 2004 2005 2006 2007 2008 2009 2010 2011 2012 2013 2014 2015 2016 2017 2018 2019 2020 2021
Gleevec 100 mg Gleevec 400 mg
Entry of Sun Pharma Generic (Feb. 2016)
31
characterization that Novo Nordisk’s long-acting insulin Levemir “‘saved the day,’” the then-Director of Strategic Pricing wrote, “From the US perspective, price really did save the day overall because without price, Diabetes growth would have been -4% and total NNI [Novo Nordisk, Inc.] -3%.” He continued: “If we were to exclude Levimir [sic] price, we would have seen NNI’s total growth cut in half, to 6%. So in short, price really did save the day on our Q2 results and Levimir [sic] price contributed to half our growth.” The email further noted that a decrease in NovoLog sales volume was offset by price and explained, “Overall diabetes volume was down, but price brought us back to growth.”125
A sales training slide deck prepared in March 2015 further illustrates Novo Nordisk’s strategy of using price increases to meet increasing corporate revenue growth targets. In response to the question “Why do we keep raising list prices?” the presentation provided the following answers:
125 NNI-ERR_0046393, at Page 1.
32
• “Management expects 10%+ YoY [year-over-year] growth.”
• “Payer negotiations focused on net price”
• “Non-contracted volume optimization”126 The slide’s reference to “non-contracted” sales refers to sales not covered by an insurance
plan or pharmacy benefit manager (PBM) under contract with Novo Nordisk. These sales would presumably include patients who do not have insurance and who are responsible for the full list price of the drug.127
The slide further explored the limitations of growing revenues through increased sales
volumes, with the follow-up question, “Why can’t we go after more accounts?” The answers noted that the increasing sales volumes had “much lower margins” than simply raising the price.
• “Sanofi and Lilly able and willing to fight back.”
• “Volume upside at much lower margins.”
• “Price war = steep price erosion.”128
Sanofi⸺Lantus Internal Sanofi documents obtained by the Committee illustrate how the company used
price increases to drive revenues. A 2014 document prepared for sales representatives called “Turbo Charge Call Flow and Outline” explained, “Sales of Lantus are critical to hitting the quarterly earnings expectations that keeps our stock price growing.” The document further stated, “Last year’s sales goal was hit primarily because of two price increase [sic] totaling almost 18% growth in total revenue for Lantus.” The document noted, “Diabetes Division remains a bright spot for the company and represents about 50% of global profit.”129 This document pushed sales representatives to “sell with passion and enthusiasm” in order to meet earnings expectations.130 Another internal Sanofi presentation, titled “Lantus Price Action for Dec 2013,” evaluated accelerating a planned January 2014 price increase on Lantus in order to generate a “positive financial impact in ’13 and ’14.” By moving its planned 14.9% increase for vials and 9.9% increase for Lantus SoloStar pens to mid-December 2013, the presentation projected that
126 NNI-ERR_0072582, at Slide 26. 127 Id. 128 Id. The slide also appears to allude to the phenomenon of shadow pricing in the insulin market, where
PBMs have been successful in extracting larger rebates, and would-be competitors raise prices in lockstep to maintain so-called “pricing parity.” This concept is explored in more detail in Chapter 5.
129 SANOFI_COR_00049967, at Page 1. 130 Id., a t Page 3.
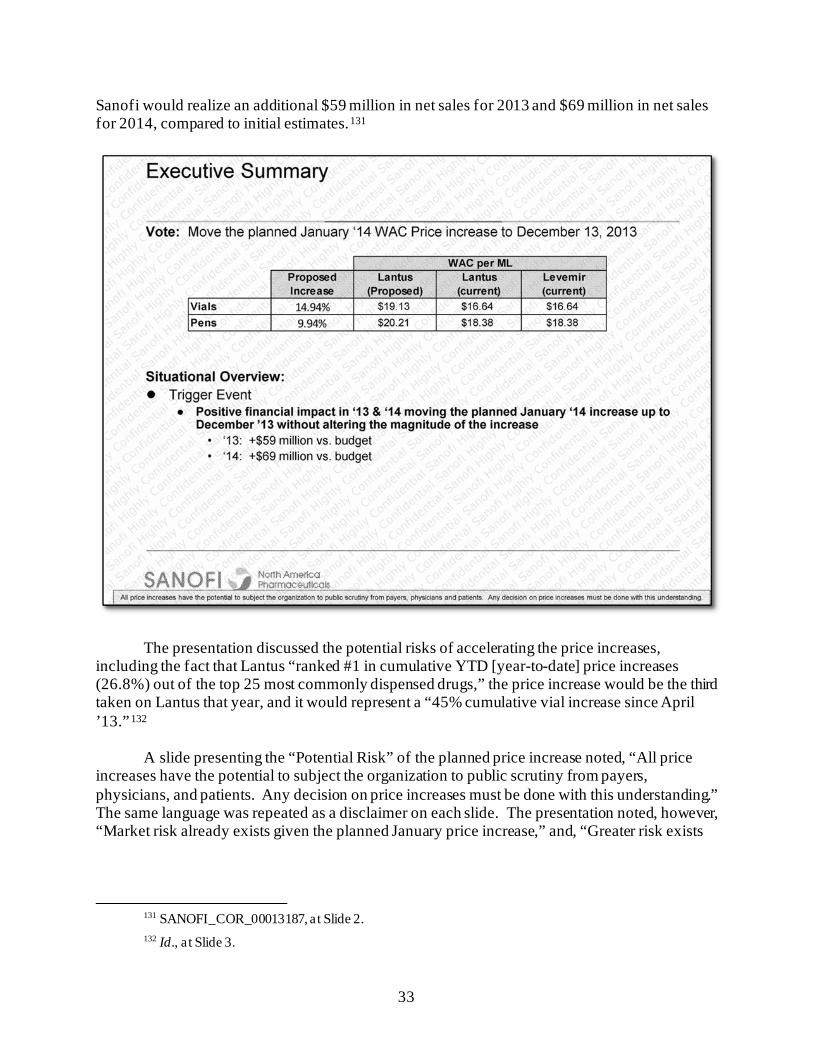
33
Sanofi would realize an additional $59 million in net sales for 2013 and $69 million in net sales for 2014, compared to initial estimates.131
The presentation discussed the potential risks of accelerating the price increases, including the fact that Lantus “ranked #1 in cumulative YTD [year-to-date] price increases (26.8%) out of the top 25 most commonly dispensed drugs,” the price increase would be the third taken on Lantus that year, and it would represent a “45% cumulative vial increase since April ’13.”132
A slide presenting the “Potential Risk” of the planned price increase noted, “All price increases have the potential to subject the organization to public scrutiny from payers, physicians, and patients. Any decision on price increases must be done with this understanding.” The same language was repeated as a disclaimer on each slide. The presentation noted, however, “Market risk already exists given the planned January price increase,” and, “Greater risk exists
131 SANOFI_COR_00013187, at Slide 2. 132 Id., a t Slide 3.
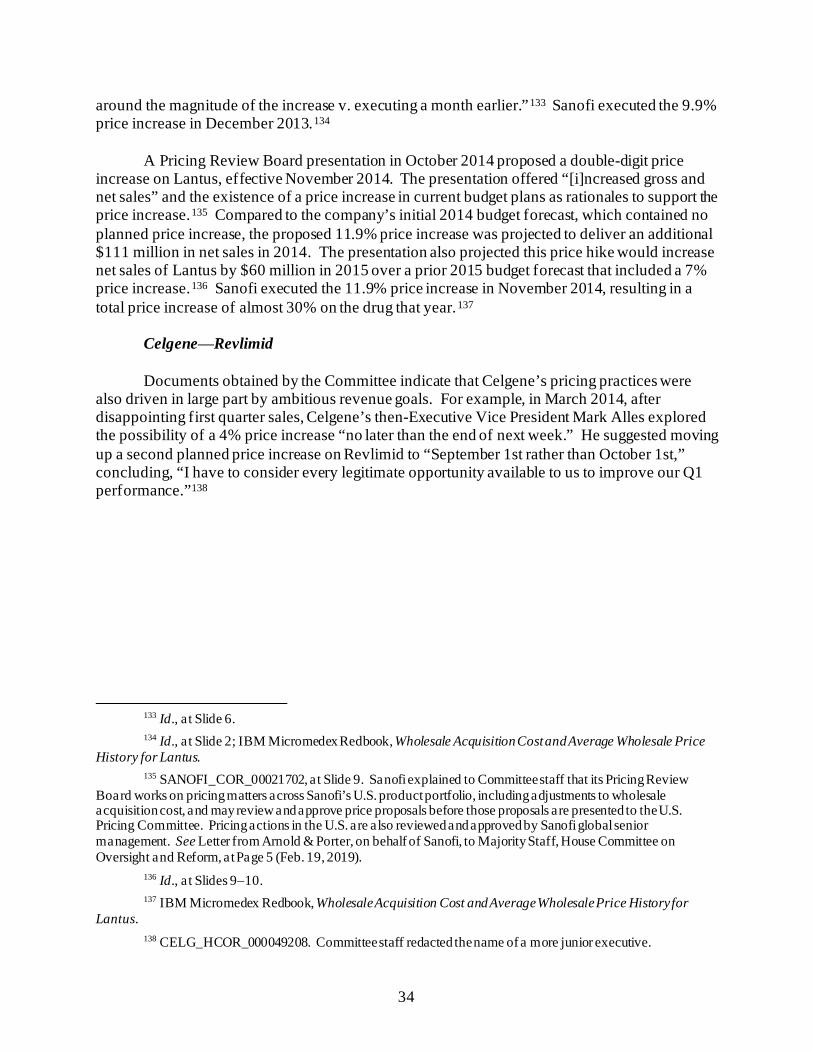
34
around the magnitude of the increase v. executing a month earlier.”133 Sanofi executed the 9.9% price increase in December 2013.134
A Pricing Review Board presentation in October 2014 proposed a double-digit price increase on Lantus, effective November 2014. The presentation offered “[i]ncreased gross and net sales” and the existence of a price increase in current budget plans as rationales to support the price increase.135 Compared to the company’s initial 2014 budget forecast, which contained no planned price increase, the proposed 11.9% price increase was projected to deliver an additional $111 million in net sales in 2014. The presentation also projected this price hike would increase net sales of Lantus by $60 million in 2015 over a prior 2015 budget forecast that included a 7% price increase.136 Sanofi executed the 11.9% price increase in November 2014, resulting in a total price increase of almost 30% on the drug that year.137
Celgene⸺Revlimid
Documents obtained by the Committee indicate that Celgene’s pricing practices were also driven in large part by ambitious revenue goals. For example, in March 2014, after disappointing first quarter sales, Celgene’s then-Executive Vice President Mark Alles explored the possibility of a 4% price increase “no later than the end of next week.” He suggested moving up a second planned price increase on Revlimid to “September 1st rather than October 1st,” concluding, “I have to consider every legitimate opportunity available to us to improve our Q1 performance.”138
133 Id., a t Slide 6. 134 Id., a t Slide 2; IBM Micromedex Redbook, Wholesale Acquisition Cost and Average Wholesale Price
History for Lantus. 135 SANOFI_COR_00021702, at Slide 9. Sanofi explained to Committee staff that its Pricing Review
Board works on pricing matters across Sanofi’s U.S. product portfolio, including adjustments to wholesale acquisition cost, and may review and approve price proposals before those proposals are presented to the U.S. Pricing Committee. Pricing actions in the U.S. are also reviewed and approved by Sanofi global senior management. See Letter from Arnold & Porter, on behalf of Sanofi, to Majority Staff, House Committee on Oversight and Reform, at Page 5 (Feb. 19, 2019).
136 Id., a t Slides 9–10. 137 IBM Micromedex Redbook, Wholesale Acquisition Cost and Average Wholesale Price History for
Lantus. 138 CELG_HCOR_000049208. Committee staff redacted the name of a more junior executive.
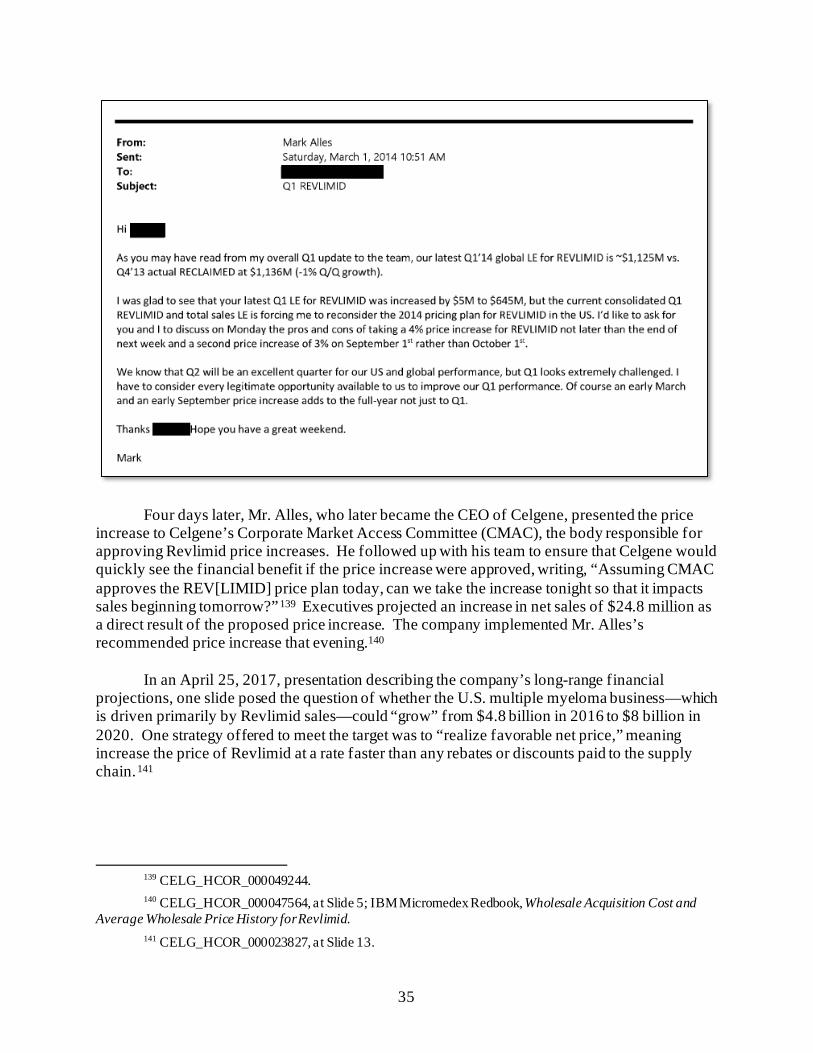
35
Four days later, Mr. Alles, who later became the CEO of Celgene, presented the price
increase to Celgene’s Corporate Market Access Committee (CMAC), the body responsible for approving Revlimid price increases. He followed up with his team to ensure that Celgene would quickly see the financial benefit if the price increase were approved, writing, “Assuming CMAC approves the REV[LIMID] price plan today, can we take the increase tonight so that it impacts sales beginning tomorrow?”139 Executives projected an increase in net sales of $24.8 million as a direct result of the proposed price increase. The company implemented Mr. Alles’s recommended price increase that evening.140
In an April 25, 2017, presentation describing the company’s long-range financial
projections, one slide posed the question of whether the U.S. multiple myeloma business—which is driven primarily by Revlimid sales—could “grow” from $4.8 billion in 2016 to $8 billion in 2020. One strategy offered to meet the target was to “realize favorable net price,” meaning increase the price of Revlimid at a rate faster than any rebates or discounts paid to the supply chain.141
139 CELG_HCOR_000049244. 140 CELG_HCOR_000047564, at Slide 5; IBM Micromedex Redbook, Wholesale Acquisition Cost and
Average Wholesale Price History for Revlimid. 141 CELG_HCOR_000023827, at Slide 13.
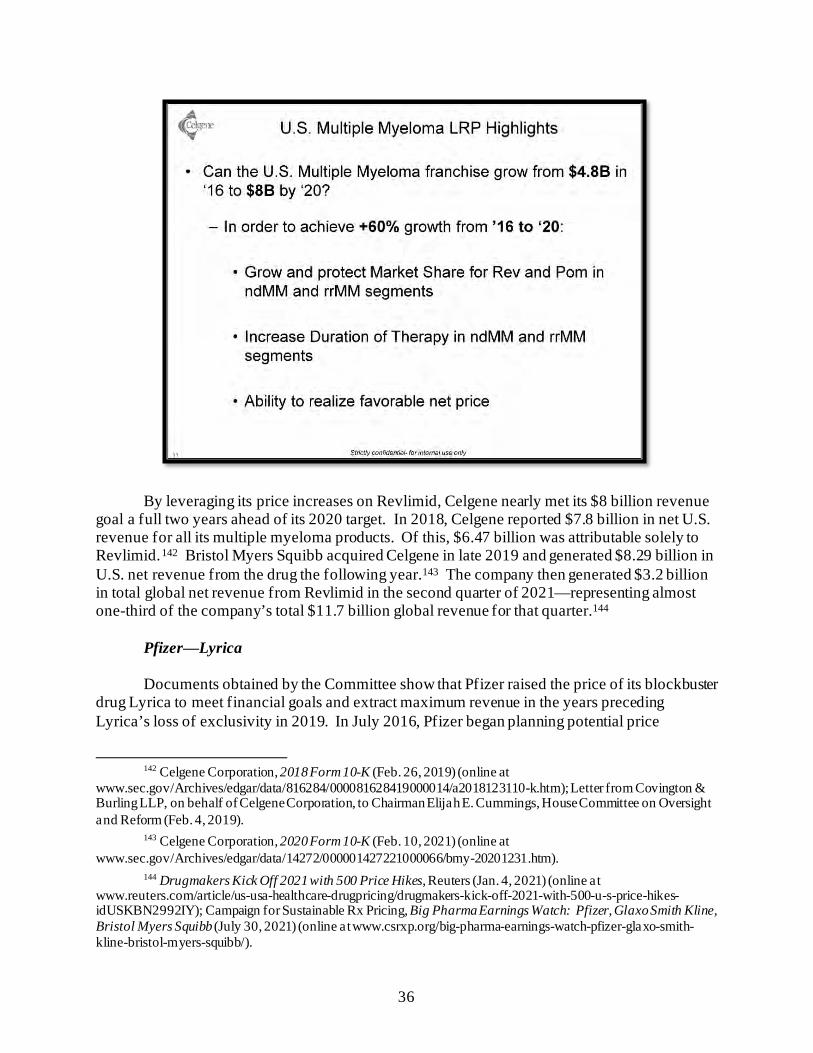
36
By leveraging its price increases on Revlimid, Celgene nearly met its $8 billion revenue
goal a full two years ahead of its 2020 target. In 2018, Celgene reported $7.8 billion in net U.S. revenue for all its multiple myeloma products. Of this, $6.47 billion was attributable solely to Revlimid.142 Bristol Myers Squibb acquired Celgene in late 2019 and generated $8.29 billion in U.S. net revenue from the drug the following year.143 The company then generated $3.2 billion in total global net revenue from Revlimid in the second quarter of 2021—representing almost one-third of the company’s total $11.7 billion global revenue for that quarter.144
Pfizer⸺Lyrica
Documents obtained by the Committee show that Pfizer raised the price of its blockbuster
drug Lyrica to meet financial goals and extract maximum revenue in the years preceding Lyrica’s loss of exclusivity in 2019. In July 2016, Pfizer began planning potential price
142 Celgene Corporation, 2018 Form 10-K (Feb. 26, 2019) (online at
www.sec.gov/Archives/edgar/data/816284/000081628419000014/a2018123110-k.htm); Letter from Covington & Burling LLP, on behalf of Celgene Corporation, to Chairman Elijah E. Cummings, House Committee on Oversight and Reform (Feb. 4, 2019).
143 Celgene Corporation, 2020 Form 10-K (Feb. 10, 2021) (online at www.sec.gov/Archives/edgar/data/14272/000001427221000066/bmy-20201231.htm).
144 Drugmakers Kick Off 2021 with 500 Price Hikes, Reuters (Jan. 4, 2021) (online at www.reuters.com/article/us-usa-healthcare-drugpricing/drugmakers-kick-off-2021-with-500-u-s-price-hikes-idUSKBN2992IY); Campaign for Sustainable Rx Pricing, Big Pharma Earnings Watch: Pfizer, Glaxo Smith Kline, Bristol Myers Squibb (July 30, 2021) (online at www.csrxp.org/big-pharma-earnings-watch-pfizer-glaxo-smith-kline-bristol-myers-squibb/).
37
increases on Lyrica for 2017 and beyond. As a part of this effort, senior managers circulated a model showing that “every 1% incremental price increase (twice a year) provides roughly 140M additional Net Sales over 2 years with all segments except Medicaid and Military.”145 An August 2016 email from Pfizer’s North America Internal Medicine Finance Team further highlighted the impact of Lyrica pricing decisions on the company’s overall revenue goals, stating: “Versus budget, the revenue shortfall for the month was driven by Lyrica (92%B) resulting primarily from the decision not to implement the budgeted mid-year price increase…”146 The email continued: “Versus prior year, revenues increased due to a positive price impact (9.4% Jan 2016), partially offset by lower demand.”147
Shortly after executing a 9.4% increase on Lyrica in January 2017, Pfizer’s Lyrica team
circulated a presentation with a slide titled “Lyrica-Maximizing the Value, Unlocking the Power.” The presentation noted that Lyrica sales represented almost half of the company’s internal medicine revenue and emphasized, “Opportunity Exists to Maximize the Asset prior to LOE [loss of exclusivity].”148
145 SRR_PFIZHCOR_00002156, at Page 1 (strategies were subject to legal and regulatory review and
approval before implementation). 146 SRR_PFIZHCOR_00006962, at Page 1. 147 Id., a t Page 2. 148 SRR_PFIZHCOR_00009966.00001, at Slide 3.
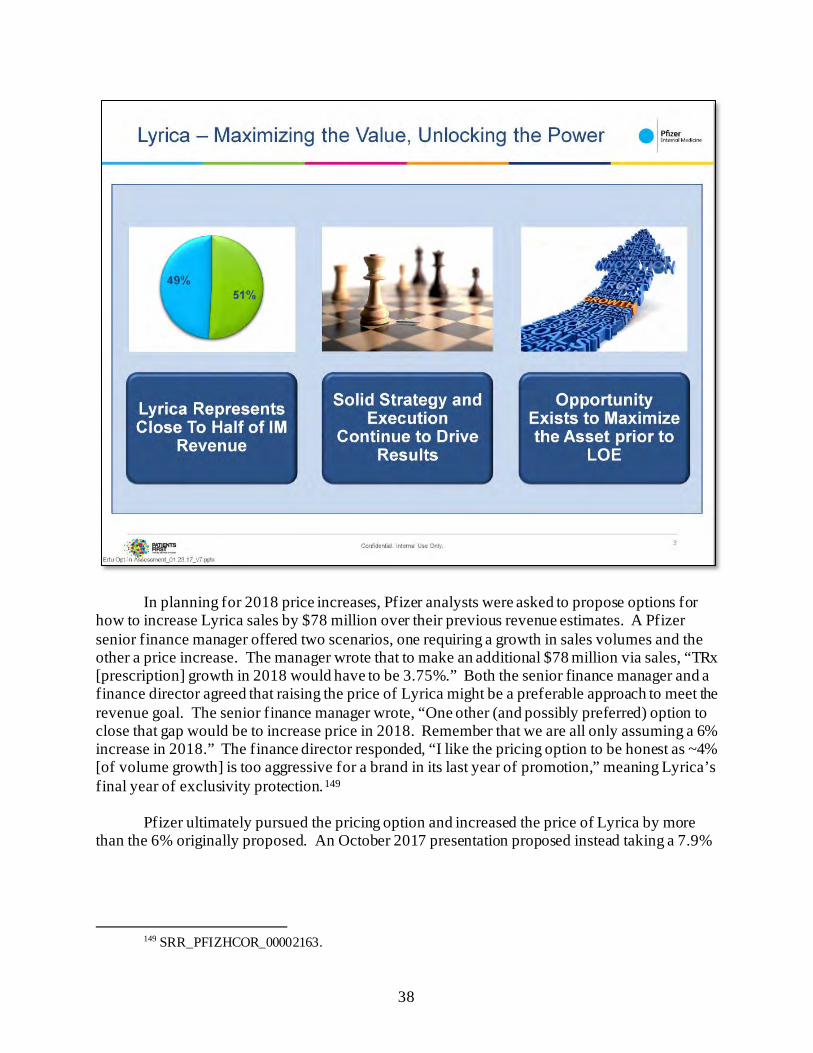
38
In planning for 2018 price increases, Pfizer analysts were asked to propose options for how to increase Lyrica sales by $78 million over their previous revenue estimates. A Pfizer senior finance manager offered two scenarios, one requiring a growth in sales volumes and the other a price increase. The manager wrote that to make an additional $78 million via sales, “TRx [prescription] growth in 2018 would have to be 3.75%.” Both the senior finance manager and a finance director agreed that raising the price of Lyrica might be a preferable approach to meet the revenue goal. The senior finance manager wrote, “One other (and possibly preferred) option to close that gap would be to increase price in 2018. Remember that we are all only assuming a 6% increase in 2018.” The finance director responded, “I like the pricing option to be honest as ~4% [of volume growth] is too aggressive for a brand in its last year of promotion,” meaning Lyrica’s final year of exclusivity protection.149
Pfizer ultimately pursued the pricing option and increased the price of Lyrica by more
than the 6% originally proposed. An October 2017 presentation proposed instead taking a 7.9%
149 SRR_PFIZHCOR_00002163.
39
price increase in January 2018, projecting the increase would yield $460 million in gross sales and $100 million in net sales.150 Pfizer executed this price increase as planned.151
Pfizer attempted to raise the price of Lyrica by an additional 4% in July 2018, but
decided to roll back the increase—along with planned price increases on approximately 40 other drugs—after criticism from the public and elected officials.152 This rollback was only temporary, however. Pfizer once again increased the price of Lyrica by 5% on January 15, 2019.153
Other companies in the Committee’s investigation also used price increases to reach revenue goals and compensate for lower sales volumes.
Mallinckrodt⸺Acthar
Prior to acquiring Acthar from Questcor Pharmaceuticals in August 2014, Mallinckrodt executives described the potential transaction as “a unique opportunity that should be pursued urgently” because Acthar was a “premium-priced product” with a “robust cash flow profile” that would allow the company to “[a]chieve aspirational goals with a single transaction.”154 After acquisition, Mallinckrodt executives acknowledged that the company used price increases to meet revenue goals when experiencing a decline in sales volume. For example, in a July 2017 email, Executive Vice President Hugh O’Neill wrote, “The vast majority of the projected growth for Acthar in 2017 will come from price appreciation as opposed to volume growth.” He went on to write that the price increase reflected “the need to dig out of the hole created by the significant loss of returning patients.”155
Amgen⸺Sensipar and Enbrel
Documents obtained by the Committee show that Amgen executives routinely raised the
prices of Sensipar and Enbrel to meet increasingly aggressive sales targets and projections. An internal “Global Product Strategy” presentation prepared in March 2018 described Amgen’s pricing strategy:
150 SRR_PFIZHCOR_00001980, at Slide 15. 151 IBM Micromedex Redbook, Wholesale Acquisition Cost and Average Wholesale Price History for
Lyrica. 152 IBM Micromedex Redbook, Wholesale Acquisition Cost History and Average Wholesale Price History
for Lyrica; Pfizer Inc., Press Release: Pfizer Announces It Will Defer Company’s Price Increases (July 10, 2018) (online at https://investors.pfizer.com/investor-news/press-release-details/2018/Pfizers-Announces-It-Will-Defer-Companys-Price-Increases/default.aspx); see Trump Says Pfizer, Others “Should Be Ashamed” for Raising Drug Prices, CNBC (July 9, 2018) (online at www.cnbc.com/2018/07/09/trump-says-pfizer-others-should-be-ashamed-for-raising-drug-prices.html).
153 IBM Micromedex Redbook, Wholesale Acquisition Cost and Average Wholesale Price History for Lyrica.
154 MNK_InCamera-000000128109, at Slide 6; MNK_InCamera-000000142599, at Slides 3, 4, 16. 155 MNK_InCamera-000000013838.
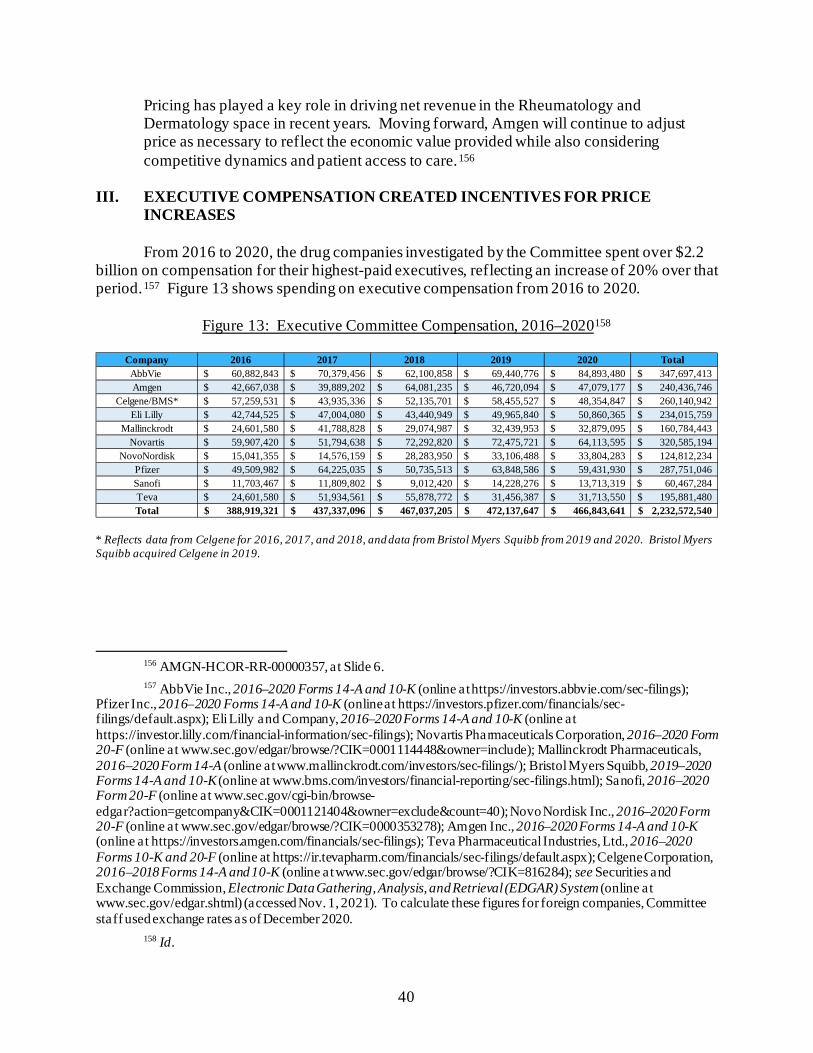
40
Pricing has played a key role in driving net revenue in the Rheumatology and Dermatology space in recent years. Moving forward, Amgen will continue to adjust price as necessary to reflect the economic value provided while also considering competitive dynamics and patient access to care.156
III. EXECUTIVE COMPENSATION CREATED INCENTIVES FOR PRICE
INCREASES
From 2016 to 2020, the drug companies investigated by the Committee spent over $2.2 billion on compensation for their highest-paid executives, reflecting an increase of 20% over that period.157 Figure 13 shows spending on executive compensation from 2016 to 2020.
Figure 13: Executive Committee Compensation, 2016–2020158
* Reflects data from Celgene for 2016, 2017, and 2018, and data from Bristol Myers Squibb from 2019 and 2020. Bristol Myers Squibb acquired Celgene in 2019.
156 AMGN-HCOR-RR-00000357, at Slide 6. 157 AbbVie Inc., 2016–2020 Forms 14-A and 10-K (online at https://investors.abbvie.com/sec-filings);
Pfizer Inc., 2016–2020 Forms 14-A and 10-K (online at https://investors.pfizer.com/financials/sec-filings/default.aspx); Eli Lilly and Company, 2016–2020 Forms 14-A and 10-K (online at https://investor.lilly.com/financial-information/sec-filings); Novartis Pharmaceuticals Corporation, 2016–2020 Form 20-F (online at www.sec.gov/edgar/browse/?CIK=0001114448&owner=include); Mallinckrodt Pharmaceuticals, 2016–2020 Form 14-A (online at www.mallinckrodt.com/investors/sec-filings/); Bristol Myers Squibb, 2019–2020 Forms 14-A and 10-K (online at www.bms.com/investors/financial-reporting/sec-filings.html); Sanofi, 2016–2020 Form 20-F (online at www.sec.gov/cgi-bin/browse-edgar?action=getcompany&CIK=0001121404&owner=exclude&count=40); Novo Nordisk Inc., 2016–2020 Form 20-F (online at www.sec.gov/edgar/browse/?CIK=0000353278); Amgen Inc., 2016–2020 Forms 14-A and 10-K (online at https://investors.amgen.com/financials/sec-filings); Teva Pharmaceutical Industries, Ltd., 2016–2020 Forms 10-K and 20-F (online at https://ir.tevapharm.com/financials/sec-filings/default.aspx); Celgene Corporation, 2016–2018 Forms 14-A and 10-K (online at www.sec.gov/edgar/browse/?CIK=816284); see Securities and Exchange Commission, Electronic Data Gathering, Analysis, and Retrieval (EDGAR) System (online at www.sec.gov/edgar.shtml) (accessed Nov. 1, 2021). To calculate these figures for foreign companies, Committee staff used exchange rates as of December 2020.
158 Id.
Company 2016 2017 2018 2019 2020 Total AbbVie 60,882,843$ 70,379,456$ 62,100,858$ 69,440,776$ 84,893,480$ 347,697,413$ Amgen 42,667,038$ 39,889,202$ 64,081,235$ 46,720,094$ 47,079,177$ 240,436,746$
Celgene/BMS* 57,259,531$ 43,935,336$ 52,135,701$ 58,455,527$ 48,354,847$ 260,140,942$ Eli Lilly 42,744,525$ 47,004,080$ 43,440,949$ 49,965,840$ 50,860,365$ 234,015,759$
Mallinckrodt 24,601,580$ 41,788,828$ 29,074,987$ 32,439,953$ 32,879,095$ 160,784,443$ Novartis 59,907,420$ 51,794,638$ 72,292,820$ 72,475,721$ 64,113,595$ 320,585,194$
NovoNordisk 15,041,355$ 14,576,159$ 28,283,950$ 33,106,488$ 33,804,283$ 124,812,234$ Pfizer 49,509,982$ 64,225,035$ 50,735,513$ 63,848,586$ 59,431,930$ 287,751,046$ Sanofi 11,703,467$ 11,809,802$ 9,012,420$ 14,228,276$ 13,713,319$ 60,467,284$ Teva 24,601,580$ 51,934,561$ 55,878,772$ 31,456,387$ 31,713,550$ 195,881,480$ Total 388,919,321$ 437,337,096$ 467,037,205$ 472,137,647$ 466,843,641$ 2,232,572,540$
41
CEO compensation accounted for a substantial portion of executive committee compensation during this period.159 For example, AbbVie paid CEO Richard Gonzalez nearly $170 million between 2013 and 2020, as AbbVie raised the price of Humira 14 times from approximately $1,000 per syringe to nearly $3,000 per syringe.160 Between 2014 and 2018, as Pfizer increased the price of Lyrica by more than 100%, the company paid CEO Ian Read approximately $100 million in compensation.161 The CEOs of the ten companies investigated by the Committee have been paid in aggregate more than $797 million in the last five years.162 Figure 14 details spending on CEO compensation from 2016 to 2020.
159 Some of the companies investigated by the Committee stated that they set executive pay in reference to
other companies, creating a peer group of similar corporations to establish benchmarks for appropriate compensation by indexing executive pay against a peer group of pharmaceutical companies, all of which award pay based on meeting revenue targets. See, e.g., Letter from King & Spalding, on behalf of Pfizer Inc., to Chairwoman Carolyn B. Maloney, House Committee on Oversight and Reform, at Page 4 (Nov. 22, 2019); Bristol Myers Squibb, 2020 Form 10-K (Feb. 24, 2020) (online at www.sec.gov/ix?doc=/Archives/edgar/data/1121404/000112140421000004/sny-20201231.htm#i1f86168c9674446ab74e270f17b85350_235 pg. 106).
160 Committee staff calculated this figure using the summary compensation tables from AbbVie’s annual Securities and Exchange Commission filings between 2013 and 2021. See AbbVie Inc., Proxy Statements (2013–2020) (online at www.sec.gov/cgi-bin/browse-edgar?CIK=1551152); IBM Micromedex Redbook, Wholesale Acquisition Cost and Average Wholesale Price History for Humira.
161 Letter from King & Spalding, on behalf of Pfizer Inc., to Chairman Elijah E. Cummings, House Committee on Oversight and Reform, at Pages 8–9 (Mar. 4, 2019).
162 AbbVie Inc., 2016–2020 Forms 14-A and 10-K (online at https://investors.abbvie.com/sec-filings); Pfizer, 2016–2020 Forms 14-A and 10-K (online at https://investors.pfizer.com/financials/sec-filings/default.aspx); Eli Lilly and Company, 2016–2020 Forms 14-A and 10-K (online at https://investor.lilly.com/financial-information/sec-filings); Novartis Pharmaceuticals Corporation, 2017–2020 Form 20-F (online at www.sec.gov/edgar/browse/?CIK=0001114448&owner=include); Mallinckrodt Pharmaceuticals, 2016–2020 Form 14-A (online at www.mallinckrodt.com/investors/sec-filings/); Bristol Myers Squibb, 2018–2020 Forms 14-A and 10-K (online at www.bms.com/investors/financial-reporting/sec-filings.html); Sanofi, 2017–2020 Form 20-F (online at www.sec.gov/cgi-bin/browse-edgar?action=getcompany&CIK=0001121404&owner=exclude&count=40); Novo Nordisk Inc., 2016–2020 Form 20-F (online at www.sec.gov/edgar/browse/?CIK=0000353278); Amgen, Forms 14-A and 10-K (2017–2021) (online at https://investors.amgen.com/financials/sec-filings); Teva Pharmaceutical Industries, Ltd., 2016–2020 Forms 10-K and 20-F (online at https://ir.tevapharm.com/financials/sec-filings/default.aspx); Celgene Corporation, 2016–2018 Forms 14-A and 10-K (online at www.sec.gov/edgar/browse/?CIK=816284). To calculate these figures for companies using foreign currencies, Committee staff used exchange rates current as of July 1, 2021.
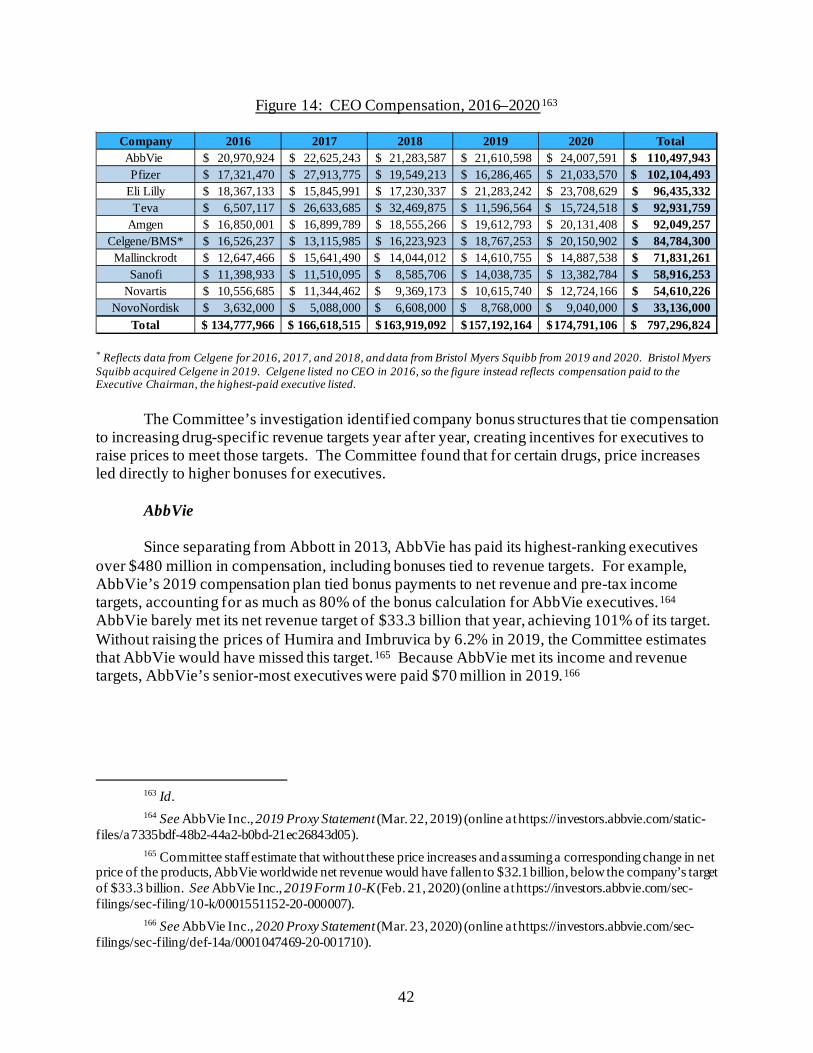
42
Figure 14: CEO Compensation, 2016–2020163
* Reflects data from Celgene for 2016, 2017, and 2018, and data from Bristol Myers Squibb from 2019 and 2020. Bristol Myers Squibb acquired Celgene in 2019. Celgene listed no CEO in 2016, so the figure instead reflects compensation paid to the Executive Chairman, the highest-paid executive listed.
The Committee’s investigation identified company bonus structures that tie compensation to increasing drug-specific revenue targets year after year, creating incentives for executives to raise prices to meet those targets. The Committee found that for certain drugs, price increases led directly to higher bonuses for executives.
AbbVie Since separating from Abbott in 2013, AbbVie has paid its highest-ranking executives
over $480 million in compensation, including bonuses tied to revenue targets. For example, AbbVie’s 2019 compensation plan tied bonus payments to net revenue and pre-tax income targets, accounting for as much as 80% of the bonus calculation for AbbVie executives.164 AbbVie barely met its net revenue target of $33.3 billion that year, achieving 101% of its target. Without raising the prices of Humira and Imbruvica by 6.2% in 2019, the Committee estimates that AbbVie would have missed this target.165 Because AbbVie met its income and revenue targets, AbbVie’s senior-most executives were paid $70 million in 2019.166
163 Id. 164 See AbbVie Inc., 2019 Proxy Statement (Mar. 22, 2019) (online at https://investors.abbvie.com/static-
files/a7335bdf-48b2-44a2-b0bd-21ec26843d05). 165 Committee staff estimate that without these price increases and assuming a corresponding change in net
price of the products, AbbVie worldwide net revenue would have fallen to $32.1 billion, below the company’s target of $33.3 billion. See AbbVie Inc., 2019 Form 10-K (Feb. 21, 2020) (online at https://investors.abbvie.com/sec-filings/sec-filing/10-k/0001551152-20-000007).
166 See AbbVie Inc., 2020 Proxy Statement (Mar. 23, 2020) (online at https://investors.abbvie.com/sec-filings/sec-filing/def-14a/0001047469-20-001710).
Company 2016 2017 2018 2019 2020 TotalAbbVie 20,970,924$ 22,625,243$ 21,283,587$ 21,610,598$ 24,007,591$ 110,497,943$ Pfizer 17,321,470$ 27,913,775$ 19,549,213$ 16,286,465$ 21,033,570$ 102,104,493$
Eli Lilly 18,367,133$ 15,845,991$ 17,230,337$ 21,283,242$ 23,708,629$ 96,435,332$ Teva 6,507,117$ 26,633,685$ 32,469,875$ 11,596,564$ 15,724,518$ 92,931,759$
Amgen 16,850,001$ 16,899,789$ 18,555,266$ 19,612,793$ 20,131,408$ 92,049,257$ Celgene/BMS* 16,526,237$ 13,115,985$ 16,223,923$ 18,767,253$ 20,150,902$ 84,784,300$ Mallinckrodt 12,647,466$ 15,641,490$ 14,044,012$ 14,610,755$ 14,887,538$ 71,831,261$
Sanofi 11,398,933$ 11,510,095$ 8,585,706$ 14,038,735$ 13,382,784$ 58,916,253$ Novartis 10,556,685$ 11,344,462$ 9,369,173$ 10,615,740$ 12,724,166$ 54,610,226$
NovoNordisk 3,632,000$ 5,088,000$ 6,608,000$ 8,768,000$ 9,040,000$ 33,136,000$ Total 134,777,966$ 166,618,515$ 163,919,092$ 157,192,164$ 174,791,106$ 797,296,824$
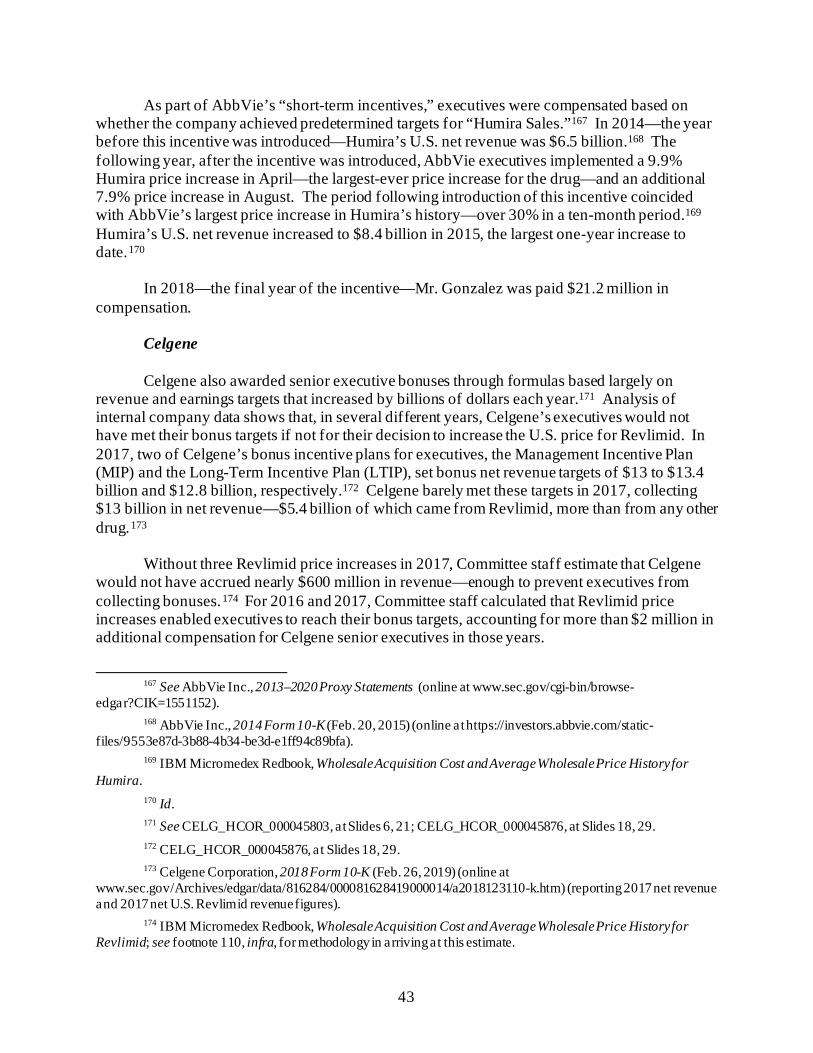
43
As part of AbbVie’s “short-term incentives,” executives were compensated based on whether the company achieved predetermined targets for “Humira Sales.”167 In 2014—the year before this incentive was introduced—Humira’s U.S. net revenue was $6.5 billion.168 The following year, after the incentive was introduced, AbbVie executives implemented a 9.9% Humira price increase in April—the largest-ever price increase for the drug—and an additional 7.9% price increase in August. The period following introduction of this incentive coincided with AbbVie’s largest price increase in Humira’s history—over 30% in a ten-month period.169 Humira’s U.S. net revenue increased to $8.4 billion in 2015, the largest one-year increase to date.170
In 2018—the final year of the incentive—Mr. Gonzalez was paid $21.2 million in compensation.
Celgene Celgene also awarded senior executive bonuses through formulas based largely on revenue and earnings targets that increased by billions of dollars each year.171 Analysis of internal company data shows that, in several different years, Celgene’s executives would not have met their bonus targets if not for their decision to increase the U.S. price for Revlimid. In 2017, two of Celgene’s bonus incentive plans for executives, the Management Incentive Plan (MIP) and the Long-Term Incentive Plan (LTIP), set bonus net revenue targets of $13 to $13.4 billion and $12.8 billion, respectively.172 Celgene barely met these targets in 2017, collecting $13 billion in net revenue—$5.4 billion of which came from Revlimid, more than from any other drug.173 Without three Revlimid price increases in 2017, Committee staff estimate that Celgene would not have accrued nearly $600 million in revenue—enough to prevent executives from collecting bonuses.174 For 2016 and 2017, Committee staff calculated that Revlimid price increases enabled executives to reach their bonus targets, accounting for more than $2 million in additional compensation for Celgene senior executives in those years.
167 See AbbVie Inc., 2013–2020 Proxy Statements (online at www.sec.gov/cgi-bin/browse-
edgar?CIK=1551152). 168 AbbVie Inc., 2014 Form 10-K (Feb. 20, 2015) (online at https://investors.abbvie.com/static-
files/9553e87d-3b88-4b34-be3d-e1ff94c89bfa). 169 IBM Micromedex Redbook, Wholesale Acquisition Cost and Average Wholesale Price History for
Humira. 170 Id. 171 See CELG_HCOR_000045803, at Slides 6, 21; CELG_HCOR_000045876, at Slides 18, 29. 172 CELG_HCOR_000045876, at Slides 18, 29. 173 Celgene Corporation, 2018 Form 10-K (Feb. 26, 2019) (online at
www.sec.gov/Archives/edgar/data/816284/000081628419000014/a2018123110-k.htm) (reporting 2017 net revenue and 2017 net U.S. Revlimid revenue figures).
174 IBM Micromedex Redbook, Wholesale Acquisition Cost and Average Wholesale Price History for Revlimid; see footnote 110, infra, for methodology in arriving at this estimate.
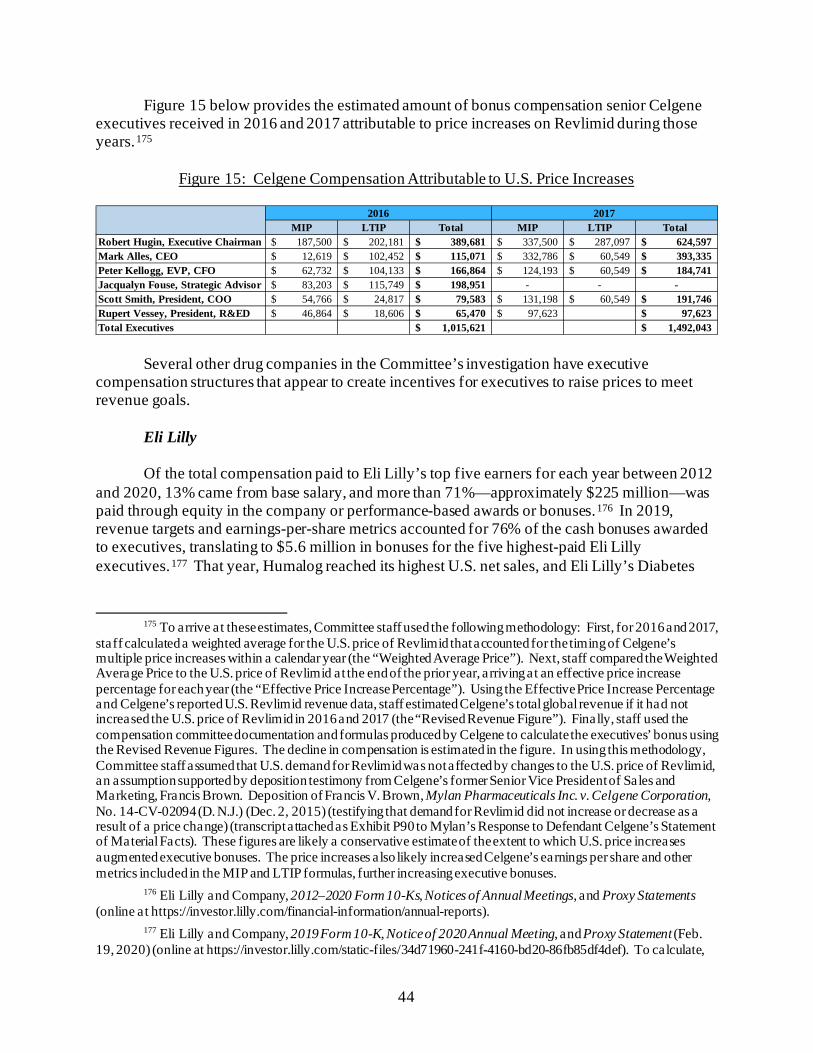
44
Figure 15 below provides the estimated amount of bonus compensation senior Celgene executives received in 2016 and 2017 attributable to price increases on Revlimid during those years.175
Figure 15: Celgene Compensation Attributable to U.S. Price Increases
Several other drug companies in the Committee’s investigation have executive compensation structures that appear to create incentives for executives to raise prices to meet revenue goals.
Eli Lilly Of the total compensation paid to Eli Lilly’s top five earners for each year between 2012
and 2020, 13% came from base salary, and more than 71%—approximately $225 million—was paid through equity in the company or performance-based awards or bonuses.176 In 2019, revenue targets and earnings-per-share metrics accounted for 76% of the cash bonuses awarded to executives, translating to $5.6 million in bonuses for the five highest-paid Eli Lilly executives.177 That year, Humalog reached its highest U.S. net sales, and Eli Lilly’s Diabetes
175 To arrive at these estimates, Committee staff used the following methodology: First, for 2016 and 2017,
staff calculated a weighted average for the U.S. price of Revlimid that accounted for the timing of Celgene’s multiple price increases within a calendar year (the “Weighted Average Price”). Next, staff compared the Weighted Average Price to the U.S. price of Revlimid at the end of the prior year, arriving at an effective price increase percentage for each year (the “Effective Price Increase Percentage”). Using the Effective Price Increase Percentage and Celgene’s reported U.S. Revlimid revenue data, staff estimated Celgene’s total global revenue if it had not increased the U.S. price of Revlimid in 2016 and 2017 (the “Revised Revenue Figure”). Finally, staff used the compensation committee documentation and formulas produced by Celgene to calculate the executives’ bonus using the Revised Revenue Figures. The decline in compensation is estimated in the figure. In using this methodology, Committee staff assumed that U.S. demand for Revlimid was not affected by changes to the U.S. price of Revlimid, an assumption supported by deposition testimony from Celgene’s former Senior Vice President of Sales and Marketing, Francis Brown. Deposition of Francis V. Brown, Mylan Pharmaceuticals Inc. v. Celgene Corporation, No. 14-CV-02094 (D. N.J.) (Dec. 2, 2015) (testifying that demand for Revlimid did not increase or decrease as a result of a price change) (transcript attached as Exhibit P90 to Mylan’s Response to Defendant Celgene’s Statement of Material Facts). These figures are likely a conservative estimate of the extent to which U.S. price increases augmented executive bonuses. The price increases also likely increased Celgene’s earnings per share and other metrics included in the MIP and LTIP formulas, further increasing executive bonuses.
176 Eli Lilly and Company, 2012–2020 Form 10-Ks, Notices of Annual Meetings, and Proxy Statements (online at https://investor.lilly.com/financial-information/annual-reports).
177 Eli Lilly and Company, 2019 Form 10-K, Notice of 2020 Annual Meeting, and Proxy Statement (Feb. 19, 2020) (online at https://investor.lilly.com/static-files/34d71960-241f-4160-bd20-86fb85df4def). To calculate,
MIP LTIP Total MIP LTIP Total Robert Hugin, Executive Chairman 187,500$ 202,181$ 389,681$ 337,500$ 287,097$ 624,597$ Mark Alles, CEO 12,619$ 102,452$ 115,071$ 332,786$ 60,549$ 393,335$ Peter Kellogg, EVP, CFO 62,732$ 104,133$ 166,864$ 124,193$ 60,549$ 184,741$ Jacqualyn Fouse, Strategic Advisor 83,203$ 115,749$ 198,951$ - - - Scott Smith, President, COO 54,766$ 24,817$ 79,583$ 131,198$ 60,549$ 191,746$ Rupert Vessey, President, R&ED 46,864$ 18,606$ 65,470$ 97,623$ 97,623$ Total Executives 1,015,621$ 1,492,043$
2016 2017
45
and Endocrinology products generated more than $12.8 billion in gross revenue—more than 57% of the company’s total revenue for the year.178
Pfizer
Incentive compensation linked to revenue targets accounted for more than 80% of top
executives’ annual compensation packages in 2018.179 More than half of the company’s internal medicine sales and more than 9% of Pfizer’s overall revenue in 2017 and 2018 came from sales of Lyrica—one of more than 300 products sold by the company. From 2014 to 2018—the five years prior to loss of exclusivity—Pfizer executives raised the price of Lyrica by more than 100%. Over the same period, members of the Executive Committee were paid over $260 million in compensation. Pfizer’s CEO earned a total of approximately $100 million in compensation from 2014 to 2018.
Sanofi In 2015, the year that primary patents expired on Sanofi’s basal insulin Lantus, 10% of
the Sanofi CEO’s variable compensation award derived from “improvement of the Diabetes franchise and the successful launch of Toujeo [a more concentrated version of Lantus] in the United States.”180
Teva In response to a February 2017 advisory notice that generic competition to Copaxone had
been delayed, one Teva executive wrote to colleagues that the delay “[m]ight be good for cash flow and debt pay down and some of your bonuses.”181
Committee staff summed the non-equity incentive plan compensation figures for 2019 and divided this total by the proportions for the bonus multiples of the earnings per share and revenue targets, as detailed in the annual report.
178 Id. 179 Pfizer Inc., Proxy Statement for 2019 Annual Meeting (Mar. 14, 2019) (online at
https://s21.q4cdn.com/317678438/files/doc_financials/interactive_proxy/2019/images/Pfizer-Proxy2019.pdf); Pfizer Inc., 2018 Form 10-K (Feb. 28, 2019) (online at http://d18rn0p25nwr6d.cloudfront.net/CIK-0000078003/6b8a74bb-3702-4c0a-a181-70df2b0e5cfb.pdf). Public filings show that 40% of the annual short-term bonus formula was based on achieving yearly revenue targets and another 40% was based on earnings targets. The short-term bonus formula is weighted as follows: 40% revenue, 40% adjusted diluted earnings per share (EPS), and 20% cash flow from operations.
180 Sanofi, 2015 Form 20-F (Mar. 4, 2016) (online at www.sanofi.com/-/media/Project/One-Sanofi-Web/Websites/Global/Sanofi-COM/Home/en/investors/docs/S-Z/Sanofi_20-F_2015_V2.pdf).
181 TEVA_HCO_IC_005008955 (February 2017 email regarding delay of generic Copaxone 40 mg because of fill/finish issues).
46
IV. PRICE INCREASES EXCEEDED REBATES
The pharmaceutical industry often claims price increases are justified to account for negotiated rebates, discounts, and other fees provided to PBMs and other third parties within the commercial distribution chain. Drug manufacturers claim that these discounts and rebates cause them to capture only a fraction of their price increases.182 The Pharmaceutical Research and Manufacturers of America (PhRMA), the pharmaceutical industry’s trade association, has claimed that “nearly 50% of brand medicine spending goes to the supply chain and others.”183
Documents and information obtained by the Committee refute this justification for
raising prices. Internal company data obtained by the Committee reveals that the net price⸺the price of a drug after accounting for all discounts and rebates⸺for nearly all of the drugs examined increased as list prices increased between 2009 and 2018, meaning rebates or discounts from the list price in those years were outpaced by the company’s price increases. As a result, the net prices for all of the drugs examined are significantly higher today than at their launch.184 The net prices of nearly all of the drugs in the Committee’s investigation increased
182 See, e.g., Big Pharma’s Go-To Defense of Soaring Drug Prices Doesn’t Add Up, The Atlantic (Mar. 23,
2019) (online at www.theatlantic.com/health/archive/2019/03/drug-prices-high-cost-research-and-development/585253/); Drug Makers Try to Justify Prescription Prices to Senators at Hearing, New York Times (Feb. 26, 2019) (online at www.nytimes.com/2019/02/26/us/politics/prescription-drug-prices.html).
183 Pharmaceutical Research and Manufacturers of America, Let’s Talk About Cost (online at www.letstalkaboutcost.org/) (accessed Nov. 1, 2021).
184 If increases in the list price of a drug directly mirror increases in rebate and discount amounts, the net price of that drug would be expected to remain flat over time. If, however, the increases in list price for a drug outpaced the increases in discounts and rebate amounts, the net price of the drug would be expected to rise. The net prices for the nine non-insulin drugs investigated by the Committee increased each year the drugs were on the market. In the insulin market, net price increased each year until the mid-2010s; in more recent years, insurance plans and PBMs have been able to use their negotiating power to secure higher rebates from insulin manufacturers in exchange for preferred placement on covered drug lists, resulting in the stabilization of net price. PBMs have also been successful in moderating price increases through the use of contractual price protection clauses, which provide additional rebates when manufacturers raise a drug’s wholesale acquisition cost, or list price, above a certain percentage over a set period of time. See Majority and Minority Staffs, Senate Committee on Finance, Insulin: Examining the Factors Driving the Rising Cost of a Century Old Drug (Jan. 2021) (online at www.finance.senate.gov/imo/media/doc/Grassley-Wyden%20Insulin%20Report%20(FINAL%201).pdf); Insulin
47
every single year between 2009 and 2018.185 Documents obtained by the Committee further show that, despite their public claims, executives internally acknowledged that their companies’ price increases cannot be entirely attributed to growing rebates or discounts provided to PBMs, health insurance plans, or other payers. In addition, documents show that PBMs secured contractual provisions that disincentivized drug companies from raising list prices. Without those provisions secured by PBMs, drug companies likely would have raised list prices more.
AbbVie⸺Humira
AbbVie’s price increases on its blockbuster arthritis drug Humira considerably outpaced increases in contractual rebates. Documents produced to the Committee show that from 2009 to 2018, the net price of Humira increased by 110% across the Medicare, Medicaid, and commercial channels. Within the Medicare channel, the net price of Humira increased by 151%—from $17,184 to $43,159. Similarly, within the commercial channel, the net price of Humira increased by 137%—from $17,833 to $42,418.186
Figure 16 shows the overall annual net price of Humira across all channels, compared to the drug’s list price, from 2009 to 2018.187
Prices Soar While Drugmakers’ Share Stays Flat, Wall Street Journal (Oct. 7, 2016) (online at www.wsj.com/articles/insulin-prices-soar-while-drugmakers-share-stays-flat-1475876764).
185 The net prices of Humira, Lyrica, Revlimid, and NovoLog Flexpen increased every year from 2009 to 2018. The net price of Imbruvica also increased every year between its market entrance in 2013 and 2018.
186 Letter from Gibson, Dunn and Crutcher LLP, on behalf of AbbVie Inc., to Chairwoman Carolyn B. Maloney, House Committee on Oversight and Reform (Sept. 11, 2020).
187 Id.
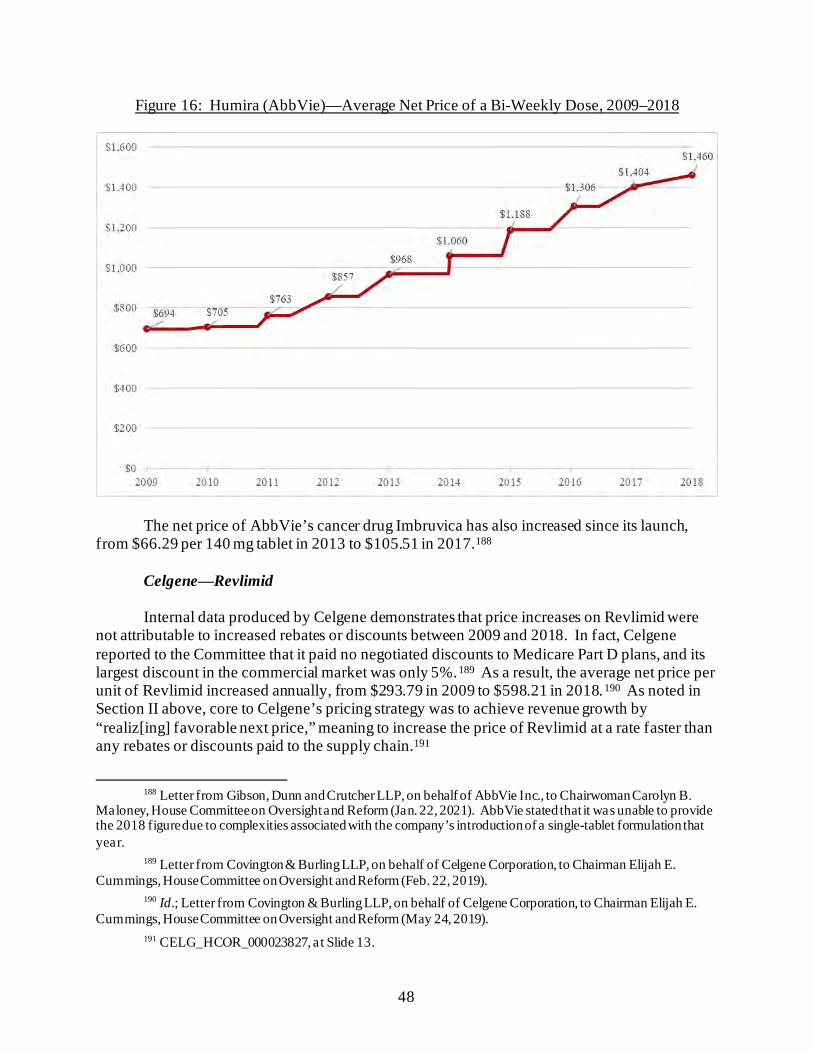
48
Figure 16: Humira (AbbVie)—Average Net Price of a Bi-Weekly Dose, 2009–2018
The net price of AbbVie’s cancer drug Imbruvica has also increased since its launch, from $66.29 per 140 mg tablet in 2013 to $105.51 in 2017.188
Celgene⸺Revlimid
Internal data produced by Celgene demonstrates that price increases on Revlimid were not attributable to increased rebates or discounts between 2009 and 2018. In fact, Celgene reported to the Committee that it paid no negotiated discounts to Medicare Part D plans, and its largest discount in the commercial market was only 5%.189 As a result, the average net price per unit of Revlimid increased annually, from $293.79 in 2009 to $598.21 in 2018.190 As noted in Section II above, core to Celgene’s pricing strategy was to achieve revenue growth by “realiz[ing] favorable next price,” meaning to increase the price of Revlimid at a rate faster than any rebates or discounts paid to the supply chain.191
188 Letter from Gibson, Dunn and Crutcher LLP, on behalf of AbbVie Inc., to Chairwoman Carolyn B.
Maloney, House Committee on Oversight and Reform (Jan. 22, 2021). AbbVie stated that it was unable to provide the 2018 figure due to complexities associated with the company’s introduction of a single-tablet formulation that year.
189 Letter from Covington & Burling LLP, on behalf of Celgene Corporation, to Chairman Elijah E. Cummings, House Committee on Oversight and Reform (Feb. 22, 2019).
190 Id.; Letter from Covington & Burling LLP, on behalf of Celgene Corporation, to Chairman Elijah E. Cummings, House Committee on Oversight and Reform (May 24, 2019).
191 CELG_HCOR_000023827, at Slide 13.
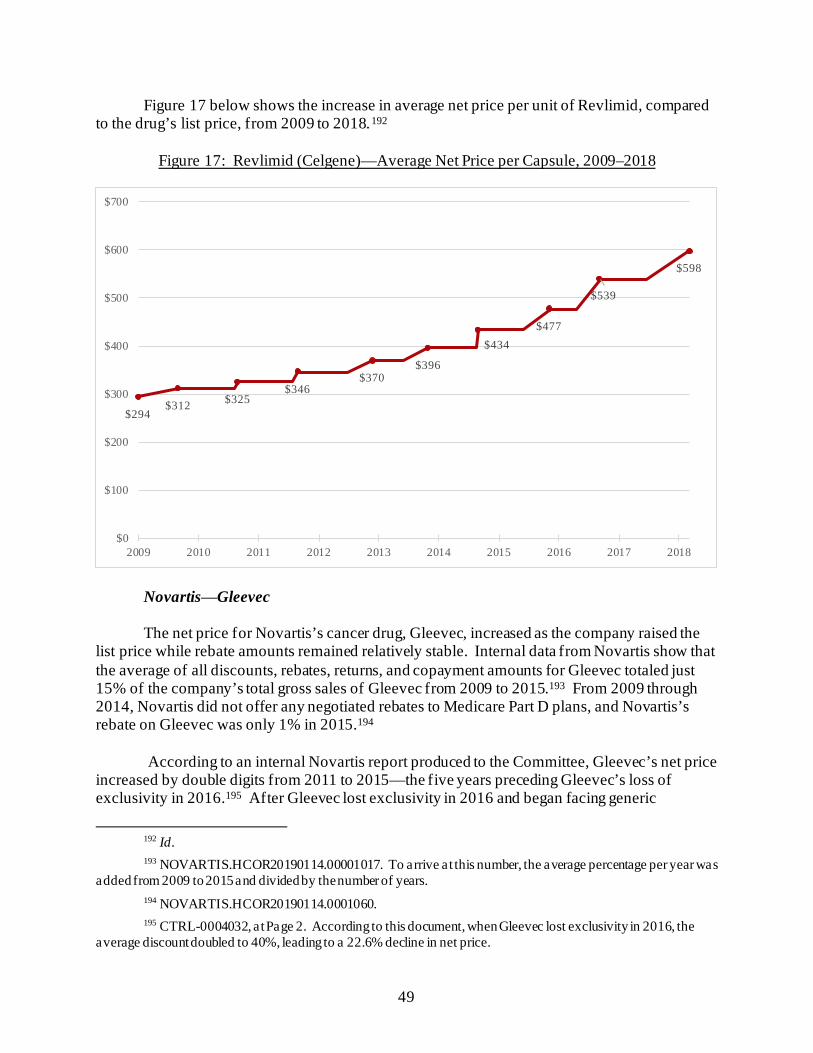
49
Figure 17 below shows the increase in average net price per unit of Revlimid, compared to the drug’s list price, from 2009 to 2018.192
Figure 17: Revlimid (Celgene)—Average Net Price per Capsule, 2009–2018
Novartis⸺Gleevec
The net price for Novartis’s cancer drug, Gleevec, increased as the company raised the list price while rebate amounts remained relatively stable. Internal data from Novartis show that the average of all discounts, rebates, returns, and copayment amounts for Gleevec totaled just 15% of the company’s total gross sales of Gleevec from 2009 to 2015.193 From 2009 through 2014, Novartis did not offer any negotiated rebates to Medicare Part D plans, and Novartis’s rebate on Gleevec was only 1% in 2015.194
According to an internal Novartis report produced to the Committee, Gleevec’s net price
increased by double digits from 2011 to 2015—the five years preceding Gleevec’s loss of exclusivity in 2016.195 After Gleevec lost exclusivity in 2016 and began facing generic
192 Id. 193 NOVARTIS.HCOR20190114.00001017. To arrive at this number, the average percentage per year was
added from 2009 to 2015 and divided by the number of years. 194 NOVARTIS.HCOR20190114.0001060. 195 CTRL-0004032, at Page 2. According to this document, when Gleevec lost exclusivity in 2016, the
average discount doubled to 40%, leading to a 22.6% decline in net price.
$294$312 $325
$346$370
$396
$434$477
$539
$598
$0
$100
$200
$300
$400
$500
$600
$700
2009 2010 2011 2012 2013 2014 2015 2016 2017 2018
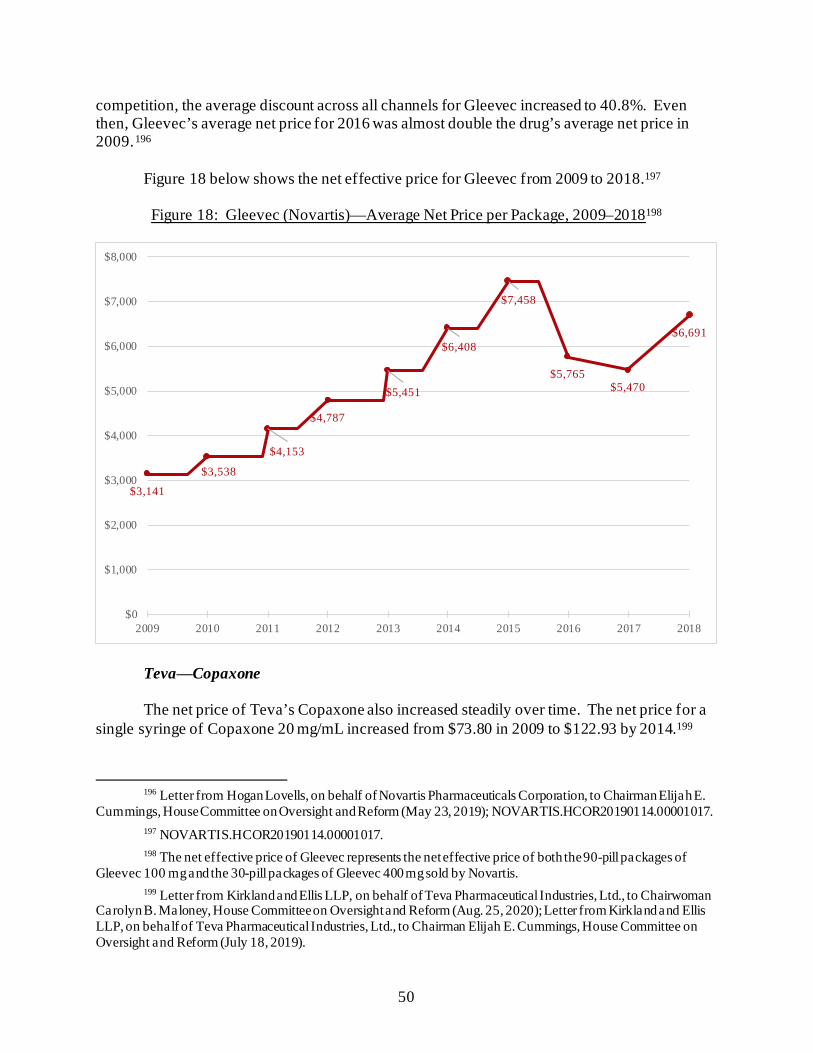
50
competition, the average discount across all channels for Gleevec increased to 40.8%. Even then, Gleevec’s average net price for 2016 was almost double the drug’s average net price in 2009.196
Figure 18 below shows the net effective price for Gleevec from 2009 to 2018.197 Figure 18: Gleevec (Novartis)—Average Net Price per Package, 2009–2018198
Teva⸺Copaxone The net price of Teva’s Copaxone also increased steadily over time. The net price for a single syringe of Copaxone 20 mg/mL increased from $73.80 in 2009 to $122.93 by 2014.199
196 Letter from Hogan Lovells, on behalf of Novartis Pharmaceuticals Corporation, to Chairman Elijah E.
Cummings, House Committee on Oversight and Reform (May 23, 2019); NOVARTIS.HCOR20190114.00001017. 197 NOVARTIS.HCOR20190114.00001017. 198 The net effective price of Gleevec represents the net effective price of both the 90-pill packages of
Gleevec 100 mg and the 30-pill packages of Gleevec 400 mg sold by Novartis. 199 Letter from Kirkland and Ellis LLP, on behalf of Teva Pharmaceutical Industries, Ltd., to Chairwoman
Carolyn B. Maloney, House Committee on Oversight and Reform (Aug. 25, 2020); Letter from Kirkland and Ellis LLP, on behalf of Teva Pharmaceutical Industries, Ltd., to Chairman Elijah E. Cummings, House Committee on Oversight and Reform (July 18, 2019).
$3,141
$3,538
$4,153
$4,787
$5,451
$6,408
$7,458
$5,765$5,470
$6,691
$0
$1,000
$2,000
$3,000
$4,000
$5,000
$6,000
$7,000
$8,000
2009 2010 2011 2012 2013 2014 2015 2016 2017 2018
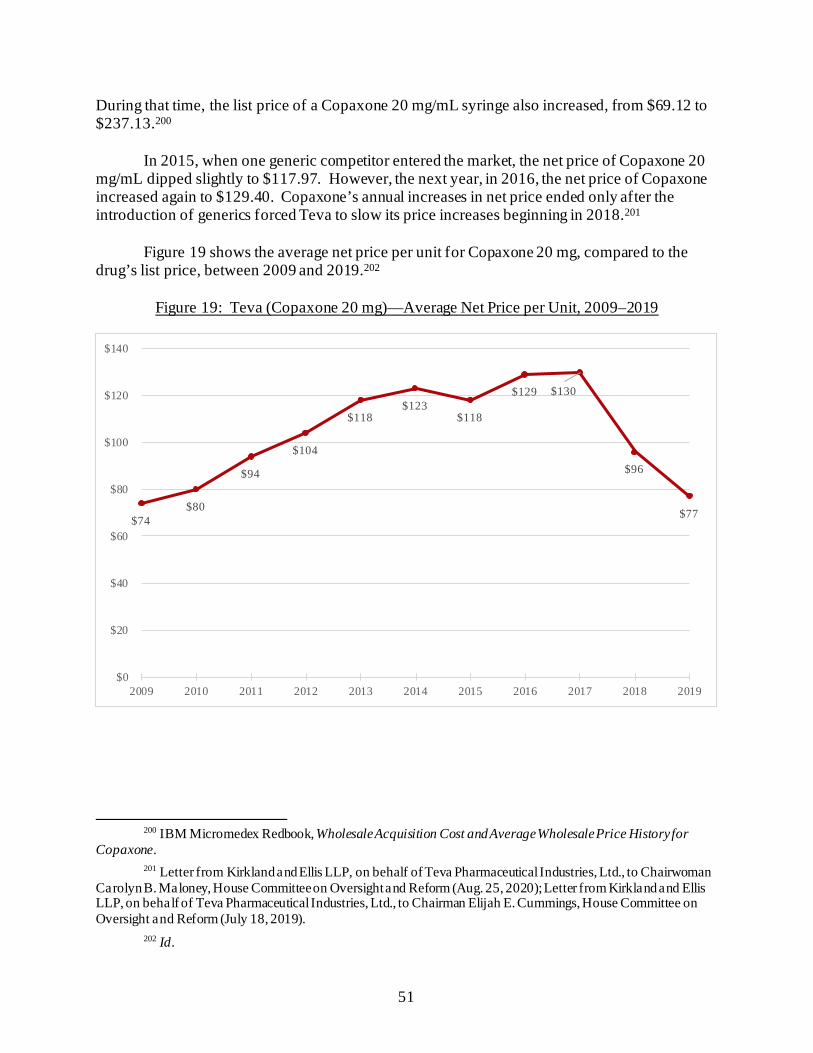
51
During that time, the list price of a Copaxone 20 mg/mL syringe also increased, from $69.12 to $237.13.200
In 2015, when one generic competitor entered the market, the net price of Copaxone 20 mg/mL dipped slightly to $117.97. However, the next year, in 2016, the net price of Copaxone increased again to $129.40. Copaxone’s annual increases in net price ended only after the introduction of generics forced Teva to slow its price increases beginning in 2018.201
Figure 19 shows the average net price per unit for Copaxone 20 mg, compared to the
drug’s list price, between 2009 and 2019.202
Figure 19: Teva (Copaxone 20 mg)—Average Net Price per Unit, 2009–2019
200 IBM Micromedex Redbook, Wholesale Acquisition Cost and Average Wholesale Price History for
Copaxone. 201 Letter from Kirkland and Ellis LLP, on behalf of Teva Pharmaceutical Industries, Ltd., to Chairwoman
Carolyn B. Maloney, House Committee on Oversight and Reform (Aug. 25, 2020); Letter from Kirkland and Ellis LLP, on behalf of Teva Pharmaceutical Industries, Ltd., to Chairman Elijah E. Cummings, House Committee on Oversight and Reform (July 18, 2019).
202 Id.
$74 $80
$94
$104
$118 $123
$118
$129 $130
$96
$77
$0
$20
$40
$60
$80
$100
$120
$140
2009 2010 2011 2012 2013 2014 2015 2016 2017 2018 2019
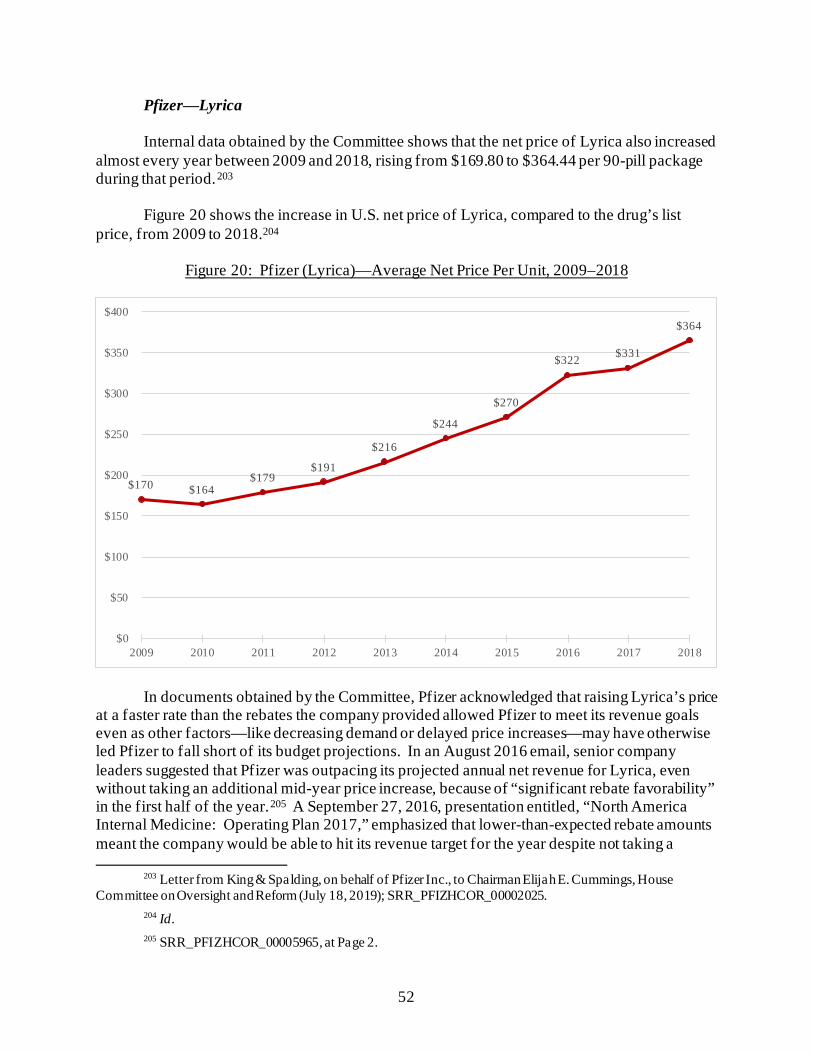
52
Pfizer⸺Lyrica Internal data obtained by the Committee shows that the net price of Lyrica also increased almost every year between 2009 and 2018, rising from $169.80 to $364.44 per 90-pill package during that period.203
Figure 20 shows the increase in U.S. net price of Lyrica, compared to the drug’s list price, from 2009 to 2018.204
Figure 20: Pfizer (Lyrica)—Average Net Price Per Unit, 2009–2018
In documents obtained by the Committee, Pfizer acknowledged that raising Lyrica’s price at a faster rate than the rebates the company provided allowed Pfizer to meet its revenue goals even as other factors—like decreasing demand or delayed price increases—may have otherwise led Pfizer to fall short of its budget projections. In an August 2016 email, senior company leaders suggested that Pfizer was outpacing its projected annual net revenue for Lyrica, even without taking an additional mid-year price increase, because of “significant rebate favorability” in the first half of the year.205 A September 27, 2016, presentation entitled, “North America Internal Medicine: Operating Plan 2017,” emphasized that lower-than-expected rebate amounts meant the company would be able to hit its revenue target for the year despite not taking a
203 Letter from King & Spalding, on behalf of Pfizer Inc., to Chairman Elijah E. Cummings, House
Committee on Oversight and Reform (July 18, 2019); SRR_PFIZHCOR_00002025. 204 Id. 205 SRR_PFIZHCOR_00005965, at Page 2.
$170 $164$179
$191
$216
$244
$270
$322 $331
$364
$0
$50
$100
$150
$200
$250
$300
$350
$400
2009 2010 2011 2012 2013 2014 2015 2016 2017 2018
53
previously planned price increase, stating “On Track to Deliver 100% of FY Budget Despite Elimination of Mid Year PI [price increase].”206
Pfizer also acknowledged in internal documents that although some of its contracts with
insurance plans and PBMs in the Medicare and commercial channels included substantial rebates, a large portion of Lyrica’s sales were not impacted by rebates. In assessing the impact of Lyrica price increases in 2016 and 2017, an internal Pfizer presentation noted, “Since significant portion of gross sales is unrebated, price increases will offset impact of price protection among top accounts in Commercial and Medicare.”207 Unrebated gross sales would presumably include sales to patients paying full price for their prescription drugs.
Insulin From 2009 to 2013, Eli Lilly, Sanofi, and Novo Nordisk raised the prices of Humalog,
Lantus, and NovoLog, respectively, with corresponding increases in net price.208 Since 2013, insurance plans and PBMs have been able to use their negotiating power to secure higher rebates from insulin manufacturers in the Medicare and commercial channels in exchange for placement on covered drug lists, or formularies.209 While data show that these higher rebates were accompanied by corresponding reductions in net price, the Committee’s investigation also reveals that the net prices for these three drugs remain significantly higher than they were at their launch.210
According to Eli Lilly documents, Humalog’s net price peaked in 2013. In 2001, Humalog’s list price was $41.84, and its net price was $36.59. In 2013, when the list price hit $164.69, Humalog’s net price reached $80.46. Even as the net price of Humalog decreased
206 SRR_PFIZHCOR_00006962, at Pages 29–30 (notes on page 21 of slide deck). Pfizer took a 9.4% price
increase on January 1, 2017, and then took another 9.4% price increase on June 1, 2017. IBM Micromedex Redbook, Wholesale Acquisition Cost and Average Wholesale Price History for Lyrica.
207 SRR_PFIZHCOR_00000001; SRR_PFIZHCOR_00000002. 208 See, e.g., SANOFI_COR_00093935, at Slide 10 (an internal Sanofi document showing Lantus’s net
price increasing by 98.4% from 2007 to 2014); COR-BOX-00024053, at Page 2 (an internal Eli Lilly document showing the net price of Humalog at $36.59 in 2001 and steadily increasing each year until 2013, when the net price peaked at $80.46).
209 PBMs have been successful in moderating price increases through the use of contractual price protection clauses, which provide additional rebates when manufacturers raise a drug’s wholesale acquisition cost, or list price, above a certain percentage over a set period of time. See Majority and Minority Staffs, Senate Committee on Finance, Insulin: Examining the Factors Driving the Rising Cost of a Century Old Drug (Jan. 2021) (online at www.finance.senate.gov/imo/media/doc/Grassley-Wyden%20Insulin%20Report%20(FINAL%201).pdf); Insulin Prices Soar While Drugmakers’ Share Stays Flat, Wall Street Journal (Oct. 7, 2016) (online at www.wsj.com/articles/insulin-prices-soar-while-drugmakers-share-stays-flat-1475876764).
210 In the years before rebates began to increase, taxpayers lost out on billions of dollars in potential savings that were provided to other federal health care programs but not to Medicare. See Majority Staff, House Committee on Oversight and Reform, Lost Savings: How Prohibiting Medicare Negotiation Has Cost Taxpayers (Sept. 23, 2021) (online at https://oversight.house.gov/sites/democrats.oversight.house.gov/files/COR%20Staff%20Report--Lost%20Savings%20-%20How%20Prohibiting%20Medicare%20Negotiation%20Has%20Cost%20Taxpayers.pdf).
54
slightly over the next three years, the drug’s 2016 net price of $70.30 was still nearly double the net price at launch.211
Humalog’s net price has stabilized since 2016. According to data provided by Eli Lilly to the Committee, the net price of the Humalog U-100 Kwikpen was $26 in both 2013 and 2014. Following an increase in net price to $28 in 2015, the Kwikpen’s net price dropped to $24 in 2016, where it remained through 2018.212 The net price of Sanofi’s Lantus also increased every year between 2005 and 2014 as Sanofi raised its list price. One internal pricing review presentation from April 2017 noted that Lantus’s net price had increased from $46.52 per unit in 2005 to $119.28 per unit in 2014—more than doubling the net price of the drug over nine years.213 According to internal data provided to the Committee by Novo Nordisk, the net price of NovoLog also increased despite increased rebates, from $80.09 in 2009 to $107.61 in 2018.214 V. RECOMMENDATIONS
The Committee’s investigation shows that uninhibited price increases have fueled corporate profits and executive compensation and that drug companies raise prices in order to meet revenue targets. Data obtained by the Committee undermines claims by the pharmaceutical industry that rebates provided to PBMs are the primary driver of price increases.
• Support Medicare Negotiation: Congress should support reforms, like those in
the Build Back Better Act, to enable Medicare to negotiate lower list prices to ensure that seniors and taxpayers are not exploited for pharmaceutical profits.
• Disincentivize Price Increases: Congress should support reforms, like those in
the Build Back Better Act, to disincentivize companies from taking price
211 COR-BOX-00024053, at Page 2. 212 Letter from Joe Kelley, Vice President, Global Government Affairs, Eli Lilly, to Chairman Elijah E.
Cummings, House Committee on Oversight and Reform (Feb. 4, 2019). 213 SANOFI_COR_00093935, at Slide 10. Since 2014, the net price for Lantus has decreased, even as list
prices have increased. According to Sanofi’s annual pricing report, the net price of Lantus decreased by 53% from 2012 to 2020 while the list price increased by 141%. The decline in net price corresponds with an 82% increase in out-of-pocket costs for Lantus users over the same period, according to this report. Though Sanofi suggests that out-of-pocket costs increased because rebates are not passed on to patients due to “the way health benefit plans are often designed,” many insured patients—including some Medicare Part D beneficiaries—face out-of-pocket spending obligations based on a drug’s list price. Sanofi, Prescription Medicine Pricing: Our Principles and Perspectives (Feb. 2021) (online at www.sanofi.us/-/media/Project/One-Sanofi-Web/Websites/North-America/Sanofi-US/Home/corporateresponsibility/Sanofi_2021_Pricing_Principles_Report.pdf?la=en); Chien-Wen Tseng et al., Impact of Higher Insulin Prices on Out-of-Pocket Costs in Medicare Part D, Diabetes Care (Apr. 2020) (online at https://care.diabetesjournals.org/content/43/4/e50).
214 NNI-ERR-0083949. Committee staff calculated the average net price across all channels for the NovoLog Flexpen using the net sales and net effective price data provided by Novo Nordisk.
55
increases by applying an inflation penalty when a manufacturer raises a drug’s price faster than the rate of inflation.
56
Chapter 3: Lost Medicare Savings and Targeting the U.S. for Higher Prices
Medicare administers prescription drug plans for seniors and other enrollees with certain
medical conditions and disabilities through its Part D program.215 In 2020, more than 47 million Americans enrolled to receive prescription drug coverage through Medicare Part D plans.216
Unlike in other federal health care programs, the Secretary of the Department of Health and Human Services (HHS) is expressly prohibited from negotiating directly with drug companies on behalf of Medicare Part D beneficiaries.217 Instead, drug prices are negotiated by plan sponsors—the private insurers and pharmacy benefit managers (PBMs) that administer Part D plans.218 Because Medicare provides prescription drug benefits in accordance with federal requirements, Medicare plans are constrained in their ability to negotiate for lower prices through coverage restrictions.219
The Committee’s investigation uncovered new information about the extent to which the pharmaceutical industry has exploited the prohibition on Medicare negotiation to raise prices in the U.S. market, while maintaining or lowering prices in the rest of the world.
The Committee’s investigation found:
• The Prohibition on Medicare Negotiation Cost U.S. Taxpayers Billions: Internal pricing data shows that if Medicare Part D plans received the same discounts as other federally administered health care programs, taxpayers could have saved billions of dollars. Between 2014 and 2018, taxpayers could have saved more than $25
billion for just seven of the drugs in the Committee’s investigation—
215 Department of Health and Human Services, Who Is Eligible for Medicare? (online at www.hhs.gov/answers/medicare-and-medicaid/who-is-elibible-for-medicare/index.html) (accessed Aug. 4, 2021).
216 Centers for Medicare and Medicaid Services, CMS Fast Facts (online at www.cms.gov/Research-Statistics-Data-and-Systems/Statistics-Trends-and-Reports/CMS-Fast-Facts) (accessed Oct. 27, 2021).
217 Federal law states that the HHS Secretary “(1) may not interfere with the negotiations between drug manufacturers and pharmacies and PDP [prescription drug plan] sponsors; and (2) may not require a particular formulary or institute a price structure for the reimbursement of covered part D drugs.” 42 U.S.C. § 1395w-111(i).
218 Beneficiaries may also obtain prescription drug coverage through Medicare Advantage plans, which offer prescription drug benefits as part of broader managed care plans. Kaiser Family Foundation, An Overview of the Medicare Part D Prescription Drug Benefit (Oct. 13, 2021) (online at www.kff.org/medicare/fact-sheet/an-overview-of-the-medicare-part-d-prescription-drug-benefit/).
219 See 42 C.F.R. § 423 (2011). Plan sponsors are required to include on their formularies all drugs in six categories or classes: (1) antidepressants; (2) antipsychotics; (3) anticonvulsants; (4) immunosuppressants for treatment of transplant rejection; (5) antiretrovirals; and (6) antineoplastics; except in limited circumstances. See Centers for Medicare and Medicaid Services, Fact Sheet: Medicare Advantage and Part D Drug Pricing Final Rule (CMS-4180-F) (May 16, 2019) (online at www.cms.gov/newsroom/fact-sheets/medicare-advantage-and-part-d-drug-pricing-final-rule-cms-4180-f); Congressional Research Service, Negotiation of Drug Prices in Medicare Part D (Oct. 31, 2019) (online at https://crsreports.congress.gov/product/pdf/IF/IF11318).
57
Lantus, Humira, Novolog, Enbrel, Lyrica, Imbruvica, and Sensipar—if Medicare plans had secured rebates comparable to those secured by other federal health care programs.
If Medicare plans had secured the same discounts as other federal health care programs for three insulin products investigated by the Committee, taxpayers could have saved more than $16 billion from 2011 through 2017.
• Medicare Sales Drove Revenues and Profits: Internal documents obtained by
the Committee reveal that companies relied on Medicare spending to drive revenues and profits. For example:
A Novo Nordisk Medicare Part D presentation from 2013 emphasized that
“Part D is the most profitable market for the Novo Nordisk insulin portfolio” and noted that insulin volume for the Part D market was growing three times faster than for the commercial market.220
An internal Pfizer presentation from 2018 showed that sales to Medicare accounted for 35% of Pfizer’s gross sales of Lyrica in 2017 and were projected to account for 42% by 2019.221
A 2016 presentation prepared for Novartis by an outside consultant emphasized the importance of Medicare for its cancer drug Gleevec, explaining that “Medicare is critical to brand success, CMS spent ~$1 billion on Gleevec in 2014.”222
• Pharmaceutical Companies Targeted the U.S. Market for Higher Prices: Internal company documents show that pharmaceutical companies targeted the United States for price increases while maintaining or lowering prices in the rest of the world—in large part because of Medicare’s inability to negotiate. For example: A draft internal Pfizer presentation from 2016 expressly linked Pfizer’s
profitability across the globe in part to its ability to raise prices in the United States, noting that growth was driven by “price increases in the U.S.”223
An internal Novo Nordisk presentation highlighted the unconstrained
pricing environment in the United States, noting, “Despite increased
220 NNI-ERR_0045711, at Page 2. 221 SRR_PFIZHCOR_00004032.00001, at Page 29. 222 CTRL-0124740, at Page 2. 223 SRR_PFIZHCOR_00002741.
58
scrutiny and pressure, the US pricing environment still remains favourable,” and, “Despite increased US rebates, payer scrutiny and pricing pressure, net sales has continued to increase.”224
Teva executives discussed the importance of keeping the prohibition on Medicare negotiation intact. In one presentation, executives identified Medicare drug price negotiation as a “Main Risk Event” with the largest potential impact on the company’s future revenue.225
• Lobbying Against Transparency and Drug Pricing Reforms: From 2017 to
2020, the ten companies in the Committee’s investigation spent a combined total of $230.2 million on lobbying Congress.226 In the first three quarters of 2021, six companies—AbbVie, Amgen,
Bristol Myers Squibb, Eli Lilly, Novartis, and Pfizer—spent more than $4.5 million each on lobbying Congress. 227
224 NNI-ERR_0011316, at Slide 2. 225 TEVA_HCO_IC_005040409, at Slide 32. 226 United States Congress Lobbying Disclosure Database, Query Results for AbbVie, Inc. (online at
www.senate.gov/legislative/Public_Disclosure/LDA_reports.htm) (accessed Oct. 27, 2021); United States Congress Lobbying Disclosure Database, Query Results for Amgen, Inc. (online at www.senate.gov/legislative/Public_Disclosure/LDA_reports.htm) (accessed Oct. 27, 2021); United States Congress Lobbying Disclosure Database, Query Results for Bristol-Myers Squibb Company (online at www.senate.gov/legislative/Public_Disclosure/LDA_reports.htm) (accessed Oct. 27, 2021); United States Congress Lobbying Disclosure Database, Query Results for Eli Lilly and Company (online at www.senate.gov/legislative/Public_Disclosure/LDA_reports.htm) (accessed Oct. 27, 2021); United States Congress Lobbying Disclosure Database, Query Results for Mallinckrodt LLC (online at www.senate.gov/legislative/Public_Disclosure/LDA_reports.htm) (accessed Oct. 27, 2021); United States Congress Lobbying Disclosure Database, Query Results for Novartis (online at www.senate.gov/legislative/Public_Disclosure/LDA_reports.htm) (accessed Oct. 27, 2021); United States Congress Lobbying Disclosure Database, Query Results for Novo Nordisk Inc. (online at www.senate.gov/legislative/Public_Disclosure/LDA_reports.htm) (accessed Oct. 27, 2021); United States Congress Lobbying Disclosure Database, Query Results for Pfizer Inc. (online at www.senate.gov/legislative/Public_Disclosure/LDA_reports.htm) (accessed Oct. 27, 2021); United States Congress Lobbying Disclosure Database, Query Results for Sanofi US Services, Inc. (online at www.senate.gov/legislative/Public_Disclosure/LDA_reports.htm) (accessed Oct. 27, 2021); United States Congress Lobbying Disclosure Database, Query Results for Teva Pharmaceuticals USA, Inc. (online at www.senate.gov/legislative/Public_Disclosure/LDA_reports.htm) (accessed Oct. 27, 2021).
227 United States Congress Lobbying Disclosure Database, Query Results for AbbVie, Inc. (online at www.senate.gov/legislative/Public_Disclosure/LDA_reports.htm) (accessed Oct. 27, 2021); United States Congress Lobbying Disclosure Database, Query Results for Amgen, Inc. (online at www.senate.gov/legislative/Public_Disclosure/LDA_reports.htm) (accessed Oct. 27, 2021); United States Congress Lobbying Disclosure Database, Query Results for Eli Lilly and Company (online at www.senate.gov/legislative/Public_Disclosure/LDA_reports.htm) (accessed Oct. 27, 2021); United States Congress Lobbying Disclosure Database, Query Results for Novartis (online at www.senate.gov/legislative/Public_Disclosure/LDA_reports.htm) (accessed Oct. 27, 2021); United States Congress Lobbying Disclosure Database, Query Results for Pfizer Inc. (online at www.senate.gov/legislative/Public_Disclosure/LDA_reports.htm) (accessed Oct. 27, 2021).
59
I. LOST MEDICARE SAVINGS
Internal pricing data obtained by the Committee reveals that over the period examined, the ten drug companies in the Committee’s investigation provided higher rebates and discounts to federal health care programs that are empowered to negotiate directly with drug manufacturers than to Medicare Part D plans.228
According to the Committee’s analysis of data from 2009 to 2018, taxpayers could have saved billions of dollars if Medicare Part D plans had secured rebates comparable to those secured by other federal health care programs.229 For example, between 2014 and 2018, taxpayers could have saved approximately $25.1 billion on just seven drugs—Humira, Imbruvica, Sensipar, Enbrel, NovoLog, Lantus, and Lyrica—if Medicare plans had achieved rebates and discounts comparable to those provided to other federal agencies. Taxpayers could have saved more than $5.6 billion in 2017 alone. Figure 1 shows Medicare’s lost savings for these seven drugs.
228 The federal health care programs examined in this report include programs run by the Department of
Defense (DOD), the Department of Veterans Affairs (VA), and other federal entities that purchase drugs directly from wholesalers and distributors, such as the Public Health Service, the Coast Guard, and the Bureau of Prisons. The prices paid by these programs are based in part on prices set in the Federal Supply Schedule. The prices paid by the largest direct purchasers (known as the “Big Four”)—DOD, the VA, the Public Health Service (including the Indian Health Service), and the Coast Guard—are statutorily capped, but these programs are empowered to negotiate directly with drug manufacturers for even deeper discounts. The VA and DOD use national drug lists that provide preferred access to certain drugs and restrict access to others. These so-called closed formularies increase agencies’ negotiating leverage. A Congressional Budget Office comparison of prices paid across federal programs found that the average price paid by DOD and the VA for top-selling drugs was approximately 55% of the average net price paid by Medicare. Congressional Budget Office, A Comparison of Brand-Name Drug Prices Among Selected Federal Programs (Feb. 2021) (online at www.cbo.gov/system/files/2021-02/56978-Drug-Prices.pdf).
229 According to a Government Accountability Office report, PBMs pass nearly all rebates on to Medicare Part D plans, retaining approximately 0.4% of total direct and indirect remuneration. Government Accountability Office, Medicare Part D: Use of Pharmacy Benefit Managers and Efforts to Manage Drug Expenditures and Utilization (July 15, 2019) (GAO-19-498) (online at www.gao.gov/assets/gao-19-498.pdf). Since the Committee did not account for this difference, the Committee’s calculations may slightly underestimate Medicare Part D spending and potential savings.
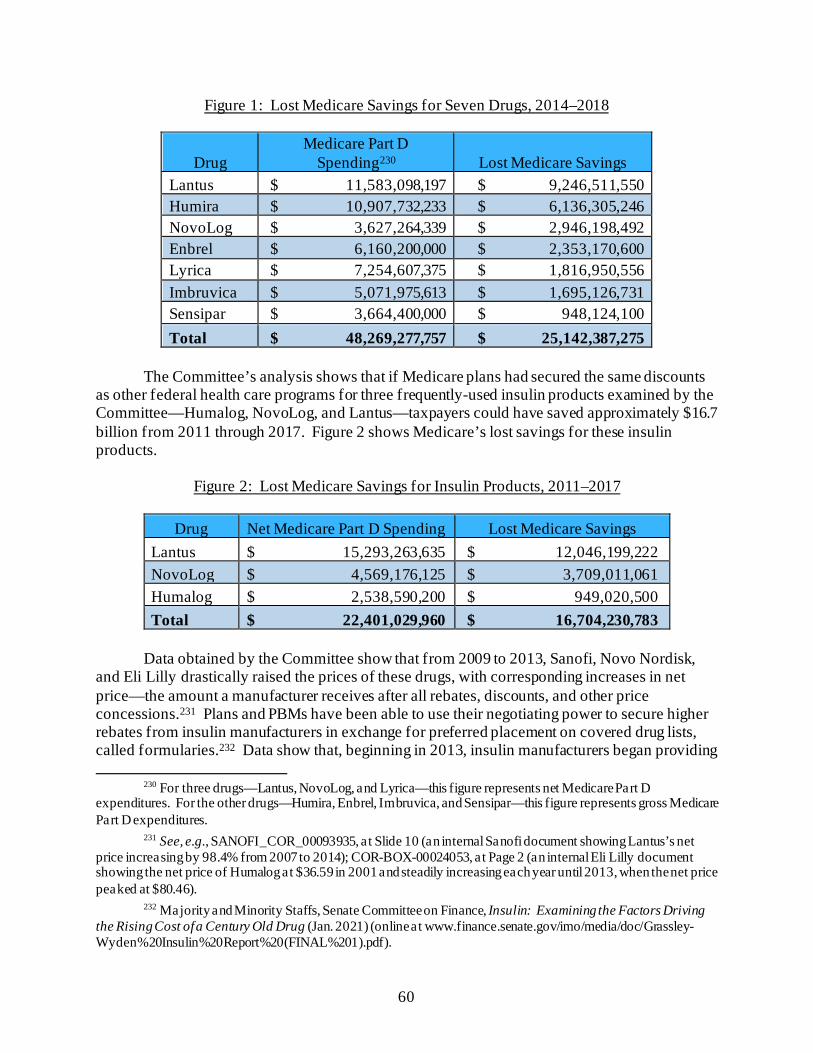
60
Figure 1: Lost Medicare Savings for Seven Drugs, 2014–2018
Drug Medicare Part D
Spending230 Lost Medicare Savings Lantus $ 11,583,098,197 $ 9,246,511,550 Humira $ 10,907,732,233 $ 6,136,305,246 NovoLog $ 3,627,264,339 $ 2,946,198,492 Enbrel $ 6,160,200,000 $ 2,353,170,600 Lyrica $ 7,254,607,375 $ 1,816,950,556 Imbruvica $ 5,071,975,613 $ 1,695,126,731 Sensipar $ 3,664,400,000 $ 948,124,100 Total $ 48,269,277,757 $ 25,142,387,275
The Committee’s analysis shows that if Medicare plans had secured the same discounts
as other federal health care programs for three frequently-used insulin products examined by the Committee—Humalog, NovoLog, and Lantus—taxpayers could have saved approximately $16.7 billion from 2011 through 2017. Figure 2 shows Medicare’s lost savings for these insulin products.
Figure 2: Lost Medicare Savings for Insulin Products, 2011–2017
Drug Net Medicare Part D Spending Lost Medicare Savings Lantus $ 15,293,263,635 $ 12,046,199,222 NovoLog $ 4,569,176,125 $ 3,709,011,061 Humalog $ 2,538,590,200 $ 949,020,500 Total $ 22,401,029,960 $ 16,704,230,783
Data obtained by the Committee show that from 2009 to 2013, Sanofi, Novo Nordisk,
and Eli Lilly drastically raised the prices of these drugs, with corresponding increases in net price—the amount a manufacturer receives after all rebates, discounts, and other price concessions.231 Plans and PBMs have been able to use their negotiating power to secure higher rebates from insulin manufacturers in exchange for preferred placement on covered drug lists, called formularies.232 Data show that, beginning in 2013, insulin manufacturers began providing
230 For three drugs—Lantus, NovoLog, and Lyrica—this figure represents net Medicare Part D
expenditures. For the other drugs—Humira, Enbrel, Imbruvica, and Sensipar—this figure represents gross Medicare Part D expenditures.
231 See, e.g., SANOFI_COR_00093935, at Slide 10 (an internal Sanofi document showing Lantus’s net price increasing by 98.4% from 2007 to 2014); COR-BOX-00024053, at Page 2 (an internal Eli Lilly document showing the net price of Humalog at $36.59 in 2001 and steadily increasing each year until 2013, when the net price peaked at $80.46).
232 Majority and Minority Staffs, Senate Committee on Finance, Insulin: Examining the Factors Driving the Rising Cost of a Century Old Drug (Jan. 2021) (online at www.finance.senate.gov/imo/media/doc/Grassley-Wyden%20Insulin%20Report%20(FINAL%201).pdf).
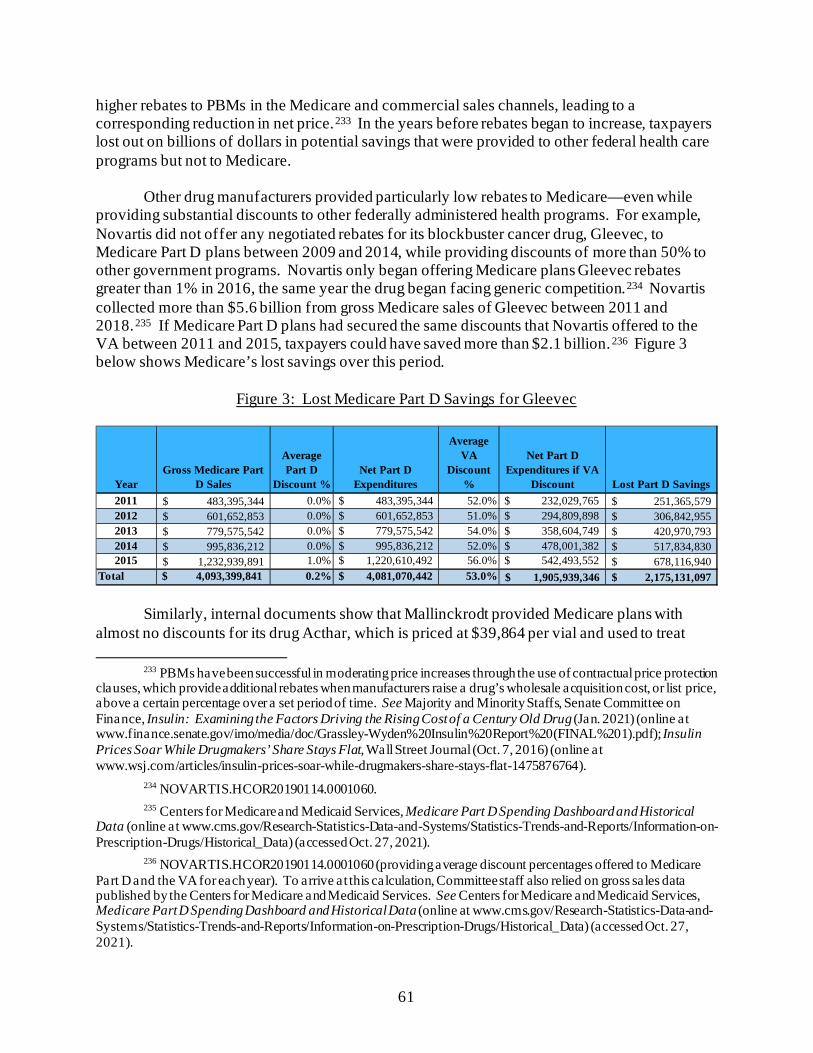
61
higher rebates to PBMs in the Medicare and commercial sales channels, leading to a corresponding reduction in net price.233 In the years before rebates began to increase, taxpayers lost out on billions of dollars in potential savings that were provided to other federal health care programs but not to Medicare.
Other drug manufacturers provided particularly low rebates to Medicare—even while providing substantial discounts to other federally administered health programs. For example, Novartis did not offer any negotiated rebates for its blockbuster cancer drug, Gleevec, to Medicare Part D plans between 2009 and 2014, while providing discounts of more than 50% to other government programs. Novartis only began offering Medicare plans Gleevec rebates greater than 1% in 2016, the same year the drug began facing generic competition.234 Novartis collected more than $5.6 billion from gross Medicare sales of Gleevec between 2011 and 2018.235 If Medicare Part D plans had secured the same discounts that Novartis offered to the VA between 2011 and 2015, taxpayers could have saved more than $2.1 billion.236 Figure 3 below shows Medicare’s lost savings over this period.
Figure 3: Lost Medicare Part D Savings for Gleevec
Similarly, internal documents show that Mallinckrodt provided Medicare plans with almost no discounts for its drug Acthar, which is priced at $39,864 per vial and used to treat
233 PBMs have been successful in moderating price increases through the use of contractual price protection
clauses, which provide additional rebates when manufacturers raise a drug’s wholesale acquisition cost, or list price, above a certain percentage over a set period of time. See Majority and Minority Staffs, Senate Committee on Finance, Insulin: Examining the Factors Driving the Rising Cost of a Century Old Drug (Jan. 2021) (online at www.finance.senate.gov/imo/media/doc/Grassley-Wyden%20Insulin%20Report%20(FINAL%201).pdf); Insulin Prices Soar While Drugmakers’ Share Stays Flat, Wall Street Journal (Oct. 7, 2016) (online at www.wsj.com/articles/insulin-prices-soar-while-drugmakers-share-stays-flat-1475876764).
234 NOVARTIS.HCOR20190114.0001060. 235 Centers for Medicare and Medicaid Services, Medicare Part D Spending Dashboard and Historical
Data (online at www.cms.gov/Research-Statistics-Data-and-Systems/Statistics-Trends-and-Reports/Information-on-Prescription-Drugs/Historical_Data) (accessed Oct. 27, 2021).
236 NOVARTIS.HCOR20190114.0001060 (providing average discount percentages offered to Medicare Part D and the VA for each year). To arrive at this calculation, Committee staff also relied on gross sales data published by the Centers for Medicare and Medicaid Services. See Centers for Medicare and Medicaid Services, Medicare Part D Spending Dashboard and Historical Data (online at www.cms.gov/Research-Statistics-Data-and-Systems/Statistics-Trends-and-Reports/Information-on-Prescription-Drugs/Historical_Data) (accessed Oct. 27, 2021).
YearGross Medicare Part
D Sales
Average Part D
Discount %Net Part D
Expenditures
Average VA
Discount %
Net Part D Expenditures if VA
Discount Lost Part D Savings2011 483,395,344$ 0.0% $ 483,395,344 52.0% $ 232,029,765 251,365,579$ 2012 601,652,853$ 0.0% $ 601,652,853 51.0% $ 294,809,898 306,842,955$ 2013 779,575,542$ 0.0% $ 779,575,542 54.0% $ 358,604,749 420,970,793$ 2014 995,836,212$ 0.0% $ 995,836,212 52.0% $ 478,001,382 517,834,830$ 2015 1,232,939,891$ 1.0% $ 1,220,610,492 56.0% $ 542,493,552 678,116,940$
Total $ 4,093,399,841 0.2% $ 4,081,070,442 53.0% 1,905,939,346$ 2,175,131,097$
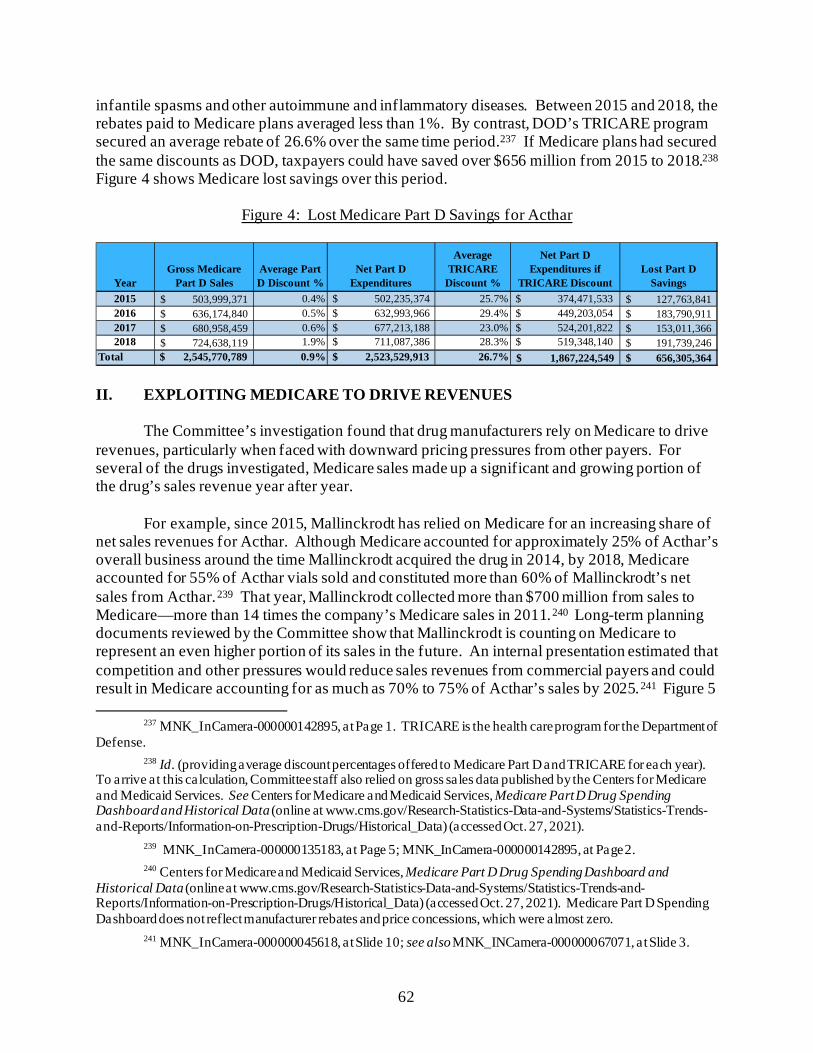
62
infantile spasms and other autoimmune and inflammatory diseases. Between 2015 and 2018, the rebates paid to Medicare plans averaged less than 1%. By contrast, DOD’s TRICARE program secured an average rebate of 26.6% over the same time period.237 If Medicare plans had secured the same discounts as DOD, taxpayers could have saved over $656 million from 2015 to 2018.238 Figure 4 shows Medicare lost savings over this period.
Figure 4: Lost Medicare Part D Savings for Acthar
II. EXPLOITING MEDICARE TO DRIVE REVENUES
The Committee’s investigation found that drug manufacturers rely on Medicare to drive revenues, particularly when faced with downward pricing pressures from other payers. For several of the drugs investigated, Medicare sales made up a significant and growing portion of the drug’s sales revenue year after year.
For example, since 2015, Mallinckrodt has relied on Medicare for an increasing share of net sales revenues for Acthar. Although Medicare accounted for approximately 25% of Acthar’s overall business around the time Mallinckrodt acquired the drug in 2014, by 2018, Medicare accounted for 55% of Acthar vials sold and constituted more than 60% of Mallinckrodt’s net sales from Acthar.239 That year, Mallinckrodt collected more than $700 million from sales to Medicare—more than 14 times the company’s Medicare sales in 2011.240 Long-term planning documents reviewed by the Committee show that Mallinckrodt is counting on Medicare to represent an even higher portion of its sales in the future. An internal presentation estimated that competition and other pressures would reduce sales revenues from commercial payers and could result in Medicare accounting for as much as 70% to 75% of Acthar’s sales by 2025.241 Figure 5
237 MNK_InCamera-000000142895, at Page 1. TRICARE is the health care program for the Department of
Defense. 238 Id. (providing average discount percentages offered to Medicare Part D and TRICARE for each year).
To arrive at this calculation, Committee staff also relied on gross sales data published by the Centers for Medicare and Medicaid Services. See Centers for Medicare and Medicaid Services, Medicare Part D Drug Spending Dashboard and Historical Data (online at www.cms.gov/Research-Statistics-Data-and-Systems/Statistics-Trends-and-Reports/Information-on-Prescription-Drugs/Historical_Data) (accessed Oct. 27, 2021).
239 MNK_InCamera-000000135183, at Page 5; MNK_InCamera-000000142895, at Page 2. 240 Centers for Medicare and Medicaid Services, Medicare Part D Drug Spending Dashboard and
Historical Data (online at www.cms.gov/Research-Statistics-Data-and-Systems/Statistics-Trends-and-Reports/Information-on-Prescription-Drugs/Historical_Data) (accessed Oct. 27, 2021). Medicare Part D Spending Dashboard does not reflect manufacturer rebates and price concessions, which were almost zero.
241 MNK_InCamera-000000045618, at Slide 10; see also MNK_INCamera-000000067071, at Slide 3.
YearGross Medicare
Part D SalesAverage Part D Discount %
Net Part D Expenditures
Average TRICARE
Discount %
Net Part D Expenditures if
TRICARE DiscountLost Part D
Savings2015 503,999,371$ 0.4% $ 502,235,374 25.7% $ 374,471,533 127,763,841$ 2016 636,174,840$ 0.5% $ 632,993,966 29.4% $ 449,203,054 183,790,911$ 2017 680,958,459$ 0.6% $ 677,213,188 23.0% $ 524,201,822 153,011,366$ 2018 724,638,119$ 1.9% $ 711,087,386 28.3% $ 519,348,140 191,739,246$
Total $ 2,545,770,789 0.9% $ 2,523,529,913 26.7% 1,867,224,549$ 656,305,364$
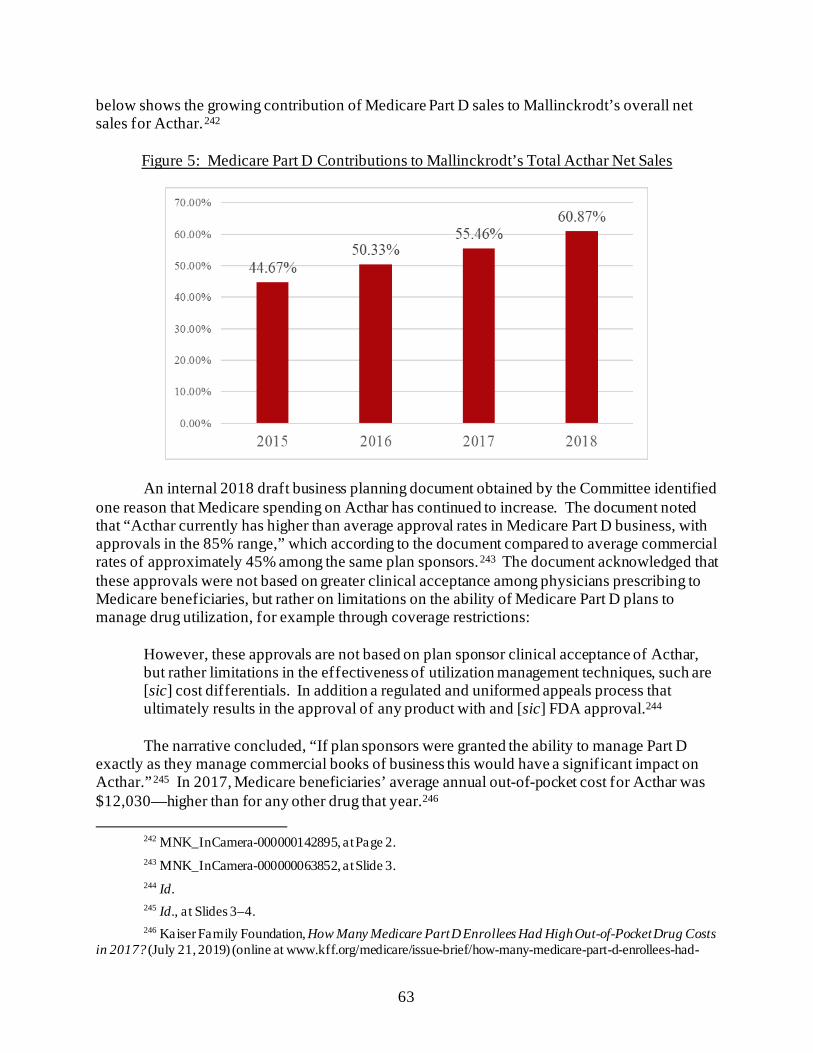
63
below shows the growing contribution of Medicare Part D sales to Mallinckrodt’s overall net sales for Acthar.242
Figure 5: Medicare Part D Contributions to Mallinckrodt’s Total Acthar Net Sales
An internal 2018 draft business planning document obtained by the Committee identified one reason that Medicare spending on Acthar has continued to increase. The document noted that “Acthar currently has higher than average approval rates in Medicare Part D business, with approvals in the 85% range,” which according to the document compared to average commercial rates of approximately 45% among the same plan sponsors.243 The document acknowledged that these approvals were not based on greater clinical acceptance among physicians prescribing to Medicare beneficiaries, but rather on limitations on the ability of Medicare Part D plans to manage drug utilization, for example through coverage restrictions:
However, these approvals are not based on plan sponsor clinical acceptance of Acthar, but rather limitations in the effectiveness of utilization management techniques, such are [sic] cost differentials. In addition a regulated and uniformed appeals process that ultimately results in the approval of any product with and [sic] FDA approval.244
The narrative concluded, “If plan sponsors were granted the ability to manage Part D
exactly as they manage commercial books of business this would have a significant impact on Acthar.”245 In 2017, Medicare beneficiaries’ average annual out-of-pocket cost for Acthar was $12,030—higher than for any other drug that year.246
242 MNK_InCamera-000000142895, at Page 2. 243 MNK_InCamera-000000063852, at Slide 3. 244 Id. 245 Id., a t Slides 3–4. 246 Kaiser Family Foundation, How Many Medicare Part D Enrollees Had High Out-of-Pocket Drug Costs
in 2017? (July 21, 2019) (online at www.kff.org/medicare/issue-brief/how-many-medicare-part-d-enrollees-had-
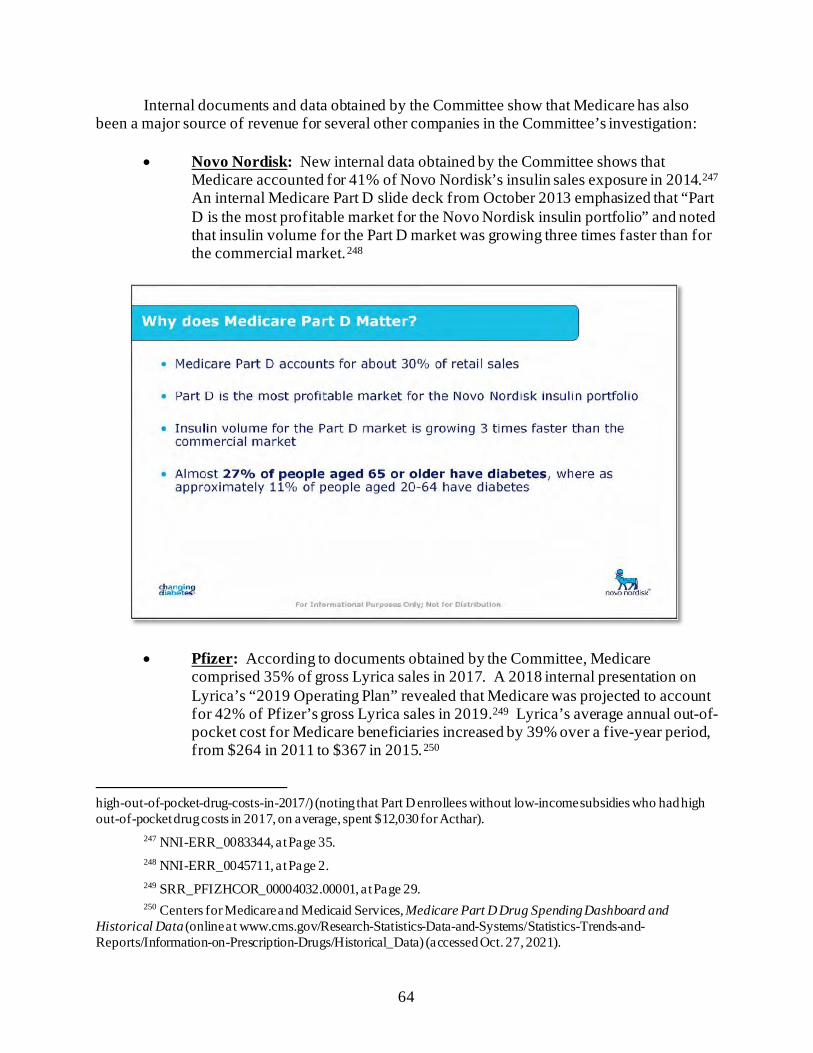
64
Internal documents and data obtained by the Committee show that Medicare has also been a major source of revenue for several other companies in the Committee’s investigation:
• Novo Nordisk: New internal data obtained by the Committee shows that Medicare accounted for 41% of Novo Nordisk’s insulin sales exposure in 2014.247 An internal Medicare Part D slide deck from October 2013 emphasized that “Part D is the most profitable market for the Novo Nordisk insulin portfolio” and noted that insulin volume for the Part D market was growing three times faster than for the commercial market.248
• Pfizer: According to documents obtained by the Committee, Medicare comprised 35% of gross Lyrica sales in 2017. A 2018 internal presentation on Lyrica’s “2019 Operating Plan” revealed that Medicare was projected to account for 42% of Pfizer’s gross Lyrica sales in 2019.249 Lyrica’s average annual out-of-pocket cost for Medicare beneficiaries increased by 39% over a five-year period, from $264 in 2011 to $367 in 2015.250
high-out-of-pocket-drug-costs-in-2017/) (noting that Part D enrollees without low-income subsidies who had high out-of-pocket drug costs in 2017, on average, spent $12,030 for Acthar).
247 NNI-ERR_0083344, at Page 35. 248 NNI-ERR_0045711, at Page 2. 249 SRR_PFIZHCOR_00004032.00001, at Page 29. 250 Centers for Medicare and Medicaid Services, Medicare Part D Drug Spending Dashboard and
Historical Data (online at www.cms.gov/Research-Statistics-Data-and-Systems/Statistics-Trends-and-Reports/Information-on-Prescription-Drugs/Historical_Data) (accessed Oct. 27, 2021).
65
• Novartis: Between 2011 and 2018, Medicare spent more than $5.6 billion on Novartis’s cancer drug Gleevec. At its peak in 2015, gross Medicare spending on Gleevec totaled more than $1.2 billion.251 A 2016 presentation prepared for Novartis by an outside consultant emphasized, “Medicare is critical to brand success, CMS spent ~$1 billion on Gleevec in 2014.”252 According to the Centers for Medicare and Medicaid Services, the average annual out-of-pocket cost for a Medicare beneficiary on Gleevec increased by almost 24% in a five-year period, from $3,566 in 2011 to $4,418 in 2015.253
• Sanofi: Executives at Sanofi recognized that the company’s price increases directly impacted Medicare beneficiaries. For example, a 2015 email exchange discussed the impact of the company’s price increases on patients entering Medicare Part D’s “donut hole,” the coverage gap where, prior to changes made by the Affordable Care Act, many Medicare beneficiaries were responsible for 100% of their drug costs.254 One senior leader noted:
[W]e can extrapolate that the driver behind more patients reaching the [Coverage] Gap and them reaching it sooner is almost exclusively, if not entirely, WAC [wholesale acquisition cost] price increases taken in the prior year. If you think about how much price we took in 2013 (45%), it’s no wonder the # of lives hitting the Donut Hole by June increased by almost 50%. We took another 30% in 2014 so I would expect the lives reaching the Gap by June in 2015 to show growth again.
251 Centers for Medicare and Medicaid Services, Medicare Part D Spending Dashboard and Historical
Data (online at www.cms.gov/Research-Statistics-Data-and-Systems/Statistics-Trends-and-Reports/Information-on-Prescription-Drugs/Historical_Data) (accessed Oct. 27, 2021).
252 CTRL-0124740, at Page 2. 253 Centers for Medicare and Medicaid Services, Medicare Part D Spending Dashboard and Historical
Data (online at www.cms.gov/Research-Statistics-Data-and-Systems/Statistics-Trends-and-Reports/Information-on-Prescription-Drugs/Historical_Data) (accessed Oct. 27, 2021).
254 The Affordable Care Act included provisions to phase out the coverage gap by decreasing beneficiary share of drug costs to 25% by 2020. Kaiser Family Foundation, Closing the Medicare Part D Coverage Gap: Trends, Recent Changes, and What’s Ahead (Aug. 2018) (online at https://files.kff.org/attachment/Data-Note-Closing-the-Medicare-Part-D-Coverage-Gap-Trends-Recent-Changes-and-Whats-Ahead). The Bipartisan Budget Act accelerated closure of the coverage gap in 2019 but also made other changes to the Part D benefit design that appear to have created unintended incentives for the use of high-cost brand-name drugs, rather than generics. See, e.g., Brooklyn46, The Flawed Design of Medicare Part D: A Copaxone Case Study (Aug. 12, 2020) (online at www.46brooklyn.com/research/2020/8/12/copaxone). The Build Back Better Act would make a number of changes to the Part D benefit design that would redistribute the majority of drug costs in the catastrophic phase from Medicare to Part D plan sponsors and manufacturers. Part D plans would cover 60% of drug costs; Medicare would cover 20% of the costs for branded drugs, biologics, and biosimilars and 40% of the costs for generics; and manufacturers would cover 20% of costs for branded drugs, biologics, and biosimilars. Manufacturers would bear no portion of the costs of generic drugs in the catastrophic phase. Realigning the distribution of costs in the catastrophic phase may address the perverse incentives in the current benefit design. H.R. 5376 § 139201.
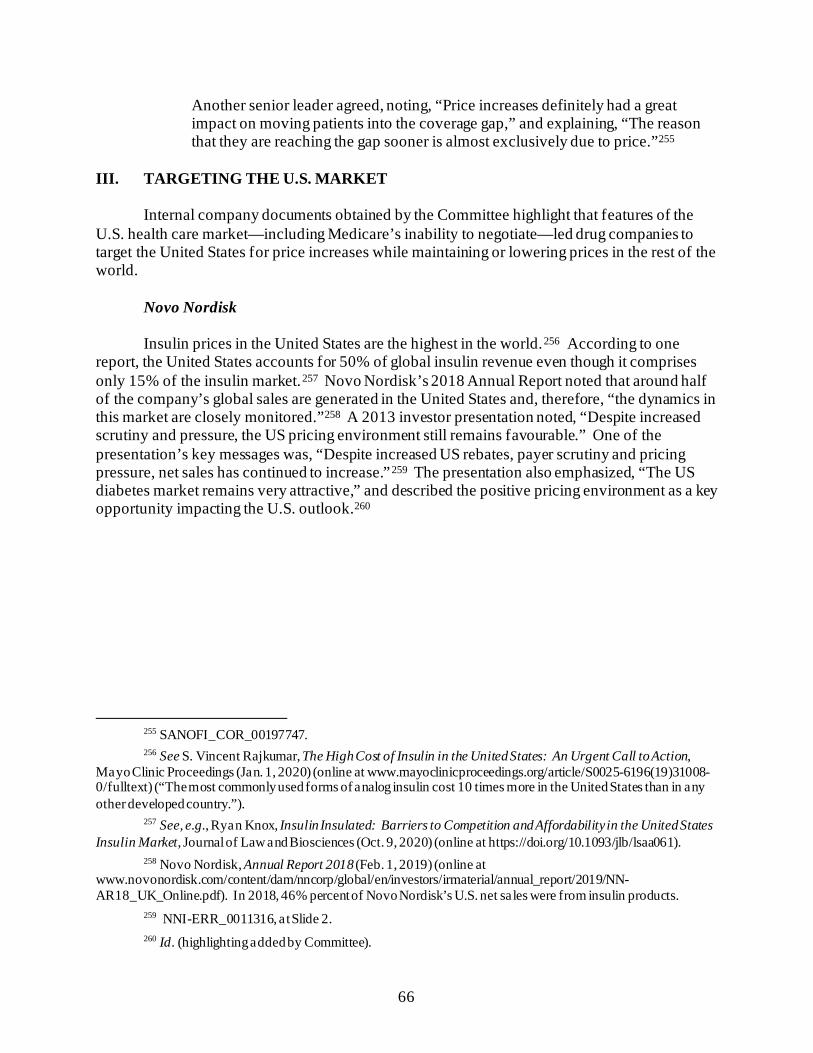
66
Another senior leader agreed, noting, “Price increases definitely had a great impact on moving patients into the coverage gap,” and explaining, “The reason that they are reaching the gap sooner is almost exclusively due to price.”255
III. TARGETING THE U.S. MARKET
Internal company documents obtained by the Committee highlight that features of the U.S. health care market—including Medicare’s inability to negotiate—led drug companies to target the United States for price increases while maintaining or lowering prices in the rest of the world.
Novo Nordisk
Insulin prices in the United States are the highest in the world.256 According to one report, the United States accounts for 50% of global insulin revenue even though it comprises only 15% of the insulin market.257 Novo Nordisk’s 2018 Annual Report noted that around half of the company’s global sales are generated in the United States and, therefore, “the dynamics in this market are closely monitored.”258 A 2013 investor presentation noted, “Despite increased scrutiny and pressure, the US pricing environment still remains favourable.” One of the presentation’s key messages was, “Despite increased US rebates, payer scrutiny and pricing pressure, net sales has continued to increase.”259 The presentation also emphasized, “The US diabetes market remains very attractive,” and described the positive pricing environment as a key opportunity impacting the U.S. outlook.260
255 SANOFI_COR_00197747. 256 See S. Vincent Rajkumar, The High Cost of Insulin in the United States: An Urgent Call to Action,
Mayo Clinic Proceedings (Jan. 1, 2020) (online at www.mayoclinicproceedings.org/article/S0025-6196(19)31008-0/fulltext) (“The most commonly used forms of analog insulin cost 10 times more in the United States than in any other developed country.”).
257 See, e.g., Ryan Knox, Insulin Insulated: Barriers to Competition and Affordability in the United States Insulin Market, Journal of Law and Biosciences (Oct. 9, 2020) (online at https://doi.org/10.1093/jlb/lsaa061).
258 Novo Nordisk, Annual Report 2018 (Feb. 1, 2019) (online at www.novonordisk.com/content/dam/nncorp/global/en/investors/irmaterial/annual_report/2019/NN-AR18_UK_Online.pdf). In 2018, 46% percent of Novo Nordisk’s U.S. net sales were from insulin products.
259 NNI-ERR_0011316, at Slide 2. 260 Id. (highlighting added by Committee).
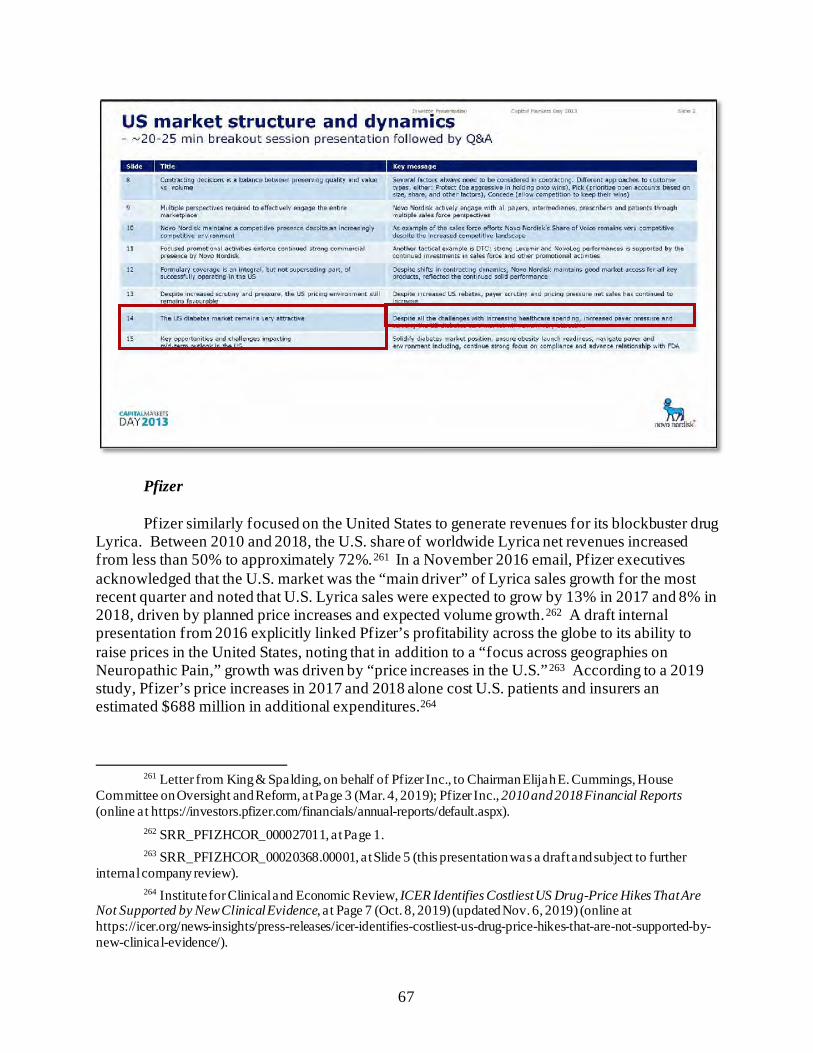
67
Pfizer
Pfizer similarly focused on the United States to generate revenues for its blockbuster drug Lyrica. Between 2010 and 2018, the U.S. share of worldwide Lyrica net revenues increased from less than 50% to approximately 72%.261 In a November 2016 email, Pfizer executives acknowledged that the U.S. market was the “main driver” of Lyrica sales growth for the most recent quarter and noted that U.S. Lyrica sales were expected to grow by 13% in 2017 and 8% in 2018, driven by planned price increases and expected volume growth.262 A draft internal presentation from 2016 explicitly linked Pfizer’s profitability across the globe to its ability to raise prices in the United States, noting that in addition to a “focus across geographies on Neuropathic Pain,” growth was driven by “price increases in the U.S.”263 According to a 2019 study, Pfizer’s price increases in 2017 and 2018 alone cost U.S. patients and insurers an estimated $688 million in additional expenditures.264
261 Letter from King & Spalding, on behalf of Pfizer Inc., to Chairman Elijah E. Cummings, House
Committee on Oversight and Reform, at Page 3 (Mar. 4, 2019); Pfizer Inc., 2010 and 2018 Financial Reports (online at https://investors.pfizer.com/financials/annual-reports/default.aspx).
262 SRR_PFIZHCOR_000027011, at Page 1. 263 SRR_PFIZHCOR_00020368.00001, at Slide 5 (this presentation was a draft and subject to further
internal company review). 264 Institute for Clinical and Economic Review, ICER Identifies Costliest US Drug-Price Hikes That Are
Not Supported by New Clinical Evidence, a t Page 7 (Oct. 8, 2019) (updated Nov. 6, 2019) (online at https://icer.org/news-insights/press-releases/icer-identifies-costliest-us-drug-price-hikes-that-are-not-supported-by-new-clinical-evidence/).
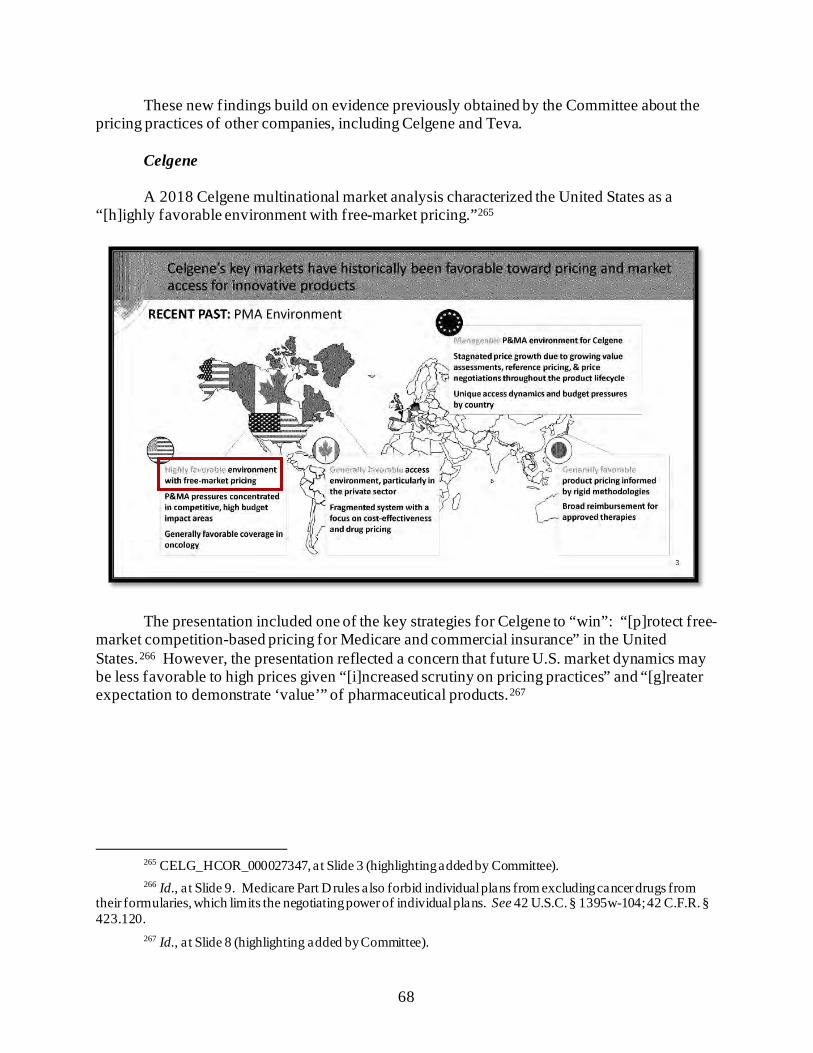
68
These new findings build on evidence previously obtained by the Committee about the pricing practices of other companies, including Celgene and Teva.
Celgene
A 2018 Celgene multinational market analysis characterized the United States as a “[h]ighly favorable environment with free-market pricing.”265
The presentation included one of the key strategies for Celgene to “win”: “[p]rotect free-market competition-based pricing for Medicare and commercial insurance” in the United States.266 However, the presentation reflected a concern that future U.S. market dynamics may be less favorable to high prices given “[i]ncreased scrutiny on pricing practices” and “[g]reater expectation to demonstrate ‘value’” of pharmaceutical products.267
265 CELG_HCOR_000027347, at Slide 3 (highlighting added by Committee). 266 Id., a t Slide 9. Medicare Part D rules also forbid individual plans from excluding cancer drugs from
their formularies, which limits the negotiating power of individual plans. See 42 U.S.C. § 1395w-104; 42 C.F.R. § 423.120.
267 Id., a t Slide 8 (highlighting added by Committee).
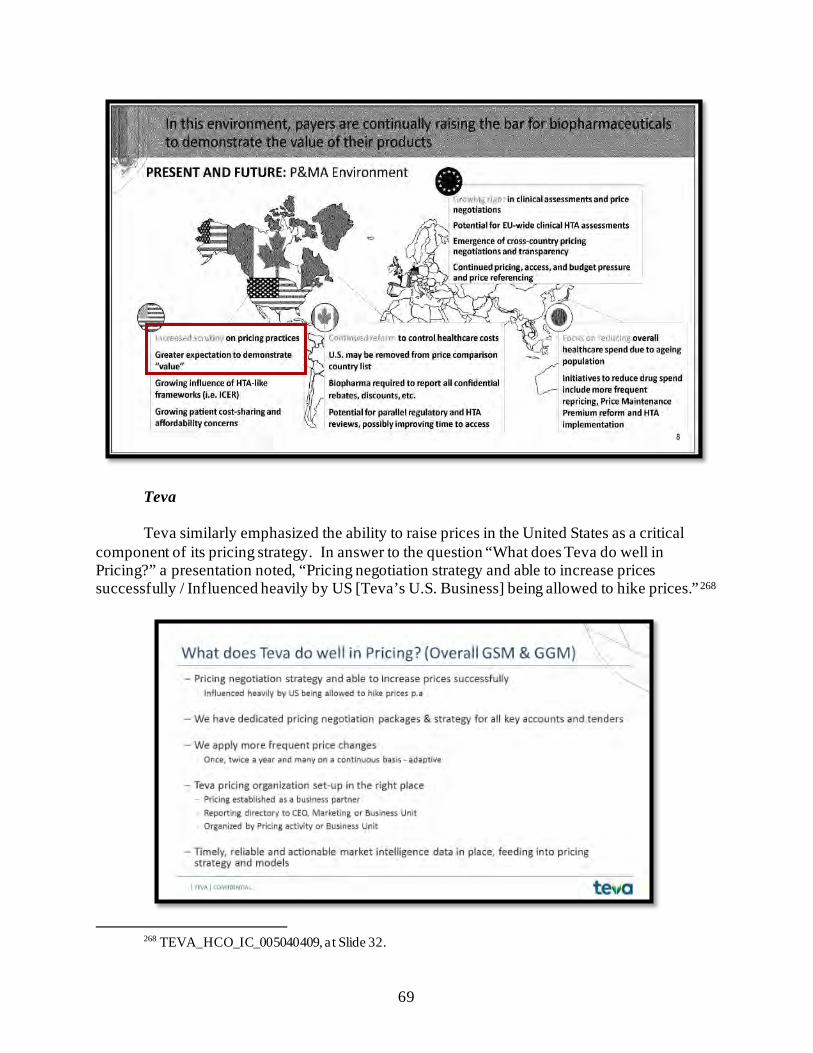
69
Teva
Teva similarly emphasized the ability to raise prices in the United States as a critical component of its pricing strategy. In answer to the question “What does Teva do well in Pricing?” a presentation noted, “Pricing negotiation strategy and able to increase prices successfully / Influenced heavily by US [Teva’s U.S. Business] being allowed to hike prices.”268
268 TEVA_HCO_IC_005040409, at Slide 32.
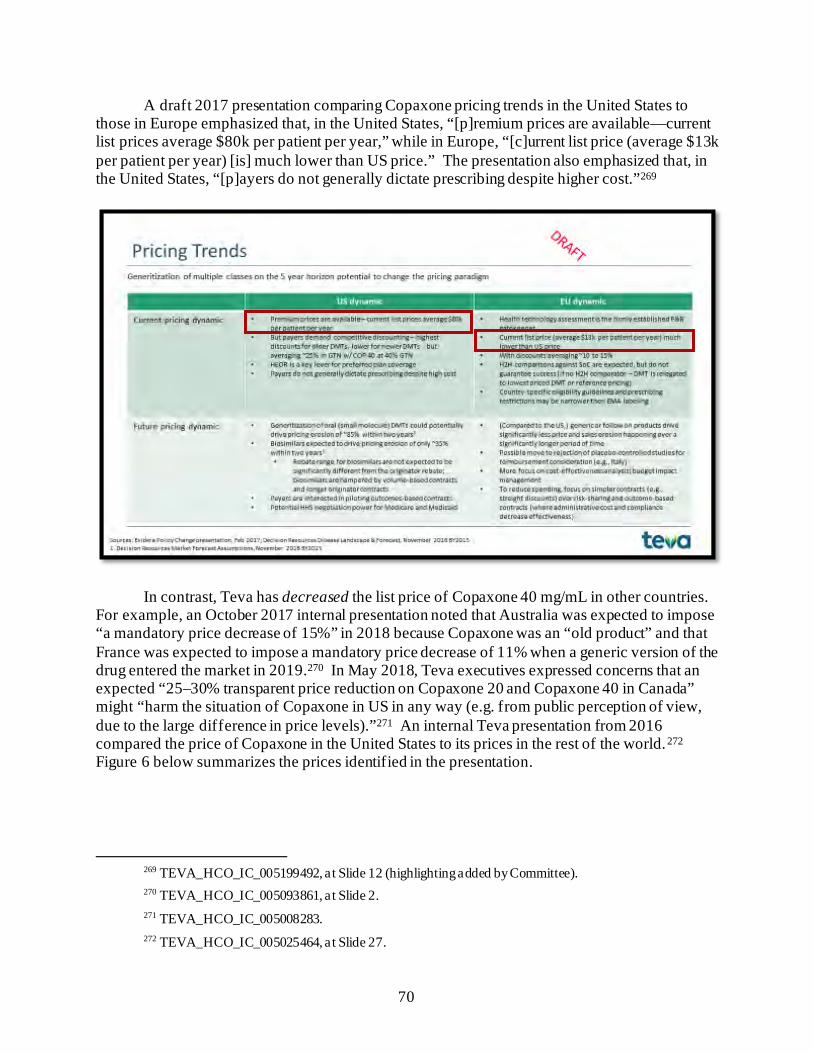
70
A draft 2017 presentation comparing Copaxone pricing trends in the United States to those in Europe emphasized that, in the United States, “[p]remium prices are available—current list prices average $80k per patient per year,” while in Europe, “[c]urrent list price (average $13k per patient per year) [is] much lower than US price.” The presentation also emphasized that, in the United States, “[p]ayers do not generally dictate prescribing despite higher cost.”269
In contrast, Teva has decreased the list price of Copaxone 40 mg/mL in other countries. For example, an October 2017 internal presentation noted that Australia was expected to impose “a mandatory price decrease of 15%” in 2018 because Copaxone was an “old product” and that France was expected to impose a mandatory price decrease of 11% when a generic version of the drug entered the market in 2019.270 In May 2018, Teva executives expressed concerns that an expected “25–30% transparent price reduction on Copaxone 20 and Copaxone 40 in Canada” might “harm the situation of Copaxone in US in any way (e.g. from public perception of view, due to the large difference in price levels).”271 An internal Teva presentation from 2016 compared the price of Copaxone in the United States to its prices in the rest of the world.272 Figure 6 below summarizes the prices identified in the presentation.
269 TEVA_HCO_IC_005199492, at Slide 12 (highlighting added by Committee). 270 TEVA_HCO_IC_005093861, at Slide 2. 271 TEVA_HCO_IC_005008283. 272 TEVA_HCO_IC_005025464, at Slide 27.
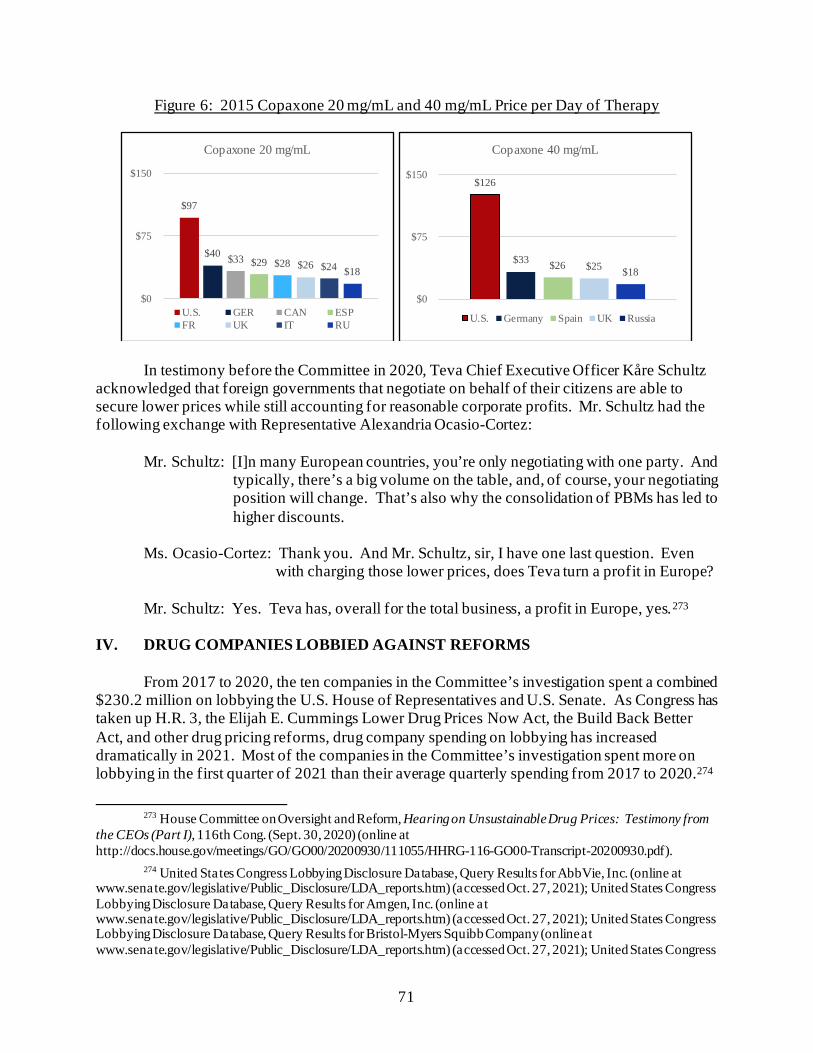
71
Figure 6: 2015 Copaxone 20 mg/mL and 40 mg/mL Price per Day of Therapy
In testimony before the Committee in 2020, Teva Chief Executive Officer Kåre Schultz acknowledged that foreign governments that negotiate on behalf of their citizens are able to secure lower prices while still accounting for reasonable corporate profits. Mr. Schultz had the following exchange with Representative Alexandria Ocasio-Cortez:
Mr. Schultz: [I]n many European countries, you’re only negotiating with one party. And typically, there’s a big volume on the table, and, of course, your negotiating position will change. That’s also why the consolidation of PBMs has led to higher discounts.
Ms. Ocasio-Cortez: Thank you. And Mr. Schultz, sir, I have one last question. Even
with charging those lower prices, does Teva turn a profit in Europe? Mr. Schultz: Yes. Teva has, overall for the total business, a profit in Europe, yes.273
IV. DRUG COMPANIES LOBBIED AGAINST REFORMS
From 2017 to 2020, the ten companies in the Committee’s investigation spent a combined $230.2 million on lobbying the U.S. House of Representatives and U.S. Senate. As Congress has taken up H.R. 3, the Elijah E. Cummings Lower Drug Prices Now Act, the Build Back Better Act, and other drug pricing reforms, drug company spending on lobbying has increased dramatically in 2021. Most of the companies in the Committee’s investigation spent more on lobbying in the first quarter of 2021 than their average quarterly spending from 2017 to 2020.274
273 House Committee on Oversight and Reform, Hearing on Unsustainable Drug Prices: Testimony from
the CEOs (Part I), 116th Cong. (Sept. 30, 2020) (online at http://docs.house.gov/meetings/GO/GO00/20200930/111055/HHRG-116-GO00-Transcript-20200930.pdf).
274 United States Congress Lobbying Disclosure Database, Query Results for AbbVie, Inc. (online at www.senate.gov/legislative/Public_Disclosure/LDA_reports.htm) (accessed Oct. 27, 2021); United States Congress Lobbying Disclosure Database, Query Results for Amgen, Inc. (online at www.senate.gov/legislative/Public_Disclosure/LDA_reports.htm) (accessed Oct. 27, 2021); United States Congress Lobbying Disclosure Database, Query Results for Bristol-Myers Squibb Company (online at www.senate.gov/legislative/Public_Disclosure/LDA_reports.htm) (accessed Oct. 27, 2021); United States Congress
$97
$40 $33 $29 $28 $26 $24 $18
$0
$75
$150
Copaxone 20 mg/mL
U.S. GER CAN ESPFR UK IT RU
$126
$33 $26 $25 $18
$0
$75
$150
Copaxone 40 mg/mL
U.S. Germany Spain UK Russia
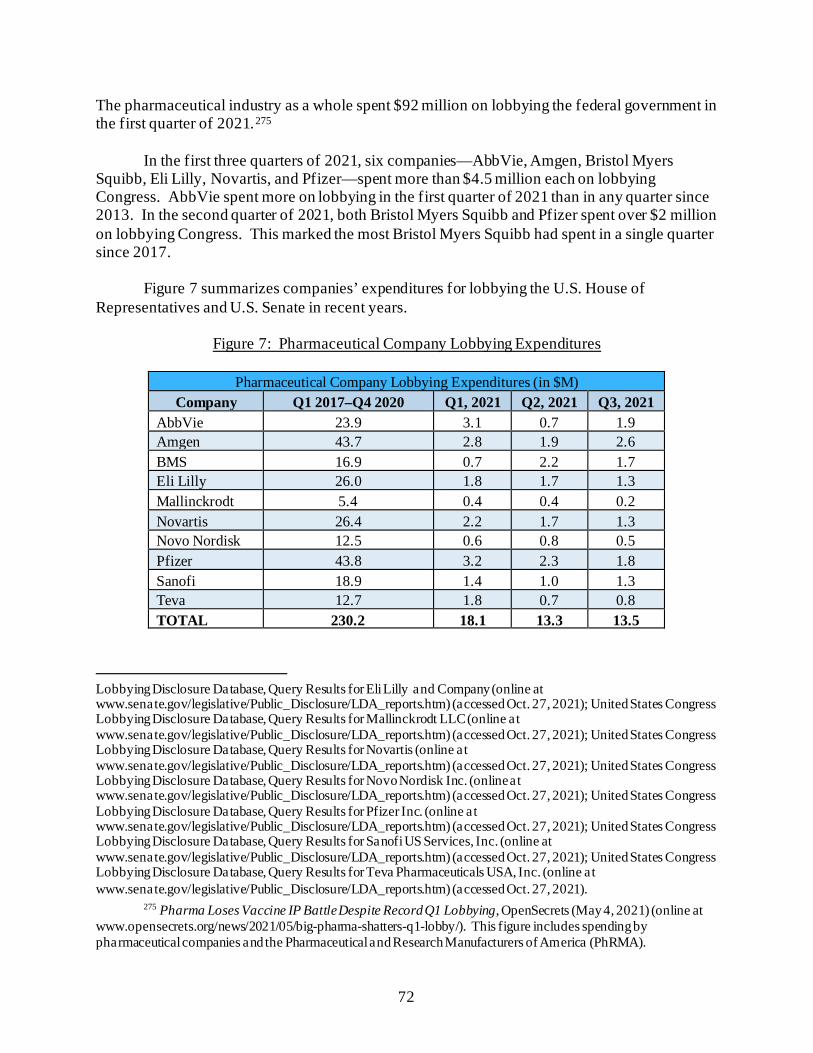
72
The pharmaceutical industry as a whole spent $92 million on lobbying the federal government in the first quarter of 2021.275
In the first three quarters of 2021, six companies—AbbVie, Amgen, Bristol Myers Squibb, Eli Lilly, Novartis, and Pfizer—spent more than $4.5 million each on lobbying Congress. AbbVie spent more on lobbying in the first quarter of 2021 than in any quarter since 2013. In the second quarter of 2021, both Bristol Myers Squibb and Pfizer spent over $2 million on lobbying Congress. This marked the most Bristol Myers Squibb had spent in a single quarter since 2017.
Figure 7 summarizes companies’ expenditures for lobbying the U.S. House of Representatives and U.S. Senate in recent years.
Figure 7: Pharmaceutical Company Lobbying Expenditures
Pharmaceutical Company Lobbying Expenditures (in $M) Company Q1 2017–Q4 2020 Q1, 2021 Q2, 2021 Q3, 2021
AbbVie 23.9 3.1 0.7 1.9 Amgen 43.7 2.8 1.9 2.6 BMS 16.9 0.7 2.2 1.7 Eli Lilly 26.0 1.8 1.7 1.3 Mallinckrodt 5.4 0.4 0.4 0.2 Novartis 26.4 2.2 1.7 1.3 Novo Nordisk 12.5 0.6 0.8 0.5 Pfizer 43.8 3.2 2.3 1.8 Sanofi 18.9 1.4 1.0 1.3 Teva 12.7 1.8 0.7 0.8 TOTAL 230.2 18.1 13.3 13.5
Lobbying Disclosure Database, Query Results for Eli Lilly and Company (online at www.senate.gov/legislative/Public_Disclosure/LDA_reports.htm) (accessed Oct. 27, 2021); United States Congress Lobbying Disclosure Database, Query Results for Mallinckrodt LLC (online at www.senate.gov/legislative/Public_Disclosure/LDA_reports.htm) (accessed Oct. 27, 2021); United States Congress Lobbying Disclosure Database, Query Results for Novartis (online at www.senate.gov/legislative/Public_Disclosure/LDA_reports.htm) (accessed Oct. 27, 2021); United States Congress Lobbying Disclosure Database, Query Results for Novo Nordisk Inc. (online at www.senate.gov/legislative/Public_Disclosure/LDA_reports.htm) (accessed Oct. 27, 2021); United States Congress Lobbying Disclosure Database, Query Results for Pfizer Inc. (online at www.senate.gov/legislative/Public_Disclosure/LDA_reports.htm) (accessed Oct. 27, 2021); United States Congress Lobbying Disclosure Database, Query Results for Sanofi US Services, Inc. (online at www.senate.gov/legislative/Public_Disclosure/LDA_reports.htm) (accessed Oct. 27, 2021); United States Congress Lobbying Disclosure Database, Query Results for Teva Pharmaceuticals USA, Inc. (online at www.senate.gov/legislative/Public_Disclosure/LDA_reports.htm) (accessed Oct. 27, 2021).
275 Pharma Loses Vaccine IP Battle Despite Record Q1 Lobbying, OpenSecrets (May 4, 2021) (online at www.opensecrets.org/news/2021/05/big-pharma-shatters-q1-lobby/). This figure includes spending by pharmaceutical companies and the Pharmaceutical and Research Manufacturers of America (PhRMA).
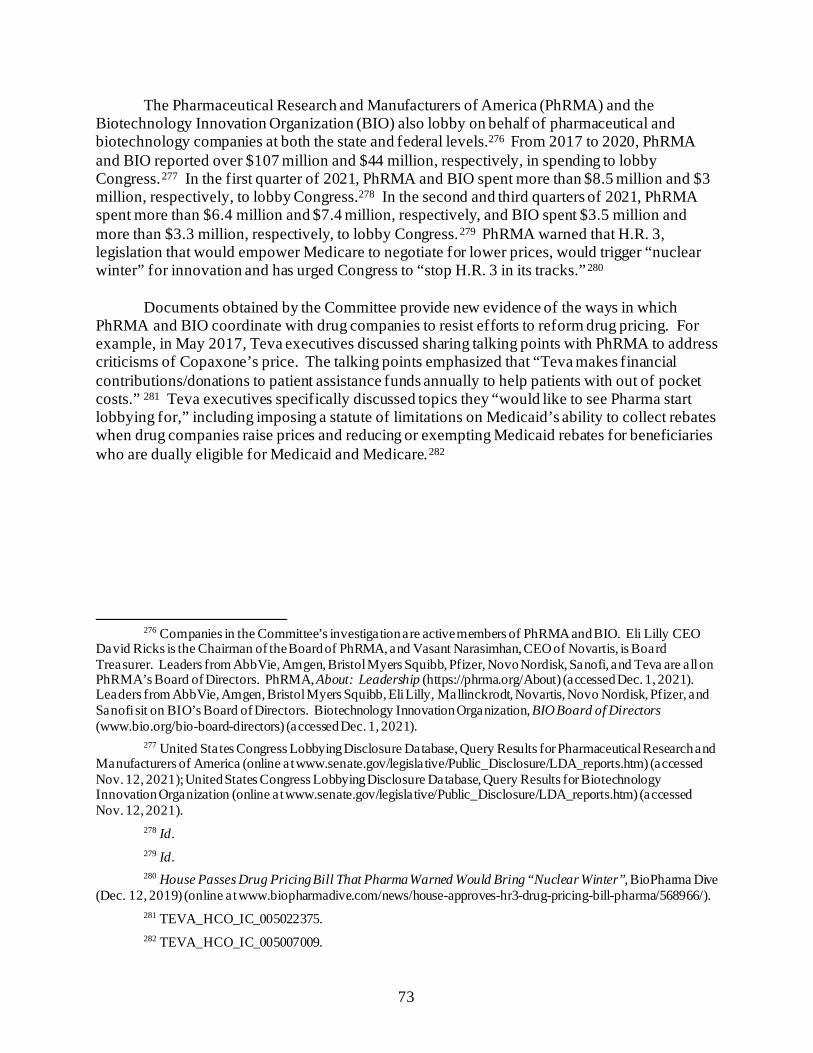
73
The Pharmaceutical Research and Manufacturers of America (PhRMA) and the Biotechnology Innovation Organization (BIO) also lobby on behalf of pharmaceutical and biotechnology companies at both the state and federal levels.276 From 2017 to 2020, PhRMA and BIO reported over $107 million and $44 million, respectively, in spending to lobby Congress.277 In the first quarter of 2021, PhRMA and BIO spent more than $8.5 million and $3 million, respectively, to lobby Congress.278 In the second and third quarters of 2021, PhRMA spent more than $6.4 million and $7.4 million, respectively, and BIO spent $3.5 million and more than $3.3 million, respectively, to lobby Congress.279 PhRMA warned that H.R. 3, legislation that would empower Medicare to negotiate for lower prices, would trigger “nuclear winter” for innovation and has urged Congress to “stop H.R. 3 in its tracks.”280
Documents obtained by the Committee provide new evidence of the ways in which PhRMA and BIO coordinate with drug companies to resist efforts to reform drug pricing. For example, in May 2017, Teva executives discussed sharing talking points with PhRMA to address criticisms of Copaxone’s price. The talking points emphasized that “Teva makes financial contributions/donations to patient assistance funds annually to help patients with out of pocket costs.” 281 Teva executives specifically discussed topics they “would like to see Pharma start lobbying for,” including imposing a statute of limitations on Medicaid’s ability to collect rebates when drug companies raise prices and reducing or exempting Medicaid rebates for beneficiaries who are dually eligible for Medicaid and Medicare.282
276 Companies in the Committee’s investigation are active members of PhRMA and BIO. Eli Lilly CEO
David Ricks is the Chairman of the Board of PhRMA, and Vasant Narasimhan, CEO of Novartis, is Board Treasurer. Leaders from AbbVie, Amgen, Bristol Myers Squibb, Pfizer, Novo Nordisk, Sanofi, and Teva are all on PhRMA’s Board of Directors. PhRMA, About: Leadership (https://phrma.org/About) (accessed Dec. 1, 2021). Leaders from AbbVie, Amgen, Bristol Myers Squibb, Eli Lilly, Mallinckrodt, Novartis, Novo Nordisk, Pfizer, and Sanofi sit on BIO’s Board of Directors. Biotechnology Innovation Organization, BIO Board of Directors (www.bio.org/bio-board-directors) (accessed Dec. 1, 2021).
277 United States Congress Lobbying Disclosure Database, Query Results for Pharmaceutical Research and Manufacturers of America (online at www.senate.gov/legislative/Public_Disclosure/LDA_reports.htm) (accessed Nov. 12, 2021); United States Congress Lobbying Disclosure Database, Query Results for Biotechnology Innovation Organization (online at www.senate.gov/legislative/Public_Disclosure/LDA_reports.htm) (accessed Nov. 12, 2021).
278 Id. 279 Id. 280 House Passes Drug Pricing Bill That Pharma Warned Would Bring “Nuclear Winter”, BioPharma Dive
(Dec. 12, 2019) (online at www.biopharmadive.com/news/house-approves-hr3-drug-pricing-bill-pharma/568966/). 281 TEVA_HCO_IC_005022375. 282 TEVA_HCO_IC_005007009.
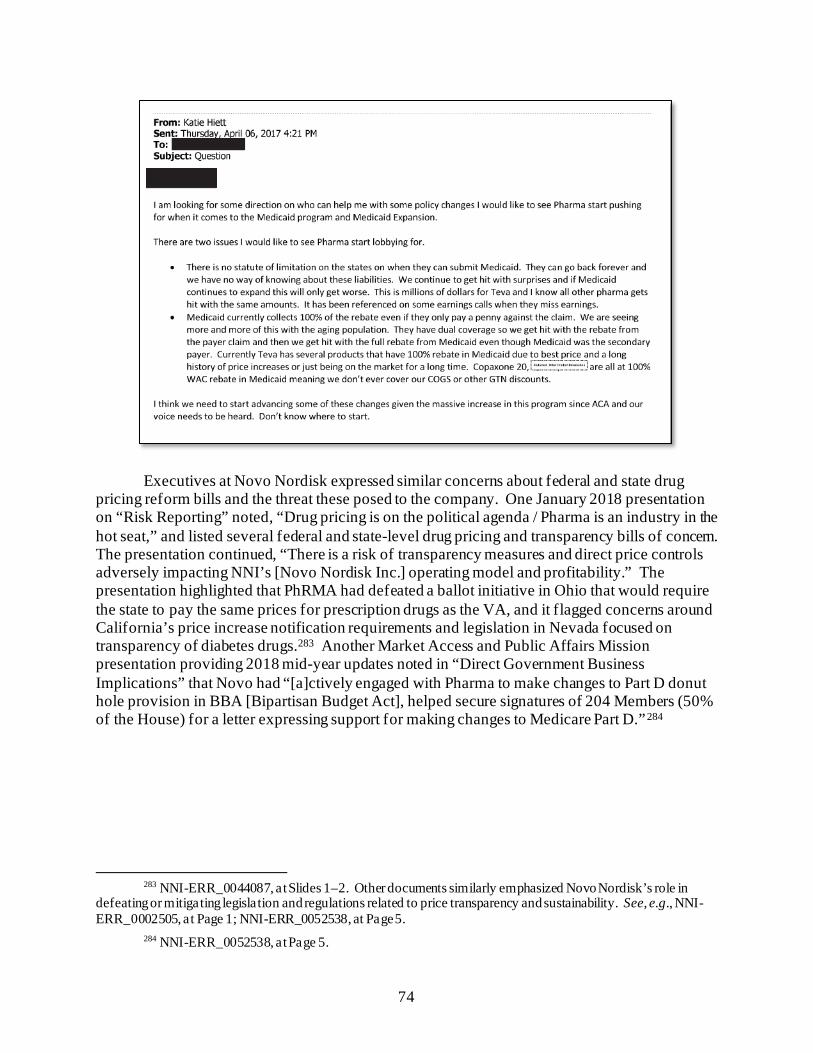
74
Executives at Novo Nordisk expressed similar concerns about federal and state drug pricing reform bills and the threat these posed to the company. One January 2018 presentation on “Risk Reporting” noted, “Drug pricing is on the political agenda / Pharma is an industry in the hot seat,” and listed several federal and state-level drug pricing and transparency bills of concern. The presentation continued, “There is a risk of transparency measures and direct price controls adversely impacting NNI’s [Novo Nordisk Inc.] operating model and profitability.” The presentation highlighted that PhRMA had defeated a ballot initiative in Ohio that would require the state to pay the same prices for prescription drugs as the VA, and it flagged concerns around California’s price increase notification requirements and legislation in Nevada focused on transparency of diabetes drugs.283 Another Market Access and Public Affairs Mission presentation providing 2018 mid-year updates noted in “Direct Government Business Implications” that Novo had “[a]ctively engaged with Pharma to make changes to Part D donut hole provision in BBA [Bipartisan Budget Act], helped secure signatures of 204 Members (50% of the House) for a letter expressing support for making changes to Medicare Part D.”284
283 NNI-ERR_0044087, at Slides 1–2. Other documents similarly emphasized Novo Nordisk’s role in
defeating or mitigating legislation and regulations related to price transparency and sustainability. See, e.g., NNI-ERR_0002505, at Page 1; NNI-ERR_0052538, at Page 5.
284 NNI-ERR_0052538, at Page 5.
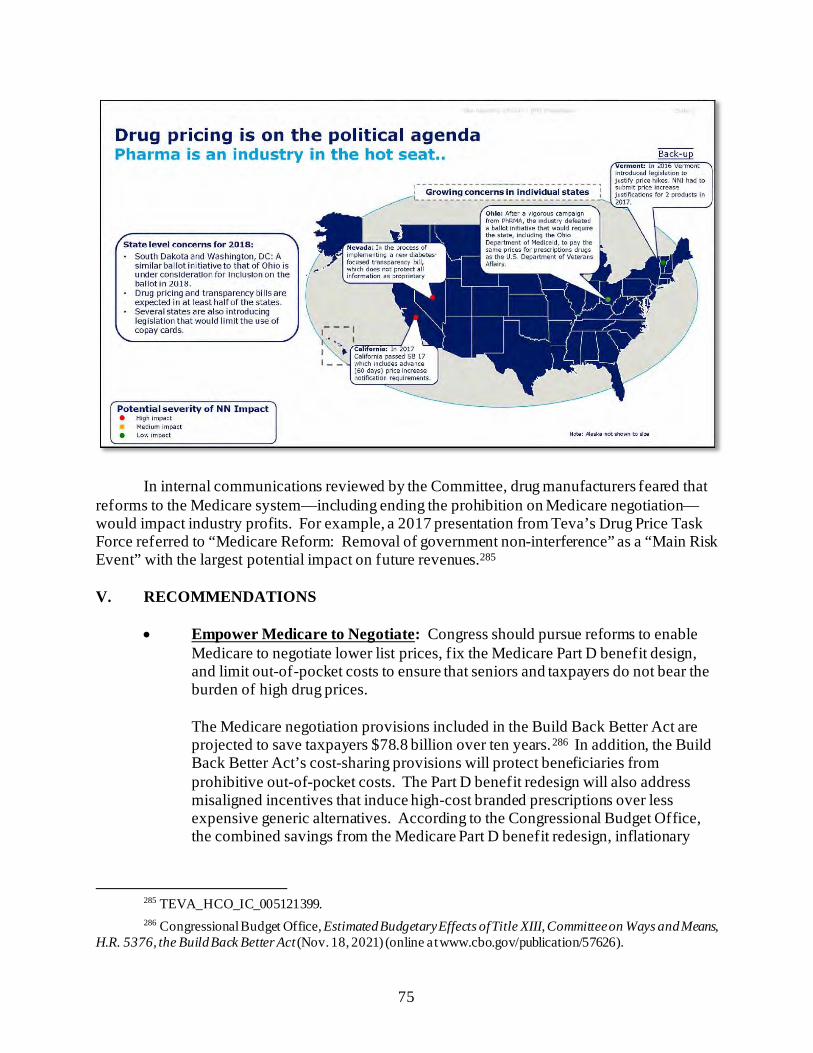
75
In internal communications reviewed by the Committee, drug manufacturers feared that reforms to the Medicare system—including ending the prohibition on Medicare negotiation—would impact industry profits. For example, a 2017 presentation from Teva’s Drug Price Task Force referred to “Medicare Reform: Removal of government non-interference” as a “Main Risk Event” with the largest potential impact on future revenues.285 V. RECOMMENDATIONS
• Empower Medicare to Negotiate: Congress should pursue reforms to enable Medicare to negotiate lower list prices, fix the Medicare Part D benefit design, and limit out-of-pocket costs to ensure that seniors and taxpayers do not bear the burden of high drug prices. The Medicare negotiation provisions included in the Build Back Better Act are projected to save taxpayers $78.8 billion over ten years.286 In addition, the Build Back Better Act’s cost-sharing provisions will protect beneficiaries from prohibitive out-of-pocket costs. The Part D benefit redesign will also address misaligned incentives that induce high-cost branded prescriptions over less expensive generic alternatives. According to the Congressional Budget Office, the combined savings from the Medicare Part D benefit redesign, inflationary
285 TEVA_HCO_IC_005121399. 286 Congressional Budget Office, Estimated Budgetary Effects of Title XIII, Committee on Ways and Means,
H.R. 5376, the Build Back Better Act (Nov. 18, 2021) (online at www.cbo.gov/publication/57626).
76
rebates, and negotiation provisions would account for approximately $160 billion in savings over the next decade.287
287 Id.; Committee for a Responsible Federal Budget, Full Estimates of the House Build Back Better Act
(Nov. 18, 2021) (online at www.crfb.org/blogs/full-estimates-house-build-back-better-act).
77
Chapter 4: Patent and Marketing Exclusivity Abuse
The Committee’s investigation has uncovered new evidence about the ways drug companies exploit the U.S. patent system and marketing exclusivities granted by the Food and Drug Administration (FDA) to extend their market monopolies by delaying generic and biosimilar competition.288 These monopolies allow drug companies to raise prices without threat to their market share, and lead to higher prices for American patients and increased spending by government programs.289
Internal company documents obtained by the Committee show that drug companies view
the U.S. patent system as far more protective of pharmaceutical property rights than patent systems in the rest of the world, and that they apply for dozens—or in some cases, hundreds—of secondary patents to extend their monopolies in the United States, while facing generic and biosimilar competition abroad. Documents also illustrate how companies exploit other FDA-granted market exclusivities, such as those for orphan drugs or pediatric indications. These efforts can delay the entry of lower-priced generics or biosimilars for months or years, resulting in billions of dollars in additional revenues for drug companies.
The Committee’s investigation found:
• Companies Obtained More than 600 Patents on 12 Drugs, Extending
Potential Monopolies for a Total of More than 290 Years: The companies in the Committee’s investigation have applied for more than 1,000 patents for the 12 drugs examined. More than 600 patents have been granted, representing a total of more than 290 years of potential patent protection. Companies such as Sanofi, Amgen, Celgene, and AbbVie obtained or applied for dozens—or, in AbbVie’s case, hundreds—of secondary patents covering the physical characteristics; formulations; or methods of using, administering, or manufacturing a drug. These
288 See, e.g., Initiative for Medicine, Access, and Knowledge, Overpatented, Overpriced: America’s
Bestselling Drugs of 2019 (online at www.i-mak.org/2019-bestselling/) (accessed Nov. 15, 2021); Robin Feldman, Our Patent System Is Broken. And It Could Be Stifling Innovation, Washington Post (Aug. 8, 2021) (online at www.washingtonpost.com/outlook/2021/08/08/our-patent-system-is-broken-it-could-be-stifling-innovation/); Erin Fox, How Pharma Companies Game the System to Keep Drugs Expensive, Harvard Business Review (Apr. 6, 2017) (online at https://hbr.org/2017/04/how-pharma-companies-game-the-system-to-keep-drugs-expensive).
289 See, e.g., Aaron Kesselheim, Jerry Avorn, and Ameet Sarpatwari, The High Cost of Prescription Drugs in the United States: Origins and Prospects for Reform, Journal of American Medicine (Aug. 2016) (online at https://jamanetwork.com/journals/jama/article-abstract/2545691); Government-Protected “Monopolies” Drive Drug Prices Higher, Study Says, Kaiser Health News (Aug. 23, 2016) (online at https://khn.org/news/government-protected-monopolies-drive-drug-prices-higher-study-says/); Study: Medicare’s Lost Savings Due to Delayed Adalimumab Biosimilar Entry, Center for Biosimilars (July 12, 2021) (online at www.centerforbiosimilars.com/view/study-medicare-s-lost-savings-due-to-delayed-adalimumab-biosimilar-entry) (calculating that Medicare lost over $2 billion in savings from 2016 to 2019 as a result of delayed biosimilar availability due to AbbVie’s patents and settlement agreements); Initiative for Medicine, Access, and Knowledge, Imbruvica’s Patent Wall (July 2020) (online at www.i-mak.org/wp-content/uploads/2020/08/I-MAK-Imbruvica-Patent-Wall-2020-07-42F.pdf) (estimating spending on Imbruvica during the nine years of extended exclusivity as at least $41 billion); Initiative for Medicines, Access, and Knowledge, America’s Overspend: How the Pharmaceutical Patent Problem Is Fueling High Drug Prices (Oct. 2017) (online at www.i-mak.org/wp-content/uploads/2020/10/Excess-Costs-Briefing-Paper-FINAL-2017-10-24-with-cover-rev.compressed.pdf).
78
follow-on patents allowed the companies to extend their monopolies in the United States, even while facing generic or biosimilar competition abroad. AbbVie also used a “drip feed” strategy to file successively more specific patents to extract a total of almost 30 years of patent protection and monopoly pricing on its cancer drug Imbruvica.
• Patent Settlements with Would-Be Competitors Cost the United States Billions: Companies like AbbVie, Amgen, and Bristol Myers Squibb delayed lower-priced biosimilar and generic drugs in the United States by entering into settlement agreements with potential competitors that challenged their patents. AbbVie has entered into nine patent settlements that delayed the U.S. entry of competition to Humira until 2023, costing the U.S. health care system an estimated $19 billion from 2016 to 2023.
• Companies Abused the Orphan Drug Act to Extend Monopolies: The Orphan
Drug Act is intended to incentivize the development of drugs that treat rare diseases, but the Committee found that companies sought orphan drug protections for widely used and commercially successful drugs. For example, AbbVie secured longer market exclusivity periods for its blockbuster drug Humira under the Orphan Drug Act by seeking separate, staggered market approvals and exclusivity periods for different age groups of patients affected by the same disease. AbbVie holds eight orphan drug designations and approvals for Humira, the top-selling drug in the world. The investigation also uncovered evidence that companies used orphan drug approval to justify charging high prices. Mallinckrodt used its orphan drug designation for Acthar as a justification to sell Acthar at a “premium” price to large populations beyond those with rare diseases.
• Companies Exploited Pediatric Exclusivity to Increase Profits: Companies,
including Pfizer, Novartis, and Sanofi, exploited the pediatric exclusivity period—intended to incentivize manufacturers to conduct studies of drugs in children—to extend their market monopolies for the blockbuster drugs Lyrica, Gleevec, and Lantus, respectively. This strategy led to billions of dollars in extra revenue for these companies in the six months of additional marketing exclusivity.
I. PATENT ABUSES
The U.S. patent system seeks to incentivize innovation by granting inventors of a new, useful, and non-obvious process, machine, product, or composition of matter a time-limited right to exclude others from using that invention (i.e., a patent). To receive a patent, the inventor must publicly disclose the details of the invention, thereby allowing others to use and replicate it when the patent term expires (typically 20 years after the date on which the patent application was filed).290
290 35 U.S.C. §§ 101-103, 112.
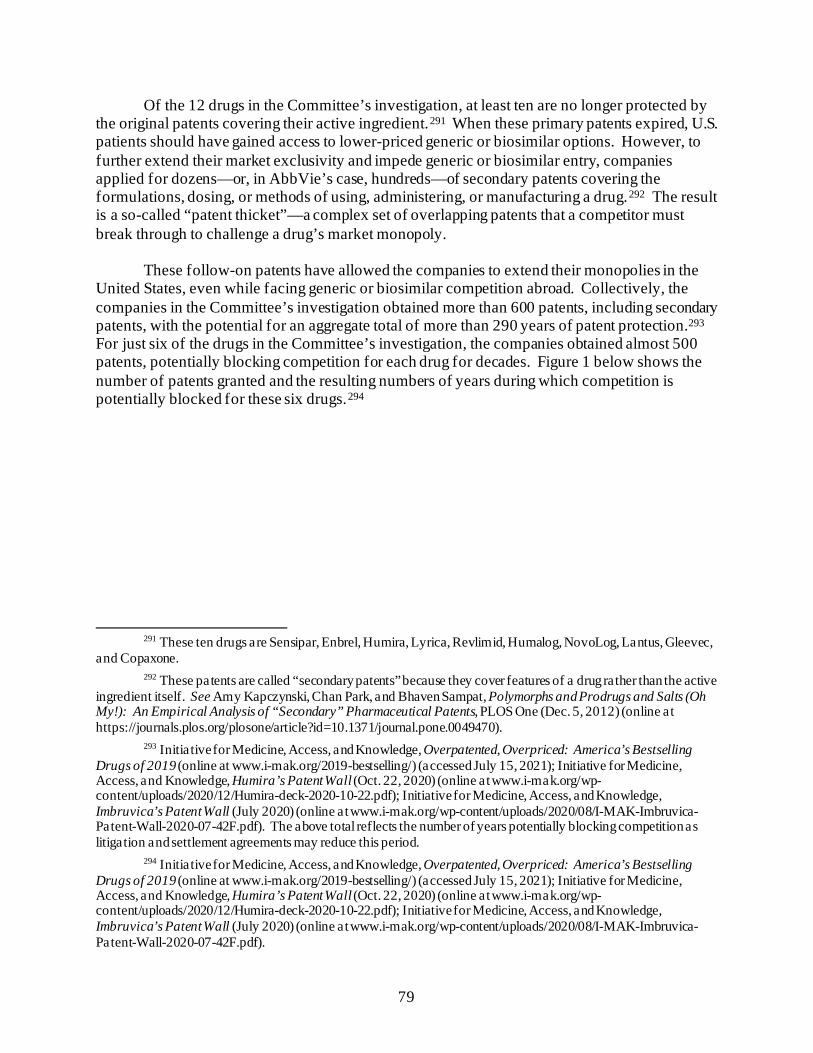
79
Of the 12 drugs in the Committee’s investigation, at least ten are no longer protected by the original patents covering their active ingredient.291 When these primary patents expired, U.S. patients should have gained access to lower-priced generic or biosimilar options. However, to further extend their market exclusivity and impede generic or biosimilar entry, companies applied for dozens—or, in AbbVie’s case, hundreds—of secondary patents covering the formulations, dosing, or methods of using, administering, or manufacturing a drug.292 The result is a so-called “patent thicket”—a complex set of overlapping patents that a competitor must break through to challenge a drug’s market monopoly.
These follow-on patents have allowed the companies to extend their monopolies in the
United States, even while facing generic or biosimilar competition abroad. Collectively, the companies in the Committee’s investigation obtained more than 600 patents, including secondary patents, with the potential for an aggregate total of more than 290 years of patent protection.293 For just six of the drugs in the Committee’s investigation, the companies obtained almost 500 patents, potentially blocking competition for each drug for decades. Figure 1 below shows the number of patents granted and the resulting numbers of years during which competition is potentially blocked for these six drugs.294
291 These ten drugs are Sensipar, Enbrel, Humira, Lyrica, Revlimid, Humalog, NovoLog, Lantus, Gleevec,
and Copaxone. 292 These patents are called “secondary patents” because they cover features of a drug rather than the active
ingredient itself. See Amy Kapczynski, Chan Park, and Bhaven Sampat, Polymorphs and Prodrugs and Salts (Oh My!): An Empirical Analysis of “Secondary” Pharmaceutical Patents, PLOS One (Dec. 5, 2012) (online at https://journals.plos.org/plosone/article?id=10.1371/journal.pone.0049470).
293 Initiative for Medicine, Access, and Knowledge, Overpatented, Overpriced: America’s Bestselling Drugs of 2019 (online at www.i-mak.org/2019-bestselling/) (accessed July 15, 2021); Initiative for Medicine, Access, and Knowledge, Humira’s Patent Wall (Oct. 22, 2020) (online at www.i-mak.org/wp-content/uploads/2020/12/Humira-deck-2020-10-22.pdf); Initiative for Medicine, Access, and Knowledge, Imbruvica’s Patent Wall (July 2020) (online at www.i-mak.org/wp-content/uploads/2020/08/I-MAK-Imbruvica-Patent-Wall-2020-07-42F.pdf). The above total reflects the number of years potentially blocking competition as litigation and settlement agreements may reduce this period.
294 Initiative for Medicine, Access, and Knowledge, Overpatented, Overpriced: America’s Bestselling Drugs of 2019 (online at www.i-mak.org/2019-bestselling/) (accessed July 15, 2021); Initiative for Medicine, Access, and Knowledge, Humira’s Patent Wall (Oct. 22, 2020) (online at www.i-mak.org/wp-content/uploads/2020/12/Humira-deck-2020-10-22.pdf); Initiative for Medicine, Access, and Knowledge, Imbruvica’s Patent Wall (July 2020) (online at www.i-mak.org/wp-content/uploads/2020/08/I-MAK-Imbruvica-Patent-Wall-2020-07-42F.pdf).
80
Figure 1: Patents and Years Blocking Competition
Company Drug Number of
Patents Issued
Potential Years
Blocking Competition
AbbVie Humira 130 39 AbbVie Imbruvica 88 29 Amgen Enbrel 39 47.5 Celgene Revlimid 109 40 Pfizer Lyrica 69 32 Sanofi Lantus 49 37
Total: 484 224.5
Due to the companies’ exploitation of the U.S. patent system, for almost all the drugs examined by the Committee, patients in Europe accessed lower-priced generic or biosimilar versions prior to patients in the United States.295
The pharmaceutical industry’s patent practices cost the U.S. health care system tens of
billions of dollars each year. The Initiative for Medicine, Access, and Knowledge (I-MAK) estimates that Bristol Myers Squibb’s patents on Revlimid will extend its monopoly until at least 2026 and will increase U.S. health care spending by $30 billion.296 The costs are particularly pronounced for biologic drugs like AbbVie’s Humira and Amgen’s Enbrel. One recent study estimated that adopting the European Union’s (EU) more rigorous patent system would have saved the U.S. health care system $16 billion between 2015 and 2026 on Enbrel and Humira alone.297 A recent study by Visante estimated that the delay of Humira and Enbrel biosimilars will cost the U.S. health system $20 billion over three years, from 2021 to 2023.298 And AbbVie’s own internal estimates suggest that the U.S. health care system would save $19 billion between 2016 and 2023 if the company had not leveraged its patent thicket and other anticompetitive practices to delay biosimilars until January 2023.299
295 These drugs are Copaxone, Enbrel, Humira, Lyrica, Revlimid, Gleevec, Sensipar, and Lantus. 296 While a limited-volume generic may enter the market in 2022 per Celgene’s Settlement Agreements
(infra note 342), unlimited generics may not enter the market until January 2026. Initiative for Medicine, Access, and Knowledge, America’s Overspend: How the Pharmaceutical Patent Problem Is Fueling High Drug Prices (Oct. 2017) (online at www.i-mak.org/wp-content/uploads/2020/10/Excess-Costs-Briefing-Paper-FINAL-2017-10-24-with-cover-rev.compressed.pdf).
297 Foundation for Research on Equal Opportunity, The Growing Power of Biotech Monopolies Threatens Affordable Care (Sept. 15, 2020) (online at https://freopp.org/the-growing-power-of-biotech-monopolies-threatens-affordable-care-e75e36fa1529).
298 Drug Manufacturer Strategies for Keeping Drug Costs High, Visante on Behalf of PCMA (Nov. 2021) (online at www.pcmanet.org/wp-content/uploads/2021/11/Visante_Pharma-Strategies-for-High-Drug-Costs.pdf).
299 See ABV-HOR-00032198, at Slide 15. The $19 billion figure is the total “price variance” estimate of biosimilar erosion. The U.S. health care system would have likely saved additional costs from a subset of patients
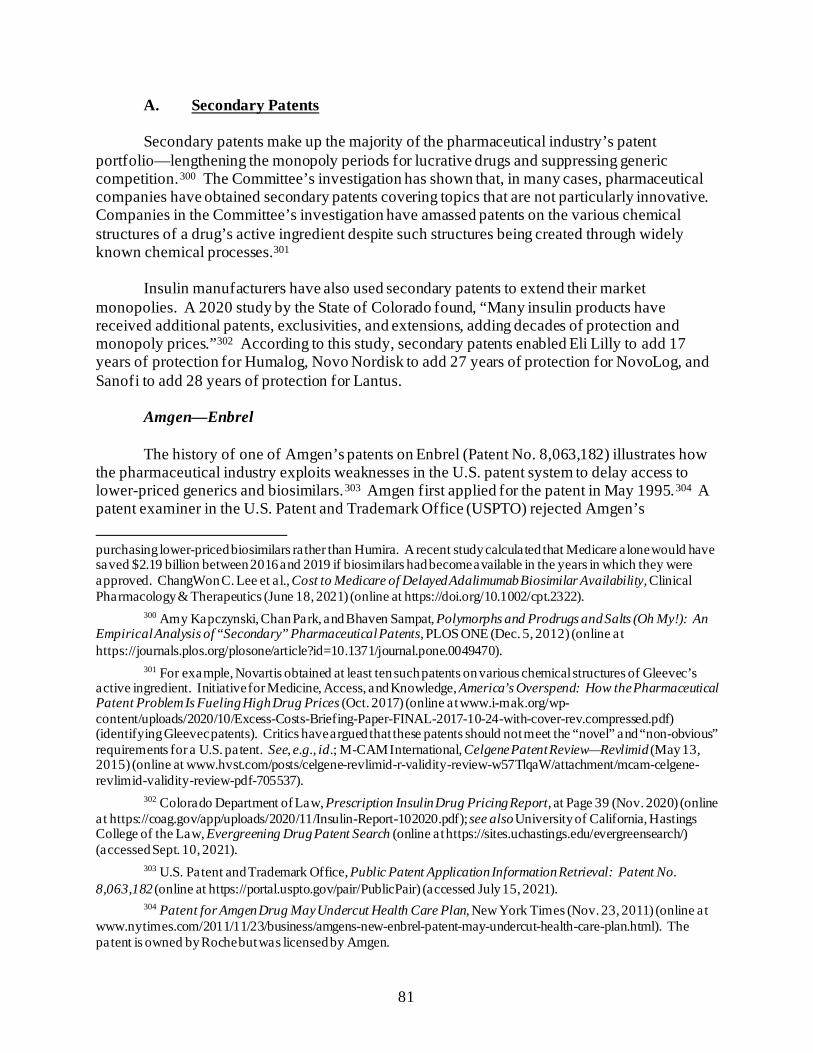
81
A. Secondary Patents
Secondary patents make up the majority of the pharmaceutical industry’s patent portfolio—lengthening the monopoly periods for lucrative drugs and suppressing generic competition.300 The Committee’s investigation has shown that, in many cases, pharmaceutical companies have obtained secondary patents covering topics that are not particularly innovative. Companies in the Committee’s investigation have amassed patents on the various chemical structures of a drug’s active ingredient despite such structures being created through widely known chemical processes.301
Insulin manufacturers have also used secondary patents to extend their market
monopolies. A 2020 study by the State of Colorado found, “Many insulin products have received additional patents, exclusivities, and extensions, adding decades of protection and monopoly prices.”302 According to this study, secondary patents enabled Eli Lilly to add 17 years of protection for Humalog, Novo Nordisk to add 27 years of protection for NovoLog, and Sanofi to add 28 years of protection for Lantus.
Amgen—Enbrel The history of one of Amgen’s patents on Enbrel (Patent No. 8,063,182) illustrates how
the pharmaceutical industry exploits weaknesses in the U.S. patent system to delay access to lower-priced generics and biosimilars.303 Amgen first applied for the patent in May 1995.304 A patent examiner in the U.S. Patent and Trademark Office (USPTO) rejected Amgen’s
purchasing lower-priced biosimilars rather than Humira. A recent study calculated that Medicare alone would have saved $2.19 billion between 2016 and 2019 if biosimilars had become available in the years in which they were approved. ChangWon C. Lee et al., Cost to Medicare of Delayed Adalimumab Biosimilar Availability, Clinical Pharmacology & Therapeutics (June 18, 2021) (online at https://doi.org/10.1002/cpt.2322).
300 Amy Kapczynski, Chan Park, and Bhaven Sampat, Polymorphs and Prodrugs and Salts (Oh My!): An Empirical Analysis of “Secondary” Pharmaceutical Patents, PLOS ONE (Dec. 5, 2012) (online at https://journals.plos.org/plosone/article?id=10.1371/journal.pone.0049470).
301 For example, Novartis obtained at least ten such patents on various chemical structures of Gleevec’s active ingredient. Initiative for Medicine, Access, and Knowledge, America’s Overspend: How the Pharmaceutical Patent Problem Is Fueling High Drug Prices (Oct. 2017) (online at www.i-mak.org/wp-content/uploads/2020/10/Excess-Costs-Briefing-Paper-FINAL-2017-10-24-with-cover-rev.compressed.pdf) (identifying Gleevec patents). Critics have argued that these patents should not meet the “novel” and “non-obvious” requirements for a U.S. patent. See, e.g., id.; M-CAM International, Celgene Patent Review—Revlimid (May 13, 2015) (online at www.hvst.com/posts/celgene-revlimid-r-validity-review-w57TlqaW/attachment/mcam-celgene-revlimid-validity-review-pdf-705537).
302 Colorado Department of Law, Prescription Insulin Drug Pricing Report, at Page 39 (Nov. 2020) (online at https://coag.gov/app/uploads/2020/11/Insulin-Report-102020.pdf); see also University of California, Hastings College of the Law, Evergreening Drug Patent Search (online at https://sites.uchastings.edu/evergreensearch/) (accessed Sept. 10, 2021).
303 U.S. Patent and Trademark Office, Public Patent Application Information Retrieval: Patent No. 8,063,182 (online at https://portal.uspto.gov/pair/PublicPair) (accessed July 15, 2021).
304 Patent for Amgen Drug May Undercut Health Care Plan, New York Times (Nov. 23, 2011) (online at www.nytimes.com/2011/11/23/business/amgens-new-enbrel-patent-may-undercut-health-care-plan.html). The patent is owned by Roche but was licensed by Amgen.
82
application, but Amgen simply amended the application and filed it again. Amgen then waited until 2007 to appeal the examiner’s decisions to the Board of Patent Appeals and Interferences.305
Amgen’s appeal was successful. In 2011, USPTO granted Amgen the ’182 patent, which
does not expire until 2028—33 years after the company filed its patent application and 30 years after Enbrel first entered the market. Soon after the 2011 patent was issued, independent analysts estimated that the patent may have added $6 per share to Amgen’s stock price.306 With approximately 870 million outstanding shares, this single patent added as much as $5 billion to Amgen’s value.307 The new patent kept prices high for U.S. patients who had expected that lower-cost biosimilar versions of Enbrel would enter the market after Amgen’s main patent on the drug expired in 2012.308 One patient who relies on Enbrel reported to the Committee that he has “been forced to dip into my savings and jeopardize my financial health to preserve my physical health.”309
AbbVie—Humira and Imbruvica AbbVie’s patent portfolio for Humira is composed almost entirely of secondary patents,
as demonstrated by a company presentation from 2015. Of 76 patents identified in the “Broad U.S. Humira Patent Estate” as of 2015, 75 were secondary patents.310
305 By delaying its appeal through the repeated filing of amendments to its patent application, Amgen
increased the value of its appeal because patent applications filed before June 1995 were still governed by outdated patent laws that granted patent protection for 17 years from the date of issuance (rather than the standard 20 years from the date of patent application). Patent for Amgen Drug May Undercut Health Care Plan, New York Times (Nov. 23, 2011) (online at www.nytimes.com/2011/11/23/business/amgens-new-enbrel-patent-may-undercut-health-care-plan.html).
306 New Patent Could Be Worth $6 a Share to Amgen, Forbes (Nov. 28, 2011) (online at www.forbes.com/sites/matthewherper/2011/11/28/new-patent-could-be-worth-6-a-share-to-amgen/#4be44a7a46e1).
307 Macrotrends, Amgen 36-Year Stock Price History (online at www.macrotrends.net/stocks/charts/AMGN/amgen/stock-price-history) (accessed July 12, 2021).
308 Patent for Amgen Drug May Undercut Health Care Plan, New York Times (Nov. 23, 2011) (online at www.nytimes.com/2011/11/23/business/amgens-new-enbrel-patent-may-undercut-health-care-plan.html).
309 House Committee on Oversight and Reform, Video Statement of Kip Burgess, Hearing on Unsustainable Drug Prices: Testimony from the CEOs (Part II), 116th Cong. (Oct. 1, 2020) (online at https://oversight.house.gov/legislation/hearings/unsustainable-drug-prices-testimony-from-the-ceos-part-ii).
310 AbbVie Inc., Long-Term Strategy (Oct. 30, 2015) (online at https://investors.abbvie.com/static-files/af79eef2-5901-4b62-9354-982d2d95404e).
83
In the nearly six years since that presentation, AbbVie’s Humira patent portfolio has continued to grow. Today, the company owns or has filed for at least 257 patents for Humira, the last of which is set to expire in 2033.311
AbbVie’s patents covering the use of Humira to treat rheumatoid arthritis and ankylosing spondylitis demonstrate the extent to which the industry is exploiting the U.S. patent system. Although the company’s first patent covering the use of Humira to treat these conditions expired in 2016, AbbVie obtained additional patents covering the treatment of these two conditions with a 40-milligram injection of Humira.312 By simply specifying the dose of Humira—something that was already known to the public and emphasized in AbbVie’s own marketing materials—AbbVie extended its patent protection by at least six years and as many as 11 years.313 In 2017, the U.S. Patent Trial and Appeal Board (PTAB) invalidated three other Humira patents covering
311 Initiative for Medicine, Access, and Knowledge, Overpatented, Overpriced: America’s Bestselling
Drugs of 2019 (online at www.i-mak.org/2019-bestselling/) (accessed July 15, 2021); Initiative for Medicine, Access, and Knowledge, Humira’s Patent Wall (Oct. 22, 2020) (online at www.i-mak.org/wp-content/uploads/2020/12/Humira-deck-2020-10-22.pdf). More information regarding AbbVie’s patent abuses is found on pages 32–35 of the Committee’s staff report on AbbVie. Majority Staff, House Committee on Oversight and Reform, Drug Pricing Investigation: AbbVie—Humira and Imbruvica (May 2021) (online at https://oversight.house.gov/sites/democrats.oversight.house.gov/files/Committee%20on%20Oversight%20and%20Reform%20-%20AbbVie%20Staff%20Report.pdf).
312 See U.S. Patent No. 6,509,015 (filed Mar. 3, 2000); U.S. Patent No. 8,926,975 (filed June 17, 2014) (anticipated expiration in 2027); U.S. Patent No. 9,546,212 (filed June 6, 2016) (anticipated expiration in 2022).
313 Id.; see Food and Drug Administration, Approved Label for Humira (July 2006) (online at www.accessdata.fda.gov/drugsatfda_docs/label/2006/125057s062lbl.pdf) (listing the dosing regimen covered in AbbVie’s subsequent patents).
84
dosing for the treatment of rheumatoid arthritis because the dosing was “obvious” and therefore unpatentable.314
Experts at I-MAK warn that companies are also using a “drip feed” patent strategy to extend their market exclusivity. Under this strategy, a company files successively more specific patents covering aspects of a drug that had already been disclosed in earlier patents. Because the U.S. patent system generally grants a 20-year patent term regardless of inventiveness, the successive patents effectively reset the clock for the same “invention.” For example, AbbVie employed this strategy to secure 30 years of patent protection for various uses of Imbruvica, including to treat chronic lymphocytic leukemia and Waldenstrom macroglobulinemia, a type of non-Hodgkin lymphoma.315
Secondary patents are also less likely to withstand scrutiny when challenged in court. For example, one study found that brand-name manufacturers only won 32% of challenges to their secondary patents when cases were litigated to completion, as compared to 92% for active-ingredient patents.316 However, drug companies have exploited the fact that patent challenges are time-consuming and expensive. In a 2015 presentation to investors, AbbVie CEO Richard Gonzalez emphasized that any company challenging AbbVie’s patents would be embroiled in “4 to 5 years” of litigation.317
314 See Coherus Biosciences Inc. v. AbbVie, IPR2016-00189 (PTAB June 9, 2017); Coherus Biosciences
Inc. v. AbbVie, IPR2016-00189 (PTAB June 9, 2017); Boehringer Ingelheim v. AbbVie, IPR2016-00408 (PTAB July 6, 2017). The Federal Circuit upheld the decision without opinion in January 2020. See AbbVie v. U.S. & Iancu, No. 17-2304 (Fed. Cir. 2020).
315 Initiative for Medicine, Access, and Knowledge, Imbruvica’s Patent Wall (July 2020) (online at www.i-mak.org/wp-content/uploads/2020/08/I-MAK-Imbruvica-Patent-Wall-2020-07-42F.pdf).
316 C. Scott Hemphill and Bhaven Sampat, Drug Patents at the Supreme Court, Science Magazine (Mar. 22, 2013) (online at http://awa2014.concurrences.com/IMG/pdf/drug_patents_at_the_supreme_court_science.pdf).
317 AbbVie Inc., Long-Term Strategy (Oct. 30, 2015) (online at https://investors.abbvie.com/static-files/af79eef2-5901-4b62-9354-982d2d95404e).
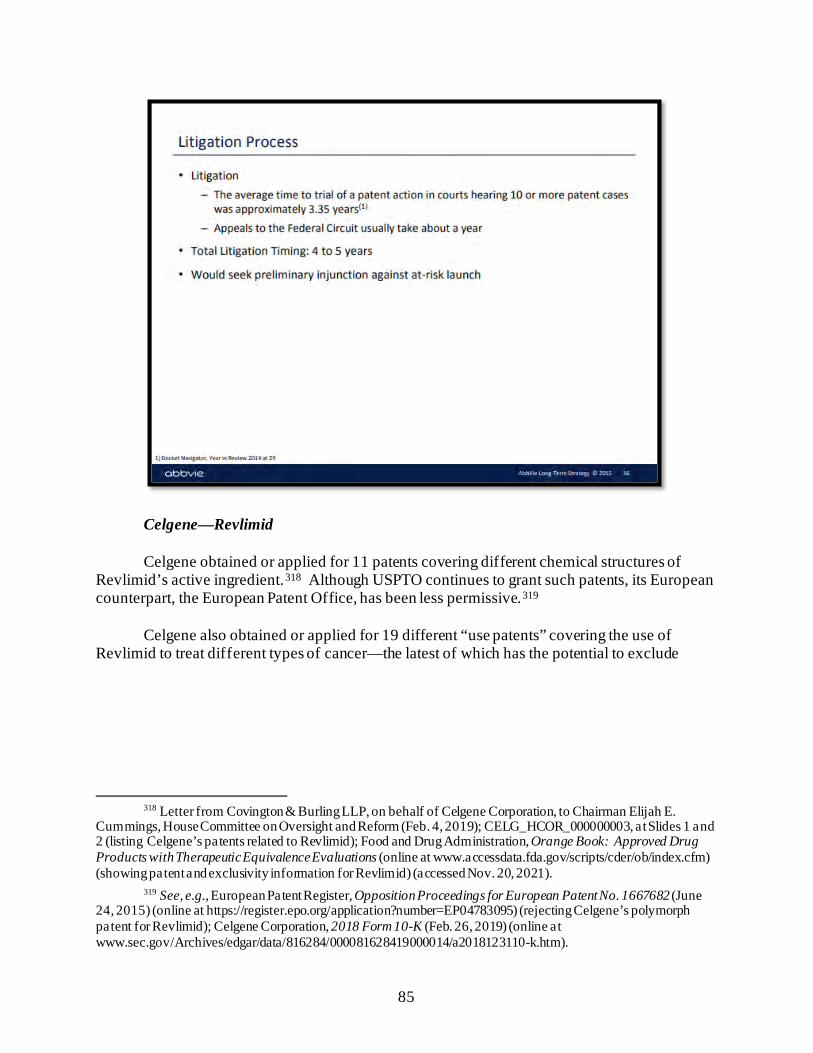
85
Celgene—Revlimid Celgene obtained or applied for 11 patents covering different chemical structures of
Revlimid’s active ingredient.318 Although USPTO continues to grant such patents, its European counterpart, the European Patent Office, has been less permissive.319
Celgene also obtained or applied for 19 different “use patents” covering the use of
Revlimid to treat different types of cancer—the latest of which has the potential to exclude
318 Letter from Covington & Burling LLP, on behalf of Celgene Corporation, to Chairman Elijah E.
Cummings, House Committee on Oversight and Reform (Feb. 4, 2019); CELG_HCOR_000000003, at Slides 1 and 2 (listing Celgene’s patents related to Revlimid); Food and Drug Administration, Orange Book: Approved Drug Products with Therapeutic Equivalence Evaluations (online at www.accessdata.fda.gov/scripts/cder/ob/index.cfm) (showing patent and exclusivity information for Revlimid) (accessed Nov. 20, 2021).
319 See, e.g., European Patent Register, Opposition Proceedings for European Patent No. 1667682 (June 24, 2015) (online at https://register.epo.org/application?number=EP04783095) (rejecting Celgene’s polymorph patent for Revlimid); Celgene Corporation, 2018 Form 10-K (Feb. 26, 2019) (online at www.sec.gov/Archives/edgar/data/816284/000081628419000014/a2018123110-k.htm).
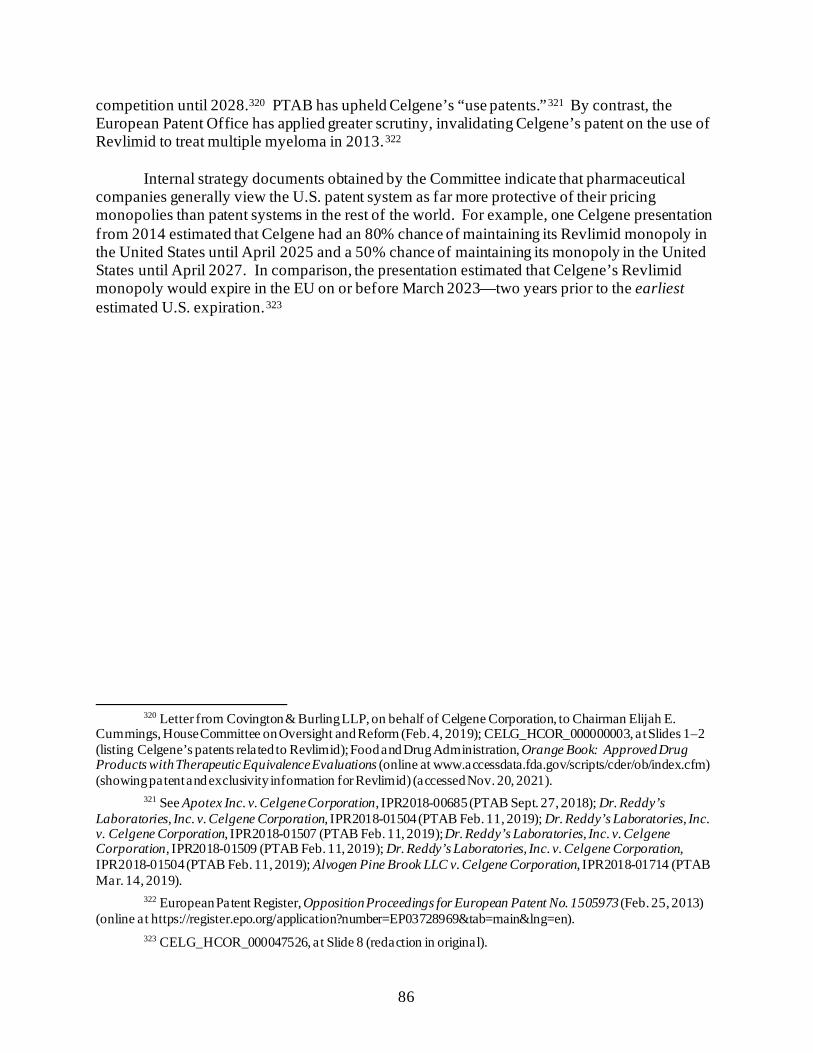
86
competition until 2028.320 PTAB has upheld Celgene’s “use patents.”321 By contrast, the European Patent Office has applied greater scrutiny, invalidating Celgene’s patent on the use of Revlimid to treat multiple myeloma in 2013.322
Internal strategy documents obtained by the Committee indicate that pharmaceutical companies generally view the U.S. patent system as far more protective of their pricing monopolies than patent systems in the rest of the world. For example, one Celgene presentation from 2014 estimated that Celgene had an 80% chance of maintaining its Revlimid monopoly in the United States until April 2025 and a 50% chance of maintaining its monopoly in the United States until April 2027. In comparison, the presentation estimated that Celgene’s Revlimid monopoly would expire in the EU on or before March 2023—two years prior to the earliest estimated U.S. expiration.323
320 Letter from Covington & Burling LLP, on behalf of Celgene Corporation, to Chairman Elijah E.
Cummings, House Committee on Oversight and Reform (Feb. 4, 2019); CELG_HCOR_000000003, at Slides 1–2 (listing Celgene’s patents related to Revlimid); Food and Drug Administration, Orange Book: Approved Drug Products with Therapeutic Equivalence Evaluations (online at www.accessdata.fda.gov/scripts/cder/ob/index.cfm) (showing patent and exclusivity information for Revlimid) (accessed Nov. 20, 2021).
321 See Apotex Inc. v. Celgene Corporation, IPR2018-00685 (PTAB Sept. 27, 2018); Dr. Reddy’s Laboratories, Inc. v. Celgene Corporation, IPR2018-01504 (PTAB Feb. 11, 2019); Dr. Reddy’s Laboratories, Inc. v. Celgene Corporation, IPR2018-01507 (PTAB Feb. 11, 2019); Dr. Reddy’s Laboratories, Inc. v. Celgene Corporation, IPR2018-01509 (PTAB Feb. 11, 2019); Dr. Reddy’s Laboratories, Inc. v. Celgene Corporation, IPR2018-01504 (PTAB Feb. 11, 2019); Alvogen Pine Brook LLC v. Celgene Corporation, IPR2018-01714 (PTAB Mar. 14, 2019).
322 European Patent Register, Opposition Proceedings for European Patent No. 1505973 (Feb. 25, 2013) (online at https://register.epo.org/application?number=EP03728969&tab=main&lng=en).
323 CELG_HCOR_000047526, at Slide 8 (redaction in original).
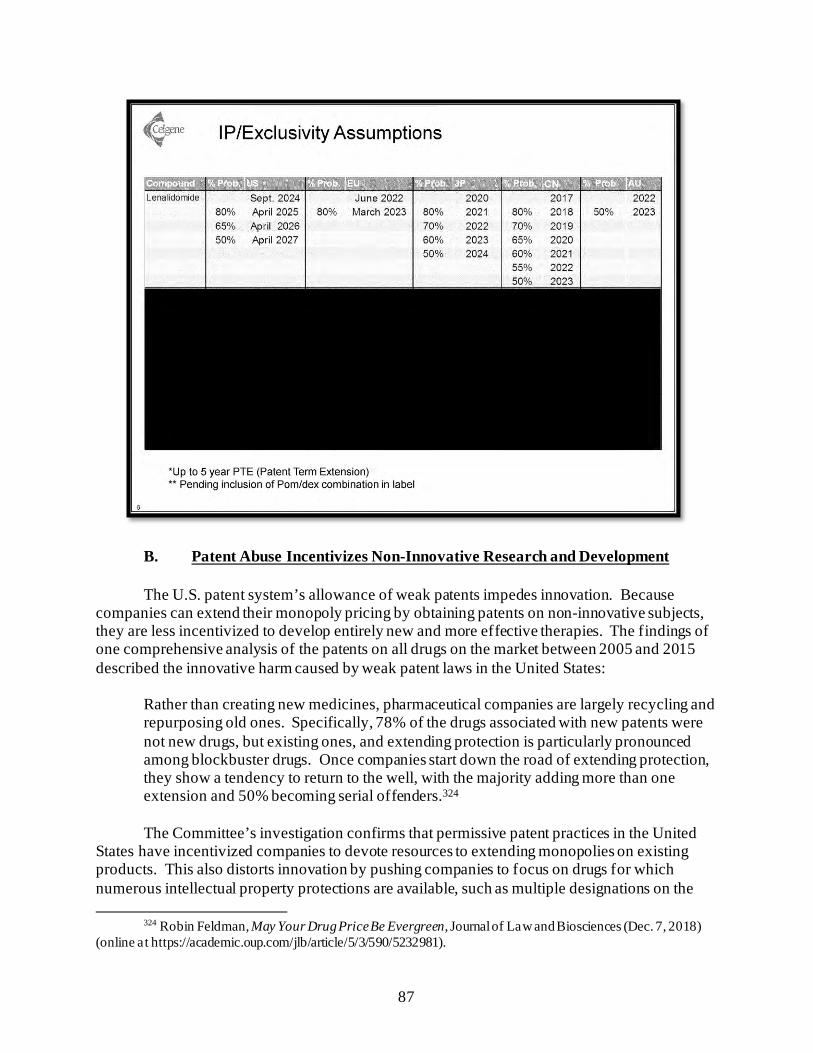
87
B. Patent Abuse Incentivizes Non-Innovative Research and Development The U.S. patent system’s allowance of weak patents impedes innovation. Because
companies can extend their monopoly pricing by obtaining patents on non-innovative subjects, they are less incentivized to develop entirely new and more effective therapies. The findings of one comprehensive analysis of the patents on all drugs on the market between 2005 and 2015 described the innovative harm caused by weak patent laws in the United States:
Rather than creating new medicines, pharmaceutical companies are largely recycling and repurposing old ones. Specifically, 78% of the drugs associated with new patents were not new drugs, but existing ones, and extending protection is particularly pronounced among blockbuster drugs. Once companies start down the road of extending protection, they show a tendency to return to the well, with the majority adding more than one extension and 50% becoming serial offenders.324 The Committee’s investigation confirms that permissive patent practices in the United
States have incentivized companies to devote resources to extending monopolies on existing products. This also distorts innovation by pushing companies to focus on drugs for which numerous intellectual property protections are available, such as multiple designations on the
324 Robin Feldman, May Your Drug Price Be Evergreen, Journal of Law and Biosciences (Dec. 7, 2018)
(online at https://academic.oup.com/jlb/article/5/3/590/5232981).
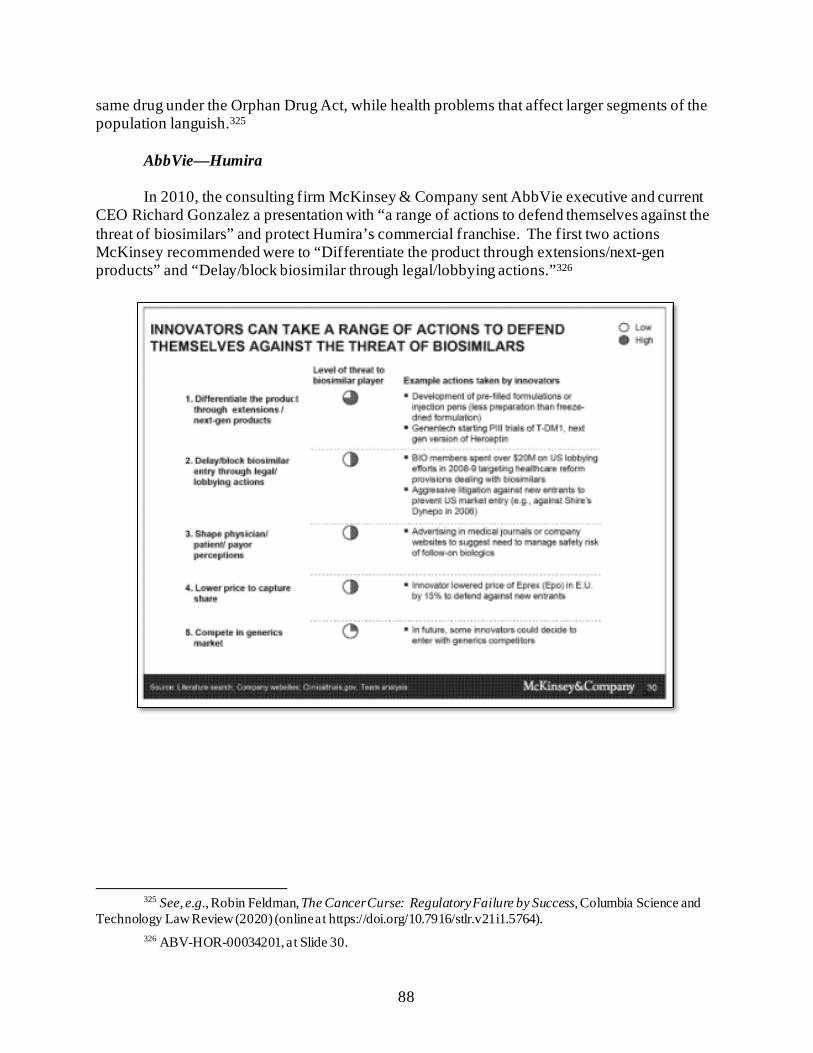
88
same drug under the Orphan Drug Act, while health problems that affect larger segments of the population languish.325
AbbVie—Humira In 2010, the consulting firm McKinsey & Company sent AbbVie executive and current
CEO Richard Gonzalez a presentation with “a range of actions to defend themselves against the threat of biosimilars” and protect Humira’s commercial franchise. The first two actions McKinsey recommended were to “Differentiate the product through extensions/next-gen products” and “Delay/block biosimilar through legal/lobbying actions.”326
325 See, e.g., Robin Feldman, The Cancer Curse: Regulatory Failure by Success, Columbia Science and
Technology Law Review (2020) (online at https://doi.org/10.7916/stlr.v21i1.5764). 326 ABV-HOR-00034201, at Slide 30.
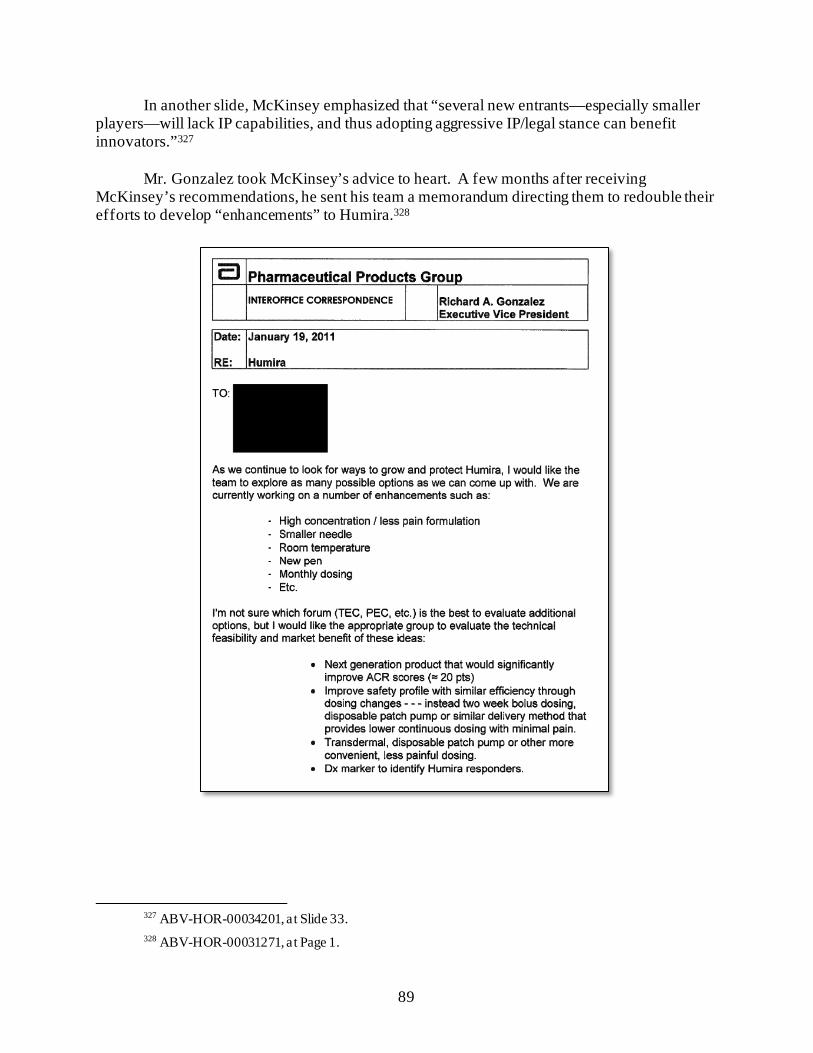
89
In another slide, McKinsey emphasized that “several new entrants—especially smaller players—will lack IP capabilities, and thus adopting aggressive IP/legal stance can benefit innovators.”327
Mr. Gonzalez took McKinsey’s advice to heart. A few months after receiving
McKinsey’s recommendations, he sent his team a memorandum directing them to redouble their efforts to develop “enhancements” to Humira.328
327 ABV-HOR-00034201, at Slide 33. 328 ABV-HOR-00031271, at Page 1.
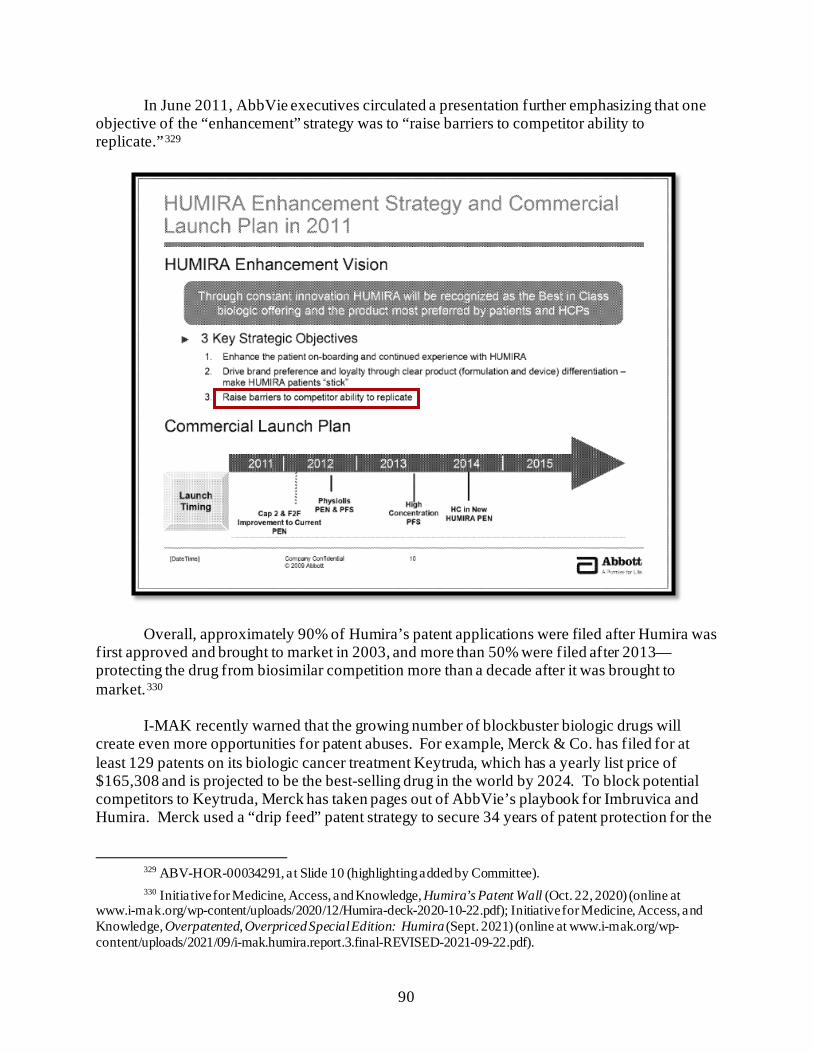
90
In June 2011, AbbVie executives circulated a presentation further emphasizing that one objective of the “enhancement” strategy was to “raise barriers to competitor ability to replicate.”329
Overall, approximately 90% of Humira’s patent applications were filed after Humira was first approved and brought to market in 2003, and more than 50% were filed after 2013—protecting the drug from biosimilar competition more than a decade after it was brought to market.330
I-MAK recently warned that the growing number of blockbuster biologic drugs will
create even more opportunities for patent abuses. For example, Merck & Co. has filed for at least 129 patents on its biologic cancer treatment Keytruda, which has a yearly list price of $165,308 and is projected to be the best-selling drug in the world by 2024. To block potential competitors to Keytruda, Merck has taken pages out of AbbVie’s playbook for Imbruvica and Humira. Merck used a “drip feed” patent strategy to secure 34 years of patent protection for the
329 ABV-HOR-00034291, at Slide 10 (highlighting added by Committee). 330 Initiative for Medicine, Access, and Knowledge, Humira’s Patent Wall (Oct. 22, 2020) (online at
www.i-mak.org/wp-content/uploads/2020/12/Humira-deck-2020-10-22.pdf); Initiative for Medicine, Access, and Knowledge, Overpatented, Overpriced Special Edition: Humira (Sept. 2021) (online at www.i-mak.org/wp-content/uploads/2021/09/i-mak.humira.report.3.final-REVISED-2021-09-22.pdf).
91
active ingredients in Keytruda. The company also filed for 95 secondary patents to build a thicket around Keytruda.331
Without structural reforms to the U.S. patent system, aggressive patent strategies like
those used by AbbVie and Merck are likely to be replicated by other pharmaceutical companies, further delaying U.S. patients’ access to lower-priced generic and biosimilar drugs.
II. PATENT SETTLEMENT AGREEMENTS
Brand-name drug companies have also delayed lower-priced biosimilar and generic drugs in the United States by entering into settlement agreements with potential competitors that have challenged their patents. Not only is this practice costly, but it also harms innovation. One recent study found that when pharmaceutical companies maintain their market power through “reverse-payment” or “pay-for-delay” agreements that delay the entry of competitors, the companies have reduced incentives to innovate.332
These settlement agreements can violate U.S. antitrust laws, particularly if the brand-
name manufacturer transfers an item of value to a competitor in exchange for that competitor’s dropping its patent challenge and keeping its competing drug off the market. In FTC v. Actavis, Inc., the Supreme Court held that such “reverse-payment settlements” warrant antitrust scrutiny because they create a “risk of significant anticompetitive effects.” The Court warned that these agreements may allow the parties to “maintain supracompetitive prices to be shared among the patentee and the challenger rather than face what might have been a competitive market.”333
The Committee’s investigation has uncovered new details about patent settlement agreements entered into by AbbVie, Amgen, and Bristol Myers Squibb. These agreements have significantly delayed U.S. patients’ access to lower-priced drugs and cost the U.S. health care system billions of dollars in excess expenditures.
AbbVie—Humira and Imbruvica
AbbVie has entered into settlement agreements with nine competitors, including six
companies that have FDA approval for their biosimilars, delaying competition and protecting monopoly pricing until January 2023. In testimony before the Committee on May 18, 2021,
331 Initiative for Medicine, Access, and Knowledge, Keytruda’s Patent Wall (May 2021) (online at www.i-
mak.org/wp-content/uploads/2021/05/i-mak.keytruda.report-2021-05-06F.pdf). 332 Xuelin Li, Andrew W. Lo, and Richard T. Thakor, Paying Off the Competition: Market Power and
Innovation Incentives, National Bureau of Economic Research (June 2021) (online at www.nber.org/system/files/working_papers/w28964/w28964.pdf?utm_campaign=PANTHEON_STRIPPED&%3Butm_medium=PANTHEON_STRIPPED&%3Butm_source=PANTHEON_STRIPPED).
333 FTC v. Actavis, Inc., 570 U.S. 136, 152, 157 (2013).
92
AbbVie CEO Richard Gonzalez attempted to defend these settlement agreements by claiming that they allow biosimilars to enter the market “11 years before the last patent expired.”334
This argument assumes that all of AbbVie’s patents are valid and that biosimilar entry
would have infringed those patents—an assumption that is not supported by evidence.335 In fact, Mr. Gonzalez’s claim is inconsistent with AbbVie’s own projections of when it expected Humira would face biosimilar competition. An August 2014 presentation sent to Mr. Gonzalez projected that Humira would face biosimilar competition in the United States no later than July 2017 and predicted this would cause “Price Erosion” and “Volume Erosion” for Humira sales.336 Amgen’s planned January 31, 2023, U.S. entry date for a Humira biosimilar is six years later than AbbVie’s original projections, and other competitors are slated to enter the market even later than Amgen.
334 House Committee on Oversight and Reform, Hearing on Unsustainable Drug Prices (Part III):
Testimony from AbbVie CEO Richard Gonzalez (May 18, 2021) (online at https://docs.house.gov/meetings/GO/GO00/20210518/112631/HHRG-117-GO00-Transcript-20210518.pdf).
335 A report from the Federal Trade Commission estimates that when generic companies challenge secondary patents, the patent holder loses 75% of the time. Federal Trade Commission, Generic Drug Entry Prior to Patent Expiration: An FTC Study (July 2002) (online at www.ftc.gov/sites/default/files/documents/reports/generic-drug-entry-prior-patent-expiration-ftc-study/genericdrugstudy_0.pdf). In October 2021, FDA approved the first interchangeable biosimilar for Humira—Boehringer Ingelheim’s Cyltezo (which is only the second fully interchangeable biosimilar ever approved by FDA)—indicating that pressure on U.S. sales of Humira may be even stronger once biosimilars finally reach the market in 2023. See, e.g., First Interchangeable Humira Biosimilar Approved, MedPage Today (Oct. 18, 2021) (online at www.medpagetoday.com/rheumatology/generalrheumatology/95098).
336 ABV-HOR-00033966, at Slide 12 (highlighting added by Committee).
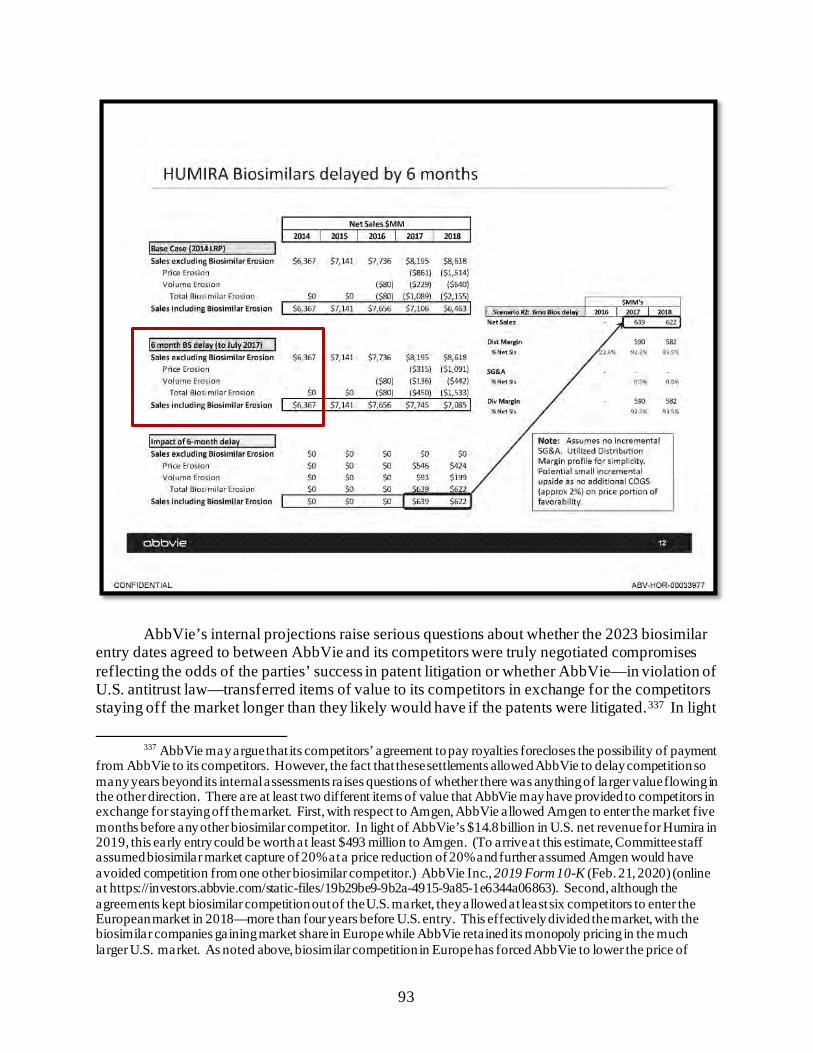
93
AbbVie’s internal projections raise serious questions about whether the 2023 biosimilar
entry dates agreed to between AbbVie and its competitors were truly negotiated compromises reflecting the odds of the parties’ success in patent litigation or whether AbbVie—in violation of U.S. antitrust law—transferred items of value to its competitors in exchange for the competitors staying off the market longer than they likely would have if the patents were litigated.337 In light
337 AbbVie may argue that its competitors’ agreement to pay royalties forecloses the possibility of payment
from AbbVie to its competitors. However, the fact that these settlements allowed AbbVie to delay competition so many years beyond its internal assessments raises questions of whether there was anything of larger value flowing in the other direction. There are at least two different items of value that AbbVie may have provided to competitors in exchange for staying off the market. First, with respect to Amgen, AbbVie allowed Amgen to enter the market five months before any other biosimilar competitor. In light of AbbVie’s $14.8 billion in U.S. net revenue for Humira in 2019, this early entry could be worth at least $493 million to Amgen. (To arrive at this estimate, Committee staff assumed biosimilar market capture of 20% at a price reduction of 20% and further assumed Amgen would have avoided competition from one other biosimilar competitor.) AbbVie Inc., 2019 Form 10-K (Feb. 21, 2020) (online at https://investors.abbvie.com/static-files/19b29be9-9b2a-4915-9a85-1e6344a06863). Second, although the agreements kept biosimilar competition out of the U.S. market, they allowed at least six competitors to enter the European market in 2018—more than four years before U.S. entry. This effectively divided the market, with the biosimilar companies gaining market share in Europe while AbbVie retained its monopoly pricing in the much larger U.S. market. As noted above, biosimilar competition in Europe has forced AbbVie to lower the price of
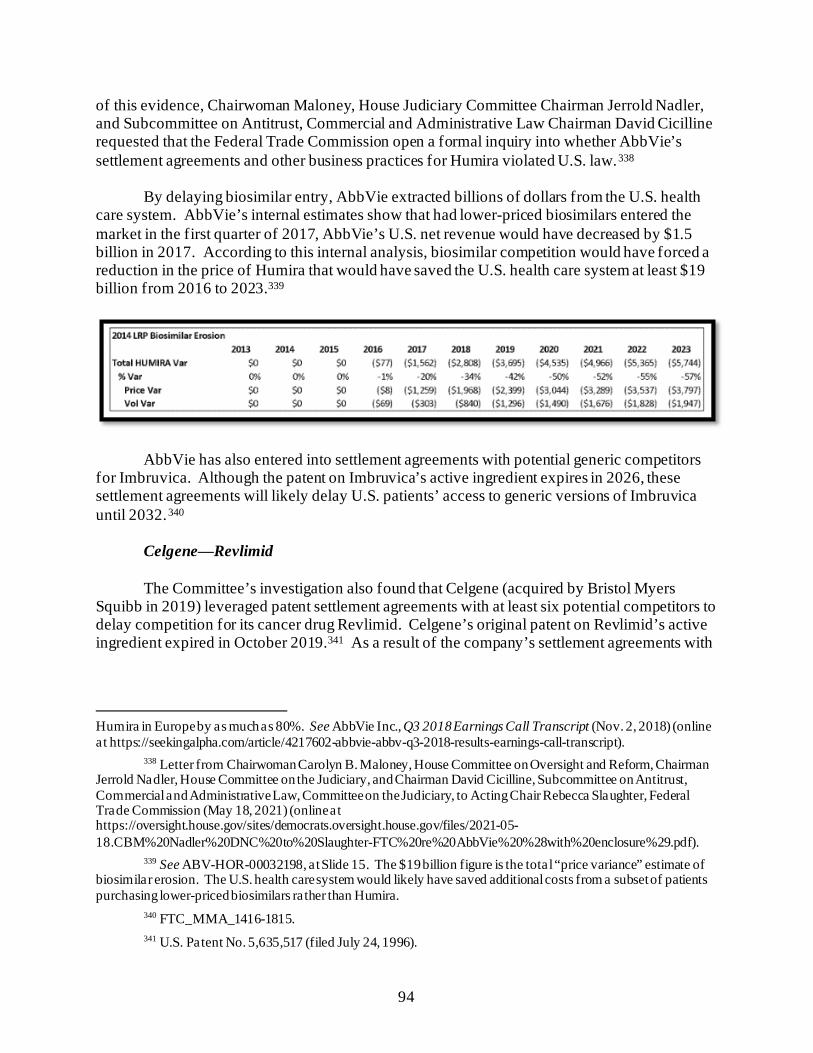
94
of this evidence, Chairwoman Maloney, House Judiciary Committee Chairman Jerrold Nadler, and Subcommittee on Antitrust, Commercial and Administrative Law Chairman David Cicilline requested that the Federal Trade Commission open a formal inquiry into whether AbbVie’s settlement agreements and other business practices for Humira violated U.S. law.338
By delaying biosimilar entry, AbbVie extracted billions of dollars from the U.S. health
care system. AbbVie’s internal estimates show that had lower-priced biosimilars entered the market in the first quarter of 2017, AbbVie’s U.S. net revenue would have decreased by $1.5 billion in 2017. According to this internal analysis, biosimilar competition would have forced a reduction in the price of Humira that would have saved the U.S. health care system at least $19 billion from 2016 to 2023.339
AbbVie has also entered into settlement agreements with potential generic competitors
for Imbruvica. Although the patent on Imbruvica’s active ingredient expires in 2026, these settlement agreements will likely delay U.S. patients’ access to generic versions of Imbruvica until 2032.340
Celgene—Revlimid
The Committee’s investigation also found that Celgene (acquired by Bristol Myers Squibb in 2019) leveraged patent settlement agreements with at least six potential competitors to delay competition for its cancer drug Revlimid. Celgene’s original patent on Revlimid’s active ingredient expired in October 2019.341 As a result of the company’s settlement agreements with
Humira in Europe by as much as 80%. See AbbVie Inc., Q3 2018 Earnings Call Transcript (Nov. 2, 2018) (online at https://seekingalpha.com/article/4217602-abbvie-abbv-q3-2018-results-earnings-call-transcript).
338 Letter from Chairwoman Carolyn B. Maloney, House Committee on Oversight and Reform, Chairman Jerrold Nadler, House Committee on the Judiciary, and Chairman David Cicilline, Subcommittee on Antitrust, Commercial and Administrative Law, Committee on the Judiciary, to Acting Chair Rebecca Slaughter, Federal Trade Commission (May 18, 2021) (online at https://oversight.house.gov/sites/democrats.oversight.house.gov/files/2021-05-18.CBM%20Nadler%20DNC%20to%20Slaughter-FTC%20re%20AbbVie%20%28with%20enclosure%29.pdf).
339 See ABV-HOR-00032198, at Slide 15. The $19 billion figure is the total “price variance” estimate of biosimilar erosion. The U.S. health care system would likely have saved additional costs from a subset of patients purchasing lower-priced biosimilars rather than Humira.
340 FTC_MMA_1416-1815. 341 U.S. Patent No. 5,635,517 (filed July 24, 1996).
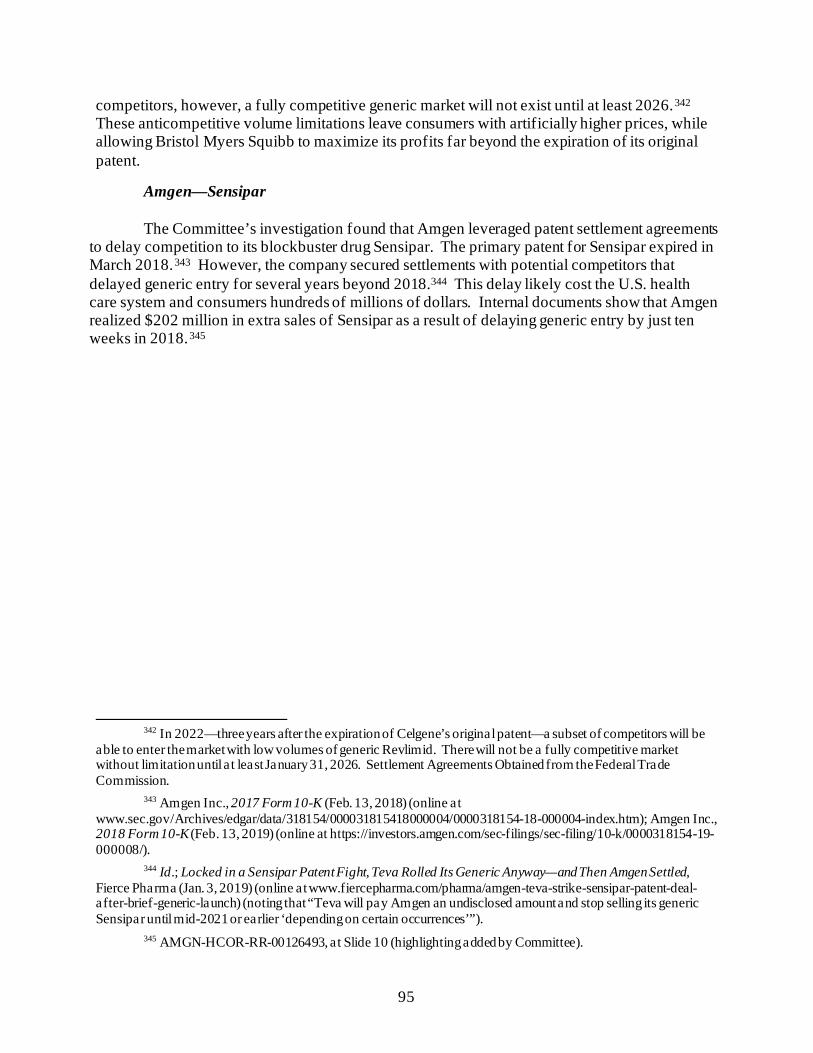
95
competitors, however, a fully competitive generic market will not exist until at least 2026.342 These anticompetitive volume limitations leave consumers with artificially higher prices, while allowing Bristol Myers Squibb to maximize its profits far beyond the expiration of its original patent.
Amgen—Sensipar The Committee’s investigation found that Amgen leveraged patent settlement agreements
to delay competition to its blockbuster drug Sensipar. The primary patent for Sensipar expired in March 2018.343 However, the company secured settlements with potential competitors that delayed generic entry for several years beyond 2018.344 This delay likely cost the U.S. health care system and consumers hundreds of millions of dollars. Internal documents show that Amgen realized $202 million in extra sales of Sensipar as a result of delaying generic entry by just ten weeks in 2018.345
342 In 2022—three years after the expiration of Celgene’s original patent—a subset of competitors will be
able to enter the market with low volumes of generic Revlimid. There will not be a fully competitive market without limitation until at least January 31, 2026. Settlement Agreements Obtained from the Federal Trade Commission.
343 Amgen Inc., 2017 Form 10-K (Feb. 13, 2018) (online at www.sec.gov/Archives/edgar/data/318154/000031815418000004/0000318154-18-000004-index.htm); Amgen Inc., 2018 Form 10-K (Feb. 13, 2019) (online at https://investors.amgen.com/sec-filings/sec-filing/10-k/0000318154-19-000008/).
344 Id.; Locked in a Sensipar Patent Fight, Teva Rolled Its Generic Anyway—and Then Amgen Settled, Fierce Pharma (Jan. 3, 2019) (online at www.fiercepharma.com/pharma/amgen-teva-strike-sensipar-patent-deal-after-brief-generic-launch) (noting that “Teva will pay Amgen an undisclosed amount and stop selling its generic Sensipar until mid-2021 or earlier ‘depending on certain occurrences’”).
345 AMGN-HCOR-RR-00126493, at Slide 10 (highlighting added by Committee).
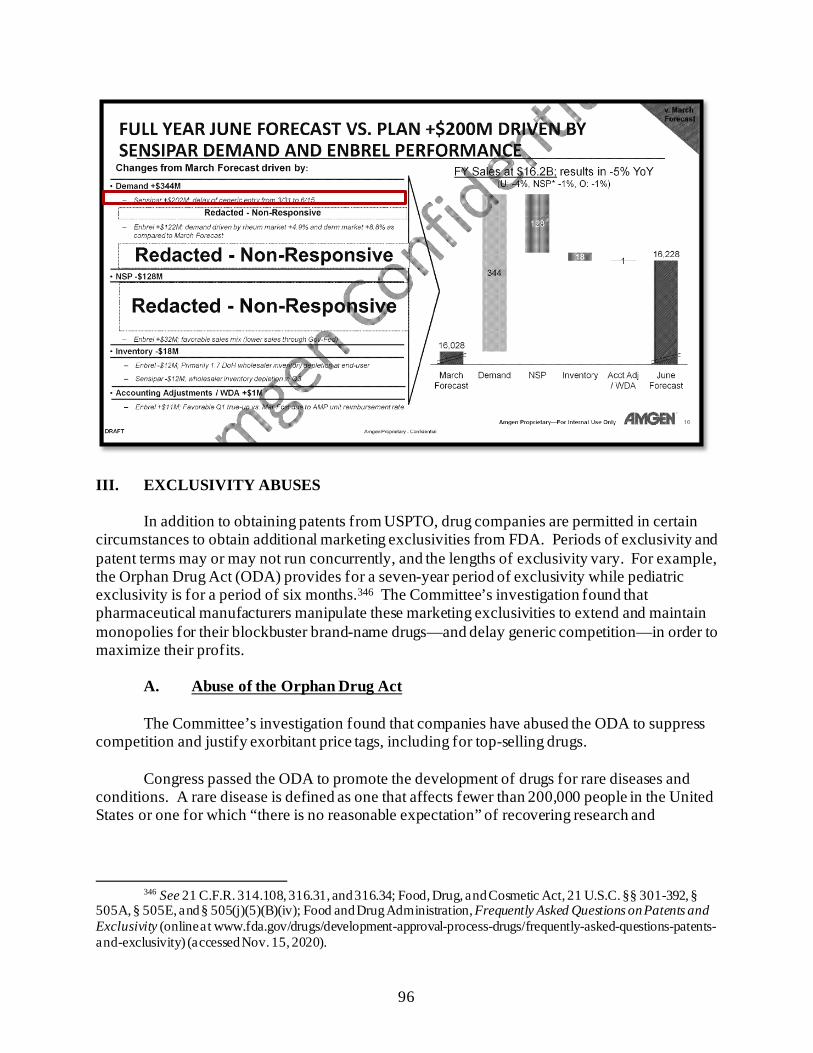
96
III. EXCLUSIVITY ABUSES
In addition to obtaining patents from USPTO, drug companies are permitted in certain
circumstances to obtain additional marketing exclusivities from FDA. Periods of exclusivity and patent terms may or may not run concurrently, and the lengths of exclusivity vary. For example, the Orphan Drug Act (ODA) provides for a seven-year period of exclusivity while pediatric exclusivity is for a period of six months.346 The Committee’s investigation found that pharmaceutical manufacturers manipulate these marketing exclusivities to extend and maintain monopolies for their blockbuster brand-name drugs—and delay generic competition—in order to maximize their profits.
A. Abuse of the Orphan Drug Act The Committee’s investigation found that companies have abused the ODA to suppress
competition and justify exorbitant price tags, including for top-selling drugs. Congress passed the ODA to promote the development of drugs for rare diseases and
conditions. A rare disease is defined as one that affects fewer than 200,000 people in the United States or one for which “there is no reasonable expectation” of recovering research and
346 See 21 C.F.R. 314.108, 316.31, and 316.34; Food, Drug, and Cosmetic Act, 21 U.S.C. §§ 301-392, §
505A, § 505E, and § 505(j)(5)(B)(iv); Food and Drug Administration, Frequently Asked Questions on Patents and Exclusivity (online at www.fda.gov/drugs/development-approval-process-drugs/frequently-asked-questions-patents-and-exclusivity) (accessed Nov. 15, 2020).
97
development costs.347 The ODA grants two primary forms of incentives. First, during the development process, pharmaceutical companies can obtain an “orphan designation” for a drug that shows promise in the treatment of a rare disease or condition. This designation allows the company to gain development incentives, including a tax credit for qualifying clinical trial costs.348 Second, if FDA approves the drug for an indication within the scope of its orphan designation, the manufacturer receives a seven-year exclusivity period, starting at the date of FDA approval, during which FDA may not approve another version of the same drug for the same indication.349
The orphan drug designation was designed for drugs that would have no reasonable
chance of recouping their research and development costs. Yet, according to one study, 80% of the best-selling biologics in 2001 either were originally approved as orphan drugs or added an orphan drug exclusivity later on.350
The Committee’s investigation has uncovered evidence that the ODA is being manipulated by drug companies to extend market monopolies for profitable drugs by blocking generics from coming to market. The Committee found that companies file for separate, staggered market approvals for subsets of patients to extend the companies’ protections under the ODA longer than the standard seven-year period—a practice known as “salami slicing.” In addition, companies have applied for orphan drug designations for drugs that are widely used and commercially successful. These findings validate concerns raised by experts that the ODA is being manipulated by drug companies to maximize profits and delay competition.351
AbbVie—Humira AbbVie’s orphan drug designations for Humira illustrate how the ODA has been
manipulated to create monopolies that limit competition. Contrary to the stated purpose of the ODA, AbbVie has sought orphan drug protections for Humira despite collecting billions of
347 See 21 U.S.C. § 360aa note (“because so few individuals are affected by any one rare disease or
condition, a pharmaceutical company which develops an orphan drug may reasonably expect the drug to generate relatively small sales in comparison to the cost of developing the drug and consequently to incur a financial loss”).
348 The Build Back Better Act limits the tax credit awarded for qualified orphan drug clinical testing expenses to expenses related to the first use or indication for an orphan drug to prevent companies from stacking up multiple tax credits. H.R. 5376 § 138141.
349 See 21 C.F.R. § 316. 350 Robin Feldman, Regulatory Property: The New IP, Columbia Journal of Law & the Arts, at Page 76
(2016) (online at https://journals.library.columbia.edu/index.php/lawandarts/article/view/2062/1022) (noting that more than 40% of all FDA-approved drugs on the market in 2015 were submitted as orphan drugs; of the drugs forecast to be the top-ten best-selling drugs in 2015, seven had some form of orphan indication).
351 See, e.g., Drugmakers Manipulate Orphan Drug Rules to Create Prized Monopolies, Kaiser Health News (Jan. 17, 2017) (online at www.khn.org/news/drugmakers-manipulate-orphan-drug-rules-to-create-prized-monopolies/).
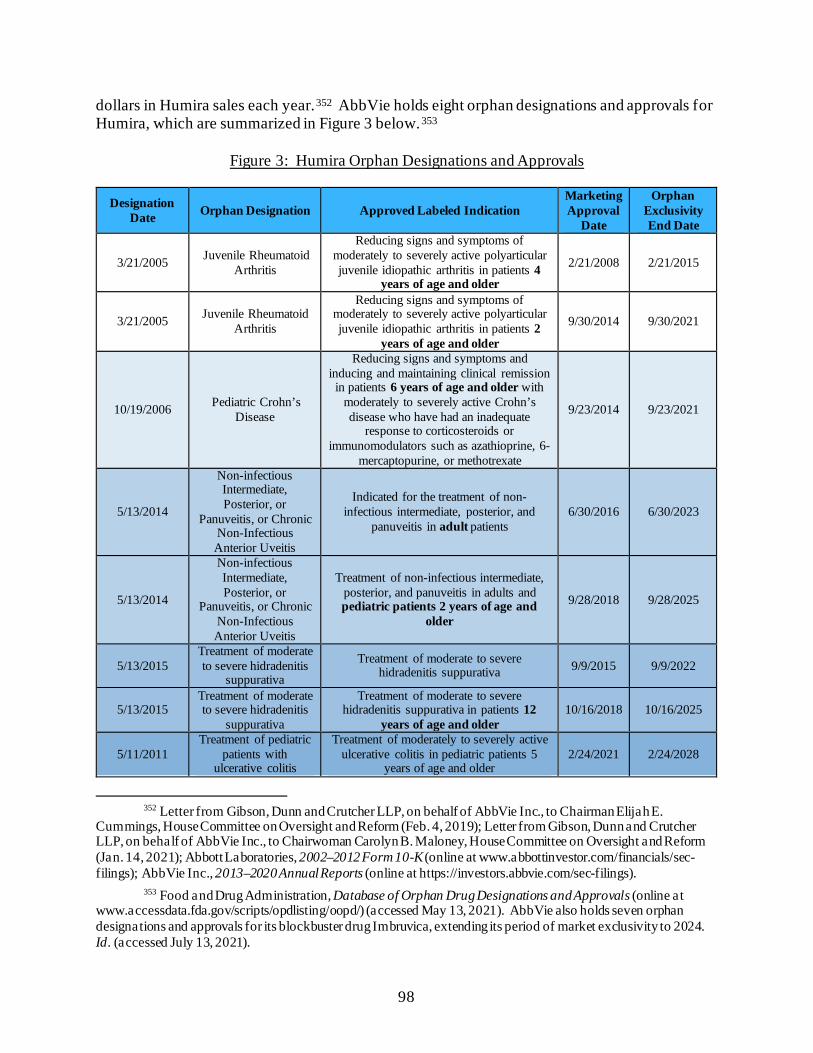
98
dollars in Humira sales each year.352 AbbVie holds eight orphan designations and approvals for Humira, which are summarized in Figure 3 below.353
Figure 3: Humira Orphan Designations and Approvals
Designation
Date Orphan Designation Approved Labeled Indication Marketing Approval
Date
Orphan Exclusivity End Date
3/21/2005 Juvenile Rheumatoid Arthritis
Reducing signs and symptoms of moderately to severely active polyarticular juvenile idiopathic arthritis in patients 4
years of age and older
2/21/2008 2/21/2015
3/21/2005 Juvenile Rheumatoid Arthritis
Reducing signs and symptoms of moderately to severely active polyarticular juvenile idiopathic arthritis in patients 2
years of age and older
9/30/2014 9/30/2021
10/19/2006 Pediatric Crohn’s Disease
Reducing signs and symptoms and inducing and maintaining clinical remission
in patients 6 years of age and older with moderately to severely active Crohn’s disease who have had an inadequate
response to corticosteroids or immunomodulators such as azathioprine, 6-
mercaptopurine, or methotrexate
9/23/2014 9/23/2021
5/13/2014
Non-infectious Intermediate, Posterior, or
Panuveitis, or Chronic Non-Infectious Anterior Uveitis
Indicated for the treatment of non-infectious intermediate, posterior, and
panuveitis in adult patients 6/30/2016 6/30/2023
5/13/2014
Non-infectious Intermediate, Posterior, or
Panuveitis, or Chronic Non-Infectious Anterior Uveitis
Treatment of non-infectious intermediate, posterior, and panuveitis in adults and pediatric patients 2 years of age and
older
9/28/2018 9/28/2025
5/13/2015 Treatment of moderate to severe hidradenitis
suppurativa
Treatment of moderate to severe hidradenitis suppurativa 9/9/2015 9/9/2022
5/13/2015 Treatment of moderate to severe hidradenitis
suppurativa
Treatment of moderate to severe hidradenitis suppurativa in patients 12
years of age and older 10/16/2018 10/16/2025
5/11/2011 Treatment of pediatric
patients with ulcerative colitis
Treatment of moderately to severely active ulcerative colitis in pediatric patients 5
years of age and older 2/24/2021 2/24/2028
352 Letter from Gibson, Dunn and Crutcher LLP, on behalf of AbbVie Inc., to Chairman Elijah E.
Cummings, House Committee on Oversight and Reform (Feb. 4, 2019); Letter from Gibson, Dunn and Crutcher LLP, on behalf of AbbVie Inc., to Chairwoman Carolyn B. Maloney, House Committee on Oversight and Reform (Jan. 14, 2021); Abbott Laboratories, 2002–2012 Form 10-K (online at www.abbottinvestor.com/financials/sec-filings); AbbVie Inc., 2013–2020 Annual Reports (online at https://investors.abbvie.com/sec-filings).
353 Food and Drug Administration, Database of Orphan Drug Designations and Approvals (online at www.accessdata.fda.gov/scripts/opdlisting/oopd/) (accessed May 13, 2021). AbbVie also holds seven orphan designations and approvals for its blockbuster drug Imbruvica, extending its period of market exclusivity to 2024. Id. (accessed July 13, 2021).
99
ODA incentives play an important role in some companies’ decisions to pursue research into treatment for rare diseases. However internal AbbVie documents suggest that the ODA was unnecessary to incentivize AbbVie’s research into the conditions for which it received orphan designations because it already viewed those conditions as having market potential, even without the ODA’s incentives.
For example, AbbVie had already planned to conduct research into treating the skin
condition hidradenitis suppurativa (HS) even without incentives under the ODA. In an April 2008 memorandum summarizing the company’s development strategy, executives stated that studying the effectiveness of Humira in treating this condition would support four strategic objectives, including the need to “competitively position [Humira] against new market entrants” and “generate patient demand for biologics in dermatology.”354 The memorandum did not mention incentives under the ODA. Another internal AbbVie analysis in October 2008 confirmed that the company viewed HS as a profitable market, without mentioning ODA incentives.355 The analysis noted that health care databases likely underestimated the number of treatable HS patients in the United States and that the “true scope of an eligible patient population would be expected to be significantly larger with the introduction of a proven effective therapy.”356
AbbVie also secured longer periods of exclusivity under the ODA by seeking separate, staggered market approvals for subsets of patients affected by HS.357 On May 13, 2015, FDA granted Humira an orphan designation for the treatment of moderate to severe HS. AbbVie leveraged this designation into two separate orphan exclusivity periods by splitting the patient population into two groups: the general population, and patients 12 years of age and older. AbbVie’s HS orphan exclusivity for the general population runs from September 9, 2015, to September 9, 2022, while the exclusivity for patients 12 years of age and older runs from October 16, 2018, to October 16, 2025.358 Combined, AbbVie enjoys a ten-year period of HS orphan exclusivity—three years longer than the seven years intended under the ODA. On March 21, 2005, FDA granted Humira another orphan designation for the treatment of juvenile rheumatoid arthritis (JRA).359 To leverage this designation into 13 years of orphan exclusivity—rather than the statutory seven years—AbbVie split its research and marketing applications into two groups: children four years of age and older and children between the ages of two and four.
354 ABV-HOR-00042146. 355 ABV-HOR-00042168. 356 Id. 357 See, e.g., Robin Feldman, Regulatory Property: The New IP, Columbia Journal of Law & the Arts
(2016) (online at https://journals.library.columbia.edu/index.php/lawandarts/article/view/2062/1022); Drugs for Rare Diseases Have Become Uncommonly Rich Monopolies, National Public Radio (Jan. 17, 2017) (online at www.npr.org/sections/health-shots/2017/01/17/509506836/drugs-for-rare-diseases-have-become-uncommonly-rich-monopolies).
358 Food and Drug Administration, Database of Orphan Drug Designations and Approvals (online at www.accessdata.fda.gov/scripts/opdlisting/oopd/) (accessed May 13, 2021).
359 Id.
100
AbbVie had completed a clinical trial demonstrating Humira’s efficacy in treating children ages four to 17 years old with JRA in January 2005.360 Based on the results of this trial, on February 21, 2008, AbbVie received marketing approval and a seven-year orphan exclusivity for Humira’s use in treating JRA in children four years of age and older.361 AbbVie waited until March 2009 to start a second trial evaluating Humira for treatment of JRA in children under the age of four, which was not completed until March 2013.362 On September 30, 2014, AbbVie received the marketing approval for Humira to treat JRA patients two years of age and older—granting AbbVie a new orphan exclusivity that did not expire until September 30, 2021—more than 13 years after its first orphan exclusivity period for JRA began.363
Mallinckrodt—Acthar
The Committee’s investigation found that Mallinckrodt used its orphan drug designation for Acthar, a drug used to treat a rare infant seizure disorder and other autoimmune and inflammatory disorders, as a justification for the drug’s high price, while at the same time seeking to market the drug to large patient populations beyond those with rare diseases.
Even though Acthar had already been approved and on the market for decades, FDA granted Acthar an orphan drug designation in 2003 to research its use in treating infantile spasms, a rare form of epilepsy that affects about 2,000 children in the United States every year.364 In 2007, the prior owner of Acthar (Questcor) raised the price of Acthar to a level “they believed was in line with orphan drug pricing”—from $1,650 per vial to $23,289.365 In 2010,
360 National Institutes of Health, Information for Clinical Trials Identifier NCT00048542 (online at
https://clinicaltrials.gov/ct2/show/NCT00048542). 361 Food and Drug Administration, Database of Orphan Drug Designations and Approvals (online at
www.accessdata.fda.gov/scripts/opdlisting/oopd/) (accessed May 13, 2021). 362 National Institutes of Health, Information for Clinical Trials Identifier NCT00775437 (online at
https://clinicaltrials.gov/ct2/show/NCT00775437) (accessed Nov. 20, 2021). 363 Food and Drug Administration, Database of Orphan Drug Designations and Approvals (online at
www.accessdata.fda.gov/scripts/opdlisting/oopd/) (accessed Nov. 9, 2021). 364 Food and Drug Administration, Orphan Drug Designations and Approval (online at
www.accessdata.fda.gov/scripts/opdlisting/oopd/) (accessed Nov. 9, 2021). In documents obtained by the Committee, Mallinckrodt notes that it has used orphan drug credits related to Acthar to reduce its tax burden. See, e.g., MNK-COR-00001894. In 2013, FDA granted Mallinckrodt’s request for orphan drug status to use Acthar in patients with amyotrophic lateral sclerosis (ALS), also known as Lou Gehrig’s disease. See Food and Drug Administration, Orphan Drug Designations and Approval (online at www.accessdata.fda.gov/scripts/opdlisting/oopd) (accessed Nov. 9, 2021). Mallinckrodt initiated a Phase 2 trial to assess the efficacy of Acthar to treat this disease, but the study was terminated in 2019 because of safety issues. See Press Release: Mallinckrodt Halts Phase 2B Trial Investigating the Use of Acthar Gel (Repository Corticotropin Injection) in Amyotrophic Lateral Sclerosis (ALS), PRNewswire (July 16, 2019) (online at www.prnewswire.com/news-releases/mallinckrodt-halts-phase-2b-trial-investigating-the-use-of-acthar-gel-repository-corticotropin-injection-in-amyotrophic-lateral-sclerosis-als-300886128.html).
365 Letter from Hogan Lovells, on behalf of Mallinckrodt Pharmaceuticals, to Chairman Elijah E. Cummings, House Committee on Oversight and Reform (Feb. 4, 2019); MNK_InCamera-000000024471, at Page 1; Medispan Price Rx, Wholesale Acquisition Cost and Average Wholesale Price H.P. Acthar Gel.
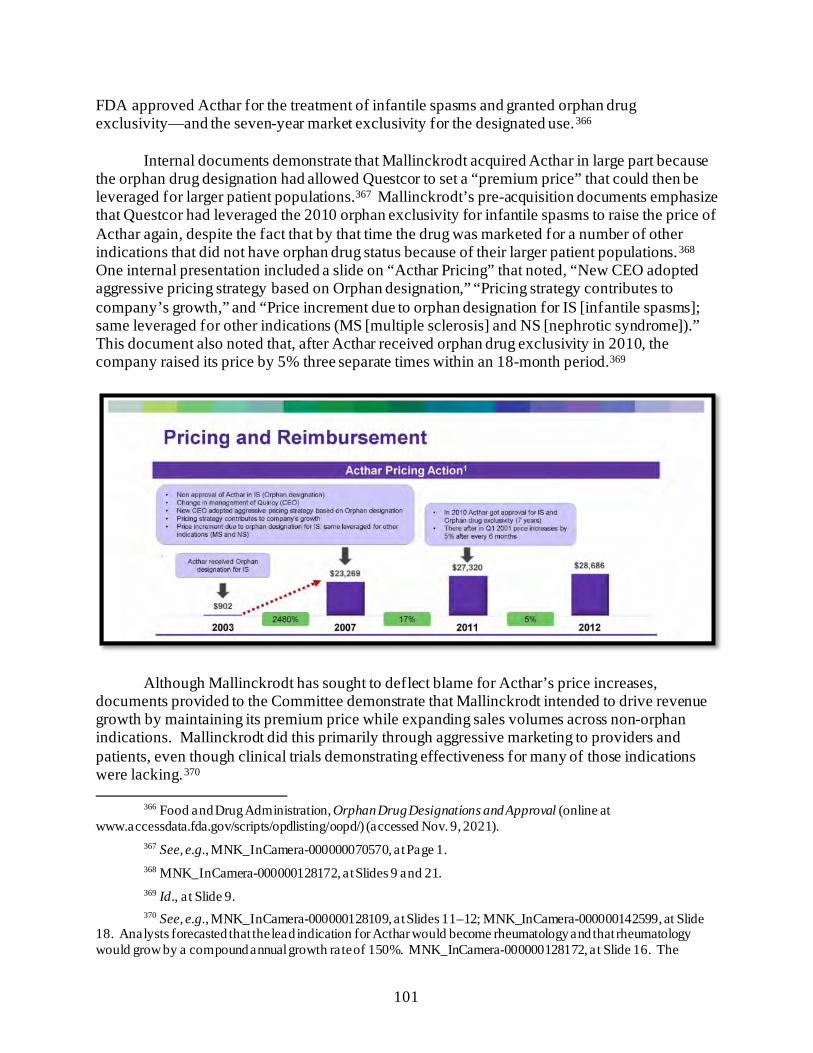
101
FDA approved Acthar for the treatment of infantile spasms and granted orphan drug exclusivity—and the seven-year market exclusivity for the designated use.366
Internal documents demonstrate that Mallinckrodt acquired Acthar in large part because
the orphan drug designation had allowed Questcor to set a “premium price” that could then be leveraged for larger patient populations.367 Mallinckrodt’s pre-acquisition documents emphasize that Questcor had leveraged the 2010 orphan exclusivity for infantile spasms to raise the price of Acthar again, despite the fact that by that time the drug was marketed for a number of other indications that did not have orphan drug status because of their larger patient populations.368 One internal presentation included a slide on “Acthar Pricing” that noted, “New CEO adopted aggressive pricing strategy based on Orphan designation,” “Pricing strategy contributes to company’s growth,” and “Price increment due to orphan designation for IS [infantile spasms]; same leveraged for other indications (MS [multiple sclerosis] and NS [nephrotic syndrome]).” This document also noted that, after Acthar received orphan drug exclusivity in 2010, the company raised its price by 5% three separate times within an 18-month period.369
Although Mallinckrodt has sought to deflect blame for Acthar’s price increases, documents provided to the Committee demonstrate that Mallinckrodt intended to drive revenue growth by maintaining its premium price while expanding sales volumes across non-orphan indications. Mallinckrodt did this primarily through aggressive marketing to providers and patients, even though clinical trials demonstrating effectiveness for many of those indications were lacking.370
366 Food and Drug Administration, Orphan Drug Designations and Approval (online at
www.accessdata.fda.gov/scripts/opdlisting/oopd/) (accessed Nov. 9, 2021). 367 See, e.g., MNK_InCamera-000000070570, at Page 1. 368 MNK_InCamera-000000128172, at Slides 9 and 21. 369 Id., at Slide 9. 370 See, e.g., MNK_InCamera-000000128109, at Slides 11–12; MNK_InCamera-000000142599, at Slide
18. Analysts forecasted that the lead indication for Acthar would become rheumatology and that rheumatology would grow by a compound annual growth rate of 150%. MNK_InCamera-000000128172, at Slide 16. The
102
Before the acquisition, an outside consultant warned Mallinckrodt that it might face challenges justifying Acthar’s premium price if it expanded the drug to indications with large patient populations. The consultant noted that Questcor may have been able to justify its price increase in 2007 because the “price was necessary solely to insure [sic] supply for IS [infantile spasms], but was then followed by an unforeseeable expansion in use.” The consultant cautioned Mallinckrodt, however, that the “same narrative cannot be used with the same degree of plausibility by an acquirer of Questcor.”371
B. Pediatric Exclusivity Abuse The Committee’s investigation found that companies have leveraged pediatric exclusivity
periods—intended to incentivize manufacturers to research the safety and efficacy of their drugs for use in children—to extend their drugs’ monopoly periods and keep prices high.
Created in 1997 as part of the Food and Drug Administration Modernization Act, the pediatric exclusivity provision was intended to provide marketing incentives to manufacturers to extend their research to include children by providing six months of additional marketing exclusivity in return for conducting pediatric studies.372 Pediatric exclusivity is a powerful tool because unlike other marketing exclusivities, pediatric exclusivity provides additional marketing exclusivity not just for the pediatric indications or formulations but for all protected indications and formulations of a drug.373 In addition, pediatric exclusivity attaches to the end of all existing marketing exclusivity and patent periods and extends each one separately for six months, whereas orphan exclusivity and patent periods run concurrently.374 As a result, if a manufacturer conducts studies of a drug on children, the company will benefit by having an effective monopoly on the drug for an additional six months. The six-month additional exclusivity can be very profitable for companies but costly for consumers as it delays lower-priced generic versions of the drug.
Although this law has been effective in increasing the number of drugs tested on children, experts have accused the pharmaceutical industry of exploiting the pediatric exclusivity provision for financial gain. According to experts, pharmaceutical companies use the pediatric extension simply as a tool to extend their period of monopoly pricing, and even the FDA has reported that the law leads to studies on products where the exclusivity has the greatest monetary
company expected rheumatology to become the largest market, estimating approximately 250,000 combined patients with these conditions in need of treatment. MNK_InCamera-000000131709, at Slide 13.
371 MNK_InCamera-000000131863, at Slide 22. 372 See 21 U.S.C. § 355a; Food and Drug Administration, The Pediatric Exclusivity Provision (online at
www.fda.gov/science-research/pediatrics/pediatric-exclusivity-provision) (accessed Nov. 9, 2021). 373 See 21 U.S.C. § 355a; Food and Drug Administration, Qualifying for Pediatric Exclusivity Under
Section 505A of the Federal Food, Drug, and Cosmetic Act: Frequently Asked Questions on Pediatric Exclusivity (505A) (online at www.fda.gov/drugs/development-resources/qualifying-pediatric-exclusivity-under-section-505a-federal-food-drug-and-cosmetic-act-frequently) (accessed Sept. 1, 2021).
374 Id.
103
value. 375 Experts have also expressed concern that some companies are using the exclusivity for drugs that treat conditions not common in children or for which drugs are already on the market.376
The Committee’s investigation found that several companies relied on the pediatric exclusivity provision as a key “life-cycle management” strategy—to maximize and extend commercial value beyond a product’s initial monopoly period. For example, Novartis filed for and received an additional six months of market exclusivity for the cancer drug Gleevec, in exchange for conducting pediatric trials on the drug, extending Gleevec’s exclusivity until July 2015.377 The additional exclusivity period generated approximately $1 billion dollars in additional net U.S. revenue for Novartis.378
Other companies in the Committee’s investigation also used pediatric exclusivity as key
life-cycle management strategies. Pfizer—Lyrica Internal Pfizer documents indicate that Pfizer relied on the six-month pediatric
exclusivity extension as a key component of Lyrica’s life-cycle management strategy. A 2015 presentation from the global and U.S. lead executives for Lyrica noted, “Pediatric Epilepsy Program for +6 months US Exclusivity Is the Most Valuable Remaining Lifecycle Deliverable.”379 A 2018 Lyrica operating plan estimated that pediatric exclusivity would generate a significant financial return: “Pediatric Program Success Results in ~ $1.6B.”380
375 See, e.g., Alfred B. Engelberg, Memo to the President: The Pharmaceutical Monopoly Adjustment Act
of 2017, Health Affairs Blog (Sept. 13, 2016) (online at www.healthaffairs.org/do/10.1377/hblog20160913.056548/full/) (“pediatric extensions generated many billions in extra revenue for dozens of blockbuster drugs having annual sales of $1 to several billion per year”); Food and Drug Administration, The Pediatric Exclusivity Provision: January 2001 Report to Congress, a t Page iii (Jan. 2001) (online at www.fda.gov/media/70272/download) (“while the incentive provided by the pediatric exclusivity provision has clearly been adequate for many products, it has naturally tended to produce pediatric studies on those products where the exclusivity has the greatest value”).
376 See, e.g., Sarah Gantz, Costs for Lifesaving Drugs Have Skyrocketed. Experts Say “Over-Patenting” to Prevent Generic Competition Is Part of the Problem, Philadelphia Inquirer (Apr. 30, 2019) (online at www.inquirer.com/health/consumer/drug-costs-generic-humira-lyrica-patent-20190430.html).
377 Christopher Chen and Aaron Kesselheim, Journey of Generic Imatinib: A Case Study in Oncology Drug Pricing, Journal of Oncology Practice (June 1, 2017) (online at https://ascopubs.org/doi/full/10.1200/JOP.2016.019737).
378 Novartis earned $2.53 billion in U.S. revenue in 2015. NOVARTIS.HCOR20190114.00001017. 379 SRR_PFIZHCOR_00026937, at Slide 17. This presentation was subject to further review by senior
management. 380 SRR_PFIZHCOR_00011875, at Slide 19 (this presentation, dated August 8, 2018, states that it
represents the “strategic vision for Lyrica” and the strategies set forth were subject to regulatory and legal review and approval before implementation).
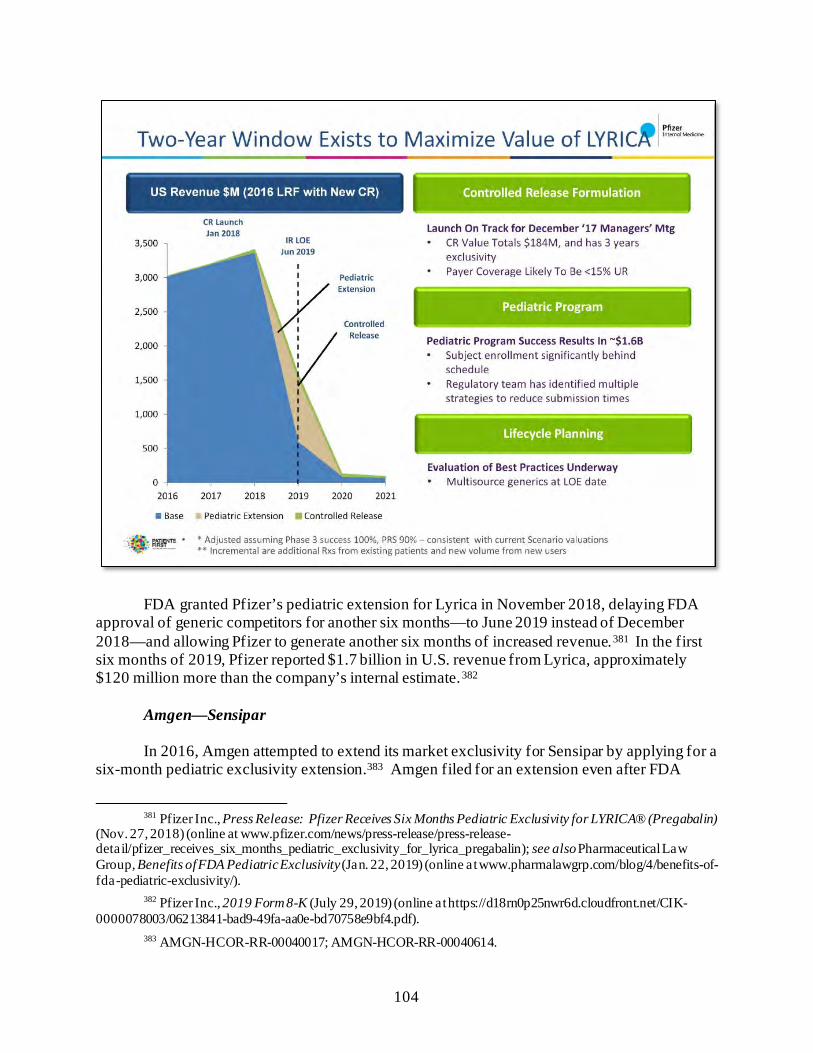
104
FDA granted Pfizer’s pediatric extension for Lyrica in November 2018, delaying FDA approval of generic competitors for another six months—to June 2019 instead of December 2018—and allowing Pfizer to generate another six months of increased revenue.381 In the first six months of 2019, Pfizer reported $1.7 billion in U.S. revenue from Lyrica, approximately $120 million more than the company’s internal estimate.382
Amgen—Sensipar
In 2016, Amgen attempted to extend its market exclusivity for Sensipar by applying for a six-month pediatric exclusivity extension.383 Amgen filed for an extension even after FDA
381 Pfizer Inc., Press Release: Pfizer Receives Six Months Pediatric Exclusivity for LYRICA® (Pregabalin)
(Nov. 27, 2018) (online at www.pfizer.com/news/press-release/press-release-detail/pfizer_receives_six_months_pediatric_exclusivity_for_lyrica_pregabalin); see also Pharmaceutical Law Group, Benefits of FDA Pediatric Exclusivity (Jan. 22, 2019) (online at www.pharmalawgrp.com/blog/4/benefits-of-fda-pediatric-exclusivity/).
382 Pfizer Inc., 2019 Form 8-K (July 29, 2019) (online at https://d18rn0p25nwr6d.cloudfront.net/CIK-0000078003/06213841-bad9-49fa-aa0e-bd70758e9bf4.pdf).
383 AMGN-HCOR-RR-00040017; AMGN-HCOR-RR-00040614.
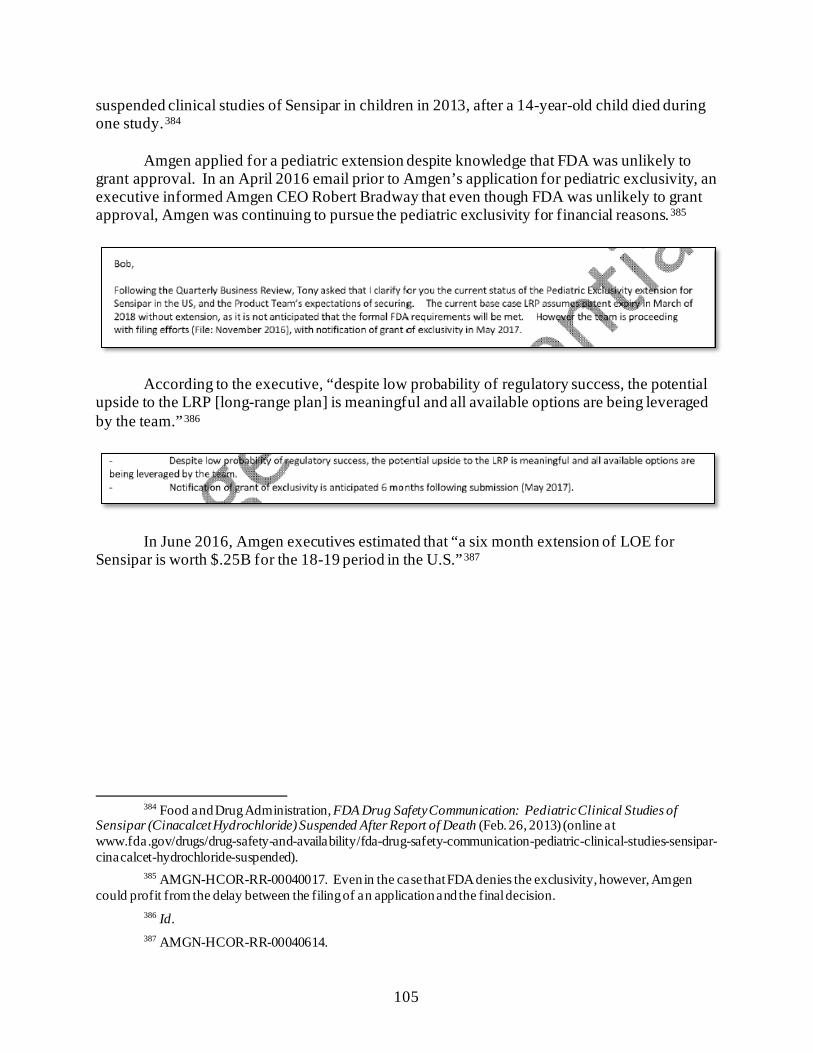
105
suspended clinical studies of Sensipar in children in 2013, after a 14-year-old child died during one study.384
Amgen applied for a pediatric extension despite knowledge that FDA was unlikely to
grant approval. In an April 2016 email prior to Amgen’s application for pediatric exclusivity, an executive informed Amgen CEO Robert Bradway that even though FDA was unlikely to grant approval, Amgen was continuing to pursue the pediatric exclusivity for financial reasons.385
According to the executive, “despite low probability of regulatory success, the potential upside to the LRP [long-range plan] is meaningful and all available options are being leveraged by the team.”386
In June 2016, Amgen executives estimated that “a six month extension of LOE for Sensipar is worth $.25B for the 18-19 period in the U.S.”387
384 Food and Drug Administration, FDA Drug Safety Communication: Pediatric Clinical Studies of
Sensipar (Cinacalcet Hydrochloride) Suspended After Report of Death (Feb. 26, 2013) (online at www.fda.gov/drugs/drug-safety-and-availability/fda-drug-safety-communication-pediatric-clinical-studies-sensipar-cinacalcet-hydrochloride-suspended).
385 AMGN-HCOR-RR-00040017. Even in the case that FDA denies the exclusivity, however, Amgen could profit from the delay between the filing of an application and the final decision.
386 Id. 387 AMGN-HCOR-RR-00040614.
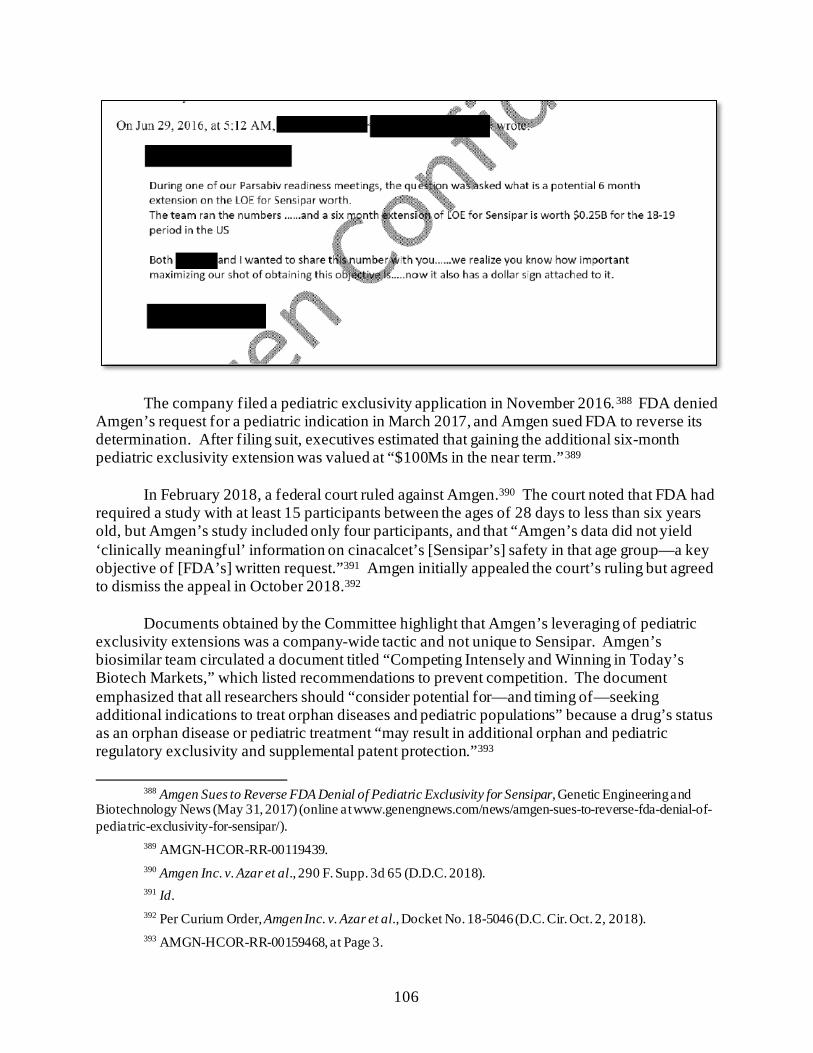
106
The company filed a pediatric exclusivity application in November 2016.388 FDA denied Amgen’s request for a pediatric indication in March 2017, and Amgen sued FDA to reverse its determination. After filing suit, executives estimated that gaining the additional six-month pediatric exclusivity extension was valued at “$100Ms in the near term.”389
In February 2018, a federal court ruled against Amgen.390 The court noted that FDA had
required a study with at least 15 participants between the ages of 28 days to less than six years old, but Amgen’s study included only four participants, and that “Amgen’s data did not yield ‘clinically meaningful’ information on cinacalcet’s [Sensipar’s] safety in that age group—a key objective of [FDA’s] written request.”391 Amgen initially appealed the court’s ruling but agreed to dismiss the appeal in October 2018.392
Documents obtained by the Committee highlight that Amgen’s leveraging of pediatric
exclusivity extensions was a company-wide tactic and not unique to Sensipar. Amgen’s biosimilar team circulated a document titled “Competing Intensely and Winning in Today’s Biotech Markets,” which listed recommendations to prevent competition. The document emphasized that all researchers should “consider potential for—and timing of—seeking additional indications to treat orphan diseases and pediatric populations” because a drug’s status as an orphan disease or pediatric treatment “may result in additional orphan and pediatric regulatory exclusivity and supplemental patent protection.”393
388 Amgen Sues to Reverse FDA Denial of Pediatric Exclusivity for Sensipar, Genetic Engineering and
Biotechnology News (May 31, 2017) (online at www.genengnews.com/news/amgen-sues-to-reverse-fda-denial-of-pediatric-exclusivity-for-sensipar/).
389 AMGN-HCOR-RR-00119439. 390 Amgen Inc. v. Azar et al., 290 F. Supp. 3d 65 (D.D.C. 2018). 391 Id. 392 Per Curium Order, Amgen Inc. v. Azar et al., Docket No. 18-5046 (D.C. Cir. Oct. 2, 2018). 393 AMGN-HCOR-RR-00159468, at Page 3.
107
IV. RECOMMENDATIONS
• Prohibit Anticompetitive Agreements: Based on the Committee investigation’s findings that companies have engaged in anticompetitive tactics to maintain monopoly pricing, including creating patent thickets and entering into settlement agreements that delay the entry of generics, the Committee recommends that Congress support reforms that address these issues. For example, the Preserve Access to Affordable Generics and Biosimilars Act, introduced by Representative Jerrold Nadler (D-NY) and Senators Amy Klobuchar (D-MN) and Charles Grassley (R-IA), aims to prohibit pharmaceutical companies from entering into anticompetitive pay-for-delay agreements. The act would make it presumptively illegal for brands to enter into such agreements.
• Prohibit Other Abuses of the Patent System: Congress should consider
reforms that prevent companies from abusing the patent system to extend their monopolies and prevent lower-priced generics or biosimilars from coming to market. For example, Congress could consider reforms that limit the ability of drug manufacturers to pile additional protections onto a single drug innovation, that limit the number of times a patent applicant can re-file the same patent application, or that clarify the laws related to patents and exclusivities to make clear that modifications or adaptations of pharmaceuticals—including but not limited to minor chemical or biological modifications or alterations in drug dosage, timing, or delivery mechanisms—do not satisfy the obviousness requirement of patent law.
108
Chapter 5: Strategies to Suppress Competition and Maintain Monopoly Pricing
The Committee’s investigation has uncovered new evidence of contracting and marketing strategies drug companies use to suppress competition from generics and biosimilars and keep prices high. Companies deploy so-called “loss of exclusivity,” or “LOE,” strategies to minimize loss of revenue from generic competition and extend a brand-name drug’s market monopoly. The Committee’s investigation focused on three such strategies: (1) shifting patients to new formulas of a drug just before facing generic competition for the old formula (known as “product hopping”); (2) pursuing contracts with pharmacy benefit managers (PBMs) and insurers that condition rebates and discounts on excluding competitor products; and (3) aggressively marketing directly to patients and physicians to drive sales of costly brand-name drugs. The Committee’s investigation also found that, in certain markets, competing brand-name pharmaceutical companies raised their prices in lockstep—a practice known as “shadow pricing”—and used competitors’ price increases as justification to continue to raise their own prices.
The Committee’s investigation found:
• Companies Engaged in Product Hopping to Suppress Competition for Blockbuster Drugs: Companies like Teva, AbbVie, Sanofi, and Pfizer pursued product-hopping strategies to switch patients to new formulations of their blockbuster drugs in anticipation of loss of market exclusivity on the older versions. Teva’s product hopping strategy is estimated to have cost the U.S. health care system between $4.3 billion and $5.6 billion in additional health care expenditures. Documents show Teva pursued the product hop even after its own scientists warned the new product “has no scientific rationale/value” and executives acknowledged they had “no supportive clinical data” for the new product.
• Companies Pursued Exclusionary Tactics to Block Generics: Companies such
as Novartis and Teva used their market power to obtain contract terms with payers or PBMs that limited or blocked generic competitors from being covered on a drug formulary. Celgene used a different exclusionary tactic—abuse of a government-mandated safety program that limits the distribution of high-risk drugs—to prevent generic manufacturers from purchasing the samples of Revlimid needed to obtain approval of generic versions of the drug.
• Companies Engaged in Aggressive Marketing to Doctors and Patients to
Drive Sales and Protect High Prices, Especially as Drugs Faced Generic Competition: In the aggregate, four companies spent more than $2.6 billion in direct-to-consumer advertising on just four products from 2015 to 2018, with AbbVie reporting that it spent over $1.5 billion in direct-to-consumer advertising for Humira in just four years, and Pfizer spending over $750 million on marketing for Lyrica in the same four-year period. New data and documents show how companies used direct-to-consumer advertising and physician marketing to drive
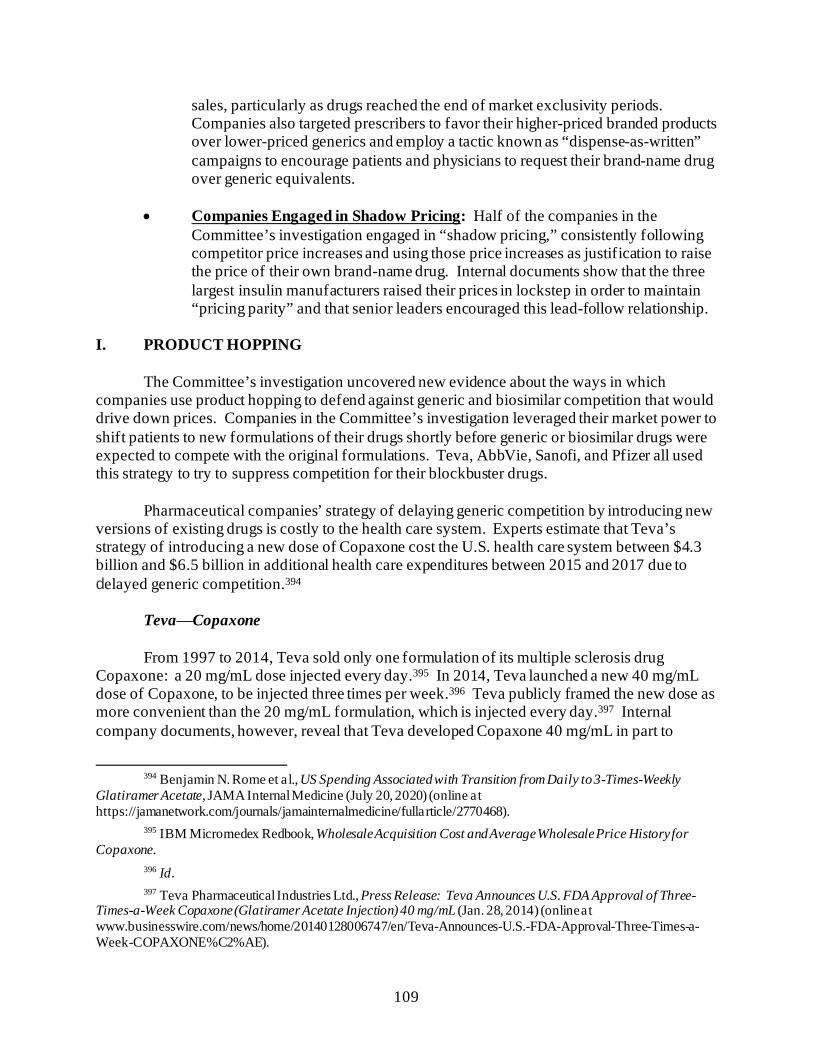
109
sales, particularly as drugs reached the end of market exclusivity periods. Companies also targeted prescribers to favor their higher-priced branded products over lower-priced generics and employ a tactic known as “dispense-as-written” campaigns to encourage patients and physicians to request their brand-name drug over generic equivalents.
• Companies Engaged in Shadow Pricing: Half of the companies in the
Committee’s investigation engaged in “shadow pricing,” consistently following competitor price increases and using those price increases as justification to raise the price of their own brand-name drug. Internal documents show that the three largest insulin manufacturers raised their prices in lockstep in order to maintain “pricing parity” and that senior leaders encouraged this lead-follow relationship.
I. PRODUCT HOPPING
The Committee’s investigation uncovered new evidence about the ways in which companies use product hopping to defend against generic and biosimilar competition that would drive down prices. Companies in the Committee’s investigation leveraged their market power to shift patients to new formulations of their drugs shortly before generic or biosimilar drugs were expected to compete with the original formulations. Teva, AbbVie, Sanofi, and Pfizer all used this strategy to try to suppress competition for their blockbuster drugs.
Pharmaceutical companies’ strategy of delaying generic competition by introducing new
versions of existing drugs is costly to the health care system. Experts estimate that Teva’s strategy of introducing a new dose of Copaxone cost the U.S. health care system between $4.3 billion and $6.5 billion in additional health care expenditures between 2015 and 2017 due to delayed generic competition.394
Teva⸺Copaxone
From 1997 to 2014, Teva sold only one formulation of its multiple sclerosis drug Copaxone: a 20 mg/mL dose injected every day.395 In 2014, Teva launched a new 40 mg/mL dose of Copaxone, to be injected three times per week.396 Teva publicly framed the new dose as more convenient than the 20 mg/mL formulation, which is injected every day.397 Internal company documents, however, reveal that Teva developed Copaxone 40 mg/mL in part to
394 Benjamin N. Rome et al., US Spending Associated with Transition from Daily to 3-Times-Weekly
Glatiramer Acetate, JAMA Internal Medicine (July 20, 2020) (online at https://jamanetwork.com/journals/jamainternalmedicine/fullarticle/2770468).
395 IBM Micromedex Redbook, Wholesale Acquisition Cost and Average Wholesale Price History for Copaxone.
396 Id. 397 Teva Pharmaceutical Industries Ltd., Press Release: Teva Announces U.S. FDA Approval of Three-
Times-a-Week Copaxone (Glatiramer Acetate Injection) 40 mg/mL (Jan. 28, 2014) (online at www.businesswire.com/news/home/20140128006747/en/Teva-Announces-U.S.-FDA-Approval-Three-Times-a-Week-COPAXONE%C2%AE).
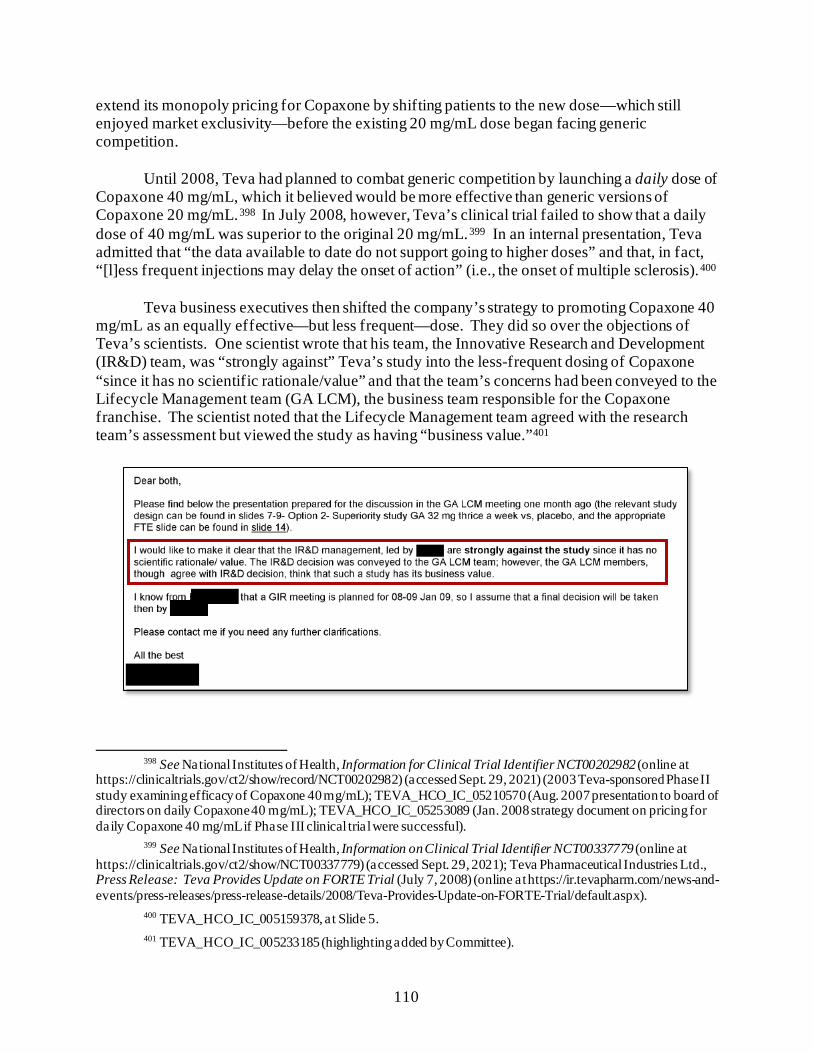
110
extend its monopoly pricing for Copaxone by shifting patients to the new dose—which still enjoyed market exclusivity—before the existing 20 mg/mL dose began facing generic competition.
Until 2008, Teva had planned to combat generic competition by launching a daily dose of
Copaxone 40 mg/mL, which it believed would be more effective than generic versions of Copaxone 20 mg/mL.398 In July 2008, however, Teva’s clinical trial failed to show that a daily dose of 40 mg/mL was superior to the original 20 mg/mL.399 In an internal presentation, Teva admitted that “the data available to date do not support going to higher doses” and that, in fact, “[l]ess frequent injections may delay the onset of action” (i.e., the onset of multiple sclerosis).400
Teva business executives then shifted the company’s strategy to promoting Copaxone 40
mg/mL as an equally effective—but less frequent—dose. They did so over the objections of Teva’s scientists. One scientist wrote that his team, the Innovative Research and Development (IR&D) team, was “strongly against” Teva’s study into the less-frequent dosing of Copaxone “since it has no scientific rationale/value” and that the team’s concerns had been conveyed to the Lifecycle Management team (GA LCM), the business team responsible for the Copaxone franchise. The scientist noted that the Lifecycle Management team agreed with the research team’s assessment but viewed the study as having “business value.”401
398 See National Institutes of Health, Information for Clinical Trial Identifier NCT00202982 (online at
https://clinicaltrials.gov/ct2/show/record/NCT00202982) (accessed Sept. 29, 2021) (2003 Teva-sponsored Phase II study examining efficacy of Copaxone 40 mg/mL); TEVA_HCO_IC_05210570 (Aug. 2007 presentation to board of directors on daily Copaxone 40 mg/mL); TEVA_HCO_IC_05253089 (Jan. 2008 strategy document on pricing for daily Copaxone 40 mg/mL if Phase III clinical trial were successful).
399 See National Institutes of Health, Information on Clinical Trial Identifier NCT00337779 (online at https://clinicaltrials.gov/ct2/show/NCT00337779) (accessed Sept. 29, 2021); Teva Pharmaceutical Industries Ltd., Press Release: Teva Provides Update on FORTE Trial (July 7, 2008) (online at https://ir.tevapharm.com/news-and-events/press-releases/press-release-details/2008/Teva-Provides-Update-on-FORTE-Trial/default.aspx).
400 TEVA_HCO_IC_005159378, at Slide 5. 401 TEVA_HCO_IC_005233185 (highlighting added by Committee).
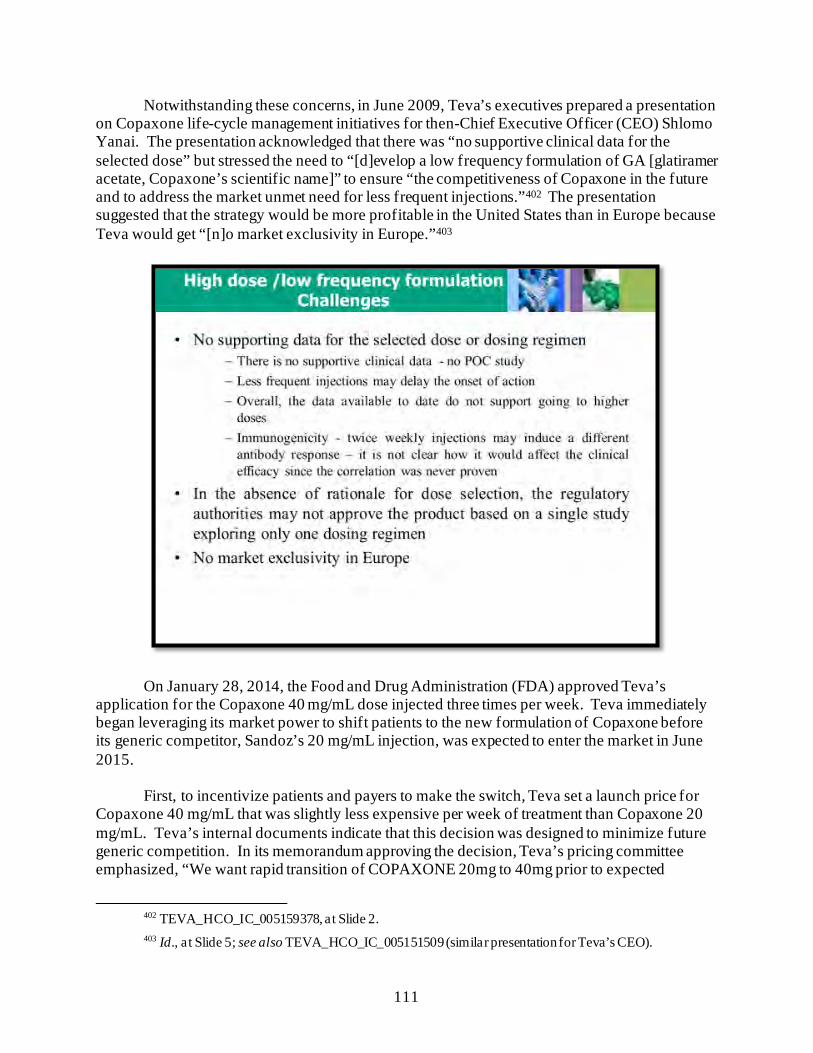
111
Notwithstanding these concerns, in June 2009, Teva’s executives prepared a presentation on Copaxone life-cycle management initiatives for then-Chief Executive Officer (CEO) Shlomo Yanai. The presentation acknowledged that there was “no supportive clinical data for the selected dose” but stressed the need to “[d]evelop a low frequency formulation of GA [glatiramer acetate, Copaxone’s scientific name]” to ensure “the competitiveness of Copaxone in the future and to address the market unmet need for less frequent injections.”402 The presentation suggested that the strategy would be more profitable in the United States than in Europe because Teva would get “[n]o market exclusivity in Europe.”403
On January 28, 2014, the Food and Drug Administration (FDA) approved Teva’s
application for the Copaxone 40 mg/mL dose injected three times per week. Teva immediately began leveraging its market power to shift patients to the new formulation of Copaxone before its generic competitor, Sandoz’s 20 mg/mL injection, was expected to enter the market in June 2015.
First, to incentivize patients and payers to make the switch, Teva set a launch price for
Copaxone 40 mg/mL that was slightly less expensive per week of treatment than Copaxone 20 mg/mL. Teva’s internal documents indicate that this decision was designed to minimize future generic competition. In its memorandum approving the decision, Teva’s pricing committee emphasized, “We want rapid transition of COPAXONE 20mg to 40mg prior to expected
402 TEVA_HCO_IC_005159378, at Slide 2. 403 Id., a t Slide 5; see also TEVA_HCO_IC_005151509 (similar presentation for Teva’s CEO).
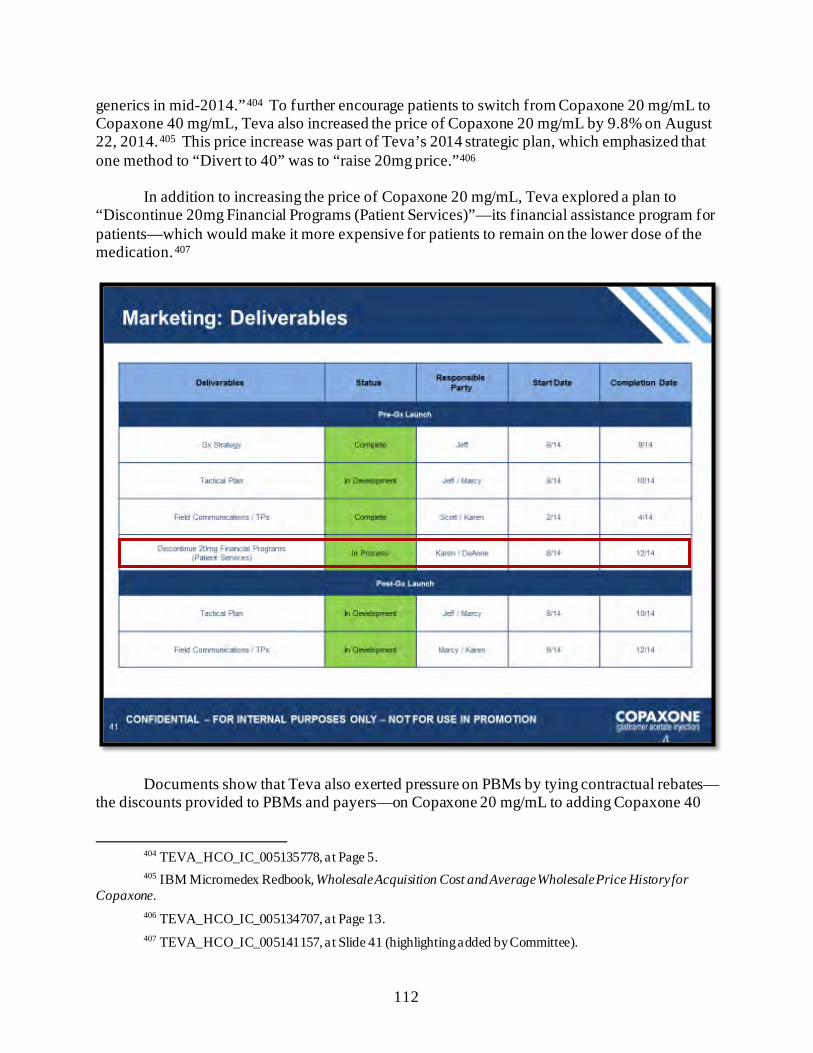
112
generics in mid-2014.”404 To further encourage patients to switch from Copaxone 20 mg/mL to Copaxone 40 mg/mL, Teva also increased the price of Copaxone 20 mg/mL by 9.8% on August 22, 2014.405 This price increase was part of Teva’s 2014 strategic plan, which emphasized that one method to “Divert to 40” was to “raise 20mg price.”406
In addition to increasing the price of Copaxone 20 mg/mL, Teva explored a plan to
“Discontinue 20mg Financial Programs (Patient Services)”—its financial assistance program for patients—which would make it more expensive for patients to remain on the lower dose of the medication.407
Documents show that Teva also exerted pressure on PBMs by tying contractual rebates—the discounts provided to PBMs and payers—on Copaxone 20 mg/mL to adding Copaxone 40
404 TEVA_HCO_IC_005135778, at Page 5. 405 IBM Micromedex Redbook, Wholesale Acquisition Cost and Average Wholesale Price History for
Copaxone. 406 TEVA_HCO_IC_005134707, at Page 13. 407 TEVA_HCO_IC_005141157, at Slide 41 (highlighting added by Committee).
113
mg/mL to their formularies.408 For example, Teva’s internal emails suggest that one PBM forfeited its 2015 rebates on Copaxone 20 mg/mL because it declined to add Copaxone 40 mg/mL to its formulary.409 This pressure campaign was successful. The PBM added 40 mg/mL to its formulary the next year.410
Teva also took steps to incentivize PBMs to lobby doctors on behalf of Copaxone 40
mg/mL. After generic Glatopa entered the market, Teva contracted with Humana to implement a “Copaxone conversion initiative.” Teva internally described the arrangement as follows:
Humana is committed to converting current Copaxone 20mg patients over to Copaxone 40mg with their physician members. Specifically, Humana is contacting the prescribers via fax and phone to make them aware of which patients are still on Copaxone 20mg and encourage them to switch these patients to Copaxone 40mg. Should a prescriber choose not to switch, the patient would simply remain on Copaxone 20mg.411 Documents show that the company also used its sales force to target doctors to encourage
them to switch patients to Copaxone 40 mg/mL.412 Teva’s strategies were successful. In December 2015, then-CEO Erez Vigodman boasted that Teva had successfully converted 76.9% of Copaxone patients to 40 mg/mL and had limited generic market share to 19.3%.413 In June 2016—nearly one year after generic Copaxone entered the market—Teva’s General Manager of Neuroscience John Hassler circulated a presentation that boasted in the speaker’s notes, “The strategy of switching patients to 40mg version of the medicine is continuing to be successful and reduce the impact of generic competition.”414
Independent experts estimate that Teva’s 40 mg/mL strategy cost the U.S. health care system between $4.3 billion and $6.5 billion in additional health care expenditures between 2015 and 2017 due to delayed generic competition related to the introduction of the new version of the drug.415
408 TEVA_HCO_IC_005006452; Office of Inspector General, Department of Health and Human Services,
Rebates for Brand-Name Drugs in Part D Substantially Reduced the Growth in Spending from 2011 to 2015 (Sept. 2019) (online at https://oig.hhs.gov/oei/reports/oei-03-19-00010.pdf).
409 TEVA_HCO_IC_005006452. 410 Id. 411 TEVA_HCO_IC_005006534; see also TEVA_HCO_IC_005141157, at Slide 43. 412 TEVA_HCO_IC_005102935, at Page 10. 413 TEVA_HCO_IC_005188452, at Slide 15. 414 TEVA_HCO_IC_005018280, at Slide 1. 415 Benjamin N. Rome et al., US Spending Associated with Transition from Daily to 3-Times-Weekly
Glatiramer Acetate, JAMA Internal Medicine (July 20, 2020) (online at https://jamanetwork.com/journals/jamainternalmedicine/fullarticle/2770468).
114
Sanofi⸺Lantus
Documents obtained by the Committee reveal new evidence of Sanofi’s product-hopping strategy to switch patients from its long-acting insulin Lantus, as it neared the end of its patent exclusivity period, to Toujeo, a more recently patented formulation of the drug.
Sanofi launched Toujeo in March 2015, shortly after Lantus’s primary patent expired.416
Toujeo is a basal insulin drug with the same active ingredient, insulin glargine, as Lantus, but it is three times more concentrated and releases the insulin more slowly.417 Documents obtained by the Committee reveal that, by promoting Toujeo to existing Lantus customers, Sanofi hoped to extend the company’s market share of its basal insulin franchise and get patients committed to their new branded product before biosimilar Lantus competitors entered the market.
In September 2014, Sanofi’s U.S. pharmaceutical operations division highlighted
Toujeo’s importance to the insulin glargine franchise. A presentation on the 2015 operational budget made clear that the company’s goal with respect to glargine was to “[e]stablish Toujeo and convert the franchise” from Lantus to Toujeo and to build and protect the patient base.418 The deck described the strategy as an “imperative” for the glargine commercial franchise: “Lantus to Toujeo switch is required to maximize the glargine family and defend our leadership position.” The launch plan included key tactics such as copay offsets and pharmacy programs designed to “ensure switch before biologic follow on entry.”419
416 Sanofi, Press Release: Sanofi Receives FDA Approval of Once-Daily Basal Insulin Toujeo (Feb. 25,
2015) (online at www.news.sanofi.us/2015-02-25-Sanofi-Receives-FDA-Approval-of-Once-Daily-Basal-Insulin-Toujeo); Confirmed: Sanofi’s Toujeo Launches in U.S. Monday, Setting up Diabetes Race, Biopharma Dive (Mar. 30, 2015) (online at www.biopharmadive.com/news/confirmed-sanofis-toujeo-launches-in-us-monday-setting-up-diabetes-race/380745/).
417 Food and Drug Administration, Toujeo FDA-Approved Label (online at www.accessdata.fda.gov/drugsatfda_docs/label/2015/206538lbl.pdf) (accessed Dec. 2, 2021); Food and Drug Administration, Lantus FDA-Approved Label (online at www.accessdata.fda.gov/drugsatfda_docs/label/2009/021081s034lbl.pdf) (accessed Dec. 2, 2021).
418 SANOFI_COR_00234570, at Page 11. 419 Id.
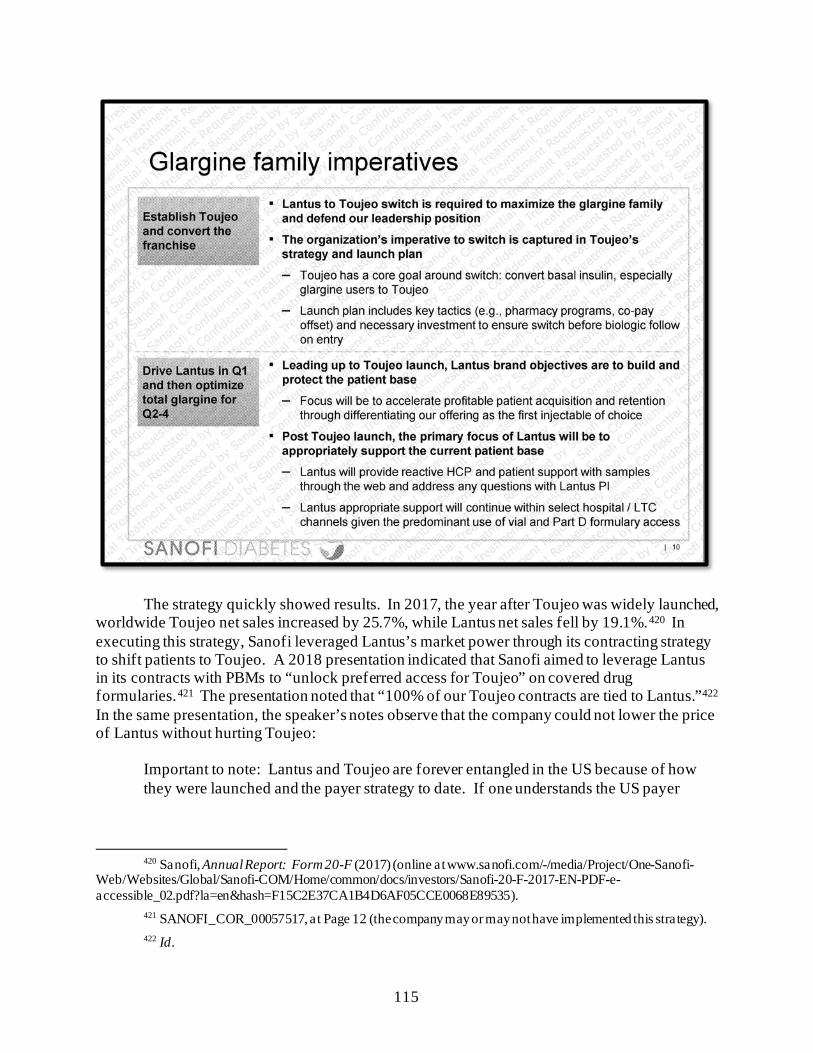
115
The strategy quickly showed results. In 2017, the year after Toujeo was widely launched,
worldwide Toujeo net sales increased by 25.7%, while Lantus net sales fell by 19.1%.420 In executing this strategy, Sanofi leveraged Lantus’s market power through its contracting strategy to shift patients to Toujeo. A 2018 presentation indicated that Sanofi aimed to leverage Lantus in its contracts with PBMs to “unlock preferred access for Toujeo” on covered drug formularies.421 The presentation noted that “100% of our Toujeo contracts are tied to Lantus.”422 In the same presentation, the speaker’s notes observe that the company could not lower the price of Lantus without hurting Toujeo:
Important to note: Lantus and Toujeo are forever entangled in the US because of how they were launched and the payer strategy to date. If one understands the US payer
420 Sanofi, Annual Report: Form 20-F (2017) (online at www.sanofi.com/-/media/Project/One-Sanofi-
Web/Websites/Global/Sanofi-COM/Home/common/docs/investors/Sanofi-20-F-2017-EN-PDF-e-accessible_02.pdf?la=en&hash=F15C2E37CA1B4D6AF05CCE0068E89535).
421 SANOFI_COR_00057517, at Page 12 (the company may or may not have implemented this strategy). 422 Id.
116
market, you understand that you cannot degrade Lantus and not have downsides for Toujeo.423
Documents obtained by the Committee show that Sanofi spent millions to market Toujeo
to patients and doctors and mostly stopped promoting Lantus, except in market segments where Toujeo was not available.424 A January 2019 slide deck revealed that Sanofi planned to spend more than double Toujeo’s manufacturing costs on marketing, sales force, and promotion of the drug.425 A presentation the following month reported that the company’s spending on the Toujeo sales force was paying off: “Toujeo market share (volume) correlates to Sales Force spending in US and EU.”426
Pfizer⸺Lyrica In October 2017, FDA approved a controlled-release (CR) version of Pfizer’s blockbuster
pain-management drug Lyrica.427 Pfizer publicly framed the new dose as more convenient than the prior formulations, which require multiple pills per day.428 However, internal company documents reveal that Pfizer developed the new formulation in part in an attempt to extend its monopoly pricing by shifting patients to the new controlled-release formulation—which still enjoyed market exclusivity—before the company anticipated Lyrica’s original formulation would begin facing generic competition.
Internally, Pfizer referred to Lyrica CR as an “anchor” for extending Lyrica’s commercial franchise.429 In 2016, the Lyrica CR launch team explained that timing the launch of the Lyrica CR formulation for January 2018 would result in a “sweet spot” for converting patients, meaning it would provide time to shift patients from the original formulation to the CR formulation before the original formulation lost patent protection and additional market exclusivity, while still ensuring years of market exclusivity for the CR formulation.430
423 Id., a t Page 4. 424 SANOFI_COR_00105420, at Slide 7; SANOFI_COR_00089955, at Slide 63. 425 SANOFI_COR_00089955, at Slide 63. 426 SANOFI_COR_00105420, at Slide 10. 427 Pfizer Inc., Once-Daily Lyrica CR Extended Release Tablets (online at https://lyrica.com/pain-after-
shingles/lyrica-cr) (accessed Oct. 2, 2021); Pfizer Inc., U.S. FDA Approves Lyrica CR (Pregabalin) Extended Release Tablets CV (online at /www.pfizer.com/news/press-release/press-release-detail/u_s_fda_approves_lyrica_cr_pregabalin_extended_release_tablets_cv) (accessed Dec. 2, 2021).
428 Pfizer Inc., Press Release: U.S. FDA Approves Lyrica CR (Pregabalin) Extended-Release Tablets CV (Oct. 12, 2017) (online at www.pfizer.com/news/press-release/press-release-detail/u_s_fda_approves_lyrica_cr_pregabalin_extended_release_tablets_cv).
429 SRR_PFIZHCOR_00004597, at Page 2 (the document was a draft and strategies were subject to legal and regulatory review and approval before implementation).
430 SRR_PFIZHCOR_00005322, at Page 3; see also SRR_PFIZHCOR_00005325, at Slide 14 (the document was a draft and strategies were subject to legal and regulatory review and approval before implementation). These documents suggest Pfizer projected Lyrica’s market monopoly would end in June 2019.
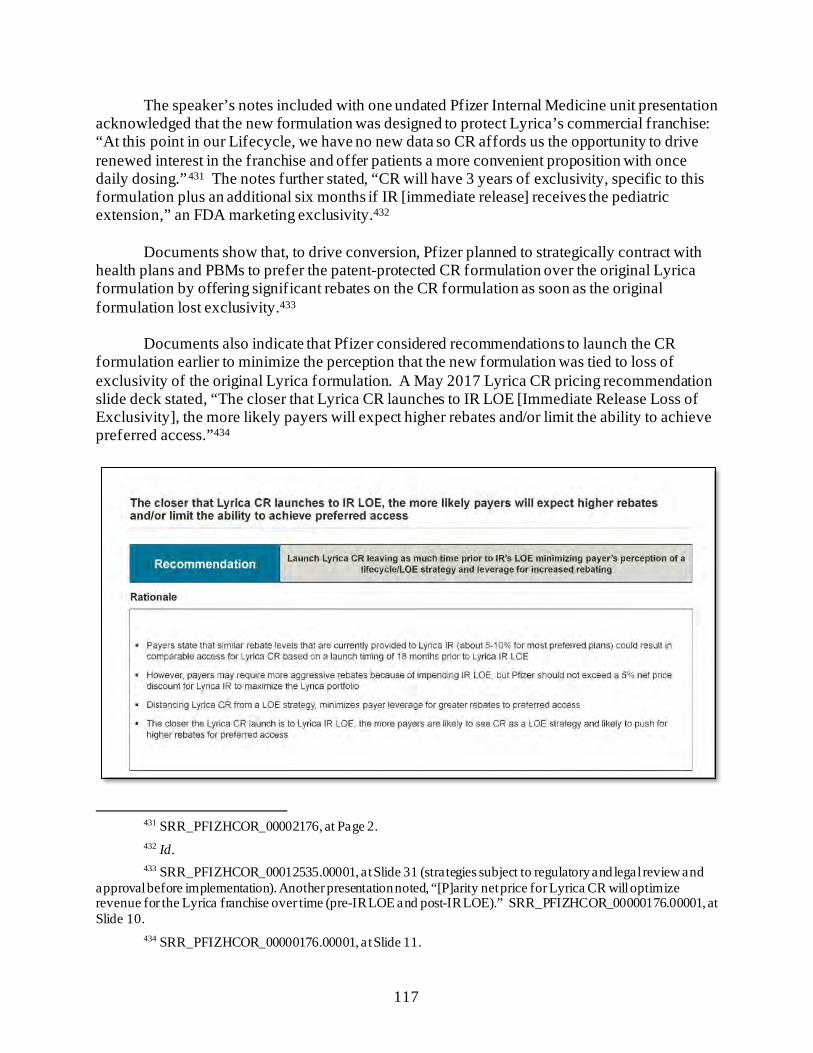
117
The speaker’s notes included with one undated Pfizer Internal Medicine unit presentation acknowledged that the new formulation was designed to protect Lyrica’s commercial franchise: “At this point in our Lifecycle, we have no new data so CR affords us the opportunity to drive renewed interest in the franchise and offer patients a more convenient proposition with once daily dosing.”431 The notes further stated, “CR will have 3 years of exclusivity, specific to this formulation plus an additional six months if IR [immediate release] receives the pediatric extension,” an FDA marketing exclusivity.432
Documents show that, to drive conversion, Pfizer planned to strategically contract with
health plans and PBMs to prefer the patent-protected CR formulation over the original Lyrica formulation by offering significant rebates on the CR formulation as soon as the original formulation lost exclusivity.433
Documents also indicate that Pfizer considered recommendations to launch the CR
formulation earlier to minimize the perception that the new formulation was tied to loss of exclusivity of the original Lyrica formulation. A May 2017 Lyrica CR pricing recommendation slide deck stated, “The closer that Lyrica CR launches to IR LOE [Immediate Release Loss of Exclusivity], the more likely payers will expect higher rebates and/or limit the ability to achieve preferred access.”434
431 SRR_PFIZHCOR_00002176, at Page 2. 432 Id. 433 SRR_PFIZHCOR_00012535.00001, at Slide 31 (strategies subject to regulatory and legal review and
approval before implementation). Another presentation noted, “[P]arity net price for Lyrica CR will optimize revenue for the Lyrica franchise over time (pre-IR LOE and post-IR LOE).” SRR_PFIZHCOR_00000176.00001, at Slide 10.
434 SRR_PFIZHCOR_00000176.00001, at Slide 11.
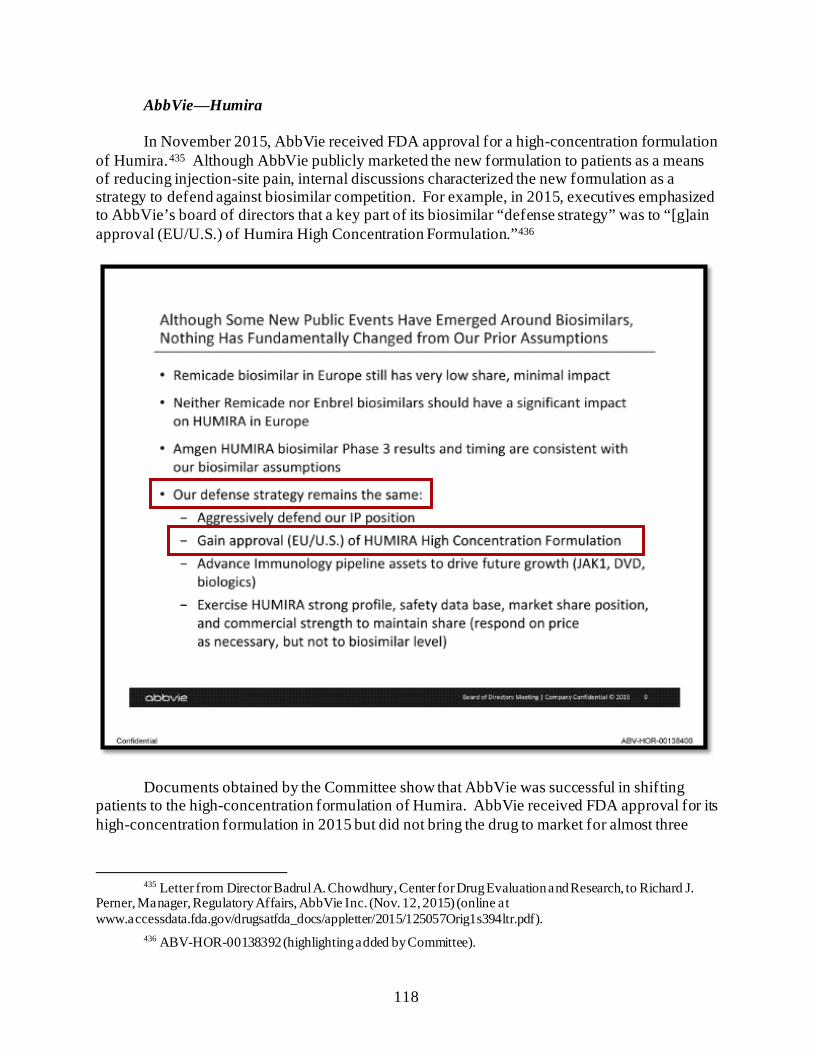
118
AbbVie⸺Humira
In November 2015, AbbVie received FDA approval for a high-concentration formulation of Humira.435 Although AbbVie publicly marketed the new formulation to patients as a means of reducing injection-site pain, internal discussions characterized the new formulation as a strategy to defend against biosimilar competition. For example, in 2015, executives emphasized to AbbVie’s board of directors that a key part of its biosimilar “defense strategy” was to “[g]ain approval (EU/U.S.) of Humira High Concentration Formulation.”436
Documents obtained by the Committee show that AbbVie was successful in shifting patients to the high-concentration formulation of Humira. AbbVie received FDA approval for its high-concentration formulation in 2015 but did not bring the drug to market for almost three
435 Letter from Director Badrul A. Chowdhury, Center for Drug Evaluation and Research, to Richard J.
Perner, Manager, Regulatory Affairs, AbbVie Inc. (Nov. 12, 2015) (online at www.accessdata.fda.gov/drugsatfda_docs/appletter/2015/125057Orig1s394ltr.pdf).
436 ABV-HOR-00138392 (highlighting added by Committee).
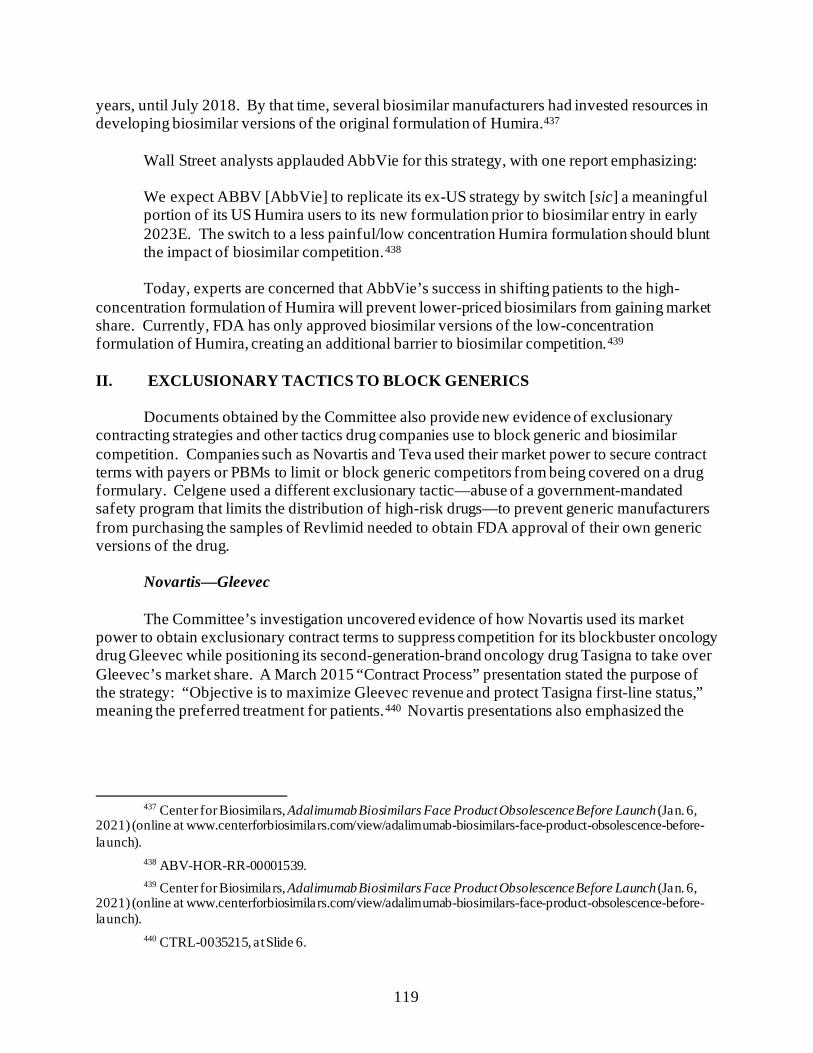
119
years, until July 2018. By that time, several biosimilar manufacturers had invested resources in developing biosimilar versions of the original formulation of Humira.437
Wall Street analysts applauded AbbVie for this strategy, with one report emphasizing:
We expect ABBV [AbbVie] to replicate its ex-US strategy by switch [sic] a meaningful portion of its US Humira users to its new formulation prior to biosimilar entry in early 2023E. The switch to a less painful/low concentration Humira formulation should blunt the impact of biosimilar competition.438
Today, experts are concerned that AbbVie’s success in shifting patients to the high-
concentration formulation of Humira will prevent lower-priced biosimilars from gaining market share. Currently, FDA has only approved biosimilar versions of the low-concentration formulation of Humira, creating an additional barrier to biosimilar competition.439
II. EXCLUSIONARY TACTICS TO BLOCK GENERICS
Documents obtained by the Committee also provide new evidence of exclusionary contracting strategies and other tactics drug companies use to block generic and biosimilar competition. Companies such as Novartis and Teva used their market power to secure contract terms with payers or PBMs to limit or block generic competitors from being covered on a drug formulary. Celgene used a different exclusionary tactic—abuse of a government-mandated safety program that limits the distribution of high-risk drugs—to prevent generic manufacturers from purchasing the samples of Revlimid needed to obtain FDA approval of their own generic versions of the drug.
Novartis—Gleevec
The Committee’s investigation uncovered evidence of how Novartis used its market
power to obtain exclusionary contract terms to suppress competition for its blockbuster oncology drug Gleevec while positioning its second-generation-brand oncology drug Tasigna to take over Gleevec’s market share. A March 2015 “Contract Process” presentation stated the purpose of the strategy: “Objective is to maximize Gleevec revenue and protect Tasigna first-line status,” meaning the preferred treatment for patients.440 Novartis presentations also emphasized the
437 Center for Biosimilars, Adalimumab Biosimilars Face Product Obsolescence Before Launch (Jan. 6,
2021) (online at www.centerforbiosimilars.com/view/adalimumab-biosimilars-face-product-obsolescence-before-launch).
438 ABV-HOR-RR-00001539. 439 Center for Biosimilars, Adalimumab Biosimilars Face Product Obsolescence Before Launch (Jan. 6,
2021) (online at www.centerforbiosimilars.com/view/adalimumab-biosimilars-face-product-obsolescence-before-launch).
440 CTRL-0035215, at Slide 6.
120
“significant upside” of this exclusionary contracting strategy, comparing “Baseline” revenues to projected revenue from “Baseline + LOE tactics.”441
One effective type of exclusionary contracting pursued by Novartis was brand-for-
generic contracting. Novartis offered higher Gleevec rebates, or discounts, to health plans and PBMs that agreed to block the generic version of Gleevec from their covered drug lists.442 This contract term meant the insurance plan would not cover the generic drug if it was prescribed to a patient, driving patients to branded Gleevec. This strategy was referred to internally as a National Drug Code (NDC) block.443
The Committee’s investigation revealed that Novartis explored these contracts even when the NDC blocks contradicted the health plans’ own policies and state laws. An April 2014 presentation on payer contracting noted that not all plans would be willing to engage in the NDC blocking contract: “Appetite for brand-for-generic contracts is likely to be limited among payers but high among SP [Specialty Pharmacy]/Mail-order pharmacies.” The presentation noted, “Some plans will not engage in Brand-for-Gx [generic] deals,” and cited an example of one national payer that was offered these contracts but did not accept them because “they go against our corporate philosophy.”444 When one senior regional account manager discovered that state
441 CTRL-0025801, at Slide 12. 442 CTRL-0025001, at Slide 5. This presentation also described this strategy as “Discount Gleevec to
establish brand only contracts.” Id., a t Slide 11. Documents provided to the Committee offer varying estimates of the rebates Novartis expected to offer.
443 CTRL-0031715, at Slide 2. 444 CTRL-0027659, at Slide 26.
121
law prohibited an NDC block, he reported that executives were exploring ways to “work around the NDC block issue.”445
Documents reviewed by the Committee indicate that Novartis also pursued its loss-of-
exclusivity contracting strategy for Gleevec’s Medicare business. In March 2016, Novartis brought in a consulting company to explore “ways to retain the most profitable access for Gleevec, e.g., keeping the generic off formulary” and “Part D–specific economic drivers that could impact Gleevec’s erosion curve.”446 That same month, a Novartis executive identified a workaround for a Part D requirement that prohibits plans from putting generics on non-preferred formulary tiers, which typically have higher out-of-pocket costs. For this particular plan, the executive suggested instead putting Gleevec and the generic on the same tier but requiring prior authorization for both drugs. The executive explained that the PBM had its own in-house specialty pharmacy and would direct the pharmacy to dispense Gleevec rather than the generic. The account manager wrote, “Since they have a SP [specialty pharmacy] requirement, they have set it up with their network SPs to ensure Gleevec is dispensed vs the generic.”447
Teva—Copaxone
Teva used exclusionary contracting with PBMs to defend its multiple sclerosis drug
Copaxone from lower-priced generic competition. In anticipation of Mylan’s generic version of Copaxone entering the market in October
2017, Teva began planning a “House Brand Strategy” to contract with—and pay rebates to—PBMs and specialty pharmacies to make Copaxone 40 mg/mL the only version of the drug covered or dispensed. Teva pursued this strategy following its product hop from Copaxone 20 mg/mL to 40 mg/mL. A January 2017 document titled “At-Risk Gx [Generic] Readiness” explained that the strategy would prevent a patient’s insurance plan from covering a generic alternative to Copaxone and prevent a specialty pharmacy from dispensing the generic:
• “2 of the House Brand target accounts will be executed at the formulary level. Blocking the generic via formulary restriction”; and
• “2 of the House Brand target accounts will be executed at the specialty pharmacy
level. Pharmacy will fill brand regardless if prescribed as generic.”448
445 CTRL-0057916, at Page 1. 446 CTRL-0124740, at Slide 2. 447 CRTL-0052051, at Pages 10–11. 448 TEVA_HCO_IC_005035591, at Slide 11.
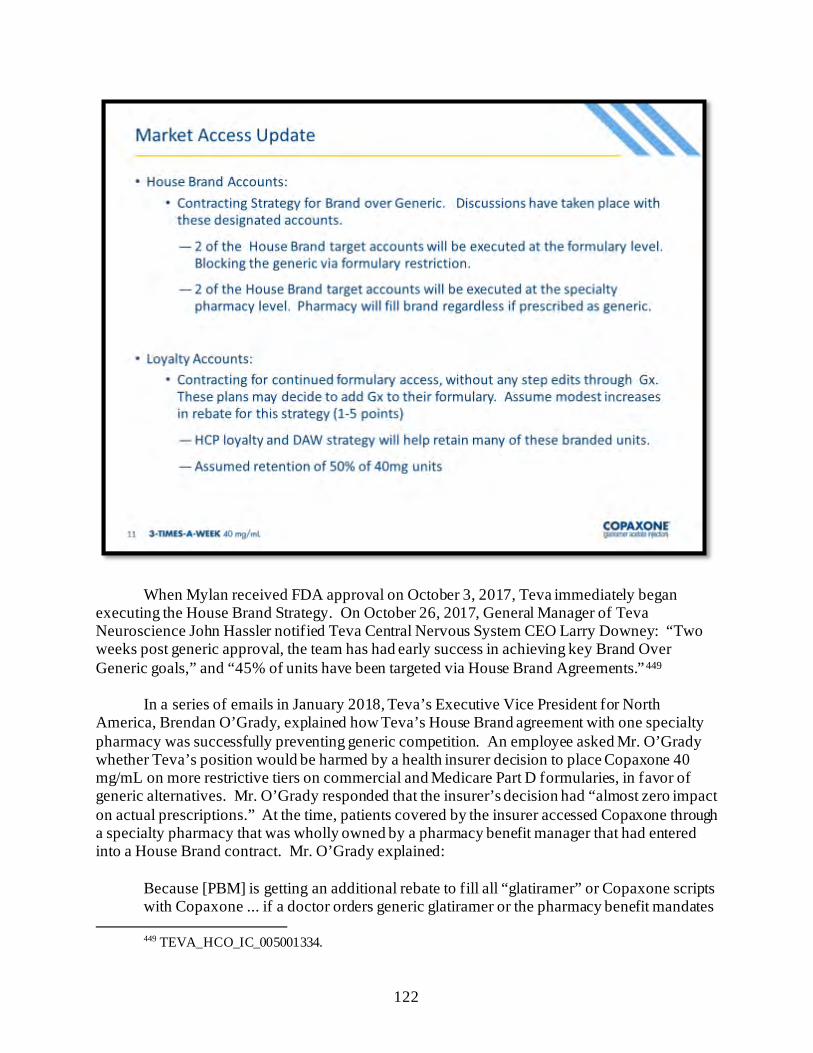
122
When Mylan received FDA approval on October 3, 2017, Teva immediately began executing the House Brand Strategy. On October 26, 2017, General Manager of Teva Neuroscience John Hassler notified Teva Central Nervous System CEO Larry Downey: “Two weeks post generic approval, the team has had early success in achieving key Brand Over Generic goals,” and “45% of units have been targeted via House Brand Agreements.”449 In a series of emails in January 2018, Teva’s Executive Vice President for North America, Brendan O’Grady, explained how Teva’s House Brand agreement with one specialty pharmacy was successfully preventing generic competition. An employee asked Mr. O’Grady whether Teva’s position would be harmed by a health insurer decision to place Copaxone 40 mg/mL on more restrictive tiers on commercial and Medicare Part D formularies, in favor of generic alternatives. Mr. O’Grady responded that the insurer’s decision had “almost zero impact on actual prescriptions.” At the time, patients covered by the insurer accessed Copaxone through a specialty pharmacy that was wholly owned by a pharmacy benefit manager that had entered into a House Brand contract. Mr. O’Grady explained:
Because [PBM] is getting an additional rebate to fill all “glatiramer” or Copaxone scripts with Copaxone ... if a doctor orders generic glatiramer or the pharmacy benefit mandates
449 TEVA_HCO_IC_005001334.
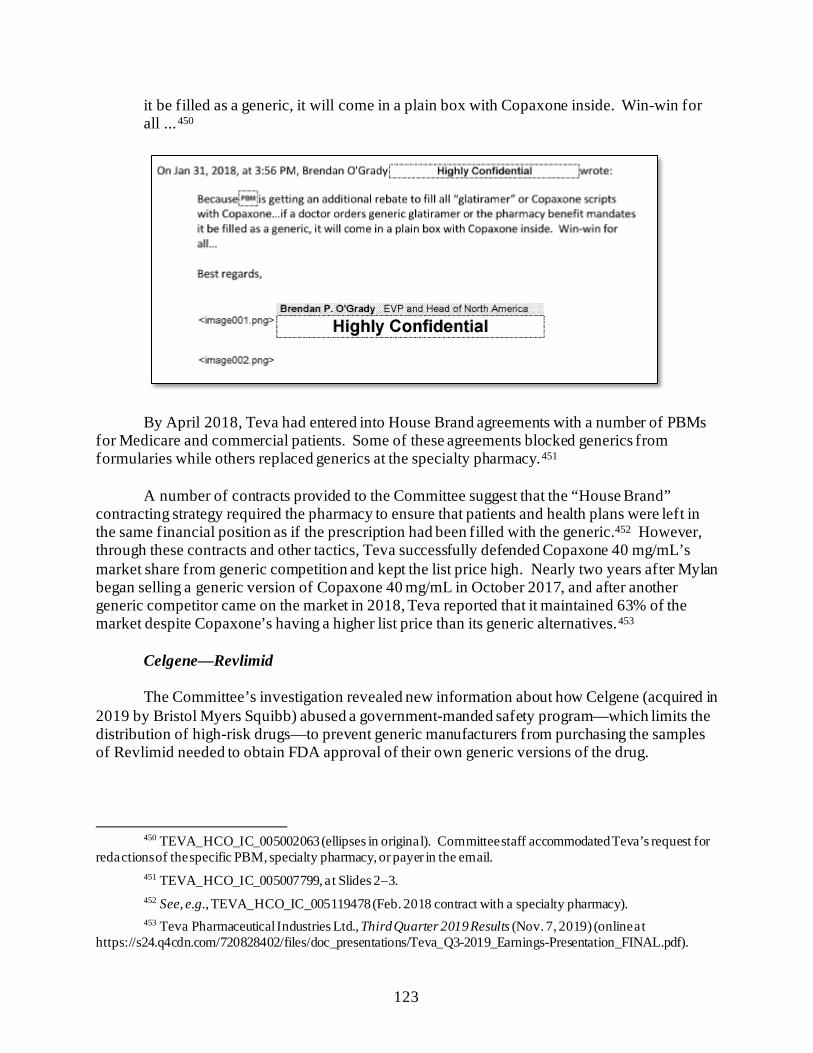
123
it be filled as a generic, it will come in a plain box with Copaxone inside. Win-win for all ...450
By April 2018, Teva had entered into House Brand agreements with a number of PBMs for Medicare and commercial patients. Some of these agreements blocked generics from formularies while others replaced generics at the specialty pharmacy.451
A number of contracts provided to the Committee suggest that the “House Brand”
contracting strategy required the pharmacy to ensure that patients and health plans were left in the same financial position as if the prescription had been filled with the generic.452 However, through these contracts and other tactics, Teva successfully defended Copaxone 40 mg/mL’s market share from generic competition and kept the list price high. Nearly two years after Mylan began selling a generic version of Copaxone 40 mg/mL in October 2017, and after another generic competitor came on the market in 2018, Teva reported that it maintained 63% of the market despite Copaxone’s having a higher list price than its generic alternatives.453
Celgene—Revlimid
The Committee’s investigation revealed new information about how Celgene (acquired in 2019 by Bristol Myers Squibb) abused a government-manded safety program—which limits the distribution of high-risk drugs—to prevent generic manufacturers from purchasing the samples of Revlimid needed to obtain FDA approval of their own generic versions of the drug.
450 TEVA_HCO_IC_005002063 (ellipses in original). Committee staff accommodated Teva’s request for
redactions of the specific PBM, specialty pharmacy, or payer in the email. 451 TEVA_HCO_IC_005007799, at Slides 2–3. 452 See, e.g., TEVA_HCO_IC_005119478 (Feb. 2018 contract with a specialty pharmacy). 453 Teva Pharmaceutical Industries Ltd., Third Quarter 2019 Results (Nov. 7, 2019) (online at
https://s24.q4cdn.com/720828402/files/doc_presentations/Teva_Q3-2019_Earnings-Presentation_FINAL.pdf).
124
FDA requires manufacturers of certain high-risk drugs to implement a risk evaluation and mitigation strategy (REMS) “to help ensure the benefits of the medication outweigh its risks.”454 Federal law prohibits manufacturers from using their REMS program to “block or delay approval” of generic manufacturers’ applications to FDA.455
In 2010, FDA required Celgene to implement a REMS safety program for Celgene’s
cancer drug Revlimid due to its risk of causing birth defects. When FDA approved Celgene’s proposed program, the agency warned Celgene that it is illegal for the company to use its REMS program to “block or delay approval” of generic versions of the drug.456
Despite this warning, Celgene used its REMS program—which strictly limits the
distribution of Revlimid—to prevent generic manufacturers from purchasing the samples of Revlimid needed to obtain FDA approval of their own generic versions of the drug. An internal Celgene presentation examining whether to implement a REMS program for Revlimid’s predecessor drug, Thalomid, stated that one benefit of a REMS program was the “prevention of generic encroachment.”457
454 Food and Drug Administration, Risk Evaluation and Mitigation Strategies (Aug. 8, 2019) (online at
www.fda.gov/drugs/drug-safety-and-availability/risk-evaluation-and-mitigation-strategies-rems). 455 21 U.S.C. § 355-1(f)(8). 456 Letter from Robert Justice, Director, Office of Drug Oncology Products, Food and Drug Administration,
to Michael B. Faletto, Director of Regulatory Affairs, Celgene Corporation (Aug. 3, 2010) (online at www.accessdata.fda.gov/drugsatfda_docs/appletter/2010/021880s013ltr.pdf).
457 Exhibit 68(b) to Mylan’s Response to Defendant Celgene’s Statement of Material Facts, Mylan Pharmaceuticals Inc. v. Celgene Corporation, No. 14-CV-02094 (D. N.J.) (Mar. 20, 2018) (discussing the benefits of modeling Thalomid’s REMS program after Revlimid’s REMS program).
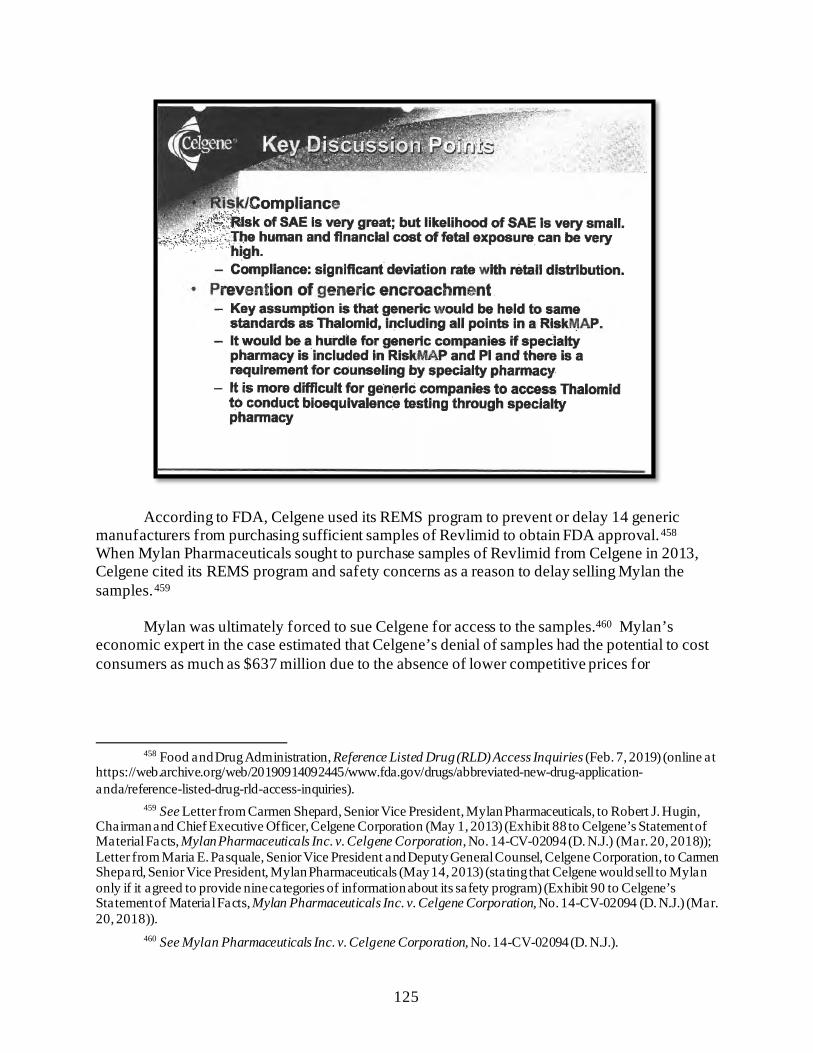
125
According to FDA, Celgene used its REMS program to prevent or delay 14 generic manufacturers from purchasing sufficient samples of Revlimid to obtain FDA approval.458 When Mylan Pharmaceuticals sought to purchase samples of Revlimid from Celgene in 2013, Celgene cited its REMS program and safety concerns as a reason to delay selling Mylan the samples.459
Mylan was ultimately forced to sue Celgene for access to the samples.460 Mylan’s
economic expert in the case estimated that Celgene’s denial of samples had the potential to cost consumers as much as $637 million due to the absence of lower competitive prices for
458 Food and Drug Administration, Reference Listed Drug (RLD) Access Inquiries (Feb. 7, 2019) (online at
https://web.archive.org/web/20190914092445/www.fda.gov/drugs/abbreviated-new-drug-application-anda/reference-listed-drug-rld-access-inquiries).
459 See Letter from Carmen Shepard, Senior Vice President, Mylan Pharmaceuticals, to Robert J. Hugin, Chairman and Chief Executive Officer, Celgene Corporation (May 1, 2013) (Exhibit 88 to Celgene’s Statement of Material Facts, Mylan Pharmaceuticals Inc. v. Celgene Corporation, No. 14-CV-02094 (D. N.J.) (Mar. 20, 2018)); Letter from Maria E. Pasquale, Senior Vice President and Deputy General Counsel, Celgene Corporation, to Carmen Shepard, Senior Vice President, Mylan Pharmaceuticals (May 14, 2013) (stating that Celgene would sell to Mylan only if it agreed to provide nine categories of information about its safety program) (Exhibit 90 to Celgene’s Statement of Material Facts, Mylan Pharmaceuticals Inc. v. Celgene Corporation, No. 14-CV-02094 (D. N.J.) (Mar. 20, 2018)).
460 See Mylan Pharmaceuticals Inc. v. Celgene Corporation, No. 14-CV-02094 (D. N.J.).
126
Revlimid.461 The parties settled the case in July 2019, with Celgene paying Mylan $62 million.462
Documents obtained by the Committee show that, internally, Celgene viewed its REMS
program as a business strategy for preventing competition. For example, a 2016 presentation identifying corporate goals stated that one way to “shape the operating environment to support [Celgene’s] business goals” was to “prevent legislative erosion of [its] REMS program.”463
In the three years after the 2016 presentation, Celgene—along with the pharmaceutical
industry trade association PhRMA—lobbied vigorously against legislative reform that would curb the company’s ability to use REMS programs to suppress competition.464
In December 2019, Congress acted to address drug companies’ anticompetitive use of
REMS. The Creating and Restoring Equal Access to Equivalent Samples (CREATES) Act, which was enacted through appropriations legislation, establishes a private cause of action to allow a generic company to sue a brand-name manufacturer to gain access to samples necessary for testing.465 The CREATES Act also authorizes FDA to permit a generic company to implement its own REMS program. Prior to this legislative change, brand-name manufacturers like Celgene used the FDA’s preference for shared REMS programs between brand-name and generic competitors to block generic manufacturers from obtaining FDA approval.466
461 See Expert Report of Philip B. Nelson (June 8, 2016) (Exhibit P33 to Mylan’s Response to Celgene’s
Statement of Material Facts, Mylan Pharmaceuticals Inc. v. Celgene Corporation, No. 14-CV-02094 (D. N.J.) (Mar. 20, 2018)).
462 Celgene to Pay Mylan $62 Million to Resolve Cancer Drug Antitrust Case, Reuters (July 30, 2019) (online at www.reuters.com/article/health-mylan/celgene-to-pay-mylan-62-million-to-resolve-cancer-drug-antitrust-case-idUSL2N24V1IQ).
463 CELG_HCOR_000042225, at Slide 22. 464 Congress first introduced the CREATES Act in 2016. S. 3056, 114th Cong. (2016). Celgene and the
Pharmaceutical Research & Manufacturers of America (PhRMA) lobbied against this bill each year until it was eventually incorporated into and passed through appropriations legislation in 2019. Center for Responsive Politics, Bills Lobbied by Celgene Corp., 2016 (online at www.opensecrets.org/federal-lobbying/clients/bills?cycle=2016&id=D000032432) (accessed Sept. 12, 2021); Center for Responsive Politics, Bills Lobbied by Pharmaceutical Research & Manufacturers of America, 2016 (online at www.opensecrets.org/federal-lobbying/clients/bills?cycle=2016&id=D000000504) (accessed Sept. 12, 2021); Center for Responsive Politics, Bills Lobbied by Celgene Corp., 2017 (online at www.opensecrets.org/federal-lobbying/clients/bills?cycle=2017&id=D000032432) (accessed Sept. 12, 2021); Center for Responsive Politics, Bills Lobbied by Celgene Corp., 2018 (online at www.opensecrets.org/federal-lobbying/clients/bills?cycle=2018&id=D000032432) (accessed Sept. 12, 2021); Center for Responsive Politics, Bills Lobbied by Bristol-Myers Squibb, 2019 (online at www.opensecrets.org/federal-lobbying/clients/bills?cycle=2019&id=D000000149) (accessed Sept. 12, 2021).
465 Further Consolidated Appropriations Act, 2020, Pub. L. No. 116-94, § 610 (2019); Representative David Cicilline, Press Release: Cicilline Bill to Lower Prescription Drug Costs to Become Law Today (Dec. 20, 2019) (online at https://cicilline.house.gov/press-release/cicilline-bill-lower-prescription-drug-costs-become-law-today).
466 The legislation allows the generic manufacturer to choose a single, shared REMS program or a separate REMS program that uses different methods or operational means, unless FDA determines that “no different, comparable aspect of the elements to assure safe use can be used.” The measure does not, however, eliminate the need for generic manufacturers to commence costly litigation, nor does it eliminate the possibility of manufacturers’
127
The CREATES Act was enacted more than six years after Mylan first sought to purchase samples of Revlimid from Celgene.467 In the intervening period, Celgene raised the price of Revlimid by 80%.468
III. TARGETING DOCTORS AND PATIENTS
The Committee’s investigation also revealed new information about drug manufacturers’ aggressive marketing to patients and physicians to drive sales of their costly brand-name drugs and protect high prices, particularly as the manufacturers anticipated generic competition.
A. Direct-to-Consumer Advertising
In recent years, pharmaceutical companies have maximized sales of their products through aggressive marketing tactics such as direct-to-consumer (DTC) advertising and sales tactics directed at physicians.469
Until the early 1990s, drug manufacturers marketed their products exclusively to health
care providers.470 DTC marketing, which drug manufacturers use to promote their products directly to patients, exploded in the 1990s and is now one of the most common types of health communication the public encounters.471 Over the past two decades, pharmaceutical manufacturers have more than quadrupled spending on DTC ads—from $2.1 billion in 1997 to
applying for patents on their REMS to exclude competition. Further Consolidated Appropriations Act, 2020, Pub. L. No. 116-94 (2019).
467 See Letter from Carmen Shepard, Senior Vice President, Mylan Pharmaceuticals, to Robert J. Hugin, Chairman and Chief Executive Officer, Celgene Corporation (May 1, 2013) (Exhibit 88 to Celgene’s Statement of Material Facts, Mylan Pharmaceuticals Inc. v. Celgene Corporation, No. 14-CV-02094 (D. N.J.) (Mar. 20, 2018)).
468 IBM Micromedex Redbook, Wholesale Acquisition Cost and Average Wholesale Price History for Revlimid.
469 See, e.g., Lisa Schwartz and Steven Woloshin, Medical Marketing in the United States, 1997–2016, Journal of the American Medical Association (Jan. 2019) (online at www.jamanetwork.com/journals/jama/fullarticle/2720029) (finding that medical marketing expanded substantially between 1997 and 2016, with DTC advertising for prescription drugs and health services accounting for the most rapid growth and pharmaceutical marketing to health professionals accounting for the most promotional spending); Steven Morgan, Direct-to-Consumer Advertising and Expenditures on Prescription Drugs: A Comparison of Experiences in the US and Canada, Open Medicine (Apr. 2007) (online at www.ncbi.nlm.nih.gov/pmc/articles/PMC2801909/) (finding that DTC advertising has a significant impact on prescription drug expenditures and noting that the return on investment from DTC advertising was nearly unprecedented); Michael Wilkes, Robert Bell, and Richard Kravitz, Direct-to-Consumer Prescription Drug Advertising: Trends, Impact, and Implications, Health Affairs (Mar./Apr. 2000) (online at https://doi.org/10.1377/hlthaff.19.2.110) (finding that drug manufacturers’ earnings have directly benefited from DTC advertising and that such advertising increases the volume of prescribed drugs).
470 Food and Drug Administration, The Impact of Direct-to-Consumer Advertising (online at www.fda.gov/drugs/information-consumers-and-patients-drugs/impact-direct-consumer-advertising) (accessed June 30, 2021).
471 Steven Morgan, Direct-to-Consumer Advertising and Expenditures on Prescription Drugs: A Comparison of Experiences in the United States and Canada, Open Medicine (Apr. 2007) (online at www.ncbi.nlm.nih.gov/pmc/articles/PMC2801909/).
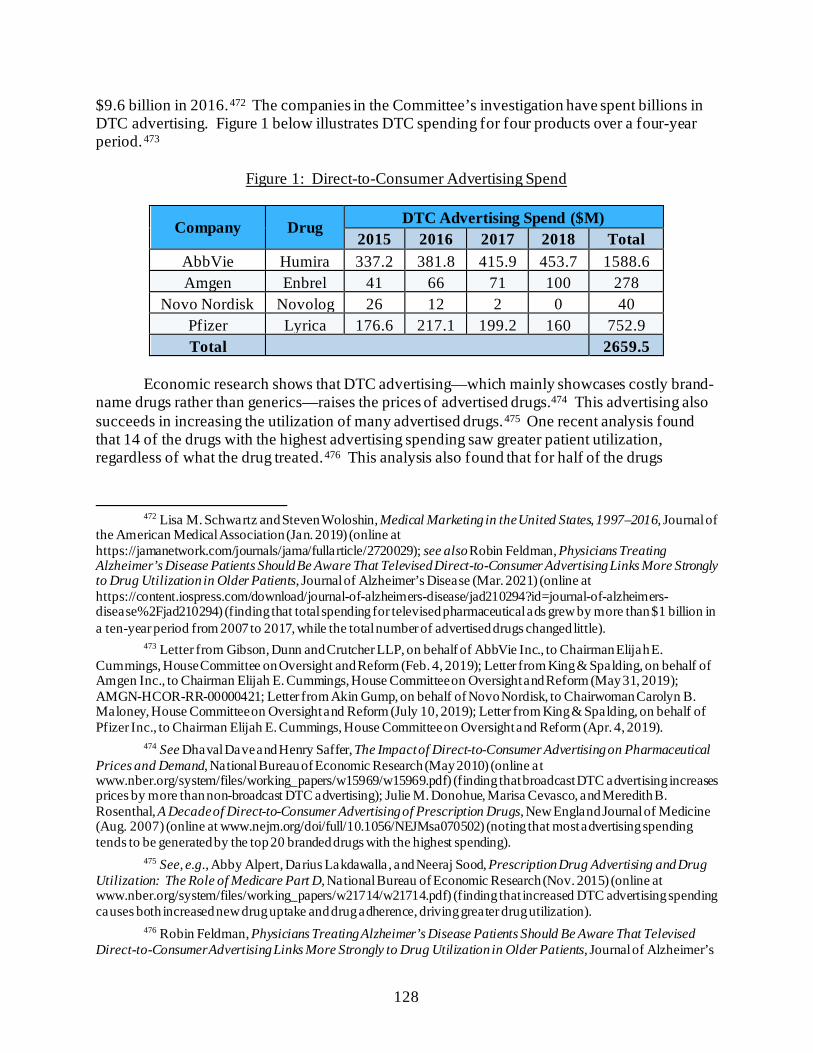
128
$9.6 billion in 2016.472 The companies in the Committee’s investigation have spent billions in DTC advertising. Figure 1 below illustrates DTC spending for four products over a four-year period.473
Figure 1: Direct-to-Consumer Advertising Spend
Company Drug DTC Advertising Spend ($M) 2015 2016 2017 2018 Total
AbbVie Humira 337.2 381.8 415.9 453.7 1588.6 Amgen Enbrel 41 66 71 100 278
Novo Nordisk Novolog 26 12 2 0 40 Pfizer Lyrica 176.6 217.1 199.2 160 752.9 Total 2659.5
Economic research shows that DTC advertising—which mainly showcases costly brand-
name drugs rather than generics—raises the prices of advertised drugs.474 This advertising also succeeds in increasing the utilization of many advertised drugs.475 One recent analysis found that 14 of the drugs with the highest advertising spending saw greater patient utilization, regardless of what the drug treated.476 This analysis also found that for half of the drugs
472 Lisa M. Schwartz and Steven Woloshin, Medical Marketing in the United States, 1997–2016, Journal of
the American Medical Association (Jan. 2019) (online at https://jamanetwork.com/journals/jama/fullarticle/2720029); see also Robin Feldman, Physicians Treating Alzheimer’s Disease Patients Should Be Aware That Televised Direct-to-Consumer Advertising Links More Strongly to Drug Utilization in Older Patients, Journal of Alzheimer’s Disease (Mar. 2021) (online at https://content.iospress.com/download/journal-of-alzheimers-disease/jad210294?id=journal-of-alzheimers-disease%2Fjad210294) (finding that total spending for televised pharmaceutical ads grew by more than $1 billion in a ten-year period from 2007 to 2017, while the total number of advertised drugs changed little).
473 Letter from Gibson, Dunn and Crutcher LLP, on behalf of AbbVie Inc., to Chairman Elijah E. Cummings, House Committee on Oversight and Reform (Feb. 4, 2019); Letter from King & Spalding, on behalf of Amgen Inc., to Chairman Elijah E. Cummings, House Committee on Oversight and Reform (May 31, 2019); AMGN-HCOR-RR-00000421; Letter from Akin Gump, on behalf of Novo Nordisk, to Chairwoman Carolyn B. Maloney, House Committee on Oversight and Reform (July 10, 2019); Letter from King & Spalding, on behalf of Pfizer Inc., to Chairman Elijah E. Cummings, House Committee on Oversight and Reform (Apr. 4, 2019).
474 See Dhaval Dave and Henry Saffer, The Impact of Direct-to-Consumer Advertising on Pharmaceutical Prices and Demand, National Bureau of Economic Research (May 2010) (online at www.nber.org/system/files/working_papers/w15969/w15969.pdf) (finding that broadcast DTC advertising increases prices by more than non-broadcast DTC advertising); Julie M. Donohue, Marisa Cevasco, and Meredith B. Rosenthal, A Decade of Direct-to-Consumer Advertising of Prescription Drugs, New England Journal of Medicine (Aug. 2007) (online at www.nejm.org/doi/full/10.1056/NEJMsa070502) (noting that most advertising spending tends to be generated by the top 20 branded drugs with the highest spending).
475 See, e.g., Abby Alpert, Darius Lakdawalla, and Neeraj Sood, Prescription Drug Advertising and Drug Utilization: The Role of Medicare Part D, National Bureau of Economic Research (Nov. 2015) (online at www.nber.org/system/files/working_papers/w21714/w21714.pdf) (finding that increased DTC advertising spending causes both increased new drug uptake and drug adherence, driving greater drug utilization).
476 Robin Feldman, Physicians Treating Alzheimer’s Disease Patients Should Be Aware That Televised Direct-to-Consumer Advertising Links More Strongly to Drug Utilization in Older Patients, Journal of Alzheimer’s
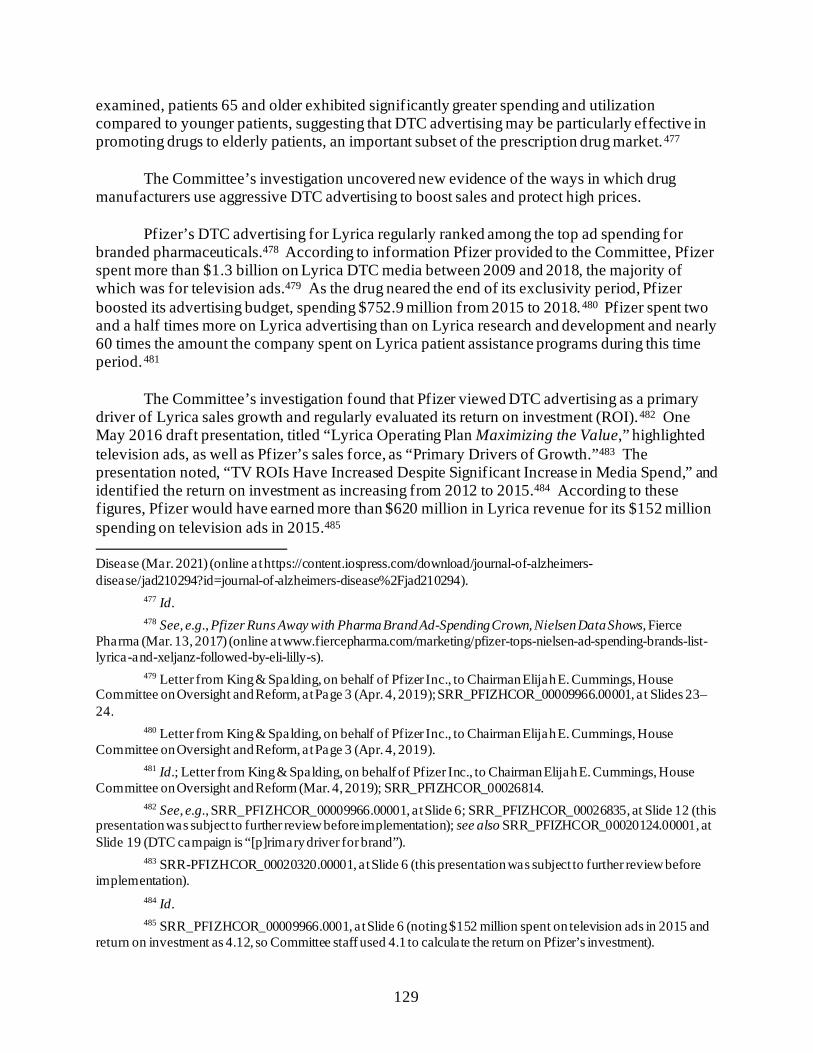
129
examined, patients 65 and older exhibited significantly greater spending and utilization compared to younger patients, suggesting that DTC advertising may be particularly effective in promoting drugs to elderly patients, an important subset of the prescription drug market.477
The Committee’s investigation uncovered new evidence of the ways in which drug
manufacturers use aggressive DTC advertising to boost sales and protect high prices.
Pfizer’s DTC advertising for Lyrica regularly ranked among the top ad spending for branded pharmaceuticals.478 According to information Pfizer provided to the Committee, Pfizer spent more than $1.3 billion on Lyrica DTC media between 2009 and 2018, the majority of which was for television ads.479 As the drug neared the end of its exclusivity period, Pfizer boosted its advertising budget, spending $752.9 million from 2015 to 2018.480 Pfizer spent two and a half times more on Lyrica advertising than on Lyrica research and development and nearly 60 times the amount the company spent on Lyrica patient assistance programs during this time period.481
The Committee’s investigation found that Pfizer viewed DTC advertising as a primary driver of Lyrica sales growth and regularly evaluated its return on investment (ROI).482 One May 2016 draft presentation, titled “Lyrica Operating Plan Maximizing the Value,” highlighted television ads, as well as Pfizer’s sales force, as “Primary Drivers of Growth.”483 The presentation noted, “TV ROIs Have Increased Despite Significant Increase in Media Spend,” and identified the return on investment as increasing from 2012 to 2015.484 According to these figures, Pfizer would have earned more than $620 million in Lyrica revenue for its $152 million spending on television ads in 2015.485
Disease (Mar. 2021) (online at https://content.iospress.com/download/journal-of-alzheimers-disease/jad210294?id=journal-of-alzheimers-disease%2Fjad210294).
477 Id. 478 See, e.g., Pfizer Runs Away with Pharma Brand Ad-Spending Crown, Nielsen Data Shows, Fierce
Pharma (Mar. 13, 2017) (online at www.fiercepharma.com/marketing/pfizer-tops-nielsen-ad-spending-brands-list-lyrica-and-xeljanz-followed-by-eli-lilly-s).
479 Letter from King & Spalding, on behalf of Pfizer Inc., to Chairman Elijah E. Cummings, House Committee on Oversight and Reform, at Page 3 (Apr. 4, 2019); SRR_PFIZHCOR_00009966.00001, at Slides 23–24.
480 Letter from King & Spalding, on behalf of Pfizer Inc., to Chairman Elijah E. Cummings, House Committee on Oversight and Reform, at Page 3 (Apr. 4, 2019).
481 Id.; Letter from King & Spalding, on behalf of Pfizer Inc., to Chairman Elijah E. Cummings, House Committee on Oversight and Reform (Mar. 4, 2019); SRR_PFIZHCOR_00026814.
482 See, e.g., SRR_PFIZHCOR_00009966.00001, at Slide 6; SRR_PFIZHCOR_00026835, at Slide 12 (this presentation was subject to further review before implementation); see also SRR_PFIZHCOR_00020124.00001, at Slide 19 (DTC campaign is “[p]rimary driver for brand”).
483 SRR-PFIZHCOR_00020320.00001, at Slide 6 (this presentation was subject to further review before implementation).
484 Id. 485 SRR_PFIZHCOR_00009966.0001, at Slide 6 (noting $152 million spent on television ads in 2015 and
return on investment as 4.12, so Committee staff used 4.1 to calculate the return on Pfizer’s investment).
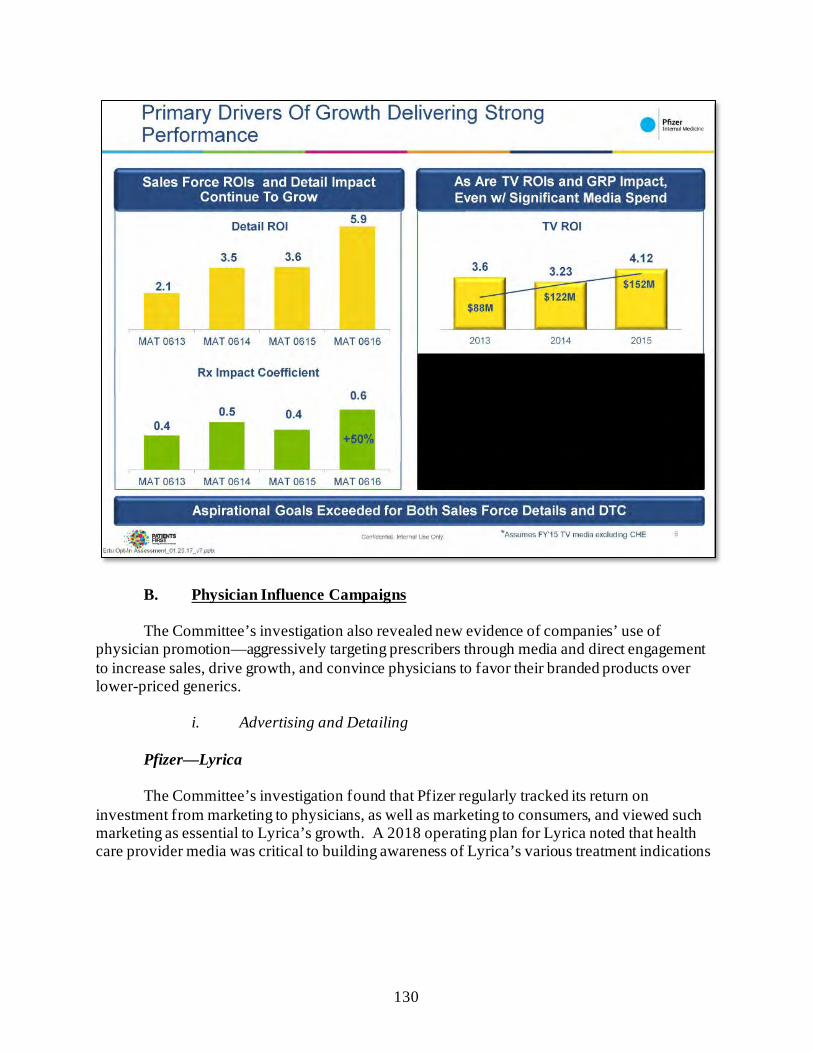
130
B. Physician Influence Campaigns
The Committee’s investigation also revealed new evidence of companies’ use of physician promotion—aggressively targeting prescribers through media and direct engagement to increase sales, drive growth, and convince physicians to favor their branded products over lower-priced generics.
i. Advertising and Detailing
Pfizer—Lyrica
The Committee’s investigation found that Pfizer regularly tracked its return on investment from marketing to physicians, as well as marketing to consumers, and viewed such marketing as essential to Lyrica’s growth. A 2018 operating plan for Lyrica noted that health care provider media was critical to building awareness of Lyrica’s various treatment indications
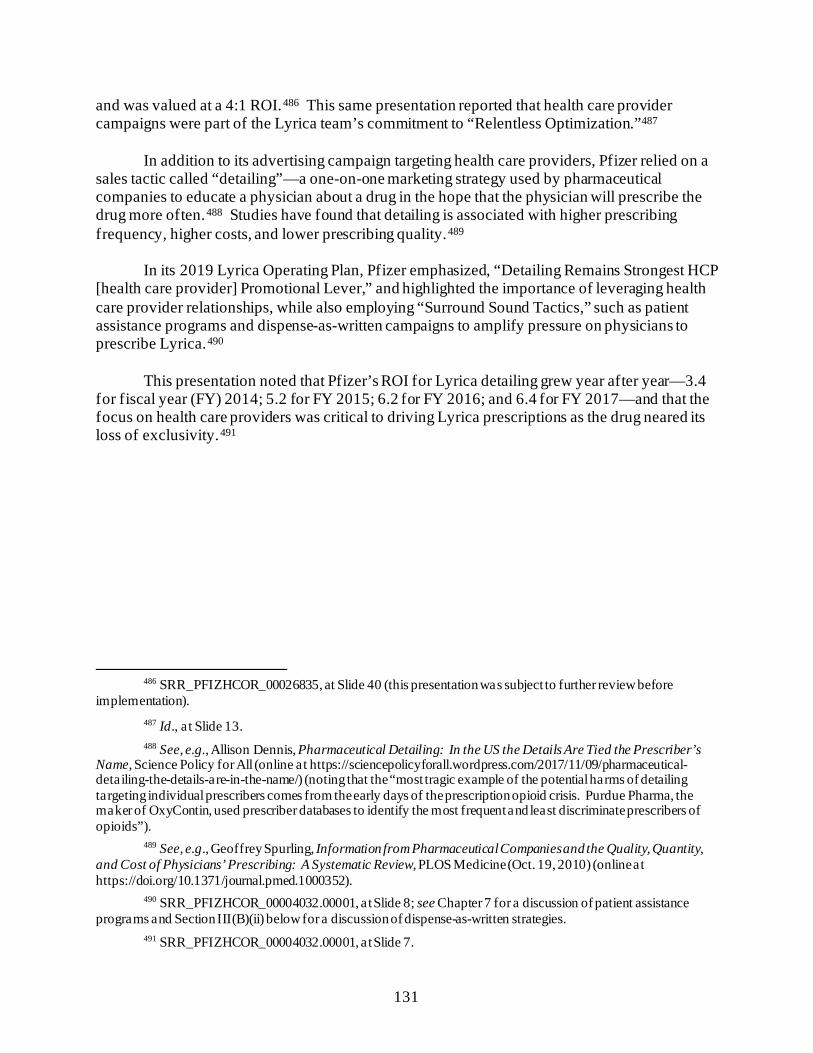
131
and was valued at a 4:1 ROI.486 This same presentation reported that health care provider campaigns were part of the Lyrica team’s commitment to “Relentless Optimization.”487
In addition to its advertising campaign targeting health care providers, Pfizer relied on a
sales tactic called “detailing”—a one-on-one marketing strategy used by pharmaceutical companies to educate a physician about a drug in the hope that the physician will prescribe the drug more often.488 Studies have found that detailing is associated with higher prescribing frequency, higher costs, and lower prescribing quality.489
In its 2019 Lyrica Operating Plan, Pfizer emphasized, “Detailing Remains Strongest HCP
[health care provider] Promotional Lever,” and highlighted the importance of leveraging health care provider relationships, while also employing “Surround Sound Tactics,” such as patient assistance programs and dispense-as-written campaigns to amplify pressure on physicians to prescribe Lyrica.490
This presentation noted that Pfizer’s ROI for Lyrica detailing grew year after year—3.4
for fiscal year (FY) 2014; 5.2 for FY 2015; 6.2 for FY 2016; and 6.4 for FY 2017—and that the focus on health care providers was critical to driving Lyrica prescriptions as the drug neared its loss of exclusivity.491
486 SRR_PFIZHCOR_00026835, at Slide 40 (this presentation was subject to further review before
implementation). 487 Id., a t Slide 13. 488 See, e.g., Allison Dennis, Pharmaceutical Detailing: In the US the Details Are Tied the Prescriber’s
Name, Science Policy for All (online at https://sciencepolicyforall.wordpress.com/2017/11/09/pharmaceutical-detailing-the-details-are-in-the-name/) (noting that the “most tragic example of the potential harms of detailing targeting individual prescribers comes from the early days of the prescription opioid crisis. Purdue Pharma, the maker of OxyContin, used prescriber databases to identify the most frequent and least discriminate prescribers of opioids”).
489 See, e.g., Geoffrey Spurling, Information from Pharmaceutical Companies and the Quality, Quantity, and Cost of Physicians’ Prescribing: A Systematic Review, PLOS Medicine (Oct. 19, 2010) (online at https://doi.org/10.1371/journal.pmed.1000352).
490 SRR_PFIZHCOR_00004032.00001, at Slide 8; see Chapter 7 for a discussion of patient assistance programs and Section III(B)(ii) below for a discussion of dispense-as-written strategies.
491 SRR_PFIZHCOR_00004032.00001, at Slide 7.
132
Numerous other Lyrica internal business presentations provided to the Committee highlighted the importance of detailing to Lyrica’s growth.492
Some of Pfizer’s aggressive marketing practices were scrutinized in a lawsuit brought by the Department of Justice (DOJ). In 2009, Pfizer agreed to settle the civil and criminal allegations that it illegally marketed four drugs, including Lyrica, for non-approved uses and misbranded another anti-inflammatory drug, and it paid a $2.3 billion fine—the largest pharmaceutical settlement in U.S. history at the time. The civil settlement also resolved allegations that Pfizer paid kickbacks to health care providers to induce them to prescribe Lyrica and other drugs.493 Although Pfizer’s DOJ settlement was the largest health care fraud settlement at the time, it represented only a fraction of the billions Pfizer earned from the four
492 See, e.g., SRR_PFIZHCOR_00007540.00001, at Page 32 (noting that Lyrica detailing impact had grown
by 29% in 2015 and had driven a 4.8% year-over-year increase in volume) (this presentation was subject to further review before implementation); SRR_PFIZHCOR_00009966.0001, at Slide 6 (noting “Sales Force ROIs and Detail Impact Continue to Grow”).
493 Department of Justice, Press Release: Justice Department Announces Largest Health Care Fraud Settlement in Its History, Pfizer to Pay $2.3 Billion for Fraudulent Marketing (Sept. 2, 2009) (online at www.justice.gov/opa/pr/justice-department-announces-largest-health-care-fraud-settlement-its-history) (these four drugs were Bextra, Geodon, Zyvox, and Lyrica).
133
drugs over the time period.494 A comprehensive study of pharmaceutical company settlements found that “the $2.75 billion Pfizer has paid in off-label penalties from 2004 to 2010 is slightly more than 1% of its revenue of $245 billion from 2004 to 2008.”495
Mallinckrodt—Acthar
Mallinckrodt also engaged in aggressive physician promotion to drive sales growth. One study found that more than half of Medicare’s expenditure for Acthar in 2015 was attributable to just 300 prescribers and that 90% of physicians who frequently prescribed Mallinckrodt’s drug Acthar received at least one payment from Mallinckrodt.496 A separate analysis based on Medicare data from 2016 found that more than 80% of doctors who filed Medicare claims in 2016 for Acthar received “money or other perks” from Mallinckrodt. The analysis found that Mallinckrodt and Questcor Pharmaceuticals, which owned Acthar before Mallinckrodt’s acquisition, “paid 288 prescribers more than $6.5 million for consulting, promotional speaking and other Acthar-related services between 2013 and 2016.”497
As with Pfizer, these aggressive marketing tactics were subject to a suit brought by DOJ.
In September 2019, Mallinckrodt paid $15.4 million to settle DOJ claims that Questcor had paid illegal kickbacks to doctors from 2009 through 2013 to induce prescriptions for the treatment of complications from multiple sclerosis. The government alleged that Questcor sales representatives who were marketing Acthar provided lavish meals and entertainment to doctors to induce Acthar Medicare referrals and that this behavior “cheats taxpayers and the patients who rely on government health care programs for essential care.”498
ii. Dispense-As-Written
Multiple companies in the Committee’s investigation targeted health care providers with “dispense-as-written” campaigns designed to suppress generic competition. Under most state
494 Marc Rodwin, Do We Need Stronger Sanctions to Ensure Legal Compliance by Pharmaceutical Firms?,
Food and Drug Law Journal (Sept. 3, 2015) (online at https://ssrn.com/abstract=2654884). 495 Id. 496 Daniel Hartung et al., Industry Payments to Physician Specialists Who Prescribe Repository
Corticotrophin, JAMA Network Open (June 29, 2018) (online at https://jamanetwork.com/journals/jamanetworkopen/fullarticle/2686039); see also Daniel Hartung et al., Trends and Characteristics of US Medicare Spending on Repository Corticotropin, JAMA Internal Medicine (Nov. 1, 2017) (online at https://jamanetwork.com/journals/jamainternalmedicine/fullarticle/2653010); Something Weird’s Going On with the Doctors Prescribing One of Pharma’s Most Controversial Blockbuster Drugs, Business Insider (Mar. 21, 2017) (online at www.businessinsider.com/acthar-risks-including-doctors-prescribing-and-efficacy-questions-2017-3).
497 Medicare Spent $2 Billion for One Drug as the Manufacturer Paid Doctors Millions, CNN (June 29, 2018) (online at www.cnn.com/2018/06/29/health/acthar-mallinckrodt-medicare-claims-doctor-payments/index.html).
498 Department of Justice, Press Release: Drug Maker Mallinckrodt Agrees to Pay $15.4 Million to Resolve False Claims Act Allegations for “Wining and Dining” Doctors (Sept. 4, 2019) (online at www.justice.gov/usao-edpa/pr/drug-maker-mallinckrodt-agrees-pay-154-million-resolve-false-claims-act-allegations).
134
laws, pharmacists are permitted to substitute a brand-name drug with a lower-cost generic version if the patient consents, and some states require that a pharmacist replace a brand-name drug with a generic if all prescribing requirements are met.499 Doctors, however, can expressly prohibit such substitution by writing “dispense as written” or “DAW” on a patient’s prescription.500 Research has shown that in the Medicare program, when physicians or patients request branded drugs when generics are available, Medicare spending increases and patients pay more.501
Pfizer—Lyrica
New documents obtained by the Committee suggest that Pfizer used this tactic as Lyrica approached loss of exclusivity and the threat of competition from lower-priced generics. Pfizer targeted doctors to write prescriptions for Lyrica that prohibited generic substitution and used its patient programs to convince patients to ask their doctors to keep them on Lyrica rather than substituting the generic version of the drug. A 2018 Lyrica loss-of-exclusivity workshop presentation noted that part of the company’s loss-of-exclusivity strategy for Lyrica was to “[d]rive prescribing of branded Lyrica via DAW.”502 This strategy was also highlighted in Lyrica’s 2019 operating plan, which included dispense-as-written campaigns as part of Lyrica’s loss-of-exclusivity promotional efforts.503
Teva—Copaxone
Teva also used a dispense-as-written campaign to limit generic competition for Copaxone. Before Mylan’s generic version of Copaxone entered the market in October 2017, Teva began encouraging physicians to “[p]rescribe Copaxone DAW for new and existing patients.”504 Teva also leveraged its patient support program, Shared Solutions, to push the dispense-as-written campaign on patients. According to an internal analysis in August 2017, DAW was written on 87% of Copaxone 40 mg/mL prescriptions requested through Teva’s
499 Yan Song and Douglas Barthold, The Effects of State-Level Pharmacist Regulations on Generic
Substitution of Prescription Drugs, Health Economics (July 10, 2018) (online at https://ncbi.nlm.nih.gov/pmc/articles/PMC6172151/pdf/nihms975944.pdf) (summarizing state generic substitution laws); National Conference of State Legislatures, Generic Drug Substitution Laws (May 3, 2019) (online at www.ncsl.org/portals/1/documents/health/Generic_Drug_Substitution_Laws_32193.pdf). A generic drug is “a medication created to be the same as an existing approved brand-name drug in dosage form, safety, strength, route of administration, quality, and performance characteristics.” Food and Drug Administration, Generic Drug Facts (online at www.fda.gov/drugs/generic-drugs/generic-drug-facts) (accessed Nov. 16, 2021).
500 William H. Shrank et al., The Consequences of Requesting “Dispense as Written”, American Journal of Medicine (Apr. 2011) (online at https://scholar.harvard.edu/files/nkc/files/2011_dispense_as_written_am_j_med.pdf).
501 Mariana Socal, Ge Bai, and Gerard Anderson, Factors Associated with Prescriptions for Branded Medications in the Medicare Part D Program, JAMA Network Open (Mar. 2, 2021) (online at https://jamanetwork.com/journals/jamanetworkopen/fullarticle/2776929).
502 SRR_PFIZHCOR_00005033.00001, at Slide 8. 503 SRR_PFIZHCOR_00004032.00001, at Slides 8 and 21. 504 TEVA_HCO_IC_005102935, at Page 10.
135
“Shared Solutions Copaxone Prescription Service Request Form.”505 Once Mylan entered the market, Teva’s campaign intensified. One presentation emphasized that the company would engage in “[o]utbound efforts to 40mg patients through Shared Solutions,” which included sending “[e]mails to all patients with DAW messaging.”506 In August 2018, Executive Vice President for North America Brendan O’Grady congratulated his team on the success of the DAW strategy:
Keep up pressure on Copaxone and maximize office calls up to the launch of [another Teva product]. The DAW campaign combined with the legacy and house brand access strategy has paid great dividends. I want to exceed $1.5b for the year on Copaxone. We did $900m in H1 so we only need to do $500m+ in H2 to accomplish this goal.507 Teva surpassed Mr. O’Grady’s goal. In 2018, the company collected $1.6 billion in net
revenue for Copaxone despite competition from generics.508
Novartis—Gleevec
Novartis used a similar approach as Gleevec neared the end of its patent exclusivity period. Novartis’s dispense-as-written campaign was projected to start around the time Gleevec’s base patent expired.509 Novartis targeted both patients and health care providers with dispense-as-written messaging. One planning document for the campaign identified messages designed to encourage patients to ask for and providers to request dispense-as-written.510 These included:
• “Generic imatinib does not have the Gleevec name imprinted on the tablet.” • “It’s your right to ask your pharmacist for branded Gleevec. Tell them to
dispense as written.” • “The power is in your hands—demand the brand.”511
These messages also aimed to scare doctors and patients away from switching to generics. Messages included:
505 TEVA_HCO_IC_005002781. 506 TEVA_HCO_IC_005021634, at Slide 4. 507 TEVA_HCO_IC_005127231. 508 Letter from Kirkland and Ellis LLP, on behalf of Teva Pharmaceutical Industries Ltd., to Chairman
Elijah E. Cummings, House Committee on Oversight and Reform (July 18, 2019). 509 CTRL-0088450, at Slide 4 (providing a complete description of the dispense-as-written campaign:
“Comprehensive education to HCP/Patients on DAW and how to remain on the brand (EHR communications, email series, SP communication, Journal ads, PR platform, patent expiration guide, EMR, etc.)”).
510 CTRL-0088408, at Page 1. 511 Id.
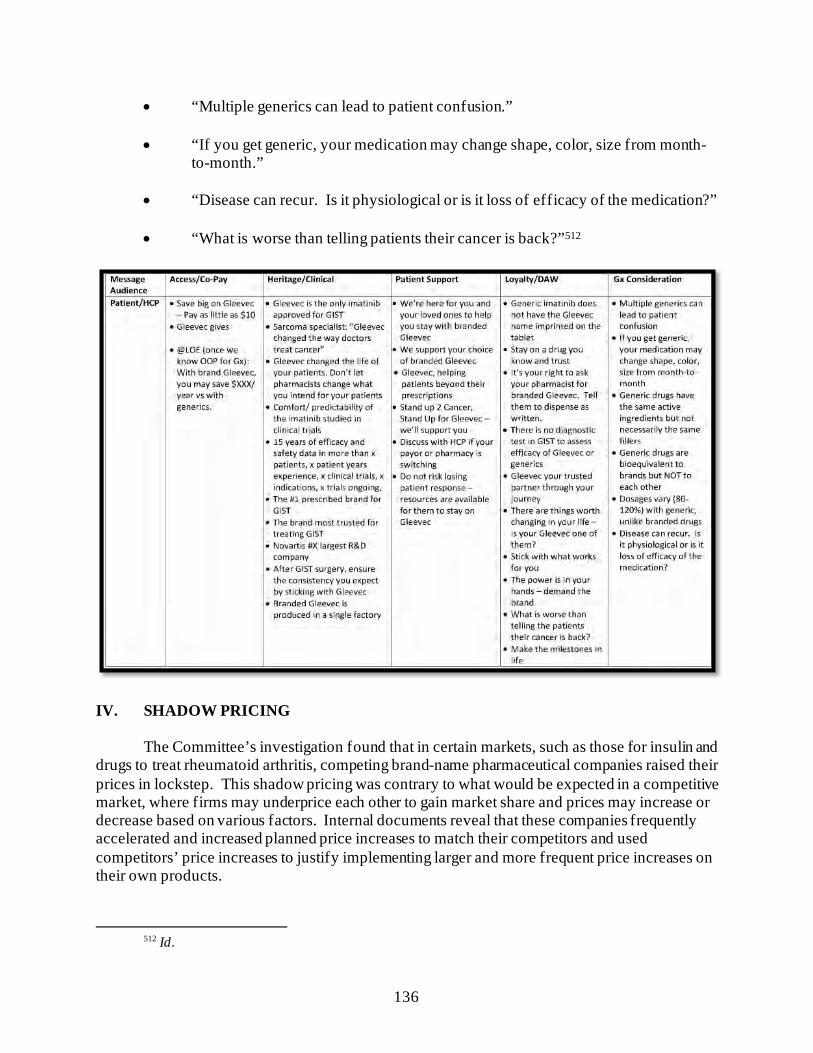
136
• “Multiple generics can lead to patient confusion.” • “If you get generic, your medication may change shape, color, size from month-
to-month.” • “Disease can recur. Is it physiological or is it loss of efficacy of the medication?” • “What is worse than telling patients their cancer is back?”512
IV. SHADOW PRICING
The Committee’s investigation found that in certain markets, such as those for insulin and
drugs to treat rheumatoid arthritis, competing brand-name pharmaceutical companies raised their prices in lockstep. This shadow pricing was contrary to what would be expected in a competitive market, where firms may underprice each other to gain market share and prices may increase or decrease based on various factors. Internal documents reveal that these companies frequently accelerated and increased planned price increases to match their competitors and used competitors’ price increases to justify implementing larger and more frequent price increases on their own products.
512 Id.
137
Experts have warned that when companies engage in shadow pricing, patients “often bear the burden of these costs through increased premiums, copayments and retail prices,” and that if shadow pricing continues, “the US healthcare model is likely to become increasingly unsustainable.”513
A. Shadow Pricing Among Insulin Manufacturers
The insulin market provides a striking example of shadow pricing. Internal documents
obtained by the Committee from the three largest insulin manufacturers demonstrate that these companies intentionally and strategically raised their prices in lockstep. As one internal slide from Novo Nordisk noted, the company’s pricing strategy was to “match what other companies are doing in the marketplace.”514
The absence of meaningful biosimilar competition in the insulin market is part of what
enables manufacturers to raise prices in lockstep. As of 2021, only one interchangeable insulin product has been approved: Semglee, a biosimilar form of Sanofi’s long-acting insulin, Lantus.515 Eli Lilly and Novo Nordisk have both launched cheaper, “authorized generic” versions of Humalog and NovoLog, respectively.516 An authorized generic is identical to a brand-name drug but is marketed or licensed as a generic by the brand-name drug company.517 Recent research has shown that authorized generic versions of Humalog and NovoLog have failed to meaningfully penetrate the market. A 2019 Senate investigation, for instance, found that just 17% of surveyed pharmacies carried Humalog’s authorized generic.518 Authorized
513 Anurag S. Rathore and Faheem Shereef, Shadow Pricing and the Art of Profiteering from Outdated
Therapies, Nature Biotechnology (Mar. 2019) (online at https://pubmed.ncbi.nlm.nih.gov/30809025/). 514 NNI-ERR_0080488, at Slide 3. 515 Food and Drug Administration, Press Release: FDA Approves First Interchangeable Biosimilar Insulin
Product for Treatment of Diabetes (Jul. 28, 2021) (online at www.fda.gov/news-events/press-announcements/fda-approves-first-interchangeable-biosimilar-insulin-product-treatment-diabetes). Insulin is a biologic—a large, complex molecule made from living cells or tissue—but because it is such an old drug, it had been regulated as a small-molecule drug under section 505 of the Federal Food, Drug, and Cosmetic Act. That changed when the Biologics Price Competition and Innovation Act deemed insulin a biologic and ordered that, after March 23, 2020, all insulins would be licensed under the Public Health Service Act. See Patient Protection and Affordable Care Act, Title VII: Biologics Price Competition and Innovation Act of 2009 (BPCIA), Pub. L. No. 111-148. Biosimilars are based on a “reference” biologic product, but since insulin was regulated as a drug, there were no previously referenced biosimilar products for which a biosimilar could be developed. Today, there are two “follow-on biologic” insulins that have received approval from FDA—Eli Lilly’s long-acting drug Basaglar and Sanofi’s rapid-acting Admelog—and, on July 28, 2021, FDA approved the first interchangeable biosimilar product, Semglee, which can be substituted for Sanofi’s long-acting insulin, Lantus.
516 Angus Liu, Novo Nordisk Rolls Out Authorized Insulin Generics, Following Similar Moves by Lilly, Sanofi, Fierce Pharma (Sep. 6, 2019) (online at www.fiercepharma.com/marketing/novo-nordisk-rolls-out-authorized-insulin-generics-following-similar-moves-by-lilly-and); Colorado Department of Law, Prescription Insulin Drug Pricing Report, a t Appendix B, Page 3, Note 8 (Nov. 2020) (online at coag.gov/app/uploads/2020/11/Insulin-Report-102020.pdf).
517 See Robin Feldman, Captive Generics: The Wolf in Sheep’s Clothing, UC Hastings Research Paper Forthcoming (June 16, 2021) (online at https://papers.ssrn.com/sol3/papers.cfm?abstract_id=3868436) (explaining the difference between true and authorized generics).
518 Staff, Offices of U.S. Senators Elizabeth Warren and Richard Blumenthal, Inaccessible Insulin: The Broken Promise of Eli Lilly’s Authorized Generic (Dec. 2019) (online at
138
generics can also serve to undermine true generic competitors in the marketplace as the presence of an authorized generic has been shown to raise both brand-name and generic prices in those markets while limiting true generic market shares.519 Thus, although the authorized generics launched by Eli Lilly and Novo Nordisk appear to be price-lowering products, in practice they may serve to entrench the companies’ costlier, brand-name option.
As a result of this lack of meaningful competition, insulin manufacturers have been able
to raise prices in lockstep, irrespective of innovation or improvement. Figures 3 and 4 below show the pricing history for Eli Lilly and Novo Nordisk’s rapid-acting insulin products, Humalog and NovoLog, respectively, and Sanofi and Novo Nordisk’s long-acting insulin products, Lantus and Levemir, respectively.520
www.warren.senate.gov/imo/media/doc/Inaccessible%20Insulin%20report.pdf); see also Amanda Brooks, Generic Insulins Are on the Market—So Why Aren’t People Using Them?, GoodRx (Apr. 3, 2020) (www.goodrx.com/blog/generic-insulins-see-low-fills-insulin-lispro-insulin-aspart/#:~:text=Eli%20Lilly%20introduced%20a%20generic,generic%20drugs%20are%20authorized%20generics) (finding that Humalog and NovoLog authorized generics comprised only 35% and 12% of all insulin sold at pharmacies by Eli Lilly and Novo Nordisk, respectively).
519 Robin Feldman, Captive Generics: The Wolf in Sheep’s Clothing, UC Hastings Research Paper Forthcoming (June 16, 2021) (online at https://papers.ssrn.com/sol3/papers.cfm?abstract_id=3868436) (finding that, on average, the increase of brand-name net prices once generics entered the market was more than three times greater in drug markets with an authorized generic than in drug markets without one).
520 IBM Micromedex Redbook, Wholesale Acquisition Cost and Average Wholesale Price History for Humalog, NovoLog, and Lantus; MediSpan Price Rx, Wholesale Acquisition Cost and Average Wholesale Price History for Levemir.
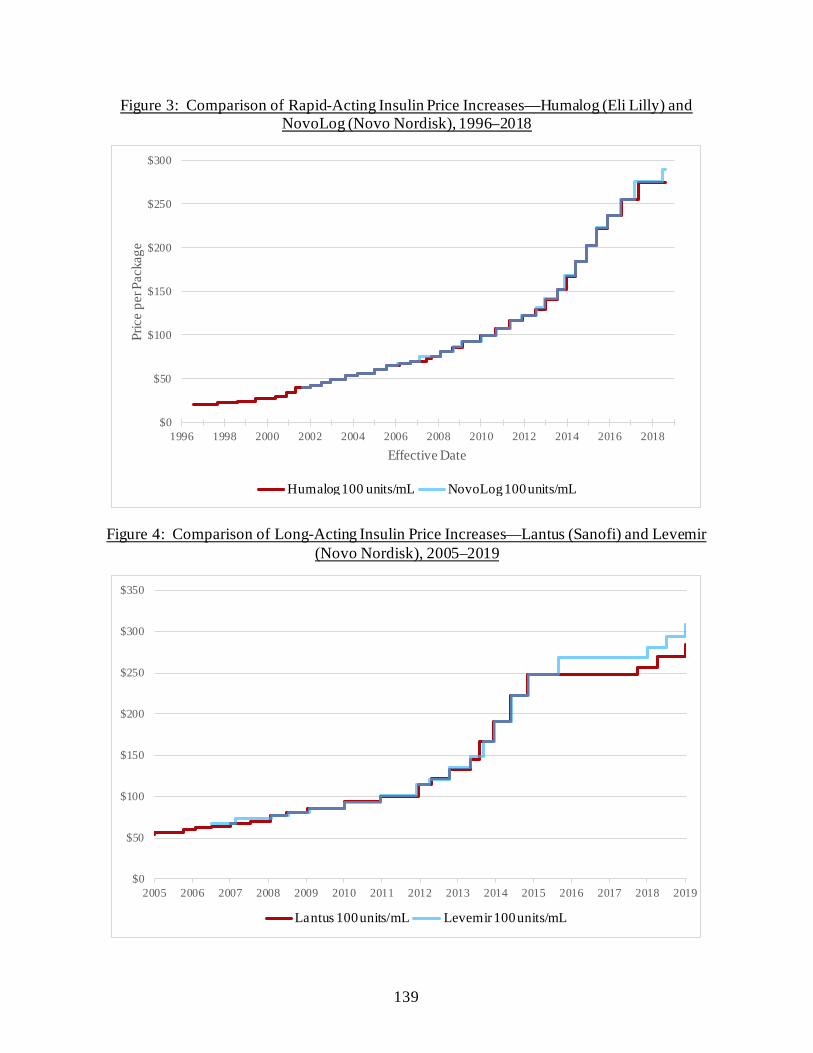
139
Figure 3: Comparison of Rapid-Acting Insulin Price Increases—Humalog (Eli Lilly) and NovoLog (Novo Nordisk), 1996–2018
Figure 4: Comparison of Long-Acting Insulin Price Increases—Lantus (Sanofi) and Levemir (Novo Nordisk), 2005–2019
$0
$50
$100
$150
$200
$250
$300
1996 1998 2000 2002 2004 2006 2008 2010 2012 2014 2016 2018
Pric
e pe
r Pac
kage
Effective Date
Humalog 100 Unit/mL NovoLog 100 Unit/mL
$0
$50
$100
$150
$200
$250
$300
$350
2005 2006 2007 2008 2009 2010 2011 2012 2013 2014 2015 2016 2017 2018 2019
Lantus 100 Unit/mL Levemir 100 Unit/mL
NovoLog 100 units/mL Humalog 100 units/mL
Lantus 100 units/mL Levemir 100 units/mL
140
Eli Lilly New documents obtained by the Committee show that executives at Eli Lilly regularly
monitored competitors’ pricing activity and viewed competitors’ price increases as justification to raise the prices of their own products.521 On May 30, 2014, a senior vice president at Eli Lilly sent a proposal to Enrique Conterno, then-President of Lilly Diabetes, for a June 2014 price increase on Humalog and related product Humulin. The executive reported that the company had learned that Novo Nordisk had just executed a 9.9% price increase across its insulin portfolio. Mr. Conterno remarked, “While the list price increase is higher than we had planned, I believe it makes sense from a competitive perspective.” 522 Eli Lilly took a 9.9% price increase shortly thereafter, on June 5, 2014.523
Six months later, on November 19, 2014, Mr. Conterno reported to then-CEO John Lechleiter that Novo Nordisk had just taken another 9.9% price increase on NovoLog—the direct competitor to Eli Lilly’s Humalog. Mr. Conterno wrote, “As you are aware, we have assumed as part of our business plan a price increase of 9.9% for Humalog before the end of the year.”524 The following Monday—six days after Mr. Conterno’s initial email to the CEO—Eli Lilly took price increases of 9.9% on all of its Humalog and Humulin products.525
Sanofi
Documents obtained by the Committee show that Sanofi also closely monitored
competitors’ pricing activity and planned its own pricing decisions around price increases by Eli Lilly and Novo Nordisk. Documents also show that executives were aware that Sanofi’s long-acting insulin competitors—particularly Novo Nordisk—would likely match its pricing actions on long-acting insulin. In internal documents Sanofi leaders welcomed price increases on competitors’ products because they allowed the company to claim it was maintaining pricing parity with competitors.
For example, on November 7, 2014, Sanofi executed a price increase of approximately 12% across its family of Lantus products.526 The following week, a Sanofi senior vice president sent an email asking, “Did Novo increase the price of Levemir following our price increase on Lantus last week? I just want to confirm we can still say that Lantus and Levemir are still priced at parity on a WAC [wholesale acquisition cost] basis.” The head of pricing responded that Novo had not yet taken the price increase but noted, “Over the past four price increases on
521 See also COR-BOX-00013359, at Slide 26. This presentation proposing price adjustments to Eli Lilly’s
products includes a chart comparing all insulin drug prices, including NovoLog, Humalog, and Lantus. 522 COR-BOX-00016555. 523 IBM Micromedex Redbook, Wholesale Acquisition Cost and Average Wholesale Price History for
Humalog. 524 COR-BOX-00014049. 525 IBM Micromedex Redbook, Wholesale Acquisition Cost and Average Wholesale Price History for
Humalog. 526 IBM Micromedex Redbook, Wholesale Acquisition Cost and Average Wholesale Price History for
Lantus.
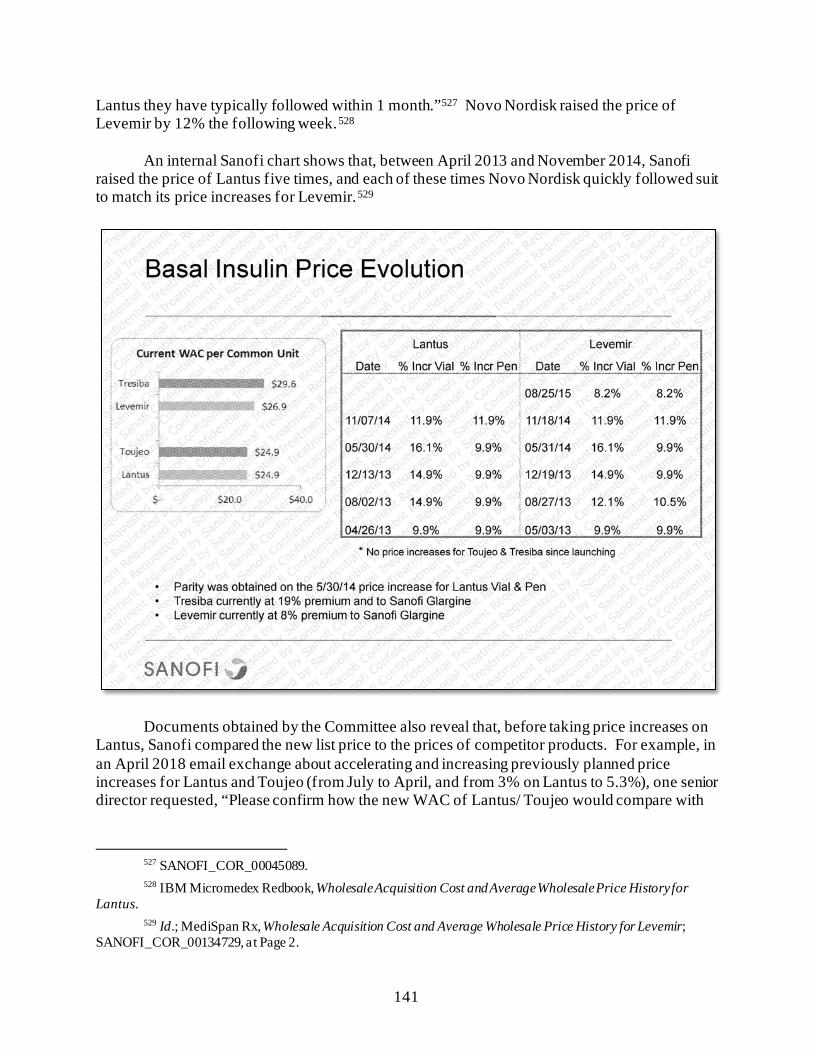
141
Lantus they have typically followed within 1 month.”527 Novo Nordisk raised the price of Levemir by 12% the following week.528
An internal Sanofi chart shows that, between April 2013 and November 2014, Sanofi raised the price of Lantus five times, and each of these times Novo Nordisk quickly followed suit to match its price increases for Levemir.529
Documents obtained by the Committee also reveal that, before taking price increases on Lantus, Sanofi compared the new list price to the prices of competitor products. For example, in an April 2018 email exchange about accelerating and increasing previously planned price increases for Lantus and Toujeo (from July to April, and from 3% on Lantus to 5.3%), one senior director requested, “Please confirm how the new WAC of Lantus/ Toujeo would compare with
527 SANOFI_COR_00045089. 528 IBM Micromedex Redbook, Wholesale Acquisition Cost and Average Wholesale Price History for
Lantus. 529 Id.; MediSpan Rx, Wholesale Acquisition Cost and Average Wholesale Price History for Levemir;
SANOFI_COR_00134729, at Page 2.
142
the WAC of Levemir/ Tresiba.”530 In reply, another senior leader provided a chart comparing Sanofi prices to those of its competition.531
Sanofi also engaged in shadow pricing with its rapid-acting insulin products, including
Apidra. Sanofi was not the market leader in the fast-acting insulin space and typically did not act first to raise prices. However, when its competitors raised prices on their fast-acting insulins, Sanofi followed suit. A 2017 Sanofi slide deck explained, “Over the past three years, we have executed a ‘fast follower’ strategy for Apidra and have executed price increases only after a price increase was announced.”532
In December 2018, Sanofi’s director of strategic pricing and planning emailed diabetes and cardiovascular pricing committee members seeking approval for across-the-board price increases for its rapid- and long-acting insulin products, including Lantus, Toujeo, and Apidra. The then-Senior Vice President and Head of Sanofi’s North America General Medicines group forwarded the proposal to the then-Senior Vice President and Head of Sanofi’s External Affairs and inquired, “Prior to my approval, just confirming that we are still on for these.” 533 The Head of Sanofi’s External Affairs wrote back, “Yes. As of now I don’t see any alternative. Not taking an increase won’t solve the broader policy/political issues, and based on intel, believe many other manufacturers plan to take increases next year as well.”534 He added, “So while doing it comes with high political risk, I don’t see any political upside to not doing it.”535
Novo Nordisk
Although Sanofi generally led price increases in the long-acting insulin market with its pricing for Lantus, Novo Nordisk often led in the rapid-acting market with NovoLog. On May 8, 2017, Novo Nordisk CEO Lars Jorgenson learned that Eli Lilly had raised U.S. list prices by approximately 8% across its injectable diabetes drug portfolio. Mr. Jorgenson emailed this information to a Novo Nordisk executive and asked, “What is our price increase strategy?”536 The executive responded, “LLY [Eli Lilly] followed our increase on NovoLog, so we’re at parity here, so no action from us. They led with Trulicity and based on our strategy, we will follow which will likely be on June or July 1st.”537
530 SANOFI_COR_00059472, at Page 1. Sanofi has implemented pricing principles to limit annual price
increases to a level at or below the projected growth rate for National Health Expenditures for that year. Sanofi, Prescription Medicine Pricing: Our Principles and Perspectives (Feb. 2021) (online at www.sanofi.us/-/media/Project/One-Sanofi-Web/Websites/North-America/Sanofi-US/Home/corporateresponsibility/Sanofi_2021_Pricing_Principles_Report.pdf?la=en).
531 SANOFI_COR_00059474, at Sheet 2. 532 SANOFI_COR_00134729, at Page 1. 533 SANOFI_COR_00282444, at Page 1. 534 Id. 535 Id. 536 NNI-ERR_0082871, at Page 1. 537 NNI-ERR_0082875, at Page 1.
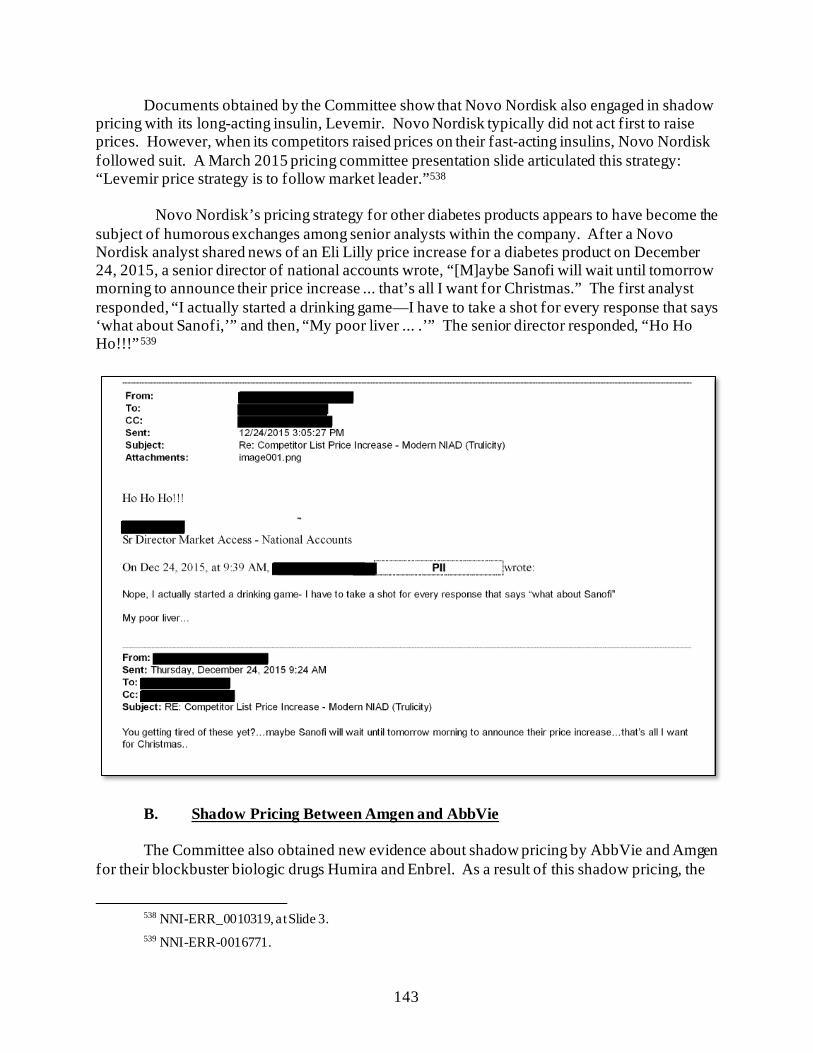
143
Documents obtained by the Committee show that Novo Nordisk also engaged in shadow pricing with its long-acting insulin, Levemir. Novo Nordisk typically did not act first to raise prices. However, when its competitors raised prices on their fast-acting insulins, Novo Nordisk followed suit. A March 2015 pricing committee presentation slide articulated this strategy: “Levemir price strategy is to follow market leader.”538
Novo Nordisk’s pricing strategy for other diabetes products appears to have become the
subject of humorous exchanges among senior analysts within the company. After a Novo Nordisk analyst shared news of an Eli Lilly price increase for a diabetes product on December 24, 2015, a senior director of national accounts wrote, “[M]aybe Sanofi will wait until tomorrow morning to announce their price increase ... that’s all I want for Christmas.” The first analyst responded, “I actually started a drinking game—I have to take a shot for every response that says ‘what about Sanofi,’” and then, “My poor liver ... .’” The senior director responded, “Ho Ho Ho!!!”539
B. Shadow Pricing Between Amgen and AbbVie
The Committee also obtained new evidence about shadow pricing by AbbVie and Amgen for their blockbuster biologic drugs Humira and Enbrel. As a result of this shadow pricing, the
538 NNI-ERR_0010319, at Slide 3. 539 NNI-ERR-0016771.
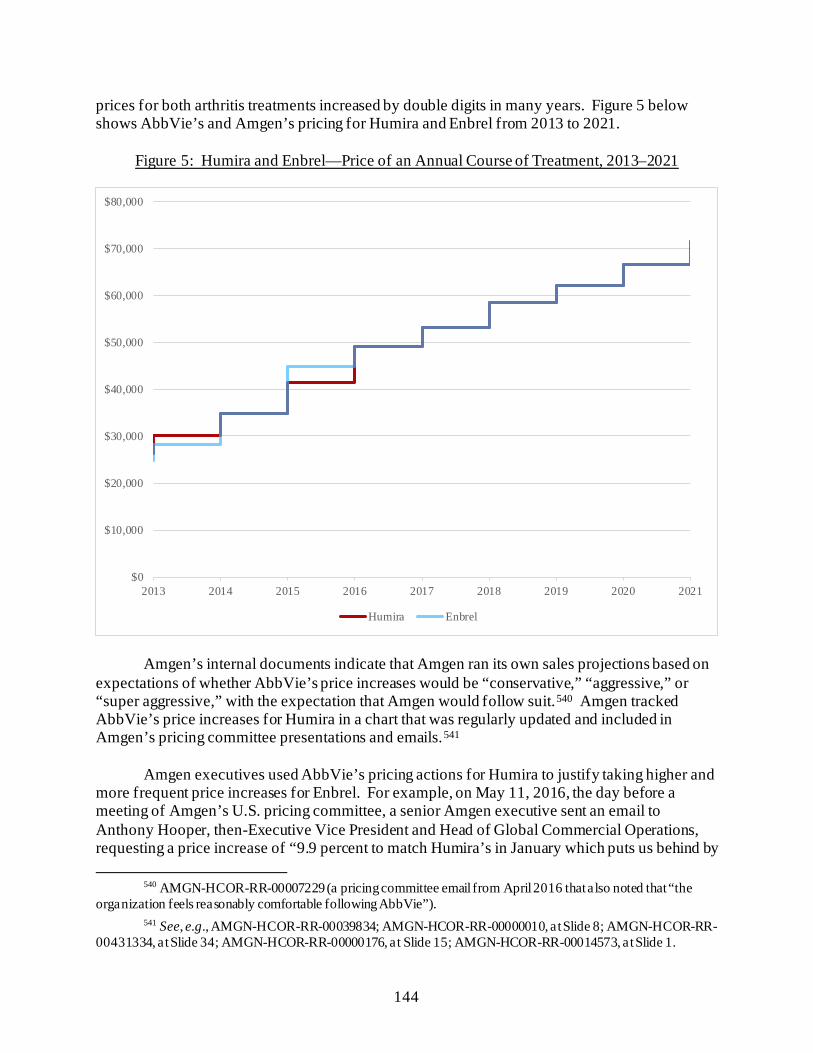
144
prices for both arthritis treatments increased by double digits in many years. Figure 5 below shows AbbVie’s and Amgen’s pricing for Humira and Enbrel from 2013 to 2021.
Figure 5: Humira and Enbrel—Price of an Annual Course of Treatment, 2013–2021
Amgen’s internal documents indicate that Amgen ran its own sales projections based on expectations of whether AbbVie’s price increases would be “conservative,” “aggressive,” or “super aggressive,” with the expectation that Amgen would follow suit.540 Amgen tracked AbbVie’s price increases for Humira in a chart that was regularly updated and included in Amgen’s pricing committee presentations and emails.541
Amgen executives used AbbVie’s pricing actions for Humira to justify taking higher and more frequent price increases for Enbrel. For example, on May 11, 2016, the day before a meeting of Amgen’s U.S. pricing committee, a senior Amgen executive sent an email to Anthony Hooper, then-Executive Vice President and Head of Global Commercial Operations, requesting a price increase of “9.9 percent to match Humira’s in January which puts us behind by
540 AMGN-HCOR-RR-00007229 (a pricing committee email from April 2016 that also noted that “the
organization feels reasonably comfortable following AbbVie”). 541 See, e.g., AMGN-HCOR-RR-00039834; AMGN-HCOR-RR-00000010, at Slide 8; AMGN-HCOR-RR-
00431334, at Slide 34; AMGN-HCOR-RR-00000176, at Slide 15; AMGN-HCOR-RR-00014573, at Slide 1.
$0
$10,000
$20,000
$30,000
$40,000
$50,000
$60,000
$70,000
$80,000
2013 2014 2015 2016 2017 2018 2019 2020 2021
Humira Enbrel
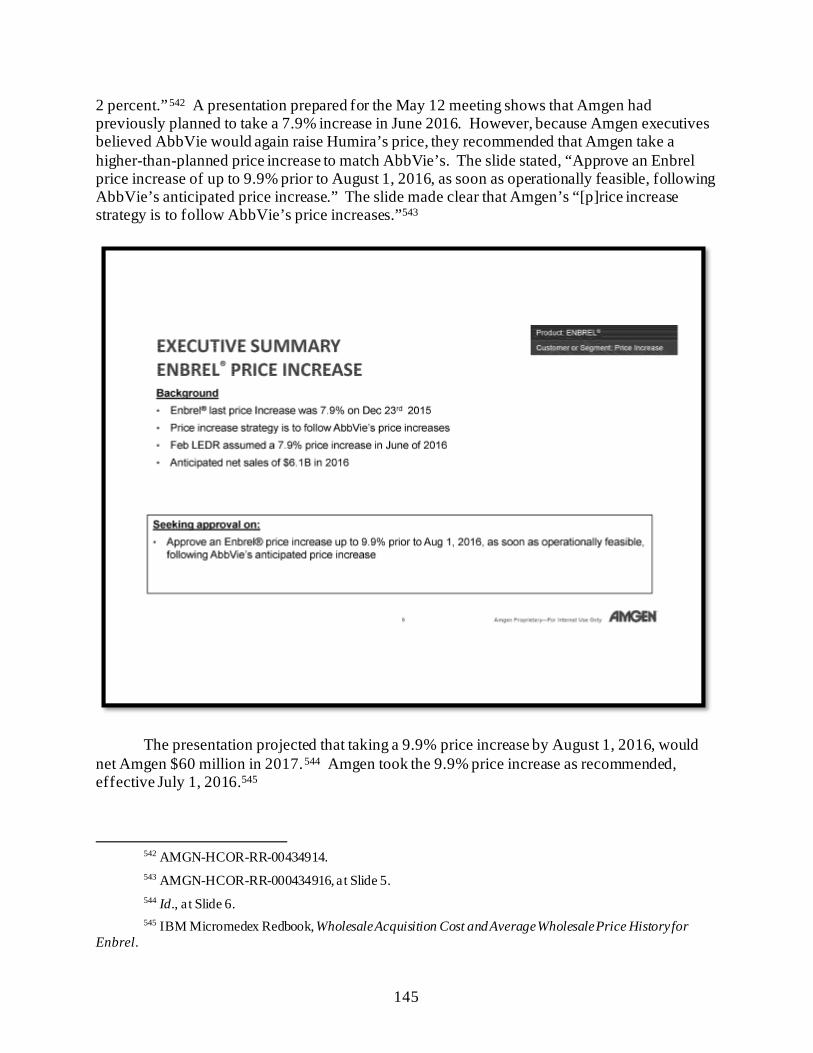
145
2 percent.”542 A presentation prepared for the May 12 meeting shows that Amgen had previously planned to take a 7.9% increase in June 2016. However, because Amgen executives believed AbbVie would again raise Humira’s price, they recommended that Amgen take a higher-than-planned price increase to match AbbVie’s. The slide stated, “Approve an Enbrel price increase of up to 9.9% prior to August 1, 2016, as soon as operationally feasible, following AbbVie’s anticipated price increase.” The slide made clear that Amgen’s “[p]rice increase strategy is to follow AbbVie’s price increases.”543
The presentation projected that taking a 9.9% price increase by August 1, 2016, would net Amgen $60 million in 2017.544 Amgen took the 9.9% price increase as recommended, effective July 1, 2016.545
542 AMGN-HCOR-RR-00434914. 543 AMGN-HCOR-RR-000434916, at Slide 5. 544 Id., a t Slide 6. 545 IBM Micromedex Redbook, Wholesale Acquisition Cost and Average Wholesale Price History for
Enbrel.
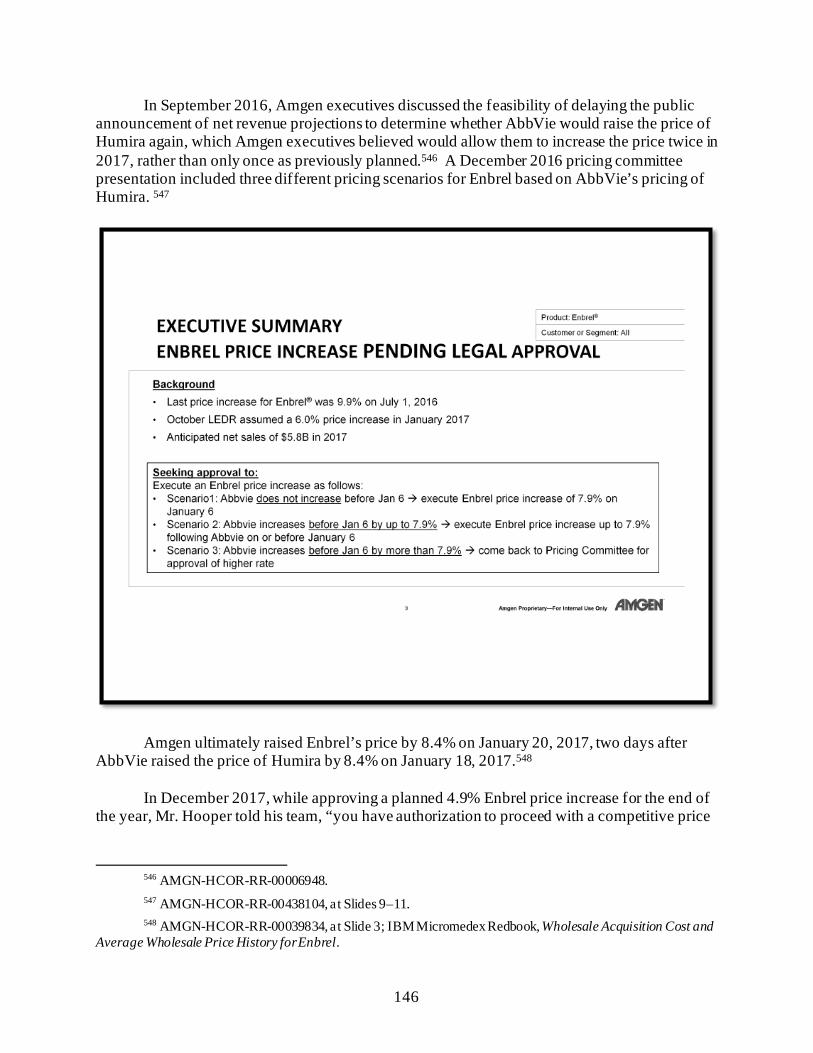
146
In September 2016, Amgen executives discussed the feasibility of delaying the public announcement of net revenue projections to determine whether AbbVie would raise the price of Humira again, which Amgen executives believed would allow them to increase the price twice in 2017, rather than only once as previously planned.546 A December 2016 pricing committee presentation included three different pricing scenarios for Enbrel based on AbbVie’s pricing of Humira. 547
Amgen ultimately raised Enbrel’s price by 8.4% on January 20, 2017, two days after AbbVie raised the price of Humira by 8.4% on January 18, 2017.548
In December 2017, while approving a planned 4.9% Enbrel price increase for the end of the year, Mr. Hooper told his team, “you have authorization to proceed with a competitive price
546 AMGN-HCOR-RR-00006948. 547 AMGN-HCOR-RR-00438104, at Slides 9–11. 548 AMGN-HCOR-RR-00039834, at Slide 3; IBM Micromedex Redbook, Wholesale Acquisition Cost and
Average Wholesale Price History for Enbrel.
147
increase for Enbrel—should Humira pull the trigger at any point.”549 The scenario that Mr. Hooper anticipated ultimately played out. Internal emails show that after learning that AbbVie planned to raise the price of Humira by 9.7% in January 2018, Amgen executed an identical 9.7% increase for Enbrel—almost double the price increase it had planned to take on December 31, 2017.550
Amgen’s internal documents indicate that it continued shadow pricing with AbbVie through 2019. A draft September 2018 strategy presentation recommended that Amgen “[r]eact competitively to AbbVie’s list price actions on Humira.”551 After AbbVie took a 6.2% price increase for Humira on January 1, 2019, Amgen took an identical price increase for Enbrel on January 17, 2019. Similarly, when AbbVie took a 7.4% price increase for Humira on January 1, 2020, Amgen took an identical price increase for Enbrel on January 17, 2020.552
AbbVie’s internal documents also show that the company viewed Amgen’s price increases as providing justification and cover for its own price increases. For example, one company executive reported to current CEO and then-Executive Vice President Richard Gonzalez that it was a “[g]reat week-end” after learning that Amgen had increased the price of Enbrel on January 20, 2012, to $25,150 annually.553 The email thread noted that earlier that month, AbbVie had increased the price of Humira to $24,913 annually.554 In July, AbbVie would top Amgen again by raising the price of Humira to $26,632. Less than three weeks later, Amgen followed suit with another price increase.555
To ensure that its price increases were in lockstep with Amgen, AbbVie circulated internal documents comparing its price increases to those of Amgen and frequently included a graph showing the price of Humira as compared to Enbrel. 556 A slide deck dated May 15, 2013, shows that on three different occasions—January 2012, July 2012, and January 2013—AbbVie and Amgen moved in lockstep to increase the price of Humira and Enbrel, respectively. The slide deck also shows that in the 12-month period preceding May 2013, Humira and Enbrel both experienced cumulative price increases of 14.3%, and in the 24-month period preceding May 2013, Humira’s price increased cumulatively by 30.6%, while Enbrel’s price increased cumulatively by 29.4%.557
549 AMGN-HCOR-RR-00029310. 550 AMGN-HCOR-RR-00030638. 551 AMGN-HCOR-RR-00041867, at Slide 4. 552 IBM Micromedex Redbook, Wholesale Acquisition Cost and Average Wholesale Price History for
Humira and Enbrel. 553 ABV-HOR-00136539. 554 Id. 555 IBM Micromedex Redbook, Wholesale Acquisition Cost and Average Wholesale Price History for
Humira and Enbrel. 556 ABV-HOR-00048274, at Slide 3. 557 ABV-HOR-00024886.
148
V. RECOMMENDATIONS The Committee recommends that Congress continue to examine anticompetitive tactics
used by the pharmaceutical industry to suppress generic or biosimilar competition and keep drug prices high and pass reforms that target these anticompetitive practices, including:
• Legislation to Prohibit Product Hopping: The Committee’s investigation
found that many drug companies engage in the anticompetitive practice of product hopping to extend their exclusivity on an expiring patent by switching patients from the old version of the drug to a new version, which keeps prescription drug costs high. Congress could consider legislation that prevents manufacturers from delaying generic competition by introducing a new version of an existing drug, such as the Affordable Prescriptions for Patients Through Promoting Competition Act, introduced by Representative David Cicilline (D-RI) and Senators Richard Blumenthal (D-CT) and Jon Cornyn (R-TX), which prohibits product hopping.
• Legislation to Prevent Pharmaceutical Manufacturers from Interfering with
Generic and Biosimilar Substitution Decisions: Congress could also consider legislation to prevent pharmaceutical manufacturers from conduct that would encourage health care providers to write “dispense as written” on a prescription, which interferes with generic and biosimilar substitution decisions.
149
Chapter 6: Patient Assistance Programs and Patient Impact
Drug companies often highlight the generosity of their patient assistance programs when responding to criticism of their pricing practices. The Committee’s investigation uncovered new evidence that companies emphasized the significant returns on investment from these programs in the form of increased sales, particularly for drugs approaching loss of exclusivity. Internal documents also show that companies view these programs as important public relations tools.
These programs often do not provide sustainable support for patients and do not address the burden that the companies’ pricing practices have placed on the nation’s health care system. The Committee obtained hundreds of pages of patient complaints describing how high drug prices have harmed them and their loved ones.
The Committee’s investigation found: • Patient Assistance Programs Provided Significant Returns on Investment
and Were Used as Public Relations Tools: Multiple companies emphasized the high rate of return of their patient assistance programs. New documents reveal that Pfizer used its copay program for the commercial market to encourage patients to stay on branded Lyrica even after the entry of generic competition, with one internal presentation noting, “Other programs aside from cost savings do not provide sufficient motivation to staying on brand.” A Teva Work Plan for 2012 to 2014 touted that Teva’s copay program for Copaxone had an average return on investment of 451%. Novartis’s internal strategy documents estimated the potential rate of return of its copay assistance program for Gleevec at $8.90 for every dollar invested. Documents from Sanofi show that when considering a price increase for Lantus, senior leaders identified the planned launch of Sanofi’s patient affordability program as a way to “help mitigate some of this negative perception” around the price increase.
• Companies Made Donations to Third-Party Foundations to Drive Sales:
Teva referred to third-party donations as an “investment” for future returns, with an expectation that the donations would drive Copaxone sales. Internal communications reveal that AbbVie made donations to third-party foundations to attract and maintain Humira patients who otherwise might not use the drug.
• Patient Assistance Programs Do Not Provide Adequate Relief for Many
Americans Struggling with High Drug Prices: Changing eligibility requirements for these programs push patients in and out of coverage. The Committee obtained hundreds of pages of patient complaints describing how high drug prices have harmed them and their loved ones.
150
I. COMPANIES LEVERAGE PATIENT ASSISTANCE PROGRAMS TO DRIVE REVENUE
Drug companies provide patient assistance in three primary ways: through copay
assistance programs for privately insured patients in the commercial market, cash donations to third-party foundations that pay out-of-pocket costs for Medicare beneficiaries and other underinsured patients, and free drug assistance programs through the companies’ own charitable foundations.558 Companies and charitable foundations may terminate or modify their patient assistance programs at any time, including decisions on eligibility criteria and level of assistance.
Copay cards or coupons reduce the amount that patients pay out of pocket through their insurance plans each month. The federal Anti-Kickback Statute prohibits pharmaceutical manufacturers from subsidizing the copay and other cost-sharing obligations incurred by Medicare Part D patients.559 Manufacturers are permitted to make donations to “independent, bona fide charitable assistance programs” when appropriate safeguards exist.560 According to the Office of Inspector General (OIG) of the Department of Health and Human Services (HHS), “the independent charity PAP [patient assistance program] must not function as a conduit for payments by the pharmaceutical manufacturer to patients and must not impermissibly influence beneficiaries’ drug choices.”561
Yet documents reviewed by the Committee reveal that drug companies view donations to third-party foundations as an “investment” for future returns, with the expectation that such donations would drive their drugs’ sales. As drugs neared the end of their exclusivity periods, several companies combined patient assistance programs with other loss-of-exclusivity strategies, such as dispense-as-written campaigns, to limit competition.562
558 See Congressional Research Service, Prescription Drug Discount Coupons and Patient Assistance
Programs (PAPs) (June 15, 2017) (R44264) (online at https://crsreports.congress.gov/product/pdf/R/R44264/5). 559 See 42 U.S.C. § 1320a-7b(b); Office of Inspector General, Department of Health and Human Services,
Special Advisory Bulletin: Patient Assistance Programs for Medicare Part D Enrollees, 70 Fed. Reg. 70623 (Nov. 22, 2005) (online at www.govinfo.gov/content/pkg/FR-2005-11-22/pdf/05-23038.pdf); Office of Inspector General, Department of Health and Human Services, Supplemental Special Advisory Bulletin: Independent Charity Patient Assistance Programs, 79 Fed. Reg. 31120 (May 30, 2014) (online at https://oig.hhs.gov/fraud/docs/alertsandbulletins/2014/independent-charity-bulletin.pdf).
560 Office of Inspector General, Department of Health and Human Services, Special Advisory Bulletin on Patient Assistance Programs for Medicare Part D Enrollees, 70 Fed. Reg. 70623 (Nov. 22, 2005) (online at www.govinfo.gov/content/pkg/FR-2005-11-22/pdf/05-23038.pdf).
561 Id. 562 See Chapter 5 for further analysis of dispense-as-written campaigns and other anticompetitive strategies.
Studies have shown that a majority of coupons are for brand-name medications for which lower-cost therapeutic alternatives are available, which has implications for patients and the health care system. See, e.g., Joseph S. Ross and Aaron S. Kesselheim, Prescription-Drug Coupons—No Such Thing as a Free Lunch, New England Journal of Medicine (Sept. 2013) (online at www3.med.unipmn.it/papers/2013/NEJM/2013-09-26_nejm/nejmp1301993.pdf).
151
Non-public data obtained by the Committee reveals that the costs of these programs for drugs in the Committee’s investigation were a small fraction of revenues brought in by those drugs.563 For example:
• Pfizer’s reported expenditures on patient assistance programs from 2015 to 2017 accounted for less than one-tenth of 1% of Pfizer’s reported Lyrica U.S. net revenue from the same period.564
• Mallinckrodt, which has priced Acthar at approximately $123,000 per year, has
touted the generosity of its patient assistance programs.565 Data obtained by the Committee reveals that the total cost of its programs was equivalent to approximately 2.5% of Mallinckrodt’s $5 billion in Acthar net revenues from the same period.566
• According to data provided by Celgene, the cost of its commercial copay program
for its cancer drug Revlimid was equivalent to approximately 0.16% of its net U.S. revenue for Revlimid from 2011 to 2018.567
563 These companies’ charitable contributions are tax deductible, meaning the actual cost of these donations
is even less. See Congressional Research Service, Prescription Drug Discount Coupons and Patient Assistance Programs (PAPs) (June 15, 2017) (R44264) (online at https://crsreports.congress.gov/product/pdf/R/R44264/5).
564 Letter from King & Spalding, on behalf of Pfizer Inc., to Chairwoman Carolyn B. Maloney, House Committee on Oversight and Reform, at Page 3 (July 31, 2020); SRR_PFIZHCOR_00026814. From 2015 to 2017, Pfizer reported a total of $5.43 million in patient assistance program expenditures related to Lyrica, excluding Lyrica product donation. Pfizer noted that due to a change in vendors mid-2018, the company incurred additional costs in 2018 related to utilizing two vendors and accompanying transition costs. Pfizer earned $9.26 billion in U.S. revenue during that three-year period.
565 IBM Micromedex Redbook, Wholesale Acquisition Cost and Average Wholesale Price History for Gleevec; Food and Drug Administration, Gleevec Label (online at www.accessdata.fda.gov/drugsatfda_docs/label/2016/021588s047lbl.pdf). A 400 mg tablet of Gleevec is priced at $337.41. Letter from Hogan Lovells, on behalf of Mallinckrodt Pharmaceuticals, to Chairman Elijah E. Cummings, House Committee on Oversight and Reform (Mar. 29, 2019).
566 Letter from Hogan Lovells, on behalf of Mallinckrodt Pharmaceuticals, to Chairman Elijah E. Cummings, House Committee on Oversight and Reform (Mar. 29, 2019). Approximately $109 million was donated to independent 501(c)(3) patient assistance organizations. Letter from Hogan Lovells, on behalf of Mallinckrodt Pharmaceuticals, to Chairwoman Carolyn B. Maloney, House Committee on Oversight and Reform (Sept. 11, 2020).
567 Letter from Covington & Burling LLP, on behalf of Celgene Corporation, to Chairman Elijah E. Cummings, House Committee on Oversight and Reform (Feb. 4, 2019); Letter from Covington & Burling LLP, on behalf of Celgene Corporation, to Chairman Elijah E. Cummings, House Committee on Oversight and Reform (May 24, 2019).
152
Sanofi—Lantus
Sanofi maintains a number of patient assistance programs.568 Internal documents show that Sanofi viewed these programs as tools for “image improvement” and to offset negative public perception of its price increases.
In April 2018, Sanofi launched the Insulins VALyou Savings Program for patients paying
full retail price for insulin medications, including uninsured patients and commercially insured patients with high deductibles that have not been reached.569 Under this program, patients would be able to access Sanofi insulins at a discount of approximately 60% below the list price.570 Two months before the program launched, in a February 2018 email exchange, Sanofi senior leaders explained the company’s rationale:
Why are we proposing “negative GTN [gross-to-net]” program? We plan to have a strong marketing push behind this initiative to have a positive impact on Sanofi insulins image as a company that truly cares about patient affordability. Long term effect of the image improvement is not accounted for in the calculations.571
Although Sanofi expected the discount program to reduce net sales for Lantus, the email
exchange noted that the impact on net sales revenue may not be significant because of an expected increase in sales volume: “In reality, we should see some improvement in adherence with decrease in OOP [out-of-pocket costs]. This increase in adherence will help to offset negative GTN impact further.”572 The slide deck attached to this email exchange noted that the new program would lead to a threefold increase of Lantus utilization by the current patient base.573
Two months later, in April 2018, Sanofi directors recommended accelerating a planned 5.3% price increase for Lantus and Toujeo, moving it from July 1, 2018, to April 15, 2018, for an incremental increase of between $10 million and $15 million in net sales.574 Among the factors impacting the decision to accelerate the increase was the contemporaneous launch of Sanofi’s
568 Letter from Arnold & Porter, on behalf of Sanofi, to the House Committee on Oversight and Reform, at
Page 3 (Mar. 4, 2019) (the company reported that, with the copay program, patients with commercial insurance pay “as little as $0 co-pay and may receive savings of up to $600 per package of the medication, for a maximum of three packages per prescription” and that the company provided 58,210 patients with free Lantus in 2017 and 52,844 patients with free product in 2018).
569 Sanofi, Press Release: New Sanofi Insulin Savings Program Aims to Lower Out-of-Pocket Costs for People Living with Diabetes (Apr. 5, 2018) (online at www.news.sanofi.us/2018-04-05-New-Sanofi-insulin-savings-program-aims-to-lower-out-of-pocket-costs-for-people-living-with-diabetes); see also, Letter from Arnold & Porter, on behalf of Sanofi, to the House Committee on Oversight and Reform, at Page 3 (Mar. 4, 2019).
570 Letter from Arnold & Porter, on behalf of Sanofi, to the House Committee on Oversight and Reform, at Page 3 (Mar. 4, 2019).
571 SANOFI_COR_00067805, at Page 2 (bold in original). 572 Id., a t Pages 1–2. 573 SANOFI_COR_00067807, at Slide 9. 574 SANOFI_COR_00059472, at Page 2.
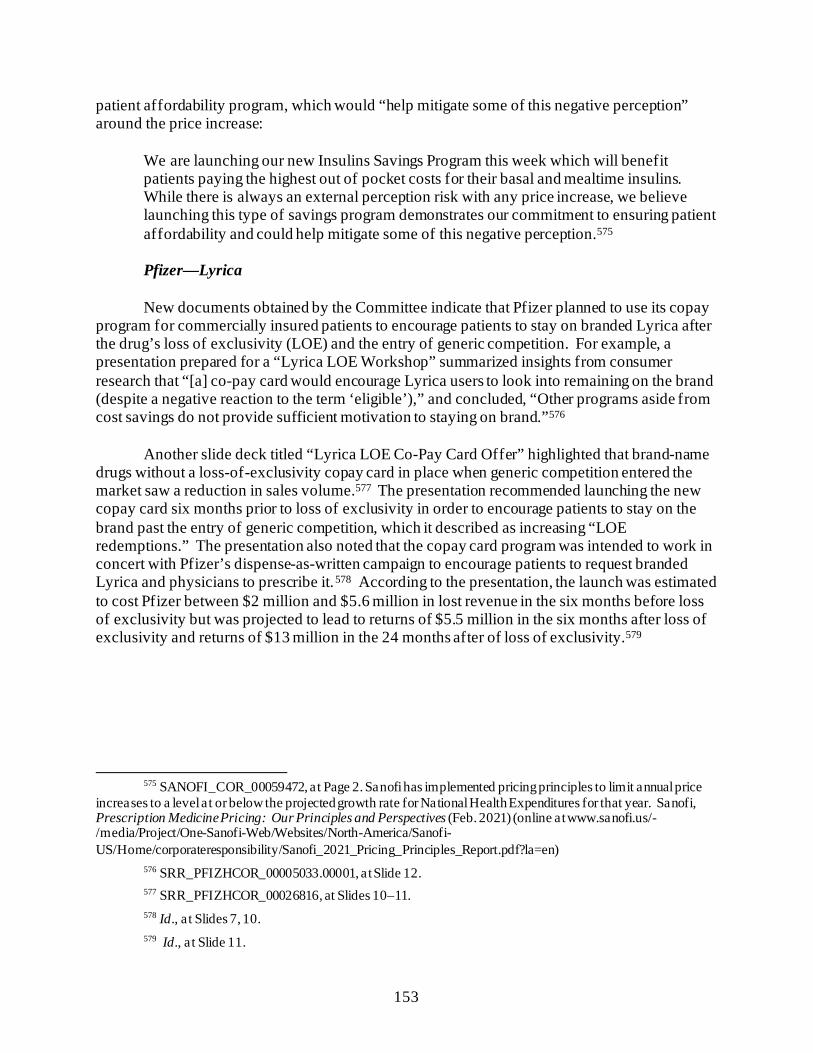
153
patient affordability program, which would “help mitigate some of this negative perception” around the price increase:
We are launching our new Insulins Savings Program this week which will benefit patients paying the highest out of pocket costs for their basal and mealtime insulins. While there is always an external perception risk with any price increase, we believe launching this type of savings program demonstrates our commitment to ensuring patient affordability and could help mitigate some of this negative perception.575
Pfizer—Lyrica
New documents obtained by the Committee indicate that Pfizer planned to use its copay
program for commercially insured patients to encourage patients to stay on branded Lyrica after the drug’s loss of exclusivity (LOE) and the entry of generic competition. For example, a presentation prepared for a “Lyrica LOE Workshop” summarized insights from consumer research that “[a] co-pay card would encourage Lyrica users to look into remaining on the brand (despite a negative reaction to the term ‘eligible’),” and concluded, “Other programs aside from cost savings do not provide sufficient motivation to staying on brand.”576
Another slide deck titled “Lyrica LOE Co-Pay Card Offer” highlighted that brand-name drugs without a loss-of-exclusivity copay card in place when generic competition entered the market saw a reduction in sales volume.577 The presentation recommended launching the new copay card six months prior to loss of exclusivity in order to encourage patients to stay on the brand past the entry of generic competition, which it described as increasing “LOE redemptions.” The presentation also noted that the copay card program was intended to work in concert with Pfizer’s dispense-as-written campaign to encourage patients to request branded Lyrica and physicians to prescribe it.578 According to the presentation, the launch was estimated to cost Pfizer between $2 million and $5.6 million in lost revenue in the six months before loss of exclusivity but was projected to lead to returns of $5.5 million in the six months after loss of exclusivity and returns of $13 million in the 24 months after of loss of exclusivity.579
575 SANOFI_COR_00059472, at Page 2. Sanofi has implemented pricing principles to limit annual price
increases to a level at or below the projected growth rate for National Health Expenditures for that year. Sanofi, Prescription Medicine Pricing: Our Principles and Perspectives (Feb. 2021) (online at www.sanofi.us/-/media/Project/One-Sanofi-Web/Websites/North-America/Sanofi-US/Home/corporateresponsibility/Sanofi_2021_Pricing_Principles_Report.pdf?la=en)
576 SRR_PFIZHCOR_00005033.00001, at Slide 12. 577 SRR_PFIZHCOR_00026816, at Slides 10–11. 578 Id., a t Slides 7, 10. 579 Id., a t Slide 11.
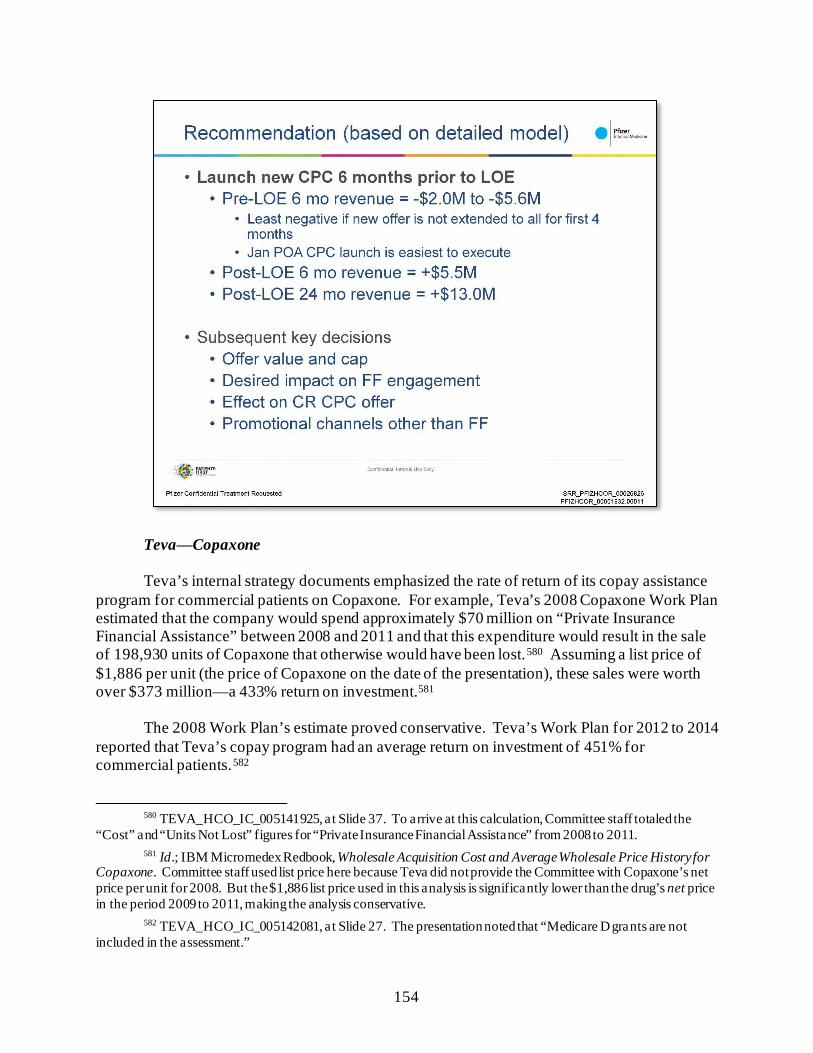
154
Teva—Copaxone
Teva’s internal strategy documents emphasized the rate of return of its copay assistance program for commercial patients on Copaxone. For example, Teva’s 2008 Copaxone Work Plan estimated that the company would spend approximately $70 million on “Private Insurance Financial Assistance” between 2008 and 2011 and that this expenditure would result in the sale of 198,930 units of Copaxone that otherwise would have been lost.580 Assuming a list price of $1,886 per unit (the price of Copaxone on the date of the presentation), these sales were worth over $373 million—a 433% return on investment.581
The 2008 Work Plan’s estimate proved conservative. Teva’s Work Plan for 2012 to 2014 reported that Teva’s copay program had an average return on investment of 451% for commercial patients.582
580 TEVA_HCO_IC_005141925, at Slide 37. To arrive at this calculation, Committee staff totaled the
“Cost” and “Units Not Lost” figures for “Private Insurance Financial Assistance” from 2008 to 2011. 581 Id.; IBM Micromedex Redbook, Wholesale Acquisition Cost and Average Wholesale Price History for
Copaxone. Committee staff used list price here because Teva did not provide the Committee with Copaxone’s net price per unit for 2008. But the $1,886 list price used in this analysis is significantly lower than the drug’s net price in the period 2009 to 2011, making the analysis conservative.
582 TEVA_HCO_IC_005142081, at Slide 27. The presentation noted that “Medicare D grants are not included in the assessment.”
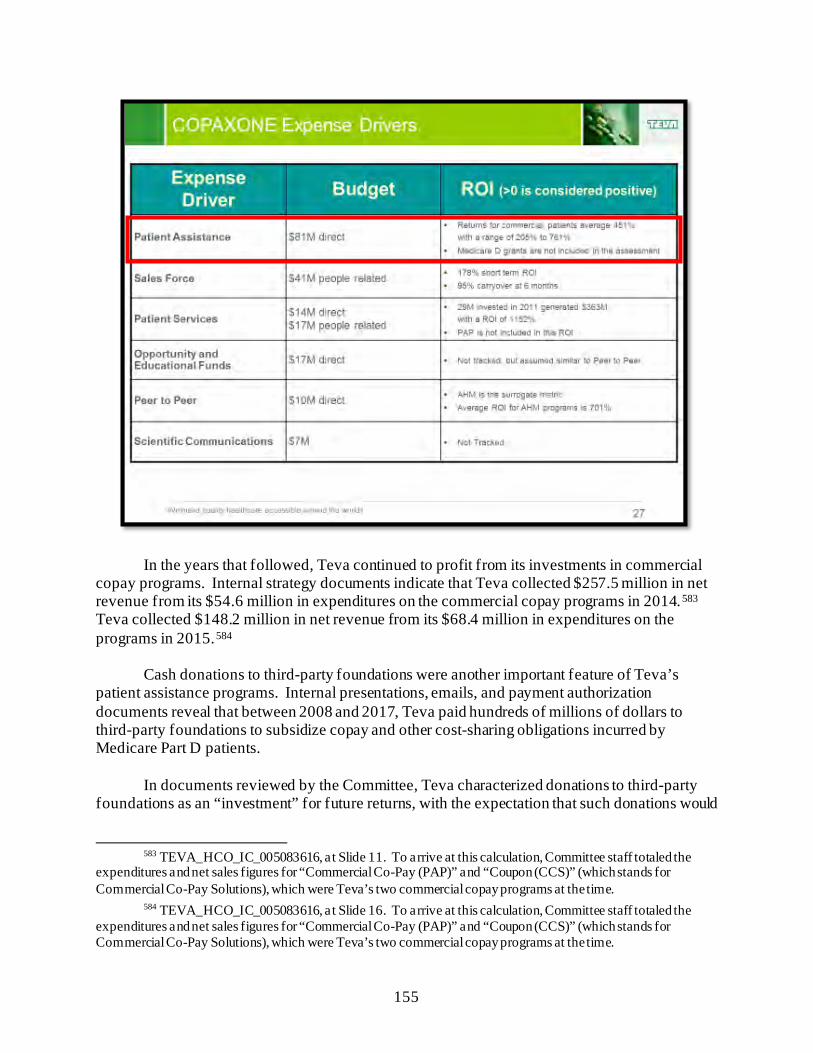
155
In the years that followed, Teva continued to profit from its investments in commercial copay programs. Internal strategy documents indicate that Teva collected $257.5 million in net revenue from its $54.6 million in expenditures on the commercial copay programs in 2014.583 Teva collected $148.2 million in net revenue from its $68.4 million in expenditures on the programs in 2015.584
Cash donations to third-party foundations were another important feature of Teva’s patient assistance programs. Internal presentations, emails, and payment authorization documents reveal that between 2008 and 2017, Teva paid hundreds of millions of dollars to third-party foundations to subsidize copay and other cost-sharing obligations incurred by Medicare Part D patients.
In documents reviewed by the Committee, Teva characterized donations to third-party foundations as an “investment” for future returns, with the expectation that such donations would
583 TEVA_HCO_IC_005083616, at Slide 11. To arrive at this calculation, Committee staff totaled the
expenditures and net sales figures for “Commercial Co-Pay (PAP)” and “Coupon (CCS)” (which stands for Commercial Co-Pay Solutions), which were Teva’s two commercial copay programs at the time.
584 TEVA_HCO_IC_005083616, at Slide 16. To arrive at this calculation, Committee staff totaled the expenditures and net sales figures for “Commercial Co-Pay (PAP)” and “Coupon (CCS)” (which stands for Commercial Co-Pay Solutions), which were Teva’s two commercial copay programs at the time.
156
drive Copaxone sales.585 For example, Teva’s 2008 Copaxone Work Plan estimated that the company would spend approximately $97 million on “Medicare Financial Assistance” between 2008 and 2011 and that this expenditure would result in the sale of an additional 155,113 units of Copaxone that were “incremental” or “not lost.”586 Assuming a list price of $1,886 per unit (the price of Copaxone on the date of the presentation), these Part D sales were worth $292.5 million—a 200% return on investment.587
In August 2020, the Department of Justice (DOJ) filed a civil lawsuit against Teva regarding its payments to third-party foundations, alleging that Teva violated the anti-kickback statute from late 2006 through at least 2015 by paying over $300 million to two third-party foundations to cover the Medicare copays of Copaxone patients.588 DOJ’s complaint alleged:
Teva paid CDF [Chronic Disease Fund] and TAF [The Assistance Fund] tens of millions of dollars each year because it knew that the foundations would use Teva’s money to cover Copaxone co-pays, thus increasing Copaxone sales and enriching Teva in amounts that far exceeded its payments to the foundations.589 Documents obtained by the Committee indicate that Teva continued its payments to TAF
and other third-party foundations through at least 2018—three years beyond the scope of DOJ’s complaint.590 These documents suggest that Teva’s donations continued to be based on the expectation that the funds ultimately would be provided to Copaxone patients.591
585 TEVA_HCO_IC_005141925, at Slide 50. 586 TEVA_HCO_IC_005141925, at Slide 37. To arrive at this calculation, Committee staff totaled the
“Incremental Units,” “Units Not Lost,” and “Cost” figures for “Medicare Financial Assistance” from 2008 to 2011. 587 Id.; IBM Micromedex Redbook, Wholesale Acquisition Cost and Average Wholesale Price History for
Copaxone. Committee staff used list price here because Teva did not provide the Committee with Copaxone’s net price per unit for 2008. But the $1,886 list price used in this analysis is significantly lower than the drug’s net price in the period 2009 to 2011, making the analysis conservative.
588 Complaint, U.S. v. Teva Pharmaceuticals USA, Inc., No. 1:20-cv-11548 (D. Mass.) (Aug. 18, 2020) (www.justice.gov/usao-ma/press-release/file/1395516/download). In September 2021, the U.S. District Court for the District of Massachusetts denied the motion by Teva Pharmaceuticals USA, Inc., to dismiss the case brought by the Department of Justice. Memorandum and Order, U.S. v. Teva Pharmaceuticals USA, Inc., No. 1:20-cv-11548 (D. Mass.) (Sep. 9, 2020).
589 Id. 590 See, e.g., TEVA_HCO_IC_05293411 (January 2016 email between executives seeking approval for a
$10 million “Copaxone Donation wire transfer” to a foundation, in which it is noted that “this is a common payment we make each year”); TEVA_HCO_IC_005036573, at Slide 28 (October 2016 business plan that included a $40 million “Medicare donation” as part of its Copaxone “marketing” strategy); TEVA_HCO_IC_005095143 (in a January 2017 email, an executive sought approval for “3 payments totaling $38M related to planned 2017 Copaxone donations,” with three attached spreadsheets detailing payment request forms for various patient assistance program foundations). Teva reported to the Committee that it provided $23,286,429 in “charitable cash contributions in connection with Copaxone” in 2018. Letter from Kirkland and Ellis LLP, on behalf of Teva Pharmaceutical Industries, Ltd., to Chairman Elijah E. Cummings, House Committee on Oversight and Reform (May 24, 2019).
591 See, e.g., TEVA_HCO_IC_005001347, at Slide 1 (as Teva began planning for 2018, early drafts of one of its strategic documents noted that eliminating its “Medicare Donation” to third-party foundations would cost Teva up to $261 million in Copaxone sales).
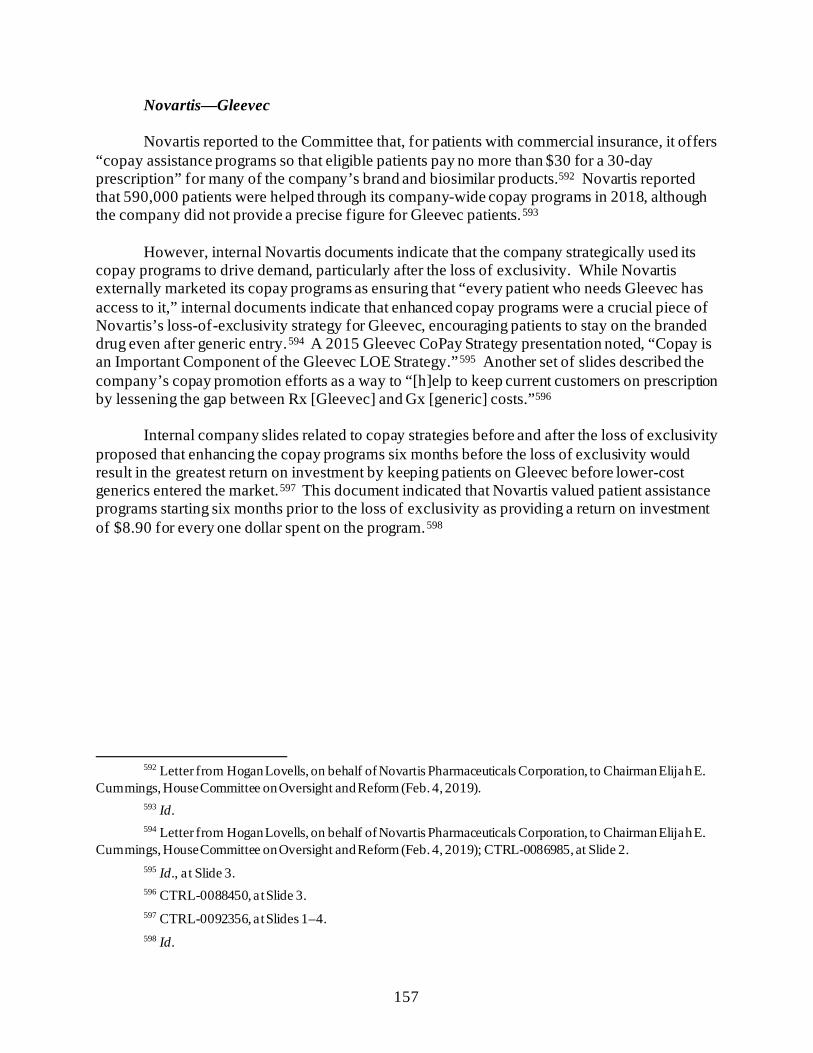
157
Novartis—Gleevec
Novartis reported to the Committee that, for patients with commercial insurance, it offers “copay assistance programs so that eligible patients pay no more than $30 for a 30-day prescription” for many of the company’s brand and biosimilar products.592 Novartis reported that 590,000 patients were helped through its company-wide copay programs in 2018, although the company did not provide a precise figure for Gleevec patients.593
However, internal Novartis documents indicate that the company strategically used its copay programs to drive demand, particularly after the loss of exclusivity. While Novartis externally marketed its copay programs as ensuring that “every patient who needs Gleevec has access to it,” internal documents indicate that enhanced copay programs were a crucial piece of Novartis’s loss-of-exclusivity strategy for Gleevec, encouraging patients to stay on the branded drug even after generic entry.594 A 2015 Gleevec CoPay Strategy presentation noted, “Copay is an Important Component of the Gleevec LOE Strategy.”595 Another set of slides described the company’s copay promotion efforts as a way to “[h]elp to keep current customers on prescription by lessening the gap between Rx [Gleevec] and Gx [generic] costs.”596
Internal company slides related to copay strategies before and after the loss of exclusivity proposed that enhancing the copay programs six months before the loss of exclusivity would result in the greatest return on investment by keeping patients on Gleevec before lower-cost generics entered the market.597 This document indicated that Novartis valued patient assistance programs starting six months prior to the loss of exclusivity as providing a return on investment of $8.90 for every one dollar spent on the program.598
592 Letter from Hogan Lovells, on behalf of Novartis Pharmaceuticals Corporation, to Chairman Elijah E.
Cummings, House Committee on Oversight and Reform (Feb. 4, 2019). 593 Id. 594 Letter from Hogan Lovells, on behalf of Novartis Pharmaceuticals Corporation, to Chairman Elijah E.
Cummings, House Committee on Oversight and Reform (Feb. 4, 2019); CTRL-0086985, at Slide 2. 595 Id., at Slide 3. 596 CTRL-0088450, at Slide 3. 597 CTRL-0092356, at Slides 1–4. 598 Id.
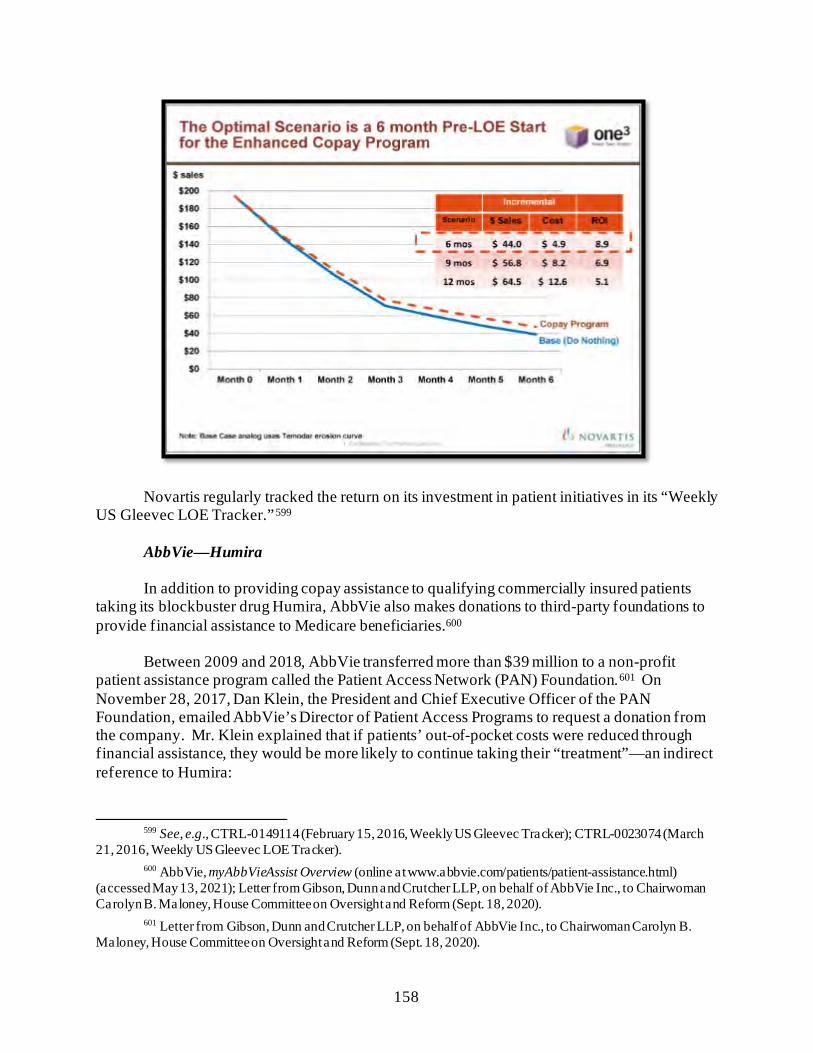
158
Novartis regularly tracked the return on its investment in patient initiatives in its “Weekly US Gleevec LOE Tracker.”599
AbbVie—Humira
In addition to providing copay assistance to qualifying commercially insured patients taking its blockbuster drug Humira, AbbVie also makes donations to third-party foundations to provide financial assistance to Medicare beneficiaries.600
Between 2009 and 2018, AbbVie transferred more than $39 million to a non-profit patient assistance program called the Patient Access Network (PAN) Foundation.601 On November 28, 2017, Dan Klein, the President and Chief Executive Officer of the PAN Foundation, emailed AbbVie’s Director of Patient Access Programs to request a donation from the company. Mr. Klein explained that if patients’ out-of-pocket costs were reduced through financial assistance, they would be more likely to continue taking their “treatment”—an indirect reference to Humira:
599 See, e.g., CTRL-0149114 (February 15, 2016, Weekly US Gleevec Tracker); CTRL-0023074 (March
21, 2016, Weekly US Gleevec LOE Tracker). 600 AbbVie, myAbbVieAssist Overview (online at www.abbvie.com/patients/patient-assistance.html)
(accessed May 13, 2021); Letter from Gibson, Dunn and Crutcher LLP, on behalf of AbbVie Inc., to Chairwoman Carolyn B. Maloney, House Committee on Oversight and Reform (Sept. 18, 2020).
601 Letter from Gibson, Dunn and Crutcher LLP, on behalf of AbbVie Inc., to Chairwoman Carolyn B. Maloney, House Committee on Oversight and Reform (Sept. 18, 2020).
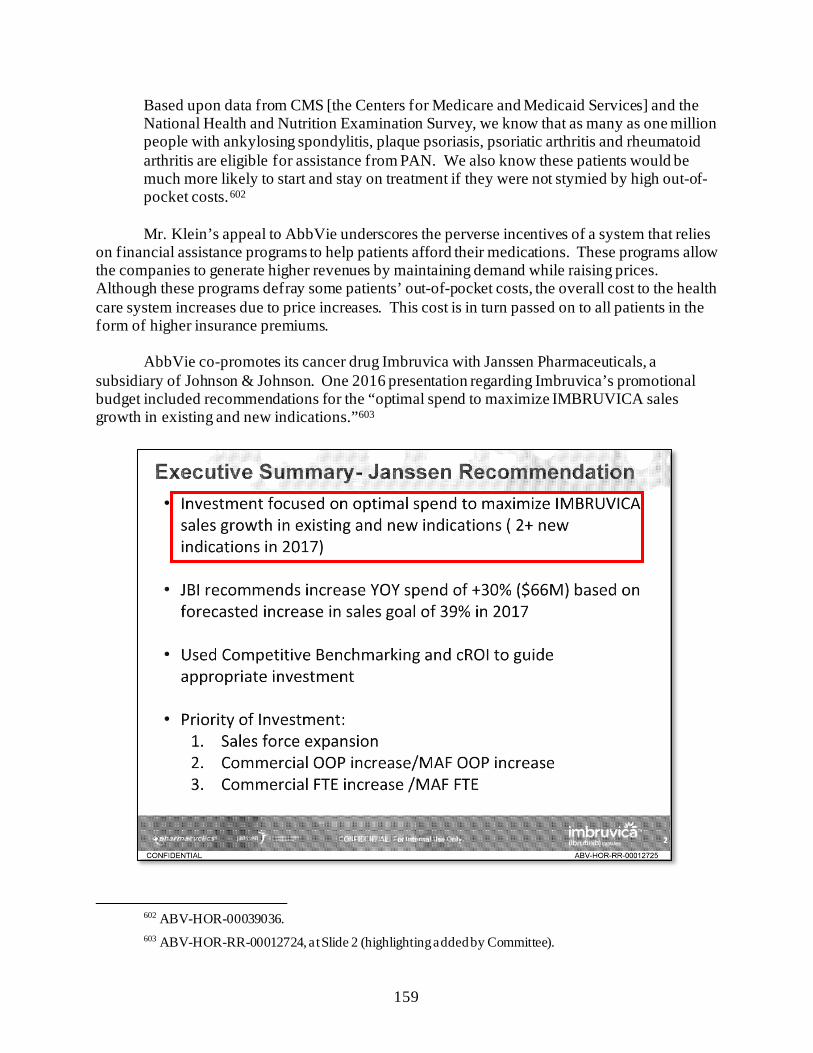
159
Based upon data from CMS [the Centers for Medicare and Medicaid Services] and the National Health and Nutrition Examination Survey, we know that as many as one million people with ankylosing spondylitis, plaque psoriasis, psoriatic arthritis and rheumatoid arthritis are eligible for assistance from PAN. We also know these patients would be much more likely to start and stay on treatment if they were not stymied by high out-of-pocket costs.602 Mr. Klein’s appeal to AbbVie underscores the perverse incentives of a system that relies
on financial assistance programs to help patients afford their medications. These programs allow the companies to generate higher revenues by maintaining demand while raising prices. Although these programs defray some patients’ out-of-pocket costs, the overall cost to the health care system increases due to price increases. This cost is in turn passed on to all patients in the form of higher insurance premiums.
AbbVie co-promotes its cancer drug Imbruvica with Janssen Pharmaceuticals, a subsidiary of Johnson & Johnson. One 2016 presentation regarding Imbruvica’s promotional budget included recommendations for the “optimal spend to maximize IMBRUVICA sales growth in existing and new indications.”603
602 ABV-HOR-00039036. 603 ABV-HOR-RR-00012724, at Slide 2 (highlighting added by Committee).
160
In order to reach that goal, the presentation proposed increasing payments to foundations from $47 million to $55 million in 2017—the single largest individual expenditure in the companies’ Imbruvica promotional budget.604
II. PATIENT IMPACT
Although patient assistance programs are an important lifeline for some patients, they are not a comprehensive solution for addressing rising drug prices. Patients can fall in and out of eligibility for these programs, and programs can be cancelled. Driving increased demand through patient assistance programs also increases other costs in the health care system.605
Documents obtained by the Committee show that drug companies are routinely contacted by patients who cannot afford their medications. The Committee’s investigation revealed that drug manufacturers were aware of the impact their price increases were having on patients. Each of the drug companies produced to the Committee hundreds of pages of patient complaints describing how the high price of their prescription medication impacted their lives and their loved ones.
604 Id., at Slide 22 (highlighting added by Committee). 605 S. Yousef Zafar and Jeffrey M. Peppercorn, Patient Financial Assistance Programs: A Path to
Affordability or a Barrier to Accessible Cancer Care?, Journal of Clinical Oncology (July 2017) (online at www.ncbi.nlm.nih.gov/pmc/articles/PMC6553813/#b13); Peter A. Ubel and Peter B. Back, Copay Assistance for Expensive Drugs: A Helping Hand That Raises Costs, Annals of Internal Medicine (Oct. 2016) (online at www.acpjournals.org/doi/10.7326/M16-1334?url_ver=Z39.88-2003&rfr_id=ori:rid:crossref.org&rfr_dat=cr_pub%20%200pubmed).
161
For example:606
• One father contacted Mallinckrodt’s medical information line to ask for help with the cost of his son’s treatment for infantile spasms. The father reported that his son’s doctor ordered a six-week treatment of Acthar requiring six vials of the drug, but his insurance plan only covered four vials. The father wrote, “We are in a serious bind here. Your medication is extremely expensive and we are unable to afford the 80,000 dollars needed for the remaining 2 vials.”607
• Mallinckrodt also received complaints from patients who relied on Acthar to
manage their conditions and had once received patient assistance but were then told that the funds were no longer available for their disease or that there was no more assistance available to them.608 For example, the adult child of a 90-year-old patient contacted Mallinckrodt’s medical information line to complain that, after two years of receiving assistance, the patient was no longer eligible. The complaint stated that “the medicine is priced way above her means of being able to pay—or anyone else for that matter” and that “she is unable to afford the astronomical copay required.”609 In other cases, patients reported being out of medicine and behind on treatment because they were waiting for copay assistance to come through.610
• One patient told the Amgen call center representative, “My insurance has changed
to Medicare ... [T]he bottom line is I can no longer take Enbrel. I have severe RA [rheumatoid arthritis]. On Medicare the cost is a third of my income. Since I turned 65 in September, I just can’t afford it. I’ve been on Enbrel for 13 years. Enbrel has saved my life. ... How horrible it is to become a senior citizen, have RA, and not be able to afford the drug that gives a quality of life.”611
• The husband of one patient pleaded with Novartis, stating, “My wife has been
using Gleevec for thirteen years, she has GIST. ... Now our medical coverage is stating that we must now pay the $4,200/mnth and it is does [sic] not contribute to our deductible. If we are forced to pay the $4,200/mth [sic] we will have to sell our home because we will not be able to pay the mortgage and the cost of the
606 It is not clear from the documents whether patients who made these complaints were provided assistance
or otherwise obtained the requested relief. 607 MNK-COR-00001949, at Page 7. 608 See, e.g., MNK-COR-00001949, at Pages 5 and 8. 609 MNK-COR-00001949, at Page 6. 610 MNK-COR-00001949, at Page 13. In another example, a patient complained about trying to get patient
assistance but needed two more denials from insurance before eligibility for the program. MNK-COR-00001949, at Page 11.
611 AMGN-HCOR-00000017 to AMGN-HCOR-00000030 (ellipses added by Committee).
162
medication. My wife is precious to me and our three beautiful daughters. Please help.”612
• One Medicare Part D patient reported facing a $5,000 copay due to the high price
of Revlimid. The patient told Celgene’s patient support specialist that the company should be “ashamed” of its prices and that she had attempted to join a research study to gain access to her medication. When Celgene’s patient support specialist asked what the patient would do if she could not afford her medication, the patient said she would likely discontinue the medication.613
Throughout its investigation, the Committee received other firsthand accounts from
patients and families about the impact of high drug prices on their lives. During the Committee’s first hearing of the 116th Congress in January 2019, the Committee heard from Antroinette Worsham, the mother of two insulin-dependent daughters. Her oldest daughter Antavia was diagnosed at the age of 16 with diabetes. She passed away six years later after being forced to ration her insulin because of the high cost.614
The Committee also heard from impacted patients during three hearings with drug company executives on September 30, 2020; October 1, 2020; and May 18, 2021. Ramae Hamrin, a single mother of two from Minnesota, takes Revlimid to treat multiple myeloma. She told the Committee:
I rely on a drug called Revlimid to keep me alive. My out-of-pocket costs are around $15,000 a year, which is impossible for me to cover on my fixed income. In order to keep taking this drug, I will have to deplete my life savings, cash out my 401K, and sell my house. When those funds run out, I am not sure what I will do.615
Therese Humphrey Ball, a nurse from Indiana, took Copaxone for her multiple sclerosis
until the cost became too much. She wiped out her savings and relied on grants to cover the cost. Once she lost those, the price of Copaxone was $6,000 and she had to discontinue use of the drug. Ms. Humphrey Ball told the Committee, “When I was not on the drug, I lost short-term memory and experienced other declines in my cognitive functions. This makes it difficult for me to enjoy the things that I love like spending time with my grandchildren.”616
612 NOVARTIS.HCOR20190114.00001059. 613 CELG_HCOR_000006166. 614 House Committee on Oversight and Reform, Testimony of Antroinette Worsham, Hearing on
Examining the Actions of Drug Companies in Raising Prescription Drug Prices, 116th Cong. (Jan. 29, 2019) (online at https://docs.house.gov/meetings/GO/GO00/20190129/108817/HHRG-116-GO00-Wstate-WorshamA-20190129.pdf).
615 House Committee on Oversight and Reform, Hearing on Unsustainable Drug Prices: Testimony from the CEOs (Part I), 116th Cong. (Sept. 30, 2020) (online at https://docs.house.gov/meetings/GO/GO00/20200930/111055/HHRG-116-GO00-Transcript-20200930.pdf).
616 Id.
163
Lynn Scarfuto, a retired nurse from New York, takes Imbruvica to treat her leukemia. Although she is a Medicare patient, the monthly cost for the drug is over $13,000. While she has been able to secure short-term assistance to cover the cost, this expires at the end of 2021. Ms. Scarfuto told the Committee, “My inability to afford Imbruvica’s astronomical price once my assistance runs out would certainly expedite my death.”617 III. RECOMMENDATIONS
• Support Structural Reforms to Lower Drug Prices: The Committee’s investigation shows that the pharmaceutical industry has used patient assistance programs to distract from price increases, even when company representatives privately acknowledged that lowering prices would be more helpful to patients. Congress should consider structural reforms, like Medicare price negotiation, to ensure that the pharmaceutical industry does not continue to raise prices at will on critical and life-saving medicines.
• Enhance Transparency of Patient Assistance Programs: The Committee’s
investigation demonstrates the need for more transparency into copay programs, including their eligibility criteria and the length of their availability relative to the length of the relevant drug regimens. This would enable policymakers to further assess these programs, including whether they are used to initiate adherence to a brand-name medicine but not last for the entire regimen, leaving consumers responsible for higher costs.
617 House Committee on Oversight and Reform, Hearing on Unsustainable Drug Prices (Part III):
Testimony from AbbVie CEO Richard Gonzalez (May 18, 2021) (online at https://oversight.house.gov/legislation/hearings/on-unsustainable-drug-prices-part-iii-testimony-from-abbvie-ceo-richard).
164
Chapter 7: Research and Manufacturing Costs Do Not Justify Price Increases
When facing criticism over its pricing practices, the pharmaceutical industry claims that
high drug prices are necessary to fund innovative research and development (R&D) for new therapies and to recoup other supply chain costs. The Committee’s investigation found that these justifications for high prices are unsupported and that drug companies spend more on stock buybacks and dividends to reward shareholders than on R&D. Internal data obtained by the Committee reveals that R&D spending was dwarfed by revenues year after year.
The Committee’s investigation found that when drug companies did invest in R&D, those
expenditures often went to research designed to protect existing market monopolies. The Committee’s investigation also found that drug companies often invested in development only after other research—much of it federally funded—demonstrated a high likelihood of financial success.
Finally, although pharmaceutical companies frequently cite rising costs of manufacturing
or other commercial expenses to justify their pricing practices, internal data obtained by the Committee reveals that manufacturing costs for many drugs were stable or even declined over time, as revenue increased.
The Committee’s investigation found: • Shareholder Payouts Outpaced R&D Expenditures: From 2016 to 2020, the
14 leading drug companies in the world spent $577 billion on stock buybacks and dividends—$56 billion more than they spent on R&D over the same period. The Committee’s analysis indicates that even if the pharmaceutical industry collected less revenue due to federal drug pricing reforms, drug companies could maintain or even exceed their current R&D expenditures if they reduced spending on buybacks and dividends.
• R&D Expenditures Were Dwarfed by Revenue: Drug companies’ investments
in R&D were dwarfed by U.S. revenues for the drugs examined. For example, Pfizer identified a total of $914 million in R&D expenditures related to Lyrica from 2009 to 2018, equivalent to 4% of its $23 billion in net U.S. revenue from the drug for that period. Eli Lilly’s estimate for Humalog R&D costs was equivalent to approximately 3.6% of the net sales generated by the product in the United States over the same period.
• Spending on R&D Was Designed to Protect Monopolies and Justify Price
Increases: Internal documents show that companies dedicated a significant portion of their R&D expenditures to research that was intended to extend market monopolies, support marketing strategies, or justify price increases. For example, a large portion of AbbVie’s research expenditures for Humira was focused on limiting biosimilar competition through “enhancements” to the drug. Teva invested in research to extend Copaxone’s monopoly by developing a new
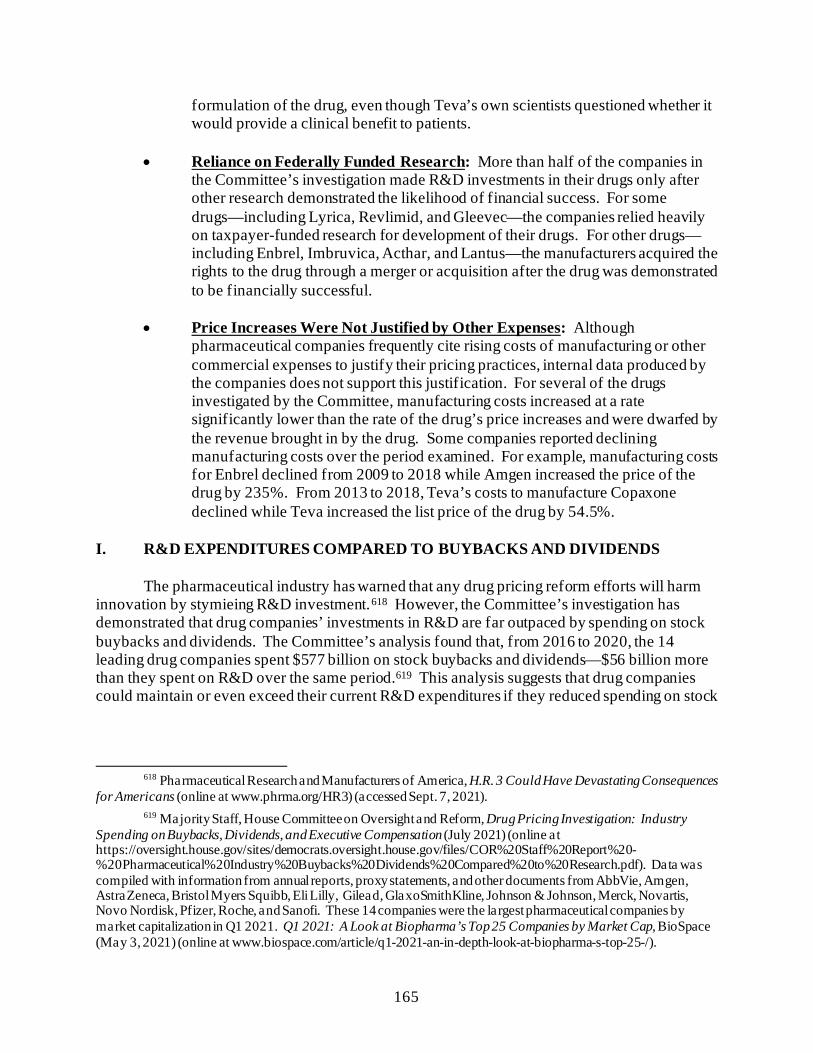
165
formulation of the drug, even though Teva’s own scientists questioned whether it would provide a clinical benefit to patients.
• Reliance on Federally Funded Research: More than half of the companies in
the Committee’s investigation made R&D investments in their drugs only after other research demonstrated the likelihood of financial success. For some drugs—including Lyrica, Revlimid, and Gleevec—the companies relied heavily on taxpayer-funded research for development of their drugs. For other drugs—including Enbrel, Imbruvica, Acthar, and Lantus—the manufacturers acquired the rights to the drug through a merger or acquisition after the drug was demonstrated to be financially successful.
• Price Increases Were Not Justified by Other Expenses: Although
pharmaceutical companies frequently cite rising costs of manufacturing or other commercial expenses to justify their pricing practices, internal data produced by the companies does not support this justification. For several of the drugs investigated by the Committee, manufacturing costs increased at a rate significantly lower than the rate of the drug’s price increases and were dwarfed by the revenue brought in by the drug. Some companies reported declining manufacturing costs over the period examined. For example, manufacturing costs for Enbrel declined from 2009 to 2018 while Amgen increased the price of the drug by 235%. From 2013 to 2018, Teva’s costs to manufacture Copaxone declined while Teva increased the list price of the drug by 54.5%.
I. R&D EXPENDITURES COMPARED TO BUYBACKS AND DIVIDENDS
The pharmaceutical industry has warned that any drug pricing reform efforts will harm innovation by stymieing R&D investment.618 However, the Committee’s investigation has demonstrated that drug companies’ investments in R&D are far outpaced by spending on stock buybacks and dividends. The Committee’s analysis found that, from 2016 to 2020, the 14 leading drug companies spent $577 billion on stock buybacks and dividends—$56 billion more than they spent on R&D over the same period.619 This analysis suggests that drug companies could maintain or even exceed their current R&D expenditures if they reduced spending on stock
618 Pharmaceutical Research and Manufacturers of America, H.R. 3 Could Have Devastating Consequences
for Americans (online at www.phrma.org/HR3) (accessed Sept. 7, 2021). 619 Majority Staff, House Committee on Oversight and Reform, Drug Pricing Investigation: Industry
Spending on Buybacks, Dividends, and Executive Compensation (July 2021) (online at https://oversight.house.gov/sites/democrats.oversight.house.gov/files/COR%20Staff%20Report%20-%20Pharmaceutical%20Industry%20Buybacks%20Dividends%20Compared%20to%20Research.pdf). Data was compiled with information from annual reports, proxy statements, and other documents from AbbVie, Amgen, AstraZeneca, Bristol Myers Squibb, Eli Lilly, Gilead, GlaxoSmithKline, Johnson & Johnson, Merck, Novartis, Novo Nordisk, Pfizer, Roche, and Sanofi. These 14 companies were the largest pharmaceutical companies by market capitalization in Q1 2021. Q1 2021: A Look at Biopharma’s Top 25 Companies by Market Cap, BioSpace (May 3, 2021) (online at www.biospace.com/article/q1-2021-an-in-depth-look-at-biopharma-s-top-25-/).
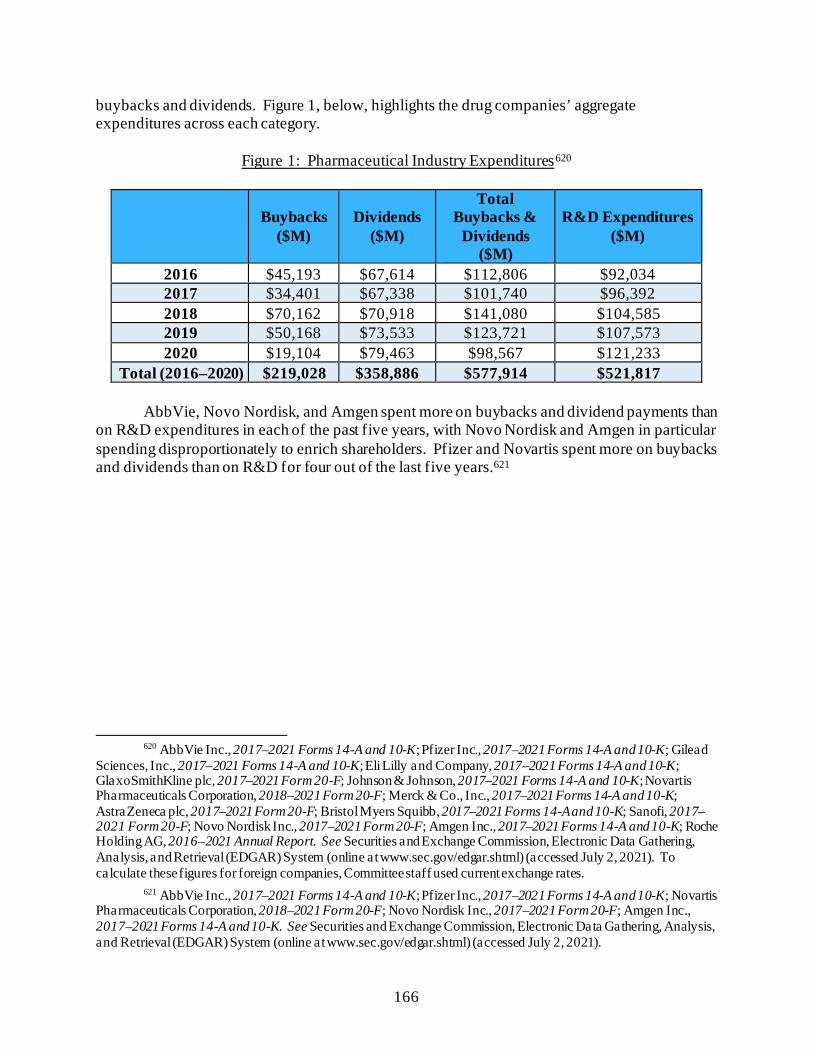
166
buybacks and dividends. Figure 1, below, highlights the drug companies’ aggregate expenditures across each category.
Figure 1: Pharmaceutical Industry Expenditures620
Buybacks ($M)
Dividends ($M)
Total Buybacks &
Dividends ($M)
R&D Expenditures ($M)
2016 $45,193 $67,614 $112,806 $92,034 2017 $34,401 $67,338 $101,740 $96,392 2018 $70,162 $70,918 $141,080 $104,585 2019 $50,168 $73,533 $123,721 $107,573 2020 $19,104 $79,463 $98,567 $121,233
Total (2016–2020) $219,028 $358,886 $577,914 $521,817
AbbVie, Novo Nordisk, and Amgen spent more on buybacks and dividend payments than on R&D expenditures in each of the past five years, with Novo Nordisk and Amgen in particular spending disproportionately to enrich shareholders. Pfizer and Novartis spent more on buybacks and dividends than on R&D for four out of the last five years.621
620 AbbVie Inc., 2017–2021 Forms 14-A and 10-K; Pfizer Inc., 2017–2021 Forms 14-A and 10-K; Gilead
Sciences, Inc., 2017–2021 Forms 14-A and 10-K; Eli Lilly and Company, 2017–2021 Forms 14-A and 10-K; GlaxoSmithKline plc, 2017–2021 Form 20-F; Johnson & Johnson, 2017–2021 Forms 14-A and 10-K; Novartis Pharmaceuticals Corporation, 2018–2021 Form 20-F; Merck & Co., Inc., 2017–2021 Forms 14-A and 10-K; AstraZeneca plc, 2017–2021 Form 20-F; Bristol Myers Squibb, 2017–2021 Forms 14-A and 10-K; Sanofi, 2017–2021 Form 20-F; Novo Nordisk Inc., 2017–2021 Form 20-F; Amgen Inc., 2017–2021 Forms 14-A and 10-K; Roche Holding AG, 2016–2021 Annual Report. See Securities and Exchange Commission, Electronic Data Gathering, Analysis, and Retrieval (EDGAR) System (online at www.sec.gov/edgar.shtml) (accessed July 2, 2021). To calculate these figures for foreign companies, Committee staff used current exchange rates.
621 AbbVie Inc., 2017–2021 Forms 14-A and 10-K; Pfizer Inc., 2017–2021 Forms 14-A and 10-K; Novartis Pharmaceuticals Corporation, 2018–2021 Form 20-F; Novo Nordisk Inc., 2017–2021 Form 20-F; Amgen Inc., 2017–2021 Forms 14-A and 10-K. See Securities and Exchange Commission, Electronic Data Gathering, Analysis, and Retrieval (EDGAR) System (online at www.sec.gov/edgar.shtml) (accessed July 2, 2021).
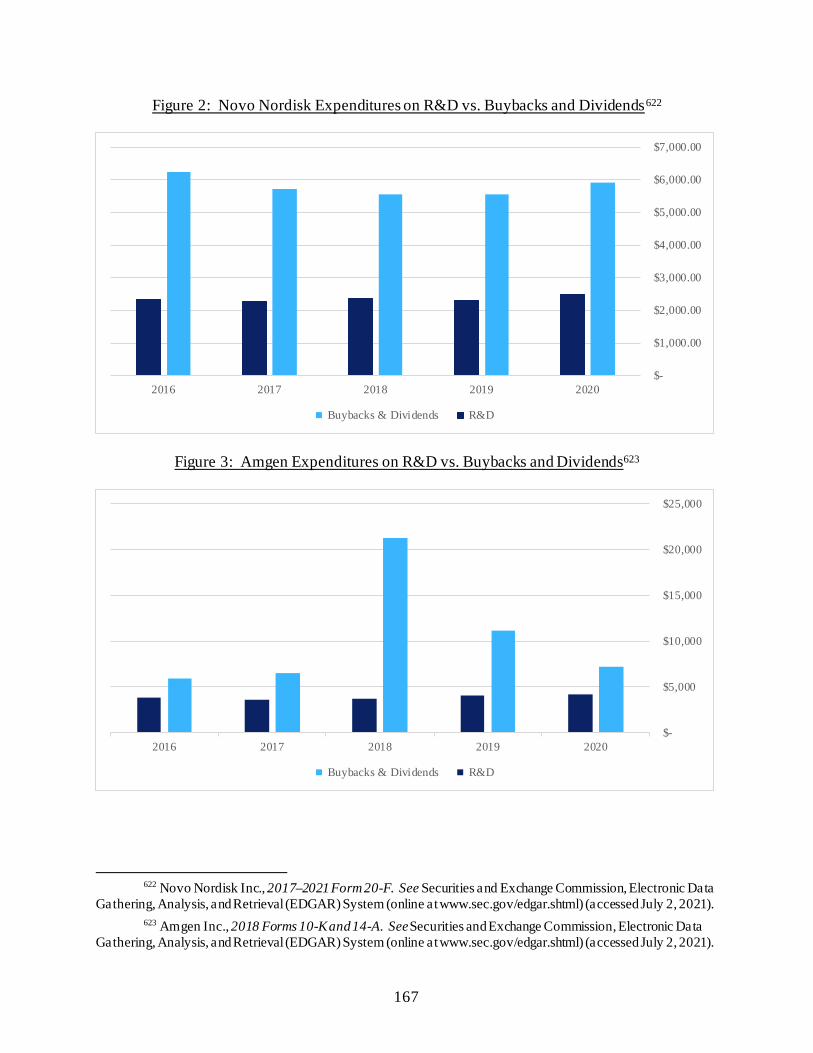
167
Figure 2: Novo Nordisk Expenditures on R&D vs. Buybacks and Dividends622
Figure 3: Amgen Expenditures on R&D vs. Buybacks and Dividends623
622 Novo Nordisk Inc., 2017–2021 Form 20-F. See Securities and Exchange Commission, Electronic Data
Gathering, Analysis, and Retrieval (EDGAR) System (online at www.sec.gov/edgar.shtml) (accessed July 2, 2021). 623 Amgen Inc., 2018 Forms 10-K and 14-A. See Securities and Exchange Commission, Electronic Data
Gathering, Analysis, and Retrieval (EDGAR) System (online at www.sec.gov/edgar.shtml) (accessed July 2, 2021).
$-
$1,000.00
$2,000.00
$3,000.00
$4,000.00
$5,000.00
$6,000.00
$7,000.00
20202019201820172016
Buybacks & Dividends R&D
$-
$5,000
$10,000
$15,000
$20,000
$25,000
20202019201820172016
Buybacks & Dividends R&D
168
II. R&D EXPENDITURES COMPARED TO REVENUE Pharmaceutical companies frequently claim that high prices are necessary to recoup the
significant cost of discovering and developing innovative therapies. Although companies may invest product revenue into research and development efforts in other therapeutic areas or products, the Committee’s investigation revealed that, for most of the companies investigated, the amount spent on research and development was a small fraction of net U.S. revenues for the respective drugs.624
Figure 4 below compares R&D spending to revenue for seven of the drugs investigated
for the time period for which the companies provided data.625
624 Additional Committee analysis of pricing decisions found that, in contrast to public messaging, analyses
and decision-making about price were largely driven by revenue and profit goals and were unrelated to past or future investment in research and development. See Chapter 2 for further analysis.
625 The figure includes the companies for which the Committee had comparable data. Teva Pharmaceutical Industries Ltd.: Letter from Kirkland and Ellis LLP, on behalf of Teva Pharmaceutical Industries Ltd., to Chairman Elijah E. Cummings, House Committee on Oversight and Reform (Aug. 9, 2019); Letter from Kirkland and Ellis LLP, on behalf of Teva Pharmaceutical Industries Ltd., to Chairman Elijah E. Cummings, House Committee on Oversight and Reform (July 18, 2019); Teva Pharmaceutical Industries Ltd., 2002–2019 Forms 10-K and 20-F (online at https://ir.tevapharm.com/financials/sec-filings/default.aspx). Teva was unable to identify any R&D expenditures related to Copaxone after 2015. Mallinckrodt Pharmaceuticals: MNK-COR-00001947, at Page 2; MNK-COR-00001704; Mallinckrodt Pharmaceuticals plc, 2014–2018 Form 10-K (online at www.mallinckrodt.com/investors/sec-filings/). Although Mallinckrodt claims that it has invested $500 million into Acthar, information reported to the Committee identified total Acthar Science and Technology investments of $363.3 million, which includes Acthar’s clinical testing, spending on clinical trials, and other R&D activities. This chart reflects that $363.3 million investment. AbbVie Inc.: Letter from Gibson, Dunn and Crutcher LLP, on behalf of AbbVie Inc., to Chairman Elijah E. Cummings, House Committee on Oversight and Reform (Feb. 4, 2019); Letter from Gibson, Dunn and Crutcher LLP, on behalf of AbbVie Inc., to Chairman Elijah E. Cummings, House Committee on Oversight and Reform (Mar. 21, 2019); Letter from Gibson, Dunn and Crutcher LLP, on behalf of AbbVie Inc., to Chairwoman Carolyn B. Maloney, House Committee on Oversight and Reform (Jan. 14, 2021); Letter from Gibson, Dunn and Crutcher LLP, on behalf of AbbVie Inc., to Chairwoman Carolyn B. Maloney, House Committee on Oversight and Reform (Jan. 18, 2021); Abbott Laboratories, 2003–2013 Form 10-K (online at www.abbottinvestor.com/financials/sec-filings); AbbVie Inc., 2013–2018 Form 10-K (online at https://investors.abbvie.com/sec-filings). In September 2020, AbbVie represented to the Committee that it identified $2.166 billion in “Humira Research & Development.” At that time, AbbVie noted that these figures do not include other Humira R&D costs that it failed to track at the product-specific level. Five days prior to the release of the Committee’s staff report regarding AbbVie and Humira, AbbVie identified an additional $3.026 billion in Humira-specific research. Although the figure above reflects the $5.19 billion identified by AbbVie, AbbVie’s methodology in allocating these additional research and development expenditures to Humira is unclear. Pfizer Inc.: Letter from King & Spalding, on behalf of Pfizer Inc., to Chairman Elijah E. Cummings, House Committee on Oversight and Reform, at Page 4 (Mar. 4, 2019); Letter from King & Spalding, on behalf of Pfizer Inc., to Chairman Elijah E. Cummings, House Committee on Oversight and Reform, at Page 2 (June 6, 2019); Pfizer Inc., 2009–2018 Form 10-K (online at https://investors.pfizer.com/financials/annual-reports/default.aspx). Amgen Inc.: Letter from King & Spalding, on behalf of Amgen Inc., to Chairman Elijah E. Cummings, House Committee on Oversight and Reform (Mar. 15, 2019); Amgen Inc., 2003–2018 Form 10-K (online at https://investors.amgen.com/financials/annual-reports).
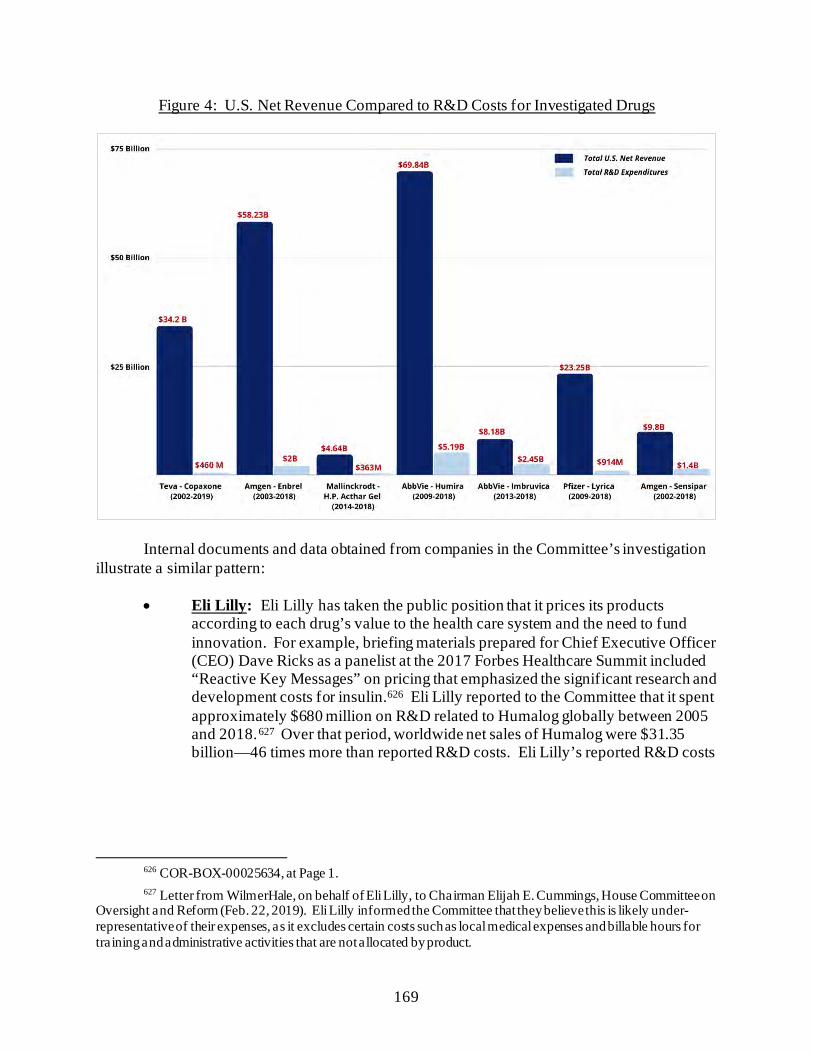
169
Figure 4: U.S. Net Revenue Compared to R&D Costs for Investigated Drugs
Internal documents and data obtained from companies in the Committee’s investigation illustrate a similar pattern:
• Eli Lilly: Eli Lilly has taken the public position that it prices its products according to each drug’s value to the health care system and the need to fund innovation. For example, briefing materials prepared for Chief Executive Officer (CEO) Dave Ricks as a panelist at the 2017 Forbes Healthcare Summit included “Reactive Key Messages” on pricing that emphasized the significant research and development costs for insulin.626 Eli Lilly reported to the Committee that it spent approximately $680 million on R&D related to Humalog globally between 2005 and 2018.627 Over that period, worldwide net sales of Humalog were $31.35 billion—46 times more than reported R&D costs. Eli Lilly’s reported R&D costs
626 COR-BOX-00025634, at Page 1. 627 Letter from WilmerHale, on behalf of Eli Lilly, to Chairman Elijah E. Cummings, House Committee on
Oversight and Reform (Feb. 22, 2019). Eli Lilly informed the Committee that they believe this is likely under-representative of their expenses, as it excludes certain costs such as local medical expenses and billable hours for training and administrative activities that are not allocated by product.
170
for Humalog were equivalent to approximately 3.6% of the net sales revenue generated in the U.S. alone over the same period.628
• Novartis: Novartis reported to the Committee that, according to its best estimate,
Gleevec development costs from when it was approved in 2001 through 2019 exceeded $700 million.629 Novartis reported that it claimed no R&D tax credits from 2009 to 2018.630 From 2009 to 2019, Novartis reported more than $39.7 billion in net worldwide revenue from Gleevec, with the U.S. market accounting for nearly $14.8 billion of that total.631 Novartis generated more net revenue from Gleevec each year between 2009 and 2016 than it spent on Gleevec R&D combined during a 19-year period.632
• Pfizer: Since launching Lyrica in 2005, Pfizer has raised the price of the drug 22
times.633 A yearly course of Lyrica is priced at more than $6,000 today compared to just over $1,000 in 2005.634 According to data Pfizer provided to the Committee, the company’s R&D costs for Lyrica from 2009 to 2018 represented the equivalent of less than 4% of the drug’s revenue. Pfizer reported that from
628 Eli Lilly, 2005–2018 Form 10-K (online at https://investor.lilly.com/financial-information/annual-
reports). 629 Letter from Hogan Lovells, on behalf of Novartis Pharmaceuticals Corporation, to Chairwoman Carolyn
B. Maloney, House Committee on Oversight and Reform (Sept. 25, 2020); Letter from Hogan Lovells, on behalf of Novartis Pharmaceuticals Corporation, to Chairman Elijah E. Cummings, House Committee on Oversight and Reform (Apr. 4, 2019). In its April 4, 2019, letter to the Committee, Novartis noted, “[T]he Company no longer has access to the records reflecting the very significant Gleevec development spend by the Company prior to FDA [Food and Drug Administration] approval.” With respect to its R&D spending after FDA approval, Novartis initially reported to the Committee, “The data after that initial FDA approval to which the Company still has access is incomplete and is only a small fraction of the significant overall spend by the Company on Gleevec development.”
630 Letter from Hogan Lovells, on behalf of Novartis Pharmaceuticals Corporation, to Chairman Elijah E. Cummings, House Committee on Oversight and Reform (July 18, 2019).
631 Novartis Pharmaceuticals Corporation, 2019 Form 20-F (Jan. 29, 2020) (online at www.sec.gov/Archives/edgar/data/1114448/000137036820000003/a20012920f.htm); Novartis Pharmaceuticals Corporation, 2016 Form 20-F (Jan. 25, 2017) (online at www.sec.gov/Archives/edgar/data/1114448/000104746917000338/a2230622z20-f.htm); Novartis Pharmaceuticals Corporation, 2013 Form 20-F (Jan. 29, 2014) (online at www.sec.gov/Archives/edgar/data/1114448/000104746914000415/a2217883z20-f.htm#dc19401_3.a_selected_financial_data); NOVARTIS.HCOR20190114.00001017 (net sales is defined as “Total Gross Sales minus contract discounts, rebates, returns, prompt payment discounts, copay card support, and any prior period adjustments related to these items”).
632 Letter from Hogan Lovells, on behalf of Novartis Pharmaceuticals Corporation, to Chairwoman Carolyn Maloney, House Committee on Oversight and Reform (Sept. 25, 2020).
633 IBM Micromedex Redbook, Wholesale Acquisition Cost and Average Wholesale Price History for Lyrica.
634 IBM Micromedex Redbook, Wholesale Acquisition Cost and Average Wholesale Price History for Lyrica. This calculation is based on the wholesale acquisition cost of a 90-pill package of the 75 mg oral capsule and assumes a patient takes 150 mg per day for one year.
171
2009 to 2018, it spent a total of $914 million on R&D related to Lyrica while the company earned over $23 billion in U.S. revenue.635
• Amgen: From 2003 to 2018, Amgen reported spending $2 billion on Enbrel
R&D expenditures, equivalent to approximately 3.5% of the company’s $58.23 billion in net U.S. revenue from Enbrel over the same period.636 Amgen reported to the Committee that from 2002 to 2018, it spent $1.4 billion on Sensipar R&D, equivalent to approximately 14.6% of its $9.8 billion in net revenue over the same period.637
• Teva: Teva identified a total of $689 million in R&D expenditures related to
Copaxone since 1987—equivalent to approximately 2% of its $34.2 billion in net U.S. revenue of Copaxone from 2002 to 2019.638
• Sanofi: Sanofi identified a total of $1.19 billion in R&D expenditures related to
Lantus products from 1990 to 2018. Approximately $1.03 billion of that $1.19 billion was post-marketing research and development expenditures from 2002 to 2018.639 That figure represents the equivalent of approximately 2.4% of the U.S. net sales generated by Lantus in the same period.640 In December 2019, Sanofi
635 Letter from King & Spalding, on behalf of Pfizer Inc., to Chairman Elijah E. Cummings, House
Committee on Oversight and Reform, at Page 4 (Mar. 4, 2019); Letter from King & Spalding, on behalf of Pfizer Inc., to Chairman Elijah E. Cummings, House Committee on Oversight and Reform, at Page 3 (June 6, 2019).
636 Letter from King & Spalding, on behalf of Amgen Inc., to Chairman Elijah E. Cummings, House Committee on Oversight and Reform (Mar. 15, 2019).
637 Id. 638 Letter from Kirkland and Ellis LLP, on behalf of Teva Pharmaceutical Industries Ltd., to Chairman
Elijah E. Cummings, House Committee on Oversight and Reform (Aug. 9, 2019); Letter from Kirkland and Ellis LLP, on behalf of Teva Pharmaceutical Industries Ltd., to Chairman Elijah E. Cummings, House Committee on Oversight and Reform (July 18, 2019); Teva Pharmaceutical Industries Ltd., 2002–2019 Forms 10-K and 20-F (online at https://ir.tevapharm.com/financials/sec-filings/default.aspx).
639 Letter from Arnold and Porter, on behalf of Sanofi, to Majority Staff, House Committee on Oversight and Reform (Apr. 10, 2019).
640 Letter from Arnold and Porter, on behalf of Sanofi, to Majority Staff, House Committee on Oversight and Reform (Apr. 10, 2019); Sanofi, 2009–2018 Form 20-F (online at www.sanofi.com/en/investors/reports-and-publications/financial-and-csr-reports); Sanofi, 2005–2009 Form 20-F (online at www.sec.gov/cgi-bin/browse-edgar?action=getcompany&CIK=0001121404&type=20-F&dateb=&owner=exclude&count=40&search_text=); Aventis, 2002–2004 Form 20-F (online at www.sec.gov/cgi-bin/browse-edgar?action=getcompany&CIK=0000807198&type=20-F&dateb=&owner=include&count=40&search_text=). Sanofi provided the numbers in U.S. dollars, converting from euros using the average annual conversion rates for the applicable year. The Committee used the most recent conversion rates from the Department of the Treasury. Department of the Treasury, Treasury Reporting Rates of Exchange (Dec. 31, 2020) (online at www.fiscal.treasury.gov/reports-statements/treasury-reporting-rates-exchange/current.html); IBM Micromedex Redbook, Wholesale Acquisition Cost and Average Wholesale Price History for Lantus. The subcutaneous solution 10 mL vial was priced at $283.56 in 2019. While each person’s dosage varies and depends on body weight, diet, and other circumstances, on average, a patient weighing 160 pounds might use 40 units of insulin per day. A Lantus 10 mL multiple-dose vial, as an example, contains 100 units and so would last this patient 25 days. If each vial cost approximately $283, that would equal $4,131 per year.
172
announced that it would discontinue its research efforts in diabetes medication.641 The following year, Sanofi reported earning $1.7 billion in U.S. net sales of diabetes products, including $1.073 billion from Lantus.642
III. NON-INNOVATIVE R&D EXPENDITURES
Internal documents obtained by the Committee show that the companies under investigation dedicated a significant portion of their R&D expenditures to research that was intended to extend market monopolies, support the companies’ marketing strategies, and otherwise suppress competition.
AbbVie—Humira
Although AbbVie claims that it has invested billions of dollars in R&D expenses related
to its blockbuster rheumatology drug Humira, the Committee’s investigation demonstrated that a large portion of these expenditures was focused on limiting biosimilar competition through “enhancements” to Humira.643
A June 2011 internal presentation from AbbVie’s predecessor company, Abbott,
emphasized that one objective of the “enhancement” strategy was to “raise barriers to competitor ability to replicate.”644
641 Sanofi Ends Research in Diabetes, Narrows Units to Spur Profit, Reuters (Dec. 9, 2019) (online at
www.reuters.com/article/us-sanofi-outlook/sanofi-ends-research-in-diabetes-narrows-units-to-spur-profit-idUSKBN1YD2BI).
642 Sanofi, 2020 Form 20-F (Mar. 4, 2021) (online at www.sanofi.com/-/media/Project/One-Sanofi-Web/Websites/Global/Sanofi-COM/Home/common/docs/investors/2021_03_23_Sanofi_20F_FINAL_Acc.pdf?la=en&hash=FE3E112315940778BD782A2F0919A086). The Committee used the most recent conversion rates from the Department of the Treasury. Department of the Treasury, Treasury Reporting Rates of Exchange (Dec. 31, 2020) (online at www.fiscal.treasury.gov/reports-statements/treasury-reporting-rates-exchange/current.html).
643 See, e.g., Letter from Gibson, Dunn and Crutcher LLP, on behalf of AbbVie Inc., to Chairwoman Carolyn B. Maloney, House Committee on Oversight and Reform (Aug. 31, 2020) (emphasizing research expenditures); ABV-HOR-RR-00000739 (filing to Vermont Attorney General emphasizing research expenditures).
644 ABV-HOR-00034291, at Slide 10.
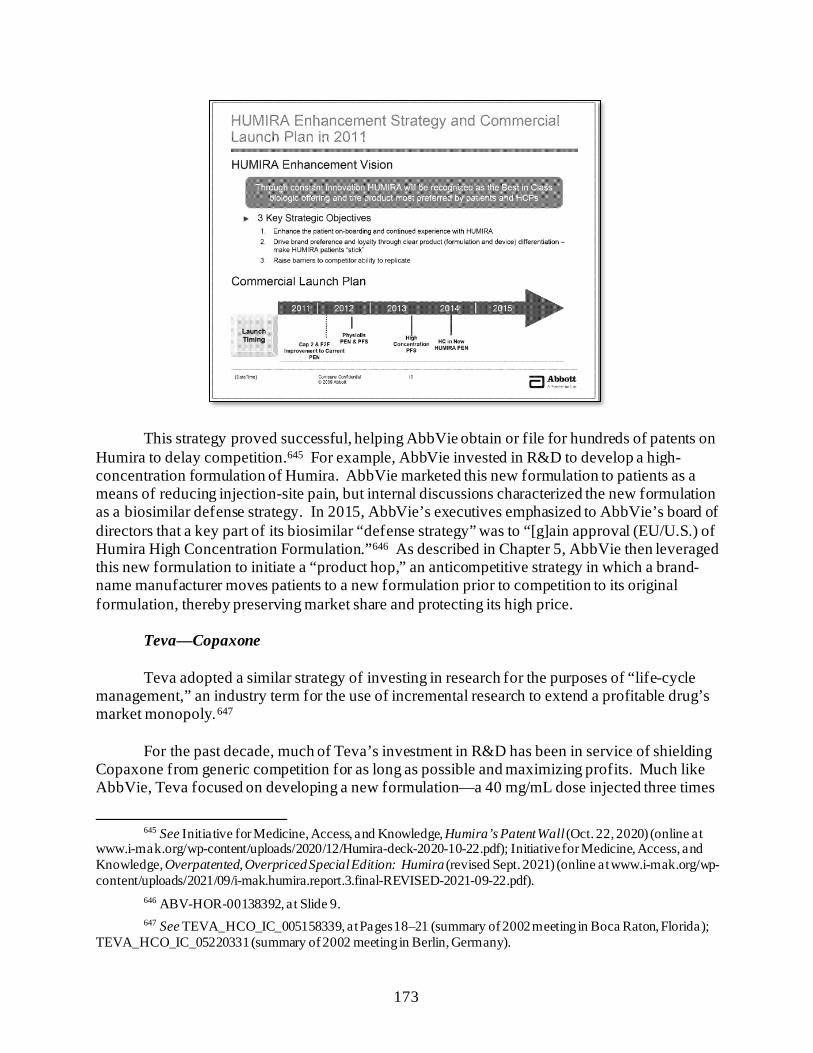
173
This strategy proved successful, helping AbbVie obtain or file for hundreds of patents on Humira to delay competition.645 For example, AbbVie invested in R&D to develop a high-concentration formulation of Humira. AbbVie marketed this new formulation to patients as a means of reducing injection-site pain, but internal discussions characterized the new formulation as a biosimilar defense strategy. In 2015, AbbVie’s executives emphasized to AbbVie’s board of directors that a key part of its biosimilar “defense strategy” was to “[g]ain approval (EU/U.S.) of Humira High Concentration Formulation.”646 As described in Chapter 5, AbbVie then leveraged this new formulation to initiate a “product hop,” an anticompetitive strategy in which a brand-name manufacturer moves patients to a new formulation prior to competition to its original formulation, thereby preserving market share and protecting its high price.
Teva—Copaxone Teva adopted a similar strategy of investing in research for the purposes of “life-cycle
management,” an industry term for the use of incremental research to extend a profitable drug’s market monopoly.647
For the past decade, much of Teva’s investment in R&D has been in service of shielding
Copaxone from generic competition for as long as possible and maximizing profits. Much like AbbVie, Teva focused on developing a new formulation—a 40 mg/mL dose injected three times
645 See Initiative for Medicine, Access, and Knowledge, Humira’s Patent Wall (Oct. 22, 2020) (online at
www.i-mak.org/wp-content/uploads/2020/12/Humira-deck-2020-10-22.pdf); Initiative for Medicine, Access, and Knowledge, Overpatented, Overpriced Special Edition: Humira (revised Sept. 2021) (online at www.i-mak.org/wp-content/uploads/2021/09/i-mak.humira.report.3.final-REVISED-2021-09-22.pdf).
646 ABV-HOR-00138392, at Slide 9. 647 See TEVA_HCO_IC_005158339, at Pages 18–21 (summary of 2002 meeting in Boca Raton, Florida);
TEVA_HCO_IC_05220331 (summary of 2002 meeting in Berlin, Germany).
174
per week rather than daily.648 Teva introduced this new formulation of Copaxone in 2014.649 As described in Chapter 5, although Teva publicly framed the new dose as more convenient than the daily 20 mg/mL formulation, internal documents reveal that Teva developed the new dose in part to extend its monopoly pricing for Copaxone by shifting patients to the new dose—which still enjoyed market exclusivity—before the existing 20 mg/mL dose began facing generic competition.650 Teva invested in research to support a less frequent dose of Copaxone, despite opposition from Teva’s own Innovative Research and Development team, which, according to one of Teva’s scientists, was “strongly against” Teva’s study into the less frequent dosing of Copaxone “since it has no scientific rationale/value.”651
Publicly, Teva defends its Copaxone price increases by claiming they are needed to fund ongoing R&D. For example, in October 2016, Teva developed talking points directing executives to emphasize that the price of Copaxone “reflects the clinical utility of the drug, while maintaining [Teva’s] commitment to ongoing clinical research.” The talking points instructed executives to argue that Teva’s price increases are justified because the company continues “to invest in researching new developments that directly translate to increased options for Copaxone patients.”652 However, when asked by the Committee to identify these investments, the company identified only $219 million in R&D from 2009 to 2015, equivalent to approximately 1.1% of
648 Teva Pharmaceutical Industries Ltd., Press Release: Teva Announces U.S. FDA Approval of Three-
Times-a-Week Copaxone (Glatiramer Acetate Injection) 40 mg/mL (Jan. 28, 2014) (online at www.businesswire.com/news/home/20140128006747/en/Teva-Announces-U.S.-FDA-Approval-Three-Times-a-Week-COPAXONE%C2%AE).
649 Letter from Billy Dunn, Acting Director, Division of Neurology Products, Food and Drug Administration, to Dennis Ahern, Senior Director for Regulatory Affairs, Teva Pharmaceuticals USA (Jan. 28, 2014) (online at www.accessdata.fda.gov/drugsatfda_docs/appletter/2014/020622Orig1s089ltr.pdf).
650 Teva Pharmaceutical Industries Ltd., Press Release: Teva Announces U.S. FDA Approval of Three-Times-a-Week Copaxone (Glatiramer Acetate Injection) 40 mg/mL (Jan. 28, 2014) (online at www.businesswire.com/news/home/20140128006747/en/Teva-Announces-U.S.-FDA-Approval-Three-Times-a-Week-COPAXONE%C2%AE); see, e.g., TEVA_HCO_IC_005235121, at Slide 6 (Teva’s executives presented new Copaxone “Life Cycle Initiatives” to the company’s board of directors, including “40 mg every other day”); TEVA_HCO_IC_005132452 (in August 2008, executives asked whether Teva could “patent the frequency” of injections, thereby limiting the ability of generic competitors to introduce a similar generic version of the drug).
651 TEVA_HCO_IC_005233185. Teva sponsored the FORTE Trial, a Phase III clinical trial examining the efficacy, safety, and tolerability of a daily version of Copaxone 40 mg/mL as compared to daily Copaxone 20 mg/mL. In July 2008, Teva announced that the trial had found no difference in efficacy between the two doses of Copaxone. Teva Pharmaceutical Industries Ltd., Press Release: Teva Provides Update on FORTE Trial (July 7, 2008) (online at https://ir.tevapharm.com/news-and-events/press-releases/press-release-details/2008/Teva-Provides-Update-on-FORTE-Trial/default.aspx).
652 TEVA_HCO_IC_005000887, at Page 5.
175
net revenues from Copaxone in those years. The company was unable to identify any R&D expenditures related to Copaxone after 2015.653 IV. RELIANCE ON FEDERALLY FUNDED RESEARCH AND INVESTMENT
ONLY AFTER OTHER RESEARCH DEMONSTRATED SUCCESS Several companies in the Committee’s investigation made R&D investments in their
drugs only after other research demonstrated the likelihood of financial success or the drugs had already been brought to market.
Lyrica, Revlimid, and Gleevec were developed through federally funded and academic
research. Drug companies did not make significant research expenditures on these drugs until other research made it clear that the drugs were likely to be commercially successful. Recent studies have found that federally funded academics have an increasingly important role in drug discovery and that academics funded by the National Institutes of Health (NIH) contribute to one-third of the newest medicines.654
Enbrel, Imbruvica, Acthar, and Lantus were acquired through mergers or acquisitions, which were completed after the prior company had demonstrated that the drug was financially successful.
Pfizer—Lyrica
Taxpayer-funded research led to the initial discovery of Lyrica. Dr. Richard B.
Silverman, a professor at Northwestern University, led the lab that discovered the synthesis of pregabalin, the active ingredient in Lyrica, and conducted the initial pharmacologic studies on the drug.655 These studies were funded by grants from NIH beginning in 1979.656 In exchange for the intellectual property related to Lyrica, Pfizer paid royalties to Northwestern University in
653 Letter from Kirkland and Ellis LLP, on behalf of Teva Pharmaceutical Industries, Ltd., to Chairman
Elijah E. Cummings, House Committee on Oversight and Reform (July 18, 2019); Letter from Kirkland and Ellis LLP, on behalf of Teva Pharmaceutical Industries, Ltd., to Chairman Elijah E. Cummings, House Committee on Oversight and Reform (Aug. 9, 2019); Letter from Kirkland and Ellis LLP, on behalf of Teva Pharmaceutical Industries, Ltd., to Chairwoman Carolyn B. Maloney, House Committee on Oversight and Reform (Aug. 25, 2020) (“Teva is writing to confirm that it had no additional Copaxone research and development expenditures other than those identified in our prior letter.”).
654 See, e.g., Michael S. Kinch et al., Expanding Roles for Academic Entrepreneurship in Drug Discovery, Drug Discovery Today (Nov. 2020) (online at www.ncbi.nlm.nih.gov/pmc/articles/PMC7484702/); Rahul Nayak, Jerry Avorn, and Aaron S. Kesselheim, Public Sector Financial Support for Late Stage Discovery of New Drugs in the United States, BMJ (Sept. 2019) (online at www.bmj.com/content/367/bmj.l5766.long).
655 Letter from King & Spalding, on behalf of Pfizer Inc., to Chairman Elijah E. Cummings, House Committee on Oversight and Reform, at Page 3 (May 3, 2019).
656 National Institutes of Health, Project Information for Project 5R01NS015703-08 (online at https://reporter.nih.gov/search/KGsLFGorBU6d5_5A2fYZcg/project-details/3396431#description); The Pregabalin Story: How Northwestern University Transformed a $681,764 Grant into a Fortune of Good, Northwestern Invo (Apr. 1, 2017) (online at www.invo.northwestern.edu/about/news/news-archive/the-pregabalin-story.html); Letter from King & Spalding, on behalf of Pfizer Inc., to Chairman Elijah E. Cummings, House Committee on Oversight and Reform, at Page 3 (May 3, 2019).
176
the amount of 4.5% of global sales, and to Professor Silverman in the amount 1.5% of gross sales.657
NIH funding of Dr. Silverman was not the only federal funding that contributed to the discovery of pregabalin. An analysis from researchers at the Program on Regulation, Therapeutics and Law at Brigham and Women’s Hospital/Harvard Medical School identified 37 NIH awards, including the initial grant—totaling $13.8 million—related to pregabalin’s development.658 Six of these awards, totaling $1.8 million, supported Dr. Silverman’s research between 1985 and 1990. Additional awards from 1988 to 1990, totaling $1.4 million, supported research by Richard J. Miller at the University of Chicago on related topics. From 1991 to 2004, an additional $10.5 million from 25 NIH awards went to related research. During this time, Parke-Davis Pharmaceuticals (later acquired by the pharmaceutical company Warner-Lambert) entered into a licensing agreement with Northwestern and began funding research into developing pregabalin.659 When Pfizer acquired Warner-Lambert in 2000, millions of dollars in this federally funded research and other academic contributions had already contributed to the pre-approval development of pregabalin.660
Celgene—Revlimid
Taxpayer-funded academic research was also critical to the development of Celgene’s blockbuster cancer drug Revlimid. Although Celgene (which is now a subsidiary of Bristol Myers Squib) claims that it invested “$800 million in research and development” for Revlimid, the company did not invest substantially until after taxpayer-funded research had made it clear that Revlimid was likely to become a blockbuster drug.661
657 Letter from King & Spalding, on behalf of Pfizer Inc., to Chairman Elijah E. Cummings, House
Committee on Oversight and Reform, at Page 3 (May 3, 2019); In Focus: As Lyrica Profits Dry Up, Northwestern Seeks Another “Blockbuster” Drug, Daily Northwestern (Apr. 10, 2016) (online at https://dailynorthwestern.com/2016/04/10/in-focus/in-focus-as-lyrica-profits-dry-up-northwestern-seeks-another-blockbuster-drug/). The distribution of royalties was part of a 1992 agreement between Northwestern and Warner-Lambert Company, which was acquired by Pfizer in 2000. In 2007, Northwestern sold 56% of its royalty interest for $700 million, and in 2013 (anticipating a drop in revenue after Lyrica lost its patent exclusivity), Northwestern sold most of its remaining royalty interest for $290 million. See, e.g., Royalty Pharma Acquires a Portion of Northwestern University’s Royalty Interest in Lyrica for $700 Million, Northwestern University (Dec. 18, 2007) (online at www.northwestern.edu/newscenter/stories/2007/12/lyrica.html).
658 Rachel Barenie et al., Discovery and Development of Pregabalin (Lyrica): The Role of Public Funding, Neurology (Oct. 2021) (online at https://pubmed.ncbi.nlm.nih.gov/34493615/).
659 Parke-Davis Pharmaceuticals was a subsidiary of Warner-Lambert. Warner-Lambert was acquired by Pfizer Inc. in 2000. This analysis also does not include earlier-stage work that led to the initial discovery.
660 Rachel Barenie et al., Discovery and Development of Pregabalin (Lyrica): The Role of Public Funding, Neurology (Oct. 2021) (online at https://pubmed.ncbi.nlm.nih.gov/34493615/).
661 Letter from Covington & Burling LLP, on behalf of Celgene Corporation, to Chairman Elijah E. Cummings, House Committee on Oversight and Reform (Feb. 4, 2019).
177
Celgene first acquired the rights to Revlimid’s precursor drug, thalidomide, from Rockefeller University in 1992.662 Thalidomide was first used in the 1950s as a treatment for morning sickness in pregnant women, but it was removed from the commercial markets after it was found to cause birth defects.663 Researchers continued to study how the drug worked and doctors began using it to treat leprosy and other rare diseases.664
In 1992, when Celgene first licensed the patent on thalidomide from Rockefeller
University, it sought approval to market the drug under the brand name Thalomid for the treatment of a form of leprosy.665 In reviewing Celgene’s application, the Food and Drug Administration (FDA) noted that Celgene was seeking approval for “an indication for which the drug had been used for over 30 years.”666 The company and FDA expected that it could be prescribed off label to patients with HIV/AIDS based on the ongoing studies by Rockefeller University researchers and others.667 FDA granted Celgene’s application in 1998.668
Celgene collected only limited revenue in the first few years of selling Thalomid.669
However, in 1993, researchers at Boston Children’s Hospital (BCH) discovered that both thalidomide and its chemical analog, EM-12, could inhibit tumor growth by stunting the development of new blood vessels.670 EM-12, which Celgene would later name Revlimid, has an almost identical molecular structure to thalidomide.671 The BCH researchers registered
662 See Celgene Corporation, 1995 Form 10-K (Apr. 1, 1996) (online at
www.sec.gov/Archives/edgar/data/816284/0000950117-96-000268.txt) (noting the 1992 licensing agreement). 663 Waquas Rehman, Lisa M. Arfons, and Hillard M. Lazarus, The Rise and Fall and Subsequent Triumph
of Thalidomide: Lessons Learned in Drug Development, Therapeutic Advances in Hematology (Oct. 2011) (online at www.ncbi.nlm.nih.gov/pmc/articles/PMC3573415/).
664 Id. 665 See Letter from Murray M. Lumpkin, Deputy Center Director, Center for Drug Evaluation and
Research, Food and Drug Administration, to Dr. Steve Thomas, Celgene Corporation (July 16, 1998) (online at www.accessdata.fda.gov/drugsatfda_docs/appletter/1998/20785ltr.pdf).
666 Food and Drug Administration, Dermatologic and Ophthalmic Drugs Advisory Committee Tr. at 14 (Sept. 4, 1997) (attached to Celgene’s Statement of Material Facts in Mylan Pharmaceuticals Inc. v. Celgene Corporation, No. 14-CV-02094 (D. N.J.) (Mar. 20, 2018)). Both Celgene and FDA expected that Thalomid also would be prescribed off label to patients with HIV/AIDS and other conditions. See id.
667 Id. 668 See Letter from Murray M. Lumpkin, Deputy Center Director, Center for Drug Evaluation and
Research, Food and Drug Administration, to Dr. Steve Thomas, Celgene Corporation (July 16, 1998) (online at www.accessdata.fda.gov/drugsatfda_docs/appletter/1998/20785ltr.pdf).
669 See CELG_HCOR_000000001 (listing Celgene’s revenue from 1992 to 2018). 670 Robert J. D’Amato et al., Thalidomide Is an Inhibitor of Angiogenesis, Proceedings of the National
Academies of Sciences (Apr. 1994) (online at www.ncbi.nlm.nih.gov/pmc/articles/PMC43727/pdf/pnas01131-0614.pdf); see also Boston Children’s Hospital, From Thalidomide to Pomalyst: Better Living Through Chemistry (Apr. 2, 2013) (online at https://damatolab.com/news/thalidomide-pomalyst-better-living-through-chemistry).
671 How a Drugmaker Gamed the System to Keep Generic Competition Away, National Public Radio (Mar. 17, 2018) (online at www.npr.org/sections/health-shots/2018/05/17/571986468/how-a-drugmaker-gamed-the-system-to-keep-generic-competition-away).
178
patents on the discovery that thalidomide and other similar chemical compounds could prevent the growth of tumors.672
The BCH researchers were the first to test thalidomide on patients with multiple myeloma, and they later conducted a larger study supported by a $2.3 million grant from NIH.673 Celgene provided free drug samples for the study and contributed to data collection and analysis.674
After the results of this larger study were published—proving that thalidomide was effective in treating multiple myeloma—Celgene’s revenue for sales of thalidomide increased.675 It was only after learning of the initial success that Celgene decided to invest in the larger trials necessary to receive FDA approval to sell thalidomide as a treatment for multiple myeloma.676
As Celgene began to collect millions of dollars from selling thalidomide, other academic
researchers—funded by taxpayer dollars—were already exploring whether drugs with a similar chemical structure to thalidomide, including the compound that would later become known as Revlimid, might be more effective than thalidomide in treating multiple myeloma. These chemicals had existed for many years, but the research into thalidomide prompted renewed interest into its analogs. Once again, Celgene capitalized on this academic and federally funded research to eventually launch Revlimid.
672 See, e.g., U.S. Patent No. 5,629,327 (filed Dec. 15, 1993); U.S. Patent No. 5,593,990 (filed Jan. 13, 1995); see also Boston Children’s Hospital’s Statement of Undisputed Material Facts, Children’s Medical Center Corp. v. Celgene Corporation, No. 13-cv-11573 (D. Mass) (Aug. 4, 2015).
673 Seema Singhal et al., Antitumor Activity of Thalidomide in Refractory Multiple Myeloma, New England Journal of Medicine (Nov. 18, 1999) (online at www.nejm.org/doi/full/10.1056/NEJM199911183412102); Boston Children’s Hospital, From Thalidomide to Pomalyst: Better Living Through Chemistry (Apr. 2, 2013) (online at https://damatolab.com/news/thalidomide-pomalyst-better-living-through-chemistry).
674 Id.; National Institutes of Health, Project Information for Project 2P01CA055819-05A1 (online at projectreporter.nih.gov/project_info_details.cfm?aid=2893415&icde=48912205).
675 Seema Singhal et al., Antitumor Activity of Thalidomide in Refractory Multiple Myeloma, New England Journal of Medicine (Nov. 18, 1999) (online at www.nejm.org/doi/full/10.1056/NEJM199911183412102); Boston Children’s Hospital, From Thalidomide to Pomalyst: Better Living Through Chemistry (Apr. 2, 2013) (online at https://damatolab.com/news/thalidomide-pomalyst-better-living-through-chemistry). The rapid revenue growth likely was due to doctors’ prescribing Thalomid off label to treat multiple myeloma while larger studies and the FDA review were ongoing. See CELG_HCOR_000000001 (listing Celgene’s research expenditures and revenue from 1992 to 2018); Letter from Renata Albrecht, Division Director, Division of Special Pathogen and Transplant Products, Food and Drug Administration, and Robert L. Justice, Acting Division Director, Division of Drug Oncology Products, Food and Drug Administration, to Megan Parsi, Director of Regulatory Affairs, Celgene Corporation (May 25, 2006) (online at www.accessdata.fda.gov/drugsatfda_docs/appletter/2006/021430s000,%20020785s031LTR.pdf).
676 CELG_HCOR_000000001 (listing Celgene’s research expenditures and revenue from 1992 to 2018); National Institutes of Health, Clinical Trials Sponsored by Celgene Corporation from 1996 to 2000 (online at www.clinicaltrials.gov) (showing that Celgene-sponsored multiple myeloma trials began after Dr. Barlogie’s first trial was collecting data from all 84 of its enrolled patients and eight months after Dr. Barlogie’s first trial began treating its patients); Seema Singhal et al., Antitumor Activity of Thalidomide in Refractory Multiple Myeloma, New England Journal of Medicine (Nov. 18, 1999) (online at www.nejm.org/doi/full/10.1056/NEJM199911183412102) (stating that enrollment occurred from December 1997 to June 1998).
179
In 2000 and 2001, researchers at the Dana Farber Cancer Institute published two studies showing that certain variations of thalidomide—including the compound that Celgene would later name Revlimid—appeared to be more effective than thalidomide in treating multiple myeloma.677 The two studies were supported by more than $3 million in grants from NIH.678 The same Dana Farber researchers then conducted a small-scale study showing that the compound that would be named Revlimid was superior to thalidomide in treating relapsed multiple myeloma patients.679 That study was also funded by grants from NIH.680 It was only after these three federally funded studies demonstrated positive results for Revlimid that Celgene invested in additional trials to obtain FDA approval to sell Revlimid to patients with multiple myeloma.
In 2006, FDA approved marketing of Revlimid for multiple myeloma patients who had
received another treatment that had failed. FDA did not allow Celgene to market Revlimid as the initial therapy for newly diagnosed multiple myeloma patients—a large percentage of patients with the disease.681
677 Teru Hideshima et al., Thalidomide and Its Analogs Overcome Drug Resistance of Human Multiple
Myeloma Cells to Conventional Therapy, Blood (Nov. 1, 2000) (online at https://ashpublications.org/blood/article/96/9/2943/181233/Thalidomide-and-its-analogs-overcome-drug) (“Supported by National Institutes of Health grant PO1 78378”); Faith E. Davies et al., Thalidomide and Immunomodulatory Derivatives Augment Natural Killer Cell Cytotoxicity in Multiple Myeloma, Blood (July 1, 2001) (online at https://ashpublications.org/blood/article/98/1/210/88908/Thalidomide-and-immunomodulatory-derivatives) (supported by “National Institutes of Health grant PO-1 78378”). The two articles use the label IMiD3 to refer to lenalidomide, which Celgene later named Revlimid. See Yu-Tzu Tai et al., Immunomodulatory Drug Lenalidomide (CC-5013, IMiD3) Augments Anti-CD40 SGN-40-Induced Cytotoxicity in Human Multiple Myeloma: Clinical Implications, Cancer Research (Dec. 2005) (online at https://cancerres.aacrjournals.org/content/65/24/11712.long).
678 Id.; National Institutes of Health, Project Information for Project 5P01CA078378-02 (online at projectreporter.nih.gov/project_info_details.cfm?aid=2896554&icde=48914442) (accessed Sep. 2020); National Institutes of Health, Project Information for Project 5P01CA078378-03 (online at https://projectreporter.nih.gov/project_info_details.cfm?aid=6174254&icde=48914442) (accessed Sep. 2020).
679 Paul Richardson et al., Immunomodulatory Drug CC-5013 Overcomes Drug Resistance and Is Well Tolerated in Patients with Relapsed Multiple Myeloma, Blood (Nov. 1, 2002) (online at https://ashpublications.org/blood/article-lookup/doi/10.1182/blood-2002-03-0996) (“Supported by National Institutes of Health grants RO-1 50947 and PO-78378”).
680 Id.; National Institutes of Health, Project Information for Project 5P01CA078378-05 (online at https://projectreporter.nih.gov/project_info_details.cfm?aid=6513266&icde=48914442) (accessed Sep. 2020); National Institutes of Health, Project Information for Project 5R01CA050947-11 (online at https://projectreporter.nih.gov/project_info_details.cfm?aid=6512662&icde=48914667) (accessed Sep. 2020).
681 See Letter from Dr. Robert Justice, Division Director, Division of Drug Oncology Products, Food and Drug Administration, to Gretchen Toolan, Director of Regulatory Affairs, Celgene Corporation (June 29, 2006) (online at www.accessdata.fda.gov/drugsatfda_docs/appletter/2006/021880s001LTR.pdf). The previous December, Celgene received approval to market Revlimid to treat a subset of patients with a rare blood disorder known as myelodysplastic syndrome. See Letter from Richard Pazdur, Director, Office of Oncology Drug Products, Food and Drug Administration, to Gretchen Toolan, Director of Regulatory Affairs, Celgene Corporation (Dec. 27, 2005). But the commercial market for this approval was very limited. American Cancer Society, Key Statistics About Multiple Myeloma (Jan. 8, 2020) (online at www.cancer.org/cancer/multiple-myeloma/about/key-statistics.html).
180
To broaden its market to newly diagnosed multiple myeloma patients, Celgene once again relied on federally funded research. In 2005, Dr. S. Vincent Rajkumar and other researchers at the Mayo Clinic published a study showing that Revlimid, combined with another drug, dexamethasone, was effective in treating newly diagnosed multiple myeloma patients.682 This study was supported by nearly $300,000 in funding from NIH, with Celgene providing additional support.683
Building on the Mayo Clinic study, Dr. Rajkumar and researchers in the Eastern
Cooperative Oncology Group (ECOG) conducted a larger study showing that Revlimid combined with a low dose of dexamethasone was more effective than Revlimid combined with a high dose of dexamethasone in treating newly diagnosed multiple myeloma patients.684 The study was funded primarily by NIH, including more than $70 million in general support funding to ECOG over the course of the study.685
Once again, it was only after two federally funded studies had demonstrated positive
results that Celgene invested in the trials that would be required to obtain FDA approval to sell Revlimid to newly diagnosed multiple myeloma patients.
An internal “Strategic Rationale” memorandum from April 2009 shows that Celgene
relied on the ECOG study as a reason to invest in a larger study.686 The memorandum emphasized the “Financial Opportunity” of the investment, describing the newly diagnosed patient population as “the largest commercial opportunity for the multiple myeloma franchise.” The memorandum estimated a net present value of “nearly $1.5 billion” and an “internal rate of return on investment of 114%.” The memorandum concluded, “No other current or planned Celgene program approaches the financial value represented by realizing the assumptions in our current newly diagnosed multiple myeloma global sales forecast.”687
682 S. Vincent Rajkumar et al., Combination Therapy with Lenalidomide Plus Dexamethasone (Rev/Dex)
for Newly Diagnosed Myeloma, Blood (Dec. 15, 2005) (online at https://ashpublications.org/blood/article/106/13/4050/133250/Combination-therapy-with-lenalidomide-plus) (“Supported in part by grants CA93842 and CA10080 from the National Cancer Institute, National Institutes of Health, and the Department of Health and Human Services and Celgene Corporation”).
683 Id.; National Institutes of Health, Project Information for Project 5R01CA093842-03 (online at https://projectreporter.nih.gov/project_info_details.cfm?aid=6739049&icde=48917597) (accessed Sep. 2020).
684 S.V. Rajkumar et al., Lenalidomide Plus High-Dose Dexamethasone Versus Lenalidomide plus Low-Dose Dexamethasone as Initial Therapy for Newly Diagnosed Multiple Myeloma: An Open-Label Randomized Controlled Trial, Lancet Oncology (Jan. 2010) (online at www.ncbi.nlm.nih.gov/pmc/articles/PMC3042271/pdf/nihms241183.pdf) (“This study was funded and sponsored by the US National Cancer Institute (NCI)” and “supported by Public Health Service Grants CA23318, CA66636, CA21115, CA13650, and CA93842 from the National Cancer Institute.”).
685 National Institutes of Health, Project Information for Projects 5U10CA021115, 5U10CA023318, 5U10CA066636 for Fiscal Years 2004 to 2008 (online at https://reporter.nih.gov/) (searched 5U10CA021115, 5U10CA023318, and 5U10CA066636) (accessed Sep. 2020).
686 CELG_HCOR_000051077, at Pages 1–7. 687 Id.
181
In 2015, Celgene received FDA approval to market Revlimid for the treatment of newly
diagnosed patients.688 In 2016, then-CEO Mark Alles sent the “Strategic Rationale” memorandum to a colleague and boasted that the analysis had “grossly underestimated the cumulative and annual sales potential for Revlimid.”689
In 2017, Celgene received FDA approval to market Revlimid as maintenance therapy for
yet another segment of multiple myeloma patients: those who had already received stem cell transplants.690 Celgene once again relied on federally funded research to obtain this approval. Nearly five years earlier, the publicly funded Alliance for Clinical Trials in Oncology had published the results of a 460-patient study showing that Revlimid maintenance therapy extended the survival of multiple myeloma patients who had received stem cell transplants.691 The study was funded primarily by NIH, including more than $80 million in general support funding to
688 Letter from Ann T. Farrell, Director, Division of Hematology Products, Food and Drug Administration,
to Maricel Fong, Senior Manager of Regulatory Affairs, Celgene Corporation (Feb. 17, 2015) (online at www.accessdata.fda.gov/drugsatfda_docs/appletter/2015/021880Orig1s041ltr.pdf).
689 CELG_HCOR_000051076. 690 Letter from Ann T. Farrell, Director, Division of Hematology Products, Food and Drug Administration,
to Michael B. Faletto, Executive Director of Regulatory Affairs, Celgene Corporation (Feb. 22, 2017) (online at www.accessdata.fda.gov/drugsatfda_docs/appletter/2017/021880Orig1s049ltr.pdf).
691 Philip L. McCarthy et al., Lenalidomide After Stem-Cell Transplantation for Multiple Myeloma, New England Journal of Medicine (May 10, 2012) (online at www.ncbi.nlm.nih.gov/pmc/articles/PMC3744390/pdf/nihms381526.pdf) (“The NCI sponsored the study. Celgene provided the lenalidomide and placebo to the NCI, which in turn provided the study drugs to the investigators. Celgene had no involvement in the study design or conduct of the study or in the analysis or reporting of the data.”).
182
Alliance over the course of the study.692 Celgene provided drug samples but otherwise “had no involvement in the study design or conduct of the study.”693
Novartis—Gleevec
Novartis was also heavily reliant on federal funding for the development of Gleevec. Public documents reveal that Gleevec’s preclinical R&D costs were almost entirely funded by grants from the National Cancer Institute (NCI), a division of NIH, and nonprofit organizations. Fifty percent of preclinical funding came from NCI, while an additional 30% came from the Leukemia and Lymphoma Society and 10% came from Oregon Health & Science University.694 Novartis’s significant investment in the development of Gleevec came after pre-clinical effectiveness was well established and commercial promise was readily apparent.695 The Bayh-Dole Act of 1980 requires companies to disclose the receipt of federal funding used in a patented drug, but Novartis failed to acknowledge federal funding it received for a key Gleevec patent for 18 years after the original patent application—only doing so after the Committee launched its investigation in 2019.696 V. PRICE INCREASES NOT JUSTIFIED BY MANUFACTURING COSTS
Pharmaceutical companies also cite the cost of manufacturing and other commercial expenses to justify their pricing practices.697 However, internal data obtained by the Committee reveals that manufacturing costs for some companies rose at a significantly slower rate than the companies’ price increases for the drugs. In some instances, manufacturing costs even declined over the period for which the companies provided data. For all of the companies, manufacturing costs for their drugs were dwarfed by the drugs’ revenues.
692 National Institutes of Health, Project Information for Projects 5U10CA0319466 for Fiscal Years 2005
to 2012 (online at https://reporter.nih.gov/) (searched 5U10CA0319466) (accessed Sep. 2020). The NIH grants were to the research consortium Cancer and Leukemia Group B, which merged with two other consortia in 2011 to form the Alliance for Clinical Trials in Oncology.
693 Id. 694 A Note on Dr. Brian Druker’s Involvement in the Research and Development of Gleevec, Consumer
Project on Technology (online at http://cptech.org/ip/health/gleevec/drucker.html). 695 B.J. Druker et al., Effects of a Selective Inhibitor of the Abl Tyrosine Kinase on the Growth of Bcr-Abl
Positive Cells, National Center for Biotechnology Information, National Library of Medicine (May 1996) (online at https://pubmed.ncbi.nlm.nih.gov/8616716/).
696 35 U.S.C. § 202(c)(1); James Love, Novartis, Dana Farber, Oregon Health & Science University Wait 18 Years to Disclose NIH Funding in Key Gleevec Patent, Bill of Health (Oct. 11, 2019) (online at https://blog.petrieflom.law.harvard.edu/2019/10/11/novartis-dana-farber-oregon-health-science-university-wait-18-years-to-disclose-nih-funding-in-key-gleevec-patent/).
697 See, e.g., Big Pharma’s Go-To Defense of Soaring Drug Prices Doesn’t Add Up, The Atlantic (Mar. 23, 2019) (online at www.theatlantic.com/health/archive/2019/03/drug-prices-high-cost-research-and-development/585253/); Drug Makers Try to Justify Prescription Prices to Senators at Hearing, New York Times (Feb. 26, 2019) (online at www.nytimes.com/2019/02/26/us/politics/prescription-drug-prices.html).
183
• AbbVie: From 2009 to 2018, AbbVie collected $121 billion in net worldwide revenue from Humira.698 AbbVie reported to the Committee that the total cost of producing and selling Humira between 2009 and 2018 was $13.9 billion, equivalent to 11% of AbbVie’s revenues from Humira in the same period.699 Although the cost of producing and selling Humira increased by 137% over that time, AbbVie raised the price of the drug approximately 220% in the same period.700
• Pfizer: According to data Pfizer provided to the Committee, Pfizer’s cost of
goods sold for Lyrica (including manufacturing costs plus other costs associated with inventory and production, as well as royalty expenses), equaled approximately 7.6% of the drug’s U.S. net revenue from 2009 to 2018.701 Pfizer raised the price of Lyrica by approximately 247% between 2009 and 2018; the cost of goods sold increased 94% over the same period.702
• Amgen: Amgen reported to the Committee that it spent $198 million to
manufacture its kidney drug Sensipar in 2016—its highest manufacturing costs for any year between 2009 and 2018.703 Amgen’s net revenue from Sensipar that year was six times higher, approximately $1.24 billion.704 Amgen reported that
698 AbbVie Inc., 2019 Form 10-K (Feb. 21, 2020) (online at https://investors.AbbVie.com/sec-filings/sec-
filing/10-k/0001551152-20-000007); AbbVie Inc., 2016 Form 10-K (Feb. 17, 2017) (online at https://investors.AbbVie.com/node/10016/html); AbbVie Inc., 2015 Form 10-K (Feb. 19, 2016) (online at https://investors.AbbVie.com/node/9521/html). Committee staff were unable to provide a similar analysis for Imbruvica because of complexities related to cost sharing and worldwide revenue due to AbbVie’s collaboration with Janssen.
699 Letter from Gibson, Dunn and Crutcher LLP, on behalf of AbbVie Inc., to Chairwoman Carolyn B. Maloney, House Committee on Oversight and Reform (Sept. 11, 2020).
700 Id.; IBM Micromedex Redbook, Wholesale Acquisition Cost and Average Wholesale Price History for Humira. This calculation is based on the wholesale acquisition cost of a 40 mg syringe on Sept. 2, 2009, ($1,523.97) and Jan. 1, 2018, ($4,872.03).
701 SRR_PFIZHCOR_00026815. 702 Id.; IBM Micromedex Redbook, Wholesale Acquisition Cost and Average Wholesale Price History for
Lyrica. This calculation is based on the wholesale acquisition cost of a 90-pill package of the 75 mg oral capsule on Jan. 3, 2009, ($192.77) and July 16, 2018, (668.84). After executing a Lyrica price increase on July 1, 2018, Pfizer rolled back the price increase following public pressure. On July 16, 2018, Pfizer returned the price of Lyrica to $668.84. See IBM Micromedex Redbook, Wholesale Acquisition Cost and Average Wholesale Price History for Lyrica; Damian Paletta, Pfizer Buckles Under Pressure from Trump, Delays Drug Price Increases, Washington Post (July 10, 2018) (online at www.washingtonpost.com/news/business/wp/2018/07/10/pfizer-buckles-under-pressure-from-trump-delays-drug-price-increases/).
703 Id. 704 Amgen Inc., 2015 Form 10-K (Feb. 16, 2016) (online at
www.sec.gov/Archives/edgar/data/318154/000031815416000031/amgn-12312015x10k.htm).
184
its manufacturing costs for Enbrel declined from 2009 to 2018. Over that time, the costs of goods sold equaled approximately 14% of net U.S. revenue.705
• Teva: From 2013 to 2018, Teva’s reported per-unit manufacturing cost for
Copaxone was between 0.5% and 3% of the net price of the drug, the price after accounting for rebates and discounts.706
• Celgene: In response to the Committee’s inquiry, Celgene reported
manufacturing costs for all of its products.707 Even when taking into account selling, general, and administrative expenses (SG&A) for all of the company’s products, sales revenue from Revlimid far exceeded costs and expenses in every year for which data was provided. While some of the company’s SG&A expenses increased over time, cost of goods sold remained relatively stable. Nevertheless, the company managed to substantially grow the profit margins that it derived from Revlimid. Figure 5 below shows the year-over-year worldwide gross profit margins for Revlimid.708
705 AMGN-HCOR-RR-00439895; Letter from King & Spalding, on behalf of Amgen Inc., to Chairman
Elijah E. Cummings, House Committee on Oversight and Reform (Mar. 15, 2019). 706 Letter from Kirkland and Ellis LLP, on behalf of Teva Pharmaceutical Industries Ltd., to Chairman
Elijah E. Cummings, House Committee on Oversight and Reform (July 18, 2019); Letter from Kirkland and Ellis LLP, on behalf of Teva Pharmaceutical Industries Ltd., to Chairman Elijah E. Cummings, House Committee on Oversight and Reform (Aug. 9, 2019).
707 Letter from Covington & Burling LLP, on behalf of Celgene Corporation, to Chairman Elijah E. Cummings, House Committee on Oversight and Reform (May 24, 2019).
708Id.; Celgene Corporation, 2018 Form 10-K (Feb. 26, 2019) (online at www.sec.gov/Archives/edgar/data/816284/000081628419000014/a2018123110-k.htm); Celgene Corporation, 2016 Form 10-K (Feb. 10, 2017) (online at www.sec.gov/Archives/edgar/data/816284/000081628417000003/a2016123110k.htm); Celgene Corporation, 2014 Form 10-K (Feb. 20, 2015) (online at www.sec.gov/Archives/edgar/data/816284/000162828015000889/a2014123110k.htm); Celgene Corporation, 2012 Form 10-K (Fed. 15, 2013) (online at www.sec.gov/Archives/edgar/data/816284/000104746913001186/a2212863z10-k.htm).
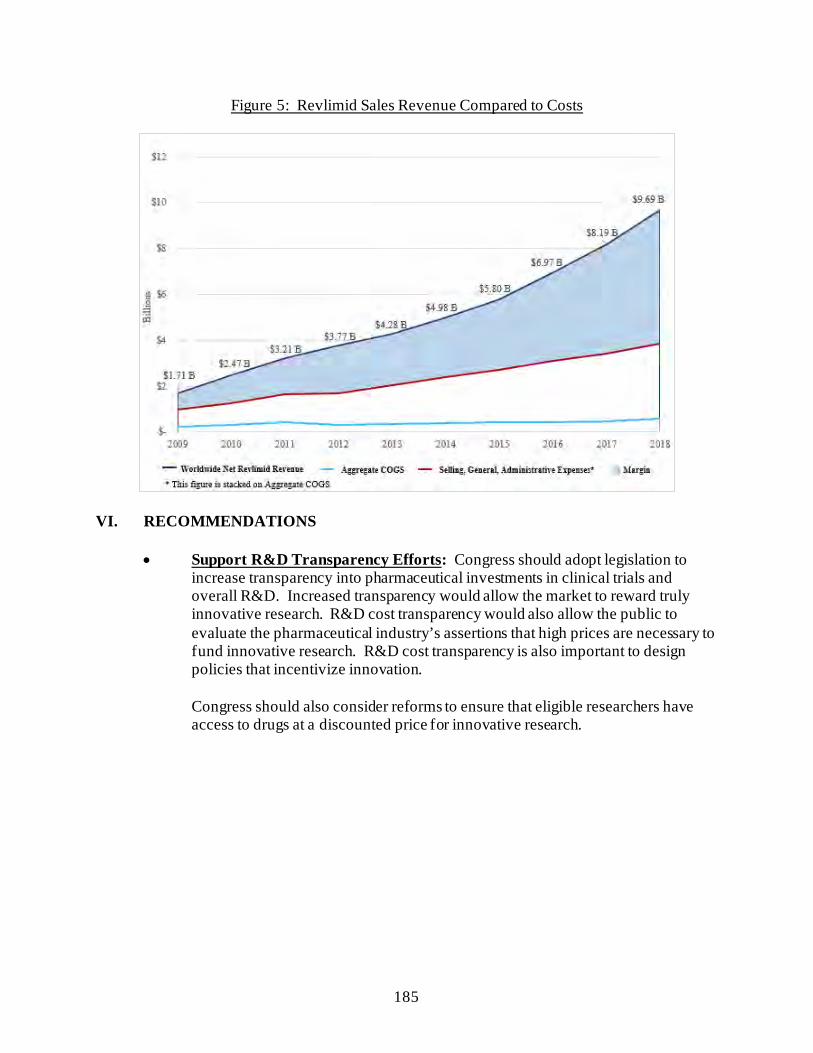
185
Figure 5: Revlimid Sales Revenue Compared to Costs
VI. RECOMMENDATIONS
• Support R&D Transparency Efforts: Congress should adopt legislation to increase transparency into pharmaceutical investments in clinical trials and overall R&D. Increased transparency would allow the market to reward truly innovative research. R&D cost transparency would also allow the public to evaluate the pharmaceutical industry’s assertions that high prices are necessary to fund innovative research. R&D cost transparency is also important to design policies that incentivize innovation. Congress should also consider reforms to ensure that eligible researchers have access to drugs at a discounted price for innovative research.
186
CONCLUSION
This report is intended to provide policymakers, regulatory enforcement agencies, and the public with a better understanding of how the marketplace for branded prescription drugs operates in the United States. The Committee’s investigation confirms that the pharmaceutical industry has targeted the United States for price increases for many years while cutting prices in the rest of the world—in part because current law prohibits Medicare from negotiating directly with drug companies to lower prices. The Committee’s investigation also uncovered new evidence about the strategies drug companies use to suppress competition and keep prices high. In addition, the investigation found that the pharmaceutical industry’s claims that price increases are needed to recoup investments in research and development or account for rebates and other discounts in the pharmaceutical supply chain are not substantiated by the companies’ own internal data and documents.
The Committee’s investigation makes clear that significant structural reforms—including provisions in the Build Back Better Act to empower Medicare to negotiate directly for certain drugs—are needed to curb the pharmaceutical industry’s uninhibited pricing practices, ensure Americans can afford their prescriptions, and reduce the high burden on taxpayers. Reforms are also needed to address the anticompetitive practices identified in the Committee’s investigation.
187
Appendix Letters to Drug Manufacturers
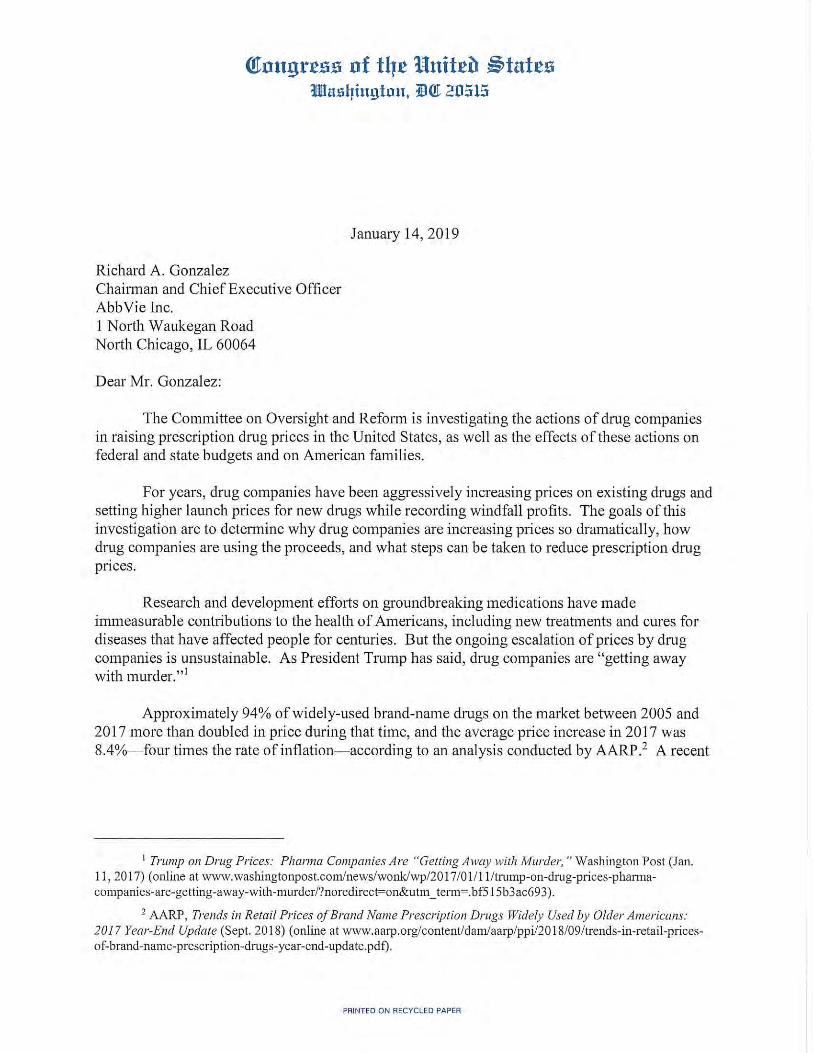
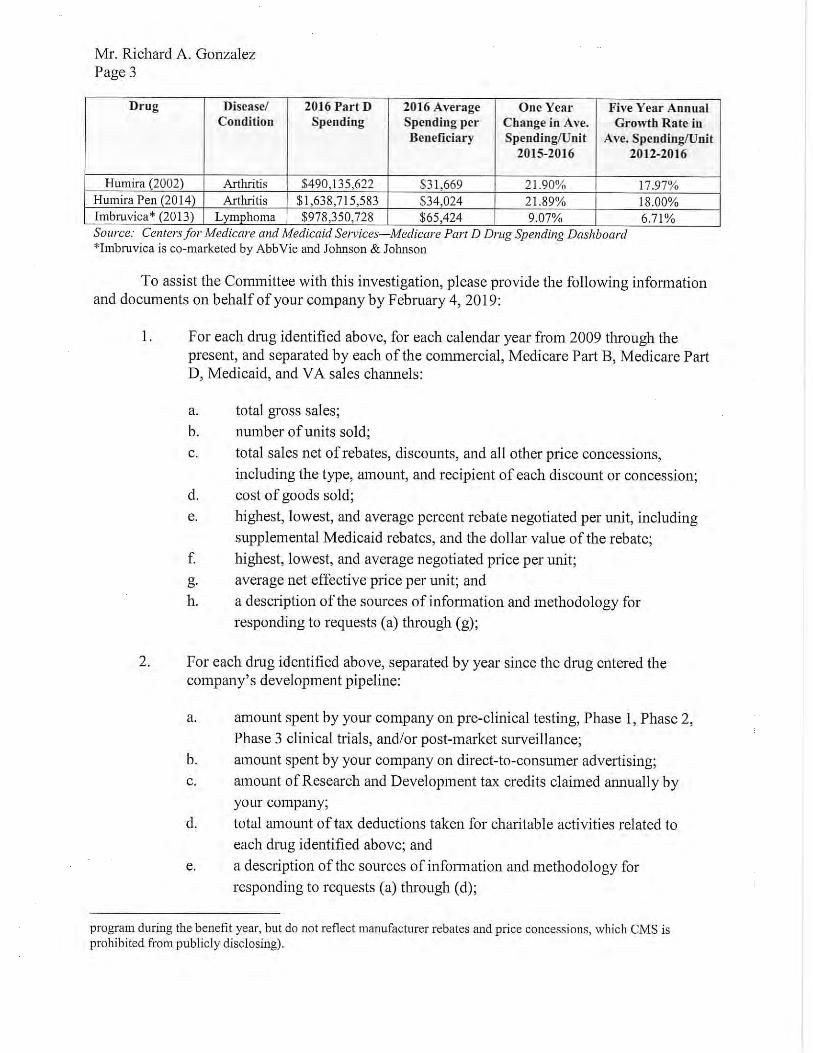

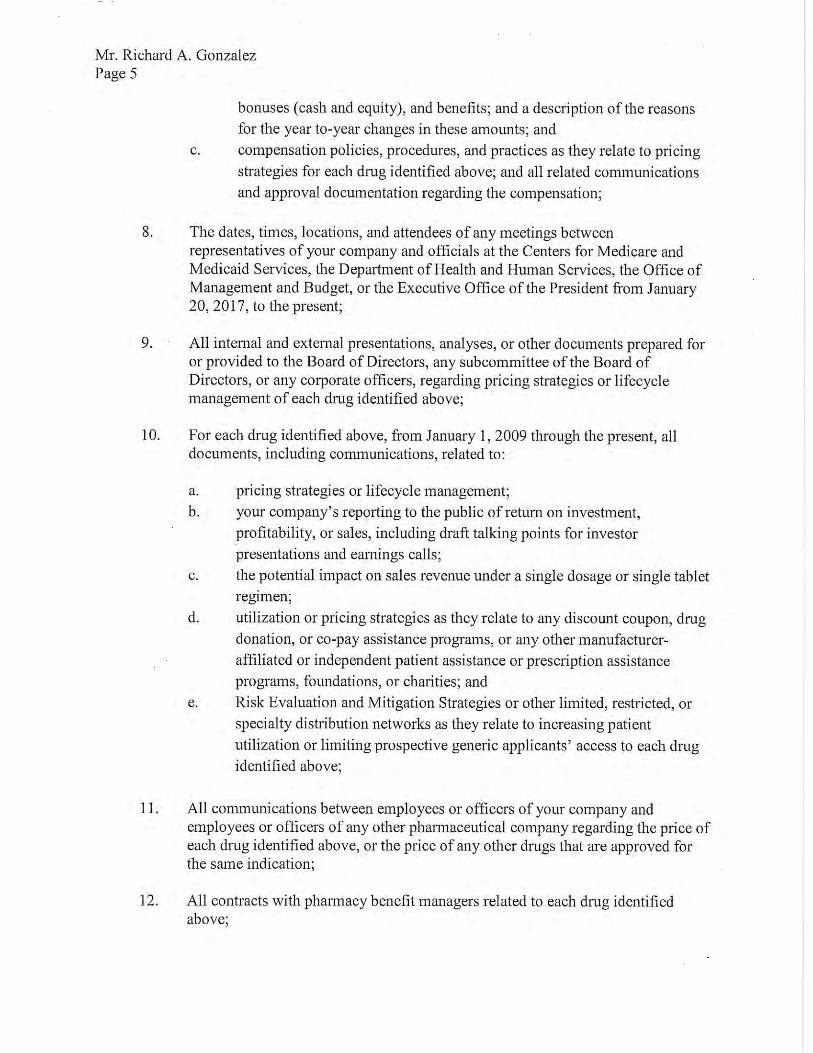
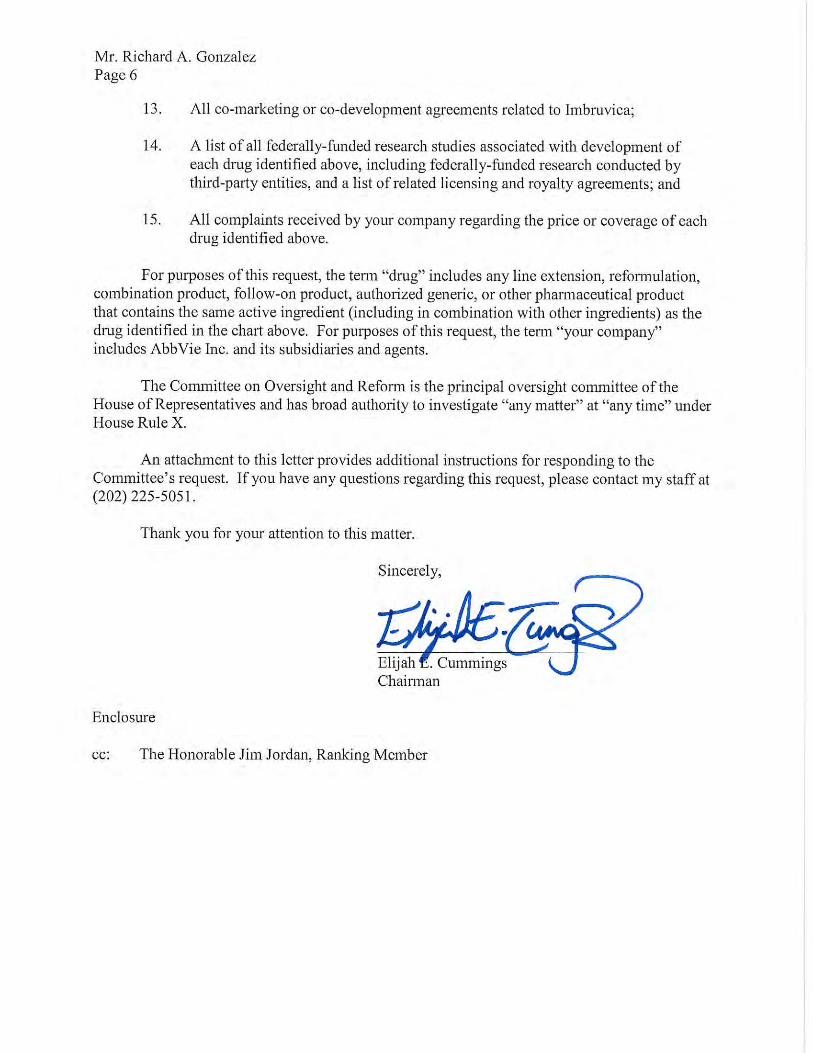
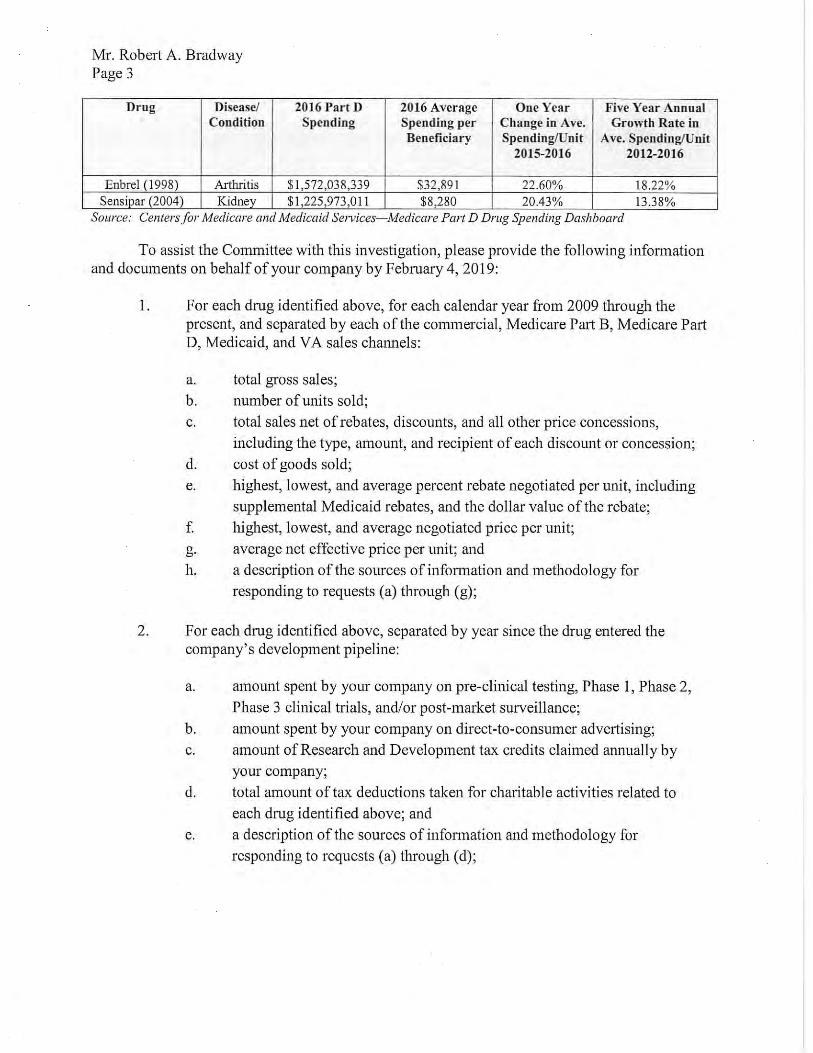


Mr. Mark J. Alles Page 3
Drug Disease/ 2016 Part D 2016 Average One Year Five Year Annual
Condition Spending Spending per Change in Ave. Growth Rate in
Beneficiary Spending/Unit Ave. Spending/Unit
2015-2016 2012-2016
8.70% Revlimid (2005) Cancer $2,661,602,600 $75,238 10.96%
Source: Centers for Medicare and Medicaid Services-Medicare Part D Drug Spending Dashboard
To assist the Committee with this investigation, please provide the following infonnation and documents on behalf of your company by February 4, 2019:
1. For each drug identified above, for each calendar year from 2009 through thepresent, and separated by each of the commercial, Medicare Part B, Medicare PartD, Medicaid, and VA sales channels:
a. total gross sales;
b. number of units sold;
c. total sales net of rebates, discounts, and all other price concessions,
including the type, amount, and recipient of each discount or concession;
d. cost of goods sold;
e. highest, lowest, and average percent rebate negotiated per unit, including
supplemental Medicaid rebates, and the dollar value of the rebate;
f. highest, lowest, and average negotiated price per unit;
g. average net effective price per unit; and
h. a description of the sources of infonnation and methodology for
responding to requests (a) through (g);
2. For each drug identified above, separated by year since the drug entered thecompany's development pipeline:
a. amount spent by your company on pre-clinical testing, Phase 1, Phase 2,
Phase 3 clinical tiials, and/or post-market surveillance;
b. amount spent by your company on direct-to-consumer advertising;
c. amount of Research and Development tax credits claimed annually by
your company;
d. total amount of tax deductions taken for charitable activities related to
each drug identified above; and
e. a description of the sources of infonnation and methodology for
responding to requests (a) through (d);
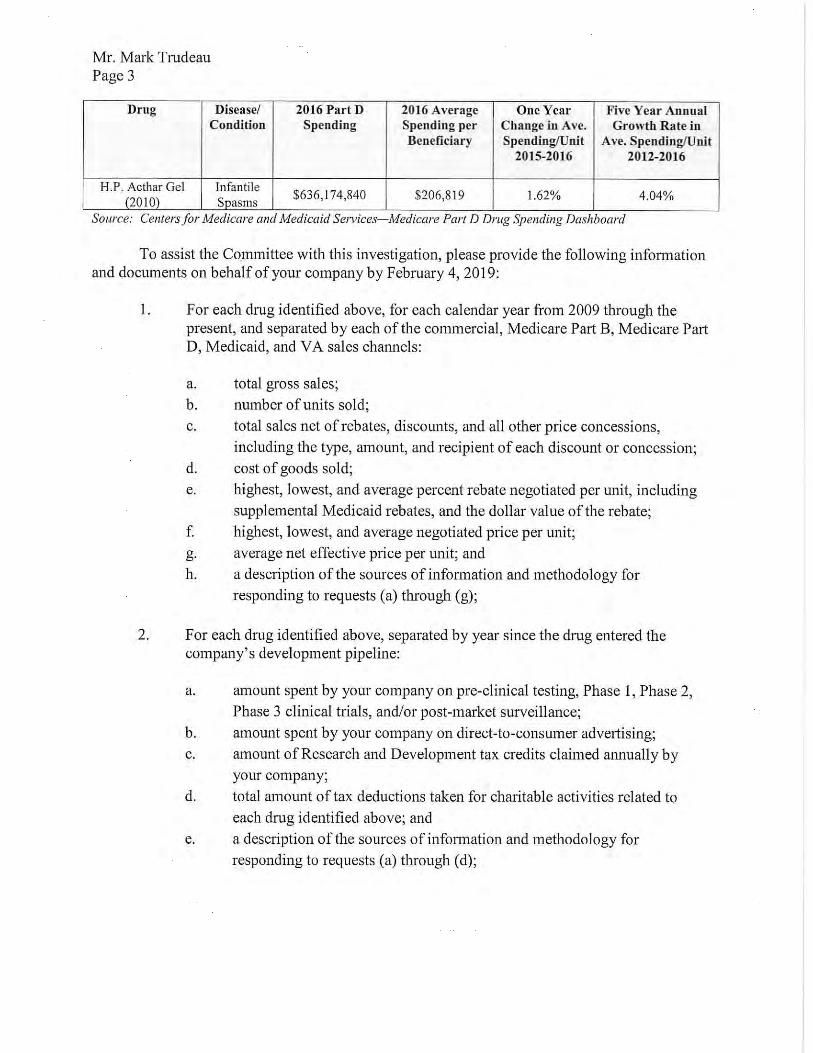
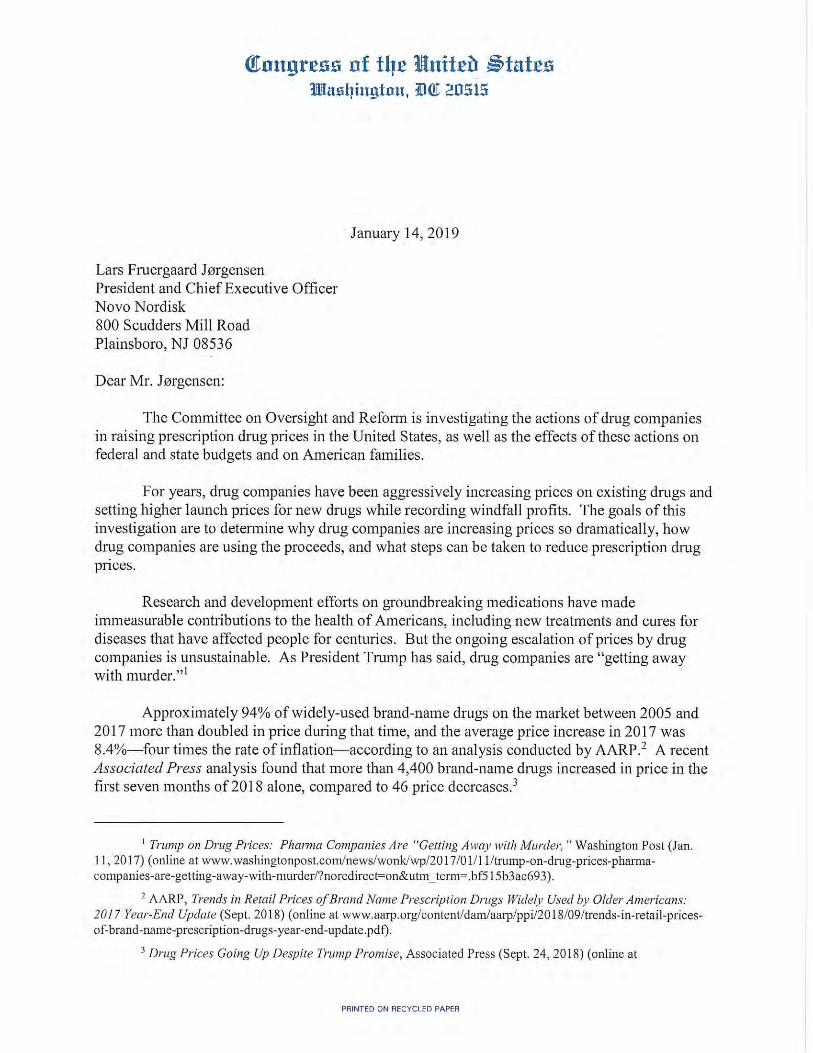
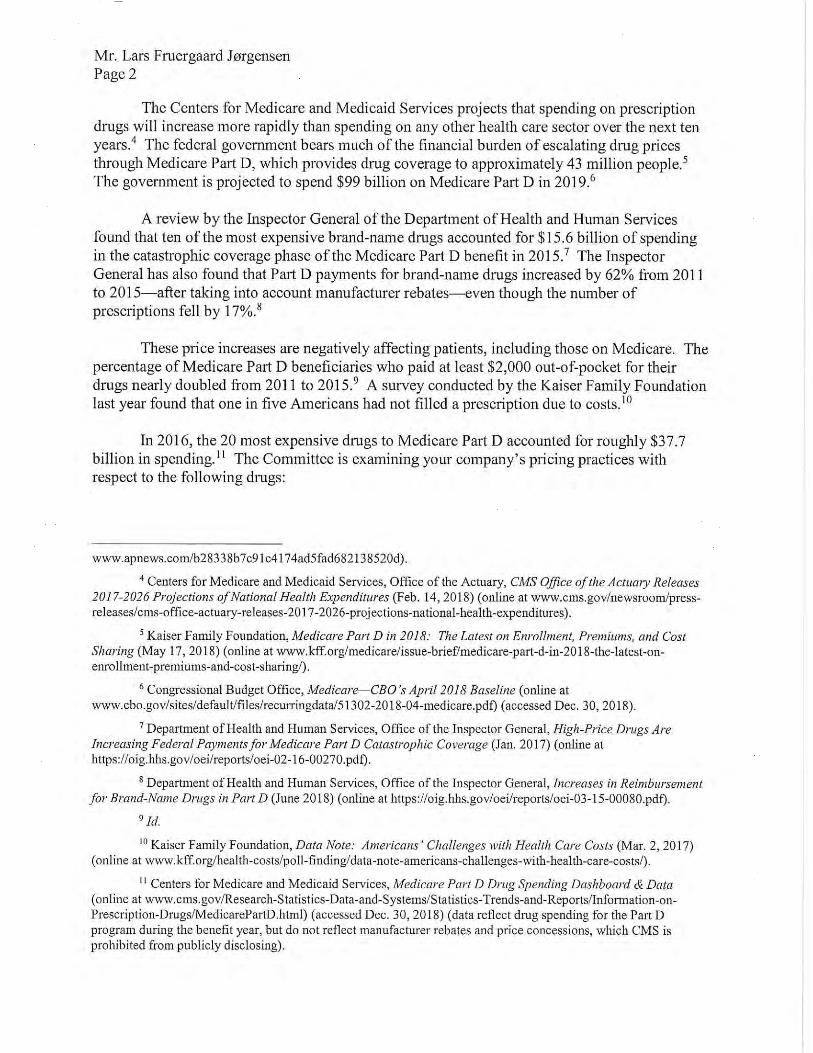

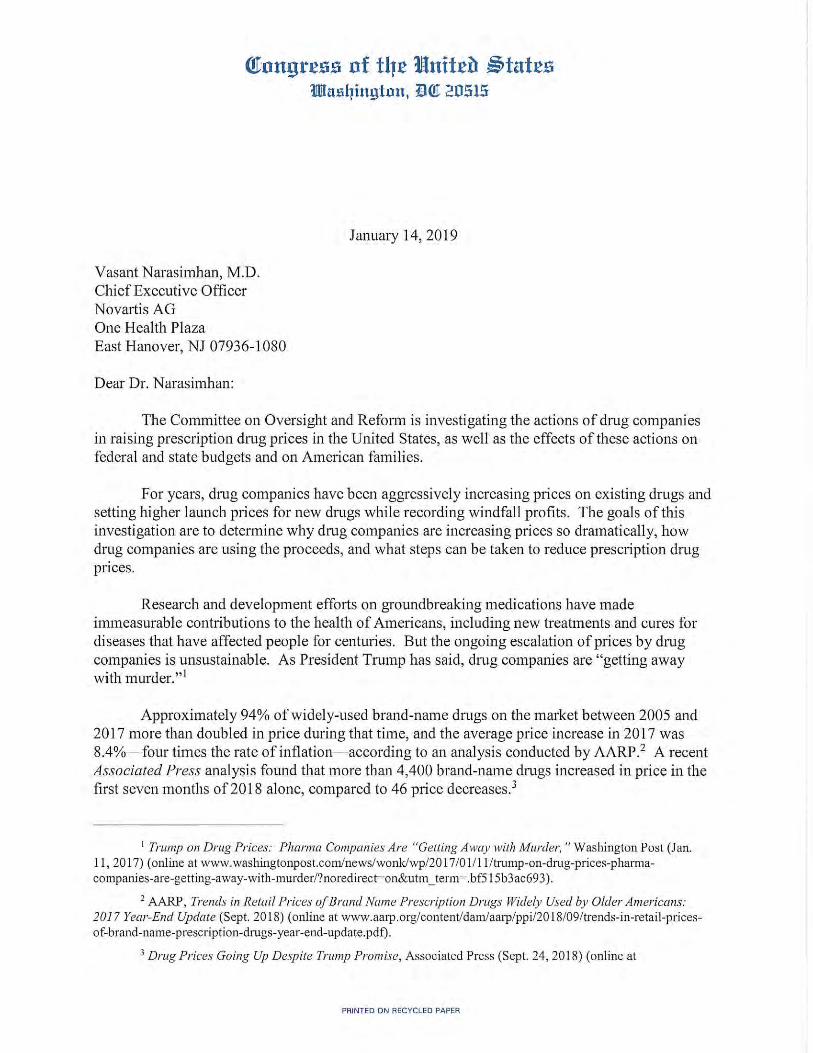


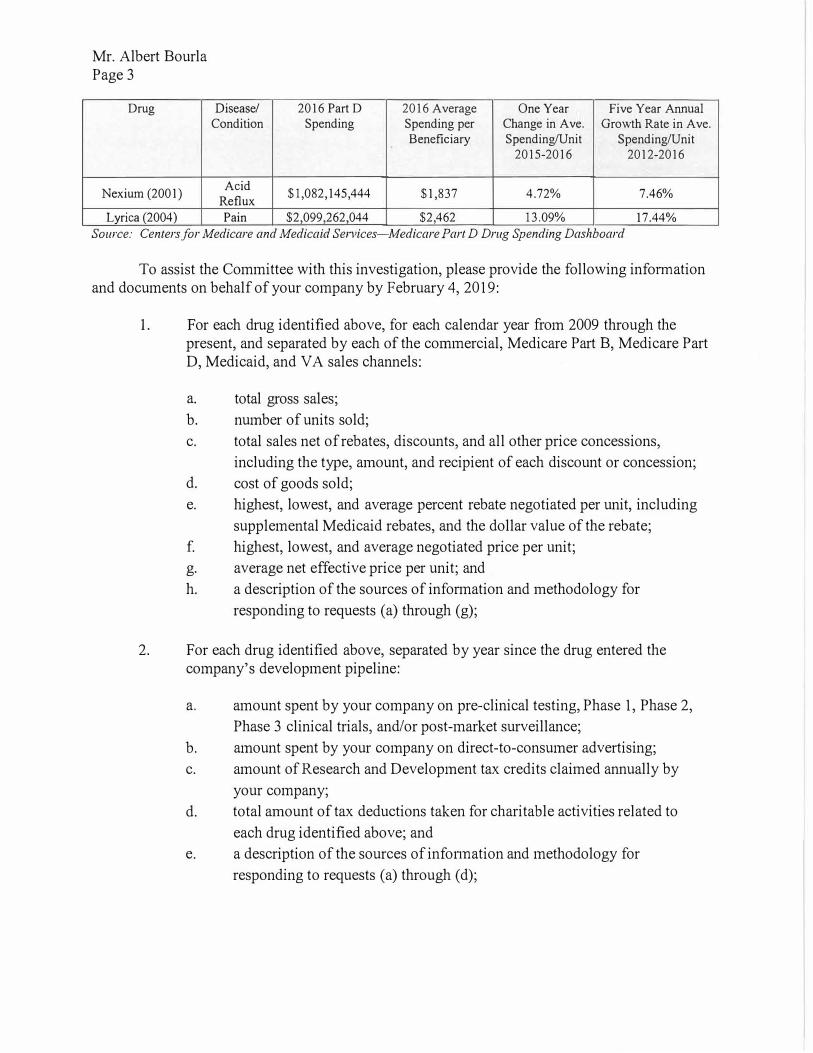
Mr. Albert Bourla Page 3
Drug Disease/ 2016 Part D 2016 Average One Year Five Year Annual Condition Spending Spending per Change in Ave. Growth Rate in Ave.
Beneficiary Spending/Unit Spending/Unit 2015-2016 2012-2016
Nexium (2001) Acid
$1,082,145,444 $1,837 4.72% 7.46% Reflux
17.44% Lvrica (2004) Pain $2,099,262,044 $2,462 13.09%
Source: Centers for Medicare and Medicaid Services-Medicare Part D Drug Spending Dashboard
To assist the Committee with this investigation, please provide the following infonnation and documents on behalf of your company by February 4, 2019:
1. For each drug identified above, for each calendar year from 2009 through thepresent, and separated by each of the c01mnercial, Medicare Part B, Medicare PartD, Medicaid, and VA sales channels:
a. total gross sales;
b. number of units sold;
c. total sales net of rebates, discounts, and all other price concessions,
including the type, amount, and recipient of each discount or concession;
d. cost of goods sold;
e. highest, lowest, and average percent rebate negotiated per unit, including
supplemental Medicaid rebates, and the dollar value of the rebate;
f. highest, lowest, and average negotiated price per unit;
g. average net effective price per unit; and
h. a description of the sources of information and methodology for
responding to requests (a) through (g);
2. For each drug identified above, separated by year since the drug entered thecompany's development pipeline:
a. amount spent by your company on pre-clinical testing, Phase 1, Phase 2,
Phase 3 clinical trials, and/or post-market surveillance;
b. amount spent by your company on direct-to-consumer advertising;
c. amount of Research and Development tax credits claimed annually by
your company;
d. total amount of tax deductions taken for charitable activities related to
each drug identified above; and
e. a description of the sources of infonnation and methodology for
responding to requests (a) through (d);