pricing sustainable development
TRANSCRIPT

Pricing Sustainable Development
Caroline GAUTHIER
Grenoble Ecole de Management – DFR Marketing BP 127 - 38003 Grenoble Cedex 01 - France
[email protected] Tel : +33 4 76 70 62 60 Fax : +33 4 76 70 60 99
Abstract. One of the difficulties in sustainable management is pricing non-market
elements of a management strategy so that they can be weighted and prioritized correctly.
Contingent valuation appears to be one approach to solving this problem.
The Contingent Valuation Method is based on consumers’ direct revelation in
contingent scenario situations. This permits revealing people’s willingness to pay for a non-
marketed good, like more fresh air or a program of environmental preservation.
This paper presents an application of the Contingent Valuation Method to a public
sector case on environmental preservation. A contingent valuation survey was carried out on a
local sample of 402 individuals to reveal the value they give to a particular biodiversity
program. Methodology and results are explained with the view to providing a tool for
managers involved in developing policies that have a sustainable advantage.
Keywords. Sustainable Development, Contingent Valuation, Research Methods, Pricing.
2
Pricing Sustainable Development
1. Introduction
The 1992 World Summit in Rio on Environment and Development clearly established the
objective of sustainable development. Ten years later, that objective still remains the goal of
the world community (Millennium Development Goals, United Nations Millennium
Declaration, 2000). Achieving this objective requires considerable resources. The official
financier will not have sufficient flows to meet the tremendous needs. Estimates indicate that
it will take on the order of an additional US$40 to $60 billion a year to reach the Millennium
Development Goals. Other sources of resources must be sought. Developing countries could
generate some of the resources they need for sustainable development. The private sector,
developing countries, donors, and local communities could contribute to this effort. Therefore,
managers need a way to measure the amount of capital such entities would be willing to
invest.
We assume people are willing to pay for sustainable development benefits. However, these
benefits are likely to be implicitly treated as zero unless their dollar value is somehow
estimated. The Contingent Valuation Method (CVM) was developed and improved by
economists Davis (1963) and Arrow et al (1993) to estimate both use and non use values of
benefits. The CVM involves directly asking people, in a survey, how much they would be
willing to pay for specific services. They are asked to state their Willingness To Pay (WTP)
contingent on a specific hypothetical scenario and description of the service. This method is
relatively flexible and is based on revealed preferences rather than stated ones. But its use is
very controversial too. People are asked to value a good in a hypothetical acquisition
situation. Because it does not correspond to a real buying situation, the value may contain
3
biases. Guidelines to avoid biases were developed by the NOAA Panel (Arrow et al, 1993)
and have been improved, for example see Berrens et al (2002).
The CVM could become a necessary tool for experts, researchers, policy makers and business
leaders who are involved in sustainable development. Getting an ex-ante value of policies
with a sustainable advantage is of great help for decisions. This paper proposes, through a
public sector case for environmental preservation, to describe the Contingent Valuation
Methodology and results. Special care is given in the description of the questionnaire design.
The 1992 World Summit recommended discussions on the approach to safeguard biodiversity
and to implement national conservation strategies (UNEP, 1992). The case presented for this
article is a pilot valuation study of a biodiversity preservation program. It was financed by the
French Ministry of Environment. The model is proposed in section 2. The study is described
in section 3. Methodological choices are explained is section 4. Results are given in section 5.
Section 6 contains the conclusions.
2. The Model
2.1 A two step-model
Researchers, policy makers, business leaders and experts in sustainable development
should be interested in getting more information on people’s incentives to participate in
sustainable development projects. Such information could help build new projects for
sustainable development.
To get richer information for the manager, the choice has been made to consider two steps in
the valuation process. Then the manager gets information on the explanatory variables of the

4
WTP amount, and on the variables of the choice to financially participate in the preservation
program.
In the first step, people are asked if they accept or refuse to financially participate in the
preservation program. The 1 toequal is i
choice if the individual wishes to participate and zero
otherwise.
In the second step, people who chose to financially participate are asked their WTP for the
program.
The Full-Likelihood model (Davidson and MacKinnon, 1993) allows revealing both the
variables explaining the choice to participate and the amount of the WTP. This is written:
11i
22
*
WTP
and
otherwise 0
0 if 1
ii
i
ii
iii
uZ
choice
choicechoice
uXchoice
+=
=
>=
+=
β
β
(1)
21 and ββ are unknown parameter vectors, 1k x :iX i.i.d. variables vector, 1 x l :
iZ i.i.d.
variables vector. We assume errors are correlated:
2
221
21
2
121 ,
0
0N~ ),(
σσρσσρσσ
iiuu (2)
The method of the maximum of likelihood allows us to deal with this two-step model. The
corresponding likelihood function L is given in appendix 8.2.
2.2 Description of variables
The variables used in the model are given in the table A.

5
Table A: Description of variables
Var. Meaning
Apprec =1 if the individual takes the valuation exercise seriously, as estimated by the interviewer, =0 otherwise
Freq =1 if the interviewee regularly frequents the river banks (at least 1 or 2 times a month), =0 otherwise
Env =1 if the environment is a priority for the individual, =0 otherwise
foy number of persons in the family
Rev monthly family income
Age age of the interviewee
Sexe =1 if the interviewee is a female, =0 otherwise
Stamar =1 if the interviewee is married, =0 otherwise
Etu individual education level (from 1 : primary school to 7 : more than 2 years university studies)
Impôt amount of local taxes paid by the household last year
Enf Number of children
Res =1 if the individual’s principal residence is in the department, =0 otherwise
The vector iX of variables describing the choice to participate is:
Const1) Res, Enf, Impôt, Etu, Stamar, Sexe, Age, Rev, Foy, Env, Freq, Apprec,(=iX (3)
The vector iZ of variables describing the amount of the WTP is:
Const2) Res, Enf, Impôt, Etu, Stamar, Sexe, Age, Rev, Foy, Env, Freq, Apprec,(=iZ (4)
Results are given in section 5.
3. The Study
3. 1 The site
The Garonne River Forests, in the South of France, were selected. The Garonne River
is the fourth longest river in France (600 km) and has historically played a important role in
the local economic activities. Its forests have an important ecological role in terms of species
reproduction and migration, natural pollution filters and bank stabilization. These forests have
been modified by human activities and are today threatened by homogeneisation and
disappearance of species by intensive production activities. The Ministry of the Environment
and the Regional Agency of Midi-Pyrénées, needed a measure of the local population

6
willingness to pay for the site preservation to determine the level of preservation to be
implemented.
3. 2 The good to value
The good to value is the preservation program of the Garonne River Forests
biodiversity. A possible preservation program with different levels of preservation was
defined by the biologists of the CESAC (Tabacci and Tabacci, 1996). It concerns a 70
kilometers portion along the river. Different levels of preservation corresponds to different
widths of preservation along the River.
3. 3 The Survey
The contingent valuation survey was carried out, in 1996, on a local sample of 402
individuals of the “Départements” of the Tarn-et-Garonne and Haute-Garonne in order to
reveal the value for the preservation program. The survey zones were uniformally distributed
around the River. Individual quotas were chosen from the general return of population
realised by the INSEE (French National Statistics Institute) with the quotas method. Criteria
are sex, age and employment. Descriptive statistics are given in appendix 8.1. Interviews were
conducted face-to-face by professional surveyors.
4. Methodological choices
4.1 CVM implications
Since it is based on stated preferences rather than observed preferences, the CVM
must be applied with great care. People are invited to announce the price they would be
willing to pay for a good in a hypothetical situation. This means that (1) there is no real

7
payment, (2) the interviewee may not be familiar with the good, and that (3) the announced
price or value is strongly dependent on the questionnaire design.
To be specific we shall expand on these items below:
(1) Since there is no real payment, the scenario has to be realistic and the
interviewee must feel, when answering the questionnaire, that the described scenario could
happen. Hence the implementation of the preservation program was presented as imminent.
The choice of the local tax like payment vehicle implies every household will have to pay.
(2) Since there is no observed behaviour, it means the individual may not be
familiar with the good, with the buying situation (see Mitchell and Carson, 1989, for a
complete typology of biases). The price he/she will announce is strongly dependent on the
information given in the questionnaire. The questionnaire must supply an objective as well as
sufficient information to the interviewee to make a decision (see 3.2 Questionnaire design).
(3) Depending on the educational level of the interviewee, it is possible
information given in the questionnaire and the questions themselves may be perceived
differently (Mitchell and Carson, 1989). A pretest of the questionnaire is recommended to
avoid misspecifications or misunderstanding errors. The questionnaire was tested by the
Verbal Protocols method and revised thereafter.
4. 2 Questionnaire design
The structure of the questionnaire contains four parts: (i) description of the context, (ii)
description of the good to value and the contingent scenario, (iii) revelation questions, (iv)
questions relative to variables under study.
Again to be specific we shall expand on these items below:

8
(i) The description of the context has to be complete and clear. “Neutral” photos and
maps of the site are provided. A simple definition of biodiversity is recalled.
(ii) The description of the good to value and the scenario in which the individual can
get the good has to be precise and illustrated. Corresponding costs have to be
shown if available. Graphical representations of the different levels of preservation
are given in the study. Advantages and drawbacks are presented, for example some
level of preservation may imply a restricted access to the site.
(iii) The revelation question may be open or closed-ended. It must contain every part of
the scenario: good to value (i.e. preservation program), payment vehicle (i.e. local
tax) and duration of the program (i.e. 5 years). In this study, interviewees were
first asked if they “accept or refuse to financially participate in the program” and
secondly they were asked to reveal “the maximum amount” they “would accept to
pay, each year and over five years, for the preservation of the biodiversity of the
Garonne River forests”. Questions are used to help interviewee to arrive at a
relevant value relative to his budget constraint, for example a possible implication
in other sustainable development programs (another site for example). At the end,
people must have the opportunity to revise their value.
(iv) Questions relative to other parameters in the study such as socioeconomic
variables are added (see 2.2 Description of variables).

9
5. Results
The CVM leads to different levels of results. The manager of sustainable development may
just want to know the price people place on a specific good, or may be interested in knowing
the parameters that determine this value or variables that explain the choice to financially
participate.
5.1 Price of good
A first step consists in eliminating the “irrelevant” responses, for example incomplete
responses. The average price is then obtained by the average mean for WTP for the reduced
sample. The price of the good will then correspond to the obtained average price multiplied
by the size of the concerned population.
In 1996, the average WTP for the preservation of the Garonne River forests biodiversity was
USD 14. This value is plausible relative to interviewees’ budget constraint and to values
found in other similar studies. Aggregate value for the program of environmental preservation
is then 2.5 millions US dollars each year over the five years. This concrete measure allows the
regional manager to define the optimal level of preservation to implement through a cost-
benefit approach.
5.2 Significant variables
The likelihood function L corresponding to the model is described in section 2. Log(L)
is maximised by the Newton-Raphson algorithm. Estimations are computed with STATA.
Significant variables are given in table B.
10
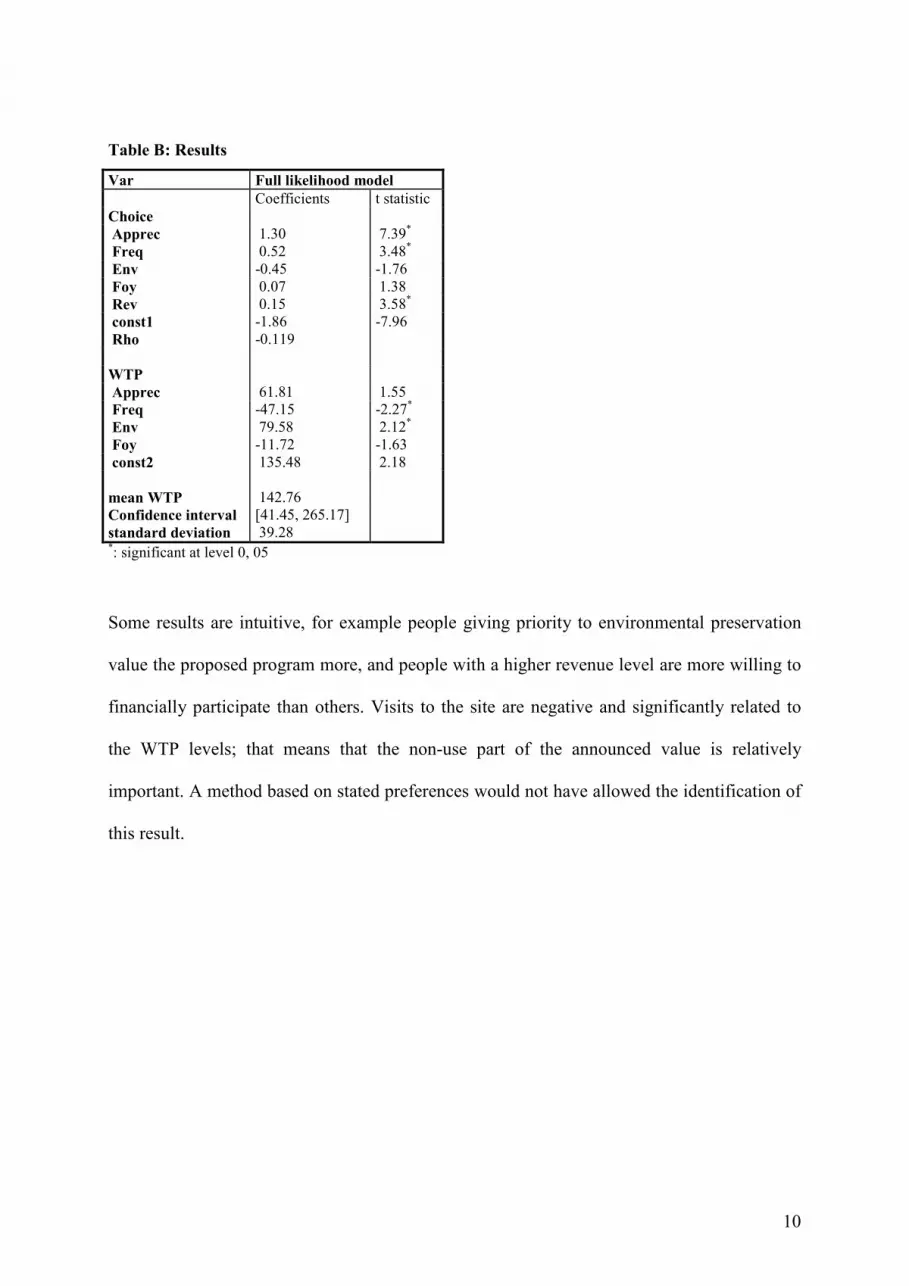
Table B: Results
Var Full likelihood model
Coefficients t statistic
Choice
Apprec 1.30 7.39*
Freq 0.52 3.48*
Env -0.45 -1.76
Foy 0.07 1.38
Rev 0.15 3.58*
const1 -1.86 -7.96
Rho -0.119
WTP
Apprec 61.81 1.55
Freq -47.15 -2.27*
Env 79.58 2.12*
Foy -11.72 -1.63
const2 135.48 2.18
mean WTP 142.76
Confidence interval [41.45, 265.17]
standard deviation 39.28 *: significant at level 0, 05
Some results are intuitive, for example people giving priority to environmental preservation
value the proposed program more, and people with a higher revenue level are more willing to
financially participate than others. Visits to the site are negative and significantly related to
the WTP levels; that means that the non-use part of the announced value is relatively
important. A method based on stated preferences would not have allowed the identification of
this result.

11
6. Conclusion
This paper proposed to present the Contingent Valuation Method to researchers and managers
on sustainable development. This methodology allows us to identify a price for non-use
benefits or non-marketed goods. Knowing such a price may help managers to define the
optimal level of sustainable development they have to implement.
The case study treated here gives a concrete illustration of the CVM. The description of the
different steps may serve as guidelines to realise a study using this methodology.
The Garonne River forests site is not a highly frequented natural site. There is then no use
value for that site. However, the use of the CVM shows inhabitants are willing to preserve the
site, and moreover to pay for such a preservation. Local population is ready to pay 2.5
millions US dollars each year over five years. The Regional Agency has then a concrete
measure of the budget it may invest in that program. That will be of great help in defining the
level of preservation to implement.
Because the CVM is the only available method to obtain prices for non-use benefits of non-
marketed goods, it is a source of many applications for marketers. This could help in finding
solutions face to the growing demand for environmental respect, sustainable development or
more generally social responsibility.
12
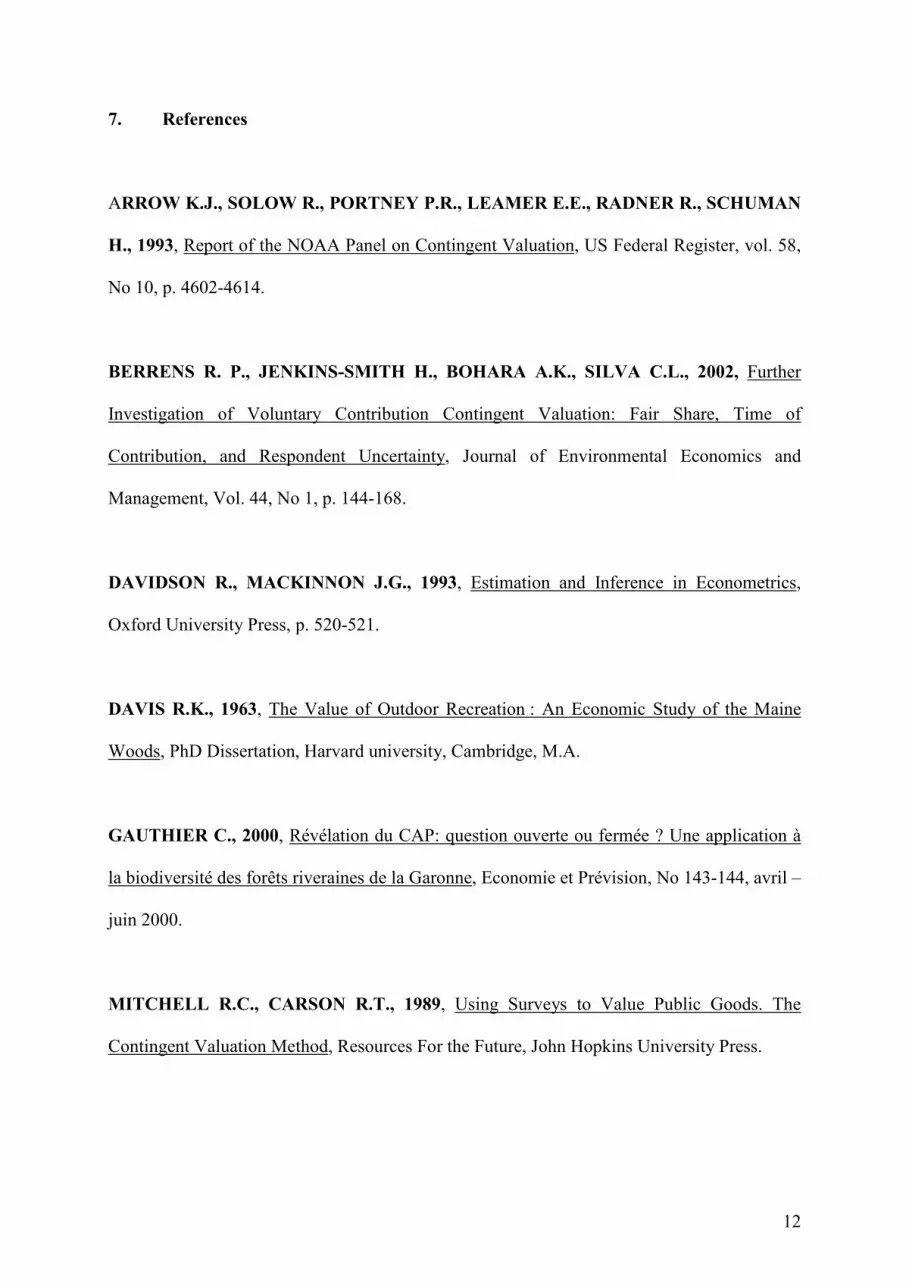
7. References
ARROW K.J., SOLOW R., PORTNEY P.R., LEAMER E.E., RADNER R., SCHUMAN
H., 1993, Report of the NOAA Panel on Contingent Valuation, US Federal Register, vol. 58,
No 10, p. 4602-4614.
BERRENS R. P., JENKINS-SMITH H., BOHARA A.K., SILVA C.L., 2002, Further
Investigation of Voluntary Contribution Contingent Valuation: Fair Share, Time of
Contribution, and Respondent Uncertainty, Journal of Environmental Economics and
Management, Vol. 44, No 1, p. 144-168.
DAVIDSON R., MACKINNON J.G., 1993, Estimation and Inference in Econometrics,
Oxford University Press, p. 520-521.
DAVIS R.K., 1963, The Value of Outdoor Recreation : An Economic Study of the Maine
Woods, PhD Dissertation, Harvard university, Cambridge, M.A.
GAUTHIER C., 2000, Révélation du CAP: question ouverte ou fermée ? Une application à
la biodiversité des forêts riveraines de la Garonne, Economie et Prévision, No 143-144, avril –
juin 2000.
MITCHELL R.C., CARSON R.T., 1989, Using Surveys to Value Public Goods. The
Contingent Valuation Method, Resources For the Future, John Hopkins University Press.

13
TABACCI A.M., TABACCI E., 1996, Annual Report of the Centre d’Etude des Systèmes
Aquatiques et Continentaux.
UNITED NATIONS MILLENNIUM DECLARATION, 2000, A/55/L2.
UNEP, 1992, Convention on Biological Diversity.
14
8. Appendices
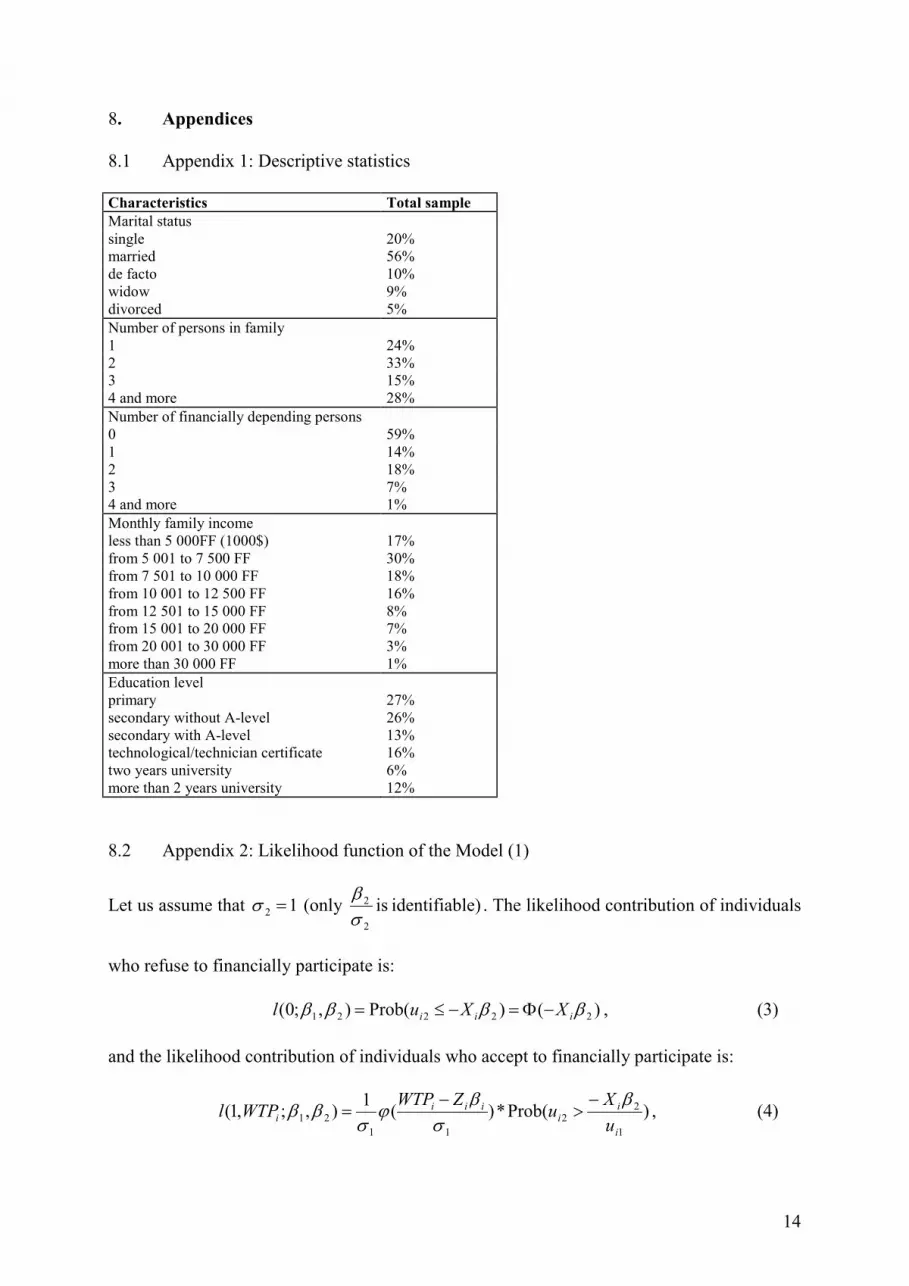
8.1 Appendix 1: Descriptive statistics
Characteristics Total sample
Marital status
single 20% married 56% de facto 10% widow 9% divorced 5%
Number of persons in family 1 24% 2 33% 3 15% 4 and more 28%
Number of financially depending persons 0 59% 1 14% 2 18% 3 7% 4 and more 1%
Monthly family income less than 5 000FF (1000$) 17% from 5 001 to 7 500 FF 30% from 7 501 to 10 000 FF 18% from 10 001 to 12 500 FF 16% from 12 501 to 15 000 FF 8% from 15 001 to 20 000 FF 7% from 20 001 to 30 000 FF 3% more than 30 000 FF 1%
Education level primary 27% secondary without A-level 26% secondary with A-level 13% technological/technician certificate 16% two years university 6% more than 2 years university 12%
8.2 Appendix 2: Likelihood function of the Model (1)
Let us assume that 12 =σ (only le)identifiab is 2
2
σβ
. The likelihood contribution of individuals
who refuse to financially participate is:
)()Prob(),;0( 22221 ββββiiiXXul −Φ=−≤= , (3)
and the likelihood contribution of individuals who accept to financially participate is:
)Prob(*)(1
),;,1(1
22
11
21
i
i
i
iii
i
u
Xu
ZWTPWTPl
βσ
βϕ
σββ
−>
−= , (4)
15
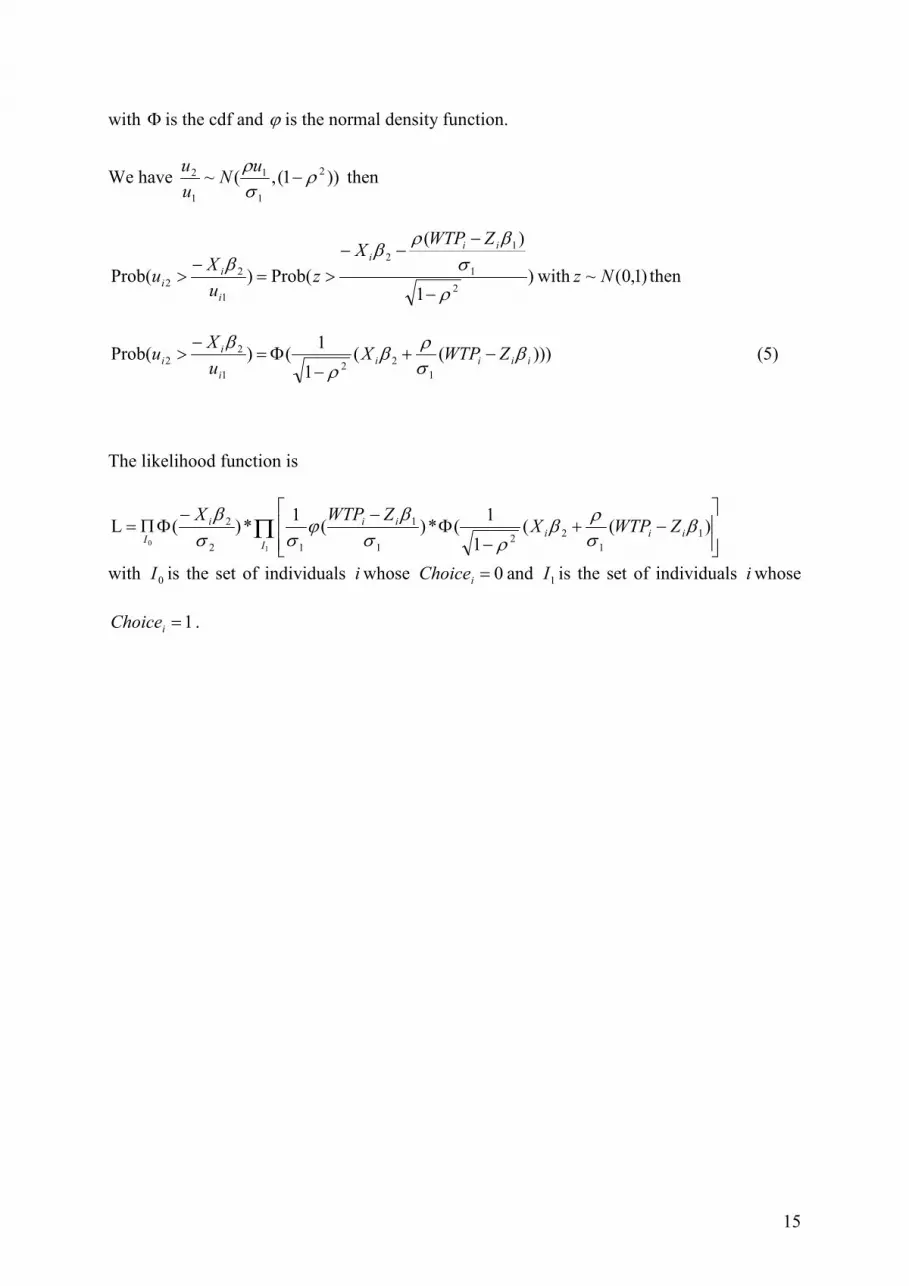
with Φ is the cdf and ϕ is the normal density function.
We have ))1(,(~ 2
1
1
1
2 ρσρ
−u
Nu
u then
)1
)(
Prob()Prob(2
1
12
1
22
ρ
σβρ
ββ
−
−−−
>=−
>
ii
i
i
i
i
ZWTPX
zu
Xu with )1,0(~ Nz then
)))((1
1()Prob(
1
22
1
22 iiii
i
i
iZWTPX
u
Xu β
σρ
βρ
β−+
−Φ=
−> (5)
The likelihood function is
with 0I is the set of individuals iwhose 0=i
Choice and 1I is the set of individuals iwhose
1=i
Choice .
−+
−Φ
−−ΦΠ= Π )((
1
1(*)(
1*)(L 1
1
22
1
1
12
2
10
βσρ
βρσ
βϕ
σσβ
iii
ii
I
i
I
ZWTPXZWTPX