planning for sustainable development of
TRANSCRIPT
PLANNING FOR SUSTAINABLE DEVELOPMENT OF WALLED CITY AREA OF JAIPUR CITY
A DISSERTATION Submitted in partial fulfillment of the
requirements for the award of the degree
of
MASTER OF URBAN AND RURAL PLANNING
By
NAND KUMAR
DEPARTMENT OF ARCHITECTURE AND PLANNING INDIAN INSTITUTE OF TECHNOLOGY ROORKEE
ROORKEE 247 667 (INDIA)
JUNE, 2006
V`
(Dr.V. Devadas)
Associate Professor of Planning
Department of Architecture and Planning,
Indian Institute of Technology - Roorkee
Roorkee — 247667, India
CANDIDATE' S DECLARATION
I hereby certify that the work, which is being presented in the dissertation, entitled
"PLANNING FOR SUSTAINABLE DEVELOPMENT OF WALLED CITY AREA OF
JAIPUR CITY", in partial fulfillment of the requirement for the award of the Degree of
MASTER OF URBAN AND RURAL PLANNING submitted in the Department of
Architecture and Planning, Indian Institute of Technology - Roorkee, Roorkee, is an
authentic record of my own work carried out during the period from July 2005 to June 2006
under the supervision of Dr.V. Devadas, Associate Professor of Planning, Department of
Architecture and Planning, Indian Institute of Technology - Roorkee, Roorkee.
The matter embodied in this dissertation has not been submitted by me for the award of any
other Degree.
Place: Roorkee
Dated: June30, 2006 (Nand Kumar)
This is to certify that the above statement made by the candidate Mr. Nand Kumar is
correct to the best of my knowledge.
Place: Roorkee
Dated: June34 2006

CERTIFICATE
Certified that this report entitled "PLANNING FOR SUSTAINABLE DEVELOPMENT
OF WALLED CITY AREA OF JAIPUR CITY" which has been submitted by
Mr. Nand Kumar, in partial fulfillment of the requirements for the award of the Post
Graduate Degree in MASTER OF URBAN AND RURAL PLANNING in the Department
of Architecture and Planning, Indian Institute of Technology - Roorkee, Roorkee, is the
student's own work carried out by him under my supervision and guidance. The matter
embodied in this dissertation has not been submitted for the award of any other degree.
Place: Roorkee
Dated: June M,2006 (11\1;r.V. Devadas)
Associate Professor of Planning
Department of Architecture and Planning,
Indian Institute of Technology - Roorkee
Roorkee — 247667, India
ACKNOWLEDGEMENT
I take this opportunity to express my deep sense of gratitude to my guide Dr.V.Devadas, for
his constant encouragement, support and expert guidance throughout this work. Without his cooperation and understanding this work would not have been possible.
I express my sincere thanks to Prof. R. Shankar, Proffessor and Head of the Department,
Department of Architecture and Planning, Indian Institute of Technology Roorkee, Roorkee
for extending all kind of help and facilities of the department to me.
I am grateful to all the faculty members of the Department of Architecture especially Prof.
Najamuddin, Prof. R.K.Jain, Dr.Nalini Singh, and Prof. R.Chandra, for their moral
support and encouragement.
I am thankful to the Director, MNIT, Jaipur and the faculty members of Department of
Architecture, MNIT Jaipur for providing me great opportunity to pursue post graduate
degree, without his kind permission and cooperation this would not have been possible.
I am grateful to officials of Jaipur Development Authority, Directorate of Economics and
Statistics, Jaipur for providing me the required data without which this report would have
been incomplete.
Finally I would like to express my heartfelt thanks to my parents, family members and
friends for their constant inspiration and encouragement.
NAND ICUNIAR
Dated: June 30,2006
ii

ABSTRACT
Cities are engines of economic growth. Indian cities are suffering from unplanned economic
development due to several factors, In . Indian the city plans are prepared by focusing physical
development alone. In this process the other important aspects, such as, social, economic, ecology, environment, infrastructure and institutional are omitted without giving proper importance.
As a consequence, the city plans concentrated only on physical aspects of the city development,
which caused existing alarming situations in almost all the Indian cities.
The sustainable development concept was evolved in the year 1980, and since then the world
started to move towards giving importance on resource mobilization, conservation of resources,
avoiding over exploitation of scarce resources, etc. in the planning stage itself. Indian city planners
also took a note of these events and started to prepare sustainable development plans for the development of the urban system. Sustainable development plan is almost a total development
plan, which relies on the key planning tools and techniques, such as, Information, Statistics,
Operation Research, System Dynamic, Discounted Cash Flows (DCF) techniques, Decision
Support System, etc. which would very much useful for preparing plausible sustainable
development plans. In this present investigation, an attempt is made to prepare a plausible
sustainable development plan for the wall city area of Jaipur city. At the outset, literature pertaining
to sustainable development is collected and reviewed thoroughly, followed by the characteristics of
the Jaipur city (Study area) is studied meticulously to understand the existing conditions of the
system. Subsequently a household survey was conducted by using a pre-tested schedule and analysed the data thoroughly for understanding urgent conditions of the city.
Theoretical models were developed based on System Dynamics Theory and Theory of Hierarchy of
Human Needs and discussed in this investigation. The study conclude with a set of plausible
. recommendations to achieve sustainable development in the system ( Study area).
iii

CONTENTS
PAGE NO. CANDIATE'S DECLARATION ACKNOWLEDGEMENTS li ABSTRACT Iii CONTENTS Iv LIST OF TABLES LIST OF FIGURES xiii CHAPTER 1 : INTRODUCTION 1.1 INTRODUCTION 1 1.2 REVIEW OF LITERATURE 3
1.2.1 Human settlement and sustainable development 3 1.2.2 Heritage and sustainable development. 4 1.2.3 Ecology and environment for sustainable development. 4 1.2.4 Infrastructure and sustainable development. 6 1.2.5 Application of Planning Techniques and sustainable
7 development research 1.3 FINDINGS AND INFERENCES 9 1.4 OBJECTIVES 11 1.5 SCOPE 11 1.6 CONCEPT 11 1.7 RESEARCH DESIGN 11
1,7.1 Data 13 1.7.2 Tools and Techniques 13 1.7.3 Analysis 13 1.7.4 Application of Statistical Techniques 13 1.7.5 Application of Theories I Models 13 1.7.6 Results & Discussions 14 1.7.7 Findings 14 1.7.8 Recommendations & Conclusions 14
CHAPTER 2 : CASE STUDIES 2.1 INTRODUCTION 15 2.2 A CASE STUDY OF UDAIPUR 15
2.2.1 A heritage city 15 2.2.2 The traditions of sustainability 15
iv
2.2.3 Traditional Water Resource Management 16 2.2.4 Systemic Issues of Sustainable Development 16 2.2.5 Water resources 17 2.2.6 Findings 17
2.3 CASE STUDY: NAVI MUMBAI 18 2.3.1 Study area 18 2.3.2 Objectives 20 2.3.3 Scope 20 2.3.4 Variables considered 20 2.3.5 Findings/Inferences 22 2.3.6 Conclusions 23
CHAPTER 3 : STUDY AREA PROFILE 3.1 INTRODUCTION 24
3.1.1 Location 24 3.1.2 Region 26 3.1.3 Regional Linkages 27 3.1.4 Constituents of Jaipur Region 28
3.2 PHYSICAL CHARACTERSTICS 29 3.2.1 Climate 29 3.2.2 land Resources 30 3.2.3 Water Resources 31 3.2.4 Forest Resources 33
3.3 HISTORICAL BACKGROUND 33 3.3.1 Phase 1:1727-1850 AD 34 3.3.2 Phase 11:1850-1930 AD 34 3.3.3 Phase 111:1930-1970 AD 34 3.3.4 Phase IV:Post 1970s 34
3.4 PLANNING OF THE CITY 35 3.5 STATISTICAL ANALYSIS 36
3.5.1 Demographic profile 36 3.5.2 Density 37 3.5.3 Population and Growth Rate 38 3.5.4 Literacy Rate 39 3.5.5 Sex Ratio 40
3.6 LAND USE DISTRIBUTION 40 3.7 REVIEW OF MASTER PLAN PROPOSALS 42
3.7.1 Master Plan for Jaipur 1971 -1991 42

3.7.2 Master Plan - 2011 43 3.8 SOCIO-ECONOMIC STRUCTURE 44
3.8.1 Role of the City and its Economic Base 44 3.8.2 Occupational Pattern 44 3.8.3 Trade and Commerce 47
3.9 TRADITIONAL ART AND CRAFT OF JAIPUR 49 3.10 INDUSTRIAL SECTOR 51
3.10.1 Large and Medium 52 3.10.2 Small Scale and Cottage Industries 52 3.10.3 Household Industry 52
3.11 INFORMAL SECTOR 53 3.12 TOURISM 53
3.12.1 Tourist Arrivals 54 3.13 Inferences 55 3.14 PROBLEMS OF THE STUDY AREA 56 3.15 NEED OF THE STUDY 57 CHAPTER 4 PROBLEMS & PROSPECTS OF WALLED CITY, JAIPUR 4.0 INTRODUCTION 58 4.1 TRAFFIC AND TRANSPORTATION 58 4.2 CHARACTERISTICS OF TRAFFIC & TRANSPORTATION 58
4.2.1 Sindhi Camp Central Bus Terminal 58 4.2.2 Vehicle Growth 59 4.2.3 Traffic and Transportation Problems 60
4.3 EXISTING CONDITION OF WATER SUPPLY SYSTEM 61 4.3.1 City Scenario 61 4.3.2 Zone-wise scenario 62
4.4 QUALITY OF SUPPLY 64 4.5 WATER AVAILABILITY OF JAIPUR REGION 65
4.5.1 Rainfall pattern 65 4.5.2 Groundwater 66
4.6 FUTURE DEMANDS 68 4.7 ANALYSIS 68 4.8 WATER RELATED ISSUES 70 4.9 PLANNING RELATED ISSUES 71 4.10 EXISTING CONDITION OF SOLID WASTE 71
4.10.1 Street Sweeping and Solid Waste Collection 71 4.10.2 Solid Waste Collection from Commercial/ Institutional Area 76
vi
4.10.3 Solid Waste Collection by Private Contractor 76 4.10.4 Disposal System 76 4.10.5 Medical Establishments — Biomedical Waste 79 4.10.6 General Observations and Deficiencies 81
4.11 EXISTING CONDITION OF DRAINAGE 82 4.12 EXISTING CONDITION OF SEWERAGE AND SANITATION 82
4.12.1 Problem Identification 83 4.13 HERRITAGE AND CONSERVATION 85
4.13.1 Introduction 85 4.13.2 Heritage Areas 85 4.13.3 Problems 88
CHAPTER 5 : ASSESSMENT OF PRESENT STATUS OF DEVELOPMENT 5.1 INTRODUCTION 89 5.2 HOUSEHOLD SURVEY 89
5.2.1 Households 90 5.2.2 Religion 91 5.2.3 Caste 92 5.2,4 Gender 93 5.2.5 Marital Status 93 5.2.6 Education 94 5.2,7 Occupation 95 5.2.8 Type of houses 95 5.2.9 Ownership of houses 96 5.2.10 Finance 97 5.2.11 Physical condition of the houses 97 5.2.12 Number of Rooms in the Household 98 5.2.13 Number of Floors in the Household 99 5.2.14 Availability of Soak PittSewer/Septic Tank 100 5.2.15 Drains 100 5.2.16 Problems of Drainage 101 5.2.17 Overflow of Drains 102 5.2.18 Duration of water supply (hrs. per day) 102 5.2.19 Vehicles Owned 103 5.2.20 Recreation 104 5.2.21 Water Quality 104 5.2.22 Air quality 105 5.2.23 Land quality 106
vii
5.2.24 Noise Pollution 106 5.2.25 Quality of Living 107 5.2.26 Waste Management 108 5.2.27 Household Appliances 108 5.2.28 Household Appliances 2 109 5.2.29 Household Appliances 3 109 5.2.30 Expenditure 1 110 5.2.31 Expenditure 2 111 5.3.32 Expenditure 3 112 5.2.33 Ventilation 112 5.2.34 Change of Land use 113 5.2.35 Informal Activities 114 5.2.36 Tourist Infrastructure 114 5.2.37 Pedestrian Facilities 115 5.2.38 Conservation 116
5.3 INFERENCES 116 CHAPTER 6: FORECASTING 61 INTRODUCTION 119 6.2 FORECASTING THE FACILITIES FOR THE YEAR 2031 119
62.1 Population 120 62.2 Housing 121 6.2.3 Physical Infrastructure 121 6.2.4 Social Infrastructure 123 6.2.5 Commercial Infrastructure 123
CHAPTER 7 : APPLICATION OF THEORIES 7.1 INTRODUCTION 124 7.2 SYSTEM CONCEPT 124 7.3 THEORY OF HIERARCHY OF NEEDS 127 7.4 SIGNIFICANCE OF MASLOW'S THEORY 129 7.5 APPLICATION OF MASLOW'S THEORY 129 CHAPTER 8 : RECOMMENDATIONS AND CONCLUSIONS 8.1 INTRODUCTION 131 8.2 RECOMMENDATIONS FOR TRAFFIC AND TRANSPORTATION 131
8.2.1 Off Street Parking Sites 131 8.2.2 Shifting of Trades 133 8.2.3 Restrictions on Parking 134 8.2.4 Pedestrianization of streets 135
Viii

82.5 Underground Parking 136 8.2.6 Shifting of Activity 137
8.3 RECOMMENDATIONS FOR WATER SUPPLY 138 8.3.1 Water supply & distribution system 139
8.4 RECOMMENDATIONS FOR SOLID WASTE MANAGEMENT 140 8.4.1 Strategies 140 8.4.2 Regulations 142
8,5 SEWERAGE AND SANITATION 143 8,6 HERITAGE AND COSERVATION 143 8.7 ENVIRONMENTAL CONSIDERATIONS 144
8.7.1 Environment Protection measures 145' 8.8 THE GENERAL CITY DEVELOPMENT GUIDELINES AND POLICIES 146 8.9 CONCLUSION 146 ANNEXURE - I xiv REFERENCES xvi BIBLIOGRAPHY xviii
ix
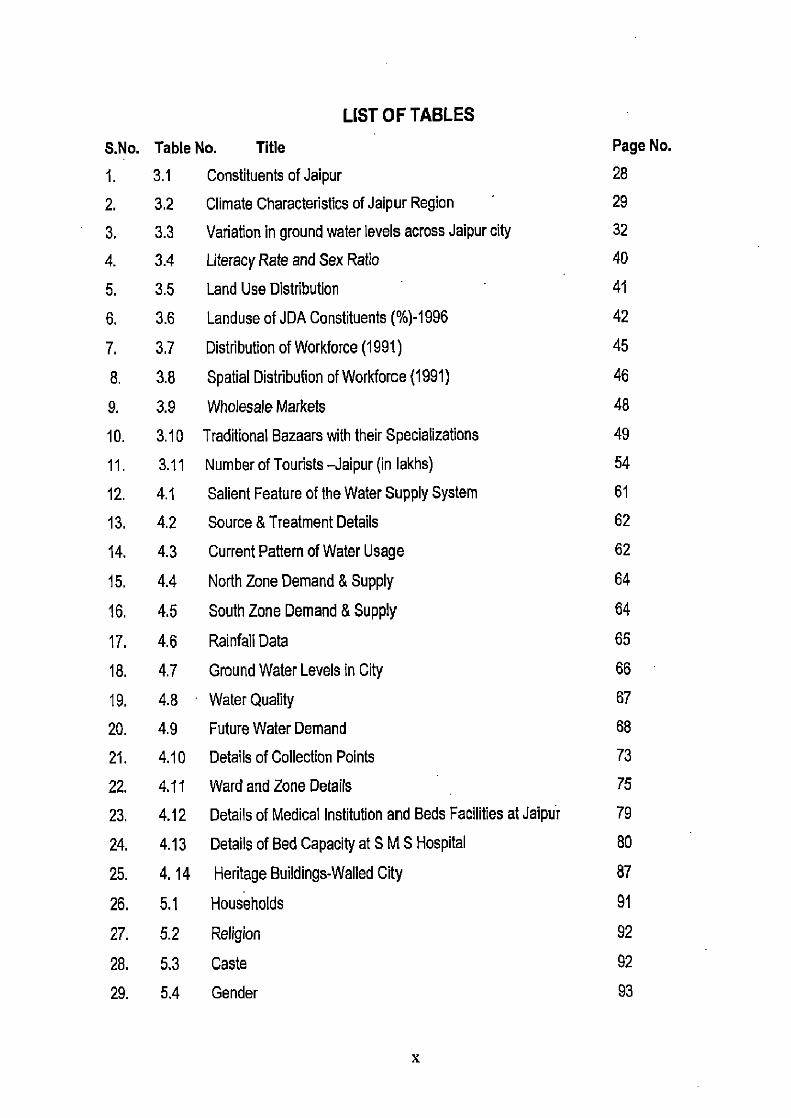
LIST OF TABLES
S.No. Table No. Title Page No. 1. 3.1 Constituents of Jaipur 28
2. 3.2 Climate Characteristics of Jaipur Region 29
3. 3.3 Variation in ground water levels across Jaipur city 32 4. 3.4 Literacy Rate and Sex Ratio 40
5. 3.5 Land Use Distribution 41
6. 3.6 Landuse of JDA Constituents (%)-1996 42
7. 3.7 Distribution of Workforce (1991) 45
8. 3.8 Spatial Distribution of Workforce (1991) 46
9. 3.9 Wholesale Markets 48
10. 3.10 Traditional Bazaars with their Specializations 49
11. 3.11 Number of Tourists -Jaipur (in lakhs) 54 12. 4.1 Salient Feature of the Water Supply System 61 13. 4.2 Source & Treatment Details 62
14. 4.3 Current Pattern of Water Usage 62
15. 4.4 North Zone Demand & Supply 64
16. 4,5 South Zone Demand & Supply 64
17. 4.6 Rainfall Data 65
18. 4.7 Ground Water Levels in City 66 19. 4.8 Water Quality 67
20. 4.9 Future Water Demand 68 21. 4.10 Detal Is of Collection Points 73 22. 4.11 Ward and Zone Details 75
23. 4.12 Details of Medical Institution and Beds Facilities at Jaipur 79
24. 4.13 Details of Bed Capacity at S M S Hospital 80
25. 4. 14 Heritage Buildings-Walled City 87
26. 5.1 Households 91
27. 5.2 Religion 92
28. 5,3 Caste 92 29. 5.4 Gender 93
30. 5.5 Marital Status 94
31, 5.6 Education 94
32. 5.7 Occupation 95 33. 5.8 Type of Houses 96 34. 5.9 Ownership of Houses 96
35. 5.10 Finance 97
36. 5.11 Physical Condition of the Houses 98
37. 5.12 Number of Rooms in the Household 99
38. 5.13 Number of Floors in the Household 99
39. 5.14 Availability of Soak Pit/Sewer/Septic Tank 100
40. 5.15 Drains 101
41. 5.16 Problems of Drainage 101
42. 5.17 Overflow of Drains 102
43. 5.18 Duration of Water Supply (hrs. per day) 103
44. 5.19 Vehicles Owned 103
45. 5.20 Recreation 104
46. 5.21 Water Quality 105
47. 5.22 Air Quality 105
48. 5.23 Land Quality 106
49. 5.24 Noise Pollution 107
50. 5.25 Quality of Living 107
51. 5,26 Waste Management 108
52. 5.27 Household Appliances 109
53. 5.28 Household Appliances 2 109
54. 5.29 Household Appliances 3 110
55. 5.30 Expenditure 1 111
56. 5.31 Expenditure 2 111
57: 5.32 Expenditure 3 112
58. 5.33 Ventilation 113
59. 5.34 Change of Land Use 113
60. 5.35 Informal Activities 114
xi

61. 5.36 Tourist Infrastructure 114
62. 5.37 Pedestrian Facilities 115
63. 5.38 Conservation 116
xii

S.No.
LIST OF FIGURES
Fig. No. Title Page No,
1. 1.1: Research Methodology 12
2. 2.1: City Map of Navi Mumbai 19
3. 3.1: Location Map 25
4. 3.2: The Study Area 26
5. 3.3: Regional Linkages 27
6. 3.4: Jaipur Development Authority Area 28
7. 3.5: Annual Rainfall 29
8. 3.6: Variation in Ground Water Levels across Jaipur City 32
9. 3.7: Forest Areas in and around City 33
10. 3.8: Jaipur Growth Pattern, 1727 - 2005 35
11. 3.9: Walled City, Jaipur 36
12. 3.'10 Population - JDA area 36
13. 3.11 Population - JMC area 36
14. 3.12 Population Density 37
15. 3.13 Density of Population 2001- Walled City 37
16. 3.14 Density of Population 2001 -JMC area 38
17. 3.15 Population - JMC 38
18. 3.16 Population Growth Rate 39
19. 3.17 Population Growth Rate -JMC constituents 39
20. 3.18 Existing Landuse Distribution-1996 41
21, 3.19 Proposed Landuse - 2011 41
22, 3.20 Distribution of Workforce -1991 45
23. 3.21 Spatial Distribution of Workforce -JMC 46
24. 3.22 Number of Shops 47
25. 3.23 Composition of Wholesale Trade 48
26. 3.24 Commercial Activities - Spatial Distribution 49
27. 3.25 Traditional Bazaars - Jaipur 51
28. 3.26 Tourist Spots - Jaipur 54
29. 3.27 Composition of Tourists 55
30. 4.1: Administrative Functions —Jaipur City 63
31. 4.2 Location of Heritage Sites in Jaipur 87
32. 4.3 Heritage Characteristics of Walled City 88
33. 7.1: Urban System 125
34. 7.2: Hierarchy of Human Needs 127
35. 8.1: Off Street Parking Sites 133
36. 8.2: Shifting of Trades 134
37. 8.3: Streets of Parking Restriction 135
38. 8.4: Underground Parking Sites 136
39. 8.5: Shifting of Activities 137
xiv
INTRODUCTION CHAPTER -
1.1 INTRODUCTION
Development, the term has often been associated with economic growth (Ingham 1933). Between 1940s and 1960s, when development as an academic study was taking shape, per capita GNP not only became the major indicator of national economic development, but also the most popular indicator of national development. While some other forms of development — such as 'human development' and 'basic needs' — are also recognized, they are subordinated to the overall goal of economic growth.
The idea of sustainable development has been added to the concept of development. The term 'sustainable development' came into the scene in 1980 when the international union for conservation of nature and natural resources (IUCN) published the World Conservation Strategy, elaborating 'the overall aim of achieving sustainable development through the conservation of living resources' (IUCN, 1980, Lele,1991). Seven years later, the World Commission on Environment and Development (WCED), also known as the Brundtland Commission, offers a definition of sustainable development. According to Brundtland Commission, "Sustainable development is development that meets the needs of the present without compromising the ability of future generations to meet their own needs". (Brundtland WCED ,1987). This commission has given two concepts, and are:
• Healthy economy • Healthy environment
The Summit produced, a major action agenda, "Agenda 21" is a blueprint of program for the 21st century. The WCED further notes that 'sustainable development must not endanger the natural systems that support life on Earth: The atmosphere, the waters, the soils, and the living beings. It advocates jeco-development', which suggests that economic growth should be based on 'a responsible and sustainable use of environmental resources'. (WCED, 1987). Sustainable economic development should not be equated with sustainable development, but only a part of it. Development means a stage of betterment and progress, and its sustainability is an enduring betterment of progress. Sustainable development is, therefore, primarily concerned with long-term development, equity and fairness between generations and potential development in future.
1

Sustainable development is basically a concern of 'design with nature'. It means development and human interventions in natural system to the extent of carrying capacity of an area. The carrying capacity of land / water area is the population or level of activity that can be sustained for a given length of time without depletion of the resources or breakdown of the biological (natural) systems. It is well accepted today that there is no universal or standard blueprint for sustainable development. (Rijsberman and Yen, 2000, UNCHS, 2001), What is sustainable today may not be sustainable tomorrow. Therefore, sustainable action will be specific to a place; the same cannot be directly applied at any other.
Cultural development should' be one of the key milestones towards achieving sustainability. It is a way to healthy living, contributing to society's well-being and prosperity. The state of society fostering healthy life leads to cultural development. According to Building and Social Housing Foundation, UK, the following key elements are very much useful for sustainable human settlements.
• Resource budgeting I management
• Energy conservation and efficiency • Renewable energy technology • Long-lasting built structures • Proximity between home and work • Efficient public transport systems
• Waste reduction and recycling
• Organic waste composting
• A circular city metabolism • Supply of staple foods from local sources.
The critical concerns for India which require priority action include water, air pollution, land, public health, energy, municipal sanitation and solid waste, and equity and rural development. The UN launched the sustainable city program (SCP) in the early 1990s, as a medium for implementing Agenda 21at the city level. In the early 1980, UNCHS and the United Nations Environment Program (UNEP) jointly prepared the Environmental Guidelines for Settlements, Planning & Management for cities. The sustainable city program is based on a development paradigm that recognizes that cities make an important contribution to social and economic development at national & local levels, they are important engines of economic growth, they absorb a sizeable portion of population growth in
2

developing countries; they offer significant economic opportunities; they provide housing and
services and are important centers of productivity and social progression.
Cities are also the chief causes of un-sustainability (WHO, 1993; Cohen; UNCHS, 2001). They
account for most of a nation's resource consumption and waste generation, besides being large-
scale pollutes of the living environment. So, sustainable action is a deliberate effort required for
every individual; the occupation of the person is immaterial. Restoring and maintaining the health
and integrity of the natural environment is fundamental to sustainability of human settlements.
1.2 REVIEW OF LITERATURE Larger number of distinguished Authors have done good amount of work and published in this field
of particular investigation, i.e., sustainable development. The Investigator collected some relevant
literature in the field of sustainable urban development since the investigators study lies in this field.
The collected literatures are classified into the following headings and are received thoroughly for
this investigation. They are:
1.2.1 Human settlement and sustainable development.
1.2.2 Heritage and sustainable development.
1.2.3 Ecology and environment for sustainable development.
1.2.4 Infrastructure and sustainable development.
1.2.5 Application of Planning Techniques and sustainable development.
The classified literature are further reviewed, and are presented as below:
1.2.1 Human settlement and sustainable development 1.2.1.1 Monto Mani, koshy Varghese, L.S.Ganesh, (2004), argued that settlements, both rural
and urban system are exploiting the surroundings natural environment. They are responsible for
altering natural processes that are predominately equilibrium — oriented. Restoring and maintaining
the health and integrity of the natural environment is fundamental to sustainability of human
settlements.1
1.2.1.2 According to Hugo Priemus, (2002), sustainable housing is a badly defined concept, both
in scientific literature and in policy documents. A narrow definition of sustainability is adopted,
whereby the Author concentrates on the ecological dimensions of the concept of 'sustainability. The
environmental impact on the greenhouse effect; the quality of air, water, and soil, noise nuisance,
3
stench, the stock of nonrenewable materials, and biodiversity are discussed, An overview of ways
in which the sustainability of housing can be measured is given and the use of a multivariate
yardstick advocated. A set of recommendations is presented for politicians and public officials
about the way in which sustainable housing can be promoted along with a research agenda on
sustainability in housing presented. The Author concludes by pointing out the analogy between the
Dutch government's policy to promote sustainable housing and the story of the emperor's new
clothes 2
1.2.2 Heritage and sustainable Development
1.2.2.1 Chan — Wai — Yin and Ma Shu — Yon, (2002), argues that under the influence of economic
growth theories, the idea of sustainable development has been revised to sustainable economic
development. As a result, cultural concern has often given way to economic calculation in the
course of development. This has been evident in the case of China, where economic construction
has destroyed a number of invaluable heritage sites. Development in China, therefore, may not be
sustainable, since the major concern of its development policy is focused on sustainable economic
development3
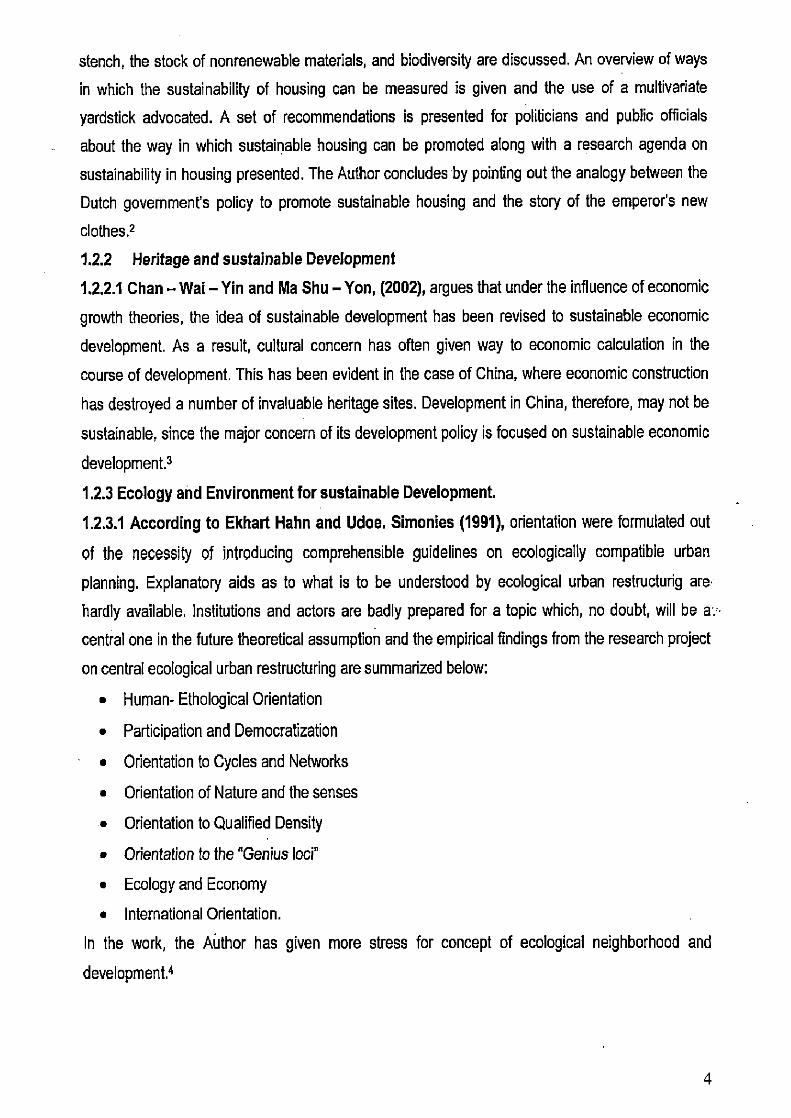
1.2.3 Ecology and Environment for sustainable Development.
1.2.3.1 According to Ekhart Hahn and Udoe. Simonies (1991), orientation were formulated out
of the necessity of introducing comprehensible guidelines on ecologically compatible urban
planning. Explanatory aids as to what is to be understood by ecological urban restructurig are
hardly available, Institutions and actors are badly prepared for a topic which, no doubt, will be a..
central one in the future theoretical assumption and the empirical findings from the research project
on central ecological urban restructuring are summarized below:
• Human- Ethological Orientation
• Participation and Democratization
• Orientation to Cycles and Networks
• Orientation of Nature and the senses
• Orientation to Qualified Density
• Orientation to the "Genius loci"
• Ecology and Economy
• International Orientation.
In the work, the Author has given more stress for concept of ecological neighborhood and
development's
4
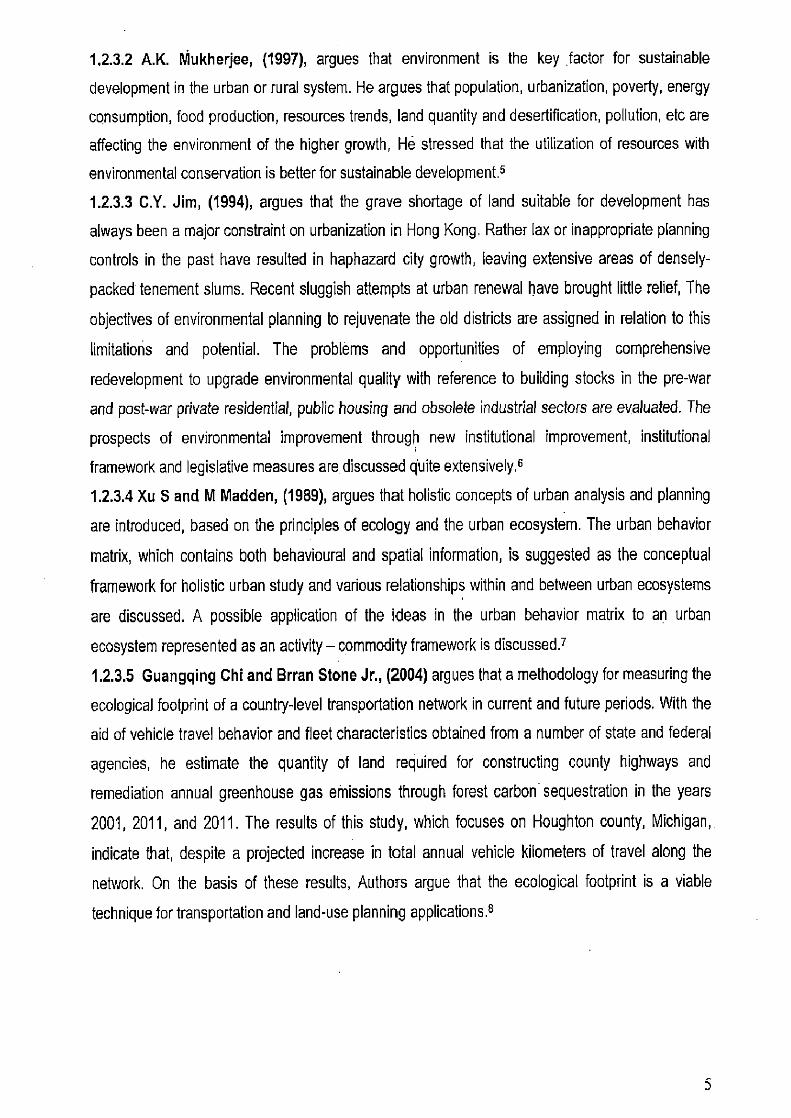
1,2.3.2 A.K. Mukherjee, (1997), argues that environment is the key factor for sustainable development in the urban or rural system. He argues that population, urbanization, poverty, energy consumption, food production, resources trends, land quantity and desertification, pollution, etc are affecting the environment of the higher growth, He stressed that the utilization of resources with environmental conservation is better for sustainable development.5 1.2.3.3 C.Y. Jim, (1994), argues that the grave shortage of land suitable for development has always been a major constraint on urbanization in Hong Kong. Rather lax or inappropriate planning controls in the past have resulted in haphazard city growth, leaving extensive areas of densely-packed tenement slums. Recent sluggish attempts at urban renewal have brought little relief, The
objectives of environmental planning to rejuvenate the old districts are assigned in relation to this
limitations and potential. The problems and opportunities of employing comprehensive
redevelopment to upgrade environmental quality with reference to building stocks in the pre-war and post-war private residential, public housing and obsolete industrial sectors are evaluated. The prospects of environmental improvement through new institutional improvement, institutional framework and legislative measures are discussed qUite extensively.° 1.2.3.4 Xu S and M Madden, (1989), argues that holistic concepts of urban analysis and planning are introduced, based on the principles of ecology and the urban ecosystem. The urban behavior
matrix, which contains both behavioural and spatial information, is suggested as the conceptual
framework for holistic urban study and various relationships within and between urban ecosystems
are discussed. A possible application of the ideas in the urban behavior matrix to an urban ecosystem represented as an activity — commodity framework is discussed.? 1.2.3.5 Guangqing Chi and Brran Stone Jr., (2004) argues that a methodology for measuring the ecological footprint of a country-level transportation network in current and future periods, With the aid of vehicle travel behavior and fleet characteristics obtained from a number of state and federal agencies, he estimate the quantity of land required for constructing county highways and remediation annual greenhouse gas emissions through forest carbon sequestration in the years
2001, 2011, and 2011. The results of this study, which focuses on Houghton county, Michigan,
indicate that, despite a projected increase in total annual vehicle kilometers of travel along the network. On the basis of these results, Authors argue that the ecological footprint is a viable
technique for transportation and land-use planning applications.°
5
1.2.4 Infrastructure & Sustainable Development
1.2.4.1 M. Sohail, M.A SCE, S. Cavill and A.P. Colton, (2004), tried to explore the constraints to
operation, maintenance and sustainability of urban services. The findings are based in case studies
from India, Pakistan, & Sri Lanka. In order to distinguish between the different constraints acting
upon urban services, the term "Sustainability" has been separated according to its technical,
financial, and institutional aspects, This paper demonstrates how finding from community.
involvement in service delivery in developing countries can be benefit to engineers or NGOs
working with communities to improve the operation & Maintenance of urban services in developed
countries. Traditional centralized system of 0 & M, which are the responsibility of municipalities and
utilities, are not delivering. Recently, there has been a search to alternatives such as community-
based approaches. Internationally it seems service uses are being encouraged to ensure the
infrastructure in their neighborhood is kept in good condition. It is hoped that getting service uses
involved will lead to increased efficiency, benchmarking raise awareness debate, contributed to
national growth, reduced waste, improyed resource allocation, and improved competitiveness It
has been recognized that neither community nor government alone can ensure the sustainability of
infrastructure, a partnership approach in needed, 9
1.2.4.2 Peter Newman, (1995) , to develop the guidelines, the Author had studied some planning
principles and their uncertainties which include (1) recognizing human values, environmental
matters, social justice, heritage matters, urban economy matters, community matters, maximizing
density, housing diversity, transport diversity, fuel diversity, infrastructure diversity, cultural
diversity, etc. The Author have discussed at how the uncertainties produced by post modernism
can be put to advantage in providing a more sustainable post-modern city. It is suggested that the
key principles are recognizing values, maximizing diversity and crossing boundaries. There are
developed into some guidelines for urban planning and transport practice.lo
1.2.4.3 Nina Herala, (2003), integrating land use planning and traffic planning to promote
sustainable development how land use planning may be used as one of the means growth in car-
borne traffic has increased rapidly and consumes more and more land because of land extensive
structure of cities and the traffic demand between human activities.
Planning solutions emphasizing the separation of urban functions, in order to avoid health
problems, have, together with the availability of inexpensive land on the outskirts of urban areas,
contributed to the current generation of environmental problems, primarily from increased
dependency on private cars. The OECD & EU have developed principles of sustainable transport
and sustainable traffic to tackle the growth of traffic.
6
Urban form and location of activities together with economic incentives and well organized public
transport has a significant impact on traffic flows. There is not yet a general political agreement on
how the reduction of traffic demand should be legally regulated, but some criteria are suggested to
measure sustainable mobility in land use planning. 11
1.2.4.4 Christy Mihyeon Jeon, S.M. ASCE, and Adjo Amekudzi, M. A SCE, (2D04), addressed
the sustainability of transportation system is an important activity as evidenced by a growing
number of initiatives around the world to define and measure sustainability in transportation
planning and infrastructure provision. While there is no standard definition for transportation system
sustainability, it is largely being defined through impacts of the system on the economy,
environment, and general social well-being; and measured by system effectiveness and efficiency,
and the impacts of the system on the natural environment. Frameworks based on important causal
relationships between restructure and broader environment, infrastructure impacts on the economy,
environment, and social well-being; and the relative influence of agencies over causal factors, are
largely being used to develop and determine indicator systems for measuring sustainability in
transportation systems,
These frameworks can be used collectively to help agencies define their visions as well as develop
policies, planning procedures, and measurement and monitoring systems for achieving stainable
transportation systems.12
1.2.5 Application of Planning Techniques and. Sustainable Development Research.
1.2.5.1 Pramod Paliwal (2005), argues that the concept of sustainable cities is based as a
development paradigm that recognizes that cities make an important contribution to social and
economic development. System thinking, including hard and soft systems, can be used to provide a
new perspective and tools to resolve questions. This paper attempts to analyze the issues
underlying sustainable development of Udaipur by applying CATWOE in order to comprehend the
systemic elements of the city from a soft systems perspective.13
1.2.5.2 B. Ramesh & N. Krishnan (1991) argued that the urban fringe development is resultant of
natural increase of population of the city and migration of rural population in search of better living.
In the process, some increased population is absorbable in the main city and the rest have to settle
is the fringe areas of the city. To monitor fringe area dynamics, Remote Sensing is the best
available technique and with it timely information generation is possible. In this paper fringe area
development trends have been studied with the help of the aerial photographs and satellite
imagery.14
7

1.2.5.3 Month Mani; Koshy Varghese; and L.S. Ganesh ( 2004), argued that balancing
conflicting requirements and rational decision making is necessary to achieve sustainability.
Simulation models to asses and forecast sustainability can aid rational decision making. In the
context of human settlements, human nature interactions need to be considered in an integrated
manner to build appropriate simulation models. The integrated model framework proposed here
severs as a base for such simulation models. The model framework is based on the premise that a
community's attitude and its living environment determine human settlement sustainability.
A generic model design comprising fundamental components of the proposed sustainability
assessment and forecasting model framework is also presented in this paper. Discussion on
relevant implementation issues inducing a simulation system and key limitations of the framework
are also presented.
This framework can be adopted for development and implementation of a simulation system for
sustainability amendment and forecasting studies:15
1.2.5.4 Bill Hopwood, Mary Mellor and Geoff 0' Brien (2003), presented a classification and
mapping of different trends of thought on sustainable development, these political and policy
frameworks and their attitudes towards change and means of change. Sustainable development
has the potential to address fundamental challenges for humanity, now and into the future.
However, to do this, it needs more clarity of meaning, concentrating on sustainable livelihoods and
well-being rather than well-having, and long term environmental sustainability, which requires a
strong basis in principles that link the social & environmental to human equity.16
1.2.5.5 Igor S Mayer and Robin Seijdel (2004), explored how the combined application of two
techniques, a decision-support tool and a simulation game, can support decision making for
sustainable urban development. The techniques are applied in decision-making for real and in
fictional sustainable urban renewal projects benefits and challenges of this combined approach are
discussed based on experiences in seven applications. The main finding is that the use of the
decision-support tool combined with the simulation-gaming procedure can support agenda setting
and help create a shared understanding of problems and potential solutions in the field of
sustainable urban renewal.17
1.2.5,6 Christopher J. Petti (2004), Studied the planning-support systems offer on effective way
of integrating social, economic and environmental datasets, enabling a number of holistic spatial
planning scenarios to be generated and evaluated by local planners. With increased acceptance of
computer technology as a platform for the development and delivery of professional tools, planning-
support system (PSS), may well be embraced by parishioners to improve current practices. The
author provides a technical and experimental examination of an application of the what if?. PSS in
8
assisting in the formulation of a sustainable land use strategy for Harvey Bay, Australia,
supplementing previous published results. The focus of the research is to examine the underlying
model and discus the collaborative application of the PSS with local planners in scenario building
exercise. Furthermore, the perceived strengths and weakness of the PSS are outlined from the
perspective of the urban modeler, together with ex-ante feed back from the local planners on the
use of the PSS to formulate urban-growth scenarios. In conclusion, the merits of the use of such a
PSS are discussed and some future directions for the development of collaborative spatial
decision-support tools are offered. 18
1.3 FINDINGS AND INFERENCES
The following inferences are drawn from the literature survey:
1. To maintain sustainable human settlement the available natural resources shall be
exploited with environmental consideration
2. To maintain sustainable human settlements good ecosystem is very much essential. To
have a good ecosystem judicious use of natural resources along with maintaining good
biodiversity is stressed
3. In urban planning, in planning stage itself ecology and environmental aspects must be
given priorities with regard to human interaction with biodiversity, orientation towards
cycles and networks, orientation towards ecology and economy etc., further it has been
stressed developing ecological neighborhood for sustainable development .
4. To have sustainable development , good environment is stressed for, in a urban system
population , urbanization , poverty , higher quality of energy consumption , over exploitation
of resources, desertification , polluting etc., are affecting the environment
5. Judicious use of resources with environmental consideration is advocated for sustainable
development
6. Transportation network plays a very major role in sustainable urban development therefore
developing optimum transportation is stressed for sustainable development with the
ecological consideration. It has been further argued that ecological footprint is viable
technique for transport and land use planning applications
7. Infrastructure services such as physical, social, and economical are more essential for
having quality of urban life to maintain the quality of urban life proper administration
mechanism is advocated
9
8. Peoples participation in management of infrastructure is stressed for having good quality of
life in the urban system.
9. Systems concept have been employed to understand the causal relationship between
infrastructure , environment , economy , social well being and their relative influence of
agencies to measure the functions of the system pertaining to transportation planning.
10. To understand the dynamic function of the urban system and its fringe area development
population have been considered as a major variable.
11. System dynamic models have been employed in planning. Simulation models, Forecasting
models etc., are used in their model tool to evolve optimal sustainable urban development
plan. In this human settlement, human and natures interactions are quantified in a
integrated manner to develop appropriate simulation model.
12. Decision support system, Game theory are also employed to evolve sustainable urban
development projects.
13. The following factors comprising spatial , social, economy and environmental are
considered for evolving and integrated plan leads to sustainable development is prepared
by using planning support system method In this sustainable land use strategies have been evolved which is useful for optimal physical planning .
14. Over the years, due to development uncertainties raised which hinder development
process to measure the uncertainties in development in pertaining to socio economic and
environment systems concept have been used.which leads to optimal plan preparation for
sustainable urban development .
The Investigator has chosen the walled City area of the Jaipur city for conducting the present
investigation after conducting the literature survey and thoroughly analyzes them. Since the study
area is having the problems of backwardness. To conduct the investigation, a set of objectives are framed.
10
1.4 OBJECTIVES
The following objectives are framed to conduct the investigations.
• To assess the existing physical, socio-economic and environmental condition of the walled
city area.
• To study the present status of development.
• To identify the control parameters, which decide the functions of the systems.
• To forecast the demand and supply of infrastructure services for 2031 A.D.
• To evolve a set of plausible guidelines for sustainable development of the system.
1.5 SCOPE
The present study aims at preparing a set of policy guidelines and evolving a feasible development
plan to achieve sustainable development in the study area. The investigator hopes that if the
proposed recommendations are implemented constructively in the system, the study area will
achieve sustainable development.
1.6 CONCEPT
System concept is employed in the investigation. A system functions as a whole with the interaction
of several sub-systems. All the subsystems of the system are interlinked and interdependent on
each other, and function as a whole with dynamic characteristics. If one of the sub-systems are
functions with advancement or defunct, or partly function, its effect can be observed in the whole
system.
The study area under investigation is considered as a system, which has the following sub-
systems, such as, physical, social, economic, ecological, environmental, infrastructure and
institution and is functioning as a whole. These entire sub-systems are interlinked & interdependent
to each other.
This system concept is employed to assess the functions of the system and to evolve a set of policy
guidelines for feasible sustainable development of the system.
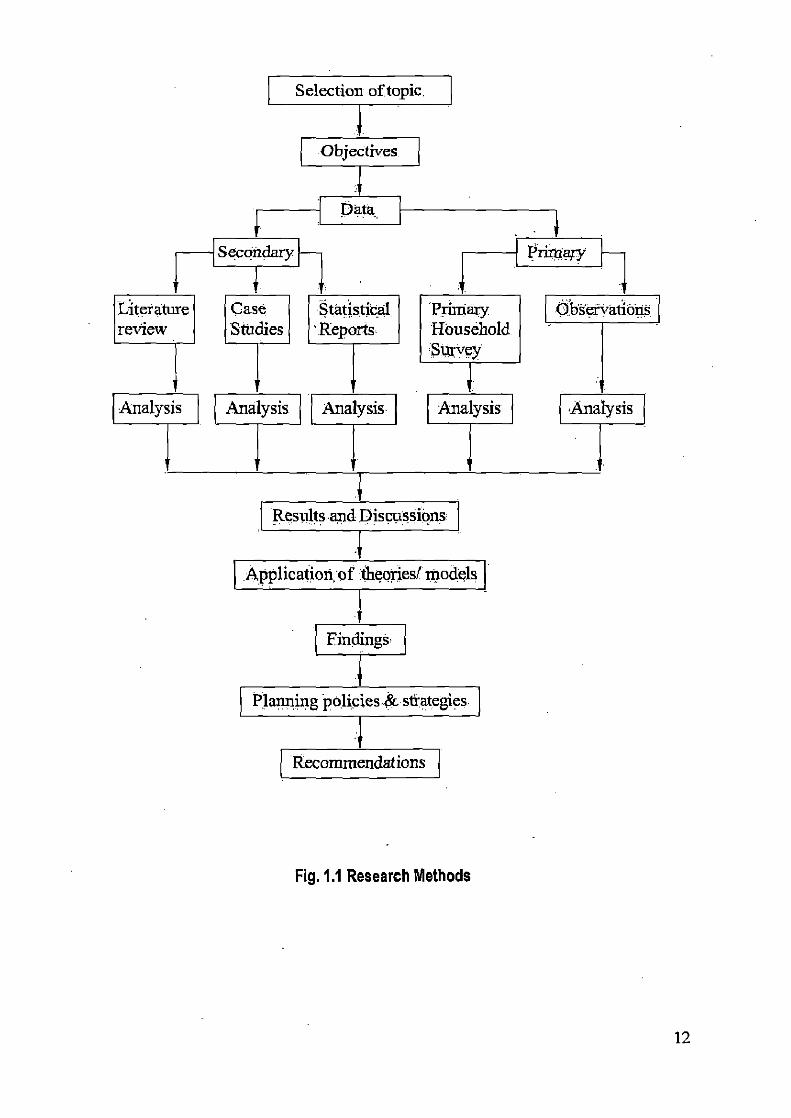
1.7 RESEARCH DESIGN
Survey research methods have been employed in this investigation. The research methodology of
this investigation is presented in Fig, 1.1
11
Selection of topic .
1.
Objectives
Pala-
se:cona413, 1
Prinigni
Literature review
lr
Analysis
Case Studies
I Analysis
Statistical 'Reports
I Analysis
Primaiy. Household S1,1rvc31
Analysis
ObSetvations
Analysis
Results arid Discussions
IApplication of theories/ models
Findings
a Planning policies & strategies
Recommendations
Fig. 1.1 Research Methods
12
1.7.1 Data
Two sources of data were collected and employed in this investigation. They are:
a) Secondary Sources: Published literature and unpublished literature, documents, etc.,
pertaining to this investigation.
b) Primary Sources: Conducting survey at various levels for obtaining the requisite data.
1.7.2 Tools and Techniques:-
1.7.2.1 Survey Tools
Relevant Survey tools, such as, schedules, questionnaire were employed.
1.7.2.2 Survey Techniques
A suitable random sampling technique was employed for identifying households, conducting
investigation, etc.
1.7.2.3 Analytical Tools
Relevant analytical tools, such as code sheets, computer hardware, software (Microsoft, Mat lab)
were used for data processing and analysis.
1.7.2.4 Analytical Techniques
Relevant Analytical techniques, such as, tabulation, correction etc., were attempted based on the
requirement.
1.7.3 Analysis
Analysis was done on the basis of literature survey and the survey results
1.7.4 Application of Statistical Techniques
Appropriate Statistical techniques, such as, standard deviation, forecasting techniques, etc., were
employed based on the requirements.
1.7.5 Application of Theories / Models
In the present investigation, the Investigator employed theoretical conceptualization of the system
dynamic theory to establish the functions of the urban system. Further, Abraham Maslow's Theory
of Hierarchy of Human Needs is also employed in this investigation.
13

1.7.6 Results & Discussions
Results of all types of analysis, such as, literature review, household survey etc., were discussed in
detail to draw inferences.
1.7.7 Findings
Plausible findings were drawn for evolving a set of policy guidelines and for developing a feasible
sustainable development plan.
1.7.8 Recommendations & Conclusions
Plausible recommendations were made to achieve sustainable development of the system (study
area).The study is concluded with the plausible recommendations.
14

CASE STUDIES CHAPTER — 2
2.1 Introduction:
The Investigator has reviewed two case studies to supplement the literature review for in depth
understanding the system. The studies, pertaining to Udaipur and Nevi Mumbai, are studies
carefully, and are presented -- as below:
2.2 CASE STUDY OF UDAIPUR
2.2.1 A Heritage City
Udaipur is confined in the State of Rajasthan lies in the, latitude: 27.4201\1, longitude: 75.33° E,
covering over 37 km2 and 577 m above sea level. It is on the banks of the River Ayad, in a valley
surrounded by the Aravalli hills, near Lake Pichola. The lakes surround imperial palaces, built in the
seventeenth century of marble and sandstone, and lend the status of heritage city to Udaipur —with
a legacy of 500 years of architecture, culture and natural beauty. The capital of Mewar State,
Udaipur, takes its name from Maharana Udai Singh, who founded the city in 1568 after retreating
from the third attack on the city of Chittaur by the armies of the Mughal Emperor Akbar.
The old city within the walls is built on small hills and consists of narrow medieval road and twisting
lanes with small temples at turnips. Interspersed with old dwellings are new and modem shops,
houses, markets and down-to earth busstands. Udaipur is home to various arts and cultural
centers, as well as promoting and supporting rural and local crafts, inCluding jewellery and fabrics.
2.2.2 The traditions of sustainability
Udaipur has traditionally maintained the spirit of living in a sustainable manner. The traditional
festival of Hariyali (green) Amavasya (no moon day) is celebrated at the onset of rainy season. The
entire community observes this festival on the banks of lakes and rivers and on the hills
surrounding the city-the objective being to spread the message of the significance of lakes and
plant life for a sustainable Udaipur.
The women of Udaipur perform an annual ritual to the goddess Dashamata, where trees are
worshipped for the long life of their spouses. The trees are holy and sacred and the message of
conservation of forests is reflected in the ritual. This is a way of communicating that the trees are
vital for the sustenance of human being, and religious symbols are strong way to put that across.
15
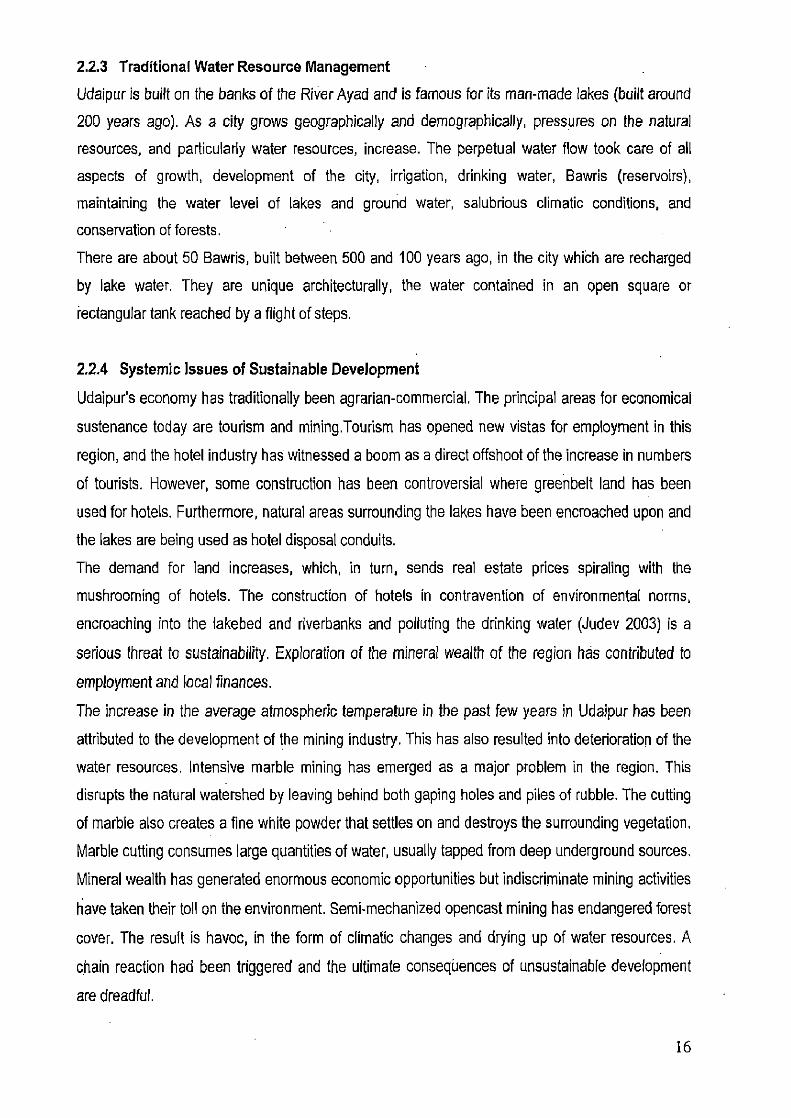
2.2.3 Traditional Water Resource Management
Udaipur is built on the banks of the River Ayad and is famous for its man-made lakes (built around
200 years ago). As a city grows geographically and demographically, pressures on the natural
resources, and particularly water resources, increase. The perpetual water flow took care of all
aspects of growth, development of the city, irrigation, drinking water, Bawris (reservoirs),
maintaining the water level of Lakes and ground water, salubrious climatic conditions, and
conservation of forests.
There are about 50 Bawris, built between 500 and 100 years ago, in the city which are recharged
by lake water. They are unique architecturally, the water contained in an open square or
rectangular tank reached by a flight of steps.
2.2.4 Systemic Issues of Sustainable Development
Udaipur's economy has traditionally been agrarian-commercial. The principal areas for economical
sustenance today are tourism and mining.Tourism has opened new vistas for employment in this
region, and the hotel industry has witnessed a boom as a direct offshoot of the increase in numbers
of tourists. However, some construction has been controversial where greenbelt land has been
used for hotels. Furthermore, natural areas surrounding the lakes have been encroached upon and
the lakes are being used as hotel disposal conduits.
The demand for land increases, which, in turn, sends real estate prices spiraling with the
mushrooming of hotels. The construction of hotels in contravention of environmental norms,
encroaching into the lakebed and riverbanks and polluting the drinking water (Judev 2003) is a
serious threat to sustainability. Exploration of the mineral wealth of the region has contributed to
employment and local finances.
The increase in the average atmospheric temperature in the past few years in Udaipur has been
attributed to the development of the mining industry. This has also resulted into deterioration of the
water resources. Intensive marble mining has emerged as a major problem in the region. This
disrupts the natural watershed by leaving behind both gaping holes and piles of rubble. The cutting
of marble also creates a fine white powder that settles on and destroys the surrounding vegetation.
Marble cutting consumes large quantities of water, usually tapped from deep underground sources.
Mineral wealth has generated enormous economic opportunities but indiscriminate mining activities
have taken their toll on the environment. Semi-mechanized opencast mining has endangered forest
cover. The result is havoc, in the form of climatic changes and drying up of water resources. A
chain reaction had been triggered and the ultimate conseqUences of unsustainable development
are dreadful.
16

2.2.5 Water resources
With the growth in population, further environmental dangers are feared. The water resources are
inadequate to sustain the growing number of inhabitants. With forest cover and the green belt in
peril, the water resources are also at risk. The recharge basins, responsible for perennial
availability of water in the traditional Bawris, have given way to a concrete jungle. The populace
perhaps is now reaping the aftermath of developing unsustainably. Thousands of tube wells both
for agricultural use and urban domestic consumption, are a primary cause of the falling water table.
World Bank, Bakshi, (2001), depicts the facts of increasing consumption of water with population
rise and over use of underground water resources and the resulting perils. The ground water level
has receded alarmingly with the increase in general demand for water. Indiscriminate underground
boring for water is a common phenomenon and has led to a drastic decrease in the water table
(Chakravarty 2003). The Bawris have been destroyed and the river is degenerating.
The rapid development of the city is becoming a serious threat to the existence of the river, lakes
and hills surrounding Udaipur. The River Ayad has become a convenient channel for the disposal
of industrial wastage and sewerage. The river carries enormous quantities of sediment, which is
both killing the river and filling up the reservoirs with silt. The people may boast of modern
development, they have used the embankments for residential settlements at the expense of
recharge basins and they have attained industrial development by using the river as a conduit for
waste disposal. They are basking in short-term increases in their quality of life but they are losing
long-term sustainable development. All this has led to an ecological disequilibrium. The disturbed
ecological balance is turning up its heat — literally — on the city.
The most significant environmental (E) aspect in the system of Udaipur is its ecology. The
disastrous consequence of unsustainable development disturbed the ecological balance in the city.
2.2.6 Findings:
The increase in population, which is a result of growing economic opportunities, has put pressure
on the land available for cultivation, forests and the beautiful hills surrounding Udaipur. As land
holdings have been divided within ever expanding families, most people no longer have enough
land for viable agriculture, even in a good rain year. The growth, if not in consonance with the
environment, is in direct contrast with the concept of sustainable development (Banerjee 1988). In
the past few years, forest cover, especially on the hills, has been seriously damaged and
encroached upon by illegal settlements. Increasing population has also caused pressure on both
residential and commercial land, resulting in large agricultural farms being sold for construction for
residential and commercial use, and existing green belt cover being destroyed.
17

1. Agriculture as an occupation is also under serious threat due to the non-availability of
cultivable land that is now being increasingly used for residential colonies, tourist resorts,
marble mining and the construction of hotels
2. Agriculture has a relatively long gestation period, whereas other businesses pay back
relatively quicker.
3. Fertile land was the source for sustainable employment for a large number of families, and
also fulfilled the demand and supply equilibrium for food grains and vegetables but is now
being used indiscriminately for nonagricultural purposed.
It is only the spirit of sustainable development amongst the people of Udaipur has kept the
city alive. The public action is required to maintain sustainability of the region and there is
no alternative any amount of government action is meaning less without the active
participation and initiative of the people.
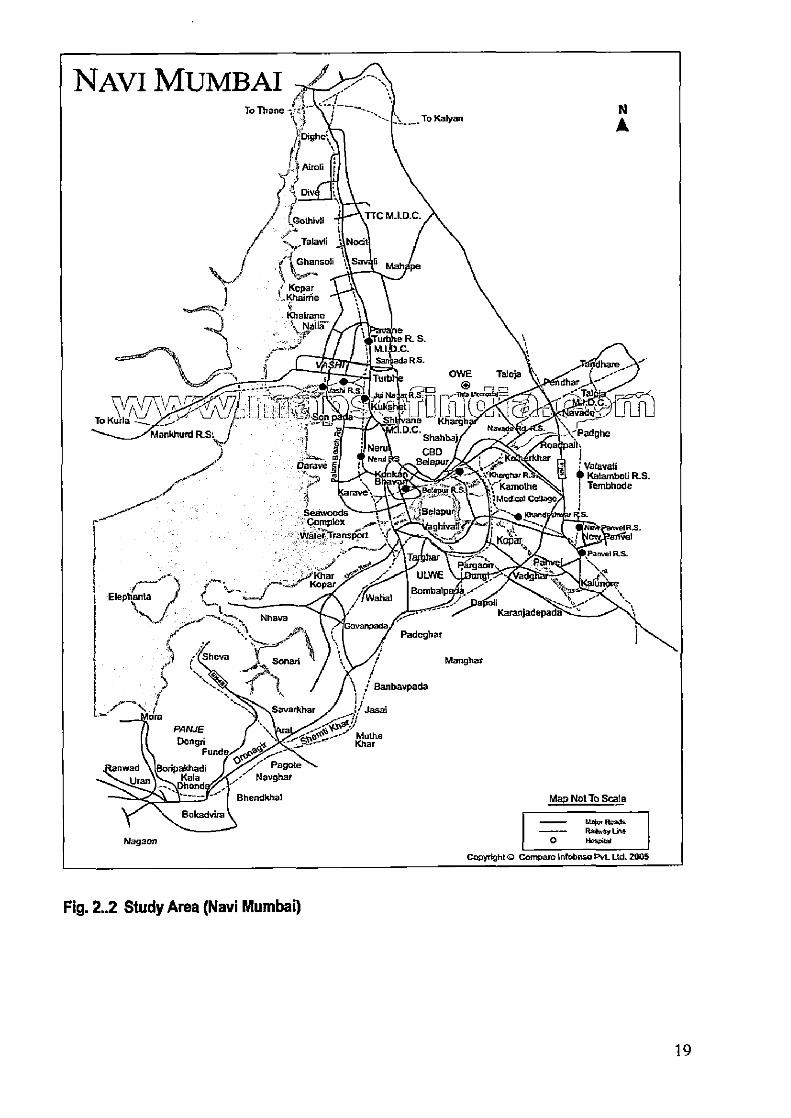
2.3 CASE STUDY: NAVI MUMBAI
Navi Mumbai project was planned to accommodate two million people from Mumbai by virtue of the
method of financing its development. Navi Mumbai acts as an effective counter magnet for Mumbai.
CIDCO formulated a strategy to develop transport and communication infrastructure in Navi
Mumbai, as part of the development program of the Mumbai Metropolitan Region.
2.3.1 Study area:-
Greater Mumbai has limits to its growth due to its peculiars physical shape. The city of Navi
Mumbai owes it origin to the realization in the late 1960s. Mumbai is a collection of small islands,
which is in the form of a narrow strip, extend into the Arabian Sea. Its central Business District
located at the Southern most tips, there by, concentrating activities in a small area and leading to
unidirectional traffic movement. The study area (Navi Mumbai) is presented in Fig. 2.2
The wedge shape of city aggravated the problems in the Mumbai they are lack of drinking water,
free flow of sewage, slums, sub — standard environment, congestion, increase in vehicular traffic
etc.
18
Ta
id 17111 av e C
--Paddhe pal
Vatav-ali Katamboli Tembhode
Oarave
41:- ;HillI-1-1i ' Sh Khargh
Shahbaj
CBD Bawer
Banbavpada
I Jasai
Muthe Khan
NAVI MUMBAI To Thane
To Kalyan N •
Tit M.LD.C.
4 Kopar I„ Khanna
Khairane Is, Nadir
e FL S. A.
R.S.
Seawoods ;'Complex ....,-- INaihrTranspcgt mile!
ULWE Bornbalp
Karanjadepada
Padeghar
Manghar
Savarkhar
Pagote N avghar
Bhendkhat Map Not To Scale
6talar Roads Railway Lim
0 Hospital
Bokadvira
Naga=
PANJE Dongd
Fund
Copyright Q Compare Infobase Pvt. Ltd. 2005
Fig. 2.2 Study Area (Navi Mumbai)
19

2.3.2 Objectives:
The Navi Mumbai has been developed in order to meet the following objectives:
• To decongest the Mumbai city in terms of population & their activities.
• To provide housing and office space at prices, which were small proportions of the
prevailing prices in Mumbai for the same.
• To ease the traffic congestion problem in Mumbai city.
• To provide new markets in Navi Mumbai for 60,000 jobs and accommodate 100,000
visitors daily.
• To release activity space in Mumbai by relocating certain trade & commercial activities.
• To create and maintain of housing stock, infrastructure financing, and maintenance of
public health by public private partnership.
• To integrate the original land owner into the new urban setting, thus making the program
financially viable through a market driven approach.
2.3.3 Scope:
The city has been planned on the principles of sustainable development. A new city was thus
developed, which has been new methodologies being applied, such as, involving people in the
development of the city through their participation, using land to generate the resources needed to
run the city, offering a better quality of life and amenities, etc.
2.3.4 Variables considered
Some of the most important variables considered in the project are as under:
(A) Housing
CIDCO built the 103,750 houses and total housing stock of Navi Mumbai is 165,000, which are
distributed among various categories such as the lower income & economically weaker section
categories (47. 39%), the middle income group category (37.33%), and the higher income group
category (15.28%). The rest of the houses are built by the private & co-operative sectors. The
private sector has catered only to the higher income group.
(B) Water Supply
The Navi Mumbai ground water is saline and hence, not potable, so rivers Barvi, Ransai,
Patalganga are the main sources of drinking water supply to Navi Mumbai. These sources supply
20

65 MLD per day of water. 12 percent of expenditure of physical infrastructure is used for drinking
water supply.
(C) Sewerage and drainage
It is planned underground, running on pumping and gravity mechanisms. The treated effluent is
used for gardening and afforestation in some cases.
(D) Solid Waste Management
The elaborate road network facilities, efficient collection and transportation system of solid waste
are introduced. Two dumping sites, served by 14 compactors are provided. In Navi Mumbai, the
total solid waste generated is 325 MT per day.
(E) Transportation
Water transport, by way of Hovercraft services is planned between the Gateway of India and Navi
Mumbai. A Mass transit rail commuter system, covering a length of 157 Km. & occupying 900 -
Hectare areas, is planned, with 7 corridors and 26 stations. Almost all the plots are approachable
by vehicular — asphalt road. A total road length of 550 Km is already developed till the end of 1994.
(F) Social Amenities:
Navi Mumbai confined 38 educational, 28 socio — cultural, 18 welfare and 14 religions institutions fill
1992, which has helped the cosmopolitan residents lead fuller and richer lives.
(G) Land Development
The land developed by shifting of wholesale markets, commissioning of commuter railway,
provision of infrastructure, etc., have helped in hiking the real estate prices in Navi Mumbai.
(H) Environment
In Navi Mumbai, the pollution levels in the city are greatly reduced except for the high level of
hydrocarbons, which is due to heavy traffic on the roads. There are 85 gardens covering an area of
40 hectare and 1.2 million trees planted under the afforestation program.
(I) Social life
Majorities of the families in Navi Mumbai are nuclear, with high education and employment rates.
The organized open spaces allow active recreation for children and youngsters.
21

2.3.5 Findings/Inferences
1. Navi Mumbai was developed on polycentric nodal pattern to avoid a situation like
Mumbai.
2. Avoiding the unidirectional flow of traffic during peak hours, the employment centers are
sought to be dispersed.
3. Better environmental control by using land use zoning and development regulations as
tools.
4. Mass transit transportation system is planned and supplemented by the road transport.
5. Controlling the development from high to low intensities, the differential floor space
percentage index for different land uses, is adopted.
6. Achieving equitable distribution of benefits of development, the entire area of Navi
Mumbai was notified for acquisition, mainly to use it as a major resource for
development.
7. Structure planning was adopted by acquisition of complete land.
8. Public — private partnership was adopted at various levels and aspects, such as, land
assembly and development planning designing, infrastructure, maintenance of municipal
services etc.
9. Participatory developers scheme has been evolved for providing the housing to lower
income groups.
10. Participation of citizens is sought in collection of bills, such as service charges,
environmental upgradation measures, etc.
22

2.3.6 Conclusions
The land is the only major resource of development, due to that the project is unique in nature,
which has been effectively utilized to generate finance for the development and maintenance of the
city. Sustainability is achieved by establishment of partnerships and involvement of the people.
The Navi Mumbai was developed with the aim of decongesting Mumbai in terms of population,
traffic and its activities. The city was developed as a counter magnet of Mum bai.Land as a resource
used for achieving physical, economic & environmental sustainability. New concept of town
planning, i.e., establishment of various partnerships, infrastructure financing, maintenance of public
health & an innovative rehabilitation program have helped in achieving the objectives of the project.
The following strategies adopted for the sustainable development of Navi Mumbai, which are
summarized into the following five heads. They are:
a) Planning
b) Land Development
c) Financing
d) Implementation
e) Rehabilitation
The efforts shown in adopting new approaches in the project is commendable, but it is not
necessary that the project may be entirely successful, gives the complexity of the problems in the
urban areas. Still such efforts are needed to achieve sustainable development of our cities.
23

STUDY AREA PROFILE CHAPTER — 3
3.1 Introduction
Jaipur is the pristine jewel in the desert sands of Rajasthan and confined in the rugged hills of the
Aravallis. Jaipur is as remarkable for its marvelous architecture and town planning as it is for the lively
spirit of the people who inhabit it. The picturesque capital of Rajasthan, Jaipur is color washed pink-the
color associated with hospitality in Rajput culture. Jaipur displays a remarkable harmony and
architectural splendor. The ancient heart of the Pink city still beats in its fairy-tale palaces, rugged
fortresses perched on barren hills and broad avenues that dominate entire city. The only planned city
of its time, Jaipur is encircled by a formidable wall.
This famous city is the capital of Rajasthan and has earned universal renown as "Pink City ", and pink
it is, with beautiful constructed palaces, havelis and forts. Jaipur, which means the city of victory was
built exactly 273 years back and is 262 km by road from Delhi (Capital of India). A strong wall encircles
the old city and even today has a suggestion of formidable strength; its function of protecting all within
is obvious. The plains of Rajasthan of which Jaipur is the capital once thundered and echoed with
clash of swords and the drums of wars. Built in 1727 by Sawai Jai Singh-II, Jaipur was the first planned
city of its time (the earlier planned city in Northern India having been built near Taxila sometime in the
2nd century BC ). Jaipur was planned by Vidhyadhar Bhattacharya, a Bengali architect, in a grid
system with wide straight avenues, roads, streets and lanes and uniform rows of shops on either side
of the main bazaars, all arranged in nine rectangular city sectors (chokris) in accordance with the
principles of town planning set down in the 'Shilpa Shastra'- and epochal treatise on the Hindu
architecture.
3.1.1 Location
Jaipur city is located at 26 degrees and 54 minutes North latitude and 75 degrees and 49 minutes east
longitude. It is bound in the North by Sikar and Alwar, in South by Tonic, Ajmer and Sawai Madhopur.,
Nagaur, Sikar and Ajmer in the West and in East by Bharatpur and Dausa districts. The study area is
presented in Fig. 3.1.
:24

PUNJAII
JAIPUR (Rajasthan)
Map not to Scale
NAGAUR
L)eoiC Boundary Ilep4 Road Road Railway track State Headquarter !Auk hieadcAlartw lonn tourist Place Naomi hiiirrivey
River Airport
cll........... Amarsat Anvo°44 /.• -KheClraultohatwag °Ramey
ill
.-1\._—,„....___ Mena ,0 o Chomr
Cha°rdwa;IA0\--.) ._./...
shan 0
gailhaltaamDpeur rac,:1 Choorhpar,d jam„47niiipm
c ° '3 /3, Raisa• - «11 Bhsslana Bhesawa
MO,* • Sandkolta
J- JAIPURGopalearh San:P ,S, , 0Jobner 0 Chanel, of To Douse SRN LJAA &WINO/If ..„...„,.. ---.--
---/.. District .4 eadouar , 11 Kanota . / phuhin. ViT, a10 0 Dah mi
0 htataina Sawarda "Bagru°Kahv*ata%n4:1-"r511:-hSjklitIltwIt7) DAUSA dart,. Mamma Bachoun Moah.:8" 0
1....,-, i 0 Renwal r 12 ,,
5 J Dudu hak
Sakhun mg.14.4nabac o Son 0, 't)Marighrwat a
Ae' , To Airneri'_''SeWa
,7CVIr
District HeeoqLarter
AJMER
/f■i/a,I;cra •
,I K0 Dant,' ot Putli , Piagiputa vy ' 1 0 0 NI Ma ndo ,
_SElhabiu 4, ,,,, To Siker To Shri MaOlopo ,---/ ° Bak...?..,
District Headquarter iShahPur a 1.1.01 ............ o •
•
SIKAR
O Lowan Watka 01 She odaspixa
OC an Chat
0 I Chitorairuntd,V *
11,adhorawcro,C) &gorta__— 0Chaydnia
Sawai aciopa To Na ours
TONK To Tonk District adouarter District -ieadoJarter SAWAI MADHOPUR
Copyrignt Co■-nparc Intobase Pvt 2301•32
To Bahror
Can't to
ALWAR
RAJASTHAN District Map
..
T
PAKISTAN
AM, CAOM
— !Me .14.10w,
Affk,, Vrik At 4,0k e
vt, Main PNADESNI
Co,.• WM.. N. Lid 7,e , 32
GUJARAT
NANYANA
JUAN PNADESK
awe
PAKISTAN
LOCATION°, NOJASISIAN IN INDIA
CHINA
SAY Os MIME IASIAN SEA
WL•• • fob
..•••111". ft> C./Tv Sr
O
FIGURE 3.1 : Location Map

Oa
I_ City Map
Sttarampura
1— Chest 1 Hospital
41# .. 'i'..•,.,
Indrapurt
ita;i,fr- ;
k astrtn
<(\
w
-- rav, 44,7
.
21
illiiiS - ....:
Patehtibba
Arial abbilipar 4
Nwww.ma lsolifdia.comr
To Reavisth Lake
Shot pure
8A e
Copyright (C) Comparc In'obase Pet. L:d 200C-2X'
68 Numbers for re/
Maruti Authorised A Service atation•
• Dealer Workshops
I Rampure Islay nil ic Scale Pupa
Lolkotbi
Suclarshanpura
eGandhirlikpar -347./ Nagor
India^ Au Ines Office
4111 D.w.2 •
D.V1,1
4 A
4
3.1.2 Region
Jaipur Region comprising of area includes Jaipur city, Amer, Sancianer, and towns and settlements of
Bassi. Chandlai, Sheodaspura, Bagru, Chomu, Achrol, Jamwa Ramgarh and Contiguous areas. The
area of Jaipur Region may work out to be approximately 1464 Sq. Km & it's 4.11 % of the state which
is shown in the Fig. 3.2
FIGURE 3.2 : The Study Area
26
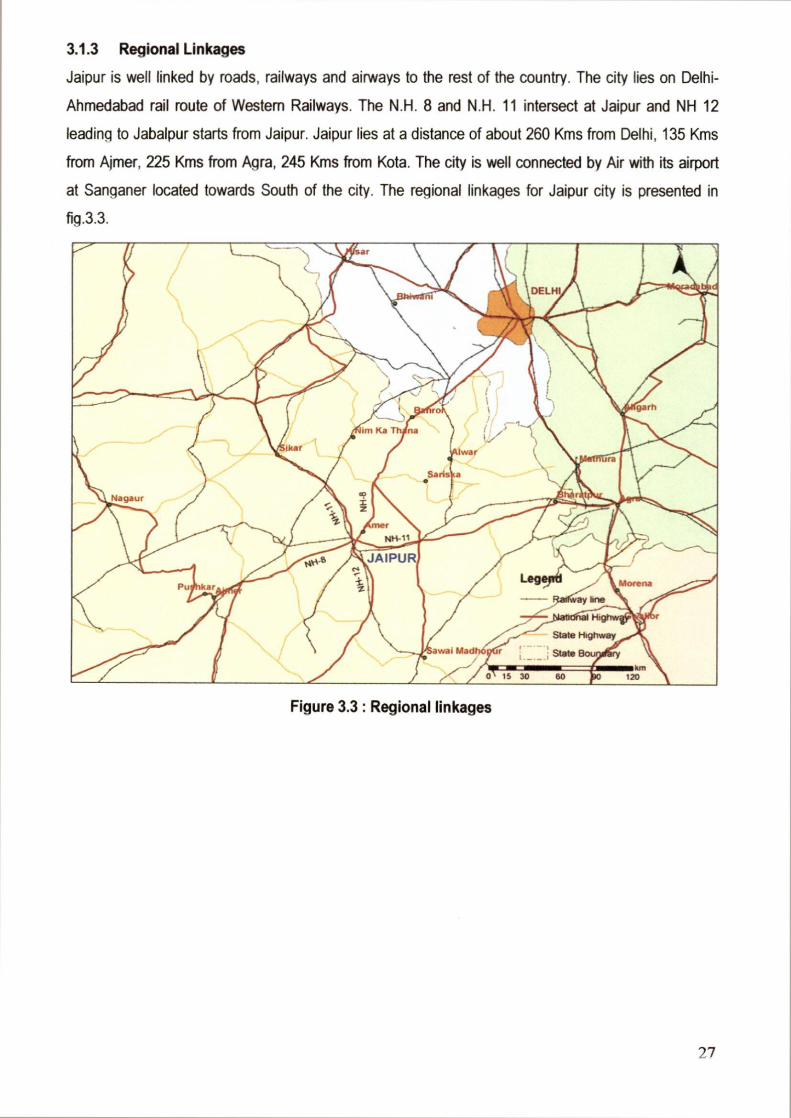
3.1.3 Regional Linkages
Jaipur is well linked by roads, railways and airways to the rest of the country. The city lies on Delhi-
Ahmedabad rail route of Western Railways. The N.H. 8 and N.H. 11 intersect at Jaipur and NH 12
leading to Jabalpur starts from Jaipur. Jaipur lies at a distance of about 260 Kms from Delhi, 135 Kms
from Ajmer, 225 Kms from Agra, 245 Kms from Kota. The city is well connected by Air with its airport
at Sanganer located towards South of the city. The regional linkages for Jaipur city is presented in
fig.3.3.
Figure 3.3 : Regional linkages
27

Achral A
Legend • Salegee Towns
Tehsd Boundary - Maior Roads
• • ratway 11.1 Antanisnan Nauan
Vdage Boundary 1 JOA Boundary
c--•
3.1.4 CONSTITUENTS OF JAIPUR REGION
The Jaipur Region comprises two distinct constituents
• The Jaipur Municipal Corporation (JMC) that includes the walled city and the rest of JMC;
• Rest of JDA area that include the satellite towns and the villages. The entire JDA area comprises Jaipur city (JMC) and the neighboring satellite towns namely, Chomu, Bagru, Bassi, Sheodaspura, Achrol and Jamwaramgarh. It covers a total area of 1464 sq.km, out of which, the municipal area of Jaipur covers 288 sq.km. The JMC Area is further divided into the walled city and the rest of JMC area. The walled city has a spatial extent of only 6.7 sq. km. but houses nearly 4 lakh people. The 2001 census shows that the population of the walled city has decline from 1991 due to out movement of inhabitants from the area to new residential colonies. The constituent of Jaipur area is presented in table 3.1 and Fig. 3.4
Table 3.1 Constituents of Jaipur
S. No. Area Total Area (sq. km.) Total Population (millions)
% to Total JDA Population
1991 2001 1991 2001 1991 2001
1. JMC 218.3 288.4 1.52 2.32 81.4 86.8
la. Walled City 6.7 6.7 0.5 0.4 26.4 15
lb. Rest of JMC 192.3 281.7 1.02 1.92 54.7 71.8
2. Rest of JDA 1220 1149.9 0.35 .36 18.6 13.2
3. Total JDA 1464 1464 1.87 2.68 100 100
Source: Census of India- 1991 and 2001.
Figure 3.4: Jaipur Development Authority (JDA) Area
7R

3.2 PHYSICAL CHARACTERSTICS
3.2.1. Climate Jaipur region falls under the semi-arid region of climatic zones and experiences a continental type of
climate owing to its proximity to the desert and it being inland. It is characterized by hot summers and
cold winters.The month of May experiences the highest maximum temperature of 40.3°C and January
the lowest minimum temperature of 7.8°C. The data is based on 30 years observations recorded by the Indian Meteorological Department. Jaipur recorded the maximum temperature of 45.2°C and
minimum temperature of 2.5°C in the year 2001. The climatic characteristics of Jaipur region are
presented in Table 3.2
Table 3.2 : Climate Characteristics of Jaipur Region
Months Temp (°C) Mean Wind
Speed (Kmph) Rainfall (mm) Relative Humidity (%)
Maximum Minimum 8:30A.M 5:30 P.M
Jan 22.5 7.8 5.6 7.9 63 35
Feb 25.7 10.7 5.5 11.7 54 28
Mar 31.5 15.8 7.9 6.1 42 19
Apr 37 21.4 9.7 4.1 30 16
May 40.3 25.4 12.6 16.2 32 17
Jun 39.3 27.2 12.5 66 52 32
Ju 33.9 25.5 9.5 216.3 75 61
Aug 32 24.3 8.4 231.2 82 70
Sep 33.2 22.9 7.6 80.3 72 55
Oct 33.4 18.6 6 22.6 51 32
Nov 29 13.1 3.9 3.2 50 33
Dec 24.4 9.1 3.9 3.3 61 38
Source: Climatological Tables, 1951-80, IMD
Normal annual rainfall received by Jaipur is 563.8 mm. August receives the highest amount of
rainfall of 231.2 mm, while November receives the lowest amount of 3.2 mm. The city gets its
maximum share of rainfall from the Southwest
monsoons. The maximum rainfall has been
recorded in the month of August. The average
annual rainfall for the year 2001 was 430.09 mm,
that witnessed a drastic decrease in the year
2002 with the average annual rainfall received
being 207.4 mm and average annual rainfall is
presented in Fig. 3.5. Figure 3.5: Annual Rainfall
29

Relative Humidity in the city is the highest in the month of August and the lowest in January. Wind
speed is the highest in the month of May. The predominant wind is flown from the Northwest direction.
3.2.2. Land Resources
(A) Topography Jaipur is surrounded by the Aravalli hills to the North and East. The South and West parts of the walled
city area is reasonably flat. The elevation varies from 382 m to 462 m above mean sea level between
the North and South parts of the city. The region is drained by a number of seasonal rivers of which
Bangarana, Dhkundh, and Bandi are prominent. The Bangarana has been impounded near Jamwa
Ramgarh by Ramgarh Dam. Amanishah nallah towards the West and the South of the city is a major
drainage channel, which meets the Dhundh River towards South -East of the city. The Northwest
region is drained by various local nallahs, which ultimately form the Bandi River. The Northern area is
drained by local nallahs converging to form Bangarana River. The general slope of the Jaipur city and
its surroundings is from North to South and then to South-east. Higher elevations in the North exist in
the form of low, flat-topped hills of Nahargarh (587 meters). Jaigarh, Amber and Amargarh, which
are deeply dissected and eroded. The overall trend is a decline of level from the areas bordering the
hills in the North to plain in the South slopes of the plain areas are in general gentle
View of the Aravali Ranges in Jaipur
View of the city from Nahargarh Fort
(B) Drainage
The general slope of the city is from North to South, which is also the direction of drainage. Nearly, all ephemeral streams flow in this direction. The Southern end of the city opens out in the plains and stretches far and wide towards Sanganer and beyond. The walled city was originally located on the rocky side to provide an easy drainage system on either side of the city but the future expansion of the city took place towards the south and west.
30

3.2.3. Water Resources
(a) Surface Water Resources
There is no perennial surface water source in the city. Amanishah Nallah and Dhund river are two non-perennial streams, which flow from North to South. The former passes through the Jaipur city while the latter flow on the East of the city and is joined by Amanishah Nallah in Southeast of the city.
There is another small drainage system in the North foothills, which fills up the artificially impounded lake called the Jal Mahal (Man Sagar). Among the large surface water bodies is Jal Mahal Lake or Mansagar Lake in the North of the city. It is approximately 130 ha in its full spread and has a catchment area of 23.5 sq.km. Approximately, 40% of the total catchment area falls inside dense urban area. The lake is used for the disposal of sewage. Other historic water bodies the Talkatora Lake in the walled city and the Ramgarh lake have dried up due to urbanization of their catchment areas. The Ramgarh Lake, which used to be the main source of supply for more than 30 years, and produces a negligible quantity today.
One of the natural drainage channels
Flowing through the city
The Mansagar Lake
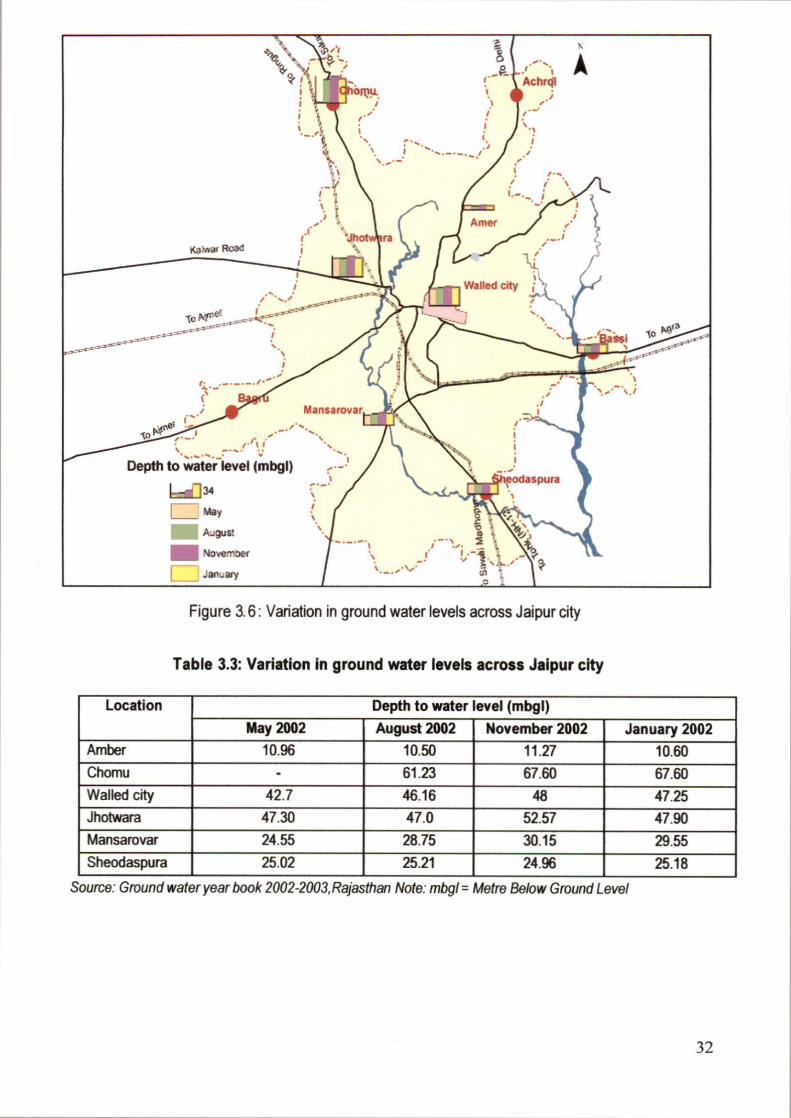
(b) Ground water Resources
Nearly 92% of the population of Jaipur depends on ground water for meeting their needs. The difference in ground water levels in various parts of the city is presented in Table 3.3 and Fig. 3.6. Ground water is available at the deepest level in the walled city and Jhotwara industrial area. This could be attributed to the high population density in the walled city and it being heavily dependent on ground water. . Jhotwara Industrial area also faces the same problem of groundwater being available at great depth. In this case, Amber is positioned very well with the water depth going upto 10-11rn.
31
r
Achrcil
• -
A
• 0 1, 2 . t _
Mansarovar ._.,...,.
r • ■I
Depth to water level (mbgl)
LAD 34 May
A.:gust
Noverrxrr
,an-ary
•
Figure 3.6: Variation in ground water levels across Jaipur city
Table 3.3: Variation in ground water levels across Jaipur city
Location Depth to water evel (mbgl) May 2002 August 2002 November 2002 January 2002
Amber 10.96 10.50 11.27 10.60 Chomu - 61.23 67.60 67.60 Walled city 42.7 46.16 48 47.25 Jhotwara 47.30 47.0 52.57 47.90 Mansarovar 24.55 28.75 30.15 29.55 Sheodaspura 25.02 25.21 24.96 25.18
Source: Ground water year book 2002-2003. Rajasthan Note: mbgl = Metre Below Ground Level
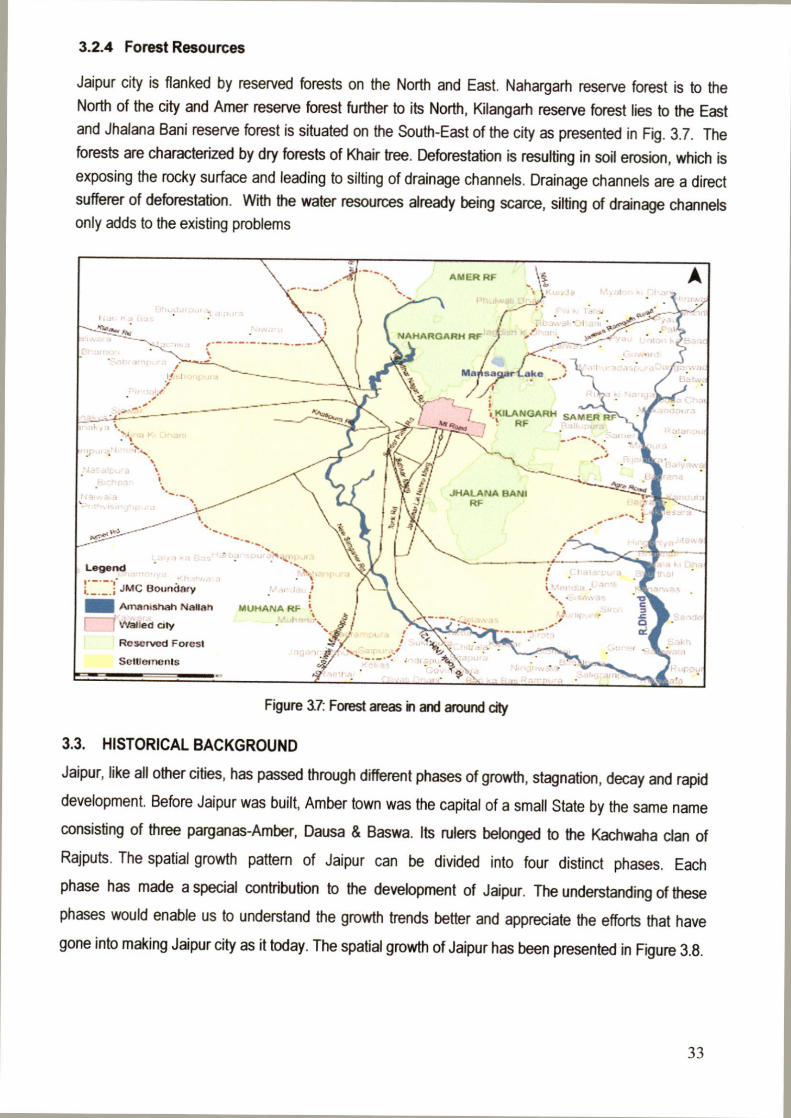
A
Legend
■._._.; JMC Elou•ictri•y
1111 Amanishan Wilted city Reserved Forest
MUHANA RF
NAHARGARH RF
3.2.4 Forest Resources
Jaipur city is flanked by reserved forests on the North and East. Nahargarh reserve forest is to the North of the city and Amer reserve forest further to its North, Kilangarh reserve forest lies to the East and Jhalana Bani reserve forest is situated on the South-East of the city as presented in Fig. 3.7. The forests are characterized by dry forests of Khair tree. Deforestation is resulting in soil erosion, which is exposing the rocky surface and leading to silting of drainage channels. Drainage channels are a direct sufferer of deforestation. With the water resources already being scarce, silting of drainage channels only adds to the existing problems
Figure 3.7: Forest areas in and around city
3.3. HISTORICAL BACKGROUND
Jaipur, like all other cities, has passed through different phases of growth, stagnation, decay and rapid
development. Before Jaipur was built, Amber town was the capital of a small State by the same name
consisting of three parganas-Amber, Dausa & Baswa. Its rulers belonged to the Kachwaha clan of
Rajputs. The spatial growth pattern of Jaipur can be divided into four distinct phases. Each
phase has made a special contribution to the development of Jaipur. The understanding of these
phases would enable us to understand the growth trends better and appreciate the efforts that have
gone into making Jaipur city as it today. The spatial growth of Jaipur has been presented in Figure 3.8.
33

3.3.1. Phase !: 1727-1850 AD
Foundation for this city of Jaipur was laid by Sawai Jai Singh II in November, 1727 as a new capital of the Amber State. Most of physical development of this new capital took place before 1800 A.D. Jai Singh's successors continued to add to the glory of the city by constructing various temples, palaces and other important buildings. Jaipur is one of the few planned cities of its times based on the principles of ancient town planning doctrine of Shilpa Shastra. The city conformed to the traditional walled city concept with the encircling wall and 9 entry gates. Jaipur walled city evolved as a gridiron plan with the main road running almost East West along the ridge in the center and the palace complex at the core. The buildings were built following a strict Architectural guideline. By 1734, the main markets of the town including Johari Bazaar, Sireh Deorhi Bazaar, Kishanpole Bazaar and Gangauri Bazaar
3.3.2. Phase II: 1850-1930 During this phase, the city grew out of the confines of the walled city. The establishment of railway line in 1868 A.D fueled the growth of the city. During the Rajasthan Famine of 1868-69, Ramniwas Garden was constructed as part of the famine relief work. Modern water Works and Gas Works for lighting the city streets was also established during this phase.
3.3.3. Phase III: 1930.1970
In 1930s, five development schemes, Fateh Tiba, area south of Ramniwas Bagh, Ashok Nagar, New Colony in Jalu pura and Bani Park were conceived to provide residential plots, land for public institutions and other amenities for the increasing population. Civil Lines area was developed primarily to house the Senior Government servants. Mirza Ismail (MI) Road was constructed as a ceremonial highway from Ajmer Road to Moti Doongri Road in the early 1940s. The beginning of Sawai Mansingh II's reign was the beginning of the modernization of Jaipur city.
After Sir Mirza Ismail took over as Dewan of Jaipur in 1942 major land development schemes outside the walled city were taken up. The Rajasthan University was inaugurated in 1947 thereby opening opportunities for the southward growth of the city. A sudden increase of population after partition was seen that was mainly due to the influx of refugees during this time. Bapu Nagar and Gandhi Nagar residential areas were developed towards south of the city. Development towards the Northwest of the city took place in the early sixties with the establishment of the Jhotwara Industrial Estate,
3.3.4. Phase IV: Post 1970s
During the last 3 decades, the major growth direction has remained largely the same i.e., towards the Southwest and Northwest of the city. This is due to the presence of hills in the
34

A ti
Phases of growth 11111 1727-185C I1 1850-1930
1930-1970 1970s onwards
ti
Northern and Eastern side of the city that act as natural barriers. Towards the South, the city has extended beyond Sanganer. On the West, the city now extends uptil the Western bypass road. New areas have developed between the Delhi railway line and the Amanishah Nalah on the West. The residential area in this place has been developed by the cooperative housing societies. Such societies have also come up in areas between Gopalpura bypass and Jhotwara Industrial Area.
Figure 3.8: Jaipur Growth Pattern, 1727 to 2005
3.4 PLANNING OF THE CITY
The walled city is planned in the valley to the North and East of the city. On the North of the walled city, was the old capital Amer while the southern boundary was determined by the ancient trade route of Delhi-Agra-Ajmer. The city has been planned on the basis of Prastara style, one of the ancient treatises on Hindu town planning with a size of 4 Km x 6 Km. The city has been designed as a nine square grid (residential sectors) in keeping with the Vastu Shastra, six of them as an orthogonal cluster. The main axis of the city followed the local topography along a ridge so that natural drainage could be made use of. The town was divided into four, nine or sixteen major wards with appropriate number of roads running East West and North South. The central Square with the observatory accommodated the palace and its gardens, administrative offices, etc. covers a larger area merged with the square on its North. Jaipur city is a geometrically square shaped city. The square of the walled city on a side of 1.61 mile is
divided into nine equal works by two intersecting lines from each side at right angle, and at equal
distances. Its approximate area is 6.77 Sq. km.
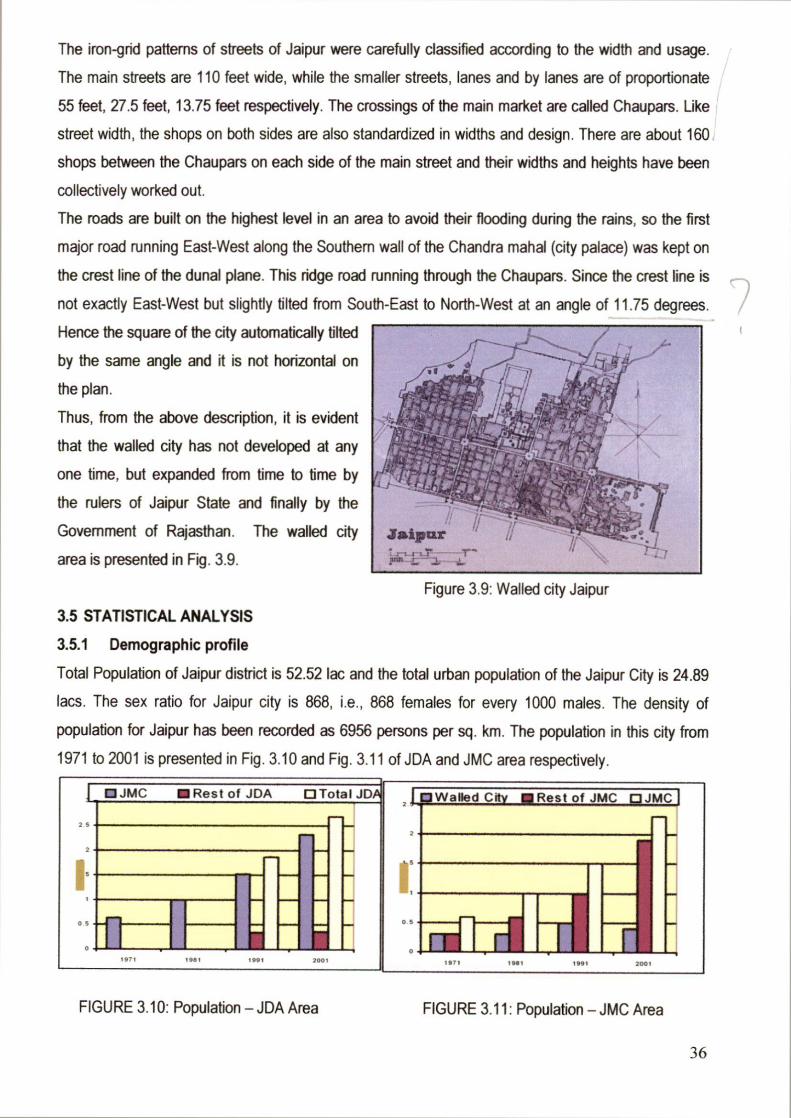
Walled City MI Rest of JMC ❑ JMC L 1:1 JMC
1971 1901
5
MI Rest of JDA ❑ Total JDA
Figure 3.9: Walled city Jaipur
The iron-grid patterns of streets of Jaipur were carefully classified according to the width and usage.
The main streets are 110 feet wide, while the smaller streets, lanes and by lanes are of proportionate
55 feet, 27.5 feet, 13.75 feet respectively. The crossings of the main market are called Chaupars. Like
street width, the shops on both sides are also standardized in widths and design. There are about 160
shops between the Chaupars on each side of the main street and their widths and heights have been
collectively worked out.
The roads are built on the highest level in an area to avoid their flooding during the rains, so the first
major road running East-West along the Southern wall of the Chandra mahal (city palace) was kept on
the crest line of the dunal plane. This ridge road running through the Chaupars. Since the crest line is
not exactly East-West but slightly tilted from South-East to North-West at an angle of 11.75 degrees.
Hence the square of the city automatically tilted
by the same angle and it is not horizontal on
the plan.
Thus, from the above description, it is evident
that the walled city has not developed at any
one time, but expanded from time to time by
the rulers of Jaipur State and finally by the
Government of Rajasthan. The walled city
area is presented in Fig. 3.9.
3.5 STATISTICAL ANALYSIS
3.5.1 Demographic profile
Total Population of Jaipur district is 52.52 lac and the total urban population of the Jaipur City is 24.89
lacs. The sex ratio for Jaipur city is 868, i.e., 868 females for every 1000 males. The density of
population for Jaipur has been recorded as 6956 persons per sq. krn. The population in this city from
1971 to 2001 is presented in Fig. 3.10 and Fig. 3.11 of JDA and JMC area respectively.
FIGURE 3.10: Population — JDA Area FIGURE 3.11: Population — JMC Area
36

61 43
60 58 57
40
34
41 42
56 45
Legend Walled City Population Density (PPM) (2001)
aco
■01 SOO
MI act . 1203
1201
• • ow am Kilornettia 110:61020304
+1c, • :3 al re af.a c• 5.41,1 No • ee-,ons • • ..12
44 47
46
sol W ailed City C Iuo
70000
E 60000
0 50000
40000
0 30000 0)
20000
10000
■ JMC DRest of JDA
•••■••••••I
•••••••••=11
—MEM 1991
0 • 2001
3.5.2 Density
The density of Jaipur increased steadily in the past decades, indicating rapid urbanization of the city.
The ward-wise analysis of density pattern in the city shows that the old city inner wards are densely
populated. New residential areas to the South and the Northeast of the city have low densities
because there are still large tracts of lands available for infill. The density level in the city is presented
in Fig. 3.12.
The population density in the Walled City
has also been analyzed that wards 45, 46
and 56 have relatively higher density of
population (more than 12 PPH) than others.
The population density of walled City and
JMC area have been presented in Fig. 3.13
and Fig. 3.14.
Figure 3.12 Population Density
Figure 3.13: Density of Population 2001-Walled City
37
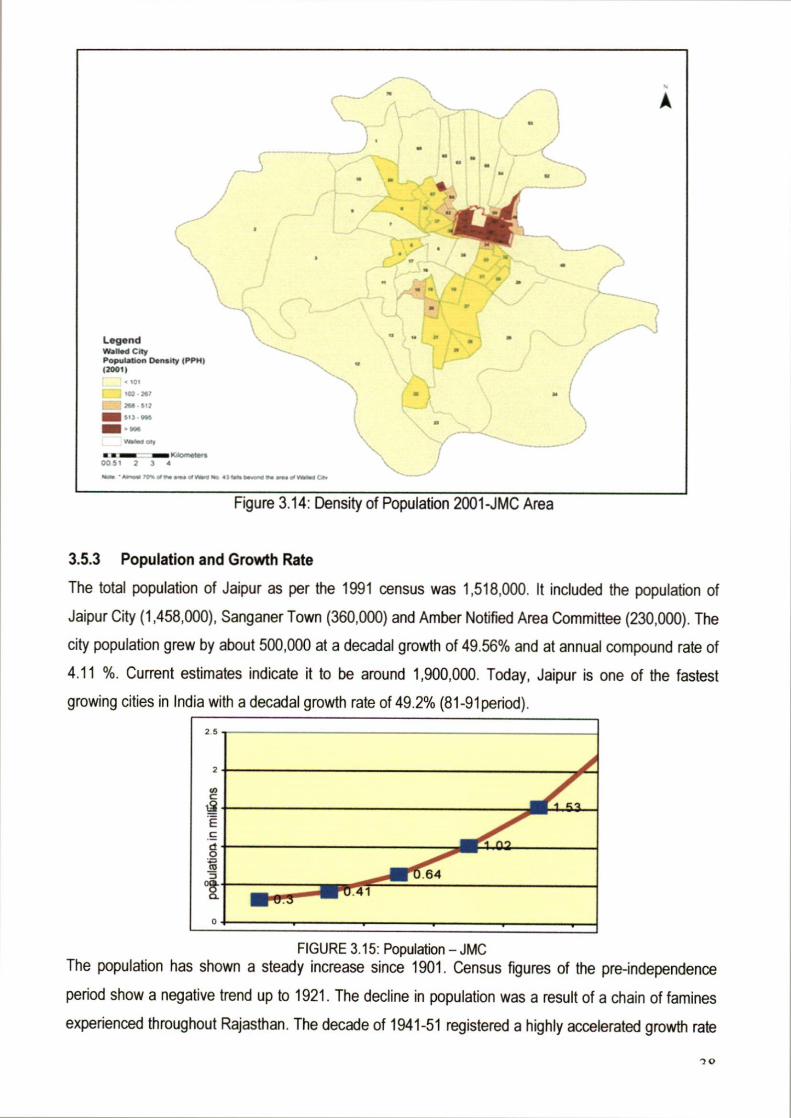
A
Legend
Walled City Population Density (PPM; (20011
tot
ne • Jet
7? na 312
513- we
eared car
• _11•1111Kaontallent 00 51 2 3 4
• 11" Flo woo of Wed Oft • 1 Ms rN moo of MOM C C.
2
p oO
ulat
ion in
mill i
o ns
0.3 .41
64
1 02
Figure 3.14: Density of Population 2001-JMC Area
3.5.3 Population and Growth Rate
The total population of Jaipur as per the 1991 census was 1,518,000. It included the population of
Jaipur City (1,458,000), Sanganer Town (360.000) and Amber Notified Area Committee (230,000). The
city population grew by about 500,000 at a decadal growth of 49.56% and at annual compound rate of
4.11 %. Current estimates indicate it to be around 1,900,000. Today, Jaipur is one of the fastest
growing cities in India with a decadal growth rate of 49.2% (81-9lperiod).
FIGURE 3.15: Population — JMC The population has shown a steady increase since 1901. Census figures of the pre-independence
period show a negative trend up to 1921. The decline in population was a result of a chain of famines
experienced throughout Rajasthan. The decade of 1941-51 registered a highly accelerated growth rate
-1 V

FIGURE 3.16: Population Growth Rate
OWalled City ■Rest of JMC OJMC 2.5
2
0.5
0
1971 1981 1991 2001
of 66% because of massive influx of refugees from across the border, and population and growth rate
in Jaipur is presented in Fig. 3 .15 and Fig. 3.16. The population growth within the walled City was
nearly equal to that of rest of the JMC area between 1981 — 91. However, between 1991-2001, the
walled City has witnessed a decline in population, and presented in Fig. 3.17
Figure 3.17 Population Growth Rate — JMC Constituents
3.5.4 LITERACY RATE
The literacy rates and sex ratio of Jaipur city and its constituent parts have been presented in Table
3.4. The number of literates in the city has grown from 58.5% in 1991 to 66.2% in 2001, which is above
the national average of 65.4%. The city level figures are higher than the corresponding state level
data, which in 1991 was only 38.5% and 49% in 2001.
The walled city has a lower rate of literacy than the rest of the JMC area. The literacy rate was only
51.65 in 1991 in the walled city whereas for rest of the city it was 55.3 %. The gap was widened in
2001 when the literacy rate of the walled city dipped to only 40% and in the rest of the city it rose to
75%. Comparison of literacy among males and females show that more percent of male are literate
than females and this holds true also for the state and the country as a whole.
39
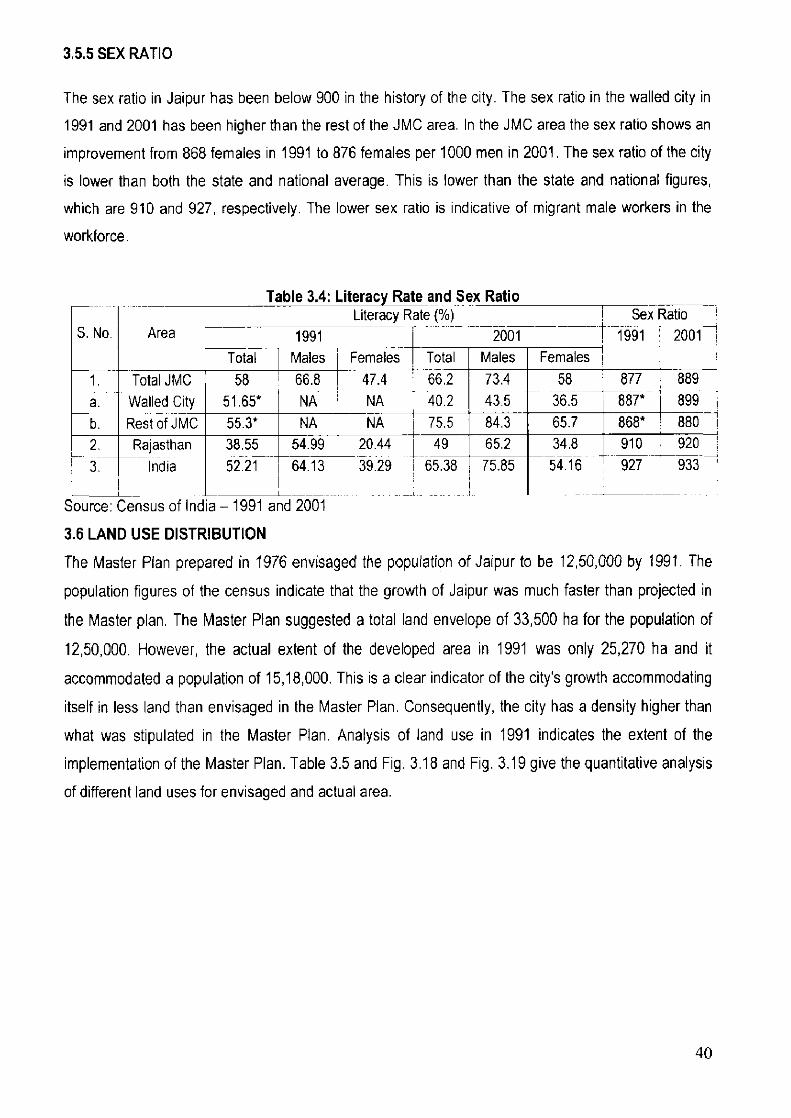
3.5.5 SEX RATIO
The sex ratio in Jaipur has been below 900 in the history of the city. The sex ratio in the walled city in 1991 and 2001 has been higher than the rest of the JMC area. In the JMC area the sex ratio shows an
improvement from 868 females in 1991 to 876 females per 1000 men in 2001. The sex ratio of the city
is lower than both the state and national average. This is lower than the state and national figures, which are 910 and 927, respectively. The lower sex ratio is indicative of migrant male workers in the
workforce.
Table 3.4: Literacy Rate and Sex Ratio
S. No. Area Literacy Rate (%) Sex Ratio
1991 2001 t 1991 I 2001 Total Males Females + Total Males Females
1. a.
Total JMC Walled City
58 66.8 NA
47.4 66.2 NA 40.2
73.4 43.5
58 877 889 51.65* 36.5 887* 899
b. Rest of JMC 55.3* NA NA 75.5 84.3 65.7 868* 880 2. Rajasthan 38.55 54.99 20.44 49 65.2 34.8 910 i 920 3. India 52.21 64.13 39.29 I 65.38 75.85 54.16 927 ' 933 '
Source: Census of India - 1991 and 2001
3.6 LAND USE DISTRIBUTION The Master Plan prepared in 1976 envisaged the population of Jaipur to be 12,50,000 by 1991. The
population figures of the census indicate that the growth of Jaipur was much faster than projected in
the Master plan. The Master Plan suggested a total land envelope of 33,500 ha for the population of
12,50,000. However, the actual extent of the developed area in 1991 was only 25,270 ha and it
accommodated a population of 15,18,000. This is a clear indicator of the city's growth accommodating
itself in less land than envisaged in the Master Plan. Consequently, the city has a density higher than
what was stipulated in the Master Plan. Analysis of land use in 1991 indicates the extent of the
implementation of the Master Plan. Table 3.5 and Fig. 3.18 and Fig. 3.19 give the quantitative analysis of different land uses for envisaged and actual area.
40
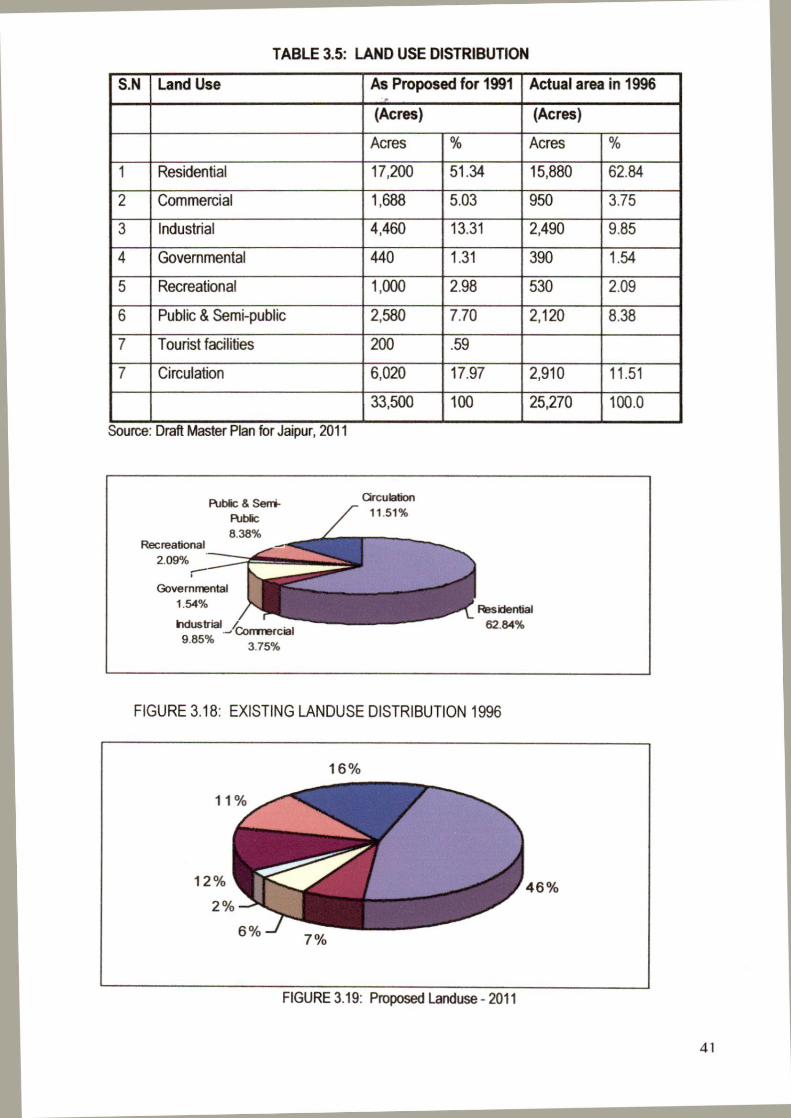
Public & Sem, Public 8.38%
Recreational 2.09%
Governmental 1.54%
Industrial / — Commercial
9.85% 3.75%
Circulation 11 51%
Residential 62 84%
1 6 %
1 1 04161WAII
.1111 LIP
6% 7%
4 6 "/■) 1 2 %
2%
TABLE 3.5: LAND USE DISTRIBUTION
S.N Land Use As Proposed for 1991 Actual area in 1996
(Acres) (Acres)
Acres % Acres
1 Residential 17,200 51.34 15,880 62.84
2 Commercial 1,688 5.03 950 3.75
3 Industrial 4,460 13.31 2,490 9.85
4 Governmental 440 1.31 390 1.54
5 Recreational 1,000 2.98 530 2.09
6 Public & Semi-public 2,580 7.70 2,120 8.38
7 Tourist facilities 200 .59
7 Circulation 6,020 17.97 2,910 11.51
33,500 100 25,270 100.0
Source Draft Master Plan for Jaipur, 2011
FIGURE 3.18: EXISTING LANDUSE DISTRIBUTION 1996
FIGURE 3.19: Proposed Landuse - 2011
41
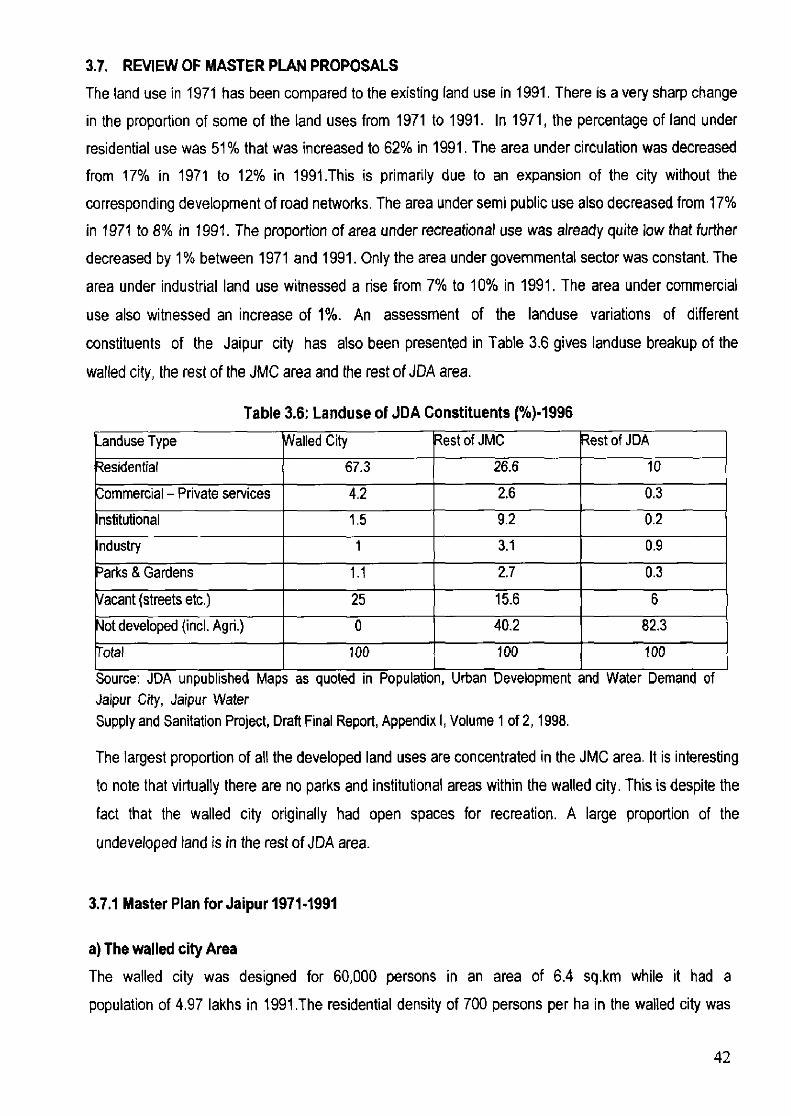
3.7. REVIEW OF MASTER PLAN PROPOSALS
The land use in 1971 has been compared to the existing land use in 1991. There is a very sharp change
in the proportion of some of the land uses from 1971 to 1991. In 1971, the percentage of land under
residential use was 51% that was increased to 62% in 1991. The area under circulation was decreased
from 17% in 1971 to 12% in 1991.This is primarily due to an expansion of the city without the
corresponding development of road networks. The area under semi public use also decreased from 17%
in 1971 to 8% in 1991. The proportion of area under recreational use was already quite low that further
decreased by 1% between 1971 and 1991. Only the area under governmental sector was constant. The
area under industrial land use witnessed a rise from 7% to 10% in 1991. The area under commercial
use also witnessed an increase of 1%. An assessment of the landuse variations of different
constituents of the Jaipur city has also been presented in Table 3.6 gives landuse breakup of the
walled city, the rest of the JMC area and the rest of JDA area.
Table 3.6: Landuse of JDA Constituents (%)•1996
anduse Type ailed City Rest of JMC Rest of JDA
esidential 67.3 26.6 10
ommercial — Private services 4.2 2.6 0.3
Institutional 1.5 9.2 0.2
ndustry 1 3.1 0.9
•arks & Gardens 1.1 2.7 0.3
acant (streets etc.) 25 15.6 6
ot developed (incl. Agri.) 0 40.2 82.3
otal 100 100 100
Source: JDA unpublished Maps as quoted in Population, Urban Development and Water Demand of Jaipur City, Jaipur Water Supply and Sanitation Project, Draft Final Report, Appendix I, Volume 1 of 2, 1998.
The largest proportion of all the developed land uses are concentrated in the JMC area. It is interesting
to note that virtually there are no parks and institutional areas within the walled city. This is despite the
fact that the walled city originally had open spaces for recreation. A large proportion of the
undeveloped land is in the rest of JDA area.
3.7.1 Master Plan for Jaipur 1971.1991
a) The walled city Area
The walled city was designed for 60,000 persons in an area of 6.4 sq.km while it had a
population of 4.97 lakhs in 1991.The residential density of 700 persons per ha in the walled city was
42

recommended by the Master Plan. Tourist facilities and a five star hotel were proposed to be developed in the Jal Mahal Lake area North West of the walled city. The small industries in the walled
city were proposed to be shifted from their location. The proposed landuse for 1991 in the master plan however, could not be attained.Whilethe
residential development far exceeded the proposals others uses such as commercial, industrial, circulation, etc fell below the targets. It is evident that instead of 52% residential land use proposed for 1991, the area under land use was 62%. The area under commercial land use was proposed to be increased to 5.4% but it got limited to 3.8%. Similarly, the area under Industrial land use was proposed to increase to 16% but only 10% of the area was under this land use in 1991
3.7.2. Master Plan 2011
The Master Plan 2011 was prepared by Jaipur Development Authority in 1995 and came into effect
from 1998.The entire Jaipur region was demarcated as the planning area. The Jaipur region
includes Chomu, Bagru, Bassi, Sheodaspura, Achrol and Jamwaramgarh as satellite towns
along with the Jaipur city. The area of the Jaipur region is 1464 sq.km. It was also proposed
to develop inner ring towns between Jaipur city and the satellite towns. The population of Jaipur was expected to reach 42.2 laths by 2011.The population of Jaipur city is assigned at 35 lakhs
for the year 2011.The spill over of 7.2 lakh population was proposed to be diverted to the satellite
towns, The satellite towns are proposed to be developed as counter- magnets for the city of
Jaipur.
a) Proposed Land utilization -1991-2011
Jaipur region was divided into three broad categories by the Master Plan. They are:
Rural Area: The rural area is proposed to cater to the predominantly agriculture- based rural
economy. The various settlements in this area will have scope for expansion for their natural growth and their related economic functions.
Ecological Zone: This zone includes the hill ranges, forest covers, water bodies, settlements
etc. Functions and activities that are eco-friendly and occupy minimum built up
area for incidental use are proposed for this zone. The area of the ecological zone is 481
sq.km.
Urbanizable Area: The unrealizable area caters to concentrated form of urban activities. These
areas have been equally distributed in the region taking into account the potentials of existing
settlements, land classifications and areas sustainable to urbanization, directions of growth, available
physical infrastructure, contiguity of urban areas, planning concepts, feasibility of development, etc.
43
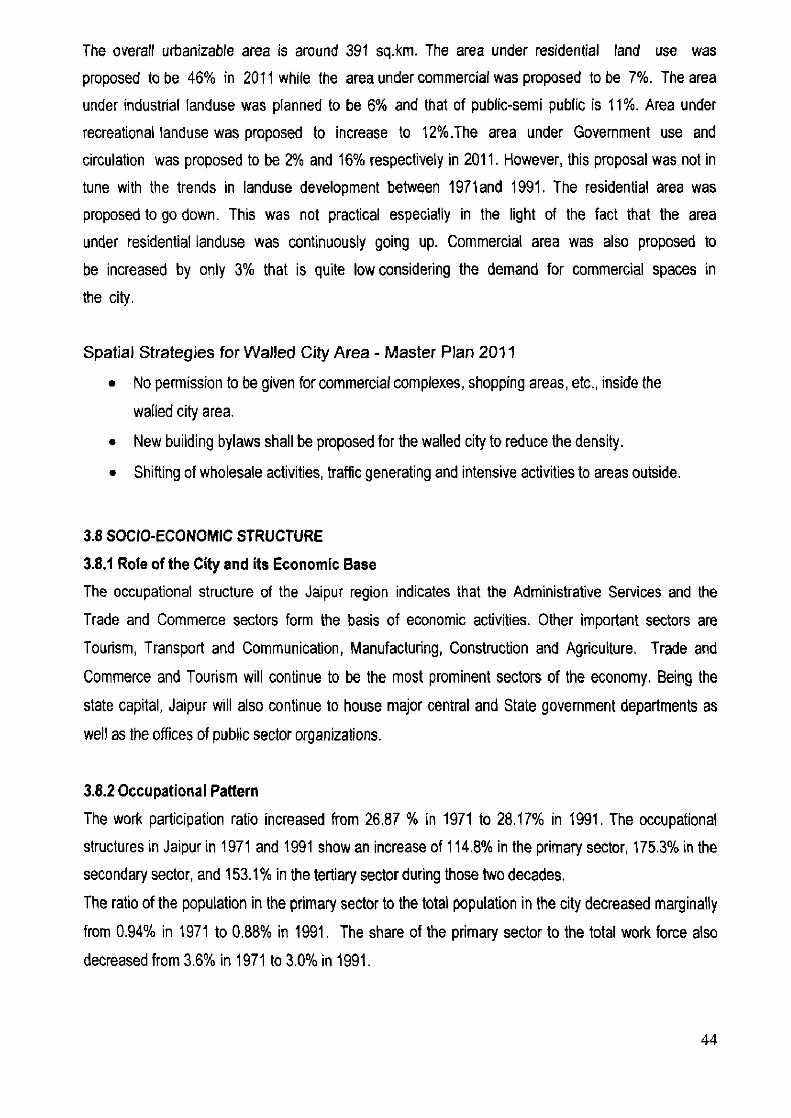
The overall urbanizable area is around 391 sq.km. The area under residential land use was
proposed to be 46% in 2011 while the area under commercial was proposed to be 7%. The area
under industrial landuse was planned to be 6% and that of public-semi public is 11%. Area under
recreational landuse was proposed to increase to 12%.The area under Government use and
circulation was proposed to be 2% and 16% respectively in 2011. However, this proposal was not in
tune with the trends in landuse development between 1971and 1991. The residential area was
proposed to go down. This was not practical especially in the light of the fact that the area
under residential landuse was continuously going up. Commercial area was also proposed to
be increased by only 3% that is quite low considering the demand for commercial spaces in
the city.
Spatial Strategies for Walled City Area - Master Plan 2011
• No permission to be given for commercial complexes, shopping areas, etc., inside the
wailed city area.
• New building bylaws shall be proposed for the walled city to reduce the density.
• Shifting of wholesale activities, traffic generating and intensive activities to areas outside.
3.8 SOCIO-ECONOMIC STRUCTURE
3.8.1 Role of the City and as Economic Base
The occupational structure of the Jaipur region indicates that the Administrative Services and the
Trade and Commerce sectors form the basis of economic activities. Other important sectors are
Tourism, Transport and Communication, Manufacturing, Construction and Agriculture. Trade and
Commerce and Tourism will continue to be the most prominent sectors of the economy. Being the
state capital, Jaipur will also continue to house major central and State government departments as
well as the offices of public sector organizations.
3.8.2 Occupational Pattern
The work participation ratio increased from 26.87 % in 1971 to 28.17% in 1991. The occupational
structures in Jaipur in 1971 and 1991 show an increase of 114.8% in the primary sector, 175.3% in the
secondary sector, and 153.1% in the tertiary sector during those two decades.
The ratio of the population in the primary sector to the total population in the city decreased marginally
from 0.94% in 1971 to 0.88% in 1991. The share of the primary sector to the total work force also
decreased from 3.6% in 1971 to 3.0% in 1991.
44

Primary Sector 3%
Tertiary Sector 63.91%
Secondary Sector 33.09%
The ratio of the workforce in the secondary sector to the total population in the city increased from 8.07% in 1971 to 9.7% in 1991. The share of the secondary sector to the total work force increased from 31.09% in 1971 to 33.09% in 1991. The ratio of the workforce in the tertiary sector to the total population in the city increased form 16.96% in 1971 to 18,74% in 1991. The share of the tertiary sector to the total work force has, however, decreased from 65.3% in 1971 to 63.91% in 1991. These trends indicate the emergence of a growing secondary sector and local entrepreneurship, and are presented in Figure 3.20 and Table 3 7
FIGURE 3.201 DISTRIBUTION OF WORKFORCE 1991
Table 3.7: Distribution of Workforce (1991)
Category Primary Sector
Cultivators Agricultural Labourers
Animal Husbandry Minin
Seconds Sector 32.3 Household Manufacturing 3.9
Non-Household Manufacturing_ 22 Construction 6.4
Tertiary Sector 63.9 Trade and Commerce 24
Trans sort, stora e and communication 8 Other Services 31.8
Source: Town Directory, Census of India, 1991
The household industry in Jaipur also shows a distinct trend in the spatial distribution of workforce. There are 30% of all employment in this sector is being generated from the walled city This is despite the fact that walled city has 15% of the population of the city. There are variations in the distribution of workers within the JMC area as well shows the proportion of workers in each of the zones of the city. The maximum percentage of workers (42%) can be seen in HawaMahal East that includes the walled city. Hawa Mahal West also has a large proportion of workers. The walled city has the largest proportion of workers of the city in household
Yo of 3
1.5 0.5 1
0.6
45
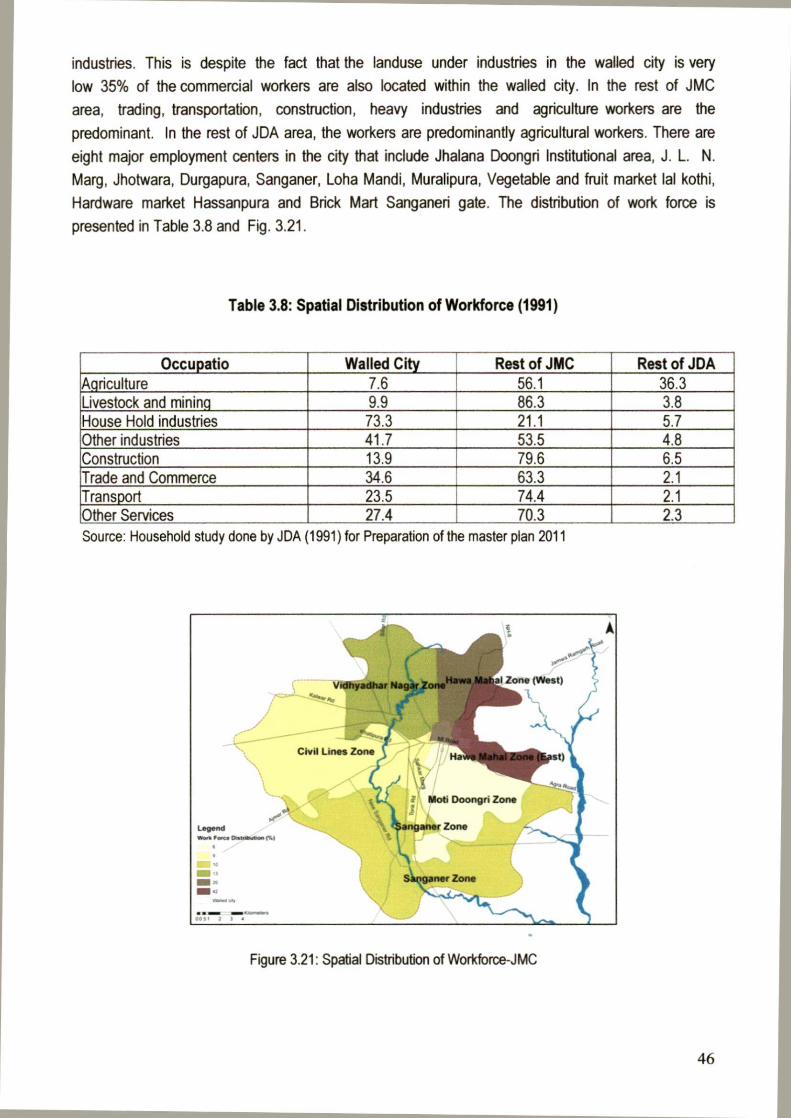
A
Hawa M al Zone (West)
L
Nagar Zone t)
tr
Civil Lines Zone
Moti Doongri Zone
legend w..Fom.Omemommr.
)*anganer Zone
ATanor Zone
• • ■ I....• 1 1 •
industries. This is despite the fact that the landuse under industries in the walled city is very low 35% of the commercial workers are also located within the walled city. In the rest of JMC area, trading, transportation, construction, heavy industries and agriculture workers are the predominant. In the rest of JDA area, the workers are predominantly agricultural workers. There are eight major employment centers in the city that include Jhalana Doongri Institutional area, J. L. N. Marg, Jhotwara, Durgapura, Sanganer, Loha Mandi, Muralipura, Vegetable and fruit market lal kothi, Hardware market Hassanpura and Brick Mart Sanganeri gate. The distribution of work force is presented in Table 3.8 and Fig. 3.21.
Table 3.8: Spatial Distribution of Workforce (1991)
Occupatio Walled City Rest of JMC Rest of JDA Agriculture 7.6 56.1 36.3 Livestock and mining 9.9 86.3 3.8 House Hold industries 73.3 21.1 5.7 Other industries 41.7 53.5 4.8 Construction 13.9 79.6 6.5 Trade and Commerce 34.6 63.3 2.1 Transport 23.5 74.4 2.1 Other Services 27.4 70.3 2.3 Source: Household study done by JDA (1991) for Preparation of the master plan 2011
Figure 3.21: Spatial Distribution of Workforce-JMC
46

AEI 0
1991 2001
Num
ber i
n '0
00.
90 80
70
60
50
40
30 20
3.8.3 TRADE AND COMMERCE Trade and commerce plays a vital role in the economic growth of Jaipur. The proportion of the
workforce in this sector constitutes 24% of the total main workers in the city and exhibits a participation
rate of 7.03% (1991 census).The growth in the sector is also gauged by the employment opportunity it
generates. The Master Plan in 1971 envisaged a workforce of 70,000 persons, in the trade and
commerce sector alone by 1991. The actual number of persons in the occupation identified was
102,521. There are an estimated 75,000 persons employed in 45,000 shops and commercial
establishments in the city. An average of 3,500 shops and commercial establishments are set up every
year in Jaipur. The surveys also reveal that there are approximately 2,500 wholesale traders in the
city. Precious stones, jewellery, marble, cement, cloth, and readymade garments comprise the major
commodities treated in Jaipur.
3.8.3.1 Retail Shops The number of retail shops has nearly doubled in the city. Between 1991-2000, the number of shops has grown from 45000 to 80000. A significant proportion of the retail shops are concentrated in the walled city. The retail markets in the city can be seen along all major roads of
the city. In one sense. the main roads can be called as the commercial corridors of the city. However, this situation results in traffic congestions (due to lack of parking spaces for both vendors as well as shoppers). Besides this, these markets are not planned properly and are intermixed with residences and household industries and godowns. The number of shops in the city is presented in Fig. 3.22.
Figure 3.22: Number of Shops
Walled City Photographs on Street Parking
47

CIG rain Market
IllFruit & Vegetable Market ❑ Building Material
❑Iron & Steel • Slaughter House
8%
58%
3.133.2 Wholesale Trade
The number of wholesale units in 1991 was 25005, There are five types of wholesale markets that include grain market, fruit and vegetable, building material, iron and steel and slaughter house. The grain markets accounts for nearly 58% of the total wholesale trade Iron and steel occupies the second place in the wholesale trade followed by fruits and vegetables and building materials. The major markets under each type of wholesale trade are presented in Table 3.9 and Fig. 3.8. Surajpole is the biggest grain market and handles nearly 35% of total trade in the city. Lal Kothi Centre is the biggest fruit and vegetable wholesale market. The largest volume of trade in building material is carried out in Agra Road area. South of Industrial Area is the only area that has slaughterhouses. The truck terminal (east) is the main iron and steel centre of the city.
Figure 3.23: Composition of Wholesale Trade
Table 3.9: Wholesale Markets
0.111.?. Mill KUL Proportion to I 113 dl
A. I Grain Market 58.5 1. Chandpole 4.8 2. Surajpole 34.6 3. Subcity Centre 5.2 4. Sikar Road Centre 13.8
B. Fruit And Vegetable Markets 8.6 5. Subcity Centre 1.7 6. Lal Kothi Centre 5.2 7. Sikar Road Centre 1.7
C. Building Material 7.6 8. , Agra Road 3.5 9. ' South of Industry Area 4.2
D. 1 Iron and Steel 10. . Ghandhinagar Railway Station 10.4 11.1 Coal and Timber 12. East of Truck Terminal 13.8
E. Slaughter House 13. 1 South of Industrial Area 1.04
L L Total
100
Source: Civic Surveys for Jaipur, Master Plan-2011.
dR
El Walled City Rest of JMC
e" ice. ;LP .\(
... & Si-
Q.7 csie
s G°
•1/4. 41° 46b ‘S
S
C c
f ‘S0-
k.S‘.SI. \.- .
• 1• ■ II =I ■ ■ •••• • ME =II mg4 I .. m• m-fii a
.1, a ofr.: mg mrg. m m mg w
80 70 60
& 50 al 40 ‘4."° 30
20 10 0
3.8.3.4 Spatial Distribution of Commercial Activities
The spatial distribution of trading activities shows that the walled city has a significant proportion of activities). On an average, 28-30% of all activities are located in the walled city. The exception is in the case of printing press, wherein the walled city has 56% of the activities. Commercial activities are presented in Fig. 3.24.
Figure 3.24: Commercial Activities-Spatial Distribution
3.9 TRADITIONAL ART AND CRAFT OF JAIPUR
The traditional bazaars located within the walled city conduct retail and wholesale trading of these handicrafts. In the traditional set up, these were systematically planned and integrated into city design. Rectangular blocks, uniform rows of shops, broad streets ending in Chaupars and chokdis are some of the features of these bazaars. During the time when they were planned each block of the bazaar had a precise of number of shops lining the streets and each rectangular block was designed for a particular craft or trading product. The bazaars of Jaipur are still known by
the names given to them 270 years ago. The main ones are Bath Chaupar, Johari Bazaar, Hawa
Mahal, Tripolia Bazaar, Chhoti Chaupar, Sanganer, Maniharon Ka Rasta, Chandpole and
Kishanpole. These bazaars, today have, outgrown their carrying capacity and over spill on to the pavements creating chaos. The informal sector also mainly locates itself in these areas, and thus, adding to the congestion. The traditional bazaars in the walled city are presented in Table 3.10. and Fig. 3.25.
49
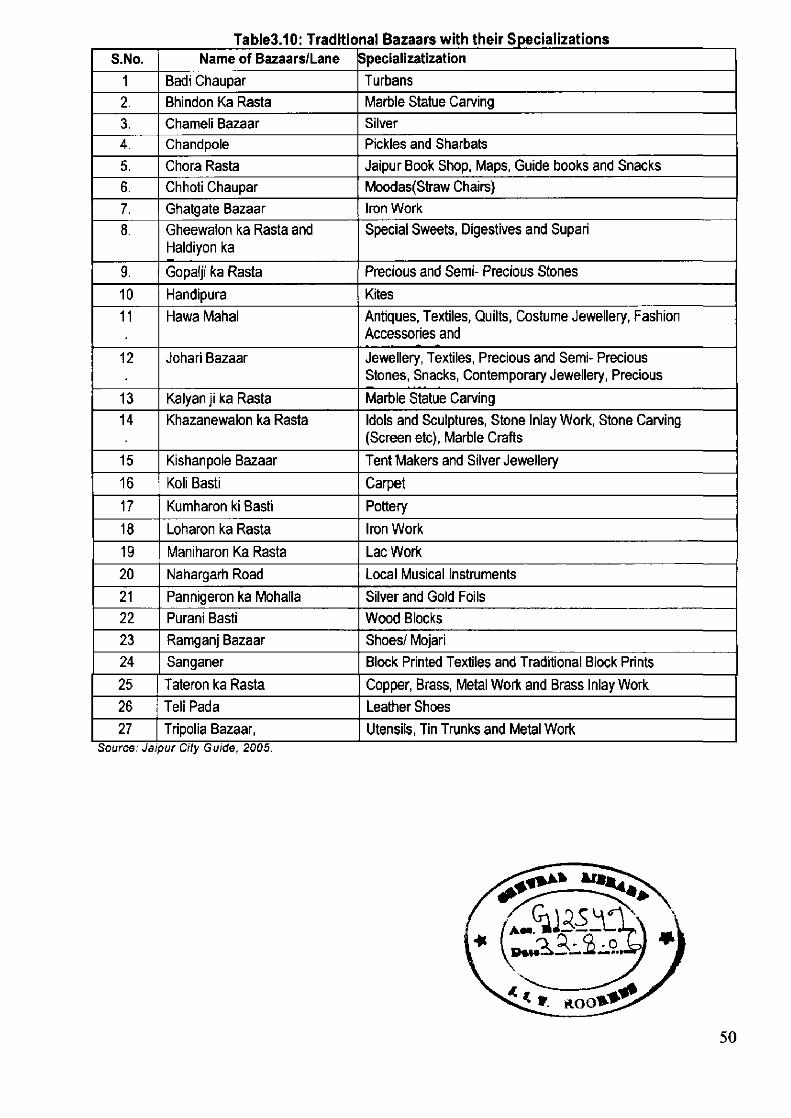
Table3.10: Traditional Bazaars with their Specializations S.No. Name of Bazaars/Lane Specializatization
1 Badi Chaupar Turbans 2. Bhindon Ka Rasta Marble Statue Carving 3. Chameli Bazaar Silver 4. Chandpole Pickles and Sharbats 5. Chora Rasta Jaipur Book Shop, Maps, Guide books and Snacks 6. Chhoti Chaupar Moodas(Straw Chairs) 7. Ghatgate Bazaar Iron Work 8. Gheewalon ka Rasta and
Haldiyon ka Special Sweets, Digestives and Supari
9. Gopaiji ka Rasta Precious and Semi- Precious Stones 10 Handipura Kites 11 Hawa Mahal Antiques, Textiles, Quilts, Costume Jewellery, Fashion
Accessories and 12 Johari Bazaar Jewellery, Textiles, Precious and Semi- Precious
Stones, Snacks, Contemporary Jewellery, Precious 13 Kalyan ji ka Rasta Marble Statue Carving 14 Khazanewalon ka Rasta Idols and Sculptures, Stone Inlay Work, Stone Carving
(Screen etc), Marble Crafts 15 Kishanpole Bazaar Tent 'Makers and Silver Jewellery 16 Koh Basti Carpet 17 Kumharon ki Basti Pottery 18 Loharon ka Rasta Iron Work 19 Maniharon Ka Rasta Lac Work 20 Nahargarh Road Local Musical Instruments 21 Pannigeron ka Mohalla Silver and Gold Foils 22 Purani Basti Wood Blocks 23 Ramganj Bazaar Shoes/ Mojari 24 Sanganer Block Printed Textiles and Traditional Block Prints 25 Tateron ka Rasta Copper, Brass, Metal Work and Brass Inlay Work 26 Teli Pada Leather Shoes 27 Tripolia Bazaar, Utensils, Tin Trunks and Metal Work
Source: Jaipur City Guide, 2005.
50

A
12 rn 5 Legend
Tradrbonat Bazars in Waned C,ty
Apo
2 aa- CPanr•
3 RAW..
a CNN,
5 Ranalan, Baer
6 Haar Yana
7 J.". Burr
B re... Bar.
9 Cow Gar* Bur
IG Kan.. Re, Bus
t t Ittwete Vettatt Ka Rota
17 avara Boat
11 alananam Road
II Sara: Rd Bar.
IS U? Ba9a Bazar
IS
17 Sae, Bars
16 Neara bar.
IS
19
Figure 3.25: Traditional Bazaars- Jaipur
3.10 INDUSTRIAL SECTOR
Industrial growth in Jaipur dates back to 1943 with the establishment of the Jaipur Metal and Electrical
Industry, Limited. This firm and the National Engineering Industries, Limited, setup in 1950, are the
oldest of the industries established in Jaipur.
The maximum growth in the workforce occurred in the decade from 1981 to 1991 was 60.43%. The
growth during the period 1961 to 1991 was at a rate of 258.30%, with the workforce in 1991 amounting
to almost three and half times that of 1961. This growth is attributed to the emergence of a large
number of small-scale industries.
The city of Jaipur experienced a growth in industry, especially in the decades of 1961-71 and 1971-81.
During a span of five years from 1986-91, the number of small-scale industries increased by almost
50%. The growth in the number of registered industries (large, medium and small) has been
phenomenal over the past three decades. In 1963 there were about 10,000 workers employed in 178
factories of all three industrial categories. By 1991, the number of small-scale industries alone had
risen to 5,000 and there were 43 large and medium scale industries.
51
3.10.1 Large and Medium
The maximum numbers of industries in Jaipur agro-based, metal and allied products, and chemical based. The machine tools and textile industry category have only one industry registered.
The maximum employment opportunities available are in the machine tools and parts category and the
metal and allied product category, are over 3,500 persons employed in each of the industries. On the other hand, the least employment opportunities generated are in the ceramics and glassware category, with just 25 persons registered in the 2 units established. For efficient functioning, the indicators
adopted are require to follow a fixed trend, wherein the production to employee and production to
investment ratio are high and the investment to employee ratio is low.
The production per employee is the highest in the ceramics and glassware industry with the value per
employee amounting to Rs. 3,840,000. The lowest efficiency is exhibited by the textile industry with the
production value per employee placed at only Rs.511, 000.
Regarding to investment per employee, in comparison with all industrial establishments, the electrical
and allied products industry have been able to restrict the investments to Rs. 960,000 per employee,
while the ceramics and glassware industry have invested at Rs. 1,444,000 per employee.
Contrary to the requirements, the per employee investment is high in the ceramics and glassware
industry. Efficient production is able to overcome this factor. The electronics and related products
industry extracted the highest benefits by attaining a high production to investment ratio of 7.65, while
the textile industries achieved a production of only 15% of the total investment.
3.10.2 Small Scale and Cottage Industries
The numbers of small-scale units have grown by 47%. The employment opportunity generated has
also grown correspondingly by 46%. The period experienced growth and at no particular time has
employment fallen.
3.103 Household Industry
The household industry sector covers activities such as blue pottery, brass carvings, lac work, silver
paper work, sandal work, puppet making, cloth printing, etc. An estimated 16,000 persons were
employed in this sector (1991 census) and have grown by 38% since 1991. The participation rate for
the household industry amounts to 1.10 % of the total population. The workforce in this sector
constitutes 4% of the total workforce of the city. The work force is predominately occupied in the
52
precious and semi-precious stone cutting and polishing. A majority of these household industries are
located in the walled city.
3.11 INFORMAL SECTOR
Their activities support trade to the major dealers and traders, and arise along frequently used traffic
corridors and market places. In continuity with the preparation of the Master Plan, the civic surveys
conducted by the Jaipur Development Authority indicate the following characteristics of the informal
sector.
■ About 36% of the migrant population residing in the city is involved in the informal sector as their
main occupation.
■ The economic profile of the workforce in the sector categorizes them into the economically weaker
section with about 75% of the workers living in single room accommodation.
■ The growth in this sector has been vibrant only in the last ten years with 63% of the workforce
having arisen during the period.
■ Nearly 80% of the workforce operates along with traffic corridors.
■ An estimated 145,000 persons are involved in informal trade, which constitutes 33.96% of Jaipur's
total workforce. This feature indicates the importance of the sector and its role in the economic
growth of the region.
3.12 TOURISM
The State of Rajasthan is associated with tourism, art, and culture of the country. Jaipur gains
importance as the gateway to Rajasthan and is an integral part of the famous 'Golden Triangle' (Delhi-
Agra-Jaipur) for international tourists coming to India. Jaipur, along with the other tourist destinations,
treasures a vast source of tourist attraction centres. From the Hawa Mahal to the Fort of Amer, it has
maintained the culture and preserved its nostalgic past.
The city attracts nearly 15% of the tourists visiting the state with about 75% of the tourists belonging to
the domestic sector. The state itself attracts one third of the foreign tourists annually.
The city is rich in its art, heritage and culture, which are also reflected in its historical
monuments. Though the monuments are more than 100-150 years old, they have retained their
traditional architectural splendor. This makes the city as one of the most attractive tourist
places in of the country. Jaipur is also known as the city of forts and palaces symbolizes the
spirit of Rajputana and preserves its rich history and culture.
The important tourist places are presented in Fig. 126.
53

Legend Important Tounst Places I Al*'n FOrl
2 Jagarh Fort
3 JO Menai Palace
• Nahargam Fort
5 ON Palace Complex
Janur Mantas
7 tiarxs Mary
8 Rarnbagh Palace
9 Moo Coortgan For!
10 Sorergasol■ or Isar Lel It Boa Temple
12 -legal Stwomar“ Tempe
13 Ram '44...as Garden
14 AJben Haa (GON Central Museum)
15 1341a Planetanum
18 Kara* VnnOarao
1 7 Gabel
00 Sr 1 a
Figure 3.26: Tourist Spots-Jaipur
k •
,.Tk •
•
74 milk...1/4_ '44- -4/41-1A'sN
1# 11# ", ititi
HAWA MAHAL CITY PALACE
3.12.1 Tourist Arrivals The arrival of both domestic as well as foreign tourists has nearly doubled. However, this increase is
not consistent in all the years. . The fluctuations are more in the case of foreign tourist arrivals.
Foreign tourists comprise about 20% of the total tourist arrivals Rajasthan as a state found a
decline trend of foreign customers. It is observed in tourism sector that the influx of tourists to the state
have declined by 10%. Amongst the foreign tourists arriving to the state, 30% of the tourists visit Jaipur
itself while 8.5% of the domestic tourists come to visit Jaipur. On an average Jaipur receives 3000
tourists every day, who stay in Jaipur for 3-4 days in the city. The number of domestic and foreign
tourists is presented in table 3.11 and Fig. 3.27.
54

Table 3.11: Number of Tourists -Jaipur (in lakhs)
Year Domestic Tourists 1 Foreign Tourists Total AAGR (%) - 1995 6.6 1.5 8.1 1996 6.6 1.5 8.1 -0.6 1997 7.0 1.8 8.8 9.4 1998 6.2 1.5 7.7 -13.2 1999 6.1 1.3 7.4 -3.1 2000 7.5 1.5 9.0 21.1 2001 6.6 1.7 8.3 -7.9 2002 5.9 0.8 6.7 19 2003 6.4 1.1 7.5 11.1 2004 9.7 2.1 11.7 57.6 2005 11.3 3.8 15.4 28.8
Source: Department of Tourism, Govt. of Rajasthan.
100% 90% 80% 70%
g60% 50% 40% 30% 20% 10%
0%
LODomestic Tourists EForeign Tourists I
1 1996 1997 1998 1999 2000 2001 2002 2003 2004 2005
Figure 3.27: Composition of Tourists
3.13 INFERENCES :
• The population for the city of Jaipur has been rising at a steady pace with an average decadal
growth rate of 49.56%.
• The population density has increased from 4,832 persons per km2 in 1981 to 6,956 in
1991within the same municipal area- indicating rapid densification of the city.
• The occupational structures for 1971 and 1991 show that there has been a decline in the
share of the tertiary sector by 1.47 % during the two decades. The secondary sector share
has increased from 31.05% to 33.02% during the same period. The share of the construction
sector has shown the highest growth of 2.8% within the secondary sector.
• The total work force in the Industrial Sector (non-household) grew by almost 187% from
33,063 in 1971 to 94,970 in 1991. In 1991, there were forty-three large and medium scale
units and 4953 small-scale units working in the district. Of the large-scale enterprises, the
machine tools, metal and allied products, and chemical based industries predominate.
55

■ The percentage of the work force in the trade and commerce sector grew from 19.7% in 1971
to 24% in 1991. The draft master Plan-2011 provides for 289 ha for all wholesale trade
activities distributed throughout Jaipur Urban Area.
■ Jaipur, being a part of the famous "Golden Triangle", has high tourist potential. There has
been steady growth in the inflow of tourists with an average growth of 40,000 per year since
1990.
3.14 PROBLEMS OF THE STUDY AREA
The study area has numerous problems and the more important problems are presented as below:-
1. The increase in population, which is a result of growing economic opportunities, has put
pressure on the infrastructure facilities available in the area and has hampered the life of the
people, residing in the walled city area, by way of creating congestion, environmental pollution,
generation of wastes, acute shortages of water, power, housing, transport, open space and
public facilities.
2. The growth in population affected the forests and marshlands due to that environmental
degradation is taking place in surrounding area of the city.
3. The urban population has created a pressure an unsystematic growth in the built up area and
infrastructure facility, which is spoiling the character of the heritage city.
4. The increased population has deteriorated the air quality by increasing the numbers of motor
vehicles. This has led to increased levels of suspended particulate matter, sulphur-dioxide,
nitrogen oxides and many other toxic gases in the atmosphere, reducing sunlight and visibility
and posing a health hazard to human beings.
5. The growth in population breaking down the municipal services. Electricity is unreliable and
water quality is in jeopardy. Public transport is uncertain and overcrowded. Frequent
epidemics and diseases like asthma, malaria and tuberculosis are spreading rapidly.
6. Increased population has also caused pressure on both residential and commercial land,
resulting in large agriculture farms being sold for construction for residential and commercial
use, and existing green belt cover being destroy.
7. The growth in population destroying the architecture character of the walled city area by doing
unauthorized construction and that affecting the economy of state, because Jaipur economy is
mainly based on tourism, trade & commerce activity.
8. The physical infrastructure is also affected by the growth in population, that is directly related
with quality of urban life and health.
56

9. The quality of water is posing a serious health hazard, because of throwing the solid waste in
the natural drainage and also leaving the sewage opened in the natural drainage systems that
causes the pollution of surface as well as groundwater in and around the city.
10. Indiscriminate underground boring for water is a common phenomenon and has led to a
drastic decrease in the water table.
11. Unprecedented Urbanization is posing challenges to the buildings, which was built in two
hundred seventy five years ago.
12. Per capita consumption of land and built space, including housing, water, power, and
generation of wastes are increasing at an alarming rate as compared to population growth
and creating the problems of overcrowding, sanitation & pollution and acute shortage of water,
power, housing, transport, open space and public faculties.
13. Most of the commercial activities are located within the walled city area, that is imposing the
pressure in the existing infrastructure facilities, and traffic is increasing in the city and that
creates the parking problem, congestion & pollution in the area.
14. Change in land use is the major cause of increasing the pressure on the infrastructure,
residential uses are converting into commercial areas for that more people are coming into the
city and the problem of pollution, traffic jams etc., increases.
15. Jaipur economy has traditionally been agrarian and commercial. The economic and
occupational patterns of the region have undergone tremendous changes. The principal areas
for economical sustenance today are tourism, trade & commerce. Therefore, these activities
are also having great threat to the city.
16. The increase in practically all spheres of activities has cause the traffic and transportation
problems. Problems in city manifest in many forms and some of these include the following:
Inadequate traffic control and management, Inadequate drainage facilities, Problems of stray
cattle, Problems of lane discipline, Problem of informal markets, Unauthorized land uses, etc.
3.15 NEED OF THE STUDY
The present investigation is very much essential to understand the functions of the system. Further, it
is also very much essential to evolve a set of policy guidelines for sustainable development of the city.
Otherwise, the pressure in the city will further aggravate the problem, and finally it would be a
tremendous loss.
57

PROBLEMS AND PROSPECTS OF THE WALLED CITY, JAIPUR CHAPTER — 4
4.1 INTRODUCTION: The Investigator has studied the problems and prospects of the Jaipur city
thoroughly to understand the function prior to conduct the thorough investigation in the walled city
area of Jaipur city since the walled city area is a part of the city by using secondary sources of data.
Moreover, the walled city area population purely depends on the rest of the city for all kinds of
infrastructure facilities. Therefore, the most important control parameters, which decide the
functions of the system (city as a whole) is studied thoroughly and presented as below:
4.2 TRAFFIC AND TRANSPORTATION
The walled city of Jaipur is spread over a compact area of 7.68 sq. km. The average population
density is of 1000 to 1500 persons per sq. km. Trade and commerce is mainly conducted from
inside the densely populated walled city area. The goods are first transported into the walled city,
form where they are again distributed to various parts of the city, which aggravates the traffic and
transportation problems, in the congested streets of the walled city. The emergence of informal
sector activities in the adjoining areas of the wholesale markets along the road corridors has further
aggravated transportation problems. The walled city is still acting as a Central Business' District of
Jaipur and getting more and more commercialized.
4.3 CHARACTERISTICS OF TRAFFIC & TRANSPORTATION
4.3.1 Sindhi Camp Central Bus Terminal Long distance inter city buses are operated by Rajasthan State Road Transport Corporation
(RSRTC) Jaipur from a central bus terminal known as Sindhi Camp on Station Road. To access
Sindhi Camp bus terminal long distance buses, have to pass through the congested walled city
area, resulting in delays and increased congestion on these roads.
There are very limited off-street facilities presently existing within or in the vicinity of the main
bazaars area of walled city. However, there are three off-street parking lots which are presently
used by cars and two-wheelers, and are described as below:
1. Off —street parking at Sanjay Market (Near Sanganeri Gate). The approach to this parking lot is from the Eastern side of Sanganeri gate. It has small
parking lot, which caters to the requirements of Johan Bazaar / Sanjay market and
accommodates about 50 cars.
58

2. Off-street parking lot at Ram Niwas Garden
This parking lot caters to the requirements of visitors to the Ram Niwas Garden and to some
extent for the shoppers of chaura Rasta/Bapu Bazaar, etc. It can accommodate around 40
cars and 50 scooters.
3. Off-street parking at Atish Market.
It is located in between the open space of the Atish Market shops. Recently, it is vacanted
from shopkeepers of Atish market and it caters the needs of Atish market and Chura Rasta.
The following points are observed in the walled city area pertaining to traffic and transportation.
They are:
1. The general practice of persisting with two way traffic operation on narrow streets.
2. There is no parking fee system, so that the available road space is narrowed.
3. Encroachments on roads and footpaths by the Hawkers and shopkeepers restricting flow of
vehicles and pedestrians.
4. At some places parking and no parking zones are specified through the sign boards, but
most of the places it is not being strictly observed and there is a mix up of different modes of
vehicles (i.e., cars, two — wheelers, cycles, carts, etc., in the area specified for particular
mode).
5. No restriction on duration of parking.
6. The high rate of personal vehicle accumulation, such as two-wheelers, automobiles, car
and auto rickshaws.
7. Heavy percentage of slow moving vehicles likes cycles, bicycle rickshaws and pedestrians.
8. Movements of large size buses, having stops in the congested area.
4.3.2 Vehicle Growth
The travel needs in the city are catered by a variety of modes of transport in the form of buses
operated by Rajasthan State Transport Corporation (RSRTC), Mini Buses run by private
operators, Auto-Rickshwas, cycle Rikshwas and private vehicles, such as, cars, two-wheelers and
cycles. The improving socio-economic status of the residents, increase in population, availability of
automobiles and lack of good mass transport services have resulted in steep growth of private
vehicle ownership in the city.
The travel needs in the city are catered by a variety of modes of transport in the form of buses
operated by Rajasthan State Transport Corporation (RSRTC), Mini Buses run by private operators,
59
Auto-Rickshawa, Tempos, Cycle Rikshawas and Private vehicles such as Cars, Two —Wheelers
and cycles. The mix of fast and slow traffic results in low speeds and hazards. The improving socio-
economic status of the residents, increase in population, availability of automobiles and lack of
good Mass Transport Services have resulted in steep growth of private vehicle ownership in the
city.
4.3.3 Traffic and Transportation Problems
1. Problem of Congestion and Delays
The walled city has observed the highest congestion throughout the day, regardless of peak or off
peak hours. The main cause of congestion is due to the inadequate capacity of the roads, mixed
traffic of two-wheelers, rickshaws and auto rickshaws, illegal parking, pedestrian movements,
loading and unloading and encroachments on the road surface.
This increased congestion results in low operating speeds, delays, reduction in level of service of
the road, environmental and noise pollution.
2. Parking Problem
Parking on the roads and streets have created several problems in the whole walled city area.
Large scale on street parking is reducing the width and capacity of the road resulting in increased
congestion, particularly low speeds and accidents. Mainly rickshaw and auto rickshaws are parking
close to the main junctions/intersections or chaupars, which is also creating big hurdles to the
traffic.
3. Problem of Encroachment and Enforcement
Poor development and lack of enforcement has resulted in several problems some of which are
mentioned as below :
Buses and mini buses stop on the main carriageway for loading and unloading of passengers,
obstructing/stopping the following traffic.
Hawkers establish their kiosks on the road/footpath reducing effective carriageway width and
capacity of the road and disturbance to the pedestrians.
Encroachments are right up to the road edge and on the pedestrian footpaths creating hazardous
for pedestrians and traffic.
4. Encroachment of Pedestrian Facilities
The pedestrian footpaths are provided in all the markets in the form of covered verandah, but some
of them are encroached by the shopkeeper's and hawkers, and they are disturbing the pedestrian
movements.
60
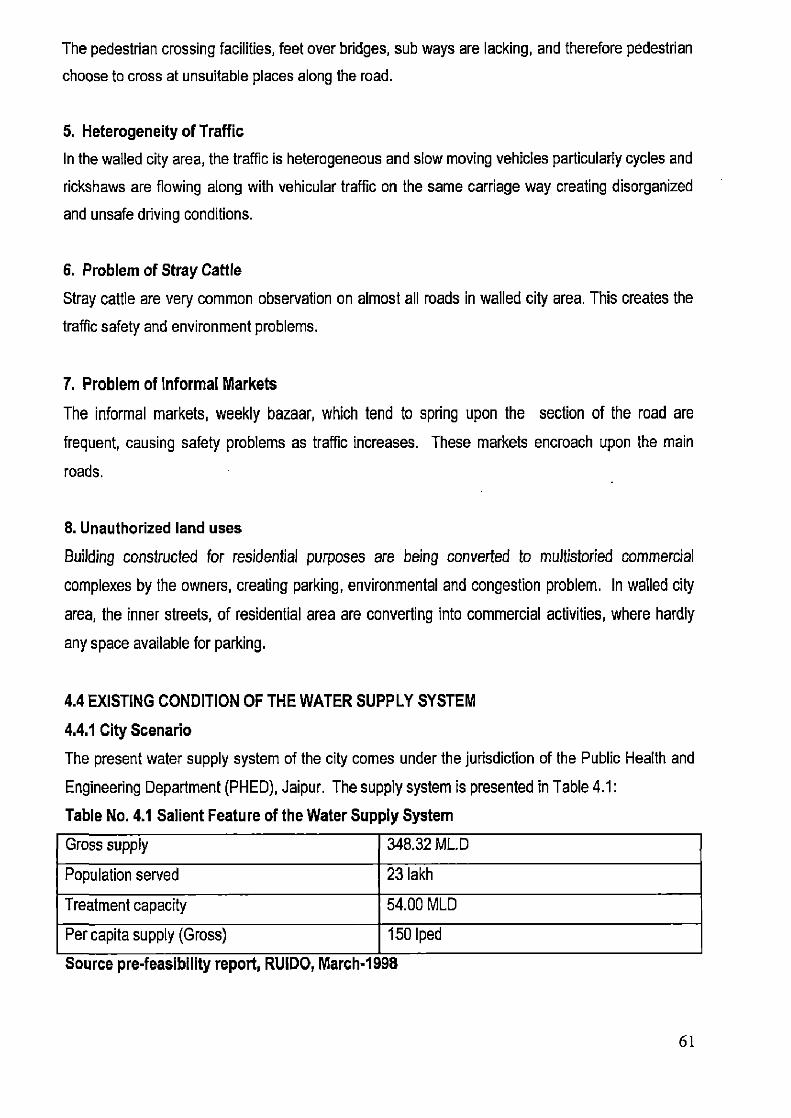
The pedestrian crossing facilities, feet over bridges, sub ways are lacking, and therefore pedestrian
choose to cross at unsuitable places along the road.
5. Heterogeneity of Traffic In the walled city area, the traffic is heterogeneous and slow moving vehicles particularly cycles and
rickshaws are flowing along with vehicular traffic on the same carriage way creating disorganized
and unsafe driving conditions.
6. Problem of Stray Cattle
Stray cattle are very common observation on almost all roads in walled city area. This creates the
traffic safety and environment problems.
7. Problem of Informal Markets The informal markets, weekly bazaar, which tend to spring upon the section of the road are
frequent, causing safety problems as traffic increases. These markets encroach upon the main
roads.
8. Unauthorized land uses Building constructed for residential purposes are being converted to multistoried commercial
complexes by the owners, creating parking, environmental and congestion problem. In walled city
area, the inner streets, of residential area are converting into commercial activities, where hardly
any space available for parking.
4.4 EXISTING CONDITION OF THE WATER SUPPLY SYSTEM 4.4.1 City Scenario The present water supply system of the city comes under the jurisdiction of the Public Health and
Engineering Department (PHED), Jaipur. The supply system is presented in Table 4.1:
Table No. 4.1 Salient Feature of the Water Supply System Gross supply 348.32 ML.D
Population served 23 lakh
Treatment capacity 54.00 MLD
Per capita supply (Gross) 150 Iped
Source pre-feasibility report, RUIDO, March-1998
61
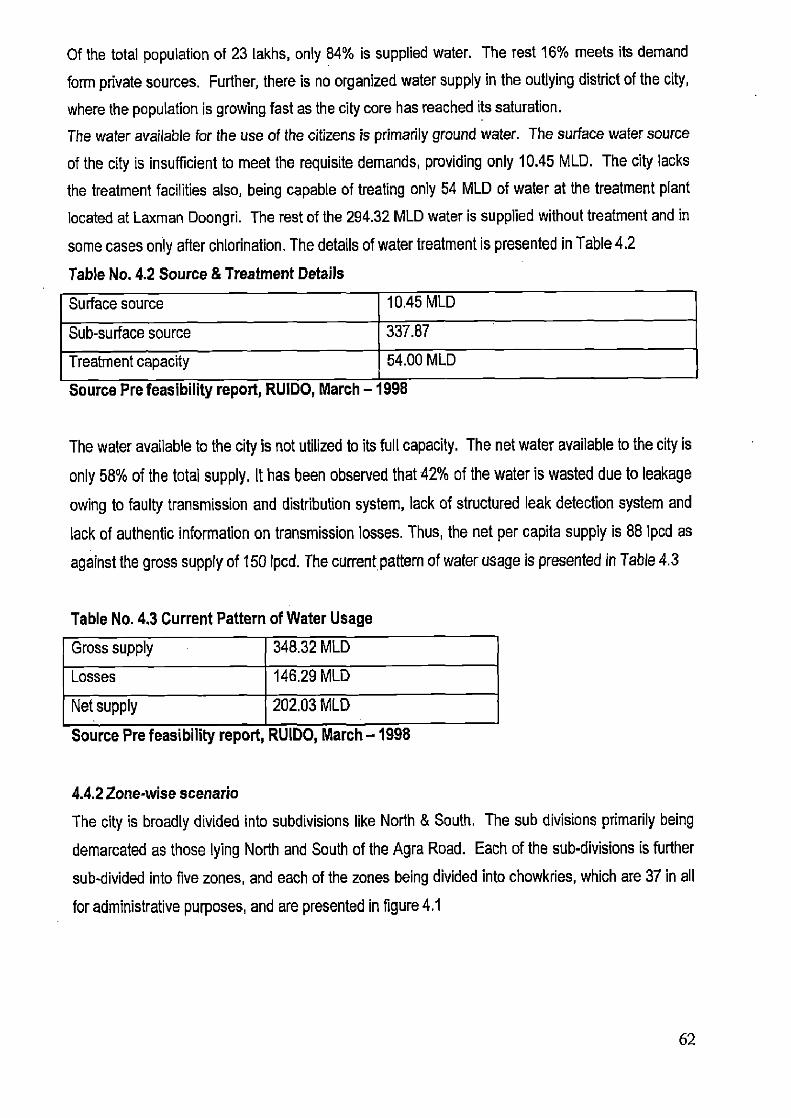
Of the total population of 23 lakhs, only 84% is supplied water. The rest 16% meets its demand
form private sources. Further, there is no organized water supply in the outlying district of the city,
where the population is growing fast as the city core has reached its saturation.
The water available for the use of the citizens is primarily ground water. The surface water source
of the city is insufficient to meet the requisite demands, providing only 10.45 MLD. The city lacks
the treatment facilities also, being capable of treating only 54 MLD of water at the treatment plant
located at Laxman Doongri. The rest of the 294.32 MLD water is supplied without treatment and in
some cases only after chlorination. The details of water treatment is presented in Table 4.2
Table No. 4.2 Source & Treatment Details
Surface source 10.45 MLD
Sub-surface source 337.87
Treatment capacity 54.00 MLD
Source Pre feasibility report, RUIDO, March — 1998
The water available to the city is not utilized to its full capacity. The net water available to the city is
only 58% of the total supply. It has been observed that 42% of the water is wasted due to leakage
owing to faulty transmission and distribution system, lack of structured leak detection system and
lack of authentic information on transmission losses. Thus, the net per capita supply is 88 'pad as
against the gross supply of 150 Ipcd. The current pattern of water usage is presented in Table 4.3
Table No. 4.3 Current Pattern of Water Usage
Gross supply 348.32 MLD
Losses 146.29 MLD
Net supply 202.03 MW
Source Pre feasibility report, RUIDO, March — 1998
4.4.2 Zone-wise scenario
The city is broadly divided into subdivisions like North & South. The sub divisions primarily being
demarcated as those lying North and South of the Agra Road. Each of the sub-divisions is further
sub-divided into five zones, and each of the zones being divided into chowkries, which are 37 in all
for administrative purposes, and are presented in figure 4.1
62
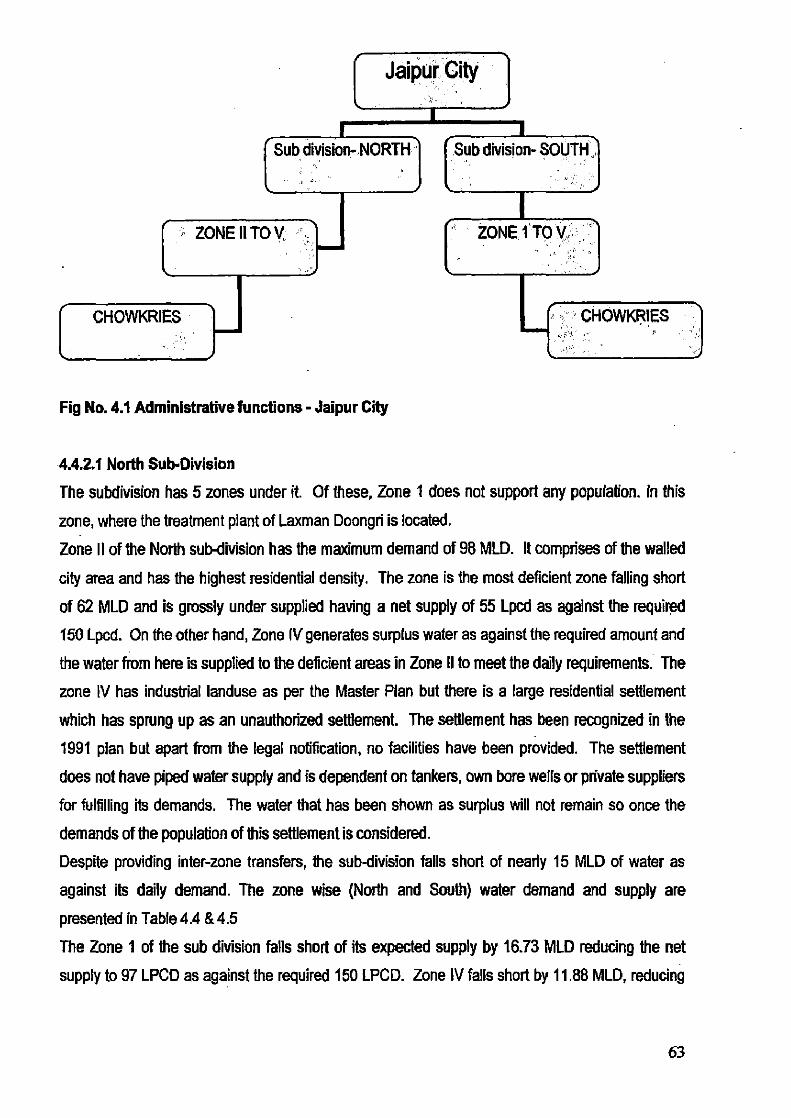
Sub division- SOUTH
Jaipur City
1.1 CHOWKRIES
Fig No. 4.1 Administrative functions - Jaipur City
4.4.2.1 North Sub-Division
The subdivision has 5 zones under it. Of these, Zone 1 does not support any population. In this
zone, where the treatment plant of Laxman Doongri is located.
Zone II of the North sub-division has the maximum demand of 98 MLD. It comprises of the walled
city area and has the highest residential density. The zone is the most deficient zone falling short
of 62 MLD and is grossly under supplied having a net supply of 55 Lpcd as against the required
150 Lpcd. On the other hand, Zone IV generates surplus water as against the required amount and
the water from here is supplied to the deficient areas in Zone II to meet the daily requirements. The
zone IV has industrial landuse as per the Master Plan but there is a large residential settlement
which has sprung up as an unauthorized settlement. The settlement has been recognized in the
1991 plan but apart from the legal notification, no facilities have been provided. The settlement
does not have piped water supply and is dependent on tankers, own bore wells or private suppliers
for fulfilling its demands. The water that has been shown as surplus will not remain so once the
demands of the population of this settlement is considered.
Despite providing inter-zone transfers, the sub-division falls short of needy 15 MLD of water as
against its daily demand. The zone wise (North and South) water demand and supply are
presented in Table 4.4 & 4.5
The Zone 1 of the sub division falls short of its expected supply by 16.73 MLD reducing the net
supply to 97 LPCD as against the required 150 LPCD. Zone IV falls short by 11.88 MLD, reducing
e Sub division- NORTH
ZONE II TO y.
63

the net supply to 140 LPCD. However, the Zone V has a surplus of 14.39 MLD, which is transferred
to zone IV & I, and still the sub-division falls short of 10.75 MLD.
Table No. 4.4 North Zone Demand & Supply
Zone Population Demand
(MLD)
Supply (MLD) Per capita
supply (Ipcd)
Gap (MLD)
I 0 0 14.08 +14.08
II 653323 98.00 36.00 @55 -62.00
III 270940 40.64 31.92 @117.8 -8.72
IV 189088 28.37 72.64 @150 +44.27
V 67340 10.10 7.50 @112 -2.60
Total 1180691 177.11 162.14 -14.97
Source: PHED, Jaipur, 2004
Demand calculated @ 150 LPCD
4.4.2.2 South sub-division
Table No. 4.5 South Zone Demand & Supply
Zone Population Demand
(MLD)
Supply (MLD) Per capita
supply (Ipcd)
Gap (MLD)
I 2634.56 42.16 25.43 @9.5 -16.73
II 130612 26.47 27.52 @150 +1.05
III 259481 47.73 50.15 @150 +2.42
IV 240630 47.50 35.62 @140.02 -11.88
V 206670 33.07 47.46 @150 +14.39
Total 1139685 196.93 186.18 -10.75
Source: PHED Jaipur, 2004
Demand calculated @ 150 LPCD
4.5 QUALITY OF SUPPLY
Often the quantity, duration and rate determine the quality of the supply system. The supply of the
city is almost functioning on a bare minimum level of @ 150 I_PCD, Nearly 15% of the population is
without the water supply connection. This section of the population falls under the areas, which are
non-planned development and were regularized water owing to large-scale development. As a
64
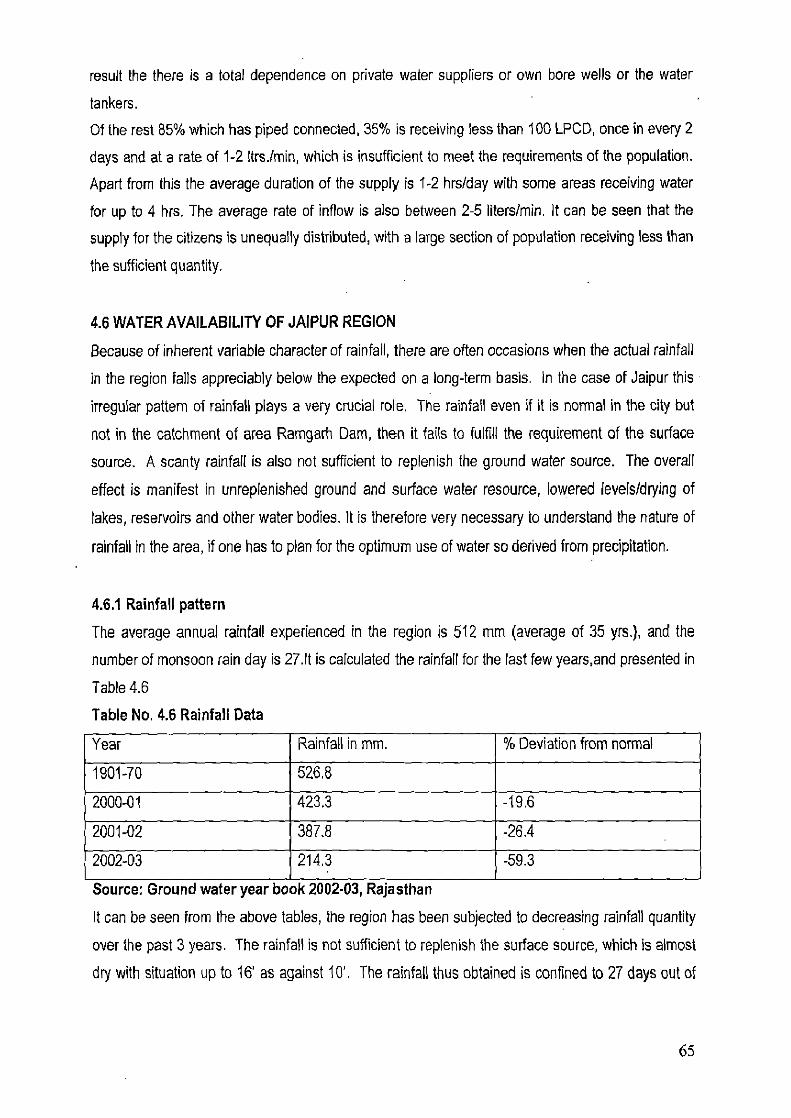
result the there is a total dependence on private water suppliers or own bore wells or the water
tankers.
Of the rest 85% which has piped connected, 35% is receiving less than 100 LPCD, once in every 2
days and at a rate of 1-2 Itrs./min, which is insufficient to meet the requirements of the population.
Apart from this the average duration of the supply is 1-2 hrs/day with some areas receiving water
for up to 4 hrs. The average rate of inflow is also between 2-5 liters/min. It can be seen that the
supply for the citizens is unequally distributed, with a large section of population receiving less than
the sufficient quantity.
4.6 WATER AVAILABILITY OF JAIPUR REGION
Because of inherent variable character of rainfall, there are often occasions when the actual rainfall
in the region falls appreciably below the expected on a long-term basis. In the case of Jaipur this
irregular pattern of rainfall plays a very crucial role. The rainfall even if it is normal in the city but
not in the catchment of area Ramgarh Dam, then it fails to fulfill the requirement of the surface
source. A scanty rainfall is also not sufficient to replenish the ground water source. The overall
effect is manifest in unreplenished ground and surface water resource, lowered levels/drying of
lakes, reservoirs and other water bodies. It is therefore very necessary to understand the nature of
rainfall in the area, if one has to plan for the optimum use of water so derived from precipitation.
4.6.1 Rainfall pattern
The average annual rainfall experienced in the region is 512 mm (average of 35 yrs.), and the
number of monsoon rain day is 27.1t is calculated the rainfall for the last few years,and presented in
Table 4.6
Table No. 4.6 Rainfall Data
Year Rainfall in mm. % Deviation from normal
1901-70 526.8
2000-01 423.3 -19.6
2001-02 387.8 -26.4
2002-03 214.3 -59.3
Source: Ground water year book 2002.03, Rajasthan
It can be seen from the above tables, the region has been subjected to decreasing rainfall quantity
over the past 3 years. The rainfall is not sufficient to replenish the surface source, which is almost
dry with situation up to 16' as against 10'. The rainfall thus obtained is confined to 27 days out of
65
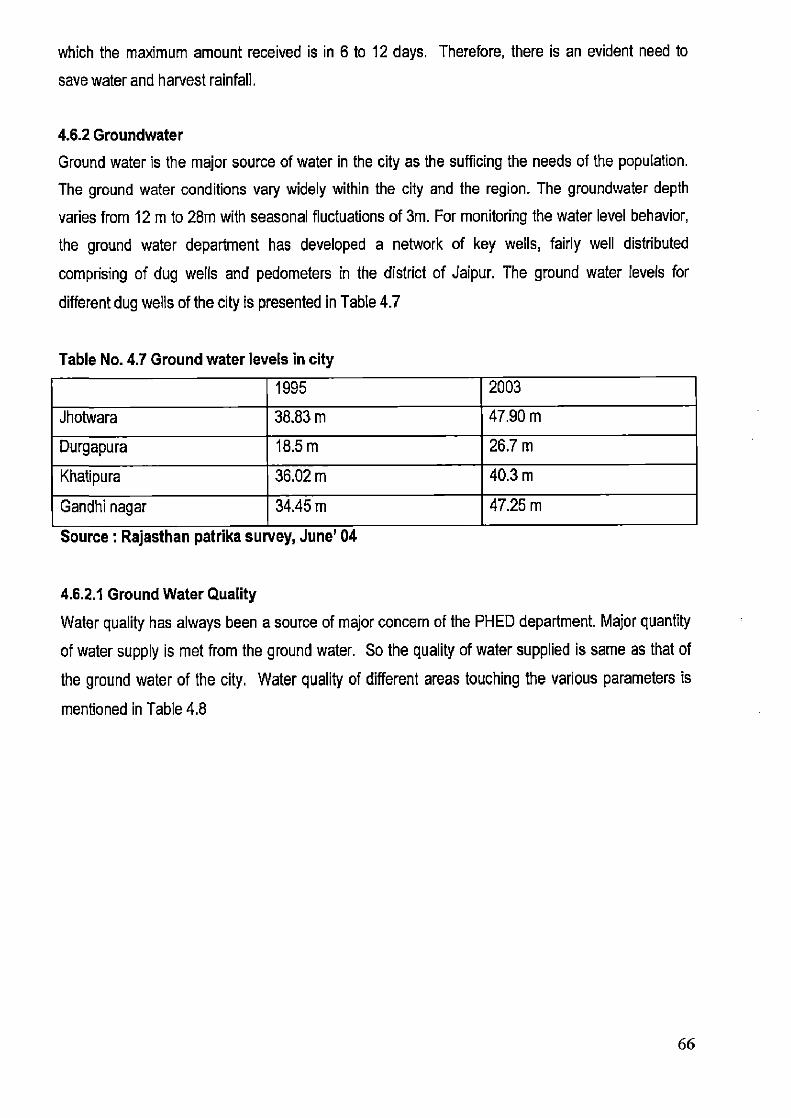
which the maximum amount received is in 6 to 12 days. Therefore, there is an evident need to
save water and harvest rainfall,
4.6.2 Groundwater Ground water is the major source of water in the city as the sufficing the needs of the population.
The ground water conditions vary widely within the city and the region. The groundwater depth
varies from 12 m to 28m with seasonal fluctuations of 3m. For monitoring the water level behavior,
the ground water department has developed a network of key wells, fairly well distributed
comprising of dug wells and pedometers in the district of Jaipur. The ground water levels for
different dug wells of the city is presented in Table 4.7
Table No. 4.7 Ground water levels in city
1995 2003
Jhotwara 38.83 m 47.90 m
Durgapura 18.5 m 26.7 m
Khatipura 36.02 m 40.3 m
Gandhi nagar 34.45 m 47.25 m
Source : Rajasthan patrika survey, June' 04
4.6.2.1 Ground Water Quality
Water quality has always been a source of major concern of the PEED department. Major quantity
of water supply is met from the ground water. So the quality of water supplied is same as that of
the ground water of the city. Water quality of different areas touching the various parameters is
mentioned in Table 4.8
66
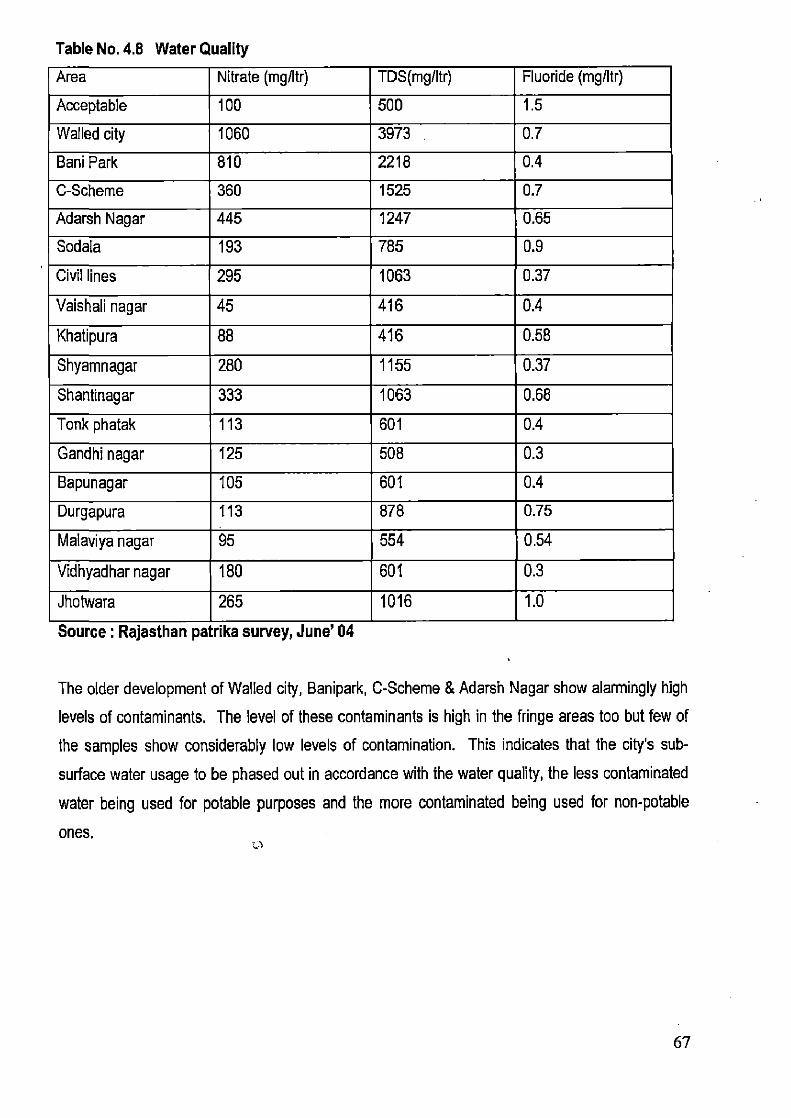
Table No. 4.8 Water Quality
Area Nitrate (mg/Itr) TDS(mg/Itr) Fluoride (mg/Itr)
Acceptable 100 500 1.5
Walled city 1060 3973 0.7
Bani Park 810 2218 0.4
C-Scheme 360 1525 0.7
Adarsh Nagar 445 1247 0.65
Sodala 193 785 0.9
Civil lines 295 1063 0.37
Vaishali nagar 45 416 0.4
Khatipura 88 416 0.58
Shyamnagar 280 1155 0.37
Shantinagar 333 1063 0.68
Tonk phatak 113 601 0.4
Gandhi nagar 125 508 0.3
Bapunagar 105 601 0.4
Durgapura 113 878 0.75
Malaviya nagar 95 554 0.54
Vidhyadhar nagar 180 601 0.3
Jhotwara 265 1016 1.0
Source : Rajasthan patrika survey, June' 04
The older development of Walled city, Banipark, C-Scheme & Adarsh Nagar show alarmingly high
levels of contaminants. The level of these contaminants is high in the fringe areas too but few of
the samples show considerably low levels of contamination. This indicates that the city's sub-
surface water usage to be phased out in accordance with the water quality, the less contaminated
water being used for potable purposes and the more contaminated being used for non-potable
ones.
67
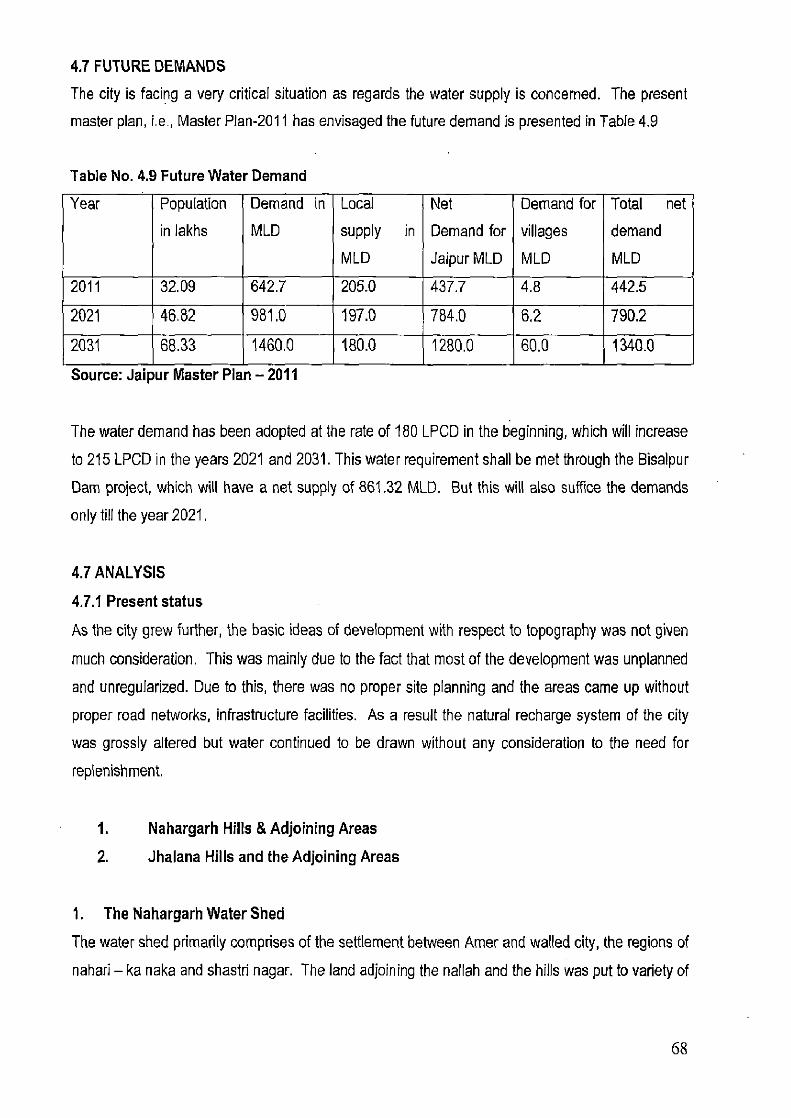
4.7 FUTURE DEMANDS
The city is facing a very critical situation as regards the water supply is concerned. The present
master plan, i.e., Master Plan-2011 has envisaged the future demand is presented in Table 4.9
Table No. 4.9 Future Water Demand
Year Population
in lakhs
Demand in
MLD
Local
supply in
MLD
Net
Demand for
Jaipur MLD
Demand for
villages
MLD
Total net
demand
MLD
2011 32.09 642.7 205.0 437.7 4.8 442.5
2021 46,82 981.0 197.0 784.0 6,2 790.2
2031 68.33 1460.0 180.0 1280.0 60.0 1340.0
Source: Jaipur Master Plan — 2011
The water demand has been adopted at the rate of 180 LPCD in the beginning, which will increase
to 215 LPCD in the years 2021 and 2031. This water requirement shall be met through the Bisalpur
Dam project, which will have a net supply of 861.32 MLD. But this will also suffice the demands
only till the year 2021.
4.7 ANALYSIS
4.7.1 Present status
As the city grew further, the basic ideas of development with respect to topography was not given
much consideration. This was mainly due to the fact that most of the development was unplanned
and unregularized. Due to this, there was no proper site planning and the areas came up without
proper road networks, infrastructure facilities. As a result the natural recharge system of the city
was grossly altered but water continued to be drawn without any consideration to the need for
replenishment.
1. Nahargarh Hills & Adjoining Areas
2. Jhalana Hills and the Adjoining Areas
1. The Nahargarh Water Shed
The water shed primarily comprises of the settlement between Amer and walled city, the regions of
nahari — ka naka and shastri nagar. The land adjoining the nallah and the hills was put to variety of
68
land uses irrespective of it being a potential recharge zone. The development was planned-high-
density type, and did not consider the topography of the area. The built-up obstructed the natural
path of the rivulets/streamlets downhill leading dual problems of-flooding of the areas during peak
rainfall & reducing the natural recharge considerably thereby lowering the water table further. The
settlement came into existence as a result of encroachment of the shallow areas. These areas play
a very vital role in the ground water recharge and thus should have been left as green areas. Since
the development was unplanned in the beginning and regularized later on, it does not have a
sewerage system due to which the waste generated is being discharged into the Amanishah Nallah
converting it into a sewerage channel.
One more after effect of such a development is that, the water continued to collect in the natural
depression/low lying areas, thereby leading to various health problems and unhygienic living
conditions. During the times of heavy rain, the streets are water logged and this rain water is
channeled into the drains carrying waste, thus leading to contamination of rain water which could
have been otherwise used for various purposes.
This region served as the main recharge zone and water collection area for the Mansagar Lake.
Since the early times, it was the walled city outskirts housing the under -privileged population of the
city. As a result not much emphasis was given to the planning and the development was more or
less organic.
The area acquired strategic importance due to its location of National Highway — 8. It saw the
starting of commercial and institutional development along the main road due to the availability of
large amount of land. Further inside of the road, residential activity continued at an un-organized
pace, without considering the topography. As a result tremendous deforestation along with fast
construction activity started taking place which obstructed the natural path of the rainwater streams
& rivulets downhill. Due to this the water inflow into Mansagar Lake was stopped and it started
stagnating and water quality deteriorated. This altered the ecology of the region to a great extent,
resulting in deterioration of ground water levels and worsening its quality due to inadequate
content.
Owing to the importance of the area in maintaining the ecological balance of the region, it should
have been declared protected greens and kept free of development. The green cover would have
assisted in maintaining the water balance by allowing water seepage into the lower strata of the
water table.
69
2. Jhallana Water Shed The water shed includes.
a. Jhalana Institutional Area developed in the natural drainage channel of the
tributary of Amanishah Nallah.
b. Jawahar Nagar Residential area at the foot of the Jhalana Hills.
c. University Area
As was observed in the previous cases, here too the development is obstructing the natural
drainage network. In the institutional area, construction has encroached in the existing channel of
Amanishah nallah. The water in the nallah is very less as compared to what it should be The land
adjoining the trickling stream is encroached for construction irrespective of the Nallah Boundary.
The residential area of Jawahar Nagar is planned in the watershed region and experiences flooding
and water logging during heavy rains due to improper drainage design. Another aspect observed is
the quarrying of the hills. The extensive quarrying has resulted not only in the depletion of green
cover but also of the hills themselves, altering the natural drainage due to the hill topography and
affecting the recharging system. To assist in this quarrying activity the workers involved have
illegally set-up their own establishments in the cleared area further affecting the water flow.
4.8 WATER RELATED ISSUES 1. The city is totally dependent on sub-surface water with negligible dependence on
surface water.
2. The city lacks treatment facility and has capacity to treat only 54 MLD of the total
demand of 350 MLD.
3. The supply losses are high reducing the net supply to 58%. The losses should not
exceed 20%.
4. Presently 26% of the city does not have piped water connection leaving —15%
population unserved. The unregularised settlements depend upon the private
suppliers, tankers and own bore wells.
5. Out of the rest of the 85% of the population, 35% receives less than 100 !pod of water.
6. There are no checks on ground water extraction leading to uncontrolled tapping of
water. The ground water level is falling at the rate of 2 mts./year. The annual ground
water extraction is much more than its replenishment.
70

7. The green spaces within the area are lessening, which adversely affect the water
recharge capacity of the city.
8. There is an evident lack of interagency coordination.
4.9 PLANNING RELATED ISSUES 1. Many areas are developed in water shed regions, obstructing the flow of run-off.
2. Most of the fringe areas already existed before their notification in master plan & thus
lack proper drainage facilities, leading to collection of run-off on the streets.
3. The Amanishah nallah has become the sewerage channel for the non-connected
areas, rather than a rainwater channel.
4. There is no provision to collect the surface run-off from the streets, leading to wastage
of rain water.
5. The green cover is very sparse, even less than what has been prescribed in the master
plan-1991. There is non-recognition of shallow areas as protected areas, which have
lead to their being encroached.
6. The rainwater harvesting measures are not being practiced even after specifications of
the master plan.
4.10 EXISTING CONDITION OF SOLID WASTE
In Jaipur transportation of solid waste is carried out partially by Jaipur Nagar Nigam and partially by
private contractors. Of the 70 wards, Jaipur Nagar Nigam is responsible for 23 wards and private
contractors for the balance 47 wards. However, Jaipur Nagar Nigam holds the overall responsibility
for transportation of solid waste. It is estimated that Jaipur Nagar Nigam transports only 35% of
solid waste generated and private contractor's balance 65% of the waste. There are mostly open
depots (3635) for collecting the solid waste.
4.10.1 Street Sweeping and Solid Waste Collection
The primary collection of solid waste is done through street and road sweeping because household
waste is thrown from house windows/doors or placed in open places. The sweeping and cleaning of
city is done on the basis of a three-tire system. Mainly the female sweeper sweeps the street and
roads and heaps it on the road/street side. The second sweeper cleans the drains (Nali) and
removes the wet silt and recyclable garbage and again heaps those on the drain side. The third
71

sweeper lifts these heaps of solid waste in handcarts and carries it to the near by collection points
and unloads it on land.
• The sweeper (most of the female) sweeps the street and road and heaps it on the road
/ street side. (Photo a, b &c)
a b
• The second sweeper cleans the roadside drains (Nail) and removes the silt, recyclable
and garbage etc. and heaps those on drain (Nall) side (Photo d, e)
d e
• The third sweeper, with handcart, lifts these heaps of solid waste in handcart and
carries either to the nearby dust bin or to open collection point and unloads is on land
(Photo f, g & h)
72

f g h
Details of zone wise collection points in the city are tabulated in Table 4.10.
Table No. 4.10 Details of Collection Points
Sr. No. Name of Zone No. of Wards
Existing Depots
Open Closed
(4.5 m3)
Total
On Land RC (1
m3)
1 Civil Line 14 580 115 6 701
2 Vidhyadhar Nagar 15 715 110 5 830
3 Hawa Mahal (E) 12 367 0 0 367
4 Hawa Mahal (W) 11 545 0 0 545
5 Motidoongri 11 850 0 0 850
6 Sanganer 7 353 0 0 353
3410 225 11 3646
Stray animals at open depot
73
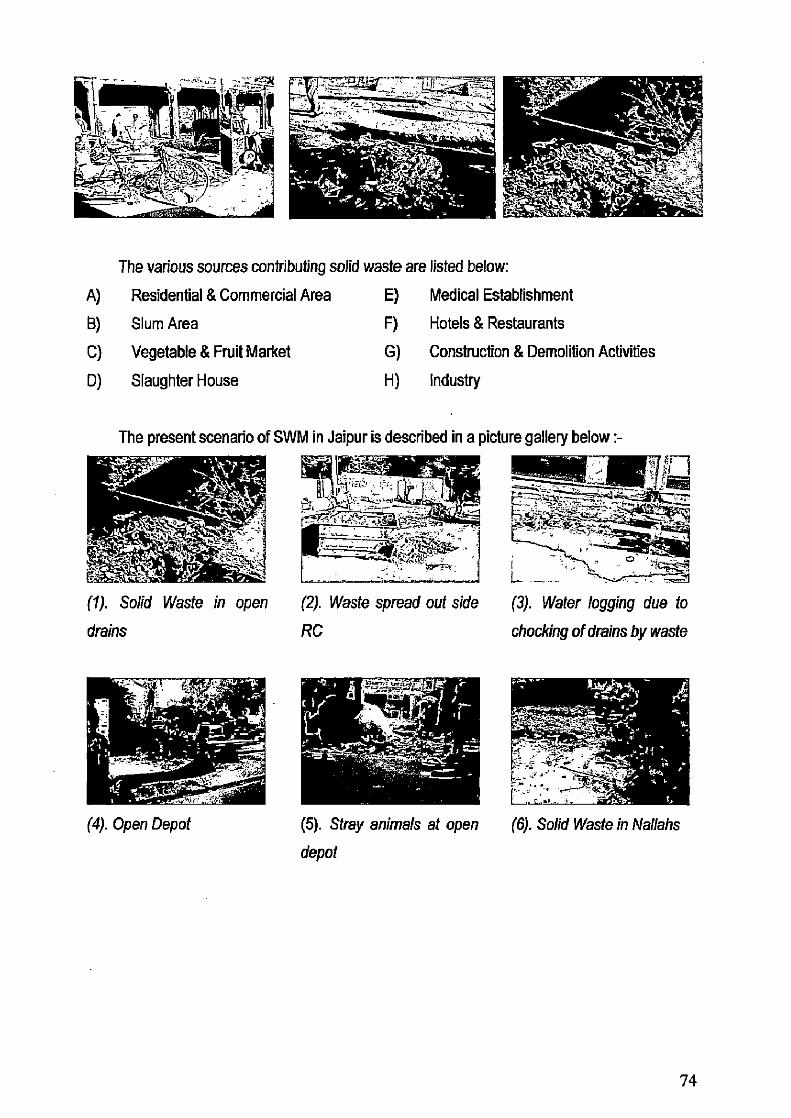
a
uni
f'ka
t
L
•
The various sources contributing solid waste are listed below:
A) Residential & Commercial Area E) Medical Establishment
B) Slum Area F) Hotels & Restaurants
C) Vegetable & Fruit Market G) Construction & Demolition Activities
D) Slaughter House H) Industry
The present scenario of SWM in Jaipur is described in a picture gallery below :-
(1). Solid Waste in open (2). Waste spread out side (3). Water logging due to
drains
RC
chocking of drains by waste
(4). Open Depot
(5). Stray animals at open
depot
(6). Solid Waste in Nallahs
74
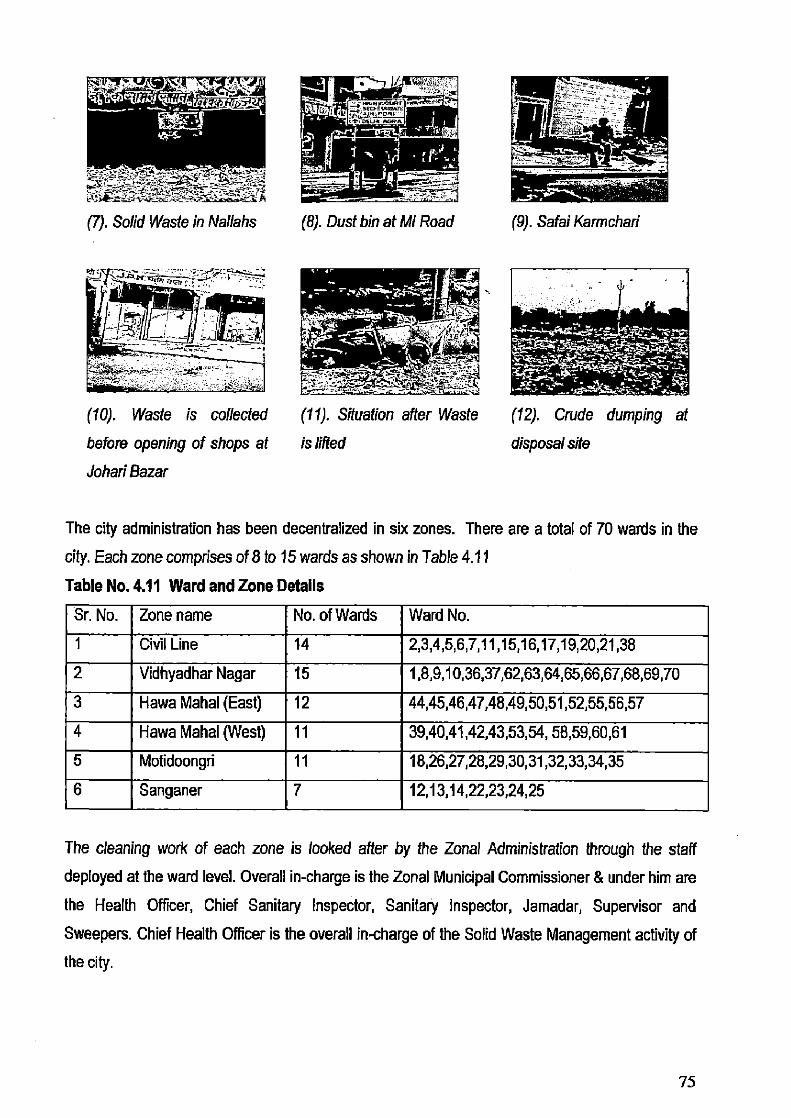
(7). Solid Waste in Nallahs (8). Dust bin at Ml Road
(9). Safai Karmchari
(10). Waste is collected (11). Situation after Waste (12). Crude dumping at
before opening of shops at is lifted disposal site
Johari Bazar
The city administration has been decentralized in six zones. There are a total of 70 wards in the
city. Each zone comprises of 8 to 15 wards as shown in Table 4.11
Table No. 4.11 Ward and Zone Details
Sr. No. Zone name No. of Wards Ward No.
1 Civil Line 14 2,3,4,5,6,7,11,15,16,17,19,20,21,38
2 Vidhyadhar Nagar 15 1,8,9,10,36,37,62,63,64,65,66,67,68,69,70
3 Hawa Mahal (East) 12 44,45,46,47,48,49,50,51,52,55,56,57
4 Hawa Mahal (West) 11 39,40,41,42,43,53,54, 58,59,60,61
5 Motidoongri 11 18,26,27,28,29,30,31,32,33,34,35
6 Sanganer 7 12,13,14,22,23,24,25
The cleaning work of each zone is looked after by the Zonal Administration through the staff
deployed at The ward level. Overall in-charge is the Zonal Municipal Commissioner & under him are
the Health Officer, Chief Sanitary Inspector, Sanitary Inspector, Jamadar, Supervisor and
Sweepers. Chief Health Officer is the overall in-charge of the Solid Waste Management activity of
the city.
75

4.10.2 Solid Waste Collection from Commercial! Institutional Area
The shops / markets and other establishments normally starts business after 9:30 — 10:00 AM.
These timing do not synchronize with the work schedule of the sweepers, as by this time most of
the collection procedure is over after collection of solid waste from main streets and roads, Waste
from these business communities again accumulates on streets and road. The city does not
appear clean. The same is true in the case of hotels, restaurants therefore and vegetable market
waste.
According to Master Development Plan, presently there are more than 6,000 registered small -
scale industries in Jaipur. There is a high degree of concentration of small scale and household
industries in the walled city area. There are about 61 number of large and medium scale type of
industries. These are mainly Vanaspati oil refinery, bearings, electricity and water meters etc. There
are also leather tanning, carpentry work, pottery and engineering industries including electroplating
industries.
4.10.3 Solid Waste Collection by Private Contractor
One Private contractor under the name of 'SWACHH JAIPUR ABHIYAN' has been collecting waste
house to house in a closed containerized tricycle. The amount charged varies from Rs. 20 to 40 per
house per month. Waste is collected from 45000 houses from 13 wards. The collected waste is
emptied at open depots. Thus, double handling of waste is not avoided. Part of the solid waste
collected is recycled by the agency at source.
Typical Tricycle Recycled Material
4.10.4 Disposal System
4.10.4.1 Land Fill Sites
Jaipur Nagar Nigam authorities have reported that they are disposing solid waste at four disposal
sites namely;
• Vishwakarma Industrial Area Road No. 6 and Bagrana In Use
• Naradpura and Maharani Farm Abandoned
76

Habitations with in site premises
The sites in use will be continued for disposal for one to one and half years, though all the sites are
unauthorized and do not have any consent from Pollution Control Board. Maharani Farm and
Naradpura landfill sites have been abandoned now. Presently, the Jaipur Nagar Nigam authorities
do not have any processing and treatment system. The existing system can not be called as
sanitary land filling, but at the best as crude dumping because neither the waste is placed properly
nor covered & compacted. There are hardly any controls at the existing sites on the entry of the rag
pickers, who during their work remove recyclable material and spread the waste all around spoiling
the ambience of the site. Presently, there is no control at the disposal sites for proper disposal.
Unauthorized disposal of industrial waste and sludge, including hazardous waste at the disposal
site without permission of municipal authority is going on. Hot ashes and cinder deposited at the
disposal site result in fire and smoke causing nuisance to the nearby residents. Some times the rag
pickers during their search for metals also set the waste on fire.
a. Bagarana Landfill Site- In Use
The site is currently under use. It is approximately 20 kms away from the city along Jaipur-Agra
National Highway no. 11 There is a but like structure (chouki) where record of incoming vehicles
are maintained.
77
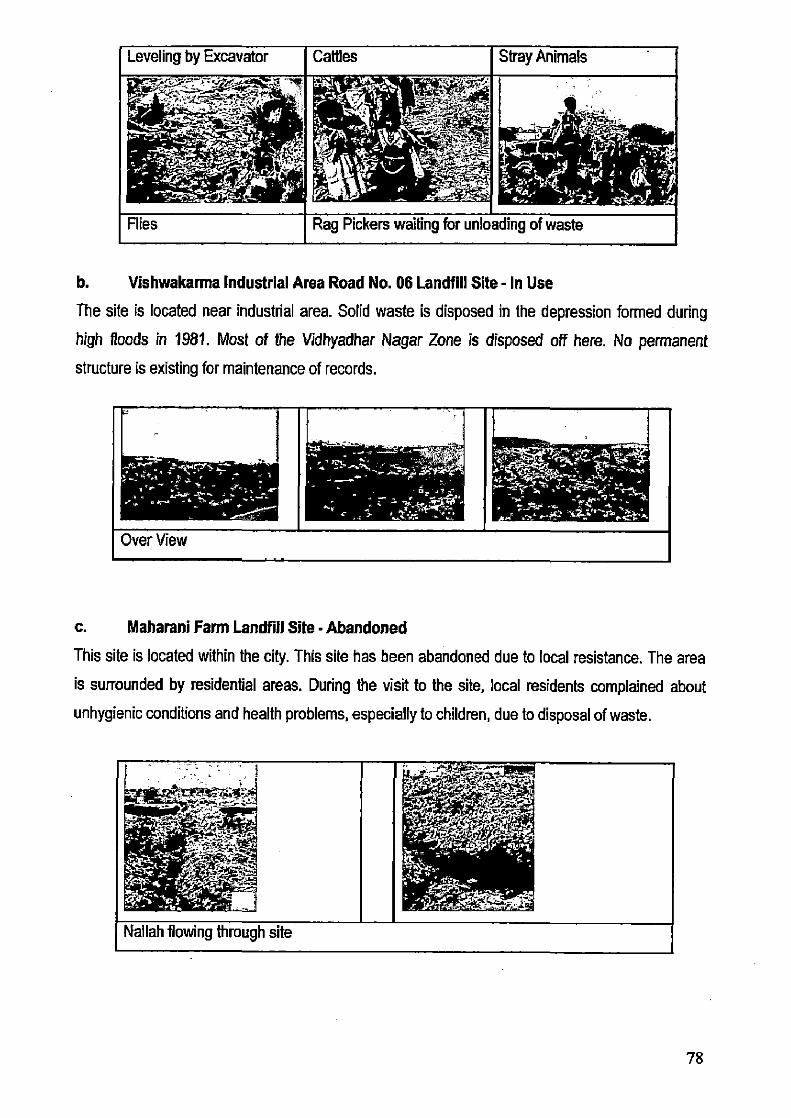
Nallah flowing through site
Leveling by Excavator Cattles Stray Animals ,,,,c;,..,e,....---r . ..,..e., 7
i t ,..„. -_ • "-Or,
jeafjEr7P7 401
pig - r •
i...
' ■•". 4 L F A
_Ai .... ' tM11-*.21,C ...., ,r.o.. 0 , .•,:.
c ' .4` 'et . 010 4, ,..) . ,
..,,f.Uft v- it w■ -p --,,,, kat., . .,.. 11 ri
c. , .c- --
-
,
I - ' - r:1 4
;714,,
4,41. t .. . Flies Rag Pickers waiting for unloading of waste
b. Vishwakarma Industrial Area Road No. 06 Landfill Site - In Use
The site is located near industrial area. Solid waste is disposed in the depression formed during
high floods in 1981. Most of the Vidhyadhar Nagar Zone is disposed off here. No permanent
structure is existing for maintenance of records.
c. Maharani Farm Landfill Site - Abandoned
This site is located within the city. This site has been abandoned due to local resistance. The area
is surrounded by residential areas. During the visit to the site, local residents complained about
unhygienic conditions and health problems, especially to children, due to disposal of waste.
78
d. Naradpura Disposal Site - Abandoned
This site is about 15 kms away from the city along the Delhi Bypass road. The site is now
abandoned. There exists a foundation stone indicating that the land was to be used for housing
colonies.
4.10.5 Medical Establishments - Biomedical Waste
t
5 -
11 ii,tra-ba)
• r f
41 ,\
It has been reported in NHDS & SEARCH 2000 that there are a total of
480 Medical Establishments in Jaipur city. It is also reported that total
bed facilities for Jaipur city is more than 8000 beds. Tableshows
details of various medical establishments with bed capacity. Details of medical institutions is
presented in Table 4.12.
Table No. 4.12 Details of Medical institution and Beds Facilities at Jaipur
Sr.
No.
Type of institution Gover-
nment
Private Trust Total Bed Quantity or waste (Kg)
1. Hospitals with beds 200 and
above
7 - 2 9 3932 7995
2. Hospitals with beds 50 to 199 7 6 3 16 1254 2550
3. Hospital with beds less than 50 5 88 14 107 1917 3898
4. Nursing homes (bed less than
50)
- 38 - 38 506 1029
5. Clinics and Dispensaries 47 245 - 292 303 616
6. Laboratories & Diagnostic
Centers
- 18 - 18 27
Total Institutions 66 395 19 480 7912 16115
Source: Report on survey of Bio-Medical waster in Jaipur by NHDS and SEARCH year 2000-01
79
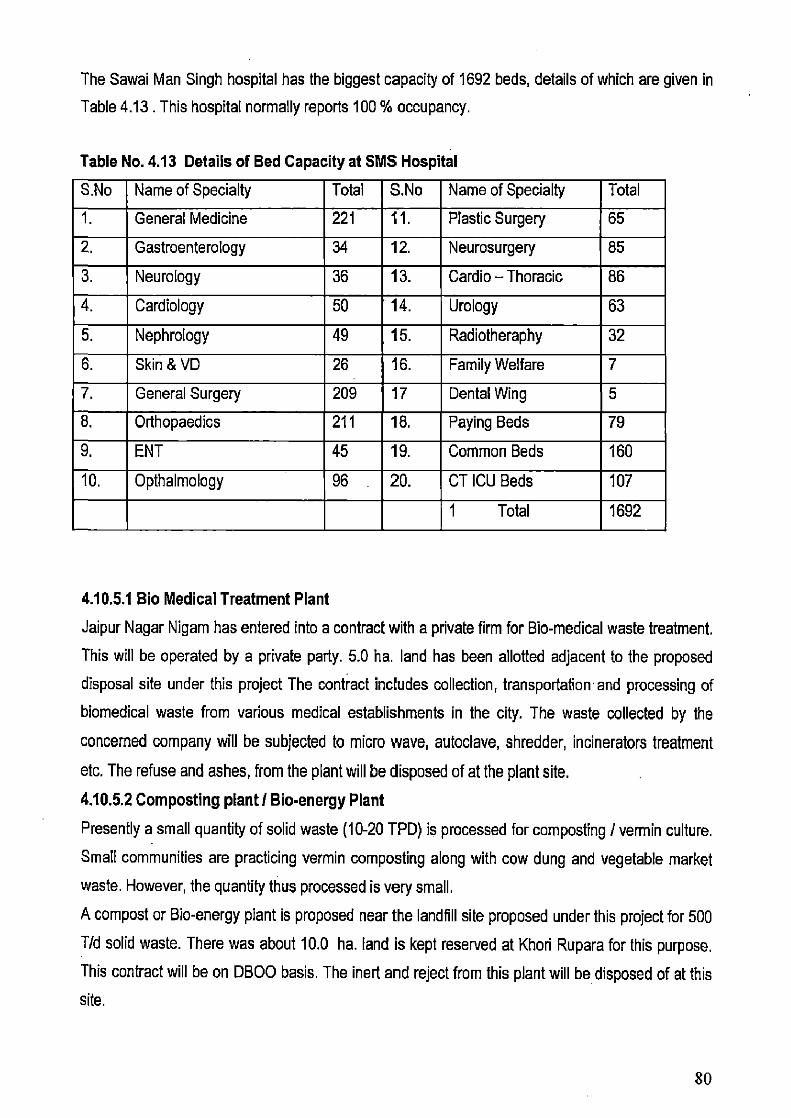
The Sawai Man Singh hospital has the biggest capacity of 1692 beds, details of which are given in
Table 4.13. This hospital normally reports 100 % occupancy.
Table No. 4.13 Details of Bed Capacity at SMS Hospital
S.No Name of Specialty Total S.No Name of Specialty Total
1. General Medicine 221 11. Plastic Surgery 65
2. Gastroenterology 34 12. Neurosurgery 85
3. Neurology 36 13. Cardio — Thoracic 86
4. Cardiology 50 14. Urology 63
5. Nephrology 49 15. Radiotheraphy 32
6. Skin & VD 26 16. Family Welfare 7
7. General Surgery 209 17 Dental Wing 5
8. Orthopaedics 211 18. Paying Beds 79
9. ENT 45 19. Common Beds 160
10. Opthalmology 96 20. CT ICU Beds 107
1 Total 1692
4.10.5.1 Bio Medical Treatment Plant
Jaipur Nagar Nigam has entered into a contract with a private firm for Bio-medical waste treatment.
This will be operated by a private party. 5.0 ha. land has been allotted adjacent to the proposed
disposal site under this project The contract includes collection, transportation and processing of
biomedical waste from various medical establishments in the city. The waste collected by the
concerned company will be subjected to micro wave, autoclave, shredder, incinerators treatment
etc. The refuse and ashes, from the plant will be disposed of at the plant site.
4.10.5.2 Composting plant ) Bio•energy Plant
Presently a small quantity of solid waste (10-20 TPD) is processed for composting / vermin culture.
Small communities are practicing vermin composting along with cow dung and vegetable market
waste. However, the quantity thus processed is very small.
A compost or Bio-energy plant is proposed near the landfill site proposed under this project for 500
T/d solid waste. There was about 10.0 ha. land is kept reserved at Khori Rupara for this purpose.
This contract will be on DBOO basis. The inert and reject from this plant will be disposed of at this
site.
80
4.10.6 General Observations and Deficiencies
i. Transportation system does not synchronize with the system of community waste
storage facility.
ii. Waste is not transported on a day to day basis leaving a backlog of waste to be
transported.
iii. As far as the transportation of the market waste is concerned it is observed that the
timings of transportation do not synchronize with the timings of primary collection of
waste.
iv. Presently, transportation in walled city is carried out during morning hours and early
afternoon.
v. Transportation vehicles are not covered, which is against the guidelines of Supreme
Court.
vi. Manual loading is still followed by the private contractors.
vii. Disposal site are far away and no transfer stations exists.
viii. In the walled city, day time lifting of solid waste has always been problematic for the
transporters. The width of main lanes of walled city not fit for two way traffic.
Moreover encroachments across the lanes also pose a problem. TransportatiOn from
the inner lanes of the city was found very difficult.
ix. The system of transfer stations in the SWM transportation of Jaipur does not exist.
x. Primary collection of solid waste in Jaipur city is primitive and inefficient.
xi. The solid waste is neither stored at source nor segregated. It is thrown on streets,
footpaths, open spaces, open drains or water bodies, back yard lanes etc.
xii. Maximum primary collection and storage points are on open land, which develops
unhygienic condition, smell, odor, proliferation of flies and mosquitoes and other
diseased vectors.
xiii. Only few important roads and markets are swept on daily basis, while the other
roads and markets are not being swept on daily basis.
xiv. All type of solid waste generated is mixed with municipal solid waste including
biomedical infectious waste, hazardous industrial waste, demolition waste, highly
putriciable waste and inert waste.
xv. Only two sites for disposal of solid waste and both are unauthorized.
xvi. Hospital waste is currently being disposed along with other waste although an
attempt is underway for separate treatment of bio medical waste.
81

xvii. Very little attempts are being made for processing and treatment of waste before
disposal or disposal sites.
xviii. The other attempt at processing at disposal sites are by rag pickers who create more
problems at the site by spreading the waste.
xix. Illegal dumping by private contractors in other low lying areas other than the landfills
is also being carried out.
xx. No systematic records are kept at landfill sites as to the quantity of waste dumped.
No weigh bridges exist at landfill sites.
xxi. No compaction of waste is done to increase life of landfill sites. Equipments like
bulldozer and loaders are not available.
xxii. There is no control over the dumping of inert and organic waste at the site. As such
the waste at the landfill site has very little use for composting. More over hazardous
industrial waste and construction debris was also dumped at the same site.
xxiii. No attempts at leachate control or recovery of biogas is being made at the site.
4.11 EXISTING CONDITION OF DRAINAGE The walled city was initially developed with a well-laid out drainage system. For the areas outside
the walled city neither the drainage has been properly planned nor has it has been provided in all
the areas. The natural slope of Jaipur City is from Northwest to Southeast and the major drains in
Jaipur are the Amanishah and Ganda Nalla.
4.12 EXISTING CONDITION OF SEWERAGE AND SANITATION The topography of Jaipur divides the town into two drainage zones (north and south) along a ridge
line through Chandpole, Tripelia, and Ramganj Bazar, The north zone consists of 70% of walled
city area. The northern portion slopes towards Jalmahal Lake but contains certain depressed areas
like Raja Mal Ka Talab, Govind Nagar and the adjoining area near Jalmahal. The southern zone
has a general slope from north to south. At present, the North zone is served by a sewerage
system which is connected to a sewage treatment plant (STP) 27 MLD capacity which was
commissioned in 1979 near Jalmahal Lake. The treatment plant consists of pretreatment units,
aeration tanks, sludge thickeners and sludge drying beds. The condition of the STP is poor. About
60% of aerators are non-functioning and this affects the quality of treated effluent. The treated
effluent from the STP is discharged into Jalmahal Lake. Major portion of the sewage in the northern
drainage zone of the city finds its way into the Jalmahal Lake. The Lake is connected to an escape
82

channel, which carries the excess sewage from the lake and leads to open land near Jaisinghpura
where sewage farming is being in practice. Parts of the north zone and most of the south zone are
unsewered. The portions of south zone are discharging sewage to open channels without any
treatment. About 33% of the population is connected to the sewer system. On site sewage disposal
through septic tanks or soakage pits are prevalent. About 40% of the households outside the walled
city limit are connected to these facilities. Jaipur Development Authority and Rajasthan Housing
Board have also developed new colonies having sewer lines, but the raw sewage is being
discharged to nallas. The private housing colony households are, in general, provided with septic
tanks and soak pits.
4.12.1 Problem Identification The present sewage treatment plant is located in a dense residential area. The treatment plant
does not often function due to inadequate maintenance.
4.12.1.1 North Zone In this zone even though the sewerage system exists, only the toilets have bee connected to the
sewerage and the sullage is let out in to the road side open drains. Because of this constraint, the
quantity of sewage actually reaching the STP is less than the expected quantity and also the BOD
concentration of Sewage is very high.
4.12.1.2 South Zone The Southern portion of the city has a slope towards Sanganer. The south zone has a partial
sewerage system and the sewage from sewer lines is being used for cultivation and balance
quantity goes into the Amanishah Nallah.
Some sewer lines and the main trunk sewers up to proposed STP site at Delawas have been laid
by PHED in the south zone.
Most of the areas resort to direct disposal to pits (Kul) manly of which are even taken up to subsoil
water level. Limited use of septic tanks and soak pits is also in use. The system of disposal of an
alarming magnitude in terms of pollution threat to ground water and increasing incidence of water
bore diseases. Waste water drainage is by way of open and covered drains left untreated. A very
large percentage of population is still using open fields for defection especially Kachchi Basti
dwellers.
R3
The small portion of the Northern area of the town is covered under full fledge sewerage scheme
with collection system and treatment plant. In the remaining part of the town, the area which is
sewered is discharging the untreated sewage in to Amanisha Nala, which finally drains to the river.
In Northern zone, the sullage flow of unsewerd areas is connected to near by open drains which
finally discharges to Jal Mahal Lake, Tal Katora Lake pollution the lakes to a large extent. In
unsewered areas, waste from toilet is either connected to the septic tank, or soak pits resulting into
the contamination of the ground water, which is an important source of water for the city at least for
next decade.
Under present scenario, the area where sewerage system is existing (viz) walled city, 90% of the
houses do not have their sullage from kitchens and baths connected to the sewers, only the W.C.
connection have been provided for the houses. This has two major impacts on the sanitation.
1. The quantity of sewage reaching the treatment plant is less and it is very
concentrated.
2. The sullage is discharged into the open storm water drains which become
extremely insanitary. These drains also get choked due to garbage, causing fly
and odour nuisance.
Hence inspite of having a full fledge sewerage system, total hygienic conditions are not be
achieved. It is immensely important, first to discharge the sullage water to the sewers so that the
existing sewerage system functions efficiently and the sewers as well as STP receive the design
flow. This will help to keep the sewers clean by achieving proper cleansing velocities. Secondly,
the sullage water should not be allowed in to the open drains by adhering to strict rules and
regulations.
The proposed water supply scheme and sewerage scheme should be implemented simultaneously
failing which problems will be faced by the environment, affecting the public health and commercial
activities.
To sustain the higher rate of growth in the town infrastructure in general is to keep up and
sewerage is an important component of the infrastructure, which needs to be developed.
84
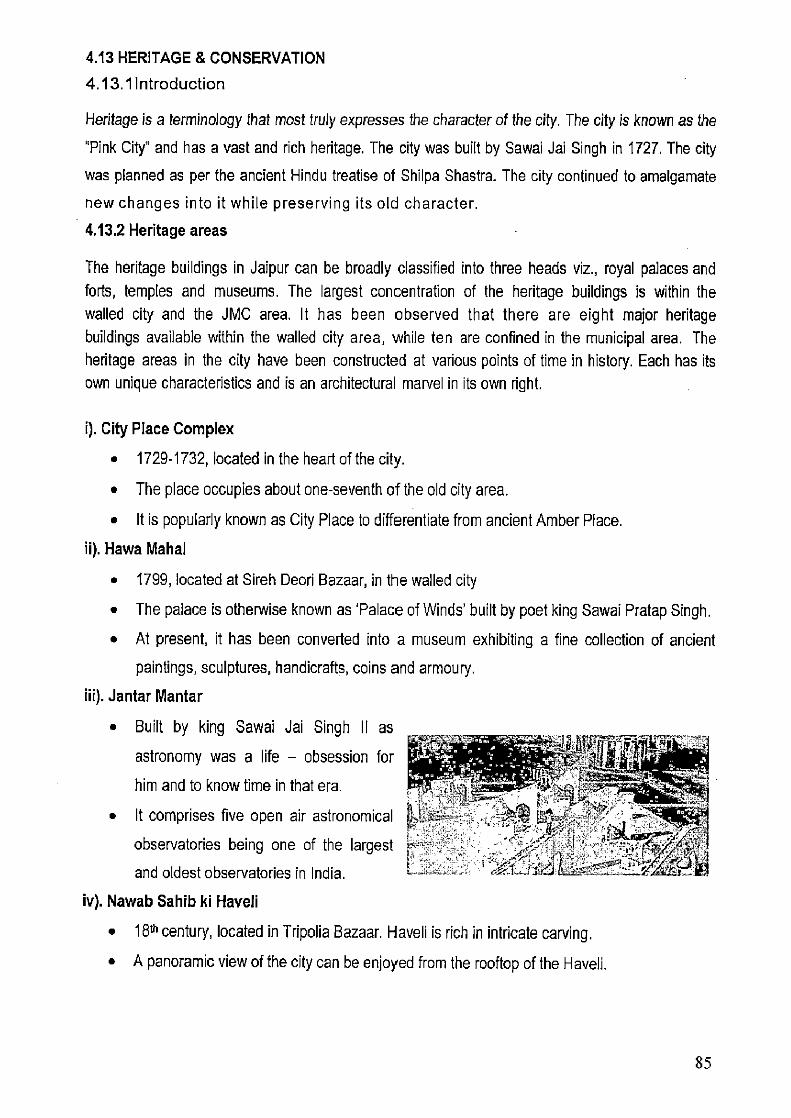
4.13 HERITAGE & CONSERVATION
4.13.1Introduction
Heritage is a terminology that most truly expresses the character of the city. The city is known as the
"Pink City" and has a vast and rich heritage. The city was built by Sawai Jai Singh in 1727. The city
was planned as per the ancient Hindu treatise of Shilpa Shastra. The city continued to amalgamate
new changes into it while preserving its old character.
4.13.2 Heritage areas
The heritage buildings in Jaipur can be broadly classified into three heads viz., royal palaces and forts, temples and museums. The largest concentration of the heritage buildings is within the walled city and the JMC area. It has been observed that there are eight major heritage buildings available within the walled city area, while ten are confined in the municipal area. The heritage areas in the city have been constructed at various points of time in history. Each has its own unique characteristics and is an architectural marvel in its own right.
i). City Place Complex
• 1729-1732, located in the heart of the city.
• The place occupies about one-seventh of the old city area.
• It is popularly known as City Place to differentiate from ancient Amber Place.
ii). Hawa Mahal
• 1799, located at Sireh Deori Bazaar, in the walled city
• The palace is otherwise known as 'Palace of Winds' built by poet king Sawai Pratap Singh.
• At present, it has been converted into a museum exhibiting a fine collection of ancient
paintings, sculptures, handicrafts, coins and armoury.
iii). Jantar Mantar
• Built by king Sawai Jai Singh II as
astronomy was a life — obsession for
him and to know time in that era.
• It comprises five open air astronomical
observatories being one of the largest
and oldest observatories in India.
iv). Nawab Sahib ki Haveli
• 18th century, located in Tripolia Bazaar. Haveli is rich in intricate carving.
• A panoramic view of the city can be enjoyed from the rooftop of the Haveli.
85
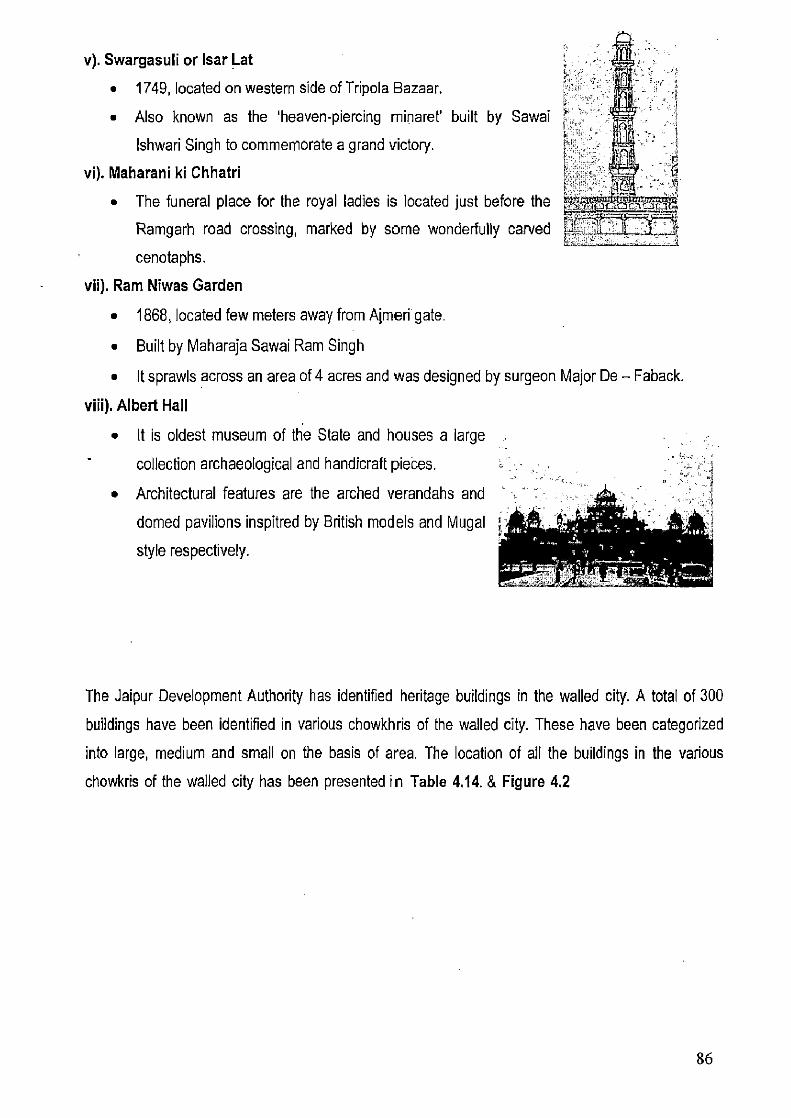
v). Swargasuli or Isar Lat
• 1749, located on western side of Tripola Bazaar.
• Also known as the 'heaven-piercing minaret' built by Sawai
lshwari Singh to commemorate a grand victory.
vi). Maharani ki Chhatri
• The funeral place for the royal ladies is located just before the
Ramgarh road crossing, marked by some wonderfully carved
cenotaphs.
vii). Ram Niwas Garden
• 1868, located few meters away from Ajmeri gate.
• Built by Maharaja Sawai Ram Singh
• It sprawls across an area of 4 acres and was designed by surgeon Major De — Faback.
viii). Albert Hall
• It is oldest museum of the State and houses a large
collection archaeological and handicraft pieces.
• Architectural features are the arched verandahs and
domed pavilions inspitred by British models and Mugal
style respectively.
The Jaipur Development Authority has identified heritage buildings in the walled city. A total of 300
buildings have been identified in various chowkhris of the walled city. These have been categorized
into large, medium and small on the basis of area. The location of all the buildings in the various
chowkris of the walled city has been presented in Table 4.14. & Figure 4.2
86
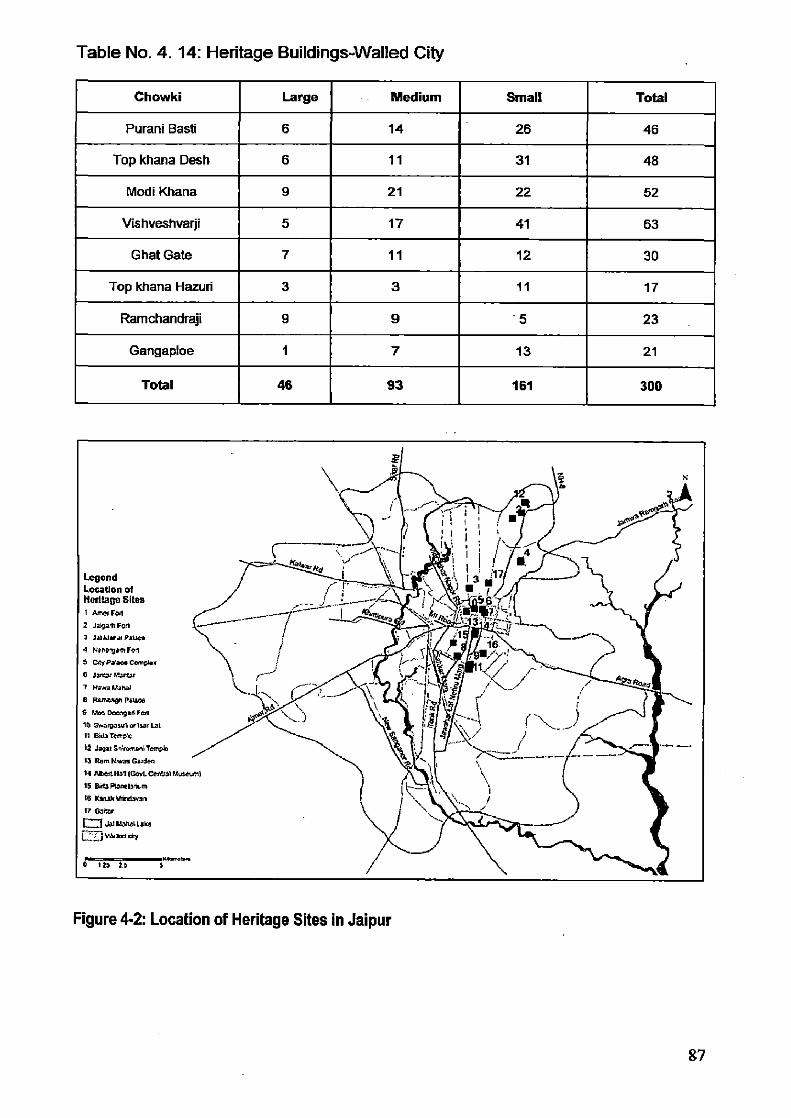
Table No. 4. 14: Heritage Buildings-Walled City
Chowki Large Medium Small Total
Purani Basti 6 14 26 46
Top khana Desh 6 11 31 48
Modi Khana 9 21 22 52
Vishveshvarji 5 17 41 63
Ghat Gate 7 11 12 30
Top khana Hazuri 3 3 11 17
Ramchandraji 9 9 ' 5 23
Gangaploe 1 7 13 21
Total 46 93 161 300
Legend Location of Heritage, Sites 1 Arne Foil
2 JaVail Forl
• JaMaltal Palace
4 None! Fori
5 ply Peace Campy*
• J3n3r martar
7 Man 'Lanai
B Illthlar Pan.
9 Me Dean col Feat
10 BV.B72730 or Mot Ur 11 134a Tempt
12 2/72•12.11romall Tempt
13 Rem Nnegas Garden
14 Altet11311G3v1.C711U511AutBwIl
15 1343 Wnelain 16 Kea* Vinttsvan
17 G37777
ri manaLLske ETA "a-1th?
1•••=1MM=M■114.7■421••• b 2.4
Figure $2: Location of Heritage Sites in Jaipur
87

NO Ismail Road
Legend mnir ray
Residential Areas Heritage Places Cial rots • Hasa Mace
E=1 aJOrthisPie-Ver
Cat Pace
e Sena& Palace
Religious Places ektoint namoner4 'Wm.* dodra De* Te41100
matrober Temple
7,7 &Iasi Agra Road
Figure 4-3: Heritage Characteristics of Walled City
4.13.3 Problems
The major issues with respect to heritage and conservation include
excessive commercialization, insufficient infrastructure facilities, encroachment on streets by
hawkers and vehicles, misuses of proposed walkways in the walled city, inadequate parking
facility, legislative and legal framework and lack of awareness.
• Excessive, uncontrolled and unchecked commercialization of the inner streets in the
walled city has led to problems, such as, traffic congestion during the peak hours.
• Haphazard construction of shops has spoiled the cultural fabric of the city.
• Due to lack of infrastructure facilities people from walled city are moving out to the
outskirts. The vacant houses are in turn converted into commercial areas.
• No rules and regulations proposed for maintenance of heritage walkways.
88

ASSESSMENT OF THE PRESENT STATUS OF DEVELOPMENT CHAPTER - 5
5.1 INTRODUCTION
An assessment of the present status of development of the walled city, Jaipur, is very much
essential in order to understand the present status of development, which required in formulating
workable recommendations to solve the existing problems. To assess the present status of
development, all the important parameters of the systems are identified, and assessed in detail.
The assessment is done in such a way that all the physical, socio-economic, ecological and
environmental parameters are considered. The assessment of the present status of development
also includes the land use, housing, traffic and transportation, recreation, water supply, sewerage,
etc. Different infrastructure facilities considered in this investigation are transportation, health,
sanitation facilities, power, education, water supply, etc. The functions of these various parameters
have been studied carefully by conducting primary household survey at household levels in the
study area. The following are the control parameters, which are identified and studied.
• Physical,
• Social,
• Economic,
• Ecology,
• Environment
• Infrastructure, and
• Institution
5.2 Household Survey
The walled city of Jaipur is divided into nine squares, and the squares are further divided into wards
for development administration. The investigators had conducted an observation study in the entire
walled city area covering all nine squares and understand the functions of the system thoroughly.
Further, he decided to conduct household survey in the study area (walled city) for understanding
the system at the micro level by employing pretested schedules. The Investigator has chosen all
nine squares to conduct household survey to give equal importance to all the squares. The
investigator has chosen 11 to 12 households randomly covering all the squares, to the conduct the
household survey and conducted the survey at the household level by him-self.
89
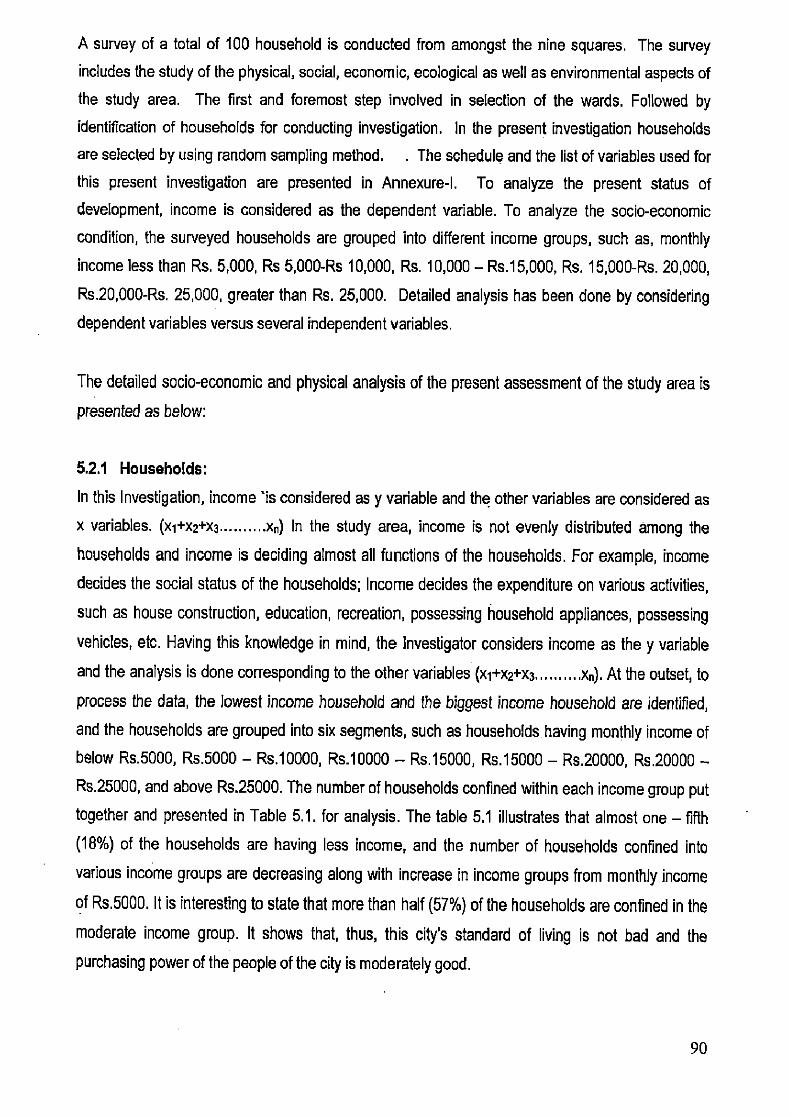
A survey of a total of 100 household is conducted from amongst the nine squares. The survey
includes the study of the physical, social, economic, ecological as well as environmental aspects of
the study area. The first and foremost step involved in selection of the wards. Followed by
identification of households for conducting investigation. In the present investigation households
are selected by using random sampling method. . The schedule and the list of variables used for
this present investigation are presented in Annexure-I. To analyze the present status of
development, income is considered as the dependent variable. To analyze the socio-economic
condition, the surveyed households are grouped into different income groups, such as, monthly
income less than Rs. 5,000, Rs 5,000-Rs 10,000, Rs. 10,000 — Rs.15,000, Rs. 15,000-Rs. 20,000,
Rs.20,000-Rs. 25,000, greater than Rs. 25,000. Detailed analysis has been done by considering
dependent variables versus several independent variables.
The detailed socio-economic and physical analysis of the present assessment of the study area is
presented as below:
5.2.1 Households:
In this Investigation, income 'is considered as y variable and the other variables are considered as
x variables. (xl+x2+x3 4) In the study area, income is not evenly distributed among the
households and income is deciding almost all functions of the households. For example, income
decides the social status of the households; Income decides the expenditure on various activities,
such as house construction, education, recreation, possessing household appliances, possessing
vehicles, etc. Having this knowledge in mind, the Investigator considers income as the y variable
and the analysis is done corresponding to the other variables (x1i-x2+x3 xn). At the outset, to
process the data, the lowest income household and the biggest income household are identified,
and the households are grouped into six segments, such as households having monthly income of
below Rs.5000, Rs.5000 — Rs.10000, Rs.10000 — Rs.15000, Rs.15000 — Rs.20000, Rs.20000 -
Rs.25000, and above Rs.25000. The number of households confined within each income group put
together and presented in Table 5.1. for analysis. The table 5.1 illustrates that almost one — fifth
(18%) of the households are having less income, and the number of households confined into
various income groups are decreasing along with increase in income groups from monthly income
of Rs.5000. It is interesting to state that more than half (57%) of the households are confined in the
moderate income group. It shows that, thus, this city's standard of living is not bad and the
purchasing power of the people of the city is moderately good.
90

Table No. 5.1 Households
S.No. Income of households No. of households
1 <5000 18 18
2 5000-10000 39 39
3 10000-15000. 18 18
4 15000-20000 12 12
5 20000-25000 7 7
6 >25000 6 6
Total 100 100
5.2.2 Religion
In India, religion is almost the opium of the human being especially among the downtrodden
communities, and religion plays a major role in the functions of the system. In the study area, the
following major religions are popular, such as Hindu and Muslim; and occupation is more or less
confined on religion. For example, Muslim Community personals are more or less engaged in
business activities. The social life is also more or less decided on the basis of religion. Having this
knowledge in mind, the Investigator, consider religion as one of the most important parameters and
analyzed properly. For doing in depth analysis, the households are grouped based on the religion,
and corresponding to their income groups and presented in Table. 5.2. The table illustrates that
about four — fifth (79%) of the households confined in Hindu religion, Followed by, about one — fifth
(19%) in Muslim, and the rest 2% are confined in others. It shows that the majority of the
households are belonging to the Hindu, and the society is Hindu religion dominated. It is interesting
to note that in both religions, availability of households are decreasing along with increasing
monthly income from Rs.5000 onwards.
91
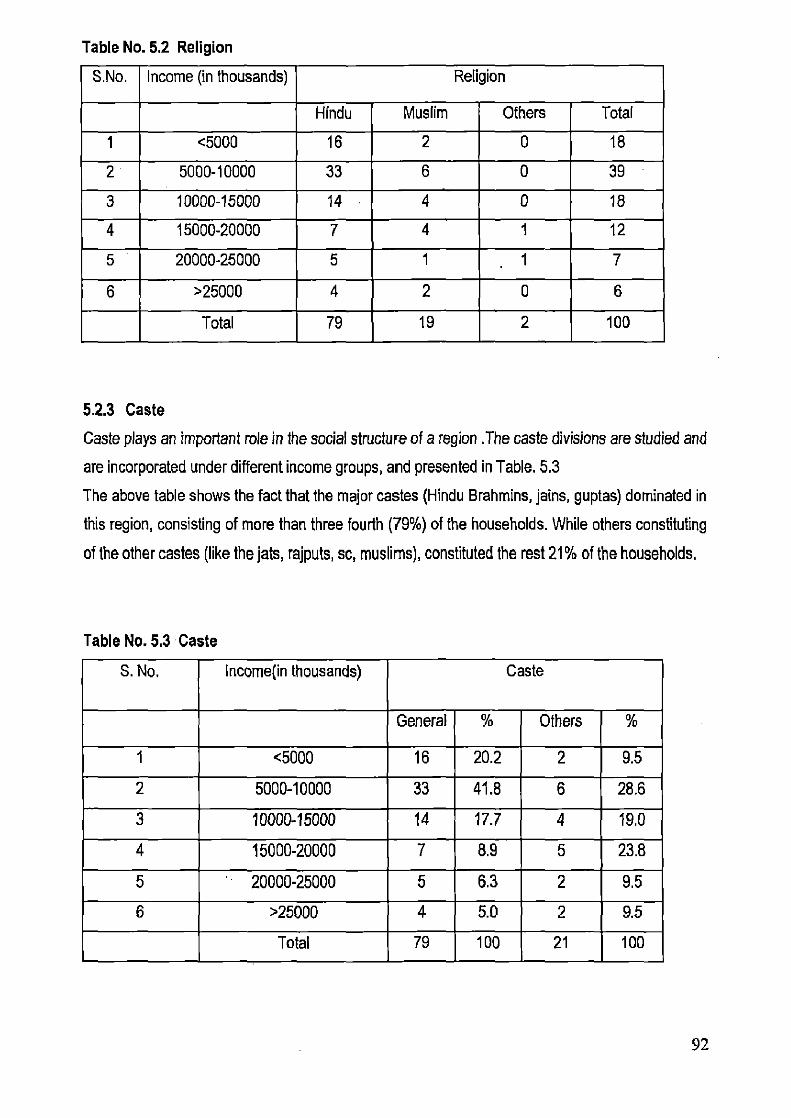
Table No. 5.2 Religion
S.No. Income (in thousands) Religion
Hindu Muslim Others Total
1 <5000 16 2 0 18
2 5000-10000 33 6 0 39
3 10000-15000 14 4 0 18
4 15000-20000 7 4 1 12
5 20000-25000 5 1 1 7
6 >25000 4 2 0 6
Total 79 19 2 100
5.2.3 Caste
Caste plays an important role in the social structure of a region The caste divisions are studied and
are incorporated under different income groups, and presented in Table. 5.3
The above table shows the fact that the major castes (Hindu Brahmins, jains, guptas) dominated in
this region, consisting of more than three fourth (79%) of the households. While others constituting
of the other castes (like the jets, rajputs, se, muslims), constituted the rest 21% of the households.
Table No. 5.3 Caste
S. No. Income(in thousands) Caste
General % Others %
1 <5000 16 20.2 2 9.5
2 5000-10000 33 41.8 6 28.6
3 10000-15000 14 17.7 4 19.0
4 15000-20000 7 8.9 5 23.8
5 20000-25000 5 6.3 2 9.5
6 >25000 4 5.0 2 9.5
Total 79 100 21 100
92

5.2.4 Gender
An attempt has been made to study the number of male and female members in a family as
grouped with six groups ranging from 1 to 6, incorporated under different income class categories,
and presented in Table,5.4. An attempt has also been made to study the Sex ratio in various categories of income as sorted out.
The above table shows that the number of females as compared with the number of males
increases as we move from the lower income group to the higher one. It may hence, be concluded
that the sex ratio gets strengthened as we move from group no.1 (621.6) to group no.6 (761.9). It
may also be concluded from the table that in overall survey of the total number of households the
system has 719 females per thousand males which is about 71.9 percent.
Table No. 5.4 Gender
S. No. Income Of Households Total
Population
Gender Sex Ratio
Males Females
1. <5000 60 37 23 621.6
2. 5000-10000 177 101 76 752.5
a 10000-15000 88 49 39 795.9
4. 15000-20000 67 41 26 634.1
5 20000-25000 42 25 17 680.0
6 >25000 37 21 16 761.9
Total 471 274 197 719.0.
5.2.5 Marital Status An attempt has been made to study the number of married and unmarried members in a family as
grouped with six income groups ranging from 1 to 6 incorporated under different income class
categories, and presented in Table 5.5.
The proportion of married to unmarried is less in income group < 5000 and income group 15001-
20000. The reason of less proportion of married to unmarried in <5000 income group is due to their
big family size, more number of children, whereas the reason among 15001-20000 income group is
due to their more inclination towards education, they are getting married at later age. The more
proportion of married to unmarried with 5001-15000 income group is due to their small family size
and more awareness of small family size due to high education standards.
93

Table No. 5.5 Marital Status S.No. Income(in thousands) Married % Unmarried % Total
1 <5000 38 13.72 22 11.34 60 12.74 2 5000-10000 107 38.63 70 36.08 177 37.58 3 10000-15000 48 17.33 40 20.62 88 18.68 4 15000-20000 38 13.72 29 14.95 67 14.23 5 20000-25000 24 8.66 18 9.28 42 8.92 6 >25000 22 7.94 15 7.73 37 7.86
Total 277 100.00 194 100.00 471 100.00
5.2.6 Education The educational status of an area is an important indicator to understand the status of development of the region. Keeping this in mind, an attempt has been made to study the educational structure of the study area. Most of educated persons (Graduates) are confined in Rs. 5001-20000 income groups where as it is least in lower income group. It may also be observed that the income group from 5001-15001 has the highest number of educated people thus indicating that the middle class is spending quite a large amount of money education.
Table No. 5.6 Education S.
No. Income (in thousands)
Primary % Secondary % Technical Graduate
% Non - Technical Graduate
% Total %
1 <5000 10 8.2 17 11.9 2 8.0 9 9.7 38 9.9 2 5000-10000 56 45.9 45 31.5 7 28.0 24 25.8 132 34.41 3 10000-15000 23 18.9 25 17.5 8 32.0 21 22.6 77 20.11 4 15000-20000 9 7.4 23 16.1 1 4.0 20 21.5 51 13.3 5 20000-25000 16 13.1 20 14.0 0 0.0 7 7.5 43 11.2 6 >25000 8 6.6 13 9.1 7 28.0 12 12.9 40 10.4
Total 122 100.0 143 100.0 25 100.0 93 100.0 383 100
94
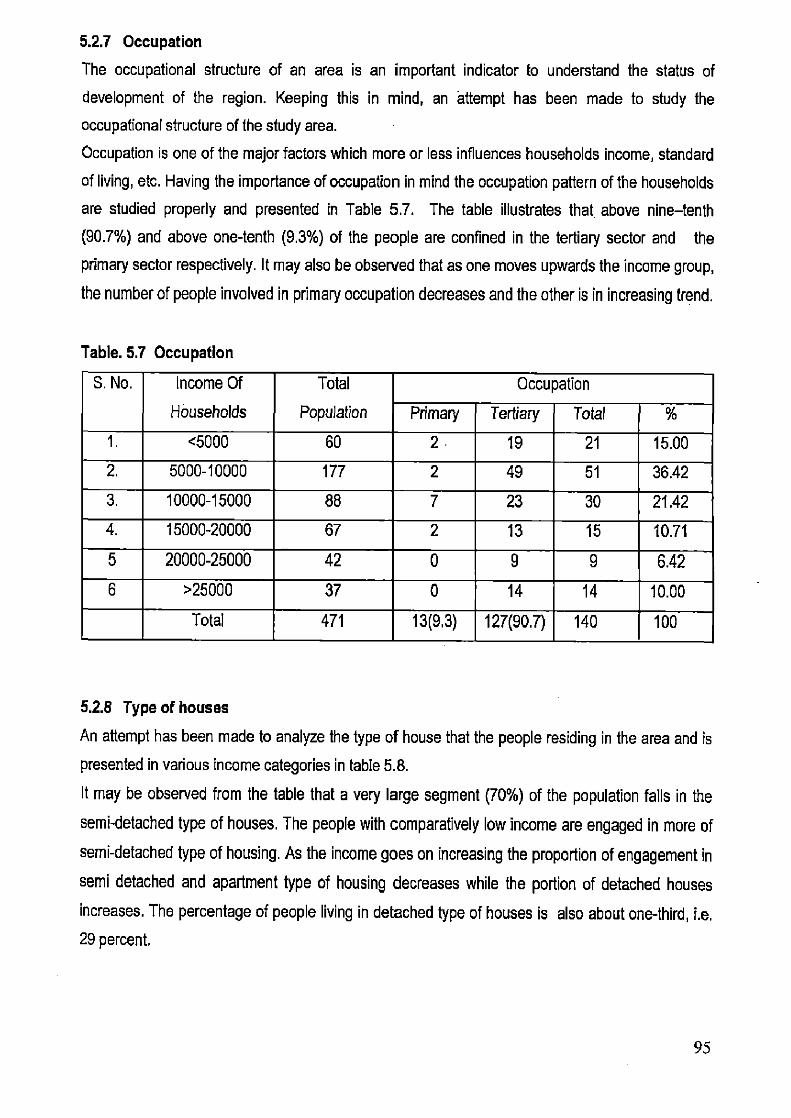
5.2.7 Occupation
The occupational structure of an area is an important indicator to understand the status of
development of the region. Keeping this in mind, an attempt has been made to study the
occupational structure of the study area.
Occupation is one of the major factors which more or less influences households income, standard
of living, etc. Having the importance of occupation in mind the occupation pattern of the households
are studied properly and presented in Table 57. The table illustrates that above nine—tenth
(90.7%) and above one-tenth (9.3%) of the people are confined in the tertiary sector and the
primary sector respectively. It may also be observed that as one moves upwards the income group,
the number of people involved in primary occupation decreases and the other is in increasing trend.
Table. 5.7 Occupation
S. No. Income Of
Households
Total
Population
Occupation
Primary Tertiary Total %
1. <5000 60 2 19 21 15.00
2. 5000-10000 177 2 49 51 36.42
3. 10000-15000 88 7 23 30 21.42
4. 15000-20000 67 2 13 15 10.71
5 20000-25000 42 0 9 9 6.42
6 >25000 37 0 14 14 10.00
Total 471 13(9,3) 127(90.7) 140 100
5.2.8 Type of houses
An attempt has been made to analyze the type of house that the people residing in the area and is
presented in various income categories in table 5.8.
It may be observed from the table that a very large segment (70%) of the population falls in the
semi-detached type of houses. The people with comparatively low income are engaged in more of
semi-detached type of housing. As the income goes on increasing the proportion of engagement in
semi detached and apartment type of housing decreases while the portion of detached houses
increases. The percentage of people living in detached type of houses is also about one-third, i.e.
29 percent,
95
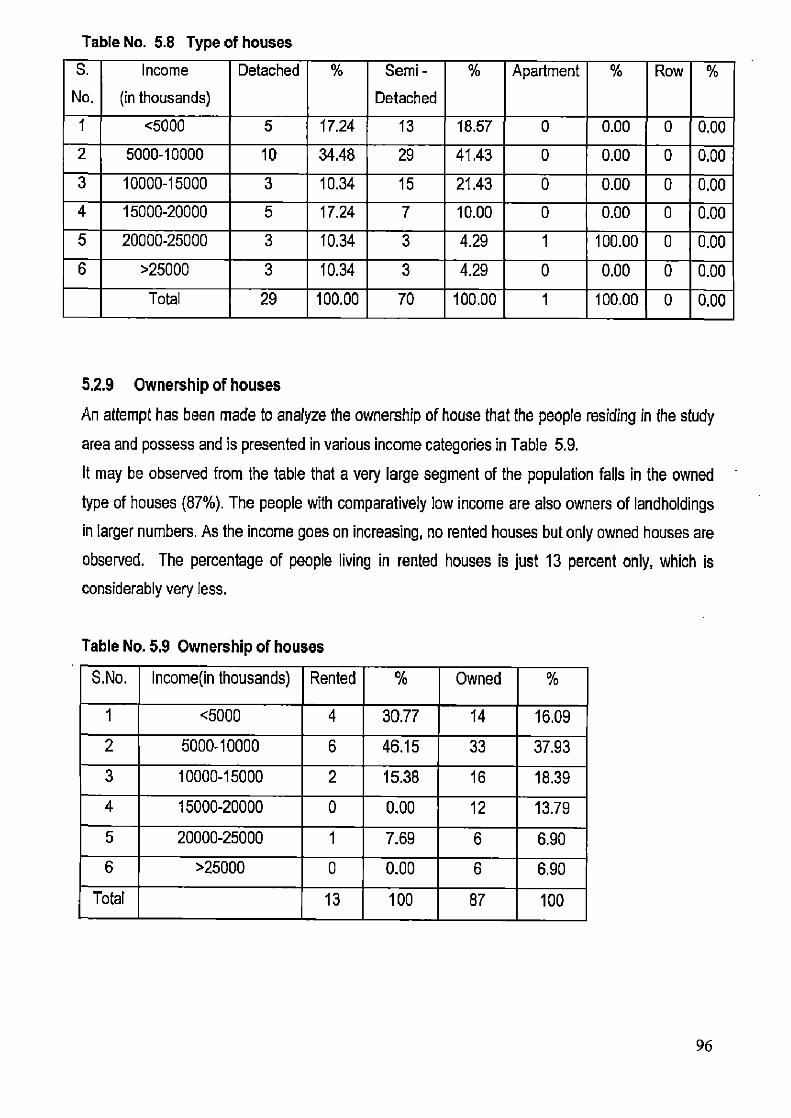
Table No. 5.8 Type of houses
S.
No.
Income
(in thousands)
Detached % Semi -
Detached
% Apartment % Row %
I <5000 5 17.24 13 18.57 0 0.00 0 0.00 2 5000-10000 10 34.48 29 41.43 0 0.00 0 0.00
3 10000-15000 3 10.34 15 21.43 0 0.00 0 0.00 4 15000-20000 5 17.24 7 10.00 0 0.00 0 0.00
5 20000-25000 3 10.34 3 4.29 1 100.00 0 0.00
6 >25000 3 10.34 3 4.29 0 0.00 0 0.00
Total 29 100.00 70 100.00 1 100.00 0 0.00
5.2.9 Ownership of houses An attempt has been made to analyze the ownership of house that the people residing in the study
area and possess and is presented in various income categories in Table 5.9.
It may be observed from the table that a very large segment of the population falls in the owned
type of houses (87%). The people with comparatively low income are also owners of landholdings
in larger numbers. As the income goes on increasing, no rented houses but only owned houses are
observed. The percentage of people living in rented houses is just 13 percent only, which is
considerably very less.
Table No. 5.9 Ownership of houses
S.No. Income(in thousands) Rented '% Owned
1 <5000 4 30.77 14 16.09
2 5000-10000 6 46.15 33 37.93
3 10000-15000 2 15.38 16 18.39
4 15000-20000 0 0.00 12 13.79
5 20000-25000 1 7.69 6 6.90
6 >25000 0 0.00 6 6.90
Total 13 100 87 100
96

5.2.10 Finance
An attempt has been made to analyze the type or source of ownership of house that the people
residing in the study area possess and is presented in various income categories in Table 5.10.
It may be observed that in terms of the type or source of ownership of house, above table depicts
that more than half of the households, i.e., 53 of them are self - financed houses. There are only a
few households having their houses financed from bank (2%). While another large section of the
households have ancestral possession of the houses which they have inherited from their
forefathers (42%). It may also be seen that (3%) of the houses have some other source of
possession.
Table No. 5.10 Finance
S.No. Income
(in thousands)
Bank % Self % Ancestral % Other %
1 <5000 0 0.0 7 13.2 9 21.4 2 66.7
2 5000-10000 0 0.0 20 37.7 18 42.9 1 33.3
3 10000-15000 0 0.0 11 20.8 7 16.7 0 0.0
4 15000-20000 0 0.0 7 13.2 5 11.9 0 0.0
5 20000-25000 0 0.0 5 9.4 2 4.8 0 0.0
6 >25000 2 100.0 3 5,7 1 2.4 0 0.0
Total 2 100.0 53 100.0 42 100.0 3 100.0
5.2.11 Physical condition of the houses
An attempt has been made to analyze the physical condition of houses that the people residing in
the area of study possess and is presented in various income categories in Table 5.11. The
condition of the households may tell us about the standard of living that the people residing in that
house possess and the way they are maintaining their houses or ancestral property.
In terms of physical conditions of houses, above table depicts that there are very few houses in the
study area which may be categorized as dilapidated (4%) and half of the surveyed houses that are
in good state (49%) and another about a set of half (47%) in categorized as livable. It may also be
observed that the houses having a dilapidated condition are possessed by the lowest income group
of < Rs.5000, which may depict their poor financial state. It is also worth mentioning that the people
belonging to the income groups Rs.20000 and above generally are residing in houses that are
sound and are in a good state, thus depicting the good financial state of that household.
97
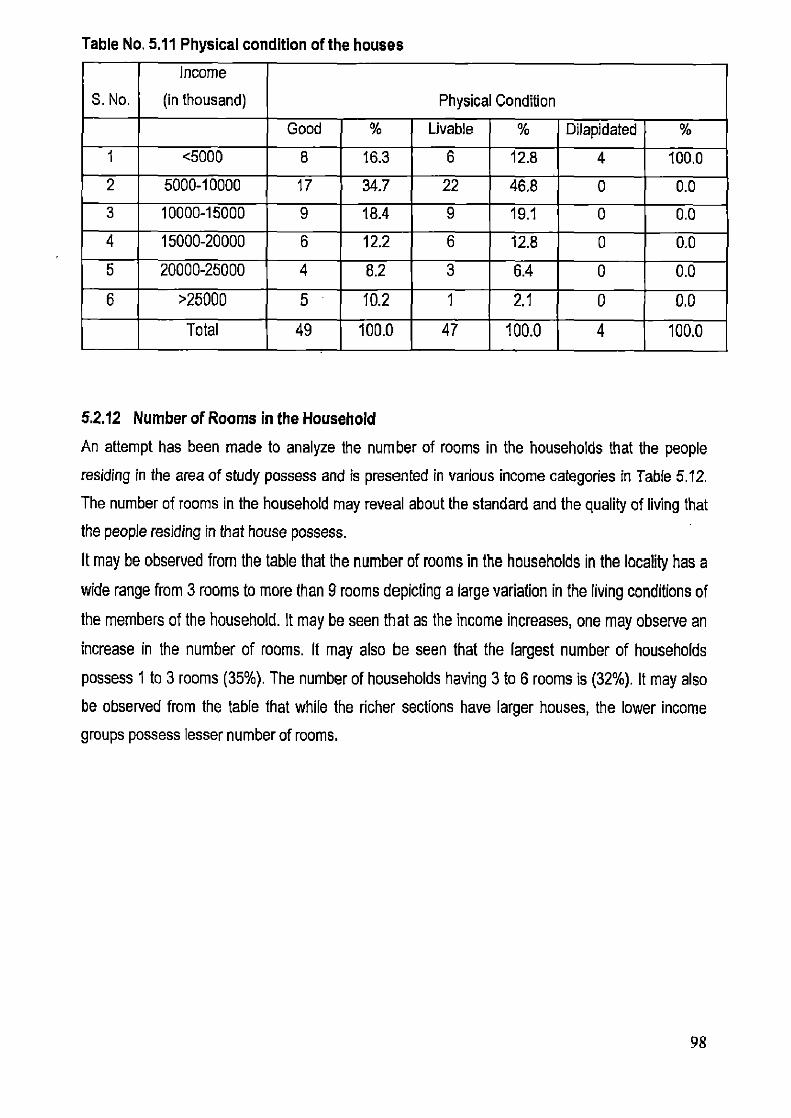
Table No. 5.11 Physical condition of the houses
S. No.
Income
(in thousand) Physical Condition
Good % Livable % Dilapidated
1 <5000 8 16.3 6 12.8 4 100.0
2 5000-10000 17 34.7 22 46.8 0 0.0
3 10000-15000 9 18.4 9 19.1 0 0.0
4 15000-20000 6 12.2 6 12.8 0 0.0
5 20000-25000 4 8.2 3 6.4 0 0.0 6 >25000 5 10.2 1 2.1 0 0.0
Total 49 100.0 47 100.0 4 100.0
5.2.12 Number of Rooms in the Household An attempt has been made to analyze the number of rooms in the households that the people
residing in the area of study possess and is presented in various income categories in Table 5.12.
The number of rooms in the household may reveal about the standard and the quality of living that
the people residing in that house possess.
It may be observed from the table that the number of rooms in the households in the locality has a
wide range from 3 rooms to more than 9 rooms depicting a large variation in the living conditions of
the members of the household. It may be seen that as the income increases, one may observe an
increase in the number of rooms. It may also be seen that the largest number of households
possess 1 to 3 rooms (35%). The number of households having 3 to 6 rooms is (32%). It may also
be observed from the table that while the richer sections have larger houses, the lower income
groups possess lesser number of rooms.
98

5.2.14 Availability of Soak Pit/SewerlSeptic Tank
An attempt has been made to analyze the availability of sewage lines, or soak pit or septic tank in
the area and is presented in various income categories in Table 5.14.
The table shows that more than half (59%) of the households utilizing the sewerage drains and
about two - fifth of the households (39%) have constructed their own manure pits for disposing the
solid waste. It is also distressing to mention that 2% of the households do not have any facility for
the disposal of the solid waste and are hence utilizing the common drains to dispose them. It can
be concluded that the public drainage system in the study area is found satisfactory.
Table No. 5.14 Availability of Soak Pit!SewerlSeptic Tank
S.No. Income
(in thousands)
Septic
Tank
% Soak
Pit
% Sewer % No
Facility
% Total %
<5000 1 33.33 9 25.00 8 13.56 0 0.00 18 18.00
2 5000-10000 2 66.67 12 33.33 25 42.37 1 50.00 40 40.00
3 10000-15000 0 0.00 4 11.11 13 22.03 0 0.00 17 17.00
4 15000-20000 0 0.00 5 13.89 6 10.17 1 50.00 12 12.00
5 20000-25000 0 0.00 3 8.33 4 6.78 0 0.00 7 7.00
6 >25000 0 0.00 3 8.33 3 5.08 0 0.00 6 6.00
Total 3 100.00 36 100.00 59 100.00 2 100.00 100 100
5.2.15 Drains
An attempt has been made to analyze the availability of drains in the area of study and is presented
in various income categories in Table 5.15. It has also been tried to observe whether the drains are
covered or open. This study helps in determining the cleanliness and the hygiene of the study area.
It may be observed from the above table that however drains are available in most of the localities
but they are generally open. Of the total surveyed, household about one-third (62%) of the having
open drainage, and followed by just above one-third (36%) are having covered drainage, and the
rest are not having drainage facilities. The above table reveals that the hygiene and the cleanliness
at most of the places are improper as the drains are not covered.
100

Table No. 5.15 Drains
S.No. Income (in thousands) Open % Covered % No Drains
1 <5000 11 17.74 7 19A4 0 0.0 2 5000-10000 27 43.55 11 30.56 1 50.0
3 10000-15000 10 16.13 8 22.22 0 0.0 4 15000-20000 7 11.29 5 13.89 0 0.0
5 20000-25000 5 8,06 1 2.78 1 50.0
6 >25000 2 3,23 4 11.11 0 0.0
Total 62 100.0 36 100.0 2 100.0
5.2.16 Problems of Drainage
An attempt has been made to analyze the condition of drains in the study area and is presented in
various income categories in Table 5.16. It has also been tried to observe whether the drains in the
area face problems like overflow or clogging. This study helps in determining the cleanliness and the hygiene of the study area.
It may be observed from the above table that, however, drains are available in most of the localities
but they are generally open and hence they overflow. It has been observed from the table that
about three-fourth (70%) of the drains of the households are overflowing, and about half (46%) of
the drains of the household are clogging. The above table reveals that the hygiene and the
cleanliness at most of the places are improper as the drainage is also improper.
Table No. 5.16 Problems of Drainage
S.No. Income
(in thousands)
Overflow % Clogging % No Problem %
1 <5000 13 18.57 8 1739 0 0.00
2 5000-10000 28 40.00 19 41.30 5 38.46
3 10000-15000 12 17.14 7 15.22 0 0.00
4 15000-20000 10 14.29 6 13.04 2 15.38
5 20000-25000 4 5.71 3 6.52 4 30.77
6 >25000 3 4.29 3 6.52 2 15.38
Total 70 100.0 46 100.0 13 100.0
101
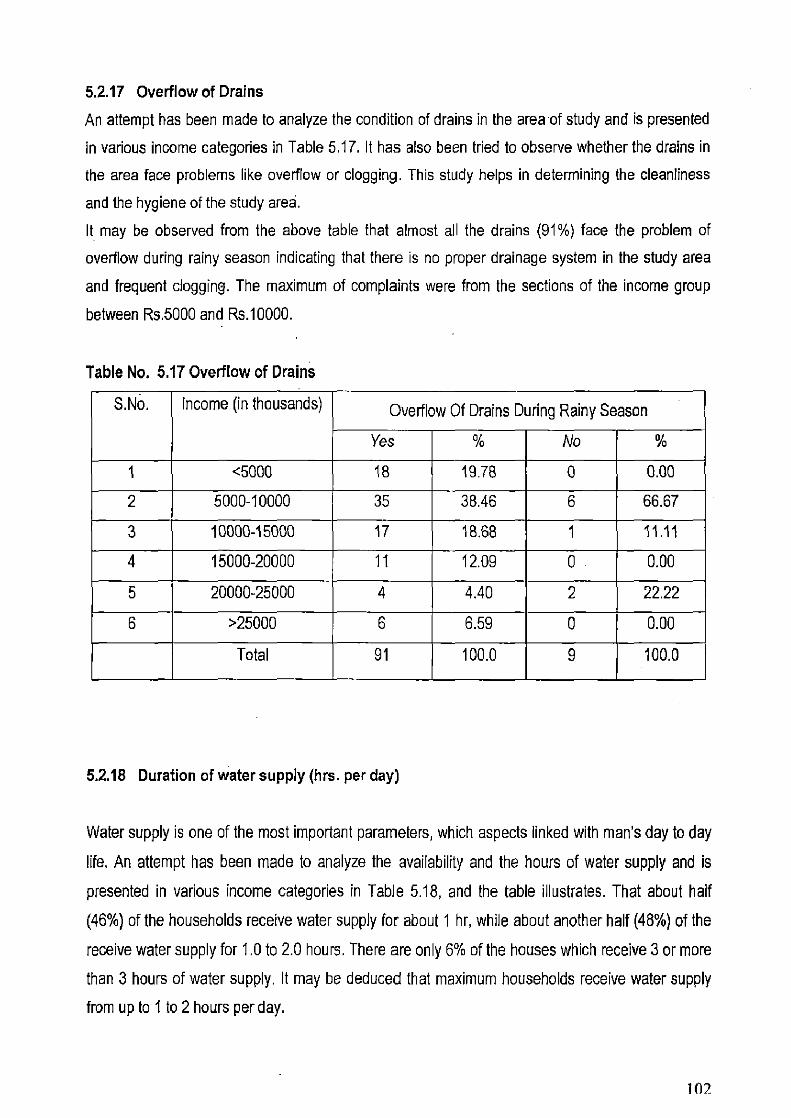
5.2.17 Overflow of Drains An attempt has been made to analyze the condition of drains in the area of study and is presented in various income categories in Table 5.17. It has also been tried to observe whether the drains in the area face problems like overflow or clogging. This study helps in determining the cleanliness and the hygiene of the study area. It may be observed from the above table that almost all the drains (91%) face the problem of overflow during rainy season indicating that there is no proper drainage system in the study area and frequent clogging. The maximum of complaints were from the sections of the income group between Rs.5000 and Rs.10000.
Table No. 5.17 Overflow of Drains
S.No. Income (in thousands) Overflow Of Drains During Rainy Season
Yes ok No %
1 <5000 18 19.78 0 0.00
2 5000-10000 35 38.46 6 66.67
3 10000-15000 17 18.68 1 11.11
4 15000-20000 11 12.09 0 0.00
5 20000-25000 4 4.40 2 22.22
6 >25000 6 6.59 0 0.00
Total 91 100.0 9 100.0
5.2.18 Duration of water supply (hrs. per day)
Water supply is one of the most important parameters, which aspects linked with man's day to day
life. An attempt has been made to analyze the availability and the hours of water supply and is
presented in various income categories in Table 5.18, and the table illustrates. That about half
(46%) of the households receive water supply for about 1 hr, while about another half (48%) of the
receive water supply for 1.0 to 2.0 hours. There are only 6% of the houses which receive 3 or more
than 3 hours of water supply. It may be deduced that maximum households receive water supply from up to 1 to 2 hours per day.
102

Table No. 5.18 Duration of water supply (hrs. per day)
S. No.
Income
(in thousand) No. of household with duration (hrs. per day)
Oto 1 % Ito 2 % 2 to3 % >3
1 <5000 11 23,9 5 10,4 0 0.0 2 50.0
2 5000-10000 20 43.5 17 35.4 0 0.0 2 50.0
3 10000-15000 4 8.7 14 29.2 0 0.0 0 0.0
4 15000-20000 8 17.4 4 8.3 0 0.0 0 0.0
5 20000-25000 1 2.2 B 12.5 0 0.0 0 0.0
6 >25000 2 4.3 2 4.2 2 100.0 0 0.0
Total 46 100.0 48 100.0 2 100.0 4 100.0
5.2.19 Vehicles Owned
An attempt has been made to analyze the availability and type of vehicles among the households in
the area and is presented in various income categories in Table. 5.19.
The table shows that more than three - fourth (77%) of the vehicles in the study area are 2 -
wheelers, followed by four wheelers (14%) and bicycles (13%). It also shows that the four wheelers
are availed by the higher income groups.
It can be concluded that bicycles and two wheelers are the major type of private vehicles
in the study area.
Table No. 5.19 Vehicles Owned
S.No. Income
(in thousands)
Cycle % 2 - Wheeler % 4 - Wheeler % Others %
1 <5000 4 30.8 9 11.7 0 0.0 0 0.0
2 5000-10000 4 30.8 31 40.3 1 7.1 0 0.0
3 10000-15000 3 23.1 13 16.9 5 35.7 0 0.0
4 15000-20000 0 0.0 12 15.6 1 7.1 0 0.0
5 20000-25000 1 7.7 6 7.8 3 21.4 0 0.0
6 >25000 1 7.7 6 7.8 4 28.6 1 100.0
Total 13 100.0 77 100.0 14 100.0 1 100.0
103

5.2.20 Recreation
An attempt has been made to analyze the availability and type of recreation available in the
localities of the households in the area and is presented in various income categories in Table
5.20.
It may be observed from the above table that more than three - fourth (76%) of the households
have recreational facilities in nearby places depicting that there is no scarcity of recreational
facilities in the study area.
Table No. 5.20 Recreation
Distance of the recreational facility from the household in km.
S.No. Income
(in thousands)
0.0 -
2.0
% 2.0 - 4.0 % 4.0 - 6.0 % > 6.0 %
1 <5000 13 17.11 5 22.73 0 0.00 0 0.00
2 5000-10000 32 42.11 7 31.82 0 0.00 0 0.00
3 10000-15000 12 15.79 5 22.73 1 50.00 0 0.00
4 15000-20000 8 10.53 3 13.64 1 50.00 0 0.00
5 20000-25000 6 7.89 1 4.55 0 0.00 0 0.00 6 >25000 5 6.58 1 4.55 0 0.00 0 0.00
Total 76 100.00 22 100.00 2 100.00 0 0.00
5.2.21 Water Quality
An attempt has been made to analyze the quality of water available in the localities of the
households in the area of study and is presented in various income categories in Table 5.21. This
table is important as it is helpful in assessing the water quality in the study area.
It may be observed from the above table that a good percentage of people (70%) believe that the
quality of water supplied in the locality is potable. However, about one - fifth (16%) of the
households opinioned that the,quality of water supplied to their households is poor and is not even
fit for drinking and the opinion is also scattered over irrespectives of all income groups.
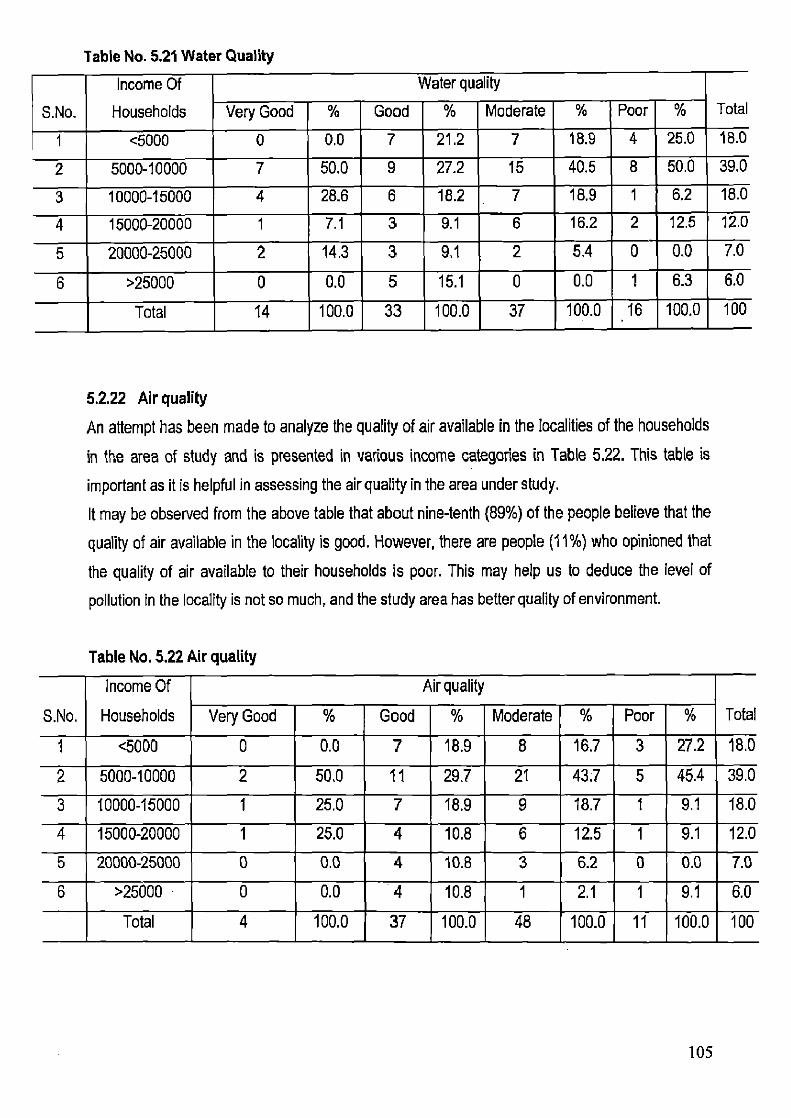
Table No. 5.21 Water Quality
S.No.
Income Of
Households
Water quality Total Very Good % Good % Moderate % Poor %
1 <5000 0 0.0 7 21.2 7 18.9 4 25.0 18.0
2 5000-10000 7 50.0 9 27.2 15 40.5 8 50.0 39.0
3 10000-15000 4 28.6 6 18.2 7 18.9 1 6.2 18.0
4 15000-20000 1 7.1 3 9.1 6 16.2 2 12.5 12.0
5 20000-25000 2 14.3 3 9.1 2 5.4 0 0.0 7.0
6 >25000 0 0.0 5 15.1 0 0.0 1 6.3 6.0
Total 14 100.0 33 100.0 37 100.0 16 100.0 100
5.2.22 Air quality
An attempt has been made to analyze the quality of air available in the localities of the households
in the area of study and is presented in various income categories in Table 5.22. This table is
important as it is helpful in assessing the air quality in the area under study.
It may be observed from the above table that about nine-tenth (89%) of the people believe that the
quality of air available in the locality is good. However, there are people (11%) who opinioned that
the quality of air available to their households is poor. This may help us to deduce the level of
pollution in the locality is not so much, and the study area has better quality of environment.
Table No. 5.22 Air quality
S.No.
Income Of
Households
Air quality
Total Very Good % Good % Moderate % Poor %
1 <5000 0 0.0 7 18.9 8 16.7 3 27.2 18.0
2 5000-10000 2 50.0 11 29.7 21 43.7 5 45.4 39.0
3 10000-15000 1 25.0 7 18.9 9 18.7 1 9.1 18.0
4 15000-20000 1 25.0 4 10.8 6 12.5 1 9.1 12.0
5 20000-25000 0 0.0 4 10.8 3 6.2 0 0.0 7.0
6 >25000 0 0.0 4 10.8 1 2.1 I-
1 9.1 6.0
Total 4 100.0 37 100.0 48 100.0 11 100.0 100
105

5.2.23 Land quality An attempt has been made to analyze the quality of land available in the localities of the households in the area of study and is presented in various income categories in Table 5.23. This table is important as it is helpful in assessing the land quality in the study area. It may be observed from the above table that more than nine-tenth (92%) of people believe that the quality of land in the locality is good. However, slight percentages (8%) of persons are not satisfied about the land.
Table No. 5.23 Land quality
S.No. Income Of
Households Land quality
Tots Very Good % Good % Moderate % Poor % 1 <5000 0 0.0 8 17.8 8 25.8 2 25.0 18.1 2 5000-10000 4 25.0 19 42.2 12 38.7 4 50.0 39.( 3 10000-15000 5 31.2 9 20.0 4 12.9 0 0.0 18.(
4 15000-20000 3 18.8 3 6.7 6 19.3 0 0.0 12.( 5 20000-25000 1 6.2 5 11.1 0 0.0 1 12.5 7.0 6 >25000 3 18.7 1 2.2 1 3.2 1 12.5 6.0
Total 16 100.0 45 100.0 31 100.0 8 100.0 100
5.2.24 Noise Pollution An attempt has been made to analyze the level of noise pollution in the localities of the households in the study area and is presented in various income categories in Table 5.24. This table is important as it is helpful in assessing the quality of living of the people in the study area. It may be observed from the above table that the level of noise pollution has been termed as high and very high by (60%) and (14%) of the household respectively. There are one-fifth (20%) of the persons opinioned that the pollution level is moderate, and just few (6%) observed that it is low. This shows that the area is suffering from acute noise pollution.
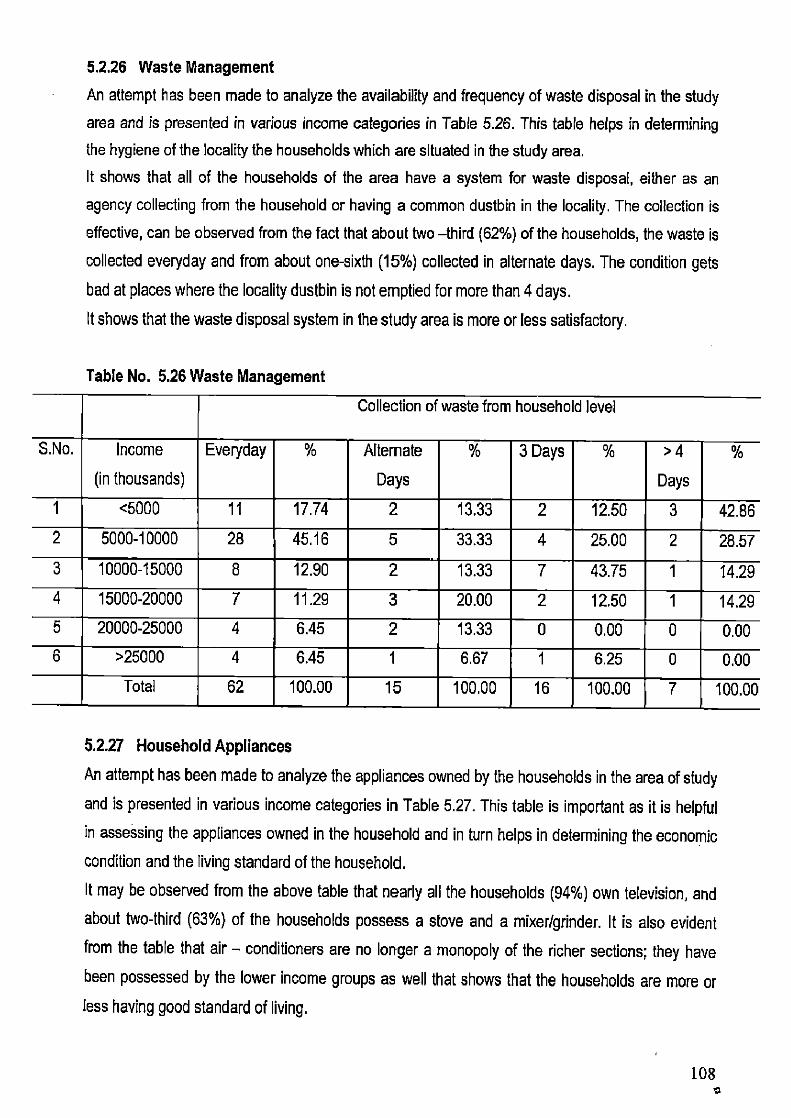
5.2.26 Waste Management
An attempt has been made to analyze the availability and frequency of waste disposal in the study
area and is presented in various income categories in Table 5.26. This table helps in determining the hygiene of the locality the households which are situated in the study area.
It shows that all of the households of the area have a system for waste disposal, either as an
agency collecting from the household or having a common dustbin in the locality. The collection is
effective, can be observed from the fact that about two —third (62%) of the households, the waste is
collected everyday and from about one-sixth (15%) collected in alternate days. The condition gets
bad at places where the locality dustbin is not emptied for more than 4 days.
It shows that the waste disposal system in the study area is more or less satisfactory.
Table No. 5.26 Waste Management
Collection of waste from household level
S.No. Income
(in thousands)
Everyday % Alternate
Days
% 3 Days % > 4
Days
%
1 <5000 11 17.74 2 13.33 2 12.50 3 42.86
2 5000-10000 28 45.16 5 33.33 4 25.00 2 28.57
3 10000-15000 8 12.90 2 13.33 7 43.75 1 14.29
4 15000-20000 7 11.29 3 20.00 2 12.50 1 14.29 5 20000-25000 4 6.45 2 13.33 0 0.00 0 0.00 6 >25000 4 6.45 1 6.67 1 6.25 0 0.00
Total 62 100.00 15 100.00 16 100.00 7 100.00
5.2.27 Household Appliances
An attempt has been made to analyze the appliances owned by the households in the area of study
and is presented in various income categories in Table 5.27. This table is important as it is helpful
in assessing the appliances owned in the household and in turn helps in determining the economic
condition and the living standard of the household.
It may be observed from the above table that nearly all the households (94%) own television, and
about two-third (63%) of the households possess a stove and a mixer/grinder. It is also evident
from the table that air — conditioners are no longer a monopoly of the richer sections; they have
been possessed by the lower income groups as well that shows that the households are more or
less having good standard of living.
108

Table No. 5.27 Household Appliances S.No. income
(in thousands) TV % AC % Stove % Mixer/
Grinder
1 <5000 11 11.70 0 0.00 10 15.87 6 9.52 2 5000-10000 40 42.55 1 33.33 13 20.63 25 39.68 3 10000-15000 18 19.15 1 33.33 26 4127 14 22.22 4 15000-20000 12 12.77 0 0.00 8 12.70 9 14.29 5 20000-25000 7 7.45 1 33,33 2 3.17 5 7.94 6 >25000 6 6.36 0 0.00 4 6.35 4 6.35
Total 94 100.00 3 100.00 63 100.00 63 100.00
5.2.28 Household Appliances 2
It may be observed from the above table that almost all the households (97%) own a pressure cooker, and more than three -fourth (77%) of the households possess a cooler. This makes it clear that the people have a good living standard. It is also evident from Table 5.28 that computers and washing machines are no longer a monopoly of the richer sections; they have been possessed by the lower income groups as well. Table No. 5.28 Household Appliances 2
.No. Income (in thousands)
Computer % Washing Machine
% Pressure Cooker
% Cooler °A
1 <5000 1 4.76 3 6.82 18 18.56 14 18. 2 5000-10000 2 9.52 13 29.55 38 39.18 28 36. 3 10000-15000 7 33.33 10 22.73 17 17.53 16 20. 4 15000-20000 3 14.29 7 15.91 12 12.37 10 12. 5 20000-25000 3 14.29 5 11.36 6 6.19 5 6.i 6 >25000 5 23.81 6 13.64 6 6.19 4 5/
• Total 21 100.00 44 100.00 97 100.00 77 100
5.2.29 Household Appliances 3 It may be observed from the above table that about half the households (47%) own tape recorder and only (2%) of the households possess a solar cooker. This makes it clear that the people have
109

no knowledge or interest in using renewable energy resources. It is also evident from Table 5.29
that microwaves are still a monopoly of the richer sections. Geysers are accounted for about one -
third (28%) but it has been scattered over in almost all income groups , however belong to the
greater proportion of the owners is still the higher income groups.
Table No. 5.29 Household Appliances 3 .No Income
(in thousands)
Geyser % Microwave % Solar
Cooker
% Tape
Recorder
1 <5000 0 0.00 0 0.00 0 0.00 8 1'
2 5000-10000 7 25.00 1 20.00 1 50.00 17 31 3 10000-15000 9 32.14 0 0.00 1 50.00 8 1' 4 15000-20000 4 14.29 0 0.00 0 0.00 5 11 5 20000-25000 5 17.86 2 40.00 0 0.00 5 11 6 >25000 3 10.71 2 40.00 0 0.00 4 8
Total 28 100.00 5 100.00 2 100.00 47 10
5.2.30 Expenditure 1 Income is one of the most important factors which control the function of the system. Income
decides each and every activity of the household. The expenditure is directly proportional to the
amount of income generated in the households. The expenditure depends upon the life style of the
people also. The expenditure incurred by the households is divided into four categories such as,
food, education, recreation, and drinking and is presented in Table 5.30.
It may be observed from the table that almost all income groups, all the families spend a lowest
amount of Rs.1500 on their food, which is increasing along with increase in income group. It may
also be seen that out of all income groups, people with lower income groups spend the least on
education implying that their children go to govt. schools or do not study, same is the case with
recreation, while people with higher income spend a lot on recreation; the poor don't have enough
left to do the same.
However, it may be seen that drinking has an opposite variation, drinking is more common among
the lower and middle income groups of the society while no drinking is observed in higher income groups.
110
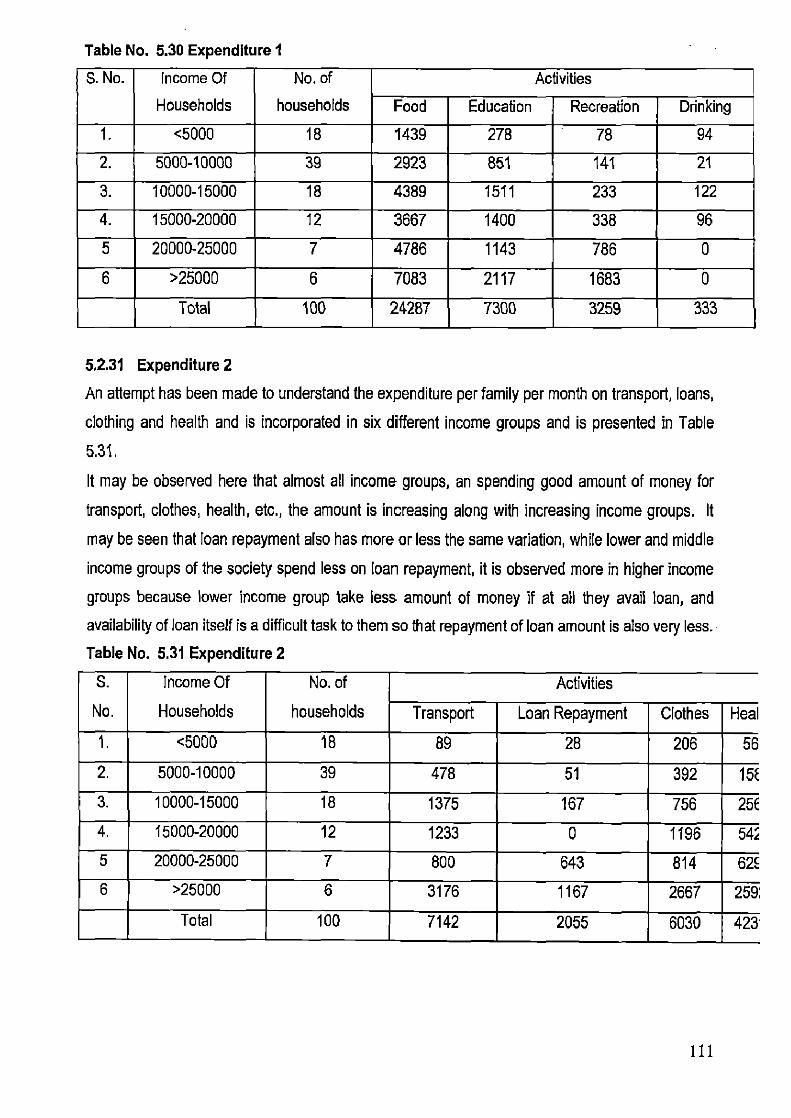
Table No. 5.30 Expenditure 1
S. No. Income Of
Households
No. of
households
Activities
Food Education Recreation Drinking
1. <5000 18 1439 278 78 94
2. 5000-10000 39 2923 851 141 21
3. 10000-15000 18 4389 1511 233 122
4. 15000-20000 12 3667 1400 338 96
5 20000-25000 7 4786 1143 786 0
6 >25000 6 7083 2117 1683 0
Total 100 24287 7300 3259 333
52.31 Expenditure 2
An attempt has been made to understand the expenditure per family per month on transport, loans,
clothing and health and is incorporated in six different income groups and is presented in Table
5.31.
It may be observed here that almost all income groups, an spending good amount of money for
transport, clothes, health, etc., the amount is increasing along with increasing income groups. It
may be seen that loan repayment also has more or less the same variation, while lower and middle
income groups of the society spend less on loan repayment, it is observed more in higher income
groups because lower income group take less amount of money if at all they avail loan, and
availability of loan itself is a difficult task to them so that repayment of loan amount is also very less.
Table No. 5.31 Expenditure 2
S.
No.
Income Of
Households
No. of
households
Activities
Transport Loan Repayment Clothes Heal
1. <5000 18 89 28 206 56
2. 5000-10000 39 478 51 392 15E
3. 10000-15000 18 1375 167 756 25E 4. 15000-20000 12 1233 0 1196 54; 5 20000-25000 7 800 643 814 62E 6 >25000 6 3176 1167 2667 259:
Total 100 7142 2055 6030 423
111
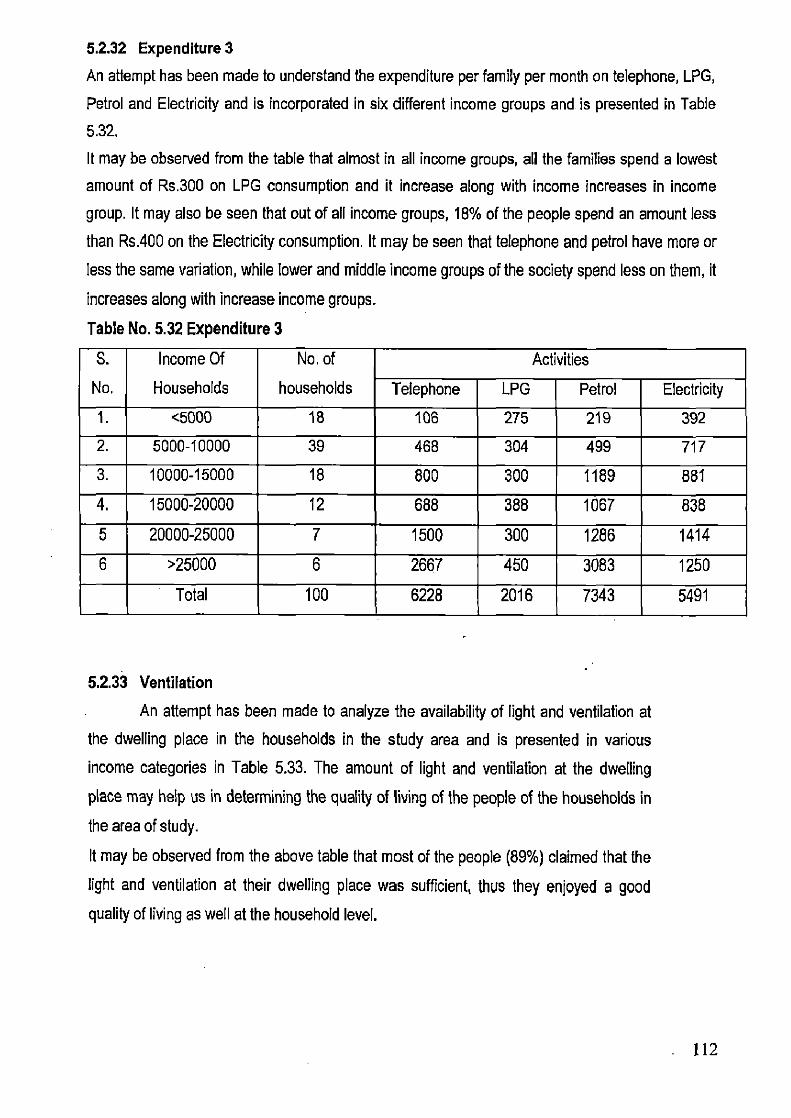
52.32 Expenditure 3
An attempt has been made to understand the expenditure per family per month on telephone, LPG,
Petrol and Electricity and is incorporated in six different income groups and is presented in Table
5.32.
It may be observed from the table that almost in all income groups, all the families spend a lowest
amount of Rs.300 on LPG consumption and it increase along with income increases in income
group. It may also be seen that out of all income groups, 18% of the people spend an amount less
than Rs.400 on the Electricity consumption. It may be seen that telephone and petrol have more or
less the same variation, while lower and middle income groups of the society spend less on them, it
increases along with increase income groups.
Table No. 5.32 Expenditure 3
S.
No.
Income Of
Households
No. of
households
Activities
Telephone LPG Petrol Electricity
1. <5000 18 106 275 219 392
2. 5000-10000 39 468 304 499 717
3. 10000-15000 18 800 300 1189 881
4. 15000-20000 12 688 388 1067 838
5 20000-25000 7 1500 300 1286 1414
6 >25000 6 2667 450 3083 1250
Total 100 6228 2016 7343 5491
5.2.33 Ventilation
An attempt has been made to analyze the availability of light and ventilation at
the dwelling place in the households in the study area and is presented in various
income categories in Table 5.33. The amount of light and ventilation at the dwelling
place may help us in determining the quality of living of the people of the households in
the area of study.
It may be observed from the above table that most of the people (89%) claimed that the
light and ventilation at their dwelling place was sufficient, thus they enjoyed a good
quality of living as well at the household level.
112
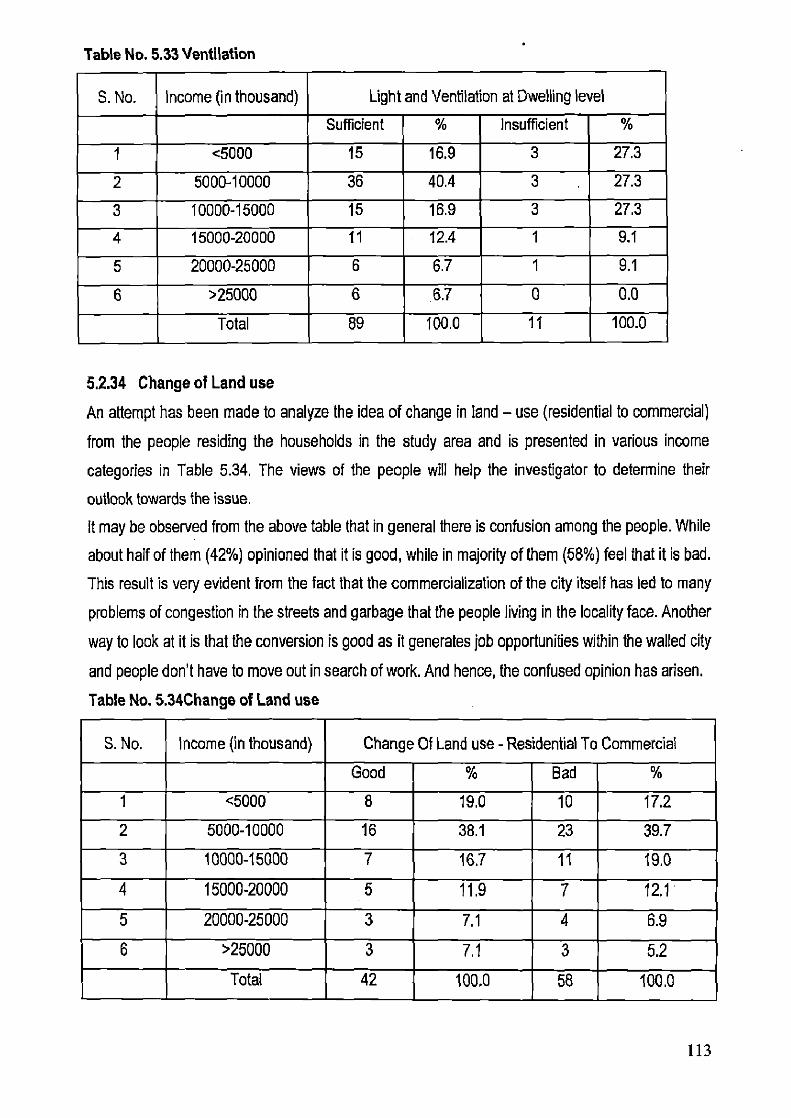
Table No. 5.33 Ventilation
S. No. Income (in thousand) Light and Ventilation at Dwelling level
Sufficient % Insufficient
1 <5000 15 16.9 3 27.3
2 5000-10000 36 40.4 3 27.3
3 10000-15000 15 16.9 3 27.3
4 15000-20000 11 12.4 1 9.1
5 20000-25000 6 6.7 1 9.1
6 )25000 6 6.7 0 0.0
Total 89 100.0 11 100.0
5.2.34 Change of Land use
An attempt has been made to analyze the idea of change in land — use (residential to commercial)
from the people residing the households in the study area and is presented in various income
categories in Table 5.34. The views of the people will help the investigator to determine their
outlook towards the issue.
It may be observed from the above table that in general there is confusion among the people. While
about half of them (42%) opinioned that it is good, while in majority of them (58%) feel that it is bad.
This result is very evident from the fact that the commercialization of the city itself has led to many
problems of congestion in the streets and garbage that the people living in the locality face. Another
way to look at it is that the conversion is good as it generates job opportunities within the walled city
and people don't have to move out in search of work. And hence, the confused opinion has arisen.
Table No. 5 34Change of Land use
S. No. Income (in thousand) Change Of Land use - Residential To Commercial
Good % Bad %
1 <5000 8 19,0 10 17.2
2 5000-10000 16 38.1 23 39.7
3 10000-15000 7 16.7 11 19.0
4 15000-20000 5 11.9 7 12.1
5 20000-25000 3 7.1 4 6.9
6 525000 3 7.1 3 5.2
Total 42 100.0 58 100.0
113

5.2.35 Informal Activities
An attempt has been made to analyze the idea of Informal activities allowed on road or not from the
people residing the households in the area of study and is presented in various income categories
in Table 5 .35. The views of the people will help us to determine their outlook towards the issue.
A major portion of the households (59%) opinioned that the informal activities shall not be allowed
on roads and they must occur at the places assigned to them. While 41% of the households are of
the view that informal activities occur all over the place and hence make their lives messy. The
informal activities, function on the streets, occupy more space on the streets and hence making
things difficult to function.
Table No. 5.35 Informal Activities
S. No. Income (in thousand) Informal Activities Allowed On Road
Yes % No
1 <5000 10 24.4 8 13.6
2 5000-10000 20 48.8 19 32.2
3 10000-15000 4 9.8 14 23.7
4 15000-20000 4 9.8 8 13.6
5 20000-25000 3 7.3 4 6.8
6 >25000 0 0.0 6 102
Total 41 100.0 59 100.0
5.2.36 Tourist Infrastructure
An attempt has been made to analyze the view on the tourist infrastructure from the people residing
the households in the study area and is presented in various income categories in Table 5.36. The
views of the people will help to determine their outlook towards the issue.
It may be clearly observed from the above table that the opinion is almost equally divided
i.e. 51% of the households were of the view that the tourist infrastructure is sufficient,
while the rest (49%) believed that it is insufficient.
114
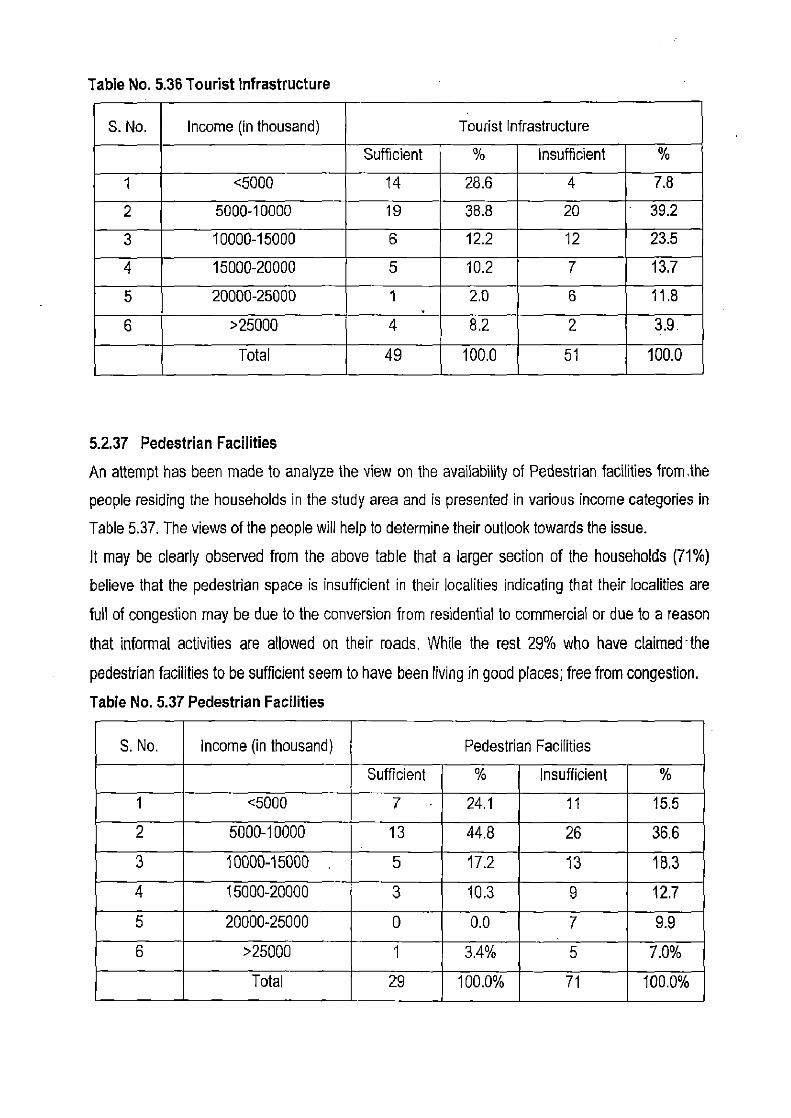
Table No. 5.38 Tourist Infrastructure
S. No. Income (in thousand) Tourist Infrastructure
Sufficient % Insufficient %
1 <5000 14 28.6 4 7.8
2 5000-10000 19 38.8 20 - 39.2
3 10000-15000 6 12.2 12 23.5
4 15000-20000 5 10.2 7 13.7
5 20000-25000 1 2.0 6 11.8
6 >25000 4 82 2 3.9.
Total 49 100.0 51 100.0
5.2.37 Pedestrian Facilities
An attempt has been made to analyze the view on the availability of Pedestrian facilities from ,the
people residing the households in the study area and is presented in various income categories in
Table 5.37. The views of the people will help to determine their outlook towards the issue.
It may be clearly observed from the above table that a larger section of the households (71%)
believe that the pedestrian space is insufficient in their localities indicating that their localities are
full of congestion may be due to the conversion from residential to commercial or due to a reason
that informal activities are allowed on their roads. While the rest 29% who have claimed •the
pedestrian facilities to be sufficient seem to have been living in good places; free from congestion.
Table No. 5.37 Pedestrian Facilities
S. No. Income (in thousand) Pedestrian Facilities
Sufficient ok Insufficient
1 <5000 7 • 24.1 11 15.5
2 5000-10000 13 44.8 26 36.6
3 10000-15000 5 17.2 13 18.3
4 15000-20000 3 10.3 9 12.7
5 20000-25000 0 0.0 7 9.9
6 >25000 1 3.4% 5 7.0%
Total 29 100.0% 71 100.0%
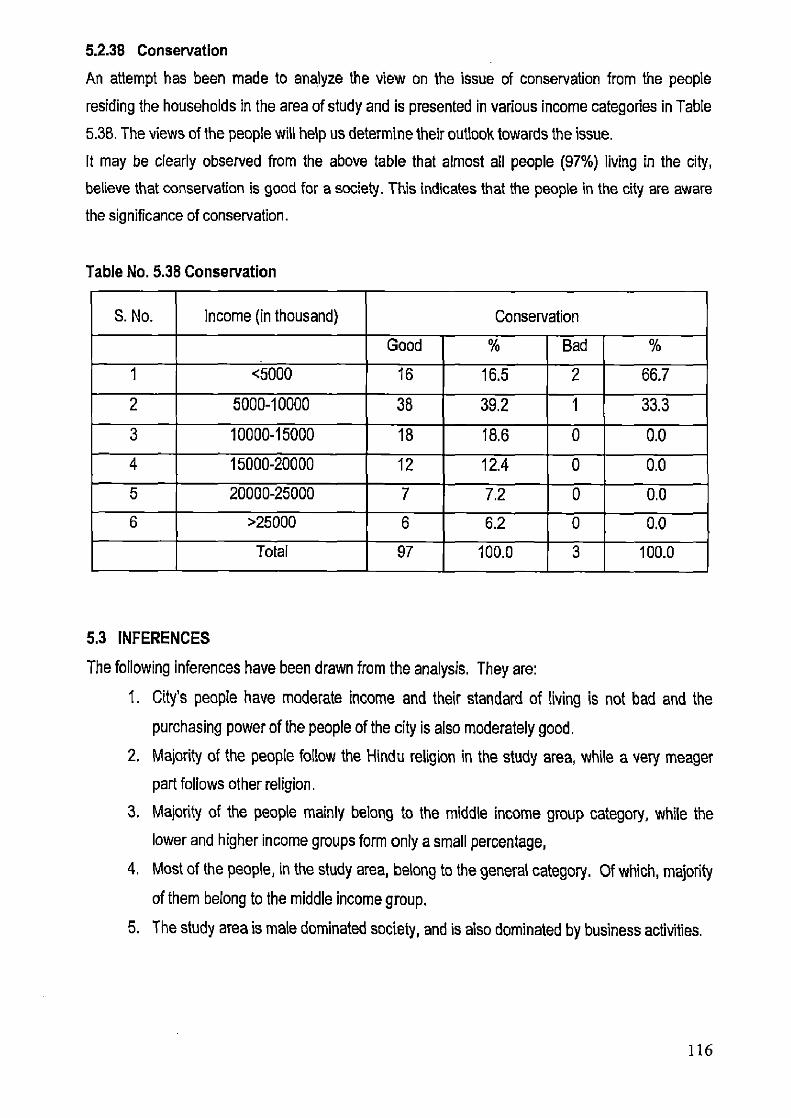
5.2.38 Conservation
An attempt has been made to analyze the view on the issue of conservation from the people
residing the households in the area of study and is presented in various income categories in Table
5.38. The views of the people will help us determine their outlook towards the issue.
It may be clearly observed from the above table that almost all people (97%) living in the city,
believe that conservation is good for a society. This indicates that the people in the city are aware
the significance of conservation.
Table No. 5.38 Conservation
S. No. Income (in thousand) Conservation
Good % Bad
1 <5000 16 16.5 2 66.7
2 5000-10000 38 39.2 1 33.3
3 10000-15000 18 18.6 0 0.0
4 15000-20000 12 12.4 0 0.0
5 20000-25000 7 7.2 0 0.0
6 >25000 6 6.2 0 0.0
Total 97 100.0 3 100.0
5.3 INFERENCES
The following inferences have been drawn from the analysis. They are:
1. City's people have moderate income and their standard of living is not had and the
purchasing power of the people of the city is also moderately good.
2. Majority of the people follow the Hindu religion in the study area, while a very meager
part follows other religion.
3. Majority of the people mainly belong to the middle income group category, while the
lower and higher income groups form only a small percentage,
4. Most of the people, in the study area, belong to the general category. Of which, majority
of them belong to the middle income group.
5. The study area is male dominated society, and is also dominated by business activities.
116

6. The proportion of married to unmarried person is less in low-income group and higher
income group which shows big family size and inclination towards education in lower
income and higher income group respectively.
7. Higher education is more prevalent in the lower income and middle income group.
8. Most of the people in the study area engaged only in tertiary sector except few of them
are engaged in primary sector.
9. Trade and commerce is the major occupation in the study area, with most of the people
working in many small and big business located in the walled city area, which is also one
of the major reasons for the people belonging to the middle income group category.
10. Most of the people in the study are living in semi detached type of houses and rest of
them are living in detached type of houses and apartment, and row type of houses are
negligible.
11. People are living in owned houses and the percentage of rented houses are
considerably very less.
12. Mainly people are living in self-financed houses and ancestral property. And there are
only a few households having their houses financed from bank and other sources.
13. The physical condition of houses, are good and livable in the study area. There are very
few houses which may be categorized as dilapidated are possessed by the lower
income group. The people belonging to the higher income are residing in sound and
good state.
14. The number of rooms in the households in the locality increases as the income
increases.
15. Most of the houses have one floor and two floors and few houses have three floor and
four floors. This shows that development in the study area is low rise.
16. The public drainage system in the study area is found satisfactory.
17. Most of the drains in the study area is open that reveals that the hygiene and the
cleanliness at the most of the places are improper.
18. The problem of overflow and clogging is observed in study area due to open drains.
19, The water supply is mainly 2 hrs. per day in the study area.
20. The bicycles and two wheelers are the major type of private vehicles in the study area.
The four wheelers belong to higher income groups.
21. The most of the households have recreational facilities in near by places depicting that
there is no scarcity of recreational facilities in the area
22. The quality of water supplied in the locality is potable.
117
23. The quality of air available in the locality is good; it means the study area has better
quality of environment.
24. The quality of land in the locality is good.
25. The study area has high noise pollution which shows that the area is suffering from acute
noise pollution.
26. The living standards are good in their households and are leading a quality life, but few
households termed that their quality of living is very poor that belong to the lower income
groups.
27. The waste disposal system in the study area is more or less satisfactory.
28. The people have a good living standard. All income group people is enjoying the all type
of household appliances such as TV, AG, Stove, Mixer/Grider, Computer, Washing,
Pressure cooker, Cooler, Tape Recoder, etc.
29. The people in the study area have no knowledge or interest in using renewable energy
resources.
30. The people with lower income groups spend the least on education, recreation while
people with higher income spend a lot on it. This shows that children belong to
household lower income either go to Govt. schools or do not study.
31. The lower income people spend less on transport, clothes, health and loan repayment as
compare to higher income groLip.
32. All the households have LPG, Telephone and electricity facility and their expenditure
increases along with increase income group.
33. Most of the people claimed that the light and ventilation at their dwelling place is
sufficient, thus they enjoyed a good quality of living in side the house.
34. The confused opinion is observed regarding the change of land use from residential to
commercial use.
35. A major portion of the households opinioned that the informal activities shall not be
allowed on roads and they must occur at the places assigned to them.
36. The opinioned regarding tourist infrastructure is half —halt
37. The pedestrian space is insufficient in their localities.
38. All people favor the conservation of the wall city area.
118
FORECASTING THE DEMAND & SUPPLY OF INFRASTRUCTURE
FACILITIES CHAPTER — 6
6.1 INTRODUCTION
It deals with forecasting the infrasrtucture facilities required, for the year 2031A.D. At the outset, population is projected for the year 2031 by using suitable statistical methods. Depending on increase in population, extra facilities, which requirements are calculated by using suitable planning
standards. Understanding the past behaviour, it is possible to have good projection or forecasting for the future. One can understand about the trend, cyclical and seasonal components of the time series by using the knowledge and can develop forecasts that will provide helpful planning and decision-making information. The forecasts may need to be modified, if the major technological breakthroughs or competitor actions significantly differ from past conditions. However, if no major changes occur, projections of past trend patterns can prove extremely helpful in forecasting future values of the time series.
The important control parameters, which decides functions of the system, considered for
projections in this present investigation are:
1. Population 2. Housing 3. Water supply 4. Sewerage
5. Electricity 6. Solid Waste Disposal 7. Education
8. Health care facilities
9. Commercial facilities 10. Parks and playgrounds
6.2 FORECASTING THE FACILITIES FOR THE YEAR 2031 There are few methods available for forecasting such as, geometric increment method, regression method, arithmetic increment method, incremental increase method, logistic curve method, etc. in
119

this investigation population is considered as the focal point. Considering the population, other
requirements are calculated by employing relevant standards, which have been set for different
variables by different concerned organizations. To have plausible projections, the planning
standards which are given in the UDPFI (Urban Development Plan Formulation & Implementation)
guidelines have been followed.
To project the population availability for the year 2031, geometric increment method was employed
by considering the population increment from 1991 census to 2001 census. The method, which is
followed, for population's calculation for the study is as follows:
6.2.1 Population Total population in the year 1991 = 336240
Total population in the year 2001 = 386905
According to Geometric Increment Method:
P,, = P. (1+11^
Where P. = forecasted population of n years
Po = Population at present
n = Number of years
r = rate of growth
To find r,
P2001 = P1991 (1+01°
386905 = 336240 (l+r)'o
1+r = 1.0141
r = 0.0141
Therefore population in the year 2031
P2031 = P2001 (1+0.0141)30
= 386905 (1,0141)30
= 5,8947.59
5,89,479
120
increase in population = P2031 - P2001
589479-386905 = 202574
Thus the population of the walled city in the year 2031 would be 589479 and gross density would be 1259.57 person/ ha.
As per the National Commission on Urbanization (NCU) only 500 person/ha. as a gross density for urban area, according to this, the walled city can take 2,34,000 population and remaining population 3,55,479 has to be shifted outside the walled city area.
It means that the walled city is already densely populated and due to that the problem of congestion, traffic and transportation is acute. To solve these problems, the extra population has to be shifted outside the walled city area for sustainable development of the area.
6.2.2 Housing Requirement of housing for the year 2031 in the study area is calculated as follows: Population to be considered for construction of houses = 202574
Considering a general family size of 5, Number of houses required = 202574/5
= 40514.80 = 40515 Lints.
If the extra population would be shifted outside the walled city area then no need of further construction of houses inside the walled city area, otherwise we have to provide provision for it.
6.2.3 Physical Infrastructure
6.2.3.1 Water supply The supply of water will also have to be increased to meet the needs of the growing population, besides, water is also required for recreational purposes, fire fighting, in hotels, hospitals, public buildings. Satisfying the requirements of all these, quantity of water required would be
Water Supply requirement for Domestic purpose = 135 Lpcd absolute min.
Taking 135 Lpcd for Domestic purpose,
121

Total Domestic requirement = 135x202574 = 27347490 litre/day = 27.34ML/day
According to 2004 data, the per capita shortage of water supply was 11.08 Litre/day. So the shortage for water supply for walled city area in 2001 = 4.28 ML/day. So the total quantity of water supply will be required in 2031 = 27.34 + 4.28
= 31.62 MI/day 6.2.3.2 Sewerage System: The quantity of sewerage generation is forecasted against a population of 202574 Sewerage is assumed to be assumed 80% of water supply in the areas as per the UDPFI guidelines.
= 80x36/100
= 28.40ML/day (2031 population) For present population (2001) = 80x 106.101100
= 84.88 ML/day Total sewerage generated = 2001+2031
= 28.40+84.88 =117.28 MI/day
Already one plant having capacity of 27 MLD is functioning. Total sewage to be treated = 117-27
= 90ML/day Assuming the capacity of the treatment plant to be 50 ML/day
No. of treatment units required = 90/50 = 2 Nos.
6.2.3.3 Electricity There are 2 KW of power required per household (including domestic, commercial & of the
requirements) Total no. of households (assuming 5 persons per household)
Total no. of households (assuming 5 persons per household) = 202574/5 = 40515 households.
Therefore, No. of service connections required = no. of households = 40515 Total quantity of power required = 2 x 40515= 81030kw.
122

1 electric sub — station of 11 kw for a population of 15,000 Hence, number of electric sub — stations required = 14
6.2.3.4 Solid Waste Management
There is no separate data of solid waste generated in walled city area. Assuming 500gms. Per capita per day of solid waste generated, solid waste generated by a population of 202574
= 202574x0.5kg = 101287kg/day = 101.287 tlday
Per person waste generated in 2001 = 0.44 kg Quantity of solid waste generated (2001) = 170.238 tlday
Thus, total quantity of solid waste to be treated in 2031 =101.2 +170.238 = 271.43 tlday
Assuming a compost plant with a capacity to handle 200tones.
No. of composting plants required = 271,34/200 = 1.35=1 nos.
6.2.4 Social Infrastructure
For social and recreational infrastructure area has sufficient number of provision of facilities in the nearby vicinity. So there is no need to provide extra infrastructure.
6.2.5 Commercial InfrastrUcture
This area already acting as a Central Business District of the city. So there is no need of further
provision of it
123
APPLICATION OF THEORIES CHAPTER 7
7.1 INTRODUCTION:
The Investigator has made an attempt to develop a theoretical conceptualization of an
urban system concept by employing system dynamic theory in the present investigation since
sustainable development is aimed at the city as a whole rather a fragment/segment manner.
System theory looks at the entire system (study area) as a whole for the development of the
system. Further, the Investigator has employed theory of hierarchy of human needs, in this
present investigation to evolve strategies for the development of the study area by providing basic
needs like water.
Therefore, system concepts and theory of hierarchy of needs has been analyzed in this
investigation.
7.2 System Concept — a system functions as a whole with the interaction of several sub-systems,
and all the sub-systems of the system are interlinked and interdependent to each other and forming
a system. If one of the sub-systems of the system, partially function or totally defunct or functions
with higher degree (taking a lead role) during its functions, its effects can be visualized in the entire
system over a period of time. In some cases, the system may function with lot of disturbance or
the smooth function of the system may be paralyzed, while in some cases, the system may
function with advancement. In this case the walled city area, (the study area) has been considered
as a system.
In an urban system, the following sub-systems are together form a system. They are: (1) Physical
(2) Social (3) Economics (4) Ecology (5) Environment (6) Infrastructure, and (7) Institutions.
124

These all the sub-systems are interlinked and interdependent to each other and form a system.
The functions of the system is presented in Figure.7.1
The urban system is complex sub system and it has the following features.
(1) It is not a mechanism system but rather an adaptive system.
(2) It is an open system, and thus it can't be studied partially or regulator apart from its
contextual environment, which are defined by the nature of external interaction.
(3) It is characterized by extreme interrelatedness of its parts.
(4) It is also characterized by substitutability of parts and functions implying that the detection
of new and independent trends as they are often masked by the apparent stability of the
parts.
Fig No. 7.1 URBAN SYSTEM
The linkages among the subsystems of the urban system are briefly presented as below by
subsystem wise. They are:
Physical: Total area, spatial interaction, such as migration flows, floating population, congestion,
density, spatial distribution of economic activities and infrastructure services, topography, etc., are
considered. Man needs three things for survival, and are shelter, food and clothes. He makes
125
shelter on land. Therefore, the basic requirement of land, and it comes under physical component of the system. So, land occupies prime significance. Social: Demographic structure, urbanization, consumption pattern, social structure, social
behavior, occupation, etc., are considered. Man is a social animal; he has to live in the society, for that purpose he has to develop social relationship with others. He builds schools, hospitals, etc., on land, Therefore physical & social sub- systems are interlinked and interdependent. Economics: Investment, Production, production function, distribution, trade and commerce,
employment, capital formation, reinvestment, etc., are considered. Man has to earn money through
trade & commercial activity, for that he needs offices of the commercial activity and that he constructs on land. Therefore, economics is interrelated with physical activity. If one subsystem fails or defunct, then the smooth functions of the system is affected, over a period of time. Ecology: Land use pattern, vegetation, domestic bovine population, flora and fauna, water-bodies, etc., are considered. When development take place, then ecology of the place disturb/affected without that there is no development. For example to construct shelter, the nature of that space is disturbed, People may even cut trees, and alter the available vegetation's character. Even in some places, the water bodies are shielded, which affect the eco system. To construct shelter, money and other resources are essential. Therefore, one can find that physical, social, economical & ecology sub systems are interrelated and interdependent. Environment: Pollution (land, water, air, noise, etc.), climate, rainfall, atmosphere, conflicts,
interest groups, etc., are considered. All these activity take place, and then their effect can be seen
on environment. The environment may be affected if it is not protected. If all the sub systems of the urban system are functioning well, the resources are exhausted much, with environment consideration, the good environment is protected. If the physical condition changes, then its effects can be seen in the environment.
Infrastructure: All physical, social and economic infrastructure, their provision, availability,
distribution, accessibility, demand and supply, maintenance, etc., are considered. Urban system
functions with the development of all kind of infrastructure, such as physical, social and economic.
If one of the sub systems like physical infrastructure is developed by improving road, rail & airways,
then its effects are clearly visible in the entire system.
126

Institutions: Government institutions, Private institutions, N.G.O.'s, C.B.O.:s, Local Bodies, etc.,
are considered. Institutions play a major role in developing any system. In an urban system, urban
local bodies, district administration, NGO's, etc., are controlling or directing the functions of the
urban system. They evolve policies, plans, programs, implement programs, etc„ for the
development of the entire system. Thus, all the subsystems of the system are interlinked and
interdependent and function as a whole in the system.
7.3 Theory of Hierarchy of Needs
In this present investigation, Abraham Maslow's Theory of Hierarchy of Human Needs (1954) is
employed to understand the socio, economic, and physiological conditions of the people of the
study area. In this theory, Abraham Maslow has clearly explained the human needs. The human
needs are divided into five stages, such as physical needs, security, love and belongingness,
esteem, and self-actualization. These five stages are organized in a pyramid starting from the basic
stage, (physical need) to the highest reaching stage (self-actualization) and is shown in Fig. 7.2
,and are discussed as below:
Fig. No. 7.2 Hierarchy of Human Needs Human Needs
127
1. Physical needs: In physical needs, the following physical needs, such as food, water,
shelter and clothing, must be at least partially satisfied before one can think about anything
else.
2. Security: Next, one needs to feel safe in his/her surroundings and to know what to
expect. One needs protection from physical harm and economic disaster.
3. Love and acceptance: At this point, one will do many things to gain affection. One needs
to be praised and accepted by the others. People need people. They need contact and
association with other human beings to become fully human. Therefore, they form social
groups, establish families of many types, and invent complex social institutions. They need
opportunities to give and receive friendship and love. A small failure can also make one
feel rejected from the society. One needs much support, assurance and personal warmth.
4. Esteem: In this stage, not only one wants to be liked by others but also want to be
respected. Each human being needs to feel positively about himself. This comes from a
feeling of belonging, of participating effectively in the group to which one belongs, and from
which as derives feelings of security. It includes feelings of self-confidence, achievement,
competence, and independence.
5. Self — actualization: To reach this level, all other needs must be fulfilled to the same
degree. Each person has unique abilities and talents. Unless lower-level needs have been
reasonably well met, there may never be the opportunity to become a self- actualizing
person-that is a person who has become what he or she is uniquely capable of becoming
a person who is self-fulfilled. If one wants to become a "fuller person, he has to learn to
develop full potential. He has to show his individuality despite social pressures.
128

As per this theory, the basic stage is physical needs. At the outset, each and every citizen tries to
achieve the basic stage. Once the basic stage is achieved; one may try to achieve the second
stage, i.e. security, then the third stage, then the fourth stage, and then the fifth stage.
7.4 Significance of Maslow's Theory
According to Abraham Maslow's theory (the pyramid), the bottom most step is the physical needs.
Unless and until people achieve the basic step, i.e., physical needs, one may not reach the second
stage, but meeting the physical needs itself is a dream to more than a quarter of the total
population in India. In this present investigation it has been observed that the people do not meet
the basic requirement, i.e., physical needs. They are very much lacking behind, water requirement.
It has been observed that the physical need, i.e., water is beyond their dreams in their lives since
several factors are functioning adversely. In this grave situation, it in very much inevitable to evolve
a set of plausible policy guideline to fulfill the physical needs of the people.
7.5 Application of Maslow's Theory
Doyal and Gough (1991); specify the basic needs of nutritious foods and clear water; protective
housing; a non-hazardous work environment and physical environment; appropriate health care
and education; security in child hood; significant primary relationship; physical and economic
security; safe birth control and child bearing Maslow, A., (1954) argued that food cloth and shelter
are the basic needs .
In the study area, the basic need such as water (see Maslow, A., 1954, and Doyal & Gough 1991)
is not met to the larger size of population. It has been observed that water availability is very
minimal, 1,e., 1-2 hrs/day. It has been also observed that the people of the study area is facing
acute water supply crisis and are meeting about 40% of the standard requirement.
129
The quality of the water supply is very poor. It has been observed that the sub-way water supply
system is often become worse since the water supply pipes are damaged and the sewage water is
intermingling with the portable water, and it creates adverse effects in the system.
Outflow of drains are also observed in the system, which led to adverse environment. Doyal and
Gough (1991) argue that non- hazardous work environment and physical environment is also a
basic need. In this case, overflow of drains creates adverse effect in the system, which disturbs the
basic needs.
In the study area, few per cent of population are not having at least moderate housing conditions
and their housing conditions and are so dilapidated. Doyal and Gough (1991) argue that protective
housing is one of the basic needs. Maslow, A., (1954) argues that shelter is one of the basic
needs. In this case, few per cent of households do not meet the basic needs in term of housing.
The study area is facing tremendous amount of problems pertain to transportation and parking,
which hamper the smooth function of the system. Requirement of conducive environment for living
is also considered as basic need. In this case, transportation and parking problems very badly
affecting the smooth functioning of the system. Thus, it has been concluded that the study area is
suffering from basic needs, and the basic needs must be met before thinking of further
development of the system. Therefore, it is an inevitable requirement for making a plausible
development plan to achieve sustainable development in the system.
130
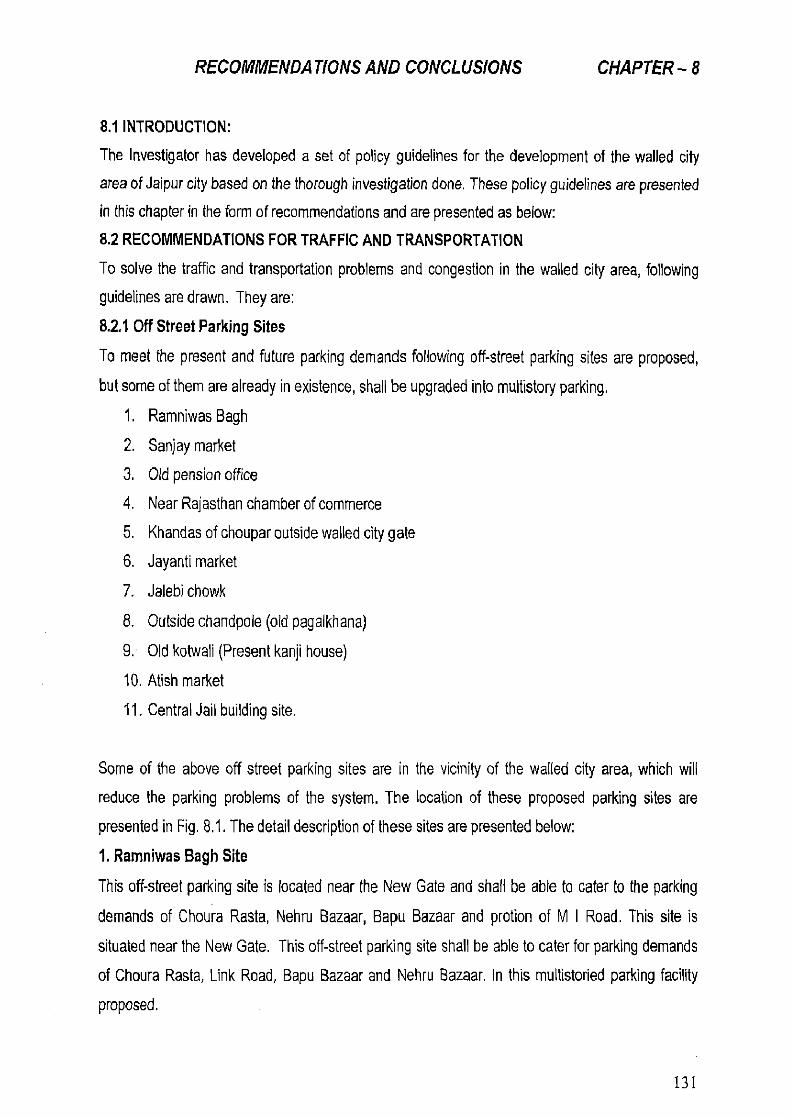
RECOMMENDATIONS AND CONCLUSIONS CHAPTER — 8
8.1 INTRODUCTION: The Investigator has developed a set of policy guidelines for the development of the walled city area of Jaipur city based on the thorough investigation done. These policy guidelines are presented in this chapter M the form of recommendations and are presented as below: 8.2 RECOMMENDATIONS FOR TRAFFIC AND TRANSPORTATION
To solve the traffic and transportation problems and congestion in the walled city area, following guidelines are drawn. They are:
8.2.1 Off Street Parking Sites
To meet the present and future parking demands following off-street parking sites are proposed,
but some of them are already in existence, shall be upgraded into multistory parking.
1. Ramniwas Bagh
2. Sanjay market 3. Old pension office 4. Near Rajasthan chamber of commerce 5. Khandas of choupar outside walled city gate 6. Jayanti market
7. Jalebi chowk
8. Outside chandpole (old pagalkhana)
9. Old kotwali (Present kanji house)
10. Atish market
11. Central Jail building site.
Some of the above off street parking sites are in the vicinity of the walled city area, which will reduce the parking problems of the system. The location of these proposed parking sites are
presented in Fig. 8.1. The detail description of these sites are presented below:
1. Ramniwas Bagh Site
This off-street parking site is located near the New Gate and shall be able to cater to the parking
demands of Choura Rasta, Nehru Bazaar, Bapu Bazaar and protion of M I Road. This site is
situated near the New Gate. This off-street parking site shall be able to cater for parking demands of Choura Rasta, Link Road, Bapu Bazaar and Nehru Bazaar. In this multistoried parking facility
proposed.
131

2. Sanjay Market Site It is located near Sanganeri gate. This parking site will cater the demands of Sanjay market and John bazaar area. In this, multistoried parking facility are proposed. 3. Old Pension Office It is located near Tripolia bazaar North of Atish market. This site shall be developed into multistoried parking. It has access through gateways of city palace road. 4. Near Rajasthan Chamber of Commerce and Industry Office It is located between Ajmeri Gate and Choura Rasta. It can cater the parking demand of Nehru Bazaar. In this area, surface as well as basement parking facilities can be developed.
5. Khandas of Choupar Outside Wall City Gate It is located at the entry to walled city at Sanganeri Gate, Ajmeri Gate and Chandpole Gate. These spaces can be developed for off-street parking of Auto Rickshaws and Taxis.
6. Jayanti Market Site It is located behind the Jayanti Market, opposite to the old passport office building. This site is
suitable for only off-street parking.
7. Jalebi Chowk Site In this area, off-street space can be developed by removing the encroachment done by the unauthorized dwellers. This parking can cater the demand for the Govind Deoji Temple. S. Outside Chanpole Gate (Old pagalkhana) In this area, parking can be provided by demolishing this building that will provide adequate space for multistoried parking. It can cater the needs of Chandpole Bazaar
9. Old Kotwali (Present Kanjihouse) This site is located behind the telephone exchange between Sanganeri Gate and Ghate Gate. At
present, this place is used for stray cattle's (Kanji house). In this area, the multi-storied parking can
be provided after demolisting of this building. This site can cater the demands of Ramganj Bazaar.
10. Atish Market This site is located among the Atish market. It is recently vacated from the Atish market shopkeepers for parking purpose. In this area, multi-storied parking can be developed, and it can cater the demand of Atish market and Tripollia Bazaar, Chaura Rasta, etc.
132
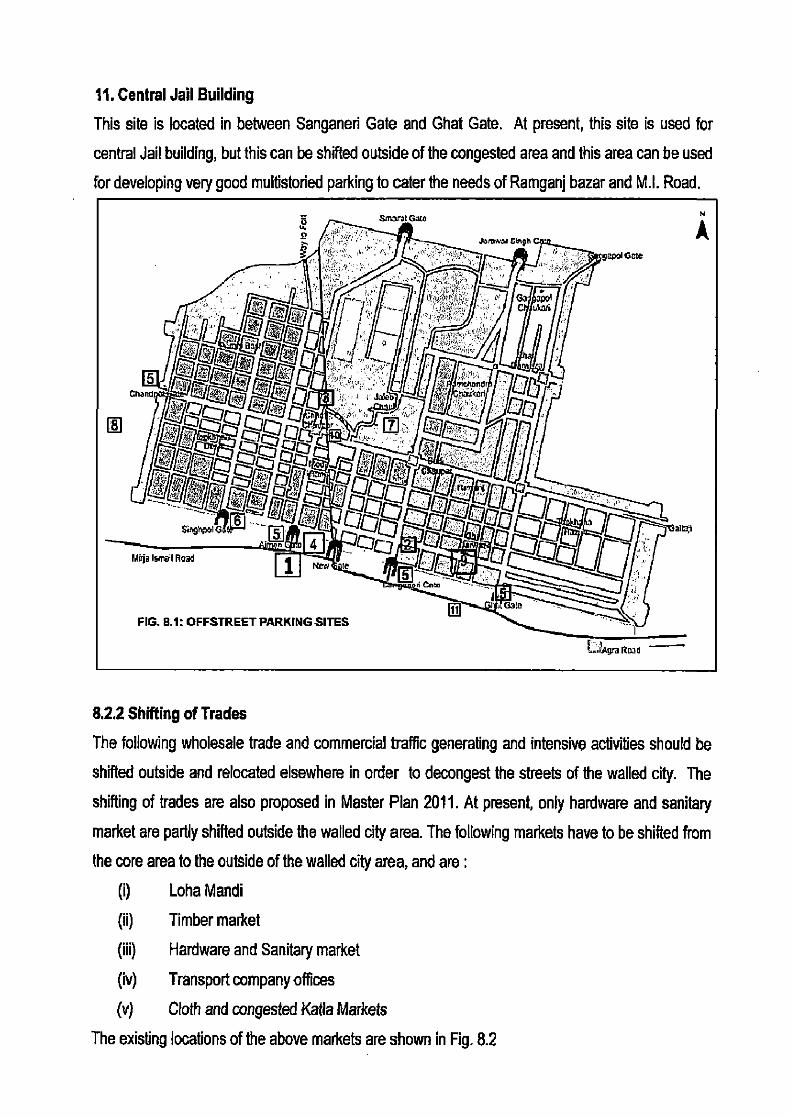
11. Central Jail Building
This site is located in between Sanganeri Gate and Ghat Gate. At present, this site is used for
central Jail building, but this can be shifted outside of the congested area and this area can be used
for developing very good multistoried parking to cater the needs of Ramganj bazar and M.I. Road.
8.2.2 Shifting of Trades
The following wholesale trade and commercial traffic generating and intensive activities should be
shifted outside and relocated elsewhere in order to decongest the streets of the walled city. The
shifting of trades are also proposed in Master Plan 2011. At present, only hardware and sanitary
market are partly shifted outside the walled city area. The following markets have to be shifted from
the core area to the outside of the walled city area, and are :
(i) Loha Mandi
(ii) Timber market
(iii) Hardware and Sanitary market
(iv) Transport company offices
(v) Cloth and congested Katie Markets
The existing locations of the above markets are shown in Fig. 8.2

8.2.3 Restrictions on Parking
Parking should be restricted on the following major streets from 9.00 A.M. to 9.00 P.M for four
wheeler vehicles. They are:
• Johri Bazaar
• Chaura Rasta
• Kishanpole Bazaar
• Tripolia Bazaar
• Ramganj Bazaar
• Chhoti Chaupar
• Badi Chaupar
In the lanes and byelanes of the walled city area, two wheelers parking and entry of four wheelers
should be restricted where road width is less than 3.0 m, and if more than this, it can be allowed.
Parking should be provided to accommodate the requirements of residents, institutions, emergency
vehicles, etc. For that parking fees can be charged and allowed on curb side parking at following
selected locations. These major streets are shown in Fig. 8.3
• n •

FIG. 8.3: STREETS OF PARKING RESTRICTIONS
Agra Road
Chaura Rasta : Amer Jain Hospital, SBBJ Building, Public Library, Jaipur College and girls school
and children's hospital, etc.
Kishanpole Bazar: Dental Hospital, Ayurved hospital, Maharaja Government school and
Rajasthan school of Arts. Parking of buses, auto rickshaws, tongas, rickshaws, etc., should not be
allowed on chaupars.
8.2.4 Pedestriarisation of streets
Pedestrian activities and flows are high in the walled city. area. For segregation of pedetrian,
considerations should be given to pedestriasation of certain streets for full or part of the day, such
as Bapu Bazaar, Nehru Bazaar, Indira Bazaar, Ramganj Bazaar, etc. No permission for commercial
complexes, shopping areas and basements should be given in the walled city area to avoid further
congestion. The public transport modes should be encouraged in the walled city area to reduce air
and noise problem. Signs and markings should be also done on besides the roads to provide road
safety to drivers and pedestrians.
135

FIG. 8.4: UNDERGROUND PARKING SITES
Agra Road -----4.
8.2.5 Underground Parking
The following open spaces are identified for underground parking, which will cause least intrusion
to the aesthetics of a place. They are :
• Badi Chaupar
• Choti Chaupar
These parking places are shown in Fig. 8.4
Badi Chaupar: This parking facility is to be developed below the chaupar intersection. The area
available for underground parking is around 8000 sq.mts. This would be highly suitable for catering
to the demand of Johri Bazaar.
Choti Chaupar: This underground parking facility is proposed to be developed below the choti
chaupar intersection. It can cater to the parking demand of Kishanpol Bazaar and portions of
Tripolia Bazaar.
136
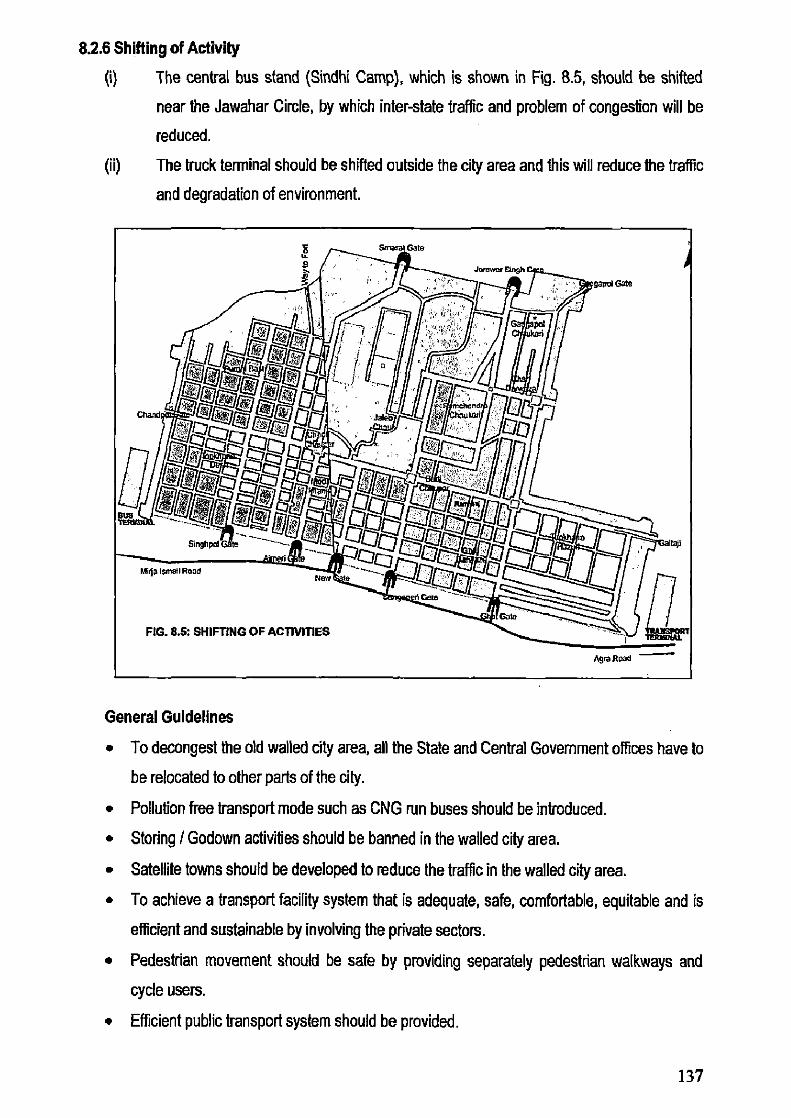
8.2.6 Shifting of Activity
(i) The central bus stand (Sindhi Camp), which is shown in Fig. 8.5, should be shifted
near the Jawahar Circle, by which inter-state traffic and problem of congestion will be
reduced.
(ii) The truck terminal should be shifted outside the city area and this will reduce the traffic
and degradation of environment.
General Guidelines
• To decongest the old walled city area, all the State and Central Government offices have to
be relocated to other parts of the city.
• Pollution free transport mode such as CNG run buses should be introduced.
• Storing / Godown activities should be banned in the walled city area.
• Satellite towns should be developed to reduce the traffic in the walled city area.
• To achieve a transport facility system that is adequate, safe, comfortable, equitable and is
efficient and sustainable by involving the private sectors.
• Pedestrian movement should be safe by providing separately pedestrian walkways and
cycle users.
• Efficient public transport system should be provided.
137

• Sufficient no. of parking spaces should be provided in the walled city area.
• No 'U turn' shall be permitted except at the end points.
• All the intersections of the streets in the wailed city should proposed geometries, for
vehicles and pedestrians. This includes provision of medians, channelisations, pedestrian
crossing facilities and signalizations.
• Bullock Carts and other animal drawn vehicles should be allowed during the night time
only. Entry of goods vehicle should be during off peak hours only, i.e. 10.00 P.M. in the
night to 8.00 A.M. in the morning. There should be a separate lane discipline for slow and
fast moving vehicles, i.e., rickshaws, bicycles, cars, etc. Encroachments should be
removed from the footpaths and roads and proper space should be provided for thelas,
Hawkers, and Hat Bazars, etc.
• The traffice & transportation department should prepare comprehensive Traffic
Management plans based on the recommendations.
8.3 RECOMMENDATIONS FOR WATER SUPPLY To make water available in adequate quantities, it is very necessary to make intervention at the
planning level too. These are:
a. Reserving areas potentially good for recharging & water harvesting The areas which are good for water recharging and harvesting should be developed as green
areas, forests or recreational areas. The rocky ridges and hilly tracts need to be given special
attention and their degradation needs to be stopped. Forest cover should be provided on such
tracts to reduce soil erosion. For this, a massive aforestation drive needs to be taken up.
b. Protection of low-lying areas Natural drainage channels, rivulets, water-bodies, low-lying areas prone to flooding need to be
preserved, and wherever possible green cover should be provided.
c. Revival of old water channels The old water channels feeding the lakes and water bodies need to be reclaimed and refurbished.
d. Discouragement of industrial activities in urban area
Industrial activities requiring large quantities of water should be discouraged from functioning in
urban areas and located at appropriate locations in the region. The regulations as mentioned in the
Master Plan-2011 need to be followed strictly in this regard.
138

c. Identification of Drainage Zones The drainage zones for storm water drainage need to be identified and drainage system planned to bring about proper utilization of water for recharging and recycling. d. Minimizing the losses The pilferage and wastage be reduced to minimum. For this, the distribution system needs to be refurbished and repaired continuously to provide for proper service. e. Generation of public awareness Enough publicity should be given to encourage each individual/institution/ public authority to participate in conservation of water and consuming less to provide more.
8.4 RECOMMENDATIONS FOR SOLID WASTE MANAGEMENT 8.4.1 Strategies: The following strategies may be practiced for effective solid waste management practices, They are: (1) House to house collection for domestic wastes by private parties should be introduced in
phased manner. Households need to be pursued to store their household wastes in two separate covered bins. One for left out food materials, vegetable peels, etc. and the other for paper, glass cans, etc. Labourers employed by private parties and provided with wheelbarrows tricycle rickshaws containing bins made of reasonably inert materials will collect the household garbage at a fixed time of a day (duly notified to the community in advance). The bins will be in two distinct colors and people from household are to dispose the garbage properly bagged in separate bins. The labourers will then carry the bins and empty the contents in separate stacks in intermediate collection points or transfer stations.
(ii) In the congested low income group housing colonies and slums, where there are a few proper approach roads to facilitate house-to-house collection, this can be organized in similar way as above, with the exception that the private operators will visit fixed places in the community at a fixed time of the day to collect the garbage. This will, however, require strong motivation of the dwellers preferably developed through a group of people selected from the community itself.
(iii) For Sabzi Mandis (vegetable markets) and other commercial complexes, the owners are to dispose their wastes either to dumping vehicles visiting the areas at pre-decided time of the day and parked at specific locations or themselves carrying to intermediate collection points. Strong involvements of market societies/traders association in strict adherence to the system by traders are expected to bring good results. Depending on type of wastes generated the traders may be advised to segregate the wastes.
140
(iv) Door-to-door collection for hotels and restaurants needs to be organized in a manner
similar to house-to-house collection. Alternately they are to carry their garbage to
intermediate collection points
(v) All infectious hospital wastes should be incinerated. This may be done by constructing an
incinerator in a large hospital (e.g. a medical college). All other hospital and nursing homes
need to be required to transport their wastes of their own in properly designed closed
containers to the incinerator. The incinerator can be set up and maintained by a private
party and to be used on cost sharing basis.
(vi) Rubbish generating from construction activities should be collected and transported by the
municipal vehicles
(vii) Safai Karamacharis sweeps streets and clean drains. They should be equipped with better
cleaning and collecting implements and tools. Improvement is expected by making same
person responsible for transporting the sweepings in small bins to collection depots, The
drain cleaning gang should be promptly followed by the collection vehicles for
transportation and disposal of silts arising out of drain cleaning, The silt will be directly
transported to disposal site and the contractor will be paid only on disposal. This will
eliminate the accumulation of the sweepings and silt on the roadsides, thereby reducing
the chance of scattering the sweepings or return silt to drains via wind and / or by moving
vehicles.
(viii) For intermediate collection points either brick masonry enclosures or properly designed
garage could be constructed. Brick masonry enclosures should be covered with a light grill
on the top and provided with a gate to prevent the animals and birds from entering. The
enclosures should be lined with glazed tiles for easy cleaning. Arrangements for regular
disinfecting are also needed. Waste segregation can be done at these locations. Private
contractors will collect and transport waste from intermediate collection depots.
(ix) All waste transportation vehicles should be covered with tarpaulins to avoid spillage,
unpleasant sights, and air pollution.
(x) Industries should treat their wastes as needed, and transport these wastes to the disposal
site.
(xi) Costs for collection, transportation and disposal should be recovered, The Municipal body
is to fix up the rates depending on the type of services provided and costs incurred.
(xii) Appropriate legislation (including necessary modifications of existing municipal bylaws)
may be necessary to enforce the recommendations. Strict implementation of the laws and
impositions of fines and punitive actions for offenders are necessary.
141

(xiii) Waste can be disposed partly by composting / making bio-fertilizers and sanitary landfills.
Private parties should manage both schemes. Garbage should be segregated at
intermediate collection points/transfer stations and at disposal sites as necessary.
(xiv) Suitable lands having a minimum possibility of ground or surface water pollution need to be
identified for the disposal. The local body should provide an approach road, fencing,
lighting, arrangement for water, a weighbridge and office for the disposal site.
(xv) The Municipality should be primarily for supervising and having overall control. They should
monitor the operations so that the desired service level is obtained. Also some specialized
transportation vehicles like compactor and collection / disposal equipment e.g. excavator,
front wheel loader, bulldozer, etc. can be procured by the local bodies to be given on rent
to private parties involved in Solid Waste Management.
(xvi) Contracts need to be drawn between the private contractors and municipal bodies so that
interest of the local body is fully safeguarded and the publics are provided with the desired
level of service. Joint venture agreements can also be prepared for composting and
disposal sites for sanitary landfills. This can reduce the initial capital expenditure in
establishing the plants and provide regular earnings for the municipal body.
(xvii) The contract should provide for heavy penalties. In the event the contractors fail to provide
desired level of service, the clause will strictly be enforced.
The municipal body should prepare comprehensive solid waste management plans based on these
recommendations. The plans should be able to clearly indicate the proposed actions, the role of the
local body, the private parties, details of land for disposal, cost of the improvements, operation and
maintenance cost, charges to be levied, revenue generation and financial plan.
8.4.2 Regulations: Plausible regulations may be developed to have feasible solid waste
management system based on the followings:
• The city needs to identify a solid waste disposal criteria which should be at reasonable distance
away from the urban area. The city should be preferably in the leeward direction of wind with
respect to the solid waste disposal site.
• Encroachment on ecological, historical, cultural or religious area should be avoided at the
disposal sites. Though some temporary loss of scenic beauty will occur at the proposed landfill
sites, this could b& reduced by prudent planning and management of the sites, such as the
construction of fencing and horticulture activities.
142
• Pollution of surface and ground water can be minimized by controlled tipping, even spreading waste evenly, and by providing sufficient cover material at regular intervals. Providing surface drainage, coupled with toe drains and earth bunds, turfing of exposed areas, and diversion of any streams will also facilitate leachate control. Bitumen surfacing of access roads will assist in controlling dust generated by vehicles.
• Lack of cover material should not be a problem in a well-planned landfill site. Controlled tipping will have to be ensured because random disposal, apart from causing environmental hazards, also limits the potential use of the reclaimed land. Positive control measures should be proposed to minimize or arrest pollution of surface or groundwater, erosion, siltation, dust, odors, vermin and flies at the proposed disposal sites,
• The solid waste management project will enhance the overall environment of the urban centres. But like any environmental improvement which collects waste for disposal at one point, the concentration of waste can pose an environmental hazard. Appropriate measures should be taken to prevent leaching of polluted water from the landfill site to ground or surface waters as well as transmitting waste by air to the surrounding areas.
8.5 SEWERAGE AND SANITATION To solve the sewerage & sanitation problems the following guidelines are drawn:
• Waste water should be discharged into sewers. • Sewerage should not be discharged into natural drain / nullah. It should be discharged after
proper treatment. • All the sullage from households should be discharged into sewers.
• Rehabilitation and replacement of sewer should be done in the walled city area.
• Sanitation facility should be provided to slum dwellers and poor.
• To promote safe and environment friendly city, effective treatment and disposal of waste water system should be ensured.
• Sewage treatment plant (STP) capacity should be upgraded and one more sewage treatment plant should be provided in the South Zone.
• The treated effluent from the STP should not be discharged into Jalmahal Lake.
8.6 HERITAGE & CONSERVATION To protect heritage & promote tourism the following guidelines are drawn:
A nodal institute for heritage conservation should be created. The role of the agency should
143

be: ✓ Database Management should be done regarding all projects related to
heritage and the implementing agencies; ✓ Co-ordination among different departments; ✓ Increase awareness; ✓ Capacity building; ✓ Formulation of special legislative measures towards heritage; and ✓ Strict regulations and restriction in walled city area to maintain its heritage fabric
• Multiple agency participation in conservation activities should be discouraged.
• Private sector participation should be encouraged.
• A database for heritage conservation should be generated.
• Restoration manuals and guidelines should be prepared.
• Public awareness about long term value of heritage conservation should be created.
• Technical support should be provided to owners for maintaining heritage structures.
• Conversion of heritage buildings into modern buildings should be stopped.
• The walled city area is famous for its heritage and culture, which is neglected in the
buildings, forts, palaces, temples, etc. These should be conserved to attract both domestic
as well as international tourists.
• Government offices within heritage buildings need to be vacated. Such buildings should be used as heritage hotels or put to uses of tourism.
• In old city, at least, the routes connecting tourist spots should be pedestrianised. All the encroachments should be removed. All the cable and utilities should be made underground to restore the old flavor of the place.
• The facade of the old city needed preservation, for this the government should offer technical inputs and financial incentives to building owners for the same.
• State and City Road network's quality need to be improved. This would increase the tourist movement through out the city and in the State.
8.7 ENVIRONMENTAL CONSIDERATIONS
Vehicles on roads in urban areas adversely affect the environment. They cause noise and air
pollution both physically and visually, however they play major part in the economic and social life.
There are two basic aspects of road traffic affecting the environment, which need considerations
and are:
144

1. NOISE:
Noise screens such as grass, trees or shrubs are planned to be planted alongside the street to
serve as barriers to the propagation of sound, apart from the improvement of the general scenery
they bring about.
2. AIR POLLUTION:
By improving and widening of roads and bridges the flow of traffic shall be improved, thereby
reducing the emission of hydrocarbons and exhaust gases, thus improving the environment.
8.7.1 Environment Protection Measures
For preserving the environment and mitigate the ill - effects of air pollution it is planned to plant
trees and shrubs. Planting also improves the appearance and aesthetics of the road, and provides
shade in summer.
For proper thriving and growth those species which have already flourished in the area are
proposed to be used, keeping the following points in view:
• Trees should be sufficiently set back from the ultimate edge of the road so that
it does not create obstruction.
• Considerations of sight distance and safety are of prime importance. Trees &
shrubs should not obstruct the sight of approaching vehicle.
• Trees & shrub should be planted in such a way that does not interfere with the
drainage system.
• The species to be planted should require minimum water, having deep roots to
be able to suck water from greater depths.
• Flower bearing, ever green species which do not shed leaves during summer
should be preferred.
• Set standards for vehicle emission.
• Protection of natural Recharge areas.
• Ecological considerations.
• Ecologically fragile zone should be identified and developed.
• Stringent norms should be implemented for pollution control.
• Dense plantation buffers should be developed in city along the natural
drainage, railway lines, national highways and around the existing hills.
145

8.8 THE GENERAL CITY DEVELOPMENT GUIDELINES AND POLICIES
The following general city development guidelines and policies are recommended:
1. Overall city development should encourage a more balanced pattern of land uses. The present
concentration of commercial activities in the walled city should be reduced and commercial
nodes developed in other parts of town.
2. Informal sector activities should be treated as a priority area for integration into the main stream
of land use.
3. Conservation of historical monuments as well as development of places of tourist interest and
cultural significance are to be declared priority areas for development. There is a need for a
more forward looking planning policy for tourist infrastructure (including hotels, services, and
other supporting facilities).
4. Areas determined to be of ecological importance should be safeguarded against inappropriate
encroachments and developed only as a major recreational facilities, tourist destinations, or
ecological reserves.
5. High potential agricultural land should be protected against indiscriminate urbanization. This
will further support the greenbelt concept for Jaipur.
8.9 CONCLUSION:
In this present investigation, the problems and prospects of the study area (walled city area) are
studied carefully pertaining to physical, social, economic, ecology, environment and infrastructure
aspects. Required data (both secondary and primary) were collected and analyzed thoroughly.
The control parameters, which decide the functions of the system, were identified, and forecasting
analysis was done based on the same. Theoretical conceptualization of Urban System Model was
employed to understand the functions of the system. Further theory of Hierarchy of Human Needs
was employed to understand the importance of certain infrastructure services. The investigation
concludes with a set of plausible recommendations for sustainable development of the system.
146

• Movement chart: Activity Mode of transportation
(public/ Private) Distance in Kms. Frequency in a week
Shopping Recreation Work
3.2 Water Supply: • Supply system: Public/ well/ Own source/ both • Distance from source of water & time of fetching water (hrs.) • Time of supply (in hrs.): • Use of equipments: filter/ zero B/ Aqua guard
3.3 Electricity: • Available/ unavailable • Tariff: monthly/ Flat rate • Metered/ Non-metered • Hours/Days of availability: • Overhead poles/ underground cables • voltage fluctuations
3.4 Drainage/ Sewerage: • Availability of: Septic Tank/ Soak pit/ Sewer/ No facility • Drains: Open/ Covered/ No drains • Problem: Overflow/ Clogging/ Bad odour/ No Problem • Overflow of drains during rainy season (Yes/ no)
3.5 Waste Disposal: • Method of collection at house:
a. Storage container b. dust-bin/ PVC bags c. burning d. throwing out • Frequency of collection from the area:
a. Everyday b. Alternate day c. 3 Days d. 4 days e. weekly • Agency for collection: a. Nagar Nigam b. Private Agency c. NGO
4. Environmental characteristics: • Water quality: Very good/ Good/ Moderate/ Poor • Air quality: Very good/ Good/ Moderate/ Poor • Land quality: Very good/ Good/ Moderate/ Poor • Noise Pollution: Very high/ High/ Moderate/ Low • Quality of Life: Very good/ Good/ Moderate/ Poor
Remark:
XV

REFEREN CES
1. Monto Mani, Koshy Varghese, L.S. Ganesh, (2004) Sustainability: Implications for Human
Settlements, Nagarlok, Vol. XXXV1,No. 1, pp. 45-51.
2. Hugo Priemus, (2005), How to make Housing Sustaibable? The Dutch Experience, Environment
and Planning B: Planning and Design, Vol. 32, pp. 5-19.
3, Chan Wai-Yim and Ma Shu-Yun, (2004), Heritage Preservation and Sustainability of China's
Development, Sustainable Development, Vol.12, pp. 15-31.
4. Ekhart Hahn and Udo E. Simonis, (1991), Ecological Urban Restructuring, Ekistics Vol. 348, pp.
199-225.
5. A.K. Mukherjee, (1997), Environment and Sustainable Development, International Conference on
Habitat and Sustainable Development, New Delhi, pp. 20-25.
6. C.Y. Jim, (1994), Urban Renewal and Environmental Planning in Hong Kong, The
Environmentalist, Vol. 14, No.3, pp. 163-181.
7. Xu S, M Madden, (1989), Urban Ecosystems: A Holistic Approach to Urban Analysis and
Planning, Environment and Planning B: Planning and Design, Vol. 16, pp. 187-200.
8. Guangqing, chi & Brian Stone Jr., (2005), Sustainable transport planning: Estimating the
Ecological Footprint of vehicle Travel in Future Years, Journal of Urban Planning and
Development @ ASCE, Vol. 131, No. 3, pp. 170-180.
9. NI. Sohail, M.ASCE; S. Cavill; and A.P. Cotton, (2005), Sustainable operation and Maintenance of
Urban Infrastructure: Myth or Reality ?, Journal of Urban Planning and Development © ASCE,
Vol. 131, No. 1, pp. 39-49.
xiv

10. Peter Newman, (1995), Sustainability and the past-modern city : Some guidelines for Urban
Planning and Transport Practice in an age of uncertainty, The Environmentalist Vol. 15, pp. 257-
266
11. Nina Herala, (2003), Regulating Traffic with Land use Planning, Sustainable Development, Vol.
11, pp. 91-102.
12. Christy Mihycan Jeon, S.M. ASCE, and Adjo Amekudzi, M.ASCE, (2005), Addressing
Sustainability in Transportation System; Definitions, Indicators, and Metrics, Journal of Urban
Planning and Development © ASCE, Vol. 11, No. 1, pp. 31-50.
13. Prannod Paliwal, (2005), Sustainable Development and Systems Thinking: A Case Study of a
Heritage City, International Journal of Sustainable Development, and World Ecology , Vol. 12, pp.
213-220.
14. B. Ramesh & N.Krishanan, (1991), Application of Remote Sensing for Analysis of Urban Fringe
Dynamics — Case Study of Jaipur, India.
15. Monto Mani, Koshy Varghese, L.S. Ganesh, (2005), Integrated Model Framework to Simulate
Sustainability of Human Settlements, Journal of Urban Planning and Development © ASCE, Vol.
131, No. 3, pp. 147-158.
16. Bill Hopwood, Mary Millor and Geoff O'Brien, (2005), Sustainable Development Mapping Different
Approaches, Sustainable Development, Vol. 13, pp. 38-52.
17. Igor S Mayer, (2005), Robin Seijdel, Collaborative decision-making for sustainable Urban Renewal
Projects: A Simulation — Gaming Approach, Environment and Planning B ; Planning and Design,
Vol. 32, pp. 403-423.
18. Christopher J. Pettit, (2005), Use of a Collaborative GIS-based planning system to assist in
formulating a sustainable-development scenario for Hervey Bay Australia, Environment and
Planning B: Planning and Design Vol. 32, pp. 523-545.
xv

BIBLIOGRAPHY
1. Monto Mani, Koshy Varghese, L.S. Ganesh, (2004) Sustainability: Implications for Human
Settlements, Nagarlok, Vol. XXXVI,No. 1.
2. Hugo Priemus, (2005), How to make Housing Sustaibable? The Dutch Experience, Environment
and Planning B: Planning and Design, Vol. 32.
3. Chan Wai-Yim and Ma Shu-Yun, (2004), Heritage Preservation and Sustainability of China's
Development, Sustainable Development, Vol.12.
4. Ekhart Hahn and Udo E. Simonis, (1991), Ecological Urban Restructuring, Ekistics Vol. 348.
5. A.K. Mukherjee, (1997), Environment and Sustainable Development, International Conference on
Habitat and Sustainable Development, New Delhi.
6. C.Y. Jim, (1994), Urban Renewal and Environmental Planning in Hong Kong, The
Environmentalist, Vol. 14, No.3.
7. Xu S, M Madden, (1989), Urban Ecosystems: A Holistic Approach to Urban Analysis and
Planning, Environment and Planning B: Planning and Design, Vol. 16.
8. Guangqing, chi & Brian Stone Jr., (2005), Sustainable transport planning: Estimating the
Ecological Footprint of vehicle Travel in Future Years, Journal of Urban Planning and
Development @ ASCE, Vol. 131, No. 3.
9. M. Sohail, M.ASCE; S. Cavil!: and A.P. Cotton, (2005), Sustainable operation and Maintenance of
Urban Infrastructure: Myth or Reality ?, Journal of Urban Planning and Development © ASCE,
Vol. 131, No. 1.
10. Peter Newman, (1995), Sustainability and the past-modern city : Some guidelines for Urban
Planning and Transport Practice in an age of uncertainty, The Environmentalist Vol. 15.
xvi
11. Nina Herala, (2003), Regulating Traffic with Land use Planning, Sustainable Development, Vol.
11.
12. Christy Mihycan Jeon, S.M. ASCE, and Adjo Amekudzi, M.ASCE, (2005), Addressing
Sustainability in Transportation System; Definitions, Indicators, and Metrics, Journal of Urban
Planning and Development © ASCE, Vol. 11, No. 1.
13. Pramod Paliwal, (2005), Sustainable Development and Systems Thinking: A Case Study of a
Heritage City, International Journal of Sustainable Development, and World Ecology , Vol. 12.
14. B. Ramesh & N.Krishanan, (1991), Application of Remote Sensing for Analysis of Urban Fringe
Dynamics — Case Study of Jaipur, India.
15. Monto Mani, Koshy Varghese, L.S. Ganesh, (2005), Integrated Model Framework to Simulate
Sustainability of Human Settlements, Journal of Urban Planning and Development ASCE, Vol.
131, No. 3.
16. Bill Hopwood, Mary Millor and Geoff O'Brien, (2005), Sustainable Development Mapping Different
Approaches, Sustainable Development, Vol. 13.
17. Igor S Mayer, (2005), Robin Seildel, Collaborative decision-making for sustainable Urban Renewal
Projects: A Simulation — Gaming Approach, Environment and Planning B : Planning and Design,
Vol. 32.
18. Christopher J. Pettit, (2005), Use of a Collaborative GIS-based planning system to assist in
formulating a sustainable-development scenario for Hervey Bay Australia, Environment and
Planning B: Planning and Design Vol. 32.
19. Doyal, Len and Ian Gough (1991), A theory of need, London: Macmillion.
20. Bourne, L.S., (1974), "Forecasting Urban System", Research design, Alternative Methodologies
and Urbanization Trends with Canadians Examples". Regional studies, Paragon Press, Great
Britain, Vol. 8.
xvii
21. Stefan Boron and Keith Murray, (2004), Bridging the unsustainability Gap: A framework for
sustainable Development, Sustainable Development, Vol. 12.
22. Calbert H. Douglas, A (2004), Prospective Health impact Assessment to Progress the Sustainable
Future of a City: The Case of Salford, UK, Sustainable Development Vol. 12,
23. Adisa Azapagic and Stabodan Perdan, (2005), An Integrated Sustainability Decision-Support
Framework Part I: Problem Structuring, International Journal of Sustainable Development and
World Ecology, Vol. 12.
24. Ar, P. Alka Bharat, Ar. Taruna Tayal, (1997), Sustainable Development of An Agrarian
Settlement: Sanchi, International Conference on Habitat and Sustainable Development,
25. Stewart Barr, (2004), What we buy, What we throw away and How we use our voice. Sustainable
Household Waste Management in the UK., Sustainable Development, Vol, 12.
26. Steve Curwell and Ian Cooper, (1998), The Implications of Urban Sustainability, Building
Research and Information Vol. 26, No. 1.
27. Cary Pivo, (1996), Toward Sustainable Urbanization on Main Street Cascadia, Cities, Vol. 13, No.
5.
28. Annapurna Shsaw, Peri-Urban Interface of Indian Cities : Growth, Governance and Local
Initiatives, Economic and Political Weekly, January 8, 2005.
29. Daniel K. Janson The Nature of Infrasystem Services, Journal of Infrastructure Systems (C) ASCE
/ March 2005.
30, K.N. Joshi, (2003), Changing urban Sprawl and its Impact on Hydrological Regime, Nagarlok, Vol.
XXXV, No. 4.
31. David W. Wright, (1996), Infrastructure Planning and Sustainable Development, Journal of Urban
Planning and Development
xviii

32. Todd A. Randall and Brian W. Baetz, (2001), Evaluating Pedestrian Connectivity for Suburban
Sustainability, Journal of Urban Planning and Development,
33. Rumi Aijaz, (2005), Decentralizing Infrastructure Provision in Developing Countries : Some
Lessons for India, ITPI Journal, Vol. 2, No. 1,
34. S.K. Sinha, (2005), Technology Vision 2020 for Urban Management and Planning, ITPI Journal,
Vol. 2, No, 1.
35, Lewis D Hopkins, (2005), Nikhil Kaza, Varkki George Pallathucherill, Representing Urban
Development Plans and Regulations as Data A Planning Data Model, Environment and
Planning B : Planning and Design, Vol. 32,
36. Elaine Stratford, Martina Jaskolski, (2004), In Pursuit of Sustainability? Challenges for deliberative
democracy in a Tasmanian local government, Environment and Planning B: Planning & Design,
Vol, 31.
37. Carey Curtis and John Punter, (2004), Design — led Sustainable Development, Town Planning
Review, Vol. 75, No. 1.
38. Mee Kam Ng, The Role of Urban Planning in China's Sustainable Development, Town Planning
Review, 75(4) 2004.
39. Bijayanand Mishra, (2001), Conflict Reduction Between Growth, Eco-Development and
Sustainability I Cities : Towards a Strategy in Developing Couhtries, Spatio-Economic
Development Record, Vol. 8, No. 4,
40. Sandra Alker and Adrian McDonald, (2003), Incorporating Sustainable Development into
Redevelopment, Sustainable Development Vol. 11.
41. Kavas Kapadia, (2005), Sustainable Cities: Reality of the Rhetoric, ITPI Journal, Vol. 2, No. 3.
42. Mukul K. Hatwal, (2000), Sustainable Urban Development through Appropriate Spatial Planning :
A Case Study of Hardwar (U.P.), Spatio-Economic Record, Vol. 7, No. 1.
xix

Survey Schedule for Wall City Area — Jaipur
1. Demographic Characteristics: 1.1 Name of the family Head: 1.2 Religion: 1.3 Address: 1.4 Caste: 1 5 Family Details:
Name of person Relation- ship with the Head
Age
(years)
Married (Yes/No)
Max. Edu. Attained
Monthly Income
Primary Occupat -ion
Sec.Occ -upation
No. of days employed in a year
1. 2. 3. 4. 5. 6. 7. 8. 9. 10 11 12 13 14 15
1.6 Monthly Expenditure a. Food c. Recreation e. Transportation g. Clothes i. Rent k. Saving
in (Rs./Month) b. Education d. Drinking £ Loan Repayment h. Health j. telephone 1. Any other
Energy a. LPG b. Petrol c. Diesel d. Electricity e. Kerosene
f. Charcoal g. Fuel wood
Household Appliances: Refrigerator.....T.V.....A.C.... Stove Mixer/Grinder Computer Washing Machine..... Cooker.... Cooler.... Geyser... Microwave..... Solar cooker..... Tape recorder... Any other
2. Housing • Type of House: Detached Semi Detached/ Apartment/ Row Housing • Age of the house (in yrs.) • Physical Condition: Good/Livable/ Dilapidated • Ownership: Rented/ Owned/ Other • No. of rooms No. of floors • Finance: Bank! Self/ Ancestral/ Any other
3.1 Transportation: • Condition of the road: Metalled/ Non-metalled • Maintenance of road: Good/ Bad/ Worse/ Not Any • Vehicle Owned (No.): Cycle...; 2-wheeler ; 4-wheeler ; Any other
XIV
43. David Gibbs, (1994), Towards the Sustainable City, Town Planning Review, Vol. 65, No. 1.
44. Mike Kelly, Paul Selman and Andrew Gilg, (2004), Taking Sustainability Forward, Town Planning
Review, Vol. 75, No. 3.
45. M.L. Senior, C.J. Webster and N.E. Blank, (2004), Residential Preferences Versus Sustainable
Cities, Town Planning Review, Vol. 75, No. 3.
46. Ellen Van Bueren, Ernst ten Heuvelhof, (2005), Improving Governance Arrangements in Support
of Sustainable Cities, Environment and Planning Planning & Design, Vol. 32.
47. Alexi Danchev, (2005), Social Capital Influence on Sustainability of Development (Case Study of
Bulgaria), Sustainable Development, Vol. 13.
48. Melissa Marschke and Fikret Berkes, (2005), Local Level Sustainability Planning for Livelihood : A
Cambodian Experience, International Journal of Sustainable Development and World Ecology,
Vol. 12.
49. Geoffrey Lamberton, (2005), Sustainable Sufficiency — An Internally Consistent Version of
Sustainability, Sustainable Development, Vol. 13.
50. Subrata Chattopadhyay, (2005), Social Housing through Urban Re-adaption and Mixed Land Use
Pattern in Trentino, Italy, Spatio-Economic Devdelopment Record, Vol. 12, No. 3.
51. Jitender Pal, Sustaining Cuttack Urban Service Improvements : Wher, are the Levers? Nagarlok,
Vol. XXXVI, No. 3, July-September 2004.
52. A.K. Jain, (2001), Ecology and Natural Resource Management for Sustainable Development,
Management Publishing Co. Dehradun, India.
53. Antonia Layard, Simin Davoudi and Susan Batty, Planning for a Sustainable Future.
54. Adriana Allen, Nicholas You, Sustainable Urbanization, Bridging the Green and Brown Agendas.
55. Ramesh K. Arora, Rakesh Hooja, Shashi Mathur, Jaipur Profile of a Changing City.
xx.