a numerical methodology for lifetime estimation of hdpe pressure pipes
TRANSCRIPT
Engineering Fracture Mechanics 78 (2011) 3049–3058
Contents lists available at SciVerse ScienceDirect
Engineering Fracture Mechanics
journal homepage: www.elsevier .com/locate /engfracmech
A numerical methodology for lifetime estimation of HDPE pressure pipes
Pavel Hutar a,⇑, Martin Ševcík a,b, Luboš Náhlík a,b, Gerald Pinter c, Andreas Frank d,Ivaylo Mitev d
a Institute of Physics of Materials, Zizkova 22, 616 62 Brno, Czech Republicb Brno University of Technology, Technická 2, 616 69 Brno, Czech Republicc Montanuniversität Leoben, Otto Glöckel-Strasse 2, A-8700 Leoben, Austriad Polymer Competence Center Leoben GmbH, Roseggerstrasse 12, A-8700 Leoben, Austria
a r t i c l e i n f o
Article history:Received 1 December 2010Received in revised form 2 June 2011Accepted 5 September 2011
Keywords:Time to failure curveFracture mechanicsPE pipesCreep crack growthLifetime estimation
0013-7944/$ - see front matter � 2011 Elsevier Ltddoi:10.1016/j.engfracmech.2011.09.001
⇑ Corresponding author.E-mail address: [email protected] (P. Hutar).
a b s t r a c t
Using linear elastic fracture mechanics a new methodology for a lifetime assessment ofinternally pressurized polymer pipes was developed. The concept is based on the numer-ical calculation of stress intensity factors for pipes under different loading conditions incombination with experimentally determined creep crack growth kinetics. Comparisonof simulated lifetimes with experimental data from tests of internally pressurized pipesproved the principal applicability of the concept suggested. Major parameters affectingthe pipe lifetime are identified and discussed. Combination of the creep crack growth testsand numerical simulations can be a very powerful tool for lifetime estimation of plasticpipes under different loading conditions.
� 2011 Elsevier Ltd. All rights reserved.
1. Introduction
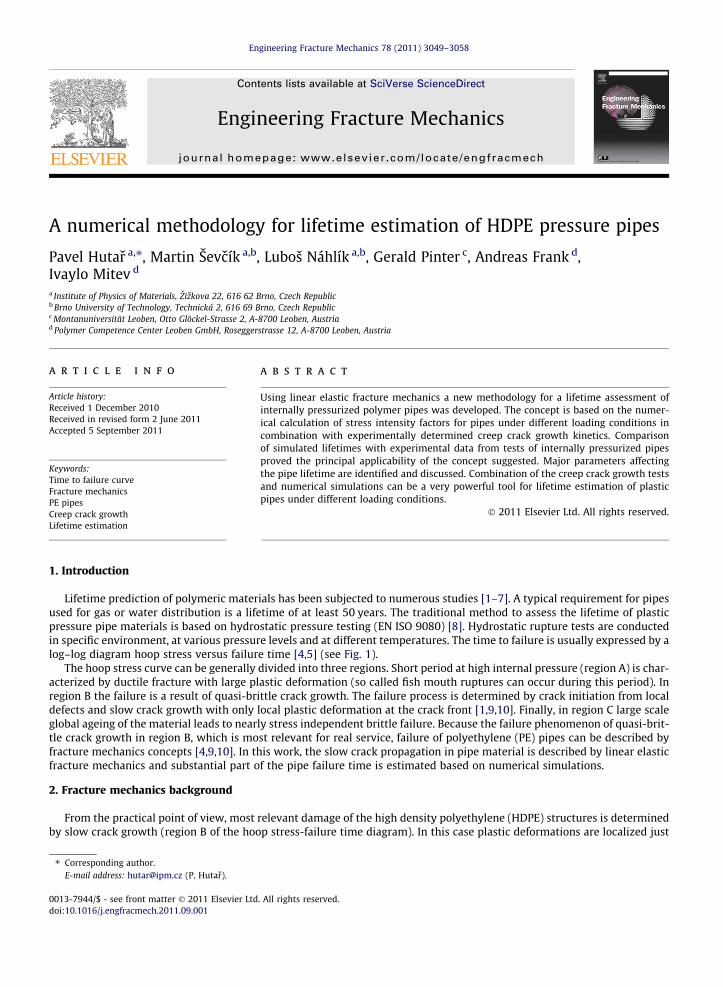
Lifetime prediction of polymeric materials has been subjected to numerous studies [1–7]. A typical requirement for pipesused for gas or water distribution is a lifetime of at least 50 years. The traditional method to assess the lifetime of plasticpressure pipe materials is based on hydrostatic pressure testing (EN ISO 9080) [8]. Hydrostatic rupture tests are conductedin specific environment, at various pressure levels and at different temperatures. The time to failure is usually expressed by alog–log diagram hoop stress versus failure time [4,5] (see Fig. 1).
The hoop stress curve can be generally divided into three regions. Short period at high internal pressure (region A) is char-acterized by ductile fracture with large plastic deformation (so called fish mouth ruptures can occur during this period). Inregion B the failure is a result of quasi-brittle crack growth. The failure process is determined by crack initiation from localdefects and slow crack growth with only local plastic deformation at the crack front [1,9,10]. Finally, in region C large scaleglobal ageing of the material leads to nearly stress independent brittle failure. Because the failure phenomenon of quasi-brit-tle crack growth in region B, which is most relevant for real service, failure of polyethylene (PE) pipes can be described byfracture mechanics concepts [4,9,10]. In this work, the slow crack propagation in pipe material is described by linear elasticfracture mechanics and substantial part of the pipe failure time is estimated based on numerical simulations.
2. Fracture mechanics background
From the practical point of view, most relevant damage of the high density polyethylene (HDPE) structures is determinedby slow crack growth (region B of the hoop stress-failure time diagram). In this case plastic deformations are localized just
. All rights reserved.
Nomenclature
a crack lengtha0 initial crack lengthaf final crack lengthA, m material parameters describing creep crack kineticsb crack widthd outer diameter of the pipeda/dt creep crack propagation rateKI stress intensity factorKIC fracture toughnessKIint stress intensity factor of the crack in internally pressured pipeKIex stress intensity factor of the crack in externally pressured pipeKIth threshold value of stress intensity factorpex external pressurepint internal pressures pipe wall thicknesstf time to failureYða=sÞ geometric factorYexða=sÞ geometric factor of the pipe loaded by external pressurer applied stressrhoop hoop stress
Fig. 1. Scheme of the failure behavior of pressurized PE pipes.
3050 P. Hutar et al. / Engineering Fracture Mechanics 78 (2011) 3049–3058
around the crack front and small scale yielding conditions are usually valid. Due to this fact linear elastic fracture mechanics(LEFM) can be used for description of the stress field around the crack tip, which is accepted also in the relevant literature[4,7,9,11,12]. In LEFM the stress distribution near the crack tip is described by the stress intensity factor K which is a functionof the external loading, geometry of structure and geometry of the crack. The value of the stress intensity factor for loadingmode I is usually expressed as [13]:
KI ¼ rffiffiffiffiffiffipap
Yða=sÞ; ð1Þ
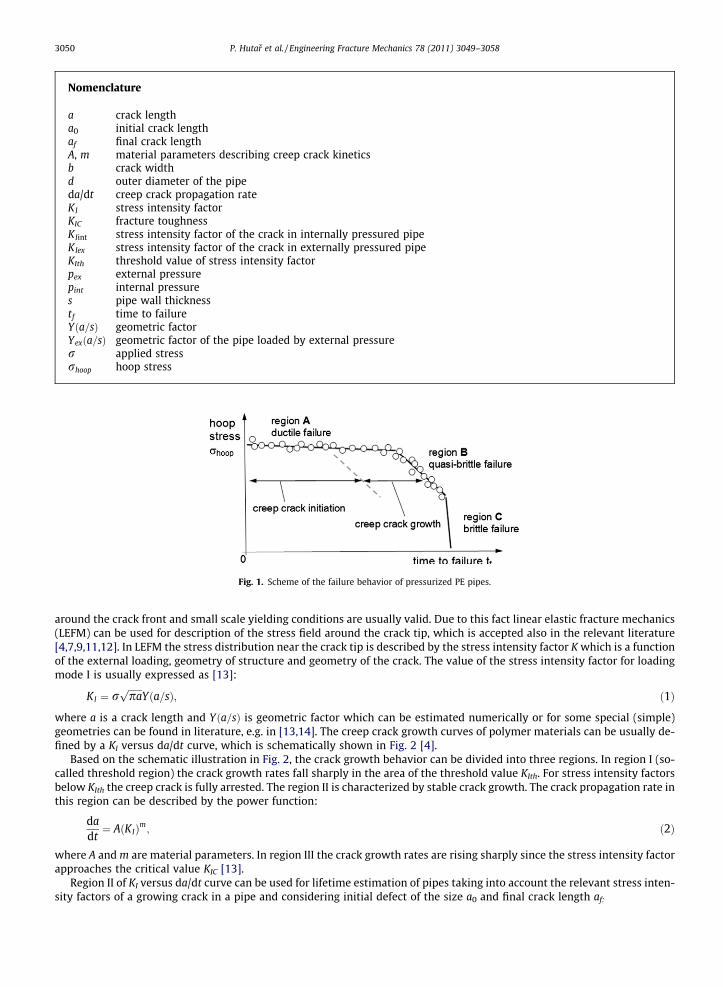
where a is a crack length and Yða=sÞ is geometric factor which can be estimated numerically or for some special (simple)geometries can be found in literature, e.g. in [13,14]. The creep crack growth curves of polymer materials can be usually de-fined by a KI versus da/dt curve, which is schematically shown in Fig. 2 [4].
Based on the schematic illustration in Fig. 2, the crack growth behavior can be divided into three regions. In region I (so-called threshold region) the crack growth rates fall sharply in the area of the threshold value KIth. For stress intensity factorsbelow KIth the creep crack is fully arrested. The region II is characterized by stable crack growth. The crack propagation rate inthis region can be described by the power function:
dadt¼ AðKIÞm; ð2Þ
where A and m are material parameters. In region III the crack growth rates are rising sharply since the stress intensity factorapproaches the critical value KIC [13].
Region II of KI versus da/dt curve can be used for lifetime estimation of pipes taking into account the relevant stress inten-sity factors of a growing crack in a pipe and considering initial defect of the size a0 and final crack length af:
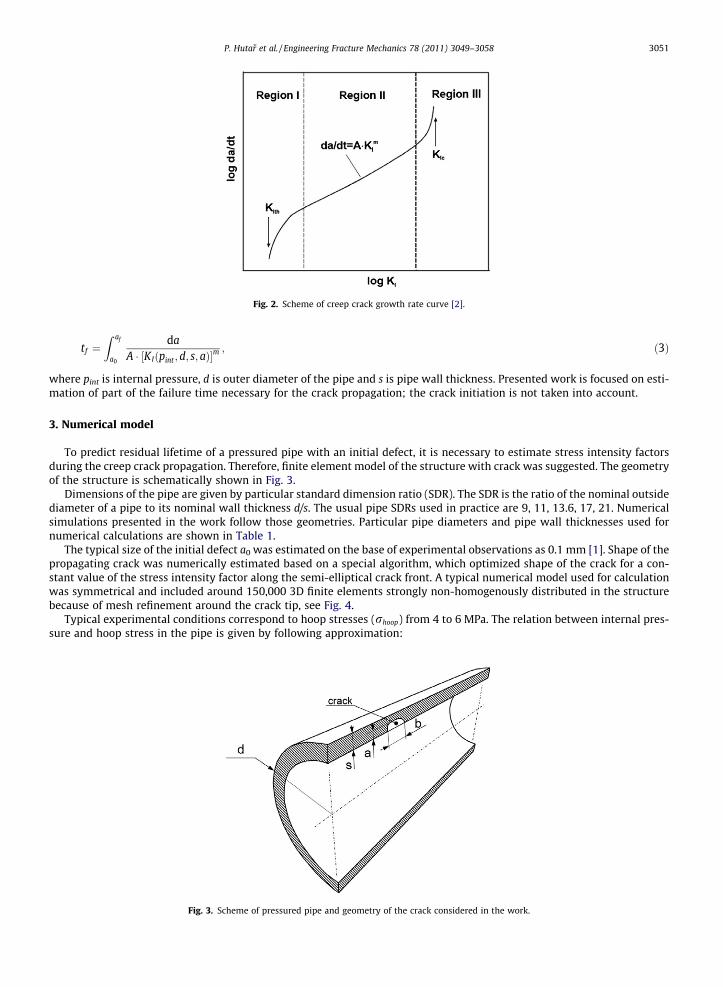
Fig. 2. Scheme of creep crack growth rate curve [2].
P. Hutar et al. / Engineering Fracture Mechanics 78 (2011) 3049–3058 3051
tf ¼Z af
a0
daA � ½KIðpint;d; s; aÞ�
m ; ð3Þ
where pint is internal pressure, d is outer diameter of the pipe and s is pipe wall thickness. Presented work is focused on esti-mation of part of the failure time necessary for the crack propagation; the crack initiation is not taken into account.
3. Numerical model
To predict residual lifetime of a pressured pipe with an initial defect, it is necessary to estimate stress intensity factorsduring the creep crack propagation. Therefore, finite element model of the structure with crack was suggested. The geometryof the structure is schematically shown in Fig. 3.
Dimensions of the pipe are given by particular standard dimension ratio (SDR). The SDR is the ratio of the nominal outsidediameter of a pipe to its nominal wall thickness d/s. The usual pipe SDRs used in practice are 9, 11, 13.6, 17, 21. Numericalsimulations presented in the work follow those geometries. Particular pipe diameters and pipe wall thicknesses used fornumerical calculations are shown in Table 1.
The typical size of the initial defect a0 was estimated on the base of experimental observations as 0.1 mm [1]. Shape of thepropagating crack was numerically estimated based on a special algorithm, which optimized shape of the crack for a con-stant value of the stress intensity factor along the semi-elliptical crack front. A typical numerical model used for calculationwas symmetrical and included around 150,000 3D finite elements strongly non-homogenously distributed in the structurebecause of mesh refinement around the crack tip, see Fig. 4.
Typical experimental conditions correspond to hoop stresses (rhoop) from 4 to 6 MPa. The relation between internal pres-sure and hoop stress in the pipe is given by following approximation:
Fig. 3. Scheme of pressured pipe and geometry of the crack considered in the work.
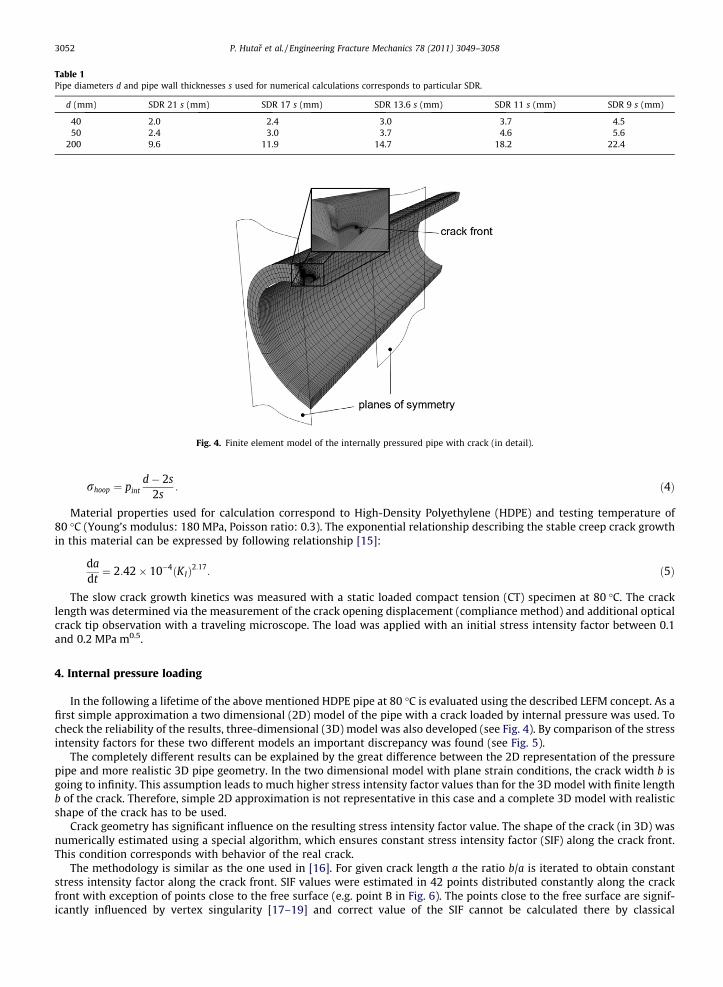
Table 1Pipe diameters d and pipe wall thicknesses s used for numerical calculations corresponds to particular SDR.
d (mm) SDR 21 s (mm) SDR 17 s (mm) SDR 13.6 s (mm) SDR 11 s (mm) SDR 9 s (mm)
40 2.0 2.4 3.0 3.7 4.550 2.4 3.0 3.7 4.6 5.6
200 9.6 11.9 14.7 18.2 22.4
Fig. 4. Finite element model of the internally pressured pipe with crack (in detail).
3052 P. Hutar et al. / Engineering Fracture Mechanics 78 (2011) 3049–3058
rhoop ¼ pintd� 2s
2s: ð4Þ
Material properties used for calculation correspond to High-Density Polyethylene (HDPE) and testing temperature of80 �C (Young’s modulus: 180 MPa, Poisson ratio: 0.3). The exponential relationship describing the stable creep crack growthin this material can be expressed by following relationship [15]:
dadt¼ 2:42� 10�4ðKIÞ2:17
: ð5Þ
The slow crack growth kinetics was measured with a static loaded compact tension (CT) specimen at 80 �C. The cracklength was determined via the measurement of the crack opening displacement (compliance method) and additional opticalcrack tip observation with a traveling microscope. The load was applied with an initial stress intensity factor between 0.1and 0.2 MPa m0.5.
4. Internal pressure loading
In the following a lifetime of the above mentioned HDPE pipe at 80 �C is evaluated using the described LEFM concept. As afirst simple approximation a two dimensional (2D) model of the pipe with a crack loaded by internal pressure was used. Tocheck the reliability of the results, three-dimensional (3D) model was also developed (see Fig. 4). By comparison of the stressintensity factors for these two different models an important discrepancy was found (see Fig. 5).
The completely different results can be explained by the great difference between the 2D representation of the pressurepipe and more realistic 3D pipe geometry. In the two dimensional model with plane strain conditions, the crack width b isgoing to infinity. This assumption leads to much higher stress intensity factor values than for the 3D model with finite lengthb of the crack. Therefore, simple 2D approximation is not representative in this case and a complete 3D model with realisticshape of the crack has to be used.
Crack geometry has significant influence on the resulting stress intensity factor value. The shape of the crack (in 3D) wasnumerically estimated using a special algorithm, which ensures constant stress intensity factor (SIF) along the crack front.This condition corresponds with behavior of the real crack.
The methodology is similar as the one used in [16]. For given crack length a the ratio b/a is iterated to obtain constantstress intensity factor along the crack front. SIF values were estimated in 42 points distributed constantly along the crackfront with exception of points close to the free surface (e.g. point B in Fig. 6). The points close to the free surface are signif-icantly influenced by vertex singularity [17–19] and correct value of the SIF cannot be calculated there by classical
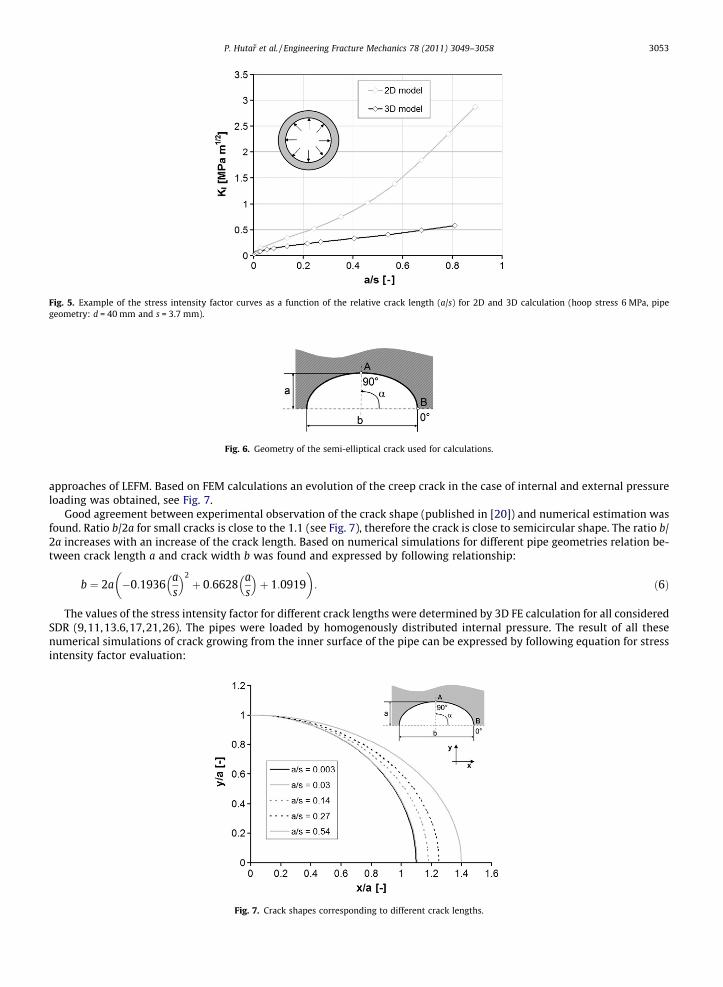
Fig. 5. Example of the stress intensity factor curves as a function of the relative crack length (a/s) for 2D and 3D calculation (hoop stress 6 MPa, pipegeometry: d = 40 mm and s = 3.7 mm).
Fig. 6. Geometry of the semi-elliptical crack used for calculations.
P. Hutar et al. / Engineering Fracture Mechanics 78 (2011) 3049–3058 3053
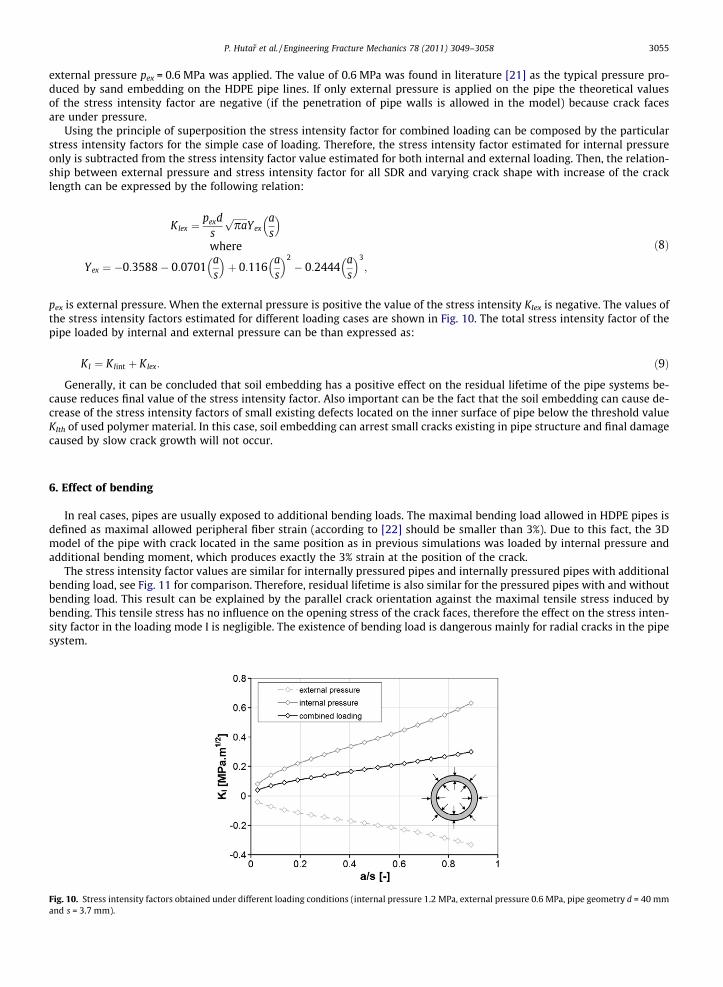
approaches of LEFM. Based on FEM calculations an evolution of the creep crack in the case of internal and external pressureloading was obtained, see Fig. 7.
Good agreement between experimental observation of the crack shape (published in [20]) and numerical estimation wasfound. Ratio b/2a for small cracks is close to the 1.1 (see Fig. 7), therefore the crack is close to semicircular shape. The ratio b/2a increases with an increase of the crack length. Based on numerical simulations for different pipe geometries relation be-tween crack length a and crack width b was found and expressed by following relationship:
b ¼ 2a �0:1936as
� �2þ 0:6628
as
� �þ 1:0919
� �: ð6Þ
The values of the stress intensity factor for different crack lengths were determined by 3D FE calculation for all consideredSDR (9,11,13.6,17,21,26). The pipes were loaded by homogenously distributed internal pressure. The result of all thesenumerical simulations of crack growing from the inner surface of the pipe can be expressed by following equation for stressintensity factor evaluation:
Fig. 7. Crack shapes corresponding to different crack lengths.
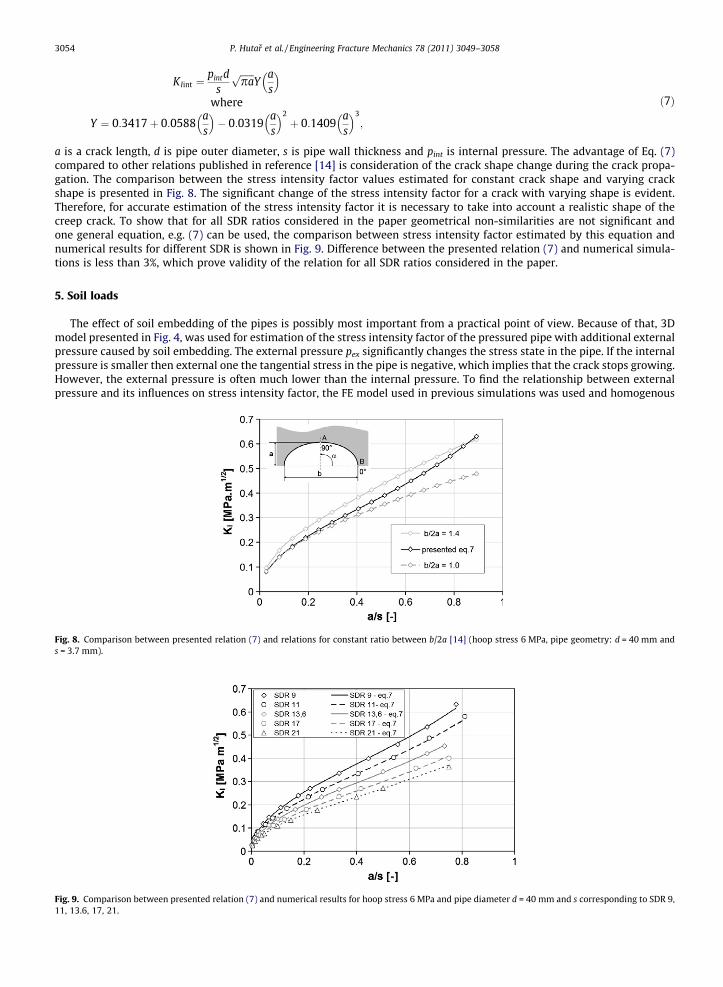
Fig. 8.s = 3.7 m
Fig. 9.11, 13.6
3054 P. Hutar et al. / Engineering Fracture Mechanics 78 (2011) 3049–3058
KIint ¼pintd
s
ffiffiffiffiffiffipap
Yas
� �where
Y ¼ 0:3417þ 0:0588as
� �� 0:0319
as
� �2þ 0:1409
as
� �3;
ð7Þ
a is a crack length, d is pipe outer diameter, s is pipe wall thickness and pint is internal pressure. The advantage of Eq. (7)compared to other relations published in reference [14] is consideration of the crack shape change during the crack propa-gation. The comparison between the stress intensity factor values estimated for constant crack shape and varying crackshape is presented in Fig. 8. The significant change of the stress intensity factor for a crack with varying shape is evident.Therefore, for accurate estimation of the stress intensity factor it is necessary to take into account a realistic shape of thecreep crack. To show that for all SDR ratios considered in the paper geometrical non-similarities are not significant andone general equation, e.g. (7) can be used, the comparison between stress intensity factor estimated by this equation andnumerical results for different SDR is shown in Fig. 9. Difference between the presented relation (7) and numerical simula-tions is less than 3%, which prove validity of the relation for all SDR ratios considered in the paper.
5. Soil loads
The effect of soil embedding of the pipes is possibly most important from a practical point of view. Because of that, 3Dmodel presented in Fig. 4, was used for estimation of the stress intensity factor of the pressured pipe with additional externalpressure caused by soil embedding. The external pressure pex significantly changes the stress state in the pipe. If the internalpressure is smaller then external one the tangential stress in the pipe is negative, which implies that the crack stops growing.However, the external pressure is often much lower than the internal pressure. To find the relationship between externalpressure and its influences on stress intensity factor, the FE model used in previous simulations was used and homogenous
Comparison between presented relation (7) and relations for constant ratio between b/2a [14] (hoop stress 6 MPa, pipe geometry: d = 40 mm andm).
Comparison between presented relation (7) and numerical results for hoop stress 6 MPa and pipe diameter d = 40 mm and s corresponding to SDR 9,, 17, 21.
P. Hutar et al. / Engineering Fracture Mechanics 78 (2011) 3049–3058 3055
external pressure pex = 0.6 MPa was applied. The value of 0.6 MPa was found in literature [21] as the typical pressure pro-duced by sand embedding on the HDPE pipe lines. If only external pressure is applied on the pipe the theoretical valuesof the stress intensity factor are negative (if the penetration of pipe walls is allowed in the model) because crack facesare under pressure.
Using the principle of superposition the stress intensity factor for combined loading can be composed by the particularstress intensity factors for the simple case of loading. Therefore, the stress intensity factor estimated for internal pressureonly is subtracted from the stress intensity factor value estimated for both internal and external loading. Then, the relation-ship between external pressure and stress intensity factor for all SDR and varying crack shape with increase of the cracklength can be expressed by the following relation:
Fig. 10.and s =
KIex ¼pexd
s
ffiffiffiffiffiffipap
Yexas
� �where
Yex ¼ �0:3588� 0:0701as
� �þ 0:116
as
� �2� 0:2444
as
� �3;
ð8Þ
pex is external pressure. When the external pressure is positive the value of the stress intensity KIex is negative. The values ofthe stress intensity factors estimated for different loading cases are shown in Fig. 10. The total stress intensity factor of thepipe loaded by internal and external pressure can be than expressed as:
KI ¼ KIint þ KIex: ð9Þ
Generally, it can be concluded that soil embedding has a positive effect on the residual lifetime of the pipe systems be-cause reduces final value of the stress intensity factor. Also important can be the fact that the soil embedding can cause de-crease of the stress intensity factors of small existing defects located on the inner surface of pipe below the threshold valueKIth of used polymer material. In this case, soil embedding can arrest small cracks existing in pipe structure and final damagecaused by slow crack growth will not occur.
6. Effect of bending
In real cases, pipes are usually exposed to additional bending loads. The maximal bending load allowed in HDPE pipes isdefined as maximal allowed peripheral fiber strain (according to [22] should be smaller than 3%). Due to this fact, the 3Dmodel of the pipe with crack located in the same position as in previous simulations was loaded by internal pressure andadditional bending moment, which produces exactly the 3% strain at the position of the crack.
The stress intensity factor values are similar for internally pressured pipes and internally pressured pipes with additionalbending load, see Fig. 11 for comparison. Therefore, residual lifetime is also similar for the pressured pipes with and withoutbending load. This result can be explained by the parallel crack orientation against the maximal tensile stress induced bybending. This tensile stress has no influence on the opening stress of the crack faces, therefore the effect on the stress inten-sity factor in the loading mode I is negligible. The existence of bending load is dangerous mainly for radial cracks in the pipesystem.
Stress intensity factors obtained under different loading conditions (internal pressure 1.2 MPa, external pressure 0.6 MPa, pipe geometry d = 40 mm3.7 mm).
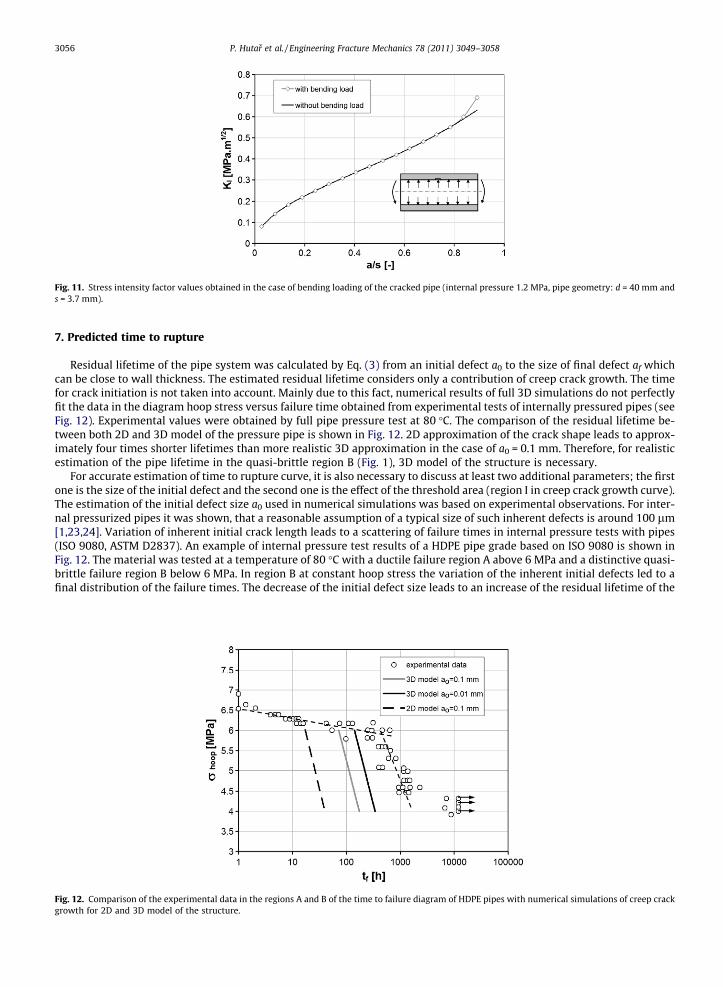
Fig. 11. Stress intensity factor values obtained in the case of bending loading of the cracked pipe (internal pressure 1.2 MPa, pipe geometry: d = 40 mm ands = 3.7 mm).
3056 P. Hutar et al. / Engineering Fracture Mechanics 78 (2011) 3049–3058
7. Predicted time to rupture
Residual lifetime of the pipe system was calculated by Eq. (3) from an initial defect a0 to the size of final defect af whichcan be close to wall thickness. The estimated residual lifetime considers only a contribution of creep crack growth. The timefor crack initiation is not taken into account. Mainly due to this fact, numerical results of full 3D simulations do not perfectlyfit the data in the diagram hoop stress versus failure time obtained from experimental tests of internally pressured pipes (seeFig. 12). Experimental values were obtained by full pipe pressure test at 80 �C. The comparison of the residual lifetime be-tween both 2D and 3D model of the pressure pipe is shown in Fig. 12. 2D approximation of the crack shape leads to approx-imately four times shorter lifetimes than more realistic 3D approximation in the case of a0 = 0.1 mm. Therefore, for realisticestimation of the pipe lifetime in the quasi-brittle region B (Fig. 1), 3D model of the structure is necessary.
For accurate estimation of time to rupture curve, it is also necessary to discuss at least two additional parameters; the firstone is the size of the initial defect and the second one is the effect of the threshold area (region I in creep crack growth curve).The estimation of the initial defect size a0 used in numerical simulations was based on experimental observations. For inter-nal pressurized pipes it was shown, that a reasonable assumption of a typical size of such inherent defects is around 100 lm[1,23,24]. Variation of inherent initial crack length leads to a scattering of failure times in internal pressure tests with pipes(ISO 9080, ASTM D2837). An example of internal pressure test results of a HDPE pipe grade based on ISO 9080 is shown inFig. 12. The material was tested at a temperature of 80 �C with a ductile failure region A above 6 MPa and a distinctive quasi-brittle failure region B below 6 MPa. In region B at constant hoop stress the variation of the inherent initial defects led to afinal distribution of the failure times. The decrease of the initial defect size leads to an increase of the residual lifetime of the
Fig. 12. Comparison of the experimental data in the regions A and B of the time to failure diagram of HDPE pipes with numerical simulations of creep crackgrowth for 2D and 3D model of the structure.
P. Hutar et al. / Engineering Fracture Mechanics 78 (2011) 3049–3058 3057
pipe structure. It is shown in Fig. 12, where lifetime is estimated for initial defect size a0 = 0.1 mm and a0 = 0.01 mm. Thischange of the initial defect size leads to the double lifetime of the pipe in this case.
The second important phenomenon is the decrease of the creep crack growth rates close to the threshold values and theeffect of the threshold itself. Unfortunately, from the experimental data of our particular material it is nearly impossible toestimate the threshold value of the stress intensity factor. The influence of the threshold region can be significant. The strongdecrease of the creep crack growth rate close to threshold value (see Fig. 2) leads to higher residual lifetime. The influence ofthe threshold values for the creep crack growth rate can be expressed by some modified relationship, which takes into ac-count creep crack grow rate decrease close to threshold, see e.g.
dadt¼ A Km
I � KmIth
� �; ð10Þ
where KIth is a threshold value of the stress intensity factor. Then residual lifetime of the structure can be calculated by inte-gration of the Eq. (10). Eq. (10) is just example of relation taking into account threshold values. For practical calculations, thebest choice is equation which well fit particular experimental data represented by means of Fig. 2.
Despite of these problematic points, a new approach that combines numerically determined lifetime of pressured pipesobtained by calculations based on linear elastic fracture mechanics with experimentally determined fracture parameters ofthe polymer materials can help to fast and realistic estimation of the time to rupture curve for particular loading configu-ration of the pipe.
8. Conclusions
In this work damage of the HDPE pipes caused by slow crack growth was numerically studied under various loading con-ditions. The realistic crack shape was considered in FE simulations. An approach that combines numerical calculations of life-time of pressured pipes with fracture mechanics testing of the polymer materials was introduced. In a case study theestimated lifetimes were compared with experimental results obtained from tests of internally pressured pipes. The mainconclusions can be summarized as follows:
– The stress intensity factor estimated using 2D simulation cannot correctly represent cracked pipe structure. Values of thestress intensity factors computed for 2D model are much higher than the values obtained in the case of 3D simulationwith realistic geometry of the crack.
– The crack geometry was found to be significant for pipe lifetime estimation. A special algorithm, which optimized thecrack front shape during simulation of crack propagation, was developed. Under assumption that cracks growth is con-trolled by stress intensity factor. Presented algorithm controls constant value of the stress intensity factor along the crackfront of propagating crack.
– General equations for an estimation of the stress intensity factor of plastic pipes loaded by internal or external pressurewith varying crack shape during crack propagation were presented. These formulas are valid for all standard SDR and canhelp to compute residual lifetime of the pressure pipes without complicated and time consuming finite elementmodeling.
– Essential parameters affecting the simulated lifetimes were identified (initial defect size, near threshold crack growth,etc.) and implementation of selected additional loads (soil loads, bending) into the model and lifetime assessment wassuccessful.
– It was found that homogenous soil embedding has a positive effect on the residual lifetime of the pipe systems, becauseexternal pressure significantly changes the stress state in the pipe. External pressure induces negative tangential stress,which can significantly reduce the value of stress intensity factor (or crack driving force) controlled by internal pressure.
– In the case of additional bending loads, the maximum tensile stress induced by the bending is parallel to the crack geom-etry and the effect on the stress intensity factor in the loading mode I is negligible. This effect is important and can bedangerous mainly for radial cracks in pipe systems.
The results presented can help for simpler designing and testing of the HDPE pressure pipes.
Acknowledgements
The research presented was performed at the Academy of Sciences of the Czech Republic and Polymer Competence CenterLeoben GmbH (PCCL, Austria) within the framework of the Kplus-program of the Austrian Ministry of Traffic, Innovation andTechnology with contributions by the University of Leoben, AGRU Kunststofftechnik GmbH (Austria), Borealis PolyolefineGmbH (Austria), OMV Exploration & Production GmbH (Austria), Österreichische Vereinigung für das Gas und Wasserfach(Austria) and SABIC Europe (Netherlands). The PCCL is funded by the Austrian Government and the State Governments ofStyria and Upper Austria. The work was also supported through the grants Nos. 101/09/J027 and 106/09/0279 of the CzechScience Foundation.
3058 P. Hutar et al. / Engineering Fracture Mechanics 78 (2011) 3049–3058
References
[1] Lang RW, Stern A, Doerner G. Applicability and limitations of current lifetime prediction models for thermoplastics pipes under internal pressure. DieAngewandte Makromolekulare Chemie 1997;247:131–45.
[2] Lang RW, Pinter G, Balika W. A Novel qualification concept for lifetime and safety assessment of PE pressure pipes for arbitrary installationconditions. Washington (DC, USA): Plastics Pipes XIII; 2006.
[3] Khelif R, Chateauneuf A, Chaoui K. Reliability-based assessment of polyethylene pipe creep lifetime. Int J Press Vessels Pip 2007;84:697–707.[4] Frank A, Pinter G, Lang RW. Prediction of the remaining lifetime of polyethylene pipes after up to 30 years in use. Polym Test 2009;28:737–45.[5] Hoang EM, Lowe D. Lifetime prediction of a blue PE100 water pipe. Polym Degrad Stab 2008;93:1496–503.[6] Krishnaswamy Rajendra K. Analysis of ductile and brittle failures from creep rupture testing of high-density polyethylene (HDPE) pipes. Polymer
2005;46(26):11664–72.[7] Andena L, Rink M, Frassine R, Corrieri R. A fracture mechanics approach for the prediction of the failure time of polybutene pipes. Engng Fract Mech
2009;76(/18):2666–77.[8] EN ISO 9080. Plastics piping and ducting systems – determination of the long-term hydrostatic strength of thermoplastics materials in pipe form by
extrapolation; 2003.[9] Frank A, Freimann W, Pinter G, Lang RW. A fracture mechanics concept for the accelerated characterization of creep crack growth in PE-HD pipe grades.
Engng Fract Mech 2009;76(/18):2780–7.[10] Janson LE. Plastic pipes for water supply and sewage disposal. Stockholm: Borealis; 1999.[11] Lu X, Brown N. A test for slow crack growth failure in polyethylene under a constant load. Polym Test 1992;11:309–19.[12] Brostow W, Fleissner M, Miller WF. Slow crack propagation in polyethylene: determination and prediction. Polymer 1991;32:419–25.[13] Anderson TL. Fracture mechanics–fundamentals and application. Boca Raton (Florida, USA): CRC Press Inc.; 1991.[14] Murakami Y. Stress intensity factors handbook, vol. 1–5. Pergamon Press; 1987.[15] Stern A. Fracture mechanical characterization of the long-term behavior of polymers under static loads. Doctoral dissertation, Austria: University of
Leoben; 1995.[16] Zhi Xue Wu. Shape prediction of fatigue crack based on a given stress intensity factor distribution. Key Engng Mater 2007;19:353–8.[17] Bazant ZP, Estenssoro LF. Surface singularity and crack propagation. Int J Solids Struct 1979;15:405–26.[18] Pook LP. Some implications of corner point singularities. Fract Mech 1994;48:367–78.[19] Hutar P, Nahlik L, Knesl Z. Quantification of the influence of vertex singularities on fatigue crack behaviour. Comput Mater Sci 2009;45:653–7.[20] Barker MB, Bowman J, Bevis M. The performance and causes of failure of polyethylene pipes subjected to constant and fluctuating internal pressure
loadings. J Mater Sci 1983;18:1095–118.[21] Kiesselbach G, Finzel W. PE-Rohrleitungssysteme in der Gas- und Wasserversorgung. 3R Int 1997;36:136–42.[22] ÖVGW Richtlinie G52. Bau von Gasrohrleitungen aus Kunststoff Teil 2 – Rohre aus PE; 2001.[23] Gray A, Mallinson JN, Price JB. Fracture behavior of polyethylene pipes. Plast Rub Proc Appl 1981;1:51–3.[24] Brown N. Intrinsic lifetime of polyethylene pipelines. Polym Engng Sci 2007;47:477–80.