a new cost management system for construction projects to
TRANSCRIPT
Revista de Contabilidad Spanish Accounting Review 24 (1) (2021) 31-47
REVISTA DE CONTABILIDAD
SPANISH ACCOUNTING REVIEW
revistas.um.es/rcsar
A New Cost Management System for Construction Projects to increaseCompetitiveness and Traceability in a Project Environment
Hossein Toosi a, Arezou Chamikarpour a, b
a) Asistant Professor, Construction and Project Management Department, School of Architecture, University of Tehran. Tehran, Iran.b) Master of Construction and Project Management, Pars University. Tehran, Iran.
bCorresponding author.E-mail address: [email protected]
A R T I C L E I N F O
Article history:Received 11 January 2019Accepted 17 September 2019Available online 1 January 2021
JEL classification:D24M11L74
Keywords:Construction Projects EnvironmentProject Cost ManagementPerformance Focused Activity Based CostingProject Overhead CostCompetitive Cost
A B S T R A C T
This research proposed a new method for project cost management based on Competitiveness and traceab-ility in a case study and operational situation. The research hypothesis is based on the synergistic abilityof performance focused activity based costing in combination of the target costing method for encouragingcompetitiveness cost control system for project environments. The method was developed to control, directand overhead costs of the project during its progress. Also, it uses the feature of activity-driven and differentresource drivers to determine the types of costs with the effect of time driver for each activity. An interviewwas conducted with financial managers during two to four times with the aim of validating and modify-ing the method. According to a semi-structured interview, the proposed method contributed to increasethe precision, certainty, traceability of costs and provided the integrity of the accounting, technical andoperational system. It also analyzes deviations and reduces costs by considering competitive and strategicconditions. Its also limiting the target cost of work packages and causing an alarm on the completion ofeach. According to Friedman test, there is a meaningful competitive ability compared to the conventionalcost control method in the projects and it is also implemented in a case study.
©2021 ASEPUC. Published by EDITUM - Universidad de Murcia. This is an open access article under theCC BY-NC-ND license (http://creativecommons.org/licenses/by-nc-nd/4.0/).
Códigos JEL:D24M11L74
Palabras clave:Entorno de los proyectos de construcciónGestión de los costes de los proyectosCálculo de costes por actividades centradoen el rendimientoGastos generales de los proyectosCostes competitivos
Un nuevo sistema de gestión de costes de proyectos de construcción paraaumentar la competitividad y la trazabilidad para entornos de proyectos
R E S U M E N
El objetivo principal de la investigación es utilizar nuevos métodos de cálculo de costes en los proyectosde construcción para reducir y controlar las desviaciones de costes y algunas limitaciones que presentanlos modelos tradicionales. La hipótesis de la investigación se basa en la capacidad sinérgica del cálculo decostes basado en actividades centradas en el rendimiento, en combinación con el método de cálculo decostes objetivo para fomentar la competitividad del sistema de control de costes para entornos de proyectos.El método se elaboró para controlar los gastos directos y generales del proyecto durante su ejecución.Se realizó una entrevista con 26 directores financieros en dos o cuatro ocasiones entre junio de 2016 ymayo de 2017 con el fin de validar y modificar el método. Siguiendo una entrevista semiestructurada, elmétodo propuesto contribuyó a aumentar la precisión, la certidumbre y la rastreabilidad de los costes yproporcionó la integridad del sistema contable, técnico y operacional. Además, se analizan las desviacionesy se reducen los costes al considerar las condiciones competitivas y estratégicas. También se limita elcoste objetivo de los paquetes de trabajo y se genera una alerta al finalizar cada uno de ellos. Además,de acuerdo con el test de Friedman, existe una capacidad competitiva significativa en comparación con elmétodo convencional de control de costes en los proyectos y también se aplica en un estudio de caso.
©2021 ASEPUC. Publicado por EDITUM - Universidad de Murcia. Este es un artículo Open Access bajo lalicencia CC BY-NC-ND (http://creativecommons.org/licenses/by-nc-nd/4.0/).
https://www.doi.org/10.6018/rcsar.357961©2021 ASEPUC. Published by EDITUM - Universidad de Murcia. This is an open access article under the CC BY-NC-ND license (http://creativecommons.org/licenses/by-nc-nd/4.0/).
32 H. Toosi, A. Chamikarpour / Revista de Contabilidad Spanish Accounting Review 24 (1)(2021) 31-47
1. Introduction
Cost management in construction projects is important sothat sometimes the success of the project is measured onlyby the cost criterion (Keisala, 2009). According to a studyconducted in Qatar between 2000 and 2013, the cost overrunwas about 54% (Senoucia, Ismailb & Eldina, 2016).
One of the growing demands of companies is the recogni-tion of cost and cost drivers and cost-driver behaviors. Theindirect or overhead costs of the project are between 8% and15% of total construction costs, which depends on the com-plexity of the project, where it can grow at a faster rate thandirect costs. Large construction firms had a significant in-crease over 77% in overhead costs of the project and 9.8%unchanged and only 3.2% down (Jaya, 2013). Typically, thecost of construction projects is controlled by the accountingdepartment, and due to the time interval in the accountingoperation, there is a late reaction to circumstances. Also,the control of the Construction performance and cost and ac-counting have different and separate processes, and there isno integrated approach (Keisala, 2009).
Management accounting with strategic position leads tomore accurate cost accounting and increases the organiza-tion’s performance (Macinati & Pessina, 2014) (Uyar & Kuzey,2016). Unlike traditional retrospective accounting, manage-ment accounting is forward-looking and aimed at predictingthe future and it helps managers to make operational andstrategic decisions (Bai & Krishnan, 2012). In the traditionalsystem Because of the limited feedback and lack reasonabletime to make decisions, management controls are late andlimited, and there is no integrity between the financial in-formation and the various information systems of the organ-ization (Castro Silva, Rocha & Oliveira Melo, 2014).
In the traditional approach, the costs with a direct impacton time are ignored, and since time lags have a significantnegative impact on costs in construction projects, the separ-ation of cost control and scheduling has made it difficult tocontrol the entire project cost, and time lags can easily lead tocost overrun (Shirowzhan, Shanaki, Sebt & Toosi, 2016). An-other issue we face with cost accounting is the lack of correl-ation between cost and performance systems (Uyar & Kuzey,2016).
Competition in the construction industry is mainly shownat competitive prices (Tang, Zhang, Tang & Chen, 2015). Incost accounting does not set the target cost for each work-package. Also, the inability to track total costs and noting thepermissible target cost by the system (Uyar & Kuzey, 2016).
The purpose of the research is to provide a cost controlsystem for construction projects based on activity based cost-ing and the target costing in order to increase competitive-ness, accuracy, certainty and optimal management of over-head costs, profitability, continuous cost reduction and timelydecision making.
2. Literature review
2.1. Problem statement: Cost Management Constraints inConstruction Projects
Construction costs include direct and indirect costs. Directcosts include materials, manpower and equipment directlyinvolved in construction and indirect costs are costs that canbe set for a specific project, but cannot be determined for aspecific part of the project, such as supervision, etc. (Singh& Taam, 2008). According to the PMBOK guide, cost man-agement includes planning, estimating, budgeting, financing,
fundraising, managing and controlling costs so that the pro-ject can be completed with a budget approved. In fact, costmanagement is a set of steps that management takes to en-sure more satisfaction and continuous control and cost re-duction. The emphasis of cost management systems is oncompany activities (Jaya, 2013).
In the traditional system, there is no causal relationshipbetween costs and activities and components of work, alsocategories are based on consumed resources rather than usercomponents and activities. Also, overhead costs are fixed atan expense and don’t have a causal relationship with con-struction activities, and there is little insight into the cost de-viations (Reddy, Venter & Olivier, 2012). On the other hand,most executives do not have an understanding of accountingreports because they are highly analytical and not related toservices and products (Castro Silva et al., 2014). For fourdecades, the earned value management has been used to pre-dict and control the cost. Tools and techniques for managingand controlling costs, such as earned value management, de-scribe cost performance based on earned value (EV), plannedvalue (PV), cost performance index (CPI), cost variance (CV)parameters. In this system, work breakdown structure (WBS)is used as a basic step to plan work. Along with the workbreakdown structure, it uses organizational breakdown struc-ture (OBS) and then allocates organizational responsibilitiesto project works.
The Earned Value Management (EVM) system has inher-ent limitations that the past data are considered to be thebest available information and also has many uncertainties atthe early stages. Cost control and estimation and budgetingof remaining works are obtained based on past performanceindicators, which can result in inaccuracies. Based on theearned values indicators, the cost deviation of each activityand project can be calculated for direct costs, and the man-agement, by examining any activity or accounting reports,can identifies roots and causes of the deviations. However,it takes time to review several reports with different controland accounting frameworks with their relation to physicalprogress. Regarding the EVM system, indirect costs is relat-ing to routine activities that cannot be specifically identifiedand interconnected between them and specific activities andprojects, and indirect costs must be budgeted and controlledseparately at the operational level or organizational manage-ment, and costs indirectly managed in overhead caches thatare typically based on the organization’s accounting process(Alberto & Narbaev, 2013).
2.2. The target costing in construction projects
Target costing is a fundamental and effective tool for man-aging costs and reducing the cost of products. The targetcosting method is just the opposite of the traditional costingmethod and starts with sales prices. This method helps organ-izations to accurately cost estimate and reduce inadequaterisk of profits, and develop better and faster products (Ba-harudina & Jusohb, 2015). In fact, the main purpose of thetarget costing is to estimate costs based on the goal pursuedby the organization in a competitive environment. Each or-ganization can have its own methods, so the companies ex-press the following basic steps: Establishing the target pricebased on competition and market needs; Establishing the tar-get profit margin; Determining the cost to be obtained; Cal-culation of costs according to the process and methods avail-able; Calculation of the target cost (meaning the amount ofthe cost to be reduced). When the target cost is calculated,companies are following the below steps: Establishing a mul-
H. Toosi, A. Chamikarpour / Revista de Contabilidad Spanish Accounting Review 24 (1)(2021) 31-47 33
tidisciplinary and multi-functional team that is in the earlystages of design and planning, using tools such as value en-gineering in design and planning and kaizen costing duringthe construction to reduce costs (Melo & Granja, 2017). Infact, the main purpose of the target costing is to estimatecosts based on the goal pursued by the organization’s com-petitive environment (Sharafoddin, 2016).
2.3. Performance Focused Activity based Costing in construc-tion projects
The basic logic of activity based costing is that the activ-ities consume resources and products consumes the activit-ies, which focuses on managing activities rather than costs(Ayorinde, Osarenren Osasrere & Ademola Adeniran, 2015).The activity-based costing system can also be described asan allocation method of overhead costs by a cost accountingmethodology based on the cost driven activity to the activitypool and cost targets. This definition indicates that projectoverheads can be assigned to project activities based on costdrivers. Activities can be grouped into units, batch, projects,and facility-sustaining overheads (Jaya, Pathirage & Sutrisna,2010).
Classifying activities can lead to the elimination of activ-ities without value-added. In fact, this method can provideuseful information on resource consumption and cost goalsfor strategic decision making (Damjanovski, 2013). One ofthe distinction points of activity-based costing and traditionalcosting is in cost drivers. Due to the activity-driven natureof this method, the costs that are not considered in the tradi-tional method are calculated and also the total cost of the pro-ject is logically calculated (Tang et al., 2015). In this system,project overheads can be allocated to project activities basedon cost drivers (Jaya et al., 2010). Of course, this method haslimitations and shortcomings for use in construction projects.In this way, the activities are divided into four units, batches,projects, and facilities levels that are not commonly used inconstruction projects because work breakdown structure ismore practical and tangible. Therefore, the activity-basedcosting process in overhead cost management in constructionprojects is as follows:
1. Identify project activities and scheduling theme.2. Identifying project overheads and their cost accounts3. Classify the overhead cost (unit, batch, project, facility)
and create a cause-and-effect relationship with activities.
4. Idealizing quantity drivers5. Calculating ideal cost drivers6. Allocation of cost accounts to activities (Cost objects.)7. Determining activity driver rates of project overheads
per activity duration (Jaya, 2013).
The proposed method is suitable for overhead costs, butit has a long and complex process for tracking direct costsand does not consider competitive conditions. Based on theproblems found in the activity-based costing model, Namaziin 2009 introduced a new generation of activity-based cost-ing that called performance focused activity based Costing(PFABC). This system can be integrated with the organiza-tion’s resource planning and performance management sys-tem. Also, in contrast to the classification of activities intofour categories in the traditional ABC model, this methoduses two types of flexible and committed costs, which hasbenefited from a simplified approach in the process of cal-culating the flexible (variable) costs. This system is used to
identify cost deviations such as rate and amount deviation. Itis also a powerful technique for determining the productivityof activities or organization as a whole and is used to analyzetwo components of productivity, including efficiency and ef-fectiveness (Namazi, 2009; Namazi & Shamsedini, 2016).
2.4. Research background
In a study to provide accurate cost information and propor-tional with cost goals, a method for allocating costs with thehelp and improvement of the first-generation activity basedcosting method has been proposed which provides more ac-curate information than traditional method and the methodof first-generation activity based costing has been facilitatedand turned into one step (Bent & Kaplan, 2017). In a studythat focuses on target costing in the Iranian market, statesthat target costing is a cost management tool to reduce costsespecially in early design and product planning, which isused to determine competitive prices and customer require-ments. Also, the use of value engineering and activity basedcosting is essential for the successful implementation of thetarget costing (Sharafoddin, 2016). In another research, thetarget life cycle costing model has been proposed based onABC model and states that the application of the target cost-ing and ABC methods in the manufacturing industry hasbrought the strategic benefits of TC and the functional bene-fits of ABC. In addition, with using techniques of cost-control,reduce costs and quality control, creates synergies in costmanagement and provides accurate information for properdecision making (Yuksel Pazarceviren & Dede, 2015). How-ever, the results of the research developed a model for processmanagement system in the manufacturing industry and thereis no evidence to contribute response differentiation betweenproject management and process management (Toosi, Sebt& Maknoon, 2014). In another study, ABC’s application hasbeen used in management efficiency, pricing decisions, im-proving decision-making processes in relation to maintainingor eliminating activities and adjusting pricing policies to in-crease product diversity, also Ranked above 80% that is help-ful and effective. Also, state that the application of the tar-get costing for pricing decisions, increasing customer satis-faction, and reasonable and quick decision making in manu-facturing plants is very appropriate and effective. Also, theskill in managing change to apply new costing methods isvital (Ayorinde et al., 2015). The use of the target costingin the construction industry has also been considered in dif-ferent countries. In a research to align the target costing inreal-estate companies, it has developed a proposal for guid-ance. In this research, they have developed guidelines thatstarted with the formulation of target costing and competit-ive price and continued to the level of components and selec-tion of key suppliers. And identifying opportunities and redu-cing costs based on value engineering (Melo & Granja, 2017).Martha Jaya in 2013 proposed a model for controlling over-head costs with using first-generation activity based costingin construction projects and calculating overhead costs foreach activity based on cost drivers, and increasing accuracyand certainty in estimates and cost budgets and costs con-trol (Jaya, 2013). In Zimina, Glenn & Pasquire (2012), atarget costing and lean methods has been used to design thetarget value on 12 construction projects, which aims at con-struction cost savings in the project’s delivery in terms of cost,time and quality. Applying the target value design in theseprojects has led to significant improvements in projects andreducing the final cost by 15% lower than market cost (Zim-ina et al., 2012). In another study, target costing has been
34 H. Toosi, A. Chamikarpour / Revista de Contabilidad Spanish Accounting Review 24 (1)(2021) 31-47
used to determine the cost of a building before design, andaims to manage the design process to achieve target costs. Inthis research, building information modeling (BIM) is usedto construct all costs and components of a building beforedesigning according to the needs of the employer and statesthat target costing leads to proposed value and reduces waste(Pennanen, Ballard & Haahtela, 2011). However, there is nospecific research around cost control system constraints inproject management for the construction industry. So, thepaper developed based on two hypothesizes:
H1: There are differentiations between the project costcontrol system for the construction industry and process costcontrol system for the manufacturing industry.
H2: There is a synergistic ability to combine performancefocused activity based costing and target costing method forencouraging competitiveness cost control system for projectenvironments.
3. Research methodology
The current research has used a developmental method,since in the development research it is intended to innovatein methods, devices, products or to improve them. The re-search utilizes modern cost accounting techniques for provid-ing cost control systems in construction projects. Surveyresearch is used qualitative, descriptive, and analytical re-search method since problem characteristics that face con-straints around cost control systems. Data collection and ana-lysis have benefited from library methodology, review of art-icles, books and research in related fields, but provide newevidence based on a semi-structured interview with expertson financial management in construction projects and withfull proficiency in the areas of research, validated and re-ceived expert opinions and improved the proposed method.The criteria for selecting experts include at least 5 years’experience in financial management and cost managementin famous construction companies, familiarity with the con-cepts of costing, having high experience or research in thefield, the willingness and motivation to interview and studyin the field. The selection of individuals was based on non-probability (or judgmental) sampling techniques, purposive,snowballing. In the first interview, they were familiarizedwith research and domination of people has been evaluated,the subsequent interviews were held two to four times untilthe best criticisms and suggestions were made and the im-provement of the method has continued.
The statistical population includes 296 financial managersof construction companies with the first grade in professionalgovernmental ranking in Tehran. According to the survey ofthirty companies by using targeted and snowball methods,the ratio of companies that using the new accounting meth-ods proposed in the research is 0.98% with a confidence coef-ficient of 90%. The sample size in Cochran method with anerror of 0.05 is 26. Sample size consists of 26 financial man-agers of construction projects that have mastered the newconcepts of costing and have research or practical experiencein the field. With Considering individuals with this featurewere limited, the method of their selection was purposefuland then process interview started by qualified individualsand another one was selected by snowball method. At thefirst interview, the explanation is provided in connection withthe research and the collected data is provided to them to ex-press themselves.
The interview tool selected for the cost control constraintsanalysis due to the differentiation project nature versus the
process nature. The project is unique and has more uncertain-ties that make a changeable environment for management.So, project management has dynamic nature activity basedthat progress under changing environment. This naturallyrequires a restricted tool to reach to project goals.
The appropriate technique for analyzing qualitative dataunder the textual analysis was widely recognized as the con-tent analysis. As Gilham points out, the process of data ana-lysis involves identifying the key words and codes and cat-egorizing them according to the themes, issues, topics, con-cepts, and propositions (Gillham, 2000). In this research, themethod of content analysis and cognitive mapping has beenused to identify the meaning and concept of the text of theinterviews and to show the relationship of words with differ-ent aspects of research. Finally, finding the research shouldbe validated. Case study selected as a research approach forthe results validation, because of the project based nature ofthe construction industry (Toosi et al., 2014).
Therefore, developing a conceptual process based on semistructured interviews with financial managers in the con-struction industry and content analysis and cognitive map-ping has been used to confront cost management constraintsin construction projects is a real added value to the scientificliterature by this research. Proposed process as a findingof this research verified in a real construction project. Con-sequently, case study just selected as a research approach forreviewing implementation steps of the proposed system. Theproposed system implements in a building construction pro-ject with changeable requirements in its tasks to evaluate thesystem’s ability for increasing competitiveness and traceabil-ity in a project environment.
4. Findings and analysis
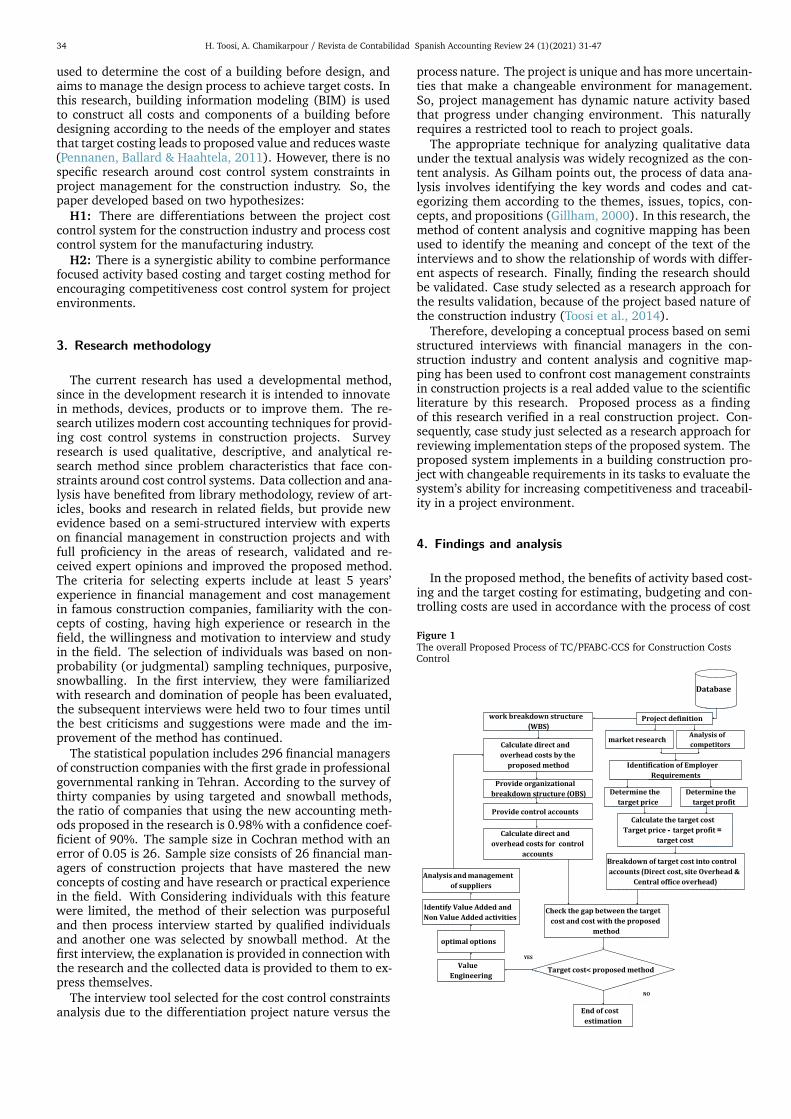
In the proposed method, the benefits of activity based cost-ing and the target costing for estimating, budgeting and con-trolling costs are used in accordance with the process of cost
Figure 1The overall Proposed Process of TC/PFABC-CCS for Construction CostsControl
Analysis of competitors
market research
Identification of Employer Requirements
Determine the target price
Determine the target profit
Calculate the target costTarget price - target profit =
target cost
Calculate direct and overhead costs by the proposed method
work breakdown structure (WBS)
Provide organizational breakdown structure (OBS)
Provide control accounts
Breakdown of target cost into control accounts (Direct cost, site Overhead &
Central office overhead)
Calculate direct and overhead costs for control
accounts
Project definition
Check the gap between the target cost and cost with the proposed
method
Target cost< proposed methodValue Engineering
End of cost estimation
Database
Identify Value Added and Non Value Added activities
Analysis and management of suppliers
optimal options
NO
YES
H. Toosi, A. Chamikarpour / Revista de Contabilidad Spanish Accounting Review 24 (1)(2021) 31-47 35
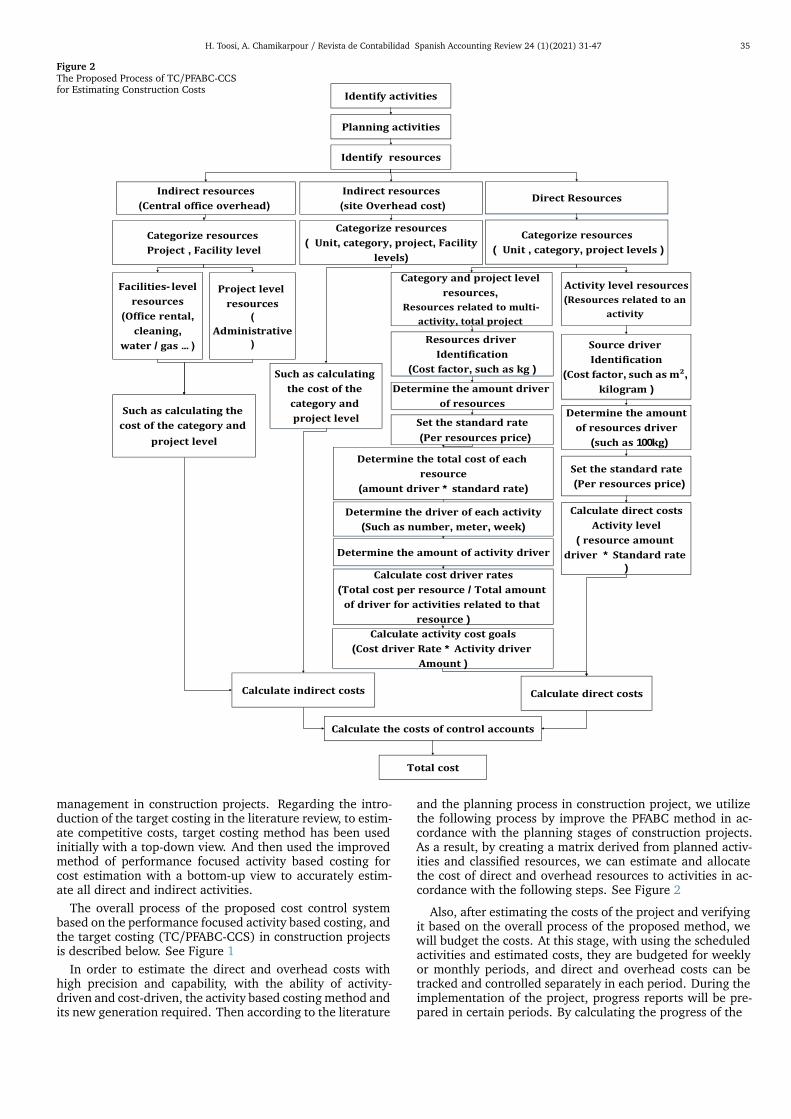
Figure 2The Proposed Process of TC/PFABC-CCSfor Estimating Construction Costs
Figure 2. The Proposed Process of TC/PFABC-CCS for Estimating Construction Costs
Identify activities
Planning activities
Identify resources
Direct ResourcesIndirect resources
(site Overhead cost)
Categorize resources
( Unit , category, project levels )
Categorize resources
( Unit, category, project, Facility
levels)
Calculate indirect costs
Calculate the costs of control accounts
Category and project level
resources,
Resources related to multi-
activity, total project
Activity level resources
(Resources related to an
activity
Calculate direct costs
Such as calculating
the cost of the
category and
project level
Total cost
Indirect resources
(Central office overhead)
Categorize resources
Project , Facility level
Such as calculating the
cost of the category and
project level
Project level
resources
)
Administrative
(
Facilities- level
resources
)Office rental,
cleaning,
water / gas ... ( Source driver
Identification
(Cost factor, such as m²,
kilogram )
Determine the amount
of resources driver
(such as 100kg)
Set the standard rate
(Per resources price)
Calculate direct costs
Activity level
( resource amount
driver * Standard rate
)
Resources driver
Identification
(Cost factor, such as kg )
Determine the amount driver
of resources
Set the standard rate
(Per resources price)
Determine the total cost of each
resource
(amount driver * standard rate)
Determine the driver of each activity
(Such as number, meter, week)
Determine the amount of activity driver
Calculate cost driver rates
(Total cost per resource / Total amount
of driver for activities related to that
resource )
Calculate activity cost goals
(Cost driver Rate * Activity driver
Amount )
management in construction projects. Regarding the intro-duction of the target costing in the literature review, to estim-ate competitive costs, target costing method has been usedinitially with a top-down view. And then used the improvedmethod of performance focused activity based costing forcost estimation with a bottom-up view to accurately estim-ate all direct and indirect activities.
The overall process of the proposed cost control systembased on the performance focused activity based costing, andthe target costing (TC/PFABC-CCS) in construction projectsis described below. See Figure 1
In order to estimate the direct and overhead costs withhigh precision and capability, with the ability of activity-driven and cost-driven, the activity based costing method andits new generation required. Then according to the literature
and the planning process in construction project, we utilizethe following process by improve the PFABC method in ac-cordance with the planning stages of construction projects.As a result, by creating a matrix derived from planned activ-ities and classified resources, we can estimate and allocatethe cost of direct and overhead resources to activities in ac-cordance with the following steps. See Figure 2
Also, after estimating the costs of the project and verifyingit based on the overall process of the proposed method, wewill budget the costs. At this stage, with using the scheduledactivities and estimated costs, they are budgeted for weeklyor monthly periods, and direct and overhead costs can betracked and controlled separately in each period. During theimplementation of the project, progress reports will be pre-pared in certain periods. By calculating the progress of the
36 H. Toosi, A. Chamikarpour / Revista de Contabilidad Spanish Accounting Review 24 (1)(2021) 31-47
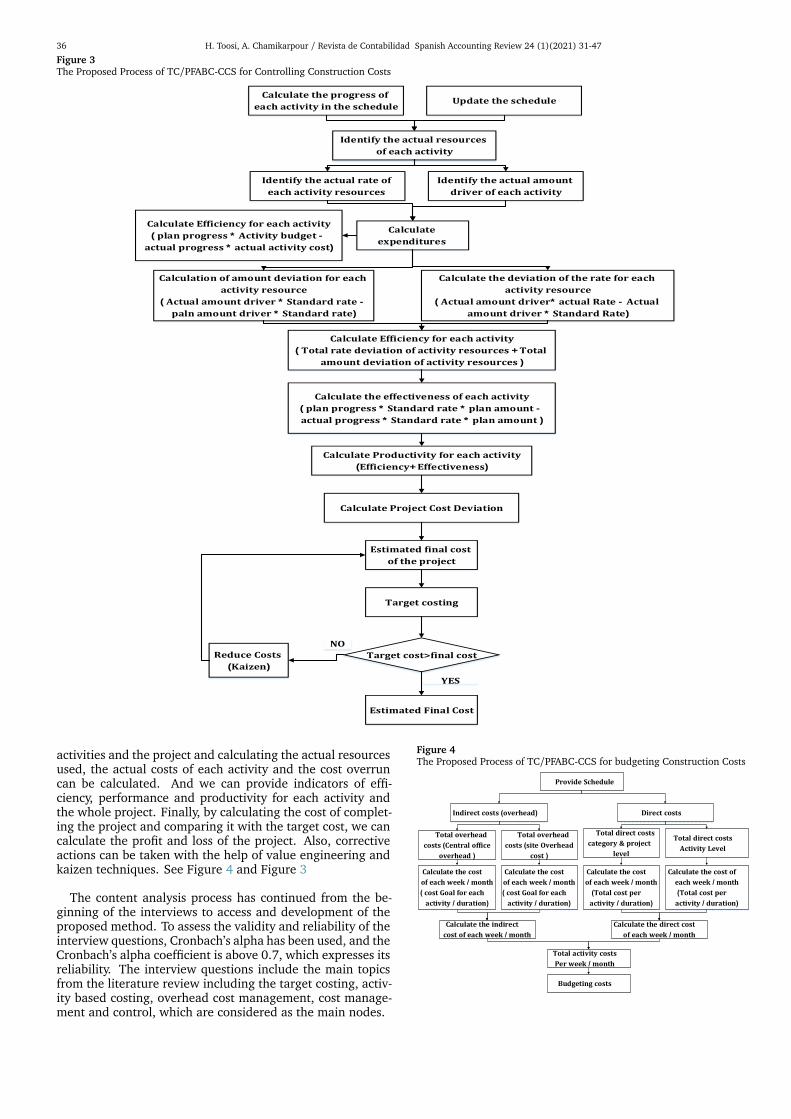
Figure 3The Proposed Process of TC/PFABC-CCS for Controlling Construction CostsFigure 4. The Proposed Process of TC/PFABC-CCS for Controlling Construction Costs
Identify the actual resources
of each activity
Identify the actual amount
driver of each activity
Identify the actual rate of
each activity resources
Calculate
expenditures
Calculate the deviation of the rate for each
activity resource
( Actual amount driver* actual Rate - Actual
amount driver * Standard Rate)
Calculation of amount deviation for each
activity resource
( Actual amount driver * Standard rate -
paln amount driver * Standard rate)
Calculate Efficiency for each activity
( Total rate deviation of activity resources + Total
amount deviation of activity resources )
Calculate the effectiveness of each activity
( plan progress * Standard rate * plan amount -
actual progress * Standard rate * plan amount )
Calculate Productivity for each activity
(Efficiency+ Effectiveness)
Update the scheduleCalculate the progress of
each activity in the schedule
Calculate Project Cost Deviation
Estimated final cost
of the project
Target cost>final cost
Target costing
Reduce Costs
(Kaizen)
Estimated Final Cost
Calculate Efficiency for each activity
( plan progress * Activity budget -
actual progress * actual activity cost)
YES
NO
activities and the project and calculating the actual resourcesused, the actual costs of each activity and the cost overruncan be calculated. And we can provide indicators of effi-ciency, performance and productivity for each activity andthe whole project. Finally, by calculating the cost of complet-ing the project and comparing it with the target cost, we cancalculate the profit and loss of the project. Also, correctiveactions can be taken with the help of value engineering andkaizen techniques. See Figure 4 and Figure 3
The content analysis process has continued from the be-ginning of the interviews to access and development of theproposed method. To assess the validity and reliability of theinterview questions, Cronbach’s alpha has been used, and theCronbach’s alpha coefficient is above 0.7, which expresses itsreliability. The interview questions include the main topicsfrom the literature review including the target costing, activ-ity based costing, overhead cost management, cost manage-ment and control, which are considered as the main nodes.
Figure 4The Proposed Process of TC/PFABC-CCS for budgeting Construction Costs
Provide Schedule
Calculate the indirect cost of each week / month
Total direct costsActivity Level
Total activity costsPer week / month
Total direct costs category & project
level
Calculate the direct cost of each week / month
Total overhead
costs (site Overhead
cost )
Budgeting costs
Calculate the cost of each week / month( cost Goal for each
activity / duration)
Calculate the cost of each week / month(Total cost per activity / duration)
Calculate the cost of each week / month
(Total cost per activity / duration)
Total overhead
costs (Central office
overhead )
Calculate the cost of each week / month( cost Goal for each
activity / duration)
Direct costsIndirect costs (overhead)
H. Toosi, A. Chamikarpour / Revista de Contabilidad Spanish Accounting Review 24 (1)(2021) 31-47 37
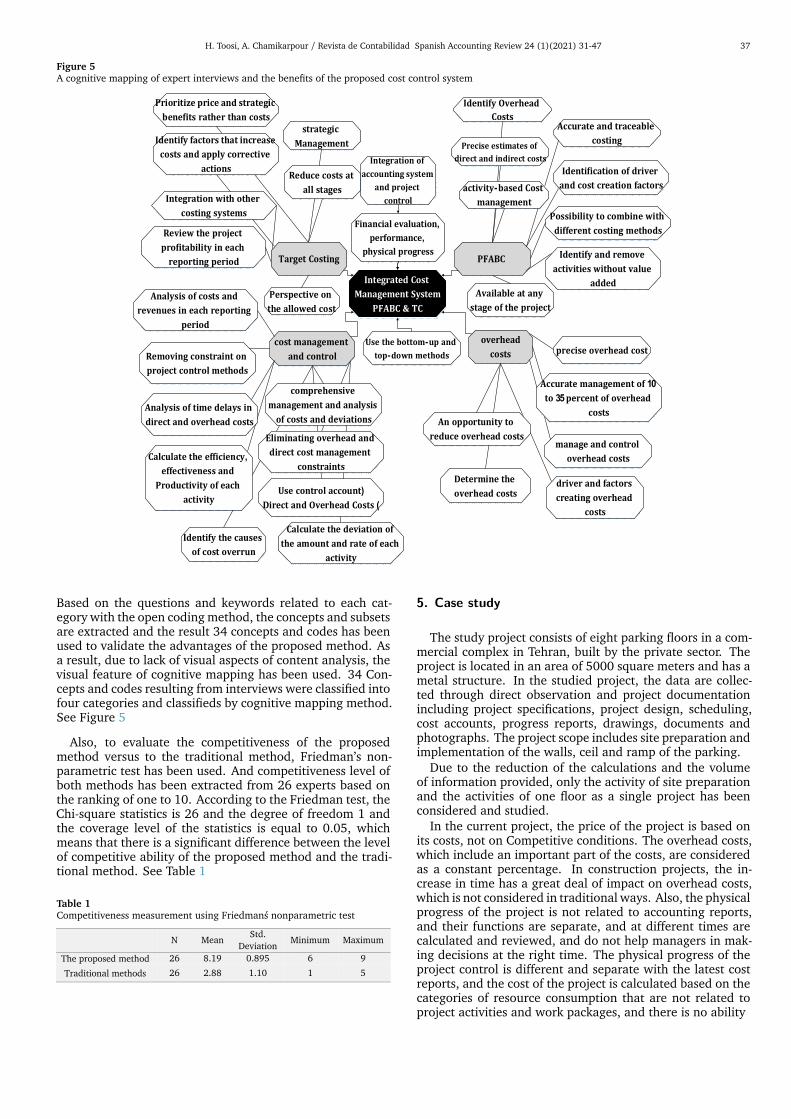
Figure 5A cognitive mapping of expert interviews and the benefits of the proposed cost control system
Integrated Cost Management System
PFABC & TC
PFABC
cost management and control
overhead
costs
Accurate and traceable
costing
Available at any
stage of the project
An opportunity to
reduce overhead costsmanage and control
overhead costs
Identify Overhead Costs
Precise estimates of direct and indirect costs
strategic Management
Prioritize price and strategic benefits rather than costs
Perspective on
the allowed cost
Use control account)Direct and Overhead Costs (
Analysis of time delays in
direct and overhead costs
Removing constraint on
project control methods
Analysis of costs and
revenues in each reporting
period
comprehensive
management and analysis of costs and deviations
Identify and remove
activities without value
added
Calculate the deviation of the amount and rate of each
activity
Calculate the efficiency,
effectiveness and
Productivity of each
activity
Review the project profitability in each
reporting period
Integration of accounting system
and project control
Eliminating overhead and
direct cost management constraints
Identify the causes of cost overrun
precise overhead cost
driver and factors creating overhead
costs
Determine the
overhead costs
Use the bottom-up and
top-down methods
Financial evaluation,
performance,
physical progress
Reduce costs at all stages
Identify factors that increase
costs and apply corrective
actions
Integration with other costing systems
Target Costing
activity-based Cost management
Identification of driver and cost creation factors
Possibility to combine with
different costing methods
Accurate management of 10
to 35 percent of overhead
costs
Based on the questions and keywords related to each cat-egory with the open coding method, the concepts and subsetsare extracted and the result 34 concepts and codes has beenused to validate the advantages of the proposed method. Asa result, due to lack of visual aspects of content analysis, thevisual feature of cognitive mapping has been used. 34 Con-cepts and codes resulting from interviews were classified intofour categories and classifieds by cognitive mapping method.See Figure 5
Also, to evaluate the competitiveness of the proposedmethod versus to the traditional method, Friedman’s non-parametric test has been used. And competitiveness level ofboth methods has been extracted from 26 experts based onthe ranking of one to 10. According to the Friedman test, theChi-square statistics is 26 and the degree of freedom 1 andthe coverage level of the statistics is equal to 0.05, whichmeans that there is a significant difference between the levelof competitive ability of the proposed method and the tradi-tional method. See Table 1
Table 1Competitiveness measurement using Friedmans nonparametric testTable 1. Competitiveness measurement using Friedman's nonparametric test
Maximum Minimum Std.
Deviation Mean N
9 6 0.895 8.19 26 The proposed method
5 1 1.10 2.88 26 Traditional methods
5. Case study
The study project consists of eight parking floors in a com-mercial complex in Tehran, built by the private sector. Theproject is located in an area of 5000 square meters and has ametal structure. In the studied project, the data are collec-ted through direct observation and project documentationincluding project specifications, project design, scheduling,cost accounts, progress reports, drawings, documents andphotographs. The project scope includes site preparation andimplementation of the walls, ceil and ramp of the parking.
Due to the reduction of the calculations and the volumeof information provided, only the activity of site preparationand the activities of one floor as a single project has beenconsidered and studied.
In the current project, the price of the project is based onits costs, not on Competitive conditions. The overhead costs,which include an important part of the costs, are consideredas a constant percentage. In construction projects, the in-crease in time has a great deal of impact on overhead costs,which is not considered in traditional ways. Also, the physicalprogress of the project is not related to accounting reports,and their functions are separate, and at different times arecalculated and reviewed, and do not help managers in mak-ing decisions at the right time. The physical progress of theproject control is different and separate with the latest costreports, and the cost of the project is calculated based on thecategories of resource consumption that are not related toproject activities and work packages, and there is no ability
38 H. Toosi, A. Chamikarpour / Revista de Contabilidad Spanish Accounting Review 24 (1)(2021) 31-47
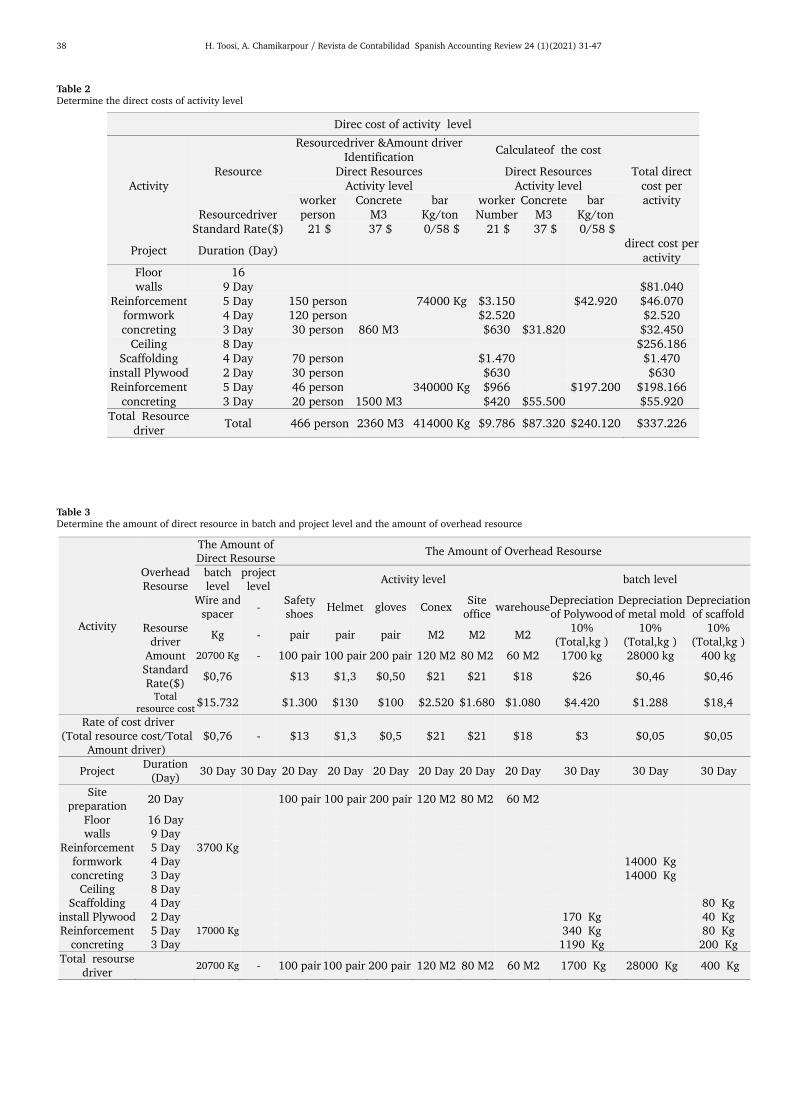
Table 2Determine the direct costs of activity level
Table 3Determine the amount of direct resource in batch and project level and the amount of overhead resource
Activity
Overhead Resourse
The Amount of Direct Resourse
The Amount of Overhead Resourse
batch level
project level
Activity level batch level
Wire and spacer
- Safety shoes
Helmet gloves Conex Site
office warehouse
Depreciation of Polywood
Depreciation of metal mold
Depreciation of scaffold
Resourse driver
Kg - pair pair pair M2 M2 M2 10%
(Total,kg ) 10%
(Total,kg ) 10%
(Total,kg ) Amount 20700 Kg - 100 pair 100 pair 200 pair 120 M2 80 M2 60 M2 1700 kg 28000 kg 400 kg Standard Rate($)
$0,76 $13 $1,3 $0,50 $21 $21 $18 $26 $0,46 $0,46
Total resource cost
$15.732 $1.300 $130 $100 $2.520 $1.680 $1.080 $4.420 $1.288 $18,4
Rate of cost driver (Total resource cost/Total
Amount driver) $0,76 - $13 $1,3 $0,5 $21 $21 $18 $3 $0,05 $0,05
Project Duration
(Day) 30 Day 30 Day 20 Day 20 Day 20 Day 20 Day 20 Day 20 Day 30 Day 30 Day 30 Day
Site preparation
20 Day 100 pair 100 pair 200 pair 120 M2 80 M2 60 M2
Floor 16 Day walls 9 Day
Reinforcement 5 Day 3700 Kg formwork 4 Day 14000 Kg concreting 3 Day 14000 Kg
Ceiling 8 Day Scaffolding 4 Day 80 Kg
install Plywood 2 Day 170 Kg 40 Kg Reinforcement 5 Day 17000 Kg 340 Kg 80 Kg
concreting 3 Day 1190 Kg 200 Kg Total resourse
driver 20700 Kg - 100 pair 100 pair 200 pair 120 M2 80 M2 60 M2 1700 Kg 28000 Kg 400 Kg
H. Toosi, A. Chamikarpour / Revista de Contabilidad Spanish Accounting Review 24 (1)(2021) 31-47 39
Table 4Continue with the amount of direct resource in batch and project level and the amount of overhead resource
Activity
Overhead Resourse
Amount of Overhead Resourse project level Facility level
Transportation Civil
engineer Surveyor
Project Planner
project manager
Office Supplies
utilities pantry &
consumables
Resourse driver items Person / month
Person / month
Person / month
Person / month
Average Month Month
Amount 25 2 1 1 1 1 1 1 Standard Rate($) $65 $1.315 $789 $526 $1.842 $1.315 $790 $730 Total resource cost $1.625 $2.630 $789 $526 $1.842 $1.315 $790 $730
Rate of cost driver (Total resource cost/ Total Amount driver)
$65 $858 $515 $343 $1.201 $858 $515 $476
Project Duration (Day) 30 Day 30 Day 30 Day 30 Day 30 Day 30 Day 30 Day 30 Day Site preparation 20 Day 8 1/33 0/67 0/67 0/67 0/67 0/67 0/67
floor 16 Day walls 9 Day
Reinforcement 5 Day 3 0/33 0/17 0/17 0/17 0/17 0/17 0/17 formwork 4 Day 3 0/27 0/13 0/13 0/13 0/13 0/13 0/13 concreting 3 Day 1 0/20 0/10 0/10 0/10 0/10 0/10 0/10
Ceiling 8 Day Scaffolding 4 Day 3 0/27 0/13 0/13 0/13 0/13 0/13 0/13
install Plywood 2 Day 2 0/13 0/07 0/07 0/07 0/07 0/07 0/07
Reinforcement 5 Day 4 0/33 0/17 0/17 0/17 0/17 0/17 0/17 concreting 3 Day 1 0/20 0/10 0/10 0/10 0/10 0/10 0/10
Total resourse driver
25 3/07 1/53 1/53 1/53 1/53 1/53 1/53
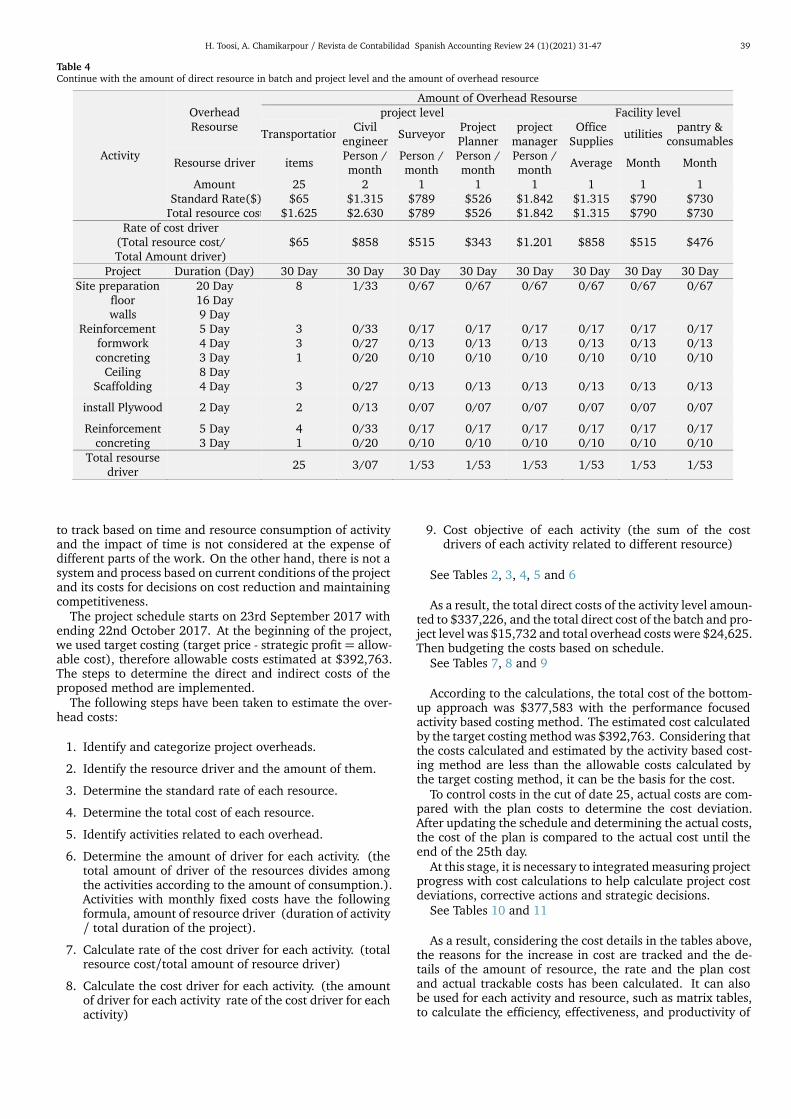
to track based on time and resource consumption of activityand the impact of time is not considered at the expense ofdifferent parts of the work. On the other hand, there is not asystem and process based on current conditions of the projectand its costs for decisions on cost reduction and maintainingcompetitiveness.
The project schedule starts on 23rd September 2017 withending 22nd October 2017. At the beginning of the project,we used target costing (target price - strategic profit = allow-able cost), therefore allowable costs estimated at $392,763.The steps to determine the direct and indirect costs of theproposed method are implemented.
The following steps have been taken to estimate the over-head costs:
1. Identify and categorize project overheads.
2. Identify the resource driver and the amount of them.
3. Determine the standard rate of each resource.
4. Determine the total cost of each resource.
5. Identify activities related to each overhead.
6. Determine the amount of driver for each activity. (thetotal amount of driver of the resources divides amongthe activities according to the amount of consumption.).Activities with monthly fixed costs have the followingformula, amount of resource driver (duration of activity/ total duration of the project).
7. Calculate rate of the cost driver for each activity. (totalresource cost/total amount of resource driver)
8. Calculate the cost driver for each activity. (the amountof driver for each activity rate of the cost driver for eachactivity)
9. Cost objective of each activity (the sum of the costdrivers of each activity related to different resource)
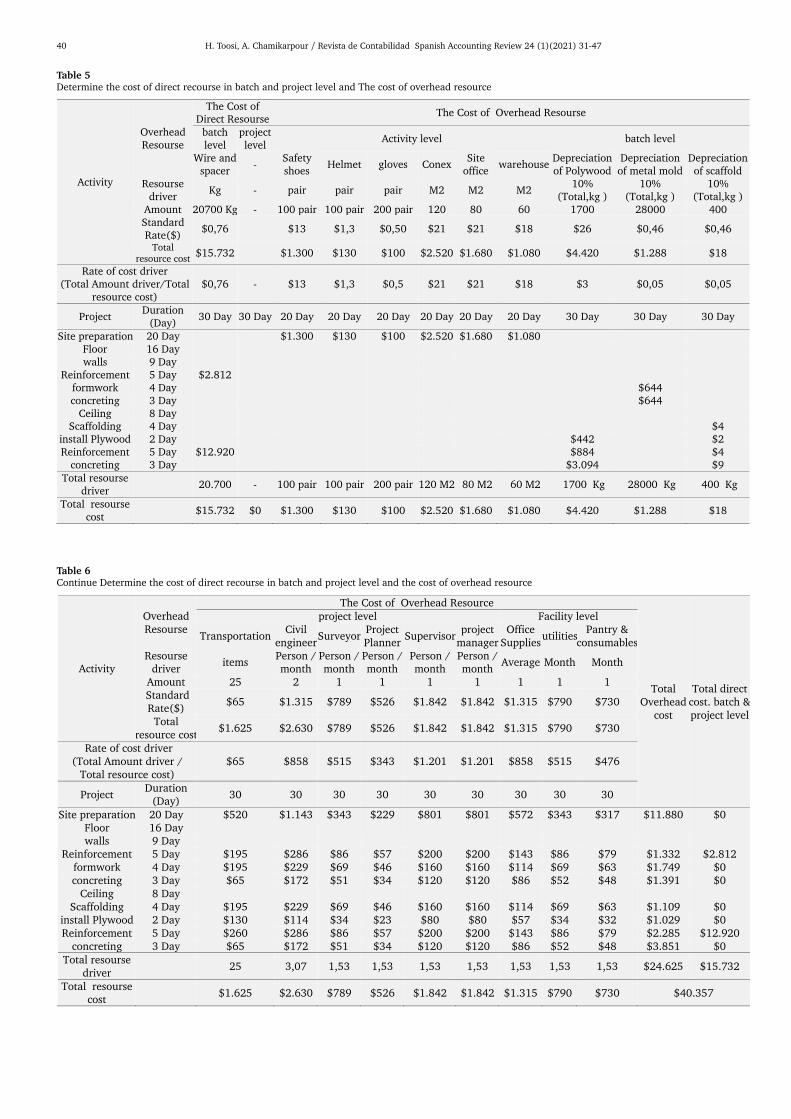
See Tables 2, 3, 4, 5 and 6
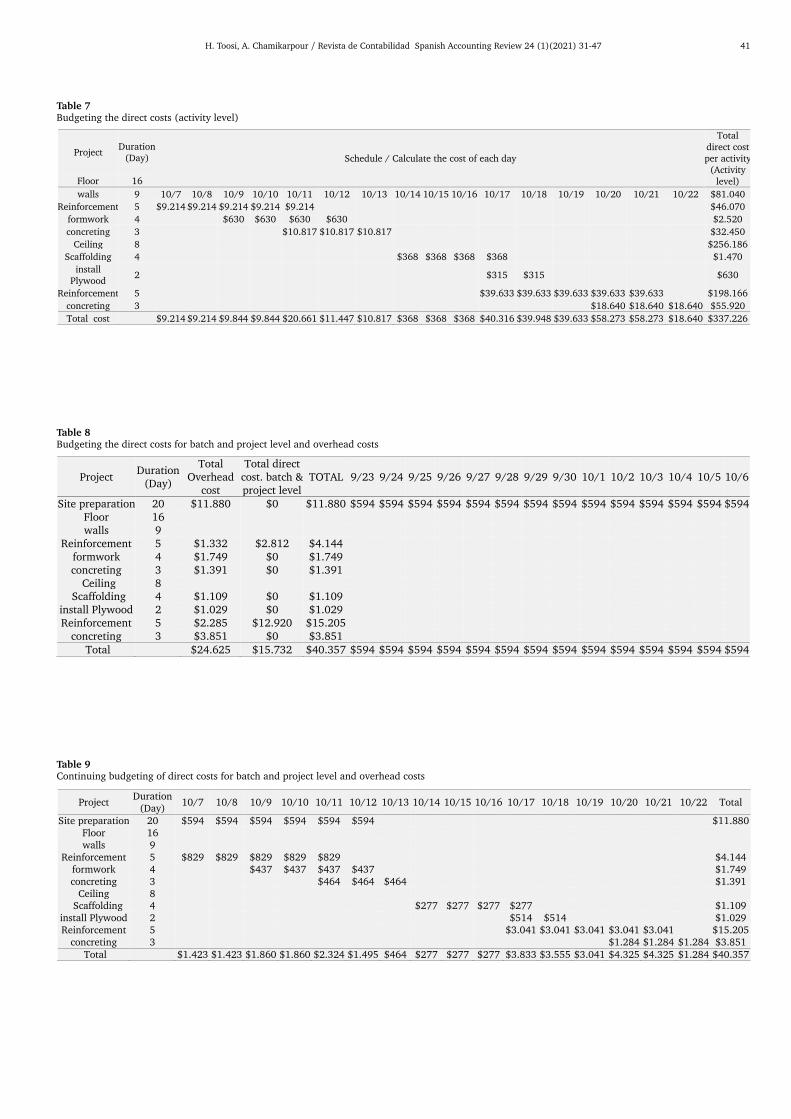
As a result, the total direct costs of the activity level amoun-ted to $337,226, and the total direct cost of the batch and pro-ject level was $15,732 and total overhead costs were $24,625.Then budgeting the costs based on schedule.
See Tables 7, 8 and 9
According to the calculations, the total cost of the bottom-up approach was $377,583 with the performance focusedactivity based costing method. The estimated cost calculatedby the target costing method was $392,763. Considering thatthe costs calculated and estimated by the activity based cost-ing method are less than the allowable costs calculated bythe target costing method, it can be the basis for the cost.
To control costs in the cut of date 25, actual costs are com-pared with the plan costs to determine the cost deviation.After updating the schedule and determining the actual costs,the cost of the plan is compared to the actual cost until theend of the 25th day.
At this stage, it is necessary to integrated measuring projectprogress with cost calculations to help calculate project costdeviations, corrective actions and strategic decisions.
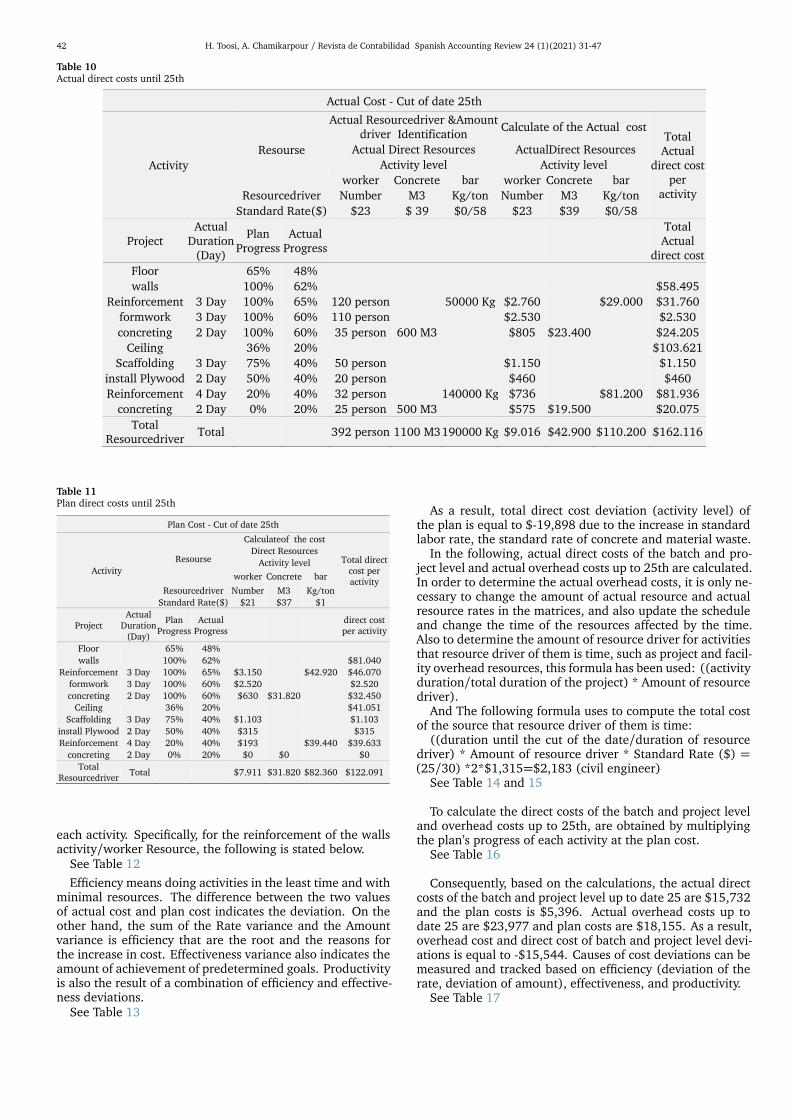
See Tables 10 and 11
As a result, considering the cost details in the tables above,the reasons for the increase in cost are tracked and the de-tails of the amount of resource, the rate and the plan costand actual trackable costs has been calculated. It can alsobe used for each activity and resource, such as matrix tables,to calculate the efficiency, effectiveness, and productivity of
40 H. Toosi, A. Chamikarpour / Revista de Contabilidad Spanish Accounting Review 24 (1)(2021) 31-47
Table 5Determine the cost of direct recourse in batch and project level and The cost of overhead resource
Activity
Overhead Resourse
The Cost of Direct Resourse
The Cost of Overhead Resourse
batch level
project level
Activity level batch level
Wire and spacer
- Safety shoes
Helmet gloves Conex Site
office warehouse
Depreciation of Polywood
Depreciation of metal mold
Depreciation of scaffold
Resourse driver
Kg - pair pair pair M2 M2 M2 10%
(Total,kg ) 10%
(Total,kg ) 10%
(Total,kg ) Amount 20700 Kg - 100 pair 100 pair 200 pair 120 80 60 1700 28000 400 Standard Rate($)
$0,76 $13 $1,3 $0,50 $21 $21 $18 $26 $0,46 $0,46
Total resource cost
$15.732 $1.300 $130 $100 $2.520 $1.680 $1.080 $4.420 $1.288 $18
Rate of cost driver (Total Amount driver/Total
resource cost) $0,76 - $13 $1,3 $0,5 $21 $21 $18 $3 $0,05 $0,05
Project Duration
(Day) 30 Day 30 Day 20 Day 20 Day 20 Day 20 Day 20 Day 20 Day 30 Day 30 Day 30 Day
Site preparation 20 Day $1.300 $130 $100 $2.520 $1.680 $1.080 Floor 16 Day walls 9 Day
Reinforcement 5 Day $2.812 formwork 4 Day $644 concreting 3 Day $644
Ceiling 8 Day Scaffolding 4 Day $4
install Plywood 2 Day $442 $2 Reinforcement 5 Day $12.920 $884 $4
concreting 3 Day $3.094 $9 Total resourse
driver 20.700 - 100 pair 100 pair 200 pair 120 M2 80 M2 60 M2 1700 Kg 28000 Kg 400 Kg
Total resourse cost
$15.732 $0 $1.300 $130 $100 $2.520 $1.680 $1.080 $4.420 $1.288 $18
Table 6Continue Determine the cost of direct recourse in batch and project level and the cost of overhead resource
Activity
Overhead Resourse
The Cost of Overhead Resource
Total Overhead
cost
Total direct cost. batch & project level
project level Facility level
Transportation Civil
engineer Surveyor
Project Planner
Supervisor project
manager Office
Supplies utilities
Pantry & consumables
Resourse driver
items Person / month
Person / month
Person / month
Person / month
Person / month
Average Month Month
Amount 25 2 1 1 1 1 1 1 1 Standard Rate($)
$65 $1.315 $789 $526 $1.842 $1.842 $1.315 $790 $730
Total resource cost
$1.625 $2.630 $789 $526 $1.842 $1.842 $1.315 $790 $730
Rate of cost driver (Total Amount driver /
Total resource cost) $65 $858 $515 $343 $1.201 $1.201 $858 $515 $476
Project Duration
(Day) 30 30 30 30 30 30 30 30 30
Site preparation 20 Day $520 $1.143 $343 $229 $801 $801 $572 $343 $317 $11.880 $0 Floor 16 Day walls 9 Day
Reinforcement 5 Day $195 $286 $86 $57 $200 $200 $143 $86 $79 $1.332 $2.812 formwork 4 Day $195 $229 $69 $46 $160 $160 $114 $69 $63 $1.749 $0 concreting 3 Day $65 $172 $51 $34 $120 $120 $86 $52 $48 $1.391 $0
Ceiling 8 Day Scaffolding 4 Day $195 $229 $69 $46 $160 $160 $114 $69 $63 $1.109 $0
install Plywood 2 Day $130 $114 $34 $23 $80 $80 $57 $34 $32 $1.029 $0 Reinforcement 5 Day $260 $286 $86 $57 $200 $200 $143 $86 $79 $2.285 $12.920
concreting 3 Day $65 $172 $51 $34 $120 $120 $86 $52 $48 $3.851 $0 Total resourse
driver 25 3,07 1,53 1,53 1,53 1,53 1,53 1,53 1,53 $24.625 $15.732
Total resourse cost
$1.625 $2.630 $789 $526 $1.842 $1.842 $1.315 $790 $730 $40.357
H. Toosi, A. Chamikarpour / Revista de Contabilidad Spanish Accounting Review 24 (1)(2021) 31-47 41
Table 7Budgeting the direct costs (activity level)
Project Duration
(Day) Schedule / Calculate the cost of each day
Total direct cost per activity
(Activity level) Floor 16
walls 9 10/7 10/8 10/9 10/10 10/11 10/12 10/13 10/14 10/15 10/16 10/17 10/18 10/19 10/20 10/21 10/22 $81.040
Reinforcement 5 $9.214 $9.214 $9.214 $9.214 $9.214 $46.070
formwork 4 $630 $630 $630 $630 $2.520
concreting 3 $10.817 $10.817 $10.817 $32.450
Ceiling 8 $256.186
Scaffolding 4 $368 $368 $368 $368 $1.470
install Plywood
2 $315 $315 $630
Reinforcement 5 $39.633 $39.633 $39.633 $39.633 $39.633 $198.166
concreting 3 $18.640 $18.640 $18.640 $55.920
Total cost $9.214 $9.214 $9.844 $9.844 $20.661 $11.447 $10.817 $368 $368 $368 $40.316 $39.948 $39.633 $58.273 $58.273 $18.640 $337.226
Table 8Budgeting the direct costs for batch and project level and overhead costs
Project Duration
(Day)
Total Overhead
cost
Total direct cost. batch & project level
TOTAL 9/23 9/24 9/25 9/26 9/27 9/28 9/29 9/30 10/1 10/2 10/3 10/4 10/5 10/6
Site preparation 20 $11.880 $0 $11.880 $594 $594 $594 $594 $594 $594 $594 $594 $594 $594 $594 $594 $594 $594 Floor 16 walls 9
Reinforcement 5 $1.332 $2.812 $4.144 formwork 4 $1.749 $0 $1.749 concreting 3 $1.391 $0 $1.391
Ceiling 8 Scaffolding 4 $1.109 $0 $1.109
install Plywood 2 $1.029 $0 $1.029 Reinforcement 5 $2.285 $12.920 $15.205
concreting 3 $3.851 $0 $3.851 Total $24.625 $15.732 $40.357 $594 $594 $594 $594 $594 $594 $594 $594 $594 $594 $594 $594 $594 $594
Table 9Continuing budgeting of direct costs for batch and project level and overhead costs
Project Duration
(Day) 10/7 10/8 10/9 10/10 10/11 10/12 10/13 10/14 10/15 10/16 10/17 10/18 10/19 10/20 10/21 10/22 Total
Site preparation 20 $594 $594 $594 $594 $594 $594 $11.880 Floor 16 walls 9
Reinforcement 5 $829 $829 $829 $829 $829 $4.144 formwork 4 $437 $437 $437 $437 $1.749 concreting 3 $464 $464 $464 $1.391
Ceiling 8 Scaffolding 4 $277 $277 $277 $277 $1.109
install Plywood 2 $514 $514 $1.029 Reinforcement 5 $3.041 $3.041 $3.041 $3.041 $3.041 $15.205
concreting 3 $1.284 $1.284 $1.284 $3.851 Total $1.423 $1.423 $1.860 $1.860 $2.324 $1.495 $464 $277 $277 $277 $3.833 $3.555 $3.041 $4.325 $4.325 $1.284 $40.357
42 H. Toosi, A. Chamikarpour / Revista de Contabilidad Spanish Accounting Review 24 (1)(2021) 31-47
Table 10Actual direct costs until 25th
Actual Cost - Cut of date 25th
Activity
Resourse
Actual Resourcedriver &Amount driver Identification
Calculate of the Actual cost Total Actual
direct cost per
activity
Actual Direct Resources ActualDirect Resources
Activity level Activity level
worker Concrete bar worker Concrete bar
Resourcedriver Number M3 Kg/ton Number M3 Kg/ton
Standard Rate($) $23 $ 39 $0/58 $23 $39 $0/58
Project Actual
Duration (Day)
Plan Progress
Actual Progress
Total Actual
direct cost
Floor 65% 48%
walls 100% 62% $58.495
Reinforcement 3 Day 100% 65% 120 person 50000 Kg $2.760 $29.000 $31.760
formwork 3 Day 100% 60% 110 person $2.530 $2.530
concreting 2 Day 100% 60% 35 person 600 M3 $805 $23.400 $24.205
Ceiling 36% 20% $103.621
Scaffolding 3 Day 75% 40% 50 person $1.150 $1.150
install Plywood 2 Day 50% 40% 20 person $460 $460
Reinforcement 4 Day 20% 40% 32 person 140000 Kg $736 $81.200 $81.936
concreting 2 Day 0% 20% 25 person 500 M3 $575 $19.500 $20.075
Total Resourcedriver
Total 392 person 1100 M3 190000 Kg $9.016 $42.900 $110.200 $162.116
Table 11Plan direct costs until 25th
Plan Cost - Cut of date 25th
Activity
Resourse
Calculateof the cost
Total direct cost per activity
Direct Resources
Activity level
worker Concrete bar
Resourcedriver Number M3 Kg/ton
Standard Rate($) $21 $37 $1
Project Actual
Duration (Day)
Plan Progress
Actual Progress
direct cost per activity
Floor 65% 48%
walls 100% 62% $81.040
Reinforcement 3 Day 100% 65% $3.150 $42.920 $46.070
formwork 3 Day 100% 60% $2.520 $2.520
concreting 2 Day 100% 60% $630 $31.820 $32.450
Ceiling 36% 20% $41.051
Scaffolding 3 Day 75% 40% $1.103 $1.103
install Plywood 2 Day 50% 40% $315 $315
Reinforcement 4 Day 20% 40% $193 $39.440 $39.633
concreting 2 Day 0% 20% $0 $0 $0
Total Resourcedriver
Total $7.911 $31.820 $82.360 $122.091
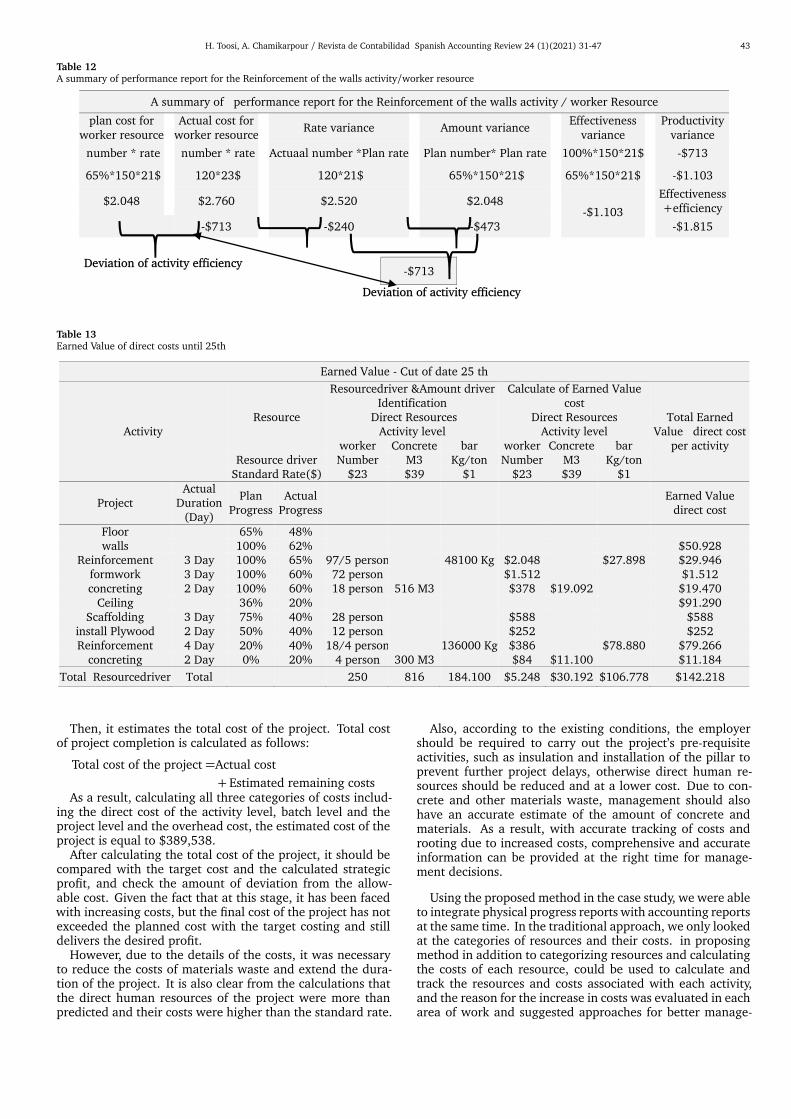
each activity. Specifically, for the reinforcement of the wallsactivity/worker Resource, the following is stated below.
See Table 12Efficiency means doing activities in the least time and with
minimal resources. The difference between the two valuesof actual cost and plan cost indicates the deviation. On theother hand, the sum of the Rate variance and the Amountvariance is efficiency that are the root and the reasons forthe increase in cost. Effectiveness variance also indicates theamount of achievement of predetermined goals. Productivityis also the result of a combination of efficiency and effective-ness deviations.
See Table 13
As a result, total direct cost deviation (activity level) ofthe plan is equal to $-19,898 due to the increase in standardlabor rate, the standard rate of concrete and material waste.
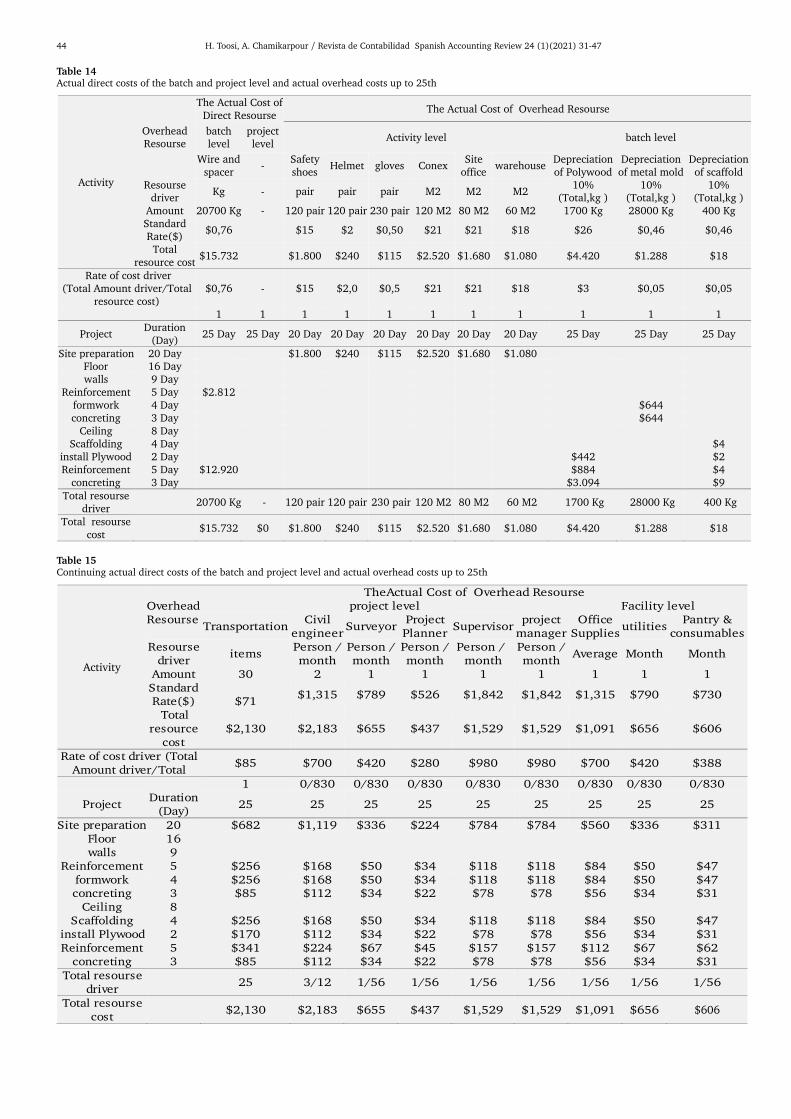
In the following, actual direct costs of the batch and pro-ject level and actual overhead costs up to 25th are calculated.In order to determine the actual overhead costs, it is only ne-cessary to change the amount of actual resource and actualresource rates in the matrices, and also update the scheduleand change the time of the resources affected by the time.Also to determine the amount of resource driver for activitiesthat resource driver of them is time, such as project and facil-ity overhead resources, this formula has been used: ((activityduration/total duration of the project) * Amount of resourcedriver).
And The following formula uses to compute the total costof the source that resource driver of them is time:
((duration until the cut of the date/duration of resourcedriver) * Amount of resource driver * Standard Rate ($) =(25/30) *2*$1,315=$2,183 (civil engineer)
See Table 14 and 15
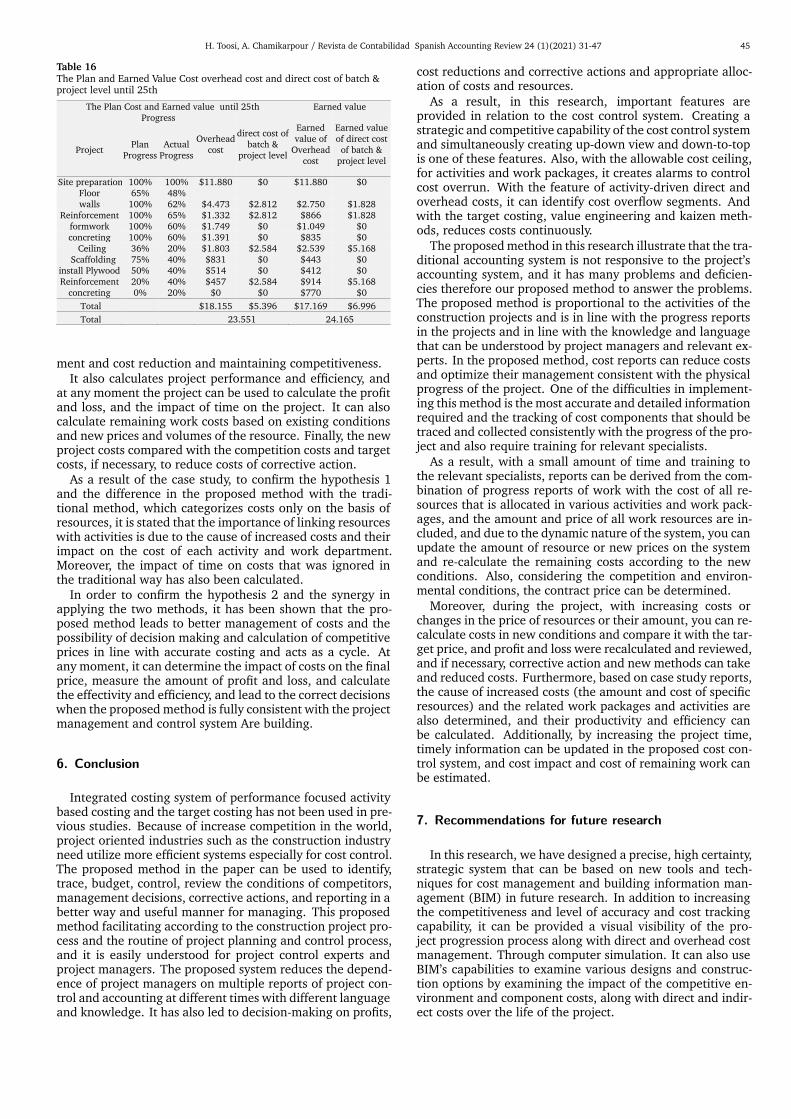
To calculate the direct costs of the batch and project leveland overhead costs up to 25th, are obtained by multiplyingthe plan’s progress of each activity at the plan cost.
See Table 16
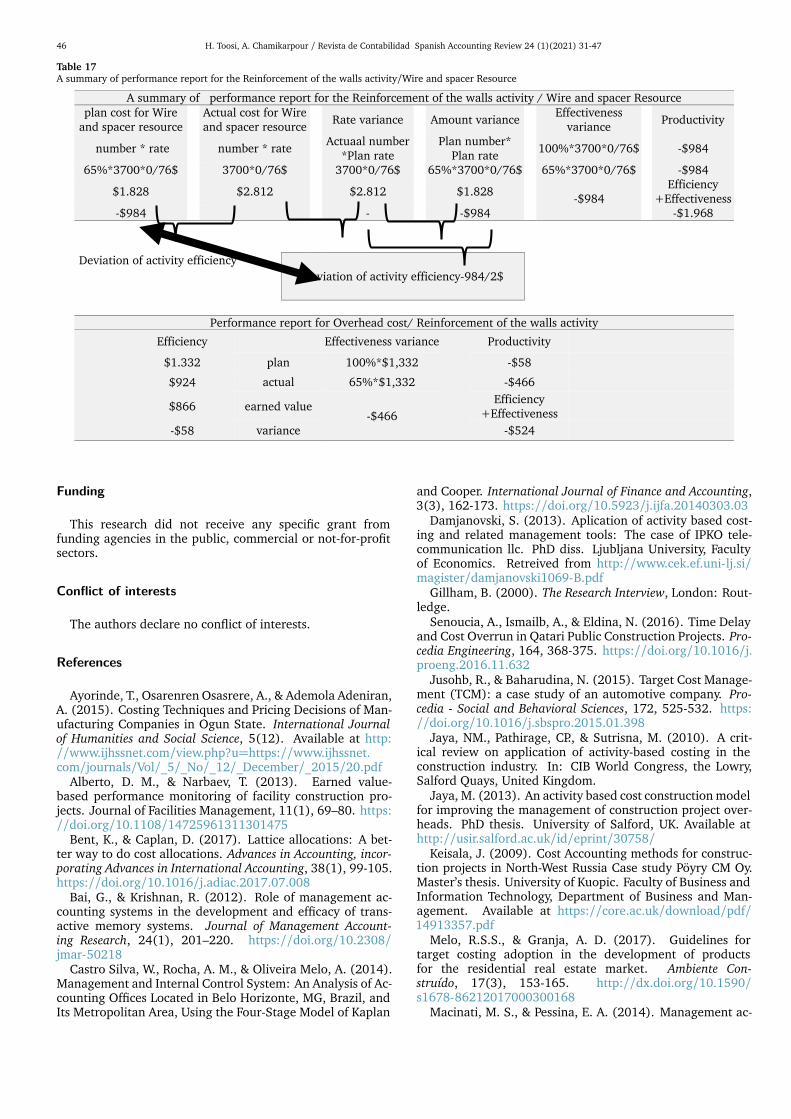
Consequently, based on the calculations, the actual directcosts of the batch and project level up to date 25 are $15,732and the plan costs is $5,396. Actual overhead costs up todate 25 are $23,977 and plan costs are $18,155. As a result,overhead cost and direct cost of batch and project level devi-ations is equal to -$15,544. Causes of cost deviations can bemeasured and tracked based on efficiency (deviation of therate, deviation of amount), effectiveness, and productivity.
See Table 17
H. Toosi, A. Chamikarpour / Revista de Contabilidad Spanish Accounting Review 24 (1)(2021) 31-47 43
Table 12A summary of performance report for the Reinforcement of the walls activity/worker resource
Table 13Earned Value of direct costs until 25th
Earned Value - Cut of date 25 th
Activity Resource
Resourcedriver &Amount driver Identification
Calculate of Earned Value cost
Total Earned Value direct cost
per activity
Direct Resources Direct Resources Activity level Activity level
worker Concrete bar worker Concrete bar Resource driver Number M3 Kg/ton Number M3 Kg/ton
Standard Rate($) $23 $39 $1 $23 $39 $1
Project Actual
Duration (Day)
Plan Progress
Actual Progress
Earned Value direct cost
Floor 65% 48% walls 100% 62% $50.928
Reinforcement 3 Day 100% 65% 97/5 person 48100 Kg $2.048 $27.898 $29.946 formwork 3 Day 100% 60% 72 person $1.512 $1.512 concreting 2 Day 100% 60% 18 person 516 M3 $378 $19.092 $19.470
Ceiling 36% 20% $91.290 Scaffolding 3 Day 75% 40% 28 person $588 $588
install Plywood 2 Day 50% 40% 12 person $252 $252 Reinforcement 4 Day 20% 40% 18/4 person 136000 Kg $386 $78.880 $79.266
concreting 2 Day 0% 20% 4 person 300 M3 $84 $11.100 $11.184
Total Resourcedriver Total 250 816 184.100 $5.248 $30.192 $106.778 $142.218
Then, it estimates the total cost of the project. Total costof project completion is calculated as follows:
Total cost of the project=Actual cost+ Estimated remaining costs
As a result, calculating all three categories of costs includ-ing the direct cost of the activity level, batch level and theproject level and the overhead cost, the estimated cost of theproject is equal to $389,538.
After calculating the total cost of the project, it should becompared with the target cost and the calculated strategicprofit, and check the amount of deviation from the allow-able cost. Given the fact that at this stage, it has been facedwith increasing costs, but the final cost of the project has notexceeded the planned cost with the target costing and stilldelivers the desired profit.
However, due to the details of the costs, it was necessaryto reduce the costs of materials waste and extend the dura-tion of the project. It is also clear from the calculations thatthe direct human resources of the project were more thanpredicted and their costs were higher than the standard rate.
Also, according to the existing conditions, the employershould be required to carry out the project’s pre-requisiteactivities, such as insulation and installation of the pillar toprevent further project delays, otherwise direct human re-sources should be reduced and at a lower cost. Due to con-crete and other materials waste, management should alsohave an accurate estimate of the amount of concrete andmaterials. As a result, with accurate tracking of costs androoting due to increased costs, comprehensive and accurateinformation can be provided at the right time for manage-ment decisions.
Using the proposed method in the case study, we were ableto integrate physical progress reports with accounting reportsat the same time. In the traditional approach, we only lookedat the categories of resources and their costs. in proposingmethod in addition to categorizing resources and calculatingthe costs of each resource, could be used to calculate andtrack the resources and costs associated with each activity,and the reason for the increase in costs was evaluated in eacharea of work and suggested approaches for better manage-
44 H. Toosi, A. Chamikarpour / Revista de Contabilidad Spanish Accounting Review 24 (1)(2021) 31-47
Table 14Actual direct costs of the batch and project level and actual overhead costs up to 25th
Activity
Overhead Resourse
The Actual Cost of Direct Resourse
The Actual Cost of Overhead Resourse
batch level
project level
Activity level batch level
Wire and spacer
- Safety shoes
Helmet gloves Conex Site
office warehouse
Depreciation of Polywood
Depreciation of metal mold
Depreciation of scaffold
Resourse driver
Kg - pair pair pair M2 M2 M2 10%
(Total,kg ) 10%
(Total,kg ) 10%
(Total,kg ) Amount 20700 Kg - 120 pair 120 pair 230 pair 120 M2 80 M2 60 M2 1700 Kg 28000 Kg 400 Kg Standard Rate($)
$0,76 $15 $2 $0,50 $21 $21 $18 $26 $0,46 $0,46
Total resource cost
$15.732 $1.800 $240 $115 $2.520 $1.680 $1.080 $4.420 $1.288 $18
Rate of cost driver (Total Amount driver/Total
resource cost) $0,76 - $15 $2,0 $0,5 $21 $21 $18 $3 $0,05 $0,05
1 1 1 1 1 1 1 1 1 1 1
Project Duration
(Day) 25 Day 25 Day 20 Day 20 Day 20 Day 20 Day 20 Day 20 Day 25 Day 25 Day 25 Day
Site preparation 20 Day $1.800 $240 $115 $2.520 $1.680 $1.080 Floor 16 Day walls 9 Day
Reinforcement 5 Day $2.812 formwork 4 Day $644 concreting 3 Day $644
Ceiling 8 Day Scaffolding 4 Day $4
install Plywood 2 Day $442 $2 Reinforcement 5 Day $12.920 $884 $4
concreting 3 Day $3.094 $9 Total resourse
driver 20700 Kg - 120 pair 120 pair 230 pair 120 M2 80 M2 60 M2 1700 Kg 28000 Kg 400 Kg
Total resourse cost
$15.732 $0 $1.800 $240 $115 $2.520 $1.680 $1.080 $4.420 $1.288 $18
Table 15Continuing actual direct costs of the batch and project level and actual overhead costs up to 25th
Activity
Overhead Resourse
TheActual Cost of Overhead Resourse project level Facility level
Transportation Civil
engineer Surveyor
Project Planner
Supervisor project
manager Office
Supplies utilities
Pantry & consumables
Resourse driver
items Person / month
Person / month
Person / month
Person / month
Person / month
Average Month Month
Amount 30 2 1 1 1 1 1 1 1 Standard Rate($) $71
$1,315 $789 $526 $1,842 $1,842 $1,315 $790 $730
Total resource
cost $2,130 $2,183 $655 $437 $1,529 $1,529 $1,091 $656 $606
Rate of cost driver (Total Amount driver/Total
$85 $700 $420 $280 $980 $980 $700 $420 $388
1 0/830 0/830 0/830 0/830 0/830 0/830 0/830 0/830
Project Duration
(Day) 25 25 25 25 25 25 25 25 25
Site preparation 20 $682 $1,119 $336 $224 $784 $784 $560 $336 $311 Floor 16 walls 9
Reinforcement 5 $256 $168 $50 $34 $118 $118 $84 $50 $47 formwork 4 $256 $168 $50 $34 $118 $118 $84 $50 $47 concreting 3 $85 $112 $34 $22 $78 $78 $56 $34 $31
Ceiling 8 Scaffolding 4 $256 $168 $50 $34 $118 $118 $84 $50 $47
install Plywood 2 $170 $112 $34 $22 $78 $78 $56 $34 $31 Reinforcement 5 $341 $224 $67 $45 $157 $157 $112 $67 $62
concreting 3 $85 $112 $34 $22 $78 $78 $56 $34 $31 Total resourse
driver 25 3/12 1/56 1/56 1/56 1/56 1/56 1/56 1/56
Total resourse cost
$2,130 $2,183 $655 $437 $1,529 $1,529 $1,091 $656 $606
H. Toosi, A. Chamikarpour / Revista de Contabilidad Spanish Accounting Review 24 (1)(2021) 31-47 45
Table 16The Plan and Earned Value Cost overhead cost and direct cost of batch &project level until 25th
The Plan Cost and Earned value until 25th Earned value Progress
Overhead cost
direct cost of batch &
project level
Earned value of
Overhead cost
Earned value of direct cost of batch &
project level Project
Plan Progress
Actual Progress
Site preparation 100% 100% $11.880 $0 $11.880 $0 Floor 65% 48% walls 100% 62% $4.473 $2.812 $2.750 $1.828
Reinforcement 100% 65% $1.332 $2.812 $866 $1.828 formwork 100% 60% $1.749 $0 $1.049 $0 concreting 100% 60% $1.391 $0 $835 $0 Ceiling 36% 20% $1.803 $2.584 $2.539 $5.168
Scaffolding 75% 40% $831 $0 $443 $0 install Plywood 50% 40% $514 $0 $412 $0 Reinforcement 20% 40% $457 $2.584 $914 $5.168
concreting 0% 20% $0 $0 $770 $0
Total $18.155 $5.396 $17.169 $6.996
Total 23.551 24.165
ment and cost reduction and maintaining competitiveness.It also calculates project performance and efficiency, and
at any moment the project can be used to calculate the profitand loss, and the impact of time on the project. It can alsocalculate remaining work costs based on existing conditionsand new prices and volumes of the resource. Finally, the newproject costs compared with the competition costs and targetcosts, if necessary, to reduce costs of corrective action.
As a result of the case study, to confirm the hypothesis 1and the difference in the proposed method with the tradi-tional method, which categorizes costs only on the basis ofresources, it is stated that the importance of linking resourceswith activities is due to the cause of increased costs and theirimpact on the cost of each activity and work department.Moreover, the impact of time on costs that was ignored inthe traditional way has also been calculated.
In order to confirm the hypothesis 2 and the synergy inapplying the two methods, it has been shown that the pro-posed method leads to better management of costs and thepossibility of decision making and calculation of competitiveprices in line with accurate costing and acts as a cycle. Atany moment, it can determine the impact of costs on the finalprice, measure the amount of profit and loss, and calculatethe effectivity and efficiency, and lead to the correct decisionswhen the proposed method is fully consistent with the projectmanagement and control system Are building.
6. Conclusion
Integrated costing system of performance focused activitybased costing and the target costing has not been used in pre-vious studies. Because of increase competition in the world,project oriented industries such as the construction industryneed utilize more efficient systems especially for cost control.The proposed method in the paper can be used to identify,trace, budget, control, review the conditions of competitors,management decisions, corrective actions, and reporting in abetter way and useful manner for managing. This proposedmethod facilitating according to the construction project pro-cess and the routine of project planning and control process,and it is easily understood for project control experts andproject managers. The proposed system reduces the depend-ence of project managers on multiple reports of project con-trol and accounting at different times with different languageand knowledge. It has also led to decision-making on profits,
cost reductions and corrective actions and appropriate alloc-ation of costs and resources.
As a result, in this research, important features areprovided in relation to the cost control system. Creating astrategic and competitive capability of the cost control systemand simultaneously creating up-down view and down-to-topis one of these features. Also, with the allowable cost ceiling,for activities and work packages, it creates alarms to controlcost overrun. With the feature of activity-driven direct andoverhead costs, it can identify cost overflow segments. Andwith the target costing, value engineering and kaizen meth-ods, reduces costs continuously.
The proposed method in this research illustrate that the tra-ditional accounting system is not responsive to the project’saccounting system, and it has many problems and deficien-cies therefore our proposed method to answer the problems.The proposed method is proportional to the activities of theconstruction projects and is in line with the progress reportsin the projects and in line with the knowledge and languagethat can be understood by project managers and relevant ex-perts. In the proposed method, cost reports can reduce costsand optimize their management consistent with the physicalprogress of the project. One of the difficulties in implement-ing this method is the most accurate and detailed informationrequired and the tracking of cost components that should betraced and collected consistently with the progress of the pro-ject and also require training for relevant specialists.
As a result, with a small amount of time and training tothe relevant specialists, reports can be derived from the com-bination of progress reports of work with the cost of all re-sources that is allocated in various activities and work pack-ages, and the amount and price of all work resources are in-cluded, and due to the dynamic nature of the system, you canupdate the amount of resource or new prices on the systemand re-calculate the remaining costs according to the newconditions. Also, considering the competition and environ-mental conditions, the contract price can be determined.
Moreover, during the project, with increasing costs orchanges in the price of resources or their amount, you can re-calculate costs in new conditions and compare it with the tar-get price, and profit and loss were recalculated and reviewed,and if necessary, corrective action and new methods can takeand reduced costs. Furthermore, based on case study reports,the cause of increased costs (the amount and cost of specificresources) and the related work packages and activities arealso determined, and their productivity and efficiency canbe calculated. Additionally, by increasing the project time,timely information can be updated in the proposed cost con-trol system, and cost impact and cost of remaining work canbe estimated.
7. Recommendations for future research
In this research, we have designed a precise, high certainty,strategic system that can be based on new tools and tech-niques for cost management and building information man-agement (BIM) in future research. In addition to increasingthe competitiveness and level of accuracy and cost trackingcapability, it can be provided a visual visibility of the pro-ject progression process along with direct and overhead costmanagement. Through computer simulation. It can also useBIM’s capabilities to examine various designs and construc-tion options by examining the impact of the competitive en-vironment and component costs, along with direct and indir-ect costs over the life of the project.
46 H. Toosi, A. Chamikarpour / Revista de Contabilidad Spanish Accounting Review 24 (1)(2021) 31-47
Table 17A summary of performance report for the Reinforcement of the walls activity/Wire and spacer Resource
A summary of performance report for the Reinforcement of the walls activity / Wire and spacer Resource plan cost for Wire
and spacer resource Actual cost for Wire and spacer resource
Rate variance Amount variance Effectiveness
variance Productivity
number * rate number * rate Actuaal number
*Plan ratePlan number*
Plan rate 100%*3700*0/76$ -$984
65%*3700*0/76$ 3700*0/76$ 3700*0/76$ 65%*3700*0/76$ 65%*3700*0/76$ -$984
$1.828 $2.812 $2.812 $1.828 -$984
Efficiency +Effectiveness
-$984 - -$984 -$1.968
Deviation of activity efficiency
Deviation of activity efficiency-984/2$
Performance report for Overhead cost/ Reinforcement of the walls activity
Efficiency Effectiveness variance Productivity
$1.332 plan 100%*$1,332 -$58
$924 actual 65%*$1,332 -$466
$866 earned value -$466
Efficiency +Effectiveness
-$58 variance -$524
Funding
This research did not receive any specific grant fromfunding agencies in the public, commercial or not-for-profitsectors.
Conflict of interests
The authors declare no conflict of interests.
References
Ayorinde, T., Osarenren Osasrere, A., & Ademola Adeniran,A. (2015). Costing Techniques and Pricing Decisions of Man-ufacturing Companies in Ogun State. International Journalof Humanities and Social Science, 5(12). Available at http://www.ijhssnet.com/view.php?u=https://www.ijhssnet.com/journals/Vol/_5/_No/_12/_December/_2015/20.pdf
Alberto, D. M., & Narbaev, T. (2013). Earned value-based performance monitoring of facility construction pro-jects. Journal of Facilities Management, 11(1), 69–80. https://doi.org/10.1108/14725961311301475
Bent, K., & Caplan, D. (2017). Lattice allocations: A bet-ter way to do cost allocations. Advances in Accounting, incor-porating Advances in International Accounting, 38(1), 99-105.https://doi.org/10.1016/j.adiac.2017.07.008
Bai, G., & Krishnan, R. (2012). Role of management ac-counting systems in the development and efficacy of trans-active memory systems. Journal of Management Account-ing Research, 24(1), 201–220. https://doi.org/10.2308/jmar-50218
Castro Silva, W., Rocha, A. M., & Oliveira Melo, A. (2014).Management and Internal Control System: An Analysis of Ac-counting Offices Located in Belo Horizonte, MG, Brazil, andIts Metropolitan Area, Using the Four-Stage Model of Kaplan
and Cooper. International Journal of Finance and Accounting,3(3), 162-173. https://doi.org/10.5923/j.ijfa.20140303.03
Damjanovski, S. (2013). Aplication of activity based cost-ing and related management tools: The case of IPKO tele-communication llc. PhD diss. Ljubljana University, Facultyof Economics. Retreived from http://www.cek.ef.uni-lj.si/magister/damjanovski1069-B.pdf
Gillham, B. (2000). The Research Interview, London: Rout-ledge.
Senoucia, A., Ismailb, A., & Eldina, N. (2016). Time Delayand Cost Overrun in Qatari Public Construction Projects. Pro-cedia Engineering, 164, 368-375. https://doi.org/10.1016/j.proeng.2016.11.632
Jusohb, R., & Baharudina, N. (2015). Target Cost Manage-ment (TCM): a case study of an automotive company. Pro-cedia - Social and Behavioral Sciences, 172, 525-532. https://doi.org/10.1016/j.sbspro.2015.01.398
Jaya, NM., Pathirage, CP., & Sutrisna, M. (2010). A crit-ical review on application of activity-based costing in theconstruction industry. In: CIB World Congress, the Lowry,Salford Quays, United Kingdom.
Jaya, M. (2013). An activity based cost construction modelfor improving the management of construction project over-heads. PhD thesis. University of Salford, UK. Available athttp://usir.salford.ac.uk/id/eprint/30758/
Keisala, J. (2009). Cost Accounting methods for construc-tion projects in North-West Russia Case study Pöyry CM Oy.Master’s thesis. University of Kuopic. Faculty of Business andInformation Technology, Department of Business and Man-agement. Available at https://core.ac.uk/download/pdf/14913357.pdf
Melo, R.S.S., & Granja, A. D. (2017). Guidelines fortarget costing adoption in the development of productsfor the residential real estate market. Ambiente Con-struído, 17(3), 153-165. http://dx.doi.org/10.1590/s1678-86212017000300168
Macinati, M. S., & Pessina, E. A. (2014). Management ac-
H. Toosi, A. Chamikarpour / Revista de Contabilidad Spanish Accounting Review 24 (1)(2021) 31-47 47
counting use and financial performance in public health-careorganisations: Evidence from the Italian National Health Ser-vice. Health Policy, 117(1), 98–111. https://doi.org/10.1016/j.healthpol.2014.03.011
Namazi, M., & Shamsodini, K. (2016). The Investigationof the Impact of Learning on the Performance Focused Activ-ity Based Costing (PFABC). Management Accounting, 9(29),73-87.
Namazi, M. (2009). Performance Focused ABC: A ThirdGeneration of Activity Based Costing System. Cost Manage-ment, 23(5), 34-46.
Pennanen, A., Ballard, G., & Haahtela, Y. (2011). Targetcosting and designing to targets in construction. Journal ofFinancial Management of Property and Construction, 16(1),52-63. https://doi.org/10.1108/13664381111116089
Reddy, K., Venter, H. S., & Olivier, M.S. (2012). Usingtime-driven activity-based costing to manage digital forensicreadiness in large organisations. Information Systems Fron-tiers, 14(5), 1061–1077. http://link.springer.com/10.1007/s10796-011-9333-x
Sharafoddin, S. (2016). The Utilization of Target Cost-ing and its Implementation Method in Iran. Procedia Eco-nomics and Finance, 36, 123-127. https://doi.org/10.1016/S2212-5671(16)30023-5
Shirowzhan, M., Shanaki, M., Sebt, M.H., & Toosi, H.N.,(2016). Evaluating delay factors in the construction and op-eration of port operational areas (case study: Shahid Ra-jaee port complex). Journal of Fundamental and AppliedSciences, 8 (2), 732-763. https://doi.org/%5B10.4314/jfas.8vi2s.33%5D
Singh, A., & Taam, T. (2008). Techniques for CalculatingUnabsorbed Overhead. School of the Built Environment. In:
Proceedings from International Conference on BuildingEducation and Research (BEAR), University of Salford, UK,113-124. Available at https://www.irbnet.de/daten/iconda/CIB11312.pdf
Tang, J., Zhang, M., Tang, H., & Chen, Y. (2015). Re-search on Cost Management of Construction Project basedon Activity-based Costing.
Proceedings of the 2nd International Conference on Civil,Materials and Environmental Sciences, [Advances in En-gineering Research], 11, 51-54. https://doi.org/10.2991/cmes-15.2015.15
Toosi, H.N., Sebt, M.H. & Maknoon, R. (2014). A dy-namic model for adjusting contemporary construction pro-jects behaviors in today changeable environments. Interna-tional Journal of Civil Engineering. 12 (4 A), 466-480.
Uyar, A., & Kuzey, C. (2016). Does management account-ing mediate the relationship between cost system designand performance? Advances in Accounting, Incorporating Ad-vances in International Accounting, 35, 170–176. https://doi.org/10.1016/j.adiac.2016.06.004
Yuksel Pazarceviren, S., & Dede, B. (2015). Life cycle cost-ing model based on target and activity based costing methodand a model proposal. European Scientific Journal, August,121-138.
Zimina, D., Glenn, B., & Pasquire, C. (2012). Target valuedesign: using collaboration and a lean approach to reduceconstruction cost. Construction Management and Economics,30(5), 383-398. https://doi.org/10.1080/01446193.2012.676658