automating progress measurement of construction projects
TRANSCRIPT

Automation in Construction 18 (2009) 294–301
Contents lists available at ScienceDirect
Automation in Construction
j ourna l homepage: www.e lsev ie r.com/ locate /autcon
Automating progress measurement of construction projects
Xiaonan Zhang a,⁎, Nick Bakis a, Timothy C. Lukins b, Yahaya M. Ibrahim c, Song Wu a, Mike Kagioglou a,Ghassan Aouad a, Ammar P. Kaka c, Emanuele Trucco d
a School of the Built Environment, University of Salford, Salford, M5 4WT, UKb School of Engineering and Physical Sciences, Heriot-Watt University, Edinburgh, EH14 4AS, UKc School of the Built Environment, Heriot-Watt University, Edinburgh, EH14 4AS, UKd School of Computing, University of Dundee, Dundee, DD1 4HN, UK
⁎ Corresponding author. Tel.: +44 161 2955072; fax: +E-mail address: [email protected] (X. Zhang).
0926-5805/$ – see front matter © 2008 Elsevier B.V. Aldoi:10.1016/j.autcon.2008.09.004
A b s t r a c t
a r t i c l e i n f oArticle history:
The accurate and up to da Accepted 15 September 2008Keywords:Progress measurementComputer visionWork breakdown structure (WBS)
te measurement of work in progress on construction sites is vital for projectmanagement functions like schedule and cost control. Currently, it takes place using traditional buildingsurveying techniques and visual inspections. The usually monthly measurements are error prone and notfrequent enough for reliable and effective project controls. This paper explores the potential of using computervision technology in assisting the project management task. In particular, it examines the development of anintegrated building information system that aims to determine the progress of construction from digitalimages captured on site in order to semi-automate the work in progress measurement and calculation ofinterim payments as well as function as an early warning system of potential delays. The study focuses on thequantity rather than quality aspect of work and is limited to the superstructure of buildings.
© 2008 Elsevier B.V. All rights reserved.
1. Introduction
Many construction companies consider the measurement of workin progress to be one of themost challenging problems faced by projectmanagement [1]. In construction projects, site managers normallyspend a significant amount of timemeasuring, recording and analysingthe progress of work. This is essential for many business and projectmanagement functions such as cost and schedule control, financialreporting, claims and productivity measurement. In order for thesefunctions to be reliable and effective, regular and accurate measure-ment is required. However, there is often lack of accurate and up-to-date as-built information due to the time consuming and expensivepractice of manual data collection [2–4]. In building construction, theaverage duration of activities is typically in the range of days. However,the average frequency of manual data collection and reporting ismonthly. The absence of accurate and real-time as-built informationhandicaps the managers' ability to monitor schedule, cost and otherperformance indicators. This in turn reduces their ability to detect ormanage the variability and uncertainty inherent in project activities [5].
Several construction companies have started exploiting the use ofdigital imaging in supporting the visual inspection task [4]. Regularlycaptured images on the construction site are used in examining theprogress of work, minimizing the need for site visiting. The main useof digital imaging however has so far been limited to supporting the
44 161 2954587.
l rights reserved.
visual inspection task, with the managers having to examine theimages anddetermine progress. There have been someattempts to linkthe captured imageswith bar charts in order to highlight the differencebetween schedule and actual progress [6]. The interpretation of theimages however is still left to the user.
Computer vision, a technology that focuses on providing computerswith the functions typical of human vision and can be used in deriving3D objects from 2D images, provides the opportunity for automaticallyanalysing the captured images and measuring the work in progress.While the application of computer vision might be limited to certainstages of construction where the progress of construction is morevisually evident (e.g. developmentof superstructure) andwhile itmightnot be possible to fully automate the work in progress measurementtask (e.g. some activitiesmight be too complex to analyse or not directlyrelated to the construction of individual building components), the useof computer vision provides the opportunity for assisting the projectmanagement task to certain extent. For example, a computer visionsystem that constantly monitors construction progress might functionas an early warning system of potential delays. Additionally, the mea-surement of the work in progress and calculation of interim paymentscan be semi-automated increasing efficiency. This paper presents thedevelopmentof such a systemaiming to assist in the constructionof thesuperstructure of buildings.
The outline of the paper is as follows. First, computer vision tech-nology is introduced along with its application in construction.Second, the importance of progress measurement is highlighted andthe main methods in measuring progress are introduced. Third, theconcepts of data integration andwork breakdown structure (WBS) are
295X. Zhang et al. / Automation in Construction 18 (2009) 294–301
presented. A flexible approach to creating a WBS is described. Fourth,the architecture of the developed system is outlined. Evaluation re-sults and feedback from the two workshops are also summarized.Finally, conclusions are drawn and potential future work is discussed.
2. Computer vision
Computer vision is concerned with modelling and replicating hu-man vision using computer software and hardware. It is a fast evolvingdiscipline that studies how to reconstruct, interpret and understand a3D scene from its 2D images [7] and [8]. The typical tasks for computervision are:
• Recognition: determiningwhether the imagedata contain some spe-cific object, feature or activity;
• Motion: estimating velocity either at each point in the image or inthe 3D scene;
• Scene reconstruction: creating a 3D model of the scene;• Image restoration: removing noise (sensor noise, motion blur, etc.)from images.
Computer vision has found applications in a large number of areas,including automatic face recognition and interpretation of expression;automated medical image analysis, interpretation and diagnosis;recognition of printed or handwritten characters and words. In theconstruction area, there have been some efforts to extract data fromconstruction site images. Dick et al. [9] present a framework inwhich adictionary of common building elements and their learned distribu-tion are fitted to observed geometry. Cantzler et al. [10] describean algorithm exploiting geometric constraints to improve the qualityof automatically reconstructed building models from images. How-ever, all these efforts are concerned with building model reconstruc-tion, not with measuring progress. In addition, the reconstructedmodels do not generally have the level of detail required in measuringthe progress of construction of building components.
Some studies have also touched the issue of quality assurance, e.g.,tolerance verification [11]. This approach to detecting defects canvisually highlight the differences between the “as-built” state andoriginalmodel. Scanning technology implies that the results canbeveryaccurate. However there are issues related to the sheer volume ofdata to be interpreted. Some research exists on the observation andverification of buildings using remote, long-distance imagery, includingLIDAR and visible-spectrum images. For example, Huertas and Nevatia[12] report a system for detecting specific changes in the overallstructure of buildings. They exploit linear structure and seek to discardfalse edges created by shadows. Generalised 3Dmodels are fitted to theresult and discrepancies are used to verify the identified changes.
2.1. Use of computer vision in progress measurement
Progress measurement is based on identifying changes either asdeparture from an a-priori model or as difference between imagestaken at different times [12] and [13]. If changes to the structureof building components can be identified from a series of imagescaptured on site, it is possible to confirm the completion date for thecomponents and therefore determine the progress of work on site.
Retrieving data on structure from images however is a hard prob-lem, especially in cases where the images are incomplete and noisy,such as images taken from construction sites [14]. The key problem isthat construction sites offer some of the worst instances of clutteredscenes. Furthermore, changes to the true structure over time, whichindicate the real progress, may be surrounded by a large number ofadditional spurious events. These can broadly be classified as noiseand include effects that are environmental (light and shadows, rain,snow, etc), partial (longer cumulative periods of work such as pouringconcrete) and occasional (people and equipment moving or stayingstill for a period of time).
3. Progress measurement
3.1. Linking construction progress to schedule information
Retrieving data on the construction of building components fromdigital images represents the first step in measuring the progressof work. This is because project managers usually define the activitiesin the schedule at a different level of detail, i.e. the work packagerather than the individual building component level (e.g. ‘formwork’,‘reinforcement’, ‘concreting’, etc, instead of ‘build wall’). A work pack-age may refer to several building components and the construction ofa building component may involve several work packages. An in-herent problem in integrating the extracted construction progressdata from the images with schedule information is enabling the com-puter tomaintain the relationships between building components andwork packages.
Some commercial 4D softwares, e.g. 4D Suite, JetStream, allow usersto specify the relationships between building components and workpackages manually [15]. However, for complex projects with a largenumberof building components, the linkingprocess couldbecome timeconsuming and error prone.
There have been some attempts to automate the process bygenerating a schedule from a 3D CAD model automatically [16–18].However, total automation is not possible and human intervention isusually required in establishing the linkages between components andpackages. This is because it is not always possible to take into accountthe multitude of non-explicit or project-specific requirements inher-ent in construction projects (for example, some of the typical tasks inthe construction of a building componentmight not be required undercertain conditions or some of the work packages might relate to themethod of construction which might not be known in advance asit depends on many different factors such as the availability of re-sources, site conditions, time and cost constraints, etc) [19] and [20].In addition, there might be tasks that cannot be inferred from thedesign (e.g. tasks referring to temporal works).
3.2. Integrating schedule and cost information
The integration of schedule and cost information requires thatcost and schedule share a Work Breakdown Structure (WBS) [21] and[22]. A WBS is defined as “a deliverable-oriented grouping of projectelements, which organizes and defines the structure of the entireproject. Each descending level represents an increasingly detaileddefinition of a project component” [23]. It is a straightforward meansof relating time and cost information, and in this paper progressinformation. The significance ofWBS in project control is twofold: firstit is a classification mechanism that decomposes the project elementsinto a manageable level; second, it is an integrating mechanismthat provides a common perspective to relevant construction businessfunctions [24].
There are two main issues in developing a WBS: the decompositioncriteria and the level of detail. The division of work packages couldchange dramatically based on the criteria used.However the difficulty ofintegrating schedule and cost information stems primarily from thelevel of detail required for effective integration [25]. Usually, a singleproject activity will involve numerous cost account categories andnumerous activities might involve expenses associated with particularcost accounts. It is usually a many-to-many relationship between activ-ities and cost accounts.
4. The Integrated Building Information System
In this research, an Integrated Building Information System (IBIS)has been developed to assist the project management task duringthe construction of the superstructure of buildings. The system semi-automates the work in progress measurement and calculation of

Fig. 1. IBIS System architecture.
296 X. Zhang et al. / Automation in Construction 18 (2009) 294–301
interim payments as well as functions as an early warning systemof potential delays. It uses computer vision technology to determinethe progress of construction from digital images captured on site and asemi-automatic approach in linking construction progress (comple-tion of building components) with schedule and cost information. Thedeveloped system consists of four main modules: (i) computer vision;(ii) WBS; (iii) scheduling and budgeting; and (iv) progress measure-ment, valuation and early alerts (Fig. 1).
Fig. 2. Computer v
4.1. Computer vision module
The computer vision module retrieves the 3D “as-planed” modelfrom the IBIS database (Fig. 2). The model is used to first align asequence of images taken from a particular position and angle withrelated building components foundwithin the site. This is effectively amodel-based fitting approach that seeks to rectify the reality of theobservations to the appearance of planned components. The alignment
ision process.

Fig. 3. A flexible approach to generate WBS (modified from: [27]).
297X. Zhang et al. / Automation in Construction 18 (2009) 294–301
in many cases requires an additional degree of fine tuning to recovera good fit to the intrinsic parameters of the camera, particularlythe focal length. This could be performed in advance by a calibrationprocedure. The output of this process is a set of component regionsand templatemasks created from the projection of themodel onto thealigned image. These component regions and template masks guidethe computer vision module to spot changes occurring over time byidentifying the corresponding building components through thosemasks.
In identifying the building components, sudden effects of lightingmay cause false detection of changes in the image. To remove as muchas possible of such variations, the image is first converted to gray scaleand the pixels within n×n sub-blocks are normalised to have zeromean and variance of one. As in this case only a relatively small area(in terms of the overall image) is considered each time, the approach isjustified for removing a considerable amount of localised brightnessand shadowing [26].
The detected changes in the images are analysed to examinewhether they are due to the appearance of scheduled components.Different algorithms, such as Adaboost detect, pixel change detect(Fig. 4), are used in cross checking the changes spotted in order toincrease the accuracy of the results. The changes detected are usedto calculate the sum and the mean change in the regions of interestdetermined by the template mask for each component. Significantchanges in the region are then considered to indicate that the relevantcomponent is appearing on site. Similarly, if no further changes inthe region are detected after a certain time, it is then considered toindicate that the component is complete. Once verified, the comple-tion time of the component is saved to the IBIS database and used forthe progress measurement in the later stage. Theoretically the verifiedchanges could also be used to compare with the 3D “as-planed”modelin order to calculate the percentage completion of building compo-nents. More information on the operation of the computer visionmodule can be found in Lukins et al. [26].
4.2. WBS module
In order for the system to measure the progress of work andcalculate interim payments as well as detect any delays based onthe progress of construction, the relationships between buildingcomponents, work packages and cost items need to be maintained.As we saw, one approach in establishing those relationships isfor the user to specify them manually. Another approach is to auto-matically generate the work packages and cost items based on thedesign information. As it is time consuming and error prone tospecify the relationships manually on the one hand and it is notpossible to fully automate the generation of the work packagesand cost items on the other, a semi-automatic approach has beenfollowed in this research.
The system automatically creates an initial WBS based on thedesign information and a number of criteria specified by the user asdescribed below. The system also allows the user to make modifica-tions to the WBS and specify any new relationships between buildingcomponents, work packages and cost items manually.
The initial WBS is automatically generated by the system using amultilevel decomposition process in which the designed constructionmodel (the design is saved in a model based form being created usingan object-based design package–Autodesk Revit in our case) is de-composed into detailed work packages based on a number criteriaspecified by the user (Fig. 3). According to a recent industry survey[27], the three most used criteria in creating a WBS are work section,geographic location (e.g. floor level) and type of components. Thesystem allows the user to select any of these criteria and the morecriteria selected, the more work packages at a higher level of detail arecreated with less number of building components associated witheach package. For example, as Fig. 4 illustrates, by choosing the ‘work
section’ criterion, three packages are created (Fig. 4A). By adding thefloor section criterion, 27 packages are created (Fig. 4B). Finally, byadding the element criterion, the number of packages increases to 35(Fig. 4C).
It should be noted that the generation of the WBS can be furtherimproved by adding more criteria or associating ‘recipes’ (typicalwork packages) with the construction of each object. However, asthe focus of this study has not been on the automatic generationof the WBS but rather on measuring the work in progress, furtherrefinements to the model were not attempted. Emphasis was placedinstead on maintaining the relationships between building compo-nents, work packages and cost items while allowing the user tomodify the automatically generated WBS, as explained in the nextsection.
The generated WBS forms the basis for the integration of design,cost and schedule information, work progress measurement, and cal-culation of the interim payments and productivity rates. For example,in order to calculate interim payments, the work packages can beused as the middle layer in linking the retrieved construction progressdata with the cost information.
4.3. Scheduling and budgeting module
The generated work packages are automatically loaded into MSProject which is used as the scheduling tool. Using the MS Projectediting functions, the user can perform any modifications to thepackages. An existing work package may be subdivided into a furtherlevel of detail (e.g. ‘Build Wall 1’ may be subdivided into ‘FormworkWall 1’, ‘ReinforcementWall 1’, ‘ConcretingWall 1’, etc).While itmightnot be possible for the system to determine the completion of theindividual sub-packages, completion of the parent package assumescompletion of the children ones. Existing work packages associatedwith building components may be also grouped under new parentpackages (e.g. ‘Build Wall 1’ and ‘Build Wall 2’ may be grouped under‘Build Walls Zone A’). Completion of the children packages assumescompletion of the parent ones. By maintaining the parent/childrelationships, the system is able to recognise the completion of theparent work packages on the completion of the child ones and viceversa.
The system also allows the user to define new work packageswhich can be manually associated (through a built-in interface) withany number of building components. By maintaining the relationsbetween components and packages the system is able to detect thepackages completed on the completion of the building components.Having defined thework packages, the user can schedule them (define

Fig. 4.Work package breakdown: (A) Selecting a single decomposition criterion in creating theWBS; (B) Selecting two decomposition criteria in creating theWBS; (C) Selecting threedecomposition criteria in creating the WBS.
298 X. Zhang et al. / Automation in Construction 18 (2009) 294–301

Fig. 4 (continued).
299X. Zhang et al. / Automation in Construction 18 (2009) 294–301
start and end dates) as well as specify the costs associated with eachpackage.
4.4. Progress measurement, valuation and early alerts module
The progress measurement, valuation and early alerts moduleuses the input from the computer vision module on the progress ofconstruction and the relationships between building components,work packages and cost items maintained by the IBIS system tohighlight the work packages detected by the system as completed.As it was mentioned, the system might not detect all completedpackages so the user has to check the remaining ones.
Based on the completed packages, the module can produce aninitial valuation report, including productivity rates, which needs tobe completed by the user. Early alerts are also raised, in the form ofemails, on detecting any work packages that have not been completedby their scheduled end date.
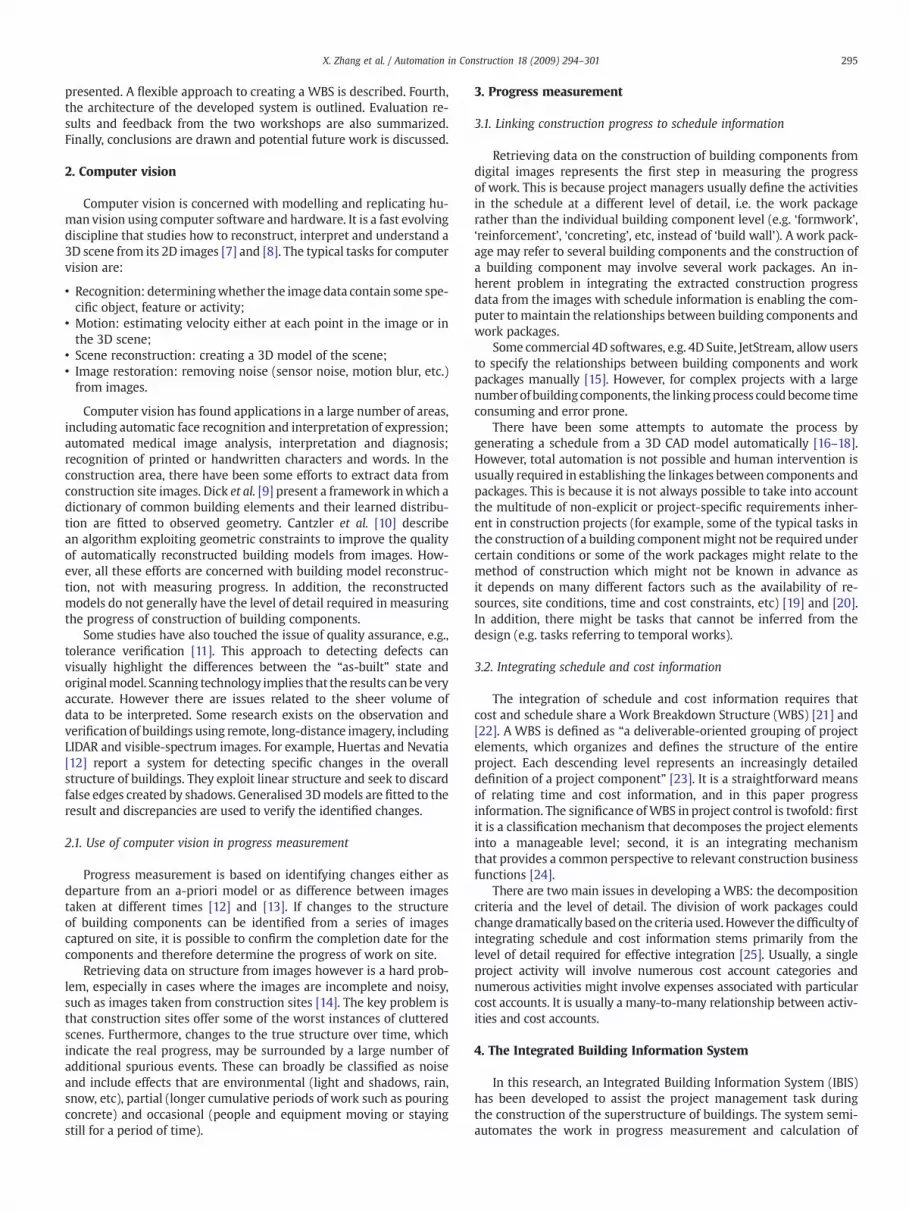
The sum of the cost of the completed work packages is the esti-mated interim payment. Productivity rates are estimated by multi-plying the percentage completion of activities with the correspondingtotal quantities divided by the time taken to achieve that level ofprogress. Performance diagrams can be also created for the projectmanger to monitor project performance (Fig. 5).
4.5. Evaluation and feedback
A real construction project was used as a case study in evaluatingthe performance of the computer vision module and two workshopswith the participation of industrialists took place in evaluating theoverall system operation.
4.5.1. Results from the case studyThe performance of the computer vision module was evaluated in
the construction of the School of Informatics building at the Universityof Edinburgh. A 3D building model was provided by BennettsAssociates while digital images were captured from cameras installedon site.
The computer vision module was tested at various stages of thebuilding's superstructure construction. The module was able to detectthe construction of building components at 70% of the time. Part of thelimited detection rate was due to the images exhibiting heavy clutterand uncontrolled lighting variations. Improvement may be achievedby refining the model based fitting for image alignment and makingthe detection algorithmmore reliable by including texture and colour.Another problem has been the limited coverage of the fixed camerasespecially in relation to the internal building. While the installationof more cameras or the use of portable ones might increase coverage,knowledge of the building model could be used in inferring the com-pletion of components in those areas where coverage is limited (e.g.,on detecting that the 2nd floor slab has been completed, the systemcan infer that the columns on the 1st floor have been completed aswell).
4.5.2. Feedback from the workshopsThe prototype was also evaluated in two workshops. In the first
workshop, 12 persons, including four industrialists, one senior LocalCouncil official, one EPSRC member and six academics (excludingthe researchers in this project), attended. In the second workshop,eight people, one planner, two project managers, one quantity sur-veyor and four academics (excluding the researchers in this project),attended.
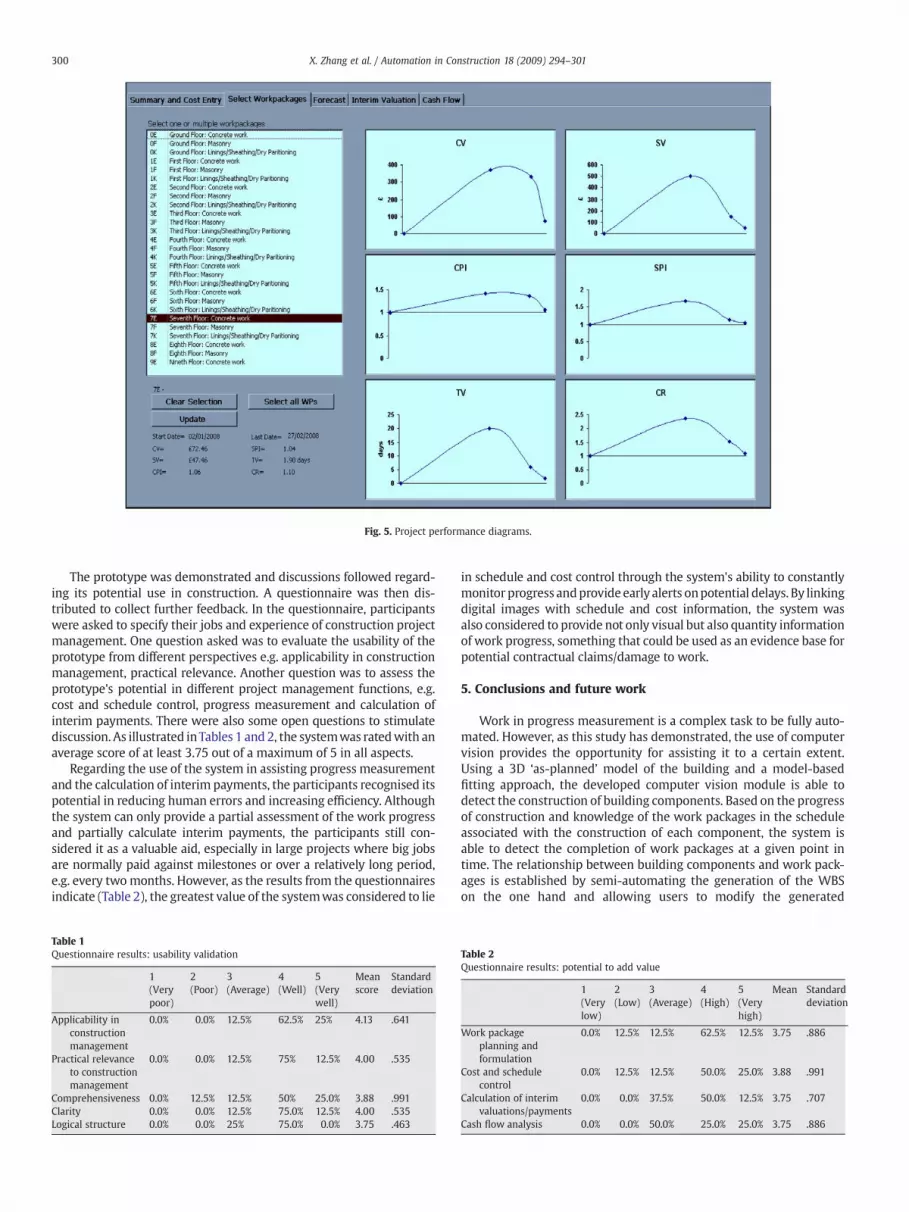
Fig. 5. Project performance diagrams.
300 X. Zhang et al. / Automation in Construction 18 (2009) 294–301
The prototype was demonstrated and discussions followed regard-ing its potential use in construction. A questionnaire was then dis-tributed to collect further feedback. In the questionnaire, participantswere asked to specify their jobs and experience of construction projectmanagement. One question asked was to evaluate the usability of theprototype from different perspectives e.g. applicability in constructionmanagement, practical relevance. Another question was to assess theprototype's potential in different project management functions, e.g.cost and schedule control, progress measurement and calculation ofinterim payments. There were also some open questions to stimulatediscussion. As illustrated inTables 1 and 2, the systemwas ratedwith anaverage score of at least 3.75 out of a maximum of 5 in all aspects.
Regarding the use of the system in assisting progress measurementand the calculation of interim payments, the participants recognised itspotential in reducing human errors and increasing efficiency. Althoughthe system can only provide a partial assessment of the work progressand partially calculate interim payments, the participants still con-sidered it as a valuable aid, especially in large projects where big jobsare normally paid against milestones or over a relatively long period,e.g. every twomonths. However, as the results from the questionnairesindicate (Table 2), the greatest value of the systemwas considered to lie
Table 1Questionnaire results: usability validation
1(Verypoor)
2(Poor)
3(Average)
4(Well)
5(Verywell)
Meanscore
Standarddeviation
Applicability inconstructionmanagement
0.0% 0.0% 12.5% 62.5% 25% 4.13 .641
Practical relevanceto constructionmanagement
0.0% 0.0% 12.5% 75% 12.5% 4.00 .535
Comprehensiveness 0.0% 12.5% 12.5% 50% 25.0% 3.88 .991Clarity 0.0% 0.0% 12.5% 75.0% 12.5% 4.00 .535Logical structure 0.0% 0.0% 25% 75.0% 0.0% 3.75 .463
in schedule and cost control through the system's ability to constantlymonitor progress andprovide early alerts onpotential delays. By linkingdigital images with schedule and cost information, the system wasalso considered to provide not only visual but also quantity informationof work progress, something that could be used as an evidence base forpotential contractual claims/damage to work.
5. Conclusions and future work
Work in progress measurement is a complex task to be fully auto-mated. However, as this study has demonstrated, the use of computervision provides the opportunity for assisting it to a certain extent.Using a 3D ‘as-planned’ model of the building and a model-basedfitting approach, the developed computer vision module is able todetect the construction of building components. Based on the progressof construction and knowledge of the work packages in the scheduleassociated with the construction of each component, the system isable to detect the completion of work packages at a given point intime. The relationship between building components and work pack-ages is established by semi-automating the generation of the WBSon the one hand and allowing users to modify the generated
Table 2Questionnaire results: potential to add value
1(Verylow)
2(Low)
3(Average)
4(High)
5(Veryhigh)
Mean Standarddeviation
Work packageplanning andformulation
0.0% 12.5% 12.5% 62.5% 12.5% 3.75 .886
Cost and schedulecontrol
0.0% 12.5% 12.5% 50.0% 25.0% 3.88 .991
Calculation of interimvaluations/payments
0.0% 0.0% 37.5% 50.0% 12.5% 3.75 .707
Cash flow analysis 0.0% 0.0% 50.0% 25.0% 25.0% 3.75 .886

301X. Zhang et al. / Automation in Construction 18 (2009) 294–301
packages while maintaining the relationships between componentsand packages on the other. By allowing users to associate cost itemswith the work packages, calculation of interim payments is alsopossible.
The system cannot provide a complete picture of work progress.The computer vision module has a limited success rate in detectingthe completion of building components. Further improvement can beachieved by refining the model based fitting for image alignment andusing knowledge of the building model in inferring the completionof components. The computer vision module also detects only thecompletion of components without giving any indication of the per-centage completion at a point in time. Such indication can be given bycomparing the 3D ‘as-planed’ model with verified changes betweenimage sequences. Furtherwork is required towards this direction. Basedon the percentage completion, the calculation of interim payments canbe improved for linear and continuous processes that produce a singleoutput [28]. The operation of the system has also been limited to thesuperstructure of buildings. Other construction stages may be covered,however, the results will be limited for stages where the progress ofconstruction is not as visually evident (e.g. fixtures and fittings).
While a number of refinements may improve the system's per-formance in measuring the work in progress, total automation is notpossible. This is not only because of the inherent complexity inanalysing the digital images as well as the presence of work packagesthat are not directly related to the construction of building com-ponents, but also because of the system's limited ability in interpret-ing user defined work packages. For example, if the user defines a‘Build foundations for Wall 1’ package, the system will not be able toimmediately detect the completion of the package unless an algorithmfor detecting the construction of foundations is implemented (thesystem however will be able to detect the completion of the packageon detecting the completion of the whole wall). Obviously, there is alimit to the number of cases that can be covered.
Nevertheless, these limitations do not dismiss the system's valueas the evaluation workshops indicated. The system can still assist theproject management task by semi-automating the work in progressmeasurement and calculation of interim payments. In addition, it canconstantly monitor the construction progress and provide early warn-ings of potential delays. Finally, while the system has been developedto support building construction, its application to other type of pro-jects is possible. In fact, the system might be more particularly suitedto projects where the progress of construction is more clearly evidentsuch as civil engineering ones.
Acknowledgments
This research has been funded by the Engineering and PhysicalSciences Research Council (EPSRC)whose support is gratefully acknowl-edged.We thank theSchool of Informatics at theUniversityof Edinburghfor the image sequence data and Bennetts Associates (Architects) forthe use of the 3D building model.
References
[1] K.S. Saidi, A.M. Lytle, W.C. Stone, Report of the NIST workshop on data exchangestandards at the construction job site, Proc. of 20th International Symposium onAutomation and Robotics in Construction (ISARC), 2003, pp. 617–622.
[2] I.N. Davidson, M.J. Skibniewshi, Simulation of automated data collection inbuildings, Journal of Computing in Civil Engineering 9 (1) (1995) 9–20.
[3] R. Navon, “Research in automated measurement of project performance indica-tors”, Automation in Construction 16 (2) (2007) 176–188.
[4] M. Tsai, J. Yang, C. Lin, Synchronization-based model for improving on-site datacollection performance, Automation in Construction 16 (3) (2007) 323–335.
[5] R. Navon, R. Sacks, Assessing research issues in Automated Project PerformanceControl (APPC), Automation in Construction 16 (4) (2007) 474–484.
[6] J.N. Abeid, D. Arditi, Time-lapse digital photography applied to projectmanagement,Journal of Construction Engineering and Management 128 (6) (2002) 530–535.
[7] L.G. Shapiro, G.C. Stockman, Computer Vision, Prentice Hall, 2001.[8] R. Fisher, K. Dawson-Howe, A. Fitzgibbon, C. Robertson, E. Trucco, Dictionary of
Computer Vision and Image Processing, Wiley, 2005.[9] A.R. Dick, P.H.S. Torr, R. Cipolla, Modelling and interpretation of architecture from
several images, International Journal of Computer Vision, 60 (2) (2004) 111–134.[10] H. Cantzler, R.B. Fisher, M. Devy, Improving architectural 3D reconstruction by plane
and edge constraining, Proc. of British Machine Vision Association Conference,Cardiff, UK, 2002, pp. 43–52.
[11] T. Werner, F. Schaffalitzky, A. Zisserman, Automated architecture reconstructionfrom close-range photogrammetry, the Proc. of CIPA International Symposium:Surveying and Documentation of Historic Buildings, Monuments, Sites, Traditionaland Modern Methods, Potsdam, Germany, 2001.
[12] A. Huertas, R. Nevatia, Detecting changes in aerial views of man-made structures,Image and Vision Computing, 18 (8) (2000) 583–596.
[13] C. Gordon, F. Boukamp, D. Huber, E. Latimer, K. Park, B. Akinci, Combining realitycapture technologies for construction defect detection: a case study, Proc. of 9thEuropIA International Conference (EIA9), Istanbul, Turkey, 2003, pp. 99–108.
[14] E. Trucco, A.P. Kaka, A framework for automatic progress assessment on constructionsites using computer vision, International Journal of IT in Architecture, Engineeringand Construction 2 (2) (2004) 147–164.
[15] X. Zhang, N. Bakis, S. Wu, M. Kagioglou, G. Aouad, T. Lukins, Y. Ibrahim, Incor-porating the progress measurement dimension to an integrated building in-formation system: a research framework, Proc. of CIB w78 conference, 2007.
[16] B. Vries, J. Harink, “Generation of a construction planning from a 3D CAD model”,Automation in Construction 16 (1) (2007) 13–18.
[17] K.W. Chau, M. Anson, J.P. Zhang, 4D dynamic construction management andvisualization software: 1. Development, Automation in Construction 14 (4) (2005)512–524.
[18] Kathleen McKinney, Martin Fischer, Generating, evaluating and visualizingconstruction schedules with CAD tools, Automation in Construction 7 (6) (1998)433–447.
[19] R. Sacks, A. Warszawski, A project model for an automated building system: designand planning phases, Automation in Construction 7 (1) (1997) 21–34.
[20] N. Bakis, X. Zhang, S.Wu,M. Kagioglou, G. Aouad, An initial assessment to automatingcost and schedule control based on the progress of construction captured usingcomputer vision and photogrammetry techniques, SCRI Symposium, 2007.
[21] O. Abudayyeh, W. Rasdorf, Prototype integrated cost and schedule control system,Journal of Computing in Civil Engineering 7 (2) (1993) 181–198.
[22] R. Carr, Cost, schedule and time variances and integration, Journal of ConstructionEngineering and Management 119 (2) (1993) 245–265.
[23] PMI, A guide to the project management body of knowledge, PMI StandardsCommittee, 1996.
[24] Y. Jung, S.Woo, Flexiblework breakdown structure for integrated cost and schedulecontrol, Journal of Construction Engineering and Management 130 (5) (2004)616–625.
[25] C. Hendrickson, Project Management for Construction, Prentice Hall, 1998.[26] T. Lukins, Y. Ibrahim, A. Kaka, E. Trucco, Now you see it: the case for measuring
progress with computer vision, SCRI Symposium, 2007.[27] Y. Ibrahim, E. Trucco, A. Kaka, M. Kagioglou, G. Aouad, Semi-automatic develop-
ment of thework breakdown structure for construction projects, SCRI Symposium,2007.
[28] Y. Jung, S. Kang, Knowledge-based standard progress measurement for integratedcost and schedule performance control, Journal of Construction Engineering andManagement 133 (1) (2007) 10–21.