design change management in construction projects using
TRANSCRIPT

Design Change Management in Construction Projects Using Building Information
Modeling (BIM)
Valeh Moayeri
A Thesis
In the Department
of
Building, Civil, and Environmental Engineering
Presented in Partial Fulfillment of the Requirements
For the Degree of
Doctor of Philosophy (Building Engineering) at
Concordia University
Montreal, Quebec, Canada
October 2017
© Valeh Moayeri, 2017
CONCORDIA UNIVERSITY
School of Graduate Studies
This is to certify that the thesis prepared
By: Valeh Moayeri
Entitled: Design Change Management in Construction Projects Using Building
Information Modeling (BIM)
and submitted in partial fulfillment of the requirements for the degree of
DOCTOR OF PHILOSOPHY (Building Engineering)
complies with the regulations of the University and meets the accepted standards with respect to
originality and quality.
Signed by the final examining committee:
______________________________________________________ Chair
Dr. Subhash Rakheja
______________________________________________________ External Examiner
Dr. Amr A. Oloufa
______________________________________________________ External to Program
Dr. Amin Hammad
______________________________________________________ Examiner
Dr. Tarek Zayed
______________________________________________________ Examiner
Dr. Luis Amador
______________________________________________________ Thesis Co-Supervisor
Dr. Osama Moselhi
______________________________________________________ Thesis Co-Supervisor
Dr. Zhenhua Zhu
Approved by ___________________________________________
Dr. Fariborz Haghighat, Graduate Program Director
November 11, 2017 ______________________________________________________
Dr. Amir Asif, Dean, Faculty of Engineering and Computer Science
iii
ABSTRACT
Design Change Management in Construction Projects Using Building Information
Modeling (BIM)
Valeh Moayeri, Ph.D.
Concordia University, 2017
Scope changes in construction can vary, and among all types of changes, design change
by owner is the type that most often threatens a project with failure. Design changes
requested by owners include additions, deletions and/or modifications to the original
scope of the work. Design changes frequently impact project cost and time and have the
potential to increase the possibility of conflicts between owners and contractors. Project
time and cost change impact can become severe if owners do not consider the fact that a
change in one part of the project may cause a series of changes in other parts of the
project, which is known as the “change ripple effect.” Therefore, for the well-organized
delivery of construction projects, it is essential to have an efficient design change
management system. The fundamental objective of any change management system is to
eliminate any unnecessary extra costs and time delays to the original contract. Therefore,
there are two main factors to effectively manage design change: first, identifying the
ripple effect of the design change on other project components, and second, quantifying
the ripple effect of a change on project cost and time. Limited work has been conducted
in this area and no integrated model has been developed that would be able to visualize,
identifies and quantifies the above-mentioned factors. This thesis presents an automated
model named BIM-Change for design professionals and owners that make it possible to
visualize the ripple effects of owners’ design changes. The developed model calculates
iv
the impact of design changes and their ripple effect on a project’s total duration and
updates the project schedule accordingly. It then estimates the impact of design changes,
and their ripple effect, on project cost. The cost data provided by the developed model
would be the updated project total cost including direct cost, indirect cost and impact
cost. As result of the proposed model, the computer program called BIM-Change was
developed using the “Visual C#. Net” programming language. This program consists of
six add-ins: Check Change, Ripple Effect, Room Grouping, Time Impact, and Cost
Impact, Data Filtering. The model has been applied to a case study to demonstrate its
usefulness, illustrate its essential features, and facilitate its evaluation. The result
validated the advantages of the BIM-Change over the available software such as Vico,
Innovaya, Autodesk Navisworks, Synchro and Assemble.

v
Acknowledgements
I would like to express my deep gratitude to Dr. Osama Moselhi and Dr. Zhenhua
Zhu, my research supervisors, for their patient guidance, immense knowledge,
enthusiastic encouragement and positive attitude, along with exceptional insights, which
made me capable of undertaking this interesting but challenging journey.
Besides my supervisors, I would like to thank my honorable committee members:
Dr. Amin Hammad, Dr. Tarek Zayeed, Dr. Louis Amador and Dr. Amr Oloufa, for their
insightful comments and encouragement, but also for the hard questions that encouraged
me to widen my research from various perspectives.
I would like to express my very great appreciation to Dr. Deborah Dysart-Gale for
her valuable and constructive suggestions during the planning and development of this
research work. Her willingness to give her time so generously has been very much
appreciated.
I am deeply grateful and will always be thankful to my mother, Haleh, father,
Masoud, and brother, Ali, for their love and support. Words are powerless to express
what I feel in my hearth towards them. I would also like to convey my most sincere
gratitude to the love of my life, Amir, who has given me his unconditional love,
affection, and encouragement.
Lastly, I also acknowledge the helpful comments and support of my friends and
colleagues at the Construction Automation Lab. I had the opportunity to work in a
professional and friendly environment.

vi
This Thesis Is Dedicated To
Gender Equality and Women’s Empowerment
vii
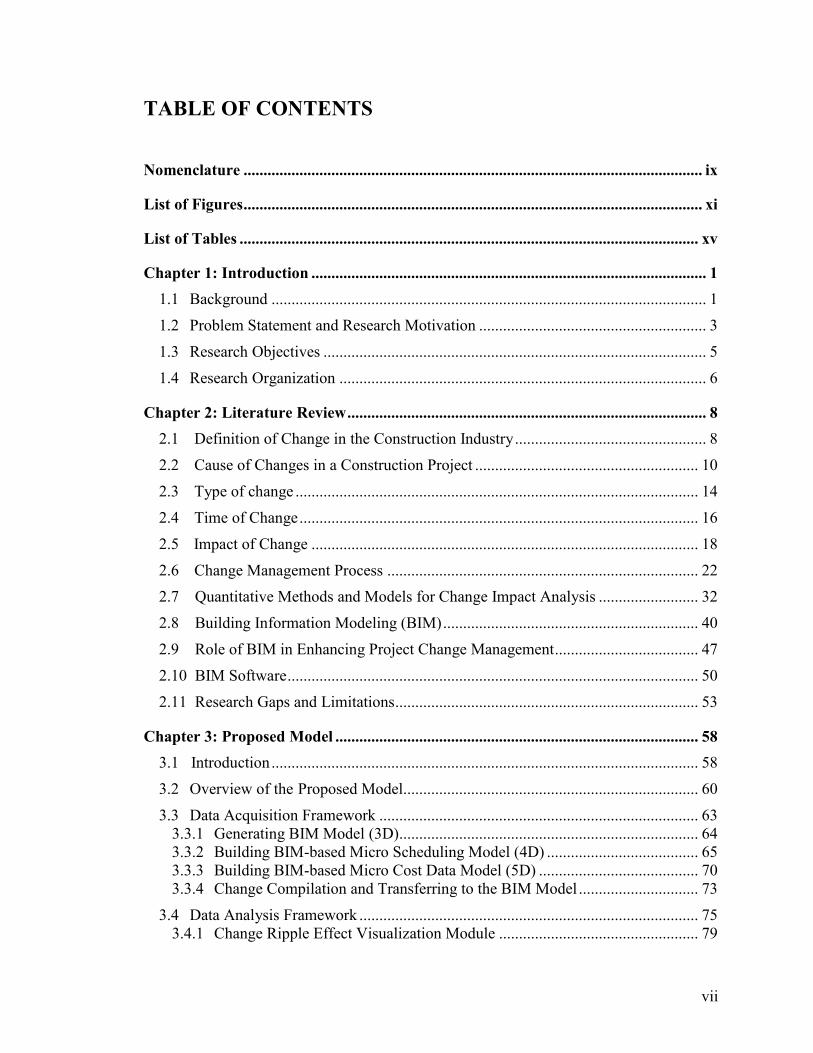
TABLE OF CONTENTS
Nomenclature ................................................................................................................... ix
List of Figures ................................................................................................................... xi
List of Tables ................................................................................................................... xv
Chapter 1: Introduction ................................................................................................... 1
1.1 Background ............................................................................................................. 1
1.2 Problem Statement and Research Motivation ......................................................... 3
1.3 Research Objectives ................................................................................................ 5
1.4 Research Organization ............................................................................................ 6
Chapter 2: Literature Review .......................................................................................... 8
2.1 Definition of Change in the Construction Industry ................................................ 8
2.2 Cause of Changes in a Construction Project ........................................................ 10
2.3 Type of change ..................................................................................................... 14
2.4 Time of Change .................................................................................................... 16
2.5 Impact of Change ................................................................................................. 18
2.6 Change Management Process .............................................................................. 22
2.7 Quantitative Methods and Models for Change Impact Analysis ......................... 32
2.8 Building Information Modeling (BIM) ................................................................ 40
2.9 Role of BIM in Enhancing Project Change Management .................................... 47
2.10 BIM Software ....................................................................................................... 50
2.11 Research Gaps and Limitations ............................................................................ 53
Chapter 3: Proposed Model ........................................................................................... 58
3.1 Introduction ........................................................................................................... 58
3.2 Overview of the Proposed Model.......................................................................... 60
3.3 Data Acquisition Framework ................................................................................ 63 3.3.1 Generating BIM Model (3D)........................................................................... 64 3.3.2 Building BIM-based Micro Scheduling Model (4D) ...................................... 65 3.3.3 Building BIM-based Micro Cost Data Model (5D) ........................................ 70 3.3.4 Change Compilation and Transferring to the BIM Model .............................. 73
3.4 Data Analysis Framework ..................................................................................... 75 3.4.1 Change Ripple Effect Visualization Module .................................................. 79
viii
3.4.2 Change Time Impact Analysis Module ........................................................... 87 3.4.3 Change Cost Impact Analysis Module ............................................................ 90
3.5 Reporting and Highlighting Framework ............................................................... 96
3.6 Data Filtering Framework ..................................................................................... 98
3.7 Summary ............................................................................................................. 100
Chapter 4: Computer Implementation and Validation ............................................. 102
4.1 Introduction ..................................................................................................... 102
4.2 Developed System ............................................................................................ 102 4.2.1 Check Change Add-in ................................................................................... 104 4.2.2 Room Grouping Add-in ................................................................................ 105 4.2.3 Ripple Effect Add-in .................................................................................... 105 4.2.4 Time Impact Add-in ...................................................................................... 107 4.2.5 Cost Impact .................................................................................................. 110 4.2.6 Reporting and Highlighting Framework ...................................................... 112 4.2.7 Data Filtering Add-in ................................................................................... 112
4.3 Model Validation to a Case Study ................................................................... 114 4.3.1 Change Ripple Effect Visualization Module ............................................... 114 4.3.2 Change Time Impact Analysis Module ....................................................... 126 4.3.3 Change Cost Impact Analysis Module ........................................................ 141 4.3.4 Data Filtering ............................................................................................... 147
4.4 Summary, Analysis and Discussion of Results ............................................... 155
Chapter 5: Conclusions and Future Work ................................................................. 163
5.1 Summary and Conclusions .............................................................................. 163
5.2 Research Contributions and Limitations ......................................................... 166
5.3 Future Work and Recommendations ............................................................... 169
References ...................................................................................................................... 170
Appendix A: Labor Hour Database Sample ................................................................... 177
Appendix B: Mapping RSMeans Components’ Assembly Type into Unit Type ............. 178
Appendix C: RSMeans Assembly Cost Database Sample ............................................... 180
Appendix D: Developed Model Algorithms and Sample Codes ...................................... 191
ix
Nomenclature
AEC Architecture, Engineering and Construction
EPC Engineering, Procurement and Construction
BIM Building Information Modeling
CAD Computer Aided Design
IFC Industry Foundation Classes
2D Two Dimensions: x, y
3D Three Dimensions: x, y, z
4D Fourth Dimensions
5D Fifth Dimensions
WBS Work Breakdown Structure
B/C Benefit-to-Cost
REP Request for Proposal
PMBOK Project Management Body of Knowledge
DPM Dynamic Planning and Control Methodology
DSM Dependency Structure Matrix
EWS Early Warning System
CBR Case Base Reasoning
CCT Change Control Tool
CCS Change Control System
KNN K Nearest Neighbor
CBR Case Base Reasoning
KBDSS Knowledge-based Decision Support System

x
NBIMS National BIM Standard
QTO Quantity Takeoff
LP Loss of Productivity
API Application Programming Interface
Q Quantity
LH Labor hours
MPP MS Project Program
CSV Comma Separated Values
DES Discrete Event Simulation
PI Process Interaction
AS Activity Scanning
EPPMS Electronic Product and Process Management
xi
LIST OF FIGURES
Figure 1–1: Research Methodology .................................................................................... 7
Figure 2–1: Change Control Process (PMBOK) .............................................................. 29
Figure 2–2: Change Management System (C. William Ibbs C. K., 2001) ....................... 30
Figure 2-3: Percentages of Market Share of BIM Tools .................................................. 52
Figure 3–1: Model Component’s Information .................................................................. 58
Figure 3–2: Overview of the Proposed Model .................................................................. 61
Figure 3–3: Data Acquisition Framework Steps ............................................................... 62
Figure 3–4: Generating BIM Model (3D) ......................................................................... 64
Figure 3–5: Proposed Work Breakdown Structure (WBS)............................................... 65
Figure 3–6: BIM Model Grouping .................................................................................... 67
Figure 3–7: BIM-based As-planned Schedule Data Model (4D) ..................................... 68
Figure 3–8: BIM-based Micro Cost Data Model (5D) ..................................................... 71
Figure 3–9: Change Compilation and Transferring to the BIM Model ............................ 73
Figure 3–10: Identifying the Impacted Component, its Change Type and Quantity ........ 75
Figure 3–11: Proposed Model: Detection Types .............................................................. 77
Figure 3–12: Direct and Indirect Impacts ......................................................................... 78
Figure 3–13: Change Ripple Effect Analysis ................................................................... 82
Figure 3–14: Change Ripple Effect Analysis Model Example ......................................... 85
Figure 3–15: Change Time Impact Analysis Module and Schedule Linking ................... 87
Figure 3–16: Change Order Cost Estimate (Moselhi, 1998) ............................................ 90
Figure 3–17: Change Cost Impact Analysis Module ........................................................ 91
Figure 3–18: Reporting and Highlighting Framework ..................................................... 97
xii
Figure 3–19: Data Filtering Framework ........................................................................... 99
Figure 4–1: Case Study Model ....................................................................................... 114
Figure 4–2: As-changed and As-planned BIM Models .................................................. 114
Figure 4–3: Room Grouping Add-in............................................................................... 115
Figure 4–4: Rooms’ Specifications Interface ................................................................. 116
Figure 4–5: Room Selection by Generated Group IDs ................................................... 116
Figure 4–6: Check Change Add-in ................................................................................. 117
Figure 4–7: Plan View of Color Coded Changes............................................................ 118
Figure 4–8: Section 3D View of the Color Code Highlight Visualization ..................... 118
Figure 4–9: Color-coded Report ..................................................................................... 119
Figure 4–10: Selecting Individual Direct Changes and Ripple Effect Add-in ............... 120
Figure 4–11: Change Ripple Effect Reports (Level 1- Level 2) ..................................... 121
Figure 4–12: First Level Ripple Effect Model Highlights and Report ........................... 122
Figure 4–13: Second Level Ripple Effect Model Highlights and Report ....................... 123
Figure 4–14: Connection between BIM Model and Ripple Effect Report ..................... 124
Figure 4–15: As-planned Model 3D View...................................................................... 125
Figure 4–16: BIM Models 3D View for Scenario 1 ....................................................... 126
Figure 4–17: BIM Models 3D View for Scenario 2 ....................................................... 127
Figure 4–18: BIM Models 3D View for Scenario 3 ....................................................... 127
Figure 4–19: Check Change Add-in and Its Report Output for Scenario 1 .................... 128
Figure 4–20: Check Change Add-in and Its Report Output for Scenario 2 .................... 128
Figure 4–21: Check Change Add-in and Its Report Output for Scenario 3 .................... 129
Figure 4–22: Time Impact Add-in and Its Report Output for Scenario 1 ....................... 130
xiii
Figure 4–23: Time Impact Add-in and Its Report Output for Scenario 2 ....................... 130
Figure 4–24: Time Impact Add-in and Its Report Output for Scenario 3 ....................... 131
Figure 4–25: Time Impact Report Output ...................................................................... 132
Figure 4–26: Room Grouping Add-in and Generated Group IDs .................................. 133
Figure 4–27: Project’s Developed As-planned Schedule in MS Project ........................ 134
Figure 4–28: Browsing for As-planned Schedule in MPP File Format .......................... 135
Figure 4–29: Export Generated As-changed Schedule in CSV Format to MS Project .. 136
Figure 4–30: Select As-changed Schedule CSV File ..................................................... 137
Figure 4–31: Map and Import the As-changed Schedule CSV File to MPP File ........... 137
Figure 4–32: Task Mapping ............................................................................................ 138
Figure 4–33: Generating the As-changed Schedule in MPP File Format ....................... 139
Figure 4–34: Case Study Model ..................................................................................... 140
Figure 4–35: Check Change Add-in and Its Report Output ........................................... 141
Figure 4–36: Check Change Add-in Color-coded Report .............................................. 142
Figure 4–37: Cost Impact Add-in and Its Report Output ............................................... 143
Figure 4–38: Cost Impact Add-in Generated Report ...................................................... 143
Figure 4–39: Report of Cost Impact Division................................................................. 145
Figure 4–40: Data Filtering Add-in and Its Report Output............................................. 147
Figure 4–41: Data Filtering Add-in Report Output ........................................................ 147
Figure 4–42: Data Filtering Add-in Report Output ........................................................ 148
Figure 4–43: Data Filtering Add-in Report Field Options.............................................. 149
Figure 4–44: Data Filtering Add-in Report Filter Method Options ................................ 149
Figure 4–45: Filter Report Based on Family Type ......................................................... 150
xiv
Figure 4–46: Filter Report Based on Assembly Code .................................................... 150
Figure 4–47: Filter Report Based on Assembly Description .......................................... 151
Figure 4–48: Filter Report Based on As-planned Time .................................................. 151
Figure 4–49: Filter Report Based on As-Changed Time ................................................ 152
Figure 4–50: Filter Report Based on As-planned Cost ................................................... 152
Figure 4–51: Filter Report Based on As-changed Cost .................................................. 153
Figure 4–52: Developed Model Add-ins ........................................................................ 154
Figure 4–53: Assemble System Cloud-based Platform .................................................. 159
Figure 4–54: Assemble Software Change Analysis Output ........................................... 160
xv
LIST OF TABLES
Table 2–1: Change Origin and Causes (Arain and Low Sui Pheng, 2006) ...................... 11
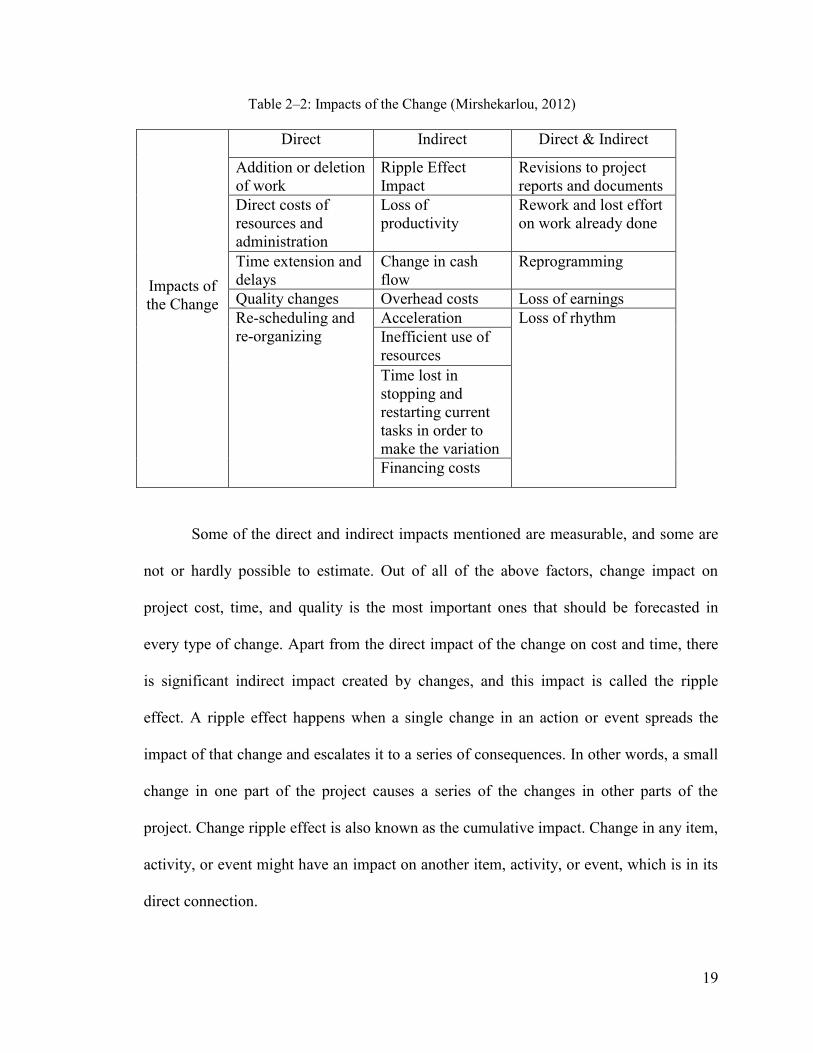
Table 2–2: Impacts of the Change (Mirshekarlou, 2012) ................................................. 19
Table 2–3: Change Management for Different Project Stages (CII 1990, Arain 2005) ... 22
Table 2–4: Overview of Change Management (Voropajev, 1997) ................................... 28
Table 2–5: Current Change Quantitative Models and Their Limitations ......................... 36
Table 2–6: BIM Tool Purpose by Category (IBC, 2011) ................................................. 41
Table 2–7: Characteristics of Highly Usable and Useful Information Visualization
Systems ............................................................................................................................. 45
Table 3–1: Linear regression of percentage loss of productivity on percentage change
(Leonard, 1991)................................................................................................................. 94
Table 3–2: Proposed Report Module ................................................................................ 95
Table 4–1: Summary of Owner Requested Design Changes .......................................... 126
Table 4–2: Comparison Table (BIM-Change Model vs. Assemble, BIMestiMate,
Innovaya, Navisworks, Synchro and Viso) ..................................................................... 156
1
Chapter 1: Introduction
1.1 Background
It is general knowledge that construction project owners have become more and
more demanding, continuously changing their project’s design. Responding to market
demands, they request changes at any phase of a project (Ibbs, 2012). Even years ago,
studies revealed that 20-25% of the construction period is lost as a result of inadequate
design (Undurraga, 1996). Also, lower quality level construction projects could be 78%
attributable to design change requests (Koskela, 1992). Change is considered as any
addition, deletion or modification to the scope of a project that may cause the project to
incur delays and adds extra costs to the original contract. As such, it can take many
forms; however, it is the owner-acknowledged change that must receive more attention
than the other types of change since this type can present a risk to owners and
contractors. In the mind of owners, a change could be something very simple, but that
perspective (most likely) does not consider the multiple effects one change may have on
many other areas of the project. Each change could add to the cost of the original contract
and cause delays in the project execution, while there could also be cases where a change
requested would not add to the project’s cost and time. Some changes can even be
beneficial to owners and contractors, but that situation is rather rare.
Therefore, a system that can evaluate changes concerning time and cost would be
a valuable tool in the construction industry. Owners should be involved in their project,
and the role and responsibility of an AEC team are to provide guidance, giving owners
assessments of each requested change and its impacts on the project. If this system could
support visualization capabilities to illustrate the impact of the contemplated change, then
2
the owner would be able to see the big picture and make better and well-informed
decisions. This system could also help avoid unnecessary conflicts and disputes between
owners and contractors, and greatly reduce recourse to lawsuits.
Having a successful management system for applying, visualizing, analyzing, and
organizing changes requested by owners would be a clear advantage. Dealing with
changes in traditional fashion, namely using paper-based printouts of 2D drawings is no
longer sufficient, as it is not possible to discover all ramifications of a contemplated
change. This problem is addressed by the development of Building Information Models
(BIM) by providing dynamic databases. BIM makes it possible to apply a change to a
model and to get new information about the impacts of that change in the design model in
every view. In other words, it can self-adjust the model’s database whenever a new
change is applied to the model. However, the problem is that the user is only able to see a
change, and the newly-affected model, but not the ripple effect of that change. Current
BIMs only visualize the new model design, but do not highlight the components affected
by the changed components.
In order to understand the impact of change on time and cost, there must be a link
between the 3D model, project cost estimation and time scheduling databases. BIM
represents that link with a 4D model (scheduling) and a 5D model (cost estimation). It
takes considerable skill to create a link among different software interfaces and to
provide a BIM all of these dimensions. As such, a more user-friendly software program is
needed, one with the ability to generate all of these dimensions, 3D/4D and 5D, under
one domain. This would make it possible to visualize the change ripple effect and analyze
the cost and time impacts in a quantitative manner, before starting the construction phase.
3
Therefore, an integrated BIM-based change management system is needed to assist
effective management of a multi-disciplinary model through the dynamic procedure of
building design.
1.2 Problem Statement and Research Motivation
The construction industry is well known for a high number, scale, and variety of
serious conflicts due to owner-requested design changes. Changes are the major cause of
project failure (Arain F. M., 2008). Most of the time, owners do not realize the
consequences of the changes they are requesting from the contractors, and they invariably
blame contractors if a project is faced with any disputes or claims. Hallock (2006) states
that changes in the construction process causes difficulties among all the parties involved
in the project and increases the probability of contractual disputes. Project changes have
visible impacts on the project construction process; they affect the project schedule, cost,
productivity, overall project performance, as well as cause ripple effects. Time and cost
are of critical importance in today’s construction market. Hallock (2006) states that
changes to project drawings affect project contract price and/or schedule. Upon receiving
any owner-requested design changes, designers should give prompt feedback about the
ripple effect of design changes on the project cost and schedule. This action is needed
before the project owner makes any final decisions regarding the requested changes to the
project’s design. However, present-day change management methods are usually more
focused on managing the change impact on project’s labor productivity, and less on
considering their impact on project time and cost. It is even less likely for current
methods to consider the ripple effect of change in other parameters of the project.
4
Current approaches that rely on 2D project drawings are not sufficient enough to
evaluate and analyze the impact of requested changes. With projects becoming
increasingly complex, the impact analysis of design changes is also becoming much more
challenging and time-consuming. These challenges have served to enhance the role of
Building Information Modeling (BIM) in today’s construction industry. BIM allows real-
time coordination of information in every view by combining a design model with a
behavioral model (Autodesk, 2010). The design model consists of the project geometry
and data. A behavioral model can be a change-management model since BIM has the
potential to control changes through its dynamic process of building design. However, as
Langroodi (2012) observed, “dynamic data are processed reasonably well in a single
BIM, with all the necessary parameters explicitly defined. Changes across inter-related
multidisciplinary designs that reside in a federated environment are significantly more
challenging to manage.” However, many BIM projects still rely on paper-based printouts
of 2D drawings that make it very difficult to see what is being changed in the model. An
effective project change management system is needed to control and manage these
changes. This system should be able to trace and visualize project changes, along with an
analysis of their impacts on project cost and time. The growing popularity of using BIM
in the construction industry while still lacking a cumulative change management system
underscores the need to improve BIM-based change management systems. Effective
management of multi-disciplinary models is needed throughout the dynamic process of
building design and construction. This thesis presents an integrated BIM-based
automated model for design professionals and owners. The goal is to visualize the ripple
effect of design changes on other project systems, along with the analysis and estimation
5
of a design change’s impact on project cost and time, to assist owners and designers in
making appropriate decisions. The motivations for conducting this research are lack of an
automated and quantitative BIM-based change management model for construction
projects that can automate the process of owner-requested design change impacts’
analysis on the project cost and time, lack of visualization for analyzing the design
changes’ ripple effect and tracking of the consequences; and lack of communication
between project owners and designers, in selecting beneficial changes that respond to the
owners’ desired criteria.
1.3 Research Objectives
This research aims to develop an integrated automated BIM-based model for
visualizing the ripple effect of design changes originating from project owners and then
analyzing these changes impacts on project time and cost to support more informed
management decisions. A set of tools and techniques are integrated into a model to
provide this capability in a user-friendly manner. This will be achieved through the
following objectives:
To study the ripple effect of design changes and develop a system for managing
these changes in construction projects using BIM;
To provide and improve the visualization capabilities of design change ripple
effects;
To automate the quantification of design changes’ impacts on project time and
update project schedules; accounting for the impact of design changes; and
To automate the quantification of design changes impact on project cost.

6
1.4 Research Organization
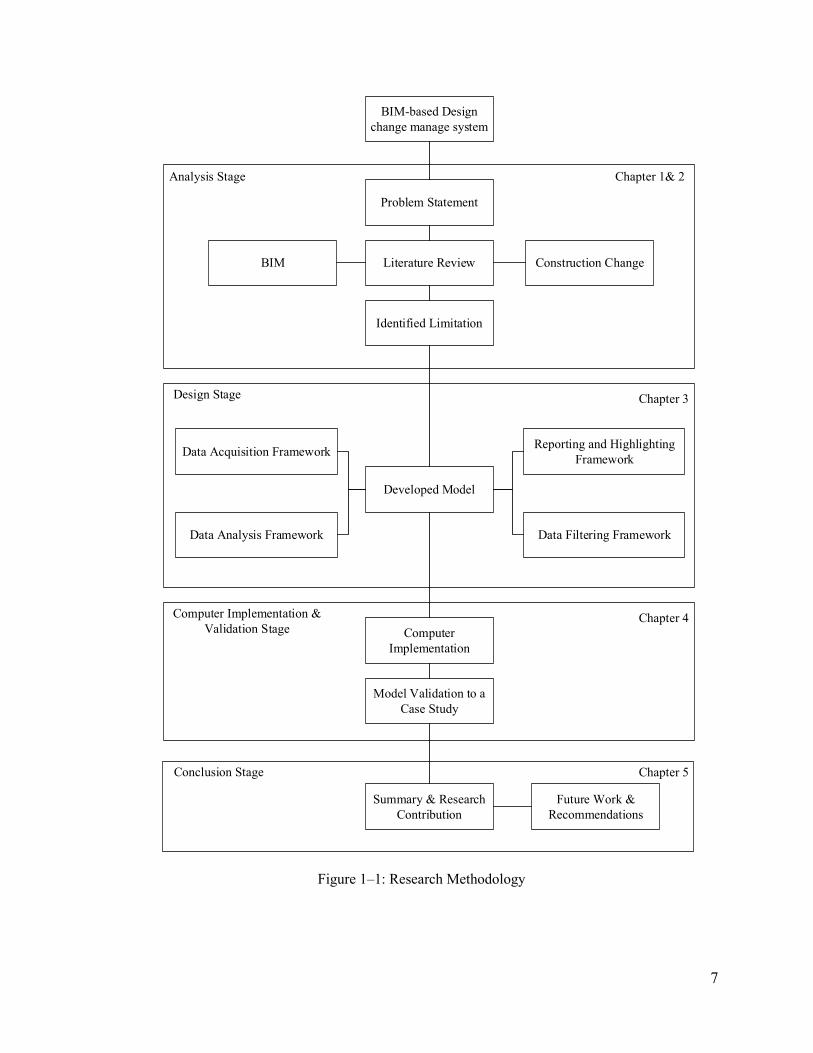
Figure 1-1 illustrates the methodology to be followed in order to achieve the
above-mentioned objectives. The methodology is summarized in five stages: analysis,
design, computer implementation, validation, and conclusion stage. The analysis stage
begins with a problem statement and the definition of the objectives (Chapter 1). It then
focuses on performing a comprehensive literature review in the following domains
(Chapter 2):
• Construction changes; and
• Building information modeling.
After the analysis stage, the gaps and limitations in the current literature are
identified (Chapter 2), and the design phase (Chapter 3) is developed to respond to these
limitations. The proposed model consists of four frameworks:
1. Data acquisition framework;
2. Data analysis framework;
3. Reporting and highlighting framework; and
4. Data filtering framework.
These frameworks are elaborated in detail in the development stage. After data
collection has been conducted in the implementation stage, the model framework can be
designed and validated through its application in a case study (Chapter 4). Finally,
highlighting the conclusions, the research contributions and recommendation for future
work (Chapter 5).
7
Figure 1–1: Research Methodology
BIM-based Design
change manage system
Problem Statement
Literature Review Construction Change BIM
Identified Limitation
Chapter 1& 2 Analysis Stage
Developed Model
Data Analysis Framework
Reporting and Highlighting
FrameworkData Acquisition Framework
Data Filtering Framework
Chapter 3 Design Stage
Model Validation to a
Case Study
Computer
Implementation
Chapter 4 Computer Implementation &
Validation Stage
Chapter 5 Conclusion Stage
Summary & Research
Contribution
Future Work &
Recommendations
8
Chapter 2: Literature Review
In this chapter, a comprehensive literature review is performed on domains of
constriction changes and Building information modeling. Changes occur in all
construction projects and cannot be avoided or disregarded. Changes are mostly initiated
from the owner’s side during the design and construction phases of the project since they
drive the project to be up-dated according to market demand and new technologies. When
a change is initiated, some modifications are required to the project design and
specifications. Therefore, AEC teams should start doing revisions on project plans and
specification and try to apply the change and see its consequences. Any misunderstanding
at this stage may face the project with failure concerning meeting the project constraints,
such as cost, time, and quality. In 2006, a group of professional engineers conducted a
survey and identified change as the major cause of project failure (Hallock, 2006).
Change should be considered as a primary source of construction projects’ cost overrun.
It may cause delays and lack of quality, and this can be the case in any different phases or
areas of the construction project (Burati J.L, 1992). Any added cost to project contract
and any delay to the project might become the main cause of conflict between project
parties. Vandenbergh (1996) observed that knowing the cost impact of changes reduces
disputes between owner and contractors.
2.1 Definition of Change in the Construction Industry
In the construction industry dealing with changes is not only a matter of applying
and accepting the changes; any change might bring about many losses to the project, and
as the project gets bigger, the more complex the effect of the change. Many authors have
come out with different definitions regarding construction change.
9
Until 1990, the construction industry described changes as modifications,
differences, subtractions, additions, or exclusions of work (Antill, 1990). Ibbs et al.
(1995) stated that change is described as any event that results in an alteration of the
project’s original scope, and that also may impact a project’s time, cost, and/or quality of
work. Coffman (1996) added that a change to the project might cause additions, deletions
or revisions in the project that lead to adjustments in the project’s contract sum and time.
CII 2000 defines change as any action initiated by the owner, owner’s agent or design
engineer that result in a project’s adjustment. Hanna et al. (2002) stated that change is an
event that may modify the original scope of the project and affect project’s time and/or
cost. Mokbel (2003) described change as an action that indicates and aligns a change to
the project’s scope that modifies the original time and total cost needed for the project’s
completion. Later, Ibbs (2005) defined change as any variation to the original scope of
work that can be classified as a physical or unphysical (less tangible) change. Physical
change is related to the project unit of work, while unphysical change belongs to a
reporting requirement or adjusting the project schedule. Change is a request to the
contractor, initiated by the owner, that modifies the project work, leading to an
adjustment in the project cost and/or time (Hallock, 2006). Meanwhile, Sun and Meng
(2009) declared that change in construction projects indicates to any variation to the
projects’ design, database, scope of work, project and any other project characteristic
caused by the requested change. In this research, change is considered as any addition,
deletion or modification on the original design drawings, plans, and documentation
requested by the project’s owner.
10
2.2 Cause of Changes in a Construction Project
All the participants of a project, such as owners, designers, and contractors, can
be the cause of the changes by requesting any modifications after signing the contracts.
Cox et al. (1999) investigated several successful projects’ requested changes, analyzing
historical data as case studies and discovered the reasons of change as follow:
Designer’s omission in tender documents;
Coordination defects in tender documents;
Forced upon project from shop drawing coordination;
Employer has changed his requirements; or
New information on existing site conditions.
According to Arian et al. (2006), changes happen due to several predictable and
unpredictable causes. They identified four origin agents for the changes in the
construction project, including:
1. Owner-related changes: changed that is requested by the owner of the project with
the purpose of achieving the project objectives that they have in their mind;
2. Consultant-related changes: originating from consultants whenever they have a
request out of the scope of the original contract;
3. Contractor-related changes: changes requested by contractors when they cannot
deliver the project requirements according to the original plans; and
4. Any other changes that do not come directly from project contributors.
Based on the above classifications, Arian et al. (2006) have also categorized
“Change Causes”; Table 2-1 illustrates this classification.
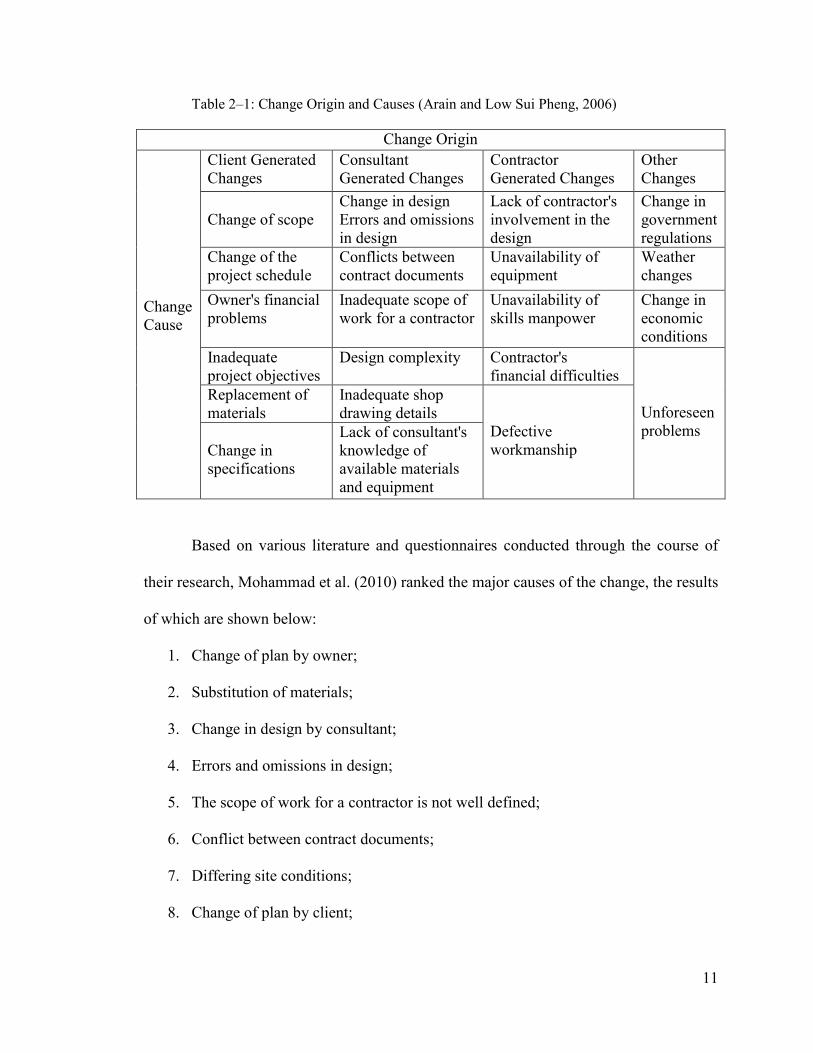
11
Table 2–1: Change Origin and Causes (Arain and Low Sui Pheng, 2006)
Change Origin
Change
Cause
Client Generated
Changes
Consultant
Generated Changes
Contractor
Generated Changes
Other
Changes
Change of scope
Change in design
Errors and omissions
in design
Lack of contractor's
involvement in the
design
Change in
government
regulations
Change of the
project schedule
Conflicts between
contract documents
Unavailability of
equipment
Weather
changes
Owner's financial
problems
Inadequate scope of
work for a contractor
Unavailability of
skills manpower
Change in
economic
conditions
Inadequate
project objectives
Design complexity Contractor's
financial difficulties
Unforeseen
problems
Replacement of
materials
Inadequate shop
drawing details
Defective
workmanship
Change in
specifications
Lack of consultant's
knowledge of
available materials
and equipment
Based on various literature and questionnaires conducted through the course of
their research, Mohammad et al. (2010) ranked the major causes of the change, the results
of which are shown below:
1. Change of plan by owner;
2. Substitution of materials;
3. Change in design by consultant;
4. Errors and omissions in design;
5. The scope of work for a contractor is not well defined;
6. Conflict between contract documents;
7. Differing site conditions;
8. Change of plan by client;
12
9. The lack of coordination between contractor and consultant;
10. The contractor’s financial difficulties;
11. Owner’s financial problems;
12. Workmanship or material is not meeting the specification;
13. Contractor’s desire to improve his financial situation;
14. The required labor skills are not available;
15. The required equipment and tools are not available;
16. New government regulations; and
17. Weather conditions.
After a cumulative investigation of causes of change in public construction
projects in Oman, Alnuaimi et al. (2010) came up with 24 items:
1. Owner instructs additional work;
2. Owner instructs modification to design;
3. Non-availability of construction manuals and procedures for project construction
in Oman;
4. Non-availability of engineering licensing for engineers in Oman to maintain the
quality of consultancy services;
5. Poor communication between relevant governmental units and the owner;
6. Non-availability of overall project planning;
7. Unrealistic design periods;
8. Unrealistic construction schedule;
9. Owner fails to make decisions or review documents at the right time;
10. Low consultancy fee or less experienced designers;
13
11. Non-availability of records of similar projects in Oman;
12. Failure by the consultant to provide adequate and clear information in the tender
documents;
13. Natural growth of the project was not anticipated at the design stage;
14. Owner’s needs during the design stage are unclear or not well-defined;
15. The contractor uses the gray areas in general conditions and request variations to
the contract;
16. Design errors;
17. The design and construction criteria are outdated and do not suit the present
construction technology;
18. The contractor misses variations instructions;
19. Non-availability of qualified engineers from the owner side;
20. Consultant not familiar with the regulations and construction permits in Oman;
21. Unilateral decisions made by the owner without proper considerations to the
contract;
22. Consultant’s supervisors do not have collective experience about construction
projects in Oman;
23. Failure by the consultant to perform design and supervision effectively; and
24. Poor project management by contractor.
Throughout their research, Alnuaimi et al. (2010) also found that major causes of changes
were:
The client’s additional works;
Modifications to design; and
14
Non-availability of construction manuals and procedures.
According to the literature above, if the cause of change is classified according to
the parties involved in the project, in other words by those responsible, the owners and
their requests are the primary cause of changes in construction projects. Owner-initiated
changes can lead the project to massive failure and losses since any change to original
plans by owners may bring up scope change and lead to additional work. Changes to the
original scope of work and design are responsible for 50% of changes reported (Pruitt, W.
Bruce, 1999; Weston Hester, 1991). Design changes are a contributing factor to redoing
work (Han et al., 2013; Zhang et al., 2012). This study considers owner-initiated design
changes to the project, since according to the literature; they are the most common major
cause of change in construction projects.
2.3 Type of change
Knowing the type of the change is important in determining which change should
receive an action first, and is a way of prioritizing changes in construction projects.
According to the engineering, procurement and construction (EPC) contractor, there are
two types of changes in detailed design: a “design development” initiated by the
engineering team, and a “design change” initiated by the client (AkerKvaerner, 2005).
Hunt (2005) categorized change into three different types:
Actual change: any change to the scope of work directed by the owner of the
project;
Constructive change: any action and/or inaction directed by the owner that
modifies the design scope, but the owner does not recognize it as a change; and
15
Cardinal change: it will be recognized in the federal sector of the contract (Hunt,
2005).
Mirshekarlou (2012), on the other hand, classified changes into whole other four
types:
Beneficial or Detrimental Changes: “beneficial” changes are those that improve
the quality of the job, decrease the cost and time, and sometimes the level of
complexity in the project design. In contrast, “detrimental” changes are those that
decrease owner benefits. However, sometimes one change can be “beneficial” for
the owner but be a “detrimental” change for the contractors, or vise versa. In
general, the “beneficial” changes must be supported, and the “detrimental”
changes must be avoided. The timing of the change is the only way to help the
project team to distinguish the “beneficial” change from “detrimental” change. If
a change occurs in the early stage of the project, it might be considered
“beneficial.” The same change, when it occurs closer to the end of the project,
might be “detrimental,” since it can face the project with an additional cost, time,
or both.
Required or Elective changes: “required” change is obligatory due to the nature of
the problem and should be evaluated and processed. For instance, matching the
design variations with building codes needs an instant action. On the other hand,
“elective” changes are not compulsory. When the project team has many
alternatives for change management, the change is considered “elective.” These
alternatives differ regarding their impacts on the contract cost and time. In order
to select the best “elective” change, a benefit-to-cost (B/C) ratio scale is applied.
16
Compensable, Excusable or Non-excusable changes: the project’s owner in
response to its needs or required modifications in the project suggest
“Compensable” changes. For example, design changes by the owner caused by
market demand. The consultant proposes “Excusable” changes in reply to
technical problems or possible document errors. For instance, the implementation
of the structure for controlling the landslides is “excusable” change, which has to
be paid to the contractor, and there is no payment for a consultant. “Non-
excusable” changes are entirely the responsibility of the contractor and there
would not be any payment for them. An example of this change would be
construction errors that lead to redoing work or demolition.
Controllable or Uncontrollable changes: “Controllable” changes are those where
the source of their cause is under the control of the contractor, such as labor
productivity or material procurement. The contractor is the only person
responsible for “controllable” changes and cannot ask for extra funds.
“Uncontrollable” changes are those where the contractor has no effective control
of them, such as weather conditions, inflation, and unforeseen ground conditions.
This study uses owner-requested actual and elective design changes in order to aid
owners to choose the most beneficial design changes to the project, which have the
lowest impact on project parameters such as cost, time and productivity.
2.4 Time of Change
Any above-mentioned type of change could happen during any phase of the
construction project and impact the project, but not all in the same way. A construction
project is divided into several phases, and together these phases define the project life
17
cycle. In general, a construction project has three phases, namely project conception,
project design, and project construction. The conception phase is the time when designers
put in the effort to get to know the owner’s desires, demands, and what they expect to see
at the end of the project. The design phase is the phase when designers start to find a way
to satisfy the owner and reply to all their requests by creating drawings. The construction
phase is when the project design and concept become a reality.
According to Ibbs (1994), later change requests in the project will affect the
project’s overall performance in comparison to changes applied earlier in the project. If
the problem is reviewed as early as possible, CII (1994) states that changes can be
reduced due to problem identification, resulting in beneficial changes. After investigating
104 projects from 35 contractors, Ibbs (1995) found that late project changes are
implemented less effectively than early project changes. Ibbs (1997) also deduced that it
is considerably more beneficial to identify changes in the early stages of the project and
manage them immediately after initiation. After collecting numerous data and statistical
relationships from 14-page questionnaires, Ibbs (1997) validated the hypothesis that a late
change is more disruptive to labor productivity than an early change. Similarly, Hanna
(1999), after interviewing the industry, concluded that changes suggested late could lead
to greater losses. Therefore, the timing of the change request makes all the difference in
change impact analysis. Understanding the impacts of the change in any phase of the
project is the only key to help the project participant choose the most beneficial changes
to the project and avoid all the detrimental changes.
18
2.5 Impact of Change
A change can have impacts on any part of the project and leads to scheduling
conflicts, cost overruns, or both at the same time. It can also affect the quality of work,
labor productivity, cause legal disputes, and in general affect the overall project
performance. According to Arian (2005), changes have impacts “on the cost, time,
productivity, quality, health and safety, hiring new professionals, delay in payment,
rework and demolition, tarnish a firm’s reputation, poor professional relations and
disputes among professionals.” For Mirshekarlou (2012), some of these impacts can be
“measurable” effects like direct costs or time overruns, while some of them can be
“immeasurable,” like moral effects of change or quality defects.
Changes can have positive or negative impacts on a project, depending on the
level of the change, but mostly it has negative effects. The main idea, however, is that
these impacts should be known before approving and applying any changes to the project.
In current practices, the impact of a change is usually classified as a “direct” or “indirect”
impact. According to Mirchekarlou (2012), direct impacts are the first and main effects of
change, such as additional costs due to design changes. An indirect impact exists on the
condition of the existence of a “direct impact.” In other words, the indirect impact is
contingent on the direct impact. For instance, the direct impact of a design change is an
additional cost to the project. This cost may result in a claim between the owner and the
contractor, which would be the indirect impact of a design change. Some of the direct and
indirect impacts of changes are summarized in table 2-2.
19
Table 2–2: Impacts of the Change (Mirshekarlou, 2012)
Impacts of
the Change
Direct Indirect Direct & Indirect
Addition or deletion
of work
Ripple Effect
Impact
Revisions to project
reports and documents
Direct costs of
resources and
administration
Loss of
productivity
Rework and lost effort
on work already done
Time extension and
delays
Change in cash
flow
Reprogramming
Quality changes Overhead costs Loss of earnings
Re-scheduling and
re-organizing
Acceleration Loss of rhythm
Inefficient use of
resources
Time lost in
stopping and
restarting current
tasks in order to
make the variation
Financing costs
Some of the direct and indirect impacts mentioned are measurable, and some are
not or hardly possible to estimate. Out of all of the above factors, change impact on
project cost, time, and quality is the most important ones that should be forecasted in
every type of change. Apart from the direct impact of the change on cost and time, there
is significant indirect impact created by changes, and this impact is called the ripple
effect. A ripple effect happens when a single change in an action or event spreads the
impact of that change and escalates it to a series of consequences. In other words, a small
change in one part of the project causes a series of the changes in other parts of the
project. Change ripple effect is also known as the cumulative impact. Change in any item,
activity, or event might have an impact on another item, activity, or event, which is in its
direct connection.
20
Mirshekarlou (2012) describes how a change might have a “single” or a
“cumulative” (ripple) effect on the project features. A change single effect has an
independent impact on a specific project characteristic without affecting other project
characteristics. Conversely, a change cumulative (ripple) effect has several impacts on
the project, affecting numerous parts of the project. Ibbs (1995) stated a change
cumulative effect increases proportionately to the number of project changes. According
to CII (2000), the problem intensifies when multiple changes are initiated into the project.
In addition to identifying the ripple effect of the requested change, knowing its impact on
project time and cost is also necessary for the change impact analysis process. Change
impact on time is also known as a delay to project schedule. It means time overrun
beyond the completion date, which is signed to the original contract by all parties. Delays
bring modification to the project schedule and require specialized experience and
knowledge to change the schedule according to days added. Some changes may add more
days to the schedule, and some may deduct some days. The time impact may be
beneficial to the project and causes it to end sooner than the date expected. However, in
the opposite scenario where the project does not finish on time according to the contract
date signed before the construction phase, severe conflicts and disputes may arise
between project parties. Mirshekarlou (2012) states that delay is “major variation to the
project planned schedule which is very common in construction projects. Delay causes
the owner faced with financial losses due to the project late operation and contractor
loaded with a delay due to higher overhead costs and potential inflation of material,
equipment and labor prices.”
21
Some researchers have put in the effort to demonstrate that changes are the main
cause of project delays and support their claim by investigating real projects. After
reviewing Hong Kong’s various construction projects, Kumaraswamy et al. (1998) found
that 50 percent of the projects surveyed suffered delays that originated from changes.
Assaf et al. (2006), after studying construction projects in Saudi Arabia, found that 70%
of the construction projects faced time overruns. As such, they concluded that changes
were the most frequent source of delay. When a change impacts the time, it also impacts
the cost. Cost and time impacts of change are directly and mutually co-related. The
change impact on project cost could be positive or negative to both the owner and
contractor. In addition to the type of project contract in some cases, it is a win-win
situation for both, and sometimes only one side gets all the benefits, and one side has to
deal with the losses that result from the change. Another scenario could be that the
change does not have any cost impact to either the owner or the contractor.
This is usually not the case since almost always most construction projects are at
risk of cost overruns during every phase of the project. Change is considered as a kind of
risk to all project participants including owners and contractors; the contractors consider
a markup in the case of change contingency to cover cost overruns, and the challenge
begins when the cost overruns exceed the markup. Many disputes between owners and
contractors arise during negotiations regarding the price for a change. The owners almost
always assume the contractor just wants to benefit from change request, and the
contractors think the owner wants to apply changes without accepting new costs.
Therefore, to reduce the negative impact of change on project, an applicable change
management system or guideline is required to protect the project and to avoid facing
22
irrecoverable damages and losses. As such, to have a successful project, a system for
managing the diverse consequences of change requests is fundamental.
2.6 Change Management Process
The construction industry should understand the necessity of having an organized
change management process. Streamlining the change management process can reduce
the time and cost of processing changes (Du, El-Gafy, & Zhao, 2015). For Tiong (1990),
“a change management process should be established for the ultimate benefit of owners.”
According to Sun et al. (2006), the purpose of project change management is not to
remove project changes but to reduce the undesirable impact of essential changes and to
prevent redundant ones. Mirshekarlou (2012) stated that having a change management
process throughout the project development helps the efficient establishment of the
presented change events and minimization of future changes. Also, it aids project
participants to be able to decrease detrimental changes and reassure constructive changes,
which also increase the project work performance and the chance of project success.
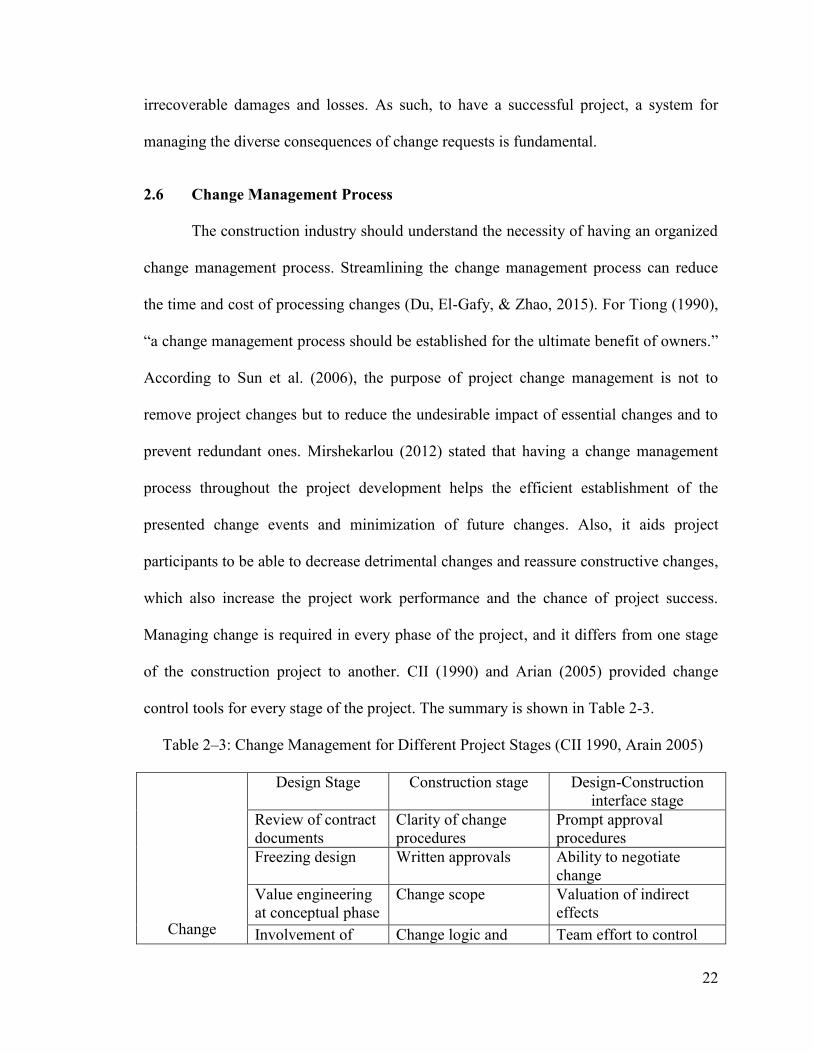
Managing change is required in every phase of the project, and it differs from one stage
of the construction project to another. CII (1990) and Arian (2005) provided change
control tools for every stage of the project. The summary is shown in Table 2-3.
Table 2–3: Change Management for Different Project Stages (CII 1990, Arain 2005)
Change
Design Stage Construction stage Design-Construction
interface stage
Review of contract
documents
Clarity of change
procedures
Prompt approval
procedures
Freezing design Written approvals Ability to negotiate
change
Value engineering
at conceptual phase
Change scope Valuation of indirect
effects
Involvement of Change logic and Team effort to control
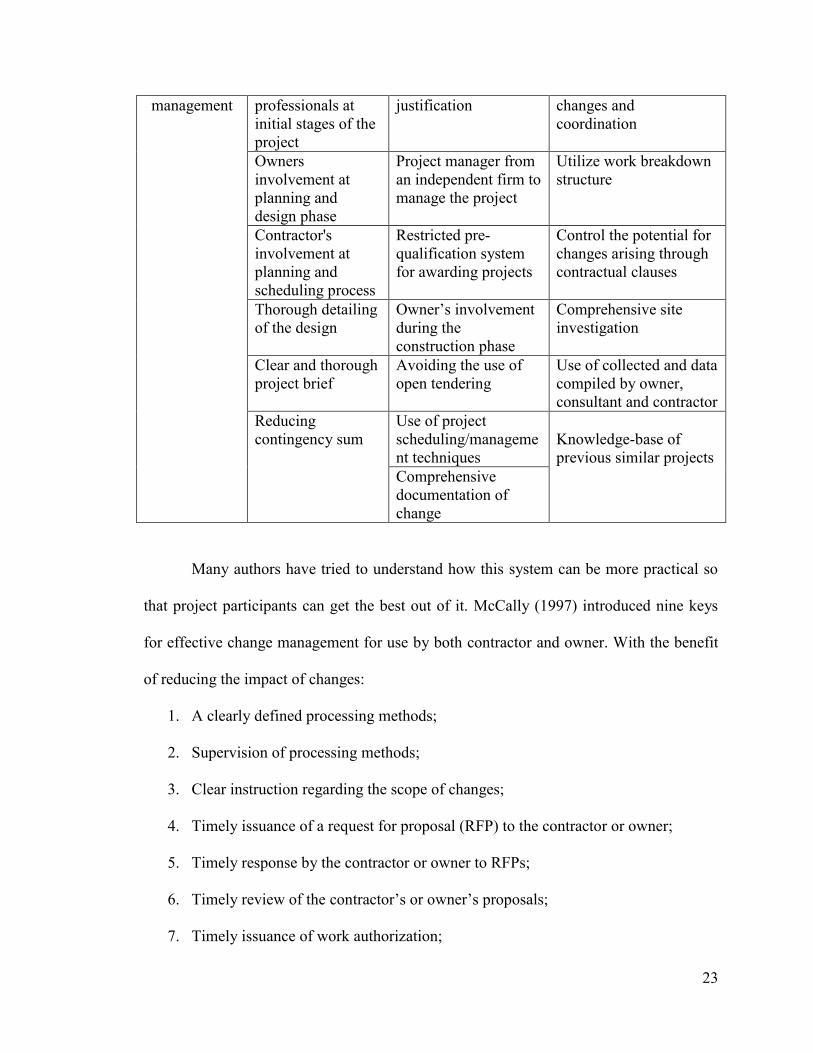
23
management professionals at
initial stages of the
project
justification changes and
coordination
Owners
involvement at
planning and
design phase
Project manager from
an independent firm to
manage the project
Utilize work breakdown
structure
Contractor's
involvement at
planning and
scheduling process
Restricted pre-
qualification system
for awarding projects
Control the potential for
changes arising through
contractual clauses
Thorough detailing
of the design
Owner’s involvement
during the
construction phase
Comprehensive site
investigation
Clear and thorough
project brief
Avoiding the use of
open tendering
Use of collected and data
compiled by owner,
consultant and contractor
Reducing
contingency sum
Use of project
scheduling/manageme
nt techniques
Knowledge-base of
previous similar projects
Comprehensive
documentation of
change
Many authors have tried to understand how this system can be more practical so
that project participants can get the best out of it. McCally (1997) introduced nine keys
for effective change management for use by both contractor and owner. With the benefit
of reducing the impact of changes:
1. A clearly defined processing methods;
2. Supervision of processing methods;
3. Clear instruction regarding the scope of changes;
4. Timely issuance of a request for proposal (RFP) to the contractor or owner;
5. Timely response by the contractor or owner to RFPs;
6. Timely review of the contractor’s or owner’s proposals;
7. Timely issuance of work authorization;

24
8. Timely performance of the changed work; and
9. Prompt payment for change work.
McCally (1997) also added four other points that contractors and owners should
pay attention to:
1. Evaluation of change time impact: owner and contractor should be aware of the
possible amount of extra time that might add to the project due to the change;
2. Having a documented scope of change: modified work must be clearly defined
and reviewed carefully by all parties in order to prevent potential disputes;
3. Evaluation of change costs impact: the cost of change should be discussed
between all parties and in this way, conflict can be reduced. The change cost
includes direct cost and indirect cost as well as mark-ups in the change proposal;
and
4. Forward pricing on changes: this technique helps the owner and contractors to
reach an agreement on any potential cost and schedule impact and plays the role
of insurance.
At the end, McCally (1997) recommends four guidelines for efficient change
management:
1. An organized process for dealing with changes;
2. A process that considers all the steps, and all the participants involved;
3. A process that is executed timely; and
4. A process to provide equitable treatment for both owner and contractor (McCally,
Bob M., 1997).
25
Conversely, Doran (2002) introduced six steps towards good change
management:
1. Gathering historical change data;
2. Gathering supplier feedback;
3. Sorting and preliminary analysis of data;
4. Statistical analysis of finding data;
5. System revisions formulation and report; and
6. Implementation
By having these key guidelines, a professional would be able to create an
effective change management process to manage change and control its impacts. There
are a number of publications and guidelines available to support change management.
Voropajev (1997) defined change management as “an integral process related to all
project internal and external factors, influencing project changes; to possible change
forecast; to the identification of already occurred changes; to planning preventive
impacts; to coordination of changes across the entire project.” According to Sun et al.
(2006), the objective of change management is to predict possible changes, recognize
changes that have already happened, plan preventive impacts and manage changes
throughout the entire project. Similarly, AkerKvaerner (2005) defined change
management as an overall work process that includes the proactive measures required to
reduce the volume of changes, and to ensure that the cost, schedule, and quality are under
control, as well as the evaluation and implementation process. A change management
process is a combination of several qualitative steps that all together make the process
work and guide the user how to process changes once they happen. These steps guide the
26
change management process from the time the change is initiated to the completion of the
project. For Mirshekarlou (2012), the main concept of any qualitative change
management process is to predict, identify, assess, resolve, record, and learn from
changes and conflicts in a way that supports the overall project priorities. CII (1994)
introduced the change management process principle:
“Promoting a balanced change culture”: this means agreeing on ‘beneficial’
changes to proceed and meanwhile preventing ‘detrimental’ changes;
“Recognize Change”: all the parties in the project should be in a good
communication and relationship and try to identify the potential changes;
“Evaluate Change”: project participants should try to figure out that the requested
change could be classified as a required change or elective change. Required
change should get an immediate action, and elective change is possible to be
omitted;
“Implement Change”: project participants must implement changes on the
schedule and have a procedure for the changes’ documentation (to follow the
change impacts) and authorization. “Authorization assures that all parties have
been communicated with regarding the change”; and
“Continuously improve from the lessons learned”: this means learning from the
lessons achieved by the previous projects. “From the outset, project strategies and
philosophies should take advantage of lessons learned from past similar projects.”
Based on the author’s experiences of project changes in Russia’s unstable
environment, Voropajev (1997) introduced the function of Change Management in
Project Management Body of Knowledge (PMBOK). The author insists that “Change
27
Management” should be presented as a “Key Integrative PM function.” Table 2-4 shows
the overview of the author’s proposed change management system.
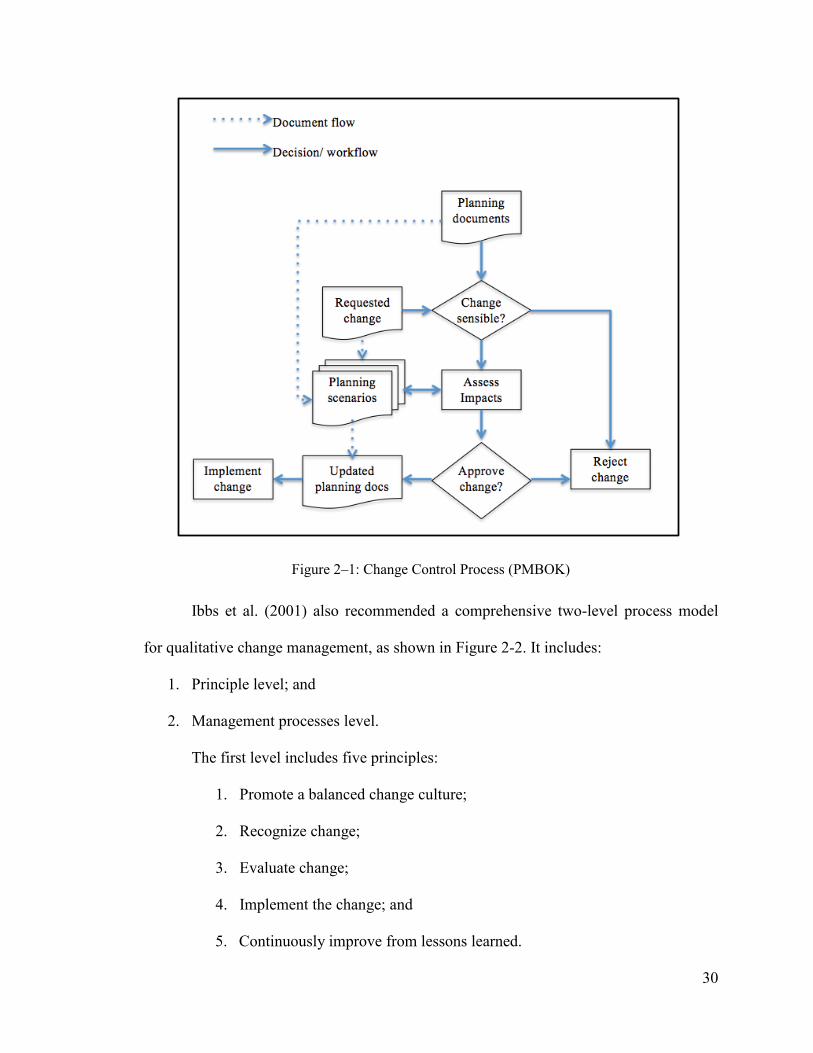
Later, PMBOK created the “Integrated Change Control Process,” shown in Figure
2-1. It includes the following change management procedures:
1. Identifying that a change is likely to occur or has occurred;
2. Influencing the factors that circumvent integrated change control to ensure that
only authorized changes are executed;
3. Reviewing and approving the requested changes;
4. Managing the approved changes when they occur, by regulating the flow of
requested changes;
5. Maintaining the integrity of baselines by releasing only approved changes for
incorporation into project products or services, and maintaining their related
configuration and planning documentation; and
6. Reviewing and approving all recommended corrective and preventive actions.

28
Table 2–4: Overview of Change Management (Voropajev, 1997)
Change Management
Change Forecast and
Detection
Project Protection
Plan Development
Plan Execution Change Control
and Result
estimation
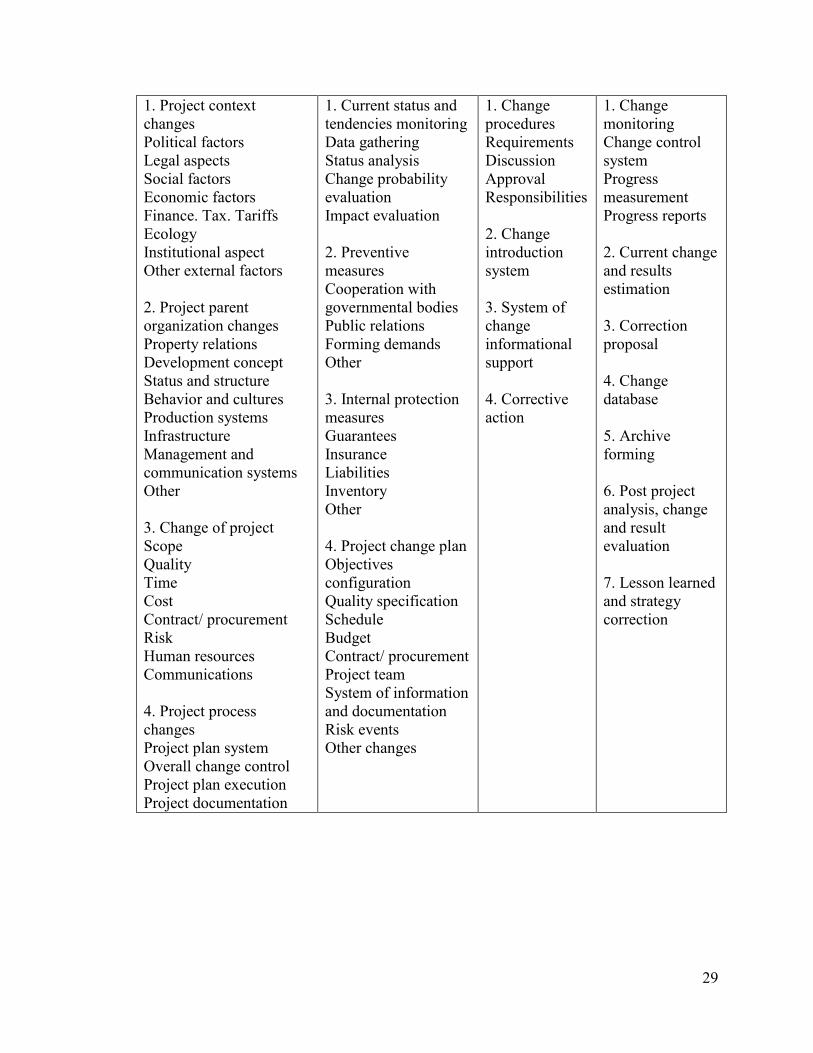
29
1. Project context
changes
Political factors
Legal aspects
Social factors
Economic factors
Finance. Tax. Tariffs
Ecology
Institutional aspect
Other external factors
2. Project parent
organization changes
Property relations
Development concept
Status and structure
Behavior and cultures
Production systems
Infrastructure
Management and
communication systems
Other
3. Change of project
Scope
Quality
Time
Cost
Contract/ procurement
Risk
Human resources
Communications
4. Project process
changes
Project plan system
Overall change control
Project plan execution
Project documentation
1. Current status and
tendencies monitoring
Data gathering
Status analysis
Change probability
evaluation
Impact evaluation
2. Preventive
measures
Cooperation with
governmental bodies
Public relations
Forming demands
Other
3. Internal protection
measures
Guarantees
Insurance
Liabilities
Inventory
Other
4. Project change plan
Objectives
configuration
Quality specification
Schedule
Budget
Contract/ procurement
Project team
System of information
and documentation
Risk events
Other changes
1. Change
procedures
Requirements
Discussion
Approval
Responsibilities
2. Change
introduction
system
3. System of
change
informational
support
4. Corrective
action
1. Change
monitoring
Change control
system
Progress
measurement
Progress reports
2. Current change
and results
estimation
3. Correction
proposal
4. Change
database
5. Archive
forming
6. Post project
analysis, change
and result
evaluation
7. Lesson learned
and strategy
correction
30
Figure 2–1: Change Control Process (PMBOK)
Ibbs et al. (2001) also recommended a comprehensive two-level process model
for qualitative change management, as shown in Figure 2-2. It includes:
1. Principle level; and
2. Management processes level.
The first level includes five principles:
1. Promote a balanced change culture;
2. Recognize change;
3. Evaluate change;
4. Implement the change; and
5. Continuously improve from lessons learned.
31
Figure 2–2: Change Management System (C. William Ibbs C. K., 2001)
In order to capture “iterative cycles” and their impacts during simultaneous design
and construction and fast track contracts, Lee et al. (2003) presented another framework
for qualitative change management. Sun et al. (2006) presented a prototype change
management toolkit (MCD) as standard framework and tool for supporting change
management in construction projects by focusing on forecasting the changes and
responding by rescheduling the workflow. Price et al. (2006) contributed to the
discussion by identifying the critical methods that could improve the management of
change. Based on a review of the literature and interviews with experts, they applied the
critical methods and developed a strategic framework for change management that
consists of six steps:
32
1. Preparing the organization;
2. Developing a vision and implementation plan;
3. Checking;
4. Communications and workforce engagement;
5. Implementation; and
6. Evaluation.
A change management process can qualitatively manage a change from
implementation to the completion. Therefore, some research has attempted to improve
the process by developing some quantitative models to calculate the impact of change
since one of the main steps in every change management process is evaluating the change
and identifying its impact on project parameters such as cost, time, productivity and
project overall performance.
2.7 Quantitative Methods and Models for Change Impact Analysis
When a change happens, impact analysis is an essential step that should be
applied in order to figure out the direct and indirect impact of the change. Quantitative
models concentrate on the impacts of the change on time, cost, quality or productivity,
and calculate everything numerically. All the theoretical models and information models
for the change can be under the quantitative change management system banner. In order
to quantify the impact of change on project cost, Ibbs (2003) proposed that the difference
between the project cost at the end of the project and the project original budgeted is
needed. This is reflected in Equation 2-1:
𝐶ℎ𝑎𝑛𝑔𝑒 𝑖𝑛 𝑐𝑜𝑠𝑡 (%) =𝑓𝑖𝑛𝑎𝑙 𝑐𝑜𝑠𝑡− 𝑜𝑟𝑖𝑔𝑖𝑛𝑎𝑙 𝑐𝑜𝑠𝑡
𝑜𝑟𝑖𝑔𝑖𝑛𝑎𝑙 𝑏𝑢𝑑𝑔𝑒𝑡× 100 2-1
33
Serag (2007) built a model to calculate the change impact on the project cost,
based on Equation 2-2:
% 𝑖𝑛𝑐. 𝑑𝑢𝑒 𝑡𝑜 𝑐ℎ𝑎𝑛𝑔𝑒 =𝑐𝑢𝑚𝑢𝑙𝑎𝑡𝑖𝑣𝑒 𝑐𝑜𝑠𝑡 𝑜𝑓 𝑡ℎ𝑒 𝑐ℎ𝑎𝑛𝑔𝑒 𝑜𝑟𝑑𝑒𝑟 𝑡𝑜 𝑑𝑎𝑡𝑒 ($)
𝑜𝑟𝑖𝑔𝑖𝑛𝑎𝑙 𝑐𝑜𝑠𝑡 𝑜𝑓 𝑡ℎ𝑒 𝑝𝑟𝑜𝑗𝑒𝑐𝑡 ($)× 100 2-2
Lee (2008) defined the concept of “cost overrun” as the differentiation of project
actual and budgeted costs as a percentage of the calculated cost, with all costs estimated
in constant amounts. Another addition was proved by Lee (2008) about actual costs and
estimated costs, as follows:
Actual costs: The amount of cost spent which is calculated by the time the project
is get completed; and
Estimated costs: The budgeted or forecasted costs at the time of project approval.
Ibbs (2003) generated an equation to calculate the percentage of change in
schedule, defined as the difference between the time used to complete the whole project
and the estimated time to complete the project, as shown in Equation 2-3:
𝐶ℎ𝑎𝑛𝑔𝑒 𝑖𝑛 𝑠𝑐ℎ𝑒𝑑𝑢𝑙𝑒 (%) =𝑡𝑜𝑡𝑎𝑙 𝑡𝑖𝑚𝑒 𝑢𝑠𝑒𝑑−𝑜𝑟𝑖𝑔𝑖𝑛𝑎𝑙 𝑒𝑠𝑡𝑖𝑚𝑎𝑡𝑒𝑑 𝑡𝑖𝑚𝑒
𝑜𝑟𝑖𝑔𝑖𝑛𝑎𝑙 𝑒𝑠𝑡𝑖𝑚𝑎𝑡𝑒𝑑 𝑡𝑖𝑚𝑒× 100 2-3
By using the data from 57 different construction projects, Leonard et al. (1991)
developed a regression model in order to quantify the impact of changes on productivity.
Mokhtar et al. (1998) implemented an information model with the objective to help
project participants coordinate design information when design changes happen by
having a central database that consist of active building components. The model can
transit design changes, track past changes, plan and schedule future changes, and improve
design change management. Hanna et al. (1999) developed a statistical model called
“%Delta,” which is a linear regression equation intended to quantify the effects of
changes on labor efficiency in electrical and mechanical construction. The model was
34
made to assist both the owners and contractors on change management and understanding
of how changes affect labor efficiency. Mokhtar et al. (2000) proposed a “computer-
assisted” methodology for managing design changes and to support planning and
scheduling of the interrelated design changes by linking knowledge to collect and
organize the data related to the design changes.
Hanna et al. (2002) also developed another statistical model to quantify whether
an electrical or mechanical project is impacted by a change by using regression
techniques. The model aids the owner or contractor to find the probability of whether a
project has been impacted by changes and acts as a forecasting tool. It classifies projects
as either impacted or not impacted by changes, and the impact is also classified either as
productivity losses or %Delta. Hanna et al. (2002) presented a new methodology, which
is the integration of statistical regression and fuzzy logic in order to quantify the
cumulative impact of changes on construction projects. The output of fuzzy membership
function would be the expected loss of labor productivity and its standard deviation.
Kettlewell (2003) recommended a framework for calculating changes in price.
The detailed costing structure can be used for providing bidding documents with the
intention of helping contractors establish change pricing and also aids owners in the
selecting of a contractor. Lee et al. (2004) developed a decision tree model for electrical
and mechanical projects in order to classify and quantify the labor productivity losses due
to the cumulative impact of changes. The model will support the owner and the
contractor to understand how changes affect labor efficiency. Moselhi et al. (2005)
developed a neural network model for quantifying the impact of changes on labor
productivity. The model is integrated with four other models developed by others in order
35
to make a prototype software system to evaluate the percentage loss of labor productivity
due to changes. In order to estimate the adverse impacts of changes on construction
performance, Lee (2003) proposed a framework incorporated into a system dynamics
model of dynamic planning and control methodology (DPM).
Chen (2005) developed a model called Early Warning System (EWS) with the use
of the Case Base Reasoning (CBR) method. EWS can resolve the changes with the
potential of recourse to lawsuits by using the previous resolutions that are saved in the
model database. The model gives a warning any time a new change case is similar to past
cases. To quantify the impact of changes on cost and time, Yitmen et al. (2006) presented
a prototype expert system named QUICOPP. To minimize disputes, QUICOPP also
provides recommendations to the parties involved in the project and helps prevent the
project from becoming a claim case. In order to analyze the negative impacts of changes
on different project parameters and to discover the “cause-and-effect relationships” of the
change events, Motawa et al. (2007) developed a change management system that
integrates a fuzzy logic-based change prediction model with the system dynamics model
of the Dynamic Planning and Control Methodology (DPM). Based on time and
compliance metrics, Karimidorabati (2008) developed a simulation model for change
management, arguing that the automated way is better than all the other electronic and
paper-based processes. In order to examine the impact of changes and to involve the
project participants in the decision-making process, Isaac (2008) proposed a new
approach for managing changes in construction projects named Change Control Tool
(CCT). By using a Knowledge-Based Decision Support System (KBDSS), Arian (2008)
presented a change management system for reducing variations and to increase overall
36
the level of productivity in the construction industry. In order to avoid disputes between
project parties and prevent unnecessary expense and loss by providing similar litigation
cases from its established comprehensive database, Chen (2008) developed a K Nearest
Neighbor (KNN) knowledge sharing model. Serag et al. (2010) demonstrated two
regression models to quantify the impact of change on a contract price in heavy
construction projects in Florida. It aids the owners to do forward pricing of changes.
Zhao et al. (2010) developed a change prediction model as a beneficial tool for
project management teams to manage changes proactively and efficiently. The model is
used activity-based dependency structure matrix (DSM) to identify the ripple effect of the
changes. Also, it used Monte Carlo simulation to analyze the change probability of
activities involved in construction projects. Nahod (2011) proposed a theoretical system
based on a Dynamic Planning and Control Methodology (DPM) for reducing the time it
takes to get change approval. For better quantification, Ibbs (2012) quantitatively studied
226 projects collected by Leonard in (1991) and Ibbs (2005). The result is “a set of
curves and reference points that contrast the amount and likelihood of change with the
amount and nature of its impact.” Heravi et al. (2014) developed a framework to predict
the change in construction projects and its impact on project objectives. The predicted
changes are inserted into the change implementation process in the form of change
request and subdivided into change implementation paths based on general possible
scenarios of conflicts/non-conflicts, followed by scenarios of request/non-request. A risk
index is developed using the event tree analysis to evaluate the developed change
implementation paths separately and analyze the occurrence of change and arising
conflicts due to the change implementation process. Du et al. (2015) developed an object-
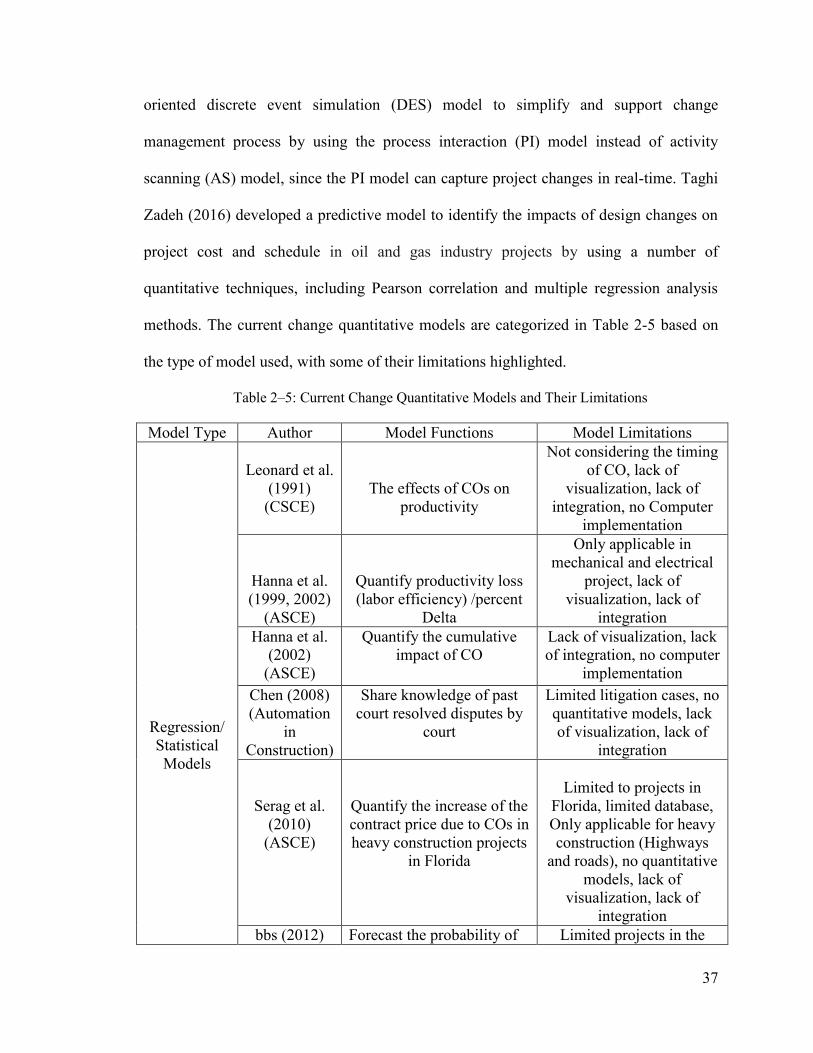
37
oriented discrete event simulation (DES) model to simplify and support change
management process by using the process interaction (PI) model instead of activity
scanning (AS) model, since the PI model can capture project changes in real-time. Taghi
Zadeh (2016) developed a predictive model to identify the impacts of design changes on
project cost and schedule in oil and gas industry projects by using a number of
quantitative techniques, including Pearson correlation and multiple regression analysis
methods. The current change quantitative models are categorized in Table 2-5 based on
the type of model used, with some of their limitations highlighted.
Table 2–5: Current Change Quantitative Models and Their Limitations
Model Type Author Model Functions Model Limitations
Regression/
Statistical
Models
Leonard et al.
(1991)
(CSCE)
The effects of COs on
productivity
Not considering the timing
of CO, lack of
visualization, lack of
integration, no Computer
implementation
Hanna et al.
(1999, 2002)
(ASCE)
Quantify productivity loss
(labor efficiency) /percent
Delta
Only applicable in
mechanical and electrical
project, lack of
visualization, lack of
integration
Hanna et al.
(2002)
(ASCE)
Quantify the cumulative
impact of CO
Lack of visualization, lack
of integration, no computer
implementation
Chen (2008)
(Automation
in
Construction)
Share knowledge of past
court resolved disputes by
court
Limited litigation cases, no
quantitative models, lack
of visualization, lack of
integration
Serag et al.
(2010)
(ASCE)
Quantify the increase of the
contract price due to COs in
heavy construction projects
in Florida
Limited to projects in
Florida, limited database,
Only applicable for heavy
construction (Highways
and roads), no quantitative
models, lack of
visualization, lack of
integration
bbs (2012) Forecast the probability of Limited projects in the
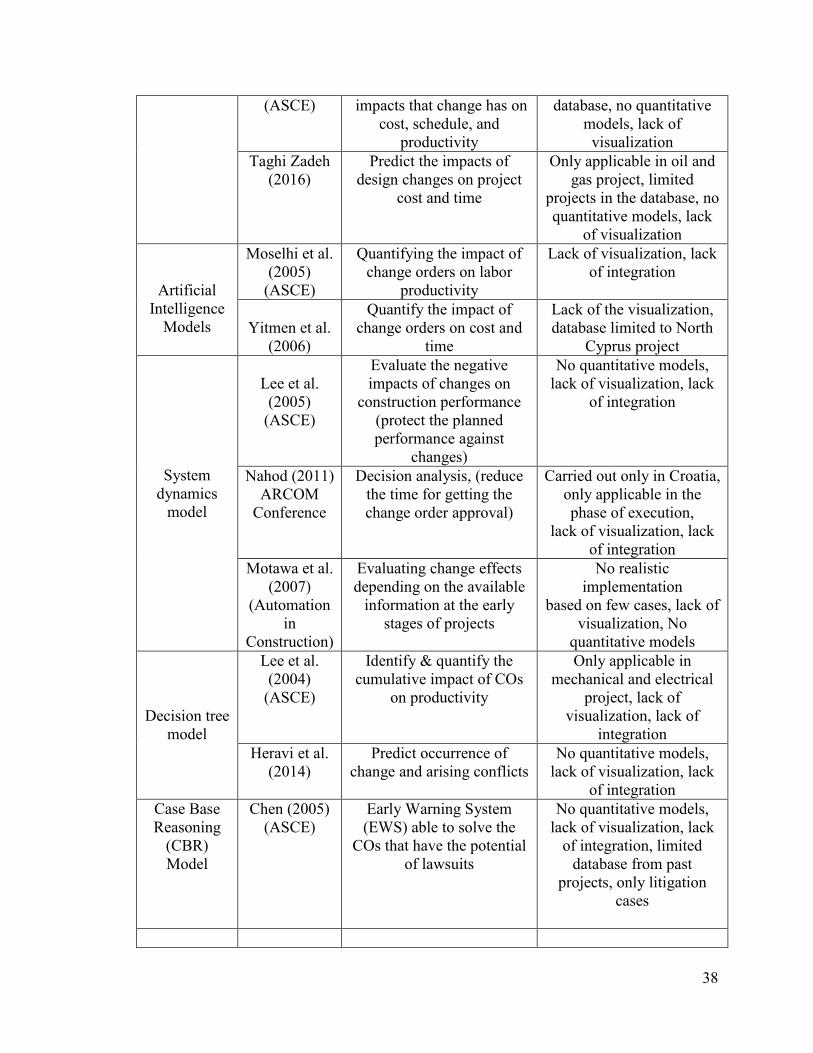
38
(ASCE) impacts that change has on
cost, schedule, and
productivity
database, no quantitative
models, lack of
visualization
Taghi Zadeh
(2016)
Predict the impacts of
design changes on project
cost and time
Only applicable in oil and
gas project, limited
projects in the database, no
quantitative models, lack
of visualization
Artificial
Intelligence
Models
Moselhi et al.
(2005)
(ASCE)
Quantifying the impact of
change orders on labor
productivity
Lack of visualization, lack
of integration
Yitmen et al.
(2006)
Quantify the impact of
change orders on cost and
time
Lack of the visualization,
database limited to North
Cyprus project
System
dynamics
model
Lee et al.
(2005)
(ASCE)
Evaluate the negative
impacts of changes on
construction performance
(protect the planned
performance against
changes)
No quantitative models,
lack of visualization, lack
of integration
Nahod (2011)
ARCOM
Conference
Decision analysis, (reduce
the time for getting the
change order approval)
Carried out only in Croatia,
only applicable in the
phase of execution,
lack of visualization, lack
of integration
Motawa et al.
(2007)
(Automation
in
Construction)
Evaluating change effects
depending on the available
information at the early
stages of projects
No realistic
implementation
based on few cases, lack of
visualization, No
quantitative models
Decision tree
model
Lee et al.
(2004)
(ASCE)
Identify & quantify the
cumulative impact of COs
on productivity
Only applicable in
mechanical and electrical
project, lack of
visualization, lack of
integration
Heravi et al.
(2014)
Predict occurrence of
change and arising conflicts
No quantitative models,
lack of visualization, lack
of integration
Case Base
Reasoning
(CBR)
Model
Chen (2005)
(ASCE)
Early Warning System
(EWS) able to solve the
COs that have the potential
of lawsuits
No quantitative models,
lack of visualization, lack
of integration, limited
database from past
projects, only litigation
cases
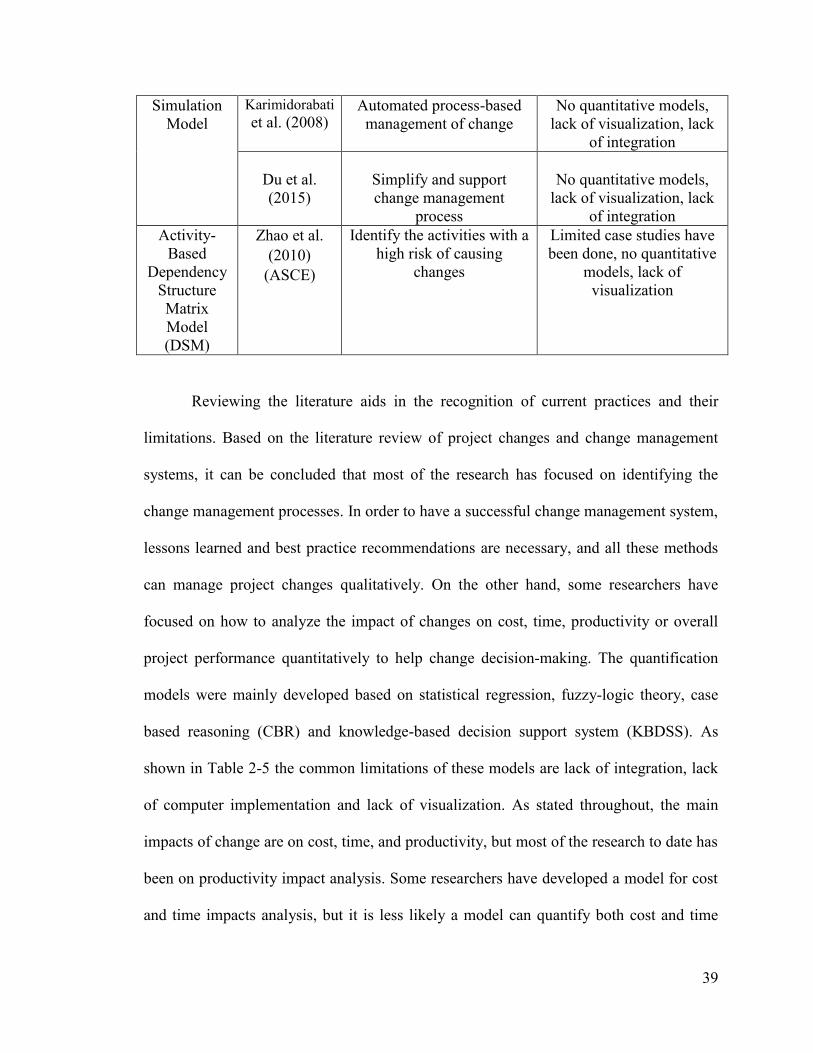
39
Simulation
Model
Karimidorabati
et al. (2008) Automated process-based
management of change
No quantitative models,
lack of visualization, lack
of integration
Du et al.
(2015)
Simplify and support
change management
process
No quantitative models,
lack of visualization, lack
of integration
Activity-
Based
Dependency
Structure
Matrix
Model
(DSM)
Zhao et al.
(2010)
(ASCE)
Identify the activities with a
high risk of causing
changes
Limited case studies have
been done, no quantitative
models, lack of
visualization
Reviewing the literature aids in the recognition of current practices and their
limitations. Based on the literature review of project changes and change management
systems, it can be concluded that most of the research has focused on identifying the
change management processes. In order to have a successful change management system,
lessons learned and best practice recommendations are necessary, and all these methods
can manage project changes qualitatively. On the other hand, some researchers have
focused on how to analyze the impact of changes on cost, time, productivity or overall
project performance quantitatively to help change decision-making. The quantification
models were mainly developed based on statistical regression, fuzzy-logic theory, case
based reasoning (CBR) and knowledge-based decision support system (KBDSS). As
shown in Table 2-5 the common limitations of these models are lack of integration, lack
of computer implementation and lack of visualization. As stated throughout, the main
impacts of change are on cost, time, and productivity, but most of the research to date has
been on productivity impact analysis. Some researchers have developed a model for cost
and time impacts analysis, but it is less likely a model can quantify both cost and time
40
impacts. As a result, a model is needed that can analyze more impacts simultaneously.
However, not enough focus has been paid on evaluating cause-and-effect relationships or
dependencies within the change process, which are essential to realizing how changes
happen and how causes influence effects. These dependencies deliver the foundation for
change evaluation within the overall change process. Most of the time, the causes of
change are not easy to identify due to lack of information. In construction projects,
experts try to make decisions based on their assumptions and previous experience in
order to figure out these relations. Also, it is hard to trace the impacts of the change in
other components or disciplines such as mechanical, electrical, HVAC, piping and
plumbing from the 2D drawings or even 3D drawings. What is missing is a model with
the ability to visualize the impact of change both qualitatively and quantitatively, and this
limitation can be addressed by taking advantage of BIM. As such, below is a review of
the literature on BIM, which is necessary to understand its definition, abilities, benefits
and its current adoption in architectural, engineering and construction industry (AEC) for
the purpose of change management.
2.8 Building Information Modeling (BIM)
Building Information Modeling (BIM) is a developing technology used all over
the world in the Architecture, Engineering, and Construction (AEC) industries because of
its ability to provide accurate building data and information. BIM allows architects and
engineers to use digital design information to analyze and understand how their projects
will perform before they are built. It has been increasingly applied by owners, designers,
and engineers during the life cycle of a project. Edgar (2007) defines BIM as “a complete
3D database that can be used for cost estimating, scheduling, detailing, advance bill
41
production, automated shop drawing and construction planning are provided by a BIM
model.” Based on the BIM Project Execution Planning Guide, BIM is defined as: “A
process focused on the development, use and transfer of a digital information model of a
building project to improve the design, construction and operations of a project or
portfolio of facilities” (CIC research group, 2009). Autodesk (2010) argued, “Developing
and evaluating multiple alternatives at the same time enables easy comparison and
informs better sustainable design decisions.” BIM is made by combining all the project
data including, cost and schedule information and allowing users access to them without
obstruction. The BIM Handbook presents BIM as a modeling tool to produce,
communicate, and analyze building models. Building models are recognized as “Building
components that are represented with digital representations (objects) that carry
computable graphic and data attributes that identify them to software applications. As
well as parametric rules that allow them to be manipulated in an intelligent fashion”
(Eastman, 2011). In BIM, a project can be viewed as 3-dimensional or 2-dimensional
from any direction, and a user can define the scale according to need. A user can also
generate more information for the model, such as construction scheduling (4D BIM) and
cost estimating (5D BIM). In addition to the 3D rendering of the building, BIM is a
combination of design technologies to make a virtual environment for building
components (Eastman, 2011). BIM upgrades the traditional 2D model to a 3D model and
further to a 4D model (scheduling) and a 5D model (cost estimating). Eastman et al.
(2011) argued, “further extended to incorporate additional management parameters to nD
CAD are already being undertaken by various solution providers.” This research attempts
to add another dimension: 6D (change management). BIM provides several types of 3D
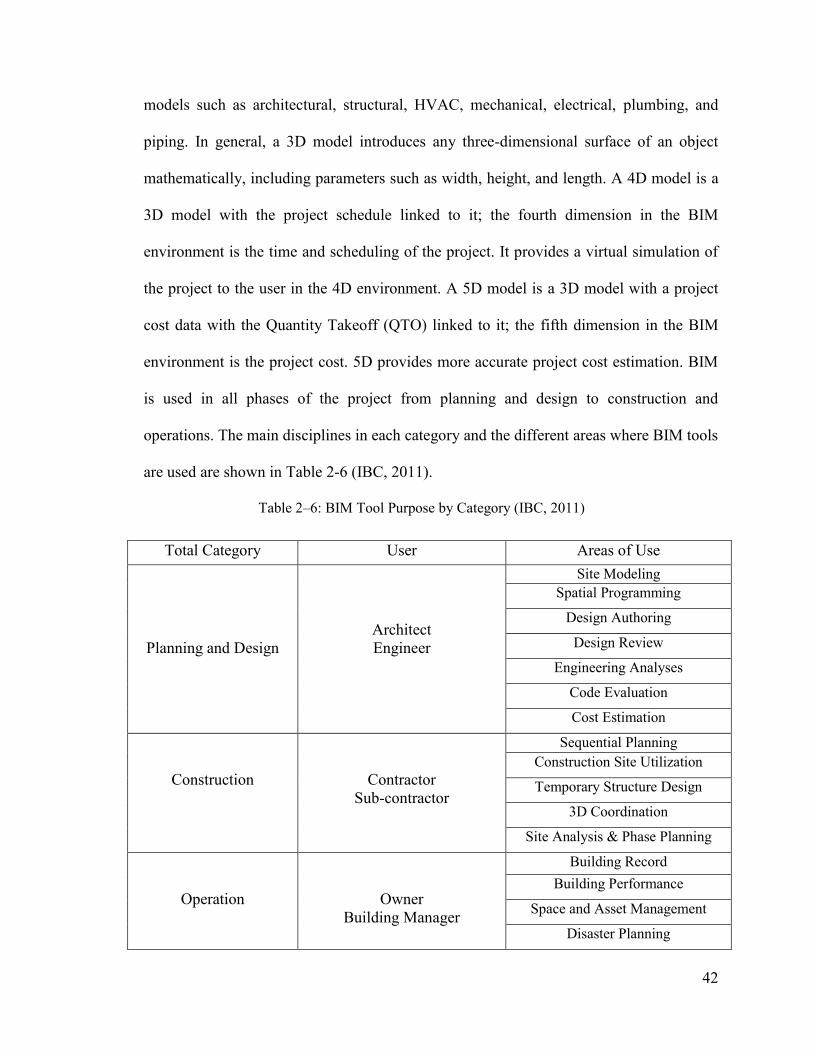
42
models such as architectural, structural, HVAC, mechanical, electrical, plumbing, and
piping. In general, a 3D model introduces any three-dimensional surface of an object
mathematically, including parameters such as width, height, and length. A 4D model is a
3D model with the project schedule linked to it; the fourth dimension in the BIM
environment is the time and scheduling of the project. It provides a virtual simulation of
the project to the user in the 4D environment. A 5D model is a 3D model with a project
cost data with the Quantity Takeoff (QTO) linked to it; the fifth dimension in the BIM
environment is the project cost. 5D provides more accurate project cost estimation. BIM
is used in all phases of the project from planning and design to construction and
operations. The main disciplines in each category and the different areas where BIM tools
are used are shown in Table 2-6 (IBC, 2011).
Table 2–6: BIM Tool Purpose by Category (IBC, 2011)
Total Category User Areas of Use
Planning and Design
Architect
Engineer
Site Modeling
Spatial Programming
Design Authoring
Design Review
Engineering Analyses
Code Evaluation
Cost Estimation
Construction
Contractor
Sub-contractor
Sequential Planning
Construction Site Utilization
Temporary Structure Design
3D Coordination
Site Analysis & Phase Planning
Operation
Owner
Building Manager
Building Record
Building Performance
Space and Asset Management
Disaster Planning
43
Various researchers considering the different uses of BIM in the construction
industry have highlighted many benefits. The Stanford University Center for Integrated
Facilities Engineering (CIFE) summarized the benefits of BIM based on 32 major
projects as follows:
Up to 40% elimination of the unbudgeted change;
Cost estimation accuracy within 3%;
Up to 80% reduction in time taken to generate a cost estimate;
A saving up to 10% of the contract value through clash detection; and
Up to 7% reduction in project time.
Azhar, et al., (2008), on the other hand, lists the benefits of BIM as follows:
Quicker processes aid to easier information sharing;
Enhanced analyzing of design alternatives allows to have innovative solutions;
Controlled whole-life costs and environmental data for better understanding of
project lifecycle costs;
Better production quality; documentation output is flexible and applies
automation;
Automated assembly;
Better customer service by providing accurate visualization that helps the
understanding of alternatives; and
Aid to facilities management by providing design, construction and operational
information (Azhar, 2008).
Maintenance scheduling
44
For Kymmell (2009), the benefits of BIM are that it decreases struggles during
construction by enhancing the mutual understanding of design, overall project quality,
and reduces construction changes and number of RFIs. The BIM Handbook summarizes
BIM’s benefits as:
Better management of the design documentation;
Simulate construction process and operation activities prior to physical
implementation;
Solve problems and forecast performance;
Coordinate the construction to reduce construction time and eliminate changes;
Facilitate data entry as part of the construction business process and then re-uses
it throughout the whole project lifecycle and beyond (Eastman, 2011).
There are eleven common “early” benefits that most contractors experience in
their use of BIM, as follows:
1. Visualization;
2. Scope Clarification;
3. Partial Trade Coordination;
4. Collision Detection/Avoidance;
5. Design Validation;
6. Construction Sequencing Planning/Phasing Plans/Site Logistics;
7. Marketing Presentation;
8. Options Analysis (Value Engineering Analysis);
9. Walk-through and Fly-through;
10. Virtual Mock-ups; and

45
11. Sight Line Studies.
One of the main benfit of BIM Visualization is the reason that this study chooses
BIM as the main platform for its developed model. When any data visualized, it can help
project participants to communicate better and more effectively, and the data will be
more understandable. Price (2006) stated that most change processes faced with failure
due to poor communications. Shneiderman (2004) stated that the visualization tools could
accelerate human thinking and strengthen human brainpower. IEEE (2005) argued that
visualization systems help quick insight to compound data; these systems are comparable
to power tools for analytical reasoning.
From the literature, when it comes to any visualization system, two values are
always discussed. The first is the usability of the system, and the other is usefulness that
is considered in this study for developing a practical visualization model. ISO (1998)
defines usability as the product extension help for specified users to accomplish specified
targets with efficiency and satisfaction in a specified framework. Nielsen (1993)
describes usability as the group of factors such as learnability, productivity,
impressiveness, few serious inaccuracies, and satisfaction and usefulness as the matter of
whether the system can be used to reach some anticipated objective. Allendoerfer (2009)
states that usability means the effort needed to use a system and usability observes how
easily the tool gets used to complete a task. For Allendoerfer (2009), usefulness is system
extension to encounter the users’ desires and provide profits. In this case, usefulness
refers to the quality of the tool output results. Table 2-7 summarizes the characteristics of
highly usable and useful information visualization systems, as outlined by Allendoerfer
(2009).
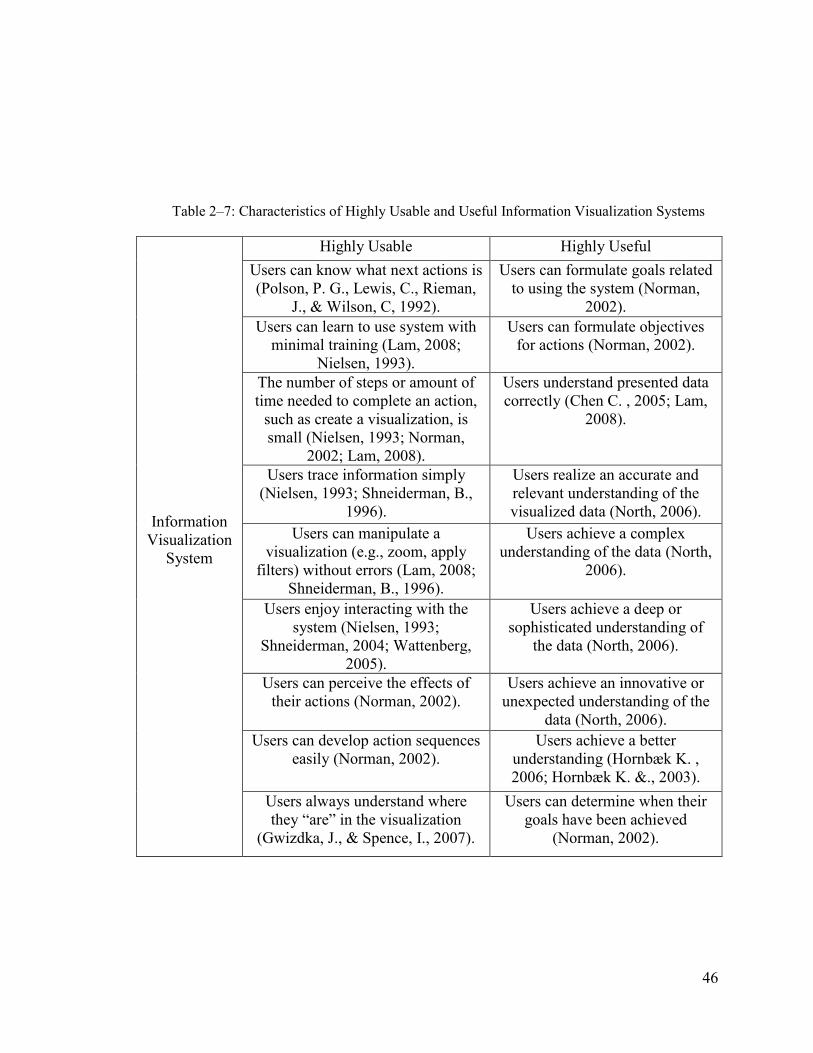
46
Table 2–7: Characteristics of Highly Usable and Useful Information Visualization Systems
Information
Visualization
System
Highly Usable Highly Useful
Users can know what next actions is
(Polson, P. G., Lewis, C., Rieman,
J., & Wilson, C, 1992).
Users can formulate goals related
to using the system (Norman,
2002).
Users can learn to use system with
minimal training (Lam, 2008;
Nielsen, 1993).
Users can formulate objectives
for actions (Norman, 2002).
The number of steps or amount of
time needed to complete an action,
such as create a visualization, is
small (Nielsen, 1993; Norman,
2002; Lam, 2008).
Users understand presented data
correctly (Chen C. , 2005; Lam,
2008).
Users trace information simply
(Nielsen, 1993; Shneiderman, B.,
1996).
Users realize an accurate and
relevant understanding of the
visualized data (North, 2006).
Users can manipulate a
visualization (e.g., zoom, apply
filters) without errors (Lam, 2008;
Shneiderman, B., 1996).
Users achieve a complex
understanding of the data (North,
2006).
Users enjoy interacting with the
system (Nielsen, 1993;
Shneiderman, 2004; Wattenberg,
2005).
Users achieve a deep or
sophisticated understanding of
the data (North, 2006).
Users can perceive the effects of
their actions (Norman, 2002).
Users achieve an innovative or
unexpected understanding of the
data (North, 2006).
Users can develop action sequences
easily (Norman, 2002).
Users achieve a better
understanding (Hornbæk K. ,
2006; Hornbæk K. &., 2003).
Users always understand where
they “are” in the visualization
(Gwizdka, J., & Spence, I., 2007).
Users can determine when their
goals have been achieved
(Norman, 2002).
47
2.9 Role of BIM in Enhancing Project Change Management
BIM is in the process of continuous development and plays an important role in
the construction industry. Considering this evolving role there is a need to improve the
understanding of change management systems in the context of a BIM environment. The
issue of managing design changes using BIM has not received much attention in the
current literature. For example, to discover changes between two versions of the same
data model, Wang et al. (2007) developed an accurate semi-automated method for finding
the differences between versions of a data model precisely and efficiently. This approach
includes a taxonomy for defining feasible differences between two versions of a data
model and provides a way to classify these differences. The method can benefit AEC-
related software developers implement data models in their software systems.
Akcamete et al. (2009) presented results from an analysis of changes found in
case studies conducted during construction and operation phases and highlighted some
initial patterns of changes occurring throughout the life cycle of a facility. They discussed
some challenges related to managing such changes and updating building information
models accordingly. They also investigated how well commercially available BIM tools
are capable of addressing these challenges, such as capturing the changes and storing
them in the BIM change history. This stored data will help users’ decision-making when
they need to analyze the changes over time for effective maintenance.
Navon and Isaac (2009) developed computer-based tools to automate the change
management process. Nour and Beucke (2010) presented an approach to integrate object
versioning (as a change management concept) and the IFC model (as a BIM) in an open,
multidisciplinary collaborative environment to address the necessity of design change
48
management in early design. Koch and Firmenich (2011) presented a modeling approach
that integrates current version-oriented information (i.e., state-oriented descriptions of
virtual buildings) with change-oriented information (i.e., moving a wall, modifying its
thickness and material) using processing-oriented modeling. The developed model
contains both the design states and design changes, and it automatically records design
changes by using a new operative modeling language.
Langroodi et al. (2012) investigated different challenges with regards to change
management in fast-tracked construction projects and looked at the abilities of available
BIM tools to overcome these challenges. In order to aid project participants who use BIM
for change management to understand change characteristics, they developed a change
ontology. Isaac and Navon (2013) presented the possible use of graph-based algorithms
that get input from BIM and other information sources to track the consequences of
design changes throughout the project, from one element to others. These algorithms can
considerably decrease the amounts of time project team members spend manually
browsing through project information and the large volume of data to evaluate the impact
of a projected change.
Liu et al. (2014) developed a new model to manage project changes by integrating
change management with BIM. The developed model is able to reduce the negative
impacts of changes on energy efficiency purposes by taking the change data and
automatically updating changes in BIM models. The automated model updating
facilitates information collection and the coordination process among team members.
Pilehchian et al. (2015) presented a method to identify, manage, and track changes in a
collaborative multi-disciplinary BIM environment. An ontology was developed to
49
characterize design changes based on the changed component attributes, dependencies
between components, and change impacts. A graph-based and dependency matrix
approach was used to determine different types of dependencies amongst different design
changes and their impact in a BIM-based project delivery process.
Karimidorabati et al. (2016) developed an automated workflow-based change
management process model for the execution of megaprojects as part of an Electronic
Product and Process Management (EPPMS). The developed automated workflow-based
process was then compared with two other change management processes in terms of
time reduction and compliance, namely: A fully paper-based process (hard copy
documentation, faxes and snail mails), and an email-based process with PDF softcopy
documentation. The results of comparison showed that the workflow-based process
improved compliance by reducing the rate of rework and the automated notice to all
project team members. Mejlaender-Larsen (2016) presented a change management
process and a corresponding change control system (CCS) for managing changes in
detailed design, evaluating how BIM can be used to identify the impact of changes.
In the construction industry, before the development of any change management
system, the project participant used to review the changes on paper by laying two
versions of plans side by side and manually locating and clouding the areas of changes.
Also, they had to switch between sets to review previous and current versions in order to
estimate the impact of changes on cost and time. Later on, this traditional setting got
easier with the development of models that allow users to review changes by overlaying
and aligning plan revisions and finding the differences in 2D. Then the user can cloud the
50
area of changes and isolate versions, and sometimes these models are able to quantify
items that are removed and added.
2.10 BIM Software
Some of the available BIM tools on the market that can be used to develop a BIM
platform for the purpose of project change management are introduced below, such as
Vico, Innovaya, Navisworks, Synchro, BIMestiMate and Assemble. These models’
capabilities are discussed later on in chapter 4, and in section 4.4 they are compared with
this study developed model. The first model is Vico Office Document Controller, which
allows users to compare versions of 2D drawings and 3D models to locate the changes
between versions. It can examine PDFs and DWGs using an overlay technique to find out
which drawings have changed, and documents these changes in the comprehensive
report. A color-code system is used to demonstrate the type of changes available between
the drawing’s versions. The user can cloud, annotate and log the located changes in Vico
Office Issue Manager. Then the estimator can use the results of a comparison to analyze
the impact of the changes. However, Vico is not accurate if the scales or the pages are
slightly shifted, and it becomes very difficult to see what has changed. Also, it is not able
to quantify the changes’ impacts on project cost and time (VICO, 2016).
The second software is the Innovaya system, which works like a bridge to transfer
the model components to an estimating database like Sage Timberline to provide an
automated visual estimation of a project by eliminating the manual mappings between the
objects and cost assemblies. For the purposes of change management, Innovaya visual
estimating can present changed, new, and deleted components using different colors, and
the new quantities can be automatically updated in the estimate. Therefore, the estimated
51
cost can be adjusted since the changed components are identified and quantified.
Innovaya also has the ability to run a 4D simulation of a project by linking the model to
its schedule. However, it is not able to update the schedule based on the requested project
changes, nor can it quantify the impact of changes (Innovaya, 2014).
The third software is Navisworks, which is able to compare two versions of a
model, and track, visualize and quantify changes. It compares two 3D versions of a
model in terms of type, unique ID, name, properties and geometry by overlaying them on
top of each other. It hides everything that is the same in both models and highlights the
modified, deleted and added items with different colors. The user can export the
comparison data to estimating Sage Timberline software. Therefore, in terms of
calculating the impact of changes on project cost the model is able to calculate only the
components’ direct cost, not the other aspects related to the cost impact estimation such
as impact cost, indirect cost, and change cost. The system also is able to do 4D
scheduling; it shows 4D construction simulations of a project model by associating tasks
straight to the 3D geometry. As with Innovaya, Navisworks links the available schedule,
but cannot update the schedule based on the changes ((Navisworks, 2016).
The fourth model is Synchro, a construction project management system that has
the capability to visualize project scheduling in 4D by auto-matching a BIM model to its
schedule. The user is also able to add changes such as the number of resources into the
4D scheduling to see their impact as they are made. Having a look ahead to the changed
reports reduces the project’s schedule and cost variances. However, this model cannot
visualize the project changes and also calculate the impact of changes on project cost
(Synchro, 2017).
52
The fifth is BIMestiMate, which allows users to compare two or more versions of
a model and then visualize the available changes that exist between them and uses color
codes to define the change types. Also, the system uses the information about the changes
to analyse the cost impact (Michal Juszczyka, 2016). Finally, the sixth model, Assemble,
is a cloud-based platform used for viewing models, estimating, scheduling, and project
control, and letting a project’s AEC team advance project collaboration and communicate
changes. The system compares the latest two versions of the model and tracks both the
graphical and cost differences between them. Then, the system highlights and visualizes
the model’s components change types: addition, deletion and modification. However, it
cannot visualize the changes’ ripple effect. The Assemble platform also provides the
components’ quantities report that the user can add to the component unit cost in order to
calculate the cost impact due to design changes which allows users to see the effect of
changes on a project’s cost (Assemble, 2015).
Investigating 424 construction firms, Burcin et al. (2010) found that “Autodesk
BIM tools are the most widely used BIM solutions in the U.S., with 54% of those
construction companies using them; Graphisoft ArchiCAD follows with 10.7% and
Bentley BIM tools with 8%. 6.5% and 5.8% of the construction companies based on the
survey uses Tekla and Vico BIM tools. The other software tools such as Innovaya,
Dprofiler, Vectorworks, etc. are also being used by a small portion of the construction
firms,” as summarized in Figure 2-3. Eastman et al. (2011) noted that any tools that
create building models and contain parametric objects are considered BIM tools.
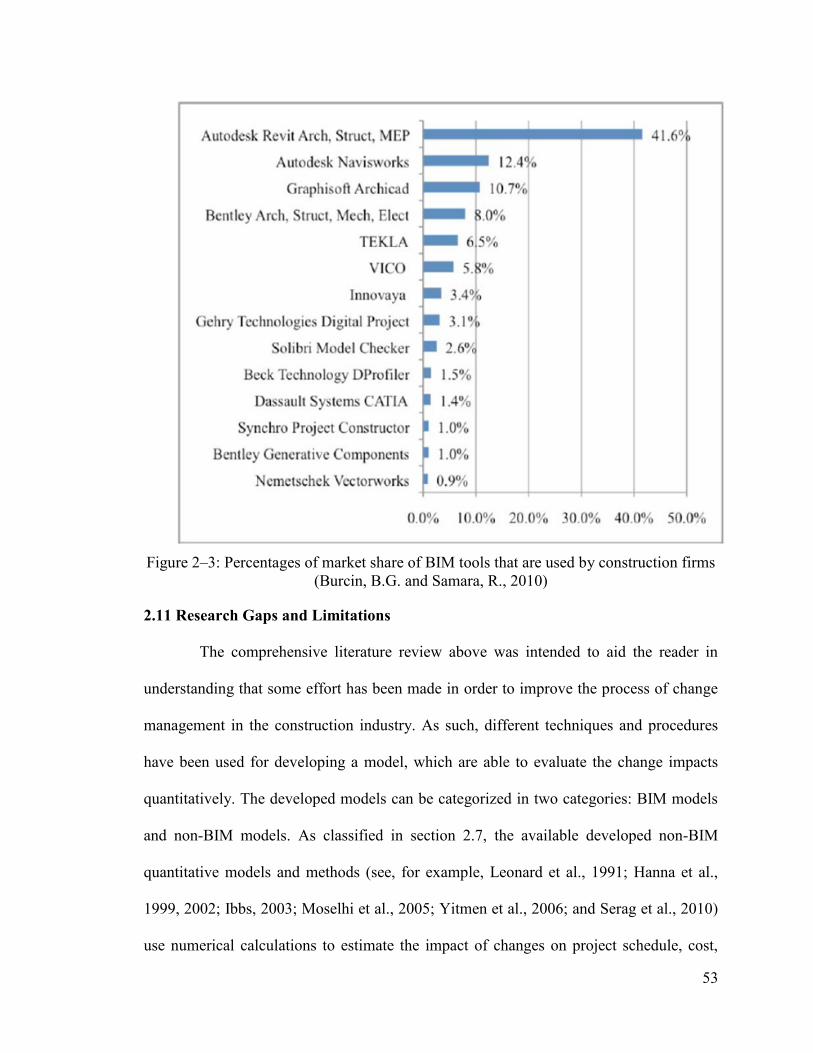
53
Figure 2–3: Percentages of market share of BIM tools that are used by construction firms
(Burcin, B.G. and Samara, R., 2010)
2.11 Research Gaps and Limitations
The comprehensive literature review above was intended to aid the reader in
understanding that some effort has been made in order to improve the process of change
management in the construction industry. As such, different techniques and procedures
have been used for developing a model, which are able to evaluate the change impacts
quantitatively. The developed models can be categorized in two categories: BIM models
and non-BIM models. As classified in section 2.7, the available developed non-BIM
quantitative models and methods (see, for example, Leonard et al., 1991; Hanna et al.,
1999, 2002; Ibbs, 2003; Moselhi et al., 2005; Yitmen et al., 2006; and Serag et al., 2010)
use numerical calculations to estimate the impact of changes on project schedule, cost,
54
productivity, and overall project performance. They only calculate the probability of a
change’s impact on these project parameters, and in doing so, render users unable to
update specific project activities’ duration and component cost in order to generate a new
project schedule and cost estimation based on requested changes. In addition, identifying
change consequences (ripple effect) and impacted components is often required after
detecting the change, which the current non-BIM models are not capable of doing;
project participants thus mostly depend on expert opinions, manual analyses and project
drawings to determine these effects. Navon and Isaac (2009) identified three common
limitations of the existing non-BIM computer models of building projects:
1. Project data are not fully integrated and stored in different sub-models.
2. Current building models do not allow continuous modification of data, so the
updating and propagation of changes throughout the project is not happening
automatically.
3. Building models that identify sources of changes and their impact on project
cost and duration of the planned activities should incorporate uncertainties and
link the project components explicitly.
Therefore, the common limitations of current non-BIM models are: lack of
computer implementation, a limited number of variables, lack of visualization, lack of
integration, and they mostly consider only the impact a change has on project
productivity. Also they are not accurate since their analysis is based on experts’
knowledge. This is due to the lack of BIM software for tracking changes among different
building information models versions and presenting the results effectively (Pilehchian,
Staub-French, & Nepal, 2015). Therefore, BIM-based project management is beginning
55
to get more attention, but is also a contentious topic in the construction industry. Various
studies on BIM have addressed the challenges related to managing changes and updating
building information models, and investigated the capabilities of commercially available
BIM tools that can be used in a way to overcome these challenges, but no actual BIM
model has yet ben developed.
For the purpose of determining the ripple effect of changes, as well as cost and
time analyses, some studies developed an ontology that can be used to characterize
design changes based on the changed component attributes, dependencies between
components, and change impacts. Some studies have developed a BIM model able to find
differences between versions of a data model, and they classify and visualize the change
types (addition, deletion, modification), quantify the variances and automatically record
these differences using a new operative modeling language (see, for example, Assemble,
Vico and Innovaya). However, in terms of ripple effect visualization, not enough research
has been conducted on evaluating cause-and-effect relationships or dependencies within
the change process, which are essential to realizing how changes happen and how the
causes influence the effects.
Some developed models, such as Innovaya, Navisworks and Synchro, are only
capable of visual 4D simulation of a project and not able to estimate the impacted
components duration and update the overall project schedule after quantifying changes;
updating the project schedule and receiving the change-impact analysis causes additional
work for project schedule developers. This means an optimized system is needed that is
able to calculate the impact of changes on the duration of each project component and the
overall project duration; the newly calculated durations can then be used to update the
56
project schedule. In terms of estimating the impact of changes on project cost, the
available BIM models such as Assemble and Innovaya is only capable of quickly
generating an automated cost estimate. Their estimation is based on calculating the
project component cost without considering the project changes’ impact costs
(productivity and time-related costs) or indirect costs. However, in this research review of
the literature, a powerful method was found that could be used for efficient cost
estimation of change: Moselhi’s framework is a strong method for cost estimation of
change. However, this method would be more powerful when combined with BIM as an
automated platform.
The literature review confirms that the existing developed BIM models are
incapable of updating the overall project cost and schedule after quantifying changes.
Therefore, updating project budget and schedule after receiving the change-impact
analysis causes additional work for project schedule developers. Additionally, previous
research did not develop an integrated BIM model able to visualize the change ripple
effect of design changes throughout the project, from one element to others, nor one with
a quantitative system that can estimate the cost and time impact of change. So there is a
need for an integrative, adaptive and stochastic model. Therefore, after analyzing the
gaps revealed above, and building on the foundation of previous research, the present
study aims to bridge some existing knowledge gaps by proposing an integrated BIM-
based model for change ripple effect recognition, visualization, and estimation of the
impact of design changes on project cost and time.
Integrating the currently available systems and methods can provide enough data
in order to make a cumulative and quantitative system for change visualization. With this
57
proposed model, owners remain involved in the project, and are able to see the results of
their request in a way that can help them make better decisions, as dealing with changes
in the traditional way (applying all the changes to the project after starting the
construction phase of the project) is not that easy and recognizing the impacts on all
systems is very time-consuming.
Using the proposed model to quantify the impact of change allows the project
team to save a significant number of man-hours that would be traditionally spent on this
task. So, the proposed model decreases the back-and-forth negotiations among project
participants by increasing the owner’s knowledge about changes and their impacts on
project cost and time. Since time and cost are the main factors for all parties involved, not
considering which side would be on the losing side of any proposed design changes may
cause conflict between the parties involved. This is when claims can arise, and the parties
involved may eventually need to resort to the court for arbitration. In the next chapter, the
ideas behind this proposed system are explained in detail.
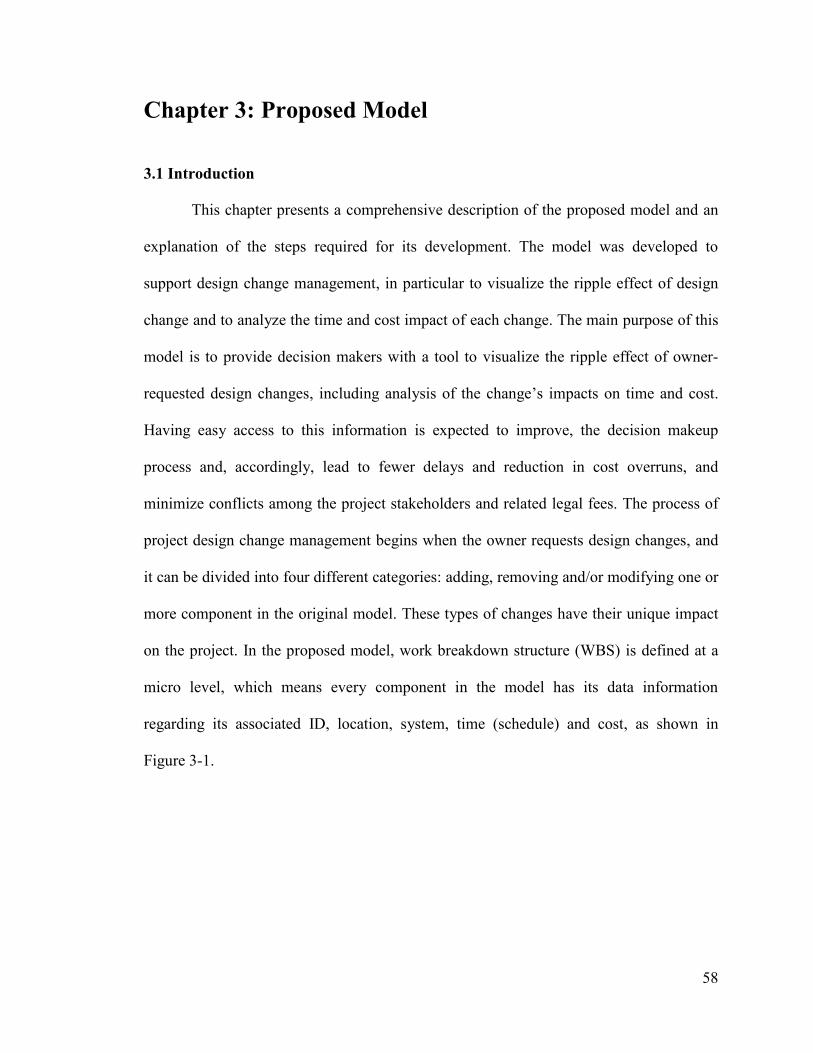
58
Chapter 3: Proposed Model
3.1 Introduction
This chapter presents a comprehensive description of the proposed model and an
explanation of the steps required for its development. The model was developed to
support design change management, in particular to visualize the ripple effect of design
change and to analyze the time and cost impact of each change. The main purpose of this
model is to provide decision makers with a tool to visualize the ripple effect of owner-
requested design changes, including analysis of the change’s impacts on time and cost.
Having easy access to this information is expected to improve, the decision makeup
process and, accordingly, lead to fewer delays and reduction in cost overruns, and
minimize conflicts among the project stakeholders and related legal fees. The process of
project design change management begins when the owner requests design changes, and
it can be divided into four different categories: adding, removing and/or modifying one or
more component in the original model. These types of changes have their unique impact
on the project. In the proposed model, work breakdown structure (WBS) is defined at a
micro level, which means every component in the model has its data information
regarding its associated ID, location, system, time (schedule) and cost, as shown in
Figure 3-1.
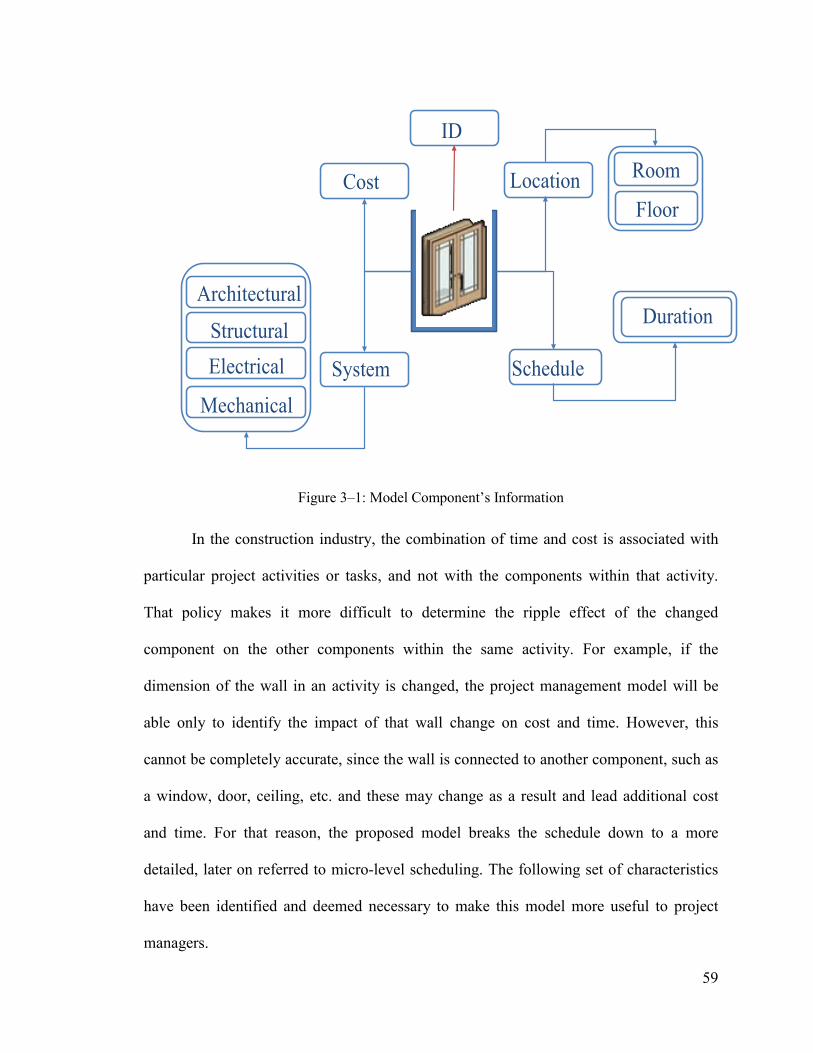
59
Figure 3–1: Model Component’s Information
In the construction industry, the combination of time and cost is associated with
particular project activities or tasks, and not with the components within that activity.
That policy makes it more difficult to determine the ripple effect of the changed
component on the other components within the same activity. For example, if the
dimension of the wall in an activity is changed, the project management model will be
able only to identify the impact of that wall change on cost and time. However, this
cannot be completely accurate, since the wall is connected to another component, such as
a window, door, ceiling, etc. and these may change as a result and lead additional cost
and time. For that reason, the proposed model breaks the schedule down to a more
detailed, later on referred to micro-level scheduling. The following set of characteristics
have been identified and deemed necessary to make this model more useful to project
managers.
16
Proposed Model
Data Acquisition
Framework
Data Analysis
Framework
Reporting & Highlighting
Framework
Data Filtering
Framework
Duration
Cost Location
Floor
Room
System Schedule
Architectural
Structural
Electrical
Mechanical
ID
60
The model should be user-friendly with the minimum need of training;
The model should be able to integrate the cost and schedule data at component
and project levels;
The model should be able to compute and update cost and schedule data to each
component and to the project after the change is applied;
The model should automate the process of identifying the change ripple effect;
The model should automate the process of change impact analysis on project cost;
The model should have the capability of extracting and exchanging data
from/with visualization information technologies such as BIM, Revit and MS-
Project;
The model should be multi-user and allow them access to the project captured
data and reports; and
The model should be flexible for facilitating future extensions.
3.2 Overview of the Proposed Model
The proposed model consists of four main frameworks utilized in change
management and owner decision-making process. The first framework is data
acquisition; the second is data analysis; the third is reporting and highlighting, and the
last is data filtering. The data acquisition framework captures four types of data. First is
the developed 3D model of the project from project 2D construction drawings. The
second is the schedule data of the project to aid in the building a project 4D BIM model
for the project. The third is the project cost estimation data in order to build the project
5D BIM model, and the final data acquisition process is applying the owner-requested
change to the model. The change data analysis framework consists of three modules,
61
namely the change ripple effect visualization module, the change time impact analysis
model, and change cost impact analysis module. The reporting and highlighting
framework generated a comparison report between the original (as-planned) and modified
(as-changed) models in terms of cost and time. The data filtering framework allows the
user to define constraints for the comparison report regarding available parameters such
as project cost and time, and get an updated report. At this stage, the quantitative model is
done after the change impact analysis and reporting. The owner is responsible for
accepting and rejecting the changes being analyzed. The proposed model is illustrated in
Figure 3-2.
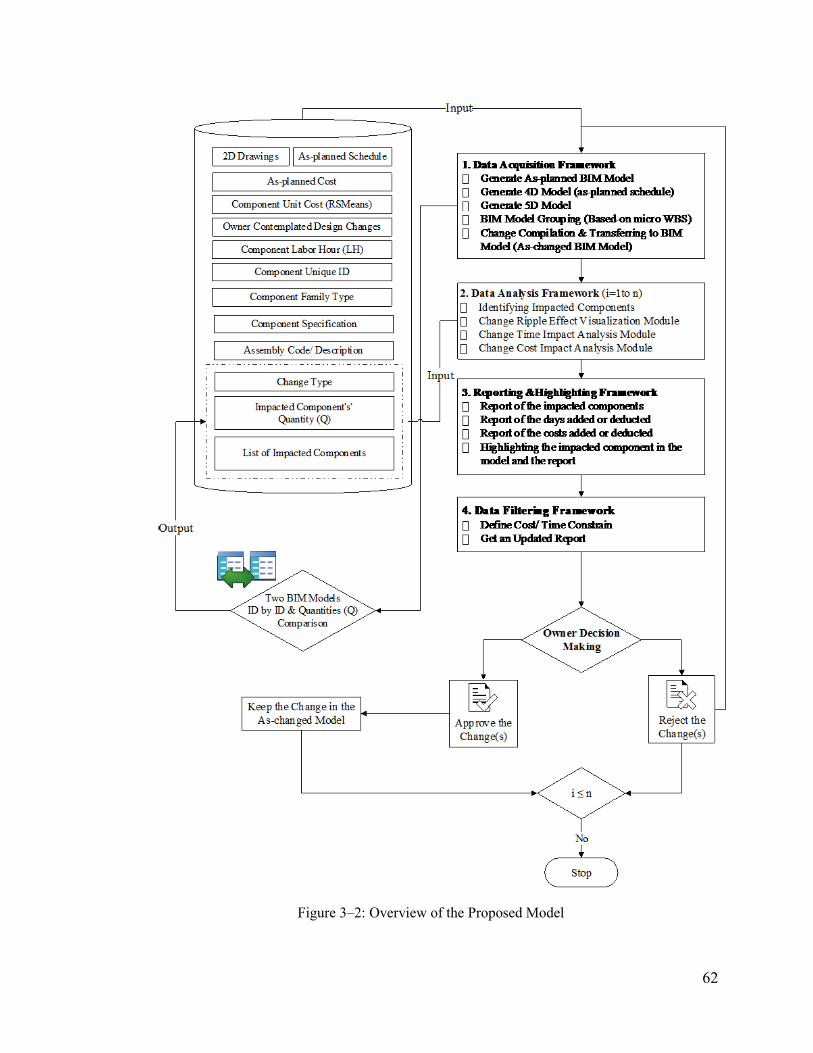
62
Figure 3–2: Overview of the Proposed Model
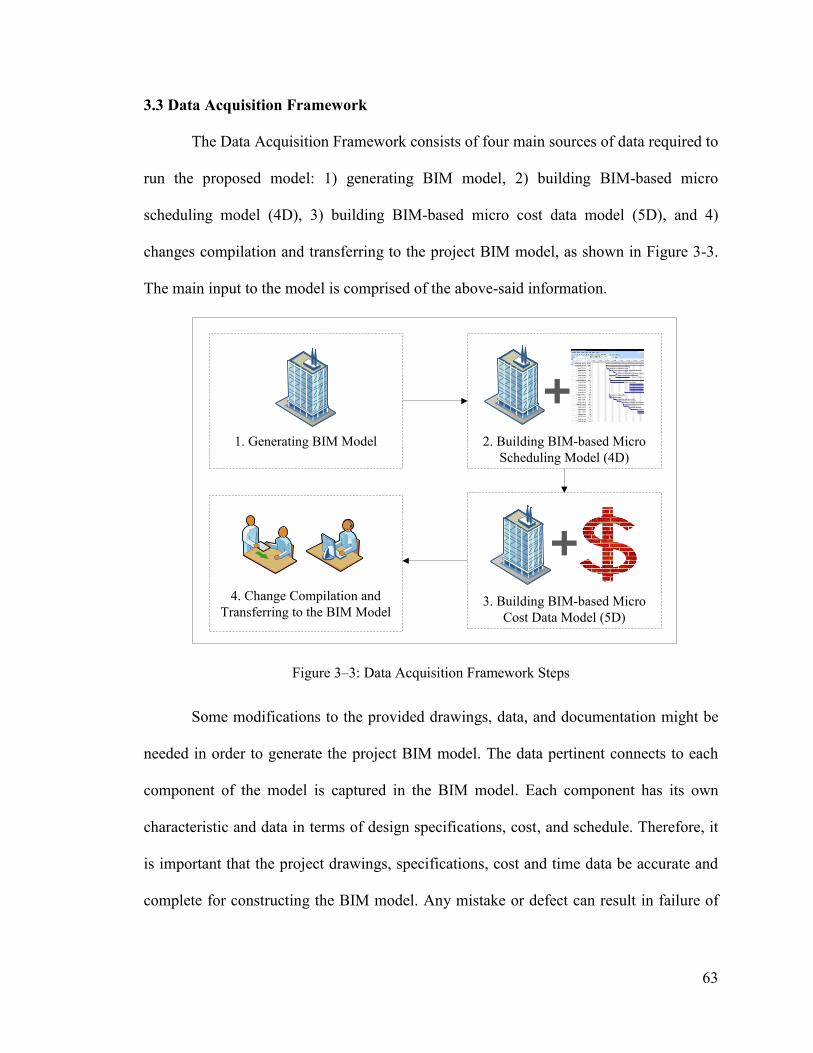
63
3.3 Data Acquisition Framework
The Data Acquisition Framework consists of four main sources of data required to
run the proposed model: 1) generating BIM model, 2) building BIM-based micro
scheduling model (4D), 3) building BIM-based micro cost data model (5D), and 4)
changes compilation and transferring to the project BIM model, as shown in Figure 3-3.
The main input to the model is comprised of the above-said information.
Figure 3–3: Data Acquisition Framework Steps
Some modifications to the provided drawings, data, and documentation might be
needed in order to generate the project BIM model. The data pertinent connects to each
component of the model is captured in the BIM model. Each component has its own
characteristic and data in terms of design specifications, cost, and schedule. Therefore, it
is important that the project drawings, specifications, cost and time data be accurate and
complete for constructing the BIM model. Any mistake or defect can result in failure of
1. Generating BIM Model 2. Building BIM-based Micro
Scheduling Model (4D)
3. Building BIM-based Micro
Cost Data Model (5D)
4. Change Compilation and
Transferring to the BIM Model
64
the BIM general model, and will corrupt the results of the ripple effect of the introduced
change and its impact on time and cost.
3.3.1 Generating BIM Model (3D)
The BIM model is generated as the first step of model development and consists
of all the project components and specifications. For the purpose of change impact
analysis, in this project all project systems—such as architectural, structural, electrical,
mechanical, plumbing, and HVAC (building systems)—should be part of the BIM model.
If a BIM model of the project exists, the system applies the second steps of data
acquisition framework. Otherwise, the user must generate a BIM model. The user first
selects a building system category and collects related 2D drawings from project database
to generate the BIM model for the selected category directly from the 2D drawings, as
shown in Figure 3-4. Then, the generated BIM model is saved in the project database.
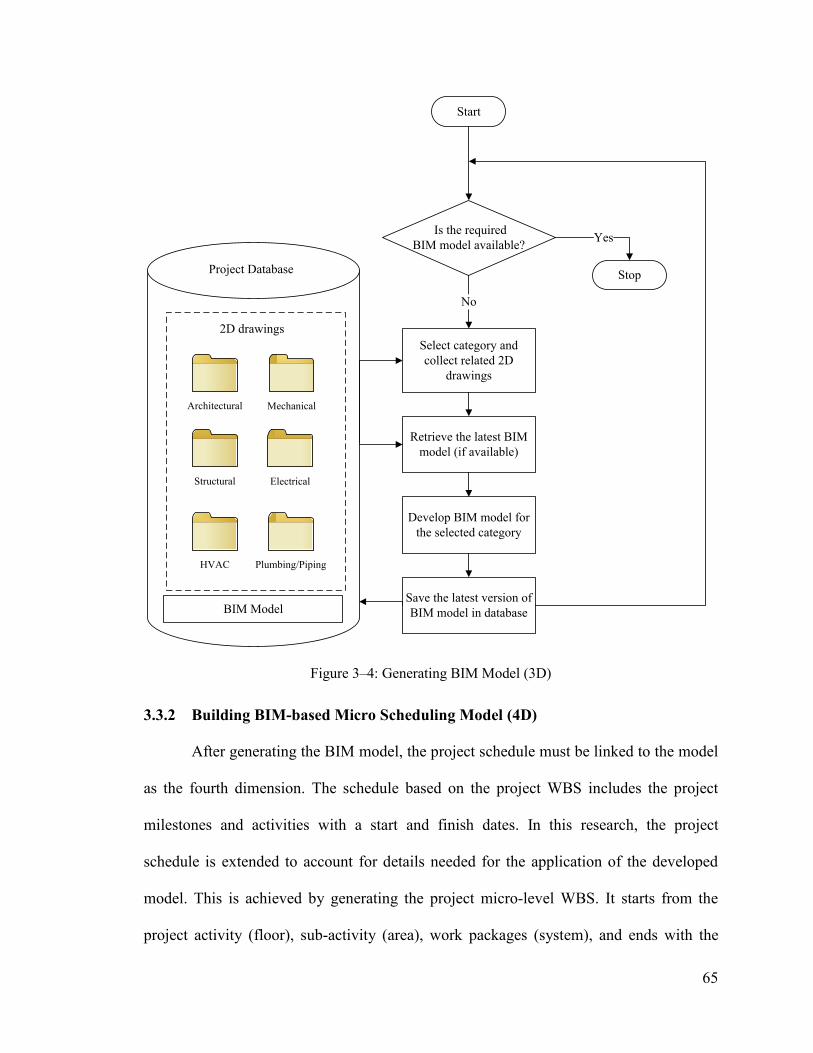
65
Figure 3–4: Generating BIM Model (3D)
3.3.2 Building BIM-based Micro Scheduling Model (4D)
After generating the BIM model, the project schedule must be linked to the model
as the fourth dimension. The schedule based on the project WBS includes the project
milestones and activities with a start and finish dates. In this research, the project
schedule is extended to account for details needed for the application of the developed
model. This is achieved by generating the project micro-level WBS. It starts from the
project activity (floor), sub-activity (area), work packages (system), and ends with the
Is the required
BIM model available?
Select category and
collect related 2D
drawings
No
Yes
Retrieve the latest BIM
model (if available)
Start
Stop
Develop BIM model for
the selected category
Save the latest version of
BIM model in database
Project Database
Architectural
Structural
Mechanical
Electrical
Plumbing/PipingHVAC
BIM Model
2D drawings
66
parts (component). In this case, constructing project floor slabs would be at the activity
level, building the areas or rooms on each floor is at the sub-activity level, constructing
the systems such the architectural, mechanical, electrical, piping, plumbing, and HVAC
in each area is the work package level, and building every component in each of these
systems would be at the part level. The proposed micro-level WBS is illustrated in the
Figure 3-5. The model is flexible if the user wants to add more levels to the schedule, like
defining activities per component in both BIM model and schedule. This means that in
the BIM model for every component the user can define activities and general
specifications related to that component.
Figure 3–5: Proposed Micro-level Work Breakdown Structure (WBS)
Project
Floor 1Activity level
(Floor)
Sub-activity Level
(Area)
Work Package Level
(System)
Part Level
(Componnet)
Floor 2 Floor 3
Room1 Room 2 Room 3
Architectural Structural Electrical Mechanical Plumping/
Piping
Wall Door Window Beam Column
67
Therefore, after generating the project BIM model, the model components are
grouped based on the generated micro WBS structure, and each group receives a unique
ID. Then, the proposed model uses these BIM model groups’ ID to map them to the
project schedule, which is available in the project database. The BIM model grouping is
shown in Figure 3-6. Then, these group IDs are used to find and read the corresponding
task in the as-planned project schedule, and after entering the as-planned tasks’
information into the BIM model, the 4D as-planned schedule is generated, as shown in
Figure 3-7. What differs the developed model from work of others (see, for example,
Montaser et al., 2013) is that grouping only used to map schedule data to a group of
components in a BIM model. So it only solves the problem of mapping, but the grouping
does not follow a particular rule like the proposed model that has a hierarchical structure
for mapping the schedule, and it is flexible based on the owner needs.
68
Figure 3–6: BIM Model Grouping
Yes
Generate new ID
Generate group ID. X based on selected building system ID
Generate group ID. X. X based on selected floor ID
Generate group ID. X. X. X based on selected area ID
Need to add another
component to the current
group?
Need to generate another
group?
Define the detail level of the group
Need more detail?
Need more detail?
Select Component
Yes
Yes
No
Start
Stop
No
Assign selected component to generated unique group
ID. X. X. X
Yes
No
69
Figure 3–7: BIM-based As-planned Schedule Data Model (4D)
Project Database
BIM model
2D drawings
Cost data
Schedule
Load schedule and BIM model
Start
Stop
Is there any
group without supporting tasks in
schedule?
Is there any more group?
Retrieve group information
Compare all group IDs in BIM with task IDs in
schedule
For each group ID find corresponding tasks in
schedule
Read all information of targeted task from schedule
Enter the read information to the related variables of
corresponding group in BIM model
Save updated BIM model (4D) in project database
Re-run grouping module to match
groups with tasks Yes
No
Yes
No
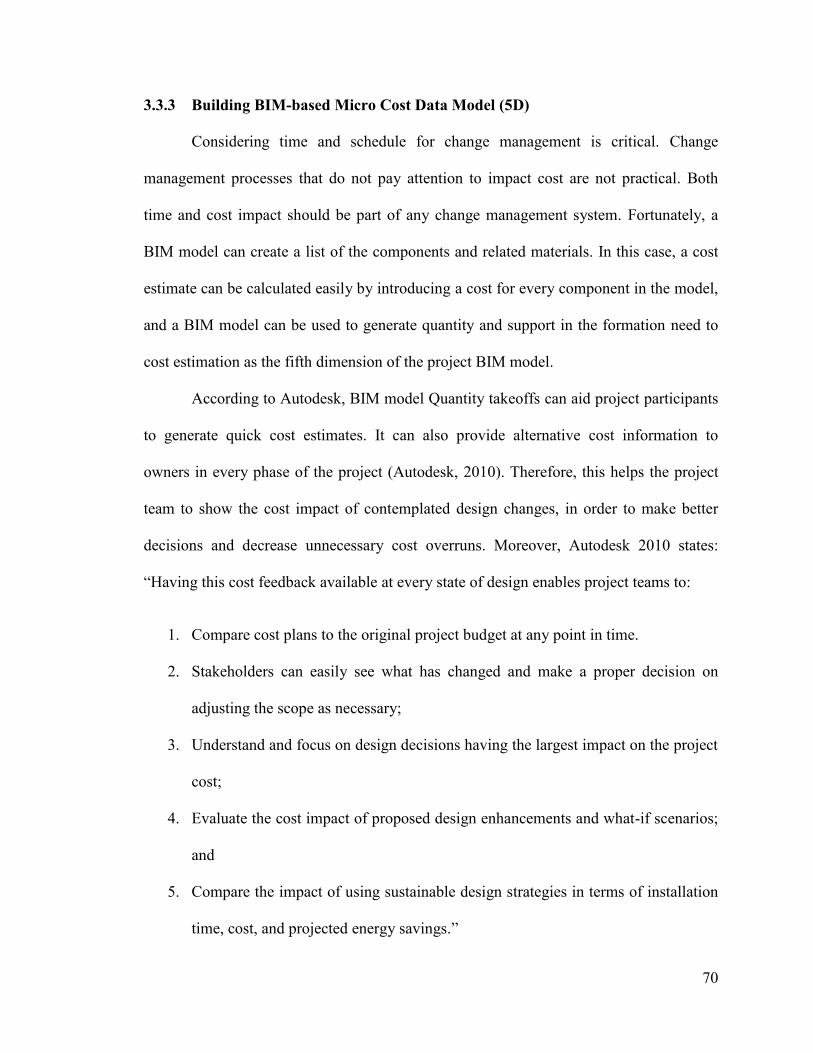
70
3.3.3 Building BIM-based Micro Cost Data Model (5D)
Considering time and schedule for change management is critical. Change
management processes that do not pay attention to impact cost are not practical. Both
time and cost impact should be part of any change management system. Fortunately, a
BIM model can create a list of the components and related materials. In this case, a cost
estimate can be calculated easily by introducing a cost for every component in the model,
and a BIM model can be used to generate quantity and support in the formation need to
cost estimation as the fifth dimension of the project BIM model.
According to Autodesk, BIM model Quantity takeoffs can aid project participants
to generate quick cost estimates. It can also provide alternative cost information to
owners in every phase of the project (Autodesk, 2010). Therefore, this helps the project
team to show the cost impact of contemplated design changes, in order to make better
decisions and decrease unnecessary cost overruns. Moreover, Autodesk 2010 states:
“Having this cost feedback available at every state of design enables project teams to:
1. Compare cost plans to the original project budget at any point in time.
2. Stakeholders can easily see what has changed and make a proper decision on
adjusting the scope as necessary;
3. Understand and focus on design decisions having the largest impact on the project
cost;
4. Evaluate the cost impact of proposed design enhancements and what-if scenarios;
and
5. Compare the impact of using sustainable design strategies in terms of installation
time, cost, and projected energy savings.”
71
Upon generating the project 5D BIM model (cost), the user can evaluate design
changes and see which design change options have less impact on project cost. Eastman
et al. (2011), managing costs with BIM applications provides owners with:
1. More reliable estimates early in the process with conceptual BIM
estimating; and
2. Faster, better-detailed, and more accurate estimates with BIM quantity
takeoff tools.
In this research, the impact of change on cost is shown in a different cost table
since cost analysis is based on micro level scheduling. The cost estimate is shown at the
part level, with the component in that part. The proposed model first calculates the
quantity takeoff from the generated BIM model, which consists of the entire model
components. Then, it loads the components unit cost from a provided cost database
(RSMeans) and links the cost database to the components that are listed in the project
quantity takeoff by matching and finding similar assembly IDs, as shown in Figure 3-8.
What differs the developed model from work of others (see for example, Ranjbaran et al.,
2014) is the capability of calculating the cost of any contemplated change dynamically on
top of finding the total cost of a project.
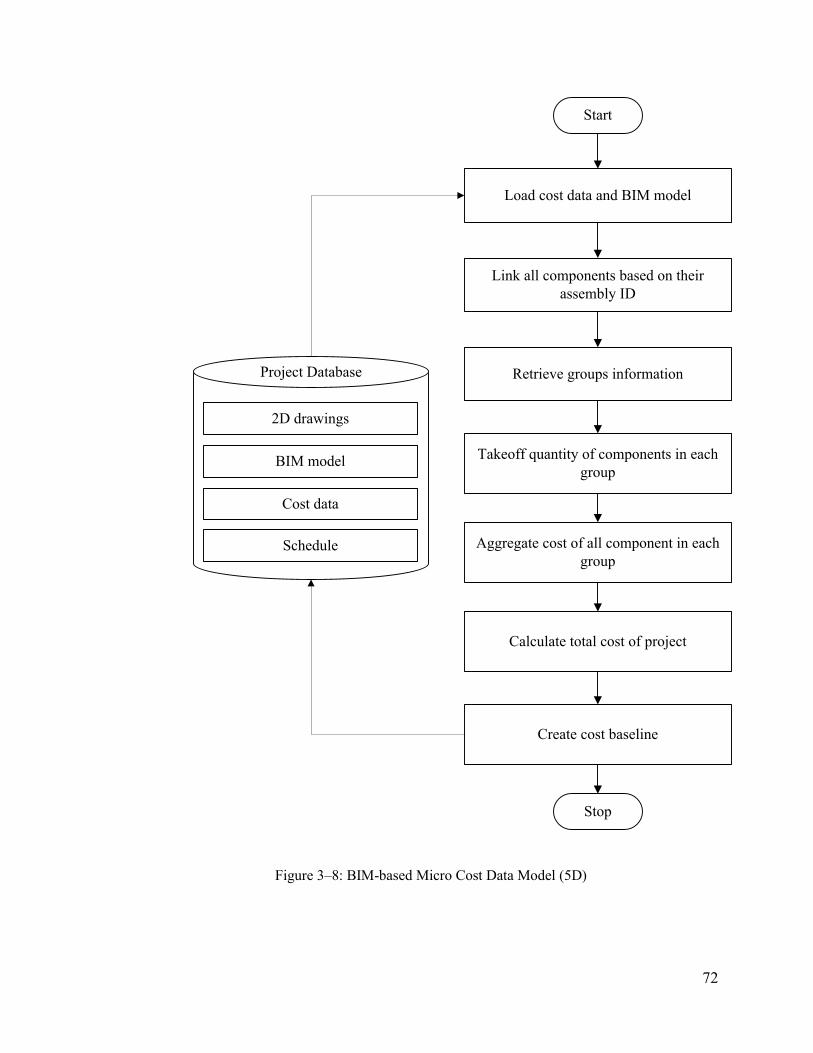
72
Figure 3–8: BIM-based Micro Cost Data Model (5D)
Load cost data and BIM model
Link all components based on their
assembly ID
Takeoff quantity of components in each
group
Aggregate cost of all component in each
group
Calculate total cost of project
Create cost baseline
Retrieve groups information
Start
Stop
Project Database
BIM model
2D drawings
Cost data
Schedule
73
3.3.4 Change Compilation and Transferring to the BIM Model
This research focuses on design change, as it is ranked as the most common type
of change in the construction industry (Motawa et al., 2007). It is defined as any change
requested by owner before starting or during the construction phase of the project. The
owner either provides a list of contemplated changes and submits it to the designer, and
the designer then applies them to the architectural model in order to visualize them for
the owner, as shown in Figure 3-9. Then the architect, after receiving this list, ensures
that the changes are only applied to the architectural system of the project, and filters out
the non-architectural changes. Then the architect introduces these changes to the BIM
model and sends the model to other project system experts for review, and they adjust
and modify the other project’s building systems model in case that change impacts other
systems. Then, the new building system adjusted BIM model is sent back to the architect,
and the architect starts integrating the new building systems design into the architectural
system. Then, the architect saves the developed integrated model as a new as-changed
version of the as-planned BIM models. The developed as-planned BIM model and as-
changed BIM model then input for data analysis in order to begin the process of tracing
the ripple effect of the changes on other systems of the project including architectural.
Impact analysis is then performed decision. This is accomplished by keeping the
beneficial changes and removing the undesirable changes that might not comply with the
budget limitations.
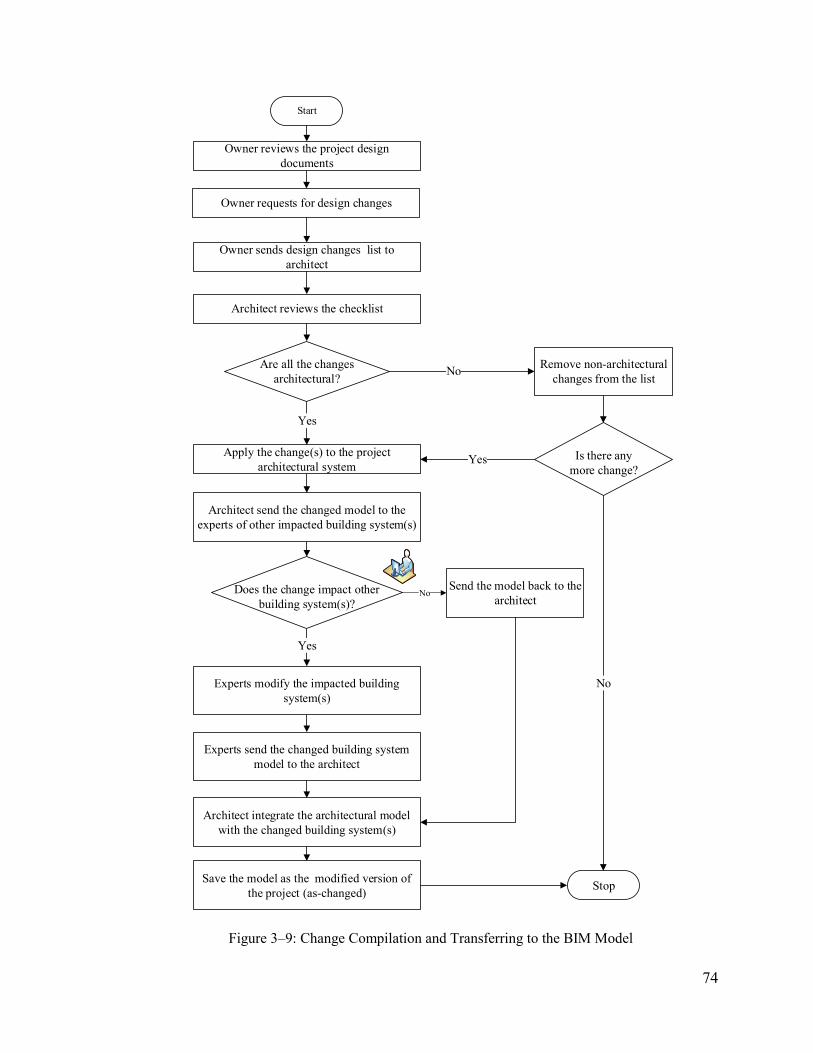
74
Figure 3–9: Change Compilation and Transferring to the BIM Model
Yes
Yes
Owner reviews the project design
documents
Owner requests for design changes
Owner sends design changes list to
architect
Architect reviews the checklist
Apply the change(s) to the project
architectural system
NoRemove non-architectural
changes from the list
Experts modify the impacted building
system(s)
Does the change impact other
building system(s)?
Architect send the changed model to the
experts of other impacted building system(s)
Experts send the changed building system
model to the architect
Architect integrate the architectural model
with the changed building system(s)
Save the model as the modified version of
the project (as-changed)
Are all the changes
architectural?
Send the model back to the
architect
Start
Is there any
more change?
Stop
No
Yes
No
75
3.4 Data Analysis Framework
The data analysis framework consists of three main modules: a) ripple effect
visualization, b) time impact analysis, and c) cost impact analysis. The proposed model
begins the analysis of these impacts by a comparison method, which means the model
starts to compare the as-planned BIM model with the as-changed BIM model. This
analysis procedure is based on a component-by-component comparison between the two
BIM models, as shown in Figure 3-10, which provides a list of impacted components
along with their change type and quantity. Each component in both models has an ID that
eases the comparison part and timely generation of analysis results. By matching both
BIM models, components’ ID and quantities, the comparison model will detect the
following change types:
If the components are found in the as-planned model but not the as-changed
model (deleted components). This applies to the types of design changes where
the owner decides to remove one or more component from the as-planned model;
If the components are found in the as-planned model but not in the as-changed
model (added components). This applies to the types of design changes where the
owner decides to add one or more components to the as-planned model;
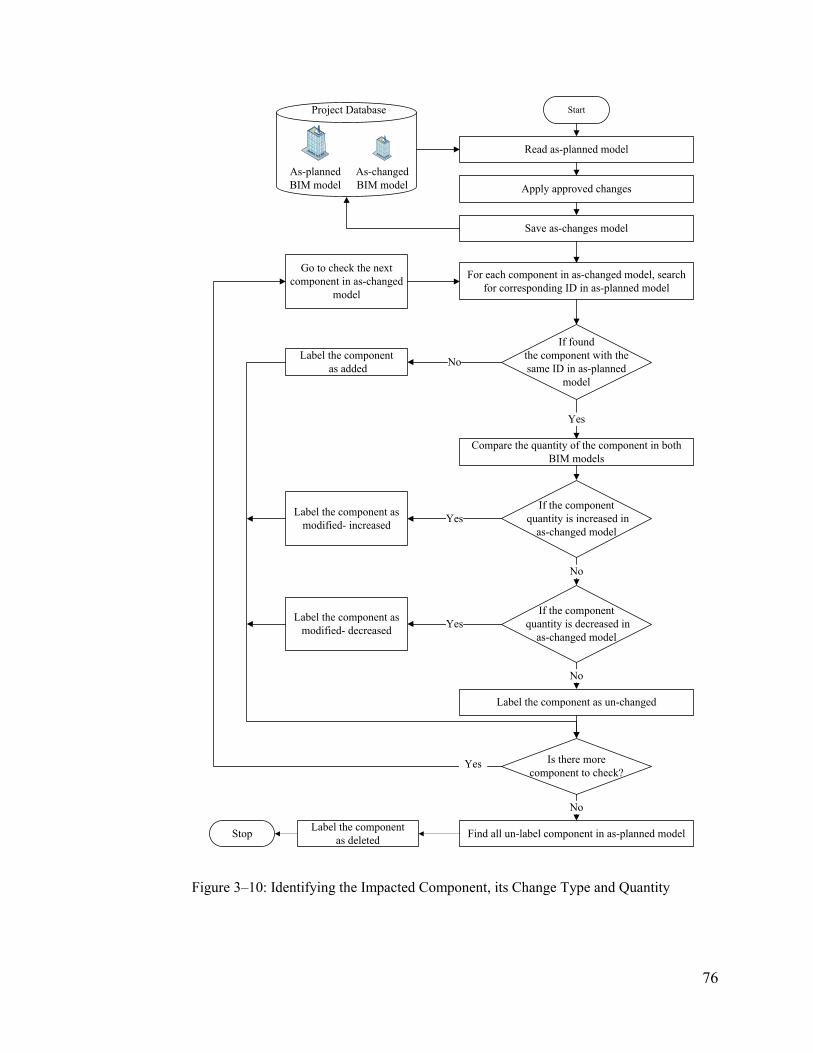
76
Figure 3–10: Identifying the Impacted Component, its Change Type and Quantity
Read as-planned model
Apply approved changes
Save as-changes model
For each component in as-changed model, search
for corresponding ID in as-planned model
If found
the component with the
same ID in as-planned
model
Compare the quantity of the component in both
BIM models
If the component
quantity is increased in
as-changed model
Label the component as un-changed
Is there more
component to check?
Start
Find all un-label component in as-planned model Stop
Project Database
As-planned
BIM model
As-changed
BIM model
Go to check the next
component in as-changed
model
Label the component
as added No
Yes
Label the component as
modified- increased
Label the component as
modified- decreased
Yes
If the component
quantity is decreased in
as-changed model
No
Yes
No
Label the component
as deleted
No
Yes
77
If the components are found in both models, but the component’s specifications
have changed in the as-changed model (modified-increased or modified-decrease
components. This type covers the design changes where the owner changes the
specifications of one or more components in the as-planned model. For instance,
the component’s modification could be material and/or geometrical, such as,
length, width, and height; and
If the components are found in both as-planned and as-changed models identical
these components are marked as “un-changed components”.
A simple example is given in Figure 3-11, which shows different types of
comparisons. This example shows the four types of changes that can be applied to the
windows of a small office. After the comparison of the two models, the proposed model
recognizes and traces the differences between the two models. As demonstrated in Figure
(3-11-a), the user has deleted one of the windows in the room, and in Figure (3-11-b) the
user has added new windows to existing ones in the room. In Figure (3-11-c), the user
modified the specifications of the two existing windows by decreasing their height, and
Figure (3-11-d) shows no difference between the two models, which means the user did
not apply any changes to the windows. The proposed model stores the comparison
analysis between the as-planned and as-changed models in its database. The stored data
can provide the list of the entire direct and indirect impacted components along with their
change type and quantity.
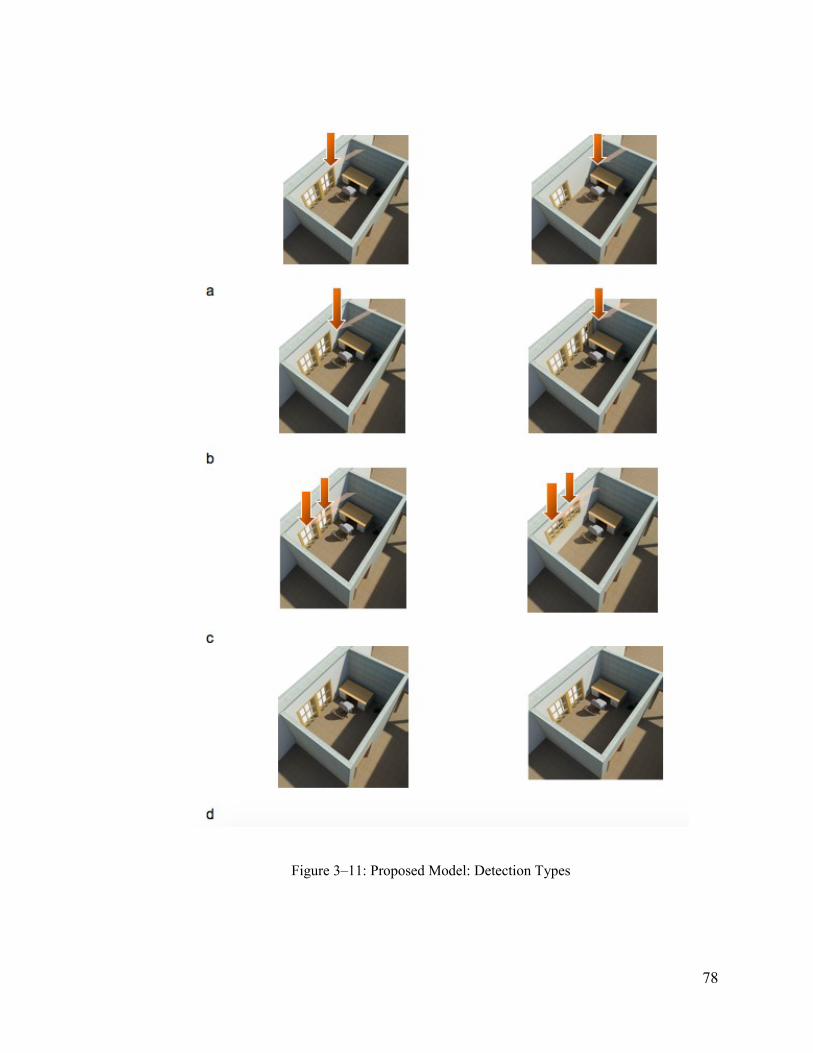
78
Figure 3–11: Proposed Model: Detection Types
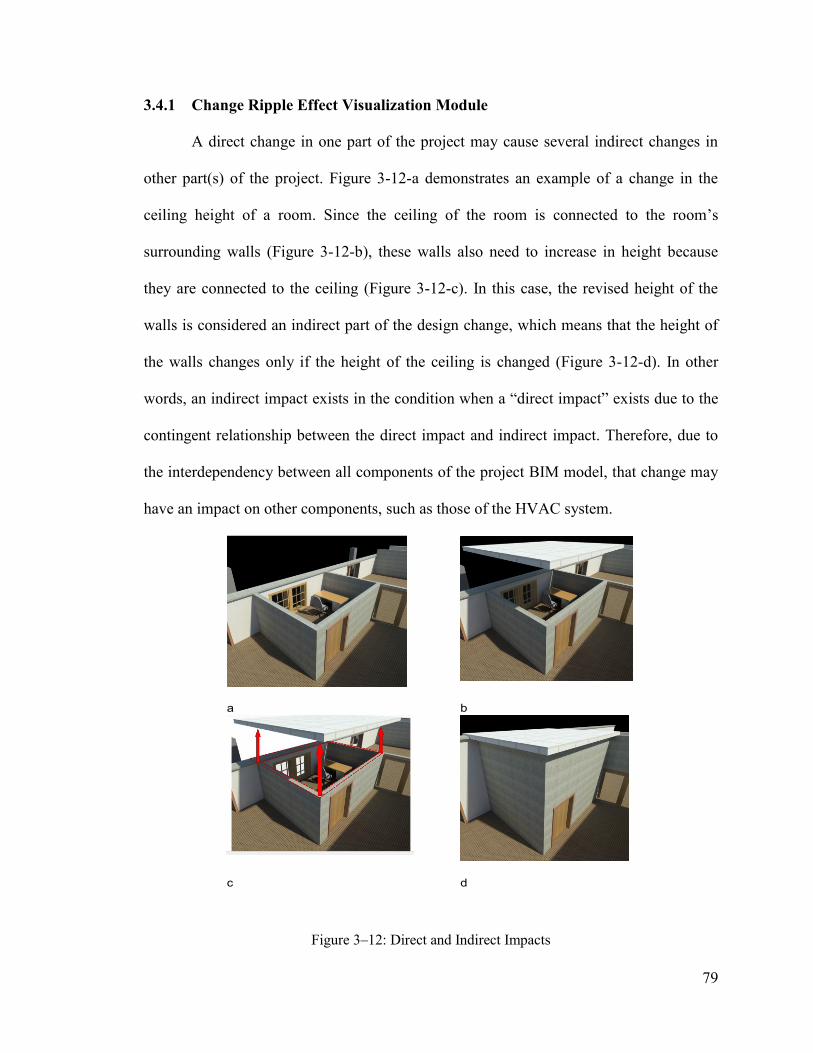
79
3.4.1 Change Ripple Effect Visualization Module
A direct change in one part of the project may cause several indirect changes in
other part(s) of the project. Figure 3-12-a demonstrates an example of a change in the
ceiling height of a room. Since the ceiling of the room is connected to the room’s
surrounding walls (Figure 3-12-b), these walls also need to increase in height because
they are connected to the ceiling (Figure 3-12-c). In this case, the revised height of the
walls is considered an indirect part of the design change, which means that the height of
the walls changes only if the height of the ceiling is changed (Figure 3-12-d). In other
words, an indirect impact exists in the condition when a “direct impact” exists due to the
contingent relationship between the direct impact and indirect impact. Therefore, due to
the interdependency between all components of the project BIM model, that change may
have an impact on other components, such as those of the HVAC system.
Figure 3–12: Direct and Indirect Impacts
a b
c d
80
Current BIM tools are able to update the entire model according to the first
change. By the time a change happens in the attributes of a component, all the other
components’ attributes related or connected to the first-changed component adjust
automatically. The automated changes in the BIM environment happen according to the
existing connectivity and defined relationships between the components of the BIM
model. Therefore, when the user changes a component, all other components connected
to it correspondingly change. Two types of connectivity can exist between the BIM’s
components: physical connections and logical connections. For example, the user
changes the height of a wall in the BIM model, and the column attached to that wall is
automatically impacted. As a result, the height of the column is changed due to the
physical connectivity between the wall and the column. Besides the height of the column,
the other specifications of the column stay unchanged because they are unique to the
column, like the column diameter, width, and material. Unless the change does not meet
the structure analysis requirement provided by the engineering team. For example, by
changing the column’s height, its slenderness ratio is exceeded then its width must get
adjusted relatively.
The user can provide some constraints in BIM during the model development
stage, which establishes logical relations between the components of the BIM model. For
example, the user can define a constraint between the height of the column and its width,
which means that whenever the column’s height is changed, its width changes according
to the proposition defined by the user between the column’s height and width. Therefore,
these constraints define the logical connections between one component and another. In
other words, there is a physical connection between the BIM components; it does not
81
mean if a change happens in one component, all the other connected components to the
changed-components will get changed too.
In order to trace the relationships between the changed component and the other
components, the first step is to determine the relationships and connections between the
changed-components and the other project components. For the ripple effect analysis of
the change, tracing is used, which means finding the indirect changes that occur due to
the direct changes requested by the owner of the project. The problem with this
automated process is that tracing and finding changes that happen in response to the main
requested design change is very time-consuming and challenging. Also, if the system
happens to deal with more complex projects involving many components and attributes,
this process becomes even more complicated.
For example, a wall is attached to a window, a door, the roof, floor, etc. The
component not only has a connection to other architectural components, but it also has a
connection to the components of non-architectural systems. Therefore, finding this
relationship and connections is the primary step in modeling the ripple effect of the
change. The micro-level WBS will ease this process. By using the model comparison
database and micro-level WBS, the proposed model is able to trace the relationships
between the changed component and the other components connected to it, which means
finding the design change path or the change sequence and visualizing the change path in
the project’s model.
The proposed model traces indirect impacted components (via the ripple effect)
by first finding the level (e.g. 1st floor) at which the selected direct change is located. The
model then checks the components that are connected to the direct change in other levels,
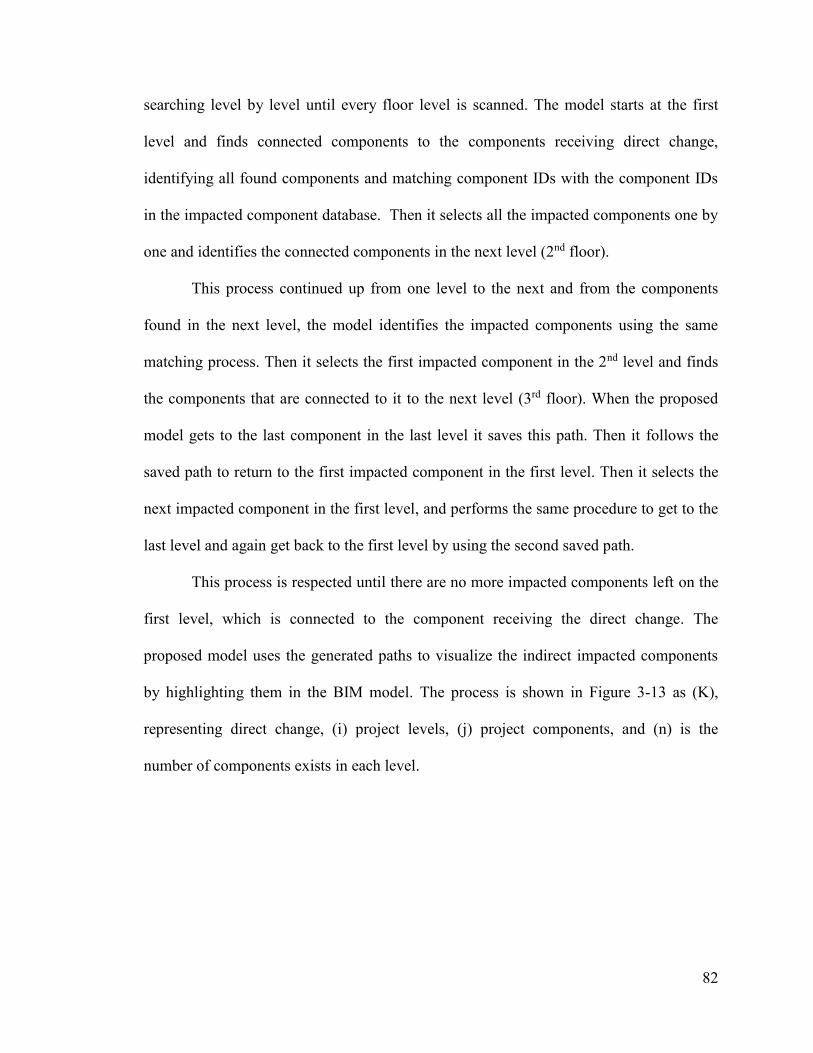
82
searching level by level until every floor level is scanned. The model starts at the first
level and finds connected components to the components receiving direct change,
identifying all found components and matching component IDs with the component IDs
in the impacted component database. Then it selects all the impacted components one by
one and identifies the connected components in the next level (2nd floor).
This process continued up from one level to the next and from the components
found in the next level, the model identifies the impacted components using the same
matching process. Then it selects the first impacted component in the 2nd level and finds
the components that are connected to it to the next level (3rd floor). When the proposed
model gets to the last component in the last level it saves this path. Then it follows the
saved path to return to the first impacted component in the first level. Then it selects the
next impacted component in the first level, and performs the same procedure to get to the
last level and again get back to the first level by using the second saved path.
This process is respected until there are no more impacted components left on the
first level, which is connected to the component receiving the direct change. The
proposed model uses the generated paths to visualize the indirect impacted components
by highlighting them in the BIM model. The process is shown in Figure 3-13 as (K),
representing direct change, (i) project levels, (j) project components, and (n) is the
number of components exists in each level.
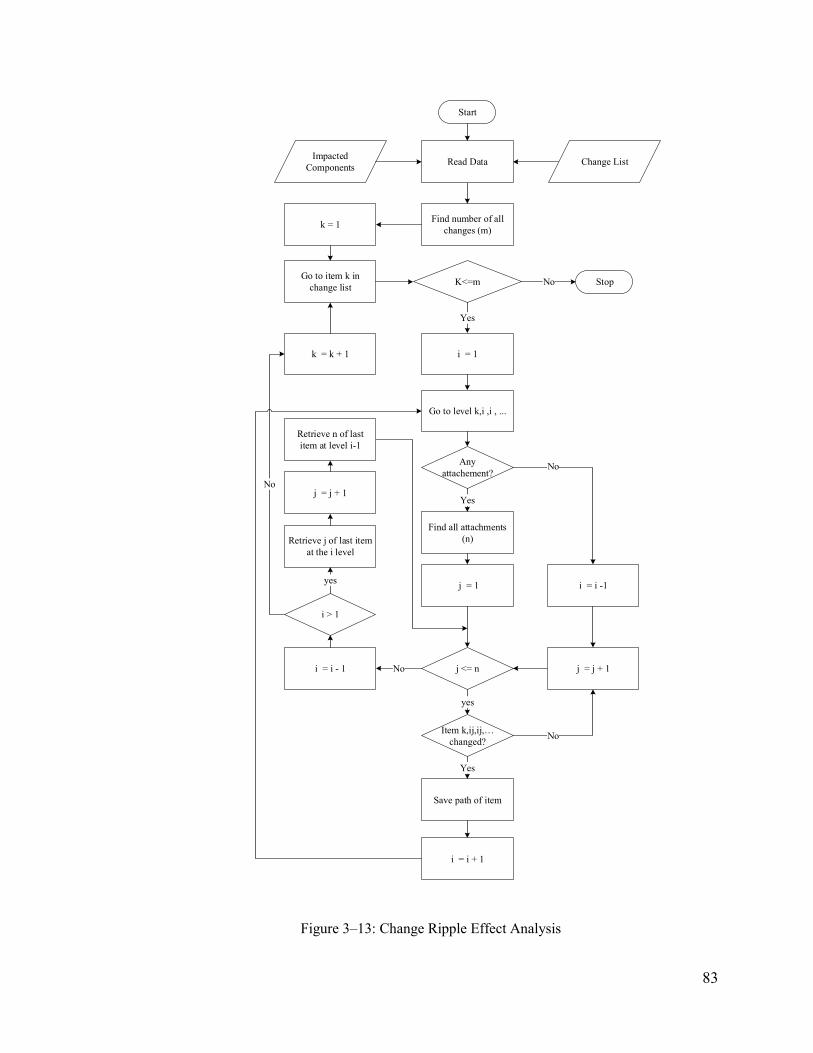
83
Figure 3–13: Change Ripple Effect Analysis
i = 1
Go to level k,i ,i , ...
Any
attachement?
Find all attachments
(n)
j = j + 1
j = 1
Item k,ij,ij,…
changed?
Save path of item
i = i + 1
Yes
Yes
j <= n
yes
No
No
i = i -1
i = i - 1 No
Retrieve j of last item
at the i level
i > 1
yes
Go to item k in
change list
k = k + 1
No
K<=m
Yes
Find number of all
changes (m)
Stop
Start
No
j = j + 1
Impacted
ComponentsChange ListRead Data
Retrieve n of last
item at level i-1
k = 1

84
The proposed change ripple effect analysis procedure is explained in the simple
example shown in Figure 3-14. In this example, there are four levels (i) (1 to 4) and three
direct changes (k=1,2 and 3) located in level (i=1). The proposed model starts with
change k=1 and by scanning the other levels (i) is able to find out the impacted
components that are connected to the direct change in other levels (i=1 to 3). The number
of components (n) identifies at this level (i=1) is three (n=3). The proposed model for
every level by searching for each levels components in the impacted components
database identifies the components that get impacted indirectly by the direct change (K).
If the levels’ components are found in the database list, it considered as an indirect
impacted component. In level (i=2), among components (j=1 to 3) (roof, door, slab),
(j=2) (door) and (j=3) (slab) are get impacted indirectly by (k=1). Then, the proposed
model starts with each impacted components one by one and apply the same procedure,
in this example it starts with j=2 and goes to the next level (i=3). In level (i=3) there are
four components (n=4) that are connected to the component (j=2) and (j=2), (j=3) and
(j=4) are found in the impacted components database. The ripple effect for (j=2) and
(j=4) in level (i=3) is stopped here since there are no components connected to them in
level (i=4). So, the proposed model from (j=3) goes to the next level (i=4) that has
connected components which are (j=1) and (j=2). From the two components in level (i=4)
only component (j=1) is impacted.
The ripple effect of (k=1) is stopped at this level (i=4) since there is no more level
and components left. It means the change paths (k, ij) at this level generated here for
(k=1) are: (k1, 22), (k1, 22, 32), (k1, 22, 33), (k1, 22, 34), (k1, 22, 33, 41). Then, the
proposed model follows the above-mentioned change path backward to get to the (k=1)
85
in level (i=1) and then it starts to identify the second impacted components in level (i=2)
which is (j=3). The second change path for (k=1) is (k1, 23) since there is no more
connectivity between j=3 and other the next level’s components. Also, the ripple effect
analysis of direct changed component (k=1) is stopped here since there are no more
impacted components in the level (i=2). Then, the proposed model does the same
procedure for the next direct changes (k=2 to m) that exist in level (i=1).
To summarize, the proposed model for each individual direct change traces all the
related components in the horizontal level and in then in the vertical level. It starts with
one of the impacted components in the first horizontal level and it goes vertically down
levels till there are no more levels left, and it finds the path of impacted component
throughout all the levels; then it goes backward to get to the first level. Then, the same
process is enacted for the all impacted components in the first horizontal level till there
are no more impacted components left in that level. The ripple effect works as a tree
diagram: on top of the tree the individual direct change is located, and in the other levels
are all the other components connected to the direct change.
86
Figure 3–14: Change Ripple Effect Analysis Model Example
Wall (k=1)
Roof (j=1) Door (j=2) Slab (j=3)
Wall (j=1) Door (j=2) Slab (j=3) Duct (j=4)
Slab (j=2)Wall (j=1)
i=1
i=2
i=3
i=4
j=n
Wall (k=2)
J=1 J=2 j=n
(k=m)
J=1 j=n
87
3.4.2 Change Time Impact Analysis Module
The purpose of the change time impact analysis module is to develop a BIM-
based model capable of calculating the number of days that need to be added or deducted
from the project’s total duration due to change impact. By calculating the total number of
days needed for each of the project’s impacted components, the proposed model is able to
estimate the change impact on the total duration of the project.
As shown in Figure 3-15, in order to evaluate the impact of change on project
schedule, a database that includes the list of all components impacted due to the applied
changes to the project’s as-planned model along with their change type (addition,
deletion, and modification) and quantity is necessary as a main input to run change time
impact analysis. The development of that database is explained in Figure 3-9. Then, the
proposed model for every direct and indirect change type determines the number of days
needed to complete each impacted component.
The proposed model uses labor hours and component quantity, which both are
available in the model’s database to calculate the duration of the impacted components
from change 1 to n to find out the number of days needed to complete each of the
impacted components. The user can use the proposed model for deferent change
scenarios to calculate the change impact on project time. The time impact can be
calculated for a change, combine some changes or for the entire design changes.
88
Figure 3–15: Change Time Impact Analysis Module and Schedule Linking
Different responses are needed to assign duration for each change type. An
addition means that a new component is added to the project, so there is no duration time
available for the newly added components. Therefore, new duration data is needed. To do
this, the proposed model uses Equation 3-1 (Leonard et al. 1991), where D is the
component’s duration, P represents productivity which calculated by dividing labor hour
(LH) by unit of work, and Q shows the component’s quantity. Also, Equation 3-1 is used
to calculate the un-impacted components’ duration for the entire model, which is
Load the impacted components
Start
Load the quantity of
the impacted components (Q)
Load component’s labor-hour data
(LH)
Match the components ID with the ID
in labor-hour data
Calculate the duration of un-impacted
components (D)
Calculate the duration of the impacted
components (D) from i = 1→ n
Generate the time comparison report
2D drawings
BIM model
Impacted
components
Impacted
components
quantity
Project
contract
As-planned
schedule
Labor-hour
Project Database
As-changed
schedule
Impacted
components’
change type
Load the impacted components
change type
Link the impacted component to the
schedule
Owner
Approval?
i ≤ n
Yes
Yes
No
Update the As-planned schedule
No
Stop
Save it as project As-changed
schedule
89
common to both as-planned and as-changed BIM models. When the change is a deletion
of a component, the duration time for that component is available, and the only action
that needs to be done is changing that duration to zero days.
D = P × Q where, P =Labor hour (LH)
Unit of work
3-1
For modification changes, the component is already part of the model, and its
specification is changed. Therefore, the duration for the changed component is available
and needs to be modified based on the components’ new quantity. The proposed model
uses Equation 3-2 (Leonard et al. 1991) to calculate the component’s duration, where ∆Q
represents the component’s quantity differences between the as-planned and as-changed
projects, as given in Equation 3-3 (Leonard et al. 1991).
D = P × ∆Q 3-2
∆𝑄 = 𝑄𝑎𝑠−𝑝𝑙𝑎𝑛𝑛𝑒𝑑 − 𝑄𝑎𝑠−𝑐ℎ𝑎𝑛𝑔𝑒𝑑 3-3
The result of the duration estimation for modification changes can either be
negative or positive, which means that days may be added to, or deducted from, the as-
planned model. The proposed model’s database consists of labor-hour data used to
identify the labor-hour for the project’s impacted components, so for this matter, the
impacted components’ IDs are matched to the components IDs in the labor-hour
database. After assigning the updated duration for every changed component in the as-
changed version of the project, the next step is to link the estimated duration to the as-
planned schedule in order to update the as-planned schedule and provide an as-changed
version. In other words, the duration of the project’s 4D as-planned schedule is replaced
with the estimated duration of the impacted components, and an updated project schedule
is generated. The grouping, as explained in section 3.3.2, eases the process of linking the
90
impacted components to the as-planned schedule and getting the update. The updated
schedule provides the number of days needed in order to complete the entire project, or
the project’s new total duration.
The project owner can use the newly updated project schedule in order to see the
quantification of the ripple effect of all design changes. The owner can then compare the
total duration of the updated project schedule with the as-planned project schedule to
determine whether the changes are going to save or add more time to the project duration.
In addition to total duration, the duration needed to complete each activity is given in the
schedule. In this research it is assumed the project’s new added activities have no
overlap and their duration is additive and calculated by the summation of all the impacted
components’ number of days within that activity so that the owner can see the
components’ duration in the updated project schedule on a smaller scale. If the owner
approves the changes, the as-changed schedule is then created. If not, the owner uses the
as-planned schedule.
3.4.3 Change Cost Impact Analysis Module
One of the main reasons for change management is to have control over the cost
of the project and respect owner’s budget constraints. From the owner’s point of view,
knowing the cost of a change assists in making better decision-making. The cost of
change consists of different parts, which should be considered in estimating the cost of
that change. In this study, the proposed model uses Moselhi’s (1998) change cost
estimation framework in order to calculate the cost of change, as shown in Figure 3-16.
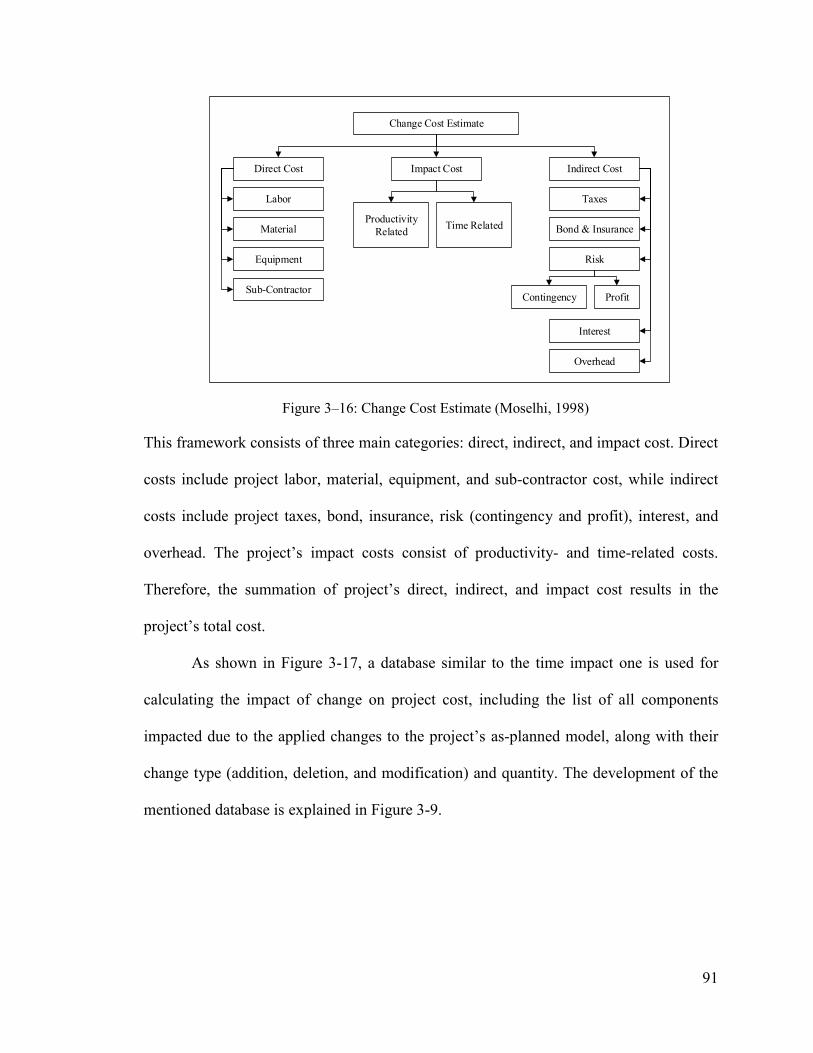
91
Figure 3–16: Change Cost Estimate (Moselhi, 1998)
This framework consists of three main categories: direct, indirect, and impact cost. Direct
costs include project labor, material, equipment, and sub-contractor cost, while indirect
costs include project taxes, bond, insurance, risk (contingency and profit), interest, and
overhead. The project’s impact costs consist of productivity- and time-related costs.
Therefore, the summation of project’s direct, indirect, and impact cost results in the
project’s total cost.
As shown in Figure 3-17, a database similar to the time impact one is used for
calculating the impact of change on project cost, including the list of all components
impacted due to the applied changes to the project’s as-planned model, along with their
change type (addition, deletion, and modification) and quantity. The development of the
mentioned database is explained in Figure 3-9.
Change Cost Estimate
Direct Cost Impact Cost
Labor
Material
Equipment
Sub-Contractor
Time Related Productivity
Related
Profit Contingency
Overhead
Interest
Risk
Bond & Insurance
Taxes
Indirect Cost
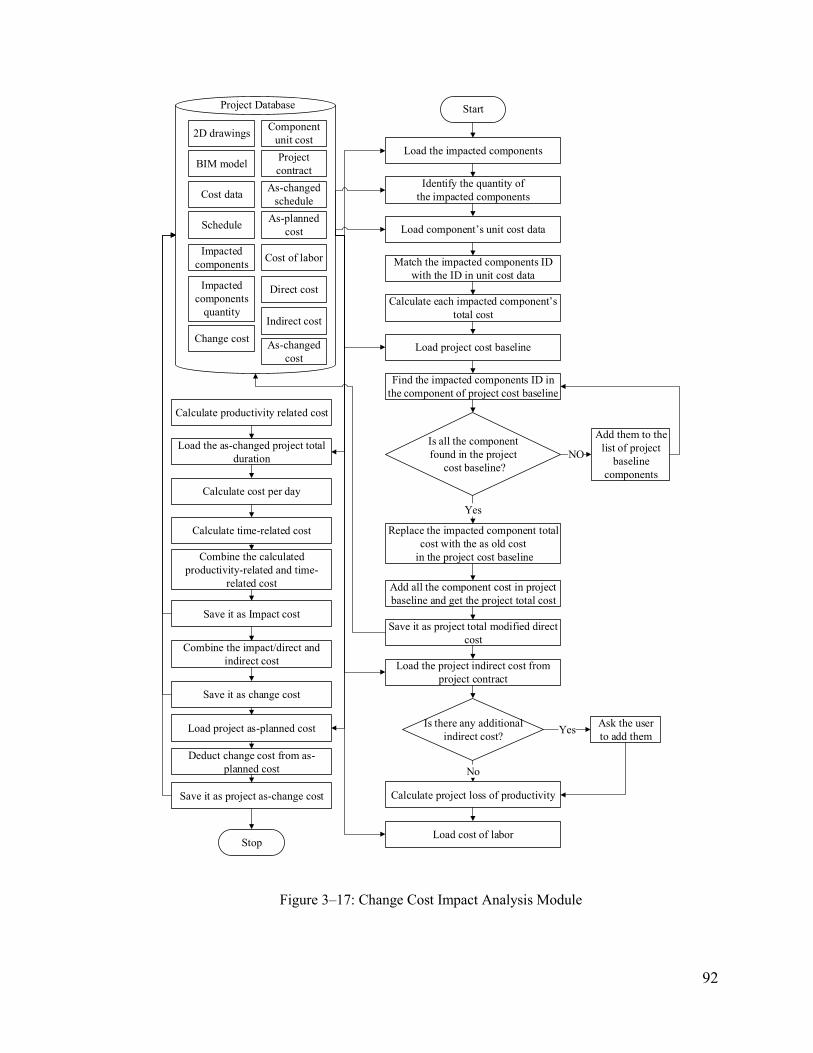
92
Figure 3–17: Change Cost Impact Analysis Module
Load the impacted components
Start
Identify the quantity of
the impacted components
Load component’s unit cost data
Match the impacted components ID
with the ID in unit cost data
Calculate each impacted component’s
total cost
Load project cost baseline
Find the impacted components ID in
the component of project cost baseline
Replace the impacted component total
cost with the as old cost
in the project cost baseline
Is all the component
found in the project
cost baseline?
Add them to the
list of project
baseline
components
Add all the component cost in project
baseline and get the project total cost
Save it as project total modified direct
cost
Load the project indirect cost from
project contract
Calculate project loss of productivity
Is there any additional
indirect cost?
Ask the user
to add them
Load cost of labor
Calculate productivity related cost
Load the as-changed project total
duration
Calculate cost per day
Calculate time-related cost
Combine the calculated
productivity-related and time-
related cost
Save it as Impact cost
Combine the impact/direct and
indirect cost
Save it as change cost
Load project as-planned cost
Deduct change cost from as-
planned cost
Save it as project as-change cost
Stop
NO
Yes
Yes
No
2D drawings
BIM model
Cost data
Schedule
Impacted
components
Impacted
components
quantity
Component
unit cost
Project
contract
As-changed
schedule
As-planned
cost
Cost of labor
Direct cost
Indirect cost
Change cost As-changed
cost
Project Database
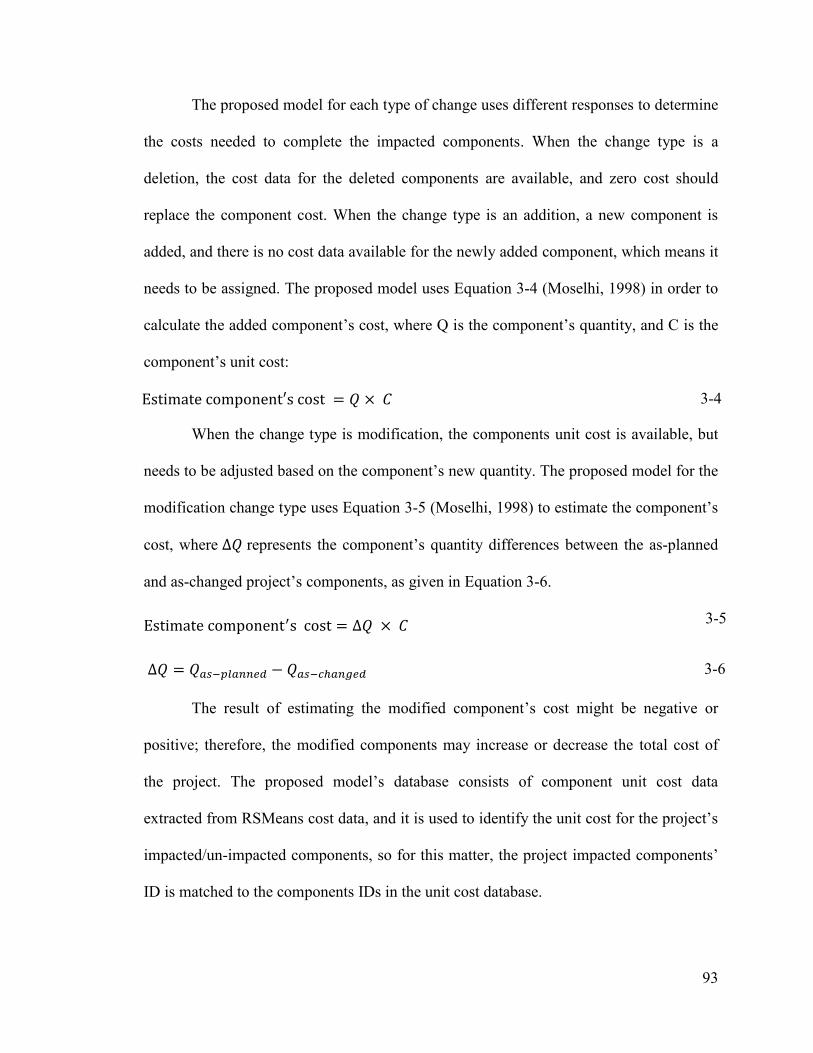
93
The proposed model for each type of change uses different responses to determine
the costs needed to complete the impacted components. When the change type is a
deletion, the cost data for the deleted components are available, and zero cost should
replace the component cost. When the change type is an addition, a new component is
added, and there is no cost data available for the newly added component, which means it
needs to be assigned. The proposed model uses Equation 3-4 (Moselhi, 1998) in order to
calculate the added component’s cost, where Q is the component’s quantity, and C is the
component’s unit cost:
Estimate component′s cost = 𝑄 × 𝐶 3-4
When the change type is modification, the components unit cost is available, but
needs to be adjusted based on the component’s new quantity. The proposed model for the
modification change type uses Equation 3-5 (Moselhi, 1998) to estimate the component’s
cost, where ∆𝑄 represents the component’s quantity differences between the as-planned
and as-changed project’s components, as given in Equation 3-6.
Estimate component′s cost = ∆𝑄 × 𝐶 3-5
∆𝑄 = 𝑄𝑎𝑠−𝑝𝑙𝑎𝑛𝑛𝑒𝑑 − 𝑄𝑎𝑠−𝑐ℎ𝑎𝑛𝑔𝑒𝑑 3-6
The result of estimating the modified component’s cost might be negative or
positive; therefore, the modified components may increase or decrease the total cost of
the project. The proposed model’s database consists of component unit cost data
extracted from RSMeans cost data, and it is used to identify the unit cost for the project’s
impacted/un-impacted components, so for this matter, the project impacted components’
ID is matched to the components IDs in the unit cost database.
94
After estimating the cost for every impacted component being added, deleted, or
modified, the proposed model updates the project cost estimation document and
calculates the total modified direct cost. The proposed model combines all the newly
estimated costs for the impacted components with the un-impacted components available
in the project’s model and provides a modified version of the project direct cost
estimation. Therefore, the proposed model generates the project’s modified direct cost
estimation by assigning a cost to the components, replacing the deleted components cost
with zero and the modified components with the calculated adjusted cost. The project’s
modified direct cost estimation provides data related to the amount of direct cost required
to construct the entire project.
After estimating the direct cost, the proposed model estimates the project’s
changes in cost. As shown in Figure 3-16, the total change cost is calculated by adding
the direct cost, indirect cost, and change impact cost. For indirect costs, project taxes,
bonds, insurance, risk (contingency and profit), interest, and overhead are needed,
reflected in the form of input by the user from the project’s as-planned contract. The
project’s impact cost, consisting of productivity and time-related costs, is calculated by
the proposed model, as shown in Equation 3-7 (Leonard et al., 1991):
Impact cost = Productivity Related + Time Related 3-7
Equation 3-8 (Leonard et al., 1991) is used to estimate the productivity-related
costs (LP), representing the loss of productivity on a percentage change, and Equation 3-
9 (Leonard et al., 1991) is used to estimate time-related costs:
Productivity related= LP × Cost of Labor 3-8
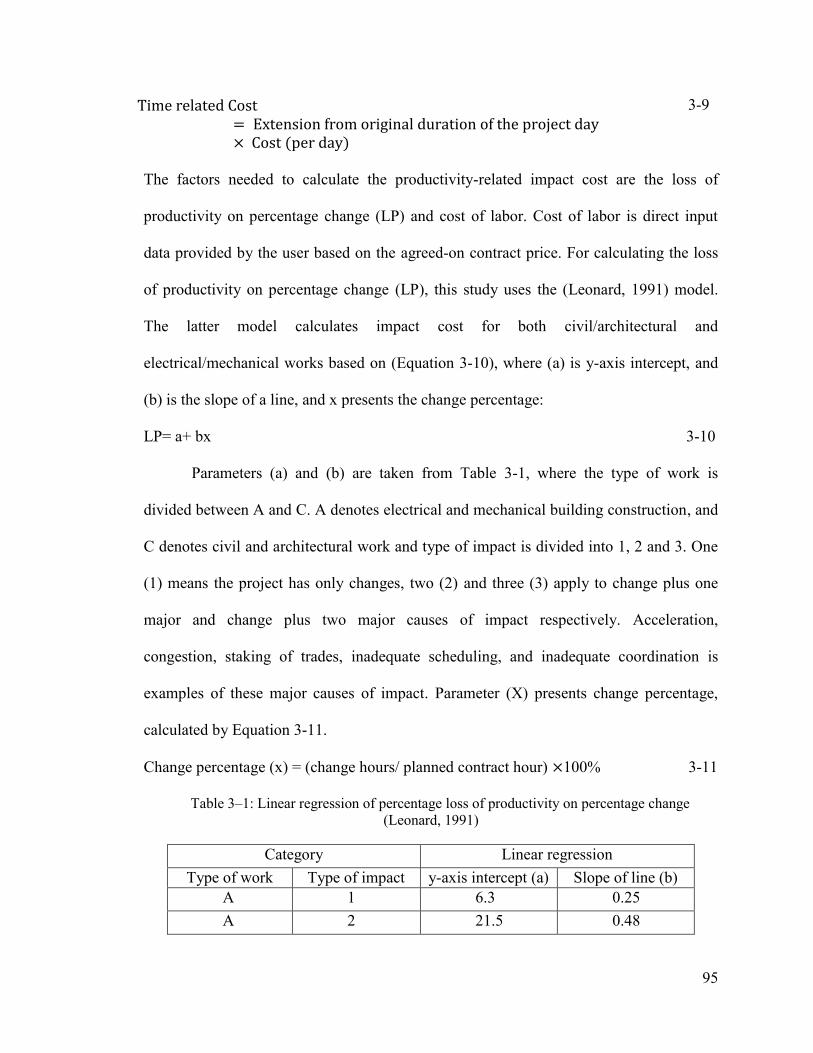
95
Time related Cost = Extension from original duration of the project day × Cost (per day)
3-9
The factors needed to calculate the productivity-related impact cost are the loss of
productivity on percentage change (LP) and cost of labor. Cost of labor is direct input
data provided by the user based on the agreed-on contract price. For calculating the loss
of productivity on percentage change (LP), this study uses the (Leonard, 1991) model.
The latter model calculates impact cost for both civil/architectural and
electrical/mechanical works based on (Equation 3-10), where (a) is y-axis intercept, and
(b) is the slope of a line, and x presents the change percentage:
LP= a+ bx 3-10
Parameters (a) and (b) are taken from Table 3-1, where the type of work is
divided between A and C. A denotes electrical and mechanical building construction, and
C denotes civil and architectural work and type of impact is divided into 1, 2 and 3. One
(1) means the project has only changes, two (2) and three (3) apply to change plus one
major and change plus two major causes of impact respectively. Acceleration,
congestion, staking of trades, inadequate scheduling, and inadequate coordination is
examples of these major causes of impact. Parameter (X) presents change percentage,
calculated by Equation 3-11.
Change percentage (x) = (change hours/ planned contract hour) ×100% 3-11
Table 3–1: Linear regression of percentage loss of productivity on percentage change
(Leonard, 1991)
Category Linear regression
Type of work Type of impact y-axis intercept (a) Slope of line (b)
A 1 6.3 0.25
A 2 21.5 0.48
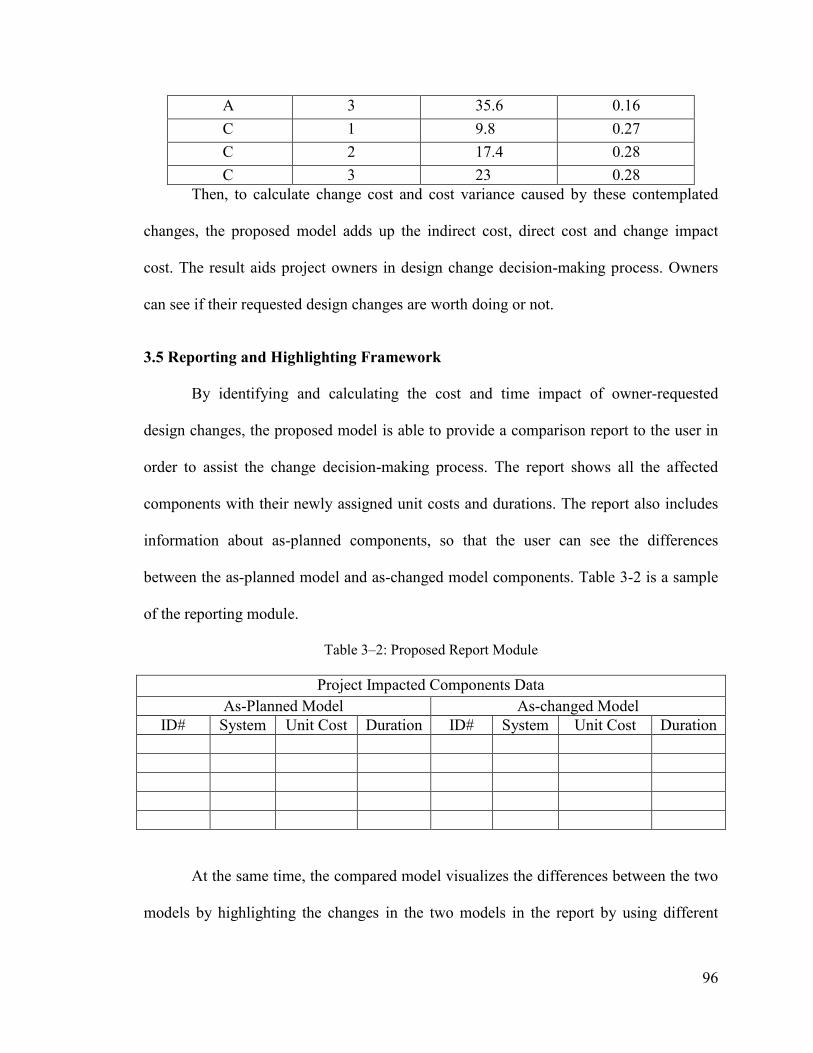
96
A 3 35.6 0.16
C 1 9.8 0.27
C 2 17.4 0.28
C 3 23 0.28
Then, to calculate change cost and cost variance caused by these contemplated
changes, the proposed model adds up the indirect cost, direct cost and change impact
cost. The result aids project owners in design change decision-making process. Owners
can see if their requested design changes are worth doing or not.
3.5 Reporting and Highlighting Framework
By identifying and calculating the cost and time impact of owner-requested
design changes, the proposed model is able to provide a comparison report to the user in
order to assist the change decision-making process. The report shows all the affected
components with their newly assigned unit costs and durations. The report also includes
information about as-planned components, so that the user can see the differences
between the as-planned model and as-changed model components. Table 3-2 is a sample
of the reporting module.
Table 3–2: Proposed Report Module
Project Impacted Components Data
As-Planned Model As-changed Model
ID# System Unit Cost Duration ID# System Unit Cost Duration
At the same time, the compared model visualizes the differences between the two
models by highlighting the changes in the two models in the report by using different
97
color codes for the different results of the comparison. For instance, components that
exist in both models but their specifications are changed in the as-changed model are
indicated in yellow in both as-planned and as-changed model report. Components that are
in the as-planned model but not in the as-changed model are visualized in red in the as-
planned model report. Components that are in the as-changed model and not in the as-
planned model are visualized in green in the as-changed model report. The components
that stay the same in both models after the owner applies design changes appear as is in
both sides of the report. Therefore, the user can receive the report from the proposed
model, which provides all the information with regards to a changed component and the
impact of those changes at the total project cost and total duration. Having all of this
information allows users to make the best decision about accepting, modifying, or
refusing the contemplated design change(s).
The proposed model provides another type of report to the user for the ripple
effect of the requested changes. The report provides the changed path based on the
project building system for each change by selecting the direct change in the model. In
the ripple effect analysis report, a highlighting ability is designed in order to link the
ripple effect report to the model when the user wants to see a changed component in the
model. It is available by simply clicking on the component ID in the report, and
immediately the clicked component is highlighted in the project’s model view. The
proposed model provides this highlighting in all model views, such as 3D, plan, section,
and elevation views. In other words, the report table and project model view are
integrated to give better visualization ability to the owner. This process is summarized in
Figure 3-18.
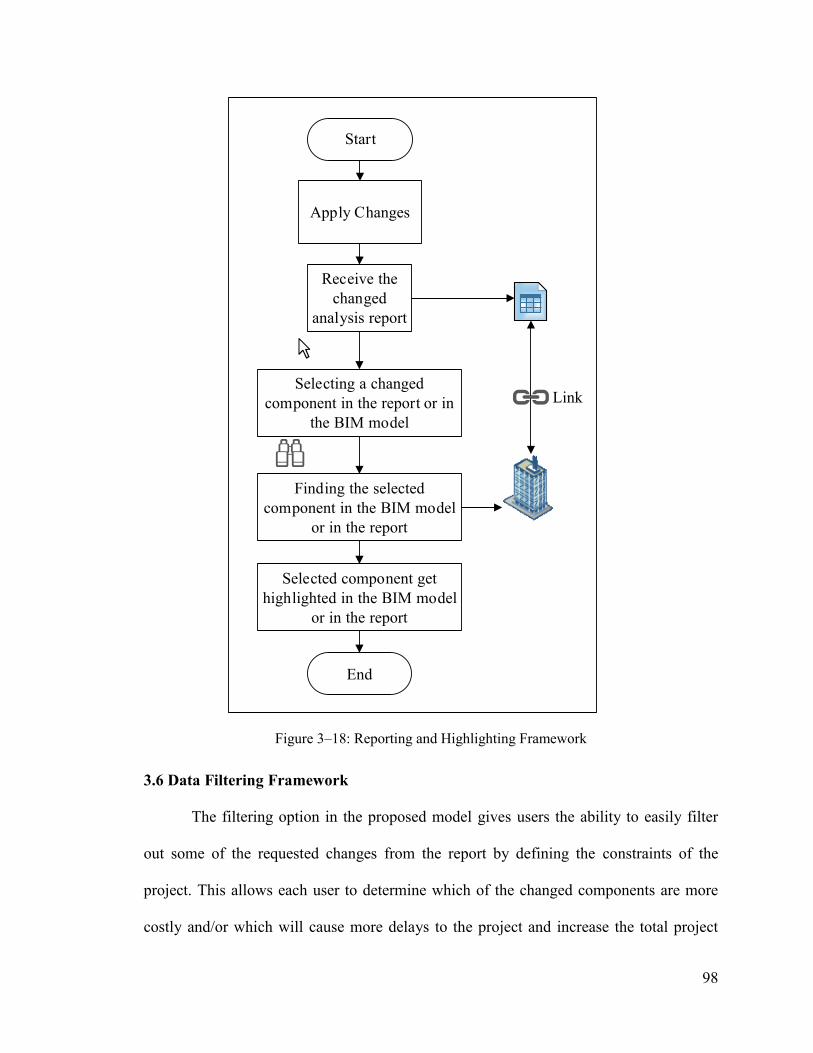
98
Figure 3–18: Reporting and Highlighting Framework
3.6 Data Filtering Framework
The filtering option in the proposed model gives users the ability to easily filter
out some of the requested changes from the report by defining the constraints of the
project. This allows each user to determine which of the changed components are more
costly and/or which will cause more delays to the project and increase the total project
Start
End
Apply Changes
Receive the
changed
analysis report
LinkSelecting a changed
component in the report or in
the BIM model
Selected component get
highlighted in the BIM model
or in the report
Finding the selected
component in the BIM model
or in the report

99
duration. For example, the user can limit the cost and duration of the changed
components, and the report will be updated by highlighting only the changes that are
within the defined constraints. Then, the user may prefer to omit some of those changes
that result in over budget or get behind schedule, and these decisions could very well be
based on the degree of impact. The user can also define different scenarios and view the
related time and cost results.
The filtering portion of the model will introduce several alternatives to the users
that can be used to assist them in choosing the most beneficial and acceptable changes.
The final report has additional beneficial changes that will be saved to the project
database and can be used for change monitoring and process control when construction
begins. The filtering module is shown in Figure 3-19.
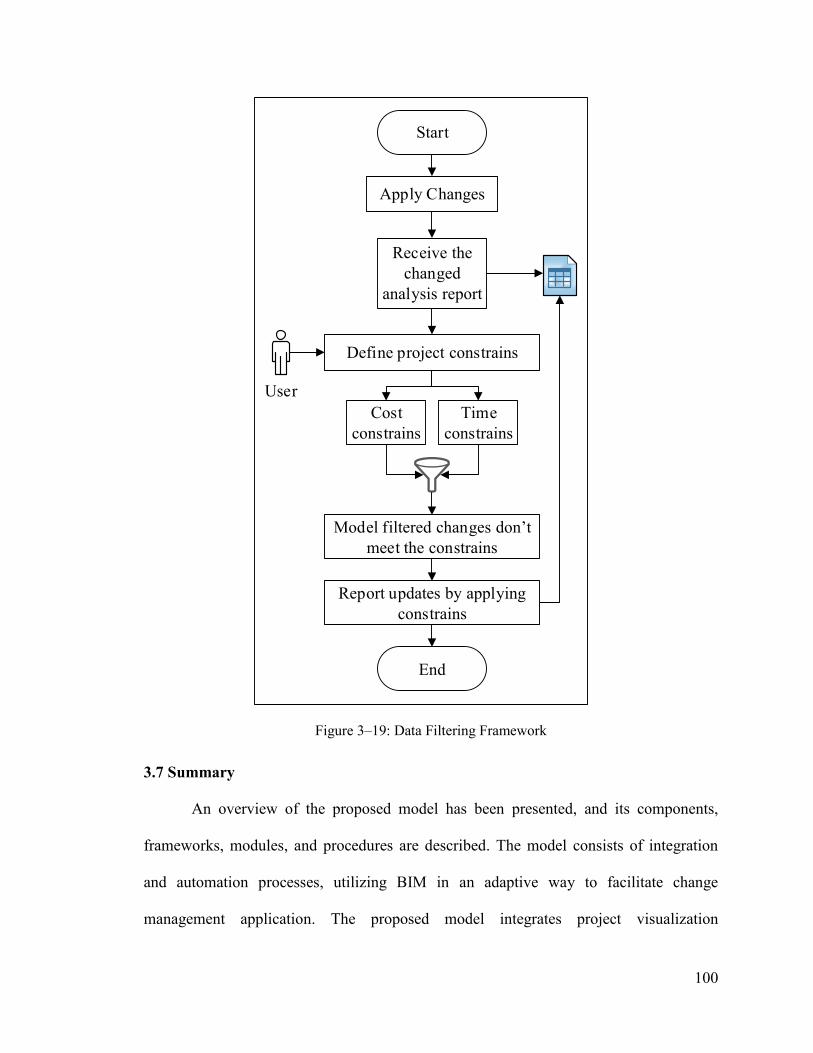
100
Figure 3–19: Data Filtering Framework
3.7 Summary
An overview of the proposed model has been presented, and its components,
frameworks, modules, and procedures are described. The model consists of integration
and automation processes, utilizing BIM in an adaptive way to facilitate change
management application. The proposed model integrates project visualization
Start
End
Apply Changes
Receive the
changed
analysis report
Define project constrains
Model filtered changes don’t
meet the constrains
Cost
constrains
User
Time
constrains
Report updates by applying
constrains

101
information aspects in 3D, automated time change impact analysis for 4D analysis, and
automated change cost impact analysis as 5D.
The proposed model is flexible and can be used to evaluate three different change
scenarios based on the owner request:
1. Evaluate each change individually and generate separate impact analysis report
for each change;
2. Evaluate all contemplated design changes and generate one cumulative impact
analysis report; and
3. Evaluate group of changes that are selected or prioritized by the owner from the
list of contemplated changes.
The flexibility of the proposed model can assist owners in selecting the most
beneficial changes by understanding the full ramifications of the changes through the
generated analysis reports.
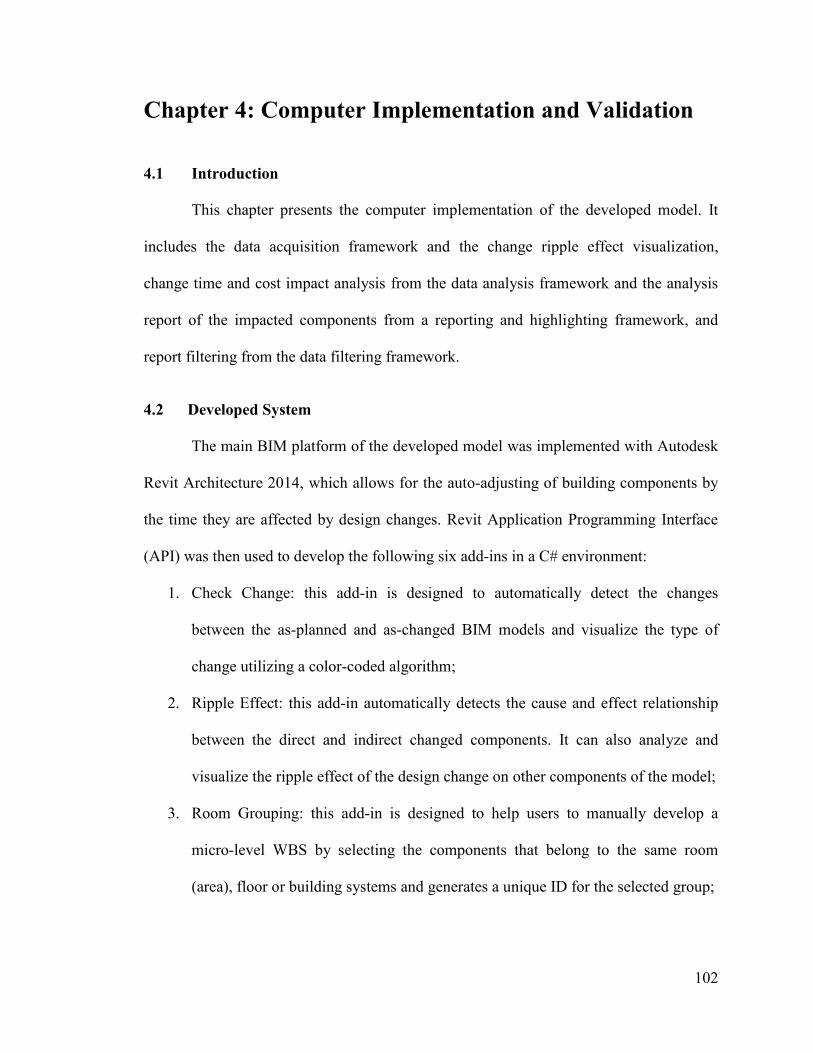
102
Chapter 4: Computer Implementation and Validation
4.1 Introduction
This chapter presents the computer implementation of the developed model. It
includes the data acquisition framework and the change ripple effect visualization,
change time and cost impact analysis from the data analysis framework and the analysis
report of the impacted components from a reporting and highlighting framework, and
report filtering from the data filtering framework.
4.2 Developed System
The main BIM platform of the developed model was implemented with Autodesk
Revit Architecture 2014, which allows for the auto-adjusting of building components by
the time they are affected by design changes. Revit Application Programming Interface
(API) was then used to develop the following six add-ins in a C# environment:
1. Check Change: this add-in is designed to automatically detect the changes
between the as-planned and as-changed BIM models and visualize the type of
change utilizing a color-coded algorithm;
2. Ripple Effect: this add-in automatically detects the cause and effect relationship
between the direct and indirect changed components. It can also analyze and
visualize the ripple effect of the design change on other components of the model;
3. Room Grouping: this add-in is designed to help users to manually develop a
micro-level WBS by selecting the components that belong to the same room
(area), floor or building systems and generates a unique ID for the selected group;
103
4. Time Impact: this add-in is developed to automatically calculate and quantify the
ripple effect of owner-requested design changes on a project schedule and link the
impacted components duration to project as-planned schedule;
5. Cost Impact: this add-in automates the quantification of owner-requested design
changes ripple effect on project cost; and
6. Data Filtering: this add-in enables users to narrow down the data in the project as-
planned and as-changed model report, allowing the users to view only the
information needed.
The development of each add-in is explained in the following subsection. These
add-ins are categorized based on the four frameworks of the developed model: data
acquisition, data analysis, reporting and highlighting, and data filtering.
1. Data Acquisition Framework
There is no add-in developed for the data acquisition framework, but the data
generated in this framework is the main input of the data analysis framework add-ins
(Check Change, Time Impact, Cost Impact). In this framework, the as-planned and as-
changed BIM models are developed, which provide data to the above-mentioned add-ins
such as component specification, family, type, assembly code, assembly description, and
unique ID. The family represents the main description of objects, such as a wall, door,
window, column, etc., and the type represents a specific kind of a family object, such as a
450mm round column, or a 600mm rectangular column. The assembly code represents a
type of component, and the unique ID represents the individual components. After the
generation of both as-planned and as-changed BIM models, the components of both BIM
104
models are saved to a central database including the above-mentioned characteristics of
each component.
2. Data Analysis Framework
The add-in belong to data analysis framework are Check Change, Time Impact
and Cost Impact, which are explained here in following subsections. In order to run the
add-ins the user has to open the two BIM models in Revit and select the as-planned BIM
model as the base model; the other is automatically saved in the system as the as-changed
model. The user can alter the as-changed model even after opening it in the interface, but
the system does not allow any changes to the as-planned base model. Then, the user can
run the data analysis framework add-ins one by one.
4.2.1 Check Change Add-in
The developed Revit add-in Check Change provides the user with 3D BIM
visualization and color-code highlighting of the all impacted components due to the
contemplated design change. The developed add-in uses the data captured in the
generated central database to identify the differences between the two BIM models by
running a component-by-component comparison. The add-in compares the quantity of
the component with the matched IDs to identify their change types. Therefore, the result
of this comparison provides a list of all components that are added to, deducted from, or
modified in the as-changed BIM model. The add-in highlight the list of impacted
components in the BIM models and also provides a color-code report to aid the
understanding the three change types in both report and models. The Check Change add-
in report has two sides, one for the components of the project as-planned, and the other
for the components of the project as-changed. The report lists all the added components
105
on the as-changed side, all the deleted components on the as-planned side, and all the
modified components on both sides.
The developed add-in also highlights the types of changes by a different color
code in both BIM models and the report: red for deletion, green for addition, yellow for
modification. The same color-coding is used through all the developed model add-ins to
differentiate the impacted components’ change types (addition, deletion and
modification); this feature is used to visually represent the proposed changes in the
developed model. The list of changed components and the report, and components’
quantity are then used to identify the ripple effect, time impact and cost impact of each
contemplated design change. The next add-in, Room Grouping, is developed to ease the
application of the Ripple Effect and Time Impact add-ins introduced in the following
subsections.
4.2.2 Room Grouping Add-in
The developed Room Grouping Revit add-in is based on the developed micro-
level WBS, which groups the project’s floor in designated areas and gives the same ID to
components that are located in the same area as in the as-changed model. So, all the
components that belong to the same group (area) carry the same group ID. The group ID
is used to run the ripple effect analysis for each changed component of the as-changed
model. The user can also define the group based on the components that are located on
the same floor, and do the selection based on project building systems.
4.2.3 Ripple Effect Add-in
This developed Revit add-in does the ripple effect analysis on two bases: by
finding the components that the direct change is connected to (same group ID) or
106
surrounded by (different group ID) throughout the building, horizontally and vertically,
and then identifies which of those components are impacted indirectly. As a result, the
developed model provides the user with the change's path, which means the direct change
and its consequences. The ripple effect add-in is only applicable after the grouping of all
the components of the as-planned and as-changed model, after grouping the user selects
the individual direct changed components in the as-changed (if the change type is
addition and modification) or as-planned (if the change type is deletion) model’s
architectural system based on the owner’s requested design changes. Then, the system
lists the components that are impacted due to the connection with the selected direct
change and belong to the same group. The generated list of components is only the ripple
effect of the selected individual direct change and does not include the rest of the
impacted components that exist in the project. The add-in is able to trace the change path
for one selected individual direct change at a time.
The developed add-in provides the result of the change’s ripple effect analysis in
two different modes, and the user has access to both modes at the same time. The first
mode is to provide the analysis of the change’s ripple effect in report format, in a Revit
interface. In the report, the user can see the direct change along with the list of its
impacted components. The report consists of two parts; the first part belongs to the as-
planned model and the second part belongs to as-changed model. The report for both
BIM models provides the type of discipline for each component, change type
(modification, addition, or deletion), component ID, and location of components. The
report also shows the component’s virtual information such as family type, assembly
code, and assembly description. By reporting the information of as-planned and as-
107
changed BIM models side by side, it eases the understanding and recognition of changed
components’ location and the building systems that they belong to. Color code
highlighting of BIM models is used in the second mode to visualize the result of the
ripple effect analysis and highlights the types of changes by a different color code in both
BIM models. To find the cause and effect relationship, the user first selects a component
as the direct change and the ripple effect of the selected change shows the BIM as-
changed model. Therefore, the change path of the selected changed components gets
highlighted in the as-changed BIM model. The developed add-in links the report and the
BIM model; the user can select a component in the model and get the component's data in
the report, and vice versa.
4.2.4 Time Impact Add-in
The developed Revit Time Impact add-in provides the user with a calculation of
the ripple effect of the owner-requested design change(s) on project time and schedule.
The add-in provides a report that consists of changed/new durations for all the
components that get impacted due to each contemplated change and/or group of approved
changes. Moreover, the add-in is capable of color-coding, highlighting, and
differentiating the impacted components based on their change types (addition, deletion,
or modification); this feature is used to visually represent the proposed changes in the
proposed model. The developed add-in first needs input data, which should consist of a
list of a project’s components impacted by owner-requested design changes. In order to
provide the required list of impacted components for time-impact analysis, the data
needed is exported form the developed Check Change add-in. Therefore, by using a
component-by-component comparison between components of the two as-planned BIM
108
models generates, a list of all impacted components caused by each contemplated design
change is generated.
The Check Change add-in provides a report of all the impacted components from
all project systems, which is used as the main input database for the developed Time
Impact add-in. The Check Change add-in’s report includes all added, deleted, and
modified components that exist in the project’s as-changed BIM model. The developed
Time Impact add-in is coded in a way to be able to extract the impacted components
change types from Check Change add-in’s report and the components’ quantity (Q) from
the Check Change add-in database, which is generated during the ID-by-ID comparison
between components of the two BIM models to determine the type of changes. For
deletion, the new quantity is considered zero; for addition and modification, the quantities
are taken from the report developed in the Check Change add-in. This means that the
difference between the old (Q1) and the new (Q2) quantity value of the component to be
modified is calculated as (∆Q)and the data used in Time Impact add-in.
The component’s quantity (Q) is used to calculate the duration of the impacted
components; since the two main factors required for calculating the impacted
component’s duration are a component’s quantity (Q) and labor hours (LH). Labor hours
(LH) are provided by an external database in format of Excel spreadsheet for Time
Impact add-in is included in Appendix A. The LH database is generated based on
RSMeans assembly data, since the components in the RSMeans assembly database
follow the same format as Autodesk Revit, which define the components’ family type,
assembly number, and assembly description. However, in the RSMeans assembly
database, a component’s labor hour data is not provided. This study uses Al-Mashta’s
109
(2010) technique to map RSMeans assembly type into RSMeans Unit Type
(UNIFORMAT II) in order to generate the labor hour (LH) data (included in Appendix
B). The Time Impact add-in links the generated list of impacted components with the
labor hour (LH) database based on their assembly number and determines the labor hour
value for each impacted component. After providing components’ quantity and its related
LH, the developed add-in uses the coded equations for a duration to estimate the duration
needed for each component in the generated list of impacted components. First, the add-
in divides components’ labor hour value by unit of work to estimate productivity and it
multiplies the calculated productivity by components’ quantity to get its duration. The
relationship between the quantity and labor hours corresponding to each component is
linear in the proposed model by default. However, the system provides flexibility for the
user to introducing a multiplying productivity factor. Therefore, the labor hours could
multiply by a productivity-related factor in the BIM model, depending on the user’s
needs.
After calculating the impacted component’s duration, the developed add-in
provides a two-sided color-coded report that shows the components of the as-planned and
as-changed models along with their duration on a component or project level. If the
owner approves the changes proposed in the Time Impact add-in report, the developed
add-in generates the as-changed schedule.
In order to generate this schedule, the developed add-in links the impacted
components with the project 4D as-planned schedule by matching the impacted
components’ group IDs (generated by Room Grouping add-in) with project schedule
activities that have the same group IDs. By linking the impacted components, the project
110
schedule components, activities, and total project duration all get updated, and the
updated schedule is saved in the Revit database as the as-changed schedule. The as-
changed schedule form that is saved in the CSV (“Comma Separated Values”) file
exports to MS Project and the user can change the format from CSV to MS Project and
then save the MS Project version of the as-changed schedule.
4.2.5 Cost Impact
The developed Cost Impact Revit add-in generates the report of project’s
impacted components due to owner-led design changes along with the calculated costs
needed to complete the impacted components and the total project cost. The Cost Impact
add-in report also uses the color-code highlighting technique to ease the understanding of
impacted components’ change type. The add-in is also calculates the change cost, which
includes direct cost, indirect cost and impact cost (productivity and time-related cost).
The two main factors in the estimation of the component’s cost are the component’s
quantity (Q) and the component’s unit cost (C). The first main factor – quantity (Q) –
similar to Time Impact add-in, the data from the Check Change add-in is used to run the
Cost Impact add-in, which means the list of impacted components are included, along
with their change type and quantity (Q). For deletion, the quantity is considered zero, for
addition change type the new quantity is taken directly from the report developed in the
Check-Change add-in, and for modification change type the quantity is calculated by
finding the difference between the old (Qas-planned) and new (Qas-changed) quantity values,
which means (∆𝑄). For the second main factor – component’s unit cost (C) – an external
cost database is developed in the Excel spreadsheet format that provides the component’s
unit cost (C), using the RSMeans assembly cost database (database samples are included
111
in Appendix C). RSMeans assembly codes’ format follows the same logic as Autodesk
Revit software uses to generate the unique ID of each component. Therefore, components
in RSMeans and Autodesk Revit software carry the same assembly number and assembly
description. The Cost Impact add-in links each impacted component to its unit cost (C)
database by matching similar assembly IDs that exist between the impacted component
list and developed cost database. After providing the cost for each impacted project
components, the developed add-in uses the equation coded to estimate impacted
component’s unit cost by multiplying component quantity (Q) and the component unit
cost (C).
The developed add-in exports the list of unimpacted components that stay the
same in both the as-changed and as-planned project BIM models, along with the unit cost
that exists in the as-planned model. Then, the unimpacted components are added to the
impacted component report, and the output report is a list of the impacted and
unimpacted components together with their estimated cost. The developed model then
adds up the cost of the project’s impacted and unimpacted components to get the
project’s modified direct cost. The total indirect cost can be input by the user, or the user
can add the indirect cost to the add-in generated default indirect cost item form; the user
is also able to add an additional indirect cost item to the default form.
The add-in then calculates the impact cost, which has two parts: productivity-
related cost and time-related cost. In Equation 3-8 (Leonard et al., 1991), the user
provides the planned contract hour from the project’s as-planned contract, and the Time
Impact developed add-in is used to get the project change hours since the Time Impact
add-in provides the duration of the impacted components, and the Cost Impact add-in
112
adds up the impacted components duration to get the change hours and divides it by
planned contract hours to get the change percentage (x). The estimates a, b, and x
parameters are used in Equation 3-7 to determine the loss of productivity on percentage
change (LP). Then, the estimated (LP) is multiplied by the cost of labor provided by the
user to determine the productivity-related impact cost. The first factor needed to calculate
the time-related cost impact is cost per day (cost per unit time), provided by the user from
the project’s signed contract documents.
To get the extension from the as-planned duration of the project day, the
developed add-in uses the impacted component duration calculated by the Time Impact
model and combines it with project’s unimpacted components’ duration to get project as-
changed duration and then compares it with project’s as-planned duration to get the
extension from the as-planned duration of the project day. The developed add-in
multiplies the calculated extension from the as-planned duration of the project day by
cost per day, provided by the user to get project’s time-related cost impact. Then, the
developed add-in adds up the productivity and time-related impact costs to estimate the
project’s total impact cost. The add-in then estimates the project’s change cost (as-
changed) by adding the project’s estimated direct cost, indirect cost and impact cost, then
deduct the change cost from project’s as-planned total cost as stated in project’s as-
planned contract to calculate the cost variance caused by owner requested design
changes. The user can then use the result of analysis to see if the changes are beneficial to
the project.
113
4.2.6 Reporting and Highlighting Framework
This section gives a summary of the add-ins’ reporting and highlighting abilities.
All the developed Revit add-ins in this study are designed in a way to present their output
in the format of a two-sided report that includes the data related to both as-planned and
as-changed BIM models components. The reporting aids the user to be able to compare
the components’ data of both models at the same time, which gives a clearer
understanding of the changes involved in the project. The color-coded highlighting in all
the add-ins is intended to visualize the project change types (addition, deletion, and
modification). The changes are highlighted in both add-in’s reports and BIM models
based on their type with a specific color, which is coded the same for the all developed
add-ins. There is connectivity between the BIM models and the reports, which gives
users the ability to search for a component’s data in a report by selecting the components
in the BIM models or by selecting components in the report.
4.2.7 Data Filtering Add-in
The developed Revit Data Filtering add-in allows the user to generate several
reports by choosing what data needs to get filtered. If the generated report contains a lot
of components, it can be difficult to find information quickly. Data Filtering can be used
to narrow down the data in the report, allowing the user to view only the information
needed. The user is then able to define the filter method in a different field, and the Data
Filtering displays only the rows that meet the criteria specified by the user and hides rows
the user does not want to be displayed. The Data Filtering add-in has four principal steps:
1) generate a general report from the impacted and unimpacted components, 2) provide
114
filtering field, 3) provide filtering method, and 4) update the general project report based
on the defined filter field and method.
First, the developed add-in combines the generated reports of Cost Impact and
Time Impact add-ins in order to make a data filtering report. Therefore, the data filtering
report consists of both as-planned and as-changed BIM model data, such as family type,
assembly code, assembly description, as-planned cost, as-planned time, as-changed cost,
as-changed time. Second, after generating the data filtering report the developed add-in
asks the user to select the field of filtering, which means the user has to select one of the
data items provided in the data filtering report (family type, assembly code, assembly
description, as-planned cost, as-planned time, as-changed cost, as-changed time). The
user can select one specific filed at the time. Third, the next step is to select the filter
method based on the type of field selected first. For example, if the type of selected field
is family type in the filter method, the user has to define the type of family that needs to
get filtered, such as a wall, door, window, column and so on. If it is assembly code and
assembly description, the corresponding information needs to be provided in the filter
method. If the type of selected field is as-planned time or as-changed time, the user has to
define the number of days in the filter method. Finally, if the type of selected field is as-
planned cost or as-changed cost, the user has to define the amount needed to filter in the
filter method. Finally, after receiving the fitter filed type and filter method data, the
developed add-in starts filtering the report based correspondingly on user input and
generates the filtered report by hiding the rows containing the data that do not meet the
defined filter field and filter method criteria, and the added filter in the report allows the
user to analyze the data better.
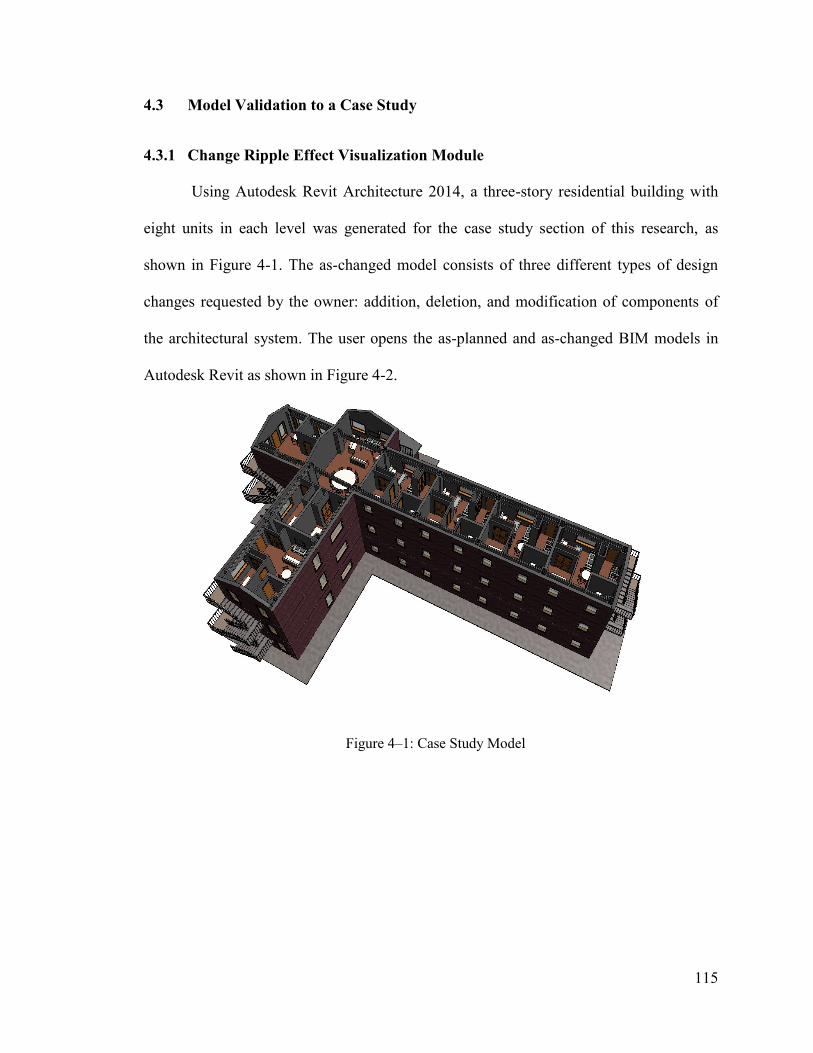
115
4.3 Model Validation to a Case Study
4.3.1 Change Ripple Effect Visualization Module
Using Autodesk Revit Architecture 2014, a three-story residential building with
eight units in each level was generated for the case study section of this research, as
shown in Figure 4-1. The as-changed model consists of three different types of design
changes requested by the owner: addition, deletion, and modification of components of
the architectural system. The user opens the as-planned and as-changed BIM models in
Autodesk Revit as shown in Figure 4-2.
Figure 4–1: Case Study Model
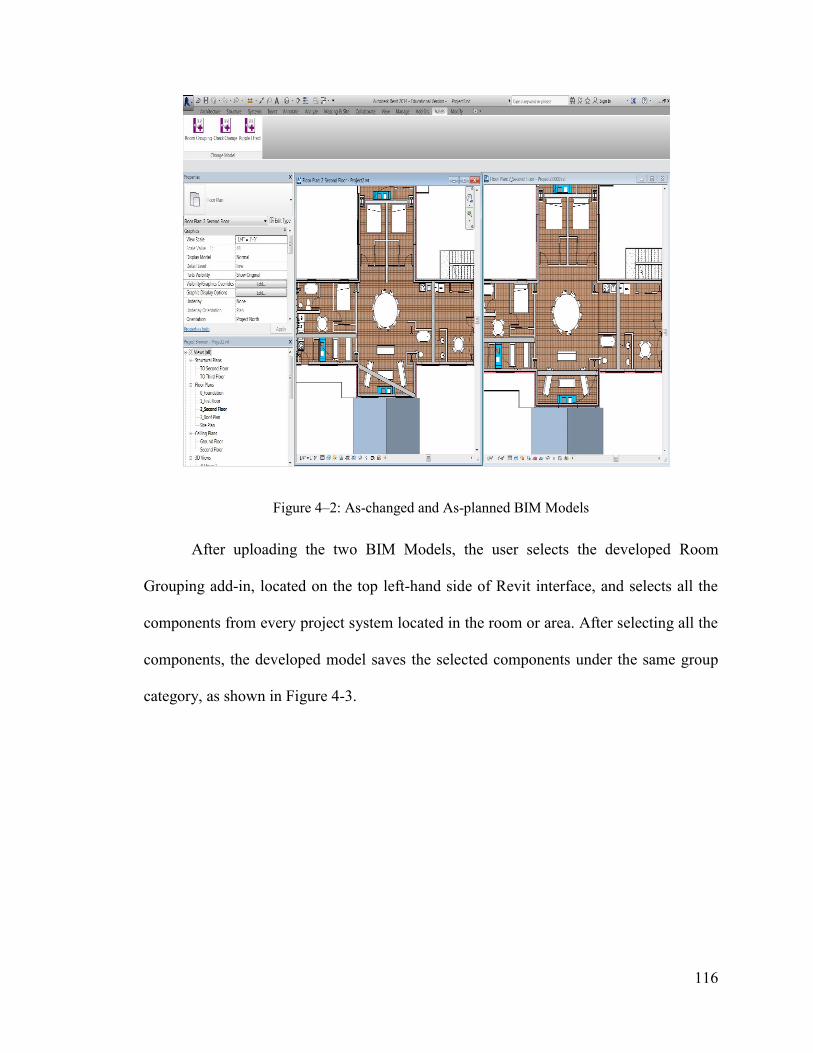
116
Figure 4–2: As-changed and As-planned BIM Models
After uploading the two BIM Models, the user selects the developed Room
Grouping add-in, located on the top left-hand side of Revit interface, and selects all the
components from every project system located in the room or area. After selecting all the
components, the developed model saves the selected components under the same group
category, as shown in Figure 4-3.
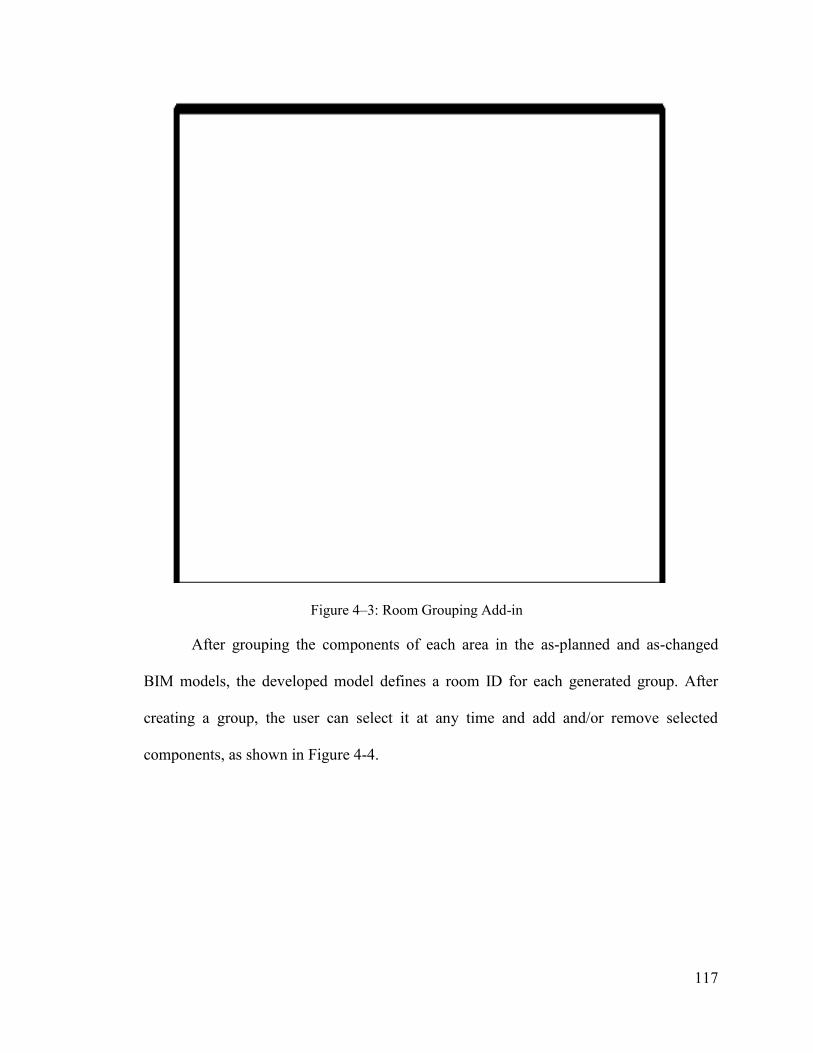
117
Figure 4–3: Room Grouping Add-in
After grouping the components of each area in the as-planned and as-changed
BIM models, the developed model defines a room ID for each generated group. After
creating a group, the user can select it at any time and add and/or remove selected
components, as shown in Figure 4-4.
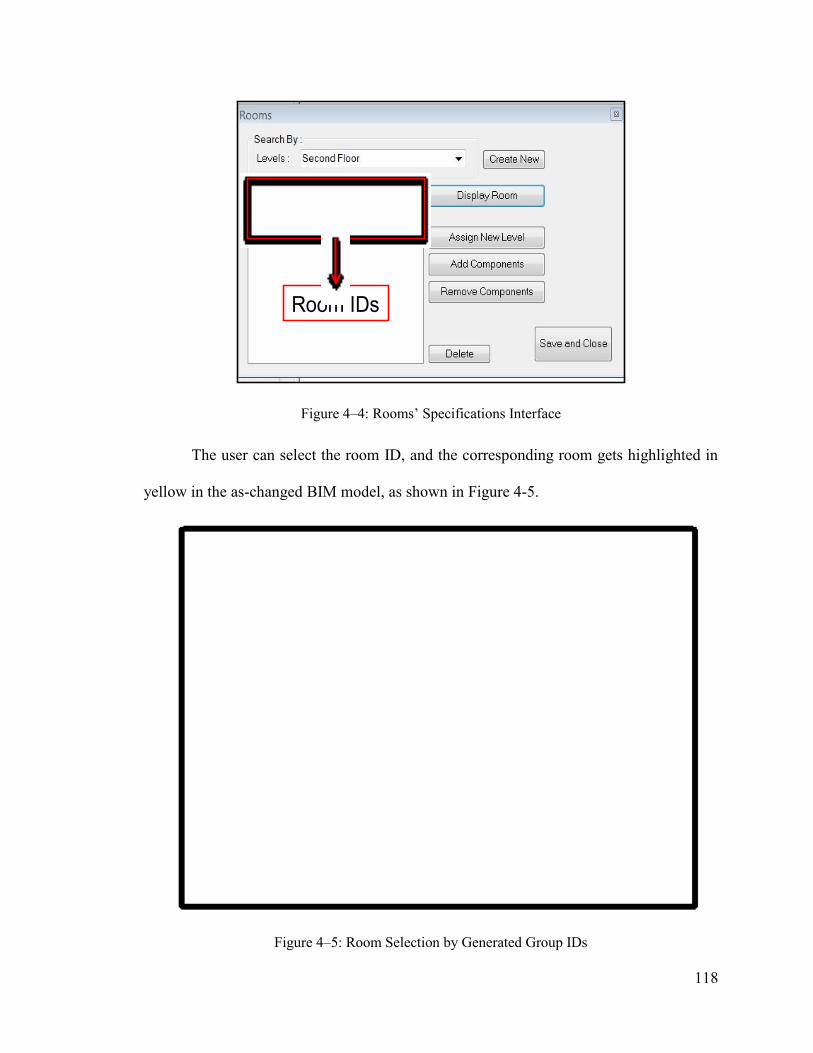
118
Figure 4–4: Rooms’ Specifications Interface
The user can select the room ID, and the corresponding room gets highlighted in
yellow in the as-changed BIM model, as shown in Figure 4-5.
Figure 4–5: Room Selection by Generated Group IDs
Room IDs
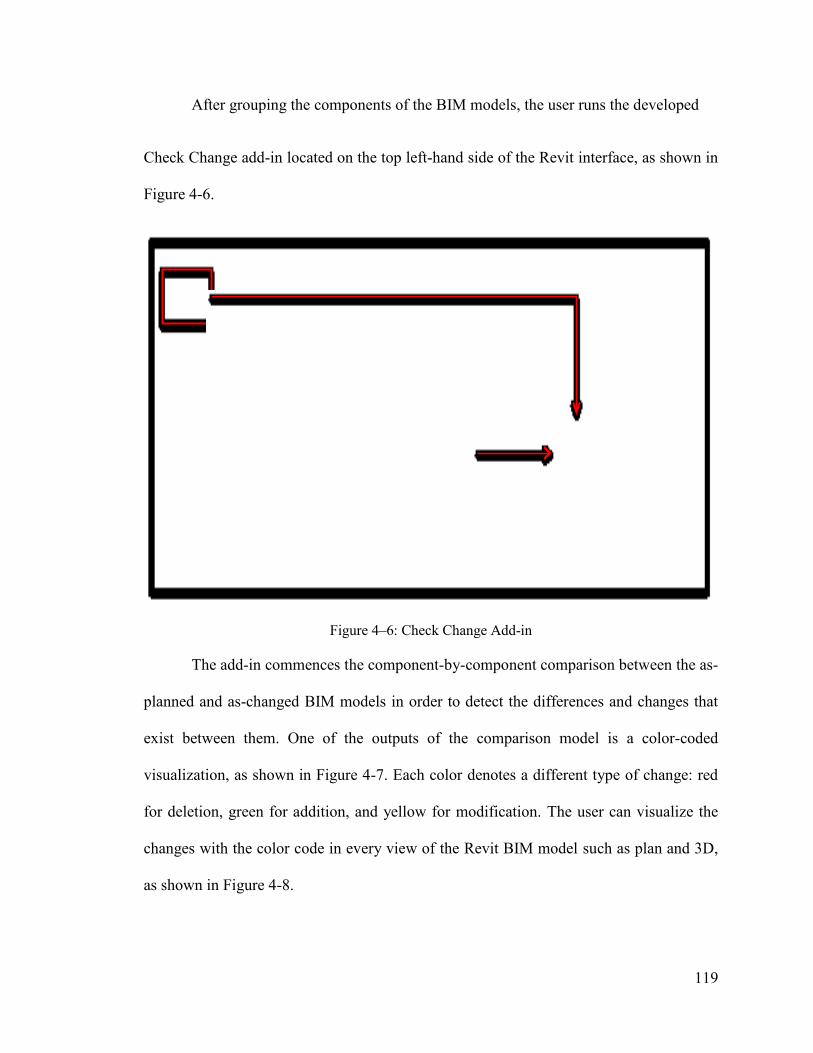
119
After grouping the components of the BIM models, the user runs the developed
Check Change add-in located on the top left-hand side of the Revit interface, as shown in
Figure 4-6.
Figure 4–6: Check Change Add-in
The add-in commences the component-by-component comparison between the as-
planned and as-changed BIM models in order to detect the differences and changes that
exist between them. One of the outputs of the comparison model is a color-coded
visualization, as shown in Figure 4-7. Each color denotes a different type of change: red
for deletion, green for addition, and yellow for modification. The user can visualize the
changes with the color code in every view of the Revit BIM model such as plan and 3D,
as shown in Figure 4-8.

120
Figure 4–7: Plan View of Color Coded Changes
Figure 4–8: Section 3D View of the Color Code Highlight Visualization
Modified Modified
Deleted Added
Modified Modified
Deleted
Added
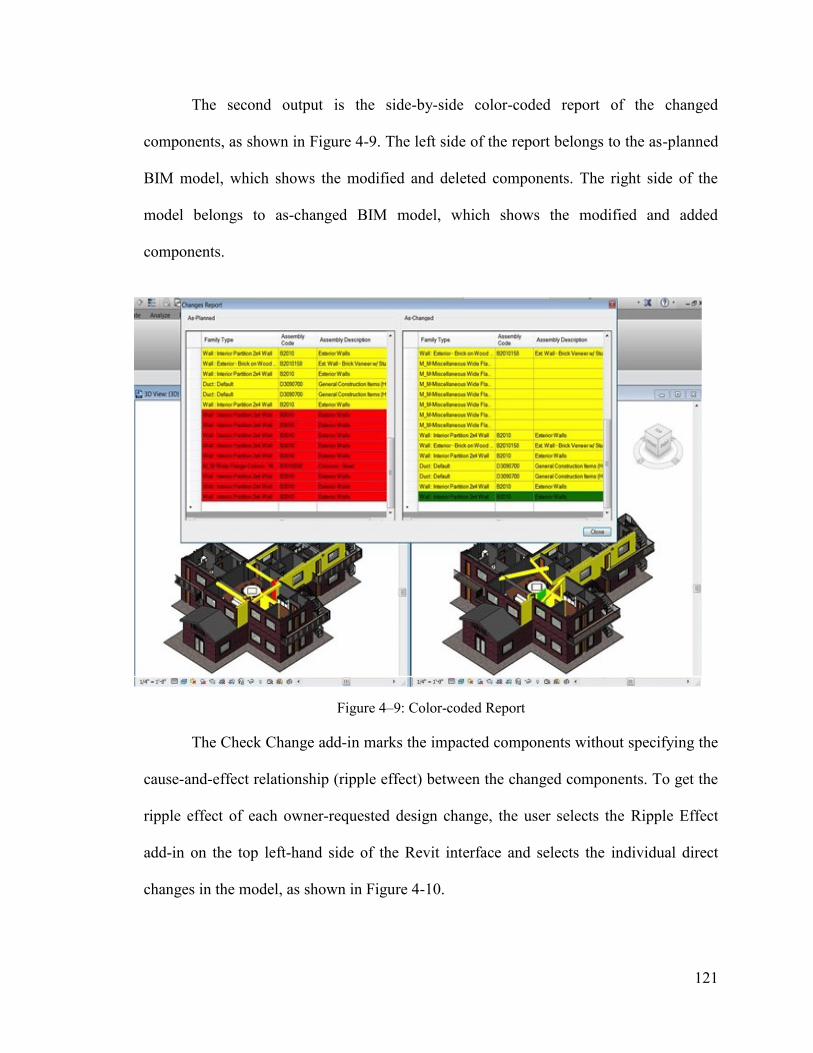
121
The second output is the side-by-side color-coded report of the changed
components, as shown in Figure 4-9. The left side of the report belongs to the as-planned
BIM model, which shows the modified and deleted components. The right side of the
model belongs to as-changed BIM model, which shows the modified and added
components.
Figure 4–9: Color-coded Report
The Check Change add-in marks the impacted components without specifying the
cause-and-effect relationship (ripple effect) between the changed components. To get the
ripple effect of each owner-requested design change, the user selects the Ripple Effect
add-in on the top left-hand side of the Revit interface and selects the individual direct
changes in the model, as shown in Figure 4-10.
1 1
122
Figure 4–10: Selecting Individual Direct Changes and Ripple Effect Add-in
Upon selecting the direct change in the BIM model, the developed model
highlights the components that are impacted due to the direct change in the BIM models.
The developed add-in, at the same time, provides a report of the impacted components.
The Ripple Effect add-in considers two levels of analysis for the impacted change on all
building systems arising from the introduced direct change, as shown in Figure 4-11. This
is performed in two stages. In the first stage, the ripple effect of the changed components
is detected in the same room, as shown in Figure 4-12.
Selecting individual direct design changes
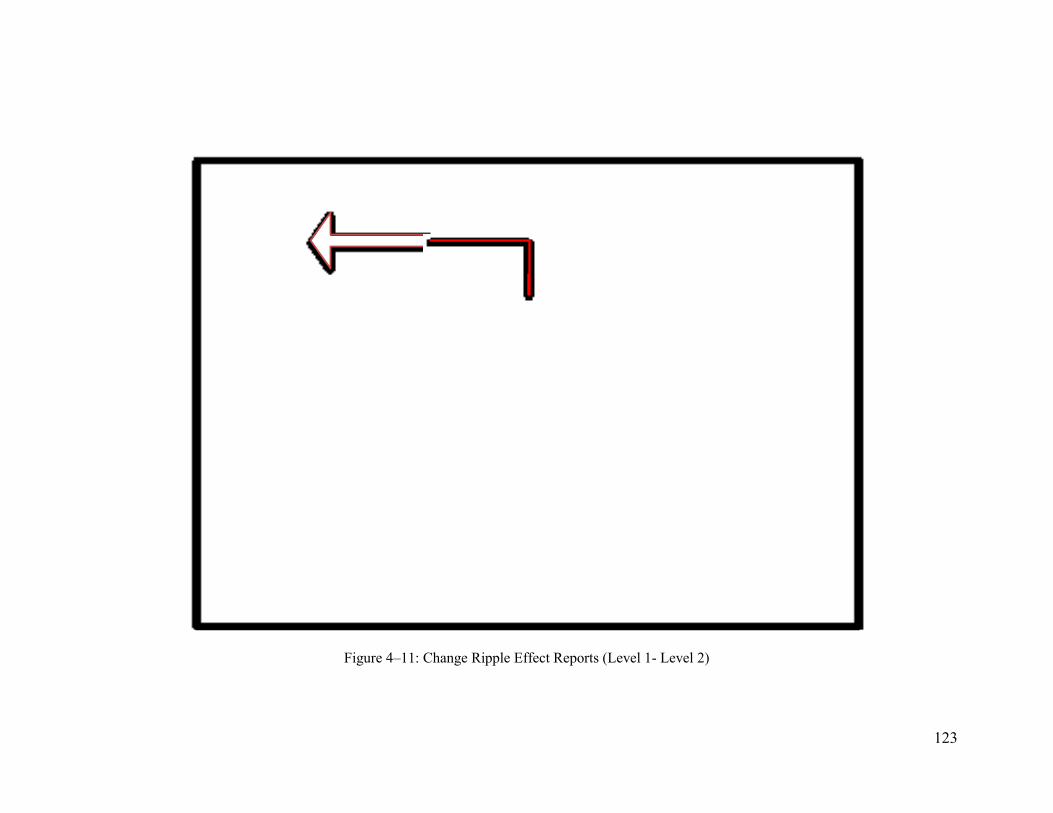
123
Figure 4–11: Change Ripple Effect Reports (Level 1- Level 2)
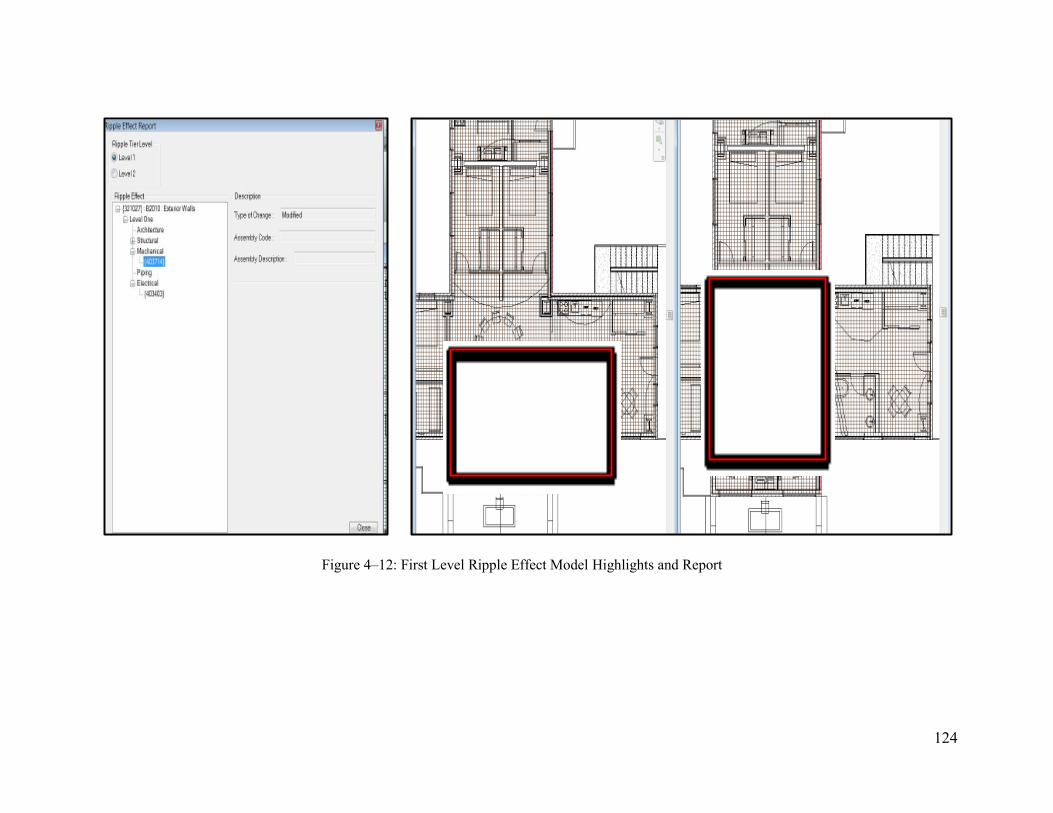
124
Figure 4–12: First Level Ripple Effect Model Highlights and Report
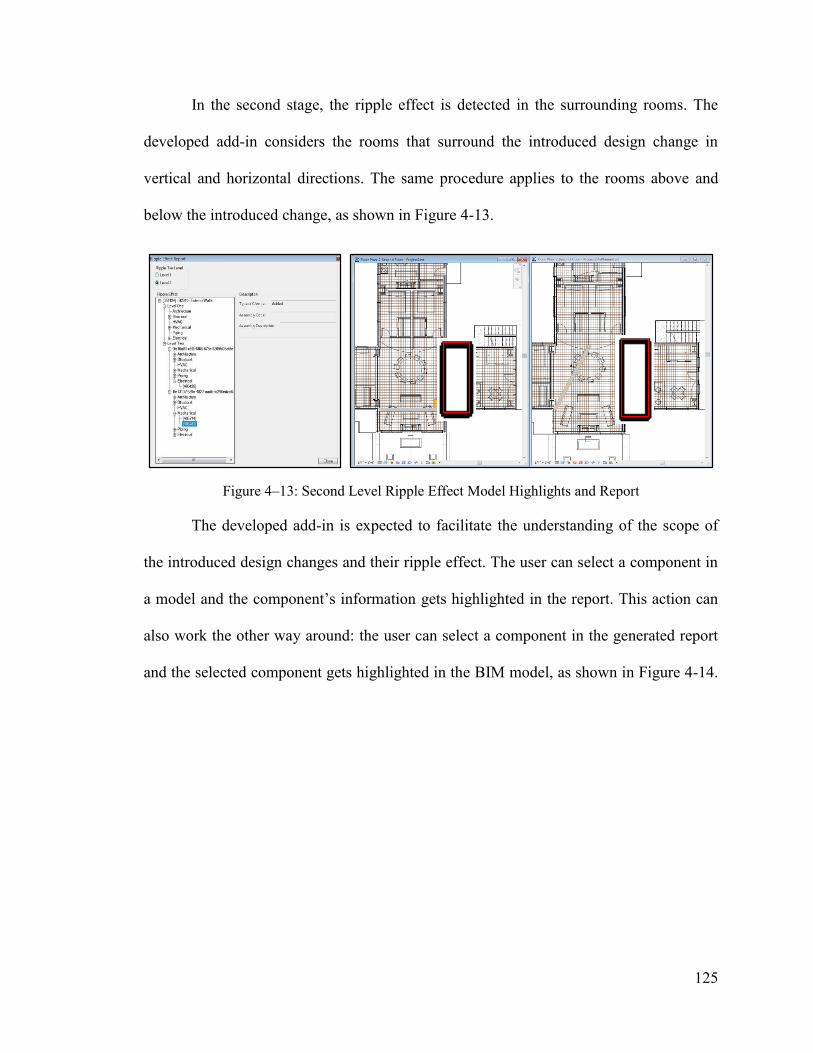
125
In the second stage, the ripple effect is detected in the surrounding rooms. The
developed add-in considers the rooms that surround the introduced design change in
vertical and horizontal directions. The same procedure applies to the rooms above and
below the introduced change, as shown in Figure 4-13.
Figure 4–13: Second Level Ripple Effect Model Highlights and Report
The developed add-in is expected to facilitate the understanding of the scope of
the introduced design changes and their ripple effect. The user can select a component in
a model and the component’s information gets highlighted in the report. This action can
also work the other way around: the user can select a component in the generated report
and the selected component gets highlighted in the BIM model, as shown in Figure 4-14.
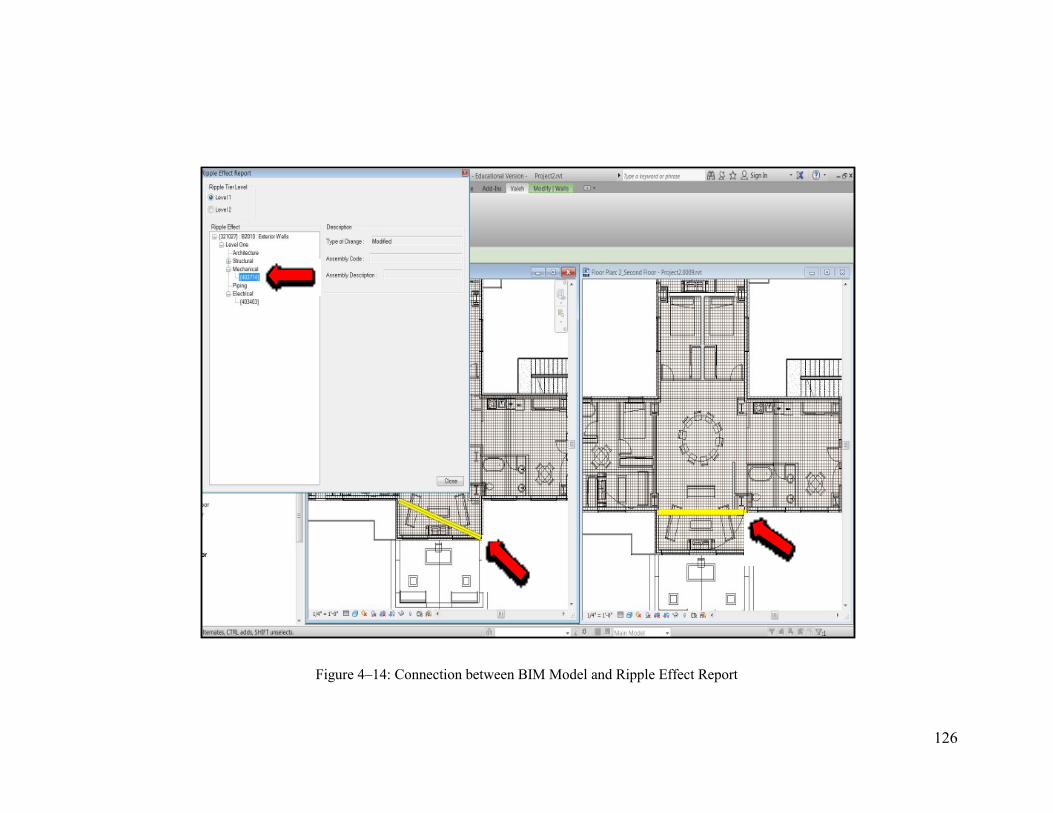
126
Figure 4–14: Connection between BIM Model and Ripple Effect Report
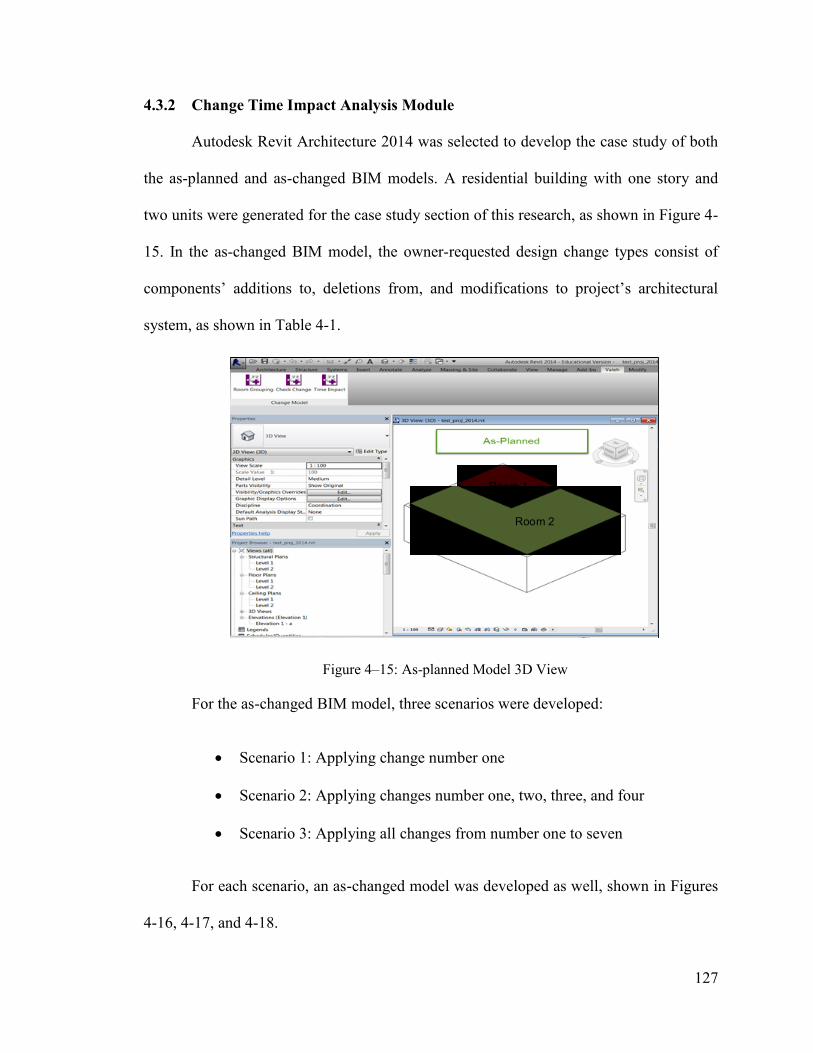
127
4.3.2 Change Time Impact Analysis Module
Autodesk Revit Architecture 2014 was selected to develop the case study of both
the as-planned and as-changed BIM models. A residential building with one story and
two units were generated for the case study section of this research, as shown in Figure 4-
15. In the as-changed BIM model, the owner-requested design change types consist of
components’ additions to, deletions from, and modifications to project’s architectural
system, as shown in Table 4-1.
Figure 4–15: As-planned Model 3D View
For the as-changed BIM model, three scenarios were developed:
Scenario 1: Applying change number one
Scenario 2: Applying changes number one, two, three, and four
Scenario 3: Applying all changes from number one to seven
For each scenario, an as-changed model was developed as well, shown in Figures
4-16, 4-17, and 4-18.
Room 1
Room 2
Figure 3. As-planned Model 3D View
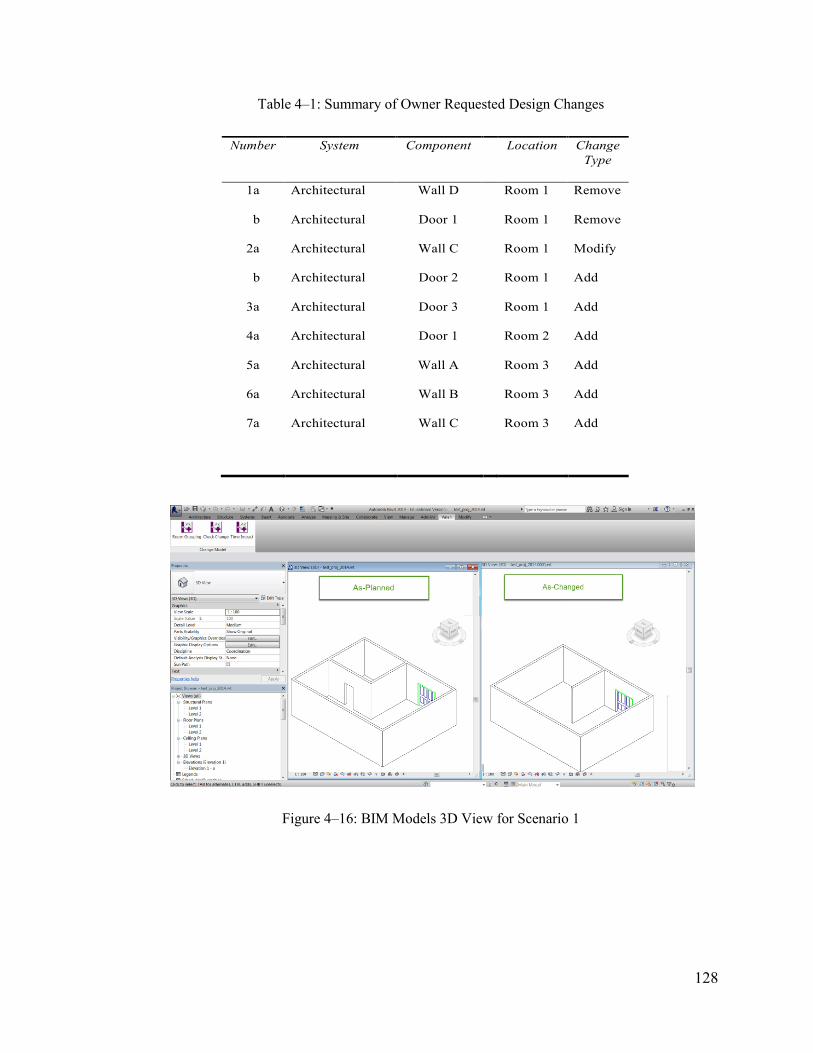
128
Table 4–1: Summary of Owner Requested Design Changes
Figure 4–16: BIM Models 3D View for Scenario 1
Table 1. Summary of Owner Requested Design Changes
Number System Component Location Change
Type
1a
b
2a
b
3a
4a
5a
6a
7a
Architectural
Architectural
Architectural
Architectural
Architectural
Architectural
Architectural
Architectural
Architectural
Wall D
Door 1
Wall C
Door 2
Door 3
Door 1
Wall A
Wall B
Wall C
Room 1
Room 1
Room 1
Room 1
Room 1
Room 2
Room 3
Room 3
Room 3
Remove
Remove
Modify
Add
Add
Add
Add
Add
Add
c cc
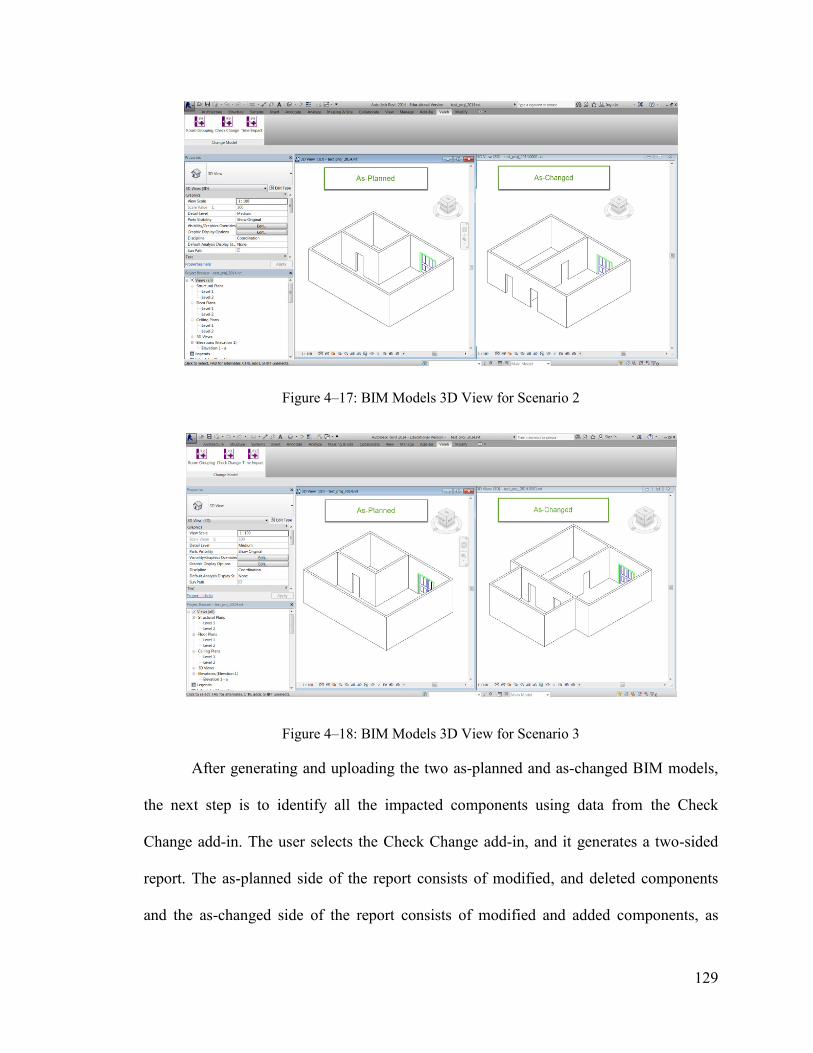
129
Figure 4–17: BIM Models 3D View for Scenario 2
Figure 4–18: BIM Models 3D View for Scenario 3
After generating and uploading the two as-planned and as-changed BIM models,
the next step is to identify all the impacted components using data from the Check
Change add-in. The user selects the Check Change add-in, and it generates a two-sided
report. The as-planned side of the report consists of modified, and deleted components
and the as-changed side of the report consists of modified and added components, as
Figure 6. Case Study Models 3D View for Scenario 3
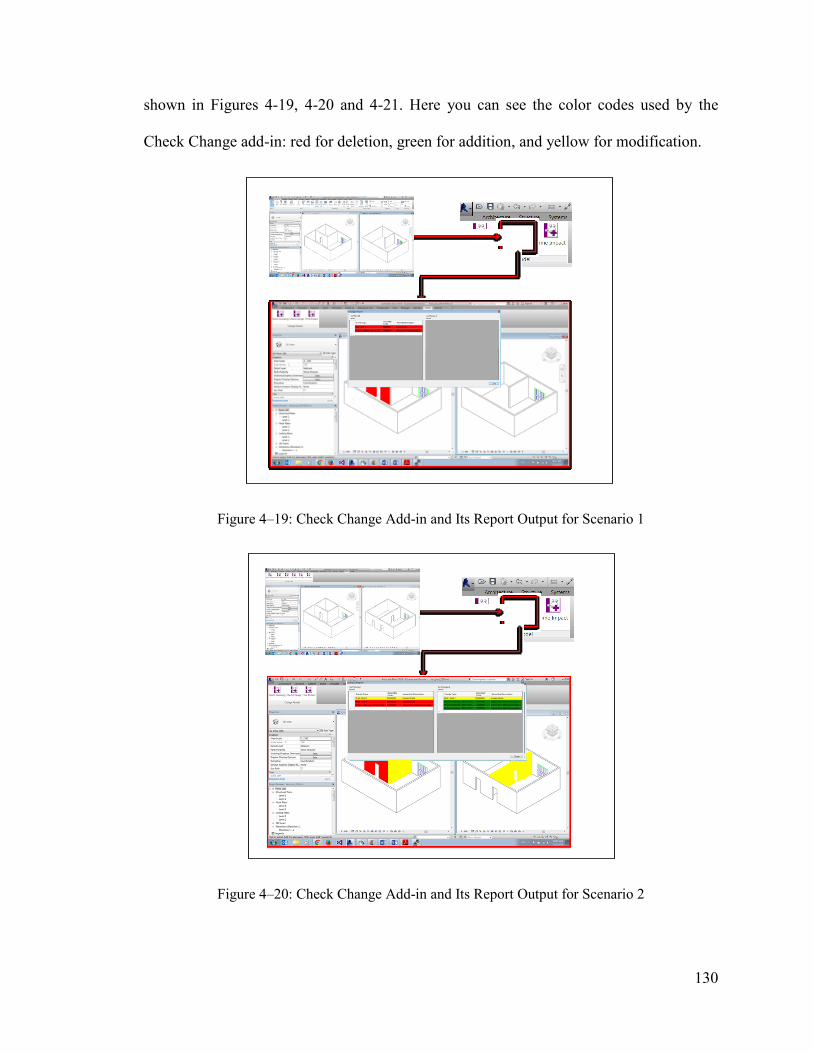
130
shown in Figures 4-19, 4-20 and 4-21. Here you can see the color codes used by the
Check Change add-in: red for deletion, green for addition, and yellow for modification.
Figure 4–19: Check Change Add-in and Its Report Output for Scenario 1
Figure 4–20: Check Change Add-in and Its Report Output for Scenario 2
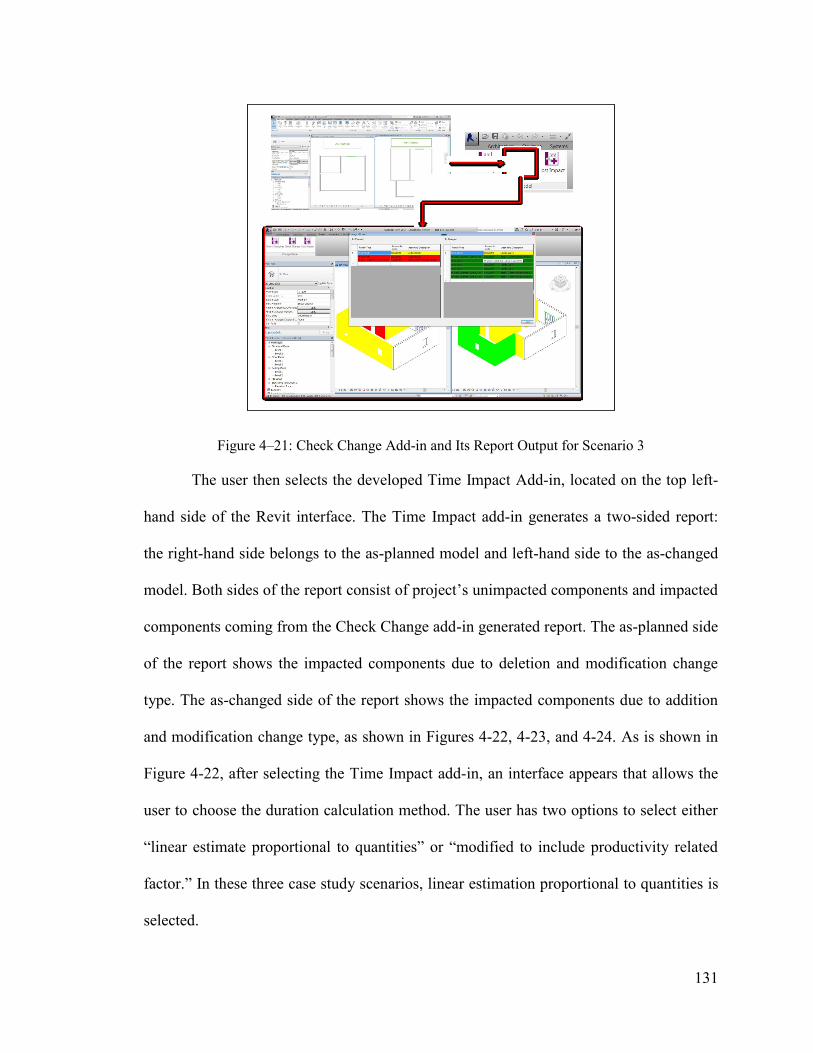
131
Figure 4–21: Check Change Add-in and Its Report Output for Scenario 3
The user then selects the developed Time Impact Add-in, located on the top left-
hand side of the Revit interface. The Time Impact add-in generates a two-sided report:
the right-hand side belongs to the as-planned model and left-hand side to the as-changed
model. Both sides of the report consist of project’s unimpacted components and impacted
components coming from the Check Change add-in generated report. The as-planned side
of the report shows the impacted components due to deletion and modification change
type. The as-changed side of the report shows the impacted components due to addition
and modification change type, as shown in Figures 4-22, 4-23, and 4-24. As is shown in
Figure 4-22, after selecting the Time Impact add-in, an interface appears that allows the
user to choose the duration calculation method. The user has two options to select either
“linear estimate proportional to quantities” or “modified to include productivity related
factor.” In these three case study scenarios, linear estimation proportional to quantities is
selected.
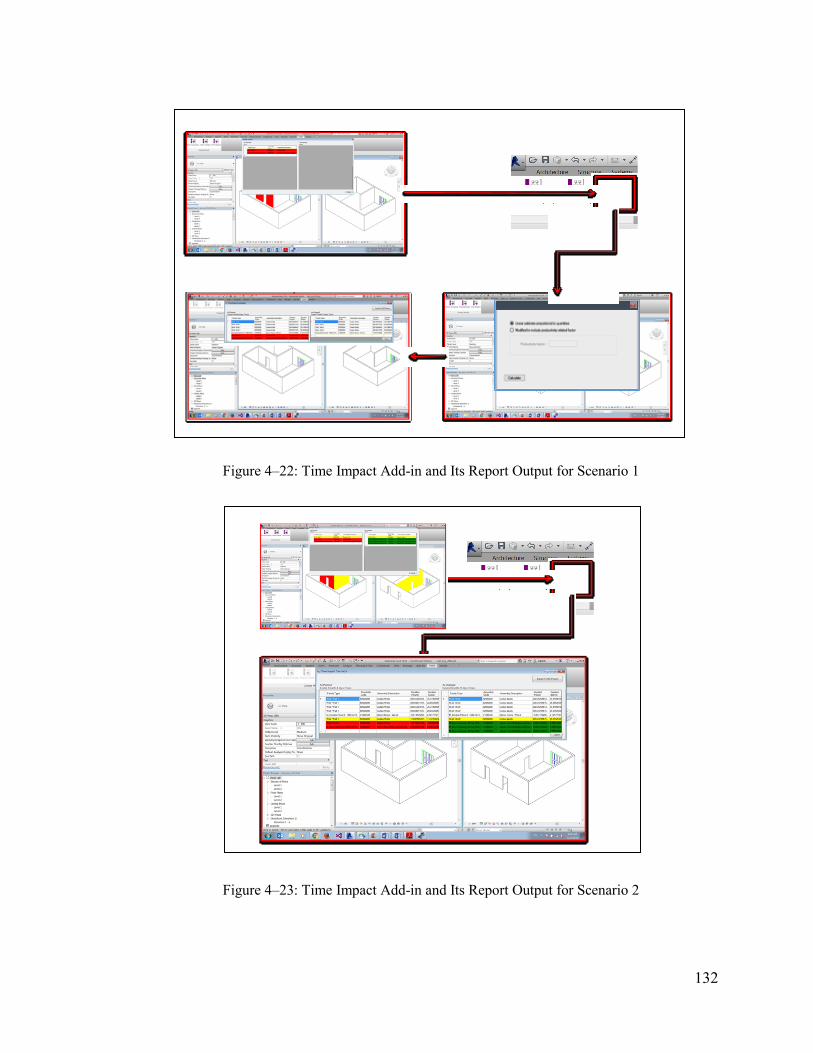
132
Figure 4–22: Time Impact Add-in and Its Report Output for Scenario 1
Figure 4–23: Time Impact Add-in and Its Report Output for Scenario 2
133
Figure 4–24: Time Impact Add-in and Its Report Output for Scenario 3
The time impact generated a report, in addition to family type, assembly code, and
assembly description, consists of components’ and the total project duration in hours and
days, and color-coded change types, as shown in Figure 4-25. The developed Time
Impact add-in is coded to calculate the duration for every impacted and unimpacted
component by multiplying the components’ quantity (Q) by their needed labor hours
(LR). When it extracts the list of impacted components, the developed Time Impact add-
in keeps the components’ color-coded highlighting for the next step, which is the
updating of the as-planned project schedule.
134
Figure 4–25: Time Impact Report Output
In this case study, the owner, after receiving the three scenarios’ time impact
reports, approved scenario number three, which is applying all changes from number one
to seven. The next move, then, is to link the time-impact report to the project as-planned
schedule and generate project as-changed schedule. The Room Grouping add-in is used
to link the impacted components’ duration to the project’s as-planned schedule to create
the as-planned schedule. To do this, the user selects the developed room grouping add-in
located on the top left-hand side of the Revit interface and selects all the components of
the project’s architectural system located in the same room or area; the selected
components are saved under the same group category, and a room ID is generated for
each group. In other words, the components belonging to the same space carry the same
room ID, as shown in Figure 4-26. All the components that are shared between two
separate areas or more are grouped in that area.
Components’ Duration in hours/days
Project Total Duration As-planned As-changed
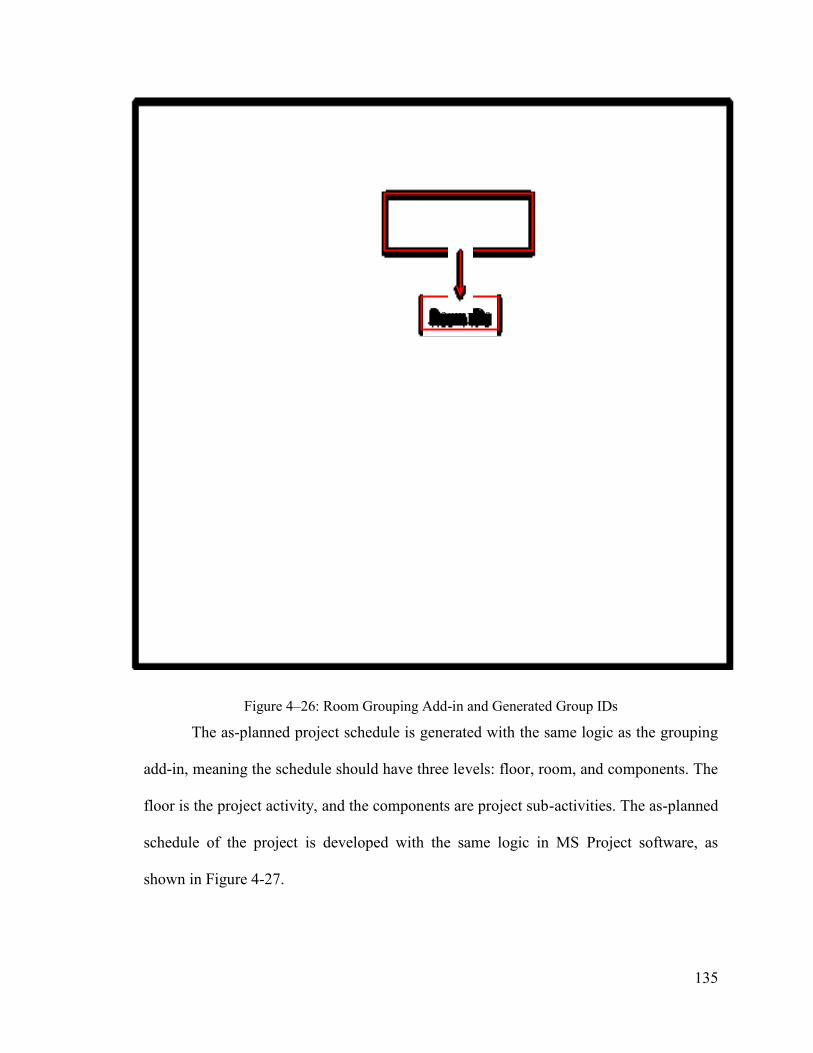
135
Figure 4–26: Room Grouping Add-in and Generated Group IDs
The as-planned project schedule is generated with the same logic as the grouping
add-in, meaning the schedule should have three levels: floor, room, and components. The
floor is the project activity, and the components are project sub-activities. The as-planned
schedule of the project is developed with the same logic in MS Project software, as
shown in Figure 4-27.
Room IDs
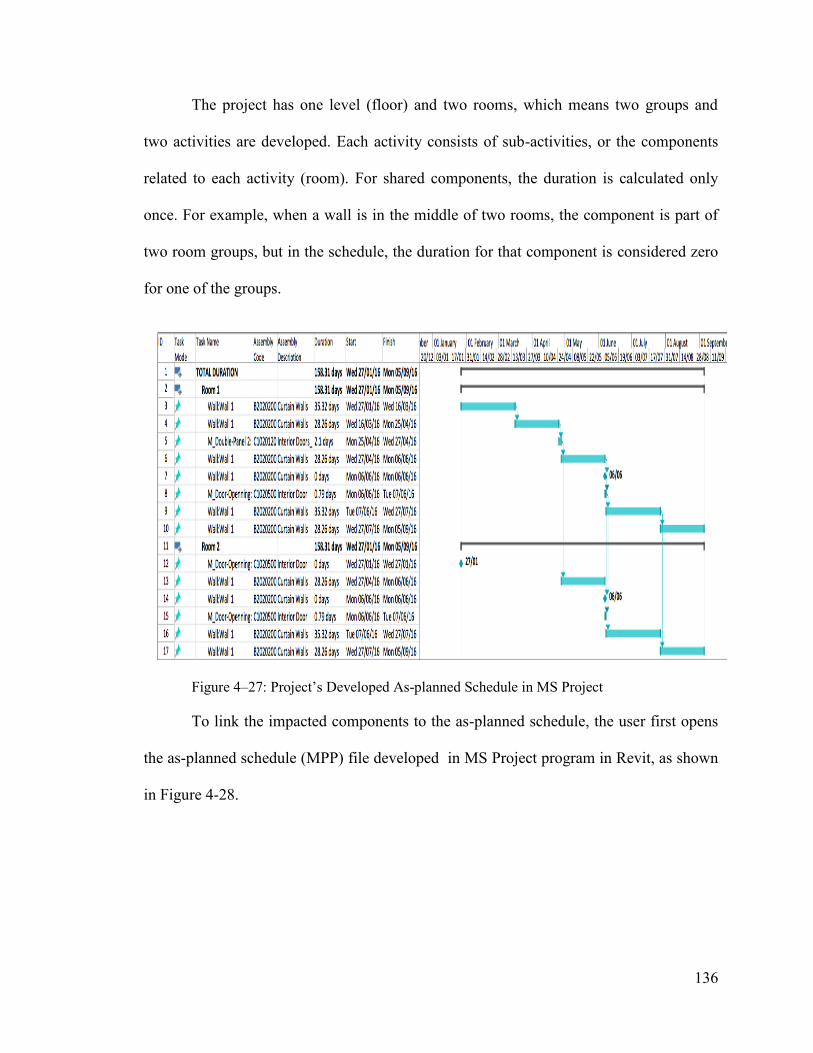
136
The project has one level (floor) and two rooms, which means two groups and
two activities are developed. Each activity consists of sub-activities, or the components
related to each activity (room). For shared components, the duration is calculated only
once. For example, when a wall is in the middle of two rooms, the component is part of
two room groups, but in the schedule, the duration for that component is considered zero
for one of the groups.
Figure 4–27: Project’s Developed As-planned Schedule in MS Project
To link the impacted components to the as-planned schedule, the user first opens
the as-planned schedule (MPP) file developed in MS Project program in Revit, as shown
in Figure 4-28.
137
Figure 4–28: Browsing for As-planned Schedule in MPP File Format
Then, the developed model links changes’ duration to the schedule by matching
the as-planned components unique IDs with the unique IDs of the developed time impact
add-in report. The developed model is coded in order to find activities that belong to the
impacted components by matching the as-planned group’s IDs with the time impact
report’s component group IDs. By mapping and updating the impacted components’
duration into the project as-planned schedule the project activity and total duration are
automatically updated in the updated schedule and generate the as-changed schedule in
CSV ("Comma Separated Values") file format in Revit. Now, the user selects the “export
to MS project” add-in on the top right-hand side of the time impact main interface to
export the as-changed CSV file to MS Project, as shown in Figure 4-29.
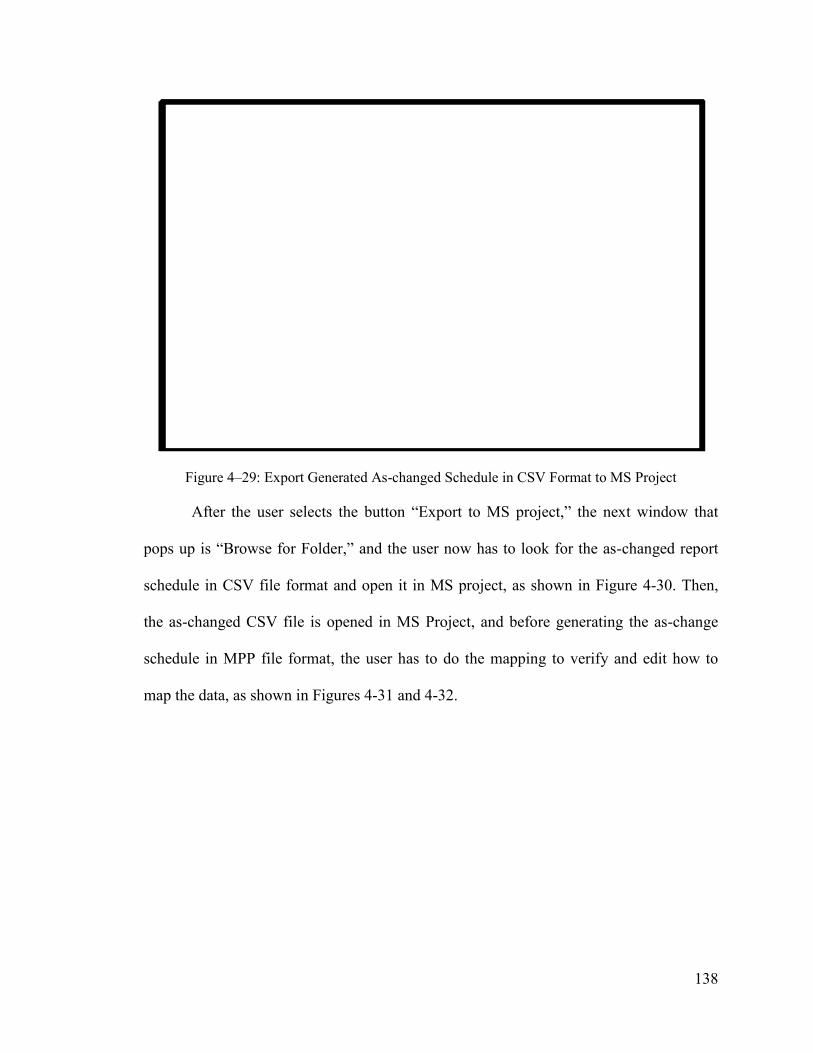
138
Figure 4–29: Export Generated As-changed Schedule in CSV Format to MS Project
After the user selects the button “Export to MS project,” the next window that
pops up is “Browse for Folder,” and the user now has to look for the as-changed report
schedule in CSV file format and open it in MS project, as shown in Figure 4-30. Then,
the as-changed CSV file is opened in MS Project, and before generating the as-change
schedule in MPP file format, the user has to do the mapping to verify and edit how to
map the data, as shown in Figures 4-31 and 4-32.
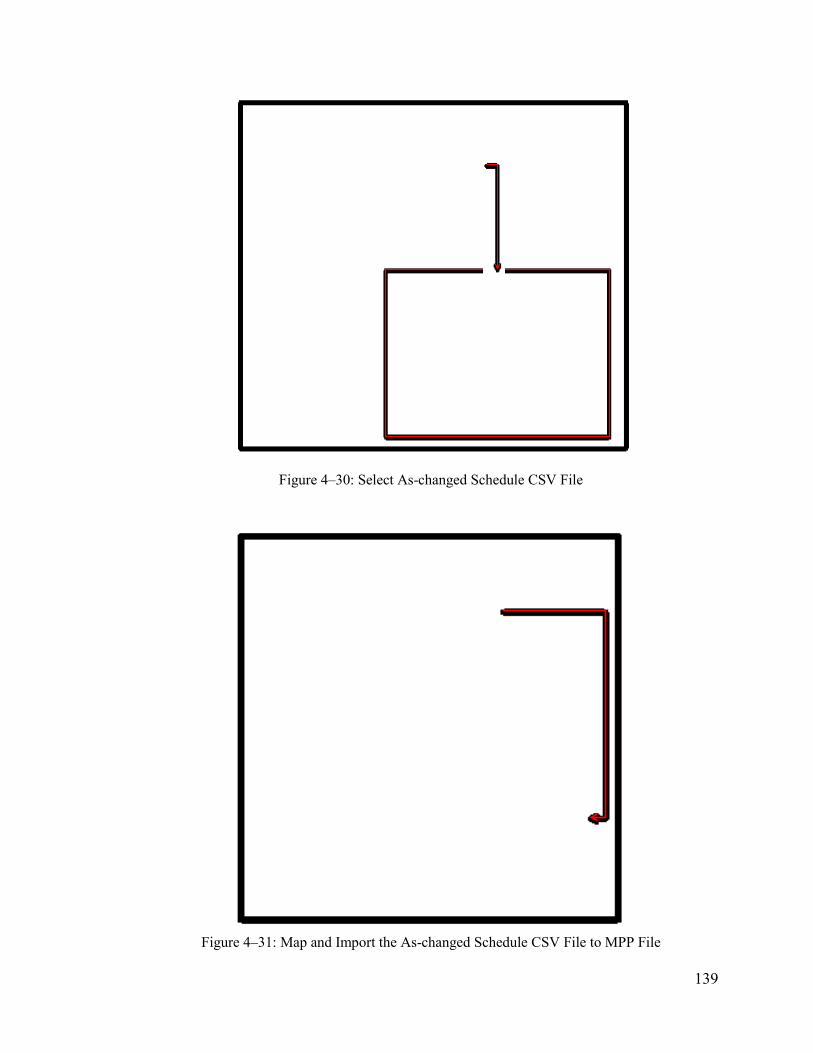
139
Figure 4–30: Select As-changed Schedule CSV File
Figure 4–31: Map and Import the As-changed Schedule CSV File to MPP File

140
Figure 4–32: Task Mapping
The user, after mapping the CSV file, now clicks the next button, then clicks
“save as MPP file,” finally clicks on the finish button. The user opens the saved MPP file,
and the project’s updated “as-changed” schedule should open, as shown in Figure 4-33.
141
Figure 4–33: Generating the As-changed Schedule in MPP File Format
ID Task Mode
Task Name Assembly Code
Assembly Description
Duration Start Finish
1 Room 1 159.1 days Wed 27/01/16 Tue 06/09/16
2 Wall:Wall 1 B2020200 Curtain Walls 28.26 days Wed 27/01/16 Mon 07/03/16
3 M_Double‐Panel 2: 1830 * 2130 C1020120 Interior Doors_ 2.1 days Mon 07/03/16 Wed 09/03/16
4 Wall:Wall 1 B2020200 Curtain Walls 28.26 days Wed 09/03/16 Mon 18/04/16
5 Wall:Wall 1 B2020200 Curtain Walls 0 days Mon 18/04/16 Mon 18/04/16
6 M_Door‐Openning: 0915 * 2134 C1020500 Interior Door 0.79 days Mon 18/04/16 Tue 19/04/16
7 Wall:Wall 1 B2020200 Curtain Walls 35.32 days Tue 19/04/16 Tue 07/06/16
8 Wall:Wall 1 B2020200 Curtain Walls 28.26 days Tue 07/06/16 Fri 15/07/16
9 M_Door‐Openning: 0915 * 2134 C1020500 Interior Door 0.79 days Fri 15/07/16 Mon 18/07/16
10 Wall:Wall 1 B2020200 Curtain Walls 35.32 days Mon 18/07/16 Tue 06/09/16
11 Room 2 159.1 days Wed 27/01/16 Tue 06/09/16
12 M_Door‐Openning: 0915 * 2134 C1020500 Interior Door 0 days Wed 27/01/16 Wed 27/01/16
13 M_Door‐Openning: 0915 * 2134 C1020500 Interior Door 0.79 days Wed 27/01/16 Wed 27/01/16
14 Wall:Wall 1 B2020200 Curtain Walls 28.26 days Wed 09/03/16 Mon 18/04/16
15 Wall:Wall 1 B2020200 Curtain Walls 0 days Mon 18/04/16 Mon 18/04/16
16 M_Door‐Openning: 0915 * 2134 C1020500 Interior Door 0.79 days Mon 18/04/16 Tue 19/04/16
17 Wall:Wall 1 B2020200 Curtain Walls 35.32 days Tue 19/04/16 Tue 07/06/16
18 Wall:Wall 1 B2020200 Curtain Walls 28.26 days Tue 07/06/16 Fri 15/07/16
19 Wall:Wall 1 B2020200 Curtain Walls 35.32 days Mon 18/07/16 Tue 06/09/16
20 Room 3 159.1 days Wed 27/01/16 Tue 06/09/16
21 Wall:Wall 1 B2020200 Curtain Walls 17.66 days Wed 27/01/16 Fri 19/02/16
22 Wall:Wall 1 B2020200 Curtain Walls 21.19 days Fri 19/02/16 Mon 21/03/16
23 Wall:Wall 1 B2020200 Curtain Walls 17.66 days Mon 21/03/16 Thu 14/04/16
24 M_Door‐Openning: 0915 * 2134 C1020500 Interior Door 0.79 days Thu 14/04/16 Fri 15/04/16
25 M_Door‐Openning: 0915 * 2134 C1020500 Interior Door 0.79 days Fri 15/04/16 Mon 18/04/16
26 Wall:Wall 1 B2020200 Curtain Walls 35.32 days Mon 18/07/16 Tue 06/09/16
18/04
27/01
18/04
20/12 03/01 17/01 31/01 14/02 28/02 13/03 27/03 10/04 24/04 08/05 22/05 05/06 19/06 03/07 17/07 31/07 14/08 28/08 11/09 2mber 01 January 01 February 01 March 01 April 01 May 01 June 01 July 01 August 01 Septemb
Task
Split
Milestone
Summary
Project Summary
External Tasks
External Milestone
Inactive Task
Inactive Milestone
Inactive Summary
Manual Task
Duration‐only
Manual Summary Rollup
Manual Summary
Start‐only
Finish‐only
Deadline
Progress
Manual Progress
Page 1
Project: As‐Changed MSProject ReDate: Tue 26/01/16
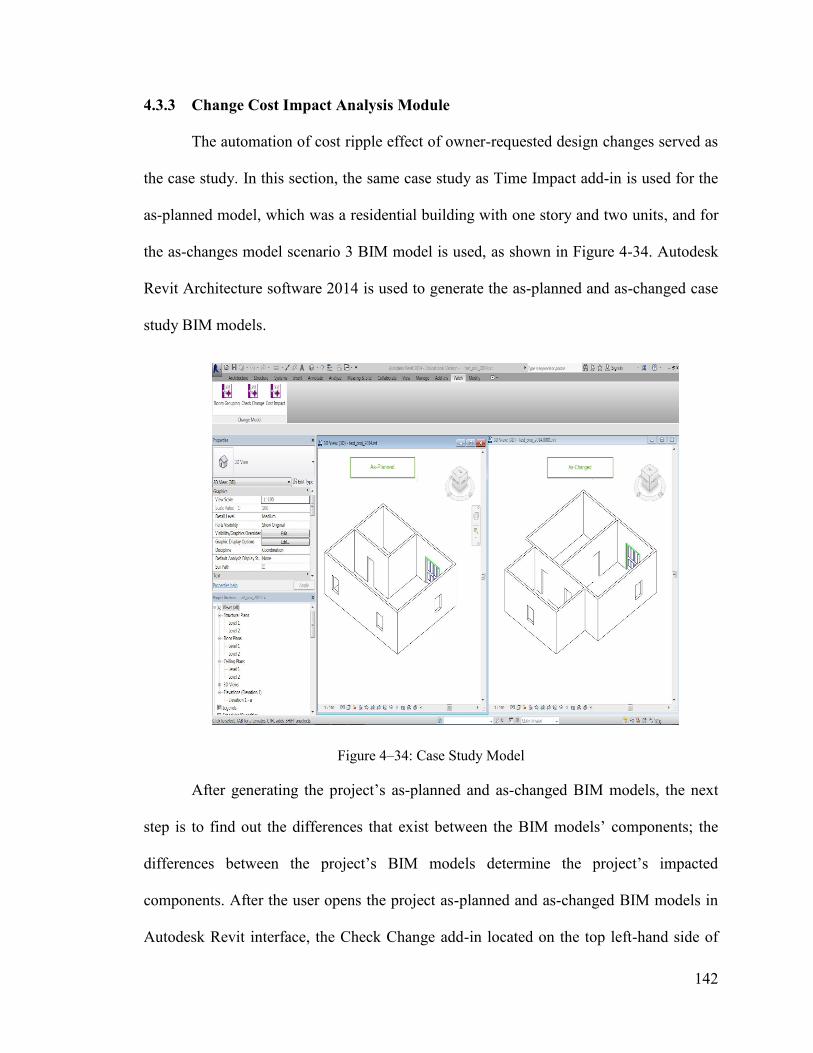
142
4.3.3 Change Cost Impact Analysis Module
The automation of cost ripple effect of owner-requested design changes served as
the case study. In this section, the same case study as Time Impact add-in is used for the
as-planned model, which was a residential building with one story and two units, and for
the as-changes model scenario 3 BIM model is used, as shown in Figure 4-34. Autodesk
Revit Architecture software 2014 is used to generate the as-planned and as-changed case
study BIM models.
Figure 4–34: Case Study Model
After generating the project’s as-planned and as-changed BIM models, the next
step is to find out the differences that exist between the BIM models’ components; the
differences between the project’s BIM models determine the project’s impacted
components. After the user opens the project as-planned and as-changed BIM models in
Autodesk Revit interface, the Check Change add-in located on the top left-hand side of
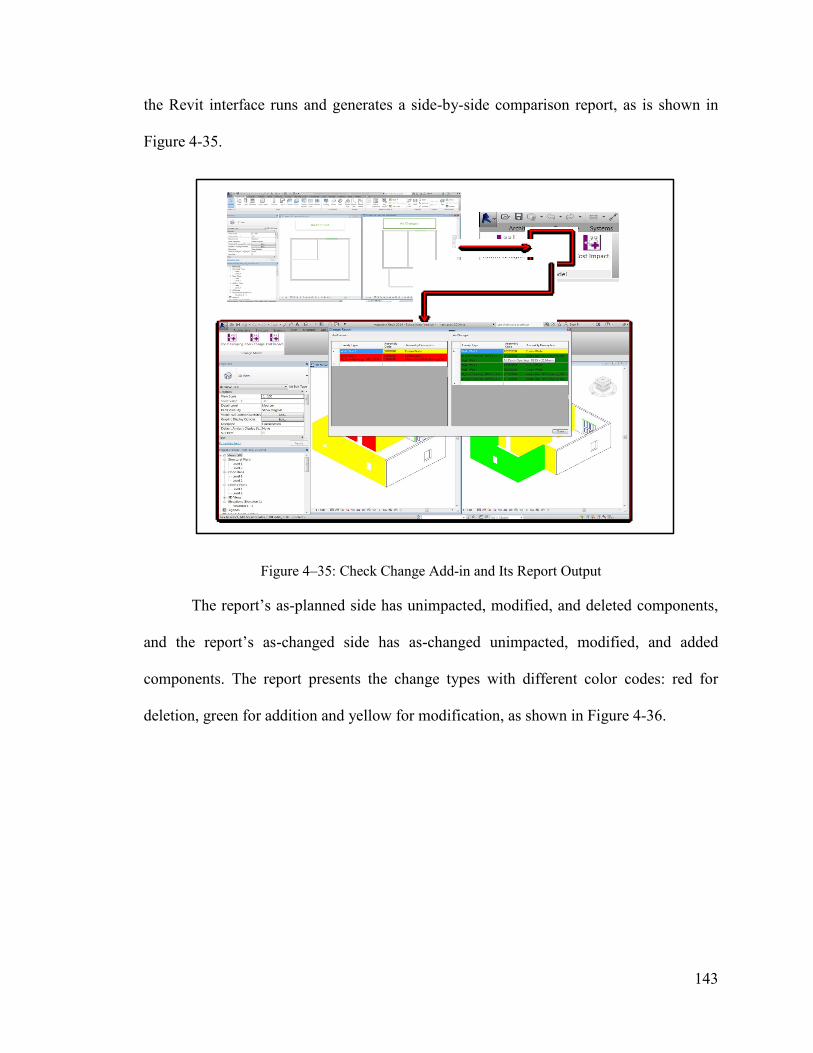
143
the Revit interface runs and generates a side-by-side comparison report, as is shown in
Figure 4-35.
Figure 4–35: Check Change Add-in and Its Report Output
The report’s as-planned side has unimpacted, modified, and deleted components,
and the report’s as-changed side has as-changed unimpacted, modified, and added
components. The report presents the change types with different color codes: red for
deletion, green for addition and yellow for modification, as shown in Figure 4-36.
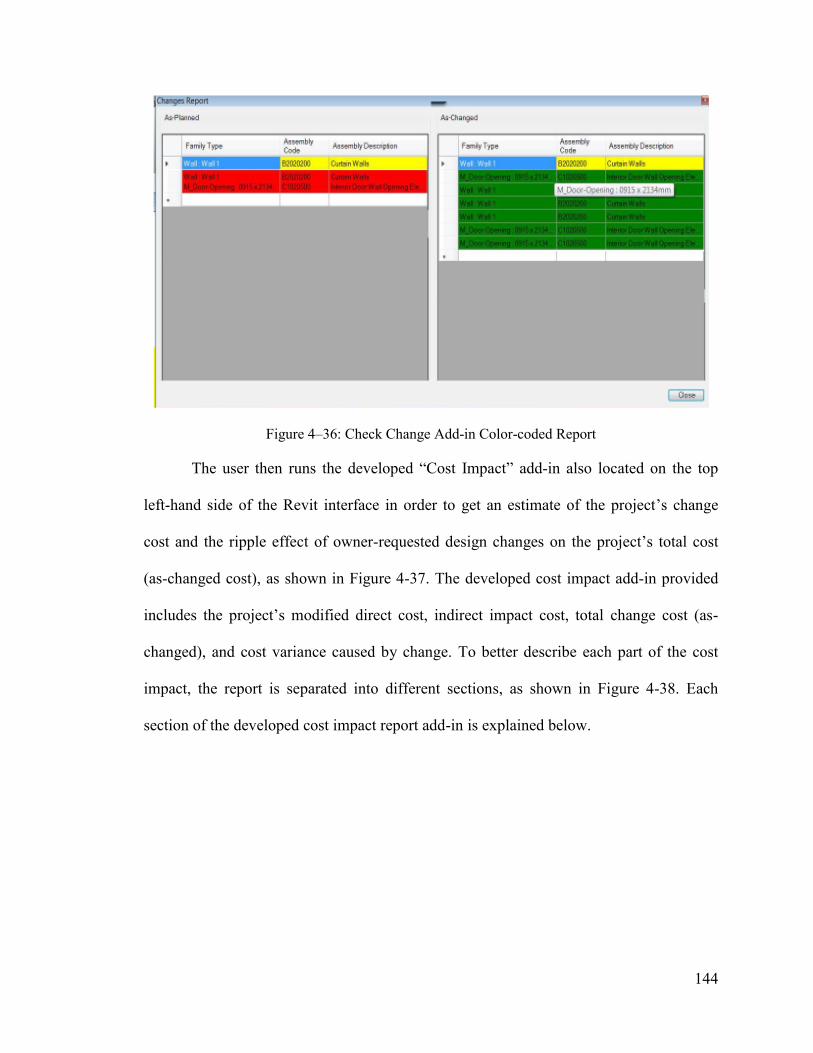
144
Figure 4–36: Check Change Add-in Color-coded Report
The user then runs the developed “Cost Impact” add-in also located on the top
left-hand side of the Revit interface in order to get an estimate of the project’s change
cost and the ripple effect of owner-requested design changes on the project’s total cost
(as-changed cost), as shown in Figure 4-37. The developed cost impact add-in provided
includes the project’s modified direct cost, indirect impact cost, total change cost (as-
changed), and cost variance caused by change. To better describe each part of the cost
impact, the report is separated into different sections, as shown in Figure 4-38. Each
section of the developed cost impact report add-in is explained below.
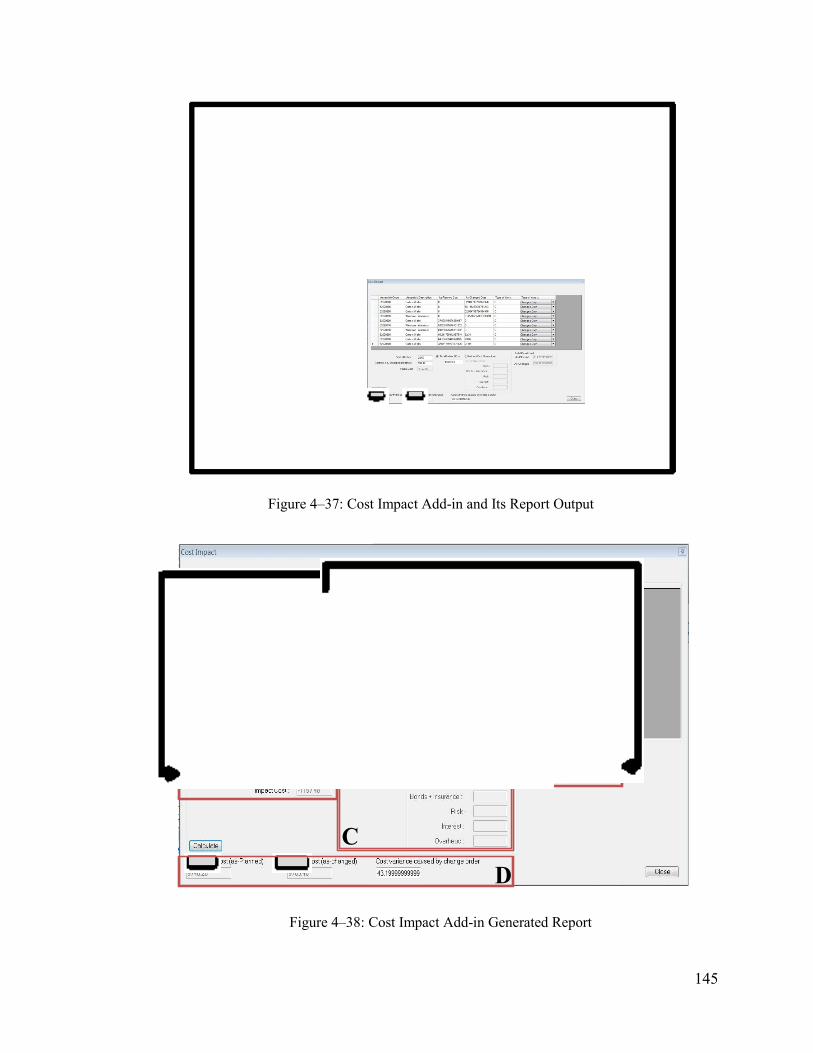
145
Figure 4–37: Cost Impact Add-in and Its Report Output
Figure 4–38: Cost Impact Add-in Generated Report
A B
C
D
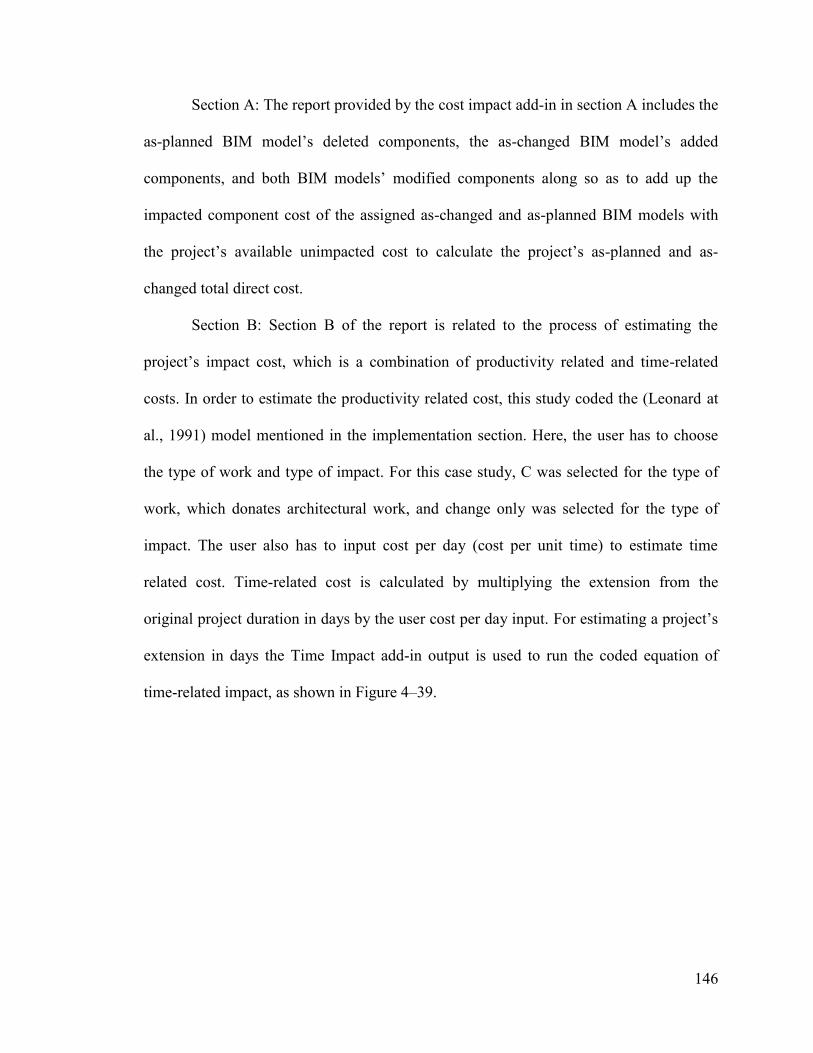
146
Section A: The report provided by the cost impact add-in in section A includes the
as-planned BIM model’s deleted components, the as-changed BIM model’s added
components, and both BIM models’ modified components along so as to add up the
impacted component cost of the assigned as-changed and as-planned BIM models with
the project’s available unimpacted cost to calculate the project’s as-planned and as-
changed total direct cost.
Section B: Section B of the report is related to the process of estimating the
project’s impact cost, which is a combination of productivity related and time-related
costs. In order to estimate the productivity related cost, this study coded the (Leonard at
al., 1991) model mentioned in the implementation section. Here, the user has to choose
the type of work and type of impact. For this case study, C was selected for the type of
work, which donates architectural work, and change only was selected for the type of
impact. The user also has to input cost per day (cost per unit time) to estimate time
related cost. Time-related cost is calculated by multiplying the extension from the
original project duration in days by the user cost per day input. For estimating a project’s
extension in days the Time Impact add-in output is used to run the coded equation of
time-related impact, as shown in Figure 4–39.
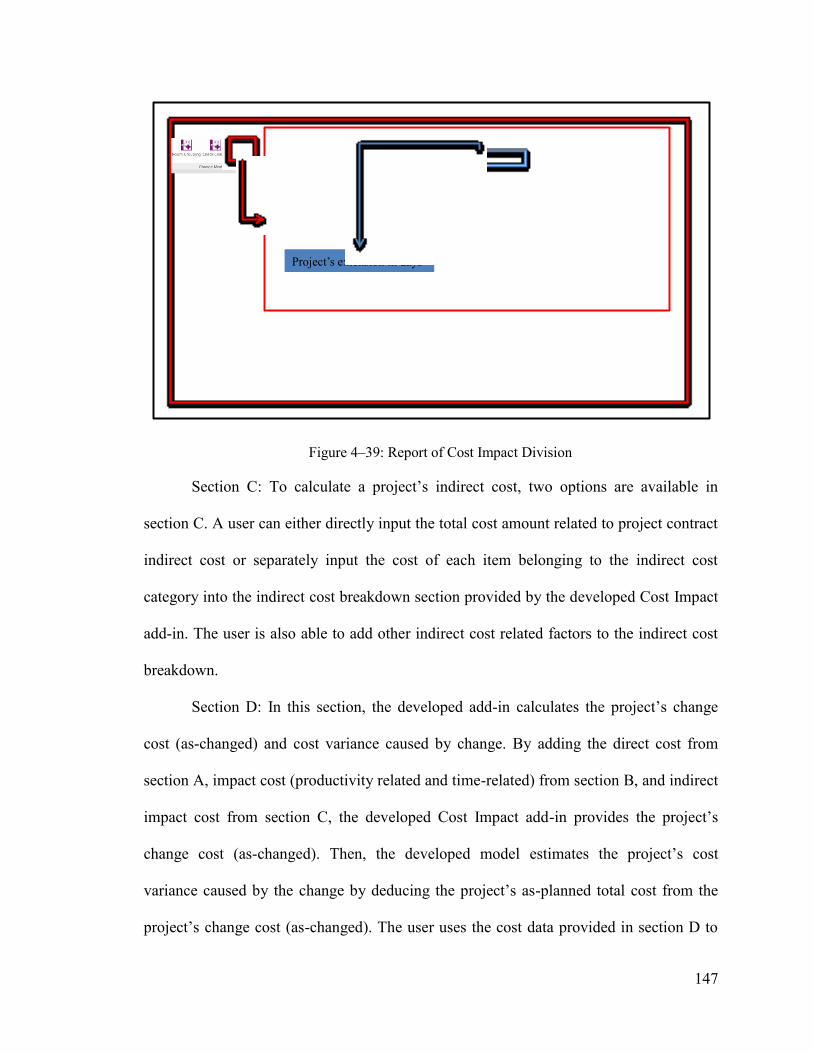
147
Figure 4–39: Report of Cost Impact Division
Section C: To calculate a project’s indirect cost, two options are available in
section C. A user can either directly input the total cost amount related to project contract
indirect cost or separately input the cost of each item belonging to the indirect cost
category into the indirect cost breakdown section provided by the developed Cost Impact
add-in. The user is also able to add other indirect cost related factors to the indirect cost
breakdown.
Section D: In this section, the developed add-in calculates the project’s change
cost (as-changed) and cost variance caused by change. By adding the direct cost from
section A, impact cost (productivity related and time-related) from section B, and indirect
impact cost from section C, the developed Cost Impact add-in provides the project’s
change cost (as-changed). Then, the developed model estimates the project’s cost
variance caused by the change by deducing the project’s as-planned total cost from the
project’s change cost (as-changed). The user uses the cost data provided in section D to
Project’s extension in days
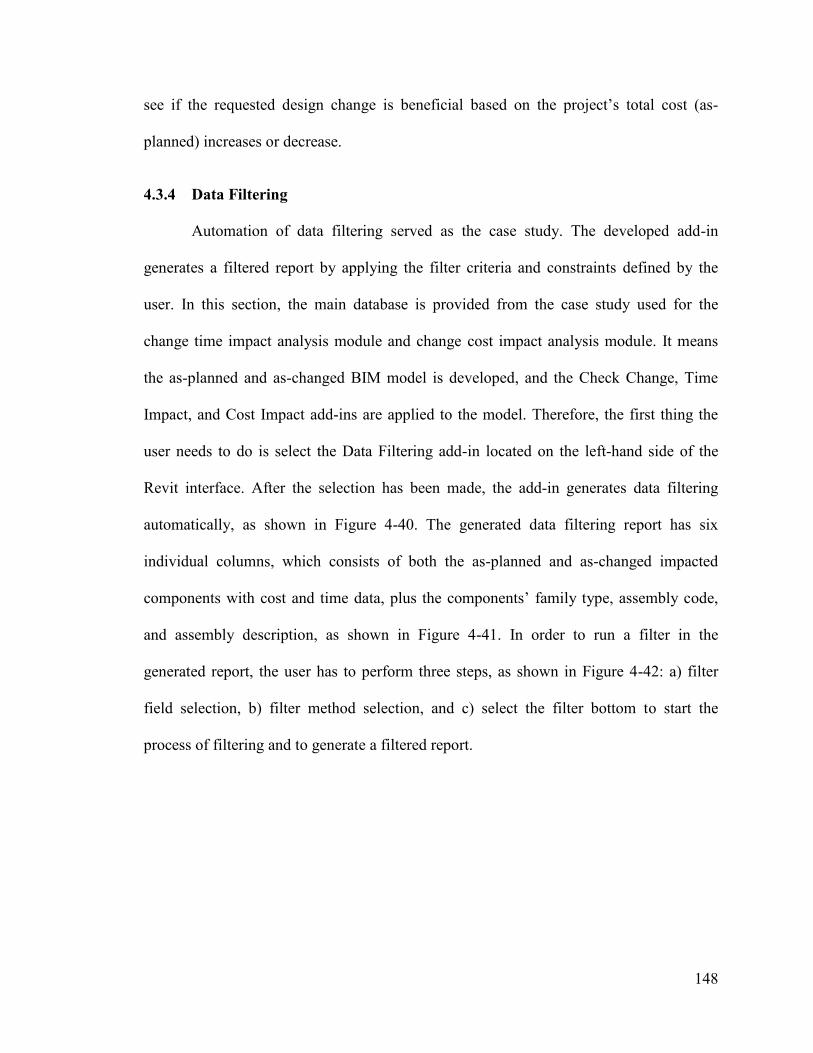
148
see if the requested design change is beneficial based on the project’s total cost (as-
planned) increases or decrease.
4.3.4 Data Filtering
Automation of data filtering served as the case study. The developed add-in
generates a filtered report by applying the filter criteria and constraints defined by the
user. In this section, the main database is provided from the case study used for the
change time impact analysis module and change cost impact analysis module. It means
the as-planned and as-changed BIM model is developed, and the Check Change, Time
Impact, and Cost Impact add-ins are applied to the model. Therefore, the first thing the
user needs to do is select the Data Filtering add-in located on the left-hand side of the
Revit interface. After the selection has been made, the add-in generates data filtering
automatically, as shown in Figure 4-40. The generated data filtering report has six
individual columns, which consists of both the as-planned and as-changed impacted
components with cost and time data, plus the components’ family type, assembly code,
and assembly description, as shown in Figure 4-41. In order to run a filter in the
generated report, the user has to perform three steps, as shown in Figure 4-42: a) filter
field selection, b) filter method selection, and c) select the filter bottom to start the
process of filtering and to generate a filtered report.
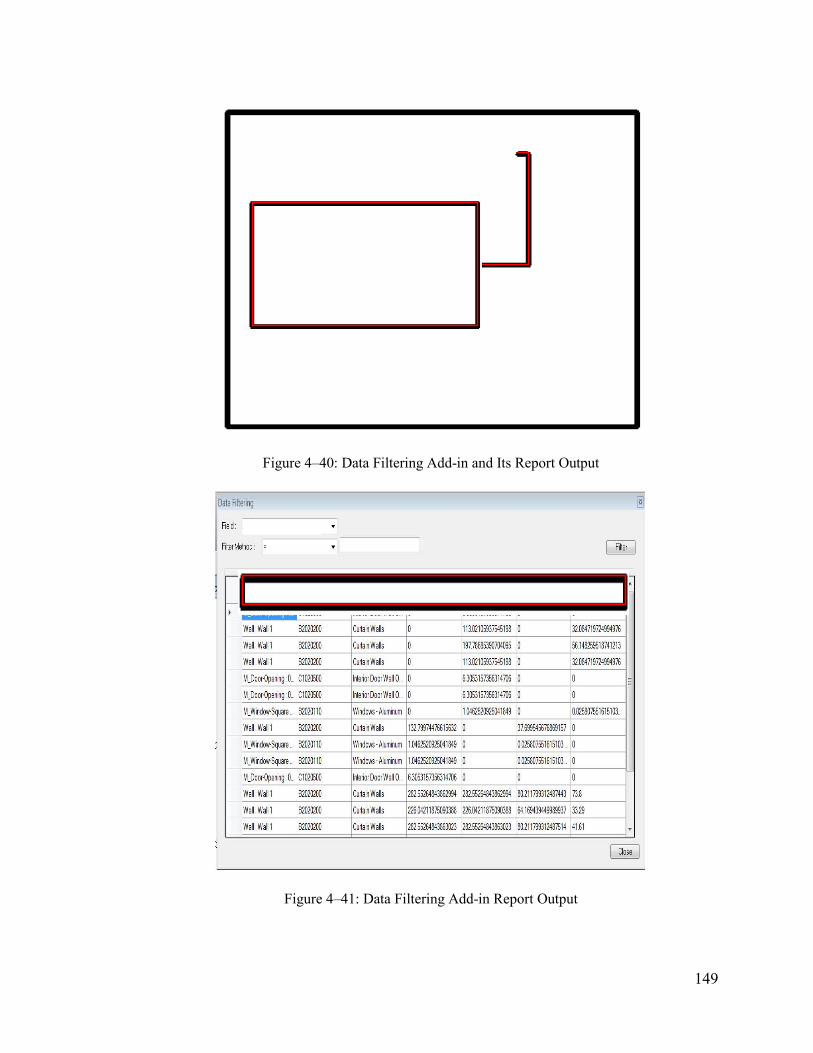
149
Figure 4–40: Data Filtering Add-in and Its Report Output
Figure 4–41: Data Filtering Add-in Report Output
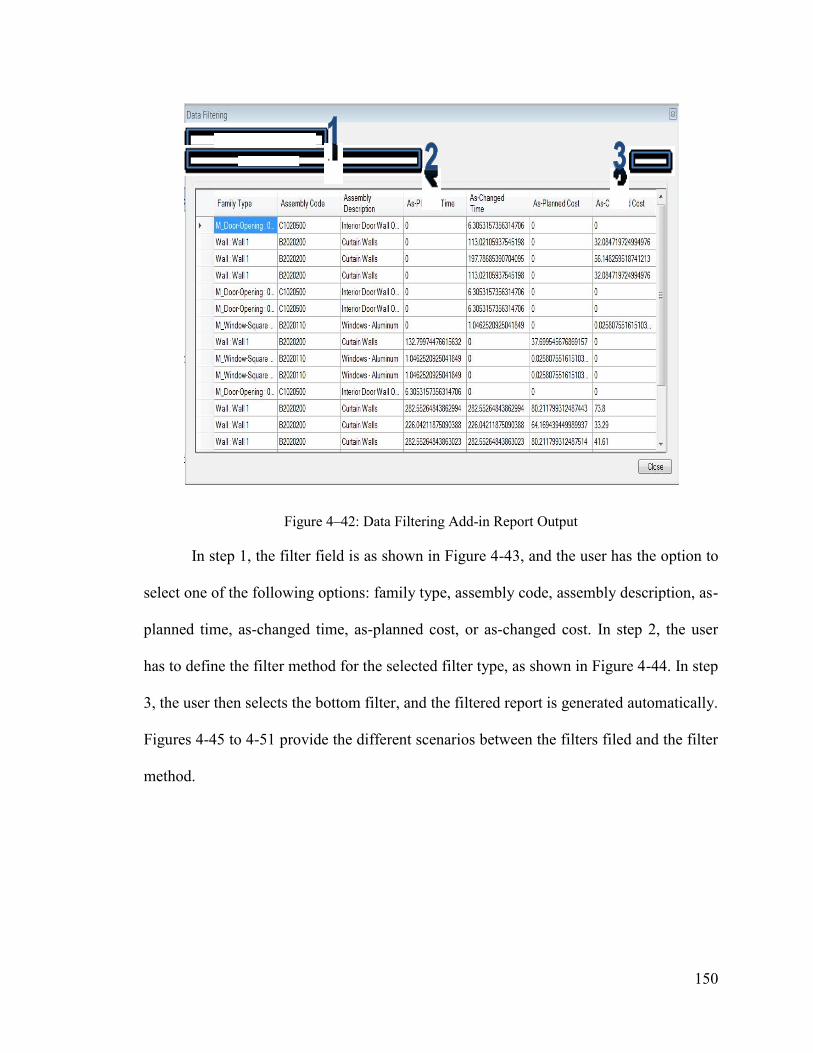
150
Figure 4–42: Data Filtering Add-in Report Output
In step 1, the filter field is as shown in Figure 4-43, and the user has the option to
select one of the following options: family type, assembly code, assembly description, as-
planned time, as-changed time, as-planned cost, or as-changed cost. In step 2, the user
has to define the filter method for the selected filter type, as shown in Figure 4-44. In step
3, the user then selects the bottom filter, and the filtered report is generated automatically.
Figures 4-45 to 4-51 provide the different scenarios between the filters filed and the filter
method.
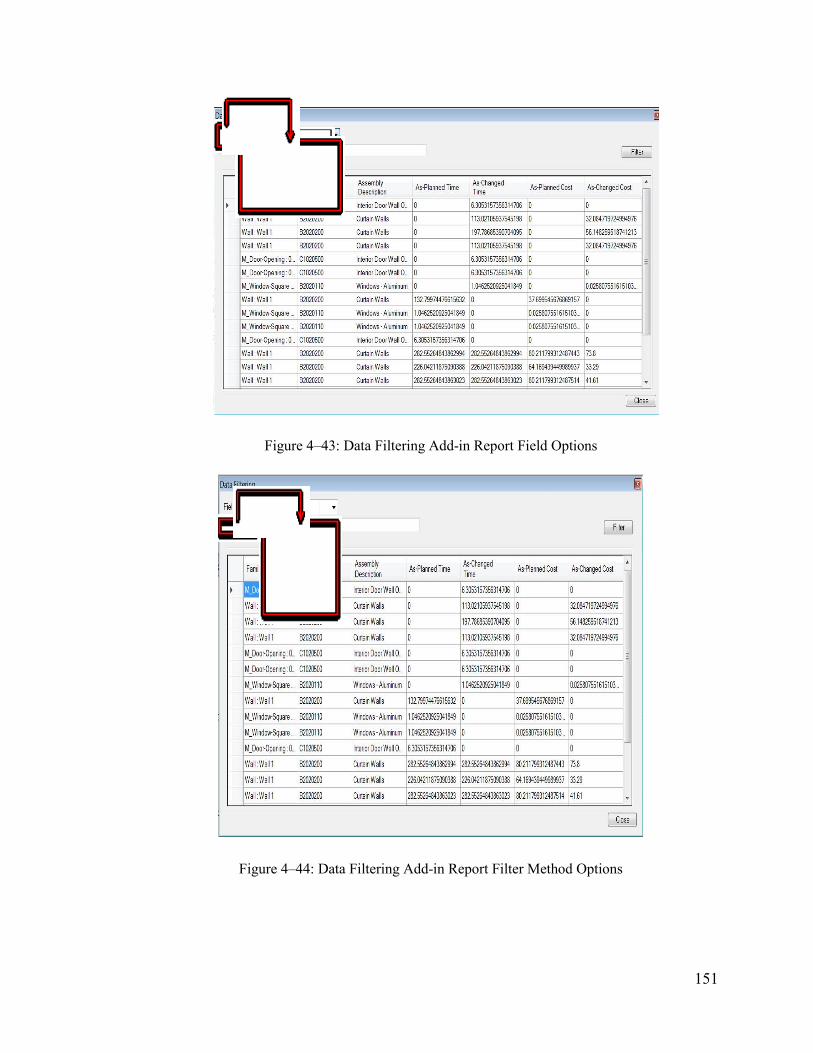
151
Figure 4–43: Data Filtering Add-in Report Field Options
Figure 4–44: Data Filtering Add-in Report Filter Method Options
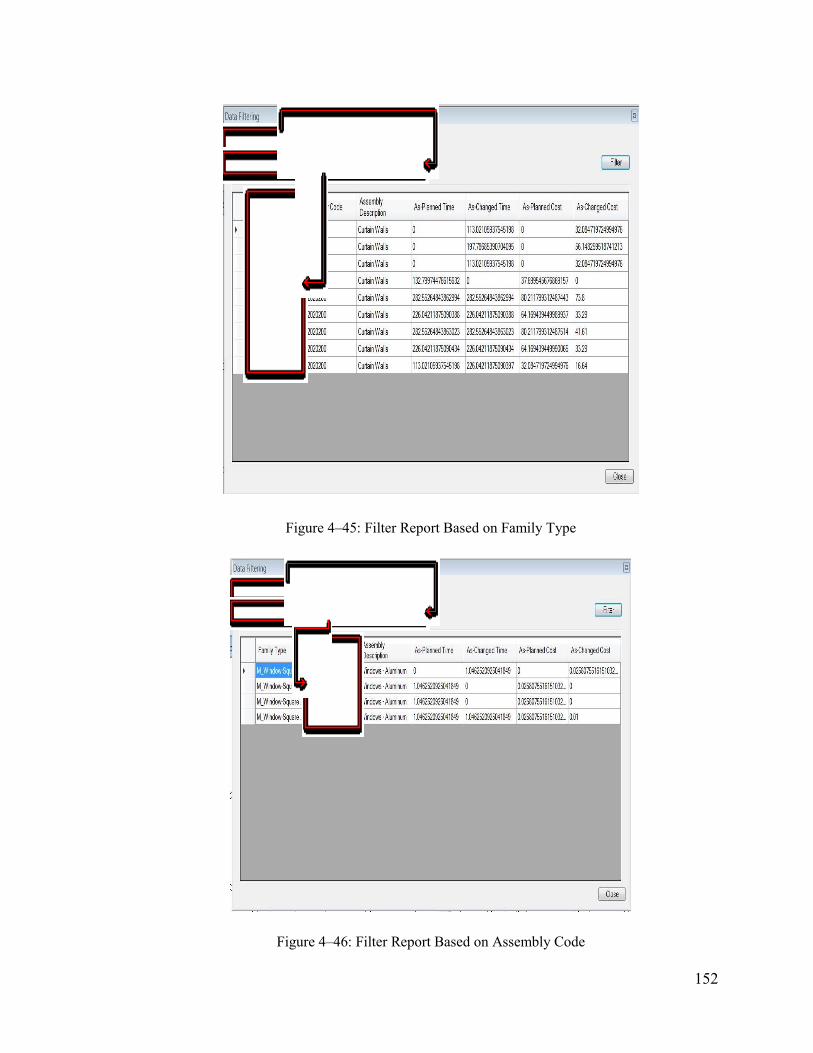
152
Figure 4–45: Filter Report Based on Family Type
Figure 4–46: Filter Report Based on Assembly Code
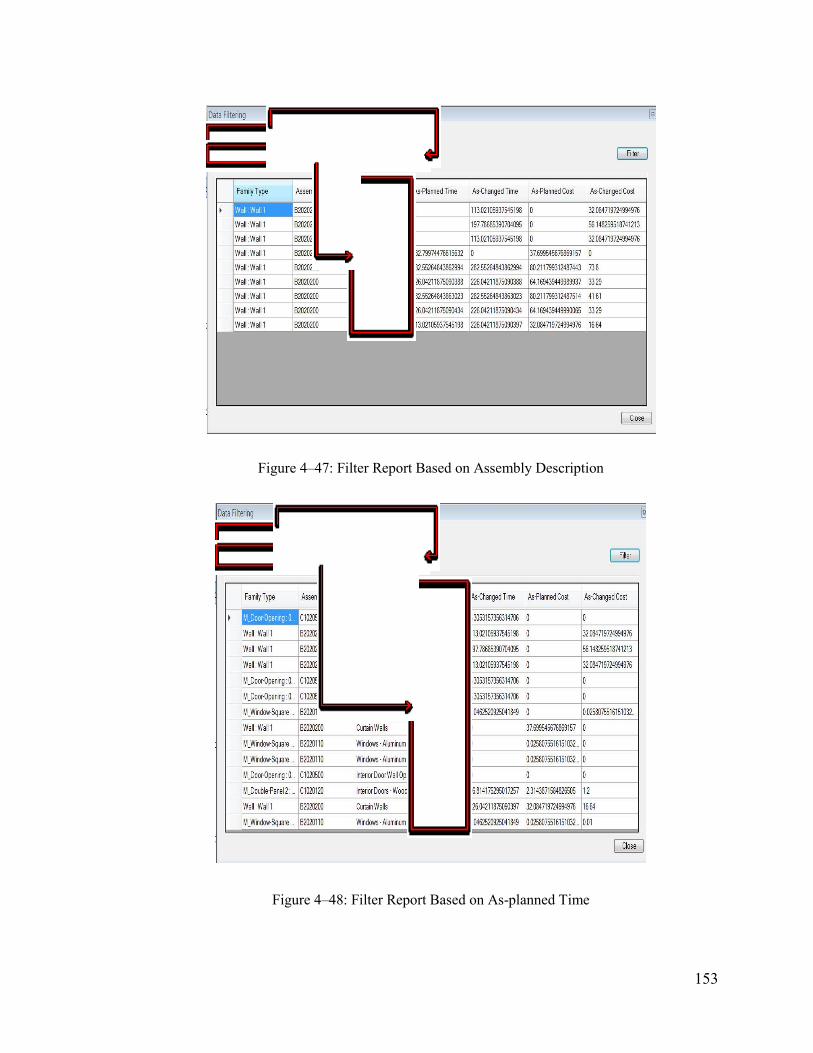
153
Figure 4–47: Filter Report Based on Assembly Description
Figure 4–48: Filter Report Based on As-planned Time
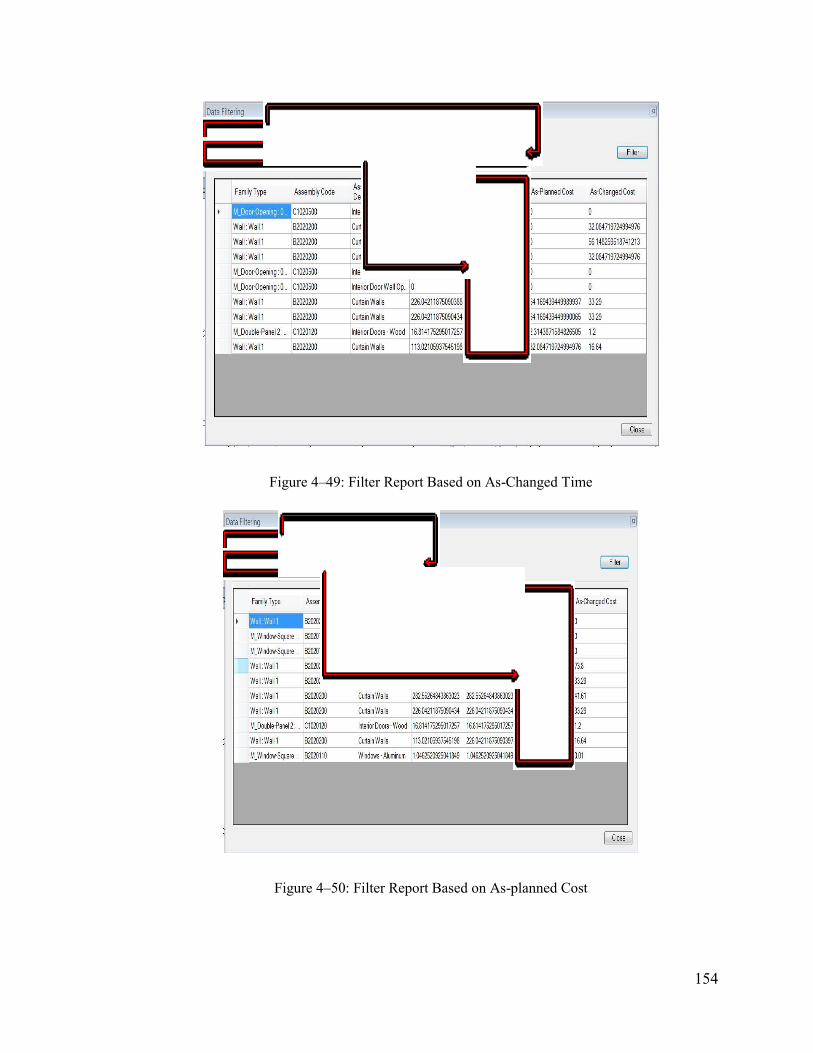
154
Figure 4–49: Filter Report Based on As-Changed Time
Figure 4–50: Filter Report Based on As-planned Cost
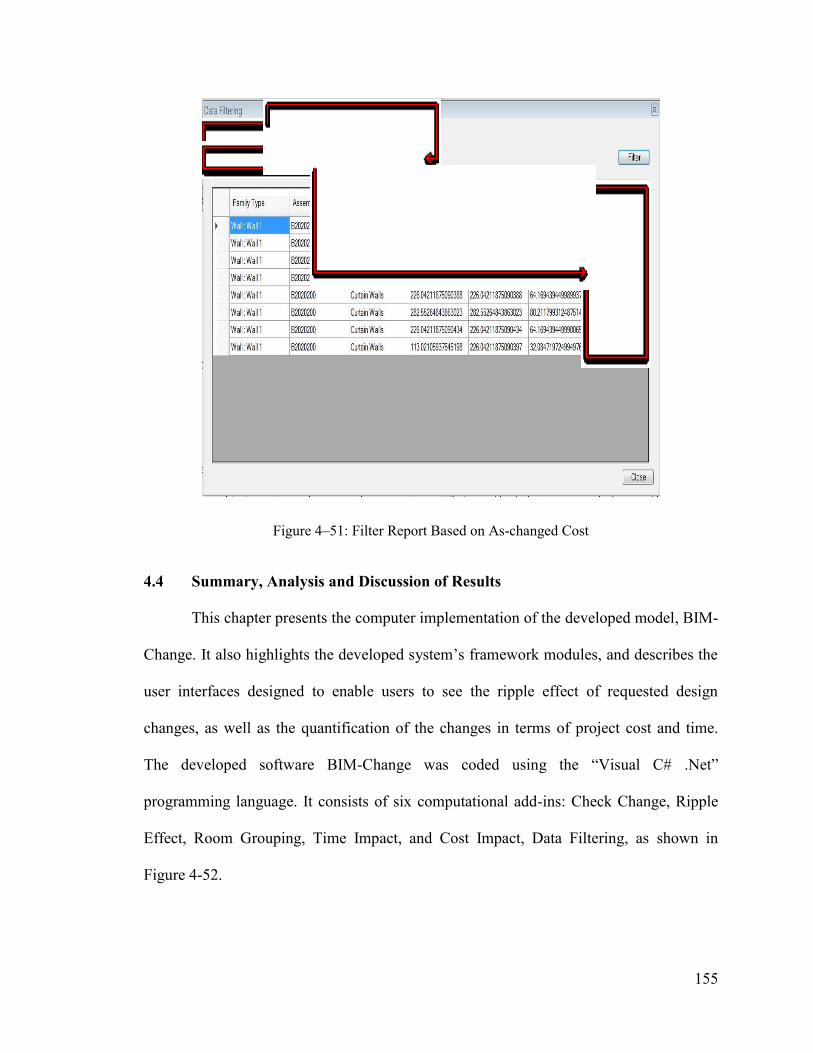
155
Figure 4–51: Filter Report Based on As-changed Cost
4.4 Summary, Analysis and Discussion of Results
This chapter presents the computer implementation of the developed model, BIM-
Change. It also highlights the developed system’s framework modules, and describes the
user interfaces designed to enable users to see the ripple effect of requested design
changes, as well as the quantification of the changes in terms of project cost and time.
The developed software BIM-Change was coded using the “Visual C# .Net”
programming language. It consists of six computational add-ins: Check Change, Ripple
Effect, Room Grouping, Time Impact, and Cost Impact, Data Filtering, as shown in
Figure 4-52.
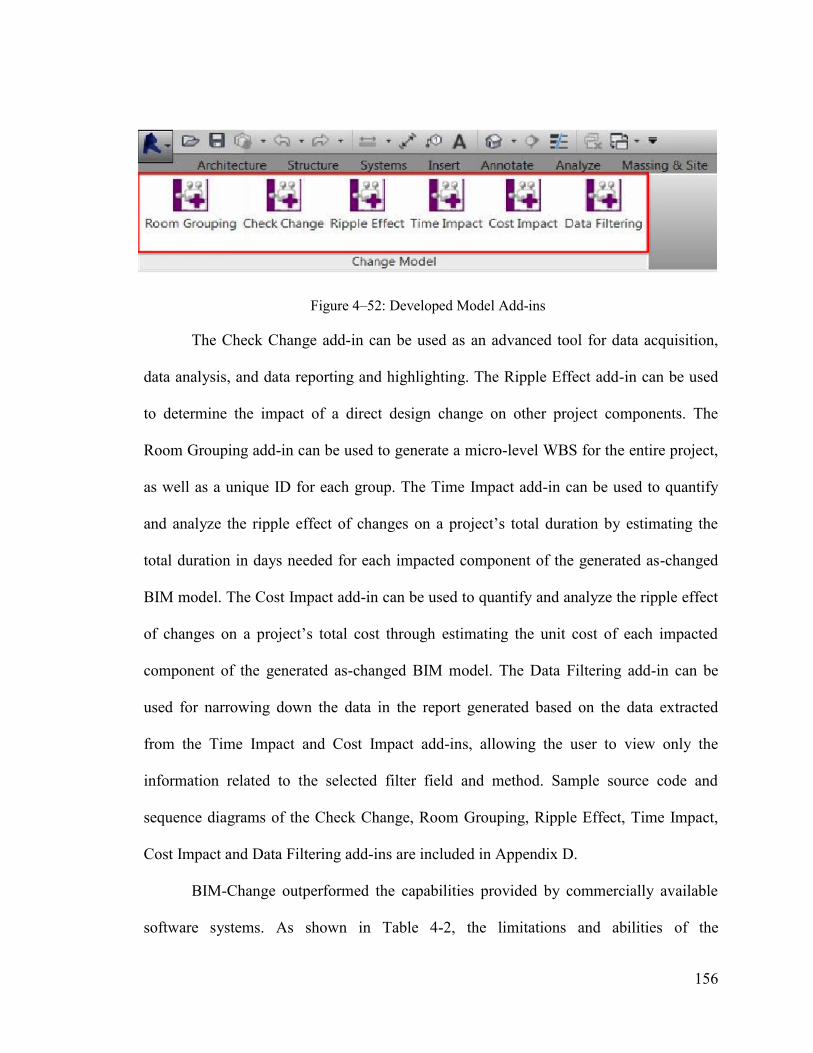
156
Figure 4–52: Developed Model Add-ins
The Check Change add-in can be used as an advanced tool for data acquisition,
data analysis, and data reporting and highlighting. The Ripple Effect add-in can be used
to determine the impact of a direct design change on other project components. The
Room Grouping add-in can be used to generate a micro-level WBS for the entire project,
as well as a unique ID for each group. The Time Impact add-in can be used to quantify
and analyze the ripple effect of changes on a project’s total duration by estimating the
total duration in days needed for each impacted component of the generated as-changed
BIM model. The Cost Impact add-in can be used to quantify and analyze the ripple effect
of changes on a project’s total cost through estimating the unit cost of each impacted
component of the generated as-changed BIM model. The Data Filtering add-in can be
used for narrowing down the data in the report generated based on the data extracted
from the Time Impact and Cost Impact add-ins, allowing the user to view only the
information related to the selected filter field and method. Sample source code and
sequence diagrams of the Check Change, Room Grouping, Ripple Effect, Time Impact,
Cost Impact and Data Filtering add-ins are included in Appendix D.
BIM-Change outperformed the capabilities provided by commercially available
software systems. As shown in Table 4-2, the limitations and abilities of the
157
commercially available models such as Vico, Innovaya, Autodesk Navisworks, Synchro
and Assemble (as described in section 2.9) are compared with the developed BIM-
Change model. All of these models have some common limitations: they do not have the
ability to track the consequences of design changes throughout the project, from one
element to the next, nor are they able to ascertain the ripple effect of changes on a
project’s time and cost. In terms of visualization, these models are able to visualize and
color-code the changed component based on change type. In terms of the impact of
changes on cost, these models are unable to perform a cost analysis, but Innovaya,
BIMestiMate, and Assemble are capable of quickly generating an automated cost
estimate, which includes only direct costs—not indirect costs, impact costs or change
costs. In addition, the only system that has an estimating platform to calculate the
component unit cost is Innovaya. In terms of determining the impact of changes on time,
Innovaya, Navisworks, and Synchro are capable of providing a visual 4D simulation by
linking the model to the available schedule. However, they cannot estimate the durations
of the impacted components and update the schedule based on these new durations. Also,
none of them consider productivity.
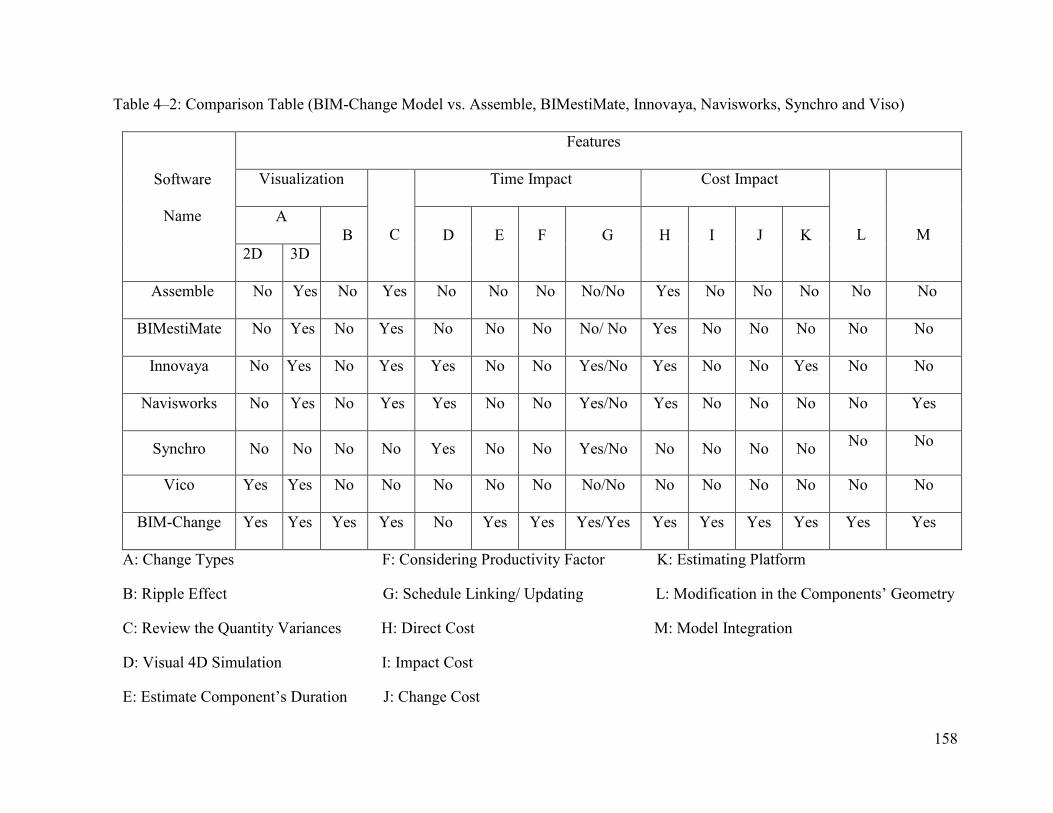
158
Table 4–2: Comparison Table (BIM-Change Model vs. Assemble, BIMestiMate, Innovaya, Navisworks, Synchro and Viso)
Software
Name
Features
Visualization
C
Time Impact Cost Impact
L
M
A
B D E F G H I J K
2D 3D
Assemble No Yes No Yes No No No No/No Yes No No No No No
BIMestiMate No Yes No Yes No No No No/ No Yes No No No No No
Innovaya No Yes No Yes Yes No No Yes/No Yes No No Yes No No
Navisworks No Yes No Yes Yes No No Yes/No Yes No No No No Yes
Synchro No No No No Yes No No Yes/No No No No No No No
Vico Yes Yes No No No No No No/No No No No No No No
BIM-Change Yes Yes Yes Yes No Yes Yes Yes/Yes Yes Yes Yes Yes Yes Yes
A: Change Types F: Considering Productivity Factor K: Estimating Platform
B: Ripple Effect G: Schedule Linking/ Updating L: Modification in the Components’ Geometry
C: Review the Quantity Variances H: Direct Cost M: Model Integration
D: Visual 4D Simulation I: Impact Cost
E: Estimate Component’s Duration J: Change Cost
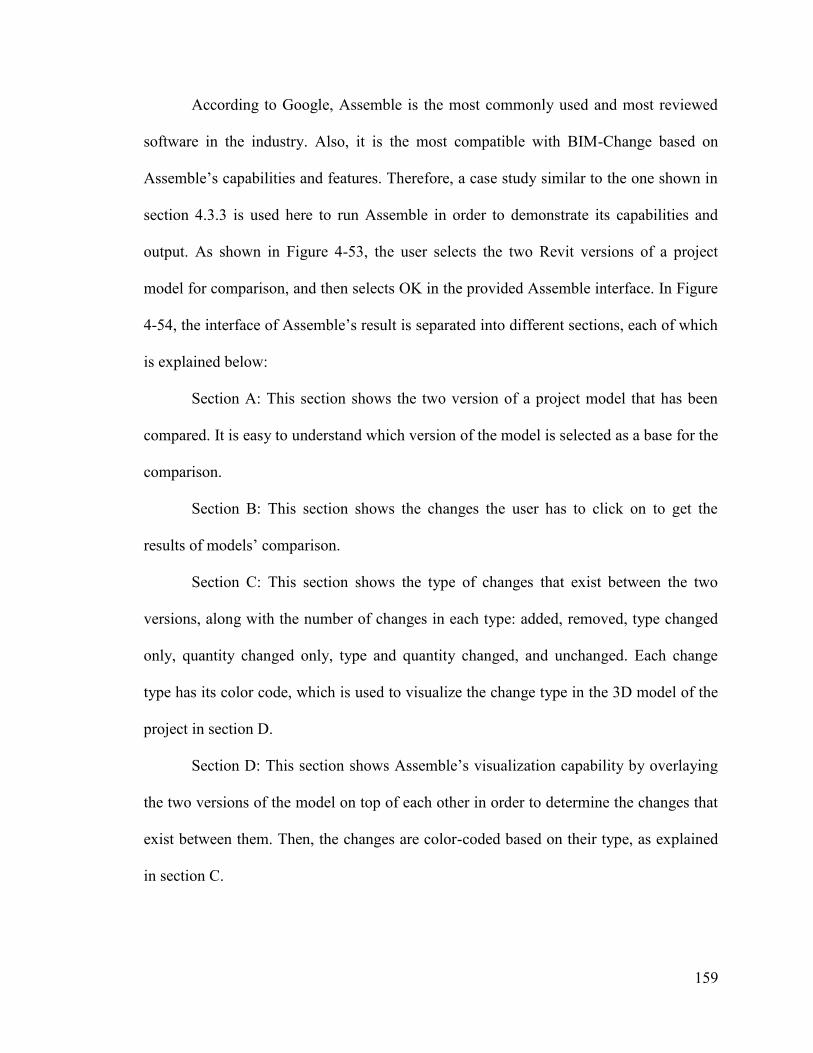
159
According to Google, Assemble is the most commonly used and most reviewed
software in the industry. Also, it is the most compatible with BIM-Change based on
Assemble’s capabilities and features. Therefore, a case study similar to the one shown in
section 4.3.3 is used here to run Assemble in order to demonstrate its capabilities and
output. As shown in Figure 4-53, the user selects the two Revit versions of a project
model for comparison, and then selects OK in the provided Assemble interface. In Figure
4-54, the interface of Assemble’s result is separated into different sections, each of which
is explained below:
Section A: This section shows the two version of a project model that has been
compared. It is easy to understand which version of the model is selected as a base for the
comparison.
Section B: This section shows the changes the user has to click on to get the
results of models’ comparison.
Section C: This section shows the type of changes that exist between the two
versions, along with the number of changes in each type: added, removed, type changed
only, quantity changed only, type and quantity changed, and unchanged. Each change
type has its color code, which is used to visualize the change type in the 3D model of the
project in section D.
Section D: This section shows Assemble’s visualization capability by overlaying
the two versions of the model on top of each other in order to determine the changes that
exist between them. Then, the changes are color-coded based on their type, as explained
in section C.
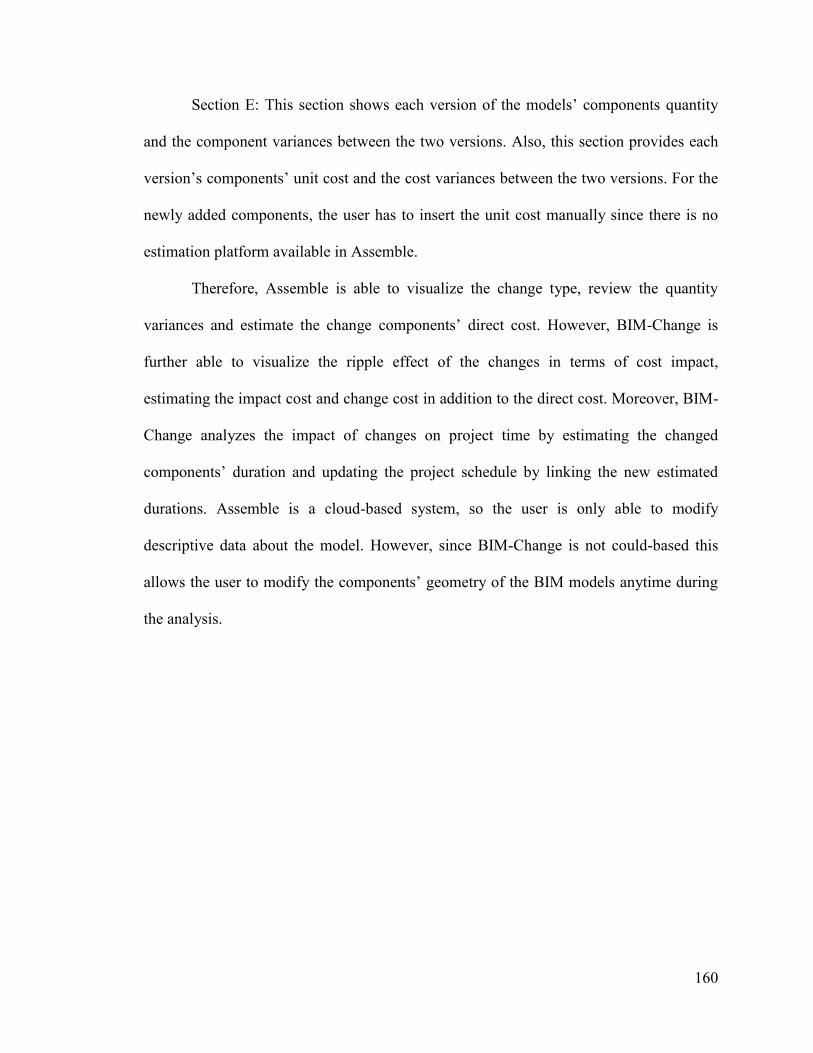
160
Section E: This section shows each version of the models’ components quantity
and the component variances between the two versions. Also, this section provides each
version’s components’ unit cost and the cost variances between the two versions. For the
newly added components, the user has to insert the unit cost manually since there is no
estimation platform available in Assemble.
Therefore, Assemble is able to visualize the change type, review the quantity
variances and estimate the change components’ direct cost. However, BIM-Change is
further able to visualize the ripple effect of the changes in terms of cost impact,
estimating the impact cost and change cost in addition to the direct cost. Moreover, BIM-
Change analyzes the impact of changes on project time by estimating the changed
components’ duration and updating the project schedule by linking the new estimated
durations. Assemble is a cloud-based system, so the user is only able to modify
descriptive data about the model. However, since BIM-Change is not could-based this
allows the user to modify the components’ geometry of the BIM models anytime during
the analysis.
161
Figure 4–53: Assemble System Cloud-based Platform
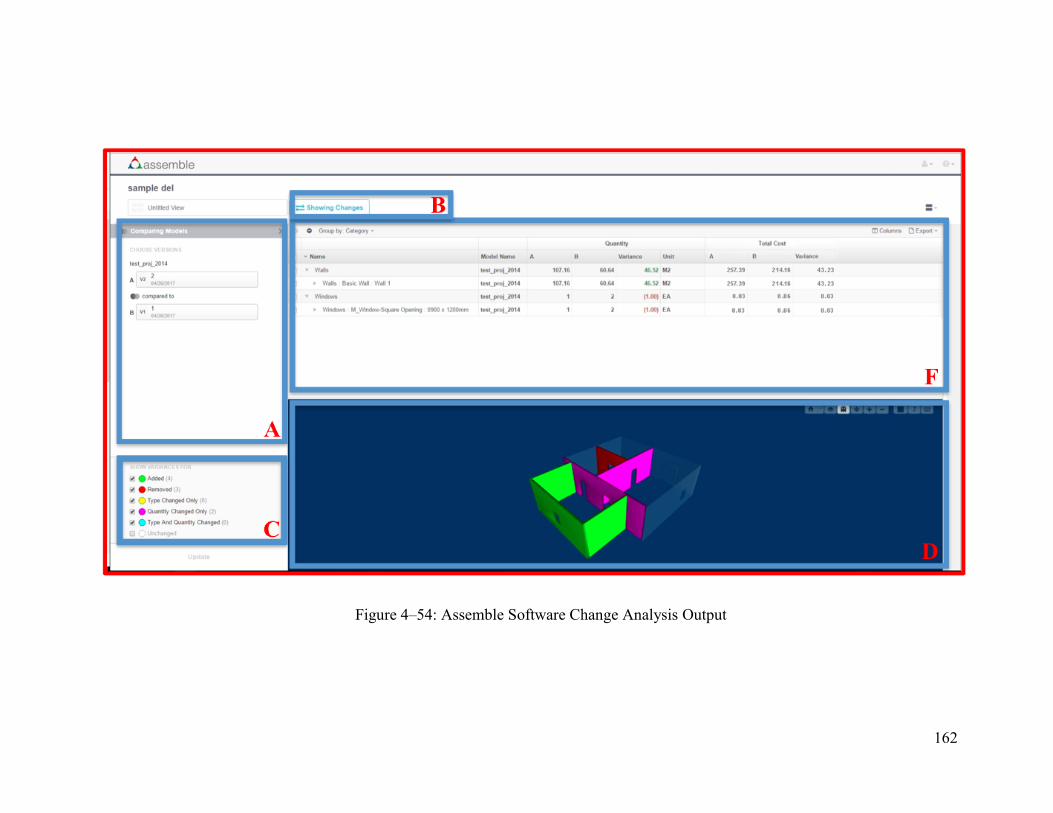
162
Figure 4–54: Assemble Software Change Analysis Output
163
Chapter 5: Conclusions and Future Work
5.1 Summary and Conclusions
Owner-generated design changes are very common in building projects, so
understanding the ripple effect of them is critical for making rational design decisions.
Often project owners request design changes after approving the final project design
without considering the impact such changes will have on the design of other interrelated
building components. Analyzing and calculating the ripple effect of owner-requested
design changes on a project’s schedule and cost is very time-consuming and requires
expert knowledge. They may also increase the probability of conflicts among project
participants. Most conflicts between project owners and contractors can be attributed to
the owners’ lack of knowledge that a simple change in one part of the project may cause
a series of changes in other parts of the project. Therefore, owner-requested design
changes need to be managed in an effective manner: first, by identifying the ripple effect
of the design change on other project components, and second, by quantifying the impact
of the design change’s ripple effect on project cost and time. The associated direct and
indirect impacts of a project change have motivated scientists to figure out a way to
minimize the chances of project failure.
A complete literature review of the existing research highlights the limitations of
previously developed BIM and non-BIM models in various aspects, such as the lack of
computer implementation, the lack of ripple effect visualization, the lack of integration
and so on. Although the impacts of change have been studied extensively in the literature,
most studies focus merely on numerical labor productivity instead of developing a
164
computed model for estimating the impact of change on project cost and time. This lack
of an integrated change management model led to the development of the current model
for the efficient management of project design changes. This study proposes a novel
BIM-based model for design-change management in building project named BIM-
Change. The main model was developed in several separate add-ins, and the Revit
Application Programming Interface (API) was used to develop these add-in(s) coded in
C#. To identify the ripple effect of owner-requested design change on other project
components, a BIM-based add-in named Check-change was developed. This add-in
compares the “as-planned” building information model with “as-changed” building
information model to identify and visualize the sequence of impacted design changes,
considering such introduced changes on the quantities and specifications of impacted
building components and their respective dependencies. Moreover, the Ripple Effect add-
in was developed to generate a detailed report for each contemplated design change and
visualize the ripple effects. The impacted components are then classified into three
categories of change type (added, deleted and modified). After a database of impacted
project components is developed and the type of impacted components is identified, its
related quantities are extracted from the project BIM model to estimate the time and cost
impacts of a design change. To quantify the ripple effect of owner-requested design
change on project time, a BIM-based quantification add-in named Time Impact calculates
the impact of design changes and their ripple effect on a project’s total duration. After
analyzing the ripple effect over time, the model updates the project schedule accordingly.
The developed model links the newly estimated components’ durations to the
project’s as-planned schedule, and updates project activities and total duration based on
165
the impacted components’ durations. The Room Grouping add-in was developed to ease
the process of schedule linking. Next, to quantify the ripple effect of owner-requested
design change on project cost, a BIM-based quantification add-in named Cost Impact was
developed. This add-in calculates the costs needed for each impacted component, and
provides the project’s updated direct cost. Moreover, it calculates the change impact cost
(in terms of productivity and time), considering the project’s total indirect costs. The
developed model is also capable of calculating the cost variance caused by a change,
which informs the owner of the costs added or deducted from the overall project cost.
Finally, the Data Filtering add-in was developed to help the user browse through data
faster by filtering unnecessary and unwanted data. This model was then applied to a case
study to demonstrate its usefulness and illustrate its essential features.
The key benefits of the developed model are: Accelerating the time-consuming
process of change impact analysis on project cost and time, aiding owners and their
agents in determining the ripple effect of a design change before making a decision;
providing owners with the information needed to make enlightened decisions in order to
identify beneficial design changes for the project and avoiding detrimental changes;
allowing users to try several what-if scenarios for owner-requested design changes and
see how they may impact project cost and schedule; controlling and prioritizing design
changes at project design based on the owner’s preferences before making any final
decisions; enhancing the level of communication among project participants, the owner,
designers and other participants; and preventing conflicts and disputes from arising, thus
decreasing the chance of project failure.
166
5.2 Research Contributions and Limitations
The contributions of this research are intended to address the limitations
associated with current practices and existing change management models. Specifically,
the main contributions of this research are:
An extensive review and study of previous BIM and non-BIM models for change
management; identifying their related advantages and limitations.
The development of an innovative and integrated method and its related
algorithms to design change management using:
o BIM Technology
o Autodesk Revit Software
o C# Visual Studio
The development of an integrated, automated BIM-based model and its associated
algorithms for tracking and visualizing the ripple effect of design changes in
building projects. This model constitutes other contributions:
o Developing a micro-level work breakdown structure (WBS) algorithm for
grouping the project’s BIM model areas by adding the project’s
components as a new project level;
o Developing a component-by-component comparison technique to track
and highlight the project’s direct and indirect changes;
o Developing a comparison report between the components of the project’s
as-planned and as-changed BIM models;
o Developing a color code visualization technique to ease the understating
of the change types in the project BIM model and generated comparison
167
report;
o Developing the ripple effect report to highlight the change path by
selecting the individual direct design change and then demonstrating the
cause and effect relationship between the direct and indirect changes; and
o Integrating and linking the ripple effect report data and BIM model to ease
the understanding of the cause and effect relationship between the
contemplated change and its ripple effect on the other project components.
The development of a BIM-based model and its respective algorithms to advance
the precision of estimating a design change’s ripple effect on a project’s total cost.
This model constitutes other contributions:
o Automated calculation of a project’s impacted component direct cost;
o Automated calculation of the change cost by using Moselhi’s (1998)
change cost estimate framework;
o An automation of Leonard’s (1991) model to calculate productivity-
related impact costs;
o Automated the estimation of time-related change costs; and
o Automated calculation of as-planned costs, as-changed costs and cost
variance due to project changes.
The development of a BIM-based model and its respective algorithms to advance
the precision of estimating a design change’s ripple effect on a project’s schedule.
This model constitutes other contributions:
o Automated calculation of a project’s impacted components and project’s
total duration; and
168
o Automated updating of project schedule (as-changed) by linking the
calculated duration of the impacted components into the as-planned
project schedule.
The utilization of different building project case studies to demonstrate the
developments made in the course of this research—namely Room Grouping,
Ripple Effect, Check Change, Time Impact, Cost Impact, and Data Filtering.
The following limitations were taken into account during the creation, validation,
and implementation of the model and add-ins developed in this research:
This study only automated the identification of change and analysis of its impact;
other steps in the change management process are not considered, such as
logging, registering and monitoring the approved design changes.
The expert knowledge is not imbedded in the system. So, the developed model
cannot automatically generate the modified BIM model, which includes all
building systems (e.g., MEP, HVAC) after applying the changes to the original
BIM model. Therefore, the user has to provide both original and modified BIM
models.
Some of the add-ins of the developed model are not fully automated and require
user interaction with the system (for example, the selection of the components in
Room Grouping add-in, and the selection of individual direct design changes in
Ripple Effect add-in).
This study used only Leonard’s (1991) regression model and Moselhi’s (1998)
developed framework to automate project’s productivity related cost and change
cost, respectively.
169
5.3 Future work and Recommendations
This study aims to develop an integrated quantitative BIM model for design
change management; however, the existing study can be improved through some
enhancements and extensions. Some recommendations for future work are:
Investigate the potential application of the proposed method on other project
types, such as industrial, highway, heavy construction, and so on.
Study and incorporate other models for estimating the impact of change.
Provide flexibility to use other software for example, link the data generated
by Time Impact add-in to Primavera instead of MS Project.
Experiment with system dynamic using the developed algorithm of this study.
The possibility of integrating the developed model with a Knowledge-based
system can be explored in order to determine the ripple effect of any design
change in other project systems, such as architectural, mechanical, electrical,
and HVAC. One of the potential solution is to integrate dependency structure
matrix (DSM) design approach with BIM.
170
References
Akcamete, A., Akinci, B., Garrett, J. Jr. (2009). “Motivation For Computational Support
For Updating BIMs.”ASCE International Workshop on Computing in Civil
Engineering, Austin, Texas, U.S. June 24-27, 2009.
Al-Hams, M. F. (2010). Simulation Model of Change Orders and their Impact on
Building Projects Performance in Gaza Strip. (Master Thesis).
Allendoerfer, K. R. (2009). “How Information Visualization Systems Change Users’
Understandings of Complex Data.” (PhD Thesis).
Alnuaimi, A., Taha, R., Al Mohsin, M., and Al-Harthi, A. (2010). "Causes, Effects,
Benefits, and Remedies of Change Orders on Public Construction Projects in
Oman." Journal of Construction of Engineering Management. 10, May, 615-622.
Antill, J. M and Woodhead, R. (1990). “Critical Path Methods in Construction Practice.”
John Wiley and Sons.
Arain, F.M. and Pheng, L.S. (2005). “Effective Management of Contract Variations using
a Knowledge Base Decision Support System.” Centre for Education in the Built
Environment CEBE, Cardiff University.
Arain, F.M., and Pheng, L.S. (2006). “The Potential Effects of Variation Order on
Institutional Buildings Projects.” Facilities, 23(11/12), 496-510.
Arain, F. M. (2008). “IT-Based Approach for Effective Management of Project Changes:
a Change Management System (CMS).” Advanced Engineering Informatics,
22(4), 457–472.
Assaf, S.A. and Alheji, S. (2006). “Causes of Delay in Large Construction Projects.”
International Journal of Project Management, 24 (4), 349–357.
Assemble. “Construction Change Management.” 14 October 2015.
http://assemblesystems.com (accessed May 20, 2016).
Autodesk. (2010). “Sustainable Design Analysis and Building Information Modeling.”
Autodesk. Retrieved from
http://images.autodesk.com/adsk/files/sustainable_design_analysis_and_building_
information_modeling_white_paper.pdf.
Azhar, S., Nadeem, A., Mok, J.Y.N., and Leung, B.H.Y. (2008). “Building Information
Modeling (BIM): A New Paradigm for Visual Interactive Modeling and
Simulation for Construction Projects.” First International Conference on
Construction in Developing Countries (ICCIDC–I). Karachi, Pakistan.
AkerKvaerner. (2005). “Change Control Methodology Manual – Change Handling.”
Retrieved from Kvaerner.
Burati, J.L., Farrington, J.J., and Ledbetter, W.B. (1992). "Causes of Quality Deviation in
Design and Construction." Journal of Construction Engineering and
Management. 118(1), 34-49.
Burcin, B.G. and Samara, R. (2010). “The Perceived Value of Building Information
Modeling in the U.S. Building Industries.” Journal of Information Technology in
Construction, 15, 185-201.
Chen, C. (2005). “Information Visualization: Beyond the Horizon.” London,
U.K.:Springer-Verlag.
171
Chen, C. (2005). “Top 10 Unsolved Information Visualization Problems.” IEEE
Computer Graphics and Applications, 25(4), 12-16.
Chen, J.H., and Hsu, S.C. (2005). "Early Warning Systems for Severe Change Orders."
Proceedings from International Conference in Computing in Civil Engineering.
Cancun: Mexico.
Chen, J.H. (2008). “KNN Based Knowledge-sharing Model for Severe Change Order
Disputes in Construction.” Automation in Construction, 7(6), 773–779.
CIC Research Group. (2009). “BIM Project Execution Planning Guide.” The
Pennsylvania State University (licensed under a Creative Commons Attribution-
Share Alike 3.0 United States License), Department of Architectural Engineering.
Retrieved from http://bim.psu.edu
CII. (1990). “The Impact of Changes on Construction Cost and Schedule.” Construction
Industry Institute. University of Texas, Austin, United States.
CII. (1994). “Project Change Management.” Construction Industry Institute. University
of Texas, Austin, United States.
CII. (1994). “Qualitative Effects of Project Changes.” Construction Industry Institute ,
University of Texas, Austin, United States.
CII. (2000), “Quantifying the Cumulative Impact of Change Orders for Electrical and
Mechanical Contractors.” Construction Industry Institute. University of Texas,
Austin, United States.
Coffman, G. M. (1996). “Impacts: Construction Management.” Madison, Wisconsin:
University of Wisconsin Madison.
Cox, I.D., Morris, J.P., Rogerson, J.H., and Jared, G.E. (1999). “A Quantitative Study of
Post Contract Award Design Changes in Construction.” Construction
Management and Economics, 17(4), 427-439.
Doran, D., and Bridgers, M. (2002). “Guide to Change Order Management: How to
Reduce and Manage Change Orders to Keep Your Project on Time and on
Budget.” FMI Corporation, North Carolina.
Du, J., El-Gafy, M., & Zhao, D. (2015). “Optimization of Change Order Management
Process with Object-Oriented Discrete Event Simulation: Case Study.” Journal of
Construction Engineering and Management, 142(4), 05015018.
Eastman, C. T., Teicholz, P., Sacks, R., and Liston, K. (2011). “BIM Handbook: A Guide
to Building Information Modeling for Owners, Managers, Designers,
Engineers,and Contractors (2nd ed.).” New Jersey, Hoboken: John Wiley & Sons,
Inc.
Edgar, A. (2007). “BIM Implementation Strategies.” National BIM Standard Committee,
OSCRE Workgroup Program Manager Chair.
Gwizdka, J., and Spence, I. (2007). “Implicit Measures of Lostness and Success in Web
Navigation.” Interacting with Computers, 19(3), 357-369.
Hallock, B. (2006). “Managing Change vs. Administering the Change Order Process.”
Nielsen-Wurster Communique, 1 (6).
Hornbæk, K. and Frøkjær, E. (2003). “Reading Patterns and Usability in Visualizations
of Electronic Documents.” ACM Transactions on Computer - Human Interaction
(TOCHI), 10 (2), 119-149.
172
Hornbæk, K. (2006). “Current Practice in Measuring Usability: Challenges to usability
Studies and Research.” International Journal of Human-Computer Studies, 64 (2),
79-102.
Hunt, G. (2005). “Change Orders Cumulative Impact.” Reservation of rights.
Hanna, A., Peterson, P., Dettwiler, J., Russell, J., and Gunduz, M. (1999). “Assessment of
Global Impact of Change Orders on Electrical and Mechanical Construction: An
Approach.” Proceedings from the Construction Congress VI, 1177-1188.
Hanna, A., Camlic, R., Peterson, P., and Nordheim, E. (2002). "Quantitative Definition of
Projects Impacted by Change Orders." Journal of Construction Engineering
Management. 1(57), 57-64.
Hanna, A., Lotfallah, W., and Lee, M. (2002). "Statistical-Fuzzy Approach to Quantify
Cumulative Impact of Change Orders." Journal of Computing Civil Engineering.
16(4), 252-258.
Hester, W., Kuprenas, A. J., Chang, T.C. (1991). “Construction Changes and Change
Orders: Their Magnitude and Impact.” The University of California- Berkeley/
CII Source Document No.66.
Han S., Love P., Pena-Mora F., 2013, “A System Dynamics Model for Assessing the
Impacts of Design Errors in Construction Projects.” Mathematical and Computer
Modelling, 53, pp: 2044 – 2053.
Heravi Gh., & Charkhakan H., 2014, “Predicting Change by Evaluating the Change
Implementation Process in Construction Projects Using Event Tree Analysis.”
Journal of Management in Engineering, 9, 1-9.
Ibbs, C. W. (1994). “Project Change Management.” Construction Industry Institute
Special Publication, Austin, Texas.
Ibbs, C. W. (1995). “Quantitative Impacts of Project Change.” The Construction Industry
Institute, University of Texas at Austin. Austin, Texas: CII.
Ibbs, C.W. (1997). “Quantitative Impacts of Project Change: Size Issues.” Journal of
Construction Engineering and Management, 123 (3), 308-311.
Ibbs, C. W., Lee, S.A., and Li, M.I., (1997). “Fast-tracking’s Impact on Project Change.”
Journal of Project Management, 29 (4), 35-41.
Ibbs, C.W., Wong, C. K., and Kwak, Y.H. (2001). “Project Change Management
System.” Journal of Management in Engineering, 17 (3), 159-165.
Ibbs, C.W., Kwak, Y., Ng, T., and Odabasi, A. (2003). “Project Delivery Systems and
Project Change: Quantitative Analysis.” Journal of Construction Engineering and
Management, 129 (4), 382 – 387.
Ibbs, C.W. (2005). “Impact of Change’s Timing on Labor Productivity.” Journal of
Construction Engineering and Management, 131 (11), 1219-1223.
Ibbs, C.W. (2012). "Construction Change: Likelihood, Severity, and Impact on
Productivity." Journal of Legal Affairs and Dispute Resolution in Engineering and
Construction. 10 (1061), 67-73.
IEEE Computer Society. (2005). “Illuminating the Path: The Research and Development
Agenda for Visual Analytics.” National Visualization and Analytics Center.
Retrieved from http://vis.pnnl.gov/pdf/RD_Agenda_VisualAnalytics.pdf
Innovaya. “Innovaya Design Estimating.” (2014). http://www.innovaya.com/index.html
(accessed 2015).

173
Institute of BIM in Canada. (2011). “Environmental Scan of BIM Tools and Standards.”
Canadian Construction Association. Retrieved from https://www.ibc-bim.ca/wp-
content/uploads/2014/10/EnvironmentalScanBIMtoolsStandards.pdf.
Isaac, S. and Navon R. (2008). “Feasibility Study of an Automated Tool for Identifying
the Implications of Changes in Construction Projects.” Journal of Construction
Engineer Management, 2 (139), 139-145.
ISO. (1998). “Ergonomic Requirements for Office Work with Visual Display Terminals
(VDTs): Guidance on Usability.” Retrieved from
http://www.iso.org/iso/catalogue_detail.htm?csnumber=16883.
Isaac, S., & Navon, R. (2013). “A Graph-based Model for the Identification of the Impact
of Design Changes.” Automation in Construction, 31, 31-40.
Juszczyka, M., Tomanab, A., Bartoszeka, M. (2016) “Current Issues of BIM-based
Design Change Management, Analysis and Visualization.” Creative Construction
Conference. Budapest, Hungary: Procedia Engineering, 518-525.
Karimidorabati, S., Haas, C.T. (2008). “A Model for Implementing & Continuously
Improving the Automated Change Management Process for Construction Mega
Projects.” University of Waterloo, Ontario, Canada.
Kettlewell, F. (2003). "Proactive Change Order Management." Proceedings from the
AACE International Transactions. United States.
Koskela, L. (1992). “Application of the New Production Philosophy to Construction.”
Technical Report # 72, Department of Civil Engineering, Stanford University,
Center for Integrated Facility Engineering. Stanford: California.
Kumaraswamy, M. M. (1998). “Claims for Extensions of Time in Civil Engineering
Projects.” Construction Management and Economics,16 (3), 283-294.
Kymmell, W. (2009). “Building Information Modeling: Planning and Managing
Construction Projects with 4D CAD and Simulations.” New York, McGraw-Hill.
Koch, C., & Firmenich, B. (2011). “An Approach to Distributed Building Modeling on
the Basis of Versions and Changes.” Advanced Engineering Informatics, 25(2),
297-310.
Karimidorabati, S., Haas, C. T., & Gray, J. (2016). “Evaluation of Automation Levels for
Construction Change Management.” Engineering, Construction and Architectural
Management, 23(5).
Lam, H. (2008). “A Framework of Interaction Costs in Information Visualization.”
Visualization and Computer Graphics, IEEE Transactions, 14, 14,(6), 242-271.
Langroodi, B., Staub-French, S. (2012). “Change Management with Building Information
Models: A Case Study.” Proceedings from the Construction Research Congress
VI, 1182-1191.
Lee, F. Pena-Mora, S., and Park, M. (2003). “Quality and Change Management
Framework for Concurrent Design and Construction Projects.” Journal of
Construction Research and Management, 131(8), 890-902.
Lee, M., Hanna, A., and Loh, W. (2004). "Decision Tree Approach to Classify and
Quantify Cumulative Impact of Change Orders on Productivity." Journal of
Computing Civil Engineering, 18 (2), 132-144.
Lee, J.K. (2008). “Cost Overrun and Cause in Korean Social Overhead Capital Projects:
Roads, Rails, Airports, and Ports.” Journal of Urban Planning and Development,
34 (2), 59-62.
174
Leonard, C., Moselhi, O., and Fazio, P. (1991). "Impact of Change Orders on
Construction Productivity." Canadian Journal of Civil Engineering. 18 (3), 484-
492. Liu, F., Jallow A.K., Anumba C.J., Wu, D. (2014). “A framework for Integrating Change
Management with Building Information Modeling.” Proceedings Computing in
Civil and Building Engineering, 439-446.
McCally, B. (1997). “Change Order Management.” AACE International Transactions,
American Association of Cost Engineers Inc.
Mirshekarlou, B. R. (2012). “A Taxonomy for Causes of Changes in Construction.”
(Master Thesis). The Middle East Technical University, Dept. of Civil
Engineering.
Mokhtar, A., Bedard, C., and Fazio, P. (1998). "Information Model for Managing Design
Changes in a Collaborative Environment." Journal of Computer and Civil
Engineering, 12 (2), 82-92.
Mokhtar, A., Bédard, C., and Fazio, P. (2000). "Collaborative Planning and Scheduling
of Interrelated Design Changes." Journal of Architectural Engineering, 2 (66), 66-
75.
Mokbel, H. (2003). “Assessing the Parametric Building Model Capabilities in
Minimizing Change Orders.” (Master Thesis). Faculty of the Worcester
Polytechnic Institute. Retrieved from
https://www.wpi.edu/Pubs/ETD/Available/etd-0203103-
134504/unrestricted/hmokbelETD.pdf.
Mohammad, N., Ani, C., Rakmat, R.A.O.K., Yusof, M.A. (2010). "Investigation on the
Causes of Variation Orders in the Construction of Building Project – A Study in
the State of Selangor, Malaysia." Journal of Building Performance,1 (1), 73-82.
Moselhi, O., 1998. “Estimating the Cost of Change Orders.” AACE International
Transactions, p.ES21.
Moselhi, O., Assem, I., El-Rayes, K. (2005), "Change Orders Impact on Labor
Productivity." ASCE, Journal of Construction Engineering and Management, 131
(3), 354-259.
Montaser, A. (2013) "Automated Site Data Acquisition for Effective Project Control."
(Phd Thesis), Department of Building, Civil, and Environmental Engineering,
Concordia University, Montreal, Canada. Motawa, I.A., Anumba, J., Lee, S., Pena-Mora, F. (2007) "An Integrated System for
Change Management in Construction." Automation in Construction, 16 (3), 368-
377.
Mejlænder-Larsen, Ø. (2016). “Using a Change Control System and Building
Information Modeling to Manage Change in Design.” Architectural Engineering
and Design Management, 1-13.
Nahod, M., Radujković, M. (2011, January) "Procedure for Change Management in the
Realization Phase of Construction Projects.” Proceedings of the 27th Annual
Conference of Association of Researchers. Bristol: United Kingdom.
National Institute of Building Sciences. (2007). “United States National Building
Information Modeling Standards - Version 1- part 1: Overview, Principals, and
Methodologies.” Retrieved from http://www.wbdg.org/pdfs/NBIMSv1_p1.pdf
175
Navisworks. “To Compare Two Versions of the Model.” 16 May 2016.
https://www.autodesk.ca/en/products/navisworks/overview (accessed September
20, 2016).
Nielsen, J. (1993). “Usability Engineering.” San Diego, California: Academic Press.
Norman, D. A. (2002). “The Design of Everyday Things (Rev. ed.).” New York, New
York: Basic Books.
North, C. (2006). “Toward Measuring Visualization Insight.” IEEE Computer Graphics
and Applications, 26 (3), 6-9.
Navon, R., and Isaac, S. 2009. “An Automated Tool for Identifying the Implications of
Changes in Construction Projects.” Construction Research Congress 2009,
Seattle, Washington. 1-10.
Nour, M., & Beucke, K. (2010, June). “Object Versioning as a Basis for Design Change
Management within a BIM Context.” In Proceedings of the 13th international
conference on computing in civil and building engineering (ICCCBE-XIII),
Nottingham, UK.
Polson, P. G., Lewis, C., Rieman, J., and Wharton, C. (1992). Cognitive Walkthroughs: A
Method for Theory-Based Evaluation of User Interfaces. International Journal of
Man-Machine Studies, 6 (5), 741-773.
Price, A.D.F., and Chanal, K. (2006). “A Strategic Framework for Change Management.”
Construction Management and Economics, 24 (3), 237-251.
Project Management Institute. (1997). “A Guide to the Project Management Body of
Knowledge (PMBOK Guide).” Newtown Square, Pa: Project Management
Institute.
Pruitt, W. B. (1999). "The Value of the System Engineering Function in Configuration
Control of a Major Technology Project." Project Management Journal. 30 (3).
Pilehchian, B., Staub-French, S., & Nepal, M. P. (2015). “A Conceptual Approach to
Track Design Changes within a Multi-disciplinary Building Information
Modeling Environment. Canadian Journal of Civil Engineering, 42 (2), 139-152.
R.S. Means. (1991). “Means Illustrated Construction Dictionary.” R.S. Means Company,
Inc. Kingston, MA: Construction Consultants & Publishers.
Ranjbaran, Y., and Moselhi, O. (2014). "4D-Based Value Engineering." Construction
Research Congress, 1606-1615. Serag, E., and Oloufa, A. (2007). “Change Orders Impact on Project Cost.” Annual
Conference, Honolulu, Hawaii. USA.
Serag, E., Oloufa, A., Malone, L., and Radwan, E. (2010). “Model for Quantifying the
Impact of Change Orders on Project Cost for U.S. Roadwork Construction.”
Journal of Construction Engineering and Management, 136 (9), 1015-1027.
Shneiderman, B. (2004). “The Eyes Have it: A Task by Data Type Taxonomy for
Information Visualizations.” Proceedings of the 1996 IEEE Symposium on Visual
Languages, 336-343.
Sun, M., Fleming, A., Senaratne, S., Motawa, I., and Yeoh, M.L. (2006). "A Change
Management Toolkit for Construction Projects." Architectural Engineering and
Design Management, 2 (4), 261-271.
Sun, M., and Meng, X. (2009). “Taxonomy for Change Causes and Effects in
Construction Projects.” International Journal of Project Management, 27 (6),
560-572.
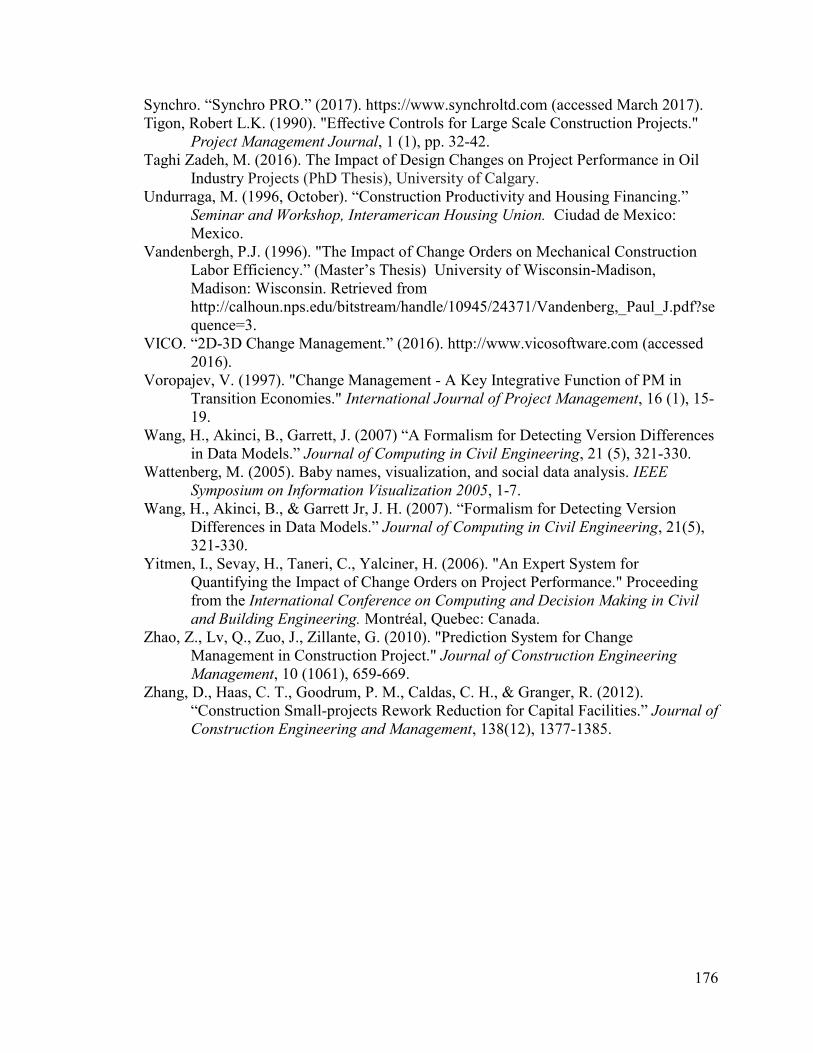
176
Synchro. “Synchro PRO.” (2017). https://www.synchroltd.com (accessed March 2017).
Tigon, Robert L.K. (1990). "Effective Controls for Large Scale Construction Projects."
Project Management Journal, 1 (1), pp. 32-42.
Taghi Zadeh, M. (2016). The Impact of Design Changes on Project Performance in Oil
Industry Projects (PhD Thesis), University of Calgary.
Undurraga, M. (1996, October). “Construction Productivity and Housing Financing.”
Seminar and Workshop, Interamerican Housing Union. Ciudad de Mexico:
Mexico.
Vandenbergh, P.J. (1996). "The Impact of Change Orders on Mechanical Construction
Labor Efficiency.” (Master’s Thesis) University of Wisconsin-Madison,
Madison: Wisconsin. Retrieved from
http://calhoun.nps.edu/bitstream/handle/10945/24371/Vandenberg,_Paul_J.pdf?se
quence=3.
VICO. “2D-3D Change Management.” (2016). http://www.vicosoftware.com (accessed
2016).
Voropajev, V. (1997). "Change Management - A Key Integrative Function of PM in
Transition Economies." International Journal of Project Management, 16 (1), 15-
19.
Wang, H., Akinci, B., Garrett, J. (2007) “A Formalism for Detecting Version Differences
in Data Models.” Journal of Computing in Civil Engineering, 21 (5), 321-330.
Wattenberg, M. (2005). Baby names, visualization, and social data analysis. IEEE
Symposium on Information Visualization 2005, 1-7.
Wang, H., Akinci, B., & Garrett Jr, J. H. (2007). “Formalism for Detecting Version
Differences in Data Models.” Journal of Computing in Civil Engineering, 21(5),
321-330.
Yitmen, I., Sevay, H., Taneri, C., Yalciner, H. (2006). "An Expert System for
Quantifying the Impact of Change Orders on Project Performance." Proceeding
from the International Conference on Computing and Decision Making in Civil
and Building Engineering. Montréal, Quebec: Canada.
Zhao, Z., Lv, Q., Zuo, J., Zillante, G. (2010). "Prediction System for Change
Management in Construction Project." Journal of Construction Engineering
Management, 10 (1061), 659-669.
Zhang, D., Haas, C. T., Goodrum, P. M., Caldas, C. H., & Granger, R. (2012).
“Construction Small-projects Rework Reduction for Capital Facilities.” Journal of
Construction Engineering and Management, 138(12), 1377-1385.
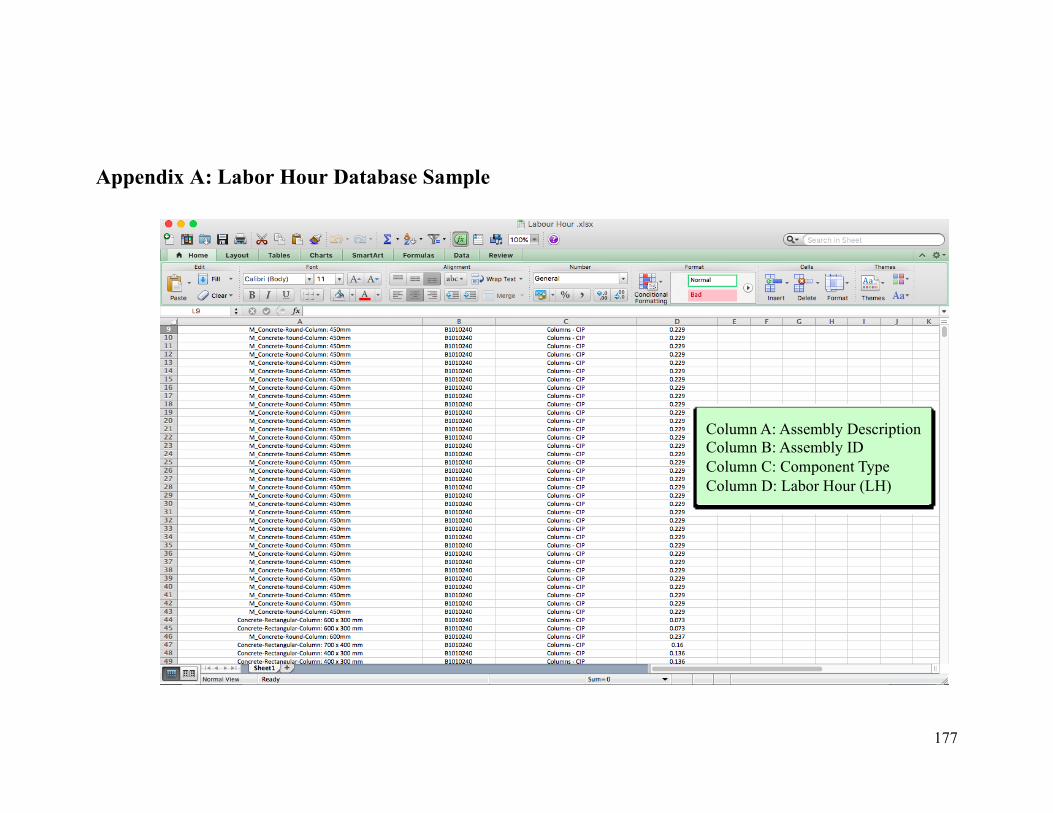
177
Appendix A: Labor Hour Database Sample
Column A: Assembly Description
Column B: Assembly ID
Column C: Component Type
Column D: Labor Hour (LH)
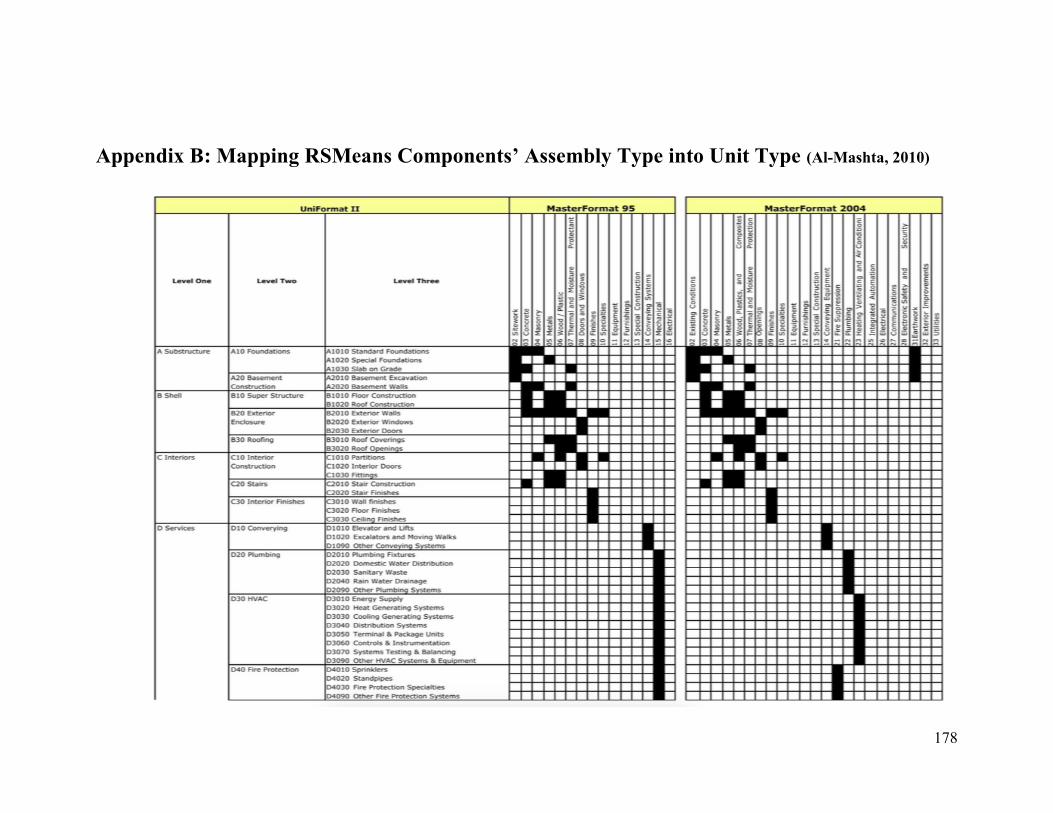
178
Appendix B: Mapping RSMeans Components’ Assembly Type into Unit Type (Al-Mashta, 2010)
179
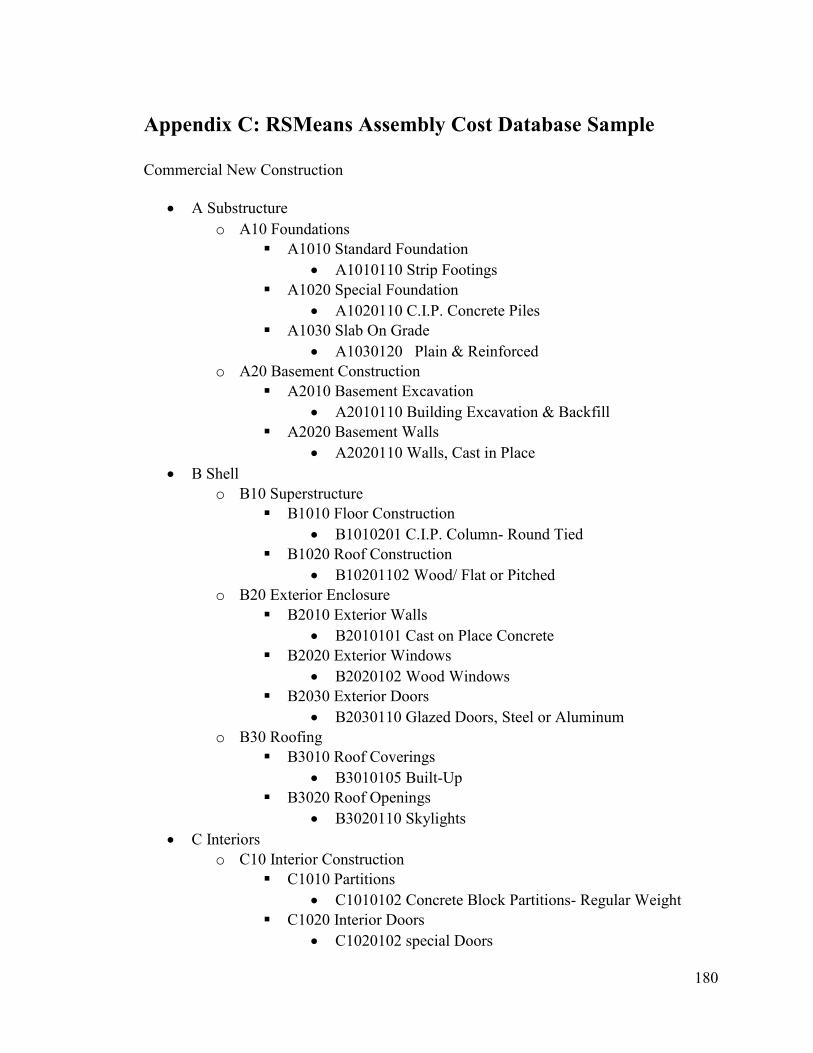
180
Appendix C: RSMeans Assembly Cost Database Sample
Commercial New Construction
A Substructure
o A10 Foundations
A1010 Standard Foundation
A1010110 Strip Footings
A1020 Special Foundation
A1020110 C.I.P. Concrete Piles
A1030 Slab On Grade
A1030120 Plain & Reinforced
o A20 Basement Construction
A2010 Basement Excavation
A2010110 Building Excavation & Backfill
A2020 Basement Walls
A2020110 Walls, Cast in Place
B Shell
o B10 Superstructure
B1010 Floor Construction
B1010201 C.I.P. Column- Round Tied
B1020 Roof Construction
B10201102 Wood/ Flat or Pitched
o B20 Exterior Enclosure
B2010 Exterior Walls
B2010101 Cast on Place Concrete
B2020 Exterior Windows
B2020102 Wood Windows
B2030 Exterior Doors
B2030110 Glazed Doors, Steel or Aluminum
o B30 Roofing
B3010 Roof Coverings
B3010105 Built-Up
B3020 Roof Openings
B3020110 Skylights
C Interiors
o C10 Interior Construction
C1010 Partitions
C1010102 Concrete Block Partitions- Regular Weight
C1020 Interior Doors
C1020102 special Doors
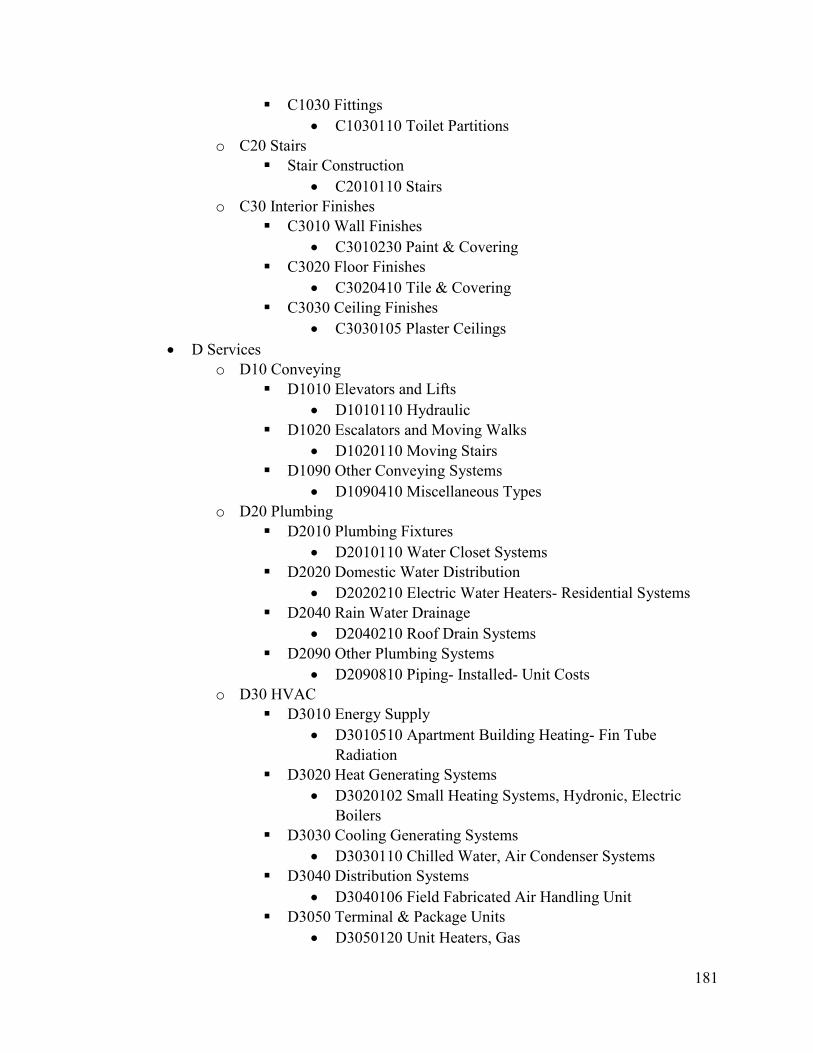
181
C1030 Fittings
C1030110 Toilet Partitions
o C20 Stairs
Stair Construction
C2010110 Stairs
o C30 Interior Finishes
C3010 Wall Finishes
C3010230 Paint & Covering
C3020 Floor Finishes
C3020410 Tile & Covering
C3030 Ceiling Finishes
C3030105 Plaster Ceilings
D Services
o D10 Conveying
D1010 Elevators and Lifts
D1010110 Hydraulic
D1020 Escalators and Moving Walks
D1020110 Moving Stairs
D1090 Other Conveying Systems
D1090410 Miscellaneous Types
o D20 Plumbing
D2010 Plumbing Fixtures
D2010110 Water Closet Systems
D2020 Domestic Water Distribution
D2020210 Electric Water Heaters- Residential Systems
D2040 Rain Water Drainage
D2040210 Roof Drain Systems
D2090 Other Plumbing Systems
D2090810 Piping- Installed- Unit Costs
o D30 HVAC
D3010 Energy Supply
D3010510 Apartment Building Heating- Fin Tube
Radiation
D3020 Heat Generating Systems
D3020102 Small Heating Systems, Hydronic, Electric
Boilers
D3030 Cooling Generating Systems
D3030110 Chilled Water, Air Condenser Systems
D3040 Distribution Systems
D3040106 Field Fabricated Air Handling Unit
D3050 Terminal & Package Units
D3050120 Unit Heaters, Gas
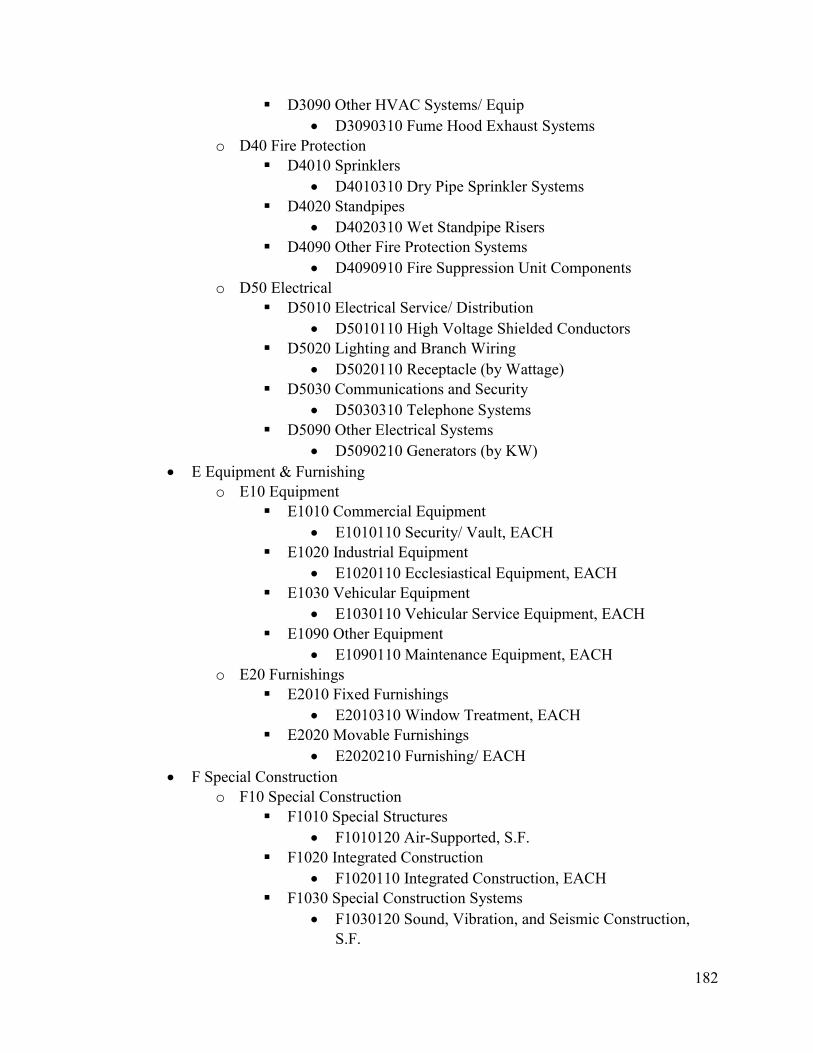
182
D3090 Other HVAC Systems/ Equip
D3090310 Fume Hood Exhaust Systems
o D40 Fire Protection
D4010 Sprinklers
D4010310 Dry Pipe Sprinkler Systems
D4020 Standpipes
D4020310 Wet Standpipe Risers
D4090 Other Fire Protection Systems
D4090910 Fire Suppression Unit Components
o D50 Electrical
D5010 Electrical Service/ Distribution
D5010110 High Voltage Shielded Conductors
D5020 Lighting and Branch Wiring
D5020110 Receptacle (by Wattage)
D5030 Communications and Security
D5030310 Telephone Systems
D5090 Other Electrical Systems
D5090210 Generators (by KW)
E Equipment & Furnishing
o E10 Equipment
E1010 Commercial Equipment
E1010110 Security/ Vault, EACH
E1020 Industrial Equipment
E1020110 Ecclesiastical Equipment, EACH
E1030 Vehicular Equipment
E1030110 Vehicular Service Equipment, EACH
E1090 Other Equipment
E1090110 Maintenance Equipment, EACH
o E20 Furnishings
E2010 Fixed Furnishings
E2010310 Window Treatment, EACH
E2020 Movable Furnishings
E2020210 Furnishing/ EACH
F Special Construction
o F10 Special Construction
F1010 Special Structures
F1010120 Air-Supported, S.F.
F1020 Integrated Construction
F1020110 Integrated Construction, EACH
F1030 Special Construction Systems
F1030120 Sound, Vibration, and Seismic Construction,
S.F.
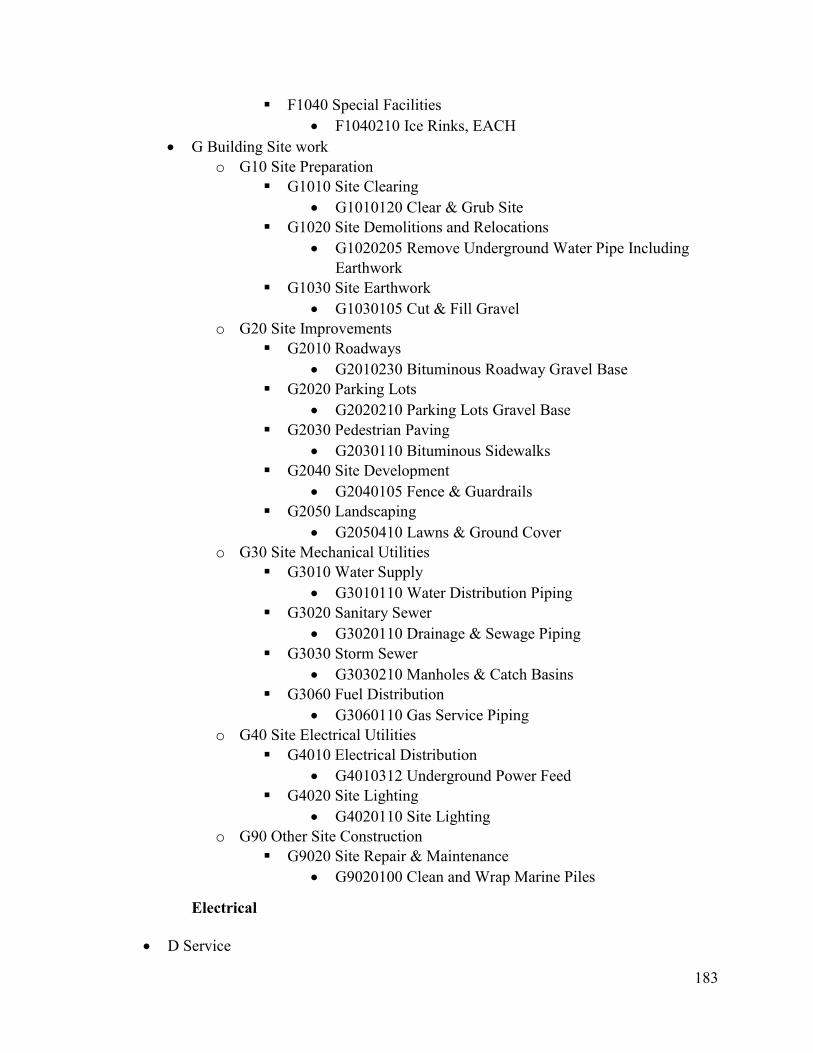
183
F1040 Special Facilities
F1040210 Ice Rinks, EACH
G Building Site work
o G10 Site Preparation
G1010 Site Clearing
G1010120 Clear & Grub Site
G1020 Site Demolitions and Relocations
G1020205 Remove Underground Water Pipe Including
Earthwork
G1030 Site Earthwork
G1030105 Cut & Fill Gravel
o G20 Site Improvements
G2010 Roadways
G2010230 Bituminous Roadway Gravel Base
G2020 Parking Lots
G2020210 Parking Lots Gravel Base
G2030 Pedestrian Paving
G2030110 Bituminous Sidewalks
G2040 Site Development
G2040105 Fence & Guardrails
G2050 Landscaping
G2050410 Lawns & Ground Cover
o G30 Site Mechanical Utilities
G3010 Water Supply
G3010110 Water Distribution Piping
G3020 Sanitary Sewer
G3020110 Drainage & Sewage Piping
G3030 Storm Sewer
G3030210 Manholes & Catch Basins
G3060 Fuel Distribution
G3060110 Gas Service Piping
o G40 Site Electrical Utilities
G4010 Electrical Distribution
G4010312 Underground Power Feed
G4020 Site Lighting
G4020110 Site Lighting
o G90 Other Site Construction
G9020 Site Repair & Maintenance
G9020100 Clean and Wrap Marine Piles
Electrical
D Service
184
o D20 Plumbing
D2020 Domestic Water Distribution
o D30 HVAC
D3020 Heat Generating Systems
o D40 Fire Protection
D4090 Other Fire Protection
o D50 Electrical
D5010 Electrical Service/ Distribution
D5010110 High Voltage Shielded Conductors
D5020 Lighting and Branch Wiring
D5020110 Receptacle (by Wattage)
D5030 Communications and Security
D5030310 Telephone Systems
D5090 Other Electrical Systems
D5090210 Generators (by KW)
G Building Sitework
G10 Site Preparation
• G1030 Site Earthwork
G1030805 Trenching Common Earth
G40 Site Electrical Utilities
• G4010 Electrical Distribution
G4010312 Underground Power Feed
• G4020 Site Lighting
G4020110 Site Lighting
Mechanical
• A Substructure
o A20 Basement Construction
A2020 Basement Walls
A2020220 Sub drainage Piping
• D Services
o D20 Plumbing
D2020 Domestic Water Distribution
o D30 HVAC
D3010 Energy Supply
D3010510 Apartment Building Heating- Fin Tube Radiation
D3020 Heat Generating Systems
D3020102 Small Heating Systems, Hydronic, Electric Boilers
D3030 Cooling Generating Systems
D3030110 Chilled Water, Air Condenser Systems
D3040 Distribution Systems
D3040106 Field Fabricated Air Handling Unit
• G Building Site work
185
o G10 Site Preparation
G1030 Site Earthwork
G1030805 Trenching Common Earth
o G30 Site Mechanical Utilities
G3010 Water Supply
G3010110 Water Distribution Piping
G3020 Sanitary Sewer
G3020110 Drainage & Sewage Piping
G3030 Storm Sewer
G3030210 Manholes & Catch Basins
G3060 Fuel Distribution
G3060110 Gas Service Piping
Plumbing
D Services
o D20 Plumbing
D2010 Plumbing Fixtures
D2010110 Water Closet Systems
D2010936 Five Fixture Bathroom, One Wall Plumbing
D2020 Domestic Water Distribution
D2020210 Electric Water Heaters- Residential Systems
D2040 Rain Water Drainage
D2040210 Roof Drain Systems
o D30 HVAC
D3010 Energy Supply
D3010510 Apartment Building Heating- Fin Tube
Radiation
D3020 Heat Generating Systems
D3020102 Small Heating Systems, Hydronic, Electric
Boiler
D3090 Other HVAC Systems/Equip
D3090320 Garage Exhaust Systems
o D40 Fire Protection
D4010 Sprinklers
D4010310 Dry Pipe Sprinkler Systems
D4020 Standpipes
D4020310 Wet Standpipe Risers
D4090 Other Fire Protection Systems
D4090910 Fire Suppression Unit Components
G Building Site work
o G10 Site Preparation
G1030 Site Earthwork

186
G1030805 Trenching Common Earth
o G20 Site Improvements
G2040 Site Development
G2040920 Swimming Pools
G2050 Landscaping
G2050710 Site Irrigation
o G30 Site Mechanical Utilities
G3010 Water Supply
G3010121 Water Service, Lead Free
G3020 Sanitary Sewer
G3020302 Septic Systems
G3030 Storm Sewer
G3030210 Manholes & Catch Basins
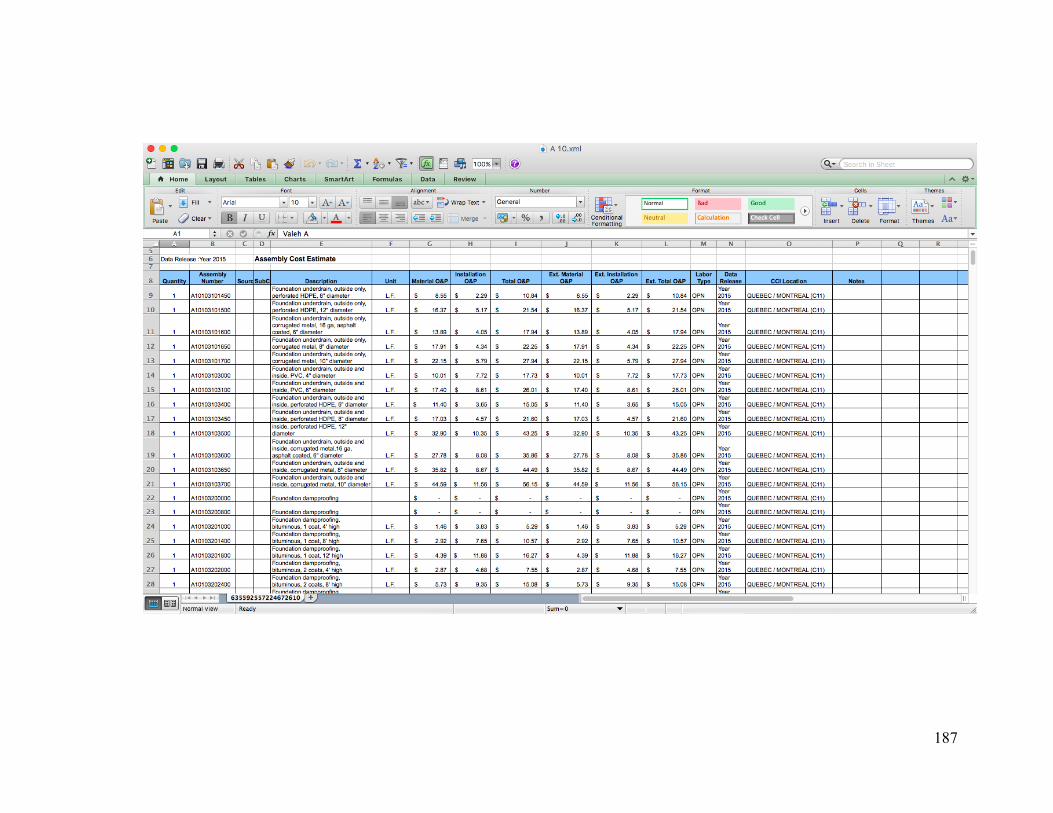
187
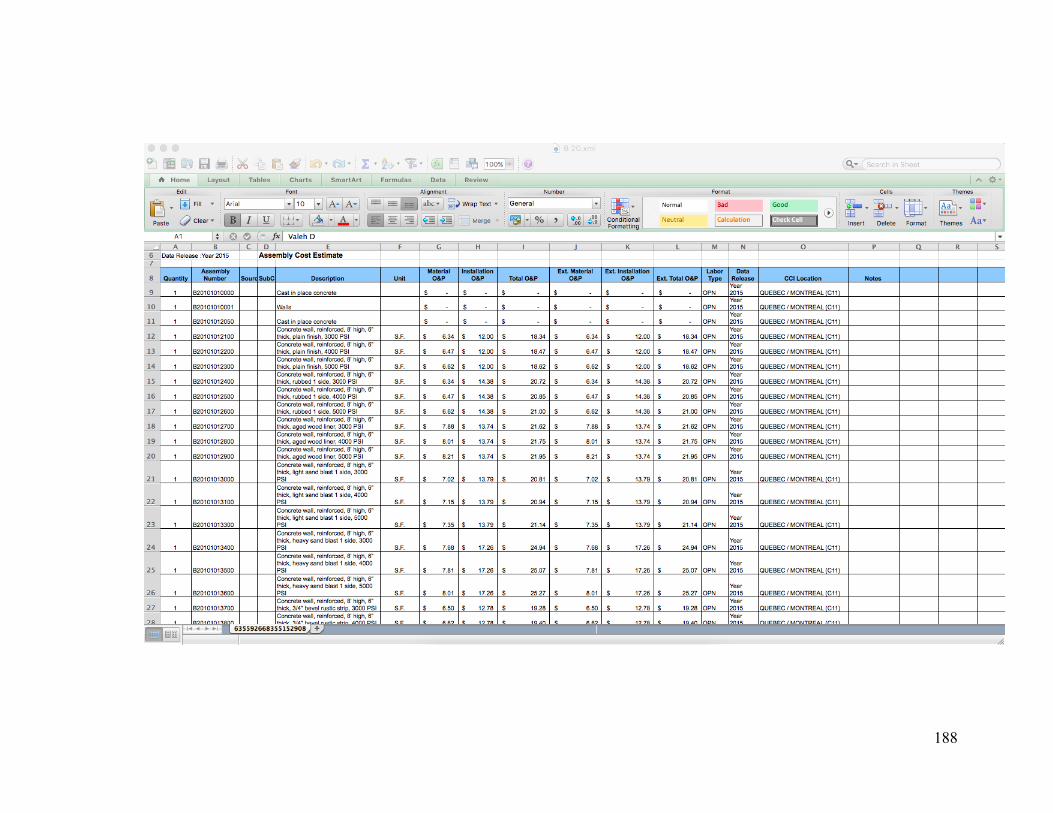
188
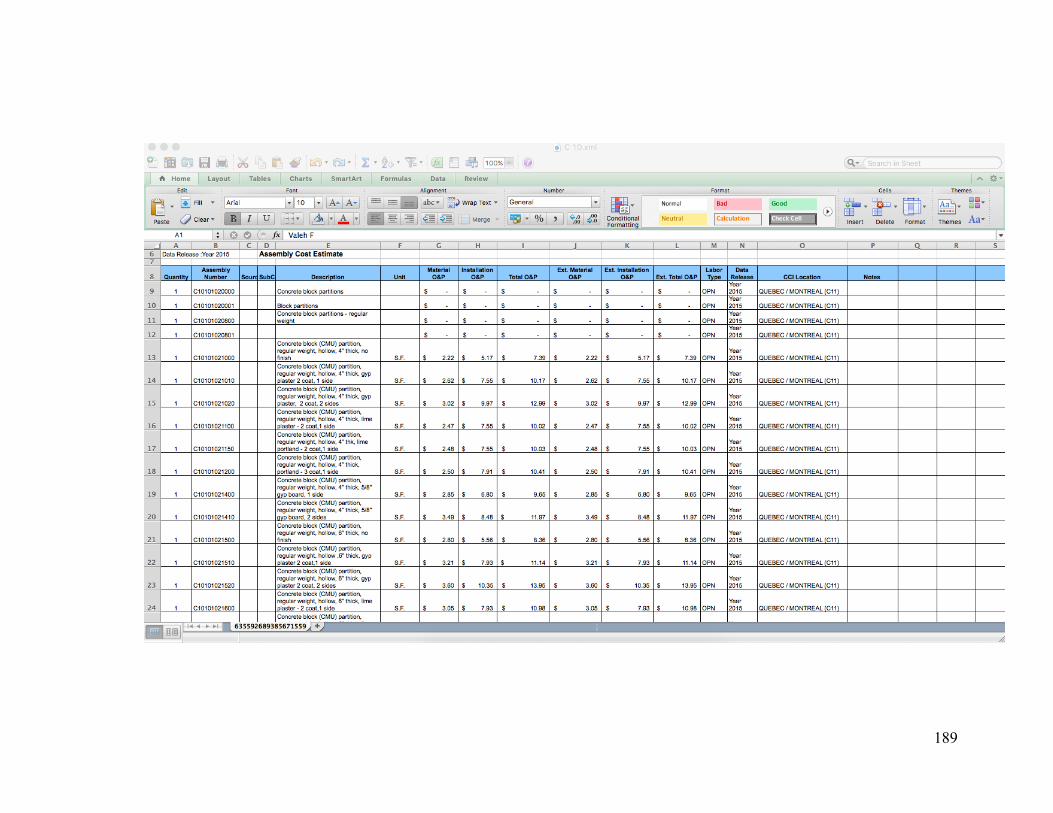
189
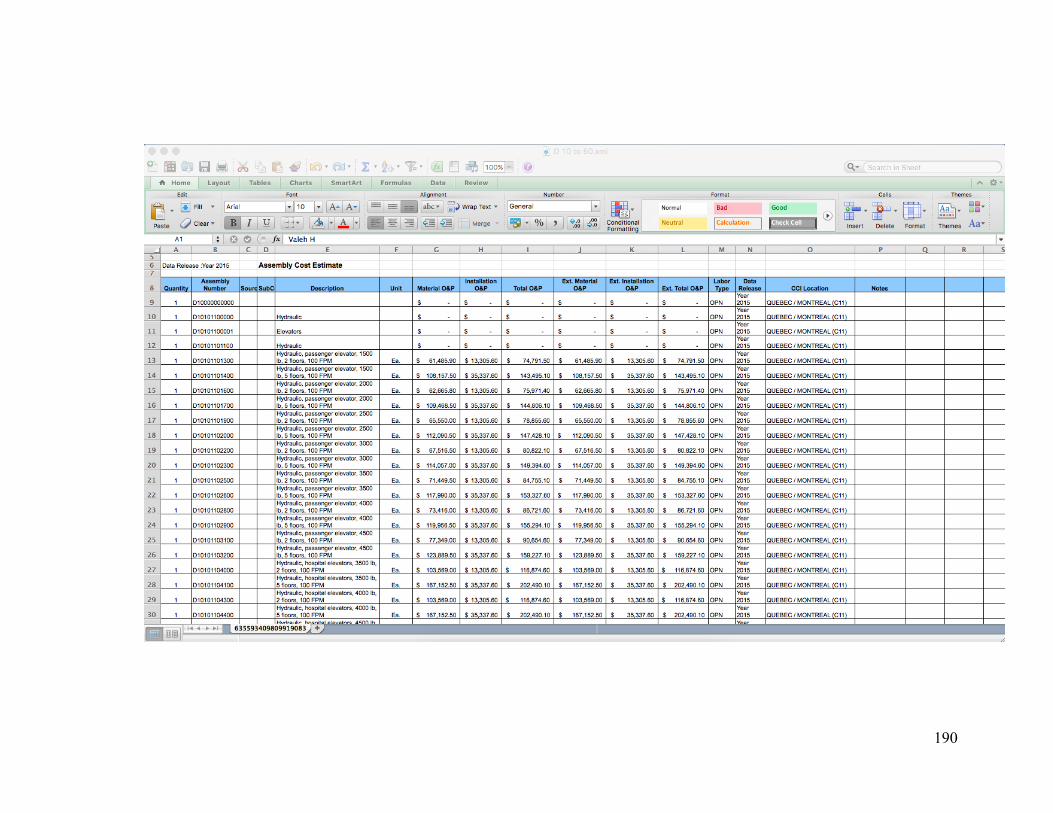
190
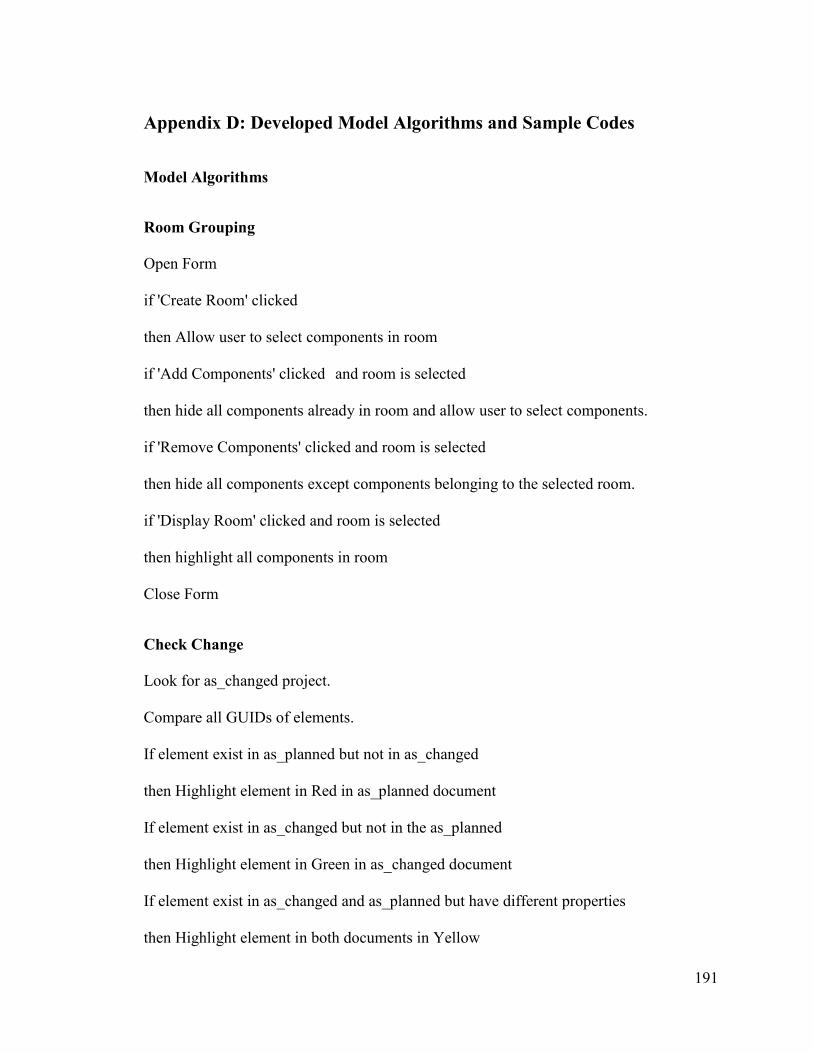
191
Appendix D: Developed Model Algorithms and Sample Codes
Model Algorithms
Room Grouping
Open Form
if 'Create Room' clicked
then Allow user to select components in room
if 'Add Components' clicked and room is selected
then hide all components already in room and allow user to select components.
if 'Remove Components' clicked and room is selected
then hide all components except components belonging to the selected room.
if 'Display Room' clicked and room is selected
then highlight all components in room
Close Form
Check Change
Look for as_changed project.
Compare all GUIDs of elements.
If element exist in as_planned but not in as_changed
then Highlight element in Red in as_planned document
If element exist in as_changed but not in the as_planned
then Highlight element in Green in as_changed document
If element exist in as_changed and as_planned but have different properties
then Highlight element in both documents in Yellow
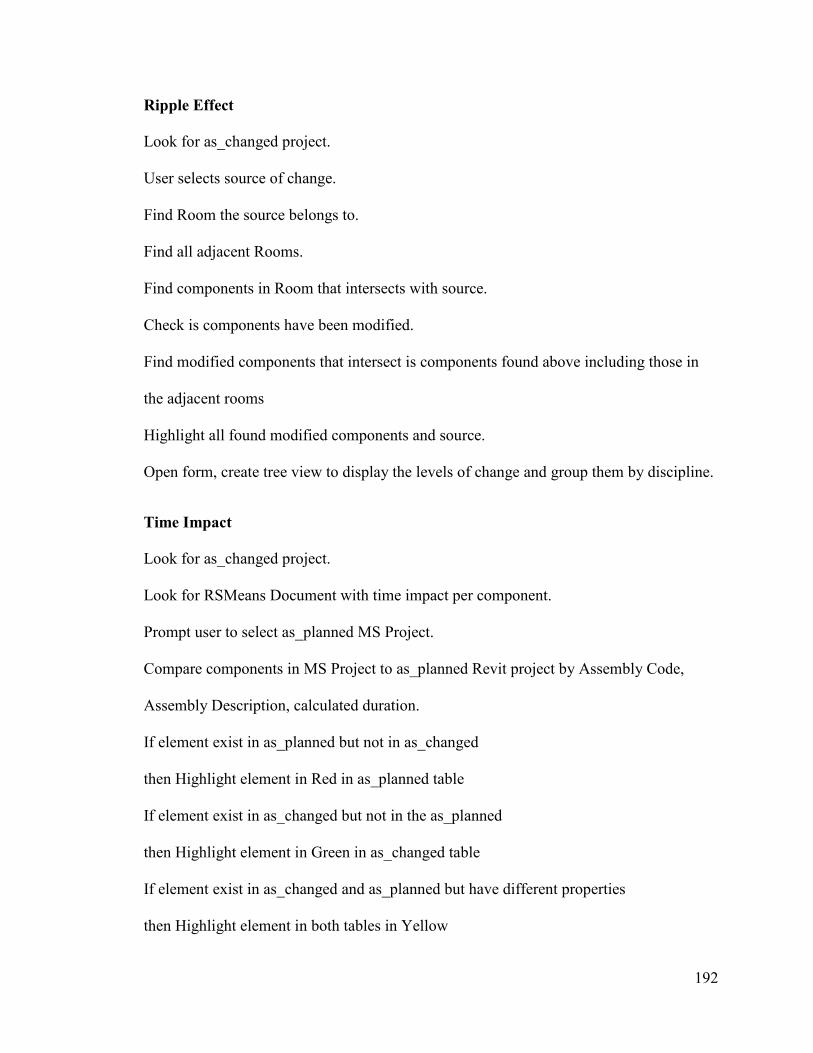
192
Ripple Effect
Look for as_changed project.
User selects source of change.
Find Room the source belongs to.
Find all adjacent Rooms.
Find components in Room that intersects with source.
Check is components have been modified.
Find modified components that intersect is components found above including those in
the adjacent rooms
Highlight all found modified components and source.
Open form, create tree view to display the levels of change and group them by discipline.
Time Impact
Look for as_changed project.
Look for RSMeans Document with time impact per component.
Prompt user to select as_planned MS Project.
Compare components in MS Project to as_planned Revit project by Assembly Code,
Assembly Description, calculated duration.
If element exist in as_planned but not in as_changed
then Highlight element in Red in as_planned table
If element exist in as_changed but not in the as_planned
then Highlight element in Green in as_changed table
If element exist in as_changed and as_planned but have different properties
then Highlight element in both tables in Yellow
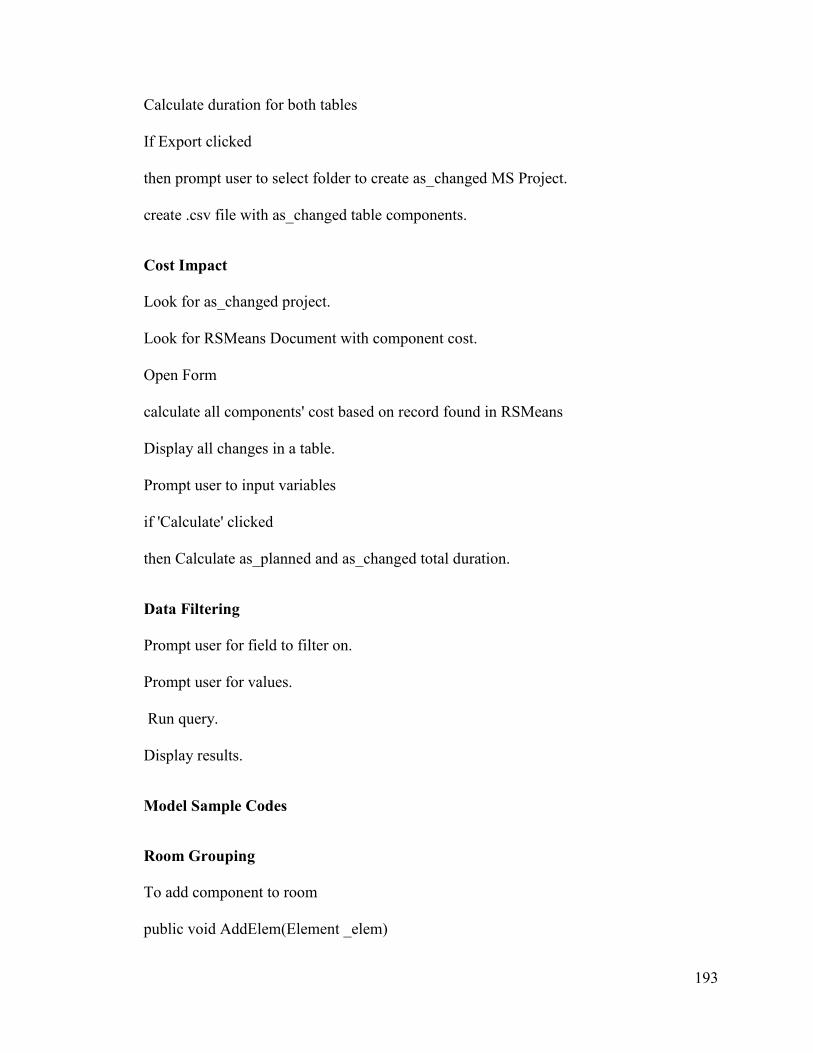
193
Calculate duration for both tables
If Export clicked
then prompt user to select folder to create as_changed MS Project.
create .csv file with as_changed table components.
Cost Impact
Look for as_changed project.
Look for RSMeans Document with component cost.
Open Form
calculate all components' cost based on record found in RSMeans
Display all changes in a table.
Prompt user to input variables
if 'Calculate' clicked
then Calculate as_planned and as_changed total duration.
Data Filtering
Prompt user for field to filter on.
Prompt user for values.
Run query.
Display results.
Model Sample Codes
Room Grouping
To add component to room
public void AddElem(Element _elem)
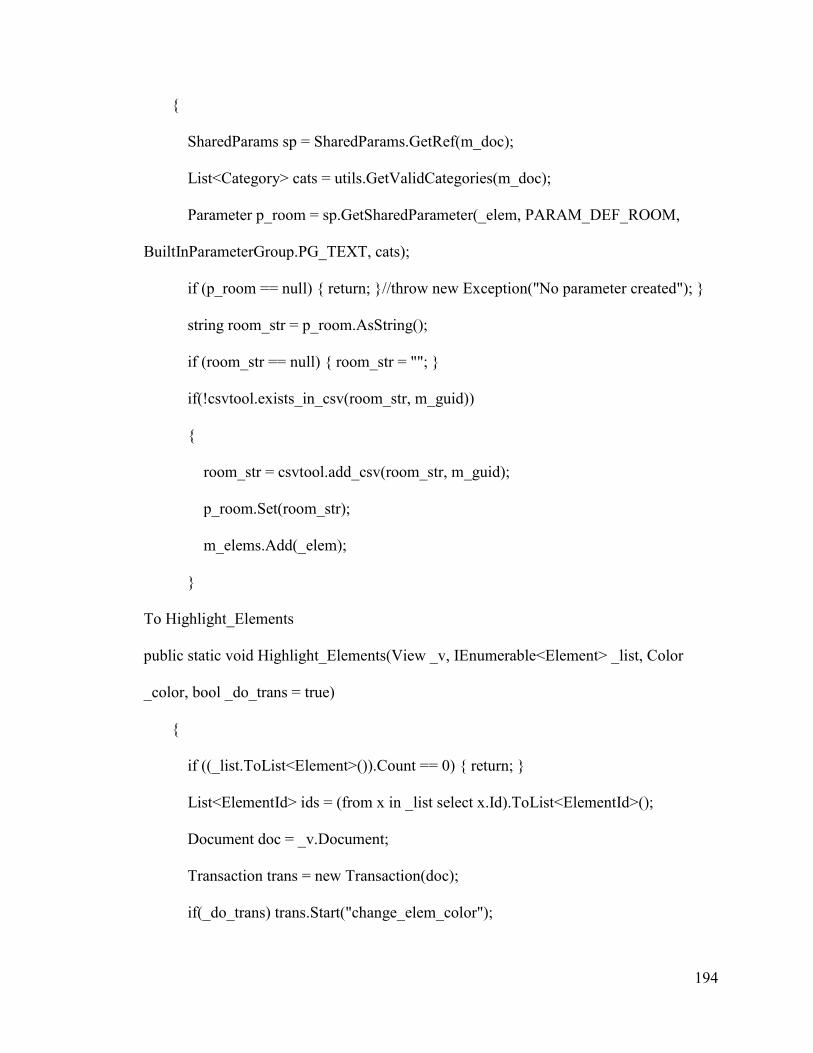
194
{
SharedParams sp = SharedParams.GetRef(m_doc);
List<Category> cats = utils.GetValidCategories(m_doc);
Parameter p_room = sp.GetSharedParameter(_elem, PARAM_DEF_ROOM,
BuiltInParameterGroup.PG_TEXT, cats);
if (p_room == null) { return; }//throw new Exception("No parameter created"); }
string room_str = p_room.AsString();
if (room_str == null) { room_str = ""; }
if(!csvtool.exists_in_csv(room_str, m_guid))
{
room_str = csvtool.add_csv(room_str, m_guid);
p_room.Set(room_str);
m_elems.Add(_elem);
}
To Highlight_Elements
public static void Highlight_Elements(View _v, IEnumerable<Element> _list, Color
_color, bool _do_trans = true)
{
if ((_list.ToList<Element>()).Count == 0) { return; }
List<ElementId> ids = (from x in _list select x.Id).ToList<ElementId>();
Document doc = _v.Document;
Transaction trans = new Transaction(doc);
if(_do_trans) trans.Start("change_elem_color");
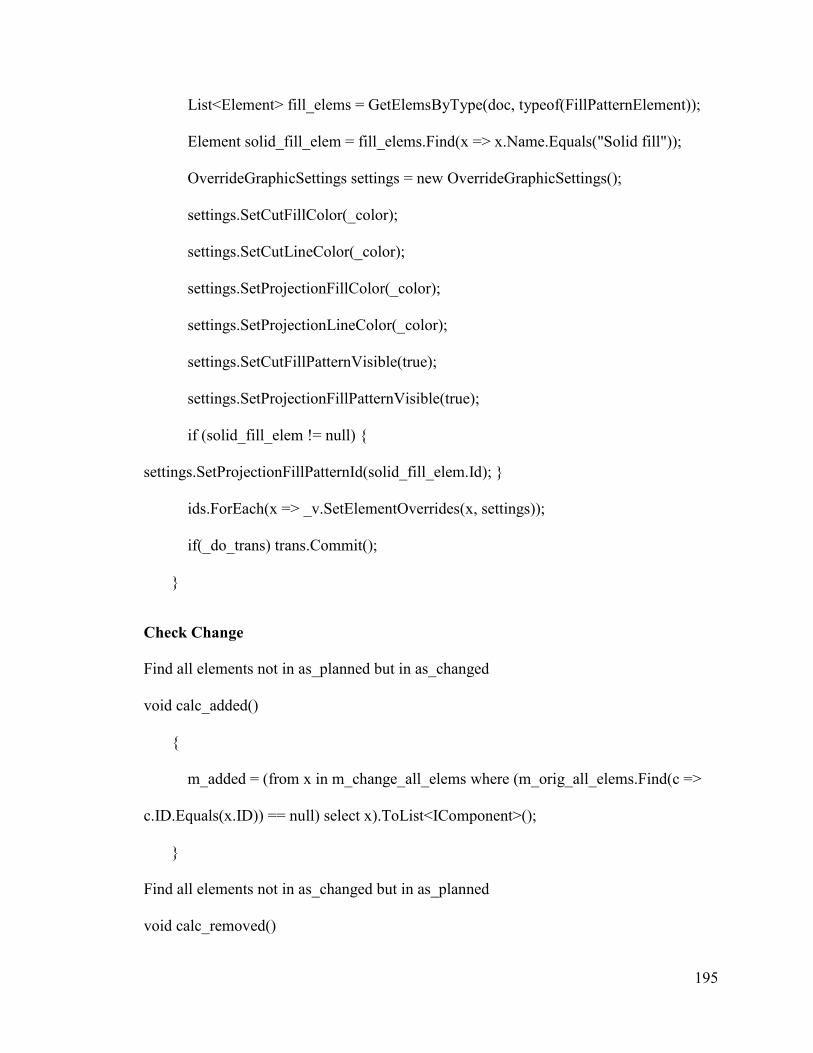
195
List<Element> fill_elems = GetElemsByType(doc, typeof(FillPatternElement));
Element solid_fill_elem = fill_elems.Find(x => x.Name.Equals("Solid fill"));
OverrideGraphicSettings settings = new OverrideGraphicSettings();
settings.SetCutFillColor(_color);
settings.SetCutLineColor(_color);
settings.SetProjectionFillColor(_color);
settings.SetProjectionLineColor(_color);
settings.SetCutFillPatternVisible(true);
settings.SetProjectionFillPatternVisible(true);
if (solid_fill_elem != null) {
settings.SetProjectionFillPatternId(solid_fill_elem.Id); }
ids.ForEach(x => _v.SetElementOverrides(x, settings));
if(_do_trans) trans.Commit();
}
Check Change
Find all elements not in as_planned but in as_changed
void calc_added()
{
m_added = (from x in m_change_all_elems where (m_orig_all_elems.Find(c =>
c.ID.Equals(x.ID)) == null) select x).ToList<IComponent>();
}
Find all elements not in as_changed but in as_planned
void calc_removed()
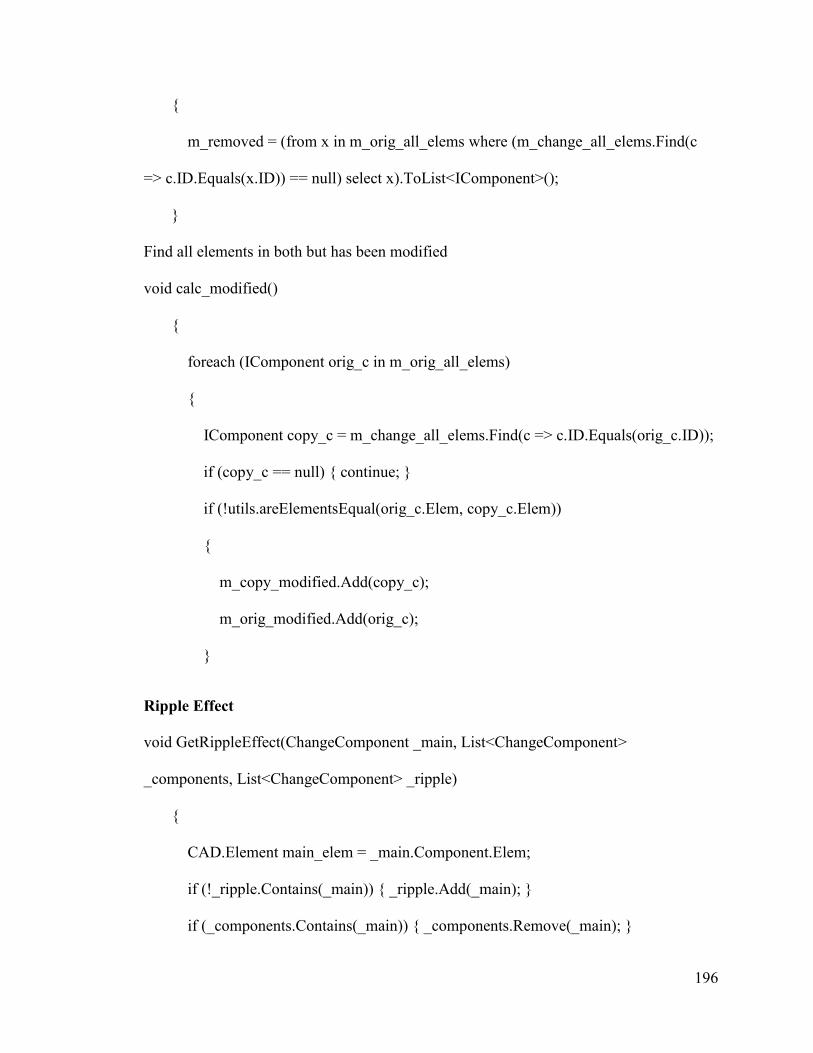
196
{
m_removed = (from x in m_orig_all_elems where (m_change_all_elems.Find(c
=> c.ID.Equals(x.ID)) == null) select x).ToList<IComponent>();
}
Find all elements in both but has been modified
void calc_modified()
{
foreach (IComponent orig_c in m_orig_all_elems)
{
IComponent copy_c = m_change_all_elems.Find(c => c.ID.Equals(orig_c.ID));
if (copy_c == null) { continue; }
if (!utils.areElementsEqual(orig_c.Elem, copy_c.Elem))
{
m_copy_modified.Add(copy_c);
m_orig_modified.Add(orig_c);
}
Ripple Effect
void GetRippleEffect(ChangeComponent _main, List<ChangeComponent>
_components, List<ChangeComponent> _ripple)
{
CAD.Element main_elem = _main.Component.Elem;
if (!_ripple.Contains(_main)) { _ripple.Add(_main); }
if (_components.Contains(_main)) { _components.Remove(_main); }
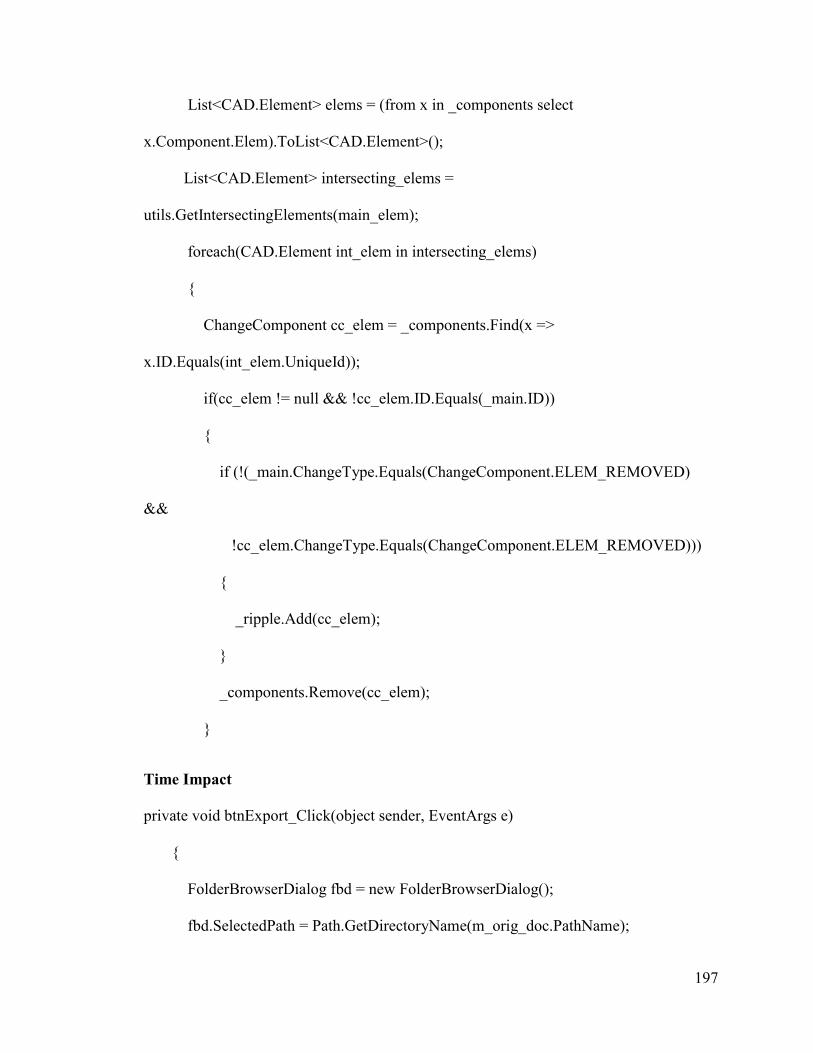
197
List<CAD.Element> elems = (from x in _components select
x.Component.Elem).ToList<CAD.Element>();
List<CAD.Element> intersecting_elems =
utils.GetIntersectingElements(main_elem);
foreach(CAD.Element int_elem in intersecting_elems)
{
ChangeComponent cc_elem = _components.Find(x =>
x.ID.Equals(int_elem.UniqueId));
if(cc_elem != null && !cc_elem.ID.Equals(_main.ID))
{
if (!(_main.ChangeType.Equals(ChangeComponent.ELEM_REMOVED)
&&
!cc_elem.ChangeType.Equals(ChangeComponent.ELEM_REMOVED)))
{
_ripple.Add(cc_elem);
}
_components.Remove(cc_elem);
}
Time Impact
private void btnExport_Click(object sender, EventArgs e)
{
FolderBrowserDialog fbd = new FolderBrowserDialog();
fbd.SelectedPath = Path.GetDirectoryName(m_orig_doc.PathName);
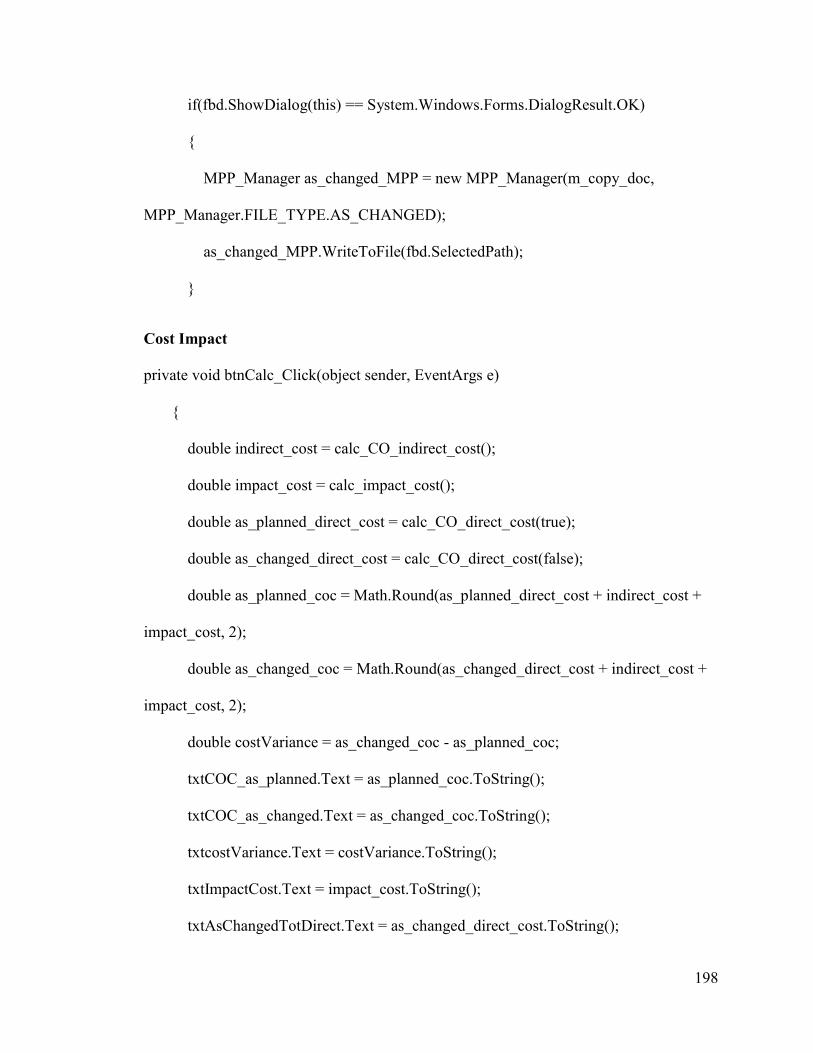
198
if(fbd.ShowDialog(this) == System.Windows.Forms.DialogResult.OK)
{
MPP_Manager as_changed_MPP = new MPP_Manager(m_copy_doc,
MPP_Manager.FILE_TYPE.AS_CHANGED);
as_changed_MPP.WriteToFile(fbd.SelectedPath);
}
Cost Impact
private void btnCalc_Click(object sender, EventArgs e)
{
double indirect_cost = calc_CO_indirect_cost();
double impact_cost = calc_impact_cost();
double as_planned_direct_cost = calc_CO_direct_cost(true);
double as_changed_direct_cost = calc_CO_direct_cost(false);
double as_planned_coc = Math.Round(as_planned_direct_cost + indirect_cost +
impact_cost, 2);
double as_changed_coc = Math.Round(as_changed_direct_cost + indirect_cost +
impact_cost, 2);
double costVariance = as_changed_coc - as_planned_coc;
txtCOC_as_planned.Text = as_planned_coc.ToString();
txtCOC_as_changed.Text = as_changed_coc.ToString();
txtcostVariance.Text = costVariance.ToString();
txtImpactCost.Text = impact_cost.ToString();
txtAsChangedTotDirect.Text = as_changed_direct_cost.ToString();
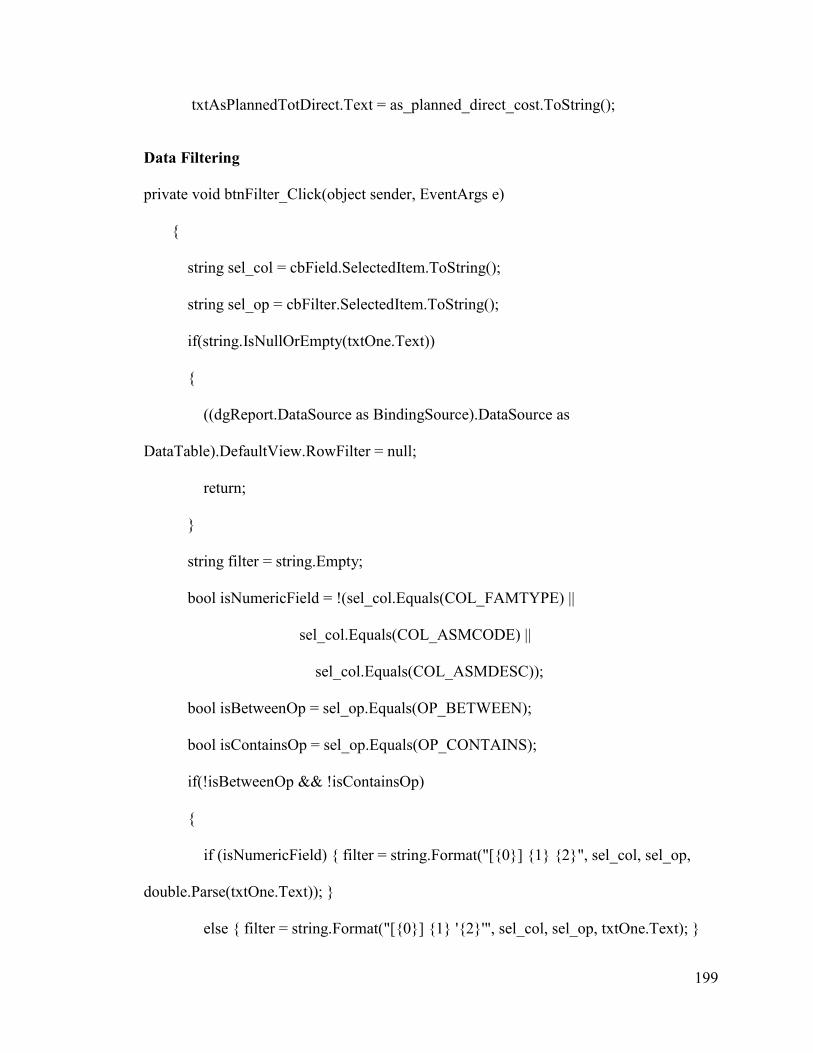
199
txtAsPlannedTotDirect.Text = as_planned_direct_cost.ToString();
Data Filtering
private void btnFilter_Click(object sender, EventArgs e)
{
string sel_col = cbField.SelectedItem.ToString();
string sel_op = cbFilter.SelectedItem.ToString();
if(string.IsNullOrEmpty(txtOne.Text))
{
((dgReport.DataSource as BindingSource).DataSource as
DataTable).DefaultView.RowFilter = null;
return;
}
string filter = string.Empty;
bool isNumericField = !(sel_col.Equals(COL_FAMTYPE) ||
sel_col.Equals(COL_ASMCODE) ||
sel_col.Equals(COL_ASMDESC));
bool isBetweenOp = sel_op.Equals(OP_BETWEEN);
bool isContainsOp = sel_op.Equals(OP_CONTAINS);
if(!isBetweenOp && !isContainsOp)
{
if (isNumericField) { filter = string.Format("[{0}] {1} {2}", sel_col, sel_op,
double.Parse(txtOne.Text)); }
else { filter = string.Format("[{0}] {1} '{2}'", sel_col, sel_op, txtOne.Text); }
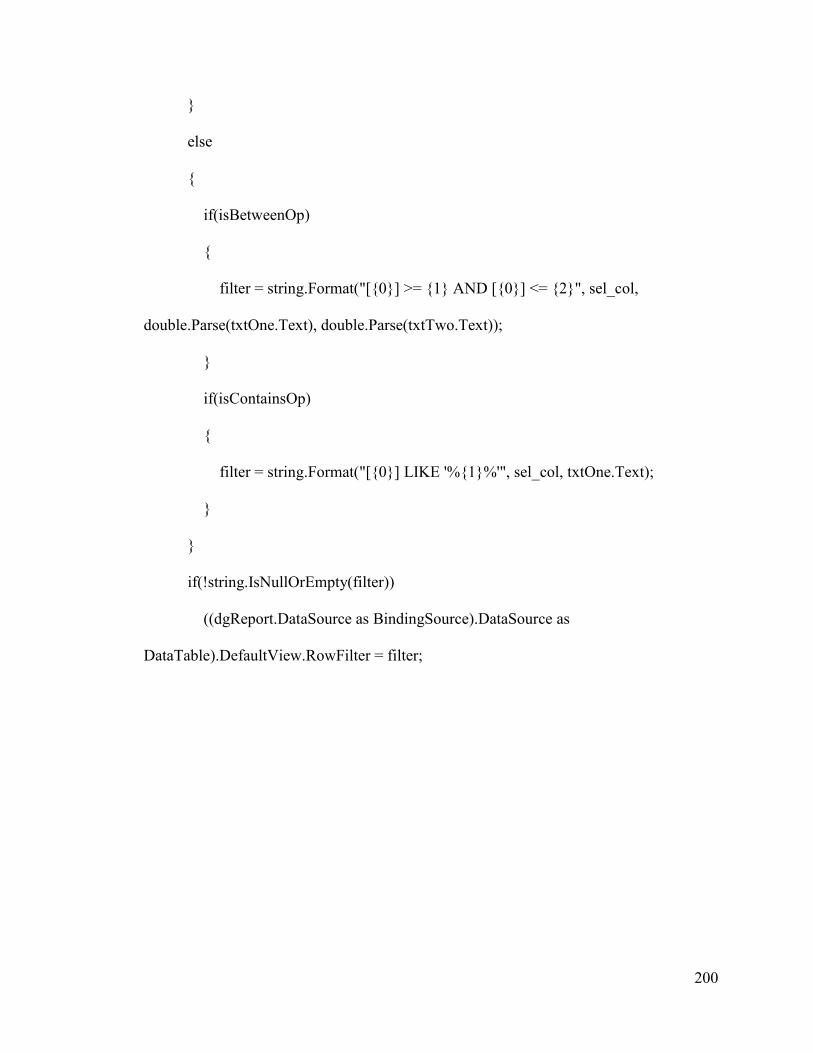
200
}
else
{
if(isBetweenOp)
{
filter = string.Format("[{0}] >= {1} AND [{0}] <= {2}", sel_col,
double.Parse(txtOne.Text), double.Parse(txtTwo.Text));
}
if(isContainsOp)
{
filter = string.Format("[{0}] LIKE '%{1}%'", sel_col, txtOne.Text);
}
}
if(!string.IsNullOrEmpty(filter))
((dgReport.DataSource as BindingSource).DataSource as
DataTable).DefaultView.RowFilter = filter;