a new approach for modelling variability in residential construction projects
TRANSCRIPT
A New Approach for Modelling Variability in Residential Construction Projects
Mehrdad Arashpour, (RMIT University, Australia)
Ron Wakefield, (RMIT University, Australia)
Nick Blismas, (RMIT University, Australia)
Eric Wai Ming Lee, (City University, Hong Kong)
Abstract The construction industry is plagued by long cycle times caused by variability in the supply chain. Variations or undesirable situations are the result of factors such as non-standard practices, work site accidents, inclement weather conditions and faults in design. This paper uses a new approach for modelling variability in construction by linking relative variability indicators to processes. The mass homebuilding sector was chosen as the scope of the analysis because data is readily available. Numerous simulation experiments were designed by varying size of capacity buffers in front of trade contractors, availability of trade contractors, and level of variability in homebuilding processes. The measurements were shown to lead to an accurate determination of relationships between these factors and production parameters. The variability indicator was found to dramatically affect the tangible performance measures such as home completion rates. This study provides for future analysis of the production homebuilding sector, which may lead to improvements in performance and a faster product delivery to homebuyers. Keywords: Computer simulaion, Production, Project management, Queuing, Residential construction, Variability in supply chain, Optimim level of work-in-process inventory
Introduction Simulation of construction processes has received much attention in recent years due to its ability to estimate the behaviour of systems in the presence of variability. Variations or undesirable situations that arise are the result of delays or interruptions in the workflow. Performance measures such as project completion time or resource utilization rates are very sensitive to changes in production variables. Attention should be paid to address present variability in production systems otherwise the cost will be paid later on in forms of lost output (throughput) rate, wasted capacity, inflated completion (cycle) times, and poor customer service (Arashpour and Arashpour 2012). Construction processes are different in nature with unequal levels of variability. In residential construction, for instance, an outdoor process such as roofing is more prone to inclement weather conditions comparing with an indoor process such as plumbing. Also, other factors such as accident risks differ from one process to another. In the construction management literature, some researchers have modelled the variability by means of longer mean process times (Walker and Shen 2002, Walsh, et al. 2007, Arashpour, et al. 2013) and some others by assuming a larger variance in process times (Peña-Mora and Dwivedi 2002, Sawhney, et al. 2009, Ghoddousi, et al. 2013). However, the negative influence of variability has been more precisely modelled in other sectors such as manufacturing. Using relative measures of variability have led to a more accurate measurement of system performance in the manufacturing sector (Hopp and Spearman 2008, Jeong, et al. 2011).
Australasian Journal of Construction Economics and Building
Arashpour, M et al. (2013) ‘A new approach for modelling variability in residential construction projects’, Australasian Journal of Construction Economics and Building, 13 (2) 83-92
84
Evidence such as lengthened completion times and poor client service particularly during boom periods calls for new approaches for variability modelling in construction projects (Dalton, et al. 2011). On this basis, the present paper uses an innovative approach for modelling variability in residential projects by linking variability indicators to processes. Volume homebuilding was chosen as the scope of this analysis because data is readily available. A two-level hierarchical model was developed to represent the typical production of detached suburban houses in Melbourne, Australia. Several simulation experiments were then conducted by varying: 1. Size of the buffers (queue of jobs to be processed) in front of trade contractors; 2. Level of resource availability; 3. Variability level in the production homebuilding network. In this paper, the effects of variability on the key performance measures such as project completion times and resource utilisation rates are explored.
Review of the Existing Approaches to Model and Address Variability in the Construction Industry Data obtained in previous studies indicate that variability, which is non-uniformity in building processes, always degrades the performance and productivity measures in construction projects (Moyal 2010, Chia, et al. 2012). Existing strategies are discussed in this section:
A. Using Capacity Buffers against Production Variability Construction processes are usually defined by the trade contractors who are responsible for them. Buffers between processes can prevent downstream trade contractors to become idle when upstream contractors experience a delay (González, et al. 2011, Koskela and Ballard 2012). Disadvantages of large buffers between interacting trade contractors include a large work-in-process (WIP) inventory and higher costs. In order to investigate this approach to model and address variability, different capacity buffer sizes are modelled and compared in the first and second simulation experiments in the next section.
B. Increasing Resource Availability Availability of trade contractors can directly affect the completion time of construction processes. During boom periods, homebuilders often use more trade contractors or overtime as buffers against undesirable situations in the work sites (Arashpour, et al. 2012). By authorization of over-time the work capacity increases temporarily and overtakes the demand rate. However, the cycle of over-time would start again by any future randomness in demand or production rate (Hopp and Spearman 2004). Any change in availability of resources has an impact on costs, similar to the crashing concept in project planning. The third simulation experiment in this paper focuses on resource availability.
C. Variability Reduction Approaches Different approaches are available to reduce the variability level in the mass production homebuilding sector. For example, complications at work sites can be decreased by using modular designs. Furthermore, using prefabrication, modularization and preassembly can dramatically leverage the constructability (Blismas, et al. 2010). Another initiative is to use advanced design and marketing methods, which enables the construction firms to schedule the production in advance (Bouchlaghem, et al. 2005, Veryzer 2005). Flow-smoothing is another way of reducing variability in the construction environment. Different techniques can be used for this aim such as standardizing construction practices (Carlos, et al. 2002), quality management and reducing rework (Henry 2000), and applications of lean principles in industrialized housing production (Höök and Stehn 2008). Furthermore, variability caused by project-based subcontractors can be decreased by developing long-term business relationships with them. In this way, much of the capacity buffer against variability is carried by subcontractors (Kumaraswamy and Matthews 2000, Greenwood 2001). The variability reduction approach has been modelled and analysed in the fourth simulation experiment.
Australasian Journal of Construction Economics and Building
Arashpour, M et al. (2013) ‘A new approach for modelling variability in residential construction projects’, Australasian Journal of Construction Economics and Building, 13 (2) 83-92
85
Pro
bab
ilit
y
den
sity
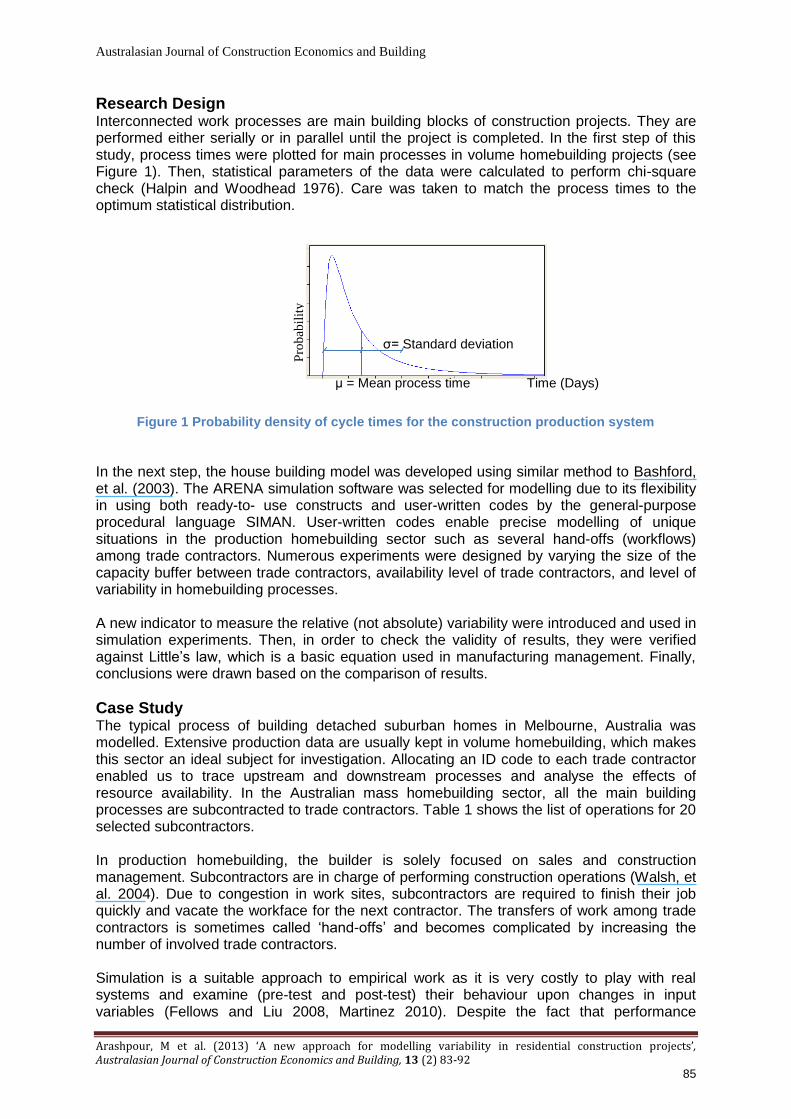
Research Design Interconnected work processes are main building blocks of construction projects. They are performed either serially or in parallel until the project is completed. In the first step of this study, process times were plotted for main processes in volume homebuilding projects (see Figure 1). Then, statistical parameters of the data were calculated to perform chi-square check (Halpin and Woodhead 1976). Care was taken to match the process times to the optimum statistical distribution.
σ= Standard deviation
μ = Mean process time Time (Days)
Figure 1 Probability density of cycle times for the construction production system
In the next step, the house building model was developed using similar method to Bashford, et al. (2003). The ARENA simulation software was selected for modelling due to its flexibility in using both ready-to- use constructs and user-written codes by the general-purpose procedural language SIMAN. User-written codes enable precise modelling of unique situations in the production homebuilding sector such as several hand-offs (workflows) among trade contractors. Numerous experiments were designed by varying the size of the capacity buffer between trade contractors, availability level of trade contractors, and level of variability in homebuilding processes. A new indicator to measure the relative (not absolute) variability were introduced and used in simulation experiments. Then, in order to check the validity of results, they were verified against Little’s law, which is a basic equation used in manufacturing management. Finally, conclusions were drawn based on the comparison of results.
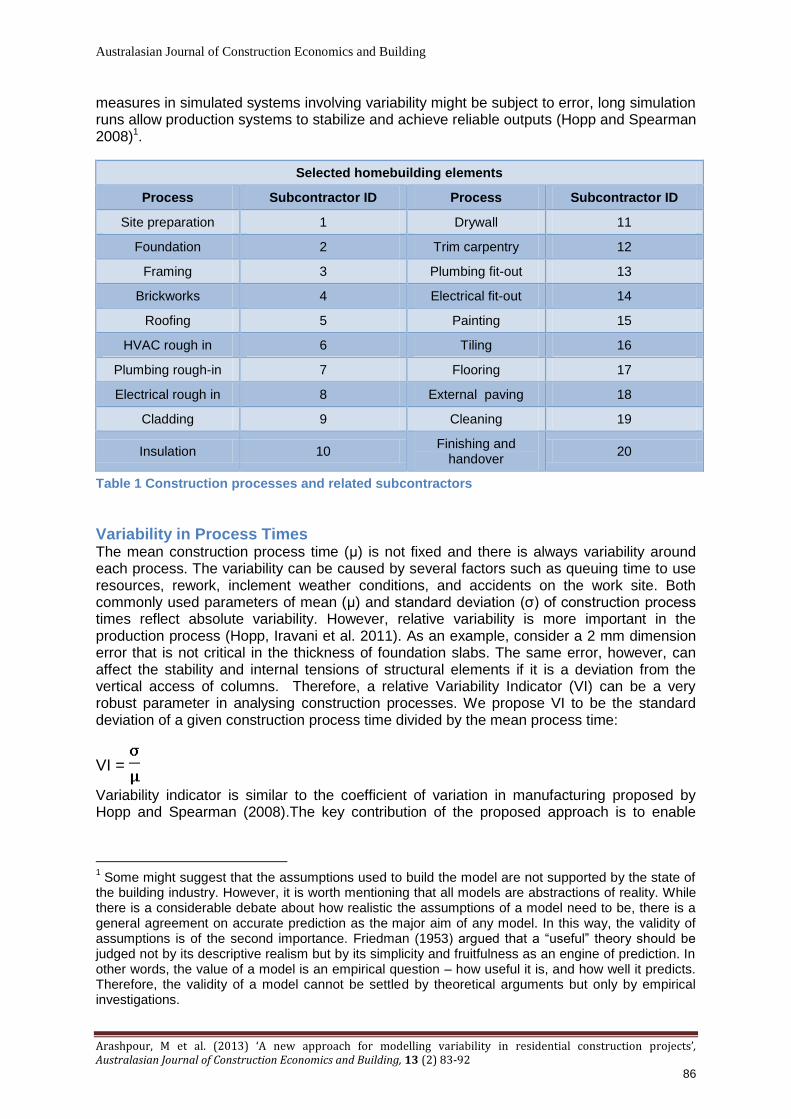
Case Study The typical process of building detached suburban homes in Melbourne, Australia was modelled. Extensive production data are usually kept in volume homebuilding, which makes this sector an ideal subject for investigation. Allocating an ID code to each trade contractor enabled us to trace upstream and downstream processes and analyse the effects of resource availability. In the Australian mass homebuilding sector, all the main building processes are subcontracted to trade contractors. Table 1 shows the list of operations for 20 selected subcontractors. In production homebuilding, the builder is solely focused on sales and construction management. Subcontractors are in charge of performing construction operations (Walsh, et al. 2004). Due to congestion in work sites, subcontractors are required to finish their job quickly and vacate the workface for the next contractor. The transfers of work among trade contractors is sometimes called ‘hand-offs’ and becomes complicated by increasing the number of involved trade contractors. Simulation is a suitable approach to empirical work as it is very costly to play with real systems and examine (pre-test and post-test) their behaviour upon changes in input variables (Fellows and Liu 2008, Martinez 2010). Despite the fact that performance
Australasian Journal of Construction Economics and Building
Arashpour, M et al. (2013) ‘A new approach for modelling variability in residential construction projects’, Australasian Journal of Construction Economics and Building, 13 (2) 83-92
86
measures in simulated systems involving variability might be subject to error, long simulation runs allow production systems to stabilize and achieve reliable outputs (Hopp and Spearman 2008)1.
Selected homebuilding elements
Process Subcontractor ID Process Subcontractor ID
Site preparation 1 Drywall 11
Foundation 2 Trim carpentry 12
Framing 3 Plumbing fit-out 13
Brickworks 4 Electrical fit-out 14
Roofing 5 Painting 15
HVAC rough in 6 Tiling 16
Plumbing rough-in 7 Flooring 17
Electrical rough in 8 External paving 18
Cladding 9 Cleaning 19
Insulation 10 Finishing and
handover 20
Table 1 Construction processes and related subcontractors
Variability in Process Times The mean construction process time (μ) is not fixed and there is always variability around each process. The variability can be caused by several factors such as queuing time to use resources, rework, inclement weather conditions, and accidents on the work site. Both commonly used parameters of mean (μ) and standard deviation (σ) of construction process times reflect absolute variability. However, relative variability is more important in the production process (Hopp, Iravani et al. 2011). As an example, consider a 2 mm dimension error that is not critical in the thickness of foundation slabs. The same error, however, can affect the stability and internal tensions of structural elements if it is a deviation from the vertical access of columns. Therefore, a relative Variability Indicator (VI) can be a very robust parameter in analysing construction processes. We propose VI to be the standard deviation of a given construction process time divided by the mean process time:
VI =
Variability indicator is similar to the coefficient of variation in manufacturing proposed by Hopp and Spearman (2008).The key contribution of the proposed approach is to enable
1 Some might suggest that the assumptions used to build the model are not supported by the state of
the building industry. However, it is worth mentioning that all models are abstractions of reality. While there is a considerable debate about how realistic the assumptions of a model need to be, there is a general agreement on accurate prediction as the major aim of any model. In this way, the validity of assumptions is of the second importance. Friedman (1953) argued that a “useful” theory should be judged not by its descriptive realism but by its simplicity and fruitfulness as an engine of prediction. In other words, the value of a model is an empirical question – how useful it is, and how well it predicts. Therefore, the validity of a model cannot be settled by theoretical arguments but only by empirical investigations.
Australasian Journal of Construction Economics and Building
Arashpour, M et al. (2013) ‘A new approach for modelling variability in residential construction projects’, Australasian Journal of Construction Economics and Building, 13 (2) 83-92
87
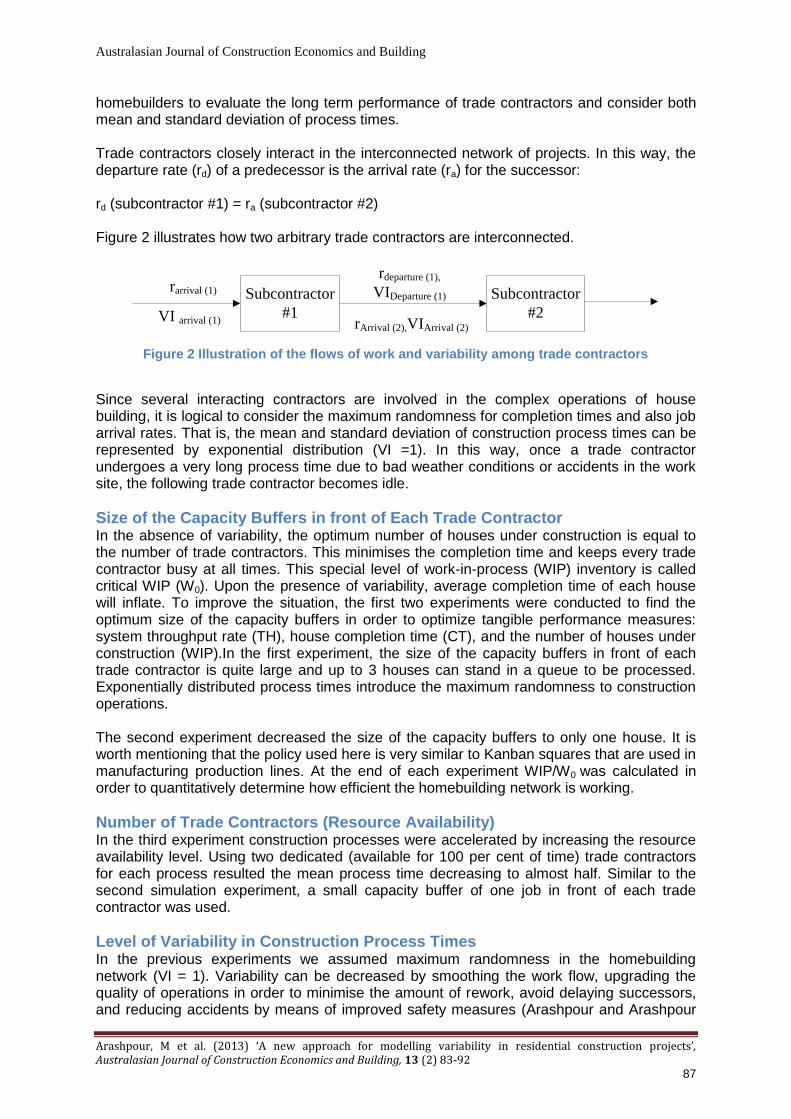
homebuilders to evaluate the long term performance of trade contractors and consider both mean and standard deviation of process times. Trade contractors closely interact in the interconnected network of projects. In this way, the departure rate (rd) of a predecessor is the arrival rate (ra) for the successor: rd (subcontractor #1) = ra (subcontractor #2) Figure 2 illustrates how two arbitrary trade contractors are interconnected.
Subcontractor
#1
Subcontractor
#2
rarrival (1)
VI arrival (1)
rdeparture (1),
VIDeparture (1)
rArrival (2),VIArrival (2)
Figure 2 Illustration of the flows of work and variability among trade contractors
Since several interacting contractors are involved in the complex operations of house building, it is logical to consider the maximum randomness for completion times and also job arrival rates. That is, the mean and standard deviation of construction process times can be represented by exponential distribution (VI =1). In this way, once a trade contractor undergoes a very long process time due to bad weather conditions or accidents in the work site, the following trade contractor becomes idle.
Size of the Capacity Buffers in front of Each Trade Contractor In the absence of variability, the optimum number of houses under construction is equal to the number of trade contractors. This minimises the completion time and keeps every trade contractor busy at all times. This special level of work-in-process (WIP) inventory is called critical WIP (W0). Upon the presence of variability, average completion time of each house will inflate. To improve the situation, the first two experiments were conducted to find the optimum size of the capacity buffers in order to optimize tangible performance measures: system throughput rate (TH), house completion time (CT), and the number of houses under construction (WIP).In the first experiment, the size of the capacity buffers in front of each trade contractor is quite large and up to 3 houses can stand in a queue to be processed. Exponentially distributed process times introduce the maximum randomness to construction operations. The second experiment decreased the size of the capacity buffers to only one house. It is worth mentioning that the policy used here is very similar to Kanban squares that are used in manufacturing production lines. At the end of each experiment WIP/W0 was calculated in order to quantitatively determine how efficient the homebuilding network is working.
Number of Trade Contractors (Resource Availability) In the third experiment construction processes were accelerated by increasing the resource availability level. Using two dedicated (available for 100 per cent of time) trade contractors for each process resulted the mean process time decreasing to almost half. Similar to the second simulation experiment, a small capacity buffer of one job in front of each trade contractor was used.
Level of Variability in Construction Process Times In the previous experiments we assumed maximum randomness in the homebuilding network (VI = 1). Variability can be decreased by smoothing the work flow, upgrading the quality of operations in order to minimise the amount of rework, avoid delaying successors, and reducing accidents by means of improved safety measures (Arashpour and Arashpour
Australasian Journal of Construction Economics and Building
Arashpour, M et al. (2013) ‘A new approach for modelling variability in residential construction projects’, Australasian Journal of Construction Economics and Building, 13 (2) 83-92
88
2010). The Variability Indicator (VI) of the processes was decreased from 1 to half in the fourth simulation experiment. Trade contractors can be promoted to a new class of variability by reducing the ratio of mean process time to standard deviation over the long term.
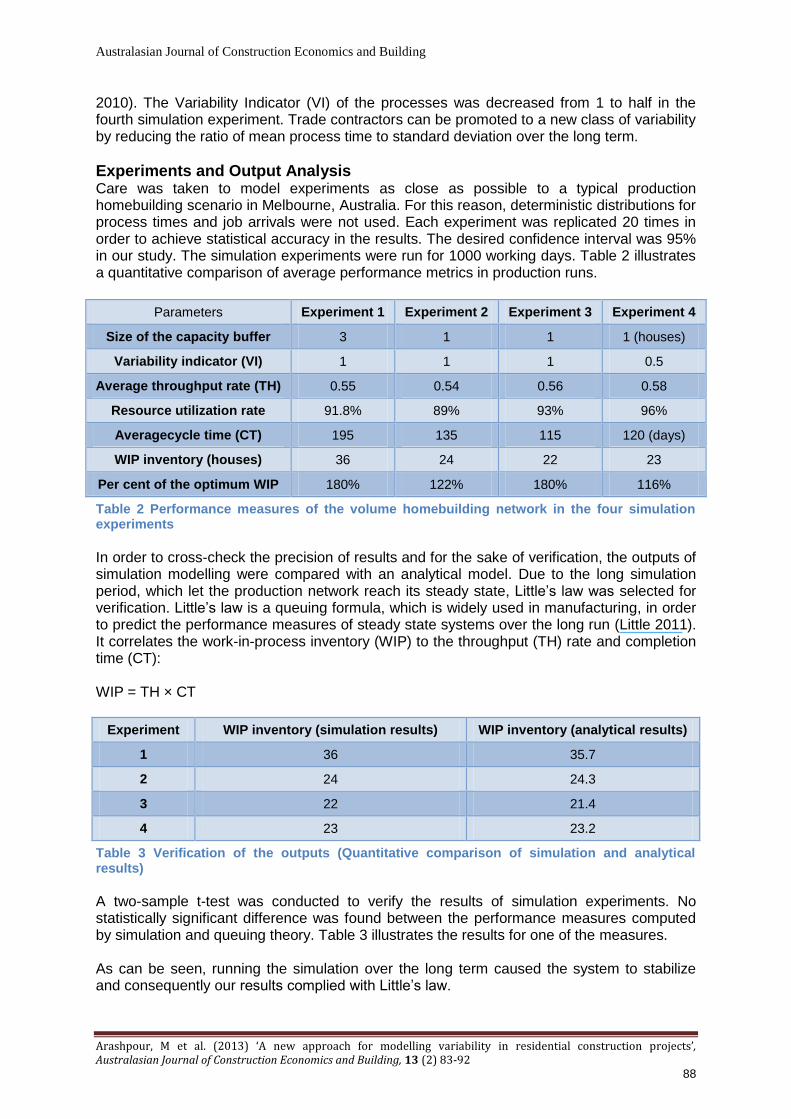
Experiments and Output Analysis Care was taken to model experiments as close as possible to a typical production homebuilding scenario in Melbourne, Australia. For this reason, deterministic distributions for process times and job arrivals were not used. Each experiment was replicated 20 times in order to achieve statistical accuracy in the results. The desired confidence interval was 95% in our study. The simulation experiments were run for 1000 working days. Table 2 illustrates a quantitative comparison of average performance metrics in production runs.
Parameters Experiment 1 Experiment 2 Experiment 3 Experiment 4
Size of the capacity buffer 3 1 1 1 (houses)
Variability indicator (VI) 1 1 1 0.5
Average throughput rate (TH) 0.55 0.54 0.56 0.58
Resource utilization rate 91.8% 89% 93% 96%
Averagecycle time (CT) 195 135 115 120 (days)
WIP inventory (houses) 36 24 22 23
Per cent of the optimum WIP 180% 122% 180% 116%
Table 2 Performance measures of the volume homebuilding network in the four simulation experiments
In order to cross-check the precision of results and for the sake of verification, the outputs of simulation modelling were compared with an analytical model. Due to the long simulation period, which let the production network reach its steady state, Little’s law was selected for verification. Little’s law is a queuing formula, which is widely used in manufacturing, in order to predict the performance measures of steady state systems over the long run (Little 2011). It correlates the work-in-process inventory (WIP) to the throughput (TH) rate and completion time (CT): WIP = TH × CT
Experiment WIP inventory (simulation results) WIP inventory (analytical results)
1 36 35.7
2 24 24.3
3 22 21.4
4 23 23.2
Table 3 Verification of the outputs (Quantitative comparison of simulation and analytical results)
A two-sample t-test was conducted to verify the results of simulation experiments. No statistically significant difference was found between the performance measures computed by simulation and queuing theory. Table 3 illustrates the results for one of the measures. As can be seen, running the simulation over the long term caused the system to stabilize and consequently our results complied with Little’s law.
Australasian Journal of Construction Economics and Building
Arashpour, M et al. (2013) ‘A new approach for modelling variability in residential construction projects’, Australasian Journal of Construction Economics and Building, 13 (2) 83-92
89
Relationship between Capacity Buffer and Production Parameters In the first experiment and by using a capacity buffer of three houses, the number of homes under construction reached a peak of 36. Consequently, the average cycle time for a single house was inflated to 195 days, as in table 2. This indicates that although capacity buffers prevent downstream contractors from work starvations and idleness, increasing the number of houses under construction results in lengthened completion times. There is a similar situation during construction boom periods, when demand exceeds the capacity of trade networks and houses have to stand in long queues before being processed. Large capacity buffers create big WIP inventories resulting in late completions and decreased service level. By decreasing the size of capacity buffers in front of trade contractors to 1 house, average completion times decreased dramatically in our second experiment. It is worth mentioning that no extra resources and investment are needed. Improvements in this scenario are the results of changing the control and management policies by limiting the size of capacity buffers. In the second experiment, the number of houses under construction declined to 24, which reduced the average completion time to 135 days (see table 2). The construction output rate (TH) is slightly less than TH in the first production scenario. This is because of occasional job starvations that downstream trade contractors undergo.
Relationship between Resource Availability and Production Parameters In the third simulation experiment, by increasing the level of resource availability, the average house completion time decreased to 115 days. Furthermore, resource utilization level stood at 93 per cent. This is more than utilization level of 89 per cent in the second experiment where trade contractors occasionally were idle. Although the third experiment achieved the shortest average CT, trade-offs need to be made as reducing the mean value of construction process times here is linked to employing more trade contractors and costs might offset the revenue (unlike the second scenario with no extra costs).
Relationship between VI and Production Parameters: Applications of the New Variability Modelling Approach The relative variability indicator introduced in this study can differentiate construction processes. Different policies can be used by trade contractors to reduce mean process times and consequently VI. These include avoiding rework by improving quality controls and preventing workflow interruption by improving safety measures. In the fourth simulation experiment, by reducing the variability indicator to half, a completion time of 120 days was achieved, which is almost identical to the third experiment with its necessary investments. The number of houses under construction is 23, which is very close to the number of involved trade contractors (there is almost no capacity buffer in front of the trades contractors). The work-in-process inventory in this experiment is only 16% more than the optimum critical WIP. In other words, the homebuilding network worked more efficiently comparing with other production experiments (116% of the optimum WIP was the minimum amongst all experiments). Overall, although there are several opportunities on construction sites to buffer against variability, there are several advantages in attempting to reduce variability. Successful variability reduction strategies, through custom-designed policies, could be implemented in a firm’s future projects (Hopp and Spearman 2008). Additionally, improving a specific construction process by finding the source of excess variability would create the mind-set of variability reduction and a culture of continual improvement within the homebuilding networks (Arashpour and Farzanehfar 2011).
Australasian Journal of Construction Economics and Building
Arashpour, M et al. (2013) ‘A new approach for modelling variability in residential construction projects’, Australasian Journal of Construction Economics and Building, 13 (2) 83-92
90
Conclusion Data obtained in previous studies indicate that variability is not accurately modelled and addressed in construction projects. This fact in the mass homebuilding sector results in inflated house completion times, reduction in outputs, and higher capital costs for homebuyers (Bashford, et al. 2005, Arashpour, et al. 2013). In the construction management literature, variability has been mostly modelled by assuming longer process times (pessimistic durations) and/or a larger variance in process times. To bridge this gap, the present paper has modelled the variability in the production homebuilding sector using an innovative approach. Several experiments were designed by varying the size of the capacity buffers between trade contractors, the availability of trade contractors, and the intensity of the variability indicator in homebuilding processes. We found that there are solid relationships between these factors and production parameters. The findings extend those of Kamat and Martinez (2008) and Li, et al. (2009), confirming that tracing, modelling and addressing sources of variability in construction can lead to achieving optimum performance measures. The key contribution of the proposed approach is to enable homebuilders to evaluate the long term performance of their trade contractors and decide on the best size of the capacity buffers (queue length of houses to be processed) in front of each trade. Although we investigated the production homebuilding sector, results may be generalized to other sectors within the construction industry. Future research could include works designed to model variability and investigate its effects on production parameters. The variables within construction projects are numerous and the underlying logic for many system behaviours in the construction sector is still unknown.
Acknowledgements Authors would like to thank anonymous reviewers of the Australasian Journal of Construction Economics and Building whose constructive comments and recommendations brought more depth to this investigation. Furthermore, the kind support of Ms Jennifer Anderson in RMIT Study and Learning Centre is highly appreciated.
References Arashpour, M. and M. Arashpour, (2010) ‘Gaining the best value from hr in construction companies', Proceedings of the 6th European Conference on Management Leadership and Governance, 23-33
Arashpour, M. and M. Arashpour (2012) 'A collaborative perspective in green construction risk management', 37th Annual Conference of the Australasian Universities Building Educators Association (AUBEA), University of New South Wales
Arashpour, M. and P. Farzanehfar (2011) Project Management and Control, vol. 1, Arkan
Arashpour, M., M. Shabanikia and M. Arashpour (2012) 'Valuing the contribution of knowledge-oriented workers to projects: a merit based approach in the construction industry', Australasian Journal of Construction Economics and Building, 12 (4), 1- 12
Arashpour, M., R. Wakefield and N. Blismas (2013) 'Improving construction productivity: implications of even flow production principles', CIB World Building Congress 2013: Construction and Society, Queensland University of Technology
Arashpour, M., R. Wakefield and N. Blismas (2013) Role of simulation in construction processes-harmony in capturing resources, Research, Development and Practice in Structural Engineering and Construction (ASEA-SEC), Research Publishing Services (RPS)
Australasian Journal of Construction Economics and Building
Arashpour, M et al. (2013) ‘A new approach for modelling variability in residential construction projects’, Australasian Journal of Construction Economics and Building, 13 (2) 83-92
91
Bashford, H. H., A. Sawhney, K. D. Walsh and K. Kot (2003) 'Implications of even flow production methodology for U.S. housing industry', Journal of Construction Engineering and Management, 129 (3), 330-337
Bashford, H. H., K. D. Walsh and A. Sawhney (2005) 'Production system loading-cycle time relationship in residential construction', Journal of Construction Engineering and Management, 131 (1), 15-22
Blismas, N., R. Wakefield and B. Hauser (2010) 'Concrete prefabricated housing via advances in systems technologies - Development of a technology roadmap', Engineering, Construction and Architectural Management, 17 (1), 99-110
Bouchlaghem, D., H. Shang, J. Whyte and A. Ganah (2005) 'Visualisation in architecture, engineering and construction (AEC)', Automation in Construction, 14 (3), 287-295
Carlos, T. F., A. Dos Santos and A. P. James (2002) 'An exploratory study on the applicability of process transparency in construction sites', Journal of Construction Research, 3 (01), 35-54
Chia, F. C., M. Skitmore, G. Runeson and A. Bridge (2012) 'An analysis of construction productivity in Malaysia', Construction Management and Economics, 30 (12), 1055-1069
Dalton, T., R. Wakefield and R. Horne (2011) 'Australian suburban house building: industry organisation, practices and constraints', Australian Housing and Urban Research Institute Positioning Paper Series, 1-56
Fellows, R. F. and A. M. M. Liu (2008) Research Methods for Construction, Wiley-Blackwell
Friedman, M. (1953) The Methodology of Positive Economics
Ghoddousi, P., E. Eshtehardian, S. Jooybanpour and A. Javanmardi (2013) 'Multi-mode resource-constrained discrete time-cost-resource optimization in project scheduling using non-dominated sorting genetic algorithm', Automation in Construction, 30, 216-227
González, V., L. Alarcón, S. Maturana and J. Bustamante (2011) 'Site Management of Work-in-Process Buffers to Enhance Project Performance Using the Reliable Commitment Model: Case Study', Journal of Construction Engineering and Management, 137 (9), 707-715
Greenwood, D. (2001) 'Subcontract procurement: are relationships changing?', Construction Management & Economics, 19 (1), 5-7
Halpin, D. W. and R. W. Woodhead (1976) Design of Construction and Process Operations, John Wiley & Sons, Inc
Henry, E. (2000) 'Quality management standardization in the French construction industry: singularities and internationalization prospects', Construction Management & Economics, 18 (6), 667-677
Höök, M. and L. Stehn (2008) 'Applicability of lean principles and practices in industrialized housing production', Construction Management and Economics, 26 (10), 1091-1100
Hopp, W. J., S. M. R. Iravani and Z. Liu (2011) ‘Mitigating the Impact of Disruptions in Supply Chains’, Supply Chain Disruptions: Theory and Practice of Managing Risk, 21
Hopp, W. J. and M. L. Spearman (2004) ‘To pull or not to pull- what is the question?’, Manufacturing and Service Operations Management, 6 (2),133-148
Hopp, W. J. and M. L. Spearman (2008) Factory Physics, McGraw-Hill Irwin Irwin
Jeong, J. G., M. Hastak, M. Syal and T. Hong (2011) ‘Internal relationship modeling and production planning optimization for the manufactured housing’, Automation in Construction, 20 (7), 864-873
Kamat, V. R. and J. C. Martinez (2008) ‘Software mechanisms for extensible and scalable 3D visualization of construction operations’, Advances in Engineering Software, 39 (8), 659-675
Australasian Journal of Construction Economics and Building
Arashpour, M et al. (2013) ‘A new approach for modelling variability in residential construction projects’, Australasian Journal of Construction Economics and Building, 13 (2) 83-92
92
Koskela, L. and G. Ballard (2012) ‘Is production outside management?’, Building Research & Information, 40 (6), 724-737
Kumaraswamy, M. M. and J. D. Matthews (2000), ‘Improved subcontractor selection employing partnering principles’, Journal of Management in Engineering, 16 (3), 47-57
Li, H., N. Chan, T. Huang, H. L. Guo, W. Lu and M. Skitmore (2009) ‘Optimizing construction planning schedules by virtual prototyping enabled resource analysis’, Automation in Construction, 18 (7) 912-918
Little, J. D. C. (2011) ‘Little's Law as Viewed on Its 50th Anniversary’, Operations Research, 59 (3), 536-549
Martinez, J. C. (2010) ‘Methodology for Conducting Discrete-Event Simulation Studies in Construction Engineering and Management’, Journal of Construction Engineering and Management-Asce, 136 (1), 3-16
Moyal, P. (2010) ‘The queue with impatience: construction of the stationary workload under FIFO’, Journal of Applied Probability, 47 (2), 498-512
Peña-Mora, F. and G. H. Dwivedi (2002) ‘Multiple device collaborative and real time analysis system for project management in civil engineering’, Journal of Computing in Civil Engineering, 16 (1), 23-38
Sawhney, A., K. D. Walsh, H. H. Bashford and S. Palaniappan (2009) ‘Impact of inspected buffers on production parameters of construction processes’, Journal of Construction Engineering and Management, 135 (4), 319-329
Veryzer, R. W. (2005) ‘The Roles of Marketing and Industrial Design in Discontinuous New Product Development’, Journal of Product Innovation Management, 22 (1), 22-41
Walker, D. H. T. and Y. J. Shen (2002) ‘Project understanding, planning, flexibility of management action and construction time performance: two Australian case studies’, Construction Management & Economics, 20 (1) 31-44
Walsh, K. D., H. H. Bashford, A. Sawhney and A. Witjakso (2004) ‘Cost of risk transfer: Pricing agreements in residential supply chains’, Journal of Architectural Engineering, 10 (3), 112-118
Walsh, K. D., A. Sawhney and H. H. Bashford (2007) ‘Production equations for unsteady-state construction processes’, Journal of Construction Engineering and Management, 133 (3), 254-261