a lange medical book pulmonary physiology seventh edition
TRANSCRIPT
PulmonaryPhysiology
Seventh Edition
Michael G. Levitzky, PhDProfessor of Physiology, Anesthesiology, and Cardiopulmonary Science
Louisiana State University Health Sciences Center
New Orleans, Louisiana
Adjunct Professor of Pediatrics and Physiology
Tulane University Medical Center
New Orleans, Louisiana
a LANGE medical book
New York Chicago San Francisco Lisbon London Madrid Mexico City Milan New Delhi San Juan Seoul Singapore Sydney Toronto
Copyright © 2007 by The McGraw-Hill Companies, Inc. All rights reserved. Manufactured in the United
States of America. Except as permitted under the United States Copyright Act of 1976, no part of this
publication may be reproduced or distributed in any form or by any means, or stored in a database or
retrieval system, without the prior written permission of the publisher.
0-07-150874-0
The material in this eBook also appears in the print version of this title: 0-07-143775-4.
All trademarks are trademarks of their respective owners. Rather than put a trademark symbol after every
occurrence of a trademarked name, we use names in an editorial fashion only, and to the benefit of the
trademark owner, with no intention of infringement of the trademark. Where such designations appear in
this book, they have been printed with initial caps.
McGraw-Hill eBooks are available at special quantity discounts to use as premiums and sales promotions,
or for use in corporate training programs. For more information, please contact George Hoare, Special
Sales, at [email protected] or (212) 904-4069.
TERMS OF USE
This is a copyrighted work and The McGraw-Hill Companies, Inc. (“McGraw-Hill”) and its licensors
reserve all rights in and to the work. Use of this work is subject to these terms. Except as permitted under
the Copyright Act of 1976 and the right to store and retrieve one copy of the work, you may not decom-
pile, disassemble, reverse engineer, reproduce, modify, create derivative works based upon, transmit, dis-
tribute, disseminate, sell, publish or sublicense the work or any part of it without McGraw-Hill’s prior
consent. You may use the work for your own noncommercial and personal use; any other use of the work
is strictly prohibited. Your right to use the work may be terminated if you fail to comply with these terms.
THE WORK IS PROVIDED “AS IS.” McGRAW-HILL AND ITS LICENSORS MAKE NO
GUARANTEES OR WARRANTIES AS TO THE ACCURACY, ADEQUACY OR COMPLETENESS
OF OR RESULTS TO BE OBTAINED FROM USING THE WORK, INCLUDING ANY INFORMA-
TION THAT CAN BE ACCESSED THROUGH THE WORK VIA HYPERLINK OR OTHERWISE,
AND EXPRESSLY DISCLAIM ANY WARRANTY, EXPRESS OR IMPLIED, INCLUDING BUT NOT
LIMITED TO IMPLIED WARRANTIES OF MERCHANTABILITY OR FITNESS FOR A PARTICU-
LAR PURPOSE. McGraw-Hill and its licensors do not warrant or guarantee that the functions contained
in the work will meet your requirements or that its operation will be uninterrupted or error free. Neither
McGraw-Hill nor its licensors shall be liable to you or anyone else for any inaccuracy, error or omission,
regardless of cause, in the work or for any damages resulting therefrom. McGraw-Hill has no responsi-
bility for the content of any information accessed through the work. Under no circumstances shall
McGraw-Hill and/or its licensors be liable for any indirect, incidental, special, punitive, consequential or
similar damages that result from the use of or inability to use the work, even if any of them has been
advised of the possibility of such damages. This limitation of liability shall apply to any claim or cause
whatsoever whether such claim or cause arises in contract, tort or otherwise.
DOI: 10.1036/0071437754
Contents
Preface ix
Chapter 1 Function & Structure of the Respiratory System 1Objectives / 1Functions of the Respiratory System / 2Structure of the Respiratory System / 4Key Concepts / 10Suggested Readings / 10
Chapter 2 Mechanics of Breathing 11Objectives / 11Generation of a Pressure Gradient Between Atmosphere & Alveoli / 12Pressure-Volume Relationships in the Respiratory System / 20Interaction of Lung & Chest Wall: The Static Pressure-Volume Curve / 29Airways Resistance / 32The Work of Breathing / 49Key Concepts / 50Clinical Problems / 51Suggested Readings / 52
Chapter 3 Alveolar Ventilation 54Objectives / 54The Lung Volumes / 54Measurement of the Lung Volumes / 57Anatomic Dead Space & Alveolar Ventilation / 65Measurement of Alveolar Ventilation / 67Alveolar Ventilation & Alveolar Oxygen & Carbon Dioxide Levels / 71Regional Distribution of Alveolar Ventilation / 75The Closing Volume / 79The Effects of Aging / 81Key Concepts / 82Clinical Problems / 83Suggested Readings / 84
Chapter 4 Blood Flow to the Lung 86Objectives / 86The Bronchial Circulation / 87The Functional Anatomy of the Pulmonary Circulation / 89Pulmonary Vascular Resistance / 92The Regional Distribution of Pulmonary Blood Flow: The Zones
of the Lung / 99Hypoxic Pulmonary Vasoconstriction / 105
iii
For more information about this title, click here
iv / CONTENTS
Pulmonary Edema / 108Key Concepts / 111Clinical Problems / 111Suggested Readings / 112
Chapter 5 Ventilation-Perfusion Relationships 113Objectives / 113The Concept of Matching Ventilation & Perfusion / 113Consequences of High & Low V̇/Q̇ / 114Testing for Nonuniform Distribution of Inspired Gas & Pulmonary Blood
Flow / 116Regional V̇/Q̇ Differences & Their Consequences in the Lung / 125Key Concepts / 128Clinical Problems / 128Suggested Readings / 129
Chapter 6 Diffusion of Gases 130Objectives / 130Fick’s Law for Diffusion / 130Limitations of Gas Transfer / 133Diffusion of Oxygen / 135Diffusion of Carbon Dioxide / 137Measurement of Diffusing Capacity / 137Key Concepts / 140Clinical Problems / 140Suggested Readings / 141
Chapter 7 The Transport of Oxygen & Carbon Dioxide in the Blood 142
Objectives / 142Transport of Oxygen by the Blood / 142Hemoglobin & the Physiologic Implications of the Oxyhemoglobin
Dissociation Curve / 145Influences on the Oxyhemoglobin Dissociation Curve / 148Transport of Carbon Dioxide by the Blood / 156The Carbon Dioxide Dissociation Curve / 158The Bohr & Haldane Effects Explained / 159Key Concepts / 161Clinical Problems / 161Suggested Readings / 162
Chapter 8 The Regulation of Acid-Base Status 163Objectives / 163The Chemistry of Acids, Bases, & Buffers / 163
CONTENTS / v
Buffer Systems of the Human Body / 166Acidosis & Alkalosis / 171Respiratory & Renal Compensatory Mechanisms / 176Clinical Interpretation of Blood Gases & Acid-Base Status / 178The Causes of Hypoxia / 181Key Concepts / 184Clinical Problems / 185Suggested Readings / 188
Chapter 9 The Control of Breathing 189Objectives / 189The Generation of Spontaneous Rhythmicity / 191The Medullary Respiratory Center / 192The Pontine Respiratory Group / 194Spinal Pathways / 195Reflex Mechanisms of Respiratory Control / 195Influences of Higher Centers / 201The Response to Carbon Dioxide / 202The Response to Hydrogen Ions / 209The Response to Hypoxia / 210The Response to Exercise / 211Key Concepts / 213Clinical Problems / 214Suggested Readings / 215
Chapter 10 Nonrespiratory Functions of the Lung 216Objectives / 216Pulmonary Defense Mechanisms / 216Nonrespiratory Functions of the Pulmonary Circulation / 222Metabolic Functions of the Lung / 224Key Concepts / 227Suggested Readings / 227
Chapter 11 The Respiratory System Under Stress 228Objectives / 228Exercise & the Respiratory System / 228Altitude & Acclimatization / 234Diving & the Respiratory System / 240Key Concepts / 247Clinical Problems / 247Suggested Readings / 248
Clinical Problem Answers 250

vi / CONTENTS
Appendix 263I. Symbols Used in Respiratory Physiology / 263II. The Laws Governing the Behavior of Gases / 263III. Frequently Used Equations / 264IV. Pulmonary Function Test Decision Tree / 265V. Table of Normal Respiratory and Circulatory Values / 266VI. General Suggested Readings / 266
Index 267
Preface
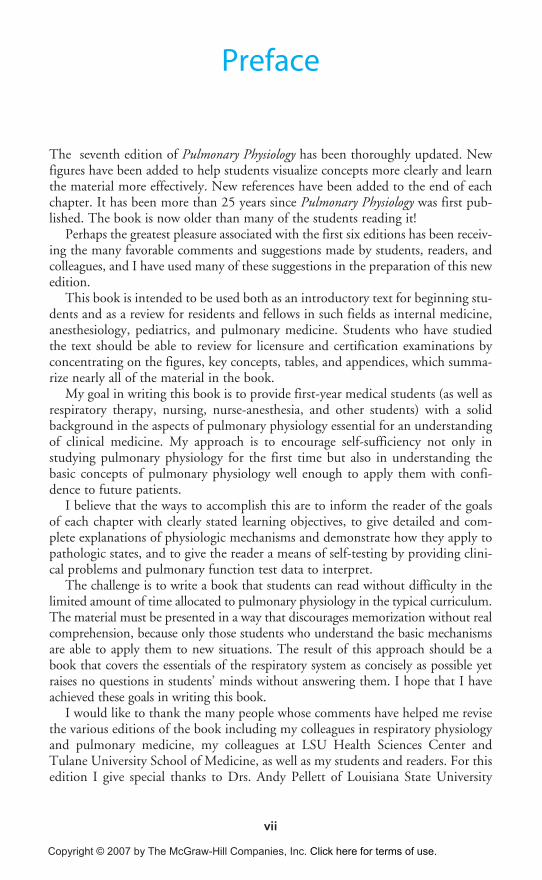
The seventh edition of Pulmonary Physiology has been thoroughly updated. Newfigures have been added to help students visualize concepts more clearly and learnthe material more effectively. New references have been added to the end of eachchapter. It has been more than 25 years since Pulmonary Physiology was first pub-lished. The book is now older than many of the students reading it!
Perhaps the greatest pleasure associated with the first six editions has been receiv-ing the many favorable comments and suggestions made by students, readers, andcolleagues, and I have used many of these suggestions in the preparation of this newedition.
This book is intended to be used both as an introductory text for beginning stu-dents and as a review for residents and fellows in such fields as internal medicine,anesthesiology, pediatrics, and pulmonary medicine. Students who have studiedthe text should be able to review for licensure and certification examinations byconcentrating on the figures, key concepts, tables, and appendices, which summa-rize nearly all of the material in the book.
My goal in writing this book is to provide first-year medical students (as well asrespiratory therapy, nursing, nurse-anesthesia, and other students) with a solidbackground in the aspects of pulmonary physiology essential for an understandingof clinical medicine. My approach is to encourage self-sufficiency not only instudying pulmonary physiology for the first time but also in understanding thebasic concepts of pulmonary physiology well enough to apply them with confi-dence to future patients.
I believe that the ways to accomplish this are to inform the reader of the goalsof each chapter with clearly stated learning objectives, to give detailed and com-plete explanations of physiologic mechanisms and demonstrate how they apply topathologic states, and to give the reader a means of self-testing by providing clini-cal problems and pulmonary function test data to interpret.
The challenge is to write a book that students can read without difficulty in thelimited amount of time allocated to pulmonary physiology in the typical curriculum.The material must be presented in a way that discourages memorization without realcomprehension, because only those students who understand the basic mechanismsare able to apply them to new situations. The result of this approach should be abook that covers the essentials of the respiratory system as concisely as possible yetraises no questions in students’ minds without answering them. I hope that I haveachieved these goals in writing this book.
I would like to thank the many people whose comments have helped me revisethe various editions of the book including my colleagues in respiratory physiologyand pulmonary medicine, my colleagues at LSU Health Sciences Center andTulane University School of Medicine, as well as my students and readers. For thisedition I give special thanks to Drs. Andy Pellett of Louisiana State University
vii
Copyright © 2007 by The McGraw-Hill Companies, Inc. Click here for terms of use.

viii / PREFACE
Health Sciences Center and C. William Davis of the University of North Carolinaat Chapel Hill School of Medicine. I would also like to thank everyone who hashelped me prepare the manuscripts, illustrations, and proofs including my manyeditors at McGraw-Hill. For this edition, I would especially like to thank BetsyGiaimo, and my wife Elizabeth. Finally, very special thanks to Gail and Jim Millerof Baton Rouge, Louisiana for taking us in after Hurricane Katrina and making usfeel at home for eight months.
This book is dedicated to Robert S. Alexander.
Michael G. Levitzky
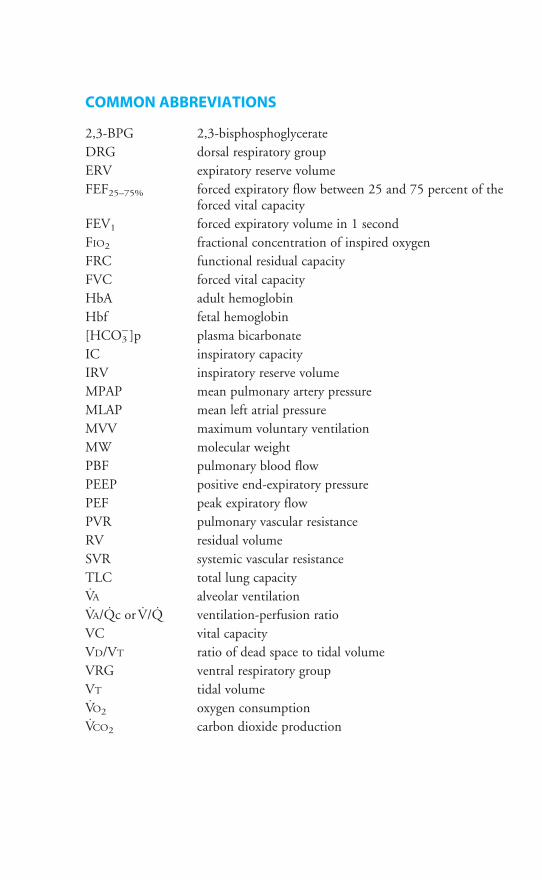
COMMON ABBREVIATIONS
2,3-BPG 2,3-bisphosphoglycerate
DRG dorsal respiratory group
ERV expiratory reserve volume
FEF25–75% forced expiratory flow between 25 and 75 percent of theforced vital capacity
FEV1 forced expiratory volume in 1 second
FIO2 fractional concentration of inspired oxygen
FRC functional residual capacity
FVC forced vital capacity
HbA adult hemoglobin
Hbf fetal hemoglobin
[HCO3�]p plasma bicarbonate
IC inspiratory capacity
IRV inspiratory reserve volume
MPAP mean pulmonary artery pressure
MLAP mean left atrial pressure
MVV maximum voluntary ventilation
MW molecular weight
PBF pulmonary blood flow
PEEP positive end-expiratory pressure
PEF peak expiratory flow
PVR pulmonary vascular resistance
RV residual volume
SVR systemic vascular resistance
TLC total lung capacity
V̇A alveolar ventilation
V̇A/Q̇c or V̇/Q̇ ventilation-perfusion ratio
VC vital capacity
VD/VT ratio of dead space to tidal volume
VRG ventral respiratory group
VT tidal volume
V̇O2 oxygen consumption
V̇CO2 carbon dioxide production

We hope you enjoy this
McGraw-Hill eBook! If
you’d like more information about this book,
its author, or related books and websites,
please click here.
Professional
Want to learn more?
1
Most of the tissues of the body require oxygen to produce energy, so a continuoussupply of oxygen must be available for their normal functioning. Carbon dioxideis a by-product of this aerobic metabolism, and it must be removed from thevicinity of the metabolizing cells. The main functions of the respiratory system are
to obtain oxygen from the external environment and supply it to the cellsand to remove from the body the carbon dioxide produced by cellularmetabolism.
The respiratory system is composed of the lungs, the conducting airways, theparts of the central nervous system concerned with the control of the muscles of res-piration, and the chest wall. The chest wall consists of the muscles of respiration—such as the diaphragm, the intercostal muscles, and the abdominal muscles—andthe rib cage.
1Function & Structure of the Respiratory System
OBJECTIVES
The reader states the functions of the respiratory system and relates the structuralorganization of the system to its functions.
� Describes the exchange of oxygen and carbon dioxide with the atmosphere andrelates gas exchange to the metabolism of the tissues of the body.
� Defines the role of the respiratory system in acid-base balance.
� Lists the nonrespiratory functions of the lungs.
� Defines and describes the alveolar-capillary unit, the site of gas exchange in thelungs.
� Describes the transport of gas through the conducting airways to and from thealveoli.
� Describes the structural characteristics of the airways.
� Lists the components of the chest wall and relates the functions of the muscles ofrespiration to the movement of air into and out of the alveoli.
� Describes the central nervous system initiation of breathing and the innervation ofthe respiratory muscles.
Copyright © 2007 by The McGraw-Hill Companies, Inc. Click here for terms of use.
2 / CHAPTER 1
FUNCTIONS OF THE RESPIRATORY SYSTEM
The functions of the respiratory system include gas exchange, acid-basebalance, phonation, pulmonary defense and metabolism, and the handlingof bioactive materials.
Gas Exchange
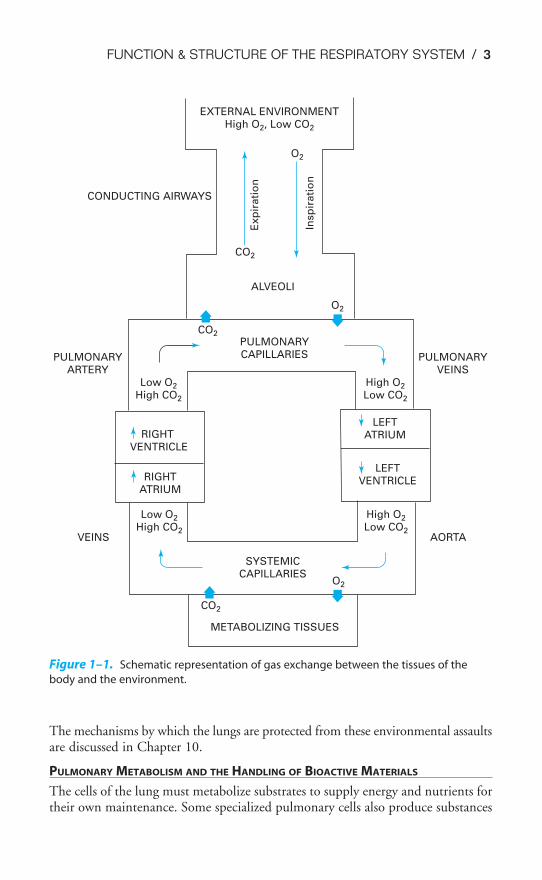
The exchange of carbon dioxide for oxygen takes place in the lungs. Fresh air, con-taining oxygen, is inspired into the lungs through the conducting airways. Theforces needed to cause the air to flow are generated by the respiratory muscles, act-ing on commands initiated by the central nervous system. At the same time,venous blood returning from the various body tissues is pumped into the lungs bythe right ventricle of the heart. This mixed venous blood has a high carbon diox-ide content and a low oxygen content. In the pulmonary capillaries, carbon diox-ide is exchanged for oxygen. The blood leaving the lungs, which now has a highoxygen content and a relatively low carbon dioxide content, is distributed to thetissues of the body by the left side of the heart. During expiration, gas with a highconcentration of carbon dioxide is expelled from the body. A schematic diagram ofthe gas exchange function of the respiratory system is shown in Figure 1–1.
Other Functions
ACID-BASE BALANCE
In the body, increases in carbon dioxide lead to increases in hydrogen ion concen-tration (and vice versa) because of the following reaction:
CO2 � H2O ⇀↽ H2CO3 ⇀
↽ H� � HCO3�
The respiratory system can therefore participate in acid-base balance by remov-ing CO2 from the body. The central nervous system has sensors for the CO2 andthe hydrogen ion levels in the arterial blood and in the cerebrospinal fluid that sendinformation to the controllers of breathing. Acid-base balance is discussed ingreater detail in Chapter 8; the control of breathing is discussed in Chapter 9.
PHONATION
Phonation is the production of sounds by the movement of air through the vocalcords. Speech, singing, and other sounds are produced by the actions of the cen-tral nervous system controllers on the muscles of respiration, causing air to flowthrough the vocal cords and the mouth. Phonation will not be discussed in detailin this book.
PULMONARY DEFENSE MECHANISMS
Each breath brings into the lungs a small sample of the local atmospheric environ-ment. This may include microorganisms such as bacteria, dust, particles of silica orasbestos, toxic gases, smoke (cigarette and other types), and other pollutants. Inaddition, the temperature and humidity of the local atmosphere vary tremendously.
FUNCTION & STRUCTURE OF THE RESPIRATORY SYSTEM / 3
The mechanisms by which the lungs are protected from these environmental assaultsare discussed in Chapter 10.
PULMONARY METABOLISM AND THE HANDLING OF BIOACTIVE MATERIALS
The cells of the lung must metabolize substrates to supply energy and nutrients fortheir own maintenance. Some specialized pulmonary cells also produce substances
EXTERNAL ENVIRONMENTHigh O2, Low CO2
CO2
O2
CONDUCTING AIRWAYS
Exp
irati
on
Insp
ira
tio
n
ALVEOLI
PULMONARYARTERY
PULMONARYCAPILLARIES PULMONARY
VEINSLow O2
High CO2
High O2
Low CO2
O2
CO2
LEFTATRIUMRIGHT
VENTRICLE
LEFTVENTRICLERIGHT
ATRIUM
Low O2
High CO2
High O2
Low CO2VEINS AORTA
SYSTEMICCAPILLARIES
O2
CO2
METABOLIZING TISSUES
Figure 1–1. Schematic representation of gas exchange between the tissues of the
body and the environment.
4 / CHAPTER 1
necessary for normal pulmonary function. In addition, the pulmonary capillaryendothelium contains a great number of enzymes that can produce, metabolize, ormodify naturally occurring vasoactive substances. These metabolic functions of therespiratory system are discussed in Chapter 10.
STRUCTURE OF THE RESPIRATORY SYSTEM
Air enters the respiratory system through the nose or mouth. Air entering through thenose is filtered, heated to body temperature, and humidified as it passes through thenose and nasal turbinates. These protective mechanisms are discussed in Chapter 10.The upper airways are shown in Figure 10–1. Air breathed through the nose entersthe airways via the nasopharynx and through the mouth via the oropharynx. It thenpasses through the glottis and the larynx and enters the tracheobronchial tree. Afterpassing through the conducting airways, the inspired air enters the alveoli, where itcomes into contact with the mixed venous blood in the pulmonary capillaries.
The Alveolar-Capillary Unit
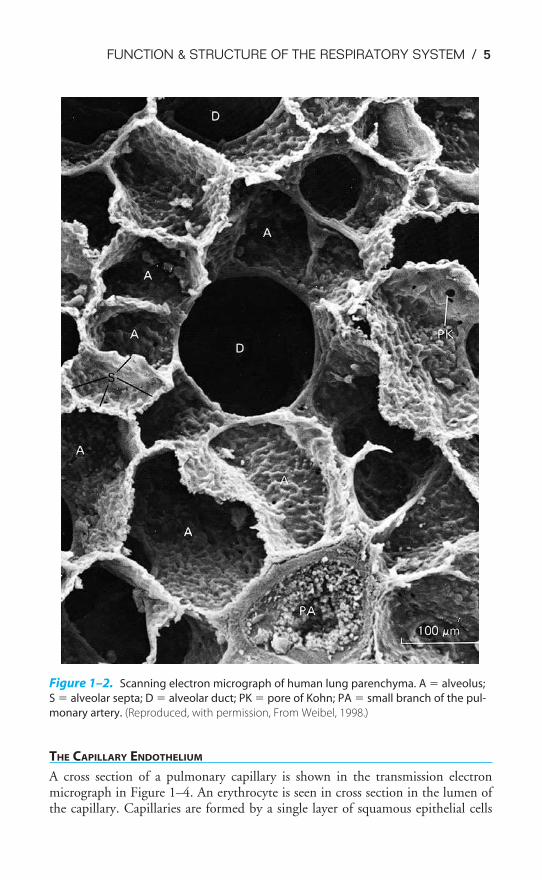
The alveolar-capillary unit is the site of gas exchange in the lung. The alveoli, tra-ditionally estimated to number about 300 million in the adult (a recent study cal-culated the mean number of alveoli to be 480 million), are almost completelyenveloped in pulmonary capillaries. There may be as many as 280 billion pul-monary capillaries, or approximately 500 to 1000 pulmonary capillaries per alveo-lus. The result of these staggering numbers of alveoli and pulmonary capillaries isa vast area of contact between alveoli and pulmonary capillaries—probably 50 to100 m2 of surface area available for gas exchange by diffusion. The alveoli are about200 to 250 �m in diameter.
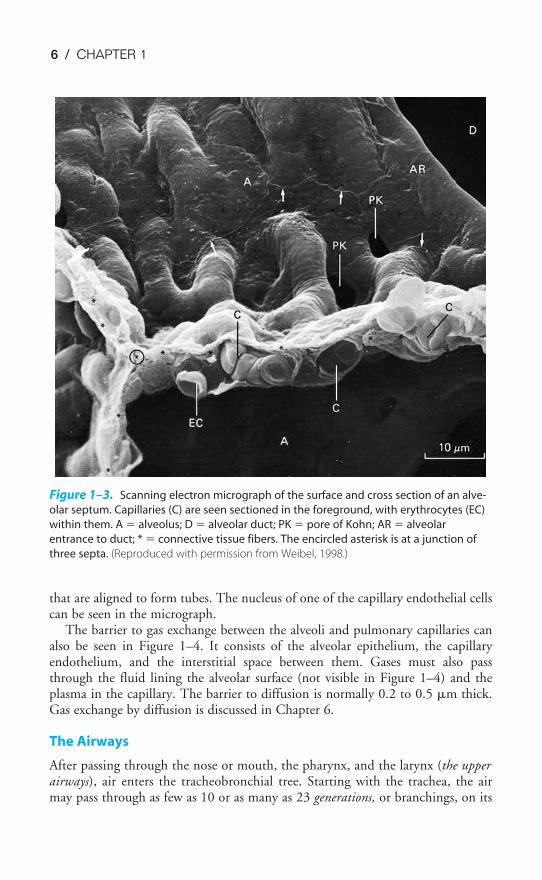
Figure 1–2 is a scanning electron micrograph of the alveolar-capillary surface.Figure 1–3 shows an even greater magnification of the site of gas exchange.
The alveolar septum appears to be almost entirely composed of pulmonary cap-illaries. Red blood cells (erythrocytes) can be seen inside the capillaries at the pointof section. Elastic and connective tissue fibers, not visible in the figure, are foundbetween the capillaries in the alveolar septa. Also shown in these figures are thepores of Kohn or interalveolar communications.
THE ALVEOLAR SURFACE
The alveolar surface is mainly composed of a single thin layer of squamous epithe-lial cells, the type I alveolar cells. Interspersed among these are the larger cuboidaltype II alveolar cells, which produce the fluid layer that lines the alveoli. Althoughthere are about twice as many type II cells as there are type I cells in the human lung,type I cells cover 90% to 95% of the alveolar surface, because the average type I cellhas a much larger surface area than the average type II cell does. The alveolar sur-face fluid layer is discussed in detail in Chapter 2. A third cell type, the free-rangingphagocytic alveolar macrophage, is found in varying numbers in the extracellularlining of the alveolar surface. These cells patrol the alveolar surface and phagocytizeinspired particles such as bacteria. Their function is discussed in Chapter 10.
FUNCTION & STRUCTURE OF THE RESPIRATORY SYSTEM / 5
THE CAPILLARY ENDOTHELIUM
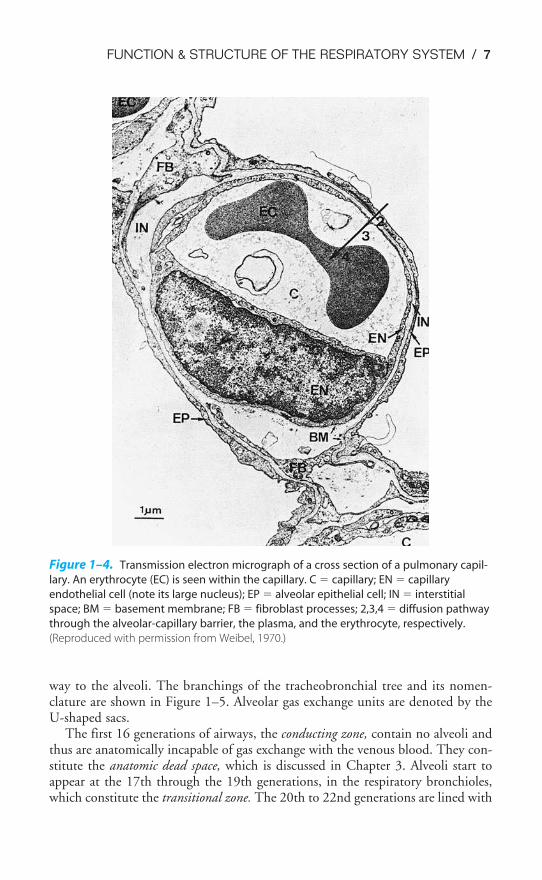
A cross section of a pulmonary capillary is shown in the transmission electronmicrograph in Figure 1–4. An erythrocyte is seen in cross section in the lumen ofthe capillary. Capillaries are formed by a single layer of squamous epithelial cells
Figure 1–2. Scanning electron micrograph of human lung parenchyma. A � alveolus;
S � alveolar septa; D � alveolar duct; PK � pore of Kohn; PA � small branch of the pul-
monary artery. (Reproduced, with permission, From Weibel, 1998.)
6 / CHAPTER 1
that are aligned to form tubes. The nucleus of one of the capillary endothelial cellscan be seen in the micrograph.
The barrier to gas exchange between the alveoli and pulmonary capillaries canalso be seen in Figure 1–4. It consists of the alveolar epithelium, the capillaryendothelium, and the interstitial space between them. Gases must also passthrough the fluid lining the alveolar surface (not visible in Figure 1–4) and theplasma in the capillary. The barrier to diffusion is normally 0.2 to 0.5 �m thick.Gas exchange by diffusion is discussed in Chapter 6.
The Airways
After passing through the nose or mouth, the pharynx, and the larynx (the upperairways), air enters the tracheobronchial tree. Starting with the trachea, the airmay pass through as few as 10 or as many as 23 generations, or branchings, on its
Figure 1–3. Scanning electron micrograph of the surface and cross section of an alve-
olar septum. Capillaries (C) are seen sectioned in the foreground, with erythrocytes (EC)
within them. A � alveolus; D � alveolar duct; PK � pore of Kohn; AR � alveolar
entrance to duct; * � connective tissue fibers. The encircled asterisk is at a junction of
three septa. (Reproduced with permission from Weibel, 1998.)
FUNCTION & STRUCTURE OF THE RESPIRATORY SYSTEM / 7
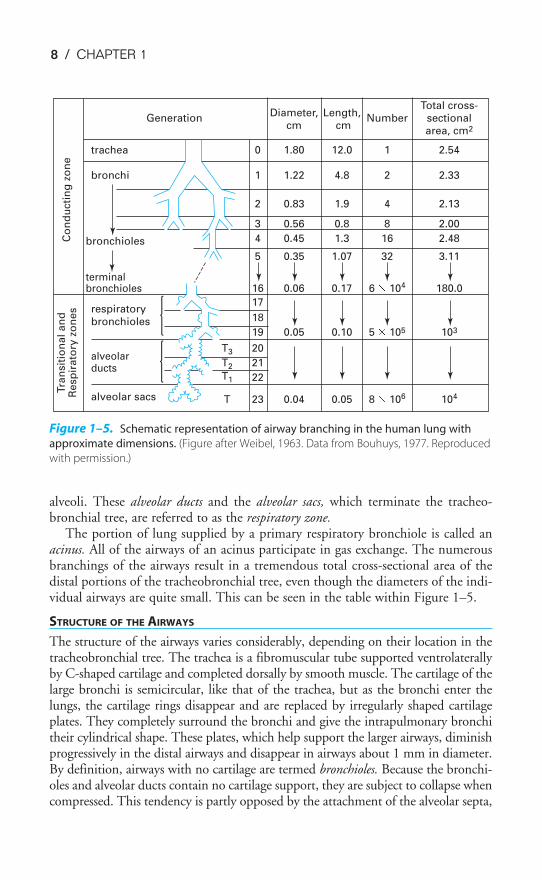
way to the alveoli. The branchings of the tracheobronchial tree and its nomen-clature are shown in Figure 1–5. Alveolar gas exchange units are denoted by theU-shaped sacs.
The first 16 generations of airways, the conducting zone, contain no alveoli andthus are anatomically incapable of gas exchange with the venous blood. They con-stitute the anatomic dead space, which is discussed in Chapter 3. Alveoli start toappear at the 17th through the 19th generations, in the respiratory bronchioles,which constitute the transitional zone. The 20th to 22nd generations are lined with
Figure 1–4. Transmission electron micrograph of a cross section of a pulmonary capil-
lary. An erythrocyte (EC) is seen within the capillary. C � capillary; EN � capillary
endothelial cell (note its large nucleus); EP � alveolar epithelial cell; IN � interstitial
space; BM � basement membrane; FB � fibroblast processes; 2,3,4 � diffusion pathway
through the alveolar-capillary barrier, the plasma, and the erythrocyte, respectively.
(Reproduced with permission from Weibel, 1970.)
8 / CHAPTER 1
alveoli. These alveolar ducts and the alveolar sacs, which terminate the tracheo-bronchial tree, are referred to as the respiratory zone.
The portion of lung supplied by a primary respiratory bronchiole is called anacinus. All of the airways of an acinus participate in gas exchange. The numerousbranchings of the airways result in a tremendous total cross-sectional area of thedistal portions of the tracheobronchial tree, even though the diameters of the indi-vidual airways are quite small. This can be seen in the table within Figure 1–5.
STRUCTURE OF THE AIRWAYS
The structure of the airways varies considerably, depending on their location in thetracheobronchial tree. The trachea is a fibromuscular tube supported ventrolaterallyby C-shaped cartilage and completed dorsally by smooth muscle. The cartilage of thelarge bronchi is semicircular, like that of the trachea, but as the bronchi enter thelungs, the cartilage rings disappear and are replaced by irregularly shaped cartilageplates. They completely surround the bronchi and give the intrapulmonary bronchitheir cylindrical shape. These plates, which help support the larger airways, diminishprogressively in the distal airways and disappear in airways about 1 mm in diameter.By definition, airways with no cartilage are termed bronchioles. Because the bronchi-oles and alveolar ducts contain no cartilage support, they are subject to collapse whencompressed. This tendency is partly opposed by the attachment of the alveolar septa,
Total cross- Generation
Diameter, Length, Number sectional
cm cm
area, cm2
trachea 0 1.80 12.0 1 2.54
bronchi 1 1.22 4.8 2 2.33
2 0.83 1.9 4 2.13
3 0.56 0.8 8 2.00
bronchioles 4 0.45 1.3 16 2.48
5 0.35 1.07 32 3.11
terminal bronchioles 16 0.06 0.17 6 3 104 180.0
17 respiratory bronchioles 18
19 0.05 0.10 5 3 105 103
alveolar T3 20
ductsT2 21
T1 22
alveolar sacs T 23 0.04 0.05 8 3 106 104
Tra
nsit
ion
al an
dR
esp
irato
ry z
on
es
Co
nd
ucti
ng
zo
ne
Figure 1–5. Schematic representation of airway branching in the human lung with
approximate dimensions. (Figure after Weibel, 1963. Data from Bouhuys, 1977. Reproduced
with permission.)
FUNCTION & STRUCTURE OF THE RESPIRATORY SYSTEM / 9
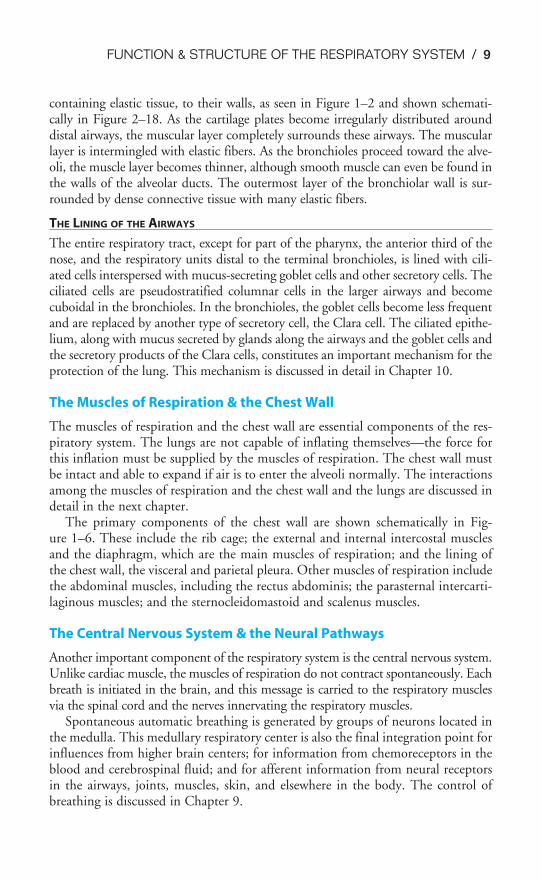
containing elastic tissue, to their walls, as seen in Figure 1–2 and shown schemati-cally in Figure 2–18. As the cartilage plates become irregularly distributed arounddistal airways, the muscular layer completely surrounds these airways. The muscularlayer is intermingled with elastic fibers. As the bronchioles proceed toward the alve-oli, the muscle layer becomes thinner, although smooth muscle can even be found inthe walls of the alveolar ducts. The outermost layer of the bronchiolar wall is sur-rounded by dense connective tissue with many elastic fibers.
THE LINING OF THE AIRWAYS
The entire respiratory tract, except for part of the pharynx, the anterior third of thenose, and the respiratory units distal to the terminal bronchioles, is lined with cili-ated cells interspersed with mucus-secreting goblet cells and other secretory cells. Theciliated cells are pseudostratified columnar cells in the larger airways and becomecuboidal in the bronchioles. In the bronchioles, the goblet cells become less frequentand are replaced by another type of secretory cell, the Clara cell. The ciliated epithe-lium, along with mucus secreted by glands along the airways and the goblet cells andthe secretory products of the Clara cells, constitutes an important mechanism for theprotection of the lung. This mechanism is discussed in detail in Chapter 10.
The Muscles of Respiration & the Chest Wall
The muscles of respiration and the chest wall are essential components of the res-piratory system. The lungs are not capable of inflating themselves—the force forthis inflation must be supplied by the muscles of respiration. The chest wall mustbe intact and able to expand if air is to enter the alveoli normally. The interactionsamong the muscles of respiration and the chest wall and the lungs are discussed indetail in the next chapter.
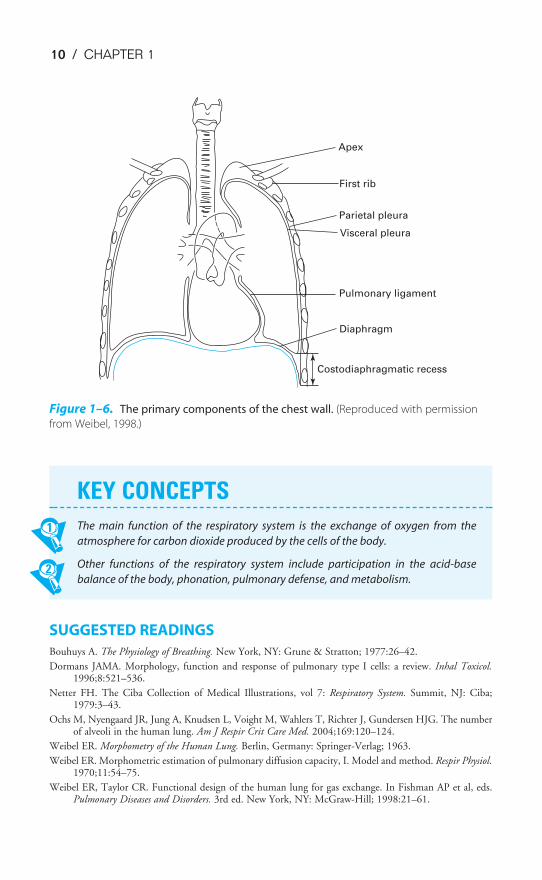
The primary components of the chest wall are shown schematically in Fig-ure 1–6. These include the rib cage; the external and internal intercostal musclesand the diaphragm, which are the main muscles of respiration; and the lining ofthe chest wall, the visceral and parietal pleura. Other muscles of respiration includethe abdominal muscles, including the rectus abdominis; the parasternal intercarti-laginous muscles; and the sternocleidomastoid and scalenus muscles.
The Central Nervous System & the Neural Pathways
Another important component of the respiratory system is the central nervous system.Unlike cardiac muscle, the muscles of respiration do not contract spontaneously. Eachbreath is initiated in the brain, and this message is carried to the respiratory musclesvia the spinal cord and the nerves innervating the respiratory muscles.
Spontaneous automatic breathing is generated by groups of neurons located inthe medulla. This medullary respiratory center is also the final integration point forinfluences from higher brain centers; for information from chemoreceptors in theblood and cerebrospinal fluid; and for afferent information from neural receptorsin the airways, joints, muscles, skin, and elsewhere in the body. The control ofbreathing is discussed in Chapter 9.
10 / CHAPTER 1
SUGGESTED READINGS
Bouhuys A. The Physiology of Breathing. New York, NY: Grune & Stratton; 1977:26–42.
Dormans JAMA. Morphology, function and response of pulmonary type I cells: a review. Inhal Toxicol.1996;8:521–536.
Netter FH. The Ciba Collection of Medical Illustrations, vol 7: Respiratory System. Summit, NJ: Ciba;1979:3–43.
Ochs M, Nyengaard JR, Jung A, Knudsen L, Voight M, Wahlers T, Richter J, Gundersen HJG. The numberof alveoli in the human lung. Am J Respir Crit Care Med. 2004;169:120–124.
Weibel ER. Morphometry of the Human Lung. Berlin, Germany: Springer-Verlag; 1963.
Weibel ER. Morphometric estimation of pulmonary diffusion capacity, I. Model and method. Respir Physiol.1970;11:54–75.
Weibel ER, Taylor CR. Functional design of the human lung for gas exchange. In Fishman AP et al, eds.Pulmonary Diseases and Disorders. 3rd ed. New York, NY: McGraw-Hill; 1998:21–61.
Apex
First rib
Parietal pleura
Visceral pleura
Pulmonary ligament
Diaphragm
Costodiaphragmatic recess
Figure 1–6. The primary components of the chest wall. (Reproduced with permission
from Weibel, 1998.)
KEY CONCEPTS
The main function of the respiratory system is the exchange of oxygen from the
atmosphere for carbon dioxide produced by the cells of the body.
Other functions of the respiratory system include participation in the acid-base
balance of the body, phonation, pulmonary defense, and metabolism.
11
Air, like other fluids, moves from a region of higher pressure to one of lower pres-sure. Therefore, for air to be moved into or out of the lungs, a pressure dif-ference between the atmosphere and the alveoli must be established. Ifthere is no pressure gradient, no airflow will occur.
Under normal circumstances, inspiration is accomplished by causing alveolarpressure to fall below atmospheric pressure. When the mechanics of breathing arebeing discussed, atmospheric pressure is conventionally referred to as 0 cm H2O,so lowering alveolar pressure below atmospheric pressure is known as negative-pressure breathing. As soon as a pressure gradient sufficient to overcome the resistance to
2Mechanics of Breathing
OBJECTIVES
The reader understands the mechanical properties of the lung and the chest wall dur-ing breathing.
� Describes the generation of a pressure gradient between the atmosphere and thealveoli.
� Describes the passive expansion and recoil of the alveoli.
� Defines the mechanical interaction of the lung and the chest wall, and relates thisconcept to the negative intrapleural pressure.
� Describes the pressure-volume characteristics of the lung and the chest wall, andpredicts changes in the compliance of the lung and the chest wall in differentphysiologic and pathologic conditions.
� States the roles of pulmonary surfactant and alveolar interdependence in the recoiland expansion of the lung.
� Defines the functional residual capacity (FRC), and uses his or her understanding oflung–chest wall interactions to predict changes in FRC in different physiologic andpathologic conditions.
� Defines airways resistance and lists the factors that contribute to or alter theresistance to airflow.
� Describes the dynamic compression of airways during a forced expiration.
� Relates changes in the dynamic compliance of the lung to alterations in airwaysresistance.
� Lists the factors that contribute to the work of breathing.
� Predicts alterations in the work of breathing in different physiologic and pathologicstates.
Copyright © 2007 by The McGraw-Hill Companies, Inc. Click here for terms of use.
12 / CHAPTER 2
airflow offered by the conducting airways is established between the atmosphere andthe alveoli, air flows into the lungs. It is also possible to cause air to flow into the lungsby raising the pressure at the nose and mouth above alveolar pressure. This positive-pres-sure ventilation is generally used on patients unable to generate a sufficient pressure gra-dient between the atmosphere and the alveoli by normal negative-pressure breathing.Air flows out of the lungs when alveolar pressure is sufficiently greater than atmosphericpressure to overcome the resistance to airflow offered by the conducting airways.
GENERATION OF A PRESSURE GRADIENT BETWEENATMOSPHERE & ALVEOLI
During normal negative-pressure breathing, alveolar pressure is made lower thanatmospheric pressure. This is accomplished by causing the muscles of inspirationto contract, which increases the volume of the alveoli, thus lowering the alveolarpressure according to Boyle’s law. (See Appendix II: The Laws Governing theBehavior of Gases.)
Passive Expansion of Alveoli
The alveoli are not capable of expanding themselves. They only expandpassively in response to an increased distending pressure across the alveo-lar wall. This increased transmural pressure gradient, generated by the mus-
cles of inspiration, further opens the highly distensible alveoli and thus lowers thealveolar pressure. The transmural pressure gradient is conventionally calculated bysubtracting the outside pressure (in this case, the intrapleural pressure) from theinside pressure (in this case, the alveolar pressure).
Negative Intrapleural Pressure
The pressure in the thin space between the visceral and parietal pleura is normallyslightly subatmospheric, even when no inspiratory muscles are contracting. This neg-ative intrapleural pressure (sometimes also referred to as negative intrathoracic pressure)of �3 to �5 cm H2O is mainly caused by the mechanical interaction between thelung and the chest wall. At the end of expiration, when all the respiratory muscles arerelaxed, the lung and the chest wall are acting on each other in opposite directions.
The lung is tending to decrease its volume because of the inward elastic recoilof the distended alveolar walls; the chest wall is tending to increase its volumebecause of its outward elastic recoil. Thus the chest wall is acting to hold the
alveoli open in opposition to their elastic recoil. Similarly, the lung is acting by itselastic recoil to hold the chest wall in. Because of this interaction, the pressure is
negative at the surface of the very thin (about 10 to 30 �m in thickness at nor-mal lung volumes), fluid-filled pleural space, as seen on the left in Figure 2–1.There is normally no gas in the intrapleural space, and the lung is held
against the chest wall by the thin layer of serous intrapleural liquid, estimated to havea total volume of about 15 to 25 mL in the average adult.
atmospheric pressure: 0 cm H2O
no air flow: atmosphericpressure = alveolar pressure
outward recoilof chest wall
atmospheric pressure: 0 cm H2O
air flows in : atmosphericpressure>alveolar pressure
force generated byinspiratory muscles
intrapleural pressure:�8 cm H2O
transmural pressure ��1 cm H2O �(�8 cm H2O)��7 cm H2O
DURING INSPIRATION
alveolar pressure:�1 cm H2O
inward recoilof alveoli
alveolar pressure:0 cm H2O
transmural pressure �0 cm H2O�(�5 cm H2O)��5 cm H2O
END EXPIRATION
intrapleural pressure:�5 cm H2O
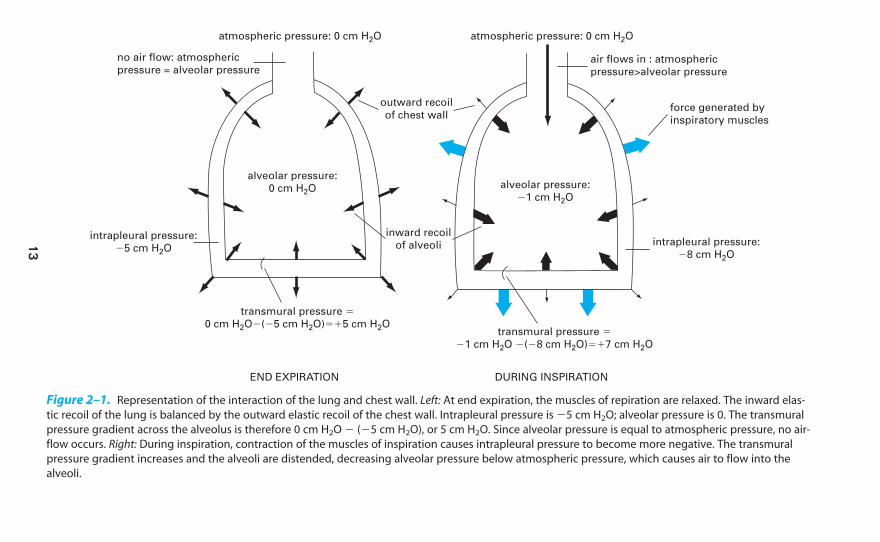
Figure 2–1. Representation of the interaction of the lung and chest wall. Left: At end expiration, the muscles of repiration are relaxed. The inward elas-
tic recoil of the lung is balanced by the outward elastic recoil of the chest wall. Intrapleural pressure is �5 cm H2O; alveolar pressure is 0. The transmural
pressure gradient across the alveolus is therefore 0 cm H2O � (�5 cm H2O), or 5 cm H2O. Since alveolar pressure is equal to atmospheric pressure, no air-
flow occurs. Right: During inspiration, contraction of the muscles of inspiration causes intrapleural pressure to become more negative. The transmural
pressure gradient increases and the alveoli are distended, decreasing alveolar pressure below atmospheric pressure, which causes air to flow into the
alveoli.
13
14 / CHAPTER 2
Initially, before any airflow occurs, the pressure inside the alveoli is the same asatmospheric pressure—by convention 0 cm H2O. Alveolar pressure is greater thanintrapleural pressure because it represents the sum of the intrapleural pressure plusthe alveolar elastic recoil pressure:
Alveolar pressure � intrapleural pressure � alveolar elastic recoil pressure
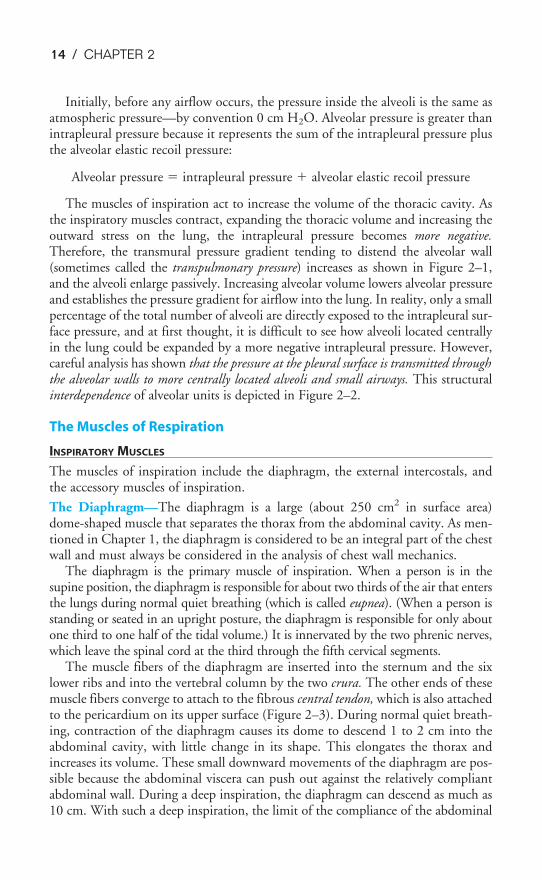
The muscles of inspiration act to increase the volume of the thoracic cavity. Asthe inspiratory muscles contract, expanding the thoracic volume and increasing theoutward stress on the lung, the intrapleural pressure becomes more negative.Therefore, the transmural pressure gradient tending to distend the alveolar wall(sometimes called the transpulmonary pressure) increases as shown in Figure 2–1,and the alveoli enlarge passively. Increasing alveolar volume lowers alveolar pressureand establishes the pressure gradient for airflow into the lung. In reality, only a smallpercentage of the total number of alveoli are directly exposed to the intrapleural sur-face pressure, and at first thought, it is difficult to see how alveoli located centrallyin the lung could be expanded by a more negative intrapleural pressure. However,careful analysis has shown that the pressure at the pleural surface is transmitted throughthe alveolar walls to more centrally located alveoli and small airways. This structuralinterdependence of alveolar units is depicted in Figure 2–2.
The Muscles of Respiration
INSPIRATORY MUSCLES
The muscles of inspiration include the diaphragm, the external intercostals, andthe accessory muscles of inspiration.
The Diaphragm—The diaphragm is a large (about 250 cm2 in surface area)dome-shaped muscle that separates the thorax from the abdominal cavity. As men-tioned in Chapter 1, the diaphragm is considered to be an integral part of the chestwall and must always be considered in the analysis of chest wall mechanics.
The diaphragm is the primary muscle of inspiration. When a person is in thesupine position, the diaphragm is responsible for about two thirds of the air that entersthe lungs during normal quiet breathing (which is called eupnea). (When a person isstanding or seated in an upright posture, the diaphragm is responsible for only aboutone third to one half of the tidal volume.) It is innervated by the two phrenic nerves,which leave the spinal cord at the third through the fifth cervical segments.
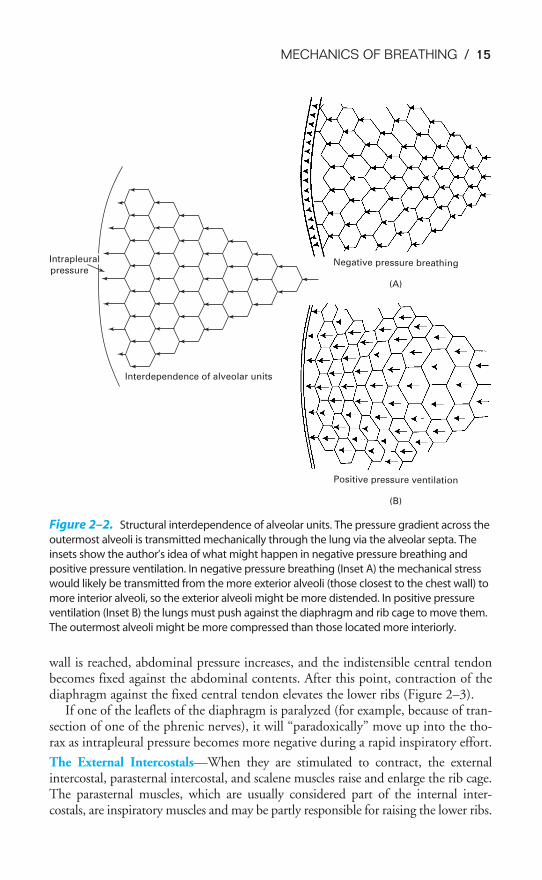
The muscle fibers of the diaphragm are inserted into the sternum and the sixlower ribs and into the vertebral column by the two crura. The other ends of thesemuscle fibers converge to attach to the fibrous central tendon, which is also attachedto the pericardium on its upper surface (Figure 2–3). During normal quiet breath-ing, contraction of the diaphragm causes its dome to descend 1 to 2 cm into theabdominal cavity, with little change in its shape. This elongates the thorax andincreases its volume. These small downward movements of the diaphragm are pos-sible because the abdominal viscera can push out against the relatively compliantabdominal wall. During a deep inspiration, the diaphragm can descend as much as10 cm. With such a deep inspiration, the limit of the compliance of the abdominal
Intrapleural
pressure
Interdependence of alveolar units
Negative pressure breathing
(A)
Positive pressure ventilation
(B)
Figure 2–2. Structural interdependence of alveolar units. The pressure gradient across the
outermost alveoli is transmitted mechanically through the lung via the alveolar septa. The
insets show the author’s idea of what might happen in negative pressure breathing and
positive pressure ventilation. In negative pressure breathing (Inset A) the mechanical stress
would likely be transmitted from the more exterior alveoli (those closest to the chest wall) to
more interior alveoli, so the exterior alveoli might be more distended. In positive pressure
ventilation (Inset B) the lungs must push against the diaphragm and rib cage to move them.
The outermost alveoli might be more compressed than those located more interiorly.
MECHANICS OF BREATHING / 15
wall is reached, abdominal pressure increases, and the indistensible central tendonbecomes fixed against the abdominal contents. After this point, contraction of thediaphragm against the fixed central tendon elevates the lower ribs (Figure 2–3).
If one of the leaflets of the diaphragm is paralyzed (for example, because of tran-section of one of the phrenic nerves), it will “paradoxically” move up into the tho-rax as intrapleural pressure becomes more negative during a rapid inspiratory effort.
The External Intercostals—When they are stimulated to contract, the externalintercostal, parasternal intercostal, and scalene muscles raise and enlarge the rib cage.The parasternal muscles, which are usually considered part of the internal inter-costals, are inspiratory muscles and may be partly responsible for raising the lower ribs.
16 / CHAPTER 2
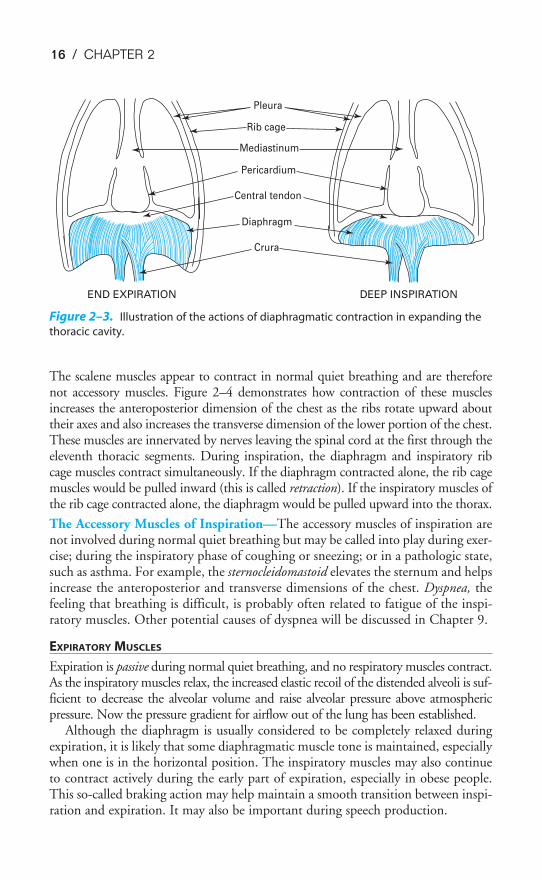
The scalene muscles appear to contract in normal quiet breathing and are thereforenot accessory muscles. Figure 2–4 demonstrates how contraction of these musclesincreases the anteroposterior dimension of the chest as the ribs rotate upward abouttheir axes and also increases the transverse dimension of the lower portion of the chest.These muscles are innervated by nerves leaving the spinal cord at the first through theeleventh thoracic segments. During inspiration, the diaphragm and inspiratory ribcage muscles contract simultaneously. If the diaphragm contracted alone, the rib cagemuscles would be pulled inward (this is called retraction). If the inspiratory muscles ofthe rib cage contracted alone, the diaphragm would be pulled upward into the thorax.
The Accessory Muscles of Inspiration—The accessory muscles of inspiration arenot involved during normal quiet breathing but may be called into play during exer-cise; during the inspiratory phase of coughing or sneezing; or in a pathologic state,such as asthma. For example, the sternocleidomastoid elevates the sternum and helpsincrease the anteroposterior and transverse dimensions of the chest. Dyspnea, thefeeling that breathing is difficult, is probably often related to fatigue of the inspi-ratory muscles. Other potential causes of dyspnea will be discussed in Chapter 9.
EXPIRATORY MUSCLES
Expiration is passive during normal quiet breathing, and no respiratory muscles contract.As the inspiratory muscles relax, the increased elastic recoil of the distended alveoli is suf-ficient to decrease the alveolar volume and raise alveolar pressure above atmosphericpressure. Now the pressure gradient for airflow out of the lung has been established.
Although the diaphragm is usually considered to be completely relaxed duringexpiration, it is likely that some diaphragmatic muscle tone is maintained, especiallywhen one is in the horizontal position. The inspiratory muscles may also continueto contract actively during the early part of expiration, especially in obese people.This so-called braking action may help maintain a smooth transition between inspi-ration and expiration. It may also be important during speech production.
Pleura
Rib cage
Mediastinum
Pericardium
Central tendon
Diaphragm
Crura
END EXPIRATION DEEP INSPIRATION
Figure 2–3. Illustration of the actions of diaphragmatic contraction in expanding the
thoracic cavity.
MECHANICS OF BREATHING / 17
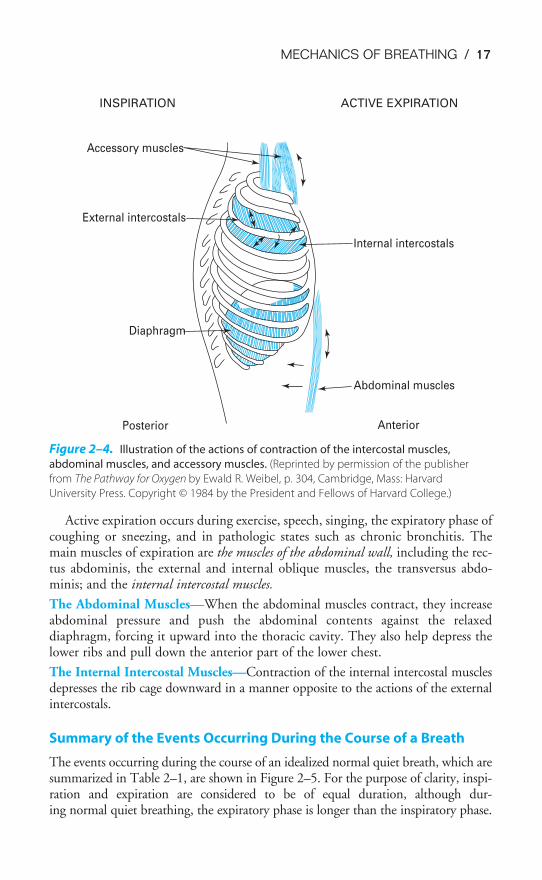
Active expiration occurs during exercise, speech, singing, the expiratory phase ofcoughing or sneezing, and in pathologic states such as chronic bronchitis. Themain muscles of expiration are the muscles of the abdominal wall, including the rec-tus abdominis, the external and internal oblique muscles, the transversus abdo-minis; and the internal intercostal muscles.
The Abdominal Muscles—When the abdominal muscles contract, they increaseabdominal pressure and push the abdominal contents against the relaxeddiaphragm, forcing it upward into the thoracic cavity. They also help depress thelower ribs and pull down the anterior part of the lower chest.
The Internal Intercostal Muscles—Contraction of the internal intercostal musclesdepresses the rib cage downward in a manner opposite to the actions of the externalintercostals.
Summary of the Events Occurring During the Course of a Breath
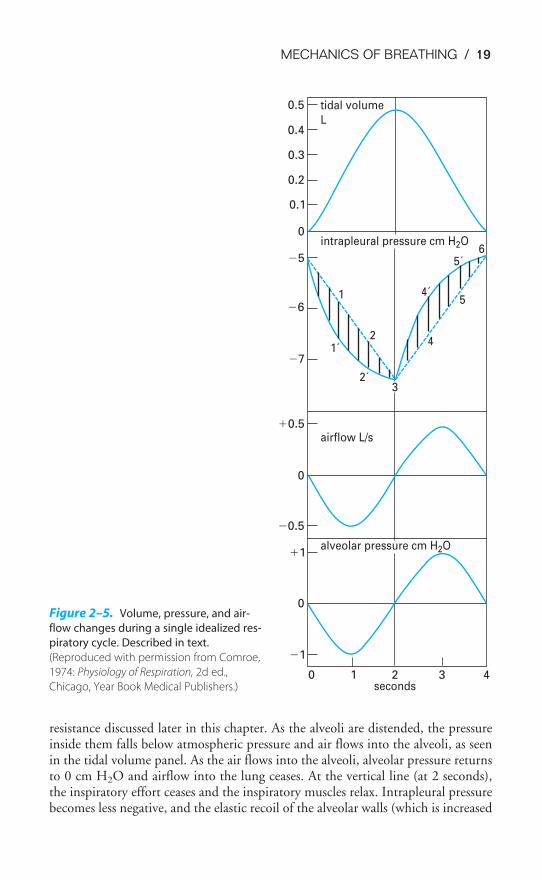
The events occurring during the course of an idealized normal quiet breath, which aresummarized in Table 2–1, are shown in Figure 2–5. For the purpose of clarity, inspi-ration and expiration are considered to be of equal duration, although dur-ing normal quiet breathing, the expiratory phase is longer than the inspiratory phase.
Accessory muscles
External intercostals
Diaphragm
Posterior Anterior
Abdominal muscles
Internal intercostals
INSPIRATION ACTIVE EXPIRATION
Figure 2–4. Illustration of the actions of contraction of the intercostal muscles,
abdominal muscles, and accessory muscles. (Reprinted by permission of the publisher
from The Pathway for Oxygen by Ewald R. Weibel, p. 304, Cambridge, Mass: Harvard
University Press. Copyright © 1984 by the President and Fellows of Harvard College.)
18 / CHAPTER 2
The volume of air entering or leaving the lungs can be measured with a spirom-eter, as will be described in Chapter 3 (Figure 3–4). Airflow can be measured bybreathing through a pneumotachograph, which measures the pressure differentialacross a fixed resistance. The intrapleural pressure can be estimated by having a sub-ject swallow a balloon into the intrathoracic portion of the esophagus. The pres-sure then measured in the balloon is nearly equal to intrapleural pressure. Alveolarpressures are not directly measurable and must be calculated.
Initially, alveolar pressure equals atmospheric pressure, and so no air flows intothe lung. Intrapleural pressure is �5 cm H2O. Contraction of the inspiratory mus-cles causes intrapleural pressure to become more negative as the lungs are pulledopen and the alveoli are distended. Note the two different courses for changes inintrapleural pressure. The dashed line (which would not really be straight for rea-sons discussed in the next section) predicts the changes in intrapleural pressurenecessary to overcome the elastic recoil of the alveoli. The solid line is a more accu-rate representation of intrapleural pressure because it also includes the additionalpressure work that must be done to overcome the resistance to airflow and tissue
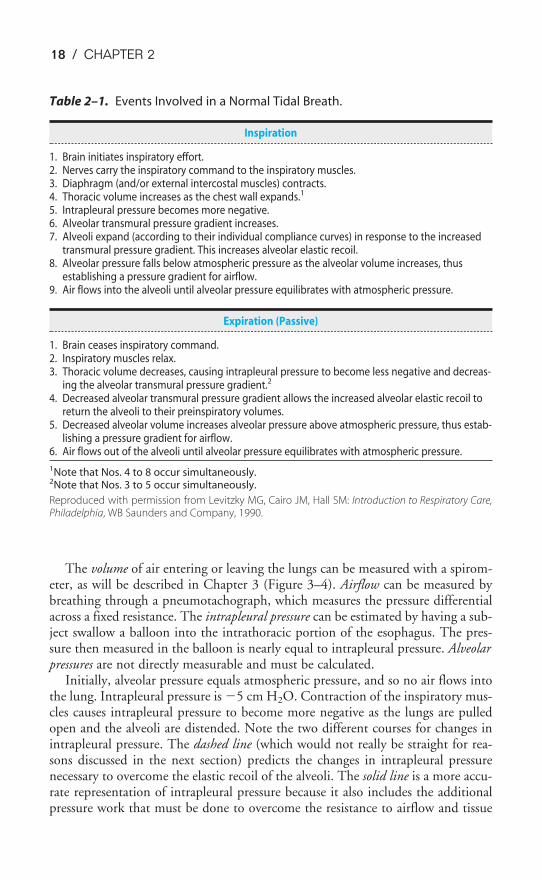
Table 2–1. Events Involved in a Normal Tidal Breath.
Inspiration
1. Brain initiates inspiratory effort.2. Nerves carry the inspiratory command to the inspiratory muscles.3. Diaphragm (and/or external intercostal muscles) contracts.4. Thoracic volume increases as the chest wall expands.1
5. Intrapleural pressure becomes more negative.6. Alveolar transmural pressure gradient increases.7. Alveoli expand (according to their individual compliance curves) in response to the increased
transmural pressure gradient. This increases alveolar elastic recoil.8. Alveolar pressure falls below atmospheric pressure as the alveolar volume increases, thus
establishing a pressure gradient for airflow.9. Air flows into the alveoli until alveolar pressure equilibrates with atmospheric pressure.
Expiration (Passive)
1. Brain ceases inspiratory command.2. Inspiratory muscles relax.3. Thoracic volume decreases, causing intrapleural pressure to become less negative and decreas-
ing the alveolar transmural pressure gradient.2
4. Decreased alveolar transmural pressure gradient allows the increased alveolar elastic recoil toreturn the alveoli to their preinspiratory volumes.
5. Decreased alveolar volume increases alveolar pressure above atmospheric pressure, thus estab-lishing a pressure gradient for airflow.
6. Air flows out of the alveoli until alveolar pressure equilibrates with atmospheric pressure.
1Note that Nos. 4 to 8 occur simultaneously.2Note that Nos. 3 to 5 occur simultaneously.
Reproduced with permission from Levitzky MG, Cairo JM, Hall SM: Introduction to Respiratory Care,Philadelphia, WB Saunders and Company, 1990.
MECHANICS OF BREATHING / 19
resistance discussed later in this chapter. As the alveoli are distended, the pressureinside them falls below atmospheric pressure and air flows into the alveoli, as seenin the tidal volume panel. As the air flows into the alveoli, alveolar pressure returnsto 0 cm H2O and airflow into the lung ceases. At the vertical line (at 2 seconds),the inspiratory effort ceases and the inspiratory muscles relax. Intrapleural pressurebecomes less negative, and the elastic recoil of the alveolar walls (which is increased
0 1 2 3 4
�1
0
�1
�0.5
0
�0.5
�7
�6
�5
0
0.1
0.2
0.3
0.4
0.5
alveolar pressure cm H2O
airflow L/s
intrapleural pressure cm H2O
tidal volume
L
seconds
32´
1´2
1 4´
5´6
5
4
Figure 2–5. Volume, pressure, and air-
flow changes during a single idealized res-
piratory cycle. Described in text.
(Reproduced with permission from Comroe,
1974: Physiology of Respiration, 2d ed.,
Chicago, Year Book Medical Publishers.)
20 / CHAPTER 2
at the higher lung volume) is allowed to compress the alveolar gas. This raises alve-olar pressure above atmospheric pressure so that air flows out of the lung until analveolar pressure of 0 cm H2O is restored. At this point, airflow ceases until thenext inspiratory effort.
PRESSURE-VOLUME RELATIONSHIPS IN THE RESPIRATORY SYSTEM
The relationship between changes in the pressure distending the alveoli andchanges in lung volume is important to understand because it dictates how thelung inflates with each breath. As mentioned before, the alveolar-distending pres-sure is often referred to as the transpulmonary pressure. Strictly speaking, thetranspulmonary pressure is equal to the pressure in the trachea minus theintrapleural pressure. Thus, it is the pressure difference across the whole lung.However, the pressure in the alveoli is the same as the pressure in the airways—including the trachea—at the beginning or end of each normal breath; that is, end-expiratory or end-inspiratory alveolar pressure is 0 cm H2O (Figure 2–5).Therefore, at the beginning or end of each lung inflation, alveolar-distending pres-sure can be referred to as the transpulmonary pressure.
Compliance of the Lung & the Chest Wall
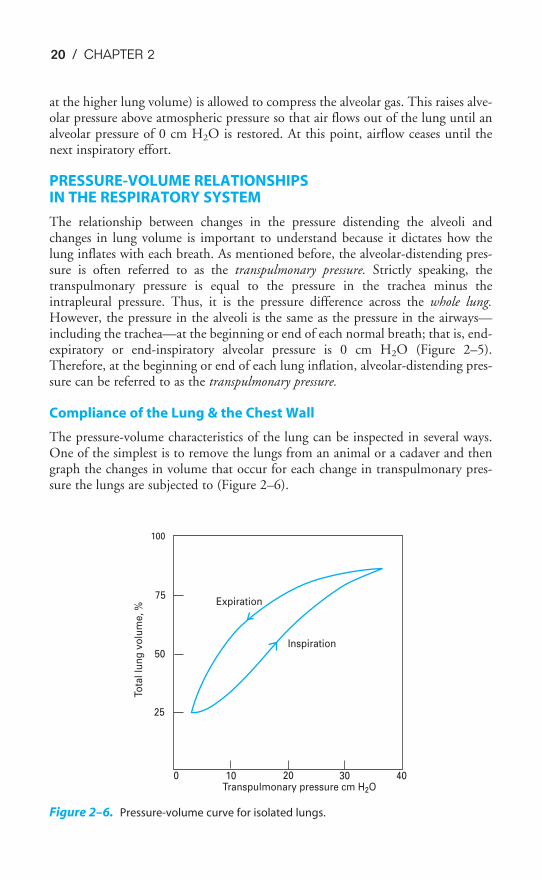
The pressure-volume characteristics of the lung can be inspected in several ways.One of the simplest is to remove the lungs from an animal or a cadaver and thengraph the changes in volume that occur for each change in transpulmonary pres-sure the lungs are subjected to (Figure 2–6).
Expiration
Inspiration
Transpulmonary pressure cm H2O
Tota
l lu
ng
vo
lum
e,
%
0 10 20 30 40
25
50
75
100
Figure 2–6. Pressure-volume curve for isolated lungs.
MECHANICS OF BREATHING / 21
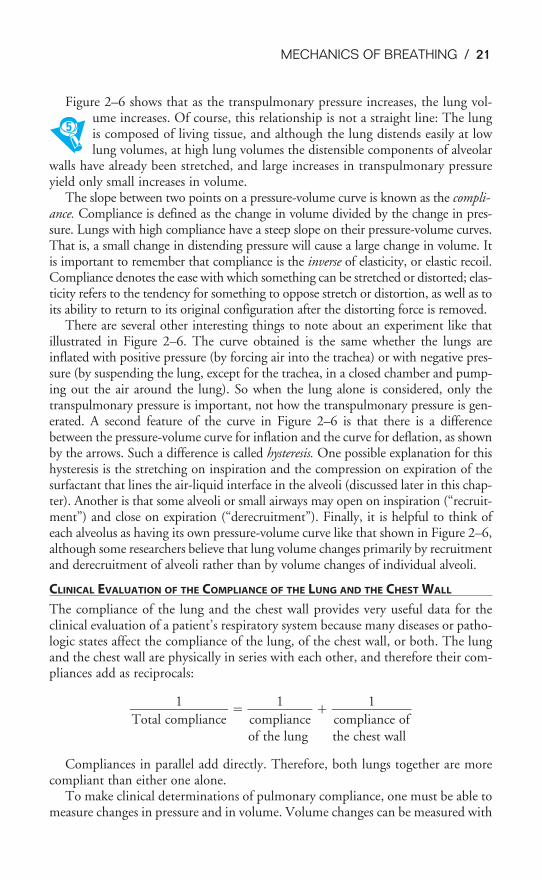
Figure 2–6 shows that as the transpulmonary pressure increases, the lung vol-ume increases. Of course, this relationship is not a straight line: The lungis composed of living tissue, and although the lung distends easily at lowlung volumes, at high lung volumes the distensible components of alveolar
walls have already been stretched, and large increases in transpulmonary pressureyield only small increases in volume.
The slope between two points on a pressure-volume curve is known as the compli-ance. Compliance is defined as the change in volume divided by the change in pres-sure. Lungs with high compliance have a steep slope on their pressure-volume curves.That is, a small change in distending pressure will cause a large change in volume. Itis important to remember that compliance is the inverse of elasticity, or elastic recoil.Compliance denotes the ease with which something can be stretched or distorted; elas-ticity refers to the tendency for something to oppose stretch or distortion, as well as toits ability to return to its original configuration after the distorting force is removed.
There are several other interesting things to note about an experiment like thatillustrated in Figure 2–6. The curve obtained is the same whether the lungs areinflated with positive pressure (by forcing air into the trachea) or with negative pres-sure (by suspending the lung, except for the trachea, in a closed chamber and pump-ing out the air around the lung). So when the lung alone is considered, only thetranspulmonary pressure is important, not how the transpulmonary pressure is gen-erated. A second feature of the curve in Figure 2–6 is that there is a differencebetween the pressure-volume curve for inflation and the curve for deflation, as shownby the arrows. Such a difference is called hysteresis. One possible explanation for thishysteresis is the stretching on inspiration and the compression on expiration of thesurfactant that lines the air-liquid interface in the alveoli (discussed later in this chap-ter). Another is that some alveoli or small airways may open on inspiration (“recruit-ment”) and close on expiration (“derecruitment”). Finally, it is helpful to think ofeach alveolus as having its own pressure-volume curve like that shown in Figure 2–6,although some researchers believe that lung volume changes primarily by recruitmentand derecruitment of alveoli rather than by volume changes of individual alveoli.
CLINICAL EVALUATION OF THE COMPLIANCE OF THE LUNG AND THE CHEST WALL
The compliance of the lung and the chest wall provides very useful data for theclinical evaluation of a patient’s respiratory system because many diseases or patho-logic states affect the compliance of the lung, of the chest wall, or both. The lungand the chest wall are physically in series with each other, and therefore their com-pliances add as reciprocals:
�Total co
1
mpliance�� �
comp
1
liance� � �
compli
1
ance of�
of the lung the chest wall
Compliances in parallel add directly. Therefore, both lungs together are morecompliant than either one alone.
To make clinical determinations of pulmonary compliance, one must be able tomeasure changes in pressure and in volume. Volume changes can be measured with
22 / CHAPTER 2
a spirometer, but measuring pressure changes is more difficult because changes inthe transmural pressure gradient must be taken into account. For the lungs, thetransmural pressure gradient is transpulmonary pressure (alveolar minusintrapleural); for the chest wall, the transmural pressure gradient is intrapleuralpressure minus atmospheric pressure. As described previously, intrapleural pressurecan be measured by having the patient swallow an esophageal balloon. The com-pliance curve for the lung can then be generated by having the patient take a verydeep breath and exhale in stages, stopping periodically for pressure and volumedeterminations. During these determinations, no airflow is occurring; alveolarpressure therefore equals atmospheric pressure, 0 cm H2O. Similar measurementscan be made as the patient inhales in stages from a low lung volume to a high lungvolume. Such curves are called static compliance curves because all measurementsare made when no airflow is occurring. The compliance of the chest wall is nor-mally obtained by determining the compliance of the total system and the com-pliance of the lungs alone and then calculating the compliance of the chest wallaccording to the above formula. Dynamic compliance, in which pressure-volumecharacteristics during the breath are considered, will be discussed later in thischapter.
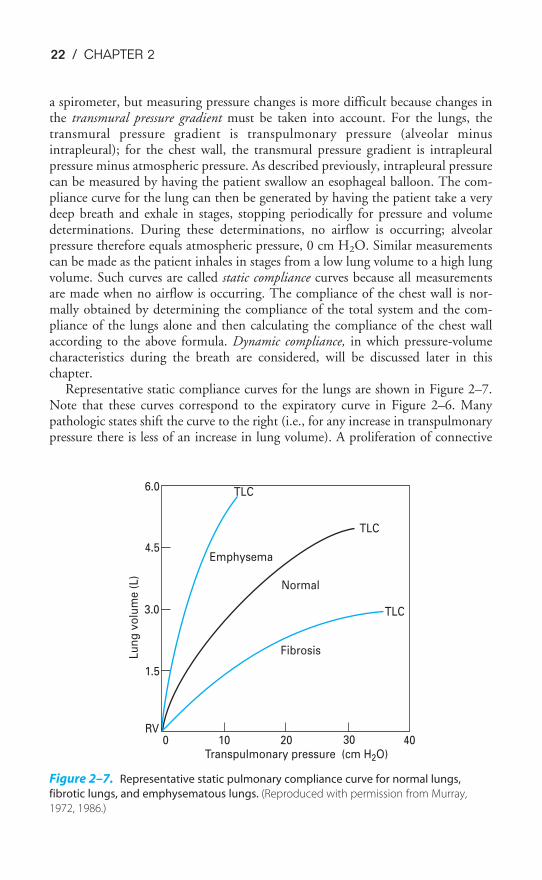
Representative static compliance curves for the lungs are shown in Figure 2–7.Note that these curves correspond to the expiratory curve in Figure 2–6. Manypathologic states shift the curve to the right (i.e., for any increase in transpulmonarypressure there is less of an increase in lung volume). A proliferation of connective
TLC
TLC
TLC
Emphysema
Normal
Fibrosis
6.0
4.5
3.0
1.5
RV0 10 20 30 40
Transpulmonary pressure (cm H2O)
Lu
ng
vo
lum
e (
L)
Figure 2–7. Representative static pulmonary compliance curve for normal lungs,
fibrotic lungs, and emphysematous lungs. (Reproduced with permission from Murray,
1972, 1986.)
MECHANICS OF BREATHING / 23
tissue called fibrosis may be seen in sarcoidosis or after chemical or thermal injury tothe lungs. Such changes will make the lungs less compliant, or “stiffer,” and increasealveolar elastic recoil. Similarly, pulmonary vascular engorgement or areas of col-lapsed alveoli (atelectasis) also make the lung less compliant. Other conditions thatinterfere with the lung’s ability to expand (such as the presence of air, excess fluid,or blood in the intrapleural space) will effectively decrease the compliance of thelungs. Emphysema increases the compliance of the lungs because it destroys the alve-olar septal tissue that normally opposes lung expansion.
The compliance of the chest wall is decreased in obese people, for whom mov-ing the diaphragm downward and the rib cage up and out is much more difficult.People suffering from a musculoskeletal disorder that leads to decreased mobilityof the rib cage, such as kyphoscoliosis, also have decreased chest wall compliance.
Because they must generate greater transpulmonary pressures to breathe in thesame volume of air, people with decreased compliance of the lungs must do morework to inspire than those with normal pulmonary compliance. Similarly, moremuscular work must be done by someone with decreased chest wall compliancethan by a person with normal chest wall compliance.
As noted in the beginning of this section, lung compliance is volume-dependent.It is greater at low lung volumes and lower at high lung volumes. For this reason,the term specific compliance is often used to denote compliance with reference tothe original lung volume.
The total compliance of a normal person near the normal end-expiratory lungvolume (the functional residual capacity [FRC] ) is about 0.1 L/cm H2O. The com-pliance of the lungs is about 0.2 L/cm H2O; that of the chest wall is also about0.2 L/cm H2O.
Elastic Recoil of the Lung
So far the elastic recoil of the lungs has been discussed as though it were only dueto the elastic properties of the pulmonary parenchyma itself. However, there isanother component of the elastic recoil of the lung besides the elastin, collagen,and other constituents of the lung tissue. That other component is the surface ten-sion at the air-liquid interface in the alveoli.
Surface tension forces occur at any gas-liquid interface (or even interfacesbetween two immiscible liquids) and are generated by the cohesive forces betweenthe molecules of the liquid. These cohesive forces balance each other within the liq-uid phase but are unopposed at the surface of the liquid. Surface tension is whatcauses water to bead and form droplets. It causes a liquid to shrink to form thesmallest possible surface area. The unit of measurement of surface tension is dynesper centimeter (dyn/cm).
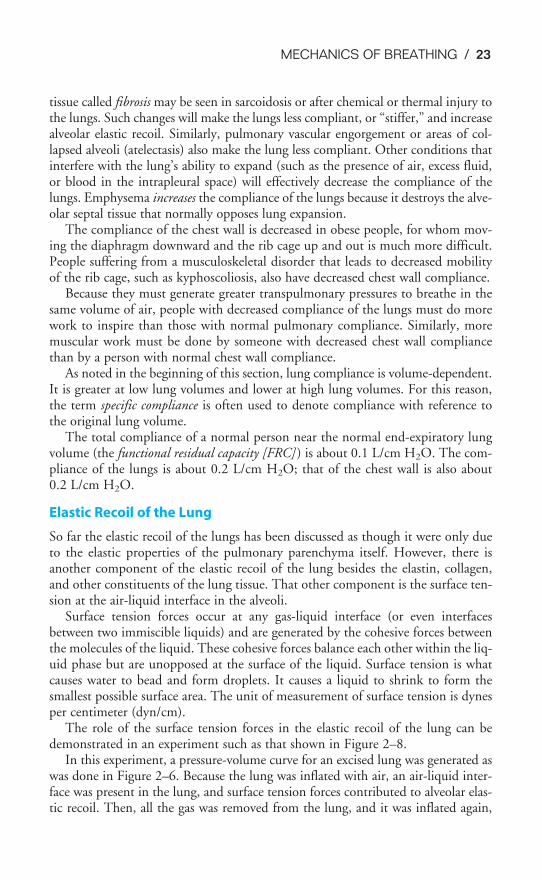
The role of the surface tension forces in the elastic recoil of the lung can bedemonstrated in an experiment such as that shown in Figure 2–8.
In this experiment, a pressure-volume curve for an excised lung was generated aswas done in Figure 2–6. Because the lung was inflated with air, an air-liquid inter-face was present in the lung, and surface tension forces contributed to alveolar elas-tic recoil. Then, all the gas was removed from the lung, and it was inflated again,
24 / CHAPTER 2
this time with saline instead of with air. In this situation, surface tension forces areabsent because there is no air-liquid interface. The elastic recoil is due only to theelastic recoil of the lung tissue itself. Note that there is no hysteresis with saline infla-tion. Whatever causes the hysteresis appears to be related to surface tension in thelung. To recapitulate, the curve at left (saline inflation) represents the elastic recoildue to only the lung tissue itself. The curve at right demonstrates the recoil due toboth the lung tissue and the surface tension forces. The difference between the twocurves is the recoil due to surface tension forces.
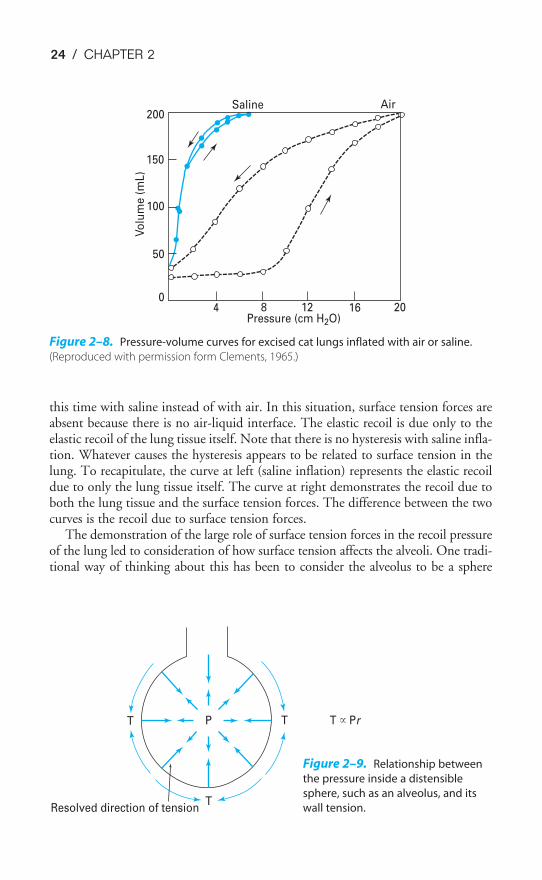
The demonstration of the large role of surface tension forces in the recoil pressureof the lung led to consideration of how surface tension affects the alveoli. One tradi-tional way of thinking about this has been to consider the alveolus to be a sphere
0
50
100
150
200Saline Air
Pressure (cm H2O)
Vo
lum
e (
mL)
4 8 12 16 20
Figure 2–8. Pressure-volume curves for excised cat lungs inflated with air or saline.
(Reproduced with permission form Clements, 1965.)
TPT
TResolved direction of tension
T � Pr
Figure 2–9. Relationship between
the pressure inside a distensible
sphere, such as an alveolus, and its
wall tension.
MECHANICS OF BREATHING / 25
hanging from the airway, as in Figure 2–9. The relationship between the pressureinside the alveolus and the wall tension of the alveolus would then be given byLaplace’s law (units in parentheses).
Pressure (dyn/cm2) �
This can be rearranged as
T � �P �
2
r�
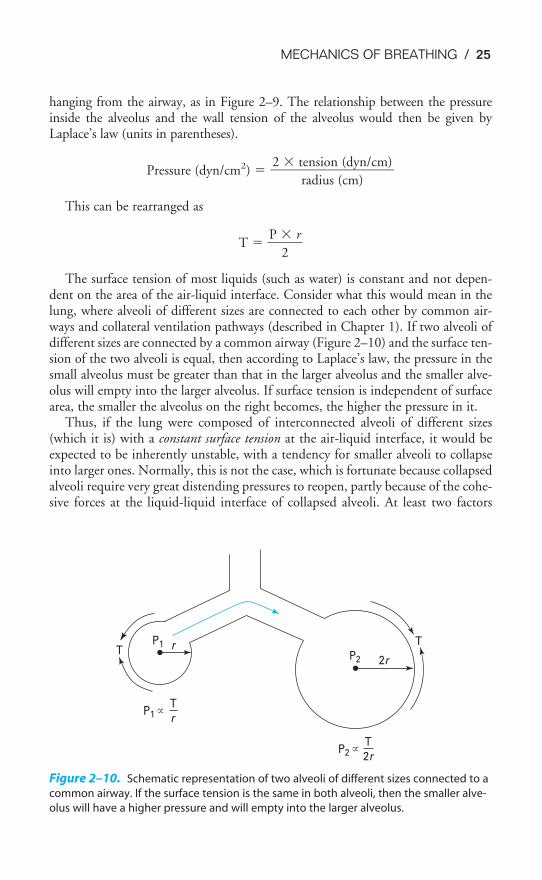
The surface tension of most liquids (such as water) is constant and not depen-dent on the area of the air-liquid interface. Consider what this would mean in thelung, where alveoli of different sizes are connected to each other by common air-ways and collateral ventilation pathways (described in Chapter 1). If two alveoli ofdifferent sizes are connected by a common airway (Figure 2–10) and the surface ten-sion of the two alveoli is equal, then according to Laplace’s law, the pressure in thesmall alveolus must be greater than that in the larger alveolus and the smaller alve-olus will empty into the larger alveolus. If surface tension is independent of surfacearea, the smaller the alveolus on the right becomes, the higher the pressure in it.
Thus, if the lung were composed of interconnected alveoli of different sizes(which it is) with a constant surface tension at the air-liquid interface, it would beexpected to be inherently unstable, with a tendency for smaller alveoli to collapseinto larger ones. Normally, this is not the case, which is fortunate because collapsedalveoli require very great distending pressures to reopen, partly because of the cohe-sive forces at the liquid-liquid interface of collapsed alveoli. At least two factors
2 � tension (dyn/cm)���
radius (cm)
TP1 r
P2 2r
P2 � T
2r
P1 � T
r
T
Figure 2–10. Schematic representation of two alveoli of different sizes connected to a
common airway. If the surface tension is the same in both alveoli, then the smaller alve-
olus will have a higher pressure and will empty into the larger alveolus.
26 / CHAPTER 2
cause the alveoli to be more stable than this prediction based on constant surfacetension. The first factor is a substance called pulmonary surfactant, which is pro-duced by specialized alveolar cells, and the second is the structural interdependenceof the alveoli.
Pulmonary Surfactant
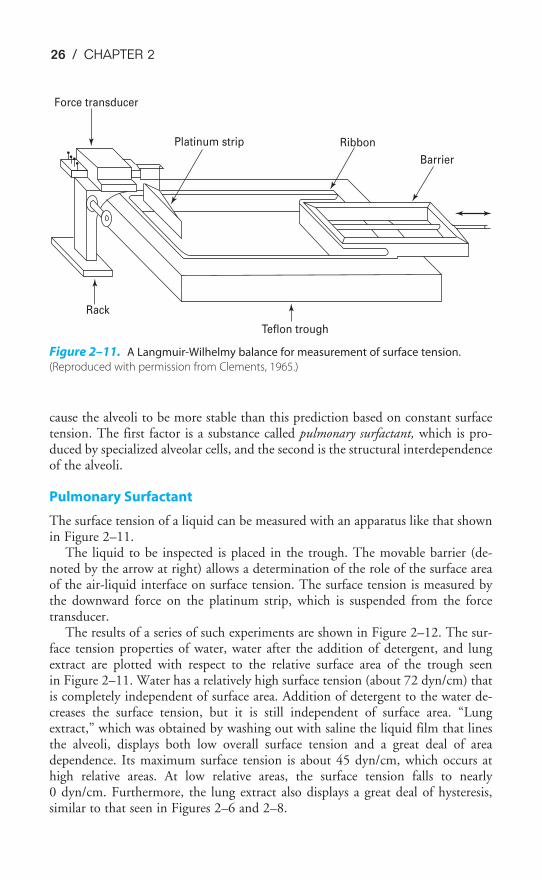
The surface tension of a liquid can be measured with an apparatus like that shownin Figure 2–11.
The liquid to be inspected is placed in the trough. The movable barrier (de-noted by the arrow at right) allows a determination of the role of the surface areaof the air-liquid interface on surface tension. The surface tension is measured bythe downward force on the platinum strip, which is suspended from the forcetransducer.
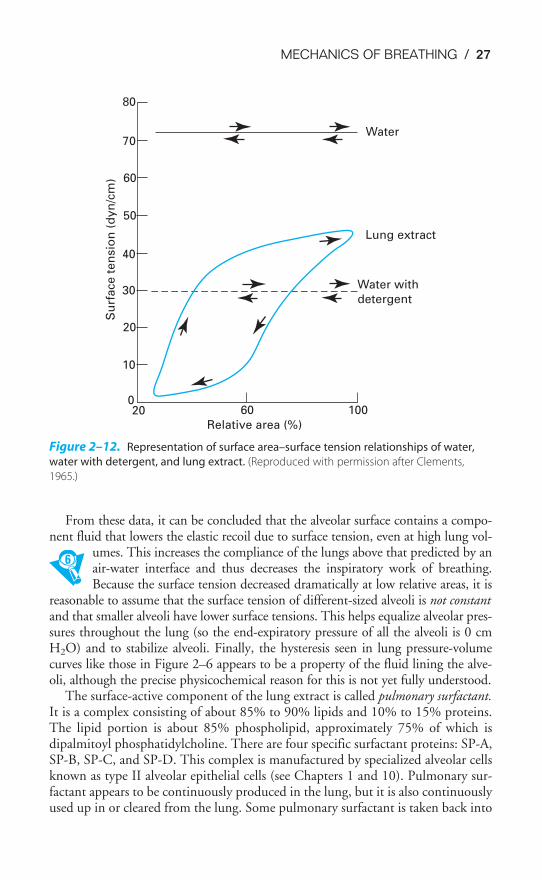
The results of a series of such experiments are shown in Figure 2–12. The sur-face tension properties of water, water after the addition of detergent, and lungextract are plotted with respect to the relative surface area of the trough seenin Figure 2–11. Water has a relatively high surface tension (about 72 dyn/cm) thatis completely independent of surface area. Addition of detergent to the water de-creases the surface tension, but it is still independent of surface area. “Lungextract,” which was obtained by washing out with saline the liquid film that linesthe alveoli, displays both low overall surface tension and a great deal of areadependence. Its maximum surface tension is about 45 dyn/cm, which occurs athigh relative areas. At low relative areas, the surface tension falls to nearly0 dyn/cm. Furthermore, the lung extract also displays a great deal of hysteresis,similar to that seen in Figures 2–6 and 2–8.
Barrier
Ribbon
Teflon trough
Rack
Platinum strip
Force transducer
Figure 2–11. A Langmuir-Wilhelmy balance for measurement of surface tension.
(Reproduced with permission from Clements, 1965.)
MECHANICS OF BREATHING / 27
From these data, it can be concluded that the alveolar surface contains a compo-nent fluid that lowers the elastic recoil due to surface tension, even at high lung vol-
umes. This increases the compliance of the lungs above that predicted by anair-water interface and thus decreases the inspiratory work of breathing.Because the surface tension decreased dramatically at low relative areas, it is
reasonable to assume that the surface tension of different-sized alveoli is not constantand that smaller alveoli have lower surface tensions. This helps equalize alveolar pres-sures throughout the lung (so the end-expiratory pressure of all the alveoli is 0 cmH2O) and to stabilize alveoli. Finally, the hysteresis seen in lung pressure-volumecurves like those in Figure 2–6 appears to be a property of the fluid lining the alve-oli, although the precise physicochemical reason for this is not yet fully understood.
The surface-active component of the lung extract is called pulmonary surfactant.It is a complex consisting of about 85% to 90% lipids and 10% to 15% proteins.The lipid portion is about 85% phospholipid, approximately 75% of which isdipalmitoyl phosphatidylcholine. There are four specific surfactant proteins: SP-A,SP-B, SP-C, and SP-D. This complex is manufactured by specialized alveolar cellsknown as type II alveolar epithelial cells (see Chapters 1 and 10). Pulmonary sur-factant appears to be continuously produced in the lung, but it is also continuouslyused up in or cleared from the lung. Some pulmonary surfactant is taken back into
20 60 100
Relative area (%)
Water with
detergent
0
10
20
30
40
50
60
Su
rface t
en
sio
n (
dyn
/cm
)
70
80
Water
Lung extract
Figure 2–12. Representation of surface area–surface tension relationships of water,
water with detergent, and lung extract. (Reproduced with permission after Clements,
1965.)
28 / CHAPTER 2
the type II cells (reuptake), where it is recycled and secreted again, or it is degradedand used to synthesize other phospholipids. Other surfactant is cleared from thealveoli by alveolar macrophages, absorption into the lymphatics, or migration upto the small airways and the mucociliary escalator (see Chapter 10). Although thealveolar surface is usually considered to be completely lined with liquid, some stud-ies have shown that the surface consists of both dry areas and wet areas. Type IIalveolar epithelial cells may also help remove liquid from the alveolar surface by ac-tively pumping sodium and water from the alveolar surface into the interstitium.
The clinical consequences of a lack of functional pulmonary surfactant can be seenin several conditions. Surfactant is not produced by the fetal lung until about thefourth month of gestation, and it may not be fully functional until the seventhmonth or later. Prematurely born infants who do not have functional pulmonary sur-factant experience great difficulty in inflating their lungs, especially on their firstbreaths. Even if their alveoli are inflated for them, the tendency toward spontaneouscollapse is great because their alveoli are much less stable without pulmonary surfac-tant. Therefore, the lack of functional pulmonary surfactant in a prematurely bornneonate may be a major factor in the infant respiratory distress syndrome. Pulmonarysurfactant may also be important in maintaining the stability of small airways.
Hypoxia or hypoxemia (low oxygen in the arterial blood), or both, may lead toa decrease in surfactant production or an increase in surfactant destruction. Thiscondition may be a contributing factor in the acute respiratory distress syndrome(also known as adult respiratory distress syndrome or “shock-lung syndrome”) seenin patients after trauma or surgery. One thing that can be done to help maintainpatients with acute or infant respiratory distress syndrome is to ventilate their lungswith positive-pressure ventilators and to keep their alveolar pressure above atmos-pheric pressure during expiration (this is known as positive end-expiratory pressure[PEEP]). This process opposes the increased elastic recoil of the alveoli and the ten-dency for spontaneous atelectasis to occur because of a lack of pulmonary surfac-tant. Exogenous pulmonary surfactant is now administered directly into the airwayof neonates with infant respiratory distress syndrome.
In summary, pulmonary surfactant helps decrease the work of inspiration bylowering the surface tension of the alveoli, thus reducing the elastic recoil of thelung and making the lung more compliant. Surfactant also helps stabilize the alve-oli by lowering even further the surface tension of smaller alveoli, equalizing thepressure inside alveoli of different sizes.
Alveolar Interdependence
A second factor tending to stabilize the alveoli is their mechanical interdependence,which was discussed at the beginning of this chapter. Alveoli do not hang from theairways like a “bunch of grapes” (the translation of the Latin word “acinus”), andthey are not spheres. They are mechanically interdependent polygons with flat wallsshared by adjacent alveoli. Alveoli are not normally held open by positive airwaypressure, as shown in Figures 2–9 and 2–10; they are held open by the chest wallpulling on the outer surface of the lung, as shown in Figure 2–2. If an alveolus,such as the one in the middle of Figure 2–13, were to begin to collapse, it would
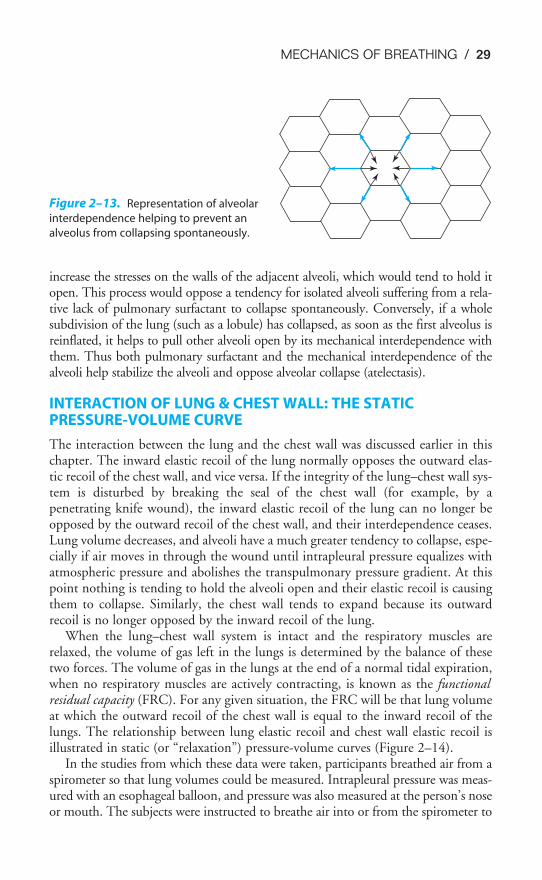
MECHANICS OF BREATHING / 29
increase the stresses on the walls of the adjacent alveoli, which would tend to hold itopen. This process would oppose a tendency for isolated alveoli suffering from a rela-tive lack of pulmonary surfactant to collapse spontaneously. Conversely, if a wholesubdivision of the lung (such as a lobule) has collapsed, as soon as the first alveolus isreinflated, it helps to pull other alveoli open by its mechanical interdependence withthem. Thus both pulmonary surfactant and the mechanical interdependence of thealveoli help stabilize the alveoli and oppose alveolar collapse (atelectasis).
INTERACTION OF LUNG & CHEST WALL: THE STATIC PRESSURE-VOLUME CURVE
The interaction between the lung and the chest wall was discussed earlier in thischapter. The inward elastic recoil of the lung normally opposes the outward elas-tic recoil of the chest wall, and vice versa. If the integrity of the lung–chest wall sys-tem is disturbed by breaking the seal of the chest wall (for example, by apenetrating knife wound), the inward elastic recoil of the lung can no longer beopposed by the outward recoil of the chest wall, and their interdependence ceases.Lung volume decreases, and alveoli have a much greater tendency to collapse, espe-cially if air moves in through the wound until intrapleural pressure equalizes withatmospheric pressure and abolishes the transpulmonary pressure gradient. At thispoint nothing is tending to hold the alveoli open and their elastic recoil is causingthem to collapse. Similarly, the chest wall tends to expand because its outwardrecoil is no longer opposed by the inward recoil of the lung.
When the lung–chest wall system is intact and the respiratory muscles arerelaxed, the volume of gas left in the lungs is determined by the balance of thesetwo forces. The volume of gas in the lungs at the end of a normal tidal expiration,when no respiratory muscles are actively contracting, is known as the functionalresidual capacity (FRC). For any given situation, the FRC will be that lung volumeat which the outward recoil of the chest wall is equal to the inward recoil of thelungs. The relationship between lung elastic recoil and chest wall elastic recoil isillustrated in static (or “relaxation”) pressure-volume curves (Figure 2–14).
In the studies from which these data were taken, participants breathed air from aspirometer so that lung volumes could be measured. Intrapleural pressure was meas-ured with an esophageal balloon, and pressure was also measured at the person’s noseor mouth. The subjects were instructed to breathe air into or from the spirometer to
Figure 2–13. Representation of alveolar
interdependence helping to prevent an
alveolus from collapsing spontaneously.
30 / CHAPTER 2
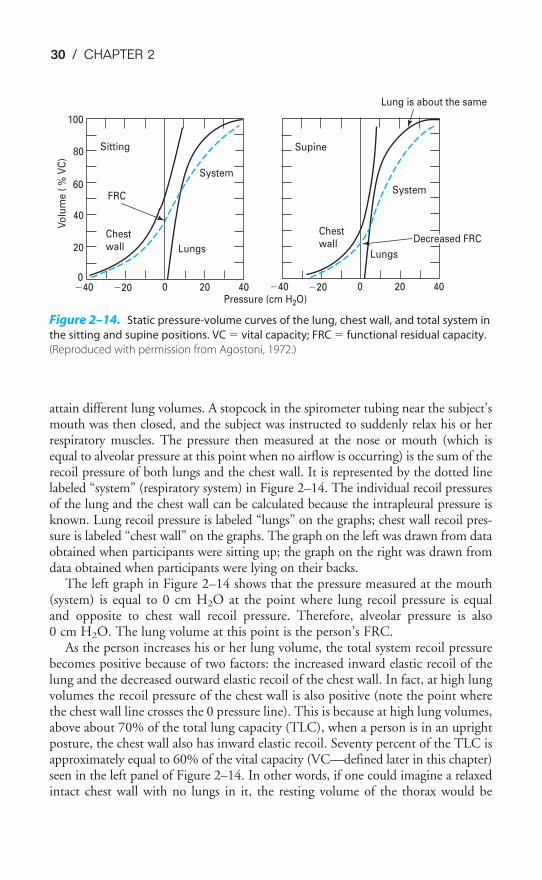
attain different lung volumes. A stopcock in the spirometer tubing near the subject’smouth was then closed, and the subject was instructed to suddenly relax his or herrespiratory muscles. The pressure then measured at the nose or mouth (which isequal to alveolar pressure at this point when no airflow is occurring) is the sum of therecoil pressure of both lungs and the chest wall. It is represented by the dotted linelabeled “system” (respiratory system) in Figure 2–14. The individual recoil pressuresof the lung and the chest wall can be calculated because the intrapleural pressure isknown. Lung recoil pressure is labeled “lungs” on the graphs; chest wall recoil pres-sure is labeled “chest wall” on the graphs. The graph on the left was drawn from dataobtained when participants were sitting up; the graph on the right was drawn fromdata obtained when participants were lying on their backs.
The left graph in Figure 2–14 shows that the pressure measured at the mouth(system) is equal to 0 cm H2O at the point where lung recoil pressure is equaland opposite to chest wall recoil pressure. Therefore, alveolar pressure is also0 cm H2O. The lung volume at this point is the person’s FRC.
As the person increases his or her lung volume, the total system recoil pressurebecomes positive because of two factors: the increased inward elastic recoil of thelung and the decreased outward elastic recoil of the chest wall. In fact, at high lungvolumes the recoil pressure of the chest wall is also positive (note the point wherethe chest wall line crosses the 0 pressure line). This is because at high lung volumes,above about 70% of the total lung capacity (TLC), when a person is in an uprightposture, the chest wall also has inward elastic recoil. Seventy percent of the TLC isapproximately equal to 60% of the vital capacity (VC—defined later in this chapter)seen in the left panel of Figure 2–14. In other words, if one could imagine a relaxedintact chest wall with no lungs in it, the resting volume of the thorax would be
Sitting
FRC
System
Chestwall Lungs
Vo
lum
e (
% V
C)
100
80
60
40
20
0�40 �20 0 20 40 �40 �20 0 20 40
Supine
Chestwall
System
Lungs
Lung is about the same
Decreased FRC
Pressure (cm H2O)
Figure 2–14. Static pressure-volume curves of the lung, chest wall, and total system in
the sitting and supine positions. VC � vital capacity; FRC � functional residual capacity.
(Reproduced with permission from Agostoni, 1972.)
MECHANICS OF BREATHING / 31
about 70% of the volume of the thorax when the lungs are maximally (voluntarily)expanded. At thoracic volumes below about 70% of the TLC, the chest wall elas-tic recoil is outward; at thoracic volumes above 70% of the TLC, the recoil isinward. Therefore, at high lung volumes the mouth pressure is highly positivebecause both lung and chest wall elastic recoil are inward.
At lung volumes below the FRC, the relaxation pressure measured at the mouthis negative because the outward recoil of the chest wall is greater than the reducedinward recoil of the lungs.
The point of this discussion can be seen in the right-hand graph of Figure 2–14,in which the data collected were from supine subjects. Although the elastic recoilcurve for the lung is relatively unchanged, the recoil curves for the chest wall andthe respiratory system are shifted to the right. The reason for this shift is the effectof gravity on the mechanics of the chest wall, especially the diaphragm. When aperson is standing up or sitting, the contents of the abdomen are being pulled awayfrom the diaphragm by gravity. When the same person lies down, the abdominalcontents are pushing inward against the relaxed diaphragm. This occurrencedecreases the overall outward recoil of the chest wall and displaces the chest wallelastic recoil curve to the right. Because the respiratory system curve is the sum ofthe lung and chest wall curves, it is also shifted to the right.
The lung volume at which the outward recoil of the chest wall is equal tothe inward recoil of the lung is much lower in the supine subject, as can be seen
Mean height = 1.68 m
3.5
3.0
2.5
2.0
1.5
Fu
nct
ion
al
resi
du
al
cap
aci
ty (
L [
BT
PS
])
30˚ 30˚ 60˚
Bars indicate � 1 standard deviation
Figure 2–15. Alterations of the functional residual capacity in different body positions.
(From Nunn’s Applied Respiratory Physiology, 4th edition by J.F. Nunn. Reprinted by permis-
sion of Elsevier Science Limited.)
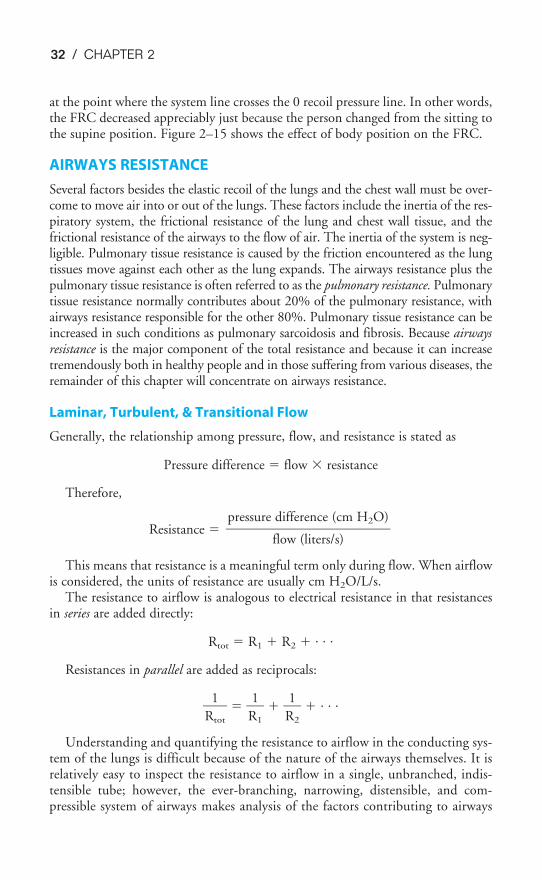
32 / CHAPTER 2
at the point where the system line crosses the 0 recoil pressure line. In other words,the FRC decreased appreciably just because the person changed from the sitting tothe supine position. Figure 2–15 shows the effect of body position on the FRC.
AIRWAYS RESISTANCE
Several factors besides the elastic recoil of the lungs and the chest wall must be over-come to move air into or out of the lungs. These factors include the inertia of the res-piratory system, the frictional resistance of the lung and chest wall tissue, and thefrictional resistance of the airways to the flow of air. The inertia of the system is neg-ligible. Pulmonary tissue resistance is caused by the friction encountered as the lungtissues move against each other as the lung expands. The airways resistance plus thepulmonary tissue resistance is often referred to as the pulmonary resistance. Pulmonarytissue resistance normally contributes about 20% of the pulmonary resistance, withairways resistance responsible for the other 80%. Pulmonary tissue resistance can beincreased in such conditions as pulmonary sarcoidosis and fibrosis. Because airwaysresistance is the major component of the total resistance and because it can increasetremendously both in healthy people and in those suffering from various diseases, theremainder of this chapter will concentrate on airways resistance.
Laminar, Turbulent, & Transitional Flow
Generally, the relationship among pressure, flow, and resistance is stated as
Pressure difference � flow � resistance
Therefore,
Resistance �
This means that resistance is a meaningful term only during flow. When airflowis considered, the units of resistance are usually cm H2O/L/s.
The resistance to airflow is analogous to electrical resistance in that resistancesin series are added directly:
Rtot � R1 � R2 � . . .
Resistances in parallel are added as reciprocals:
�R
1
tot
� � �R
1
1
� � �R
1
2
� � . . .
Understanding and quantifying the resistance to airflow in the conducting sys-tem of the lungs is difficult because of the nature of the airways themselves. It isrelatively easy to inspect the resistance to airflow in a single, unbranched, indis-tensible tube; however, the ever-branching, narrowing, distensible, and com-pressible system of airways makes analysis of the factors contributing to airways
pressure difference (cm H2O)���
flow (liters/s)
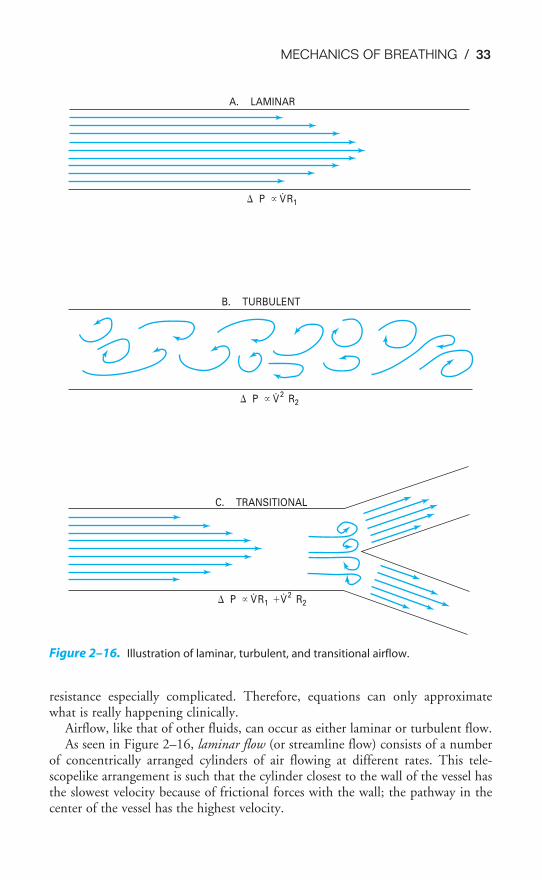
MECHANICS OF BREATHING / 33
resistance especially complicated. Therefore, equations can only approximatewhat is really happening clinically.
Airflow, like that of other fluids, can occur as either laminar or turbulent flow.As seen in Figure 2–16, laminar flow (or streamline flow) consists of a number
of concentrically arranged cylinders of air flowing at different rates. This tele-scopelike arrangement is such that the cylinder closest to the wall of the vessel hasthe slowest velocity because of frictional forces with the wall; the pathway in thecenter of the vessel has the highest velocity.
A. LAMINAR
P � V
R1
B. TURBULENT
P � V 2
R2
C. TRANSITIONAL
P � V
R1 �V 2
R2
Figure 2–16. Illustration of laminar, turbulent, and transitional airflow.
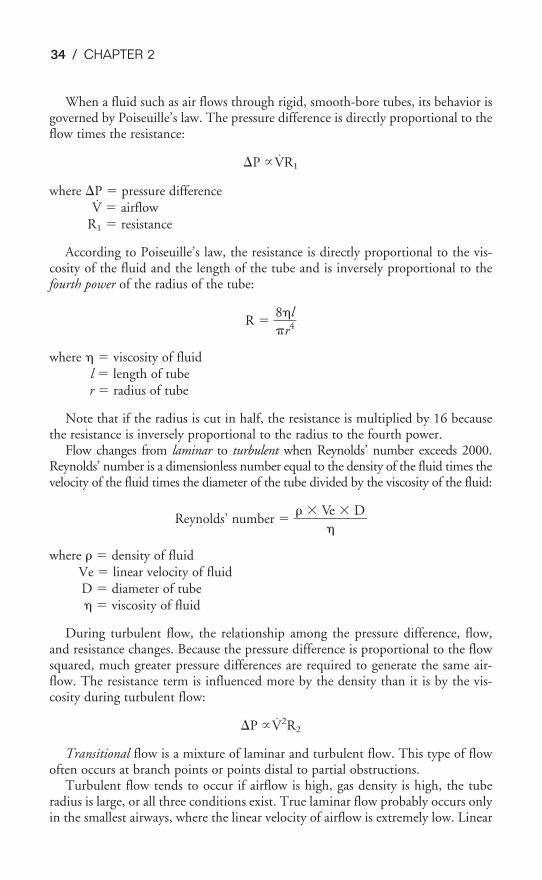
34 / CHAPTER 2
When a fluid such as air flows through rigid, smooth-bore tubes, its behavior isgoverned by Poiseuille’s law. The pressure difference is directly proportional to theflow times the resistance:
P �V̇R1
where P � pressure differenceV̇ � airflow
R1 � resistance
According to Poiseuille’s law, the resistance is directly proportional to the vis-cosity of the fluid and the length of the tube and is inversely proportional to thefourth power of the radius of the tube:
R � ��
8�
r4
l�
where � � viscosity of fluidl � length of tuber � radius of tube
Note that if the radius is cut in half, the resistance is multiplied by 16 becausethe resistance is inversely proportional to the radius to the fourth power.
Flow changes from laminar to turbulent when Reynolds’ number exceeds 2000.Reynolds’ number is a dimensionless number equal to the density of the fluid times thevelocity of the fluid times the diameter of the tube divided by the viscosity of the fluid:
Reynolds’ number � � � V
�
e � D�
where � density of fluidVe � linear velocity of fluidD � diameter of tube� � viscosity of fluid
During turbulent flow, the relationship among the pressure difference, flow,and resistance changes. Because the pressure difference is proportional to the flowsquared, much greater pressure differences are required to generate the same air-flow. The resistance term is influenced more by the density than it is by the vis-cosity during turbulent flow:
P �V̇2R2
Transitional flow is a mixture of laminar and turbulent flow. This type of flowoften occurs at branch points or points distal to partial obstructions.
Turbulent flow tends to occur if airflow is high, gas density is high, the tuberadius is large, or all three conditions exist. True laminar flow probably occurs onlyin the smallest airways, where the linear velocity of airflow is extremely low. Linear
MECHANICS OF BREATHING / 35
velocity (cm/s) is equal to the flow (cm3/s) divided by the cross-sectional area. Thetotal cross-sectional area of the smallest airways is very large (see Chapter 1), andso the linear velocity of airflow is very low. The airflow in the trachea and largerairways is usually either turbulent or transitional.
Distribution of Airways Resistance
About 25–40% of the total resistance to airflow is located in the upper airways: thenose, nasal turbinates, oropharynx, nasopharynx, and larynx. Resistance is higherwhen one breathes through the nose than when one breathes through the mouth.
The vocal cords open slightly during normal inspirations and close slightly dur-ing expirations. During deep inspirations, they open widely. The muscles of theoropharynx also contract during normal inspirations, which dilates and stabilizesthe upper airway. During deep forced inspirations, the development of negativepressure could cause the upper airway to be pulled inward and partly or com-pletely obstruct airflow. Reflex contraction of these pharyngeal dilator muscles nor-mally keeps the airway open (see Figure 2–25).
As for the tracheobronchial tree, the component with the highest individual resist-ance is obviously the smallest airway, which has the smallest radius. Nevertheless,because the smallest airways are arranged in parallel, their resistances add as recipro-cals, so that the total resistance to airflow offered by the numerous small airways isextremely low during normal, quiet breathing. Therefore, under normal circum-stances the greatest resistance to airflow resides in the medium-sized bronchi.
Control of Bronchial Smooth Muscle
The smooth muscle of the airways from the trachea down to the alveolar ducts isunder the control of efferent fibers of the autonomic nervous system. Stimulationof the cholinergic parasympathetic postganglionic fibers causes constriction ofbronchial smooth muscle as well as increased glandular mucus secretion. The pre-ganglionic fibers travel in the vagus. Stimulation of the adrenergic sympatheticfibers causes dilation of bronchial and bronchiolar smooth muscle as well as inhi-bition of glandular secretion. This dilation of the airways smooth muscle is medi-ated by beta2 (�2) receptors, which predominate in the airways. Selective stimulationof the alpha (�) receptors with pharmacologic agents causes bronchoconstriction.Adrenergic transmitters carried in the blood may be as important as those releasedfrom the sympathetic nerves in causing bronchodilation. The bronchial smoothmuscle is normally under greater parasympathetic than sympathetic tone.
Inhalation of chemical irritants, smoke, or dust; stimulation of the arterialchemoreceptors; and substances such as histamine cause reflex constriction of theairways. Decreased CO2 in the branches of the conducting system causes a localconstriction of the smooth muscle of the nearby airways; increased CO2 ordecreased O2 causes a local dilation. This may help balance ventilation and perfu-sion (see Chapter 5). Many other substances can have direct or indirect effects onairway smooth muscle (Table 2–2). Leukotrienes usually cause bronchoconstric-tion, as do some prostaglandins.
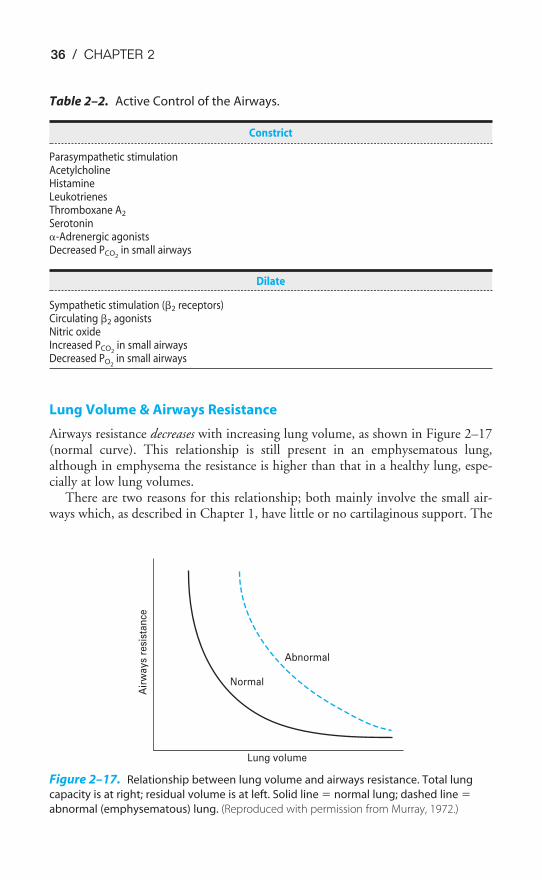
36 / CHAPTER 2
Lung Volume & Airways Resistance
Airways resistance decreases with increasing lung volume, as shown in Figure 2–17(normal curve). This relationship is still present in an emphysematous lung,although in emphysema the resistance is higher than that in a healthy lung, espe-cially at low lung volumes.
There are two reasons for this relationship; both mainly involve the small air-ways which, as described in Chapter 1, have little or no cartilaginous support. The
Table 2–2. Active Control of the Airways.
Constrict
Parasympathetic stimulationAcetylcholineHistamineLeukotrienesThromboxane A2
Serotonin�-Adrenergic agonistsDecreased PCO2
in small airways
Dilate
Sympathetic stimulation (�2 receptors)Circulating �2 agonistsNitric oxideIncreased PCO2
in small airwaysDecreased PO2
in small airways
Air
wa
ys
resi
sta
nce
Normal
Abnormal
Lung volume
Figure 2–17. Relationship between lung volume and airways resistance. Total lung
capacity is at right; residual volume is at left. Solid line � normal lung; dashed line �
abnormal (emphysematous) lung. (Reproduced with permission from Murray, 1972.)
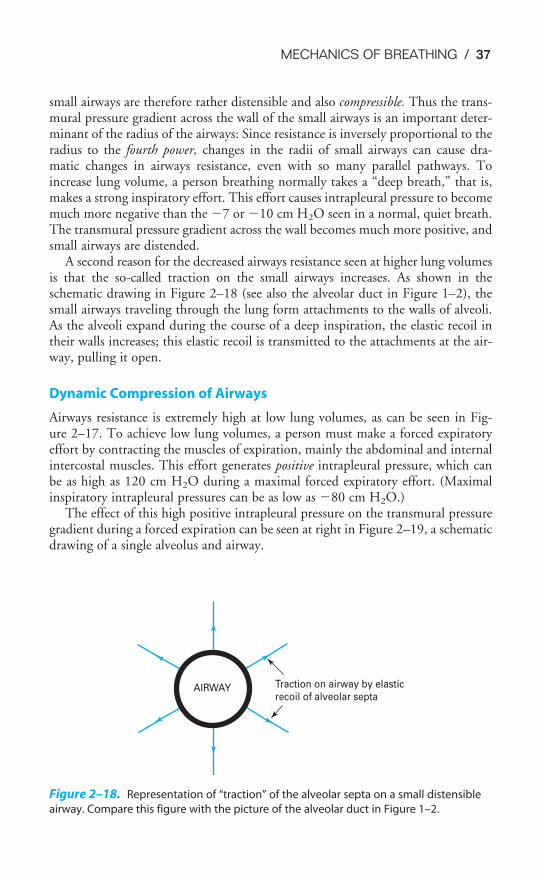
MECHANICS OF BREATHING / 37
small airways are therefore rather distensible and also compressible. Thus the trans-mural pressure gradient across the wall of the small airways is an important deter-minant of the radius of the airways: Since resistance is inversely proportional to theradius to the fourth power, changes in the radii of small airways can cause dra-matic changes in airways resistance, even with so many parallel pathways. Toincrease lung volume, a person breathing normally takes a “deep breath,” that is,makes a strong inspiratory effort. This effort causes intrapleural pressure to becomemuch more negative than the �7 or �10 cm H2O seen in a normal, quiet breath.The transmural pressure gradient across the wall becomes much more positive, andsmall airways are distended.
A second reason for the decreased airways resistance seen at higher lung volumesis that the so-called traction on the small airways increases. As shown in theschematic drawing in Figure 2–18 (see also the alveolar duct in Figure 1–2), thesmall airways traveling through the lung form attachments to the walls of alveoli.As the alveoli expand during the course of a deep inspiration, the elastic recoil intheir walls increases; this elastic recoil is transmitted to the attachments at the air-way, pulling it open.
Dynamic Compression of Airways
Airways resistance is extremely high at low lung volumes, as can be seen in Fig-ure 2–17. To achieve low lung volumes, a person must make a forced expiratoryeffort by contracting the muscles of expiration, mainly the abdominal and internalintercostal muscles. This effort generates positive intrapleural pressure, which canbe as high as 120 cm H2O during a maximal forced expiratory effort. (Maximalinspiratory intrapleural pressures can be as low as �80 cm H2O.)
The effect of this high positive intrapleural pressure on the transmural pressuregradient during a forced expiration can be seen at right in Figure 2–19, a schematicdrawing of a single alveolus and airway.
AIRWAY Traction on airway by elasticrecoil of alveolar septa
Figure 2–18. Representation of “traction” of the alveolar septa on a small distensible
airway. Compare this figure with the picture of the alveolar duct in Figure 1–2.
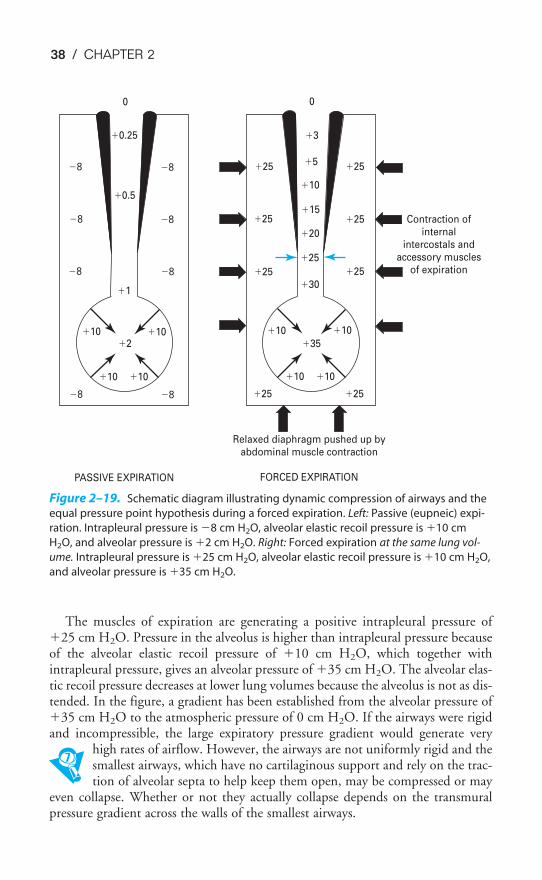
38 / CHAPTER 2
The muscles of expiration are generating a positive intrapleural pressure of�25 cm H2O. Pressure in the alveolus is higher than intrapleural pressure becauseof the alveolar elastic recoil pressure of �10 cm H2O, which together withintrapleural pressure, gives an alveolar pressure of �35 cm H2O. The alveolar elas-tic recoil pressure decreases at lower lung volumes because the alveolus is not as dis-tended. In the figure, a gradient has been established from the alveolar pressure of�35 cm H2O to the atmospheric pressure of 0 cm H2O. If the airways were rigidand incompressible, the large expiratory pressure gradient would generate very
high rates of airflow. However, the airways are not uniformly rigid and thesmallest airways, which have no cartilaginous support and rely on the trac-tion of alveolar septa to help keep them open, may be compressed or may
even collapse. Whether or not they actually collapse depends on the transmuralpressure gradient across the walls of the smallest airways.
�8
�8
�8
�8
�8
�8
0
�0.25
�0.5
�1
�2�10 �10
�10 �10
�8 �8
�25
�25
�25
�25
�25
�25
0
�3
�10
�30
�35
�10 �10
�10 �10
�25 �25
�5
�15
�20
�25
Contraction ofinternal
intercostals andaccessory muscles
of expiration
Relaxed diaphragm pushed up byabdominal muscle contraction
FORCED EXPIRATIONPASSIVE EXPIRATION
Figure 2–19. Schematic diagram illustrating dynamic compression of airways and the
equal pressure point hypothesis during a forced expiration. Left: Passive (eupneic) expi-
ration. Intrapleural pressure is �8 cm H2O, alveolar elastic recoil pressure is �10 cm
H2O, and alveolar pressure is �2 cm H2O. Right: Forced expiration at the same lung vol-
ume. Intrapleural pressure is �25 cm H2O, alveolar elastic recoil pressure is �10 cm H2O,
and alveolar pressure is �35 cm H2O.
MECHANICS OF BREATHING / 39
The situation during a normal passive expiration at the same lung volume (notethe same alveolar elastic recoil pressure) is shown in the left part of Figure 2–19.The transmural pressure gradient across the smallest airways is
�1 cm H2O � (�8)cm H2O � �9 cm H2O
tending to hold the airway open. During the forced expiration at right, the trans-mural pressure gradient is 30 cm H2O � 25 cm H2O, or only 5 cm H2O holdingthe airway open. The airway may then be slightly compressed, and its resistance toairflow will be even greater than during the passive expiration. This increasedresistance during a forced expiration is called dynamic compression of airways.
Consider what must occur during a maximal forced expiration. As the expira-tory effort is increased to attain a lower and lower lung volume, intrapleural pres-sure is getting more and more positive, and more and more dynamic compressionwill occur. Furthermore, as lung volume decreases, there will be less alveolar elas-tic recoil pressure and the difference between alveolar pressure and intrapleuralpressure will decrease.
One way of looking at this process is the equal pressure point hypothesis. (Anotherexplanation of flow limitation during forced expiration, the wave speed flow-limitingmechanism, is too complex to discuss here.) At any instant during a forced expiration,there is a point along the airways where the pressure inside the airway is just equal tothe pressure outside the airway. At that point the transmural pressure gradient is 0(note the arrows in Figure 2–19). Above that point, the transmural pressure gradientis negative: The pressure outside the airway is greater than the pressure inside it, andthe airway will collapse if cartilaginous support or alveolar septal traction is insuffi-cient to keep it open.
As the forced expiratory effort continues, the equal pressure point is likely tomove down the airway from larger to smaller airways. This movement happensbecause, as the muscular effort increases, intrapleural pressure increases and because,as lung volume decreases, alveolar elastic recoil pressure decreases. As the equal pres-sure point moves down the airway, dynamic compression increases and the airwaysultimately begin to collapse. This airways closure can be demonstrated only at espe-cially low lung volumes in healthy subjects, but the closing volume may occur athigher lung volumes in patients with emphysema, which will be discussed at the endof this chapter. The closing volume test itself will be discussed in Chapter 3.
It is important to consider the pressure gradient for airflow when thinking abouta forced expiration. During a passive expiration the pressure gradient for airflow(the P in P �V̇R) is simply alveolar pressure minus atmospheric pressure. Butif dynamic compression occurs, the effective pressure gradient is alveolar pressureminus intrapleural pressure (which equals the alveolar elastic recoil pressure) becauseintrapleural pressure is higher than atmospheric pressure and becauseintrapleural pressure can exert its effects on the compressible portion of the airways.
Thus, during a forced expiration, when intrapleural pressure becomes positiveand dynamic compression occurs, the effective driving pressure for airflow fromthe lung is the alveolar elastic recoil pressure. Alveolar elastic recoil is also impor-tant in opposing dynamic compression of the airways because of its role in the
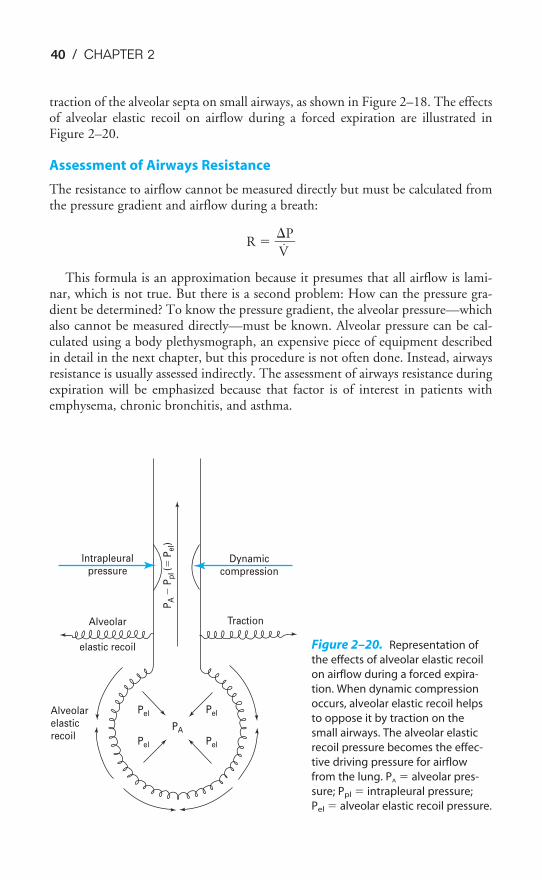
40 / CHAPTER 2
traction of the alveolar septa on small airways, as shown in Figure 2–18. The effectsof alveolar elastic recoil on airflow during a forced expiration are illustrated inFigure 2–20.
Assessment of Airways Resistance
The resistance to airflow cannot be measured directly but must be calculated fromthe pressure gradient and airflow during a breath:
R � �
V̇
P�
This formula is an approximation because it presumes that all airflow is lami-nar, which is not true. But there is a second problem: How can the pressure gra-dient be determined? To know the pressure gradient, the alveolar pressure—whichalso cannot be measured directly—must be known. Alveolar pressure can be cal-culated using a body plethysmograph, an expensive piece of equipment describedin detail in the next chapter, but this procedure is not often done. Instead, airwaysresistance is usually assessed indirectly. The assessment of airways resistance duringexpiration will be emphasized because that factor is of interest in patients withemphysema, chronic bronchitis, and asthma.
Traction
Dynamiccompression
Intrapleuralpressure
Alveolar
elastic recoil
Alveolarelasticrecoil
Pel Pel
Pel Pel
PA
PA
� P
pl(�
Pe
l)
Figure 2–20. Representation of
the effects of alveolar elastic recoil
on airflow during a forced expira-
tion. When dynamic compression
occurs, alveolar elastic recoil helps
to oppose it by traction on the
small airways. The alveolar elastic
recoil pressure becomes the effec-
tive driving pressure for airflow
from the lung. PA � alveolar pres-
sure; Ppl � intrapleural pressure;
Pel � alveolar elastic recoil pressure.
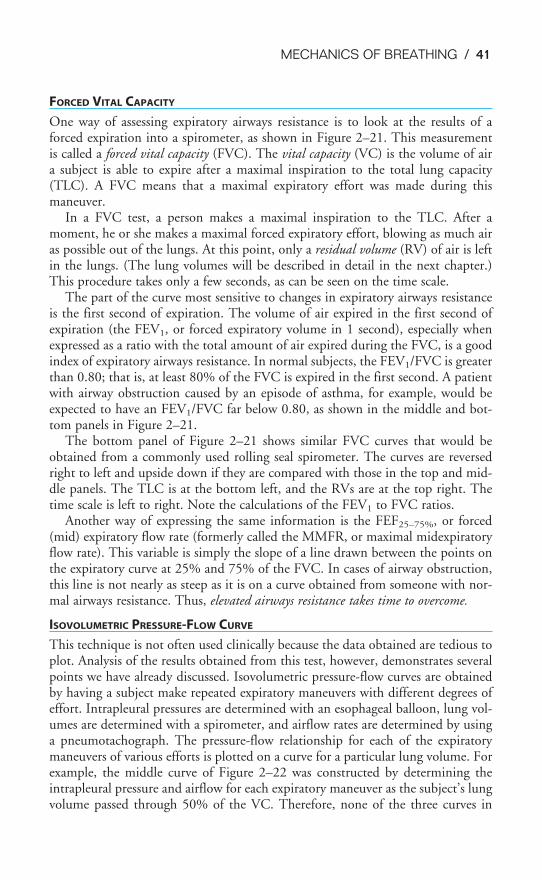
MECHANICS OF BREATHING / 41
FORCED VITAL CAPACITY
One way of assessing expiratory airways resistance is to look at the results of aforced expiration into a spirometer, as shown in Figure 2–21. This measurementis called a forced vital capacity (FVC). The vital capacity (VC) is the volume of aira subject is able to expire after a maximal inspiration to the total lung capacity(TLC). A FVC means that a maximal expiratory effort was made during thismaneuver.
In a FVC test, a person makes a maximal inspiration to the TLC. After amoment, he or she makes a maximal forced expiratory effort, blowing as much airas possible out of the lungs. At this point, only a residual volume (RV) of air is leftin the lungs. (The lung volumes will be described in detail in the next chapter.)This procedure takes only a few seconds, as can be seen on the time scale.
The part of the curve most sensitive to changes in expiratory airways resistanceis the first second of expiration. The volume of air expired in the first second ofexpiration (the FEV1, or forced expiratory volume in 1 second), especially whenexpressed as a ratio with the total amount of air expired during the FVC, is a goodindex of expiratory airways resistance. In normal subjects, the FEV1/FVC is greaterthan 0.80; that is, at least 80% of the FVC is expired in the first second. A patientwith airway obstruction caused by an episode of asthma, for example, would beexpected to have an FEV1/FVC far below 0.80, as shown in the middle and bot-tom panels in Figure 2–21.
The bottom panel of Figure 2–21 shows similar FVC curves that would beobtained from a commonly used rolling seal spirometer. The curves are reversedright to left and upside down if they are compared with those in the top and mid-dle panels. The TLC is at the bottom left, and the RVs are at the top right. Thetime scale is left to right. Note the calculations of the FEV1 to FVC ratios.
Another way of expressing the same information is the FEF25–75%, or forced(mid) expiratory flow rate (formerly called the MMFR, or maximal midexpiratoryflow rate). This variable is simply the slope of a line drawn between the points onthe expiratory curve at 25% and 75% of the FVC. In cases of airway obstruction,this line is not nearly as steep as it is on a curve obtained from someone with nor-mal airways resistance. Thus, elevated airways resistance takes time to overcome.
ISOVOLUMETRIC PRESSURE-FLOW CURVE
This technique is not often used clinically because the data obtained are tedious toplot. Analysis of the results obtained from this test, however, demonstrates severalpoints we have already discussed. Isovolumetric pressure-flow curves are obtainedby having a subject make repeated expiratory maneuvers with different degrees ofeffort. Intrapleural pressures are determined with an esophageal balloon, lung vol-umes are determined with a spirometer, and airflow rates are determined by usinga pneumotachograph. The pressure-flow relationship for each of the expiratorymaneuvers of various efforts is plotted on a curve for a particular lung volume. Forexample, the middle curve of Figure 2–22 was constructed by determining theintrapleural pressure and airflow for each expiratory maneuver as the subject’s lungvolume passed through 50% of the VC. Therefore, none of the three curves in
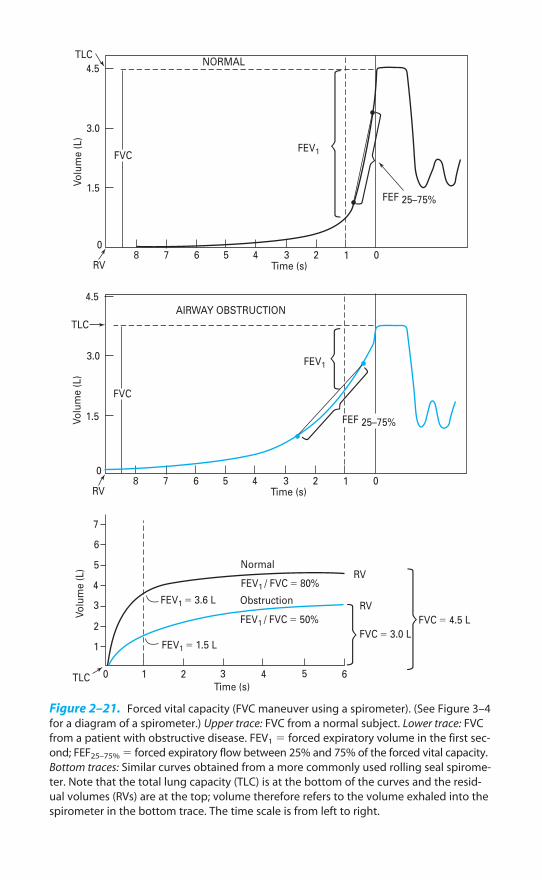
TLC
4.5
3.0
1.5
0
Vo
lum
e (
L)
8 7 6 5 4 3 2 1 0Time (s)
FEF 25–75%
FEV1FVC
RV
NORMAL
TLC
4.5
3.0
1.5
0
Vo
lum
e (
L)
8 7 6 5 4 3 2 1 0Time (s)
FEF 25–75%
FEV1
FVC
RV
AIRWAY OBSTRUCTION
Vo
lum
e (
L)
7
6
5
4
3
2
1
0 1 2 3 4 5 6
Time (s)TLC
FEV1 � 3.6 L
FEV1 � 1.5 L
Normal
FEV1 / FVC � 80%
FEV1 / FVC � 50%
Obstruction
FVC � 3.0 L
RV
RV
FVC � 4.5 L
Figure 2–21. Forced vital capacity (FVC maneuver using a spirometer). (See Figure 3–4
for a diagram of a spirometer.) Upper trace: FVC from a normal subject. Lower trace: FVC
from a patient with obstructive disease. FEV1 � forced expiratory volume in the first sec-
ond; FEF25–75% � forced expiratory flow between 25% and 75% of the forced vital capacity.
Bottom traces: Similar curves obtained from a more commonly used rolling seal spirome-
ter. Note that the total lung capacity (TLC) is at the bottom of the curves and the resid-
ual volumes (RVs) are at the top; volume therefore refers to the volume exhaled into the
spirometer in the bottom trace. The time scale is from left to right.
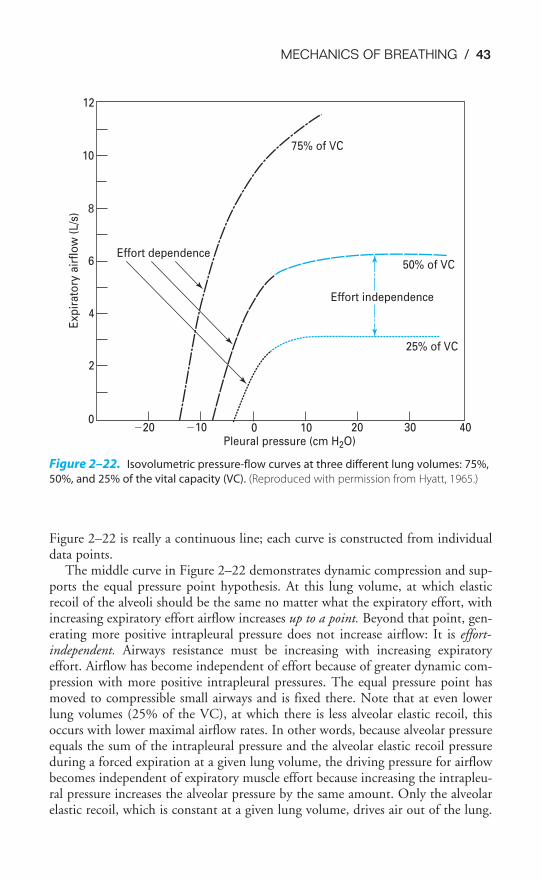
MECHANICS OF BREATHING / 43
Figure 2–22 is really a continuous line; each curve is constructed from individualdata points.
The middle curve in Figure 2–22 demonstrates dynamic compression and sup-ports the equal pressure point hypothesis. At this lung volume, at which elasticrecoil of the alveoli should be the same no matter what the expiratory effort, withincreasing expiratory effort airflow increases up to a point. Beyond that point, gen-erating more positive intrapleural pressure does not increase airflow: It is effort-independent. Airways resistance must be increasing with increasing expiratoryeffort. Airflow has become independent of effort because of greater dynamic com-pression with more positive intrapleural pressures. The equal pressure point hasmoved to compressible small airways and is fixed there. Note that at even lowerlung volumes (25% of the VC), at which there is less alveolar elastic recoil, thisoccurs with lower maximal airflow rates. In other words, because alveolar pressureequals the sum of the intrapleural pressure and the alveolar elastic recoil pressureduring a forced expiration at a given lung volume, the driving pressure for airflowbecomes independent of expiratory muscle effort because increasing the intrapleu-ral pressure increases the alveolar pressure by the same amount. Only the alveolarelastic recoil, which is constant at a given lung volume, drives air out of the lung.
50% of VC
Effort independence
25% of VC
75% of VC
Effort dependence
10
12
8
6
4
2
0�20 �10 0 10 20 30 40
Pleural pressure (cm H2O)
Exp
irato
ry a
irfl
ow
(L/s
)
Figure 2–22. Isovolumetric pressure-flow curves at three different lung volumes: 75%,
50%, and 25% of the vital capacity (VC). (Reproduced with permission from Hyatt, 1965.)
44 / CHAPTER 2
At high lung volumes (75% of VC), airflow increases steadily with increasingeffort. It is entirely effort-dependent because alveolar elastic recoil pressure is high(which increases both the alveolar septal traction on small airways and the pressuregradient for airflow) and because highly positive intrapleural pressures cannot beattained at such high lung volumes with the airway wide open.
FLOW-VOLUME CURVES
These same principles are demonstrated in the expiratory portion of flow-volumecurves (Figure 2–23).
A family of flow-volume curves such as those depicted in Figure 2–23 isobtained in the same way as were the data in Figure 2–22, only in this case flowrates are plotted against lung volume for expiratory efforts of different intensities.Intrapleural pressures are not necessary. Because such curves can be plotted instan-taneously if one has an X–Y plotter, this test is often used clinically. There are twointeresting points about this family of curves, which corresponds to the threecurves in Figure 2–22. At high lung volumes, the airflow rate is effort-dependent,which can be seen in the left-hand portion of the curves. At low lung volumes,however, the expiratory efforts of different initial intensities all merge into the sameeffort-independent curve, as seen in the right-hand portion of the curve. Again,this difference is because intrapleural pressures high enough to cause dynamic com-pression are necessary to attain very low lung volumes, no matter what the initialexpiratory effort. Also, at low lung volumes there is less alveolar elastic recoil pres-sure, and so there is less traction on the same airways and a smaller pressure gradi-ent for airflow.
The maximal flow-volume curve is often used as a diagnostic tool, as shown inFigure 2–24, because it helps distinguish between two major classes of pulmonarydiseases—airway obstructive diseases and restrictive diseases, such as fibrosis.Obstructive diseases are those diseases that interfere with airflow; restrictive dis-eases are those diseases that restrict the expansion of the lung (see the pulmonaryfunction test decision tree in the Appendix).
Figure 2–24 shows that both obstruction and restriction can cause a decrease inthe maximal flow rate that the patient can attain, the peak expiratory flow (PEF;shown in Figure 2–23), but that this decrease occurs for different reasons.Restrictive diseases, which usually entail elevated alveolar elastic recoil, may havedecreased PEF because the TLC (and thus the VC) is decreased. The effort-independent part of the curve is similar to that obtained from a person withnormal lungs. In fact, the FEV1/FVC is usually normal or even above normal sinceboth the FEV1 and FVC are decreased because the lung has a low volume andbecause alveolar elastic recoil pressure may be increased. On the other hand, inpatients with obstructive diseases, the PEF and FEV1/FVC are both low.
Obstructive diseases—such as asthma, bronchitis, and emphysema—are oftenassociated with high lung volumes, which is helpful because the high volumesincrease the alveolar elastic recoil pressure. The RV may be greatly increasedif airway closure occurs at relatively high lung volumes. A second importantfeature of the flow-volume curve of a patient with obstructive disease is the
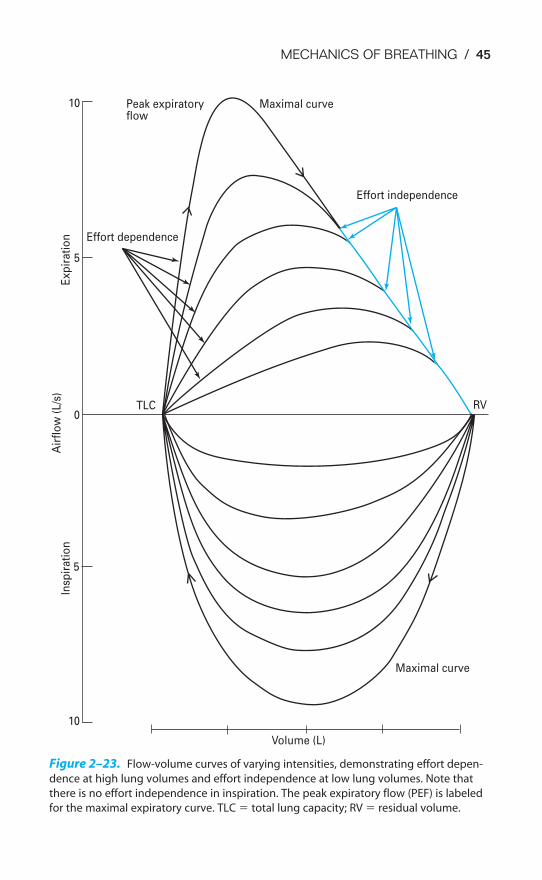
MECHANICS OF BREATHING / 45
10
5
Insp
irati
on
0
Air
flo
w (
L/s
)
5
Exp
irati
on
10 Peak expiratoryflow
Effort dependence
Maximal curve
Effort independence
RVTLC
Maximal curve
Volume (L)
Figure 2–23. Flow-volume curves of varying intensities, demonstrating effort depen-
dence at high lung volumes and effort independence at low lung volumes. Note that
there is no effort independence in inspiration. The peak expiratory flow (PEF) is labeled
for the maximal expiratory curve. TLC � total lung capacity; RV � residual volume.
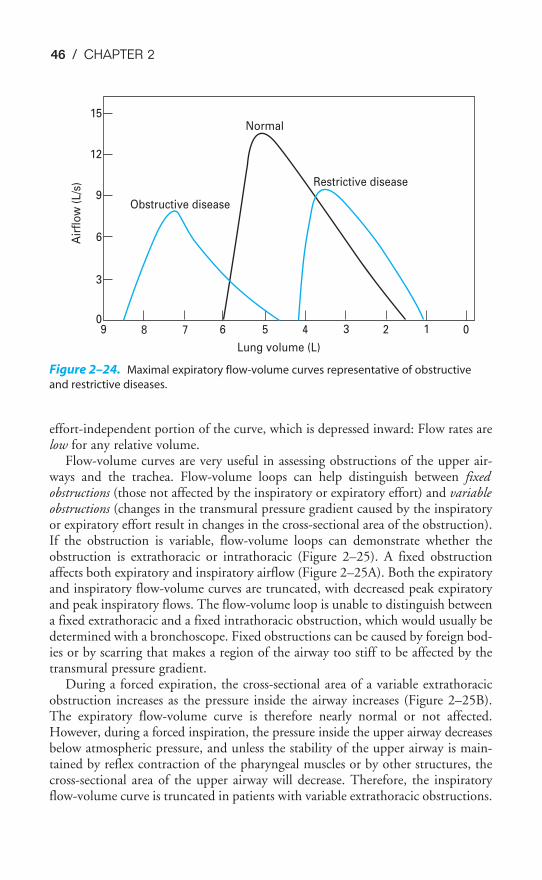
46 / CHAPTER 2
effort-independent portion of the curve, which is depressed inward: Flow rates arelow for any relative volume.
Flow-volume curves are very useful in assessing obstructions of the upper air-ways and the trachea. Flow-volume loops can help distinguish between fixedobstructions (those not affected by the inspiratory or expiratory effort) and variableobstructions (changes in the transmural pressure gradient caused by the inspiratoryor expiratory effort result in changes in the cross-sectional area of the obstruction).If the obstruction is variable, flow-volume loops can demonstrate whether theobstruction is extrathoracic or intrathoracic (Figure 2–25). A fixed obstructionaffects both expiratory and inspiratory airflow (Figure 2–25A). Both the expiratoryand inspiratory flow-volume curves are truncated, with decreased peak expiratoryand peak inspiratory flows. The flow-volume loop is unable to distinguish betweena fixed extrathoracic and a fixed intrathoracic obstruction, which would usually bedetermined with a bronchoscope. Fixed obstructions can be caused by foreign bod-ies or by scarring that makes a region of the airway too stiff to be affected by thetransmural pressure gradient.
During a forced expiration, the cross-sectional area of a variable extrathoracicobstruction increases as the pressure inside the airway increases (Figure 2–25B).The expiratory flow-volume curve is therefore nearly normal or not affected.However, during a forced inspiration, the pressure inside the upper airway decreasesbelow atmospheric pressure, and unless the stability of the upper airway is main-tained by reflex contraction of the pharyngeal muscles or by other structures, thecross-sectional area of the upper airway will decrease. Therefore, the inspiratoryflow-volume curve is truncated in patients with variable extrathoracic obstructions.
15
12
9
6
3
09 8 7 6 5 4 3 2 1 0
Lung volume (L)
Air
flo
w (
L/s
)
Obstructive disease
Normal
Restrictive disease
Figure 2–24. Maximal expiratory flow-volume curves representative of obstructive
and restrictive diseases.
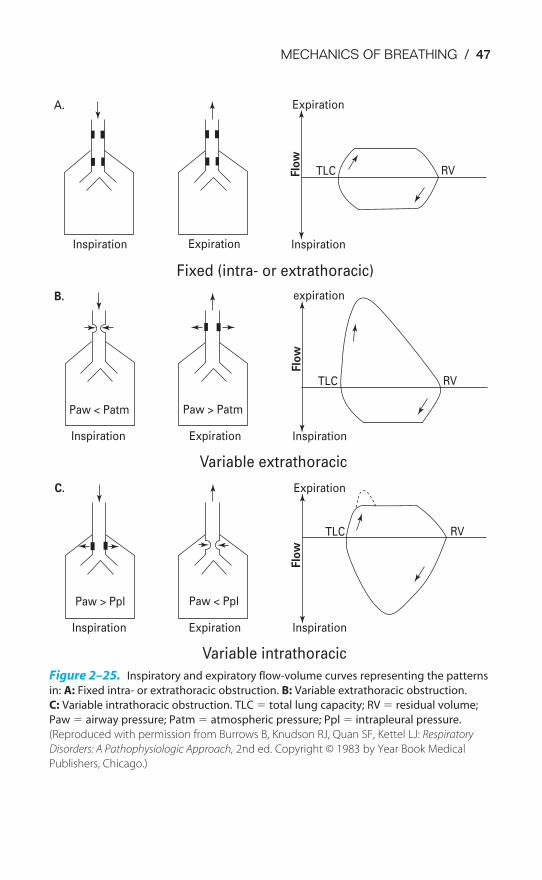
MECHANICS OF BREATHING / 47
A.
Inspiration Expiration
Fixed (intra- or extrathoracic)
Inspiration
TLC RVFlo
wB.
Flo
w
Inspiration
TLC RV
TLC RV
Flo
w
Inspiration
Expiration
expiration
Expiration
Inspiration Expiration
Paw > Ppl Paw < Ppl
C.
Inspiration
Paw < Patm Paw > Patm
Expiration
Variable extrathoracic
Variable intrathoracic
Figure 2–25. Inspiratory and expiratory flow-volume curves representing the patterns
in: A: Fixed intra- or extrathoracic obstruction. B: Variable extrathoracic obstruction.
C: Variable intrathoracic obstruction. TLC � total lung capacity; RV � residual volume;
Paw � airway pressure; Patm � atmospheric pressure; Ppl � intrapleural pressure.
(Reproduced with permission from Burrows B, Knudson RJ, Quan SF, Kettel LJ: Respiratory
Disorders: A Pathophysiologic Approach, 2nd ed. Copyright © 1983 by Year Book Medical
Publishers, Chicago.)
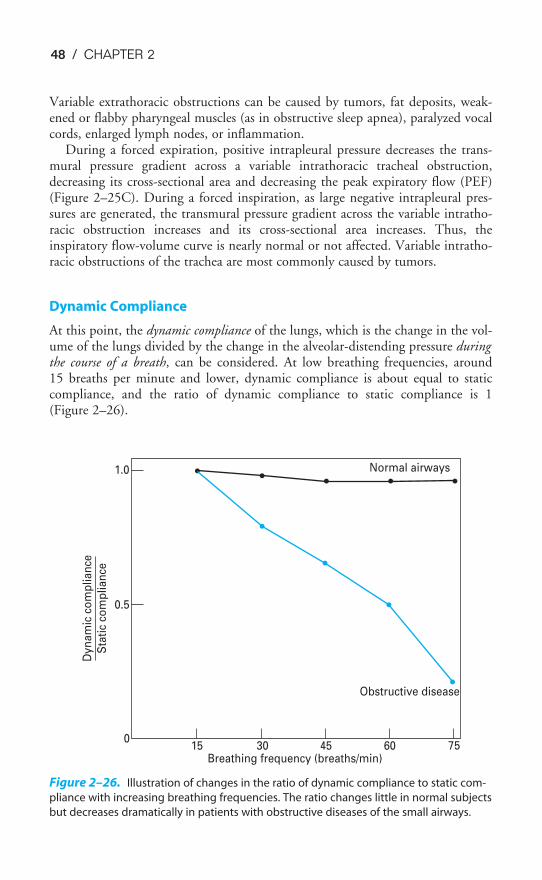
48 / CHAPTER 2
Variable extrathoracic obstructions can be caused by tumors, fat deposits, weak-ened or flabby pharyngeal muscles (as in obstructive sleep apnea), paralyzed vocalcords, enlarged lymph nodes, or inflammation.
During a forced expiration, positive intrapleural pressure decreases the trans-mural pressure gradient across a variable intrathoracic tracheal obstruction,decreasing its cross-sectional area and decreasing the peak expiratory flow (PEF)(Figure 2–25C). During a forced inspiration, as large negative intrapleural pres-sures are generated, the transmural pressure gradient across the variable intratho-racic obstruction increases and its cross-sectional area increases. Thus, theinspiratory flow-volume curve is nearly normal or not affected. Variable intratho-racic obstructions of the trachea are most commonly caused by tumors.
Dynamic Compliance
At this point, the dynamic compliance of the lungs, which is the change in the vol-ume of the lungs divided by the change in the alveolar-distending pressure duringthe course of a breath, can be considered. At low breathing frequencies, around15 breaths per minute and lower, dynamic compliance is about equal to staticcompliance, and the ratio of dynamic compliance to static compliance is 1 (Figure 2–26).
Obstructive disease
Breathing frequency (breaths/min) 7560453015
0
0.5
1.0
Dyn
am
ic c
om
plian
ce
Sta
tic
com
plian
ce
Normal airways
Figure 2–26. Illustration of changes in the ratio of dynamic compliance to static com-
pliance with increasing breathing frequencies. The ratio changes little in normal subjects
but decreases dramatically in patients with obstructive diseases of the small airways.
MECHANICS OF BREATHING / 49
In normal persons, this ratio stays near 1 even at much higher breathing fre-quencies. However, in patients with elevated resistance to airflow in some of theirsmall airways, the ratio of dynamic compliance to static compliance falls dramati-cally as breathing frequency is increased. This indicates that changes in dynamiccompliance reflect changes in airways resistance as well as changes in the compli-ance of alveoli.
The effects of increased breathing frequency on dynamic compliance can beexplained by thinking of a pair of hypothetical alveoli supplied by the same airway.Consider the time courses of their changes in volume in response to an abruptincrease in airway pressure (a “step” increase) in a situation in which the compli-ance of each alveolus or the resistance in the branch of the airway supplying it canbe arbitrarily altered.
If the resistances and compliances of the two units were equal, the two alveoliwould fill with identical time courses. If the resistances were equal, but the com-pliance of one were half that of the other, then it would be expected that the alve-oli would fill with nearly identical time courses but that the less compliant onewould receive only half the volume received by the other. If the compliances of thetwo units were equal but one was supplied by an airway with twice the resistanceto airflow of the one supplying the other, then it would be expected that the twounits would ultimately fill to the same volume. However, the one supplied by theairway with elevated resistance fills more slowly than the other because of its ele-vated resistance. This difference means that at high breathing frequencies the onethat fills more quickly than the other will accommodate a larger volume of air perbreath.
This situation may also lead to a redistribution of alveolar air after the inflatingpressure has ceased because one alveolus has more air in it than the other. But bothhave equal compliance characteristics. The more distended one therefore has ahigher elastic recoil pressure, and because they are joined by a common airway,some air is likely to follow the pressure gradient and move to the other.
Now let’s extrapolate this two-unit situation to a lung with millions of airwayssupplying millions of alveoli. In a patient with small-airways disease, many alveolimay be supplied by airways with higher resistance to airflow than normal. Thesealveoli are sometimes referred to as “slow alveoli” or alveoli with long “time con-stants.” As the patient increases the breathing frequency, the slowest alveoli will nothave enough time to fill and will contribute nothing to the dynamic compliance.As the frequency increases, more and more slow alveoli will drop out and dynamiccompliance will continue to fall.
THE WORK OF BREATHING
The major points discussed in this chapter can be summarized by considering thework of breathing. The work done in breathing is proportional to the pressurechange times the volume change. The volume change is the volume of air moved
into and out of the lung—the tidal volume. The pressure change is thechange in transpulmonary pressure necessary to overcome the elastic workof breathing and the resistive work of breathing.
50 / CHAPTER 2
Elastic Work
The elastic work of breathing is the work done to overcome the elastic recoil of thechest wall and the pulmonary parenchyma and the work done to overcome the sur-face tension of the alveoli. Restrictive diseases are those diseases in which the elas-tic work of breathing is increased. For example, the work of breathing is elevatedin obese patients (who have increased inward chest wall elastic recoil) and inpatients with pulmonary fibrosis or a relative lack of pulmonary surfactant (whohave increased elastic recoil of the alveoli).
Resistive Work
The resistive work of breathing is the work done to overcome the tissue resistanceand the airways resistance. The tissue resistance may be elevated in conditions suchas sarcoidosis. Elevated airways resistance is much more common and is seen inobstructive diseases such as asthma, bronchitis, and emphysema; upper airwayobstruction; and accidental aspirations of foreign objects. Normally, most of theresistive work is that done to overcome airways resistance.
The resistive work of breathing can be extremely great during a forced expira-tion, when dynamic compression occurs. This is especially true in patients whoalready have elevated airways resistance during normal, quiet breathing. For exam-ple, in patients with emphysema, a disease that attacks and obliterates alveolarwalls, the work of breathing can be tremendous because of the destruction of theelastic tissue support of their small airways, which allows dynamic compression tooccur unopposed. Also, the decreased elastic recoil of alveoli leads to a decreasedpressure gradient for expiration.
The oxygen cost of normal, quiet (eupneic) breathing is normally less than 5%of the total body oxygen uptake. This percentage can increase to as much as 30%in normal persons during maximal exercise. In patients with obstructive lung dis-ease, however, the work of breathing can be the factor that limits exercise.
KEY CONCEPTS
A pressure gradient between the atmosphere and the alveoli must be established to
move air into or out of the alveoli.
During inspiration, alveoli expand passively in response to an increased transmural
pressure gradient; during normal quiet expiration, the elastic recoil of the alveoli
returns them to their original volume.
The volume of gas in the lungs at the end of a normal tidal expiration (the FRC),
when no respiratory muscles are actively contracting, is determined by the balance
point of the inward recoil of the lungs and the outward recoil of the chest wall.
MECHANICS OF BREATHING / 51
2–1. A woman inspires 500 mL from a spirometer. The intrapleural pressure, determined using
an esophageal balloon, was �5 cm H2O before the inspiratory effort and �10 cm H2O at
the end of the inspiration. What is the pulmonary compliance?
2–2. A postoperative patient whose respiratory muscles have been paralyzed with pancuro-
nium bromide, a curare-like drug, is maintained by a positive-pressure respirator. At end
expiration (when alveolar pressure equals 0), intrapleural pressure, as measured by an
esophageal balloon, is equal to �3 cm H2O. At the peak of inspiration, alveolar pressure
is �20 cm H2O and intrapleural pressure is �10 cm H2O. Tidal volume is 500 mL.
a. What is the patient’s pulmonary compliance?
b. What is the patient’s total compliance?
c. What is the patient’s chest wall compliance?
2–3. Which of the following conditions are reasonable explanations for a patient’s decreased
static pulmonary compliance (the pressure-volume curve for the lungs shifted to the
right)?
a. Decreased functional pulmonary surfactant
b. Fibrosis of the lungs
c. Surgical removal of one lobe
d. Pulmonary vascular congestion
e. All of the above
2–4. Which of the following tend to increase airways resistance?
a. Stimulation of the parasympathetic postganglionic fibers innervating the bronchial
and bronchiolar smooth muscle
b. Low lung volumes
c. Forced expirations
d. Breathing through the nose instead of the mouth
e. All of the above
At the FRC, intrapleural pressure is negative because the pleural liquid is between
the opposing forces of the inward recoil of the lungs and the outward recoil of the
chest wall.
Alveoli are more compliant (and have less elastic recoil) at low volumes; alveoli are
less compliant (and have more elastic recoil) at high volumes.
Pulmonary surfactant increases alveolar compliance and helps prevent atelectasis
by reducing surface tension in the alveoli.
During forced expiration, when intrapleural pressure becomes positive, small air-
ways are compressed (dynamic compression) and may even collapse.
The two main components of the work of breathing are the elastic recoil of the
lungs and chest wall and the resistance to air flow.
CLINICAL PROBLEMS
52 / CHAPTER 2
2–5. Which of the following statements concerning alveolar pressure is/are correct?
a. Alveolar pressure is lower than atmospheric pressure during a normal negative-pres-
sure inspiration.
b. Alveolar pressure is greater than atmospheric pressure during a forced expiration.
c. Alveolar pressure equals the sum of the intrapleural pressure plus the alveolar elastic
recoil pressure.
d. Alveolar pressure equals atmospheric pressure at the end of a normal tidal expiration.
e. All of the above.
2–6. Which of the following statements concerning small airways is/are true?
a. The total resistance to airflow decreases with successive generations of airways
because there are increasing numbers of units arranged in parallel.
b. The linear velocity of airflow decreases as the airways decrease in size because their
total cross-sectional area increases.
c. Alveolar elastic recoil plays an important role in determining the resistance to
airflow in small airways because alveolar septal traction helps to oppose dynamic
compression.
d. Airflow in small airways is usually laminar.
e. All of the above.
2–7. Which of the following statements concerning pulmonary mechanics during the early
portion of a forced expiration, when lung volume is still high, is/are correct?
a. There is less alveolar elastic recoil at high lung volumes than there is at low lung
volumes.
b. Airways resistance is greater at high lung volumes than it is at low lung volumes.
c. There is more dynamic compression of airways at high lung volumes than there is at
low lung volumes.
d. The effective pressure gradient for airflow is greater at high lung volumes than it is at
low lung volumes.
SUGGESTED READINGS
Agostoni E. Mechanics of the pleural space. Physiol Rev. 1972;52:57–128.
Agostoni E, Hyatt RE. Static behavior of the respiratory system. In: Macklem PT, Mead J, eds. Mechanicsof Breathing, part 1, Handbook of Physiology, sec 3: The Respiratory System. Bethesda, Md: AmericanPhysiological Society; 1986;3:113–130.
Boggs DS, Kinasewitz GT. Review: pathophysiology of the pleural space. Am J Med Sci. 1995;309:53–59.
Burrows B, Knudson RJ, Quan SF, Kettel LJ. Respiratory Disorders: A Pathophysiologic Approach. 2nd ed.Chicago, Ill: Year Book; 1983:78–93.
Carney D, DiRocco J, Nieman G. Dynamic alveolar mechanics and ventilator-induced lung injury. CritCare Med. 2005;33[Suppl]:S122–S128.
Clements JA, Tierney DF. Alveolar instability associated with altered surface tension. In: Fenn WO, RahnH, eds. Handbook of Physiology, sec 3: Respiration. Washington, DC: American Physiological Society;1965;2:1567–1568.
Comroe JH. Physiology of Respiration. 2nd ed. Chicago: Year Book; 1974:94–141.
Decramer M. The respiratory muscles. In: Fishman AP et al, eds. Pulmonary Diseases and Disorders, 3rd ed.New York: McGraw-Hill; 1998:63–71.
MECHANICS OF BREATHING / 53
De Troyer A, Kirkwood PA, Wilson TA. Respiratory action of the intercostal muscles. Physiol Rev.2005;85:717–756.
Dorrington KL, Young JD. Development of a concept of a liquid pulmonary alveolar lining layer (editorial).Brit J Anaesth. 2001;86:614–617.
Griese M. Pulmonary surfactant in health and human lung diseases: state of the art. Eur Respir J.1999;13:1455–1476.
Hyatt RE. Dynamic lung volumes. In: Fenn WO, Rahn H, eds. Handbook of Physiology, sec 3: Respiration.Washington, DC: American Physiological Society; 1965;2:1381–1398.
Hyatt RE. Forced expiration. In: Macklem PT, Mead J, eds. Mechanics of Breathing, part 1, Handbook ofPhysiology, sec 3: The Respiratory System. Bethesda, Md: American Physiological Society;1986;3:295–314.
Ingram RH Jr, Pedley TJ. Pressure-flow relationships in the lungs. In: Macklem PT, Mead J, eds. Mechanicsof Breathing, part 1, Handbook of Physiology, sec 3: The Respiratory System. Bethesda, Md: AmericanPhysiological Society; 1986;3:277–293.
Lai-Fook SJ. Pleural mechanics and fluid exchange. Physiol Rev. 2004;84:385–410.
Levitzky MG, Cairo JM, Hall SM. Introduction to Respiratory Care. Philadelphia, PA: WB Saunders andCompany; 1990.
Mead J, Takashima T, Leith D. Stress distribution in lungs: A model of pulmonary elasticity. J Appl Physiol.1970;28:596–608.
Mead J, Turner JM, Macklem PT, Little JB. Significance of the relationship between lung recoil and maxi-mum expiratory flow. J Appl Physiol. 1967;22:95–108.
Murray JF. The Normal Lung. 2nd ed. Philadelphia, PA: WB Saunders and Company; 1986:83–138.
Murray JF, Greenspan RH, Gold WM, Cohen AB. Early diagnosis of chronic obstructive lung disease. CalifMed. 1972;116:37–55.
Nunn JF. Nunn’s Applied Respiratory Physiology. 4th ed. Oxford: Butterworth-Heinemann; 1993:36–90,117–134.
Osmond DG. Functional anatomy of the chest wall. In: Roussos C, Macklem PT, eds. The Thorax, part A.New York: Marcel Dekker; 1985:199–233.
Poole DC, Sexton WL, Farkas GA, Powers SK, Reid MB. Diaphragm structure and function in health anddisease. Med Sci Sports Exerc. 1997;29:738–754.
Prange HD. Laplace’s law and the alveolus: A misconception of anatomy and a misapplication of physics.Adv Physiol Educ. 2003;27:34–40.
Weibel ER. The Pathway for Oxygen: Structure and Function in the Mammalian Respiratory System.Cambridge, Mass: Harvard University Press; 1984.
Wetzel RC, Herold CJ, Zerhouni EA, Robotham JL. Hypoxic bronchodilation. J Appl Physiol.1992;73:1202–1206.
54
Alveolar ventilation is the exchange of gas between the alveoli and the externalenvironment. It is the process by which oxygen is brought into the lungs from theatmosphere and by which the carbon dioxide carried into the lungs in the mixedvenous blood is expelled from the body. Although alveolar ventilation is usuallydefined as the volume of fresh air entering the alveoli per minute, a similar volumeof alveolar air leaving the body per minute is implicit in this definition.
THE LUNG VOLUMES
The volume of gas in the lungs at any instant depends on the mechanics of thelungs and chest wall and the activity of the muscles of inspiration and expiration.The lung volume under any specified set of conditions can be altered by patho-logic and normal physiologic processes. Standardization of the conditions underwhich lung volumes are measured allows comparisons to be made among subjectsor patients. The size of a person’s lungs depends on his or her height and weight orbody surface area, as well as on his or her age and sex. Therefore, the lung volumesfor a patient are usually compared with data in a table of “predicted” lung volumes
3Alveolar Ventilation
OBJECTIVES
The reader understands the ventilation of the alveoli.
� Defines alveolar ventilation.
� Defines the standard lung volumes and understands their measurement.
� Predicts the effects of alterations in lung and chest wall mechanics, due to normalor pathologic processes, on the lung volumes.
� Defines anatomic dead space and relates the anatomic dead space and the tidalvolume to alveolar ventilation.
� Understands the measurement of the anatomic dead space and the determinationof alveolar ventilation.
� Defines physiologic and alveolar dead space and understands their determination.
� Predicts the effects of alterations of alveolar ventilation on alveolar carbon dioxideand oxygen levels.
� Describes the regional differences in alveolar ventilation found in the normal lungand explains these differences.
� Predicts the effects of changes in lung volume, aging, and disease processes on theregional distribution of alveolar ventilation.
� Defines the closing volume and explains how it can be demonstrated.
� Predicts the effects of changes in pulmonary mechanics on the closing volume.
Copyright © 2007 by The McGraw-Hill Companies, Inc. Click here for terms of use.
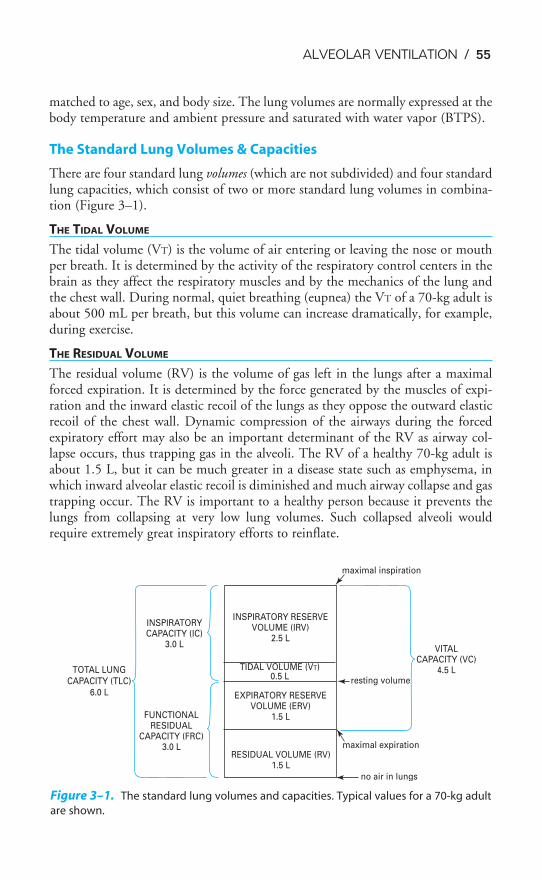
ALVEOLAR VENTILATION / 55
matched to age, sex, and body size. The lung volumes are normally expressed at thebody temperature and ambient pressure and saturated with water vapor (BTPS).
The Standard Lung Volumes & Capacities
There are four standard lung volumes (which are not subdivided) and four standardlung capacities, which consist of two or more standard lung volumes in combina-tion (Figure 3–1).
THE TIDAL VOLUME
The tidal volume (VT) is the volume of air entering or leaving the nose or mouthper breath. It is determined by the activity of the respiratory control centers in thebrain as they affect the respiratory muscles and by the mechanics of the lung andthe chest wall. During normal, quiet breathing (eupnea) the VT of a 70-kg adult isabout 500 mL per breath, but this volume can increase dramatically, for example,during exercise.
THE RESIDUAL VOLUME
The residual volume (RV) is the volume of gas left in the lungs after a maximalforced expiration. It is determined by the force generated by the muscles of expi-ration and the inward elastic recoil of the lungs as they oppose the outward elasticrecoil of the chest wall. Dynamic compression of the airways during the forcedexpiratory effort may also be an important determinant of the RV as airway col-lapse occurs, thus trapping gas in the alveoli. The RV of a healthy 70-kg adult isabout 1.5 L, but it can be much greater in a disease state such as emphysema, inwhich inward alveolar elastic recoil is diminished and much airway collapse and gastrapping occur. The RV is important to a healthy person because it prevents thelungs from collapsing at very low lung volumes. Such collapsed alveoli wouldrequire extremely great inspiratory efforts to reinflate.
TOTAL LUNG
CAPACITY (TLC)
6.0 L
INSPIRATORYCAPACITY (IC)
3.0 L
FUNCTIONALRESIDUAL
CAPACITY (FRC)3.0 L
INSPIRATORY RESERVEVOLUME (IRV)
2.5 L
TIDAL VOLUME (VT)0.5 L
EXPIRATORY RESERVEVOLUME (ERV)
1.5 L
RESIDUAL VOLUME (RV)1.5 L
maximal inspiration
resting volume
maximal expiration
no air in lungs
VITALCAPACITY (VC)
4.5 L
Figure 3–1. The standard lung volumes and capacities. Typical values for a 70-kg adult
are shown.
56 / CHAPTER 3
THE EXPIRATORY RESERVE VOLUME
The expiratory reserve volume (ERV) is the volume of gas that is expelled from thelungs during a maximal forced expiration that starts at the end of a normal tidalexpiration. It is therefore determined by the difference between the functional resid-ual capacity (FRC) and the RV. The ERV is about 1.5 L in a healthy 70-kg adult.
THE INSPIRATORY RESERVE VOLUME
The inspiratory reserve volume (IRV) is the volume of gas that is inhaled into thelungs during a maximal forced inspiration starting at the end of a normal tidalinspiration. It is determined by the strength of contraction of the inspiratory mus-cles, the inward elastic recoil of the lung and the chest wall, and the starting point,which is the FRC plus the VT. The IRV of a normal 70-kg adult is about 2.5 L.
THE FUNCTIONAL RESIDUAL CAPACITY
The functional residual capacity (FRC) is the volume of gas remaining in the lungsat the end of a normal tidal expiration. Because it was traditionally assumed thatno muscles of respiration are contracting at the end of a normal tidal expiration,the FRC is usually considered to represent the balance point between the inwardelastic recoil of the lungs and the outward elastic recoil of the chest wall, as dis-cussed in Chapter 2.
However, the respiratory muscles may have significant tone at the FRC, and incertain circumstances the FRC may be greater than or even less than the lung vol-ume of the totally relaxed respiratory system. Thus, the lung volume at which theinward elastic recoil of the lungs is equal and opposite to the outward elastic recoilof the chest wall is sometimes referred to as the relaxation volume of the respiratorysystem. The FRC may be greater than the relaxation volume if the next inspirationoccurs before the relaxation volume is reached, either because of high breathingrates or high resistance to expiratory airflow in the larynx or peripheral airways; oractive contraction of the inspiratory muscles at end expiration. Either or both ofthese may occur in babies, who have higher FRCs than would be predicted fromthe great inward elastic recoil of their lungs and the small outward recoil of theirchest walls. During exercise, the FRC may be lower than the relaxation volumebecause of active contraction of the expiratory muscles.
The FRC, as seen in Figure 3–1, consists of the RV plus the ERV. It is there-fore about 3 L in a healthy 70-kg adult.
THE INSPIRATORY CAPACITY
The inspiratory capacity (IC) is the volume of air that is inhaled into the lungs dur-ing a maximal inspiratory effort that begins at the end of a normal tidal expiration(the FRC). It is therefore equal to the VT plus the IRV, as shown in Figure 3–1.The IC of a normal 70-kg adult is about 3 L.
THE TOTAL LUNG CAPACITY
The total lung capacity (TLC) is the volume of air in the lungs after a maximalinspiratory effort. It is determined by the strength of contraction of the inspiratory
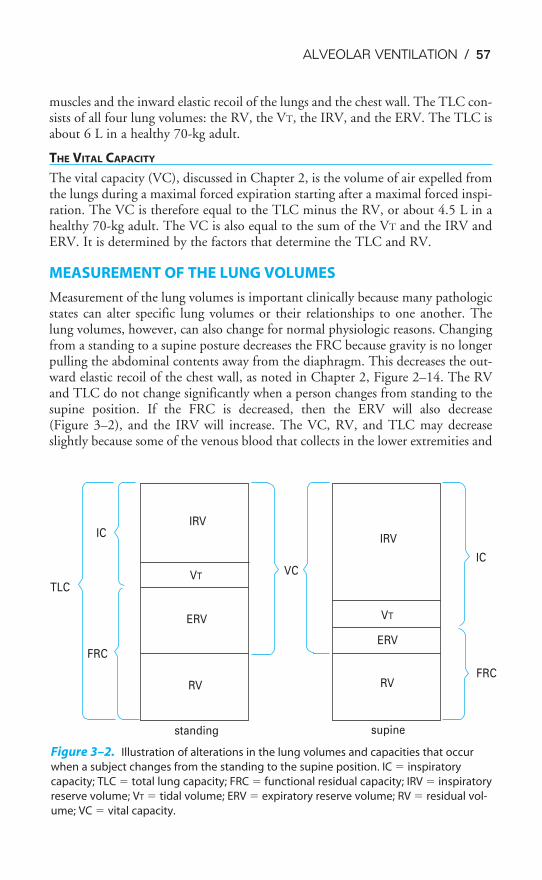
ALVEOLAR VENTILATION / 57
muscles and the inward elastic recoil of the lungs and the chest wall. The TLC con-sists of all four lung volumes: the RV, the VT, the IRV, and the ERV. The TLC isabout 6 L in a healthy 70-kg adult.
THE VITAL CAPACITY
The vital capacity (VC), discussed in Chapter 2, is the volume of air expelled fromthe lungs during a maximal forced expiration starting after a maximal forced inspi-ration. The VC is therefore equal to the TLC minus the RV, or about 4.5 L in ahealthy 70-kg adult. The VC is also equal to the sum of the VT and the IRV andERV. It is determined by the factors that determine the TLC and RV.
MEASUREMENT OF THE LUNG VOLUMES
Measurement of the lung volumes is important clinically because many pathologicstates can alter specific lung volumes or their relationships to one another. Thelung volumes, however, can also change for normal physiologic reasons. Changingfrom a standing to a supine posture decreases the FRC because gravity is no longerpulling the abdominal contents away from the diaphragm. This decreases the out-ward elastic recoil of the chest wall, as noted in Chapter 2, Figure 2–14. The RVand TLC do not change significantly when a person changes from standing to thesupine position. If the FRC is decreased, then the ERV will also decrease (Figure 3–2), and the IRV will increase. The VC, RV, and TLC may decreaseslightly because some of the venous blood that collects in the lower extremities and
TLC
FRC
ICIRV
VT
ERV
RV
standing
VC
IRV
VT
ERV
RV
supine
FRC
IC
Figure 3–2. Illustration of alterations in the lung volumes and capacities that occur
when a subject changes from the standing to the supine position. IC � inspiratory
capacity; TLC � total lung capacity; FRC � functional residual capacity; IRV � inspiratory
reserve volume; VT � tidal volume; ERV � expiratory reserve volume; RV � residual vol-
ume; VC � vital capacity.
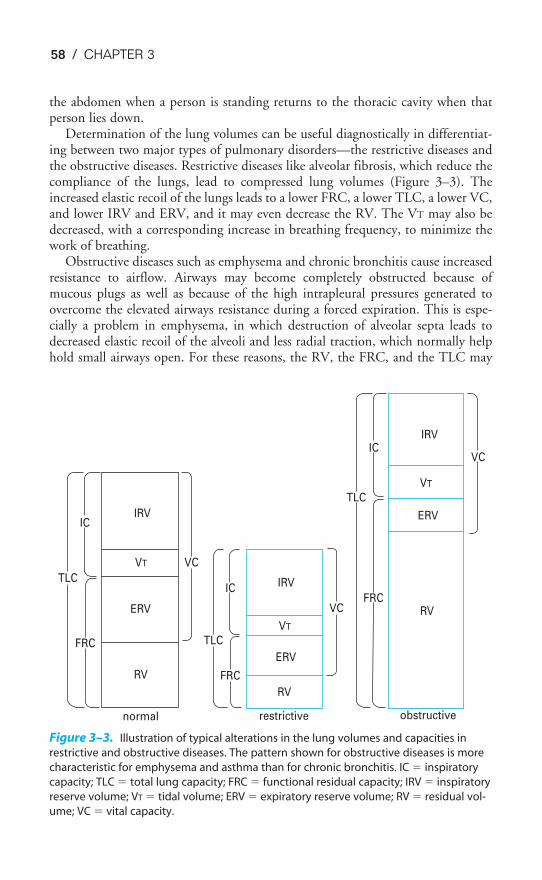
TLC
IC
FRC
IRV
VCVT
ERV
RV
TLC
FRC
IC IRV
VT
ERV
VC
RV
restrictivenormal
FRC
TLC
ICIRV
VT
VC
ERV
RV
obstructive
Figure 3–3. Illustration of typical alterations in the lung volumes and capacities in
restrictive and obstructive diseases. The pattern shown for obstructive diseases is more
characteristic for emphysema and asthma than for chronic bronchitis. IC � inspiratory
capacity; TLC � total lung capacity; FRC � functional residual capacity; IRV � inspiratory
reserve volume; VT � tidal volume; ERV � expiratory reserve volume; RV � residual vol-
ume; VC � vital capacity.
58 / CHAPTER 3
the abdomen when a person is standing returns to the thoracic cavity when thatperson lies down.
Determination of the lung volumes can be useful diagnostically in differentiat-ing between two major types of pulmonary disorders—the restrictive diseases andthe obstructive diseases. Restrictive diseases like alveolar fibrosis, which reduce thecompliance of the lungs, lead to compressed lung volumes (Figure 3–3). Theincreased elastic recoil of the lungs leads to a lower FRC, a lower TLC, a lower VC,and lower IRV and ERV, and it may even decrease the RV. The VT may also bedecreased, with a corresponding increase in breathing frequency, to minimize thework of breathing.
Obstructive diseases such as emphysema and chronic bronchitis cause increasedresistance to airflow. Airways may become completely obstructed because ofmucous plugs as well as because of the high intrapleural pressures generated toovercome the elevated airways resistance during a forced expiration. This is espe-cially a problem in emphysema, in which destruction of alveolar septa leads todecreased elastic recoil of the alveoli and less radial traction, which normally helphold small airways open. For these reasons, the RV, the FRC, and the TLC may
ALVEOLAR VENTILATION / 59
be greatly increased in obstructive diseases, as seen in Figure 3–3. The VC andERV are usually decreased. The breathing frequency may be decreased to reducethe work expended overcoming the airways resistance, with a correspondingincrease in the VT.
Spirometry
The spirometer is a simple device for measuring gas volumes. The frequently usedwater spirometer, shown in Figure 3–4, consists of an inverted canister, or “bell,”floating in a water-filled space between two concentrically arranged cylinders. Thespace inside the inner drum, which is closed off from the atmosphere by the bell,is connected to tubing that extends to a mouthpiece into which the personbreathes. As the person breathes in and out, gas enters and leaves the spirometer,and the bell then floats higher (during expiration) and lower (during inspiration).The top of the bell is connected by a pulley to a pen that writes on a rotating drum,thus tracing the person’s breathing pattern.
As is evident from Figure 3–4, the spirometer can measure only the lung vol-umes that the subject can exchange with it. As is the case with many pulmonaryfunction tests, the subject must be conscious and cooperative and understand theinstructions for performing the test. The VT, IRV, ERV, IC, and VC can all bemeasured with a spirometer (as can the forced expiratory volume in 1 second[FEV1], forced vital capacity [FVC], and forced expiratory flow [FEF25–75%], asdiscussed in Chapter 2). The RV, the FRC, and the TLC, however, cannot be deter-mined with a spirometer because the subject cannot exhale all the gas in the lungs.The gas in a spirometer is at ambient temperature, pressure, and water vapor satu-ration, and the volumes of gas collected in a spirometer must be converted toequivalent volumes in the body. Other kinds of spirometers include rolling seal andbellows spirometers. These spirometers are not water-filled and are more portable.
Measurement of Lung Volumes Not Measurable with Spirometry
The lung volumes not measurable with spirometry can be determined by the nitro-gen-washout technique, by the helium-dilution technique, and by body plethys-mography. The FRC is usually determined, and RV (which is equal to FRC minusERV) and the TLC (which is equal to VC plus RV) are then calculated from vol-umes obtained by spirometry.
NITROGEN-WASHOUT TECHNIQUE
In the nitrogen-washout technique, the person breathes 100% oxygen through aone-way valve so that all the expired gas is collected. The concentration of nitrogenin the expired air is monitored with a nitrogen analyzer until it reaches zero. At thispoint all the nitrogen is washed out of the person’s lungs. The total volume of allthe gas the person expired is determined, and this amount is multiplied by the per-centage of nitrogen in the mixed expired air, which can be determined with thenitrogen analyzer. The total volume of nitrogen in the person’s lungs at the begin-ning of the test can thus be determined. Nitrogen constitutes about 80% of the
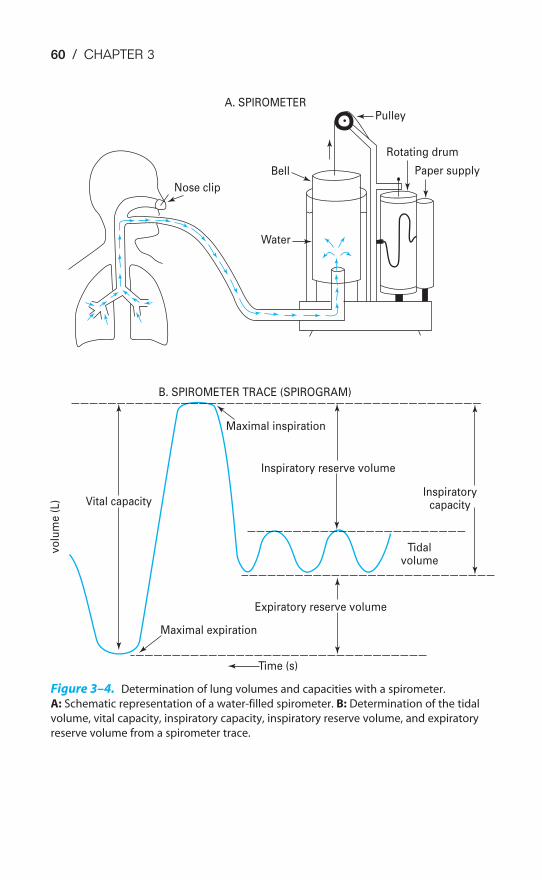
60 / CHAPTER 3
Tidalvolume
Inspiratorycapacity
Inspiratory reserve volume
Expiratory reserve volume
Time (s)
Maximal expiration
Maximal inspiration
Vital capacity
vo
lum
e (
L)
B. SPIROMETER TRACE (SPIROGRAM)
Nose clip
Water
Bell
A. SPIROMETERPulley
Rotating drum
Paper supply
Figure 3–4. Determination of lung volumes and capacities with a spirometer.
A: Schematic representation of a water-filled spirometer. B: Determination of the tidal
volume, vital capacity, inspiratory capacity, inspiratory reserve volume, and expiratory
reserve volume from a spirometer trace.
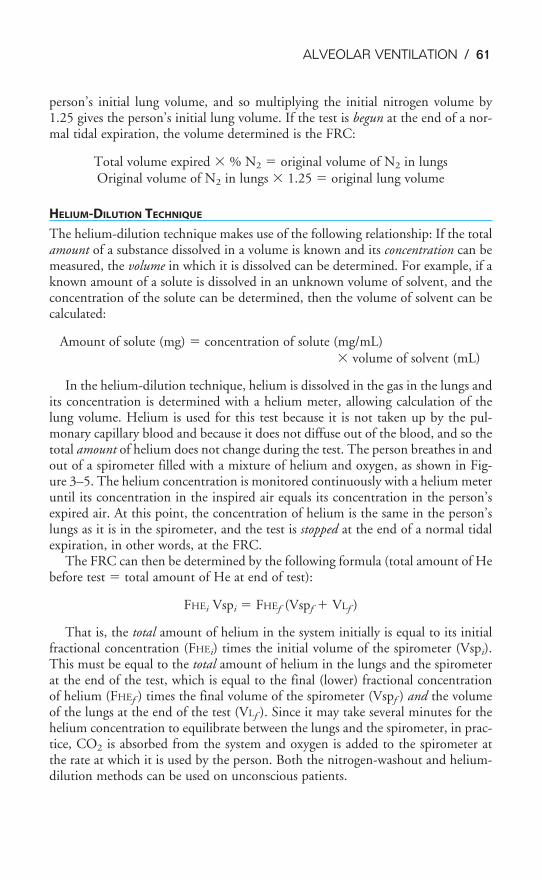
ALVEOLAR VENTILATION / 61
person’s initial lung volume, and so multiplying the initial nitrogen volume by1.25 gives the person’s initial lung volume. If the test is begun at the end of a nor-mal tidal expiration, the volume determined is the FRC:
Total volume expired � % N2 � original volume of N2 in lungsOriginal volume of N2 in lungs � 1.25 � original lung volume
HELIUM-DILUTION TECHNIQUE
The helium-dilution technique makes use of the following relationship: If the totalamount of a substance dissolved in a volume is known and its concentration can bemeasured, the volume in which it is dissolved can be determined. For example, if aknown amount of a solute is dissolved in an unknown volume of solvent, and theconcentration of the solute can be determined, then the volume of solvent can becalculated:
Amount of solute (mg) � concentration of solute (mg/mL)� volume of solvent (mL)
In the helium-dilution technique, helium is dissolved in the gas in the lungs andits concentration is determined with a helium meter, allowing calculation of thelung volume. Helium is used for this test because it is not taken up by the pul-monary capillary blood and because it does not diffuse out of the blood, and so thetotal amount of helium does not change during the test. The person breathes in andout of a spirometer filled with a mixture of helium and oxygen, as shown in Fig-ure 3–5. The helium concentration is monitored continuously with a helium meteruntil its concentration in the inspired air equals its concentration in the person’sexpired air. At this point, the concentration of helium is the same in the person’slungs as it is in the spirometer, and the test is stopped at the end of a normal tidalexpiration, in other words, at the FRC.
The FRC can then be determined by the following formula (total amount of Hebefore test � total amount of He at end of test):
FHEi Vspi � FHEf (Vspf � VLf )
That is, the total amount of helium in the system initially is equal to its initialfractional concentration (FHEi) times the initial volume of the spirometer (Vspi).This must be equal to the total amount of helium in the lungs and the spirometerat the end of the test, which is equal to the final (lower) fractional concentrationof helium (FHEf ) times the final volume of the spirometer (Vspf ) and the volumeof the lungs at the end of the test (VLf ). Since it may take several minutes for thehelium concentration to equilibrate between the lungs and the spirometer, in prac-tice, CO2 is absorbed from the system and oxygen is added to the spirometer atthe rate at which it is used by the person. Both the nitrogen-washout and helium-dilution methods can be used on unconscious patients.
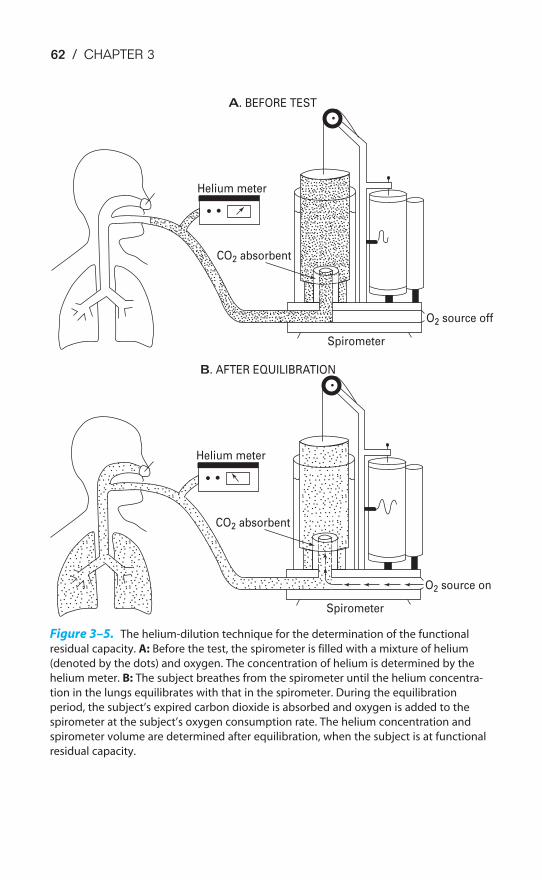
62 / CHAPTER 3
A. BEFORE TEST
Helium meter
CO2 absorbent
O2 source off
Spirometer
B. AFTER EQUILIBRATION
Helium meter
CO2 absorbent
O2 source on
Spirometer
Figure 3–5. The helium-dilution technique for the determination of the functional
residual capacity. A: Before the test, the spirometer is filled with a mixture of helium
(denoted by the dots) and oxygen. The concentration of helium is determined by the
helium meter. B: The subject breathes from the spirometer until the helium concentra-
tion in the lungs equilibrates with that in the spirometer. During the equilibration
period, the subject’s expired carbon dioxide is absorbed and oxygen is added to the
spirometer at the subject’s oxygen consumption rate. The helium concentration and
spirometer volume are determined after equilibration, when the subject is at functional
residual capacity.
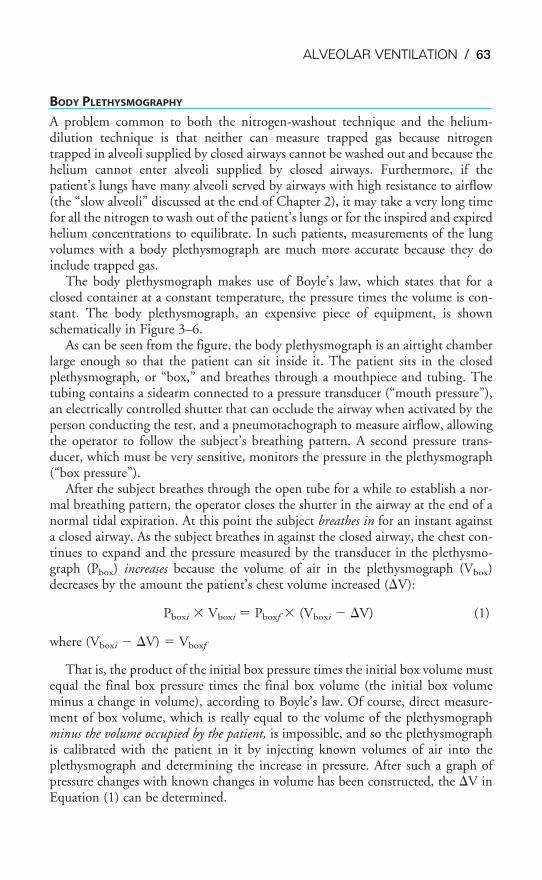
ALVEOLAR VENTILATION / 63
BODY PLETHYSMOGRAPHY
A problem common to both the nitrogen-washout technique and the helium-dilution technique is that neither can measure trapped gas because nitrogentrapped in alveoli supplied by closed airways cannot be washed out and because thehelium cannot enter alveoli supplied by closed airways. Furthermore, if thepatient’s lungs have many alveoli served by airways with high resistance to airflow(the “slow alveoli” discussed at the end of Chapter 2), it may take a very long timefor all the nitrogen to wash out of the patient’s lungs or for the inspired and expiredhelium concentrations to equilibrate. In such patients, measurements of the lungvolumes with a body plethysmograph are much more accurate because they doinclude trapped gas.
The body plethysmograph makes use of Boyle’s law, which states that for aclosed container at a constant temperature, the pressure times the volume is con-stant. The body plethysmograph, an expensive piece of equipment, is shownschematically in Figure 3–6.
As can be seen from the figure, the body plethysmograph is an airtight chamberlarge enough so that the patient can sit inside it. The patient sits in the closedplethysmograph, or “box,” and breathes through a mouthpiece and tubing. Thetubing contains a sidearm connected to a pressure transducer (“mouth pressure”),an electrically controlled shutter that can occlude the airway when activated by theperson conducting the test, and a pneumotachograph to measure airflow, allowingthe operator to follow the subject’s breathing pattern. A second pressure trans-ducer, which must be very sensitive, monitors the pressure in the plethysmograph(“box pressure”).
After the subject breathes through the open tube for a while to establish a nor-mal breathing pattern, the operator closes the shutter in the airway at the end of anormal tidal expiration. At this point the subject breathes in for an instant againsta closed airway. As the subject breathes in against the closed airway, the chest con-tinues to expand and the pressure measured by the transducer in the plethysmo-graph (Pbox) increases because the volume of air in the plethysmograph (Vbox)decreases by the amount the patient’s chest volume increased (V):
Pboxi � Vboxi � Pboxf � (Vboxi � V) (1)
where (Vboxi � V) � Vboxf
That is, the product of the initial box pressure times the initial box volume mustequal the final box pressure times the final box volume (the initial box volumeminus a change in volume), according to Boyle’s law. Of course, direct measure-ment of box volume, which is really equal to the volume of the plethysmographminus the volume occupied by the patient, is impossible, and so the plethysmographis calibrated with the patient in it by injecting known volumes of air into theplethysmograph and determining the increase in pressure. After such a graph ofpressure changes with known changes in volume has been constructed, the V inEquation (1) can be determined.
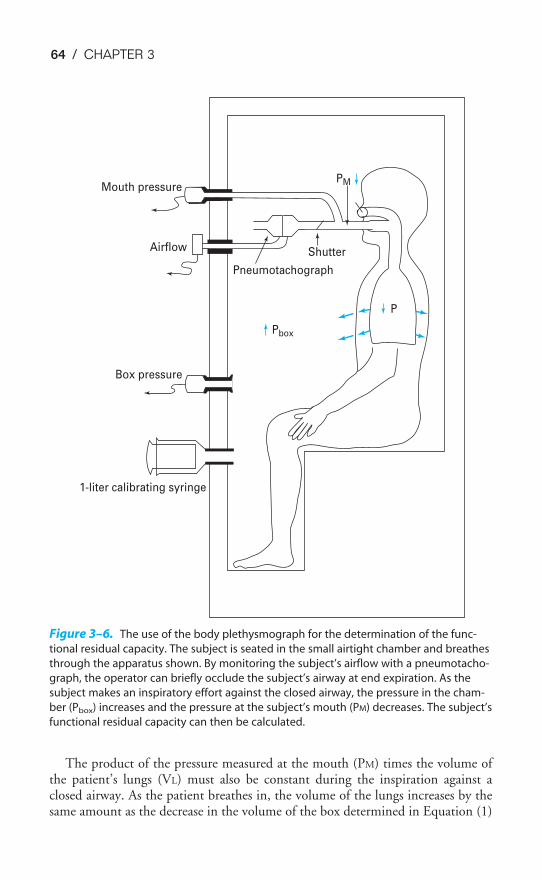
64 / CHAPTER 3
The product of the pressure measured at the mouth (PM) times the volume ofthe patient’s lungs (VL) must also be constant during the inspiration against aclosed airway. As the patient breathes in, the volume of the lungs increases by thesame amount as the decrease in the volume of the box determined in Equation (1)
Mouth pressure
Airflow
Box pressure
1-liter calibrating syringe
Pneumotachograph
Shutter
Pbox
PM
P
Figure 3–6. The use of the body plethysmograph for the determination of the func-
tional residual capacity. The subject is seated in the small airtight chamber and breathes
through the apparatus shown. By monitoring the subject’s airflow with a pneumotacho-
graph, the operator can briefly occlude the subject’s airway at end expiration. As the
subject makes an inspiratory effort against the closed airway, the pressure in the cham-
ber (Pbox) increases and the pressure at the subject’s mouth (PM) decreases. The subject’s
functional residual capacity can then be calculated.
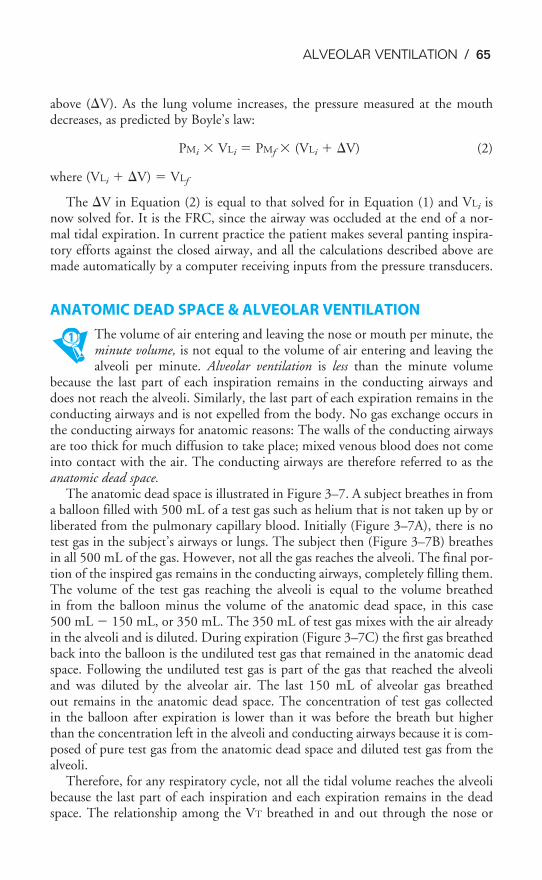
ALVEOLAR VENTILATION / 65
above (V). As the lung volume increases, the pressure measured at the mouthdecreases, as predicted by Boyle’s law:
PMi � VLi � PMf � (VLi � V) (2)
where (VLi � V) � VLf
The V in Equation (2) is equal to that solved for in Equation (1) and VLi isnow solved for. It is the FRC, since the airway was occluded at the end of a nor-mal tidal expiration. In current practice the patient makes several panting inspira-tory efforts against the closed airway, and all the calculations described above aremade automatically by a computer receiving inputs from the pressure transducers.
ANATOMIC DEAD SPACE & ALVEOLAR VENTILATION
The volume of air entering and leaving the nose or mouth per minute, theminute volume, is not equal to the volume of air entering and leaving thealveoli per minute. Alveolar ventilation is less than the minute volume
because the last part of each inspiration remains in the conducting airways anddoes not reach the alveoli. Similarly, the last part of each expiration remains in theconducting airways and is not expelled from the body. No gas exchange occurs inthe conducting airways for anatomic reasons: The walls of the conducting airwaysare too thick for much diffusion to take place; mixed venous blood does not comeinto contact with the air. The conducting airways are therefore referred to as theanatomic dead space.
The anatomic dead space is illustrated in Figure 3–7. A subject breathes in froma balloon filled with 500 mL of a test gas such as helium that is not taken up by orliberated from the pulmonary capillary blood. Initially (Figure 3–7A), there is notest gas in the subject’s airways or lungs. The subject then (Figure 3–7B) breathesin all 500 mL of the gas. However, not all the gas reaches the alveoli. The final por-tion of the inspired gas remains in the conducting airways, completely filling them.The volume of the test gas reaching the alveoli is equal to the volume breathedin from the balloon minus the volume of the anatomic dead space, in this case500 mL � 150 mL, or 350 mL. The 350 mL of test gas mixes with the air alreadyin the alveoli and is diluted. During expiration (Figure 3–7C) the first gas breathedback into the balloon is the undiluted test gas that remained in the anatomic deadspace. Following the undiluted test gas is part of the gas that reached the alveoliand was diluted by the alveolar air. The last 150 mL of alveolar gas breathedout remains in the anatomic dead space. The concentration of test gas collectedin the balloon after expiration is lower than it was before the breath but higherthan the concentration left in the alveoli and conducting airways because it is com-posed of pure test gas from the anatomic dead space and diluted test gas from thealveoli.
Therefore, for any respiratory cycle, not all the tidal volume reaches the alveolibecause the last part of each inspiration and each expiration remains in the deadspace. The relationship among the VT breathed in and out through the nose or
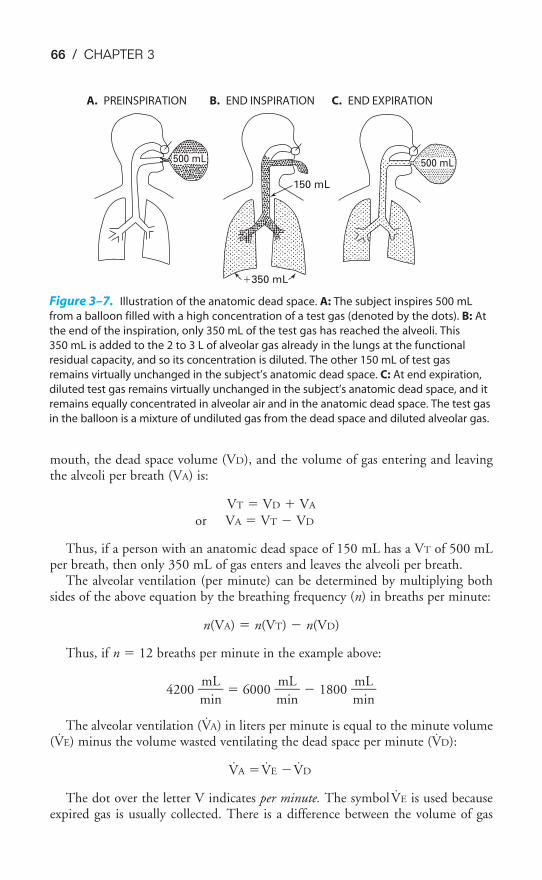
66 / CHAPTER 3
mouth, the dead space volume (VD), and the volume of gas entering and leavingthe alveoli per breath (VA) is:
VT � VD � VA
or VA � VT � VD
Thus, if a person with an anatomic dead space of 150 mL has a VT of 500 mLper breath, then only 350 mL of gas enters and leaves the alveoli per breath.
The alveolar ventilation (per minute) can be determined by multiplying bothsides of the above equation by the breathing frequency (n) in breaths per minute:
n(VA) � n(VT) � n(VD)
Thus, if n � 12 breaths per minute in the example above:
4200 �m
m
i
L
n� � 6000 �
m
m
i
L
n� � 1800 �
m
m
i
L
n�
The alveolar ventilation (V̇A) in liters per minute is equal to the minute volume(V̇E) minus the volume wasted ventilating the dead space per minute (V̇D):
V̇A �V̇E �V̇D
The dot over the letter V indicates per minute. The symbol V̇E is used becauseexpired gas is usually collected. There is a difference between the volume of gas
150 mL
�350 mL
500 mL 500 mL
Figure 3–7. Illustration of the anatomic dead space. A: The subject inspires 500 mL
from a balloon filled with a high concentration of a test gas (denoted by the dots). B: At
the end of the inspiration, only 350 mL of the test gas has reached the alveoli. This
350 mL is added to the 2 to 3 L of alveolar gas already in the lungs at the functional
residual capacity, and so its concentration is diluted. The other 150 mL of test gas
remains virtually unchanged in the subject’s anatomic dead space. C: At end expiration,
diluted test gas remains virtually unchanged in the subject’s anatomic dead space, and it
remains equally concentrated in alveolar air and in the anatomic dead space. The test gas
in the balloon is a mixture of undiluted gas from the dead space and diluted alveolar gas.
A. PREINSPIRATION B. END INSPIRATION C. END EXPIRATION
ALVEOLAR VENTILATION / 67
inspired and the volume of gas expired because as air is inspired, it is heated tobody temperature and humidified and also because normally less carbon dioxide isproduced than oxygen is consumed.
MEASUREMENT OF ALVEOLAR VENTILATION
Alveolar ventilation cannot be measured directly but must be determined from theVT, the breathing frequency, and the dead space ventilation, as noted in the previ-ous section.
Measurement of Anatomic Dead Space
For a normal, healthy subject, the anatomic dead space can be estimated by refer-ring to a table of standard values matched to sex, age, height, and weight or bodysurface area. A reasonable estimate of anatomic dead space is 1 mL of dead spaceper pound of ideal body weight. Nevertheless, it may be important to determinethe anatomic dead space in a particular patient. This can be done by using Fowler’smethod. This method uses a nitrogen meter to analyze the expired nitrogen con-centration after a single inspiration of 100% oxygen. The expired gas volume ismeasured simultaneously. Fowler’s method is summarized in Figure 3–8.
The subject breathes in a single breath of 100% oxygen through a one-wayvalve, holds it in for a second, and then exhales through the one-way valve.Nitrogen concentration at the mouth and the volume expired are monitored simul-taneously. Initially, the nitrogen concentration at the mouth is 80%, the same asthat of the ambient atmosphere. As the stopcock is turned and the subject beginsto inspire 100% oxygen, the nitrogen concentration at the mouth falls to zero. Thesubject holds his or her breath for a second or so and then exhales through the valveinto a spirometer or pneumotachograph. The first part of the expired gas registers0% nitrogen because it is undiluted 100% oxygen from the anatomic dead space.In the transitional period that follows, the expired gas registers a slowly risingnitrogen concentration. During this time, the expired gas is a mixture of deadspace gas and alveolar gas because of a gradual transition between the conductingpathways and the respiratory bronchioles, as was seen in Figure 1–5. The final por-tion of expired gas comes solely from the alveoli and is called the alveolar plateau.Its nitrogen concentration is less than 80% because some of the breath of100% oxygen reached the alveoli and diluted the alveolar nitrogen concentration,as shown in Figure 3–7. The volume of the anatomic dead space is the volumeexpired between the beginning of the expiration and the midpoint of the transi-tional phase, as shown in Figure 3–8.
Physiologic Dead Space: The Bohr Equation
Fowler’s method is especially useful for the determination of the anatomic deadspace. It does not, however, permit the calculation of another form of wasted ven-
tilation in the lung—the alveolar dead space. The alveolar dead space is thevolume of gas that enters unperfused alveoli per breath. Alveolar dead spaceis therefore ventilated but not perfused. No gas exchange occurs in these
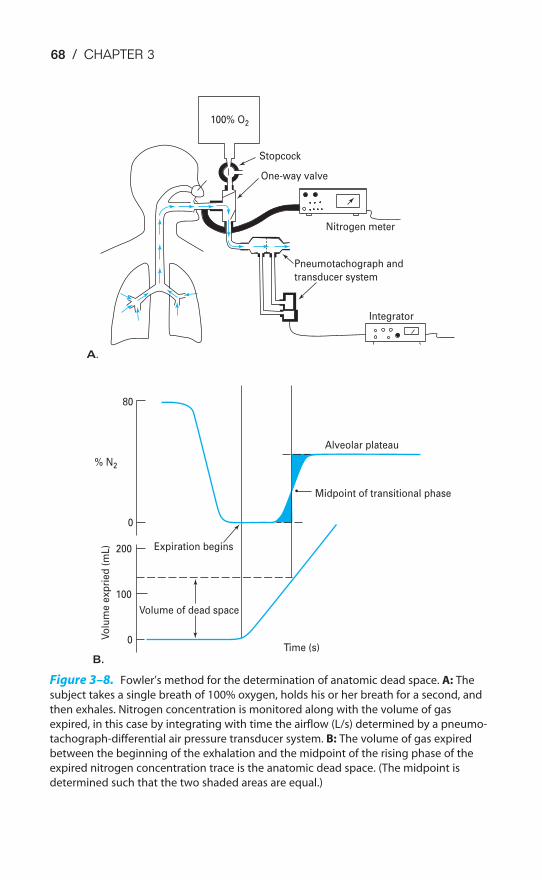
68 / CHAPTER 3
Pneumotachograph and
transducer system
Nitrogen meter
Integrator
One-way valve
Stopcock
100% O2
Alveolar plateau
Midpoint of transitional phase
Expiration begins
Volume of dead space
% N2
80
0
200
100
0Vo
lum
e e
xp
rie
d (
mL
)
Time (s)
A.
B.
Figure 3–8. Fowler’s method for the determination of anatomic dead space. A: The
subject takes a single breath of 100% oxygen, holds his or her breath for a second, and
then exhales. Nitrogen concentration is monitored along with the volume of gas
expired, in this case by integrating with time the airflow (L/s) determined by a pneumo-
tachograph-differential air pressure transducer system. B: The volume of gas expired
between the beginning of the exhalation and the midpoint of the rising phase of the
expired nitrogen concentration trace is the anatomic dead space. (The midpoint is
determined such that the two shaded areas are equal.)
ALVEOLAR VENTILATION / 69
alveoli for physiologic, rather than anatomic, reasons. A healthy person has little orno alveolar dead space, but a person with a low cardiac output might have a greatdeal of alveolar dead space, for reasons explained in the next chapter.
The Bohr equation permits the determination of the sum of the anatomic andthe alveolar dead space. The anatomic dead space plus the alveolar deadspace is known as the physiologic dead space:
Physiologic dead space � anatomic dead space � alveolar dead space
The Bohr equation makes use of a simple concept: Any measurable volume ofcarbon dioxide found in the mixed expired gas must come from alveoli that areboth ventilated and perfused because there are negligible amounts of carbon dioxidein inspired air. Inspired air remaining in the anatomic dead space or enteringunperfused alveoli will leave the body as it entered (except for having been heatedto body temperature and humidified), contributing little or no carbon dioxide tothe mixed expired air:
FE�CO2� VT � FICO2
� VDCO2� FACO2
� VA
Volume of CO2 Volume of CO2 Volume of CO2
in mixed expired air coming from dead space coming from alveoli
where F � fractional concentrationE� � mixed expiredI � inspired
A � alveolarVDCO2
� dead space for CO2 (physiologic dead space)FACO2
� fractional concentration of CO2 in alveoli that are both ventilatedand perfused
Since FICO2is approximately equal to zero, the FICO2
� VDCO2term drops out.
Substituting (VT � VDCO2) for VA:
FE�CO2� VT � FACO2
(VT � VDCO2)
FE�CO2� VT � FACO2
� VT � FACO2� VDCO2
VDCO2� FACO2
� VT(FACO2� FE�CO2
)
�V
V
DC
T
O2� � �
FACO
F
2
A
�
CO
F
2
E�CO2�
Since FCO2� �
P
P
C
to
O
t
2�
then �V
V
DC
T
O2� � �
PACO
P
2
A
�
CO
P
2
E�CO2�
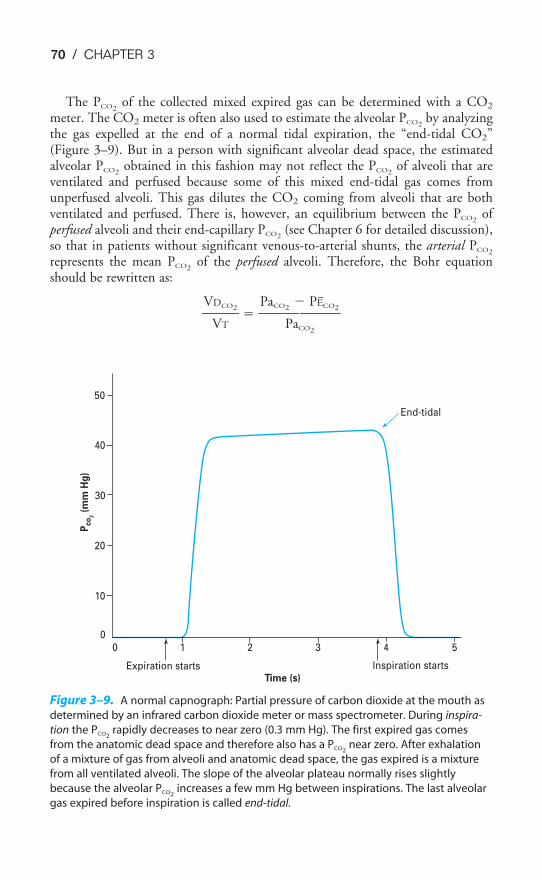
70 / CHAPTER 3
The PCO2of the collected mixed expired gas can be determined with a CO2
meter. The CO2 meter is often also used to estimate the alveolar PCO2by analyzing
the gas expelled at the end of a normal tidal expiration, the “end-tidal CO2”(Figure 3–9). But in a person with significant alveolar dead space, the estimatedalveolar PCO2
obtained in this fashion may not reflect the PCO2of alveoli that are
ventilated and perfused because some of this mixed end-tidal gas comes fromunperfused alveoli. This gas dilutes the CO2 coming from alveoli that are bothventilated and perfused. There is, however, an equilibrium between the PCO2
ofperfused alveoli and their end-capillary PCO2
(see Chapter 6 for detailed discussion),so that in patients without significant venous-to-arterial shunts, the arterial PCO2
represents the mean PCO2of the perfused alveoli. Therefore, the Bohr equation
should be rewritten as:
�V
V
DC
T
O2� � �
PaCO2
Pa
�
CO
P
2
E�CO2�
50
40
30
20
10
0
0 1 2 3 4 5
Inspiration startsExpiration startsTime (s)
Pco
2 (
mm
Hg
)
End-tidal
Figure 3–9. A normal capnograph: Partial pressure of carbon dioxide at the mouth as
determined by an infrared carbon dioxide meter or mass spectrometer. During inspira-
tion the PCO2rapidly decreases to near zero (0.3 mm Hg). The first expired gas comes
from the anatomic dead space and therefore also has a PCO2near zero. After exhalation
of a mixture of gas from alveoli and anatomic dead space, the gas expired is a mixture
from all ventilated alveoli. The slope of the alveolar plateau normally rises slightly
because the alveolar PCO2increases a few mm Hg between inspirations. The last alveolar
gas expired before inspiration is called end-tidal.
ALVEOLAR VENTILATION / 71
The VT is determined with a spirometer, and the physiologic dead space is thencalculated. If the arterial PCO2
is greater than the mixed alveolar PCO2determined
by sampling the end-tidal CO2, then the physiologic dead space is probably greaterthan the anatomic dead space; that is, a significant arterial-alveolar CO2 differencemeans that there is significant alveolar dead space. As already noted, this differenceis determined from the PCO2
from an arterial blood gas sample and from the end-tidal PCO2
. Situations in which alveoli are ventilated but not perfused include thosein which portions of the pulmonary vasculature have been occluded by blood clotsin the venous blood (pulmonary emboli), situations in which there is low venousreturn leading to low right ventricular output (hemorrhage), and situations inwhich alveolar pressure is high (positive-pressure ventilation with positive end-expiratory pressure).
The anatomic dead space can be altered by bronchoconstriction, which de-creases VD; bronchodilation, which increases VD; or traction or compression of theairways, which increases and decreases VD, respectively.
ALVEOLAR VENTILATION & ALVEOLAR OXYGEN & CARBON DIOXIDE LEVELS
The levels of oxygen and carbon dioxide in alveolar gas are determined by the alve-olar ventilation, the oxygen consumption (V̇O2) of the body, and the carbon diox-ide production of the body (V̇CO2). Each inspiration brings into the 3 L of gasalready in the lungs approximately 350 mL of fresh air containing about 21% oxy-gen, and each expiration removes about 350 mL of air containing about 5 to6% carbon dioxide. Meanwhile, about 250 mL of carbon dioxide per minute dif-fuses from the pulmonary capillary blood into the alveoli, and about 300 mL ofoxygen per minute diffuses from the alveolar air into the pulmonary capillaryblood.
Partial Pressures of Respiratory Gases
According to Dalton’s law, in a gas mixture, the pressure exerted by each individ-ual gas is independent of the pressures of other gases in the mixture. The partialpressure of a particular gas is equal to its fractional concentration times the totalpressure of all the gases in the mixture. Thus for any gas in a mixture (gas1) its par-tial pressure is
Pgas1� % total gas � Ptot
Oxygen constitutes 20.93% of dry atmospheric air. At a standard barometricpressure of 760 mm Hg,
PO2� 0.2093 � 760 mm Hg � 159 mm Hg
72 / CHAPTER 3
(The units mm Hg are also expressed as torr, in honor of Evangelista Torricelli,the inventor of the barometer.) Carbon dioxide constitutes only about 0.04% ofdry atmospheric air, and so,
PCO2� 0.0004 � 760 mm Hg � 0.3 mm Hg
As air is inspired through the upper airways, it is heated and humidified, as willbe discussed in Chapter 10. The partial pressure of water vapor is a relatively con-stant 47 mm Hg at body temperature, and so the humidification of 1 L of dry gasin a closed container at 760 mm Hg would increase its total pressure to 760 mm Hg� 47 mm Hg � 807 mm Hg. In the body, the gas will simply expand, accordingto Boyle’s law, so that 1 L of gas at 760 mm Hg is diluted by the added water vapor.The PO2
of inspired air, or PIO2(saturated with water vapor at a standard baromet-
ric pressure), then is equal to the fractional concentration of inspired oxygen (theFIO2
) times the barometric pressure minus the water vapor pressure:
PIO2� FIO2
(PB � PH2O)
where PB � barometric pressure and PH2O � the water vapor pressure
0.2093 (760 � 47) mm Hg � 149 mm Hg
The PCO2of inspired air (the PICO2
) is equal to the FICO2(PB � PH2O) or 0.0004
(760 � 47) mm Hg � 0.29 mm Hg. This rounds back up to 0.3 mm Hg.
Alveolar gas is composed of the 2.5 to 3 L of gas already in the lungs at the FRCand the approximately 350 mL per breath entering and leaving the alveoli. About300 mL of oxygen is continuously diffusing from the alveoli into the pulmonarycapillary blood per minute at rest and is being replaced by alveolar ventilation.
Inspired Gas at Standard Barometric Pressure
PIO2149.0 mm Hg
PICO20.3 mm Hg
PIN2564.0 mm Hg
PIH2O 47.0 mm Hg
Dry Atmospheric Gas at StandardBarometric Pressure
PO2159.0 mm Hg
PCO20.3 mm Hg
PN2600.6 mm Hg
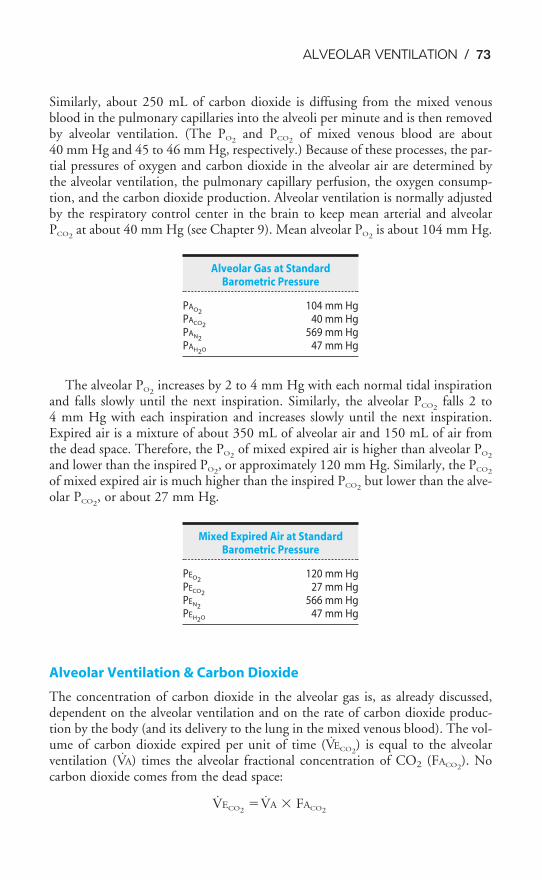
ALVEOLAR VENTILATION / 73
Similarly, about 250 mL of carbon dioxide is diffusing from the mixed venousblood in the pulmonary capillaries into the alveoli per minute and is then removedby alveolar ventilation. (The PO2
and PCO2of mixed venous blood are about
40 mm Hg and 45 to 46 mm Hg, respectively.) Because of these processes, the par-tial pressures of oxygen and carbon dioxide in the alveolar air are determined bythe alveolar ventilation, the pulmonary capillary perfusion, the oxygen consump-tion, and the carbon dioxide production. Alveolar ventilation is normally adjustedby the respiratory control center in the brain to keep mean arterial and alveolarPCO2
at about 40 mm Hg (see Chapter 9). Mean alveolar PO2is about 104 mm Hg.
The alveolar PO2increases by 2 to 4 mm Hg with each normal tidal inspiration
and falls slowly until the next inspiration. Similarly, the alveolar PCO2falls 2 to
4 mm Hg with each inspiration and increases slowly until the next inspiration.Expired air is a mixture of about 350 mL of alveolar air and 150 mL of air fromthe dead space. Therefore, the PO2
of mixed expired air is higher than alveolar PO2
and lower than the inspired PO2, or approximately 120 mm Hg. Similarly, the PCO2
of mixed expired air is much higher than the inspired PCO2but lower than the alve-
olar PCO2, or about 27 mm Hg.
Alveolar Ventilation & Carbon Dioxide
The concentration of carbon dioxide in the alveolar gas is, as already discussed,dependent on the alveolar ventilation and on the rate of carbon dioxide produc-tion by the body (and its delivery to the lung in the mixed venous blood). The vol-ume of carbon dioxide expired per unit of time (V̇ECO2
) is equal to the alveolarventilation (V̇A) times the alveolar fractional concentration of CO2 (FACO2
). Nocarbon dioxide comes from the dead space:
V̇ECO2�V̇A � FACO2
Mixed Expired Air at StandardBarometric Pressure
PEO2120 mm Hg
PECO227 mm Hg
PEN2566 mm Hg
PEH2O 47 mm Hg
Alveolar Gas at Standard Barometric Pressure
PAO2104 mm Hg
PACO240 mm Hg
PAN2569 mm Hg
PAH2O 47 mm Hg
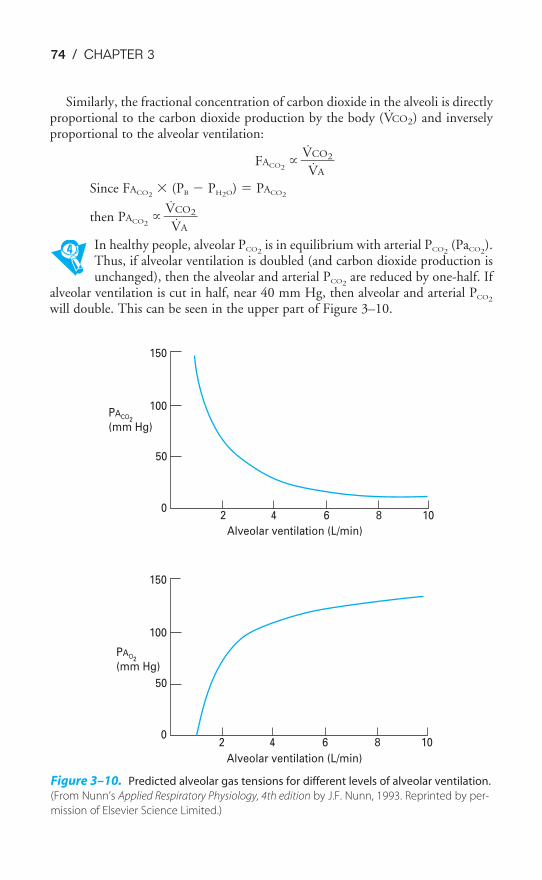
0
50
100
150
0
50
100
150
2 4 6 8 10
2 4 6 8 10
Alveolar ventilation (L/min)
PAO2
(mm Hg)
PACO2
(mm Hg)
Alveolar ventilation (L/min)
Figure 3–10. Predicted alveolar gas tensions for different levels of alveolar ventilation.
(From Nunn’s Applied Respiratory Physiology, 4th edition by J.F. Nunn, 1993. Reprinted by per-
mission of Elsevier Science Limited.)
74 / CHAPTER 3
Similarly, the fractional concentration of carbon dioxide in the alveoli is directlyproportional to the carbon dioxide production by the body (V̇CO2) and inverselyproportional to the alveolar ventilation:
FACO2�
˙�V
V̇
C
A
O2�
Since FACO2� (PB � PH2O) � PACO2
then PACO2�
˙�V
V̇
C
A
O2�
In healthy people, alveolar PCO2is in equilibrium with arterial PCO2
(PaCO2).
Thus, if alveolar ventilation is doubled (and carbon dioxide production isunchanged), then the alveolar and arterial PCO2
are reduced by one-half. Ifalveolar ventilation is cut in half, near 40 mm Hg, then alveolar and arterial PCO2
will double. This can be seen in the upper part of Figure 3–10.
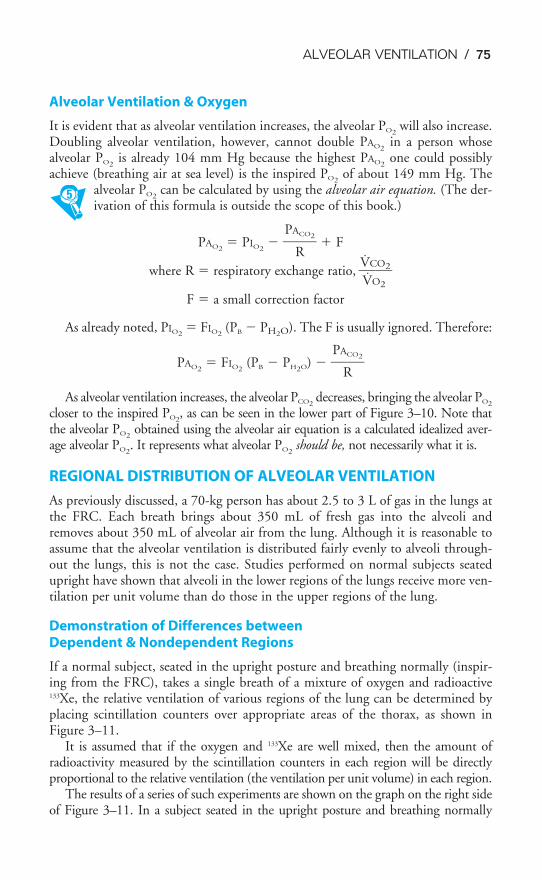
ALVEOLAR VENTILATION / 75
Alveolar Ventilation & Oxygen
It is evident that as alveolar ventilation increases, the alveolar PO2will also increase.
Doubling alveolar ventilation, however, cannot double PAO2in a person whose
alveolar PO2is already 104 mm Hg because the highest PAO2
one could possiblyachieve (breathing air at sea level) is the inspired PO2
of about 149 mm Hg. Thealveolar PO2
can be calculated by using the alveolar air equation. (The der-ivation of this formula is outside the scope of this book.)
PAO2� PIO2
� �PA
R
CO2� � F
where R � respiratory exchange ratio,˙�V
V̇
C
O
O
2
2�
F � a small correction factor
As already noted, PIO2� FIO2
(PB � PH2O). The F is usually ignored. Therefore:
PAO2� FIO2
(PB � PH2O) � �PA
R
CO2�
As alveolar ventilation increases, the alveolar PCO2decreases, bringing the alveolar PO2
closer to the inspired PO2, as can be seen in the lower part of Figure 3–10. Note that
the alveolar PO2obtained using the alveolar air equation is a calculated idealized aver-
age alveolar PO2. It represents what alveolar PO2
should be, not necessarily what it is.
REGIONAL DISTRIBUTION OF ALVEOLAR VENTILATION
As previously discussed, a 70-kg person has about 2.5 to 3 L of gas in the lungs atthe FRC. Each breath brings about 350 mL of fresh gas into the alveoli andremoves about 350 mL of alveolar air from the lung. Although it is reasonable toassume that the alveolar ventilation is distributed fairly evenly to alveoli through-out the lungs, this is not the case. Studies performed on normal subjects seatedupright have shown that alveoli in the lower regions of the lungs receive more ven-tilation per unit volume than do those in the upper regions of the lung.
Demonstration of Differences between Dependent & Nondependent Regions
If a normal subject, seated in the upright posture and breathing normally (inspir-ing from the FRC), takes a single breath of a mixture of oxygen and radioactive133Xe, the relative ventilation of various regions of the lung can be determined byplacing scintillation counters over appropriate areas of the thorax, as shown inFigure 3–11.
It is assumed that if the oxygen and 133Xe are well mixed, then the amount ofradioactivity measured by the scintillation counters in each region will be directlyproportional to the relative ventilation (the ventilation per unit volume) in each region.
The results of a series of such experiments are shown on the graph on the right sideof Figure 3–11. In a subject seated in the upright posture and breathing normally
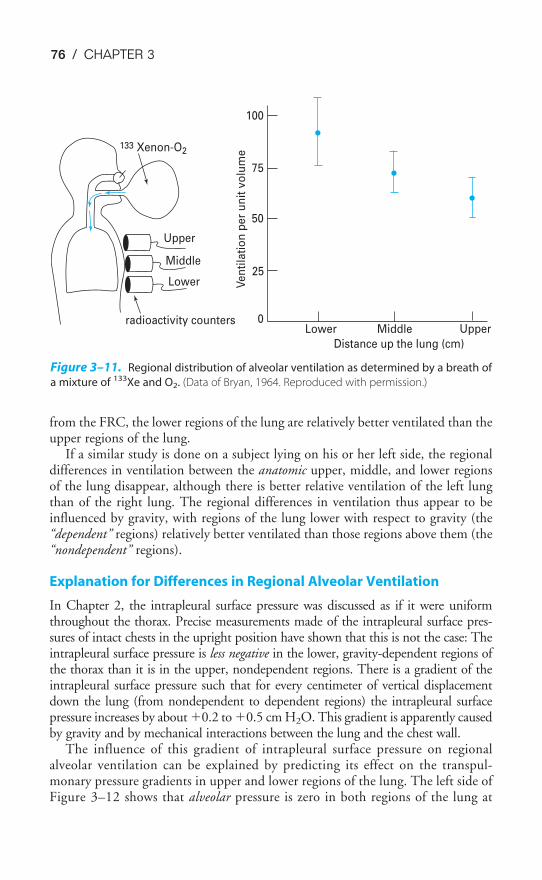
76 / CHAPTER 3
from the FRC, the lower regions of the lung are relatively better ventilated than theupper regions of the lung.
If a similar study is done on a subject lying on his or her left side, the regionaldifferences in ventilation between the anatomic upper, middle, and lower regionsof the lung disappear, although there is better relative ventilation of the left lungthan of the right lung. The regional differences in ventilation thus appear to beinfluenced by gravity, with regions of the lung lower with respect to gravity (the“dependent” regions) relatively better ventilated than those regions above them (the“nondependent” regions).
Explanation for Differences in Regional Alveolar Ventilation
In Chapter 2, the intrapleural surface pressure was discussed as if it were uniformthroughout the thorax. Precise measurements made of the intrapleural surface pres-sures of intact chests in the upright position have shown that this is not the case: Theintrapleural surface pressure is less negative in the lower, gravity-dependent regions ofthe thorax than it is in the upper, nondependent regions. There is a gradient of theintrapleural surface pressure such that for every centimeter of vertical displacementdown the lung (from nondependent to dependent regions) the intrapleural surfacepressure increases by about �0.2 to �0.5 cm H2O. This gradient is apparently causedby gravity and by mechanical interactions between the lung and the chest wall.
The influence of this gradient of intrapleural surface pressure on regionalalveolar ventilation can be explained by predicting its effect on the transpul-monary pressure gradients in upper and lower regions of the lung. The left side ofFigure 3–12 shows that alveolar pressure is zero in both regions of the lung at
radioactivity counters
Lower
Middle
Upper
133 Xenon-O2
100
75
50
25
0
Ven
tila
tio
n p
er
un
it v
olu
me
Lower Middle Upper
Distance up the lung (cm)
Figure 3–11. Regional distribution of alveolar ventilation as determined by a breath of
a mixture of 133Xe and O2. (Data of Bryan, 1964. Reproduced with permission.)
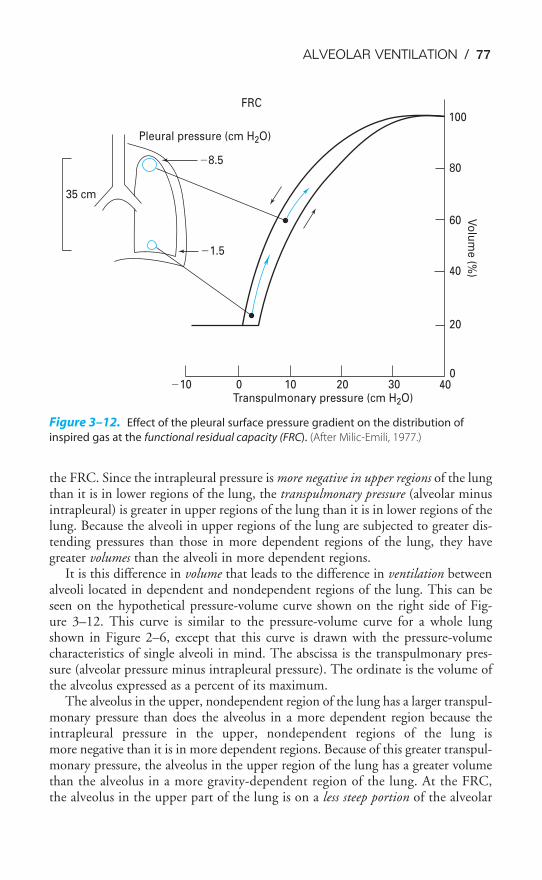
ALVEOLAR VENTILATION / 77
the FRC. Since the intrapleural pressure is more negative in upper regions of the lungthan it is in lower regions of the lung, the transpulmonary pressure (alveolar minusintrapleural) is greater in upper regions of the lung than it is in lower regions of thelung. Because the alveoli in upper regions of the lung are subjected to greater dis-tending pressures than those in more dependent regions of the lung, they havegreater volumes than the alveoli in more dependent regions.
It is this difference in volume that leads to the difference in ventilation betweenalveoli located in dependent and nondependent regions of the lung. This can beseen on the hypothetical pressure-volume curve shown on the right side of Fig-ure 3–12. This curve is similar to the pressure-volume curve for a whole lungshown in Figure 2–6, except that this curve is drawn with the pressure-volumecharacteristics of single alveoli in mind. The abscissa is the transpulmonary pres-sure (alveolar pressure minus intrapleural pressure). The ordinate is the volume ofthe alveolus expressed as a percent of its maximum.
The alveolus in the upper, nondependent region of the lung has a larger transpul-monary pressure than does the alveolus in a more dependent region because theintrapleural pressure in the upper, nondependent regions of the lung ismore negative than it is in more dependent regions. Because of this greater transpul-monary pressure, the alveolus in the upper region of the lung has a greater volumethan the alveolus in a more gravity-dependent region of the lung. At the FRC,the alveolus in the upper part of the lung is on a less steep portion of the alveolar
�10 0 10 20 30 400
20
40
60
80
100
Vo
lum
e (%
)
Transpulmonary pressure (cm H2O)
35 cm
�8.5
�1.5
FRC
Pleural pressure (cm H2O)
Figure 3–12. Effect of the pleural surface pressure gradient on the distribution of
inspired gas at the functional residual capacity (FRC). (After Milic-Emili, 1977.)
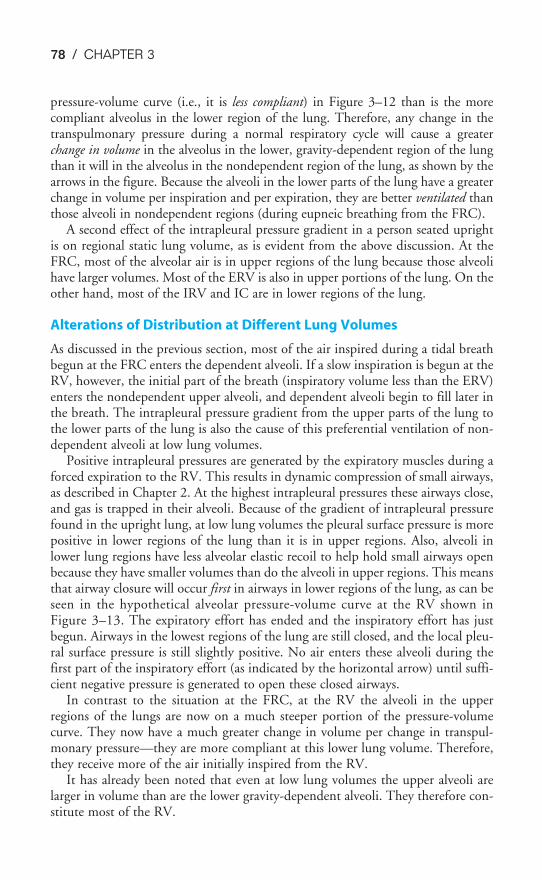
78 / CHAPTER 3
pressure-volume curve (i.e., it is less compliant) in Figure 3–12 than is the morecompliant alveolus in the lower region of the lung. Therefore, any change in thetranspulmonary pressure during a normal respiratory cycle will cause a greaterchange in volume in the alveolus in the lower, gravity-dependent region of the lungthan it will in the alveolus in the nondependent region of the lung, as shown by thearrows in the figure. Because the alveoli in the lower parts of the lung have a greaterchange in volume per inspiration and per expiration, they are better ventilated thanthose alveoli in nondependent regions (during eupneic breathing from the FRC).
A second effect of the intrapleural pressure gradient in a person seated uprightis on regional static lung volume, as is evident from the above discussion. At theFRC, most of the alveolar air is in upper regions of the lung because those alveolihave larger volumes. Most of the ERV is also in upper portions of the lung. On theother hand, most of the IRV and IC are in lower regions of the lung.
Alterations of Distribution at Different Lung Volumes
As discussed in the previous section, most of the air inspired during a tidal breathbegun at the FRC enters the dependent alveoli. If a slow inspiration is begun at theRV, however, the initial part of the breath (inspiratory volume less than the ERV)enters the nondependent upper alveoli, and dependent alveoli begin to fill later inthe breath. The intrapleural pressure gradient from the upper parts of the lung tothe lower parts of the lung is also the cause of this preferential ventilation of non-dependent alveoli at low lung volumes.
Positive intrapleural pressures are generated by the expiratory muscles during aforced expiration to the RV. This results in dynamic compression of small airways,as described in Chapter 2. At the highest intrapleural pressures these airways close,and gas is trapped in their alveoli. Because of the gradient of intrapleural pressurefound in the upright lung, at low lung volumes the pleural surface pressure is morepositive in lower regions of the lung than it is in upper regions. Also, alveoli inlower lung regions have less alveolar elastic recoil to help hold small airways openbecause they have smaller volumes than do the alveoli in upper regions. This meansthat airway closure will occur first in airways in lower regions of the lung, as can beseen in the hypothetical alveolar pressure-volume curve at the RV shown inFigure 3–13. The expiratory effort has ended and the inspiratory effort has justbegun. Airways in the lowest regions of the lung are still closed, and the local pleu-ral surface pressure is still slightly positive. No air enters these alveoli during thefirst part of the inspiratory effort (as indicated by the horizontal arrow) until suffi-cient negative pressure is generated to open these closed airways.
In contrast to the situation at the FRC, at the RV the alveoli in the upperregions of the lungs are now on a much steeper portion of the pressure-volumecurve. They now have a much greater change in volume per change in transpul-monary pressure—they are more compliant at this lower lung volume. Therefore,they receive more of the air initially inspired from the RV.
It has already been noted that even at low lung volumes the upper alveoli arelarger in volume than are the lower gravity-dependent alveoli. They therefore con-stitute most of the RV.
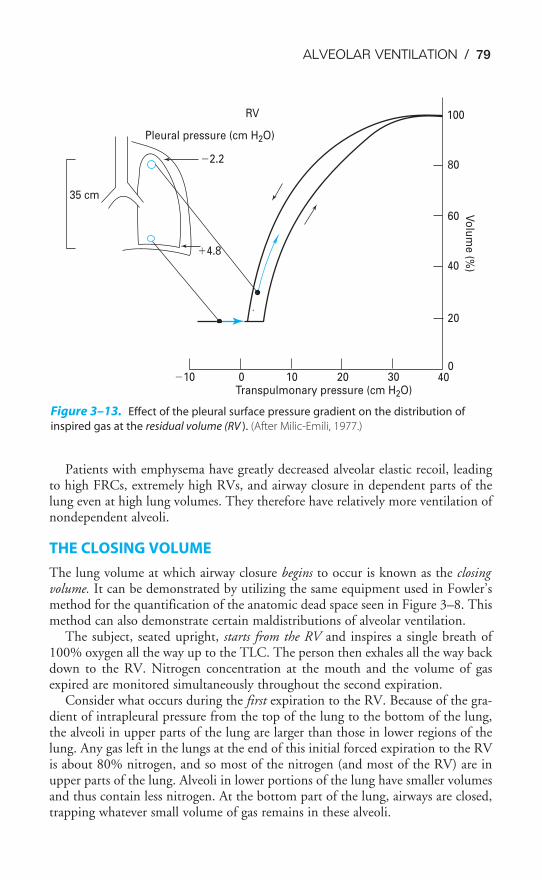
ALVEOLAR VENTILATION / 79
Patients with emphysema have greatly decreased alveolar elastic recoil, leadingto high FRCs, extremely high RVs, and airway closure in dependent parts of thelung even at high lung volumes. They therefore have relatively more ventilation ofnondependent alveoli.
THE CLOSING VOLUME
The lung volume at which airway closure begins to occur is known as the closingvolume. It can be demonstrated by utilizing the same equipment used in Fowler’smethod for the quantification of the anatomic dead space seen in Figure 3–8. Thismethod can also demonstrate certain maldistributions of alveolar ventilation.
The subject, seated upright, starts from the RV and inspires a single breath of100% oxygen all the way up to the TLC. The person then exhales all the way backdown to the RV. Nitrogen concentration at the mouth and the volume of gasexpired are monitored simultaneously throughout the second expiration.
Consider what occurs during the first expiration to the RV. Because of the gra-dient of intrapleural pressure from the top of the lung to the bottom of the lung,the alveoli in upper parts of the lung are larger than those in lower regions of thelung. Any gas left in the lungs at the end of this initial forced expiration to the RVis about 80% nitrogen, and so most of the nitrogen (and most of the RV) are inupper parts of the lung. Alveoli in lower portions of the lung have smaller volumesand thus contain less nitrogen. At the bottom part of the lung, airways are closed,trapping whatever small volume of gas remains in these alveoli.
�10 0 10 20 30 400
20
40
60
80
100
Vo
lum
e (%
)
Transpulmonary pressure (cm H2O)
35 cm
�2.2
�4.8
RV
Pleural pressure (cm H2O)
Figure 3–13. Effect of the pleural surface pressure gradient on the distribution of
inspired gas at the residual volume (RV ). (After Milic-Emili, 1977.)
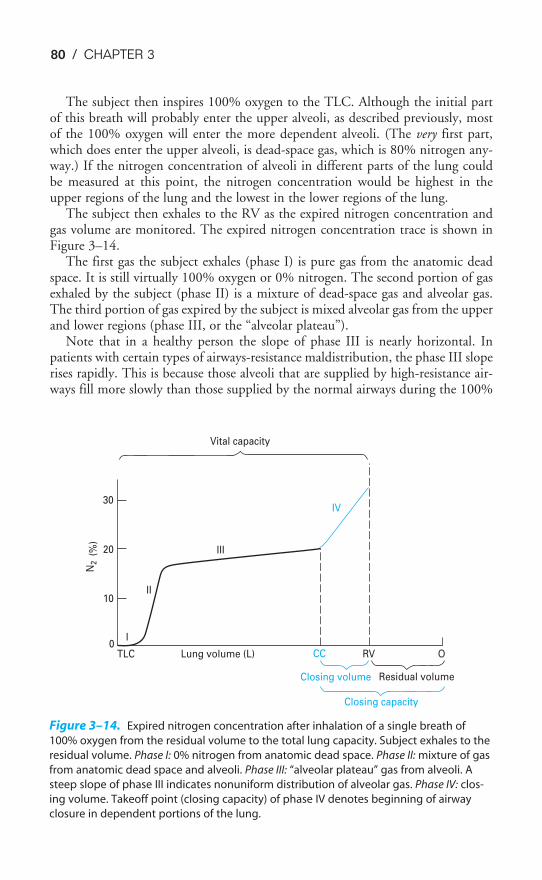
0
10
20
30
N2
(%
)
TLC
I
Lung volume (L) CC RV O
Closing volume Residual volume
Closing capacity
Vital capacity
IV
III
II
Figure 3–14. Expired nitrogen concentration after inhalation of a single breath of
100% oxygen from the residual volume to the total lung capacity. Subject exhales to the
residual volume. Phase I: 0% nitrogen from anatomic dead space. Phase II: mixture of gas
from anatomic dead space and alveoli. Phase III: “alveolar plateau” gas from alveoli. A
steep slope of phase III indicates nonuniform distribution of alveolar gas. Phase IV: clos-
ing volume. Takeoff point (closing capacity) of phase IV denotes beginning of airway
closure in dependent portions of the lung.
80 / CHAPTER 3
The subject then inspires 100% oxygen to the TLC. Although the initial partof this breath will probably enter the upper alveoli, as described previously, mostof the 100% oxygen will enter the more dependent alveoli. (The very first part,which does enter the upper alveoli, is dead-space gas, which is 80% nitrogen any-way.) If the nitrogen concentration of alveoli in different parts of the lung couldbe measured at this point, the nitrogen concentration would be highest in theupper regions of the lung and the lowest in the lower regions of the lung.
The subject then exhales to the RV as the expired nitrogen concentration andgas volume are monitored. The expired nitrogen concentration trace is shown inFigure 3–14.
The first gas the subject exhales (phase I) is pure gas from the anatomic deadspace. It is still virtually 100% oxygen or 0% nitrogen. The second portion of gasexhaled by the subject (phase II) is a mixture of dead-space gas and alveolar gas.The third portion of gas expired by the subject is mixed alveolar gas from the upperand lower regions (phase III, or the “alveolar plateau”).
Note that in a healthy person the slope of phase III is nearly horizontal. Inpatients with certain types of airways-resistance maldistribution, the phase III sloperises rapidly. This is because those alveoli that are supplied by high-resistance air-ways fill more slowly than those supplied by the normal airways during the 100%
ALVEOLAR VENTILATION / 81
oxygen inspiration. Thus, they have a relatively higher nitrogen concentration.During expiration they empty more slowly, and when they do, the expired nitro-gen concentration rises.
As the expiration to the RV continues, the positive pleural surface pressurecauses dynamic compression and ultimately airway closure. Because of the intra-pleural pressure gradient from the upper parts of the lung to the lower parts of thelung and because the smaller alveoli in lower parts of the lung have less elasticrecoil, the airway closure first occurs in lower regions of the lung where the nitro-gen concentration is the lowest. Thus, as airway closure begins, the expired nitro-gen concentration rises abruptly because more and more of the expired gas iscoming from alveoli in upper regions of the lung. These alveoli have the highestnitrogen concentration. The point at which the expired nitrogen concentrationtrace rises abruptly is the volume at which airway closure in dependent parts of thelung begins. At this point, the subject is at his or her closing capacity, which is equalto the RV plus the volume expired between the beginning of airway closure andthe RV. This volume is called the closing volume. (Unfortunately, many people, theauthor included, commonly use the terms closing volume and closing capacityinterchangeably.)
THE EFFECTS OF AGING
Aging causes important changes in the structure and function of the respiratory sys-tem. These include a loss of alveolar elastic recoil, alterations in chest wall structurecausing it to have increased outward elastic recoil, decreased respiratory musclestrength, and a loss of alveolar surface area and pulmonary capillary blood volume.
The progressive loss of alveolar elastic recoil, combined with calcification ofcostal cartilages, decreased spaces between the spinal vertebrae, and a greaterdegree of spinal curvature, leads to increased static lung compliance and decreasedchest wall compliance. This usually leads to an increase in the FRC with aging, asshown in Figure 3–15. The TLC, if adjusted for the decrease in height seen inolder people, stays fairly constant with age.
Loss of alveolar elastic recoil results in decreased traction on small airways tooppose dynamic compression during forced expirations, as well as decreased driv-ing pressures for airflow. This leads to airway closure at higher lung volumes, asshown by the rising closing capacity illustrated in Figure 3–15, and, combinedwith a decrease in the strength of the expiratory muscles, leads to an increase inthe RV and decreased maximal expiratory airflow rates such as the FEF25–75% andFEV1. As shown in Figure 3–15, airway closure may occur in dependent airwaysof the elderly even at lung volumes above the FRC. Such older persons may there-fore have relatively more ventilation of upper airways than do younger individu-als. If blood flow to these poorly ventilated dependent regions is not reduced, thiswill lead to decreased arterial oxygen tension, which will be discussed in Chap-ter 5. The loss of alveolar surface area and decreased pulmonary capillary bloodvolume result in a decreased pulmonary diffusing capacity, which will be discussedin Chapter 6. This can also contribute to a progressive decrease in arterial oxygentension with aging.
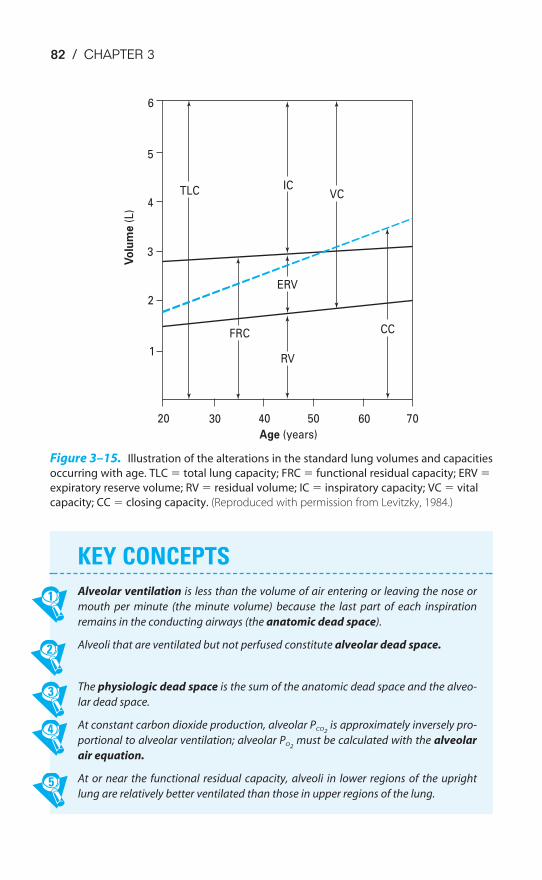
KEY CONCEPTS
Alveolar ventilation is less than the volume of air entering or leaving the nose or
mouth per minute (the minute volume) because the last part of each inspiration
remains in the conducting airways (the anatomic dead space).
Alveoli that are ventilated but not perfused constitute alveolar dead space.
The physiologic dead space is the sum of the anatomic dead space and the alveo-
lar dead space.
At constant carbon dioxide production, alveolar PCO2is approximately inversely pro-
portional to alveolar ventilation; alveolar PO2must be calculated with the alveolar
air equation.
At or near the functional residual capacity, alveoli in lower regions of the upright
lung are relatively better ventilated than those in upper regions of the lung.
82 / CHAPTER 3
6
5
4TLC
3
2
1
FRC
20 30 40 50 60 70
Age (years)
Vo
lum
e (
L)
ERV
VCIC
RV
CC
Figure 3–15. Illustration of the alterations in the standard lung volumes and capacities
occurring with age. TLC � total lung capacity; FRC � functional residual capacity; ERV �
expiratory reserve volume; RV � residual volume; IC � inspiratory capacity; VC � vital
capacity; CC � closing capacity. (Reproduced with permission from Levitzky, 1984.)
ALVEOLAR VENTILATION / 83
3–1. Which of the following conditions are reasonable explanations for a patient’s functional
residual capacity that is significantly less than predicted?
a. Third trimester of pregnancy
b. Pulmonary fibrosis
c. Obesity
d. Emphysema
e. All of the above
f. a, b, and c
3–2. What is the effect on each of the following standard lung volumes and capacities of
changing from a supine to an upright position?
Functional residual capacity (FRC)
Residual volume (RV)
Expiratory reserve volume (ERV)
Total lung capacity (TLC)
Tidal volume VT
Inspiratory reserve volume (IRV)
Inspiratory capacity (IC)
Vital capacity (VC)
3–3. How would the predicted values for the standard lung volumes and capacities and the
closing capacity of a healthy elderly person differ from those of a young healthy person?
3–4. A volume of 1 L of gas is measured in a spirometer at 23°C (296 K; PH2O is 21 mm Hg), and
barometric pressure is 770 mm Hg.
a. What would the volume be under STPD conditions?
b. What would the volume be under BTPS conditions?
3–5. A subject starts at her FRC and breathes 100% O2 through a one-way valve. The expired
air is collected in a very large spirometer (called a Tissot spirometer). The test is contin-
ued until the expired N2 concentration, as measured by a nitrogen analyzer, is virtually
zero. At this time there are 36 L of gas in the spirometer, of which 5.6% is N2. What is the
subject’s FRC?
3–6. A 63-year-old-woman who is 5 ft 5 in tall and weighs 100 lb complains of dyspnea.
During the determination of her lung volumes, she rebreathes the gas in a 20-L-capacity
spirometer that originally contained 10 L of 15% helium. After a number of breaths, the
concentration of helium in her lungs is equal to that now in the spirometer, which is 11%
helium. (During the equilibration period, the expired CO2 was absorbed by an absorbent
chemical in the spirometer and O2 was added to the spirometer at the subject’s V̇O2.) At
the end of a normal expiration, the spirometer contains 10.64 L when corrected to BTPS.
What is her FRC?
3–7. The same patient discussed in the previous problem, now in a body plethysmograph,
breathes normally through a mouthpiece. At the end of a normal expiration, a valve in
the mouthpiece is closed. The next inspiratory effort is made against the closed valve.
Additional air cannot enter the lungs; instead, the inspiratory effort lowers the pressure
CLINICAL PROBLEMS
84 / CHAPTER 3
at the mouth by 10 mm Hg and expands the gas in the lungs by 50 mL, as determined
by the increase in the plethysmograph pressure and its calibration curve with the sub-
ject in the box. What is the patient’s FRC measured with this technique?
3–8. How do you explain the difference between the two FRCs obtained for this patient?
3–9. A patient on a ventilator has a rate of 10 breaths per minute and a tidal volume (VT) of
500 mL.
a. What is the patient’s V̇E?
b. If the patient’s anatomic dead space is estimated to be 150 mL, what is his V̇A?
c. If his rate is increased to 15 breaths per minute with VT remaining at 500 mL, what
will his new V̇E and V̇A be?
d. If his VT is increased to 750 mL, with his rate remaining at 10 breaths per minute,
what will his new V̇E and V̇A be?
3–10. The following measurements were made on a patient when the barometric pressure
was 747 mm Hg:
PACO2� 40 mm Hg
FE�CO2� 0.04
V̇E � �m
6
i
L
n�
breathing frequency ��12 b
m
re
in
aths�
where FE�CO2� fractional concentration of CO2 in the subject’s mixed expired air.
What is the patient’s VD/VT? What is the patient’s physiologic dead space? Assuming
the patient’s anatomic dead space is 100 mL, what is her alveolar dead space? Is this
patient’s arterial PCO2likely to be lower than, greater than, or equal to her end-tidal PCO2
?
3–11. A person with a PACO2of 40 mm Hg, a PAO2
of 104 mm Hg, and a respiratory exchange
ratio of 0.8 breathing room air at a barometric pressure of 760 mm Hg doubles alveolar
ventilation. What will this person’s new steady-state PACO2and PAO2
be (assuming no
change in oxygen consumption and carbon dioxide production and assuming that the
correction factor [F] � 0)?
3–12. A normal person, seated upright, begins to inspire from the residual volume. The first
100 mL of inspired gas is labeled with xenon 133. Most of this radioactive gas (i.e., the
first 100 mL of gas inspired after the dead space) will probably be found:
a. in alveoli in lower portions of the lung.
b. in alveoli in upper portions of the lung.
c. uniformly distributed to all alveoli.
SUGGESTED READINGS
Bryan AC, Bentivoglio LG, Beerel F, MacLeish H, Zidulka A, Bates DV. Factors affecting regional distri-bution of ventilation and perfusion in the lung. J Appl Physiol. 1964;19:395–402.
Cotes JE. Lung Function: Assessment and Application in Medicine. 4th ed. Oxford: Blackwell; 1979.
Forster RE II, Dubois AB, Briscoe WA, Fisher AB. The Lung: Physiologic Basis of Pulmonary Function Tests.3rd ed. Chicago, Ill: Year Book; 1986.
ALVEOLAR VENTILATION / 85
Levitzky MG. The effect of aging on the respiratory system. Physiologist. 1984;27:102–107.
Macklem PT, Murphy BR. The forces applied to the lung in health and disease. Am J Med.1974;57:371–377.
Milic-Emili J. Ventilation. In: West JB, ed. Regional Differences in the Lung. New York, NY: Academic Press;1977:167–199.
Milic-Emili J. Pulmonary statics. In: Widdicombe JG, ed. MTP International Review of Sciences: RespiratoryPhysiology. London, England: Butterworth; 1974:105–137.
Milic-Emili J. Static distribution of lung volumes. In: Macklem PT, Mead J, eds. Mechanics of Breathing,part 2, Handbook of Physiology, sec 3: The Respiratory System. Bethesda, Md: American PhysiologicalSociety; 1986;3:561–574.
Murray JF. The Normal Lung. 2nd ed. Philadelphia, Pa: WB Saunders and Company; 1986:108–117,339–358.
Palecek F. Hyperinflation: Control of Functional Residual Capacity. Physiol Res. 2001;50:221–230.
Nunn JF. Nunn’s Applied Respiratory Physiology. 4th ed. Oxford: Butterworth-Heinemann; 1993:117–134,156–163.
Watson RA, Pride NB. Postural changes in lung volumes and respiratory resistance in subjects with obesity.J Appl Physiol. 2005;98:512–517.
West JB. Ventilation/Blood Flow and Gas Exchange. 5th ed. Oxford: Blackwell; 1990:25–29.
86
The lung receives blood flow via both the bronchial circulation and the pulmonarycirculation. Bronchial blood flow constitutes a very small portion of the output ofthe left ventricle and supplies part of the tracheobronchial tree with systemic arte-rial blood. Pulmonary blood flow constitutes the entire output of the right ventricleand supplies the lung with the mixed venous blood draining all the tissues of thebody. It is this blood that undergoes gas exchange with the alveolar air in the pul-monary capillaries. Because the right and left ventricles are arranged in series in
4Blood Flow to the Lung
OBJECTIVES
The reader knows the structure, function, distribution, and control of the blood supplyof the lung.
� Compares and contrasts the bronchial circulation and the pulmonary circulation.
� Describes the anatomy of the pulmonary circulation, and explains its physiologicconsequences.
� Compares and contrasts the pulmonary circulation and the systemic circulation.
� Describes and explains the effects of lung volume on pulmonary vascular resis-tance.
� Describes and explains the effects of elevated intravascular pressures on pul-monary vascular resistance.
� Lists the neural and humoral factors that influence pulmonary vascular resistance.
� Describes the effect of gravity on pulmonary blood flow.
� Describes the interrelationships of alveolar pressure, pulmonary arterial pressure,and pulmonary venous pressure, as well as their effects on the regional distributionof pulmonary blood flow.
� Predicts the effects of alterations in alveolar pressure, pulmonary arterial andvenous pressure, and body position on the regional distribution of pulmonaryblood flow.
� Describes hypoxic pulmonary vasoconstriction and discusses its role in localizedand widespread alveolar hypoxia.
� Describes the causes and consequences of pulmonary edema.
Copyright © 2007 by The McGraw-Hill Companies, Inc. Click here for terms of use.
BLOOD FLOW TO THE LUNG / 87
normal adults, pulmonary blood flow is approximately equal to 100% of the out-put of the left ventricle. That is, pulmonary blood flow is equal to the cardiac out-put—normally about 3.5 L/min/m2 of body surface area at rest.
There is about 250 to 300 mL of blood per square meter of body surface areain the pulmonary circulation. About 60 to 70 mL/m2 of this blood is located inthe pulmonary capillaries. It takes a red blood cell about 4 to 5 seconds to travelthrough the pulmonary circulation at resting cardiac outputs; about 0.75 of a sec-ond of this time is spent in pulmonary capillaries. Pulmonary capillaries have aver-age diameters of around 6 �m; that is, they are slightly smaller than the averageerythrocyte, which has a diameter of about 8 �m. Erythrocytes must thereforechange their shape slightly as they pass through the pulmonary capillaries. Anerythrocyte passes through a number of pulmonary capillaries as it travels throughthe lung. Gas exchange starts to take place in smaller pulmonary arterial vessels,which are not truly capillaries by histologic standards. These arterial segments andsuccessive capillaries may be thought of as functional pulmonary capillaries. In mostcases in this book, pulmonary capillaries refer to functional pulmonary capillariesrather than to anatomic capillaries.
About 280 billion pulmonary capillaries supply the approximately 300 millionalveoli, resulting in a potential surface area for gas exchange estimated to be 50 to100 m2. As was shown in Figure 1–3, the alveoli are completely enveloped in pul-monary capillaries. The capillaries are so close to one another that some researchershave described pulmonary capillary blood flow as resembling blood flowingthrough two parallel sheets of endothelium held together by occasional connectivetissue supports.
THE BRONCHIAL CIRCULATION
The bronchial arteries arise variably, either directly from the aorta or from theintercostal arteries. They supply arterial blood to the tracheobronchial tree and toother structures of the lung down to the level of the terminal bronchioles. Theyalso provide blood flow to the hilar lymph nodes, visceral pleura, pulmonary arter-ies and veins, vagus, and esophagus. Lung structures distal to the terminal bron-chioles, including the respiratory bronchioles, alveolar ducts, alveolar sacs, andalveoli, receive oxygen directly by diffusion from the alveolar air and nutrientsfrom the mixed venous blood in the pulmonary circulation. The bronchial circu-lation may be important in the “air-conditioning” of inspired air, which is dis-cussed in Chapter 10.
The blood flow in the bronchial circulation constitutes about 2% of the outputof the left ventricle. Blood pressure in the bronchial arteries is the same as that inthe other systemic arteries (disregarding differences due to hydrostatic effects,which will be discussed later in this chapter). This is much higher than the bloodpressure in the pulmonary arteries (Figure 4–1). The reasons for this difference willbe discussed in the next section.
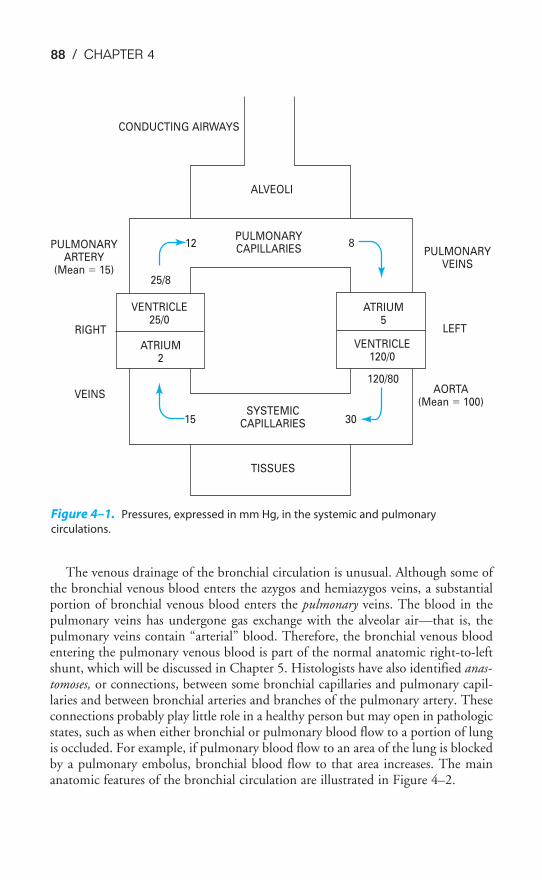
88 / CHAPTER 4
The venous drainage of the bronchial circulation is unusual. Although some ofthe bronchial venous blood enters the azygos and hemiazygos veins, a substantialportion of bronchial venous blood enters the pulmonary veins. The blood in thepulmonary veins has undergone gas exchange with the alveolar air—that is, thepulmonary veins contain “arterial” blood. Therefore, the bronchial venous bloodentering the pulmonary venous blood is part of the normal anatomic right-to-leftshunt, which will be discussed in Chapter 5. Histologists have also identified anas-tomoses, or connections, between some bronchial capillaries and pulmonary capil-laries and between bronchial arteries and branches of the pulmonary artery. Theseconnections probably play little role in a healthy person but may open in pathologicstates, such as when either bronchial or pulmonary blood flow to a portion of lungis occluded. For example, if pulmonary blood flow to an area of the lung is blockedby a pulmonary embolus, bronchial blood flow to that area increases. The mainanatomic features of the bronchial circulation are illustrated in Figure 4–2.
CONDUCTING AIRWAYS
ALVEOLI
PULMONARYARTERY
(Mean � 15)
PULMONARYCAPILLARIES
12 8
25/8
VENTRICLE25/0
ATRIUM2
ATRIUM5
VENTRICLE120/0
120/80
15 30SYSTEMIC
CAPILLARIES
TISSUES
PULMONARYVEINS
RIGHT
VEINS
LEFT
AORTA(Mean � 100)
Figure 4–1. Pressures, expressed in mm Hg, in the systemic and pulmonary
circulations.
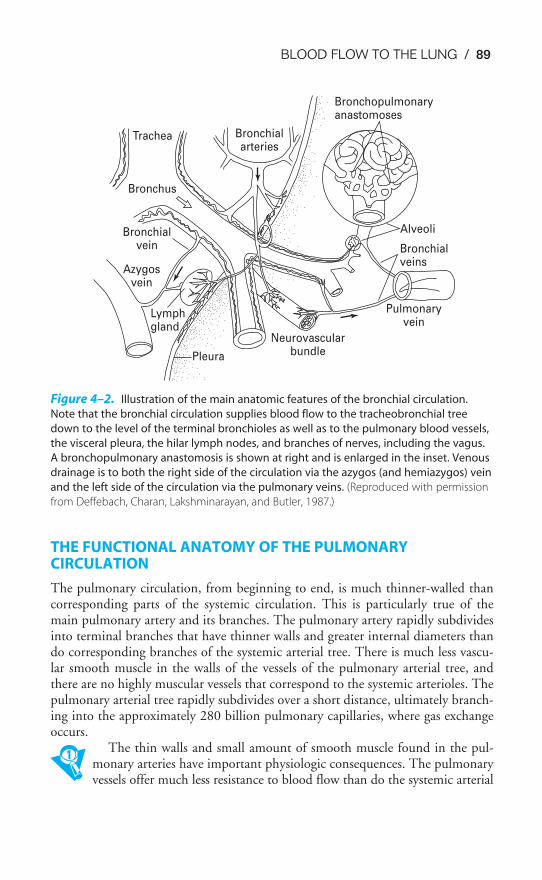
BLOOD FLOW TO THE LUNG / 89
THE FUNCTIONAL ANATOMY OF THE PULMONARYCIRCULATION
The pulmonary circulation, from beginning to end, is much thinner-walled thancorresponding parts of the systemic circulation. This is particularly true of themain pulmonary artery and its branches. The pulmonary artery rapidly subdividesinto terminal branches that have thinner walls and greater internal diameters thando corresponding branches of the systemic arterial tree. There is much less vascu-lar smooth muscle in the walls of the vessels of the pulmonary arterial tree, andthere are no highly muscular vessels that correspond to the systemic arterioles. Thepulmonary arterial tree rapidly subdivides over a short distance, ultimately branch-ing into the approximately 280 billion pulmonary capillaries, where gas exchangeoccurs.
The thin walls and small amount of smooth muscle found in the pul-monary arteries have important physiologic consequences. The pulmonaryvessels offer much less resistance to blood flow than do the systemic arterial
Lymphgland
Pleura
Azygosvein
Bronchialvein
Bronchus
Trachea Bronchialarteries
Bronchopulmonaryanastomoses
Alveoli
Bronchialveins
Pulmonaryvein
Neurovascularbundle
Figure 4–2. Illustration of the main anatomic features of the bronchial circulation.
Note that the bronchial circulation supplies blood flow to the tracheobronchial tree
down to the level of the terminal bronchioles as well as to the pulmonary blood vessels,
the visceral pleura, the hilar lymph nodes, and branches of nerves, including the vagus.
A bronchopulmonary anastomosis is shown at right and is enlarged in the inset. Venous
drainage is to both the right side of the circulation via the azygos (and hemiazygos) vein
and the left side of the circulation via the pulmonary veins. (Reproduced with permission
from Deffebach, Charan, Lakshminarayan, and Butler, 1987.)
90 / CHAPTER 4
vessels. They are also much more distensible and compressible than systemic arterialvessels. These factors lead to much lower intravascular pressures than those foundin the systemic arteries. The pulmonary vessels are located in the thorax and aresubject to alveolar and intrapleural pressures that can change greatly. Therefore,
factors other than the tone of the pulmonary vascular smooth muscle mayhave profound effects on pulmonary vascular resistance (PVR).
Determination of Pulmonary Vascular Resistance
PVR cannot be measured directly but must be calculated. Poiseuille’s law, whichstates that for a Newtonian fluid flowing steadily through a nondistensible tube, P1 � P2 � Q̇ � R, is usually used to estimate PVR. This can be rearranged to:
R � �P1 �
Q̇
P2�
where P1 � pressure at the beginning of the tube (in millimeters of mercury)P2 � pressure at the end of the tubeQ̇ � flow (in milliliters per minute)R � resistance (in millimeters of mercury per milliliter per minute)
For the pulmonary circulation, then,
PVR ��MPAP
P
�
BF
MLAP�
That is, the PVR is equal to the mean pulmonary artery pressure (MPAP) minusthe mean left atrial pressure (MLAP), with the result divided by pulmonary bloodflow (PBF), which is equal to the cardiac output.
This formula, however, is only an approximation because blood is not aNewtonian fluid, because pulmonary blood flow is pulsatile (and may also be tur-bulent), because the pulmonary circulation is distensible (and compressible), andbecause the pulmonary circulation is a very complex branching structure.(Remember that resistances in series add directly; resistances in parallel add asreciprocals.) Furthermore, the mean left atrial pressure may not be the effectivedownstream pressure for the calculation of PVR under all lung conditions (see thesection on zones of the lung later in this chapter).
The intravascular pressures in the pulmonary circulation are lower than those inthe systemic circulation (Figure 4–1). This is particularly striking with respect tothe arterial pressures of the two circuits.
Because the right and left circulations are in series, the outputs of the right andleft ventricles must be approximately equal to each other over the long run. (If theyare not, blood and fluid will build up in the lungs or periphery.) If the two out-puts are the same and the measured pressure drops across the systemic circulationand the pulmonary circulation are about 98 and 10 mm Hg, respectively, thenthe PVR must be about one tenth that of the systemic vascular resistance (SVR)
BLOOD FLOW TO THE LUNG / 91
(see Figure 4–1). (SVR is sometimes called TPR for total peripheral resistance.) Thislow resistance to blood flow offered by the pulmonary circulation is due to thestructural aspects of the pulmonary circulation already discussed. The pulmonaryvasculature is thinner walled, has much less vascular smooth muscle, and is gener-ally more distensible than the systemic circulation.
Distribution of Pulmonary Vascular Resistance
The distribution of pulmonary vascular resistance (PVR) can be seen by looking atthe pressure drop across each of the three major components of the pulmonary vas-culature: the pulmonary arteries, the pulmonary capillaries, and the pulmonaryveins. In Figure 4–1, the resistance is fairly evenly distributed among the threecomponents. At rest, about one third of the resistance to blood flow is located inthe pulmonary arteries, about one third is located in the pulmonary capillaries, andabout one third is located in the pulmonary veins. This is in contrast to the sys-temic circulation, in which about 70% of the resistance to blood flow is located inthe systemic arteries, mostly in the highly muscular systemic arterioles.
Consequences of Differences in Pressure between the Systemic & Pulmonary Circulations
The pressure at the bottom of a column of a liquid is proportional to the height ofthe column times the density of the liquid times gravity. Thus, when the normalmean systemic arterial blood pressure is stated to be about 100 mm Hg, the pres-sure developed in the aorta is equivalent to the pressure at the bottom of a columnof mercury that is 100 mm high (it will push a column of mercury up 100 mm).Mercury is chosen for pressure measurement when high pressures are expectedbecause it is a very dense liquid. Water is used when lower pressures are to be mea-sured because mercury is 13.6 times as dense as water. Therefore, lower pressures,such as alveolar and pleural pressures, are expressed in centimeters of water.
Nevertheless, when mean arterial blood pressure is stated to be 100 mm Hg,this is specifically with reference to the level of the left atrium. Blood pressure inthe feet of a person who is standing is much higher than 100 mm Hg because ofthe additional pressure exerted by the “column” of blood from the heart to the feet.In fact, blood pressure in the feet of a standing person of average height with amean arterial blood pressure of 100 mm Hg is likely to be about 180 mm Hg.Because venous pressure is similarly increased in the feet (about 80 mm Hg), thepressure difference between arteries and veins is unaffected. Conversely, pressuredecreases with distance above the heart (“above” with respect to gravity), so thatblood pressure at the top of the head may only be 40 to 50 mm Hg.
The left ventricle, then, must maintain a relatively high mean arterial pressurebecause such high pressures are necessary to overcome hydrostatic forces and pumpblood “uphill” to the brain. The apices of the lungs are a much shorter distanceabove the right ventricle, and so such high pressures are unnecessary.
A second consequence of the high arterial pressure in the systemic circulation isthat it allows the redistribution of left ventricular output and the control of blood
92 / CHAPTER 4
flow to different tissues. Because the left ventricle is supplying all the tissues of thebody with blood, it must be able to meet varying demands for blood flow in dif-ferent tissues under various circumstances. For example, during exercise the bloodvessels supplying the exercising muscle dilate in response to the increased localmetabolic demand (and blood flow to the skin also increases to aid in thermoreg-ulation). Blood pressure is partly maintained by increasing the resistance to bloodflow in other vascular beds. A high pressure head is thus necessary to allow suchredistributions by altering the vascular resistance to blood flow in different organs;also, these redistributions help maintain the pressure head. In the pulmonary cir-culation, redistributions of right ventricular output are usually unnecessary becauseall alveolar-capillary units that are participating in gas exchange are performing thesame function. The pressure head is low and the small amount of smooth musclein the pulmonary vessels (which is in large part responsible for the low pressurehead) makes such local redistributions unlikely. An exception to this will be seenin the section on hypoxic pulmonary vasoconstriction.
A final consequence of the pressure difference between the systemic and pul-monary circulations is that the workload of the left ventricle (stroke work equalsstroke volume times arterial pressure) is much greater than that of the right ven-tricle. The metabolic demand of the left ventricle is also much greater than that ofthe right ventricle. The difference in wall thickness of the left and right ventriclesof the adult is a reminder of the much greater workload of the left ventricle.
PULMONARY VASCULAR RESISTANCE
The relatively small amounts of vascular smooth muscle, low intravascular pres-sures, and high distensibility of the pulmonary circulation lead to a much greaterimportance of extravascular effects (“passive factors”) on PVR. Gravity, body posi-tion, lung volume, alveolar and intrapleural pressures, intravascular pressures, andright ventricular output all can have profound effects on PVR without any alter-ation in the tone of the pulmonary vascular smooth muscle.
The Concept of a Transmural Pressure Gradient
For distensible-compressible vessels, the transmural pressure gradient is an impor-tant determinant of the vessel diameter (see discussion of airways resistance inChapter 2). As the transmural pressure gradient (which is equal to pressure insideminus pressure outside) increases, the vessel diameter increases and resistance falls;as the transmural pressure decreases, the vessel diameter decreases and the resis-tance increases. Negative transmural pressure gradients lead to compression or evencollapse of the vessel.
Lung Volume & Pulmonary Vascular Resistance
Two different groups of pulmonary vessels must be considered when the effects oflung volume changes on PVR are analyzed—namely, the alveolar and extraalveolarvessels (Figure 4–3).
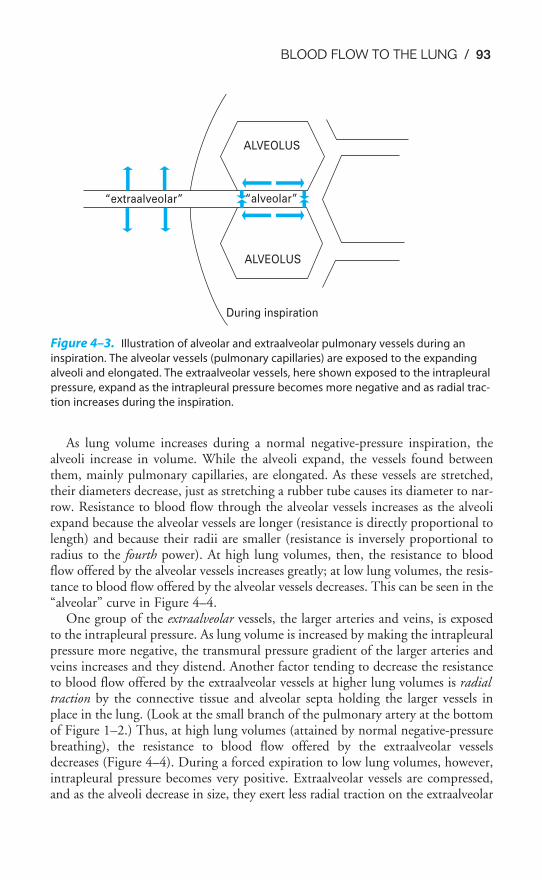
BLOOD FLOW TO THE LUNG / 93
As lung volume increases during a normal negative-pressure inspiration, thealveoli increase in volume. While the alveoli expand, the vessels found betweenthem, mainly pulmonary capillaries, are elongated. As these vessels are stretched,their diameters decrease, just as stretching a rubber tube causes its diameter to nar-row. Resistance to blood flow through the alveolar vessels increases as the alveoliexpand because the alveolar vessels are longer (resistance is directly proportional tolength) and because their radii are smaller (resistance is inversely proportional toradius to the fourth power). At high lung volumes, then, the resistance to bloodflow offered by the alveolar vessels increases greatly; at low lung volumes, the resis-tance to blood flow offered by the alveolar vessels decreases. This can be seen in the“alveolar” curve in Figure 4–4.
One group of the extraalveolar vessels, the larger arteries and veins, is exposedto the intrapleural pressure. As lung volume is increased by making the intrapleuralpressure more negative, the transmural pressure gradient of the larger arteries andveins increases and they distend. Another factor tending to decrease the resistanceto blood flow offered by the extraalveolar vessels at higher lung volumes is radialtraction by the connective tissue and alveolar septa holding the larger vessels inplace in the lung. (Look at the small branch of the pulmonary artery at the bottomof Figure 1–2.) Thus, at high lung volumes (attained by normal negative-pressurebreathing), the resistance to blood flow offered by the extraalveolar vesselsdecreases (Figure 4–4). During a forced expiration to low lung volumes, however,intrapleural pressure becomes very positive. Extraalveolar vessels are compressed,and as the alveoli decrease in size, they exert less radial traction on the extraalveolar
“extraalveolar” “alveolar”
ALVEOLUS
ALVEOLUS
During inspiration
Figure 4–3. Illustration of alveolar and extraalveolar pulmonary vessels during an
inspiration. The alveolar vessels (pulmonary capillaries) are exposed to the expanding
alveoli and elongated. The extraalveolar vessels, here shown exposed to the intrapleural
pressure, expand as the intrapleural pressure becomes more negative and as radial trac-
tion increases during the inspiration.
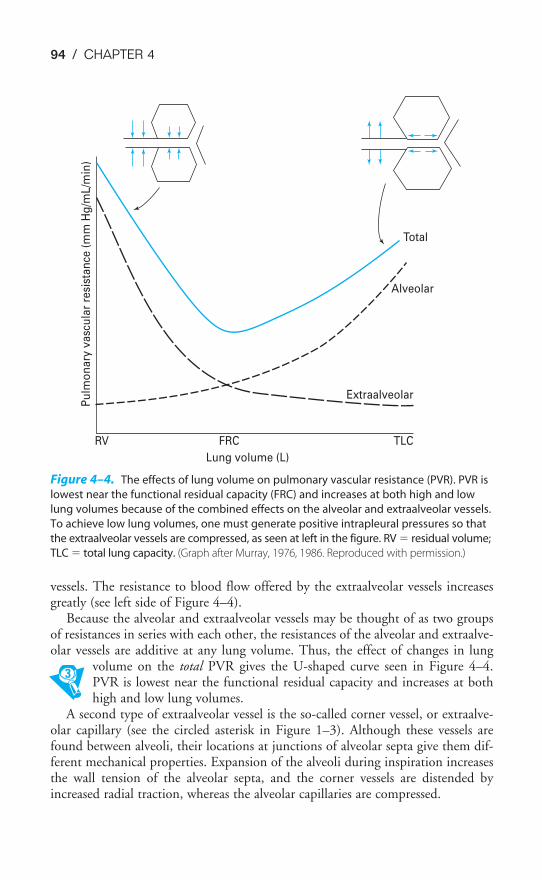
94 / CHAPTER 4
vessels. The resistance to blood flow offered by the extraalveolar vessels increasesgreatly (see left side of Figure 4–4).
Because the alveolar and extraalveolar vessels may be thought of as two groupsof resistances in series with each other, the resistances of the alveolar and extraalve-olar vessels are additive at any lung volume. Thus, the effect of changes in lung
volume on the total PVR gives the U-shaped curve seen in Figure 4–4.PVR is lowest near the functional residual capacity and increases at bothhigh and low lung volumes.
A second type of extraalveolar vessel is the so-called corner vessel, or extraalve-olar capillary (see the circled asterisk in Figure 1–3). Although these vessels arefound between alveoli, their locations at junctions of alveolar septa give them dif-ferent mechanical properties. Expansion of the alveoli during inspiration increasesthe wall tension of the alveolar septa, and the corner vessels are distended byincreased radial traction, whereas the alveolar capillaries are compressed.
Pu
lmo
nary
vasc
ula
r re
sist
an
ce (
mm
Hg
/mL/m
in)
RV FRC
Lung volume (L)
TLC
Extraalveolar
Alveolar
Total
Figure 4–4. The effects of lung volume on pulmonary vascular resistance (PVR). PVR is
lowest near the functional residual capacity (FRC) and increases at both high and low
lung volumes because of the combined effects on the alveolar and extraalveolar vessels.
To achieve low lung volumes, one must generate positive intrapleural pressures so that
the extraalveolar vessels are compressed, as seen at left in the figure. RV � residual volume;
TLC � total lung capacity. (Graph after Murray, 1976, 1986. Reproduced with permission.)
BLOOD FLOW TO THE LUNG / 95
Also note that during mechanical positive-pressure ventilation, alveolar pressure(PA) and intrapleural pressure are positive during inspiration. In this case, both thealveolar and extraalveolar vessels are compressed as lung volume increases, and theresistance to blood flow offered by both alveolar and extraalveolar vessels increasesduring lung inflation. This is especially a problem during mechanical positive-pressure ventilation with positive end-expiratory pressure (PEEP). During PEEP,airway pressure (and thus alveolar pressure) is kept positive at end expiration tohelp prevent atelectasis. In this situation, alveolar pressure and intrapleural pressureare positive during both inspiration and expiration. PVR is elevated in both alve-olar and extraalveolar vessels throughout the respiratory cycle. In addition, becauseintrapleural pressure is always positive, the other intrathoracic blood vessels aresubjected to decreased transmural pressure gradients; the venae cavae, which havelow intravascular pressure, are also compressed. If cardiovascular reflexes are unableto adjust to this situation, cardiac output may fall precipitously because ofdecreased venous return and high PVR.
Recruitment & Distention
During exercise, cardiac output can increase several-fold without a correspondinglygreat increase in mean pulmonary artery pressure. Although the mean pulmonaryartery pressure does increase, the increase is only a few millimeters of mercury, evenif cardiac output has doubled or tripled. Since the pressure drop across the pul-monary circulation is proportional to the cardiac output times the PVR (i.e.,P � Q̇ � R), this must indicate a decrease in PVR.
Like the effects of lung volume on PVR, this decrease appears to be passive—that is, it is not a result of changes in the tone of pulmonary vascular smooth mus-cle caused by neural mechanisms or humoral agents. In fact, a fall in PVR inresponse to increased blood flow or even an increase in perfusion pressure can bedemonstrated in a vascularly isolated perfused lung, as was used to obtain the datasummarized in Figure 4–5.
In this experiment, the blood vessels of the left lung of a dog were isolated, can-nulated, and perfused with a pump. The lung was ventilated with a mechanical res-pirator. Blood flow to the lung and mean pulmonary artery pressure were elevatedby increasing the pump output. As can be seen from the graph, increasing theblood flow to the lung caused a decrease in the calculated PVR. Increasing the leftatrial pressure also decreased PVR in these studies.
There are two different mechanisms that can explain this decrease inPVR in response to elevated blood flow and perfusion pressure: recruit-ment and distention (Figure 4–6).
RECRUITMENT
As indicated in the diagram, at resting cardiac outputs, not all the pulmonary cap-illaries are perfused. A substantial number of capillaries are probably unperfusedbecause of hydrostatic effects that will be discussed later in this chapter. Othersmay be unperfused because they have a relatively high critical opening pressure.
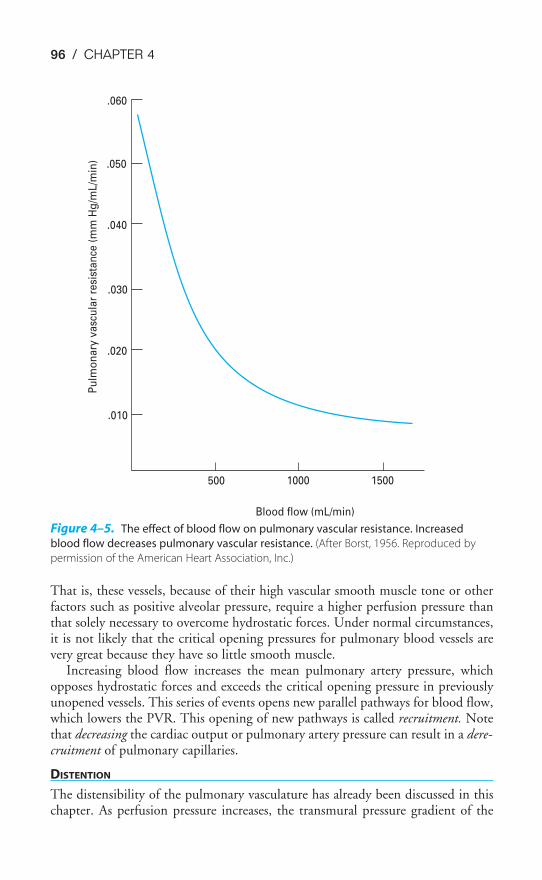
96 / CHAPTER 4
That is, these vessels, because of their high vascular smooth muscle tone or otherfactors such as positive alveolar pressure, require a higher perfusion pressure thanthat solely necessary to overcome hydrostatic forces. Under normal circumstances,it is not likely that the critical opening pressures for pulmonary blood vessels arevery great because they have so little smooth muscle.
Increasing blood flow increases the mean pulmonary artery pressure, whichopposes hydrostatic forces and exceeds the critical opening pressure in previouslyunopened vessels. This series of events opens new parallel pathways for blood flow,which lowers the PVR. This opening of new pathways is called recruitment. Notethat decreasing the cardiac output or pulmonary artery pressure can result in a dere-cruitment of pulmonary capillaries.
DISTENTION
The distensibility of the pulmonary vasculature has already been discussed in thischapter. As perfusion pressure increases, the transmural pressure gradient of the
.060
.050
.040
.030
.020
.010
500 1000 1500
Blood flow (mL/min)
Pu
lmo
na
ry v
asc
ula
r re
sist
an
ce (
mm
Hg
/mL
/min
)
Figure 4–5. The effect of blood flow on pulmonary vascular resistance. Increased
blood flow decreases pulmonary vascular resistance. (After Borst, 1956. Reproduced by
permission of the American Heart Association, Inc.)
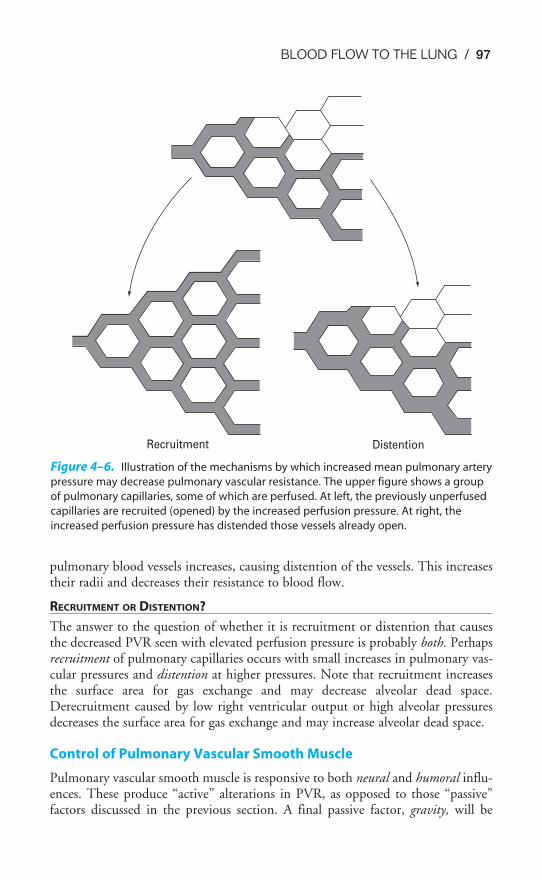
BLOOD FLOW TO THE LUNG / 97
pulmonary blood vessels increases, causing distention of the vessels. This increasestheir radii and decreases their resistance to blood flow.
RECRUITMENT OR DISTENTION?
The answer to the question of whether it is recruitment or distention that causesthe decreased PVR seen with elevated perfusion pressure is probably both. Perhapsrecruitment of pulmonary capillaries occurs with small increases in pulmonary vas-cular pressures and distention at higher pressures. Note that recruitment increasesthe surface area for gas exchange and may decrease alveolar dead space.Derecruitment caused by low right ventricular output or high alveolar pressuresdecreases the surface area for gas exchange and may increase alveolar dead space.
Control of Pulmonary Vascular Smooth Muscle
Pulmonary vascular smooth muscle is responsive to both neural and humoral influ-ences. These produce “active” alterations in PVR, as opposed to those “passive”factors discussed in the previous section. A final passive factor, gravity, will be
DistentionRecruitment
Figure 4–6. Illustration of the mechanisms by which increased mean pulmonary artery
pressure may decrease pulmonary vascular resistance. The upper figure shows a group
of pulmonary capillaries, some of which are perfused. At left, the previously unperfused
capillaries are recruited (opened) by the increased perfusion pressure. At right, the
increased perfusion pressure has distended those vessels already open.
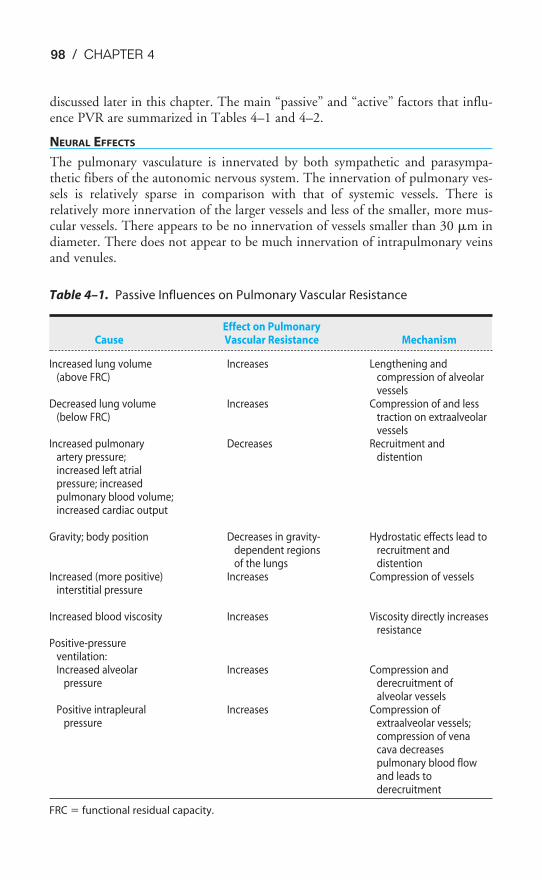
98 / CHAPTER 4
discussed later in this chapter. The main “passive” and “active” factors that influ-ence PVR are summarized in Tables 4–1 and 4–2.
NEURAL EFFECTS
The pulmonary vasculature is innervated by both sympathetic and parasympa-thetic fibers of the autonomic nervous system. The innervation of pulmonary ves-sels is relatively sparse in comparison with that of systemic vessels. There isrelatively more innervation of the larger vessels and less of the smaller, more mus-cular vessels. There appears to be no innervation of vessels smaller than 30 �m indiameter. There does not appear to be much innervation of intrapulmonary veinsand venules.
Table 4–1. Passive Influences on Pulmonary Vascular Resistance
Effect on PulmonaryCause Vascular Resistance Mechanism
Increased lung volume Increases Lengthening and(above FRC) compression of alveolar
vesselsDecreased lung volume Increases Compression of and less
(below FRC) traction on extraalveolarvessels
Increased pulmonary Decreases Recruitment andartery pressure; distentionincreased left atrialpressure; increasedpulmonary blood volume;increased cardiac output
Gravity; body position Decreases in gravity- Hydrostatic effects lead todependent regions recruitment andof the lungs distention
Increased (more positive) Increases Compression of vesselsinterstitial pressure
Increased blood viscosity Increases Viscosity directly increasesresistance
Positive-pressureventilation:Increased alveolar Increases Compression and
pressure derecruitment ofalveolar vessels
Positive intrapleural Increases Compression ofpressure extraalveolar vessels;
compression of venacava decreasespulmonary blood flowand leads toderecruitment
FRC � functional residual capacity.
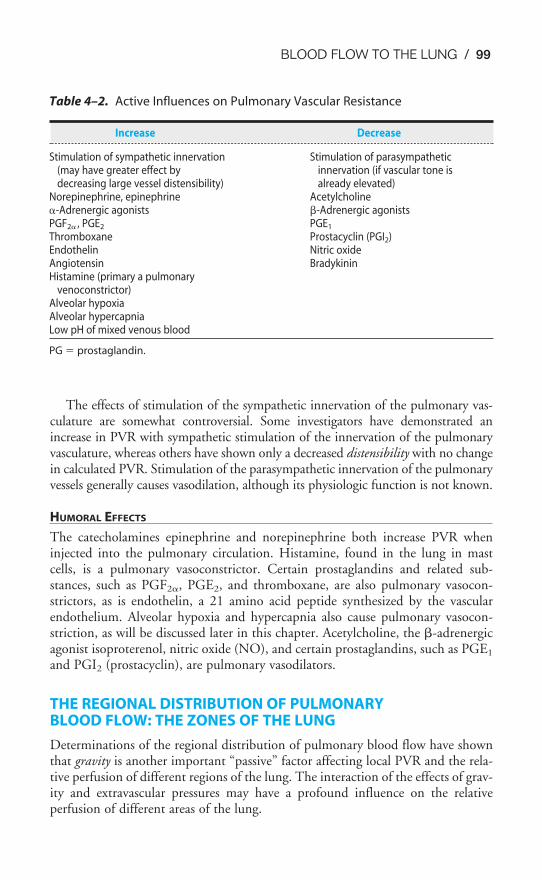
BLOOD FLOW TO THE LUNG / 99
The effects of stimulation of the sympathetic innervation of the pulmonary vas-culature are somewhat controversial. Some investigators have demonstrated anincrease in PVR with sympathetic stimulation of the innervation of the pulmonaryvasculature, whereas others have shown only a decreased distensibility with no changein calculated PVR. Stimulation of the parasympathetic innervation of the pulmonaryvessels generally causes vasodilation, although its physiologic function is not known.
HUMORAL EFFECTS
The catecholamines epinephrine and norepinephrine both increase PVR wheninjected into the pulmonary circulation. Histamine, found in the lung in mastcells, is a pulmonary vasoconstrictor. Certain prostaglandins and related sub-stances, such as PGF2�, PGE2, and thromboxane, are also pulmonary vasocon-strictors, as is endothelin, a 21 amino acid peptide synthesized by the vascularendothelium. Alveolar hypoxia and hypercapnia also cause pulmonary vasocon-striction, as will be discussed later in this chapter. Acetylcholine, the �-adrenergicagonist isoproterenol, nitric oxide (NO), and certain prostaglandins, such as PGE1
and PGI2 (prostacyclin), are pulmonary vasodilators.
THE REGIONAL DISTRIBUTION OF PULMONARY BLOOD FLOW: THE ZONES OF THE LUNG
Determinations of the regional distribution of pulmonary blood flow have shownthat gravity is another important “passive” factor affecting local PVR and the rela-tive perfusion of different regions of the lung. The interaction of the effects of grav-ity and extravascular pressures may have a profound influence on the relativeperfusion of different areas of the lung.
Table 4–2. Active Influences on Pulmonary Vascular Resistance
Increase Decrease
Stimulation of sympathetic innervation Stimulation of parasympathetic(may have greater effect by innervation (if vascular tone isdecreasing large vessel distensibility) already elevated)
Norepinephrine, epinephrine Acetylcholine�-Adrenergic agonists �-Adrenergic agonistsPGF2� , PGE2 PGE1
Thromboxane Prostacyclin (PGI2)Endothelin Nitric oxideAngiotensin BradykininHistamine (primary a pulmonary
venoconstrictor)Alveolar hypoxiaAlveolar hypercapniaLow pH of mixed venous blood
PG � prostaglandin.
100 / CHAPTER 4
Measurement of Total Pulmonary Blood Flow
The total pulmonary blood flow (which is the cardiac output) can currently bedetermined clinically in several ways, each of which has the disadvantage of beinginvasive to the patient (i.e., requiring minor surgery).
THE FICK PRINCIPLE
In 1870, Adolf Fick pointed out the following relationship, now known as the Fickprinciple: The total amount of oxygen absorbed by the body per minute (V̇O2)must be equal to the cardiac output in milliliters per minute (Q̇t) times the differ-ence in oxygen content, in milliliters of oxygen per 100 mL of blood, between thearterial and mixed venous blood (CaO2
� Cv�O2):
V̇O2 � Q̇t � (CaO2� Cv�O2
)
Q̇t � �CaO2
V
�
O2
Cv�O2
�
Both arterial and mixed venous (which is equal to pulmonary artery) bloodmust be sampled in this method.
THE INDICATOR DILUTION TECHNIQUE
In this method, a known amount of an indicator dye that stays in the blood ves-sels, such as indocyanine green, is injected intravenously as a bolus. The systemicarterial dye concentration is monitored continuously with a densitometer as thedye passes through the aorta. Correction must be made for recirculating dyebecause the concentration change of interest is that which occurs in a single passthrough the pulmonary circulation. A curve of the dye concentration as it changeswith time is constructed, and then the area under the curve is determined by inte-gration. Dividing this amount by the time of passage of the dye gives the averageconcentration of dye through the passage. If the cardiac output is high, the dyeconcentration falls rapidly, and so the area under the curve is small and the aver-age dye concentration is low. If the cardiac output is low, the area under the curveis large and the average dye concentration is high. The cardiac output (Q̇t) is equalto the amount of dye injected in milligrams (I) divided by the mean dye concen-tration in milligrams per milliliter (c) times the time of passage (t) in seconds:
Q̇t � �c
I
t�
The calculations are usually done automatically in newer densitometers. Botharterial and venous catheters are necessary for this technique.
THE THERMAL DILUTION TECHNIQUE
This method is similar in principle to the indicator dilution technique. Cold fluid,for example, saline, is injected into a central vein, and the change in temperature ofthe blood downstream is monitored continuously with a thermistor. With high car-diac outputs, the temperature returns to normal rapidly; with low cardiac outputs,
˙
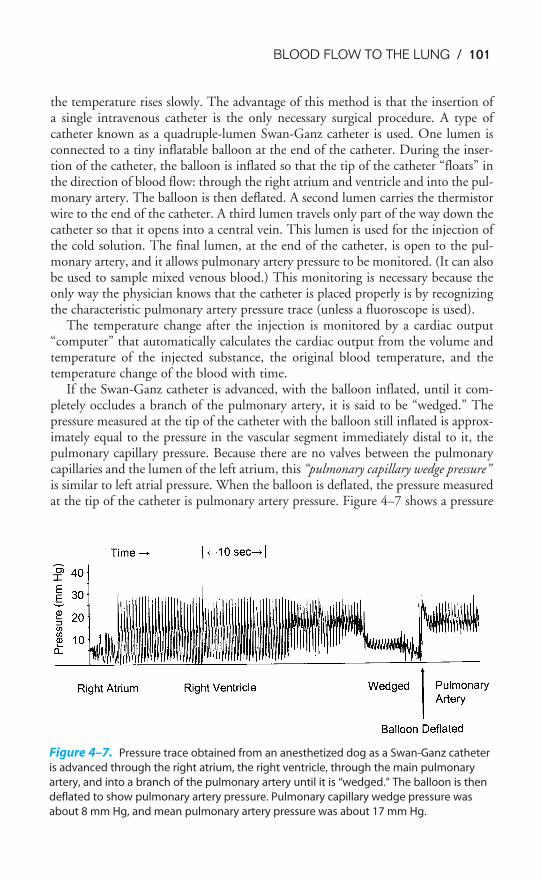
BLOOD FLOW TO THE LUNG / 101
the temperature rises slowly. The advantage of this method is that the insertion ofa single intravenous catheter is the only necessary surgical procedure. A type ofcatheter known as a quadruple-lumen Swan-Ganz catheter is used. One lumen isconnected to a tiny inflatable balloon at the end of the catheter. During the inser-tion of the catheter, the balloon is inflated so that the tip of the catheter “floats” inthe direction of blood flow: through the right atrium and ventricle and into the pul-monary artery. The balloon is then deflated. A second lumen carries the thermistorwire to the end of the catheter. A third lumen travels only part of the way down thecatheter so that it opens into a central vein. This lumen is used for the injection ofthe cold solution. The final lumen, at the end of the catheter, is open to the pul-monary artery, and it allows pulmonary artery pressure to be monitored. (It can alsobe used to sample mixed venous blood.) This monitoring is necessary because theonly way the physician knows that the catheter is placed properly is by recognizingthe characteristic pulmonary artery pressure trace (unless a fluoroscope is used).
The temperature change after the injection is monitored by a cardiac output“computer” that automatically calculates the cardiac output from the volume andtemperature of the injected substance, the original blood temperature, and thetemperature change of the blood with time.
If the Swan-Ganz catheter is advanced, with the balloon inflated, until it com-pletely occludes a branch of the pulmonary artery, it is said to be “wedged.” Thepressure measured at the tip of the catheter with the balloon still inflated is approx-imately equal to the pressure in the vascular segment immediately distal to it, thepulmonary capillary pressure. Because there are no valves between the pulmonarycapillaries and the lumen of the left atrium, this “pulmonary capillary wedge pressure”is similar to left atrial pressure. When the balloon is deflated, the pressure measuredat the tip of the catheter is pulmonary artery pressure. Figure 4–7 shows a pressure
Figure 4–7. Pressure trace obtained from an anesthetized dog as a Swan-Ganz catheter
is advanced through the right atrium, the right ventricle, through the main pulmonary
artery, and into a branch of the pulmonary artery until it is “wedged.” The balloon is then
deflated to show pulmonary artery pressure. Pulmonary capillary wedge pressure was
about 8 mm Hg, and mean pulmonary artery pressure was about 17 mm Hg.
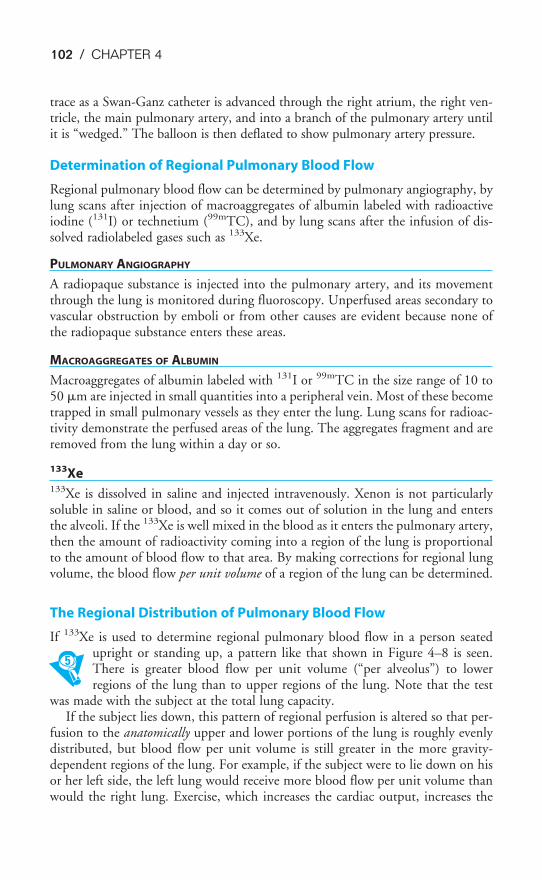
102 / CHAPTER 4
trace as a Swan-Ganz catheter is advanced through the right atrium, the right ven-tricle, the main pulmonary artery, and into a branch of the pulmonary artery untilit is “wedged.” The balloon is then deflated to show pulmonary artery pressure.
Determination of Regional Pulmonary Blood Flow
Regional pulmonary blood flow can be determined by pulmonary angiography, bylung scans after injection of macroaggregates of albumin labeled with radioactiveiodine (131I) or technetium (99mTC), and by lung scans after the infusion of dis-solved radiolabeled gases such as 133Xe.
PULMONARY ANGIOGRAPHY
A radiopaque substance is injected into the pulmonary artery, and its movementthrough the lung is monitored during fluoroscopy. Unperfused areas secondary tovascular obstruction by emboli or from other causes are evident because none ofthe radiopaque substance enters these areas.
MACROAGGREGATES OF ALBUMIN
Macroaggregates of albumin labeled with 131I or 99mTC in the size range of 10 to50 �m are injected in small quantities into a peripheral vein. Most of these becometrapped in small pulmonary vessels as they enter the lung. Lung scans for radioac-tivity demonstrate the perfused areas of the lung. The aggregates fragment and areremoved from the lung within a day or so.
133Xe133Xe is dissolved in saline and injected intravenously. Xenon is not particularlysoluble in saline or blood, and so it comes out of solution in the lung and entersthe alveoli. If the 133Xe is well mixed in the blood as it enters the pulmonary artery,then the amount of radioactivity coming into a region of the lung is proportionalto the amount of blood flow to that area. By making corrections for regional lungvolume, the blood flow per unit volume of a region of the lung can be determined.
The Regional Distribution of Pulmonary Blood Flow
If 133Xe is used to determine regional pulmonary blood flow in a person seatedupright or standing up, a pattern like that shown in Figure 4–8 is seen.There is greater blood flow per unit volume (“per alveolus”) to lowerregions of the lung than to upper regions of the lung. Note that the test
was made with the subject at the total lung capacity.If the subject lies down, this pattern of regional perfusion is altered so that per-
fusion to the anatomically upper and lower portions of the lung is roughly evenlydistributed, but blood flow per unit volume is still greater in the more gravity-dependent regions of the lung. For example, if the subject were to lie down on hisor her left side, the left lung would receive more blood flow per unit volume thanwould the right lung. Exercise, which increases the cardiac output, increases the
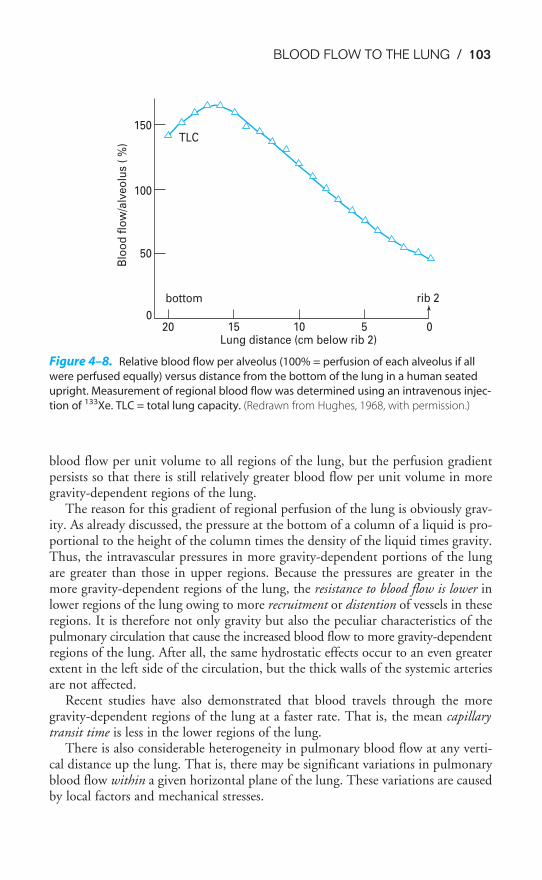
BLOOD FLOW TO THE LUNG / 103
blood flow per unit volume to all regions of the lung, but the perfusion gradientpersists so that there is still relatively greater blood flow per unit volume in moregravity-dependent regions of the lung.
The reason for this gradient of regional perfusion of the lung is obviously grav-ity. As already discussed, the pressure at the bottom of a column of a liquid is pro-portional to the height of the column times the density of the liquid times gravity.Thus, the intravascular pressures in more gravity-dependent portions of the lungare greater than those in upper regions. Because the pressures are greater in themore gravity-dependent regions of the lung, the resistance to blood flow is lower inlower regions of the lung owing to more recruitment or distention of vessels in theseregions. It is therefore not only gravity but also the peculiar characteristics of thepulmonary circulation that cause the increased blood flow to more gravity-dependentregions of the lung. After all, the same hydrostatic effects occur to an even greaterextent in the left side of the circulation, but the thick walls of the systemic arteriesare not affected.
Recent studies have also demonstrated that blood travels through the moregravity-dependent regions of the lung at a faster rate. That is, the mean capillarytransit time is less in the lower regions of the lung.
There is also considerable heterogeneity in pulmonary blood flow at any verti-cal distance up the lung. That is, there may be significant variations in pulmonaryblood flow within a given horizontal plane of the lung. These variations are causedby local factors and mechanical stresses.
Figure 4–8. Relative blood flow per alveolus (100% = perfusion of each alveolus if all
were perfused equally) versus distance from the bottom of the lung in a human seated
upright. Measurement of regional blood flow was determined using an intravenous injec-
tion of 133Xe. TLC = total lung capacity. (Redrawn from Hughes, 1968, with permission.)
150TLC
100
50
0
bottom
20 15 10Lung distance (cm below rib 2)
5 0
rib 2
Blo
od
flo
w/a
lveo
lus
( %
)
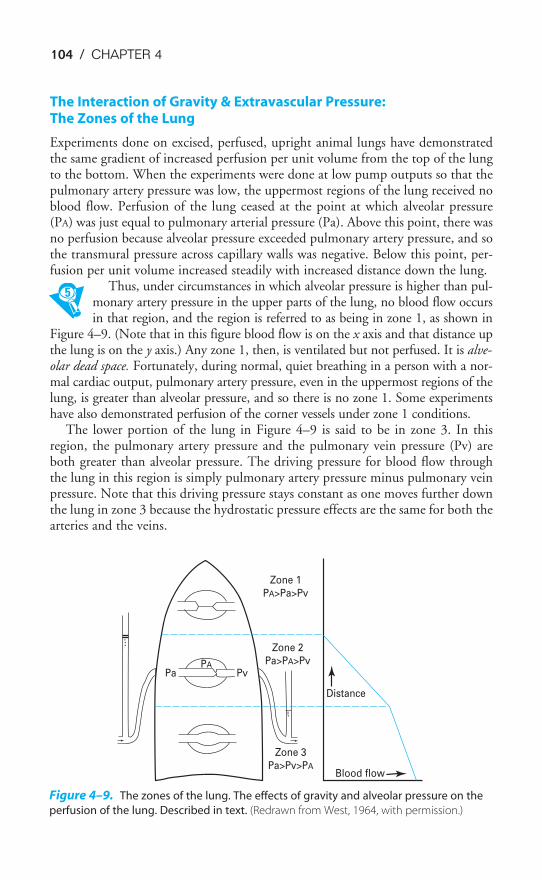
104 / CHAPTER 4
The Interaction of Gravity & Extravascular Pressure: The Zones of the Lung
Experiments done on excised, perfused, upright animal lungs have demonstratedthe same gradient of increased perfusion per unit volume from the top of the lungto the bottom. When the experiments were done at low pump outputs so that thepulmonary artery pressure was low, the uppermost regions of the lung received noblood flow. Perfusion of the lung ceased at the point at which alveolar pressure(PA) was just equal to pulmonary arterial pressure (Pa). Above this point, there wasno perfusion because alveolar pressure exceeded pulmonary artery pressure, and sothe transmural pressure across capillary walls was negative. Below this point, per-fusion per unit volume increased steadily with increased distance down the lung.
Thus, under circumstances in which alveolar pressure is higher than pul-monary artery pressure in the upper parts of the lung, no blood flow occursin that region, and the region is referred to as being in zone 1, as shown in
Figure 4–9. (Note that in this figure blood flow is on the x axis and that distance upthe lung is on the y axis.) Any zone 1, then, is ventilated but not perfused. It is alve-olar dead space. Fortunately, during normal, quiet breathing in a person with a nor-mal cardiac output, pulmonary artery pressure, even in the uppermost regions of thelung, is greater than alveolar pressure, and so there is no zone 1. Some experimentshave also demonstrated perfusion of the corner vessels under zone 1 conditions.
The lower portion of the lung in Figure 4–9 is said to be in zone 3. In thisregion, the pulmonary artery pressure and the pulmonary vein pressure (Pv) areboth greater than alveolar pressure. The driving pressure for blood flow throughthe lung in this region is simply pulmonary artery pressure minus pulmonary veinpressure. Note that this driving pressure stays constant as one moves further downthe lung in zone 3 because the hydrostatic pressure effects are the same for both thearteries and the veins.
Figure 4–9. The zones of the lung. The effects of gravity and alveolar pressure on the
perfusion of the lung. Described in text. (Redrawn from West, 1964, with permission.)
Distance
Blood flow
Zone 3
Pa>Pv>PA
Zone 2
Pa>PA>Pv
Zone 1
PA>Pa>Pv
PvPA
Pa
BLOOD FLOW TO THE LUNG / 105
The middle portion of the lung in Figure 4–9 is in zone 2. In zone 2, pulmonaryartery pressure is greater than alveolar pressure, and so blood flow does occur.Nevertheless, because alveolar pressure is greater than pulmonary vein pressure, theeffective driving pressure for blood flow is pulmonary artery pressure minus alveolarpressure in zone 2. (This is analogous to the situation described in Chapter 2:During a forced expiration the driving pressure for airflow is equal to alveolar pres-sure minus intrapleural pressure.) Notice that in zone 2 (at right in Figure 4–9) theincrease in blood flow per distance down the lung is greater than it is in zone 3. Thisis because the upstream driving pressure, the pulmonary artery pressure, increasesaccording to the hydrostatic pressure increase, but the effective downstream pres-sure, alveolar pressure, is constant throughout the lung at any instant.
To summarize then: In zone 1,
PA � Pa � Pv
and there is no blood flow (except perhaps in “corner vessels,” which are notexposed to alveolar pressure); in zone 2,
Pa � PA � Pv
and the effective driving pressure for blood flow is Pa � PA; in zone 3,
Pa � Pv � PA
and the driving pressure for blood flow is Pa � Pv.It is important to realize that the boundaries between the zones are dependent on
physiologic conditions—they are not fixed anatomic landmarks. Alveolar pressurechanges during the course of each breath. During eupneic breathing these changesare only a few centimeters of water, but they may be much greater during speech,exercise, and other conditions. A patient on a positive-pressure ventilator with PEEPmay have substantial amounts of zone 1 because alveolar pressure is always high.Similarly, after a hemorrhage or during general anesthesia, pulmonary blood flowand pulmonary artery pressure are low and zone 1 conditions are also likely. Duringexercise, cardiac output and pulmonary artery pressure increase and any existing zone1 will be recruited to zone 2. The boundary between zones 2 and 3 will move upwardas well. Pulmonary artery pressure is highly pulsatile, and so the borders between thezones probably even move up a bit with each contraction of the right ventricle.
Changes in lung volume also affect the regional distribution of pulmonary bloodflow and will therefore affect the boundaries between zones. Finally, changes in bodyposition alter the orientation of the zones with respect to the anatomic locations in thelung, but the same relationships exist with respect to gravity and alveolar pressure.
HYPOXIC PULMONARY VASOCONSTRICTION
Alveolar hypoxia or atelectasis causes an active vasoconstriction in the pul-monary circulation. The site of vascular smooth muscle constrictionappears to be in the arterial (precapillary) vessels very close to the alveoli.
Mechanism of Hypoxic Pulmonary Vasoconstriction
The mechanism of hypoxic pulmonary vasoconstriction is not completely under-stood. The response occurs locally, that is, only in the area of the alveolar hypoxia.Connections to the central nervous system are not necessary: An isolated, excisedlung, perfused with blood by a mechanical pump with a constant output, exhibitsan increased perfusion pressure when ventilated with hypoxic gas mixtures. Thisindicates that the increase in PVR can occur without the influence of extrinsicnerves. Thus, it is not surprising that hypoxic pulmonary vasoconstriction wasrecently demonstrated to persist in human patients who had received heart-lungtransplants. Hypoxia may cause the release of a vasoactive substance from the pul-monary parenchyma or mast cells in the area. Histamine, serotonin, cate-cholamines, and prostaglandins have all been suggested as the mediator substance,but none appears to completely mimic the response. Decreased release of a vasodila-tor such as nitric oxide may also be involved in hypoxic pulmonary vasoconstric-tion. Possibly several mediators act together. Recent studies have strongly indicatedthat hypoxia acts directly on pulmonary vascular smooth muscle to producehypoxic pulmonary vasoconstriction. Hypoxia inhibits an outward potassium cur-rent, which causes pulmonary vascular smooth muscle cells to depolarize, allowingcalcium to enter the cells. This, in turn, causes them to contract. The potassiumchannel appears to be open when it is oxidized and closed when it is reduced.
The hypoxic pulmonary vasoconstriction response is graded—constrictionbegins to occur at alveolar PO2
s in the range of 100 to 150 mm Hg and increasesuntil PAO2
falls to about 20 to 30 mm Hg.
Physiologic Function of Hypoxic Pulmonary Vasoconstriction
The function of hypoxic pulmonary vasoconstriction in localized hypoxia is fairly obvi-ous. If an area of the lung becomes hypoxic because of airway obstruction or if local-ized atelectasis occurs, any mixed venous blood flowing to that area will undergo littleor no gas exchange (Figure 4–10B) and will mix with blood draining well-ventilatedareas of the lung as it enters the left atrium. This mixing will lower the overall arte-rial PO2
and may even increase the arterial PCO2(see Chapter 5). The hypoxic pulmonary
vasoconstriction diverts mixed venous blood flow away from poorly ventilated areasof the lung by locally increasing vascular resistance, as shown in Figure 4–10C.Therefore, mixed venous blood is sent to better-ventilated areas of the lung(Figure 4–10D). The problem with hypoxic pulmonary vasoconstriction is that it isnot a very strong response because there is so little smooth muscle in the pulmonaryvasculature. Very high pulmonary artery pressures can interfere with hypoxic pul-monary vasoconstriction, as can other physiologic disturbances, such as alkalosis.
In hypoxia of the whole lung, such as might be encountered at high altitude (see Chapter 11) or in hypoventilation, hypoxic pulmonary vasoconstrictionoccurs throughout the lung. Even this may be useful in increasing gas exchangebecause greatly increasing the pulmonary artery pressure recruits many previouslyunperfused pulmonary capillaries. This increases the surface area available for gasdiffusion (see Chapter 6) and improves the matching of ventilation and perfusion,
106 / CHAPTER 4
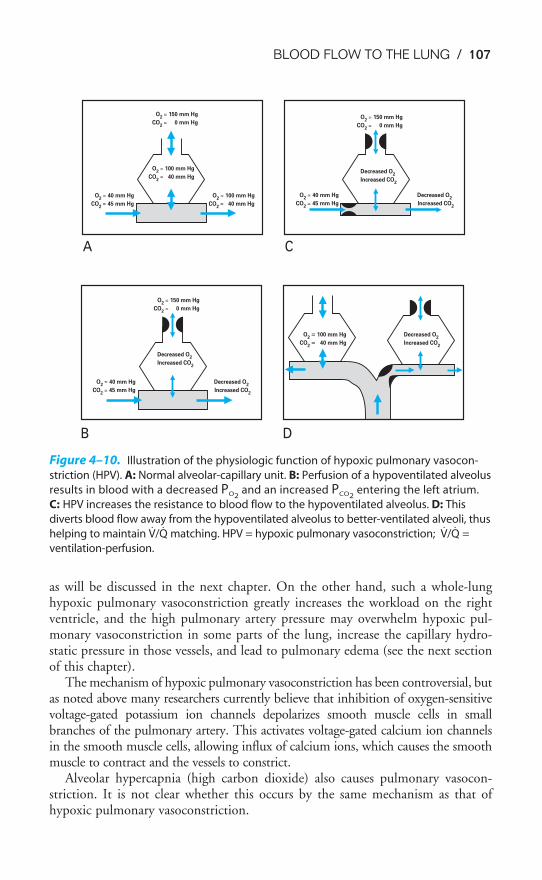
BLOOD FLOW TO THE LUNG / 107
as will be discussed in the next chapter. On the other hand, such a whole-lunghypoxic pulmonary vasoconstriction greatly increases the workload on the rightventricle, and the high pulmonary artery pressure may overwhelm hypoxic pul-monary vasoconstriction in some parts of the lung, increase the capillary hydro-static pressure in those vessels, and lead to pulmonary edema (see the next sectionof this chapter).
The mechanism of hypoxic pulmonary vasoconstriction has been controversial, butas noted above many researchers currently believe that inhibition of oxygen-sensitivevoltage-gated potassium ion channels depolarizes smooth muscle cells in smallbranches of the pulmonary artery. This activates voltage-gated calcium ion channelsin the smooth muscle cells, allowing influx of calcium ions, which causes the smoothmuscle to contract and the vessels to constrict.
Alveolar hypercapnia (high carbon dioxide) also causes pulmonary vasocon-striction. It is not clear whether this occurs by the same mechanism as that ofhypoxic pulmonary vasoconstriction.
A C
O2
� 150 mm Hg
CO2
� 0 mm Hg
O2
� 100 mm Hg
CO2
� 40 mm Hg
O2
� 40 mm Hg
CO2
� 45 mm Hg
O2
� 100 mm Hg
CO2
� 40 mm Hg
O2
� 150 mm Hg
CO2
� 0 mm Hg
Decreased O2
Increased CO2
O2
� 40 mm Hg
CO2
� 45 mm Hg
Decreased O2
Increased CO2
CO2
� 40 mm Hg
B D
O2
� 150 mm Hg
CO2
� 0 mm Hg
Decreased O2
Increased CO2
Decreased O2
Increased CO2
O2
� 100 mm Hg
O2
� 40 mm Hg
CO2
� 45 mm Hg
Decreased O2
Increased CO2
Figure 4–10. Illustration of the physiologic function of hypoxic pulmonary vasocon-
striction (HPV). A: Normal alveolar-capillary unit. B: Perfusion of a hypoventilated alveolus
results in blood with a decreased PO2and an increased PCO2
entering the left atrium.
C: HPV increases the resistance to blood flow to the hypoventilated alveolus. D: This
diverts blood flow away from the hypoventilated alveolus to better-ventilated alveoli, thus
helping to maintain V̇/Q̇ matching. HPV = hypoxic pulmonary vasoconstriction; V̇/Q̇ =
ventilation-perfusion.
108 / CHAPTER 4
PULMONARY EDEMA
Pulmonary edema is the extravascular accumulation of fluid in the lung. This patho-logic condition may be caused by one or more physiologic abnormalities, but the resultis inevitably impaired gas transfer. As the edema fluid builds up, first in the interstitiumand later in alveoli, diffusion of gases—particularly oxygen—decreases (see Chapter 6).
The capillary endothelium is much more permeable to water and solutes thanis the alveolar epithelium. Edema fluid therefore accumulates in the interstitiumbefore it accumulates in the alveoli.
The Factors Influencing Liquid Movement in the Pulmonary Capillaries
The Starling equation describes the movement of liquid across the capillaryendothelium:
Q̇ f � Kf [(Pc � Pis) � �(�pl � �is)]
where Q̇ f � net flow of fluidK f � capillary filtration coefficient; this describes the permeability
characteristics of the membrane to fluidsPc � capillary hydrostatic pressurePis � hydrostatic pressure of the interstitial fluid� � reflection coefficient; this describes the ability of the membrane to
prevent extravasation of solute particles�pl � colloid osmotic (oncotic) pressure of the plasma�is � colloid osmotic pressure of the interstitial fluid
The equation is shown schematically in Figure 4–11. The Starling equation isvery useful in understanding the potential causes of pulmonary edema, eventhough only the plasma colloid osmotic pressure (�pl) can be measured clinically.
Lymphatic Drainage of the Lung
Any fluid that makes its way into the pulmonary interstitium must be removed bythe lymphatic drainage of the lung. The volume of lymph flow from the human lungis now believed to be as great as that from other organs under normal circumstances,and it is capable of increasing as much as 10-fold under pathologic conditions. It isonly when this large safety factor is overwhelmed that pulmonary edema occurs.
Conditions That May Lead to Pulmonary Edema
The Starling equation provides a useful method of categorizing most of the poten-tial causes of pulmonary edema (Table 4–3).
PERMEABILITY
Infections, circulating or inhaled toxins, oxygen toxicity, and other factors thatdestroy the integrity of the capillary endothelium lead to localized or generalizedpulmonary edema.
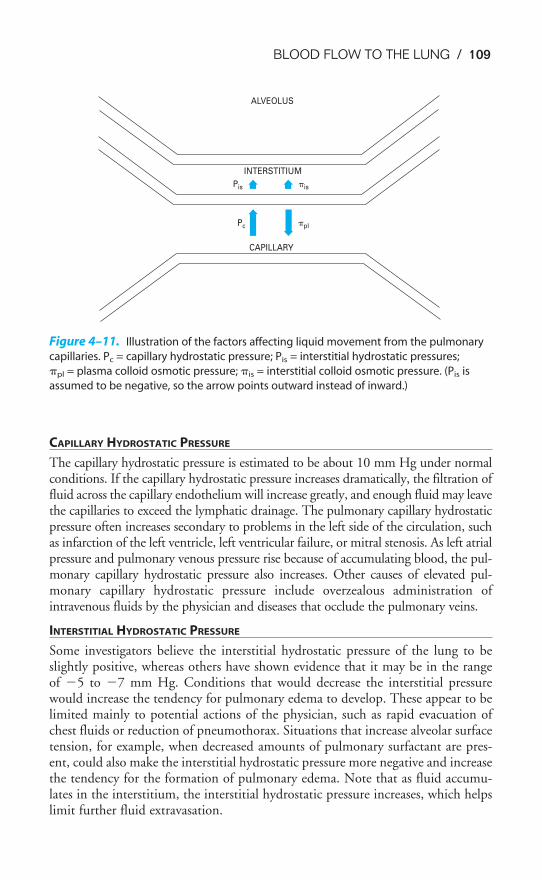
BLOOD FLOW TO THE LUNG / 109
CAPILLARY HYDROSTATIC PRESSURE
The capillary hydrostatic pressure is estimated to be about 10 mm Hg under normalconditions. If the capillary hydrostatic pressure increases dramatically, the filtration offluid across the capillary endothelium will increase greatly, and enough fluid may leavethe capillaries to exceed the lymphatic drainage. The pulmonary capillary hydrostaticpressure often increases secondary to problems in the left side of the circulation, suchas infarction of the left ventricle, left ventricular failure, or mitral stenosis. As left atrialpressure and pulmonary venous pressure rise because of accumulating blood, the pul-monary capillary hydrostatic pressure also increases. Other causes of elevated pul-monary capillary hydrostatic pressure include overzealous administration ofintravenous fluids by the physician and diseases that occlude the pulmonary veins.
INTERSTITIAL HYDROSTATIC PRESSURE
Some investigators believe the interstitial hydrostatic pressure of the lung to beslightly positive, whereas others have shown evidence that it may be in the rangeof �5 to �7 mm Hg. Conditions that would decrease the interstitial pressurewould increase the tendency for pulmonary edema to develop. These appear to belimited mainly to potential actions of the physician, such as rapid evacuation ofchest fluids or reduction of pneumothorax. Situations that increase alveolar surfacetension, for example, when decreased amounts of pulmonary surfactant are pres-ent, could also make the interstitial hydrostatic pressure more negative and increasethe tendency for the formation of pulmonary edema. Note that as fluid accumu-lates in the interstitium, the interstitial hydrostatic pressure increases, which helpslimit further fluid extravasation.
Figure 4–11. Illustration of the factors affecting liquid movement from the pulmonary
capillaries. Pc = capillary hydrostatic pressure; Pis = interstitial hydrostatic pressures;
�pl = plasma colloid osmotic pressure; �is = interstitial colloid osmotic pressure. (Pis is
assumed to be negative, so the arrow points outward instead of inward.)
ALVEOLUS
INTERSTITIUM
CAPILLARY
Pc
Pis �is
�pl
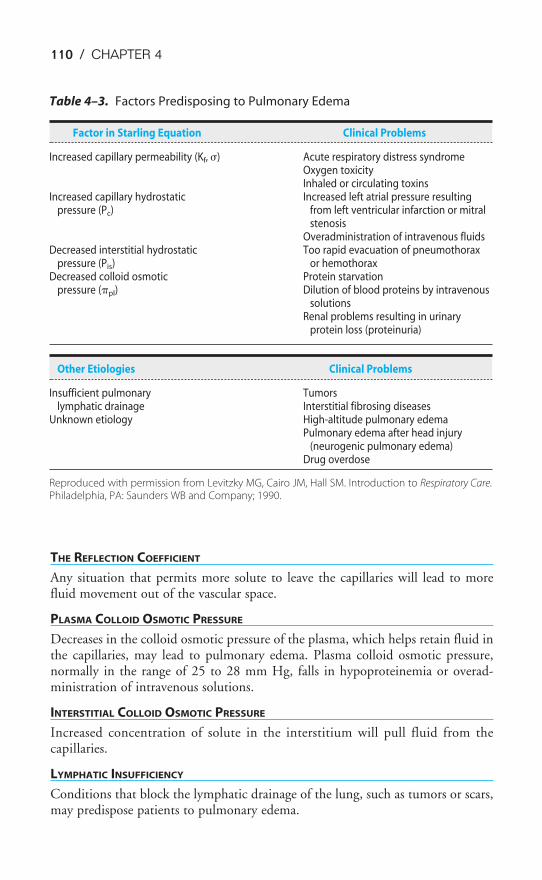
110 / CHAPTER 4
THE REFLECTION COEFFICIENT
Any situation that permits more solute to leave the capillaries will lead to morefluid movement out of the vascular space.
PLASMA COLLOID OSMOTIC PRESSURE
Decreases in the colloid osmotic pressure of the plasma, which helps retain fluid inthe capillaries, may lead to pulmonary edema. Plasma colloid osmotic pressure,normally in the range of 25 to 28 mm Hg, falls in hypoproteinemia or overad-ministration of intravenous solutions.
INTERSTITIAL COLLOID OSMOTIC PRESSURE
Increased concentration of solute in the interstitium will pull fluid from thecapillaries.
LYMPHATIC INSUFFICIENCY
Conditions that block the lymphatic drainage of the lung, such as tumors or scars,may predispose patients to pulmonary edema.
Table 4–3. Factors Predisposing to Pulmonary Edema
Factor in Starling Equation Clinical Problems
Increased capillary permeability (Kf, �) Acute respiratory distress syndromeOxygen toxicityInhaled or circulating toxins
Increased capillary hydrostatic Increased left atrial pressure resultingpressure (Pc) from left ventricular infarction or mitral
stenosisOveradministration of intravenous fluids
Decreased interstitial hydrostatic Too rapid evacuation of pneumothoraxpressure (Pis) or hemothorax
Decreased colloid osmotic Protein starvationpressure (�pl) Dilution of blood proteins by intravenous
solutionsRenal problems resulting in urinary
protein loss (proteinuria)
Other Etiologies Clinical Problems
Insufficient pulmonary Tumorslymphatic drainage Interstitial fibrosing diseases
Unknown etiology High-altitude pulmonary edemaPulmonary edema after head injury
(neurogenic pulmonary edema)Drug overdose
Reproduced with permission from Levitzky MG, Cairo JM, Hall SM. Introduction to Respiratory Care.Philadelphia, PA: Saunders WB and Company; 1990.
BLOOD FLOW TO THE LUNG / 111
OTHER CONDITIONS ASSOCIATED WITH PULMONARY EDEMA
Pulmonary edema is often seen associated with head injury, heroin overdose, andhigh altitude. The causes of the edema formation in these conditions are notknown, although high-altitude pulmonary edema may be caused by high pul-monary artery pressures secondary to the hypoxic pulmonary vasoconstriction.
KEY CONCEPTS
Compared with the systemic arteries, the pulmonary arteries have much less vascu-
lar smooth muscle and therefore offer much less resistance to blood flow. Pulmonary
arteries are more distensible and because their intravascular pressures are lower,
more compressible than systemic arteries. The vascular transmural pressure gradi-
ent is therefore an important determinant of pulmonary vascular resistance (PVR).
Although pulmonary vascular smooth muscle can actively contract or relax in
response to neural and humoral influences, “passive” factors play a more important
role in determining PVR than they do in determining systemic vascular resistance.
PVR is usually lowest at the functional residual capacity and increases at higher and
at lower lung volumes.
PVR usually decreases with increases in pulmonary blood flow, pulmonary artery pres-
sure, left atrial pressure, or pulmonary capillary blood volume because of distention
of already open blood vessels, recruitment of previously unopened vessels, or both.
There is more blood flow in lower regions of the lung than in upper regions. The
effects of pulmonary artery pressure, pulmonary vein pressure, and alveolar pressure
on pulmonary blood flow are described as the “zones of the lung.”
Alveolar hypoxia (or hypercapnia) can cause constriction of precapillary pulmonary
vessels, diverting blood flow away from poorly ventilated or unventilated alveoli.
CLINICAL PROBLEMS
4–1. A patient’s mean arterial blood pressure is 100 mm Hg and his right atrial pressure is
2 mm Hg. His mean pulmonary artery pressure and pulmonary capillary wedge pres-
sure (� left atrial pressure) determined using a Swan-Ganz catheter, are 15 and
5 mm Hg, respectively. If his cardiac output is 5 L/min, calculate his pulmonary vascular
resistance and systemic vascular resistance.
4–2. Which of the following situations would be expected to decrease pulmonary vascular
resistance?
a. Ascent to 15,000 ft above sea level
b. Inspiration to the total lung capacity
112 / CHAPTER 4
c. Expiration to the residual volume
d. Moderate exercise
e. Blood loss secondary to trauma
4–3. Which of the following situations would be expected to lead to an increase in the
amount of the lung under zone 1 conditions?
a. Ascent to 15,000 ft above sea level
b. Blood loss secondary to trauma
c. Moderate exercise
d. Positive-pressure ventilation with positive end-expiratory pressure (PEEP)
e. Changing from the standing to the supine position
4–4. Which of the following circumstances might be expected to contribute to the formation
of pulmonary edema?
a. Overtransfusion with saline
b. Occlusion of the lymphatic drainage of an area of the lung
c. Left ventricular failure
d. Low concentration of plasma proteins
e. Destruction of portions of the pulmonary capillary endothelium by toxins
f. All of the above
SUGGESTED READINGS
Aaronson PI, Robertson TP, Knock GA, Becker S, Lewis TH, Snetkov V, Ward JPT. Hypoxic pulmonaryvasoconstriction: mechanisms and controversies. J Physiol. 2006;570:53–58.
Borst HG, McGregor M, Whittenberger JL, Berglund E. Influence of pulmonary arterial and left atrial pres-sure on pulmonary vascular resistance. Circ Res. 1956;4:393–399.
Deffebach ME, Charan NB, Lakshminarayan S, Butler J. The bronchial circulation: Small, but a vital attrib-ute of the lung. Am Rev Respir Dis. 1987;135:463–481.
Dumas JP, Bardou M, Goirand F, Dumas M. Hypoxic pulmonary vasoconstriction. General Pharm.1999;33:289–297.
Hughes JMB, Glazier JB, Maloney JE, West JB. Effect of lung volume on the distribution of pulmonaryblood flow in man. Respir Physiol. 1968;4:58–72.
Hughes JM, Glazier JB, Maloney JE, West JB. Effect of extraalveolar vessels on distribution of blood flowin the dog lung. J Appl Physiol. 1968;25:701–712.
Levitzky MG, Cairo JM, Hall SM. Introduction to Respiratory Care. Philadelphia Pa: WB Saunders andCompany; 1990.
Moudgil R, Michelakis ED, Archer, SL. Hypoxic pulmonary vasoconstriction. J Appl Physiol.2005;98:390–403.
Murray JF. The Normal Lung. Philadelphia, Pa: WB Saunders and Company; 1976:131.
Murray JF. The Normal Lung. 2nd ed. Philadelphia, Pa: WB Saunders and Company; 1986:35–43,139–162.
Schuster DP. Pulmonary edema. In: Fishman AP, ed. Pulmonary Diseases and Disorders. 3rd ed. New York,NY: McGraw-Hill; 1998:1331–1356.
Ward JPT, Aaronson PI. Mechanisms of hypoxic pulmonary vasoconstriction: can anyone be right? RespirPhysiol. 1999;115:261–271.
West JB. Ventilation/Blood Flow and Gas Exchange. 5th ed. Oxford: Blackwell; 1990:15–25.
West JB, Dollery CT, Naimark A. Distribution of blood flow in isolated lung: Relation to vascular and alve-olar pressures. J Appl Physiol. 1964;19:713–724.
113
Gas exchange between the alveoli and the pulmonary capillary blood occurs by dif-fusion, as will be discussed in the next chapter. Diffusion of oxygen and carbondioxide occurs passively, according to their concentration gradients across thealveolar-capillary barrier. These concentration gradients must be maintained byventilation of the alveoli and perfusion of the pulmonary capillaries.
THE CONCEPT OF MATCHING VENTILATION & PERFUSION
Alveolar ventilation brings oxygen into the lung and removes carbon dioxide fromit. Similarly, the mixed venous blood brings carbon dioxide into the lung and takesup alveolar oxygen. The alveolar PO2
and PCO2are thus determined by the rela-
tionship between alveolar ventilation and perfusion. Alterations in the ratio of ven-tilation to perfusion, called the V̇A/Q̇c, will result in changes in the alveolar PO2
andPCO2
, as well as in gas delivery to or removal from the lung.Alveolar ventilation is normally about 4 to 6 L/min and pulmonary blood flow
(which is equal to cardiac output) has a similar range, and so the V̇/Q̇ for the wholelung is in the range of 0.8 to 1.2. However, ventilation and perfusion mustbe matched on the alveolar-capillary level, and theV̇/Q̇for the whole lungis really of interest only as an approximation of the situation in all the
alveolar-capillary units of the lung. For instance, suppose that all 5 L/min of thecardiac output went to the left lung and all 5 L/min of alveolar ventilation went to
OBJECTIVES
The reader understands the importance of the matching of ventilation and perfusion inthe lung.
� Predicts the consequences of mismatched ventilation and perfusion.
� Describes the methods used to assess the matching of ventilation and perfusion.
� Describes the methods used to determine the uniformity of the distribution of theinspired gas and pulmonary blood flow.
� Explains the regional differences in the matching of ventilation and perfusion ofthe normal upright lung.
� Predicts the consequences of the regional differences in the ventilation and perfu-sion of the normal upright lung.
5Ventilation-PerfusionRelationships
Copyright © 2007 by The McGraw-Hill Companies, Inc. Click here for terms of use.
114 / CHAPTER 5
the right lung. The whole lung V̇/Q̇ would be 1.0, but there would be no gasexchange because there could be no gas diffusion between the ventilated alveoli andthe perfused pulmonary capillaries.
CONSEQUENCES OF HIGH & LOW V̇/Q̇
Oxygen is delivered to the alveolus by alveolar ventilation, is removed from thealveolus as it diffuses into the pulmonary capillary blood, and is carried away byblood flow. Similarly, carbon dioxide is delivered to the alveolus in the mixedvenous blood and diffuses into the alveolus in the pulmonary capillary. The car-bon dioxide is removed from the alveolus by alveolar ventilation. As will be dis-cussed in Chapter 6, at resting cardiac outputs the diffusion of both oxygen andcarbon dioxide is normally limited by pulmonary perfusion. Thus, the alveolar par-tial pressures of both oxygen and carbon dioxide are determined by the V̇/Q̇. If the
V̇/Q̇ in an alveolar-capillary unit increases, the delivery of oxygen relativeto its removal will increase, as will the removal of carbon dioxide relativeto its delivery. Alveolar PO2
will therefore rise, and alveolar PCO2will fall. If
theV̇/Q̇ in an alveolar-capillary unit decreases, the removal of oxygen relative to itsdelivery will increase and the delivery of carbon dioxide relative to its removal willincrease. Alveolar PO2
will therefore fall, and alveolar PCO2will rise.
Figure 5–1 shows the consequences of alterations in the relationship of ventila-tion and perfusion on hypothetical alveolar-capillary units. Unit A has a normalV̇/Q̇. Inspired air enters the alveolus with a PO2
of about 150 mm Hg and a PCO2of
nearly 0 mm Hg. Mixed venous blood enters the pulmonary capillary with a PO2
of about 40 mm Hg and a PCO2of about 45 mm Hg. This results in an alveolar PO2
of about 100 mm Hg and an alveolar PCO2of 40 mm Hg (see Chapter 3). The par-
tial pressure gradient for oxygen diffusion from alveolus to pulmonary capillary isthus about 100 � 40 mm Hg, or 60 mm Hg; the partial pressure gradient for CO2
diffusion from pulmonary capillary to alveolus is about 45 � 40, or 5 mm Hg.The airway supplying unit B has become completely occluded. Its V̇/Q̇ is zero.
As time goes on, the air trapped in the alveolus equilibrates by diffusion with thegas dissolved in the mixed venous blood entering the alveolar-capillary unit. (If theocclusion persists, the alveolus is likely to collapse.) No gas exchange can occur,and any blood perfusing this alveolus will leave it exactly as it entered it. Unit B istherefore acting as a right-to-left shunt.
The blood flow to unit C is blocked by a pulmonary embolus, and unit C istherefore completely unperfused. It has an infinite V̇/Q̇. Because no oxygen candiffuse from the alveolus into pulmonary capillary blood and because no carbondioxide can enter the alveolus from the blood, the PO2
of the alveolus is approxi-mately 150 mm Hg and its PCO2
is approximately zero. That is, the gas composi-tion of this unperfused alveolus is the same as that of inspired air. Unit C is alveolardead space. If unit C were unperfused because its alveolar pressure exceeded its pre-capillary pressure (rather than because of an embolus), then it would also corre-spond to part of zone 1.
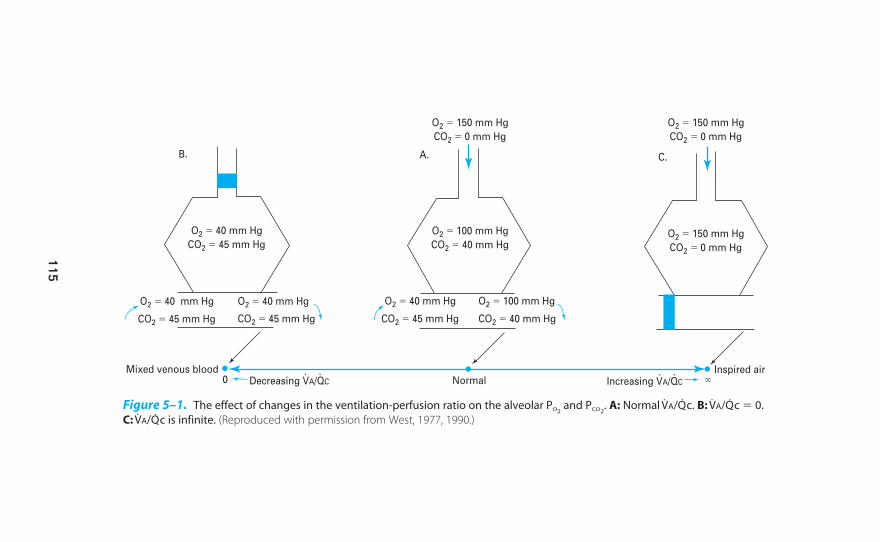
B.
O2 � 40 mm Hg
CO2 � 45 mm Hg
O2 � 100 mm Hg
CO2 � 40 mm Hg
O2 � 150 mm Hg
CO2 � 0 mm Hg
O2 � 150 mm Hg
CO2 � 0 mm Hg
O2 � 150 mm Hg
CO2 � 0 mm Hg
O2 � 40 mm Hg
CO2 � 45 mm Hg
O2 � 40 mm Hg
CO2 � 45 mm Hg CO2 � 40 mm Hg
O2 � 40 mm Hg
CO2 � 45 mm Hg
O2 � 100 mm Hg
C.A.
Mixed venous blood0 Decreasing VA/QC Increasing VA/QC �Normal
Inspired air
Figure 5–1. The effect of changes in the ventilation-perfusion ratio on the alveolar PO2and PCO2
. A: Normal V̇A/Q̇c. B: V̇A/Q̇c � 0.
C: V̇A/Q̇c is infinite. (Reproduced with permission from West, 1977, 1990.)
115
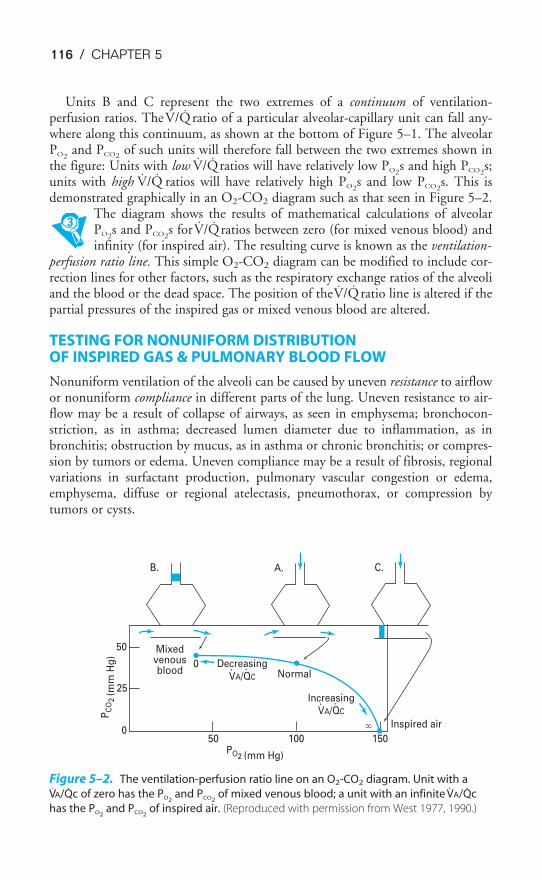
116 / CHAPTER 5
Units B and C represent the two extremes of a continuum of ventilation-perfusion ratios. The V̇/Q̇ ratio of a particular alveolar-capillary unit can fall any-where along this continuum, as shown at the bottom of Figure 5–1. The alveolarPO2
and PCO2of such units will therefore fall between the two extremes shown in
the figure: Units with low V̇/Q̇ratios will have relatively low PO2s and high PCO2
s;units with high V̇/Q̇ ratios will have relatively high PO2
s and low PCO2s. This is
demonstrated graphically in an O2-CO2 diagram such as that seen in Figure 5–2.The diagram shows the results of mathematical calculations of alveolarPO2
s and PCO2s for V̇/Q̇ ratios between zero (for mixed venous blood) and
infinity (for inspired air). The resulting curve is known as the ventilation-perfusion ratio line. This simple O2-CO2 diagram can be modified to include cor-rection lines for other factors, such as the respiratory exchange ratios of the alveoliand the blood or the dead space. The position of the V̇/Q̇ ratio line is altered if thepartial pressures of the inspired gas or mixed venous blood are altered.
TESTING FOR NONUNIFORM DISTRIBUTION OF INSPIRED GAS & PULMONARY BLOOD FLOW
Nonuniform ventilation of the alveoli can be caused by uneven resistance to airflowor nonuniform compliance in different parts of the lung. Uneven resistance to air-flow may be a result of collapse of airways, as seen in emphysema; bronchocon-striction, as in asthma; decreased lumen diameter due to inflammation, as inbronchitis; obstruction by mucus, as in asthma or chronic bronchitis; or compres-sion by tumors or edema. Uneven compliance may be a result of fibrosis, regionalvariations in surfactant production, pulmonary vascular congestion or edema,emphysema, diffuse or regional atelectasis, pneumothorax, or compression bytumors or cysts.
B. A. C.
150100500
25
50 Mixedvenousblood
0 DecreasingVA/QC Normal
IncreasingVA/QC
PO2 (mm Hg)
PC
O2
(mm
Hg
)
Inspired air�
Figure 5–2. The ventilation-perfusion ratio line on an O2-CO2 diagram. Unit with a
V̇A/Q̇c of zero has the PO2and PCO2
of mixed venous blood; a unit with an infinite V̇A/Q̇c
has the PO2and PCO2
of inspired air. (Reproduced with permission from West 1977, 1990.)
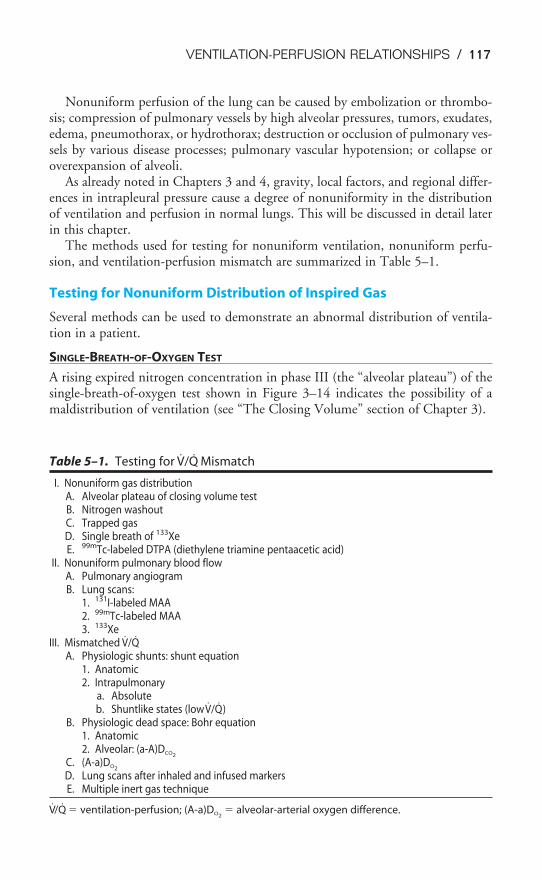
VENTILATION-PERFUSION RELATIONSHIPS / 117
Nonuniform perfusion of the lung can be caused by embolization or thrombo-sis; compression of pulmonary vessels by high alveolar pressures, tumors, exudates,edema, pneumothorax, or hydrothorax; destruction or occlusion of pulmonary ves-sels by various disease processes; pulmonary vascular hypotension; or collapse oroverexpansion of alveoli.
As already noted in Chapters 3 and 4, gravity, local factors, and regional differ-ences in intrapleural pressure cause a degree of nonuniformity in the distributionof ventilation and perfusion in normal lungs. This will be discussed in detail laterin this chapter.
The methods used for testing for nonuniform ventilation, nonuniform perfu-sion, and ventilation-perfusion mismatch are summarized in Table 5–1.
Testing for Nonuniform Distribution of Inspired Gas
Several methods can be used to demonstrate an abnormal distribution of ventila-tion in a patient.
SINGLE-BREATH-OF-OXYGEN TEST
A rising expired nitrogen concentration in phase III (the “alveolar plateau”) of thesingle-breath-of-oxygen test shown in Figure 3–14 indicates the possibility of amaldistribution of ventilation (see “The Closing Volume” section of Chapter 3).
Table 5–1. Testing for V̇/Q̇ Mismatch
I. Nonuniform gas distributionA. Alveolar plateau of closing volume testB. Nitrogen washoutC. Trapped gasD. Single breath of 133XeE. 99mTc-labeled DTPA (diethylene triamine pentaacetic acid)
II. Nonuniform pulmonary blood flowA. Pulmonary angiogramB. Lung scans:
1. 131I-labeled MAA2. 99mTc-labeled MAA3. 133Xe
III. Mismatched V̇/Q̇A. Physiologic shunts: shunt equation
1. Anatomic2. Intrapulmonary
a. Absoluteb. Shuntlike states (low V̇/Q̇)
B. Physiologic dead space: Bohr equation1. Anatomic2. Alveolar: (a-A)DCO2
C. (A-a)DO2
D. Lung scans after inhaled and infused markersE. Multiple inert gas technique
V̇/Q̇ � ventilation-perfusion; (A-a)DO2� alveolar-arterial oxygen difference.
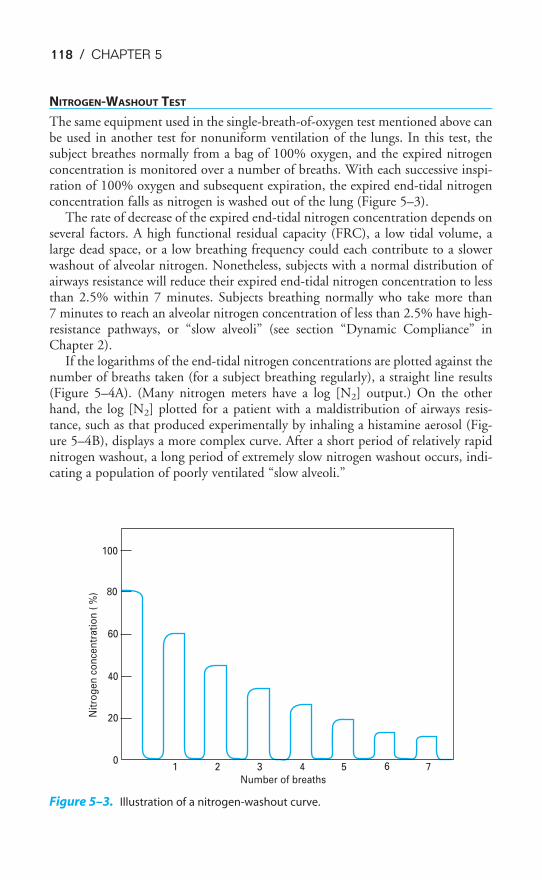
118 / CHAPTER 5
NITROGEN-WASHOUT TEST
The same equipment used in the single-breath-of-oxygen test mentioned above canbe used in another test for nonuniform ventilation of the lungs. In this test, thesubject breathes normally from a bag of 100% oxygen, and the expired nitrogenconcentration is monitored over a number of breaths. With each successive inspi-ration of 100% oxygen and subsequent expiration, the expired end-tidal nitrogenconcentration falls as nitrogen is washed out of the lung (Figure 5–3).
The rate of decrease of the expired end-tidal nitrogen concentration depends onseveral factors. A high functional residual capacity (FRC), a low tidal volume, alarge dead space, or a low breathing frequency could each contribute to a slowerwashout of alveolar nitrogen. Nonetheless, subjects with a normal distribution ofairways resistance will reduce their expired end-tidal nitrogen concentration to lessthan 2.5% within 7 minutes. Subjects breathing normally who take more than7 minutes to reach an alveolar nitrogen concentration of less than 2.5% have high-resistance pathways, or “slow alveoli” (see section “Dynamic Compliance” inChapter 2).
If the logarithms of the end-tidal nitrogen concentrations are plotted against thenumber of breaths taken (for a subject breathing regularly), a straight line results(Figure 5–4A). (Many nitrogen meters have a log [N2] output.) On the otherhand, the log [N2] plotted for a patient with a maldistribution of airways resis-tance, such as that produced experimentally by inhaling a histamine aerosol (Fig-ure 5–4B), displays a more complex curve. After a short period of relatively rapidnitrogen washout, a long period of extremely slow nitrogen washout occurs, indi-cating a population of poorly ventilated “slow alveoli.”
100
80
60
40
20
01 2 3 4 5 6 7
Number of breaths
Nit
rog
en
co
nce
ntr
ati
on
( %
)
Figure 5–3. Illustration of a nitrogen-washout curve.
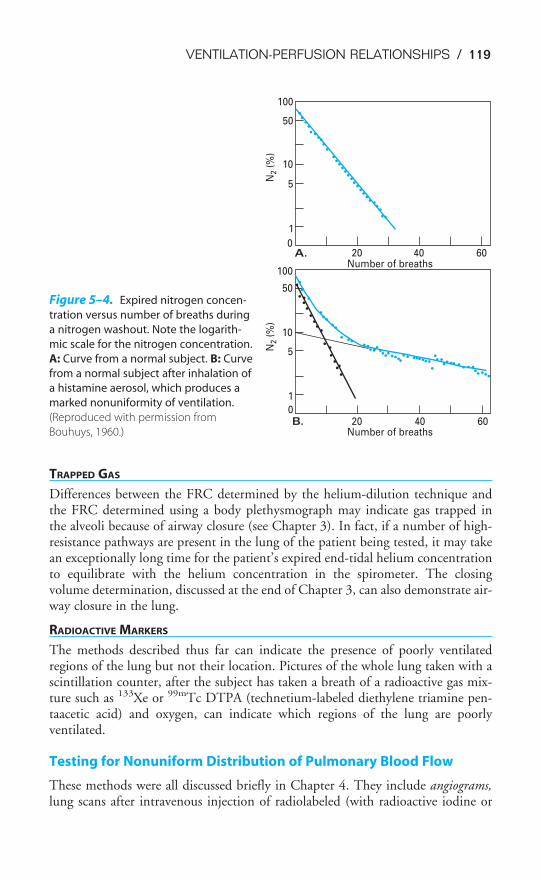
VENTILATION-PERFUSION RELATIONSHIPS / 119
TRAPPED GAS
Differences between the FRC determined by the helium-dilution technique andthe FRC determined using a body plethysmograph may indicate gas trapped in the alveoli because of airway closure (see Chapter 3). In fact, if a number of high-resistance pathways are present in the lung of the patient being tested, it may takean exceptionally long time for the patient’s expired end-tidal helium concentrationto equilibrate with the helium concentration in the spirometer. The closingvolume determination, discussed at the end of Chapter 3, can also demonstrate air-way closure in the lung.
RADIOACTIVE MARKERS
The methods described thus far can indicate the presence of poorly ventilatedregions of the lung but not their location. Pictures of the whole lung taken with ascintillation counter, after the subject has taken a breath of a radioactive gas mix-ture such as 133Xe or 99mTc DTPA (technetium-labeled diethylene triamine pen-taacetic acid) and oxygen, can indicate which regions of the lung are poorlyventilated.
Testing for Nonuniform Distribution of Pulmonary Blood Flow
These methods were all discussed briefly in Chapter 4. They include angiograms,lung scans after intravenous injection of radiolabeled (with radioactive iodine or
100
50
10
5
1
0A. 20 40 60
Number of breaths
Number of breaths
N2 (
%)
N2 (
%)
100
50
10
5
1
0B. 20 40 60
Figure 5–4. Expired nitrogen concen-
tration versus number of breaths during
a nitrogen washout. Note the logarith-
mic scale for the nitrogen concentration.
A: Curve from a normal subject. B: Curve
from a normal subject after inhalation of
a histamine aerosol, which produces a
marked nonuniformity of ventilation.
(Reproduced with permission from
Bouhuys, 1960.)
120 / CHAPTER 5
technetium) macroaggregates of albumin, and lung scans after intravenous adminis-tration of dissolved 133Xe. Each of these methods can indicate the locations of rel-atively large regions of poor perfusion.
Testing for Mismatched Ventilation & Perfusion
Several methods can demonstrate the presence or location of areas of the lungwith mismatched ventilation and perfusion. These methods include calculationsof the physiologic shunt, the physiologic dead space, differences between the alve-olar and arterial PO2
s and PCO2s, and lung scans after inhaled and intravenously
administered 133Xe or 99mTc.
PHYSIOLOGIC SHUNTS AND THE SHUNT EQUATION
A right-to-left shunt is the mixing of venous blood that has not been oxygenated(or not fully oxygenated) into the arterial blood. The physiologic shunt, which cor-responds to the physiologic dead space, consists of the anatomic shunts plus theintrapulmonary shunts. The intrapulmonary shunts can be absolute shunts, or theycan be “shuntlike states,” that is, areas of low ventilation-perfusion ratios in whichalveoli are underventilated and/or overperfused.
Physiologic shunt � Anatomic shunt � Intrapulmonary shunt
Absolute shunts “Shunt-like states”
Anatomic Shunts—Anatomic shunts consist of systemic venous blood enteringthe left ventricle without having entered the pulmonary vasculature. In a normalhealthy adult, about 2–5% of the cardiac output, including venous blood from thebronchial veins, the thebesian veins, and the pleural veins, enters the left side of thecirculation directly without passing through the pulmonary capillaries. (This nor-mal anatomic shunt is also occasionally referred to as the physiologic shunt becauseit does not represent a pathologic condition.) Pathologic anatomic shunts such asright-to-left intracardiac shunts can also occur, as in tetralogy of Fallot.
Absolute Intrapulmonary Shunts—Mixed venous blood perfusing pulmonarycapillaries associated with totally unventilated or collapsed alveoli constitutes anabsolute shunt (like the anatomic shunts) because no gas exchange occurs as theblood passes through the lung. Absolute shunts are sometimes also referred to astrue shunts.
Shuntlike States—Alveolar-capillary units with low V̇A/Q̇cs also act to lower thearterial oxygen content because blood draining these units has a lower PO2
thanblood from units with well-matched ventilation and perfusion.
The Shunt Equation—The shunt equation conceptually divides all alveolar-capillary units into two groups: those with well-matched ventilation and perfusionand those with ventilation-perfusion ratios of zero. Thus, the shunt equation combinesthe areas of absolute shunt (including the anatomic shunts) and the shuntlike areas
VENTILATION-PERFUSION RELATIONSHIPS / 121
into a single conceptual group. The resulting ratio of shunt flow to the cardiac out-put, often referred to as the venous admixture, is the part of the cardiac output thatwould have to be perfusing absolutely unventilated alveoli to cause the systemic arte-rial oxygen content obtained from a patient. A much larger portion of the cardiacoutput could be overperfusing poorly ventilated alveoli and yield the same ratio.
The shunt equation can be derived as follows: Let Q̇t represent the total pul-monary blood flow per minute (i.e., the cardiac output), and let Q̇s represent theamount of blood flow per minute entering the systemic arterial blood withoutreceiving any oxygen (the “shunt f low”). The volume of blood per minute that per-fuses alveolar-capillary units with well-matched ventilation and perfusion thenequals Q̇t � Q̇s.
The total volume of oxygen per time entering the systemic arteries is therefore
Q̇t � CaO2
where CaO2equals oxygen content of arterial blood in milliliters of oxygen per
100 mL of blood. This total amount of oxygen per time entering the systemicarteries is composed of the oxygen coming from the well-ventilated and well-perfused alveolar-capillary units:
(Q̇t � Q̇s) � CcO�2
where CcO�2equals the oxygen content of the blood at the end of the ventilated
and perfused pulmonary capillaries, plus the oxygen in the unaltered mixedvenous blood coming from the shunt, Q̇s � Cv�O2
(where Cv�O2is equal to the
oxygen content of the mixed venous blood).
That is,
Q̇t � CaO2� (Q̇t � Q̇s) � Cc�O2
�Q̇s � Cv�O2
Oxygen delivery Oxygen coming Oxygen from
to systemic arteries from normal shunted blood
V̇A/Q̇c units flow
Q̇t � CaO2� Q̇t � Cc�O2
� Q̇s � Cc�O2� Q̇s � Cv�O2
Q̇s � (Cc �O2� Cv�O2
) � Q̇t � (Cc�O2� CaO2
)
�Q
Q̇˙s
t� � �
C
C
c
c
�
�
O
O
2
2
�
�
C
C
v
a
�
O
O
2
2
�
The shunt fraction Q̇s/Q̇t is usually multiplied by 100% so that the shunt flowis expressed as a percentage of the cardiac output.
The arterial and mixed venous oxygen contents can be determined if blood sam-ples are obtained from a systemic artery and from the pulmonary artery (for mixedvenous blood), but the oxygen content of the blood at the end of the pulmonarycapillaries with well-matched ventilation and perfusion is, of course, impossible to
122 / CHAPTER 5
measure directly. This must be calculated from the alveolar air equation, discussedin Chapter 3, and the patient’s hemoglobin concentration, which will be discussedin Chapter 7.
The relative contributions of the true intrapulmonary shunts and the shuntlikestates to the calculated shunt flow can be estimated by repeating the measurementsand calculations with the patient on a normal or slightly elevated inspired concentra-tion of oxygen and then on a very high inspired oxygen concentration (FIO2
of 0.95 to1.00). At the lower inspired oxygen concentrations, the calculated Q̇s/Q̇t will includeboth the true shunts and the alveolar-capillary units with low V̇/Q̇ ratios. After apatient has inspired nearly 100% oxygen for 20 to 30 minutes, even alveoli with verylow V̇/Q̇s will have high enough alveolar PO2
s to completely saturate the hemoglobinin the blood perfusing them. These units will therefore no longer contribute to thecalculated Q̇s/Q̇t, and the new calculated shunt should include only areas of absoluteshunt. Unfortunately, very high inspired oxygen concentrations may lead to absorp-tion atelectasis of very poorly ventilated alveoli that remain perfused, and so this testmay alter what it is trying to measure when high levels of FIO2
are used.
PHYSIOLOGIC DEAD SPACE
The use of the Bohr equation to determine the physiologic dead space was discussedin detail in Chapter 3. If the anatomic dead space is subtracted from the physiologicdead space, the result (if there is a difference) is alveolar dead space, or areas of infi-nite V̇/Q̇s. Alveolar dead space also results in an arterial-alveolar CO2 difference; thatis, the end-tidal PCO2
is normally equal to the arterial PCO2. An arterial PCO2
greaterthan the end-tidal PCO2
usually indicates the presence of alveolar dead space.
ALVEOLAR-ARTERIAL OXYGEN DIFFERENCE
Throughout most of this book, the alveolar and arterial PO2s are treated as though
they are equal. However, the arterial PO2is normally a few mm Hg less than the
alveolar PO2. This normal alveolar-arterial oxygen difference, the (A-a)DO2
, is causedby the normal anatomic shunt, some degree of ventilation-perfusion mismatch (seelater in this chapter), and diffusion limitation in some parts of the lung. Of these,V̇/Q̇ mismatch is usually the most important, with a small contribution fromshunts and very little from diffusion limitation. Larger-than-normal differencesbetween the alveolar and arterial PO2
may indicate significant ventilation-perfusionmismatch; however, increased alveolar-arterial oxygen differences (Table 5–2) canalso be caused by anatomic or intrapulmonary shunts, diffusion block, low mixedvenous PO2
s, breathing higher than normal oxygen concentrations, or shifts of theoxyhemoglobin dissociation curve (also see Table 8–6).
The alveolar-arterial PO2difference is normally about 5 to 15 mm Hg in a young
healthy person breathing room air at sea level. It increases with age because of theprogressive decrease in arterial PO2
that occurs with aging for the reasons discussedat the end of Chapter 3. The normal alveolar-arterial PO2
difference increases byabout 20 mm Hg between the ages of 20 and 70.
VENTILATION-PERFUSION RELATIONSHIPS / 123
Note that the “alveolar” PO2used in determining the alveolar-arterial oxygen dif-
ference is the PAO2calculated using the alveolar air equation. As noted in Chapter 3,
it is an idealized average alveolar PO2that represents what alveolar PO2
should be,not necessarily what it is.
Another useful clinical index in addition to the alveolar-arterial oxygen differ-ence is the ratio of arterial PO2
to the fractional concentration of oxygen in theinspired air. The PAO2
/FiO2should be greater than or equal to 200; a PAO2
/FiO2less
than 200 is seen in acute respiratory distress syndrome.
SINGLE-BREATH CARBON DIOXIDE TEST
The expired concentration of carbon dioxide can be monitored by a rapid-responsecarbon dioxide meter in a manner similar to that used in the single-breath tests uti-lizing a nitrogen meter, as described in Chapter 3 (see Figure 3–9). The alveolarplateau phase of the expired carbon dioxide concentration may show signs ofpoorly matched ventilation and perfusion if such regions empty asynchronouslywith other regions of the lung.
LUNG SCANS AFTER INHALED AND INFUSED MARKERS
Lung scans after both inhaled and injected markers can be used to inspect the loca-tion and amount of ventilation and perfusion to the various regions of the lung (seeChapters 3 and 4).
MULTIPLE INERT GAS ELIMINATION TECHNIQUE
A more specific graphic method for assessing ventilation-perfusion relationships inhuman subjects is called the multiple inert gas elimination technique. This techniqueuses the concept that the elimination via the lungs of different gases dissolved in themixed venous blood is affected differently by variations in the ventilation-perfusionratios of alveolar-capillary units, according to the solubility of each gas in the blood.At a ventilation-perfusion ratio of 1.0, a greater volume of a relatively soluble gaswould be retained in the blood than would be the case with a relatively insoluble gas.Thus, the retention of any particular gas by a single alveolar-capillary unit is depend-ent on the blood-gas partition coefficient of the gas and the ventilation-perfusion ratioof the unit. Gases with very low solubilities in the blood would be retained in the
Table 5–2. Causes of Increased Alveolar-Arterial Oxygen Difference
Increased right-to-left shuntAnatomicIntrapulmonary
Increased ventilation-perfusion mismatchImpaired diffusionIncreased inspired partial pressure of oxygenDecreased mixed venous partial pressure of oxygenShift of oxyhemoglobin dissociation curve
Reproduced with permission from Marshall and Wyche, 1972.
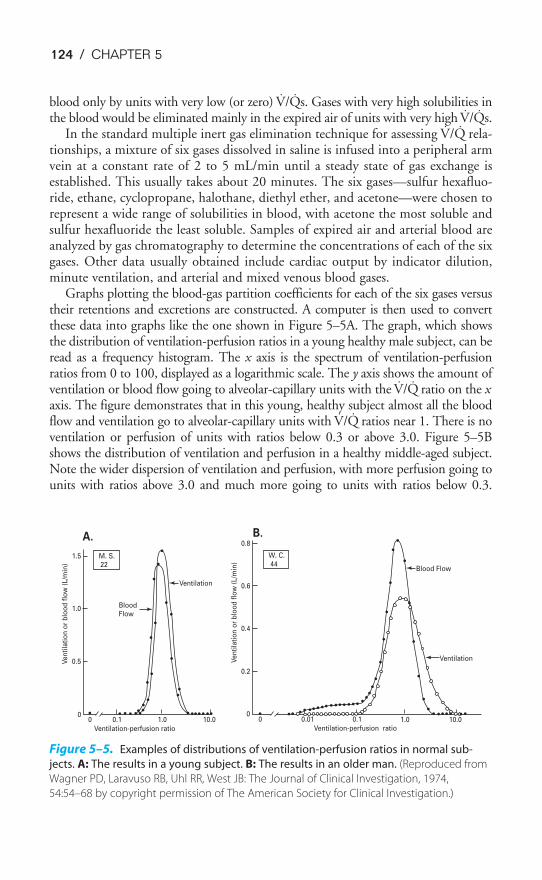
124 / CHAPTER 5
blood only by units with very low (or zero) V̇/Q̇s. Gases with very high solubilities inthe blood would be eliminated mainly in the expired air of units with very high V̇/Q̇s.
In the standard multiple inert gas elimination technique for assessing V̇/Q̇ rela-tionships, a mixture of six gases dissolved in saline is infused into a peripheral armvein at a constant rate of 2 to 5 mL/min until a steady state of gas exchange isestablished. This usually takes about 20 minutes. The six gases—sulfur hexafluo-ride, ethane, cyclopropane, halothane, diethyl ether, and acetone—were chosen torepresent a wide range of solubilities in blood, with acetone the most soluble andsulfur hexafluoride the least soluble. Samples of expired air and arterial blood areanalyzed by gas chromatography to determine the concentrations of each of the sixgases. Other data usually obtained include cardiac output by indicator dilution,minute ventilation, and arterial and mixed venous blood gases.
Graphs plotting the blood-gas partition coefficients for each of the six gases versustheir retentions and excretions are constructed. A computer is then used to convertthese data into graphs like the one shown in Figure 5–5A. The graph, which showsthe distribution of ventilation-perfusion ratios in a young healthy male subject, can beread as a frequency histogram. The x axis is the spectrum of ventilation-perfusionratios from 0 to 100, displayed as a logarithmic scale. The y axis shows the amount ofventilation or blood flow going to alveolar-capillary units with the V̇/Q̇ ratio on the xaxis. The figure demonstrates that in this young, healthy subject almost all the bloodflow and ventilation go to alveolar-capillary units with V̇/Q̇ ratios near 1. There is noventilation or perfusion of units with ratios below 0.3 or above 3.0. Figure 5–5Bshows the distribution of ventilation and perfusion in a healthy middle-aged subject.Note the wider dispersion of ventilation and perfusion, with more perfusion going tounits with ratios above 3.0 and much more going to units with ratios below 0.3.
0.8
0.6
0.4
0.2
1.5
1.0
0.5
00 0.1 1.0 10.0 0
00.01 0.1 1.0 10.0
Ventilation-perfusion ratioVentilation-perfusion ratio
Ventilation
Ventilation
Blood Flow
BloodFlow
W. C.44
M. S.22
Ve
nti
lati
on
or
blo
od
flo
w (
L/m
in)
Ve
nti
lati
on
or
blo
od
flo
w (
L/m
in)
B.A.
Figure 5–5. Examples of distributions of ventilation-perfusion ratios in normal sub-
jects. A: The results in a young subject. B: The results in an older man. (Reproduced from
Wagner PD, Laravuso RB, Uhl RR, West JB: The Journal of Clinical Investigation, 1974,
54:54–68 by copyright permission of The American Society for Clinical Investigation.)
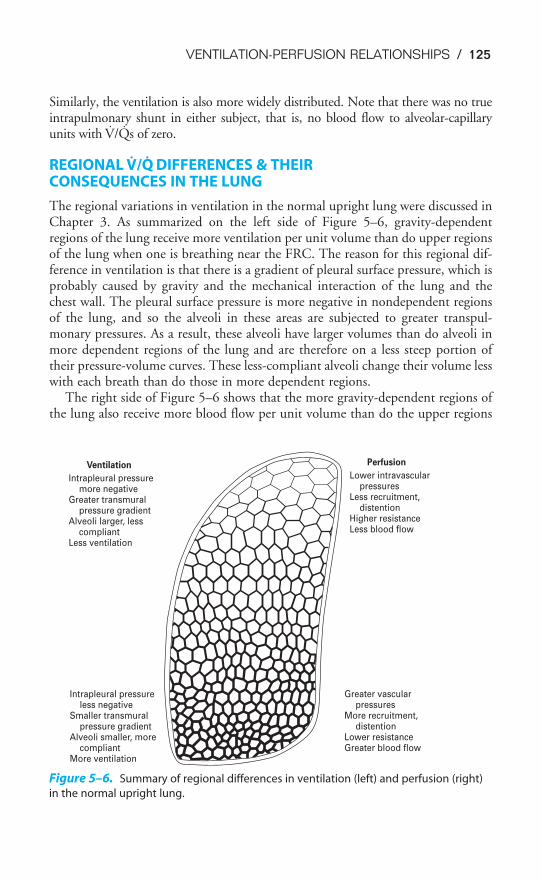
VENTILATION-PERFUSION RELATIONSHIPS / 125
Similarly, the ventilation is also more widely distributed. Note that there was no trueintrapulmonary shunt in either subject, that is, no blood flow to alveolar-capillaryunits with V̇/Q̇s of zero.
REGIONAL V̇/Q̇ DIFFERENCES & THEIR CONSEQUENCES IN THE LUNG
The regional variations in ventilation in the normal upright lung were discussed inChapter 3. As summarized on the left side of Figure 5–6, gravity-dependentregions of the lung receive more ventilation per unit volume than do upper regionsof the lung when one is breathing near the FRC. The reason for this regional dif-ference in ventilation is that there is a gradient of pleural surface pressure, which isprobably caused by gravity and the mechanical interaction of the lung and thechest wall. The pleural surface pressure is more negative in nondependent regionsof the lung, and so the alveoli in these areas are subjected to greater transpul-monary pressures. As a result, these alveoli have larger volumes than do alveoli inmore dependent regions of the lung and are therefore on a less steep portion oftheir pressure-volume curves. These less-compliant alveoli change their volume lesswith each breath than do those in more dependent regions.
The right side of Figure 5–6 shows that the more gravity-dependent regions ofthe lung also receive more blood flow per unit volume than do the upper regions
Ventilation
Intrapleural pressure more negativeGreater transmural pressure gradientAlveoli larger, less compliantLess ventilation
Perfusion
Lower intravascular pressuresLess recruitment, distentionHigher resistanceLess blood flow
Intrapleural pressure less negativeSmaller transmural pressure gradientAlveoli smaller, more compliantMore ventilation
Greater vascular pressuresMore recruitment, distentionLower resistanceGreater blood flow
Figure 5–6. Summary of regional differences in ventilation (left) and perfusion (right)
in the normal upright lung.
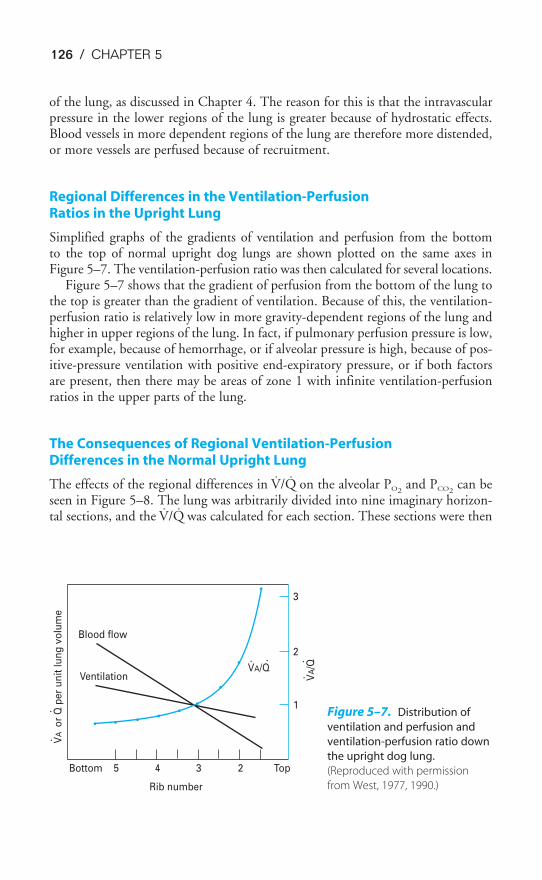
126 / CHAPTER 5
of the lung, as discussed in Chapter 4. The reason for this is that the intravascularpressure in the lower regions of the lung is greater because of hydrostatic effects.Blood vessels in more dependent regions of the lung are therefore more distended,or more vessels are perfused because of recruitment.
Regional Differences in the Ventilation-Perfusion Ratios in the Upright Lung
Simplified graphs of the gradients of ventilation and perfusion from the bottomto the top of normal upright dog lungs are shown plotted on the same axes inFigure 5–7. The ventilation-perfusion ratio was then calculated for several locations.
Figure 5–7 shows that the gradient of perfusion from the bottom of the lung tothe top is greater than the gradient of ventilation. Because of this, the ventilation-perfusion ratio is relatively low in more gravity-dependent regions of the lung andhigher in upper regions of the lung. In fact, if pulmonary perfusion pressure is low,for example, because of hemorrhage, or if alveolar pressure is high, because of pos-itive-pressure ventilation with positive end-expiratory pressure, or if both factorsare present, then there may be areas of zone 1 with infinite ventilation-perfusionratios in the upper parts of the lung.
The Consequences of Regional Ventilation-Perfusion Differences in the Normal Upright Lung
The effects of the regional differences in V̇/Q̇ on the alveolar PO2and PCO2
can beseen in Figure 5–8. The lung was arbitrarily divided into nine imaginary horizon-tal sections, and the V̇/Q̇ was calculated for each section. These sections were then
Bottom 5 4 3
3
2
1
2 Top
VA/Q
VA/Q
VA
or
Q p
er
un
it l
un
g v
olu
me
Blood flow
Ventilation
Rib number
Figure 5–7. Distribution of
ventilation and perfusion and
ventilation-perfusion ratio down
the upright dog lung.
(Reproduced with permission
from West, 1977, 1990.)
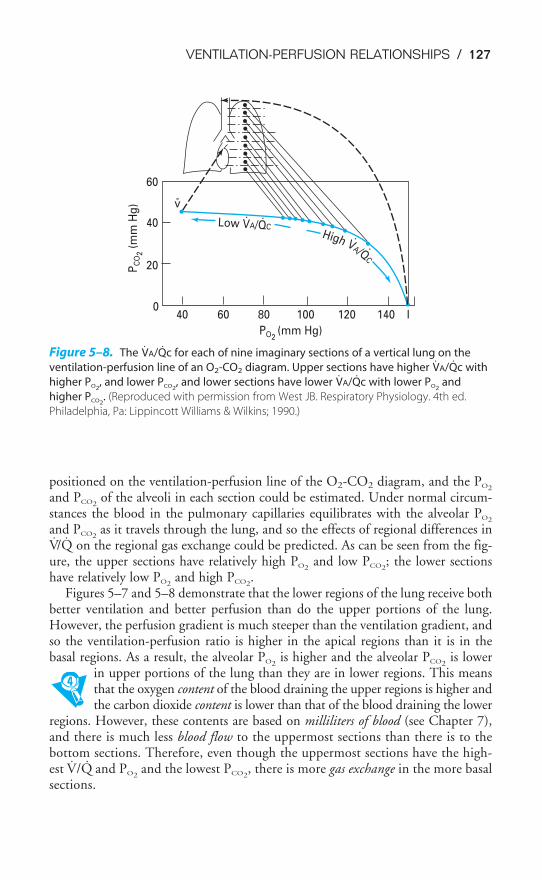
VENTILATION-PERFUSION RELATIONSHIPS / 127
positioned on the ventilation-perfusion line of the O2-CO2 diagram, and the PO2
and PCO2of the alveoli in each section could be estimated. Under normal circum-
stances the blood in the pulmonary capillaries equilibrates with the alveolar PO2
and PCO2as it travels through the lung, and so the effects of regional differences in
V̇/Q̇ on the regional gas exchange could be predicted. As can be seen from the fig-ure, the upper sections have relatively high PO2
and low PCO2; the lower sections
have relatively low PO2and high PCO2
.Figures 5–7 and 5–8 demonstrate that the lower regions of the lung receive both
better ventilation and better perfusion than do the upper portions of the lung.However, the perfusion gradient is much steeper than the ventilation gradient, andso the ventilation-perfusion ratio is higher in the apical regions than it is in thebasal regions. As a result, the alveolar PO2
is higher and the alveolar PCO2is lower
in upper portions of the lung than they are in lower regions. This meansthat the oxygen content of the blood draining the upper regions is higher andthe carbon dioxide content is lower than that of the blood draining the lower
regions. However, these contents are based on milliliters of blood (see Chapter 7),and there is much less blood flow to the uppermost sections than there is to thebottom sections. Therefore, even though the uppermost sections have the high-est V̇/Q̇ and PO2
and the lowest PCO2, there is more gas exchange in the more basal
sections.
040 60 80 100 120 140
20
40
60
PO2(mm Hg)
PC
O2 (
mm
Hg
)
Low VA/QCHigh VA/Q
C
v
I
-
Figure 5–8. The V̇A/Q̇c for each of nine imaginary sections of a vertical lung on the
ventilation-perfusion line of an O2-CO2 diagram. Upper sections have higher V̇A/Q̇c with
higher PO2, and lower PCO2
, and lower sections have lower V̇A/Q̇c with lower PO2and
higher PCO2. (Reproduced with permission from West JB. Respiratory Physiology. 4th ed.
Philadelphia, Pa: Lippincott Williams & Wilkins; 1990.)
128 / CHAPTER 5
5–1. An otherwise normal person is brought to the emergency department after having acci-
dentally aspirated a foreign body into the right main-stem bronchus, partially occluding
it. Which of the following is/are likely to occur?
a. The right lung’s PAO2will be lower and its PACO2
will be higher than those of the left
lung.
b. The calculated shunt fraction, Q̇s/Q̇t, will increase.
c. Blood flow to the right lung will decrease.
d. The arterial PO2will fall.
e. All of the above are correct.
5–2. A normal person lies down on her right side and breathes normally. Her right lung, in
comparison to her left lung, will be expected to have a
a. Lower PAO2and a higher PACO2
b. Higher blood flow per unit volume
c. Greater ventilation per unit volume
d. Higher ventilation-perfusion ratio
e. Larger alveoli
KEY CONCEPTS
Ventilation and perfusion must be matched on the alveolar-capillary level for opti-
mal gas exchange.
Ventilation-perfusion ratios close to 1.0 result in alveolar PO2s of approximately
100 mm Hg and PCO2s close to 40 mm Hg; ventilation-perfusion ratios greater than
1.0 increase the PO2and decrease the PCO2
; ventilation-perfusion ratios less than
1.0 decrease the PO2and increase the PCO2
.
Alveolar dead space and intrapulmonary shunt represent the two extremes of
ventilation-perfusion ratios, infinite and zero, respectively.
The ventilation-perfusion ratios in lower regions of the normal upright lung are lower
than 1.0, resulting in lower PO2s and higher PCO2
s; the ventilation-perfusion ratios in
upper parts of the lung are greater than 1.0, resulting in higher PO2s and lower PCO2
s;
nonetheless, there is normally more gas exchange in lower regions of the lung
because they receive more blood flow.
CLINICAL PROBLEMS
VENTILATION-PERFUSION RELATIONSHIPS / 129
SUGGESTED READINGS
Bouhuys A, Jonsson R, Lichtneckert S, et al. Effects of histamine on pulmonary ventilation in man. Clin Sci.1960;19:79–94.
Comroe JH. Physiology of Respiration. 2nd ed. Chicago, Ill: Year Book; 1974:168–182.
Marshall BE, Wyche MQ Jr. Hypoxemia during and after anesthesia. Anesthesiology. 1972;37:178–209.
Nunn JF. Nunn’s Applied Respiratory Physiology. 4th ed. Oxford: Butterworth-Heinemann; 1993:156–197.
Roca J, Wagner PD. Principles and information content of the multiple inert gas elimination technique.Thorax. 1993;49:815–824.
Wagner PD, Laravuso RB, Uhl RR, West JB. Continuous distributions of ventilation-perfusion ratios innormal subjects breathing air and 100% O2. J Clin Invest. 1974;54:54–58.
West JB. Ventilation/Blood Flow and Gas Exchange. 3rd ed. Oxford: Blackwell; 1977:33–52.
West JB. Ventilation/Blood Flow and Gas Exchange. 5th ed. Oxford: Blackwell; 1990:29–49, 80–109.
West JB. Respiratory Physiology—The Essentials. 5th ed. Baltimore, Md: Lippincott Williams & Wilkins;1995:51–69.
130
Diffusion of a gas occurs when there is a net movement of molecules from an areain which that particular gas exerts a high partial pressure to an area in which itexerts a lower partial pressure. Movement of a gas by diffusion is therefore differ-ent from the movement of gases through the conducting airways, which occurs by“bulk flow” (mass movement or convection). During bulk flow, gas movementresults from differences in total pressure, and molecules of different gases movetogether along the total pressure gradient. During diffusion, different gases eachmove according to their own individual partial pressure gradients. Gas transferduring diffusion occurs by random molecular movement. It is therefore dependenton temperature because molecular movement increases at higher temperatures.Gases move in both directions during diffusion, but the area of higher partial pres-sure, because of its greater number of molecules per unit volume, has proportion-ately more random “departures.” Thus, the net movement of gas is dependent onthe partial pressure difference between the two areas. In a static situation, diffusioncontinues until no partial pressure differences exist for any gases in the two areas;in the lungs, oxygen and carbon dioxide continuously enter and leave the alveoli,and so such an equilibrium does not take place.
FICK’S LAW FOR DIFFUSION
Oxygen is brought into the alveoli by bulk flow through the conducting airways.When air flows through the conducting airways during inspiration, the linear
6Diffusion of Gases
OBJECTIVES
The reader understands the diffusion of gases in the lung.
� Defines diffusion, and distinguishes it from “bulk flow.”
� States Fick’s law for diffusion.
� Distinguishes between perfusion limitation and diffusion limitation of gas transferin the lung.
� Describes the diffusion of oxygen from the alveoli into the blood.
� Describes the diffusion of carbon dioxide from the blood to the alveoli.
� Defines the diffusing capacity and discusses its measurement.
Copyright © 2007 by The McGraw-Hill Companies, Inc. Click here for terms of use.
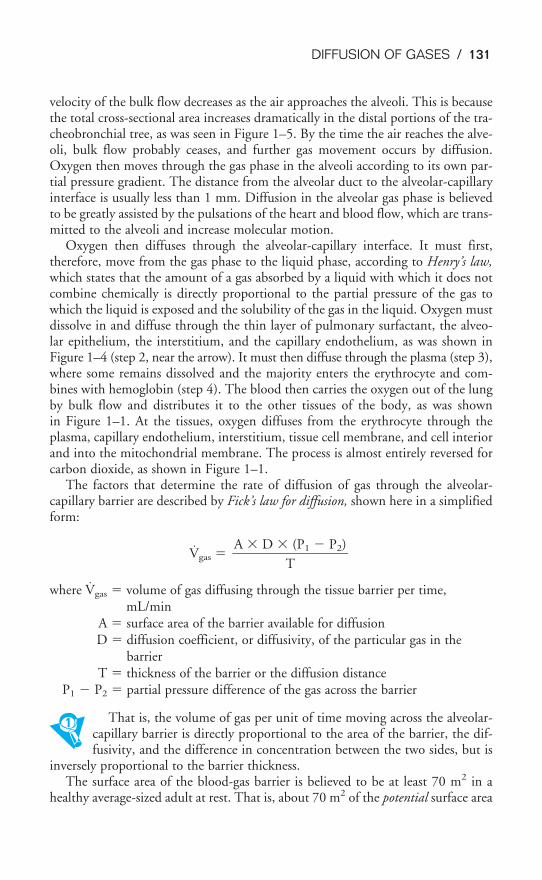
DIFFUSION OF GASES / 131
velocity of the bulk flow decreases as the air approaches the alveoli. This is becausethe total cross-sectional area increases dramatically in the distal portions of the tra-cheobronchial tree, as was seen in Figure 1–5. By the time the air reaches the alve-oli, bulk flow probably ceases, and further gas movement occurs by diffusion.Oxygen then moves through the gas phase in the alveoli according to its own par-tial pressure gradient. The distance from the alveolar duct to the alveolar-capillaryinterface is usually less than 1 mm. Diffusion in the alveolar gas phase is believedto be greatly assisted by the pulsations of the heart and blood flow, which are trans-mitted to the alveoli and increase molecular motion.
Oxygen then diffuses through the alveolar-capillary interface. It must first,therefore, move from the gas phase to the liquid phase, according to Henry’s law,which states that the amount of a gas absorbed by a liquid with which it does notcombine chemically is directly proportional to the partial pressure of the gas towhich the liquid is exposed and the solubility of the gas in the liquid. Oxygen mustdissolve in and diffuse through the thin layer of pulmonary surfactant, the alveo-lar epithelium, the interstitium, and the capillary endothelium, as was shown inFigure 1–4 (step 2, near the arrow). It must then diffuse through the plasma (step 3),where some remains dissolved and the majority enters the erythrocyte and com-bines with hemoglobin (step 4). The blood then carries the oxygen out of the lungby bulk flow and distributes it to the other tissues of the body, as was shown in Figure 1–1. At the tissues, oxygen diffuses from the erythrocyte through theplasma, capillary endothelium, interstitium, tissue cell membrane, and cell interiorand into the mitochondrial membrane. The process is almost entirely reversed forcarbon dioxide, as shown in Figure 1–1.
The factors that determine the rate of diffusion of gas through the alveolar-capillary barrier are described by Fick’s law for diffusion, shown here in a simplifiedform:
V̇gas �
where V̇gas � volume of gas diffusing through the tissue barrier per time,mL/min
A � surface area of the barrier available for diffusionD � diffusion coefficient, or diffusivity, of the particular gas in the
barrierT � thickness of the barrier or the diffusion distance
P1 � P2 � partial pressure difference of the gas across the barrier
That is, the volume of gas per unit of time moving across the alveolar-capillary barrier is directly proportional to the area of the barrier, the dif-fusivity, and the difference in concentration between the two sides, but is
inversely proportional to the barrier thickness.The surface area of the blood-gas barrier is believed to be at least 70 m2 in a
healthy average-sized adult at rest. That is, about 70 m2 of the potential surface area
A � D � (P1 � P2)���
T
132 / CHAPTER 6
is both ventilated and perfused at rest. If more capillaries are recruited, as in exer-cise, the surface area available for diffusion increases; if venous return falls, forexample, because of hemorrhage, or if alveolar pressure is raised by positive-pressure ventilation, then capillaries may be derecruited and the surface area avail-able for diffusion may decrease.
The thickness of the alveolar-capillary diffusion barrier is only about 0.2 to 0.5 �m. This barrier thickness can increase in interstitial fibrosis or interstitialedema, thus interfering with diffusion. Diffusion probably increases at higher lungvolumes because as alveoli are stretched, the diffusion distance decreases slightly (andalso because small airways subject to closure may be open at higher lung volumes).
The diffusivity, or diffusion constant, for a gas is directly proportional to thesolubility of the gas in the diffusion barrier and is inversely proportional to thesquare root of the molecular weight (MW) of the gas:
D �
The relationship between solubility and diffusion through the barrier hasalready been discussed. The diffusivity is inversely proportional to the square rootof the molecular weight of the gas because different gases with equal numbers ofmolecules in equal volumes have the same molecular energy if they are at the sametemperature. Therefore, light molecules travel faster, have more frequent collisions,and diffuse more rapidly. Thus, Graham’s law states that the relative rates of dif-fusion of two gases are inversely proportional to the square roots of their molecu-lar weights, if all else is equal.
For the two gases of greatest interest in the lung,
� 0.85
Because the relative diffusion rates are inversely proportional to the ratio of thesquare roots of their molecular weights,
� �0.
1
85� � 1.17
That is, because oxygen is less dense than carbon dioxide, it should diffuse 1.2times as fast as carbon dioxide (which it does as it moves through the alveoli). Inthe alveolar-capillary barrier, however, the relative solubilities of oxygen and car-bon dioxide must also be considered. The solubility of carbon dioxide in the liq-uid phase is about 24 times that of oxygen, and so carbon dioxide diffuses about0.85 � 24, or about 20 times, more rapidly through the alveolar-capillary barrierthan does oxygen. For this reason, patients develop problems in oxygen diffusionthrough the alveolar-capillary barrier before carbon dioxide retention due to diffu-sion impairment occurs.
Diffusion rate for O2���Diffusion rate for CO2
�MW o�f O2����MW o�f CO2�
solubility��MW�
DIFFUSION OF GASES / 133
LIMITATIONS OF GAS TRANSFER
The factors that limit the movement of a gas through the alveolar-capillary barrier,as described by Fick’s law for diffusion, can be arbitrarily divided into three com-ponents: the diffusion coefficient, the surface area and thickness of the alveolar-capillary membrane, and the partial pressure gradient across the barrier for eachparticular gas. The diffusion coefficient, as discussed in the previous section, isdependent on the physical properties of the gases and the alveolar-capillary mem-brane. The surface area and thickness of the membrane are physical properties ofthe barrier, but they can be altered by changes in the pulmonary capillary bloodvolume, the cardiac output or the pulmonary artery pressure, or by changes in lungvolume. The partial pressure gradient of a gas (across the barrier) is the final majordeterminant of its rate of diffusion. The partial pressure of a gas in the mixedvenous blood and in the pulmonary capillaries is just as important a factor as its alve-olar partial pressure in determining its rate of diffusion. This will be demonstratedin the next section.
Diffusion Limitation
An erythrocyte and its attendant plasma spend an average of about 0.75 to 1.2 sec-onds inside the pulmonary capillaries at resting cardiac outputs. This time can beestimated by dividing the pulmonary capillary blood volume by the pulmonaryblood flow (expressed in milliliters per second). Some erythrocytes may take lesstime to traverse the pulmonary capillaries; others may take longer. Figure 6–1shows schematically the calculated change with time in the partial pressures in theblood of three gases: oxygen, carbon monoxide, and nitrous oxide. These areshown in comparison to the alveolar partial pressures for each gas, as indicated bythe dotted line. This alveolar partial pressure is different for each of the three gases,and it depends on its concentration in the inspired gas mixture and on how rap-idly it is removed by the pulmonary capillary blood. The schematic is drawn asthough all three gases were administered simultaneously, but this is not necessarilythe case. Consider each gas as though it were acting independently of the others.
The partial pressure of carbon monoxide in the pulmonary capillary blood risesvery slowly compared with that of the other two gases in the figure. (Obviously, alow inspired concentration of carbon monoxide must be used for a very short timein such an experiment.) Nevertheless, if the content of carbon monoxide (in milli-liters of carbon monoxide per milliliter of blood) were measured simultaneously, itwould be rising very rapidly. The reason for this rapid rise is that carbon monox-ide combines chemically with the hemoglobin in the erythrocytes. Indeed, theaffinity of carbon monoxide for hemoglobin is about 210 times that of oxygen forhemoglobin. The carbon monoxide that is chemically combined with hemoglobindoes not contribute to the partial pressure of carbon monoxide in the bloodbecause it is no longer physically dissolved in it. Therefore, the partial pressure of
carbon monoxide in the pulmonary capillary blood does not come close tothe partial pressure of carbon monoxide in the alveoli during the time thatthe blood is exposed to the alveolar carbon monoxide. The partial pressure
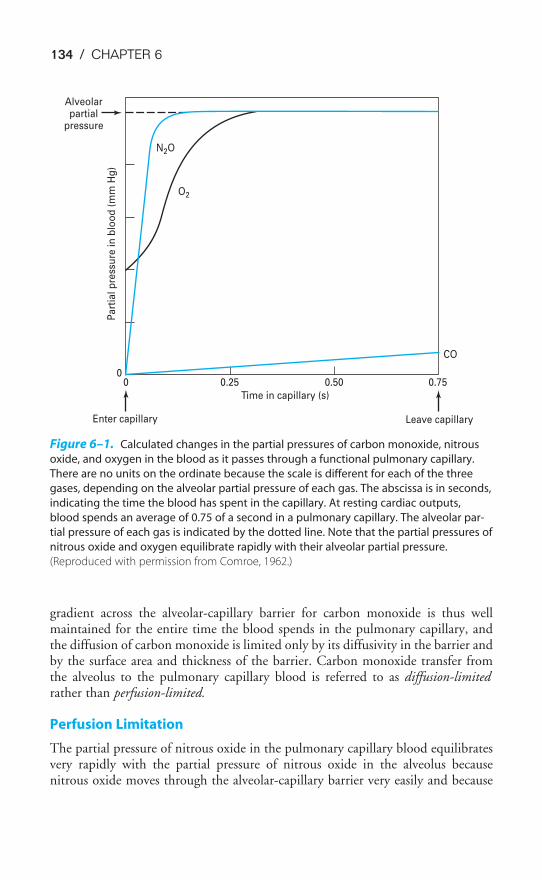
134 / CHAPTER 6
gradient across the alveolar-capillary barrier for carbon monoxide is thus wellmaintained for the entire time the blood spends in the pulmonary capillary, andthe diffusion of carbon monoxide is limited only by its diffusivity in the barrier andby the surface area and thickness of the barrier. Carbon monoxide transfer fromthe alveolus to the pulmonary capillary blood is referred to as diffusion-limitedrather than perfusion-limited.
Perfusion Limitation
The partial pressure of nitrous oxide in the pulmonary capillary blood equilibratesvery rapidly with the partial pressure of nitrous oxide in the alveolus becausenitrous oxide moves through the alveolar-capillary barrier very easily and because
Alveolarpartial
pressure
Pa
rtia
l p
ress
ure
in
blo
od
(m
m H
g)
N2O
O2
00 0.50 0.75
CO
Leave capillary
0.25
Time in capillary (s)
Enter capillary
Figure 6–1. Calculated changes in the partial pressures of carbon monoxide, nitrous
oxide, and oxygen in the blood as it passes through a functional pulmonary capillary.
There are no units on the ordinate because the scale is different for each of the three
gases, depending on the alveolar partial pressure of each gas. The abscissa is in seconds,
indicating the time the blood has spent in the capillary. At resting cardiac outputs,
blood spends an average of 0.75 of a second in a pulmonary capillary. The alveolar par-
tial pressure of each gas is indicated by the dotted line. Note that the partial pressures of
nitrous oxide and oxygen equilibrate rapidly with their alveolar partial pressure.
(Reproduced with permission from Comroe, 1962.)
DIFFUSION OF GASES / 135
it does not combine chemically with the hemoglobin in the erythrocytes. Afteronly about 0.1 of a second of exposure of the pulmonary capillary blood to thealveolar nitrous oxide, the partial pressure gradient across the alveolar-capillary bar-rier has been abolished. From this point on, no further nitrous oxide transferoccurs from the alveolus to that portion of the blood in the capillary that hasalready equilibrated with the alveolar nitrous oxide partial pressure; during the last
0.6 to 0.7 of a second, no net diffusion occurs between the alveolus andthe blood as it travels through the pulmonary capillary. Of course, bloodjust entering the capillary at the arterial end will not be equilibrated with
the alveolar partial pressure of nitrous oxide, and so nitrous oxide can diffuse intothe blood at the arterial end. The transfer of nitrous oxide is therefore perfusion-limited. Nitrous oxide transfer from a particular alveolus to one of its pulmonarycapillaries can be increased by increasing the cardiac output and thus reducing theamount of time the blood stays in the pulmonary capillary after equilibration withthe alveolar partial pressure of nitrous oxide has occurred. (Because increasing thecardiac output may recruit previously unperfused capillaries, the total diffusion ofboth carbon monoxide and nitrous oxide may increase as the surface area for dif-fusion increases.)
DIFFUSION OF OXYGEN
As can be seen in Figure 6–1, the time course for oxygen transfer falls betweenthose for carbon monoxide and nitrous oxide. The partial pressure of oxygen risesfairly rapidly (note that it starts at the PO2
of the mixed venous blood, about40 mm Hg, rather than at zero), and equilibration with the alveolar PO2
of about100 mm Hg occurs within about 0.25 of a second, or about one third of the timethe blood is in the pulmonary capillary at normal resting cardiac outputs. Oxygenmoves easily through the alveolar-capillary barrier and into the erythrocytes, whereit combines chemically with hemoglobin. The partial pressure of oxygen rises morerapidly than the partial pressure of carbon monoxide. Nonetheless, the oxygenchemically bound to hemoglobin (and therefore no longer physically dissolved)exerts no partial pressure, and so the partial pressure gradient across the alveolar-capillary membrane is initially well maintained and oxygen transfer occurs. Thechemical combination of oxygen and hemoglobin, however, occurs rapidly (withinhundredths of a second), and at the normal alveolar partial pressure of oxygen, thehemoglobin becomes nearly saturated with oxygen very quickly, as will be dis-cussed in the next chapter. As this happens, the partial pressure of oxygen in theblood rises rapidly to that in the alveolus, and from that point, no further oxygentransfer from the alveolus to the equilibrated blood can occur. Therefore, underthe conditions of normal alveolar PO2
and a normal resting cardiac output, oxygentransfer from alveolus to pulmonary capillary is perfusion-limited.
Figure 6–2A shows similar graphs of calculated changes in the partial pressureof oxygen in the blood as it moves through a pulmonary capillary. The alveolar PO2
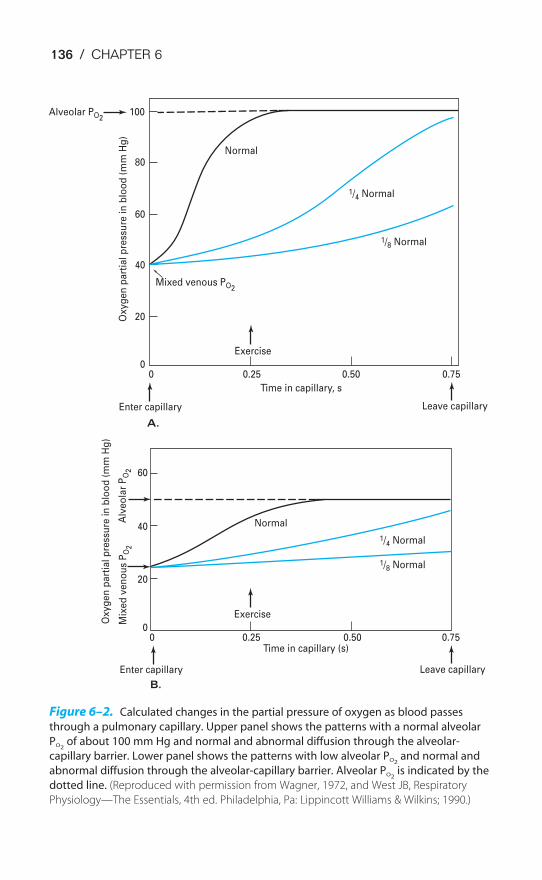
136 / CHAPTER 6
Alveolar PO2100
80
60
40
20
0
60
40
20
0
0 0.25 0.50 0.75
Enter capillary
Mixed venous PO2
Ox
yg
en
pa
rtia
l p
ress
ure
in
blo
od
(m
m H
g)
Normal
Exercise
1/4 Normal
1/8 Normal
Leave capillary
Time in capillary, s
0 0.25 0.50 0.75
Enter capillary
Exercise
Leave capillary
Time in capillary (s)
Alv
eo
lar
PO
2M
ixe
d v
en
ou
s P
O2
Ox
yg
en
pa
rtia
l p
ress
ure
in
blo
od
(m
m H
g)
Normal
1/4 Normal
1/8 Normal
B.
A.
Figure 6–2. Calculated changes in the partial pressure of oxygen as blood passes
through a pulmonary capillary. Upper panel shows the patterns with a normal alveolar
PO2of about 100 mm Hg and normal and abnormal diffusion through the alveolar-
capillary barrier. Lower panel shows the patterns with low alveolar PO2and normal and
abnormal diffusion through the alveolar-capillary barrier. Alveolar PO2is indicated by the
dotted line. (Reproduced with permission from Wagner, 1972, and West JB, Respiratory
Physiology—The Essentials, 4th ed. Philadelphia, Pa: Lippincott Williams & Wilkins; 1990.)
DIFFUSION OF GASES / 137
is normal. During exercise, blood moves through the pulmonary capillary muchmore rapidly than it does at resting cardiac outputs. In fact, the blood may stay inthe “functional” pulmonary capillary an average of only about 0.25 of a secondduring severe exercise, as indicated on the graph. Oxygen transfer into the bloodper time will be greatly increased because there is little or no perfusion limitationof oxygen transfer. (Indeed, that part of the blood that stays in the capillary lessthan the average may be subjected to diffusion limitation of oxygen transfer.) Ofcourse, total oxygen transfer is also increased during exercise because of recruitmentof previously unperfused capillaries, which increases the surface area for diffusion,and because of better matching of ventilation and perfusion. A person with anabnormal alveolar-capillary barrier due to a fibrotic thickening or interstitial edemamay approach diffusion limitation of oxygen transfer at rest and may have a seri-ous diffusion limitation of oxygen transfer during strenuous exercise, as can be seenin the middle curve in Figure 6–2A. A person with an extremely abnormal alveo-lar-capillary barrier might have diffusion limitation of oxygen transfer even at rest,as seen at right in the figure.
The effect of a low alveolar partial pressure of oxygen on oxygen transfer fromthe alveolus to the capillary is seen in Figure 6–2B. The low alveolar PO2
setsthe upper limit for the end-capillary blood PO2
. Because the oxygen content of thearterial blood is decreased, the mixed venous PO2
is also depressed. The even greaterdecrease in the alveolar partial pressure of oxygen, however, causes a decreased alve-olar-capillary partial pressure gradient, and the blood PO2
takes longer to equili-brate with the alveolar PO2
. For this reason, a normal person exerting himselfor herself at high altitude might be subject to diffusion limitation of oxygentransfer.
DIFFUSION OF CARBON DIOXIDE
The time course of carbon dioxide transfer from the pulmonary capillary blood tothe alveolus is shown in Figure 6–3. In a normal person with a mixed venous par-tial pressure of carbon dioxide of 45 mm Hg and an alveolar partial pressure of car-bon dioxide of 40 mm Hg, an equilibrium is reached in about 0.25 of a second, orabout the same time as that for oxygen. This fact may seem surprising, consider-ing that the diffusivity of carbon dioxide is about 20 times that of oxygen, but thepartial pressure gradient is normally only about 5 mm Hg for carbon dioxide,whereas it is about 60 mm Hg for oxygen. Carbon dioxide transfer is therefore nor-mally perfusion-limited, although it may be diffusion-limited in a person with anabnormal alveolar-capillary barrier, as shown in the figure.
MEASUREMENT OF DIFFUSING CAPACITY
It is often useful to determine the diffusion characteristics of a patient’s lungs dur-ing their assessment in the pulmonary function laboratory. It may be particularly
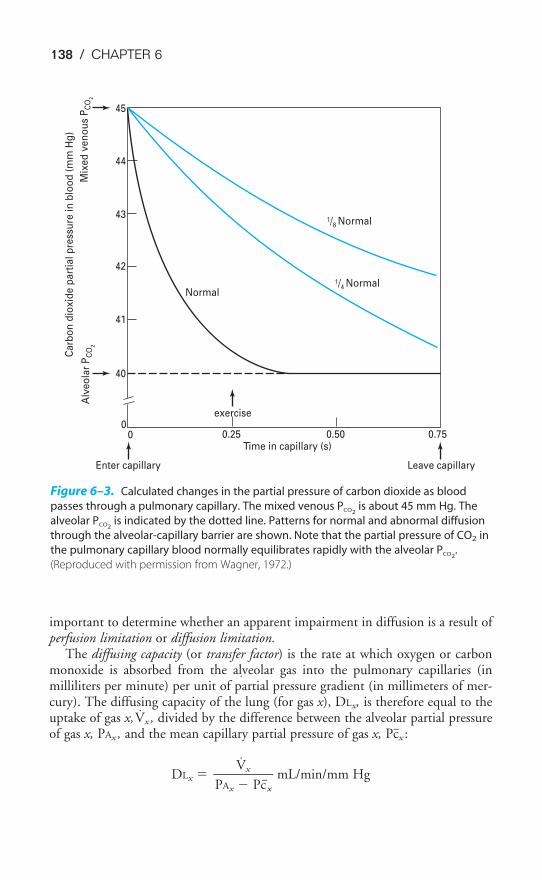
138 / CHAPTER 6
important to determine whether an apparent impairment in diffusion is a result ofperfusion limitation or diffusion limitation.
The diffusing capacity (or transfer factor) is the rate at which oxygen or carbonmonoxide is absorbed from the alveolar gas into the pulmonary capillaries (inmilliliters per minute) per unit of partial pressure gradient (in millimeters of mer-cury). The diffusing capacity of the lung (for gas x), DLx, is therefore equal to theuptake of gas x,V̇x , divided by the difference between the alveolar partial pressureof gas x, PAx , and the mean capillary partial pressure of gas x, Pc�x :
DLx � �PAx
V
�
x
Pc�x
� mL/min/mm Hg
0.750.500.25Time in capillary (s)
00
40
41
42
43
44
45
Alv
eo
lar
PC
O2
Ca
rbo
n d
iox
ide
pa
rtia
l p
ress
ure
in
blo
od
(m
m H
g)
Mix
ed
ve
no
us
PC
O2
Normal
exercise
1/4 Normal
1/8 Normal
Leave capillaryEnter capillary
Figure 6–3. Calculated changes in the partial pressure of carbon dioxide as blood
passes through a pulmonary capillary. The mixed venous PCO2is about 45 mm Hg. The
alveolar PCO2is indicated by the dotted line. Patterns for normal and abnormal diffusion
through the alveolar-capillary barrier are shown. Note that the partial pressure of CO2 in
the pulmonary capillary blood normally equilibrates rapidly with the alveolar PCO2.
(Reproduced with permission from Wagner, 1972.)
˙
˙
DIFFUSION OF GASES / 139
This is really just a rearrangement of the Fick equation given at the beginningof this chapter. The terms for area, diffusivity, and thickness have been combinedinto DLx and the equation has been rearranged:
V̇x �
�P1
V
�
x
P2
� � �A �
T
D�
DLx � �P1
V
�
x
P2
�
The mean partial pressure of oxygen or carbon monoxide is, as already dis-cussed, affected by their chemical reactions with hemoglobin, as well as by theirtransfer through the alveolar-capillary barrier. For this reason, the diffusing capac-ity of the lung is determined by both the diffusing capacity of the membrane, DM,and the reaction with hemoglobin, expressed as � � Vc, where � is the volume ofgas in milliliters per minute taken up by the erythrocytes in 1 mL of blood per mil-limeter of mercury partial pressure gradient between the plasma and the erythro-cyte and Vc is the capillary blood volume in milliliters. (The units of � � Vc aretherefore mL/min/mm Hg.) The diffusing capacity of the lung, DL, can be shownto be related to DM and � � Vc as follows:
�D
1
L� � �
D
1
M� � �
� �
1
Vc� �� �
D
1
A��
DA, or diffusion through the alveolus, is normally very rapid and usually can bedisregarded.
Carbon monoxide is most frequently used in determinations of the diffusingcapacity because the mean pulmonary capillary partial pressure of carbon monox-ide is virtually zero when nonlethal alveolar partial pressures of carbon monoxideare used:
DLCO � �PACO
V
�
CO
Pc�CO
�
but Pc�CO � 0
and so DLCO � �P
V
A
C
C
O
O
�
Several different methods are used clinically to measure the carbon monoxidediffusing capacity and involve both single-breath and steady-state techniques,sometimes during exercise. The DLCO is decreased in diseases associated with inter-stitial or alveolar fibrosis, such as sarcoidosis, scleroderma, and asbestosis, or with conditions causing interstitial or alveolar pulmonary edema, as indicated in
A � D � (P1 � P2)���
T
˙
˙
˙
˙
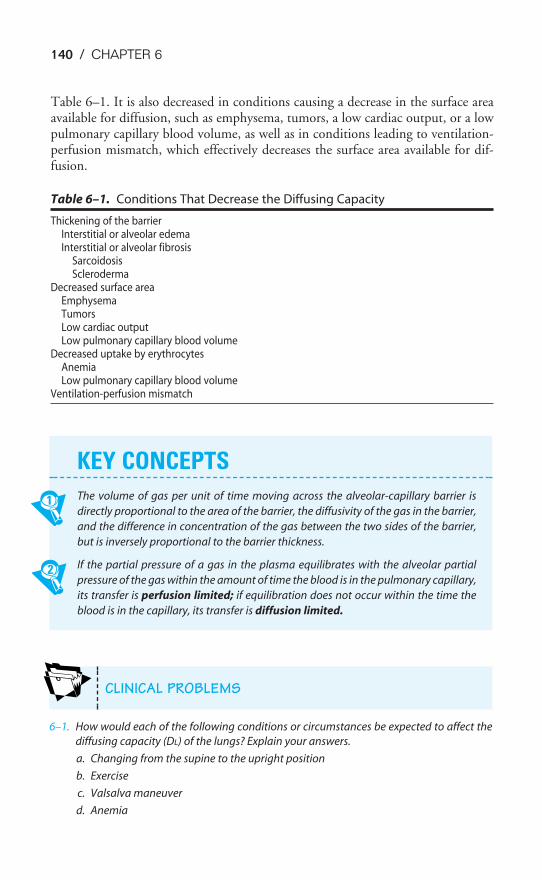
CLINICAL PROBLEMS
140 / CHAPTER 6
Table 6–1. It is also decreased in conditions causing a decrease in the surface areaavailable for diffusion, such as emphysema, tumors, a low cardiac output, or a lowpulmonary capillary blood volume, as well as in conditions leading to ventilation-perfusion mismatch, which effectively decreases the surface area available for dif-fusion.
Table 6–1. Conditions That Decrease the Diffusing Capacity
Thickening of the barrierInterstitial or alveolar edemaInterstitial or alveolar fibrosis
SarcoidosisScleroderma
Decreased surface areaEmphysemaTumorsLow cardiac outputLow pulmonary capillary blood volume
Decreased uptake by erythrocytesAnemiaLow pulmonary capillary blood volume
Ventilation-perfusion mismatch
KEY CONCEPTS
The volume of gas per unit of time moving across the alveolar-capillary barrier is
directly proportional to the area of the barrier, the diffusivity of the gas in the barrier,
and the difference in concentration of the gas between the two sides of the barrier,
but is inversely proportional to the barrier thickness.
If the partial pressure of a gas in the plasma equilibrates with the alveolar partial
pressure of the gas within the amount of time the blood is in the pulmonary capillary,
its transfer is perfusion limited; if equilibration does not occur within the time the
blood is in the capillary, its transfer is diffusion limited.
6–1. How would each of the following conditions or circumstances be expected to affect the
diffusing capacity (DL) of the lungs? Explain your answers.
a. Changing from the supine to the upright position
b. Exercise
c. Valsalva maneuver
d. Anemia
DIFFUSION OF GASES / 141
e. Low cardiac output due to blood loss
f. Diffuse interstitial fibrosis of the lungs
g. Emphysema
6–2. If the pulmonary capillary partial pressure of a gas equilibrates with that in the alveolus
before the blood leaves the capillary (assume the gas is diffusing from the alveolus to the
pulmonary capillary):
a. its transfer is said to be perfusion limited.
b. its transfer is said to be diffusion limited.
c. increasing the cardiac output will not increase the amount of the gas diffusing across
the alveolar-capillary barrier.
d. increasing the alveolar partial pressure of the gas will not increase the amount of the
gas diffusing across the alveolar-capillary barrier.
e. recruiting additional pulmonary capillaries will not increase the amount of the gas
diffusing across the alveolar capillary barrier.
SUGGESTED READINGS
Comroe JH, Forster RE II, DuBois AB, Briscoe WA, Carlsen E. The Lung. 2nd ed. Chicago, Ill: Year Book;1962:111–139.
Forster RE II, Dubois AB, Briscoe WA, Fisher AB. The Lung: Physiologic Basis of Pulmonary Function Tests.3rd ed. Chicago, Ill: Year Book; 1986:190–222.
Maeda N, Shiga T. Velocity of oxygen transfer and erythrocyte rheology. News Physiol Sci. 1994;9:22–27.
Wagner PD, West JB. Effects of diffusion impairment on O2 and CO2 time courses in pulmonary capillar-ies. J Appl Physiol. 1972;33:62–71.
West JB. Respiratory Physiology—The Essentials. 6th ed. Baltimore, Md: Lippincott Williams & Wilkins;2000:21–28.
142
The final step in the exchange of gases between the external environment and thetissues is the transport of oxygen and carbon dioxide to and from the lung by theblood. Oxygen is carried both physically dissolved in the blood and chemicallycombined to hemoglobin. Carbon dioxide is carried physically dissolved in theblood, chemically combined to blood proteins as carbamino compounds, and asbicarbonate.
TRANSPORT OF OXYGEN BY THE BLOOD
Oxygen is transported both physically dissolved in blood and chemicallycombined to the hemoglobin in the erythrocytes. Much more oxygen isnormally transported combined with hemoglobin than is physically
7The Transport of Oxygen &Carbon Dioxide in the Blood
OBJECTIVES
The reader understands how oxygen and carbon dioxide are transported to and fromthe tissues in the blood.
� States the relationship between the partial pressure of oxygen in the blood and theamount of oxygen physically dissolved in the blood.
� Describes the chemical combination of oxygen with hemoglobin and the “oxyhe-moglobin dissociation curve.”
� Defines hemoglobin saturation, the oxygen-carrying capacity, and the oxygencontent of blood.
� States the physiologic consequences of the shape of the oxyhemoglobin dissocia-tion curve.
� Lists the physiologic factors that can influence the oxyhemoglobin dissociationcurve, and predicts their effects on oxygen transport by the blood.
� States the relationship between the partial pressure of carbon dioxide in the bloodand the amount of carbon dioxide physically dissolved in the blood.
� Describes the transport of carbon dioxide as carbamino compounds with bloodproteins.
� Explains how most of the carbon dioxide in the blood is transported as bicarbonate.
� Describes the carbon dioxide dissociation curve for whole blood.
� Explains the Bohr and Haldane effects.
Copyright © 2007 by The McGraw-Hill Companies, Inc. Click here for terms of use.
THE TRANSPORT OF OXYGEN & CARBON DIOXIDE / 143
dissolved in the blood. Without hemoglobin, the cardiovascular system could notsupply sufficient oxygen to meet tissue demands.
Physically Dissolved
At a temperature of 37°C, 1 mL of plasma contains 0.00003 mL O2/mm Hg PO2.
This corresponds to Henry’s law, as discussed in Chapter 6. Whole blood containsa similar amount of dissolved oxygen per milliliter because oxygen dissolves in thefluid of the erythrocytes in about the same amount. Therefore, normal arterialblood with a PO2
of approximately 100 mm Hg contains only about 0.003 mLO2/mL of blood, or 0.3 mL O2/100 mL of blood. (Blood oxygen content is con-ventionally expressed in milliliters of oxygen per 100 mL of blood, or volumespercent.)
A few simple calculations can demonstrate that the oxygen physically dissolvedin the blood is not sufficient to fulfill the body’s oxygen demand (at normal FIO2
and barometric pressure). The resting oxygen consumption of an adult is approx-imately 250 to 300 mL O2/min. If the tissues were able to remove the entire 0.3 mL O2/100 mL of blood flow they receive, the cardiac output would have tobe about 83.3 L/min to meet the tissue demand for oxygen at rest:
�250
m
m
in
L O2� � �10
0
0
.3
m
m
L
L
b
O
lo2
od� � �
83.3
m
3
i
3
n
mL� � �
83
m
.3
in
L�
During severe exercise, the oxygen demand can increase as much as 16-fold to4 L/min or more. Under such conditions, the cardiac output would have to begreater than 1000 L/min if physically dissolved oxygen were to supply all the oxy-gen required by the tissues. The maximum cardiac outputs attainable by normaladults during severe exercise are in the range of 25 L/min. Clearly, the physicallydissolved oxygen in the blood cannot meet the metabolic demand for oxygen, evenat rest.
Chemically Combined with Hemoglobin
THE STRUCTURE OF HEMOGLOBIN
Hemoglobin is a complex molecule with a molecular weight of about 64,500. Theprotein portion (globin) has a tetrameric structure consisting of four linkedpolypeptide chains, each of which is attached to a protoporphyrin (heme) group.Each heme group consists of four symmetrically arranged pyrroles with a ferrous(Fe2�) iron atom at its center. The iron atom is bound to each of the pyrrolegroups and to one of the four polypeptide chains. A sixth binding site on the fer-rous iron atom is freely available to bind with oxygen (or carbon monoxide).Therefore each of the four polypeptide chains can bind a molecule of oxygen (orcarbon monoxide) to the iron atom in its own heme group, and so the tetramerichemoglobin molecule can combine chemically with four oxygen molecules (oreight oxygen atoms). Both the globin component and the heme component (withits iron atom in the ferrous state), in their proper spatial orientation to each other,
144 / CHAPTER 7
are necessary for the chemical reaction with oxygen to take place—neither hemenor globin alone will combine with oxygen. Each of the tetrameric hemoglobinsubunits can combine with oxygen by itself (see Figure 7–4C).
Variations in the amino acid sequences of the four globin subunits may haveimportant physiologic consequences. Normal adult hemoglobin (HbA) consists oftwo alpha (�) chains, each of which has 141 amino acids, and two beta (�) chains,each of which has 146 amino acids. Fetal hemoglobin (HbF), which consists oftwo � chains and two gamma (�) chains, has a higher affinity for oxygen than doesadult hemoglobin. Synthesis of � chains normally begins about 6 weeks beforebirth, and HbA usually replaces almost all the HbF by the time an infant is 4 months old. Other, abnormal hemoglobin molecules may be produced by ge-netic substitution of a single amino acid for the normal one in an � or � chain or(rarely) by alterations in the structure of heme groups. These alterations may pro-duce changes in the affinity of the hemoglobin for oxygen, change the physicalproperties of hemoglobin, or alter the interaction of hemoglobin and other sub-stances that affect its combination with oxygen, such as 2,3-bisphosphoglycerate(2,3-BPG) (discussed later in this chapter). More than 120 abnormal variants ofnormal adult hemoglobin have been demonstrated in patients. The best known ofthese, hemoglobin S, is present in sickle cell disease. Hemoglobin S tends to poly-merize and crystallize in the cytosol of the erythrocyte when it is not combined with oxygen. This polymerization and crystallization decreases the solubility ofhemoglobin S within the erythrocyte and changes the shape of the cell from thenormal biconcave disk to a crescent or “sickle” shape. A sickled cell is more fragilethan a normal cell. In addition, the cells have a tendency to stick to one another,which increases blood viscosity and also favors thrombosis or blockage of bloodvessels.
Chemical Reaction of Oxygen & Hemoglobin
Hemoglobin rapidly combines reversibly with oxygen. It is the reversibility of thereaction that allows oxygen to be released to the tissues; if the reaction did not pro-ceed easily in both directions, hemoglobin would be of little use in delivering oxy-gen to satisfy metabolic needs. The reaction is very fast, with a half-time of 0.01 ofa second or less. Each gram of hemoglobin is capable of combining with about1.39 mL of oxygen under optimal conditions, but under normal circumstancessome hemoglobin exists in forms such as methemoglobin (in which the iron atomis in the ferric state) or is combined with carbon monoxide, in which case thehemoglobin cannot bind oxygen. For this reason, the oxygen-carrying capacity ofhemoglobin is conventionally considered to be 1.34 mL O2/g Hb. That is, eachgram of hemoglobin, when fully saturated with oxygen, binds 1.34 mL of oxygen.Therefore, a person with 15 g Hb/100 mL of blood has an oxygen-carrying capac-ity of 20.1 mL O2/100 mL of blood:
�100
15
m
g
L
H
bl
b
ood� � �
1.34
g
m
H
L
b
O2� � �1
2
0
0
0
.1
m
m
L
L
bl
O
oo2
d�
THE TRANSPORT OF OXYGEN & CARBON DIOXIDE / 145
The reaction of hemoglobin and oxygen is conventionally written
Hb � O2 ⇀↽ HbO2
Deoxyhemoglobin Oxyhemoglobin
HEMOGLOBIN & THE PHYSIOLOGIC IMPLICATIONS OF THE OXYHEMOGLOBIN DISSOCIATION CURVE
The equilibrium point of the reversible reaction of hemoglobin and oxygen is, ofcourse, dependent on how much oxygen the hemoglobin in blood is exposed to.
This corresponds directly to the partial pressure of oxygen in the plasmaunder the conditions in the body. Thus, the PO2
of the plasma determinesthe amount of oxygen that binds to the hemoglobin in the erythrocytes.
The Oxyhemoglobin Dissociation Curve
One way to express the proportion of hemoglobin that is bound to oxygen is aspercent saturation. This is equal to the content of oxygen in the blood (minus thatpart physically dissolved) divided by the oxygen-carrying capacity of the hemoglo-bin in the blood times 100%:
% Hb saturation ��O
O
2
2
c
b
a
o
p
u
ac
n
i
d
ty
t
o
o
f
H
H
b
b�� 100%
Note that the oxygen-carrying capacity of an individual depends on the amountof hemoglobin in that person’s blood. The blood oxygen content also depends onthe amount of hemoglobin present (as well as on the PO2
). Both content and capac-ity are expressed as milliliters of oxygen per 100 mL of blood. On the other hand,the percent hemoglobin saturation expresses only a percentage and not an amountor volume of oxygen. Therefore, “percent saturation” is not interchangeable with“oxygen content.” For example, two patients might have the same percent ofhemoglobin saturation, but if one has a lower blood hemoglobin concentrationbecause of anemia, he or she will have a lower blood oxygen content.
The relationship between the PO2of the plasma and the percent of hemoglobin
saturation is demonstrated graphically as the oxyhemoglobin dissociation curve. Anoxyhemoglobin dissociation curve for normal blood is shown in Figure 7–1.
The oxyhemoglobin dissociation curve is really a plot of how the availability ofone of the reactants, oxygen (expressed as the PO2
of the plasma), affects thereversible chemical reaction of oxygen and hemoglobin. The product, oxyhemo-globin, is expressed as percent saturation—really a percentage of the maximum forany given amount of hemoglobin.
As can be seen in Figure 7–1, the relationship between PO2and HbO2 is not lin-
ear; it is an S-shaped curve, steep at the lower PO2s and nearly flat when the
PO2is above 70 mm Hg. It is this S shape that is responsible for several very
important physiologic properties of the reaction of oxygen and hemoglo-bin. The reason that the curve is S-shaped and not linear is that it is actually a plotof four reactions rather than one. That is, each of the four subunits of hemoglobin
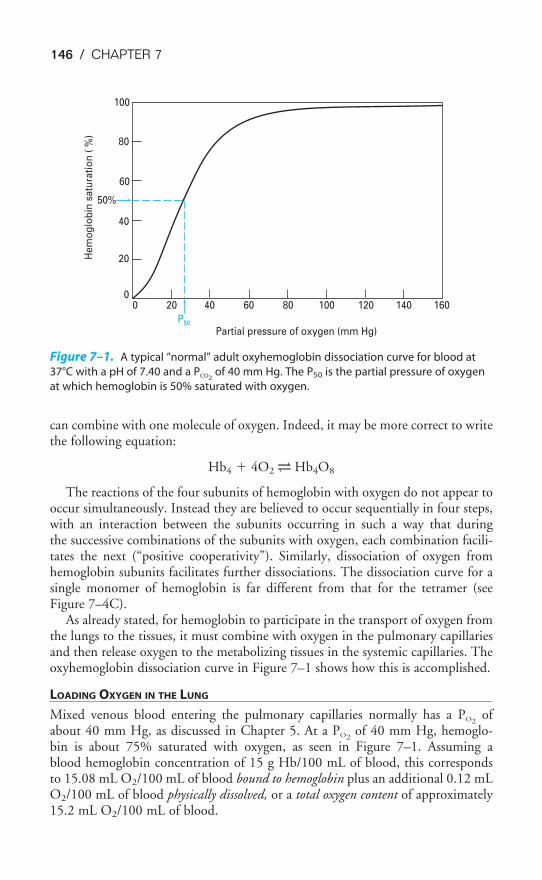
146 / CHAPTER 7
can combine with one molecule of oxygen. Indeed, it may be more correct to writethe following equation:
Hb4 � 4O2 ⇀↽ Hb4O8
The reactions of the four subunits of hemoglobin with oxygen do not appear tooccur simultaneously. Instead they are believed to occur sequentially in four steps,with an interaction between the subunits occurring in such a way that during the successive combinations of the subunits with oxygen, each combination facili-tates the next (“positive cooperativity”). Similarly, dissociation of oxygen fromhemoglobin subunits facilitates further dissociations. The dissociation curve for asingle monomer of hemoglobin is far different from that for the tetramer (seeFigure 7–4C).
As already stated, for hemoglobin to participate in the transport of oxygen fromthe lungs to the tissues, it must combine with oxygen in the pulmonary capillariesand then release oxygen to the metabolizing tissues in the systemic capillaries. Theoxyhemoglobin dissociation curve in Figure 7–1 shows how this is accomplished.
LOADING OXYGEN IN THE LUNG
Mixed venous blood entering the pulmonary capillaries normally has a PO2of
about 40 mm Hg, as discussed in Chapter 5. At a PO2of 40 mm Hg, hemoglo-
bin is about 75% saturated with oxygen, as seen in Figure 7–1. Assuming a blood hemoglobin concentration of 15 g Hb/100 mL of blood, this correspondsto 15.08 mL O2/100 mL of blood bound to hemoglobin plus an additional 0.12 mLO2/100 mL of blood physically dissolved, or a total oxygen content of approximately15.2 mL O2/100 mL of blood.
100
80
60
50%
40
20
00
P50
Partial pressure of oxygen (mm Hg)
He
mo
glo
bin
sa
tura
tio
n (
%)
20 40 60 80 100 120 140 160
Figure 7–1. A typical “normal” adult oxyhemoglobin dissociation curve for blood at
37°C with a pH of 7.40 and a PCO2of 40 mm Hg. The P50 is the partial pressure of oxygen
at which hemoglobin is 50% saturated with oxygen.
THE TRANSPORT OF OXYGEN & CARBON DIOXIDE / 147
Oxygen-carrying capacity is
�100
15
m
g
L
H
bl
b
ood� � �
1.34
g
m
H
L
b
O2� � �1
2
0
0
0
.1
m
m
L
L
bl
O
oo2
d�
Oxygen bound to hemoglobin at a PO2of 40 mm Hg (37°C, pH 7.4) is
�1
2
0
0
0
.1
m
m
L
L
bl
O
oo2
d� � 75% � �
1
1
0
5
0
.0
m
8
L
m
b
L
lo
O
o2
d�
Capacity % saturation Content
Oxygen physically dissolved at a PO2of 40 mm Hg is
� 40 mm Hg � �1
0
0
.
0
12
m
m
L
L
bl
O
oo2
d�
Total blood oxygen content at a PO2of 40 mm Hg (37°C, pH 7.4) is
�1
1
0
5
0
.0
m
8
L
m
b
L
lo
O
o2
d� � �
1
0
0
.
0
12
m
m
L
L
bl
O
oo2
d� � �
1
1
0
5
0
.2
m
m
L
L
bl
O
oo2
d�
Bound to Hb Physically dissolved Total
As the blood passes through the pulmonary capillaries, it equilibrates with thealveolar PO2
of about 100 mm Hg. At a PO2of 100 mm Hg, hemoglobin is about
97.4% saturated with oxygen, as seen in Figure 7–1. This corresponds to 19.58 mLO2/100 mL of blood bound to hemoglobin plus 0.3 mL O2/100 mL of blood phys-ically dissolved, or a total oxygen content of 19.88 mL O2/100 mL of blood.
Oxygen bound to hemoglobin at a PO2of 100 mm Hg (37°C, pH 7.4) is
�1
2
0
0
0
.1
m
m
L
L
bl
O
oo2
d� � 97.4% � �
1
1
0
9
0
.5
m
8
L
m
b
L
lo
O
o2
d�
Capacity % saturation Content
Oxygen physically dissolved at a PO2of 100 mm Hg is
� 100 mm Hg � �10
0
0
.3
m
m
L
L
b
O
lo2
od�
Total blood oxygen content at a PO2of 100 mm Hg (37°C, pH 7.4) is
�1
1
0
9
0
.5
m
8
L
m
b
L
lo
O
o2
d� � �
10
0
0
.3
m
m
L
L
b
O
lo2
od� � �
1
1
0
9
0
.8
m
8
L
m
b
L
lo
O
o2
d�
Bound to Hb Physically dissolved Total
Thus, in passing through the lungs, each 100 mL of blood has loaded (19.88 �15.20) mL O2, or 4.68 mL O2. Assuming a cardiac output of 5 L/min, this meansthat approximately 234 mL O2 is loaded into the blood per minute:
�5 L
m
b
i
l
n
ood� � �
4
l
6
it
.
e
8
r
m
bl
L
oo
O
d2� � �
234
m
m
in
L O2�
0.003 mL O2����100 mL blood PO2
(in mm Hg)
0.003 mL O2����100 mL blood PO2
(in mm Hg)
148 / CHAPTER 7
Note that the oxyhemoglobin dissociation curve is relatively flat when PO2is
greater than approximately 70 mm Hg. This is very important physiologicallybecause it means that there is only a small decrease in the oxygen content of bloodequilibrated with a PO2
of 70 mm Hg instead of 100 mm Hg. In fact, the curveshows that at a PO2
of 70 mm Hg, hemoglobin is still approximately 94.1% satu-rated with oxygen. This constitutes an important safety factor because a patientwith a relatively low alveolar or arterial PO2
of 70 mm Hg (owing to hypoventila-tion or intrapulmonary shunting, for example) is still able to load oxygen into theblood with little difficulty. A quick calculation shows that at 70 mm Hg the totalblood oxygen content is approximately 19.12 mL O2/100 mL of blood comparedwith the 19.88 mL O2/100 mL of blood at a PO2
of 100 mm Hg. These calcula-tions show that PO2
is often a more sensitive diagnostic indicator of the status of apatient’s respiratory system than is the arterial oxygen content. Of course, the oxy-gen content is more important physiologically to the patient.
It should also be noted that since hemoglobin is approximately 97.4% saturatedat a PO2
of 100 mm Hg, raising the alveolar PO2above 100 mm Hg can combine
little additional oxygen with hemoglobin (only about 0.52 mL O2/100 mL ofblood at a hemoglobin concentration of 15 g/100 mL of blood). Hemoglobin isfully saturated with oxygen at a PO2
of about 250 mm Hg.
UNLOADING OXYGEN AT THE TISSUES
As blood passes from the arteries into the systemic capillaries, it is exposed to lowerPO2
s, and oxygen is released by the hemoglobin. The PO2in the capillaries varies
from tissue to tissue, being very low in some (e.g., myocardium) and relativelyhigher in others (e.g., kidney). As can be seen in Figure 7–1, the oxyhemoglobindissociation curve is very steep in the range of 40 to 10 mm Hg. This means thata small decrease in PO2
can result in a substantial further dissociation of oxygen andhemoglobin, unloading more oxygen for use by the tissues. At a PO2
of 40 mm Hg,hemoglobin is about 75% saturated with oxygen, with a total blood oxygen con-tent of 15.2 mL O2/100 mL of blood (at 15 g Hb/100 mL of blood). At a PO2
of20 mm Hg, hemoglobin is only 32% saturated with oxygen. The total bloodoxygen content is only 6.49 mL O2/100 mL of blood, a decrease of 8.71 mLO2/100 mL of blood for only a 20-mm Hg decrease in PO2
.The unloading of oxygen at the tissues is also facilitated by other physiologic
factors that can alter the shape and position of the oxyhemoglobin dissociationcurve. These include the pH, PCO2
, temperature of the blood, and concentration of2,3-BPG in the erythrocytes.
INFLUENCES ON THE OXYHEMOGLOBIN DISSOCIATION CURVE
Figure 7–2 shows the influence of alterations in temperature, pH, PCO2, and
2,3-BPG on the oxyhemoglobin dissociation curve. High temperature, lowpH, high PCO2
, and elevated levels of 2,3-BPG all “shift the oxyhemoglo-bin dissociation curve to the right.” That is, for any particular PO2
there isless oxygen chemically combined with hemoglobin at higher temperatures, lowerpHs, higher PCO2
s, and elevated levels of 2,3-BPG.
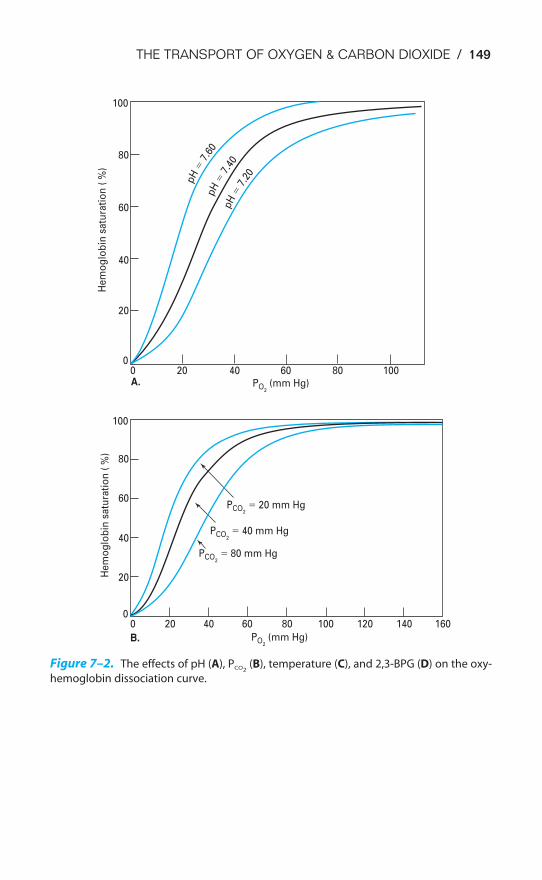
THE TRANSPORT OF OXYGEN & CARBON DIOXIDE / 149
100
80
60
40
20
00
PO2 (mm Hg)
PCO2
� 20 mm Hg
PCO2
� 40 mm Hg
PCO2
� 80 mm Hg
20 40 60 80 100
He
mo
glo
bin
sa
tura
tio
n (
%)
100
80
60
40
20
0
He
mo
glo
bin
sa
tura
tio
n (
%)
pH
�7.
60pH
�7.
40pH
�7.
20
A.
0
PO2 (mm Hg)
20 40 60 80 100 120 140 160
B.
Figure 7–2. The effects of pH (A), PCO2(B), temperature (C), and 2,3-BPG (D) on the oxy-
hemoglobin dissociation curve.
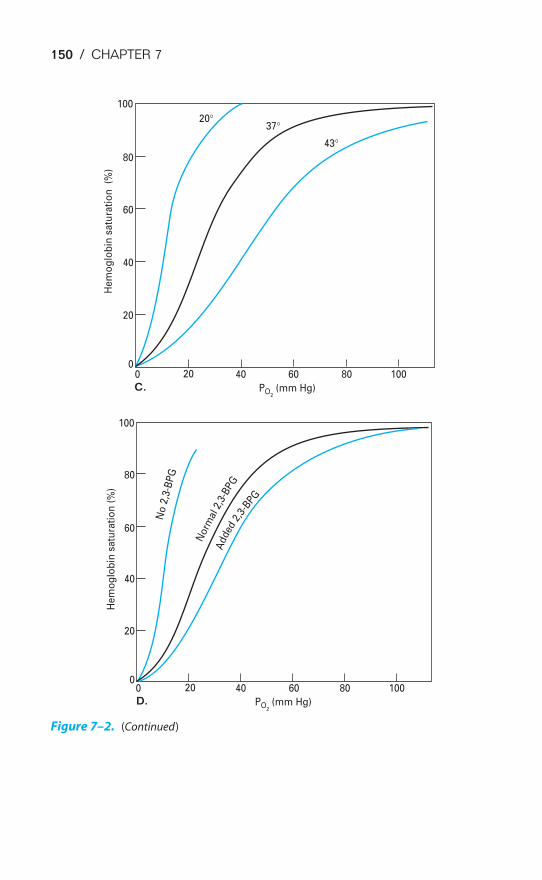
150 / CHAPTER 7
00
20
40
60
80
100
0
20
40
60
80
100
20°37°
20 40 60 80 100
43°
PO2 (mm Hg)
He
mo
glo
bin
sa
tura
tio
n
(%)
He
mo
glo
bin
sa
tura
tio
n (
%)
C.
0 20 40 60 80 100
PO2 (mm Hg) D.
No
2,3
-BP
G
Norm
al2,
3-B
PGA
dde
d2,
3-BPG
Figure 7–2. (Continued)
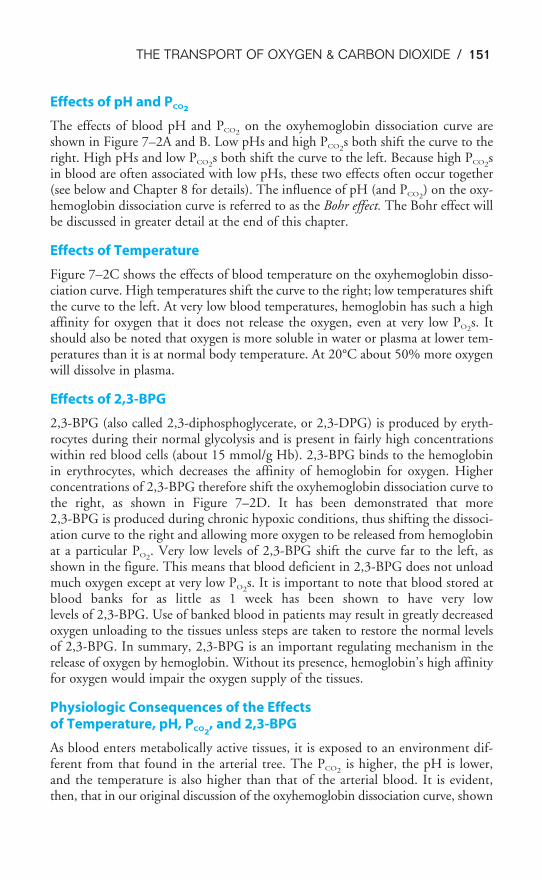
THE TRANSPORT OF OXYGEN & CARBON DIOXIDE / 151
Effects of pH and PCO2
The effects of blood pH and PCO2on the oxyhemoglobin dissociation curve are
shown in Figure 7–2A and B. Low pHs and high PCO2s both shift the curve to the
right. High pHs and low PCO2s both shift the curve to the left. Because high PCO2
sin blood are often associated with low pHs, these two effects often occur together(see below and Chapter 8 for details). The influence of pH (and PCO2
) on the oxy-hemoglobin dissociation curve is referred to as the Bohr effect. The Bohr effect willbe discussed in greater detail at the end of this chapter.
Effects of Temperature
Figure 7–2C shows the effects of blood temperature on the oxyhemoglobin disso-ciation curve. High temperatures shift the curve to the right; low temperatures shiftthe curve to the left. At very low blood temperatures, hemoglobin has such a highaffinity for oxygen that it does not release the oxygen, even at very low PO2
s. Itshould also be noted that oxygen is more soluble in water or plasma at lower tem-peratures than it is at normal body temperature. At 20°C about 50% more oxygenwill dissolve in plasma.
Effects of 2,3-BPG
2,3-BPG (also called 2,3-diphosphoglycerate, or 2,3-DPG) is produced by eryth-rocytes during their normal glycolysis and is present in fairly high concentrationswithin red blood cells (about 15 mmol/g Hb). 2,3-BPG binds to the hemoglobinin erythrocytes, which decreases the affinity of hemoglobin for oxygen. Higherconcentrations of 2,3-BPG therefore shift the oxyhemoglobin dissociation curve tothe right, as shown in Figure 7–2D. It has been demonstrated that more2,3-BPG is produced during chronic hypoxic conditions, thus shifting the dissoci-ation curve to the right and allowing more oxygen to be released from hemoglobinat a particular PO2
. Very low levels of 2,3-BPG shift the curve far to the left, asshown in the figure. This means that blood deficient in 2,3-BPG does not unloadmuch oxygen except at very low PO2
s. It is important to note that blood stored atblood banks for as little as 1 week has been shown to have very lowlevels of 2,3-BPG. Use of banked blood in patients may result in greatly decreasedoxygen unloading to the tissues unless steps are taken to restore the normal levelsof 2,3-BPG. In summary, 2,3-BPG is an important regulating mechanism in therelease of oxygen by hemoglobin. Without its presence, hemoglobin’s high affinityfor oxygen would impair the oxygen supply of the tissues.
Physiologic Consequences of the Effects of Temperature, pH, PCO2
, and 2,3-BPG
As blood enters metabolically active tissues, it is exposed to an environment dif-ferent from that found in the arterial tree. The PCO2
is higher, the pH is lower,and the temperature is also higher than that of the arterial blood. It is evident,then, that in our original discussion of the oxyhemoglobin dissociation curve, shown
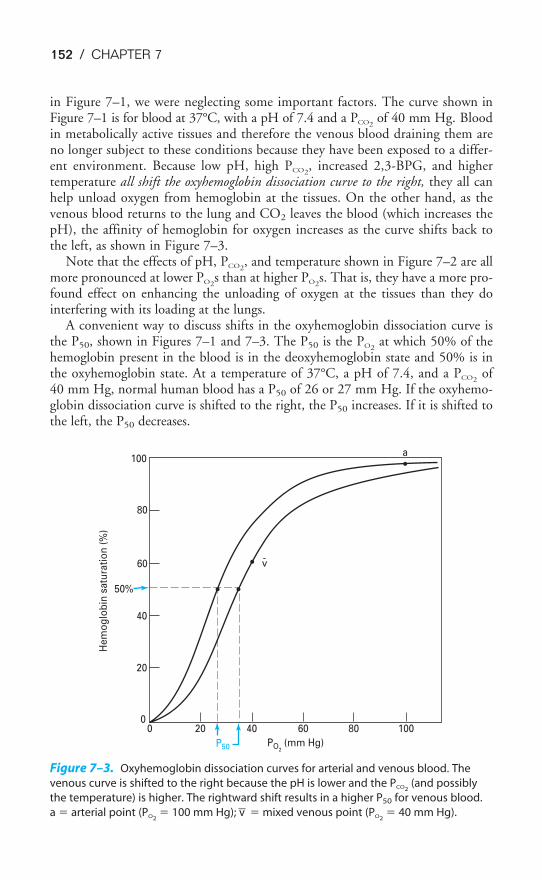
152 / CHAPTER 7
in Figure 7–1, we were neglecting some important factors. The curve shown inFigure 7–1 is for blood at 37°C, with a pH of 7.4 and a PCO2
of 40 mm Hg. Bloodin metabolically active tissues and therefore the venous blood draining them areno longer subject to these conditions because they have been exposed to a differ-ent environment. Because low pH, high PCO2
, increased 2,3-BPG, and highertemperature all shift the oxyhemoglobin dissociation curve to the right, they all canhelp unload oxygen from hemoglobin at the tissues. On the other hand, as thevenous blood returns to the lung and CO2 leaves the blood (which increases thepH), the affinity of hemoglobin for oxygen increases as the curve shifts back tothe left, as shown in Figure 7–3.
Note that the effects of pH, PCO2, and temperature shown in Figure 7–2 are all
more pronounced at lower PO2s than at higher PO2
s. That is, they have a more pro-found effect on enhancing the unloading of oxygen at the tissues than they dointerfering with its loading at the lungs.
A convenient way to discuss shifts in the oxyhemoglobin dissociation curve isthe P50, shown in Figures 7–1 and 7–3. The P50 is the PO2
at which 50% of thehemoglobin present in the blood is in the deoxyhemoglobin state and 50% is inthe oxyhemoglobin state. At a temperature of 37°C, a pH of 7.4, and a PCO2
of40 mm Hg, normal human blood has a P50 of 26 or 27 mm Hg. If the oxyhemo-globin dissociation curve is shifted to the right, the P50 increases. If it is shifted tothe left, the P50 decreases.
100
80
60
40
20
00 20 40 60 80 100
50%
v
a
-
He
mo
glo
bin
sa
tura
tio
n (
%)
PO2 (mm Hg)P50
Figure 7–3. Oxyhemoglobin dissociation curves for arterial and venous blood. The
venous curve is shifted to the right because the pH is lower and the PCO2(and possibly
the temperature) is higher. The rightward shift results in a higher P50 for venous blood.
a � arterial point (PO2� 100 mm Hg); v� � mixed venous point (PO2
� 40 mm Hg).
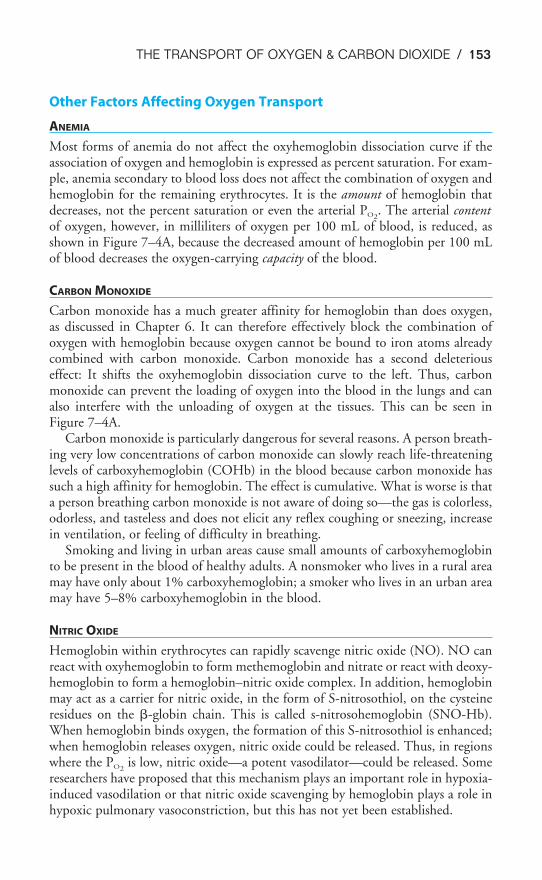
THE TRANSPORT OF OXYGEN & CARBON DIOXIDE / 153
Other Factors Affecting Oxygen Transport
ANEMIA
Most forms of anemia do not affect the oxyhemoglobin dissociation curve if theassociation of oxygen and hemoglobin is expressed as percent saturation. For exam-ple, anemia secondary to blood loss does not affect the combination of oxygen andhemoglobin for the remaining erythrocytes. It is the amount of hemoglobin thatdecreases, not the percent saturation or even the arterial PO2
. The arterial contentof oxygen, however, in milliliters of oxygen per 100 mL of blood, is reduced, asshown in Figure 7–4A, because the decreased amount of hemoglobin per 100 mLof blood decreases the oxygen-carrying capacity of the blood.
CARBON MONOXIDE
Carbon monoxide has a much greater affinity for hemoglobin than does oxygen,as discussed in Chapter 6. It can therefore effectively block the combination ofoxygen with hemoglobin because oxygen cannot be bound to iron atoms alreadycombined with carbon monoxide. Carbon monoxide has a second deleteriouseffect: It shifts the oxyhemoglobin dissociation curve to the left. Thus, carbonmonoxide can prevent the loading of oxygen into the blood in the lungs and canalso interfere with the unloading of oxygen at the tissues. This can be seen inFigure 7–4A.
Carbon monoxide is particularly dangerous for several reasons. A person breath-ing very low concentrations of carbon monoxide can slowly reach life-threateninglevels of carboxyhemoglobin (COHb) in the blood because carbon monoxide hassuch a high affinity for hemoglobin. The effect is cumulative. What is worse is thata person breathing carbon monoxide is not aware of doing so—the gas is colorless,odorless, and tasteless and does not elicit any reflex coughing or sneezing, increasein ventilation, or feeling of difficulty in breathing.
Smoking and living in urban areas cause small amounts of carboxyhemoglobinto be present in the blood of healthy adults. A nonsmoker who lives in a rural areamay have only about 1% carboxyhemoglobin; a smoker who lives in an urban areamay have 5–8% carboxyhemoglobin in the blood.
NITRIC OXIDE
Hemoglobin within erythrocytes can rapidly scavenge nitric oxide (NO). NO canreact with oxyhemoglobin to form methemoglobin and nitrate or react with deoxy-hemoglobin to form a hemoglobin–nitric oxide complex. In addition, hemoglobinmay act as a carrier for nitric oxide, in the form of S-nitrosothiol, on the cysteineresidues on the �-globin chain. This is called s-nitrosohemoglobin (SNO-Hb).When hemoglobin binds oxygen, the formation of this S-nitrosothiol is enhanced;when hemoglobin releases oxygen, nitric oxide could be released. Thus, in regionswhere the PO2
is low, nitric oxide—a potent vasodilator—could be released. Someresearchers have proposed that this mechanism plays an important role in hypoxia-induced vasodilation or that nitric oxide scavenging by hemoglobin plays a role inhypoxic pulmonary vasoconstriction, but this has not yet been established.
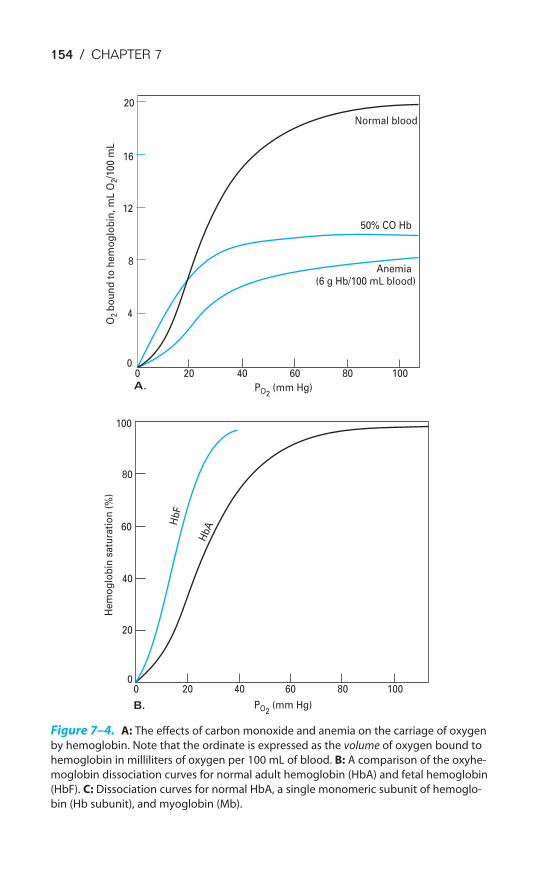
154 / CHAPTER 7
00A. PO2
(mm Hg)
O2
bo
un
d t
o h
em
og
lob
in,
mL
O2/1
00
mL
20 40 60 80 100
0
B. PO2 (mm Hg)
20 40 60 80 100
4
8
12
16
20
0
He
mo
glo
bin
sa
tura
tio
n (
%)
20
40
60
80
100
Normal blood
50% CO Hb
Anemia(6 g Hb/100 mL blood)
Hb
F
HbA
Figure 7–4. A: The effects of carbon monoxide and anemia on the carriage of oxygen
by hemoglobin. Note that the ordinate is expressed as the volume of oxygen bound to
hemoglobin in milliliters of oxygen per 100 mL of blood. B: A comparison of the oxyhe-
moglobin dissociation curves for normal adult hemoglobin (HbA) and fetal hemoglobin
(HbF). C: Dissociation curves for normal HbA, a single monomeric subunit of hemoglo-
bin (Hb subunit), and myoglobin (Mb).
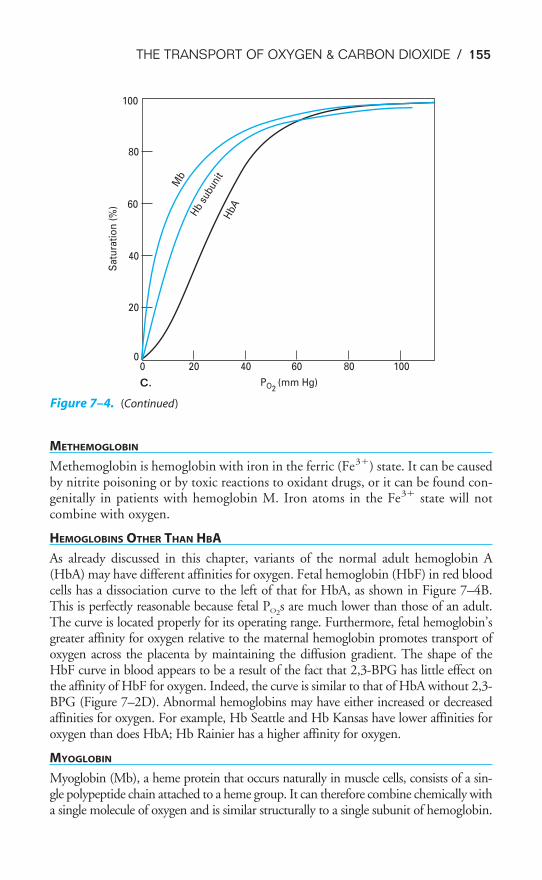
THE TRANSPORT OF OXYGEN & CARBON DIOXIDE / 155
METHEMOGLOBIN
Methemoglobin is hemoglobin with iron in the ferric (Fe3�) state. It can be causedby nitrite poisoning or by toxic reactions to oxidant drugs, or it can be found con-genitally in patients with hemoglobin M. Iron atoms in the Fe3� state will notcombine with oxygen.
HEMOGLOBINS OTHER THAN HBA
As already discussed in this chapter, variants of the normal adult hemoglobin A(HbA) may have different affinities for oxygen. Fetal hemoglobin (HbF) in red bloodcells has a dissociation curve to the left of that for HbA, as shown in Figure 7–4B.This is perfectly reasonable because fetal PO2
s are much lower than those of an adult.The curve is located properly for its operating range. Furthermore, fetal hemoglobin’sgreater affinity for oxygen relative to the maternal hemoglobin promotes transport ofoxygen across the placenta by maintaining the diffusion gradient. The shape of theHbF curve in blood appears to be a result of the fact that 2,3-BPG has little effect onthe affinity of HbF for oxygen. Indeed, the curve is similar to that of HbA without 2,3-BPG (Figure 7–2D). Abnormal hemoglobins may have either increased or decreasedaffinities for oxygen. For example, Hb Seattle and Hb Kansas have lower affinities foroxygen than does HbA; Hb Rainier has a higher affinity for oxygen.
MYOGLOBIN
Myoglobin (Mb), a heme protein that occurs naturally in muscle cells, consists of a sin-gle polypeptide chain attached to a heme group. It can therefore combine chemically witha single molecule of oxygen and is similar structurally to a single subunit of hemoglobin.
0
C. PO2(mm Hg)
20 40 60 80 1000
Sa
tura
tio
n (
%)
20
40
60
80
100
HbAHb
subu
nit
Mb
Figure 7–4. (Continued)
156 / CHAPTER 7
As can be seen in Figure 7–4C, the hyperbolic dissociation curve of myoglobin (whichis similar to that of a single hemoglobin subunit) is far to the left of that of normal adulthemoglobin. That is, at lower PO2
s, much more oxygen remains bound to myoglobin.Myoglobin can therefore act to transport and store oxygen in skeletal muscle. As bloodpasses through the muscle, oxygen leaves hemoglobin and binds to myoglobin. It canbe released from the myoglobin when conditions cause lower PO2
s.
ARTIFICIAL BLOOD
Oxygen can bind reversibly to emulsions of fluorocarbons. Although these fluoro-carbon emulsions do not have nearly as much oxygen-carrying capacity as doeshemoglobin at normal PO2
s, they can carry significantly more oxygen than plasmacan. At very high PO2
s (e.g., around 660 mm Hg, which would be attained in thepulmonary capillaries of alveoli ventilated with 100% O2), these fluorocarbonemulsions can carry nearly as much oxygen as hemoglobin can. Fluorocarbonsmay become useful as emergency blood substitutes, for transfusions, and to aug-ment blood transport in anemic patients or during surgery. They are already usedfor oxygenating the myocardium during coronary angioplasty procedures.
CYANOSIS
Cyanosis is not really an influence on the transport of oxygen but rather is a signof poor transport of oxygen. Cyanosis occurs when more than 5 g Hb/100 mL ofarterial blood is in the deoxy state. It is a bluish purple discoloration of the skin,nail beds, and mucous membranes, and its presence is indicative of an abnormallyhigh concentration of deoxyhemoglobin in the arterial blood. Its absence, however,does not exclude hypoxemia because an anemic patient with hypoxemia may nothave sufficient hemoglobin to appear cyanotic. Patients with abnormally highlevels of hemoglobin in their arterial blood, such as those with polycythemia, mayappear cyanotic without being hypoxemic.
TRANSPORT OF CARBON DIOXIDE BY THE BLOOD
Carbon dioxide is carried in the blood in physical solution, chemically com-bined to amino acids in blood proteins, and as bicarbonate ions. About 200to 250 mL of carbon dioxide is produced by the tissue metabolism each
minute in a resting 70-kg person and must be carried by the venous blood to the lungfor removal from the body. At a cardiac output of 5 L/min, each 100 mL of bloodpassing through the lungs must therefore unload 4 to 5 mL of carbon dioxide.
Physically Dissolved
Carbon dioxide is about 20 times as soluble in the plasma (and inside the erythro-cytes) as is oxygen. About 5% to 10% of the total carbon dioxide transported bythe blood is carried in physical solution.
About 0.0006 mL CO2/mm Hg PCO2will dissolve in 1 mL of plasma at 37°C.
One hundred milliliters of plasma or whole blood at a PCO2of 40 mm Hg, there-
fore, contains about 2.4 mL CO2 in physical solution. Figure 7–5 shows that the
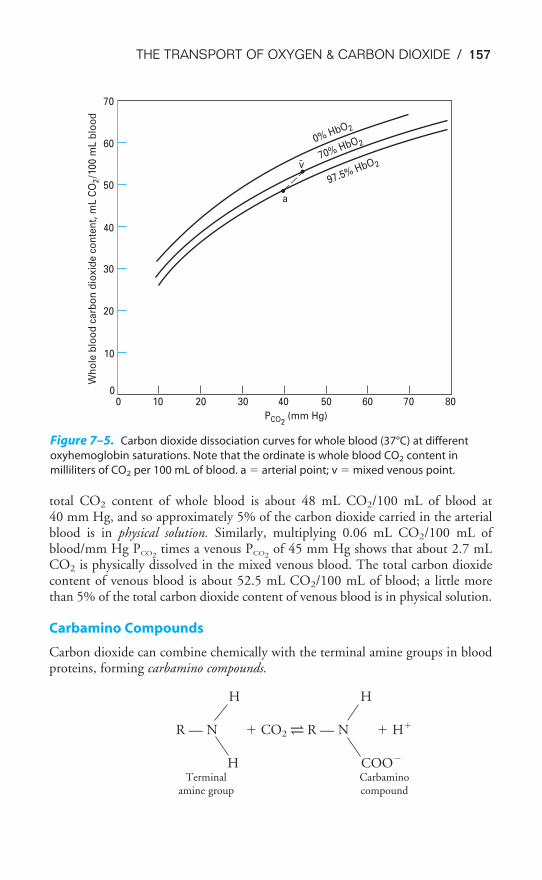
THE TRANSPORT OF OXYGEN & CARBON DIOXIDE / 157
total CO2 content of whole blood is about 48 mL CO2/100 mL of blood at 40 mm Hg, and so approximately 5% of the carbon dioxide carried in the arterialblood is in physical solution. Similarly, multiplying 0.06 mL CO2/100 mL ofblood/mm Hg PCO2
times a venous PCO2of 45 mm Hg shows that about 2.7 mL
CO2 is physically dissolved in the mixed venous blood. The total carbon dioxidecontent of venous blood is about 52.5 mL CO2/100 mL of blood; a little morethan 5% of the total carbon dioxide content of venous blood is in physical solution.
Carbamino Compounds
Carbon dioxide can combine chemically with the terminal amine groups in bloodproteins, forming carbamino compounds.
H H
R — N � CO2 ⇀↽ R — N � H�
H COO�
Terminal Carbaminoamine group compound
0% HbO2
70% HbO2
97.5% HbO2v-
a
0
10
20
30
40
50
60
70W
ho
le b
loo
d c
arb
on
dio
xid
e c
on
ten
t, m
L C
O2/1
00
mL
blo
od
0 10 20 30 40 50 60 70 80
PCO2 (mm Hg)
Figure 7–5. Carbon dioxide dissociation curves for whole blood (37°C) at different
oxyhemoglobin saturations. Note that the ordinate is whole blood CO2 content in
milliliters of CO2 per 100 mL of blood. a � arterial point; v � mixed venous point.
158 / CHAPTER 7
The reaction occurs rapidly; no enzymes are necessary. Note that a hydrogenion is released when a carbamino compound is formed.
Because the protein found in greatest concentration in the blood is the globinof hemoglobin, most of the carbon dioxide transported in this manner is bound to
amino acids of hemoglobin (“carbaminohemoglobin”). Deoxyhemoglobincan bind more carbon dioxide as carbamino groups than can oxyhemoglo-bin. Therefore, as the hemoglobin in the venous blood enters the lung and
combines with oxygen, it releases carbon dioxide from its terminal amine groups.About 5% to 10% of the total carbon dioxide content of blood is in the form ofcarbamino compounds.
Bicarbonate
The remaining 80% to 90% of the carbon dioxide transported by the blood is car-ried as bicarbonate ions. This is made possible by the following reaction:
carbonicanhydrase
CO2 � H2O H2CO3 ⇀↽ H� � HCO3
�
Carbon dioxide can combine with water to form carbonic acid, which then dis-sociates into a hydrogen ion and a bicarbonate ion.
Very little carbonic acid is formed by the association of water and carbon diox-ide without the presence of the enzyme carbonic anhydrase because the reactionoccurs so slowly. Carbonic anhydrase, which is present in high concentration inerythrocytes (but not in plasma), makes the reaction proceed about 13,000 timesfaster. Hemoglobin also plays an integral role in the transport of carbon dioxidebecause it can accept the hydrogen ion liberated by the dissociation of carbonicacid, thus allowing the reaction to continue. This will be discussed in detail in thelast section of this chapter.
THE CARBON DIOXIDE DISSOCIATION CURVE
The carbon dioxide dissociation curve for whole blood is shown in Figure 7–5.Within the normal physiologic range of PCO2
s, the curve is nearly a straight line,with no steep or flat portions. If it is plotted on axes similar to those for oxygen,the carbon dioxide dissociation curve for whole blood is steeper than the oxygendissociation curve for whole blood. That is, there is a greater change in CO2 con-tent per mm Hg change in PCO2
than there is in oxygen content per mm Hg changein PO2
.The carbon dioxide dissociation curve for whole blood is shifted to the right at
greater levels of oxyhemoglobin and shifted to the left at greater levels of deoxyhe-moglobin. This is known as the Haldane effect, which will be explained in the next
THE TRANSPORT OF OXYGEN & CARBON DIOXIDE / 159
section. The Haldane effect allows the blood to load more carbon dioxide at thetissues, where there is more deoxyhemoglobin, and unload more carbon dioxide inthe lungs, where there is more oxyhemoglobin.
THE BOHR & HALDANE EFFECTS EXPLAINED
The Bohr and Haldane effects are both explained by the fact that deoxyhemoglo-bin is a weaker acid than oxyhemoglobin. That is, deoxyhemoglobin morereadily accepts the hydrogen ion liberated by the dissociation of carbonicacid, thus permitting more carbon dioxide to be transported in the form
of bicarbonate ion. This is referred to as the isohydric shift. Conversely, theassociation of hydrogen ions with the amino acids of hemoglobin lowers the affin-ity of hemoglobin for oxygen, thus shifting the oxyhemoglobin dissociation curveto the right at low pHs or high PCO2
s. The following “equation” can therefore bewritten
H� Hb � O2 ⇀↽ H� � HbO2
These effects can be seen in the schematic diagrams of oxygen and carbon diox-ide transport shown in Figure 7–6.
At the tissues, the PO2is low and the PCO2
is high. Carbon dioxide dissolves inthe plasma, and some diffuses into the erythrocyte. Some of this carbon dioxidedissolves in the cytosol, some forms carbamino compounds with hemoglobin, andsome is hydrated by carbonic anhydrase to form carbonic acid. At low PO2
s, thereare substantial amounts of deoxyhemoglobin in the erythrocytes and the deoxy-hemoglobin is able to accept the hydrogen ions liberated by the dissociation ofcarbonic acid and the formation of carbamino compounds. The hydrogen ionsreleased by the dissociation of carbonic acid and the formation of carbamino com-pounds bind to specific amino acid residues on the globin chains and facilitate therelease of oxygen from hemoglobin (the Bohr effect). Bicarbonate ions diffuse outof the erythrocyte through the cell membrane much more readily than do hydro-gen ions. Because more bicarbonate ions than hydrogen ions leave the erythro-cyte, electrical neutrality is maintained by the exchange of chloride ions forbicarbonate ions by the bicarbonate-chloride carrier protein. This is the “chlorideshift.” Small amounts of water also move into the cell to maintain the osmoticequilibrium.
At the lung, the PO2is high and the PCO2
is low. As oxygen combines with hemo-globin, the hydrogen ions that were taken up when it was in the deoxyhemoglobinstate are released. They combine with bicarbonate ions, forming carbonic acid.This breaks down into carbon dioxide and water. At the same time, carbon diox-ide is also released from the carbamino compounds. Carbon dioxide then diffusesout of the red blood cells and plasma and into the alveoli. A chloride shift oppo-site in direction to that in the tissues also occurs to maintain electrical neutrality.
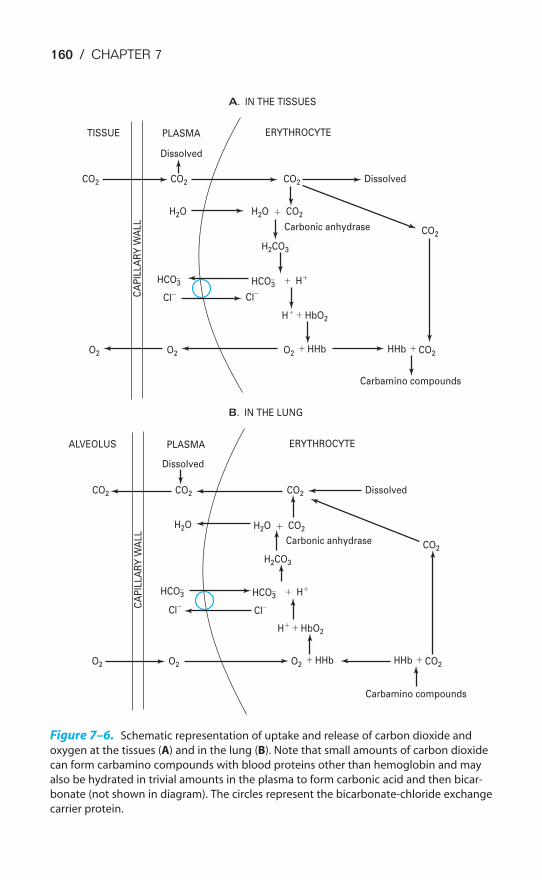
160 / CHAPTER 7
A. IN THE TISSUES
B. IN THE LUNG
TISSUE PLASMAC
AP
ILL
AR
Y W
AL
LERYTHROCYTE
CO2 CO2 CO2
H2O H2O
H2CO3
CO2
Dissolved
Dissolved
Carbonic anhydrase
Carbamino compounds
�
�
� �
�
HCO3� HCO3
�
HbO2
HHb HHbO2 CO2
CO2
O2O2
H�
H�
Cl� Cl�
ALVEOLUS PLASMA
CA
PIL
LA
RY
WA
LL
ERYTHROCYTE
CO2 CO2 CO2
H2O H2O
H2CO3
CO2
Dissolved
Dissolved
Carbonic anhydrase
Carbamino compounds
�
�
� �
�
HCO3� HCO3
�
HbO2
HHb HHbO2 CO2
CO2
O2O2
H�
H�
Cl� Cl�
Figure 7–6. Schematic representation of uptake and release of carbon dioxide and
oxygen at the tissues (A) and in the lung (B). Note that small amounts of carbon dioxide
can form carbamino compounds with blood proteins other than hemoglobin and may
also be hydrated in trivial amounts in the plasma to form carbonic acid and then bicar-
bonate (not shown in diagram). The circles represent the bicarbonate-chloride exchange
carrier protein.
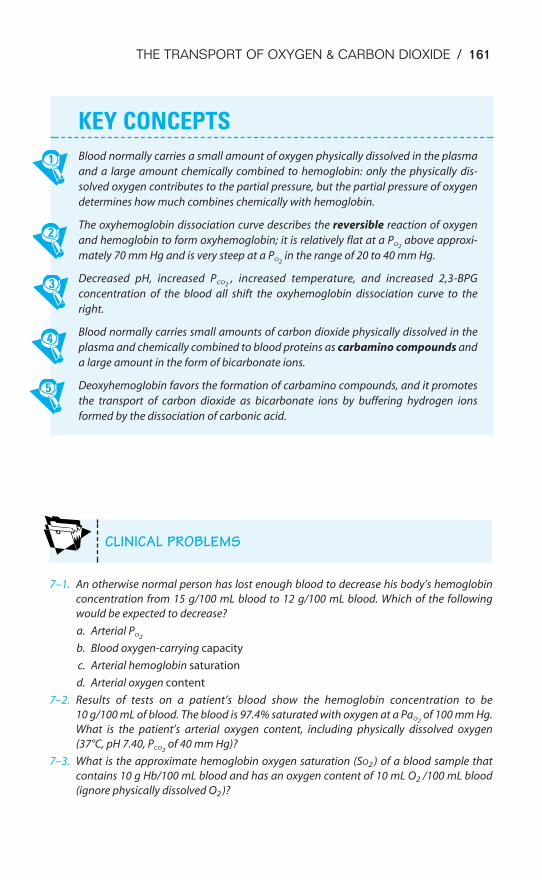
THE TRANSPORT OF OXYGEN & CARBON DIOXIDE / 161
7–1. An otherwise normal person has lost enough blood to decrease his body’s hemoglobin
concentration from 15 g/100 mL blood to 12 g/100 mL blood. Which of the following
would be expected to decrease?
a. Arterial PO2
b. Blood oxygen-carrying capacity
c. Arterial hemoglobin saturation
d. Arterial oxygen content
7–2. Results of tests on a patient’s blood show the hemoglobin concentration to be
10 g/100 mL of blood. The blood is 97.4% saturated with oxygen at a PaO2of 100 mm Hg.
What is the patient’s arterial oxygen content, including physically dissolved oxygen
(37°C, pH 7.40, PCO2of 40 mm Hg)?
7–3. What is the approximate hemoglobin oxygen saturation (SO2 ) of a blood sample that
contains 10 g Hb/100 mL blood and has an oxygen content of 10 mL O2 /100 mL blood
(ignore physically dissolved O2 )?
KEY CONCEPTS
Blood normally carries a small amount of oxygen physically dissolved in the plasma
and a large amount chemically combined to hemoglobin: only the physically dis-
solved oxygen contributes to the partial pressure, but the partial pressure of oxygen
determines how much combines chemically with hemoglobin.
The oxyhemoglobin dissociation curve describes the reversible reaction of oxygen
and hemoglobin to form oxyhemoglobin; it is relatively flat at a PO2above approxi-
mately 70 mm Hg and is very steep at a PO2in the range of 20 to 40 mm Hg.
Decreased pH, increased PCO2, increased temperature, and increased 2,3-BPG
concentration of the blood all shift the oxyhemoglobin dissociation curve to the
right.
Blood normally carries small amounts of carbon dioxide physically dissolved in the
plasma and chemically combined to blood proteins as carbamino compounds and
a large amount in the form of bicarbonate ions.
Deoxyhemoglobin favors the formation of carbamino compounds, and it promotes
the transport of carbon dioxide as bicarbonate ions by buffering hydrogen ions
formed by the dissociation of carbonic acid.
CLINICAL PROBLEMS

162 / CHAPTER 7
7–4. Which of the following should increase the P50 of the oxyhemoglobin dissociation curve?
a. Hypercapnia
b. Acidosis
c. Increased blood levels of 2,3-BPG
d. Increased body temperature
e. All of the above
SUGGESTED READINGS
Comroe JH. Physiology of Respiration. 2nd ed. Chicago, Ill: Year Book; 1974:183–196.
Hsia CCW. Respiratory function of hemoglobin. N Engl J Med. 1998;338:239–247.
Robinson JM, Lancaster JR. Hemoglobin-mediated hypoxia-induced vasodilation via nitric oxide. Am J RespirCell Mol Biol. 2005;32:257–261.
Roughton FJW. Transport of oxygen and carbon dioxide. In: Fenn WO, Rahn H, eds. Handbook ofPhysiology, sec 3: Respiration. Washington, DC: American Physiological Society; 1964;1:767–825.
Veeramachaneni NK, Harken AH, Cairns CB. Clinical implications of hemoglobin as a nitric oxide carrier.Arch Surg. 1999;134:434–437.
163
The maintenance of a relatively constant internal environment is one of the majorphysiologic functions of the organ systems of the body. Body temperature, fluidvolume and osmolarity, and electrolytes—including acids and bases—are normallycarefully regulated. A thorough knowledge of the mechanisms that control thesevariables is essential to clinical practice.
The respiratory system is intimately involved in the maintenance of the balanceof acids and bases in the body. This chapter will introduce the major concepts ofacid-base balance, particularly with respect to the respiratory system; a moredetailed study of this important subject is strongly encouraged.
THE CHEMISTRY OF ACIDS, BASES, & BUFFERS
Although there are several ways to define acids and bases, the most useful physio-logically is to define an acid as a substance that can donate a hydrogen ion (a pro-ton) to another substance and a base as a substance that can accept a hydrogen ionfrom another substance. A strong acid is a substance that is completely or almost
OBJECTIVES
The reader understands the basic concepts of the regulation of the acid-base status ofthe body.
� Defines acids, bases, and buffers.
� Lists the buffer systems available in the human body.
� Describes the interrelationships of the pH, the PCO2of the blood, and the plasma
bicarbonate concentration, and states the Henderson-Hasselbalch equation.
� States the normal ranges of arterial pH, PCO2and bicarbonate concentration, and
defines alkalosis and acidosis.
� Lists the potential causes of respiratory acidosis and alkalosis and metabolic acido-sis and alkalosis.
� Discusses the respiratory and renal mechanisms that help compensate for acidosisand alkalosis.
� Evaluates blood gas data to determine a subject’s acid-base status.
� Classifies and explains the causes of tissue hypoxia.
8The Regulation of Acid-Base Status
Copyright © 2007 by The McGraw-Hill Companies, Inc. Click here for terms of use.
164 / CHAPTER 8
completely dissociated into a hydrogen ion and its corresponding or conjugate basein dilute aqueous solution; a weak acid is only slightly ionized in aqueous solution.In general, a strong acid has a weak conjugate base and a weak acid has a strongconjugate base. The strength of an acid or a base should not be confused with itsconcentration.
A buffer is a mixture of substances in aqueous solution (usually a combinationof a weak acid and its conjugate base) that can resist changes in hydrogen ion con-centration when strong acids or bases are added. That is, the changes in hydrogenion concentration that occur when a strong acid or base is added to a buffer sys-tem are much smaller than those that would occur if the same amount of acid orbase were added to pure water or another nonbuffer solution.
The Quantification of Acidity
The acidity of a solution is determined by the activity of the hydrogen ions in thesolution. The hydrogen ion activity, which is denoted by the symbol �H
�, isclosely related to the concentration of hydrogen ions ([H�]) in a solution. Inextremely dilute solutions, the hydrogen ion activity is equal to the hydrogen ionconcentration; in highly concentrated solutions, the activity is less than the con-centration. The hydrogen ion concentration of the blood is low enough that thehydrogen ion activity may be considered to be equal to the hydrogen ion concen-tration.
The hydrogen ion activity of pure water is about 1.0 � 10�7 mol/L. By con-vention, solutions with hydrogen ion activities above 10�7 mol/L are consideredto be acid; those with hydrogen ion activities below 10�7 are considered to be alka-line. The range of hydrogen ion concentrations or activities in the body is normallyfrom about 10�1 for gastric acid to about 10�8 for the most alkaline pancreaticsecretion. This wide range of hydrogen ion activities necessitates the use of themore convenient pH scale. The pH of a solution is the negative logarithm of itshydrogen ion activity. With the exception of the highly concentrated gastric acid,in most instances in the body the hydrogen ion activity is about equal to the hydro-gen ion concentration. Therefore,
pH � �log (�H�)or pH � �log [H�]
Thus, the pH of gastric acid is on the order of 1; the pH of the alkaline pan-creatic secretion may be as high as 8.
The pH of arterial blood is normally close to 7.40, with a normal range consid-ered to be about 7.35 to 7.45. An arterial pH less than 7.35 is considered acidemia;an arterial pH greater than 7.45 is considered alkalemia. The underlying conditioncharacterized by hydrogen ion retention or by loss of bicarbonate or other bases isreferred to as acidosis; the underlying condition characterized by hydrogen ion lossor retention of base is referred to as alkalosis. Under pathologic conditions theextremes of arterial blood pH have been noted to range as high as 7.8 and as low
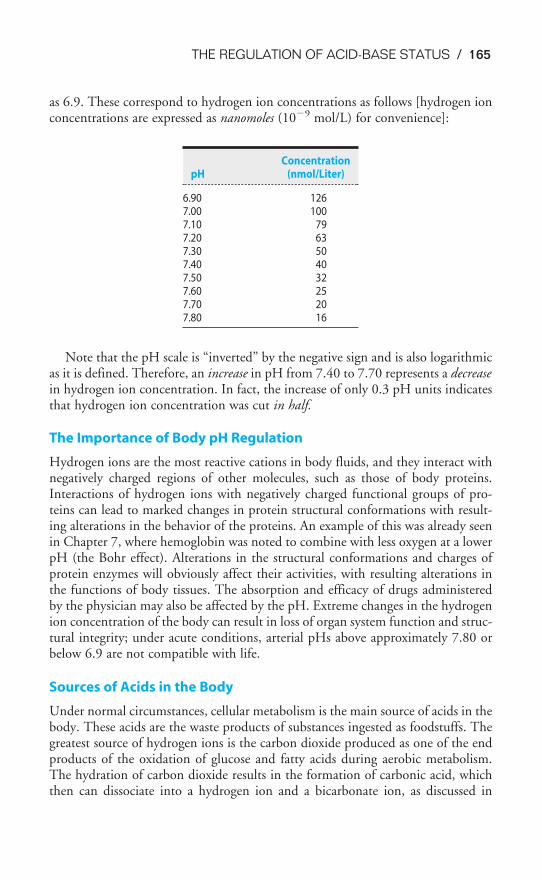
THE REGULATION OF ACID-BASE STATUS / 165
as 6.9. These correspond to hydrogen ion concentrations as follows [hydrogen ionconcentrations are expressed as nanomoles (10�9 mol/L) for convenience]:
Note that the pH scale is “inverted” by the negative sign and is also logarithmicas it is defined. Therefore, an increase in pH from 7.40 to 7.70 represents a decreasein hydrogen ion concentration. In fact, the increase of only 0.3 pH units indicatesthat hydrogen ion concentration was cut in half.
The Importance of Body pH Regulation
Hydrogen ions are the most reactive cations in body fluids, and they interact withnegatively charged regions of other molecules, such as those of body proteins.Interactions of hydrogen ions with negatively charged functional groups of pro-teins can lead to marked changes in protein structural conformations with result-ing alterations in the behavior of the proteins. An example of this was already seenin Chapter 7, where hemoglobin was noted to combine with less oxygen at a lowerpH (the Bohr effect). Alterations in the structural conformations and charges ofprotein enzymes will obviously affect their activities, with resulting alterations inthe functions of body tissues. The absorption and efficacy of drugs administeredby the physician may also be affected by the pH. Extreme changes in the hydrogenion concentration of the body can result in loss of organ system function and struc-tural integrity; under acute conditions, arterial pHs above approximately 7.80 orbelow 6.9 are not compatible with life.
Sources of Acids in the Body
Under normal circumstances, cellular metabolism is the main source of acids in thebody. These acids are the waste products of substances ingested as foodstuffs. Thegreatest source of hydrogen ions is the carbon dioxide produced as one of the endproducts of the oxidation of glucose and fatty acids during aerobic metabolism.The hydration of carbon dioxide results in the formation of carbonic acid, whichthen can dissociate into a hydrogen ion and a bicarbonate ion, as discussed in
ConcentrationpH (nmol/Liter)
6.90 1267.00 1007.10 797.20 637.30 507.40 407.50 327.60 257.70 207.80 16
166 / CHAPTER 8
Chapter 7. This process is reversed in the pulmonary capillaries, and CO2 thendiffuses through the alveolar-capillary barrier into the alveoli, from which it isremoved by alveolar ventilation. Carbonic acid is therefore said to be a volatile acidbecause it can be converted into a gas and then removed from an open system likethe body. Very great amounts of carbon dioxide can be removed from the lungs byalveolar ventilation: Under normal circumstances, about 15,000 to 25,000 mmolof carbon dioxide is removed via the lungs daily.
A much smaller quantity of fixed or nonvolatile acids is also normally produced dur-ing the course of the metabolism of foodstuffs. The fixed acids produced by the bodyinclude sulfuric acid, which originates from the oxidation of sulfur-containing amino acids such as cysteine; phosphoric acid from the oxidation of phos-pholipids and phosphoproteins; hydrochloric acid, which is produced during the con-version of ingested ammonium chloride to urea and by other reactions; and lactic acidfrom the anaerobic metabolism of glucose. Of course, lactic acid is sometimes con-verted to carbon dioxide, and so it is not always a fixed acid. Other fixed acids may beingested accidentally or formed in abnormally large quantities by disease processes,such as the acetoacetic and butyric acid formed during diabetic ketoacidosis. About 70mEq of fixed acids is normally removed from the body each day (about 1mEq/kg/body weight/day); the range is 50 to 100 mEq. A vegetarian diet may pro-duce significantly less fixed acid and may even result in no net production of fixedacids. The removal of fixed acids is accomplished mainly by the kidneys, as will be dis-cussed later in this chapter. Some may also be removed via the gastrointestinal tract.Fixed acids normally represent only about 0.2% of the total body acid production.
BUFFER SYSTEMS OF THE HUMAN BODY
The body contains a variety of substances that can act as buffers in the physiologicpH range. These include bicarbonate, phosphate, and proteins in the blood, theinterstitial fluid, and inside cells. One way to express the ability of a substance to actas a buffer is its buffer value. The buffer value of a solution is the amount of hydro-gen ions in milliequivalents per liter that can be added to or removed from the solu-tion with a resultant change of one pH unit. Another way is to determine thesubstance’s titration curve. The pK of the acid is another important consideration.
An acid, HA, can dissociate into a hydrogen ion, H�, and its base, A�:
HA ⇀↽ H� � A�
According to the law of mass action, the relationship between the undissociated acidand the proton and the base at equilibrium can be expressed as the following ratio:
�[H
[
�
H
][
A
A
]
�]� � K
That is, the product of the concentrations of hydrogen ion and base divided by theconcentration of the acid is equal to a constant K, the dissociation constant. This canbe rearranged to
THE REGULATION OF ACID-BASE STATUS / 167
[H�] � K �[
[
H
A�
A
]
]�
After taking the logarithm of both sides,
log [H�] � log K � log �[
[
H
A�
A
]
]�
After multiplying both sides by �1,
�log [H�] � �log K � log �[
[
H
A�
A
]
]�
or pH � pK � log �[
[
H
A�
A
]
]�
This is the general form of the Henderson-Hasselbalch equation.The buffer value or buffering capacity of a buffer pair is greatest at or near the
pK of the weak acid. Note that when the concentrations of HA and A� are equal,the pH of a solution is equal to its pK.
As already stated, the human body contains a number of buffers and bufferpairs. The isohydric principle states that all the buffer pairs in a homogeneous solu-tion are in equilibrium with the same hydrogen ion concentration. For this reason,all the buffer pairs in the plasma behave similarly, with the relative concentrationsof their undissociated acids and their bases determined by their respective pKs:
pH � pK1 � log �[
[
H
A
A1�
1
]
]� � pK2 � log �
[
[
H
A
A2�
2
]
]� � pK3 � log �
[
[
H
A
A3�
3
]
]�
An implication of the isohydric principle is that the detailed analysis of a singlebuffer pair, like the bicarbonate buffer system, can reveal a great deal about thechemistry of all the plasma buffers.
Buffers of the Blood
The main buffers of the blood are bicarbonate, phosphate, and proteins.
Bicarbonate
The bicarbonate buffer system consists of the buffer pair of the weak acid, carbonicacid, and its conjugate base, bicarbonate. As already stated, in the body:
carbonicanhydrase
CO2 ⇀↽ CO2 � H2O H2CO3 ⇀
↽ H� � HCO3�
Gas phase Dissolvedin the
aqueous phase
168 / CHAPTER 8
The ability of the bicarbonate system to function as a buffer of fixed acids in thebody is largely due to the ability of the lungs to remove carbon dioxide from thebody. In a closed system bicarbonate would not be nearly as effective.
At a temperature of 37°C about 0.03 mmol of carbon dioxide per mm Hg ofPCO2
will dissolve in a liter of plasma. (Note that the solubility of CO2 wasexpressed as milliliters of CO2 per 100 mL of plasma in Chapter 7.) Therefore, thecarbon dioxide dissolved in the plasma, expressed as millimoles per liter, is equal to0.03 � PCO2
. At body temperature in the plasma, the equilibrium of the secondpart of the series of equations given above is far to the left so that there is roughly1000 times as much carbon dioxide present physically dissolved in the plasma asthere is in the form of carbonic acid. The dissolved carbon dioxide is in equilib-rium with the carbonic acid, though, and so both the dissolved carbon dioxide andthe carbonic acid are considered as the undissociated HA in the Henderson-Hasselbalch equation for the bicarbonate system:
pH � pK � log�[CO
[H
2 �
CO
H
3�
2
]
C
p
O3]�
where [HCO3�]p stands for plasma bicarbonate concentration. The concentration
of carbonic acid is negligible, and so
pH � pK � � log �0
[
.
H
03
C
�
O3�
P
]
C
p
O2
�
where pK� is the pK of the HCO3�-CO2 system in blood.
The pK� of this system at physiologic pHs and at 37°C is 6.1. Therefore, at anarterial pH of 7.40 and an arterial PCO2
of 40 mm Hg,
7.40 � 6.1 � log �1
[
.
H
2
C
m
O
m
3�
o
]
l/
p
L�
Therefore, the arterial plasma bicarbonate concentration is about 24 mmol/L(the normal range is 23 to 28 mmol/L) because the logarithm of 20 is equal to 1.3.
Note that the term total CO2 refers to the dissolved carbon dioxide (includingcarbonic acid) plus the carbon dioxide present as bicarbonate.
A useful way to display the interrelationships among the variables of pH, PCO2,
and bicarbonate concentration of the plasma, as expressed by the Henderson-Hasselbalch equation, is the pH-bicarbonate diagram shown in Figure 8–1.
As can be seen from Figure 8–1, pH is on the abscissa of the pH-bicarbonate dia-gram, and the plasma bicarbonate concentration in millimoles per liter is on the ordi-nate. For each value of pH and bicarbonate ion concentration, there is a singlecorresponding PCO2
on the graph. Conversely, for any particular pH and PCO2, only
one bicarbonate ion concentration will satisfy the Henderson-Hasselbalch equation.If the PCO2
is held constant, for example, at 40 mm Hg, an isobar line can be con-structed, connecting the resulting points as the pH is varied. The representative
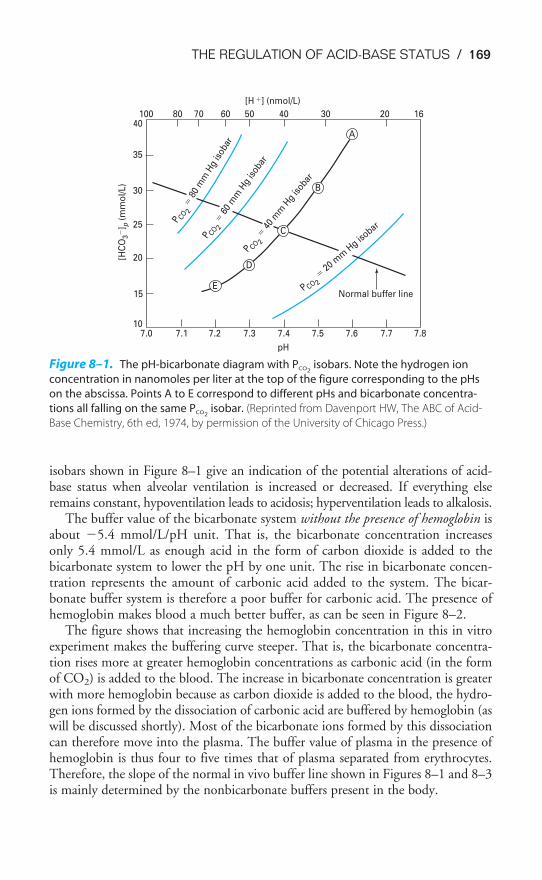
THE REGULATION OF ACID-BASE STATUS / 169
isobars shown in Figure 8–1 give an indication of the potential alterations of acid-base status when alveolar ventilation is increased or decreased. If everything elseremains constant, hypoventilation leads to acidosis; hyperventilation leads to alkalosis.
The buffer value of the bicarbonate system without the presence of hemoglobin isabout �5.4 mmol/L/pH unit. That is, the bicarbonate concentration increasesonly 5.4 mmol/L as enough acid in the form of carbon dioxide is added to thebicarbonate system to lower the pH by one unit. The rise in bicarbonate concen-tration represents the amount of carbonic acid added to the system. The bicar-bonate buffer system is therefore a poor buffer for carbonic acid. The presence ofhemoglobin makes blood a much better buffer, as can be seen in Figure 8–2.
The figure shows that increasing the hemoglobin concentration in this in vitroexperiment makes the buffering curve steeper. That is, the bicarbonate concentra-tion rises more at greater hemoglobin concentrations as carbonic acid (in the formof CO2) is added to the blood. The increase in bicarbonate concentration is greaterwith more hemoglobin because as carbon dioxide is added to the blood, the hydro-gen ions formed by the dissociation of carbonic acid are buffered by hemoglobin (aswill be discussed shortly). Most of the bicarbonate ions formed by this dissociationcan therefore move into the plasma. The buffer value of plasma in the presence ofhemoglobin is thus four to five times that of plasma separated from erythrocytes.Therefore, the slope of the normal in vivo buffer line shown in Figures 8–1 and 8–3is mainly determined by the nonbicarbonate buffers present in the body.
107.0 7.1 7.2 7.3 7.4 7.5 7.6 7.7 7.8
pH
15
20
25
30
35
40100 80 70 60 50 40 30 20 16
[H �] (nmol/L)
[HC
O3
�] p
(m
mo
l/L)
P CO 2�
20 m
m H
g isobar
P CO 2�
40
mm
Hg
isob
ar
P CO 2
� 6
0 m
mH
g is
obar
P CO 2
� 8
0 m
mH
g is
obar
A
B
D
E
C
Normal buffer line
Figure 8–1. The pH-bicarbonate diagram with PCO2isobars. Note the hydrogen ion
concentration in nanomoles per liter at the top of the figure corresponding to the pHs
on the abscissa. Points A to E correspond to different pHs and bicarbonate concentra-
tions all falling on the same PCO2isobar. (Reprinted from Davenport HW, The ABC of Acid-
Base Chemistry, 6th ed, 1974, by permission of the University of Chicago Press.)
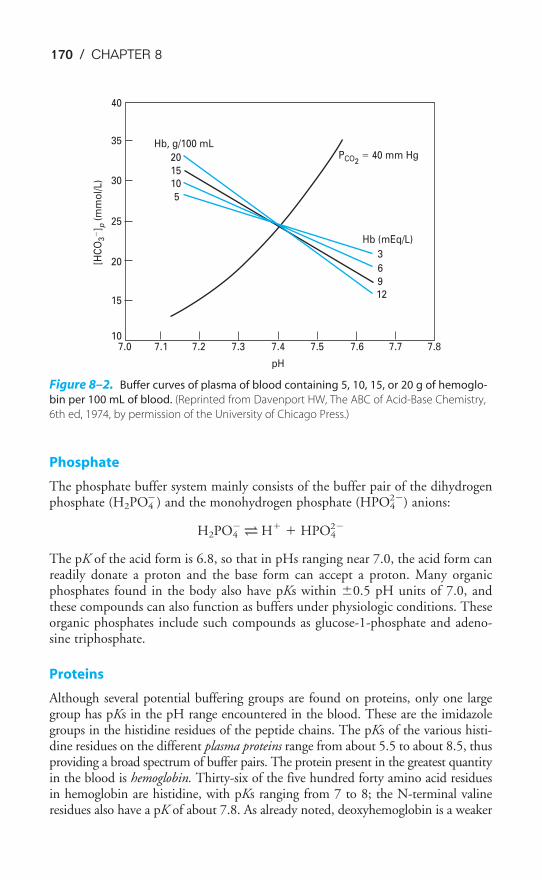
170 / CHAPTER 8
Phosphate
The phosphate buffer system mainly consists of the buffer pair of the dihydrogenphosphate (H2PO4
�) and the monohydrogen phosphate (HPO42�) anions:
H2PO4�
⇀↽ H� � HPO4
2�
The pK of the acid form is 6.8, so that in pHs ranging near 7.0, the acid form canreadily donate a proton and the base form can accept a proton. Many organicphosphates found in the body also have pKs within �0.5 pH units of 7.0, andthese compounds can also function as buffers under physiologic conditions. Theseorganic phosphates include such compounds as glucose-1-phosphate and adeno-sine triphosphate.
Proteins
Although several potential buffering groups are found on proteins, only one largegroup has pKs in the pH range encountered in the blood. These are the imidazolegroups in the histidine residues of the peptide chains. The pKs of the various histi-dine residues on the different plasma proteins range from about 5.5 to about 8.5, thusproviding a broad spectrum of buffer pairs. The protein present in the greatest quantityin the blood is hemoglobin. Thirty-six of the five hundred forty amino acid residuesin hemoglobin are histidine, with pKs ranging from 7 to 8; the N-terminal valineresidues also have a pK of about 7.8. As already noted, deoxyhemoglobin is a weaker
PCO2� 40 mm Hg
[HC
O3
�] p
(m
mo
l/L
)
Hb (mEq/L)
3
5
10
15
20
6
9
12
10
15
20
25
30
35
40
pH
7.87.77.67.57.47.37.27.17.0
Hb, g/100 mL
Figure 8–2. Buffer curves of plasma of blood containing 5, 10, 15, or 20 g of hemoglo-
bin per 100 mL of blood. (Reprinted from Davenport HW, The ABC of Acid-Base Chemistry,
6th ed, 1974, by permission of the University of Chicago Press.)
THE REGULATION OF ACID-BASE STATUS / 171
acid than is oxyhemoglobin. That is, the pK of an imidazole group of one of the his-tidine residues in deoxygenated hemoglobin is greater than it is in the oxyhemoglo-bin state. Thus, as oxygen leaves hemoglobin in the tissue capillaries, the imidazolegroup removes hydrogen ions from the erythrocyte interior, allowing more carbondioxide to be transported as bicarbonate. This process is reversed in the lungs.
Buffers of the Interstitial Fluid
The bicarbonate buffer system is the major buffer found in the interstitial fluid,including the lymph. The phosphate buffer pair is also found in the interstitialfluid. The volume of the interstitial compartment is much larger than that of theplasma, and so the interstitial fluid may play an important role in buffering.
Bone
The extracellular portion of bone contains very large deposits of calcium and phos-phate salts, mainly in the form of hydroxyapatite. Although bone growth in a childcauses a net production of hydrogen ions, in an otherwise healthy adult, wherebone growth and resorption are in a steady state, bone salts can buffer hydrogenions in chronic acidosis. Chronic buffering of hydrogen ions by the bone salts maytherefore lead to demineralization of bone.
Intracellular Buffering
The intracellular proteins and organic phosphates of most cells can function tobuffer both fixed acids and carbonic acid. Again, this is largely a function of thehistidine groups on the proteins and phosphate groups on such compounds asATP (adenosine triphosphate) and glucose-1-phosphate. Of course, buffering bythe hemoglobin in erythrocytes is intracellular buffering.
ACIDOSIS & ALKALOSIS
Acid-base disorders can be divided into four major categories: respiratory acidosis,respiratory alkalosis, metabolic acidosis, and metabolic alkalosis. These primaryacid-base disorders may occur singly (“simple”) or in combination (“mixed”) ormay be altered by compensatory mechanisms.
Respiratory Acidosis
The arterial PCO2is normally kept at or near 40 mm Hg (normal range is 35 to
45 mm Hg by convention) by the mechanisms that regulate breathing. Sensorsexposed to the arterial blood and to the cerebrospinal fluid provide the central con-trollers of breathing with the information necessary to regulate the arterial PCO2
ator near 40 mm Hg (see Chapter 9). Any short-term alterations (i.e., those which
occur without renal compensation) in alveolar ventilation that result in anincrease in alveolar and therefore also in arterial PCO2
tend to lower thearterial pH, resulting in respiratory acidosis. This can be seen by looking at
the PCO2� 60 mm Hg and PCO2
� 80 mm Hg isobars in Figure 8–1. The exact
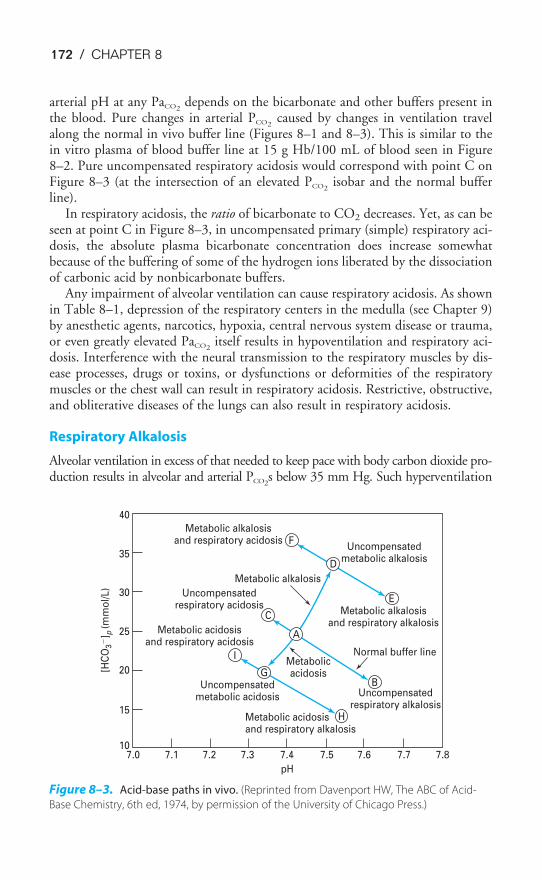
172 / CHAPTER 8
arterial pH at any PaCO2depends on the bicarbonate and other buffers present in
the blood. Pure changes in arterial PCO2caused by changes in ventilation travel
along the normal in vivo buffer line (Figures 8–1 and 8–3). This is similar to thein vitro plasma of blood buffer line at 15 g Hb/100 mL of blood seen in Figure8–2. Pure uncompensated respiratory acidosis would correspond with point C onFigure 8–3 (at the intersection of an elevated PCO2
isobar and the normal bufferline).
In respiratory acidosis, the ratio of bicarbonate to CO2 decreases. Yet, as can beseen at point C in Figure 8–3, in uncompensated primary (simple) respiratory aci-dosis, the absolute plasma bicarbonate concentration does increase somewhatbecause of the buffering of some of the hydrogen ions liberated by the dissociationof carbonic acid by nonbicarbonate buffers.
Any impairment of alveolar ventilation can cause respiratory acidosis. As shownin Table 8–1, depression of the respiratory centers in the medulla (see Chapter 9)by anesthetic agents, narcotics, hypoxia, central nervous system disease or trauma,or even greatly elevated PaCO2
itself results in hypoventilation and respiratory aci-dosis. Interference with the neural transmission to the respiratory muscles by dis-ease processes, drugs or toxins, or dysfunctions or deformities of the respiratorymuscles or the chest wall can result in respiratory acidosis. Restrictive, obstructive,and obliterative diseases of the lungs can also result in respiratory acidosis.
Respiratory Alkalosis
Alveolar ventilation in excess of that needed to keep pace with body carbon dioxide pro-duction results in alveolar and arterial PCO2
s below 35 mm Hg. Such hyperventilation
F
D
E
B
H
G
I
C
Metabolic alkalosisand respiratory acidosis
Metabolic alkalosisand respiratory alkalosis
Metabolic acidosisand respiratory acidosis
Metabolic acidosisand respiratory alkalosis
7.010
15
20
25
30
35
40
7.1 7.2 7.3 7.4 7.5 7.6 7.7 7.8
pH
Uncompensatedmetabolic alkalosis
Uncompensatedmetabolic acidosis Uncompensated
respiratory alkalosis
Metabolicacidosis
Metabolic alkalosis
Uncompensatedrespiratory acidosis
Normal buffer line
[HC
O3
�] p
(mm
ol/
L)
A
Figure 8–3. Acid-base paths in vivo. (Reprinted from Davenport HW, The ABC of Acid-
Base Chemistry, 6th ed, 1974, by permission of the University of Chicago Press.)
THE REGULATION OF ACID-BASE STATUS / 173
leads to respiratory alkalosis. Uncompensated primary respiratory alkalosisresults in movement to a lower PCO2
isobar along the normal buffer line, asseen at point B in Figure 8–3. The decreased PaCO2
shifts the equilibriumof the series of reactions describing carbon dioxide hydration and carbonic acid dis-sociation to the left. This results in a decreased arterial hydrogen ion concentra-tion, raising the pH, and a decreased plasma bicarbonate concentration. The ratioof bicarbonate to carbon dioxide increases.
The causes of respiratory alkalosis include anything leading to hyperventilation.As shown in Table 8–2, hyperventilation syndrome, a psychological dysfunction ofunknown cause, results in chronic or recurrent episodes of hyperventilation and res-piratory alkalosis. Drugs, hormones (such as progesterone), toxic substances, centralnervous system diseases or disorders, bacteremias, fever, overventilation by mechan-ical ventilators (or the physician), or ascent to high altitude may all result in respi-ratory alkalosis. Students are often surprised to see acute asthma included in a list ofproblems that can cause respiratory alkalosis. Asthma is an episodic obstructive dis-ease and it is reasonable to assume that it would cause CO2 retention and thereforerespiratory acidosis during attacks. That is true in very severe asthma attacks, butmost asthma attacks result in hypocapnia and respiratory alkalosis. As the asthma
Table 8–1. Common Causes of Respiratory Acidosis
Depression of the respiratory control centersAnestheticsSedativesOpiatesBrain injury or diseaseSevere hypercapnia, hypoxia
Neuromuscular disordersSpinal cord injuryPhrenic nerve injuryPoliomyelitis, Guillain-Barré syndrome, etc.Botulism, tetanusMyasthenia gravisAdministration of curarelike drugsDiseases affecting the respiratory muscles
Chest wall restrictionKyphoscoliosisExtreme obesity
Lung restrictionPulmonary fibrosisSarcoidosisPneumothorax, pleural effusions, etc.
Pulmonary parenchymal diseasesPneumonia, etc.Pulmonary edema
Airway obstructionChronic obstructive pulmonary diseaseUpper airway obstruction
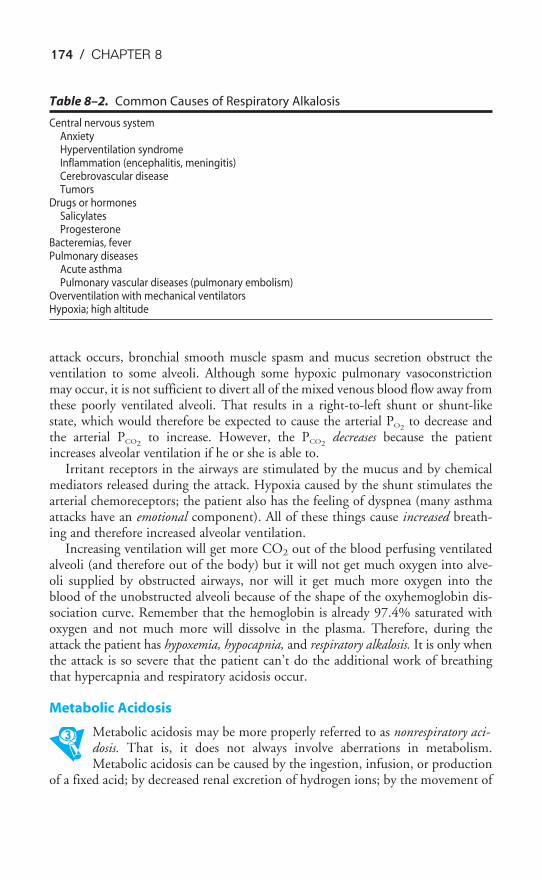
174 / CHAPTER 8
attack occurs, bronchial smooth muscle spasm and mucus secretion obstruct theventilation to some alveoli. Although some hypoxic pulmonary vasoconstrictionmay occur, it is not sufficient to divert all of the mixed venous blood flow away fromthese poorly ventilated alveoli. That results in a right-to-left shunt or shunt-likestate, which would therefore be expected to cause the arterial PO2
to decrease andthe arterial PCO2
to increase. However, the PCO2decreases because the patient
increases alveolar ventilation if he or she is able to.Irritant receptors in the airways are stimulated by the mucus and by chemical
mediators released during the attack. Hypoxia caused by the shunt stimulates thearterial chemoreceptors; the patient also has the feeling of dyspnea (many asthmaattacks have an emotional component). All of these things cause increased breath-ing and therefore increased alveolar ventilation.
Increasing ventilation will get more CO2 out of the blood perfusing ventilatedalveoli (and therefore out of the body) but it will not get much oxygen into alve-oli supplied by obstructed airways, nor will it get much more oxygen into theblood of the unobstructed alveoli because of the shape of the oxyhemoglobin dis-sociation curve. Remember that the hemoglobin is already 97.4% saturated withoxygen and not much more will dissolve in the plasma. Therefore, during theattack the patient has hypoxemia, hypocapnia, and respiratory alkalosis. It is only whenthe attack is so severe that the patient can’t do the additional work of breathingthat hypercapnia and respiratory acidosis occur.
Metabolic Acidosis
Metabolic acidosis may be more properly referred to as nonrespiratory aci-dosis. That is, it does not always involve aberrations in metabolism.Metabolic acidosis can be caused by the ingestion, infusion, or production
of a fixed acid; by decreased renal excretion of hydrogen ions; by the movement of
Table 8–2. Common Causes of Respiratory Alkalosis
Central nervous systemAnxietyHyperventilation syndromeInflammation (encephalitis, meningitis)Cerebrovascular diseaseTumors
Drugs or hormonesSalicylatesProgesterone
Bacteremias, feverPulmonary diseases
Acute asthmaPulmonary vascular diseases (pulmonary embolism)
Overventilation with mechanical ventilatorsHypoxia; high altitude
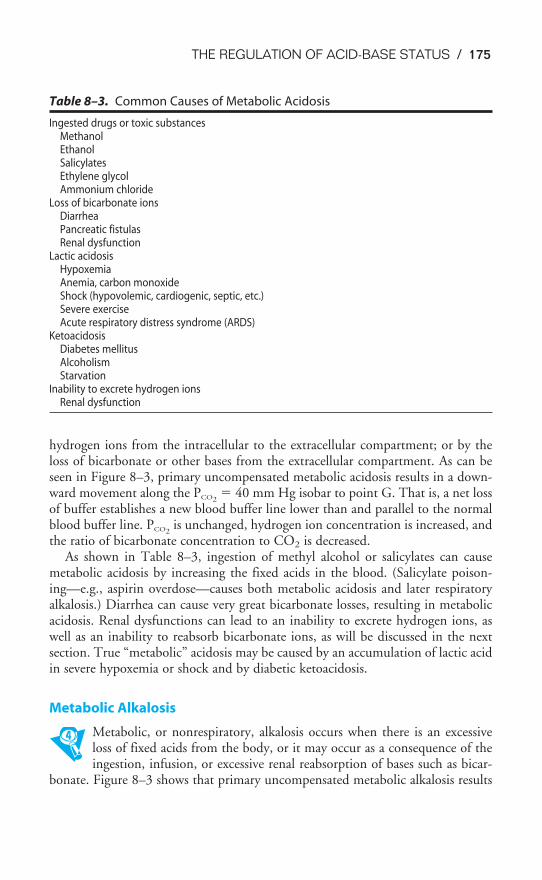
THE REGULATION OF ACID-BASE STATUS / 175
hydrogen ions from the intracellular to the extracellular compartment; or by theloss of bicarbonate or other bases from the extracellular compartment. As can beseen in Figure 8–3, primary uncompensated metabolic acidosis results in a down-ward movement along the PCO2
� 40 mm Hg isobar to point G. That is, a net lossof buffer establishes a new blood buffer line lower than and parallel to the normalblood buffer line. PCO2
is unchanged, hydrogen ion concentration is increased, andthe ratio of bicarbonate concentration to CO2 is decreased.
As shown in Table 8–3, ingestion of methyl alcohol or salicylates can causemetabolic acidosis by increasing the fixed acids in the blood. (Salicylate poison-ing—e.g., aspirin overdose—causes both metabolic acidosis and later respiratoryalkalosis.) Diarrhea can cause very great bicarbonate losses, resulting in metabolicacidosis. Renal dysfunctions can lead to an inability to excrete hydrogen ions, aswell as an inability to reabsorb bicarbonate ions, as will be discussed in the nextsection. True “metabolic” acidosis may be caused by an accumulation of lactic acidin severe hypoxemia or shock and by diabetic ketoacidosis.
Metabolic Alkalosis
Metabolic, or nonrespiratory, alkalosis occurs when there is an excessiveloss of fixed acids from the body, or it may occur as a consequence of theingestion, infusion, or excessive renal reabsorption of bases such as bicar-
bonate. Figure 8–3 shows that primary uncompensated metabolic alkalosis results
Table 8–3. Common Causes of Metabolic Acidosis
Ingested drugs or toxic substancesMethanolEthanolSalicylatesEthylene glycolAmmonium chloride
Loss of bicarbonate ionsDiarrheaPancreatic fistulasRenal dysfunction
Lactic acidosisHypoxemiaAnemia, carbon monoxideShock (hypovolemic, cardiogenic, septic, etc.)Severe exerciseAcute respiratory distress syndrome (ARDS)
KetoacidosisDiabetes mellitusAlcoholismStarvation
Inability to excrete hydrogen ionsRenal dysfunction
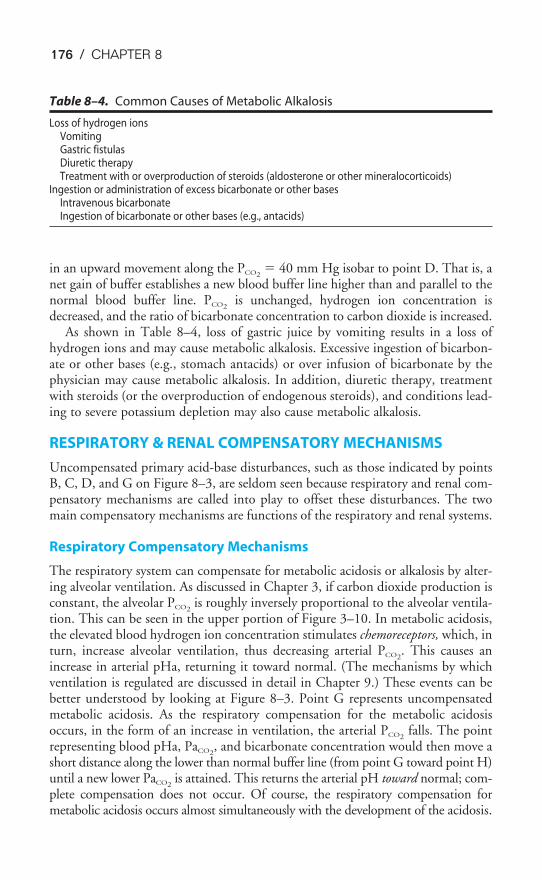
176 / CHAPTER 8
in an upward movement along the PCO2� 40 mm Hg isobar to point D. That is, a
net gain of buffer establishes a new blood buffer line higher than and parallel to thenormal blood buffer line. PCO2
is unchanged, hydrogen ion concentration isdecreased, and the ratio of bicarbonate concentration to carbon dioxide is increased.
As shown in Table 8–4, loss of gastric juice by vomiting results in a loss ofhydrogen ions and may cause metabolic alkalosis. Excessive ingestion of bicarbon-ate or other bases (e.g., stomach antacids) or over infusion of bicarbonate by thephysician may cause metabolic alkalosis. In addition, diuretic therapy, treatmentwith steroids (or the overproduction of endogenous steroids), and conditions lead-ing to severe potassium depletion may also cause metabolic alkalosis.
RESPIRATORY & RENAL COMPENSATORY MECHANISMS
Uncompensated primary acid-base disturbances, such as those indicated by pointsB, C, D, and G on Figure 8–3, are seldom seen because respiratory and renal com-pensatory mechanisms are called into play to offset these disturbances. The twomain compensatory mechanisms are functions of the respiratory and renal systems.
Respiratory Compensatory Mechanisms
The respiratory system can compensate for metabolic acidosis or alkalosis by alter-ing alveolar ventilation. As discussed in Chapter 3, if carbon dioxide production isconstant, the alveolar PCO2
is roughly inversely proportional to the alveolar ventila-tion. This can be seen in the upper portion of Figure 3–10. In metabolic acidosis,the elevated blood hydrogen ion concentration stimulates chemoreceptors, which, inturn, increase alveolar ventilation, thus decreasing arterial PCO2
. This causes anincrease in arterial pHa, returning it toward normal. (The mechanisms by whichventilation is regulated are discussed in detail in Chapter 9.) These events can bebetter understood by looking at Figure 8–3. Point G represents uncompensatedmetabolic acidosis. As the respiratory compensation for the metabolic acidosisoccurs, in the form of an increase in ventilation, the arterial PCO2
falls. The pointrepresenting blood pHa, PaCO2
, and bicarbonate concentration would then move ashort distance along the lower than normal buffer line (from point G toward point H)until a new lower PaCO2
is attained. This returns the arterial pH toward normal; com-plete compensation does not occur. Of course, the respiratory compensation formetabolic acidosis occurs almost simultaneously with the development of the acidosis.
Table 8–4. Common Causes of Metabolic Alkalosis
Loss of hydrogen ionsVomitingGastric fistulasDiuretic therapyTreatment with or overproduction of steroids (aldosterone or other mineralocorticoids)
Ingestion or administration of excess bicarbonate or other basesIntravenous bicarbonateIngestion of bicarbonate or other bases (e.g., antacids)
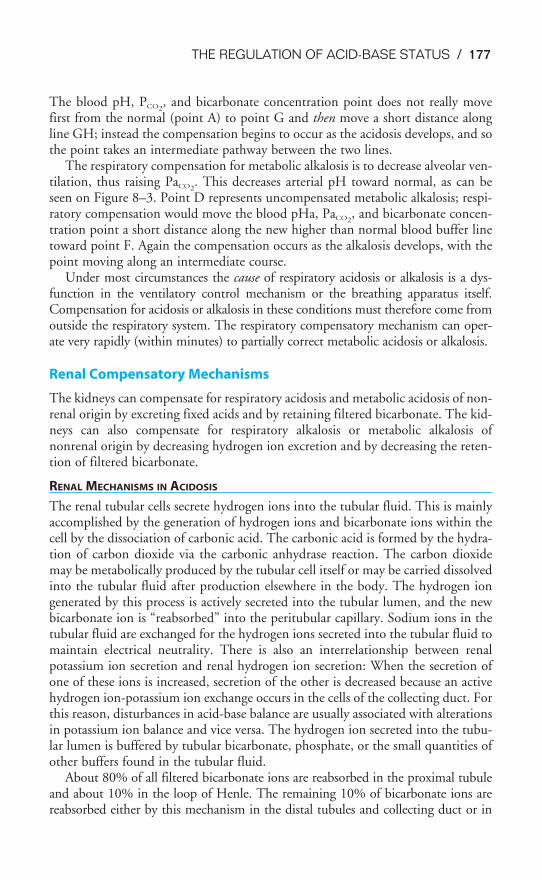
THE REGULATION OF ACID-BASE STATUS / 177
The blood pH, PCO2, and bicarbonate concentration point does not really move
first from the normal (point A) to point G and then move a short distance alongline GH; instead the compensation begins to occur as the acidosis develops, and sothe point takes an intermediate pathway between the two lines.
The respiratory compensation for metabolic alkalosis is to decrease alveolar ven-tilation, thus raising PaCO2
. This decreases arterial pH toward normal, as can beseen on Figure 8–3. Point D represents uncompensated metabolic alkalosis; respi-ratory compensation would move the blood pHa, PaCO2
, and bicarbonate concen-tration point a short distance along the new higher than normal blood buffer linetoward point F. Again the compensation occurs as the alkalosis develops, with thepoint moving along an intermediate course.
Under most circumstances the cause of respiratory acidosis or alkalosis is a dys-function in the ventilatory control mechanism or the breathing apparatus itself.Compensation for acidosis or alkalosis in these conditions must therefore come fromoutside the respiratory system. The respiratory compensatory mechanism can oper-ate very rapidly (within minutes) to partially correct metabolic acidosis or alkalosis.
Renal Compensatory Mechanisms
The kidneys can compensate for respiratory acidosis and metabolic acidosis of non-renal origin by excreting fixed acids and by retaining filtered bicarbonate. The kid-neys can also compensate for respiratory alkalosis or metabolic alkalosis ofnonrenal origin by decreasing hydrogen ion excretion and by decreasing the reten-tion of filtered bicarbonate.
RENAL MECHANISMS IN ACIDOSIS
The renal tubular cells secrete hydrogen ions into the tubular fluid. This is mainlyaccomplished by the generation of hydrogen ions and bicarbonate ions within thecell by the dissociation of carbonic acid. The carbonic acid is formed by the hydra-tion of carbon dioxide via the carbonic anhydrase reaction. The carbon dioxidemay be metabolically produced by the tubular cell itself or may be carried dissolvedinto the tubular fluid after production elsewhere in the body. The hydrogen iongenerated by this process is actively secreted into the tubular lumen, and the newbicarbonate ion is “reabsorbed” into the peritubular capillary. Sodium ions in thetubular fluid are exchanged for the hydrogen ions secreted into the tubular fluid tomaintain electrical neutrality. There is also an interrelationship between renalpotassium ion secretion and renal hydrogen ion secretion: When the secretion ofone of these ions is increased, secretion of the other is decreased because an activehydrogen ion-potassium ion exchange occurs in the cells of the collecting duct. Forthis reason, disturbances in acid-base balance are usually associated with alterationsin potassium ion balance and vice versa. The hydrogen ion secreted into the tubu-lar lumen is buffered by tubular bicarbonate, phosphate, or the small quantities ofother buffers found in the tubular fluid.
About 80% of all filtered bicarbonate ions are reabsorbed in the proximal tubuleand about 10% in the loop of Henle. The remaining 10% of bicarbonate ions arereabsorbed either by this mechanism in the distal tubules and collecting duct or in
178 / CHAPTER 8
the process of titration of tubular phosphate ions, or by the generation of ammoniumions. In each mechanism, bicarbonate ions are returned to the peritubular capillary.
Ammonium (NH4) is actively formed in the renal cells mainly by the deamina-tion of the amino acid glutamine. Ammonium then diffuses into the tubular lumen.
Normally, the kidneys secrete about 70 mEq of hydrogen ions and reabsorbabout 70 mEq of bicarbonate daily. This process can increase during acidosis to theextent that the urine can be acidified to a pH as low as 4.0 to 5.0. This is about800 times as acidic as normal plasma.
RENAL MECHANISMS IN ALKALOSIS
In alkalotic states, the kidney decreases the secretion of hydrogen ions anddecreases bicarbonate reabsorption. The kidney tends to reabsorb almost all the fil-tered bicarbonate until the plasma bicarbonate concentration reaches about 27 to28 mEq/L (normally it is about 24 mEq/L). Plasma bicarbonate is excreted abovethis threshold.
TIME COURSE OF RENAL MECHANISMS
Renal compensatory mechanisms for acid-base disturbances operate much moreslowly than respiratory compensatory mechanisms. For example, the renal compen-satory responses to sustained respiratory acidosis or alkalosis may take 3 to 6 days.
Summary of Renal & Respiratory Contributions to Acid-Base Balance
The kidneys help regulate acid-base balance by altering the excretion of fixed acidsand the retention of the filtered bicarbonate; the respiratory system helps regulatebody acid-base balance by adjusting alveolar ventilation to alter alveolar PCO2
. Forthese reasons, some authors suggest that the Henderson-Hasselbalch equation is ineffect
pH � a constant � �k
l
i
u
d
n
n
g
e
s
ys�
CLINICAL INTERPRETATION OF BLOOD GASES & ACID-BASE STATUS
Samples of arterial blood are usually analyzed clinically to determine the “arterialblood gases”: the arterial PO2
, PCO2, and pH. The plasma bicarbonate can then be
calculated from the pH and PCO2by using the Henderson-Hasselbalch equation.
This can be done directly, or by using a nomogram, or by graphical analysis suchas the pH-bicarbonate diagram (the “Davenport plot,” after its popularizer), thepH-PCO2
diagram (the “Siggaard-Andersen”), or the composite acid-base diagram.Most blood gas analyzers perform these calculations automatically.
Table 8–5 summarizes the changes in pHa, PaCO2, and plasma bicarbonate con-
centration seen in simple, mixed, and partially compensated acid-base distur-bances. It contains the same information shown in Figure 8–3, depicted
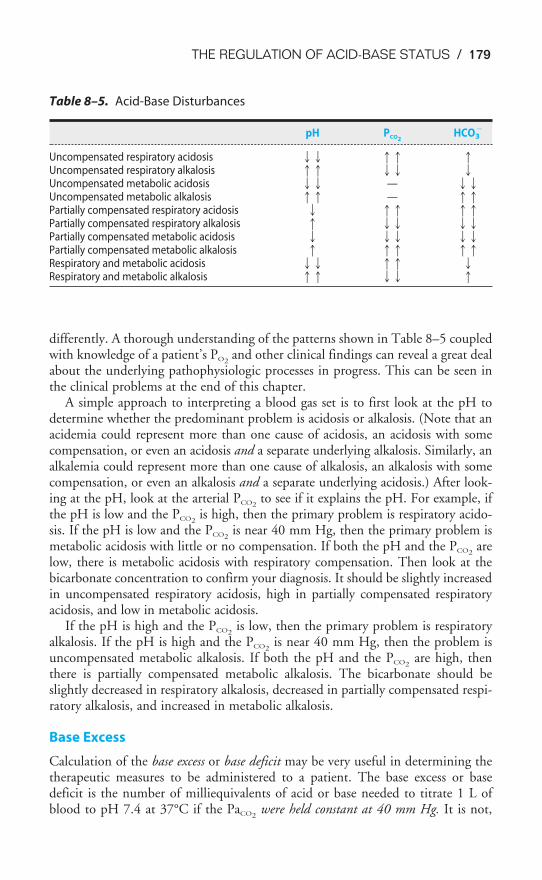
THE REGULATION OF ACID-BASE STATUS / 179
differently. A thorough understanding of the patterns shown in Table 8–5 coupledwith knowledge of a patient’s PO2
and other clinical findings can reveal a great dealabout the underlying pathophysiologic processes in progress. This can be seen inthe clinical problems at the end of this chapter.
A simple approach to interpreting a blood gas set is to first look at the pH todetermine whether the predominant problem is acidosis or alkalosis. (Note that anacidemia could represent more than one cause of acidosis, an acidosis with somecompensation, or even an acidosis and a separate underlying alkalosis. Similarly, analkalemia could represent more than one cause of alkalosis, an alkalosis with somecompensation, or even an alkalosis and a separate underlying acidosis.) After look-ing at the pH, look at the arterial PCO2
to see if it explains the pH. For example, ifthe pH is low and the PCO2
is high, then the primary problem is respiratory acido-sis. If the pH is low and the PCO2
is near 40 mm Hg, then the primary problem ismetabolic acidosis with little or no compensation. If both the pH and the PCO2
arelow, there is metabolic acidosis with respiratory compensation. Then look at thebicarbonate concentration to confirm your diagnosis. It should be slightly increasedin uncompensated respiratory acidosis, high in partially compensated respiratoryacidosis, and low in metabolic acidosis.
If the pH is high and the PCO2is low, then the primary problem is respiratory
alkalosis. If the pH is high and the PCO2is near 40 mm Hg, then the problem is
uncompensated metabolic alkalosis. If both the pH and the PCO2are high, then
there is partially compensated metabolic alkalosis. The bicarbonate should beslightly decreased in respiratory alkalosis, decreased in partially compensated respi-ratory alkalosis, and increased in metabolic alkalosis.
Base Excess
Calculation of the base excess or base deficit may be very useful in determining thetherapeutic measures to be administered to a patient. The base excess or basedeficit is the number of milliequivalents of acid or base needed to titrate 1 L ofblood to pH 7.4 at 37°C if the PaCO2
were held constant at 40 mm Hg. It is not,
Table 8–5. Acid-Base Disturbances
pH PCO2HCO3
�
Uncompensated respiratory acidosis �� �� �Uncompensated respiratory alkalosis �� �� �Uncompensated metabolic acidosis �� — ��Uncompensated metabolic alkalosis �� — ��Partially compensated respiratory acidosis � �� ��Partially compensated respiratory alkalosis � �� ��Partially compensated metabolic acidosis � �� ��Partially compensated metabolic alkalosis � �� ��Respiratory and metabolic acidosis �� �� �Respiratory and metabolic alkalosis �� �� �
180 / CHAPTER 8
therefore, just the difference between the plasma bicarbonate concentration of thesample in question and the normal plasma bicarbonate concentration because res-piratory adjustments also cause a change in bicarbonate concentration: The arterialPCO2
must be considered. Base excess can be determined by actually titrating a sam-ple or by using a nomogram, diagram, or calculator program. Most blood gas ana-lyzers calculate the base excess automatically. The base excess is expressed inmilliequivalents per liter above or below the normal buffer-base range—it thereforehas a normal value of 0 � 2 mEq/L. A base deficit is also called a negative base excess.
The base deficit can be used to estimate how much sodium bicarbonate (inmEq) should be given to a patient by multiplying the base deficit (in mEq/L) timesthe patient’s estimated extracellular fluid (ECF) space (in liters), which is the dis-tribution space for the bicarbonate. The ECF is usually estimated to be 0.3 timesthe lean body mass in kilograms.
Anion Gap
Calculation of the anion gap can be helpful in determining the cause of a patient’smetabolic acidosis. It is determined by subtracting the sum of a patient’s plasmachloride and bicarbonate concentrations (in mEq/L) from his or her plasmasodium concentration:
Anion gap � [Na�] � ([Cl�] � [HCO−
3])
The anion gap is normally 12 � 4 mEq/L.The sum of all of the plasma cations must equal the sum of all of the plasma
anions, so the anion gap exists only because all of the plasma cations and anionsare not measured when standard blood chemistry is done. Sodium, chloride, andbicarbonate concentrations are almost always reported. The normal anion gap is aresult of the presence of more unmeasured anions than unmeasured cations innormal blood.
[Na�] � [unmeasured cations] � [Cl�] � [HCO−
3] � [unmeasured anions][Na�] � ([Cl�] � [HCO−
3]) � [unmeasured anions] � [unmeasured cations]
The anion gap is therefore the difference between the unmeasured anions and theunmeasured cations.
The negative charges on the plasma proteins probably make up most of the nor-mal anion gap, because the total charges of the other plasma cations (K�, Ca2�,Mg2�) are approximately equal to the total charges of the other anions (PO4
3�,SO4
2�, organic anions).An increased anion gap usually indicates an increased number of
unmeasured anions (those other than C1� and HCO−
3) or a decreasednumber of unmeasured cations (K�, Ca2�, or Mg2�), or both. This is
most likely to happen when the measured anions, [HCO3�] or [Cl�] are lost andreplaced by unmeasured anions. For example, the buffering by HCO−
3s of H�sfrom ingested or metabolically produced acids produces an increased anion gap.
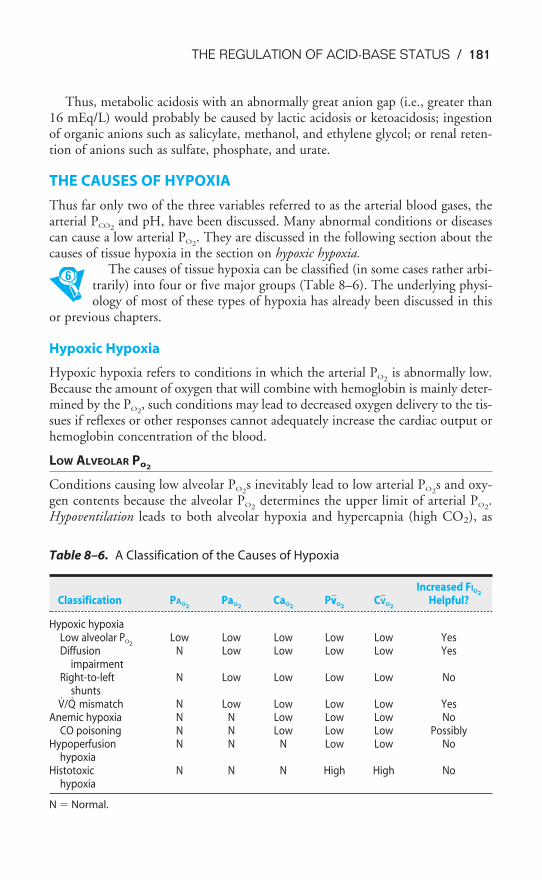
THE REGULATION OF ACID-BASE STATUS / 181
Thus, metabolic acidosis with an abnormally great anion gap (i.e., greater than16 mEq/L) would probably be caused by lactic acidosis or ketoacidosis; ingestionof organic anions such as salicylate, methanol, and ethylene glycol; or renal reten-tion of anions such as sulfate, phosphate, and urate.
THE CAUSES OF HYPOXIA
Thus far only two of the three variables referred to as the arterial blood gases, thearterial PCO2
and pH, have been discussed. Many abnormal conditions or diseasescan cause a low arterial PO2
. They are discussed in the following section about thecauses of tissue hypoxia in the section on hypoxic hypoxia.
The causes of tissue hypoxia can be classified (in some cases rather arbi-trarily) into four or five major groups (Table 8–6). The underlying physi-ology of most of these types of hypoxia has already been discussed in this
or previous chapters.
Hypoxic Hypoxia
Hypoxic hypoxia refers to conditions in which the arterial PO2is abnormally low.
Because the amount of oxygen that will combine with hemoglobin is mainly deter-mined by the PO2
, such conditions may lead to decreased oxygen delivery to the tis-sues if reflexes or other responses cannot adequately increase the cardiac output orhemoglobin concentration of the blood.
LOW ALVEOLAR Po2
Conditions causing low alveolar PO2s inevitably lead to low arterial PO2
s and oxy-gen contents because the alveolar PO2
determines the upper limit of arterial PO2.
Hypoventilation leads to both alveolar hypoxia and hypercapnia (high CO2), as
Table 8–6. A Classification of the Causes of Hypoxia
Increased FIO2
Classification PAO2PaO2
CaO2PVV�O2
CV�O2Helpful?
Hypoxic hypoxiaLow alveolar PO2
Low Low Low Low Low YesDiffusion N Low Low Low Low Yes
impairmentRight-to-left N Low Low Low Low No
shuntsV̇/Q̇ mismatch N Low Low Low Low Yes
Anemic hypoxia N N Low Low Low NoCO poisoning N N Low Low Low Possibly
Hypoperfusion N N N Low Low Nohypoxia
Histotoxic N N N High High Nohypoxia
N � Normal.
182 / CHAPTER 8
discussed in Chapter 3. Hypoventilation can be caused by depression or injury ofthe respiratory centers in the brain (discussed in Chapter 9); interference with thenerves supplying the respiratory muscles, as in spinal cord injury; neuromuscularjunction diseases such as myasthenia gravis; and altered mechanics of the lung orchest wall, as in noncompliant lungs due to sarcoidosis, reduced chest wall mobilitybecause of kyphoscoliosis or obesity, and airway obstruction. Ascent to high altitudescauses alveolar hypoxia because of the reduced total barometric pressure encoun-tered above sea level. Reduced FIO2
s (fraction of inspired oxygen) have similar effects.Alveolar carbon dioxide is decreased because of the reflex increase in ventilationcaused by hypoxic stimulation, as will be discussed in Chapter 11. Hypoventilationand ascent to high altitudes lead to decreased venous PO2
and oxygen content as oxy-gen is extracted from the already hypoxic arterial blood. Administration of elevatedoxygen concentrations in the inspired gas can alleviate the alveolar and arterialhypoxia in hypoventilation and in ascent to high altitude, but it cannot reverse thehypercapnia of hypoventilation. In fact, administration of elevated FIO2
s to sponta-neously breathing patients hypoventilating because of a depressed central responseto carbon dioxide (see Chapter 9) can further depress ventilation.
DIFFUSION IMPAIRMENT
Alveolar-capillary diffusion is discussed in greater detail in Chapter 6. Conditionssuch as interstitial fibrosis and interstitial or alveolar edema can lead to low arterialPO2
s and contents with normal or elevated alveolar PO2s. High FIO2
s that increasethe alveolar PO2
to very high levels may raise the arterial PO2by increasing the par-
tial pressure gradient for oxygen diffusion, as discussed in Chapter 6.
SHUNTS
True right-to-left shunts, such as anatomic shunts and absolute intrapulmonaryshunts, can cause decreased arterial PO2
s with normal or even elevated alveolar PO2s.
Patients with intrapulmonary shunts have low arterial PO2s, but may not have sig-
nificantly increased PCO2s if they are able to increase their alveolar ventilation or if
they are mechanically ventilated. This is a result of the different shapes of the oxy-hemoglobin dissociation curve (see Figure 7–1) and the carbon dioxide dissocia-tion curve (see Figure 7–5). The carbon dioxide dissociation curve is almost linearin the normal range of arterial PCO2
s, and arterial PCO2is very tightly regulated by
the respiratory control system (see Chapter 9). Carbon dioxide retained in theshunted blood stimulates increased alveolar ventilation, and because the carbondioxide dissociation curve is nearly linear, increased ventilation will allow more car-bon dioxide to diffuse from the nonshunted blood into well-ventilated alveoli andbe exhaled. On the other hand, increasing alveolar ventilation will not get any moreoxygen into the shunted blood and, because of the shape of the oxyhemoglobindissociation curve, very little more into the unshunted blood. This is because thehemoglobin of well-ventilated and perfused alveoli is nearly saturated with oxygen,and little more will dissolve in the plasma. Similarly, arterial hypoxemia caused bytrue shunts is not relieved by high FIO2
s because the shunted blood does not comeinto contact with the high levels of oxygen. The hemoglobin of the unshunted
THE REGULATION OF ACID-BASE STATUS / 183
blood is nearly completely saturated with oxygen at a normal FIO2of 0.21, and the
small additional volume of oxygen dissolved in the blood at high FIO2s cannot
make up for the low hemoglobin saturation of the shunted blood.
VENTILATION-PERFUSION MISMATCH
Alveolar-capillary units with low ventilation-perfusion ( V̇A/Q̇c) ratios contributeto arterial hypoxia, as already discussed. Units with high V̇A/Q̇cs do not by them-selves lead to arterial hypoxia, of course, but large lung areas that are underperfusedare usually associated either with overperfusion of other units or with low cardiacoutputs (see the section on Hypoperfusion Hypoxia below). Hypoxic pulmonaryvasoconstriction (discussed in Chapter 4) and local airway responses (discussed inChapter 2) normally help minimize V̇/Q̇ mismatch.
Note that diffusion impairment, shunts, and V̇/Q̇ mismatch increase the alve-olar-arterial PO2
difference (see Table 5–2).
Anemic Hypoxia
Anemic hypoxia is caused by a decrease in the amount of functioning hemoglobin,which can be a result of decreased hemoglobin or erythrocyte production, the pro-duction of abnormal hemoglobin or red blood cells, pathologic destruction oferythrocytes, or interference with the chemical combination of oxygen andhemoglobin. Carbon monoxide poisoning, for example, results from the greateraffinity of hemoglobin for carbon monoxide than for oxygen. Methemoglobinemiais a condition in which the iron in hemoglobin has been altered from the Fe2� tothe Fe3� form, which does not combine with oxygen.
Anemic hypoxia results in a decreased oxygen content when both alveolar andarterial PO2
are normal. Standard analysis of arterial blood gases could thereforegive normal values unless a co-oximeter is also used to determine blood oxygen con-tent. Venous PO2
and oxygen content are both decreased. Administration of highFIO2
s is not effective in greatly increasing the arterial oxygen content (except possi-bly in carbon monoxide poisoning).
Hypoperfusion Hypoxia
Hypoperfusion hypoxia (sometimes called stagnant hypoxia) results from low bloodflow. This can occur either locally, in a particular vascular bed, or systemically, inthe case of a low cardiac output. The alveolar PO2
and the arterial PO2and oxygen
content may be normal, but the reduced oxygen delivery to the tissues may resultin tissue hypoxia. Venous PO2
and oxygen content are low. Raising the FIO2is of
little value in hypoperfusion hypoxia (unless it directly increases the perfusion)because the blood flowing to the tissues is already oxygenated normally.
Histotoxic Hypoxia
Histotoxic hypoxia refers to a poisoning of the cellular machinery that uses oxygen toproduce energy. Cyanide, for example, binds to cytochrome oxidase in the respiratory
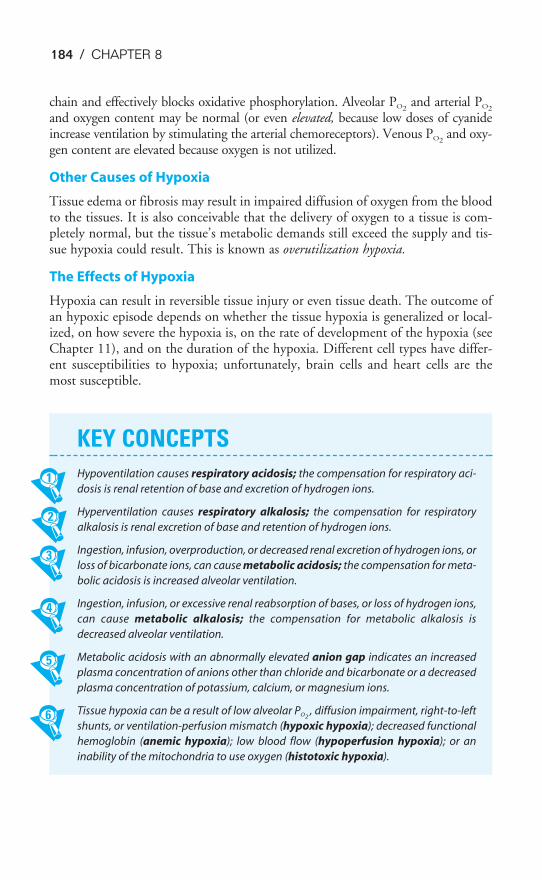
184 / CHAPTER 8
chain and effectively blocks oxidative phosphorylation. Alveolar PO2and arterial PO2
and oxygen content may be normal (or even elevated, because low doses of cyanideincrease ventilation by stimulating the arterial chemoreceptors). Venous PO2
and oxy-gen content are elevated because oxygen is not utilized.
Other Causes of Hypoxia
Tissue edema or fibrosis may result in impaired diffusion of oxygen from the bloodto the tissues. It is also conceivable that the delivery of oxygen to a tissue is com-pletely normal, but the tissue’s metabolic demands still exceed the supply and tis-sue hypoxia could result. This is known as overutilization hypoxia.
The Effects of Hypoxia
Hypoxia can result in reversible tissue injury or even tissue death. The outcome ofan hypoxic episode depends on whether the tissue hypoxia is generalized or local-ized, on how severe the hypoxia is, on the rate of development of the hypoxia (seeChapter 11), and on the duration of the hypoxia. Different cell types have differ-ent susceptibilities to hypoxia; unfortunately, brain cells and heart cells are themost susceptible.
KEY CONCEPTS
Hypoventilation causes respiratory acidosis; the compensation for respiratory aci-
dosis is renal retention of base and excretion of hydrogen ions.
Hyperventilation causes respiratory alkalosis; the compensation for respiratory
alkalosis is renal excretion of base and retention of hydrogen ions.
Ingestion, infusion, overproduction, or decreased renal excretion of hydrogen ions, or
loss of bicarbonate ions, can cause metabolic acidosis; the compensation for meta-
bolic acidosis is increased alveolar ventilation.
Ingestion, infusion, or excessive renal reabsorption of bases, or loss of hydrogen ions,
can cause metabolic alkalosis; the compensation for metabolic alkalosis is
decreased alveolar ventilation.
Metabolic acidosis with an abnormally elevated anion gap indicates an increased
plasma concentration of anions other than chloride and bicarbonate or a decreased
plasma concentration of potassium, calcium, or magnesium ions.
Tissue hypoxia can be a result of low alveolar PO2, diffusion impairment, right-to-left
shunts, or ventilation-perfusion mismatch (hypoxic hypoxia); decreased functional
hemoglobin (anemic hypoxia); low blood flow (hypoperfusion hypoxia); or an
inability of the mitochondria to use oxygen (histotoxic hypoxia).
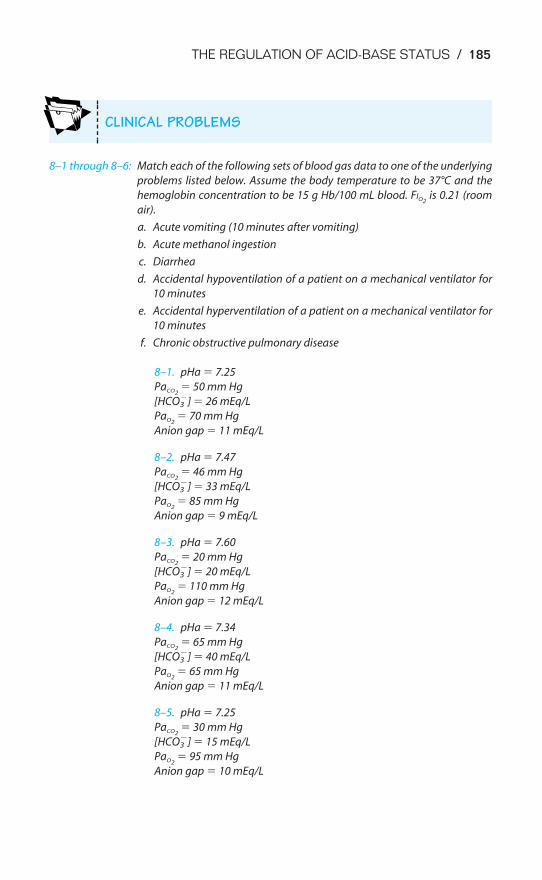
THE REGULATION OF ACID-BASE STATUS / 185
8–1 through 8–6: Match each of the following sets of blood gas data to one of the underlying
problems listed below. Assume the body temperature to be 37°C and the
hemoglobin concentration to be 15 g Hb/100 mL blood. FIO2is 0.21 (room
air).
a. Acute vomiting (10 minutes after vomiting)
b. Acute methanol ingestion
c. Diarrhea
d. Accidental hypoventilation of a patient on a mechanical ventilator for
10 minutes
e. Accidental hyperventilation of a patient on a mechanical ventilator for
10 minutes
f. Chronic obstructive pulmonary disease
8–1. pHa � 7.25
PaCO2� 50 mm Hg
[HCO3�] � 26 mEq/L
PaO2� 70 mm Hg
Anion gap � 11 mEq/L
8–2. pHa � 7.47
PaCO2� 46 mm Hg
[HCO3�] � 33 mEq/L
PaO2� 85 mm Hg
Anion gap � 9 mEq/L
8–3. pHa � 7.60
PaCO2� 20 mm Hg
[HCO3�] � 20 mEq/L
PaO2� 110 mm Hg
Anion gap � 12 mEq/L
8–4. pHa � 7.34
PaCO2� 65 mm Hg
[HCO3�] � 40 mEq/L
PaO2� 65 mm Hg
Anion gap � 11 mEq/L
8–5. pHa � 7.25
PaCO2� 30 mm Hg
[HCO3�] � 15 mEq/L
PaO2� 95 mm Hg
Anion gap � 10 mEq/L
CLINICAL PROBLEMS
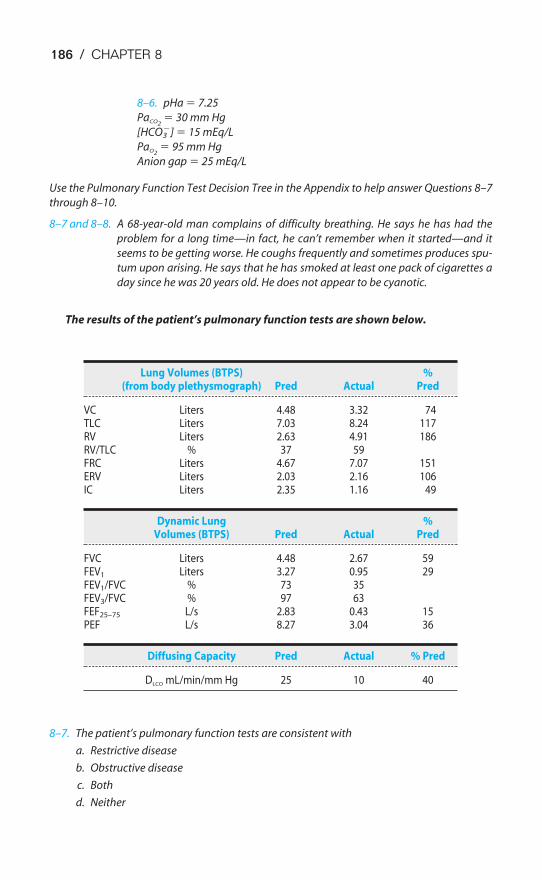
8–6. pHa � 7.25
PaCO2� 30 mm Hg
[HCO3�] � 15 mEq/L
PaO2� 95 mm Hg
Anion gap � 25 mEq/L
Use the Pulmonary Function Test Decision Tree in the Appendix to help answer Questions 8–7
through 8–10.
8–7 and 8–8. A 68-year-old man complains of difficulty breathing. He says he has had the
problem for a long time—in fact, he can’t remember when it started—and it
seems to be getting worse. He coughs frequently and sometimes produces spu-
tum upon arising. He says that he has smoked at least one pack of cigarettes a
day since he was 20 years old. He does not appear to be cyanotic.
The results of the patient’s pulmonary function tests are shown below.
8–7. The patient’s pulmonary function tests are consistent with
a. Restrictive disease
b. Obstructive disease
c. Both
d. Neither
Lung Volumes (BTPS) %(from body plethysmograph) Pred Actual Pred
VC Liters 4.48 3.32 74TLC Liters 7.03 8.24 117RV Liters 2.63 4.91 186RV/TLC % 37 59FRC Liters 4.67 7.07 151ERV Liters 2.03 2.16 106IC Liters 2.35 1.16 49
Dynamic Lung %Volumes (BTPS) Pred Actual Pred
FVC Liters 4.48 2.67 59FEV1 Liters 3.27 0.95 29FEV1/FVC % 73 35FEV3/FVC % 97 63FEF25–75 L/s 2.83 0.43 15PEF L/s 8.27 3.04 36
Diffusing Capacity Pred Actual % Pred
DLCO mL/min/mm Hg 25 10 40
186 / CHAPTER 8
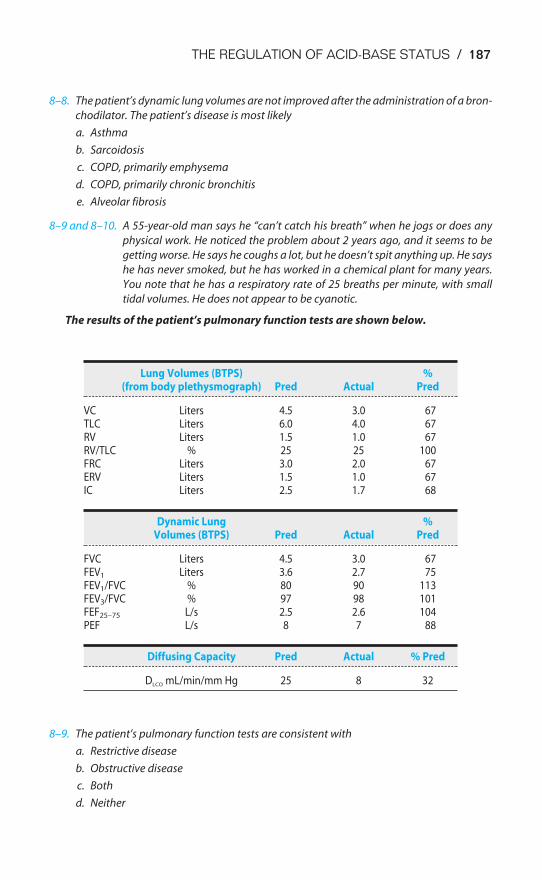
THE REGULATION OF ACID-BASE STATUS / 187
8–8. The patient’s dynamic lung volumes are not improved after the administration of a bron-
chodilator. The patient’s disease is most likely
a. Asthma
b. Sarcoidosis
c. COPD, primarily emphysema
d. COPD, primarily chronic bronchitis
e. Alveolar fibrosis
8–9 and 8–10. A 55-year-old man says he “can’t catch his breath” when he jogs or does any
physical work. He noticed the problem about 2 years ago, and it seems to be
getting worse. He says he coughs a lot, but he doesn’t spit anything up. He says
he has never smoked, but he has worked in a chemical plant for many years.
You note that he has a respiratory rate of 25 breaths per minute, with small
tidal volumes. He does not appear to be cyanotic.
The results of the patient’s pulmonary function tests are shown below.
8–9. The patient’s pulmonary function tests are consistent with
a. Restrictive disease
b. Obstructive disease
c. Both
d. Neither
Lung Volumes (BTPS) %(from body plethysmograph) Pred Actual Pred
VC Liters 4.5 3.0 67TLC Liters 6.0 4.0 67RV Liters 1.5 1.0 67RV/TLC % 25 25 100FRC Liters 3.0 2.0 67ERV Liters 1.5 1.0 67IC Liters 2.5 1.7 68
Dynamic Lung %Volumes (BTPS) Pred Actual Pred
FVC Liters 4.5 3.0 67FEV1 Liters 3.6 2.7 75FEV1/FVC % 80 90 113FEV3/FVC % 97 98 101FEF25–75 L/s 2.5 2.6 104PEF L/s 8 7 88
Diffusing Capacity Pred Actual % Pred
DLCO mL/min/mm Hg 25 8 32
188 / CHAPTER 8
8–10. The patient’s disease is most likely
a. COPD, primarily emphysema
b. COPD, primarily chronic bronchitis
c. Interstitial alveolar fibrosis
d. Arthritis of the rib cage
e. Respiratory muscle weakness
SUGGESTED READINGS
Davenport HW. The ABC of Acid-Base Chemistry. 6th ed. Chicago, Ill: University of Chicago Press; 1974.
Dejours P (translated by Farhi L). Respiration. New York, NY: Oxford University Press; 1966:54–56,201–212.
Koeppen BM. Renal regulation of acid-base balance. Adv Physiol Educ. 1998;20:S132–S141.
Rose BD, Post TW. Clinical Physiology of Acid-Base and Electrolyte Disorders. 5th ed. New York, NY:McGraw-Hill; 2001.
Siggaard-Anderson O, Ulrich A, Gøthgen IH. Classes of tissue hypoxia. Acta Anaesthesiol Scand.1995;39:S137–S142.
Vander AJ. Renal Physiology. 5th ed. New York, NY: McGraw-Hill; 1995:162–189.
189
Breathing is spontaneously initiated in the central nervous system. A cycleof inspiration and expiration is automatically generated by neurons locatedin the brainstem; in eupneic states, breathing occurs without a conscious
initiation of inspiration and expiration. Normal individuals do not have to worryabout forgetting to breathe while they sleep.
This spontaneously generated cycle of inspiration and expiration can be modi-fied, altered, or even temporarily suppressed by a number of mechanisms. Asshown in Figure 9–1, these include reflexes arising in the lungs, the airways, andthe cardiovascular system; information from receptors in contact with the cere-brospinal fluid; and commands from higher centers of the brain such as the hypo-thalamus, the centers of speech, or other areas in the cortex. The centers that areresponsible for the generation of the spontaneous rhythmicity of inspiration andexpiration are, therefore, able to alter their activity to meet the increased metabolicdemand on the respiratory system during exercise or may even be temporarilysuperseded or suppressed during speech or breath holding.
9The Control of Breathing
OBJECTIVES
The reader understands the organization and function of the respiratory control system.
� Describes the general organization of the respiratory control system.
� Localizes the centers that generate the spontaneous rhythmicity of breathing.
� Describes the groups of neurons that effect inspiration and expiration.
� Describes the other centers in the brainstem that may influence the spontaneousrhythmicity of breathing.
� Lists the cardiopulmonary and other reflexes that influence the breathing pattern.
� States the ability of the brain cortex to override the normal pattern of inspirationand expiration temporarily.
� Describes the effects of alterations in body oxygen, carbon dioxide, and hydrogenion levels on the control of breathing.
� Describes the sensors of the respiratory system for oxygen, carbon dioxide, andhydrogen ion concentration.
Copyright © 2007 by The McGraw-Hill Companies, Inc. Click here for terms of use.
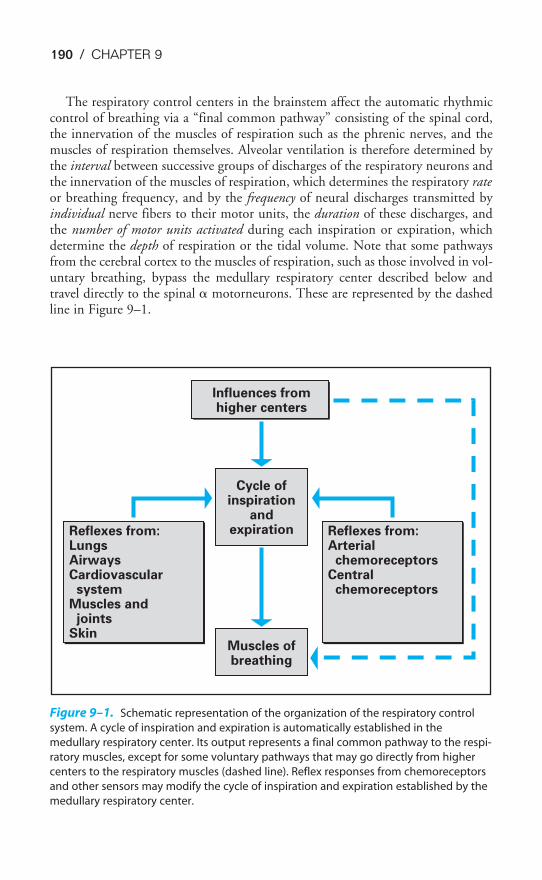
190 / CHAPTER 9
The respiratory control centers in the brainstem affect the automatic rhythmiccontrol of breathing via a “final common pathway” consisting of the spinal cord,the innervation of the muscles of respiration such as the phrenic nerves, and themuscles of respiration themselves. Alveolar ventilation is therefore determined bythe interval between successive groups of discharges of the respiratory neurons andthe innervation of the muscles of respiration, which determines the respiratory rateor breathing frequency, and by the frequency of neural discharges transmitted byindividual nerve fibers to their motor units, the duration of these discharges, andthe number of motor units activated during each inspiration or expiration, whichdetermine the depth of respiration or the tidal volume. Note that some pathwaysfrom the cerebral cortex to the muscles of respiration, such as those involved in vol-untary breathing, bypass the medullary respiratory center described below andtravel directly to the spinal � motorneurons. These are represented by the dashedline in Figure 9–1.
Influences fromhigher centers
Reflexes from:LungsAirwaysCardiovascular systemMuscles and jointsSkin
Reflexes from:Arterial chemoreceptorsCentral chemoreceptors
Cycle ofinspiration
andexpiration
Muscles ofbreathing
Figure 9–1. Schematic representation of the organization of the respiratory control
system. A cycle of inspiration and expiration is automatically established in the
medullary respiratory center. Its output represents a final common pathway to the respi-
ratory muscles, except for some voluntary pathways that may go directly from higher
centers to the respiratory muscles (dashed line). Reflex responses from chemoreceptors
and other sensors may modify the cycle of inspiration and expiration established by the
medullary respiratory center.
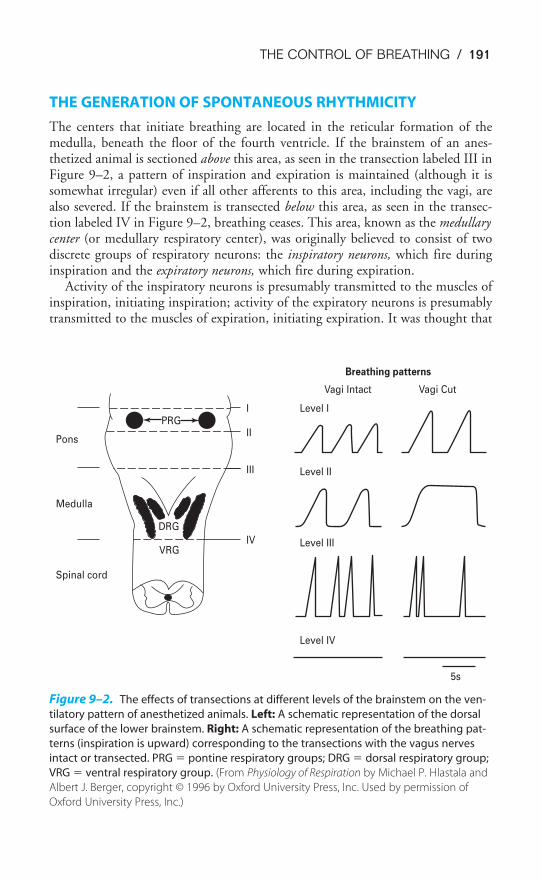
THE CONTROL OF BREATHING / 191
THE GENERATION OF SPONTANEOUS RHYTHMICITY
The centers that initiate breathing are located in the reticular formation of themedulla, beneath the floor of the fourth ventricle. If the brainstem of an anes-thetized animal is sectioned above this area, as seen in the transection labeled III inFigure 9–2, a pattern of inspiration and expiration is maintained (although it issomewhat irregular) even if all other afferents to this area, including the vagi, arealso severed. If the brainstem is transected below this area, as seen in the transec-tion labeled IV in Figure 9–2, breathing ceases. This area, known as the medullarycenter (or medullary respiratory center), was originally believed to consist of twodiscrete groups of respiratory neurons: the inspiratory neurons, which fire duringinspiration and the expiratory neurons, which fire during expiration.
Activity of the inspiratory neurons is presumably transmitted to the muscles ofinspiration, initiating inspiration; activity of the expiratory neurons is presumablytransmitted to the muscles of expiration, initiating expiration. It was thought that
DRG
VRG
Spinal cord
Medulla
Pons
IV
III
II
I Level I
Level II
Level III
Level IV
5s
Vagi Intact Vagi Cut
Breathing patterns
PRG
Figure 9–2. The effects of transections at different levels of the brainstem on the ven-
tilatory pattern of anesthetized animals. Left: A schematic representation of the dorsal
surface of the lower brainstem. Right: A schematic representation of the breathing pat-
terns (inspiration is upward) corresponding to the transections with the vagus nerves
intact or transected. PRG � pontine respiratory groups; DRG � dorsal respiratory group;
VRG � ventral respiratory group. (From Physiology of Respiration by Michael P. Hlastala and
Albert J. Berger, copyright © 1996 by Oxford University Press, Inc. Used by permission of
Oxford University Press, Inc.)
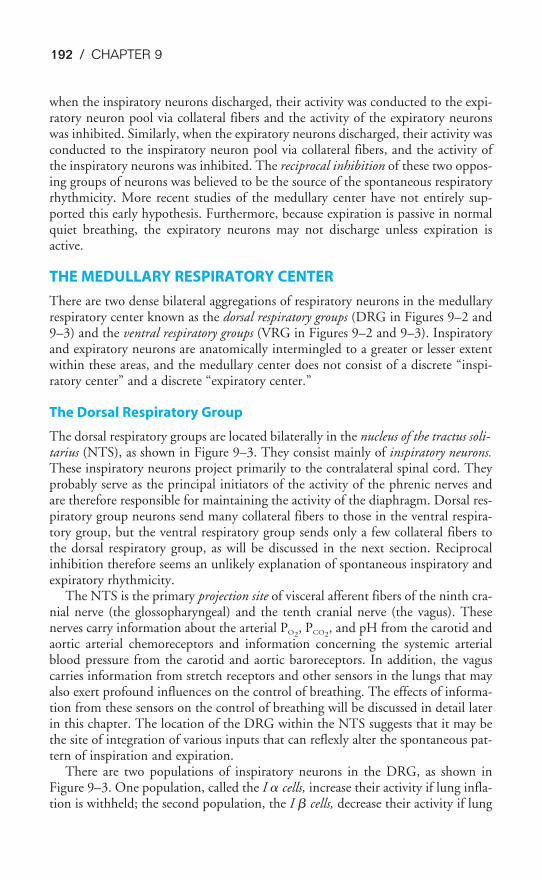
192 / CHAPTER 9
when the inspiratory neurons discharged, their activity was conducted to the expi-ratory neuron pool via collateral fibers and the activity of the expiratory neuronswas inhibited. Similarly, when the expiratory neurons discharged, their activity wasconducted to the inspiratory neuron pool via collateral fibers, and the activity ofthe inspiratory neurons was inhibited. The reciprocal inhibition of these two oppos-ing groups of neurons was believed to be the source of the spontaneous respiratoryrhythmicity. More recent studies of the medullary center have not entirely sup-ported this early hypothesis. Furthermore, because expiration is passive in normalquiet breathing, the expiratory neurons may not discharge unless expiration isactive.
THE MEDULLARY RESPIRATORY CENTER
There are two dense bilateral aggregations of respiratory neurons in the medullaryrespiratory center known as the dorsal respiratory groups (DRG in Figures 9–2 and9–3) and the ventral respiratory groups (VRG in Figures 9–2 and 9–3). Inspiratoryand expiratory neurons are anatomically intermingled to a greater or lesser extentwithin these areas, and the medullary center does not consist of a discrete “inspi-ratory center” and a discrete “expiratory center.”
The Dorsal Respiratory Group
The dorsal respiratory groups are located bilaterally in the nucleus of the tractus soli-tarius (NTS), as shown in Figure 9–3. They consist mainly of inspiratory neurons.These inspiratory neurons project primarily to the contralateral spinal cord. Theyprobably serve as the principal initiators of the activity of the phrenic nerves andare therefore responsible for maintaining the activity of the diaphragm. Dorsal res-piratory group neurons send many collateral fibers to those in the ventral respira-tory group, but the ventral respiratory group sends only a few collateral fibers tothe dorsal respiratory group, as will be discussed in the next section. Reciprocalinhibition therefore seems an unlikely explanation of spontaneous inspiratory andexpiratory rhythmicity.
The NTS is the primary projection site of visceral afferent fibers of the ninth cra-nial nerve (the glossopharyngeal) and the tenth cranial nerve (the vagus). Thesenerves carry information about the arterial PO2
, PCO2, and pH from the carotid and
aortic arterial chemoreceptors and information concerning the systemic arterialblood pressure from the carotid and aortic baroreceptors. In addition, the vaguscarries information from stretch receptors and other sensors in the lungs that mayalso exert profound influences on the control of breathing. The effects of informa-tion from these sensors on the control of breathing will be discussed in detail laterin this chapter. The location of the DRG within the NTS suggests that it may bethe site of integration of various inputs that can reflexly alter the spontaneous pat-tern of inspiration and expiration.
There are two populations of inspiratory neurons in the DRG, as shown inFigure 9–3. One population, called the I � cells, increase their activity if lung infla-tion is withheld; the second population, the I � cells, decrease their activity if lung
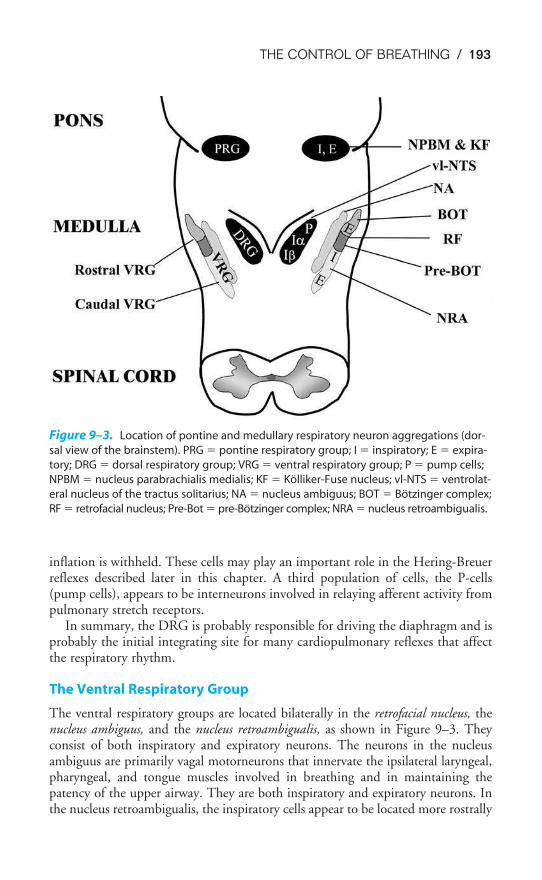
THE CONTROL OF BREATHING / 193
inflation is withheld. These cells may play an important role in the Hering-Breuerreflexes described later in this chapter. A third population of cells, the P-cells(pump cells), appears to be interneurons involved in relaying afferent activity frompulmonary stretch receptors.
In summary, the DRG is probably responsible for driving the diaphragm and isprobably the initial integrating site for many cardiopulmonary reflexes that affectthe respiratory rhythm.
The Ventral Respiratory Group
The ventral respiratory groups are located bilaterally in the retrofacial nucleus, thenucleus ambiguus, and the nucleus retroambigualis, as shown in Figure 9–3. Theyconsist of both inspiratory and expiratory neurons. The neurons in the nucleusambiguus are primarily vagal motorneurons that innervate the ipsilateral laryngeal,pharyngeal, and tongue muscles involved in breathing and in maintaining thepatency of the upper airway. They are both inspiratory and expiratory neurons. Inthe nucleus retroambigualis, the inspiratory cells appear to be located more rostrally
Figure 9–3. Location of pontine and medullary respiratory neuron aggregations (dor-
sal view of the brainstem). PRG � pontine respiratory group; I � inspiratory; E � expira-
tory; DRG � dorsal respiratory group; VRG � ventral respiratory group; P � pump cells;
NPBM � nucleus parabrachialis medialis; KF � Kölliker-Fuse nucleus; vl-NTS � ventrolat-
eral nucleus of the tractus solitarius; NA � nucleus ambiguus; BOT � Bötzinger complex;
RF � retrofacial nucleus; Pre-Bot � pre-Bötzinger complex; NRA � nucleus retroambigualis.
194 / CHAPTER 9
and the expiratory cells are located more caudally. There appear to be two popula-tions of inspiratory cells in the nucleus retroambigualis: One group mainly projectscontralaterally to external intercostal muscles, with some fibers also sent to thephrenic nerves, thus innervating the diaphragm; the second group appears to proj-ect only within the medulla to other inspiratory and expiratory cells. The expiratoryneurons in the nucleus retroambigualis project to the contralateral spinal cord todrive the internal intercostal and abdominal muscles. The retrofacial nucleus,located most rostrally in the ventral respiratory groups, mainly contains expiratoryneurons in a group of cells called the Bötzinger complex. This group of neurons hasbeen shown to inhibit inspiratory cells in the DRG, as well as some phrenicmotorneurons.
In summary, the VRG neurons consist of both inspiratory and expiratory cells.Their major function is to drive either spinal respiratory neurons, innervatingmainly the intercostal and abdominal muscles, or the auxiliary muscles of respira-tion innervated by the vagus nerves. Many expiratory cells may not fire at all dur-ing the passive expirations seen in eupneic breathing (see Chapter 2); those that dodischarge do not cause contraction of the expiratory muscles. It now appears thatcells in the pre-Bötzinger complex probably act as pacemakers and establish the res-piratory rhythm.
The “Apneustic Center”
If the brainstem is transected in the pons at the level denoted by the line labeled IIin Figure 9–2, a breathing pattern called apneusis results if the vagus nerves havealso been transected. Apneustic breathing consists of prolonged inspiratory effortsinterrupted by occasional expirations. Afferent information that reaches this so-called apneustic center via the vagus nerves must be important in preventing apneu-sis because apneusis does not occur if the vagus nerves are intact, as shownschematically in Figure 9–2.
Apneusis is probably caused by a sustained discharge of medullary inspiratoryneurons. Therefore, the apneustic center may be the site of the normal “inspiratorycutoff switch”; that is, it is the site of projection and integration of various types ofafferent information that can terminate inspiration. Apneusis is a result of the inac-tivation of the inspiratory cutoff mechanism. The specific group of neurons thatfunction as the apneustic center has not been identified, but it must be locatedsomewhere between the lines labeled II and III in Figure 9–2.
THE PONTINE RESPIRATORY GROUPS
If the brainstem is transected immediately caudal to the inferior colliculus, asdenoted by the line labeled I in Figure 9–2, the breathing pattern shows an essen-tially normal balance between inspiration and expiration, even if the vagus nervesare transected. As discussed in the previous section, transections made caudal to theline labeled II in Figure 9–2 lead to apneusis in the absence of the vagus nerves. Agroup of respiratory neurons known as the pontine respiratory groups, (formerlycalled the pneumotaxic center) therefore functions to modulate the activity of the
THE CONTROL OF BREATHING / 195
apneustic center. These cells, located in the upper pons in the nucleusparabrachialis medialis and the Kölliker-Fuse nucleus (shown in Figure 9–3), prob-ably function to “fine-tune” the breathing pattern. Electrical stimulation of thesestructures can result in synchronization of phrenic nerve activity with the stimulusor premature switching from inspiration to expiration and vice versa. Pulmonaryinflation afferent information can inhibit the activity of the pontine respiratorygroups, which may in turn act to modulate the threshold for lung inflation inspi-ratory cutoff. The pontine respiratory groups may also modulate the respiratorycontrol system’s response to other stimuli, such as hypercapnia and hypoxia.
SPINAL PATHWAYS
Axons projecting from the DRG, the VRG, the cortex, and other supraspinal sitesdescend in the spinal white matter to influence the diaphragm and the intercostaland abdominal muscles of respiration, as already discussed. At the level of thesespinal respiratory motorneurons, there is integration of descending influences aswell as the presence of local spinal reflexes that can affect these motorneurons.Descending axons with inspiratory activity excite phrenic and external intercostalmotorneurons and also inhibit internal intercostal motorneurons by exciting spinalinhibitory interneurons. They are actively inhibited during expiratory phases of therespiratory cycle.
Ascending pathways in the spinal cord, carrying information from pain, touch,and temperature receptors, as well as from proprioceptors, can also influencebreathing, as will be discussed in the next section. Inspiratory and expiratory fibersappear to be separated in the spinal cord.
REFLEX MECHANISMS OF RESPIRATORY CONTROL
A large number of sensors located in the lungs, the cardiovascular system, the mus-cles and tendons, and the skin and viscera can elicit reflex alterations in the con-trol of breathing. These are summarized in Table 9–1.
Respiratory Reflexes Arising from Pulmonary Stretch Receptors
Three respiratory reflexes can be elicited by stimulation of the pulmonary stretchreceptors: the Hering-Breuer inflation reflex, the Hering-Breuer deflation reflex,and the “paradoxical” reflex of Head.
THE HERING-BREUER INFLATION REFLEX
In 1868, Breuer and Hering reported that a maintained distention of the lungs ofanesthetized animals decreased the frequency of the inspiratory effort or caused atransient apnea. The stimulus for this reflex is pulmonary inflation. The sensors arestretch receptors located within the smooth muscle of large and small airways. Theyare sometimes referred to as slowly adapting pulmonary stretch receptors because theiractivity is maintained with sustained stretches. The afferent pathway consists oflarge myelinated fibers in the vagus; as mentioned previously, these fibers appear toenter the brainstem and project to the DRGs, the apneustic center, and the pontine
196 / CHAPTER 9
respiratory groups. The efferent limb of the reflex consists of bronchodilation inaddition to the apnea or slowing of the ventilatory frequency (due to an increase inthe time spent in expiration) already mentioned. Lung inflation also causes reflexeffects in the cardiovascular system: Moderate lung inflations cause an increase inheart rate and may cause a slight vasoconstriction; very large inflations may cause adecrease in heart rate and systemic vascular resistance.
The Hering-Breuer inflation reflex was originally believed to be an importantdeterminant of the rate and depth of ventilation. Vagotomized anesthetized ani-mals breathe much more deeply and less frequently than they did before theirvagus nerves were transected. It was therefore assumed that the Hering-Breuerinflation reflex acts tonically to limit the tidal volume and establish the depth andrate of breathing. More recent studies on unanesthetized humans have cast doubton this conclusion because the central threshold of the reflex is much higher thanthe normal tidal volume during eupneic breathing. Tidal volumes of 800 to1500 mL are generally required to elicit this reflex in conscious eupneic adults. TheHering-Breuer inflation reflex may help minimize the work of breathing byinhibiting large tidal volumes (see Chapter 2) as well as to prevent overdistentionof the alveoli at large volumes. It may also be important in the control of breath-ing in babies. Infants have Hering-Breuer inflation reflex thresholds within theirnormal tidal volume ranges, and the reflex may be an important influence on theirtidal volumes and respiratory rates.
THE HERING-BREUER DEFLATION REFLEX
Breuer and Hering also noted that abrupt deflation of the lungs increases the ven-tilatory rate. This could be a result of decreased stretch receptor activity or of stim-ulation of other pulmonary receptors, or rapidly adapting receptors such as theirritant receptors and J receptors, which will be discussed later in this chapter. Theafferent pathway is the vagus, and the effect is hyperpnea. This reflex may beresponsible for the increased ventilation elicited when the lungs are deflated abnor-mally, as in pneumothorax, or it may play a role in the periodic spontaneous deepbreaths (“sighs”) that help prevent atelectasis. These sighs occur occasionally andirregularly during the course of normal, quiet, spontaneous breathing. They consistof a slow deep inspiration (larger than a normal tidal volume) followed by a slowdeep expiration. This response appears to be very important because patients main-tained on mechanical ventilators must be given large tidal volumes or periodic deepbreaths or they develop diffuse atelectasis, which may lead to arterial hypoxemia.
The Hering-Breuer deflation reflex may be very important in helping to activelymaintain infants’ functional residual capacities (FRCs). It is very unlikely thatinfants’ FRCs are determined passively like those of adults because the inwardrecoil of their lungs is considerably greater than the outward recoil of their verycompliant chest walls.
THE PARADOXICAL REFLEX OF HEAD
In 1889, Henry Head performed experiments designed to show the effects of theHering-Breuer inflation reflex on the control of breathing. Instead of transecting
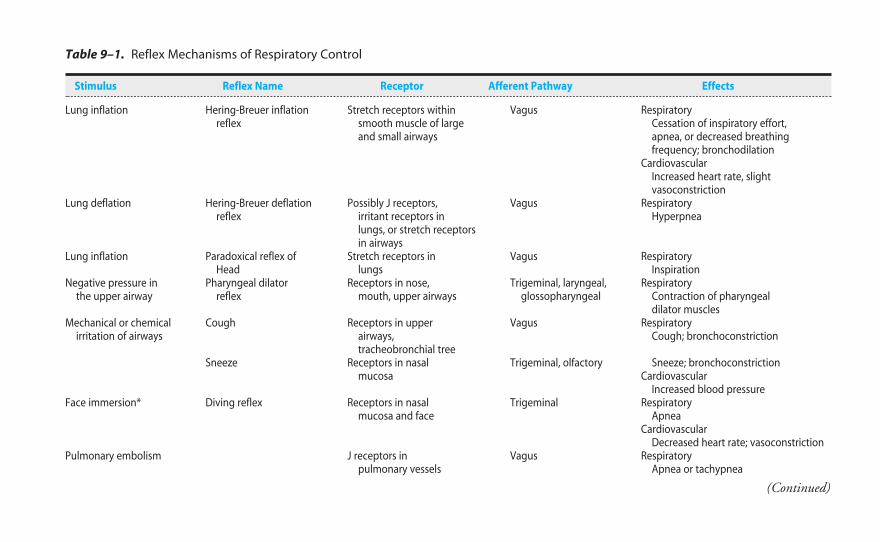
Table 9–1. Reflex Mechanisms of Respiratory Control
Stimulus Reflex Name Receptor Afferent Pathway Effects
Lung inflation Hering-Breuer inflation Stretch receptors within Vagus Respiratoryreflex smooth muscle of large Cessation of inspiratory effort,
and small airways apnea, or decreased breathingfrequency; bronchodilation
CardiovascularIncreased heart rate, slightvasoconstriction
Lung deflation Hering-Breuer deflation Possibly J receptors, Vagus Respiratoryreflex irritant receptors in Hyperpnea
lungs, or stretch receptorsin airways
Lung inflation Paradoxical reflex of Stretch receptors in Vagus RespiratoryHead lungs Inspiration
Negative pressure in Pharyngeal dilator Receptors in nose, Trigeminal, laryngeal, Respiratorythe upper airway reflex mouth, upper airways glossopharyngeal Contraction of pharyngeal
dilator musclesMechanical or chemical Cough Receptors in upper Vagus Respiratory
irritation of airways airways, Cough; bronchoconstrictiontracheobronchial tree
Sneeze Receptors in nasal Trigeminal, olfactory Sneeze; bronchoconstrictionmucosa Cardiovascular
Increased blood pressureFace immersion* Diving reflex Receptors in nasal Trigeminal Respiratory
mucosa and face ApneaCardiovascular
Decreased heart rate; vasoconstrictionPulmonary embolism J receptors in Vagus Respiratory
pulmonary vessels Apnea or tachypnea
(Continued)
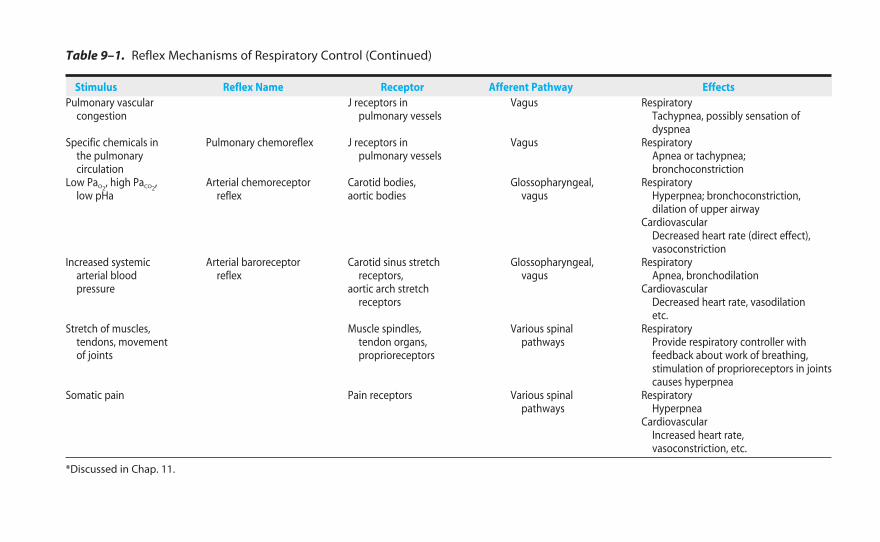
Pulmonary vascular J receptors in Vagus Respiratorycongestion pulmonary vessels Tachypnea, possibly sensation of
dyspneaSpecific chemicals in Pulmonary chemoreflex J receptors in Vagus Respiratory
the pulmonary pulmonary vessels Apnea or tachypnea;circulation bronchoconstriction
Low PaO2, high PaCO2
, Arterial chemoreceptor Carotid bodies, Glossopharyngeal, Respiratorylow pHa reflex aortic bodies vagus Hyperpnea; bronchoconstriction,
dilation of upper airwayCardiovascular
Decreased heart rate (direct effect),vasoconstriction
Increased systemic Arterial baroreceptor Carotid sinus stretch Glossopharyngeal, Respiratoryarterial blood reflex receptors, vagus Apnea, bronchodilationpressure aortic arch stretch Cardiovascular
receptors Decreased heart rate, vasodilationetc.
Stretch of muscles, Muscle spindles, Various spinal Respiratorytendons, movement tendon organs, pathways Provide respiratory controller withof joints proprioreceptors feedback about work of breathing,
stimulation of proprioreceptors in jointscauses hyperpnea
Somatic pain Pain receptors Various spinal Respiratorypathways Hyperpnea
CardiovascularIncreased heart rate,vasoconstriction, etc.
*Discussed in Chap. 11.
Table 9–1. Reflex Mechanisms of Respiratory Control (Continued)
Stimulus Reflex Name Receptor Afferent Pathway Effects
THE CONTROL OF BREATHING / 199
the vagus nerves, he decided to block their function by cooling them to 0°C. As herewarmed the vagus nerves, he noted that in the situation of a selective partialblock of the vagus nerves, lung inflation caused a further inspiration instead of theapnea expected when the vagus nerves were completely functional. The receptorsfor this paradoxical reflex are located in the lungs, but their precise location is notknown. Afferent information travels in the vagus; the effect is very deep inspira-tions. This reflex may also be involved in the sigh response, or it may be involvedin generating the first breath of the newborn baby; very great inspiratory effortsmust be generated to inflate the fluid-filled lungs.
Respiratory Reflexes Arising from Receptors in the Airways & the Lungs
THE PHARYNGEAL DILATOR REFLEX
As discussed in Chapter 2, negative pressure in the upper airway causes reflex con-traction of the pharyngeal dilator muscles. The receptors appear to be located inthe nose, mouth, and upper airways; the afferent pathways appear to be in thetrigeminal, laryngeal, and glossopharyngeal nerves.
IRRITANT RECEPTORS
Mechanical or chemical irritation of the airways (and possibly the alveoli) can elicita reflex cough or sneeze, or it can cause hyperpnea, bronchoconstriction, andincreased blood pressure. The receptors are located in the nasal mucosa, upper air-ways, tracheobronchial tree, and possibly the alveoli themselves. Those in the largerairways of the tracheobronchial tree, which also respond to stretch, are sometimesreferred to as rapidly adapting pulmonary stretch receptors because their activitydecreases rapidly during a sustained stimulus. The afferent pathways are the vagusnerves for all but the receptors located in the nasal mucosa, which send informa-tion centrally via the trigeminal and olfactory tracts. The cough and the sneezereflexes are discussed in greater detail in Chapter 10.
Respiratory Reflexes Arising from Pulmonary Vascular Receptors (J Receptors)
Pulmonary embolism causes apnea or rapid shallow breathing (tachypnea); pul-monary vascular congestion causes tachypnea. Injection of chemicals such asphenyldiguanide and capsaicin into the pulmonary circulation may also elicit apneaor rapid shallow breathing. The receptors responsible for initiating these responsesare believed to be located in the walls of the pulmonary capillaries or in the inter-stitium; therefore, they are called J (for juxtapulmonary-capillary) receptors.Stimulation of these receptors by pulmonary vascular congestion or an increase inpulmonary interstitial fluid volume leads to tachypnea; decreased stimulation of thereceptors caused by pulmonary emboli obstructing vessels proximal to the capillar-ies leads to decreased ventilation. In addition, these receptors might be responsiblefor the dyspnea (a feeling of difficult or labored breathing) encountered during thepulmonary vascular congestion and edema secondary to left ventricular failure or
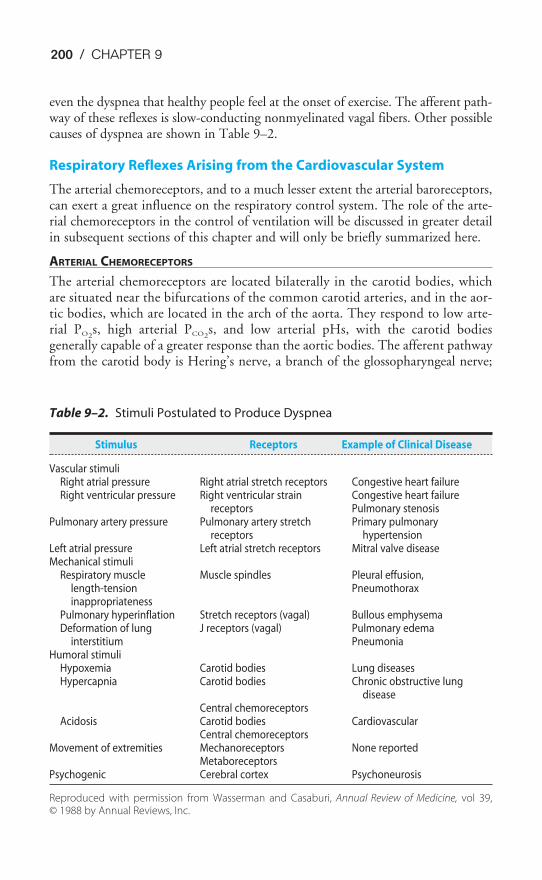
200 / CHAPTER 9
even the dyspnea that healthy people feel at the onset of exercise. The afferent path-way of these reflexes is slow-conducting nonmyelinated vagal fibers. Other possiblecauses of dyspnea are shown in Table 9–2.
Respiratory Reflexes Arising from the Cardiovascular System
The arterial chemoreceptors, and to a much lesser extent the arterial baroreceptors,can exert a great influence on the respiratory control system. The role of the arte-rial chemoreceptors in the control of ventilation will be discussed in greater detailin subsequent sections of this chapter and will only be briefly summarized here.
ARTERIAL CHEMORECEPTORS
The arterial chemoreceptors are located bilaterally in the carotid bodies, whichare situated near the bifurcations of the common carotid arteries, and in the aor-tic bodies, which are located in the arch of the aorta. They respond to low arte-rial PO2
s, high arterial PCO2s, and low arterial pHs, with the carotid bodies
generally capable of a greater response than the aortic bodies. The afferent pathwayfrom the carotid body is Hering’s nerve, a branch of the glossopharyngeal nerve;
Table 9–2. Stimuli Postulated to Produce Dyspnea
Stimulus Receptors Example of Clinical Disease
Vascular stimuliRight atrial pressure Right atrial stretch receptors Congestive heart failureRight ventricular pressure Right ventricular strain Congestive heart failure
receptors Pulmonary stenosisPulmonary artery pressure Pulmonary artery stretch Primary pulmonary
receptors hypertensionLeft atrial pressure Left atrial stretch receptors Mitral valve diseaseMechanical stimuli
Respiratory muscle Muscle spindles Pleural effusion,length-tension Pneumothoraxinappropriateness
Pulmonary hyperinflation Stretch receptors (vagal) Bullous emphysemaDeformation of lung J receptors (vagal) Pulmonary edema
interstitium PneumoniaHumoral stimuli
Hypoxemia Carotid bodies Lung diseasesHypercapnia Carotid bodies Chronic obstructive lung
diseaseCentral chemoreceptors
Acidosis Carotid bodies CardiovascularCentral chemoreceptors
Movement of extremities Mechanoreceptors None reportedMetaboreceptors
Psychogenic Cerebral cortex Psychoneurosis
Reproduced with permission from Wasserman and Casaburi, Annual Review of Medicine, vol 39, © 1988 by Annual Reviews, Inc.
THE CONTROL OF BREATHING / 201
the afferent pathway from the aortic body is the vagus. The reflex effects of stim-ulation of the arterial chemoreceptors are hyperpnea, bronchoconstriction, dilationof the upper airway, and increased blood pressure. The direct effect of arterialchemoreceptor stimulation is a decrease in heart rate; however, this is usuallymasked by an increase in heart rate secondary to the increase in lung inflation.
ARTERIAL BARORECEPTORS
The arterial baroreceptors exert a minor influence on the control of ventilation.Baroreceptors are stretch receptors that are responsive to changes in pressure. Theyare located in the carotid sinuses, which are situated at the origin of the internalcarotid arteries near the bifurcation of the common carotid arteries, and in the aor-tic arch. The afferent pathways are Hering’s nerve and the glossopharyngeal nervefor the carotid baroreceptors and the vagus nerve for the aortic baroreceptors. Theeffects of stimulation of the arterial baroreceptors by elevated blood pressure are abrief apnea and bronchodilation.
Respiratory Reflexes Arising from Muscles & Tendons
Stimulation of receptors located in the muscles, the tendons, and the joints canincrease ventilation. Included are receptors in the muscles of respiration (e.g., musclespindles) and rib cage as well as other skeletal muscles, joints, and tendons. Thesereceptors may play an important role in adjusting the ventilatory effort to elevatedworkloads and may help minimize the work of breathing. They may also partici-pate in initiating and maintaining the elevated ventilation that occurs duringexercise, as will be discussed later in this chapter. Afferent information ascends tothe respiratory controller via the spinal cord, as mentioned previously in thischapter.
Reflex Respiratory Responses to Pain
Somatic pain generally causes hyperpnea; visceral pain generally causes apnea ordecreased ventilation.
INFLUENCES OF HIGHER CENTERS
The spontaneous rhythmicity generated in the medullary respiratory center can becompletely overwhelmed (at least temporarily) by influences from higher braincenters. In fact, the greatest minute ventilations obtainable from healthy conscioushuman subjects can be attained voluntarily, exceeding those obtained with thestimuli of severe exercise, hypercapnia, or hypoxia. This is the underlying conceptof the maximum voluntary ventilation (MVV) test often used to assess the respira-tory system. Conversely, the respiratory rhythm can be completely suppressed forseveral minutes by voluntary breath holding, until the chemical drive to respiration(high PCO2
and low PO2and pH) overwhelms the voluntary suppression of breath-
ing at the “breakpoint.”During speech, singing, or playing a wind instrument, the normal cycle of
inspiration and expiration is automatically modified by higher brain centers.
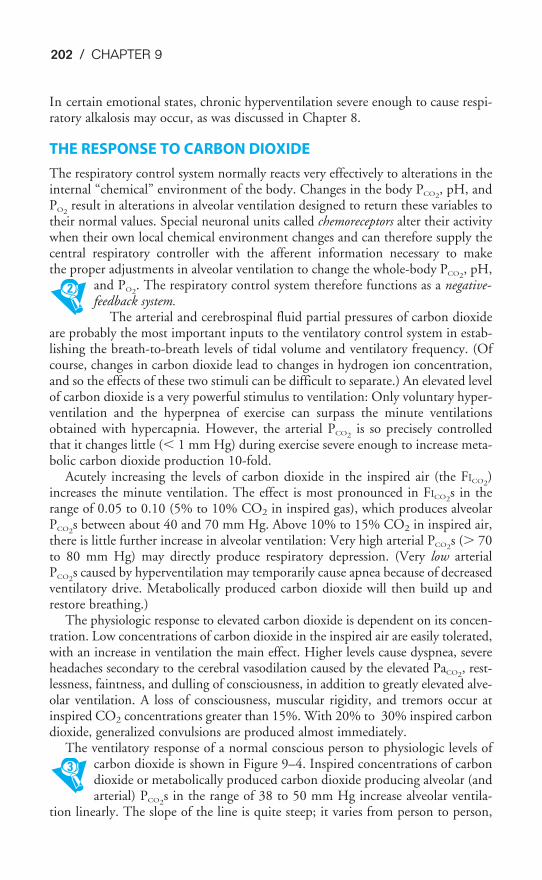
202 / CHAPTER 9
In certain emotional states, chronic hyperventilation severe enough to cause respi-ratory alkalosis may occur, as was discussed in Chapter 8.
THE RESPONSE TO CARBON DIOXIDE
The respiratory control system normally reacts very effectively to alterations in theinternal “chemical” environment of the body. Changes in the body PCO2
, pH, andPO2
result in alterations in alveolar ventilation designed to return these variables totheir normal values. Special neuronal units called chemoreceptors alter their activitywhen their own local chemical environment changes and can therefore supply thecentral respiratory controller with the afferent information necessary to makethe proper adjustments in alveolar ventilation to change the whole-body PCO2
, pH,and PO2
. The respiratory control system therefore functions as a negative-feedback system.
The arterial and cerebrospinal fluid partial pressures of carbon dioxideare probably the most important inputs to the ventilatory control system in estab-lishing the breath-to-breath levels of tidal volume and ventilatory frequency. (Ofcourse, changes in carbon dioxide lead to changes in hydrogen ion concentration,and so the effects of these two stimuli can be difficult to separate.) An elevated levelof carbon dioxide is a very powerful stimulus to ventilation: Only voluntary hyper-ventilation and the hyperpnea of exercise can surpass the minute ventilationsobtained with hypercapnia. However, the arterial PCO2
is so precisely controlledthat it changes little (� 1 mm Hg) during exercise severe enough to increase meta-bolic carbon dioxide production 10-fold.
Acutely increasing the levels of carbon dioxide in the inspired air (the FICO2)
increases the minute ventilation. The effect is most pronounced in FICO2s in the
range of 0.05 to 0.10 (5% to 10% CO2 in inspired gas), which produces alveolarPCO2
s between about 40 and 70 mm Hg. Above 10% to 15% CO2 in inspired air,there is little further increase in alveolar ventilation: Very high arterial PCO2
s (� 70to 80 mm Hg) may directly produce respiratory depression. (Very low arterialPCO2
s caused by hyperventilation may temporarily cause apnea because of decreasedventilatory drive. Metabolically produced carbon dioxide will then build up andrestore breathing.)
The physiologic response to elevated carbon dioxide is dependent on its concen-tration. Low concentrations of carbon dioxide in the inspired air are easily tolerated,with an increase in ventilation the main effect. Higher levels cause dyspnea, severeheadaches secondary to the cerebral vasodilation caused by the elevated PaCO2
, rest-lessness, faintness, and dulling of consciousness, in addition to greatly elevated alve-olar ventilation. A loss of consciousness, muscular rigidity, and tremors occur atinspired CO2 concentrations greater than 15%. With 20% to 30% inspired carbondioxide, generalized convulsions are produced almost immediately.
The ventilatory response of a normal conscious person to physiologic levels ofcarbon dioxide is shown in Figure 9–4. Inspired concentrations of carbondioxide or metabolically produced carbon dioxide producing alveolar (andarterial) PCO2
s in the range of 38 to 50 mm Hg increase alveolar ventila-tion linearly. The slope of the line is quite steep; it varies from person to person,
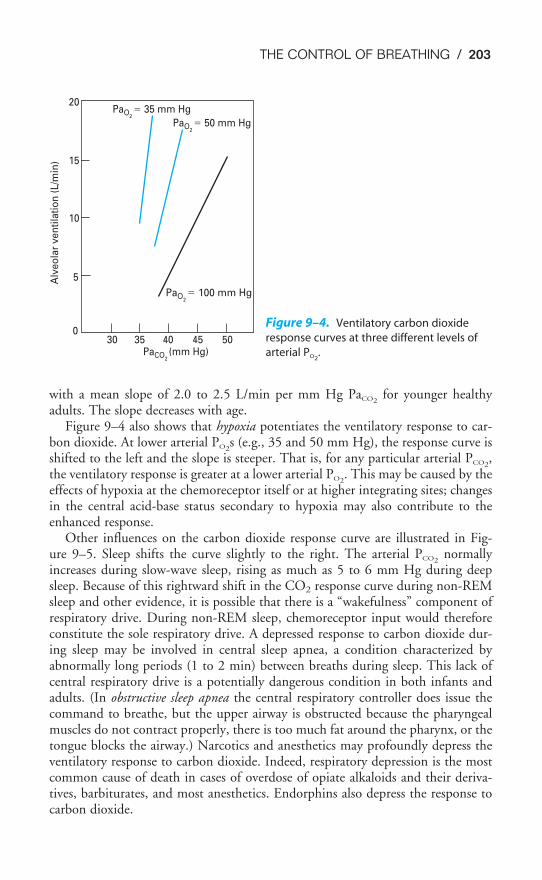
THE CONTROL OF BREATHING / 203
with a mean slope of 2.0 to 2.5 L/min per mm Hg PaCO2for younger healthy
adults. The slope decreases with age.Figure 9–4 also shows that hypoxia potentiates the ventilatory response to car-
bon dioxide. At lower arterial PO2s (e.g., 35 and 50 mm Hg), the response curve is
shifted to the left and the slope is steeper. That is, for any particular arterial PCO2,
the ventilatory response is greater at a lower arterial PO2. This may be caused by the
effects of hypoxia at the chemoreceptor itself or at higher integrating sites; changesin the central acid-base status secondary to hypoxia may also contribute to theenhanced response.
Other influences on the carbon dioxide response curve are illustrated in Fig-ure 9–5. Sleep shifts the curve slightly to the right. The arterial PCO2
normallyincreases during slow-wave sleep, rising as much as 5 to 6 mm Hg during deepsleep. Because of this rightward shift in the CO2 response curve during non-REMsleep and other evidence, it is possible that there is a “wakefulness” component ofrespiratory drive. During non-REM sleep, chemoreceptor input would thereforeconstitute the sole respiratory drive. A depressed response to carbon dioxide dur-ing sleep may be involved in central sleep apnea, a condition characterized byabnormally long periods (1 to 2 min) between breaths during sleep. This lack ofcentral respiratory drive is a potentially dangerous condition in both infants andadults. (In obstructive sleep apnea the central respiratory controller does issue thecommand to breathe, but the upper airway is obstructed because the pharyngealmuscles do not contract properly, there is too much fat around the pharynx, or thetongue blocks the airway.) Narcotics and anesthetics may profoundly depress theventilatory response to carbon dioxide. Indeed, respiratory depression is the mostcommon cause of death in cases of overdose of opiate alkaloids and their deriva-tives, barbiturates, and most anesthetics. Endorphins also depress the response tocarbon dioxide.
PaCO2(mm Hg)
PaO2� 100 mm Hg
PaO2� 50 mm Hg
PaO2� 35 mm Hg
300
5
10
15
20
35 40 45 50
Alv
eo
lar
ve
nti
lati
on
(L
/min
)
Figure 9–4. Ventilatory carbon dioxide
response curves at three different levels of
arterial PO2.
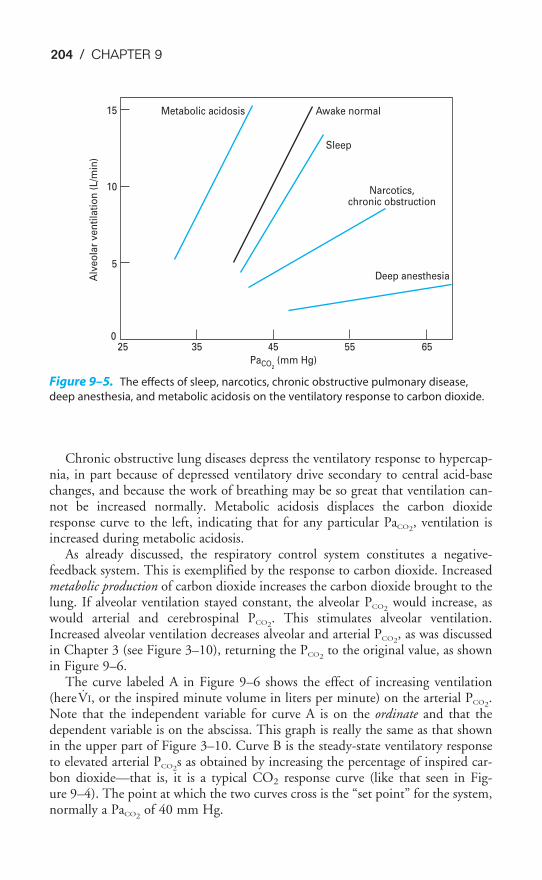
204 / CHAPTER 9
Chronic obstructive lung diseases depress the ventilatory response to hypercap-nia, in part because of depressed ventilatory drive secondary to central acid-basechanges, and because the work of breathing may be so great that ventilation can-not be increased normally. Metabolic acidosis displaces the carbon dioxideresponse curve to the left, indicating that for any particular PaCO2
, ventilation isincreased during metabolic acidosis.
As already discussed, the respiratory control system constitutes a negative-feedback system. This is exemplified by the response to carbon dioxide. Increasedmetabolic production of carbon dioxide increases the carbon dioxide brought to thelung. If alveolar ventilation stayed constant, the alveolar PCO2
would increase, aswould arterial and cerebrospinal PCO2
. This stimulates alveolar ventilation.Increased alveolar ventilation decreases alveolar and arterial PCO2
, as was discussedin Chapter 3 (see Figure 3–10), returning the PCO2
to the original value, as shownin Figure 9–6.
The curve labeled A in Figure 9–6 shows the effect of increasing ventilation(hereV̇I, or the inspired minute volume in liters per minute) on the arterial PCO2
.Note that the independent variable for curve A is on the ordinate and that thedependent variable is on the abscissa. This graph is really the same as that shownin the upper part of Figure 3–10. Curve B is the steady-state ventilatory responseto elevated arterial PCO2
s as obtained by increasing the percentage of inspired car-bon dioxide—that is, it is a typical CO2 response curve (like that seen in Fig-ure 9–4). The point at which the two curves cross is the “set point” for the system,normally a PaCO2
of 40 mm Hg.
15
10
5
025 35 45 55 65
Deep anesthesia
Narcotics,chronic obstruction
Sleep
Awake normalMetabolic acidosis
PaCO2 (mm Hg)
Alv
eo
lar
ve
nti
lati
on
(L
/min
)
Figure 9–5. The effects of sleep, narcotics, chronic obstructive pulmonary disease,
deep anesthesia, and metabolic acidosis on the ventilatory response to carbon dioxide.
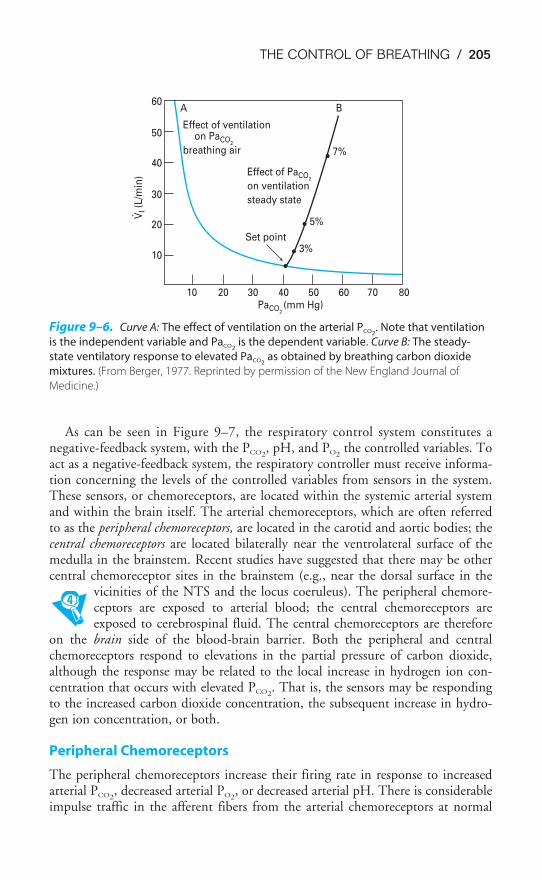
THE CONTROL OF BREATHING / 205
As can be seen in Figure 9–7, the respiratory control system constitutes anegative-feedback system, with the PCO2
, pH, and PO2the controlled variables. To
act as a negative-feedback system, the respiratory controller must receive informa-tion concerning the levels of the controlled variables from sensors in the system.These sensors, or chemoreceptors, are located within the systemic arterial systemand within the brain itself. The arterial chemoreceptors, which are often referredto as the peripheral chemoreceptors, are located in the carotid and aortic bodies; thecentral chemoreceptors are located bilaterally near the ventrolateral surface of themedulla in the brainstem. Recent studies have suggested that there may be othercentral chemoreceptor sites in the brainstem (e.g., near the dorsal surface in the
vicinities of the NTS and the locus coeruleus). The peripheral chemore-ceptors are exposed to arterial blood; the central chemoreceptors areexposed to cerebrospinal fluid. The central chemoreceptors are therefore
on the brain side of the blood-brain barrier. Both the peripheral and centralchemoreceptors respond to elevations in the partial pressure of carbon dioxide,although the response may be related to the local increase in hydrogen ion con-centration that occurs with elevated PCO2
. That is, the sensors may be respondingto the increased carbon dioxide concentration, the subsequent increase in hydro-gen ion concentration, or both.
Peripheral Chemoreceptors
The peripheral chemoreceptors increase their firing rate in response to increasedarterial PCO2
, decreased arterial PO2, or decreased arterial pH. There is considerable
impulse traffic in the afferent fibers from the arterial chemoreceptors at normal
10
10
20
30
40
50
60A
Effect of ventilation on PaCO
2
breathing air
B
20 30 40 50 60 70 80PaCO
2(mm Hg)
Effect of PaCO2
on ventilation
steady state
Set point
7%
5%
3%
VI (
L/m
in)
Figure 9–6. Curve A: The effect of ventilation on the arterial PCO2. Note that ventilation
is the independent variable and PaCO2is the dependent variable. Curve B: The steady-
state ventilatory response to elevated PaCO2as obtained by breathing carbon dioxide
mixtures. (From Berger, 1977. Reprinted by permission of the New England Journal of
Medicine.)
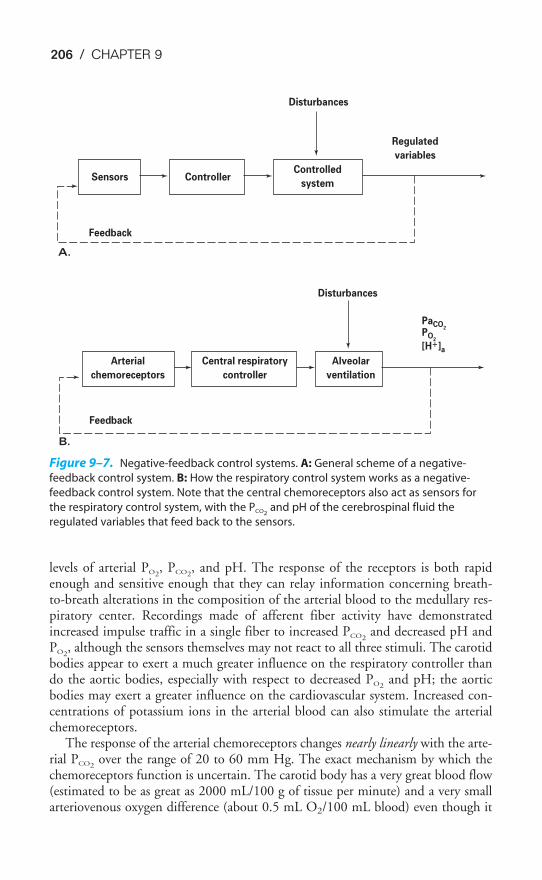
206 / CHAPTER 9
levels of arterial PO2, PCO2
, and pH. The response of the receptors is both rapidenough and sensitive enough that they can relay information concerning breath-to-breath alterations in the composition of the arterial blood to the medullary res-piratory center. Recordings made of afferent fiber activity have demonstratedincreased impulse traffic in a single fiber to increased PCO2
and decreased pH andPO2
, although the sensors themselves may not react to all three stimuli. The carotidbodies appear to exert a much greater influence on the respiratory controller thando the aortic bodies, especially with respect to decreased PO2
and pH; the aorticbodies may exert a greater influence on the cardiovascular system. Increased con-centrations of potassium ions in the arterial blood can also stimulate the arterialchemoreceptors.
The response of the arterial chemoreceptors changes nearly linearly with the arte-rial PCO2
over the range of 20 to 60 mm Hg. The exact mechanism by which thechemoreceptors function is uncertain. The carotid body has a very great blood flow(estimated to be as great as 2000 mL/100 g of tissue per minute) and a very smallarteriovenous oxygen difference (about 0.5 mL O2/100 mL blood) even though it
PaCO2
PO2
[H�]a
Disturbances
Regulated
variables
ControllerSensors
Feedback
A.
Feedback
B.
Controlled
system
Arterial
chemoreceptors
Central respiratory
controller
Alveolar
ventilation
Disturbances
Figure 9–7. Negative-feedback control systems. A: General scheme of a negative-
feedback control system. B: How the respiratory control system works as a negative-
feedback control system. Note that the central chemoreceptors also act as sensors for
the respiratory control system, with the PCO2and pH of the cerebrospinal fluid the
regulated variables that feed back to the sensors.
THE CONTROL OF BREATHING / 207
has one of the highest metabolic rates in the body. Certain drugs and enzyme poi-sons that block the cytochrome chain or the formation of adenosine triphosphate(ATP) stimulate the carotid body. For example, both cyanide and dinitrophenolstimulate the carotid body; this may be related to the stimulatory effect of hypoxiaon the arterial chemoreceptors. Some studies have shown two different types ofcytochrome a3, with different oxygen affinities, to be present in the carotid body.Ganglionic stimulators such as nicotine also stimulate the carotid body. The mech-anism for transducing low arterial PO2
, like that of hypoxic pulmonary vasocon-striction, may involve inhibiting the permeability of the chemosensitive cells topotassium ions. This would decrease the outward flux of potassium ions and lead todepolarization of the chemoreceptors. Heme oxygenase in the cytochromes of mito-chondria in the glomus cells of the chemoreceptors may also be involved in thetransduction process.
Central Chemoreceptors
The central chemoreceptors are exposed to the cerebrospinal fluid and are not indirect contact with the arterial blood. As shown in Figure 9–8, the cerebrospinalfluid is separated from the arterial blood by the blood-brain barrier. Carbon diox-ide can easily diffuse through the blood-brain barrier, but hydrogen ions and bicar-bonate ions do not. Because of this, alterations in the arterial PCO2
are rapidlytransmitted to the cerebrospinal fluid, with a time constant of about 60 seconds.Changes in arterial pH that are not caused by changes in PCO2
take much longer toinfluence the cerebrospinal fluid; in fact, the cerebrospinal fluid may have changesin hydrogen ion concentration opposite to those seen in the blood in certain cir-cumstances, as will be discussed later in this chapter.
The composition of the cerebrospinal fluid is considerably different from thatof the blood. It is formed mainly in the choroid plexus of the lateral ventricles.Enzymes, including carbonic anhydrase, play a large role in cerebrospinal fluidformation: The cerebrospinal fluid is not merely an ultrafiltrate of the plasma. ThepH of the cerebrospinal fluid is normally about 7.32, compared with the pH of7.40 of arterial blood. The PCO2
of the cerebrospinal fluid is about 50 mm Hg—about 10 mm Hg higher than the normal arterial PCO2
of 40 mm Hg. The con-centration of proteins in the cerebrospinal fluid is only in the range of 15 to 45mg/100 mL, whereas the concentration of proteins in the plasma normally rangesfrom 6.6 to 8.6 g/100 mL. This does not even include the hemoglobin in the ery-throcytes. Bicarbonate is therefore the only buffer of consequence in the cere-brospinal fluid, and the buffer line of the cerebrospinal fluid is lower than and notas steep as that of the blood. Arterial hypercapnia will therefore lead to greaterchanges in cerebrospinal fluid hydrogen ion concentration than it does in the arte-rial blood. The brain produces carbon dioxide as an end product of metabolism.Brain carbon dioxide levels are higher than those of the arterial blood, whichexplains the high PCO2
of the cerebrospinal fluid.The central chemoreceptors respond to local increases in hydrogen ion concen-
tration or PCO2, or both. They do not respond to hypoxia.

208 / CHAPTER 9
The relative contributions of the peripheral and central chemoreceptors in theventilatory response to elevated carbon dioxide levels are dependent on the timeframe considered. Animals experimentally deprived of the afferent fibers from thearterial chemoreceptors and patients with surgically removed carotid bodies showabout 80% to 90% of the normal total steady-state response to elevated inspired car-bon dioxide concentrations delivered in hyperoxic gas mixtures, indicating that theperipheral chemoreceptors contribute only 10% to 20% of the steady-state response.
BRAIN TISSUE
Blo
od
-bra
in b
arr
ier
Blo
od
-bra
in b
arr
ier
Metabolic
CO2
production
Venous blood
CO2 CO2 CO2
CO2CO2CO2CO2
CO2
Slow (h)
Sm
oo
th m
usc
le
Sm
oo
th m
usc
leCSFBRAIN TISSUE
H �H
�
Central
Chemoreceptor
HCO 3�HCO 3
�
Dilates
Dilates
CSF:
pH � 7.32
PCO2
� 50 mm Hg
Little protein
Arterial
blood:
pH � 7.40
PCO2
� 40 mm Hg
Protein Buffers
Figure 9–8. Representation of the central chemoreceptor showing its relationship to
carbon dioxide (CO2), hydrogen (H�), and bicarbonate (HCO3�) ions in the arterial blood
and cerebrospinal fluid (CSF). CO2 crosses the blood-brain barrier easily; H�s and HCO3�s
do not.
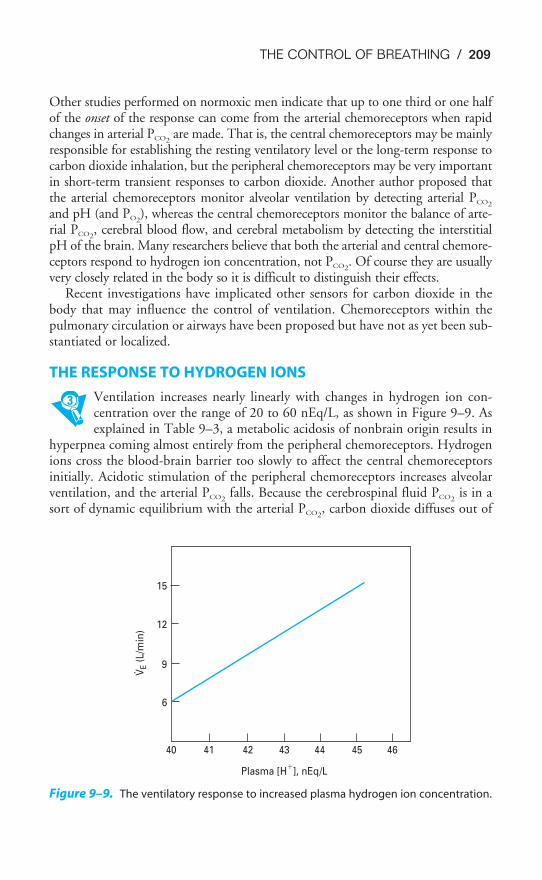
THE CONTROL OF BREATHING / 209
Other studies performed on normoxic men indicate that up to one third or one halfof the onset of the response can come from the arterial chemoreceptors when rapidchanges in arterial PCO2
are made. That is, the central chemoreceptors may be mainlyresponsible for establishing the resting ventilatory level or the long-term response tocarbon dioxide inhalation, but the peripheral chemoreceptors may be very importantin short-term transient responses to carbon dioxide. Another author proposed thatthe arterial chemoreceptors monitor alveolar ventilation by detecting arterial PCO2
and pH (and PO2), whereas the central chemoreceptors monitor the balance of arte-
rial PCO2, cerebral blood flow, and cerebral metabolism by detecting the interstitial
pH of the brain. Many researchers believe that both the arterial and central chemore-ceptors respond to hydrogen ion concentration, not PCO2
. Of course they are usuallyvery closely related in the body so it is difficult to distinguish their effects.
Recent investigations have implicated other sensors for carbon dioxide in thebody that may influence the control of ventilation. Chemoreceptors within thepulmonary circulation or airways have been proposed but have not as yet been sub-stantiated or localized.
THE RESPONSE TO HYDROGEN IONS
Ventilation increases nearly linearly with changes in hydrogen ion con-centration over the range of 20 to 60 nEq/L, as shown in Figure 9–9. Asexplained in Table 9–3, a metabolic acidosis of nonbrain origin results in
hyperpnea coming almost entirely from the peripheral chemoreceptors. Hydrogenions cross the blood-brain barrier too slowly to affect the central chemoreceptorsinitially. Acidotic stimulation of the peripheral chemoreceptors increases alveolarventilation, and the arterial PCO2
falls. Because the cerebrospinal fluid PCO2is in a
sort of dynamic equilibrium with the arterial PCO2, carbon dioxide diffuses out of
15
12
9
6
40 41 42 43 44 45 46
Plasma [H�
], nEq/L
VE (
L/m
in)
Figure 9–9. The ventilatory response to increased plasma hydrogen ion concentration.
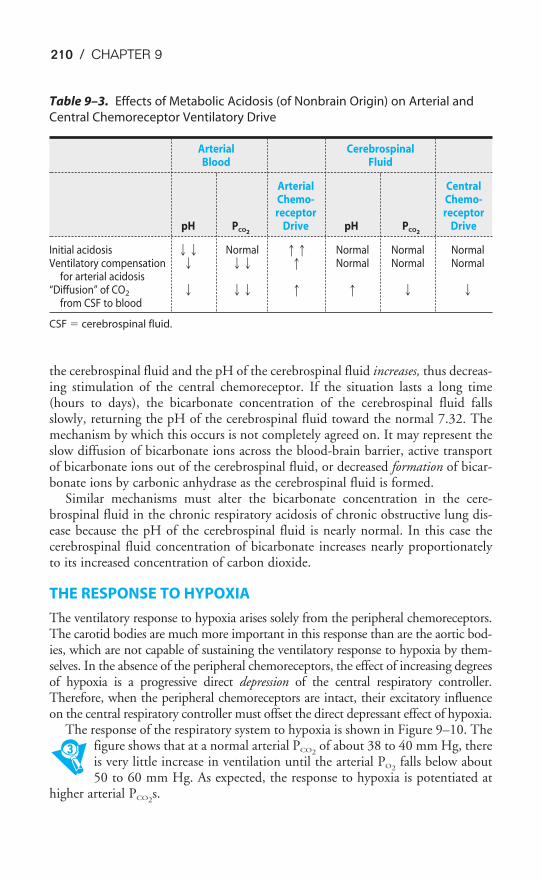
210 / CHAPTER 9
the cerebrospinal fluid and the pH of the cerebrospinal fluid increases, thus decreas-ing stimulation of the central chemoreceptor. If the situation lasts a long time(hours to days), the bicarbonate concentration of the cerebrospinal fluid fallsslowly, returning the pH of the cerebrospinal fluid toward the normal 7.32. Themechanism by which this occurs is not completely agreed on. It may represent theslow diffusion of bicarbonate ions across the blood-brain barrier, active transportof bicarbonate ions out of the cerebrospinal fluid, or decreased formation of bicar-bonate ions by carbonic anhydrase as the cerebrospinal fluid is formed.
Similar mechanisms must alter the bicarbonate concentration in the cere-brospinal fluid in the chronic respiratory acidosis of chronic obstructive lung dis-ease because the pH of the cerebrospinal fluid is nearly normal. In this case thecerebrospinal fluid concentration of bicarbonate increases nearly proportionatelyto its increased concentration of carbon dioxide.
THE RESPONSE TO HYPOXIA
The ventilatory response to hypoxia arises solely from the peripheral chemoreceptors.The carotid bodies are much more important in this response than are the aortic bod-ies, which are not capable of sustaining the ventilatory response to hypoxia by them-selves. In the absence of the peripheral chemoreceptors, the effect of increasing degreesof hypoxia is a progressive direct depression of the central respiratory controller.Therefore, when the peripheral chemoreceptors are intact, their excitatory influenceon the central respiratory controller must offset the direct depressant effect of hypoxia.
The response of the respiratory system to hypoxia is shown in Figure 9–10. Thefigure shows that at a normal arterial PCO2
of about 38 to 40 mm Hg, thereis very little increase in ventilation until the arterial PO2
falls below about50 to 60 mm Hg. As expected, the response to hypoxia is potentiated at
higher arterial PCO2s.
Table 9–3. Effects of Metabolic Acidosis (of Nonbrain Origin) on Arterial and
Central Chemoreceptor Ventilatory Drive
Arterial CerebrospinalBlood Fluid
Arterial CentralChemo- Chemo-receptor receptor
pH PCO2Drive pH PCO2
Drive
Initial acidosis �� Normal �� Normal Normal NormalVentilatory compensation � �� � Normal Normal Normal
for arterial acidosis“Diffusion” of CO2 � �� � � � �
from CSF to blood
CSF � cerebrospinal fluid.
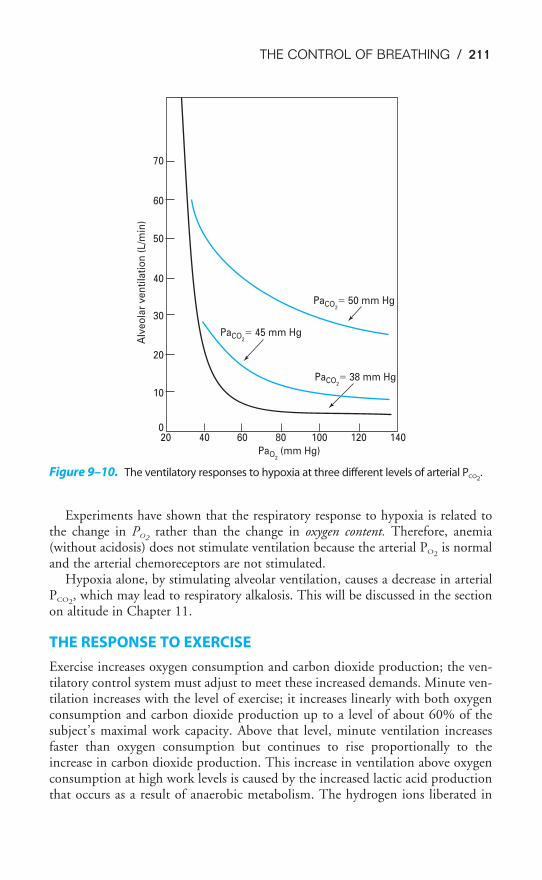
THE CONTROL OF BREATHING / 211
Experiments have shown that the respiratory response to hypoxia is related tothe change in PO2
rather than the change in oxygen content. Therefore, anemia(without acidosis) does not stimulate ventilation because the arterial PO2
is normaland the arterial chemoreceptors are not stimulated.
Hypoxia alone, by stimulating alveolar ventilation, causes a decrease in arterialPCO2
, which may lead to respiratory alkalosis. This will be discussed in the sectionon altitude in Chapter 11.
THE RESPONSE TO EXERCISE
Exercise increases oxygen consumption and carbon dioxide production; the ven-tilatory control system must adjust to meet these increased demands. Minute ven-tilation increases with the level of exercise; it increases linearly with both oxygenconsumption and carbon dioxide production up to a level of about 60% of thesubject’s maximal work capacity. Above that level, minute ventilation increasesfaster than oxygen consumption but continues to rise proportionally to theincrease in carbon dioxide production. This increase in ventilation above oxygenconsumption at high work levels is caused by the increased lactic acid productionthat occurs as a result of anaerobic metabolism. The hydrogen ions liberated in
020 40 60 80 100 120 140
PaO2 (mm Hg)
PaCO2� 50 mm Hg
PaCO2� 38 mm Hg
PaCO2� 45 mm Hg
10
20
30
40
50
60
70
Alv
eo
lar
ve
nti
lati
on
(L
/min
)
Figure 9–10. The ventilatory responses to hypoxia at three different levels of arterial PCO2.
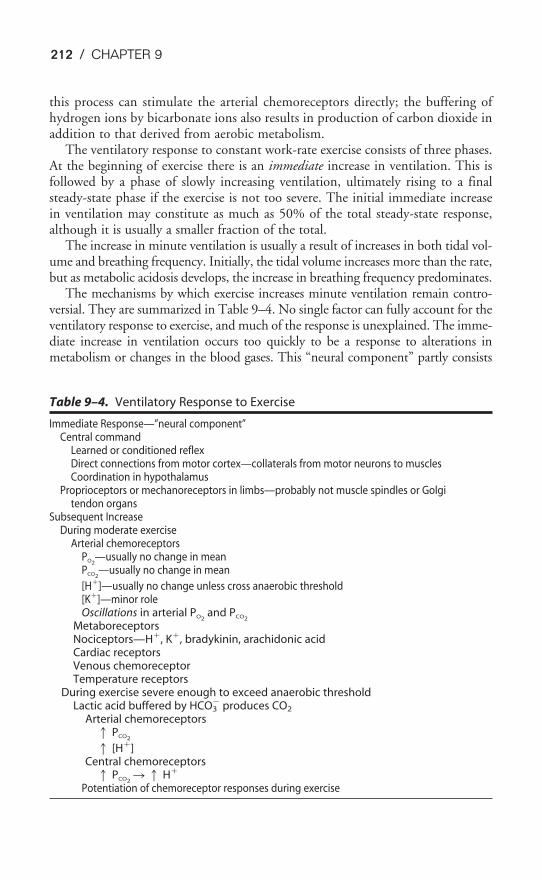
212 / CHAPTER 9
this process can stimulate the arterial chemoreceptors directly; the buffering ofhydrogen ions by bicarbonate ions also results in production of carbon dioxide inaddition to that derived from aerobic metabolism.
The ventilatory response to constant work-rate exercise consists of three phases.At the beginning of exercise there is an immediate increase in ventilation. This isfollowed by a phase of slowly increasing ventilation, ultimately rising to a finalsteady-state phase if the exercise is not too severe. The initial immediate increasein ventilation may constitute as much as 50% of the total steady-state response,although it is usually a smaller fraction of the total.
The increase in minute ventilation is usually a result of increases in both tidal vol-ume and breathing frequency. Initially, the tidal volume increases more than the rate,but as metabolic acidosis develops, the increase in breathing frequency predominates.
The mechanisms by which exercise increases minute ventilation remain contro-versial. They are summarized in Table 9–4. No single factor can fully account for theventilatory response to exercise, and much of the response is unexplained. The imme-diate increase in ventilation occurs too quickly to be a response to alterations inmetabolism or changes in the blood gases. This “neural component” partly consists
Table 9–4. Ventilatory Response to Exercise
Immediate Response—”neural component”Central command
Learned or conditioned reflexDirect connections from motor cortex—collaterals from motor neurons to musclesCoordination in hypothalamus
Proprioceptors or mechanoreceptors in limbs—probably not muscle spindles or Golgitendon organs
Subsequent IncreaseDuring moderate exercise
Arterial chemoreceptorsPO2
—usually no change in meanPCO2
—usually no change in mean
[H�]—usually no change unless cross anaerobic threshold[K�]—minor roleOscillations in arterial PO2
and PCO2
MetaboreceptorsNociceptors—H�, K�, bradykinin, arachidonic acidCardiac receptorsVenous chemoreceptorTemperature receptors
During exercise severe enough to exceed anaerobic thresholdLactic acid buffered by HCO3
� produces CO2
Arterial chemoreceptors� PCO2
� [H�]Central chemoreceptors
� PCO2� � H�
Potentiation of chemoreceptor responses during exercise
THE CONTROL OF BREATHING / 213
of collateral fibers to the respiratory muscles from the motor cortex neurons inner-vating the exercising skeletal muscles and may also be partly accounted for by a con-ditioned reflex, that is, a learned response to exercise. Experiments have alsodemonstrated that input to the respiratory centers from proprioceptors located in thejoints and muscles of the exercising limbs may play a large role in the ventilatoryresponse to exercise. Passive movements of the limbs of anesthetized animals or con-scious human subjects cause an increase in ventilation. The ventilatory and cardio-vascular responses to exercise may be coordinated (and in part initiated) in an“exercise center” in the hypothalamus.
The arterial chemoreceptors do not appear to play a role in the initial immediateventilatory response to exercise. In mild or moderate exercise (that below the pointat which anaerobic metabolism plays a role in energy supply), mean arterial PCO2
and PO2remain relatively constant, even during the increasing ventilation phase (the
“humoral component”), and may actually improve. It is therefore unlikely thathypercapnic or hypoxic stimulation of the arterial chemoreceptors is important inthe ventilatory response to exercise in this situation. Nevertheless, patients who havehad their carotid bodies surgically removed for medical reasons do show a slowerincrease in ventilation during the second phase of constant work-rate exercise, evenin the absence of lactic acidosis. It is possible that the arterial chemoreceptors areresponding to greater oscillations in the blood gases during exercise, despite relativelyconstant mean PaCO2
s and PaO2s. During exercise levels above the “anaerobic thresh-
old,” these patients do not further increase their ventilation despite metabolic aci-dosis, indicating the importance of the peripheral chemoreceptors in this portion ofthe response. Another possibility is that elevated arterial potassium concentrationcauses stimulation of the arterial chemoreceptors. Potassium ions are released intothe interstitium during the action potentials of the exercising skeletal muscle, enterthe venous blood, and travel through the pulmonary capillaries into the arterialblood, where they can stimulate the arterial chemoreceptors.
Several investigators have suggested that there may be receptors in the pulmonarycirculation that could respond to an increased carbon dioxide load in the mixed venousblood or in the heart that could respond to the increased cardiac output or increasedcardiac work. Others have proposed that receptors in the exercising muscles thatrespond to the metabolites released during exercise, some of which can stimulate painreceptors (nociceptors), may send information about the increased muscle metabolismto the respiratory controllers. Thus far, these “mixed venous chemoreceptors” and“metaboreceptors” have not been demonstrated conclusively. The increase in bodytemperature that occurs during exercise may also contribute to the ventilatory response.
KEY CONCEPTS
A cycle of inspiration and expiration is automatically generated by neurons in the
medulla; this cycle can be modified or temporarily suppressed by reflexes or influ-
ences from higher brain centers.
214 / CHAPTER 9
9–1. Voluntary apnea for 90 seconds will
a. Increase arterial PCO2
b. Decrease arterial PO2
c. Stimulate the arterial chemoreceptors
d. Stimulate the central chemoreceptors
e. All of the above
9–2. Which of the following conditions would be expected to stimulate the arterial chemore-
ceptors?
a. Mild anemia
b. Severe exercise
c. Hypoxia due to ascent to high altitude
d. Acute airway obstruction
e. Large intrapulmonary shunts
9–3. Stimulation of which of the following receptors should result in decreased ventilation?
a. Aortic chemoreceptors
b. Carotid chemoreceptors
c. Central chemoreceptors
d. Hering-Breuer inflation (stretch) receptors
9–4. Which of the following would be expected to decrease the ventilatory response to carbon
dioxide, shifting the CO2 response curve to the right?
a. Barbiturates
b. Hypoxia
c. Slow-wave sleep
d. Metabolic acidosis
e. Deep anesthesia
The respiratory control system functions as a negative-feedback system; arterial
PO2, PCO2
, and pH and cerebrospinal fluid PCO2and pH are the regulated variables.
The increases in alveolar ventilation in response to increases in arterial PCO2and
hydrogen ion concentrations are nearly linear within their normal ranges; the
increase in alveolar ventilation in response to decreases in arterial PO2is small near
the normal range and very large when the PO2falls below 50 to 60 mm Hg.
The arterial chemoreceptors rapidly respond to changes in arterial PO2, PCO2
, and
pH; the central chemoreceptors are on the brain side of the blood-brain barrier and
respond to changes in cerebrospinal fluid PCO2and pH.
CLINICAL PROBLEMS
THE CONTROL OF BREATHING / 215
SUGGESTED READINGS
Berger AJ. Control of breathing. In: Murray JF, Nadel JA. Textbook of Respiratory Medicine. 3rd ed.Philadelphia, Pa: WB Saunders and Company; 2000:179–196.
Berger AJ, Mitchell RA, Severinghaus JW. Regulation of respiration. N Engl J Med. 1977;297:92–97,138–143, 194–201.
Cherniack NS, Coleridge JCG. Pulmonary reflexes: Neural mechanisms of pulmonary defense. Annu RevPhysiol. 1994;56:69–91.
Comroe JH Jr. Physiology of Respiration. 2nd ed. Chicago, Ill: Year Book; 1974:22–93.
Duffin J. Role of acid-base balance in the chemoreflex control of breathing. J Appl Physiol.2005;99:2255–2265.
Eldridge FL. Central integration of mechanisms in exercise hyperpnea. Med Sci Sports Exerc.1994;26:319–327.
Hannam S, Ingram DM, Rabe-Hesketh S, Milner AD. Characterisation of the Hering-Breuer deflationreflex in the human neonate. Respir Physiol. 2000;124:51–64.
Hassan A, Gossage J, Ingram D, Lee S, Milner AD. Volume of activation of the Hering-Breuer inflationreflex in the newborn infant. J Appl Physiol. 2001;90:763–769.
Hlastala MP, Berger AJ. Physiology of Respiration. 2nd ed. New York, NY: Oxford University Press;2001:134–147.
Kazemi H, Johnson DC. Regulation of cerebrospinal fluid acid-base balance. Physiol Rev.1986;66:953–1037.
Mahamed S, Ali AF, Ho D, Wang B, Duffin J. The contribution of chemoreflex drives to resting breathingin man. Exp Physiol. 2001;86.1:109–116.
Mateika JH, Duffin J. A review of the control of breathing during exercise. Eur J Appl Physiol. 1995;71:1–27.
Nattie E. Why do we have both peripheral and central chemoreceptors? J Appl Physiol. 2006;100:9–10.
Nunn JF. Nunn’s Applied Respiratory Physiology. 4th ed. Oxford: Butterworth-Heinemann; 1993:90–116.
Paintal AS. Sensations from J receptors. News Physiol Sci. 1995;10:238–243.
Prabhakar NR. Oxygen sensing by the carotid body chemoreceptors. J Appl Physiol. 2000;88:2287–2295.
Rabbette PS, Stocks J. Influence of volume dependency and timing of airway occlusions on the Hering-Breuer reflex in infants. J Appl Physiol. 1998;85:2033–2039.
Shea SA. Life without ventilatory chemosensitivity. Respir Physiol. 1997;110:199–210.
Rekling JC, Feldman JL. Pre Bötzinger complex and pacemaker neurons: Hypothesized site and kernel forrespiratory rhythm generation. Annu Rev Physiol. 1998;60:385–405.
Schwab RJ, Goldberg AN, Pack AI. Sleep apnea syndromes. In: Fishman AP, ed. Pulmonary Diseases andDisorders. 3rd ed. New York, NY: McGraw-Hill; 1998:1617–1637.
Wasserman K. Breathing during exercise. N Engl J Med. 1978;298:780–785.
Wasserman K, Casaburi R. Dyspnea: Physiological and pathophysiological mechanisms. Annu Rev Med.1988;39:503–515.
Weir EK, Lopez-Barneo J, Buckler KJ, et al. Acute oxygen-sensing mechanisms. N Engl J Med.2005;353:2042–2055.
Wenninger JM, Pan LG, Klum L, et al. Large lesions in the pre-Boetzinger complex area eliminate eupneicrespiratory rhythm in awake goats. J Appl Physiol. 2004;97:1629–1636.
216
The main function of the respiratory system in general and of the lung in particu-lar is gas exchange. However, the lung has several other tasks to perform. Thesenonrespiratory functions of the lung include its own defense against inspired par-ticulate matter, the storage and filtration of blood for the systemic circulation, thehandling of vasoactive substances in the blood, and the formation and release ofsubstances used in the alveoli or circulation.
PULMONARY DEFENSE MECHANISMS
Every day about 10,000 L of air is inspired into the airways and the lungs,bringing it into contact with approximately 50 to 100 m2 of what may bethe most delicate tissues of the body. This inspired air contains (or may
contain) dust, pollen, fungal spores, ash, and other products of combustion;
10Nonrespiratory Functions of the Lung
OBJECTIVES
The reader understands the nonrespiratory functions of the components of the respira-tory system.
� Lists and describes the mechanisms by which the lung is protected from the con-taminants in inspired air.
� Describes the “air-conditioning” function of the upper airways.
� Describes the filtration and removal of particles from the inspired air.
� Describes the removal of biologically active material from the inspired air.
� Describes the reservoir and filtration functions of the pulmonary circulation.
� Lists the metabolic functions of the lung, including the handling of vasoactivematerials in the blood.
Copyright © 2007 by The McGraw-Hill Companies, Inc. Click here for terms of use.
NONRESPIRATORY FUNCTIONS OF THE LUNG / 217
microorganisms such as bacteria; particles of substances such as asbestos and silica;and hazardous chemicals or toxic gases. As one reviewer (Green) put it, “Each daya surface as large as a tennis court is exposed to a volume of air and contaminantsthat would fill a swimming pool.” In this section, the mechanisms by which thelungs are protected from contaminants in inspired air, as well as from material suchas liquids, food particles, and bacteria that may be aspirated (accidentally inspiredfrom the oropharynx or nasopharynx) into the airways are discussed.
Air-Conditioning
The temperature and the humidity of the ambient air vary widely, and the alveolimust be protected from the cold and from drying out. The mucosa of the nose, thenasal turbinates, the oropharynx, and the nasopharynx have a rich blood supplyand constitute a large surface area. The nasal turbinates alone have a surface areasaid to be about 160 cm2. As inspired air passes through these areas and continuesthrough the tracheobronchial tree, it is heated to body temperature and humidi-fied, especially if one is breathing through the nose.
Olfaction
Because the olfactory receptors are located in the posterior nasal cavity rather thanin the trachea or alveoli, a person can sniff to attempt to detect potentially haz-ardous gases or dangerous material in the inspired air. This rapid, shallow inspira-tion brings gases into contact with the olfactory sensors without bringing theminto the lung.
Filtration & Removal of Inspired Particles
The respiratory tract has an elaborate system for the filtration of the inspired airand the removal of particulate matter from the airways. The filtration system worksbetter if one is breathing through the nose.
FILTRATION OF INSPIRED AIR
Inhaled particles may be deposited in the respiratory tract as a result of impaction,sedimentation, Brownian motion, and other, less important mechanisms. Air pass-ing through the nose is first filtered by passing through the nasal hairs, or vibrissae.This removes most particles larger than 10 to 15 �m in diameter. Most of the par-ticles greater than 10 �m in diameter are removed by impacting in the large sur-face area of the nasal septum and turbinates (Figure 10–1). The inspired air streamchanges direction abruptly at the nasopharynx so that many of these larger parti-cles impact on the posterior wall of the pharynx because of their inertia. The ton-sils and adenoids are located near this impaction site, providing immunologicdefense against biologically active material filtered at this point. Air entering thetrachea contains few particles larger than 10 �m, and most of these will impactmainly at the carina or within the bronchi.
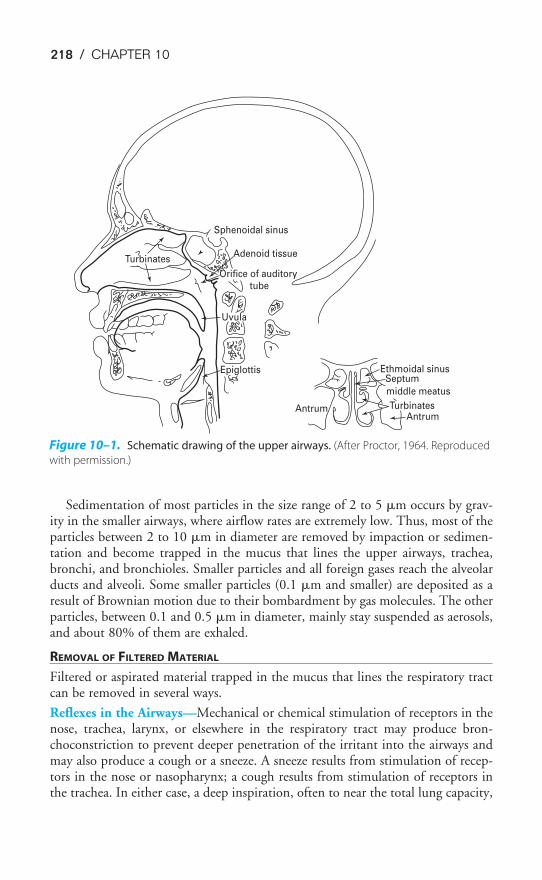
218 / CHAPTER 10
Sedimentation of most particles in the size range of 2 to 5 �m occurs by grav-ity in the smaller airways, where airflow rates are extremely low. Thus, most of theparticles between 2 to 10 �m in diameter are removed by impaction or sedimen-tation and become trapped in the mucus that lines the upper airways, trachea,bronchi, and bronchioles. Smaller particles and all foreign gases reach the alveolarducts and alveoli. Some smaller particles (0.1 �m and smaller) are deposited as aresult of Brownian motion due to their bombardment by gas molecules. The otherparticles, between 0.1 and 0.5 �m in diameter, mainly stay suspended as aerosols,and about 80% of them are exhaled.
REMOVAL OF FILTERED MATERIAL
Filtered or aspirated material trapped in the mucus that lines the respiratory tractcan be removed in several ways.
Reflexes in the Airways—Mechanical or chemical stimulation of receptors in thenose, trachea, larynx, or elsewhere in the respiratory tract may produce bron-choconstriction to prevent deeper penetration of the irritant into the airways andmay also produce a cough or a sneeze. A sneeze results from stimulation of recep-tors in the nose or nasopharynx; a cough results from stimulation of receptors inthe trachea. In either case, a deep inspiration, often to near the total lung capacity,
AntrumAntrum
Turbinates
middle meatus
SeptumEthmoidal sinusEpiglottis
Uvula
Orifice of auditory tube
Adenoid tissue
Sphenoidal sinus
Turbinates
Figure 10–1. Schematic drawing of the upper airways. (After Proctor, 1964. Reproduced
with permission.)
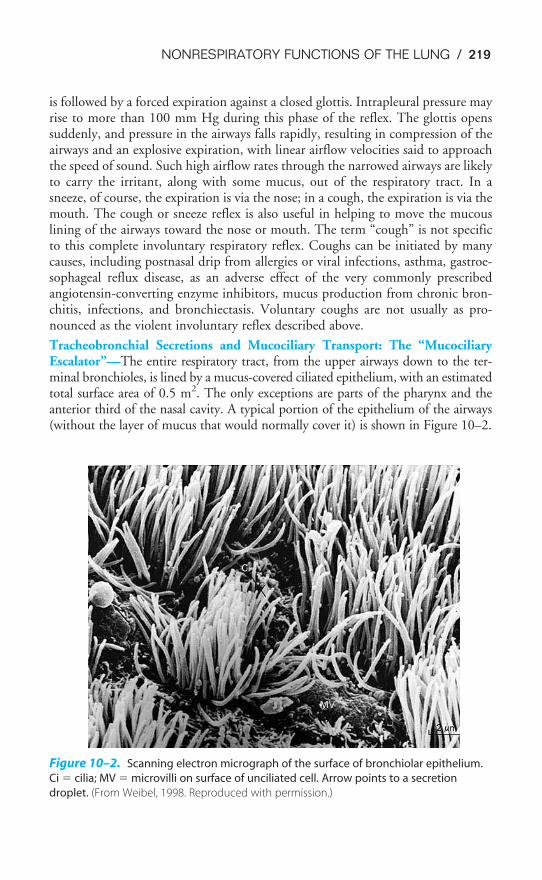
NONRESPIRATORY FUNCTIONS OF THE LUNG / 219
is followed by a forced expiration against a closed glottis. Intrapleural pressure mayrise to more than 100 mm Hg during this phase of the reflex. The glottis openssuddenly, and pressure in the airways falls rapidly, resulting in compression of theairways and an explosive expiration, with linear airflow velocities said to approachthe speed of sound. Such high airflow rates through the narrowed airways are likelyto carry the irritant, along with some mucus, out of the respiratory tract. In asneeze, of course, the expiration is via the nose; in a cough, the expiration is via themouth. The cough or sneeze reflex is also useful in helping to move the mucouslining of the airways toward the nose or mouth. The term “cough” is not specificto this complete involuntary respiratory reflex. Coughs can be initiated by manycauses, including postnasal drip from allergies or viral infections, asthma, gastroe-sophageal reflux disease, as an adverse effect of the very commonly prescribedangiotensin-converting enzyme inhibitors, mucus production from chronic bron-chitis, infections, and bronchiectasis. Voluntary coughs are not usually as pro-nounced as the violent involuntary reflex described above.
Tracheobronchial Secretions and Mucociliary Transport: The “MucociliaryEscalator”—The entire respiratory tract, from the upper airways down to the ter-minal bronchioles, is lined by a mucus-covered ciliated epithelium, with an estimatedtotal surface area of 0.5 m2. The only exceptions are parts of the pharynx and theanterior third of the nasal cavity. A typical portion of the epithelium of the airways(without the layer of mucus that would normally cover it) is shown in Figure 10–2.
Ci
MV
Figure 10–2. Scanning electron micrograph of the surface of bronchiolar epithelium.
Ci � cilia; MV � microvilli on surface of unciliated cell. Arrow points to a secretion
droplet. (From Weibel, 1998. Reproduced with permission.)
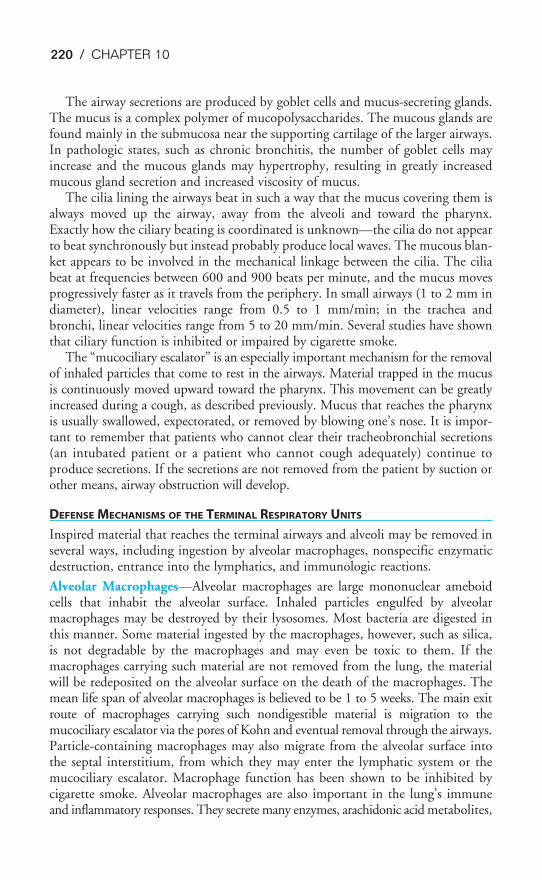
220 / CHAPTER 10
The airway secretions are produced by goblet cells and mucus-secreting glands.The mucus is a complex polymer of mucopolysaccharides. The mucous glands arefound mainly in the submucosa near the supporting cartilage of the larger airways.In pathologic states, such as chronic bronchitis, the number of goblet cells mayincrease and the mucous glands may hypertrophy, resulting in greatly increasedmucous gland secretion and increased viscosity of mucus.
The cilia lining the airways beat in such a way that the mucus covering them isalways moved up the airway, away from the alveoli and toward the pharynx.Exactly how the ciliary beating is coordinated is unknown—the cilia do not appearto beat synchronously but instead probably produce local waves. The mucous blan-ket appears to be involved in the mechanical linkage between the cilia. The ciliabeat at frequencies between 600 and 900 beats per minute, and the mucus movesprogressively faster as it travels from the periphery. In small airways (1 to 2 mm indiameter), linear velocities range from 0.5 to 1 mm/min; in the trachea andbronchi, linear velocities range from 5 to 20 mm/min. Several studies have shownthat ciliary function is inhibited or impaired by cigarette smoke.
The “mucociliary escalator” is an especially important mechanism for the removalof inhaled particles that come to rest in the airways. Material trapped in the mucusis continuously moved upward toward the pharynx. This movement can be greatlyincreased during a cough, as described previously. Mucus that reaches the pharynxis usually swallowed, expectorated, or removed by blowing one’s nose. It is impor-tant to remember that patients who cannot clear their tracheobronchial secretions(an intubated patient or a patient who cannot cough adequately) continue toproduce secretions. If the secretions are not removed from the patient by suction orother means, airway obstruction will develop.
DEFENSE MECHANISMS OF THE TERMINAL RESPIRATORY UNITS
Inspired material that reaches the terminal airways and alveoli may be removed inseveral ways, including ingestion by alveolar macrophages, nonspecific enzymaticdestruction, entrance into the lymphatics, and immunologic reactions.
Alveolar Macrophages—Alveolar macrophages are large mononuclear ameboidcells that inhabit the alveolar surface. Inhaled particles engulfed by alveolarmacrophages may be destroyed by their lysosomes. Most bacteria are digested inthis manner. Some material ingested by the macrophages, however, such as silica,is not degradable by the macrophages and may even be toxic to them. If themacrophages carrying such material are not removed from the lung, the materialwill be redeposited on the alveolar surface on the death of the macrophages. Themean life span of alveolar macrophages is believed to be 1 to 5 weeks. The main exitroute of macrophages carrying such nondigestible material is migration to themucociliary escalator via the pores of Kohn and eventual removal through the airways.Particle-containing macrophages may also migrate from the alveolar surface intothe septal interstitium, from which they may enter the lymphatic system or themucociliary escalator. Macrophage function has been shown to be inhibited bycigarette smoke. Alveolar macrophages are also important in the lung’s immuneand inflammatory responses. They secrete many enzymes, arachidonic acid metabolites,
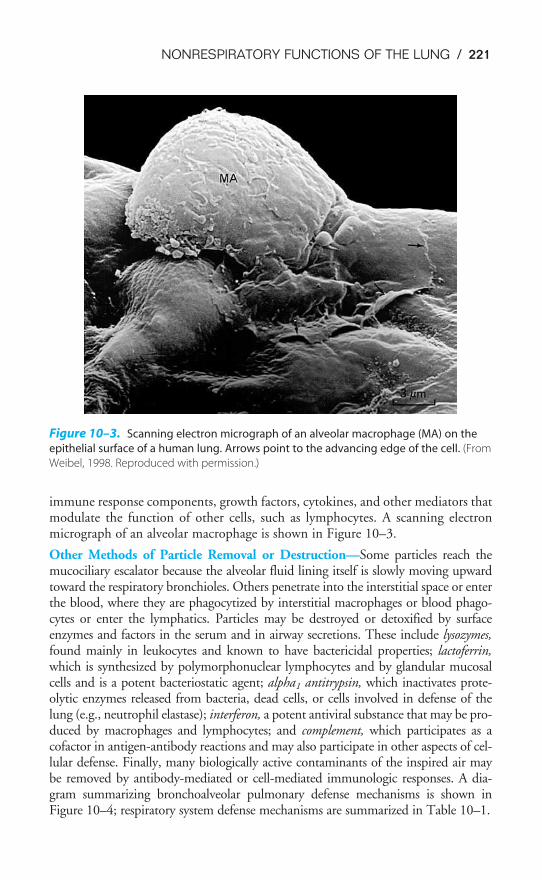
NONRESPIRATORY FUNCTIONS OF THE LUNG / 221
immune response components, growth factors, cytokines, and other mediators thatmodulate the function of other cells, such as lymphocytes. A scanning electronmicrograph of an alveolar macrophage is shown in Figure 10–3.
Other Methods of Particle Removal or Destruction—Some particles reach themucociliary escalator because the alveolar fluid lining itself is slowly moving upwardtoward the respiratory bronchioles. Others penetrate into the interstitial space or enterthe blood, where they are phagocytized by interstitial macrophages or blood phago-cytes or enter the lymphatics. Particles may be destroyed or detoxified by surfaceenzymes and factors in the serum and in airway secretions. These include lysozymes,found mainly in leukocytes and known to have bactericidal properties; lactoferrin,which is synthesized by polymorphonuclear lymphocytes and by glandular mucosalcells and is a potent bacteriostatic agent; alpha1 antitrypsin, which inactivates prote-olytic enzymes released from bacteria, dead cells, or cells involved in defense of thelung (e.g., neutrophil elastase); interferon, a potent antiviral substance that may be pro-duced by macrophages and lymphocytes; and complement, which participates as acofactor in antigen-antibody reactions and may also participate in other aspects of cel-lular defense. Finally, many biologically active contaminants of the inspired air maybe removed by antibody-mediated or cell-mediated immunologic responses. A dia-gram summarizing bronchoalveolar pulmonary defense mechanisms is shown inFigure 10–4; respiratory system defense mechanisms are summarized in Table 10–1.
Figure 10–3. Scanning electron micrograph of an alveolar macrophage (MA) on the
epithelial surface of a human lung. Arrows point to the advancing edge of the cell. (From
Weibel, 1998. Reproduced with permission.)
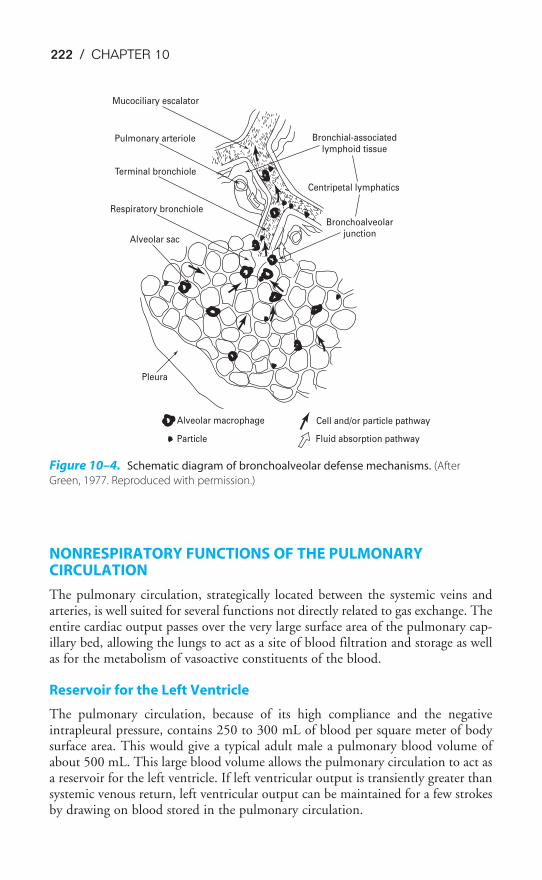
222 / CHAPTER 10
NONRESPIRATORY FUNCTIONS OF THE PULMONARYCIRCULATION
The pulmonary circulation, strategically located between the systemic veins andarteries, is well suited for several functions not directly related to gas exchange. Theentire cardiac output passes over the very large surface area of the pulmonary cap-illary bed, allowing the lungs to act as a site of blood filtration and storage as wellas for the metabolism of vasoactive constituents of the blood.
Reservoir for the Left Ventricle
The pulmonary circulation, because of its high compliance and the negativeintrapleural pressure, contains 250 to 300 mL of blood per square meter of bodysurface area. This would give a typical adult male a pulmonary blood volume ofabout 500 mL. This large blood volume allows the pulmonary circulation to act asa reservoir for the left ventricle. If left ventricular output is transiently greater thansystemic venous return, left ventricular output can be maintained for a few strokesby drawing on blood stored in the pulmonary circulation.
Centripetal lymphatics
Mucociliary escalator
Bronchial-associatedlymphoid tissue
Bronchoalveolarjunction
Pulmonary arteriole
Terminal bronchiole
Respiratory bronchiole
Alveolar sac
Pleura
Alveolar macrophage
Particle
Cell and/or particle pathway
Fluid absorption pathway
Figure 10–4. Schematic diagram of bronchoalveolar defense mechanisms. (After
Green, 1977. Reproduced with permission.)
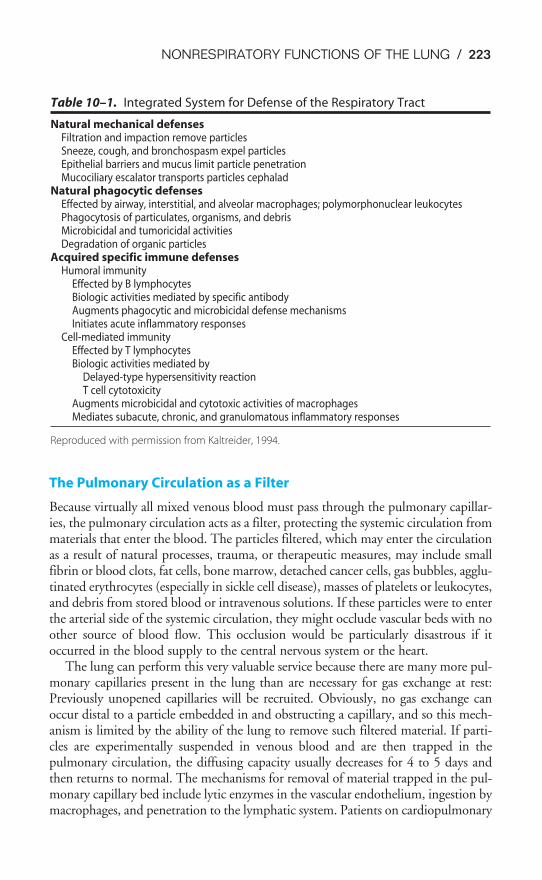
NONRESPIRATORY FUNCTIONS OF THE LUNG / 223
The Pulmonary Circulation as a Filter
Because virtually all mixed venous blood must pass through the pulmonary capillar-ies, the pulmonary circulation acts as a filter, protecting the systemic circulation frommaterials that enter the blood. The particles filtered, which may enter the circulationas a result of natural processes, trauma, or therapeutic measures, may include smallfibrin or blood clots, fat cells, bone marrow, detached cancer cells, gas bubbles, agglu-tinated erythrocytes (especially in sickle cell disease), masses of platelets or leukocytes,and debris from stored blood or intravenous solutions. If these particles were to enterthe arterial side of the systemic circulation, they might occlude vascular beds with noother source of blood flow. This occlusion would be particularly disastrous if itoccurred in the blood supply to the central nervous system or the heart.
The lung can perform this very valuable service because there are many more pul-monary capillaries present in the lung than are necessary for gas exchange at rest:Previously unopened capillaries will be recruited. Obviously, no gas exchange canoccur distal to a particle embedded in and obstructing a capillary, and so this mech-anism is limited by the ability of the lung to remove such filtered material. If parti-cles are experimentally suspended in venous blood and are then trapped in thepulmonary circulation, the diffusing capacity usually decreases for 4 to 5 days andthen returns to normal. The mechanisms for removal of material trapped in the pul-monary capillary bed include lytic enzymes in the vascular endothelium, ingestion bymacrophages, and penetration to the lymphatic system. Patients on cardiopulmonary
Table 10–1. Integrated System for Defense of the Respiratory Tract
Natural mechanical defensesFiltration and impaction remove particlesSneeze, cough, and bronchospasm expel particlesEpithelial barriers and mucus limit particle penetrationMucociliary escalator transports particles cephalad
Natural phagocytic defensesEffected by airway, interstitial, and alveolar macrophages; polymorphonuclear leukocytesPhagocytosis of particulates, organisms, and debrisMicrobicidal and tumoricidal activitiesDegradation of organic particles
Acquired specific immune defensesHumoral immunity
Effected by B lymphocytesBiologic activities mediated by specific antibodyAugments phagocytic and microbicidal defense mechanismsInitiates acute inflammatory responses
Cell-mediated immunityEffected by T lymphocytesBiologic activities mediated by
Delayed-type hypersensitivity reactionT cell cytotoxicity
Augments microbicidal and cytotoxic activities of macrophagesMediates subacute, chronic, and granulomatous inflammatory responses
Reproduced with permission from Kaltreider, 1994.
224 / CHAPTER 10
bypass do not have the benefit of this pulmonary capillary filtration, and bloodadministered to these patients must be filtered for them.
Fluid Exchange & Drug Absorption
The colloid osmotic pressure of the plasma proteins normally exceeds the pulmonarycapillary hydrostatic pressure. This tends to pull fluid from the alveoli into the pul-monary capillaries and keep the alveolar surface free of liquids other than pulmonarysurfactant. Water taken into the lungs is rapidly absorbed into the blood. This pro-tects the gas exchange function of the lungs and opposes transudation of fluid fromthe capillaries to the alveoli. As noted in Chapter 2, type II alveolar epithelial cells mayalso actively pump sodium and water from the alveolar surface into the interstitium.
Drugs or chemical substances that readily pass through the alveolar-capillarybarrier by diffusion or by other means rapidly enter the systemic circulation. Thelungs are frequently used as a route of administration of drugs and for anestheticgases, such as halothane and nitrous oxide. Aerosol drugs intended for the airwaysonly, such as the bronchodilator isoproterenol, may rapidly pass into the systemiccirculation, where they may have large effects. The effects of isoproterenol, forexample, could include cardiac stimulation and vasodilation.
METABOLIC FUNCTIONS OF THE LUNG
Until recently, the lung was thought of as an organ with little metabolic activity.The main function of the lung, gas exchange, is accomplished by passive diffusion.Movement of air and blood is accomplished by the muscles of respiration and theright ventricle. Because the lung appeared to do little that required energy and didnot appear to produce any substances utilized elsewhere in the body, it was notbelieved to have any metabolic requirements other than those necessary for the
maintenance of its own cells. In the last three decades, however, the meta-bolic activities of the lung have become an area of intense investigation,and the lung has been shown to be involved in the conversion or uptake of
vasoactive substances found in mixed venous blood and the production, storage,and release of substances used locally in the lung or elsewhere in the body.
Metabolism of Vasoactive Substances
Many vasoactive substances are inactivated, altered, or removed from the blood asthey pass through the lungs. The site of this metabolic activity is the endotheliumof the vessels of the pulmonary circulation, which constitute a tremendous surfacearea in contact with the mixed venous blood. For example, as shown in Table 10–2,prostaglandins E1, E2, and F2� are nearly completely removed in a single passthrough the lungs. On the other hand, prostaglandins A1, A2, and I2 (prostacyclin)are not affected by the pulmonary circulation. Similarly, about 30% of the norep-inephrine in mixed venous blood is removed by the lung, but epinephrine and iso-proterenol are unaffected.
These alterations of vasoactive substances in the lung imply several things. First,some substances released into specific vascular beds for local effects are inactivated
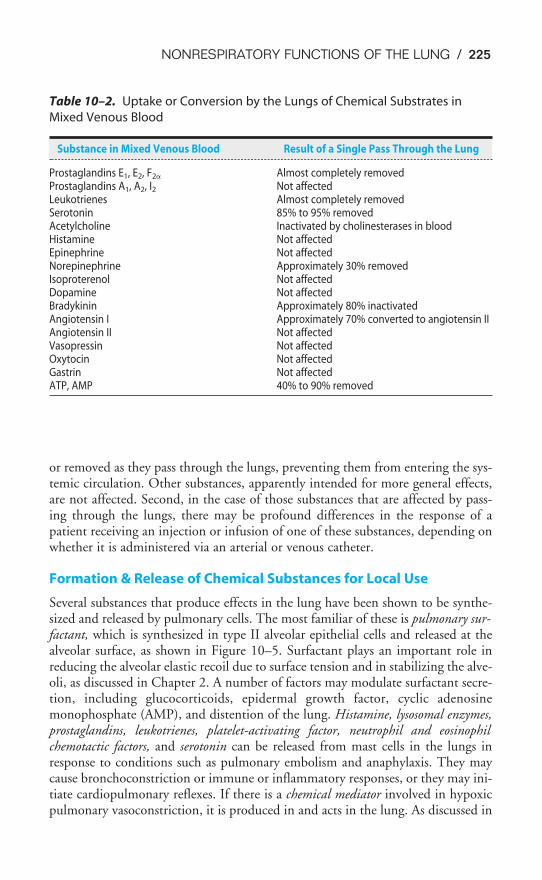
NONRESPIRATORY FUNCTIONS OF THE LUNG / 225
or removed as they pass through the lungs, preventing them from entering the sys-temic circulation. Other substances, apparently intended for more general effects,are not affected. Second, in the case of those substances that are affected by pass-ing through the lungs, there may be profound differences in the response of apatient receiving an injection or infusion of one of these substances, depending onwhether it is administered via an arterial or venous catheter.
Formation & Release of Chemical Substances for Local Use
Several substances that produce effects in the lung have been shown to be synthe-sized and released by pulmonary cells. The most familiar of these is pulmonary sur-factant, which is synthesized in type II alveolar epithelial cells and released at thealveolar surface, as shown in Figure 10–5. Surfactant plays an important role inreducing the alveolar elastic recoil due to surface tension and in stabilizing the alve-oli, as discussed in Chapter 2. A number of factors may modulate surfactant secre-tion, including glucocorticoids, epidermal growth factor, cyclic adenosinemonophosphate (AMP), and distention of the lung. Histamine, lysosomal enzymes,prostaglandins, leukotrienes, platelet-activating factor, neutrophil and eosinophilchemotactic factors, and serotonin can be released from mast cells in the lungs inresponse to conditions such as pulmonary embolism and anaphylaxis. They maycause bronchoconstriction or immune or inflammatory responses, or they may ini-tiate cardiopulmonary reflexes. If there is a chemical mediator involved in hypoxicpulmonary vasoconstriction, it is produced in and acts in the lung. As discussed in
Table 10–2. Uptake or Conversion by the Lungs of Chemical Substrates in
Mixed Venous Blood
Substance in Mixed Venous Blood Result of a Single Pass Through the Lung
Prostaglandins E1, E2, F2� Almost completely removedProstaglandins A1, A2, I2 Not affectedLeukotrienes Almost completely removedSerotonin 85% to 95% removedAcetylcholine Inactivated by cholinesterases in bloodHistamine Not affectedEpinephrine Not affectedNorepinephrine Approximately 30% removedIsoproterenol Not affectedDopamine Not affectedBradykinin Approximately 80% inactivatedAngiotensin I Approximately 70% converted to angiotensin IIAngiotensin II Not affectedVasopressin Not affectedOxytocin Not affectedGastrin Not affectedATP, AMP 40% to 90% removed
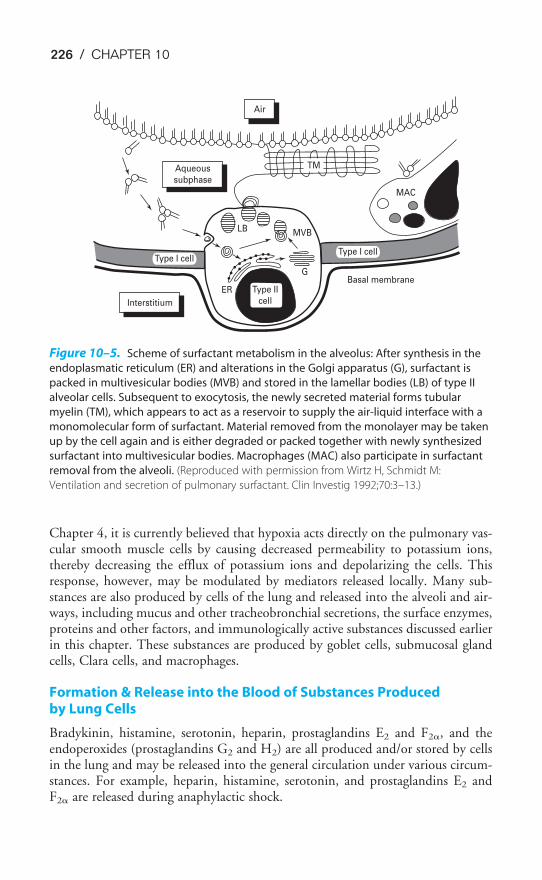
226 / CHAPTER 10
Chapter 4, it is currently believed that hypoxia acts directly on the pulmonary vas-cular smooth muscle cells by causing decreased permeability to potassium ions,thereby decreasing the efflux of potassium ions and depolarizing the cells. Thisresponse, however, may be modulated by mediators released locally. Many sub-stances are also produced by cells of the lung and released into the alveoli and air-ways, including mucus and other tracheobronchial secretions, the surface enzymes,proteins and other factors, and immunologically active substances discussed earlierin this chapter. These substances are produced by goblet cells, submucosal glandcells, Clara cells, and macrophages.
Formation & Release into the Blood of Substances Produced by Lung Cells
Bradykinin, histamine, serotonin, heparin, prostaglandins E2 and F2�, and theendoperoxides (prostaglandins G2 and H2) are all produced and/or stored by cellsin the lung and may be released into the general circulation under various circum-stances. For example, heparin, histamine, serotonin, and prostaglandins E2 andF2� are released during anaphylactic shock.
Type II
cell
G
MVBLB
ER
Type I cell
Basal membrane
MAC
TM
Type I cell
Interstitium
Air
Aqueous
subphase
Figure 10–5. Scheme of surfactant metabolism in the alveolus: After synthesis in the
endoplasmatic reticulum (ER) and alterations in the Golgi apparatus (G), surfactant is
packed in multivesicular bodies (MVB) and stored in the lamellar bodies (LB) of type II
alveolar cells. Subsequent to exocytosis, the newly secreted material forms tubular
myelin (TM), which appears to act as a reservoir to supply the air-liquid interface with a
monomolecular form of surfactant. Material removed from the monolayer may be taken
up by the cell again and is either degraded or packed together with newly synthesized
surfactant into multivesicular bodies. Macrophages (MAC) also participate in surfactant
removal from the alveoli. (Reproduced with permission from Wirtz H, Schmidt M:
Ventilation and secretion of pulmonary surfactant. Clin Investig 1992;70:3–13.)
NONRESPIRATORY FUNCTIONS OF THE LUNG / 227
Other Metabolic Functions
The lung must be able to meet its own cellular energy requirements as well asrespond to injury. The type II alveolar epithelial cell also plays a major role in theresponse of the lung to injury. As type I alveolar epithelial cells are injured, type IIcells proliferate to reestablish a continuous epithelial surface. Studies in animalshave shown that these type II cells can develop into type I cells after injury.
SUGGESTED READINGS
Ali J. Cough. In: Ali J, Summer W, Levitzky M. Pulmonary Pathophysiology. 2nd. ed. New York: LangeMedical Books/McGraw-Hill; 2005:21–34.
Banner AS. Cough: Physiology, evaluation, and treatment. Lung. 1986;164:79–92.
Green GM, Jakab GJ, Low RB, Davis GS. Defense mechanisms of the respiratory membrane. Am Rev RespirDis. 1977;115:479–514.
Houtmeyers E, Gosselink R, Gayan-Ramirez G, Decramer M. Regulation of mucociliary clearance in healthand disease. Eur Respir J. 1999;13:1177–1188.
Kaltreider HB. Macrophages, lymphocytes, and antibody- and cell-mediated immunity. In: Murray JF,Nadel JA, eds. Textbook of Respiratory Medicine. 2nd ed. Philadelphia, Pa: WB Saunders andCompany; 1994:370–401.
Nicod LP. Pulmonary defence mechanisms. Respiration. 1999;66:2–11.
Pierce RJ, Worsnop CJ. Upper airway function and dysfunction in respiration. Clin Exp Pharm Physiol1999;26:1–10.
Proctor DF. Physiology of the upper airway. In: Fenn WO, Rahn H, eds. Handbook of Physiology, sec 3:Respiration. Washington, DC: American Physiological Society. 1964;1:309–345.
Proctor DF, Andersen I, eds. The Nose: Upper Airway Physiology and the Atmospheric Environment.Amsterdam: Elsevier Biomedical; 1982.
Ryan US, Makrides SC. Nonrespiratory functions of the lungs. In: Fishman AP, ed. Pulmonary Diseases andDisorders. 3rd ed. New York, NY: McGraw-Hill; 1998:139–148.
Wanner A, Salathé M, O’Riordan TG. Mucociliary clearance in the airways. Am J Respir Crit Care Med.1998;154:1868–1902.
Weibel ER, Taylor CR. Design of the human lung for gas exchange. In: Fishman AP, ed. Pulmonary Diseasesand Disorders. 3rd ed. New York, NY: McGraw-Hill; 1998:21–61.
Wirtz H, Schmidt M. Ventilation and secretion of pulmonary surfactant. Clin Investig. 1992;70:3–13.
KEY CONCEPTS
Alveolar ventilation brings thousands of liters of air each day into the airways and
alveoli, which must be protected from contaminants, microorganisms, low humidity,
and cold temperatures.
Metabolic functions of the lung include alterations of many vasoactive substances as
they pass through the pulmonary vascular endothelium; formation and release of
substances for use in the lungs, such as pulmonary surfactant, or elsewhere in the
body; and repair of the alveolar surface in response to injury.
228
This chapter is mainly intended to be a review of the preceding chapters of thebook. The responses of the respiratory system to three physiologic stresses areexamined as they relate to the material already covered; the discussions of theresponses to each stress will therefore be brief and rather superficial. For a morecomplete discussion of each stress, consult the Suggested Readings at the end ofthis chapter.
EXERCISE & THE RESPIRATORY SYSTEM
Exercise increases the metabolism of the working muscles. It stresses therespiratory system by increasing the demand for oxygen and increasing theproduction of carbon dioxide. Moderate to severe levels of exercise also
cause increased lactic acid production. The respiratory and cardiovascular systemsmust increase the volume of oxygen supplied to the exercising tissues and increasethe removal of carbon dioxide and hydrogen ions from the body.
11The Respiratory System Under Stress
OBJECTIVES
The reader uses the knowledge he or she gained from the preceding chapters to predictthe response of the respiratory system to three physiologic stresses: exercise, ascent toaltitude, and diving.
� Identifies the physiologic stresses involved in exercise.
� Predicts the responses of the respiratory system to acute exercise.
� Describes the effects of long-term exercise programs (training) on the respiratorysystem.
� Identifies the physiologic stresses involved in the ascent to altitude.
� Predicts the initial responses of the respiratory system to the ascent to altitude.
� Describes the acclimatization of the cardiovascular and respiratory systems to resi-dence at high altitudes.
� Identifies the physiologic stresses involved in diving.
� Predicts the responses of the respiratory system to various types of diving.
Copyright © 2007 by The McGraw-Hill Companies, Inc. Click here for terms of use.
THE RESPIRATORY SYSTEM UNDER STRESS / 229
Acute Effects
The effects of exercise in an untrained person are mainly a function of an increasein the cardiac output coupled with an increase in alveolar ventilation.
CONTROL OF BREATHING
As discussed at the end of Chapter 9, both the tidal volume and the breathing fre-quency are increased during exercise. The causes of the increased alveolar ventila-tion during exercise were discussed in that section.
MECHANICS OF BREATHING
The work of breathing is increased during exercise. Larger tidal volumes result inincreased work necessary to overcome the elastic recoil of the lungs and chest wallduring inspiration because the lungs are less compliant at higher lung volumes andbecause the elastic recoil of the chest wall is inward at high thoracic volumes. Ofcourse, the greater elastic recoil tends to make expiration easier, but this is offset byother factors. The high airflow rates generated during exercise result in a muchgreater airways resistance component of the work of breathing. Greater turbulenceand dynamic compression of airways secondary to active expiration combine togreatly increase the work of breathing. (Recall that during turbulent airflow P � V̇2R.) Increasing airflow rates especially increases the resistive work ofbreathing through the nose: Minute ventilations above about 40 L/min are nor-mally accomplished by breathing through the mouth.
ALVEOLAR VENTILATION
In normal adults, the resting minute ventilation (V̇E) of 5 to 6 L/min can beincreased to as much as 150 L/min during short periods of maximal exercise.Maximal increases in cardiac output during exercise are only in the range of fourto six times the resting level in healthy adults compared with this 25-fold potentialincrease in minute ventilation. Therefore, it is the cardiovascular system ratherthan the respiratory system that is the limiting factor in exercise by healthy people.
As discussed in Chapter 9, at less strenuous levels of exercise, the increase inventilation is accomplished mainly by increasing the tidal volume. During strenu-ous exercise, the tidal volume usually increases to a maximum of about 50% to60% of the vital capacity of a normal subject, or about 2.5 to 3.0 L in an average-sized man. This increase in tidal volume appears to occur mainly at the expense ofthe inspiratory reserve volume, with the expiratory reserve volume somewhat lessaffected. An increase in the central blood volume (caused by increased venousreturn) may decrease the total lung capacity slightly. The residual volume andfunctional residual capacity may be unchanged or slightly elevated. The vitalcapacity may be slightly decreased or unchanged. The breathing frequency mayincrease to 40 to 50 breaths per minute in healthy adults (and as high as 70 breathsper minute in children) with strenuous exercise.
The anatomic dead space may increase slightly in inspiration during exercisebecause of airway distention at high lung volumes; any alveolar dead space present atrest normally decreases as cardiac output increases. As a result, there is little change
230 / CHAPTER 11
in physiologic dead space during exercise. Because the tidal volume does increase,however, the ratio of physiologic dead space to tidal volume (VD/VT) decreases.
The arterial PO2stays relatively constant during even strenuous exercise. Arterial
PCO2also stays relatively constant until anaerobic metabolism results in appreciable
lactic acid generation. The hydrogen ions liberated directly stimulate alveolar ven-tilation and may cause arterial PCO2
to fall a few millimeters of mercury below theresting arterial PCO2
.The regional differences in alveolar ventilation seen in upright lungs (which
were discussed in Chapter 3) are probably slightly attenuated during exercise. Thelarger tidal volumes, occurring at the expense of both the inspiratory and expira-tory reserve volumes, indicate that alveoli in more dependent regions of the lungare more fully inflated. However, these alveoli may also suffer airway collapse dur-ing active expirations. Similarly, alveoli in upper portions of the lung (with respectto gravity) should deflate more fully during expiration, resulting in greater ventila-tion of upper parts of the lung.
PULMONARY BLOOD FLOW
As already mentioned, the cardiac output increases linearly with oxygen consump-tion during exercise. This normally occurs more as a result of an autonomicallymediated increase in heart rate than from an increase in stroke volume. Anincreased venous return, due to deeper inspiratory efforts (in addition to extravas-cular compression by the exercising muscles and by a decrease in venous capaci-tance), also contributes to the increase in cardiac output. Mean pulmonary arteryand mean left atrial pressures increase, but the increase is not as great as the increasein pulmonary blood flow. This indicates a decrease in pulmonary vascular resis-tance. As discussed in Chapter 4, this decrease occurs passively by recruitment anddistention of pulmonary vessels. Much of the recruitment of pulmonary blood ves-sels occurs in upper regions of the lung, thus tending to decrease the regional inho-mogeneity of pulmonary blood flow discussed in Chapter 4. The expected effectof the deeper tidal volumes and active expirations that occur during exercise is toincrease pulmonary vascular resistance. During active expiration the extraalveolarvessels should be compressed; during inspiration the alveolar vessels should bestretched. Mean pulmonary vascular resistance decreases, so the effects of recruit-ment and distention must be greater than the effects of extravascular compression.
VENTILATION-PERFUSION RELATIONSHIPS
The more uniform regional perfusion that occurs during exercise results in a muchmore uniform matching of ventilation and perfusion throughout the lung. Studiesdone on normal subjects engaged in exercise in the upright position have demon-strated a greatly increased perfusion of upper regions of the lung, resulting inimproved matching of ventilation and perfusion. Because in moderate to severeexercise ventilation increases more than perfusion, the whole lung ventilation-per-fusion ratio (V̇A/Q̇c) increases to a range of 2.0 to 4.0, as seen in Figure 11–1, wherethe V̇A/Q̇c for the whole lung is approximately 2.5. A comparison of these findingswith the ventilation-perfusion ratios seen at rest in the figure and in Figure 5–7
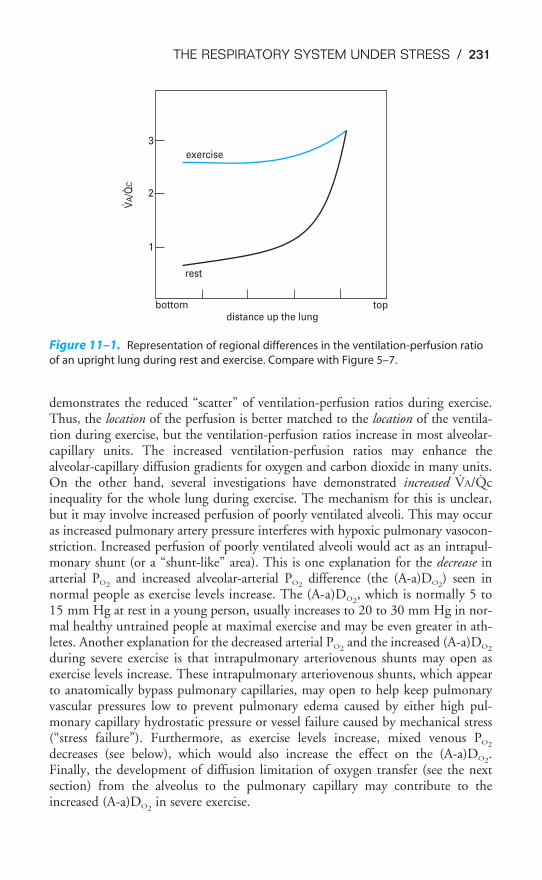
THE RESPIRATORY SYSTEM UNDER STRESS / 231
demonstrates the reduced “scatter” of ventilation-perfusion ratios during exercise.Thus, the location of the perfusion is better matched to the location of the ventila-tion during exercise, but the ventilation-perfusion ratios increase in most alveolar-capillary units. The increased ventilation-perfusion ratios may enhance thealveolar-capillary diffusion gradients for oxygen and carbon dioxide in many units.On the other hand, several investigations have demonstrated increased V̇A/Q̇cinequality for the whole lung during exercise. The mechanism for this is unclear,but it may involve increased perfusion of poorly ventilated alveoli. This may occuras increased pulmonary artery pressure interferes with hypoxic pulmonary vasocon-striction. Increased perfusion of poorly ventilated alveoli would act as an intrapul-monary shunt (or a “shunt-like” area). This is one explanation for the decrease inarterial PO2
and increased alveolar-arterial PO2difference (the (A-a)DO2
) seen innormal people as exercise levels increase. The (A-a)DO2
, which is normally 5 to15 mm Hg at rest in a young person, usually increases to 20 to 30 mm Hg in nor-mal healthy untrained people at maximal exercise and may be even greater in ath-letes. Another explanation for the decreased arterial PO2
and the increased (A-a)DO2
during severe exercise is that intrapulmonary arteriovenous shunts may open asexercise levels increase. These intrapulmonary arteriovenous shunts, which appearto anatomically bypass pulmonary capillaries, may open to help keep pulmonaryvascular pressures low to prevent pulmonary edema caused by either high pul-monary capillary hydrostatic pressure or vessel failure caused by mechanical stress(“stress failure”). Furthermore, as exercise levels increase, mixed venous PO2
decreases (see below), which would also increase the effect on the (A-a)DO2.
Finally, the development of diffusion limitation of oxygen transfer (see the nextsection) from the alveolus to the pulmonary capillary may contribute to theincreased (A-a)DO2
in severe exercise.
top
exercise
rest
bottom
1
2
3
distance up the lung
VA/Q
C
Figure 11–1. Representation of regional differences in the ventilation-perfusion ratio
of an upright lung during rest and exercise. Compare with Figure 5–7.

DIFFUSION THROUGH THE ALVEOLAR CAPILLARY BARRIER
The diffusing capacities for oxygen and carbon dioxide normally increase substan-tially during exercise. Some studies have shown a nearly linear increase in diffusingcapacity as oxygen uptake increases, although the diffusing capacity may reach a max-imum level before the V̇O2 does. The increase in diffusing capacity during exercise islargely a result of the increase in pulmonary blood flow. Recruitment of capillaries,especially in upper regions of the lungs, increases the surface area available for diffu-sion. Increased linear velocity of blood flow through pulmonary capillaries reducesthe time that red blood cells spend in contact with the alveolar air to less than the0.75 seconds normally seen at rest, decreasing the perfusion limitation of gas trans-fer. As noted in Chapter 6, the PO2
and PCO2of the plasma in the pulmonary capil-
laries normally equilibrate with the alveolar PO2and PCO2
within about the first 0.25seconds of the time blood spends in the pulmonary capillaries. After this equilibra-tion, no further gas diffusion between the equilibrated blood and the alveoli takesplace because the partial pressure gradient (P1 � P2 in Fick’s law) is equal to zero.Increased velocity of blood flow through the lung therefore increases the diffusingcapacity by bringing unequilibrated blood into the lung faster, thus maintaining thepartial pressure gradient for diffusion. On the other hand, very great blood flowvelocities may increase the possibility of diffusion limitation of gas transfer, even ina healthy person. Diffusion limitation is likely to develop in a person who has somediffusion impairment, as can be seen in Figure 6–2.
Another related factor, less dependent on the increased cardiac output, thathelps increase diffusion during exercise is that the mixed venous PO2
may be lowerand the mixed venous PCO2
may be higher than those seen at rest. These factorsmay also help increase and maintain the partial pressure gradients for diffusion.
The total effect on diffusion through the alveolar-capillary barrier of theincreased surface area and the better maintenance of the alveolar-capillary partialpressure gradients may be seen by reviewing Fick’s law for diffusion:
V̇gas �
The thickness of the alveolar-capillary barrier may also be affected during exer-cise, but the net effect may be either an increase or a decrease. At high lung vol-umes, the alveolar vessels are stretched and the thickness of the barrier maydecrease. On the other hand, high cardiac outputs may be associated with vascularcongestion, increasing the thickness of the barrier.
The alveolar-arterial oxygen difference increases during exercise. This is proba-bly because of a number of factors, including V̇A/Q̇c mismatch, diffusion limita-tion of gas transfer, a decreased mixed venous PO2
, an increased alveolar PO2, and
alterations in the oxyhemoglobin dissociation curve.
OXYGEN AND CARBON DIOXIDE TRANSPORT BY THE BLOOD
The loading of carbon dioxide into the blood and the unloading of oxygen fromthe blood are enhanced in exercising muscles. Oxygen unloading is improvedbecause the PO2
in the exercising muscle is decreased, causing a larger percentage of
A � D � (P1 � P2)���
T
232 / CHAPTER 11
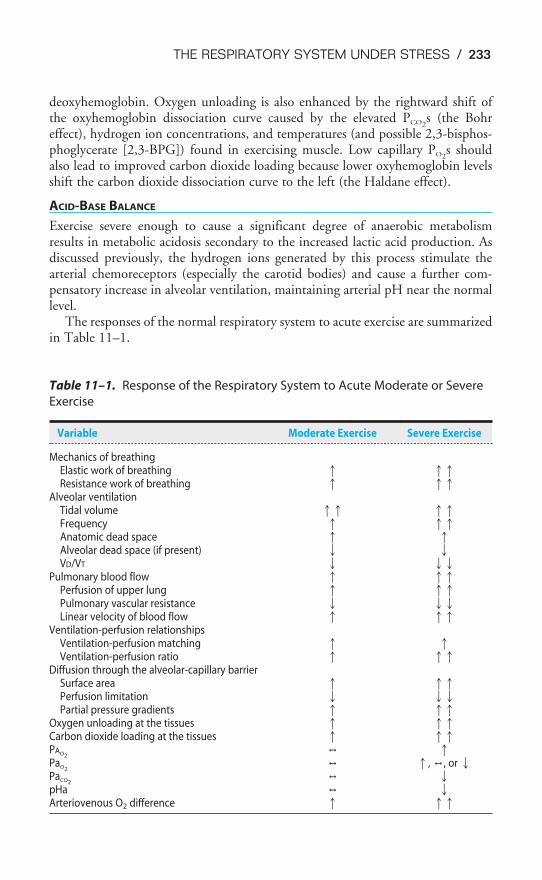
THE RESPIRATORY SYSTEM UNDER STRESS / 233
deoxyhemoglobin. Oxygen unloading is also enhanced by the rightward shift ofthe oxyhemoglobin dissociation curve caused by the elevated PCO2
s (the Bohreffect), hydrogen ion concentrations, and temperatures (and possible 2,3-bisphos-phoglycerate [2,3-BPG]) found in exercising muscle. Low capillary PO2
s shouldalso lead to improved carbon dioxide loading because lower oxyhemoglobin levelsshift the carbon dioxide dissociation curve to the left (the Haldane effect).
ACID-BASE BALANCE
Exercise severe enough to cause a significant degree of anaerobic metabolismresults in metabolic acidosis secondary to the increased lactic acid production. Asdiscussed previously, the hydrogen ions generated by this process stimulate thearterial chemoreceptors (especially the carotid bodies) and cause a further com-pensatory increase in alveolar ventilation, maintaining arterial pH near the normallevel.
The responses of the normal respiratory system to acute exercise are summarizedin Table 11–1.
Table 11–1. Response of the Respiratory System to Acute Moderate or Severe
Exercise
Variable Moderate Exercise Severe Exercise
Mechanics of breathingElastic work of breathing � ��Resistance work of breathing � ��
Alveolar ventilationTidal volume �� ��Frequency � ��Anatomic dead space � �Alveolar dead space (if present) � �VD/VT � ��
Pulmonary blood flow � ��Perfusion of upper lung � ��Pulmonary vascular resistance � ��Linear velocity of blood flow � ��
Ventilation-perfusion relationshipsVentilation-perfusion matching � �Ventilation-perfusion ratio � ��
Diffusion through the alveolar-capillary barrierSurface area � ��Perfusion limitation � ��Partial pressure gradients � ��
Oxygen unloading at the tissues � ��Carbon dioxide loading at the tissues � ��PAO2
, �PaO2
, �, ,, or �PaCO2
, �pHa , �Arteriovenous O2 difference � ��
Training Effects
The ability to perform physical exercise increases with training. Most of thechanges that occur as a result of physical training, however, are a function of alter-ations in the cardiovascular system and in muscle metabolism rather than changesin the respiratory system. The maximal oxygen uptake increases with physicaltraining. This increase appears to be mainly a result of an increased maximal car-diac output. As was stated earlier in this chapter, the maximal cardiac output isprobably a limiting factor in exercise. Physical training lowers the resting heart rateand increases the resting stroke volume. The maximal heart rate does not appear tobe affected by physical training, but the heart rate of a trained person is lower thanthat of an untrained person at any level of physical activity. Stroke volume isincreased. The arterial hemoglobin concentration and the hematocrit do notappear to change with physical training at sea level, but the arteriovenous oxygencontent difference does appear to increase with physical training. This is probablya function of the increased effects of local pH, PCO2
, and temperature in the exer-cising muscles, as well as an increased ability of the muscles to use oxygen. Bloodvolume is usually increased by training.
Physical training increases the oxidative capacity of skeletal muscle by inducingmitochondrial proliferation and increasing the concentration of oxidative enzymesand the synthesis of glycogen and triglyceride. These alterations result in lower con-centrations of blood lactate in trained subjects than those found in untrained people,reflecting increased aerobic energy production. Nevertheless, blood lactate levels dur-ing maximal exercise may be higher in trained athletes than in untrained people.
Maximal ventilation and resting ventilation do not appear to be affected byphysical training, but ventilation at submaximal loads is decreased, probablybecause of the lower lactic acid levels of the trained person during submaximalexercise. The strength and endurance of the respiratory muscles appear to improvewith training. Total lung capacity is not affected by training; vital capacity may benormal or elevated. Pulmonary diffusing capacity is often elevated in athletes,probably as a result of their increased blood volumes and maximal cardiac outputs.
ALTITUDE & ACCLIMATIZATION
As one ascends to greater altitudes, the total barometric pressure decreases becausethe total barometric pressure at any altitude is proportional to the weight of the airabove it. Air is attracted to the earth’s surface by gravity. Because air is compress-ible, the change in barometric pressure per change in vertical distance is not con-stant. There is a greater change in barometric pressure per change in altitude closerto the earth’s surface than there is at very great altitudes.
The fractional concentration of oxygen in the atmosphere does not change appre-ciably with altitude. Oxygen constitutes about 21% of the total pressure of dry ambi-ent air, and so the PO2
of dry air at any altitude is about 0.21 times total barometricpressure at that altitude. Water vapor pressure, however, must also be considered incalculations of the PO2
. The water vapor pressure depends on the temperature andhumidity of the air. As the inspired air passes through the airways, it is warmed to
234 / CHAPTER 11
THE RESPIRATORY SYSTEM UNDER STRESS / 235
body temperature and completely humidified. Therefore, the partial pressure exertedby the water vapor in the air entering the alveoli is fixed at 47 mm Hg.
The alveolar PO2can therefore be calculated by using the alveolar air equation
discussed in Chapter 3:
PAO2� PIO2
� � [F]
The inspired PO2is equal to 0.21 times the total barometric pressure (if ambi-
ent air is breathed) after the subtraction of the water vapor pressure of 47 mm Hg:
PIO2� 0.21 � (PB � 47 mm Hg)
The alveolar PCO2falls at greater altitudes because hypoxic stimulation of the
arterial chemoreceptors increases alveolar ventilation. For example, at an altitudeof 15,000 ft, the total barometric pressure is about 429 mm Hg. The inspired PO2
is therefore 0.21 � (429 � 47) mm Hg, or 80.2 mm Hg. The alveolar PCO2is
likely to be decreased to about 32 mm Hg, resulting in a PAO2of about 45 mm Hg.
At 18,000 ft, the total barometric pressure is about 380 mm Hg; at 20,000 ft, it is349 mm Hg. At 50,000 ft, the total barometric pressure is only 87 mm Hg. Evenif 100% oxygen is breathed, the PAO2
plus the PACO2divided by R can only total
40 mm Hg after water vapor pressure is subtracted. At 63,000 ft, the total baro-metric pressure is 47 mm Hg and the fluid in blood “boils.”
Acute Effects
An unacclimatized person suffers a deterioration of nervous system function whenascending rapidly to great heights. Similar dysfunctions occur if cabin pressure is lostin an airplane. The symptoms are mainly due to hypoxia and may include sleepiness,laziness, a false sense of well-being, impaired judgment, blunted pain perception,increasing errors on simple tasks, decreased visual acuity, clumsiness, and tremors.Severe hypoxia, of course, may result in a loss of consciousness or even death.
If an unacclimatized person ascends to a moderate altitude, he or she may sufferfrom a group of symptoms known collectively as acute mountain sickness.The symptoms include headache, dizziness, breathlessness at rest, weakness,malaise, nausea, anorexia, sweating, palpitations, dimness of vision, partial
deafness, sleeplessness, fluid retention, and dyspnea on exertion. These symptomsare a result of hypoxia and hypocapnia, and alkalosis or cerebral edema, or both.
CONTROL OF BREATHING
The decreased alveolar and arterial PO2s that occur at altitude result in stimulation of
the arterial chemoreceptors and an increase in alveolar ventilation; the central chemore-ceptors are not responsive to hypoxia. At an arterial PO2
of 45 mm Hg, minute venti-lation is approximately doubled. Because carbon dioxide production is initially normal(it does increase with the elevated work of breathing caused by greater alveolar ventila-tion), alveolar and arterial PCO2
fall, causing respiratory alkalosis. Arterial hypocapniaalso results in “diffusion” of carbon dioxide out of the cerebrospinal fluid, causing an
PACO2�R
increase in the pH of the cerebrospinal fluid. The central chemoreceptors are thereforenot only unresponsive to the hypoxia of altitude; their activity is depressed by the sec-ondary hypocapnia and alkalosis of the cerebrospinal fluid.
MECHANICS OF BREATHING
The increased rate and depth of breathing increase the work of breathing. Greatertranspulmonary pressures are necessary to generate greater tidal volumes and also toovercome the possible effects of vascular engorgement and increased interstitial fluidvolume of the lung, which may also decrease the vital capacity during the first 24hours at altitude. High ventilatory rates may be accompanied by active expiration,resulting in dynamic compression of airways. This airway compression, coupled witha reflex parasympathetic bronchoconstriction in response to the arterial hypoxemia,results in elevated resistance work of breathing. More turbulent airflow, which is likelyto be encountered at elevated ventilatory rates, may also contribute to elevated resist-ance work. Maximum airflow rates may increase because of decreased gas density.
ALVEOLAR VENTILATION
The anatomic dead space may decrease slightly at altitude because of the reflexbronchoconstriction or increase slightly because of the opposing effect of increasedtidal volumes. In any event the ratio of dead space to tidal volume falls with greatertidal volumes. A more uniform regional distribution of alveolar ventilation is alsoexpected at altitude because of deeper inspirations and fuller expirations.Previously collapsed or poorly ventilated alveoli will be better ventilated.
PULMONARY BLOOD FLOW
There is an increase in cardiac output, heart rate, and systemic blood pressure at alti-tude. These effects are probably a result of increased sympathetic stimulation of thecardiovascular system secondary to arterial chemoreceptor stimulation and increasedlung inflation. There may also be a direct stimulatory effect of hypoxia on themyocardium. Alveolar hypoxia results in pulmonary vasoconstriction—hypoxic pul-monary vasoconstriction. The increased cardiac output, along with hypoxic pul-monary vasoconstriction and sympathetic stimulation of larger pulmonary vessels,results in an increase in mean pulmonary artery pressure and tends to abolish any pre-existing zone 1 by recruiting previously unperfused capillaries. Undesirable conse-quences of these effects include vascular distention and engorgement of the lungsecondary to the pulmonary hypertension, which may lead to “high-altitude pul-monary edema” and a greatly increased right ventricular workload. Some climbersseem particularly susceptible to high-altitude pulmonary edema; it is possible that theydo not have as extensive or responsive intrapulmonary arteriovenous shunts (describedin the exercise section earlier) as those climbers less susceptible to high-altitude pul-monary edema. People who are more susceptible to high-altitude pulmonary edemaalso seem to have greater hypoxic pulmonary vasoconstriction responses than less sus-ceptible individuals. Furthermore, their pulmonary blood flow appears to be moreheterogeneous during hypoxia, which may be a result of uneven hypoxic pulmonaryvasoconstriction. Analysis of the fluid from high-altitude pulmonary edema showsthat it contains large molecular weight proteins, which indicates that the edema is
236 / CHAPTER 11
THE RESPIRATORY SYSTEM UNDER STRESS / 237
caused by increased capillary permeability as well as increased capillary hydrostatic pres-sure. The increased capillary permeability may result from capillary stress failure causedby high pulmonary artery pressure and blood flow and by altered release of cytokinesor other mediators.
VENTILATION-PERFUSION RELATIONSHIPS
The increase in pulmonary blood flow seen acutely at high altitude, coupled withthe more uniform alveolar ventilation, would be expected to make regional V̇A/Q̇cmore uniform. Surprisingly, studies have not shown striking differences in V̇A/Q̇crelationships at high altitude, although they do appear to improve.
DIFFUSION THROUGH THE ALVEOLAR-CAPILLARY BARRIER
At high altitude, the partial pressure gradient for oxygen diffusion is decreased becausethe alveolar PO2
is decreased more than the mixed venous PO2(see Figure 6–2B). This
decrease in the partial pressure gradient is partly offset by effects of the increase in car-diac output and increased pulmonary artery pressure, which increase the surface areaavailable for diffusion and decrease the time erythrocytes spend in pulmonary capil-laries. The thickness of the barrier may be slightly decreased at higher lung volumesor increased because of pulmonary vascular distention.
OXYGEN AND CARBON DIOXIDE TRANSPORT BY THE BLOOD
Oxygen loading in the lung may be compromised at alveolar PO2s low enough to
be below the flat part of the oxyhemoglobin dissociation curve, causing a low arte-rial oxygen content. Hypocapnia may aid somewhat in oxygen loading in the lungbut will interfere with oxygen unloading at the tissues. The main short-term com-pensatory mechanism for maintenance of oxygen delivery is the increased cardiacoutput. The hemoglobin concentration may increase slightly within the first 2 days. This is a result of hemoconcentration secondary to fluid shifting into theextravascular space, not an increase in erythrocyte production.
CEREBRAL CIRCULATION
The cerebral circulation is an area of special difficulty at high altitude. Hypocapniais a strong cerebral vasoconstrictor. The brain therefore receives not only bloodwith a low oxygen content but could also receive reduced blood flow. On the otherhand, hypoxia causes cerebral vasodilation and can cause hyperperfusion and dis-tention of cerebral vessels.
Hypoxic stimulation of the arterial chemoreceptors causes hypocapnia and respira-tory alkalosis, as already discussed. Cerebral arterial hypocapnia not only could causeconstriction of the cerebral blood vessels, it would also cause alkalosis of the cere-brospinal fluid (as discussed under Control of Breathing above; see also Figure 9–8).Most of the central nervous system symptoms of acute mountain sickness could beattributed to cerebral hypoperfusion, alkalosis, or both. However, it now appearsthat in most cases the symptoms of acute mountain sickness result from cerebralhyperperfusion and edema. This hyperperfusion is mainly a result of vasodilation,which is the direct effect of hypoxia on the cerebral blood vessels. As the cerebral
arterioles dilate, the hydrostatic pressure in the cerebral capillaries increases, increas-ing the tendency of fluid to leave the cerebral capillaries and cause cerebral edema. Thehyperperfusion and cerebral edema elevate intracranial pressure, compressing and dis-torting intracranial structures. This may lead to a general increase in sympathetic activ-ity in the body, increasing the possibility of pulmonary edema and promoting renalsalt and water retention.
ACID-BASE BALANCE
As already mentioned, the increased alveolar ventilation at altitude results inhypocapnia and respiratory alkalosis.
PREVENTION OF ACUTE MOUNTAIN SICKNESS
Acetazolamide, a carbonic anhydrase inhibitor, taken for a few days before ascend-ing to altitude can prevent the symptoms of acute mountain sickness in many people.The mechanism by which it does this is unclear because acetazolamide has severalactions that may help prevent acute mountain sickness. It decreases reabsorption ofbicarbonate by the proximal tubule of the kidney. This may lead to a moderatemetabolic acidosis that may partly offset the respiratory alkalosis and therefore alsohelp stimulate ventilation. Acetazolamide is also a diuretic, so it may help preventfluid retention and edema. Similarly, a recent study demonstrated that subjects lessprone to acute mountain sickness have decreased levels of antidiuretic hormone atsimulated altitudes, whereas subjects prone to acute mountain sickness haveincreased levels of antidiuretic hormone at simulated altitudes and therefore morefluid retention. Therefore acetazolamide may act to prevent acute mountain sick-ness by preventing fluid retention. It is likely that both proposed mechanisms areinvolved. Acetazolamide may also inhibit hypoxic pulmonary vasoconstriction.
Acclimatization
Longer-term compensations to the ascent to high altitude begin to occur after sev-eral hours and continue for days or even weeks. The immediate responses to theascent and the early and late adaptive responses are summarized in Table 11–2.
Renal compensation for respiratory alkalosis begins within a day: Renal excre-tion of base is increased, and hydrogen ions are conserved. A second majorcompensatory mechanism is erythropoiesis. Within 3 to 5 days, new redblood cells are produced, increasing the hematocrit and the oxygen-carry-
ing capacity. Thus, although the arterial PO2is not increased, the arterial oxygen
content increases because of the increased blood hemoglobin concentration. Thisis at the cost of increased blood viscosity and ventricular workload. Increased con-centrations of 2,3-BPG may help release oxygen at the tissues.
Hypoxic stimulation of the arterial chemoreceptors persists indefinitely,although it may be somewhat diminished after prolonged periods at high altitude.A more immediate finding is that the ventilatory response curve to carbon dioxideshifts to the left. That is, for any given alveolar or arterial PCO2
, the ventilatoryresponse is greater after several days at high altitude. This increased response prob-ably reflects alterations in central acid-base balance. It occurs at about the same time as
238 / CHAPTER 11
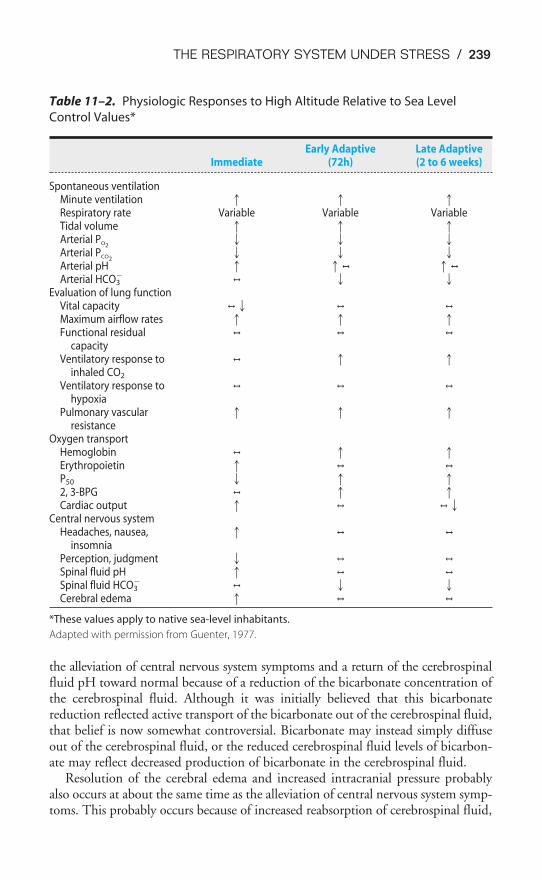
THE RESPIRATORY SYSTEM UNDER STRESS / 239
Table 11–2. Physiologic Responses to High Altitude Relative to Sea Level
Control Values*
Early Adaptive Late AdaptiveImmediate (72h) (2 to 6 weeks)
Spontaneous ventilationMinute ventilation � � �Respiratory rate Variable Variable VariableTidal volume � � �Arterial PO2
� � �Arterial PCO2
� � �Arterial pH � �, �,
Arterial HCO3�
, � �Evaluation of lung function
Vital capacity ,� , ,
Maximum airflow rates � � �Functional residual , , ,
capacityVentilatory response to , � �
inhaled CO2
Ventilatory response to , , ,
hypoxiaPulmonary vascular � � �
resistanceOxygen transport
Hemoglobin , � �Erythropoietin � , ,
P50 � � �2, 3-BPG , � �Cardiac output � , ,�
Central nervous systemHeadaches, nausea, � , ,
insomniaPerception, judgment � , ,
Spinal fluid pH � , ,
Spinal fluid HCO3�
, � �Cerebral edema � , ,
*These values apply to native sea-level inhabitants.
Adapted with permission from Guenter, 1977.
the alleviation of central nervous system symptoms and a return of the cerebrospinalfluid pH toward normal because of a reduction of the bicarbonate concentration ofthe cerebrospinal fluid. Although it was initially believed that this bicarbonatereduction reflected active transport of the bicarbonate out of the cerebrospinal fluid,that belief is now somewhat controversial. Bicarbonate may instead simply diffuseout of the cerebrospinal fluid, or the reduced cerebrospinal fluid levels of bicarbon-ate may reflect decreased production of bicarbonate in the cerebrospinal fluid.
Resolution of the cerebral edema and increased intracranial pressure probablyalso occurs at about the same time as the alleviation of central nervous system symp-toms. This probably occurs because of increased reabsorption of cerebrospinal fluid,
autoregulation of cerebral blood flow, and a sympathetically mediated vasocon-striction that for some reason takes several days to develop. It is also possible thatthe cerebral vessels produce less nitric oxide, which probably mediates the cerebralvasodilation in response to hypoxia.
The elevated cardiac output, heart rate, and systemic blood pressure return tonormal levels after a few days at high altitude. This probably reflects a decrease insympathetic activity or changes in sympathetic receptors. Nevertheless, hypoxic pul-monary vasoconstriction and pulmonary hypertension persist (along with increasedblood viscosity), leading to right ventricular hypertrophy and frequently chronic corpulmonale (right ventricular failure secondary to pulmonary hypertension).
Many of the predicted responses of the respiratory system to chronic and acutealtitude may be seen in the data obtained from one of two medical scientistclimbers who made it to the top of Mount Everest without supplemental oxygenin 1981. They were members of the American Medical Research Expedition andhad undergone lengthy periods of acclimatization at somewhat less severe high alti-tudes. Total barometric pressure on top of Mount Everest was 253 mm Hg. Thiswas about 17 mm Hg greater than expected and was explained by local weatherconditions and because barometric pressure is higher at lower latitudes. The alve-olar PCO2
of the scientist who reached the summit and was able to take samples wasan incredibly low 7.5 mm Hg, with a calculated arterial pH of 7.76. This extremehyperventilation allowed an alveolar PO2
of 35 mm Hg, resulting in a calculatedarterial PO2
of 28 mm Hg.The scientist’s arterial hemoglobin concentration was elevated to 18.4 g/100
mL of blood, and his extremely high levels of 2,3-BPG should have shifted hisoxyhemoglobin dissociation curve to the right, with a P50 of 29.6 at a pH of 7.40.However, his respiratory alkalosis actually shifted the curve to the left, resulting ina P50 of 19.4. This leftward shift allowed sufficient loading at the summit to satu-rate 75% of his hemoglobin with oxygen.
Similar results were obtained under the more controlled conditions of a simu-lated 40-day “ascent” (in a decompression chamber) to a maximum altitude of29,028 ft. Arterial blood samples taken from five subjects at the simulated summithad a mean PO2
of 30 mm Hg, a mean PCO2of 12 mm Hg, and a mean pH of 7.56.
DIVING & THE RESPIRATORY SYSTEM
The major physiologic stresses involved in diving include elevated ambientpressure, decreased effects of gravity, altered respiration, hypothermia, andsensory impairment. The severity of the stress involved depends on the depth
attained, the length of the dive, and whether the breath is held or a breathing appa-ratus is used. The first three physiologic stresses are the focus of this discussion.
Physical Principles
The pressure at the bottom of a column of liquid is proportional to the height ofthe column, the density of the liquid, and the acceleration of gravity. For example,for each 33 ft of seawater (or 34 ft of fresh water) ambient pressure increases by
240 / CHAPTER 11
THE RESPIRATORY SYSTEM UNDER STRESS / 241
1 atmosphere (atm). Thus, at a depth of 33 ft of seawater, total ambient pressureis equal to 1520 mm Hg.
The tissues of the body are composed mainly of water and are therefore nearlyincompressible, but gases are compressible and follow Boyle’s law. Thus, in abreath-hold dive the volume of gas in the lungs is inversely proportional to thedepth attained. At 33 ft of depth (2 atm) lung volume is cut in half; at 66 ft (3 atm) it is one third the original lung volume. As gases are compressed, their den-sities increase.
As the total pressure increases, the partial pressures of the constituent gases alsoincrease, according to Dalton’s law. The biologic effects of gases are generallydependent on their partial pressures rather than on their fractional concentrations.Also, as the partial pressures of gases increase, the amounts dissolved in the tissuesof the body increase, according to Henry’s law.
Effects of Immersion up to the Neck
Merely immersing oneself up to the neck in water causes profound alterations inthe cardiovascular and pulmonary systems. These effects are mainly a result of anincrease in pressure outside the thorax, abdomen, and limbs.
MECHANICS OF BREATHING
The pressure outside the chest wall of a person standing or seated in neck-deepwater is greater than atmospheric, averaging about 20 cm H2O. This positive pres-sure outside the chest opposes the normal outward elastic recoil of the chest wall anddecreases the functional residual capacity by about 50%. This occurs at the expenseof the expiratory reserve volume, which may be decreased by as much as 70%. Theintrapleural pressure is less negative at the functional residual capacity because ofdecreased outward elastic recoil of the chest wall. The work that must be done tobring air into the lungs is greatly increased because extra inspiratory work is neces-sary to overcome the positive pressure outside the chest. Nonetheless, the vitalcapacity and total lung capacity are only slightly decreased. As was already pointedout, the expiratory reserve volume is decreased by neck-deep immersion, and theinspiratory reserve volume is therefore increased. The residual volume is slightlydecreased because of an increase in pulmonary blood volume. Immersion up to theneck in water results in an increase in the work of breathing of about 60%.
The hydrostatic pressure effects of water outside the chest prevent a submergedperson who is trying to breathe through a tube that is communicating with the airabove the surface of the water from descending more than about 3 ft. This is trueeven if the increased airways resistance offered by the tube were negligible and ifthe person avoided increasing the effective dead space by occluding the mouth endof the tube and exhaling directly into the water (or by using a one-way valve). Thereason is that the maximal inspiratory pressure that normal individuals can gener-ate with their inspiratory muscles is about 80 to 100 cm H2O (that is, intrapleuralpressures of �80 to �100 cm H2O). Because 100 cm is 1 m, or 39.37 in, the max-imum depth a person can attain while breathing through a tube in this manner isa little more than 3 ft.
PULMONARY BLOOD FLOW
During neck-deep immersion, increased pressure outside the limbs and abdomenresults in less pooling of systemic venous blood in gravity-dependent regions of thebody. If the water temperature is below body temperature, a sympathetically medi-ated venoconstriction occurs, also augmenting venous return. The increasedvenous return increases the central blood volume by approximately 500 mL. Rightatrial pressure increases from about �2 to �16 mm Hg. As a result, the cardiacoutput and stroke volume increase by about 30%. The increases in pulmonaryblood flow and pulmonary blood volume probably result in elevated mean pul-monary artery pressure, capillary recruitment, an increase in the diffusing capacity,and a somewhat improved matching of ventilation and perfusion.
An additional effect of neck-deep immersion is “immersion diuresis.” Within afew minutes of immersion, urine flow increases 4- to 5-fold. Osmolal clearanceincreases only slightly. These findings are consistent with stimulation of stretchreceptors in the left atrium and elsewhere in thoracic vessels by the increased tho-racic blood volume. This, in turn, is believed either to decrease the secretion ofantidiuretic hormone (ADH) by the posterior pituitary gland or to cause therelease of a natriuretic hormone from the atria.
Breath-Hold Diving
During a breath-hold dive, the total pressure of gases within the lungs is approxi-mately equal to ambient pressure. Therefore, the volume within the thorax mustdecrease proportionately and partial pressures of gases increase.
THE DIVING REFLEX
Many subjects demonstrate a profound bradycardia (decreased heart rate) andincreased systemic vascular resistance with face immersion (especially into coldwater) as well as apnea. This “diving reflex” is initiated by as yet unknown sensorsin the face or nose. A similar (but greater) response is seen when aquatic mammalssuch as whales and seals dive. The reflex decreases the workload of the heart andseverely limits perfusion to all systemic vascular beds except for the strongestautoregulators—namely, the heart and brain. The cardiovascular effects of the div-ing reflex are similar to those produced by stimulation of the arterial chemorecep-tors when no increase in ventilation can occur, except that the diving reflex alsoappears to cause the spleen to slowly contract, which releases erythrocytes stored inthe spleen into the venous blood. This increases the oxygen-carrying capacity of theblood and therefore the oxygen content of the blood at the same arterial PO2
. Thebradycardic component of the diving reflex is demonstrated in Figure 11–2.
GAS EXCHANGE IN THE LUNGS
Breath-hold divers usually hyperventilate before a dive so that typical alveolar PO2s
and PCO2s might be 120 and 30 mm Hg, respectively. Indeed, breath-hold divers
must take care not to hyperventilate so much that their PCO2gets so low that they
do not reach their “breakpoint” (mainly determined by PaCO2) until after they lose
consciousness from arterial hypoxemia. During a breath-hold dive to a depth of 33 ft,
242 / CHAPTER 11
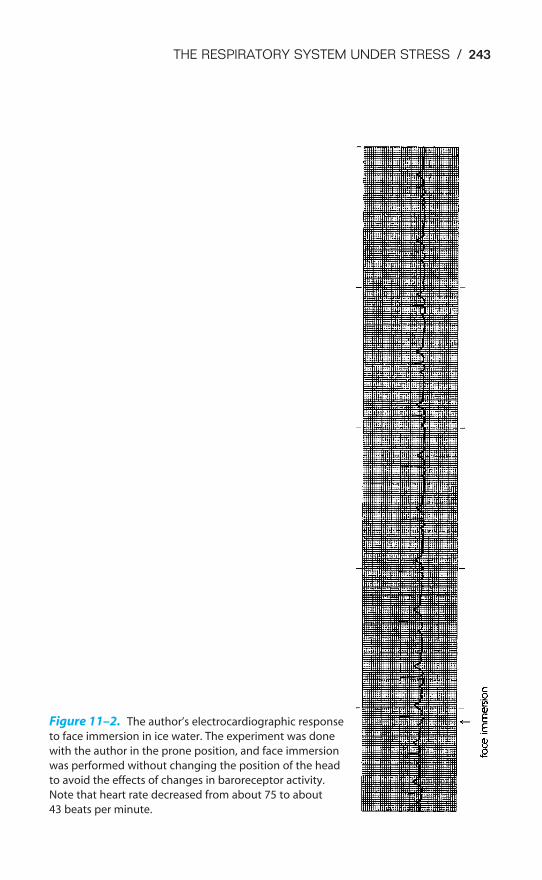
THE RESPIRATORY SYSTEM UNDER STRESS / 243
Figure 11–2. The author’s electrocardiographic response
to face immersion in ice water. The experiment was done
with the author in the prone position, and face immersion
was performed without changing the position of the head
to avoid the effects of changes in baroreceptor activity.
Note that heart rate decreased from about 75 to about
43 beats per minute.
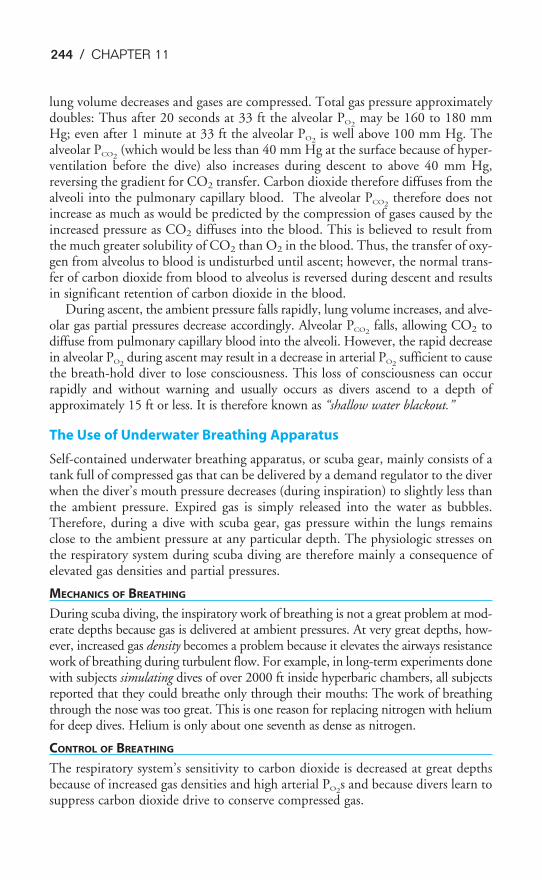
244 / CHAPTER 11
lung volume decreases and gases are compressed. Total gas pressure approximatelydoubles: Thus after 20 seconds at 33 ft the alveolar PO2
may be 160 to 180 mmHg; even after 1 minute at 33 ft the alveolar PO2
is well above 100 mm Hg. Thealveolar PCO2
(which would be less than 40 mm Hg at the surface because of hyper-ventilation before the dive) also increases during descent to above 40 mm Hg,reversing the gradient for CO2 transfer. Carbon dioxide therefore diffuses from thealveoli into the pulmonary capillary blood. The alveolar PCO2
therefore does notincrease as much as would be predicted by the compression of gases caused by theincreased pressure as CO2 diffuses into the blood. This is believed to result fromthe much greater solubility of CO2 than O2 in the blood. Thus, the transfer of oxy-gen from alveolus to blood is undisturbed until ascent; however, the normal trans-fer of carbon dioxide from blood to alveolus is reversed during descent and resultsin significant retention of carbon dioxide in the blood.
During ascent, the ambient pressure falls rapidly, lung volume increases, and alve-olar gas partial pressures decrease accordingly. Alveolar PCO2
falls, allowing CO2 todiffuse from pulmonary capillary blood into the alveoli. However, the rapid decreasein alveolar PO2
during ascent may result in a decrease in arterial PO2sufficient to cause
the breath-hold diver to lose consciousness. This loss of consciousness can occurrapidly and without warning and usually occurs as divers ascend to a depth ofapproximately 15 ft or less. It is therefore known as “shallow water blackout.”
The Use of Underwater Breathing Apparatus
Self-contained underwater breathing apparatus, or scuba gear, mainly consists of atank full of compressed gas that can be delivered by a demand regulator to the diverwhen the diver’s mouth pressure decreases (during inspiration) to slightly less thanthe ambient pressure. Expired gas is simply released into the water as bubbles.Therefore, during a dive with scuba gear, gas pressure within the lungs remainsclose to the ambient pressure at any particular depth. The physiologic stresses onthe respiratory system during scuba diving are therefore mainly a consequence ofelevated gas densities and partial pressures.
MECHANICS OF BREATHING
During scuba diving, the inspiratory work of breathing is not a great problem at mod-erate depths because gas is delivered at ambient pressures. At very great depths, how-ever, increased gas density becomes a problem because it elevates the airways resistancework of breathing during turbulent flow. For example, in long-term experiments donewith subjects simulating dives of over 2000 ft inside hyperbaric chambers, all subjectsreported that they could breathe only through their mouths: The work of breathingthrough the nose was too great. This is one reason for replacing nitrogen with heliumfor deep dives. Helium is only about one seventh as dense as nitrogen.
CONTROL OF BREATHING
The respiratory system’s sensitivity to carbon dioxide is decreased at great depthsbecause of increased gas densities and high arterial PO2
s and because divers learn tosuppress carbon dioxide drive to conserve compressed gas.
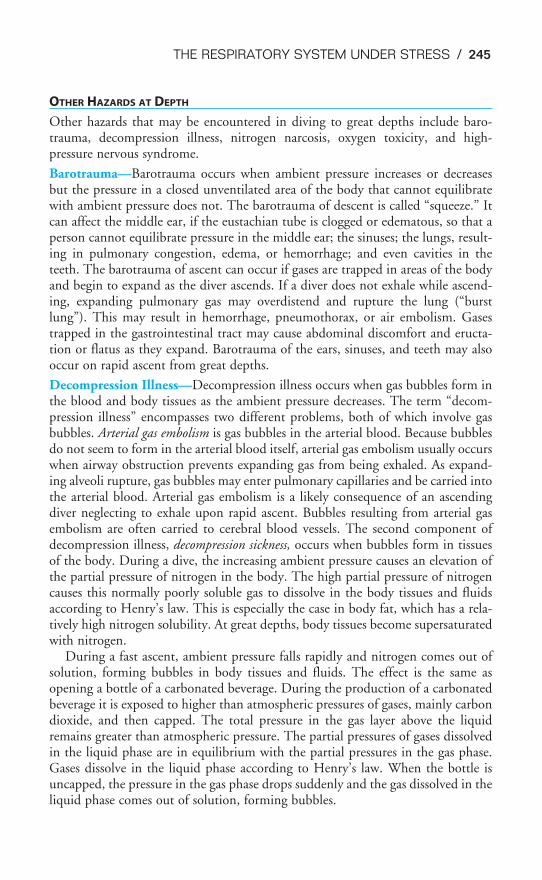
THE RESPIRATORY SYSTEM UNDER STRESS / 245
OTHER HAZARDS AT DEPTH
Other hazards that may be encountered in diving to great depths include baro-trauma, decompression illness, nitrogen narcosis, oxygen toxicity, and high-pressure nervous syndrome.
Barotrauma—Barotrauma occurs when ambient pressure increases or decreasesbut the pressure in a closed unventilated area of the body that cannot equilibratewith ambient pressure does not. The barotrauma of descent is called “squeeze.” Itcan affect the middle ear, if the eustachian tube is clogged or edematous, so that aperson cannot equilibrate pressure in the middle ear; the sinuses; the lungs, result-ing in pulmonary congestion, edema, or hemorrhage; and even cavities in theteeth. The barotrauma of ascent can occur if gases are trapped in areas of the bodyand begin to expand as the diver ascends. If a diver does not exhale while ascend-ing, expanding pulmonary gas may overdistend and rupture the lung (“burstlung”). This may result in hemorrhage, pneumothorax, or air embolism. Gasestrapped in the gastrointestinal tract may cause abdominal discomfort and eructa-tion or flatus as they expand. Barotrauma of the ears, sinuses, and teeth may alsooccur on rapid ascent from great depths.
Decompression Illness—Decompression illness occurs when gas bubbles form inthe blood and body tissues as the ambient pressure decreases. The term “decom-pression illness” encompasses two different problems, both of which involve gasbubbles. Arterial gas embolism is gas bubbles in the arterial blood. Because bubblesdo not seem to form in the arterial blood itself, arterial gas embolism usually occurswhen airway obstruction prevents expanding gas from being exhaled. As expand-ing alveoli rupture, gas bubbles may enter pulmonary capillaries and be carried intothe arterial blood. Arterial gas embolism is a likely consequence of an ascendingdiver neglecting to exhale upon rapid ascent. Bubbles resulting from arterial gasembolism are often carried to cerebral blood vessels. The second component ofdecompression illness, decompression sickness, occurs when bubbles form in tissuesof the body. During a dive, the increasing ambient pressure causes an elevation ofthe partial pressure of nitrogen in the body. The high partial pressure of nitrogencauses this normally poorly soluble gas to dissolve in the body tissues and fluidsaccording to Henry’s law. This is especially the case in body fat, which has a rela-tively high nitrogen solubility. At great depths, body tissues become supersaturatedwith nitrogen.
During a fast ascent, ambient pressure falls rapidly and nitrogen comes out ofsolution, forming bubbles in body tissues and fluids. The effect is the same asopening a bottle of a carbonated beverage. During the production of a carbonatedbeverage it is exposed to higher than atmospheric pressures of gases, mainly carbondioxide, and then capped. The total pressure in the gas layer above the liquidremains greater than atmospheric pressure. The partial pressures of gases dissolvedin the liquid phase are in equilibrium with the partial pressures in the gas phase.Gases dissolve in the liquid phase according to Henry’s law. When the bottle isuncapped, the pressure in the gas phase drops suddenly and the gas dissolved in theliquid phase comes out of solution, forming bubbles.
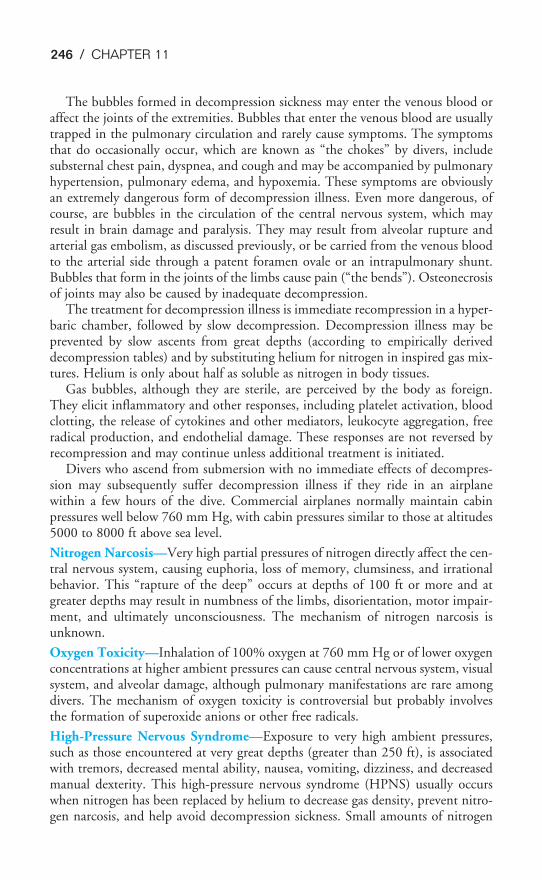
The bubbles formed in decompression sickness may enter the venous blood oraffect the joints of the extremities. Bubbles that enter the venous blood are usuallytrapped in the pulmonary circulation and rarely cause symptoms. The symptomsthat do occasionally occur, which are known as “the chokes” by divers, includesubsternal chest pain, dyspnea, and cough and may be accompanied by pulmonaryhypertension, pulmonary edema, and hypoxemia. These symptoms are obviouslyan extremely dangerous form of decompression illness. Even more dangerous, ofcourse, are bubbles in the circulation of the central nervous system, which mayresult in brain damage and paralysis. They may result from alveolar rupture andarterial gas embolism, as discussed previously, or be carried from the venous bloodto the arterial side through a patent foramen ovale or an intrapulmonary shunt.Bubbles that form in the joints of the limbs cause pain (“the bends”). Osteonecrosisof joints may also be caused by inadequate decompression.
The treatment for decompression illness is immediate recompression in a hyper-baric chamber, followed by slow decompression. Decompression illness may beprevented by slow ascents from great depths (according to empirically deriveddecompression tables) and by substituting helium for nitrogen in inspired gas mix-tures. Helium is only about half as soluble as nitrogen in body tissues.
Gas bubbles, although they are sterile, are perceived by the body as foreign.They elicit inflammatory and other responses, including platelet activation, bloodclotting, the release of cytokines and other mediators, leukocyte aggregation, freeradical production, and endothelial damage. These responses are not reversed byrecompression and may continue unless additional treatment is initiated.
Divers who ascend from submersion with no immediate effects of decompres-sion may subsequently suffer decompression illness if they ride in an airplanewithin a few hours of the dive. Commercial airplanes normally maintain cabinpressures well below 760 mm Hg, with cabin pressures similar to those at altitudes5000 to 8000 ft above sea level.
Nitrogen Narcosis—Very high partial pressures of nitrogen directly affect the cen-tral nervous system, causing euphoria, loss of memory, clumsiness, and irrationalbehavior. This “rapture of the deep” occurs at depths of 100 ft or more and atgreater depths may result in numbness of the limbs, disorientation, motor impair-ment, and ultimately unconsciousness. The mechanism of nitrogen narcosis isunknown.
Oxygen Toxicity—Inhalation of 100% oxygen at 760 mm Hg or of lower oxygenconcentrations at higher ambient pressures can cause central nervous system, visualsystem, and alveolar damage, although pulmonary manifestations are rare amongdivers. The mechanism of oxygen toxicity is controversial but probably involvesthe formation of superoxide anions or other free radicals.
High-Pressure Nervous Syndrome—Exposure to very high ambient pressures,such as those encountered at very great depths (greater than 250 ft), is associatedwith tremors, decreased mental ability, nausea, vomiting, dizziness, and decreasedmanual dexterity. This high-pressure nervous syndrome (HPNS) usually occurswhen nitrogen has been replaced by helium to decrease gas density, prevent nitro-gen narcosis, and help avoid decompression sickness. Small amounts of nitrogen
246 / CHAPTER 11
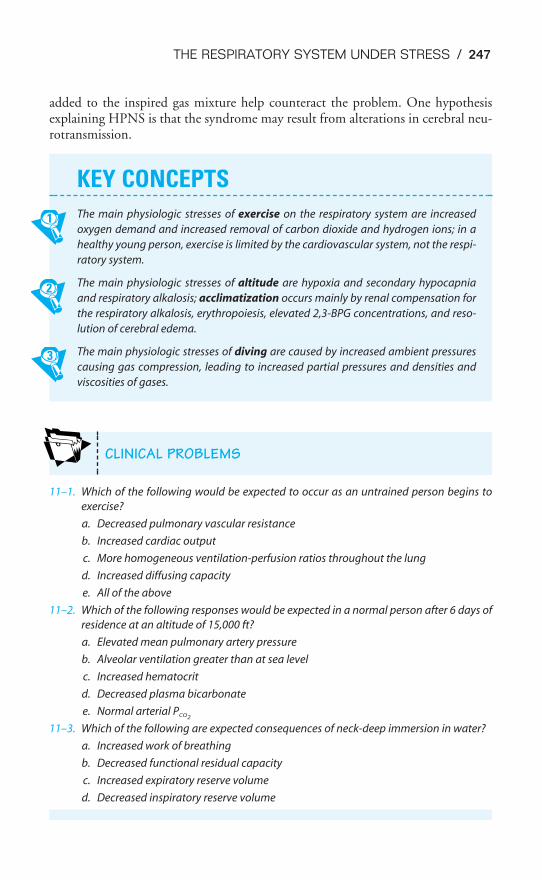
THE RESPIRATORY SYSTEM UNDER STRESS / 247
KEY CONCEPTS
The main physiologic stresses of exercise on the respiratory system are increased
oxygen demand and increased removal of carbon dioxide and hydrogen ions; in a
healthy young person, exercise is limited by the cardiovascular system, not the respi-
ratory system.
The main physiologic stresses of altitude are hypoxia and secondary hypocapnia
and respiratory alkalosis; acclimatization occurs mainly by renal compensation for
the respiratory alkalosis, erythropoiesis, elevated 2,3-BPG concentrations, and reso-
lution of cerebral edema.
The main physiologic stresses of diving are caused by increased ambient pressures
causing gas compression, leading to increased partial pressures and densities and
viscosities of gases.
CLINICAL PROBLEMS
added to the inspired gas mixture help counteract the problem. One hypothesisexplaining HPNS is that the syndrome may result from alterations in cerebral neu-rotransmission.
11–1. Which of the following would be expected to occur as an untrained person begins to
exercise?
a. Decreased pulmonary vascular resistance
b. Increased cardiac output
c. More homogeneous ventilation-perfusion ratios throughout the lung
d. Increased diffusing capacity
e. All of the above
11–2. Which of the following responses would be expected in a normal person after 6 days of
residence at an altitude of 15,000 ft?
a. Elevated mean pulmonary artery pressure
b. Alveolar ventilation greater than at sea level
c. Increased hematocrit
d. Decreased plasma bicarbonate
e. Normal arterial PCO2
11–3. Which of the following are expected consequences of neck-deep immersion in water?
a. Increased work of breathing
b. Decreased functional residual capacity
c. Increased expiratory reserve volume
d. Decreased inspiratory reserve volume
248 / CHAPTER 11
SUGGESTED READINGS
Exercise
Eldridge MW, Dempsey JA, Haverkamp HC, Lovering AT, Hokanson JS. Exercise-induced intrapulmonaryarteriovenous shunting in healthy humans. J Appl Physiol. 2004;797–805.
Hammond MD, Gale GE, Kapitan KS, Ries A, Wagner PD. Pulmonary gas exchange in humans duringexercise at sea level. J Appl Physiol. 1986;60:1590–1598.
Harf A, Pratt T, Hughes JMB. Regional distribution of V̇A/Q̇ in man at rest and with exercise measuredwith Krypton-81 m. J Appl Physiol. 1978;44:115–123.
Wasserman K, Whipp BJ. Exercise physiology in health and disease. Am Rev Respir Dis. 1975;112:219–249.
Whipp BJ. Breathing during exercise. In: Fishman AP, ed. Pulmonary Diseases and Disorders. 3rd ed. NewYork, NY: McGraw-Hill; 1998:229–241.
Altitude
Bartsch P, Mairbaurl H, Maggiorini M, Swenson ER. Physiological aspects of high-altitude pulmonaryedema. J Appl Physiol. 2005;98:1101–1110.
Guenter CA, Welch MH, Hogg JC. Clinical Aspects of Respiratory Physiology. Philadelphia, Pa: Lippincott;1977:3–37.
Hackett PH, Roach RC. High altitude illness. N Engl J Med. 2001;345:107–114.
Hohne C, Krebs MO, Seiferheld M, Boemke W, Kaczmarczyk G, Swenson ER. Acetazolamide preventshypoxic pulmonary vasoconstriction in conscious dogs. J Appl Physiol. 2004;97:515–521.
Hopkins SR, Garg J, Bolar DS, Balouch J, Levin DL. Pulmonary blood flow heterogeneity during hypoxiaand high-altitude pulmonary edema. Am J Respir Crit Care Med 2005;171:83–87.
Houston CS. Mountain sickness. Sci Am. 1992;267:58–66.
Houston CS, Sutton JR, Cymerman A, Reeves JT. Operation Everest II: Man at extreme altitude. J ApplPhysiol. 1987;63:877–882.
Lahiri S, Milledge JS. Pulmonary adaptation and clinical disorders related to high altitude. In: Fishman AP,ed. Pulmonary Diseases and Disorders. 3rd ed. New York, NY: McGraw-Hill; 1998:965–977.
Loeppky JA, Icenogle MV, Maes D, Riboni K, Hinghofer-Szalkay H, Roach RC. Early fluid retention andsevere mountain sickness. J Appl Physiol. 2005;98:591–597.
Richalet J-P, Rivera M, Bouchet P, Chirinos E, Onnen I, Petitjean O, Bienvenu A, Lasne F, Moutereau S,Leon-Velarde F. Acetazolamide: A treatment for chronic mountain sickness. Am J Respir Crit CareMed. 2005;172:1427–1433.
Schoene RB, Hackett PH, Hornbein TF. High altitude. In: Murray JF, Nadel JA, eds. Textbook ofRespiratory Medicine. 3rd ed. Philadelphia, Pa: WB Saunders and Company; 2000:1915–1950.
West JB. Everest: The Testing Place. New York, McGraw-Hill, 1985.
West JB, Hackett PH, Maret KH, et al. Pulmonary gas exchange on the summit of Mount Everest. J ApplPhysiol. 1983;55:678–687.
Winslow RM, Samaja M, West JB. Red cell function at extreme altitude on Mount Everest. J Appl Physiol.1984;56:109–116.
Diving
Clark JM. Diving injuries and air embolism. In: Fishman AP, ed. Pulmonary Diseases and Disorders. 3rd ed.New York, NY: McGraw-Hill; 1998:980–987.
Espersen K, Frandsen H, Lorentzen T, Kanstrup I-L, Christensen NJ. The human spleen as an erythrocytereservoir in diving-related interventions. J Appl Physiol. 2002;92:2071–2079.
Hong SK, Ceretelli P, Cruz JC, Rahn H. Mechanics of respiration during submersion in water. J ApplPhysiol. 1969;27:535–538.
Liner MH. Cardiovascular and pulmonary responses to breath-hold diving in humans. Acta Physiol Scand.1994;151(suppl 620):1–32.
Moon RE, Vann RD, Bennett PB. The physiology of decompression illness. Sci Am. 1995;273:70–77.
THE RESPIRATORY SYSTEM UNDER STRESS / 249
Muth CM, Radermacher P, Pittner A, Steinacker J, Schabana R, Hamich S, Paulat K, Calzia E. Arterialblood gases during diving in elite apnea divers. Int J Sports Med. 2003;24:104–107.
Neuman TS. Arterial gas embolism and decompression sickness. News Physiol Sci. 2002;17:77–81.
Pollock NW, Natoli MJ, Gerth WA, Thalman ED, Vann RD. Risk of decompression sickness duringexposure to high cabin altitude after diving. Aviat Space Environ Med. 2003;74:1163–1168.
Strauss RH (ed). Diving Medicine. New York, NY: Grune & Stratton; 1976.
Strauss RH. Diving medicine. Am Rev Respir Dis. 1979;19:1001–1023.
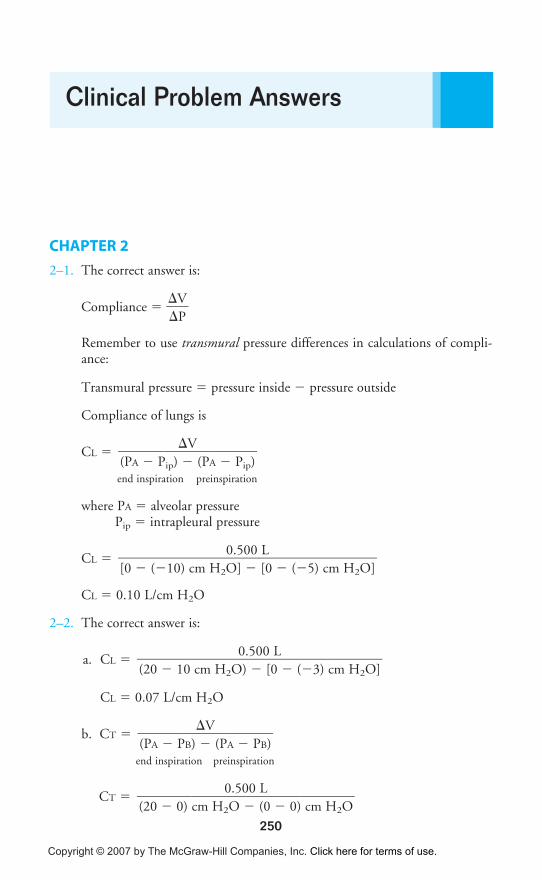
250
CHAPTER 2
2–1. The correct answer is:
Compliance � �
V
P�
Remember to use transmural pressure differences in calculations of compli-ance:
Transmural pressure � pressure inside � pressure outside
Compliance of lungs is
CL �
end inspiration preinspiration
where PA � alveolar pressurePip � intrapleural pressure
CL �
CL � 0.10 L/cm H2O
2–2. The correct answer is:
a. CL �
CL � 0.07 L/cm H2O
b. CT �
end inspiration preinspiration
CT �0.500 L
����(20 � 0) cm H2O � (0 � 0) cm H2O
V���(PA � PB) � (PA � PB)
0.500 L�����(20 � 10 cm H2O) � [0 � (�3) cm H2O]
0.500 L�����[0 � (�10) cm H2O] � [0 � (�5) cm H2O]
V���(PA � Pip) � (PA � Pip)
Clinical Problem Answers
Copyright © 2007 by The McGraw-Hill Companies, Inc. Click here for terms of use.
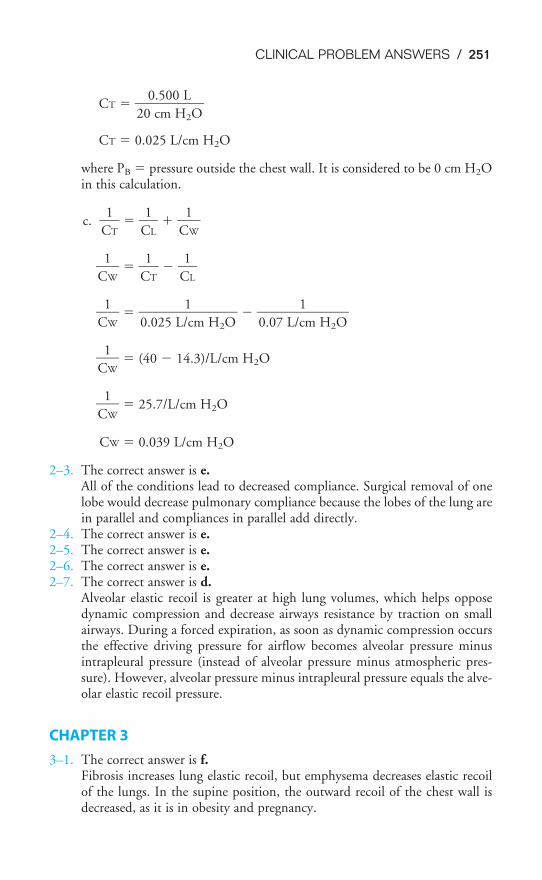
CLINICAL PROBLEM ANSWERS / 251
CT � �20
0
c
.5
m
00
H
L
2O�
CT � 0.025 L/cm H2O
where PB � pressure outside the chest wall. It is considered to be 0 cm H2Oin this calculation.
c. �C
1
T� � �
C
1
L� � �
C
1
W�
�C
1
W� � �
C
1
T� � �
C
1
L�
�C
1
W� ��
0.025 L/
1
cm H2O�� �
0.07 L/c
1
m H2O�
�C
1
W� � (40 � 14.3)/L/cm H2O
�C
1
W� � 25.7/L/cm H2O
CW � 0.039 L/cm H2O
2–3. The correct answer is e.All of the conditions lead to decreased compliance. Surgical removal of onelobe would decrease pulmonary compliance because the lobes of the lung arein parallel and compliances in parallel add directly.
2–4. The correct answer is e.2–5. The correct answer is e.2–6. The correct answer is e.2–7. The correct answer is d.
Alveolar elastic recoil is greater at high lung volumes, which helps opposedynamic compression and decrease airways resistance by traction on smallairways. During a forced expiration, as soon as dynamic compression occursthe effective driving pressure for airflow becomes alveolar pressure minusintrapleural pressure (instead of alveolar pressure minus atmospheric pres-sure). However, alveolar pressure minus intrapleural pressure equals the alve-olar elastic recoil pressure.
CHAPTER 3
3–1. The correct answer is f.Fibrosis increases lung elastic recoil, but emphysema decreases elastic recoilof the lungs. In the supine position, the outward recoil of the chest wall isdecreased, as it is in obesity and pregnancy.
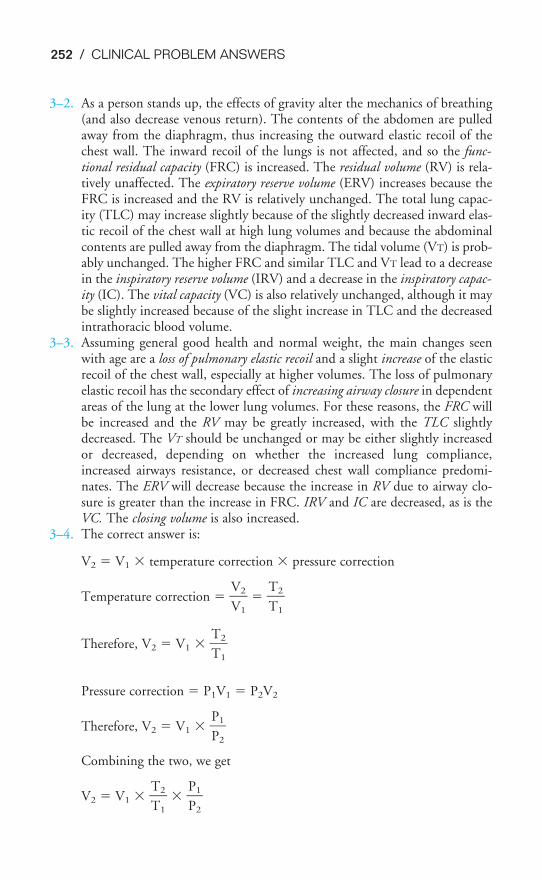
252 / CLINICAL PROBLEM ANSWERS
3–2. As a person stands up, the effects of gravity alter the mechanics of breathing(and also decrease venous return). The contents of the abdomen are pulledaway from the diaphragm, thus increasing the outward elastic recoil of thechest wall. The inward recoil of the lungs is not affected, and so the func-tional residual capacity (FRC) is increased. The residual volume (RV) is rela-tively unaffected. The expiratory reserve volume (ERV) increases because theFRC is increased and the RV is relatively unchanged. The total lung capac-ity (TLC) may increase slightly because of the slightly decreased inward elas-tic recoil of the chest wall at high lung volumes and because the abdominalcontents are pulled away from the diaphragm. The tidal volume (VT) is prob-ably unchanged. The higher FRC and similar TLC and VT lead to a decreasein the inspiratory reserve volume (IRV) and a decrease in the inspiratory capac-ity (IC). The vital capacity (VC) is also relatively unchanged, although it maybe slightly increased because of the slight increase in TLC and the decreasedintrathoracic blood volume.
3–3. Assuming general good health and normal weight, the main changes seenwith age are a loss of pulmonary elastic recoil and a slight increase of the elasticrecoil of the chest wall, especially at higher volumes. The loss of pulmonaryelastic recoil has the secondary effect of increasing airway closure in dependentareas of the lung at the lower lung volumes. For these reasons, the FRC willbe increased and the RV may be greatly increased, with the TLC slightlydecreased. The VT should be unchanged or may be either slightly increasedor decreased, depending on whether the increased lung compliance,increased airways resistance, or decreased chest wall compliance predomi-nates. The ERV will decrease because the increase in RV due to airway clo-sure is greater than the increase in FRC. IRV and IC are decreased, as is theVC. The closing volume is also increased.
3–4. The correct answer is:
V2 � V1 � temperature correction � pressure correction
Temperature correction � �V
V
2
1
� � �T
T
2
1
�
Therefore, V2 � V1 � �T
T
2
1
�
Pressure correction � P1V1 � P2V2
Therefore, V2 � V1 � �P
P
1
2
�
Combining the two, we get
V2 � V1 � �T
T2
1
� � �P
P1
2
�
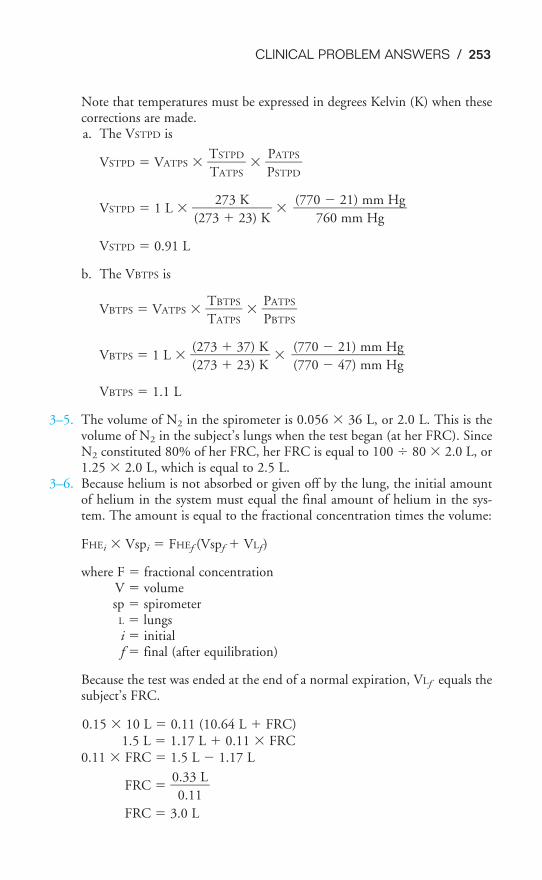
CLINICAL PROBLEM ANSWERS / 253
Note that temperatures must be expressed in degrees Kelvin (K) when thesecorrections are made.a. The VSTPD is
VSTPD � VATPS � �T
T
S
A
T
T
P
P
D
S� � �
P
P
S
A
T
T
P
P
D
S�
VSTPD � 1 L � �(273
27
�
3
2
K
3) K� �
VSTPD � 0.91 L
b. The VBTPS is
VBTPS � VATPS � �T
T
A
BT
T
P
P
S
S� � �
P
P
A
BT
T
P
P
S
S�
VBTPS � 1 L � �(
(
2
2
7
7
3
3
�
�
3
2
7
3
)
)
K
K� �
VBTPS � 1.1 L
3–5. The volume of N2 in the spirometer is 0.056 � 36 L, or 2.0 L. This is thevolume of N2 in the subject’s lungs when the test began (at her FRC). SinceN2 constituted 80% of her FRC, her FRC is equal to 100 � 80 � 2.0 L, or1.25 � 2.0 L, which is equal to 2.5 L.
3–6. Because helium is not absorbed or given off by the lung, the initial amountof helium in the system must equal the final amount of helium in the sys-tem. The amount is equal to the fractional concentration times the volume:
FHEi � Vspi � FHEf (Vspf � VLf )
where F � fractional concentrationV � volumesp � spirometer
L � lungsi � initialf � final (after equilibration)
Because the test was ended at the end of a normal expiration, VLf equals thesubject’s FRC.
0.15 � 10 L � 0.11 (10.64 L � FRC)1.5 L � 1.17 L � 0.11 � FRC
0.11 � FRC � 1.5 L � 1.17 L
FRC � �0
0
.3
.1
3
1
L�
FRC � 3.0 L
(770 � 21) mm Hg���(770 � 47) mm Hg
(770 � 21) mm Hg���
760 mm Hg
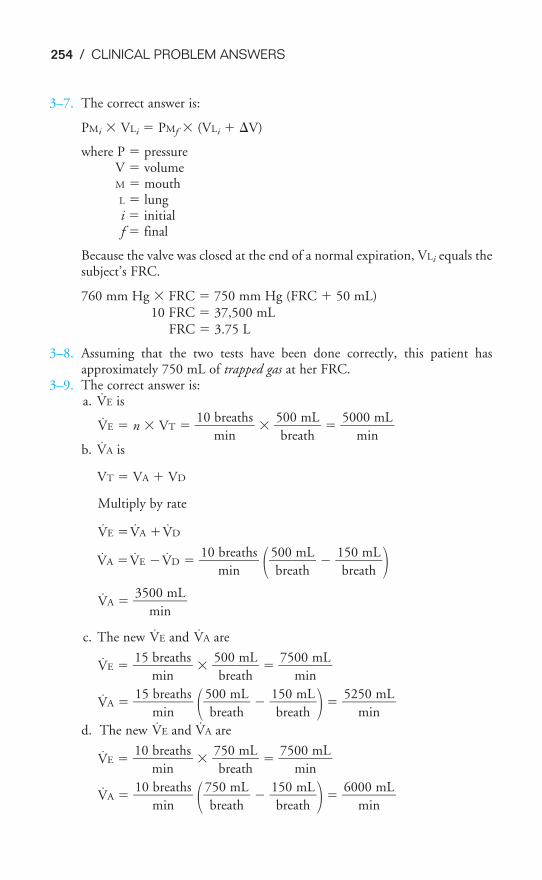
3–7. The correct answer is:
PMi � VLi � PMf � (VLi � V)
where P � pressureV � volumeM � mouthL � lungi � initialf � final
Because the valve was closed at the end of a normal expiration, VLi equals thesubject’s FRC.
760 mm Hg � FRC � 750 mm Hg (FRC � 50 mL)10 FRC � 37,500 mL
FRC � 3.75 L
3–8. Assuming that the two tests have been done correctly, this patient hasapproximately 750 mL of trapped gas at her FRC.
3–9. The correct answer is:a. V̇E is
V̇E � n � VT � �10
m
br
i
e
n
aths� � �
5
b
0
r
0
ea
m
th
L� � �
500
m
0
in
mL�
b. V̇A is
VT � VA � VD
Multiply by rate
V̇E �V̇A �V̇D
V̇A �V̇E �V̇D � �10
m
br
i
e
n
aths� ��5b
0
r
0
ea
m
th
L� � �
1
b
5
r
0
ea
m
th
L��
V̇A � �350
m
0
in
mL�
c. The new V̇E and V̇A are
V̇E � �15
m
br
i
e
n
aths� � �
5
b
0
r
0
ea
m
th
L� � �
750
m
0
in
mL�
V̇A � �15
m
br
i
e
n
aths� ��5b
0
r
0
ea
m
th
L� � �
1
b
5
r
0
ea
m
th
L�� � �
525
m
0
in
mL�
d. The new V̇E and V̇A are
V̇E � �10
m
br
i
e
n
aths� � �
7
b
5
r
0
ea
m
th
L� � �
750
m
0
in
mL�
V̇A � �10
m
br
i
e
n
aths� ��7b
5
r
0
ea
m
th
L� � �
1
b
5
r
0
ea
m
th
L�� � �
600
m
0
in
mL�
254 / CLINICAL PROBLEM ANSWERS
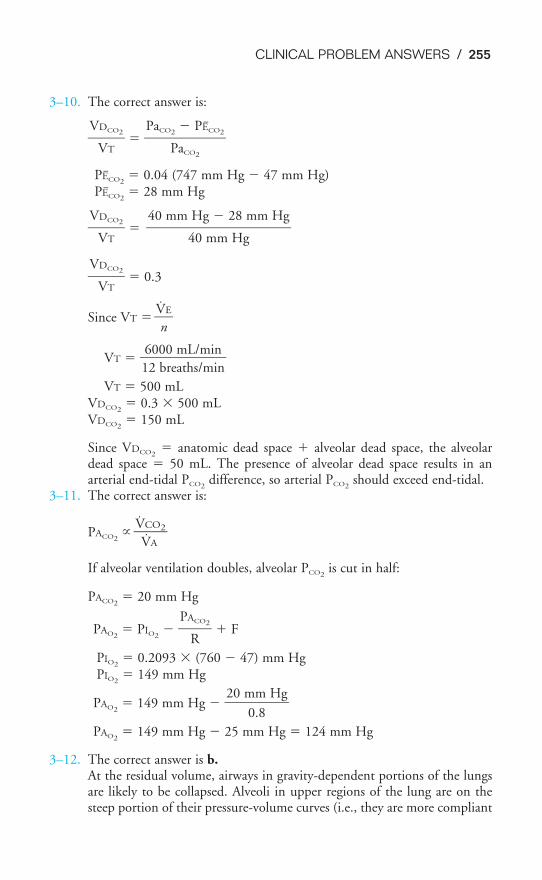
CLINICAL PROBLEM ANSWERS / 255
3–10. The correct answer is:
�V
V
DC
T
O2� � �
PaCO
P
2
a
�
CO
P
2
E�CO2�
PE�CO2� 0.04 (747 mm Hg � 47 mm Hg)
PE�CO2� 28 mm Hg
�V
V
DC
T
O2� �
�V
V
DC
T
O2� � 0.3
Since VT �˙
�V
n
E�
VT � �1
6
2
00
b
0
re
m
ath
L
s
/
/
m
m
i
i
n
n�
VT � 500 mLVDCO2
� 0.3 � 500 mLVDCO2
� 150 mL
Since VDCO2� anatomic dead space � alveolar dead space, the alveolar
dead space � 50 mL. The presence of alveolar dead space results in anarterial end-tidal PCO2
difference, so arterial PCO2should exceed end-tidal.
3–11. The correct answer is:
PACO2�
˙�V
V̇
C
A
O2�
If alveolar ventilation doubles, alveolar PCO2is cut in half:
PACO2� 20 mm Hg
PAO2� PIO2
� �PA
R
CO2� � F
PIO2� 0.2093 � (760 � 47) mm Hg
PIO2� 149 mm Hg
PAO2� 149 mm Hg � �
20 m
0
m
.8
Hg�
PAO2� 149 mm Hg � 25 mm Hg � 124 mm Hg
3–12. The correct answer is b.At the residual volume, airways in gravity-dependent portions of the lungsare likely to be collapsed. Alveoli in upper regions of the lung are on thesteep portion of their pressure-volume curves (i.e., they are more compliant
40 mm Hg � 28 mm Hg���
40 mm Hg
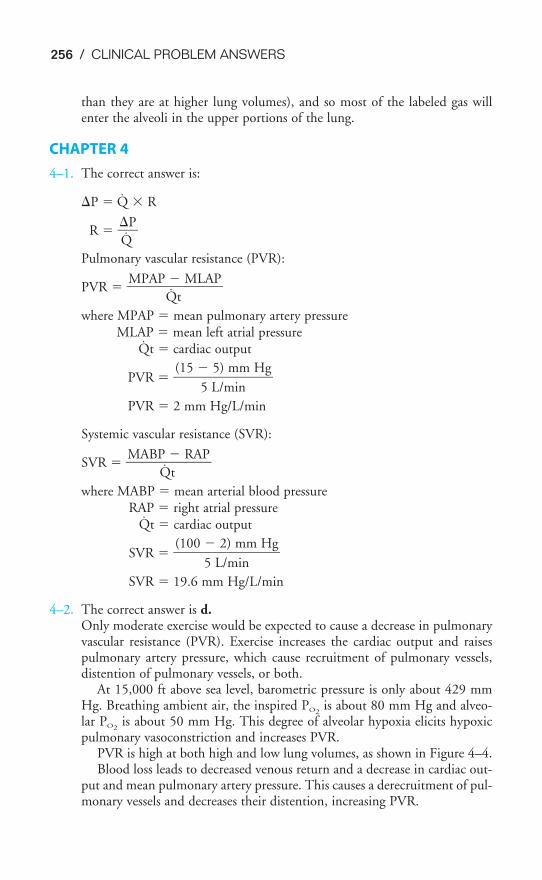
256 / CLINICAL PROBLEM ANSWERS
than they are at higher lung volumes), and so most of the labeled gas willenter the alveoli in the upper portions of the lung.
CHAPTER 4
4–1. The correct answer is:
P � Q̇ � R
R � �
Q̇
P�
Pulmonary vascular resistance (PVR):
PVR ��MPAP
Q̇
�
t
MLAP�
where MPAP � mean pulmonary artery pressureMLAP � mean left atrial pressure
Q̇t � cardiac output
PVR ��(15 �
5 L
5
/
)
m
m
in
m Hg�
PVR � 2 mm Hg/L/min
Systemic vascular resistance (SVR):
SVR � �MABP
Q̇
�
t
RAP�
where MABP � mean arterial blood pressureRAP � right atrial pressure
Q̇t � cardiac output
SVR ��(100
5
�
L
2
/
)
m
m
in
m Hg�
SVR � 19.6 mm Hg/L/min
4–2. The correct answer is d.Only moderate exercise would be expected to cause a decrease in pulmonaryvascular resistance (PVR). Exercise increases the cardiac output and raisespulmonary artery pressure, which cause recruitment of pulmonary vessels,distention of pulmonary vessels, or both.
At 15,000 ft above sea level, barometric pressure is only about 429 mmHg. Breathing ambient air, the inspired PO2
is about 80 mm Hg and alveo-lar PO2
is about 50 mm Hg. This degree of alveolar hypoxia elicits hypoxicpulmonary vasoconstriction and increases PVR.
PVR is high at both high and low lung volumes, as shown in Figure 4–4.Blood loss leads to decreased venous return and a decrease in cardiac out-
put and mean pulmonary artery pressure. This causes a derecruitment of pul-monary vessels and decreases their distention, increasing PVR.
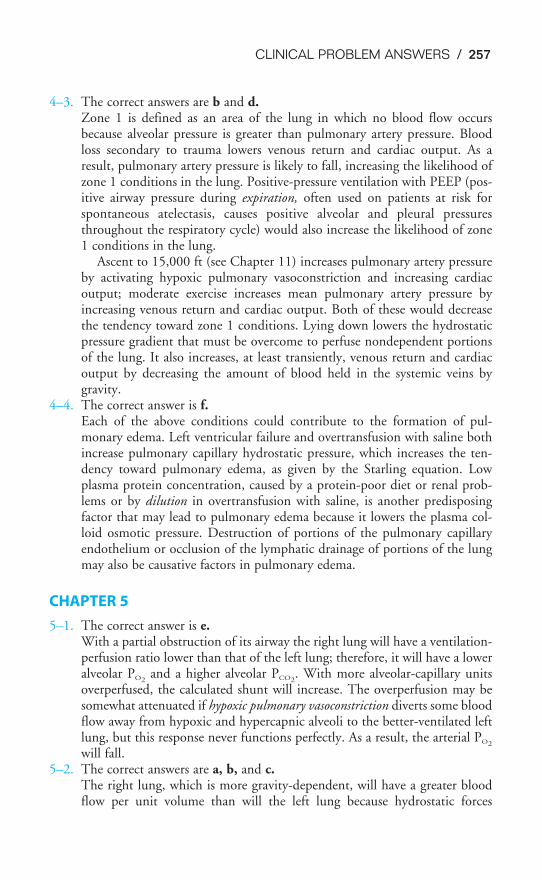
CLINICAL PROBLEM ANSWERS / 257
4–3. The correct answers are b and d.Zone 1 is defined as an area of the lung in which no blood flow occursbecause alveolar pressure is greater than pulmonary artery pressure. Bloodloss secondary to trauma lowers venous return and cardiac output. As aresult, pulmonary artery pressure is likely to fall, increasing the likelihood ofzone 1 conditions in the lung. Positive-pressure ventilation with PEEP (pos-itive airway pressure during expiration, often used on patients at risk forspontaneous atelectasis, causes positive alveolar and pleural pressuresthroughout the respiratory cycle) would also increase the likelihood of zone1 conditions in the lung.
Ascent to 15,000 ft (see Chapter 11) increases pulmonary artery pressureby activating hypoxic pulmonary vasoconstriction and increasing cardiacoutput; moderate exercise increases mean pulmonary artery pressure byincreasing venous return and cardiac output. Both of these would decreasethe tendency toward zone 1 conditions. Lying down lowers the hydrostaticpressure gradient that must be overcome to perfuse nondependent portionsof the lung. It also increases, at least transiently, venous return and cardiacoutput by decreasing the amount of blood held in the systemic veins bygravity.
4–4. The correct answer is f.Each of the above conditions could contribute to the formation of pul-monary edema. Left ventricular failure and overtransfusion with saline bothincrease pulmonary capillary hydrostatic pressure, which increases the ten-dency toward pulmonary edema, as given by the Starling equation. Lowplasma protein concentration, caused by a protein-poor diet or renal prob-lems or by dilution in overtransfusion with saline, is another predisposingfactor that may lead to pulmonary edema because it lowers the plasma col-loid osmotic pressure. Destruction of portions of the pulmonary capillaryendothelium or occlusion of the lymphatic drainage of portions of the lungmay also be causative factors in pulmonary edema.
CHAPTER 5
5–1. The correct answer is e.With a partial obstruction of its airway the right lung will have a ventilation-perfusion ratio lower than that of the left lung; therefore, it will have a loweralveolar PO2
and a higher alveolar PCO2. With more alveolar-capillary units
overperfused, the calculated shunt will increase. The overperfusion may besomewhat attenuated if hypoxic pulmonary vasoconstriction diverts some bloodflow away from hypoxic and hypercapnic alveoli to the better-ventilated leftlung, but this response never functions perfectly. As a result, the arterial PO2
will fall.5–2. The correct answers are a, b, and c.
The right lung, which is more gravity-dependent, will have a greater bloodflow per unit volume than will the left lung because hydrostatic forces
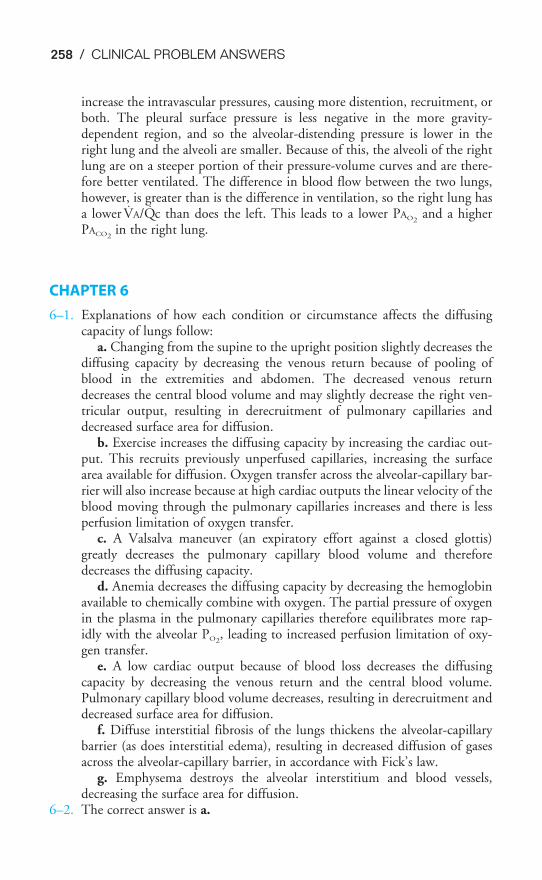
258 / CLINICAL PROBLEM ANSWERS
increase the intravascular pressures, causing more distention, recruitment, orboth. The pleural surface pressure is less negative in the more gravity-dependent region, and so the alveolar-distending pressure is lower in theright lung and the alveoli are smaller. Because of this, the alveoli of the rightlung are on a steeper portion of their pressure-volume curves and are there-fore better ventilated. The difference in blood flow between the two lungs,however, is greater than is the difference in ventilation, so the right lung hasa lower V̇A/Q̇c than does the left. This leads to a lower PAO2
and a higherPACO2
in the right lung.
CHAPTER 6
6–1. Explanations of how each condition or circumstance affects the diffusingcapacity of lungs follow:
a. Changing from the supine to the upright position slightly decreases thediffusing capacity by decreasing the venous return because of pooling ofblood in the extremities and abdomen. The decreased venous returndecreases the central blood volume and may slightly decrease the right ven-tricular output, resulting in derecruitment of pulmonary capillaries anddecreased surface area for diffusion.
b. Exercise increases the diffusing capacity by increasing the cardiac out-put. This recruits previously unperfused capillaries, increasing the surfacearea available for diffusion. Oxygen transfer across the alveolar-capillary bar-rier will also increase because at high cardiac outputs the linear velocity of theblood moving through the pulmonary capillaries increases and there is lessperfusion limitation of oxygen transfer.
c. A Valsalva maneuver (an expiratory effort against a closed glottis)greatly decreases the pulmonary capillary blood volume and thereforedecreases the diffusing capacity.
d. Anemia decreases the diffusing capacity by decreasing the hemoglobinavailable to chemically combine with oxygen. The partial pressure of oxygenin the plasma in the pulmonary capillaries therefore equilibrates more rap-idly with the alveolar PO2
, leading to increased perfusion limitation of oxy-gen transfer.
e. A low cardiac output because of blood loss decreases the diffusingcapacity by decreasing the venous return and the central blood volume.Pulmonary capillary blood volume decreases, resulting in derecruitment anddecreased surface area for diffusion.
f. Diffuse interstitial fibrosis of the lungs thickens the alveolar-capillarybarrier (as does interstitial edema), resulting in decreased diffusion of gasesacross the alveolar-capillary barrier, in accordance with Fick’s law.
g. Emphysema destroys the alveolar interstitium and blood vessels,decreasing the surface area for diffusion.
6–2. The correct answer is a.
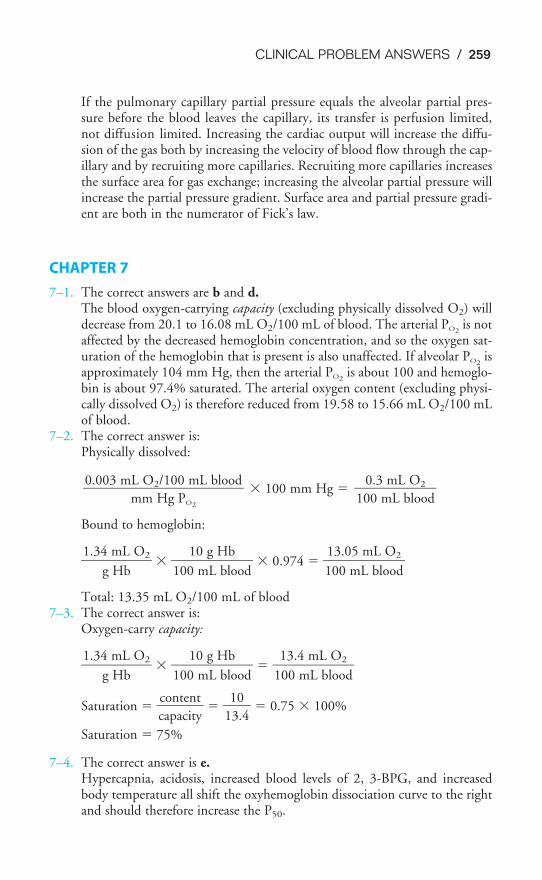
CLINICAL PROBLEM ANSWERS / 259
If the pulmonary capillary partial pressure equals the alveolar partial pres-sure before the blood leaves the capillary, its transfer is perfusion limited,not diffusion limited. Increasing the cardiac output will increase the diffu-sion of the gas both by increasing the velocity of blood flow through the cap-illary and by recruiting more capillaries. Recruiting more capillaries increasesthe surface area for gas exchange; increasing the alveolar partial pressure willincrease the partial pressure gradient. Surface area and partial pressure gradi-ent are both in the numerator of Fick’s law.
CHAPTER 7
7–1. The correct answers are b and d.The blood oxygen-carrying capacity (excluding physically dissolved O2) willdecrease from 20.1 to 16.08 mL O2/100 mL of blood. The arterial PO2
is notaffected by the decreased hemoglobin concentration, and so the oxygen sat-uration of the hemoglobin that is present is also unaffected. If alveolar PO2
isapproximately 104 mm Hg, then the arterial PO2
is about 100 and hemoglo-bin is about 97.4% saturated. The arterial oxygen content (excluding physi-cally dissolved O2) is therefore reduced from 19.58 to 15.66 mL O2/100 mLof blood.
7–2. The correct answer is:Physically dissolved:
� 100 mm Hg �
Bound to hemoglobin:
�1.34
g
m
H
L
b
O2� � �
100
10
m
g
L
H
bl
b
ood� � 0.974 � �
1
1
0
3
0
.0
m
5
L
m
b
L
lo
O
o
2
d�
Total: 13.35 mL O2/100 mL of blood7–3. The correct answer is:
Oxygen-carry capacity:
�1.34
g
m
H
L
b
O2� � �
100
10
m
g
L
H
bl
b
ood� � �
1
1
0
3
0
.4
m
m
L
L
bl
O
oo
2
d�
Saturation � �c
c
a
o
p
n
a
t
c
e
i
n
ty
t� � �
1
1
3
0
.4� � 0.75 � 100%
Saturation � 75%
7–4. The correct answer is e.Hypercapnia, acidosis, increased blood levels of 2, 3-BPG, and increasedbody temperature all shift the oxyhemoglobin dissociation curve to the rightand should therefore increase the P50.
0.3 mL O2��100 mL blood
0.003 mL O2/100 mL blood���
mm Hg PO2
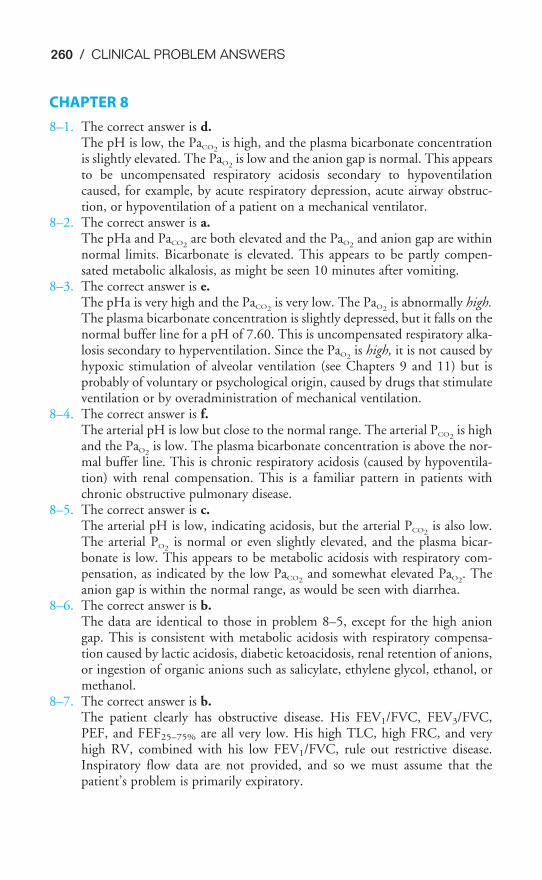
260 / CLINICAL PROBLEM ANSWERS
CHAPTER 8
8–1. The correct answer is d.The pH is low, the PaCO2
is high, and the plasma bicarbonate concentrationis slightly elevated. The PaO2
is low and the anion gap is normal. This appearsto be uncompensated respiratory acidosis secondary to hypoventilationcaused, for example, by acute respiratory depression, acute airway obstruc-tion, or hypoventilation of a patient on a mechanical ventilator.
8–2. The correct answer is a.The pHa and PaCO2
are both elevated and the PaO2and anion gap are within
normal limits. Bicarbonate is elevated. This appears to be partly compen-sated metabolic alkalosis, as might be seen 10 minutes after vomiting.
8–3. The correct answer is e.The pHa is very high and the PaCO2
is very low. The PaO2is abnormally high.
The plasma bicarbonate concentration is slightly depressed, but it falls on thenormal buffer line for a pH of 7.60. This is uncompensated respiratory alka-losis secondary to hyperventilation. Since the PaO2
is high, it is not caused byhypoxic stimulation of alveolar ventilation (see Chapters 9 and 11) but isprobably of voluntary or psychological origin, caused by drugs that stimulateventilation or by overadministration of mechanical ventilation.
8–4. The correct answer is f.The arterial pH is low but close to the normal range. The arterial PCO2
is highand the PaO2
is low. The plasma bicarbonate concentration is above the nor-mal buffer line. This is chronic respiratory acidosis (caused by hypoventila-tion) with renal compensation. This is a familiar pattern in patients withchronic obstructive pulmonary disease.
8–5. The correct answer is c.The arterial pH is low, indicating acidosis, but the arterial PCO2
is also low.The arterial PO2
is normal or even slightly elevated, and the plasma bicar-bonate is low. This appears to be metabolic acidosis with respiratory com-pensation, as indicated by the low PaCO2
and somewhat elevated PaO2. The
anion gap is within the normal range, as would be seen with diarrhea.8–6. The correct answer is b.
The data are identical to those in problem 8–5, except for the high aniongap. This is consistent with metabolic acidosis with respiratory compensa-tion caused by lactic acidosis, diabetic ketoacidosis, renal retention of anions,or ingestion of organic anions such as salicylate, ethylene glycol, ethanol, ormethanol.
8–7. The correct answer is b.The patient clearly has obstructive disease. His FEV1/FVC, FEV3/FVC,PEF, and FEF25–75% are all very low. His high TLC, high FRC, and veryhigh RV, combined with his low FEV1/FVC, rule out restrictive disease.Inspiratory flow data are not provided, and so we must assume that thepatient’s problem is primarily expiratory.
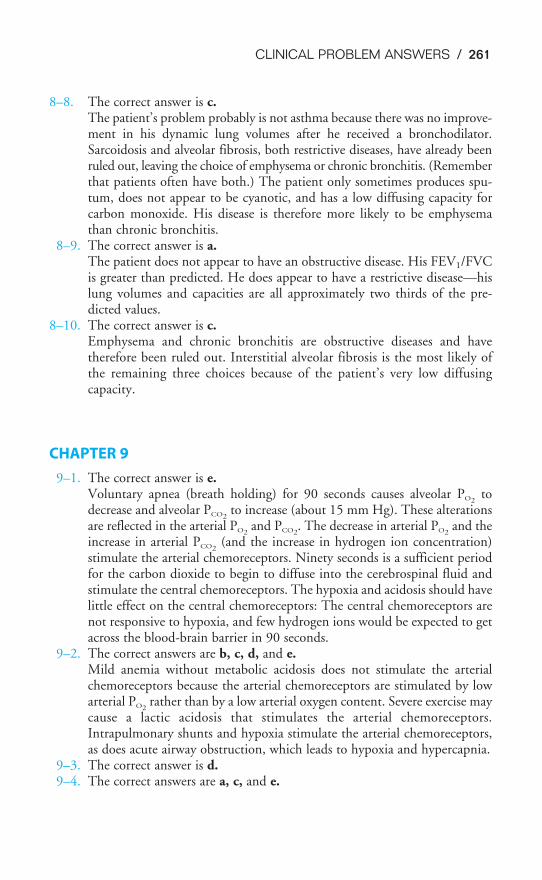
CLINICAL PROBLEM ANSWERS / 261
8–8. The correct answer is c.The patient’s problem probably is not asthma because there was no improve-ment in his dynamic lung volumes after he received a bronchodilator.Sarcoidosis and alveolar fibrosis, both restrictive diseases, have already beenruled out, leaving the choice of emphysema or chronic bronchitis. (Rememberthat patients often have both.) The patient only sometimes produces spu-tum, does not appear to be cyanotic, and has a low diffusing capacity forcarbon monoxide. His disease is therefore more likely to be emphysemathan chronic bronchitis.
8–9. The correct answer is a.The patient does not appear to have an obstructive disease. His FEV1/FVCis greater than predicted. He does appear to have a restrictive disease—hislung volumes and capacities are all approximately two thirds of the pre-dicted values.
8–10. The correct answer is c.Emphysema and chronic bronchitis are obstructive diseases and havetherefore been ruled out. Interstitial alveolar fibrosis is the most likely ofthe remaining three choices because of the patient’s very low diffusingcapacity.
CHAPTER 9
9–1. The correct answer is e.Voluntary apnea (breath holding) for 90 seconds causes alveolar PO2
todecrease and alveolar PCO2
to increase (about 15 mm Hg). These alterationsare reflected in the arterial PO2
and PCO2. The decrease in arterial PO2
and theincrease in arterial PCO2
(and the increase in hydrogen ion concentration)stimulate the arterial chemoreceptors. Ninety seconds is a sufficient periodfor the carbon dioxide to begin to diffuse into the cerebrospinal fluid andstimulate the central chemoreceptors. The hypoxia and acidosis should havelittle effect on the central chemoreceptors: The central chemoreceptors arenot responsive to hypoxia, and few hydrogen ions would be expected to getacross the blood-brain barrier in 90 seconds.
9–2. The correct answers are b, c, d, and e.Mild anemia without metabolic acidosis does not stimulate the arterialchemoreceptors because the arterial chemoreceptors are stimulated by lowarterial PO2
rather than by a low arterial oxygen content. Severe exercise maycause a lactic acidosis that stimulates the arterial chemoreceptors.Intrapulmonary shunts and hypoxia stimulate the arterial chemoreceptors,as does acute airway obstruction, which leads to hypoxia and hypercapnia.
9–3. The correct answer is d.9–4. The correct answers are a, c, and e.
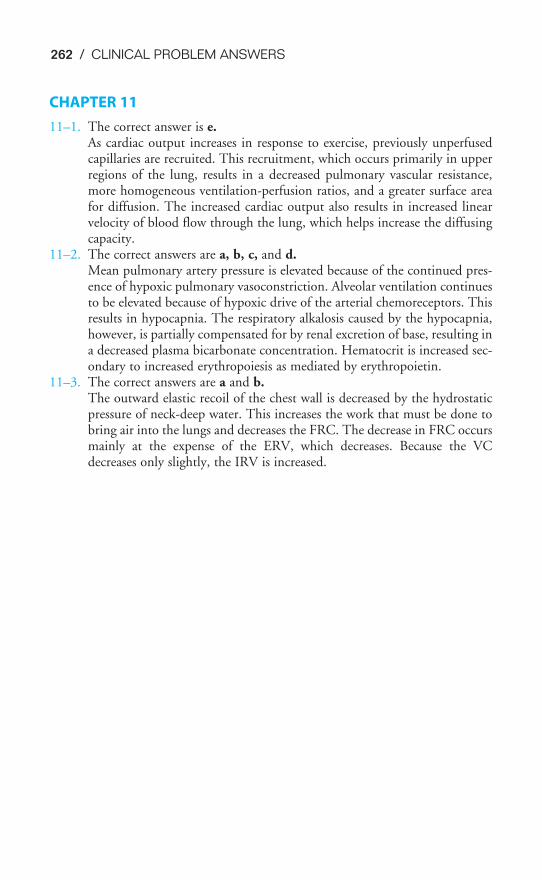
262 / CLINICAL PROBLEM ANSWERS
CHAPTER 11
11–1. The correct answer is e.As cardiac output increases in response to exercise, previously unperfusedcapillaries are recruited. This recruitment, which occurs primarily in upperregions of the lung, results in a decreased pulmonary vascular resistance,more homogeneous ventilation-perfusion ratios, and a greater surface areafor diffusion. The increased cardiac output also results in increased linearvelocity of blood flow through the lung, which helps increase the diffusingcapacity.
11–2. The correct answers are a, b, c, and d.Mean pulmonary artery pressure is elevated because of the continued pres-ence of hypoxic pulmonary vasoconstriction. Alveolar ventilation continuesto be elevated because of hypoxic drive of the arterial chemoreceptors. Thisresults in hypocapnia. The respiratory alkalosis caused by the hypocapnia,however, is partially compensated for by renal excretion of base, resulting ina decreased plasma bicarbonate concentration. Hematocrit is increased sec-ondary to increased erythropoiesis as mediated by erythropoietin.
11–3. The correct answers are a and b.The outward elastic recoil of the chest wall is decreased by the hydrostaticpressure of neck-deep water. This increases the work that must be done tobring air into the lungs and decreases the FRC. The decrease in FRC occursmainly at the expense of the ERV, which decreases. Because the VCdecreases only slightly, the IRV is increased.
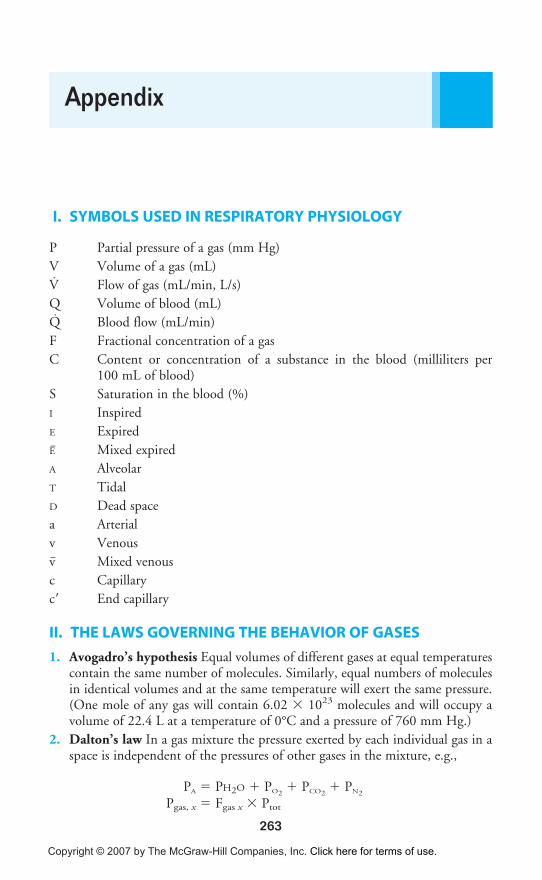
263
I. SYMBOLS USED IN RESPIRATORY PHYSIOLOGY
P Partial pressure of a gas (mm Hg)
V Volume of a gas (mL)
V̇ Flow of gas (mL/min, L/s)
Q Volume of blood (mL)
Q̇ Blood flow (mL/min)
F Fractional concentration of a gas
C Content or concentration of a substance in the blood (milliliters per100 mL of blood)
S Saturation in the blood (%)
I Inspired
E Expired
E� Mixed expired
A Alveolar
T Tidal
D Dead space
a Arterial
v Venous
v� Mixed venous
c Capillary
c� End capillary
II. THE LAWS GOVERNING THE BEHAVIOR OF GASES
1. Avogadro’s hypothesis Equal volumes of different gases at equal temperaturescontain the same number of molecules. Similarly, equal numbers of moleculesin identical volumes and at the same temperature will exert the same pressure.(One mole of any gas will contain 6.02 � 1023 molecules and will occupy avolume of 22.4 L at a temperature of 0°C and a pressure of 760 mm Hg.)
2. Dalton’s law In a gas mixture the pressure exerted by each individual gas in aspace is independent of the pressures of other gases in the mixture, e.g.,
PA � PH2O � PO2� PCO2
� PN2
Pgas, x � Fgas x � Ptot
Appendix
Copyright © 2007 by The McGraw-Hill Companies, Inc. Click here for terms of use.
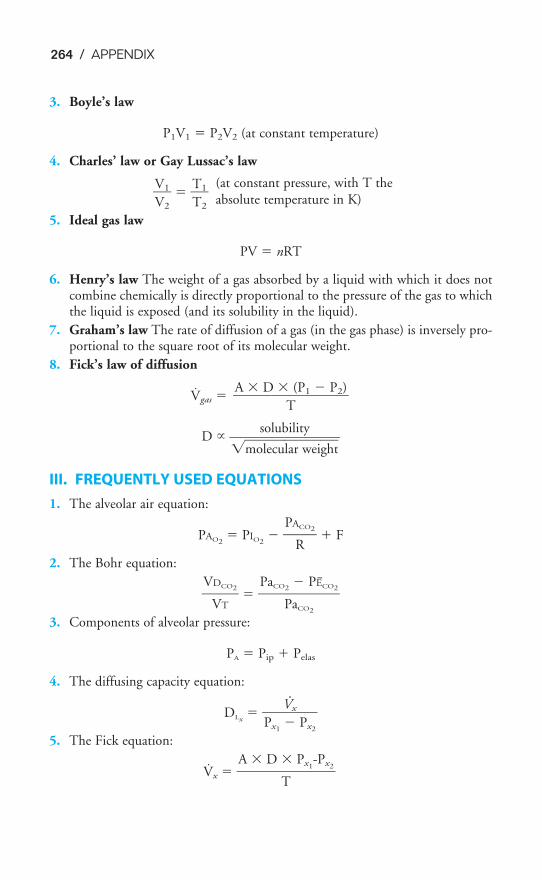
264 / APPENDIX
3. Boyle’s law
P1V1 � P2V2 (at constant temperature)
4. Charles’ law or Gay Lussac’s law
�V
V1
2
� � �T
T1
2
�
5. Ideal gas law
PV � nRT
6. Henry’s law The weight of a gas absorbed by a liquid with which it does notcombine chemically is directly proportional to the pressure of the gas to whichthe liquid is exposed (and its solubility in the liquid).
7. Graham’s law The rate of diffusion of a gas (in the gas phase) is inversely pro-portional to the square root of its molecular weight.
8. Fick’s law of diffusion
V̇gas �
D ���mo
s
l
o
e
l
c
u
u�b
la
il
r
it
w
y
ei�ght��
III. FREQUENTLY USED EQUATIONS
1. The alveolar air equation:
PAO2� PIO2
� �PA
R
CO2� � F
2. The Bohr equation:
�V
V
DC
T
O2� � �
PaCO
P
2
a
�
CO
P
2
E�CO2�
3. Components of alveolar pressure:
PA � Pip � Pelas
4. The diffusing capacity equation:
DLx� �
Px1
V
�x
Px2
�
5. The Fick equation:
V̇x ��A � D �
T
Px1-Px2
�
A � D � (P1 � P2)���
T
(at constant pressure, with T theabsolute temperature in K)
·
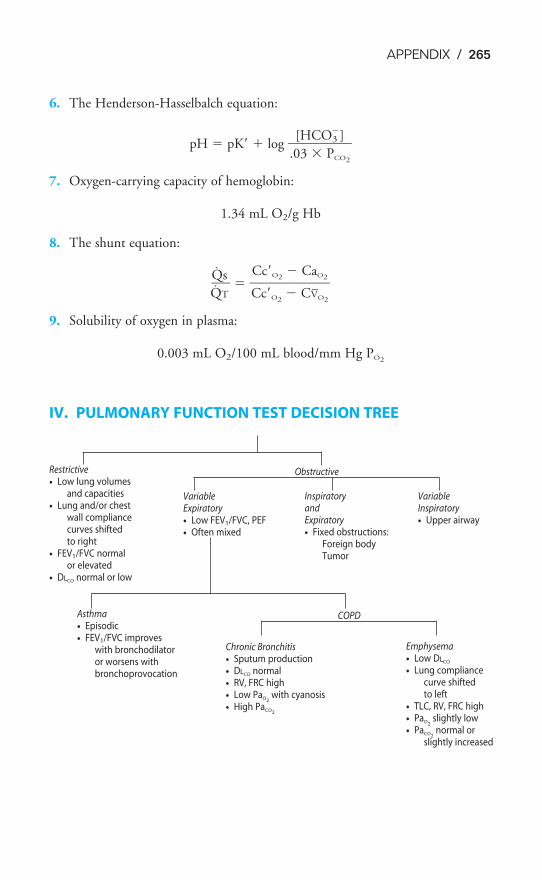
APPENDIX / 265
6. The Henderson-Hasselbalch equation:
pH � pK� � log �.0
[H
3 �
CO
P3�
CO
]
2
�
7. Oxygen-carrying capacity of hemoglobin:
1.34 mL O2/g Hb
8. The shunt equation:
�̇Q
Q̇
T
s� � �
C
C
c
c
�
�
O
O
2
2
�
�
C
C
V
a
�
O
O
2
2
�
9. Solubility of oxygen in plasma:
0.003 mL O2/100 mL blood/mm Hg PO2
IV. PULMONARY FUNCTION TEST DECISION TREE
Restrictive
• Low lung volumesand capacities
• Lung and/or chest wall compliancecurves shiftedto right
• FEV1/FVC normalor elevated
• DLCO normal or low
Obstructive
COPDAsthma
• Episodic
• FEV1/FVC improves with bronchodilatoror worsens withbronchoprovocation
VariableExpiratory
• Low FEV1/FVC, PEF
• Often mixed
VariableInspiratory
• Upper airway
InspiratoryandExpiratory
• Fixed obstructions:Foreign bodyTumor
Chronic Bronchitis
• Sputum production
• DLCO normal
• RV, FRC high
• Low PaO2with cyanosis
• High PaCO2
Emphysema
• Low DLCO
• Lung compliancecurve shifted to left
• TLC, RV, FRC high
• PaO2slightly low
• PaCO2normal or
slightly increased
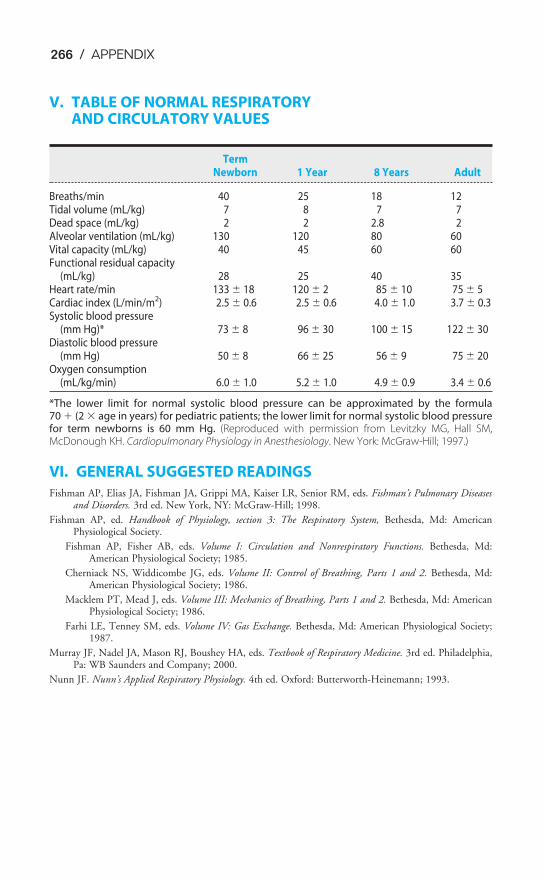
266 / APPENDIX
V. TABLE OF NORMAL RESPIRATORY AND CIRCULATORY VALUES
TermNewborn 1 Year 8 Years Adult
Breaths/min 40 25 18 12Tidal volume (mL/kg) 7 8 7 7Dead space (mL/kg) 2 2 2.8 2Alveolar ventilation (mL/kg) 130 120 80 60Vital capacity (mL/kg) 40 45 60 60Functional residual capacity
(mL/kg) 28 25 40 35Heart rate/min 133 � 18 120 � 2 85 � 10 75 � 5Cardiac index (L/min/m2) 2.5 � 0.6 2.5 � 0.6 4.0 � 1.0 3.7 � 0.3Systolic blood pressure
(mm Hg)* 73 � 8 96 � 30 100 � 15 122 � 30Diastolic blood pressure
(mm Hg) 50 � 8 66 � 25 56 � 9 75 � 20Oxygen consumption
(mL/kg/min) 6.0 � 1.0 5.2 � 1.0 4.9 � 0.9 3.4 � 0.6
*The lower limit for normal systolic blood pressure can be approximated by the formula70 � (2 � age in years) for pediatric patients; the lower limit for normal systolic blood pressurefor term newborns is 60 mm Hg. (Reproduced with permission from Levitzky MG, Hall SM,McDonough KH. Cardiopulmonary Physiology in Anesthesiology. New York: McGraw-Hill; 1997.)
VI. GENERAL SUGGESTED READINGS
Fishman AP, Elias JA, Fishman JA, Grippi MA, Kaiser LR, Senior RM, eds. Fishman’s Pulmonary Diseasesand Disorders. 3rd ed. New York, NY: McGraw-Hill; 1998.
Fishman AP, ed. Handbook of Physiology, section 3: The Respiratory System, Bethesda, Md: AmericanPhysiological Society.
Fishman AP, Fisher AB, eds. Volume I: Circulation and Nonrespiratory Functions. Bethesda, Md:American Physiological Society; 1985.
Cherniack NS, Widdicombe JG, eds. Volume II: Control of Breathing, Parts 1 and 2. Bethesda, Md:American Physiological Society; 1986.
Macklem PT, Mead J, eds. Volume III: Mechanics of Breathing, Parts 1 and 2. Bethesda, Md: AmericanPhysiological Society; 1986.
Farhi LE, Tenney SM, eds. Volume IV: Gas Exchange. Bethesda, Md: American Physiological Society;1987.
Murray JF, Nadel JA, Mason RJ, Boushey HA, eds. Textbook of Respiratory Medicine. 3rd ed. Philadelphia,Pa: WB Saunders and Company; 2000.
Nunn JF. Nunn’s Applied Respiratory Physiology. 4th ed. Oxford: Butterworth-Heinemann; 1993.
267
abdominal muscles, actions of contraction and,17, 17f
absolute intrapulmonary shunts, 120accessory muscles of inspiration, 16
actions of contraction and, 17facclimatization
acute mountain sickness and, 239t, 238–240exercise and, 234–235physiologic stresses, 247
acetazolamide, acute mountain sickness and, 238acid-base balance, 2
exercise and, 233, 239renal and respiratory contributions, 178
acid-base disturbances, 179tacid-base paths, in vivo, 172facid-base status
clinical interpretation of, 178–181regulation of, 163–188
clinical problems, 185–188acidemia, 164acidity, quantification of, 164–165acidosis, 164
renal mechanisms in, 177acids, in body, sources of, 165–166acinus, 8, 8facute exercise, respiratory system, response,
233, 233tacute mountain sickness
ADH, 238cardiac output, 240prevention of, 238–240symptoms of, 235
acute respiratory distress syndrome, 28adenosine triphosphate (ATP), peripheral
chemoreceptors and, 207ADH. See antidiuretic hormoneadrenergic sympathetic fibers, stimulation of, 35aerobic metabolism, acids in body and, 165aerosol drugs, pulmonary circulation and, 224aging, respiratory system and, 81, 82fair volume, 18air-conditioning, pulmonary defense
mechanisms and, 217airflow, 18airway(s), 1, 6–8
active control of, 36tclosure, aging and, 81, 82f
lining of, 9pharyngeal dilator muscles and, 35, 47fpulmonary defense mechanisms and,
217–219, 218frestrictive diseases, 44secretions, pulmonary defense mechanisms
and, 219f, 220smooth muscle, irritants and, 35, 36tstructure of, 8–9
airways resistance, 32–49assessment of, 40–48clinical problems and, 51distribution of, 35low lung volumes and, 37
alkalemia, 164alkalosis, 164, 171–176
renal mechanisms in, 178alpha1 antitrypsin, pulmonary defense
mechanisms and, 221altitude, high. See also acute mountain sickness
acute effects of, 235breathing control at, 235–236cerebral hyperperfusion and edema and, 237exercise and, 234–235hypoventilation and, 182physiologic response, sea level control values
and, 239tphysiologic stresses, 247pulmonary edema and, 111
alveolar air equation, 75, 82, 264alveolar curve, blood flow resistance and, 5f, 93alveolar dead space, 128
Fowler’s method for, 67, 68falveolar ducts, 8alveolar elastic recoil
aging and, 81emphysema, 79
alveolar elastic recoil pressure, 39, 40, 43effects of, 40f
alveolar epithelial cells, types I and II, lung and,227
alveolar fibrosis, lung volumes and capacitiesand, 57, 57f
alveolar hypercapnia, 107alveolar hypoxia, 105
exercise and, pulmonary blood flow, 236PVR and, 99
Index
Copyright © 2007 by The McGraw-Hill Companies, Inc. Click here for terms of use.
268 / INDEX
alveolar interdependence, 28–29, 29falveolar macrophages, electron micrograph of,
221falveolar oxygen levels, 71–75alveolar Pco2
, calculation of, high altitude and,235
alveolar plateau, 66f, 67alveolar pressure, 18, 19, 20
body plethysmograph and, 40diffusion and, 132formula, 14mechanical positive-pressure ventilation, 95wall tension v., 24f, 25
alveolar sacs, 8alveolar septum, scanning electron micrograph
of, 6falveolar surface, 4alveolar units, structural interdependence of, 15falveolar ventilation (
.VA), 54–85, 65, 66,
71–75, 82, 113, 227alveolar gas tensions, predicted, 74fand arterial Pco2
, 214and carbon dioxide, 73–75exercise and, 229–230, 230, 233, 236measurement of, 67–71metabolic acidosis and, 176, 177and oxygen, 75regional distribution of, 75–79respiratory acidosis and, 172, 173t
alveolar vessels, lung volume and, 94, 94falveolar-arterial oxygen difference, 122–123
causes of, 123texercise and, 232
alveolar-capillary barrier, 131, 132, 135, 140diffusing capacity, 232diffusion through, exercise and, 237Fick’s law for diffusion and, 131gas transfer and, 133
alveolar-capillary diffusion, impairment, 182alveolar-capillary level, 113alveolar-capillary unit, gas exchange and, 4, 5f, 6falveoli, 19, 51
passive expansion of, 12schematic, surface tension and, 25fsurfactant metabolism in, 226f
American Medical Research Expedition, acutemountain sickness and, 240
amino acid sequences, globin subunits and, 144ammonium (NH4), acidosis and, 178AMP. See cyclic adenosine monophosphateanaphylactic shock, lung cells and, 226anastomoses, 88
anatomic dead space, 7, 65–67, 66f, 82exercise and, 229volume of, 67, 68f
anatomic shunts, 120anemia, oxygen transport and, 153, 154f–155fanemic hypoxia, 183, 184anesthesia, ventilatory carbon dioxide response
curves and, 203, 204fanesthetics
pulmonary circulation and, 224ventilatory carbon dioxide response curves
and, 203, 204fangiograms, nonuniform distribution of
pulmonary blood flow and, 119–120anion gap, 180–181, 184antidiuretic hormone (ADH)
acute mountain sickness and, 239diving and, 241
apnea, carbon dioxide and, 202apneusis, 194apneustic center, 191f, 194arterial baroreceptors, 201arterial blood
oxyhemoglobin dissociation curve, 152fpH scale, 164
arterial blood pressure, left atrium and, 91arterial catheter, vasoactive substances, 225arterial chemoreceptors, 200–201, 214
respiratory control system, negative-feedback system of, 205, 207f
arterial gas embolism, diving and, 245arterial hemoglobin concentration, acute
mountain sickness and, 240arterial hypercapnia, cerebrospinal fluid and, 207arterial hypocapnia, high altitude and, 235arterial oxygen tension, aging and, 81arterial Pco2
and V.
A, 214alveolar ventilation and, 214central chemoreceptors and, 209exercise and, 230hypoxia and, 210oxyhemoglobin dissociation curve and, 148,
149f–150f, 151arterial vessels, pulmonary vessels v., 89–90artificial blood, oxygen transport and, 156asthma, 44
respiratory alkalosis, 173–174atelectasis, 105atmospheric air, constituents of, 71–72ATP. See adenosine triphosphateAvogadro’s hypothesis, 263
INDEX / 269
barometric pressure, alveolar gas and, 73base deficit, 179base excess, 179bases, chemistry of, 163–166bicarbonate
carbon dioxide transport and, 158cerebrospinal fluid and, 207hydrogen ion and, 210
bicarbonate buffer system, 167–169, 171bicarbonate ions, acidosis, 1772,3-bisphosphoglycerate, oxyhemoglobin disso-
ciation curve and, 148, 149f–150f, 151blood
buffers of, 167carbon dioxide transport by, 156–158oxygen transport in, 142–158
blood flow, to lung, 86–112blood flow resistance, pulmonary vessels and,
89–90blood gas analyzers, 178blood gas set, interpreting, 179blood gases, clinical interpretation of,
178–181blood oxygen content, hemoglobin and, 145blood pressure
arterial baroreceptors, 201pulmonary arteries and, 87, 88fsystemic, 91, 92
blood-brain barrier, central chemoreceptorsand, 207, 208f
blood-gas barrier, Fick law for diffusion and,131–132
body plethysmographalveolar pressure and, 40lung volumes and, 59, 63–65
body temperature and ambient pressure andsaturated water vapor (BTPS), lung volumes, 55
Bohr effectcarbon dioxide dissociation curves and, 159,
160fexercise and, 233
Bohr equation, for physiologic dead space,69–71, 122
bone, buffer system, 171Bötzinger complex, 194Boyle’s law, 264
body plethysmograph, 63BTPS. See body temperature and ambient pres-
sure and saturated water vaporbradycardia, diving reflex and, 242bradykinin, lung cells and, 226
braincarbon dioxide levels, cerebrospinal fluid
and, 207hypoventilation and, 182
brain centers, spontaneous rhythmicity and,201–202
brainstembreathing and, 191, 191frespiratory control system, negative-
feedback system of, 205, 207frespiratory control system and, 190, 190f
breath-hold dive, 241breathing
brainstem and, 191, 191fcontrol, 189–215
clinical problems, 214exercise and, 229, 235–236
events during, 17–20, 18tfrequencies
determination of, 190dynamic compliance and, 48, 48f, 49
mechanics, 11–53diving and, 241exercise and, 229, 236scuba diving and, 243f, 244
nitrogen-washout test and, 118, 118fwork of, 49–50
bronchial arteries, 87bronchial blood flow, 86bronchial circulation
anatomic features of, 88, 89fblood flow in, 87–89
bronchial smooth muscle, control of, 35bronchiolar epithelium, pulmonary defense
mechanisms and, 219fbronchiolar wall, 9bronchioles, 8bronchitis, 44bronchoalveolar pulmonary defense mecha-
nisms, 221, 222fbronchoconstriction, anatomic dead space
and, 71bronchodilation, arterial baroreceptors and, 201buffer curves, plasma of blood, 170fbuffer systems, of human body, 166–171buffer value, 166buffers
of blood, 167chemistry of, 163–166
capillary endothelium, 5–8pulmonary edema, 108
270 / INDEX
capillary hydrostatic pressure, pulmonary edemaand, 109
capillary transit time, lung and, 103capnograph, normal, 70fcarbamino compounds, 157–158, 161carbaminohemoglobin, 158carbon dioxide, 1, 2
alveolar ventilation and, 73–75exercise and, 228levels, 71–75metabolic production of, 204response to, 202–209
carbon dioxide dissociation curves, 158–159for whole blood, 157, 157f
carbon dioxide transportby blood, 156–158
exercise and, 232–233clinical problems, 161–162exercise and, 237, 239t
carbon monoxidediffusing capacity and, 139oxygen transport and, 153, 154f–155fpartial pressure changes in, 134f
carbonic acidacidosis and, 177acids in body and, 165, 166
carbonic anhydrase, carbon dioxide transportand, 158
carboxyhemoglobin (COHb), carbon monoxideand, 153
cardiac bypass, pulmonary capillary filtrationand, 223–224
cardiac output, 90acute mountain sickness and, 240exercise and, 95, 143, 229measurement of, 100–102
cardiovascular systemdiving reflex and, 242, 243frespiratory reflexes from, 200–201
carotid body, peripheral chemoreceptors and, 207catecholamines, PVR and, 99cellular metabolism, acids in body and, 165central chemoreceptors, 207–209, 214
respiratory control system, negative-feedback system of, 205, 207f
central nervous system, 1neural pathways and, 9
central tendon, inspiratory muscles and, 14, 16fcerebral circulation, exercise and, 237cerebral cortex, breathing and, 190cerebral edema, acute mountain sickness and,
238
cerebral hyperperfusion and edema, altitudeand, 237
cerebrospinal fluidacute mountain sickness and, 238breathing control and, 236composition of, 207, 208f
Charles’ law, 264chemical irritants, reflex constriction of airway
and, 35chemical mediator, pulmonary surfactant secre-
tion and, 225chemical substrates, lungs and, uptake or con-
version by, 224, 225, 225tchemoreceptors, metabolic acidosis and, 172f, 176chest wall, 1
compliance, 20–23clinical evaluation of, 21–29
lung and, interaction of, 13fmuscles of, 9primary components of, 10fstatic pressure-volume curves, 30f
cholinergic parasympathetic postganglionicfibers, stimulation of, 35
chronic obstructive pulmonary disease, ventila-tory carbon dioxide response curves and,203, 204f
cilia, pulmonary defense mechanisms and, 219f,220
Clara cells, 9clinical problems
acid-base status and, regulation of, 185–188
airways resistance, 51alveolar pressure, 52alveolar ventilation, 84answers to, 250–262barometric pressure, 84blood flow to lungs, 111–112body plethysmograph, 83breathing control, 214carbon dioxide transport, 161–162diffusion of gases in, 140–141dyspnea, 83forced expiration, pulmonary mechanics
during, 52FRC, spirometry and, 83oxygen transport, 161–162pulmonary compliance curve, 51radioactive gas, 84respiratory system, under stress, 247small airways, 52ventilation-perfusion and, 128
INDEX / 271
closing capacity, 81closing volume, 79–81
emphysema and, 39COHb. See carboxyhemoglobincompliance, 21components of alveolar pressure equation, 264conducting zone, 7conjugate base, 164constant surface tension, 25corner vessel, 94cough, pulmonary defense mechanisms and,
218–219critical opening pressure, 95crura, 14cyanosis, oxygen transport and, 156cyclic adenosine monophosphate (AMP),
pulmonary surfactant secretion and, 225
Dalton’s law, 263diving and, 241gas mixture and, 71
dead space volume (VD), 66decompression chamber, acute mountain
sickness and, 240decompression illness, diving and, 245–246deoxyhemoglobin, 161
carbamino compounds and, 158derecruitment, of pulmonary capillaries, 96diabetic ketoacidosis, 166diaphragm, 14diarrhea, metabolic acidosis and, 175diffusing capacity
alveolar capillary barrier and, 232conditions decreasing, 139, 140tmeasurement of, 137–140
diffusing capacity equation, 264diffusion
through alveolar-capillary barrier, exerciseand, 237
of carbon dioxide, 137gas exchange and, 113of gases, 130–141
clinical problems, 140–141limitation, 133–134, 134f, 140
diffusion impairment and, 136f, 232of oxygen, 135–137
dissociation constant, 166–167distention, 96–97
PVR and, 96fdiving
breathing control, 244breathing mechanics in, 241, 244
depth and, hazards in, 245–247physical principles of, 240–241physiologic stresses, 247pulmonary blood flow and, immersion to
neck, 242respiratory system and, 240–247
diving reflex, 242, 243fdorsal respiratory groups (DRG), 192–193, 193fDRG. See dorsal respiratory groupsdrug absorption, pulmonary circulation and, 224drugs. See also specific drug
peripheral chemoreceptors and, 207pH and, 165
dynamic compliance, 22breathing rate and, 48–49
dynamic compressionof airways, 37–40, 37fforced expiration and, 51
dynes, surface tension and, 23dyspnea, 16
pulmonary vascular receptors and, 199stimuli causing, 200, 200t
ECF. See extracellular fluidedema fluid, pulmonary edema and, 108elastic work of breathing, 49, 50emphysema, 44
alveolar elastic recoil and, 79closing volume and, 39
endoperoxides, lung cells and, 226endorphins, ventilatory carbon dioxide response
curves and, 203, 204fendothelium, PVR and, 99end-tidal CO2, 70, 70feosinophil chemotactic factors, pulmonary
surfactant secretion and, 225epidermal growth factor, pulmonary surfactant
secretion and, 225epinephrine
metabolism of, 224, 225tPVR and, 99
equal pressure point hypothesis, 39, 43equations, frequently used, 264–265ERV. See expiratory reserve volumeerythrocytes
oxygen and, 135pulmonary capillary and, 5, 7f
exercise. See also acute exerciseV.A and, 229–230
acute effects of, 229–233altitude and, 234–235breathing and, 229, 235–236
272 / INDEX
exercise (Cont.):carbon dioxide transport and, 237, 239tcardiac output during, 95, 143, 229diffusion and, 237lactic acid and, 228, 233lactic acidosis and, 211lung blood flow and, 102–103oxygen demand, 143physiologic stresses, 228pulmonary capillary and, 137respiratory system and, 228–234training, 234ventilatory response to, 211–213, 212tV̇/Q̇ ratio and, 126f, 230–231, 231f
expiration. See also forced expirationairways resistance during, 40anatomic dead space and, 65, 66fhigher brain centers and, 201
expiration cyclebreathing and, 189DRG and, 192
expiratory flow-volume curves, obstruction and, 47fexpiratory muscles, 16–17expiratory neurons, 191expiratory reserve volume (ERV), 56external intercostals, 15–16extraalveolar vessels
intrapleural pressure and, 93lung volume and, 94, 94f
extracellular fluid (ECF), 180extrathoracic obstructions, 48extravascular pressure, gravity v., lung zones in,
104–105, 105f
FEF25–75%. See forced mid-expiratory flow rateferrous iron atom, hemoglobin and, 143fetal hemoglobin (HbF), 144
oxygen affinity of, 154f, 155FEV1/FVC, 41fibrosis, 23Fick equation, 264Fick principle, total pulmonary blood flow and,
100Fick’s law for diffusion, 130–132, 133, 232, 264
alveolar-capillary barrier, 131filtered material
pulmonary circulation and, 223–224removal of, pulmonary defense mechanisms
and, 218–220filtration
inspired air and, pulmonary defense mechanisms and, 217–218
respiratory tract and, pulmonary defensemechanisms and, 217
fixed obstructions, 46, 47fflow-volume curves, 44, 45f, 46, 48
maximal expiratory, 46fobstructive and restrictive diseases, 46f
flow-volume loops, 46fluid exchange, pulmonary circulation and, 224forced expiration, 38f, 39, 46, 47f
dynamic compression and, 51resistive work of breathing and, 50
forced mid-expiratory flow rate (FEF25–75%), 41forced vital capacity (FVC), spirometer and,
41, 42fFowler’s method, anatomic dead space and,
67, 68fFRC. See functional residual capacityfunctional pulmonary capillaries, 6f, 87functional residual capacity (FRC), 23, 29, 50,
51, 55f, 56alveoli and, 82body plethysmograph, 83, 84body positions and, 31, 31f, 32clinical problems and, 83helium-dilution technique, 61infants, Hering-Breuer deflation reflex, 196pleural surface pressure gradient, 77fspirometry and, clinical problems, 83
FVC. See forced vital capacity
gas bubbles, diving and, 245, 246gas exchange, 2, 3f, 142–162
alveolar-capillary unit and, 4, 5f, 6fbarrier to, 6, 7fdiffusion and, 113diving and, 242–244ventilation and perfusion, 128
gas transfer, 130limitations in, 133–135
gases, laws governing, 263–264gastric juice, metabolic alkalosis and, 176Gay Lussac’s law, 264glomus cells, peripheral chemoreceptors and, 207glossopharyngeal nerve. See ninth cranial nerveglucocorticoids, pulmonary surfactant secretion
and, 225, 225tglucose, acids in body and, 165Graham’s law, 132, 264gravity
extravascular pressure v., lung zones in,104–105, 105f
lung and, 125
INDEX / 273
pulmonary vascular smooth muscle, 97–98PVR and, 99
Haldane effect, carbon dioxide dissociationcurves, 158–159, 160f
Hb Kansas, oxygen affinity and, 155Hb Rainier, oxygen affinity and, 155Hb Seattle, oxygen affinity and, 155HbA. See hemoglobinHbF. See fetal hemoglobinheart rate
acute mountain sickness and, 240diving reflex and, 243f
helium-dilution technique, lung volumes and,59, 61, 62f
hemoglobin (HbA)bicarbonate buffer system and, 169oxygen and, chemical reaction of,
144–145oxygen transport and, 142–143oxyhemoglobin dissociation curve,
145–156protein buffering groups and, 170structure of, 143–144variants of, 155
hemoglobin S, 144Henderson-Hasselbalch equation, 167, 168,
178, 265Henry’s law, 131, 143, 264
diving and, 241, 245heparin, lung cells and, 226Hering-Breuer deflation reflex, 196Hering-Breuer inflation reflex, 195–196Hering-Breuer reflexes, 195–196
I cells and, 192heroin, pulmonary edema and, 111high-altitude pulmonary edema, 236–237high-pressure nervous syndrome (HPNS),
diving and, 246–247histamine
lung cells and, 226pulmonary surfactant secretion and, 225
histidine residues, protein buffering groups,170–171
histotoxic hypoxia, 183–184, 184HPNS. See high-pressure nervous syndromehydrogen ion
acidity and, 164–165acidosis, 177and arterial Pco2
, 209buffering, bone salts and, 171exercise and, 211, 233response to, 209–210, 209f
hypercapniacarbon dioxide and, 202hypoventilation and, 181–182pontine respiratory groups, 195PVR and, 99
hyperventilation, respiratory alkalosis and, 173,184
hyperventilation syndrome, 173, 174fhypocapnia, 238
respiratory alkalosis, 174hypoperfusion hypoxia, 183, 184hypothalamus, exercise and, 213hypoventilation, 181–182
respiratory acidosis and, 184hypoxemia, respiratory alkalosis, 174hypoxia
causes of, 181–184, 184classification of, 181t
effects of, 184hypoventilation and, 181–182response to, 210–211, 211fventilatory carbon dioxide response curves
and, 203, 203fhypoxic hypoxia, 181–183, 184hypoxic pulmonary vasoconstriction, 105–107
physiologic function of, 106–107, 107fhysteresis, 20f, 21
I cells, 192imidazole groups, protein buffering groups and,
170, 171indicator dilution technique, total pulmonary
blood flow and, 100infant respiratory distress syndrome, 28infants, FRC and, Hering-Breuer deflation
reflex and, 196inspiration, 11
higher brain centers and, 201pulmonary vessels during, 92–93, 93ftermination, apneusis and, 194
inspiration cyclebreathing, 189DRG and, 192
inspiration-expiration cycle, 213inspiratory capacity (IC), 55f, 56inspiratory cells, nucleus retroambigualis, 194inspiratory flow-volume curves, 46, 47f
obstruction and, 47finspiratory muscles, 14–16inspiratory neurons, 191–192
DRG and, 192, 193fNTS and, 192
274 / INDEX
inspiratory reserve volume (IRV), 56inspired air, filtration of, pulmonary defense
mechanisms and, 217–218inspired gas, nonuniform distribution of,
testing for, 116–125inspired particles, filtration of, pulmonary
defense mechanisms and, 217intercostal muscles, actions of contraction
and, 17finterferon, pulmonary defense mechanisms and,
221internal intercostal muscles, 17finterstitial colloid osmotic pressure, pulmonary
edema and, 110interstitial fluid, buffers of, 171interstitial hydrostatic pressure, pulmonary
edema and, 109intracellular buffering, 171intracranial pressure, acute mountain sickness
and, 238intrapleural pressure, high, 37, 38fintrapleural pressure gradient, effect of, 78, 79fintrapleural space, 12intrapulmonary arteriovenous shunts, 128
contributions of, 122exercise and, 231
intravascular pressures, in pulmonary circula-tion, systemic circulation v., 88f, 90
irritant receptors, 199IRV. See inspiratory reserve volumeisohydric principle, buffer pairs and, 167isoproterenol
metabolism of, 224, 225tpulmonary circulation and, 224
isovolumetric pressure-flow curve, 41, 43–44, 43f
J receptors. See pulmonary vascular receptorsjoints, respiratory reflexes from, 201
ketoacidosis, 181kidneys
alkalosis and, 178respiratory acidosis and, 177
Kölliker-Fuse nucleus, 191f, 195kyphoscoliosis, hypoventilation and, 182
lactic acid, exercise and, 228, 233lactic acidosis, 181
exercise and, 211lactoferrin, pulmonary defense mechanisms
and, 221laminar flow, 33, 33f, 34
Langmuir-Wilhelmy balance, surface tensionmeasurement, 26f
law of mass action, 166left atrium, arterial blood pressure and, 91left ventricle
mean arterial blood pressure and, 91, 92pulmonary circulation and, 222
leukotrienes, pulmonary surfactant secretionand, 225
low alveolar Po2, hypoxic hypoxia and, 181
lung(s), 1blood flow to, 86–112chest wall, 13fcompliance, 20–23
clinical evaluation of, 21–29diffusing capacity of, determining, 139elastic recoil of, 23–26loading oxygen in, 146lymphatic drainage of, 108metabolic functions of, 224–227, 227negative intrapleural pressure and, 12, 14nonrespiratory functions of, 216–227parenchyma, scanning electron micrograph
of, 5fpressure-volume relationships of, 20fregional
.V/Q
.differences and, 125–127
scansafter inhaled and infused markers, 123nonuniform distribution of pulmonary
blood flow and, 120regional pulmonary blood flow and,
102static pressure-volume curves, 30f
lung cells, substances produced by, formationand release of, 226
lung recoil pressure, 30, 30flung volume, 54–55
airways resistance and, 36–37, 36fblood flow resistance and, 93, 94fand capacities
patient positioning and, 57, 57fstandard, 55f
distribution, alterations of, 78–79higher, 37, 37fmeasurement of, 57–65PVR and, 92–95, 93f
lung zones. See Zones of lunglymphatic drainage, of lung, 108lymphatic insufficiency, pulmonary edema and,
110lysosomal enzymes, pulmonary surfactant
secretion and, 225
INDEX / 275
lysozymes, pulmonary defense mechanisms and,221
lytic enzymes, pulmonary circulation and, 223
macroaggregates of albuminnonuniform distribution of pulmonary
blood flow and, 120regional pulmonary blood flow and, 102
macrophages, terminal respiratory units and,220–221
maldistribution of ventilation, 117maximum ventilation, exercise training, 234maximum voluntary ventilation test (MVV
test), 201Mb. See myoglobinmean arterial blood pressure
exercise and, 95left ventricle and, 91
mean pulmonary artery pressure (MPAP)decreased PVR and, 97fPVR and, 90
mechanical positive-pressure ventilation, alveo-lar pressure and, 95
medullary respiratory centeranatomy and physiology of, 192–194breathing and, 191, 191fspontaneous rhythmicity and, 201
metabolic acidosis, 175anion gap and, 181non-brain origin, effects of, 210f
metabolic alkalosis, 179, 184causes of, 176t
metaboreceptors, 213methemoglobin, oxygen transport and, 155methyl alcohol, metabolic acidosis and, 175minute volume, 65mixed venous chemoreceptors, 213molecular weight (MW), of gas, diffusion and,
132motor cortex neurons, exercise and, 213MPAP. See mean pulmonary artery pressure“mucociliary escalator,” pulmonary defense
mechanisms and, 219–220, 219fmucociliary transport, pulmonary defense
mechanisms and, 219–220multiple inert gas elimination technique, venti-
lation perfusion relationships, assessing,123–125
muscles, respiratory reflexes from, 201muscles of inspiration. See inspiratory musclesMVV test. See maximum voluntary
ventilation test
MW. See molecular weightmyasthenia gravis, hypoventilation and, 182myoglobin (Mb), oxygen transport and, 155–156
narcotics, ventilatory carbon dioxide responsecurves and, 203, 204f
nasal septum, filtration and, pulmonary defensemechanisms and, 217, 218f
negative base excess, 180negative intrapleural pressure (negative
intrathoracic pressure), 12, 14negative intrathoracic pressure. See negative
intrapleural pressurenegative pressure breathing, 11negative-feedback system
carbon dioxide, 202of respiratory control system, 205, 207f, 214
nervous system, acclimatization, exercise and,235
neural pathways, central nervous system and, 9neutrophil, pulmonary surfactant secretion and,
225nicotine, carotid body and, 207ninth cranial nerve (glossopharyngeal nerve),
NTS and, 192nitric oxide (NO)
acute mountain sickness and, 240oxygen transport and, 153
nitrogen concentration, anatomic dead spaceand, 67
nitrogen meters, 118nitrogen narcosis, diving and, 246nitrogen-washout technique, lung volume, 59,
61nitrogen-washout test
expired nitrogen concentration and, numberof breaths v., 119f
nonuniform ventilation of lungs and, 118,118f
nitrous oxide, partial pressure changes in, 134fnitrous oxide transfer, perfusion-limited, 135NO. See nitric oxidenonuniform distribution of pulmonary blood
flow, testing for, 116–125, 119–120nonuniform perfusion of lung, 117nonuniform ventilation of alveoli, 116–125nonuniform ventilation of lungs, nitrogen-
washout test, 118, 118fnonvolatile acids, 166norepinephrine
metabolism of, 224, 225tPVR and, 99
276 / INDEX
normal respiratory and circulatory values table, 266NTS. See nucleus of tractus solitariusnucleus of tractus solitarius (NTS), 192, 193fnucleus parabrachialis medialis, 191f, 195nucleus retroambigualis
inspiratory cells and, 194VRG and, 193, 193f
O2-CO2 diagram, 127, 127fobesity, hypoventilation and, 182obstructive diseases
flow-volume curves of, 46flung volumes and capacities and, 57–58, 57f
obstructive sleep apnea, 203olfaction, pulmonary defense mechanisms and,
217olfactory receptors, pulmonary defense mecha-
nisms and, 217over utilization hypoxia, 184oxygen
alveolar ventilation, 75body tissues and, 1bound to hemoglobin, formula, 147diffusion of gases and, 130, 131exercise and, 211–212, 228, 234–235hemoglobin affinities for, 155hemoglobin and, chemical reaction of,
144–145partial pressure changes in, 134fphysically dissolved, formula, 147pulmonary edema and, 108
oxygen carrying capacity, of hemoglobin, equa-tion, 147, 265
oxygen cost, resistive work of breathing and, 50oxygen diffusion, 132oxygen loading, in blood, 148oxygen toxicity, diving and, 246oxygen transfer, 135oxygen transport
altitude and, 237, 239tby blood and, 232–233, 239tin blood, 142–158clinical problems, 161–162factors affecting, 153, 154f, 155–156hemoglobin and, 146
oxygen unloading, exercise and, 232–233oxyhemoglobin dissociation curve, 161
arterial and venous blood, 152farterial Po2
and, 1822,3-BPG
effects of, 151physiologic consequences of, 151–152
exercise and, 233hemoglobin and, 145–156influences on, 148–156normal, hemoglobin and, 146fPco2
s oneffects of, 151physiologic consequences of, 151–152
pH on, effects of, 151–152temperature on
effects of, 151physiologic consequences of, 151–152
oxyhemoglobin levels, exercise and, 233
PA. See alveolar pressurepain, respiratory reflexes from, 201paradoxical reflex of head, 196, 199partial pressure of carbon dioxide, 137, 138fpartial pressure of carbon monoxide, 135partial pressure of gas
diving and, 241in plasma, 140
partial pressure of oxygen, changes in, 135, 136fparticles
filtration and, pulmonary defense mecha-nisms and, 217–218
removal, pulmonary defense mechanismsand, 221
passive expiration, 38f, 39patient positioning, lung volumes and capaci-
ties, 57, 57fPBF. See pulmonary blood flowP-cells, pulmonary stretch receptors and, 193,
193fpeak expiratory flow (PEF), 44, 45f, 47f, 48PEEP. See positive end-expiratory pressurePEF. See peak expiratory flowperfusion-limited, 134–135, 140
nitrous oxide transfer and, 135peripheral chemoreceptors, 205, 207
respiratory control system, negative-feedback system of, 205, 207f
permeability, pulmonary edema and, 108pH
oxyhemoglobin dissociation curve and, 148,149f–150f, 151
regulation of, 165pH scale, hydrogen ion, 164pharyngeal dilator muscles, airway and, 35, 47fpharyngeal dilator reflex, 199pharynx, filtration and, pulmonary defense
mechanisms and, 217, 218fpH-bicarbonate diagram, 168, 169f, 178
INDEX / 277
phonation, 2phosphate buffer system, 170physically dissolved oxygen, 143physiologic dead space, 82
Bohr equation for, 69–71, 122exercise and, 230
physiologic dead space to tidal volume ration(VD/VT), exercise and, 230
plasma, central chemoreceptors and, 207, 208fplasma anions, anion gap and, 180plasma bicarbonate, 178plasma cations, anion gap and, 180plasma colloid osmotic pressure, pulmonary
edema and, 110plasma proteins, protein buffering groups and, 170platelet-activating factor, pulmonary surfactant
secretion and, 225pleural surface pressure gradient, inspired gas
distribution and, 77fPo2
, central chemoreceptors and, 209Poiseuille’s law, 34pontine respiratory groups, 191f, 194–195positive end-expiratory pressure (PEEP), 28
lung zones and, 105PVR and, 95
positive pleural surface pressure, expiration and, 81
positive pressure breathing, 12positive pressure ventilation, 12pre-Bötzinger complex, 194pressure difference, 32pressure, flow, resistance relationship, 32pressure gradient, 50
generation of, atmosphere v. alveoli,12–20
pressure-volume curve, 20f, 23, 78for isolated lungs, 24f
pressure-volume relationshipslungs and, 20f, 21respiratory system and, 20
prostacyclin, metabolism of, 224, 225tprostaglandins
lung cells and, 226metabolism of, 224, 225t
protein buffering groups, 170–171pulmonary angiography, regional pulmonary
blood flow and, 102pulmonary artery pressure, 105
alveolar pressure v., 104f, 105pulmonary blood flow (PBF), 86
diving and, 241exercise and, 230, 236–237
PVR and, 90regional distribution of, 102–103
lung zones, 99–105pulmonary capillaries, 87
acids in body and, 166cross section of, 5, 7fderecruitment of, 96liquid movement in, factors in, 108–111,
109fpartial pressure of oxygen and, 136fpartial pressures of gases, changes in, 133,
134fpulmonary capillary blood, nitrous oxide, par-
tial pressure of, 134–135pulmonary capillary filtration, cardiac bypass,
223–224pulmonary capillary wedge pressure, 101,
101fpulmonary cells, chemical substrates and, 225pulmonary circulation
as filter, 223–224blood in, 87blood pressure in, 87, 88ffunctional anatomy of, 89–92nonrespiratory functions of, 222–224
pulmonary circulation receptors, exercise and,213
pulmonary compliance curveclinical evaluation of, 22fclinical problems and, 51
pulmonary defense mechanisms, 2–3, 216–221pulmonary diffusing capacity, exercise training,
234pulmonary edema, 108–111
conditions leading to, 108–111exercise and, 231factors predisposing, 110t
pulmonary function test, decision tree, 265pulmonary inflation, Hering-Breuer inflation
reflex and, 195–196pulmonary metabolism, bioactive materials and,
handling of, 3–4pulmonary resistance, 32pulmonary stretch receptors
irritant receptors and, 199P-cells, 193, 193frespiratory reflexes from, 195, 196
pulmonary surfactant, 26–28, 51lungs and, uptake or conversion by, 225,
225tpulmonary system, static pressure-volume
curves, 30f
278 / INDEX
pulmonary vascular receptors (J receptors), res-piratory reflexes from, 199–200
pulmonary vascular resistance (PVR), 92–99active influences of, 97–98, 99tdetermination of, 90–91distribution of, 88f, 91lung volume and, 92–95, 93, 93f, 94fpassive influences of, 97–98, 98tpulmonary vascular smooth muscle and, 90recruitment and distention in, 95, 96f
pulmonary vascular smooth musclecontrol of, 97–98PVR and, 90
pulmonary veins, 88pulmonary vessels
blood flow resistance and, 89–90humoral effects of, 99inspiration and, 92–93, 93f
PVR. See pulmonary vascular resistance
radial traction, 93radioactive markers, nonuniform ventilation of
lungs and, 119reciprocal inhibition, neurons and, 192recoil pressure, 24recruitment, 95–96, 97
PVR and, 96freflection coefficient, pulmonary edema and,
110reflex constriction of airway, chemical irritants,
35reflex mechanisms, respiratory control system
and, 195, 197t–198tregional alveolar ventilation, 76–78regional pulmonary blood flow, 102–104regional ventilation-perfusion ratios, conse-
quences of, normal upright lung, 126–127relative blood flow, per alveolus, 102, 103frelaxation volume, 56renal compensatory mechanisms, 176–181,
177–178renal dysfunctions, metabolic acidosis and, 175residual volume (RV), 55, 79resistance to airflow, 32resistive work of breathing, 49, 50respiratory acidosis, 169f, 171–172
causes of, 173t, 175thypoventilation and, 184kidneys and, 177
respiratory alkalosis, 172–174, 238arterial Pco2
, 211
causes of, 173, 174thyperventilation and, 184
respiratory compensatory mechanisms,176–177, 176–181
respiratory control systemnegative-feedback system of, 205, 207f, 214organization of, 190, 190freflex mechanisms of, 195, 197t–198t
respiratory cycle, changes during, 19frespiratory depression, carbon dioxide and, 202respiratory gases, partial pressures of, 71–73respiratory neurons, 191respiratory physiology, symbols used, 263respiratory rate, 190respiratory reflexes
airway and lung receptors, 199cardiovascular system and, 200
respiratory system. See also normal respiratoryand circulatory values tabledefense mechanisms, 221, 223tdiving and, 240–247exercise and, 228–234function of, 2–4, 216pressure-volume relationships in, 20response of, acute exercise and, 233, 233tstructure of, 4–10under stress, 228–248
clinical problems, 247respiratory tract, filtration of, pulmonary
defense mechanisms and, 217respiratory zone, 8resting minute ventilation (
.VE), exercise and,
229resting ventilation, exercise training, 234resting ventilatory level, central chemoreceptors
and, 209restrictive diseases
flow-volume curves of, 46flung volumes and capacities and, 58
retrofacial nucleus, VRG and, 193Reynolds’ number, 34RV. See residual volume
salicylates, metabolic acidosis and, 175sarcoidosis, 23
resistive work of breathing and, 50scalene muscles, 16, 17scuba diving. See divingserotonin
lung cells and, 226pulmonary surfactant secretion and, 225
INDEX / 279
shallow water blackout, 244shock, metabolic acidosis and, 175shunt equation, 120–122, 265shuntlike states, 120
contributions of, 122shunts. See also specific shunt
arterial Po2and, 182
single-breath carbon dioxide test, 123carbon monoxide diffusing capacity and, 139
single-breath-of-oxygen test, nonuniform distri-bution of pulmonary blood flow and, 117
sleep, ventilatory carbon dioxide responsecurves and, 203, 204f
small airways, clinical problems and, 52small airways disease, alveoli and, 49smoking, COHb and, 153sneeze, pulmonary defense mechanisms and,
218–219s-nitrosohemoglobin (SNO-Hb), oxygen trans-
port and, 153SNO-Hb. See s-nitrosohemoglobinsodium ion, acidosis, 177solid line, 18solubility of oxygen in plasma equation, 265specific compliance, 23spinal pathways, 195spirometry, 30, 59, 60f
air volume and, 18FRC and, clinical problems, 83VT and, 71
spontaneous respiratory rhythmicity, 191–192medullary respiratory center and, 201
stagnant hypoxia, 183standard barometric pressure, mixed expired air
at, 73standard lung volumes, patient positioning and, 83Starling equation, 108
pulmonary edema, 108static compliance curves, 22, 22fstatic pressure-volume curves, 30fsteady-state response, carbon dioxide and, 208steady-state techniques, carbon monoxide
diffusing capacity and, 139sternocleidomastoid, 16stress, respiratory system, 228–248stress failure, exercise and, 231strong acid, 163–164surface tension
dynes and, 23measurement, Langmuir-Wilhelmy balance
and, 26, 26f
surfactant metabolism, in alveolus, 226fSVR. See systemic vascular resistanceSwan-Ganz catheter
pressure trace, 101fthermal dilution technique, 100–102
systemic blood pressure, acute mountain sickness and, 240
systemic circulation, high arterial pressure in,consequences, 91–92
systemic vascular resistance (SVR), 88f,90–91pulmonary circulation pressures v., 91–92
temperature, oxyhemoglobin dissociation curveand, 148, 149f–150f, 151
tendons, respiratory reflexes from, 201tenth cranial nerve (vagus nerve)
apneustic center, 191f, 194NTS and, 192paradoxical reflex of head, 199
terminal respiratory units, defense mechanismsof, 220–221
thermal dilution technique, total pulmonaryblood flow and, 100–102
thoracic cavity, diaphragmatic contraction and,15, 16f
thromboxane, PVR and, 99tidal breath, normal, events during, 17–20, 18ttidal volume (VT), 49, 55
Hering-Breuer inflation reflex and, 196tissue death, hypoxia and, 184tissue edema, hypoxia and, 184tissues, unloading oxygen at, 148TLC. See total lung capacitytotal blood oxygen content, formula, 147total lung capacity (TLC), 30, 31, 56–57
exercise training, 234expired nitrogen concentration and,
80, 80ftotal oxygen transfer, 137total pulmonary blood flow, measurement of,
100–104trachea, tumors and, extrathoracic obstructions
and, 48tracheobronchial secretions, pulmonary defense
mechanisms and, 219–220tracheobronchial tree
airway and, 35, 47fbranchings, 7, 8f
transitional flow, 33f, 34transitional zone, 7
280 / INDEX
transmural pressure gradient, 22, 38, 39, 50,92, 111alveoli and, 12small airways, 37
transpulmonary pressure, 14, 77trapped gas, airway closure and, 119tumors, trachea and, extrathoracic obstructions,
48turbinates, filtration and, pulmonary defense
mechanisms and, 217, 218fturbulent flow, 33f, 34
unloading oxygen, at tissues, 148upper airways, 6
pulmonary defense mechanisms and, 217,218f
V.
A. See alveolar ventilationvagus nerve. See tenth cranial nervevariable obstructions, 46, 47fvasoactive substances, metabolism of, 224–225vasoconstrictors, pulmonary, PVR and, 99vasodilation, pulmonary vessels and, 99VC. See vital capacityVD. See dead space volumeVD/VT. See physiologic dead space to tidal vol-
ume rationV.
E. See resting minute ventilationvegetarian diet, fixed acids and, 166venous blood, oxyhemoglobin dissociation
curve, 152fvenous drainage, bronchial circulation and, 88ventilation. See also alveolar ventilation
exercise training, 234Hering-Breuer inflation reflex and, 196increase, effects of, 204, 205fnonuniform, of alveoli, 116–125patterns, brainstem and, 191fregional differences, 125f
ventilation-perfusion ratio (.V/Q
.), 116f, 128
concept of matching, 113–114exercise and, 126f, 230–231, 231f
high and low, consequences of, 114, 115f,116
normal subjects, 124fregional differences, upright lung, 126, 126f
ventilation-perfusion ratio (.V/Q
.), mismatch
arterial hypoxia and, 183testing for, 117t, 120–125
ventilation-perfusion relationships, 113–129exercise and, 230–231, 231f, 237
ventilatory carbon dioxide response curves,203fresponses to, 203, 204f
ventilatory response, exercise and, 211–213,212t
ventral respiratory group (VRG), 193–194vibrissae, filtration and, pulmonary defense
mechanisms and, 217vital capacity (VC), 30, 41, 57
exercise training, 234volatile acids, 166voluntary breath holding, 201vomiting, metabolic alkalosis and, 176V./Q
., See ventilation-perfusion ratio
VRG. See ventral respiratory groupVT. See tidal volume
water, hydrostatic pressure effects of, 241water immersion, electrocardiographic response
to, 243fwave speed flow-limiting mechanism, 39weak acid, 164whole blood, oxygen and, 143whole lung hypoxic pulmonary vasoconstric-
tion, 107work of breathing, components of, 51
133 Xe, regional pulmonary blood flow and,102
zones of lung, 111extravascular pressure and, gravity v.,
104–105, 105f