physiology ospe - ksumsc
TRANSCRIPT
Spirometry
Physiology lab Team 436 – Respiratory block This work include Boy’s + girl’s slides + girl’s handout
Team work : Leena Alwakeel – Hassan Alshammari –Ruba Ali
Objectives :• Use a spirometer and determine lung volumes and capacities • Define and provide values for the various lung volumes and
capacities .• Recognize the physiological and some pathological factors that
modify lung volumes and capacities.
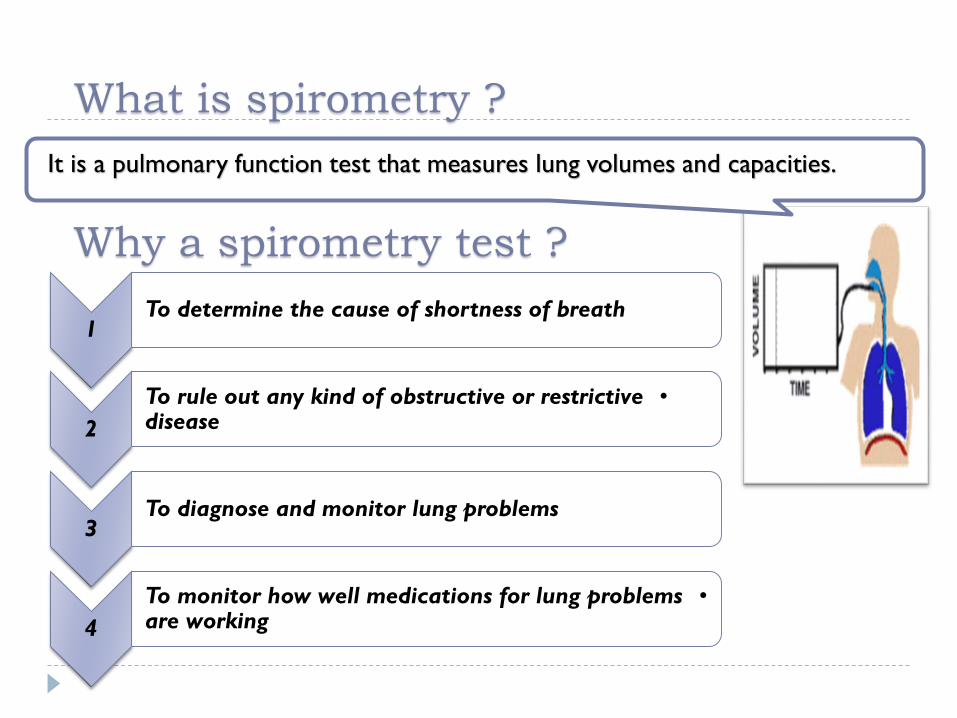
What is spirometry ?It is a pulmonary function test that measures lung volumes and capacities.
Why a spirometry test ?
1To determine the cause of shortness of breath
2•To rule out any kind of obstructive or restrictive
disease
3To diagnose and monitor lung problems
4•To monitor how well medications for lung problems
are working
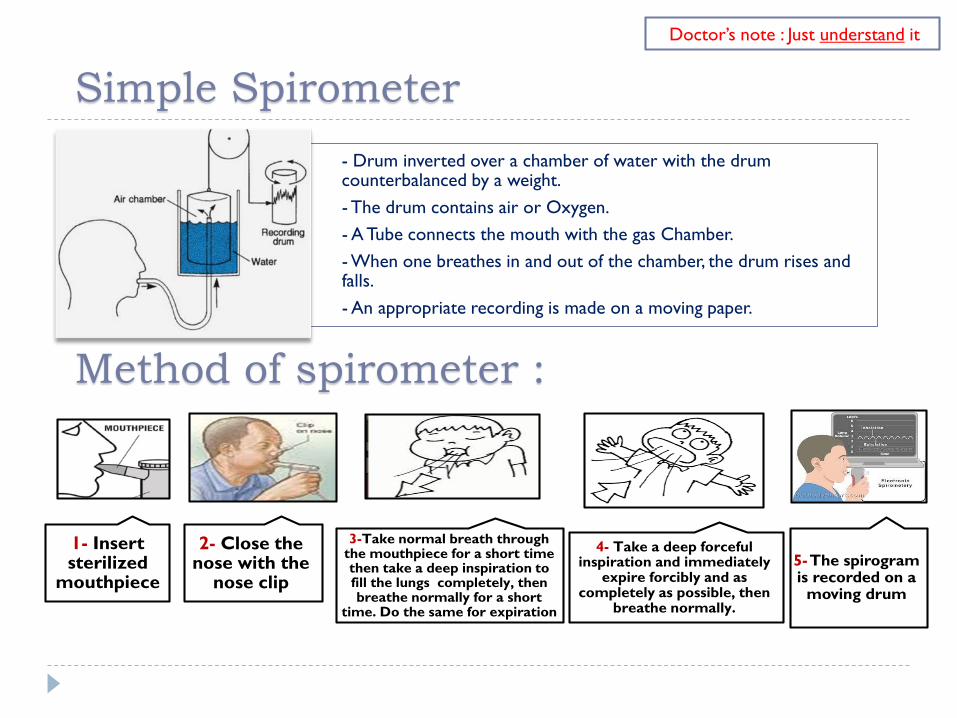
Simple Spirometer- Drum inverted over a chamber of water with the drum counterbalanced by a weight.- The drum contains air or Oxygen.- A Tube connects the mouth with the gas Chamber.- When one breathes in and out of the chamber, the drum rises and falls. - An appropriate recording is made on a moving paper.
Method of spirometer :
5-The spirogram is recorded on a
moving drum
3-Take normal breath through the mouthpiece for a short time then take a deep inspiration to fill the lungs completely, then breathe normally for a short
time. Do the same for expiration
2- Close the nose with the
nose clip
1- Insert sterilized
mouthpiece
4- Take a deep forceful inspiration and immediately
expire forcibly and as completely as possible, then
breathe normally.
Doctor’s note : Just understand it
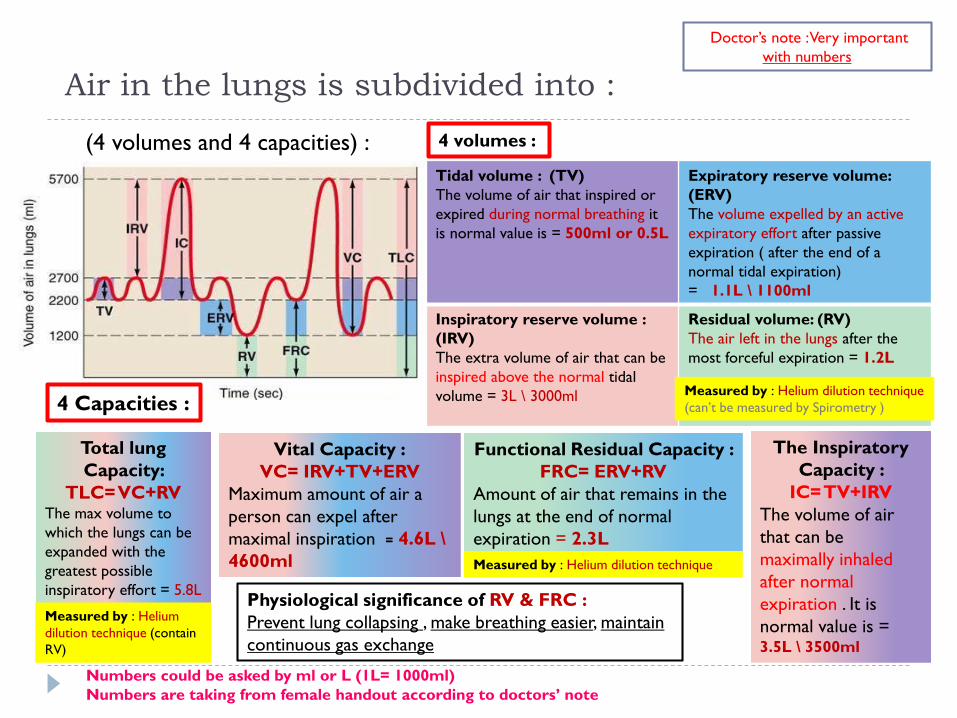
Air in the lungs is subdivided into :4 volumes :
4 Capacities :
Tidal volume : (TV)The volume of air that inspired or expired during normal breathing it is normal value is = 500ml or 0.5L
Expiratory reserve volume: (ERV) The volume expelled by an active expiratory effort after passive expiration ( after the end of a normal tidal expiration) = 1.1L \ 1100ml
Inspiratory reserve volume : (IRV)The extra volume of air that can be inspired above the normal tidal volume = 3L \ 3000ml
Residual volume: (RV)The air left in the lungs after the most forceful expiration = 1.2L
Total lung Capacity:
TLC= VC+RV The max volume to which the lungs can be expanded with the greatest possible inspiratory effort = 5.8L
Vital Capacity :VC= IRV+TV+ERV
Maximum amount of air a person can expel after maximal inspiration = 4.6L \4600ml
Functional Residual Capacity : FRC= ERV+RV
Amount of air that remains in the lungs at the end of normal expiration = 2.3L
The Inspiratory Capacity :
IC= TV+IRV The volume of air that can be maximally inhaled after normal expiration . It is normal value is = 3.5L \ 3500ml
Physiological significance of RV & FRC : Prevent lung collapsing , make breathing easier, maintain continuous gas exchange
Numbers could be asked by ml or L (1L= 1000ml)Numbers are taking from female handout according to doctors’ note
Measured by : Helium dilution technique (can’t be measured by Spirometry )
(4 volumes and 4 capacities) :
Doctor’s note : Very important with numbers
Measured by : Helium dilution technique
Measured by : Helium dilution technique (contain RV)
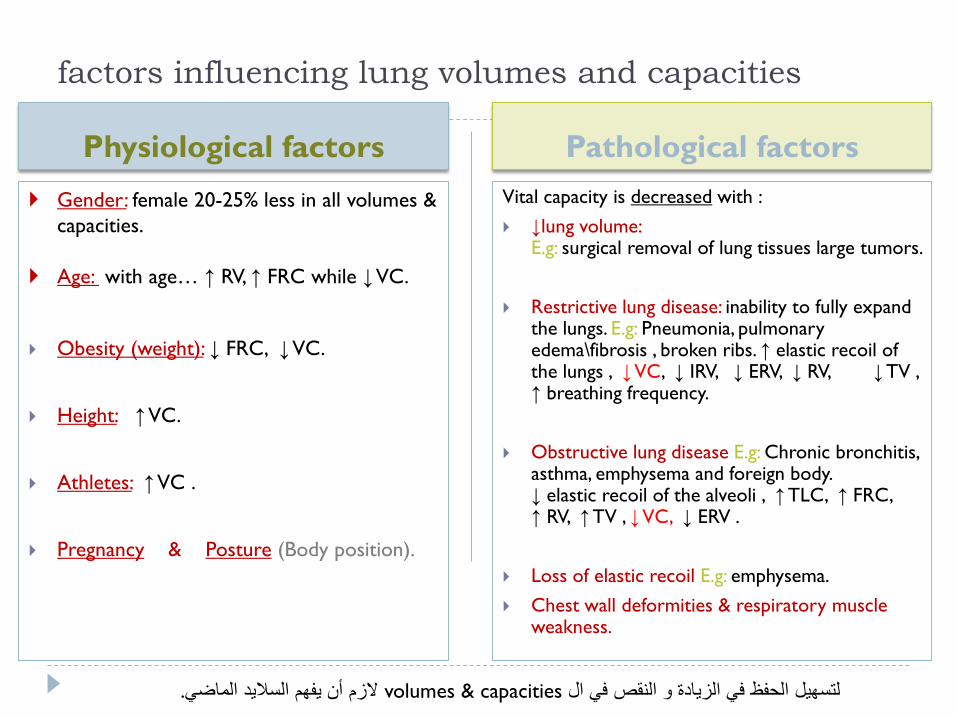
Physiological factors Pathological factors Gender: female 20-25% less in all volumes &
capacities.
Age: with age… ↑ RV, ↑ FRC while ↓VC.
Obesity (weight): ↓ FRC, ↓VC.
Height: ↑VC.
Athletes: ↑VC .
Pregnancy & Posture (Body position).
Vital capacity is decreased with : ↓lung volume:
E.g: surgical removal of lung tissues large tumors.
Restrictive lung disease: inability to fully expand the lungs. E.g: Pneumonia, pulmonary edema\fibrosis , broken ribs. ↑ elastic recoil of the lungs , ↓VC, ↓ IRV, ↓ ERV, ↓ RV, ↓ TV , ↑ breathing frequency.
Obstructive lung disease E.g: Chronic bronchitis, asthma, emphysema and foreign body. ↓ elastic recoil of the alveoli , ↑ TLC, ↑ FRC, ↑ RV, ↑ TV , ↓VC, ↓ ERV .
Loss of elastic recoil E.g: emphysema. Chest wall deformities & respiratory muscle
weakness.
factors influencing lung volumes and capacities
.الزم أن یفھم السالید الماضيvolumes & capacitiesلتسھیل الحفظ في الزیادة و النقص في ال
Dynamic spirometry
Physiology lab Team 436 – Respiratory block This work include Boy’s + girl’s slides + girl’s handout
Team work : Leena Alwakeel – Hassan Alshammari –Ruba Ali
Objectives :• Understanding Forced expiratory volume curve (FEV).• Understanding Flow-volume curve (Loops).• Calculating : FVC, FEV1and FEV1% of FEV Curve.• Calculating : FVC, PEFR, PIFR and MEF50 of Loops Curve.
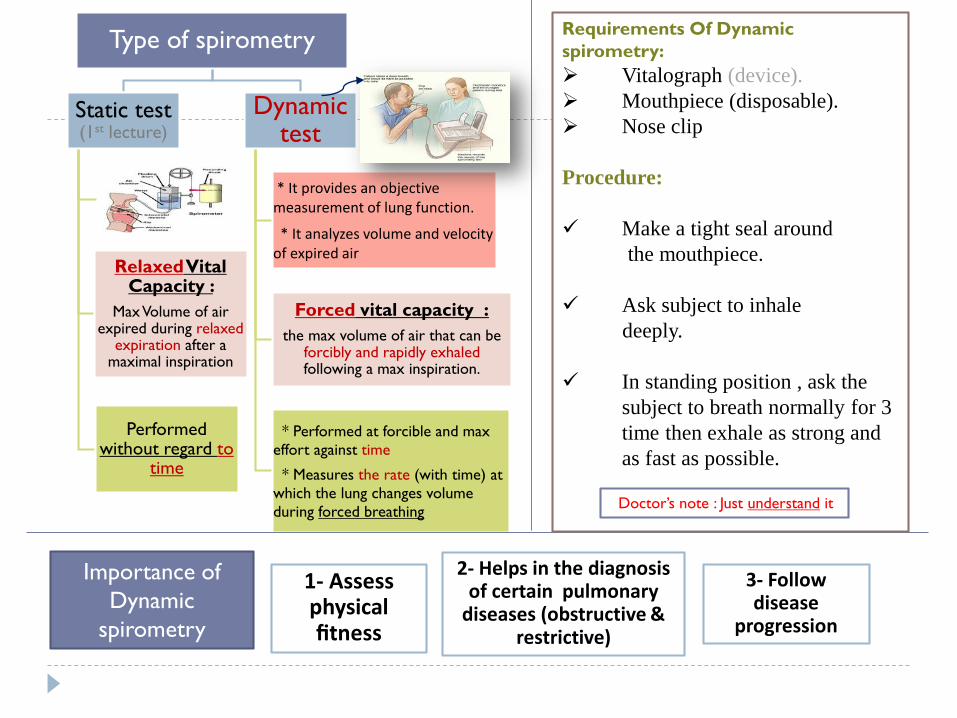
Type of spirometry
Static test (1st lecture)
RelaxedVital Capacity :
Max Volume of air expired during relaxed
expiration after a maximal inspiration
Performed without regard to
time
Dynamic test
* It provides an objective measurement of lung function.
* It analyzes volume and velocity of expired air
Forced vital capacity :the max volume of air that can be
forcibly and rapidly exhaled following a max inspiration.
* Performed at forcible and max effort against time
* Measures the rate (with time) at which the lung changes volume during forced breathing
Importance of Dynamic
spirometry
Requirements Of Dynamic spirometry: Vitalograph (device). Mouthpiece (disposable). Nose clip
Procedure:
Make a tight seal aroundthe mouthpiece.
Ask subject to inhaledeeply.
In standing position , ask the subject to breath normally for 3 time then exhale as strong and as fast as possible.
Doctor’s note : Just understand it
3- Follow disease
progression
2- Helps in the diagnosis of certain pulmonary
diseases (obstructive & restrictive)
1- Assess physical fitness
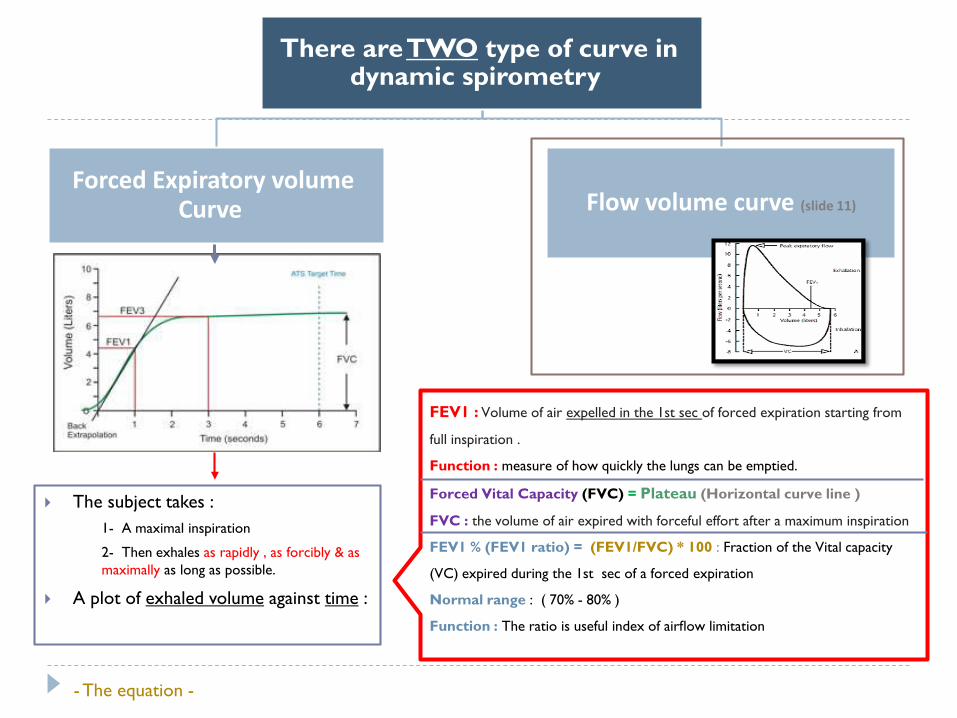
There are TWO type of curve in dynamic spirometry
Forced Expiratory volume Curve Flow volume curve (slide 11)
FEV1 : Volume of air expelled in the 1st sec of forced expiration starting from
full inspiration .
Function : measure of how quickly the lungs can be emptied.
Forced Vital Capacity (FVC) = Plateau (Horizontal curve line )
FVC : the volume of air expired with forceful effort after a maximum inspiration
FEV1 % (FEV1 ratio) = (FEV1/FVC) * 100 : Fraction of the Vital capacity
(VC) expired during the 1st sec of a forced expiration
Normal range : ( 70% - 80% )
Function : The ratio is useful index of airflow limitation
- The equation -
The subject takes :1- A maximal inspiration
2- Then exhales as rapidly , as forcibly & as maximally as long as possible.
A plot of exhaled volume against time :
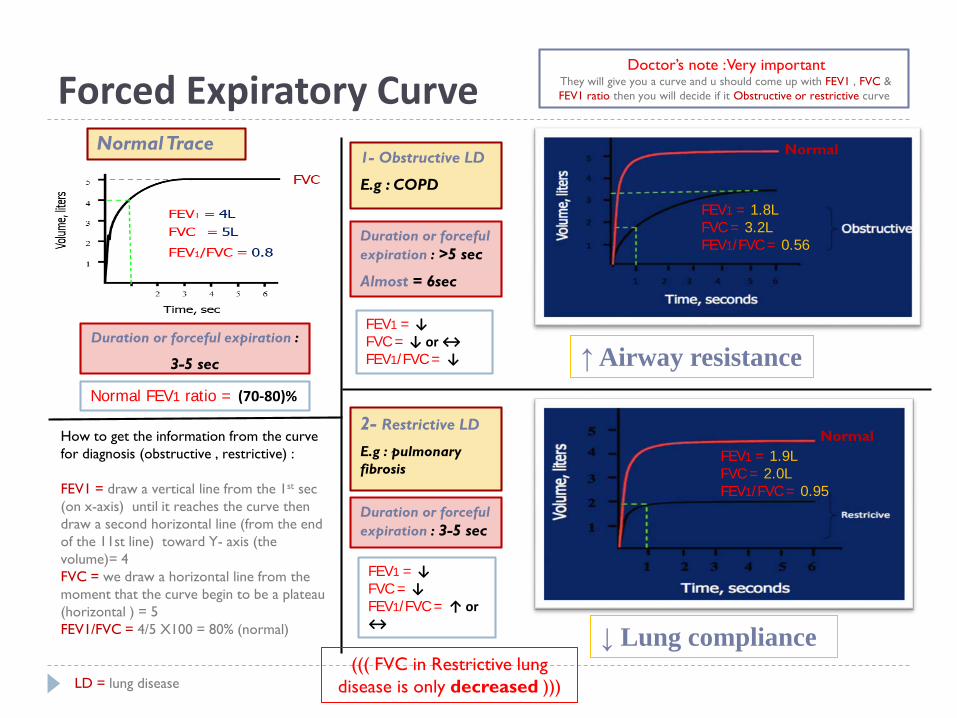
Forced Expiratory Curve
How to get the information from the curve for diagnosis (obstructive , restrictive) :
FEV1 = draw a vertical line from the 1st sec (on x-axis) until it reaches the curve then draw a second horizontal line (from the end of the 11st line) toward Y- axis (the volume)= 4FVC = we draw a horizontal line from the moment that the curve begin to be a plateau (horizontal ) = 5FEV1/FVC = 4/5 X100 = 80% (normal)
1- Obstructive LD
E.g : COPD
LD = lung disease
Normal
FEV1 = 1.8LFVC = 3.2LFEV1/FVC = 0.56
2- Restrictive LD
E.g : pulmonary fibrosis
FEV1 = 1.9LFVC = 2.0LFEV1/FVC = 0.95
Normal
Doctor’s note : Very important They will give you a curve and u should come up with FEV1 , FVC & FEV1 ratio then you will decide if it Obstructive or restrictive curve
FEV1 = ↓FVC = ↓ or ↔FEV1/FVC = ↓
Normal FEV1 ratio = (70-80)%
↑ Airway resistance
↓ Lung compliance
Normal Trace
FEV1 = ↓FVC = ↓ FEV1/FVC = ↑ or ↔
Duration or forceful expiration :
3-5 sec
Duration or forceful expiration : >5 sec
Almost = 6sec
Duration or forceful expiration : 3-5 sec
((( FVC in Restrictive lung disease is only decreased )))
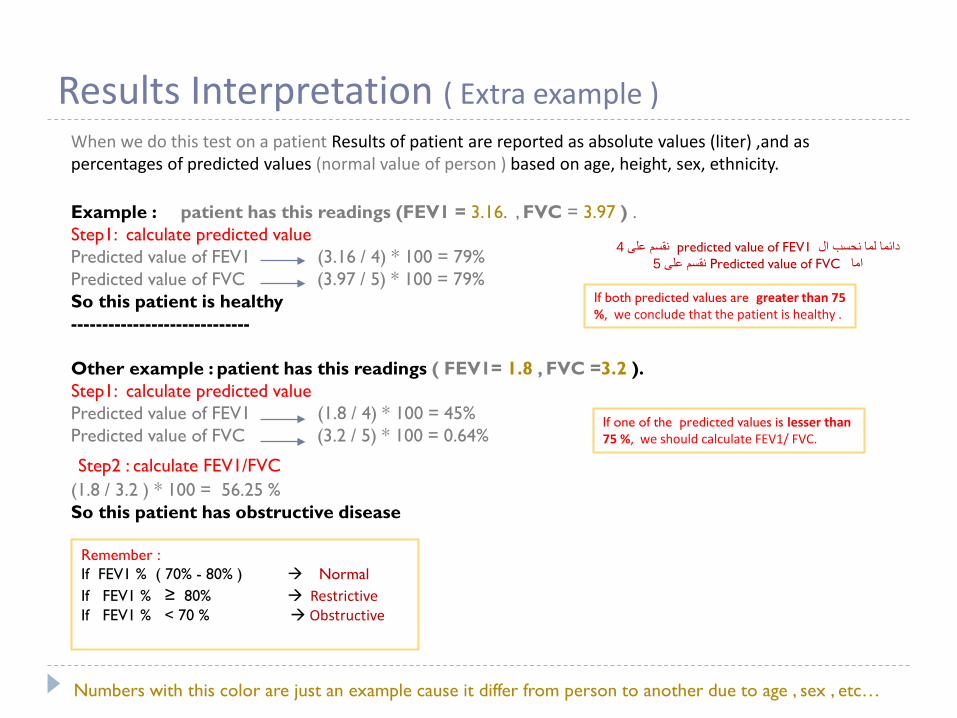
Results Interpretation ( Extra example )When we do this test on a patient Results of patient are reported as absolute values (liter) ,and as percentages of predicted values (normal value of person ) based on age, height, sex, ethnicity.
Example : patient has this readings (FEV1 = 3.16. , FVC = 3.97 ) . Step1: calculate predicted value Predicted value of FEV1 (3.16 / 4) * 100 = 79%Predicted value of FVC (3.97 / 5) * 100 = 79% So this patient is healthy-----------------------------
Other example : patient has this readings ( FEV1= 1.8 , FVC =3.2 ).Step1: calculate predicted value Predicted value of FEV1 (1.8 / 4) * 100 = 45%Predicted value of FVC (3.2 / 5) * 100 = 0.64%
Step2 : calculate FEV1/FVC (1.8 / 3.2 ) * 100 = 56.25 % So this patient has obstructive disease
Numbers with this color are just an example cause it differ from person to another due to age , sex , etc…
If both predicted values are greater than 75 %, we conclude that the patient is healthy .
If one of the predicted values is lesser than 75 %, we should calculate FEV1/ FVC.
Remember :If FEV1 % ( 70% - 80% ) Normal If FEV1 % ≥ 80% Restrictive If FEV1 % < 70 % Obstructive
4نقسم على predicted value of FEV1دائما لما نحسب ال 5نقسم على Predicted value of FVCاما
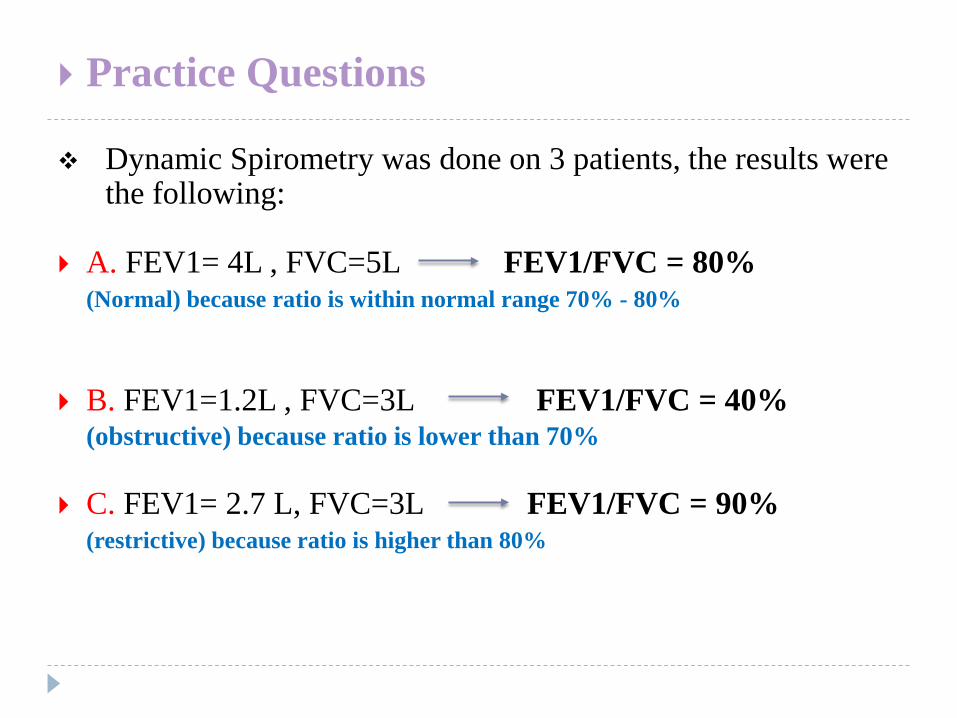
Practice Questions
Dynamic Spirometry was done on 3 patients, the results were the following:
A. FEV1= 4L , FVC=5L FEV1/FVC = 80% (Normal) because ratio is within normal range 70% - 80%
B. FEV1=1.2L , FVC=3L FEV1/FVC = 40% (obstructive) because ratio is lower than 70%
C. FEV1= 2.7 L, FVC=3L FEV1/FVC = 90% (restrictive) because ratio is higher than 80%
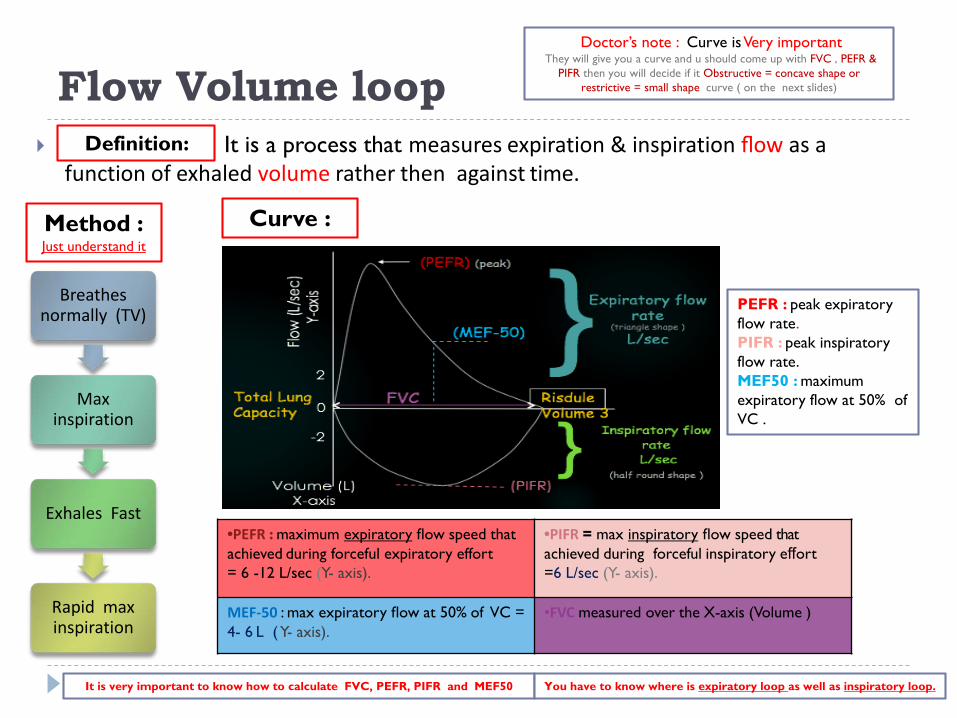
Flow Volume loop It is a process that measures expiration & inspiration flow as a
function of exhaled volume rather then against time.
Breathes normally (TV)
Max inspiration
Exhales Fast
Rapid max inspiration
Method :Just understand it
•PEFR : maximum expiratory flow speed that achieved during forceful expiratory effort = 6 -12 L/sec (Y- axis).
•PIFR = max inspiratory flow speed that achieved during forceful inspiratory effort =6 L/sec (Y- axis).
MEF-50 : max expiratory flow at 50% of VC = 4- 6 L ( Y- axis).
•FVC measured over the X-axis (Volume )
Curve :
Definition:
Doctor’s note : Curve is Very important They will give you a curve and u should come up with FVC , PEFR &
PIFR then you will decide if it Obstructive = concave shape or restrictive = small shape curve ( on the next slides)
It is very important to know how to calculate FVC, PEFR, PIFR and MEF50
PEFR : peak expiratory flow rate.PIFR : peak inspiratory flow rate.MEF50 : maximum expiratory flow at 50% of VC .
You have to know where is expiratory loop as well as inspiratory loop.
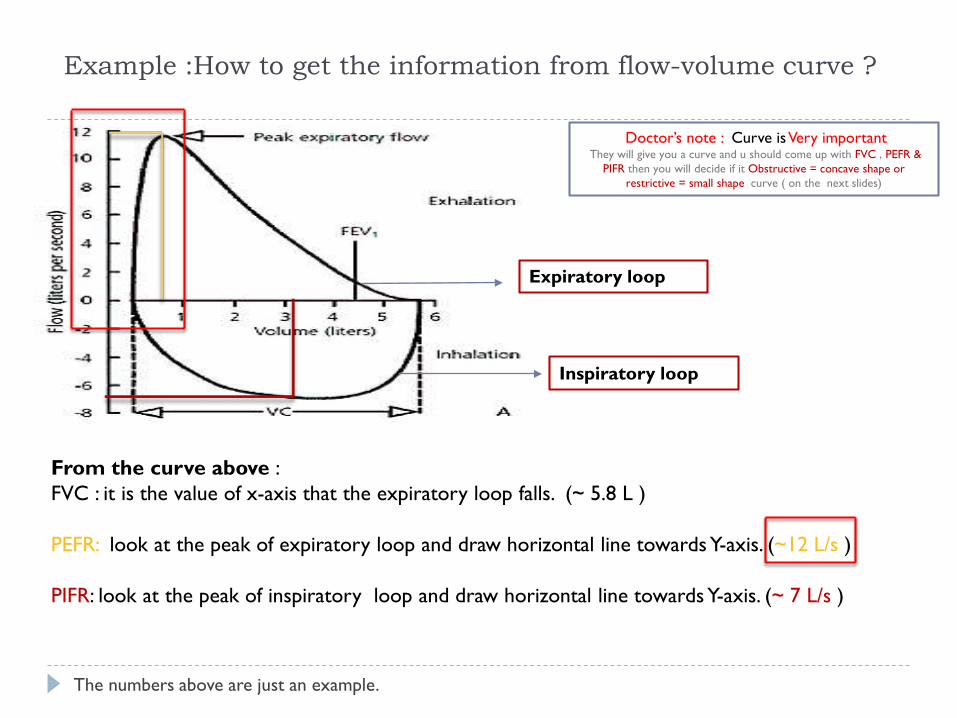
Example :How to get the information from flow-volume curve ?
From the curve above :FVC : it is the value of x-axis that the expiratory loop falls. (~ 5.8 L )
PEFR: look at the peak of expiratory loop and draw horizontal line towards Y-axis. (~12 L/s )
PIFR: look at the peak of inspiratory loop and draw horizontal line towards Y-axis. (~ 7 L/s )
The numbers above are just an example.
Expiratory loop
Inspiratory loop
Doctor’s note : Curve is Very important They will give you a curve and u should come up with FVC , PEFR &
PIFR then you will decide if it Obstructive = concave shape or restrictive = small shape curve ( on the next slides)
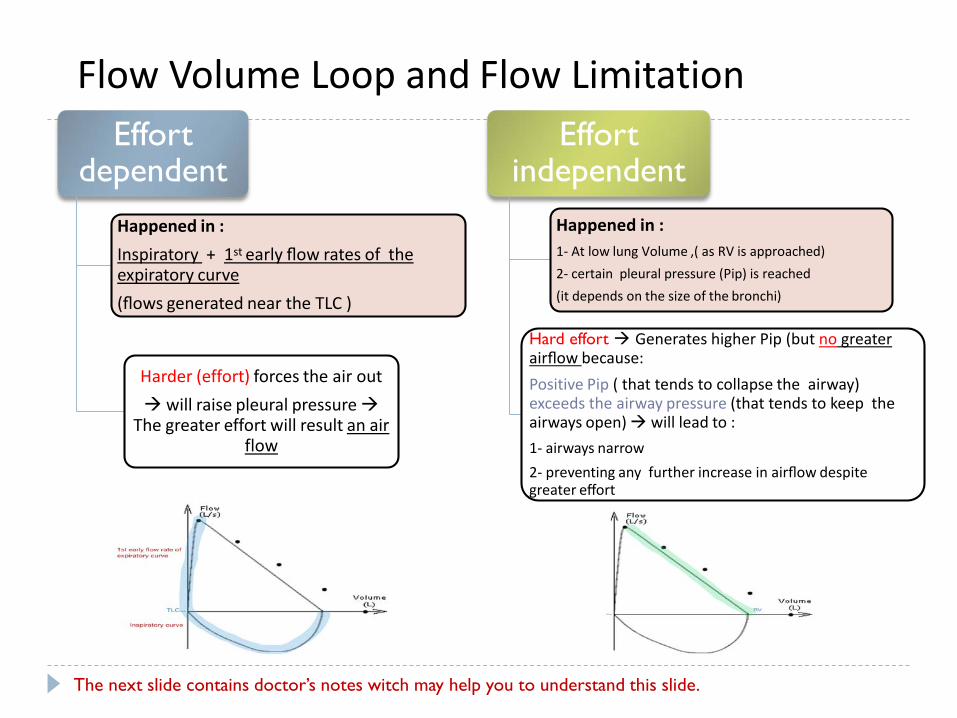
Flow Volume Loop and Flow LimitationEffort
dependent Happened in :Inspiratory + 1st early flow rates of the expiratory curve (flows generated near the TLC )
Harder (effort) forces the air out will raise pleural pressure
The greater effort will result an air flow
Effort independent
Happened in :1- At low lung Volume ,( as RV is approached)2- certain pleural pressure (Pip) is reached(it depends on the size of the bronchi)
Hard effort Generates higher Pip (but no greater airflow because:Positive Pip ( that tends to collapse the airway) exceeds the airway pressure (that tends to keep the airways open) will lead to :1- airways narrow 2- preventing any further increase in airflow despite greater effort
The next slide contains doctor’s notes witch may help you to understand this slide.
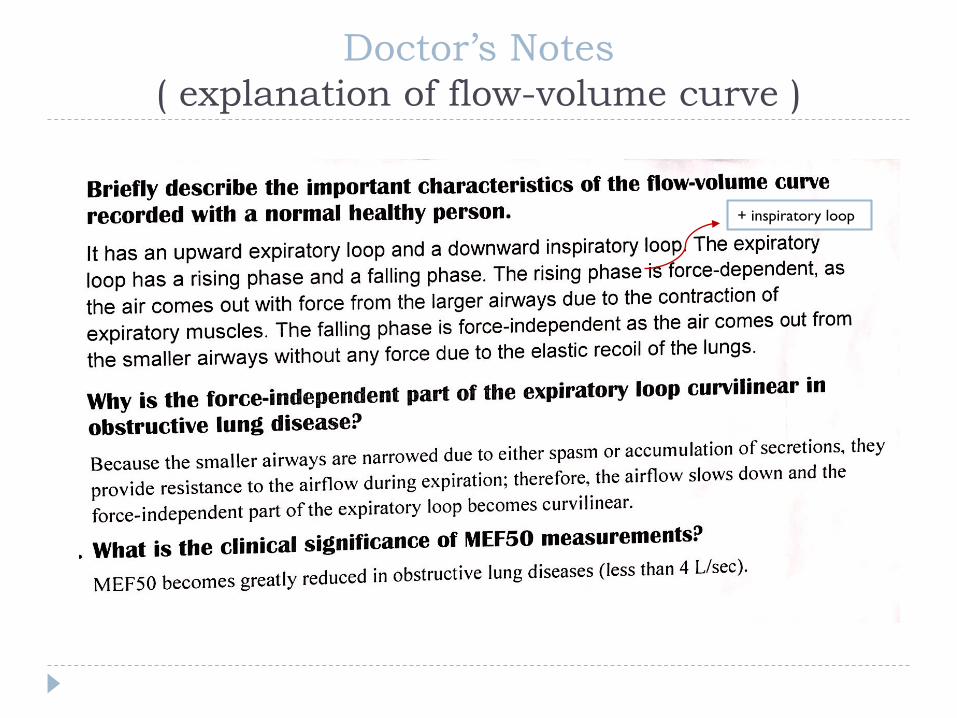
Doctor’s Notes ( explanation of flow-volume curve )
+ inspiratory loop
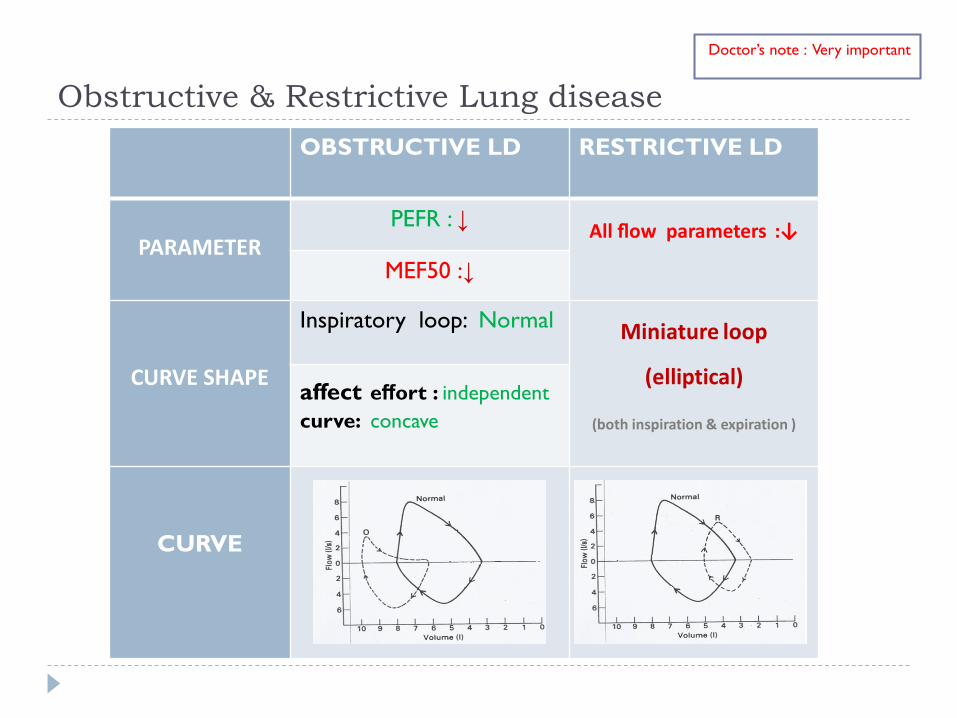
Obstructive & Restrictive Lung diseaseOBSTRUCTIVE LD RESTRICTIVE LD
PARAMETERPEFR : ↓ All flow parameters :↓
MEF50 :↓
CURVE SHAPE
Inspiratory loop: Normal Miniature loop
(elliptical)
(both inspiration & expiration )
affect effort : independent curve: concave
CURVE
Doctor’s note : Very important