399. the use of credit instruments in payments in the united
TRANSCRIPT
61ST CONGRESS! CFTJATE-2d Session J SENATE
/ D O C U M E N T \ No. 399
I NATIONAL MONETARY COMMISSION
THE USE OF
CREDIT INSTRUMENTS | IN PAYMENTS IN THE
UNITED STATES
REPORT COMPILED BY
DAVID KINLEY, Ph. D . , LL. D. 1 U\ 1 University of Illinois
1 Washington : Government Printing Office : 1910
Digitized for FRASER http://fraser.stlouisfed.org/ Federal Reserve Bank of St. Louis
NATIONAL MONETARY SYSTEM.
NBLSON W. ALDRICH, Rhode Island, Chairman.
EDWARD B. VRBBLAND, New York, Vice-Chairman.
JtrwtJS C. BTTRROWS, Michigan.
KUGBNB HALB, Maine.
PHIUUCDER C. KNOX, Pennsylvania.
THEODORE E. BURTON, Ohio.
JOHN W. DANIEL, Virginia.
HBNRY M. TELLER, Colorado.
HBRNANDO D. MONBY, Mississippi.
JOSEPH W. BAILEY, Texas.
JESSB OvERSTREBT, Indiana.
JOHN W. W E E K S , Massachusetts.
ROBERT W. BONYNGE, Colorado.
SYLVESTER C. SMITH, California.
LEMUEL P. PADGETT, Tennessee.
' GEORGE F. BURGESS, Texas.
ARSENE P. PUJO, Louisiana.
ARTHUR B. SHELTON, Secretary.
A. PIATT ANDREW, Special Assistant to Commission.
Digitized for FRASER http://fraser.stlouisfed.org/ Federal Reserve Bank of St. Louis
CONTENTS.
Page*
Purposes of the inquiry i Methods of inquiry 5
The clearing-house method _ 6 The bank-deposit method 8 Method of getting information direct from merchants 11
History of inquiries previously made ... r 1 English investigations—
The Slater inquiry 12 The Babbage inquiry 13 The Palgrave inquiry . 13 The Lubbock inquiry . _ 15 The Martin inquiry 16 The Pownall inquiry 17 Criticism of English inquiries_ 18
American investigations— The Garfield inquiry _ _ 20 The inquiry of 1881 20 The inquiry of 1890 23 The inquiry of 1892 24 The inquiry of 1894 26 The inquiry of 1896 ........ 28 Criticism of these American inquiries.. 30
The present inquiry: The letter of inquiry 31 Form of blank for reply, with explanations. 33 General discussion of the statistics 38 The day selected T 40 General criticism of the replies 42 Table showing number of replies received and rejected 47 Classes of banks reporting 50 Classes of business and customs as to methods of payment 53 The retail returns—
Table of retail deposits in banks by classes of banks and States 58
Table of aggregate retail deposits by states 66 Table of aggregate retail deposits by banks 68
111
Digitized for FRASER http://fraser.stlouisfed.org/ Federal Reserve Bank of St. Louis
National Monetary Commission
The present inquiry—Continued. The retail returns—Continued.
Discussion of tables— p a g e . Retail deposits of national banks 69 Retail deposits of state banks 69 Retail deposits of private banks 70 Retail deposits of loan and trust companies 71 Retail deposits of stock savings banks 72 Retail deposits of mutual savings banks 73 Aggregate retail deposits 73
Allowances and corrections— Banks not heard from. 75 Allowances for possible excess of checks 78 Ignorance of business of depositors 81
Retail returns by geographical divisions 82 Tables of retail deposits by geographical divisions 83
Checks in cities and agricultural districts 86 Reserve cities _ 86
Tables of retail deposits in banks in representative reserve cities 88
Country without these reserve cities 92 Table of retail deposits in certain states in cities of
less than 25,000 inhabitants 94 Returns from industrial centers 95
Evidence of pay rolls 96 Tables of reported average pay rolls in cash and
checks, with discussion of same 96 Returns from merchants—
In previous inquiries 105 In present inquiry 109
What the deposits show 115 Estimates from expenditure and population 117
The wholesale returns 122 Corrections for nonreplying banks 123 Table of wholesale deposits by classes of banks and States . 124 Table of aggregate wholesale deposits by States 131 Table of aggregate wholesale deposits by banks 133 Discussion of tables—
Wholesale deposits of the national banks 134 Wholesale deposits of the State banks 134 Wholesale deposits of the private banks 135 Wholesale deposits of loan and trust companies 136 Wholesale deposits of savings banks 136 Aggregate wholesale deposits 136
IV
Digitized for FRASER http://fraser.stlouisfed.org/ Federal Reserve Bank of St. Louis
The Use of Credit Instruments
The present inquiry—Continued. Page. Returns of wholesale deposits in certain reserve cities and by
geographical divisions 137 Reserve cities: Wholesale deposits of national banks 137 Wholesale deposits of state and other banks 138 Reserve cities: Aggregate wholesale deposits 138 Tables of wholesale deposits of banks at representative
reserve cities 139 Wholesale deposits by geographical divisions 144 Conclusion as to wholesale deposits 148 Wholesale deposits for certain States, less those in cities of
over 25,000 inhabitants 149 The "all o thers" class of deposits 150
Allowances and corrections in '' all other ' * class 151 Returns of " all other ' ' depositors in national banks 154 " All other " returns of state and private banks 155 "All o ther" returns of loan and trust companies and sav
ings banks 156 Conclusions as to percentage of checks in "all o ther" de
posits 158 Tables of "all o ther" deposits in the various classes of
banks 160 Tables of "all o ther" deposits in representative reserve
cities - 174 Table of aggregate "all o ther" deposits in cities of less than
25,000 inhabitants 177 Table of "all o ther" deposits by geographical divisions__ 177
Study of the aggregate figures 180 Table of aggregate deposits, by States 181 Distribution of aggregate deposits, by banks 183 Aggregate deposits of all classes in reserve cities 185 Aggregate percentage in country deposits 187 Collateral evidence as to the use of checks—
Change in small bills 189 Evidence from the number of bank accounts 191
Final conclusions as to the average proportion of payments made with checks, etc 196
Summary of results of inquiry 199 The bearing of these investigations on the monetary situation 202
The amount of money rendered unnecessary by credit paper_ _ 203 Relation of credit exchanges and the volume of money and
prices 211 Our monetary circulation 214 Do we need more money 217 Additional supply of circulating medium 219
Bibliography 221
v
Digitized for FRASER http://fraser.stlouisfed.org/ Federal Reserve Bank of St. Louis
LIST OF TABLES.
Page.
TABLES I.—Number of replies received and rejected 47 TABLE II.—Retail deposits by classes of banks 58 TABLE III.—Aggregate deposits of retail dealers, all banks, by S ta tes . 66 TABLE IV.—Aggregate retail deposits, by banks 68 TABLE V.—Retail deposits by geographical divisions 83 T A B L ^ VI.—Retail deposits at representative reserve cities, all classes
of banks 88 TABLE VII.—Retail deposits of banks, except those in cities of more
than 25,000 population , 94 TABLE VIII.—Wage pay rolls for week ended March 13, 1909 96 T A B L E IX.—Wholesale deposits, by classes of banks 124 TABLE X.—Aggregate wholesale deposits by States 131 TABLE XI.—Aggregate wholesale deposits by classes of banks 133 TABLE XII.—Wholesale deposits at representative reserve cities by
classes of banks 139 TABLE XIII.—Wholesale deposits by geographical divisions, by
classes of banks 145 TABLE XIV.—Wholesale deposits for certain States, less those in
cities of over 25,000 population 149 TABLE XV.—All other deposits by classes of banks 160 TABLE XVI.—Aggregate all other deposits by States 169 TABLE XVII.—Aggregate all other deposits by banks 171 TABLE XVIII.—All other deposits at representative reserve cities by
classes of banks 172 TABLE XIX.—Aggregate all other deposits in certain States, except
ing in places of more than 25,000 population 177 TABLE XX.—Aggregate all other deposits by geographical divisions. 177 TABLE XXI.—Aggregate deposits by States 181 TABLE XXII.—Aggregate deposits by classes of banks 184 TABLE XXIII.—Aggregate of all classes of deposits in representative
reserve cities , 186 TABLE XXIV.—Aggregate deposits of banks of certain States, ex
cepting those in places of more than 25,000 population 188 TABLE XXV.—Proportion of bills of different denominations 190 TABLE XXVI.—Aggregate individual and other deposits and num
ber of accounts .- 193 D I A G R A M S 220-222
VI
Digitized for FRASER http://fraser.stlouisfed.org/ Federal Reserve Bank of St. Louis
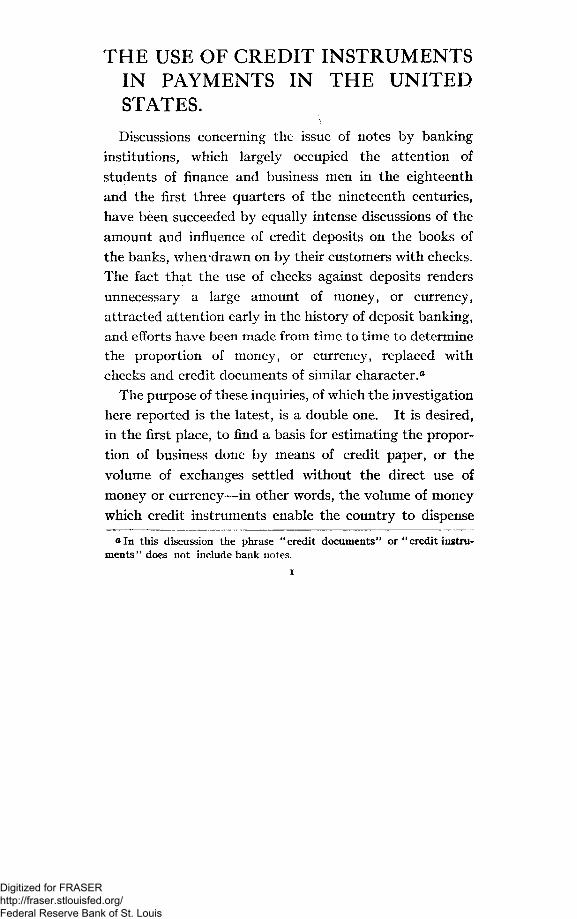
THE USE OF CREDIT INSTRUMENTS IN PAYMENTS IN THE UNITED STATES. Discussions concerning the issue of notes by banking
institutions, which largely occupied the attention of students of finance and business men in the eighteenth and the first three quarters of the nineteenth centuries, have been succeeded by equally intense discussions of the amount and influence of credit deposits on the books of the banks, when "drawn on by their customers with checks. The fact that the use of checks against deposits renders unnecessary a large amount of money, or currency, attracted attention early in the history of deposit banking, and efforts have been made from time to time to determine the proportion of money, or currency, replaced with checks and credit documents of similar character.0
The purpose of these inquiries, of which the investigation here reported is the latest, is a double one. It is desired, in the first place, to find a basis for estimating the proportion of business done by means of credit paper, or the volume of exchanges settled without the direct use of money or currency—in other words, the volume of money which credit instruments enable the country to dispense
oln this discussion the phrase "credit documents" or "credit instruments" does not include bank notes.
i
Digitized for FRASER http://fraser.stlouisfed.org/ Federal Reserve Bank of St. Louis
National Monetary Commission
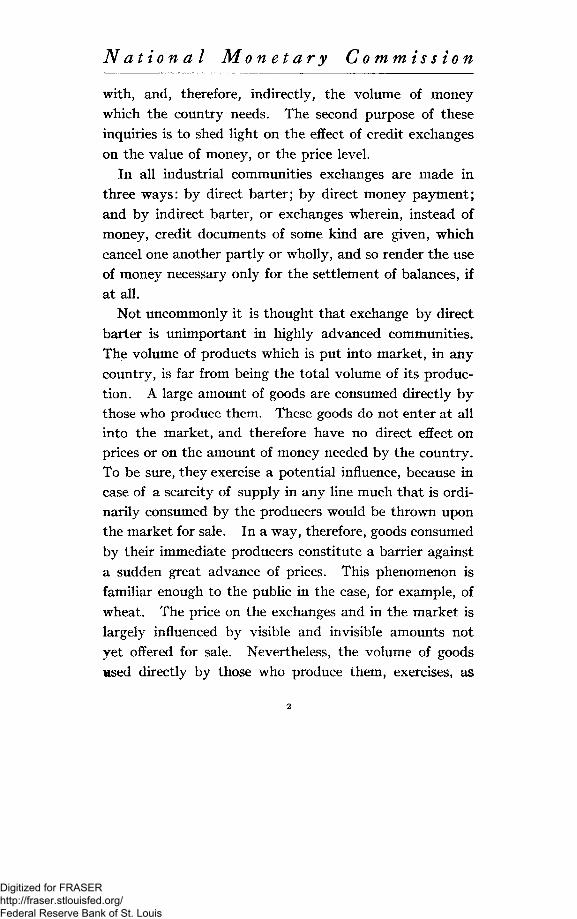
with, and, therefore, indirectly, the volume of money which the country needs. The second purpose of these inquiries is to shed light on the effect of credit exchanges on the value of money, or the price level.
In all industrial communities exchanges are made in three ways: by direct barter; by direct money payment; and by indirect barter, or exchanges wherein, instead of money, credit documents of some kind are given, which cancel one another partly or wholly, and so render the use of money necessary only for the settlement of balances, if at all.
Not uncommonly it is thought that exchange by direct barter is unimportant in highly advanced communities. The volume of products which is put into market, in any country, is far from being the total volume of its production. A large amount of goods are consumed directly by those who produce them. These goods do not enter at all into the market, and therefore have no direct effect on prices or on the amount of money needed by the country. To be sure, they exercise a potential influence, because in case of a scarcity of supply in any line much that is ordinarily consumed by the producers would be thrown upon the market for sale. In a way, therefore, goods consumed by their immediate producers constitute a barrier against a sudden great advance of prices. This phenomenon is familiar enough to the public in the case, for example, of wheat. The price on the exchanges and in the market is largely influenced by visible and invisible amounts not yet offered for sale. Nevertheless, the volume of goods used directly by those who produce them, exercises, as
2
Digitized for FRASER http://fraser.stlouisfed.org/ Federal Reserve Bank of St. Louis
The Use of Credit Instruments
already remarked, no important direct influence on prices. This is so whether the articles are finished goods ready for the so-called "ultimate consumer" or become the raw material of another intermediate producer, provided, of course, the article is not monopolized by a single producer.
A second portion of the goods produced are sold for money. Many portions of these goods are doubtless sold many times before they reach the consumer. The sale of this volume of goods constitutes a direct demand for money to effect payment, the amount necessary for the purpose depending not only upon the average price, but upon the number of times the goods change hands before reaching the consumer.
Still a third volume of goods produced and entered into market are sold on the basis of a price established by the money exchanges, but are not paid for with money in any form. For a large majority of these purchases checks are given either at the time of purchase or soon after. These checks are deposited with the banks; by means of bookkeeping they are set off against one another, and the balances only call for money payment. Even these balances, however, may not call for the use of money for their settlement; they may, and indeed frequently are, entered to the credit of the owner on the books of his bank, and in time canceled by the payments against him coming in at a later period. Obviously this volume of goods, since it does not call for the direct use of money, enables a community to do away with a large volume of money which would otherwise be necessary. It is not true, however, as some apparently have thought, that no
3
Digitized for FRASER http://fraser.stlouisfed.org/ Federal Reserve Bank of St. Louis
National Monetary Commission
money is necessary for these transactions. In normal times, when business is good and confidence unimpaired, there are always some balances from these transactions the owners of which call for settlement in money, and the banks must keep a reserve against these demands. When confidence is impaired, these balances are likely to be larger, even if the total volume of credit is smaller.
There is no way of determining the relative amounts of business done in the three ways mentioned—by direct barter, direct money payment, and credit paper. No data exist which would enable us to make even an approximate estimate of the first portion or indeed of the second. It is possible, however, to determine with some degree of accuracy the volume of business done by indirect barter or settled with credit paper, for we can get some idea of the amount of business thus done by a study of the statistics of the banks.
The amount of the country's business settled with credit paper has long been a matter of dispute, on which widely different opinions have been expressed. On the one hand, men of affairs, especially in banking and other business circles, impressed as they naturally are with the vast volume of business transacted under their eyes by means of credit paper, have usually overemphasized the importance of credit paper settlements and minimized the importance of the large volume of currency. On the other hand, others, particularly those who from time to time urge upon the public the necessity of a larger volume of currency, have denied that the volume of credit business was as large as claimed and have minimized its influence,
4
Digitized for FRASER http://fraser.stlouisfed.org/ Federal Reserve Bank of St. Louis
The Use of Credit Instruments
urging, on the contrary, the necessity for a larger volume of money. Some of them have gone further and insisted that even if the volume of credit payments were as large as many claim, it is a bad thing to have business done so largely in this way and that it is desirable for the best interests of the country that the volume of credit business should be diminished and that of direct money payment enlarged.
More careful students of the subject, in both of the above groups, have insisted, like Francis A. Walker, upon a middle view. They have admitted freely the claims of the business men, bankers, and others, that over 90 per cent of the " wholesale" business of the country was done by means of checks, drafts, or bills, but have urged that the retail business was mainly done with money; that wages were mainly paid with money, and that the demand for money for these purposes constituted the most important part of the country's need for money.
The second and indirect purpose of the inquiry is to get some light on the amount of money needed and the effect of the volume of credit transactions on its value. The discussion of this topic, however, will be more opportune after we have reached some conclusion concerning the first matter.
METHODS OF INQUIRY.
Three methods have been pursued in the effort to determine the proportion of business done by credit documents. For the sake of brevity these may be referred to as the method of clearing-house statistics, the method
5
Digitized for FRASER http://fraser.stlouisfed.org/ Federal Reserve Bank of St. Louis
National Monetary Commission
of bank deposits, and the method of getting information direct from the merchant.
The clearing-house method.—The first method consists, briefly, in noting the volume of clearings from time to time and their relation to the estimated volume of business done. If the volume of clearings increases more rapidly than the volume of business, obviously the ratio of exchanges settled on the basis of credit paper is increasing. This method was first employed by R. H. Inglis Palgrave, esq., in a paper, "Methods of Banking," published in the Journal of the Statistical Society of London for 1873. Mr. Palgrave took as a measure of the increase in the volume of business, the increase of the aggregate exports and imports of Great Britain, calling the sum of the exports and imports for 1868, 100, or the base. The index number for the aggregate of exports and imports was 102 in 1869, 106 in 1870, 116 in i87i,and 129 m 1872. Meantime the clearings, making the aggregate clearings of 1868 the base, or 100, as in the case of exports and imports, increased to the index number 104 in 1869, 114 in 1870, 138 in 1871, and 171 in 1872. Putting the matter in another way, in i860 the aggregate exports and imports, or the volume of business, was 137 to every thousand of clearings. In 1869 it was 134 to the thousand, in 1870 it was 128, in 1871 it was 115, in 1872 it was 103.
This method is not satisfactory. It merely shows the general tendency of credit paper payments and they can not to any degree show the character of the business done.
It is doubtful, too, whether this method is applicable in the United States, for, in the first place, we have
6
Digitized for FRASER http://fraser.stlouisfed.org/ Federal Reserve Bank of St. Louis
The Use of Credit Instruments
been for years constantly establishing new clearing houses in places where banks formerly exchanged checks by sending them to one another with their own messengers. In other words, our credit system is growing all the time. Moreover, it is becoming more refined and perfect.
Again, this method would hardly be applicable to the United States, because the volume of our exports and imports is affected by changes in our tariff legislation, whereas in England that element of disturbance is not present.
Another method of using the clearing-house returns for the purpose of determining the proportion of credit paper and business payments was employed by Prof. Willard Fisher."
The method is to determine the amount of credit paper in the total clearings. This may be done by computing from the amount of credit paper that passes through the clearing house the amount that is probably received by all the banks of the country, both those which are members of clearing houses and those which are not. This sum, whatever it is, is then to be compared with the estimated purchasing power of money in active circulation; that is to say, the amount of the money outside the banks, multiplied by its velocity of circulation or the probable number of times it changes hands to effect a given volume of business in a given time.
Prof. Willard Fisher, using this method, came to the conclusion that probably money and credit transactions stood, at the time he wrote, in the ratio of about i to i.
a See Journ. Pol. Econ., 3:39111
7
Digitized for FRASER http://fraser.stlouisfed.org/ Federal Reserve Bank of St. Louis
National Monetary Commission
Although the theory of this method is excellent, some of the necessary data is very difficult to get. We can determine the total clearings with approximate exactness, but the velocity of circulation is something about which, at present, we know very little, if anything. Our estimates of the amount of money in circulation are also very approximate. Our Treasury Department gives the estimate from month to month, and the figures are doubtless as good as can be obtained. Nevertheless they are very unreliable.
The bank-deposit method.—The second method of determining the proportion of business done by credit paper is that of finding the proportion of checks and other credit instruments in the bank deposits. The general theory underlying this method is that the deposits in the banks represent in character and volume the receipts of the merchants or tradesmen; that these receipts are, of course, from their customers and, therefore, represent fairly the means of payment used by the customers. This method is the one which has been most extensively employed, especially in the inquiries made in this country, in 1881, 1890, 1892, 1894, a n d 1896.
Of course, the questions obviously arise whether the bank deposits do fairly represent the receipts of the merchants for sales, and whether the business done by the merchants, the statistics of whose bank deposits are collected, are really representative of the whole business of the country. These and other points will be discussed IB connection with the details of the present report. It is important to bear in mind, however, that, while the
8
Digitized for FRASER http://fraser.stlouisfed.org/ Federal Reserve Bank of St. Louis
The Use of Credit Instruments
deposits of the merchants may fairly enough represent the habits of their customers as to paying by check and, therefore, the volume of their business paid for in this way, the habits of their customers will depend on a variety of circumstances. In England, for example, banks do not usually accept small accounts. Consequently, the average size of the checks drawn in England is larger than is the case where many banks are glad to take almost any account that may be offered. Our multitude of small banks facilitates the carrying of small accounts and the payment by check. Of course, the largest checks in the English banks, as in our own, are those used in stock-exchange transactions. In 1885 Mr. Lubbock a selected 1,500 checks which passed through his bank, representing a total sum of £871,000 and giving an average for each check of £579. This was on a settling day and included stock-exchange checks. On an ordinary day 1,000 checks examined gave an average of £299. Again, 8,500 clearing checks gave an average of over £300. Mr. Lubbock remarked that checks on bankers who do not clear are much smaller in amount, but do not generally represent commercial transactions. By this he undoubtedly means what we might call wholesale trade and stock exchange dealings. He reported that 1,000 checks of this kind averaged £80 each. Again, 5,848 checks on country banks gave an average of £28 each, and this is the lowest that Mr. Lubbock 'mentions. A little later, Mr. Palgrave said that " the number of checks under £5 is so small as not materially to supplant the use of coin, which is chiefly used for retail trade and wages."5
« Journ. vStatis. Soc, 28:364. & Idem, 36:86.
9
Digitized for FRASER http://fraser.stlouisfed.org/ Federal Reserve Bank of St. Louis
National Monetary Commission
In 1881 R. W. Barnett, esq., wrote that "out of 10,000 checks passing through the country clearing it was ascertained recently that 25 per cent were for less than £5, whilst the average of the whole was less than £30."° In this country checks are not infrequently drawn for as small amounts as 50 or even 25 cents, and occasionally for less, although the average is much higher. Hence, it is obvious that the field of the check is a far larger one with us than it is in England. Merchants' deposits will therefore represent more accurately the methods of payment in this country than would be the case in England. Consequently, greater reliance can be placed on the returns from our banks for the purpose of such an inquiry. Less allowance has to be made with us in the study of bank deposits for business of merchants who do not bank than would be the case in England.
The fact that we use checks for smaller sums than the people of other countries is shown, too, by the large number of cases in which wages are paid by check, as seen by Tables XX to XXV. The total amount of wages paid by check in the week ending March 16, so far as returns were made, aggregated $40,595,874. Many of these checks, doubtless most of them, were for amounts much smaller than people in England would think of drawing checks for.
Still again, our small banks do not as a rule require customers to carry a fixed balance. While that practice is doubtless necessary and has grown considerably in large places, our country banks seldom require it. As has already been remarked, this facilitates the keeping of
0 Journ. Inst. Bankers, 2:78.
1 0
Digitized for FRASER http://fraser.stlouisfed.org/ Federal Reserve Bank of St. Louis
The Use of Credit Instruments
small accounts and promotes what may be called the '' check habit."
From all these considerations it would seem that the method of securing bank deposits for determining the proportion of business done on credit is more likely to yield accurate results in this country than elsewhere. When we come to discuss the deposits of retail merchants, reasons will be given for thinking that their bank deposits really do represent the character of their business receipts. Hence it is not necessary to go into that subject here.
Method of getting information direct from merchants.—A third method of studying this subject is that of securing direct replies from merchants. This is impracticable on a large scale. Multitudes of merchants, especially those whose business is small, do not keep accounts which would give a clear idea of the character of their receipts. No means exist for the collection of such data by any central authority or authorities, or to afford any guaranty of their accuracy when collected. This method of studying the subject can be used only in a small measure in checking up the other methods. It has been used for this purpose in the present inquiry. A number of cases will be mentioned where the merchants themselves have reported their receipts so that it is possible to determine exactly the proportion of credit paper in a month's business.
HISTORY OF INQUIRIES PREVIOUSLY MADE.
As has been remarked, attention was early directed to inquiries concerning the volume of credit transactions, more especially the volume of business transactions settled by means of credit paper.
7071—10 2 11
Digitized for FRASER http://fraser.stlouisfed.org/ Federal Reserve Bank of St. Louis
National Monetary Commission
E N G U S H INVESTIGATIONS.
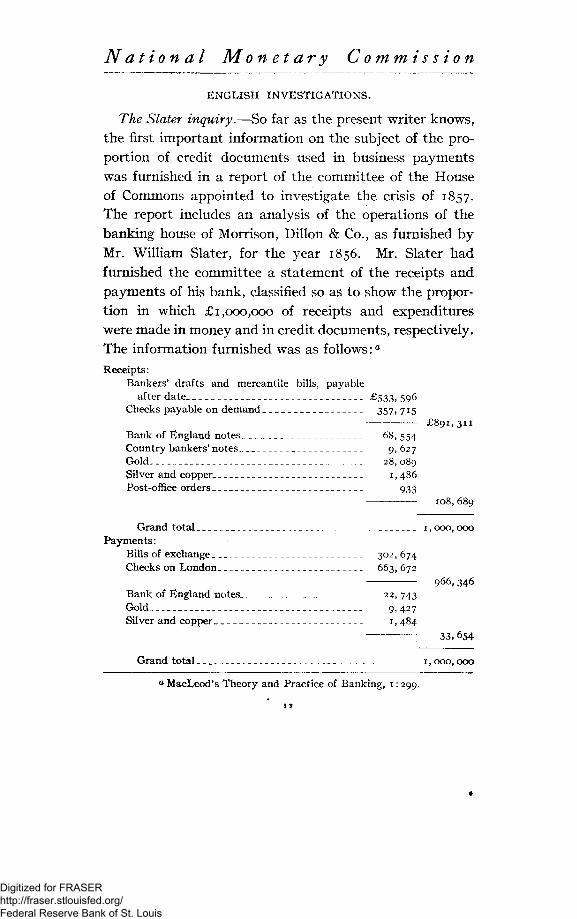
The Slater inquiry.—So far as the present writer knows, the first important information on the subject of the proportion of credit documents used in business payments was furnished in a report of the committee of the House of Commons appointed to investigate the crisis of 1857. The report includes an analysis of the operations of the banking house of Morrison, Dillon & Co., as furnished by Mr. William Slater, for the year 1856. Mr. Slater had furnished the committee a statement of the receipts and payments of his bank, classified so as to show the proportion in which £1,000,000 of receipts and expenditures were made in money and in credit documents, respectively. The information furnished was as follows:0
Receipts: Bankers' drafts and mercantile bills, payable
after date £533, 596 Checks payable on demand 357> 715
£891,311 Bank of England notes 68, 554 Country bankers' notes 9, 627 Gold 28,089 Silver and copper 1, 486 Post-office orders 933
108,689
Grand total 1, 000,000 Payments:
Bills of exchange 302, 674 Checks on London 663, 672
966,346 Bank of England notes 22, 743 Gold 9*427 Silver and copper 1, 484
33,654
Grand total 1, 000, 000
0 MacLeod's Theory and Practice of Banking, 1:299.
12
Digitized for FRASER http://fraser.stlouisfed.org/ Federal Reserve Bank of St. Louis
The Use of Credit Instruments
The Babbage inquiry.—The next attempt to secure statistics showing the proportion in which checks and other credit instruments enter into business payments was made by Charles Babbage, esq., who read a paper before the Statistical Society of London in 1855 on "An Analysis of the Statistics of the Clearing House."0 This inquiry was made by what has been called above the " clearing-house method.'' Mr. Babbage attempted, among other things, to determine " the proportion of payments made in bank notes by the public, both in town and in the country. " It appeared from the data secured by Mr. Babbage at that time that the percentage of credit paper varied with the volume of the clearings; or, as he puts it, " the larger the clearing the smaller the percentage of bank notes used in the operation." He found that 5.49 per cent of the bank notes occurred in the average of the thirty largest total clearings, this average being £4,553,600; while 8.45 per cent occurred in the average of the thirty smallest clearings, which average was £2,006,800. He found that of the clearings discussed by him, the average for the days of settlement on the English Stock Exchange was £4,504,400, of which 6.42 per cent were bank notes; the average for the days of settlement at the foreign stock exchange was £4,148,900, of which 5.66 per cent were bank notes; that for settlement days of inland bills of exchange amounted to £4,092,100, of which 6.61 per cent were notes.
The Palgrave inquiry.—The next inquiry probably was that of W. Langton, esq., general manager of the Manchester and Salford Bank, Manchester, England. Mr. Langton
a Journ . Statis. Soc. of London, i9:28ff.
13
Digitized for FRASER http://fraser.stlouisfed.org/ Federal Reserve Bank of St. Louis
National Monetary Commission
reported figures in 1873 to R. H. Inglis Palgrave, esq., for the years 1859, 1864, and 1872, and other figures furnished at a later date by Mr. T. R. Wilkinson for Professor Jevons. Mr. Palgrave reported on the matter in an address entitled " Notes on Banking in the United Kingdom, Sweden, Denmark, and Hamburg/' etc., read before the Statistical Society of London in February,
1873.0
Mr. Palgrave reported from Mr. Langton's figures that in 1859 cash payments, or payments in coin and notes, were about 53 per cent of the total turnover of his bank; in 1864, 42 per cent, and in 1872, 32 per cent. By turnover Mr. Langton meant the total receipts and total out-payments of his bank. These figures show a gradual increase in the proportion of credit paper. Mr. Langton pointed out what most investigators since have ignored, the influence of the amount and manner of payment of wages on the proportionate use of credit paper.
In the article in which he quotes the figures of Mr. Langton, Mr. Palgrave also attempts to show in a general way the growth of credit exchanges by the use of clearinghouse statistics, the method which has been described above. He remarks, " If we compare the general circumstances, we shall see how completely the circulation of the country has in recent times passed from being a circulation in notes to being a circulation in cheques."6
He points out in this article that the increase in bank clearings has been greater than the increase in the country's trade, and thus infers that an increased proportion
o Journ. Statis. Soc , 36:2yff. & Idem, 36:80.
*4
Digitized for FRASER http://fraser.stlouisfed.org/ Federal Reserve Bank of St. Louis
The Use of Credit Instruments
of the country's business was settled through the banks by credit paper.
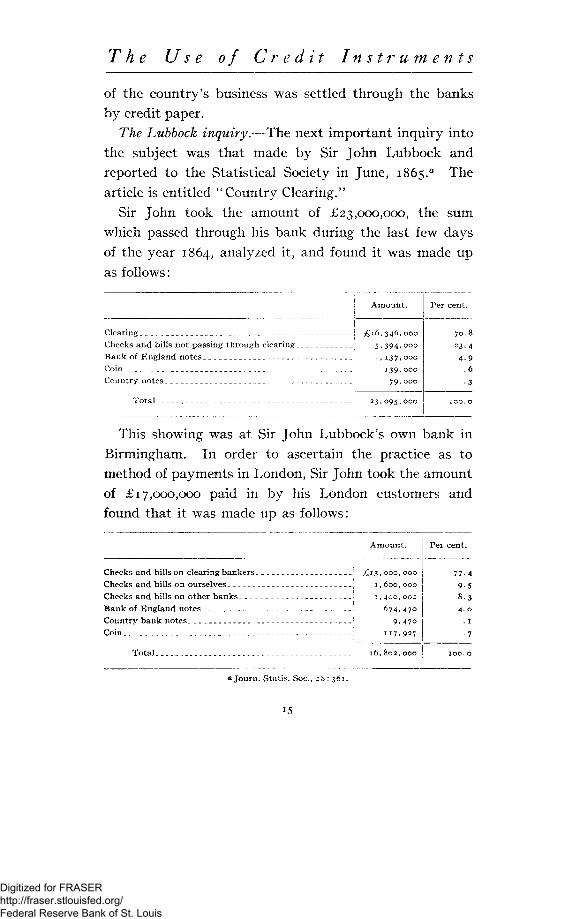
The Lubbock inquiry.—The next important inquiry into the subject was that made by Sir John Lubbock and reported to the Statistical Society in June, 1865.^ The article is entitled "Country Clearing."
Sir John took the amount of £23,000,000, the sum which passed through his bank during the last few days of the year 1864, analyzed it, and found it was made up as follows:
Amount.
Clearing ! £16,346, 000 Checks and bills not passing through clearing-Bank of England notes Coin Cou ntry notes
5 , 3 9 4 , 0 0 0
1 ,137 ,000
139 ,000
79 ,000
Total _ 2 3 . 0 9 5 , 0 0 0
Per cent.
7 0 . 8
2 3 . 4
4 . 9 .6 •3
100. o
This showing was at Sir John Lubbock's own bank in Birmingham. In order to ascertain the practice as to method of payments in London, Sir John took the amount of £17,000,000 paid in by his London customers and found that it was made up as follows:
Checks and bills on clearing bankers j £13. 000, 000 Checks and bills on ourselves Checks and bills on other banks _ Bank of England notes Country bank notes Coin
1 ,600 ,000
1 ,400 ,000
6 7 4 , 4 7 0
9 , 4 7 o
117 ,927
T o t a l _ 16, 8 0 2 , 0 0 0
Per cent.
ajourn. Statis. Soc, 28 : 361.
15
Digitized for FRASER http://fraser.stlouisfed.org/ Federal Reserve Bank of St. Louis
National Monetary Commission
In discussing the last table, Sir John is of the opinion that the amount of bank notes is too large, because the note account includes notes drawn by the bank itself to replenish its daily supply and in so far did not represent bills paid in by customers. He deducted this amount, £266,000, but added as the amount of notes paid in for collection, discounts, and loans on security the sum of £2,460,686. With these alterations made he came to the conclusion that "out of £19,000,000 credited to our town customers, £408,000 consisted of bank notes, £79,000 of country bank notes, and £118,000 of coin," making the percentages 96.8 for checks and bills, 0.6 for coin, and 2.6 for bank notes.
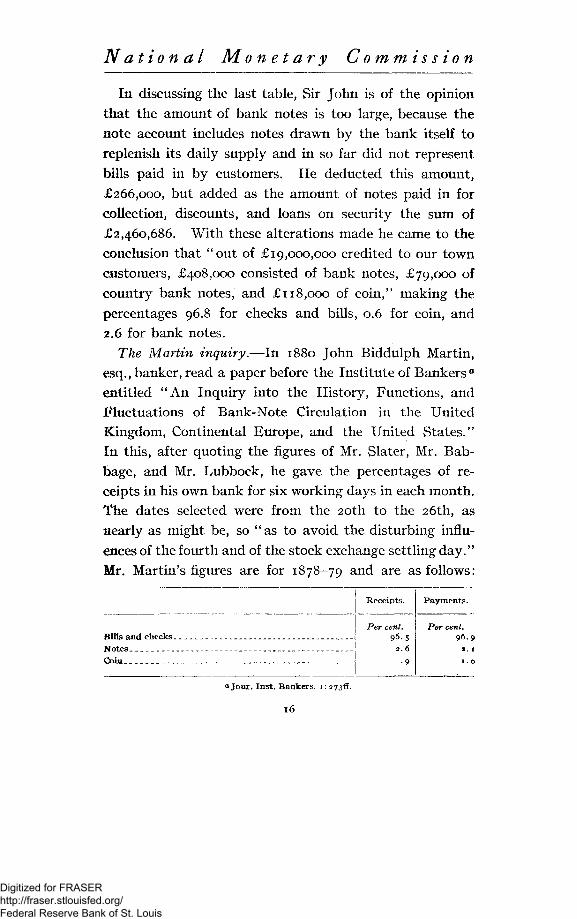
The Martin inquiry.—In 1880 John Biddulph Martin, esq., banker, read a paper before the Institute of Bankers0
entitled "An Inquiry into the History, Functions, and Fluctuations of Bank-Note Circulation in the United Kingdom, Continental Europe, and the United States." In this, after quoting the figures of Mr. Slater, Mr. Bab-bage, and Mr. Lubbock, he gave the percentages of receipts in his own bank for six working days in each month. The dates selected were from the 20th to the 26th, as nearly as might be, so "as to avoid the disturbing influences of the fourth and of the stock exchange settling day." Mr. Martin's figures are for 1878-79 and are as follows:
Bills and checks Notes Coin __
Receipts.
Per cent. 96.5
2.6 9
Payments.
Per cent. 96.9
a. 1
1 . 0
a Jour. Inst. Bankers, i : 273S.
16
Digitized for FRASER http://fraser.stlouisfed.org/ Federal Reserve Bank of St. Louis
The Use of Credit Instruments
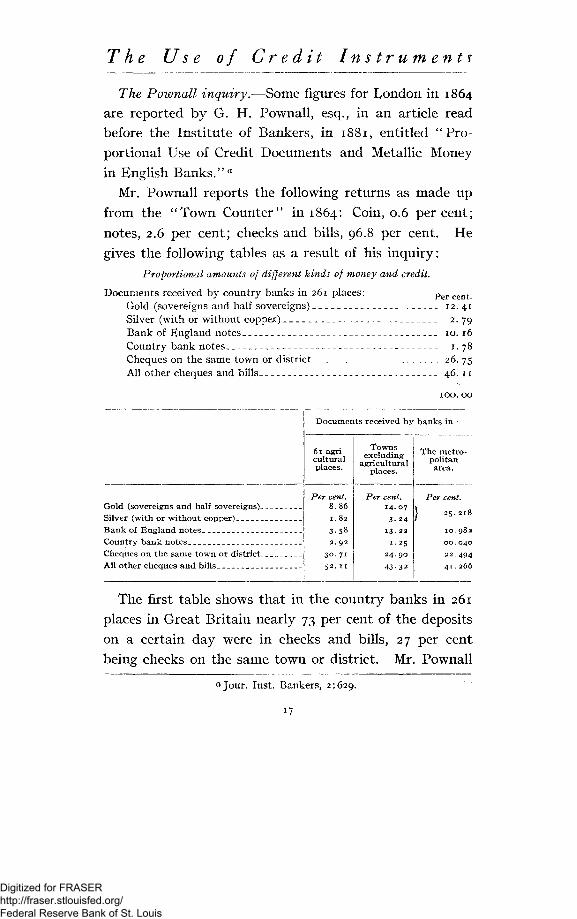
The Pownall inquiry.—Some figures for London in 1864 are reported by G. H. Pownall, esq., in an article read before the Institute of Bankers, in 1881, entitled " Proportional Use of Credit Documents and Metallic Money in English Banks."0
Mr. Pownall reports the following returns as made up from the "Town Counter" in 1864: Coin, 0.6 percent; notes, 2.6 per cent; checks and bills, 96.8 per cent. He gives the following tables as a result of his inquiry:
Proportional amounts of different kinds of money and credit.
Documents received by country banks in 261 places: Percent. Gold (sovereigns and half sovereigns) 12.41 Silver (with or without copper) 2.79 Bank of England notes ^ 10. 16 Country bank notes 1.78 Cheques on the same town or district 26. 75 All other cheques and bills 46. 11
Documents received by banks i n -
61 agricultural places.
Towns excluding
agricultural places.
The metropolitan area.
Gold (sovereigns and half sovereigns). _ Silver (with or without copper) Bank of England notes Country bank notes Cheques on the same town or district. _ All other cheques and bills
Per cent. 8.86 1.82
3-58 2. 92
3 0 . 7 1
52. 11
Per cent. 14 .07
3 - 2 4 13- 23
1. 25
2 4 . 9 0
43-32
Per cent.
25 .218
10.982
00.040
22.494
41.266
The first table shows that in the country banks in 261 places in Great Britain nearly 73 per cent of the deposits on a certain day were in checks and bills, 27 per cent being checks on the same town or district. Mr. Pownall
a Jour. Inst. Bankers, 2:629.
17
Digitized for FRASER http://fraser.stlouisfed.org/ Federal Reserve Bank of St. Louis
National Monetary Commission
further makes a careful classification to show the relative use of credit paper in agricultural towns and the metro-pob* an area. From the second of his tables it appears that nearly 83 per cent of the deposits in 61 agricultural places were in checks and bills, 68 per cent were of a similar character in the towns, and 64 per cent in the metro-pc litan area.
Mr. Pownall's article shows that at the time at which he wrote the deposits of checks and bills in banks in the suburbs of Manchester were a little over 45 per cent. He further classified the proportional receipts of money and credit paper received by the banks of Manchester and its suburbs according to the trades, including cotton, wool, iron, pottery, and silk. He finds that in the bank receipts from these trades the proportion of checks and bills was as follows: Cotton, 61.5; wool, 68.9; iron, 67.9; pottery, 71.8; silk, 65.7. Other valuable details are given in this excellent article, but it is not necessary to repeat them here because the English practice differs somewhat from our own in the minimum amount for which checks are commonly drawn.
CRITICISM OF ENGLISH INQUIRIES.
The English investigations, although interesting, are hardly comparable in extent with those of this country or valuable as a basis for conclusions applicable to this country. For, in the first place, the number of banks from which statistics were obtained was small in each inquiry. In the second place, the classes of people who use the banks in England are only the larger merchants the great business firms, and wealthy individuals. The
18
Digitized for FRASER http://fraser.stlouisfed.org/ Federal Reserve Bank of St. Louis
The Use of Credit Instruments
English banks would not show as large a proportion of
small checks as the deposits of our own banks. This was
certainly t rue at the t ime the English investigations re
ferred to were made, for it was not until 1854 t h a t it was
legal to issue drafts for a less sum than 20s., and "long
after t ha t t ime great uncertainty appears to have existed
on the subject ."" Moreover, we know from these inqui
ries t ha t when they were made wages were paid and retail
t rade carried on more largely with coin, which forms so
large a proportion of the English circulation.
Another defect of the English statistics is their com
paratively non-representative character. With the ex
ception possibly of those gathered by Mr. Pownall, the
statistics presented by the various writers are, so to speak,
' ' sample cases," and it may be doubted whether they
were representative. They certainly represent fairly the
practice of merchants and the wealthy classes in England
with reference to the use of bank accounts and the issue
of checks. Can we be sure tha t they represent the
method of making payments used by the larger propor
tion of the English people, or tha t used in settling the
larger proportion of British trade? Finally, there is no
doubt tha t the returns given by most of the writers in
clude such items as "bills paid in for collection and dis
count, loans on security," and other items which should
not be included if what we are trying to determine is the
volume of business payments made from day to day by
credit paper.
a R. W. Barnett, " Effect of the Development of Banking Facilities Upon the Circulation of the Country," Jour. Inst. Bankers, 2: 78.
*9
Digitized for FRASER http://fraser.stlouisfed.org/ Federal Reserve Bank of St. Louis
National Monetary Commission
AMERICAN INVESTIGATIONS.
The Garfield inquiry.—Our next information on this subject comes from a former President, then a Representative, James A. Garfield. In his speech on Resumption, November 16, 1877, he stated that when serving as chairman of the Committee on Banking and Currency, in 1871, he had become interested in the matter and had asked the Comptroller of the Currency to secure for him data on the proportionate use of credit paper and money from 52 selected banks. His remarks as to the results are as follows: " I selected three groups. The first was the city banks. The second consisted of banks in cities of the size of Toledo and Dayton, in the State of Ohio. In the third group, if I may coin a word, I selected the 'countriest' banks—the smallest that could be found at points away from railroads and telegraphs. The order was that those banks should analyze all their receipts for six consecutive days, putting into one list all that can be called cash—either coin, greenbacks, bank notes, or coupons—and into the other list all drafts, checks, or commercial bills. What was the result? During these six days $157,000,000 were received over the counters of the 52 banks and of that amount $19,370,000—12 per cent only—in cash, and 88 per cent—that vast amount representing every grade of business—was in checks, drafts, and commercial bills. " a
The inquiry of 1881.—In 1881 John J. Knox, while he was still Comptroller of the Currency, made an inquiry into the proportion of bank receipts made by credit paper on two dates, June 30 and September 17, 1881.6 His
a Congressional Record, Nov. 16, 1877, p . 462. &See Report of Comptroller of Currency, 1881.
20
Digitized for FRASER http://fraser.stlouisfed.org/ Federal Reserve Bank of St. Louis
The Use of Credit Instruments
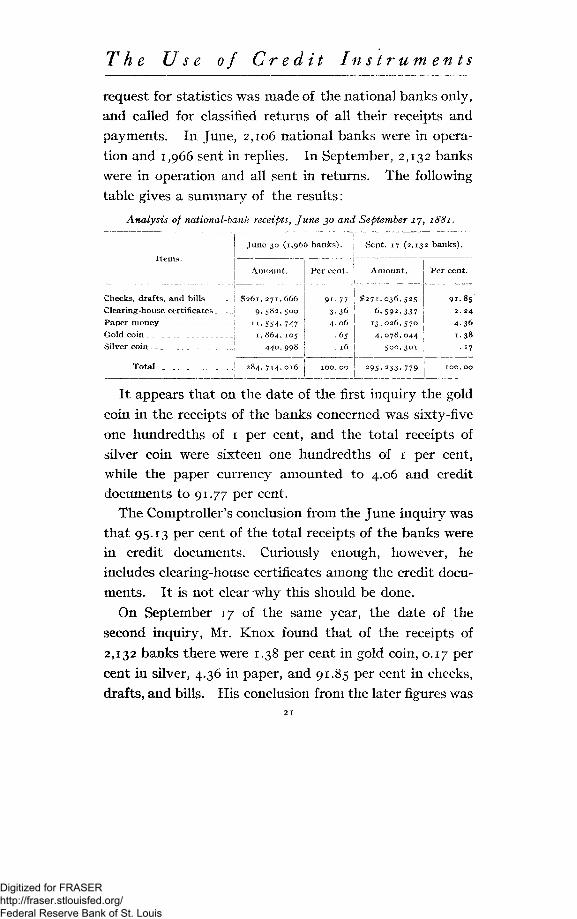
request for statistics was made of the national banks only, and called for classified returns of all their receipts and payments. In June, 2,106 national banks were in operation and 1,966 sent in replies. In September, 2,132 banks were in operation and all sent in returns. The following table gives a summary of the results:
Analysis of national-bank receipts, June 30 and September ijy 1881.
Items.
Checks, drafts, and bills _ _ Clearing-house certificates Paper money _ _ _ Gold coin _ Silver coin
Total
June 30 (1,966 banks).
Amount.
$261,271,666 9,582,500
11,554, 747 1,864,105
284,714,016
Per cent.
91.77 3-36 4. 06
.65
. 16
1 0 0 . 0 0
Sept. 17 (2,132 banks).
Amount.
$271,036,525
6,592,337 13,026,570
4.078,044 500,301
295.233.779
Per cent.
91.85 2 . 2 4
1.38 . 17
1 0 0 . 0 0
It appears that on the date of the first inquiry the gold coin in the receipts of the banks concerned was sixty-five one hundredths of i per cent, and the total receipts of silver coin were sixteen one hundredths of i per cent, while the paper currency amounted to 4.06 and credit documents to 91.77 per cent.
The Comptroller's conclusion from the June inquiry was that 95.13 per cent of the total receipts of the banks were in credit documents. Curiously enough, however, he includes clearing-house certificates among the credit documents. It is not clear why this should be done.
On September 17 of the same year, the date of the second inquiry, Mr. Knox found that of the receipts of 2,132 banks there were 1.38 per cent in gold coin, 0.17 per cent in silver, 4.36 in paper, and 91.85 per cent in checks, drafts, and bills. His conclusion from the later figures was
Digitized for FRASER http://fraser.stlouisfed.org/ Federal Reserve Bank of St. Louis
National Monetary Commission
that 94.09 per cent of the receipts of the banks was in credit documents, including as before clearing-house certificates.
In this inquiry the Comptroller was careful to classify separately the returns from banks in New York City and other reserve cities and the banks elsewhere. In the June inquiry the proportion of credit documents in the banks not in reserve cities was 81.72 per cent, as against 98.7 per cent in New York City and 94.38 per cent in the other reserve cities. The September inquiry gave for the respective classes 81.74 per cent, 98.8 per cent, and 92.35 per cent. These figures thus show the inaccuracy of the statement not infrequently made in the past that over 90 per cent of the whole business of the country was done with credit documents. The 81 per cent of the " banks elsewhere " should have made students suspicious.
The Comptroller further presented a table showing the proportion of checks, drafts, and bills in the receipts of the two dates selected, by States. This table shows that according to the inquiry of June, 1881, 92 per cent was the largest proportion of credit documents in the banks ef any State or Territory and was accredited to New Jersey, and the smallest percentage appeared in the returns of Wyoming, as 33.6 per cent. In the inquiry of September of the same year, New Jersey again appears with the largest percentage of credit documents, 91 per cent; while Nevada shows the smallest, only 8.2 per cent. Both in the case of Wyoming and Nevada the amounts from which the percentages were drawn were so insignificant that the two places may be left out of the consideration. In general, the tables showed that checks in the bank returns of
22
Digitized for FRASER http://fraser.stlouisfed.org/ Federal Reserve Bank of St. Louis
The Use of Credit Instruments
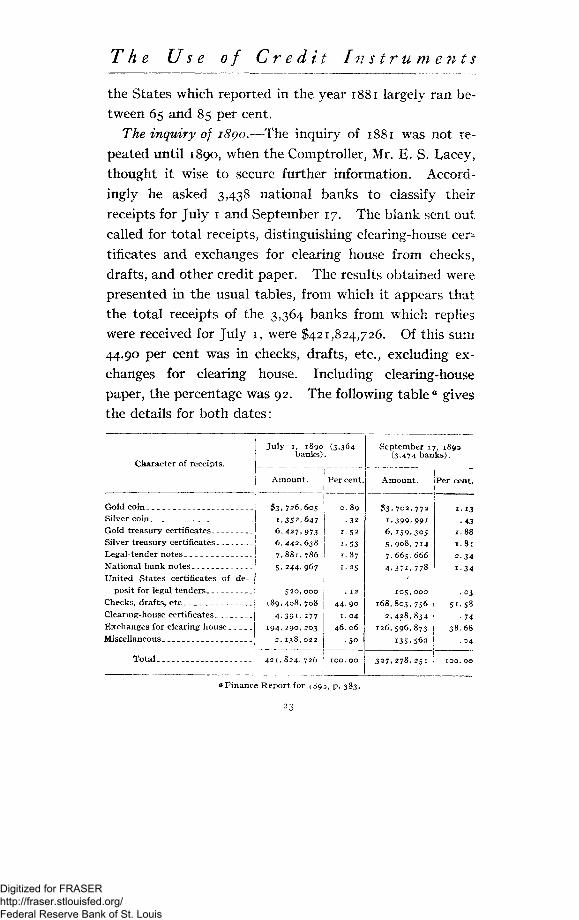
the States which reported in the year 1881 largely ran between 65 and 85 per cent.
The inquiry of 1890.—The inquiry of 1881 was not repeated until 1890, when the Comptroller, Mr. E. S. Lacey, thought it wise to secure further information. Accordingly he asked 3,438 national banks to classify their receipts for July 1 and September 17. The blank sent out called for total receipts, distinguishing clearing-house cer^ tificates and exchanges for clearing house from checks, drafts, and other credit paper. The results obtained were presented in the usual tables, from which it appears that the total receipts of the 3,364 banks from which replies were received for July 1, were $421,824,726. Of this sum 44.90 per cent was in checks, drafts, etc., excluding exchanges for clearing house. Including clearing-house paper, the percentage was 92. The following table a gives the details for both dates:
Character of receipts.
July 1, 1890 (3,364 banks).
Amount.
September 17, 1890 (3,474 banks).
Amount. Per cent.
Gold coin Silver coin Gold treasury certificates Silver treasury certificates Legal-tender notes National-bank notes United States certificates of de
posit for legal tenders Checks, drafts, etc Clearing-house certificates Exchanges for clearing house Miscellaneous
Total ,
$3, 726,605 1,352,647 6,427,973 6,442,638 7,881,786 5,244,967
520,000 X89,408,708
4.391,177 194,290,203
2,138,022
421, 824,726
46
$3,702,772
i,399,99i
6, 159,305
5,908, 714
7,665,666
4.371, 778
105,000 168,803,756
2,428,834 126,596,873
135,562
327,278, 251
i-13 -43
1.88 1.81 2-34 1 3 4
•03 5r.58
•74 38.68
.04
T O O , O O
<* Finance Report for 1890, p. 383.
Digitized for FRASER http://fraser.stlouisfed.org/ Federal Reserve Bank of St. Louis
National Monetary Commission
Returns were presented as usual for the reserve cities and the banks outside of reserve cities. The total receipts of the banks were $94,000,000 less in September than in July, and practically all of this was in items " which represent substitutes for money." The larger proportion of it was in clearing-house certificates and exchanges. The percentage of checks, drafts, etc., actually received by the banks was larger in September, as the table shows, although the total receipts were less. Other tables classified the facts in different ways to bring out the comparison between them and the data obtained in 1881. It is to be noted, however, that one-half of the total receipts came from 47 banks in New York City.
The inquiry of 1892.—This inquiry, like the two preceding ones, was based on reports obtained from national banks. The purpose of the Comptroller, Mr. A. B. Hepburn, in making the inquiry was " to furnish reliable data from which the public could see and realize how small a percentage of business transactions are represented by actual money, and how impossible it is for the Government to furnish a volume of currency sufficient to meet the wants of the people at all times—that is, in times of general distress or quasi-panic." The Comptroller goes on to say: "Over 90 per cent of all business transactions are done by means of credit. When the public lose confidence and credit is impaired and refused, over 90 per cent of all business transactions are directly affected. It is easy to realize how impossible it is for the remaining 10 per cent of money to carry on the business of the country without monetary stringency and financial distress."*1
« Comptroller's Report, 1892, p. 32.
24
Digitized for FRASER http://fraser.stlouisfed.org/ Federal Reserve Bank of St. Louis
The Use of Credit Instruments
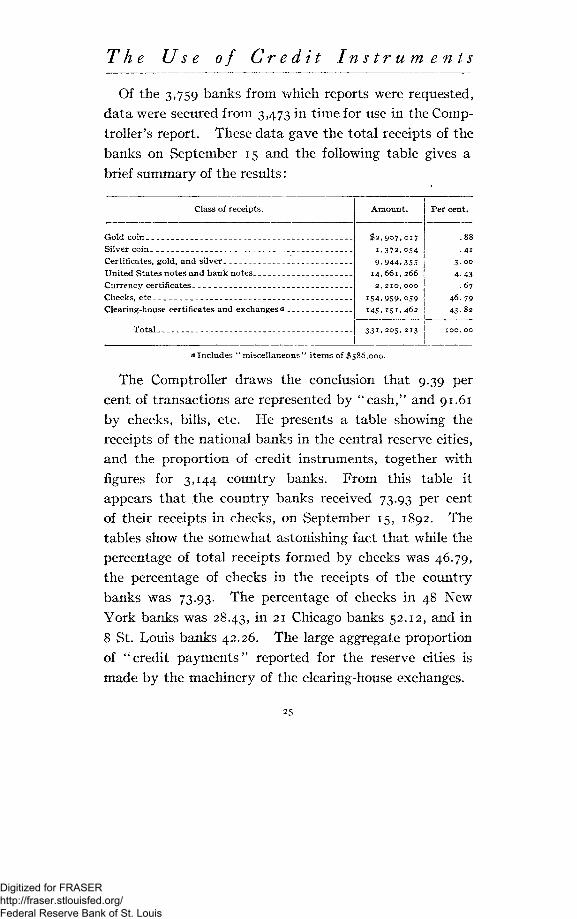
Of the 3,759 banks from which reports were requested,
d a t a were secured from 3,473 in t ime for use in the Comp
troller's report. These da ta gave the total receipts of the
banks on September 15 and the following table gives a
brief summary of the results:
Class of receipts.
Gold coin _ _ -Silver coin _ _
United States notes and bank notes. Currency certificates Checks, etc _ __ Clearing-house certificates and exchanges <*
Total
Amount.
$2,907,017 1,372,054 9,944.355
14,661,266 2 , 2 1 0 , 0 0 0
I54.959.059 145. 151.462
331,205.213
Per cent.
.88
• 41 3 -00
4. 43 . 67
46.79 43. 82
<* Includes "miscellaneous" items of $586,000.
The Comptroller draws the conclusion tha t 9.39 per
cent of transactions are represented by "cash ," and 91.61
by checks, bills, etc. He presents a table showing the
receipts of the national banks in the central reserve cities,
and the proportion of credit instruments, together with
figures for 3,144 country banks. From this table it
appears t ha t the country banks received 73.93 per cent
of their receipts in checks, on September 15, 1892. The
tables show the somewhat astonishing fact tha t while the
percentage of total receipts formed by checks was 46.79,
the percentage of checks in the receipts of the country
banks was 73.93. The percentage of checks in 48 New
York banks was 28.43, m 2 I Chicago banks 52.12, and in
8 St. Louis banks 42.26. The large aggregate proportion
of "credi t p a y m e n t s " reported for the reserve cities is
made by the machinery of the clearing-house exchanges.
25
Digitized for FRASER http://fraser.stlouisfed.org/ Federal Reserve Bank of St. Louis
National Monetary Commission
From another table given in this report it appears that the smallest percentage of checks in the receipts of banks on the date in question was in Oklahoma Territory, where it was 42.37; the largest was 95.64 in the returns from Arizona, while Connecticut showed 92.3, Colorado 92.11, and Rhode Island 92.04.
The Comptroller calls attention to the fact that as contrasted with the inquiry of 1881 the returns of 1892 for New York City indicate " a marked increase in the amount of paper currency received.,, The amount in the returns of September, 1881, was sixty-five one-hundredths of 1 per cent, while in the returns of 1892 it was 7.53 per cent. He noted also a marked diminution in the proportion of receipts of checks and drafts as between the two dates, " the average per cent for the two days in 1881 being 2.91 per cent greater than the average for the two days in 1890; September 15, 1892, is 3.28 per cent less than September, 1890."
The inquiry of 1894.—The conclusion from the inquiries thus far discussed, as it was given in the public press and elsewhere, was to the effect that over 90 per cent of the business of the country was done on a credit basis, so that the need for money was small. During the next few years the monetary agitation was intense and this statement in its broad form was severely challenged, less as a matter of fact, however, than because of the inference drawn from it. It was urged, not only by those who were insisting on a larger volume of currency, but by careful students of the question, that the large proportion of credit transactions shown by bank receipts did not by
26
Digitized for FRASER http://fraser.stlouisfed.org/ Federal Reserve Bank of St. Louis
The Use of Credit Instruments
any means disprove the need for a larger volume of currency. It was urged, as Francis A. Walkera pointed out, that "in spite of barter and in spite of credit a very large part, in most countries by far the largest part, in many countries almost the whole, of retail trade is still conducted by the use of money; and this is after all the vital thing."
The statement that the world over retail trade is conducted by the use of money is in the main correct. In order to test it the present writer suggested to the Comptroller of the Currency, Hon. James H. Eckels, the expediency of making an inquiry into the character of deposits made in the national banks of the country by selected classes of retail traders. The classes selected were those on whose goods between 70 and 80 per cent of the income of the laboring people of the country is spent, as shown by the reports of the Commissioner of Labor in 1890-1892. Accordingly a blank was prepared by the writer and sent out by the Comptroller, asking the national banks of the country to give their deposits in gold, silver, gold certificates, silver certificates, treasury notes, checks and other instruments of credit, made on May 15, 1894, by retail grocers, butchers, clothiers, furniture dealers, and fuel dealers. Replies were received from 2,465 national banks out of a total of 3,774. The aggregate deposits returned were $5,999,065, of which 58.9 per cent was in checks and store orders, and 41.1 per cent in various kinds of money. These figures indicated that the belief that checks did not enter largely
a Francis A. Walker, Discussions in Economics and Statistics, 1: 204.
7071—10 3 27
Digitized for FRASER http://fraser.stlouisfed.org/ Federal Reserve Bank of St. Louis
National Monetary Commission
into retail trade was a mistaken one. The returns, however, were on the whole meager, and two years later the writer again urged the Comptroller of the Currency to institute a similar inquiry on a much larger scale. The Comptroller kindly consented, and the result was the inquiry of 1896.
The inquiry of 1896.—The inquiry of 1896 was planned along the lines of that of 1894 for the purpose of determining if possible the proportion of credit paper received in what is commonly called "legitimate trade' ' as distinguished from speculative transactions. It was desired, moreover, to test the statement so commonly made that the large proportion of credit documents shown in the bank returns was practically due to wholesale trade and speculation. Accordingly a blank was prepared by the writer and submitted to the Comptroller of the Currency and afterwards sent out by him to all banking institutions in the country, calling for the deposits made by retail dealers, wholesale dealers, and all other depositors, in gold, silver, currency, and checks. Certain supplementary questions were added in order to get, as it were, a side light on the returns. These questions were as follows:
1. Does the above statement show the usual proportion of checks, drafts, etc., to total deposits? If not, please indicate how much it differs therefrom.
2. Is it customary in your community to pay wages by check?
3. Are wages as a rule paid weekly or monthly in your community?
The circular also called for the total number of depositors and amount of individual deposits, and the cash on
28
Digitized for FRASER http://fraser.stlouisfed.org/ Federal Reserve Bank of St. Louis
The Use of Credit Instruments
hand classified in the usual way. The request, like that of 1894, was for deposits, not receipts. The date selected was the settlement day nearest the 1st of July. Of nearly 13,000 banking institutions of all classes then in existence, 5,700 sent replies, of which 5,530 were in such shape as to be useful for the purposes of the inquiry. Of these, 3,474 were from national banks and the remainder from state, private and savings banks, and loan and trust companies. The number of replies from private and savings banks and loan and trust companies was comparatively small, so that in writing up the report they were included with the state banks. The returns were analyzed by the writer of this report and presented in numerous tables in the report of the Comptroller for 1896. It is unnecessary here to go into great detail in reviewing the report. Suffice it to say that the grand total deposits of the 5,530 banks was $302,936,232. Of this amount 0.6 per cent was in gold, 0.5 per cent in silver, 6.3 per cent in currency, and 92.5 per cent in credit paper.
Of the retail deposits the aggregate was $26,536,930, and of this amount 2.4 per cent was in gold, 3.2 per cent in silver, 26.7 per cent in currency, and 67.4 per cent in checks. Of the aggregate retail deposits about $15,000,000 were in the six States of Illinois, Massachusetts, Missouri, New York, Ohio, and Pennsylvania, leaving between $11,000,000 and $12,000,000 for the rest of the country. The smallest percentage of checks in retail deposits was shown by Indian Territory, with 52.7 per cent; New Hampshire was next, with 53.2 per cent, while the largest percentage of checks was in Kentucky, which had 77.4 per
cent, 29
Digitized for FRASER http://fraser.stlouisfed.org/ Federal Reserve Bank of St. Louis
National Monetary Commission
The bank returns were supplemented with data secured directly from merchants in several places and also with certain calculations as to the probable pract ice and expenditures of various classes of people. After all allowances, including the omission of $100,000,000 from the deposits of "all others " to allow for speculative transactions, the conclusion was reached that 80 per cent was a fair estimate of the total proportion of the deposits of the day made in credit paper.
CRITICISM OF THESE AMERICAN INQUIRIES.
The first obvious criticism to be made upon the earlier inquiries in this country is that they called for the total receipts of the banks on a given day. Receipts, of course, are different from deposits,0 for they include checks presented for collection and not credited until the collection is made. The percentage of credit transactions is calculated too commonly, moreover, on the basis of the inclusion of clearing-house certificates.
Still, again, the returns in the earlier inquiries in this country were criticised because they were received from a limited number of banks. National banks only were used, but at the times when the investigations were made these banks formed a larger proportion of the total number of banks in the country than they do now.
The report of the inquiry of 1894 is to be criticised for not giving aggregate of deposits as well as percentages, and for the omission of the percentages of deposit by the various classes of dealers. The present writer, who made that report, did not realize at the time how helpful the percentages would have been if classified by trades.
a The word "deposits " was used in the inquiries of 1894, 1896, and 1909.
30
Digitized for FRASER http://fraser.stlouisfed.org/ Federal Reserve Bank of St. Louis
The Use of Credit Instruments
A criticism which has been made on the inquiry of 1896 is that the returns were obtained for a settlement day. Deposits on such a day would, it is urged, show a larger proportion of credit paper than on other days. This criticism will be discussed later on in connection with the present investigation, as will also the further question whether bank deposits of merchants may be taken fairly to represent the method of payment of their customers.
THE PRESENT INQUIRY.
The questions,—The present inquiry is undertaken by the National Monetary Commission in connection with its attempt to secure all possible information as a basis for its report to Congress. After careful consideration and consultation with a number of bankers and students of finance, and representatives of the Commission, as well as the Comptroller of the Currency, it was decided to adhere to the general form of the inquiry of 1896. It was desired to secure for purposes of comparison the deposits classified as at the earlier date, and certain additional information was asked for in order to throw some side light on the inquiry. Following is the circular letter and blank form which was sent out by the Comptroller:
TREASURY DEPARTMENT,
Washington, March 1, 1909. To the Cashier:
SIR: The National Monetary Commission, created by an act of Congress on May 30, 1908, is seeking information concerning the bank deposits and the proportion of payments made on an average throughout the country from
31
Digitized for FRASER http://fraser.stlouisfed.org/ Federal Reserve Bank of St. Louis
National Monetary Commission
day to day by means of checks and similar instruments of credit. On several occasions in the past the Comptroller has made requests of this kind, but the last such inquiry was made thirteen years ago. It is desired on this occasion to obtain returns as complete and representative as possible and to get a response not only from the national banks but from state and private banking institutions of all kinds. Similar inquiries are being made for the Monetary Commission during the current year in England, France, Germany, and other European countries for purposes of comparison with the practice in our own country. For this reason, and on account of the importance of the present investigation and of the purpose for which it is to be used, it is earnestly requested that the recipients of the accompanying blank will give it their best attention and return it promptly to the Comptroller in the inclosed envelope which does not require postage.
Information is desired as to the number and classification of depositors, methods of paying wages, etc., as indicated in the questions relating thereto. The statistics asked for will be published only in a general summary, the figures for the individual banks being treated as confidential.
Trusting that your institution will give me all the information asked for and that you will find it possible to transmit your report promptly after March 16, I am,
Yours, very respectfully,
LAWRENCE O, MURRAY,
Comptroller of the Currency.
32
Digitized for FRASER http://fraser.stlouisfed.org/ Federal Reserve Bank of St. Louis
The Use of Credit Instruments
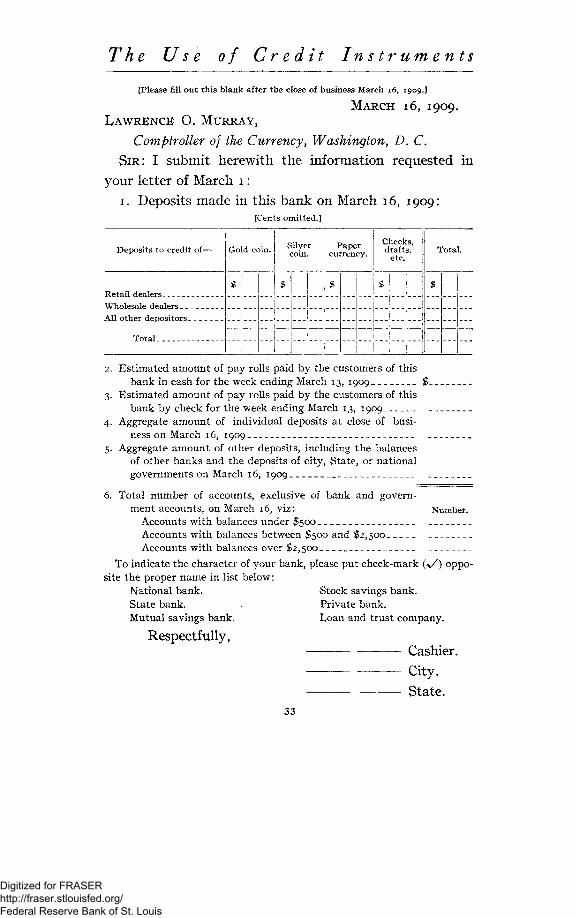
[Please fill out this blank after the close of business March 16, 1909.]
MARCH 16, 1909. LAWRENCE 0. MURRAY,
Comptroller of the Currency, Washington, D. C. SIR: I submit herewith the information requested in
your letter of March 1 : 1. Deposits made in this bank on March 16, 1909:
[Cents omitted.]
Deposits to credit of—
All other depositors
Total ._ -_
Gold coin.
$ j ! i i
i
Silver coin.
$
\
Paper currency.
$
Checks, drafts,
etc.
$
Total.
$
2. Estimated amount of pay rolls paid by the customers of this bank in cash for the week ending March 13, 1909 $_
3. Estimated amount of pay rolls paid by the customers of this bank by check for the week ending March 13, 1909
4. Aggregate amount of individual deposits at close of business on March 16, 1909
5. Aggregate amount of other deposits, including the balances of other banks and the deposits of city, State, or national governments on March 16, 1909
6. Total number of accounts, exclusive of bank and government accounts, on March 16, viz: Number.
Accounts with balances under $500 Accounts with balances between $500 and $2,500 Accounts with balances over $2,500
To indicate the character of your bank, please put check-mark (%/) opposite the proper name in list below:
National bank. Stock savings bank. State bank. Private bank. Mutual savings bank. Loan and trust company.
Respectfully, Cashier.
City.
State. 33
Digitized for FRASER http://fraser.stlouisfed.org/ Federal Reserve Bank of St. Louis
National Monetary Commission
The deposits made on March 16 were called for. This date came on Tuesday, so that the returns of the present inquiry are not those of a settlement day, and consequently are free from the objection made in connection with the previous inquiry, that bank deposits on settlement days usually show a larger proportion of checks than on other days. This objection had been anticipated in the report made to the Comptroller in 1896, and an effort was made at that time to determine whether there was any important variation in the deposits of the bank from day to day throughout a month, or two. As shown in that report, the writer got information from several banks showing the proportion of credit paper in their deposits daily for from thirty to sixty or ninety days. As a result of this inquiry he formed the opinion that there was no important difference in the proportion of credit paper on settlement days and other days. The reason may be that there is no such thing as a general settlement day the country over. At any rate, the present returns for a nonsettlement day show a higher proportion of credit paper in the retail class of deposits than was shown by the deposits for a sett ement day in 1896. The time of year chosen was simply 2 matter of convenience for those making the inquiry. As shown by the circular, certain supplementary questions were added, as had been done in 1896. The first of tliese was a request for the estimated amount of pay rol s paid by the customers of the bank in cash for the week ending March 13, and also the amount paid by check. The blank also called for the aggregate amount of individual deposits
34
Digitized for FRASER http://fraser.stlouisfed.org/ Federal Reserve Bank of St. Louis
The Use of Credit Instruments
at the close of business, and the aggregate amount of other deposits, including the balances of other banks and the deposits of city, State, or National Government, if any.
Finally, a request was made for a statement of the number of accounts with balances under $500, the number with balances between $500 and $2,500, and the number with balances over $2,500. The blank was sent out by the Comptroller to all the banking institutions of the country known to him. The replies were sent, of course, to the Comptroller and forwarded by him to the writer for classification, analysis, and report.
It may not be out of place to say a word about the amount of labor involved in putting the material into shape for use. The blanks were received by the writer early in May. They were arranged by States and classes of banks, and the replies from each State numbered serially. The returns were then tabulated on large ruled sheets, each bank being given a separate entry for the replies for each question. The figures were arranged in columns to correspond to the columns of the circular of inquiry; but three columns were used for the specie—one for gold, one for silver, and one for the total specie. The last column on the sheet was the sum of the specie, currency, and checks from each bank. The columns were then added independently, and in every case of course the column of totals had to equal the sum of the footings of the specie, currency, and checks. Where a discrepancy was found, the error was run down, until it is believed that the figures, as finally presented, are very free from mistakes.
35
Digitized for FRASER http://fraser.stlouisfed.org/ Federal Reserve Bank of St. Louis
National Monetary Commission
From these primary tables supplementary tables were made, as shown by the report, presenting the data in various ways from various points of view. The other data called for in the circular were also tabulated, but it is not necessary to go into tire details of the method of manipulation.
The percentages are made out to one decimal place. They were found mostly by the slide rule and Crelle's Rechentafeln, but a few were found by actual division. Where the figure is less than o.i per cent, it is omitted. For this reason a figure sometimes occurs for the per cent of total specie when none is given for gold and silver separately.
Before taking up a discussion of the present returns, it is interesting and worth while to make some preliminary remarks concerning the general character of the statistics, the attitude of the banks toward the inquiry, and the character and form of the replies.
In the first place, all questionnaires and inquiries by means of circulars are under suspicion among some people. It is the opinion of some that it is impossible to frame a questionnaire which will elicit the points that are of importance to the inquiry. Of course it is true, as those familiar with statistical investigations need not be told, that it is quite impossible to prepare a form so phrased as to preclude the likelihood of misinterpretation or to secure information so accurate as to cover all possible variations in the conditions that it seeks to investigate. It almost seems as if common words were turned into stumbling blocks by the mere fact of
36
Digitized for FRASER http://fraser.stlouisfed.org/ Federal Reserve Bank of St. Louis
The Use of Credit Instruments
being used in a formal way. It is exceedingly difficult to get a uniform interpretation of even simple questions and terms. The present investigation is no exception to these experiences.
For example, in the inquiry of 1896 the question was asked: " Is it customary in your community to pay wages by checks ?" Objection has been made to the phraseology of this question by one keen critic, Prof. E. W. Kemmerer.a
He thinks that the information obtained at that time as to the proportion of wages paid by check was inadequate because the word " customary " might be interpreted to mean either " a custom " or " the custom " and that small States were given as much importance as large ones in the table.
It is always possible, of course, for students to take a sentence and find various meanings for a word. It is very doubtful, however, whether one man in a thousand in the community would misunderstand the use of the word customary in this question. The business man, when asked such a question, does not stop to analyze the possibility of various interpretations. If asked what is the custom in your community with reference to a certain matter, he will give an answer which conveys his impression of what is the general practice. He will not stop to say that Jones always does this, but Smith never does. The idea that he will convey in his answer is that if the majority or a considerable proportion of the people do this way, then this is the custom of the community. A question to be sent out for purposes of this kind must be framed in ordinary language and from the point of view of the
' o Money and Prices, Cornell Studies, 1907, p. 106.
37
Digitized for FRASER http://fraser.stlouisfed.org/ Federal Reserve Bank of St. Louis
National Monetary Commission
people who read it and not from the point of view of possible critical analysis by professors and other students.
Still it seemed better to change the phrasing of the questions with reference to wage payment. It can hardly be said, however, that the present information on this topic points to a more definite conclusion.
General discussion of the statistics,—In reading over statistics so voluminous and drawn from so many different sources one naturally wonders whether, after all, the figures are very reliable or of great utility. It is true, of course, of statistical matter generally that it presents a case or a subject only partially and with a great many imperfections and defects. Nevertheless, if the figures are carefully collected and properly grouped and interpreted, there is no doubt that such collections of figures as we are about to discuss present a picture of the general conditions of activity which they are designed to represent and from which they are drawn. It is important that we be certain of their general accuracy, the honesty with which they are given, and the honesty with which they are grouped and manipulated. Assuming these conditions, we may rely on the conclusions as presenting the general features at least of the situation.
It is often assumed by critics of such investigations that the statistics can not be relied on because the banks are not interested in such inquiries and are careless about making returns. The writer, having examined all the returns in the present inquiry, as well as in that of thirteen years ago, and having read the numerous letters which correspondents have sent, without being requested to do so, in connection with their returns, is convinced that there is not
38
Digitized for FRASER http://fraser.stlouisfed.org/ Federal Reserve Bank of St. Louis
The Use of Credit Instruments
only a widespread interest in the inquiry, but that the correspondents have been careful as a rule to give the figures as accurately as they could, according to their understanding of the question. In the present inquiry, the interest of the correspondents has been evinced in many ways. In one of the larger cities of the country, for example, representatives of the banks associated in the clearing house, on receiving these blanks, were sufficiently interested to get together and discuss the purpose and meaning of the questions and decide upon a plan whereby the replies from that city would be based upon a uniform interpretation. Several letters written by individual bank officers express their interest, indicating that although the compilation of the returns required a good deal of time and therefore subjected the bank to considerable expense, they were glad to comply with the request. Indeed, the general interest of all classes of banks is shown by the large number of replies. The interest extended not only to national bank officers but to the officers of other classes of banks. The officers of some banks who by mischance failed to receive blanks, nevertheless having seen notices of the inquiry and the form of the blank in the newspapers, sent in the information wanted. The examining officers of the state banks in the various States, such as the state auditors, also evinced great interest and were very helpful in the inquiry by urging upon the banks under their jurisdiction a full and prompt compliance with the Comptroller's request. For all of this willing response the commission, the writer, and the public in general certainly owe a debt of gratitude to those who went to so much trouble.
39
Digitized for FRASER http://fraser.stlouisfed.org/ Federal Reserve Bank of St. Louis
National Monetary Commission
The day selected,—In the inquiry of 1896 the day selected for securing information was the settlement day nearest the first Monday of July. It has been objected by critics of the report of 1896 that a settlement day is not representative of the ordinary day-to-day deposits of the business men of the country, particularly of the retail tradesmen. Supplementary inquiries made in 1896 seemed to show that there really was little or no difference in the proportion of checks and other credit documents deposited from day to day throughout a month or two and the percentage determined by the returns of the banks on the day chosen. The writer is convinced that this is true, not only from having gone through the books of several banks at the time of the inquiry of 1896, but as a result of considerable inquiry here and there among bankers. The returns of the present inquiry confirm this opinion. The day selected is not a settlement day, yet the proportion of credit documents in retail trade runs even higher than it did in 1896 or in 1894.
Of course the habits of the people in the matter of paying by check may have changed somewhat in that time; but even if so, it is doubtful whether it can have changed so greatly.
Moreover we must remember that a good many monthly accounts are probably settled with money instead of checks. If a person is in the habit of paying by check, he would very likely pay a month's account or a day's purchase of any importance with a check.
40
Digitized for FRASER http://fraser.stlouisfed.org/ Federal Reserve Bank of St. Louis
The Use of Credit Instruments
If he is in the habit of paying money, he will pay both accounts with money.
As indicated in what has just been said, other critics have urged that one day, whether a settlement day or a nonsettlement day, is not enough to give a fair idea of the character of the receipts of business men, to say nothing of the habits of the people of the country in settling accounts. No reason has ever been given for this opinion, excepting that one day is one day out of three hundred and sixty-five in the year. It should be noted, however, that the various inquiries have been made on different dates, and the results have been substantially the same. It should be noted further, as remarked in the preceding paragraph, that so far as a direct inquiry has been made upon this point the testimony of bankers and the evidence from their books is that one day is typical. There are many banks in the country of which this is not true.
If the settlement day selected in 1896 were not typical, because it would show an undue proportion of checks in the deposits, a nonsettlement day ought to show an undue proportion of cash. The opposite is the fact. If one day which was a settlement day was not typical, one day which is a nonsettlement day ought to be as nontypical in the opposite direction. The contrary is the fact brought out by the figures in the present inquiry.
In discussing the returns of settlement days, moreover, we must not forget that a settlement day is not the same for all classes of business, nor for all classes of purchasers, nor for all parts of the country. Many
41
Digitized for FRASER http://fraser.stlouisfed.org/ Federal Reserve Bank of St. Louis
National Monetary Commission
retail business men consider a customer sufficiently prompt if he settles a month's account within ten days after receiving his bill, while others expect payment the next day. Not a few accounts are settled semimonthly, instead of monthly, and till others are settled quarterly. There is ground for thinking that the distribution of settlement days is sue h as to reduce materially what would otherwise be a disproportion of the amount of credit paper in bank deposits on those days.
We may fairly conclude therefore that for purposes of such inquiries almost any day will do, because of the vast extent of our country, the large number of banking institutions that send replies, and the multifariousness of the business involved. The habits of our people and the customs of widely separated communities are likely to be very different from what they would be if our population were condensed into a small area, like England or Belgium.
General criticism of the replies,—As has been remarked, the inquiry was sent to all the banking institutions in the country known to the Comptroller. This number was about 25,000. Notwithstanding the interest and care exhibited, there were, of course, a great many who filled out the blanks carelessly and with an apparent lack of appreciation of the public importance of such an inquiry and the moral obligation on individual citizens to do what they can to help on the progress of enlightenment in all matters of such public interest. Perhaps the most surprising thing in the study of the
42
Digitized for FRASER http://fraser.stlouisfed.org/ Federal Reserve Bank of St. Louis
The Use of Credit Instruments
returns was the necessity of checking up additions, because of the numerous errors in addition made in the original blanks. This defect has been noticed in earlier inquiries. There was not a very large number of such blanks, but the fact that there were some and that there was no certainty as to when an error would be found made it necessary to check up all. Of the total number of blanks sent out, 12,190 were returned. Of this number 698 were rejected, leaving 11,492 which were used in making the report.
The reasons for the rejection of nearly 700 blanks were numerous. Some gave all deposits as retail deposits, some gave them as wholesale only, some gave them as the deposits of "all others," and some entered only aggregate deposits on the day in question. When a blank was found which had entries only under retail deposits it was scrutinized to determine whether the entry was correct or whether the total deposits of the day had been entered under the head of '' retail.'' In many cases accompanying letters gave a clew to the determination of this question. Where there was any doubt the returns were calculated in the "all others " rather than in the "retail." The number rejected on this account was not very large.
The same remarks apply to those which returned all deposits as wholesale, all others, or aggregate. There were some cases in which this was a correct return, as accompanying letters showed.
Blanks which gave the aggregate deposits of gold coin, silver coin, currency, and checks, without classifying them according to depositors, were not used. It may be said,
7071—10 4 43
Digitized for FRASER http://fraser.stlouisfed.org/ Federal Reserve Bank of St. Louis
National Monetary Commission
however, that in no case did any one of these present any striking differences from the general run of the replies in regard to the proportion of credit documents in the aggregate deposits. A good many of the 1 ilanks were rejected because the aggregate deposits of the day were all entered under one head instead of being classi lied. For example, one blank from West Virginia reported a receipt of nearly $250,000 in gold coin from the three classes of depositors on the 16th day of March. Farther on in the blank the aggregate deposits at the close of business on the day in question are given as a trifle over $200,000. The inaccuracy of such a statement is too obvious; to need comment.
In the case of a good many rejected blanks the persons who made them out evidently read them carelessly, for they gave the same figure for the deposits of the day as is given lower down in the blank for the aggregate deposits of the bank at the close of business.
One or two made the strange and inexplicable mistake of giving not the deposits of tlie day, but the aggregate deposits of the bank, and yet returned them classified as gold, silver, currency, etc., for different classes of dealers.
Probably, however, the largest proportion of those rejected were thrown out because they gave no information at all in answer to the first question, but filled out carefully the answers to the other questions. These are helpful, however, in discussing the later questions. Probably half or more of the rejections were due to this cause.
As already stated, some banks returned all deposits under '' retail," and others all under '' wholesale.'' Where possible, these were properly entered But in so far as
44
Digitized for FRASER http://fraser.stlouisfed.org/ Federal Reserve Bank of St. Louis
The Use of Credit Instruments
deposits returned as retail were not really so and were not detected as not being so, the total retail deposits, of course;
will be too large. The same is true of the total wholesale deposits in so far as the same cause of error was at work, but the error in either case is trifling. It can not amount to more than a few thousand dollars in the total retail deposits or in the total wholesale. The probability is that if there is any error due to bad classification by the correspondents, it tends to make the deposits accredited to " all other" depositors large at the expense of the others, for the reason that it is easier to enter the returns under "all others " than to classify them. The figures given for retail trade, however, are without doubt representative of retail trade as that phrase is commonly understood.
Twenty were received too late for use, and the seven blanks received from Alaska and Hawaii were not used because they were so few that their use would reveal the business of individual banks. Moreover, they were hardly germane to the purpose "of the discussion, and they show no marked differences from those received from banks on the continent.
It is worth while noting that of the blanks rejected the proportion of the national banks is smaller than that of any of the others. Of the national bank replies 1.7 per cent were rejected, of those of the state banks 7.4, of those of the private banks 12.3, of those of the stock savings banks 13, of those of mutual savings banks 14.5, of those of the loan and trust companies 7.2, and of the total 5.5.
The national banks are more accustomed to making out forms, and probably they are in a position to answer such
45
Digitized for FRASER http://fraser.stlouisfed.org/ Federal Reserve Bank of St. Louis
National Monetary Commission
questions more easily than any of the other classes of banks. On the whole, there seemed to be a large amount of careless answering from the state and private banks. Obviously, the questions in some cases were not carefully read. It will be noticed that of the 385 stock savings banks from which replies were received 183 were in Iowa, and it was the stock and the mutual savings banks whose replies were most commonly defective.
Many of the cashiers of the savings banks evidently thought that it was not the intention to have them answer the first question on account of the classification of depositors and so omitted it altogether. Nevertheless, they gave some valuable information in connection with the other questions. The following table shows the total number of replies received and the number rejected in considering question 1. The number of banks giving replies is afterwards entered only in the tables of aggregates because not all banks gave returns for. all classes of depositors. The States with the largest percentages of rejections of replies of "all banks" are Arkansas and Rhode Island, each having 14.2.
46
Digitized for FRASER http://fraser.stlouisfed.org/ Federal Reserve Bank of St. Louis
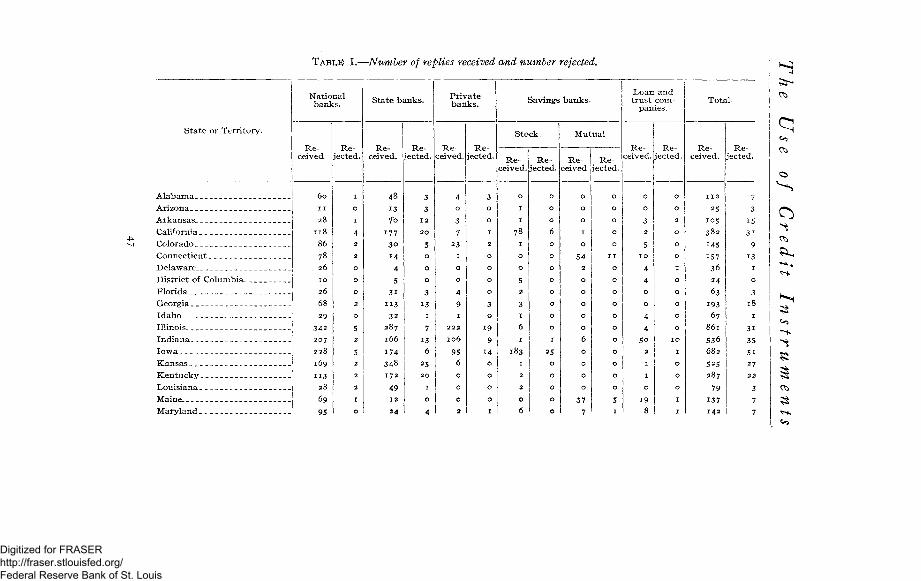
TABLE I.—Number of replies received and number rejected.
S t a t e or T e r r i t o r y .
A r i z o n a
A r k a n s a s -
Cal i fornia
Colorado
C o n n e c t i c u t
D e l a w a r e
D i s t r i c t of C o l u m b i a
F l o r i d a
Georg i a
I d a h o
I l l inois __ __
I n d i a n a
I o w a . .
K a n s a s
K e n t u c k y
L o u i s i a n a
N a t i o n a l b a n k s .
R e ceived
60
1 1
28
118
86
78
26
10
26
68
29
342
207
228
169
113
28
69
95
R e jec ted .
1
0
1
4
2
2
0
0
0
2
0
5
2
5
2
2
2
1
0
S t a t e b a n k s .
R e ceived.
48
13 7"o
177
30
14
4
5
3 i
1 1 3
3 2
287
166
174
348
1 7 2
49 12
24
R e jec ted .
3
3 1 2
2 0
5
0
0
0
3
13 1
7
13 6
25
2 0
1
0
4
P r i v a t e b a n k s .
R e ce ived.
4 0
3
7
23
1
0
0
4
9
1
2 2 2
106
95
6
0
0
0
3
R e j ec t ed .
3
0
0
1
2
0
0
0
0
3
0
19
9
14
0
0
0
0
1
S a v i n g s b a n k s .
S t o c k .
R e ce ived .
0
1
1
78
1
0
0
5
2
! 3
1
6
1
183
1
2
2
1 0
6
R e j ec ted .
0
0
0
6
0
0
0
0
0
0
0
0
1
25
0
0
0
0
0
M u t u a l
R e ce ived
0
0
0
1
0
54
2
0
0
0
0
0
6
0
0
0
0
37
7
R e j ec t ed .
0
0
0
0
0
11
0
0
0
0
0
0
0
0
0
0
0
5
1
L o a n a n d t r u s t c o m
panies .
R e ceived.
0
0
3
2
5
1 0
4
4
0
0
4
4
50
2
1
1
0
19 8
R e j e c t e d .
0
0
2
0
0
0
1
0
0
0
0
0
1 0
1
0
0
0
1
1
T o t a l
R e ce ived .
1 1 2
25 105
382
145
i57
36
24
63
193
67 861
536
682
525 287
79
137 1 4 2
R e jec ted .
7
3
15
3 1
9
13
1
0
3
1 8
1
3 1
35 5 1
2 7
2 2
3
7
7
<0
Digitized for FRASER http://fraser.stlouisfed.org/ Federal Reserve Bank of St. Louis
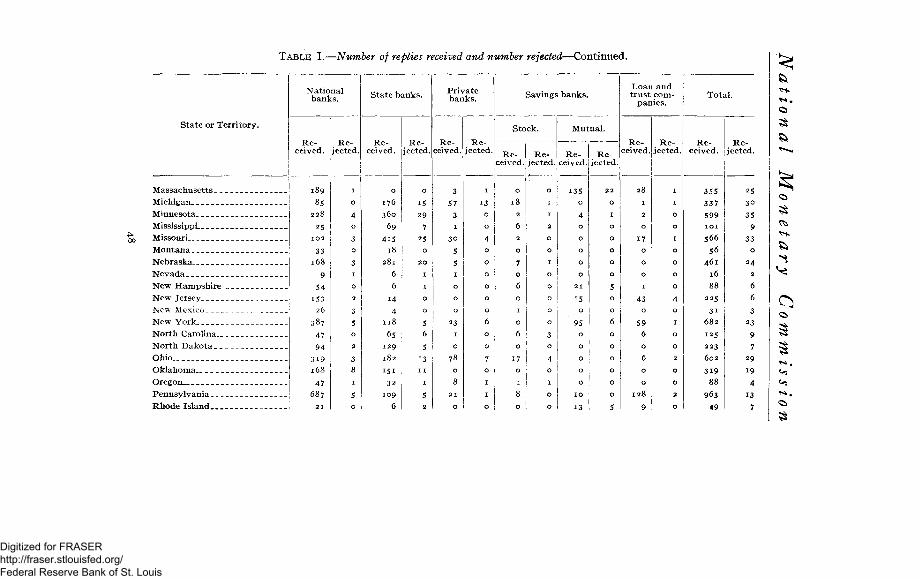
TABLE I.—Number of replies received and number rejected—Continued.
State or Territory.
Massachusetts _ _ Michigan Minnesota Mississippi Missouri Montana Nebraska Nevada New Hampshire New Jersey New Mexico New York North Carolina. _ North Dakota . _ Ohio Oklahoma Oregon Pennsylvania Rhode Island
National banks.
Received.
189 85
228
25 102
33 168
9 54
153 26
387
47 94
319 168 47
687 21
Rejected
State banks.
Received.
176 360
69 4i5
18 281
6 6
14
4 118
65 129
182
ISI 32
109
6
Rejected,
Re ceived.l
Private banks.
3 57
3 1
30
5 5
78
Rejected
Savings banks.
Stock.
R e - R e - R e ceived, ijected.jceived
15 o
95
Rejected.
Loan and trust com
panies.
Received.
2
0
I
0
0
0
0
0
5 0
0
6
0
0
0
0
0
0
5
28
1
2
0
17
0
0
0
1
43
0
59
6
0
6
0
0
128
9
Rejected.
Total.
Received.
I
I
0
0
I
0
0
0
0
4
0
1
0
0
2
0
0
2
O
355
337
599
ior
566
56
461
16
88
225
31
682
125
223
602
3i9
88
963
49
Rejected.
25 30 35
9 33
6 6 3
23
9 7
29
19
4 13 7
Digitized for FRASER http://fraser.stlouisfed.org/ Federal Reserve Bank of St. Louis
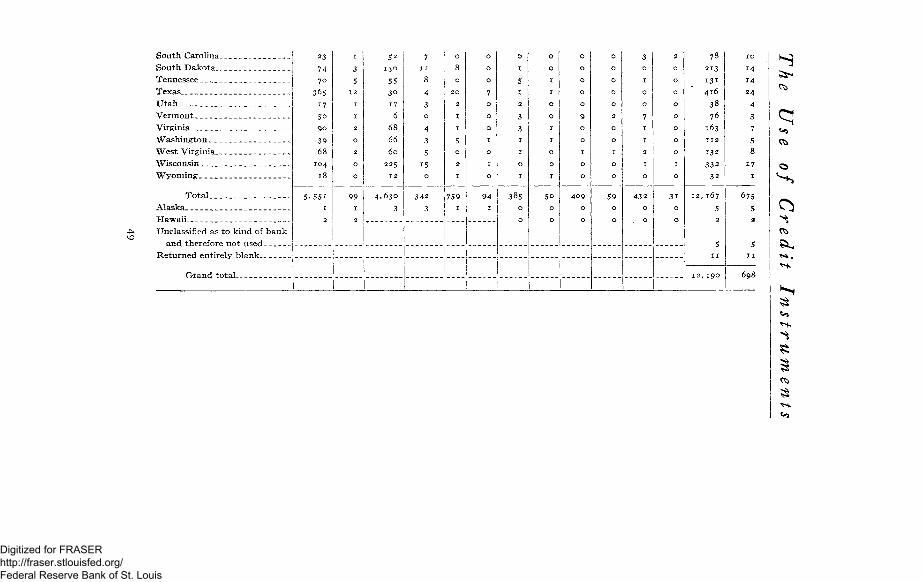
South Carolina South Dakota Tennessee Texas Utah Vermont Virginia Washington West Virginia Wisconsin Wyoming
Total Alaska Hawaii Unclassified as to kind of bank
23
74
70
365
17
So
90
39
68
104
18
5 .551
1
2
1
3
5
12
1
1
2
0
2
0
0
99
1
2
52
130
55
30
17
6
68
66
60
225
12
4 . 6 3 0
3
7
1 1
8
4
3
0
4
3
5
15
0
342
3
0
8
0
2 0
2
1
1
5
0
2
1
759 1
j 0
0
0
1 7 0
0
0
1
0
1
0
94 I
O
I
5
1
2
3
3
1
1
0
1
385
0
0
1 i
0
0
1
1
0
0
1
1
0
0
1
5o 0
0
0
0
0
0
0
9
0
0
1
0
0
409
0
0
0
0
0
0
0
2
0
0
1
0
0
59
0
0
3
0
1
0
0
7
1
1
2
1
0
43 2
0
0
2
0
0
0
0
0
0
0
0
1
0
3 i
0
0
78
2 1 3
1 3 1
416
38
76
163
1 1 2
1 3 2
332
32
12 ,167
5
2
5 1 1
1 2 , 1 9 0
1 0
14
14 24
4
3
7
5 8
17 1
675
5 2
s 1 1
698
8
Digitized for FRASER http://fraser.stlouisfed.org/ Federal Reserve Bank of St. Louis
National Monetary Commission
CLASSES OF BANKS REPORTING.
In all previous inquiries on this subject, excepting that of 1896, no effort was made to get returns from banks other than national. The courteous treatment accorded the inquiry of the Comptroller in 1896 showed clearly that bankers of all classes would be glad to give information. Accordingly, as has been stated, the inquiry was sent to all classes of banks and the interest of state banking officers was enlisted to promote the cooperation of the state and private banks of the different States.
A few words of explanation concerning the classification of banks is therefore desirable. There was no difficulty, of course, with the national banks. Every bank with a national charter knew how to classify itself.
In a few cases banks thought they could not be classified under any of headings in the circular, and therefore entered themselves under the head of "foreign bank." There were not more than half a dozen of these, and as they are probably operating under state charters they were classified as state banks. The mutual savings banks, as that* term is understood in Massachusetts, and the trustee savings banks, as the phrase is used in New York, were classed together. Some bank officers in New York, however, seemed to think that the savings banks of New York could not be properly classified under any of the headings of the circular. Whatever reasons there may be for holding this view, for the purposes of this inquiry they should be classed with those of Massachusetts. In some cases a bank properly entered itself under more than one head. Two or three could say that they were
50
Digitized for FRASER http://fraser.stlouisfed.org/ Federal Reserve Bank of St. Louis
The Use of Credit Instruments
state banks, stock-savings banks, and loan and trust companies. Obviously, what was meant was that they were loan and trust companies operating under a state charter and doing a savings-bank business in addition to their commercial business. They were classified as loan and trust companies.
It developed that a great many national banks are carrying savings accounts. These were obviously separated in the reports from the commercial accounts in practically all cases. In answering question 4 of the circular, however, many banks included the savings and commercial accounts without distinction.
Of course, the classification of deposits by retail dealers, wholesale dealers, and all others was hardly applicable to the mutual savings banks. Returns from the savings banks under the head of "all others" alone would have been entirely satisfactory, since, of course, people who deposit in savings banks do so as individuals and not as classes of business men. Nevertheless, savings banks evidently endeavored to classify their deposits exactly as the circular called for. While, for purposes of discussion by and by, we shall find their total deposits the thing of most importance without reference to the classification, it is interesting to note that a good many tradesmen are using the savings banks.
It is interesting to notice, too, the distribution of the kinds of banks from which replies were received. The state banks figure less prominently in the Eastern States than in the Middle West, Northwest, and Southwest. In the New England States and in New York, New Jersey,
51
Digitized for FRASER http://fraser.stlouisfed.org/ Federal Reserve Bank of St. Louis
National Monetary Commission
Pennsylvania, Delaware; Maryland, Ohio, and Texas the national banks are much in excess of the state banks, in number. The difference is much less in Illinois, Indiana, Iowa, Louisiana, and Oklahoma, while the state banks which replied largely outnumbered the national banks in California, Georgia, Kansas, Louisiana, Michigan, Minnesota, Mississippi, Missouri, Nebraska, North Carolina, North Dakota, South Carolina, South Dakota, and Wisconsin.
Of the 759 private banks from which replies were received 675 were in ten States. Illinois had the largest number, 222; Indiana came next with 106; and the other 8 in order were Iowa 95, Ohio 78, Michigan 57, Missouri 30, New York 23, Colorado 23, Pennsylvania 21, aad Texas 20.
Of the 385 replies from the stock-savings banks, 183 came from Iowa and 113 from California, Michigan, and Ohio together. The remaining 89 are pretty evenly distributed throughout the country.
Of the 409 replies from mutual savings banks, under which head cooperative savings banks of all kinds not organized for profit of stockholders were included, 135 came from Massachusetts, 95 from New York, 54 from Connecticut, 37 from Maine, and the rest were scattering. I t is to be noted, however, that so far as the returns of this inquiry show, this class of banks is confined to the New England States and New York, California, Delaware Indiana, Maryland, Minnesota, New Jersey, Pennsylvania and West Virginia.
52
Digitized for FRASER http://fraser.stlouisfed.org/ Federal Reserve Bank of St. Louis
The Use of Credit Instruments
The distribution of these through the country at large is much more uneven than that of the stock-savings banks.
Loan and trust companies reported from all the states excepting Alabama, Arizona, Florida, Louisiana, Mississippi, Montana, Nebraska, Nevada, New Mexico, North Dakota, Oklahoma, Oregon, South Dakota, Texas, Utah, Washington, and Wyoming. The states from which the loan and trust companies are absent are in the main those which may be said to be without great commercial development.
CLASSES OK BUSINESS AND CUSTOMS AS TO METHODS OF
PAYMENT.
It seems pretty obvious that it would be difficult to mention any class of business, in any kind of community, even in " retail trade," of which it could be said with assurance that no part of its receipts were in the form of credit documents. Given a community in which the habit of paying by checks is well developed, the question whether a given purchase will be paid for in that way depends principally on two things, its amount and time of payment. If the sale is a " cash sale " it is likely to be paid for with a check according as its value is $i, $5, or more. By some people the dollar purchase would be paid for by check The instances are not few in which checks are drawn for sums smaller than $1. If, on the other hand, the sale is a "charged sale" to be settled at the beginning of the following month or at the end of some designated credit period, it will very likely be paid for with a check, if the
53
Digitized for FRASER http://fraser.stlouisfed.org/ Federal Reserve Bank of St. Louis
National Monetary Commission
purchaser is in the habit of paying with checks; otherwise it will be paid with money; for it seems to have been forgotten in all statements about the disproportion of credit paper in the deposits of so-called settlement days that even a month's account will be paid with money by people who are not in the habit of using checks. It is probably true, however, that the larger proportion of charged sales are made by people who are in the habit of paying with checks.
If, now, we consider the character of various kinds of retail business it will be evident that we might guess beforehand that in certain kinds of business the proportion of credit paper received in payment would be pretty large, while in others it would be pretty small or entirely disappear. No evidence exists to show that it disappears altogether in any kind of business, although it undoubtedly does vanish in the case of a great many individual stores in every business. A short discussion of some of these points will help us.
The grocer's sales to the people who enter his store from day to day are both cash sales and charged. A cash sale of such a character that the purchaser will likely take the goods with him will almost always be paid for with money, even in communities where most of the customers are personally known. If it is a sale, for example, to a family whose income is $15 or $20 a week and it is charged, it will very likely be paid for with money, provided the family is of the wage-earning class. It is just as likely to be paid with a check as with money if the purchaser belongs to the professional or semiprofessional class. A bookkeeper or
54
Digitized for FRASER http://fraser.stlouisfed.org/ Federal Reserve Bank of St. Louis
The Use of Credit Instruments
clerk whose total yearly income is $1,000 is not unlikely to be a check user, whereas a carpenter or bricklayer with the same annual wages will not be.
Now, single purchases made in the average-sized grocery in a country town are moderate in value, and yet of sufficient value to justify payment by checks in a large number of cases by people who are in the habit of paying in that way. The individual purchases at any one time in a confectionery store or the ordinary drug store, on the other hand, assuming again that the customer is known, are usually so small that if they are cash sales they .will very likely be paid for in money. One does not draw a check to pay for a dish of ice cream or a dime's worth of candy, or a bottle of medicine filled on a physician's prescription. The small sales when charged, however, make an aggregate which makes the use of the check evident. If, however, the purchase is one that aggregates $i, $5, or more, even though a cash sale, it may be paid by check.
If we consider the business of the furniture dealer, we see that the average purchase here is considerable, so that we would expect a larger proportion of checks in his payments than in the case of the druggist, for example. It is evident that if the total receipts of the business in a community such as we have in mind are made up mostly from a large number of sales, each small in volume, we are likely to find a larger proportion of money. But " small in volume " is a relative term. What would be a small single sale here would be a large one, for example, in many a small shop in Berlin. What is in the writer's mind in using the phrase ''small sale" may be described, perhaps,
55
Digitized for FRASER http://fraser.stlouisfed.org/ Federal Reserve Bank of St. Louis
National Monetary Commission
as a sale less than $5. Consequently we would expect a large proportion of checks also in the receipts, for example, of custom tailors, jewelers, coal dealers, and lumber dealers. The average purchase in the field of each class of these is considerable. The confectioner, the barber, the notion store, on the other hand, each has a small average single sale. Here we would expect the volume of checks received in payment to run down.
Circumstances alter considerably if we take the case of a large city like New York or Chicago, where customers are nearly all personally unknown to the sellers of the goods. A stranger would not think of going into Wanamaker's in Philadelphia, or R. H. White's in Boston, or Marshall Field's or "The Fair" in Chicago, and offering to pay a $5 purchase with a check. Of course, this is done. I t is not, however, done without trouble. The percentage of checks in the receipts of certain stores in the Loop district of Chicago, to be given later on, may therefore be taken as a fair average of the proportion of payments made with checks by the middle class of people, in so far as they purchase at places where they are not personally known. Many of them will pay bills at other places, however, with checks. Consequently the average given for these stores can not be taken as the true average of the proportion of payments made with checks even by this class of people. It is too low. We must remember, too, that although the purchasers in these stores represent the great group of the middle-class purchasers, the total volume of their purchases may be less than that of a smaller class above them and that the average percentage of
56
Digitized for FRASER http://fraser.stlouisfed.org/ Federal Reserve Bank of St. Louis
The Use of Credit Instruments
check payments for the whole country is raised by the latter.
If one would find the store in which the proportion of cash reaches its maximum, he should seek a store each of whose single purchases is of small value, like cigars or candy or "knick knacks;" whose clientele is exclusively of the class of day laborers and people unknown personally to the dealer. One would find such a store on lower State street in Chicago, or on Milwaukee avenue, or on the east side in New York. Even here, however, the chance customer of means, whom the dealer is glad to welcome once in a while, will come in and give his check for a box of cigars, or enough Christmas toys to make a group of children in a neighborhood house happy at some season of the year, or for some purchase arising from unusual circumstances of that kind. In fact, the retail trade of the country shows that the habit of paying by check has probably reached down in some measure to all economic classes of the community whose income is $1,000 or more, provided they are other than what are classified as manual laborers.
THE RETAIL RETURNS.
The following table shows the retail returns of the present inquiry:
57
Digitized for FRASER http://fraser.stlouisfed.org/ Federal Reserve Bank of St. Louis
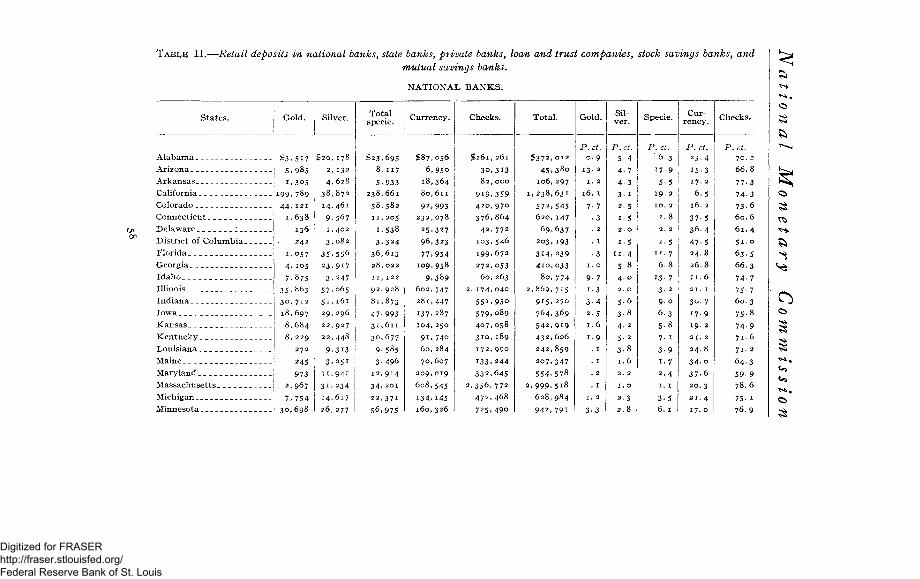
TABLE II.—Retail deposits in national banks, state banks, private banks, loan and trust companies, stock savings banks, and mutual savings banks.
N A T I O N A L B A N K S .
S t a t e s .
A l a b a m a
Ar izona
A r k a n s a s
California
Colorado
C o n n e c t i c u t
D e l a w a r e ;_
D i s t r i c t of C o l u m b i a
F lo r i da
Georg ia
I d a h o
I l l inois
I n d i a n a
I o w a
K a n s a s
K e n t u c k y
Lou i s i ana
Maine
M a r y l a n d
M a s s a c h u s e t t s
Michigan
Minneso t a
Gold . Si lver .
$ 3 , 5 i 7
5 . 9 8 s
1.305 199 ,789
4 4 , 1 2 1
1 .638
136
242
1.057
4, 105
7 ,875
3 5 . 8 6 3
30,712
18 ,697 8 , 6 8 4 8, 229
272
245
973 2, 967
7 . 7 5 4 3 0 . 6 9 8
$ 2 0 , 1 7 8
2, 132
4 . 6 2 8
3 8 , 8 7 2
14 ,461
9 ,567 1, 402
3 .082
3 5 . 5 5 6
23 ,917
3 . 247
57 .065
5 1 , 1 6 1
29 ,296
22 ,927
22 ,448
9 ,313
3 . 2 5 1
11 ,941
3 1 . 234
14 .617
26 ,277
T o t a l specie.
$ 2 3 , 6 9 5
8, 117
5 ,933
238 ,661
58 ,582
11 ,205
1.538
3 . 3 2 4
3 6 , 6 1 3
28 ,022
11 , 122
9 2 , 9 2 8 81 ,873
47 ,993 3 1 . 6 1 1 3 0 , 6 7 7
9 ,585 3 . 4 9 6
12 ,914 3 4 . 2 0 I 2 2 , 3 7 1
56 ,975
Cur rency .
$ 8 7 , 0 5 6
6 ,950
18 ,364 8 0 , 6 1 1
92 ,993 232 ,078
25 .327
96 ,323
77 ,954
109,958
9 ,389
602 ,747
281,447
137,287
104, 250
9 L 7 4 0
6 0 , 2 8 4
70 ,607
209 ,019
608 ,545
134, 145 160,326
Checks .
$ 2 6 1 , 2 6 1
3 0 , 3 1 3 8 2 , 0 0 0
9 1 9 . 3 5 9 4 2 0 , 9 7 0
3 7 6 , 8 6 4
4 2 , 7 7 2
103 ,546
199 ,672
272 ,053
6 0 , 2 6 3
2 , 1 7 4 , 0 4 0
5 5 L 9 5 0
5 7 9 , 0 8 9
4 0 7 , 0 5 8
310, 189
172 ,990
133 ,244
3 3 2 , 6 4 5
2 , 3 5 6 , 772
4 7 2 , 4 6 8
725 ,490
T o t a l .
$372,012
45,38o
106, 297
1, 238,631
572,545
620,147
69,637
203,193
314,239
410,033
8o,774
2,869, 7i5
915.270
764,369
542,919
432,606
242,859
207,347
554,578
2 , 9 9 9 , 5 i 8
6 2 8 , 9 8 4
9 4 2 , 7 9 1
Gold .
P.ct. 0 . 9
13- 2
1. 2
16. 1
7- 7
• 3
3
1. o
9- 7
i - 3
3 - 4
2-5
1.6
1-9
1. 2
3-3
Silve r .
P.ct.
5-4
4 -7
4 -3
3- 1
2-5
i - 5
2. o
1-5
1 1 . 4
5-8 4 . 0
2. o
5-6 3 - 8 4. 2
5-2
3 - 8
1.6
2. 2
1. o
2 . 3
2 . 8
Spec ie .
P.ct 6,
17.
5-19-
6. 13-
9-6.
5-
7-
3-
Cur r e n c y .
P.ct. 23- 4
15-3 17. 2
6 . 5 16. 2
3 7 - 5
3 6 . 4
4 7 . 5
2 4 . 8
2 6 . 8
1 1 . 6
2 1 . 1
30 . 7
1 7 . 9
19. 2
2 1 . 2
2 4 . 8
3 4 . o
3 7 - 6
2 0 . 3
2 1 . 4
17. o
C h e c k s .
P. ct.
6 6 . 8
77-3
74-3 73 -6
60.
6 1 .
Si-6 3 . 66 .
74-
75-
6 0 . 3
75 -8
74 -9 7 1 . 6
7 1 . 2
6 4 - 3
5 9 - 9 7 8 . 6
75- 1
7 6 . 9
Digitized for FRASER http://fraser.stlouisfed.org/ Federal Reserve Bank of St. Louis
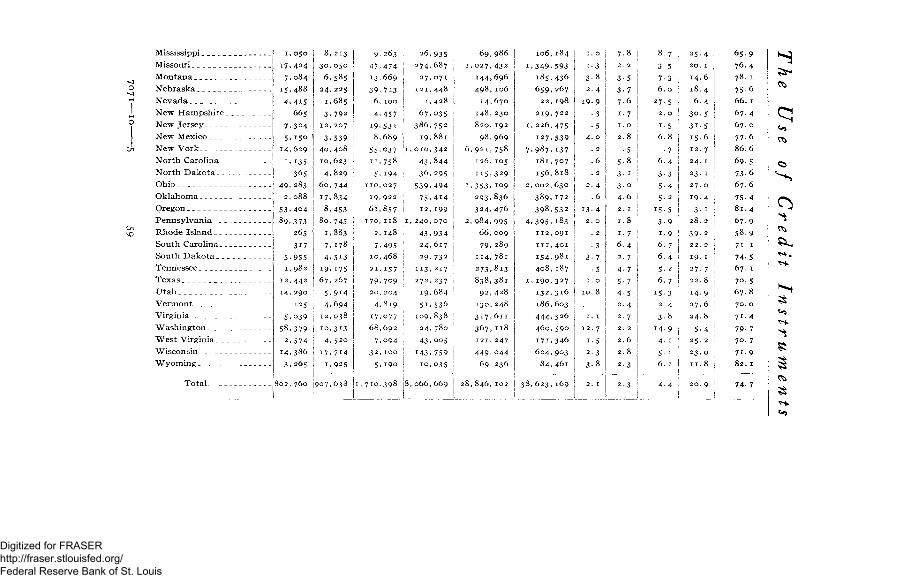
Mississippi Missouri Montana Nebraska Nevada New Hampshire. New Jersey New Mexico New York North Carolina _ _ North Dakota Ohio Oklahoma Oregon Pennsylvania Rhode Island South Carolina. _ South Dakota . _. Tennessee Texas Utah Vermont Virginia Washington "West Virginia Wisconsin Wyoming
Total
1 , 0 5 0
1 7 , 4 2 4
7 , 0 8 4
1 5 , 4 8 8
4 . 4 1 5
6 6 5
7 , 3 2 4
5 , 1 5 0
1 4 , 6 2 9
1. 1 3 5
3 6 5
4 9 , 2 8 3
2 , 0 8 8
5 3 , 4 0 4
8 9 , 3 7 3
2 6 5
3 1 7
5 . 9 5 5
1 , 9 8 2
1 2 , 4 4 2
1 4 , 2 9 0
1 2 5
5 , 0 3 9
5 8 , 3 7 9
2 , 5 7 4
1 4 . 3 8 6
3 . 2 6 5
8 0 2 , 7 6 0
8 , 2 1 3
3 0 , 0 5 0
6 , 5 8 5
2 4 . 2 2 5
1 , 6 8 5
3 . 7 9 2
1 2 , 2 0 7
3 , 5 3 9
4 0 , 4 0 8
1 0 , 6 2 3
4 . 8 2 9
6 0 , 7 4 4
1 7 . 8 3 4
8 , 4 5 3
8 0 , 7 4 5
1 , 8 8 3
7 , 1 7 8
4 . 5 1 3
1 9 , 1 7 5
6 7 , 2 6 7
5 , 9 1 4
4 . 6 9 4
1 2 , 0 3 8
1 0 , 3 1 3
4 , 5 2 0
1 7 , 7 1 4
1 , 9 2 5
9 0 7 , 6 3 8
9 , 2 6 3
4 7 , 4 7 4
1 3 - 6 6 9
3 9 , 7 1 3
6 , 1 0 0
4 , 4 5 7
I 9 , 5 3 i
8 , 6 8 9
55 ,037
n , 7 5 8
5, 194 n o , 027
19,922
6 1 , 8 5 7
1 7 0 , 1 1 8
2 , 1 4 8
7 , 4 9 5
1 0 , 4 6 8
2 1 , 1 5 7
7 9 , 7 0 9
2 0 , 2 0 4
4 , 8 1 9
1 7 . 0 7 7
6 8 , 6 9 2
7 , 0 9 4
3 2 , 1 0 0
5 , 1 9 0
1, 7 1 0 , 3 9 8
2 6 , 9 3 5
2 7 4 , 6 8 7
2 7 , 0 7 1
1 2 1 , 4 4 8
1 , 4 2 8
6 7 . 0 3 5
3 8 6 , 7 5 2
1 9 , 8 8 1
1 , 0 1 0 , 3 4 2
4 3 , 8 4 4
3 6 , 2 9 5
5 3 9 , 4 9 4
7 5 , 4 1 4
1 2 , 1 9 9
1 , 2 4 0 , 0 7 0
4 3 , 9 3 4
2 4 , 6 1 7
2 9 , 7 3 2
1 1 3 , 2 1 7
2 7 2 , 2 3 7
1 9 , 6 8 4
5 L 5 3 6
1 0 9 , 8 3 8
2 4 , 7 8 0
4 3 , 0 0 5
1 4 3 , 7 5 9
1 0 , 0 3 5
8 , 0 6 6 , 6 6 9
6 9 , 9 8 6
1 , 0 2 7 , 4 3 2
1 4 4 , 6 9 6
4 9 8 , 1 0 6
1 4 , 6 7 0
1 4 8 , 2 3 0
8 2 0 , 1 9 2
9 8 , 9 6 9
6 , 9 2 1 , 7 5 8
1 2 6 , 1 0 5
! 1 1 5 , 3 2 9
1 , 3 5 3 , 1 0 9
293 ,836
1 3 2 4 , 4 7 6
i 2 , 9 8 4 , 9 9 5 | 6 6 , 0 0 9
7 9 . 2 8 9 1 1 4 , 7 8 1
2 7 3 , 8 1 3
1 838,381 ! 9 2 , 4 2 8
| 1 3 0 , 2 4 8
3 1 7 . 6 n
3 6 7 , 1 1 8
j 121 ,247
I 4 4 9 , 0 4 4
6 9 , 2 3 6
2 8 , 8 4 6 , 1 0 2
1 0 6 , 1 8 4
1 , 3 4 9 , 5 9 3
1 8 5 , 4 3 6
6 5 9 , 2 6 7
2 2 , 1 9 8
2 1 9 , 7 2 2
1 , 2 2 6 , 4 7 5
1 2 7 , 5 3 9
7 , 9 8 7 , 1 3 7
1 8 1 , 7 0 7
1 5 6 , 8 1 8
2 , 0 0 2 , 6 3 0
3 8 9 , 1 7 2
3 9 8 , 5 3 2
4 , 3 9 5 , 1 8 3
112 ,091
i n , 401
1 5 4 , 9 8 1
4 0 8 , 1 8 7
1 , 1 9 0 , 3 2 7
1 3 2 , 3 1 6
1 8 6 , 6 0 3
4 4 4 , 5 2 6
4 6 0 , 5 9 0
1 7 1 , 3 4 6
6 2 4 , 9 0 3
8 4 , 4 6 1
3 8 , 6 2 3 , 1 6 9
1 . 0
1 3
3 . 8
2 . 4
1 9 . 9
• 3
• 5
4 . 0
. 2
. 6
. 2
2 . 4
. 6
1 3 - 4
2 . 0
. 2
• 3
3 - 7
• 5
1 . 0
1 0 . 8
1 . 1
1 2 . 7
i - 5
2 . 3
3 - 8
2 . 1
7 . 8
2 . 2
3 - 5
3 - 7
7 . 6
1. 7
1 . 0
2 . 8
• 5
5 - 8
3 - 1
3 - o
4 . 6
2 . 1
1 . 8
1. 7
6 . 4
2 . 7
4- 7
5- 7
4- 5
2 . 4
2 . 7
2 . 2
2 . 6
2 . 8
2 . 3
2 3
8 - 7
3 - 5
7 - 3
6 . 0
2 7 - 5
2 . 0
i - 5
6 . 8
• 7
6 . 4
3-3
5 - 4
5 - 2
1 5 - 5
3 - 9
1 . 9
6 - 7
6 . 4
5 - 2
6 . 7
1 5 - 3
2 . 4
3 - 8
1 4 . 9
4 . 1
5- 1
6 . 1
4- 4
2 5 . 4
2 0 . 1
1 4 - 6
1 8 . 4
6 . 4
3 0 . 5
3 I - S
1 5 . 6
1 2 . 7
2 4 . 1
2 3 . 1
2 7 . 0
1 9 . 4
3 - 1
2 8 . 2
3 9 - 2
2 2 . 2
1 9 . 1
2 7 . 7
2 2 . 8
1 4 . 9
2 7 . 6
2 4 . 8
5 - 4
2 5 . 2
2 3 . 0
1 1 . 8
2 0 . 9
6 5 9
7 6 . 4
7 8 . 1
7 5 - 6
6 6 . 1
6 7 . 4
6 7 . 0
7 7 . 6
8 6 . 6
6 9 - 5
7 3 - 6
6 7 . 6
7 5 - 4
8 1 . 4
6 7 9
5 8 . 9
7 i . 1
7 4 - 5
6 7 . 1
7 0 . 5
6 7 . 8
7 0 . 0
7 i - 4
7 9 - 7
7 0 . 7
7 1 . 9
8 2 . 1
7 4 - 7
Digitized for FRASER http://fraser.stlouisfed.org/ Federal Reserve Bank of St. Louis
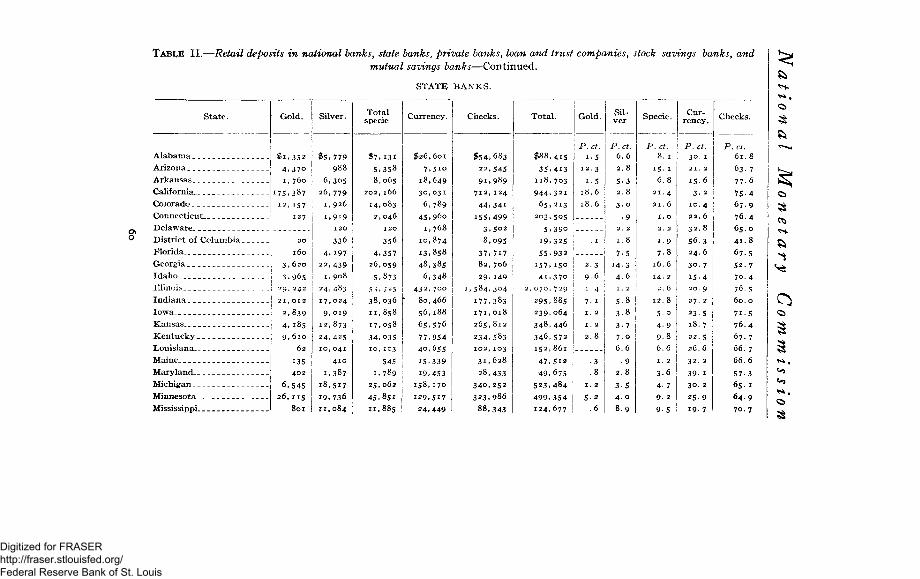
TABLE II.—Retail deposits in national banks, state banks, private banks, loan and trust companies, stock savings banks, and mutual savings banks—Continued.
o
Alabama
Arizona
Arkansas
California
Colorado
Connecticut
Delaware
District of Columbia _
Florida
Georgia
Idaho
Illinois
Indiana
Iowa
Kansas
Kentucky
Louisiana
Maine
Maryland
Michigan
Minnesota
Mississippi
Gold.
I
# 1 , 3 5 2 4 , 3 7 0 1, 760
175 .387 12, 157
127
160
3 . 620
3 . 9 6 5
2 9 , 2 4 2
2 1 , 0 1 2
2 , 8 3 9
4 , 1 8 5
9, 610
62
135 4 0 2
6 , 5 4 5 2 6 , 1 1 5
801
Silver.
$ 5 , 7 7 9 988
6 ,305 26 ,779
1, 926
i , 9 i 9 1 2 0
336
4, 197 22 ,439 1, 908
24.483
17,024
9,019
12,873
24,425 10,041
410
1,387
18,517
19,736
II,084
STATE BANKS.
Total specie.
$ 7 . i 3 i 5 ,358 8 ,065
202 ,166 14 ,083
2, 046
1 2 0
356
4 .357 26 ,059
5 ,873
53 .725
3 8 , 0 3 6
11 ,858
17 .058 34 .035 1 0 , 1 C 3
545 1.789
25 ,062
45 .851 11,885
Currency.
$26 ,601
7 . 5 i o
18 ,649
3 0 , 0 3 1
6 ,789
4 5 . 9 6 o
1,768
10,874
13.858
48 ,385
6,348
432 ,700
80 ,466
56 ,188
6 5 . 5 7 6
77 .954
40 ,655
15 ,339
19.453 158 ,170
129,517 24,449
Checks.
$ 5 4 , 6 8 3 22 ,545
9 1 , 9 8 9 7 1 2 , 1 2 4
4 4 , 3 4 1
155 ,499 3 . 5 0 2
8 ,095 3 7 , 7 1 7 8 2 , 7 0 6
2 9 , 1 4 9
1 , 5 8 4 , 3 0 4
177 ,383 1 7 1 , 0 1 8
265 ,812
234 ,583 1 0 2 , 1 0 3
3 1 , 6 2 8
28 ,433
3 4 0 , 2 5 2
3 2 3 , 9 8 6
8 8 , 3 4 3
Total.
£ 8 8 , 4 1 5
3 5 , 4 1 3
118 ,703
9 4 4 . 3 2 1
6 5 , 2 1 3
203 ,505
5 , 3 9 o
19 .325
5 5 . 9 3 2
157 ,150
4 1 , 3 7 0
, 0 7 0 , 7 2 9
295 .885
2 3 9 , 0 6 4
3 4 8 , 4 4 6
3 4 6 , 5 7 2
152 ,861
4 7 , 5 1 2
49 ,675
5 2 3 , 4 8 4
4 9 9 , 3 5 4 124 ,677
Gold.
P.ct, i - 5
12 .3
i - 5 1 8 . 6 1 8 . 6
2 .3 9 -6 1.4 7- 1 1 . 2
1 . 2
2 . 8
5 -2 .6
Silver
P.ct. 6.6 2 . 8 5-3 2 . 8
1 .8
7-5
1 4 3
4 . 6
1 . 2
5-8
3 - 8
3- 7
7 . 0
6 . 6
• 9
2 . 8
3 5
4 . 0
8.9
Specie. Currency.
P.ct. 8. 1
15- 1 6.8
2 1 . 4
21. 6
1 9
7-8
16 .6
14. 2
2 ,6
1 2 . 8
5-o
4 -9
9 -8
6 . 6
1 . 2
3 - 6
4 7
9 . 2
9 5
Checks.
i P.ct. 3 0 . 1 21. 2
1 5 . 6 3 - 2
10. 4 22. 6
3 2 . 8
5 6 . 3 24. 6
3 0 . 7 15-4 20. 9 27. 2
23-5 18 .7 22. 5
2 6 . 6
32 . 2
39- 1 30 . 2
2 5 9
1 9 . 7
P.ct. 6 1 . 8
6 3 . 7 77-6
7 5 4
6 7 . 9
7 6 . 4 6 5 . 0
4 1 . 8
6 7 . 5 5 2 . 7 7 0 . 4
76 .5 60. 0
7 1 . 5 7 6 . 4 6 7 . 7
6 6 . 7
6 6 . 6
57-3
6 5 . 1 6 4 . 9
7 0 . 7
Digitized for FRASER http://fraser.stlouisfed.org/ Federal Reserve Bank of St. Louis
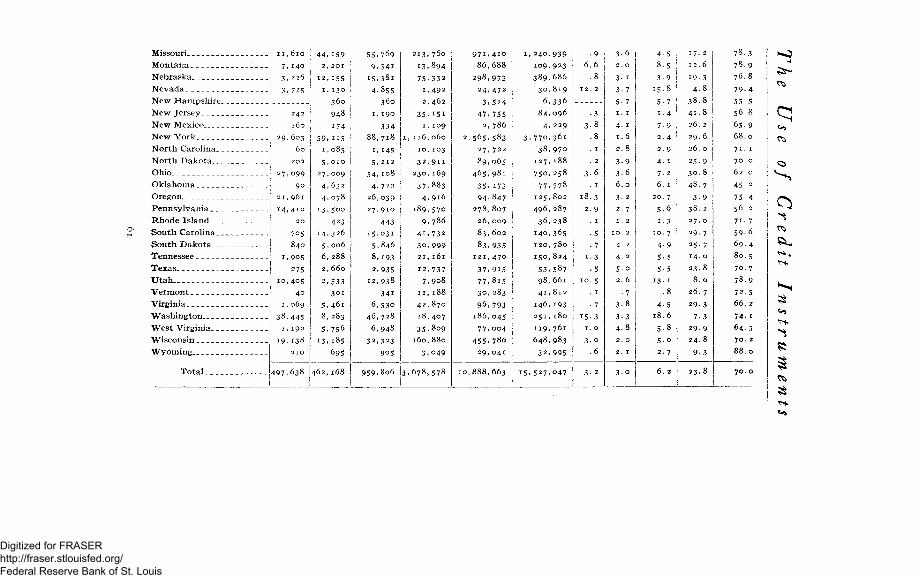
Missouri
Montana
Nebraska
Nevada
New Hampshire,
New Jersey
New Mexico
New York
North Carolina. _
North Dakota. _ _
Ohio
Oklahoma
Oregon
Pennsylvania
Rhode Island
South Carolina. _
South Dakota
Tennessee
Texas
Utah
Vermont
Virginia
Washington
West Virginia
Wisconsin
Wyoming
I I , 6 1 0
7, 140
3 , 226
3 . 725
Tota l .
242
160
29 ,603
60
202
27 ,099
90
21 , 961
14 ,410
20
705
840
1,905
275
10 ,405
40
1, 069
38,445 1, 192
19. 138
210
497.638
4 4 . 1 5 9
2, 201
12 ,155
1. 130
360
948
174
59 ,115
1.085
5. 010
27 ,009
4 . 6 3 2
4 , 0 7 8
13 .500
423
14,326
5.006
6,288 2, 660
2,533
301
5.46i
8,283
5.756
13.185
695
462,168
55,769
9,34i \
15.381
4,855
360
1, 190
334
88,718
1, 145
5, 212
54,108
4.722
26,039
27,910
443
15.031
5.846
8,193
2,935
12,938
34i
6,530
46,728
6,948 |
32,323
905 I
959,8o6
213,760
13,894
75,332
1,492
2, 462
3 5 . 1 5 1
1, 109
, 1 1 6 , 0 6 0
10 ,103
3 2 , 9 H
2 3 0 , 1 6 9
37,883
4,9i6
189,570
9,786
4i, 732
30,999
21,161
12,737
7,9o8
11,188
42,870
18,407
35.809
160,880
3 . 0 4 9
[3,678,578
971,410
86,688
298,973
24,472
3,5i4
47,755 2, 786
,565,583
27,722
89,065
465,981
35,173
94,847
278, 807
26,009
83,602
83,935
121,470
37,915
77,8i5
30, 283
96,793
186,045
77,004
4SS.78o
29,041
if 240,
I09;
389
30
6
84
4
3,770
38
127
750
77
125
496
36
140
120
IS©
53
98
41:
I46
25i:
ii9,
648,
32,
939
923
686
819
336
096
229
361
97o
188
258
778
802
287
238
365
780
824
587
6 6 !
812
193
180
761
983
995
• 9
6.6
3-6
. 1
18.3
2.9
. 1
• 5
• 7
1-3
• 5
10.5
. 1
• 7
15-3
3-6
4. 1
1.6
2.8
3-9
3-6
6.0
3- 2
2-7
1. 2
10. 2
4. 2
4. 2
5-0
2.6
• 7
3-8
3 3
4-8
2. o
2. 1
4 - 5
8 - 5
3 - 9
15-8
5- 7
1 . 4
7 - 9
2. 4
2 . 9
4- 1
7. 2
6 . 1
20. 7
5-6
1 - 3
10. 7
4 - 9
5 - 5
5 5
13- 1
. 8
4 - 5
1 8 . 6
5-8
5-o
2. 7
6 . 2
17. 2 |
12.6 1
19-3
4 - 8
3 8 . 8
4 1 . 8
26. 2
29. 6
26. 0
25 -9
3 0 . 8
4 8 . 7
3 - 9
3 8 . 2
2 7 . 0
29. 7
25- 7
14. 0
2 3 . 8
8 . 0
26. 7 1
29-3
7 - 3
2 9 . 9
2 4 . 8
9 - 3
2 3 . 8
78.3
78.9
76.8
79.4
5 5 5
56.8
65.9
68.0
71. 1
70. o
62. o
45- 2
75-4
56. 2
7i
59
69
80
70
78
72
66. 2
74. 1
64-3
70. 2
88.0
10,888,663 15,527,047 70.0
Digitized for FRASER http://fraser.stlouisfed.org/ Federal Reserve Bank of St. Louis
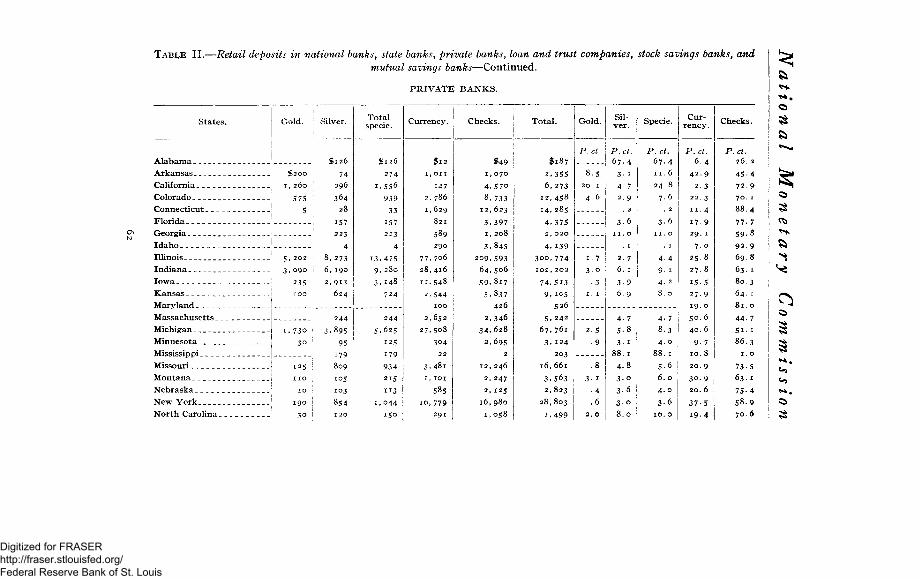
TABLE II.—Retail deposits in national hanks, state hanks, private banks, loan and trust companies, stock savings banks, and
mutual savings banks—Continued.
PRIVATE BANKS.
States. Gold.
$ 2 0 0
, 260
575
5
I
I
Alabama Arkansas California Colorado Connecticut Florida. Georgia Idaho Illinois J s, 202 Indiana j 3,090 Iowa ' 235 Kansas \ 100 Maryland Massachusetts Michigan Minnesota Mississippi Missouri Montana Nebraska New York North Carolina
Silver.
$126
74 296
364 28
157
223
4
8 ,273 6, 190
2 ,913 624
73o
30
125 n o
1 9 0
3 0
244
,895
95
179
809
105
103
854
120
Total specie.
$126
274
i,556
939
33
157 223
4
13,475
9, 280
3.148
724
244
5,625
125
179
934
215
113
1,044
150
Currency.
$ 1 2
i , o n
147 2, 786 1, 629
82 !
589
290
77,706
28,416
n , 5 4 8
2 ,544
1 0 0
2,652
27 ,508 304
22
3 , 4 8 i
1, 1 0 1
585 10 ,779
2 9 1
Checks. Total.
$49 1 , 0 7 0
4 , 5 7 0
8 ,733 12, 623
3 . 3 9 7 1 ,208
3 , 8 4 5
209 ,593 6 4 , 5 0 6
5 9 , 8 i 7
5 .83 7 426
2,346 3 4 , 6 2 8
2 ,695 2
12 ,246
2 ,247
2, 125
16 ,980
1 ,058
$187
2 ,355 6, 273
1 2 , 4 5 8 14 ,285
4 ,375 2 , 0 2 0
4, 139 3 0 0 , 7 7 4 1 0 2 , 2 0 2
74 .513
9, 105 526
5, 242
67, 761
3 . 124
203
16 ,661
3 , 5 6 3
2 ,823
28 ,803
1 ,499
Gold.
P.ct
8-5
4 6
1. 7 3 - o
• 3 1 . 1
2-5 9
3- 1 • 4 .6
2 . 0
Silver.
P.ct, 6 7 . 4
3- 1
4- 7 2 . 9
. 2
3 - 6
1 1 . o
. 1
2. 7
6. 1
3 - 9
6 . 9
4- 7 5 - 8 3- 1
8 8 . 1 4 . 8 3 0 3 - 6 3 - o 8 . 0
Specie .
P.ct. 6 7 . 4 n . 6 2 4 . 8
7.6
. 2
3 - 6
4- 4 9- 1 4- 2
4-7
8 . 3
4 . 0
88. 1
5-6
6 . 0
4 . 0
3 - 6
10. o
Currency.
P.ct. 6.4
4 2 . 9 2 . 3
2 2 . 3 1 1 . 4 1 7 . 9 29. 1
7 . 0 2 5 . 8 2 7 . 8 15-5 2 7 . 9 19. o 5 0 . 6 40. 6
9- 7
1 0 . 8
20. 9
3 0 . 9
20. 6
3 7 - 5
1 9 . 4
Checks.
\ct. 26. 2 4 5 - 4 7 2 . 9 7 0 . 1
8 8 . 4 77-7 5 9 - 8 9 2 . 9 6 9 8 63 . 1 8 0 . 3 64. 1 8 1 . 0 44- 7 Si - 1 8 6 . 3
1. o 73-5 63 . 1 7 5 - 4 5 8 . 9 70. 6 3
Digitized for FRASER http://fraser.stlouisfed.org/ Federal Reserve Bank of St. Louis
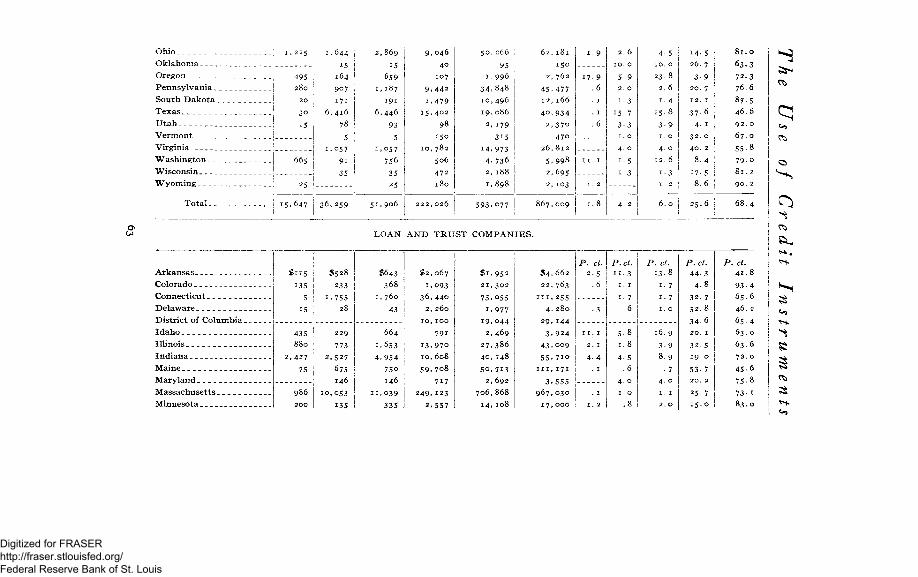
Ohio
O k l a h o m a
Oregon
P e n n s y l v a n i a _.
S o u t h D a k o t a .
T e x a s
U t a h
V e r m o n t
Vi rg in ia
W a s h i n g t o n _ _ .
W i s c o n s i n
W y o m i n g
66S
T o t a l i 15 ,647
1,644
15 164
907
171
6, 416
78
5
1,057
9 i
35
3 6 , 2 5 9
,869
15
659
,187
191
,446
93
5
,057
756
35
25
51 .906
9, 046
40
107
9 ,442
1,479
15 ,402
98
150
10 ,782
506
472
180
2 2 2 , 0 2 6
5 0 , 2 6 6
95
1,996
34,848
10,496
19,086
2, 179
315
14 ,973
4, 736 2 , 1 8 8
62,181
150
2, 762
45,477
12,166
40,934
2,37o
470
26,812
5,998
2,695
2, 103
867,009
1-9
17.9
.6
. 1
. 1
.6
11. 1
1. 2
1.8
2.6
10. 0
5-9 !
2. 0
i-3
15- 7
3-3 1. 0
4.0
i-5
i-3
4. 2
4-5
10. o
2 3 . 8
2 . 6
1.4
1 5 . 8
3 -9
1. o
4 . 0
1 2 . 6
1-3 1. 2
14-5 26. 7
3 9
20. 7
12. 1
3 7 - 6
4. 1
32 . o
40. 2
8 . 4
17-5 8.6
6.0 2 5 -
8 1 . 0
6 3 - 3
7 2 . 3
7 6 . 6
87- 5
4 6 . 6
92. o
67. o
55 -8
7 9 . 0
8 1 . 2
90. 2
6 8 . 4
*3
8
<v\>
L O A N A N D T R U S T C O M P A N I E S .
A r k a n s a s
Co lo rado
C o n n e c t i c u t
D e l a w a r e
D i s t r i c t of C o l u m b i a
I d a h o
I l l inois
I n d i a n a
Ma ine
M a r y l a n d
M a s s a c h u s e t t s
M i n n e s o t a
# 1 , 9 5 2
21 ,302
73 ,055
1,977
19 ,044
2,469
27,386
40,148
50, 713
2, 692
706,868
14,108
$4,662
22,763
i n , 255
4, 280
29,144
3,924
43,009
55,7io
i n , 171
3,555 967,030
17,000
P. ct. 2.5
.6
2. 1
4.4
P.ct. n-3 1. 1
i- 7
.6
5-8
4-5
.6
P. ct. 1 3 . 8
1.7
i- 7
1. 0
16. 9
3-9
8.9
•7
4.0
1. 1
2. 0
P.ct. 44-3
4.8
32. 7
52.8
34-6
20. 1
32.5
19. 0
53-7
20. 2
25-7
15-0
. ct. 41.8
93-4
656 46. 2
654 63. o
63.6
72. o
45-6
75-8
73- i
83.0
Digitized for FRASER http://fraser.stlouisfed.org/ Federal Reserve Bank of St. Louis
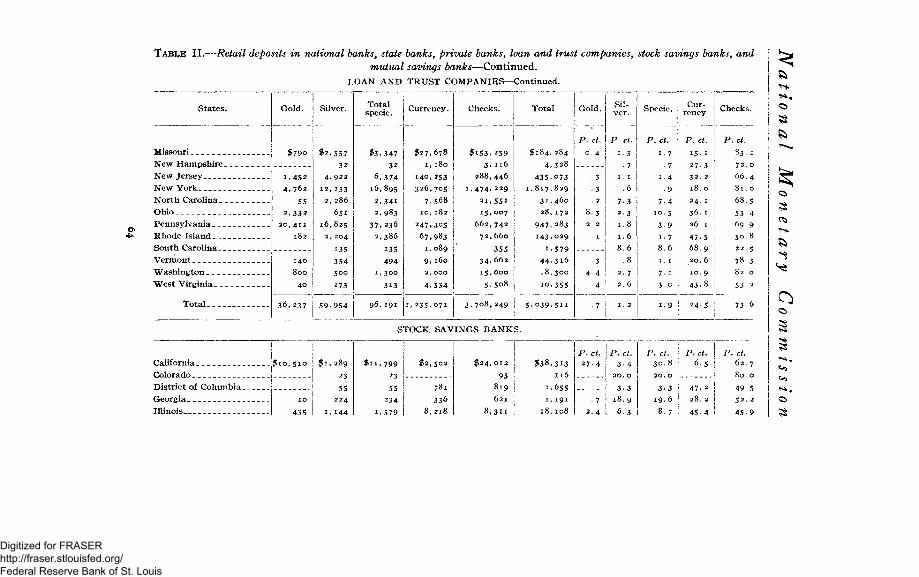
TABLE II.—Retail deposits in national banks, state banks, private banks, loan and trust companies, stock savings banks, and
mutual savings banks—Continued.
LOAN AND TRUST COMPANIES—Continued.
States.
Missouri New Hampshire. New Jersey New York North Carolina _ _ Ohio Pennsylvania Rhode Island South Carolina.. Vermont 1 _ Washington West Virginia
Total _
Silver.
$79o
1 ,452 4,762
55 2 , 3 3 2
2 0 , 4 1 1 182
140
800
40
36, 237
$2,557 32
4 . 9 2 2
12 ,133 2,286
651 16,825
2, 204
135 354 500
273
59,954
Total specie.
$3,347 32
6,374 16.895
2,341 2 ,983
37, 236 2,386
135 494
1.300
313
Currency.
$27,678
1,180
140,253 326 ,705
7.568 10 ,182
247,305 67,983
1. 089 9,160
2, 000
4,534
96, 191 i i , 235, 071
Checks.
$ 1 5 3 , 2 5 9 3, n 6
288,446 1 ,474 , 229
2 i , 5 5 i 15 ,007
662,742 72,660
355 34.662 15 ,000
5.5o8
3 , 7 0 8 , 2 4 9
Total.
$ 1 8 4 . 2 8 4 4 , 3 2 8
4 3 5 . 0 7 3 1 . 8 x 7 , 8 2 9
3 1 . 4 6 0
2 8 , 1 7 2
9 4 7 , 2 8 3 1 4 3 , 0 2 9
1 .579 4 4 . 3 i 6 18 ,300
i o , 3 5 5
5 , 0 3 9 , 5 1 1
Gold,
P. ct. o- 4
Silver. Specie.
ct. i- 7
• 7 1 .4
9 7-4 0 . 5 3 - 9 i - 7 8 . 6
7-
3 - o i
Currency.
P.ct.
i5- 1 27-3 32 . 2 1 8 . 0 24. 1 3 6 . 1 26. 1 47-5 68.9 20. 6 1 0 . 9 43-8
Checks.
24-5
P.ct. 83.2
72. o
66.4 8 1 . 0
68.5
53- 4
69.9
50.8
22. 5
78.3
82.0
O
« r*> >̂K
S> ^ ^
7 3 - 6
California Colorado District of Columbia _ Georgia Illinois
STOCK SAVINGS BANKS.
j$to,5io $ 1 , 2 8 9
23
55 224
1, 144
$ I I , 7 9 9
23
55 234
1.579
$ 2 , 5 0 2
78i 336
8 , 2 1 8
$ 2 4 , 0 1 2
93 819
621
8 , 3 1 1
$3&,313 116
1.655
1, 191
18,108
P.ct. 27.4
• 7
2.4
P. ct. 3-4
20. 0
33 18.9
6.3
P. ct. 30.8
20. 0
3-3
19.6
8.7
P.ct. 6-5
47-2
28. 2
45-4
P. ct. 62. 7 8 0 . 0 49-5 5 2 . 2 45-9
Digitized for FRASER http://fraser.stlouisfed.org/ Federal Reserve Bank of St. Louis
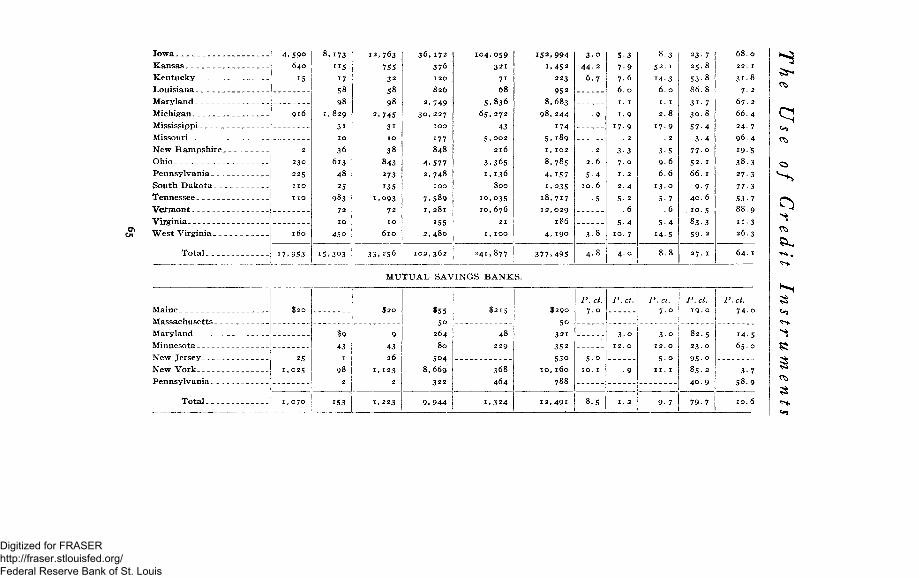
Iowa Kansas Kentucky Louisiana Maryland Michigan Mississippi Missouri New Hampshire _ Ohio Pennsylvania South Dakota Tennessee Vermont Virginia West Virginia
Tota l 17 ,953
4 . 5 9 0 640
15
9 1 6
230
225
n o n o
8 ,173
115
17
58 98
1,829
31
10
36
613
48
25
983
72
10
450
12 ,763
755 32
58 98
2 ,745
3 i
10
38
843
273
135
1,093
72
10
610
3 3 , 2 5 6
3 6 , 1 7 2
376 120
826
2 , 7 4 9 3 0 , 2 2 7
100
177 848
4.577 2,748
100
7,589 1, 281
I5S 2, 480
1 0 2 , 3 6 2
1 0 4 , 0 5 9 321
7 i 68
5.836 6 5 , 2 7 2
43
5 . 0 0 2
216
3.365 1, 136
800
10 ,035
1 0 , 6 7 6
241 ,877
994
452
223
952
683 244
174
189
102
785
157
035
717
029
186
190
3 0
4 4 . 2
6 . 7
. 9
. 2
2 . 6
5-4 1 0 . 6
• 5
3 . 8
4 . 8
5-3 1 7 9 | 7-6 1 6 . 0
1 . 1
1 - 9
1 7 - 9
• 2
3-3 7 . o
1 . 2
2 . 4
5- 2
. 6
5 -4 1 0 . 7
4 . 0
8 .3
5 2 . 1
1 4 - 3
6 . 0
1. 1
2 . 8
1 7 . 9
. 2
3 5 9 -6
6 . 6
1 3 0
5- 7 . 6
5 -4
1 4 - 5
8 . 8
23- 7 1 25.8 53-8 86.8
3 i . 7 30.8
57-4 3 - 4
77-0 5 2 . 1
66. 1
9-7
40. 6 . 1 0 . 5
83.3 59- 2
2 7 . 1
MUTUAL SAVINGS BANKS,
68.0
31.8
7. 2
67. 2
66 24
96
19
38
27
77
53
88
64. 1
Maine
Maryland _ _
New Jersey New York Pennsylvania
Total
$ 2 0
25
1 , 0 2 5
1 , 0 7 0
$9 43
1
98 2
153
$ 2 0
9 43 26
1 . 1 2 3
2
1 , 2 2 3
$55 So
264 80
504 8,669
3 2 2
9.944
$ 2 1 5
48 2 2 9
368
464
1 . 3 2 4
$ 2 9 0
5 0
3 2 1
352 530
io,160 788
1 2 , 4 9 1
P.ct. 7 . 0
5-o
1 0 . 1
8 .5
P.ct.
3-o 1 2 . 0
9
1 . 2
P.ct. 7 . 0
3 0
1 2 . O
5 . 0
I I . I
9- 7
P.ct. 1 9 . 0
82.5 2 3 . 0
9 5 o 85.2 40.9
79- 7
P.ct. 74. 0
1 4 5 65.0
3-7 58.9
1 0 . 6
ft-
Digitized for FRASER http://fraser.stlouisfed.org/ Federal Reserve Bank of St. Louis
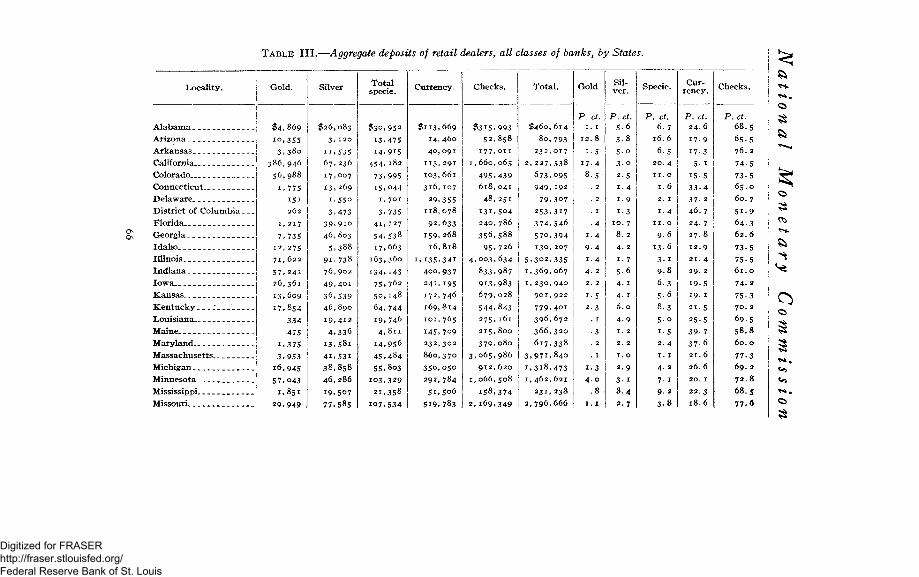
TABLE III.—Aggregate deposits of retail dealers, all classes of banks, by States.
Locality.
Alabama
Arizona
Arkansas
California
Colorado
Connecticut
Delaware
District of Columbia
Florida
Georgia
Idaho
Illinois
Indiana
Iowa
Kansas
Kentucky _•
Louisiana
Maine
Maryland
Massachusetts
Michigan
Minnesota
Mississippi
Missouri
Gold.
$ 4 , 8 6 9
10 ,355 3 , 3 8 o
3 8 6 , 9 4 6
5 6 , 9 8 8
1,775
151 262
1,217
7 ,735 12 ,275
7 1 , 6 2 2
5 7 , 2 4 i
26 ,361
13 .609
1 7 , 8 5 4
334
475
1 ,375
3 . 9 5 3
16 .945
5 7 . 0 4 3 1 .851
2 9 . 9 4 9
Silver
$ 2 6 , 0 8 3
3 . 120
11 .535
67, 236
17 ,007
13 ,269
I . 5 5 0
3 ,473
3 9 , 9 i o
46 ,803
5 , 3 8 8
9 L 7 3 8
76 ,902
4 9 , 4 0 1 3 6 , 5 3 9 4 6 , 8 9 0
19 ,412
4 , 3 3 6
I 3 , 5 8 i
4 L 5 3 I
3 8 . 8 5 8
46,286
19 .507
77 .585
Total specie.
$30,952
13.475
i4,9iS
454.182
73,995
15.044
r, 701
3.735
41,127
54,538
17,663
163,360
134,143 I
75 ,762
5 0 , 1 4 8
6 4 , 7 4 4
19 .746
4 ,811
14 .956
4 5 . 4 8 4
55 .8o3
103 .329
21 .358
107 ,534
Currency.
$ 1 1 3 , 6 6 9 14, 460 40 ,091
113 ,291 103,661
316 ,107
29 ,355 118 ,078
92 ,633
159 ,268
16 ,818
1, 135 ,341 400 ,937
241 ,195 172, 746
169 ,814
101,765
145 ,709
232 ,302
860, 370
3 5 0 . 0 5 0
292 ,784 5 r . 5 o 6
519 .783
Checks.
$ 3 1 5 , 9 9 3 5 2 , 8 5 8
177, o n
I,660,065
495,439
618,041
48,251
131,504
240,786
356,588
95,726
4,003,634
833.987
913,983
679,028
544,843
275,161
215,800
370,080
3 , 0 6 5 , 9 8 6
9 1 2 , 6 2 0
I , 0 6 6 , 5 0 8
1 5 8 , 3 7 4 2 . 1 6 9 , 3 4 9
Total.
$ 4 6 0 , 6 1 4
8 0 , 7 9 3 232, 017
2, 2 2 7 , 5 3 8
673 ,095 9 4 9 , 1 9 2
7 9 , 3 0 7
253 .317 3 7 4 , 5 4 6
5 7 0 , 3 9 4 130 ,207
5 . 3 0 2 , 3 3 5 1 , 3 6 9 . 0 6 7
1, 2 3 0 , 9 4 0
901 , 922
7 7 9 , 4 0 1
3 9 6 , 6 7 2
366,320
6 1 7 . 3 3 8
3 , 9 7 1 , 8 4 0
1 . 3 1 8 . 4 7 3 1, 462, 621
231, 238
2.796,666
Gold
P. ct. 1 . 1
1 2 . 8
T-5
1 7 . 4
8.5
i - 5 2 .3
1-3 4 . 0
.8
z. z
Silver.
P.ct.
5.6
3-8
5 . 0 3 . 0 2 .5 1 .4 i . 9 1-3
10. 7
i - 7 5-6
6 . 0
4 - 9
1. o
2 . 9
3- 1
8.4
2 . 7
Specie.
P. ct. 6.7
1 6 . 6
6 .5 20. 4
11. o
1 .6
2 . 1
1.4
I I . O
9 . 6
1 3 . 6
3- 1 9 - 8 6 . 3 5 . 6 8-3 5 -o 1-5 2 . 4 1 . 1
4 . 2 7 1 9 . 2 3.8
Currency.
P. ct. 24. 6
17-9
17-3
5- 1
15-5
3 3 - 4
3 7 - 2
4 6 . 7
2 4 . 7
2 7 . 8
12. 9
2 1 . 4
29. 2
19-5
19. 1
2 1 . 5
25-5
39- 7
3 7 - 6
21. 6
2 6 . 6
20. 1
22.3
1 8 . 6
Checks.
P.ct. 68.5
65.5
76. 2 74-5 73-5 6 5 . 0 60. 7 5 i - 9 6 4 3 6 2 . 6
7 3 - 5
7 5 5
6 1 . o
7 4 . 2
75-3
70. 2
69.5
58.8
60 . o
7 7 . 3
69 . 2
7 3 . 8
68.5
77.6
Digitized for FRASER http://fraser.stlouisfed.org/ Federal Reserve Bank of St. Louis
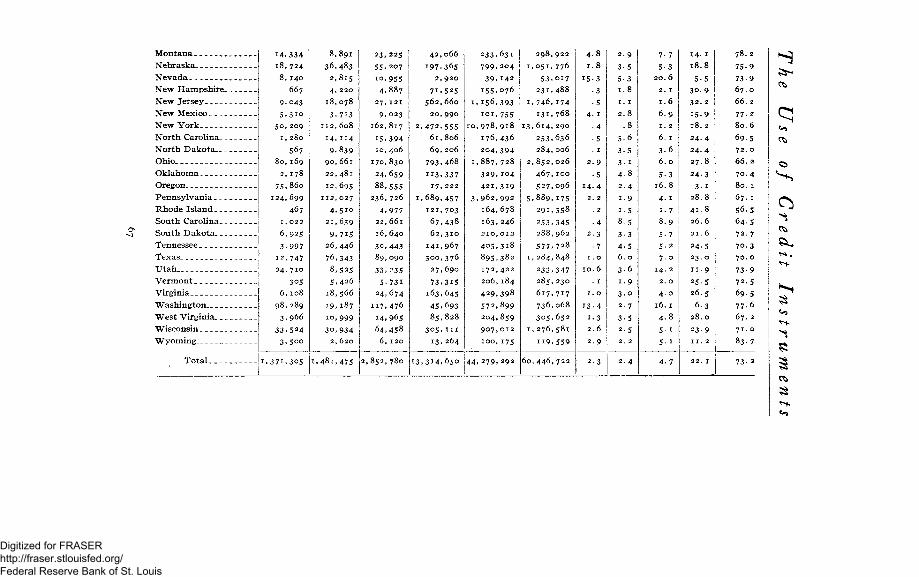
Montana
Nebraska
Nevada
New Hampshire.
New Jersey
New Mexico
New York
North Carolina..
North Dakota._.
Ohio
Oklahoma
Oregon
Pennsylvania
Rhode Island _ _.
South Carolina _.
South Dakota. _.
Tennessee
Texas
Utah
Vermont
Virginia
Washington
West Virginia
Wisconsin
Wyoming
Total
1 4 . 3 3 4
18 ,724
8, 140
667
9 .043
5 . 3 i o
5 0 , 2 0 9
1 ,280
567 8 0 , 1 6 9
2, 178
75 .860
124 ,699
467 1, 0 2 2
6 ,925
3 . 9 9 7
12 ,747
24 ,710
305
6 , 1 0 8
9 8 , 2 8 9
3 . 9 6 6
3 3 . 5 2 4 3 . 5 o o
1 . 3 7 i . 3 0 5
8 ,891
3 6 . 4 8 3
2 ,815
4 , 2 2 0
18 ,078
3 . 713 112 ,608
14 .114
9 , 8 3 9 9 0 , 6 6 1
22 ,481
12 ,695 112,027
4.5IO
21 ,639
9,715
26,446
76,343
8,525
5,426
18,566
19,187
10,999
30,934 2, 620
1,481,475
23, 225
55.207
io,955
4.887
27,121
9.023
162,817
15.394
10,406
170,830
24.659
88,555 236,726
4.977
22,661
16,640
30,443
89,090
33, 235
5 .731
2 4 , 6 7 4
117 ,476
14 .965
6 4 . 4 5 8
6 , 1 2 0
2, 852, 780
4 2 , 0 6 6
197 ,365 2 , 9 2 0
7 L 5 2 5 5 6 2 , 6 6 0
2 0 , 9 9 0
2 . 4 7 2 , 5 5 5
6 1 , 8 0 6
6 9 , 2 0 6
7 9 3 . 4 6 8
H 3 . 3 3 7
1 7 , 2 2 2
1 , 6 8 9 , 4 5 7
1 2 1 , 7 0 3
6 7 , 4 3 8
62,310
141,967
300,376
27,690
73 .315 163 ,645
4 5 , 6 9 3
8 5 , 8 2 8
305 . i n 1 3 , 2 6 4
1 3 , 3 1 4 , 6 5 0
233 .631
7 9 9 . 2 0 4 3 9 . 1 4 2
1 5 5 . 0 7 6
1. 156 .393
IOI .755 1 0 , 9 7 8 , 9 1 8
176 ,436
2 0 4 , 3 9 4
1 , 8 8 7 , 7 2 8
3 2 9 , 1 0 4
4 2 1 , 3 1 9
3 . 9 6 2 , 9 9 2
164 ,678
163 ,246
2 1 0 , 0 1 2
4 0 5 , 3 1 8
8 9 5 , 3 8 2
1 7 2 , 4 2 2
2 0 6 , 1 8 4
4 2 9 , 3 9 8
5 7 2 , 8 9 9
2 0 4 , 8 5 9
9 0 7 , 0 1 2
100 ,175
4 4 . 2 7 9 , 2 9 2
298,922
1,051,776
53,017
231,488
I,746,174
131,768
13,614,290
253,636
284,006
2, 852, 026
467,IOO
527,096
5.889,175
291,358
253,345 288,962
577,728
I, 284,848
233,347
285,23O
617,717
736,068
305,652
I,276,581
119,559
60,446,722
4-8
1.8
15-3
•3
• 5
4. 1
• 4
•5
. 1
2.9
•5
14.4
2. 2
. 2
• 4
2.3
• 7
1. 0
10. 6
. 1
1. 0
13.4
1-3 2.6
2.9
2.3
2.9 1
3-5
5-3 1
1.8
1. 1
2.8
.8
5-6
3-5
3- 1
4-8
2.4
i-9
i-5
8-5
3-3
4.5 6.0
3-6
1-9
3.0
2.7
3-5 2-5 2. 2
2.4
7- 7
5 -3
20. 6
2 . 1
1.6
6 . 9
1 . 2
6. 1
3 - 6
6 . 0
5-3 1 6 . 8
4- 1
1. 7
8 . 9
5- 7
5 -2
7 . 0
14. 2
2. o
4 . 0
16. 1
4 . 8
5- 1
5- 1
4 . 7
14. 1 1 8 . 8
5-5
3 0 . 9
32 . 2
15-9
1 8 . 2
2 4 . 4
2 4 . 4
2 7 . 8
2 4 . 3
3- 1
2 8 . 8
4 1 . 8
2 6 . 6
21. 6
24-5
2 3 . 0
1 1 . 9
2 5 5
2 6 . 5
6 . 3 2 8 . 0 23-9 1 1 . 2
2 2 . 1
78. 2
75-9
73-9
67. o
6 6 . 2
77-2
8 0 . 6
69 -5
72. o
6 6 . 2
7 0 . 4
80. 1
67. 1
5 6 . 5
6 4 - 5
72 .7
7 0 . 3
70. o
73-9
7 2 . 5
69-5
77 -6
67. 2
71. o
8 3 . 7
73- 2
3
Digitized for FRASER http://fraser.stlouisfed.org/ Federal Reserve Bank of St. Louis
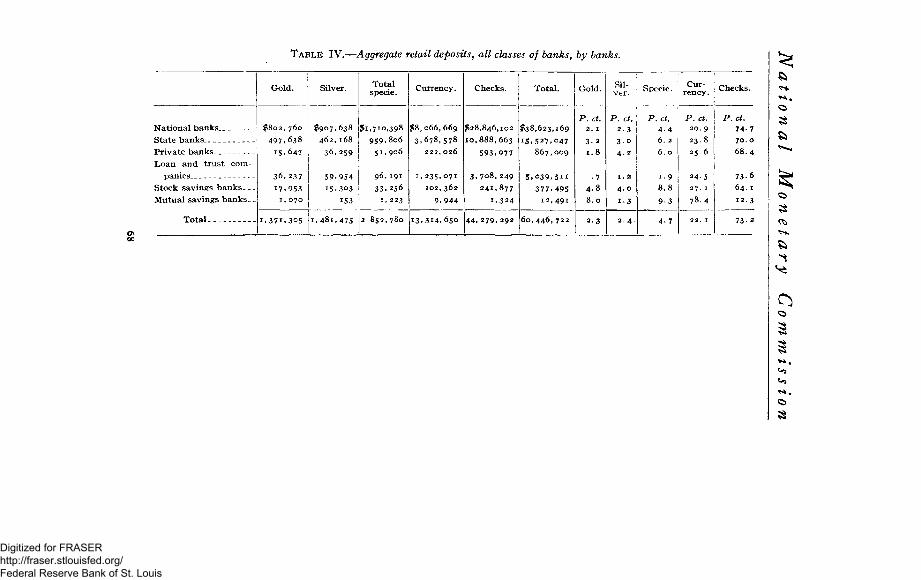
TABLE IV.—Aggregate retail deposits, all classes of banks, by banks.
National banks State banks Private banks. _ Loan and trust corn-
Stock savings b a n k s — Mutual savings banks . _
Total
Gold.
$802,760 497.638
15.647
36,237
17.953 1, 070
1 , 3 7 1 , 3 0 5
Silver.
$907,638 462,168
36,259
59,954 15,303
153
1,481,475
Total specie.
$1,710,398 959,806
51.906
96,191 33.256
1, 223
2 852,780
Currency.
$8,066,669 3.678,578
222, 026
1, 235 .071 102, 362
9,944
13,314,650
Checks.
$28,846,102 10,888,663
593,077
3,708,249 241,877
1,324
4 4 , 2 7 9 , 2 9 2
Total.
$38,623,169
15.527,047 867,009
5.039,511 377,495
12 ,491
60,446,722
Gold,
P.ct. 2. 1 3-2 1.8
• 7 4.8 8.0
2 . 3
Silver.
P . ct. 2 3 3 - o 4 . 2
1. 2
4 . 0
1-3
2 . 4
Specie.
P.ct. 4 - 4 6 . 2 6 . 0
i - 9
8.8 9-3
4 7
Currency.
P . ct. 20. 9 23.8 25.6
24-5 27. 1 78.4
22. 1
Checks.
P.ct. 7 4 7 70. 0
68.4
73. 6 64. 1 1 2 . 3
73. 2
ft
ft
3
Digitized for FRASER http://fraser.stlouisfed.org/ Federal Reserve Bank of St. Louis
The Use of Credit Instruments
DISCUSSION OF TABLES.
Retail deposits of national banks.—These returns are classified, as has been indicated, by banks and classes of deposits. Of the national banks 5,452 sent in replies which were used. The aggregate amount deposited by retail dealers in these banks on the day in question was $38,623,169. Of this total, $28,846,102, or 74.7 per cent, was in checks; $8,066,669, or 20.9 per cent, in currency; and $1,710,398, or 4.4 per cent, in coin. The State in whose deposits the largest per cent of checks appears is New York, with 86.6 per gent. The State showing the smallest per cent was Rhode Island, with 58.9 per cent. Thirty States show a percentage of credit instruments in retail deposits of 70 or more. Sixteen show a percentage higher than 60 and less than 70.
Retail deposits of state banks.—The retail deposits of the state banks aggregated $15,527,047 from 4,288 banks. The checks amounted to $10,888,663, or 70 per cent, as compared with 74.7 of the national banks. The currency amounted to $3,678,578, or 23.8 per cent; the specie to $959,806, or 6.2 per cent, almost equally divided between gold and silver. The highest per cent shown by the returns of any State was 88 in the case of Wyoming. It should be noted, however, that the aggregate deposits of the 12 banks reported for Wyoming were only $32,995. The State whose returns show the lowest per cent among the state banks is Oklahoma, with 45.2 per cent. Twenty-two States returned percentages of 70 or more, but less than 88, while seventeen show percentages of 60 and less than 70. The lowest percentage of checks in deposits
69
Digitized for FRASER http://fraser.stlouisfed.org/ Federal Reserve Bank of St. Louis
National Monetary Commission
was that of the state banks in the District of Columbia. The figure is 41.8. It will be noted that the percentages of the District of Columbia were lowest for the national banks also. It will be noted also that Wyoming, which stands highest in the per cent of checks returned in the state banks, stands second with 82.1 per cent according to the returns from the national banks.
Retail deposits of the private banks.—The number of private banks whose returns were used was 665. The aggregate deposits returned to the credit of retail dealers was $867,009. Of this amount $593,077, or 68.4 per cent, was in checks. The highest percentage returned was that of Idaho, 92.9. This, however, was from only one bank. Utah returned 92 per cent from two banks; Wyoming 90.2 per cent from one bank. More than one-third of the total returns were from 203 private banks in Illinois; and these show 69.8 per cent of checks and other credit paper deposited. Mississippi makes the very remarkable showing of 1 per cent of credit documents, but the returns are from only one bank and aggregate only $203. The figure therefore has no significance for the average.
Fourteen States and the District of Columbia gave no returns from private banks. Nineteen of those replying returned percentages of checks higher than 70. Six showed percentages between 60 and 70 and nine between 50 and 60. Aside from that of Mississippi, already noted, the lowest per cent of checks in the deposits was in Alabama, 26.2. Here, again, only one bank was represented.
If we consider only those banks of this group which returned deposits of $10,000 or more from not less than
7«
Digitized for FRASER http://fraser.stlouisfed.org/ Federal Reserve Bank of St. Louis
The Use of Credit Instruments
eight banks—those of Colorado, Illinois, Indiana, Iowa, Michigan, Missouri, New York, Ohio, Pennsylvania, South Dakota, and Texas—we find that the percentages range from 51.1 in Michigan to 87.5 in South Dakota.
Retail deposits of loan and trust companies.—Of these institutions 401 reported aggregate retail deposits of $5,039,511 made on the day in question. Of this amount $3,708,249, or 73.6 per cent, were in checks; $1,235,071, or 24.5, in currency; and $96,191, or 1.9, in specie, the silver being $23,717 more than the gold. No usable returns of this class were received from Alabama, Arizona, California, Florida, Georgia, Iowa, Kansas, Kentucky, Louisiana, Michigan, Mississippi, Montana, Nebraska, Nevada, New Mexico, North Dakota, Oklahoma, Oregon, South Dakota, Tennessee, Texas, Utah, Virginia, Wisconsin, or Wyoming.
The largest per cent snown, 93.4, was in the State of Colorado, from 5 banks. Missouri comes next with 83.2 per cent from 16 banks. Minnesota stands next with 83 per cent from 2 banks. New York has 81 per cent from 58 banks.
Pennsylvania, with returns from 126 banks, shows 69.9 per cent. It is noticeable that in this group there are five States which show more than 80 per cent of retail deposits of these companies.
The lowest per cent returned is 22.5 from one bank in South Carolina, whose deposits of this class on the day in question were $1,579. The array of percentages in the loan and trust companies shows a greater variation than
71
Digitized for FRASER http://fraser.stlouisfed.org/ Federal Reserve Bank of St. Louis
National Monetary Commission
in the case of the three preceding classes of banking institutions.
Retail deposits of stock savings banks.—The aggregate deposits of this class returned by 335 of the stock savings banks were $377,495. Of this amount $241,877/or 64.1 per cent, was in checks; $102,362, or 27.1 per cent, was in currency; $33,256, or 8.8 per cent, was in specie, pretty evenly divided between gold and silver, but with a preponderance in favor of the gold on account of the California deposits. The highest percentage of credit instruments returned in the retail deposits of this class of banks was 96.4 from two banks in Missouri with aggregate deposits of $5,189.
The lowest percentage, 7.2 per cent, is shown by the deposits of two banks in Louisiana aggregating $952. Two banks in Virginia with $186 deposits show 11.3 per cent of checks. Six banks in New Hampshire with deposits of $1,102 show 19.5 per cent; two in Colorado and Vermont show percentages of 80 and 88.9 per cent, respectively. Four States give percentages higher than 70 and four between 60 and 70.
Of the States which sent replies from three or more banks New Hampshire had 19.5 per cent of credit paper in $1,102 deposits in six banks.
It should be noted, of course, in considering the returns of the stock saving banks, that while these are commercial banks with active checking accounts in the West, in States like Mississippi, Louisiana, and New Hampshire, they are probably more for savings accounts proper.
72
Digitized for FRASER http://fraser.stlouisfed.org/ Federal Reserve Bank of St. Louis
The Use of Credit Instruments
Retail deposits of the mutual savings banks.—That the mutual savings banks returned any deposits for retail dealers as such is due doubtless to the literalness with which the officers of a few of these banks interpreted the circular of inquiry. Strictly speaking, the deposits in the mutual savings banks should all be included in one class. Nevertheless, as a matter of interest, they are presented with the same classification as in the case of the other banks.
We find that $12,491 are returned as deposited by retail traders. Of this amount $1,324, or 10.6 per cent, was in checks; $9,944, or 79.7 per cent, in currency; $1,223, or 9.7 per cent, in specie, $1,070 of this being in gold, practically all deposited in the New York banks. The amounts involved are so small that the returns have no significance whatever, of course, as referring to the class of dealers to whom they are accredited.
We shall find the same thing true of the depositors classified as wholesale dealers in the mutual savings banks. Therefore the important table for this class of banks is the "all others/'
Aggregate retail deposits.—Tables III and IV show the aggregate retail deposits according to the usual classification, by states and classes of banks.
The aggregate retail deposits were $60,446,722. Of this amount $44,279,292, or 73.2 per cent, were in credit documents, as against 67.4 per cent in 1896; $13,314,650, or 22 per cent, were in currency, and $2,852,780, or 4.8 per cent, were in specie, pretty evenly divided between gold and silver. The largest volume of deposits
73
Digitized for FRASER http://fraser.stlouisfed.org/ Federal Reserve Bank of St. Louis
National Monetary Commission
is in the returns of the national banks and the percentage of checks in these deposits is 74.7, the highest shown by any class of banks. The loan and trust companies come next with 73.7 per cent, but their total deposits were only about one-eighth of those of the national banks. The third in order of percentage is the state banks and the percentage of credit paper in their deposits is 70 in aggregate deposits of fifteen and one-half millions, or about 40 per cent of the deposits of the national banks. The private banks, with aggregate retail deposits of $867,009, show 68.4 per cent of checks, while the stock savings banks, with deposits of $377,495, show $64.1 per cent of checks. The mutual savings banks show 12.3 percent in checks in deposits of $12,491. The returns of the mutual savings banks are of no importance in the discussion of retail deposits as such.
What now do these figures mean? What is the significance of this 73.2 per cent, which, on the basis of the returns, is the proportion of checks deposited by retail merchants? The real interest of such an investigation as this centers on these retail deposits. There has never been any dispute of the statement that 90 per cent of the wholesale transactions of the country are settled ordinarily by means of credit paper. The contention has been that the method of settlement of wholesale payments gave no indication of the habits of the people with reference to the use of money and checks. To meet this point the inquiries of 1894, 1896, and 1909 have sought to secure a classification of the deposits of the retail merchants.
74
Digitized for FRASER http://fraser.stlouisfed.org/ Federal Reserve Bank of St. Louis
The Use of Credit Instruments
It is very clear that we can not take the figures on the basis of the returns as representing exactly the proportion of payments made by the people of this country with checks in their retail purchases. Various allowances and corrections must first be made before we can reach anything like a satisfactory conclusion.
ALLOWANCES AND CORRECTIONS.
Banks not heard from.—The number of banks whose reports were used, as already indicated, was 11,491; the total number of different kinds of banking institutions in the country at the time of this inquiry is not exactly known. The report of the Comptroller of the Currency, from year to year, purports to give the number of national, state, private, and other banks, and for the year 1908 the number given is 25,000. There are some so-called banks, however, which are not banks in the ordinary sense of the word. For example, a good many stock brokers have deposits of their customers waiting for opportune investments. They may or may not allow interest on these accounts. They advertise themselves, however, as doing a banking business. The accounts are not checking accounts, nor are they intended to be accounts as ordinarily understood.
On April 28, 1909, about six weeks after the date on which the deposits were called for in this inquiry, there were 6,926 national banks reported as in active operation. Of the whole number, 5,551 replied in some form to this inquiry, and the returns of 5,452 have been used— that is, 80 per cent were heard from. If the aggregate
7071—10 6 75
Digitized for FRASER http://fraser.stlouisfed.org/ Federal Reserve Bank of St. Louis
National Monetary Commission
retail deposits of the banks not heard from is in the ratio of their number to the whole number, the amount to be added to the deposits received, in order to get the aggregate retail deposits of all the national banks on the date in question, would be about $9,655,000, making the aggregate deposits by retail dealers in all the national banks of the country on the date in question about $48,285,000.
The Comptroller's report in 1908 gave the aggregate number of state banks reporting as 11,220. Of this number 4,630, or 41 per cent, sent in returns, of which 4,302 were used. The aggregate retail deposits of this number was $15,527,047. If we increase the deposits of the retail dealers of the state banks for the nonreporting banks in the proportion of those reporting, the retail deposits for all the state banks of the country would be about $38,000,000. This is probably too large.
By similar processes of calculation the deposits of private banks by retail dealers on the day in question, after allowance is made for nonreporting banks, would be $1,150,000. For stock savings banks, which are really commercial banks, the figures would be $750,000 for the aggregate of retail deposits on the day in question. For loan and trust companies the retail deposits thus figured would be $7,600,000. We need not include the mutual savings banks. The total is $95,000,000.
It is doubtful, however, whether it is fair to increase the deposits of state banks and private banks in the ratio of the number reporting to the number not reporting, for the state and private banks which sent in replies
76
Digitized for FRASER http://fraser.stlouisfed.org/ Federal Reserve Bank of St. Louis
The Use of Credit Instruments
were probably in the main located in the larger places. The 11,220 state banks reported by the Comptroller had $2,937,129,598 of deposits. This is an average of $261,000 for each state bank. The average individual deposits of the national banks on April 28 last per bank was $656,000. The relative commercial importance of the national bank and the state bank, measured by the individual deposits, is therefore in the ratio of to 2.5 to 1. It is probably greater than this. In allowing, then, for deposits for nonreporting state banks it would be fair to add a smaller sum per bank than the average shows. Moreover, since these nonreporting state banks were probably the smaller banks, the amount to be added to the check deposits should be proportionately larger, because, as we shall see later, the proportion of checks in the deposits of banks in agricultural communities runs very high, and it is in the agricultural communities of the West that we find the stronghold of the small state commercial banks.
When we have allowed for the aggregate deposits of the nonreporting banks, we are confronted with the question what proportion we shall put in the column of checks and other credit documents. It has been urged in the past in the discussion of this topic that the non-reporting or smaller banks will likely show the largest proportion of cash in their deposits, and that on that account, in making allowances for their returns, the proportion of cash entered as against the amount of checks should be larger. The present inquiry does not bear out that contention, but rather the opposite, as the returns from agricultural districts show.
77
Digitized for FRASER http://fraser.stlouisfed.org/ Federal Reserve Bank of St. Louis
National Monetary Commission
After we have made allowances for the nonreporting banks in the column of checks for each class of banks and added the proportion shown by thepercentagederived from the returns of those which sent in replies, we have a grand aggregate of deposits of retail dealers on the day of our inquiry amounting to $95,000,000, of which about 70 per cent were in checks.
Allowances for possible excess of checks.—Do these bank deposits give a true view of the payments in retail trade? Do the payments by merchants into their banks fairly represent the payments received for sales of goods? The merchants can deposit only what they receive. If they deposit checks from their customers, this fact can only mean that the customers give them checks in payment of some transactions or other. Were the checks given wholly in payment for goods bought? If not, for what other reasons were they given and to what extent? There are several sources from which the retail dealers might get checks which show in their bank deposits. In the first place, merchants cash checks for their customers and friends as a matter of accommodation. So far as this was done on the day in question, the proportion of checks in the merchants' deposits would be too large. How much too large we do not know. In the few cases in which the writer has made inquiry he has been told that from 5 to 10 per cent would cover any error due to this cause. Ten per cent, the larger of the two figures, was given by one of the largest retail dealers in Chicago. I t is hardly to be believed that so large a percentage is common. One can hardly believe that the retail stores
78
Digitized for FRASER http://fraser.stlouisfed.org/ Federal Reserve Bank of St. Louis
The Use of Credit Instruments
of the country cashed nearly $10,000,000 of checks as a matter of accommodation for their friends on the day of our inquiry; yet this is what they must have done if they cashed 10 per cent. In the smaller stores where the inquiry was made the percentage ran down to nothing. If we allow 5 per cent for this source of error, we shall, in the opinion of the writer, be doing enough and more.
In the next place, the merchants often cash "pay checks" or take them in payment of bills or purchases which are less than the face value of the checks and give the balance to the customer in money. Very likely some checks of this class are included in the deposits of the retail dealers. They could not have amounted to much, however, for the day of the inquiry was Tuesday, and it is likely that pay checks received on Saturday would have been turned into the banks by Monday. The correction for this source of error for the day in question must be insignificant.
In the third place, we must remember that merchants do not all deposit daily. The deposits made by some merchants represent the receipts of from two to six days, and even longer. In so far as the accumulated receipts of several days appear in the returns, our ratio might be affected. It is doubtful, however, whether any allowance need to be made for this possible source of error. For, in the first place, the dealers who do this are those whose business is small and who are not within convenient reach of a bank; in the second place, they are just as likely to deposit checks as cash; and, in the third place, Tuesday is an unlikely day for such deposits. There is no reason to think that the proportion of cash and checks in their
79
Digitized for FRASER http://fraser.stlouisfed.org/ Federal Reserve Bank of St. Louis
National Monetary Commission
receipts from day to day would show large variation. In the opinion of the writer, no correction needs to be made on this account.
It has been urged also as a possible source of error that many dealers pay their wages to employees and other expenses with the money receipts of the day and deposit the balance. In so far as merchants follow this practice the proportion of checks in their deposits would be too large. We have no way of checking such an error. In some instances a firm draws a check against itself for its pay roll and other expenses. The cash is taken out of the day's receipts and the check deposited in the bank. This and similar methods of wage payment would swell the proportion of the merchants' checks. I t is difficult to believe, however, that the amount involved can be very great as compared with the total deposits of the retail merchants. But however great or small the amount, it would be reduced to a minimum in the returns of the present inquiry, because the day of the week selected would not be a pay day, to a large extent, anywhere in the country. For this source of error, again, therefore, we need make no correction. It is more probable that a small error occurs from paying out money for certain other expenses than wages on the day in question. We must remember, however, that the merchant has a bank account and that he is just as likely, perhaps more likely, to pay his bills with checks as with cash. No extensive inquiry on this point has been made. In the few cases in which the writer was able to ask the question, he found that dealers other than those whose business was exceedingly small preferred to pay with checks because they can keep better track of their payments.
80
Digitized for FRASER http://fraser.stlouisfed.org/ Federal Reserve Bank of St. Louis
The Use of Credit Instruments
Finally, it is urged that checks may pass through several hands before they reach the merchants and are deposited by them in the banks, and that they may be deposited in several banks on the same day before reaching the place where they are finally paid. Such duplications, however, could not occur in the "deposits" of retail merchants, because these deposits contain the checks which they themselves have received from customers and other individuals. These duplications will appear in the "all others" class if these should include the deposits of banks and bankers. No correction needs to be made for such a cause of error, therefore, in the retail figures.
Ignorance of business of depositors.—Perhaps the first point that needs to be settled in the discussion of these returns is who are "retail dealers/' The term, of course, is somewhat indefinite. Ordinarily, we think of the retail dealer as one who sells directly to the consumer. He is generally the purveyor of what are called finished goods to those who are themselves to make use of them in final consumption. Even this is not quite accurate, but the phrase certainly conveys to most people pretty definitely the idea expressed above. Even when we have agreed upon a meaning of the term there still is difficulty from the fact that some merchants do both a wholesale and retail business, and do not, perhaps can not, always keep their accounts separate. There is no reason to think, however, that any error occurs in the returns from confusion as to the meaning of the term "retail dealer.'' As was pointed out in the discussion of 1896, the question where, for example, we shall class the jobber or the lumber merchant,
81
Digitized for FRASER http://fraser.stlouisfed.org/ Federal Reserve Bank of St. Louis
National Monetary Commission
depends upon the community, the extent of the business, and the point of view.
Another possible source of confusion in the returns may arise from the impossibility that banks in large places with a large number of customers can know the business of each individual. In all but the larger cities it is very likely true that this would not be the case, and that the banks would be able to classify with fair accuracy. From the care with which replies were evidently made as a rule it is fair to infer that the banks in the larger cities entered as retail dealers only those of whom they felt sure. Therefore, whatever error there may be in the returns on account of ignorance of the business of particular depositors is likely to arise from the inclusion among "all other" depositors of retail dealers whose business was not known. For it is in that third group that the unknown would be classified.
RETAIL RETURNS BY GEOGRAPHICAL DIVISIONS.
It is interesting to classify the returns by the geographical divisions of the census with a view to detecting any evidence of differences in the practice of paying by checks in different sections of the country. Of the whole sixty-odd millions of deposits returned, $27,000,000 were in the North Atlantic Division and 75 per cent were in checks. The North Central Division had a total of something over $20,000,000, of which 72.5 per cent were in checks. The South Atlantic Division, with aggregate deposits of $3,325,000, had 63.8 per cent in checks. The South Central Division shows retail returns of $4,400,000, of which 69.9 per cent were in checks. The deposits of the Western Division were over $5,000,000, with a percentage of 75.7 in checks. The average is 73.2. Following are the tables:
82
Digitized for FRASER http://fraser.stlouisfed.org/ Federal Reserve Bank of St. Louis
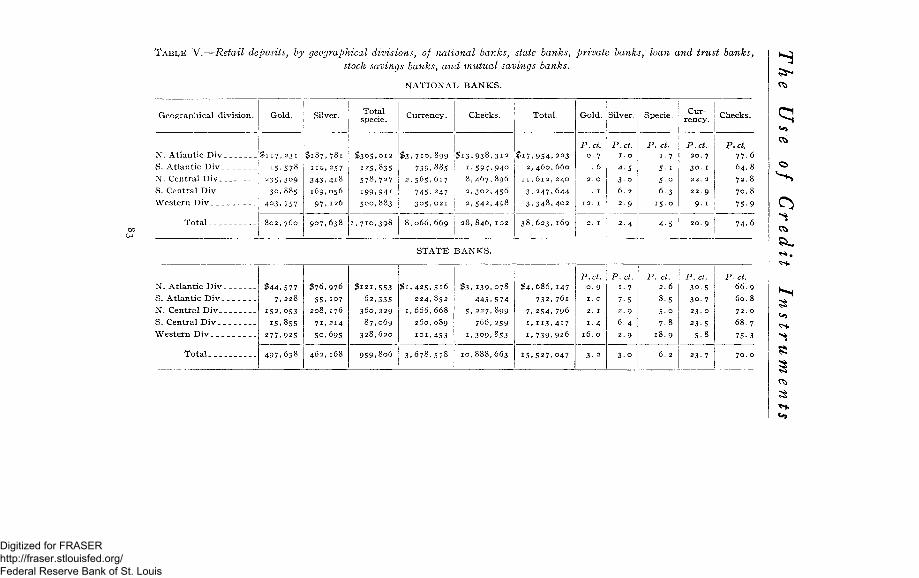
TABLK V.—Retail deposits, hy geographical divisions, of national hanks, state hanks, private hanks, loan and trust hanks,
stock savings hanks, and mutual savings banks.
NATIONAL BANKS.
Geographical division.
N. Atlantic Div
S. Atlantic Div _
N. Central Div__
S. Central Div _ _ _ _ _
Western Div _ _ _
Total
Gold.
$ 1 1 7 , 2 3 1
15 .578
235 ,309
3 0 . 8 8 5
403 .757
8 0 2 , 7 6 0
Silver.
$ 1 8 7 , 7 8 1
n o , 257
3 4 3 , 4 i 8
169 ,056
9 7 , 1 2 6
9 0 7 , 6 3 8
Total specie.
$305 ,012
125 ,835
578 ,727
199 ,941
500 ,883
Currency.
$ 3 , 7 1 0 , 8 9 9
7 3 9 , 8 8 5 2 , 5 6 5 , 6 1 7
745 .247
1 .710 ,398 8 , 0 6 6 , 6 6 9
Checks.
$ 1 3 , 9 3 8 , 3 1 2
L 5 9 4 . 9 4 0
8 , 4 6 7 . 8 9 6
2, 302 , 456
2 , 5 4 2 , 4 9 8
28, 846, 102
Total.
$ 1 7 , 9 5 4 , 2 2 3 2, 460, 660
1 1 , 6 1 2 , 240
3 , 2 4 7 , 6 4 4 3 , 3 4 8 , 4 0 2
3 8 , 6 2 3 , 1 6 9
Gold.
P.ct. 0. 7
. 6
2. 0
. 1
12. 1
2. 1
Silver.
P.ct. 1. 0
4 - 5 3 -o 6 . 2 2 . 9
2 . 4
Specie.
P. ct.
i - 7 5- 1 5-o 6-3
1 5 0
4 - 5
Currency.
P.ct.
20. 7
3 0 . 1
22. 2
22. 9
9- 1
20. 9
Checks.
P.ct.
77-6
6 4 . 8
7 2 . 8
7 0 . 8
75-9
74. 6
STATE BANKS.
N . A t l a n t i c D i v
S. A t l a n t i c D i v
N . C e n t r a l D i v
S. C e n t r a l D i v
W e s t e r n D i v
Total
$ 4 4 , 5 7 7 7, 228
152 ,053
15 .855
277 .925
4 9 7 . 6 3 8
$ 7 6 , 9 7 6
55 .107
208 ,176
71 ,214
50 .695
4 6 2 , 1 6 8
$121 ,553 62 ,335
3 6 0 , 2 2 9 8 7 , 0 6 9
3 2 8 , 6 2 0
959 ,806
$ 1 , 4 2 5 , 5 1 6
224 ,852
1 , 6 6 6 , 6 6 8
2 6 0 , 0 8 9
101 ,453
3 . 6 7 8 , 5 7 8
$ 3 . 1 3 9 , 0 7 8
4 4 5 . 5 7 4 5, 2 2 7 , 8 9 9
766 .259
1 ,309 ,853
1 0 , 8 8 8 , 6 6 3
$ 4 , 6 8 6 , 1 4 7 732, 761
7, 254, 796
1, H 3 , 4 i 7 1. 7 3 9 . 9 2 6
I 5 . 5 2 7 . 0 4 7
P.ct. 0 . 9 1. 0
2. 1
1. 4
16. 0
3- 2
P.ct. i- 7 7-5 2 . 9 6 . 4 2 . 9
3 . o
P. ct. 2 . 6
8-5 5-o
7-8
1 8 . 9
6. 2
P.ct.
30.5
30. 7 23- 0 23-5
5-8
23 . 7
P.ct.
6 6 . 9
6 0 . 8
72. 0
68. 7
75-3
70. 0
A.
Digitized for FRASER http://fraser.stlouisfed.org/ Federal Reserve Bank of St. Louis
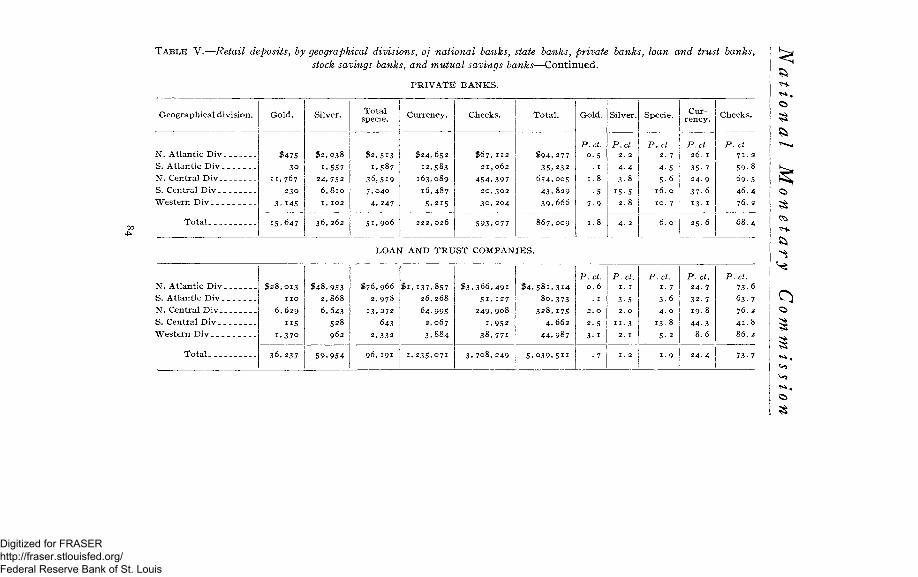
TABLE V.—Retail deposits, by geographical divisions, of national banks, state banks, private banks, loan and trust banks,
stock savings banks, and mutual savings banks—Continued.
PRIVATE BANKS.
^ fc ^
Geographical division.
N. Atlantic Div S. Atlantic Div. N. Central Div. S. Central Div. . Western Div
Total
N. Atlantic Div S. Atlantic Div. N. Central Div_ S. Central Div _ Western Div
Tota l . ._
Gold.
$475 30
11,767 230
3 . 145
IS.647
Silver.
$ 2 , 0 3 8
1.557
24 ,752 6 , 8 1 0 1, 102
3 6 , 2 6 2
Total specie.
$2 ,513
1,587
36 ,519 7 ,040
4 ,247
51 , 906
Currency.
$ 2 4 , 6 5 2
12,583 163,089
16 ,487
5 .215
222,026
Checks.
$ 6 7 . 1 1 2 21 ,062
4 5 4 , 3 9 7 20, 302 3 0 , 2 0 4
593 ,077
Total.
$ 9 4 , 2 7 7 3 5 , 2 3 2
654,005
43,829
39,666
8 6 7 , 0 0 9
Gold.
P.ct. 0 . 5
. 1
1 . 8
• 5
7 9
1 . 8
Silver.
P.ct. 2 . 2
4 . 4
3 - 8
i 5 - 5 2 . 8
4. 2
Specie. Cur
rency.
P. ct 2 . 7
4 - 5
5 - 6
16. o
10. 7
P.ct 26. I
35- 7
2 4 . 9
3 7 - 6
13. x
6 . 0 25. 6
Checks.
LOAN AND TRUST COMPANIES.
P. ct. 71. 2 5 9 - 8 6 9 . 5 4 6 . 4 76. 2
68.4
$28 ,013 n o
6, 629
115 i , 3 7o
36,237
$ 4 8 , 9 5 3 2,868
6,643 528
962
59,954
$76,966 2 .978
13 .272
643
2,332
96 ,191
5i. 137.»57 26.268
64 .995 2, 067
3,884
I , 2 3 5 , 0 7 1
$ 3 , 3 6 6 , 4 9 1
5 1 . 1 2 7
2 4 9 , 9 0 8
1 .952
3 8 , 7 7 1
3 , 7 0 8 , 2 4 9
$ 4 , 5 8 1 , 3 1 4
8 0 , 3 7 3 3 2 8 , 1 7 5
4. 662
4 4 , 9 8 7
5 . 0 3 9 . 5 1 1
P.ct. 0 . 6
. 1
2 . 0
2 - 5
3- 1
• 7
P.ct. 1 . 1
3 - 5
2 . 0
H - 3
2 . 1
1 . 2
P.ct. i- 7 3 - 6
4 . 0
13-8 5 - 2
i - 9
P. ct. 2 4 . 7 32. 7 1 9 . 8
4 4 - 3 8.6
24. 4
P.ct.
7 3 . 6
6 3 . 7
76. 2 41.8 86.2
73- 7
Digitized for FRASER http://fraser.stlouisfed.org/ Federal Reserve Bank of St. Louis
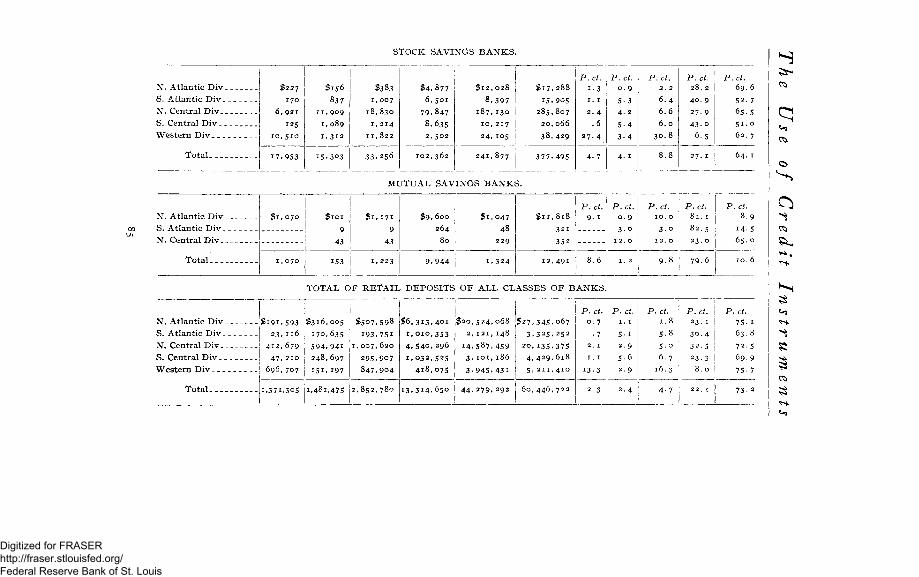
STOCK SAVINGS BANKS.
N. Atlantic Div S. Atlantic Div _ N. Central Div_ _ _ S. Central Div Western Div
Total
$ 2 2 7
1 7 0
6 , 9 2 1
1 2 5
1 0 , 5 1 0
1 7 , 9 5 3
$ 1 5 6
8 3 7
1 1 , 9 0 9
1 , 0 8 9
1 , 3 1 2
1 5 . 3 0 3
$ 3 8 3
1 , 0 0 7
1 8 , 8 3 0
1 , 2 1 4
1 1 , 8 2 2
3 3 , 2 5 6
$ 4 , 8 7 7
6 , 5 0 1
7 9 . 8 4 7
8 , 6 3 5
2 , 5 0 2
1 0 2 , 3 6 2
$ 1 2 , 0 2 8
8 , 3 9 7
1 8 7 , 1 3 0
1 0 , 2 1 7
2 4 , 1 0 5
2 4 1 , 8 7 7
$ 1 7 , 2 8 8
1 5 . 9 0 5
2 8 5 , 8 0 7
2 0 , 0 6 6
3 8 , 4 2 9
3 7 7 . 4 9 5
P.ct. 1 - 3
1 . 1
2 . 4
. 6
2 7 . 4
4- 7
P. ct. 0 . 9
5 - 3
4 . 2
5 - 4
3 - 4
4- 1
P.ct. 2 . 2
6 . 4 6 . 6
6 . 0
3 0 . 8
8 . 8
P.ct. 2 8 . 2
4 0 . 9
2 7 . 9
4 3 . o
6 . 5
2 7 . 1
P.ct. 6 9 . 6
5 2 . 7
6 5 . 5 5 i - o
62 . 7
64 . 1
MUTUAL SAVINGS BANKS.
N. Atlantic Div S. Atlantic Div N. Central Div
Total
$ 1 , 0 7 0
1 , 0 7 0
$ 1 0 1
9
4 3
1 5 3
$ 1 , 1 7 1
9
4 3
1 , 2 2 3
$ 9 , 6 0 0
2 6 4
8 0
$ 1 , 0 4 7
4 8
2 2 9
9 , 9 4 4 1 . ^ 2 1
$ 1 1 , 8 1 8
3 2 1
3 5 2
1 2 , 4 9 1
P.ct. 9- 1
8 .6
P.ct. 0 . 9
3 - o
1 2 . 0
1 . 2
P.ct. 1 0 . 0
3-o 1 2 . 0
9 - 8
P.ct. 8 1 . 1
8 2 . s
2 3 . 0
7 9 . 6
P. ct.
8 . 9
14- 5 6 5 . 0
1 0 . 6
TOTAL OF RETAIL DEPOSITS OF ALL CLASSES OF BANKS.
t o
N. Atlantic Div_ S. Atlantic Div_ N. Central Div._ S. Central Div __ Western Div
Total .
$ i 9 i , 5 9 3 23 ,116
4 1 2 , 6 7 9
4 7 . 2 1 0
696 ,707
1,371,305
5316, 005
170,635
594 .941
248 ,697
1 5 1 . i 9 7
1,481,475
$507 ,598
i 9 3 , 7 5 i 1, 0 0 7 , 6 2 0
295,907
847 ,904
2 , 8 5 2 , 7 8 0
! $ 6 , 3 i 3 . 4 0 i
1 , 0 1 0 , 3 5 3
4 , 5 4 0 , 296
1 , 0 3 2 , 5 2 5
418 ,075
1 3 . 3 1 4 , 6 5 0
52o, 524, 068
2 , 1 2 1 , I 4 8
1 4 , 5 8 7 , 4 5 9
3 , 1 0 1 , 1 8 6
3 . 9 4 5 , 4 3 1
4 4 , 2 7 9 , 292
5 2 7 , 3 4 5 . 0 6 7
3 , 3 2 5 . 2 5 2
2 0 , 1 3 5 . 3 7 5
4 , 4 2 9 , 6 1 8
5 , 2 1 1 , 4 1 0
6 0 , 4 4 6 , 7 2 2
P.ct. 0 . 7
• 7
2 . 1
1 . 1
1 3 - 3
2 . 3
P.ct. I . I
5- 1
2 . 9
5 . 6
2 . 9
2 . 4
P.ct. 1 . 8
5-8
5-o
6 .7 1 6 . 3
4 - 7
P.ct. 2 3 . 1
3 0 . 4
3 2 . 5
2 3 - 3
8 . 0
2 2 . 1
P.ct. 7 5 - 1
6 3 . 8
7 2 . 5
6 9 - 9
7 5 - 7
73- 2
Digitized for FRASER http://fraser.stlouisfed.org/ Federal Reserve Bank of St. Louis
National Monetary Commission
These percentages are striking. Can it be possible that with so large a negro population, in which the use of checks practically does not exist, the method of payment of a community for its purchases can be fairly represented by the percentages of the South Central and the South Atlantic divisions? The answer is, as before, that the real consideration is the proportion of purchases, not the proportion of the number of people who use checks. It is true that there are millions of negroes in these two divisions. It is equally true that in the distribution of wealth their share is very small and that their purchases must be correspondingly so. We must remember, too, that a large number of plantation negroes and workers in the lumber districts of the South are still paid to a considerable extent by orders for goods on the stores of the companies for which they work. Indeed, one might almost use these averages as a basis for a study of the distribution of wealth as well as of method of payments.
CHECKS IN CITIES AND AGRICULTURAL DISTRICTS.
Reserve cities.—It is sometimes said that the use of checks is greatest in the cities. Those who claim that most of the proportion of business done by means of checks is composed of stock-exchange transactions, transactions between banks and wholesale business houses, have inferred that a small proportion of check payments would be found in the country districts.
In order to test this view, the percentages have been calculated for the principal reserve cities a by themselves>
and for the rest of the country. a There seems nothing to be gained by calculating the returns for all the
reserve cities separately. 86
Digitized for FRASER http://fraser.stlouisfed.org/ Federal Reserve Bank of St. Louis
The Use of Credit Instruments
The returns are shown for the various classes of banks in these reserve cities in order that no undue weight may be attached to the class of banks that do most of the business. An inspection of Table VI shows that these reserve cities had $24,191,414 of retail deposits and that of these, 80 per cent were in checks. The national banks in these reserve cities had $15,198,436, of which 84.2 per cent were in checks. The state banks in the same cities had $6,035,175, of which 70.8 per cent were in checks. The private banks had $44,206, of which 47.8 per cent were in checks. The loan and trust companies in these cities had $2,824,387 of the retail deposits, of which 78.6 per cent were in checks. The stock savings banks had $79,050 of retail deposits, of which 59.3 per cent were in checks and the mutual savings banks had $10,160, with ^.6 per cent in checks.
87
Digitized for FRASER http://fraser.stlouisfed.org/ Federal Reserve Bank of St. Louis
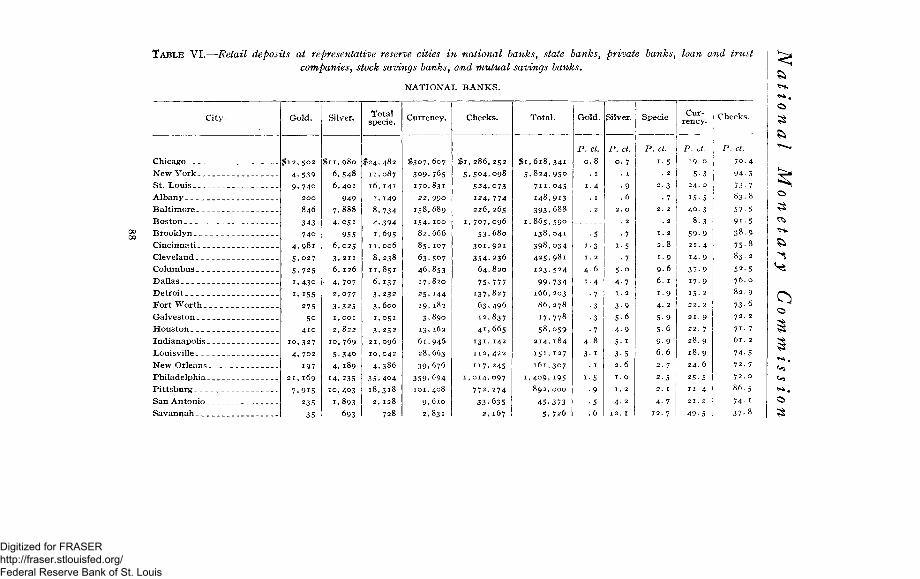
TABLE VI.- -Retail deposits at representative reserve cities in national banks, state banks, private banks, loan and trust companies, stock savings banks, and mutual savings banks.
N A T I O N A L B A N K S .
Ci ty .
Chicago
N e w Y o r k . . .
S t . L o u i s
A l b a n y
B a l t i m o r e
B o s t o n
B r o o k l y n
Cinc inna t i _ _.
C leve land
C o l u m b u s
D a l l a s
D e t r o i t
F o r t W o r t h _
G a l v e s t o n
H o u s t o n
I n d i a n a p o l i s .
Louisvi l le
N e w O r l e a n s
P h i l a d e l p h i a .
P i t t s b u r g
S a n A n t o n i o .
S a v a n n a h
Gold .
$ 1 2 , 5 0 2
4. 539
9, 740
2 0 0
846
343 740
4 . 9 8 i
5 . 0 2 7
5 . 7 2 5
1 , 4 3 0
1 . 1 5 5
2 7 5
So 4 1 0
1 0 , 3 2 7
4 , 7 0 2
1 9 7
2 1 , 1 6 9
7 . 9 1 5
2 3 5
35
Silver.
Si 1, 980
6 ,548
6 , 4 0 1
949 7 ,888 4 . 0 5 1
955 6 ,025
3 . 2 1 1
6 , 1 2 6
4 . 7 0 7
2 , 0 7 7
3 . 3 2 5
1 , 0 0 1
2 , 8 2 2
1 0 , 7 6 9
5 . 3 4 0
4 . 1 8 9
1 4 , 2 3 5
1 0 , 4 0 3
1 . 8 9 3
693
T o t a l specie .
$24,482
11,087
16,141
1 . 1 4 9
8 ,734
4 . 3 9 4
1.69S
1 1 , 0 0 6
8 ,238
1 1 . 8 5 1
6 .137 3 . 2 3 2
3 , 6 0 0
1 , 0 5 1
3 , 2 3 2
2 1 , 0 9 6
1 0 , 0 4 2
4,386
3 5 , 4 0 4 18 ,318
2 , 1 2 8
728
Cur rency .
$ 3 0 7 , 6 0 7
3 0 9 . 7 6 5
1 7 0 , 8 3 1
2 2 , 9 9 0
1 5 8 , 6 8 9
1 5 4 . 1 0 0
82,666
85 .107
63 .507
46 ,853 17 ,820
2 5 . i 4 4 19,182
3 ,890
13,162
61 ,946
28 ,663
39 ,676
359 .694 101,408
9, 610
2 ,831
C h e c k s .
$ i , 2 8 6 , 2 5 2
5 , 5 0 4 , 0 9 8
5 2 4 . 0 7 3
1 2 4 . 7 7 4 226 ,265
1 . 7 0 7 . 0 9 6
5 3 . 6 8 o
3 0 1 , 9 2 1
3 5 4 . 2 3 6
64, 820
75 .777
137 ,827
6 3 , 4 9 6
12 .837 4 1 , 6 6 5
1 3 1 , 1 4 2
1 1 2 , 4 2 2
1 1 7 , 2 4 5
1 . 0 1 4 . 0 9 7
7 7 2 , 2 7 4
3 3 , 6 3 5 2, 167
T o t a l .
, 6 1 8 ,
. 8 2 4 ,
7 1 1 .
148,
3 9 3 , . 8 6 5 ,
138, 398,
425, 1 2 3 .
99 . 166,
86,
1 7 .
58, 2 1 4 ,
1 5 1 .
1 6 1 ,
, 4 0 9 ,
8 9 2 ,
45 .
5,
3 4 1
9 5 0
0 4 5
9 1 3
688
59o
0 4 1
034
981
524
734
2 0 3
278
778
0 5 9
1 8 4
1 2 7
3 0 7
1 9 5
0 0 0
373
726
Go ld .
P. ct.
•5
1 - 3
1 . 2
4 . 6
1 . 4
•7
•3
•3
• 7 4 . 8
3 - 1
. 1
i - 5
•9
•5
. 6
Silver.
P. ct.
0 . 7
. 1
• 9
. 6
2. o
. 2
•7
i - 5
• 7
5-o
4 -7
1 . 2
3 - 9
5-6
4 - 9
5- 1
3-5
2 . 6
Spec ie
5 2
3
7 2
2
2
8
9 6
1
9 2
9 6
9 6
7
5 1
7
7
Currency.
P. ct. 1 9 . 0
5-3 2 4 . 0
15-5
4 0 . 3
8 . 3 ]
5 9 - 9 '
2 1 . 4
14- 9
3 7 - 9
1 7 . 9 15 .2 2 2 . 2
2 1 . 9 22. 7
28. 9
18. 9
24. 6
25-5 11. 4 2 1 . 2
49-5 1
Checks .
\ ct.
7 0 . 4
94-5
73- 7
8 3 . 8
57-5
9 i - 5
3 8 . 9
75 -8
8 3 . 2
5 2 . 5
76. o
82 . 9
73 -6
7 2 . 2
7 i - 7
6 1 . 2
74-5
72. 7
72. o
8 6 . 5
74. 1
3 7 - 8
Digitized for FRASER http://fraser.stlouisfed.org/ Federal Reserve Bank of St. Louis
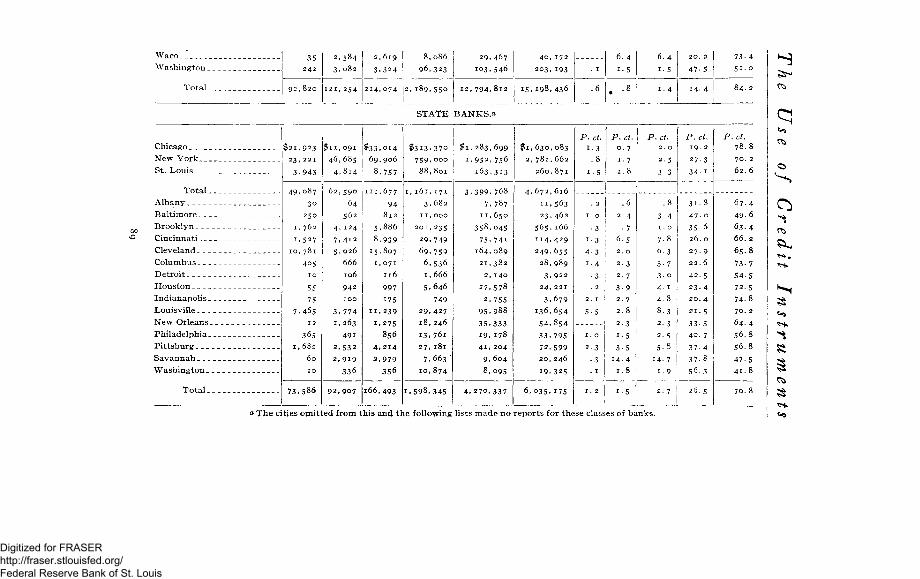
Waco_ _ _ __ _
Washington
Total _ _
35 242
9 2 , 8 2 0
2 .584 3 .082
121 ,254
2, 619
3 . 3 2 4
214 ,074
8 ,086
9 6 , 3 2 3
2 , 1 8 9 , 5 5 0
2 9 , 4 6 7 103 ,546
1 2 , 7 9 4 , 8 1 2
4 0 , 1 7 2
203 ,193
15, 198 ,436
. 1
. 6
6.4
i .5
• '8
6.4
i-5
1 . 4
20. 2
47 -5
14. 4
73- 4 5 1 . 0
84. 2
STATE BANKS.a
Chicago
New York
St. Louis
Tota l .
Albany
Baltimore
Brooklyn
Cincinnati
Cleveland
Columbus
Detroit
Houston
Indianapolis _
Louisville
New Orleans.
Philadelphia _
Pittsburg
Savannah
Washington. .
Tota l . .
$ 2 1 , 9 2 3 2 3 , 2 2 1
3 , 9 4 3
4 9 , 0 8 7
30
250
1, 762
1.527 10 ,781
405 10
55
75
7 ,465 12
365 1,682
60
73.586
5 n , 091 4 6 , 6 8 5
4 . 8 1 4
6 2 , 5 9 0
64
562
4, 124
7 ,412
5 ,026
666
106
942
100
3 , 7 7 4
1, 263
49 i
2 ,532
2 ,919
336
9 2 , 9 0 7
$ 3 3 , o i 4 69 ,906
8,757
i n , 677
94
812
5 .886
8 ,939
15 .807
1, 071
116
997
175 11 ,239
1.275 856
4 , 2 1 4
2 ,979
356
166 ,493
$ 3 i 3 . 3 7 o
7 5 9 . 0 0 0
8 8 , 8 0 1
1 , 1 6 1 , 1 7 1
3 ,682
11 ,000
201 ,235
2 9 , 7 4 9
6 9 , 7 5 9
6 ,536
1,666
5 . 6 4 6
749
29 ,427
18 ,246
I 3 . 7 6 i
2 7 , 1 8 1
7 ,663
10 ,874
1 .598 ,345
$1, 2 8 3 , 6 9 9
1 .952, 756
163 ,313
, 3 9 9 , 768
7,787 11 ,650
3 5 8 , 0 4 5
7 5 , 7 4 i
164 ,089
21 ,382
2, 140
1 7 , 5 7 8
2 ,755 9 5 . 9 8 8
3 5 . 3 3 3
1 9 . 1 7 8
4 1 . 2 0 4
9, 604
8 .095
$1, 6 3 0 , 0 8 3
2 , 7 8 1 , 6 6 2
2 6 0 , 8 7 1
, 6 7 2 , 6 1 6
11 ,563
2 3 . 4 6 2
5 6 5 . 1 6 6
114 ,429 249 ,655
2 8 , 9 8 9
3 . 9 2 2
2 4 , 2 2 1
3 . 6 7 9
136 ,654
5 4 . 8 5 4
3 3 . 7 9 5
7 2 , 5 9 9 20 ,246
19 .325
6 , 0 3 5 , 175
P.ct. 1-3
P.ct.
o. 7
1- 7
1.8
•3
1-3
4 -3
1. o
2 3
•3
.6
2 . 4
• 7
6-5
2. o
2 . 3
2 .7
3 - 9
2. 7
2 . 8
2 . 3
i - 5
3 -5
1 4 . 4
P.ct. 2. o
2-5
3-3
P. ct. 19. 2
27-3
34- 1
3 1 . 8
47- o
3 5 - 6
26. o
2 7 . 9
22. 6
4 2 . 5
2 3 . 4
20. 4
2 1 . 5
333
40. 7
3 7 - 4
3 7 - 8
5 6 . 3
26. 5
P. ct.
78.8
70. 2
6 2 . 6
6 7 4
4 9 - 6
6 3 . 4
6 6 . 2
6 5 . 8
73- 7
54 -5
72 .5
74-8
70. 2
6 4 . 4
5 6 . 8
5 6 . 8
47-5
4 1 . 8
70. 8
a The cities omitted from this and the following lists made no reports for these classes of banks.
Digitized for FRASER http://fraser.stlouisfed.org/ Federal Reserve Bank of St. Louis
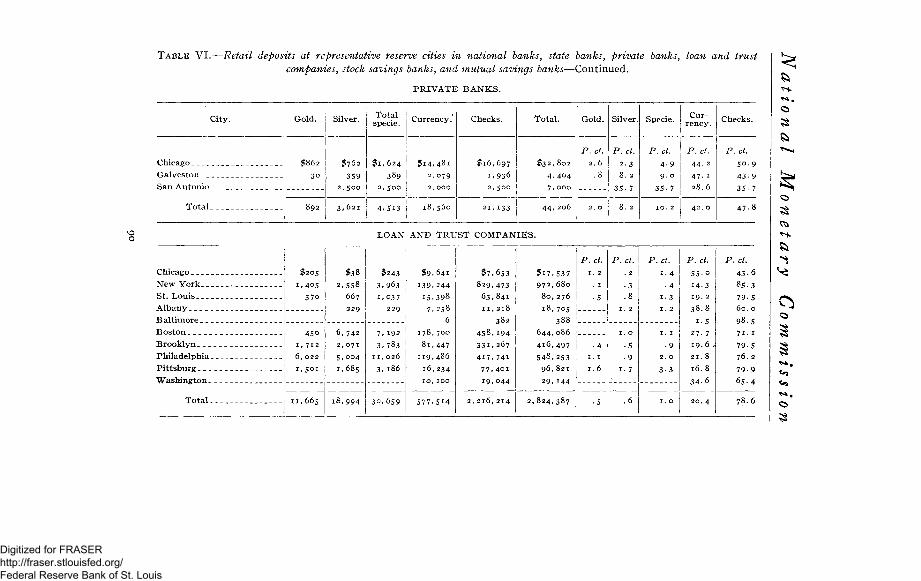
TABLE VI.—Retail deposits at representative reserve cities in national hanks, state hanks, private hanks, loan and trust companies, stock savings banks, and mutual savings hanks—Continued.
PRIVATE BANKS.
City.
Chicago __ Galveston San Antonio _
Total _
Gold.
$ 8 6 2
3 0
8 9 2
Silver.
$ 7 6 2
3 5 9
2 , 5 0 0
3 , 6 2 1
Total specie.
$ 1 , 6 2 4
3 8 9
2 . 5 0 0
4 . 5 1 3
Currency.'
$ 1 4 , 4 8 1
2 . 0 7 9
2 , 0 0 0
1 8 , 5 6 0
Checks.
$ 1 6 , 6 9 7
1 . 9 3 6
2 , 5 0 0
2 1 , 1 3 3
Total.
$ 3 2 , 8 0 2
4 . 4 0 4
7 , 0 0 0
4 4 , 2 0 6
Gold.
P.ct. 2 . 6
.8
2 . 0
Silver.
P.ct. 2 . 3
8 . 2
3 5 - 7
8 . 2
Specie.
P. ct. 4 - 9
9 . 0
3 5 - 7
1 0 . 2
Currency.
P.ct. 4 4 - 2
4 7 - 1
2 8 . 6
4 2 . 0
Checks.
P.ct.
4 3 - 9
3 5 . 7
4 7 . 8
LOAN AND TRUST COMPANIES.
Chicago New York _ St. Louis Albany _ Baltimore Boston_ __ Brooklyn Philadelphia Pittsburg Washington
Total
$ 2 0 5
1 . 4 0 5
37o
4 5 0
1 , 7 1 2
6 , 0 2 2
1 , 5 0 1
1 1 , 6 6 5
$ 3 8
2 . 5 5 8
6 6 7
2 2 9
6 , 7 4 2
2 , 0 7 1
5 . 0 0 4
1 , 6 8 5
1 8 , 9 9 4
$ 2 4 3
3 , 9 6 3
1 , 0 3 7
2 2 9
7 , 1 9 2
3 , 7 8 3
1 1 , 0 2 6
3 . 1 8 6
3 0 , 6 5 9
$ 9 , 6 4 1
1 3 9 . 2 4 4
1 5 , 3 9 8
7 . 2 5 8
6
1 7 8 , 7 0 0
8 1 , 4 4 7
1 1 9 , 4 8 6
1 6 , 2 3 4
1 0 , 1 0 0
5 7 7 , 5 1 4
$7,653 829,473
63.841
11,218
382 458,194
331.267
417.741
77.401
19.044
2,2l6,214
$17.
972,
80,
644,
4l6,
548,
96,
29,
537
680
276
705
388
086
497
253
821
2,824,387
P.ct. 1. 2
1.6
P.ct.
I. O
.5
.9
i-7
P.ct. 1.4
• 4
1-3
1. 2
1. 1
.9
2. o
3-3
P. ct.
55
1 4
1 9
38 1
2 7
1 9
2 1
1 6
3 4
2 0
0
3
2
8
5
7 6 ; 8
8 ! 6
4
Digitized for FRASER http://fraser.stlouisfed.org/ Federal Reserve Bank of St. Louis
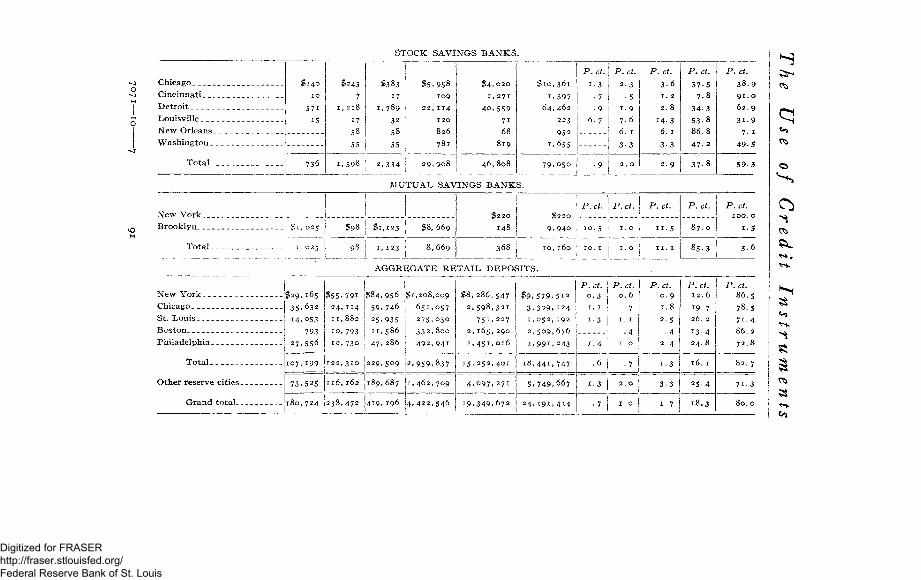
STOCK SAVINGS BANKS.
Chicago
Cincinnati
Detroit
Louisville
New Orleans.
Washington _.
Total _
57i
15
736
$243
7 1,218
17
58
55
$383
17
1,789
32
58
55
1,598 2 , 3 3 4
$5,958
109
2 2 , 1 1 4
120
826
78i
2 9 , 9 0 8
$ 4 , 0 2 0
1, 271
40,559
7i 68
819
46,808
$ 1 0 , 3 6 1
1,397 6 4 , 4 6 2
2 2 3
9 5 2
1,655
7 9 , 0 5 0
P. ct.
i - 3
•7
•9
6 . 7
•9
P.ct.
2 . 3
•5
i - 9
7-6
6. 1
3 - 3
2. 0
P.ct.
3.6
I . 2
2.8
14-3
6. 1
3-3
2 . 9
P. ct,
57
7
34
53
86
47
37-8
P.ct.
38.9
91. o
62. 9
31.9
7- 1
49-5
59-3
j
New York _ _ _
Brooklyn
Total .
$ 1 , 0 2 5
1,025 i
$98
98
MUTUAL SAVINGS BANKS.
$1,123 $8, 669
1,123 i 8, 669
$220
148
368
$220
9 . 9 4 0
1 0 , 1 6 0
P.ct.
1 0 . 5
10. 1
P.ct.
1 . 0
i . o |
P.ct.
1 1 . 5
1 1 . 1
P.ct.
8 7 . 0
85.3
P.ct.
1 . 5
3>6
New York
Chicago
St. Louis
Boston _ __
Philadelphia _
Total __
Other reserve cities
Grand total
$ 2 9 , 1 6 5 3 5 . 6 3 2
14 ,053
793
27 ,556
107 ,199
73,525
180 ,724
$55,791
24 ,114
11 ,882
10 ,793
i 9 , 7 3 o
122 ,310
116 ,162
238 ,472
AGGR]
$ 8 4 , 9 5 6
59 ,746
25 .935
11 ,586
4 7 , 2 8 6
229 ,509
189,687
419 ,196
SGATE RETAIL DEPOSITS.
$1,208,009
651 ,057
275 ,030
3 3 2 , 8 0 0
4 9 2 , 9 4 1
2,959,837
1 , 4 6 2 , 7 0 9
4 , 4 2 2 , 5 4 6
$8,286,547 2 , 5 9 8 , 3 2 1
7 5 i , 2 2 7
2 , 1 6 5 , 2 9 0
1 , 4 5 1 , 0 1 6
1 5 , 2 5 2 , 4 0 1
4 , 0 9 7 , 2 7 1
1 9 , 3 4 9 , 6 7 2
$ 9 , 5 7 9 , 5 1 2
3 , 3 0 9 , 1 2 4
1 ,052 ,192
2 , 5 0 9 , 6 7 6
1 , 9 9 1 , 2 4 3
1 8 , 4 4 1 , 7 4 7
5,749,667
2 4 , 1 9 1 , 4 1 4
P.ct.
0 . 3
1. 1
i - 3
1-4
. 6
. . 3
•7
P.ct. 0 . 6
• 7 1. 1
• 4 1. 0
•7
2. 0
1. 0
P.ct.
0 . 9
1.8
2-5
• 4
2 . 4
1 - 3
3-3
1 - 7
P.ct. 12. 6
19. 7
26. 2
1 3 . 4
2 4 . 8
16. 1
2 5 - 4
1 8 . 3
P.ct. 86.5
78.5
7 1 . 4
86. 2
7 2 . 8
8 2 . 7
7 i . 3
80. 0
Digitized for FRASER http://fraser.stlouisfed.org/ Federal Reserve Bank of St. Louis
National Monetary Commission
Country without reserve cities.—If we take the returns for the rest of the country without these reserve cities, we find that the retail deposits aggregate $36,255,308, of which $24,929,620, or 68.7 per cent, is in checks. We see, therefore, that the percentage of checks in the retail deposits outside of the reserve cities was pretty high.
If we examine the returns of agricultural States we find the same thing true. The following table shows the retail deposits in five States, less the deposits in cities of more than 25,000 in 1902-3, according to Census Bulletin No. 20. The percentage runs from 68.5 in Texas to 78.5 in Nebraska and the average for retail deposits is 72.8. Other States, like North Dakota and South Dakota, in which there are no cities of this size, show a similar state of affairs. This goes to show what bankers in agricultural districts say—that the farmers are using checks very largely. Indeed, there is a great change in this respect since the hard times of 1890-1896. Farmers who then had no surplus now have bank accounts, and there has been a notable increase in deposit banking and therefore in payments by means of checks.
A striking illustration of the large use of checks in an agricultural community was found by the writer in the summer on the Green Bay peninsula in Wisconsin. In reply to questions about the methods of doing business, he was shown some checks of local creameries and was told that of payments aggregating about $65,000, for milk and cream, by one of these in two years, only 2 or 3 per cent was in money and that the receipts showed about the same proportion. The business of the other
92
Digitized for FRASER http://fraser.stlouisfed.org/ Federal Reserve Bank of St. Louis
The Use of Credit Instruments
two creameries was done in the same way. The postmaster, from whom the information was obtained, added that money was so scarce that he was in the habit of "cashing" the warrants of rural carriers with local checks to use the warrants for remittance to the money-order department of the post-office instead of money. The returns of retail deposits of the banks at Sturgeon Bay, the banking center, appear to validate this information. They show 95.9 per cent of checks.
93
Digitized for FRASER http://fraser.stlouisfed.org/ Federal Reserve Bank of St. Louis
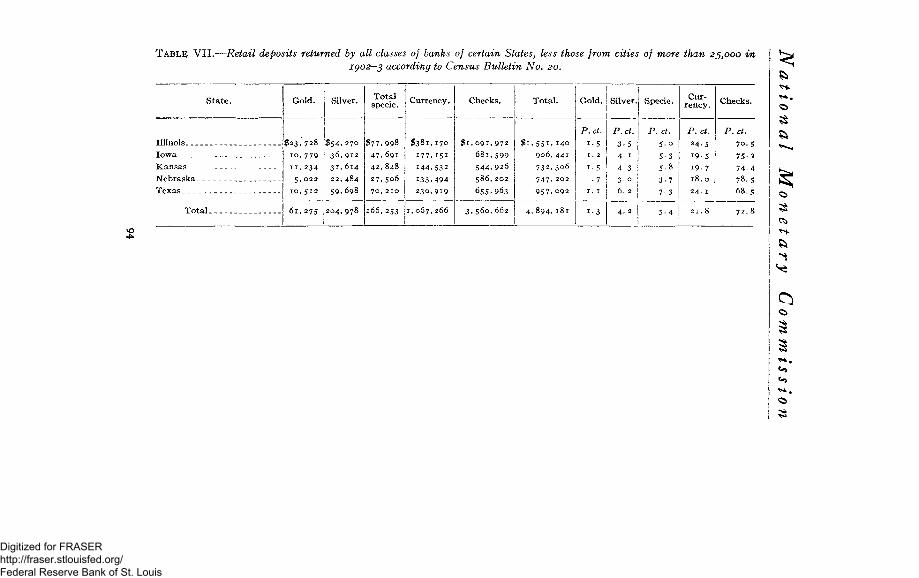
TABLE VII.—Retail deposits returned by all classes of banks of certain States, less those from cities of more than 25,000 in
1902-3 according to Census Bulletin No. 20.
State,
Illinois Iowa __
Kansas
Nebraska
Texas
Total
Gold,
$ 2 3 , 7 2 8
1 0 , 7 7 9
11 , 234 5 ,022
1 0 , 5 1 2
6 1 , 2 7 5
Silver.
$ 5 4 . 2 7 0
3 6 , 9 1 2
3 1 , 6 1 4
22 ,484
59,698
204 ,978
Total specie,
$ 7 7 , 9 9 8
4 7 , 6 9 1
4 2 , 8 4 8
27 ,506
70 ,210
266 ,253
Currency.
$381 ,170
177 ,151
144,532
133.494
230 ,919
1 ,067 ,266
Checks.
$ 1 , 0 9 1 , 9 7 2
6 8 1 , 5 9 9
5 4 4 , 9 2 6
586 ,202
6 5 5 . 9 6 3
3 , 5 6 0 , 6 6 2
Total.
$ 1 , 5 5 1 , 140
9 0 6 , 4 4 1
7 3 2 , 306
747 ,202
9 5 7 , 0 9 2
4, 894, 181
Gold.
P.ct.
i - 5
1. 2
I . 5
Silver.
P.ct.
3 - 5 4. 1
• 7 1. O
I . I
1 - 3
6 . 2
4. 2
Specie.
P.ct.
5.o
5-3
5-8
3 -7
7-3
5 - 4
Currency.
P.ct.
2 4 . 5
1 9 . 5
19. 7
1 8 . 0
24. 1
2 1 . 8
Checks.
P.ct.
7 0 . 5 75. 2
74-4 78.5 68.5
72. 8
0
Digitized for FRASER http://fraser.stlouisfed.org/ Federal Reserve Bank of St. Louis
The Use of Credit Instruments
RETURNS FROM INDUSTRIAL CENTERS.
It has been remarked that the wage-earners, especially manual laborers, probably use checks to a very small extent. If we examine the returns from industrial cities like Lawrence, Fall River, Lowell, and Brockton, Mass.; Paterson, N. J.; and Pawtucket, R. I., we find that the proportion of checks in retail deposits in those places is well up with the average of the general tables. Taking the returns from the national banks alone, Lawrence shows a percentage of 63 in total deposits of $72,198; Fall River 80.7 per cent of checks in deposits of $110,589; Lowell 69 per cent in deposits of $79,567; Brockton shows 46.4 per cent of checks in a total of $26,407; Paterson shows 52.6 per cent in a total of $78,373.
These percentages are high for cities where the number of wage-earners is so large. We must remember, however, that it is the proportion of purchases thus paid for that we are considering, and not the number of people who purchase. Again, each place is the center of a large district and the deposits of the merchants represent thousands of dollars of sales to people outside of the cities proper. Moreover, one fact brought out by the returns may be significant of the use of checks by wage-earners themselves. The mutual savings banks are commonly regarded as the banks of the poor man, particularly the wage-earner. But the mutual savings banks in Lawrence show 41.9 per cent of their total receipts, on the day in question, in checks. Those of Lowell had 44 per cent in checks. But these high percentages are due in each case to the high ratio in one bank. On the other hand, of the deposits in the
95
Digitized for FRASER http://fraser.stlouisfed.org/ Federal Reserve Bank of St. Louis
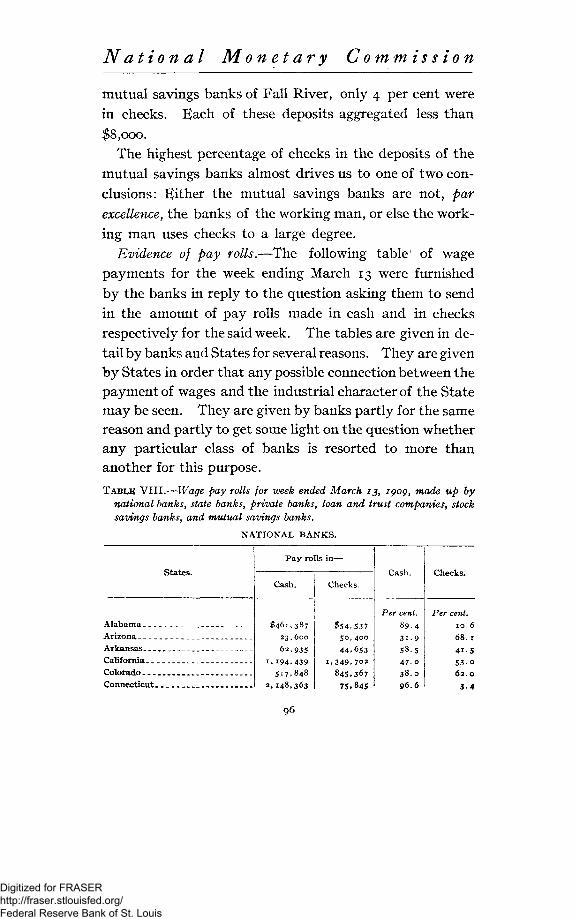
National Monetary Commission
mutual savings banks of Fall River, only 4 per cent were in checks. Each of these deposits aggregated less than $8,000.
The highest percentage of checks in the deposits of the mutual savings banks almost drives us to one of two conclusions: Either the mutual savings banks are not, par excellence, the banks of the working man, or else the working man uses checks to a large degree.
Evidence of pay rolls.—The following table' of wage payments for the week ending March 13 were furnished by the banks in reply to the question asking them to send in the amount of pay rolls made in cash and in checks respectively for the said week. The tables are given in detail by banks and States for several reasons. They are given by States in order that any possible connection between the payment of wages and the industrial character of the State may be seen. They are given by banks partly for the same reason and partly to get some light on the question whether any particular class of banks is resorted to more than another for this purpose. TABLE VIII.—Wage pay rolls for week ended March 13, 1909, made up by
national banks, state banks, private banks, loan and trust companies, stock
savings banks, and mutual savings banks.
NATIONAL BANKS.
States.
Alabama Arizona Arkansas California Colorado Connecticut
Pay rolls in—
Cash.
$461,387 23,600 62,935
i , i94 .439 517.848
3,148,363
Checks.
$54,537 50,400 44.653
L349.702 845.367
75.845
Cash.
Per cent. 89.4 3 i -9 58.5 47.o 38.0 96.6
Checks.
Per cent.
6 8 . 1
4 1 5 5 3 0
3 . 4
96
Digitized for FRASER http://fraser.stlouisfed.org/ Federal Reserve Bank of St. Louis
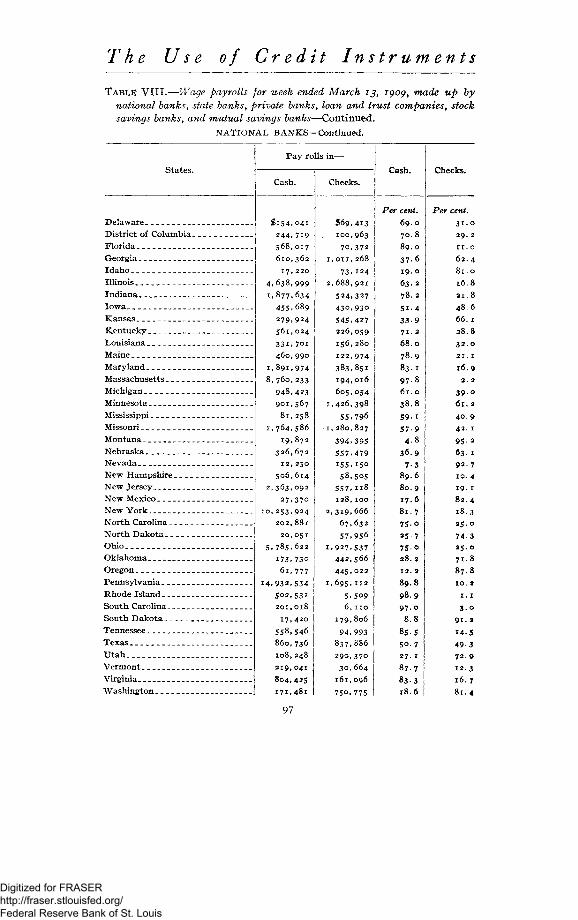
The Use of Credit Instruments
TABLE VIII.—Wage payrolls for week ended March 13, 1909, made up by
national hanks, state hanks, private banks, loan and trust companies, stock
savings banks, and mutual savings banks—Continued.
NATIONAL BANKS—Continued.
States.
Pay rolls in-
Cash. Checks. Cash.
Delaware District of Columbia Florida Georgia -Idaho Illinois Indiana Iowa Kansas Kentucky Louisiana Maine Maryland Massachusetts Michigan Minnesota Mississippi Missouri Montana Nebraska Nevada New Hampshire New Jersey New Mexico New York North Carolina North Dakota Ohio _ Oklahoma Oregon Pennsylvania Rhode Island South Carolina South Dakota Tennessee Texas U t a h . . _ Vermont. Virginia Washington
$ 1 5 4 , 0 4 1
244 ,719
568 ,017
610,362
17 ,220
I, 638 . 999
[ ,877.634 4 5 5 . 6 8 9
2 7 9 , 9 2 4
5 6 1 , 0 2 4
3 3 L 7 0 I
4 6 0 , 9 9 0
[ , 891 ,974 $,760, 233
9 4 8 , 4 2 3 901 ,567
8 1 , 2 5 8
.764.586
19 ,872
3 2 6 , 6 7 2
12 ,250
5 0 6 , 6 1 4
! , 3 6 3 . 0 9 2
27 .370
» ,253 ,924
2 0 2 , 8 8 l
20,O51
; , 7 8 5 , 6 2 2
173 .73o
6 i , 7 7 7
\. 932, 534
502,531
201,018
17,420
558.546
860,736
108,248
219,041
804,425
171,481
$ 6 9 , 4 1 3 100 ,963
70 ,372
, o n , 268
7 3 . 1 2 4
, 6 8 8 , 9 2 1
524 ,327
4 3 0 . 9 3 0
545 .427
226 ,059
156 ,280
122 ,974
3 8 3 . 8 5 1
194 ,016
6 0 5 , 0 5 4
, 4 2 6 , 3 9 8
55.796 , 2 8 0 , 8 2 7
3 9 4 , 3 9 5
5 5 7 , 4 7 9
155 .150
5 8 , 5 0 5
5 5 7 . H 8
128 ,100
, 3 1 9 , 6 6 6
67.632
5 7 . 9 5 6
. 9 2 7 . 5 3 7
442.566 445 .022
, 6 9 5 , 1 1 2
5 . 5 0 9 6, n o
179 ,806
9 4 , 9 9 3 8 3 7 . 8 8 6
290 ,370
30,664 161 ,096
750 ,775
Per cent. 6 9 . 0
7 0 . 8
8 9 . 0
3 7 - 6
1 9 . 0
6 3 . 2
7 8 . 2
5 i - 4
3 3 - 9
7 1 . 2
6 8 . 0
7 8 . 9
8 3 . 1
9 7 - 8
6 1 . o
3 8 . 8
5 9 - i
5 7 - 9
4 - 8
3 6 . 9
7 3
8 9 . 6
8 0 . 9
1 7 . 6
8 1 . 7
7 5 . o
2 5 - 7
7 5 - 0
2 8 . 2
12. 2
8 9 . 8
9 8 . 9
9 7 . o
8 . 8
85-5
5 0 . 7
2 7 . 1
8 7 . 7
8 3 . 3
1 8 . 6
97
Digitized for FRASER http://fraser.stlouisfed.org/ Federal Reserve Bank of St. Louis
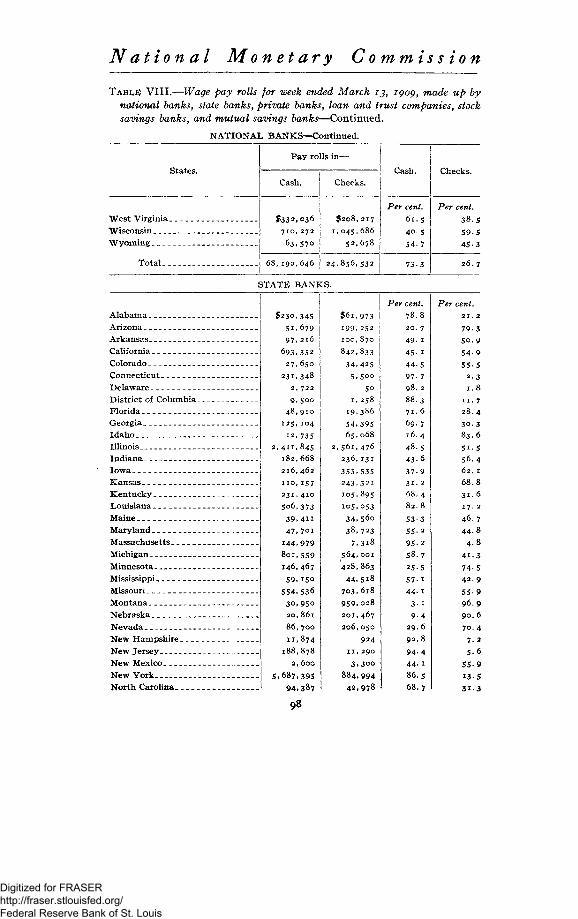
National Monetary Commission
TABLE VIII.—Wage pay rolls for week ended March 13, 1909, made up by national banks, state banks, private banks, loan and trust companies, stock savings banks, and mutual savings banks—Continued.
NATIONAL BANKS—Continued.
States.
West Virginia Wisconsin Wyoming _
Total _
Pay rolls in—
Cash.
$332,036 7 1 0 , 2 7 2
63,570
68,192,646
Checks.
$ 2 0 8 , 2 1 7
1,045,686 52,678
24.856,532
Cash.
Per cent.
61.5 40.5 54-7
73.3
Checks.
Per cent.
38. s 59-5 45-3
26. 7
STATE BANKS.
Alabama Arizona Arkansas California Colorado Connecticut Delaware District of Columbia. Florida Georgia __ _ Idaho Illinois Indiana Iowa Kansas Kentucky Louisiana Maine Maryland -Massachusetts. Michigan _ Minnesota Mississippi Missouri __ __ Montana Nebraska Nevada New Hampshire New Jersey New Mexico New York North Carolina
$230,345 51.679 97,216
693.352 27,650
231.348 2, 722 9,500
48,910 125,104
12,735 2,411.845
182,668 216,462 n o , 157 231,410 506,373 39,411 47.70I
144,979 8oi,559 146,467 59,i5o
554.536 30,950 20,861
86,700
11,874 188,878
2, 600
5.687.395 94.387
98
$6i,973 199,252 100,870
842,833 34,425
5,5oo
50 1.258
19,386
54,395 65,068
,561,476 236, 131
355,535 243.321 105,895 105,053 34,56o
38,723 7.3i8
564,001 '428,863
44,5i8 703,618 959.028
201,467 206,050
924 11,290 3.300
884.994 42.978
Per cent. 78.8 20. 7 49- 1 45-1 44-5 97-7 98.2 88.3
6 7i 69 16 48 43 37 31- 2 68.4 82.8 53-3 55-2 95- 2 58.7 25-5 57-1 44- 1
3- 1 9-4
29. 6 92.8 9 4 4 44. 1 86.5 68.7
Digitized for FRASER http://fraser.stlouisfed.org/ Federal Reserve Bank of St. Louis
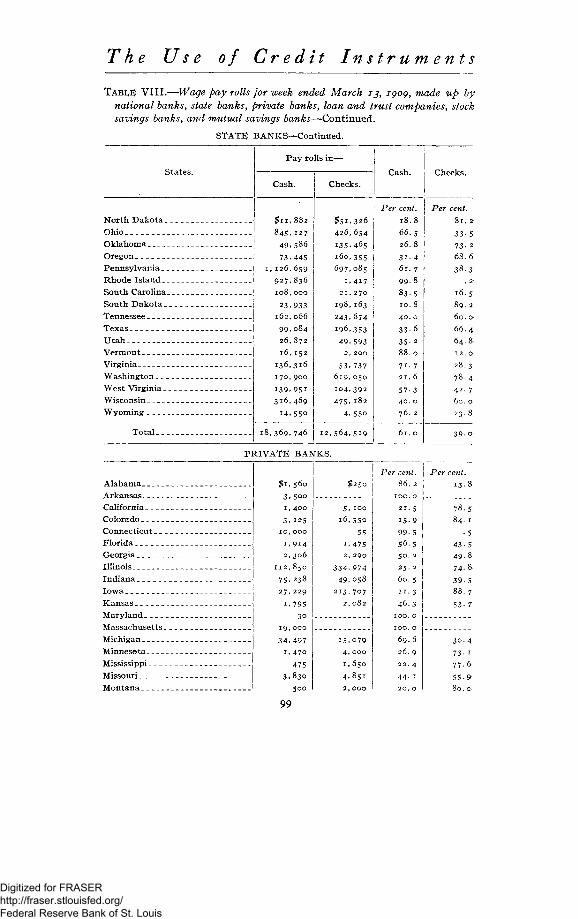
The Use of Credit Instruments
TABI^E VIII.—Wage pay rolls for week ended March 13, 1000, made up by
national banks, state banks, private banks, loan and trust companies, stock
savings banks, and mutual savings banks—Continued.
STATE BANKS—Continued.
States.
North Dakota . . Ohio Oklahoma Oregon Pennsylvania _ _ Rhode I s land . . South Carolina. South Dakota . _ Tennessee Texas Utah Vermont Virginia Washington West Virginia __ Wisconsin Wyoming
Total .
Pay rolls in—
Cash.
$11,882 84s.127
49,586
73,445 ,126,659 927,836 108 ,000
23 ,933
162 ,066
9 9 , 0 8 4
26,872
16 ,152
136 ,316
170 ,900
139 ,951 316,469
i4,55o
18,369, 746
Checks. Cash.
$51,326
426,654
135.465
160,355
697,085
1,417
21,270
198,163
243,674
196,353
49,593 2, 200
53,737 619 ,050
104 ,392
475 ,182
4,55o
12 ,564 , 519
Per cent. 18.8 66.5 26.8 3 i -4 61. 7 99-8 83-5 10.8 40. o 3 3 - 6
3 5 - 2
8 8 . 0
7 1 . 7
2 1 . 6
57-3 40. o 76. 2
61. o
Checks.
Per cent. 8 1 . 2
3 3 - 5
73 • 2
68.6 3^-3
. 2
16.5 89.2 60. o 66.4 64.8 1 2 . 0
28.3 78.4 42. 7 60. o 2 3 . 8
39.0^
PRIVATE BANKS.
Alabama Arkansas California Colorado Connecticut Florida Georgia Illinois Indiana Iowa Kansas Maryland Massachusetts _ Michigan Minnesota Mississippi Missouri Montana
$ 1 , 5 6 0
3 . 5 0 0
1, 400
3 , 125
10 ,000
1,914
2, 306
112 ,850
75 .238
27 ,229
1, 795 30
19 ,000
3 4 , 4 9 7 1,470
475 3.830
500
99
$250
5 .100
16 ,550
55
1,475 2, 290
3 3 4 , 9 7 4 4 9 , 0 5 8
213 ,707 2 , 0 8 2
15 ,079 4, 000
1,650
4,851
2, OOO
Per cent. 86.2
100. o 21.5 15.9 99-5 56.5 50. 2
25. 2
60. 5
H - 3
46.3 100. o 100. o 69.6 26. 9
2 2 . 4
44. 1
20. o
Per cent,
13
3 0 . 4
73- 1
77-6-55-9' 80. a
Digitized for FRASER http://fraser.stlouisfed.org/ Federal Reserve Bank of St. Louis
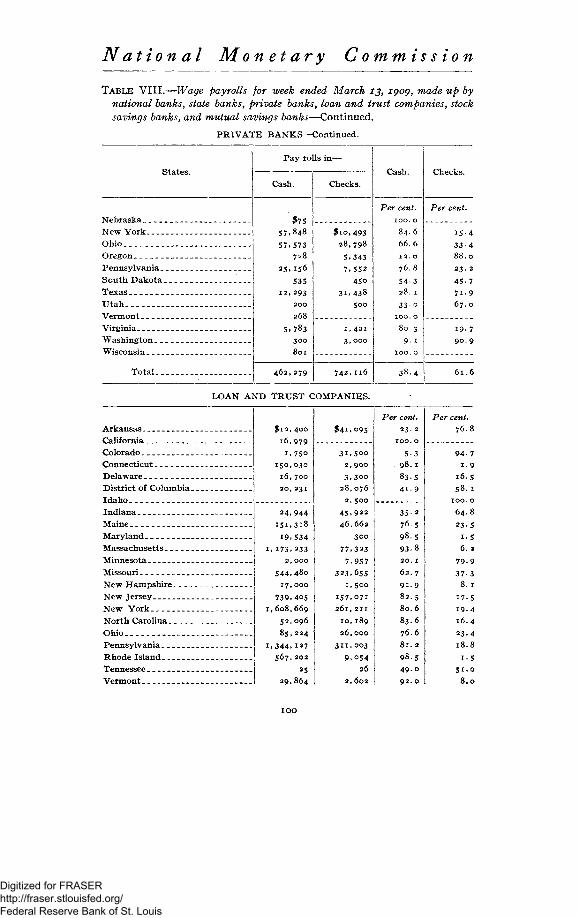
National Monetary Commission
TABLE VIII.—Wage payrolls for week ended March J J , 1909, made up by
national banks, state banks, private banks, loan and trust companies, stock
savings banks, and mutual savings banks—Continued.
PRIVATE BANKS—Continued.
States.
New York Ohio Oregon Pennsylvania South Dakota Texas Utah
V i r g i n i a , J.
Washington Wisconsin
Total
Pay rolls in—
Cash.
$ 7 5
5 7 . 8 4 8
5 7 . 5 7 3
7 2 8
2 5 . 1 5 6
5 3 5
1 2 , 2 9 3
2 0 0
2 6 8
5 . 7 8 3
3 0 0
8 0 1
4 6 2 , 2 7 9
Checks.
$ i o , 4 9 3
2 8 , 7 9 8
5 . 3 4 3
7 . 5 5 2
45©
3 L 4 3 8
5 0 0
1 , 4 2 1
3 . 0 0 0
7 4 2 , 1 1 6
Cash.
Per cent. 1 0 0 . 0
8 4 . 6
6 6 . 6
1 2 . 0
7 6 . 8
5 4 - 3
2 8 . 1
3 3 0
1 0 0 . 0
8 0 . 3
9- 1
1 0 0 . 0
3 8 . 4
Checks.
Per cent.
1 5 - 4
3 3 . 4
8 8 . 0
2 3 . 2
4 5 - 7
7 1 . 9
6 7 . 0
1 9 . 7
9 0 . 9
6 1 . 6
LOAN AND TRUST COMPANIES.
Arkansas California Colorado __ Connecticut Delaware District of Columbia. Idaho Indiana Maine Maryland __. Massachusetts Minnesota Missouri New Hampshire New Jersey New York North Carolina O h i o . . Pennsylvania Rhode Island Tennessee Vermont
$ 1 2 , 4 0 O
1 6 , 9 7 9
I . 7 5 0
1 5 0 . 0 3 0
l 6 , 7 0 0
2 0 , 2 3 1
2 4 , 9 4 4
1 5 1 . 3 l 8
1 9 , 5 3 4
1 7 3 , 2 3 3
2 , OOO
5 4 4 , 4 8 0
1 7 , 0 0 0
7 3 9 , 4 0 5
6 0 8 , 6 6 9
5 2 , 0 9 6
8 5 , 2 2 4
3 4 4 . 1 2 7
5 6 7 , 2 0 2
25
2 9 , 8 6 4
$ 4 1 , 0 9 5
3 L 5 0 0
2 , 9 0 0
3 . 3 0 0
2 8 , O 7 6
2 , 5 0 0
4 5 . 9 2 2
4 6 , 6 6 2
3 0 0
7 7 . 3 2 3
7 , 9 5 7
3 2 3 . 6 5 5
1 , 5 0 0
1 5 7 , 0 7 1
2 6 1 , 2 1 1
1 0 , 1 8 9
2 6 , 0 0 0
3 1 1 . 0 0 3
9 . 0 5 4
2 6
2 , 6 0 2
Per cent. 2 3 . 2
5 - 3
9 8 . 1
8 3 . 5
4 1 . 9
3 5 - 2
7 6 . 5
9 8 . 5
9 3 - 8
2 0 . 1
6 2 . 7
9 1 . 9
8 2 . s
8 0 . 6
83.6 76.6 8 1 . 2
9 8 . 5
4 9 0
9 2 . 0
Per cent.
7 6 . 8
9 4 - 7
1 - 9
1 6 . 5
5 8 . 1
6 4 . 8
2 3 5
1 - 5
6 . 2
7 9 - 9
3 7 - 3
8 . 1
1 7 . 5
1 9 . 4
1 6 . 4
2 3 . 4
1 8 . 8
i - 5
5 1 . 0
8 . 0
Digitized for FRASER http://fraser.stlouisfed.org/ Federal Reserve Bank of St. Louis
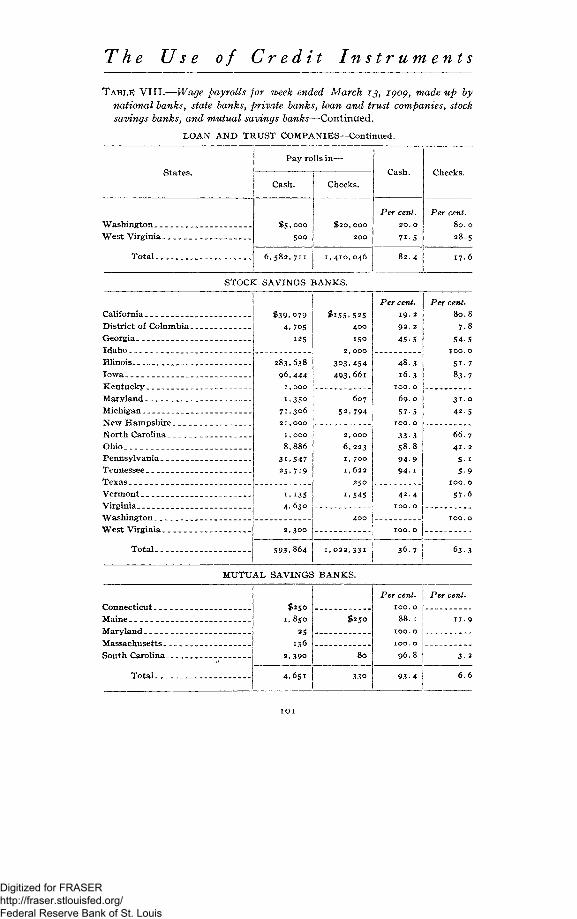
The Use of Credit Instruments
T A B L E VIII.—Wage payrolls for week ended March 13, 1900, made up by
national banks, state banks, private banks, loan and trust companies, stock
savings banks, and mutual savings banks—Continued.
LOAN AND TRUST COMPANIES—Continued.
States.
Washington West Virginia
Total
Pay rolls in—
Cash.
$ 5 , 0 0 0
500
6 , 5 8 2 , 7 1 1
Checks.
$ 2 0 , 0 0 0
200
1 , 4 1 0 , 0 4 6
Cash.
Per cent.
20. 0
7 i - 5
8 2 . 4
Checks.
Per cent. 8 0 . 0
28 .5
17. 6
STOCK SAVINGS BANKS.
California District of Columbia _ Georgia. _ Idaho Illinois Iowa Kentucky Maryland- _ _ Michigan New Hampshire North Carolina Ohio Pennsylvania Tennessee Texas Vermont Virginia Washington West Virginia
Tota l .
$39,079 4,705
125
283,638 96,444
i , 000
I.3SO
7L3o6 21,OOO
I , OOO
8,886
31.547
25,719
1.135 4 , 6 3 0
593.864
8»i55.525 400
150
2 ,000
303,454 493,66i
607
52, 794
Per cent. 19. 2
92 . 2
45-5
2 , OOO
6,223 I, 700 I, 622
250
1.545
48.3 16.3
100. o
69. o 57-5
100. o
33-3 58.8 9 4 9
9 4 . 1
4 2 . 4 100. o
36.7
Per cent. 80.8
7.8 54.5
100. o
5i-7 83.7
3 1 0
4 2 . 5
66.7 41 . 2
5- 1 5-9
100. o
57-6
63.3
MUTUAL SAVINGS BANKS.
South Carolina r
Total
a
$250 I.85O
25 136
2 ,390
4 .651
$250
8 0
3 3 0
Per cent. 100. 0
8 8 . 1
100. 0
100. 0
9 6 . 8
9 3 - 4
Per cent.
n . 9
3 . 2
6.6
Digitized for FRASER http://fraser.stlouisfed.org/ Federal Reserve Bank of St. Louis
National Monetary Commission
It will be seen from the tables of the returns of 4,306 national banks which furnished this information, that pay rolls amounting to $68,192,646 were made up in cash and $24,856,532 in checks. The percentages are 73.3 and 26.7, respectively. The largest percentage of checks, 95.2, was in Montana, and it will be noticed that the percentages run highest in the States of Arizona, Colorado, Idaho, Kansas, Minnesota, Montana, Nevada, New Mexico, North Dakota, Oklahoma, Oregon, South Dakota, Utah, and Washington. These are, in general, agricultural States. The industrial States of Connecticut, Massachusetts, New Jersey, Pennsylvania, and Rhode Island show a very small proportion of wage payments by checks. South Carolina seems peculiar in having only 3 per cent in checks, as against Georgia with 62.4 and North Carolina with 25.
The returns of the state banks show pay rolls aggregating $18,369,746 in cash and $12,564,519 in checks, the former being 61 per cent and the latter 39 per cent. The amount paid in checks through the state banks is half that shown by the national banks, while the amount paid in cash is about one-fourth. In the state bank returns the check percentages run highest in Arizona, Idaho, Iowa, Kansas, Minnesota, Montana, Nebraska, Nevada, North Dakota, Oklahoma, Oregon, South Dakota, Texas, and Washington. Again we see the agricultural States to the front. The lowest percentages are shown by the industrial States, as in the preceding group—Connecticut, Delaware, Massachusetts, New Hampshire, New Jersey, and Rhode Island. The last-named State shows only 0.2
1 0 2
Digitized for FRASER http://fraser.stlouisfed.org/ Federal Reserve Bank of St. Louis
The Use of Credit Instruments
per cent of its pay rolls in checks; New Hampshire has 7.2 per cent, and the other States classed here as industrial come in between.
Turning to the pay rolls made by the private banks, the aggregate is small, being little over $1,000,000. Of the whole amount, however, 61.6 per cent was in checks. The highest percentages are in California, Colorado, Illinois, Iowa, Minnesota, Mississippi, Montana, Oregon, Texas, and Washington. We find the agricultural States again with the largest percentages.
Similar figures for the loan and trust companies show that of the aggregate of about $8,000,000 in pay rolls 17.6 per cent was in checks. The highest percentage was in Colorado, if we ignore the returns of one bank in Idaho, all paid by checks. Minnesota shows about 80 per cent and Washington also has 80.
Similar figures for the stock savings banks show $1,500,000 in pay rolls, with Idaho, Texas, and Washington showing three small pay rolls all in checks, while Kentucky, New Hampshire, Virginia, and West Virginia show four altogether in cash. The returns of the mutual savings banks are trifling.
We have, then, an aggregate of pay rolls for the week ending March 13 of $134,811,771, of which 30 per cent was in checks and 70 per cent in cash. It should be said that some of these pay rolls were not actually made up. In many places wages are paid monthly, and in a good many such instances the banks stated that fact and returned one-fourth of the month's pay roll, indicating, however, how it was made up.
103
Digitized for FRASER http://fraser.stlouisfed.org/ Federal Reserve Bank of St. Louis
National Monetary Commission
Of course there is no way of knowing how many people are represented in this wage payment, for doubtless salaries of officers are included as well as wages. The figures show, however, that a large number of the wage-earners of the country are accustomed to receive payment by check, and that this custom predominates in agricultural rather than in industrial sections of the country. This is in keeping with the showing made by all the other tables that the proportion, of checks in country payments is high. The showing made by the table is evidence of the fact that large numbers of wage-earners at any rate receive checks, whether they draw them or not. If they receive them, they must cash them. In some cases, unquestionably, the pay check will be deposited to the account of the recipient and he will draw his own checks. In the large majority of cases, however, the probability is that these checks are turned into the stores or cashed at the banks. There is some reason to think that in some places they are largely cashed in saloons. Nevertheless, they swell the volume of business done by checks to the extent to which they are used in paying bills, and to the degree that they promote the use of bank accounts and checks by the wage-earners themselves. There is no way of making any allowance for these items.
The common belief is that wage-earners do not use checks in making payments to any extent worth mentioning. This is probably true if by wage-earners is meant the manual laborers. People in clerical positions, with no larger income than many manual laborers, are users of checks to a degree as large proportionally
104
Digitized for FRASER http://fraser.stlouisfed.org/ Federal Reserve Bank of St. Louis
The Use of Credit Instruments
as wealthy people. The manual laborer is in another class in this respect. He is usually paid by the week, or, at any rate, by the month. Some States, indeed, now require weekly payments. In so far as they do the amount which each person receives is smaller than if the wage period were longer. The wages received, therefore, are usually too small to be the basis of a bank account. The banks, it is urged, do not want such accounts. This statement, however, must be taken with many grains of allowance, especially in the smaller places. Many banks in small places are glad to get all accounts, however small.
We must remember that the volume of expenditures of wage-earners, in the sense of manual laborers, is, after all, not so large a proportion of the total expenditure of the country as would drag down the percentage of business done by checks to a very great extent.
Moreover, the use of pay checks makes a contribution of some amount, even from the wage-earning class, to the percentage of checks in doing business. If 30,000,000 individual wage-earners had spent $1 a day in addition to the amount of our retail bank returns, and had spent it all in money, the total retail deposits would have been $90,000,000, approximately the sum obtained after allowance for returns of nonreporting banks. With the amount of checks deposited remaining as in the tables, the checks would still be 50 per cent of the payments.
Returns from merchants.—When the investigation of the deposits of retail tradesmen was under way in 1894,
105
Digitized for FRASER http://fraser.stlouisfed.org/ Federal Reserve Bank of St. Louis
National Monetary Commission
the writer requested friends in different parts of the country to secure for him some information directly from merchants in retail trade concerning the proportion of their receipts in checks from day to day. The information was meager, and it came too late to be of use to the Comptroller in 1894. It was included, however, in the report of 1896 and will be found there in detail. The information thus received has been made the basis of some criticism of the report of 1896 and used as evidence that a large proportion of the people pay their retail purchases with checks, despite the showing of the bank deposits. For that reason it seems worth while to discuss the value of the evidence received at that time and to add a little more to it now. In the criticism based on this information emphasis has been put on the returns which were lowest and but little attention paid to those which tallied fairly with the general percentage shown in the bank reports; and so far as the writer knows no attempt has ever been made by the critics to reconcile differences or to give a reasonable explanation for assuming that the lowest returns were the proper ones to choose as typical.
The first place mentioned in the discussion of 1896 from which this kind of evidence was secured was New Brunswick, N. J. Of four stores there from which reports were received, three, whose patronage was general, received a trifle over 51 per cent in checks in payment of a total trade of somewhat over $10,000. A fourth grocery store there received 1.6 per cent, but its trade for the whole month was less than $1,000—that
106
Digitized for FRASER http://fraser.stlouisfed.org/ Federal Reserve Bank of St. Louis
The Use of Credit Instruments
is, less than one-tenth of the trade of the other three. But the important matter is not the proportion of purchasers who pay by check, but the proportion of the volume of purchases paid for by check. The average percentage of the four groceries, however, is 47.5, which is almost exactly the figure of the bank returns for the city of New Brunswick in 1896. Two grocers and two fuel dealers in Lewiston, Me., received during the month of September, 1894, I O P e r c e n t a n ( i 25-4 P e r cent, respectively. There is reason to think that the average of these, 17 per cent, was low.
Undue emphasis has been placed on certain returns from Iowa City, Iowa. The returns were for the trade of one day, a Saturday, November 24, and showed that the percentage of checks received " varied from 2 in the case of grocers to 30 in the case of furniture dealers, butchers, and dealers in flour and feed." The returns are given in detail in the report of 1896. To one who is familiar with the trading customs of the Middle West there is nothing at all surprising in this showing, and it does not invalidate so fully as some critics have thought the average proportion of checks in the retail bank returns of Iowa City at that time, which was 74 per cent. Saturday is the day when the smaller purchasers do their trading. The larger purchasers avoid the rush of Saturday trade in cities of this kind and buy in the quiet days of the week. No attention has been paid, however, in criticisms of these Iowa City returns to the percentage of checks shown in the running accounts. Attention has been called to the cash sales only. The running
7071—10 8 107
Digitized for FRASER http://fraser.stlouisfed.org/ Federal Reserve Bank of St. Louis
National Monetary Commission
accounts of the returns received directly from merchants and which we are discussing show 33 per cent of checks in Iowa City, 44 in Davenport, 31 in Winterset, while the percentage of checks in the cash sales were 8.7 and 7, respectively. But the running accounts outweigh the cash sales of the day many times. Therefore even the lowest showing for the proportion of checks in payments to merchants in these places at this time would be much larger than the 14 of which so much may be made if one is trying to prove a point rather than to describe the situation or find conclusions based on all the facts.
The table giving the returns from Iowa City and the other two places mentioned was inserted by the writer in his report just as it was received. It will be seen from an inspection of that table, as given in the Comptroller's report for 1896, that the cash and running accounts together show the average of 14 per cent in checks. The writer has always questioned whether in making this average the cash sales and the running accounts were properly weighted according to their volumes.
Similar remarks will apply to Lawrence, Kans. The percentage shown by the direct replies of merchants in 1894 was low. As a matter of fact, however, it is probably demonstrable that as Lawrence, Kans., is a university town, it is one in which the habit of paying by check is well developed.
The direct data of 1894 w e r e supplemented in 1896 with information representing the accounts of about 40 retail traders for a month each. The figures were in substantial harmony with the general returns of the banks.
108
Digitized for FRASER http://fraser.stlouisfed.org/ Federal Reserve Bank of St. Louis
The Use of Credit Instruments
A large number of returns direct from merchants of the character of their receipts from day to day for a week or a month would be very valuable in such an inquiry. However, the writer doubts whether they would change the general conclusion as to the proportion of checks used in retail trades if proper allowance is made for errors in the bank returns, as was done in 1896. It would not seem worth while, therefore, in the present investigation to go extensively into this phase of the matter, especially when the labor entailed in the analysis of the 12,000 bank reports was as much as could be undertaken in the limited time at the writer's disposal before the report had to be made. A few test cases, however, have again been sought and are here listed. All these cases are in Illinois, although not in the same place.
Returns from merchants.—Case 1: A retail furniture store on one day took in $634, of which $10 was in money; the rest was in checks. On another day it took in $265, of which only $10 was in money. The average receipts of this store from month to month show not much more than 10 per cent in money. It is situated in a city of a little less than 25,000. Like all stores in such places in this part of the country, it has a large farmers' trade.
Case 2: A retail butcher reports to the writer $105 in money in a total of $540.
Case 3: One of the largest retail stores in the city of Chicago reports for the month of June, 52.9 per cent of its receipts in checks. This is one of the stores which are thronged every Saturday by purchasers of all classes.
1 0 9
Digitized for FRASER http://fraser.stlouisfed.org/ Federal Reserve Bank of St. Louis
National Monetary Commission
Case 4: A confectioner; the writer supposed that here would be a kind of business in which checks would probably not appear at all. The proprietor told him that from 5 to 10 per cent of his cash sales a daily were paid for in checks and that about 50 per cent of his "charged" sales were paid for with checks. The "charged" sales were three-fourths of the total sales for the month, so that the proportion of checks in his total month's receipts would run about 40 per cent.
Case 5: A retail baker; here again the writer was of the opinion, a priori, that there would be few checks in the month's receipts. As he stood and watched people buying " a 5-cent loaf, " " 10 cents' worth of cookies," " half a dozen rolls," for half an hour at a time on several occasions, before he put the question to the proprietor, his belief was strengthened. To his surprise, the proprietor of the bakery told him that while none of his cash sales were paid for by check, 80 per cent of his "charged" sales were so paid for and that they amounted to about 50 per cent of his business. This would give approximately 40 per cent, in his case, of checks in his total payments.
Case 6: The writer then went into a barber shop thinking that here he certainly would find the place where checks were unknown. However, as he entered the door the first thing in sight was a large array of the shaving mugs of customers. The proprietor said that he received about 15 per cent of his month's receipts in checks.
Case 7: This was for one of the largest retail general stores in the city of Chicago, in which one can buy anything
flA" cash sale" is a sale paid for at the time of purchase, whether the payment be made with check or money.
n o
Digitized for FRASER http://fraser.stlouisfed.org/ Federal Reserve Bank of St. Louis
The Use of Credit Instruments
from a case of pins to a piano or a diamond. Its patronage is drawn mainly from the middle class of wage-earners. It reports: "We figure about 15 per cent of payments for retail purchases are paid by checks." In this case no statement of the volume of business was given, nor of the length of time for which the statement is made.
Case 8: " Notion store " in a small city. In this store, of a total of $3,750 received in a certain period of time, 1 ]/2 per cent was in checks. This is one of the stores sometimes called in different parts of the country "five and ten cent stores."
Case 9: A grocer in the same city with the furniture store first mentioned. This store is known as a strictly first-class grocery store, and professes to sell "no cheap goods," in the sense of poor goods. Its reputation is of the best. The proprietor told the writer that on an average, month in and month out, probably more than 60 per cent of his receipts were in checks. Of course there are days when no checks come in for cash sales. There are other days when they are received pretty heavily. On the Friday on which the writer happened to call on the proprietor there were no checks in the cash sales, but 70 per cent of the sales were charged, and of these 85 per cent, he said, are usually paid in checks. So that his average of probably more than 60 per cent was sustained by these figures.
Case 10: A druggist; the drug business, again, is one which a person would expect the money payments to predominate. The writer called on three druggists. One gave the actual figures of his business for a certain period
i n
Digitized for FRASER http://fraser.stlouisfed.org/ Federal Reserve Bank of St. Louis
National Monetary Commission
and was able to tell what percentage of this was received in the form of credit paper, since he, like some other business men, keeps track of every check he receives. It appeared that 62 and a fraction per cent of his receipts for a year were in checks.
Case 11: Another druggist ° whose store is of the same general character, reported a very small percentage of checks in his receipts—not more than 10, he thought. This was his ' 'best guess.''
Case 12: The third druggist reported as his "best guess " a figure between the two others, about 25 per cent.
Case 13: Another large store in Chicago doing a business of many millions a year, and catering in the main to the middle class of people. Their checks and money orders for the month of May were 17.7 per cent of their receipts and in June 15.1 per cent.
Case 14: It was urged on the writer by some disputants that the street car companies and the steam railroads would certainly show a very small percentage of checks in their receipts. Of course this is true because of their regulations against receiving checks and because the fare is such, especially on the street car, as to preclude the use of checks. However, the writer decided to test the matter and secured figures from a station agent on an important railroad in one of the smaller towns. Of course his statement showed at once that while the passenger receipts were practically all cash, the receipts for freight payments showed a large percentage of checks. Checks are not
a It should be said that although called drug stores, these stores, in addition to their drug business, sell a miscellaneous assortment of articles, since they are located in a country town.
1 1 2
Digitized for FRASER http://fraser.stlouisfed.org/ Federal Reserve Bank of St. Louis
The Use of Credit Instruments
received at the passenger offices except as a matter of accommodation to well-known patrons. Perhaps not more than 5 per cent of the passenger receipts at this station are in checks, and they are taken, as has been noted, as a matter of accommodation. This practice, however, is much more general than one might at first think. The total receipts and the percentage of receipts in cash at this station on freight account were obtained for each of five days and showed 80.2, 95.3, 94.9, 89.1, 96.1, and 92.1, respectively, of checks.
Case 15: A retail clothier reports that of the amount of his cash sales about 35 per cent is paid with checks and of his "charged" sales about 90 per cent. His "charged" sales are about three-fourths of his total sales. This would make the proportion of checks in his total sales probably a little over 75 per cent. The business is principally ready-made clothing and gentlemen's furnishings.
Case 16: A department store in a town of 20,000 in Illinois, reports that about 18 per cent of the receipts for sales (not including checks cashed) is in checks. This proportion is an average of actual receipts for three months in the spring. The patronage of the store is largely wage-earners.
Case 17: This was for a department store in the same city of about the same grade and catering to the same general class of people. The proportion of checks in its total receipts for a week was 43.
Case 18: This store deals principally in ladies' furnishings, although some men's furnishings are also sold, as well as lace curtains and other articles of that kind for house
113
Digitized for FRASER http://fraser.stlouisfed.org/ Federal Reserve Bank of St. Louis
National Monetary Commission
furnishing. The proportion of checks in a week's receipts in August for cash sales alone was 69. In addition are to be counted the checks in payment of "charged'' sales which were 23 per cent of the total business. About 90 per cent of the charged sales were paid with checks, so that the percentage of checks in all payments is about 73.
Case 19: A considerable percentage of the checks deposited by this firm—a great department store—are checks which they have cashed for customers. The proportion of checks deposited to total receipts averages 62 per cent for a month. The following extract from a letter received from the firm explains the conditions: " We cash a great many teachers' and other city employees' checks, a very small proportion of which applies to payments of accounts or for merchandise. We also cash a great many checks for our customers, as it frequently is much more convenient than going to a bank for their funds. It is also customary for a great many employees of manufacturing concerns, who are paid by check to cash same in our establishment. Again many cash customers will make a purchase of a few dollars and draw a check for a larger amount, when they desire some currency. As we have a great many cashiers all over the house, and each one receives checks, it is impossible when they come to the counting room for us to determine whether they have been applied in whole or part upon purchases.
" I presume that the above conditions prevail to a very much larger extent in our retail establishment than in a majority of other concerns. You will readily see from the points enumerated that the amount of checks we receive
114
Digitized for FRASER http://fraser.stlouisfed.org/ Federal Reserve Bank of St. Louis
The Use of Credit Instruments
and deposit bears no relation in any way to the volume of business done, as a very large amount of the checks would be considered as 'accommodation banking.'
"The proportion of currency in our bank deposits is comparatively small, as our heavy pay rolls are paid from currency receipts. also all other necessary currency disbursements/ '
Case 20: Another great department store in Chicago, whose yearly business reaches into the millions, reports: "We have taken several months as a basis for the information which you desire, and find that the percentage of checks to our total receipts is 46.45."
Case 21: A retail shoe store in a small city in Illinois. The receipts of several months, approximating $30,000, showed 34 per cent in checks.
WHAT THE DEPOSITS SHOW.
What, now, do the figures tell us? They certainly show what the merchants deposited and what, therefore, they received. They must include the money and the checks received in payment of sales of goods, in so far as expenses have not been paid in the meantime from these receipts, plus any pay checks which have been taken in settlement of purchases, but in excess of the value of the purchase, so that "change" for the balance was given the customer.
We have seen, however, that the pay checks and expenses paid are in all probability negligible quantities for the day in question. The retail deposits on this occasion may therefore be taken as fairly representing the receipts of the merchants for sales, plus some amount of checks
115
Digitized for FRASER http://fraser.stlouisfed.org/ Federal Reserve Bank of St. Louis
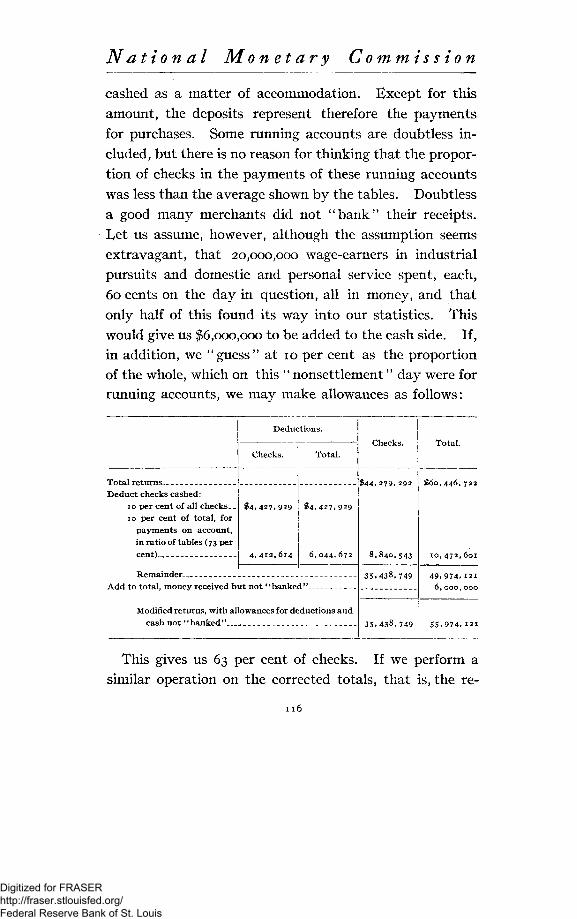
National Monetary Commission
cashed as a matter of accommodation. Except for this amount, the deposits represent therefore the payments for purchases. Some running accounts are doubtless included, but there is no reason for thinking that the proportion of checks in the payments of these running accounts was less than the average shown by the tables. Doubtless a good many merchants did not "bank" their receipts. I/et us assume, however, although the assumption seems extravagant, that 20,000,000 wage-earners in industrial pursuits and domestic and personal service spent, each, 60 cents on the day in question, all in money, and that only half of this found its way into our statistics. This would give us $6,000,000 to be added to the cash side. If, in addition, we "guess" at 10 per cent as the proportion of the whole, which on this " nonsettlement" day were for running accounts, we may make allowances as follows:
Total returns Deduct checks cashed:
10 per cent of all checks.-10 per cent of total, for
payments on account, in ratio of tables (73 per cent)
Remainder
Deductions.
Checks.
$4,427,929
4, 412, 614
Add to total, money received but not "banke
Total.
$4,427,929
6,044,672
i "
Modified returns, with allowances for deductions and cash not "banked"
Checks.
$44.279,292
8,840,543
35.438,749
35,438,749
Total.
$60,446,722
10,472,601
49.974. 121
55,974,121
This gives us 63 per cent of checks. If we perform a similar operation on the corrected totals, that is, the re-
116
Digitized for FRASER http://fraser.stlouisfed.org/ Federal Reserve Bank of St. Louis
The Use of Credit Instruments
turns increased by the amounts allowed for the banks
which did not report, first deducting the $6,000,000 money
not " b a n k e d ' ' from the corrected check totals, we find an
average of 60 per cent of checks.
ESTIMATES FROM EXPENDITURE AND POPULATION.
We may make an estimate of the average total retail
expenditure of the country for purposes of comparison
with the retail deposits returned by the banks in this
inquiry.
According to Bulletin No. 77, July, 1908, of the United
States Bureau of Labor, the average food cost per working-
man ' s family in 1907, allowing for advances in prices from
the figures of 1901 which were taken as a base, was
$374.75. Allowing 10 per cent advance a since the figures
were published, the average food cost would be $412.
This expenditure for food is about 43 per cent of the total
expenditure. This gives $958 as the average annual ex
penditure of each workingman's family, or, for an average
family of five, a per capita daily expenditure of about
52 cents. Let us take this as the average for those in the
manufacturing industries, in which about 12,000,000
people are employed, representing, perhaps, 36,000,000 of
our population. This is on the assumption tha t half are
married and t h a t the average family numbers five persons.
Thus we get for total daily expenditure for this class
$ 1 8 , 7 2 0 , 0 0 0 .
fl There has been little or no advance. But the point is to be sure not to underestimate the expenditure of those economic classes who use money more largely than checks.
1 1 7
Digitized for FRASER http://fraser.stlouisfed.org/ Federal Reserve Bank of St. Louis
National Monetary Commission
Other classes doubtless are spending more than this .
The professional classes, the farmers, and many of those in
what is called " personal and domestic service/ ' spent more
than these did. Suppose the average amount is 80 cents,
representing an annual income of about $1,500; then
the total daily expenditure of the other classes would be
about $43,000,000, giving a total of about $60,000,000,
estimating the population a t 90,000,000. When we con
sider the advance in wages and salaries and the large
amounts spent by the wealthy, this amount appears too
small, and it probably is so.
The report of the Inters ta te Commerce Commission for
1907 gives 1,672,074 as the number of railway employees
in the year ending June 30, 1907. The aggregate amount
of compensation received by these was $1,072,386,427.
This is an average yearly wage of $641, which is consider
ably higher than for manufactures. Of the whole number
of employees, however, the general officers, other officers,
general office clerks, station agents, enginemen, and con
ductors receive a high enough wage and belong to the
general class of people who use checks to justify us in sup
posing tha t a considerable proportion of them keep bank
accounts and pay with checks. Fa r the larger proportion
of these employees receive over $2 a day.
Alqout 50 per cent of the people engaged in t ransporta
tion, as well as in manufacturing, are reported by the
census of 1900 as married. Undoubtedly more than one
member of each family is working, so tha t the aggregate
family income is considerably more than is shown by the
earnings of any one individual. Women in manufactures
receive on an average about $300 a year, while the men
u s
Digitized for FRASER http://fraser.stlouisfed.org/ Federal Reserve Bank of St. Louis
The Use of Credit Instruments
receive about $500. If one man and one woman in the same family are working, we would have, therefore, an aggregate family income of from $800 to $1,000, which is approximately the amount previously estimated.
The matter of using checks is largely determined by the social class of the individual. As has been remarked before, a clerk with an income of $1,000 or $1,200 would probably have a bank account and check against it, when a laborer would not. The same is true in a measure of teachers, stenographers, private secretaries, and most of the other people employed in this kind of personal service. The same is true, too, to a much greater extent of the professional classes and the so-called wealthy class. Now, those who use checks doubtless make far the largest part—possibly 90 per cent—of their payments therewith. Their per capita expenditure undoubtedly exceeds that of the wage-earning class. How much we do not know, but we might guess that it would be more than double. If, then, we consider the aggregate of the expenditures of those people in trade and the manufacturing industries and in transportation who are in the habit of using checks, together with those of the various classes just mentioned, concerning whose practice there is little doubt, there seems little ground for not believing that the larger proportion of the expenditure of the community is made by means of checks. This is the conclusion to which our tables also point.
Another way of going at the problem may perhaps be based on the character of the population. In the inquiry of 1896 there was a discussion of the probable percentage of checks used by negroes and the foreign population. An
1 1 9
Digitized for FRASER http://fraser.stlouisfed.org/ Federal Reserve Bank of St. Louis
National Mon etary Commission
inspection of the table of occupations of negroes in 1900 shows that the number engaged in occupations in which they would be likely to use checks is very small. The whole number at that date was 8,000,000, and of these less than 80,000 were engaged in business pursuits in which checks would ordinarily be used. That there must be some use of checks by this great population we are bound to conclude, not only because some of them are engaged, as just said, in occupations in which checks are ordinarily used, but also because no inconsiderable number of them have amassed fair amounts of wealth. Ten years ago there were 156,372 negroes who owned their own farms, and about 30,000 more who were part owners.
In the discussion of this subject in 1896, 5 per cent was the average assigned in the negro population as compared with other divisions of the people in the use of checks. This must be weighted by their probable per capita expenditure in computing the general average. As to the foreign population, practically none of them, in their home countries, have been used to deposit banking, and are therefore unacquainted with payments by check. In 1896 it was found that among the foreign population along Milwaukee avenue, in Chicago, one retail grocer got 15.5 per cent of his proceeds for the month in checks, one butcher 10 per cent, a coal dealer 12 per cent, one clothier 9 per cent, one dry-goods merchant 19 per cent, one furniture dealer 18 per cent. We may perhaps assume, therefore, that 15 per cent of the payments of this population are made by means of checks, for we must remember that the foreigner learns very rapidly.
The native white population, aside from the wage-earners, undoubtedly are users of checks to a very great
1 2 0
Digitized for FRASER http://fraser.stlouisfed.org/ Federal Reserve Bank of St. Louis
The Use of Credit Instruments
extent. Payment by check is, of course, the custom among people of large incomes, and probably also with all classes of people with an income of $1,200 or more, in all occupations excepting manual labor. The writer believes that it will be found true that of two men, each with an income of $1,200 a year, the one making his as bookkeeper or by other clerical service, and the other by manual labor, the former will very likely have a bank account and pay his bills to a large extent with checks, while the latter will pay with money.
We must remember, however, that what we are trying to get is the average volume of purchases paid for with credit documents. We are not trying to find the number of people who use checks. If one person pays out as much as ten others and pays all his bills with checks, the percentage of business payments made with checks would be 50, although the number of people would be 11, only one of whom used checks. A good deal of the misapprehension as to the extent of the use of checks in business payments arises from not keeping clearly in mind the distinction between the proportion of people who use checks and the proportion of business done with checks. I t is the latter that we are discussing.
The returns of the present inquiry certainly do not support the views of critics who assert that the figure assigned from the investigation of 1896 as the fair one to represent the proportion of retail payments made with credit paper was too large. That figure was 50 per cent. A careful consideration of the present data leads the writer to believe that the ratio then assigned was nearly correct, and that 60 would be nearer the truth to-day.
1 2 1
Digitized for FRASER http://fraser.stlouisfed.org/ Federal Reserve Bank of St. Louis
National Monetary Commission
THE WHOLESALE RETURNS.
We come now to a discussion of the returns of the deposits of wholesale dealers. In this term, as in the case of retail dealers, there is likely to be some indefinite-ness. A merchant or firm may do both wholesale and retail business, and a bank may not be able to distinguish his deposits as retail and wholesale. Occasionally such cases occurred, but not many were specifically mentioned and the whole number was few. There can not be more than the most trifling error, if any, in the returns, due to this cause.
There was doubtless, also, some question in the minds of a good many of the correspondents as to the propriety of including certain kinds of business firms under the term "wholesale dealers," such as lumbermen and commission merchants. These latter, however, so far as could be determined, were all classed with the wholesale dealers. Businesses like the lumber business were probably classed under " all others " in most cases. If any depositors in this or similar kinds of business were classed with wholesale dealers, the presence of their deposits would introduce no error into the returns because their methods of payment are doubtless the same as those of wholesale dealers.
The error due to a bank's ignorance of the business of its patrons would be much smaller in the case of wholesale dealers than in the case of retail traders. A wholesale merchant's account is large enough to make the bank sufficiently interested to know about it. He undoubtedly is an occasional, if not a frequent, borrower, and his business therefore would be known to his banker. So far, then, as concerns the character of the returns, they may
1 2 2
Digitized for FRASER http://fraser.stlouisfed.org/ Federal Reserve Bank of St. Louis
The Use of Credit Instruments
be taken as reflecting pretty accurately the method of payments of the wholesale merchants.
We must remember, however, that wholesale trade, after all, is a relative term, if we have regard to its magnitude in an individual case. A man may class himself as a wholesale merchant, and yet sell goods in such quantities as would be regarded as small by a wholesale merchant in the same line, perhaps, in a neighboring city.
The classification depends, as in the case of retail merchants, not so much on the amount sold as on the class of customers. If the merchant sells, not directly to consumers, but to retail merchants or others who are to sell again to the consumer, he may properly be classed as a wholesale dealer.
Corrections for nonreplying banks.—As in the case of the retail dealers, we might make some allowance for banks which did not reply. This can not be in proportion to the nonreplying banks, because a very large part of the banks which did not send returns are the smaller state and private banks. However, it is hardly worth while to go to the trouble of making such a correction, for the evidence is overwhelming that wherever wholesale business is done in the country the method of payment used is preponder-atingly by means of checks. The percentage of checks in payments derived from three-fourths of the deposits, or even one-half of the deposits, of wholesale merchants in the banks in the country would doubtless be practically the same as that which would be obtained if we had an exact statement of the entire sum of the deposits. Following are the tables of deposits of wholesale dealers by banks:
7071—10 9 123
Digitized for FRASER http://fraser.stlouisfed.org/ Federal Reserve Bank of St. Louis
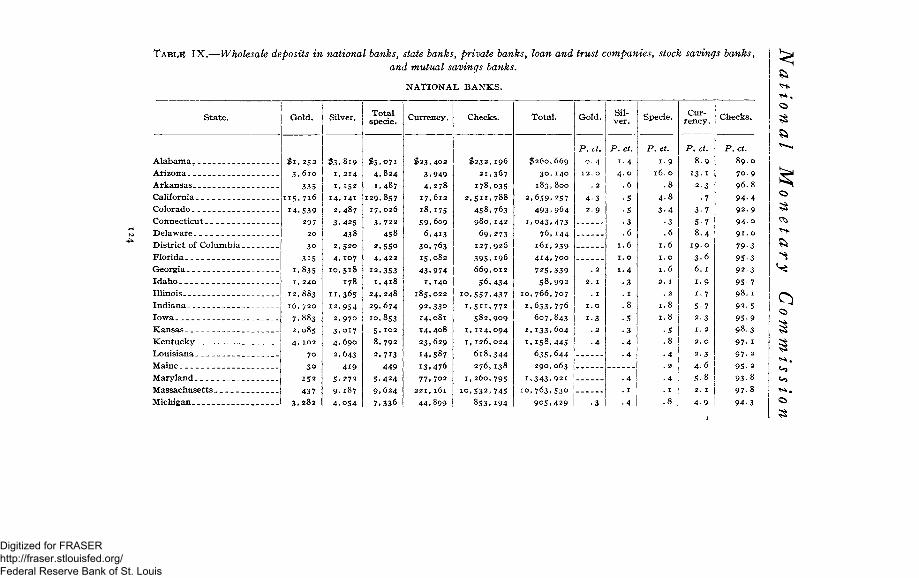
TABLE IX.- -Wholesale deposits in national banks, state banks, private banks, loan and trust companies, stock savings banks,
and mutual savings banks.
NATIONAL BANKS.
State.
Alabama
Arizona
Arkansas
California
Colorado
Connecticut
Delaware
District of Columbia
Florida
Georgia
Idaho _
Illinois
Indiana
Iowa
Kansas
Kentucky
Louisiana
Maine
Maryland
Massachusetts
Michigan
Gold.
$ 1 , 2 5 2
3 , 6 1 0
335 £15.716
1 4 , 5 3 9
297
20
30
315
1 .835 1, 240
12 ,883
1 6 , 7 2 0
7 .883
2 ,085
4, 102
70
30
152
437 3 . 2 8 2
Silver.
$ 3 , 8 1 9
1, 214
1 ,152
14.141
2,487
3.425
438
2,520
4,107
1 0 , 5 1 8
178
n . 3 6 5
12,954
2,970
3.017
4, 690
2,643
419
5.272
9,187
4.054
Total specie.
$ 5 , 0 7 1 4 , 8 2 4
1.487
129 ,857 17,026 3.722
458
2 , 5 5 0 4 , 4 2 2
12 ,353 1 ,418
2 4 , 2 4 8
2 9 , 6 7 4 10 ,853
5 , 1 0 2
8 , 7 9 2
2.713 449
5 . 4 2 4 9 , 6 2 4
7 , 3 3 6
Currency.
$ 2 3 , 4 0 2
3 . 9 4 9 4 . 2 7 8
17 ,612
18 ,175 5 9 , 6 0 9
6 ,413
3 0 , 7 6 3 15 .082
4 3 . 9 7 4
1 ,140
185 ,022
9 2 , 3 3 0
14 ,081
14 ,408
23 ,629
14 ,587
I3»476
77 .702
221 ,161
44 ,899
Checks.
$ 2 3 2 , 1 9 6
21 ,367
178 ,035 2 , 5 1 1 , 7 8 8
4 5 8 , 7 6 3 9 8 0 , 1 4 2
6 9 , 2 7 3 1 2 7 , 9 2 6
3 9 5 , 1 9 6 6 6 9 , 0 1 2
5 6 , 4 3 4
i o , 5 5 7 , 4 3 7 1 , 5 1 1 , 7 7 2
5 8 2 , 9 0 9 1 , 1 1 4 , 0 9 4 1 , 1 2 6 , 0 2 4
6 1 8 , 3 4 4
276,138 1 , 2 6 0 , 7 9 5
1 0 , 5 3 2 , 7 4 5
8 5 3 , 1 9 4
Total.
$260 ,
30 ,
183,
2 , 6 5 9 ,
493 ,
1 , 0 4 3 , 76,
161 ,
414 ,
725, 58,
1 0 , 7 6 6 ,
1 , 6 3 3 , 607 ,
1 , 1 3 3 . 1 ,158 ,
635 , 290,
1 , 3 4 3 ,
1 0 , 7 6 3 ,
905 ,
669
140
800
257
964
473
144
239
700
339
992
707
776
843
604
445
644
063
921
530
429
Gold.
P.ct.
0. 4
1 2 . 0
. 2
4-3
2 . 9
. 2
2. 1
. 1
1 .0
1-3 . 2
• 4
• 3
Silver.
P.ct.
1 .4 4 . 0
.6
•5
•5 • 3 .6
1.6
1. 0
1 .4
.3
. 1
. 8
• 5
• 3
• 4
•4 i
• 4 . 1
• 4
Specie.
P.ct.
1-9 16. o
4 . 8
3 - 4
• 3
1 . 6
1 . 8
Currency.
P.ct.
8.9
13- 1
2 . 3
• 7
3 - 7
5 . 7
8 . 4
19. o
3.6
6 . 1
1-9
1.7
5-7
^•3
1. 2
2 . 0
2 . 3
4.6
5-8
2. 1
4 - 9
Digitized for FRASER http://fraser.stlouisfed.org/ Federal Reserve Bank of St. Louis
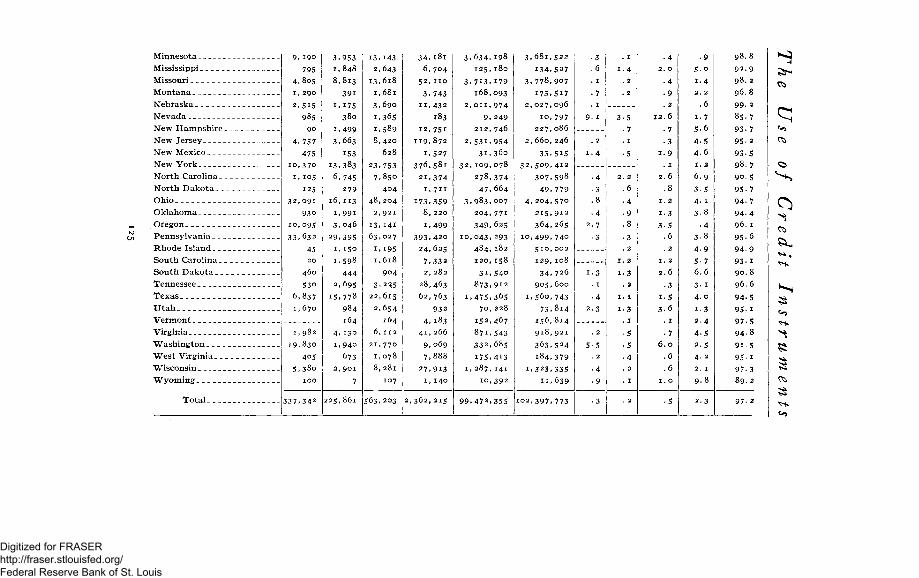
Minnesota Mississippi Missouri Montana Nebraska Nevada New Hampshire. New Jersey New Mexico New York North Carolina _ _ North Dakota Ohio Oklahoma Oregon Pennsylvania Rhode Island South Carolina _ _ South Dakota Tennessee Texas Utah Vermont Virginia Washington West Virginia Wisconsin Wyoming
To ta l .
9 . 1 9 0
795 4.805 1, 290
2.S1S 985
90
4.757 475
10 ,370
1, 105
125
3 2 , 0 9 1
93o 10,095 3 3 . 6 3 2
45 20
460
530
6 .837
1, 670
1,982
19 ,830
405 5.38o
100
3.953 1,848 8.813
39i 1,175
380 1.499 3.663
153
13,383
6,745 279
16,113 i ,99i 3.046
29.395 1. 150 1 .598
444
2 ,695 15 ,778
984
164
4, 130
1 ,940
673 2, 901
7
225 ,861
13.143 2 ,643
13.618
1.681
3.690
1.365
1,589
8,420
628
23 .753 7 ,850
404
48, 204
2, 921
13 .141 63,027
I . I 9 5 1.618
904
3 .2^5 22,615
2,654 164
6 ,112
21 ,770
1,078
8 ,281
107
563 .203
3 4 . I 8 I 6,704
52, n o 3,743
n , 4 3 2 183
12,751 119,872
1.527 376,581
21,374 1, 711
173,359
8, 220
1 ,499
3 9 3 , 4 2 0
24 ,625
7 , 3 3 2
2, 282
28,463
62,763
932
4 , 1 8 3
4 1 , 2 6 6
9, 069
7,888 2 7 , 9 1 3
1, 140
2 , 3 6 2 , 215
3,634. 125,
3 , 7 1 3 ,
168,
2 , 0 1 1 ,
9, 212,
2,53i , 3 i ,
32, 109, 278,
47, 3,983,
204,
349, 10,043.
484, 120 ,
3 i .
873, 1,475.
70,
152,
871 ,
332 ,
175. 1 ,287 ,
198
180
179
093
974
249
746
954
360
078
374
664
007
77r
625
293
182
158
540
912
365
228
467
543
685
413
141
392
99,472,355
3.681,
134.
3.778.
173.
2,027,
10,
227,
2,660,
33, 32,509,
307,
49,
4,204,
215,
364,
10,499.
Sio,
129,
34,
905,
1,560,
73,
156,
918,
363,
184,
1.323,
11,
522
527
907
517
096
797
086
246
515
412
598
779
57o
912
265
740
002
108
726
600
743
814
814
921
524
379
335
639
1 0 2 , 3 9 7 , 7 7 3
• 4 • 3 .8
• 4
2-7
•3
•4
2 - 3
3-5 •7
2. 2
.6 • 4 9
.8 • 3 . 2
1. 2
1-3
. 2
1. 1
i - 3
. 1
5 •5 • 4
• 4 -9 3.0 5-o
• 4 1.4 .9 2.2 .2 .6
2.6 1.7 • 7 5-6 • 3 4-5
1.9 4-6 . 1 1. a
2.6 6.9 .8 3-5
1.2 4-1
1.3 3-8 3-5 -4
. 6 3.8
. 2 4 - 9
1 .2 5-7 2.6 6.6
• 3 3-1 1.5 4-0 3-6 1.3
• 1 I 2.4 •7 4-5
6.0 2.5 .6 4.2 .6 2.1
1. o 9. 8
• 5 2.3
9 8 . 8
9 2 . 9
9 8 . 2
96.8 9 9 - 2
85-7 93-7 95-2
93-5 98.7 90.5 95 94 94 96 95 94 93-I 90.8 96.6
94-5 95-1 97-5 94-8
91.5 95-1 97-3 89-2
97. 2
8
Digitized for FRASER http://fraser.stlouisfed.org/ Federal Reserve Bank of St. Louis
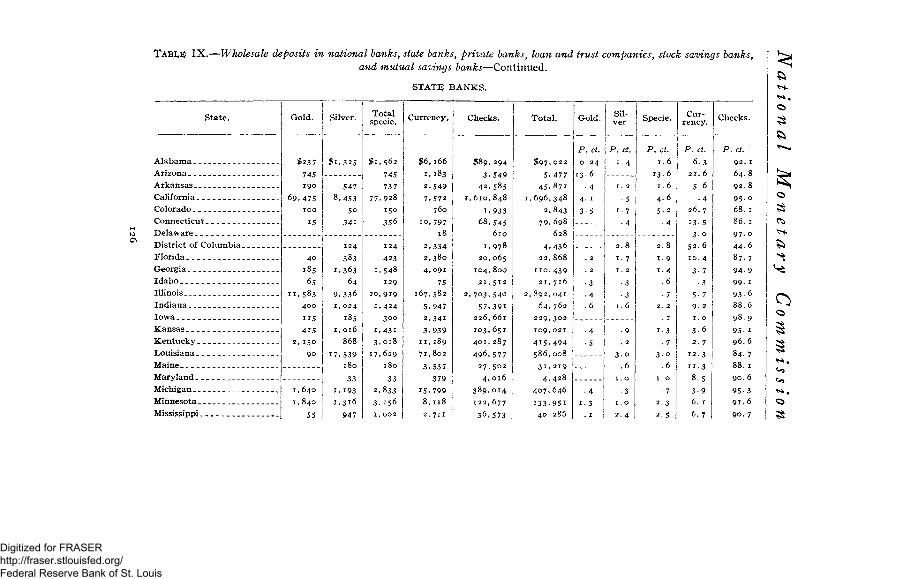
TABLE IX.—Wholesale deposits in national banks, state banks, private banks, loan and trust companies, stock savings banks,
and mutual savings banks—Continued.
STATE BANKS.
State.
Alabama Arizona Arkansas California Colorado Connecticut Delaware District of Columbia. Florida Georgia Idaho Illinois Indiana Iowa Kansas Kentucky Louisiana Maine Maryland Michigan Minnesota Mississippi
Gold.
$237
745 190
6 9 , 4 7 5 100
IS
40 185
65
11 ,583 400
i i 5 415
2, 150 90
Silver.
547 8 ,453
5o 3 4 i
1, 640
1, 840
55
124 383
1.363
64 9 , 3 3 6 i , 024
185 1, 016
868
17 ,539 180
33
1. 193
1.316
947
Total specie.
$ 1 , 5 6 2
745
737
77 .928
150
356
124 423
1.548 129
20 ,919
1 ,424
300
i , 4 3 i 3 . 0 1 8
17 ,629
180
33
2.833 3, 156 I, 002
Currency.
$6 1
2
7
10
2
2
4
166
183
549
572
760
797 18
334 380
091
75 167.582
5 2
3 11
7i
3
15, 8.
2,
947
341
939 189
802
537
379
799
118
711 j
Checks.
$89. 294
3 . 5 4 9
4 2 . 5 8 5 1 , 6 1 0 , 8 4 8
1.933
6 8 , 5 4 5 610
1 ,978
20 ,065
104 ,800
2 1 , 5 1 2
2 , 7 0 3 , 5 4 0
5 7 , 3 9 1
226 .661
103 ,651
401 ,287 496 ,577
2 7 , 5 0 2
4, 016
3 8 9 , 0 1 4
122 ,677
3 6 . 5 7 3
Total.
$97-
5.
45, . 6 9 6 ,
2,
79,
2, 892
64 229
109
415 586;
3 i
4
407.
133. 40
477 871 348 843 698 628 436 868 439 716 041 762 302 021 494 008 219 428 646 951 286
Gold.
P. ct. o. 24
1 3 . 6
• 4
4. 1
3 - 5
• 4
1-3
Silver
P. ct. 1.4
2 . 8
1 7
1. 2
•3
•3
1 .6
3 . o
. 6
1. o
• 3 I. O 2 . 4
Specie.
P. ct. 1.6
1 3 . 6
1 .6
4 - 6
5 - 2
. 4
2 . 8
1.9
1 .4
. 6
• 7
1-3 • 7
3 - o . 6
1. o
Currency.
P. ct. 6 . 3
2 1 . 6
5-6
• 4 26 . 7
13-5 3 - o
5 2 . 6
10. 4
3 -7
3-6
2. 7
12 .3
n - 3
8-5
3 9
6 . 1
6 . 7
C h e c k s .
». ct.
92 . 1
6 4 . 8
9 2 . 8
9 5 o
68. 1
86. 1
9 7 . 0
4 4 . 6
8 7 . 7
9 4 - 9
99- 1
9 3 - 6
8 8 . 6
9 8 . 9
95- 1
9 6 . 6
8 4 . 7
8 8 . 1
90. 6
9 5 - 3
91 . 6
90. 7
Digitized for FRASER http://fraser.stlouisfed.org/ Federal Reserve Bank of St. Louis
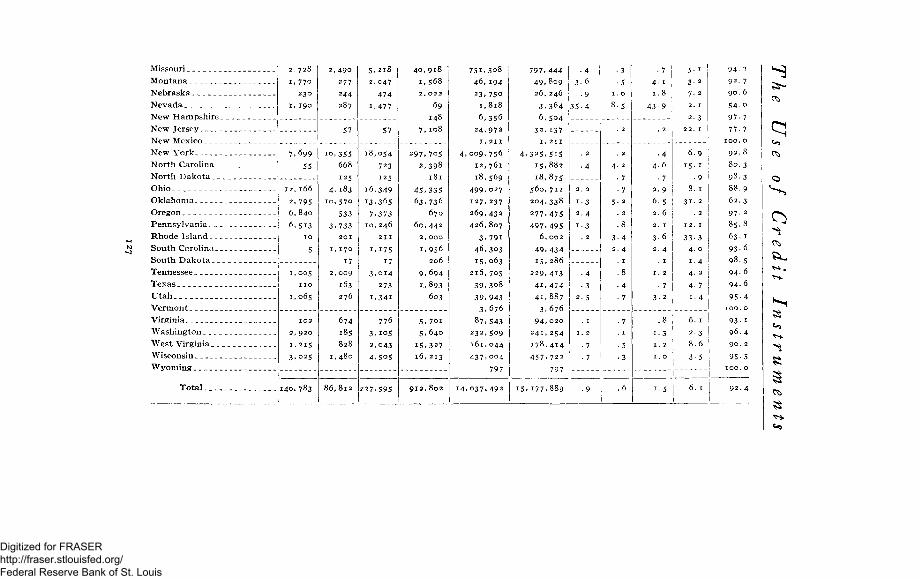
Missouri Montana Nebraska Nevada New Hampshire. New Jersey New Mexico New York North Carolina _ _ North Dakota Ohio Oklahoma Oregon Pennsylvania Rhode Island South Carolina __ South Dakota Tennessee Texas Utah Vermont Virginia Washington West Virginia Wisconsin Wyoming
Total .
2. 728
I , 770
23O
I . I90
7.699 55
12,166
2. 795 6.840
6,513 10
1,005
n o
1,065
102
2, 920
1, 215
3.025
140.783
,490
277
244
287
57
io,355
668
125
4.183
10,570
533
3.733
201
1, 170
17
2, 009
163
276
674
185
828
1, 480
86,812
5.218
2.047
474
1.477
57
18,054
723
125
i6,349
13.365
7-373
10, 246
211
1.175
17
3.014
273
i,34i
776
3.105
2,043
4,505
40,918
1,568
2, 022
69
148
7, 108
297.705
2,398
181
45.335
63.736
670
60.442
2, 000
1.956
206
9,694
1. 893
603
5. 7oi
5,640
15.327
16,213
912,802
7Si,3o8
46, 194
23.750
1,818
6,356
24,972
I, 211
4.009,756
12,761
18,569
499.027
127.237
269,432
426,807
3.791
46,303
I5.063
2l6,705
39.308
39.943
3.676
87,543
232, 509
161,044
437.004
797
14,037,492
797.
49.
26,
3.
6,
32.
I,
4.325,
15,
18.
560,
204,
277.
497.
6.
49.
15.
229,
41.
41,
3,
94,
241,
178,
457,
444
809
246
364
504
137
211
515
882
875
7ii
338
475
495
002
434
286
413
474
887
676
020
254
414
722
797
• 4
3-6
• 9
35.4
1-3
2.4
1-3
• 4
4.6
• 7
2.9
6-5
2.6
2. 1
3-6
2.4
1-3
1. 2
1. 0
5- 1
3- 2
7- 2
6.9
15. 1
• 9
12. 1
33-3
4.0
1.4
4. 2
4- 7
1.4
6. 1
2-3
8.6
3-5
94. 2
92. 7
90. 6
54-o
97- 7
77-7
100. o
92.8
80.3
98.3
88.9
62.3
97- 2
85.8
63.1
93- 6
98.5
94-6
94.6
95- 4
100. o
93- I
96.4
90. 2
95-5 100. o
92.4
Digitized for FRASER http://fraser.stlouisfed.org/ Federal Reserve Bank of St. Louis
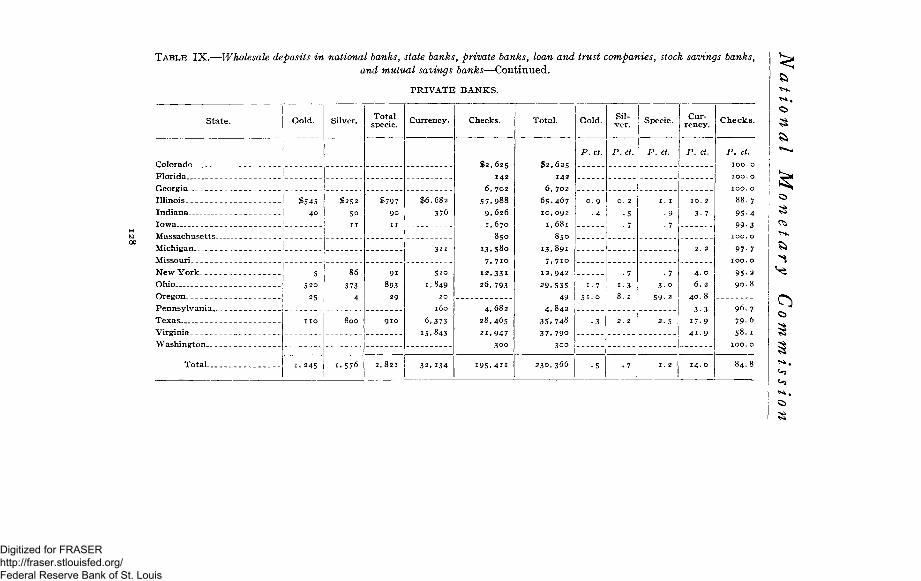
TABLE IX.—Wholesale deposits in national banks, state banks, private banks, loan and trust companies, stock savings banks,
and mutual savings banks—Continued.
PRIVATE BANKS.
State.
Florida „
Gold.
Georgia Illinois __ _ _ Indiana Iowa ____ _
$545 40
New York Ohio Oregon Pennsylvania Texas Virginia Washington _ _ _ - _
Total
5 5 2 0
25
n o
1, 245
Silver.
$ 2 5 2
5 0
11
86
373
4
8 0 0
1,576
Total specie.
$797 9 0
11
91
893
2 9
9 1 0
2 , 8 2 1
Currency.
$6 ,682
376
3 1 1
5 2 0
1,849 2 0
1 6 0
6,373
15.843
32, 134
Checks.
$ 2 , 6 2 5
142
6, 702
5 7 . 9 8 8
9 , 626
1, 670
850
1 3 , 5 8 0
7 , 7 i o
1 2 , 3 3 1
2 6 , 7 9 3
4 , 6 8 2
2 8 , 4 6 5
2 1 , 9 4 7 3 0 0
I 9 5 , 4 H
Total.
$ 2 , 6 2 5
142
6, 702
6 5 . 4 6 7
1 0 , 0 9 2
1,681
850
1 3 . 8 9 1 7 . 7 i o
1 2 , 9 4 2
2 9 . 5 3 5
49
4, 842
3 5 , 7 4 8
3 7 , 7 9 0
3 0 0
2 3 0 , 3 6 6
Gold.
P. ct.
0 . 9
• 4
1 . 7
5 1 . 0
• 3
• 5
Silver.
P. ct.
0 . 2
•5
• 7
• 7 1-3 8. 2
2 . 2
. 7
Specie .
P. ct.
1 . 1
• 9
• 7
• 7 3 -o
59- 2
2 - 5
1 . 2
Currency.
P. ct.
1 0 . 2
3- 7
2 . 2
4 . 0
6 . 2
4 0 . 8
3-3
1 7 . 9
4 1 . 9
1 4 . 0
Checks.
P. ct. 1 0 0 . 0
1 0 0 . 0
1 0 0 . 0
8 8 . 7
9 5 - 4
99- 3 1 0 0 . 0
97. 7
95- 2 9 0 . 8
96 . 7
79. 6
58 . 1
1 0 0 . 0
8 4 . 8
Digitized for FRASER http://fraser.stlouisfed.org/ Federal Reserve Bank of St. Louis
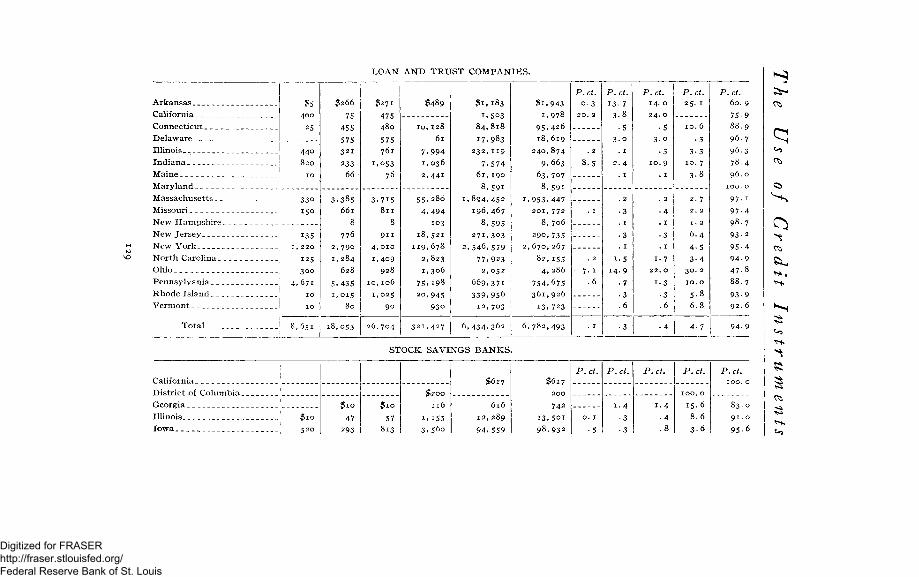
L O A N A N D T R U S T C O M P A N I E S .
<0
A r k a n s a s
Cal i fornia
C o n n e c t i c u t
D e l a w a r e
I l l i n o i s . .
I n d i a n a
Ma ine
M a r y l a n d
M a s s a c h u s e t t s
Missouri
N e w H a m p s h i r e .
N e w J e r s e y
N e w Y o r k
N o r t h Caro l ina _ _
Ohio
P e n n s y l v a n i a
R h o d e I s l a n d
V e r m o n t
T o t a l .
400
25
440 820
33o
150
135 , 220
12s
300
, 671
10
8 ,651
$266
75
455
575
321
233
66
3.385
661
8
776
2, 790
1, 284
628
5.435
1,015
80
18,053
$271
475
480
575
761
1.053
76
3.715
811
8
911
4, 010
1,409
928
10,106
1,025
90
26,704
$489
10,120
61
7.994
1.036
2,441
55.250
4.494
103
18,521
119,678
2,823
1,306
75.198
20,945
930
321,427
$1,183
1.503
84,818
17.983
232,119
7.574
61,190
8,591
,894,452
196,467
8,595
271,303
,546,579
77.923
2,052
669,371
339,956
12,703
6,434,362
$1,943
1,978
95.426
18,619
240,874
9.663
63,707
8,591
1.953.447
201,772
8,706
290,735
2,670,267
82,155
4,286
754,675
361,926
13.723
6,782,493
P.ct.
o. 3
8.5
P.ct.
13. 7
3.8
. 1
1-5
14.9
• 7
• 3 .6
•3
P.ct. 14. 0
24. c
P.ct.
25- 1
10. 6
•3
3-3 10. 7
3-8
2.7
2. 2
1. 2
6.4
4-5
3-4
30. 2
10. o
5-8
6.8
4-7
P.ct.
60. 9
75-9
88.9
96.7
96.3
78.4
96. o
IOO. O
97.1
97
93-
95-
94-
47-
88.
93-
92.
S T O C K S A V I N G S B A N K S .
Cal i fornia __ _ _
D i s t r i c t of C o l u m b i a
Georg ia i
I l l inois 1 $10
I o w a J 520
$ 1 0
47
293
$ 1 0
57
813
$ 2 0 0
116
1. 155 3 . 5 6 o
$617
616
1 2 , 2 8 9
9 4 . 5 5 9
$617
2 0 0
742
I 3 . 5 0 I
9 8 , 9 3 2
P.ct.
0 . 1
•5
P.ct.
1.4
•3
• 3
P.ct.
1.4
• 4 . 8
P.ct.
IOO. O
1 5 . 6
8 . 6
3 . 6
P.ct.
8 3 . 0
9 1 . 0
9 5 - 6
Digitized for FRASER http://fraser.stlouisfed.org/ Federal Reserve Bank of St. Louis
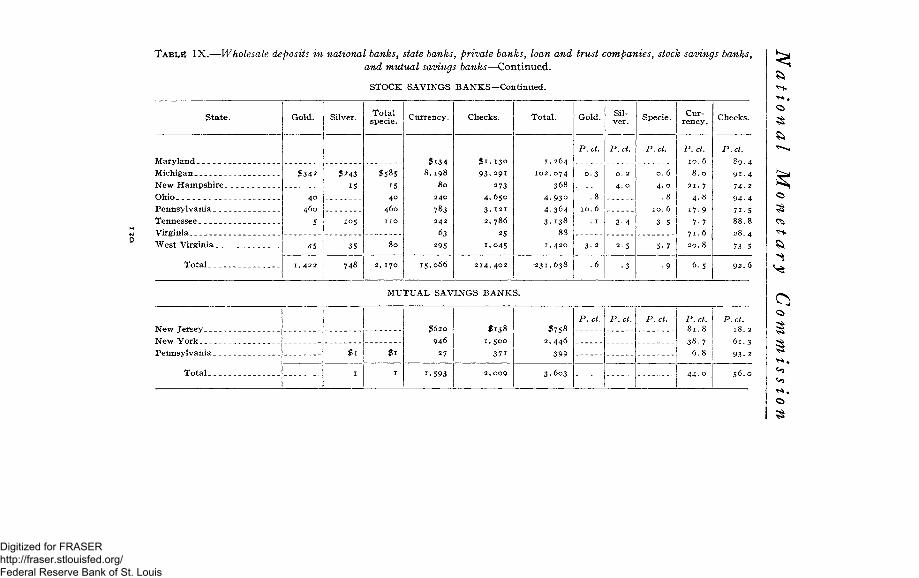
TABLE IX.—Wholesale deposits in national banks, state banks, private banks, loan and trust companies, stock savings banks,
and mutual savings banks—Continued.
STOCK SAVINGS BANKS—Continued. & ^
State.
Michigan New Hampshire Ohio Pennsylvania Tennessee Virginia West Virginia
Total _
Gold.
$342
40
460
5
4 5
1, 422
Silver.
$243
15
105
3 5
7 4 8
Total specie.
$585 15 40
460
no
8 0
2, 170
Currency.
$ i 3 4 8, 198
80 240
783 242
63
295
15 ,066
Checks.
$ 1 . 130
9 3 . 2 9 1
273
4 . 6 5 0
3 . 121
2. 786
25
I . 0 4 5
214 ,402
Total.
1, 264
102 ,074
368
4 . 9 3 0
4 . 3 6 4
3 . 1 3 8
88
1, 420
231 ,638
Gold.
P.ct.
0 . 3
. 8
1 0 . 6
. 1
3- 2
.6
Silver.
P.ct.
0. 2 4 . 0
3 - 4
2 . 5
• 3
Specie.
P.ct.
0 . 6
4 . 0 . 8
10. 6
3 -5
5 - 7
• 9
Currency.
P.ct. 10. 6
8 . 0 21. 7
4 . 8
1 7 . 9 7-7
71. 6 2 0 . 8
6.5
Checks.
P.ct. 89. 4
74- 2
7 i . 5 8 8 . 8
2 8 . 4
73-5
MUTUAL SAVINGS BANKS.
Total
$ 1
1
$ 1
1
$620
946
27
1.593
$138 1.500
371
2, 009
$758
2 . 4 4 6
399
3 . 6 0 3
P.ct. P.ct. P.ct. P.ct.
8 1 . 8
3 8 . 7 6 . 8
4 4 . 0
P.ct. 18 2
6 1 . 3 93- 2
5 6 . 0
3
Digitized for FRASER http://fraser.stlouisfed.org/ Federal Reserve Bank of St. Louis
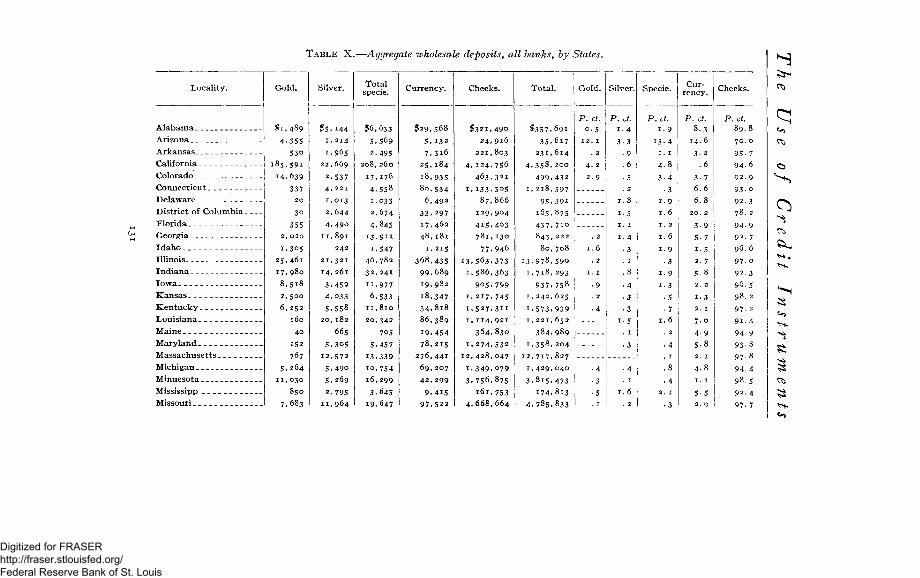
TABLE) X.—Aggregate wholesale deposits, all banks, by States.
Locality.
Alabama
Arizona
Arkansas
California
Colorado
Connecticut
Delaware
District of Columbia
Florida
Georgia
Idaho
Illinois
Indiana
Iowa
Kansas
Kentucky
Louisiana
Maine
Maryland
Massachusetts
Michigan
Minnesota
Mississipp
Missouri
Gold.
$ 1 , 4 8 9
4 ,355 530
185,591
14 ,639
337
20
30
355 2, 020 1,305
25 ,461 17 ,980 8 ,5x8 2 ,500
6, 252
160
40
152 767
5 .264 11 ,030
850
7 .683
Silver.
$ 5 , 1 4 4
1, 214
1,965
22,669
2,537
4, 221
1,013
2,644
4,49o
11,891
242
21,321
14,261
3,459
4,033
5.558
20,182
665
5.305
12 .572
5 .490
5 , 2 6 9
2, 795
11 ,964
Total specie.
$6 ,633
5 ,569
2,495
208 ,260
17,176
4,558
1,033 2 ,674
4 ,845 i 3 , 9 H
1,547 46 ,782
32 ,241
H . 9 7 7
6 ,533 11 ,810 20,342
705
5 .457
13 .339
10 ,754 16 ,299
3 ,645
19,647
Currency.
$ 2 9 , 5 6 8
5 , 1 3 2 7 . 3 i 6
2 5 . 1 8 4
i 8 , 9 3 5 8 0 , 5 3 4
6 , 4 9 2
3 3 , 2 9 7 17 ,462
4 8 , 1 8 1
1, 215 368,435
99,689
19,982
18,347
34.8i8
86,389
19,454
78,215
276,441
69,207
42,299
9 ,415 9 7 , 5 2 2
Checks.
$ 3 2 1 , 4 9 0
2 4 , 9 1 6
221 ,803
4 , 1 2 4 , 7 5 6
4 6 3 . 3 2 1
1 , 1 3 3 . 5 0 5 87,866
1 2 9 , 9 0 4
4 1 5 . 4 0 3 7 8 1 , 1 3 0
7 7 . 9 4 6
i 3 . 5 6 3 » 3 7 3 1 . 5 8 6 , 3 6 3
9 0 5 , 7 9 9 1 , 2 1 7 , 7 4 5
1 . 5 2 7 . 3 i i 1 , 1 1 4 , 9 2 1
364 , 830
1 . 2 7 4 . 5 3 2 1 2 , 4 2 8 , 0 4 7
1 , 3 4 9 , 0 7 9 3 , 7 5 6 , 8 7 5
I 6 I , 7 5 3
4 , 6 6 8 , 6 6 4
Total.
$357,
35 .
231,
4 , 3 5 8 ,
499, 1 ,218 ,
95. 165,
437,
843,
80,
1 3 . 9 7 8 ,
1, 718,
937, 1, 242,
1 .573 , 1 , 221 ,
384, 1 .358 ,
1 2 , 7 1 7 ,
1 ,429 , 3 , 8 1 5 ,
174, 4 , 7 8 5 .
691
617
614
200
43 2
597
391
875
710
222
708
590
293
758
625
939
652
989
204
827
040
473
813
833
Gold.
P. ct. 0 . 5
12. 1
. 2
4. 2
2 . 9
1. 1
•9
Silver.
P.ct.
4
3 - 3
9
6
5
Specie.
P.ct.
1-9 15-4
1. 1 4 -8 3 - 4
•3 1-9 1 .6 1. 2 1 .6 1-9
• 3 1-9 1.3
•5 • 7
1 .6
• 4 2. 1
3
Currency. Checks.
P. ct. 8.3
14. 6 3- 2
.6
3-7
6.6
6.8
20. 2
2. 1
7 . 0
4 -9
5-8
2. 1
4.8
5-5 2. o
P.ct. 8 9 . 8
70. o
95-7
94-6
92. 9
93 -o
9 2 . 3
78. 2
94 -9
92. 7
9 6 . 6
9 7 - 0
9 2 . 3
9 6 . 5
98. 2
97- 2
91 . 4
94 -9
9 3 . 8
97 -8
94 -4
9 8 . 5
9 2 . 4
97-7
Digitized for FRASER http://fraser.stlouisfed.org/ Federal Reserve Bank of St. Louis
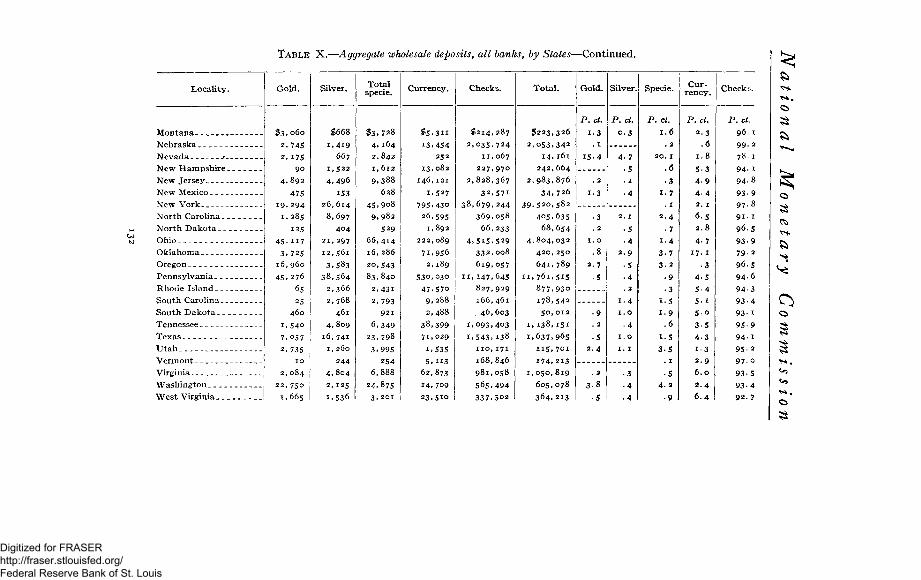
TABLE X.—Aggregate wholesale deposits, all banks, by States—Continued.
Locality.
Montana Nebraska Nevada _-. New Hampshire New Jersey New Mexico New York North Carolina. North Dakota . _ Ohio Oklahoma Oregon Pennsylvania Rhode Island South Carolina.. South Dakota . _ Tennessee Texas Utah Vermont Virginia Washington West Virginia ._
Gold.
$ 3 , 0 6 0
2 ,745
2 , 1 7 5 90
4 . 8 9 2
475 1 9 . 2 9 4
1 .285
125
4 5 . 1 1 7
3 , 7 2 5
1 6 , 9 6 0
45,276
65
25
460
1 .540
7 .057
2 ,735
10
2, 084
2 2 , 7 5 0
1 ,665
Silver.
$668
1,419 667
1,522
4 , 4 9 6
153 2 6 , 6 1 4
8 ,697
404 21 ,297
12 ,561
3 , 5 8 3
3 8 , 5 6 4
2,366
2,768
461
4, 809
16 ,741 I , 260
244 4, 804 2 ,125
1 ,536
Total specie.
$ 3 , 7 2 8
4 . 1 6 4 2 .842
1, 612
9.388 628
45.9o8 9, 982
529 66,414 16.286 20,543 83,840
2 ,431
2 ,793 921
6 , 3 4 9 23 ,798
3 , 9 9 5 254
6 , 8 8 8
24 ,875 3 , 201
Currency.
$ 5 , 3 "
13 ,454 252
13 ,082
146,121
1.527 795 .430
26,595 1,892
222 ,089
7L956 2,189
530,030 47,57o 9,288 2,488
38,399 71 ,029
1.535 5 , " 3
62 ,873
14 ,709 23 ,510
Checks.
$ 2 1 4 , 2 8 7 2 , 0 3 5 . 7 2 4
11 ,067
2 2 7 , 9 7 0
2 , 8 2 8 , 3 6 7
3 2 . 5 7 1 3 8 , 6 7 9 , 2 4 4
3 6 9 , 0 5 8
6 6 , 2 3 3
4 , 5 1 5 , 5 2 9
3 3 2 , 0 0 8
6 1 9 , 0 5 7
11, 147 .645
8 2 7 , 9 2 9
1 6 6 , 4 6 1
4 6 , 6 0 3
1 , 0 9 3 , 4 0 3
1 , 5 4 3 , 138
110 ,171
1 6 8 , 8 4 6
9 8 1 , 0 5 8 5 6 5 , 4 9 4 3 3 7 . 5 0 2
Total.
$ 2 2 3 ,
2 , 0 5 3 , 14.
242,
2 , 9 8 3 ,
34 , 3 9 , 5 2 0 ,
405 , 68,
4, 804 ,
420 ,
641 ,
11, 761 ,
877.
178,
50 .
1. 138,
1 ,637 ,
" 5 . 174.
1 ,050 ,
605 ,
364.
326
342
161
664
876
726
582
635
654
032
250
789 5i5 93o 542 012
151
965
701
213
819
078
213
Gold.
P.ct.
1.3
2 .7
• 5
3.8
• 5
Silver
P.ct.
0 . 3
4 . 7
•5
2. 1 • 5 • 4
2 . 9
• 5 • 4 . 2
1 . 4 1. o
• 4 1 .0 1 .1
Specie.
P. ct. 1 .6
. 2
2 0 . 1
.6 • 3
1-7 . 1
2.4
• 7 1.4 3-7 3-2
• 9 • 3
i -5 1-9
.6
i-5
3.5
Currency.
P.ct. 2 . 3
.6 1 .8
5 3
4 9
4 4
2. 1
6.5 2 . 8
4 7
17. 1
3 4-5 5-4 5- 1 5-o 3 5 4 3 i -3 2.9 6.0 2.4 6.4
Checks.
P.ct. 96. 1 99 . 2 7 8 . 1
94- 1
9 4 - 8
9 3 9
9 7 - 8
91 . 1
9 6 . 5
9 3 - 9
79 -2
9 6 . 5
9 4 - 6
9 4 - 3
9 3 - 4
9 3 - 1
9 5 - 9
9 4 - 1
95- 2
9 7 0
9 3 5
9 3 - 4 92 . 7
Digitized for FRASER http://fraser.stlouisfed.org/ Federal Reserve Bank of St. Louis
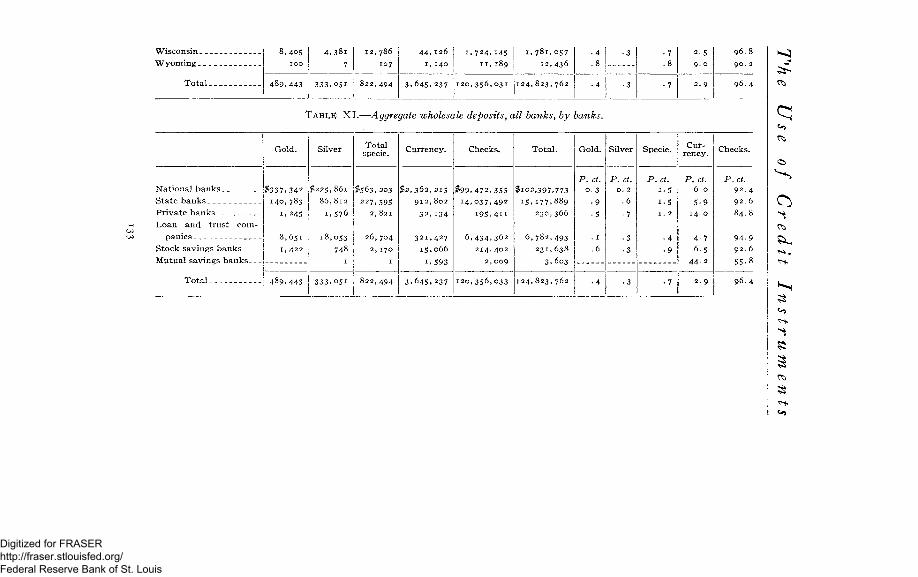
Wisconsin__
Total
8 , 4 0 5
1 0 0
4 8 9 , 4 4 3
4 . 3 8 1
7
3 3 3 , o 5 i
1 2 , 7 8 6
107
8 2 2 , 4 9 4
4 4 . 1 2 6
1 , 1 4 0
3 , 6 4 5 . 2 3 7
1 , 7 2 4 , 1 4 5
1 1 , 1 8 9
1 2 0 , 3 5 6 , 0 3 1
1 , 7 8 1 , 0 5 7
1 2 , 4 3 6
1 2 4 , 8 2 3 , 7 6 2
• 4
. 8
• 4
• 3
• 3
• 7
.8
• 7
2 - 5
9 . 0
2 . 9
9 6 . 8
9 0 . 2
9 6 . 4
TABLE XI.—Aggregate wholesale deposits, all hanks, by hanks.
National banks State banks _ _ _ _ _
Loan and trust companies _
Stock savings banks Mutual savings banks
Total
Gold.
$ 3 3 7 , 3 4 2
1 4 0 , 7 8 3
1 . 2 4 5
8 , 6 5 1
1 , 4 2 2
4 8 9 . 4 4 3
Silver
$ 2 2 5 , 8 6 1
8 6 , 8 1 2
1 . 5 7 6
1 8 , 0 5 3
7 4 8
1
3 3 3 , 0 5 1
Total specie.
$ 5 6 3 , 2 0 3
2 2 7 , 5 9 5
2 , 8 2 1
2 6 , 7 0 4
2 , 1 7 0
1
8 2 2 , 4 9 4
Currency.
$ 2 , 3 6 2 , 2 1 5
9 1 2 , 8 0 2
3 2 , 1 3 4
3 2 1 , 4 2 7
1 5 , 0 6 6
1 . 5 9 3
3 , 6 4 5 , 2 3 7
Checks.
$ 9 9 , 4 7 2 , 3 5 5
1 4 , 0 3 7 , 4 9 2
1 9 5 , 4 1 1
6 , 4 3 4 , 3 6 2
2 1 4 , 4 0 2
2 , 0 0 9
1 2 0 , 3 5 6 , 0 3 3
Total.
$ 1 0 2 , 3 9 7 , 7 7 3
1 5 , 1 7 7 . 8 8 9
2 3 0 , 3 6 6
6 , 7 8 2 , 4 9 3
2 3 1 , 6 3 8
3 . 6 0 3
1 2 4 , 8 2 3 , 7 6 2
Gold.
P. ct. 0 . 3
• 9
• 5
. 1
.6
• 4
Silver
P.ct. 0 . 2
. 6
• 7
• 3
• 3
• 3
Specie.
P.ct. 1 - 5
i - 5
1 . 2
• 4
• 9
• 7
Currency.
P.ct. 6 . 0
5 - 9
1 4 . 0
4 - 7
6 . 5
4 4 - 2
2 . 9
Checks.
P.ct. 9 2 . 4
9 2 . 6
8 4 . 8
9 4 - 9
9 2 . 6
5 5 - 8
9 6 . 4
OK
CO
Digitized for FRASER http://fraser.stlouisfed.org/ Federal Reserve Bank of St. Louis
National Monetary Commission
DISCUSSION OF TABIDS.
The wholesale deposits of the national banks.—The deposits of wholesale dealers returned by the 5,452 national banks aggregated $102,397,773, of which 97.2 per cent were in checks and other credit documents. The currency aggregated $2,362,215, or 2.3 per cent; and the specie $563,203, or about one-half of 1 per cent, two-fifths being silver and three-fifths gold. In this table, as in all the others, in figuring the percentages, the small amounts of gold, silver, and currency have been favored in keeping or throwing away fractions of 1 per cent.
The highest percentage shown by the returns is 99.2 in Nebraska; Minnesota has 98.8, New York shows 98.7, Kansas 98.3, Vermont 97.5, Missouri 98.2, Wisconsin 97.3, Illinois 98.1, Massachusetts 97.8, Pennsylvania 95.6. The States which show the largest volume of deposits are New York, Illinois, Massachusetts, and Pennsylvania. The lowest percentage shown by any of the States is that of Arizona, 70.9. The total deposits there were $30,140. The District of Columbia, with total deposits of $161,239, has 79.3 per cent of checks. Nevada, with aggregate deposits of $10,797, gives a return of 85.7; Wyoming with $11,639 has 89.2 per cent; Alabama with $260,669, shows 89 per cent. No other State shows less than 90 per cent.
In 44 States the percentage of checks in deposits is over 90; in 24 States it is over 95.
The wholesale deposits of the state banks.—The 4,288 state banks from which replies were received returned wholesale deposits amounting to $15,177,889. Of this amount 92.4
134
Digitized for FRASER http://fraser.stlouisfed.org/ Federal Reserve Bank of St. Louis
The Use of Credit Instruments
per cent, or $14,037,492, were in checks. The currency, $912,802, was 6.1 per cent of the aggregate. The specie, $227,595, was about 1.5 per cent, and gold formed about three-fifths of it.
In three instances the percentage of checks shown in the returns is 100. These are the deposits of New Mexico, Vermont, and Wyoming. The volume of deposits in each case, however, is so trifling that no significance attaches to this fact. Otherwise, the percentages run very like those of the national banks. Aside from the three cases of 100 per cent just mentioned, the highest percentage returned is 99.1 from Idaho. Iowa has 98.9, North Dakota 98.3, Oregon 97.2, South Dakota 98.5, and New York 92.8.
Omitting the three cases of 100 per cent already mentioned, as not being significant, 14 States show a percentage of 95 or more, and 30 of 90 or more. The lowest percentage is that of the District of Columbia, 44.6; but, as remarked before, the total deposits are a little over $4,000, and therefore trifling. Nevada has 54 per cent, but here again the deposits are only $3,000. The state banks are evidently not used throughout the country by wholesale dealers to so great an extent as the national banks. Nevertheless the proportion of checks in the deposits runs very much the same.
The wholesale deposits of the private banks.—The wholesale returns of private banks were trifling, being in the aggregate only $230,366. More than half the returns come from four states, Ohio, Virginia, Texas, and Illinois. Therefore they are not significant.
135
Digitized for FRASER http://fraser.stlouisfed.org/ Federal Reserve Bank of St. Louis
National Monetary Commission
The wholesale deposits of the loan and trust companies.— The aggregate of these was $6,780,000, 94.9 per cent being in checks. There were only ten States in which the amount of deposits was large enough to be worthy of consideration for our purpose. New York leads with deposits of $2,670,267, and 95 per cent of them in checks. Massachusetts comes second with $1,953,447 a n d 97 per cent in checks. Of the States with deposits of more than $50,000, the highest percentage, 97.4, is afforded by Missouri, from deposits of $201,000. The lowest, 88.7, is Pennsylvania, whose total deposits of this class are $754,000.
Nothing need be said about the wholesale deposits of the savings banks, because the number of banks and the amount involved are both unimportant. Moreover, as has been already remarked, the accounts of the mutual savings banks in no case have any bearing upon our present inquiry.
The aggregate wholesale deposits.—Tables X and XI give the aggregate wholesale deposits in all reporting banks by states and by classes of banks, respectively. The total is $124,823,762, of which 96.4 per cent is in checks. The highest percentage is that of Nebraska, 99.2. New York has 97.8, and so is fourth in the list, Kansas, Minnesota, and Nebraska all showing larger percentages. Massachusetts shows the same as New York.
The percentage of checks shown in the table of wholesale deposits by banks is approximately the same for the national banks, the state banks, the loan and trust
136
Digitized for FRASER http://fraser.stlouisfed.org/ Federal Reserve Bank of St. Louis
The Use of Credit Instruments
companies, and the stock savings bank. The loan and trust companies show the highest percentage. The private banks show 84.8 per cent of their wholesale deposits in checks. The percentage for mutual savings banks is not significant.
RETURNS OF WHOLESALE DEPOSITS IN REPRESENTATIVE
RESERVE CITIES AND BY GEOGRAPHICAL DIVISIONS.
There is no reason for so detailed an examination of the wholesale returns as was thought necessary in the case of the retail deposits. Nevertheless the data are presented in corresponding tables to show the similarity of practice in different parts of the country. It will be seen that, despite the fact that so large a part of the business shown by the returns was done in these cities, the proportion of payments made by check is not materially different from that of the rest of the country. Nor is the proportion for the country at large, without the reserve cities, modified much by omitting the reserve cities. There is a change of about 3 per cent—from about 97 to 94.
Reserve cities—Wholesale deposits of national banks.—It will be seen that of the deposits returned by the national banks for representative reserve cities, 98.2 per cent was in the form of credit documents. Remembering what has been said about the preponderating influence of the national banks as compared with other commercial banks, the significance of this high figure is emphasized. Of wholesale deposits of sixty-five odd millions returned by the national banks for these reserve cities, nearly 29 were in New York, and the percentage of checks and other
137
Digitized for FRASER http://fraser.stlouisfed.org/ Federal Reserve Bank of St. Louis
National Monetary Commission
credit instruments in the deposits of that city was 99.4. Boston shows 98.6, Cincinnati 96.8, and Chicago and St. Louis each have 98.4. Thirteen of the 24 cities show 95 per cent of checks or over in their wholesale deposits. Brooklyn's figure is low because, of course, of the fact that it is a suburb of New York, and its business is mostly done in that city.
Reserve cities—Wholesale deposits of state banks.—The amount in this case is insignificant, being a little less than $8,000,000. Of this whole amount over $6,000,000 are in the deposits of the three central reserve cities. The percentage of Chicago, 93.8, in this case is highest; New York shows 92.9, St. Louis 92.6. The amounts involved in the other cases are small.
Reserve cities—Wholesale deposits of other banks.—The details for the other banks show no peculiarities, excepting that the amounts involved are much smaller and the percentages run somewhat lower. Here, again, we see that these banks, aside from the loan and trust companies, play a relatively small part in the volume of the commercial life of the country when contrasted with the national banks. The tables show the distribution of the deposits among the various classes of banks.
Reserve cities—Aggregate wholesale deposits.—The table of aggregate wholesale deposits for the reserve cities shows that the percentages run highest for the five cities of New York, Boston, St. Louis, Chicago, and Philadelphia, in the order named. The average for the five is 98.1 per cent and for the whole country 97.4.
138
Digitized for FRASER http://fraser.stlouisfed.org/ Federal Reserve Bank of St. Louis
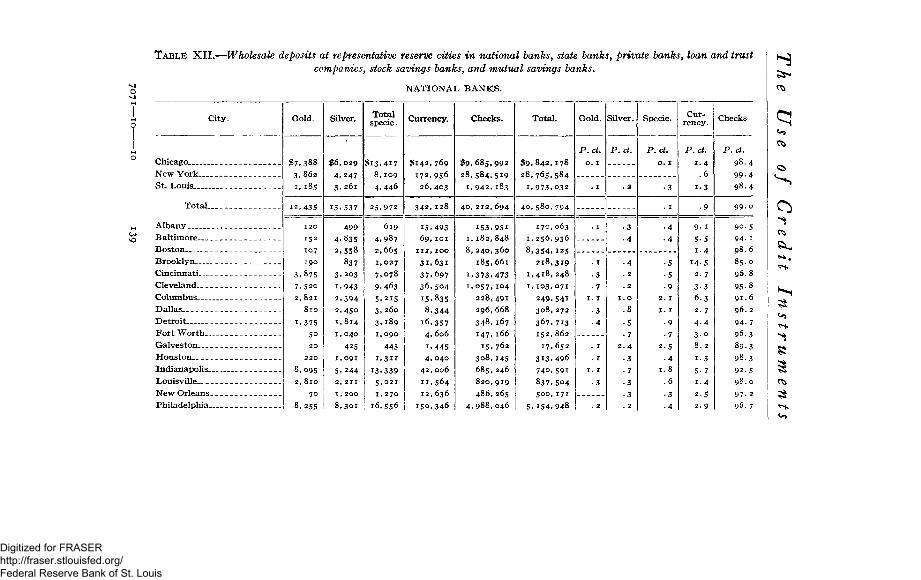
TABLE XII.—Wholesale deposits at representative reserve cities in national banks, state banks, private banks, loan and trust companies, stock savings banks, and mutual savings banks.
NATIONAL BANKS.
City,
Chicago
New York
St. Louis
TotaL.
Albany
Baltimore
Boston
Brooklyn
Cincinnati
Cleveland
Columbus
Dallas
Detroit
Fort Worth__
Galveston
Houston
Indianapolis-
Louisville
New Orleans.
Philadelphia.
Gold,
$7,388
3 . 8 6 2
1,185
12 ,435
120 152 107 190
3 ,875 7 ,520
2 , 8 2 1
810
i , 3 7 5
50
20
220
8 ,095
2 ,810
70
8 ,255
Silver.
$6, 029
4 ,247
3 , 261
[ $ i 3 , 4 i 7 8 ,109 4 ,446
13,537
499
4,835
2.558
837
3,203
1,943
2,394
2,450
1,814
1, 040
425
1,091
5 , 2 4 4
2, 211
1, 200
8 ,301
Total specie.
25 ,972
619
4.987
2,665
1,027
7,078
9,463
5.215
3, 260
3.189
1.090
445
1,311
13,339
5,021
1, 270
16 ,556
Currency.
$ 1 4 2 , 7 6 9
1 7 2 , 9 5 6 26,403
3 4 2 , 1 2 8
15,493
69,101
III,100
31.631
37.697
36,504
15 .835
8 , 3 4 4
i 6 , 3 5 7 4, 606
1.445 4 , 0 4 0
42,006
1 1 , 5 6 4 12, 636
1 5 0 , 3 4 6
Checks.
$ 9 , 6 8 5 , 9 9 2
2 8 , 5 8 4 , 5 1 9 1 , 9 4 2 , 1 8 3
40, 212, 694
i 5 3 , 9 5 i 1 . 1 8 2 , 8 4 8
8, 240,360 185 ,661
1 , 3 7 3 , 4 7 3 1 ,057 , 104
2 2 8 , 4 9 1
2 9 6 , 6 6 8
348, 167
147 ,166
1 5 , 7 6 2
3 0 8 , 1 4 5 6 8 5 , 2 4 6
8 2 0 , 9 1 9
486 ,265
4 , 9 8 8 , 0 4 6
Total.
$ 9 , 8 4 2 , 1 7 8
2 8 , 7 6 5 , 5 8 4 1 , 9 7 3 , 0 3 2
4 0 , 5 8 0 , 794
170 ,063
1. 2 5 6 , 9 3 6
8 . 3 5 4 , 1 2 5
2 1 8 , 3 1 9
1 , 4 1 8 , 2 4 8
1 , 1 0 3 , 0 7 1
2 4 9 . 5 4 1 3 0 8 , 2 7 2
367.713 152 ,862
17 .652
3 1 3 . 4 9 6
740 ,591
8 3 7 , 5 0 4 500 ,171
5. 154 .948
Gold. Silver.
P.ct.
o. 1
. 1
• 3
• 7 1 .1
•3
• 4
1. I
• 3
P.ct.
1 .0
. 8
• 5
• 7
2 . 4
•3
•7
• 3
• 3 . 2
Specie.
P.ct.
o. 1
•5 •5
• 9 2. 1 1 .1
• 9
• 7
2-5
• 4 1 .8
.6
• 3 • 4
Currency.
P.ct.
1 .4 .6
1.3
• 9
Checks
P.ct.
9 8 . 4
9 9 - 4
9 8 . 4
9 9 . 0
9 . 1
5 . 5
1 . 4
4 . 5
2 . 7
3 3
6.3
2 - 7
4 . 4
3 - o
8 . 2
i - 3
5 - 7
1 . 4
2 - 5
2 . 9
9 0 . 5
94- 1 9 8 . 6
8 5 . 0
9 6 . 8
95-8
91 . 6
96. 2
94-7
9 6 . 3
8 9 . 3
9 8 . 3
9 2 . 5 9 8 . 0
9 7 . 2
96. 7
Digitized for FRASER http://fraser.stlouisfed.org/ Federal Reserve Bank of St. Louis
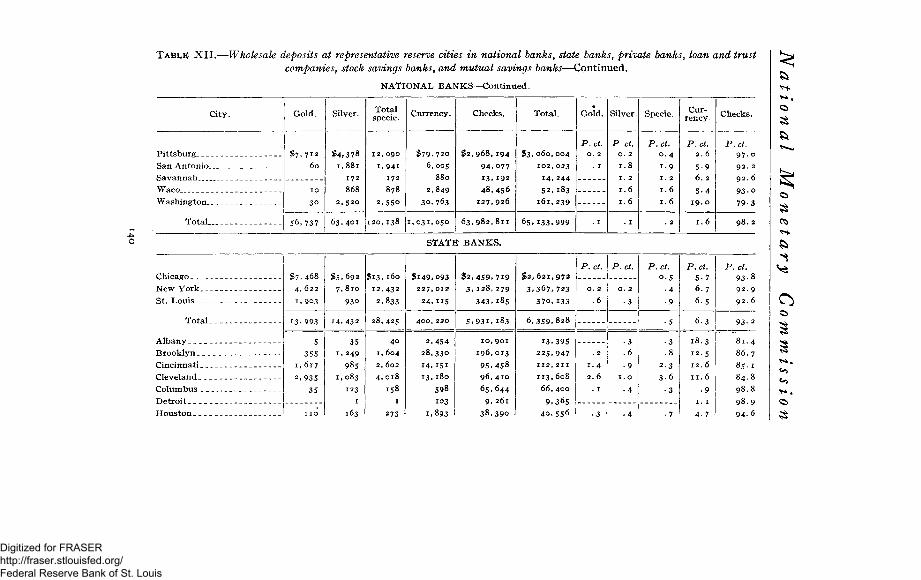
T A B L E XII.—Wholesale deposits at representative reserve cities in national banks, state banks, private banks, loan and trust
companies, stock savings banks, and mutual savings banks—Continued.
NATIONAL BANKS—Continued.
City.
Pittsburg _ San Antonio__ ___ _
Waco Washington
Total
Gold.
$ 7 , 7 1 2
60
10
30
56, 737
Silver.
$4 ,378 1,881
172 868
2 ,520
63 .401
Total specie.
12 ,090
1 .94 i 172
878
2 .550
120 ,138
Currency.
$ 7 9 . 7 2 0 6 ,005
880
2 ,849
30 .763
1 ,031 ,050
Checks.
$ 2 , 9 6 8 , 1 9 4
9 4 . 0 7 7 1 3 . 1 9 2 4 8 , 4 5 6
1 2 7 , 9 2 6
6 3 , 9 8 2 , 8 1 1
Total.
$ 3 , 0 6 0 , 0 0 4
102 ,023
1 4 , 2 4 4
5 2 . 1 8 3
161, 239
6 5 . 1 3 3 , 9 9 9
Gold.
P.ct. 0. 2
. 1
. 1
Silver.
P ct. 0. 2
1 .8
1. 2
1 .6
1 .6
. 1
Specie.
P.ct. 0 . 4 1 9 1. 2 1 .6 1 .6
. 2
Currency.
P.ct. 2 . 6
5 -9 6 . 2
5 - 4 19. 0
1 . 6
Checks.
P.ct. 9 7 . 0 92 . 2
93.o 79. 3
98. 2
STATE BANKS.
8
Chicago New York_ St. Louis._
Total _
Albany Brooklyn _. Cincinnati _ Cleveland. Columbus _ Detroit Houston _ _
$7,468
4, 622
1.903
13.993
5
355
1,617
2,935
35
$5,692
7,8io
930
14,432
35
,249
985
,083
123
1
163
$13,160
12,432
2.833
28,425
40
1, 604
2, 602
4.018
158
$149,093
227,012
24,115
400,220
2,454
28,330
14. 151
13.180
598
103
1.893
$2,459,719
3,128,279
343.185
5.931. 183
10,901
196,013
95.458
96,410
65,644
9, 261
38,390
$2, 621,972
3.367,723
370,133
6,359,828
13,395
225,947
112,211
113,608
66,400
9.365
40,556
P.ct.
O. 2
.6
1.4
2.6
P.ct.
O. 2
•3
•3
.6
•9
I. O
•4
P.ct. 5 4
9
P.ct. 5-7
6.7
6.5
6.3
18.3
12.5
12. 6
11.6
• 9
1. 1
P.ct. 93-8
92.9
92. 6
93- 2
81.4
86.7
85.1
84.8
98.8
98.9
94-6
Digitized for FRASER http://fraser.stlouisfed.org/ Federal Reserve Bank of St. Louis
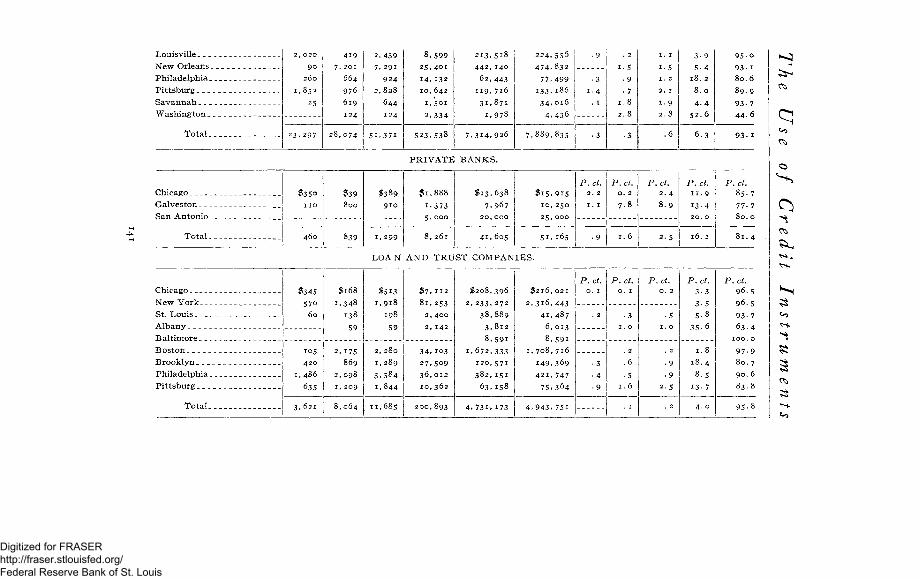
Philadelphia__ _ __
Pittsburg
Washington__
Total
2 , 0 2 0
90
260
I . 8 5 2
25
23. 297
419
7, 201
664
976
619
124
28 ,074
2 ,439
7, 291
924 2 ,828
644 124
5 I . 3 7 I
8 , 5 9 9
2 5 , 4 0 1
14, 132
10 ,642
1, So i
2 , 3 3 4
5 2 3 , 5 3 8
2 1 3 , 5 1 8
4 4 2 , 1 4 0
6 2 , 4 4 3
119 ,716
3 1 , 8 7 1
1.978
7 , 3 1 4 , 9 2 6
224 ,556
4 7 4 . 8 3 2
7 7 . 4 9 9 I 3 3 . I 8 6
3 4 . 016
4 . 4 3 6
7 . 8 8 9 , 8 3 5
• 9
•3
1. 4
. 1
• 3
. 2
i - 5
• 9
• 7
1.8
2 . 8
• 3
1 . 1
i - 5
1. 2
2. 1
1-9
2 . 8
. 6
3 - 9
5-4
1 8 . 2
8 . 0
4 . 4
5 2 . 6
6 -3
9 5 - o
93- 1
8 0 . 6
89 . 9
9 3 . 7
9 3 . 1
PRIVATE BANKS.
Chicago
Galveston _ _ _
San Antonio _ _
Total_ __
$35o
n o
4 6 0
$39 800
8 3 9
$389 910
1, 299
$ 1 , 8 8 8
1.373
S.ooo
8 , 2 6 1
$ 1 3 , 6 3 8
7 .967
2 0 , 0 0 0
4 1 , 6 0 5
$ 1 5 , 9 1 5
1 0 , 2 5 0
2 5 , 0 0 0
5 i . 165
P.ct. 2. 2 1. 1
P.ct.
O. 2
7.8
I
• 9 1 . 6
P.ct.
2 . 4
8 . 9
2 . 5
P.ct.
1 1 . 9 13 -4 2 0 . 0
16. 1
P.ct. 8 5 . 7
77- 7 8 0 . 0
8 1 . 4
LOAN AND TRUST COMPANIES.
Chicago
St. Louis __
Albany
Baltimore _ __
Boston, _ _
Brooklyn. _ _ .
Philadelphia _
Pittsburg
Total
$345
570
60
105
420
1,486
635
3 . 6 2 1
$168
1.348
138
59
2, 175
869
2, 098
I , 209
8 ,064
$513 I , 9 l 8
198
59
2, 280
1, 289
3 , 5 8 4
1,844
11,685
$ 7 , 1 1 2
8 1 , 2 5 3
2, 400
2, 142
3 4 , 1 0 3
2 7 , 5 0 9
36, 012
10 ,362
200 ,893
$ 2 0 8 , 3 9 6
2 , 2 3 3 , 2 7 2
3 8 , 8 8 9
3 , 8 1 2
8 , 5 9 1
1 , 6 7 2 , 3 3 3
120 ,571
382, 151
6 3 . 1 5 8
4 . 7 3 1 . 1 7 3
$ 2 1 6 , 0 2 1
2 , 3 1 6 , 4 4 3
4 1 , 4 8 7
6, 013
8 , 5 9 i 1 , 7 0 8 , 7 1 6
149 ,369
4 2 1 , 7 4 7
7 5 . 3 6 4
4 . 9 4 3 . 75 i
P . ct. 0 . I
. 2
•3
•4
•9
P.ct. 0 . 1
•3 1 . 0
. 2
. 6
•5 1.6
. 1
P.ct. 0. 2
•5 1 . 0
. 2
•9
• 9
2 -5
. 2
P.ct.
3-3
3-5
5-8
3 5 - 6
1.8
1 8 . 4
8 .5
13- 7
4 . 0
P.ct. 96
96
93
63
1 0 0
97
80
90
83
9 5
5
5 7
/|
0
7 6
8
8
Digitized for FRASER http://fraser.stlouisfed.org/ Federal Reserve Bank of St. Louis
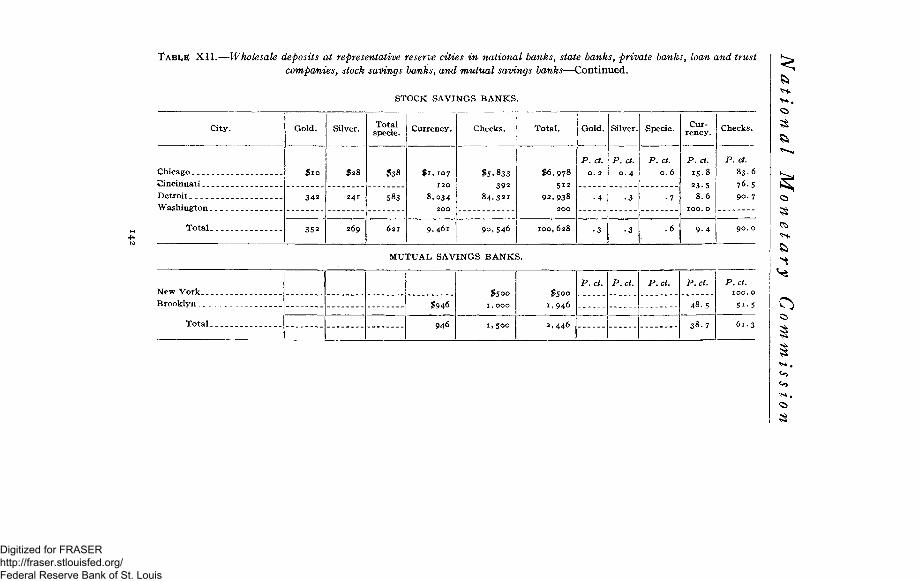
TABL,E XII.—Wholesale deposits at representative reserve cities in national banks, state banks, private banks, loan and trust
companies, stock savings banks, and mutual savings banks—Continued.
STOCK SAVINGS BANKS.
City.
Chicago Cincinnati Detroit Washington
Total
Gold.
$ I O
342
352
Silver.
$28
2 4 1
269
Total specie.
$38
583
6 2 1
Currency.
$ 1 , 1 0 7
120
8,034 200
9.461
Checks.
$5,833 392
84.321
90,546
Total.
$6,978 512
92,938 200
100 ,628
Gold.
P.ct. 0. 2
• 4
•3
Silver.
P.ct.
0 . 4
• 3
• 3
Specie.
P. ct. 0.6
• 7
. 6
Currency.
P. ct. 15-8
23.5 8.6
100. 0
9 . 4
Checks.
P.ct. 83.6
76. 5 90. 7
90. 0
MUTUAL SAVINGS BANKS.
New York__ __ Brooklyn ___ . ._ _
Total___.
$946
946
$500
I , OOO
1,500
$500
1,946
2,446
P.ct. P.ct. P.ct. P.ct.
48.5
38.7
P.ct. IOO. 0
51- 5
61.3
ft
<5>
Digitized for FRASER http://fraser.stlouisfed.org/ Federal Reserve Bank of St. Louis
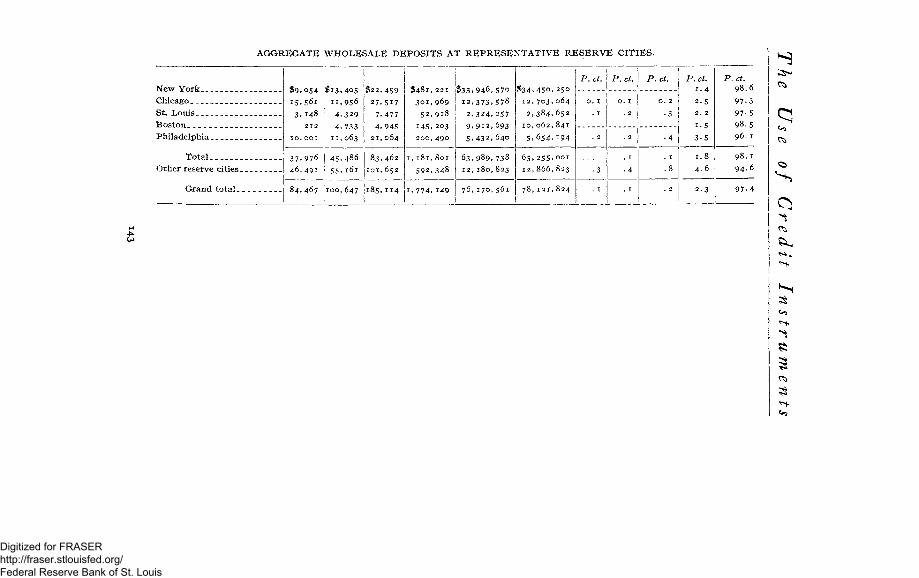
AGGREGATE WHOLESALE DEPOSITS AT REPRESENTATIVE RESERVE CITIES.
Chicago
St. Louis
Philadelphia
Tota l
Other reserve cit ies
Grand tota l
$ 9 , 0 5 4
15 .561
3 , 1 4 8
2 1 2
1 0 , 0 0 1
3 7 , 9 7 6
46 ,491
84 ,467
$13 ,405
n , 9 5 6
4 , 3 2 9
4, 733 11 ,063
45-486
5 5 , 1 6 1
100,647
$ 2 2 , 4 5 9
27 ,517
7 .477
4 .945 21, 064
8 3 , 4 6 2
101, 652
185 ,114
$ 4 8 1 , 2 2 1
3 0 1 , 9 6 9 5 2 , 9 1 8
145 ,203 2 0 0 , 4 9 0
i , 181 ,801
5 9 2 , 3 4 8
1 , 7 7 4 , 1 4 9
$ 3 3 , 9 4 6 , 5 7 0
1 2 , 3 7 3 , 5 7 8
2 , 3 2 4 , 2 5 7 9 , 9 1 2 , 6 9 3
5 , 4 3 2 , 6 4 0
6 3 , 9 8 9 , 738 1 2 , 1 8 0 , 8 2 3
7 6 , 1 7 0 , 5 6 1
$ 3 4 , 4 5 0 , 250
1 2 , 7 0 3 , 0 6 4
2 , 3 8 4 , 6 5 2
1 0 , 0 6 2 , 8 4 1
5 , 6 5 4 , 194
6 5 , 2 5 5 , 0 0 1 1 2 , 8 6 6 , 8 2 3
7 8 , 1 2 1 , 8 2 4
P.ct.
0 . 1
. 1
. 2
• 3
. 1
P.ct.
0 . 1
. 2
. 2
. 1
• 4
. 1
P.ct.
O. 2
•3
• 4
. 1
. 8
. 2
P.ct.
1.4
2 .5
2 . 2
1.5
3 -5
1.8
4 -6
2 . 3
P.ct. 9 8 . 6
97 -3
97-5
9 8 . 5 96. 1
98. 1
94 -6
9 7 - 4
8
Digitized for FRASER http://fraser.stlouisfed.org/ Federal Reserve Bank of St. Louis
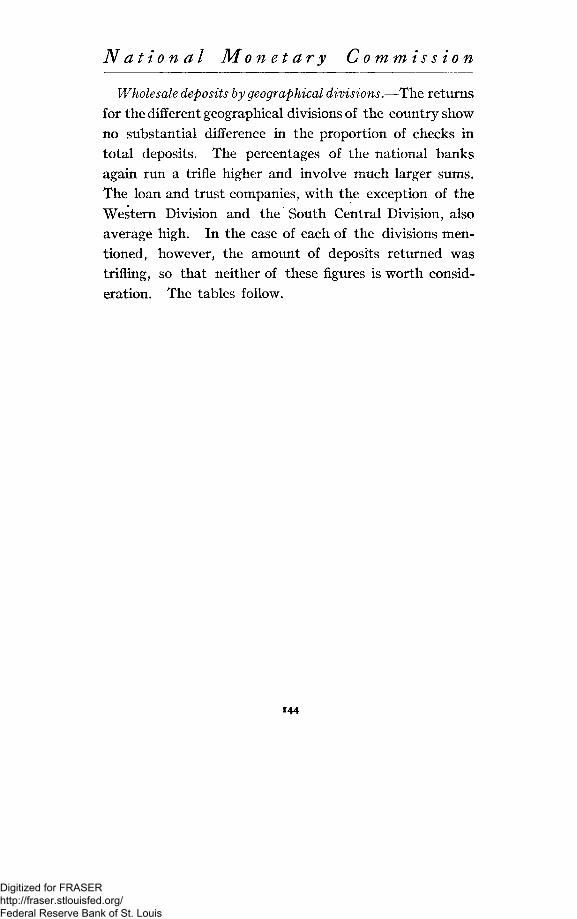
National Monetary Commission
Wholesale deposits by geographical divisions.—The returns for the different geographical divisions of the country show no substantial difference in the proportion of checks in total deposits. The percentages of the national banks again run a trifle higher and involve much larger sums. The loan and trust companies, with the exception of the Western Division and the South Central Division, also average high. In the case of each of the divisions mentioned, however, the amount of deposits returned was trifling, so that neither of these figures is worth consideration. The tables follow.
144
Digitized for FRASER http://fraser.stlouisfed.org/ Federal Reserve Bank of St. Louis
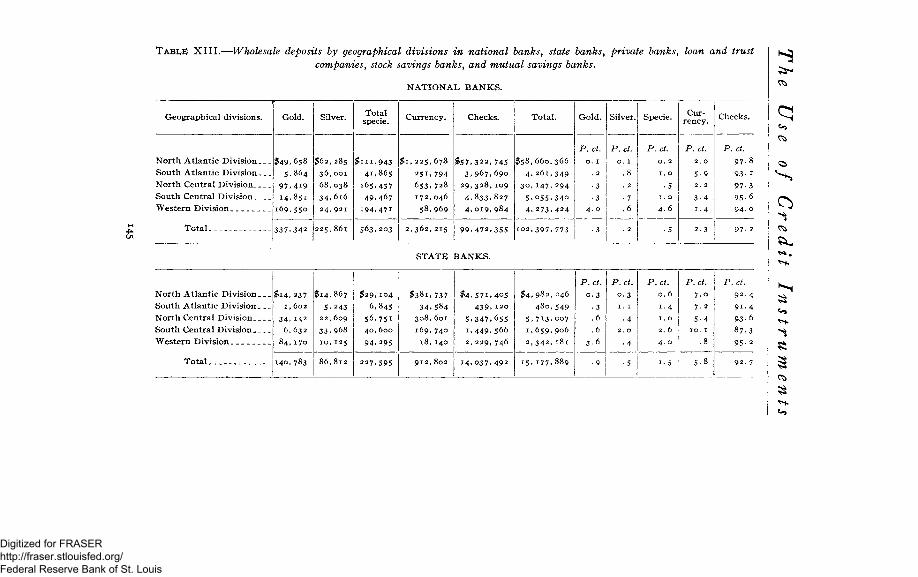
T A B L E XIII.—Wholesale deposits by geographical divisions in national banks, state banks, private banks, loan and trust companies, stock savings banks, and mutual savings banks.
NATIONAL BANKS.
\ Geographical divisions.
Nor th At lant ic Div is ion S o u t h At lant ic Div is ion Nor th Central Divis ion
S o u t h Central Div is ion Western Div is ion
Tota l __
Gold.
$ 4 9 , 6 5 8
5 . 8 6 4
9 7 . 4 1 9 14 .851
169.5S0
337 .342
Silver.
$62 ,285 3 6 , 0 0 1 6 8 , 0 3 8 34. 616 24 ,921
225 ,861
Total specie.
$ I I I , 9 4 3
41.865
165,457 49 ,467
i 9 4 , 4 7 i
563 ,203
Currency.
$ 1 , 2 2 5 , 6 7 8
251, 794 6 5 3 , 7 2 8 172 ,046
5 8 , 9 6 9
2 , 3 6 2 , 2 1 5
Checks.
$ 5 7 , 3 2 2 , 7 4 5 3 . 9 6 7 , 6 9 0
2 9 , 3 2 8 , 1 0 9
4 . 8 3 3 . 8 2 7
4 , 0 1 9 , 9 8 4
9 9 , 4 7 2 , 3 5 5
Total .
$ 5 8 , 6 6 0 , 3 6 6
4 . 2 6 1 , 3 4 9
30 , 147. 294 5 . 0 5 5 . 3 4 0
4. 2 7 3 . 4 2 4
102 ,397 . 773
Gold.
P.ct.
0. 1
. 2
•3
•3 4 . 0
• 3
Silver.
P.cL
0. 1 .8 . 2 • 7 . 6
. 2
Specie.
P.ct.
0. 2
1. 0
•5 1. 0 4 . 6
• 5
Currency.
P.cL
2. 0
5-9
2. 2
3 - 4
1. 4
2.3
Checks.
P.cL
9 7 . 8 93- 1 97 -3 95 -6 9 4 - 0
97. 2
*9
STATE BANKS.
North At lant ic Div is ion S o u t h At lant ic Div i s ion Nor th Central Divis ion
South Central Divis ion Western Divis ion
Tota l
$14 ,237 1, 602
34 ,142 6 .632
8 4 . 1 7 0
140,783
$14 ,867
5 .243 22 ,609
3 3 . 9 6 8
10 ,125
8 6 , 8 1 2
$ 2 9 , 1 0 4
6 ,845
56 ,751 4 0 , 6 0 0
94 ,295
227,595
$ 3 8 i , 7 3 7
3 4 , 5 8 4 3 0 8 , 6 0 1 169 ,740
18 ,140
912 ,802
$ 4 , 5 7 1 , 4 0 5 4 3 9 , 1 2 0
5 . 3 4 7 , 6 5 5 1 , 4 4 9 , 5 6 6
2 , 2 2 9 , 7 4 6
1 4 , 0 3 7 , 4 9 2
$ 4 , 9 8 2 , 2 4 6
4 8 0 , 5 4 9
5 . 7 i 3 , o o 7 1 ,659 , 906 2, 342 , 181
15, 1 7 7 , 8 8 9
P.ct.
0 . 3
• 3 .6 .6
3 - 6
• 9
P.ct.
0 . 3
1. 1
• 4 2. 0
• 4
• 5
P.ct. 0 . 6
1 . 4
1. 0 2 . 6
4 . 0
i - 5
P.ct. 7 . 0
7 . 2
5 - 4
10. 1 . 8
5 - 8
P.ct.
9 2 . 4
9 1 . 4 9 3 - 6
8 7 . 3
95- 2
92. 7
Digitized for FRASER http://fraser.stlouisfed.org/ Federal Reserve Bank of St. Louis
TABLE XIII.—Wholesale deposits by geographical divisions in national banks, state banks, private banks, loan and trust
companies, stock savings banks, and mutual savings banks—Continued.
PRIVATE BANKS.
Geographical divisions.
North Atlantic Division South Atlantic Division North Central Division South Central Division Western Division
Tota l . _
Gold.
$5
1.105 n o
25
1 ,245
Silver.
$86
686 800
4
1 .576
Total specie.
$ 9 i
1. 79 i 910
29
2 ,821
Currency.
$680
15 .843 9 , 2 1 8
6 .373 20
3 2 , 1 3 4
Checks.
$ 1 7 , 8 6 3
2 8 , 7 9 1
117 .367
28 ,465
2 ,925
1 9 5 . 4 i i
Total.
$ 1 8 , 6 3 4
44 . 634
1 2 8 , 3 7 6
3 5 . 7 4 8
2 . 9 7 4
2 3 0 , 3 6 6
Gold.
P.ct. 4 . 0
• 9 •3 . 8
• 5
Silver.
P.ct.
0 . 5
•5 2. 2
. 1
• 7
Specie.
P.ct.
0 . 5
1 .4
2 . 5
• 9
1. 2
Currency.
P.ct.
3 - 7
3 5 - 5 7 . 2
17 -9
•7
14. 0
Checks.
P.ct. 95-8 64.5
9 1 . 4 7 9 . 6 9 8 . 4
8 4 . 8
LOAN AND TRUST COMPANIES.
N orth Atlantic Division South Atlantic Division North Central Division South Central Division Western Division
Total
$ 6 , 4 1 1
1 2 5
1, 710
5
4 0 0
8 , 6 5 1
$ 1 4 , 0 1 0
1 .859
1.843 2 6 6
7 5
18 ,053
$ 2 0 , 4 2 1
1 ,984
3 , 5 5 3 2 7 1
4 7 5
2 6 , 7 0 4
$303 ,224
2 ,884
14 .830
4 8 9
321 ,427
$ 5 , 8 8 8 , 9 6 7
104 ,497 4 3 8 , 2 1 2
1,183
1,503
6 , 4 3 4 , 3 6 2
$6 , 2 1 2 , 6 1 2
109 ,365
4 5 6 . 5 9 5
1 .943 1 .978
6 , 7 8 2 , 4 9 3
P.ct. 0. 1
. 2
• 4
• 3
20. 2
. r
P.ct. 0. 2
i - 7
• 4
13 .7 3 - 8
• 3
P.ct.
0 . 3
1 - 9
. 8
14. 0 24. 0
• 4
P.ct.
4 - 9
2 . 6
3 - 2
25. 1
4- 7
P.ct. 9 4 - 8
9 5 . 5 9 6 . 0
6 0 . 9
75-9
94- 9
o ^ ^ ^ ^ ^ ^ CN O
3
Digitized for FRASER http://fraser.stlouisfed.org/ Federal Reserve Bank of St. Louis
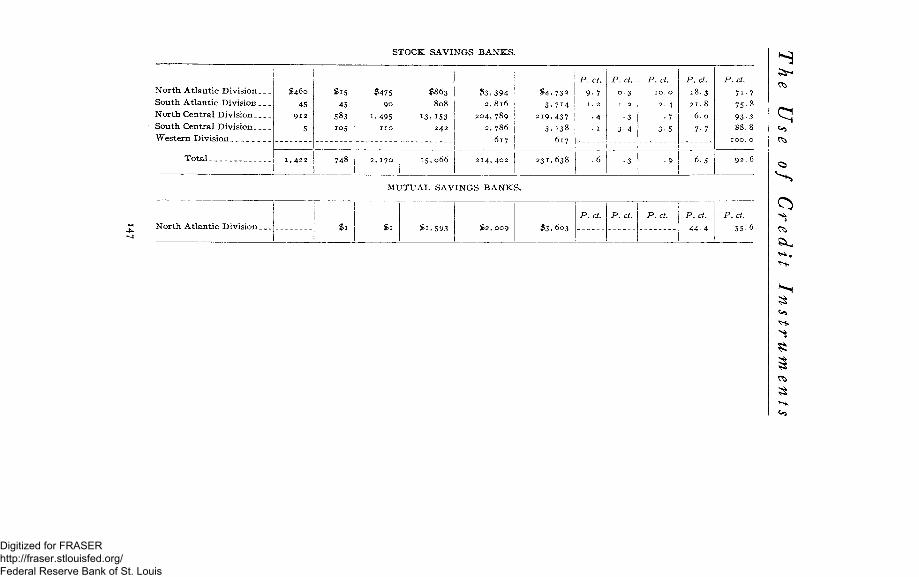
STOCK SAVINGS BANKS.
North Atlantic Division South Atlantic Division North Central Division South Central Division Western Division
Total _
$460
45 9 1 2
5
1 , 4 2 2
$15
45
583
105
7 4 8
$475 90
1,495 1 1 0
2 , 1 7 0
$863
808
13 ,153 2 4 2
15 ,066
$ 3 , 3 9 4 2 , 8 1 6
2 0 4 , 7 8 9
2, 786
617
2 1 4 , 4 0 2
$ 4 , 7 3 2
3 , 714
219 .437 3 , 1 3 8
617
2 3 1 . 638
P.ct. 9- 7 1 . 2
• 4 . 1
. 6
P. ct.
0 . 3
1 . 2
•3
3 -4
P.ct. 1 0 . 0
2 . 4
• 7
3-5
1
• 3 • 9
P.ct. 1 8 . 3
2 1 . 8
6 . 0
7- 7
6 .5
P.ct.
7 1 . 7
75-8
93 -3
8 8 . 8
92 . 6
MUTUAL SAVINGS BANKS.
North Atlantic Division. $ 1 $ 2 , 0 0 9 $3,603 P. ct. P.ct. P. ct.
4 4 - 4
P.ct. 55-6
<0
Digitized for FRASER http://fraser.stlouisfed.org/ Federal Reserve Bank of St. Louis
National Monetary Commission
Conclusion as to wholesale deposits.—There is no reason to think that the percentage of checks represented in the deposits of the wholesale dealers of the various classes of banks is not typical. The average percentage in the total wholesale deposits of $124,823,762 is 96.3. The percentage does not diffei materially in the small cities from what is shown in the returns of the banks of the large cities. If we eliminate from the deposits of the five States of Illinois, Iowa, Kansas, Nebraska, and Texas the returns from banks in cities of more than 25,000, as was done in the case of the retail deposits, we find, as the following table shows, that there is no important change.
148
Digitized for FRASER http://fraser.stlouisfed.org/ Federal Reserve Bank of St. Louis
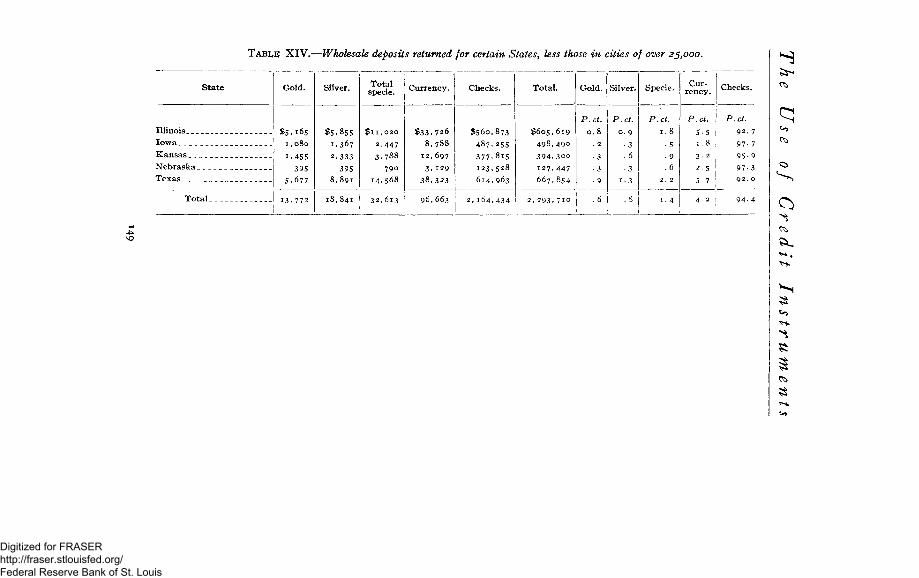
TABLE XIV.—Wholesale deposits returned for certain States, less those in cities of over 23,000.
State
Illinois
Iowa
Kansas
Nebraska__ __
Texas
Total
Gold.
$ 5 , 1 6 5 1,080
1.455
395
5 .677
13 ,772
Silver.
$ 5 , 8 5 5
1.367
2 ,333
395
8 ,891
18 ,841
Total specie.
$ 1 1 , 0 2 0
2 .447
3 . 7 8 8
790
14 ,568
3 2 , 6 1 3
Currency.
$ 3 3 , 7 2 6
8 , 7 8 8
12 ,697
3 . 129
3^,323
9 6 , 6 6 3
Checks.
$ 5 6 0 , 8 7 3
4 8 7 . 2 5 5
3 7 7 . 8 1 5
1 2 3 , 5 2 8
6 1 4 . 9 6 3
2, 164 .434
Total.
$ 6 0 5 , 6 1 9
4 9 8 , 4 9 0
3 9 4 . 3 o o
127 ,447
6 6 7 , 8 5 4
2 , 2 9 3 , 7 1 0
Gold.
P.ct.
0 . 8
. 2
•3
•3
• 9
. 6
Silver.
P.ct.
0 . 9
•3 . 6
•3
i - 3
. 8
Specie.
P.ct.
1.8
• 5
• 9 . 6
2. 2
1. 4
Currency.
P.ct.
5-5
1.8
3- 2
2 . 5
5- 7
4. 2
Checks.
P.ct.
92 . 7
97- 7
95- 9
97- 3 92 . 0
94- 4
vO
^ ^
Digitized for FRASER http://fraser.stlouisfed.org/ Federal Reserve Bank of St. Louis
National Monetary Commission
Moreover, the percentages for North and South Dakota, in which there are no cities of the size mentioned, range among the highest. There are no important sources of error; hence no allowances to be made for corrections. Further, there is no variation of importance in the percentages shown by the different classes of banks, excepting of course the mutual savings banks, which are of no significance for the present purpose. The general conclusion is, therefore, that no reason exists for not accepting 96 as the percentage which fairly represents the proportion of wholesale business of the country done by checks on the day in question.
THE "AIX OTHERS" CLASS OF DEPOSITS.
What constitutes the class of "all others" deposits in the bank returns ? The intention was to have these figures represent the deposits of all accounts excepting those of retail and wholesale merchants and of other banks. This seems to be the interpretation put upon the question by nearly all the banks that sent in replies. However, some were in doubt whether to include the accounts of other banks and bankers and gave figures from both points of view, while some doubtless included the deposits made to the credit of other banks. Some of the blanks returned were accompanied with letters explaining the character of the "all others" class in the bank concerned. To supplement this information and prevent as far as possible any mistake about the inclusion of the accounts of other banks, the writer asked a dozen or so of the correspondents to explain what kind of accounts
150
Digitized for FRASER http://fraser.stlouisfed.org/ Federal Reserve Bank of St. Louis
The Use of Credit Instruments
were included in this class. Except in one case, the answers were that bank accounts were not included and that the list would be too long and too miscellaneous to give. However, the following were instanced: Museums, publishers, railroads, livery, printers, machinists, travelers, hotels, insurance, treasurers of organizations, real estate, pool rooms, laundry, professional men, brokers, stock and bond financial corporation accounts, church and charitable accounts, public funds, students and college professors, women, " those who have no specific business," and all other individual accounts. Of course many other classes are included. The list is a very miscellaneous one, representing pretty nearly all classes in the community. Doubtless the deposits of corporations and other business firms constituted a large part of the deposits of this class made on the day in question.
Allowances and corrections to be made in the figures of the "all others11 class of deposits.—It is urged by critics that in this class there must be a great many duplications of checks already counted. It is difficult to see how this is possible. The retail merchant has deposited his receipts, the wholesale merchant has deposited his receipts, and since the accounts of other banks are nearly all excluded from the third class, it is difficult to see how there can be much duplication.
The first obvious thing to do is to add to the returns received an amount to allow for the deposits of banks that did not reply. In the opinion of the writer it is not important to do this for this class of deposits any more than it is for the wholesale deposits. The character of the returns
151
Digitized for FRASER http://fraser.stlouisfed.org/ Federal Reserve Bank of St. Louis
National Monetary Commission
is too nearly uniform, and the percentage of the credit documents everywhere ranges about the same. The indications are that the percentage of credit documents in any reasonable proportion of the total returns will be as accurate as a percentage derived from the total itself. It has been urged that the banks which do not reply to such inquiries are the small banks in the agricultural districts and that in their deposits we would expect naturally a larger proportion of money. The figures show, however, that this claim is not well founded. The proportion of credit paper in the deposits of the banks of the agricultural portions of the country ranges higher, if anything, than in the cities, so far as concerns the retail trade and, inferen-tially, individual deposits. Moreover, it is a mere assumption that the nonreporting banks are mainly the small banks in the country districts. A great many city banks also did not report. However, even if we were to admit the point and were to add the total deposits of the non-reporting banks on the day in question, and class them all on the money rather than the credit side of our account, it is doubtful whether the proportion of credit paper in the total receipts would be materially changed.
It is in this third class of deposits that we find the accounts of the broker and the speculator. What shall we do with these? In discussing this subject, Francis A. Walker once said:a " Was I not justified in saying that a very large part of the credit transactions, the amount of which is so freely adduced to show the comparative insignificance of the cash transactions, are, with respect to
a Discussions in Economics and Statistics, 1:204.
152
Digitized for FRASER http://fraser.stlouisfed.org/ Federal Reserve Bank of St. Louis
The Use of Credit Instruments
that object, purely fictitious? Those who roll as sweet morsels under their tongues such gigantic figures as thirty and forty thousand millions a year, in speaking of the work of a single clearing house, are really deceived if they think that these sums represent either transactions that would have taken place did not the clearing-house mill stand ready to take the grist, or transactions the nonexistence of which would impair production and legitimate trade."
The remark of Mr. Walker is true, but not pertinent. Very likely the vast volume of these transactions would not take place in the absence of our credit system, or if it were less efficient. It is true, too, doubtless, that the blotting out of many of these transactions would not impair what Mr. Walker calls " legitimate trade." A large proportion of deposits in this "all others" class undoubtedly represents speculative transactions, all of which, or practically all of which, are settled with credit paper, and most of which the business of the country might well get on without. This, however, is no reason for omitting them from consideration in the inquiry in hand. To say that they are not a part of legitimate trade and therefore should be omitted, is beside the point. The important question is whether they constitute a part of the demand for a medium of exchange. The "legitimacy" is not in question. It would be just as reasonable to omit from our money column the deposits of people who make their living by gambling with cards, or at horse races, or in other illegitimate ways, as to omit the "speculative" or "fictitious" transactions in the credit column of the bank
153
Digitized for FRASER http://fraser.stlouisfed.org/ Federal Reserve Bank of St. Louis
National Monetary Commission
returns. These transactions call for money for reserve purposes if not for direct payment; therefore they constitute one of the factors in the demand for money. For that reason they should be included.
If, however, the whole volume of "speculative'' transactions on the day in question should be eliminated, all of it being regarded as represented in the figures of our deposits by checks, the proportion of checks in the remaining deposits would evidently still be over 90 per cent. For, surely, of the $502,800,000 of "all others" deposits not more than half were probably speculative in their character. If, therefore, we subtract $250,000,000 from the total, and also subtract $250,000,000 from the check account, we have remaining $232,000,000 odd of checks in a total of $252,000,000 of deposits, which is 92.1 per cent.
The returns of "all other depositors" from the national banks.—The aggregate deposits of the "all others" class returned by the national banks is $407,268,393, of which 96.8 per cent, or $394,157,077, was in checks. Of the whole amount, nearly $230,000,000 were returned by the banks of New York, and 99 per cent of their deposits was in credit paper. Massachusetts had $34,000,000 of deposits, of which 97.1 per cent were in credit paper. Pennsylvania had $32,000,000 of deposits, with 92.4 per cent of checks. Illinois had $25,000,000 of deposits, with a percentage of 96.3 in checks. California shows $7,000,000 of deposits, of which 94.8 per cent were in checks. Missouri, with $15,000,000 of deposits, had 97.4 per cent in checks; and the Ohio returns show nearly $8,000,000 of
154
Digitized for FRASER http://fraser.stlouisfed.org/ Federal Reserve Bank of St. Louis
The Use of Credit Instruments
deposits, with 90.3 per cent in checks. The highest percentage is that of New York, the 99 already mentioned; the lowest is that of Rhode Island, which shows 81.5, with aggregate deposits of $338,328. Ten States show a percentage of 95 or more in checks, and 28 States show a percentage of 90 or more.
The all other deposits of state banks.—The aggregate deposits of this class in the returns of the state banks was $62,172,815, or less than one-sixth of the figures given by the national banks. Of this amount, 94.1 per cent, or $58,512,025, were in checks. The largest deposits of this class in the state banks of any State were those of New York, aggregating a little over $34,600,000, with a percentage of 98 in checks. Illinois shows nearly $7,000,000 of deposits of this class in the state banks, with 89.9 per cent as the proportion of checks. The lowest percentage returned was 47.8 for the District of Columbia, with total deposits of $28,994. The returns of three States show a percentage of checks of 95 or more; 17 States show 90 or more. The averages as a rule run a trifle lower than those of the national banks, but the difference is not great and the amounts involved are considerably smaller.
All other deposits of the private banks.—The aggregate of these was $2,198,677, and of this amount $1,878,319, or 85.4 per cent, was in checks. Omitting the returns of the two States of Idaho and Wisconsin, in which the total deposits were in checks, but insignificant in amount, we find that the highest percentage of checks was in Massachusetts. This was caused by the returns of a firm of peculiar character, rather stock jobbing than banking,
7071—10 n 155
Digitized for FRASER http://fraser.stlouisfed.org/ Federal Reserve Bank of St. Louis
National Monetary Commission
and the deposits were the money of customers held for investment. It is therefore not a fair case. Having regard only to those States in which the aggregate deposits of this class exceeded $50,000, we find Illinois in the lead with deposits of over $1,000,000, with 90 per cent in checks. The next largest is Indiana, with a little over $200,000 and 85 per cent in checks. Iowa has $250,000, with 94 per cent in checks; Ohio, with $186,000, has 66 per cent in checks; Pennsylvania, with $58,000, has 50 per cent; and Texas, with $70,000, has 83 per cent. The relatively inferior part played by the private banks in the commercial transactions of the country is strikingly emphasized by this table.
All other deposits of loan and trust companies.—The sum of these was $27,650,000, and 93.6 per cent of this amount was deposited in the form of checks. Nearly half of the total amount is credited to New York State, the amount being $12,576,000. Massachusetts has a little over $5,000,000; Pennsylvania has $2,871,000; New Jersey, $1,749,000; Missouri, $1,534,000. Illinois is the only other State whose banks of this kind show more than $500,000 of these deposits. Omitting the cases in which a high percentage of checks was derived from very small returns, we find that New York leads with 96.6 per cent of checks; that Maryland is second with 95.& per cent, and Massachusetts third with 95.5 per cent
All other deposits of the savings banks. — These amounted to $3,523,449, of which $1,170,097, or 33 per cent, were in checks. Of the whole amount, two millions are to be credited to the stock savings banks and
156
Digitized for FRASER http://fraser.stlouisfed.org/ Federal Reserve Bank of St. Louis
The Use of Credit Instruments
about one and one-half millions to the mutual savings banks. The stock savings banks by themselves gave an average of 83.9 per cent in checks. Omitting again two unimportant cases in which the percentage of checks deposited was 100, we find that the percentages in stock savings banks range from 95.8 in Pennsylvania, with $367,000 of deposits, to 25.6 in Alabama, with $481,000 deposits. Michigan shows 76 per cent, with $113,000 deposits; Illinois, 77.8, with $116,000; California, 76.3, with $439,000. Ohio, with $60,000 deposits has 64 per cent in checks.
In the case of the mutual savings banks, including under this name all savings banks of a cooperative character, we find the percentage of checks in " all others " deposits, which, of course, are the general deposits, running much lower than for the commercial banks. The average is 31.8 per cent of total deposits of $1,509,818. It is remarkable that the percentage should be so high for these banks, which, it has been commonly supposed, are the banks of the laboring classes. Some of the deposits may have been made by out-of-town customers with money orders or drafts, but it is doubtful whether this amount could be very much on the day in question. Massachusetts, which is par excellence the mutual savings bank State, received on March 16, in the banks which reported, $235,661, of which 38 per cent was deposited in the form of checks. New York State, on the other hand, with its trustee savings banks, which are essentially of the same class, received $776,561, of which one-fourth, or 25 per cent, was in checks. The comparison strength-
157
Digitized for FRASER http://fraser.stlouisfed.org/ Federal Reserve Bank of St. Louis
National Monetary Commission
ens the suspicion which some students of the subject have had for some time—that the savings banks of Massachusetts are used pretty largely by people not of the laboring class. A similar inference may apparently be drawn from Connecticut's figures of $84,420 of deposits with 35 per cent of checks. The aggregate returns of all classes in these banks is $1,509,818, of which $480,640, or 31.8 per cent, are in checks. Such a showing as this does not strengthen the argument against postal savings banks.
The percentage of the figures of the stock savings banks shows pretty clearly that they, at any rate, are not the banks of the wage-earners.
Conclusions as to the percentage of checks in all others deposits.—The total deposits of this class are $502,817,194, of which 95.9 per cent were in checks. Of this whole amount $499,000,000 were held by the national and state banks and loan and trust companies, and $481,-500,000 of their holdings were deposited in the form of checks and other credit instruments. This is 96.5 per cent. The deposits of these institutions, therefore, dominate the percentage by their proportion of checks, which is only six-tenths of 1 per cent above the average. We have seen that to this class of deposits, if anywhere in our returns, we must look for duplications and for all so-called speculative and gambling transactions which some people would throw out. We have seen further, however, that most of the banks which replied to the circular were careful to omit from this class their deposits of banks and bankers. Some such deposits were undoubtedly included.
158
Digitized for FRASER http://fraser.stlouisfed.org/ Federal Reserve Bank of St. Louis
The Use of Credit Instruments
The duplication of checks, however, is not as great as would have been the case if all the banks had included these. No reason appears for thinking that the percentage of checks in the deposits of this class does not fairly represent the methods of payment ordinarily followed by those whose accounts made up these deposits, and we may fairly take the average of 95 as representing this class. The tables follow, arranged as for the other classes of deposits:
159
Digitized for FRASER http://fraser.stlouisfed.org/ Federal Reserve Bank of St. Louis
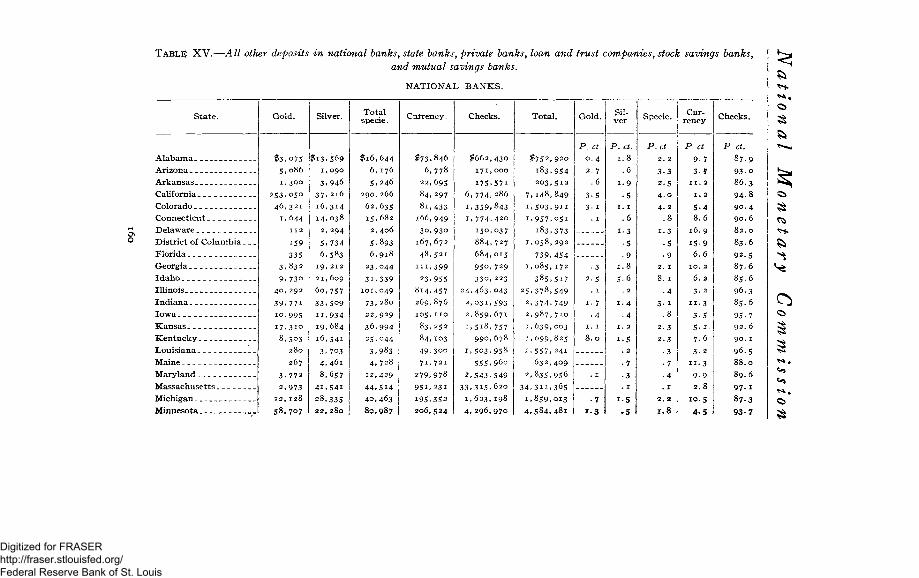
TABLE XV.—A11 other deposits in national banks, state banks, private banks, loan and trust companies, stock savings banks, and mutual savings banks.
N A T I O N A L B A N K S .
ft
ft
<-9
S t a t e .
A l a b a m a
A r i z o n a
A r k a n s a s
California
Colorado
C o n n e c t i c u t
D e l a w a r e
D i s t r i c t of C o l u m b i a
F l o r i d a
Georg ia
I d a h o
I l l inois
I n d i a n a
I o w a
K a n s a s
K e n t u c k y
L o u i s i a n a
Ma ine
M a r y l a n d
M a s s a c h u s e t t s
Mich igan
Minnesota
Gold.
$3,075
5, 086
1.300
2 5 3 . 0 5 0
4 6 , 3 2 1
1,644 112
159
335 3 . 8 3 2
9. 730 4 0 , 2 9 2
3 9 , 7 7 1
i o , 9 9 5
I 7 . 3 I O
8 .503
280
267
3 . 7 7 2
2 , 9 7 3 1 2 , 1 2 8
5 8 , 7 0 7
Silver.
| $ i 3 . 569
1,090
3 . 9 4 6
3 7 . 2 1 6
16 ,314 14 .038
2 ,294
5 , 7 3 4
6 .583 19 ,212
21 ,609
6 0 , 7 5 7
3 3 , 5 0 9
H . 9 3 4
19 ,684
1 6 , 5 4 1
3 . 703
4 , 4 6 1
8 ,657
4 L 5 4 I
28 ,335 2 2 , 2 8 0
T o t a l specie.
# 1 6 , 6 4 4 6 ,176
5 .246
290 ,266
62 ,635
15 ,682
2 , 406
5 ,893
6 ,918
23 ,044
3 L 3 3 9 101 ,049
73 ,280
2 2 , 9 2 9
3 6 , 9 9 4
25 ,044 3 , 9 8 3 4 , 7 2 8
12 ,429
4 4 , 5 1 4
40,463
8 0 , 9 8 7
Currency .
$ 7 3 , 8 4 6
6 , 7 7 8 22 ,695
8 4 , 2 9 7
8 i , 4 3 3 166 ,949
3 0 , 9 3 0
167, 672
4 8 , 5 2 1
111 ,399
23 ,955
8 i 4 , 4 5 7
269 ,876
105, n o
83, 252
84 ,103
4 9 , 3 o o
71 , 721
279 ,978
951 ,231
195,352
206 ,524
Checks .
$662,
i 7 i ,
175,
6 , 7 7 4 ,
1,359,
1. 774,
150,
884,
684,
95o,
33o,
2 4 , 4 6 3 ,
2, 031 ,
2 , 8 5 9 ,
1 ,518,
990,
1 ,503 ,
555 ,
2 , 5 4 3 ,
3 3 . 3 1 5 , 1 ,623 ,
4 , 2 9 6 ,
430
000
5 7 i
286
843
420
037
727
015
729
223
043
593
671
757
678
958
960
549
620
198
97o
T o t a l .
$752,
183, 203,
, 1 4 8 ,
, 5 0 3 ,
, 9 5 7 ,
183, , 0 5 8 ,
739, , 0 8 5 ,
385,
3
2 , 3 7 4 ,
2 , 9 8 7 ,
1 ,639,
1 ,099,
1 ,557,
632,
2 , 8 3 5 ,
3 4 , 3 i i ,
1 ,859,
4 , 5 8 4 ,
2 5 , 3 7 8
920
954
512
849
911
051
373
292
454
172
517
549
749
710
003
825
241
409
956
365
013
Gold .
P. ct
0 . 4
2 . 7
. 6
3 -5
3- 1
• 7
1 .3
Silv e r
P.ct, 1.8
. 6
1-9 •5
1. 1
.6 1.3
•5 9
1.8
5-6
. 2
1.4 • 4
1-5
.5
Specie.
P.ct 2. 2
3 - 3
2 . 5
4 . 0
4 . 2
. 8
1 . 3
•5 . 9
2. 1
8 . 1
• 4
3- 1 . 8
2.3
2 . 3
• 3 • 7 . 4 . 1
2 . 2
1 .8
Currency
P ct 9-7
3-7 1 1 . 2
1. 2
5 -4 8 . 6
16. 9
1 5 . 9 6.6
10. 2
6 . 2
3 - 2
11 .3
3 -5
5 - 1 . 7 . 6
3 - 2
1 1 . 3 9 - 9
2 . 8
1 0 . 5
4-5 1
Checks ,
\ct.
8 7 . 9
9 3 - 0
8 6 . 3
9 4 - 8
9 0 . 4
90. 6
8 2 . 0
8 3 . 6
9 2 - 5
8 7 . 6
85
96
85
95
92
90. 1
9 6 . 5
8 8 . 0
8 9 . 6
9 7 - 1
8 7 . 3
9 3 . 7
Digitized for FRASER http://fraser.stlouisfed.org/ Federal Reserve Bank of St. Louis
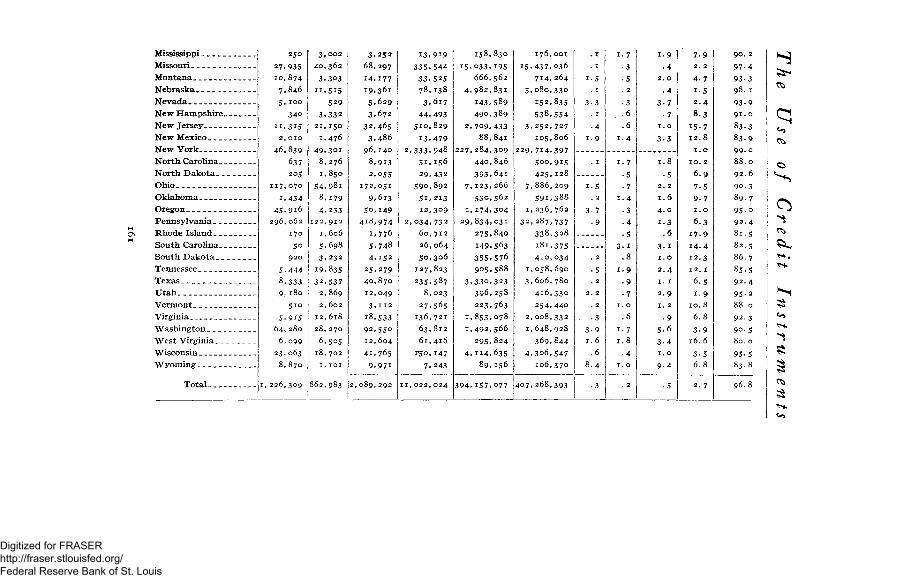
Mississippi
Missouri
Montana
Nebraska
Nevada
New Hampshire
New Jersey
New Mexico
New York
North Carolina
North Dakota
Ohio
Oklahoma
Oregon
Pennsylvania
Rhode Island
South Carolina
South Dakota
Tennessee
Texas
Utah
Vermont
Virginia
Washington
West Virginia
Wisconsin
Wyoming
Total
250 27 ,935 10 ,874
7,846
5. 100 34o
11 .315 2, 010
4 6 , 8 3 9
637 205
117 ,070
1 ,434
4 S . 9 i 6
296 ,062
170
50
920
5 , 4 4 4
8 ,333 9, 180
5 i o
5 .915 6 4 , 2 8 0
6, 099
23 ,063
8 ,870
1 , 2 2 6 , 3 0 9
3 , 0 0 2
4 0 , 3 6 2
3 ,303
11 .515
529
3 . 3 3 2
21 ,150
i , 4 7 6
4 9 , 3 0 1
8 , 2 7 6
1,850
5 4 , 9 8 i
8 , 1 7 9
4 ,233
122 ,912
1, 606
5 , 6 9 8
3 , 2 3 2
19 ,835
3 2 , 5 3 7
2 ,869
2, 602
12 ,618
28 ,270
6 ,505 18,702
1, 101
862 ,983
3 . 2 5 2 68 ,297
14 ,177 19 .361
5 , 6 2 9 3 . 6 7 2
32 ,465
3.486
9 6 , 1 4 0
8 ,913
2 ,055
172,051
9 ,613
5 0 , 1 4 9
4 1 8 , 9 7 4
1,776
5,748
4 ,152
2 5 , 2 7 9
4 0 , 8 7 0
12 ,049
3 , 1 1 2
i 8 , 5 3 3
9 2 , 5 5 0
12,604 41 ,765
9 , 9 7 i
2 , 0 8 9 , 2 9 2
I 3 , 9 i 9
3 3 5 . 5 4 4
33,525
7 8 , 1 3 8
3 , 6 i 7
4 4 , 4 9 3 5 1 0 , 8 2 9
1 3 , 4 7 9
2 , 3 3 3 . 9 4 8
5 1 . 1 5 6
2 9 , 4 3 2
590,892
51,213
12,309
2,034,732
60,712
26,064
50,306
127,823
235,587 8,023
27,565
136,721
63,812
61,416
1*50,147
7.243
:i, 022, 024
158,830
15.033,195
666,562
4,982,831
143,589
490,389
2,709.433
88,841
227,284,309
440,846
393,641
7,123,266
530,562
1,174,304
29,834,031
275,840
149,563
355.576
905.588
3,330,323
396,258
223,763
1.853,078
1,492,566
295,824
4, 114,635
89.156
394.157,077
176,OOI
15,437,036
714,264
5,080,330
152,835
538,554
3,252,727
105,806
229,714,397
500,915
425,128
7,886,209
591,388
1,236,762
32,287,737
338,328
i8i,375
410,034
1,058,690
3,606,780
416,330
254,440
2,008,332
1,648,928
369,844
4,3o6,547
106,370
407,268,393
• 4
1-9
1-5
3-7
•9
. 2
• 3
3-9
1.6
.6
8.4
1-7
• 3
•5
. 2
• 3
. -6
.6
1.4
1-7
•5
• 7
1.4
• 3
• 4
• 5
3-1
.8
1.9 • 9
• 7
1.0
.6
1-7
i.9
• 4
2. o
.4
3-7
• 7
I. O
3.3
1.8
• 5
2. 2
1.6
4.0
1-3
.6
3.1
1.0
2.4
1.1
2.9
1. 2
• 9
5.6
3-4
1. o
9-4
•5
7.9
2. 2
4.7
i-5
2.4
8.3
15.7
12.8
1.0
10. 2
6.9
7.5
9.7
I. O
6.3
17.9
14.4
12.3
12. I
6.5
1.9
IO.8
6.8
3-9
16.6
3-5
6.8
90. 2
97-4
93-3
98.1
93-9
91. o
83.3
83.9
99-o
88.0
92. 6
90.3
89.7
95-o
92.4
81.5
82.5
86.7
85.5
92.4
95-2
88.0
92.3
90.5
80.0
95-5
83.8
96.8
<"0
Digitized for FRASER http://fraser.stlouisfed.org/ Federal Reserve Bank of St. Louis
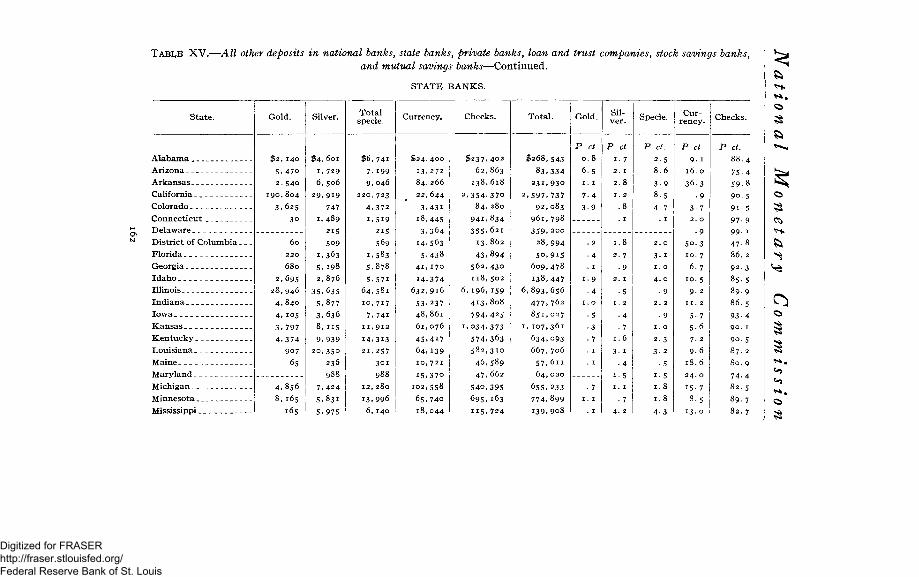
TABI,E XV.—All other deposits in national banks, state banks, private banks, loan and trust companies, stock savings banks, and mutual savings banks—Continued.
S T A T E B A N K S . ft
ft
C5
S t a t e . Gold . Silver. T o t a l specie. Currency . Checks . T o t a l . Gold . Sil
v e r . Specie. Cur r e n c y . Checks .
A l a b a m a
A r i z o n a
A r k a n s a s
California
Co lorado
C o n n e c t i c u t
D e l a w a r e
D i s t r i c t of C o l u m b i a
F l o r i d a
Georg ia
I d a h o
I l l inois
I n d i a n a
I o w a
K a n s a s
K e n t u c k y
L o u i s i a n a
Maine
M a r y l a n d
Mich igan
M i n n e s o t a
Mississippi
$2,I40
S.470
2.540
I90.804
3.62S
30
60
220
680
2,695
28,946
4. 84O
4, 105
3.797
4.374
907
65
4.856
8,165
165
$4,601
1, 729
6,506
29,919
747
1.489
215
509
1.363 5.198
2,876
35.635
5.877
3.636
8,115
9,939
20,350
236
988
7,424
5.831
5.975
$6,741
7. 199
9, 046
220,723
4.372
1,519
215
569
1.583 5.878
5.571
64.581
10,717
7.741 11,912
14,313
21,257
301
988
12,280
13.996
6, 140
$24,400
13.272
84.266
22,644
3.431
i8,445
3.364
14.563
5.438
41.170
14.374
632,916
53.237
48,861
61,076
45.417
64.139
10,721
i5.37o
102,558
65,740
18,044
$237,402
62,863
138.618
2,354.37o
84, 280
941.834 355.621
13.862
43.894
562,430
118,502
6,196,159
413,808
794.425
1,034,373
574,363 582,310
46,589
47,662
540,395
695,163
115.724
$268,
83.
231,
2,597,
92,
961,
359, 28,
5o,
609,
138,
6,893,
477.
851, if 107,
634, 667,
57,
64,
655,
774,
139,
543
334
930
737
083
798
200
994
915
478
447
656
762
027
361
093
706
611
020
233
899
908
P ct
0 . 8
6-5
1. 1
7-4
3 9
P ct
i . 7 2. 1 2 . 8
1. 2
P ct.
2 . 5
8 . 6
3 - 9
8-5
4- 7
• 7 1. 1
2. o
3- 1
1. o 4 . 0
• 9 2. 2
• 9
1. o
2 .3
3- 2
•5
1-5
1.8
1.8
4 -3
P ct
9- 1 16. o
36.3 . 9
3- 7
2. o
• 9
5 0 . 3
10. 7
6 . 7
1 0 . 5
9 . 2
11. 2
5-7
5-6
7-2
9-6
1 8 . 6
24. o
15- 7
8-5
1 3 . 0
P ct.
88
75
59
90
9 i
97
99
47
86
92
85
89
86
93
90
90
87
80,
74
82
89
82,
Digitized for FRASER http://fraser.stlouisfed.org/ Federal Reserve Bank of St. Louis
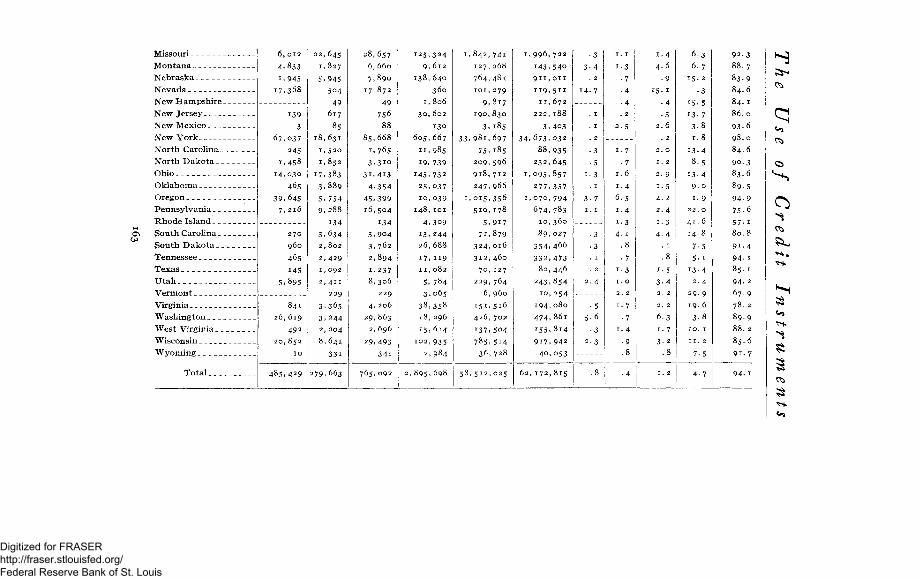
Missouri Montana Nebraska Nevada New Hampshire _ New Jersey New Mexico New York North Carolina _. North Dakota . _ Ohio Oklahoma Oregon Pennsylvania Rhode Island _ South Carolina _ South Dakota . Tennessee Texas Utah Vermont Virginia Washington West Virginia _. Wisconsin Wyoming
Tota l .
6 , 0 1 2
4,833
1 , 9 4 5
1 7 , 3 6 8
1 3 9
3
6 7 , 0 3 7
2 4 5
i , 4 5 8
1 4 , 0 3 0
4 6 5
3 9 , 6 4 5
7 , 2 1 6
8 4 1
2 6 , 6 1 9
4 9 2
2 0 , 8 5 2
1 0
4 8 5 , 4 2 9
2 2 , 6 4 5
1 , 8 2 7
5 , 9 4 5 !
5 0 4
4 9
6 1 7 !
8 5
1 8 , 6 3 1
1 , 5 2 0
1 , 8 5 2
1 7 , 3 8 3
3 , 8 8 9
5 , 7 5 4
9 , 2 8 8
1 3 4
3 , 6 3 4
2 , 8 0 2
2 , 4 2 9
1 , 0 9 2
2 , 4 1 1
2 2 9
3 , 3 6 5
3 , 2 4 4
2 , 2 0 4
8 , 6 4 1
3 3 1
2 7 9 , 6 6 3
2 8 , 6 5 7
6 , 6 6 0
7 , 8 9 0 !
17,872
49
756
88
85,668
1,765 3 , 3 i o
3 L 4 I 3 '
4 , 3 5 4
4 5 , 3 9 9
16 ,504
134
3 , 9 0 4
3, 762
2 ,894
1 , 2 3 7
8 , 3 0 6
2 2 9
4 , 2 0 6
2 9 , 8 6 3
2 , 6 9 6
2 9 , 4 9 3
3 4 1
7 6 5 , 0 9 2
, 8 4 2 ,
1 2 7 ,
7 6 4 ,
1 0 1 ,
9,
1 9 0 ,
3 ,
, 9 8 1 ,
7 5 ,
2 0 9 ,
9 1 8 ,
2 4 7 ,
, 0 1 5 ,
5 1 0 ,
5,
7 r ,
3 2 4 ,
312,
7o,
2 2 9 ,
6 ,
1 5 1 ,
426,
i 3 7 ,
785,
36 ,
74i 268
2 7 9
8 1 7
8 3 0
1 8 5
6 9 7
1 8 5
5 9 6
7 1 2
9 6 6
3 5 6
1 7 8
9 1 7
8 7 9
0 1 6
4 6 0
1 2 7
764
960
5 i 6
7 0 2
5 0 4
5 i 4
728
5 8 , 5 1 2 , 0 2 5
1 , 9 9 6 ,
1 4 3 ,
9 1 1 ,
1 1 9 ,
1 1 ,
2 2 2 ,
3 ,
34,673,
8 8 ,
2 3 2 ,
1 , 0 9 5 ,
2 7 7 ,
1 , 0 7 0 ,
674<
i o ,
8 9 ,
3 5 4 ,
3 3 2 ,
8 2 ,
2 4 3 ,
10 ,
1 9 4
4 7 4 :
1 5 5 :
9 1 7
4 0
7 2 2
5 4 0
o n
5 1 1
6 7 2
1 8 8
4 0 3
0 3 2
9 3 5
6 4 5
8 5 7
3 5 7
7 9 4
7 8 3
3 6 0
0 2 7
4 6 6
4 7 3
4 4 6
8 5 4
2 5 4
0 8 0
8 6 1
8 1 4
9 4 2
0 5 3
6 2 , 1 7 2 , 8 1 5
1 - 7
• 7
1 . 6
1 . 4
6 - 5
1 . 4
1 - 3
4 . 1
. 8
• 7
i - 3 1. o
2 . 2
i - 7
• 7
1 . 4
• 9
1 . 2
2. 9
1-5
4. 2
2 . 4
i - 3
4 - 4
1 - 5
3 - 4
6 . 3
i- 7
3- 2
6.3
6 . 7
1 5 - 2
1 5 . 5
13-7
3 -8
r . 8
13-4
8 - 5
1 3 - 4
9 . 0
1. 9
22. o 4 1 . 6
1 4 . 8
7 - 5
5- 1
13-4
2 . 4
2 9 . 9
1 9 - 6
3 - 8
9 2 . 3
8 8 . 7
8 3 . 9
8 4 . 6
8 4 . 1
8 6 . 0
9 3 - 6
9 4 -
7 5 -
5 7 - 1
8 0 . 8
9 1 . 4
9 4 - 1
8 5 . 1
9 4 - 2
6 7 . 9
7 8 . 2
8 9 . 9
«-5
5 ^
<*9
Digitized for FRASER http://fraser.stlouisfed.org/ Federal Reserve Bank of St. Louis
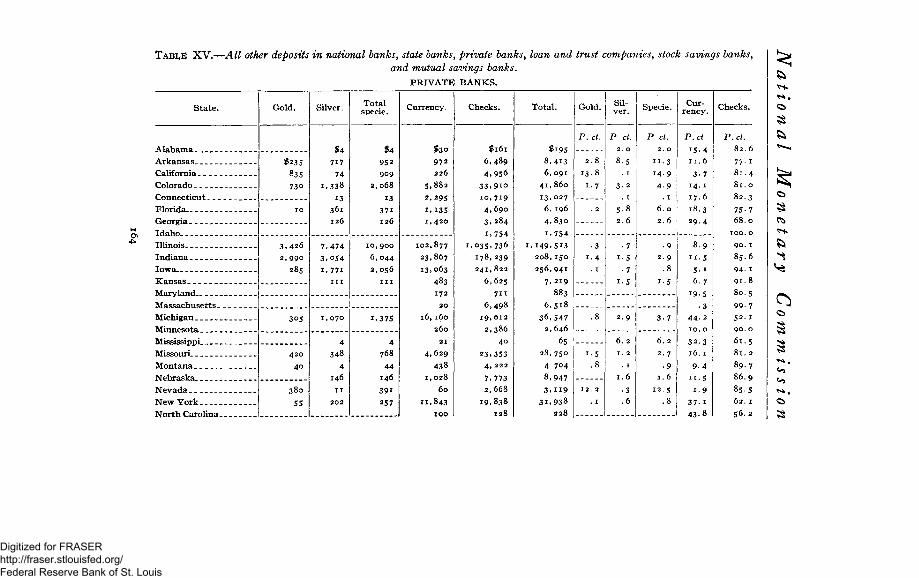
ON
TABLE XV.—All other deposits in national banks, state banks, private banks, loan and trust companies, stock savings banks, and mutual savings banks.
P R I V A T E B A N K S .
S t a t e .
A l a b a m a
Arkansas
California
Colorado
Connect icut
Florida
Georgia
Idaho
Ill inois
Indiana
Iowa
K a n s a s
Maryland
M a s s a c h u s e t t s . .
Michigan
Minnesota
Mississippi
Missouri
Montana
Nebraska
N e v a d a
N e w York
N o r t h Carol ina.
Gold.
$235
835
73o
3.426
2, 990
285
420
40
380
55
Silver.
$4
717
74
. 338
13 36 i 126
7 ,474
3 . 0 5 4
1.771 i n
4 348
4 146
II
Tota l specie.
$4
952
909
2,068
13
37i
126
10 ,900
6.044
2 ,056
i n
1.375
4
768
44
146
39i
257
Currency.
$30
972
226
,882
.295
.135
. 4 2 0
102,877
23.867 13.063
483 172
20
16 ,160
260
21
4 . 6 2 9
438
1,028
60
11 .843 100
Checks.
$161
6 . 4 8 9
4 . 9 5 6
3 3 . 9 i o
1 0 , 7 1 9
4 . 6 9 0
3 . 2 8 4
1 .754
. 0 3 5 , 7 3 6
178 ,239
241 ,822
6 ,625
711
6 , 4 9 8
19 ,012
2,386
40
23 .353 4, 222
7 .773 2,668
19 .838
128
Total .
$ i 9 5
8 . 4 1 3
6 , 0 9 1
4 1 , 8 6 0
1 3 . 0 2 7
6, 196
4 , 8 3 0
1 .754
, 1 4 9 , 5 1 3 2 0 8 , 1 5 0
256 ,941
7 , 2 1 9
883
6 , 5 1 8
3 6 , 5 4 7 2, 646
65
2 8 , 7 5 0
4 704
8 ,947
3 , i i 9 3 L 9 3 8
228
Gold.
P.ct.
2 . 8
1 3 . 8
1.7
•3
1 .4
Silver.
P, ct. 2. o
8 .5
5 . 8
2.6
2 . 9
6.2
I. 2
. I
1 .6
• 3
. 6
Specie .
P ct.
2. o
1 1 . 3 1 4 . 9
4 9 . 1
6.0 2.6
•9
2 . 9
3 7
6.2
2.7
• 9 1 .6
12 .5
Currency.
P.ct
15-4
1 1 . 6
3- 7
14. 1
1 7 . 6
18 .3
2 9 - 4
8 . 9
n - 5
5 1
6 . 7
19 .5
• 3
4 4 - 2
10. o
3 2 . 3
16. 1
9 4
1 1 . 5
i - 9
3 7 . 1
4 3 - 8
Checks.
P.ct.
8 2 . 6
77- 1
8 1 . 4
8 1 . 0
8 2 . 3
75-7
6 8 . 0
100. o
90 . 1
8 5 . 6
94- 1
9 1 . 8
80.
99-
52.
90.
61 .
8 9 . 7
8 6 . 9
85. s
62 . 1
56. 2
<*3
Digitized for FRASER http://fraser.stlouisfed.org/ Federal Reserve Bank of St. Louis
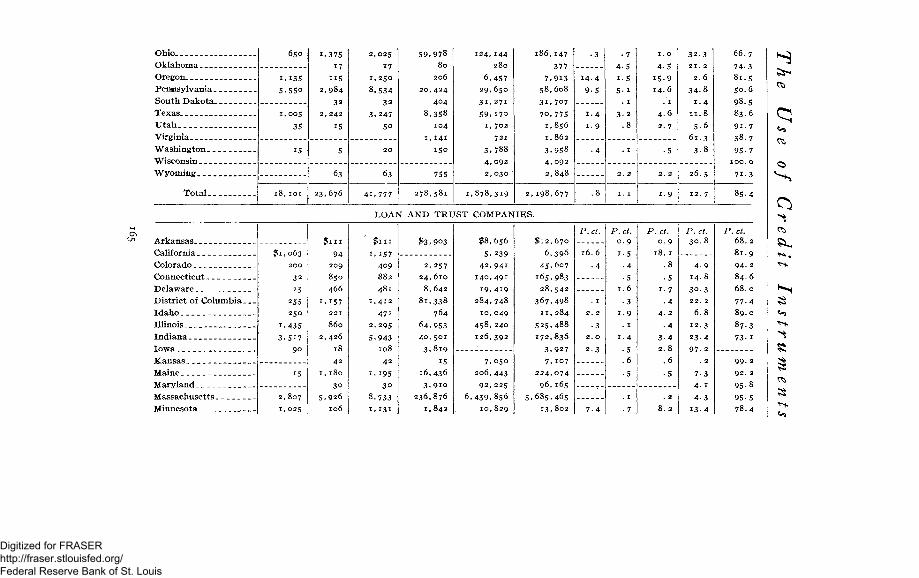
Ohio __ _
Oklahoma
Oregon
Pennsylvania
South Dakota
Texas
Utah
Virginia
Washington
"Wisconsin
Wyoming
Total
6 5 0
1.135 5 . 5 5 o
1,005
35
15
18 ,101
1.375
17
U S
2 ,984
32
2, 242
15
5
6 3
23 ,676
2 ,025
17
1, 250
8 . 5 3 4
32
3 .247
So
2 0
6 3
4 L 7 7 7
5 9 , 9 7 8
80
206
2 0 , 4 2 4
404
8 , 3 5 8
104
1,141
150
7 5 5
278 ,581
124 ,144
280
6 . 4 5 7 2 9 , 6 5 0
3 1 , 2 7 1
5 9 , 1 7 0
1, 702
721
3 , 7 8 8
4 , 0 9 2
2 , 0 3 0 '
1 , 8 7 8 , 3 1 9
186 ,147
377
7 , 9 1 3 5 8 , 6 0 8
3 L 7 0 7
7 0 . 7 7 5 1 .856
1, 862
3 . 9 5 8
4 , 0 9 2
2 , 8 4 8
2 , 1 9 8 , 6 7 7
•3
1 4 . 4
9 5
1 .4
1-9
• 4
. 8
• 7
4 -5
1-5
5 - i
. 1
3 - 2
.8
. 1
2. 2
1. 1
1. 0
4-5
1 5 9
14. 6
. 1
4 . 6
2 .7
5
2. 2
1 9
3 2 . 3 21 . 2
2 . 6
3 4 - 8
1 .4 1 1 . 8
5-6
6 1 . 3 3 . 8
2 6 . 5
12. 7
6 6 . 7
74- 3 8 1 . 5
50. 6
9 8 . 5 8 3 . 6
91 . 7
38. 7
95- 7
71. 3
8 5 . 4
LOAN AND TRUST COMPANIES.
Arkansas
California
Colorado
Connecticut
Delaware
District of Columbia .
Idaho
Illinois
Indiana
Iowa
Kansas
Maine
Maryland
Massachusetts
Minnesota _ .
$111
i , i 5 7
409
882
481
1, 412
4 7 i 2 ,295
5 ,943 108
42
1,195 30
8 ,733
1,131
$3.903
2 ,257
2 4 , 6 1 0
8 , 6 4 2
8 i , 3 3 8
764
6 4 , 9 5 3
4 0 , 5 0 1
3 , 8 1 9
15 16 ,436 3 , 9 i o
236,876
1 .843
$8,656
5 . 2 3 9 4 2 , 9 4 1
1 4 0 , 4 9 1
1 9 , 4 1 9
2 8 4 , 7 4 8
1 0 , 0 4 9
4 5 8 . 2 4 0
1 2 6 , 3 9 2
7 . 0 5 0 2 0 6 , 4 4 3
92 , 225 6 , 4 3 9 . 8 5 6
1 0 , 8 2 9
$ 1 2 , 6 7 0
6 , 3 9 6
4 5 . 6 0 7
165 .983
2 8 , 5 4 2
3 6 7 , 4 9 8
1 1 , 2 8 4
5 2 5 , 4 8 8
1 7 2 , 8 3 6
3 , 9 2 7
7 .107
2 2 4 , 0 7 4
9 6 , 1 6 5
.685,465 1 3 . 8 0 2
P.ct.
1 6 . 6
• 4
2. 2
• 3 2. o
2 . 3
P.ct. 0 . 9
1.5
. 4
. 5
1 .6
3 1 9
. 1
1 .4
•5
.6
•5
ct.
0 . 9
8 . 1
.8
•5
i . 7
• 4 4 . 2
• 4
3 4
2 . 8
.6
5
. 2
8 . 2
P.ct. 3 0 . 8
4 9
1 4 . 8
3 0 . 3 22. 2
6.8
1 2 . 3
2 3 . 4 9 7 - 2
. 2
7 - 3
4- 1
4 -3
13 -4
'.ct.
6 8 . 2
8 1 . 9
94- 2
8 4 . 6
6 8 . 0
7 7 - 4
8 9 . 0
8 7 . 3
73-1
99- 2
92. 2
9 5 - 8
95-5
7 8 . 4
Digitized for FRASER http://fraser.stlouisfed.org/ Federal Reserve Bank of St. Louis
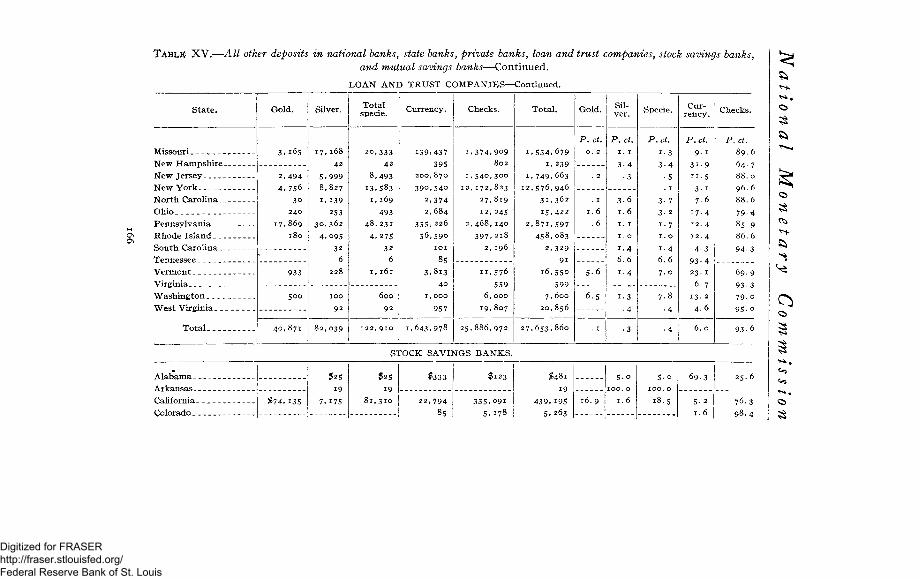
TABLE XV.—A11 other deposits in national hanks, state hanks, private hanks, loan and trust companies, stock savings banks,
and mutual savings hanks—Continued.
LOAN AND TRUST COMPANIES—Continued.
State. Gold. Silver, Total specie. Currency. Checks. Total. Gold. Sil
ver. Specie. Cur
rency. Checks.
Missouri New Hampshire. New Jersey New York North Carolina __ Ohio Pennsylvania Rhode Island South Carolina __ Tennessee Vermont Virginia Washington West Virginia
To ta l .
3 . 1 6 5
2 , 4 9 4 4 , 7 5 6
30 240
1 7 . 8 6 9
1 7 , 1 6 8
42
5 . 9 9 9
8 ,827
1, 139
253 3 0 , 3 6 2
4 ,o95 32
6 228
20 ,333
42
8 ,493
13 .583 1, 169
493 48,231
4 ,275 32
6 1, 161
5 0 0 100
92
600
92
139 ,437 395
200 ,870
3 9 0 , 5 4 0
2 ,374
2,684 3 5 5 , 2 2 6
5 6 , 5 9 0 101
85 3,813
40 1 , 0 0 0
957
1 , 3 7 4 , 9 0 9 802
1 , 5 4 0 , 3 0 0
1 2 , 1 7 2 , 8 2 3
2 7 , 8 1 9
12 ,245
2 , 4 6 8 , 1 4 0
3 9 7 , 2 1 8
2, 196
11 ,576
559 6, 000
19 ,807
1 , 5 3 4 , 6 7 9
1, 239 1 , 7 4 9 , 6 6 3
1 2 , 5 7 6 , 9 4 6 3 1 , 3 6 2 15 ,422
2 , 8 7 1 , 5 9 7 4 5 8 , 0 8 3
2 , 3 2 9
9 i 1 6 , 5 5 0
599 7, 600
2 0 , 8 5 6
P. ct. O . 2
P.d.
3 - 4
• 3
5.6
3-6
1.6
1 .4
6.6
1.4
P.ct. 3 4 5
6-5
4 0 , 8 7 1 8 2 , 0 3 9 1 , 6 4 3 , 9 7 8 2 5 , 8 8 6 , 9 7 2 2 7 , 6 5 3 , 8 6 0
P.ct.
9- 1
3 i - 9
11 .S 3- 1 7-6
1 7 . 4 12. 4
1 2 . 4
4 -3
9 3 - 4
23. 1
6-7 13. 2
4 . 6
6 . 0
P.ct
89
64
88
96
88
79
85
86
94
STOCK SAVINGS BANKS.
$74,135
$25
19
7,175
$25
19
81,310
$333
22,794
85
$123
335,091
5.178
$481
19
439,195
5.263
5.0
100.0
16. 9 1. 6
S-o
100. 0
.8.s
69.3
5-2
1.6
25. 6
76.3
98.4
Digitized for FRASER http://fraser.stlouisfed.org/ Federal Reserve Bank of St. Louis
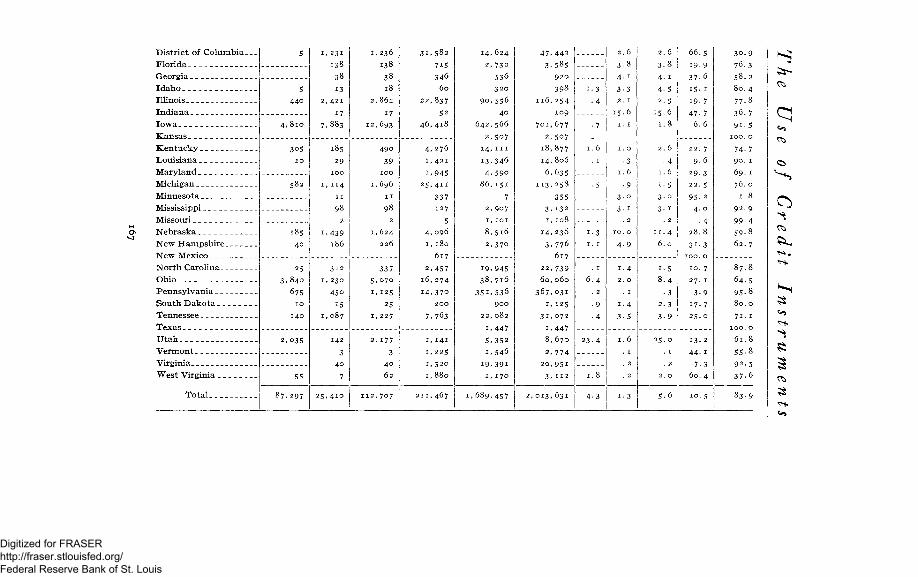
District of Columbia Florida Georgia Idaho Illinois Indiana Iowa Kansas Kentucky Louisiana Maryland Michigan Minnesota Mississippi Missouri Nebraska New Hampshire New Mexico North Carolina Ohio Pennsylvania South Dakota Tennessee Texas Utah Vermont Virginia West Virginia _
Tota l .
5
440
5 8 2
185 40
25 3 . 8 4 0
675 1 0
140
2,03s
87 ,297
i» 231
138
38
13
2 , 4 2 1
17 7 .883
185
29
1 0 0
, 1 1 4
11
98
2
, 439 186
3 1 2
1 , 2 3 0
450
15 1,087
1 4 2
3 4 0
7
, 236
138
38
17 12,693
49o
39
1 0 0
,696
1 1
98
2
, 624
226
337
S.07O
1, 1 2 5
25 1, 2 2 7
2,177
3
40
62
3 1 , 5 8 2
715
346
60
2 2 , 8 3 7
52
4 6 , 4 1 8
4, 276 1, 4 2 1
1,945
2 5 , 4 H
337 127
5
4, 096
1, 1 8 0
617
2 ,457
16 ,274
i 4 , 3 7 o
2 0 0
7,763
1, 141
1, 225
1,520
I, 880
211 ,467
14 ,624
2 ,732
536
3 2 0
9 0 , 5 5 6
4 0
6 4 2 , 5 6 6
2 ,507
14, i n
13 ,346
4 , 5 9 0
8 6 , 1 5 1
7
2, 907
1, 1 0 1
8 ,516
2 ,37o
19 ,945
3 8 , 7 1 6
3 5 1 , 5 3 6
9 0 0
22,082
i,447
5,352
i,546
i9,39i
1, 170
1,689,457
442
585
920
398
254
109
677
507
877
806
635
258
355
132
108
236
776
617
739
060
031
125
072
447
670
774
95i
112
2,013, 631
18,
14:
6
113
6o,
367<
1-3
• 4
6.4
2.6
3-8
4- 1
3-3
2. 1
15.6
1. 1
• 3
1.6
• 9
3-0
10. o
4-9
1.4
2. o
1.4
3-5
1.6
2.6
3-8
4. 1
4-5
2-5
15.6
2.6
• 4
1.6
1-5
3-o
3- 1
. 2
11.4
6.0
i-5
8.4
•3
2.3
3-9
5-6
66.5
19.9
37-6
15- 1
19. 7
47-7
6.6
22. 7
9-6
29.3
22. 5
95-2
4.0
• 4 28.8
3i-3
100. o
10. 7
27. 1
3-9
17.7
25- o
13- 2
44- 1
7-3
60. 4
10.5
30.9
76.3
58.2
80.4
77-8
36.7
9i.5
100. o
74-7
90. 1
69. 1
76. o
1.8
92.9
99-4
59.8
62. 7
87.8
64-5
95-8
80.0
71.1
100. o
61.8
55-8
92.5
37-6
83.9
«-5
Digitized for FRASER http://fraser.stlouisfed.org/ Federal Reserve Bank of St. Louis
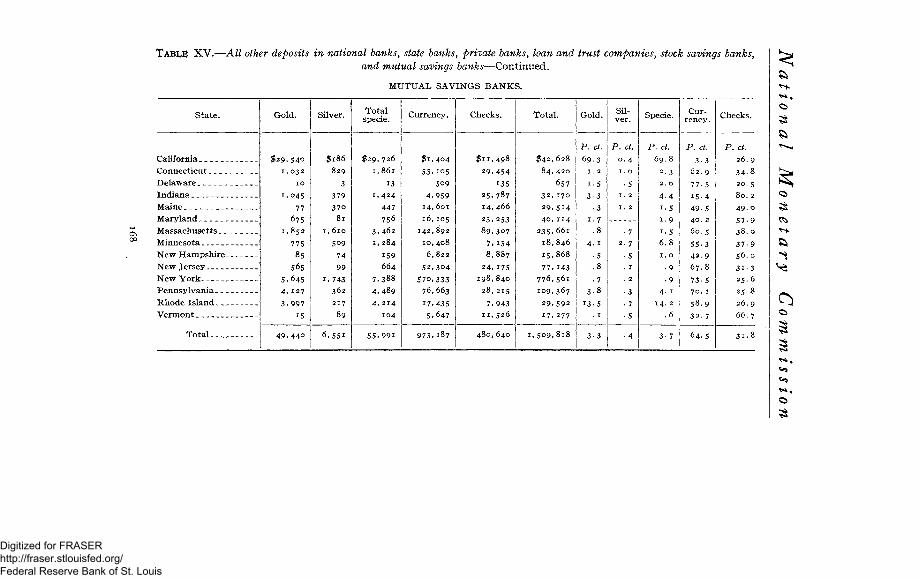
TABLE XV.—All other deposits in national hanks, state banks, private hanks, loan and trust companies, stock savings banks,
and mutual savings banks—Continued.
MUTUAL SAVINGS BANKS.
State.
California Connecticut Delaware Indiana Maine Maryland Massachusetts _ _ Minnesota New Hampshire New Jersey New York Pennsylvania _ _ Rhode Island. _ Vermont
Tota l . __
Gold.
$ 2 9 , 5 4 0
1 , 0 3 2
04s
77
6 7 5
8 5 2
7 7 5
8 5
5 6 5
645
1 2 7
9 9 7
15
Silver.
$ 1 8 6
8 2 9
3
3 7 9
3 7 o
8 1
1 , 6 1 0
5 0 9
7 4
9 9
1 . 7 4 3
362
2 1 7
8 9
6 , 5 5 1
Total specie.
$ 2 9 , 7 2 6
1 , 8 6 1
13
1 , 4 2 4
4 4 7
7 5 6
3 . 4 6 2
1 , 2 8 4
1 5 9
664
7 , 3 8 8
4 , 4 8 9
4 , 2 1 4
1 0 4
5 5 , 9 9 1
Currency.
$ i , 4 0 4
5 3 . 1 0 5
5 0 9
4 , 9 5 9
1 4 , 6 0 1
1 6 , 1 0 5
1 4 2 , 8 9 2
1 0 , 4 0 8
6 , 8 2 2
5 2 , 3 0 4
5 7 0 , 3 3 3
7 6 , 6 6 3
1 7 , 4 3 5
5 . 6 4 7
9 7 3 , 1 8 7
Checks.
$ 1 1 , 4 9 8
2 9 , 4 5 4
i 3 5
2 5 . 7 8 7
1 4 , 4 6 6
2 3 . 2 5 3
8 9 , 3 0 7
7 , 1 5 4
8,887 2 4 , i 7 5
1 9 8 , 8 4 0
2 8 , 2 1 5
7 , 9 4 3
1 1 , 5 2 6
480,640
Total.
$ 4 2 ,
8 4 ,
32,
29<
4 0 ,
2 3 5 ,
1 8 ,
1 5 .
7 7 ,
7 7 6 ,
1 0 9 ,
2 9 ,
1 7 ,
628
420
657
170
514
114
661
846
868
143
56i
367
592
277
1 , 5 0 9 , 8 1 8
Gold.
P. ct.
6 9 . 3
3-3
Silver.
P. ct. 0 . 4
1 . o
•5
Specie.
P. ct. 69.8
2 . 3
2 . o
4 . 4
i - 5
1 - 9
1 - 5
6.8
1 . o
• 9
• 9
4 . 1
1 4 . 2
.6
Currency.
P. ct. 3-3
6 2 . 9
7 7 - 5
1 5 - 4
4 9 - 5
4 0 . 2
6 0 . 5
5 5 - 3
4 2 . 9
6 7 . 8
7 3 - 5
7 0 . 1
5 8 . 9
3 2 . 7
3-7 6 4 . 5 3 1 . 8
Digitized for FRASER http://fraser.stlouisfed.org/ Federal Reserve Bank of St. Louis
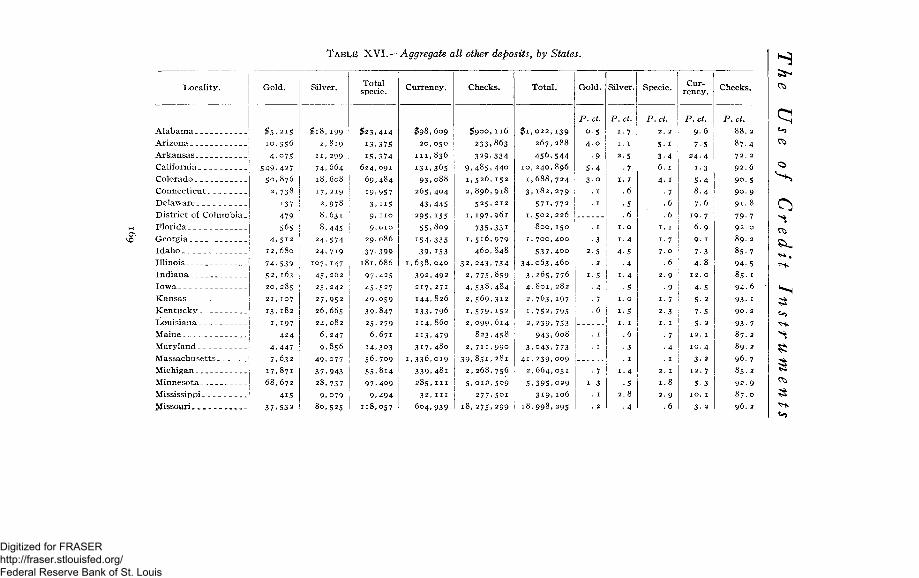
TABLE XVI.—Aggregate all other deposits, by States.
«-5
Locality.
Alabama
Arizona
Arkansas
California
Colorado
Connecticut
Delaware
District of Columbia
Florida
Georgia
Idaho
Illinois
Indiana
Iowa
Kansas
Kentucky
Louisiana
Maine
Maryland
Massachusetts
Michigan
Minnesota
Mississippi
Missouri . , . , . , . . . . .„- ,
Gold.
# 5 . 2 1 5 10 ,556
4 , 0 7 5
549 ,427
5 0 , 8 7 6
2 ,738
i37
479
565
4 , 5 1 2
12 ,680
7 4 , 5 3 9
52, 163
20 ,285
21,107
13 ,182
1, 197
424
4 ,447 7 ,632
1 7 , 8 7 1 6 8 , 6 7 2
415 3 7 ' 5 3 2
Silver.
# 1 8 , 1 9 9 2 ,819
11 ,299
74 ,664
18 ,608
17 ,219
2 ,978
8 ,631
8 ,445
24 ,574
2 4 , 7 i 9 107 ,147
4 5 , 2 6 2 25 ,242
27 ,952
26 ,665
24 ,082
6 ,247
9 ,856
49 ,077
3 7 ,943
28 ,737
9 ,079 80 ,525
Total specie.
$ 2 3 , 4 1 4
13 ,375
15 ,374
624 ,091
69 ,484
19,957
3 , n 5
9, n o
9, 010
29 ,086
3 7 , 3 9 9 181,686
97 ,425
45 ,527
49 ,059
39 ,847
25 ,279 6 ,671
14,303
5 6 , 7 0 9
5 5 , 8 i 4
9 7 . 4 0 9
9 ,494
118,057
Currency.
$ 9 8 , 6 0 9
20,050
111,836
131,365
93,088
265,404
43,445
295,155
55,8o9
154,335
39 , 153
1, 638 , 040
3 9 2 , 4 9 2
2 1 7 , 2 7 1
144 ,826
133 ,796
114 ,860
113 ,479
3 i 7 , 4 8 o
1 , 3 3 6 , 0 1 9
3 3 9 , 4 8 i
285, i n
32 , i n
6 0 4 , 9 3 9
Checks.
$900 ,
233 .
329 ,
9 , 4 8 5 ,
1 ,526 ,
2 , 8 9 6 ,
525 ,
1 ,197 ,
735,
1 ,516,
460,
3 2 , 2 4 3 ,
2 , 7 7 5 ,
4 , 5 3 8 ,
2 , 5 6 9 ,
1 ,579,
2 , 0 9 9 ,
823 ,
2 , 7 1 1 ,
3 9 , 8 5 1 ,
2 , 2 6 8 ,
5 , 0 1 2 ,
277. 1 8 , 2 7 5 ,
116
863
334
440
152
918
212
961
331
979
848
734
859
484
312
152
614
458
990
281
756
509
5oi
299
Total.
#1,022,
267,
456,
10,240,
1,688,
3,182,
571,
1,502,
800,
1,700,
537,
34,063,
3,265,
4,801,
2,763,
i,752,
2, 239,
943,
3,o43,
41,239, 2,664,
5,395.
319. 18,998,
544 896
724
279
772
226
150
400
400
460
776
282
197
795
753
608
773
009
051
029
106
295
Gold.
P.ct.
5
4-
Silver.
P.ct.
i . 7
2 . 5 • 7
. 6
• 3 . 1
1.4
• 5 2 . 8
•4
Specie.
P.ct.
Currency.
P.ct.
9-6
7-5
2 4 . 4
1.3
5-4
8 . 4
7-6
19. 7
6 . 9
9- 1
7-3
4 . 8
1 2 . 0
4 -5
5- 2
7-5
5- 2
Checks.
P.ct.
8 8 . 2
8 7 . 4
72. 2
92 . 6
9 0 . 5
9 0 . 9
9 1 . 8
79- 7
92 . o
85 .
94-
85 .
94-
93-
90.
93-
87 .
89 .
96 .
8 5 .
92 .
87.
96 .
Digitized for FRASER http://fraser.stlouisfed.org/ Federal Reserve Bank of St. Louis
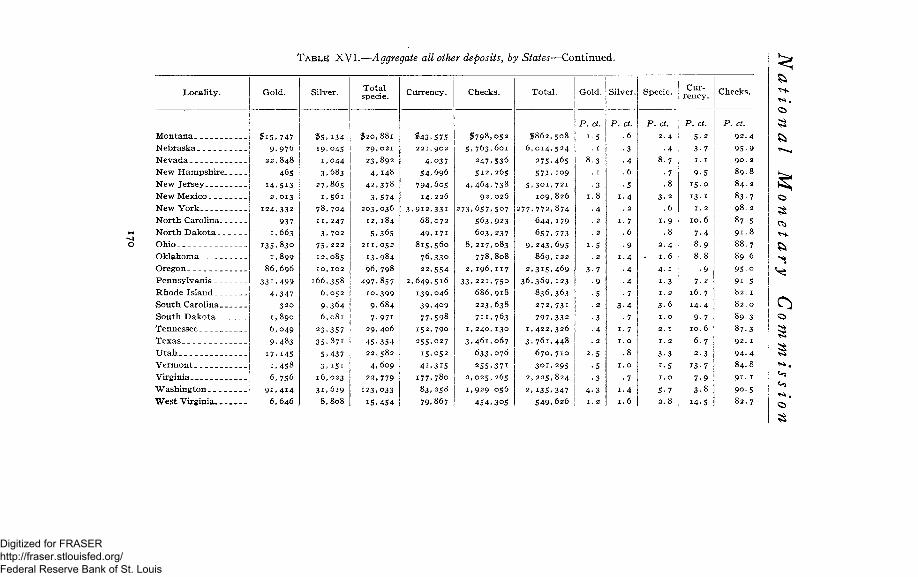
TABLE XVI.—Aggregate all other deposits, by States—Continued.
L o c a l i t y .
M o n t a n a
N e b r a s k a
N e v a d a
N e w H a m p s h i r e .
N e w J e r s e y
N e w Mexico
N e w Y o r k
N o r t h Caro l ina-
N o r t h D a k o t a . _
Oh io
O k l a h o m a
O r e g o n
P e n n s y l v a n i a
R h o d e I s l a n d _ _
S o u t h Carol ina, . .
S o u t h D a k o t a . _
T e n n e s s e e
T e x a s
U t a h
V e r m o n t
Vi rg in ia
W a s h i n g t o n
W e s t Virginia. _.
Go ld .
$ 1 5 , 7 4 7
9 , 9 7 6
2 2 , 8 4 8
465
1 4 , 5 1 3
2 , 0 1 3
124 ,332
93 7 1,663
1 3 5 , 8 3 0
1,899
8 6 , 6 9 6
3 3 L 4 9 9
4 , 3 4 7
320
1, 890
6, 049
9 , 4 8 3
17 ,145
i , 4 5 8
6 , 7 5 6
9 1 , 4 1 4
6,646
Si lver .
$ 5 , i 3 4
19 ,045
1,044
3,683
2 7 , 8 6 5
1, 561
7 8 , 7 0 4
11 ,247
3 , 7 0 2
7 5 . 2 2 2
12 ,085
10 ,102
166 ,358
6 , 0 5 2
9 , 3 6 4 6 , 0 8 1
23 ,357
3 5 , 8 7 1
5 ,437
3 . I 5 I 16,023
3 1 , 6 1 9 8 , 8 0 8
T o t a l specie .
$ 2 0 , 8 8 1
2 9 , 0 2 1
23 ,892
4 , 1 4 8
4 2 , 3 7 8
3 . 5 7 4 203,036
12 ,184
5.365 211 ,052
13 .984
9 6 , 7 9 8
497 ,857
i o , 3 9 9
9 , 6 8 4
7 , 9 7 i 29 ,406
4 5 , 3 5 4
22 ,582
4, 609
2 2 , 7 7 9
123 ,033
1 5 . 4 5 4
Cur rency .
$ 4 3 , 5 7 5
221 , 902
4 ,037
5 4 , 6 9 6
794 ,6o5
14 ,226
, 9 1 2 , 3 3 1 68,072
4 9 , i 7 i
815 ,560
76,330
22 ,554
, 6 4 9 . 5 1 6
139 ,046
3 9 , 4 0 9
77 ,598
152 ,790
255 ,027
15 ,052
4 L 3 I 5
i77,78o
83,258
79,867
Checks .
$ 7 9 8 , 0 5 2
5 , 7 6 3 , 6 0 1
2 4 7 , 5 3 6
5 1 2 , 2 6 5
4 , 4 6 4 , 738
9 2 , 0 2 6
2 7 3 , 6 5 7 , 5 0 7
5 6 3 , 9 2 3
603,237
8 , 2 1 7 , 0 8 3
7 7 8 , 8 0 8
2 , 1 9 6 , 1 1 7
3 3 , 2 2 1 , 7 5 0
6 8 6 , 9 1 8
223,638
7 1 1 , 7 6 3
1, 240, 130
3 , 4 6 1 , 0 6 7
633,076
2 5 5 , 3 7 1 2 , 0 2 5 , 265
1,929 056
4 5 4 , 3 0 5
T o t a l .
6 , 0 1 4 ,
275 .
5 7 1 ,
5 , 3 0 i ,
109,
2 7 7 , 7 7 2 ,
644,
657 ,
9 , 2 4 3 ,
869 ,
2 , 3 1 5 ,
3 6 , 3 6 9 ,
836, 272,
797,
1, 422 ,
3 , 7 6 i ,
670,
301 ,
2 , 2 2 5 ,
2 , 1 3 5 ,
549,
508
524
465
109
721
826
874
179
773
695
122
469
123
363
73i
332
326
448
710
295
824
347
626
Gold .
P. ct.
5
Si lver .
P. ct.
.6
•3
• 4 .6
5 1.4
. 2
1-7 .6 • 9
1.4
• 4
• 4
• 7
3 . 4
• 7
1-7
1. o
• 7 1.4 1.6
P. ct. 2 . 4
. 4
8.7 .7 .8
3 - 2
.6
1 . 9
.8 2 . 4
1 . 6
4. 1
i - 3
1. 2
3 . 6
1. 0
2. 1
1. 2
3 - 3
1 - 5
1. 0
5-7 2 . 8
Currency.
P. ct. 5 - 2
3 . 7
I . I
9 . 5
15-0
13 . 1 1. 2
10. 6
7 - 4
8 . 9
8.8
• 9 7 . 2
16. 7
1 4 . 4
9 - 7
10. 6
6.7 2 . 3
13-7
7-9 3-8
1 4 . 5
Checks .
'. ct.
9 2 . 4
9 5 - 9
90. 2
8 9 . 8
84 . 2
8 3 . 7
98 . 2
8 7 . 5
9 1 . 8
8 8 . 7
8 9 . 6
95 o
9 i . 5
8 2 . 1
8 2 . 0
8 9 . 3
8 7 . 3
92 . 1
9 4 - 4
8 4 . 8
9 1 . 1
9 0 . 5
8 2 . 7
Digitized for FRASER http://fraser.stlouisfed.org/ Federal Reserve Bank of St. Louis
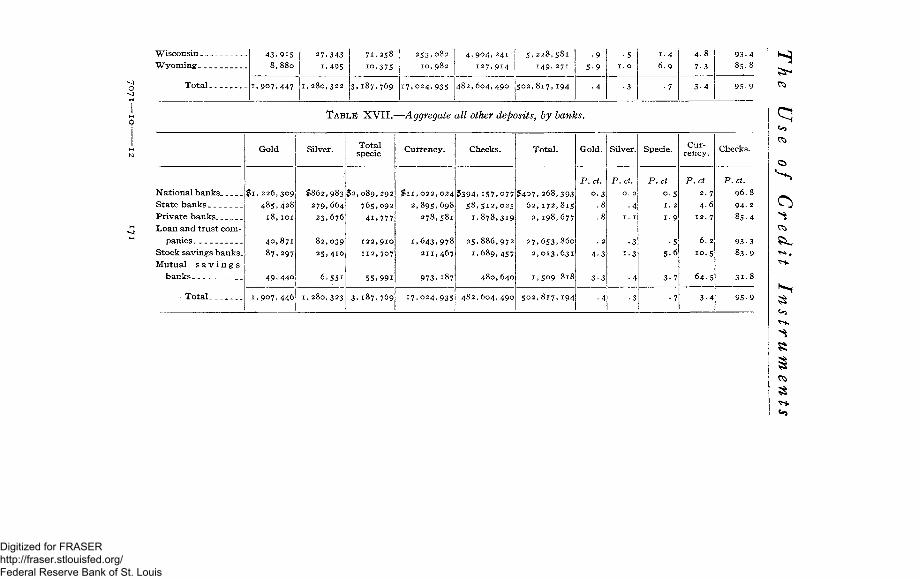
Wisconsin
Wyoming
Total
4 3 , 9 i 5 8 , 8 8 0
1 , 9 0 7 , 4 4 7
27 ,343
1,495
1 ,280 ,322
7 1 , 2 5 8
i o , 3 7 5
3 , 1 8 7 , 7 6 9
253 ,082
10 ,982
1 7 , 0 2 4 , 9 3 5
4 , 9 0 4 , 241
127 ,914
4 8 2 , 6 0 4 , 4 9 0
5 . 2 2 8 , 5 8 1
149 ,271
5 0 2 , 8 1 7 , 1 9 4
•9
5 -9
• 4
•5 1. 0
• 3
1.4
6 . 9
• 7
4 . 8
7 3
3 - 4
93 . 4
8 5 . 8
9 5 - 9
TABLE XVII.—Aggregate all other deposits, by banks.
National banks
State banks
Private banks
Loan and trust com
panies
Stock savings banks.
Mutual s a v i n g s
banks
Total
Gold
$ 1 , 2 2 6 , 3 0 9
4 8 5 , 4 2 8
18 ,101
4 0 , 8 7 1
8 7 , 2 9 7
4 9 , 4 4 o
1 , 9 0 7 , 4 4 6
Silver.
$862 ,983
279 ,664
23 ,676
8 2 , 0 3 9
25 ,410
6 , 5 5 i
1, 280 ,323
Total specie
$ 2 , 0 8 9 , 292
765 ,092
4 L 7 7 7
122 ,910
112,707
5 5 , 9 9 i
3 , 1 8 7 , 7 6 9
Currency.
$ 1 1 , 0 2 2 , 0 2 4
2 , 8 9 5 . 6 9 8
278 ,581
1 , 6 4 3 , 9 7 8 211 ,467
9 7 3 , 1 8 7
1 7 , 0 2 4 , 9 3 5
Checks.
$394, 157 ,077 5 8 , 5 1 2 , 0 2 5
1 , 8 7 8 , 3 1 9
2 5 , 8 8 6 , 9 7 2
1 , 6 8 9 , 4 5 7
4 8 0 , 6 4 0
4 8 2 , 6 0 4 , 4 9 0
Total.
$ 4 0 7 , 2 6 8 , 3 9 3 6 2 , 1 7 2 , 8 1 5
2 , 1 9 8 , 677
2 7 , 6 5 3 , 8 6 0
2 , 0 1 3 , 6 3 1
1 ,509 818
5 0 2 , 8 1 7 , 1 9 4
Gold.
P.ct.
0 . 3 .8
.8
. 2
4 . 3
3 - 3
• 4
Silver.
P.ct.
0. 2
• 4 1.1
• 3
1.3
• 4
• 3
Specie.
P.ct
0 . 5
1. 2
1 .9
• 5 5.6
3-7
•7
Currency.
P.ct
2 . 7
4.6
12. 7
6 . 2
1 0 . 5
6 4 . 5
3 - 4
Checks.
P.ct.
9 6 . 8
94- 2
8 5 . 4
93- 3
8 3 . 9
3 1 . 8
9 5 - 9
Digitized for FRASER http://fraser.stlouisfed.org/ Federal Reserve Bank of St. Louis
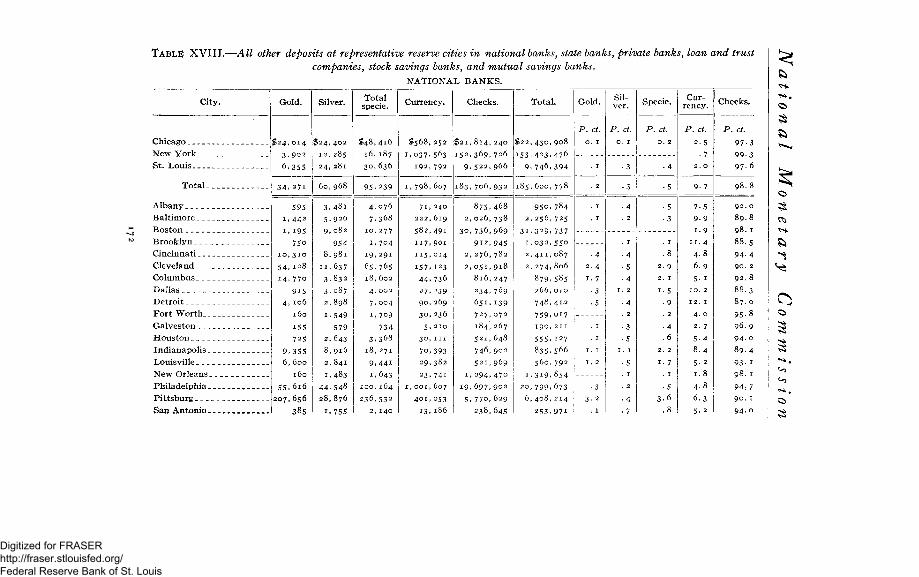
TABUS XVIII.- -All other deposits at representative reserve cities in national banks, state banks, private banks, loan and trust
companies, stock savings banks, and mutual savings banks.
NATIONAL BANKS.
City.
Chicago
New York __
St. Louis
Total
Albany __
Baltimore
Brooklyn ^
Cincinnati
Cleveland _
Columbus _
Dallas _ _ _ _ _ _ _
Detroit _ _ _
Fort Worth. _
Galveston
Houston __
Indianapolis
New Orleans
Philadelphia
Pittsburg _
Gold.
$ 2 4 , 0 1 4
3 . 9 0 2
6 , 3 5 5
34 , 271
595 1,442
1. 195 750
i o , 310
54 . 128
1 4 , 7 7 o
915
4, 106
160
155
725
9 . 3 5 5
6, 600
160
5 5 . 6 i 6
2 0 7 , 6 5 6 385
Silver.
$ 2 4 , 4 0 2
12 ,285
2 4 , 2 8 1
6 0 , 9 6 8
3 . 4 8 1 5 . 9 2 6
9, 082
954 8 , 9 8 1
11 ,637 3 .832
3 , o S 7
2 , 8 9 8
1,549
579
2 ,643 8 ,916
2 , 8 4 1
1,483 4 4 , 5 4 8 2 8 , 8 7 6
1,755
Total specie.
$ 4 8 , 4 1 6
16 ,187
3 0 , 6 3 6
9 5 , 2 3 9
4 , 0 7 6
7 ,368
10 ,277
1,704 19 ,291
65 ,765
18 ,602
4, 002
7 ,004
1, 709
734
3,368
18 ,271
9 . 4 4 1
1,643 100 ,164
236 ,532 2, 140
Currency.
$568 ,252
1,037, 563 192,792
1 ,798 ,607
71 ,240
222 ,619
582 ,491
117 ,901
115 ,014
i 5 7 . 123
4 4 . 7 3 6
27 .239
9 0 , 2 6 9
30 , 236
5. 210
30, i n
7o ,393 29 .382
23 ,741 1, 0 0 1 , 607
401 ,053
13 ,186
Checks.
$ 2 1 , 8 1 4 , 2 4 0
1 5 2 , 3 6 9 , 726 9 , 5 2 2 , 9 6 6
183, 706 ,932
8 7 5 , 4 6 8
2 , 0 2 6 , 7 3 8
30 . 7 3 6 , 9 6 9
9 1 2 , 9 4 5
2 , 2 7 6 , 7 8 2
2, 0 5 1 , 918
8 1 6 , 2 4 7 234, 769
6 5 1 , i 3 9 727 ,072
184 ,267
5 2 1 , 6 4 8
746 ,902
5 2 1 , 9 6 9 1, 2 9 4 , 4 7 0
19, 697, 902
5, 770 ,629
2 3 8 , 6 4 5
Total.
$ 2 2 , 4 3 0 , 9 0 8
1 5 3 , 4 2 3 , 4 7 6
9 , 7 4 6 , 3 9 4
1 8 5 , 6 0 0 , 7 7 8
9 5 0 , 7 8 4 2 , 2 5 6 , 7 2 5
3 L 3 2 9 , 737 1,032, 550
2 , 4 1 1 , 087
2 , 2 7 4 , 8 0 6
8 7 9 , 5 8 5 266,010
748, 41.2
7 5 9 , o i 7
1 9 0 , 2 1 1
5 5 5 , 1 2 7
8 3 5 , 5 6 6
560 ,792
1 , 3 1 9 , 8 5 4
20, 799 ,673
6 , 4 0 8 , 2 1 4
2 5 3 , 9 7 1
Gold.
P. ct.
0 . 1
. 1
. 2
. 1
. 1
•4
2 . 4
1. 7
• 3
•5
. 1
. 1
1. 1
1. 2
•3
3- 2 . I
Silver.
P. ct.
0 . 1
• 3
• 3
•4 . 2
. 1
• 4
•5 • 4
1 . 2
• 4
. 2
•3
•5
1 . 1
•5
. 1
. 2
• 4
Specie.
P. ct.
0 . 2
• 4
• 5
•5
•3
. 1
.8
2 . 9
2 . 1
i - 5
. 9
. 2
• 4 .6
2. 2
i . 7 . 1
• 5 3-6
.8
Currency.
P. ct.
2 . 5
• 7 2 . 0
9- 7
7-5
9-9
i . 9
11 . 4
4 - 8
6 . 9
5- 1
1 0 . 2
1 2 . 1
4 . 0
2 . 7
5-4
8 . 4 5-2
1.8
4-8
6 . 3
5-2
Checks.
P. ct.
97. 3
99 . 3
97 . 6
9 8 . 8
9 2 . 0
8 9 . 8
9 8 . 1
88.5
94- 4 90 . 2
9 2 . 8
88.3
8 7 . 0
9 5 - 8
96 . 9
94. 0
8 9 . 4
93- 1 98 . 1
94- 7 90 . 1
9 4 . o
Digitized for FRASER http://fraser.stlouisfed.org/ Federal Reserve Bank of St. Louis
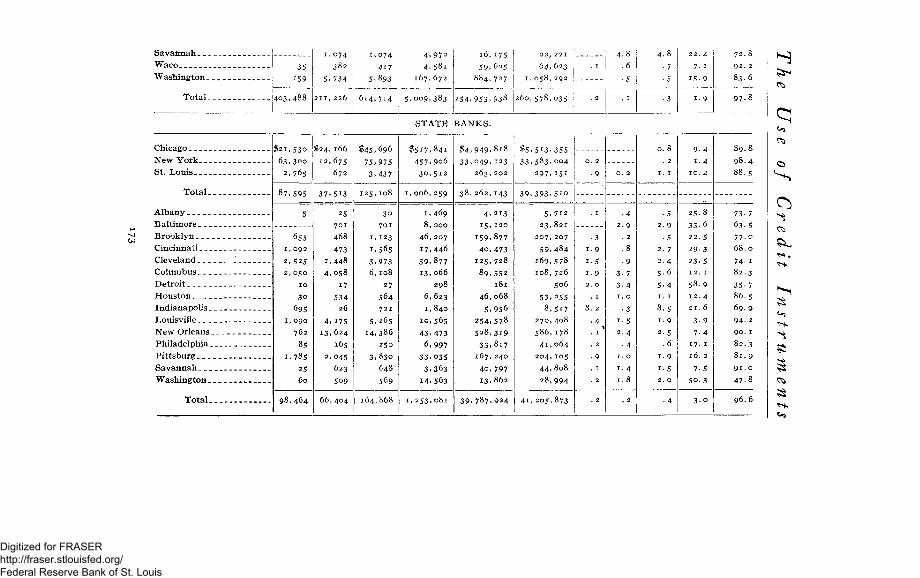
Savannah
Waco __
Washington
Total
35
159
4 0 3 , 4 8 8
1,074
382
5 .734
211 ,226
1,074
•417
5 .893
614 ,714
4 , 9 7 2
4 , 5 8 i
167 ,672
5 . 0 0 9 , 3 8 3
16 ,175 5 9 , 6 2 5
8 8 4 , 7 2 7
2 5 4 . 9 5 3 , 9 3 8
22, 221
6 4 , 6 2 3
1, 0 5 8 , 2 9 2
260, 5 7 8 , 0 3 5
. 1
. 2
4 . 8
. 6
•5
. 1
4 . 8
•5
• 3
22. 4
7- 1
15-9
1 - 9
7 2 . 8
8 3 . 6
9 7 . 8
STATE BANKS.
5X-
Chicago
New York_
St. Louis __
Tota l .
Albany
Baltimore
Brooklyn
Cincinnati
Cleveland
Columbus
Detroit
Houston
Indianapolis _.
Louisville
New Orleans.
Philadelphia _
Pittsburg
Savannah
Washington..
To ta l .
521,530
6 3 . 3 0 0
2 ,765
$ 2 4 , 1 6 6
12 ,675 672
8 7 , 5 9 5
655 1, 092
2 . 5 2 5
2 , 0 5 0
10
30
695 1,090
762
85
1,785
25
60
9 8 , 4 6 4
3 7 , 5 i 3
25 701
468
473 1,448
4 , 0 5 8
17
534 26
4, 175
13 ,624
165
2 ,045 623
509
6 6 , 4 0 4
$ 4 5 , 6 9 6
75 ,975
3 .437
125 ,108
30
701
1, 123
1,565
3 ,973
6, 108
27
S64
721
5 .265
14 ,386
250
3 ,830
648
569
164 ,868
$ 5 1 7 , 8 4 1
4 5 7 , 9 o 6
3 0 , 5 1 2
1 , 0 0 6 , 2 5 9
1 , 2 5 3 , 0 8 1
$ 4 , 9 4 9 , 8 i 8
3 3 , 0 4 9 , 1 2 3
263,202
38,262,143
1,469 8, 000
4 6 , 2 0 7
1 7 , 4 4 6
3 9 , 8 7 7 13 ,066
2 9 8
6, 623
1, 840
10 ,565
4 3 , 4 7 3
6 ,997 3 3 , 0 3 5
3 . 3 6 3
14 ,563
4 , 2 1 3
15 ,120
159 ,877
4 o , 4 7 3 1 2 5 , 7 2 8
8 9 , 5 5 2
1 8 1
4 6 , 0 6 8
5 , 9 5 6
2 5 4 , 5 7 8
5 2 8 , 3 1 9
3 3 , 8 i 7 167 ,240
4 0 , 7 9 7 13 ,862
3 9 , 7 8 7 , 9 2 4
$ 5 , 5 1 3 , 3 5 5
3 3 , 5 8 3 . 0 0 4
2 9 7 , 1 5 1
3 9 , 3 9 3 . 5 1 0
5, 712
2 3 , 8 2 1
207 ,207
5 9 , 4 8 4
169 ,578
108 ,726
506
5 3 , 2 5 5
8 , 5 1 7
2 7 0 , 4 0 8
5 8 6 , 1 7 8
41,064
2 0 4 , 1 0 5
4 4 , 8 0 8
2 8 , 9 9 4
4 1 , 205 ,873
o. 2
•9
•3
1-9
i - 5
i - 9 2. o
• 4 2 . 9
•9
3 -7
3 - 4
1. o
• 3
i - 5
2 . 4
• 4
1. o
1.4
1.8
• 5
2 . 9
•5
2 . 7
2 . 4
5-6
5-4
1 . 1
8.5
1.9
2-5
.6
1.9
i - 5 2. o
9 -4
1.4
10. 4
8 9 . 8
9 8 . 4
8 8 . 5
73-7
6 3 . 5
7 7 . o
6 8 . 0
74- 1
8 2 . 3
3 5 - 7
8 6 . 5
6 9 . 9
94- 2
90. 1
8 2 . 3
8 1 . 9
9 1 . o
4 7 - 8
9 6 . 6
Digitized for FRASER http://fraser.stlouisfed.org/ Federal Reserve Bank of St. Louis
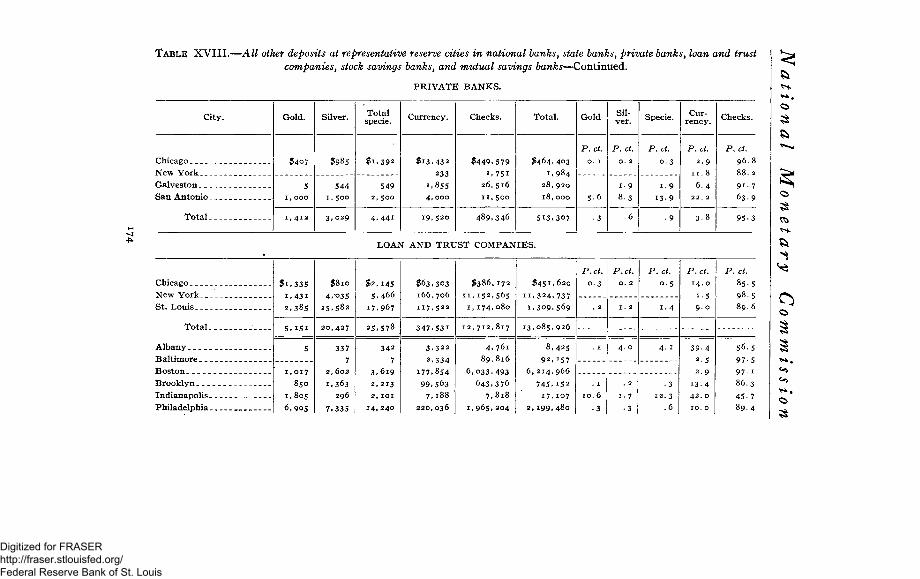
TABLE XVIII.—All other deposits at representative reserve cities in national banks, state banks, private banks, loan and trust companies, stock savings banks, and mutual savings banks—Continued.
PRIVATE BANKS. 6 ^ K
City.
Chicago
Galveston__
San Antonio
Total
Gold.
$407
5 1, 000
1 ,412
Silver.
$985
544 1, 5oo
3 . 0 2 9
Total specie.
$ i . 3 9 2
549 2, 500
4 . 4 4 1
Currency.
$ 1 3 , 4 3 2
233
1,855 4 , 0 0 0
19 ,520
Checks.
$ 4 4 9 , 5 7 9
i , 7 5 i 26, 516
11, 500
4 8 9 , 3 4 6
Total.
$ 4 6 4 , 4 0 3
1 ,984
2 8 , 9 2 0
18 ,000
513 ,307
Gold
P.ct.
0. 1
5-6
- 3
Silver.
P.ct.
0. 2
1 .9
8 . 3
. 6
Specie.
P.ct.
0 . 3
1 .9
13-9
. 9
Currency.
P.ct.
2 . 9
1 1 . 8
6 . 4 22. 2
3 - 8
Checks.
P.ct.
9 6 . 8
8 8 . 2
91 . 7
63 . 9
95- 3
LOAN AND TRUST COMPANIES.
Chicago
New York
St. Louis
Total
Albany
Baltimore
Brooklyn _
Indianapolis
Philadelphia _
$ i , 3 3 5
i , 4 3 i
2 , 3 8 5
5 , i 5 i
5
1, 017
850
1 ,805
6 , 9 0 5
$810
4 , 0 3 5 15 ,582
2 0 , 4 2 7
337
7 2, 602
1,363
296
7 .335
$ 2 , 1 4 5 5 . 4 6 6
17 ,967
2 5 , 5 7 8
342
7
3 , 6 1 9
2 ,213
2, 101
1 4 , 2 4 0
$ 6 3 , 3 0 3 166 ,706 117 ,522
3 4 7 , 5 3 1
3 , 3 2 2
2 ,334
177 ,854
99 ,563 7 , i 8 8
220 ,036
$ 3 8 6 , 1 7 2
1 1 , 1 5 2 , 5 6 5 1 , 1 7 4 , 0 8 0
1 2 , 7 1 2 , 8 1 7
4 , 7 6 i
8 9 , 8 1 6
6 , 0 3 3 , 4 9 3 6 4 3 , 3 76
7 . 8 i 8
1 ,965 , 204
$ 4 5 1 , 6 2 0
1 1 . 3 2 4 , 7 3 7
1 , 3 0 9 , 5 6 9
1 3 , 0 8 5 , 9 2 6
8 ,425
9 2 , 1 5 7
6 , 2 1 4 , 9 6 6
7 4 5 , 1 5 2
1 7 , 1 0 7
2 , 1 9 9 . 4 8 0
P.ct.
0 . 3
. 2
. 1
. 1
10. 6
3
P.ct.
0. 2
1. 2
4 . 0
. 2
1. 7
3
P.ct.
0 . 5
1 . 4
4. 1
•3 12 .3
.6
P.ct.
14. 0
1-5 9 . 0
3 9 - 4
2-5
2 . 9
13-4
42 . 0
10. 0
P.ct.
8 5 . 5 98 . 5
8 9 . 6
5 6 . 5 97. 5
97. 1
8 6 . 3
45- 7
8 9 . 4
<2>
<-9
Digitized for FRASER http://fraser.stlouisfed.org/ Federal Reserve Bank of St. Louis
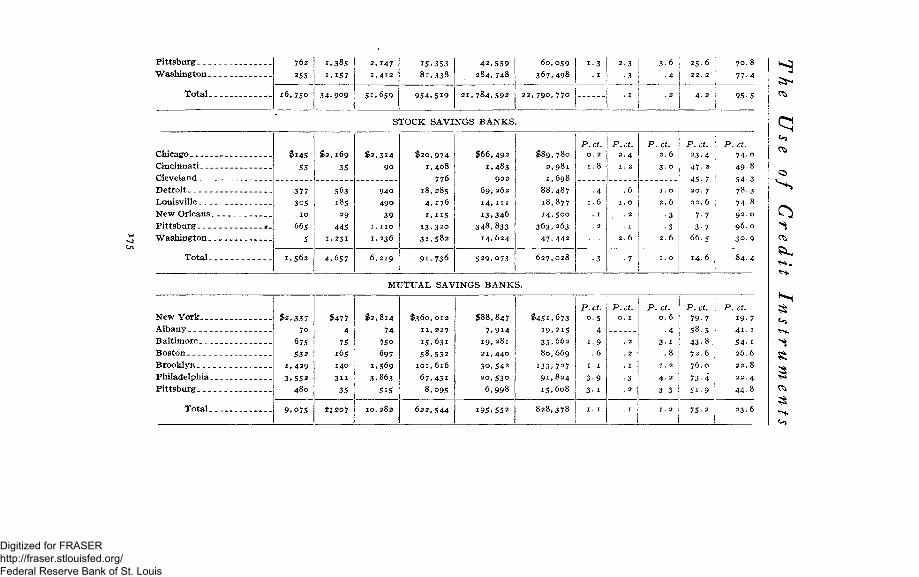
Pittsburg
Washington
Total -.
762
255
16 ,750
1,385
1.157
3 4 . 9 0 9
2 ,147 1, 412
5 1 , 6 5 9
15 .353 8 1 , 3 3 8
9 5 4 , 5 1 9
4 2 , 5 5 9 2 8 4 , 7 4 8
2 1 , 7 8 4 , 5 9 2
6 0 , 0 5 9
3 6 7 , 4 9 8
2 2 , 7 9 0 , 7 7 0
1 3 . 1
2 . 3
•3
. 1
3 - 6
• 4
. 2
2 5 6
2 2 . 2
4. 2
7 0 . 8
77 -4
95-5
Chicago
Cincinnati
Cleveland
Detroit
Louisville
New Orleans
Pittsburg M-
Washington
Total
$145
55
377
305
1 0
665
5
1,562
$ 2 , 1 6 9
35
563
185
29
445
1 , 2 3 1
4 ,657
STOCK SAVINGS BANKS
$ 2 , 3 1 4 90
94o
490
39 1, n o
1, 236
6, 219
$ 2 0 , 9 7 4
1, 408
776
18 ,285 4 , 2 7 6
1,115 1 3 , 3 2 0
3 L 5 8 2
9 L 7 3 6
$ 6 6 , 4 9 2
1 ,483
922
6 9 , 2 6 2
14, i n
1 3 , 3 4 6
3 4 8 , 8 3 3 1 4 , 6 2 4
5 2 9 , 0 7 3
$ 8 9 , 7 8 o
2 , 9 8 1
1 ,698
8 8 , 4 8 7 1 8 , 8 7 7
1 4 , 5 0 0
3 6 3 , 2 6 3
4 7 . 4 4 2
6 2 7 , 0 2 8
P.ct. 0 . 2
1.8
•4 1 .6
. 1
. 2
• 3
P.ct. 2 . 4 1 . 2
.6
1 . 0
. 2
. 1
2 . 6
• 7
P.ct. 2 . 6 3 - 0
1 . 0
2 . 6
• 3
•3 2 . 6
1 . 0
P.ct. 2 3 - 4
47. 2
45-7
20. 7
22. 6
7- 7
3 - 7
6 6 . 5
14. 6
P.ct. 7 4 . 0
4 9 . 8
54-3 7 8 . 3 7 4 . 8
96. 0
30 . 9
8 4 . 4
New York
Albany
Baltimore
Boston
Brooklyn
Philadelphia.
Pittsburg
MUTUAL SAVINGS BANKS.
To ta l .
. 337
70
675
532
, 4 2 9
.552
480
$477
4
75
165 140
3 i i
35
15 207
$ 2 , 8 1 4
74
75o
697
1,569
3 .863
515
10 ,282
$360,012
11,227
15.631
58.532
101,616
67.431
8,095
622,544
$88,847
7,914
19,281
21,440
30,542
20,530
6,998
195.552
$451,673
19,215
35.662
80,669
133,727
91,824
15,608
828,378
P.ct. 0 . 5
. 4
1 . 9
.6
1 . 1
3 - 9
3- 1
1 . 1
P.ct. 0 . 1
. 2
. 2
" r
• 3
. 2
. 1
P.ct. 0 . 6
• 4
3 . 1 .8
1 . 2
4 . 2
3 - 3
1 . 2
P.ct. 79- 7
5 8 . 5 4 3 - 8 .
72. 6
76. 0
73 -4
5 i . 9
75 -2
P.ct.
19.7
41.1
54.1
26.6
22.8
22. 4
44-8
23.6
Digitized for FRASER http://fraser.stlouisfed.org/ Federal Reserve Bank of St. Louis
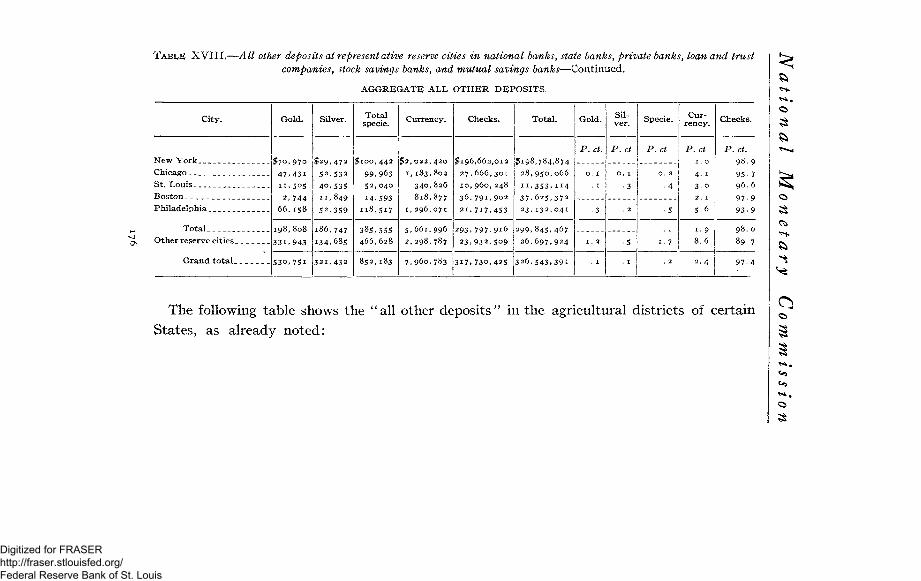
T A B L E XVIII .—All other deposits at representative reserve cities in national banks, state hanks, private hanks, loan and trust
companies, stock savings hanks, and mutual savings hanks—Continued.
AGGREGATE ALL OTHER DEPOSITS.
City.
New York
Chicago
St. Louis __
Boston
Philadelphia
Tota l .
Other reserve cities _ _
Grand total
Gold.
$ 7 0 , 9 7 0
4 7 . 4 3 1
n . 5 0 5
2, 744 6 6 , 1 5 8
1 9 8 , 8 0 8
3 3 L 9 4 3
5 3 0 , 7 5 1
Silver.
$ 2 9 , 4 7 2
5 2 , 5 3 2
4 0 , 5 3 5
1 1 , 8 4 9
5 2 , 3 5 9
186 ,747 134 ,685
3 2 1 , 4 3 2
Total specie.
$100 ,442
99 ,963 5 2 , 0 4 0
14 ,593
118,517
385 .555 4 6 6 , 6 2 8
852 ,183
Currency.
$ 2 , 0 2 2 , 4 2 0
i , 1 8 3 , 8 0 2
3 4 0 , 8 2 6
818 ,877
1 ,296 ,071
5 , 6 6 1 , 9 9 6 2 , 2 9 8 , 7 8 7
7 , 9 6 0 , 7 8 3
Checks.
$196,662,012
2 7 , 6 6 6 , 3 0 1
1 0 , 9 6 0 , 2 4 8
3 6 , 7 9 1 . 9 0 2
2 1 , 7 1 7 , 4 5 3
2 9 3 , 7 9 7 . 9 i 6
2 3 , 9 3 2 , 5 0 9
3 1 7 , 7 3 0 , 4 2 5
Total.
$198,784,874 2 8 , 9 5 0 , 0 6 6 1 1 , 3 5 3 , 1 1 4 3 7 . 6 2 5 , 3 7 2 23, 132 ,041
2 9 9 , 8 4 5 , 4 6 7
2 6 , 6 9 7 , 9 2 4
3 2 6 , 5 4 3 , 3 9 1
Gold.
P.ct.
0. 1 . 1
• 3
1. 2
. 1
Silver.
P.ct
0. 1
•3
. 2
5
. 1
Specie.
P.ct
0. 2
• 4
• 5
. 1
i . 7
. 2
Currency.
P.ct.
1. 0
4- 1
3 - o
2. 1
5-6
i- 9 8.6
2 . 4
Checks.
P.ct.
98. 9
95- 7 9 6 . 6
93 . 9
9 8 . 0
8 9 . 7
9 7 - 4
ft
ft
ft
The following table shows the "all other deposits" in the agricultural districts of certain States, as already noted:
Digitized for FRASER http://fraser.stlouisfed.org/ Federal Reserve Bank of St. Louis
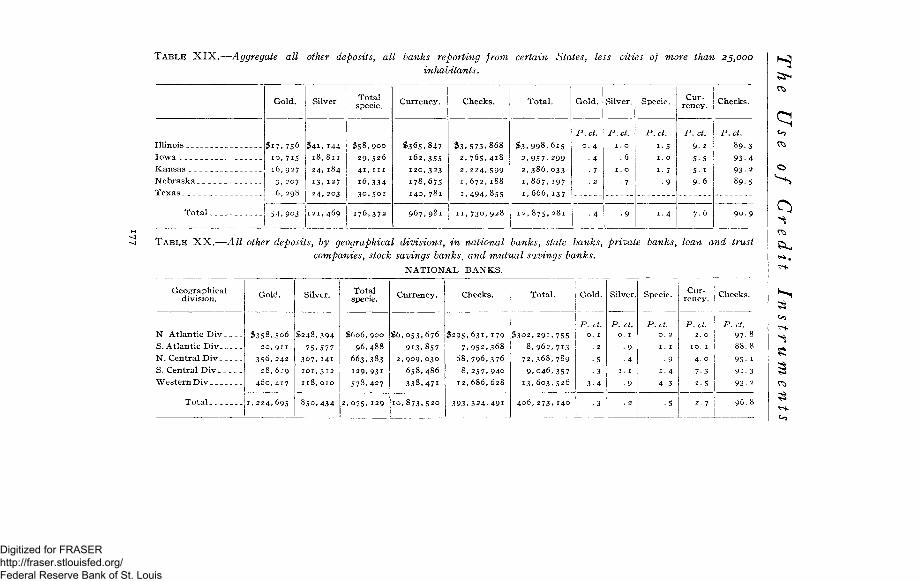
TABLE XIX.—Aggregate all other deposits, all banks reporting from certain States, less cities of more than 25,000
inhabitants.
Illinois
Iowa __
Kansas _ _
Nebraska _ _ _
Texas - __
Total
Gold.
$ 1 7 , 7 5 6
10 ,715 16, 927
3 , 207 6, 298
5 4 , 9 0 3
Silver
$ 4 1 , 1 4 4
1 8 , 8 1 1
2 4 , 1 8 4
13 .127
2 4 , 2 0 3
121 ,469
Total specie.
$ 5 8 , 9 0 0
29. 526
4 1 , i n
i 6 , 3 3 4
3 0 , 5 0 1
176 ,372
Currency.
$ 3 6 5 , 8 4 7
1 6 2 , 3 5 5
1 2 0 , 3 2 3
1 7 8 , 6 7 5
1 4 0 , 7 8 1
9 6 7 , 9 8 1
Checks.
$ 3 , 5 7 3 , 8 6 8
2, 7 6 5 , 4 1 8
2, 2 2 4 , 5 9 9
1 ,672 , 188
1, 4 9 4 , 8 5 5
1 1 , 7 3 o , 9 2 8
Total.
$ 3 , 9 9 8 , 6 1 5
2 , 9 5 7 , 2 9 9
2, 3 8 6 , 0 3 3
1, 867 , 197
1, 666 , 137
1 2 , 8 7 5 , 2 8 1
Gold.
P.ct.
0. 4
• 4
• 7 . 2
• 4
Silver,
P.ct.
1. 0
.6
1. 0
• 7
• 9
Specie.
P.ct.
1-5 1. 0
1. 7
• 9
1 . 4
Currency.
P.ct.
9. 2
5-5
5- 1
9.6
7-6
Checks.
P.ct.
8 9 . 3
9 3 - 4
93- 2
8 9 . 5
9 0 . 9
TABLE XX.—All other deposits, by geographical divisions, in national hanks, state banks, private banks, loan and trust
companies, stock savings bankst and mutual savings banks.
NATIONAL BANKS.
Geographical division.
N Atlantic Div
S. Atlantic Div _
N. Central Div
S. Central Div
Western Div
Total
Gold.
$ 3 5 8 , 5 0 6
2 0 , 9 1 1
356 ,242
28,6.-9
460 ,417
1 ,224 ,695
Silver.
$ 2 4 8 , 3 9 4
75 ,577
3 0 7 , 1 4 1 101, 312 118 ,010
8 5 0 . 4 3 4
Total specie.
$ 6 0 6 , 9 0 0
9 6 , 4 8 8
663 ,383
129, 93 i
578 ,427
2 , 0 7 5 , 129
Currency.
$ 6 , 0 5 3 , 6 7 6
9 1 3 , 8 5 7
2, 909, 030 6 5 8 , 4 8 6
3 3 8 , 4 7 1
1 0 , 8 7 3 , 5 2 0
Checks.
$ 2 9 5 , 6 3 1 , 1 7 9
7 , 9 5 2 , 3 6 8
6 8 , 7 9 6 , 3 7 6
8 , 2 5 7 , 9 4 0
1 2 , 6 8 6 , 6 2 8
3 9 3 . 3 2 4 , 4 9 i
Total.
$ 3 0 2 , 2 9 1 , 7 5 5 8 , 9 6 2 , 7 1 3
7 2 , 3 6 8 , 7 8 9
9 , 0 4 6 , 3 5 7 1 3 . 6 0 3 , 5 2 6
4 0 6 , 2 7 3 , 1 4 0
Gold.
P. ct.
0. 1
. 2
•5
• 3
3 -4
• 3
Silver.
P. ct. 0. 1
•9
•4
1. 1
•9
. 2
Specie.
P.ct.
0. 2
1. r
• 9
1. 4
4 -3
5
Currency.
P.ct.
2. 0
10. 1
4 . 0
7-3
2 .5
2. 7
Checks.
P. ct.
97-8
88.8
95- 1
9 i . 3
93- 2
9 6 . 8
^ 1
8
Digitized for FRASER http://fraser.stlouisfed.org/ Federal Reserve Bank of St. Louis
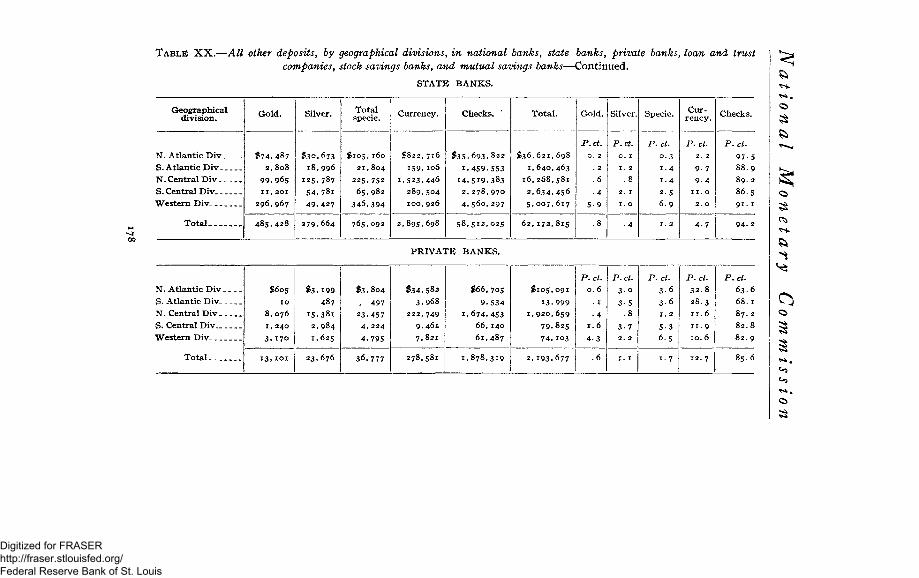
TABLB XX.—All other deposits, by geographical divisions, in national banks, state banks, private banks, loan and trust companies, stock savings banks, and mutual savings banks—Continued.
STATE BANKS.
Geographical division.
N. Atlantic Div
S. Atlantic Div
N. Central Div
S. Central Div_
Western Div. _
Total
Gold.
$ 7 4 , 4 8 7 2 , 8 0 8
9 9 . 9 6 5 I I , 2 0 1
2 9 6 , 9 6 7
4 8 5 . 4 2 8
Silver.
$ 3 0 , 6 7 3
1 8 , 9 9 6
125 ,787
5 4 . 7 8 i
4 9 , 4 2 7
2 7 9 , 6 6 4
Total specie.
$ 1 0 5 , 1 6 0
2 1 , 8 0 4
225, 752
6 5 , 9 8 2
3 4 6 , 3 9 4
765 ,092
Currency.
$822 , 716
159 .106
1 . 5 2 3 . 4 4 6
289 ,504 100 ,926
2 , 8 9 5 . 6 9 8
Checks. *
$ 3 5 , 6 9 3 , 8 2 2
L 4 5 9 . 5 5 3
1 4 . 5 1 9 . 3 8 3 2, 2 7 8 , 9 7 0
4 , 5 6 0 , 2 9 7
5 8 , 5 1 2 , 0 2 5
Total.
$ 3 6 , 6 2 1 , 6 9 8
1 , 6 4 0 , 4 6 3
1 6 , 2 6 8 , 5 8 1
2 , 6 3 4 , 4 5 6
5 , 0 0 7 , 6 1 7
6 2 , 1 7 2 , 815
Gold.
P.ct.
0. 2
. 2
. 6
•4
5 -9
. 8
Silver.
P.ct.
0. 1
1. 2
. 8
2. 1
1. 0
• 4
Specie.
P.ct.
0 . 3
1 .4
1 .4
2 .5
6 . 9
1. 2
Currency.
P.ct.
2. 2
9 -7
9 - 4
11. 0
2. 0
4 - 7
Checks.
P.ct.
9 7 - 5
8 8 . 9
89. 2
8 6 . 5
9 1 . 1
9 4 - 2
PRIVATE BANKS.
N. Atlantic Div
S. Atlantic Div
N. Central Div
S. Central Div_
Western Div_ _
Total
$605
1 0
8 , 0 7 6
1, 240
3 . 1 7 0
1 3 , 1 0 1
$ 3 . i 9 9
4 8 7
15 .381
2 . 9 8 4 1,625
2 3 , 6 7 6
$ 3 . 8 0 4
.- 497
23 .457 4 , 2 2 4
4 .795
3 6 . 7 7 7
$ 3 4 , 5 8 2
3 . 9 6 8
222 ,749
9 . 4 6 i 7 .821
278 ,581
$ 6 6 , 7 0 5
9 , 5 3 4
1 . 6 7 4 , 4 5 3 6 6 , 1 4 0
6 1 , 4 8 7
1 . 8 7 8 , 3 1 9
$ 1 0 5 , 0 9 1
1 3 . 9 9 9
1 , 9 2 0 , 6 5 9 7 9 . 8 2 5
74 .103
2 . 1 9 3 . 6 7 7
P.ct.
0 . 6
. 1
4
1 . 6
4 3
. 6
P.ct.
3 - o
3 - 5
. 8
3 - 7
2. 2
1. 1
P.ct.
3 - 6
3-6
1. 2
5 - 3
6 . 5
1 - 7
P.ct.
3 2 . 8
2 8 . 3
1 1 . 6
1 1 . 9 10. 6
12. 7
P.ct.
63.6
68. 1
87. 2
8 2 . 8
8 2 . 9
85.6
O ^
Digitized for FRASER http://fraser.stlouisfed.org/ Federal Reserve Bank of St. Louis
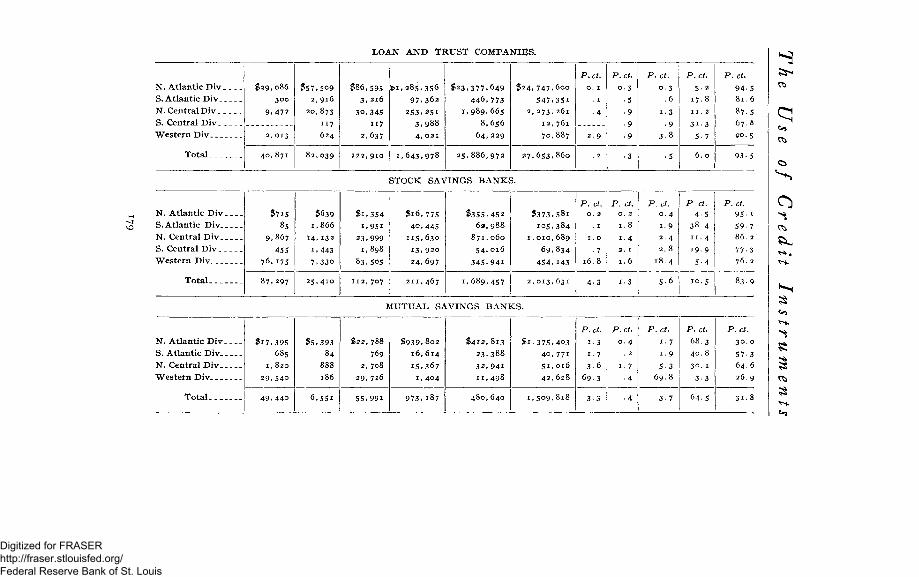
LOAN AND TRUST COMPANIES.
N. Atlantic Div
S. Atlantic Div
N. Central Div
S. Central Div
Western Div
Total
$ 2 9 , 0 8 6
300
9 . 4 7 2
2 ,013
4 0 , 8 7 1
$ 5 7 , 5 0 9 2, 916
20 ,873
117 624
8 2 , 0 3 9
$86 ,595 3 . 216
30 ,345 117
2.637
122,910
fci,285,356
9 7 . 3 6 2
253 .251
3 , 9 8 8
4, 021
1 . 6 4 3 . 9 7 8
$ 2 3 , 3 7 7 , 6 4 9
4 4 6 , 7 7 3 1 , 9 8 9 , 6 6 5
8 . 6 5 6
6 4 , 2 2 9
2 5 , 8 8 6 , 9 7 2
$ 2 4 , 7 4 7 , 6 0 0
5 4 7 , 3 5 1 2 , 2 7 3 , 2 6 1
12 ,761
70 ,887
2 7 . 6 5 3 , 8 6 0
P.ct.
0. 1
. 1
• 4
2 . 9
. 2
P.ct.
0 . 3
•5
9
9
9
• 3
P.ct.
0 . 3
. 6
1.3
• 9 3 - 8
• 5
P.ct.
5-2
1 7 . 8
I I . 2
3 1 - 3 5-7
6 . 0
P.ct.
94-5
8 1 . 6
8 7 5
6 7 . 8
90 .5
93- 5
STOCK SAVINGS BANKS.
N. Atlantic Div
S.Atlantic Div
N. Central Div
S. Central Div_ ___
Western Div
Total
$715
85
9 ,867
455
76 ,175
8 7 , 2 9 7
$639
1.866
14, 132
1,443 7 ,330
25 ,410
$ 1 , 3 5 4
i , 9 5 i
23 ,999 1,898
83 ,505
112,707
$ i 6 , 7 7 5
4 0 . 4 4 5
1 1 5 . 6 3 0
1 3 . 9 2 0
2 4 . 6 9 7
211 ,467
$ 3 5 5 , 4 5 2
6 2 , 9 8 8
8 7 1 , 0 6 0
5 4 . o i 6
3 4 5 . 9 4 1
1 , 6 8 9 . 4 5 7
$ 3 7 3 . 5 8 i
105 ,384
1 , 0 1 0 , 6 8 9
6 9 . 8 3 4
4 5 4 , 1 4 3
2 , 0 1 3 , 631
P.ct. 0. 2
. 1
1. 0
• 7 1 6 . 8
4 - 3
P ct.
0. 2 1 .8 1-4 2. 1 1 .6
1 3
P.ct,
0 . 4 1-9 2 . 4 2 . 8
1 8 . 4
5-6
P ct.
4-5
3 8 . 4
1 1 . 4
19-9
5 - 4
10 .5
P.ct.
95- 1 59-7 8 6 . 2 77-3 76. 2
8 3 . 9
MUTUAL SAVINGS BANKS.
N. Atlantic Div
S. Atlantic Div
N. Central Div
Western Div.
Tota l .
$ 1 7 , 3 9 5 685
1, 820
29 ,540
4 9 . 4 4 o
$ 5 , 3 9 3
84 888
186
6 .551
$22 ,788
769 2, 708
29 ,726
55 .991
$ 9 3 9 , 8 o 2
1 6 , 6 1 4
15 .367
1 .404
9 7 3 . 1 8 7
$ 4 1 2 , 8 1 3
2 3 . 3 8 8
3 2 , 9 4 1
1 1 , 4 9 8
4 8 0 , 6 4 0
$ 1 , 3 7 5 , 4 0 3
4 0 , 7 7 i
5 1 . 0 1 6
4 2 , 6 2 8
1 , 5 0 9 , 8 1 8
P.ct.
i - 3
i- 7
3 - 6
69 -3
3 - 3
P.ct.
0 . 4 . 2
1. 7
• 4
• 4
P.ct.
i - 7
1-9
5-3 6 9 . 8
3 - 7
P.ct.
68.3
4 0 . 8
30 . 1
3-3
6 4 . 5
P.ct.
3 0 . 0
57-3
6 4 . 6
26. 9
3 1 . 8
Digitized for FRASER http://fraser.stlouisfed.org/ Federal Reserve Bank of St. Louis
National Monetary Commission
STUDY OF THE AGGREGATE FIGURES-
If we add the various kinds of receipts of all classes of dealers in all kinds of banks which reported, we get a grand total of $688,087,678. Of this vast sum $647,239,813 were deposited in the form of checks and other credit documents; this is 94 per cent. The corresponding percentages shown by the returns of the inquiry of 1896 was 92.5. Of the whole amount of our present total $33,984,822 was in currency and $6,863,043 in specie, pretty evenly divided between gold and silver. Of the total deposits nearly half, or $330,907,747, are credited to New York State, and her percentage of checks is 97.7. If we omit New York State altogether, in order to eliminate with absolute certainty the vast mass of speculative transactions occurring on the New York City Stock Exchange which lead some students of this question to doubt whether the figures represent the method of payment in legitimate trade, we have a grand total for the rest of the country of $357,179,935, of which $323,-924,144 were in checks. This is approximately 91 per cent.
The highest percentage shown by any State is 97.7, for New York. The lowest is that of the District of Columbia, 76. Massachusetts comes next to New York with 95.6. These are the only two States whose percentages are above 95. California, Illinois, Iowa, Kansas, Louisiana, Minnesota, Missouri, Montana, Nebraska, Oregon, and Wisconsin are all 90 or more.
Following is the table of returns by States:
1 8 0
Digitized for FRASER http://fraser.stlouisfed.org/ Federal Reserve Bank of St. Louis
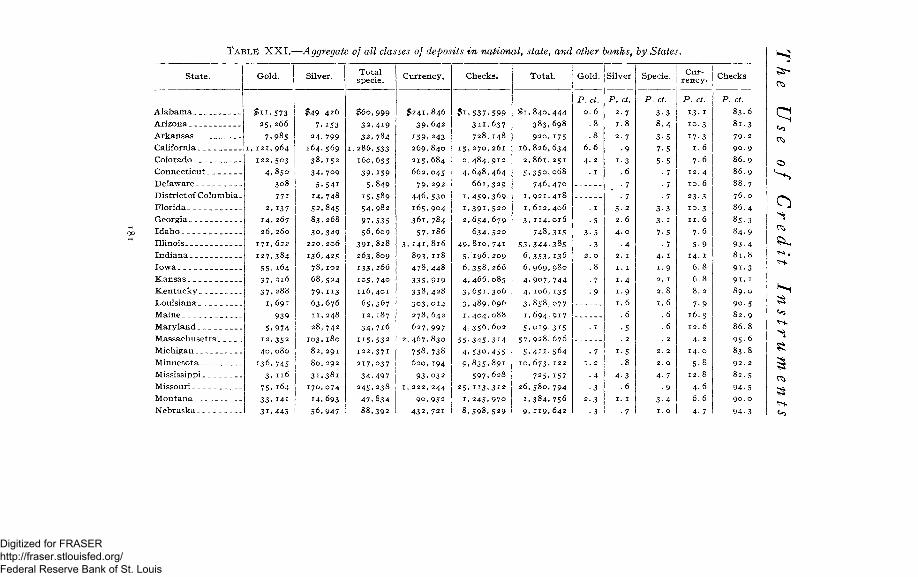
TAB!,E XXI.—Aggregate of all classes of deposits in national, state, and other banks, by States.
5^
8
«>5
Alabama
Arizona
Arkansas
California
Colorado
Connecticut
Delaware
Districtof Columbia.
Florida
Georgia
Idaho
Illinois
Indiana
Iowa
Kansas
Kentucky
Louisiana
Maine
Maryland
Massachusetts
Michigan
Minnesota
Mississippi
Missouri
Montana
Nebraska
Gold.
$ 1 1 , 5 7 3
2 5 . 2 6 6
7 , 9 8 s
, 1 2 1 , 9 6 4
122 ,503
4 , 8 5 0
308
771 2, 137
1 4 . 2 6 7
2 6 , 2 6 0
171 ,622
1 2 7 , 3 8 4
5 5 , 1 6 4 3 7 . 2 1 6 3 7 , 2 8 8
1, 691
939
5 , 9 7 4
12 ,352
4 0 , 0 8 0
136 ,745
3 , n 6
7 5 , 1 6 4
3 3 , I 4 i
3 1 . 4 4 5
Silver.
$49 426
7 .153
2 4 , 7 9 9
164.569
38,152
34,709
5,541
14,748
52,845
83,268
30,349
220,206
136 ,425
7 8 , 1 0 2
6 8 , 5 2 4
7 9 , H 3
63,676
11 ,248
28 ,742
103,180
82.291
80.292
31.381
170,074
14.693
56.947
Total specie.
$ 6 0 , 9 9 9
3 2 , 4 1 9
32, 784
1 ,286 ,533 160 ,655
39 , 159
5 ,849
15 ,589 5 4 , 9 8 2
9 7 , 5 3 5
5 6 , 6 0 9
3 9 1 , 8 2 8
263 ,809
133 .266
105 ,740
116 ,401
6 5 , 3 6 7
12 ,187
34, 7 i 6
115 .532
122 ,371
217 ,037
3 4 . 4 9 7 245 .238
4 7 , 8 3 4 8 8 , 3 9 2
Currency*
$ 2 4 1 , 8 4 6
3 9 . 6 4 2
159 ,243 2 6 9 , 8 4 0 2 1 5 . 6 8 4 6 6 2 , 0 4 5
7 9 . 2 9 2
4 4 6 , 5 3 0 1 6 5 , 9 0 4
3 6 1 , 7 8 4 5 7 . 1 8 6
3 , 1 4 1 , 8 1 6
8 9 3 . 1 1 8
4 7 8 , 4 4 8
3 3 5 . 9 1 9
3 3 8 , 4 2 8
3 0 3 , 0 1 4
2 7 8 , 6 4 2
6 2 7 , 9 9 7
2, 467, 830
758,738
6 2 0 , 1 9 4
9 3 , 0 3 2
1, 222, 244
9 0 , 9 5 2
4 3 2 , 7 2 1
Checks.
$ 1 , 5 3 7 , 5 9 9 3 1 1 , 6 3 7 7 2 8 , 1 4 8
15,270,261
2, 484, 912
4,648,464
661, 329
1, 459,369
1,391, 520
2,654.679
634,520
49, 810,741
5, 196, 209
6,358, 266
4,466,085
3,651,306
3,489, 696
I,404,088
4,356, 602
55.345.314
4,530,455
9,835,891
597,628
25,113,312
r. 245,970
8,598,529
Total.
,840,
383,
920,
,826,
,861,
.35o,
746,
, 921,
, 612,
, 114,
748,
344.
353,
969,
907,
106,
858,
694,
019,
928,
411,
673,
725.
580,
384,
119,
444
698
175
634
251
068
470
418
406
016
315
385
136
980
744
135
077
917
3*5
676
564
122
157
794
756
642
Gold.
P.ct.
0 . 6
6.6
4. 2
. 7 1. 2
• 4
• 3
2.3
• 3
Silver.j Specie. | ££*' I Checks
P. ct.
2 . 7
1.8
2 . 7
• 9
1-3 .6
. 7
•7 3 -2 2 . 6
4 . 0
• 4
4 - 3 . 6
1. 1
•7
P. ct.
3 - 3
8 . 4
3 -5
7 . 5
5-5
• 7
• 7
• 7
3-3
P . ct.
13 . 1
1 0 . 3
17-3
1.6
7.6
1 2 . 4 10. 6
2 3 . 3
1 0 . 3 1 1 . 6
7-6
5 -9 14. 1
6.8
6.8
8 . 2
7-9
1 6 . 5
1 2 . 6
4. 2
14. o
5-8
1 2 . 8
4 . 6
6 . 6
4 -7
. ct.
83.6
8 1 . 3
79. 2
9 0 . 9
8 6 . 9 86.
88 .
76.
86.
85 .
84.
93-
8 1 .
9 1 .
9 i .
9 0 . 5
8 2 . 9
8 6 . 8
9 5 - 6
8 3 . 8
92 . 2
8 2 . 5
9 4 - 5
90 . o
9 4 - 3
Digitized for FRASER http://fraser.stlouisfed.org/ Federal Reserve Bank of St. Louis
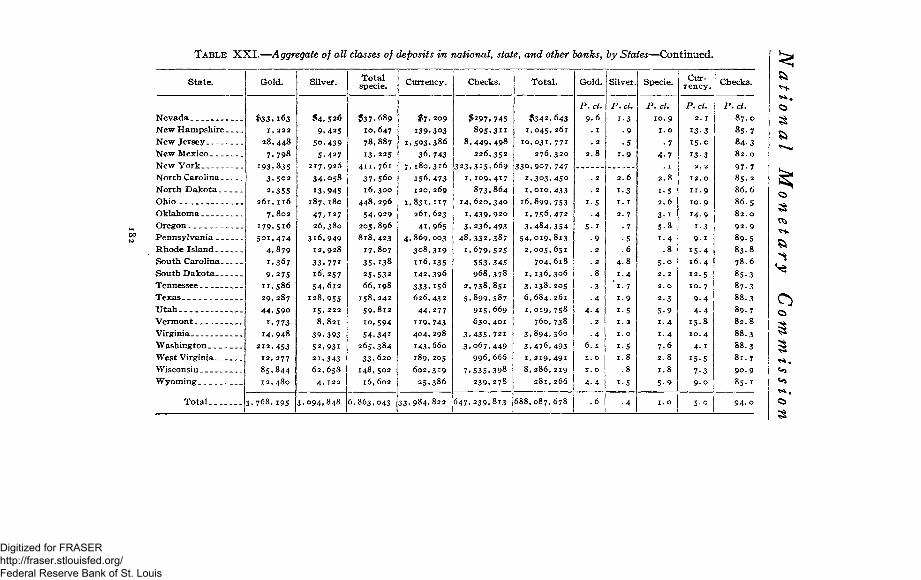
TABLE XXI.—Aggregate of all classes of deposits in national, state, and other banks, by States—Continued.
State.
Nevada
New Hampshire
New Jersey
New Mexico
New York
North Carolina
North Dakota
Ohio
Oklahoma
Oregon
Pennsylvania
Rhode Island
South Carolina
South Dakota
Tennessee
Texas __
U t a h .
Vermont
Virginia.
Washington
West Virginia
Wisconsin
Wyoming. _
Total __
Gold.
£ 3 3 . 1 6 3
1, 222
2 8 , 4 4 8
7 . 7 9 8
1 9 3 . 8 3 5 3 . 5 0 2
2 . 3 5 5 2 6 1 , 1 1 6
7 , 8 0 2
I 7 9 , 5 i 6
5 0 1 . 4 7 4
4 . 8 7 9
1 .367
9 . 2 7 5
1 1 , 5 8 6
2 9 , 2 8 7
4 4 . 5 9 o
1 .773
1 4 . 9 4 8
2 1 2 , 4 5 3
12, 277
8 5 . 8 4 4 1 2 , 4 8 0
3 , 7 6 8 , 1 9 5
Silver.
$ 4 , 5 2 6
9 . 4 2 5
5 o , 4 3 9
5 , 4 2 7 2 1 7 , 9 2 6
3 4 . 0 5 8
13 .945 1 8 7 , 1 8 0
4 7 , 1 2 7 26,380
3 i 6 , 9 4 9 1 2 , 9 2 8
3 3 . 7 7 1 1 6 , 2 5 7
5 4 . 6 1 2
128 ,955 1 5 , 2 2 2
8 , 8 2 1
3 9 . 3 9 3
5 2 , 9 3 1
21,343 6 2 , 6 5 8
4, 122
3 , 0 9 4 , 8 4 8
Total specie.
$37,689
10,647
78,887
13.225
411,761
37.56o
16,300
448,296
54,929 205,896
818,423
17,807
35.138
25.532
66,198
158,242
59.812
io,594
54.341
265,384
33,620
148 ,502
16 ,602
6,863,043
Currency.
$ 7 , 2 0 9
139 .303 1 , 5 0 3 . 3 8 6
3 6 , 7 4 3 7 , 1 8 0 , 3 1 6
156 ,473 120 ,269
1 , 8 3 1 , 1 1 7 261 ,623
4 1 , 9 6 5
4 , 8 6 9 , 0 0 3
3 0 8 , 3 1 9
116 ,135
142 ,396
3 3 3 . 1 5 6
626,432 44,277
i i 9 , 7 4 3
4 0 4 , 2 9 8
143 ,660
189,205
6 0 2 , 3 1 9
25 ,386
3 3 . 9 8 4 , 8 2 2
Checks.
$297,745
895.311
8 , 4 4 9 . 4 9 8 2 2 6 , 3 5 2
[323,315. 669 1 , 1 0 9 , 4 1 7
873.864 14, 620, 340
L 4 3 9 . 9 2 0
3 . 2 3 6 , 4 9 3
4 8 , 3 3 2 , 3 8 7
1.679,525
553.345
968,378
2,738,851
5,899.587
915,669
630,401
3 , 4 3 5 . 7 2 1
3 , 0 6 7 , 4 4 9
9 9 6 , 6 6 6
7 . 5 3 5 . 3 9 8
2 3 9 , 2 7 8
6 4 7 . 2 3 9 . 8 1 3
Total .
$ 3 4 2 ,
1 ,045 . 1 0 , 0 3 1 ,
276,
[330,907,
1 , 3 0 3 ,
1, 010,
1 6 , 8 9 9 ,
1 .756 ,
3 . 4 8 4 ,
5 4 , 0 1 9 ,
2 , 0 0 5 ,
704,
1 .136 ,
3 , 1 3 8 ,
6 , 6 8 4 ,
1 ,019 ,
760,
3 . 8 9 4 , 3 , 4 7 6 , 1 ,219 ,
8,286,
643
261
77 i
320
747
450
433
753
472
354
813
651
618
306
205
261
758
738
360
493
491
219
266
6 8 8 , 0 8 7 , 6 7 8
Gold.
P.ct.
9 . 6
• 3
. 4 4 - 4
. 2
• 4
6 . 1
1. o
1. o
4 - 4
. 6
Silver.
P.ct.
1 3
. 9
• 5
1 .9
2.6
1.3
1 .1
2 . 7
• 7
•5
.6
4-8
1 .4
" i . 7
1 .9
1-5
Specie.
P.ct.
10. 9
1 .0
• 7
4 -7 . 1
2 . 8
1-5 2.6
3 - 1 5 -8
1 .4
.8
5.o
2. 2
2. o
2 . 3
5 9
1 .4
1 .4
7 . 6
2 . 8
1 .8
Currency.
P.ct. 2 . 1
1 3 . 3 1 5 . 0
1 3 . 3 2. 2
1 2 . 0
1 1 . 9
10. 9
1 4 . 9
1.3
9 1
1 5 - 4
16. 4
1 2 . 5
10. 7
9 - 4
4 . 4
1 5 . 8
1 0 . 4
4 . 1
1 5 . 5
7-3 9 . 0
5-o
Checks.
'. ct.
8 7 . 0
8 5 . 7
8 4 . 3
8 2 . 0
9 7 - 7
8 5 . 2
8 6 . 6
8 6 . 5
8 2 . 0
9 2 . 9
8 9 . 5
8 3 . 8
7 8 . 6
8 5 . 3
8 7 . 3
8 8 . 3
8 9 . 7
8 2 . 8
8 8 . 3
8 8 . 3
8 1 . 7
9 0 . 9
8 5 . 1
Digitized for FRASER http://fraser.stlouisfed.org/ Federal Reserve Bank of St. Louis
The Use of Credit Instruments
Distribution of aggregate deposits by banks.—Of the whole amount of over $688,000,000 shown in our tables, the national banks reported more than $548,000,000. The state banks returned about $90,000,000 and the loan and trust companies about $40,000,000. The percentages run from 31.8 in the mutual savings banks to 95.3 in the national banks. The returns, put in this form, bring out strikingly again the overwhelming importance of the national banks in our commercial activity, although their number is so much smaller than that of the others. They bring out, too, the fact already commented on, that even the mutual savings banks receive part of their deposits in the form of checks. The table follows:
183
Digitized for FRASER http://fraser.stlouisfed.org/ Federal Reserve Bank of St. Louis
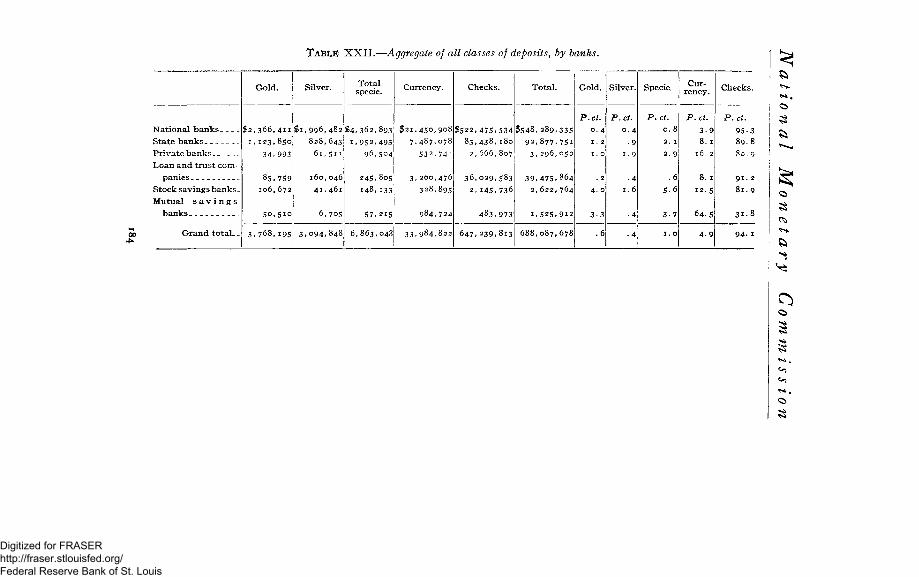
TABLE XXII.—Aggregate of all classes of deposits, by banks.
National banks
State banks
Private banks
Loan and trust com
panies
Stock savings banks.
Mutual s a v i n g s
banks
Grand totaL _
Gold.
$ 2 , 3 6 6 , 4 1 1 1 , 1 2 3 , 8 5 0
3 4 , 9 9 3
8 5 . 7 5 9 1 0 6 , 6 7 2
5 0 , 5 1 0
3 . 7 6 8 , 1 9 5
Silver.
$ 1 , 9 9 6 , 4 8 2
8 2 8 , 6 4 3 6 i , 511
160 ,046
4 1 . 4 6 1
6 ,705
3 , 0 9 4 , 8 4 8
Total specie.
$ 4 , 3 6 2 , 8 9 3
1 , 9 5 2 , 4 9 3
9 6 , 5 0 4
245 .805
148,133
57 .215
6 . 8 6 3 , 0 4 3
Currency.
$ 2 1 . 4 5 0 , 9 0 8
7 . 4 8 7 , 0 7 8
532 .741
3 , 2 0 0 , 4 7 6
328 ,895
9 8 4 , 7 2 4
3 3 . 9 8 4 . 8 2 2
Checks.
$ 5 2 2 , 4 7 5 , 5 3 4 8 3 , 4 3 8 , 1 8 0
2 , 6 6 6 . 8 0 7
3 6 , 0 2 9 , 5 8 3
2, 145 .736
4 8 3 . 9 7 3 6 4 7 . 2 3 9 , 8 1 3
Total.
$ 5 4 8 , 2 8 9 , 3 3 5
9 2 . 8 7 7 . 7 5 1 3 , 2 9 6 , 0 5 2
3 9 , 4 7 5 . 8 6 4 2 , 6 2 2 , 7 6 4
1 . 5 2 5 , 9 1 2
6 8 8 , 0 8 7 , 6 7 8
Gold.
P.ct.
0 . 4
1 . 2
1 . 0
. 2
4 . 0
3 3
.6
Silver.
P,ct.
0 . 4
• 9
• 4 1.6
• 4
• 4
Specie
P.ct.
0 . 8
2 . 1
2 . 9
. 6
5 - 6
3 - 7
1 . 0
Currency.
P.cU
3 - 9
8 . 1
16. 2
8 . 1
1 2 . 5
6 4 . 5
4 - 9
Checks.
P.ct.
9 5 - 3
8 9 . 8
9 1 . 2
8 l . 9
3 1 . 8
94- I
Digitized for FRASER http://fraser.stlouisfed.org/ Federal Reserve Bank of St. Louis
The Use of Credit Instruments
The aggregate deposits of all classes in reserve cities.—If we look at the returns from the selected reserve cities only, New York leads again with 98.5, Boston is second with 97.5, St. Louis is third with 95, Chicago is fourth with 94.9, Philadelphia is fifth with 93.2. The other reserve cities have a percentage of checks in total deposits amounting to 88.9, and the average for the country is 96.4. Of the whole amount of deposits in reserve cities, New York City alone has more than half, while the five leading cities have all but $45,000,000. The following table gives the details:
185
Digitized for FRASER http://fraser.stlouisfed.org/ Federal Reserve Bank of St. Louis
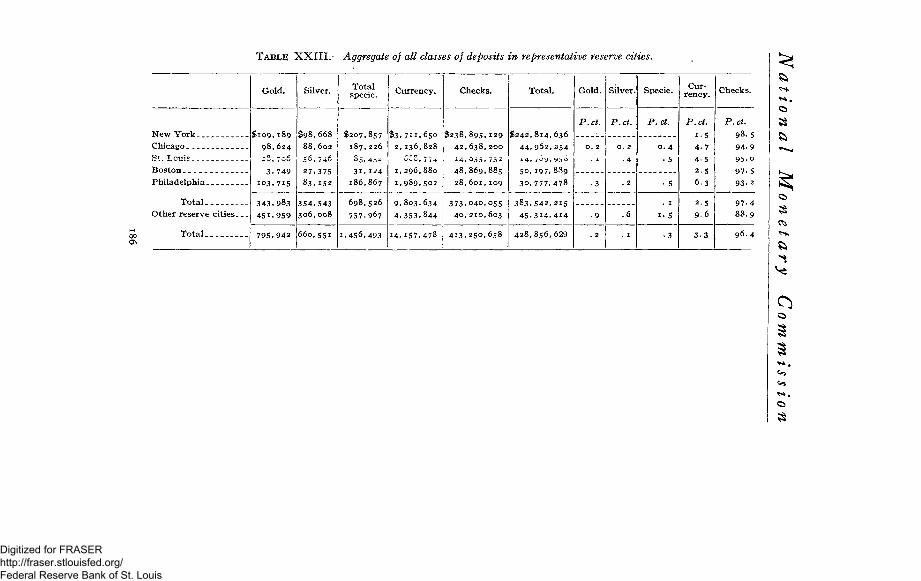
T A B L E XXIII.—Aggregate of all classes of deposits in representative reserve cities.
New York
Chicago
St, Louis
Boston. _
Philadelphia
Total
Other reserve cities
Total
Gold.
$ 1 0 9 , 1 8 9 9 8 , 6 2 4 „o ~-<
3 , 749
1 0 3 . 7 1 5
3 4 3 . 9 8 3
4 5 L 9 5 9
7 9 5 . 9 4 2
Silver.
$ 9 8 , 6 6 8 8 8 , 6 0 2
2 7 . 3 7 5 8 3 . 1 5 2
3 5 4 , 5 4 3 3 0 6 , 0 0 8
6 6 0 , 5 5 1
Total specie.
$207 ,857 187 ,226
85 ,452
3 1 . 1 2 4 186 ,867
6 9 8 , 5 2 6
757 .967
1 , 4 5 6 , 4 9 3
Currency.
$ 3 , 7 1 1 , 6 5 0 2 , 1 3 6 , 8 2 8
r. r.Q - =. .
1 , 2 9 6 , 8 8 0
1 , 9 8 9 , 5 0 2
9 , 8 0 3 , 6 3 4
4 . 3 5 3 . 8 4 4
1 4 , 1 5 7 . 4 7 8
Checks.
$ 2 3 8 , 8 9 5 , 1 2 9 4 2 , 6 3 8 , 2 0 0
i4> ^35. 73-* 4 8 , 8 6 9 , 8 8 5 2 8 , 6 0 1 , 1 0 9
3 7 3 . 0 4 0 , 0 5 5
4 0 , 2 1 0 , 6 0 3
4 1 3 , 2 5 0 , 6 5 8
Total.
$ 2 4 2 , 8 1 4 , 6 3 6 4 4 , 9 6 2 , 2 5 4
i 4 . / o 9 , 9 5 6
50, 1 9 7 . 8 8 9
3 0 , 7 7 7 , 4 7 8
3 8 3 , 5 4 2 , 2 1 5
4 5 . 3 1 4 . 4 1 4
4 2 8 , 8 5 6 , 6 2 9
Gold.
P.ct.
0. 2
. J.
• 3
• 9
. 2
Silver.
P.ct.
0. 2
• 4
. 2
. 6
. 1
Specie.
P.ct.
0 . 4
• 5
• 5
. 1
1. 5
• 3
Currency.
P.ct.
1-5
4 -7
4 5
2-5
6 . 3
2 . 5 9 - 6
3 - 3
Checks.
P.ct.
98. 5
94. 9
9 5 . 0 97. 5
93 . 2
97' 4
8 8 . 9
96 . 4
Digitized for FRASER http://fraser.stlouisfed.org/ Federal Reserve Bank of St. Louis
The Use of Credit Instruments
The aggregate percentage shown in country deposits.—For purposes of comparison the following table has been prepared to show the aggregate deposits and the percentage of checks in the returns from the banks of certain States, omitting the returns from banks in cities of 25,000 or more. The table shows that in Iowa 90 per cent of the returns of the deposits were in credit documents; in Kansas, 89.7; Nebraska, 86.9. The tables which have already been given showing the aggregate returns by States will show that other agricultural States range within about the same limits.
7071—10 13 187
Digitized for FRASER http://fraser.stlouisfed.org/ Federal Reserve Bank of St. Louis
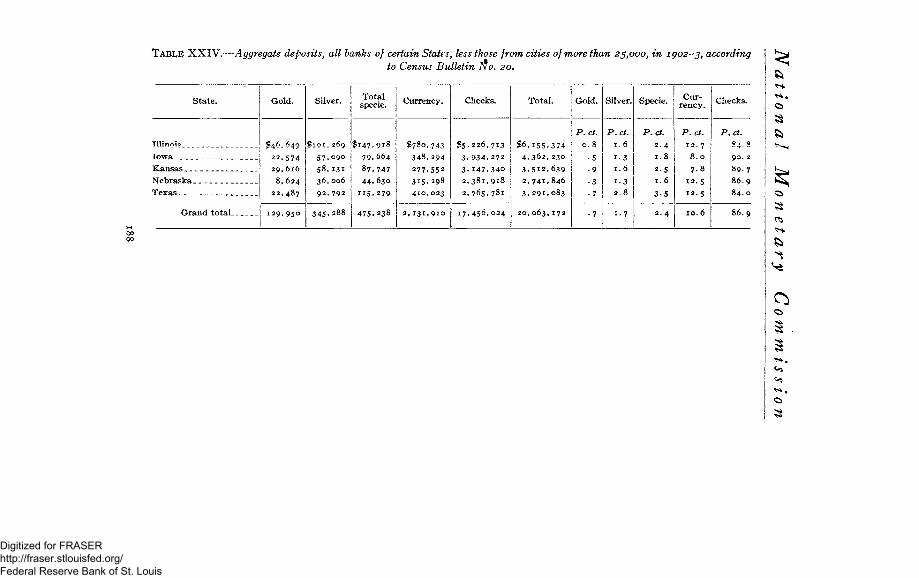
TABLE XXIV.—Aggregate deposits, all banks of certain States, less those from cities of more than 25,000, in 1902-3, according
to Census Bulletin No. 20.
State.
Illinois
Iowa
Kansas
Nebraska
Texas
Grand total
Gold.
$46,649
2 2 , 5 7 4
2 9 , 6 1 6
8 , 6 2 4
2 2 , 4 8 7
1 2 9 . 9 5 0
Silver.
$101 , 269
5 7 . 0 9 0
5 8 . 1 3 1
3 6 , 0 0 6
9 2 , 7 9 2
3 4 5 . 2 8 8
Total specie.
$ 1 4 7 , 9 1 8 7 9 . 6 6 4
8 7 . 7 4 7 4 4 , 6 3 0
115 .279
4 7 5 . 2 3 8
Currency.
$780 ,743 3 4 8 . 2 9 4 277 .552 3 1 5 . 2 9 8 410 ,023
2 , I 3 1 , 9 1 0
Checks.
$ 5 , 2 2 6 , 7 1 3 3 . 9 3 4 . 2 7 2 3 , 1 4 7 , 3 4 0 2 , 3 8 1 , 9 1 8 2 , 7 6 5 . 7 8 1
1 7 . 4 5 6 . 0 2 4
Total.
$ 6 , 1 5 5 , 3 7 4 4 . 3 6 2 , 230 3 . 5 1 2 . 6 3 9 2 , 7 4 1 , 8 4 6 3 , 2 9 1 , 0 8 3
2 0 , 0 6 3 , 1 7 2
Gold.
P.ct.
0 . 8
• 5
• 9
• 3
•7
• 7
Silver.
P.ct.
1. 6
1-3
1 .6
i - 3
2 . 8
1 - 7
Specie.
P.ct.
2 . 4
1 .8
2-5
1 .6
3 5
2 . 4
Currency.
P.ct.
1 2 . 7 8 . 0
7.8
1 2 . 5
1 2 . 5
zo. 6
Checks.
P.ct.
8 *. 8
90. 2 89. 7
8 6 . 9
8 4 . 0
86.9
Digitized for FRASER http://fraser.stlouisfed.org/ Federal Reserve Bank of St. Louis
The Use of Credit Instruments
COLLATERAL EVIDENCE AS TO THE USE OF CHECKS.
Change in small bills.—If that part of the population of the country which makes payments wholly or partly with cash is increasing more rapidly than the rest of the country, the kind of currency which this part of the population uses might be expected to increase more rapidly than the total volume of currency. Table XXVI shows the total volume of currency outstanding, by five-year periods, by denominations, calculated from figures given in the reports of the Treasurer of the United States. Of course the amount outstanding is not the amount in circulation, yet the errors probably average up about the same from year to year, so that changes in the amount outstanding may be taken as a fair illustration of changes in the amount in active use.
We give, first, the sum of the amounts of currency of all denominations annually outstanding, for five-year periods. The second column gives corresponding data for currency of denominations up to and including $20. The next column gives the ratio of these small denominations to the total per million. The other columns give similar data for other denominations. There is no marked increase corresponding to the increase of the population, but it is with the increase of the population rather than the volume of business to which this part of our currency should show a particular sensitiveness. The ratios for the five-year periods show a periodicity, with, on the whole, an upward tendency, but the increase is by no means great enough to take care of the increased volume of business in the period in question.
189
Digitized for FRASER http://fraser.stlouisfed.org/ Federal Reserve Bank of St. Louis
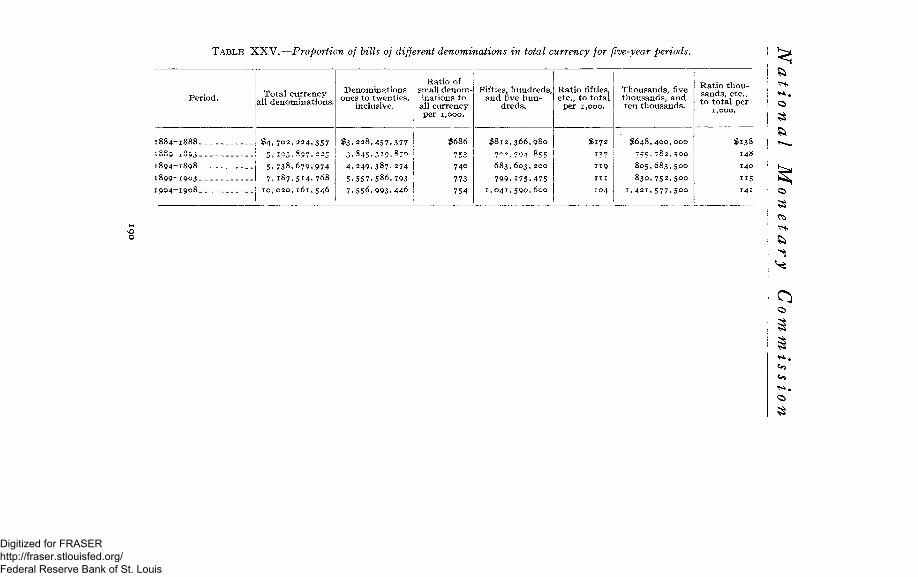
TABLE XXV.—Proportion of bills of different denominations in total currency for five-year periods.
Period.
1884-1888
1889 1893 1894-1898
1899—1903
1904—1908
Total currency all denominations.
$ 4 , 7 0 2 , 2 2 4 , 3 5 7 5> * ~ 3 . •-'97» - - j 5 , 7 3 8 . 6 7 9 . 9 7 4 7 , 1 8 7 , 5 1 4 . 7 6 8
1 0 , 0 2 0 , 1 6 1 , 5 4 6
Denominations ones to twenties,
inclusive.
$ 3 , 2 2 8 , 4 5 7 , 3 7 7 3 . 8 4 5 , 3 1 9 , 8 7 0 4 , 2 4 9 , 3 8 7 , 2 7 4 5 . 5 5 7 , 5 8 6 , 7 9 3 7 . 5 5 6 , 9 9 3 . 4 4 6
Ratio of small denominations to
all currency per 1,000.
$686
74o
773
754
Fifties, hundreds, and five hun
dreds.
$ 8 1 2 , 3 6 6 , 9 8 0
7n9_79^ ; 855
6 8 3 , 6 0 3 , 2 0 0
7 9 9 . 1 7 5 . 4 7 5 1 , 0 4 1 , 5 9 0 , 6 0 0
Ratio fifties, etc., to total
per 1,000.
$172 i37 119 i n 104
Thousands, five thousands, and ten thousands.
$ 6 4 8 , 4 0 0 , 0 0 0
75?. 782. <;oo
8 0 5 , 6 8 3 , 5 0 0
8 3 0 , 7 5 2 , 5 0 0
1 , 4 2 1 , 5 7 7 , 5 0 0
Ratio thousands, etc., to total per
1,000.
$138
148 140
1 1 5
1 4 1
Digitized for FRASER http://fraser.stlouisfed.org/ Federal Reserve Bank of St. Louis
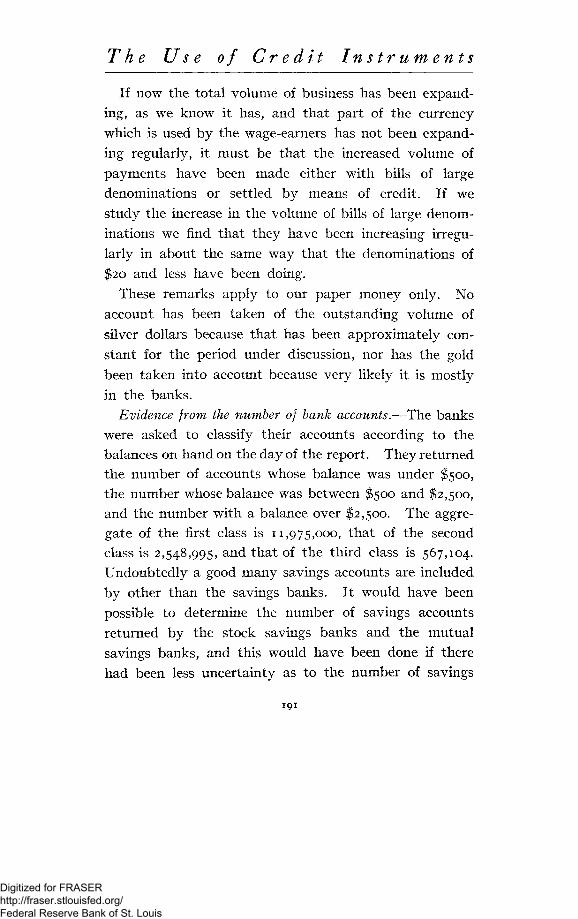
The Use of Credit Instruments
If now the total volume of business has been expand
ing, as we know it has, and tha t par t of the currency
which is used by the wage-earners has not been expand
ing regularly, it must be tha t the increased volume of
payments have been made either with bills of large
denominations or settled by means of credit. If we
study the increase in the volume of bills of large denom
inations we find tha t they have been increasing irregu
larly in about the same way tha t the denominations of
$20 and less have been doing.
These remarks apply to our paper money only. No
account has been taken of the outstanding volume of
silver dollars because tha t has been approximately con
s tant for the period under discussion, nor has the gold
been taken into account because very likely it is mostly
in the banks.
Evidence from the number of bank accounts.—The banks
were asked to classify their accounts according to the
balances on hand on the day of the report. They returned
the number of accounts whose balance was under $500,
the number whose balance was between $500 and $2,500,
and the number with a balance over $2,500. The aggre
gate of the first class is 11,975,000, t ha t of the second
class is 2,548,995, and t h a t of the third class is 567,104.
Undoubtedly a good many savings accounts are included
by other than the savings banks. I t would have been
possible to determine the number of savings accounts
returned by the stock savings banks and the mutual
savings banks, and this would have been done if there
had been less uncertainty as to the number of savings
191
Digitized for FRASER http://fraser.stlouisfed.org/ Federal Reserve Bank of St. Louis
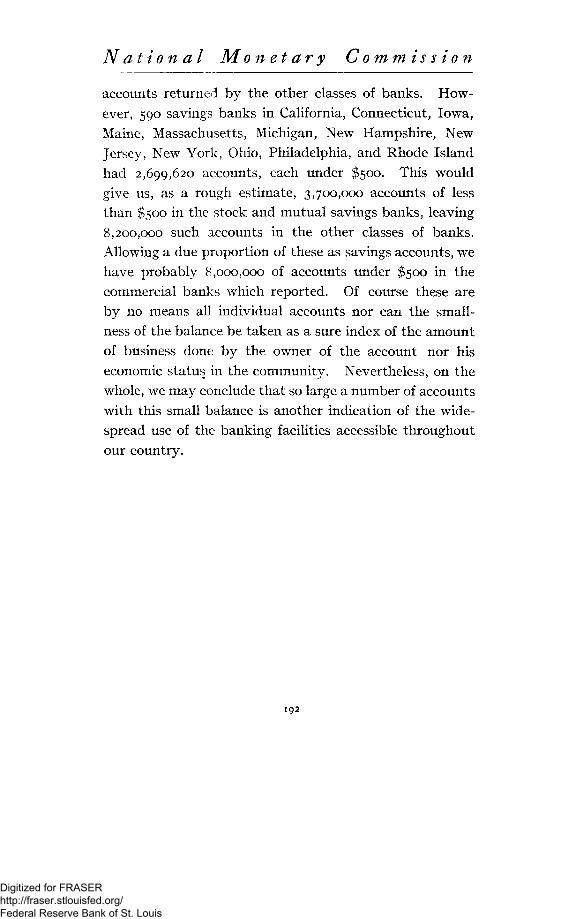
National Monetary Commission
accounts returned by the other classes of banks. However, 590 savings banks in California, Connecticut, Iowa, Maine, Massachusetts, Michigan, New Hampshire, New Jersey, New York, Ohio, Philadelphia, and Rhode Island had 2,699,620 accounts, each under $500. This would give us, as a rough estimate, 3,700,000 accounts of less than $500 in the stock and mutual savings banks, leaving 8,200,000 such accounts in the other classes of banks. Allowing a due proportion of these as savings accounts, we have probably 8,000,000 of accounts under $500 in the commercial banks which reported. Of course these are by no means all individual accounts nor can the small-ness of the balance be taken as a sure index of the amount of business done by the owner of the account nor his economic status in the community. Nevertheless, on the whole, we may conclude that so large a number of accounts with this small balance is another indication of the widespread use of the banking facilities accessible throughout our country.
192
Digitized for FRASER http://fraser.stlouisfed.org/ Federal Reserve Bank of St. Louis
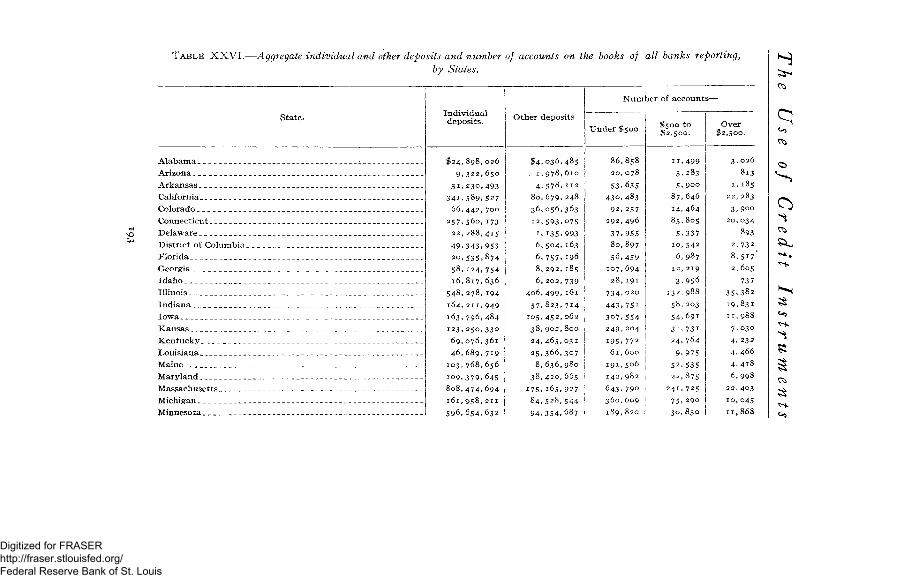
TABLE) XXVI.—Aggregate individual and other deposits and number of accounts on the books of all banks reporting, by States.
3
8
State.
Alabama Arizona Arkansas California Colorado Connecticut Delaware District of Columbia Florida Georgia Idaho Illinois Indiana Iowa Kansas Kentucky. Louisiana Maine Maryland Massachusetts Michigan Minnesota
Individual deposits.
$ 2 4 ,
9,
3i.
341. 66,
257. 22,
49, 20,
58,
16,
548,
164,
163,
123,
69,
46,
I03,
109,
808,
161,
596,
898,026
322,650
230,493
589,527
442,700
560, 173
288,415
343,953
535,874
124,754
817,636
278,194
211,949
796,484
250,330
076,361
689,719
768,656
379,645
474,694
958,211
654,632
Other deposits
$4,036, • i ,978,
4,578, 80,679, 36,056, 12,593,
1.135, 6,504, 6,757, 8, 292, 6, 202,
406,499, 57,823,
105,452, 38,902,
24,465, 25,366,
8,636,
38,420,
175,165, 84,528,
94,354,
485 610 112 248 363
o75 993 163 196 185 739 161
714 062
800
031 307 980 665 927 j
544 I 687 i
Number of accounts-
Under $500
86,858 20,078
53,635 430,483
92, 257 292,496
37,955 80,897 56,459
107,694 28,191
734,020
443.75i 307, 554 249,204 195,772 61,600
191,506 142,982
643,79o 360, 609 189,820
$500 to $2,500.
11,499 3,283 5, 9oo
87,646 14,464 85,805
5,337 10,542 6,987
12,219 3,956
132,988 58,203 54,691 3 i , 73i 24,764
9,975 52,535 22,875
241,725 75,290 30, 830
Over $2,500.
3,026 813
1, 185 22,283 3,900
20,034
893 2,732 8,517' 2,605
73 7 35,382 19,831 11,988 7,030 4, 232 4, 466 4,4i8 6,998
22,403 10,045 11,868
Digitized for FRASER http://fraser.stlouisfed.org/ Federal Reserve Bank of St. Louis
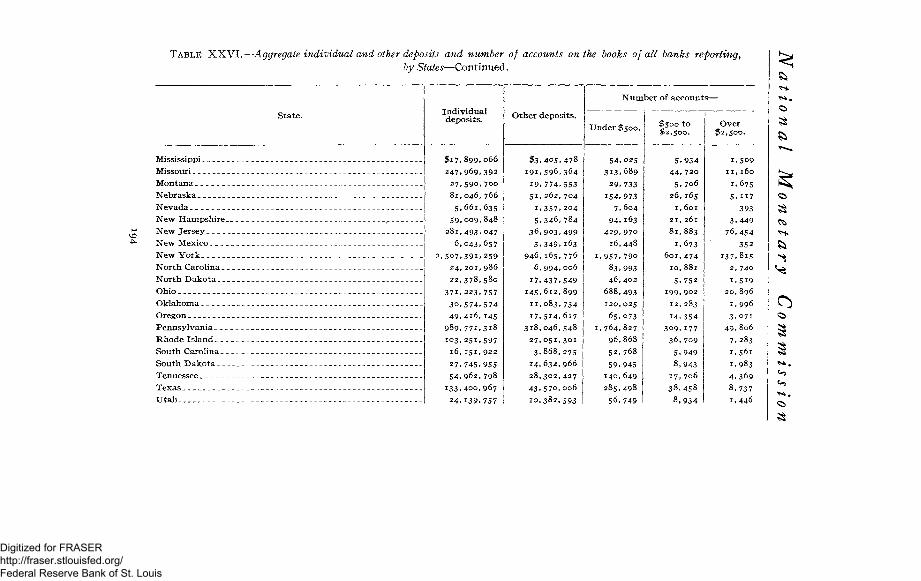
TABLE XXVI.—Aggregate individual and other deposits and number of accounts on the books of all banks reporting, by States—Continued.
State. Individual deposits. Other deposits.
Number of accounts—
Under $500. $500 t o $2 ,500 .
Over $2 ,500 .
Mississippi Missouri Montana Nebraska Nevada New Hampshire New Jersey New Mexico New York North Carolina-North Dakota . _ Ohio Oklahoma Oregon Pennsylvania Rhode Island--South Carolina. South Dakota . _ Tennessee Texas Utah
$17.
247.
27,
81,
5.
59,
281,
6,
, 507 ,
24. 22,
371, 30,
49, 989,
103,
16,
27,
54,
133,
24,
899,066 969,392 590,700 046,766 661,635 009,848 493.047 043.657 391.259 201,986 378,580 223,757 574,574 416,145 77L3I8 25i»597 I5L922 745,955 962,798 400,967 139,757
$3,405,478
191,596,364 19,774,553 51, 262, 704
1,357, 204 5,346,784
36,903,499 3,349,i63
946,165,776 6, 994, 006
17,437,549 145,612,899
11,083,734 17,514,617
318,046, 548 2 7 , 0 5 1 , 3 0 1
3,868,275 14,634,966 28,302,427 43,570,oo6
10,382,593
54,025 313,689
29. 733 154,973
7,604 94,163
4 2 9 , 9 7 0
16 ,448
, 9 5 7 , 7 9 0
8 3 , 9 9 3
4 6 , 4 0 2
6 8 8 , 4 9 3
120 ,025 6 5 , 0 7 3
, 7 6 4 , 8 2 7
9 6 , 8 6 8
52, 768
59,945
140,649
285,498
56,749
5,934 44,720
5,7o6
26,165
I, 601
21,261
81,883
1,673
601,474
10,881
5,752
199,902
12,283
14,354
309,177
36, 709
5,949
8,943
17, 706
38,458
8 , 9 3 4
1 .509 1 1 , 1 6 0
1,675 5 ,H7
393 3,449
76.454 352
I37,8i5 2, 740 L 5 I 9
20,896 1,996 3,071 49,806
7,283
1,561
1,983
4,369
8,737
1,446
Digitized for FRASER http://fraser.stlouisfed.org/ Federal Reserve Bank of St. Louis
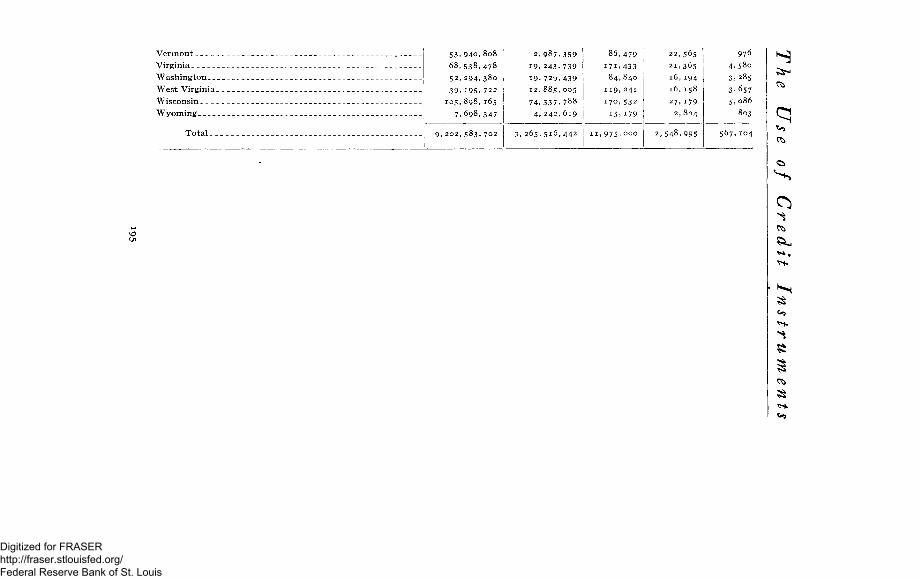
Vermont
Virginia
Washington __
West Virginia
Wisconsin
Wyoming
T o t a l s
53,940,808
68,538,478
52, 294,380
39,195.722
105,898,165
7,698,347
9,202,583,702
2,987.359
19.243,739
19, 729,439
12,885,005
74,337. 788
4, 242,619
3,265,516,442
86,479
I7L433
84,840
119,241
170,532
15.179
11,975,000
22, 565
21,365
16,194
16,158
27, 179
2, 824
2,548,995
976
4.580
3.285
3.657
5.086
803
567,104
Digitized for FRASER http://fraser.stlouisfed.org/ Federal Reserve Bank of St. Louis
National Mon etary Commission
FINAL CONCLUSIONS AS TO THE AVERAGE PROPORTION OF
PAYMENTS MADE WITH CHECKS AND OTHER CREDIT
INSTRUMENTS.
The conclusion reached in the inquiry of 1896 was that at least 80 per cent of the total business of the country at that time was settled by means of credit paper. The average per cent of the retail deposits made in the form of credit instruments, on the basis of the returns of that year, was 67. In the present returns it is 73 per cent. The discussion in the report of 1896, which has been repeated in part in the present discussion, with some additional points, led to the conclusion that "40 per cent is as low as could in reason be claimed to be correct and that 55 per cent is, all things considered, probably about correct." This is for retail trade.
From the present discussion, the writer is of the opinion that this is probably too low. Undoubtedly the use of checks has grown considerably in the past fifteen years. The number of national banks increased from 3,689 in July, 1896, to 6,893 last April, while the number of state and private banks and loan and trust companies is now about 14,550 as against about 5,700 thirteen years ago. The percentage of increase in the number of banks in the past thirteen years is about 128. The "banking power" of the United States as measured by the Comptroller of the Currency0 has increased 242 per cent since 1890. In the meantime the population of the country is estimated to have increased from about 70,000,000 in
a Reports of Comptroller, 1896, p. 691, and 1908, p. 458.
196
Digitized for FRASER http://fraser.stlouisfed.org/ Federal Reserve Bank of St. Louis
The Use of Credit Instruments
1896 to about 90,000,000 now. In other words, the banking power of the country has been increasing more rapidly than the population. Meantime the business of the country, as measured by the total bank clearings in 1896 and 1908 has increased from $51,977,799,114 to $126,238,694,398.
The total estimated circulating medium of the country has increased from $1,506,434,966 to $3,038,000,000. As the population of the country increases, very likely an increasing proportion of the people belong to the wage-earning class, or to the class just above, with relatively small incomes. If so, the smaller number of the population with the larger income would do a larger proportion of the business, and it is this class who most commonly make their payments with checks. These reflections are especially applicable in a period of prosperity such as this country has on the whole experienced in the past fifteen years. Consequently, it is altogether likely that the percentage of the volume of ordinary payments made by check has been increasing somewhat, as the figures of the bank returns would seem to show. In the opinion of the writer it would not be far out of the way to assume that 60 per cent of the retail trade of the country, under existing conditions, is paid for with checks.
We have found no reason to think that the figures obtained for the wholesale trade are not representative. So far as the writer is aware, no one has ever produced any evidence that invalidates the truth of the common belief that 90 per cent or more of the wholesale business of the country is done by means of credit paper. In
197
Digitized for FRASER http://fraser.stlouisfed.org/ Federal Reserve Bank of St. Louis
National Monetary Commission
getting at our final average we may therefore take the figures on the face of our returns as substantially correct. If now we take the percentage of checks in the retail payments at 60 and the percentage in the wholesale payments at 95 and weight these in the proportion of the deposits returned for the two classes of dealers, we get 86 as the average percentage of retail and wholesale business done with checks and other credit paper.
It is not a matter of great importance whether we take the figures of "all others" at their face value or lessen them by a considerable amount to meet the objections that have been discussed as to the duplication of checks, the deposits by speculators, etc. The writer is of the opinion that this form of demand for payment should not be omitted. If, nevertheless, we omit from the third class of deposits those of the New York City banks, where the greatest speculative transactions take place, allow $6,000,000 for retail business not "banked," and then weight the percentages of the respective classes according to the volumes of deposits with the $6,000,000 added to the retail total and retail cash, and New York City out of the " all others " total, we reach a final average percentage of 88 as that which represents that part of the trade of the country which from day to day is settled by means of checks and other credit paper.
The conclusion reached in 1896 was that 80 per cent was a fair probable average. Considering the facts that the volume of business has increased more rapidly than population, that we have probably one bank to every 4,000 people, that the country has seen a long period of
198
Digitized for FRASER http://fraser.stlouisfed.org/ Federal Reserve Bank of St. Louis
The Use of Credit Instruments
prosperity, there doubtless has been some increase in the use of checks. Surely we may conclude that the 1896 percentage was not too high. Very likely a figure between 80 and 88 would be about right.
Is the use of checks and credit instruments increasing? It has been said that the use of checks is not increasing, because the percentage shown in the bank inquiries of various dates, as described in this paper, has not shown a steady increase. On June 30, 1881, the percentage was given as 95.1; on September 17, 1881, it was 94.1; on July 1, 1890, it was 92.5; on September 17, 1890, it was 91; on September 15, 1892, it was 90.6; on July 1, 1896, it was given as 92.5; and on March 16, 1909, it is 94. These figures can not be used as the basis of an argument that the proportion of checks used in payment has increased. That the absolute volume of business settled in this way is increasing, no one denies. The variation in these percentages seems to indicate a larger proportion of this kind of settlement in June and July than in the fall. Still it would not be safe to accept this inference as true without further evidence. The opposite, however, certainly is not true. The movement is probably periodic.
SUMMARY.
We may summarize the results of our inquiry and inferences therefrom briefly as follows:
1. In the first place, it is very clear that a large proportion of the business of the country, even the retail trade, is done by means of credit instruments. While it is probably true that wage-earners, as a class, do not
199
Digitized for FRASER http://fraser.stlouisfed.org/ Federal Reserve Bank of St. Louis
National Monetary Commission
commonly use checks, it is also true that a great many of them do. Moreover, the use of checks is common among people who derive their income from other sources, even though it be not larger than the well-paid day laborer. We are justified, therefore, in concluding that 50 or 60" per cent of the retail trade of the country is settled in this way.
2. There is no reason to modify the percentage of checks in the wholesale business of the country. The figures of the table are probably as nearly correct as any that could be gotten. Over 90 per cent of the wholesale trade of the country is done with checks and other credit documents.
3. The very general use of checks is shown in the deposits of "all other" depositors. The average is close up to that of the wholesale trade, and while many corporations, public and private, are doubtless represented here, and many speculative transactions are included, there is no reason for excluding any one of those in determining the proportion of business done, whatever we may think of its legitimacy from the point of view of public morals or public utility.
4. The use of checks is promoted in a measure by the payment of wages by check. It appears from our investigation that of weekly pay rolls reported by the banks, aggregating. $134,800,000 for the week ending March 13 last, 70 per cent was in checks. These pay checks are probably cashed largely by the merchants and would appear in their accounts mainly on the following Saturday or Monday. Some doubtless got into our deposits
200
Digitized for FRASER http://fraser.stlouisfed.org/ Federal Reserve Bank of St. Louis
The Use of Credit Instruments
on the Tuesday for which we have returns. However, they may be counted, in part at least, as checks used in the settlement of transactions, because in most cases they would be given in settlement of an account, the owner getting back the difference between his account and the check.
5. The great use of checks is shown also by the large number of accounts under $500. This evidence is not conclusive, but shows a tendency. Of course, the accounts include not only those of individuals, but of firms, corporations, and others.
6. We may therefore safely accept an average of 80 to 85 per cent as the probable percentage of business of this country done by check.
7. The fact that so large a proportion of business is done with credit paper may or may not be a good thing. Whether it is or not depends on circumstances. If any part of the country is compelled to use checks because of the lack of currency, when it would prefer the latter, the situation is an evil.
8. The transaction of so large a volume of our business by checks is an element of danger in times of stringency and crisis. In such times the uncanceled balance of credit transactions creates a larger demand for money, but the habit of settling by check has meantime kept the available amount of money at a minimum.
9. Consequently there ought to be some means of supplying additional currency when credit as a means of payment diminishes. This currency ought to be as safe and as uniform as the ordinary currency, and it should
2 0 1
Digitized for FRASER http://fraser.stlouisfed.org/ Federal Reserve Bank of St. Louis
National Monetary Commission
be capable of being quickly emitted and recalled. That is, it should possess elasticity.
10. The large money circulation of the country is explained by the facts that our prices and wages range high, that our people probably carry a larger average amount of money on their persons than do foreigners, that some portion of our currency has been destroyed or lost or hoarded, and that some of our money is abroad in the hands of money brokers and others. Finally, as our business grows, the amount of money needed as reserve to perform this vast volume of business transactions increases, too.
11. The amount of money released by our credit transactions is not equal in amount to the volume of credit instruments, for there must always be enough to settle the uncanceled balances called for in money from day to day.
12. This demand for reserve has an influence in determining the value of money on general prices just as has the demand for money for direct payment.
13. The volume of credit transactions very likely tends to increase as population and business grow. It does not increase uniformly, however, but by periodic movements. That is to say, the rate of increase of credit transactions, as compared with the whole volume of business, grows, as it were, by jerks and at a decreasing rate.
THE BEARING OF THESE INVESTIGATIONS ON THE MONETARY SITUATION.
Several important questions are closely related to the inquiry which has been reported and discussed. Among them are these:
202
Digitized for FRASER http://fraser.stlouisfed.org/ Federal Reserve Bank of St. Louis
The Use of Credit Instruments
i. What is the amount of money rendered unnecessary by the use of credit paper?
2. What is the influence of the vast volume of credit transactions on the value of money or the level of prices?
3. Why is it that our per capita circulation is so large and where is the money in active circulation?
4. Does this discussion show the need of more money for circulation, or may we safely rely upon our method of credit payments to meet the business needs of the country?
5. If more money is needed, under what conditions can it be best supplied?
1. We will take these questions up in order. It is not a correct view of the case to suppose that the credit paper used in settling debts displaces a volume of money equal to itself. The amount of money displaced is the difference between the amount that would be needed in a purely money regime and the amount needed to pay the uncanceled balances of the credit transactions. Now, the same unsettled balance may result from very different volumes of business. This is not the place to discuss what factors make the uncanceled balance large or small, nor do we know any way of telling beforehand what volume of business may be settled by credit cancellation in a community with a given money circulation. In a city where there is no clearing house and the banks exchange checks from day to day the volume of business settled by cancellation of checks, on the basis of a given amount of money as a reserve, will be smaller than can be so handled when the credit machinery is made more perfect by the establishment of a clearing house. The process is well illustrated
7071—10 14 203
Digitized for FRASER http://fraser.stlouisfed.org/ Federal Reserve Bank of St. Louis
National Monetary Commission
in times of stringency when the clearing-house banks pool their reserves. This is only another way of saying that a larger volume of transactions is canceled and a smaller balance left to drain the reserve. Therefore, the amount of money displaced by the use of credit paper in a community with the simplest form of credit machinery would be the whole volume of the transactions, minus the reserve necessary to settle balances. If we could separate all the transactions of the day or week into aggregate credits and debits to be settled at the same moment, the amount of money necessary to settle them would be the part of the balance settled immediately with cash, plus the amount necessary as a reserve for the part carried over on the books of the banks. Obviously, now, the amount necessary for reserves is a very variable one, depending not only on the total amount of business, but also upon that part of the unsettled balances which is called for in money form immediately. It is for this reason that the volume of credit business that can be done on a particular reserve is a very variable one. It is also very unstable. Credit built upon credit, as so many of our transactions are, trembles and falls at very slight shakings of confidence in the future. A comparatively slight depression of the market, a comparatively small change in the amount of credit transactions, may produce a large uncanceled balance and make necessary a much greater amount of money. The more our credit machinery expands the more delicate it becomes.
No one can say, therefore, with definiteness what is the amount of money released if 75 or 80 per cent of
2 0 4
Digitized for FRASER http://fraser.stlouisfed.org/ Federal Reserve Bank of St. Louis
The Use of Credit Instruments
our business transactions are settled by means of credit paper. This is a matter in which the long experience of practical bankers is the only safe guide, because the amount in question is changing from day to day as the conditions change. No simple rule about it can be laid down. Certainly, however, it is not 75 per cent of the money which would be necessary if all transactions were settled with money. It is an amount varying from one-third to one-fifth of uncanceled credit balances, according to the perfection of the banking machinery, the state of credit, prosperity, and public confidence.
One point needs to be carefully borne in mind. However great the volume of credit exchanges, however extensive the use of credit may become in a community, they can never fully displace sales for direct money payment. The extensive use of credit is not of itself a sign that a community is well off. Credit is used in poor as well as in rich communities. Its extensive use in a poor and undeveloped country is likely to indicate a lack of capital rather than an abundance of wealth. Every community tends to use the cheapest medium of exchange accessible to it. If its capital is of very high value for producing goods for direct consumption, a community will be averse to investing much of it in a medium of exchange.
This is the reason why undeveloped countries, as our own was a century ago, try to effect their exchanges by means of credit paper to a larger extent than wealthier communities. Under such conditions paper money is commonly thought to be the cheapest medium of
205
Digitized for FRASER http://fraser.stlouisfed.org/ Federal Reserve Bank of St. Louis

National Monetary Commission
exchange. If, now, part of the money exchanges are replaced with credit exchanges, the amount of money released, or the amount without which the community could now get on, would be the whole amount formerly used in money payments, provided these payments now done on credit exactly canceled one another, and we could be sure that they would continue to balance one another forever. We know, however, that we can not be sure of that; we know that transactions are not likely to cancel one another completely from time to time; hence the amount of money released by the substitution of credit payments for direct money payments is the • amount formerly used minus the reserve necessary to do this credit business. The important point, however, is that less money is necessary. How much less we can not be sure. We can get some light on the subject, however, by noting the volume of business done by credit paper and the balances which from time to time are carried as a basis of settlement.
It is important to note also that an increase in the volume of credit transactions does not necessarily mean that we must get a proportionate increase in our reserve of money. Every refinement of the credit mechanism makes it possible to do a larger volume of business on the same reserve.
Of course, it will not do to over-emphasize the importance of credit exchanges, vast as they are. Credit and credit documents can not replace money altogether. They reduce the amount necessary, but against them some reserve must always be kept, accessible for emer-
2 0 6
Digitized for FRASER http://fraser.stlouisfed.org/ Federal Reserve Bank of St. Louis
The Use of Credit Instruments
gencies in the settlement of balances. The volume of business that can be done by credit paper depends on several circumstances. Obviously, in the first place, it depends upon the banking facilities of the country. If the banks are widely distributed, if they are willing to deal in transactions small enough to be within the reach of large numbers of people, many more transactions will be settled through them than would otherwise be the case. This fact undoubtedly explains in large measure the development of what may be called the " banking habit" among the people of the United States. Undoubtedly our people pay by check much more commonly and much more largely than people of any other country. We settle smaller transactions by check; our banks are willing to carry smaller accounts. Indeed, the rapid industrial development of our country is probably due in no small degree to our system of independent banks and the facility with which we have permitted banks to be established. The small independent bank in the country community has felt that its interests and success were bound up with the interests and success of the community, and, therefore, has undoubtedly been willing to do more for the general interests than a branch of a large bank in some remote commercial center would have felt like doing, even if it had been justified in doing so. The small capital with which we have permitted banks to be established also has undoubtedly been a contributing factor to our rapid economic development, as well as to the promotion of the banking habit among our people.
207
Digitized for FRASER http://fraser.stlouisfed.org/ Federal Reserve Bank of St. Louis
National Monetary Commission
In the next place, the density of population is, of course, an important factor for the growth of credit exchanges. A larger volume of business is settled by bank paper in a commercial center than in an agricultural community, even though the proportion of total business thus settled may not be larger. However, it is necessary that there should be a certain number of people within reach of a common center in order to have a bank established there. Of course the smaller the bank the fewer the people thus required. Thus again our inclination in the past to favor the establishment of the small independent banks has facilitated the spread of banking and promoted the volume of business settled in the country districts by credit payment and stimulated the banking habit among our people.
Finally, the general education and intelligence of the mass of the people is an important factor. Men do not use banks unless they have confidence in them, and they have come to be regarded as a settled part of the ordinary commercial mechanism of the community. Our people are people of a wide general education and high order of intelligence. They understand the place and work of the bank in a community much better than the same number of people, for example, in a European country. This fact is strikingly brought out by a study of the proportion of retail business settled by means of checks in what are called the " foreign " districts of our large cities, on the one hand, and in an agricultural community on the other. The European immigrant is; not a man who has had banking connections in his home country, and
208
Digitized for FRASER http://fraser.stlouisfed.org/ Federal Reserve Bank of St. Louis
The Use of Credit Instruments
he does not use them here, even though the facilities are more numerous.
Such evidence as there is seems to indicate that payment by check has shown an increase during the past few years:
(a) In the first place, the returns of our reports show a larger percentage in retail trade. This evidence, of course, is by no means conclusive, but the checks could not be deposited if they were not drawn; therefore, whether they are largely "cashed" checks or checks received in payment of purchases, the fact that they are deposited in a larger degree indicates a wider use.
(b) The prosperity of the farmers in the Central West has enabled many to have bank accounts who fifteen years ago could not carry balances. The writer's information from central Illinois is strongly in this direction.
(c) The third evidence is found in the growth of the • number of small banks, especially in the country districts. Since national banks have been permitted to establish themselves with a capital of $25,000 their number has increased from 3,617 to 6,926.
(d) The appearance of a considerable proportion of checks in the deposits of mutual savings banks is also, to some degree, significant. Of course the credit documents received in the deposits of these banks may be to a considerable extent money orders. Nevertheless their deposits show a certain use of credit paper by the patrons of these banks.
On the other hand, the increase of that part of the population which consists of the wage-earning class, by whom
209
Digitized for FRASER http://fraser.stlouisfed.org/ Federal Reserve Bank of St. Louis
National Monetary Commission
the use of checks is small, is undoubtedly greater than that of our other classes of population. However, the wealthy classes, though fewer in number, have more to spend and their use of checks raises the proportion of credit paper in payments.
We can not expect any social movement to continue steadily in one direction for an indefinite time. Such evidence as inquiries of this character furnish seems to show that there is a certain ebb and flow in the proportion of checks used in business payments. With a given amount of money a certain proportion of it can be used for bank reserves on which to build credit transactions. For a time the volume of business will increase more rapidly than the money supplies, so that the proportion of credit business to the whole will increase, the improvement of the credit machinery in the meantime facilitating the movement. But the perfection of the facilities for utilizing to the utmost a given reserve, or a slowly increasing one, will come to a stop after a time, and it will be necessary to increase the money supply for any further expansion of credit. In the language of business, another unit of capital must be added to plant. The unit added to the social capital devoted to exchange—that is, the additional amount of money—will be larger than is necessary for most profitable immediate use, consequently the proportion of money exchanges will for a time show an increase. We may conclude, therefore, that the volume of business done on credit gradually increases as the population and total amount of business are enlarged,
2 I O
Digitized for FRASER http://fraser.stlouisfed.org/ Federal Reserve Bank of St. Louis
The Use of Credit Instruments
but at a decreasing rate and with occasional or periodic retardations.
2. Relation of credit exchanges to the volume of money and prices.—It is pertinent to inquire, now, what effect, if any, this great settlement of indebtedness by means of credit paper has upon the value of money. Evidently, it can influence this value, or the general price level, only as it changes the amount of demand for money. We have seen reason, now, to think that 80 per cent of our business transactions are settled by means of credit paper. Credit paper cancellation enables a larger amount of business to be done with the same amount of money and has an effect in determining the value of money by increasing the demand for reserves. Francis A. Walker, who may be taken as a representative of the extreme opponents of the doctrine that the extensive use of credit documents has a large influence on prices, insists that the growth of settlement by credit paper and the general transfer of credit paper by indorsement, the extension of bank deposits and the cancellation of indebtedness based thereon, have practically no effect on prices. "These transactions are, so far as concerns the use and by consequence the value of money, the same essentially as if they had been acts of barter. Exchanges in this category do not involve the employment of money, and they are therefore to be counted out when we are considering the causes and conditions which determine the value of money. They constitute no part of the demand for money/' °
« Francis A. Walker: Discussions in Economics and Statistics, I: 199.
2 1 1
Digitized for FRASER http://fraser.stlouisfed.org/ Federal Reserve Bank of St. Louis
National Monetary Commission
Admitting the partial truth of all this, it still holds that the use of credit paper in effecting credit exchanges makes possible a far larger volume of business than could otherwise be done, and that this increased volume of business must in some way influence prices seem undeniable. Mr. Walker and those who agree with him insist that its effect is nil. He urges that all transactions by direct barter, and by indirect barter or credit, are made upon the basis of prices determined by the direct money exchanges and that they thus have no influence whatever on the price level. " Were barter goods to be multiplied fourfold (but not at the expense of the goods exchanged for money) this would have no effect upon prices, since it would alter neither the demand for nor the supply of money." a
Again, it is urged that the volume of business shown by bank deposits or credit transactions does not represent truly the trade of the country. We are told by many that there is a vast amount of credit transactions embodied in banking and clearing-house statistics which may be termed "fictitious." That is to say, they are not a part of the necessary work of exchange in a community. For example, the cotton and wheat crops are sold several times over on the exchanges of the country, but not all these purchases and sales are a necessary part of the process of getting the cotton from the planter to the manufacturer. These sales, we are told, are purely speculative and born out of the credit organization, which, it is urged, merely makes the transactions pos
ts Francis A. Walker: Ibid., 198.
2 1 2
Digitized for FRASER http://fraser.stlouisfed.org/ Federal Reserve Bank of St. Louis
The Use of Credit Instruments
sible. If this credit organization did not exist, these multifarious and unnecessary speculative purchases and sales would not be carried on. In a sense, of course, this statement is true. In a sense, these speculative purchases and sales are not necessary to get the raw material to the manufacturer. In a sense, also, it is true that the jobbers, commission merchants, and other middlemen are not " necessary " to get the goods from the manufacturer to the consumer. All the existing agencies are necessary, however, to get the cotton or the wool to the manufacturer and the goods to the consumer at the price at which they buy them, under the existing machinery of transportation and exchange.
These exchanges actually exist. All the purchases involved constitute a part of the demand for means of settlement. Therefore they are to be regarded as a proper part of the exchange business of the country, and in some degree they must influence, the need for money.
The influence of the volume of business settled by means of credit paper on the value of money, or the general level of prices, is far greater than Mr. Walker admits. The demand for money to effect exchanges includes, first, demand for money for direct exchanges; second, demand for reserves for credit exchanges. Some goods exchange by direct barter and still more probably by indirect barter. If these last exchanges just canceled one another, the credit paper that grows out of them would also cancel, and no balances would remain to be settled with money. Usually, however, they do not cancel and the balance must be settled with cash; hence a reserve is necessary. We
213
Digitized for FRASER http://fraser.stlouisfed.org/ Federal Reserve Bank of St. Louis
National Monetary Commission
never can tell whether credit exchanges will cancel; experience shows, indeed, that they never do cancel, and in the absence of certainty it is necessary for every community through its banks to keep a reserve of money for, the purpose of settlement. Even if at some time they do cancel, we could never be sure that the next day or the next month or the nex t " season " would not give the community or the country or the world a disproportionate production of some goods as compared with others, which would impair the equality of cancellation in exchange and create a new balance of indebtedness, for the settlement of which money would be necessary. Or a new supply of money may become available and so disturb the equality of cancellation, create a new level of prices, and therefore require a balance for settlement in the shape of a larger reserve. This demand for reserve is certainly one of the influences that go to determine the value of money. In short, the demand for money includes a demand for direct payment and a demand for reserve. Disregarding for our present purpose all other factors, the value of money or the general level of prices will settle at a point where a unit of money may be used either for direct payment or for reserves. Thus we see that the volume of credit exchanges is of great importance, not only in enabling us to determine the volume of business done, but because of the influence on prices when acting through bank reserves.
3. Our monetary circulation.—Our per capita circulation, as estimated by the Comptroller of the Currency, has increased from $21.10 in 1906 to $34.72 in 1908. This is larger than the per capita circulation of other great
214
Digitized for FRASER http://fraser.stlouisfed.org/ Federal Reserve Bank of St. Louis
The Use of Credit Instruments
industrial and commercial countries with the exception of France. Why is it necessary and where is it? It is necessary, perhaps, for the following reasons:
(a) A larger amount of money is needed in this country because, in the first place, our prices range higher. If the prices of articles commonly consumed range 20 per cent higher than they do abroad, the people who buy them and pay for them with money need a larger amount to make their purchases. The same cause makes a larger reserve necessary to exchange a given volume of goods by credit. The demand for money, therefore, both for reserve and direct money transactions, is greater on account of the higher scale of prices.
(6) The same kind of reasoning applies to our wage scale. Whether the wage scale be the cause of the higher cost of living or the higher cost of living be the cause of the higher wage scale, more money is needed to pay wages. If wages are paid directly in cash, more money will be needed in proportion to the trade- If wages are paid with checks, more money will be needed by the amount that the reserve must be increased to furnish a basis for the checks.
(c) Our country is more sparsely settled than England, France, or Germany. In spite of the large increase in the banking facilities of the country, it still remains true that very many places are remote from banks, so that business, so far as it is not barter, will probably be carried on with money. It is necessary, therefore, to have a larger amount of money than if population were denser. We have seen that the proportion of credit paper in the
215
Digitized for FRASER http://fraser.stlouisfed.org/ Federal Reserve Bank of St. Louis
National Monetary Commission
deposits of the agricultural parts of the country is higher. This condition is probably due as much to the difficulty of getting a sufficient amount of money as to the desire to use the bank-deposit system of payment.
(d) I t may be that our spirit of individualism plays some part. So large a proportion of our wage-earning population have come from conditions where they had opportunity to handle very little money, that they like to carry money on their persons. I t makes them feel, as one man said to the writer, "more independent." To quote the same informant, they would "rather pay higher prices and have more money to pay with."
(e) Doubtless there is a good deal of hoarding by people who distrust banks or are not near enough to use them. I t might be urged that no larger proportion of people here hoard than is the case in Europe. Without disputing this, it is true, however, that if only the same proportion hoard and in the same relative amounts as is done by corresponding classes of the population, the absolute amount thus withdrawn would be larger because of our higher scale of wages and prices.
I t is a dangerous thing to attempt, but we may make a rough estimate of the amount of money necessary for business in this country, somewhat as follows:
If we add returns for the nonreporting banks according to their ratio to the whole number and the various classes of deposits, we get in round numbers $990,000,000 as the bank deposits of the day. Of this amount 5 per cent, let us say, was in money, amounting to about $50,000,000. If we add $20,000,000 for business not
216
Digitized for FRASER http://fraser.stlouisfed.org/ Federal Reserve Bank of St. Louis
The Use of Credit Instruments
"banked" we get $70,000,000 as the amount of money passing in the business of one day. How often does this turn over? Probably once in about twenty-one days. For the week is a common wage period; three to ten days are the payment period of many business houses which take advantage of discounts; and, of course, thirty days are also common. Let us take twenty days as the average.0 Then $1,400,000,000 is the amount of money used in the turnover. The banks have $1,500,000,000. Take $100,000,000 to $200,000,000 as the amount abroad hoarded, lost, and destroyed. This gives us a grand total of $3,000,000,000 to $3,100,000,000, or approximately our reported circulation.
4. Do we need more money f—-It is sometimes urged that an increasing use of credit renders a larger volume of money unnecessary; or at any rate that the increase in the need for a medium of exchange may be met by our very admirable elastic system of bank deposits. There are two or three considerations that must be urged in reply to this last opinion. As we have already noted, the use of credit paper is not of itself proof that a community is wealthy. Indeed this circumstance may show the very opposite condition. Some of our agricultural communities which are using checks so largely may be doing so because of the difficulty of getting money, or they may be doing so by choice. In other words, the large use of credit paper may under some circumstances mean that it is difficult to get currency. We can not be sure without knowing the
o I am indebted to Professor Irving Fisher for this estimate for 1896. I t is based on the report of that year.
217
Digitized for FRASER http://fraser.stlouisfed.org/ Federal Reserve Bank of St. Louis
National Monetary Commission
circumstances of the particular case. It is the opinion of the writer that this is in part an explanation of the large use of deposit banking in this country.
In the next place, the settlement of a very large proportion of exchanges by means of credit paper introduces a delicacy of character into the trading mechanism of a community which may cause it to be more easily upset. The larger the volume of credit settlements in proportion to the volume of money settlements, the greater the panic when confidence breaks down and the balance of canceled credit transactions thereby is made larger. A breakdown of confidence means an increase in the amount of transactions that must be settled by ready money. Therefore it is not a safe condition for the country to have the amount of actual money so small for its retail transactions that when confidence fails, the strain on it will be severely felt. It would be better for the country to have a smaller volume of credit transactions and a larger volume of direct money payments. If the habits of the people preclude this, then some means should be provided of supplying readily and efficiently the increased demand for ready money which occurs on account of a breakdown of confidence and the increase of the uncanceled balances of credit transactions. In other words, sources of additional currency supply which will flow out rapidly when it is needed to the places where it is needed, and will retreat with equal efficiency when the emergency passes, is an especial desideratum in a country where the proportion of transactions settled by credit paper is very large.
218
Digitized for FRASER http://fraser.stlouisfed.org/ Federal Reserve Bank of St. Louis
The Use of Credit Instruments
5. The additional supply of circulating medium necessary in times of stringency can be supplied in any one of three ways. In the first place, it may be issued under some arrangement by the existing independent banks of the country in their various communities. This is virtually an increase of credit currency. In the second place, it might possibly be supplied from some central bank to the existing banks in the various communities. In the third place, the existing credit currency, United States notes, might be retired and their place taken with specie which, in time of stress, could be gathered in to a greater or less extent in return for an increased volume of bank notes to be issued in either one of the first two ways.
It is not the province of this paper, however, to discuss this matter. Therefore the writer contents himself with simply mentioning these three ways.
7071—10 15 319
Digitized for FRASER http://fraser.stlouisfed.org/ Federal Reserve Bank of St. Louis
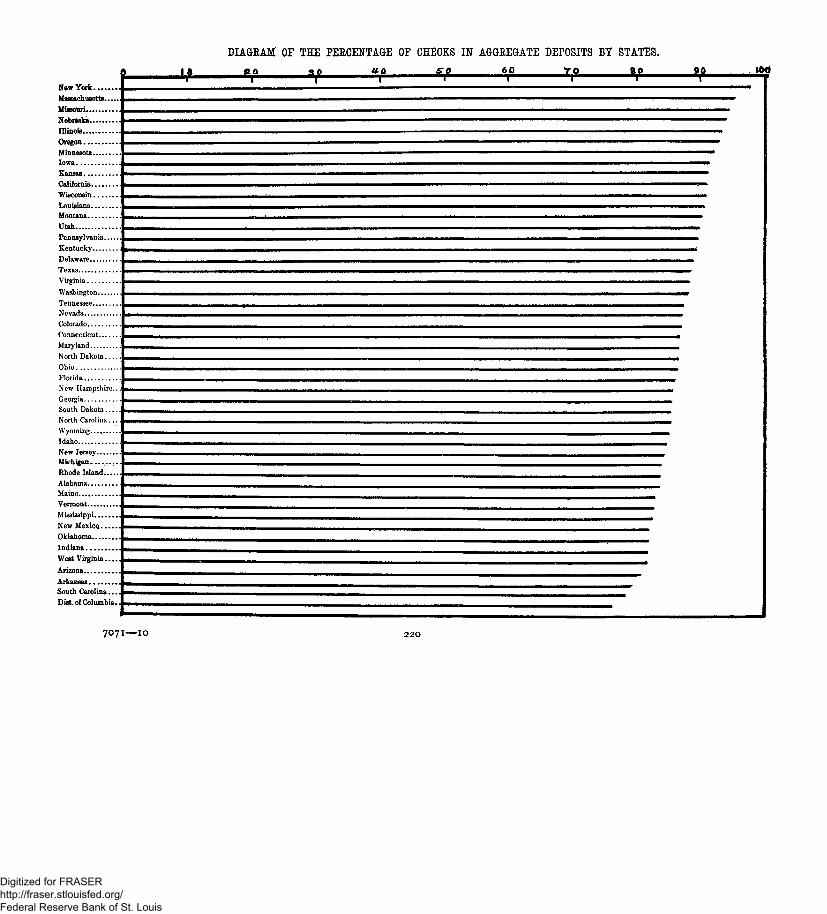
DIAGRAM OF THE PERCENTAGE OF CHECKS IN AGGREGATE DEPOSITS BY STATES.
ftp U-Q SO 6 0 -Z£. ao -2£- 160
New York Massachusetts..... Missouri Nebraska. Illinois Oregon Minnesota Iowa Kansas California Wisconsin liOuieiana Montana Utah ] Pennsylvania..... Kentucky. Delaware Texas Virginia Washington; ,
"ennessee Nevada Colorado Connecticut Maryland North Dakota Ohio Florida. New Hampshire.. Georgia South Dakota North Carolina... Wyoming Idaho New Jersey Michigan . . . . Rhode Island Alabama Maine Vermont Mississippi New Mexico Oklahoma Indiana West Virginia....
Arizona Arkansas South Carolina... J Diet, of Columbia. J
7 0 7 1 — I O
Digitized for FRASER http://fraser.stlouisfed.org/ Federal Reserve Bank of St. Louis
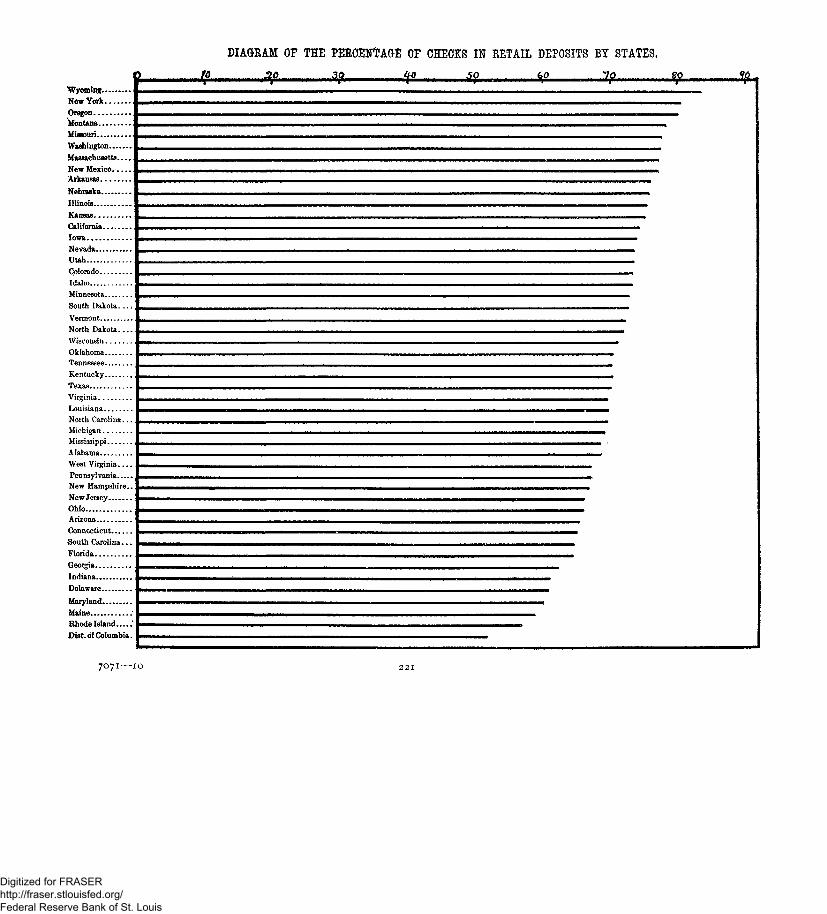
DIAGRAM OF THE PERCENTAGE OF CHECKS IN RETAIL DEPOSITS BY STATES.
Wyoming. NewYork ,
Oregon Montana Missouri Washington Massachusetts....
New Mexico. Arkansas
Nebraska
Illinois
Kansas California. Iowa Nevada Utah Colorado
Idaho Minnesota
South Dako ta . . . .
Vermont
North Dakota
Wisconsin
Oklahoma
Tennessee
Kentucky..
Texas
Virginia
Louisiana
North Carolina.. .
Michigan
Mississippi
Alabama
West Virginia. . . .
Pennsylvania
New Hampshire..
New Jersey
Ohio Arizona
Connecticut..
South Carolina.. .
Florida Georgia Indiana Delaware
Maryland
Maine .' Rhode Island.....* Dist. of Columbia.
to -¥ 30 •4ft- JSL GO 7Q SO _fiL
7071—10
Digitized for FRASER http://fraser.stlouisfed.org/ Federal Reserve Bank of St. Louis
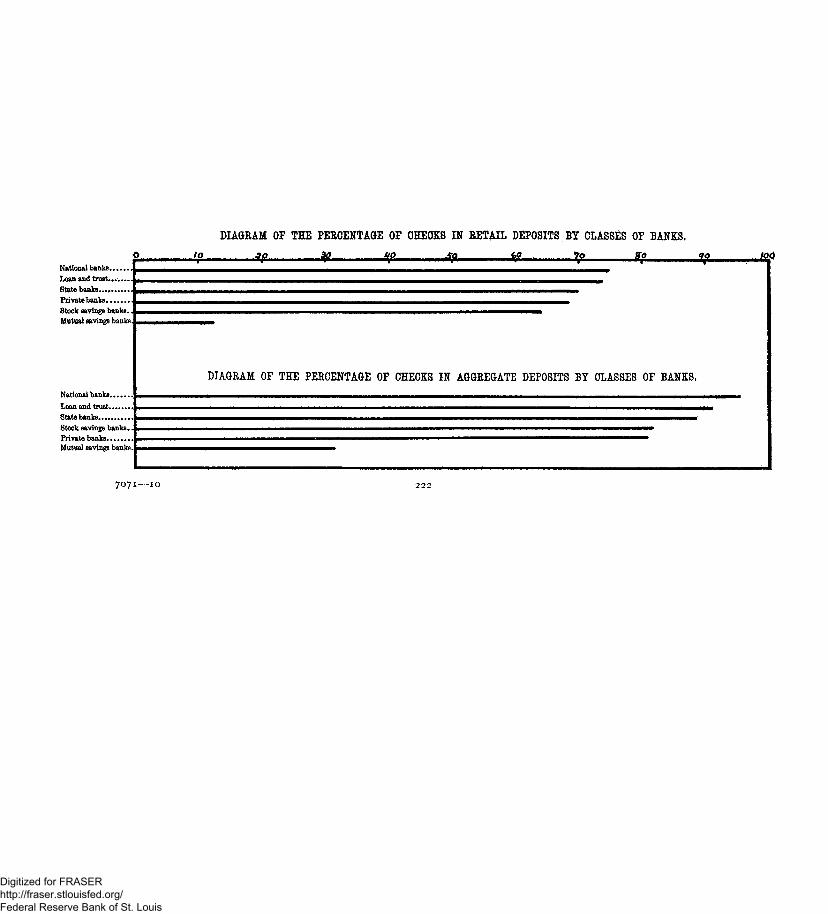
National banks Loan and trust.... . . . . State banks.... Private banks . . . . . . . . Stock savings banks., Mutual savings banks,
National banks
Loan and trust , State banks , Stock savings banks., Private banks Mutual savings banks.
DIAGEAM OF THE PEECENTAGE OF CHECKS IN EETAIL DEPOSITS.BY CLASSES OF BANKS.
_ ' . l o _ JZQ M £° .so y fro - * - -4L J * . 4 0 joo
DIAGEAM OF THE PEECENTAGE OF CHECKS IN AGGEEGATE DEPOSITS BY CLASSES OF BANKS.
7071—10
Digitized for FRASER http://fraser.stlouisfed.org/ Federal Reserve Bank of St. Louis
SELECT BIBLIOGRAPHY. ANDREW, A. P. : Credit and the Value of Money. Publ. Amer. Econ.
Assoc, 3d ser., VI: 103-107. BABBAGE, CHAS. : Analysis of the Statistics of the Clearing House During
the Year 1839. Journ. Stat. Soc , Lond., X I X : 28. BARNETT, R. W.: The Effect of the Development of Banking Facilities,
etc. Journ. Inst. Bankers, I I : 73, esp. 78. CONANT, C. A.: Extension of the Clearing System. Bank. Mag., N. Y.,
LXX: 433-D U N , J O H N : The Banking Institutions, Bullion Reserves, etc., of the
United Kingdom. Journ. Stat. Soc , Lond., X X X I X : 1. ESSARS, PiERRE DES: La Vitesse de la Circulation de la Monnaie. Journ.
de la Soc. de Statist, de Paris, Apr., 1895, 143 ff. FARRER, Sir T. H. : What do we Pay With? or, Gold, Credit, and Prices.
London, 1889. FISHER, IRVING: A Practical Method of Estimating the Volocity of Circu
lation of Money. Journ. Stat . Soc , Lond., LXXII , Pt. I I I . FISHER, WILLARD: Money and Credit Paper in the Modern Market
Journ. Pol. Econ., Chicago, I I I : 391-413. GARFIELD, JAMES A.: Speech in Cong. R e c , Nov. 16, 1877, p. 462. GILBART, J. W.: The Laws of the Currency in Scotland. Journ. Statist.
Soc , X I X : 144-169. Especially pp. 157, 167, 168. London. KEMMERER, EDWIN WALTER: Money and Credit Instruments in their
Relation to General Prices. New York, 1907. 2d ed., 1909. KINLEY, DAVID: Credit Instruments in Retail Trade. Journ. Pol. Econ.,
I l l : 203-217. Chicago, 1895. Credit Instruments in Business Transactions. Journ. Pol. Econ.,
V: 157-174. Chicago, 1897, Credit Currency and Population. Journ. Pol. Econ., X: 72-93.
Chicago, 1901. Money. A Study of the Theory of the Medium of Exchange. Pp.
43, 44, 199-223. New York, 1904. Report to Comptroller of the Currency, 1894. (See Report of the
Comptroller.) Report to the Comptroller of the Currency, 1896. (See Report of
the Comptroller.) The Relation of the Credit System to the Value of Money. Publ. Amer.
Econ. Assoc, 3d ser., VI: 84-94. New York, 1905. KNOX, JOHN J A Y : Address to the American Bankers' Association. Pro
ceedings of the Convention of the American Bankers' Association, 1881, pp. 33-49. New York, 1881.
223
Digitized for FRASER http://fraser.stlouisfed.org/ Federal Reserve Bank of St. Louis
National Monetary Commission
LANDRY, A.: La Rapidite* de la circulation mon£taire. Rev. d'Econ. Pol., 1905.
LUBBOCK, Sir J O H N : The Country Clearing. Journ. Statist. Soc , X X V I I I : 361-371. London, 1865.
MACLEOD, HENRY DUNNING: The Theory and Practice of Banking. 5th ed., 2 vols. London, 1892.
MARTIN, JOHN B.: An Inquiry into the History, Functions, and Fluctuations of the Bank Note Circulation in the United Kingdom, Continental Europe, and the United States. Journ. Inst . Bankers, I : 273-341, especially 282-292. London, 1880.
MUHLEMAN, MAURICE L.: Monetary and Banking Systems. New York, 1908.
PALGRAVE, R. H. I.: Notes on Banking in Great Britain and Ireland, Sweden, Denmark, and Hamburg, etc. Journ. Statist. Soc , X X X V I : 27-157, especially 80-86. London, 1874.
POWNALL, GEORGE H. : The Proportional Use of Credit Documents and Metallic Money in English Banks. Journ. Inst. Bankers, I I : 629-675. London, 1881.
Report of the Comptroller of the Currency, 1881, pp. 11-23. Washington, 1882.
Report of the Comptroller of the Currency, 1890, pp. 19 fT. Washington, 1890.
Report of the Comptroller of the Currency, 1892, pp. 31-39. Washington, 1892.
Report of the Comptroller of the Currency, 1894, pp. 17-24. Washington, 1895.
Report of the Comptroller of the Currency, 1896, pp. 57-98. Washington, 1896.
Review of the Annual Report of the Comptroller of the Currency of the United States, 1894. Journ. Inst. Bankers, XVI : 83-85. London, 1895.
SPRAGUE, O. M. W.: Distribution of Money between the Banks and the People since 1893. Quar. Journ. Econ., XVII I : 513-523. Boston, 1904.
VEBiyEN, T. B. : The Use of Loan Credit in Modern Business. Chicago, 1903. Wnxis , H. PARKER: Credit Devices and the Quantity Theory. Journ.
Pol. Econ., IV: 281-308. Chicago, 1896.
224
Digitized for FRASER http://fraser.stlouisfed.org/ Federal Reserve Bank of St. Louis
INDEX
Accounts, number of bank, 191 ff.; and use of checks, 201. Aggregate, all other deposits, by banks, 171; in representative reserve
cities, 172; by States, 169. Agricultural districts, checks in, 86; deposits in 152; retail deposits in, 92 ff. Allowances and corrections in statistics, 75 ff.; 116; for all other deposits,
151; for ignorance of business, 122; in wholesale figures, 123. American investigations, 20 ff.; criticism of, 30. Babbage, Charles, investigations by, 13. Bakers, checks in payments to, 110. Bank accounts, number of, 191 ff. Bank deposits as showing proportion of credit paper, 8. Banking power of the United States, 196. Banks, aggregate retail deposits of, 68; cash and checks in pay rolls made
up by national, 96; by state, 98; by private, 99; by stock savings, 101; by mutual savings, 101; classes of reporting, 50; classification of in this inquiry, 50; discussion of "al l o ther" deposits in, 154; discussion of retail deposits of national, 69; of State, 69; of private, 70; of stock savings, 72; of mutual savings, 73; not replying, 75; number of, 75 ff.; number of reporting in this inquiry by States, 47 ff.; retail deposits in national, 58; in State, 60; in private, 62; in stock savings, 64; in mutual savings, 65; retail deposits of at representative reserve cities, 88 ff.; wholesale deposits in, 137 ff.
Barbers, checks in payments to, n o . Barnett, R. W., quoted, 10, 19. Barter, 2. Bibliography, 223. Bills, change in denominations of, 189 ff. Blank form sent out, 33. Brockton, Mass., checks in retail deposits of, 95. Business, influence of character of, on payment by checks, 54 ff.; volume
of, settled by credit paper, 4; what determines volume of, done by credit paper, 207.
Butchers, checks in payments to, 27, 109. Checks, allowance for excess of, in bank deposits, 78 ff.; average size of, in
England and U. S., 9, 10; business represented by, 115; cashing of, for accommodation, 78; conclusion as to use of, 199; danger in too great use of, 201; duplication of, 151, 159; errors in proportion of, 80; final conclusion as to proportion of, 196 ff.; and habit, 119; increase of payments by, 209; in deposits in cities and agricultural districts, 86; in reserve cities, 86; influence of habit on payment writh, 53; influence of payments on use of, 104; pay, 79; and payrolls, 96; percentages of, at
225
Digitized for FRASER http://fraser.stlouisfed.org/ Federal Reserve Bank of St. Louis
National Monetary Commission
different dates, 199; proportion of, in business in Great Britain, 12 ff.; use of by clerks, 104; by foreigners, 120; by manual laborers, 105; by negroes, 120; by wage-earners, 95, 209; and volume of money displaced by, 203 ff.
Chicago, checks in stores in Loop district of, 56. Circulation, explanation of our large, 202, 214; reasons for our large,
215 ff.; total currency, 197. Cities of less than 25,000, checks in, 86; retail deposits in, 94; wholesale
deposits in, 149. Classification of banks, 50. Clearing-house returns and volume of money needed, 6; and proportion of
credit paper, 7. Clothiers, checks in payments to, 113. Confectioners, checks in payments to, n o . Contents I I I . Corrections. See Allowances. Credit, and volume of money, 3, 4; relation to density of population and
general education, 208; relation of, to volume of, money and prices, 211. Credit paper in payments, criticism of replies in 1909, 42; interest in inves
tigation of, 39; inquiries into 1909, 31 ff.; proportion of in bank deposits in 1881, 21; in 1890, 23; in 1892, 25; in 1894, 27; in 1896, 29.
Credit transactions, mode of growth of, 202. Currency, amount of, in country, 197; change in denominations of, 189 ff.;
means of supplying additional, 201. Custom, influence of, on payments with checks, 53. Date of inquiry, why chosen, 40 ff. Davenport, Iowa, checks in payments at, 1896, 108. Denominations of currency, 189 ff. Department stores, checks in payments to, 109, n o , 112, 113, 114, 115. Deposits, aggregate, all classes of banks by States, 181 ff.; aggregate all
other in five States except in cities of more than 25,000, 177; aggregate in reserve cities, 185; aggregate retail a t representative reserve cities, 9 1 ; allowances and corrections for all other, 151; classification of, 27, 28, 33, 51; conclusion as to percentage of checks in all other, 158; conclusion as to wholesale, 148; discussion of all other than retail and wholesale, 150; by classes of banks, 154 ff.; discussion of retail, by banks, 69 ff.; of aggregate retail, 73 ff.; in agricultural districts, 152; of wholesale, 134 ff.; distribution of aggregate by banks, 183 ff.; estimate of, in banks not replying, 75 ff.; percentage of, in country districts, 187 ff.; retail, 57 ff.; retail, a t representative reserve cities by banks, 88 ff.; retail, in five states less large cities, 94; size and number of individual, by states, 193 ff.; tables of retail, by banks and states, 58 ff.; tables of all other by banks and states, 160 ff.; by geographical divisions, 177; table of aggregate retail, by states, 66 ff.; by banks, 68; wholesale, tables of, by banks and states, 124 ff.; table of aggregate wholesale, by states, 131; by banks, 133; by geographical divisions, 144 ff
226
Digitized for FRASER http://fraser.stlouisfed.org/ Federal Reserve Bank of St. Louis
The Use of Credit Instruments
Diagram of percentage of checks in aggregate deposits by States, 220. Diagram of percentage of checks in retail deposits by States, 221. Diagram of percentage of checks in retail deposits by classes of banks, 222. Druggists, checks in payments to, m , 112. Duplication of checks in deposits, 81. Eckels, James H., investigation by, 27. Education, and use of credit, 208. England, inquiries made in, concerning proportion of credit paper in bank
receipts of, 12 ff.; criticism of, 18 ff. Exchange, methods of, 2. Expenditure of workingmen, 117; of other classes, 118, 119. Fall River, Mass., checks in retail deposits at, 95. Farmers, bank accounts of, 92. Fisher, Prof. Willard, views of, 7. Foreigners, use of checks by, 120. Furniture dealers, checks in payments to, 109. Garfield, James A., quoted, 20. Geographical divisions, retail deposits by, 82 ff.; wholesale deposits, by,
144 ff. Green Bay, Wis., use of checks in business at, 92. Grocers, checks in payments to, 55, i n . Hepburn, A. B., investigation by, 24. History of inquiries into the proportion of credit paper in payments, 11 ff. Hoarding, 216. Investigation of 1896, 28, 121; merchants* reports in, 106. Iowa City, Iowa, checks in payments at, in 1896, 107. Knox, John J., investigations by, 20. Lawrence, Kans., checks in payments at, in 1896, 108. Lawrence, Mass., checks in retail deposits at, 95. Lewiston, Me., checks in payments at, in 1896, 107. Loan and trust companies, cash and checks in pay rolls made up by, 100;
discussion of all other deposits in, 155; discussion of retail deposits in, 71; discussion of wholesale deposits in, 136; retail deposits of, a t representative reserve cities, 90; retail deposits in, 63 ff; table of retail deposits of, 63.
Lowell, Mass., checks in retail deposits at, 95. Lubbock, Sir John, referred to, 9; investigations by, 15 ff. Manufactures, expenditures of employees in, 117. Martin, John Biddulph, investigation by, 16. Merchants, information received from, 11, 105 ff; information from in
1909, 109 ff. Money, amount needed, 1, 2; and credit, 5; estimate of amount of, neces
sary, 210 ff; exchanges, 3; need for more, 217; not deposited, 116; significance of large use of, 205; volume of and credit exchanges, 211; volume of displaced by checks, 203 ff.
227
Digitized for FRASER http://fraser.stlouisfed.org/ Federal Reserve Bank of St. Louis
National Monetary Commission
Morrison, Dillon & Co., report on receipts of by Mr. Slater, 12. Murray, Lawrence O., Comptroller of the Currency, letter of, in present
inquiry, 31; form of reply, 33. Mutual savings banks, cash and checks in pay rolls made up by, 101;
checks in all other deposits of, 157; discussion of retail deposits of, 73; in inquiry, 52; retail deposits in, 65; retail deposits of at representative reserve cities, 91.
National banks, accuracy of answers of, 45; cash and checks in pay rolls made up by, 96; discussion of all other deposits in, 154; discussion of retail deposits of, 69; discussion of wholesale deposits of, 134; number of, 196; retail deposits in, 58 ff; retail deposits of a t representative reserve cities, 88; savings accounts in, 51; wholesale deposits of a t representative reserve cities, 137.
National Monetary Commission, membership of, 2. Negroes, use of checks by, 120. New Brunswick, N. J., checks in payments at, in 1896, 106. Notion stores, checks in payments to, 111. Palgrave, R. H. Inglis, investigations by, 13 ff.; quoted, 9, article of,
quoted, 6. Paterson, N. J., checks in payments at, in 1896, 95. Pawtucket, R. I., checks in payments at, 1896, 95. Pay checks, 79. Pay rolls, in checks, how cashed, 104; use of checks in, 96. Population and checks deposited, 119; density of and growth of credit, 208. Pownall, G. H., investigations by, 17; referred to, 19. Price, money, exchanges and, 3; effect of barter on, 2. Prices, and credit exchanges, 211; range of and amount of money, 215. Private banks, cash and checks in pay rolls made up by, 99; discussion of
all other deposits in, 155; discussion of retail deposits of, 70; discussion of wholesale deposits of, 135; retail deposits in, 62; retail deposits of a t representative reserve cities, 90.
Questionnaires, defects of, in investigations, 36. Railroad companies, checks in payments to, electric and steam, 112. Railway employees, expenditure of, 118. Replies to inquiry, table of, 47; distribution of, 51. Reserves, volume of credit transactions and bank, 206. Reserve cities, aggregate deposits in representative, 185 ff.; all other depos
its in representative, 172 ff.; checks in, 86; discussion of wholesale deposits at representative, 137; wholesale deposits of state banks in, 138; of other banks in, 138; aggregate in, 138.
Retail dealers, description of, 81. Retail deposits, 57 ff.; in representative reserve cities by banks, 88 ff.;
aggregate in representative reserve cities, 91; in five states, less large cities, 94; of national banks, discussion of, 69; of state banks, 69; of private banks, 70; of loan and trust companies, 71; of stock savings banks, 72; of mutual savings banks, 73; of aggregate, 73.
228
Digitized for FRASER http://fraser.stlouisfed.org/ Federal Reserve Bank of St. Louis
The Use of Credit Instruments
Retail stores, checks in payments to, 106 ff., 109 ff. Retail trade, proportion of paper in payments in, 27, 29; difficulty of
defining, 44 ff. Salford bank, credit paper in deposits of, 13 ff. Savings accounts in national banks, 51. Savings Banks, discussion of all other deposits in, 156; Mutual and Trus
tee, 50; Mutual, in inquiry, 52. Slater, William, investigations by, 12. Speculators, 158; checks of, 180; checks in transactions of, 198; deposits
of, 152 ff.; transactions of, 212 ff. State banks, cash and checks in pay rolls made up by, 98; discussion of all
other deposits in, 155; discussion of retail deposits of, 69; discussion of wholesale deposits of, 134; retail deposits of, at representative reserve cities, 89; retail deposits in, 60; wholesale deposits of, in reserve cities, 138.
Statistics obtained in present inquiry, discussion of, 38. Stock savings banks, cash and checks in pay rolls made up by, 101; dis
cussion of retail deposits of, 72; in inquiry, 52; retail deposits in, 64, 65; retail deposits of, a t representative reserve cities, 91.
Sturgeon Bay, Wis., proportion of checks in deposits at, 93. Trustee savings banks, checks in all other deposits of, 157. Wage earners and use of checks, 95, 209. Wages, mode of payment of, 80; payment of, by check, 200; range of and
amount of money, 215; table of payrolls of, in money and checks, 96 ff. Walker, Francis A., quoted, 152, 211; views of, on proportion of business
payments made with credit paper, 5. Wholesale dealers, meaning of, 122. Wholesale deposits, 122 ff.; by geographical divisions, 144 ff.; conclusion
concerning, 148; discussion of aggregate of, 136; discussion of loan and trust companies, 136; of national banks, 134; of private banks, 135; of state banks, 134; in five States in cities of less than 25,000, 149; in representative reserve cities, 137; tables of, 124 ff.; tables of, at representative reserve cities by banks and States, 139 ff.; aggregate, 143.
Wholesale trade, difficulty of defining, 44 ff. Winterset, Iowa, checks in payments at, in 1896, 108.
j-
229
Digitized for FRASER http://fraser.stlouisfed.org/ Federal Reserve Bank of St. Louis