2012 annual report - parliament of western australia
TRANSCRIPT
2012 ANNUAL REPORTwww.mainroads.wa.gov.au
Providing safe and e� cient road access that will enhance
community lifestyles and ensure economic prosperity
#6
40
8 ja
z.co
m.a
u
Welcome to our 2011-12 Annual and Sustainability Report.
This report is designed to provide you with easy to read information
on how we performed over the past 12 months in our custodianship
of Western Australia’s State road network. We take a comprehensive
look at the services that were delivered to the Western Australian
community over the past year.
We remain committed to being recognised as a sustainable, transparent and responsive organisation. We want to keep stakeholders, the community and the Government well informed of our operations. This report highlights, recognises and addresses any successes, challenges and opportunities that we face.
We continue our efforts in Sustainability Reporting by fulfilling the requirements of Application Level B of the Global Reporting Initiative Index Sustainability Reporting Guidelines. The report content is governed by our reporting processes that cover content materiality and inclusiveness.
We begin with the Year in Review presenting a snapshot of our performance and financial highlights, together with a summary of our performance scorecard.
The remainder of the report is structured in keeping with our Corporate Governance framework to showcase how we direct and manage our business activities to optimise performance, regulate compliance and deliver value for our customers and are categorised as follows:
» Leadership – provides an overview from the Director General Transport and Managing Director and introduces you to our Corporate Executive team.
» performance – reviews the services we provide to the community for each of the Programs for which we receive funding.
» improvement and innovation – reports on our endeavours to continually improve and be innovative in our workforce, safety and environmental practices whilst enhancing relationships.
» Governance – ensures consistency in our business practices.
ABOUT THIS REPORT
1
Our efforts have continued to focus on the improved readability and accessibility of our report. The simplified design and layout is maintained with our online Annual Report to continue providing an enhanced reading experience and quick access to specific sections of the report.
As part of our continuous improvement approach we welcome any feedback you might have on this report. Additionally, your queries on any aspect of the activities undertaken by Main Roads or suggestions on how we can enhance the information we provide are also welcome. To offer your comments or ask a question, please contact the Manager Business Performance by:
Phone: 138 138
Web: www.mainroads.wa.gov.au and click on Contact Us
Mail: Write to us at Main Roads Western australia, Po box 6202, east Perth, Wa 6892
Visit: Call into any of our offices located throughout the State.
Statement of ComplianCe
to the Honourable troy Buswell mla, Bec treasurer; minister for transport; emergency Services
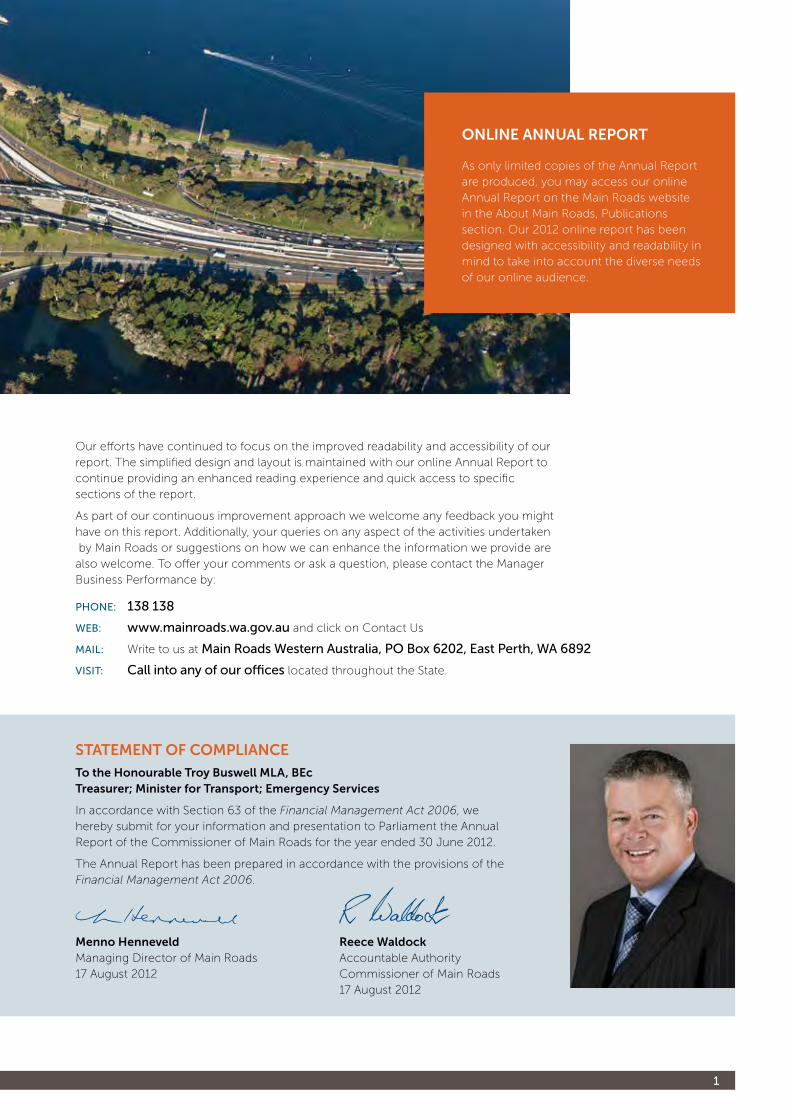
In accordance with Section 63 of the Financial Management Act 2006, we hereby submit for your information and presentation to Parliament the Annual Report of the Commissioner of Main Roads for the year ended 30 June 2012.
The Annual Report has been prepared in accordance with the provisions of the Financial Management Act 2006.
menno Henneveld Reece Waldock Managing Director of Main Roads Accountable Authority 17 August 2012 Commissioner of Main Roads 17 August 2012
online annual RepoRt
As only limited copies of the Annual Report are produced, you may access our online Annual Report on the Main Roads website in the About Main Roads, Publications section. Our 2012 online report has been designed with accessibility and readability in mind to take into account the diverse needs of our online audience.
Main Roads Western Australia 2012 Annual Report2
ouR puRpoSe
Is to provide safe and efficient road access that will enhance community lifestyles and ensure economic prosperity.
ouR ViSion
Is to be recognised for excellence in customer service and world-class road access.
ouR StakeHoldeRS
Include every person who lives or does business in Western Australia. A wide range of groups are consulted within the course of conducting our business, including community, business and Government stakeholders and representatives.
ouR StRategiC diReCtion
Is to achieve excellence through inspiring leadership and strong collaborative relationships. There are five strategic areas of focus that will assist in achieving this:
» Providing the right roads for Western Australia
» Making roads work for the community
» Creating our workforce of the future
» Inspiring leadership
» Enhancing relationships.
ouR ValueS
Form the foundation upon which Main Roads is built. They represent our culture, guide our behaviours and influence the decision-making process and relationships with each other, our customers and partners.
Our values are:
About Us
Roads MatterTaking pride in managing the road network for the benefit of the community.
embracing ChallengeAnticipating and taking up challenges.
excellence in Customer serviceUnderstanding and providing what is important to our customers.
Working togetherEnhancing relationships and teamwork.
ProfessionalismProviding high levels of expertise in delivering our services.
FamilyRespecting and supporting our customers, the community and each other.
about Us 3
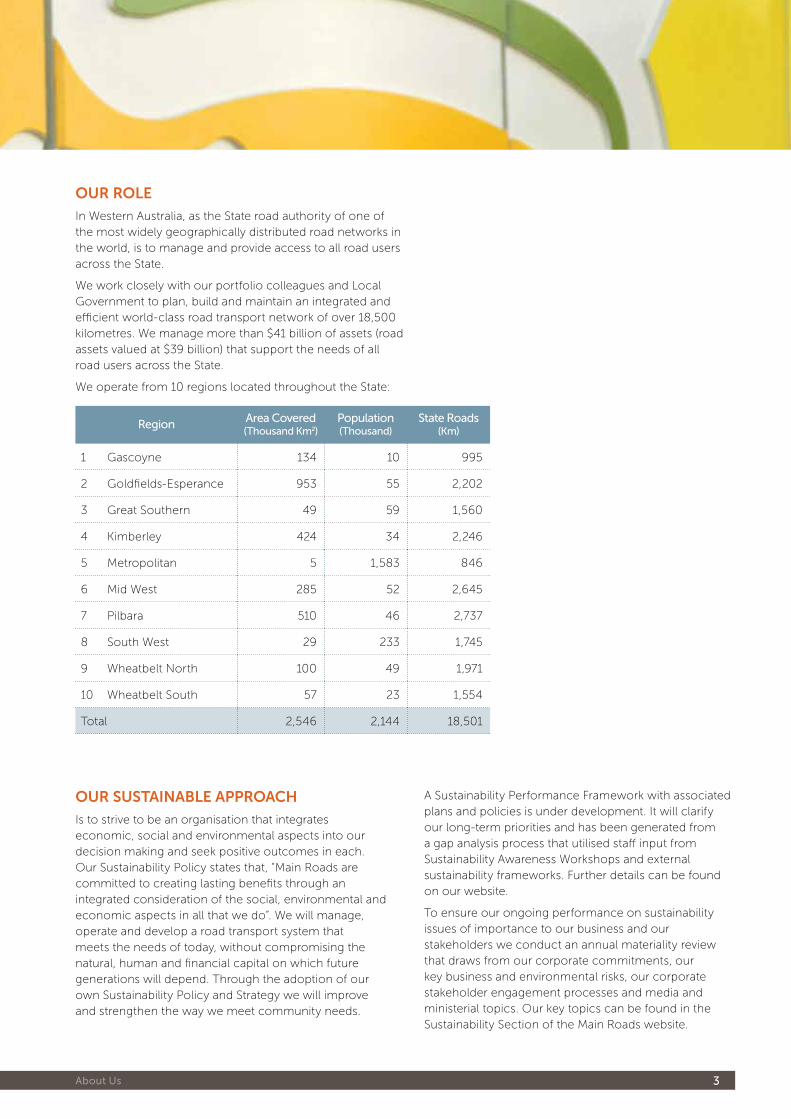
ouR Role
In Western Australia, as the State road authority of one of the most widely geographically distributed road networks in the world, is to manage and provide access to all road users across the State.
We work closely with our portfolio colleagues and Local Government to plan, build and maintain an integrated and efficient world-class road transport network of over 18,500 kilometres. We manage more than $41 billion of assets (road assets valued at $39 billion) that support the needs of all road users across the State.
We operate from 10 regions located throughout the State:
Region area Covered (thousand Km2)
Population (thousand)
state Roads (Km)
1 Gascoyne 134 10 995
2 Goldfields-Esperance 953 55 2,202
3 Great Southern 49 59 1,560
4 Kimberley 424 34 2,246
5 Metropolitan 5 1,583 846
6 Mid West 285 52 2,645
7 Pilbara 510 46 2,737
8 South West 29 233 1,745
9 Wheatbelt North 100 49 1,971
10 Wheatbelt South 57 23 1,554
Total 2,546 2,144 18,501
ouR SuStainaBle appRoaCH
Is to strive to be an organisation that integrates economic, social and environmental aspects into our decision making and seek positive outcomes in each. Our Sustainability Policy states that, “Main Roads are committed to creating lasting benefits through an integrated consideration of the social, environmental and economic aspects in all that we do”. We will manage, operate and develop a road transport system that meets the needs of today, without compromising the natural, human and financial capital on which future generations will depend. Through the adoption of our own Sustainability Policy and Strategy we will improve and strengthen the way we meet community needs.
A Sustainability Performance Framework with associated plans and policies is under development. It will clarify our long-term priorities and has been generated from a gap analysis process that utilised staff input from Sustainability Awareness Workshops and external sustainability frameworks. Further details can be found on our website.
To ensure our ongoing performance on sustainability issues of importance to our business and our stakeholders we conduct an annual materiality review that draws from our corporate commitments, our key business and environmental risks, our corporate stakeholder engagement processes and media and ministerial topics. Our key topics can be found in the Sustainability Section of the Main Roads website.
Main Roads Western Australia 2012 Annual Report4
Contents 5
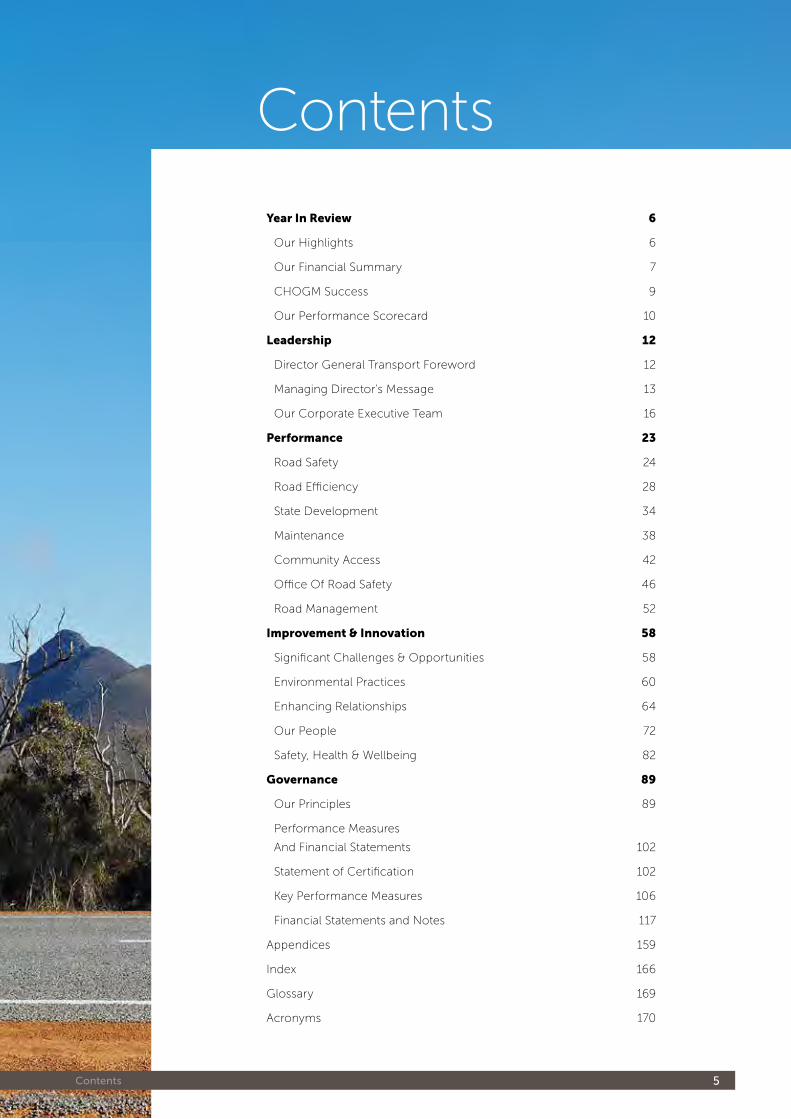
Contents
Year In Review 6
Our Highlights 6
Our Financial Summary 7
CHOGM Success 9
Our Performance Scorecard 10
Leadership 12
Director General Transport Foreword 12
Managing Director's Message 13
Our Corporate Executive Team 16
Performance 23
Road Safety 24
Road Efficiency 28
State Development 34
Maintenance 38
Community Access 42
Office Of Road Safety 46
Road Management 52
Improvement & Innovation 58
Significant Challenges & Opportunities 58
Environmental Practices 60
Enhancing Relationships 64
Our People 72
Safety, Health & Wellbeing 82
Governance 89
Our Principles 89
Performance Measures
And Financial Statements 102
Statement of Certification 102
Key Performance Measures 106
Financial Statements and Notes 117
Appendices 159
Index 166
Glossary 169
Acronyms 170
Main Roads Western Australia 2012 Annual Report6
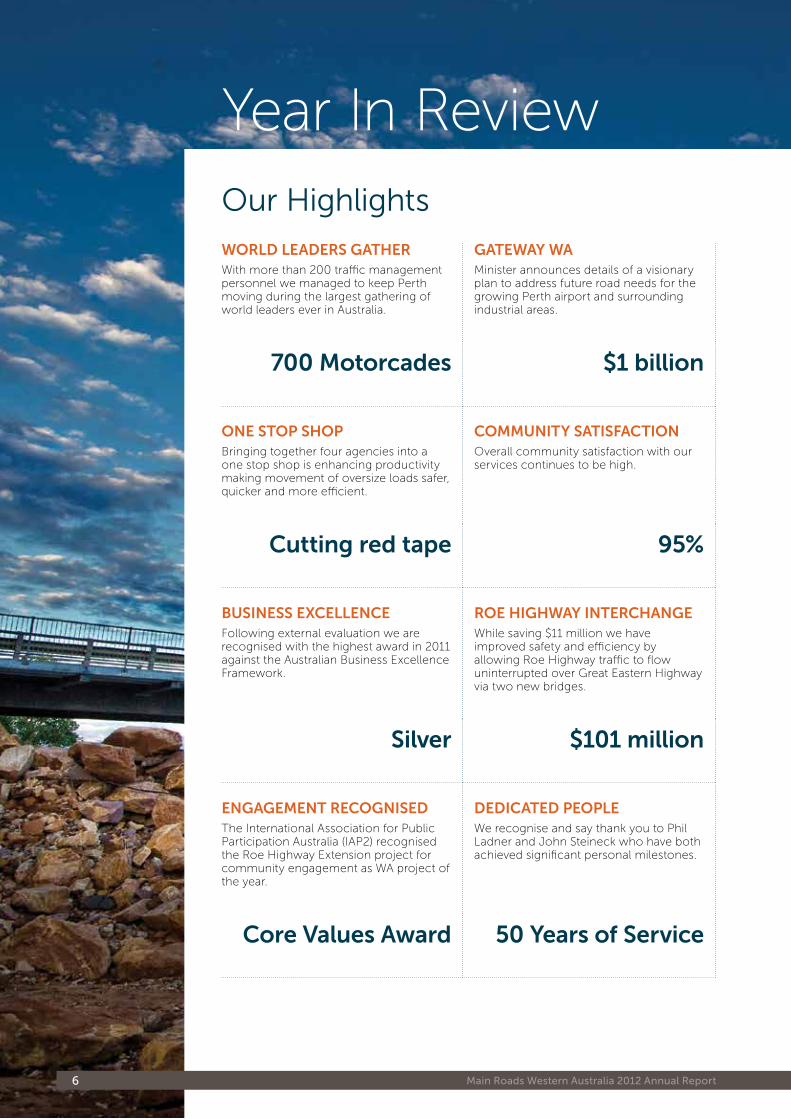
WoRld leadeRS gatHeRWith more than 200 traffic management personnel we managed to keep Perth moving during the largest gathering of world leaders ever in Australia.
gateWay WaMinister announces details of a visionary plan to address future road needs for the growing Perth airport and surrounding industrial areas.
700 motorcades $1 billion
one Stop SHopBringing together four agencies into a one stop shop is enhancing productivity making movement of oversize loads safer, quicker and more efficient.
Community SatiSfaCtionOverall community satisfaction with our services continues to be high.
Cutting red tape 95%
BuSineSS exCellenCeFollowing external evaluation we are recognised with the highest award in 2011 against the Australian Business Excellence Framework.
Roe HigHWay inteRCHangeWhile saving $11 million we have improved safety and efficiency by allowing Roe Highway traffic to flow uninterrupted over Great Eastern Highway via two new bridges.
Silver $101 million
engagement ReCogniSedThe International Association for Public Participation Australia (IAP2) recognised the Roe Highway Extension project for community engagement as WA project of the year.
dediCated peopleWe recognise and say thank you to Phil Ladner and John Steineck who have both achieved significant personal milestones.
Core Values award 50 years of Service
Year In ReviewOur Highlights
Year in Review 7
Our Financial Summary seeks to provide a view on some key elements of our financial statements. The information is intended to complement our full financial statements for 2011–12 which are available at pages 117 to 158.
Our Financial Summary
key HigHligHtS
» $1.5 billion of Services Delivered
» $67.3 million Increase in the Value of Infrastructure Assets
» $565 million Invested in Capital Works
inCome
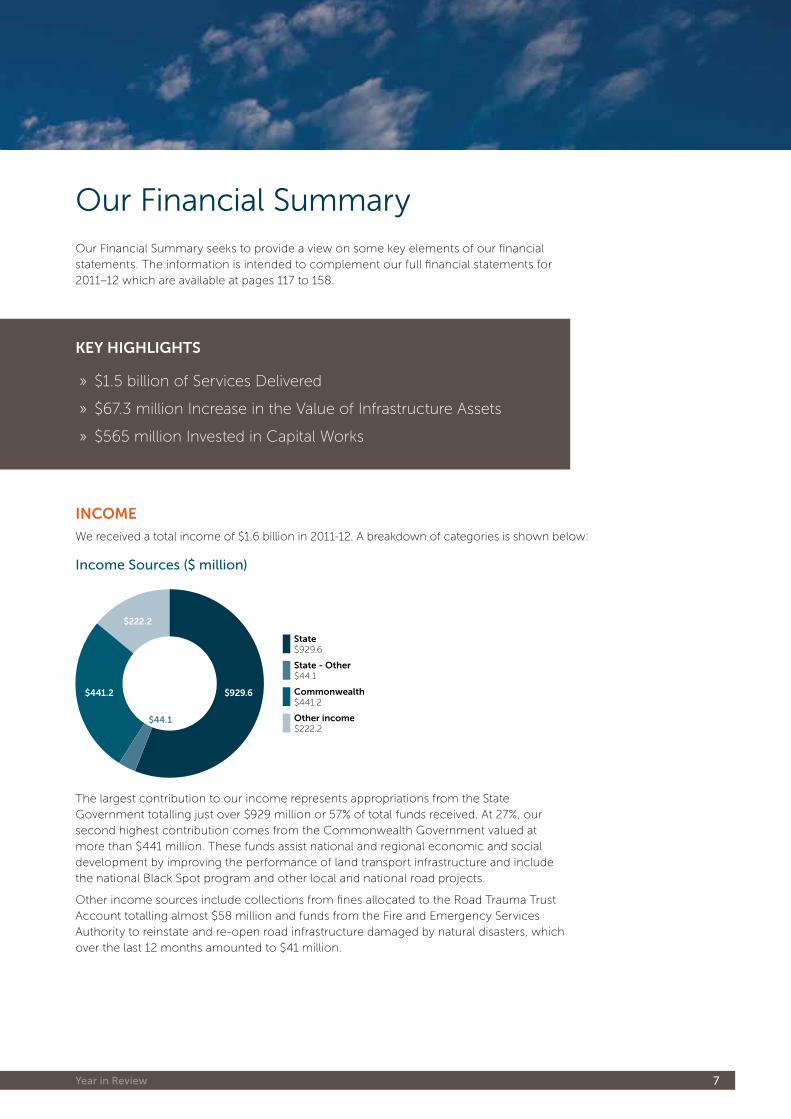
We received a total income of $1.6 billion in 2011-12. A breakdown of categories is shown below:
income sources ($ million)
State$929.6
Commonwealth$441.2
Other income$222.2
State - Other$44.1
$929.6
$222.2
$441.2
$44.1
The largest contribution to our income represents appropriations from the State Government totalling just over $929 million or 57% of total funds received. At 27%, our second highest contribution comes from the Commonwealth Government valued at more than $441 million. These funds assist national and regional economic and social development by improving the performance of land transport infrastructure and include the national Black Spot program and other local and national road projects.
Other income sources include collections from fines allocated to the Road Trauma Trust Account totalling almost $58 million and funds from the Fire and Emergency Services Authority to reinstate and re-open road infrastructure damaged by natural disasters, which over the last 12 months amounted to $41 million.
Main Roads Western Australia 2012 Annual Report8
expendituRe
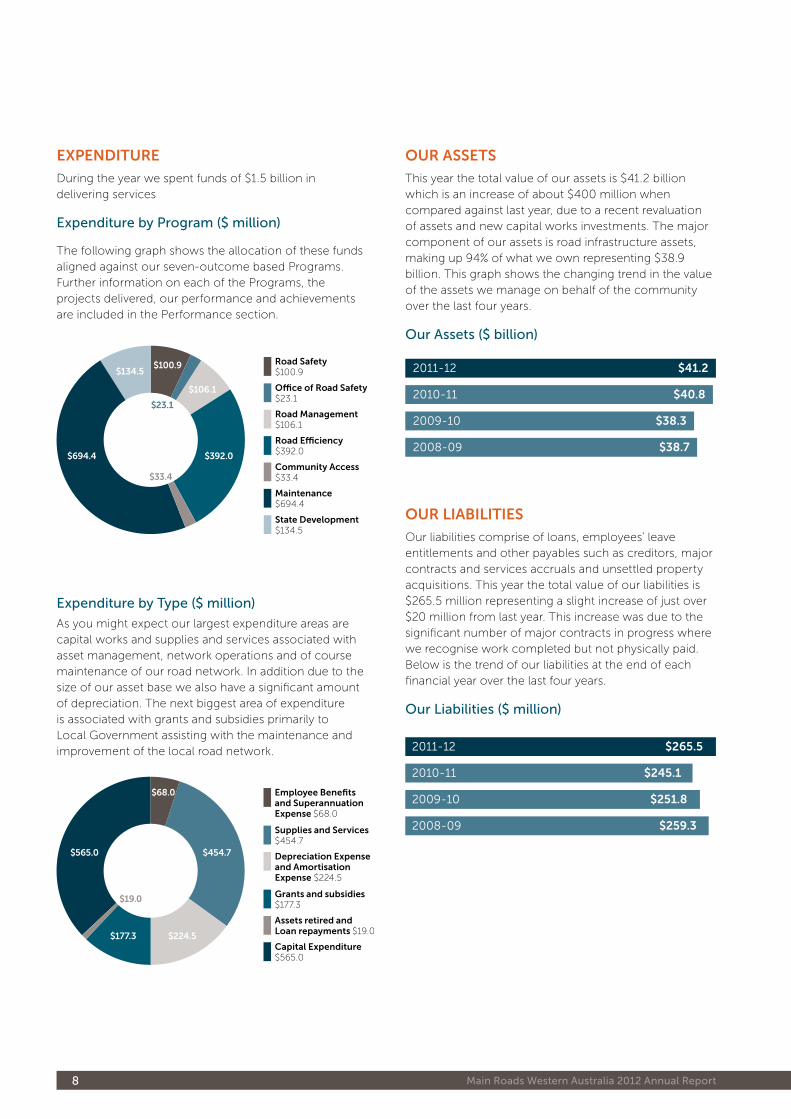
During the year we spent funds of $1.5 billion in delivering services
expenditure by Program ($ million)
The following graph shows the allocation of these funds aligned against our seven-outcome based Programs. Further information on each of the Programs, the projects delivered, our performance and achievements are included in the Performance section.
State Development$134.5
Road Safety$100.9
Road Management$106.1
Road E�ciency$392.0
O�ce of Road Safety$23.1
Community Access$33.4
Maintenance$694.4
$100.9
$106.1
$392.0$694.4
$134.5
$23.1
$33.4
expenditure by type ($ million)
As you might expect our largest expenditure areas are capital works and supplies and services associated with asset management, network operations and of course maintenance of our road network. In addition due to the size of our asset base we also have a significant amount of depreciation. The next biggest area of expenditure is associated with grants and subsidies primarily to Local Government assisting with the maintenance and improvement of the local road network.
Employee Benefitsand SuperannuationExpense $68.0
Depreciation Expense and Amortisation Expense $224.5
Grants and subsidies$177.3
Supplies and Services $454.7
Capital Expenditure$565.0
Assets retired and Loan repayments $19.0
$68.0
$454.7
$224.5$177.3
$19.0
$565.0
ouR aSSetS
This year the total value of our assets is $41.2 billion which is an increase of about $400 million when compared against last year, due to a recent revaluation of assets and new capital works investments. The major component of our assets is road infrastructure assets, making up 94% of what we own representing $38.9 billion. This graph shows the changing trend in the value of the assets we manage on behalf of the community over the last four years.
our assets ($ billion)
2011-12
2010-11
$41.2
$40.8
2009-10
2008-09
$38.3
$38.7
ouR liaBilitieS
Our liabilities comprise of loans, employees’ leave entitlements and other payables such as creditors, major contracts and services accruals and unsettled property acquisitions. This year the total value of our liabilities is $265.5 million representing a slight increase of just over $20 million from last year. This increase was due to the significant number of major contracts in progress where we recognise work completed but not physically paid. Below is the trend of our liabilities at the end of each financial year over the last four years.
our liabilities ($ million)
2011-12
2010-11
$265.5
$245.1
2009-10
2008-09
$251.8
$259.3
Year in Review 9
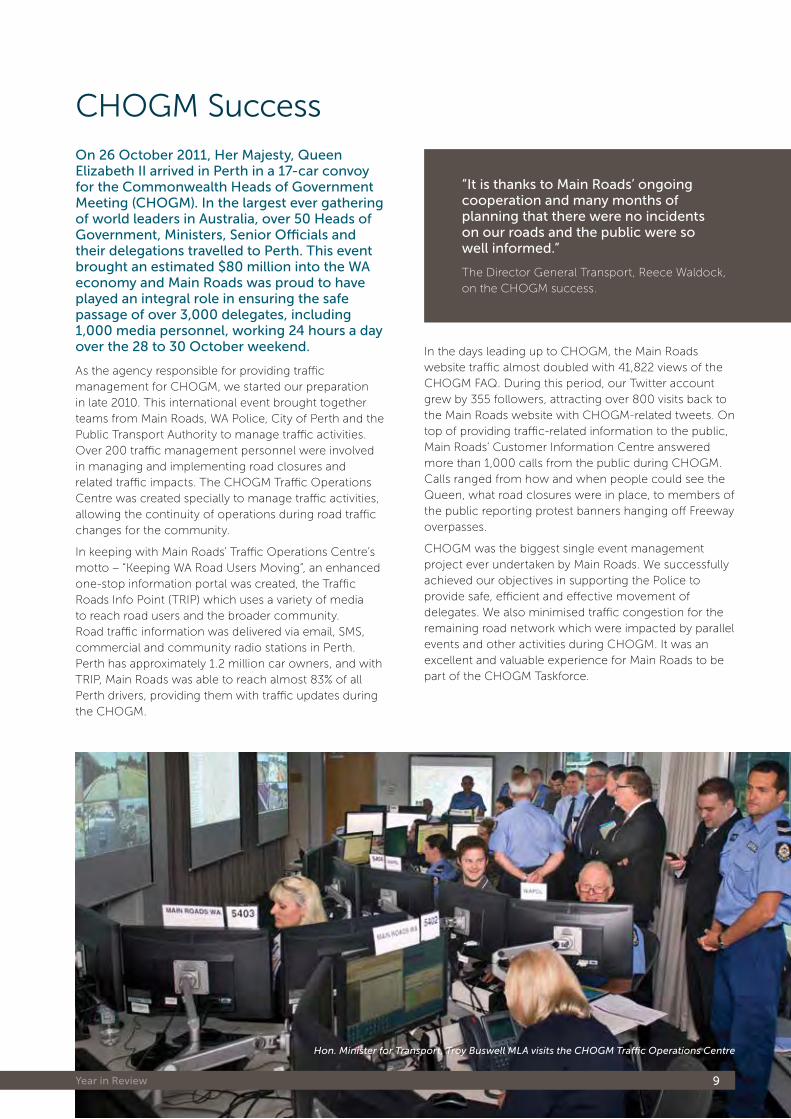
on 26 october 2011, her Majesty, Queen elizabeth ii arrived in Perth in a 17-car convoy for the Commonwealth heads of Government Meeting (ChoGM). in the largest ever gathering of world leaders in australia, over 50 heads of Government, Ministers, senior officials and their delegations travelled to Perth. this event brought an estimated $80 million into the Wa economy and Main Roads was proud to have played an integral role in ensuring the safe passage of over 3,000 delegates, including 1,000 media personnel, working 24 hours a day over the 28 to 30 october weekend.
As the agency responsible for providing traffic management for CHOGM, we started our preparation in late 2010. This international event brought together teams from Main Roads, WA Police, City of Perth and the Public Transport Authority to manage traffic activities. Over 200 traffic management personnel were involved in managing and implementing road closures and related traffic impacts. The CHOGM Traffic Operations Centre was created specially to manage traffic activities, allowing the continuity of operations during road traffic changes for the community.
In keeping with Main Roads’ Traffic Operations Centre’s motto – “Keeping WA Road Users Moving”, an enhanced one-stop information portal was created, the Traffic Roads Info Point (TRIP) which uses a variety of media to reach road users and the broader community. Road traffic information was delivered via email, SMS, commercial and community radio stations in Perth. Perth has approximately 1.2 million car owners, and with TRIP, Main Roads was able to reach almost 83% of all Perth drivers, providing them with traffic updates during the CHOGM.
CHOGM Success
“it is thanks to Main Roads’ ongoing cooperation and many months of planning that there were no incidents on our roads and the public were so well informed.”
The Director General Transport, Reece Waldock, on the CHOGM success.
In the days leading up to CHOGM, the Main Roads website traffic almost doubled with 41,822 views of the CHOGM FAQ. During this period, our Twitter account grew by 355 followers, attracting over 800 visits back to the Main Roads website with CHOGM-related tweets. On top of providing traffic-related information to the public, Main Roads’ Customer Information Centre answered more than 1,000 calls from the public during CHOGM. Calls ranged from how and when people could see the Queen, what road closures were in place, to members of the public reporting protest banners hanging off Freeway overpasses.
CHOGM was the biggest single event management project ever undertaken by Main Roads. We successfully achieved our objectives in supporting the Police to provide safe, efficient and effective movement of delegates. We also minimised traffic congestion for the remaining road network which were impacted by parallel events and other activities during CHOGM. It was an excellent and valuable experience for Main Roads to be part of the CHOGM Taskforce.
Hon. Minister for Transport, Troy Buswell MLA visits the CHOGM Traffic Operations Centre
Main Roads Western Australia 2012 Annual Report10
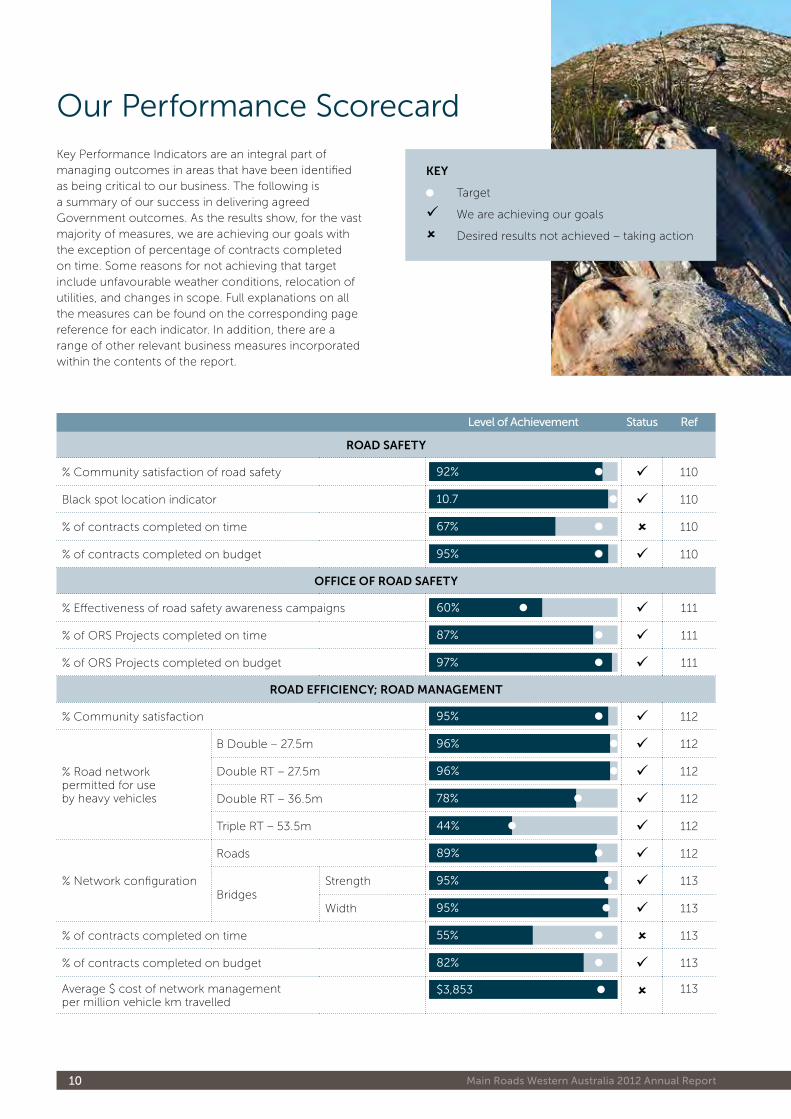
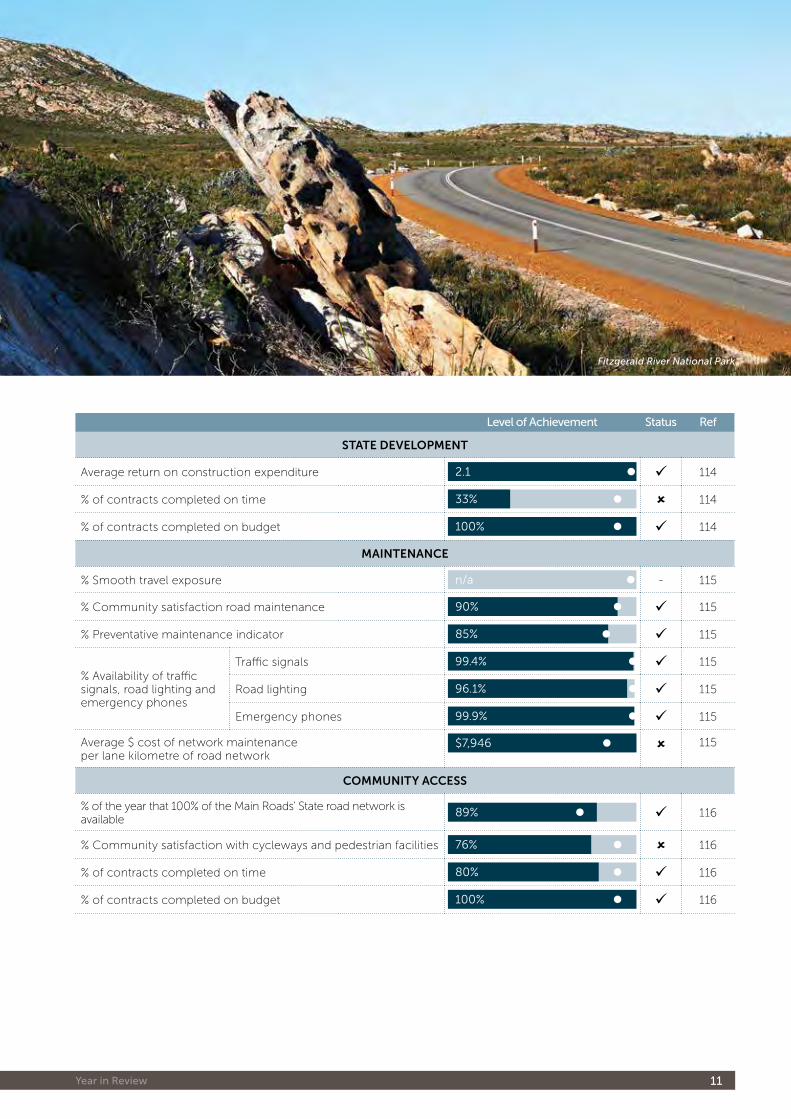
Key Performance Indicators are an integral part of managing outcomes in areas that have been identified as being critical to our business. The following is a summary of our success in delivering agreed Government outcomes. As the results show, for the vast majority of measures, we are achieving our goals with the exception of percentage of contracts completed on time. Some reasons for not achieving that target include unfavourable weather conditions, relocation of utilities, and changes in scope. Full explanations on all the measures can be found on the corresponding page reference for each indicator. In addition, there are a range of other relevant business measures incorporated within the contents of the report.
Our Performance Scorecard
level of achievement status Ref
Road Safety
% Community satisfaction of road safety 92% 110
Black spot location indicator 10.7 110
% of contracts completed on time 67% 110
% of contracts completed on budget 95% 110
offiCe of Road Safety
% Effectiveness of road safety awareness campaigns 60% 111
% of ORS Projects completed on time 87% 111
% of ORS Projects completed on budget 97% 111
Road effiCienCy; Road management
% Community satisfaction 95% 112
% Road network permitted for use by heavy vehicles
B Double – 27.5m 96% 112
Double RT – 27.5m 96% 112
Double RT – 36.5m 78% 112
Triple RT – 53.5m 44% 112
% Network configuration
Roads 89% 112
BridgesStrength 95% 113
Width 95% 113
% of contracts completed on time 55% 113
% of contracts completed on budget 82% 113
Average $ cost of network management per million vehicle km travelled
$3,853 113
key
Target
We are achieving our goals
Desired results not achieved – taking action
Year in Review 11
level of achievement status Ref
State deVelopment
Average return on construction expenditure 2.1 114
% of contracts completed on time 33% 114
% of contracts completed on budget 100% 114
maintenanCe
% Smooth travel exposure n/a - 115
% Community satisfaction road maintenance 90% 115
% Preventative maintenance indicator 85% 115
% Availability of traffic signals, road lighting and emergency phones
Traffic signals 99.4% 115
Road lighting 96.1% 115
Emergency phones 99.9% 115
Average $ cost of network maintenance per lane kilometre of road network
$7,946 115
Community aCCeSS
% of the year that 100% of the Main Roads’ State road network is available
89% 116
% Community satisfaction with cycleways and pedestrian facilities 76% 116
% of contracts completed on time 80% 116
% of contracts completed on budget 100% 116
Fitzgerald River National Park
Main Roads Western Australia 2012 Annual Report12
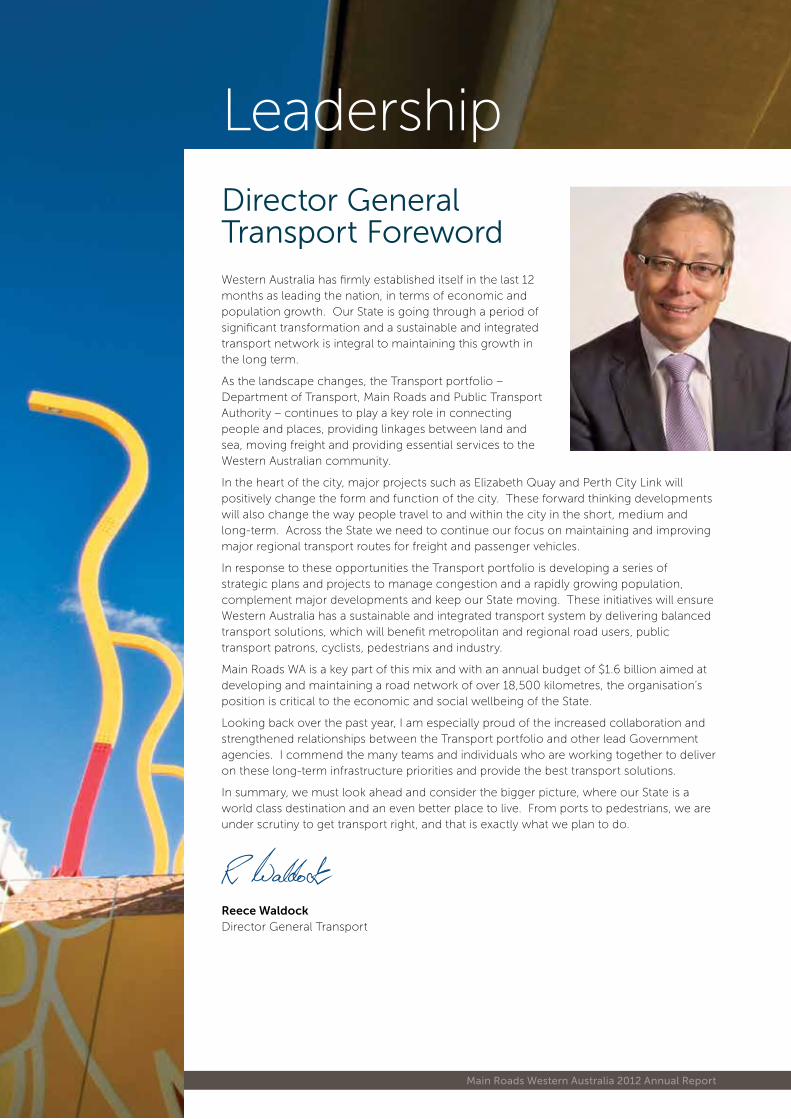
Western Australia has firmly established itself in the last 12 months as leading the nation, in terms of economic and population growth. Our State is going through a period of significant transformation and a sustainable and integrated transport network is integral to maintaining this growth in the long term.
As the landscape changes, the Transport portfolio – Department of Transport, Main Roads and Public Transport Authority – continues to play a key role in connecting people and places, providing linkages between land and sea, moving freight and providing essential services to the Western Australian community.
In the heart of the city, major projects such as Elizabeth Quay and Perth City Link will positively change the form and function of the city. These forward thinking developments will also change the way people travel to and within the city in the short, medium and long-term. Across the State we need to continue our focus on maintaining and improving major regional transport routes for freight and passenger vehicles.
In response to these opportunities the Transport portfolio is developing a series of strategic plans and projects to manage congestion and a rapidly growing population, complement major developments and keep our State moving. These initiatives will ensure Western Australia has a sustainable and integrated transport system by delivering balanced transport solutions, which will benefit metropolitan and regional road users, public transport patrons, cyclists, pedestrians and industry.
Main Roads WA is a key part of this mix and with an annual budget of $1.6 billion aimed at developing and maintaining a road network of over 18,500 kilometres, the organisation’s position is critical to the economic and social wellbeing of the State.
Looking back over the past year, I am especially proud of the increased collaboration and strengthened relationships between the Transport portfolio and other lead Government agencies. I commend the many teams and individuals who are working together to deliver on these long-term infrastructure priorities and provide the best transport solutions.
In summary, we must look ahead and consider the bigger picture, where our State is a world class destination and an even better place to live. From ports to pedestrians, we are under scrutiny to get transport right, and that is exactly what we plan to do.
Reece Waldock Director General Transport
LeadershipDirector General Transport Foreword
leadership: Managing Director's Message 13
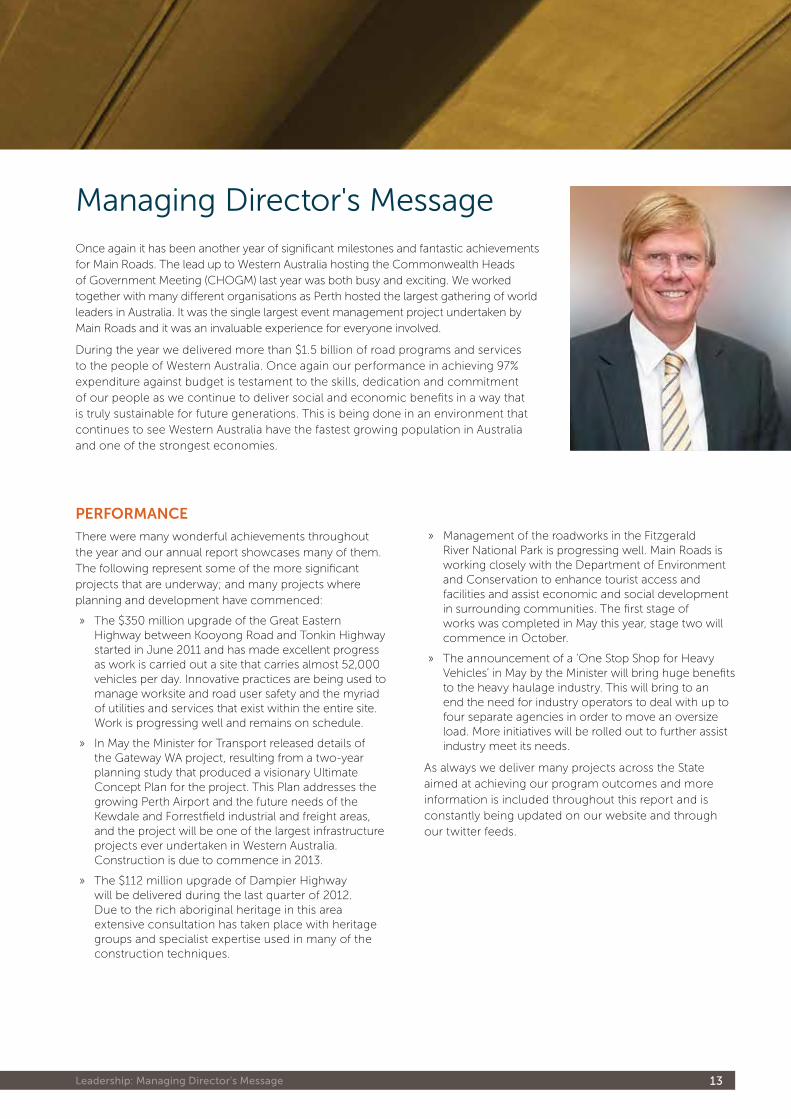
Once again it has been another year of significant milestones and fantastic achievements for Main Roads. The lead up to Western Australia hosting the Commonwealth Heads of Government Meeting (CHOGM) last year was both busy and exciting. We worked together with many different organisations as Perth hosted the largest gathering of world leaders in Australia. It was the single largest event management project undertaken by Main Roads and it was an invaluable experience for everyone involved.
During the year we delivered more than $1.5 billion of road programs and services to the people of Western Australia. Once again our performance in achieving 97% expenditure against budget is testament to the skills, dedication and commitment of our people as we continue to deliver social and economic benefits in a way that is truly sustainable for future generations. This is being done in an environment that continues to see Western Australia have the fastest growing population in Australia and one of the strongest economies.
Managing Director's Message
peRfoRmanCe
There were many wonderful achievements throughout the year and our annual report showcases many of them. The following represent some of the more significant projects that are underway; and many projects where planning and development have commenced:
» The $350 million upgrade of the Great Eastern Highway between Kooyong Road and Tonkin Highway started in June 2011 and has made excellent progress as work is carried out a site that carries almost 52,000 vehicles per day. Innovative practices are being used to manage worksite and road user safety and the myriad of utilities and services that exist within the entire site. Work is progressing well and remains on schedule.
» In May the Minister for Transport released details of the Gateway WA project, resulting from a two-year planning study that produced a visionary Ultimate Concept Plan for the project. This Plan addresses the growing Perth Airport and the future needs of the Kewdale and Forrestfield industrial and freight areas, and the project will be one of the largest infrastructure projects ever undertaken in Western Australia. Construction is due to commence in 2013.
» The $112 million upgrade of Dampier Highway will be delivered during the last quarter of 2012. Due to the rich aboriginal heritage in this area extensive consultation has taken place with heritage groups and specialist expertise used in many of the construction techniques.
» Management of the roadworks in the Fitzgerald River National Park is progressing well. Main Roads is working closely with the Department of Environment and Conservation to enhance tourist access and facilities and assist economic and social development in surrounding communities. The first stage of works was completed in May this year, stage two will commence in October.
» The announcement of a ‘One Stop Shop for Heavy Vehicles’ in May by the Minister will bring huge benefits to the heavy haulage industry. This will bring to an end the need for industry operators to deal with up to four separate agencies in order to move an oversize load. More initiatives will be rolled out to further assist industry meet its needs.
As always we deliver many projects across the State aimed at achieving our program outcomes and more information is included throughout this report and is constantly being updated on our website and through our twitter feeds.
Main Roads Western Australia 2012 Annual Report14
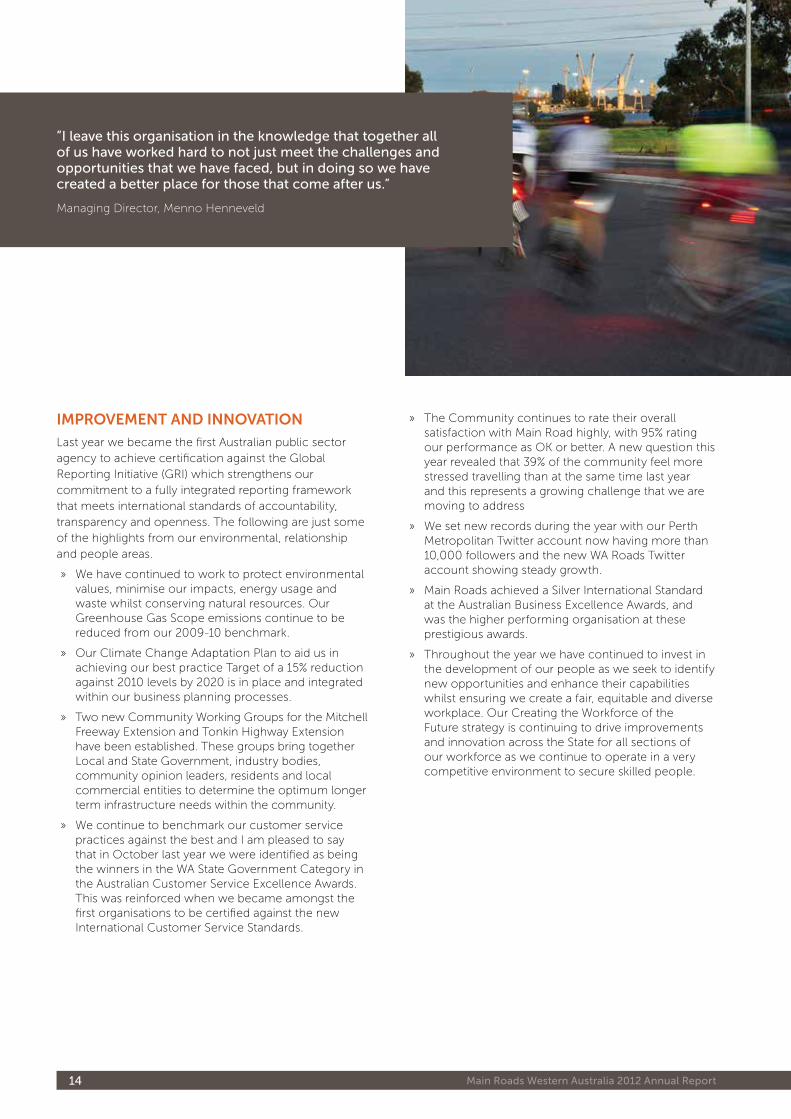
impRoVement and innoVation
Last year we became the first Australian public sector agency to achieve certification against the Global Reporting Initiative (GRI) which strengthens our commitment to a fully integrated reporting framework that meets international standards of accountability, transparency and openness. The following are just some of the highlights from our environmental, relationship and people areas.
» We have continued to work to protect environmental values, minimise our impacts, energy usage and waste whilst conserving natural resources. Our Greenhouse Gas Scope emissions continue to be reduced from our 2009-10 benchmark.
» Our Climate Change Adaptation Plan to aid us in achieving our best practice Target of a 15% reduction against 2010 levels by 2020 is in place and integrated within our business planning processes.
» Two new Community Working Groups for the Mitchell Freeway Extension and Tonkin Highway Extension have been established. These groups bring together Local and State Government, industry bodies, community opinion leaders, residents and local commercial entities to determine the optimum longer term infrastructure needs within the community.
» We continue to benchmark our customer service practices against the best and I am pleased to say that in October last year we were identified as being the winners in the WA State Government Category in the Australian Customer Service Excellence Awards. This was reinforced when we became amongst the first organisations to be certified against the new International Customer Service Standards.
» The Community continues to rate their overall satisfaction with Main Road highly, with 95% rating our performance as OK or better. A new question this year revealed that 39% of the community feel more stressed travelling than at the same time last year and this represents a growing challenge that we are moving to address
» We set new records during the year with our Perth Metropolitan Twitter account now having more than 10,000 followers and the new WA Roads Twitter account showing steady growth.
» Main Roads achieved a Silver International Standard at the Australian Business Excellence Awards, and was the higher performing organisation at these prestigious awards.
» Throughout the year we have continued to invest in the development of our people as we seek to identify new opportunities and enhance their capabilities whilst ensuring we create a fair, equitable and diverse workplace. Our Creating the Workforce of the Future strategy is continuing to drive improvements and innovation across the State for all sections of our workforce as we continue to operate in a very competitive environment to secure skilled people.
”i leave this organisation in the knowledge that together all of us have worked hard to not just meet the challenges and opportunities that we have faced, but in doing so we have created a better place for those that come after us.”
Managing Director, Menno Henneveld
leadership: Managing Director's Message 15
looking aHead
I mentioned at the outset that we have a number of very large projects currently underway that will be scheduled to be completed next financial year including works on Great Eastern Highway, widening of the Kwinana Freeway, completion of the Dampier Highway duplication works, complete upgrade works on the Morley Drive intersection at Tonkin Highway and completion of Stage Two of the Bunbury Outer Ring road to name a few. In addition we should see substantial progress on the Esperance Port Corridor works, and the realignment works on Great Northern Highway around the Wedgefield industrial area in Port Hedland.
Work has already commenced on the development and creation of a new strategic plan to take us through to 2020. Building on the success we enjoyed from 2k12 we have once again adopted scenario planning as the basis for determining our future direction and priorities. We have already begun engaging extensively with our own people, our portfolio partners and key stakeholders as we work together to identify our new areas of strategic focus paving the way forward. It is an exciting time of growth across many sectors in the State and it is important that we identify the right direction to ensure that we continue to work successfully with our portfolio partners, our suppliers and the community in providing the right transport solutions now and into the future.
RefleCtionS
This will be my last annual report as Managing Director of Main Roads. Over the last decade, firstly as Commissioner and more recently as Managing Director I have had the pleasure and privilege of working with a team of talented and professional people across the entire State. These are people who are absolutely dedicated, committed and passionate about delivering the best possible road services to the community of Western Australia. These are the people that make Main Roads the success that it is today, and I believe will continue to make it one of WA State's leading Government agencies.
I leave this organisation in the knowledge that together all of us have worked hard to not just meet the challenges and opportunities that we have faced, but in doing so we have created a better place for those that come after us.
Thanks to everyone in Main Roads who has contributed to our success over the last decade and I wish you all the very best for the future.
menno Henneveld Managing Director
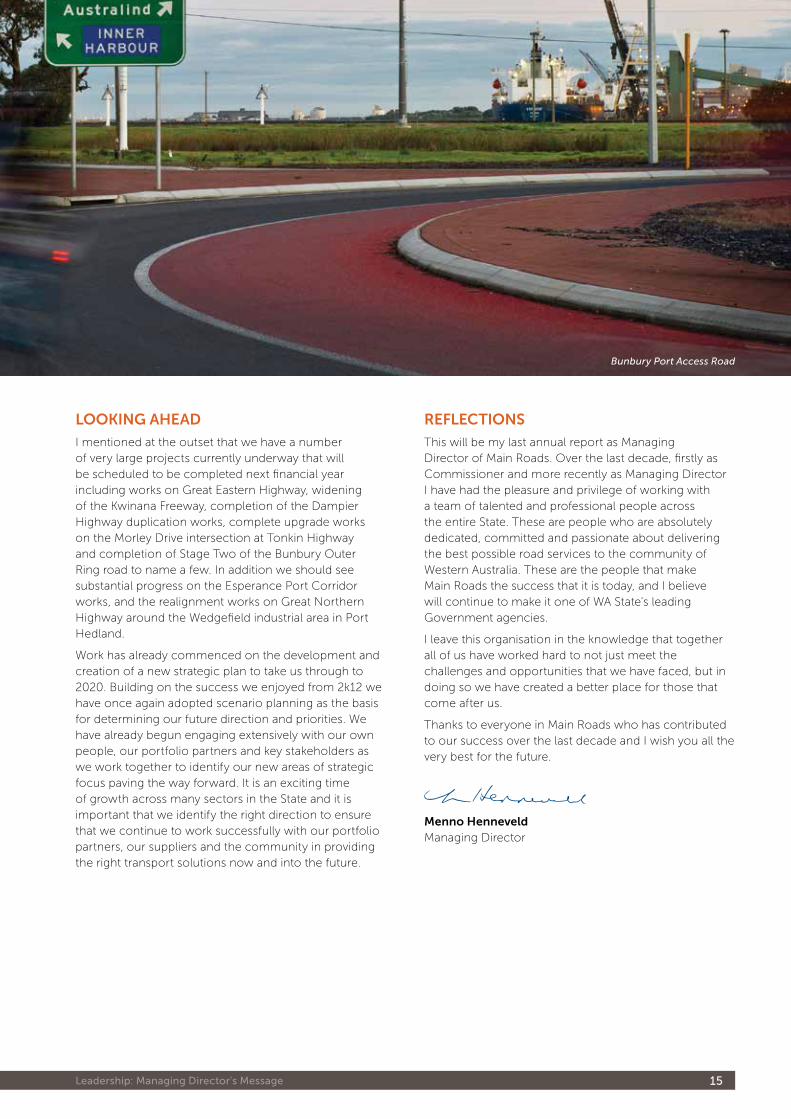
Bunbury Port Access Road
Main Roads Western Australia 2012 Annual Report16
Our Corporate Executive Team
Each member of the leadership team heads one of the corporate areas responsible for managing the business. This team provides the direction that ensures we provide safe and efficient road access to the community.
leadeRSHip team CHange
» After 38 years of service, Rob Giles,
Director Strategic Relationships, is
currently on extended leave and will
retire in September 2012.
» Phil Ladner, formerly Executive
Director Infrastructure Delivery,
has continued with his transition
to Phased Retirement in his role of
Executive Director Project Delivery
Development.
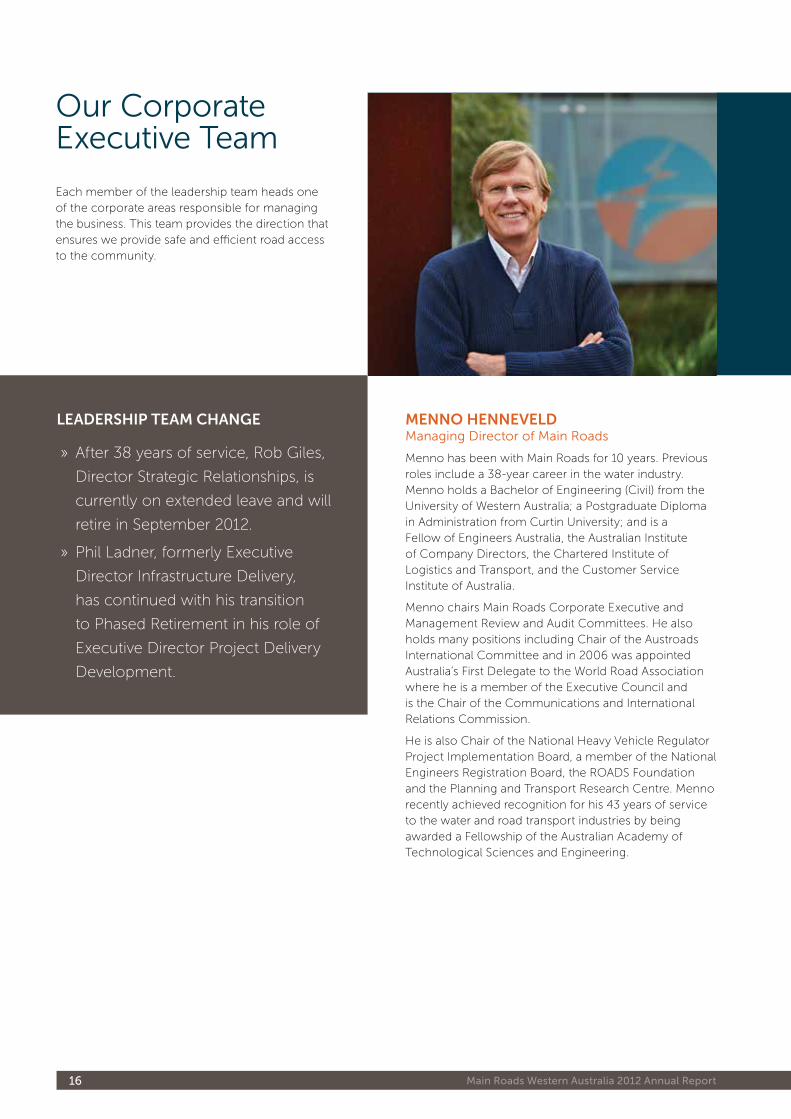
menno HenneVeld Managing Director of Main Roads
Menno has been with Main Roads for 10 years. Previous roles include a 38-year career in the water industry. Menno holds a Bachelor of Engineering (Civil) from the University of Western Australia; a Postgraduate Diploma in Administration from Curtin University; and is a Fellow of Engineers Australia, the Australian Institute of Company Directors, the Chartered Institute of Logistics and Transport, and the Customer Service Institute of Australia.
Menno chairs Main Roads Corporate Executive and Management Review and Audit Committees. He also holds many positions including Chair of the Austroads International Committee and in 2006 was appointed Australia’s First Delegate to the World Road Association where he is a member of the Executive Council and is the Chair of the Communications and International Relations Commission.
He is also Chair of the National Heavy Vehicle Regulator Project Implementation Board, a member of the National Engineers Registration Board, the ROADS Foundation and the Planning and Transport Research Centre. Menno recently achieved recognition for his 43 years of service to the water and road transport industries by being awarded a Fellowship of the Australian Academy of Technological Sciences and Engineering.
leadership: our Corporate executive team 17
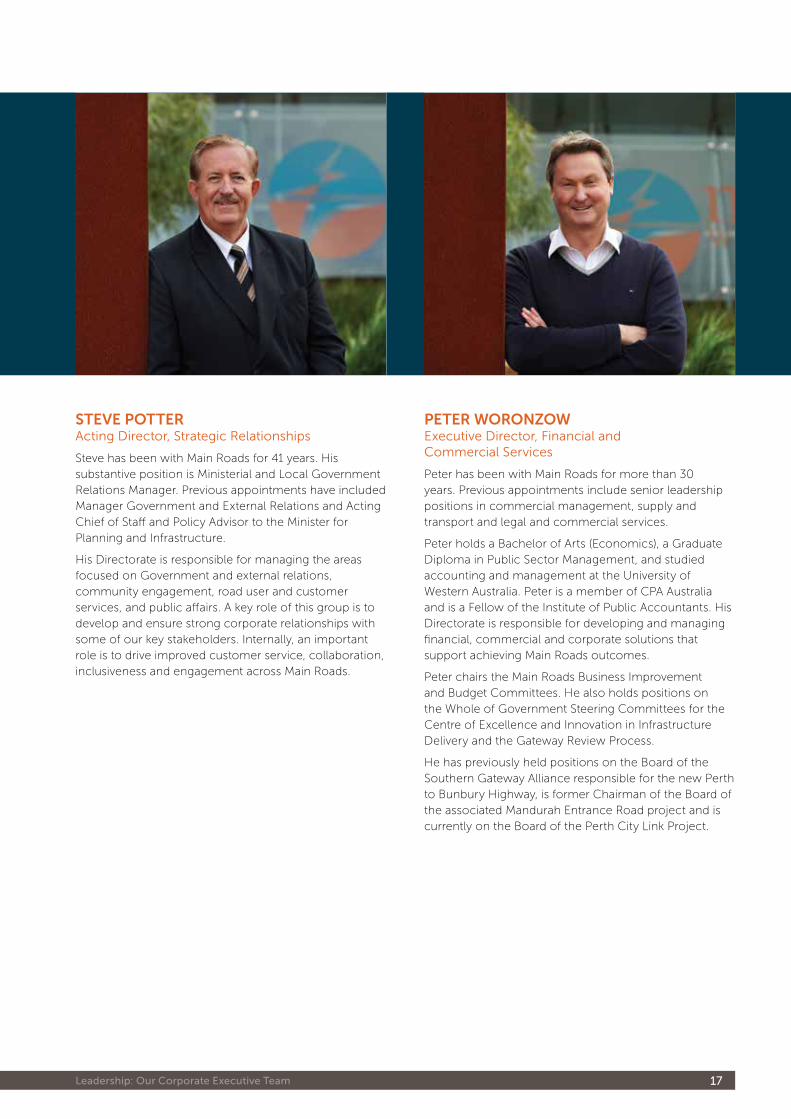
SteVe potteR Acting Director, Strategic Relationships
Steve has been with Main Roads for 41 years. His substantive position is Ministerial and Local Government Relations Manager. Previous appointments have included Manager Government and External Relations and Acting Chief of Staff and Policy Advisor to the Minister for Planning and Infrastructure.
His Directorate is responsible for managing the areas focused on Government and external relations, community engagement, road user and customer services, and public affairs. A key role of this group is to develop and ensure strong corporate relationships with some of our key stakeholders. Internally, an important role is to drive improved customer service, collaboration, inclusiveness and engagement across Main Roads.
peteR WoRonzoW Executive Director, Financial and Commercial Services
Peter has been with Main Roads for more than 30 years. Previous appointments include senior leadership positions in commercial management, supply and transport and legal and commercial services.
Peter holds a Bachelor of Arts (Economics), a Graduate Diploma in Public Sector Management, and studied accounting and management at the University of Western Australia. Peter is a member of CPA Australia and is a Fellow of the Institute of Public Accountants. His Directorate is responsible for developing and managing financial, commercial and corporate solutions that support achieving Main Roads outcomes.
Peter chairs the Main Roads Business Improvement and Budget Committees. He also holds positions on the Whole of Government Steering Committees for the Centre of Excellence and Innovation in Infrastructure Delivery and the Gateway Review Process.
He has previously held positions on the Board of the Southern Gateway Alliance responsible for the new Perth to Bunbury Highway, is former Chairman of the Board of the associated Mandurah Entrance Road project and is currently on the Board of the Perth City Link Project.
Main Roads Western Australia 2012 Annual Report18
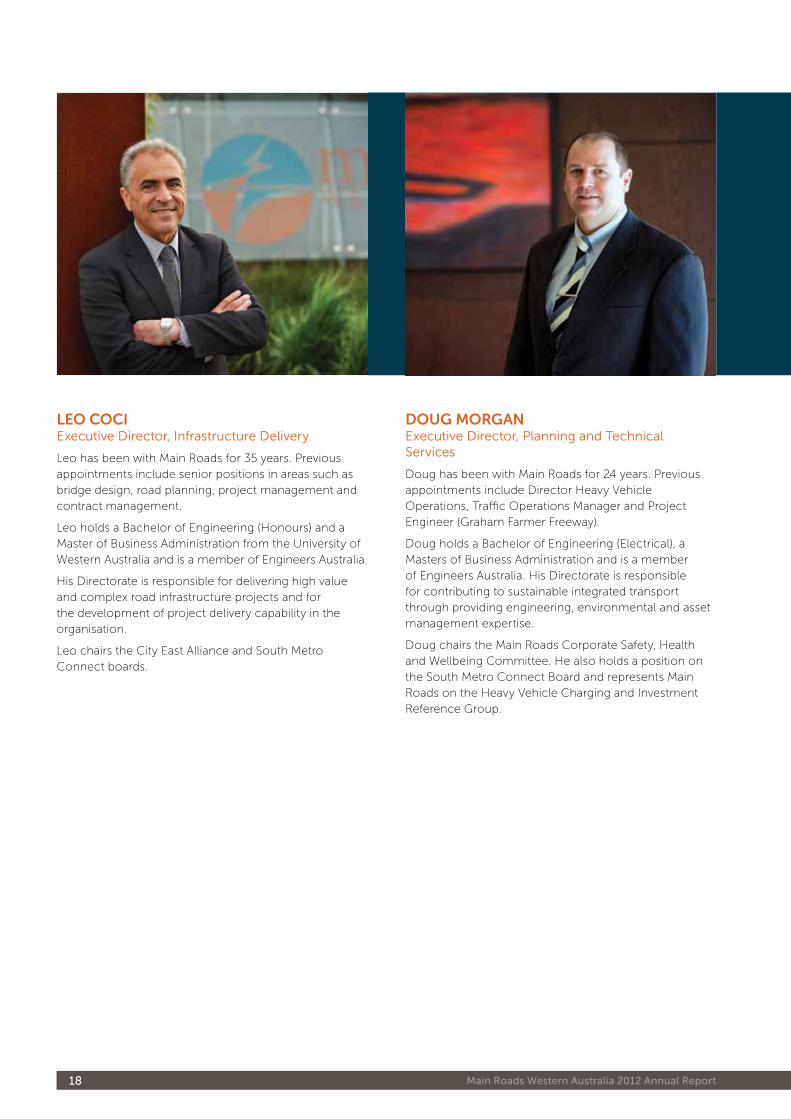
leo CoCi Executive Director, Infrastructure Delivery
Leo has been with Main Roads for 35 years. Previous appointments include senior positions in areas such as bridge design, road planning, project management and contract management.
Leo holds a Bachelor of Engineering (Honours) and a Master of Business Administration from the University of Western Australia and is a member of Engineers Australia.
His Directorate is responsible for delivering high value and complex road infrastructure projects and for the development of project delivery capability in the organisation.
Leo chairs the City East Alliance and South Metro Connect boards.
doug moRgan Executive Director, Planning and Technical Services
Doug has been with Main Roads for 24 years. Previous appointments include Director Heavy Vehicle Operations, Traffic Operations Manager and Project Engineer (Graham Farmer Freeway).
Doug holds a Bachelor of Engineering (Electrical), a Masters of Business Administration and is a member of Engineers Australia. His Directorate is responsible for contributing to sustainable integrated transport through providing engineering, environmental and asset management expertise.
Doug chairs the Main Roads Corporate Safety, Health and Wellbeing Committee. He also holds a position on the South Metro Connect Board and represents Main Roads on the Heavy Vehicle Charging and Investment Reference Group.
leadership: our Corporate executive team 19
JoHn eRCeg Executive Director, Regional Services
John has been with Main Roads for 29 years. Previous roles include Regional Manager Gascoyne, Acting Director Heavy Vehicle Operations and Manager Road Network Operations. John holds a Bachelor of Engineering (Civil) from the University of Western Australia.
His Directorate is responsible for road asset management, network operation and maintenance and capital delivery throughout Western Australia. These services are delivered from our 10 regional offices. John has previously represented Australia on the World Road Association Management of Road Network Operations Technical Committee and Main Roads on the Austroads Network Taskforce.
deS Snook Executive Director, Road Network Services
Des has been with Main Roads for 33 years. Previous appointments include Executive Director Urban Roads, Operations Manager North, and Regional Manager in Wheatbelt South and Pilbara regions.
Des holds a Bachelor of Engineering (Civil) and is a member of Engineers Australia and the Australian Institute of Company Directors. His Directorate is responsible for leading road network operations, which enables our community to benefit from safe, reliable and efficient journeys. The major functional areas are in Traffic Management, Road Safety and Heavy Vehicle Operations.
Des is a member of the Road Safety Council, a Director on the Board of Transport Certification Australia Ltd and a member of the Ministerial Heavy Vehicle Advisory Panel. At a national level Des is the State’s representative on the High Level Reference Group for the development and implementation of the National Heavy Vehicle Regulator.
Main Roads Western Australia 2012 Annual Report20
JoHn taya Executive Director, Organisational Development
John has been a member of Main Roads’ Corporate Executive for 13 years. Previous appointments include Executive Director Human Resources, working for the Department of the Premier and Cabinet, and in the Public and Private Sectors in Australia and in London.
John holds a Bachelor of Commerce and a Master of Industrial Relations from the University of Western Australia. He has lectured in the MBA programs at the Graduate School of Management at the University of Western Australia, Chifley Business School and at the Graduate School of Business at Curtin University.
His Directorate is responsible for the strategic planning of the organisation, Human Resource Management, Human Capital Management, Cultural Corporate Governance, Innovation and Internal Communication.
John chairs the Main Roads Corporate Development Committee and the Workforce Management Committee. He also holds a position on the board of the ROADS Foundation, is the Chair of the Management Advisory Board of Curtin University, is on the Advisory Board of the UWA Engineering Futures Foundation and is a member of the Austroads Capability Taskforce.
Collie River Bridge
leadership: our Corporate executive team 21
BoB pHilipS Director, Budget and Financial Planning
Bob has been with Main Roads for 24 years. Previous appointments include 22 years’ experience in senior accounting positions at the WA College of Advanced Education (now Edith Cowan University) and West Australian Newspapers.
Bob holds a Diploma in Accountancy, a Graduate Diploma in Professional Accounting and is a Certified Practicing Accountant.
His Directorate is responsible for contributing to the development, management and preparation of the budget and programming activities. This includes the annual budget and forward works program, liaising with the Department of Transport, Department of Treasury and the Commonwealth Department of Infrastructure and Transport. He also has responsibility for managing the State Road Funds to Local Government Agreement with the WA Local Government Association.
Bob is a member of the Transport Portfolio Investment Sub-Committee, the State Road Funds to Local Government Advisory Committee and the Commonwealth Nation Building Black Spot Consultative Panel.
iain CameRon Executive Director, Office of Road Safety
Iain has been with the Office of Road Safety for 12 years. Previous appointments include various roles with the departments of Education and Health and Edith Cowan University. Iain holds a Bachelor of Physical Education and Diploma of Education from the University of Western Australia, a Post-graduate Diploma in Health Promotion and Master of Public Health from Curtin University. Iain is a Graduate of the Australian Institute of Company Directors.
His office is responsible for providing policy and strategy advice and support to the Road Safety Council (RSC) and Minister for Road Safety on measures to reduce road trauma on WA roads. This includes monitoring and reporting on progress, delivering road safety education campaigns and working collaboratively with agencies and stakeholders to coordinate the implementation and funding of projects to reduce road trauma from the Road Trauma Trust Account.
Iain holds a position as an Independent Director on the Board of the Australasian New Car Assessment Program and the RSC.

Main Roads Western Australia 2012 Annual Report22
Performance 23
How We Achieve Government GoalsThe Government has identified four goals that we must achieve in delivering services to the community. Main Roads achieves the delivery of these goals through a Program Management approach. There are seven Programs that drive outcome-based decision making to achieve agreed business outcomes. Key performance measures assist the Government, Main Roads and the community in determining the impact of the delivery of services within each Program.
The following table shows the relationship between the Government’s Goals and the services and outcomes we deliver in order to achieve those Goals.
Government Goals Main Roads outcomes Main Roads Programs Page Ref.
Results Based Service Delivery
Providing a safe road environmentRoad Safety 24
Office of Road Safety 46
Reliable and efficient movement of people and goods
Road Management 52
Road Efficiency 28
State Building – Major ProjectsFacilitate economic and regional development
State Development 34
Stronger Focus on the Regions A well maintained road network Maintenance 38
Social and Environmental Responsibility
Improved community access and roadside amenity
Community Access 42
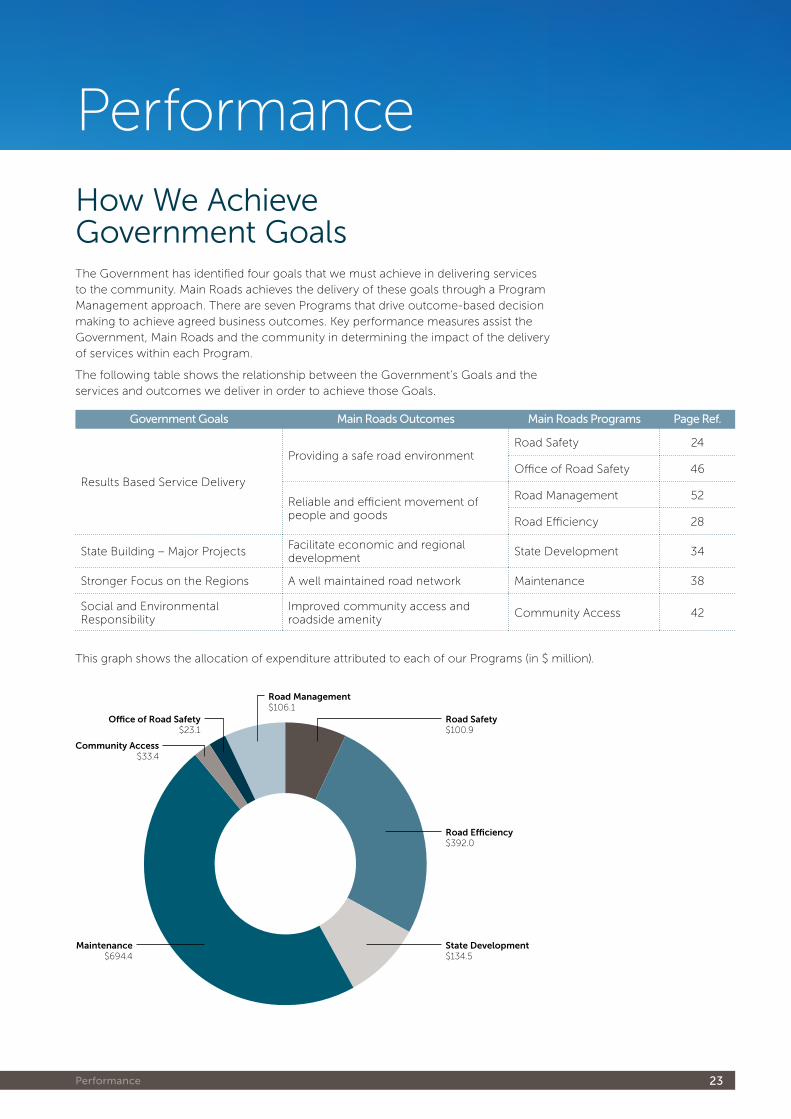
This graph shows the allocation of expenditure attributed to each of our Programs (in $ million).
Road Management$106.1
Community Access$33.4
Road Safety$100.9
Maintenance$694.4
Road Eciency$392.0
Oce of Road Safety$23.1
State Development$134.5
Performance
Main Roads Western Australia 2012 Annual Report24
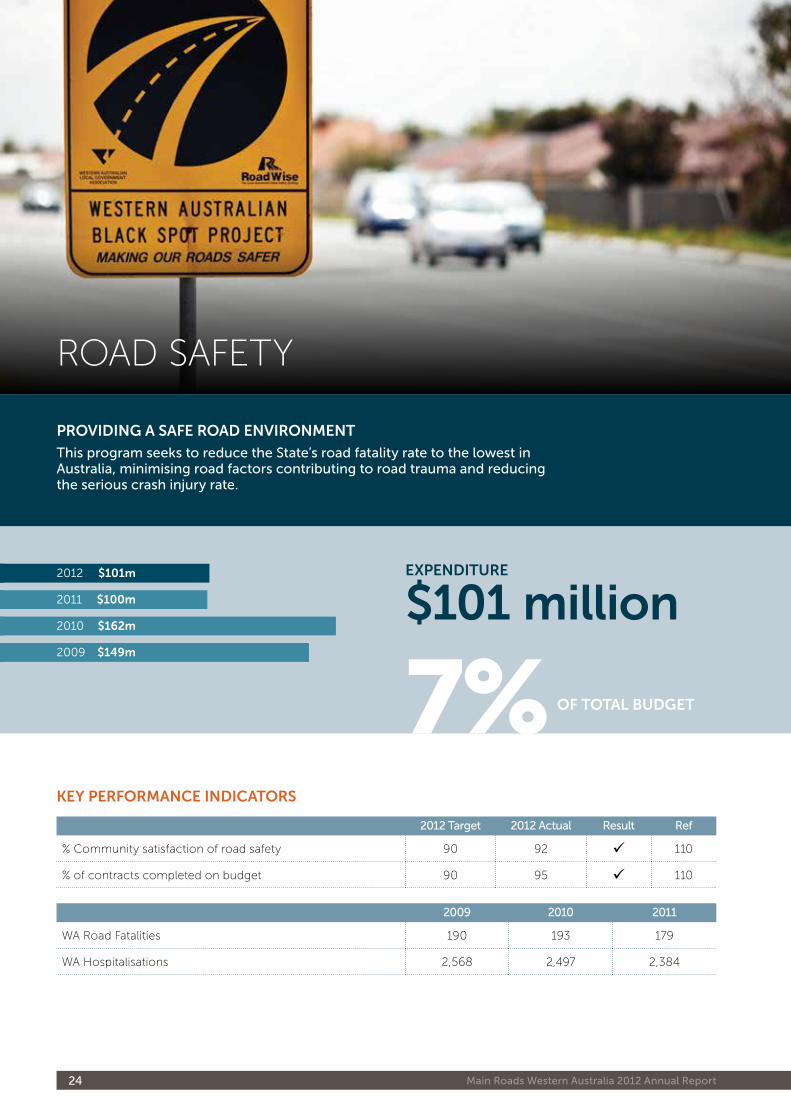
pRoViding a Safe Road enViRonment
this program seeks to reduce the state’s road fatality rate to the lowest in australia, minimising road factors contributing to road trauma and reducing the serious crash injury rate.
ROAD SAFETY
$101 million
7%
expendituRe
key peRfoRmanCe indiCatoRS
2012 target 2012 actual Result Ref
% Community satisfaction of road safety 90 92 110
% of contracts completed on budget 90 95 110
2009 2010 2011
WA Road Fatalities 190 193 179
WA Hospitalisations 2,568 2,497 2,384
2012
2011
$101m
$100m
2010
2009
$162m
$149m
of total Budget
Performance: Road safety 25
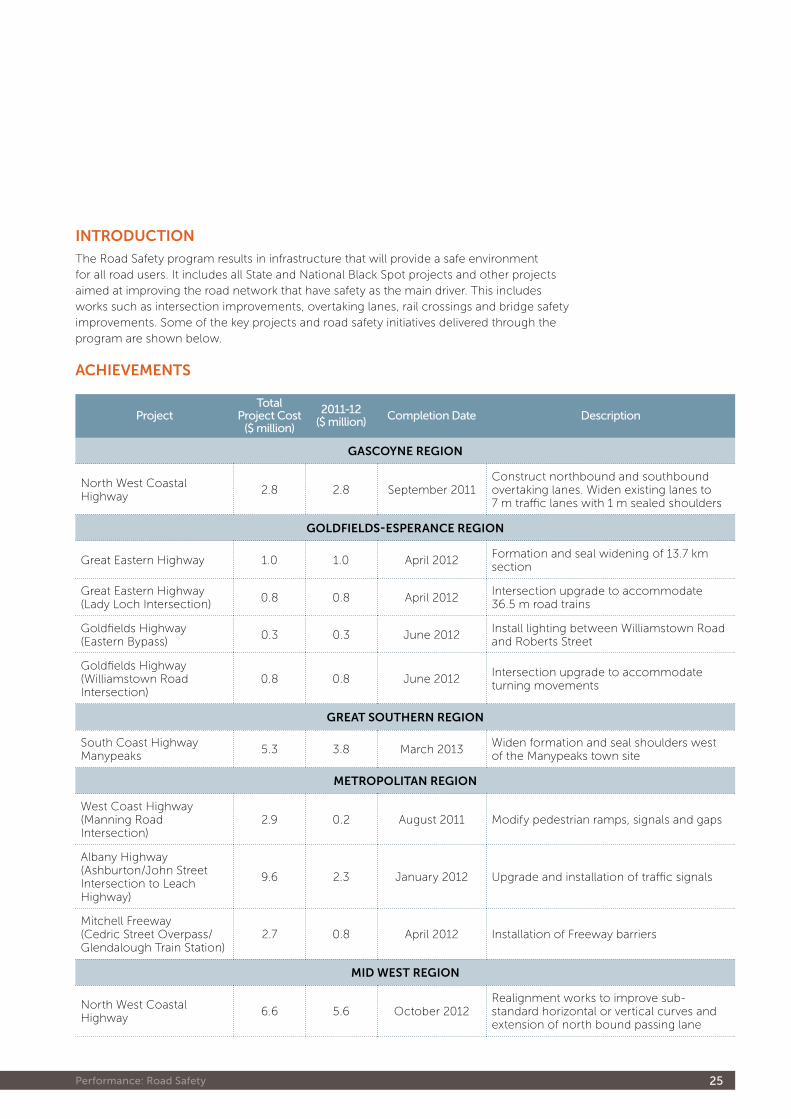
intRoduCtion
The Road Safety program results in infrastructure that will provide a safe environment for all road users. It includes all State and National Black Spot projects and other projects aimed at improving the road network that have safety as the main driver. This includes works such as intersection improvements, overtaking lanes, rail crossings and bridge safety improvements. Some of the key projects and road safety initiatives delivered through the program are shown below.
aCHieVementS
$101 million
Projecttotal
Project Cost ($ million)
2011-12 ($ million) Completion Date Description
gaSCoyne Region
North West Coastal Highway
2.8 2.8 September 2011Construct northbound and southbound overtaking lanes. Widen existing lanes to 7 m traffic lanes with 1 m sealed shoulders
goldfieldS-eSpeRanCe Region
Great Eastern Highway 1.0 1.0 April 2012Formation and seal widening of 13.7 km section
Great Eastern Highway (Lady Loch Intersection)
0.8 0.8 April 2012Intersection upgrade to accommodate 36.5 m road trains
Goldfields Highway (Eastern Bypass)
0.3 0.3 June 2012Install lighting between Williamstown Road and Roberts Street
Goldfields Highway (Williamstown Road Intersection)
0.8 0.8 June 2012Intersection upgrade to accommodate turning movements
gReat SoutHeRn Region
South Coast Highway Manypeaks
5.3 3.8 March 2013Widen formation and seal shoulders west of the Manypeaks town site
metRopolitan Region
West Coast Highway (Manning Road Intersection)
2.9 0.2 August 2011 Modify pedestrian ramps, signals and gaps
Albany Highway (Ashburton/John Street Intersection to Leach Highway)
9.6 2.3 January 2012 Upgrade and installation of traffic signals
Mitchell Freeway (Cedric Street Overpass/Glendalough Train Station)
2.7 0.8 April 2012 Installation of Freeway barriers
mid WeSt Region
North West Coastal Highway
6.6 5.6 October 2012Realignment works to improve sub-standard horizontal or vertical curves and extension of north bound passing lane
Main Roads Western Australia 2012 Annual Report26
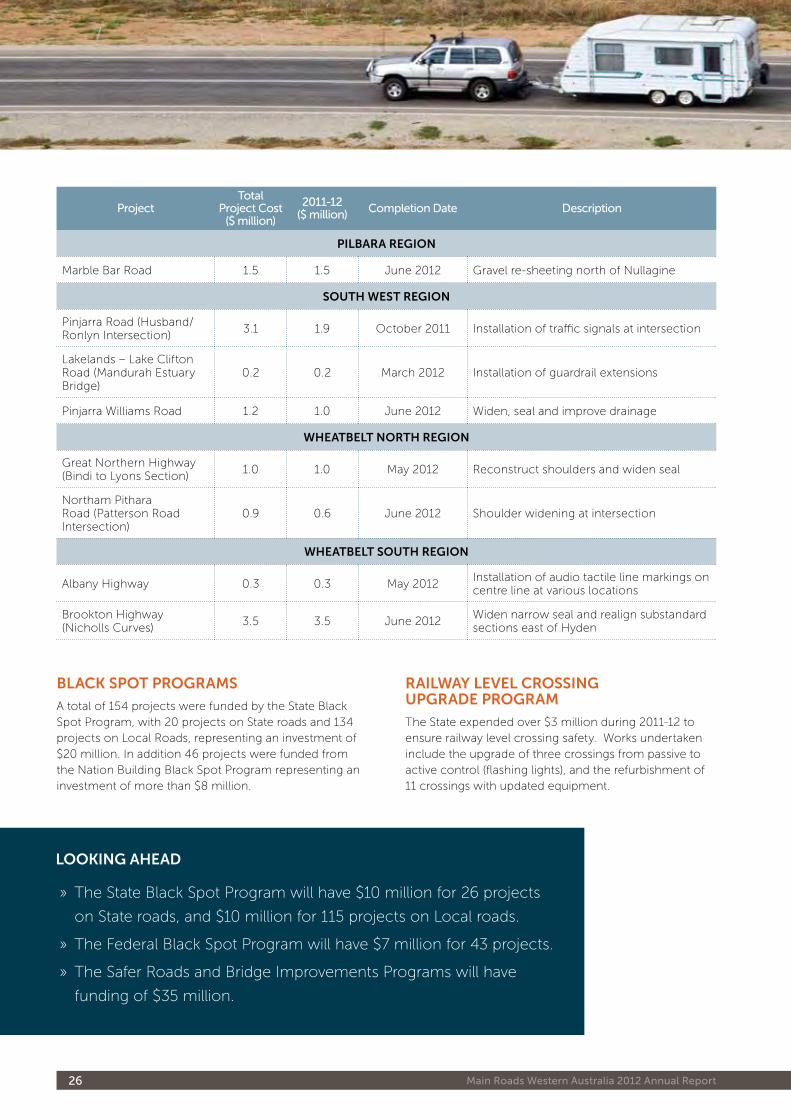
Projecttotal
Project Cost ($ million)
2011-12 ($ million) Completion Date Description
pilBaRa Region
Marble Bar Road 1.5 1.5 June 2012 Gravel re-sheeting north of Nullagine
SoutH WeSt Region
Pinjarra Road (Husband/Ronlyn Intersection)
3.1 1.9 October 2011 Installation of traffic signals at intersection
Lakelands – Lake Clifton Road (Mandurah Estuary Bridge)
0.2 0.2 March 2012 Installation of guardrail extensions
Pinjarra Williams Road 1.2 1.0 June 2012 Widen, seal and improve drainage
WHeatBelt noRtH Region
Great Northern Highway (Bindi to Lyons Section)
1.0 1.0 May 2012 Reconstruct shoulders and widen seal
Northam Pithara Road (Patterson Road Intersection)
0.9 0.6 June 2012 Shoulder widening at intersection
WHeatBelt SoutH Region
Albany Highway 0.3 0.3 May 2012Installation of audio tactile line markings on centre line at various locations
Brookton Highway (Nicholls Curves)
3.5 3.5 June 2012Widen narrow seal and realign substandard sections east of Hyden
BlaCk Spot pRogRamS
A total of 154 projects were funded by the State Black Spot Program, with 20 projects on State roads and 134 projects on Local Roads, representing an investment of $20 million. In addition 46 projects were funded from the Nation Building Black Spot Program representing an investment of more than $8 million.
RailWay leVel CRoSSing upgRade pRogRam
The State expended over $3 million during 2011-12 to ensure railway level crossing safety. Works undertaken include the upgrade of three crossings from passive to active control (flashing lights), and the refurbishment of 11 crossings with updated equipment.
looking aHead
» The State Black Spot Program will have $10 million for 26 projects
on State roads, and $10 million for 115 projects on Local roads.
» The Federal Black Spot Program will have $7 million for 43 projects.
» The Safer Roads and Bridge Improvements Programs will have
funding of $35 million.
Performance: Road safety 27
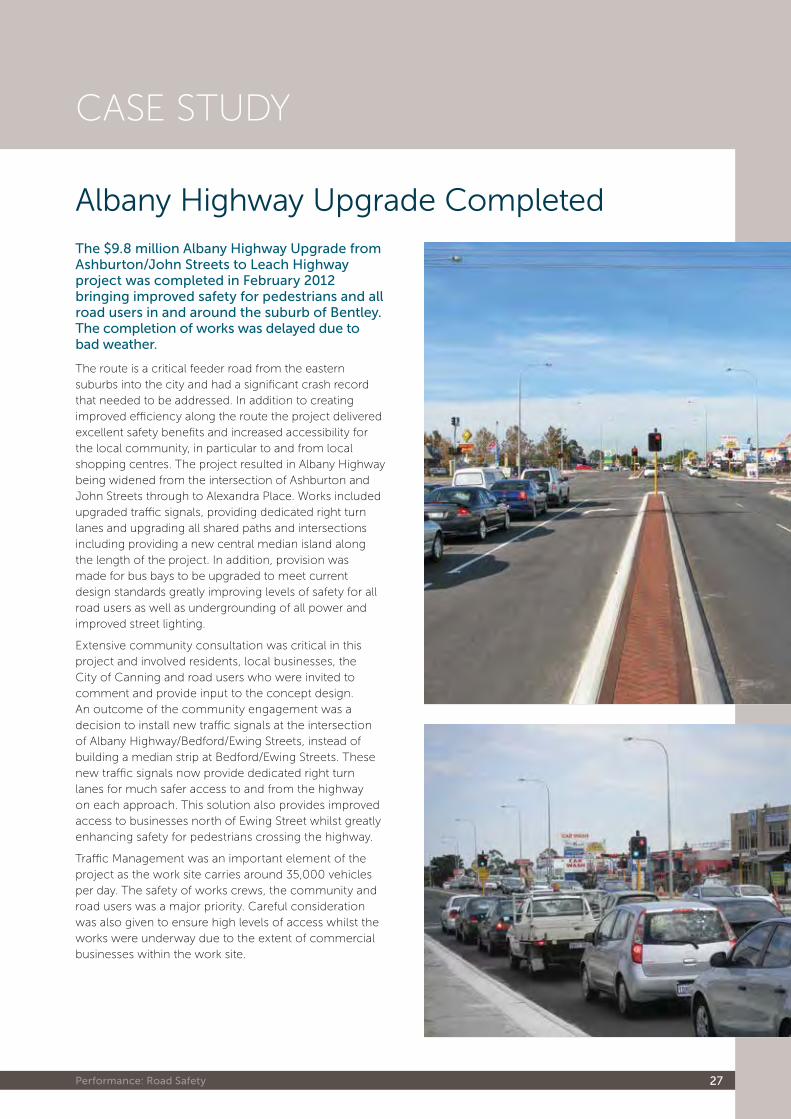
Case study
Albany Highway Upgrade Completedthe $9.8 million albany highway Upgrade from ashburton/John streets to leach highway project was completed in February 2012 bringing improved safety for pedestrians and all road users in and around the suburb of bentley. the completion of works was delayed due to bad weather.
The route is a critical feeder road from the eastern suburbs into the city and had a significant crash record that needed to be addressed. In addition to creating improved efficiency along the route the project delivered excellent safety benefits and increased accessibility for the local community, in particular to and from local shopping centres. The project resulted in Albany Highway being widened from the intersection of Ashburton and John Streets through to Alexandra Place. Works included upgraded traffic signals, providing dedicated right turn lanes and upgrading all shared paths and intersections including providing a new central median island along the length of the project. In addition, provision was made for bus bays to be upgraded to meet current design standards greatly improving levels of safety for all road users as well as undergrounding of all power and improved street lighting.
Extensive community consultation was critical in this project and involved residents, local businesses, the City of Canning and road users who were invited to comment and provide input to the concept design. An outcome of the community engagement was a decision to install new traffic signals at the intersection of Albany Highway/Bedford/Ewing Streets, instead of building a median strip at Bedford/Ewing Streets. These new traffic signals now provide dedicated right turn lanes for much safer access to and from the highway on each approach. This solution also provides improved access to businesses north of Ewing Street whilst greatly enhancing safety for pedestrians crossing the highway.
Traffic Management was an important element of the project as the work site carries around 35,000 vehicles per day. The safety of works crews, the community and road users was a major priority. Careful consideration was also given to ensure high levels of access whilst the works were underway due to the extent of commercial businesses within the work site.
Main Roads Western Australia 2012 Annual Report28
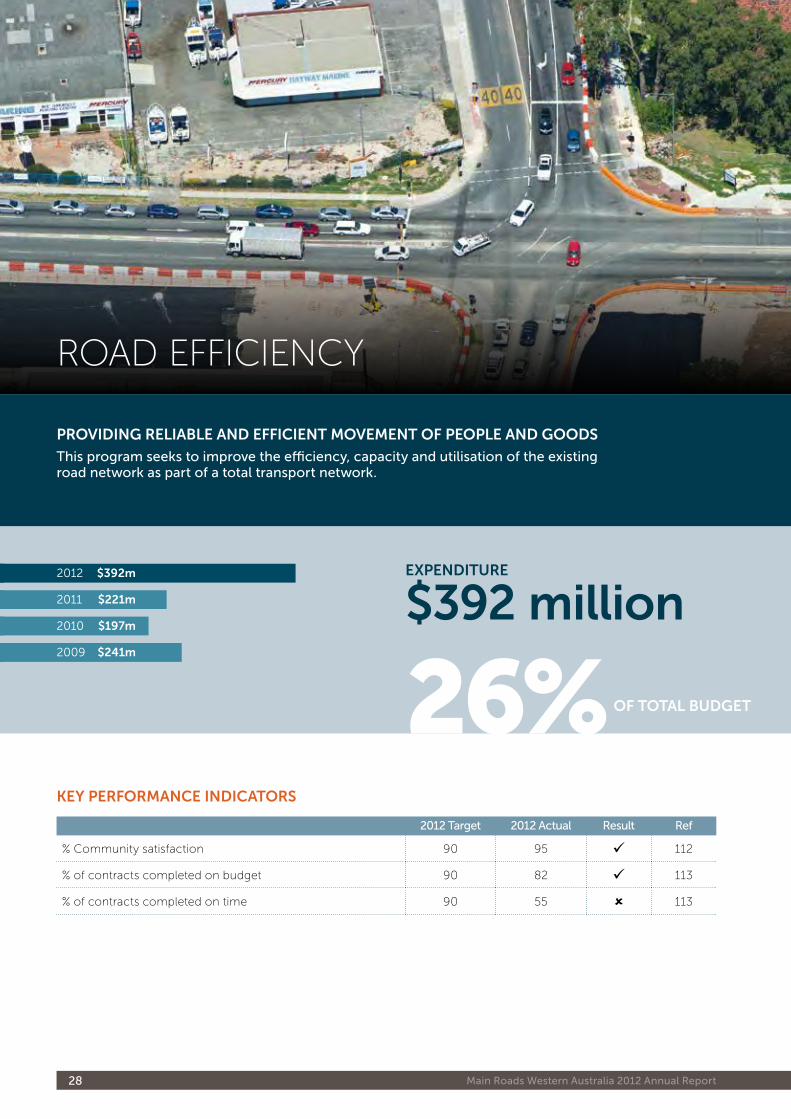
key peRfoRmanCe indiCatoRS
2012 target 2012 actual Result Ref
% Community satisfaction 90 95 112
% of contracts completed on budget 90 82 113
% of contracts completed on time 90 55 113
pRoViding ReliaBle and effiCient moVement of people and goodS
this program seeks to improve the efficiency, capacity and utilisation of the existing road network as part of a total transport network.
$392 million
26%
expendituRe
of total Budget
2012
2011
$392m
$221m
2010
2009
$197m
$241m
ROAD EFFICIENCY
Performance: Road efficiency 29
$392 million
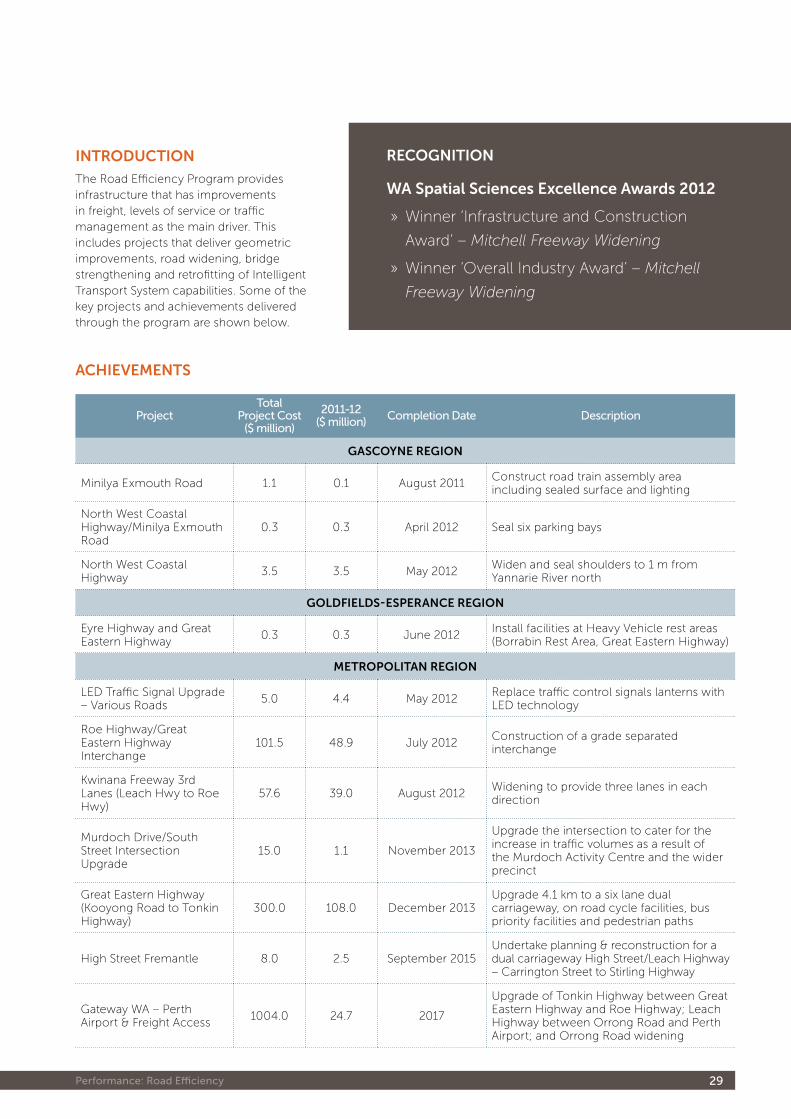
intRoduCtion
The Road Efficiency Program provides infrastructure that has improvements in freight, levels of service or traffic management as the main driver. This includes projects that deliver geometric improvements, road widening, bridge strengthening and retrofitting of Intelligent Transport System capabilities. Some of the key projects and achievements delivered through the program are shown below.
aCHieVementS
Projecttotal
Project Cost ($ million)
2011-12 ($ million) Completion Date Description
gaSCoyne Region
Minilya Exmouth Road 1.1 0.1 August 2011Construct road train assembly area including sealed surface and lighting
North West Coastal Highway/Minilya Exmouth Road
0.3 0.3 April 2012 Seal six parking bays
North West Coastal Highway
3.5 3.5 May 2012Widen and seal shoulders to 1 m from Yannarie River north
goldfieldS-eSpeRanCe Region
Eyre Highway and Great Eastern Highway
0.3 0.3 June 2012Install facilities at Heavy Vehicle rest areas (Borrabin Rest Area, Great Eastern Highway)
metRopolitan Region
LED Traffic Signal Upgrade – Various Roads
5.0 4.4 May 2012Replace traffic control signals lanterns with LED technology
Roe Highway/Great Eastern Highway Interchange
101.5 48.9 July 2012Construction of a grade separated interchange
Kwinana Freeway 3rd Lanes (Leach Hwy to Roe Hwy)
57.6 39.0 August 2012Widening to provide three lanes in each direction
Murdoch Drive/South Street Intersection Upgrade
15.0 1.1 November 2013
Upgrade the intersection to cater for the increase in traffic volumes as a result of the Murdoch Activity Centre and the wider precinct
Great Eastern Highway (Kooyong Road to Tonkin Highway)
300.0 108.0 December 2013Upgrade 4.1 km to a six lane dual carriageway, on road cycle facilities, bus priority facilities and pedestrian paths
High Street Fremantle 8.0 2.5 September 2015Undertake planning & reconstruction for a dual carriageway High Street/Leach Highway – Carrington Street to Stirling Highway
Gateway WA – Perth Airport & Freight Access
1004.0 24.7 2017
Upgrade of Tonkin Highway between Great Eastern Highway and Roe Highway; Leach Highway between Orrong Road and Perth Airport; and Orrong Road widening
ReCognition
Wa Spatial Sciences excellence awards 2012
» Winner ‘Infrastructure and Construction
Award’ – Mitchell Freeway Widening
» Winner ‘Overall Industry Award’ – Mitchell
Freeway Widening
Main Roads Western Australia 2012 Annual Report30
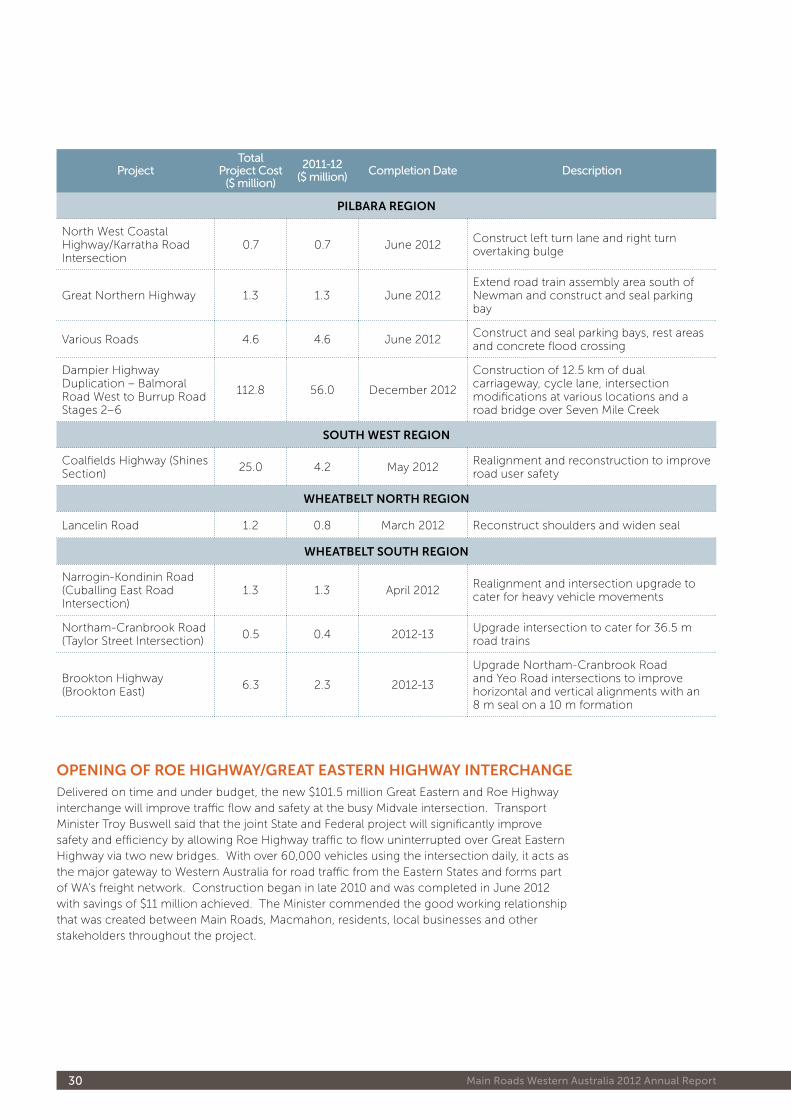
Projecttotal
Project Cost ($ million)
2011-12 ($ million) Completion Date Description
pilBaRa Region
North West Coastal Highway/Karratha Road Intersection
0.7 0.7 June 2012Construct left turn lane and right turn overtaking bulge
Great Northern Highway 1.3 1.3 June 2012Extend road train assembly area south of Newman and construct and seal parking bay
Various Roads 4.6 4.6 June 2012Construct and seal parking bays, rest areas and concrete flood crossing
Dampier Highway Duplication – Balmoral Road West to Burrup Road Stages 2–6
112.8 56.0 December 2012
Construction of 12.5 km of dual carriageway, cycle lane, intersection modifications at various locations and a road bridge over Seven Mile Creek
SoutH WeSt Region
Coalfields Highway (Shines Section)
25.0 4.2 May 2012Realignment and reconstruction to improve road user safety
WHeatBelt noRtH Region
Lancelin Road 1.2 0.8 March 2012 Reconstruct shoulders and widen seal
WHeatBelt SoutH Region
Narrogin-Kondinin Road (Cuballing East Road Intersection)
1.3 1.3 April 2012Realignment and intersection upgrade to cater for heavy vehicle movements
Northam-Cranbrook Road (Taylor Street Intersection)
0.5 0.4 2012-13Upgrade intersection to cater for 36.5 m road trains
Brookton Highway (Brookton East)
6.3 2.3 2012-13
Upgrade Northam-Cranbrook Road and Yeo Road intersections to improve horizontal and vertical alignments with an 8 m seal on a 10 m formation
opening of Roe HigHWay/gReat eaSteRn HigHWay inteRCHangeDelivered on time and under budget, the new $101.5 million Great Eastern and Roe Highway interchange will improve traffic flow and safety at the busy Midvale intersection. Transport Minister Troy Buswell said that the joint State and Federal project will significantly improve safety and efficiency by allowing Roe Highway traffic to flow uninterrupted over Great Eastern Highway via two new bridges. With over 60,000 vehicles using the intersection daily, it acts as the major gateway to Western Australia for road traffic from the Eastern States and forms part of WA’s freight network. Construction began in late 2010 and was completed in June 2012 with savings of $11 million achieved. The Minister commended the good working relationship that was created between Main Roads, Macmahon, residents, local businesses and other stakeholders throughout the project.
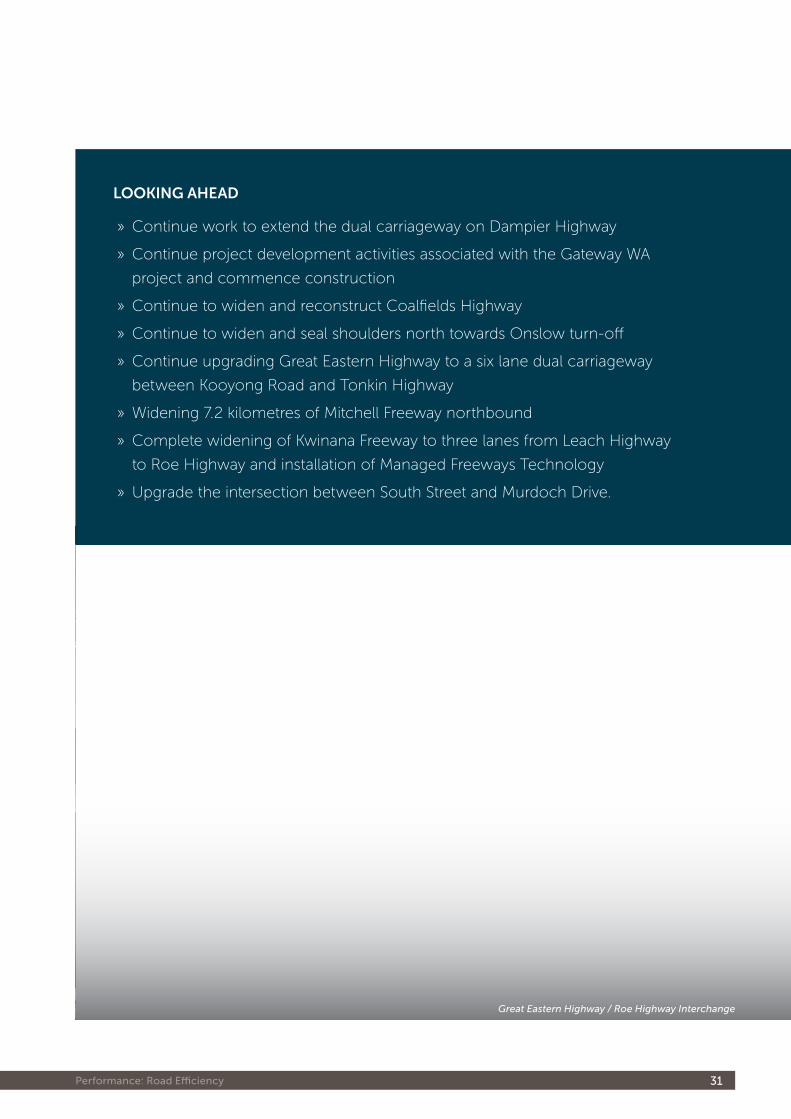
Great Eastern Highway / Roe Highway Interchange
Performance: Road efficiency 31
looking aHead
» Continue work to extend the dual carriageway on Dampier Highway
» Continue project development activities associated with the Gateway WA
project and commence construction
» Continue to widen and reconstruct Coalfields Highway
» Continue to widen and seal shoulders north towards Onslow turn-off
» Continue upgrading Great Eastern Highway to a six lane dual carriageway
between Kooyong Road and Tonkin Highway
» Widening 7.2 kilometres of Mitchell Freeway northbound
» Complete widening of Kwinana Freeway to three lanes from Leach Highway
to Roe Highway and installation of Managed Freeways Technology
» Upgrade the intersection between South Street and Murdoch Drive.
Main Roads Western Australia 2012 Annual Report32
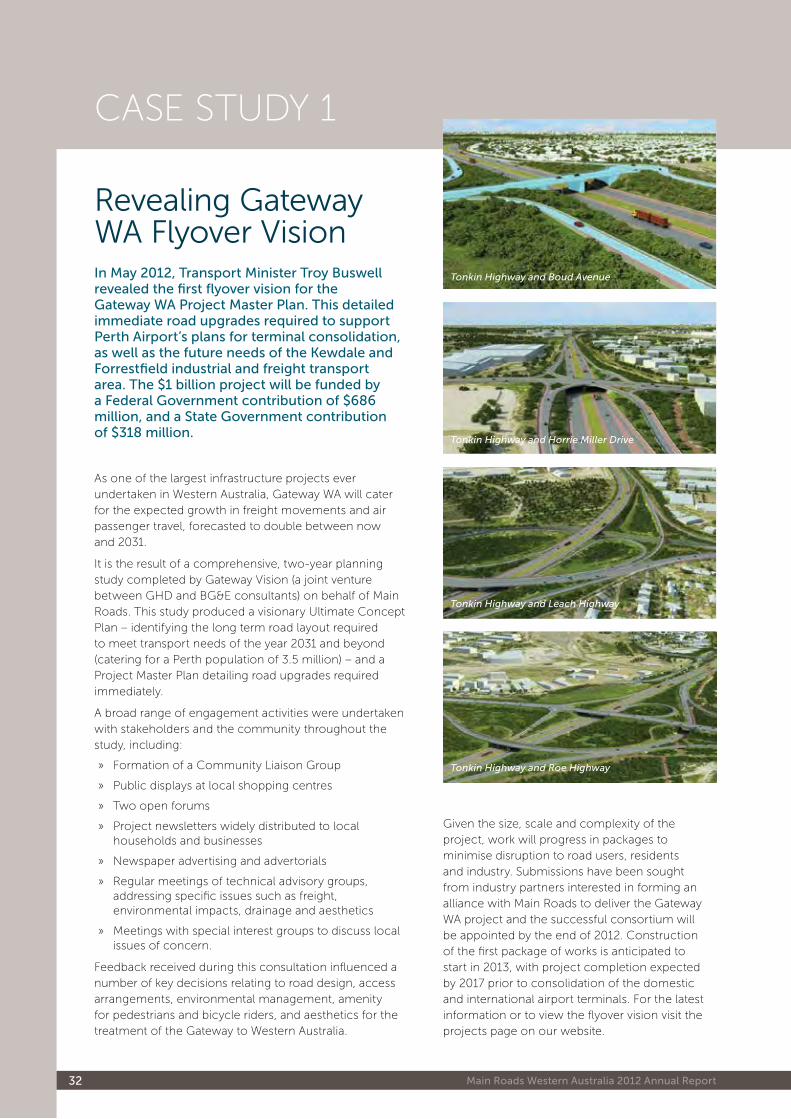
Revealing Gateway WA Flyover Visionin May 2012, transport Minister troy buswell revealed the first flyover vision for the Gateway Wa Project Master Plan. this detailed immediate road upgrades required to support Perth airport’s plans for terminal consolidation, as well as the future needs of the Kewdale and Forrestfield industrial and freight transport area. the $1 billion project will be funded by a Federal Government contribution of $686 million, and a state Government contribution of $318 million.
As one of the largest infrastructure projects ever undertaken in Western Australia, Gateway WA will cater for the expected growth in freight movements and air passenger travel, forecasted to double between now and 2031.
It is the result of a comprehensive, two-year planning study completed by Gateway Vision (a joint venture between GHD and BG&E consultants) on behalf of Main Roads. This study produced a visionary Ultimate Concept Plan – identifying the long term road layout required to meet transport needs of the year 2031 and beyond (catering for a Perth population of 3.5 million) – and a Project Master Plan detailing road upgrades required immediately.
A broad range of engagement activities were undertaken with stakeholders and the community throughout the study, including:
» Formation of a Community Liaison Group
» Public displays at local shopping centres
» Two open forums
» Project newsletters widely distributed to local households and businesses
» Newspaper advertising and advertorials
» Regular meetings of technical advisory groups, addressing specific issues such as freight, environmental impacts, drainage and aesthetics
» Meetings with special interest groups to discuss local issues of concern.
Feedback received during this consultation influenced a number of key decisions relating to road design, access arrangements, environmental management, amenity for pedestrians and bicycle riders, and aesthetics for the treatment of the Gateway to Western Australia.
CASE STUDY 1
Tonkin Highway and Boud Avenue
Given the size, scale and complexity of the project, work will progress in packages to minimise disruption to road users, residents and industry. Submissions have been sought from industry partners interested in forming an alliance with Main Roads to deliver the Gateway WA project and the successful consortium will be appointed by the end of 2012. Construction of the first package of works is anticipated to start in 2013, with project completion expected by 2017 prior to consolidation of the domestic and international airport terminals. For the latest information or to view the flyover vision visit the projects page on our website.
Tonkin Highway and Horrie Miller Drive
Tonkin Highway and Leach Highway
Tonkin Highway and Roe Highway
Performance: Road efficiency 33
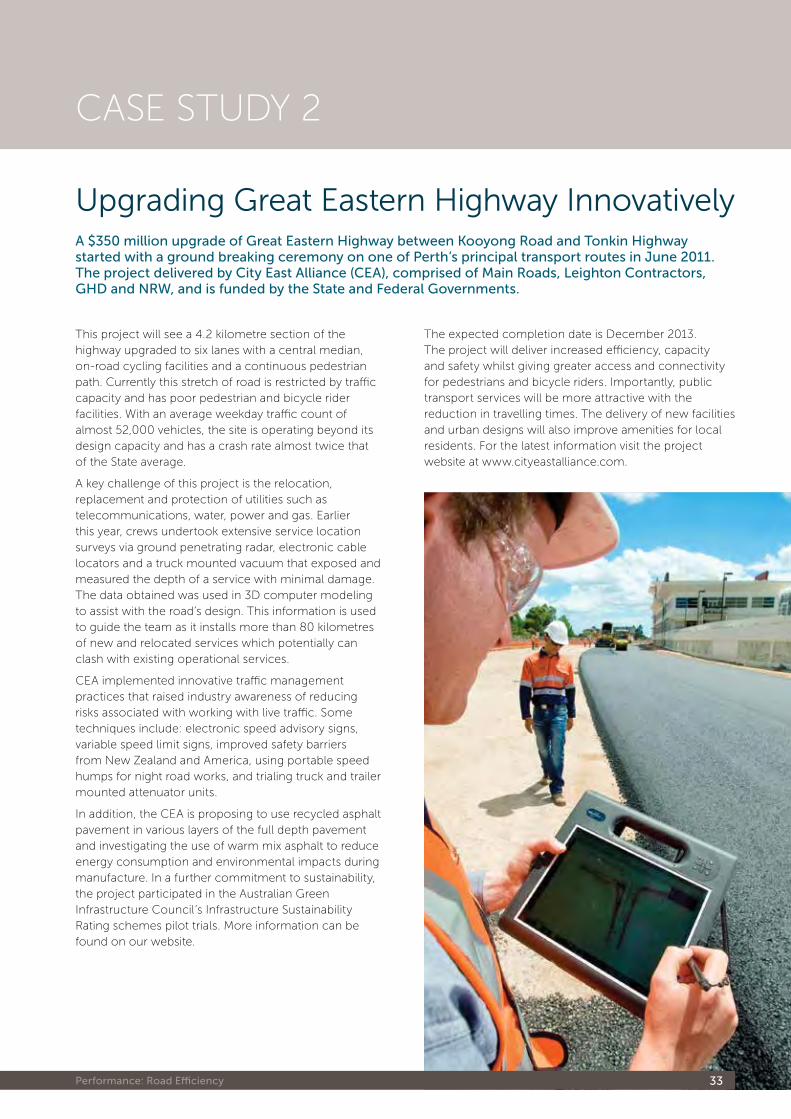
Upgrading Great Eastern Highway Innovativelya $350 million upgrade of Great eastern highway between Kooyong Road and tonkin highway started with a ground breaking ceremony on one of Perth’s principal transport routes in June 2011. the project delivered by City east alliance (Cea), comprised of Main Roads, leighton Contractors, GhD and nRW, and is funded by the state and Federal Governments.
CASE STUDY 2
This project will see a 4.2 kilometre section of the highway upgraded to six lanes with a central median, on-road cycling facilities and a continuous pedestrian path. Currently this stretch of road is restricted by traffic capacity and has poor pedestrian and bicycle rider facilities. With an average weekday traffic count of almost 52,000 vehicles, the site is operating beyond its design capacity and has a crash rate almost twice that of the State average.
A key challenge of this project is the relocation, replacement and protection of utilities such as telecommunications, water, power and gas. Earlier this year, crews undertook extensive service location surveys via ground penetrating radar, electronic cable locators and a truck mounted vacuum that exposed and measured the depth of a service with minimal damage. The data obtained was used in 3D computer modeling to assist with the road’s design. This information is used to guide the team as it installs more than 80 kilometres of new and relocated services which potentially can clash with existing operational services.
CEA implemented innovative traffic management practices that raised industry awareness of reducing risks associated with working with live traffic. Some techniques include: electronic speed advisory signs, variable speed limit signs, improved safety barriers from New Zealand and America, using portable speed humps for night road works, and trialing truck and trailer mounted attenuator units.
In addition, the CEA is proposing to use recycled asphalt pavement in various layers of the full depth pavement and investigating the use of warm mix asphalt to reduce energy consumption and environmental impacts during manufacture. In a further commitment to sustainability, the project participated in the Australian Green Infrastructure Council’s Infrastructure Sustainability Rating schemes pilot trials. More information can be found on our website.
The expected completion date is December 2013. The project will deliver increased efficiency, capacity and safety whilst giving greater access and connectivity for pedestrians and bicycle riders. Importantly, public transport services will be more attractive with the reduction in travelling times. The delivery of new facilities and urban designs will also improve amenities for local residents. For the latest information visit the project website at www.cityeastalliance.com.
Main Roads Western Australia 2012 Annual Report34
key peRfoRmanCe indiCatoRS
2012 target 2012 actual Result Ref
Return on construction expenditure (as an average) 2.0 2.1 114
% of contracts completed on budget 90 100 114
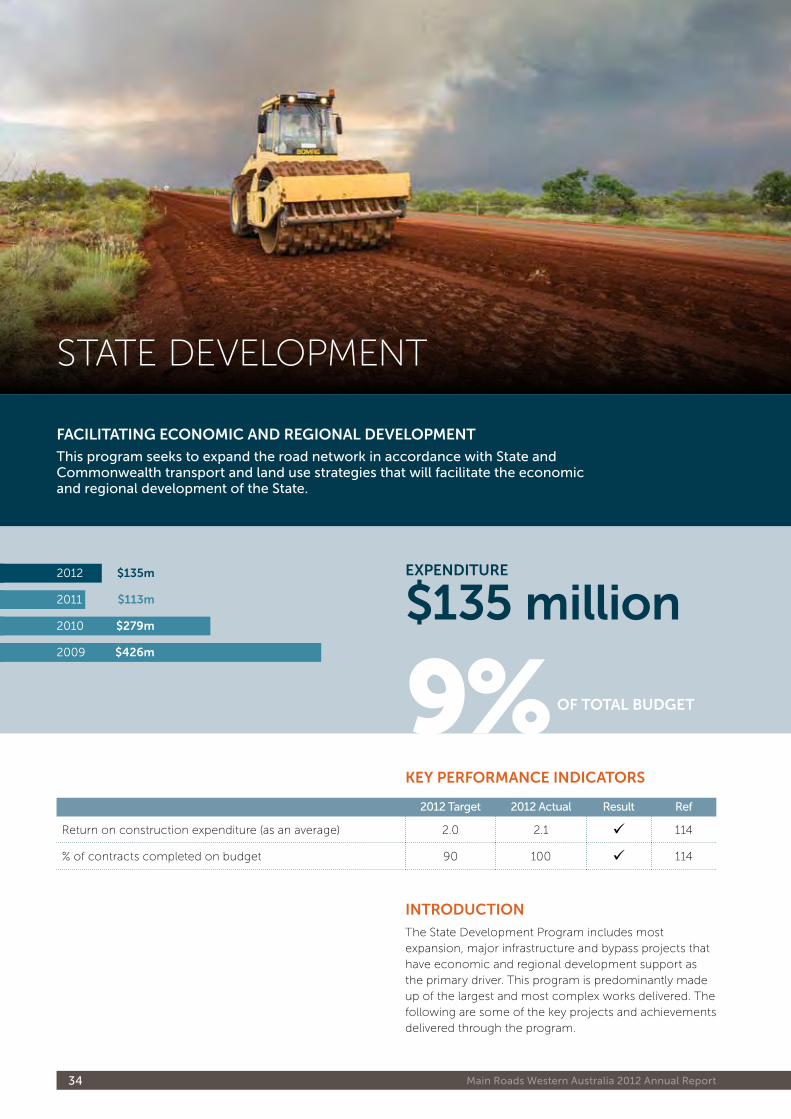
faCilitating eConomiC and Regional deVelopment
this program seeks to expand the road network in accordance with state and Commonwealth transport and land use strategies that will facilitate the economic and regional development of the state.
STATE DEVELOPMENT
$135 million
9%
expendituRe
intRoduCtion
The State Development Program includes most expansion, major infrastructure and bypass projects that have economic and regional development support as the primary driver. This program is predominantly made up of the largest and most complex works delivered. The following are some of the key projects and achievements delivered through the program.
2012
2011
$135m
$113m
2010
2009
$279m
$426m
of total Budget
Performance: state Development 35
$135 million
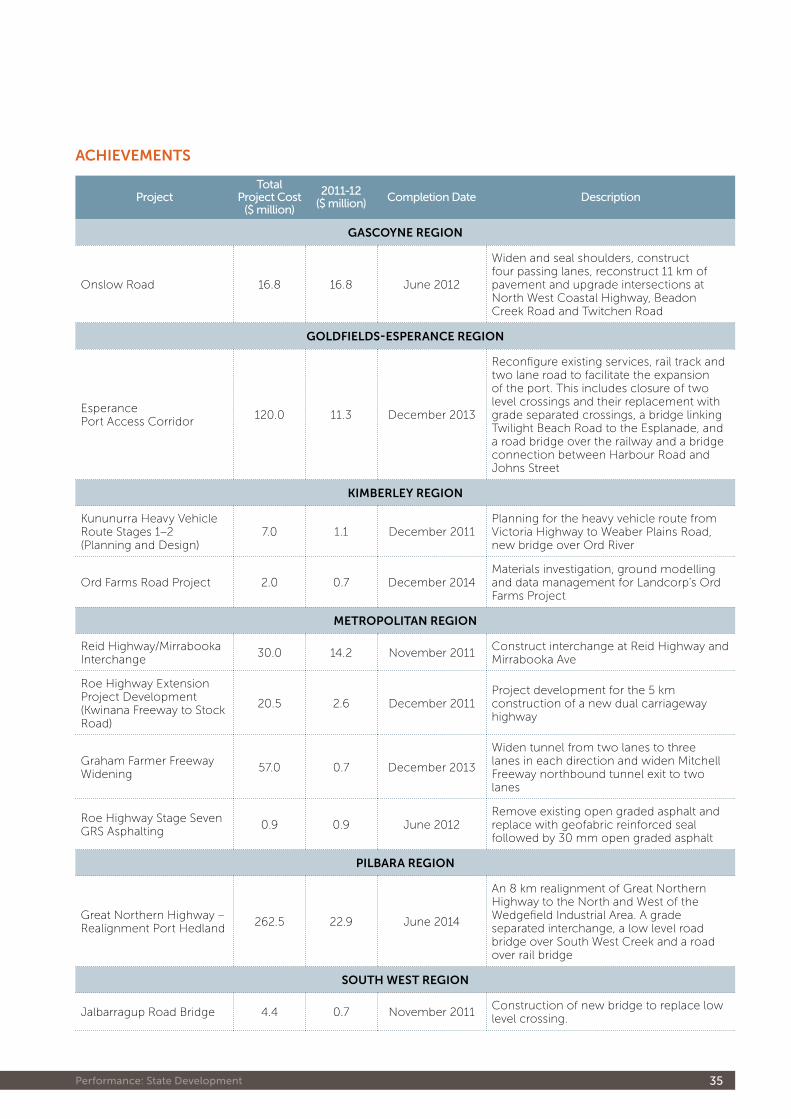
aCHieVementS
Projecttotal
Project Cost ($ million)
2011-12 ($ million) Completion Date Description
gaSCoyne Region
Onslow Road 16.8 16.8 June 2012
Widen and seal shoulders, construct four passing lanes, reconstruct 11 km of pavement and upgrade intersections at North West Coastal Highway, Beadon Creek Road and Twitchen Road
goldfieldS-eSpeRanCe Region
Esperance Port Access Corridor
120.0 11.3 December 2013
Reconfigure existing services, rail track and two lane road to facilitate the expansion of the port. This includes closure of two level crossings and their replacement with grade separated crossings, a bridge linking Twilight Beach Road to the Esplanade, and a road bridge over the railway and a bridge connection between Harbour Road and Johns Street
kimBeRley Region
Kununurra Heavy Vehicle Route Stages 1–2 (Planning and Design)
7.0 1.1 December 2011Planning for the heavy vehicle route from Victoria Highway to Weaber Plains Road, new bridge over Ord River
Ord Farms Road Project 2.0 0.7 December 2014Materials investigation, ground modelling and data management for Landcorp’s Ord Farms Project
metRopolitan Region
Reid Highway/Mirrabooka Interchange
30.0 14.2 November 2011Construct interchange at Reid Highway and Mirrabooka Ave
Roe Highway Extension Project Development (Kwinana Freeway to Stock Road)
20.5 2.6 December 2011Project development for the 5 km construction of a new dual carriageway highway
Graham Farmer Freeway Widening
57.0 0.7 December 2013
Widen tunnel from two lanes to three lanes in each direction and widen Mitchell Freeway northbound tunnel exit to two lanes
Roe Highway Stage Seven GRS Asphalting
0.9 0.9 June 2012Remove existing open graded asphalt and replace with geofabric reinforced seal followed by 30 mm open graded asphalt
pilBaRa Region
Great Northern Highway – Realignment Port Hedland
262.5 22.9 June 2014
An 8 km realignment of Great Northern Highway to the North and West of the Wedgefield Industrial Area. A grade separated interchange, a low level road bridge over South West Creek and a road over rail bridge
SoutH WeSt Region
Jalbarragup Road Bridge 4.4 0.7 November 2011Construction of new bridge to replace low level crossing.
Main Roads Western Australia 2012 Annual Report36
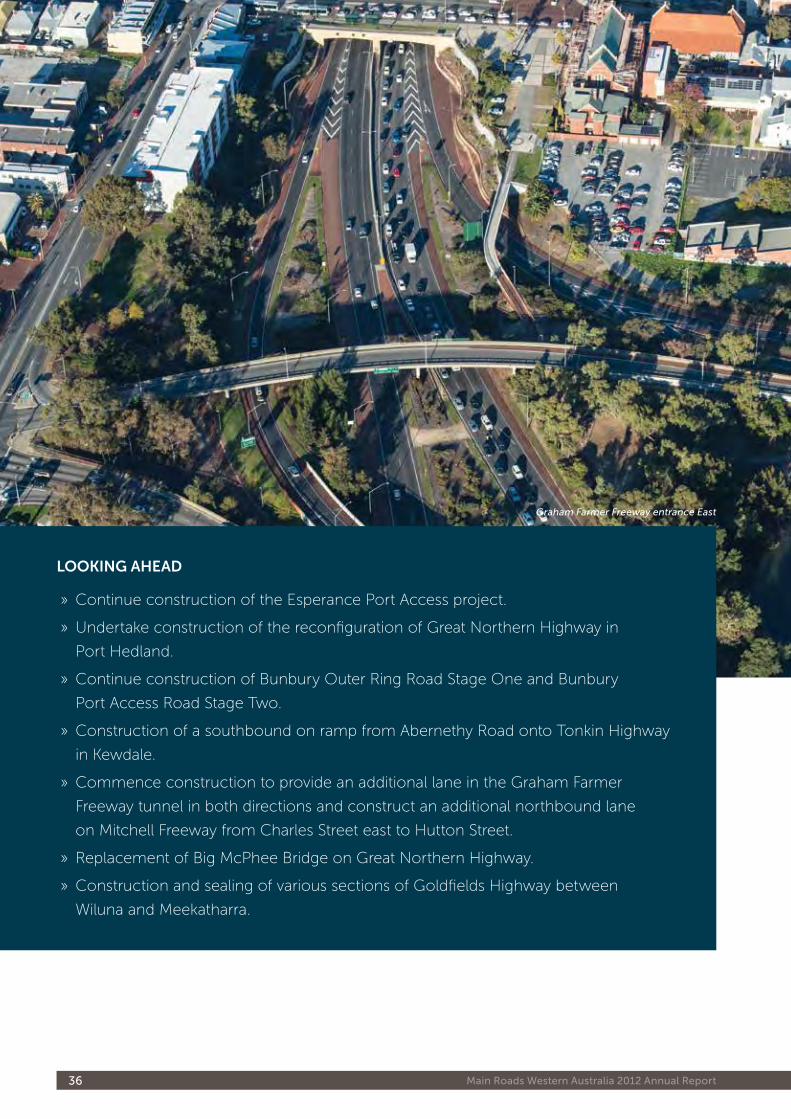
looking aHead
» Continue construction of the Esperance Port Access project.
» Undertake construction of the reconfiguration of Great Northern Highway in
Port Hedland.
» Continue construction of Bunbury Outer Ring Road Stage One and Bunbury
Port Access Road Stage Two.
» Construction of a southbound on ramp from Abernethy Road onto Tonkin Highway
in Kewdale.
» Commence construction to provide an additional lane in the Graham Farmer
Freeway tunnel in both directions and construct an additional northbound lane
on Mitchell Freeway from Charles Street east to Hutton Street.
» Replacement of Big McPhee Bridge on Great Northern Highway.
» Construction and sealing of various sections of Goldfields Highway between
Wiluna and Meekatharra.
Graham Farmer Freeway entrance East
Performance: state Development 37
Case study
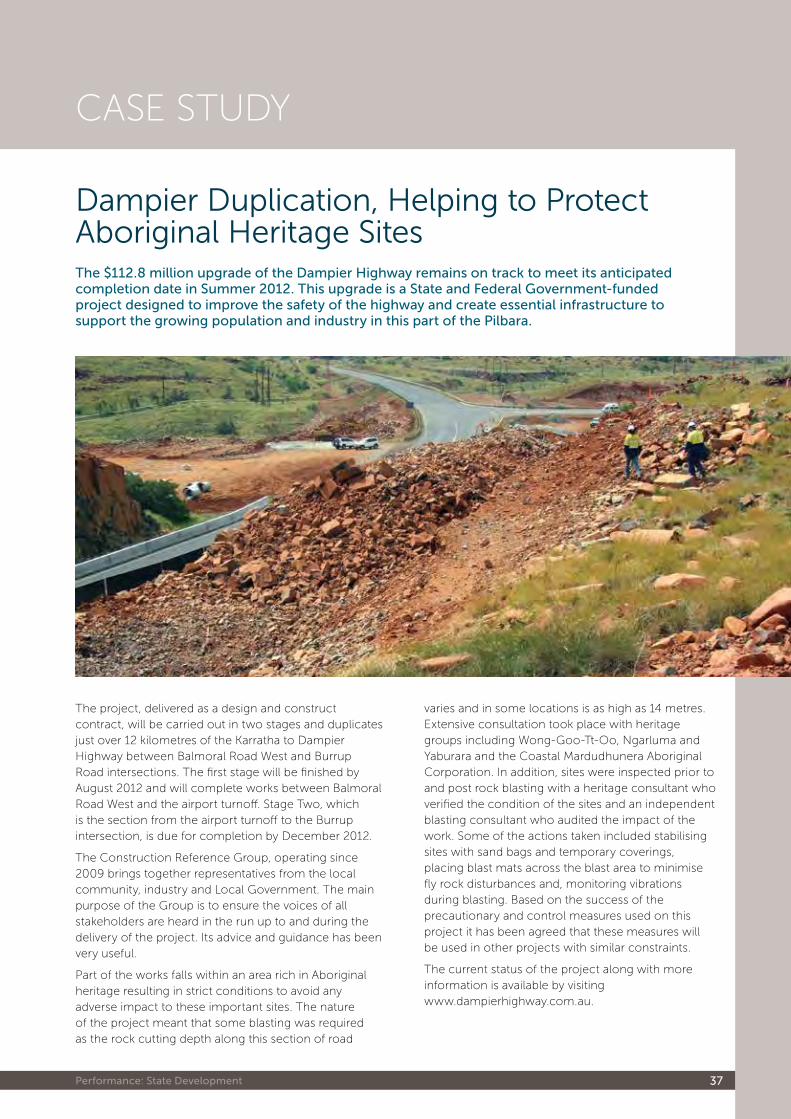
Dampier Duplication, Helping to Protect Aboriginal Heritage Sitesthe $112.8 million upgrade of the Dampier highway remains on track to meet its anticipated completion date in summer 2012. this upgrade is a state and Federal Government-funded project designed to improve the safety of the highway and create essential infrastructure to support the growing population and industry in this part of the Pilbara.
The project, delivered as a design and construct contract, will be carried out in two stages and duplicates just over 12 kilometres of the Karratha to Dampier Highway between Balmoral Road West and Burrup Road intersections. The first stage will be finished by August 2012 and will complete works between Balmoral Road West and the airport turnoff. Stage Two, which is the section from the airport turnoff to the Burrup intersection, is due for completion by December 2012.
The Construction Reference Group, operating since 2009 brings together representatives from the local community, industry and Local Government. The main purpose of the Group is to ensure the voices of all stakeholders are heard in the run up to and during the delivery of the project. Its advice and guidance has been very useful.
Part of the works falls within an area rich in Aboriginal heritage resulting in strict conditions to avoid any adverse impact to these important sites. The nature of the project meant that some blasting was required as the rock cutting depth along this section of road
varies and in some locations is as high as 14 metres. Extensive consultation took place with heritage groups including Wong-Goo-Tt-Oo, Ngarluma and Yaburara and the Coastal Mardudhunera Aboriginal Corporation. In addition, sites were inspected prior to and post rock blasting with a heritage consultant who verified the condition of the sites and an independent blasting consultant who audited the impact of the work. Some of the actions taken included stabilising sites with sand bags and temporary coverings, placing blast mats across the blast area to minimise fly rock disturbances and, monitoring vibrations during blasting. Based on the success of the precautionary and control measures used on this project it has been agreed that these measures will be used in other projects with similar constraints.
The current status of the project along with more information is available by visiting www.dampierhighway.com.au.
Main Roads Western Australia 2012 Annual Report38
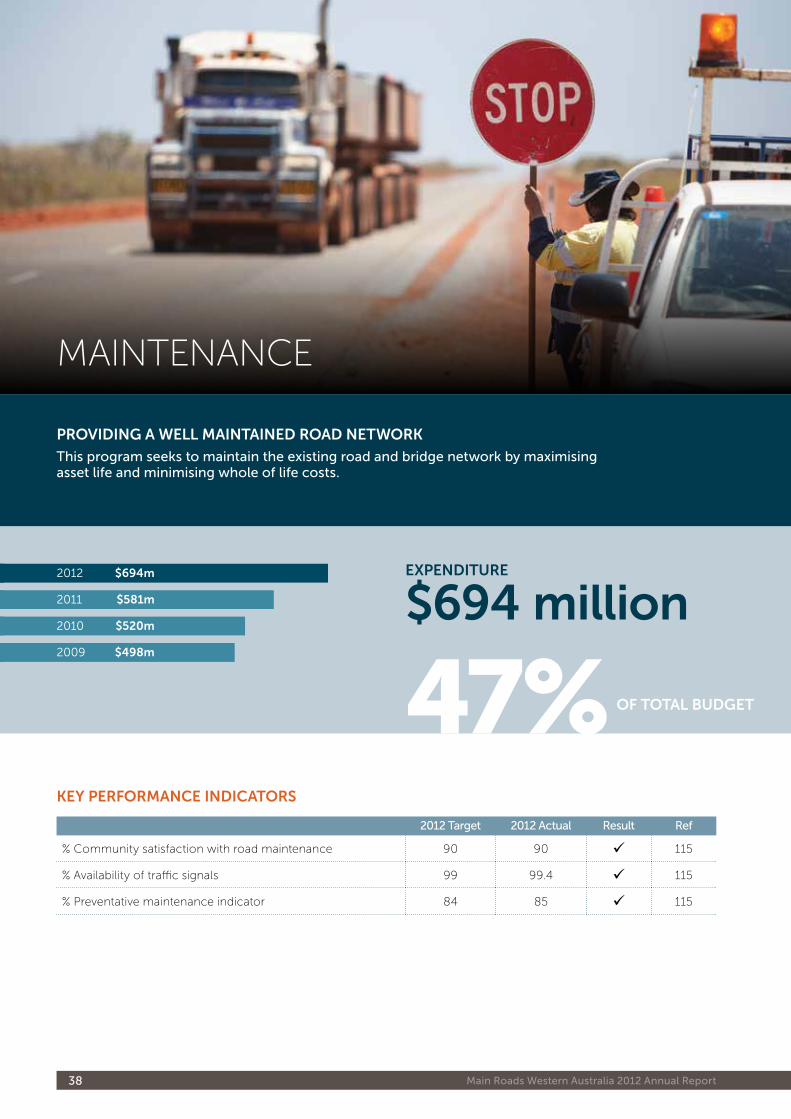
key peRfoRmanCe indiCatoRS
2012 target 2012 actual Result Ref
% Community satisfaction with road maintenance 90 90 115
% Availability of traffic signals 99 99.4 115
% Preventative maintenance indicator 84 85 115
pRoViding a Well maintained Road netWoRk
this program seeks to maintain the existing road and bridge network by maximising asset life and minimising whole of life costs.
MAINTENANCE
$694 million
47%
expendituRe2012
2011
$694m
$581m
2010
2009
$520m
$498m
of total Budget
Performance: Maintenance 39
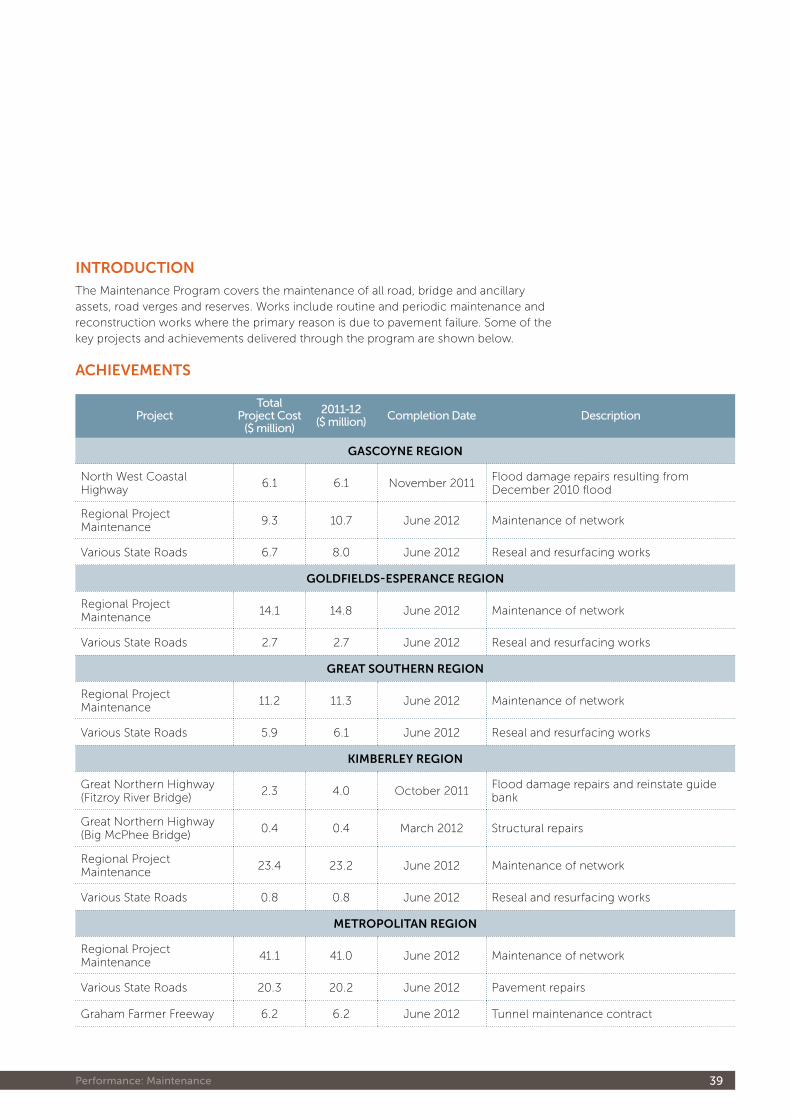
Projecttotal
Project Cost ($ million)
2011-12 ($ million) Completion Date Description
gaSCoyne Region
North West Coastal Highway
6.1 6.1 November 2011Flood damage repairs resulting from December 2010 flood
Regional Project Maintenance
9.3 10.7 June 2012 Maintenance of network
Various State Roads 6.7 8.0 June 2012 Reseal and resurfacing works
goldfieldS-eSpeRanCe Region
Regional Project Maintenance
14.1 14.8 June 2012 Maintenance of network
Various State Roads 2.7 2.7 June 2012 Reseal and resurfacing works
gReat SoutHeRn Region
Regional Project Maintenance
11.2 11.3 June 2012 Maintenance of network
Various State Roads 5.9 6.1 June 2012 Reseal and resurfacing works
kimBeRley Region
Great Northern Highway (Fitzroy River Bridge)
2.3 4.0 October 2011Flood damage repairs and reinstate guide bank
Great Northern Highway (Big McPhee Bridge)
0.4 0.4 March 2012 Structural repairs
Regional Project Maintenance
23.4 23.2 June 2012 Maintenance of network
Various State Roads 0.8 0.8 June 2012 Reseal and resurfacing works
metRopolitan Region
Regional Project Maintenance
41.1 41.0 June 2012 Maintenance of network
Various State Roads 20.3 20.2 June 2012 Pavement repairs
Graham Farmer Freeway 6.2 6.2 June 2012 Tunnel maintenance contract
$694 million
intRoduCtion
The Maintenance Program covers the maintenance of all road, bridge and ancillary assets, road verges and reserves. Works include routine and periodic maintenance and reconstruction works where the primary reason is due to pavement failure. Some of the key projects and achievements delivered through the program are shown below.
aCHieVementS
Main Roads Western Australia 2012 Annual Report40
Projecttotal
Project Cost ($ million)
2011-12 ($ million) Completion Date Description
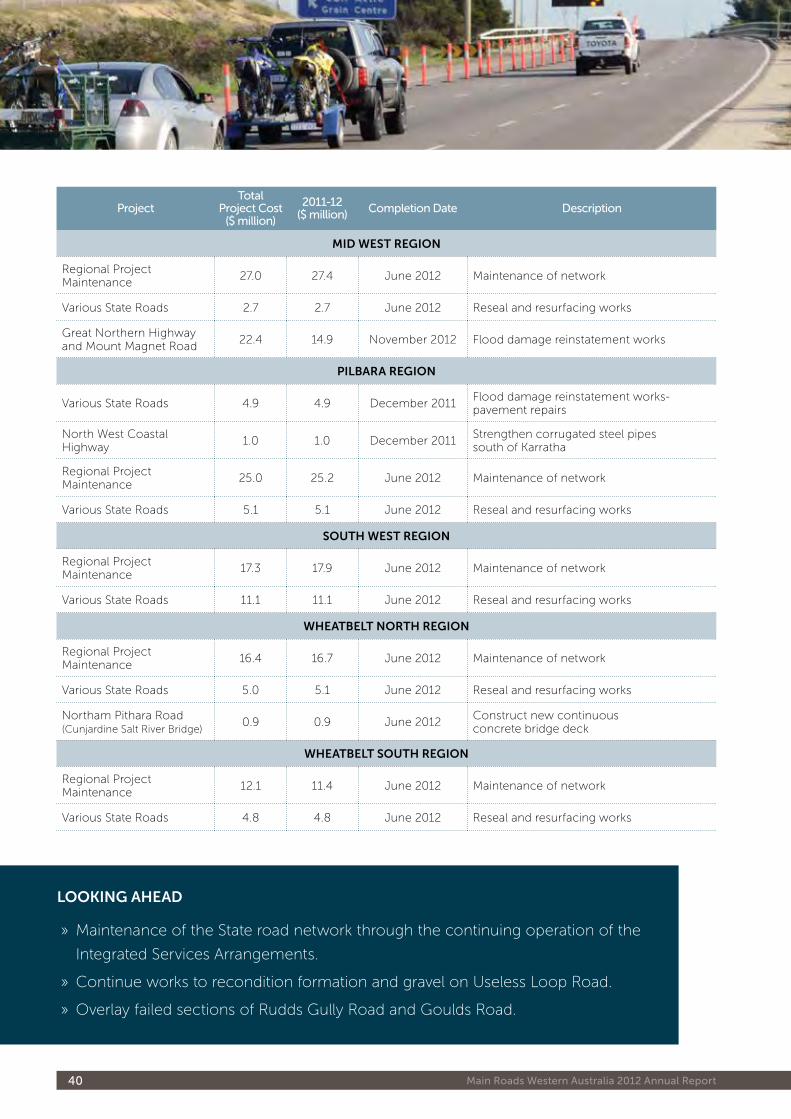
mid WeSt Region
Regional Project Maintenance
27.0 27.4 June 2012 Maintenance of network
Various State Roads 2.7 2.7 June 2012 Reseal and resurfacing works
Great Northern Highway and Mount Magnet Road
22.4 14.9 November 2012 Flood damage reinstatement works
pilBaRa Region
Various State Roads 4.9 4.9 December 2011Flood damage reinstatement works-pavement repairs
North West Coastal Highway
1.0 1.0 December 2011Strengthen corrugated steel pipes south of Karratha
Regional Project Maintenance
25.0 25.2 June 2012 Maintenance of network
Various State Roads 5.1 5.1 June 2012 Reseal and resurfacing works
SoutH WeSt Region
Regional Project Maintenance
17.3 17.9 June 2012 Maintenance of network
Various State Roads 11.1 11.1 June 2012 Reseal and resurfacing works
WHeatBelt noRtH Region
Regional Project Maintenance
16.4 16.7 June 2012 Maintenance of network
Various State Roads 5.0 5.1 June 2012 Reseal and resurfacing works
Northam Pithara Road (Cunjardine Salt River Bridge)
0.9 0.9 June 2012Construct new continuous concrete bridge deck
WHeatBelt SoutH Region
Regional Project Maintenance
12.1 11.4 June 2012 Maintenance of network
Various State Roads 4.8 4.8 June 2012 Reseal and resurfacing works
looking aHead
» Maintenance of the State road network through the continuing operation of the
Integrated Services Arrangements.
» Continue works to recondition formation and gravel on Useless Loop Road.
» Overlay failed sections of Rudds Gully Road and Goulds Road.
Performance: Maintenance 41
Case study
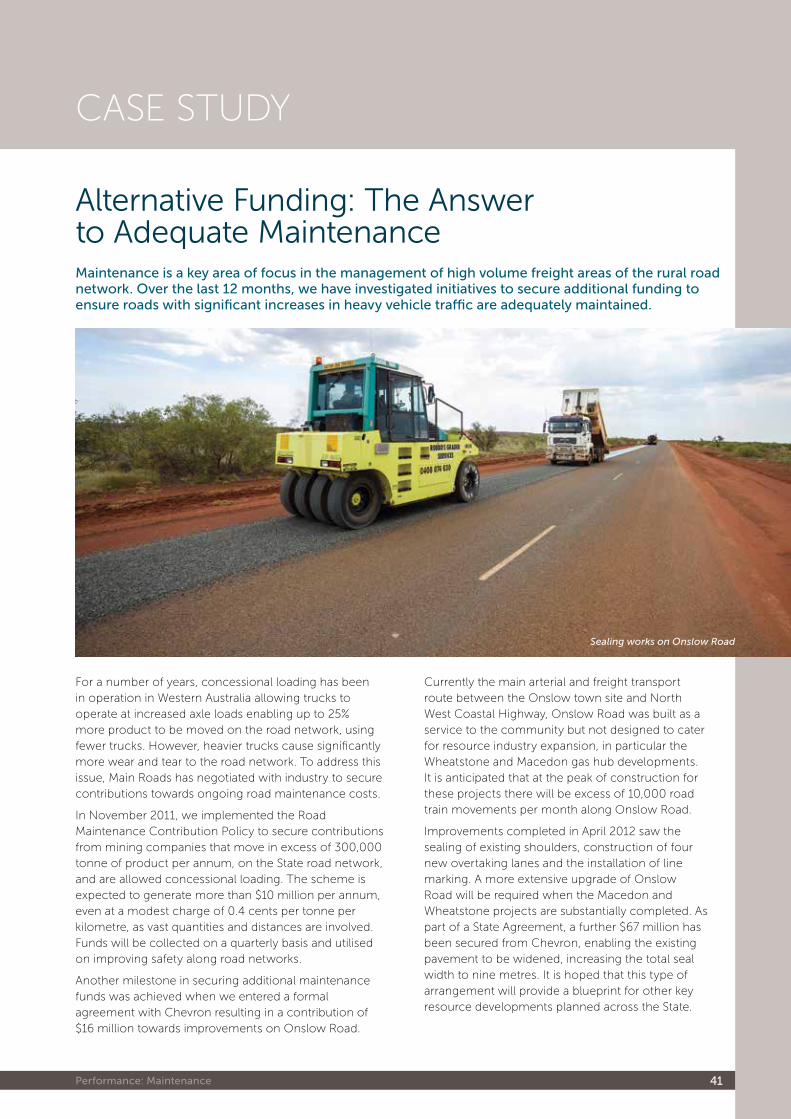
Alternative Funding: The Answer to Adequate MaintenanceMaintenance is a key area of focus in the management of high volume freight areas of the rural road network. over the last 12 months, we have investigated initiatives to secure additional funding to ensure roads with significant increases in heavy vehicle traffic are adequately maintained.
For a number of years, concessional loading has been in operation in Western Australia allowing trucks to operate at increased axle loads enabling up to 25% more product to be moved on the road network, using fewer trucks. However, heavier trucks cause significantly more wear and tear to the road network. To address this issue, Main Roads has negotiated with industry to secure contributions towards ongoing road maintenance costs.
In November 2011, we implemented the Road Maintenance Contribution Policy to secure contributions from mining companies that move in excess of 300,000 tonne of product per annum, on the State road network, and are allowed concessional loading. The scheme is expected to generate more than $10 million per annum, even at a modest charge of 0.4 cents per tonne per kilometre, as vast quantities and distances are involved. Funds will be collected on a quarterly basis and utilised on improving safety along road networks.
Another milestone in securing additional maintenance funds was achieved when we entered a formal agreement with Chevron resulting in a contribution of $16 million towards improvements on Onslow Road.
Sealing works on Onslow Road
Currently the main arterial and freight transport route between the Onslow town site and North West Coastal Highway, Onslow Road was built as a service to the community but not designed to cater for resource industry expansion, in particular the Wheatstone and Macedon gas hub developments. It is anticipated that at the peak of construction for these projects there will be excess of 10,000 road train movements per month along Onslow Road.
Improvements completed in April 2012 saw the sealing of existing shoulders, construction of four new overtaking lanes and the installation of line marking. A more extensive upgrade of Onslow Road will be required when the Macedon and Wheatstone projects are substantially completed. As part of a State Agreement, a further $67 million has been secured from Chevron, enabling the existing pavement to be widened, increasing the total seal width to nine metres. It is hoped that this type of arrangement will provide a blueprint for other key resource developments planned across the State.
Main Roads Western Australia 2012 Annual Report42
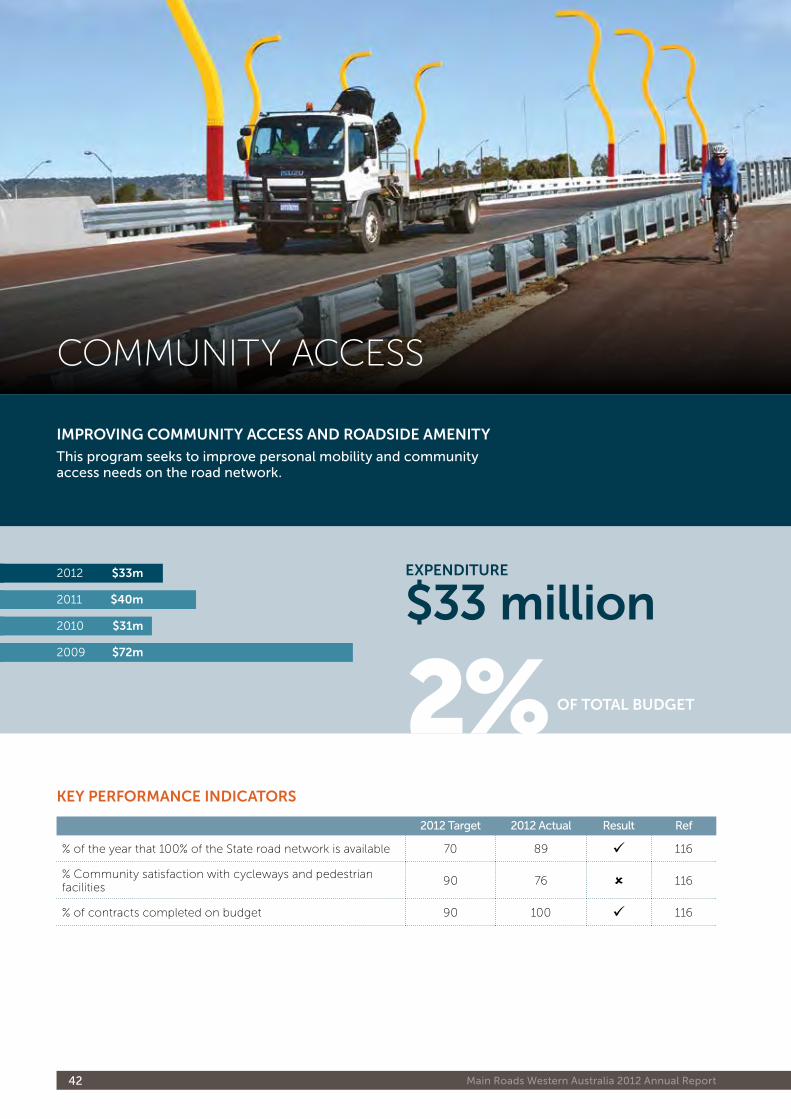
key peRfoRmanCe indiCatoRS
2012 target 2012 actual Result Ref
% of the year that 100% of the State road network is available 70 89 116
% Community satisfaction with cycleways and pedestrian facilities
90 76 116
% of contracts completed on budget 90 100 116
impRoVing Community aCCeSS and RoadSide amenity
this program seeks to improve personal mobility and community access needs on the road network.
COMMUNITY ACCESS
$33 million
2%
expendituRe
Image caption
2012
2011
$33m
$40m
2010
2009
$31m
$72m
of total Budget
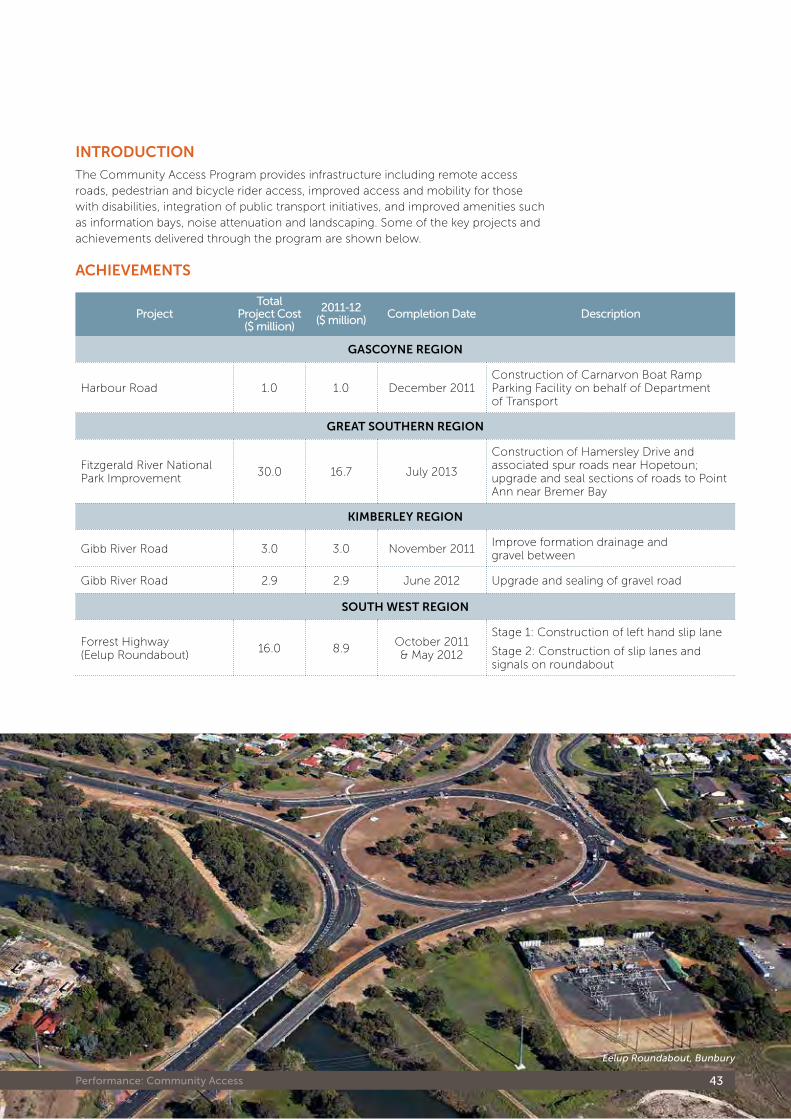
Performance: Community access 43
Projecttotal
Project Cost ($ million)
2011-12 ($ million) Completion Date Description
gaSCoyne Region
Harbour Road 1.0 1.0 December 2011Construction of Carnarvon Boat Ramp Parking Facility on behalf of Department of Transport
gReat SoutHeRn Region
Fitzgerald River National Park Improvement
30.0 16.7 July 2013
Construction of Hamersley Drive and associated spur roads near Hopetoun; upgrade and seal sections of roads to Point Ann near Bremer Bay
kimBeRley Region
Gibb River Road 3.0 3.0 November 2011Improve formation drainage and gravel between
Gibb River Road 2.9 2.9 June 2012 Upgrade and sealing of gravel road
SoutH WeSt Region
Forrest Highway (Eelup Roundabout)
16.0 8.9October 2011 & May 2012
Stage 1: Construction of left hand slip lane
Stage 2: Construction of slip lanes and signals on roundabout
$33 million
intRoduCtion
The Community Access Program provides infrastructure including remote access roads, pedestrian and bicycle rider access, improved access and mobility for those with disabilities, integration of public transport initiatives, and improved amenities such as information bays, noise attenuation and landscaping. Some of the key projects and achievements delivered through the program are shown below.
aCHieVementS
Eelup Roundabout, Bunbury
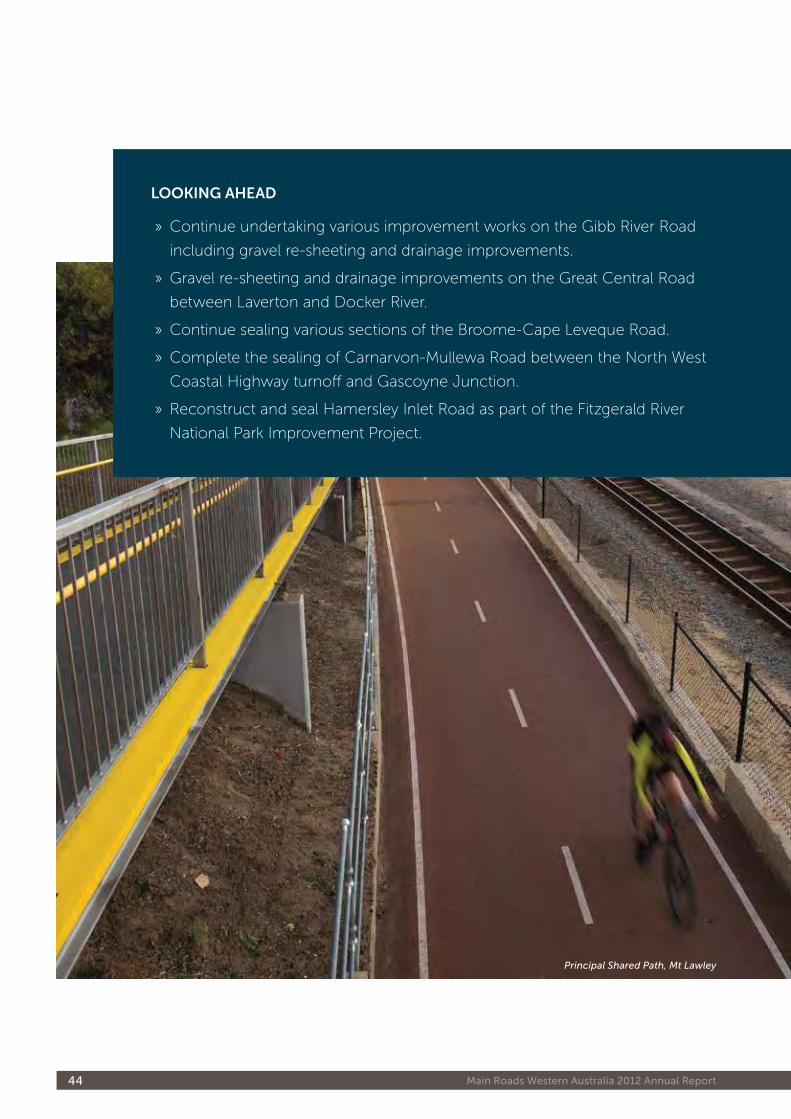
Main Roads Western Australia 2012 Annual Report44
looking aHead
» Continue undertaking various improvement works on the Gibb River Road
including gravel re-sheeting and drainage improvements.
» Gravel re-sheeting and drainage improvements on the Great Central Road
between Laverton and Docker River.
» Continue sealing various sections of the Broome-Cape Leveque Road.
» Complete the sealing of Carnarvon-Mullewa Road between the North West
Coastal Highway turnoff and Gascoyne Junction.
» Reconstruct and seal Hamersley Inlet Road as part of the Fitzgerald River
National Park Improvement Project.
Principal Shared Path, Mt Lawley
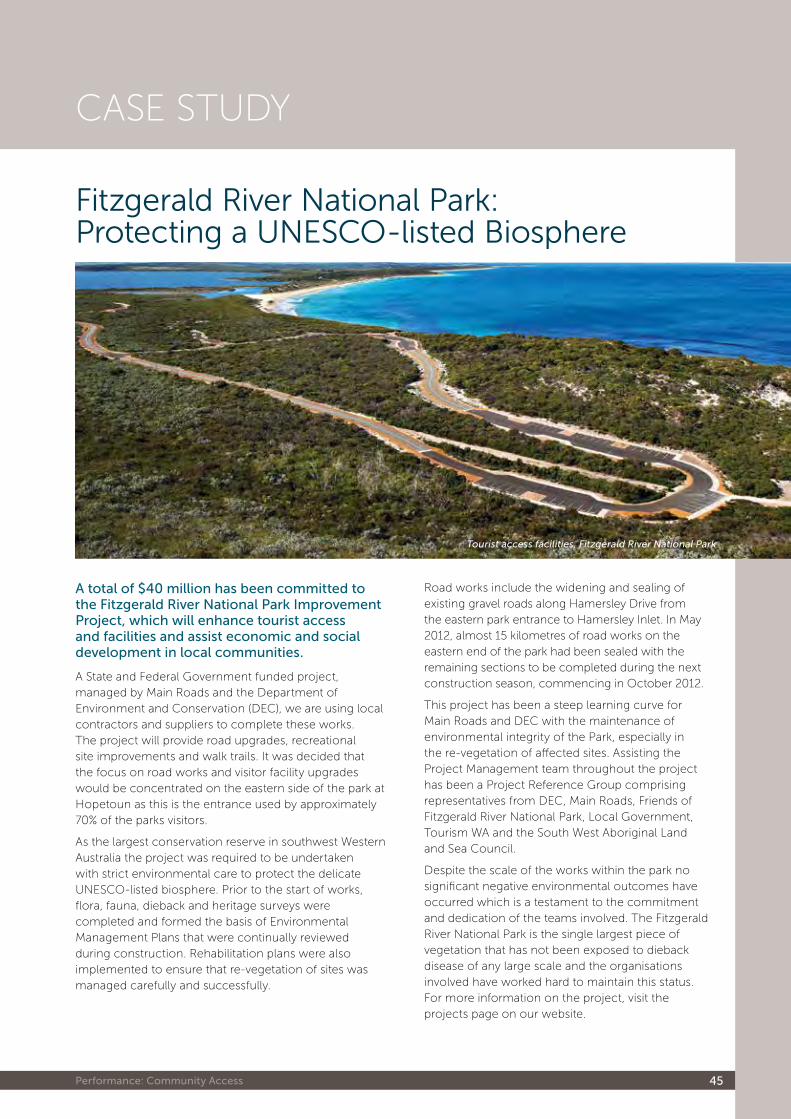
Performance: Community access 45
Case study
Fitzgerald River National Park: Protecting a UNESCO-listed Biosphere
a total of $40 million has been committed to the Fitzgerald River national Park improvement Project, which will enhance tourist access and facilities and assist economic and social development in local communities.
A State and Federal Government funded project, managed by Main Roads and the Department of Environment and Conservation (DEC), we are using local contractors and suppliers to complete these works. The project will provide road upgrades, recreational site improvements and walk trails. It was decided that the focus on road works and visitor facility upgrades would be concentrated on the eastern side of the park at Hopetoun as this is the entrance used by approximately 70% of the parks visitors.
As the largest conservation reserve in southwest Western Australia the project was required to be undertaken with strict environmental care to protect the delicate UNESCO-listed biosphere. Prior to the start of works, flora, fauna, dieback and heritage surveys were completed and formed the basis of Environmental Management Plans that were continually reviewed during construction. Rehabilitation plans were also implemented to ensure that re-vegetation of sites was managed carefully and successfully.
Road works include the widening and sealing of existing gravel roads along Hamersley Drive from the eastern park entrance to Hamersley Inlet. In May 2012, almost 15 kilometres of road works on the eastern end of the park had been sealed with the remaining sections to be completed during the next construction season, commencing in October 2012.
This project has been a steep learning curve for Main Roads and DEC with the maintenance of environmental integrity of the Park, especially in the re-vegetation of affected sites. Assisting the Project Management team throughout the project has been a Project Reference Group comprising representatives from DEC, Main Roads, Friends of Fitzgerald River National Park, Local Government, Tourism WA and the South West Aboriginal Land and Sea Council.
Despite the scale of the works within the park no significant negative environmental outcomes have occurred which is a testament to the commitment and dedication of the teams involved. The Fitzgerald River National Park is the single largest piece of vegetation that has not been exposed to dieback disease of any large scale and the organisations involved have worked hard to maintain this status. For more information on the project, visit the projects page on our website.
Tourist access facilities, Fitzgerald River National Park
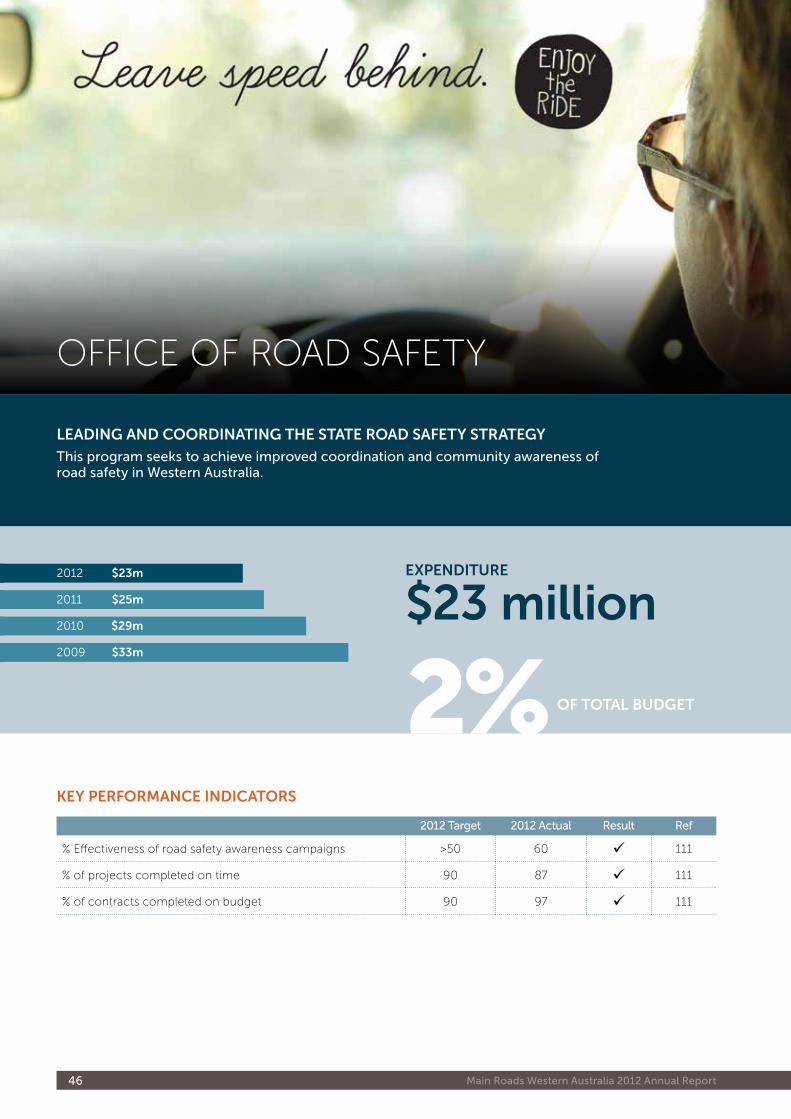
Main Roads Western Australia 2012 Annual Report46
key peRfoRmanCe indiCatoRS
2012 target 2012 actual Result Ref
% Effectiveness of road safety awareness campaigns >50 60 111
% of projects completed on time 90 87 111
% of contracts completed on budget 90 97 111
leading and CooRdinating tHe State Road Safety StRategy
this program seeks to achieve improved coordination and community awareness of road safety in Western australia.
OFFICE OF ROAD SAFETY
$23 million
2%
expendituRe2012
2011
$23m
$25m
2010
2009
$29m
$33m
of total Budget
Performance: office of Road safety 47
intRoduCtion
This program is unique within the Main Roads’ program structure and represents the activities of a single business unit. This program represents the Office of Road Safety which is the lead organisation for road safety in Western Australia and has responsibility for developing, coordinating, promoting and monitoring the State’s road safety strategy, Towards Zero. We provide road safety policy, research, evaluation and community education. As the administrative body for the Road Safety Council (RSC) and Government, we are responsible for administering the Road Trauma Trust Account (RTTA) for road safety programs which from 1 July 2012 will receive 100% of the speed and red light camera fines revenue. Funds are provided to agencies and organisations to implement priority safety projects consistent with the Government’s Towards Zero strategy. The Office monitors and reports on the implementation and the results being achieved. Together with the RSC, we promote the shared responsibility of road safety with the main objective of significantly reducing road trauma on our roads.
towards zero
Towards Zero is the State’s Road Safety Strategy. The underlying philosophy of the strategy means we do not accept that any human being should die or be seriously injured on our roads. Realistically, we understand it is not practical to achieve zero fatalities on our roads by the year 2020, but we do not accept any death or serious injury as inevitable. Using a Safe System approach, Towards Zero advocates for safe drivers in safe vehicles, travelling at safe speeds on safe roads. If all cornerstones of the Towards Zero strategy are fully implemented, we have the potential to save 11,000 people from being killed or seriously injured between 2008 and 2020. That is a reduction of around 40% on present day levels. There is also a potential cost saving to the community of up to $2.4 billion. For more information visit our website at www.ors.wa.gov.au/
Road Safety Council
The Road Safety Council is independently chaired by Professor D’Arcy Holman and includes representatives from the Departments of Transport, Planning, Education, Health, Main Roads, Western Australian Local Government Association, Office of Road Safety, Insurance Commission of Western Australia, Western Australia Police and the Royal Automobile Club of Western Australia, representing the State’s road users. The Council identifies measures to improve road safety; identifies and recommends measures to reduce deaths and injuries resulting from road crashes; evaluates and monitors the effectiveness of these measures; and makes recommendations to Government to improve the safety of the State’s roads.
$23 million
ReCognition
2011 premier’s award » Joint Winner in ‘Improving Government Category’ – Online Crash Reporting Facility
2011 Campaign Brief Wa awards » Advertiser of the Year Award – Office of Road Safety » Best of Year ‘Television Advertisement’ – Enjoy the Ride
2011 adnews national awards » Ad Campaign of the Year – Enjoy the Ride
2011 perth advertising and design awards » Gold ‘Best of Show’ – Enjoy the Ride » Gold ‘TV and Cinema Social Marketing/Charity’ – Enjoy the Ride » Gold ‘Newspaper and Magazine Social Marketing and Charity’ – Behind Closed Doors/ Driver Distraction » Eight further awards for Radio, TV and online – Enjoy the Ride
aWaRd awards » Best of Year Radio for Advertisement and Campaign – Interrupted » Four Bronze awards for TVC, Website, Digital Campaign and Viral film – Enjoy the Ride
Main Roads Western Australia 2012 Annual Report48
aCHieVementS
leading Business planning and projects to Reduce Road trauma in Wa
We have led the most significant change to road safety budgeting and strategy in WA in partnership with other Road Safety Council agencies, to gain approved funding for projects in five priority areas that address major crash types on our roads. Additional funds from the 100% allocation of speed and red light camera fines to the RTTA will ensure achievement of maximum effective road safety benefits.
On behalf of the Council and Government, we have led the development of a results focused performance monitoring framework improving road safety by identifying major projects, preparing business cases for consideration and funding, encouraging government to maximise the effective use of additional funds into the RTTA to reduce road trauma.
Hosting the australasian Road Safety, policing and education Conference
We hosted the Australasian Road Safety Research, Policy and Education Conference in November 2011 at the Perth Convention Centre. With over 100 concurrent presentations and six interactive workshops covering the safe system, research engineering and education, the conference theme was ‘Driving Research, Policy and Action towards Zero Deaths and Serious Injuries’.
Aimed at deliberately addressing the crucial process of setting bold and ambitious targets and turning knowledge into action to reduce road trauma, former Minister for Road Safety, Police and Emergency Services, Rob Johnson MLA, outlined his commitment to WA’s road safety in his opening speech.
The conference featured three keynote speakers: psychologist, social researcher and novelist, Hugh Mackay, Superintendent Paula Rose from New Zealand Police and Dharmesh Shah from the Traffic and Public Transport Authority, City of Gothenburg, Sweden.
Road Safety Council extranet
Developed in house to help manage the administration and business activities of the RSC, the extranet was a prime example of leading organisational and online communication skills. Members can now download current papers and search for historic papers through a custom built, secure and functional extranet.
Research programs
On behalf of the Road Safety Council, we reviewed and funded the following research:
novice Driver Research and Recommendations
An independent study by the Curtin-Monash Accident Research Centre (C-MARC) in collaboration with the Centre for Automotive Safety Research of the University of Adelaide, found that a power to weight ratio restriction had little road safety benefit. As a result, the State Government accepted the recommendation to not introduce power to weight ratio restrictions for novice or young drivers.
The Government is considering other recommendations from the RSC that will be more effective in further enhancing the safety of novice drivers.
Management of the Road safety Council Research Program
We fund road safety research to understand the causes of road trauma, identify new and evaluate existing safety measures, and research ways to prevent road trauma. Since 2009, C-MARC developed programs of work in response to identified RSC needs. During the year, the Research Program produced the following reports:
» designing Safer Roads to accommodate driver error – assisted in identifying and prioritising road design counter measures to improve safety at metropolitan intersections.
» an enhanced Road Safety information System for Wa – outlined a framework for a proposed information system, facilitating the systematic monitoring, reporting and management of road safety performance for WA.
» identifying measures to promote Benefits of Safer Speeds – provided consideration for measures designed to promote greater acceptance of safer speeds for WA.
» the Relationship Between Vehicle performance and novice driver Crash involvement – provided contemporary recommendations regarding proposed vehicle restrictions for novice drivers in WA.
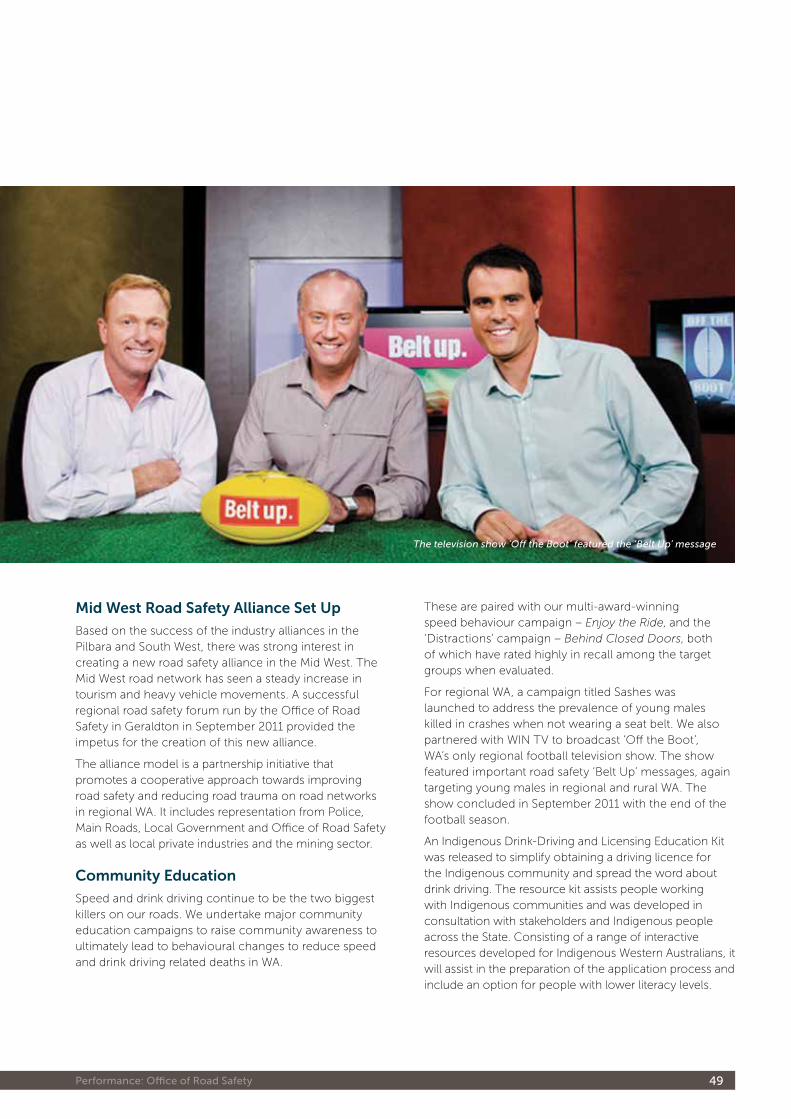
Performance: office of Road safety 49
mid West Road Safety alliance Set up
Based on the success of the industry alliances in the Pilbara and South West, there was strong interest in creating a new road safety alliance in the Mid West. The Mid West road network has seen a steady increase in tourism and heavy vehicle movements. A successful regional road safety forum run by the Office of Road Safety in Geraldton in September 2011 provided the impetus for the creation of this new alliance.
The alliance model is a partnership initiative that promotes a cooperative approach towards improving road safety and reducing road trauma on road networks in regional WA. It includes representation from Police, Main Roads, Local Government and Office of Road Safety as well as local private industries and the mining sector.
Community education
Speed and drink driving continue to be the two biggest killers on our roads. We undertake major community education campaigns to raise community awareness to ultimately lead to behavioural changes to reduce speed and drink driving related deaths in WA.
These are paired with our multi-award-winning speed behaviour campaign – Enjoy the Ride, and the ‘Distractions’ campaign – Behind Closed Doors, both of which have rated highly in recall among the target groups when evaluated.
For regional WA, a campaign titled Sashes was launched to address the prevalence of young males killed in crashes when not wearing a seat belt. We also partnered with WIN TV to broadcast ‘Off the Boot’, WA’s only regional football television show. The show featured important road safety ‘Belt Up’ messages, again targeting young males in regional and rural WA. The show concluded in September 2011 with the end of the football season.
An Indigenous Drink-Driving and Licensing Education Kit was released to simplify obtaining a driving licence for the Indigenous community and spread the word about drink driving. The resource kit assists people working with Indigenous communities and was developed in consultation with stakeholders and Indigenous people across the State. Consisting of a range of interactive resources developed for Indigenous Western Australians, it will assist in the preparation of the application process and include an option for people with lower literacy levels.
The television show ‘Off the Boot’ featured the ‘Belt Up’ message
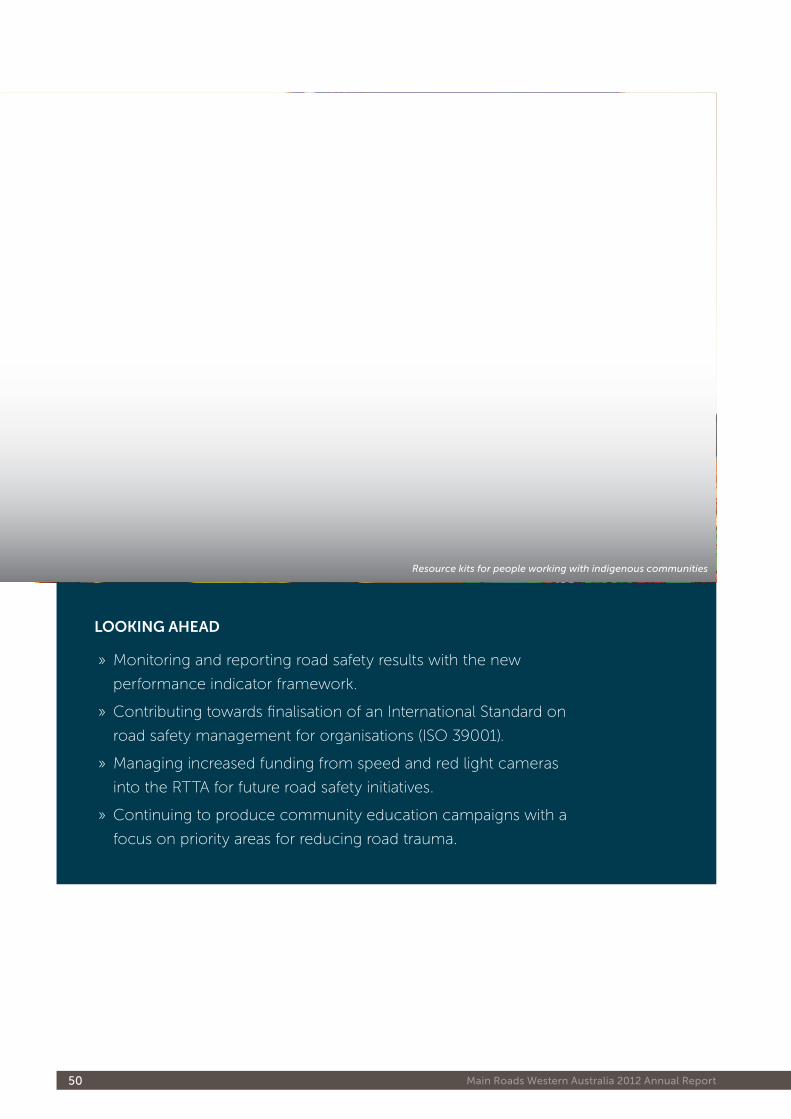
Main Roads Western Australia 2012 Annual Report50
looking aHead
» Monitoring and reporting road safety results with the new
performance indicator framework.
» Contributing towards finalisation of an International Standard on
road safety management for organisations (ISO 39001).
» Managing increased funding from speed and red light cameras
into the RTTA for future road safety initiatives.
» Continuing to produce community education campaigns with a
focus on priority areas for reducing road trauma.
Resource kits for people working with indigenous communities
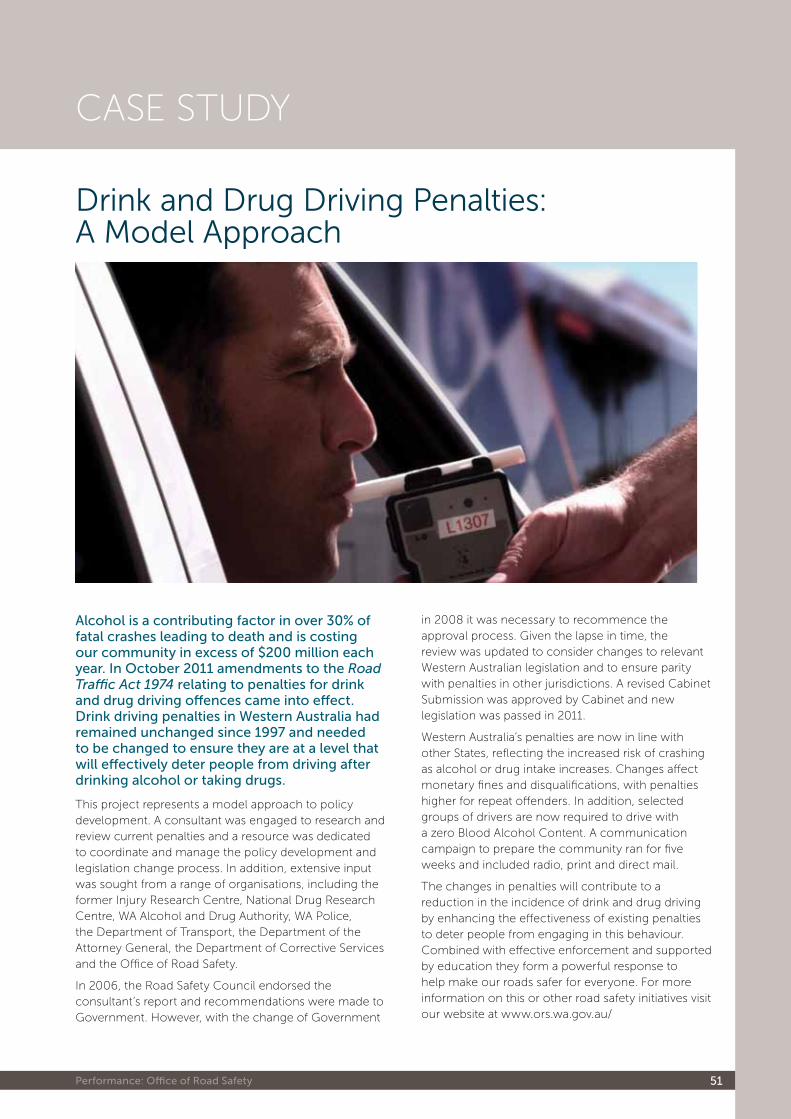
Performance: office of Road safety 51
Case study
Drink and Drug Driving Penalties: A Model Approach
alcohol is a contributing factor in over 30% of fatal crashes leading to death and is costing our community in excess of $200 million each year. in october 2011 amendments to the Road Traffic Act 1974 relating to penalties for drink and drug driving offences came into effect. Drink driving penalties in Western australia had remained unchanged since 1997 and needed to be changed to ensure they are at a level that will effectively deter people from driving after drinking alcohol or taking drugs.
This project represents a model approach to policy development. A consultant was engaged to research and review current penalties and a resource was dedicated to coordinate and manage the policy development and legislation change process. In addition, extensive input was sought from a range of organisations, including the former Injury Research Centre, National Drug Research Centre, WA Alcohol and Drug Authority, WA Police, the Department of Transport, the Department of the Attorney General, the Department of Corrective Services and the Office of Road Safety.
In 2006, the Road Safety Council endorsed the consultant’s report and recommendations were made to Government. However, with the change of Government
in 2008 it was necessary to recommence the approval process. Given the lapse in time, the review was updated to consider changes to relevant Western Australian legislation and to ensure parity with penalties in other jurisdictions. A revised Cabinet Submission was approved by Cabinet and new legislation was passed in 2011.
Western Australia’s penalties are now in line with other States, reflecting the increased risk of crashing as alcohol or drug intake increases. Changes affect monetary fines and disqualifications, with penalties higher for repeat offenders. In addition, selected groups of drivers are now required to drive with a zero Blood Alcohol Content. A communication campaign to prepare the community ran for five weeks and included radio, print and direct mail.
The changes in penalties will contribute to a reduction in the incidence of drink and drug driving by enhancing the effectiveness of existing penalties to deter people from engaging in this behaviour. Combined with effective enforcement and supported by education they form a powerful response to help make our roads safer for everyone. For more information on this or other road safety initiatives visit our website at www.ors.wa.gov.au/
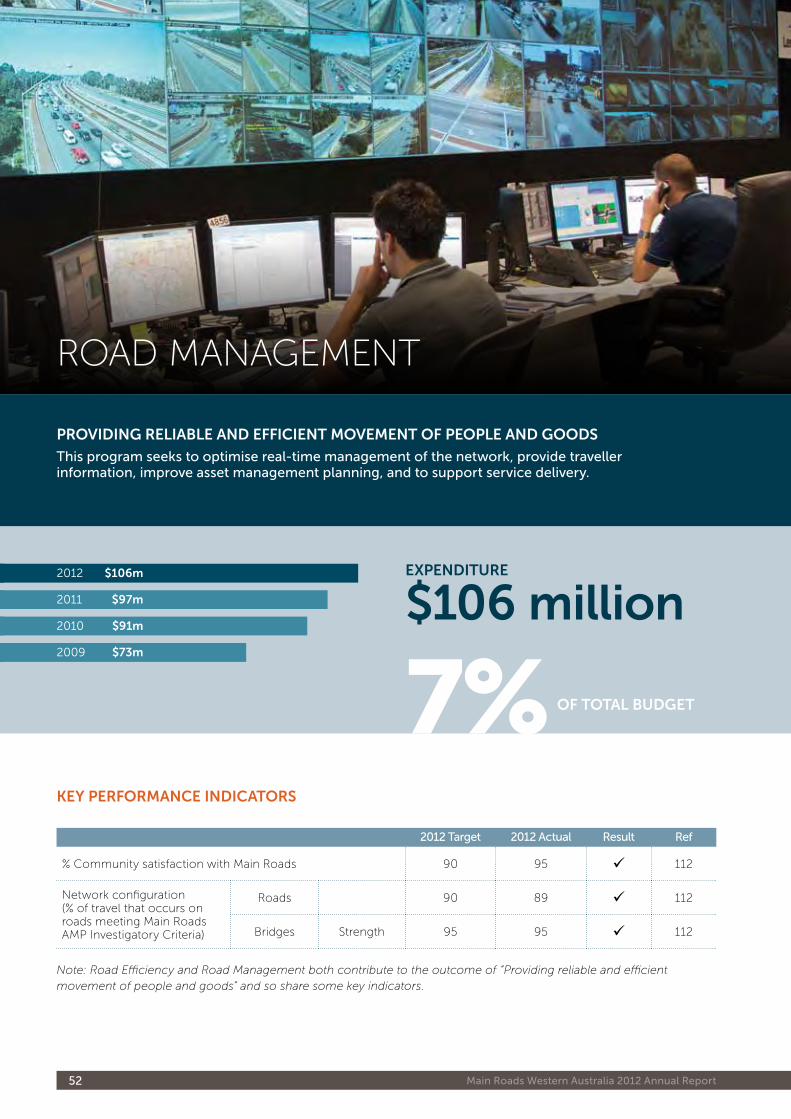
Main Roads Western Australia 2012 Annual Report52
key peRfoRmanCe indiCatoRS
2012 target 2012 actual Result Ref
% Community satisfaction with Main Roads 90 95 112
Network configuration (% of travel that occurs on roads meeting Main Roads AMP Investigatory Criteria)
Roads 90 89 112
Bridges Strength 95 95 112
Note: Road Efficiency and Road Management both contribute to the outcome of “Providing reliable and efficient movement of people and goods” and so share some key indicators.
pRoViding ReliaBle and effiCient moVement of people and goodS
this program seeks to optimise real-time management of the network, provide traveller information, improve asset management planning, and to support service delivery.
ROAD MANAGEMENT
$106 million
7%
expendituRe2012
2011
$106m
$97m
2010
2009
$91m
$73m
of total Budget
Performance: Road Management 53
$106 million
tRaffiC opeRationS and SeRViCeS aCHieVementS
intelligent transport Systems – enhancing perth’s freeways
We have continued to roll-out Intelligent Transport Systems (ITS) aimed at providing new opportunities to manage congestion and reduce road crashes and the environmental impacts of transport. The continued deployment of foundation Intelligent Transport Systems will enable real-time traffic monitoring, incident management, traveller information and congestion management on Perth’s freeways. Some of the foundation ITS, delivered through the Efficiency Program, and other initiatives implemented over the past year include:
» 12 additional CCTV Cameras installed, providing real time vision of the road network and assisting with Incident Response Management
» 24 Web Cameras installed on Freeways to allow the public to view traffic conditions online
» Roe Highway ITS expansion: 16 kilometres of fibre optic cable added from Orrong Road to Great Northern Highway
» Tonkin Highway ITS expansion: 4.5 kilometres of conduit and pits installed to cater for fibre optic cable along Reid Highway to Great Eastern Highway.
Road Safety SuppoRt SeRViCeS aCHieVementS
All details of our Road Safety policy and guidelines, along with a range of safety tools and information that may be of use to practitioners and the community, are available on our website. Below is an update to some of our initiatives this year:
Road Safety Strategy 2011-15
‘To eliminate death and serious injury crashes on the Western Australian road network.’ This is the vision of Main Roads Road Safety Strategy – The Road Toward Zero, which embeds the ‘Safe System’ approach across the organisation and road sector. The Road Safety Strategy and its principles have been disseminated as part of the annual regional training/workshops on Road Safety Auditing, Crash Investigation and Traffic Management.
fatal Crash investigations
A total of 135 preliminary fatal crash investigations were undertaken over the past year. In addition, 44 comprehensive full reports have been completed in circumstances where the road may have contributed to the crash. The road improvements identified during the assessments are collated into a Corrective Action Report and sent to the relevant Asset Managers for their action.
Crash analysis Reporting System
The ‘Crash Analysis Reporting System’ (CARS) is a new web based application for the analysis of crash data and Benefit Cost Ratio (BCR) calculations. The program which has replaced the old ‘CRASHtool’ system was launched in conjunction with the new ‘Web Reporting Centre’ earlier this year, and training is currently being held at regional forums for Main Roads staff, Local Government and contractors, across the state.
intRoduCtion
The Road Management Program covers activities associated with the management and operations of the road network including providing technical advice about the road network that cannot be allocated to a specific road project. It includes achievements of the State’s Traffic Operations Centre, Road Safety Support, Heavy Vehicle Operations and Planning and Technical Services. Some of the key projects and research activities delivered through the program are outlined below.
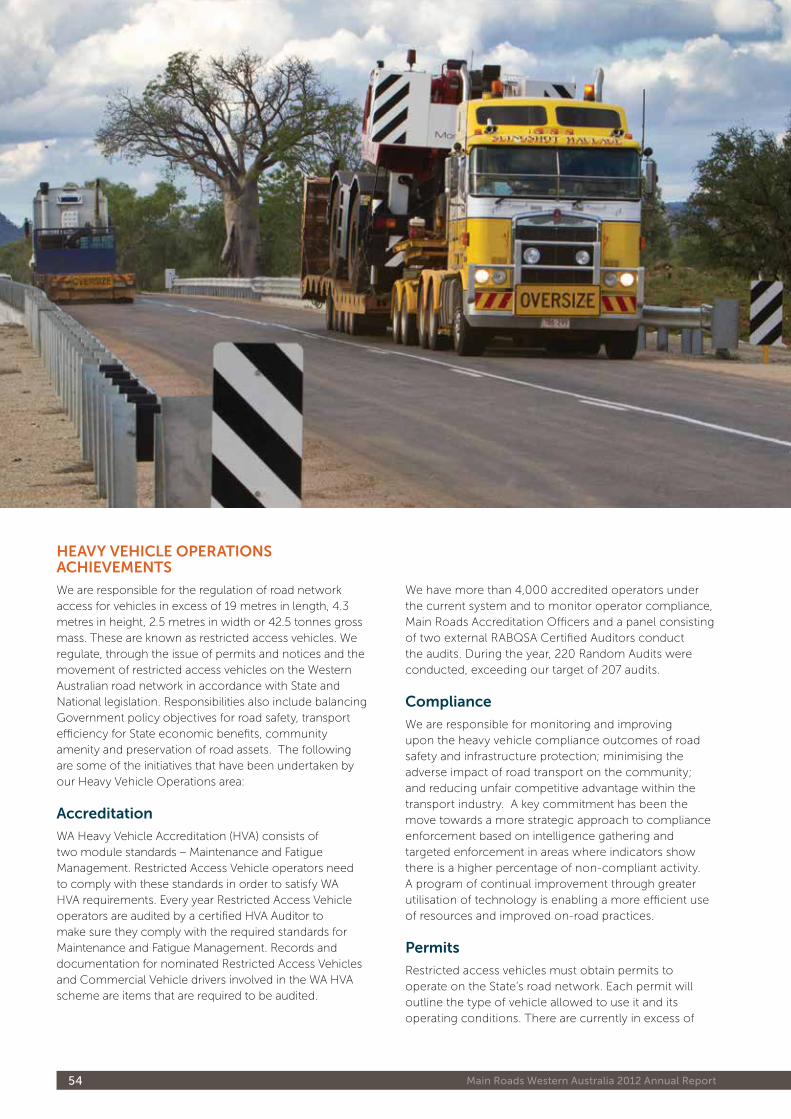
Main Roads Western Australia 2012 Annual Report54
HeaVy VeHiCle opeRationS aCHieVementS
We are responsible for the regulation of road network access for vehicles in excess of 19 metres in length, 4.3 metres in height, 2.5 metres in width or 42.5 tonnes gross mass. These are known as restricted access vehicles. We regulate, through the issue of permits and notices and the movement of restricted access vehicles on the Western Australian road network in accordance with State and National legislation. Responsibilities also include balancing Government policy objectives for road safety, transport efficiency for State economic benefits, community amenity and preservation of road assets. The following are some of the initiatives that have been undertaken by our Heavy Vehicle Operations area:
accreditation
WA Heavy Vehicle Accreditation (HVA) consists of two module standards – Maintenance and Fatigue Management. Restricted Access Vehicle operators need to comply with these standards in order to satisfy WA HVA requirements. Every year Restricted Access Vehicle operators are audited by a certified HVA Auditor to make sure they comply with the required standards for Maintenance and Fatigue Management. Records and documentation for nominated Restricted Access Vehicles and Commercial Vehicle drivers involved in the WA HVA scheme are items that are required to be audited.
We have more than 4,000 accredited operators under the current system and to monitor operator compliance, Main Roads Accreditation Officers and a panel consisting of two external RABQSA Certified Auditors conduct the audits. During the year, 220 Random Audits were conducted, exceeding our target of 207 audits.
Compliance
We are responsible for monitoring and improving upon the heavy vehicle compliance outcomes of road safety and infrastructure protection; minimising the adverse impact of road transport on the community; and reducing unfair competitive advantage within the transport industry. A key commitment has been the move towards a more strategic approach to compliance enforcement based on intelligence gathering and targeted enforcement in areas where indicators show there is a higher percentage of non-compliant activity. A program of continual improvement through greater utilisation of technology is enabling a more efficient use of resources and improved on-road practices.
permits
Restricted access vehicles must obtain permits to operate on the State’s road network. Each permit will outline the type of vehicle allowed to use it and its operating conditions. There are currently in excess of
Performance: Road Management 55
20 permit products available to operators including oversize, product specific and extra mass permits. Across these products we issued just over 35,000 permits last year. The current movement of over-size and over-mass items has generated an increase in the number of complex permit assessments. Permits are now delivered through a new Restricted Access Vehicle System.
Restricted access Vehicle System update
The Restricted Access Vehicle System (RAVS) was launched in June 2012 completing Stage One of its development. With an improved look and feel to the application, we were able to realise the immediate benefits of automated letter preparation and storage into our document storage system. The introduction of the application will enable improvements in the accuracy and quality of data being captured, consistency in the content of correspondence, and more importantly, improved turnaround time in preparing and distributing Permits and reminder notices for our customers.
The next stage of the project is a web-based online Permit component where customers will be able to prepare, submit and pay for their Permit applications. The initial release of that stage is planned for December 2012.
planning and teCHniCal SeRViCeS aCHieVementS
Bridge management System
The Bridge Management System (BMS) is a central system to capture and store bridge related data. The BMS will assist in asset management by providing information on bridge condition and configuration. Maintenance and upgrades can then occur in a consistent, transparent and informed manner.
Phase One of the Program Management Module was released in September 2011 for regional Asset Managers (Structures). The BMS enabled managers to prepare their annual work program in an agreed, consistent format and is being used to prepare future works. Phase Two is currently under development and will track approvals and assist with bridge asset management processes through to project delivery phase.
Work has started on the development of a Route Selector and Period Permits module. Due for completion in December 2012, the efficiency of the assessment and approval process for Period Permits, as reviewed by Structures Engineering, will be improved.
emerging Surveying technologies
As a result of being continuously proactive in testing new surveying technologies and techniques, survey work on a section of Mitchell Freeway between Hepburn Avenue and Hodges Drive won the 2012 WA Spatial Sciences Excellence Awards. Utilising the Mobile Light Detection and Ranging System Scanning Technology, Main Roads worked with McMullen Nolan group to survey the freeway carriageways without a single surveyor present. This meant that survey work had no impact on traffic flow and significantly reduced safety issues to both surveyors and road users. Data capture for 15 kilometres of the targeted area was completed in just one day, a significant improvement from using conventional data collection methods which take three weeks to complete. This new technique saves substantial time, money, traffic management and manpower.
Clever Road designs
As part of the Graham Farmer Freeway Tunnel/Mitchell Freeway widening project, a new freeway on-ramp will be constructed from an existing freeway off-ramp. By using existing road geometry and structures, this low-cost, easy to build solution maximises the use of existing infrastructure and requires no major clearing. The new slip lane will make better use of the underutilised left-hand lane on the Mitchell Freeway northbound and will facilitate motorists wishing to exit the Freeway at Vincent or Powis Streets. The concepts underpinning this solution can potentially be used in other urban road networks.
Big Mabel Creek
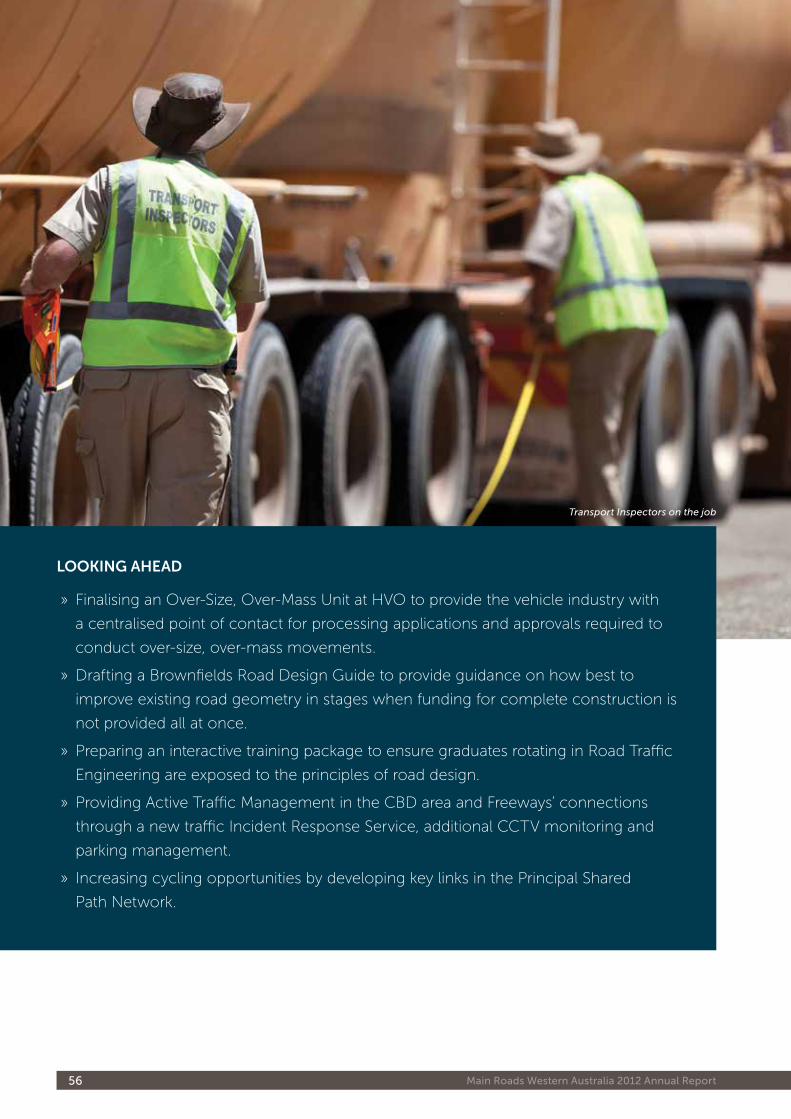
Transport Inspectors on the job
Main Roads Western Australia 2012 Annual Report56
looking aHead
» Finalising an Over-Size, Over-Mass Unit at HVO to provide the vehicle industry with
a centralised point of contact for processing applications and approvals required to
conduct over-size, over-mass movements.
» Drafting a Brownfields Road Design Guide to provide guidance on how best to
improve existing road geometry in stages when funding for complete construction is
not provided all at once.
» Preparing an interactive training package to ensure graduates rotating in Road Traffic
Engineering are exposed to the principles of road design.
» Providing Active Traffic Management in the CBD area and Freeways’ connections
through a new traffic Incident Response Service, additional CCTV monitoring and
parking management.
» Increasing cycling opportunities by developing key links in the Principal Shared
Path Network.
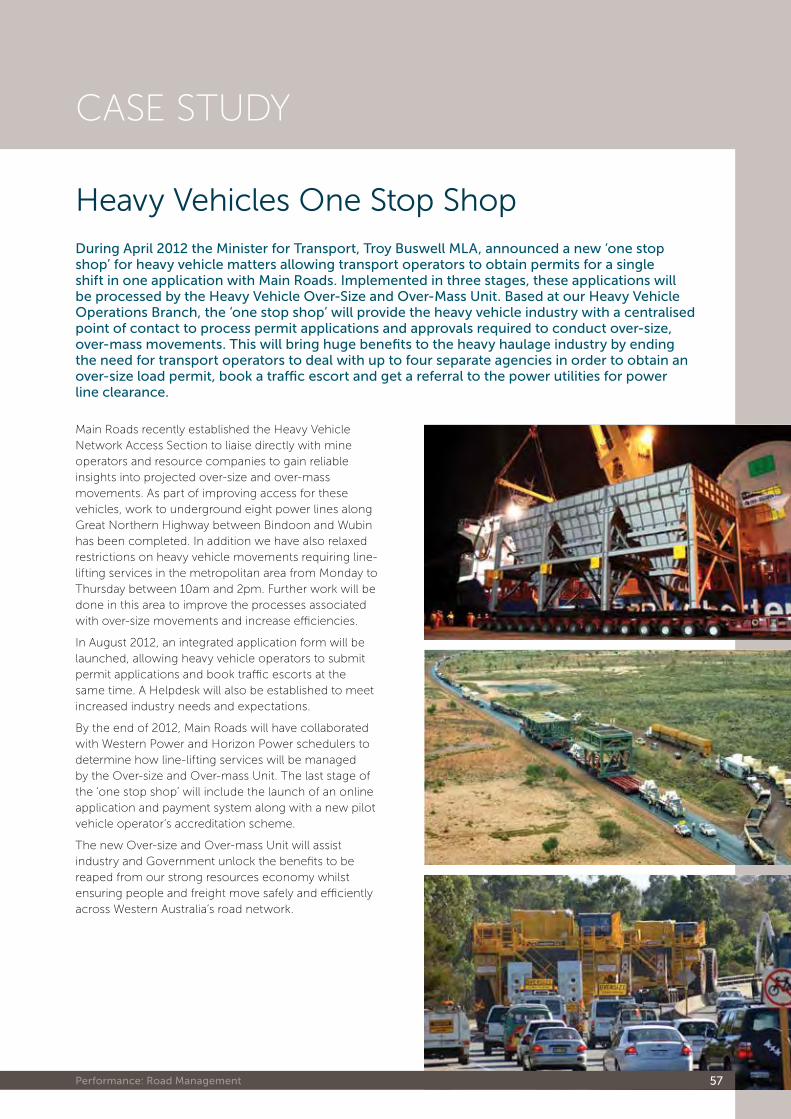
Performance: Road Management 57
Case study
Heavy Vehicles One Stop ShopDuring april 2012 the Minister for transport, troy buswell Mla, announced a new ‘one stop shop’ for heavy vehicle matters allowing transport operators to obtain permits for a single shift in one application with Main Roads. implemented in three stages, these applications will be processed by the heavy Vehicle over-size and over-Mass Unit. based at our heavy Vehicle operations branch, the ‘one stop shop’ will provide the heavy vehicle industry with a centralised point of contact to process permit applications and approvals required to conduct over-size, over-mass movements. this will bring huge benefits to the heavy haulage industry by ending the need for transport operators to deal with up to four separate agencies in order to obtain an over-size load permit, book a traffic escort and get a referral to the power utilities for power line clearance.
Main Roads recently established the Heavy Vehicle Network Access Section to liaise directly with mine operators and resource companies to gain reliable insights into projected over-size and over-mass movements. As part of improving access for these vehicles, work to underground eight power lines along Great Northern Highway between Bindoon and Wubin has been completed. In addition we have also relaxed restrictions on heavy vehicle movements requiring line-lifting services in the metropolitan area from Monday to Thursday between 10am and 2pm. Further work will be done in this area to improve the processes associated with over-size movements and increase efficiencies.
In August 2012, an integrated application form will be launched, allowing heavy vehicle operators to submit permit applications and book traffic escorts at the same time. A Helpdesk will also be established to meet increased industry needs and expectations.
By the end of 2012, Main Roads will have collaborated with Western Power and Horizon Power schedulers to determine how line-lifting services will be managed by the Over-size and Over-mass Unit. The last stage of the ‘one stop shop’ will include the launch of an online application and payment system along with a new pilot vehicle operator’s accreditation scheme.
The new Over-size and Over-mass Unit will assist industry and Government unlock the benefits to be reaped from our strong resources economy whilst ensuring people and freight move safely and efficiently across Western Australia’s road network.
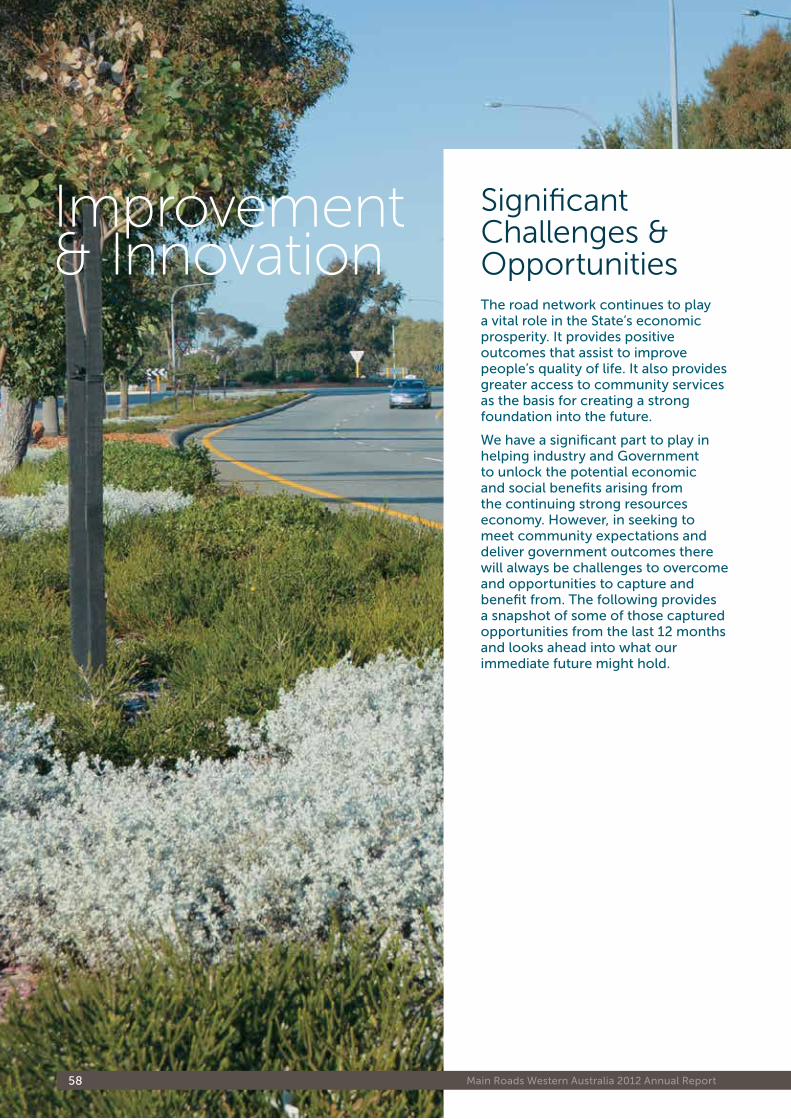
Main Roads Western Australia 2012 Annual Report58
Significant Challenges & Opportunitiesthe road network continues to play a vital role in the state’s economic prosperity. it provides positive outcomes that assist to improve people’s quality of life. it also provides greater access to community services as the basis for creating a strong foundation into the future.
We have a significant part to play in helping industry and Government to unlock the potential economic and social benefits arising from the continuing strong resources economy. however, in seeking to meet community expectations and deliver government outcomes there will always be challenges to overcome and opportunities to capture and benefit from. the following provides a snapshot of some of those captured opportunities from the last 12 months and looks ahead into what our immediate future might hold.
Improvement & Innovation
improvement & innovation 59
eConomiC
As an organisation we need to ensure that we continue to be well placed in order to achieve the delivery of more than $5.5 billion in services over the next four years including, $1.7 billion of capital works and distributing $760 million in grants to Local Government. With our Portfolio Partners, Local Government and other agencies we will be working to deliver a range of significant major projects across the State.
Whilst major capital projects form a large part of the budget, it is imperative that we achieve the best value and outcomes from the equally important smaller initiatives on our program, especially in rural areas. In addition, we need to ensure that the objectives identified in our Integrated Service Arrangements are achieved as almost $1.4 billion is invested over the next four years in maintaining the road asset. Whilst we are still seeking to understand the full implications of the Carbon Tax it is apparent that it will have an impact in terms of costs associated with management of the network and the delivery of our projects.
SoCial
Western Australia now has the fastest growing population in Australia with the most recent figures showing an increase of 2.6% to almost two and a half million people. The latest projections show that the State’s population will reach three million people before 2026; these new figures are around 400,000 higher than previous projections made just five years ago. Our task is to serve the needs of a growing population while addressing the impacts this has on meeting land use and access needs of individuals, the community and business.
Responding to this significant change in our communities and meeting both new and additional needs of road users as a result of that change is a growing challenge. The State’s vehicle fleet continues to grow at the fastest rate in Australia. In less than a decade, there will be a 30% increase in kilometres travelled. In response to this increasing urban congestion, the Transport Portfolio will need to work together to maintain the quality of life and meet the access needs of individuals and the community. This will be occurring in an environment where growth in the freight sector is expected to almost double from 2008 levels by 2030.
We have a clear and important responsibility in contributing to the solutions that will address these growing concerns. It will be a great challenge to provide services that will enable the community to make more informed travel decisions as well as to achieve a better integration of transport modes to improve productivity, efficiency and safety. We will be strongly supporting a transport system that supports shared access including walking, cycling, public transport and use of all forms of vehicles.
enViRonmental
Our natural environment is a valuable asset that is subject to many pressures, including the loss and degradation of native vegetation which is seen as a long-term issue. Developing and managing an extensive road network creates such pressure but is also an opportunity to make gains in biodiversity, the efficient use of natural resources and reductions in carbon-based emissions. In addressing environmental challenges, a key focus will be on continuing the development of our people to be more effective in fulfilling their environmental responsibilities and endeavours. We will be seeking more consistent outcomes in land rehabilitation, roadside habitat preservation, and reducing carbon emission intensity across our business.
In terms of climate change, we are proactively looking to manage the road asset and its use in a way that seeks to reduce the significant contributions that transport makes to carbon emissions and the resultant impact that has on communities, the economy and the environment. Climate change is predicted to have a significant impact on transportation, therefore affecting the way we plan, design, construct, operate and maintain our infrastructure. Decisions taken today related to the redesign and retrofitting of existing infrastructure, or the location and design of new infrastructure, will affect how well our network is able to adapt to climate change into the future.
looking aHead
This year marks the end of our current Strategic Plan, 2k12, and significant effort is going into the development of our next Strategic Plan, 2020. We have decided to build our Plan on the highly successful scenario-based planning approach, previously used. We will take all challenges and opportunities into account as we work with our stakeholders and partners to deliver integrated transport solutions through enhanced road services aimed at improving the travel wellbeing of all Western Australians.
Main Roads Western Australia 2012 Annual Report60
intRoduCtion
Our commitment to responsibly managing our road operations is established through a corporate Environmental Policy, which addresses the principles of protecting environmental values, minimising impacts, energy use and waste, and conserving natural resources. The Environmental Policy is implemented throughout the organisation via management systems and processes. Our Environmental Policy Statement can be found on our website. Our environmental objectives are as follows:
» Implement a systems-based approach to environmental management
» Seek full compliance with all statutory environmental requirements
» Maintain or improve the biodiversity values of roadsides
» Minimise the impacts of noise associated with the road network
» Protect Aboriginal heritage values of road reserves
» Minimise the environmental impacts of materials used in road construction
» Maximise the efficiency of resources used by Main Roads
» Minimise impacts of roads on water quality.
ReCognition
2011 Wa environmental awards
» Finalist ‘Government Leading
by Example’ – New Perth
Bunbury Highway Project
key peRfoRmanCe indiCatoRS
2009-10 2010-11 2011-12 Ref
GRI Achievements B B (GRI checked) B (GRI Checked) 161
Scope 1 and 2 Emissions (t CO2) 31,575 28,042 28,368 62
Electricity Usage (MJ) 117,008,514 108,319,936 112,238,856 -
Fuel and Gas Usage (MJ) 67,913,220 46,728,944 41,623,216 -
Note: Emissions calculated as per Department of Environment and Conservation requirements which align to the National Greenhouse and Energy Reporting Act 2007.
ENVIRONMENTAL PRACTICES
Committed to ReSponSiBle enViRonment SteWaRdSHip
We seek to protect the environmental values of road reserves, minimise impacts on the natural environment, energy consumption and waste and conserve natural resources.
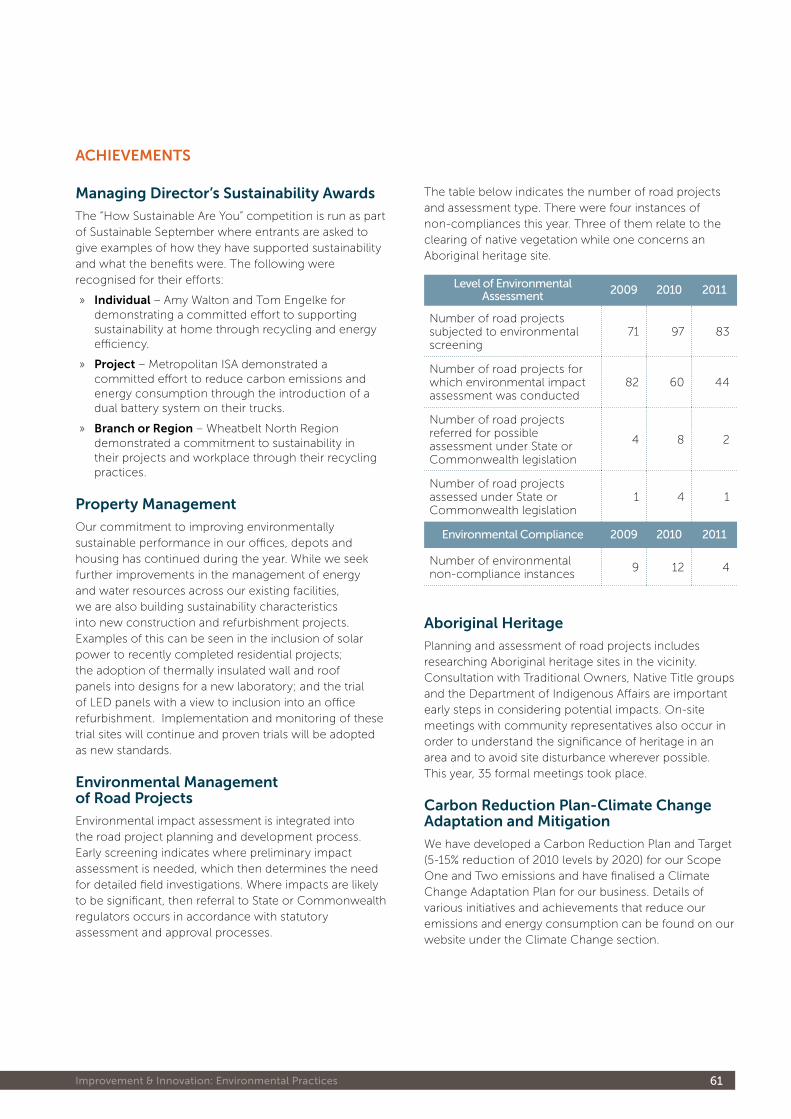
improvement & innovation: environmental Practices 61
managing director’s Sustainability awards
The “How Sustainable Are You” competition is run as part of Sustainable September where entrants are asked to give examples of how they have supported sustainability and what the benefits were. The following were recognised for their efforts:
» individual – Amy Walton and Tom Engelke for demonstrating a committed effort to supporting sustainability at home through recycling and energy efficiency.
» project – Metropolitan ISA demonstrated a committed effort to reduce carbon emissions and energy consumption through the introduction of a dual battery system on their trucks.
» Branch or Region – Wheatbelt North Region demonstrated a commitment to sustainability in their projects and workplace through their recycling practices.
property management
Our commitment to improving environmentally sustainable performance in our offices, depots and housing has continued during the year. While we seek further improvements in the management of energy and water resources across our existing facilities, we are also building sustainability characteristics into new construction and refurbishment projects. Examples of this can be seen in the inclusion of solar power to recently completed residential projects; the adoption of thermally insulated wall and roof panels into designs for a new laboratory; and the trial of LED panels with a view to inclusion into an office refurbishment. Implementation and monitoring of these trial sites will continue and proven trials will be adopted as new standards.
environmental management of Road projects
Environmental impact assessment is integrated into the road project planning and development process. Early screening indicates where preliminary impact assessment is needed, which then determines the need for detailed field investigations. Where impacts are likely to be significant, then referral to State or Commonwealth regulators occurs in accordance with statutory assessment and approval processes.
The table below indicates the number of road projects and assessment type. There were four instances of non-compliances this year. Three of them relate to the clearing of native vegetation while one concerns an Aboriginal heritage site.
level of environmental assessment 2009 2010 2011
Number of road projects subjected to environmental screening
71 97 83
Number of road projects for which environmental impact assessment was conducted
82 60 44
Number of road projects referred for possible assessment under State or Commonwealth legislation
4 8 2
Number of road projects assessed under State or Commonwealth legislation
1 4 1
environmental Compliance 2009 2010 2011
Number of environmental non-compliance instances
9 12 4
aboriginal Heritage
Planning and assessment of road projects includes researching Aboriginal heritage sites in the vicinity. Consultation with Traditional Owners, Native Title groups and the Department of Indigenous Affairs are important early steps in considering potential impacts. On-site meetings with community representatives also occur in order to understand the significance of heritage in an area and to avoid site disturbance wherever possible. This year, 35 formal meetings took place.
Carbon Reduction plan-Climate Change adaptation and mitigation
We have developed a Carbon Reduction Plan and Target (5-15% reduction of 2010 levels by 2020) for our Scope One and Two emissions and have finalised a Climate Change Adaptation Plan for our business. Details of various initiatives and achievements that reduce our emissions and energy consumption can be found on our website under the Climate Change section.
aCHieVementS
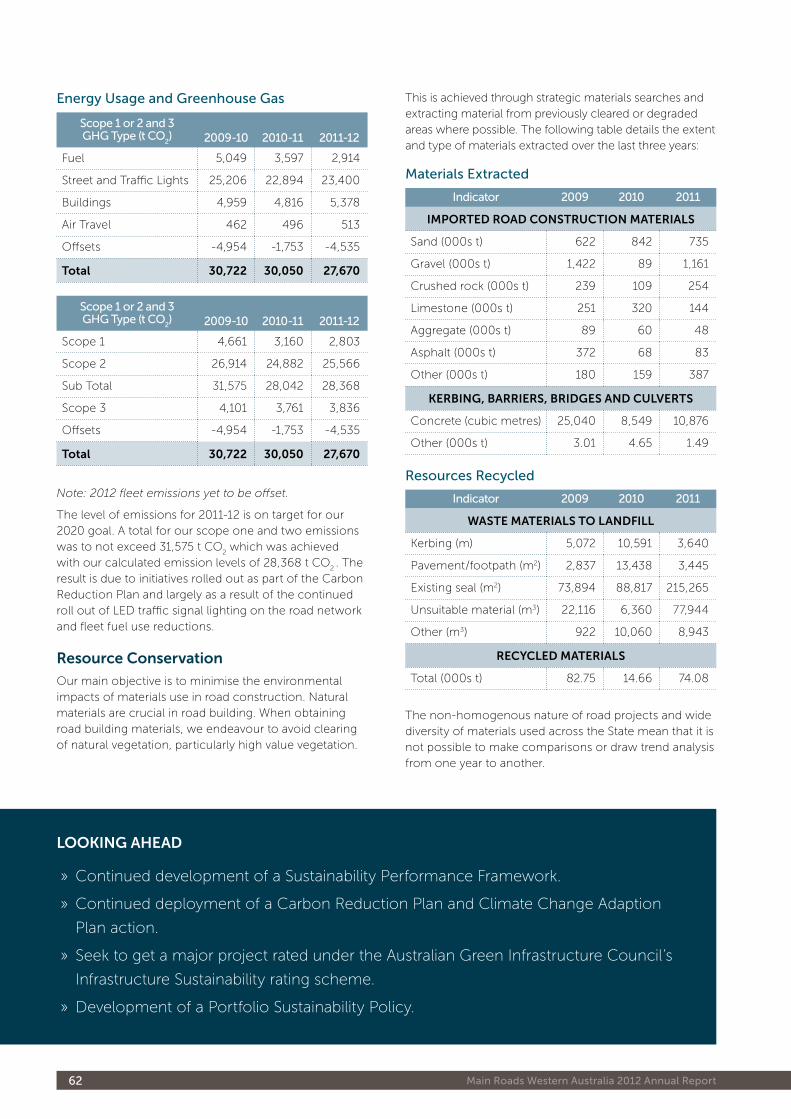
Main Roads Western Australia 2012 Annual Report62
energy Usage and Greenhouse Gas
scope 1 or 2 and 3GhG type (t Co
2) 2009-10 2010-11 2011-12
Fuel 5,049 3,597 2,914
Street and Traffic Lights 25,206 22,894 23,400
Buildings 4,959 4,816 5,378
Air Travel 462 496 513
Offsets -4,954 -1,753 -4,535
total 30,722 30,050 27,670
scope 1 or 2 and 3GhG type (t Co
2) 2009-10 2010-11 2011-12
Scope 1 4,661 3,160 2,803
Scope 2 26,914 24,882 25,566
Sub Total 31,575 28,042 28,368
Scope 3 4,101 3,761 3,836
Offsets -4,954 -1,753 -4,535
total 30,722 30,050 27,670
Note: 2012 fleet emissions yet to be offset.
The level of emissions for 2011-12 is on target for our 2020 goal. A total for our scope one and two emissions was to not exceed 31,575 t CO
2 which was achieved
with our calculated emission levels of 28,368 t CO2 . The
result is due to initiatives rolled out as part of the Carbon Reduction Plan and largely as a result of the continued roll out of LED traffic signal lighting on the road network and fleet fuel use reductions.
Resource Conservation
Our main objective is to minimise the environmental impacts of materials use in road construction. Natural materials are crucial in road building. When obtaining road building materials, we endeavour to avoid clearing of natural vegetation, particularly high value vegetation.
This is achieved through strategic materials searches and extracting material from previously cleared or degraded areas where possible. The following table details the extent and type of materials extracted over the last three years:
Materials extracted
indicator 2009 2010 2011
impoRted Road ConStRuCtion mateRialS
Sand (000s t) 622 842 735
Gravel (000s t) 1,422 89 1,161
Crushed rock (000s t) 239 109 254
Limestone (000s t) 251 320 144
Aggregate (000s t) 89 60 48
Asphalt (000s t) 372 68 83
Other (000s t) 180 159 387
keRBing, BaRRieRS, BRidgeS and CulVeRtS
Concrete (cubic metres) 25,040 8,549 10,876
Other (000s t) 3.01 4.65 1.49
Resources Recycled
indicator 2009 2010 2011
WaSte mateRialS to landfill
Kerbing (m) 5,072 10,591 3,640
Pavement/footpath (m2) 2,837 13,438 3,445
Existing seal (m2) 73,894 88,817 215,265
Unsuitable material (m3) 22,116 6,360 77,944
Other (m3) 922 10,060 8,943
ReCyCled mateRialS
Total (000s t) 82.75 14.66 74.08
The non-homogenous nature of road projects and wide diversity of materials used across the State mean that it is not possible to make comparisons or draw trend analysis from one year to another.
looking aHead
» Continued development of a Sustainability Performance Framework.
» Continued deployment of a Carbon Reduction Plan and Climate Change Adaption
Plan action.
» Seek to get a major project rated under the Australian Green Infrastructure Council’s
Infrastructure Sustainability rating scheme.
» Development of a Portfolio Sustainability Policy.
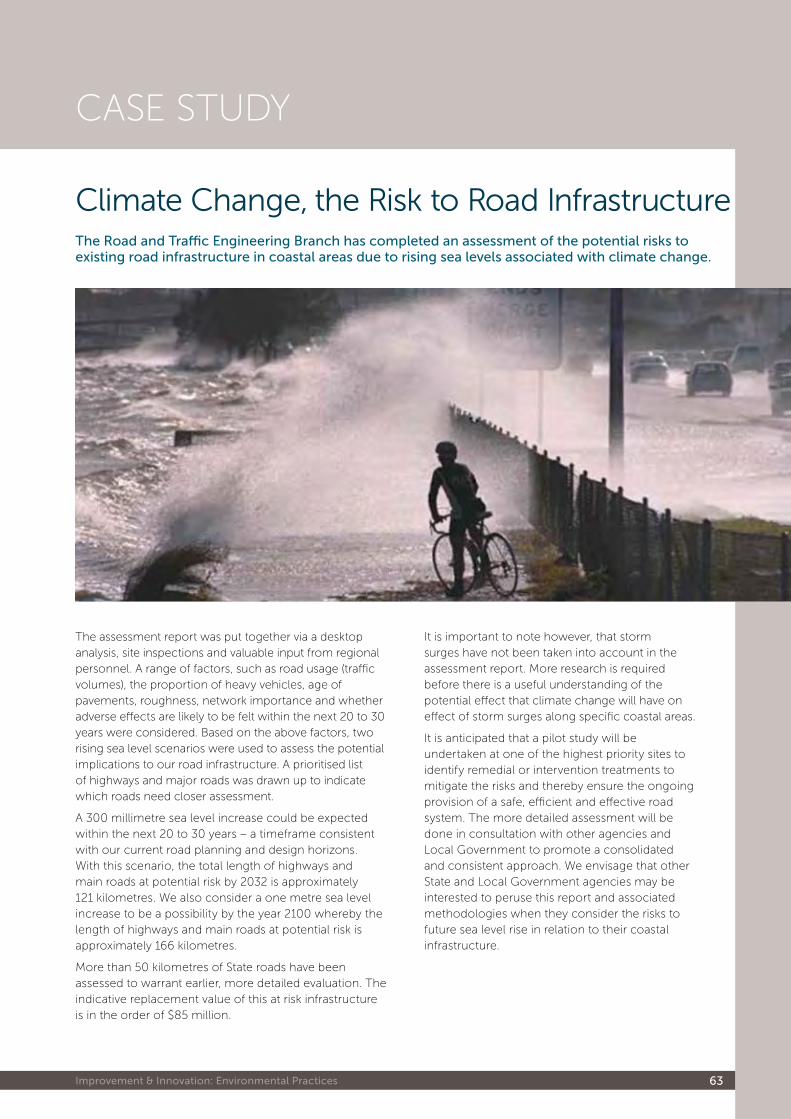
improvement & innovation: environmental Practices 63
Case study
Climate Change, the Risk to Road Infrastructurethe Road and traffic engineering branch has completed an assessment of the potential risks to existing road infrastructure in coastal areas due to rising sea levels associated with climate change.
The assessment report was put together via a desktop analysis, site inspections and valuable input from regional personnel. A range of factors, such as road usage (traffic volumes), the proportion of heavy vehicles, age of pavements, roughness, network importance and whether adverse effects are likely to be felt within the next 20 to 30 years were considered. Based on the above factors, two rising sea level scenarios were used to assess the potential implications to our road infrastructure. A prioritised list of highways and major roads was drawn up to indicate which roads need closer assessment.
A 300 millimetre sea level increase could be expected within the next 20 to 30 years – a timeframe consistent with our current road planning and design horizons. With this scenario, the total length of highways and main roads at potential risk by 2032 is approximately 121 kilometres. We also consider a one metre sea level increase to be a possibility by the year 2100 whereby the length of highways and main roads at potential risk is approximately 166 kilometres.
More than 50 kilometres of State roads have been assessed to warrant earlier, more detailed evaluation. The indicative replacement value of this at risk infrastructure is in the order of $85 million.
It is important to note however, that storm surges have not been taken into account in the assessment report. More research is required before there is a useful understanding of the potential effect that climate change will have on effect of storm surges along specific coastal areas.
It is anticipated that a pilot study will be undertaken at one of the highest priority sites to identify remedial or intervention treatments to mitigate the risks and thereby ensure the ongoing provision of a safe, efficient and effective road system. The more detailed assessment will be done in consultation with other agencies and Local Government to promote a consolidated and consistent approach. We envisage that other State and Local Government agencies may be interested to peruse this report and associated methodologies when they consider the risks to future sea level rise in relation to their coastal infrastructure.
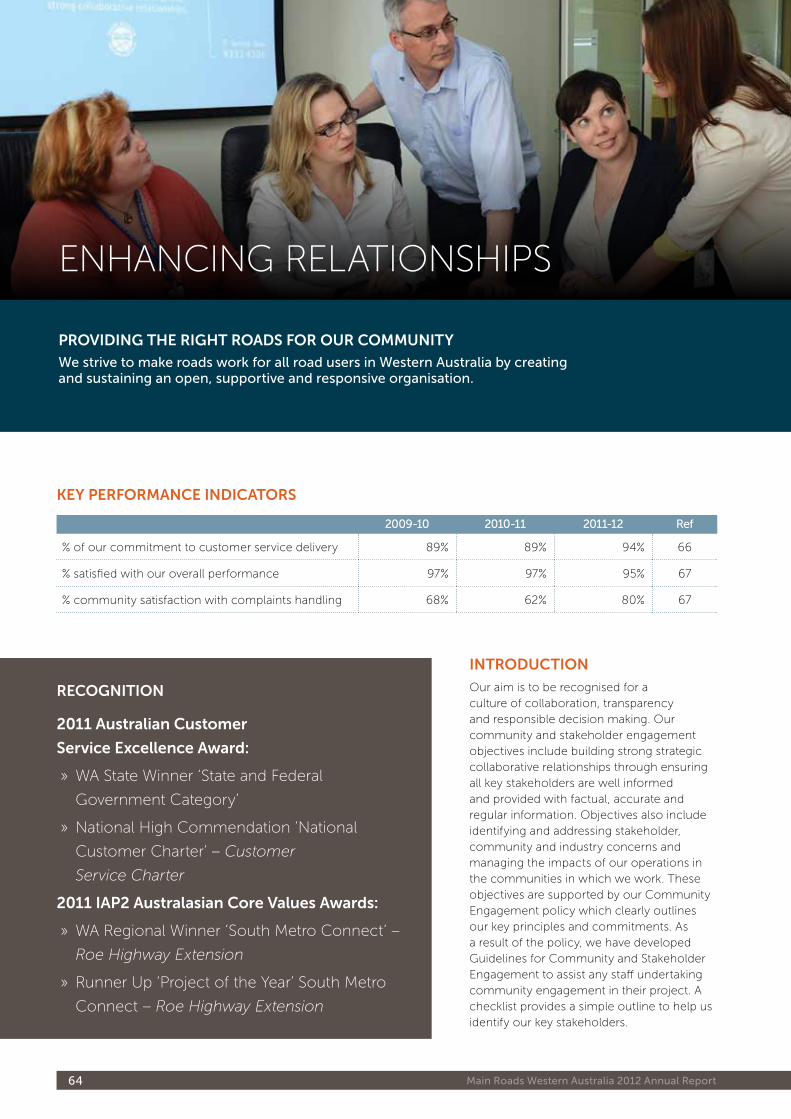
Main Roads Western Australia 2012 Annual Report64
key peRfoRmanCe indiCatoRS
2009-10 2010-11 2011-12 Ref
% of our commitment to customer service delivery 89% 89% 94% 66
% satisfied with our overall performance 97% 97% 95% 67
% community satisfaction with complaints handling 68% 62% 80% 67
ENHANCING RELATIONSHIPS
pRoViding tHe RigHt RoadS foR ouR Community
We strive to make roads work for all road users in Western australia by creating and sustaining an open, supportive and responsive organisation.
intRoduCtion
Our aim is to be recognised for a culture of collaboration, transparency and responsible decision making. Our community and stakeholder engagement objectives include building strong strategic collaborative relationships through ensuring all key stakeholders are well informed and provided with factual, accurate and regular information. Objectives also include identifying and addressing stakeholder, community and industry concerns and managing the impacts of our operations in the communities in which we work. These objectives are supported by our Community Engagement policy which clearly outlines our key principles and commitments. As a result of the policy, we have developed Guidelines for Community and Stakeholder Engagement to assist any staff undertaking community engagement in their project. A checklist provides a simple outline to help us identify our key stakeholders.
ReCognition
2011 australian Customer
Service excellence award:
» WA State Winner ‘State and Federal
Government Category’
» National High Commendation ‘National
Customer Charter’ – Customer
Service Charter
2011 iap2 australasian Core Values awards:
» WA Regional Winner ‘South Metro Connect’ –
Roe Highway Extension
» Runner Up ‘Project of the Year’ South Metro
Connect – Roe Highway Extension
improvement & innovation: enhancing Relationships 65
Strategic Review
A strategic review is currently underway on our community engagement program to ensure it meets the current and future needs of our community and stakeholders. This review includes:
» Evaluation of our goals
» Utilising new technologies
» Internal restructuring possibilities to effectively implement and manage community engagement initiatives
» Re-evaluating our corporate KPIs and aligning these to our stakeholder’s needs.
Value assurance Review: our internal project Review process
These reviews, implemented as part of the RO&DS methodology, are conducted internally on each major strategic project, with a budget of $10 million or more, to ensure that projects are meeting both internal project management objectives as well as external stakeholder expectations. A Value Assurance Review can be conducted at each project phase or when it is felt that an assessment is warranted. This approach is utilised to ensure consistency over projects, risk mitigation and gap analysis. We average around five reviews per annum using accredited personnel.
Reviews are either planned or underway for the following projects:
» South Metro Connect – Roe Highway Extension
» Gateway WA – Airport and Freight Project
» City East Alliance – Great Eastern Highway Kooyong Road to Tonkin Highway Upgrade
» Great Northern Highway Project
» Fremantle Traffic Bridge
» Mitchell Freeway Extension Community Working Group
» South Street Interchange
» Esperance Port Access Project
» Stirling City Centre Alliance
» Managed Motorways Project
We consider the project cost, timeframe, progress, stage and risk when conducting the above review.
Ro&dS/gateway Review: our external project Review process
We have brought onboard Sinclair Knight Merz’s community engagement and strategic relationships capability to undertake an independent review of our RO&DS Methodology and the Department of Treasury’s Gateway Review. This is to ensure that the delivery of community engagement aligns with key project management methodologies and that the Gateway Review meets the whole-of-government priorities.
The Value Assurance Review process and community engagement initiatives are reviewed to ensure they meet the objectives of their processes.
A key initiative that will stem from this review will be the development of a relationships policy that will identify and build long-term mutually beneficial relationships. Main Roads is in the process of implementing a new consultation paradigm through the support of the Minister for Transport that aims to develop these key relationships.
ministerial Community Working groups: a new Consultation paradigm
Through the endorsement of the Minister for Transport, we are tasked to undertake a new consultation approach that aims to align commercial, government and community interests in developing effective road transport solutions. This engagement model is proposed to be adopted on strategic assessments triggered by State and Federal Government.
There are currently two ministerial initiatives that are implementing this long-term strategic, integrated approach which include the Mitchell Freeway Extension Community Working Group and the Tonkin Highway Extension Community Working Group.
These Community Working Groups work in partnership with Local Government to bring on board input from: high level government, industry bodies, community opinion leaders, residents and local commercial industry to determine the correct infrastructure requirements for that region. This consultation process is transparent and accountable, conducted via a strategic Value Management Process and endorsed by the Centre for Excellence for Infrastructure Delivery. The outcome of this consultation process will be a preliminary business case with recommendations that will list the cost and benefits of each option to allow Government to better engage with communities and make decisions thereby delivering effective transport solutions.
Community engagement aCHieVementS
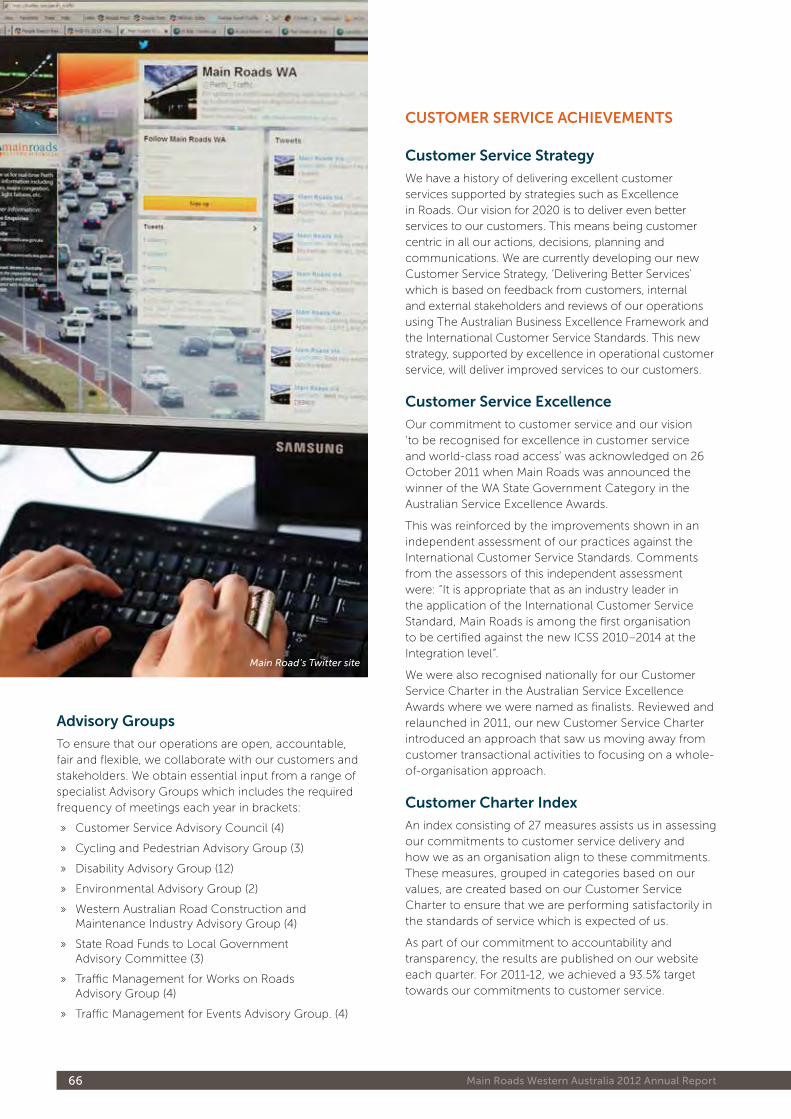
Main Road's Twitter site
Main Roads Western Australia 2012 Annual Report66
advisory groups
To ensure that our operations are open, accountable, fair and flexible, we collaborate with our customers and stakeholders. We obtain essential input from a range of specialist Advisory Groups which includes the required frequency of meetings each year in brackets:
» Customer Service Advisory Council (4)
» Cycling and Pedestrian Advisory Group (3)
» Disability Advisory Group (12)
» Environmental Advisory Group (2)
» Western Australian Road Construction and Maintenance Industry Advisory Group (4)
» State Road Funds to Local Government Advisory Committee (3)
» Traffic Management for Works on Roads Advisory Group (4)
» Traffic Management for Events Advisory Group. (4)
CuStomeR SeRViCe aCHieVementS
Customer Service Strategy
We have a history of delivering excellent customer services supported by strategies such as Excellence in Roads. Our vision for 2020 is to deliver even better services to our customers. This means being customer centric in all our actions, decisions, planning and communications. We are currently developing our new Customer Service Strategy, ‘Delivering Better Services’ which is based on feedback from customers, internal and external stakeholders and reviews of our operations using The Australian Business Excellence Framework and the International Customer Service Standards. This new strategy, supported by excellence in operational customer service, will deliver improved services to our customers.
Customer Service excellence
Our commitment to customer service and our vision ‘to be recognised for excellence in customer service and world-class road access’ was acknowledged on 26 October 2011 when Main Roads was announced the winner of the WA State Government Category in the Australian Service Excellence Awards.
This was reinforced by the improvements shown in an independent assessment of our practices against the International Customer Service Standards. Comments from the assessors of this independent assessment were: “It is appropriate that as an industry leader in the application of the International Customer Service Standard, Main Roads is among the first organisation to be certified against the new ICSS 2010–2014 at the Integration level”.
We were also recognised nationally for our Customer Service Charter in the Australian Service Excellence Awards where we were named as finalists. Reviewed and relaunched in 2011, our new Customer Service Charter introduced an approach that saw us moving away from customer transactional activities to focusing on a whole-of-organisation approach.
Customer Charter index
An index consisting of 27 measures assists us in assessing our commitments to customer service delivery and how we as an organisation align to these commitments. These measures, grouped in categories based on our values, are created based on our Customer Service Charter to ensure that we are performing satisfactorily in the standards of service which is expected of us.
As part of our commitment to accountability and transparency, the results are published on our website each quarter. For 2011-12, we achieved a 93.5% target towards our commitments to customer service.
improvement & innovation: enhancing Relationships 67
Community perception Survey
The Community Perception Survey (CPS) has been conducted annually for 17 years and tracks a wide range of issues such as our overall performance on congestion, road safety and maintenance of the road network.
The survey is a key source of information which is used to identify improvements and contributions to our business planning cycle. It highlights areas of focus and helps us to ensure the needs of the wider community are addressed. For more information, and to obtain a copy of the full 2011-12 results, please visit our website.
In December 2011, we completed qualitative research around the CPS which involved dialogue with our customers to better understand what drives their satisfaction. This research has resulted in a revised survey which now measures 96% of what drives overall satisfaction. Previous surveys only measured 35%.
This revised survey was conducted in April 2012. Some key points from the 2012 survey report include:
» Overall satisfaction of 95%, a slight decrease from 97.1% last year.
» Our Corporate Performance Indicators show strong and relatively stable performance in the areas of Road Safety and Road Maintenance. However, there is a long-term, gradual decrease in satisfaction levels.
» There is a significant decrease in performance in providing cycleways and pedestrians facilities and work is being done to identify why the significant decrease has occurred.
» New questions in the 2012 survey revealed that 42% of community members perceive their journey times to be taking longer than last year and 39% of the community feels more stressed travelling than this time last year.
Customer feedback
As an organisation we use customer feedback, including complaints, to improve our business practices. Employees who join the organisation are trained in our Complaints Handling Policy and Procedures as part of their induction and we analyse and report on complaint trends and customer interactions monthly to Corporate Executive.
Feedback received is analysed and reported to our Business Improvement Committee where improvement actions are allocated to individual Executive Directors. Remedial actions taken to address feedback received are monitored in a closed-loop reporting cycle introduced in 2011 by the committee.
The following shows the types of feedback that we have received:
Feedback type total
Complaints 1,783
Compliments 154
Customer Requests 336
Business Improvements 100
Whilst this table shows the top five areas for complaints:
Category of Complaints Percentage (%)
Traffic Signals 12
Planning Issues 10
Safety Issues 9
Road Works 6
Road Condition/Quality 6
Our policies and procedures are supported by a monthly quality assurance check using the complaints handling survey. This assesses customer satisfaction with the complaints process and how complaints were handled. For the quarter ending 30 June 2012, 80% of people interviewed indicated that they were satisfied with how their complaint was handled.
online Services
In recognition of the growing demand for the provision of information in an electronic format, we have committed significant time and effort to enhancing our online services. Our website is currently undergoing a redesign which will enable more pertinent information being provided to our customers in a timely manner. Our traffic camera service is also being upgraded and a further focus is concentrated on enhancing our social media presence to deliver more effective customer services.
Twitter continues to be a successful method of communication for the delivery of incident and traffic information on the Perth road network, which is unmatched by any other road agency in Australia. The Perth metropolitan Twitter account now has more than 10,000 followers. Due to this success, a WA Roads’ Twitter account has been created to provide regional traffic information, which is seeing steady growth in its number of followers. In just six months, this account has acquired almost 750 followers.
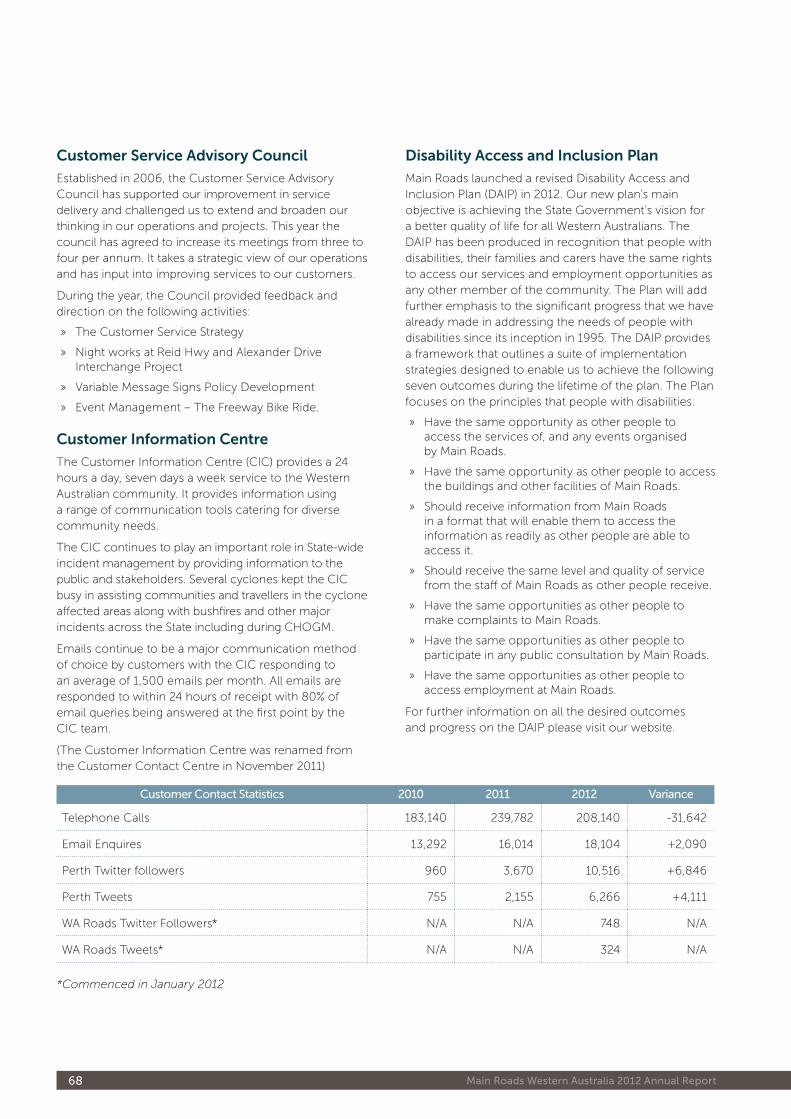
Main Roads Western Australia 2012 Annual Report68
Customer Service advisory Council
Established in 2006, the Customer Service Advisory Council has supported our improvement in service delivery and challenged us to extend and broaden our thinking in our operations and projects. This year the council has agreed to increase its meetings from three to four per annum. It takes a strategic view of our operations and has input into improving services to our customers.
During the year, the Council provided feedback and direction on the following activities:
» The Customer Service Strategy
» Night works at Reid Hwy and Alexander Drive Interchange Project
» Variable Message Signs Policy Development
» Event Management – The Freeway Bike Ride.
Customer information Centre
The Customer Information Centre (CIC) provides a 24 hours a day, seven days a week service to the Western Australian community. It provides information using a range of communication tools catering for diverse community needs.
The CIC continues to play an important role in State-wide incident management by providing information to the public and stakeholders. Several cyclones kept the CIC busy in assisting communities and travellers in the cyclone affected areas along with bushfires and other major incidents across the State including during CHOGM.
Emails continue to be a major communication method of choice by customers with the CIC responding to an average of 1,500 emails per month. All emails are responded to within 24 hours of receipt with 80% of email queries being answered at the first point by the CIC team.
(The Customer Information Centre was renamed from the Customer Contact Centre in November 2011)
Customer Contact statistics 2010 2011 2012 Variance
Telephone Calls 183,140 239,782 208,140 -31,642
Email Enquires 13,292 16,014 18,104 +2,090
Perth Twitter followers 960 3,670 10,516 +6,846
Perth Tweets 755 2,155 6,266 +4,111
WA Roads Twitter Followers* N/A N/A 748 N/A
WA Roads Tweets* N/A N/A 324 N/A
*Commenced in January 2012
disability access and inclusion plan
Main Roads launched a revised Disability Access and Inclusion Plan (DAIP) in 2012. Our new plan’s main objective is achieving the State Government’s vision for a better quality of life for all Western Australians. The DAIP has been produced in recognition that people with disabilities, their families and carers have the same rights to access our services and employment opportunities as any other member of the community. The Plan will add further emphasis to the significant progress that we have already made in addressing the needs of people with disabilities since its inception in 1995. The DAIP provides a framework that outlines a suite of implementation strategies designed to enable us to achieve the following seven outcomes during the lifetime of the plan. The Plan focuses on the principles that people with disabilities:
» Have the same opportunity as other people to access the services of, and any events organised by Main Roads.
» Have the same opportunity as other people to access the buildings and other facilities of Main Roads.
» Should receive information from Main Roads in a format that will enable them to access the information as readily as other people are able to access it.
» Should receive the same level and quality of service from the staff of Main Roads as other people receive.
» Have the same opportunities as other people to make complaints to Main Roads.
» Have the same opportunities as other people to participate in any public consultation by Main Roads.
» Have the same opportunities as other people to access employment at Main Roads.
For further information on all the desired outcomes and progress on the DAIP please visit our website.
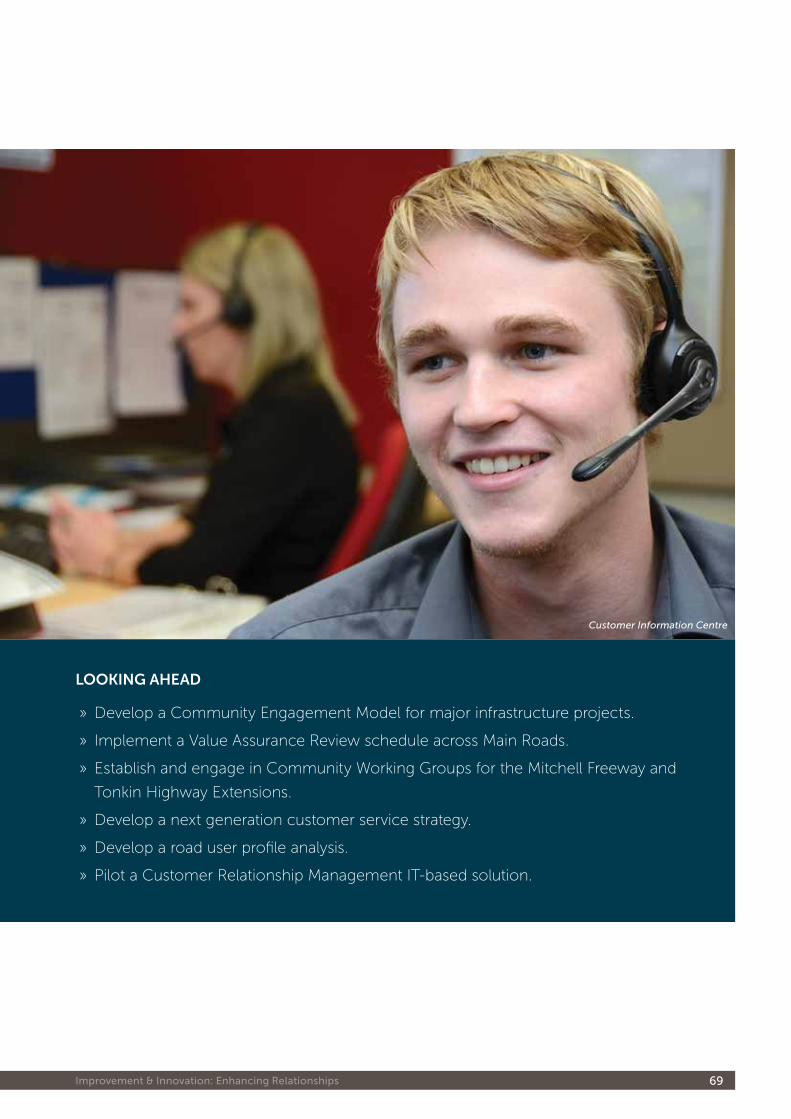
Customer Information Centre
improvement & innovation: enhancing Relationships 69
looking aHead
» Develop a Community Engagement Model for major infrastructure projects.
» Implement a Value Assurance Review schedule across Main Roads.
» Establish and engage in Community Working Groups for the Mitchell Freeway and
Tonkin Highway Extensions.
» Develop a next generation customer service strategy.
» Develop a road user profile analysis.
» Pilot a Customer Relationship Management IT-based solution.
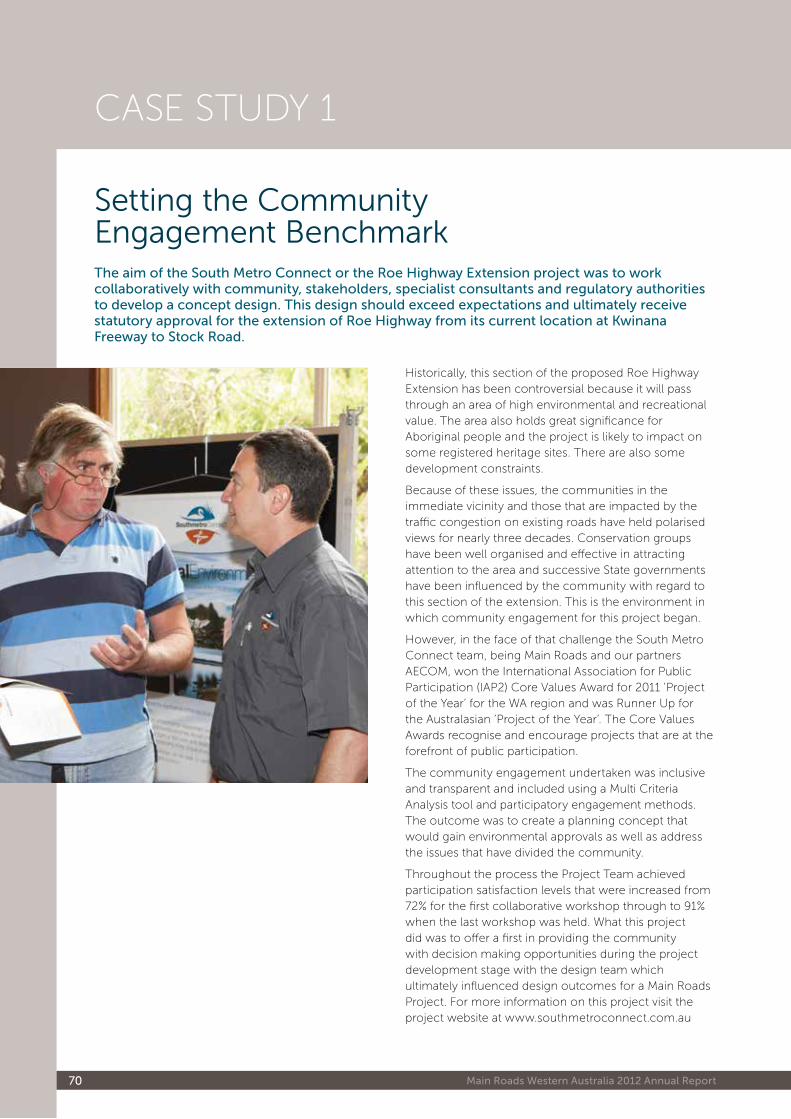
Main Roads Western Australia 2012 Annual Report70
Setting the Community Engagement Benchmarkthe aim of the south Metro Connect or the Roe highway extension project was to work collaboratively with community, stakeholders, specialist consultants and regulatory authorities to develop a concept design. this design should exceed expectations and ultimately receive statutory approval for the extension of Roe highway from its current location at Kwinana Freeway to stock Road.
CASE STUDY 1
Historically, this section of the proposed Roe Highway Extension has been controversial because it will pass through an area of high environmental and recreational value. The area also holds great significance for Aboriginal people and the project is likely to impact on some registered heritage sites. There are also some development constraints.
Because of these issues, the communities in the immediate vicinity and those that are impacted by the traffic congestion on existing roads have held polarised views for nearly three decades. Conservation groups have been well organised and effective in attracting attention to the area and successive State governments have been influenced by the community with regard to this section of the extension. This is the environment in which community engagement for this project began.
However, in the face of that challenge the South Metro Connect team, being Main Roads and our partners AECOM, won the International Association for Public Participation (IAP2) Core Values Award for 2011 ‘Project of the Year’ for the WA region and was Runner Up for the Australasian ‘Project of the Year’. The Core Values Awards recognise and encourage projects that are at the forefront of public participation.
The community engagement undertaken was inclusive and transparent and included using a Multi Criteria Analysis tool and participatory engagement methods. The outcome was to create a planning concept that would gain environmental approvals as well as address the issues that have divided the community.
Throughout the process the Project Team achieved participation satisfaction levels that were increased from 72% for the first collaborative workshop through to 91% when the last workshop was held. What this project did was to offer a first in providing the community with decision making opportunities during the project development stage with the design team which ultimately influenced design outcomes for a Main Roads Project. For more information on this project visit the project website at www.southmetroconnect.com.au
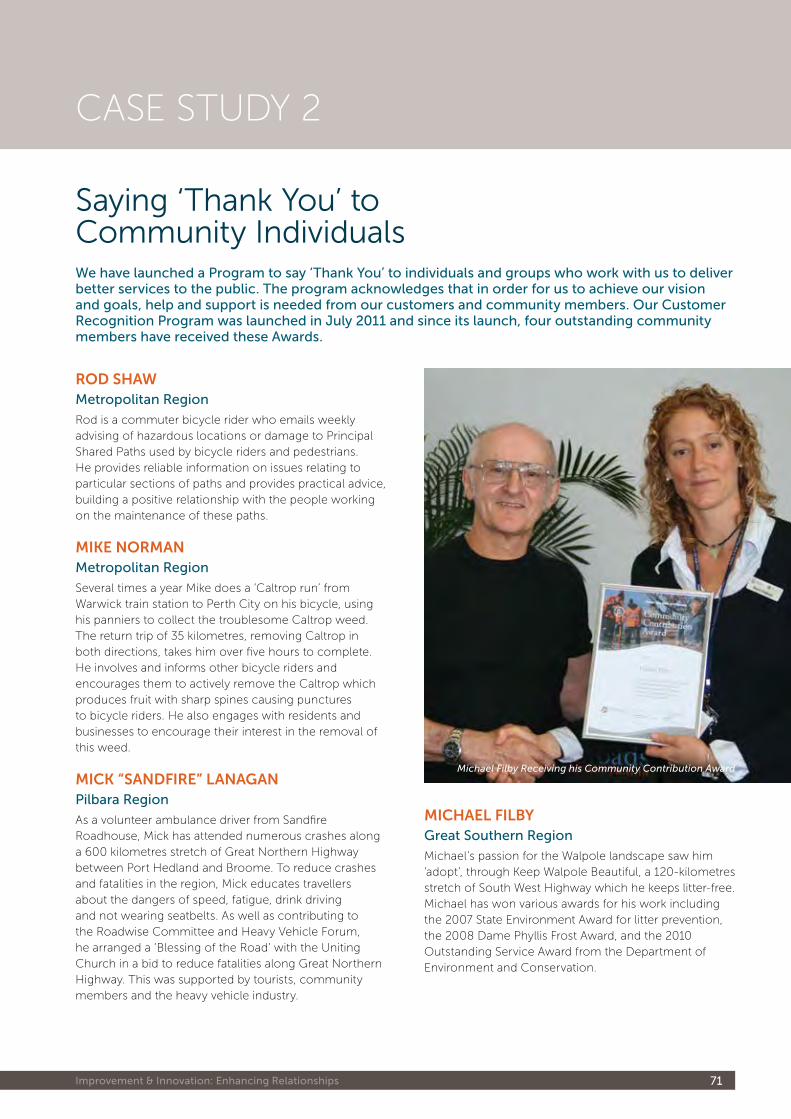
Michael Filby Receiving his Community Contribution Award
improvement & innovation: enhancing Relationships 71
Saying ‘Thank You’ to Community IndividualsWe have launched a Program to say ‘thank You’ to individuals and groups who work with us to deliver better services to the public. the program acknowledges that in order for us to achieve our vision and goals, help and support is needed from our customers and community members. our Customer Recognition Program was launched in July 2011 and since its launch, four outstanding community members have received these awards.
CASE STUDY 2
Rod SHaWMetropolitan Region
Rod is a commuter bicycle rider who emails weekly advising of hazardous locations or damage to Principal Shared Paths used by bicycle riders and pedestrians. He provides reliable information on issues relating to particular sections of paths and provides practical advice, building a positive relationship with the people working on the maintenance of these paths.
mike noRmanMetropolitan Region
Several times a year Mike does a ‘Caltrop run’ from Warwick train station to Perth City on his bicycle, using his panniers to collect the troublesome Caltrop weed. The return trip of 35 kilometres, removing Caltrop in both directions, takes him over five hours to complete. He involves and informs other bicycle riders and encourages them to actively remove the Caltrop which produces fruit with sharp spines causing punctures to bicycle riders. He also engages with residents and businesses to encourage their interest in the removal of this weed.
miCk “SandfiRe” lanagan Pilbara Region
As a volunteer ambulance driver from Sandfire Roadhouse, Mick has attended numerous crashes along a 600 kilometres stretch of Great Northern Highway between Port Hedland and Broome. To reduce crashes and fatalities in the region, Mick educates travellers about the dangers of speed, fatigue, drink driving and not wearing seatbelts. As well as contributing to the Roadwise Committee and Heavy Vehicle Forum, he arranged a ‘Blessing of the Road’ with the Uniting Church in a bid to reduce fatalities along Great Northern Highway. This was supported by tourists, community members and the heavy vehicle industry.
miCHael filByGreat southern Region
Michael’s passion for the Walpole landscape saw him ‘adopt’, through Keep Walpole Beautiful, a 120-kilometres stretch of South West Highway which he keeps litter-free. Michael has won various awards for his work including the 2007 State Environment Award for litter prevention, the 2008 Dame Phyllis Frost Award, and the 2010 Outstanding Service Award from the Department of Environment and Conservation.
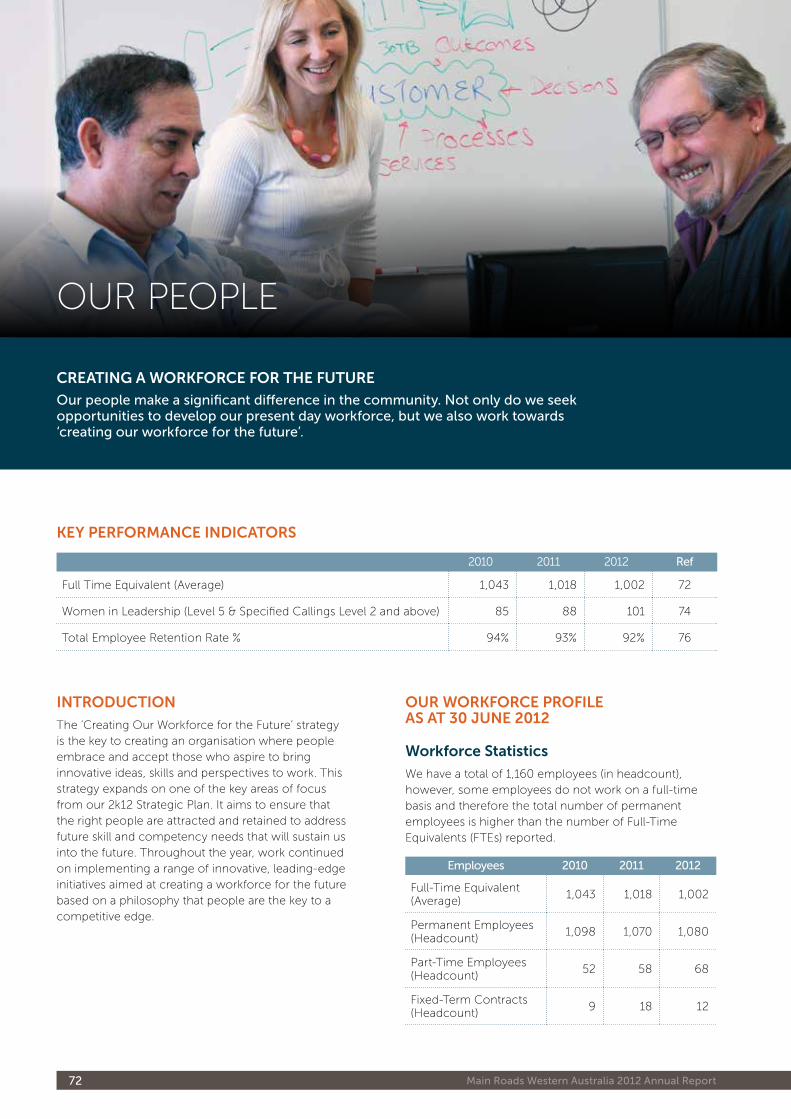
Main Roads Western Australia 2012 Annual Report72
key peRfoRmanCe indiCatoRS
2010 2011 2012 Ref
Full Time Equivalent (Average) 1,043 1,018 1,002 72
Women in Leadership (Level 5 & Specified Callings Level 2 and above) 85 88 101 74
Total Employee Retention Rate % 94% 93% 92% 76
ouR WoRkfoRCe pRofile aS at 30 June 2012
Workforce Statistics
We have a total of 1,160 employees (in headcount), however, some employees do not work on a full-time basis and therefore the total number of permanent employees is higher than the number of Full-Time Equivalents (FTEs) reported.
employees 2010 2011 2012
Full-Time Equivalent (Average)
1,043 1,018 1,002
Permanent Employees (Headcount)
1,098 1,070 1,080
Part-Time Employees (Headcount)
52 58 68
Fixed-Term Contracts (Headcount)
9 18 12
OUR PEOPLE
CReating a WoRkfoRCe foR tHe futuRe
our people make a significant difference in the community. not only do we seek opportunities to develop our present day workforce, but we also work towards ‘creating our workforce for the future’.
intRoduCtion
The ‘Creating Our Workforce for the Future’ strategy is the key to creating an organisation where people embrace and accept those who aspire to bring innovative ideas, skills and perspectives to work. This strategy expands on one of the key areas of focus from our 2k12 Strategic Plan. It aims to ensure that the right people are attracted and retained to address future skill and competency needs that will sustain us into the future. Throughout the year, work continued on implementing a range of innovative, leading-edge initiatives aimed at creating a workforce for the future based on a philosophy that people are the key to a competitive edge.
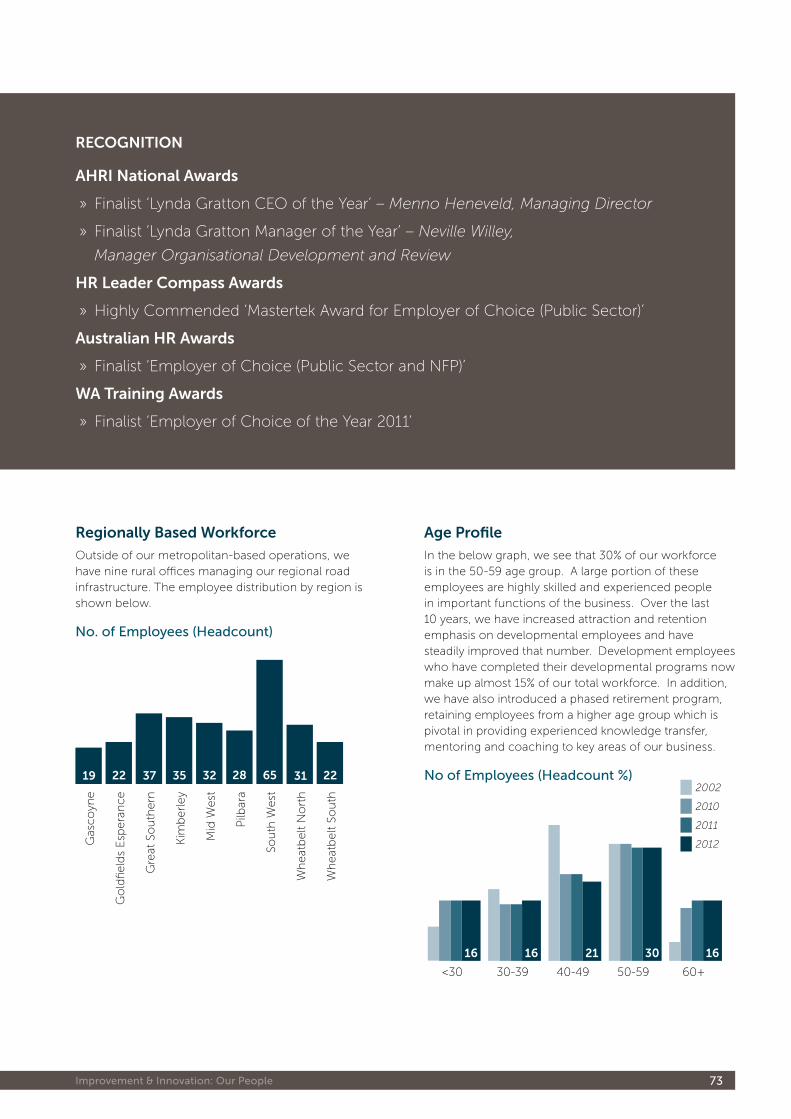
improvement & innovation: our People 73
ReCognition
aHRi national awards
» Finalist ‘Lynda Gratton CEO of the Year’ – Menno Heneveld, Managing Director
» Finalist ‘Lynda Gratton Manager of the Year’ – Neville Willey,
Manager Organisational Development and Review
HR leader Compass awards
» Highly Commended ‘Mastertek Award for Employer of Choice (Public Sector)’
australian HR awards
» Finalist ‘Employer of Choice (Public Sector and NFP)’
Wa training awards
» Finalist ‘Employer of Choice of the Year 2011’
Regionally Based Workforce
Outside of our metropolitan-based operations, we have nine rural offices managing our regional road infrastructure. The employee distribution by region is shown below.
no. of employees (headcount)
Gas
co
yne
Go
ldfie
lds
Esp
era
nce
Gre
at S
ou
thern
Kim
berl
ey
Mid
West
Pilb
ara
Sou
th W
est
Wh
eat
belt N
ort
h
Wh
eat
belt S
ou
th
19 22 37 35 32 28 65 31 22
age profile
In the below graph, we see that 30% of our workforce is in the 50-59 age group. A large portion of these employees are highly skilled and experienced people in important functions of the business. Over the last 10 years, we have increased attraction and retention emphasis on developmental employees and have steadily improved that number. Development employees who have completed their developmental programs now make up almost 15% of our total workforce. In addition, we have also introduced a phased retirement program, retaining employees from a higher age group which is pivotal in providing experienced knowledge transfer, mentoring and coaching to key areas of our business.
no of employees (headcount %)
<30
16
30-39
16
40-49
21
60+
16
50-59
30
2010
2002
2011
2012
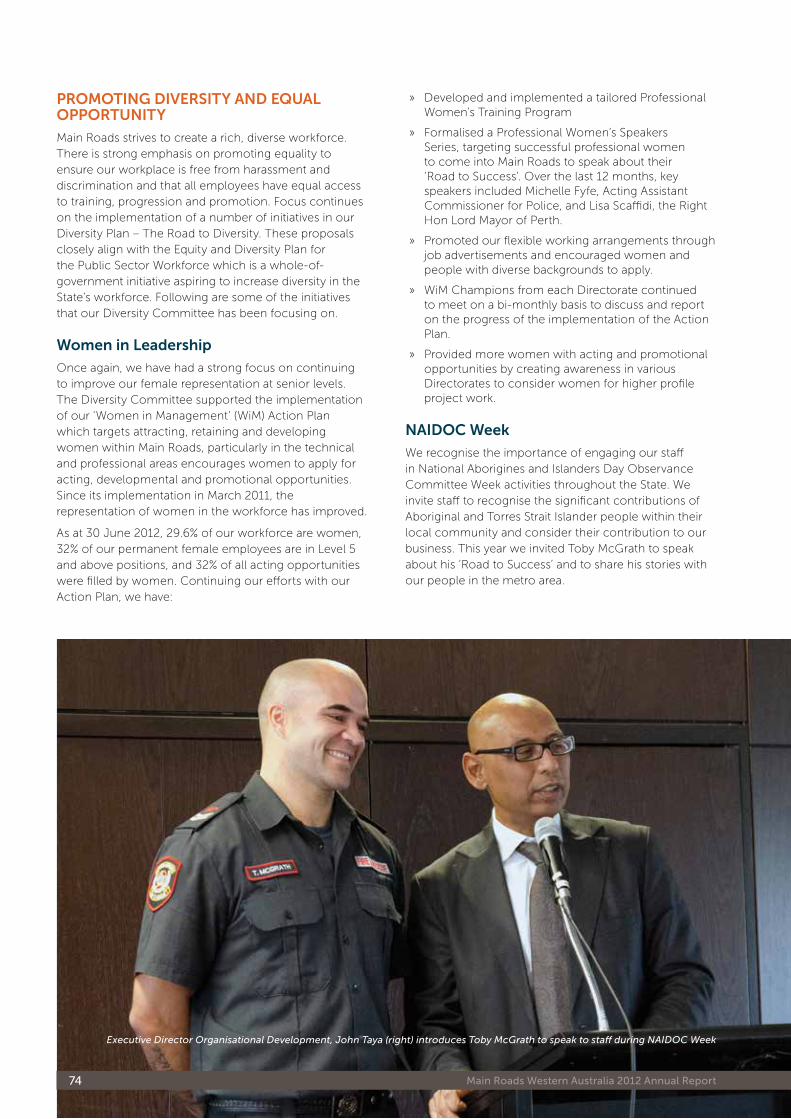
Executive Director Organisational Development, John Taya (right) introduces Toby McGrath to speak to staff during NAIDOC Week
Main Roads Western Australia 2012 Annual Report74
pRomoting diVeRSity and equal oppoRtunity
Main Roads strives to create a rich, diverse workforce. There is strong emphasis on promoting equality to ensure our workplace is free from harassment and discrimination and that all employees have equal access to training, progression and promotion. Focus continues on the implementation of a number of initiatives in our Diversity Plan – The Road to Diversity. These proposals closely align with the Equity and Diversity Plan for the Public Sector Workforce which is a whole-of-government initiative aspiring to increase diversity in the State’s workforce. Following are some of the initiatives that our Diversity Committee has been focusing on.
Women in leadership
Once again, we have had a strong focus on continuing to improve our female representation at senior levels. The Diversity Committee supported the implementation of our ‘Women in Management’ (WiM) Action Plan which targets attracting, retaining and developing women within Main Roads, particularly in the technical and professional areas encourages women to apply for acting, developmental and promotional opportunities. Since its implementation in March 2011, the representation of women in the workforce has improved.
As at 30 June 2012, 29.6% of our workforce are women, 32% of our permanent female employees are in Level 5 and above positions, and 32% of all acting opportunities were filled by women. Continuing our efforts with our Action Plan, we have:
» Developed and implemented a tailored Professional Women’s Training Program
» Formalised a Professional Women’s Speakers Series, targeting successful professional women to come into Main Roads to speak about their ‘Road to Success’. Over the last 12 months, key speakers included Michelle Fyfe, Acting Assistant Commissioner for Police, and Lisa Scaffidi, the Right Hon Lord Mayor of Perth.
» Promoted our flexible working arrangements through job advertisements and encouraged women and people with diverse backgrounds to apply.
» WiM Champions from each Directorate continued to meet on a bi-monthly basis to discuss and report on the progress of the implementation of the Action Plan.
» Provided more women with acting and promotional opportunities by creating awareness in various Directorates to consider women for higher profile project work.
naidoC Week
We recognise the importance of engaging our staff in National Aborigines and Islanders Day Observance Committee Week activities throughout the State. We invite staff to recognise the significant contributions of Aboriginal and Torres Strait Islander people within their local community and consider their contribution to our business. This year we invited Toby McGrath to speak about his ‘Road to Success’ and to share his stories with our people in the metro area.
improvement & innovation: our People 75
Harmony Week
All Directorates and Regional Offices celebrated 2012 Harmony Week in their own special way. One of the most popular activities was based around sharing tasty international treats and wearing costumes to events. Morning teas and lunches were held across the State. Harmony Week allows us to celebrate the richness and diversity of all of our employees and the added value this brings to enrich all of our lives and communities.
the RoadS foundation
The Austroads capability program identified growing skills shortages in the civil construction industry and in response Main Roads working with the Western Australian Local Government Association established The ROADS Foundation in November 2006. The Foundation facilitates traineeships for young or unemployed people in regional communities that will lead to long-term careers in the industry.
Since its inception, The ROADS Foundation has successfully assisted and supported 164 young people in civil construction traineeships through 10 road construction contractors and alliances, 14 Local Governments and throughout Main Roads regional offices. In the past 12 months The ROADS Foundation has commenced supporting an additional 28 existing worker trainees employed by the Cities of Armadale, Gosnells and Swan, while a further 15 trainees have been placed within the Shire of Brookton, Leighton Contractors, NRW and Main Roads. The ROADS Foundation continues to support its existing 75 trainees across the State.
In addition job readiness training has been provided to indigenous young people with new mentors continuing to be recruited and inducted across the State. As part of its support of the Foundation, Main Roads provides access to a fleet vehicle and office accommodation, furniture and supplies within our head office at the Don Aitken Centre for three employees. During the year our Managing Director, Menno Henneveld took over as Chair of ROADS following the retirement of the inaugural Chair Mike Wallwork.
family day
Family Day promotes a healthy work-life balance while recognising all contributions to the organisation. Each Directorate and region puts together a display for visiting family and friends outlining past achievements and current projects as well as new and upcoming projects and events. In turn, it allows our families and friends to be involved in all aspects of our work.
giving back to the Community
Throughout the year we supported a number of charities including the Starlight Children’s Foundation, SIDS, Kids WA and Cancer Council WA to name a few. This complements other initiatives including our ‘workplace giving program’ offered through payroll enabling staff to donate to selected charities throughout the year.
Main Roads supports a variety of charities throughout the year
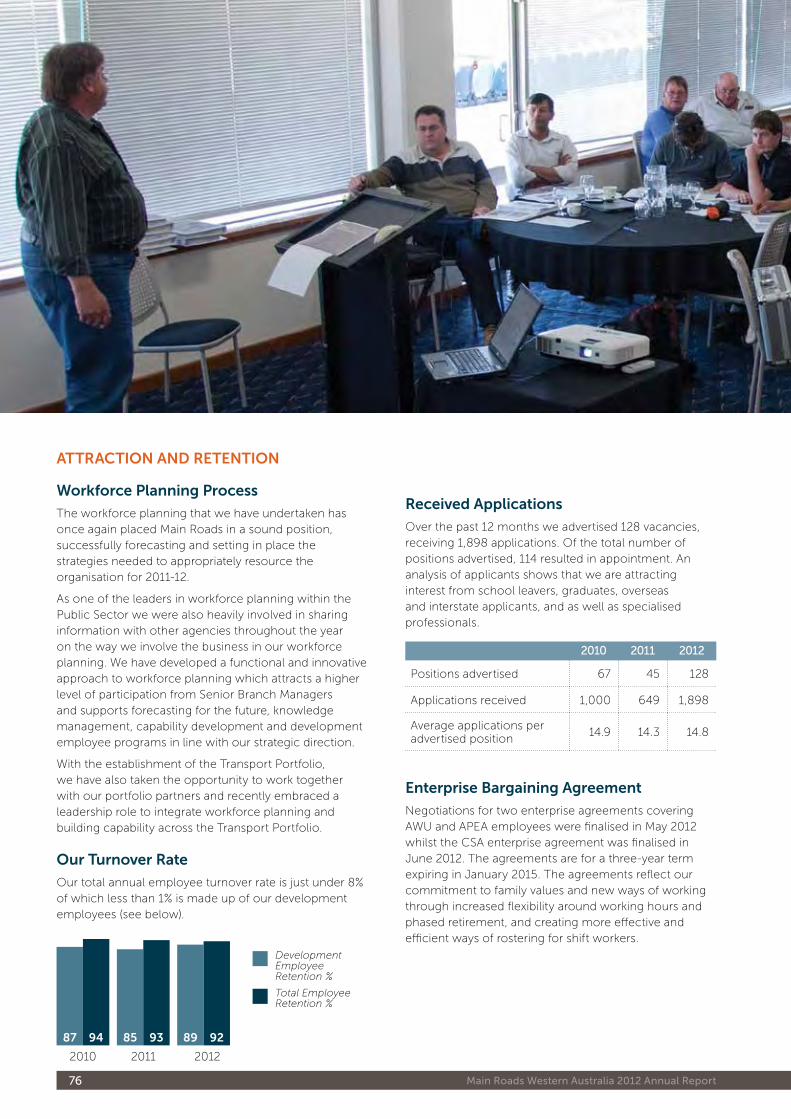
Main Roads Western Australia 2012 Annual Report76
Workforce planning process
The workforce planning that we have undertaken has once again placed Main Roads in a sound position, successfully forecasting and setting in place the strategies needed to appropriately resource the organisation for 2011-12.
As one of the leaders in workforce planning within the Public Sector we were also heavily involved in sharing information with other agencies throughout the year on the way we involve the business in our workforce planning. We have developed a functional and innovative approach to workforce planning which attracts a higher level of participation from Senior Branch Managers and supports forecasting for the future, knowledge management, capability development and development employee programs in line with our strategic direction.
With the establishment of the Transport Portfolio, we have also taken the opportunity to work together with our portfolio partners and recently embraced a leadership role to integrate workforce planning and building capability across the Transport Portfolio.
our turnover Rate
Our total annual employee turnover rate is just under 8% of which less than 1% is made up of our development employees (see below).
2010
9487 9385 9289
2011 2012
Development Employee Retention %
Total Employee Retention %
attRaCtion and Retention
Received applications
Over the past 12 months we advertised 128 vacancies, receiving 1,898 applications. Of the total number of positions advertised, 114 resulted in appointment. An analysis of applicants shows that we are attracting interest from school leavers, graduates, overseas and interstate applicants, and as well as specialised professionals.
2010 2011 2012
Positions advertised 67 45 128
Applications received 1,000 649 1,898
Average applications per advertised position
14.9 14.3 14.8
enterprise Bargaining agreement
Negotiations for two enterprise agreements covering AWU and APEA employees were finalised in May 2012 whilst the CSA enterprise agreement was finalised in June 2012. The agreements are for a three-year term expiring in January 2015. The agreements reflect our commitment to family values and new ways of working through increased flexibility around working hours and phased retirement, and creating more effective and efficient ways of rostering for shift workers.
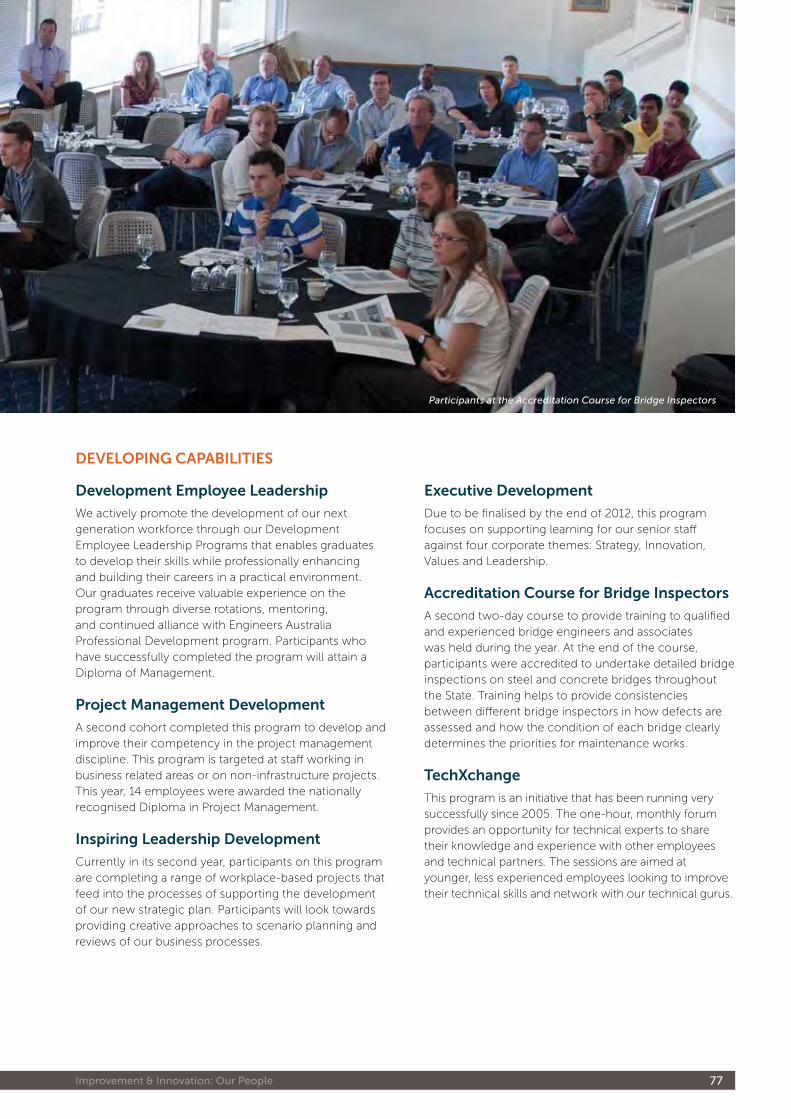
Participants at the Accreditation Course for Bridge Inspectors
improvement & innovation: our People 77
executive development
Due to be finalised by the end of 2012, this program focuses on supporting learning for our senior staff against four corporate themes: Strategy, Innovation, Values and Leadership.
accreditation Course for Bridge inspectors
A second two-day course to provide training to qualified and experienced bridge engineers and associates was held during the year. At the end of the course, participants were accredited to undertake detailed bridge inspections on steel and concrete bridges throughout the State. Training helps to provide consistencies between different bridge inspectors in how defects are assessed and how the condition of each bridge clearly determines the priorities for maintenance works.
techxchange
This program is an initiative that has been running very successfully since 2005. The one-hour, monthly forum provides an opportunity for technical experts to share their knowledge and experience with other employees and technical partners. The sessions are aimed at younger, less experienced employees looking to improve their technical skills and network with our technical gurus.
development employee leadership
We actively promote the development of our next generation workforce through our Development Employee Leadership Programs that enables graduates to develop their skills while professionally enhancing and building their careers in a practical environment. Our graduates receive valuable experience on the program through diverse rotations, mentoring, and continued alliance with Engineers Australia Professional Development program. Participants who have successfully completed the program will attain a Diploma of Management.
project management development
A second cohort completed this program to develop and improve their competency in the project management discipline. This program is targeted at staff working in business related areas or on non-infrastructure projects. This year, 14 employees were awarded the nationally recognised Diploma in Project Management.
inspiring leadership development
Currently in its second year, participants on this program are completing a range of workplace-based projects that feed into the processes of supporting the development of our new strategic plan. Participants will look towards providing creative approaches to scenario planning and reviews of our business processes.
deVeloping CapaBilitieS
Main Roads Western Australia 2012 Annual Report78
inSpiRing innoVation
At Main Roads, innovation is a key area of ongoing focus. We encourage innovative thinking in our employees, with graduates working in groups on innovation projects as part of our Development Employee Leadership Program (DELP). Some ideas explored include document currency audit system, digital signatures for verified submission of electronic timesheets, installation of solar bus shelters along Great Eastern Highway and an Online Graduate Rotation Booking System.
Some other initiatives that we have been working on in support of our commitment to developing innovative thinking include:
» Innovation Work Groups
» Publication of Innovation Magazine
» Development of an Innovation Framework
» Development of an Innovation Architecture
» Innovation Sessions
» Calendars
» Monthly Awards
» Benchmarking Survey
» Development Programs.
lunch and learn Seminars
Our Learning and Development Branch has continued running ‘Lunch and Learn’ sessions. Designed to broaden employees’ thinking and encourage creativity, these workshops complement key components of our leadership framework and include strategy, innovation, leadership and values. Each 45 minute session allowed employees to leave the workshops with useful tips and tools to apply to their own working life. All sessions were presented by Curtin University and included kits designed to engage leadership, management, creativity and innovation.
Competency development
With almost 50% of our workforce already over the age of 50 years, it is essential that we are able to maintain and increase our workforce capability as a large proportion of our employees with a wealth of experience retire. The new system is a competency-based approach for targeting the development of leadership and technical competencies of our workforce. This system focuses on operational and our employees’ career development needs. It supports our workforce planning, succession planning, knowledge management and learning and development strategies through a modified Individual Competency Development Plan process. Training on the new competency development system has commenced in priority areas which have the greatest need for retention and competency development. All employees will benefit from this new competency approach which provides greater transparency and objectivity in our existing individual performance development system.
giving the green light to masters placement Students
Over the past year we have played host to Masters’ students from the University of Western Australia and Curtin University. We welcome the contribution that these students make to the organisation through additional capability and the completion of complex projects which significantly adds to our knowledge base.
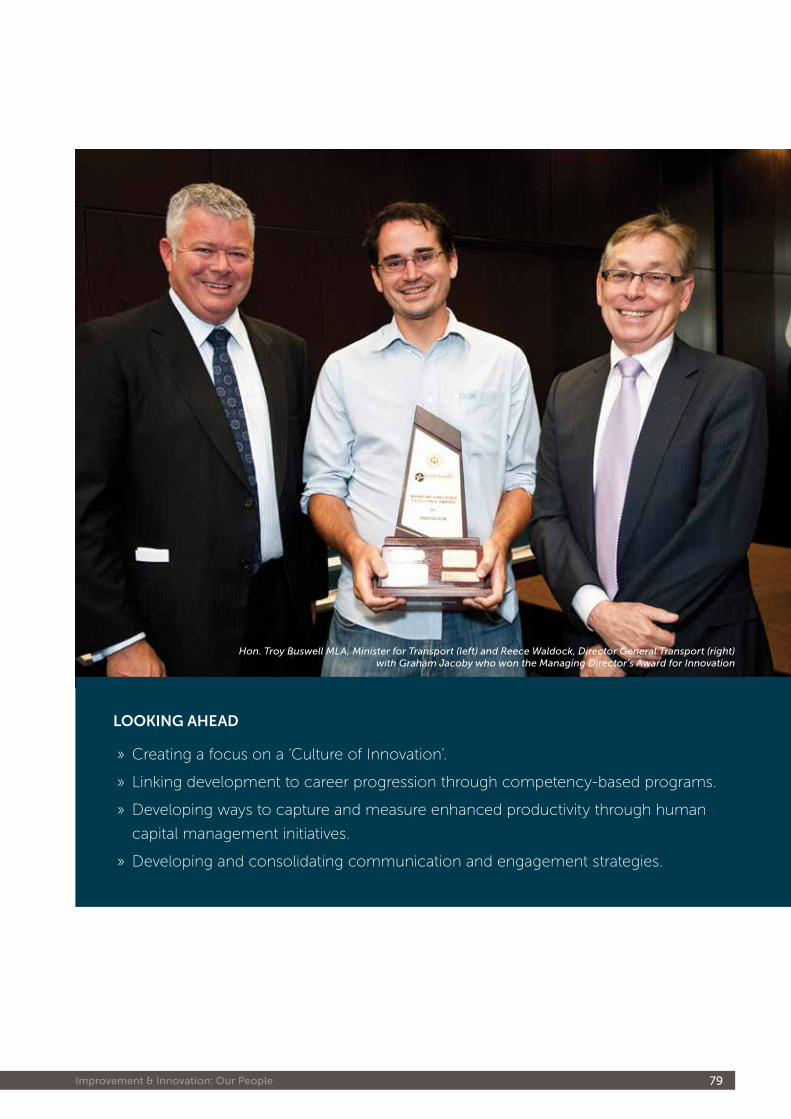
Hon. Troy Buswell MLA, Minister for Transport (left) and Reece Waldock, Director General Transport (right) with Graham Jacoby who won the Managing Director’s Award for Innovation
improvement & innovation: our People 79
looking aHead
» Creating a focus on a ‘Culture of Innovation’.
» Linking development to career progression through competency-based programs.
» Developing ways to capture and measure enhanced productivity through human
capital management initiatives.
» Developing and consolidating communication and engagement strategies.
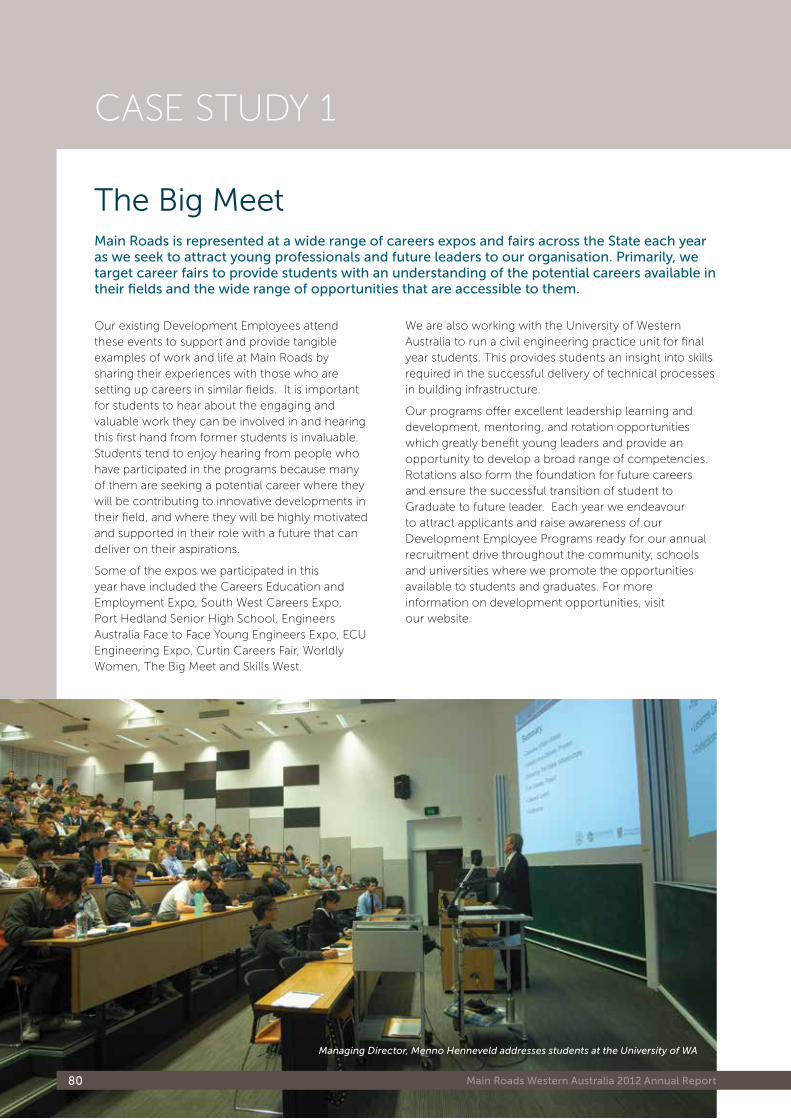
Managing Director, Menno Henneveld addresses students at the University of WA
Main Roads Western Australia 2012 Annual Report80
CASE STUDY 1
The Big MeetMain Roads is represented at a wide range of careers expos and fairs across the state each year as we seek to attract young professionals and future leaders to our organisation. Primarily, we target career fairs to provide students with an understanding of the potential careers available in their fields and the wide range of opportunities that are accessible to them.
Our existing Development Employees attend these events to support and provide tangible examples of work and life at Main Roads by sharing their experiences with those who are setting up careers in similar fields. It is important for students to hear about the engaging and valuable work they can be involved in and hearing this first hand from former students is invaluable. Students tend to enjoy hearing from people who have participated in the programs because many of them are seeking a potential career where they will be contributing to innovative developments in their field, and where they will be highly motivated and supported in their role with a future that can deliver on their aspirations.
Some of the expos we participated in this year have included the Careers Education and Employment Expo, South West Careers Expo, Port Hedland Senior High School, Engineers Australia Face to Face Young Engineers Expo, ECU Engineering Expo, Curtin Careers Fair, Worldly Women, The Big Meet and Skills West.
We are also working with the University of Western Australia to run a civil engineering practice unit for final year students. This provides students an insight into skills required in the successful delivery of technical processes in building infrastructure.
Our programs offer excellent leadership learning and development, mentoring, and rotation opportunities which greatly benefit young leaders and provide an opportunity to develop a broad range of competencies. Rotations also form the foundation for future careers and ensure the successful transition of student to Graduate to future leader. Each year we endeavour to attract applicants and raise awareness of our Development Employee Programs ready for our annual recruitment drive throughout the community, schools and universities where we promote the opportunities available to students and graduates. For more information on development opportunities, visit our website.
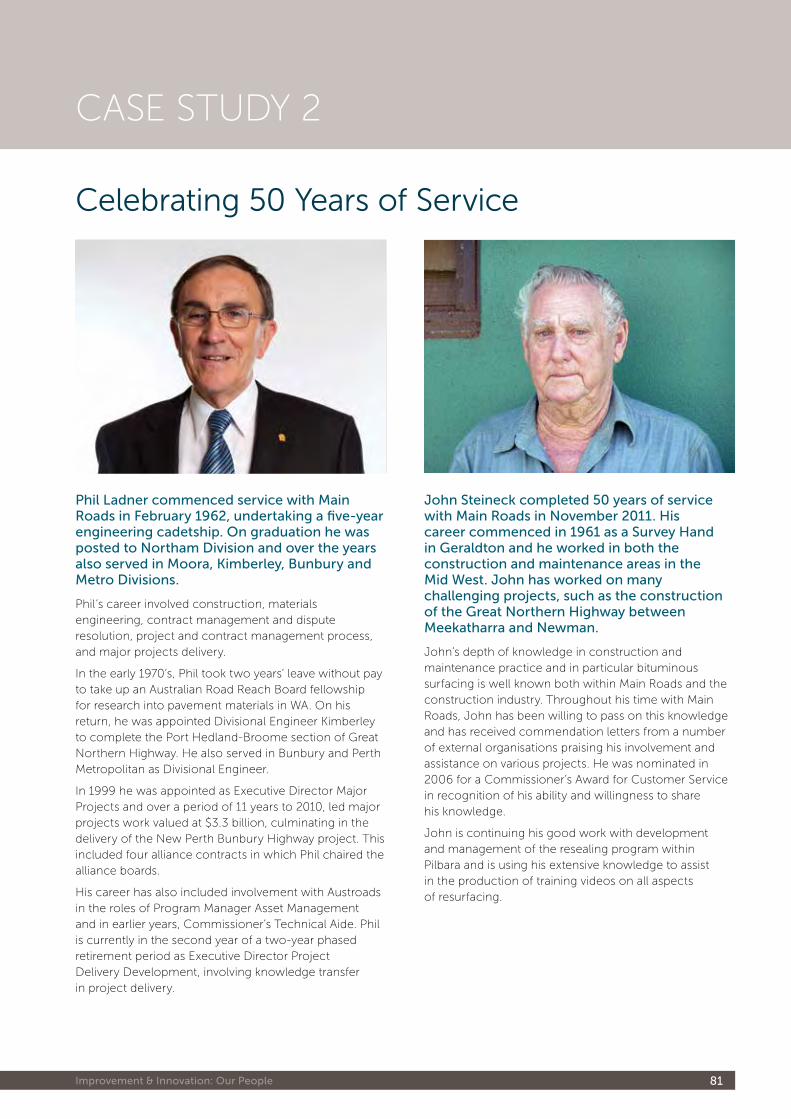
improvement & innovation: our People 81
CASE STUDY 2
Celebrating 50 Years of Service
Phil ladner commenced service with Main Roads in February 1962, undertaking a five-year engineering cadetship. on graduation he was posted to northam Division and over the years also served in Moora, Kimberley, bunbury and Metro Divisions.
Phil’s career involved construction, materials engineering, contract management and dispute resolution, project and contract management process, and major projects delivery.
In the early 1970’s, Phil took two years’ leave without pay to take up an Australian Road Reach Board fellowship for research into pavement materials in WA. On his return, he was appointed Divisional Engineer Kimberley to complete the Port Hedland-Broome section of Great Northern Highway. He also served in Bunbury and Perth Metropolitan as Divisional Engineer.
In 1999 he was appointed as Executive Director Major Projects and over a period of 11 years to 2010, led major projects work valued at $3.3 billion, culminating in the delivery of the New Perth Bunbury Highway project. This included four alliance contracts in which Phil chaired the alliance boards.
His career has also included involvement with Austroads in the roles of Program Manager Asset Management and in earlier years, Commissioner’s Technical Aide. Phil is currently in the second year of a two-year phased retirement period as Executive Director Project Delivery Development, involving knowledge transfer in project delivery.
John steineck completed 50 years of service with Main Roads in november 2011. his career commenced in 1961 as a survey hand in Geraldton and he worked in both the construction and maintenance areas in the Mid West. John has worked on many challenging projects, such as the construction of the Great northern highway between Meekatharra and newman.
John’s depth of knowledge in construction and maintenance practice and in particular bituminous surfacing is well known both within Main Roads and the construction industry. Throughout his time with Main Roads, John has been willing to pass on this knowledge and has received commendation letters from a number of external organisations praising his involvement and assistance on various projects. He was nominated in 2006 for a Commissioner’s Award for Customer Service in recognition of his ability and willingness to share his knowledge.
John is continuing his good work with development and management of the resealing program within Pilbara and is using his extensive knowledge to assist in the production of training videos on all aspects of resurfacing.
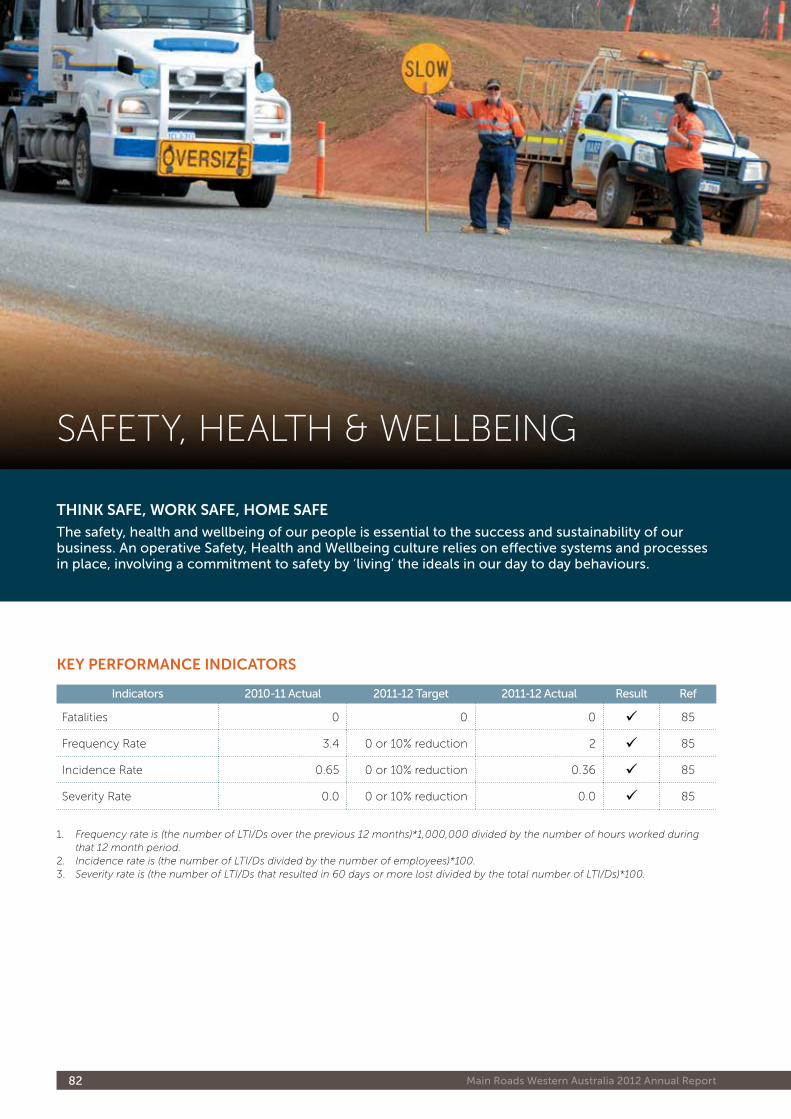
Main Roads Western Australia 2012 Annual Report82
key peRfoRmanCe indiCatoRS
indicators 2010-11 actual 2011-12 target 2011-12 actual Result Ref
Fatalities 0 0 0 85
Frequency Rate 3.4 0 or 10% reduction 2 85
Incidence Rate 0.65 0 or 10% reduction 0.36 85
Severity Rate 0.0 0 or 10% reduction 0.0 85
1. Frequency rate is (the number of LTI/Ds over the previous 12 months)*1,000,000 divided by the number of hours worked during that 12 month period.
2. Incidence rate is (the number of LTI/Ds divided by the number of employees)*100.3. Severity rate is (the number of LTI/Ds that resulted in 60 days or more lost divided by the total number of LTI/Ds)*100.
SAFETY, HEALTH & WELLBEING
tHink Safe, WoRk Safe, Home Safe
the safety, health and wellbeing of our people is essential to the success and sustainability of our business. an operative safety, health and Wellbeing culture relies on effective systems and processes in place, involving a commitment to safety by ‘living’ the ideals in our day to day behaviours.
improvement & innovation: safety, health & Wellbeing 83
intRoduCtion
Our corporate safety slogan ‘Think Safe – Work Safe – Home Safe’ serves as a reminder of the emphasis we place on behavioural safety, safe work practices and ongoing health and lifestyle education to support the wellbeing of our people.
aCHieVementS
third party and Work Safe plan Certification
Our Occupational Safety and Health Management System (OSHMS) was assessed and re-certified to Australian Standard 4801 in October 2011. Corporately, we are proudly in the process of undergoing assessment to maintain our WorkSafe Plan – Gold Certification.
organisational oSH Commitment and engagement
We continue to be committed to providing a safe and healthy work environment for our people that is based on strong collaborative relationships and visible leadership at all levels of the organisation. Through the OSHMS’s multi-layered committee structure (at both the Directorate and regional level) our management plans are based on corporate initiatives, local issues and consultation, which thereby ensures that we are aware of our risks and can manage them effectively. Our committees comprise senior management, employees and elected safety and health representatives. The commitment from these committee representatives allows a forum for consideration of contentious issues, and provides a conduit through which all our people can be informed and involved in OSH matters.
In February 2012 a Safety, Health and Wellbeing (SHW) Communication Working Group was established with the intent of bringing together individuals from across the organisation to discuss methods of effectively communicating SHW and enhancing the SHW culture. Initiatives from this working group are referred to the Corporate Committee for endorsement.
Safe Work Week 2011
All Regions and Directorates were encouraged to organise activities for Safe Work week to put safety in the spotlight and increase awareness of how our overall health and wellbeing can impact our safety at work and at home. In 2011 we celebrated Safe Work week over the period 31 October to 4 November. Activities included a nutrition presentation, healthy cooking demonstrations, safety video’s and Take 10@10 toolbox safety talks.
The biggest event during the week was the Health Expo which included a variety of services that staff could take part in and these included iridology, reflexology, live blood screening, seated massage, upper and lower body fitness testing and blood pressure testing. We will again host this successful event in 2012.
Corporate oSH management Systems training
OSH for Line Managers is a one day intensive training course customised for Main Roads with relevance to our OSHMS. The course contains five modules including OSH Law; OSH Management Systems; Hazard Management; Incident and Injury Management; and OSH Leadership, Culture and Communication.
The objectives of the course are to make line managers aware of their legal responsibilities and of potential exposures to legal risk that could impact Main Roads as an agency. The course also aims to provide line managers with OSH management skills enabling them to implement the OSH management systems in their area of responsibility and to effectively carry out their OSH activities. Over the last three years, more than 90% of our managers have completed this training.
ReCognition
ipaa lonnie awards
» Special Commendation ‘Occupational
Safety, Health and Injury Management’
– 2011 Annual Report
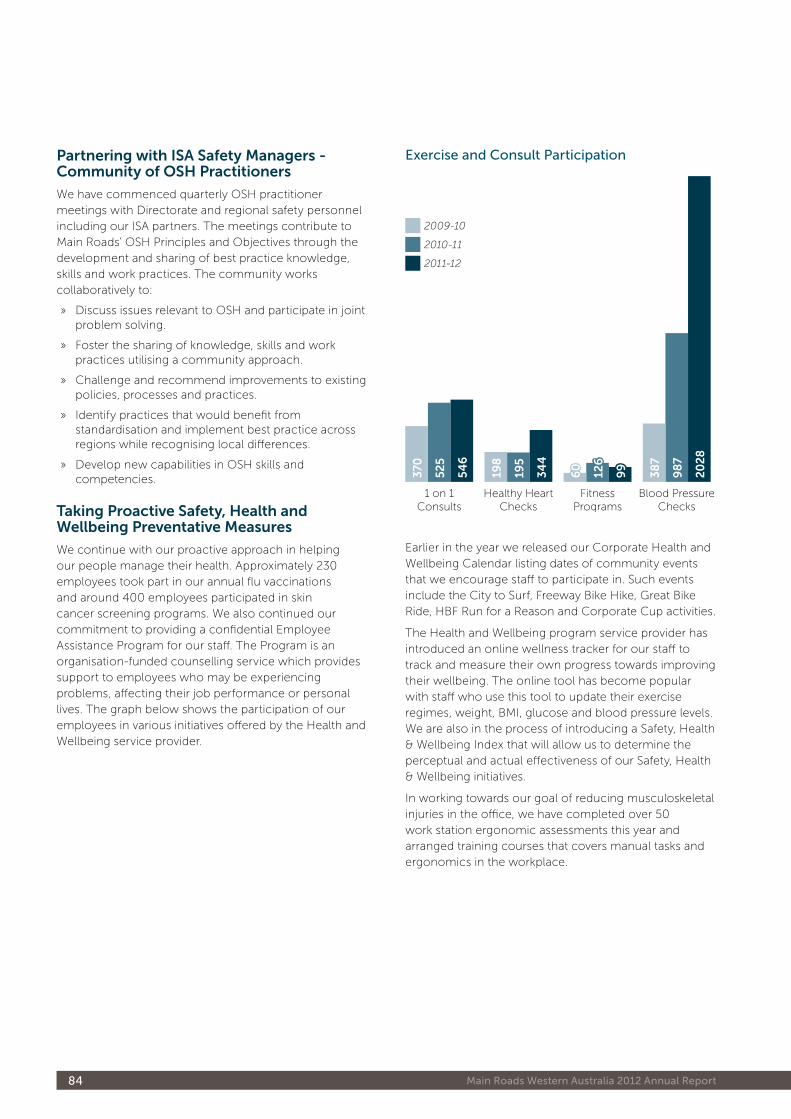
Main Roads Western Australia 2012 Annual Report84
exercise and Consult Participation
1 on 1Consults
Healthy HeartChecks
FitnessPrograms
Blood PressureChecks
54
6
525
370
34
4
195
198
99
126
20
28
98
7
38
7
2009-10
2010-11
2011-12
60
Earlier in the year we released our Corporate Health and Wellbeing Calendar listing dates of community events that we encourage staff to participate in. Such events include the City to Surf, Freeway Bike Hike, Great Bike Ride, HBF Run for a Reason and Corporate Cup activities.
The Health and Wellbeing program service provider has introduced an online wellness tracker for our staff to track and measure their own progress towards improving their wellbeing. The online tool has become popular with staff who use this tool to update their exercise regimes, weight, BMI, glucose and blood pressure levels. We are also in the process of introducing a Safety, Health & Wellbeing Index that will allow us to determine the perceptual and actual effectiveness of our Safety, Health & Wellbeing initiatives.
In working towards our goal of reducing musculoskeletal injuries in the office, we have completed over 50 work station ergonomic assessments this year and arranged training courses that covers manual tasks and ergonomics in the workplace.
partnering with iSa Safety managers - Community of oSH practitioners
We have commenced quarterly OSH practitioner meetings with Directorate and regional safety personnel including our ISA partners. The meetings contribute to Main Roads’ OSH Principles and Objectives through the development and sharing of best practice knowledge, skills and work practices. The community works collaboratively to:
» Discuss issues relevant to OSH and participate in joint problem solving.
» Foster the sharing of knowledge, skills and work practices utilising a community approach.
» Challenge and recommend improvements to existing policies, processes and practices.
» Identify practices that would benefit from standardisation and implement best practice across regions while recognising local differences.
» Develop new capabilities in OSH skills and competencies.
taking proactive Safety, Health and Wellbeing preventative measures
We continue with our proactive approach in helping our people manage their health. Approximately 230 employees took part in our annual flu vaccinations and around 400 employees participated in skin cancer screening programs. We also continued our commitment to providing a confidential Employee Assistance Program for our staff. The Program is an organisation-funded counselling service which provides support to employees who may be experiencing problems, affecting their job performance or personal lives. The graph below shows the participation of our employees in various initiatives offered by the Health and Wellbeing service provider.
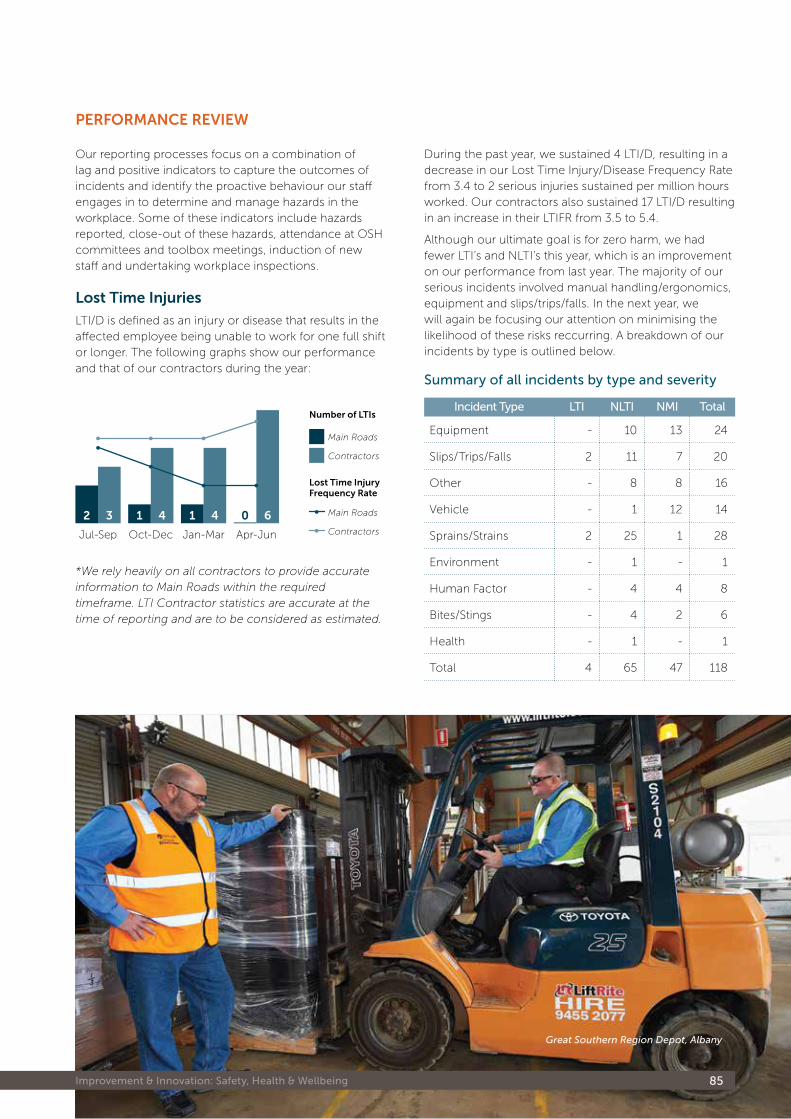
Great Southern Region Depot, Albany
improvement & innovation: safety, health & Wellbeing 85
Our reporting processes focus on a combination of lag and positive indicators to capture the outcomes of incidents and identify the proactive behaviour our staff engages in to determine and manage hazards in the workplace. Some of these indicators include hazards reported, close-out of these hazards, attendance at OSH committees and toolbox meetings, induction of new staff and undertaking workplace inspections.
lost time injuries
LTI/D is defined as an injury or disease that results in the affected employee being unable to work for one full shift or longer. The following graphs show our performance and that of our contractors during the year:
Jul-Sep Oct-Dec Jan-Mar Apr-Jun
2 3 1 4 1 4 0 6
Main Roads
Number of LTIs
Lost Time Injury Frequency Rate
Contractors
Main Roads
Contractors
*We rely heavily on all contractors to provide accurate information to Main Roads within the required timeframe. LTI Contractor statistics are accurate at the time of reporting and are to be considered as estimated.
During the past year, we sustained 4 LTI/D, resulting in a decrease in our Lost Time Injury/Disease Frequency Rate from 3.4 to 2 serious injuries sustained per million hours worked. Our contractors also sustained 17 LTI/D resulting in an increase in their LTIFR from 3.5 to 5.4.
Although our ultimate goal is for zero harm, we had fewer LTI’s and NLTI’s this year, which is an improvement on our performance from last year. The majority of our serious incidents involved manual handling/ergonomics, equipment and slips/trips/falls. In the next year, we will again be focusing our attention on minimising the likelihood of these risks reccurring. A breakdown of our incidents by type is outlined below.
summary of all incidents by type and severity
incident type lti nlti nMi total
Equipment - 10 13 24
Slips/Trips/Falls 2 11 7 20
Other - 8 8 16
Vehicle - 1 12 14
Sprains/Strains 2 25 1 28
Environment - 1 - 1
Human Factor - 4 4 8
Bites/Stings - 4 2 6
Health - 1 - 1
Total 4 65 47 118
peRfoRmanCe ReVieW
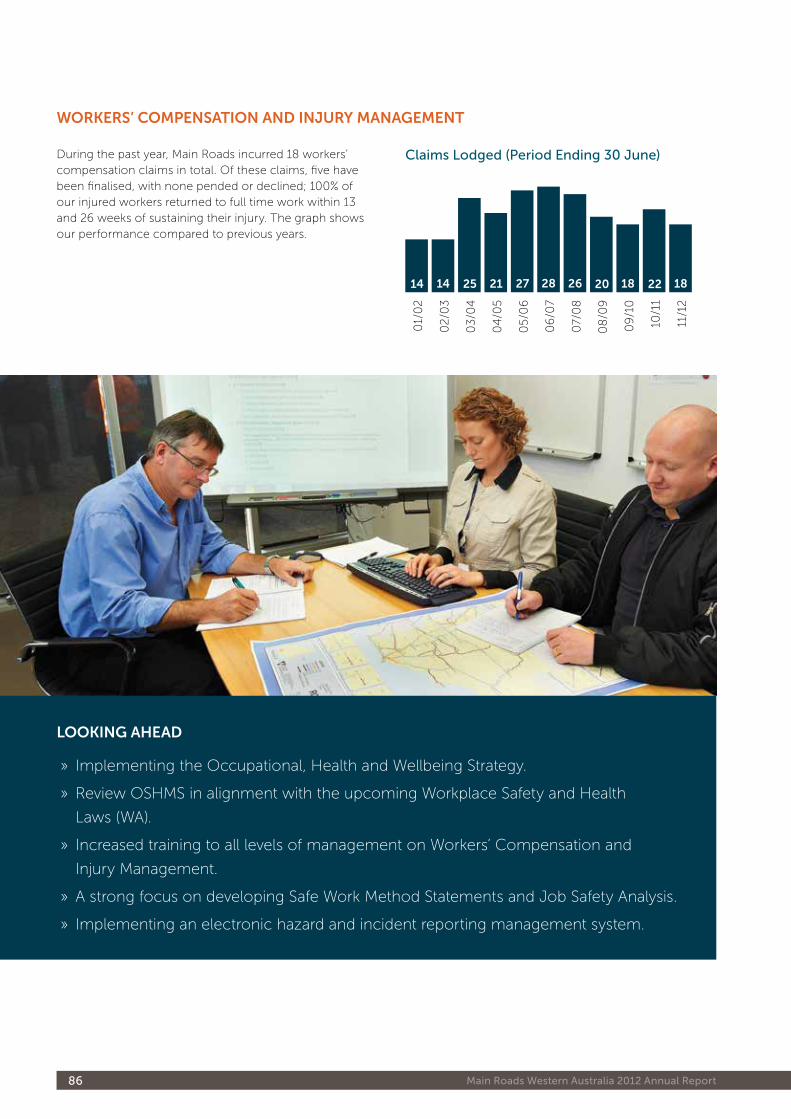
Main Roads Western Australia 2012 Annual Report86
During the past year, Main Roads incurred 18 workers’ compensation claims in total. Of these claims, five have been finalised, with none pended or declined; 100% of our injured workers returned to full time work within 13 and 26 weeks of sustaining their injury. The graph shows our performance compared to previous years.
WoRkeRS’ CompenSation and inJuRy management
Claims lodged (Period ending 30 June)
01/
02
02
/03
03
/04
04
/05
05
/06
06
/07
07/
08
08
/09
09
/10
14 14 25 21 27 28 26 20 18
10/1
1
11/1
2
22 18
looking aHead
» Implementing the Occupational, Health and Wellbeing Strategy.
» Review OSHMS in alignment with the upcoming Workplace Safety and Health
Laws (WA).
» Increased training to all levels of management on Workers’ Compensation and
Injury Management.
» A strong focus on developing Safe Work Method Statements and Job Safety Analysis.
» Implementing an electronic hazard and incident reporting management system.
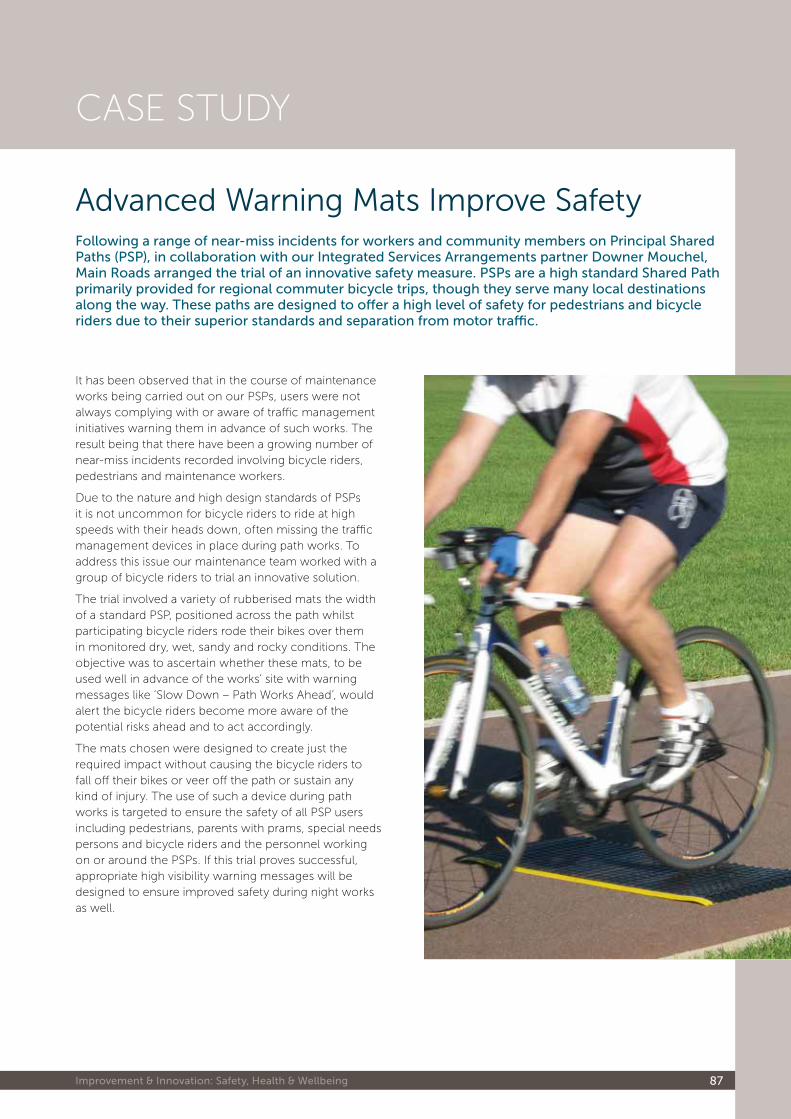
improvement & innovation: safety, health & Wellbeing 87
Case study
Advanced Warning Mats Improve SafetyFollowing a range of near-miss incidents for workers and community members on Principal shared Paths (PsP), in collaboration with our integrated services arrangements partner Downer Mouchel, Main Roads arranged the trial of an innovative safety measure. PsPs are a high standard shared Path primarily provided for regional commuter bicycle trips, though they serve many local destinations along the way. these paths are designed to offer a high level of safety for pedestrians and bicycle riders due to their superior standards and separation from motor traffic.
It has been observed that in the course of maintenance works being carried out on our PSPs, users were not always complying with or aware of traffic management initiatives warning them in advance of such works. The result being that there have been a growing number of near-miss incidents recorded involving bicycle riders, pedestrians and maintenance workers.
Due to the nature and high design standards of PSPs it is not uncommon for bicycle riders to ride at high speeds with their heads down, often missing the traffic management devices in place during path works. To address this issue our maintenance team worked with a group of bicycle riders to trial an innovative solution.
The trial involved a variety of rubberised mats the width of a standard PSP, positioned across the path whilst participating bicycle riders rode their bikes over them in monitored dry, wet, sandy and rocky conditions. The objective was to ascertain whether these mats, to be used well in advance of the works’ site with warning messages like ‘Slow Down – Path Works Ahead’, would alert the bicycle riders become more aware of the potential risks ahead and to act accordingly.
The mats chosen were designed to create just the required impact without causing the bicycle riders to fall off their bikes or veer off the path or sustain any kind of injury. The use of such a device during path works is targeted to ensure the safety of all PSP users including pedestrians, parents with prams, special needs persons and bicycle riders and the personnel working on or around the PSPs. If this trial proves successful, appropriate high visibility warning messages will be designed to ensure improved safety during night works as well.

Main Roads Western Australia 2012 Annual Report88
89 Governance: Our Principles
IntroductIon
Main Roads reports against the Good Governance Guide developed by the Office of the Public Sector Standards Commissioner. The guide references the ASX Corporate Governance Principles and assists us in assessing and managing compliance with the requirements for accountability across Government. We continue to refine our corporate governance framework within these guidelines and use other best practice standards to adopt a continuous improvement approach to governance.
Governance
our Governance Model
Our corporate governance system is how we direct and manage our business activities to optimise performance, achieve regulatory compliance and deliver value for customers. We are committed to ensuring that our core corporate governance system and processes are aligned with values-driven management. The framework enables us to govern with integrity, accountability and transparency. Our Governance Model and Organisational Structure can be found on page 94 and shows the relationships between our Minister, Director General Transport, Managing Director and members of Corporate Executive.
Performance Agreement
The Managing Director has a performance agreement with the Director General Transport while other members of the Corporate Executive have Individual Development Plans with the Managing Director.
Empowering Legislation
1. Main Roads Act
The Main Roads Act 1930, as last amended in 1997, establishes the Commissioner of Main Roads as a corporate body and sets out the powers and duties of the office. The Commissioner of Main Roads administers the Main Roads Act and the accompanying Regulations and is accountable to the Minister for Transport.
rEcoGnItIon
office of the Auditor General
» Green Rating ‘Better Practice Agency’
– 2010-11 Financial Reporting
Australian Business Excellence
» Silver Excellence Award
IPAA Lonnie Awards
» Gold Award – 2011 Annual Report
» OAG Award for Transparency and
Accountability – 2011 Annual Report
Australasian reporting Award
» Gold Award – 2011 Annual Report
» Finalist ‘On-Line Reporting Public Sector’
– 2011 Annual Report
PrIncIPLE 1: GovErnMEnt And PuBLIc SEctor rELAtIonShIP
Our Principles
90 Main Roads Western Australia 2012 Annual Report
2. The Office of Road Safety Empowering Legislation
The Road Safety Council Act 2002 and the Road Safety Council of Western Australia Governance Charter 2008 are the enabling legislation for the Office of Road Safety.
3. Other Empowering Legislation
» The Land Administration Act 1997 provides powers for the resumption of land
» Section 84 of the Road Traffic Act 1974 provides a right of recovery for road damage
» Regulation 297 of the Road Traffic Code 2000 provides the Commissioner with the power to erect road signs and traffic signals, and install road marking
» Part 4 of the Road Traffic (Vehicle Standards) Regulations 2002 provides the Commissioner with the authority to issue permits for restricted access vehicles that exceed certain mass and dimension limits, as defined in the Regulations.
We have processes and controls in place to ensure that we comply with other State and Commonwealth legislation and regulations which impact on our activities.
Ministerial directives
There were no directives issued by the Minister for Transport under Section 19B of the Main Roads Act 1930 during the year.
Strategic Plan
Our Strategic Plan, known as 2k12, sets the high-level strategic direction for our organisation up to the end of 2012. It reflects the dynamic environment we operate in and represents our response to the challenges and opportunities we face. The 2k12 Plan is aligned with our purpose and vision and our aim to ‘achieve excellence through inspiring leadership and strong collaborative relationships’. Most importantly, it helps us to work towards achieving the following five areas of strategic focus:
Strategic Area of Focus Objective
Providing the right roads for WA
To plan, develop and deliver effective outcome based road programs
Making roads work for the community
Ensuring people and freight can move safely, reliably and efficiently across the road network
Creating our workforce of the future
Creating an environment that will attract, develop and retain employees
Inspiring leadership
Creating an environment that develops and recognises leadership throughout the organisation
Enhancing relationships
To enhance existing and forge new relationships
PrIncIPLE 2: MAnAGEMEnt And ovErSIGht
Work has already commenced on the development and creation of a new strategic plan to take us through to 2020. Building on the success of 2k12 we have once again adopted Scenario Planning as the basis for determining our future direction and priorities. At this time we have already engaged extensively with our own people, our portfolio partners and key stakeholders as we all work together to identify our new areas of strategic focus. The strength and whole-of-organisation engagement in our strategic planning process is one of the fundamental planks to Main Roads ongoing success.
corporate Executive
Corporate Executive consists of the Managing Director, all Executive Directors and the Directors of Budget and Financial Planning and Strategic Relationships. The outcomes sought from Corporate Executive are to set clear strategic direction and delivery of government priorities, Main Roads purpose and defined performance goals. It meets monthly to review organisational performance both directly and through a series of formally established sub-committees.
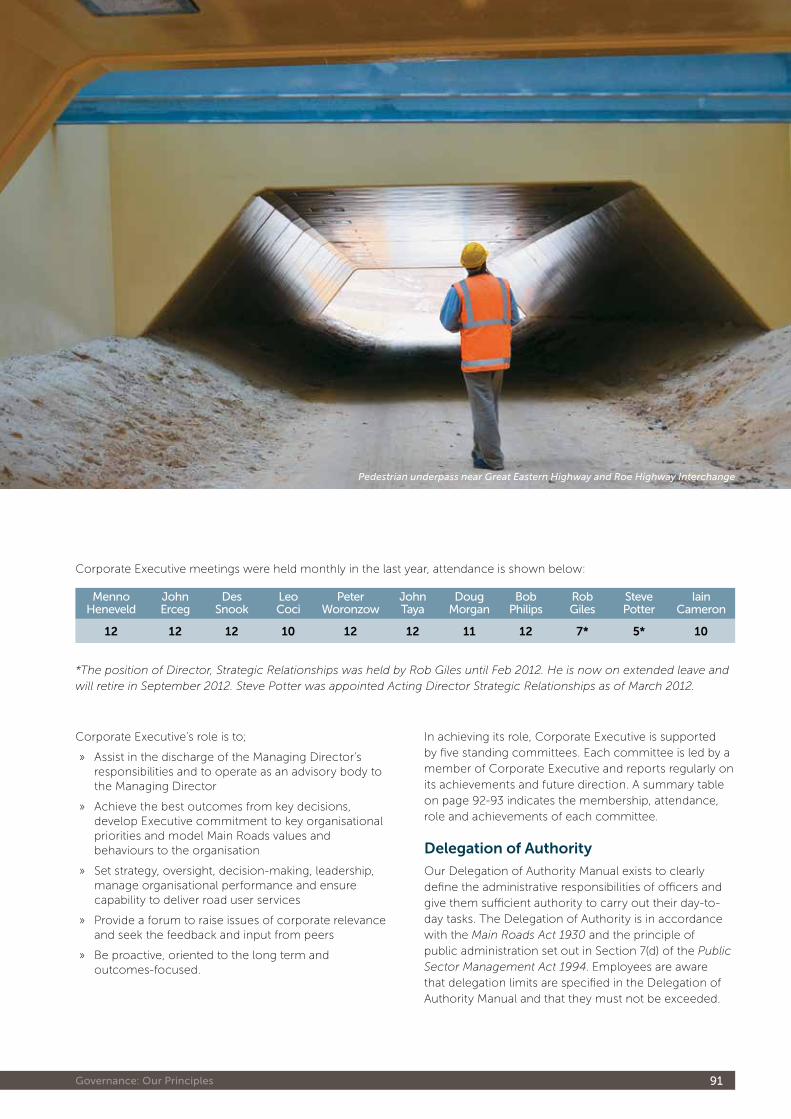
91 Governance: Our Principles
Corporate Executive meetings were held monthly in the last year, attendance is shown below:
Menno Heneveld
John Erceg
Des Snook
Leo Coci
Peter Woronzow
John Taya
Doug Morgan
Bob Philips
Rob Giles
Steve Potter
Iain Cameron
12 12 12 10 12 12 11 12 7* 5* 10
*The position of Director, Strategic Relationships was held by Rob Giles until Feb 2012. He is now on extended leave and will retire in September 2012. Steve Potter was appointed Acting Director Strategic Relationships as of March 2012.
Corporate Executive’s role is to;
» Assist in the discharge of the Managing Director’s responsibilities and to operate as an advisory body to the Managing Director
» Achieve the best outcomes from key decisions, develop Executive commitment to key organisational priorities and model Main Roads values and behaviours to the organisation
» Set strategy, oversight, decision-making, leadership, manage organisational performance and ensure capability to deliver road user services
» Provide a forum to raise issues of corporate relevance and seek the feedback and input from peers
» Be proactive, oriented to the long term and outcomes-focused.
In achieving its role, Corporate Executive is supported by five standing committees. Each committee is led by a member of Corporate Executive and reports regularly on its achievements and future direction. A summary table on page 92-93 indicates the membership, attendance, role and achievements of each committee.
delegation of Authority
Our Delegation of Authority Manual exists to clearly define the administrative responsibilities of officers and give them sufficient authority to carry out their day-to-day tasks. The Delegation of Authority is in accordance with the Main Roads Act 1930 and the principle of public administration set out in Section 7(d) of the Public Sector Management Act 1994. Employees are aware that delegation limits are specified in the Delegation of Authority Manual and that they must not be exceeded.
Pedestrian underpass near Great Eastern Highway and Roe Highway Interchange
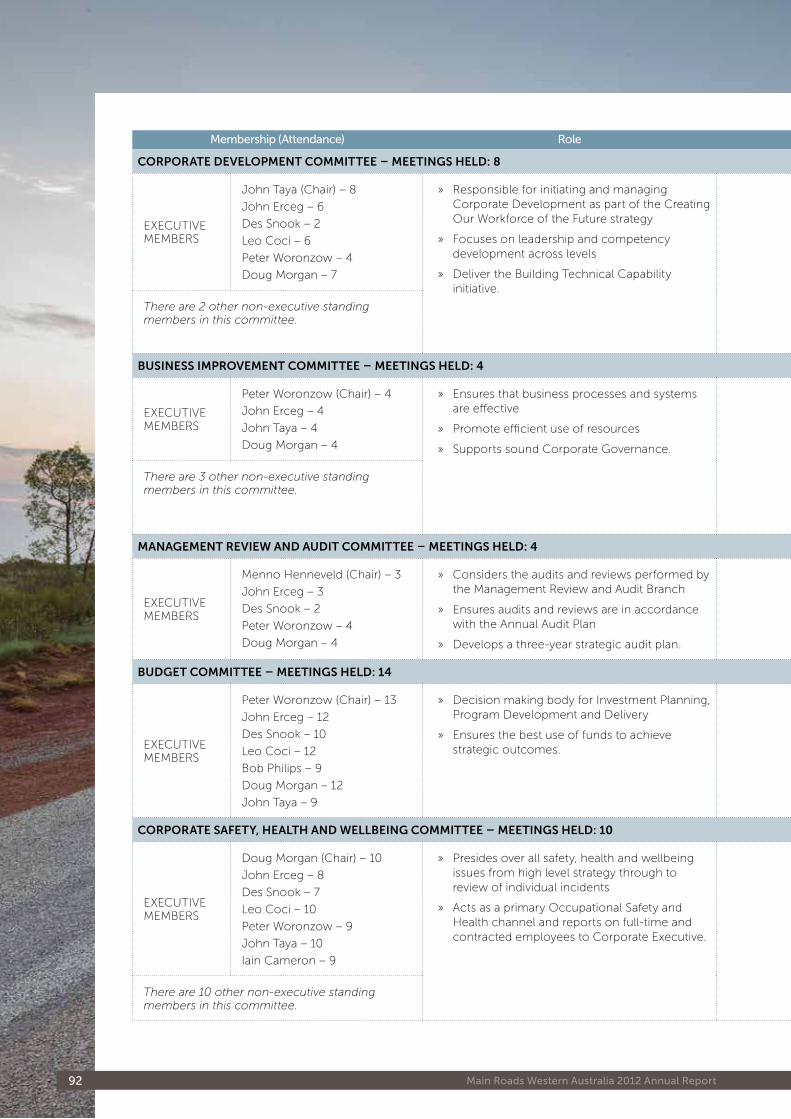
92 Main Roads Western Australia 2012 Annual Report
Membership (Attendance) Role Achievements
corPorAtE dEvELoPMEnt coMMIttEE – MEEtInGS hELd: 8
EXECuTIvE MEMBERS
John Taya (Chair) – 8
John Erceg – 6
Des Snook – 2
Leo Coci – 6
Peter Woronzow – 4
Doug Morgan – 7
» Responsible for initiating and managing Corporate Development as part of the Creating Our Workforce of the Future strategy
» Focuses on leadership and competency development across levels
» Deliver the Building Technical Capability initiative.
» Realignment of the criteria applied to the committee’s consideration of internal research and innovation projects, to more clearly define the role and support this area
» Progressed the Competency Development System project to finalise a competency framework. The project included the commencement of a pilot implementation in the functional areas of Financial Services, Project/Contract Management and Organisational Development
» Development of an online Employee Development System. The new system will automate – Individual Development Planning, Competency Development, 360 feedback surveys and training administration
» Endorsed the following staff development activities such as the Senior Manager and Executive Coaching Program, Inspiring Leadership Development Program, Executive Development Program, and Project Management Development Program and provided extensive training to staff in Accountable and Ethical Decision Making
There are 2 other non-executive standing members in this committee.
BuSInESS IMProvEMEnt coMMIttEE – MEEtInGS hELd: 4
EXECuTIvE MEMBERS
Peter Woronzow (Chair) – 4
John Erceg – 4
John Taya – 4
Doug Morgan – 4
» Ensures that business processes and systems are effective
» Promote efficient use of resources
» Supports sound Corporate Governance.
» Adoption, alignment and gap assessment of measures against Global Reporting Initiative and the Australian Business Excellence Framework
» Driving the development of a revamped intranet site, ‘iRoads’
» Reviewed, considered and endorsed the results from tracking business improvements arising from customer feedback complaints and analysis
» Oversight of the Third Party Certified Integrated Management System
» Oversight of organisational reviews including Outcome-Based Performance Measures and Effectiveness of the Operations of Corporate Executive
There are 3 other non-executive standing members in this committee.
MAnAGEMEnt rEvIEw And AudIt coMMIttEE – MEEtInGS hELd: 4
EXECuTIvE MEMBERS
Menno Henneveld (Chair) – 3
John Erceg – 3
Des Snook – 2
Peter Woronzow – 4
Doug Morgan – 4
» Considers the audits and reviews performed by the Management Review and Audit Branch
» Ensures audits and reviews are in accordance with the Annual Audit Plan
» Develops a three-year strategic audit plan.
» Health Checks on six of the seven Integrated Service Agreements
» Financial compliance audits of six of the seven Integrated Service Agreements
» Review of Main Roads’ Readiness for CHOGM
» Review of the Network Operations Plan and the Link to Main Roads’ Planning Processes
BudGEt coMMIttEE – MEEtInGS hELd: 14
EXECuTIvE MEMBERS
Peter Woronzow (Chair) – 13
John Erceg – 12
Des Snook – 10
Leo Coci – 12
Bob Philips – 9
Doug Morgan – 12
John Taya – 9
» Decision making body for Investment Planning, Program Development and Delivery
» Ensures the best use of funds to achieve strategic outcomes.
» Monitoring and actioning budgetary and financial matters including program strategies and structures to deliver outcomes linked with Government objectives
» Provision of strategic direction for project development funding and activities
» Supervision of transitional arrangements in preparation for new maintenance delivery arrangements
» Supervision of managed transfer of assets between State and Local Government
» Approval of the final four-year and 10-year program submissions to Department of Treasury
corPorAtE SAfEty, hEALth And wELLBEInG coMMIttEE – MEEtInGS hELd: 10
EXECuTIvE MEMBERS
Doug Morgan (Chair) – 10
John Erceg – 8
Des Snook – 7
Leo Coci – 10
Peter Woronzow – 9
John Taya – 10
Iain Cameron – 9
» Presides over all safety, health and wellbeing issues from high level strategy through to review of individual incidents
» Acts as a primary Occupational Safety and Health channel and reports on full-time and contracted employees to Corporate Executive.
» Maintaining certification to AS 4801
» Further development and implementation of a suite of positive indicators based on proactive safety, health and wellbeing behaviour
» Continued coordination and review of the OSH management system to facilitate continuous improvement
» Integration of wellbeing into the existing safety and health management system as part of a holistic approach to OSH management
» Develop a community of OSH Practitioners that contributes to our OSH Principles and Objectives
There are 10 other non-executive standing members in this committee.
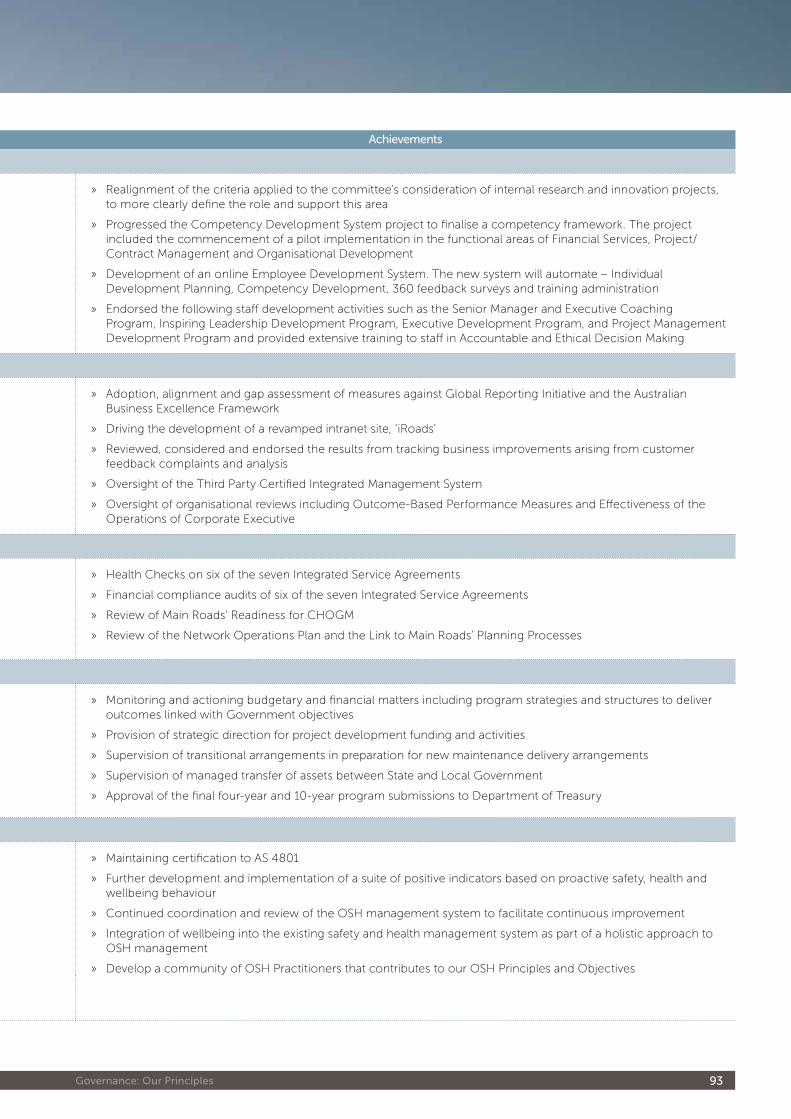
93 Governance: Our Principles
Membership (Attendance) Role Achievements
corPorAtE dEvELoPMEnt coMMIttEE – MEEtInGS hELd: 8
EXECuTIvE MEMBERS
John Taya (Chair) – 8
John Erceg – 6
Des Snook – 2
Leo Coci – 6
Peter Woronzow – 4
Doug Morgan – 7
» Responsible for initiating and managing Corporate Development as part of the Creating Our Workforce of the Future strategy
» Focuses on leadership and competency development across levels
» Deliver the Building Technical Capability initiative.
» Realignment of the criteria applied to the committee’s consideration of internal research and innovation projects, to more clearly define the role and support this area
» Progressed the Competency Development System project to finalise a competency framework. The project included the commencement of a pilot implementation in the functional areas of Financial Services, Project/Contract Management and Organisational Development
» Development of an online Employee Development System. The new system will automate – Individual Development Planning, Competency Development, 360 feedback surveys and training administration
» Endorsed the following staff development activities such as the Senior Manager and Executive Coaching Program, Inspiring Leadership Development Program, Executive Development Program, and Project Management Development Program and provided extensive training to staff in Accountable and Ethical Decision Making
There are 2 other non-executive standing members in this committee.
BuSInESS IMProvEMEnt coMMIttEE – MEEtInGS hELd: 4
EXECuTIvE MEMBERS
Peter Woronzow (Chair) – 4
John Erceg – 4
John Taya – 4
Doug Morgan – 4
» Ensures that business processes and systems are effective
» Promote efficient use of resources
» Supports sound Corporate Governance.
» Adoption, alignment and gap assessment of measures against Global Reporting Initiative and the Australian Business Excellence Framework
» Driving the development of a revamped intranet site, ‘iRoads’
» Reviewed, considered and endorsed the results from tracking business improvements arising from customer feedback complaints and analysis
» Oversight of the Third Party Certified Integrated Management System
» Oversight of organisational reviews including Outcome-Based Performance Measures and Effectiveness of the Operations of Corporate Executive
There are 3 other non-executive standing members in this committee.
MAnAGEMEnt rEvIEw And AudIt coMMIttEE – MEEtInGS hELd: 4
EXECuTIvE MEMBERS
Menno Henneveld (Chair) – 3
John Erceg – 3
Des Snook – 2
Peter Woronzow – 4
Doug Morgan – 4
» Considers the audits and reviews performed by the Management Review and Audit Branch
» Ensures audits and reviews are in accordance with the Annual Audit Plan
» Develops a three-year strategic audit plan.
» Health Checks on six of the seven Integrated Service Agreements
» Financial compliance audits of six of the seven Integrated Service Agreements
» Review of Main Roads’ Readiness for CHOGM
» Review of the Network Operations Plan and the Link to Main Roads’ Planning Processes
BudGEt coMMIttEE – MEEtInGS hELd: 14
EXECuTIvE MEMBERS
Peter Woronzow (Chair) – 13
John Erceg – 12
Des Snook – 10
Leo Coci – 12
Bob Philips – 9
Doug Morgan – 12
John Taya – 9
» Decision making body for Investment Planning, Program Development and Delivery
» Ensures the best use of funds to achieve strategic outcomes.
» Monitoring and actioning budgetary and financial matters including program strategies and structures to deliver outcomes linked with Government objectives
» Provision of strategic direction for project development funding and activities
» Supervision of transitional arrangements in preparation for new maintenance delivery arrangements
» Supervision of managed transfer of assets between State and Local Government
» Approval of the final four-year and 10-year program submissions to Department of Treasury
corPorAtE SAfEty, hEALth And wELLBEInG coMMIttEE – MEEtInGS hELd: 10
EXECuTIvE MEMBERS
Doug Morgan (Chair) – 10
John Erceg – 8
Des Snook – 7
Leo Coci – 10
Peter Woronzow – 9
John Taya – 10
Iain Cameron – 9
» Presides over all safety, health and wellbeing issues from high level strategy through to review of individual incidents
» Acts as a primary Occupational Safety and Health channel and reports on full-time and contracted employees to Corporate Executive.
» Maintaining certification to AS 4801
» Further development and implementation of a suite of positive indicators based on proactive safety, health and wellbeing behaviour
» Continued coordination and review of the OSH management system to facilitate continuous improvement
» Integration of wellbeing into the existing safety and health management system as part of a holistic approach to OSH management
» Develop a community of OSH Practitioners that contributes to our OSH Principles and Objectives
There are 10 other non-executive standing members in this committee.
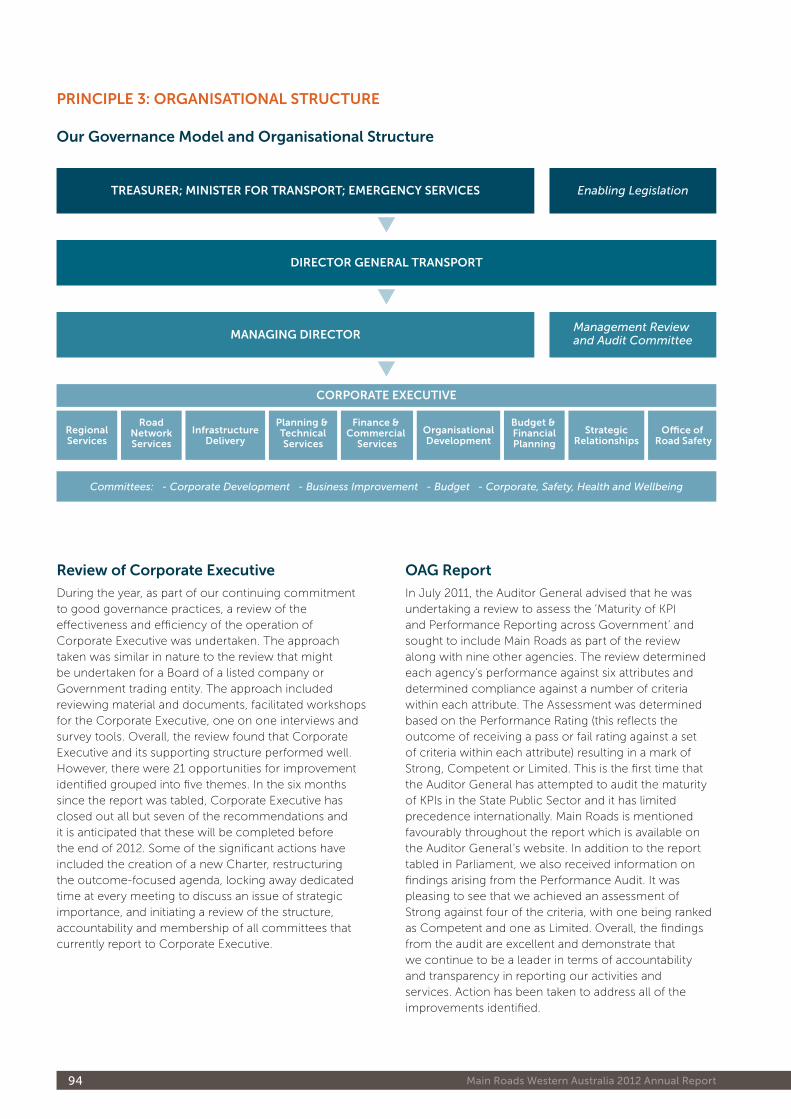
94 Main Roads Western Australia 2012 Annual Report
review of corporate Executive
During the year, as part of our continuing commitment to good governance practices, a review of the effectiveness and efficiency of the operation of Corporate Executive was undertaken. The approach taken was similar in nature to the review that might be undertaken for a Board of a listed company or Government trading entity. The approach included reviewing material and documents, facilitated workshops for the Corporate Executive, one on one interviews and survey tools. Overall, the review found that Corporate Executive and its supporting structure performed well. However, there were 21 opportunities for improvement identified grouped into five themes. In the six months since the report was tabled, Corporate Executive has closed out all but seven of the recommendations and it is anticipated that these will be completed before the end of 2012. Some of the significant actions have included the creation of a new Charter, restructuring the outcome-focused agenda, locking away dedicated time at every meeting to discuss an issue of strategic importance, and initiating a review of the structure, accountability and membership of all committees that currently report to Corporate Executive.
oAG report
In July 2011, the Auditor General advised that he was undertaking a review to assess the ‘Maturity of KPI and Performance Reporting across Government’ and sought to include Main Roads as part of the review along with nine other agencies. The review determined each agency’s performance against six attributes and determined compliance against a number of criteria within each attribute. The Assessment was determined based on the Performance Rating (this reflects the outcome of receiving a pass or fail rating against a set of criteria within each attribute) resulting in a mark of Strong, Competent or Limited. This is the first time that the Auditor General has attempted to audit the maturity of KPIs in the State Public Sector and it has limited precedence internationally. Main Roads is mentioned favourably throughout the report which is available on the Auditor General’s website. In addition to the report tabled in Parliament, we also received information on findings arising from the Performance Audit. It was pleasing to see that we achieved an assessment of Strong against four of the criteria, with one being ranked as Competent and one as Limited. Overall, the findings from the audit are excellent and demonstrate that we continue to be a leader in terms of accountability and transparency in reporting our activities and services. Action has been taken to address all of the improvements identified.
PrIncIPLE 3: orGAnISAtIonAL StructurE
our Governance Model and organisational Structure
TREASURER; MINISTER FOR TRANSPORT; EMERGENCY SERVICES Enabling Legislation
DIRECTOR GENERAL TRANSPORT
MANAGING DIRECTOR
CORPORATE EXECUTIVE
Management Review and Audit Committee
Committees: - Corporate Development - Business Improvement - Budget - Corporate, Safety, Health and Wellbeing
RegionalServices
RoadNetworkServices
InfrastructureDelivery
Planning & TechnicalServices
Finance & Commercial
ServicesOrganisationalDevelopment
Budget & FinancialPlanning
StrategicRelationships
O�ce of Road Safety
95 Governance: Our Principles
Silver Award for Business Excellence
Main Roads received a prestigious Silver Award as part of the 2011 Australian Business Excellence Awards. Only two Excellence Awards were granted in 2011 with Main Roads receiving the highest accolade. For 22 years, the Australian Business Excellence
Awards have been recognising outstanding achievement on the journey to excellence by Australian organisations both large and small. To be recognised, organisations are independently assessed by a review panel against a set of internationally recognised criteria demonstrating a commitment to sustainable results, leadership and people. The framework is amongst the world’s most rigorous business excellence models and our most recent success builds on our June 2007 achievement when we received recognition at the Bronze level. The result demonstrates that by working together we are continuing to achieve excellence as an organisation and moving close to achieving our vision of providing excellent customer service and world class road access.
Integrated Management System
We have adopted a systematic approach to business performance improvement based on quality management principles. The Integrated Management System brings together all of our third-party certified processes into a single structure. During the year we maintained certification of our entire Management System. Continuous improvement is the cornerstone of all of the management processes and procedures.
Current Certification
Standard Processes
Quality Management System ISO AS/NZS 9001:2008
Project Management, Contract Management, Supply, Corporate including Learning and Development, and Customer Service
Environmental Management System ISO AS/NZS 14001:2004
Environmental
Occupational Health and Safety Management System AS/NZS 4801:2001
Occupational Health and Safety
PrIncIPLE 4: oPErAtIonS
Main Roads is keeping a close watch on the development of new International Standards for Road Safety and Asset Management. We have people involved in the development and review of the direction being undertaken for each of the new standards and would be seeking to adopt them within our Integrated Management System at the earliest opportunity.
Procurement Policies and Procedures
Our procurement policies and procedures comply with the requirements of the State Supply Commission and are certified to AS/NZS 9001:2008. Policies are documented in the Procurement Management Manual and all tendering and contract administration procedures are documented in the Tendering and Contract Administration Manual. An ongoing compliance program is in place to ensure that these policies and procedures are implemented. A Tender Committee, consisting of two experienced senior officers from our organisation and two senior external Government officials provide additional assurance that procurement actions comply with policies and standards for high risk, potentially contentious procurements. In addition, we submit all Procurement Plans and Tender Recommendations for Goods and Services arrangements over $5 million for review and endorsement by the WA Government’s State Tender Review Committee.
Better Business Project
This project is our innovative response to the 3% Efficiency Dividend brought in by the WA State Government in 2009 during the global economic downturn. We conducted an organisation-wide consultation to identify improvements and efficiencies to the way we run our business and identified 106 Better Business recommendations. 70% if the Better Business efficiencies have now been comnpleted.
One of Better Business's aims was to ensure that we have the flexibility, culture and right capabilities to meet the communities future needs. To achieve this, we have concentrated on:
» Identifying opportunities to increase capability and skills development
» Providing a single point for information on all period and panel contracts
» Process improvements have been seen across the board
» Knowledge sharing initiatives have been developed to help spread innovative practices and ideas.
96 Main Roads Western Australia 2012 Annual Report
Sustainable Procurement and Buy Local
The State Supply Commission Policy on sustainable procurement requires us to demonstrate that we have considered sustainability in our procurement of goods and services. We have gone beyond the requirements of this policy to reflect this in not only our processes for procuring goods and services but also in procuring works. In addition, we apply the Buy Local Policy where we consider and give preference to local providers in our purchases as the benefits to industry development and employment are recognised. Buy Local Policy clauses are also included in all our tender documents and tender assessments. Reporting for Buy Local is extracted from information contained within the Department of Finance’s ‘Tenders WA’ website. Data is not yet available for the current year.
2009-10 2010-11
Metro Regional Metro Regional
Awarded to businesses located within the ‘prescribed distance’ of a regional delivery point as defined in the Buy Local Policy
n/a 40% n/a 60%
Awarded to a ‘local business’ as defined in the Buy Local Policy (Target 80%)
100% 97% 98% 93%
financial targets: Actuals compared to Budget
The following table provides a comparison of the financial targets and outcomes against criteria included in the Resource Agreement between the Commissioner of Main Roads, Minister of Transport and the Treasurer.
2011-12 Target(1) $000
2011-12 Actual $000
Variation(2) $000
Total Cost of Services
1,549,776 1,503,54246,234
Net Cost of Services
996,543 840,203156,340
Total Equity 42,240,829 40,925,987 1,314,842
Net increase / (decrease) in cash held
31,465 204,525 (173,060)
Notes:
(1) As specified in the latest budgets statements relating to estimates for 2011-12.
(2) Explanations of variations:
(a) The variations in relation to Total Cost of Services can be mainly attributed to claims by Local Government for road project grants being lower than expected, as well as some delays in major capital projects as a result of contract award issues, and unfavourable weather conditions.
(b) The variation in Net Cost of Services relates to advanced Commonwealth grants received under the Nation Building program, as well as some delays in major capital projects as a result of contract award issues, and unfavourable weather conditions.
(c) The variation in relation to Total Equity relates mainly to revaluation decreases in the value of Land Under Road Reserves required under Accounting Standards to prevailing market based written down replacement costs.
(d) The increase in cash being higher than budgeted can be attributed to advanced Commonwealth grants received under the Nation Building program, as well as some delays in major capital projects as a result of contract award issues, and unfavourable weather conditions.
Further explanations are also contained at Note 41 of the Financial Statements.
relationships with Suppliers
We have a procedure in place for dealing with procurement grievances which is referenced in all tender documents and a copy is accessible from our website. The procedure has been endorsed by the Western Australian Road Construction and Maintenance Industry Advisory Group and provides for a customer-focused, fair, structured and relationship-based approach to reviewing grievances lodged by contractors. During the year two grievances were received and these have been closed out. The grievances did not highlight any common areas of concern. The low number of grievances, which represented less than 1% of all contracts awarded, is consistent with previous years and indicates that our procurement processes continue to be fair and equitable. The table below lists our major suppliers/contractors and their award value over the past year.
Major Suppliers/Contractors 2011-12 Award Value (GST Excl)
Macmahon Contractors Pty Ltd $398.0 million
John Holland Pty Ltd $98.2 million
Abigroup Contractors Pty Ltd $92.6 million
Fulton Hogan Pty Ltd $53.4 million
Albem Highway Joint venture $18.5 million
Fulton Hogan Industries Pty Ltd $12.6 million
Intersectional Linemarkers Pty Ltd $12.5 million
Supalux Paint Company Pty Ltd $12.5 million
GHD Pty Ltd (Perth) $6.3 million
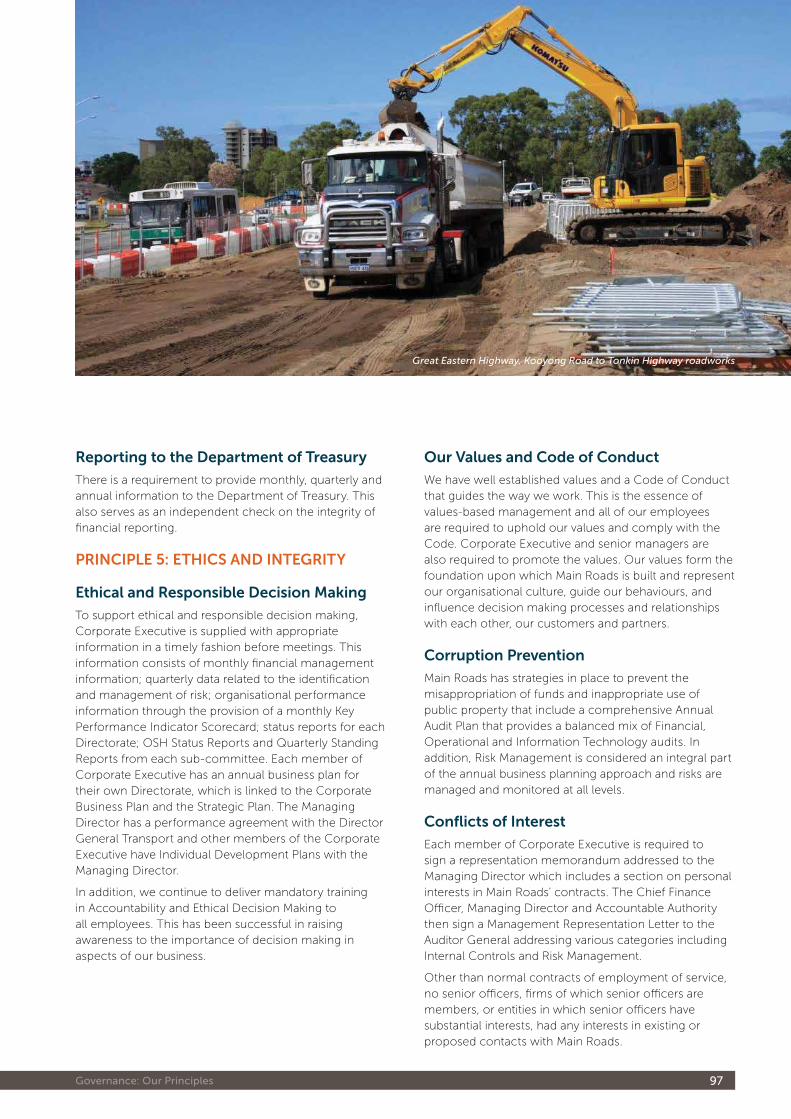
97 Governance: Our Principles
reporting to the department of treasury
There is a requirement to provide monthly, quarterly and annual information to the Department of Treasury. This also serves as an independent check on the integrity of financial reporting.
PrIncIPLE 5: EthIcS And IntEGrIty
Ethical and responsible decision Making
To support ethical and responsible decision making, Corporate Executive is supplied with appropriate information in a timely fashion before meetings. This information consists of monthly financial management information; quarterly data related to the identification and management of risk; organisational performance information through the provision of a monthly Key Performance Indicator Scorecard; status reports for each Directorate; OSH Status Reports and Quarterly Standing Reports from each sub-committee. Each member of Corporate Executive has an annual business plan for their own Directorate, which is linked to the Corporate Business Plan and the Strategic Plan. The Managing Director has a performance agreement with the Director General Transport and other members of the Corporate Executive have Individual Development Plans with the Managing Director.
In addition, we continue to deliver mandatory training in Accountability and Ethical Decision Making to all employees. This has been successful in raising awareness to the importance of decision making in aspects of our business.
our values and code of conduct
We have well established values and a Code of Conduct that guides the way we work. This is the essence of values-based management and all of our employees are required to uphold our values and comply with the Code. Corporate Executive and senior managers are also required to promote the values. Our values form the foundation upon which Main Roads is built and represent our organisational culture, guide our behaviours, and influence decision making processes and relationships with each other, our customers and partners.
corruption Prevention
Main Roads has strategies in place to prevent the misappropriation of funds and inappropriate use of public property that include a comprehensive Annual Audit Plan that provides a balanced mix of Financial, Operational and Information Technology audits. In addition, Risk Management is considered an integral part of the annual business planning approach and risks are managed and monitored at all levels.
conflicts of Interest
Each member of Corporate Executive is required to sign a representation memorandum addressed to the Managing Director which includes a section on personal interests in Main Roads’ contracts. The Chief Finance Officer, Managing Director and Accountable Authority then sign a Management Representation Letter to the Auditor General addressing various categories including Internal Controls and Risk Management.
Other than normal contracts of employment of service, no senior officers, firms of which senior officers are members, or entities in which senior officers have substantial interests, had any interests in existing or proposed contacts with Main Roads.
Great Eastern Highway, Kooyong Road to Tonkin Highway roadworks
98 Main Roads Western Australia 2012 Annual Report
our recruitment Guidelines
Our objective is to recruit the most suitable people through a fair and equitable process and in a cost effective and timely manner. Our recruitment framework complies with the Public Sector Commissioner’s Employment Standard and the Commissioner’s Instruction on Filling a Public Sector vacancy and is based on the principles of Merit, Equity, Interest and Transparency.
We are currently in the process of identifying trends from Exit interviews to formulate a Retention Policy.
Equal Employment opportunity Management Plan 2011-2015
Main Roads considers diversity to be respecting, recognising and utilising the many different backgrounds, skills, talents and perspectives of our workforce. The Equal Employment Opportunity (EEO) Management Plan is developed in accordance with Part IX of the Equal Opportunity Act 1984 and is aligned to the Office of Equal Employment Opportunity’s outcome standards framework:
1. The organisation values EEO/diversity and the work environment is freed from racial and sexual harassment.
2. Workplaces are free from employment practices that are biased or discriminate unlawfully against employees or potential employees.
3. Employment programs and practices recognise and include strategies for EEO groups to achieve workforce diversity.
In 2012, we saw a focus on providing more opportunities for women to be appointed to management positions. For more information, please refer to the Our People section, page 74.
During the next five years, we will focus on the following specific areas of focus: Women in Management, Aboriginal and Torres Strait Islander groups, Youth, People with Disabilities and People from Culturally Diverse Backgrounds. As a ‘live’ document, the plan will continue to be developed and updated. This ensures that Main Roads attracts, selects, motivates, develops and retains a skilled, diverse group of employees. The Equity Index table below shows how we track areas of diversity.
Areas of Diversity2010 2011 2012
Representation Index Representation Index Representation Index
Women 27.7% 52.5 28.6% 54.9 29.8% 54.8
Culturally Diverse Background
10% 104 9.8% 106.1 9.3%114.3
People with Disabilities 2.20% 71.2 1.8% 79.1 1.5% 80.3
Indigenous Australians 1.10% 21.1 0.9% 21.1 0.9% 17.1
PrIncIPLE 6: PEoPLE
Individual development Plan
The Individual Development Plan (IDP) identifies developmental needs of employees and allows for discussion on career planning and progression. It also provides the opportunity to identify how employees specifically contribute towards our Strategic Plan and how personal behaviours reflect our values. At a corporate level, the data collected from the IDP is used to identify and manage skill gaps across the organisation. used together with workforce planning data, the information is used to develop corporate programs and short-course training.
During the year, 62% of the eligible workforce completed an annual Individual Development Plan. Whilst IDP completion was not as high as the previous year, a high degree of access to targeted learning and development opportunities was sustained.
The focus has been on planning for the future through the identification and procurement of a new online system to better support the individual development process. The new system, due for delivery in the second quarter of 2012-13, will provide a fully-automated individual development and career plan, 360 Feedback capture, and a fully functional learning management system. With a greater range of data collection and reporting available to managers, the system will provide new tools for individuals and managers to enhance their competencies, work performance and careers. By making the process easier for the employees it is anticipated that higher completion rates will ensue, resulting in more accurate information used for needs analysis.
99 Governance: Our Principles
compliance with Public Sector Standards and Ethical codes
Compliance issues that arose during the year regarding the Public Sector Standards included lodgment of four breach claims against recruitment, selection and appointment processes and one against the Grievance Standard. In all cases, these breaches were received through standard processed and were subsequently dismissed. Every year we take steps to enhance processes to ensure compliance including:
» Providing information about Public Sector Standards and Codes of Conduct on our intranet and including this information in induction material
Accounting and financial Management Policies
A comprehensive Accounting Manual containing accounting and financial management policies and procedures is maintained. It communicates accountability for procedures within various responsibility areas and enhances the level of internal control. The Manual enables management as well as internal and external auditors to monitor compliance with established procedures and, together with the Financial Management Act 2006 and the Treasurer’s Instructions, is available online to all employees.
capital works
All disclosures in relation to capital works are included in the Financial Statements.
Main Roads Strategic Asset Management Plan, produced annually, details our 10-year investment needs and drivers. The Strategic Asset Plan adheres to WA Treasury’s Strategic Asset Management Framework. We assess projects for funding based on their economic, environment and social impacts. Each capital project follows the national Austroads project evaluation methodology where a Benefit Cost Ratio (BCR) must be conducted. This incorporates quantifiable economic data and is supplemented by simplified economic, environmental and social assessments. The BCR records information on the benefits of a project on travel time savings, vehicle operating costs and smoother travel, safety, and maintenance. Other benefits and costs are considered via a multi-criteria analysis.
Internal Audit
A comprehensive system of internal controls is in place to ensure that there is an appropriate division of responsibilities to safeguard the assets and financial interests of the organisation. The Management Review and Audit Branch regularly assess the adequacy of internal controls within the organisation by conducting audits of our financial and management information systems in accordance with an Annual Audit Plan.
Statutory Audit
The annual independent external audit on controls, compliance and assurance is carried out by the Auditor General of Western Australia, in accordance with the Auditor General Act 2006. The Auditor General’s opinion is addressed to both Houses of the Parliament of Western Australia.
Management reporting
Financial reports are tabled monthly and quarterly at the Budget Committee which comprises all Executive Directors and is chaired by the Chief Finance Officer. Key financial highlights are reported monthly to Corporate Executive along with progress against Key Financial Performance Indicators.
Pricing Policies of Services Provided
The supply of goods and services we undertake represents works and services carried out for other public sector and private bodies on a cost recovery basis. Further details are available in the Notes to the Financial Statements.
PrIncIPLE 7: fInAncE
» Correspondence to applicants for recruitment, selection and appointment processes with details on how to access the Public Sector Standards
» Ongoing training provided to recruitment and selection panel members to ensure compliance with relevant Public Sector Standards
» Providing an experienced independent person for all recruitment and selection panels
» Providing a network of Grievance Officers across the State
» Reviewing and auditing all recruitment, selection and appointment processes both permanent and temporary, to ensure compliance with Public Sector Standards.
100 Main Roads Western Australia 2012 Annual Report
records Keeping
The State Records Act (2000) requires that we maintain a Records Keeping Plan. The Plan has been approved by the State Records Commission and reflects our current functions. We meet the requirement to undertake efficiency and effectiveness of our record-keeping systems not less than once every five years. The following is a summary of compliance requirements and achievements during the year.
1. Policies and Procedures Updated:
» Term Network Contracts (TNC) has been replaced by Integrated Services Arrangements and a new Code of Practice and Policies to manage contract records has been created. A review is being conducted on the close-out arrangements for TNC to ensure that relevant records are captured and accessible.
» Invoice processing will be a Records Keeping function when the Office of Shared Services is decommissioned. Preparations have commenced for processes involved with invoice processing such as documenting procedures, identifying resource requirements, and compliance in the management of source records in liaison with other government agencies and shared services.
» Development of a Records’ Social Media Strategy has commenced as we continue to work towards being better positioned to embrace a broader electronic environment. Technological development has had a major impact on record keeping and we continue to respond to new developments.
» Areas for improvement identified in the Records Keeping Plan are addressed progressively, in particular, improving storage facilities. These changing needs will be taken into consideration when designing our new Regional Offices.
» The Records Disaster Recovery and Management Plan is distributed Statewide, addressing requirements for our Regional and Site Offices. The vital Records Register and Mitigation strategies are being finalised.
» The Archiving/ Disposal program continues to be undertaken.
» Fact sheets, guidelines, procedures and policies continue to be developed, updated and promoted to assist staff. This is with particular emphasis in the last year on new ISA staff.
2. Record Keeping and TRIM Training
» An extensive TRIM training program has been created for ISA staff with more than 370 staff attending training sessions.
» A TRIM ‘n’ Win training program was developed and trialed where a suite of short subject specific courses was delivered. The effectiveness of this course is currently under review and, subject to improvements, will be progressively rolled out to branches.
» Our induction program addresses employee record keeping responsibilities, compliance with our record keeping plan, and mandatory Record Keeping Awareness and TRIM Online courses for all new starters. Handout brochures and the Induction Checklist have been updated. In addition, updates and tips are regularly provided in our Statewide newsletter, Weekly Roads Wrap.
» Documents placed on our website and our new iRoads Intranet site are required to be registered and kept updated in TRIM. Training is provided for this process.
3. Reinforcing Record Keeping Practices
» To address Main Roads’ future corporate record keeping requirements, we held a workshop for 60 invited stakeholders. Outcomes were reported in a Business Case for the Review of Services and Functions and the identified issues are addressed through a range of improvement projects.
» Central Records provides a Help Desk Facility to assist with TRIM EDMS technical operational problems which handles almost 9,000 requests for assistance per annum. TRIM remote assistance is provided and continues to be well received by customers.
» We have commenced monthly meetings with IT Managers, discussing and resolving technical TRIM and Records-related issues.
» An Internal Auditor continues to monitor and provide feedback on our record-keeping practices, in particular the management of contract records, with the assistance of checklists.
» The Annual Records’ Seminar was well received with the feedback indicating that the seminar is a good forum for exploring common issues and provided an opportunity to meet and learn from others.
» We utilise feedback and statistics collected from staff to measure record keeping effectiveness and efficiency.
» Recognising the importance of Records Keeping, Main Roads has recruited a second Records’ graduate to undertake a Records Training Program over the next two years. We have also given recognition to Central Records’ Officers for their efforts in Records Keeping and training.
PrIncIPLE 8: coMMunIcAtIon
101 Governance: Our Principles
freedom of Information
Certain information can be obtained under the Freedom of Information Act 1992. An information statement, which has been produced in accordance with the requirements of the Act, is available on our website. The statement provides a guide on how to obtain information from us under the Act as well as information available without a formal application. During the year, we received 38 applications with the majority of applications related to potential third-party liability claims and land acquisitions matters associated with road projects. The table below provides further statistics on applications received:
Freedom of Information Applications
Year 2009–10 2010–11 2011-12
Received 47 38 46
Internally Reviewed 2 4 4
Externally Reviewed 2 2 0
Our Freedom of Information Coordinator can be contacted on 138 138.
Internal communications
‘Enhancing Internal Communication and Engagement: A Plan for Main Roads’ was created in 2011 to improve communication among and between managers, employees, branches, Directorates and regions. It addresses various facets of communication including formal and informal, written, visual, verbal, electronic and two-way communication and is designed to engage employees via a consultative process rather than simply providing information.
Key achievements since the introduction of the plan include:
» Holding three Organisational Development ‘X-Changes’ forums. They are designed to share knowledge and build relationships between Organisational Development and other business units across Main Roads. All regions have the opportunity to take part via teleconference and NetMeeting.
» The launch of ‘Main Roads WA Careers’ Facebook page, which complements our existing recruitment activities, provides the opportunity to highlight the career opportunities available and give prospective employees an understanding of what it is like to work at Main Roads. Members of the public are able to post questions and comments, a feature currently not offered by our static website. Primarily targeting the development employee market, it also offers information relevant to existing and prospective employees.
» The ‘Getting the Best Out of Your Communication’ training series was introduced in late 2011. These workshops are designed to enhance communication skills by giving participants an understanding of their own communication styles and enhance skills in communication to keep employees engaged and motivated. Four workshops have been held and were well received by the managers and employees who attended.
» Communication strategies have been developed for key corporate initiatives such as the ‘Main Roads 2020 Strategic Plan’. The ‘2020 Communication Plan’ included various actions designed to raise awareness and understanding of Main Roads’ strategic direction over the next eight years, including the utilisation of an intranet site, branding, articles, participation from key stakeholders and provision of two-way feedback opportunities.
» A communication plan template and checklist have been developed to assist employees to develop communication strategies. The internal communications function has also provided advice to various managers who are aiming to improve their communication across Main Roads.
We have in place a ‘Corporate Risk Management Policy and Procedure’ to identify, assess, monitor and manage risk throughout the organisation. Identified key risks and associated treatment plans are incorporated in the annual Directorate and Branch Business Plans and form part of the quarterly reporting cycle to Corporate Executive.
PrIncIPLE 9: rISK MAnAGEMEnt
102 Main Roads Western Australia 2012 Annual Report
KEy PErforMAncE IndIcAtorS
We hereby certify that the key performance indicators are based on proper records, are relevant and appropriate for assisting users to assess the Commissioner of Main Roads performance and fairly represent the performance of the Commissioner of Main Roads for the financial year ended 30 June 2012.
fInAncIAL StAtEMEntS
The accompanying financial statements of the Commissioner of Main Roads have been prepared in compliance with the provisions of the Financial Management Act 2006 from proper accounts and records to present fairly the financial transactions for the financial year ending 30 June 2012 and the financial position as at 30 June 2012.
At the date of signing we are not aware of any circumstances which would render the particulars included in the financial statements misleading or inaccurate.
Peter woronzow Chief Finance Officer 17 August 2012
Menno henneveld Managing Director of Main Roads 17 August 2012
reece waldock Accountable Authority 17 August 2012
PERFORMANCE MEASuRES AND FINANCIAL STATEMENTS
Statement of Certification
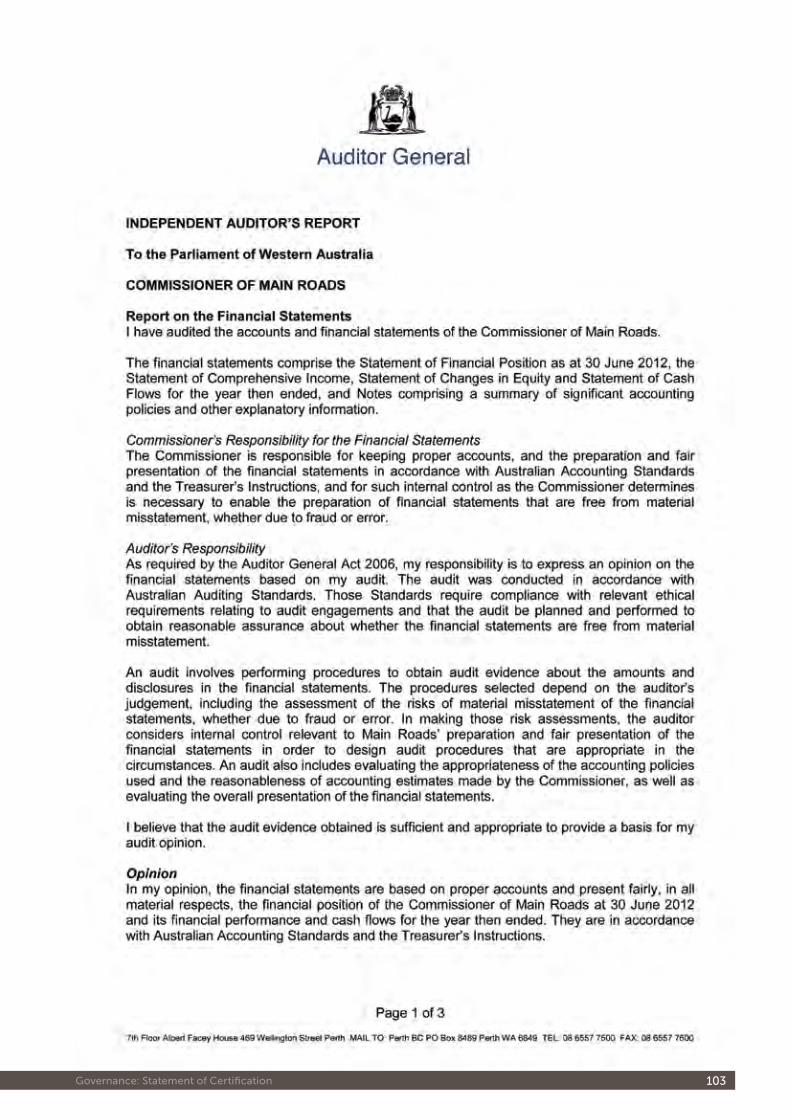
103 Governance: Statement of Certification
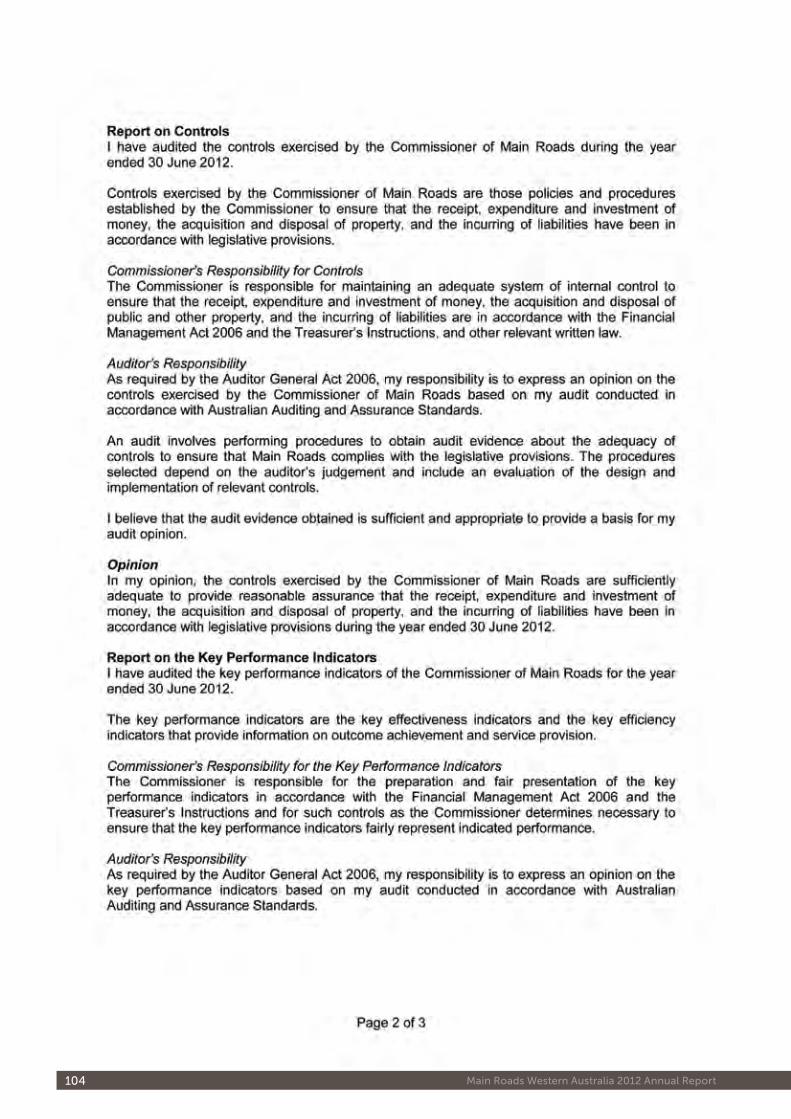
104 Main Roads Western Australia 2012 Annual Report
105 Governance: Statement of Certification
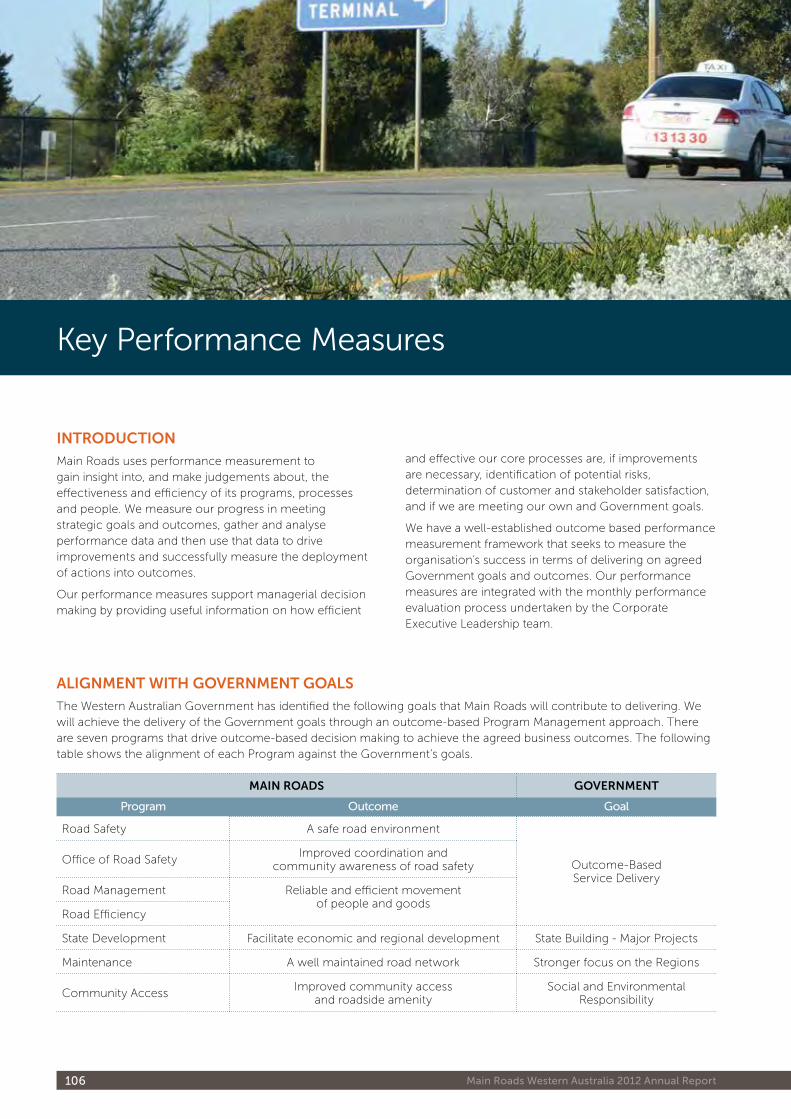
106 Main Roads Western Australia 2012 Annual Report
Key Performance Measures
ALIGnMEnt wIth GovErnMEnt GoALS
The Western Australian Government has identified the following goals that Main Roads will contribute to delivering. We will achieve the delivery of the Government goals through an outcome-based Program Management approach. There are seven programs that drive outcome-based decision making to achieve the agreed business outcomes. The following table shows the alignment of each Program against the Government’s goals.
MAIn roAdS GovErnMEnt
Program Outcome Goal
Road Safety A safe road environment
Outcome-Based Service Delivery
Office of Road SafetyImproved coordination and
community awareness of road safety
Road Management Reliable and efficient movement of people and goods
Road Efficiency
State Development Facilitate economic and regional development State Building - Major Projects
Maintenance A well maintained road network Stronger focus on the Regions
Community AccessImproved community access
and roadside amenitySocial and Environmental
Responsibility
IntroductIon
Main Roads uses performance measurement to gain insight into, and make judgements about, the effectiveness and efficiency of its programs, processes and people. We measure our progress in meeting strategic goals and outcomes, gather and analyse performance data and then use that data to drive improvements and successfully measure the deployment of actions into outcomes.
Our performance measures support managerial decision making by providing useful information on how efficient
and effective our core processes are, if improvements are necessary, identification of potential risks, determination of customer and stakeholder satisfaction, and if we are meeting our own and Government goals.
We have a well-established outcome based performance measurement framework that seeks to measure the organisation’s success in terms of delivering on agreed Government goals and outcomes. Our performance measures are integrated with the monthly performance evaluation process undertaken by the Corporate Executive Leadership team.
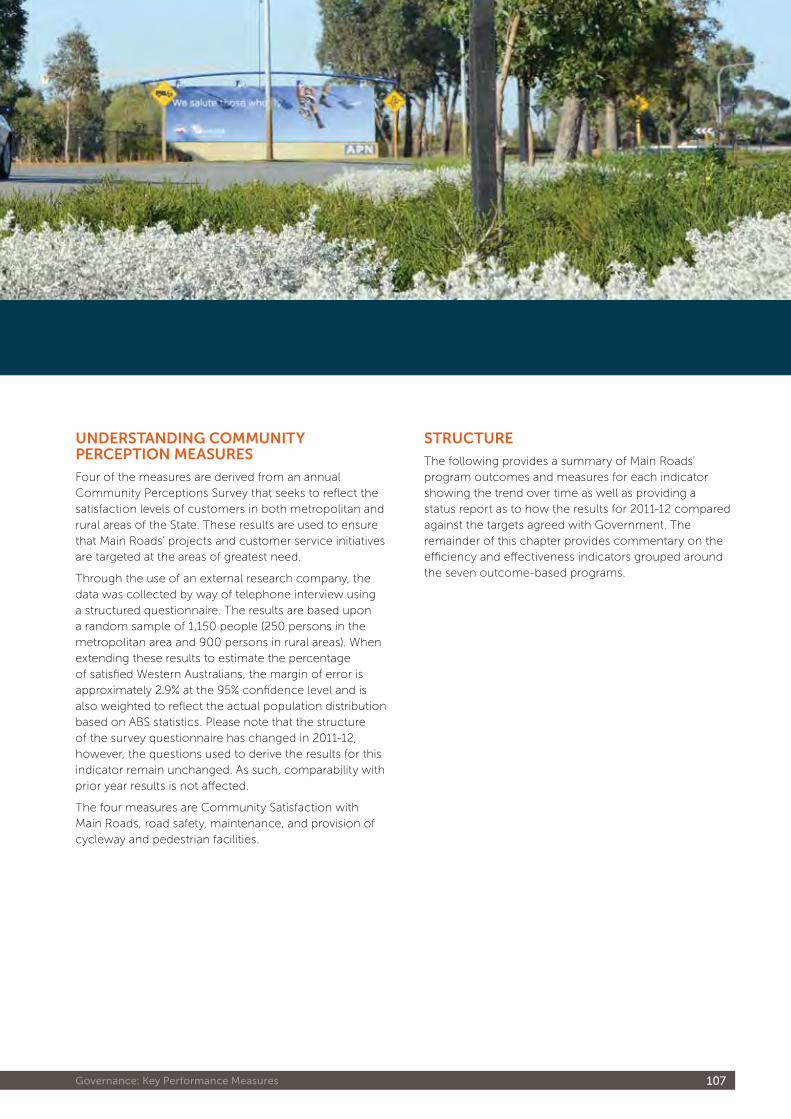
107 Governance: Key Performance Measures
undErStAndInG coMMunIty PErcEPtIon MEASurES
Four of the measures are derived from an annual Community Perceptions Survey that seeks to reflect the satisfaction levels of customers in both metropolitan and rural areas of the State. These results are used to ensure that Main Roads’ projects and customer service initiatives are targeted at the areas of greatest need.
Through the use of an external research company, the data was collected by way of telephone interview using a structured questionnaire. The results are based upon a random sample of 1,150 people (250 persons in the metropolitan area and 900 persons in rural areas). When extending these results to estimate the percentage of satisfied Western Australians, the margin of error is approximately 2.9% at the 95% confidence level and is also weighted to reflect the actual population distribution based on ABS statistics. Please note that the structure of the survey questionnaire has changed in 2011-12, however, the questions used to derive the results for this indicator remain unchanged. As such, comparability with prior year results is not affected.
The four measures are Community Satisfaction with Main Roads, road safety, maintenance, and provision of cycleway and pedestrian facilities.
StructurE
The following provides a summary of Main Roads’ program outcomes and measures for each indicator showing the trend over time as well as providing a status report as to how the results for 2011-12 compared against the targets agreed with Government. The remainder of this chapter provides commentary on the efficiency and effectiveness indicators grouped around the seven outcome-based programs.
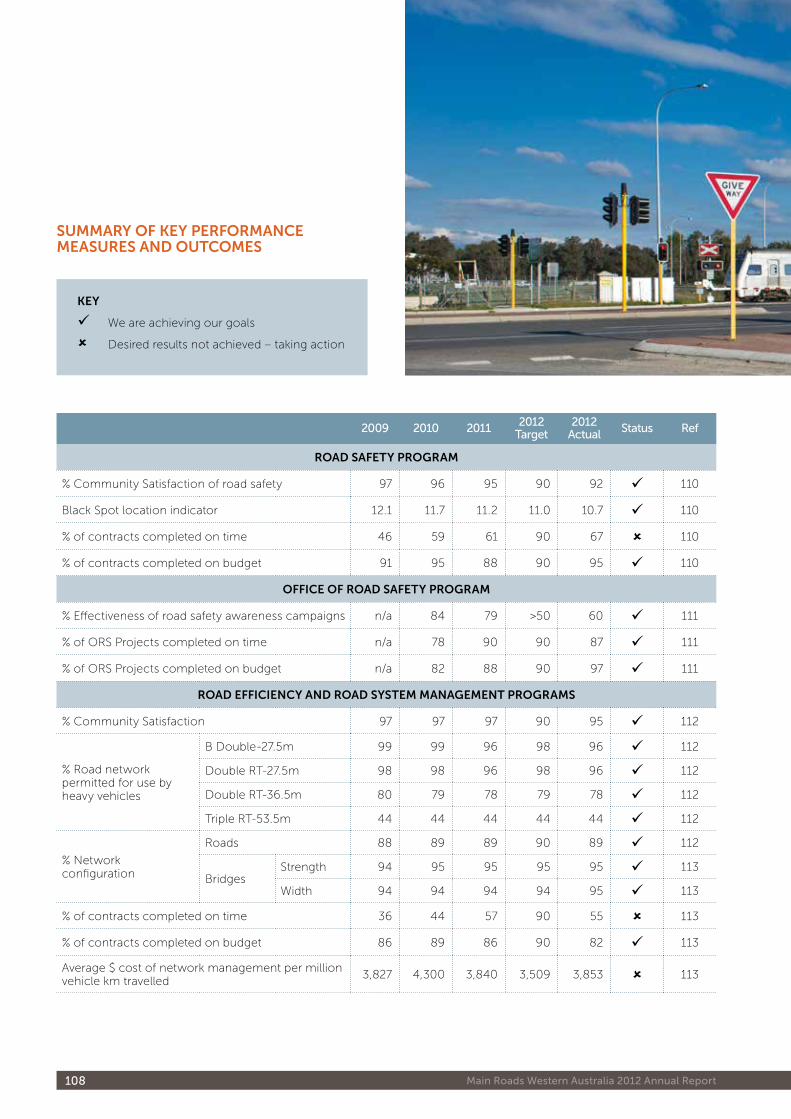
108 Main Roads Western Australia 2012 Annual Report
2009 2010 2011 2012 Target
2012 Actual Status Ref
roAd SAfEty ProGrAM
% Community Satisfaction of road safety 97 96 95 90 92 110
Black Spot location indicator 12.1 11.7 11.2 11.0 10.7 110
% of contracts completed on time 46 59 61 90 67 110
% of contracts completed on budget 91 95 88 90 95 110
offIcE of roAd SAfEty ProGrAM
% Effectiveness of road safety awareness campaigns n/a 84 79 >50 60 111
% of ORS Projects completed on time n/a 78 90 90 87 111
% of ORS Projects completed on budget n/a 82 88 90 97 111
roAd EffIcIEncy And roAd SyStEM MAnAGEMEnt ProGrAMS
% Community Satisfaction 97 97 97 90 95 112
% Road network permitted for use by heavy vehicles
B Double-27.5m 99 99 96 98 96 112
Double RT-27.5m 98 98 96 98 96 112
Double RT-36.5m 80 79 78 79 78 112
Triple RT-53.5m 44 44 44 44 44 112
% Network configuration
Roads 88 89 89 90 89 112
BridgesStrength 94 95 95 95 95 113
Width 94 94 94 94 95 113
% of contracts completed on time 36 44 57 90 55 113
% of contracts completed on budget 86 89 86 90 82 113
Average $ cost of network management per million vehicle km travelled
3,827 4,300 3,840 3,509 3,853 113
SuMMAry of KEy PErforMAncE MEASurES And outcoMES
KEy
We are achieving our goals
Desired results not achieved – taking action
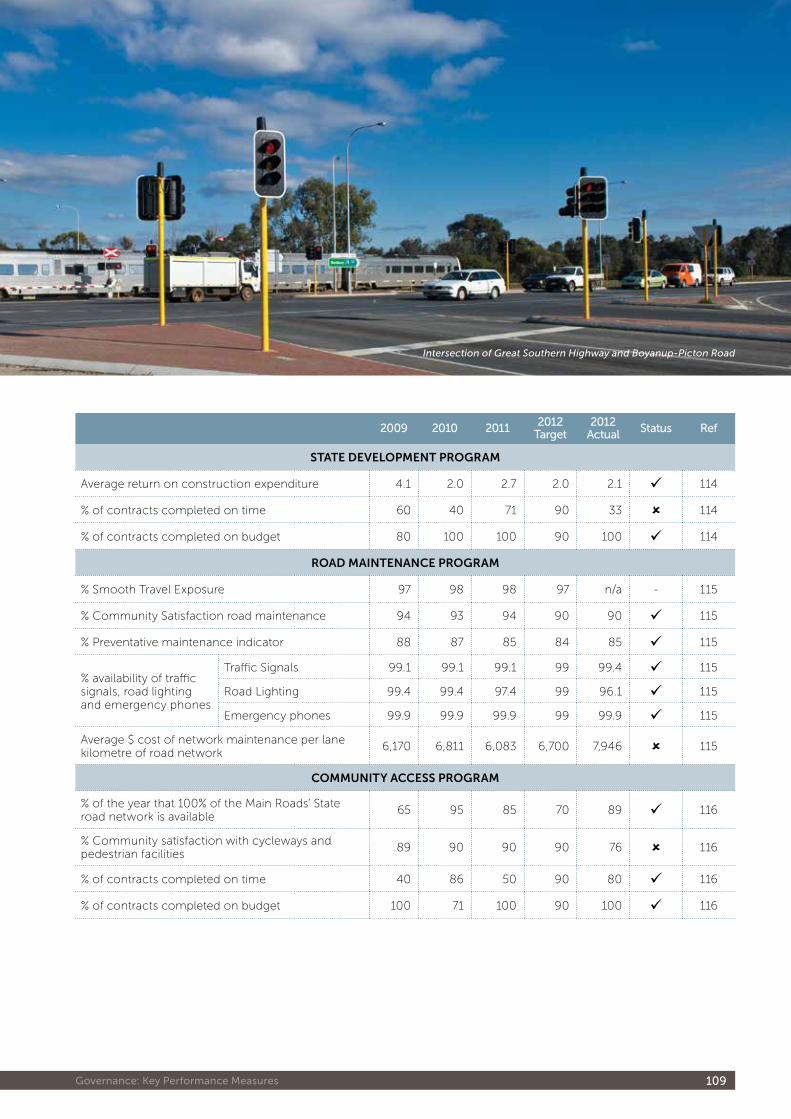
109 Governance: Key Performance Measures
2009 2010 2011 2012 Target
2012 Actual Status Ref
StAtE dEvELoPMEnt ProGrAM
Average return on construction expenditure 4.1 2.0 2.7 2.0 2.1 114
% of contracts completed on time 60 40 71 90 33 114
% of contracts completed on budget 80 100 100 90 100 114
roAd MAIntEnAncE ProGrAM
% Smooth Travel Exposure 97 98 98 97 n/a - 115
% Community Satisfaction road maintenance 94 93 94 90 90 115
% Preventative maintenance indicator 88 87 85 84 85 115
% availability of traffic signals, road lighting and emergency phones
Traffic Signals 99.1 99.1 99.1 99 99.4 115
Road Lighting 99.4 99.4 97.4 99 96.1 115
Emergency phones 99.9 99.9 99.9 99 99.9 115
Average $ cost of network maintenance per lane kilometre of road network
6,170 6,811 6,083 6,700 7,946 115
coMMunIty AccESS ProGrAM
% of the year that 100% of the Main Roads’ State road network is available
65 95 85 70 89 116
% Community satisfaction with cycleways and pedestrian facilities
89 90 90 90 76 116
% of contracts completed on time 40 86 50 90 80 116
% of contracts completed on budget 100 71 100 90 100 116
Intersection of Great Southern Highway and Boyanup-Picton Road
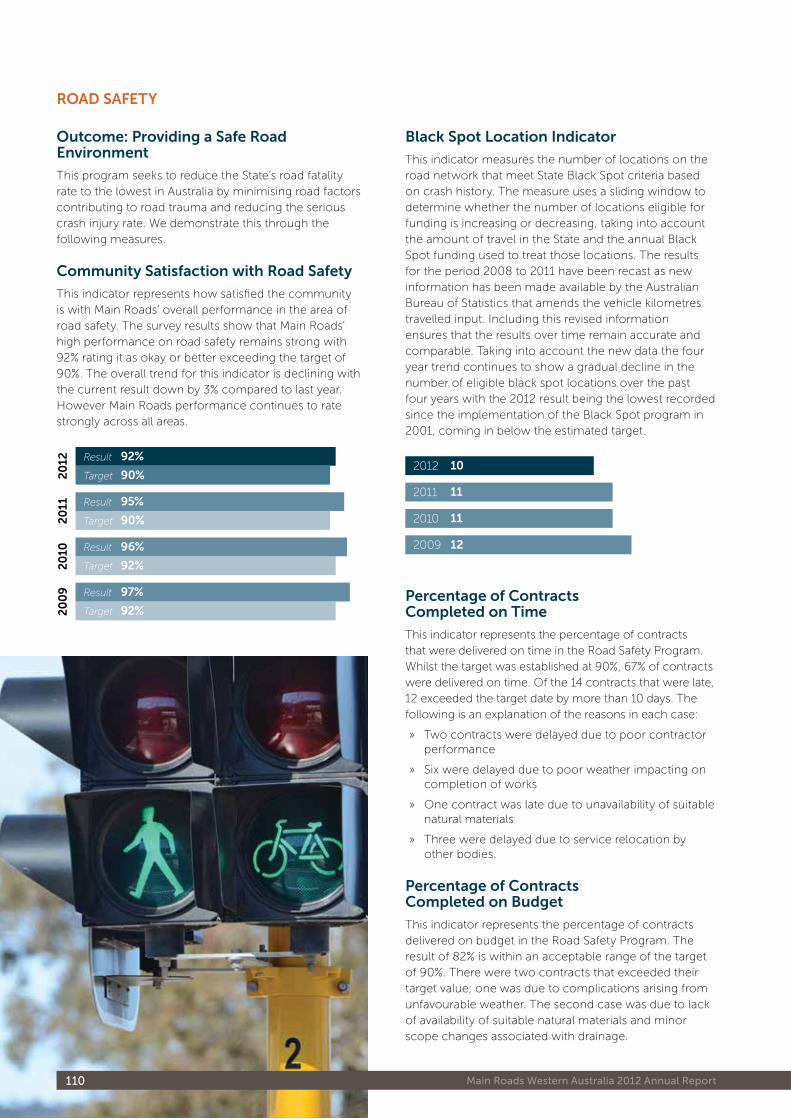
110 Main Roads Western Australia 2012 Annual Report
outcome: Providing a Safe road Environment
This program seeks to reduce the State’s road fatality rate to the lowest in Australia by minimising road factors contributing to road trauma and reducing the serious crash injury rate. We demonstrate this through the following measures.
community Satisfaction with road Safety
This indicator represents how satisfied the community is with Main Roads’ overall performance in the area of road safety. The survey results show that Main Roads’ high performance on road safety remains strong with 92% rating it as okay or better exceeding the target of 90%. The overall trend for this indicator is declining with the current result down by 3% compared to last year. However Main Roads performance continues to rate strongly across all areas.
20
09
20
102
011 95%
90%
92%
90%Target
Result
Target
Result
20
12
97%
92%
96%
92%Target
Result
Target
Result
Black Spot Location Indicator
This indicator measures the number of locations on the road network that meet State Black Spot criteria based on crash history. The measure uses a sliding window to determine whether the number of locations eligible for funding is increasing or decreasing, taking into account the amount of travel in the State and the annual Black Spot funding used to treat those locations. The results for the period 2008 to 2011 have been recast as new information has been made available by the Australian Bureau of Statistics that amends the vehicle kilometres travelled input. Including this revised information ensures that the results over time remain accurate and comparable. Taking into account the new data the four year trend continues to show a gradual decline in the number of eligible black spot locations over the past four years with the 2012 result being the lowest recorded since the implementation of the Black Spot program in 2001, coming in below the estimated target.
11
102012
2011
12
112010
2009
Percentage of contracts completed on time
This indicator represents the percentage of contracts that were delivered on time in the Road Safety Program. Whilst the target was established at 90%, 67% of contracts were delivered on time. Of the 14 contracts that were late, 12 exceeded the target date by more than 10 days. The following is an explanation of the reasons in each case:
» Two contracts were delayed due to poor contractor performance
» Six were delayed due to poor weather impacting on completion of works
» One contract was late due to unavailability of suitable natural materials
» Three were delayed due to service relocation by other bodies.
Percentage of contracts completed on Budget
This indicator represents the percentage of contracts delivered on budget in the Road Safety Program. The result of 82% is within an acceptable range of the target of 90%. There were two contracts that exceeded their target value; one was due to complications arising from unfavourable weather. The second case was due to lack of availability of suitable natural materials and minor scope changes associated with drainage.
roAd SAfEty
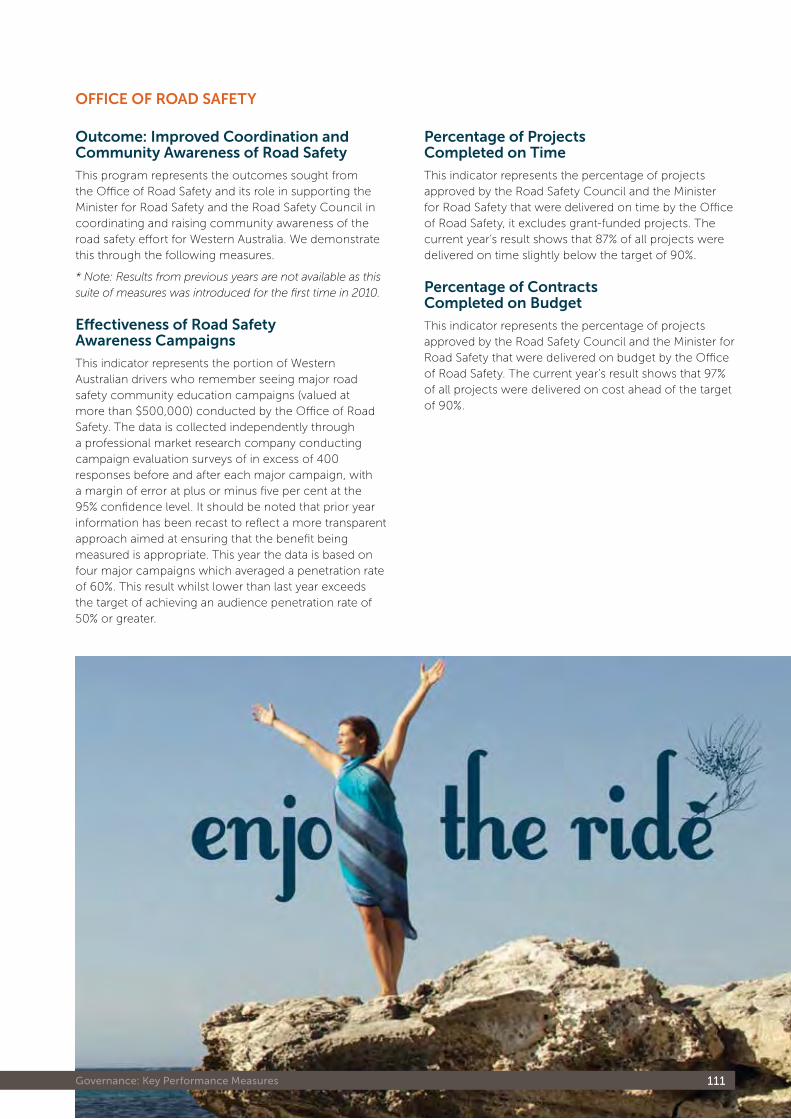
111 Governance: Key Performance Measures
outcome: Improved coordination and community Awareness of road Safety
This program represents the outcomes sought from the Office of Road Safety and its role in supporting the Minister for Road Safety and the Road Safety Council in coordinating and raising community awareness of the road safety effort for Western Australia. We demonstrate this through the following measures.
* Note: Results from previous years are not available as this suite of measures was introduced for the first time in 2010.
Effectiveness of road Safety Awareness campaigns
This indicator represents the portion of Western Australian drivers who remember seeing major road safety community education campaigns (valued at more than $500,000) conducted by the Office of Road Safety. The data is collected independently through a professional market research company conducting campaign evaluation surveys of in excess of 400 responses before and after each major campaign, with a margin of error at plus or minus five per cent at the 95% confidence level. It should be noted that prior year information has been recast to reflect a more transparent approach aimed at ensuring that the benefit being measured is appropriate. This year the data is based on four major campaigns which averaged a penetration rate of 60%. This result whilst lower than last year exceeds the target of achieving an audience penetration rate of 50% or greater.
Percentage of Projects completed on time
This indicator represents the percentage of projects approved by the Road Safety Council and the Minister for Road Safety that were delivered on time by the Office of Road Safety, it excludes grant-funded projects. The current year’s result shows that 87% of all projects were delivered on time slightly below the target of 90%.
Percentage of contracts completed on Budget
This indicator represents the percentage of projects approved by the Road Safety Council and the Minister for Road Safety that were delivered on budget by the Office of Road Safety. The current year’s result shows that 97% of all projects were delivered on cost ahead of the target of 90%.
offIcE of roAd SAfEty
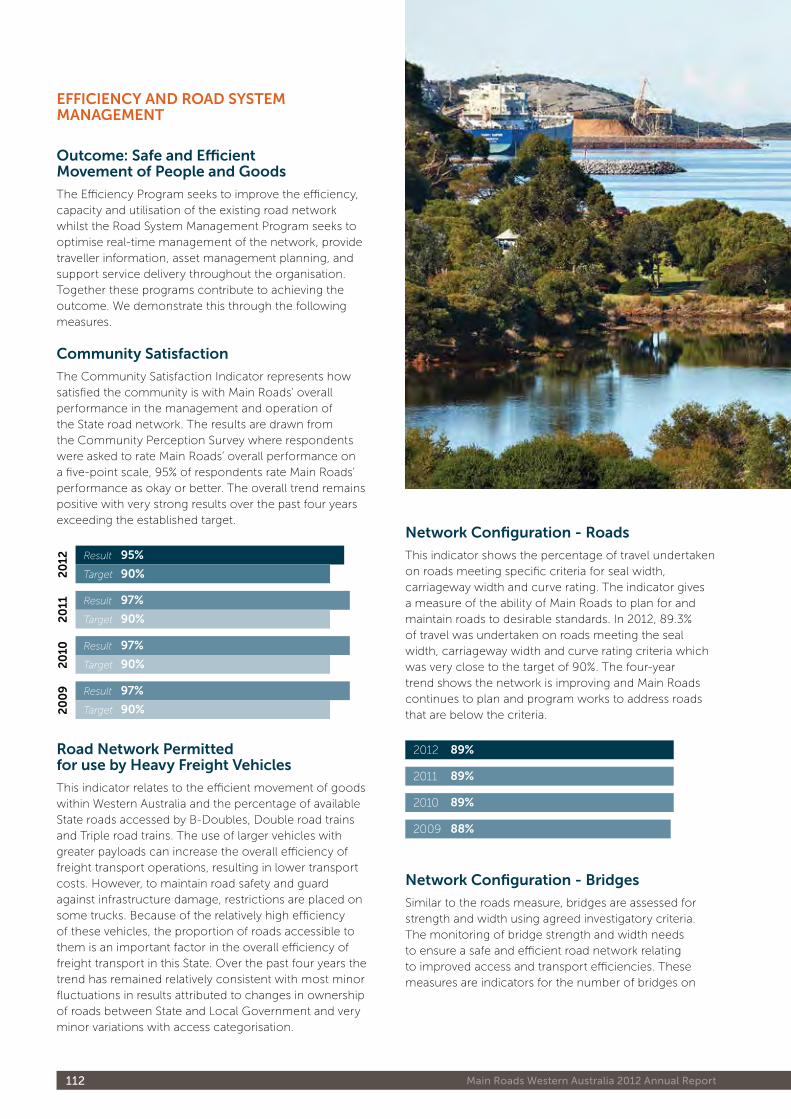
112 Main Roads Western Australia 2012 Annual Report
outcome: Safe and Efficient Movement of People and Goods
The Efficiency Program seeks to improve the efficiency, capacity and utilisation of the existing road network whilst the Road System Management Program seeks to optimise real-time management of the network, provide traveller information, asset management planning, and support service delivery throughout the organisation. Together these programs contribute to achieving the outcome. We demonstrate this through the following measures.
community Satisfaction
The Community Satisfaction Indicator represents how satisfied the community is with Main Roads’ overall performance in the management and operation of the State road network. The results are drawn from the Community Perception Survey where respondents were asked to rate Main Roads’ overall performance on a five-point scale, 95% of respondents rate Main Roads’ performance as okay or better. The overall trend remains positive with very strong results over the past four years exceeding the established target.
20
09
20
102
011 97%
90%
95%
90%Target
Result
Target
Result
20
12
97%
90%
97%
90%Target
Result
Target
Result
road network Permitted for use by heavy freight vehicles
This indicator relates to the efficient movement of goods within Western Australia and the percentage of available State roads accessed by B-Doubles, Double road trains and Triple road trains. The use of larger vehicles with greater payloads can increase the overall efficiency of freight transport operations, resulting in lower transport costs. However, to maintain road safety and guard against infrastructure damage, restrictions are placed on some trucks. Because of the relatively high efficiency of these vehicles, the proportion of roads accessible to them is an important factor in the overall efficiency of freight transport in this State. Over the past four years the trend has remained relatively consistent with most minor fluctuations in results attributed to changes in ownership of roads between State and Local Government and very minor variations with access categorisation.
EffIcIEncy And roAd SyStEM MAnAGEMEnt
network configuration - roads
This indicator shows the percentage of travel undertaken on roads meeting specific criteria for seal width, carriageway width and curve rating. The indicator gives a measure of the ability of Main Roads to plan for and maintain roads to desirable standards. In 2012, 89.3% of travel was undertaken on roads meeting the seal width, carriageway width and curve rating criteria which was very close to the target of 90%. The four-year trend shows the network is improving and Main Roads continues to plan and program works to address roads that are below the criteria.
89%
89%2012
2011
88%
89%2010
2009
network configuration - Bridges
Similar to the roads measure, bridges are assessed for strength and width using agreed investigatory criteria. The monitoring of bridge strength and width needs to ensure a safe and efficient road network relating to improved access and transport efficiencies. These measures are indicators for the number of bridges on
Princess Royal Drive, Albany
113 Governance: Key Performance Measures
main roads and highways. Therefore, the percentage of bridges meeting these network configuration criteria should continue to rise but only slightly in future years. All bridges that do not meet the investigatory criteria for strength or width are considered in assessing, scoping and prioritising works, as part of the 10-year bridge strategy. The results of this indicator show that 95% of the bridges meet the agreed criteria for strength against a target of 95%. In relation to width, 95% of bridges meet the criteria against a target of 94%.
Percentage of contracts completed on time
This indicator represents the percentage of contracts that were delivered on time in the Road Efficiency Program. Whilst the target was established at 90%, 55% of contracts were delivered on time. Of the five contracts that were late, only three exceeded the target date by more than 10 days. The following is an explanation of the reasons in each case:
» Two contracts were delayed due to poor contractor performance. In one case the sub-contractor is no longer eligible to tender for Main Roads works. The second instance resulted in reduced payments due to remedial works being carried out by the Principal.
» One contract was late due to delays in service relocations.
Percentage of contracts completed on Budget
This indicator represents the percentage of contracts delivered on budget in the Road Efficiency Program. The result of 82% is within an acceptable range of the target of 90%. There were two contracts that exceeded their target value: one was due to complications arising from unfavourable weather; the second was due to lack of availability of suitable natural materials and minor scope changes associated with drainage.
Average cost of network Management
This indicator measures the financial efficiency of the Road System Management program in terms of cost per million vehicle kilometres travelled to manage the road system. This measure has been calculated for the current and preceding three financial years in 2011-12 dollars. The overall four-year trend is inconsistent as this program includes occasional one-off development costs that can affect the overall results. In respect of the current year, the result of $3,853 per million vehicle kilometres travelled (mvkt) exceeds the target. The target was established using an estimate of mvkt. Now that the actual figures are available it is apparent that the estimate used to establish the target was overstated.
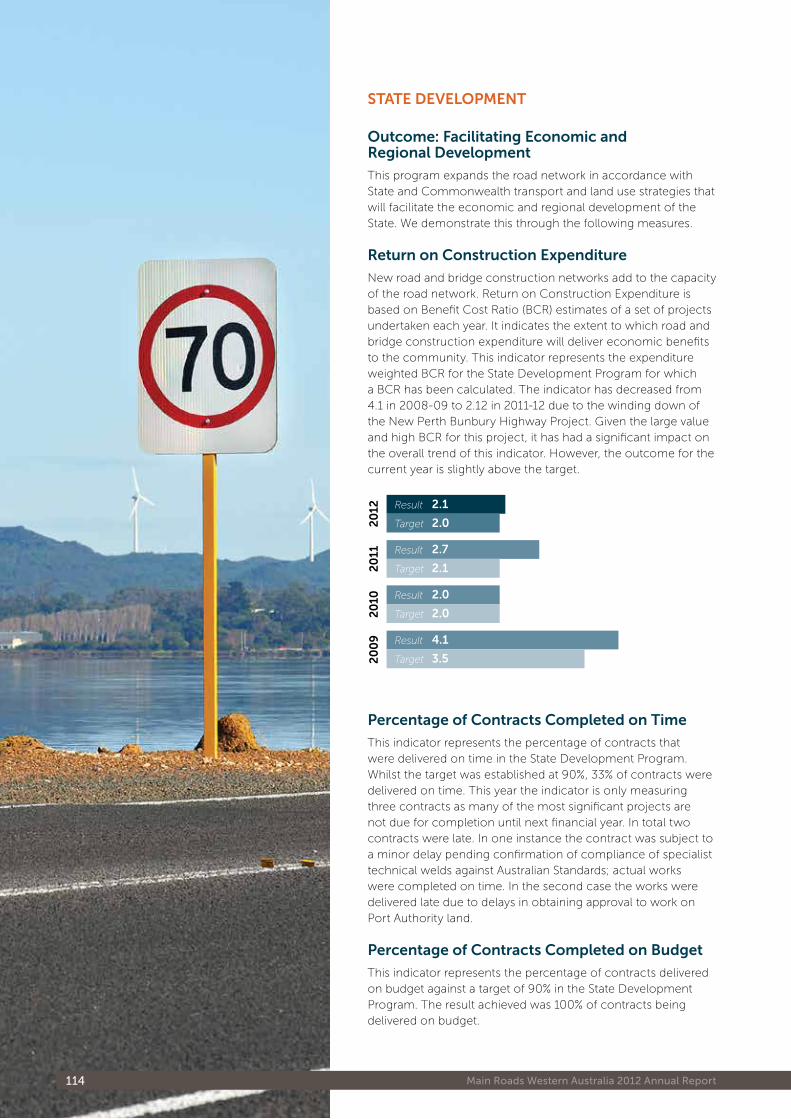
114 Main Roads Western Australia 2012 Annual Report
outcome: facilitating Economic and regional development
This program expands the road network in accordance with State and Commonwealth transport and land use strategies that will facilitate the economic and regional development of the State. We demonstrate this through the following measures.
return on construction Expenditure
New road and bridge construction networks add to the capacity of the road network. Return on Construction Expenditure is based on Benefit Cost Ratio (BCR) estimates of a set of projects undertaken each year. It indicates the extent to which road and bridge construction expenditure will deliver economic benefits to the community. This indicator represents the expenditure weighted BCR for the State Development Program for which a BCR has been calculated. The indicator has decreased from 4.1 in 2008-09 to 2.12 in 2011-12 due to the winding down of the New Perth Bunbury Highway Project. Given the large value and high BCR for this project, it has had a significant impact on the overall trend of this indicator. However, the outcome for the current year is slightly above the target.
20
09
20
102
011 2.7
2.1
2.1
2.0Target
Result
Target
Result
20
12
4.1
3.5
2.0
2.0Target
Result
Target
Result
Percentage of contracts completed on time
This indicator represents the percentage of contracts that were delivered on time in the State Development Program. Whilst the target was established at 90%, 33% of contracts were delivered on time. This year the indicator is only measuring three contracts as many of the most significant projects are not due for completion until next financial year. In total two contracts were late. In one instance the contract was subject to a minor delay pending confirmation of compliance of specialist technical welds against Australian Standards; actual works were completed on time. In the second case the works were delivered late due to delays in obtaining approval to work on Port Authority land.
Percentage of contracts completed on Budget
This indicator represents the percentage of contracts delivered on budget against a target of 90% in the State Development Program. The result achieved was 100% of contracts being delivered on budget.
StAtE dEvELoPMEnt
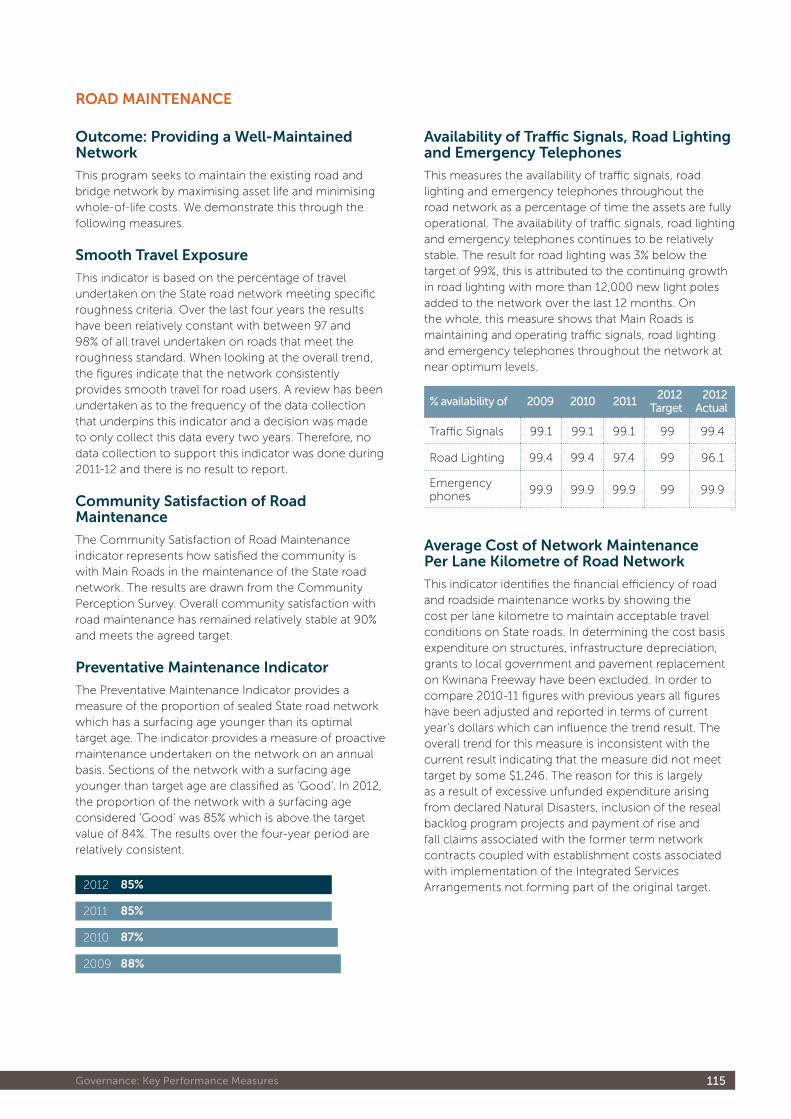
115 Governance: Key Performance Measures
outcome: Providing a well-Maintained network
This program seeks to maintain the existing road and bridge network by maximising asset life and minimising whole-of-life costs. We demonstrate this through the following measures.
Smooth travel Exposure
This indicator is based on the percentage of travel undertaken on the State road network meeting specific roughness criteria. Over the last four years the results have been relatively constant with between 97 and 98% of all travel undertaken on roads that meet the roughness standard. When looking at the overall trend, the figures indicate that the network consistently provides smooth travel for road users. A review has been undertaken as to the frequency of the data collection that underpins this indicator and a decision was made to only collect this data every two years. Therefore, no data collection to support this indicator was done during 2011-12 and there is no result to report.
community Satisfaction of road Maintenance
The Community Satisfaction of Road Maintenance indicator represents how satisfied the community is with Main Roads in the maintenance of the State road network. The results are drawn from the Community Perception Survey. Overall community satisfaction with road maintenance has remained relatively stable at 90% and meets the agreed target.
Preventative Maintenance Indicator
The Preventative Maintenance Indicator provides a measure of the proportion of sealed State road network which has a surfacing age younger than its optimal target age. The indicator provides a measure of proactive maintenance undertaken on the network on an annual basis. Sections of the network with a surfacing age younger than target age are classified as ‘Good’. In 2012, the proportion of the network with a surfacing age considered ‘Good’ was 85% which is above the target value of 84%. The results over the four-year period are relatively consistent.
85%
85%2012
2011
88%
87%2010
2009
roAd MAIntEnAncE
Availability of traffic Signals, road Lighting and Emergency telephones
This measures the availability of traffic signals, road lighting and emergency telephones throughout the road network as a percentage of time the assets are fully operational. The availability of traffic signals, road lighting and emergency telephones continues to be relatively stable. The result for road lighting was 3% below the target of 99%, this is attributed to the continuing growth in road lighting with more than 12,000 new light poles added to the network over the last 12 months. On the whole, this measure shows that Main Roads is maintaining and operating traffic signals, road lighting and emergency telephones throughout the network at near optimum levels.
% availability of 2009 2010 20112012
Target2012
Actual
Traffic Signals 99.1 99.1 99.1 99 99.4
Road Lighting 99.4 99.4 97.4 99 96.1
Emergency phones
99.9 99.9 99.9 99 99.9
Average cost of network Maintenance Per Lane Kilometre of road network
This indicator identifies the financial efficiency of road and roadside maintenance works by showing the cost per lane kilometre to maintain acceptable travel conditions on State roads. In determining the cost basis expenditure on structures, infrastructure depreciation, grants to local government and pavement replacement on Kwinana Freeway have been excluded. In order to compare 2010-11 figures with previous years all figures have been adjusted and reported in terms of current year’s dollars which can influence the trend result. The overall trend for this measure is inconsistent with the current result indicating that the measure did not meet target by some $1,246. The reason for this is largely as a result of excessive unfunded expenditure arising from declared Natural Disasters, inclusion of the reseal backlog program projects and payment of rise and fall claims associated with the former term network contracts coupled with establishment costs associated with implementation of the Integrated Services Arrangements not forming part of the original target.
116 Main Roads Western Australia 2012 Annual Report
outcome: Improving community Access and roadside Amenity
This program seeks to provide infrastructure that will increase personal mobility and community access. We demonstrate this through the following measures:
unplanned road closure on the State road network
Generally 100% of Main Roads’ road network is available to all road users; however, there are unplanned road closures due to a number of reasons including flooding, cyclones, major bushfires and major road accidents, which may vary in duration. The availability of the sealed road network is measured as a percentage of calendar days that the whole network is available to the road user. Closure is determined by measuring the number of whole days (24 hours commencing from the time the road is closed) that any section of the sealed road network is closed. This year the road network was available 89% of the year which exceeds the 70% target. With the exception of bushfire events in the Mid West and Gascoyne, all other closures were due to flooding and rainfall events including Tropical Cyclone Lua.
community Satisfaction with cycleways and Pedestrian facilities
This indicator represents how satisfied the community is with Main Roads’ performance in the construction, maintenance and management of cycleways and pedestrian facilities. The results are drawn from the Community Perception Survey. The overall result shows that community satisfaction regarding provision of cycleway and pedestrian facilities has fallen significantly to 76% and is well below the target of 90%. The 24% who rated Main Roads as poor or terrible were asked to provide a reason for their rating, common themes that emerged included limited pedestrian facilities on major roads, not enough places for pedestrians to safely cross roads, and a view that bicycle riders need to have their own cycle lanes.
Percentage of contracts completed on time
This indicator represents the percentage of contracts that were delivered on time in the Community Access Program. Whilst the target was established at 90%, 80% of contracts were delivered on time. Only one contract was late which was due to defective works, rework was undertaken at the contractors own cost.
Percentage of contracts completed on Budget
This indicator represents the percentage of contracts delivered on budget against a target of 90%. The result achieved was 100% of contracts being delivered on budget.
coMMunIty AccESS
117 Governance: Financial Statements and Notes
Financial Statements and Notes
Financial Statement contentS
Statement Of Comprehensive Income �����������������������������������������������������������������������������������������������������������������������119
Statement Of Financial Position ������������������������������������������������������������������������������������������������������������������������������������ 120
Statement Of Changes In Equity �����������������������������������������������������������������������������������������������������������������������������������121
Statement Of Cash Flows ����������������������������������������������������������������������������������������������������������������������������������������������� 122
Notes To The Financial Statements ����������������������������������������������������������������������������������������������������������������������������� 123
1 Australian Accounting Standards ����������������������������������������������������������������������������������������������������������������������� 123
2 Summary of significant accounting policies�������������������������������������������������������������������������������������������������� 123
3 Judgements made by management in applying accounting policies ��������������������������������������������������� 129
4 Key sources of estimation uncertainty �������������������������������������������������������������������������������������������������������������������129
5 Disclosure of changes in accounting policy and estimates ����������������������������������������������������������������������130
6 Employee benefits expense ������������������������������������������������������������������������������������������������������������������������������� 134
7 Supplies and services �������������������������������������������������������������������������������������������������������������������������������������������� 134
8 Depreciation expense of infrastructure assets ���������������������������������������������������������������������������������������������� 134
9 Depreciation and amortisation expense of other assets ��������������������������������������������������������������������������� 134
10 Finance costs �������������������������������������������������������������������������������������������������������������������������������������������������������� 135
11 Grants and subsidies ������������������������������������������������������������������������������������������������������������������������������������������� 135
12 Infrastructure assets retired/replaced ������������������������������������������������������������������������������������������������������������ 135
118 Main Roads Western Australia 2012 Annual Report
13 Regulatory fines �������������������������������������������������������������������������������������������������������������������������������������������������� 135
14 Sale of goods and services ������������������������������������������������������������������������������������������������������������������������������� 135
15 Commonwealth grants and contributions ��������������������������������������������������������������������������������������������������� 136
16 Contributions to roadworks ���������������������������������������������������������������������������������������������������������������������������� 136
17 Grants from other bodies ���������������������������������������������������������������������������������������������������������������������������������� 136
18 Interest revenue �������������������������������������������������������������������������������������������������������������������������������������������������� 137
19 Other revenue ������������������������������������������������������������������������������������������������������������������������������������������������������ 137
20 Net gain/(loss) on disposal of non current assets �������������������������������������������������������������������������������������� 137
21 Income from State Government ��������������������������������������������������������������������������������������������������������������������� 138
22 Restricted cash and cash equivalents ����������������������������������������������������������������������������������������������������������� 139
23 Receivables ����������������������������������������������������������������������������������������������������������������������������������������������������������� 139
24 Amounts receivable for services (Holding Account ���������������������������������������������������������������������������������� 140
25 Inventories ������������������������������������������������������������������������������������������������������������������������������������������������������������� 140
26 Prepayments ��������������������������������������������������������������������������������������������������������������������������������������������������������� 140
27 Non-current assets classified as held for sale ��������������������������������������������������������������������������������������������� 140
28 Property, plant and equipment ������������������������������������������������������������������������������������������������������������������������141
29 Infrastructure �������������������������������������������������������������������������������������������������������������������������������������������������������� 143
30 Intangible assets �������������������������������������������������������������������������������������������������������������������������������������������������� 143
31 Impairment of assets ������������������������������������������������������������������������������������������������������������������������������������������ 144
32 Payables ����������������������������������������������������������������������������������������������������������������������������������������������������������������� 144
33 Borrowings ������������������������������������������������������������������������������������������������������������������������������������������������������������ 144
34 Provisions �������������������������������������������������������������������������������������������������������������������������������������������������������������� 145
35 Equity ���������������������������������������������������������������������������������������������������������������������������������������������������������������������� 146
36 Notes to the Statement of Cash Flows ����������������������������������������������������������������������������������������������������������147
37 Resources provided free of charge �����������������������������������������������������������������������������������������������������������������147
38 Commitments ������������������������������������������������������������������������������������������������������������������������������������������������������ 148
39 Contingent liabilities and contingent assets ������������������������������������������������������������������������������������������������ 148
40 Events occurring after the end of the reporting period ��������������������������������������������������������������������������� 149
41 Explanatory statements ������������������������������������������������������������������������������������������������������������������������������������� 150
42 Financial instruments ����������������������������������������������������������������������������������������������������������������������������������������� 152
43 Remuneration of members of the accountable authority and senior officers ��������������������������������� 155
44 Remuneration of auditor ���������������������������������������������������������������������������������������������������������������������������������� 156
45 Affiliated bodies ��������������������������������������������������������������������������������������������������������������������������������������������������� 156
46 Special purpose accounts �������������������������������������������������������������������������������������������������������������������������������� 156
47 Supplementary financial information ������������������������������������������������������������������������������������������������������������ 157
48 Indian Ocean Territories ������������������������������������������������������������������������������������������������������������������������������������ 157
49 Administered Transactions ������������������������������������������������������������������������������������������������������������������������������� 157
50 Schedule of income and expenses by service ������������������������������������������������������������������������������������������� 158
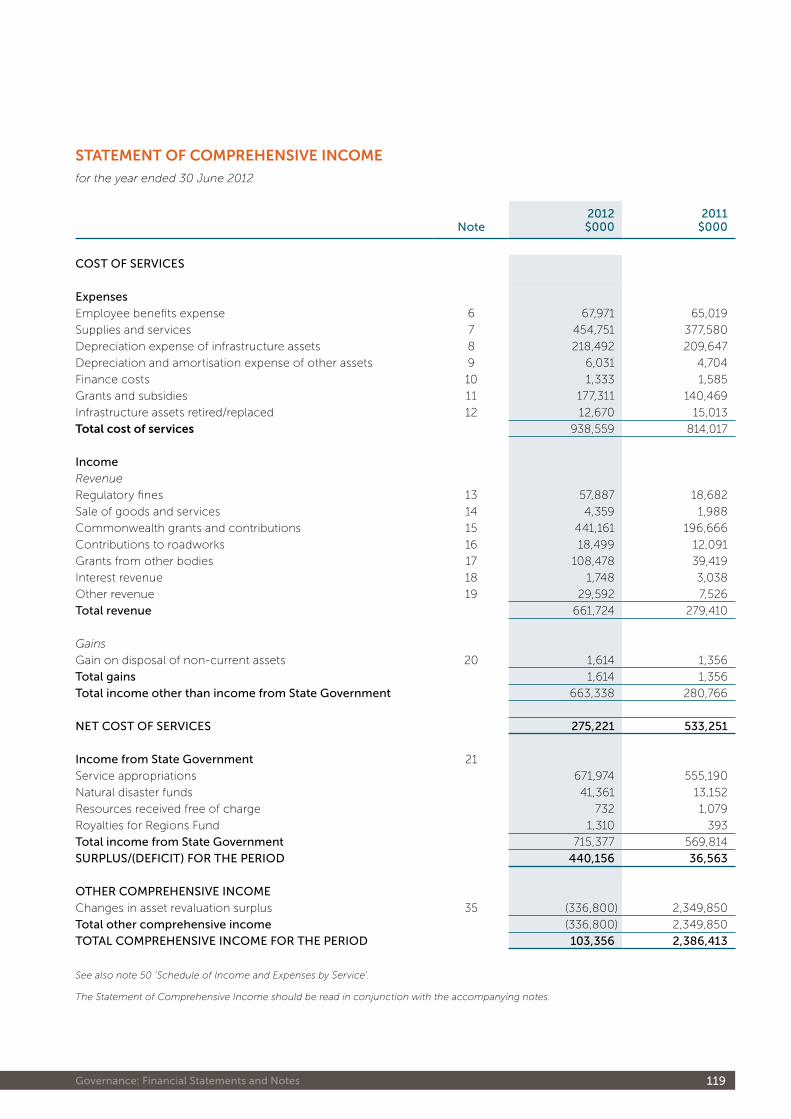
119 Governance: Financial Statements and Notes
Statement oF comprehenSive income
for the year ended 30 June 2012
Note 2012$000
2011$000
COST OF SERVICES
Expenses
Employee benefits expense 6 67,971 65,019
Supplies and services 7 454,751 377,580
Depreciation expense of infrastructure assets 8 218,492 209,647
Depreciation and amortisation expense of other assets 9 6,031 4,704
Finance costs 10 1,333 1,585
Grants and subsidies 11 177,311 140,469
Infrastructure assets retired/replaced 12 12,670 15,013
total cost of services 938,559 814,017
Income
Revenue
Regulatory fines 13 57,887 18,682
Sale of goods and services 14 4,359 1,988
Commonwealth grants and contributions 15 441,161 196,666
Contributions to roadworks 16 18,499 12,091
Grants from other bodies 17 108,478 39,419
Interest revenue 18 1,748 3,038
Other revenue 19 29,592 7,526
Total revenue 661,724 279,410
Gains
Gain on disposal of non-current assets 20 1,614 1,356
Total gains 1,614 1,356
Total income other than income from State Government 663,338 280,766
NET COST OF SERVICES 275,221 533,251
Income from State Government 21
Service appropriations 671,974 555,190
Natural disaster funds 41,361 13,152
Resources received free of charge 732 1,079
Royalties for Regions Fund 1,310 393
Total income from State Government 715,377 569,814
SURPLUS/(DEFICIT) FOR THE PERIOD 440,156 36,563
OTHER COMPREHENSIVE INCOME
Changes in asset revaluation surplus 35 (336,800) 2,349,850
Total other comprehensive income (336,800) 2,349,850
TOTAL COMPREHENSIVE INCOME FOR THE PERIOD 103,356 2,386,413
See also note 50 'Schedule of Income and Expenses by Service'.
The Statement of Comprehensive Income should be read in conjunction with the accompanying notes.
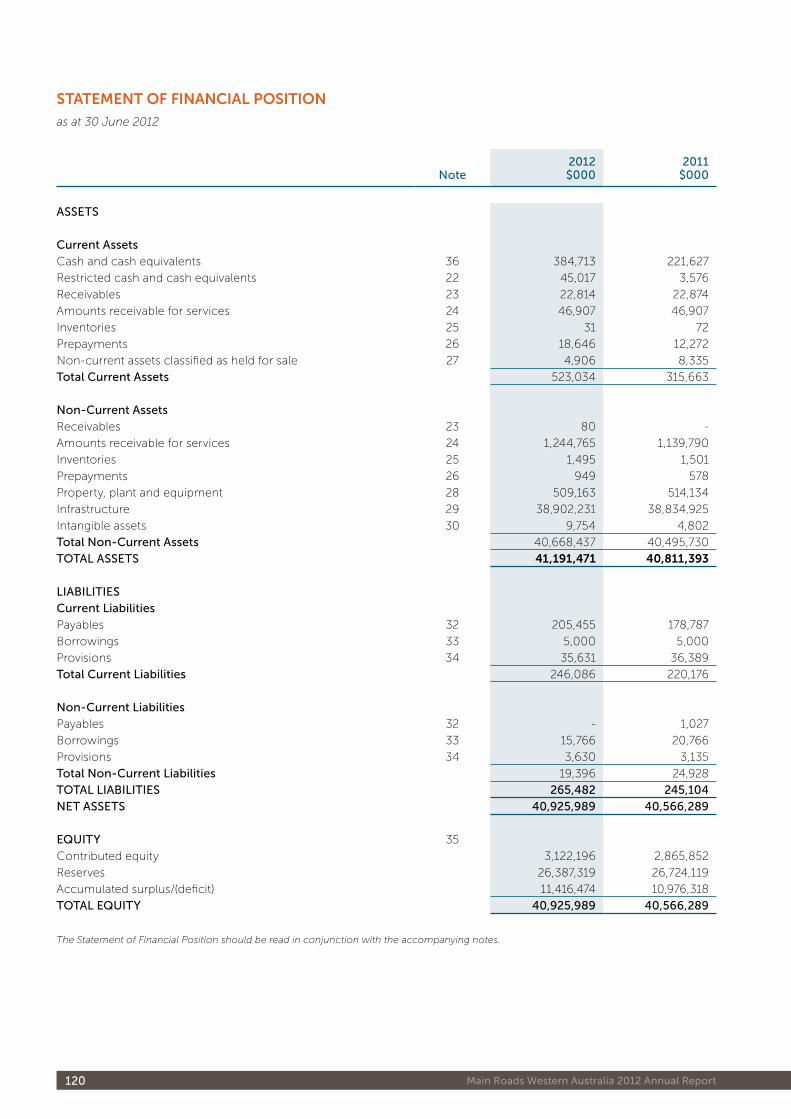
120 Main Roads Western Australia 2012 Annual Report
Note 2012$000
2011$000
ASSETS
Current Assets
Cash and cash equivalents 36 384,713 221,627
Restricted cash and cash equivalents 22 45,017 3,576
Receivables 23 22,814 22,874
Amounts receivable for services 24 46,907 46,907
Inventories 25 31 72
Prepayments 26 18,646 12,272
Non-current assets classified as held for sale 27 4,906 8,335
Total Current Assets 523,034 315,663
Non-Current Assets
Receivables 23 80 -
Amounts receivable for services 24 1,244,765 1,139,790
Inventories 25 1,495 1,501
Prepayments 26 949 578
Property, plant and equipment 28 509,163 514,134
Infrastructure 29 38,902,231 38,834,925
Intangible assets 30 9,754 4,802
Total Non-Current Assets 40,668,437 40,495,730
TOTAL ASSETS 41,191,471 40,811,393
LIABILITIES
Current Liabilities
Payables 32 205,455 178,787
Borrowings 33 5,000 5,000
Provisions 34 35,631 36,389
Total Current Liabilities 246,086 220,176
Non-Current Liabilities
Payables 32 - 1,027
Borrowings 33 15,766 20,766
Provisions 34 3,630 3,135
Total Non-Current Liabilities 19,396 24,928
TOTAL LIABILITIES 265,482 245,104
NET ASSETS 40,925,989 40,566,289
EQUITY 35
Contributed equity 3,122,196 2,865,852
Reserves 26,387,319 26,724,119
Accumulated surplus/(deficit) 11,416,474 10,976,318
TOTAL EQUITY 40,925,989 40,566,289
The Statement of Financial Position should be read in conjunction with the accompanying notes.
Statement oF Financial poSition
as at 30 June 2012
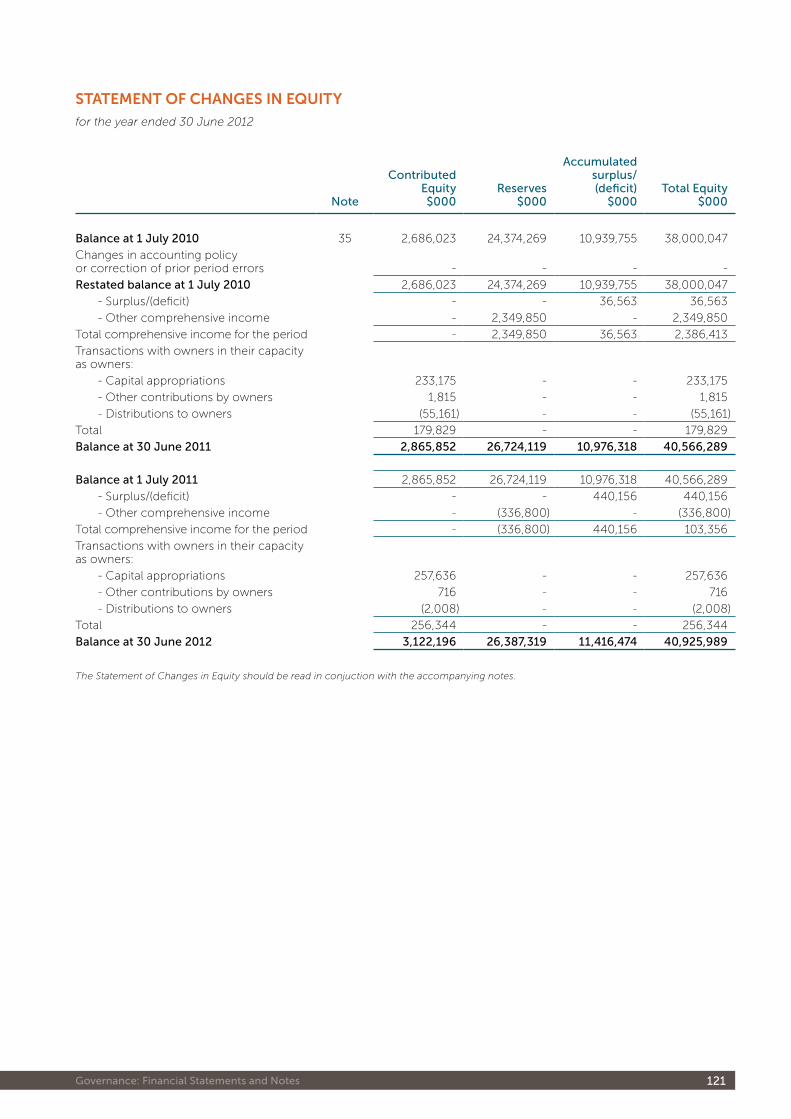
121 Governance: Financial Statements and Notes
Note
Contributed Equity$000
Reserves$000
Accumulated surplus/(deficit)
$000Total Equity
$000
Balance at 1 July 2010 35 2,686,023 24,374,269 10,939,755 38,000,047
Changes in accounting policy or correction of prior period errors - - - -
Restated balance at 1 July 2010 2,686,023 24,374,269 10,939,755 38,000,047
- Surplus/(deficit) - - 36,563 36,563
- Other comprehensive income - 2,349,850 - 2,349,850
Total comprehensive income for the period - 2,349,850 36,563 2,386,413
Transactions with owners in their capacity as owners:
- Capital appropriations 233,175 - - 233,175
- Other contributions by owners 1,815 - - 1,815
- Distributions to owners (55,161) - - (55,161)
Total 179,829 - - 179,829
Balance at 30 June 2011 2,865,852 26,724,119 10,976,318 40,566,289
Balance at 1 July 2011 2,865,852 26,724,119 10,976,318 40,566,289
- Surplus/(deficit) - - 440,156 440,156
- Other comprehensive income - (336,800) - (336,800)
Total comprehensive income for the period - (336,800) 440,156 103,356
Transactions with owners in their capacity as owners:
- Capital appropriations 257,636 - - 257,636
- Other contributions by owners 716 - - 716
- Distributions to owners (2,008) - - (2,008)
Total 256,344 - - 256,344
Balance at 30 June 2012 3,122,196 26,387,319 11,416,474 40,925,989
The Statement of Changes in Equity should be read in conjuction with the accompanying notes.
Statement oF changeS in equity
for the year ended 30 June 2012
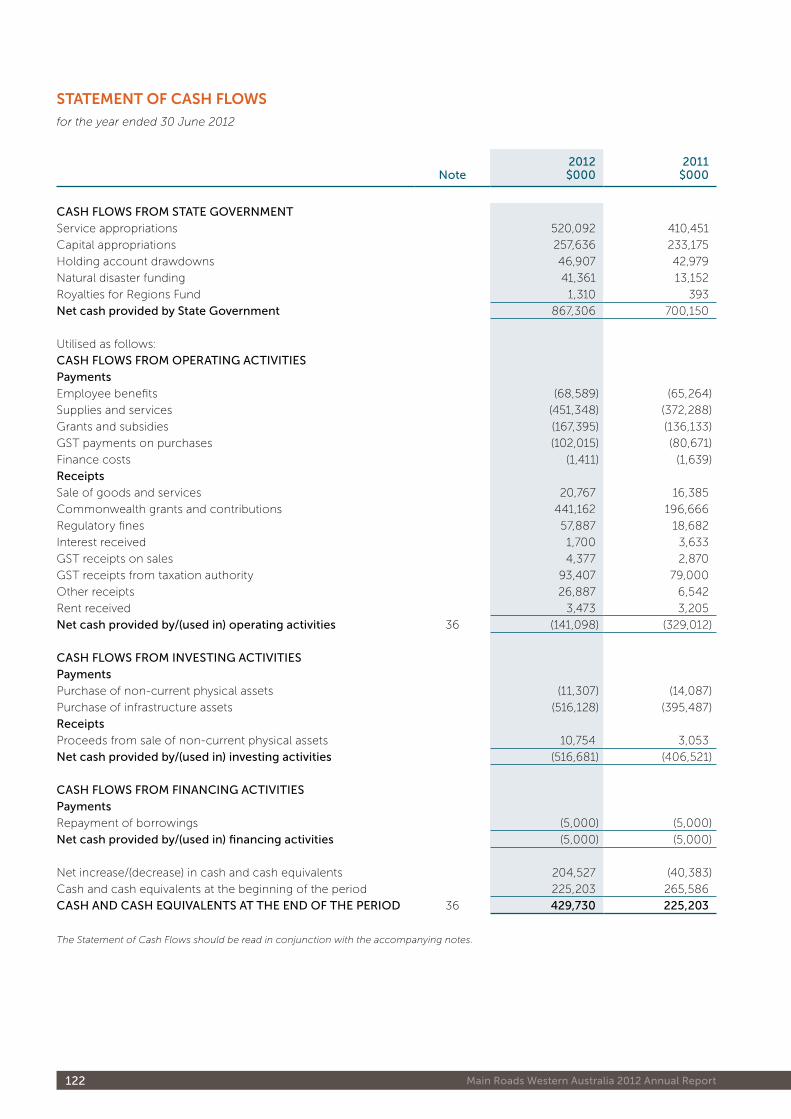
122 Main Roads Western Australia 2012 Annual Report
Note 2012$000
2011$000
CASH FLOWS FROM STATE GOVERNMENT
Service appropriations 520,092 410,451
Capital appropriations 257,636 233,175
Holding account drawdowns 46,907 42,979
Natural disaster funding 41,361 13,152
Royalties for Regions Fund 1,310 393
Net cash provided by State Government 867,306 700,150
Utilised as follows:
CASH FLOWS FROM OPERATING ACTIVITIES
Payments
Employee benefits (68,589) (65,264)
Supplies and services (451,348) (372,288)
Grants and subsidies (167,395) (136,133)
GST payments on purchases (102,015) (80,671)
Finance costs (1,411) (1,639)
Receipts
Sale of goods and services 20,767 16,385
Commonwealth grants and contributions 441,162 196,666
Regulatory fines 57,887 18,682
Interest received 1,700 3,633
GST receipts on sales 4,377 2,870
GST receipts from taxation authority 93,407 79,000
Other receipts 26,887 6,542
Rent received 3,473 3,205
Net cash provided by/(used in) operating activities 36 (141,098) (329,012)
CASH FLOWS FROM INVESTING ACTIVITIES
Payments
Purchase of non-current physical assets (11,307) (14,087)
Purchase of infrastructure assets (516,128) (395,487)
Receipts
Proceeds from sale of non-current physical assets 10,754 3,053
Net cash provided by/(used in) investing activities (516,681) (406,521)
CASH FLOWS FROM FINANCING ACTIVITIES
Payments
Repayment of borrowings (5,000) (5,000)
Net cash provided by/(used in) financing activities (5,000) (5,000)
Net increase/(decrease) in cash and cash equivalents 204,527 (40,383)
Cash and cash equivalents at the beginning of the period 225,203 265,586
CASH AND CASH EQUIVALENTS AT THE END OF THE PERIOD 36 429,730 225,203
The Statement of Cash Flows should be read in conjunction with the accompanying notes.
Statement oF caSh FlowS
for the year ended 30 June 2012
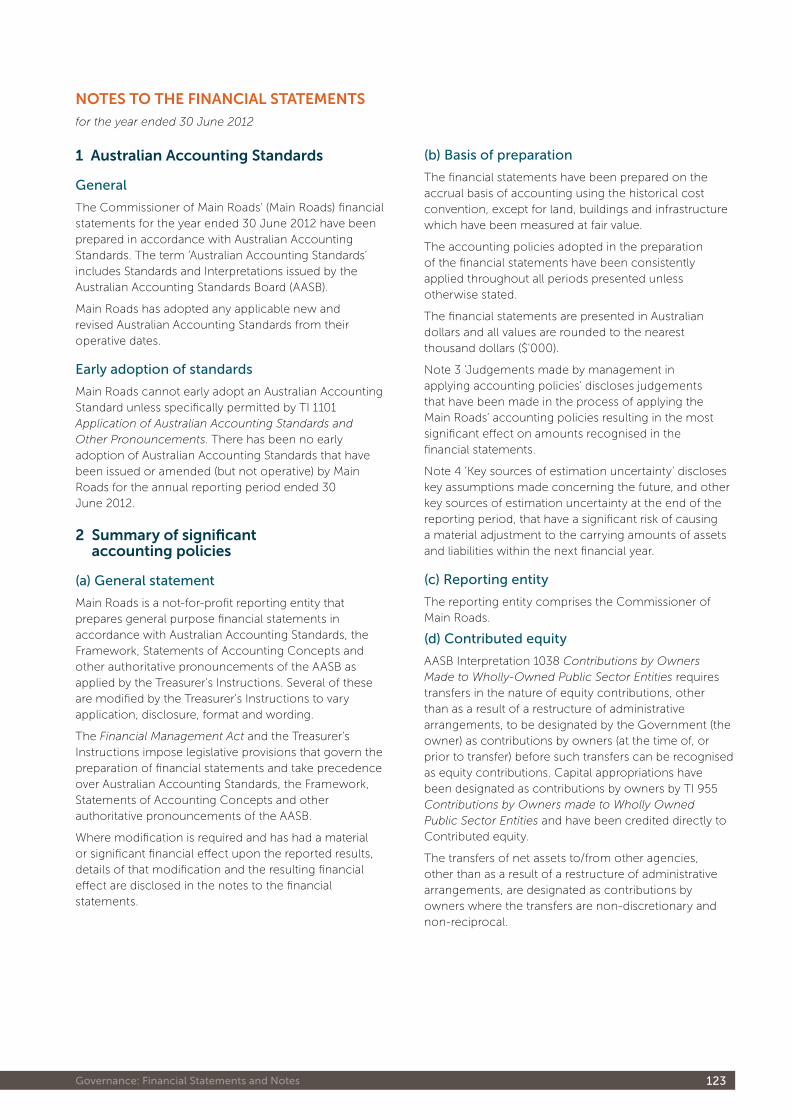
123 Governance: Financial Statements and Notes
1 australian accounting Standards
General
The Commissioner of Main Roads' (Main Roads) financial statements for the year ended 30 June 2012 have been prepared in accordance with Australian Accounting Standards� The term ‘Australian Accounting Standards’ includes Standards and Interpretations issued by the Australian Accounting Standards Board (AASB)�
Main Roads has adopted any applicable new and revised Australian Accounting Standards from their operative dates�
Early adoption of standards
Main Roads cannot early adopt an Australian Accounting Standard unless specifically permitted by TI 1101 Application of Australian Accounting Standards and Other Pronouncements� There has been no early adoption of Australian Accounting Standards that have been issued or amended (but not operative) by Main Roads for the annual reporting period ended 30 June 2012�
2 Summary of significant accounting policies
(a) General statement
Main Roads is a not-for-profit reporting entity that prepares general purpose financial statements in accordance with Australian Accounting Standards, the Framework, Statements of Accounting Concepts and other authoritative pronouncements of the AASB as applied by the Treasurer's Instructions� Several of these are modified by the Treasurer's Instructions to vary application, disclosure, format and wording�
The Financial Management Act and the Treasurer's Instructions impose legislative provisions that govern the preparation of financial statements and take precedence over Australian Accounting Standards, the Framework, Statements of Accounting Concepts and other authoritative pronouncements of the AASB�
Where modification is required and has had a material or significant financial effect upon the reported results, details of that modification and the resulting financial effect are disclosed in the notes to the financial statements�
(b) Basis of preparation
The financial statements have been prepared on the accrual basis of accounting using the historical cost convention, except for land, buildings and infrastructure which have been measured at fair value�
The accounting policies adopted in the preparation of the financial statements have been consistently applied throughout all periods presented unless otherwise stated�
The financial statements are presented in Australian dollars and all values are rounded to the nearest thousand dollars ($'000)�
Note 3 ‘Judgements made by management in applying accounting policies’ discloses judgements that have been made in the process of applying the Main Roads’ accounting policies resulting in the most significant effect on amounts recognised in the financial statements�
Note 4 ‘Key sources of estimation uncertainty’ discloses key assumptions made concerning the future, and other key sources of estimation uncertainty at the end of the reporting period, that have a significant risk of causing a material adjustment to the carrying amounts of assets and liabilities within the next financial year�
(c) Reporting entity
The reporting entity comprises the Commissioner of Main Roads�
(d) Contributed equity
AASB Interpretation 1038 Contributions by Owners Made to Wholly-Owned Public Sector Entities requires transfers in the nature of equity contributions, other than as a result of a restructure of administrative arrangements, to be designated by the Government (the owner) as contributions by owners (at the time of, or prior to transfer) before such transfers can be recognised as equity contributions� Capital appropriations have been designated as contributions by owners by TI 955 Contributions by Owners made to Wholly Owned Public Sector Entities and have been credited directly to Contributed equity�
The transfers of net assets to/from other agencies, other than as a result of a restructure of administrative arrangements, are designated as contributions by owners where the transfers are non-discretionary and non-reciprocal�
noteS to the Financial StatementS
for the year ended 30 June 2012
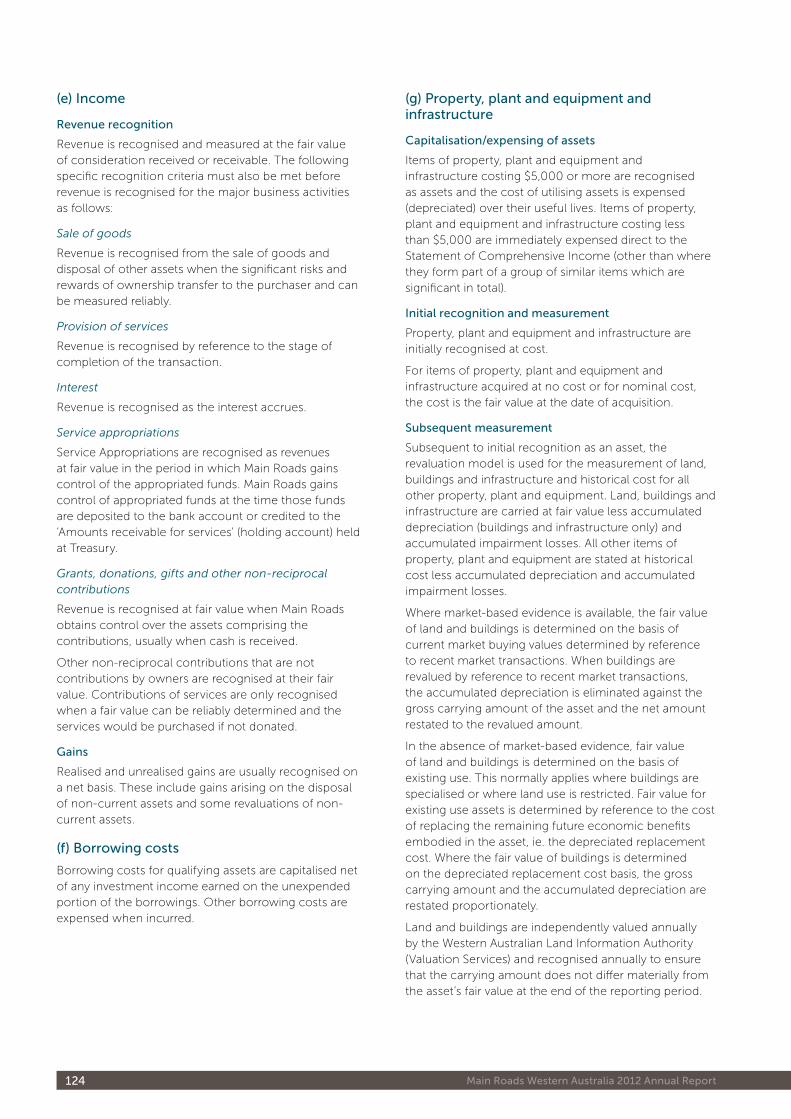
124 Main Roads Western Australia 2012 Annual Report
(e) Income
Revenue recognition
Revenue is recognised and measured at the fair value of consideration received or receivable� The following specific recognition criteria must also be met before revenue is recognised for the major business activities as follows:
Sale of goods
Revenue is recognised from the sale of goods and disposal of other assets when the significant risks and rewards of ownership transfer to the purchaser and can be measured reliably�
Provision of services
Revenue is recognised by reference to the stage of completion of the transaction�
Interest
Revenue is recognised as the interest accrues�
Service appropriations
Service Appropriations are recognised as revenues at fair value in the period in which Main Roads gains control of the appropriated funds� Main Roads gains control of appropriated funds at the time those funds are deposited to the bank account or credited to the ‘Amounts receivable for services’ (holding account) held at Treasury�
Grants, donations, gifts and other non-reciprocal contributions
Revenue is recognised at fair value when Main Roads obtains control over the assets comprising the contributions, usually when cash is received�
Other non-reciprocal contributions that are not contributions by owners are recognised at their fair value� Contributions of services are only recognised when a fair value can be reliably determined and the services would be purchased if not donated�
Gains
Realised and unrealised gains are usually recognised on a net basis� These include gains arising on the disposal of non-current assets and some revaluations of non-current assets�
(f) Borrowing costs
Borrowing costs for qualifying assets are capitalised net of any investment income earned on the unexpended portion of the borrowings� Other borrowing costs are expensed when incurred�
(g) Property, plant and equipment and infrastructure
Capitalisation/expensing of assets
Items of property, plant and equipment and infrastructure costing $5,000 or more are recognised as assets and the cost of utilising assets is expensed (depreciated) over their useful lives� Items of property, plant and equipment and infrastructure costing less than $5,000 are immediately expensed direct to the Statement of Comprehensive Income (other than where they form part of a group of similar items which are significant in total)�
Initial recognition and measurement
Property, plant and equipment and infrastructure are initially recognised at cost�
For items of property, plant and equipment and infrastructure acquired at no cost or for nominal cost, the cost is the fair value at the date of acquisition�
Subsequent measurement
Subsequent to initial recognition as an asset, the revaluation model is used for the measurement of land, buildings and infrastructure and historical cost for all other property, plant and equipment� Land, buildings and infrastructure are carried at fair value less accumulated depreciation (buildings and infrastructure only) and accumulated impairment losses� All other items of property, plant and equipment are stated at historical cost less accumulated depreciation and accumulated impairment losses�
Where market-based evidence is available, the fair value of land and buildings is determined on the basis of current market buying values determined by reference to recent market transactions� When buildings are revalued by reference to recent market transactions, the accumulated depreciation is eliminated against the gross carrying amount of the asset and the net amount restated to the revalued amount�
In the absence of market-based evidence, fair value of land and buildings is determined on the basis of existing use� This normally applies where buildings are specialised or where land use is restricted� Fair value for existing use assets is determined by reference to the cost of replacing the remaining future economic benefits embodied in the asset, ie� the depreciated replacement cost� Where the fair value of buildings is determined on the depreciated replacement cost basis, the gross carrying amount and the accumulated depreciation are restated proportionately�
Land and buildings are independently valued annually by the Western Australian Land Information Authority (Valuation Services) and recognised annually to ensure that the carrying amount does not differ materially from the asset’s fair value at the end of the reporting period�
125 Governance: Financial Statements and Notes
Fair value of infrastructure, other than land under roads, has been determined by reference to the depreciated replacement cost (existing use basis) as the assets are specialised and no market-based evidence of value is available� The replacement cost is determined by Main Roads every three years by reference to the cost of a new asset and adjusted in the intervening years by reference to a cost index (ABS Road and Bridge Construction Cost Index) to ensure asset values do not materially differ from fair value� The value of roads and principal shared paths (earthworks, drainage, pavements and seals), bridges and road furniture at 30 June 2012 is based on the current depreciated replacement cost determined at 30 June 2011 by Main Roads and a cost index (ABS Road and Bridge Construction Cost Index) has been applied to ensure asset values do not materially differ from fair value�
When infrastructure is revalued, the accumulated depreciation is restated proportionately with the change in the gross carrying amount of the asset so that the carrying amount of the asset after revaluation equals its revalued amount�
Work in Progress is recognised at cost�
The fair value of land under roads (i�e� land within road reserves) is based on the market value of the land adjoining the road reserve� The land values are provided by geographic location on an annual basis by the Western Australian Land Information Authority (Valuation Services) as follows:
» Metropolitan area – median value for single residential land for each Local Government Area� Land parcels up to 899 square metres are assumed to have a single residential zoning�
» South West Region - nominal unimproved valuation rates covering the south west of the State from Geraldton to Esperance�
» Balance of State - nominal unimproved valuation rates based on leasehold rates for Crown land�
The most significant assumptions in estimating fair value are made in assessing whether to apply the existing use basis to assets and in determining estimated useful life� Professional judgement by the valuer is required where the evidence does not provide a clear distinction between market type assets and existing use assets�
Land acquired for road reserves is initially reported as ‘land acquired for roadworks’ under ‘property, plant and equipment’ until the land is required for road construction� It is then transferred to ‘land within road reserves’ and reported as part of infrastructure assets�
Land determined to be surplus to the requirements of the road reserve is available for disposal and is transferred to ‘surplus land’ or ‘non current assets held for sale’ depending on the timetable for disposal�
Wherever possible, the properties are rented or leased until required for roadworks� Income from these properties is recognised as revenue in the financial year it is earned�
Derecognition
Upon disposal or derecognition of an item of property, plant and equipment and infrastructure, any revaluation surplus relating to that asset is retained in the asset revaluation surplus�
Asset revaluation surplus
The asset revaluation surplus is used to record increments and decrements on the revaluation of non-current assets as described in note 28 'Property, plant and equipment’�
Depreciation
All non-current assets having a limited useful life are systematically depreciated over their estimated useful lives in a manner that reflects the consumption of their future economic benefits�
Road earthworks do not generally have a finite life� Physical deterioration and commercial obsolescence are not significant factors� The small percentage of earthworks that are depreciated have been assessed to be substandard in terms of horizontal alignment and therefore impacted by technical obsolescence� An engineering review is completed annually to identify these segments of the network�
Depreciation is calculated using the straight line method, using rates which are reviewed annually� Estimated useful lives for each class of depreciable asset are:
road inFraStructure:
Earthworks Up to 173 years
Pavement, drainage and seals:
Metropolitan asphalt roads 40 years
Sealed rural roads 50 years
Gravel roads 12 years
Bridges 60 to 100 years
Road furniture 25 to 40 years
property, plant & equipment:
Buildings 10 to 40 years
Plant and vehicles 5 to 10 years
Equipment and furniture 5 to 13 years
Computer hardware and software (a) 3 to 13 years
(a) Software that is integral to the operation of related hardware
Land is not depreciated�
126 Main Roads Western Australia 2012 Annual Report
(h) Intangible assets
Capitalisation/expensing of assets
Acquisitions of intangible assets costing $5,000 or more and internally generated intangible assets costing $50,000 or more are capitalised� The cost of utilising the assets is expensed (amortised) over their useful life� Costs incurred below these thresholds are immediately expensed directly to the Statement of Comprehensive Income�
Intangible assets are initially recognised at cost� For assets acquired at no cost or for nominal cost, the cost is their fair value at the date of acquisition�
The cost model is applied for subsequent measurement requiring the asset to be carried at cost less any accumulated amortisation and accumulated impairment losses�
Amortisation for intangible assets with finite useful lives is calculated for the period of the expected benefit (estimated useful life which is reviewed annually) on the straight line basis� All intangible assets controlled by Main Roads have a finite useful life and zero residual value�
The expected useful lives for each class of intangible asset are:
Computer software (a) and licences 3 to 10 years
(a) Software that is not integral to the operation of any related
hardware
Computer software and licences
Software that is an integral part of the related hardware is treated as property, plant and equipment� Software that is not an integral part of the related hardware is treated as an intangible asset� Software costing less than $5,000 is expensed in the year of acquisition�
Drainage easements
Easements secured over properties for the purpose of road drainage have an indefinite useful life�
(i) Impairment of assets
Property, plant and equipment, infrastructure and intangible assets are tested for any indication of impairment at the end of each reporting period� Where there is an indication of impairment, the recoverable amount is estimated� Where the recoverable amount is less than the carrying amount, the asset is considered impaired and is written down to the recoverable amount and an impairment loss is recognised� As Main Roads is a not-for-profit entity, unless an asset has been identified as a surplus asset, the recoverable amount is the higher of an asset’s fair value less costs to sell and depreciated replacement cost�
The risk of impairment is generally limited to circumstances where an asset’s depreciation is materially understated, where the replacement cost is falling or where there is a significant change in useful life�
The exception is road earthworks when the alignment of a section of road may be assessed to be deficient and the useful life of the asset is revised from infinite to finite� Each relevant class of assets is reviewed annually to verify that the accumulated depreciation/amortisation reflects the level of consumption or expiration of asset’s future economic benefits and to evaluate any impairment risk from falling replacement costs�
Intangible assets with an indefinite useful life and intangible assets not yet available for use are tested for impairment at the end of each reporting period irrespective of whether there is any indication of impairment�
The recoverable amount of assets identified as surplus assets is the higher of fair value less costs to sell and the present value of future cash flows expected to be derived from the asset� Surplus assets carried at fair value have no risk of material impairment where fair value is determined by reference to market-based evidence� Where fair value is determined by reference to depreciated replacement cost, surplus assets are at risk of impairment and the recoverable amount is measured� Surplus assets at cost are tested for indications of impairment at the end of each reporting period�
(j) Non-current assets (or disposal groups) classified as held for sale
Non-current assets (or disposal groups) held for sale are recognised at the lower of carrying amount and fair value less costs to sell, and are disclosed separately from other assets in the Statement of Financial Position� Assets classified as held for sale are not depreciated or amortised�
(k) Leases
Operating leases are expensed on a straight line basis over the lease term as this represents the pattern of benefits derived from the leased properties�
(l) Financial instruments
In addition to cash, Main Roads has two categories of financial instrument:
» Loans and receivables; and
» Financial liabilities measured at amortised cost�
Financial instruments have been disaggregated into the following classes:
» Financial Assets
– Cash and cash equivalents
– Restricted cash and cash equivalents
– Receivables
– Amounts receivable for services
» Financial Liabilities
– Payables
– WATC Loan
127 Governance: Financial Statements and Notes
Initial recognition and measurement of financial instruments is at fair value which normally equates to the transaction cost or the face value� Subsequent measurement is at amortised cost using the effective interest method�
The fair value of short-term receivables and payables is the transaction cost or the face value because there is no interest rate applicable and subsequent measurement is not required as the effect of discounting is not material�
(m) Cash and cash equivalents
For the purpose of the Statement of Cash Flows, cash and cash equivalent (and restricted cash and cash equivalent) assets comprise cash on hand and short-term deposits with original maturities of three months or less that are readily convertible to a known amount of cash and which are subject to insignificant risk of changes in value�
(n) Accrued salaries
Accrued salaries (see note 32 'Payables’) represent the amount due to staff but unpaid at the end of the financial year� Accrued salaries are settled within a fortnight of the financial year end� Main Roads considers the carrying amount of accrued salaries to be equivalent to its fair value�
(o) Amounts receivable for services (holding account)
Main Roads receives income from the State Government partly in cash and partly as an asset (holding account receivable)� The accrued amount appropriated is accessible on the emergence of the cash funding requirement to cover leave entitlements and asset replacement�
(p) Inventories
Inventories held for distribution (for roadworks) are measured at the lower of cost and current replacement cost� Costs are assigned on a standard, average or last known cost basis�
Inventories held for resale are valued at the lower of cost and net realisable value� See note 25 'Inventories’�
(q) Receivables
Receivables are recognised at original invoice amount less an allowance for any uncollectible amounts (i�e� impairment)� The collectability of receivables is reviewed on an ongoing basis and any receivables identified as uncollectible are written-off against the allowance account� The allowance for uncollectible amounts (doubtful debts) is raised when there is objective evidence that Main Roads will not be able to collect the debts� The carrying amount is equivalent to fair value as it is due for settlement within 30 days�
(r) Payables
Payables are recognised when Main Roads becomes obliged to make future payments as a result of a purchase of assets or services� The carrying amount is equivalent to fair value, as settlement is generally within 30 days�
(s) Borrowings
All loans payable are initially recognised at fair value, being the net proceeds received� Subsequent measurement is at amortised cost using the effective interest method�
(t) Provisions
Provisions are liabilities of uncertain timing or amount and are recognised where there is a present legal or constructive obligation as a result of a past event and when the outflow of resources embodying economic benefits is probable and a reliable estimate can be made of the amount of the obligation� Provisions are reviewed at the end of each reporting period�
Provisions - employee benefits
All annual leave and long service leave provisions are in respect of employees’ services up to the end of the reporting period�
Annual leave
The liability for annual leave that is expected to be settled within 12 months after the end of the reporting period is recognised and measured at the undiscounted amounts expected to be paid when the liability is settled�
Annual leave that is not expected to be settled within 12 months after the end of the reporting period is recognised and measured at the present value of amounts expected to be paid when the liabilities are settled using the remuneration rate expected to apply at the time of settlement�
When assessing expected future payments consideration is given to expected future wage and salary levels including non-salary components such as employer superannuation contributions, as well as the experience of employee departures and periods of service� The expected future payments are discounted using market yields at the end of the reporting period on national government bonds with terms to maturity that match, as closely as possible, the estimated future cash outflows�
The provision for annual leave is classified as a current liability as Main Roads does not have an unconditional right to the defer settlement of the liability for at least 12 months after the end of the reporting period�
Long service leave
The liability for long service leave that is expected to be settled within 12 months after the end of the reporting period is recognised and measured at the undiscounted amounts expected to be paid when the liability is settled�
128 Main Roads Western Australia 2012 Annual Report
Long service leave that is not expected to be settled within 12 months after the end of the reporting period is recognised and measured at the present value of amounts expected to be paid when the liabilities are settled using the remuneration rate expected to apply at the time of settlement�
When assessing expected future payments consideration is given to expected future wage and salary levels including non-salary components such as employer superannuation contributions, as well as the experience of employee departures and periods of service� The expected future payments are discounted using market yields at the end of the reporting period on national government bonds with terms to maturity that match, as closely as possible, the estimated future cash outflows�
Unconditional long service leave provisions are classified as current liabilities as Main Roads does not have an unconditional right to defer settlement of the liability for at least 12 months after the end of the reporting period� Pre-conditional and conditional long service leave provisions are classified as non-current liabilities because Main Roads has an unconditional right to defer the settlement of the liability until the employee has completed the requisite years of service�
Sick leave
Liabilities for sick leave are recognised when it is probable that sick leave paid in the future will be greater than the entitlement that will accrue in the future�
Past history indicates that on average, sick leave taken each reporting period is less than the entitlement accrued� This is expected to continue in future periods� Accordingly, it is unlikely that existing accumulated entitlements will be used by employees and no liability for unused sick leave entitlements is recognised� As sick leave is non-vesting, an expense is recognised in the Statement of Comprehensive Income for this leave as it is taken�
Deferred leave
The provision for deferred leave relates to Public Service employees who have entered into an agreement to self-fund an additional twelve months leave in the fifth year of the agreement� The provision recognises the value of salary set aside for employees to be used in the fifth year� This liability is measured on the same basis as annual leave� Deferred leave is reported as a current provision as employees can leave the scheme at their discretion at any time�
Purchased leave
The provision for purchased leave relates to Public Service employees who have entered into an agreement to self-fund up to an additional ten weeks leave per calendar year� The provision recognises the value of salary set aside for employees and is measured at the nominal amounts expected to be paid when the liabilities are settled� This liability is measured on the same basis as annual leave�
Superannuation
The Government Employees Superannuation Board (GESB) and other funds administer public sector superannuation arrangements in Western Australia in accordance with legislative requirements� Eligibility criteria for membership in particular schemes for public sector employees varies according to commencement and implementation dates�
Eligible employees contribute to the Pension Scheme, a defined benefit pension scheme closed to new members since 1987, or the Gold State Superannuation Scheme (GSS), a defined benefit lump sum scheme closed to new members since 1995�
The GSS is a defined benefit scheme for the purposes of employees and whole-of-government reporting� However, it is a defined contribution plan for agency purposes because the concurrent contributions (defined contributions) made by Main Roads to GESB extinguishes the agency’s obligations to the related superannuation liability�
Main Roads has no liabilities under the Pension Scheme or the GSS� The liabilities for the unfunded Pension Scheme and the unfunded GSS transfer benefits attributable to members who transferred from the Pension Scheme, are assumed by the Treasurer� All other GSS obligations are funded by concurrent contributions made by Main Roads to the GESB�
Employees commencing employment prior to 16 April 2007 who were not members of either the Pension Scheme or the GSS became non-contributory members of the West State Superannuation Scheme (WSS)� Employees commencing employment on or after 16 April 2007 became members of the GESB Super Scheme (GESBS)� From 30 March 2012, existing members of the WSS or GESBS and new employees became able to choose their preferred superannuation fund� Main Roads makes concurrent contributions to GESB or other funds on behalf of the employees in compliance with the Commonwealth Government's Superannuation Guarantee (Administration) Act 1992� Contributions to these accumulation schemes extinguish Main Roads' liability for superannuation charges in respect of employees who are not members of the Pension Scheme or GSS�
129 Governance: Financial Statements and Notes
The GESB makes all benefit payments in respect of the Pension Scheme and GSS, and is recouped from the Treasurer for the employer’s share�
Provisions – other
Employment on-costs
Employment on-costs, including workers’ compensation insurance, are not employee benefits and are recognised separately as liabilities and expenses when the employment to which they relate has occurred� Employment on-costs are included as part of ‘Other expenses’ and are not included as part of Main Roads' ‘Employee benefits expense’� The related liability is included in ‘Employment on-costs provision’�
(u) Superannuation expense
The superannuation expense in the Statement of Comprehensive Income comprises employer contributions paid to the GSS (concurrent contributions), WSS, the GESBS, or other superannuation fund�
(v) Resources received free of charge or for nominal cost
Resources received free of charge or for nominal cost that can be reliably measured are recognised as income at fair value� Where the resource received represents a service that Main Roads would otherwise pay for, a corresponding expense is recognised� Receipts of assets are recognised in the Statement of Financial Position�
Assets or services received from other State Government agencies are separately disclosed under Income from State Government in the Statement of Comprehensive Income�
(w) Comparative figures
Comparative figures are, where appropriate, reclassified to be comparable with the figures presented in the current financial year�
(x) Insurance
Main Roads regularly reviews its insurance arrangements including areas where self-insurance is deemed to be economically justified� Self insurance covers the risks of natural disasters causing damage to infrastructure assets� Currently, these self-insurance areas are:
» roads, bridges and road furniture
(y) Property liabilities and commitments
A liability has been recognised in respect of properties for which a Notice of Resumption under the Land Administration Act 1997 has been issued and formal possession has taken place but where settlement has not been achieved at the end of the reporting period� Liabilities in such circumstances have been based on valuations and include costs of acquisition� This liability is included in Payables� See note 32 ‘Payables’�
3 Judgements made by management in applying accounting policies
There were no material judgements made by management in applying accounting policies for the 2011-12 financial year, other than those disclosed at note 2(y) ‘Property liabilities and commitments’�
4 Key sources of estimation uncertainty
Key estimates and assumptions concerning the future are based on historical experience and various other factors that have a significant risk of causing a material adjustment to the carrying amount of assets and liabilities within the next financial year�
Long Service Leave
The liability for long service leave is measured at the present value of amounts expected to be paid when the liabilities are settled� The assessment of future payments is based on estimated retention rates and remuneration levels and discounted using current market yields on national government bonds with maturity dates that match the estimated future cash outflows�
Depreciated replacement cost of infrastructure assets
Infrastructure assets, other than land within road reserves, are measured at current depreciated replacement cost by reference to the cost of new assets� The replacement cost is reviewed every three years on the basis of actual contract construction rates and adjusted in the intervening years by applying the Road and Bridge Construction Index published by the Australian Bureau of Statistics�
130 Main Roads Western Australia 2012 Annual Report
5 disclosure of changes in accounting policy and estimates
Initial application of an Australian Accounting Standard
Main Roads has applied the following Australian Accounting Standards effective for annual reporting periods beginning on or after 1 July 2011 that impacted on Main Roads�
AASB 1054 Australian Additional Disclosures
This Standard, in conjunction with AASB 2011-1 Amendments to Australian Accounting Standards arising from the Trans-Tasman Convergence Project, removes disclosure requirements from other Standards and incorporates them in a single Standard to achieve convergence between Australian and New Zealand Accounting Standards� There is no financial impact�
AASB 2009-12 Amendments to Australian Accounting Standards [AASB 5, 8, 108, 110, 112, 119, 133, 137, 139, 1023 & 1031 and Int 2, 4, 16, 1039 & 1052]
This Standard makes editorial amendments to a range of Australian Accounting Standards and Interpretations� There is no financial impact�
AASB 2010-4 Further Amendments to Australian Accounting Standards arising from the Annual Improvements Project [AASB 1, 7, 101 & 134 and Int 13]
The amendments to AASB 7 clarify financial instrument disclosures in relation to credit risk� The carrying amount of financial assets that would otherwise be past due or impaired whose terms have been negotiated is no longer required to be disclosed� There is no financial impact�
The amendments to AASB 101 clarify the presentation of the Statement of the Changes in Equity� The disaggregation of other comprehensive income reconciling the carrying amount at the beginning and the end of the period for each component of equity can be presented in either the Statement of Changes in Equity or the Notes� There is no financial impact�
AASB 2010-5 Amendments to Australian Accounting Standards [AASB 1, 3, 4, 5, 101, 107, 112, 118, 119, 121, 132, 133, 134, 137, 139, 140, 1023 & 1038 and Int 112, 115, 127, 132 & 1042]
This Standard makes editorial amendments to a range of Australian Accounting Standards and Interpretations� There is no financial impact�
AASB 2010-6 Amendments to Australian Accounting Standards - Disclosures on Transfers of Financial Assets [AASB 1 & 7]
This Standards introduces additional disclosures relating to transfers of financial assets in AASB 7� An equity shall disclose all transferred financial assets that are not derecognised and any continuing involvement in a transferred asset, existing at the reporting date, irrespective of when the related transfer transaction occurred� There is no financial impact�
AASB 2011-1 Amendments to Australian Accounting Standards arising from the Trans-Tasman Convergence Project [AASB 1, 5, 101, 107, 108, 121, 128, 132 & 134 and Int 2, 112 & 113]
This Standard, in conjunction with AASB 1054, removes disclosure requirements from other Standards and incorporates them in a single Standard to achieve convergence between Australian and New Zealand Accounting Standards� There is no financial impact�
AASB 2011-5
Amendments to Australian Accounting Standards - Extending Relief from Consolidation, the Equity Method and Proportionate Consolidation [AASB 127, 128 & 131]
This Standard extends the relief from consolidation, the equity method and proportionate consolidation by removing the requirement for the consolidated financial statements prepared by the ultimate or any intermediate parent entity to be IFRS compliant, provided that the parent entity, investor or venturer and the ultimate or intermediate parent entity are not-for-profit non-reporting entities that comply with Australian Accounting Standards� There is no financial impact�
131 Governance: Financial Statements and Notes
Future impact of Australian Accounting Standards not yet operative
Main Roads cannot early adopt an Australian Accounting Standard unless specifically permitted by TI 1101 Application of Australian Accounting Standards and Other Pronouncements� Consequently, Main Roads has not applied early any of the following Australian Accounting Standards that have been issued that may impact Main Roads� Where applicable, Main Roads plans to apply these Australian Accounting Standards from their application date�
Operative for reporting periods beginning on/after
AASB 9 Financial Instruments
This Standard supersedes AASB 139 Financial Instruments: Recognition and Measurement, introducing a number of changes to accounting treatments�
The Standard was reissued in December 2010� Main Roads has not yet determined the application or the potential impact of the Standard�
1 Jan 2013
AASB 10 Consolidated Financial Statements
This Standard supersedes requirements under AASB 127 Consolidated and Separate Financial Statements and Int 112 Consolidation - Special Purpose Entities, introducing a number of changes to accounting treatments�
The Standard was issued in August 2011� Main Roads has not yet determined the application or the potential impact of the Standard�
1 Jan 2013
AASB 11 Joint Arrangements
This Standard supersedes AASB 131 Interests in Joint Ventures, introducing a number of changes to accounting treatments�
The Standard was issued in August 2011� Main Roads has not yet determined the application or the potential impact of the Standard�
1 Jan 2013
AASB 12 Disclosure of Interests in Other Entities
This Standard supersedes disclosure requirements under AASB 127 Consolidated and Separate Financial Statements, AASB 128 Investments in Associates and AASB 131 Interests in Joint Ventures�
The Standard was issued in August 2011� Main Roads has not yet determined the application or the potential impact of the Standard�
1 Jan 2013
AASB 13 Fair Value Measurement
This Standard defines fair value, sets out a framework for measuring fair value and requires disclosures about fair value measurements� There is no financial impact�
1 Jan 2013
AASB 119 Employee Benefits
This Standard supersedes AASB 119 (October 2010)� As Main Roads does not operate a defined benefit plan, the impact of the change is limited to measuring annual leave as a long-term employee benefit� The resultant discounting of the annual leave benefit has an immaterial impact�
1 Jan 2013
AASB 127 Separate Financial Statements
This Standard supersedes requirements under AASB 127 Consolidated and Separate Financial Statements, introducing a number of changes to accounting treatments�
The Standard was issued in August 2011� Main Roads has not yet determined the application or the potential impact of the Standard�
1 Jan 2013
AASB 128 Investments in Associates and Joint Ventures
This Standard supersedes AASB 128 Investments in Associates, introducing a number of changes to accounting treatments�
The Standard was issued in August 2011� Main Roads has not yet determined the application or the potential impact of the Standard�
1 Jan 2013
132 Main Roads Western Australia 2012 Annual Report
Operative for reporting periods beginning on/after
AASB 1053 Application of Tiers of Australian Accounting Standards
This Standard establishes a differential financial reporting framework consisting of two tiers of reporting requirements for preparing general purpose financial statements� There is no financial impact�
1 Jul 2013
AASB 2009-11 Amendments to Australian Accounting Standards arising from AASB 9 [AASB 1, 3, 4, 5, 7, 101, 102, 108, 112, 118, 121, 127, 128, 131, 132, 136, 139, 1023 & 1038 and Int 10 & 12]
[Modified by AASB 2010-7]
1 Jul 2013
AASB 2010-2 Amendments to Australian Accounting Standards arising from Reduced Disclosure Requirements [AASB 1, 2, 3, 5, 7, 8, 101, 102, 107, 108, 110, 111, 112, 116, 117, 119, 121, 123, 124, 127, 128, 131, 133, 134, 136, 137, 138, 140, 141, 1050 & 1052 and Int 2, 4, 5, 15, 17, 127, 129 & 1052]
This Standard makes amendments to Australian Accounting Standards and Interpretations to introduce reduced disclosure requirements for certain types of entities� There is no financial impact�
1 Jul 2013
AASB 2010-7 Amendments to Australian Accounting Standards arising from AASB 9 (December 2010) [AASB 1, 3, 4, 5, 7, 101, 102, 108, 112, 118, 120, 121, 127, 128, 131, 132, 136, 137, 139, 1023 & 1038 and Int 2, 5, 10, 12, 19 & 127]
This Standard makes consequential amendments to other Australian Accounting Standards and Interpretations as a result of issuing AASB 9 in December 2010� Main Roads has not yet determined the application or the potential impact of the Standard�
1 Jan 2013
AASB 2011-2 Amendments to Australian Accounting Standards arising from the Trans-Tasman Convergence Project – Reduced Disclosure Requirements [AASB 101 & 1054]
This Standard removes disclosure requirements from other Standards and incorporates them in a single Standard to achieve convergence between Australian and New Zealand Accounting Standards for reduced disclosure reporting� There is no financial impact�
1 Jul 2013
AASB 2011-6 Amendments to Australian Accounting Standards - Extending Relief from Consolidation, the Equity Method and Proportionate Consolidation – Reduced Disclosure Requirements [AASB 127, 128 & 131]
This Standard extends the relief from consolidation, the equity method and proportionate consolidation by removing the requirement for the consolidated financial statements prepared by the ultimate or any intermediate parent entity to be IFRS compliant, provided that the parent entity, investor or venturer and the ultimate or intermediate parent entity comply with Australian Accounting Standards or Australian Accounting Standards - Reduced Disclosure Requirements � There is no financial impact�
1 Jul 2013
AASB 2011-7 Amendments to Australian Accounting Standards arising from the Consolidation and Joint Arrangements Standards [AASB 1, 2, 3, 5, 7, 9, 2009-11, 101, 107, 112, 118, 121, 124, 132, 133, 136, 138, 139, 1023 & 1038 and Int 5, 9, 16 & 17]
This Standard gives effect to consequential changes arising from the issuance of AASB 10, AASB 11, AASB 127 Separate Financial Statements and AASB 128 Investments in Associates and Joint Ventures� Main Roads has not yet determined the application or the potential impact of the Standard�
1 Jan 2013
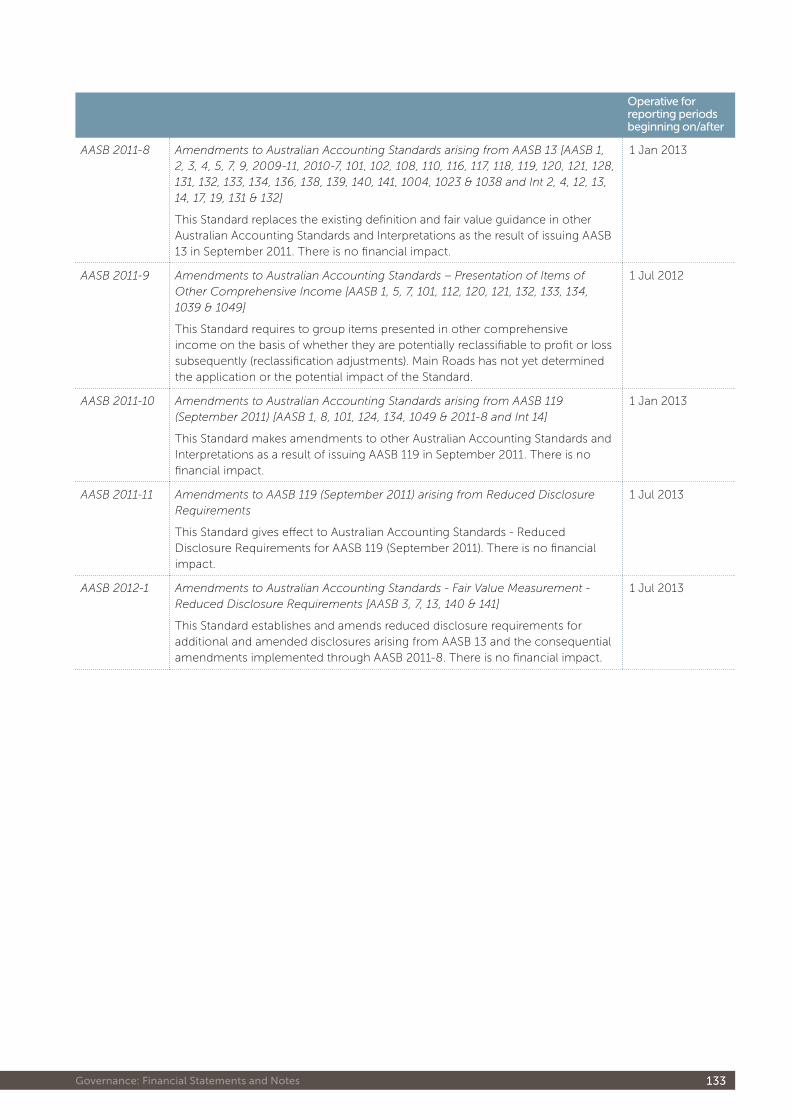
133 Governance: Financial Statements and Notes
Operative for reporting periods beginning on/after
AASB 2011-8 Amendments to Australian Accounting Standards arising from AASB 13 [AASB 1, 2, 3, 4, 5, 7, 9, 2009-11, 2010-7, 101, 102, 108, 110, 116, 117, 118, 119, 120, 121, 128, 131, 132, 133, 134, 136, 138, 139, 140, 141, 1004, 1023 & 1038 and Int 2, 4, 12, 13, 14, 17, 19, 131 & 132]
This Standard replaces the existing definition and fair value guidance in other Australian Accounting Standards and Interpretations as the result of issuing AASB 13 in September 2011� There is no financial impact�
1 Jan 2013
AASB 2011-9 Amendments to Australian Accounting Standards – Presentation of Items of Other Comprehensive Income [AASB 1, 5, 7, 101, 112, 120, 121, 132, 133, 134, 1039 & 1049]
This Standard requires to group items presented in other comprehensive income on the basis of whether they are potentially reclassifiable to profit or loss subsequently (reclassification adjustments)� Main Roads has not yet determined the application or the potential impact of the Standard�
1 Jul 2012
AASB 2011-10 Amendments to Australian Accounting Standards arising from AASB 119 (September 2011) [AASB 1, 8, 101, 124, 134, 1049 & 2011-8 and Int 14]
This Standard makes amendments to other Australian Accounting Standards and Interpretations as a result of issuing AASB 119 in September 2011� There is no financial impact�
1 Jan 2013
AASB 2011-11 Amendments to AASB 119 (September 2011) arising from Reduced Disclosure Requirements
This Standard gives effect to Australian Accounting Standards - Reduced Disclosure Requirements for AASB 119 (September 2011)� There is no financial impact�
1 Jul 2013
AASB 2012-1 Amendments to Australian Accounting Standards - Fair Value Measurement - Reduced Disclosure Requirements [AASB 3, 7, 13, 140 & 141]
This Standard establishes and amends reduced disclosure requirements for additional and amended disclosures arising from AASB 13 and the consequential amendments implemented through AASB 2011-8� There is no financial impact�
1 Jul 2013
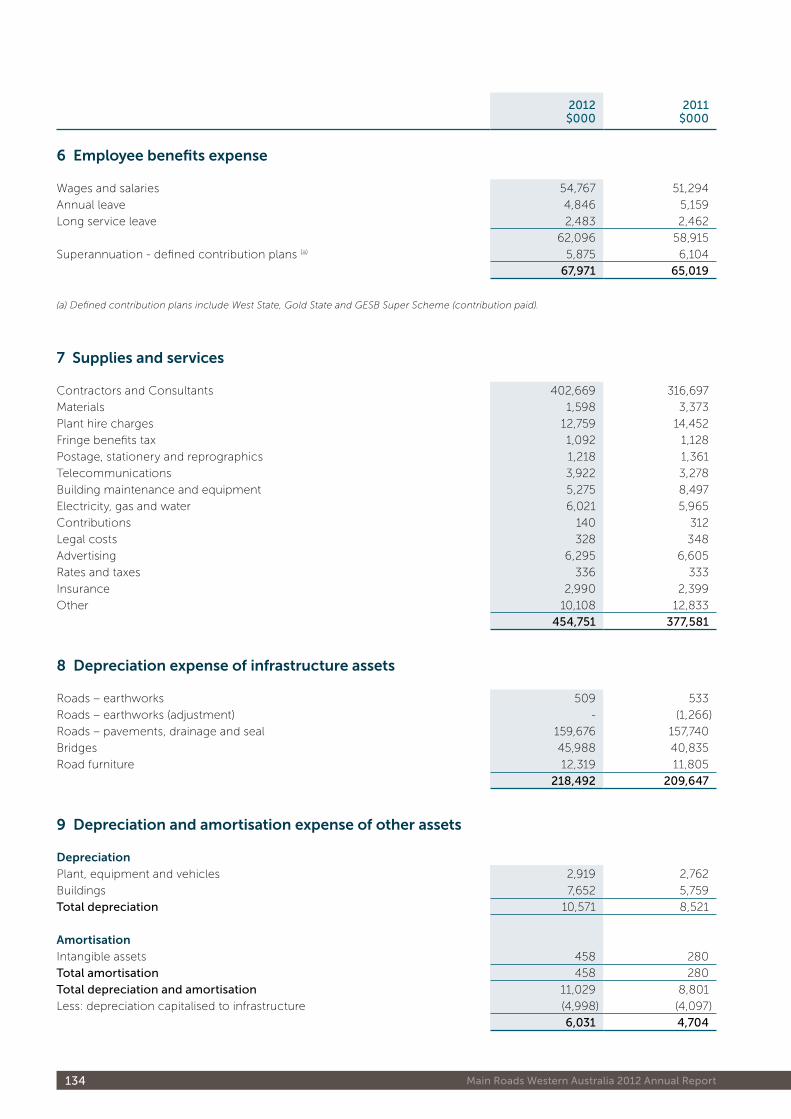
134 Main Roads Western Australia 2012 Annual Report
6 employee benefits expense
Wages and salaries 54,767 51,294
Annual leave 4,846 5,159
Long service leave 2,483 2,462
62,096 58,915
Superannuation - defined contribution plans (a) 5,875 6,104
67,971 65,019
(a) Defined contribution plans include West State, Gold State and GESB Super Scheme (contribution paid).
7 Supplies and services
Contractors and Consultants 402,669 316,697
Materials 1,598 3,373
Plant hire charges 12,759 14,452
Fringe benefits tax 1,092 1,128
Postage, stationery and reprographics 1,218 1,361
Telecommunications 3,922 3,278
Building maintenance and equipment 5,275 8,497
Electricity, gas and water 6,021 5,965
Contributions 140 312
Legal costs 328 348
Advertising 6,295 6,605
Rates and taxes 336 333
Insurance 2,990 2,399
Other 10,108 12,833
454,751 377,581
8 depreciation expense of infrastructure assets
Roads – earthworks 509 533
Roads – earthworks (adjustment) - (1,266)
Roads – pavements, drainage and seal 159,676 157,740
Bridges 45,988 40,835
Road furniture 12,319 11,805
218,492 209,647
9 depreciation and amortisation expense of other assets
depreciationPlant, equipment and vehicles 2,919 2,762
Buildings 7,652 5,759
Total depreciation 10,571 8,521
amortisationIntangible assets 458 280
Total amortisation 458 280
Total depreciation and amortisation 11,029 8,801
Less: depreciation capitalised to infrastructure (4,998) (4,097)
6,031 4,704
2012$000
2011$000
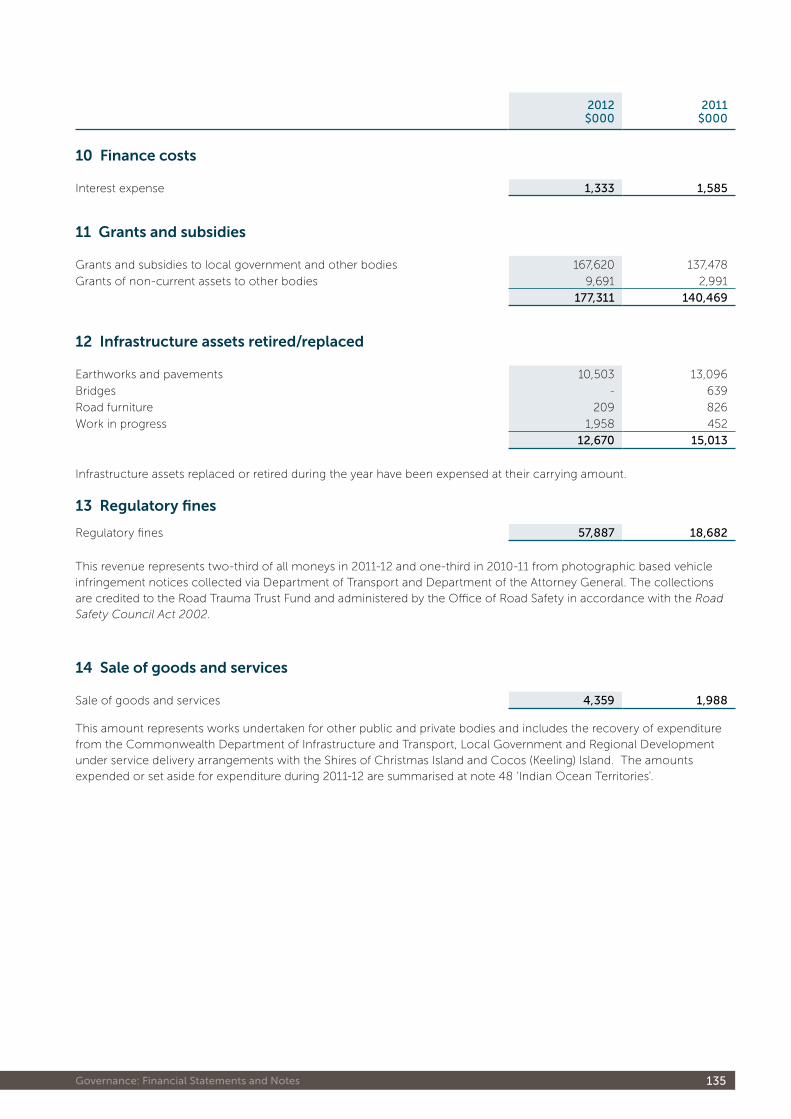
135 Governance: Financial Statements and Notes
10 Finance costs
Interest expense 1,333 1,585
11 grants and subsidies
Grants and subsidies to local government and other bodies 167,620 137,478
Grants of non-current assets to other bodies 9,691 2,991
177,311 140,469
12 infrastructure assets retired/replaced
Earthworks and pavements 10,503 13,096
Bridges - 639
Road furniture 209 826
Work in progress 1,958 452
12,670 15,013
Infrastructure assets replaced or retired during the year have been expensed at their carrying amount�
13 regulatory fines
Regulatory fines 57,887 18,682
This revenue represents two-third of all moneys in 2011-12 and one-third in 2010-11 from photographic based vehicle infringement notices collected via Department of Transport and Department of the Attorney General� The collections are credited to the Road Trauma Trust Fund and administered by the Office of Road Safety in accordance with the Road Safety Council Act 2002�
14 Sale of goods and services
Sale of goods and services 4,359 1,988
This amount represents works undertaken for other public and private bodies and includes the recovery of expenditure from the Commonwealth Department of Infrastructure and Transport, Local Government and Regional Development under service delivery arrangements with the Shires of Christmas Island and Cocos (Keeling) Island� The amounts expended or set aside for expenditure during 2011-12 are summarised at note 48 'Indian Ocean Territories'�
2012$000
2011$000
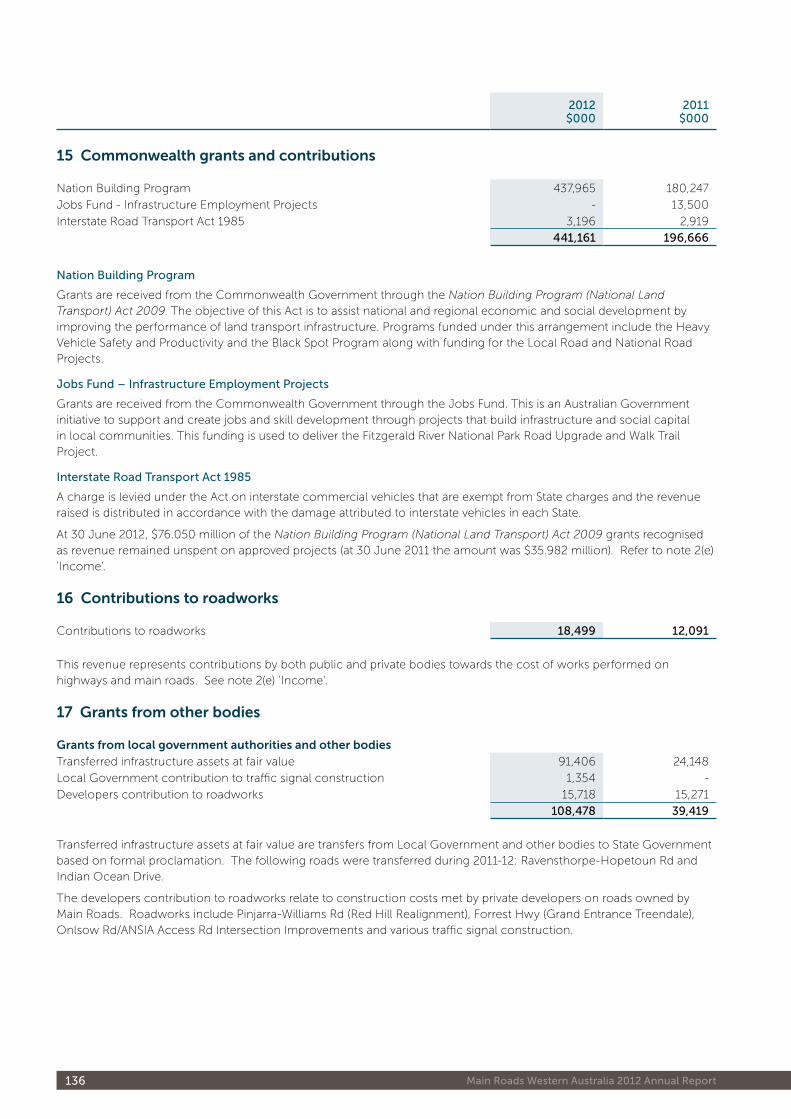
136 Main Roads Western Australia 2012 Annual Report
15 commonwealth grants and contributions
Nation Building Program 437,965 180,247
Jobs Fund - Infrastructure Employment Projects - 13,500
Interstate Road Transport Act 1985 3,196 2,919
441,161 196,666
Nation Building Program
Grants are received from the Commonwealth Government through the Nation Building Program (National Land Transport) Act 2009� The objective of this Act is to assist national and regional economic and social development by improving the performance of land transport infrastructure� Programs funded under this arrangement include the Heavy Vehicle Safety and Productivity and the Black Spot Program along with funding for the Local Road and National Road Projects�
Jobs Fund – Infrastructure Employment Projects
Grants are received from the Commonwealth Government through the Jobs Fund� This is an Australian Government initiative to support and create jobs and skill development through projects that build infrastructure and social capital in local communities� This funding is used to deliver the Fitzgerald River National Park Road Upgrade and Walk Trail Project�
Interstate Road Transport Act 1985
A charge is levied under the Act on interstate commercial vehicles that are exempt from State charges and the revenue raised is distributed in accordance with the damage attributed to interstate vehicles in each State�
At 30 June 2012, $76�050 million of the Nation Building Program (National Land Transport) Act 2009 grants recognised as revenue remained unspent on approved projects (at 30 June 2011 the amount was $35�982 million)� Refer to note 2(e) 'Income’�
16 contributions to roadworks
Contributions to roadworks 18,499 12,091
This revenue represents contributions by both public and private bodies towards the cost of works performed on highways and main roads� See note 2(e) 'Income’�
17 grants from other bodies
grants from local government authorities and other bodiesTransferred infrastructure assets at fair value 91,406 24,148
Local Government contribution to traffic signal construction 1,354 -
Developers contribution to roadworks 15,718 15,271
108,478 39,419
Transferred infrastructure assets at fair value are transfers from Local Government and other bodies to State Government based on formal proclamation� The following roads were transferred during 2011-12: Ravensthorpe-Hopetoun Rd and Indian Ocean Drive�
The developers contribution to roadworks relate to construction costs met by private developers on roads owned by Main Roads� Roadworks include Pinjarra-Williams Rd (Red Hill Realignment), Forrest Hwy (Grand Entrance Treendale), Onlsow Rd/ANSIA Access Rd Intersection Improvements and various traffic signal construction�
2012$000
2011$000
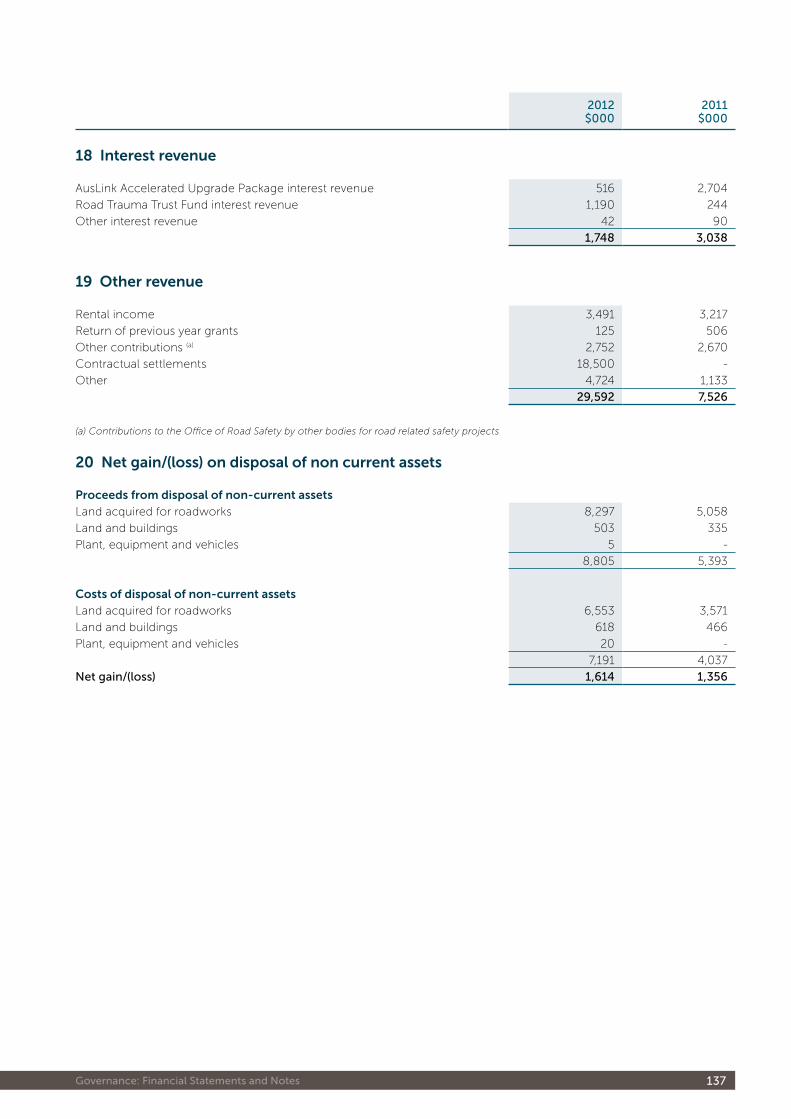
137 Governance: Financial Statements and Notes
18 interest revenue
AusLink Accelerated Upgrade Package interest revenue 516 2,704
Road Trauma Trust Fund interest revenue 1,190 244
Other interest revenue 42 90
1,748 3,038
19 other revenue
Rental income 3,491 3,217
Return of previous year grants 125 506
Other contributions (a) 2,752 2,670
Contractual settlements 18,500 -
Other 4,724 1,133
29,592 7,526
(a) Contributions to the Office of Road Safety by other bodies for road related safety projects
20 net gain/(loss) on disposal of non current assets
proceeds from disposal of non-current assetsLand acquired for roadworks 8,297 5,058
Land and buildings 503 335
Plant, equipment and vehicles 5 -
8,805 5,393
costs of disposal of non-current assetsLand acquired for roadworks 6,553 3,571
Land and buildings 618 466
Plant, equipment and vehicles 20 -
7,191 4,037
Net gain/(loss) 1,614 1,356
2012$000
2011$000
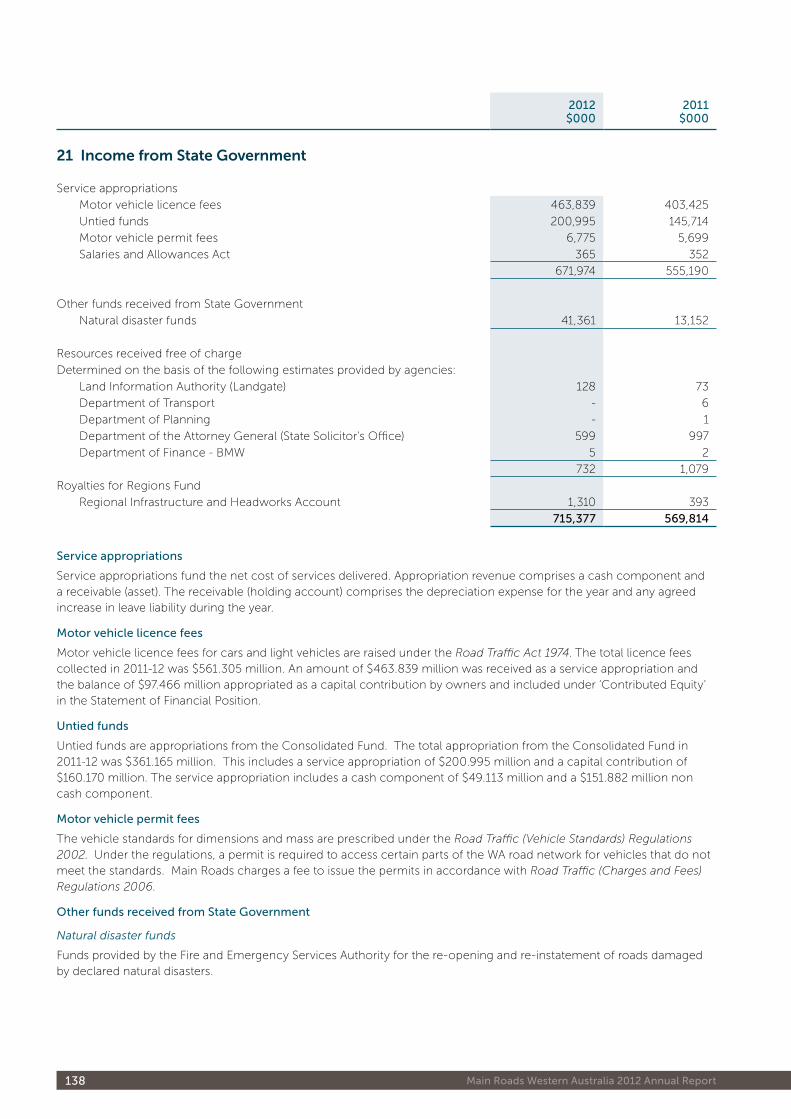
138 Main Roads Western Australia 2012 Annual Report
21 income from State government
Service appropriations
Motor vehicle licence fees 463,839 403,425
Untied funds 200,995 145,714
Motor vehicle permit fees 6,775 5,699
Salaries and Allowances Act 365 352
671,974 555,190
Other funds received from State Government
Natural disaster funds 41,361 13,152
Resources received free of charge
Determined on the basis of the following estimates provided by agencies:
Land Information Authority (Landgate) 128 73
Department of Transport - 6
Department of Planning - 1
Department of the Attorney General (State Solicitor's Office) 599 997
Department of Finance - BMW 5 2
732 1,079
Royalties for Regions Fund
Regional Infrastructure and Headworks Account 1,310 393
715,377 569,814
Service appropriations
Service appropriations fund the net cost of services delivered� Appropriation revenue comprises a cash component and a receivable (asset)� The receivable (holding account) comprises the depreciation expense for the year and any agreed increase in leave liability during the year�
Motor vehicle licence fees
Motor vehicle licence fees for cars and light vehicles are raised under the Road Traffic Act 1974� The total licence fees collected in 2011-12 was $561�305 million� An amount of $463�839 million was received as a service appropriation and the balance of $97�466 million appropriated as a capital contribution by owners and included under ‘Contributed Equity’ in the Statement of Financial Position�
Untied funds
Untied funds are appropriations from the Consolidated Fund� The total appropriation from the Consolidated Fund in 2011-12 was $361�165 million� This includes a service appropriation of $200�995 million and a capital contribution of $160�170 million� The service appropriation includes a cash component of $49�113 million and a $151�882 million non cash component�
Motor vehicle permit fees
The vehicle standards for dimensions and mass are prescribed under the Road Traffic (Vehicle Standards) Regulations 2002� Under the regulations, a permit is required to access certain parts of the WA road network for vehicles that do not meet the standards� Main Roads charges a fee to issue the permits in accordance with Road Traffic (Charges and Fees) Regulations 2006�
Other funds received from State Government
Natural disaster funds
Funds provided by the Fire and Emergency Services Authority for the re-opening and re-instatement of roads damaged by declared natural disasters�
2012$000
2011$000
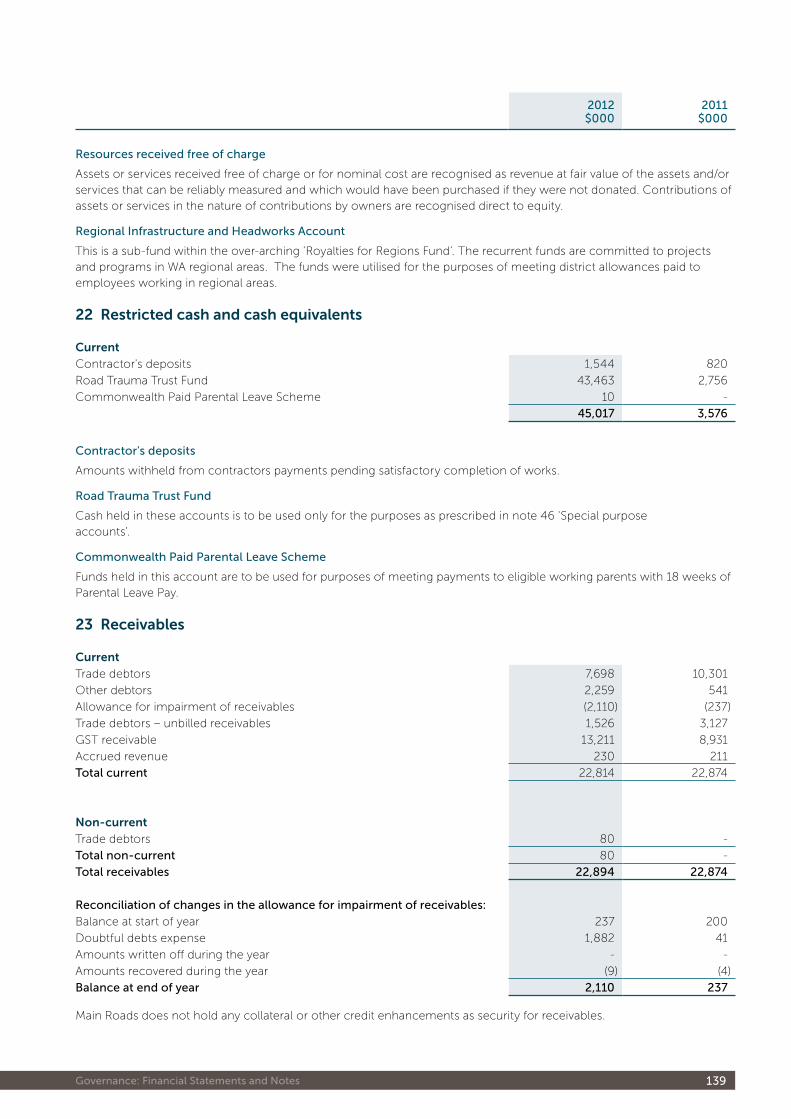
139 Governance: Financial Statements and Notes
Resources received free of charge
Assets or services received free of charge or for nominal cost are recognised as revenue at fair value of the assets and/or services that can be reliably measured and which would have been purchased if they were not donated� Contributions of assets or services in the nature of contributions by owners are recognised direct to equity�
Regional Infrastructure and Headworks Account
This is a sub-fund within the over-arching ‘Royalties for Regions Fund’� The recurrent funds are committed to projects and programs in WA regional areas� The funds were utilised for the purposes of meeting district allowances paid to employees working in regional areas�
22 restricted cash and cash equivalents
currentContractor's deposits 1,544 820
Road Trauma Trust Fund 43,463 2,756
Commonwealth Paid Parental Leave Scheme 10 -
45,017 3,576
Contractor's deposits
Amounts withheld from contractors payments pending satisfactory completion of works�
Road Trauma Trust Fund
Cash held in these accounts is to be used only for the purposes as prescribed in note 46 'Special purpose accounts’�
Commonwealth Paid Parental Leave Scheme
Funds held in this account are to be used for purposes of meeting payments to eligible working parents with 18 weeks of Parental Leave Pay�
23 receivables
currentTrade debtors 7,698 10,301
Other debtors 2,259 541
Allowance for impairment of receivables (2,110) (237)
Trade debtors – unbilled receivables 1,526 3,127
GST receivable 13,211 8,931
Accrued revenue 230 211
Total current 22,814 22,874
non-currentTrade debtors 80 -
Total non-current 80 -
Total receivables 22,894 22,874
Reconciliation of changes in the allowance for impairment of receivables:
Balance at start of year 237 200
Doubtful debts expense 1,882 41
Amounts written off during the year - -
Amounts recovered during the year (9) (4)
Balance at end of year 2,110 237
Main Roads does not hold any collateral or other credit enhancements as security for receivables�
2012$000
2011$000
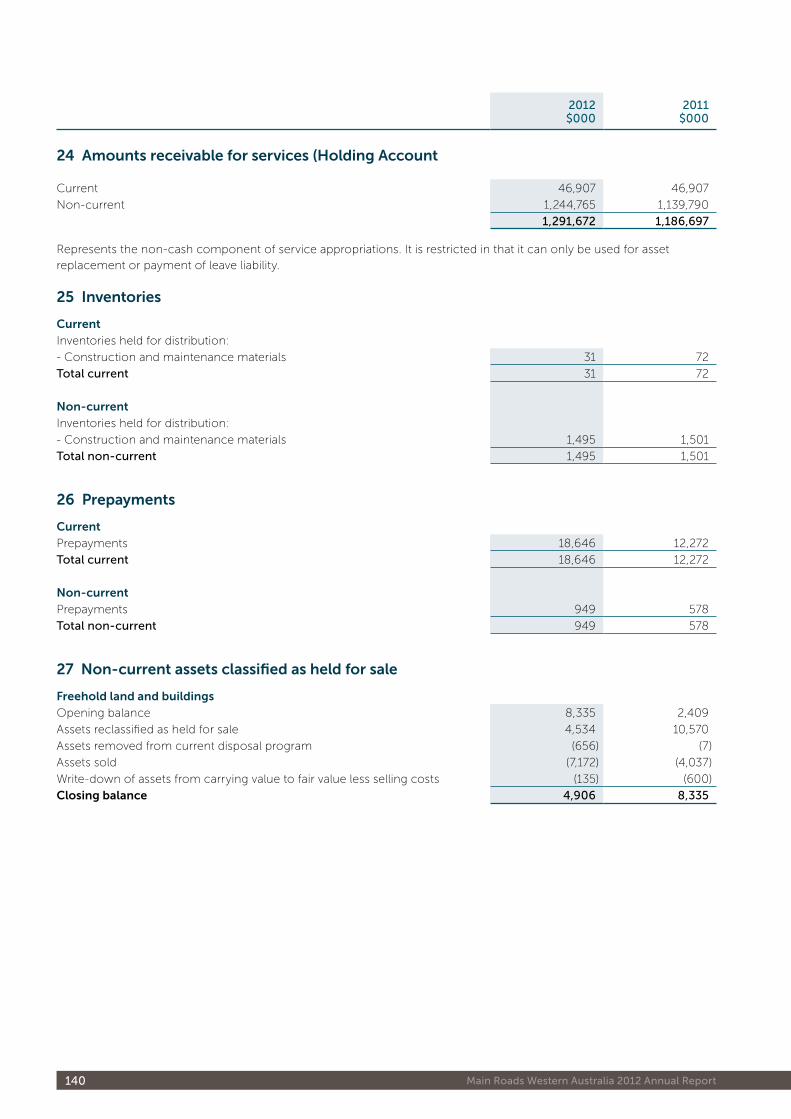
140 Main Roads Western Australia 2012 Annual Report
24 amounts receivable for services (holding account
Current 46,907 46,907
Non-current 1,244,765 1,139,790
1,291,672 1,186,697
Represents the non-cash component of service appropriations� It is restricted in that it can only be used for asset replacement or payment of leave liability�
25 inventories
currentInventories held for distribution:
- Construction and maintenance materials 31 72
Total current 31 72
non-currentInventories held for distribution:
- Construction and maintenance materials 1,495 1,501
Total non-current 1,495 1,501
26 prepayments
currentPrepayments 18,646 12,272
Total current 18,646 12,272
non-currentPrepayments 949 578
Total non-current 949 578
27 non-current assets classified as held for sale
Freehold land and buildingsOpening balance 8,335 2,409
Assets reclassified as held for sale 4,534 10,570
Assets removed from current disposal program (656) (7)
Assets sold (7,172) (4,037)
Write-down of assets from carrying value to fair value less selling costs (135) (600)
closing balance 4,906 8,335
2012$000
2011$000
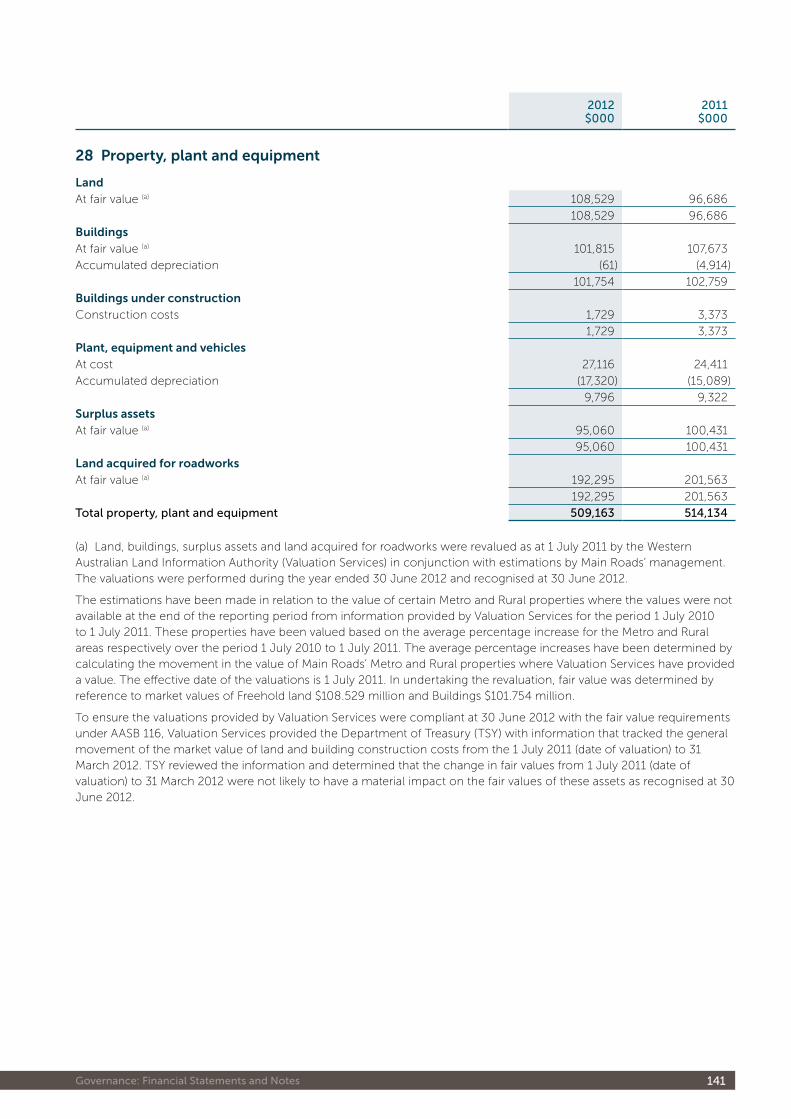
141 Governance: Financial Statements and Notes
28 property, plant and equipment
landAt fair value (a) 108,529 96,686
108,529 96,686
BuildingsAt fair value (a) 101,815 107,673
Accumulated depreciation (61) (4,914)
101,754 102,759
Buildings under constructionConstruction costs 1,729 3,373
1,729 3,373
plant, equipment and vehiclesAt cost 27,116 24,411
Accumulated depreciation (17,320) (15,089)
9,796 9,322
Surplus assetsAt fair value (a) 95,060 100,431
95,060 100,431
land acquired for roadworks At fair value (a) 192,295 201,563
192,295 201,563
Total property, plant and equipment 509,163 514,134
(a) Land, buildings, surplus assets and land acquired for roadworks were revalued as at 1 July 2011 by the Western Australian Land Information Authority (Valuation Services) in conjunction with estimations by Main Roads’ management� The valuations were performed during the year ended 30 June 2012 and recognised at 30 June 2012�
The estimations have been made in relation to the value of certain Metro and Rural properties where the values were not available at the end of the reporting period from information provided by Valuation Services for the period 1 July 2010 to 1 July 2011� These properties have been valued based on the average percentage increase for the Metro and Rural areas respectively over the period 1 July 2010 to 1 July 2011� The average percentage increases have been determined by calculating the movement in the value of Main Roads’ Metro and Rural properties where Valuation Services have provided a value� The effective date of the valuations is 1 July 2011� In undertaking the revaluation, fair value was determined by reference to market values of Freehold land $108�529 million and Buildings $101�754 million�
To ensure the valuations provided by Valuation Services were compliant at 30 June 2012 with the fair value requirements under AASB 116, Valuation Services provided the Department of Treasury (TSY) with information that tracked the general movement of the market value of land and building construction costs from the 1 July 2011 (date of valuation) to 31 March 2012� TSY reviewed the information and determined that the change in fair values from 1 July 2011 (date of valuation) to 31 March 2012 were not likely to have a material impact on the fair values of these assets as recognised at 30 June 2012�
2012$000
2011$000
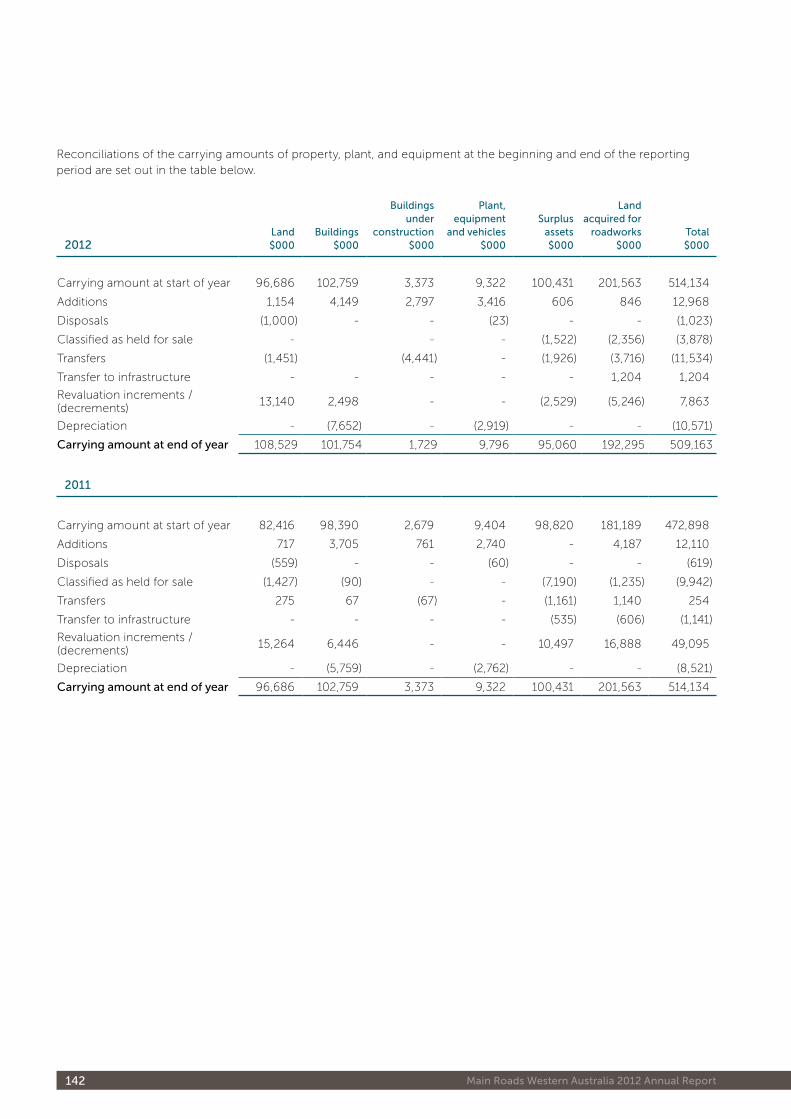
142 Main Roads Western Australia 2012 Annual Report
Reconciliations of the carrying amounts of property, plant, and equipment at the beginning and end of the reporting period are set out in the table below�
2012Land$000
Buildings$000
Buildings under
construction$000
Plant, equipment
and vehicles$000
Surplus assets$000
Land acquired for
roadworks$000
Total$000
Carrying amount at start of year 96,686 102,759 3,373 9,322 100,431 201,563 514,134
Additions 1,154 4,149 2,797 3,416 606 846 12,968
Disposals (1,000) - - (23) - - (1,023)
Classified as held for sale - - - (1,522) (2,356) (3,878)
Transfers (1,451) (4,441) - (1,926) (3,716) (11,534)
Transfer to infrastructure - - - - - 1,204 1,204
Revaluation increments / (decrements)
13,140 2,498 - - (2,529) (5,246) 7,863
Depreciation - (7,652) - (2,919) - - (10,571)
Carrying amount at end of year 108,529 101,754 1,729 9,796 95,060 192,295 509,163
2011
Carrying amount at start of year 82,416 98,390 2,679 9,404 98,820 181,189 472,898
Additions 717 3,705 761 2,740 - 4,187 12,110
Disposals (559) - - (60) - - (619)
Classified as held for sale (1,427) (90) - - (7,190) (1,235) (9,942)
Transfers 275 67 (67) - (1,161) 1,140 254
Transfer to infrastructure - - - - (535) (606) (1,141)
Revaluation increments / (decrements)
15,264 6,446 - - 10,497 16,888 49,095
Depreciation - (5,759) - (2,762) - - (8,521)
Carrying amount at end of year 96,686 102,759 3,373 9,322 100,431 201,563 514,134
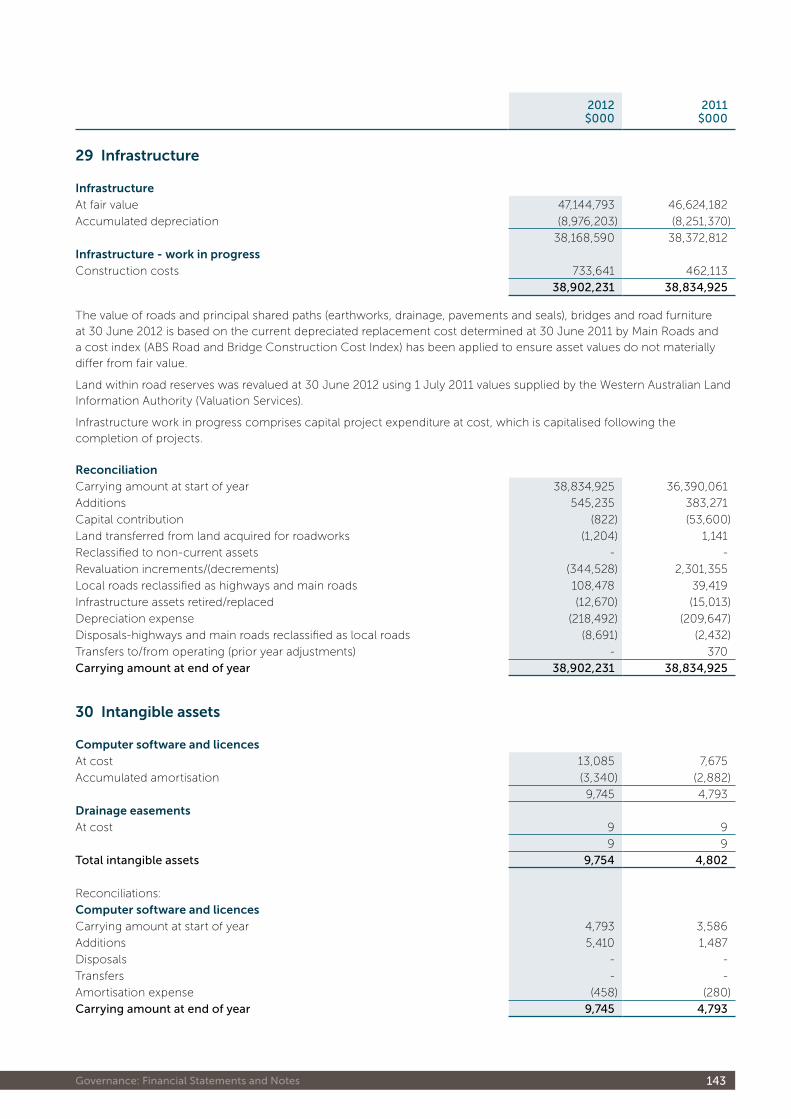
143 Governance: Financial Statements and Notes
29 infrastructure
infrastructureAt fair value 47,144,793 46,624,182
Accumulated depreciation (8,976,203) (8,251,370)
38,168,590 38,372,812
infrastructure - work in progressConstruction costs 733,641 462,113
38,902,231 38,834,925
The value of roads and principal shared paths (earthworks, drainage, pavements and seals), bridges and road furniture at 30 June 2012 is based on the current depreciated replacement cost determined at 30 June 2011 by Main Roads and a cost index (ABS Road and Bridge Construction Cost Index) has been applied to ensure asset values do not materially differ from fair value�
Land within road reserves was revalued at 30 June 2012 using 1 July 2011 values supplied by the Western Australian Land Information Authority (Valuation Services)�
Infrastructure work in progress comprises capital project expenditure at cost, which is capitalised following the completion of projects�
reconciliationCarrying amount at start of year 38,834,925 36,390,061
Additions 545,235 383,271
Capital contribution (822) (53,600)
Land transferred from land acquired for roadworks (1,204) 1,141
Reclassified to non-current assets - -
Revaluation increments/(decrements) (344,528) 2,301,355
Local roads reclassified as highways and main roads 108,478 39,419
Infrastructure assets retired/replaced (12,670) (15,013)
Depreciation expense (218,492) (209,647)
Disposals-highways and main roads reclassified as local roads (8,691) (2,432)
Transfers to/from operating (prior year adjustments) - 370
Carrying amount at end of year 38,902,231 38,834,925
30 intangible assets
computer software and licencesAt cost 13,085 7,675
Accumulated amortisation (3,340) (2,882)
9,745 4,793
drainage easementsAt cost 9 9
9 9
Total intangible assets 9,754 4,802
Reconciliations:
computer software and licencesCarrying amount at start of year 4,793 3,586
Additions 5,410 1,487
Disposals - -
Transfers - -
Amortisation expense (458) (280)
Carrying amount at end of year 9,745 4,793
2012$000
2011$000
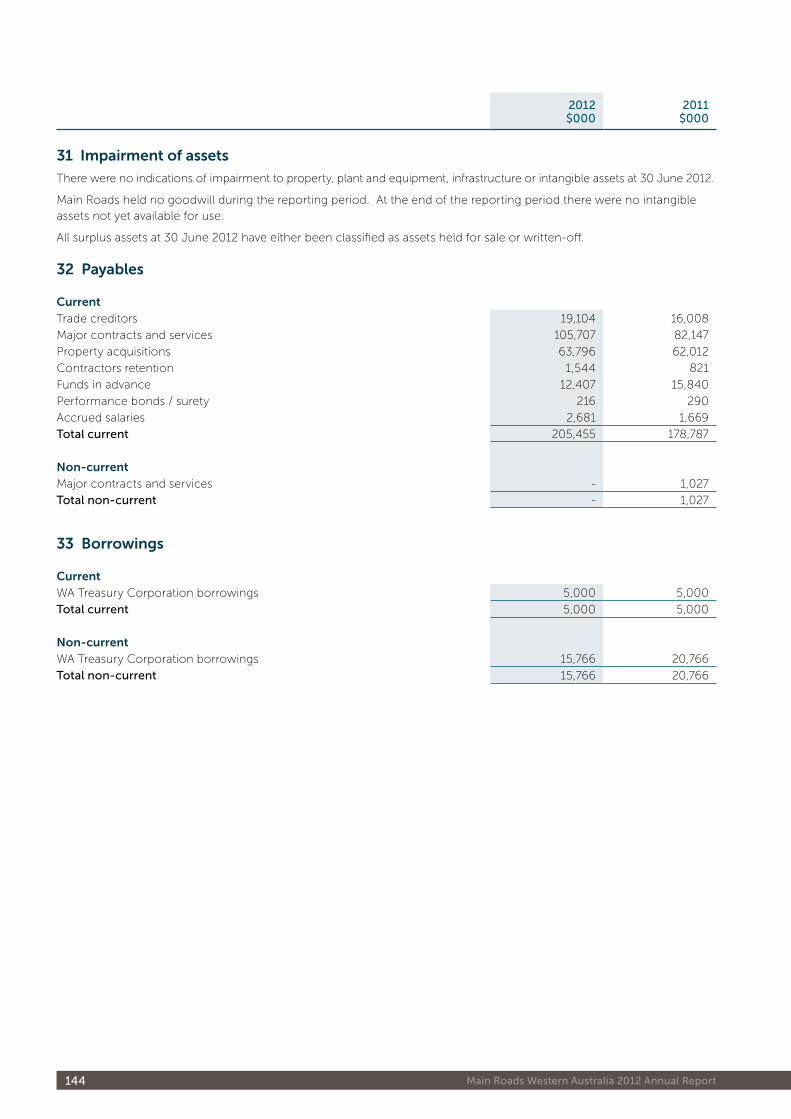
144 Main Roads Western Australia 2012 Annual Report
31 impairment of assets
There were no indications of impairment to property, plant and equipment, infrastructure or intangible assets at 30 June 2012�
Main Roads held no goodwill during the reporting period� At the end of the reporting period there were no intangible assets not yet available for use�
All surplus assets at 30 June 2012 have either been classified as assets held for sale or written-off�
32 payables
currentTrade creditors 19,104 16,008
Major contracts and services 105,707 82,147
Property acquisitions 63,796 62,012
Contractors retention 1,544 821
Funds in advance 12,407 15,840
Performance bonds / surety 216 290
Accrued salaries 2,681 1,669
Total current 205,455 178,787
non-currentMajor contracts and services - 1,027
Total non-current - 1,027
33 Borrowings
currentWA Treasury Corporation borrowings 5,000 5,000
Total current 5,000 5,000
non-currentWA Treasury Corporation borrowings 15,766 20,766
Total non-current 15,766 20,766
2012$000
2011$000
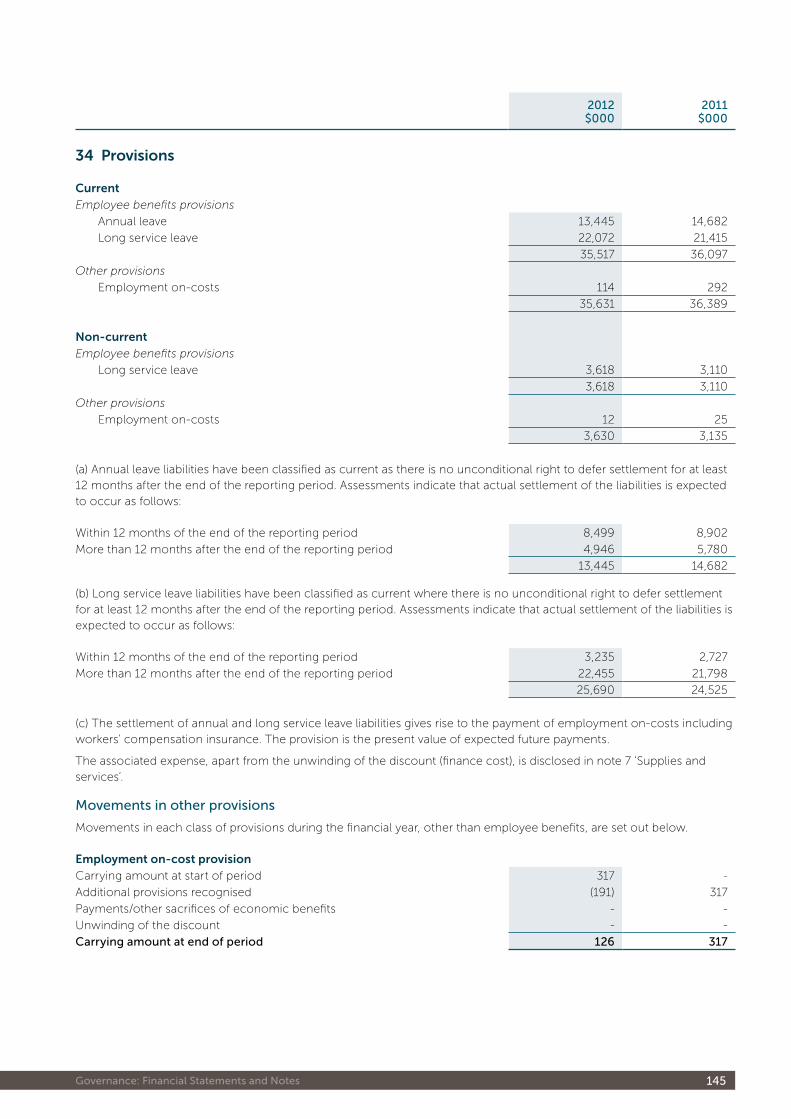
145 Governance: Financial Statements and Notes
34 provisions
currentEmployee benefits provisions
Annual leave 13,445 14,682
Long service leave 22,072 21,415
35,517 36,097
Other provisions
Employment on-costs 114 292
35,631 36,389
non-currentEmployee benefits provisions
Long service leave 3,618 3,110
3,618 3,110
Other provisions
Employment on-costs 12 25
3,630 3,135
(a) Annual leave liabilities have been classified as current as there is no unconditional right to defer settlement for at least 12 months after the end of the reporting period� Assessments indicate that actual settlement of the liabilities is expected to occur as follows:
Within 12 months of the end of the reporting period 8,499 8,902
More than 12 months after the end of the reporting period 4,946 5,780
13,445 14,682
(b) Long service leave liabilities have been classified as current where there is no unconditional right to defer settlement for at least 12 months after the end of the reporting period� Assessments indicate that actual settlement of the liabilities is expected to occur as follows:
Within 12 months of the end of the reporting period 3,235 2,727
More than 12 months after the end of the reporting period 22,455 21,798
25,690 24,525
(c) The settlement of annual and long service leave liabilities gives rise to the payment of employment on-costs including workers’ compensation insurance� The provision is the present value of expected future payments�
The associated expense, apart from the unwinding of the discount (finance cost), is disclosed in note 7 'Supplies and services’�
Movements in other provisions
Movements in each class of provisions during the financial year, other than employee benefits, are set out below�
employment on-cost provisionCarrying amount at start of period 317 -
Additional provisions recognised (191) 317
Payments/other sacrifices of economic benefits - -
Unwinding of the discount - -
Carrying amount at end of period 126 317
2012$000
2011$000
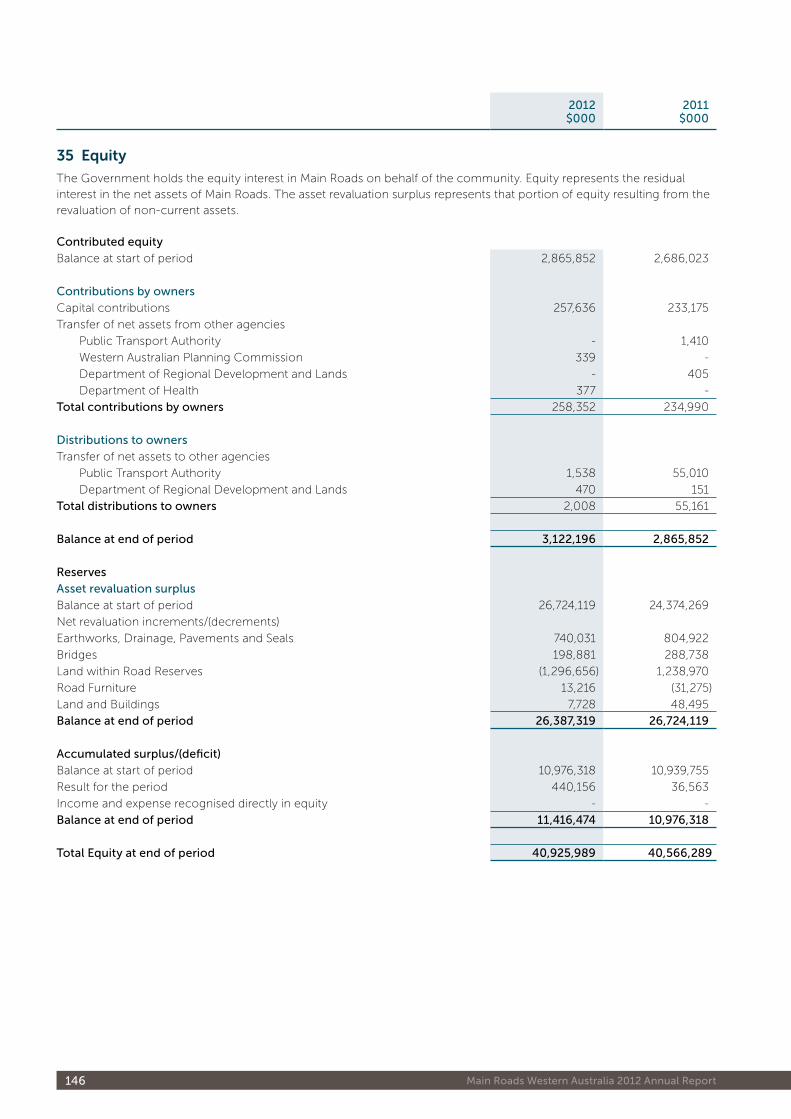
146 Main Roads Western Australia 2012 Annual Report
35 equity
The Government holds the equity interest in Main Roads on behalf of the community� Equity represents the residual interest in the net assets of Main Roads� The asset revaluation surplus represents that portion of equity resulting from the revaluation of non-current assets�
Contributed equity
Balance at start of period 2,865,852 2,686,023
Contributions by owners
Capital contributions 257,636 233,175
Transfer of net assets from other agencies
Public Transport Authority - 1,410
Western Australian Planning Commission 339 -
Department of Regional Development and Lands - 405
Department of Health 377 -
Total contributions by owners 258,352 234,990
Distributions to owners
Transfer of net assets to other agencies
Public Transport Authority 1,538 55,010
Department of Regional Development and Lands 470 151
Total distributions to owners 2,008 55,161
Balance at end of period 3,122,196 2,865,852
Reserves
Asset revaluation surplus
Balance at start of period 26,724,119 24,374,269
Net revaluation increments/(decrements)
Earthworks, Drainage, Pavements and Seals 740,031 804,922
Bridges 198,881 288,738
Land within Road Reserves (1,296,656) 1,238,970
Road Furniture 13,216 (31,275)
Land and Buildings 7,728 48,495
Balance at end of period 26,387,319 26,724,119
Accumulated surplus/(deficit)
Balance at start of period 10,976,318 10,939,755
Result for the period 440,156 36,563
Income and expense recognised directly in equity - -
Balance at end of period 11,416,474 10,976,318
Total Equity at end of period 40,925,989 40,566,289
2012$000
2011$000
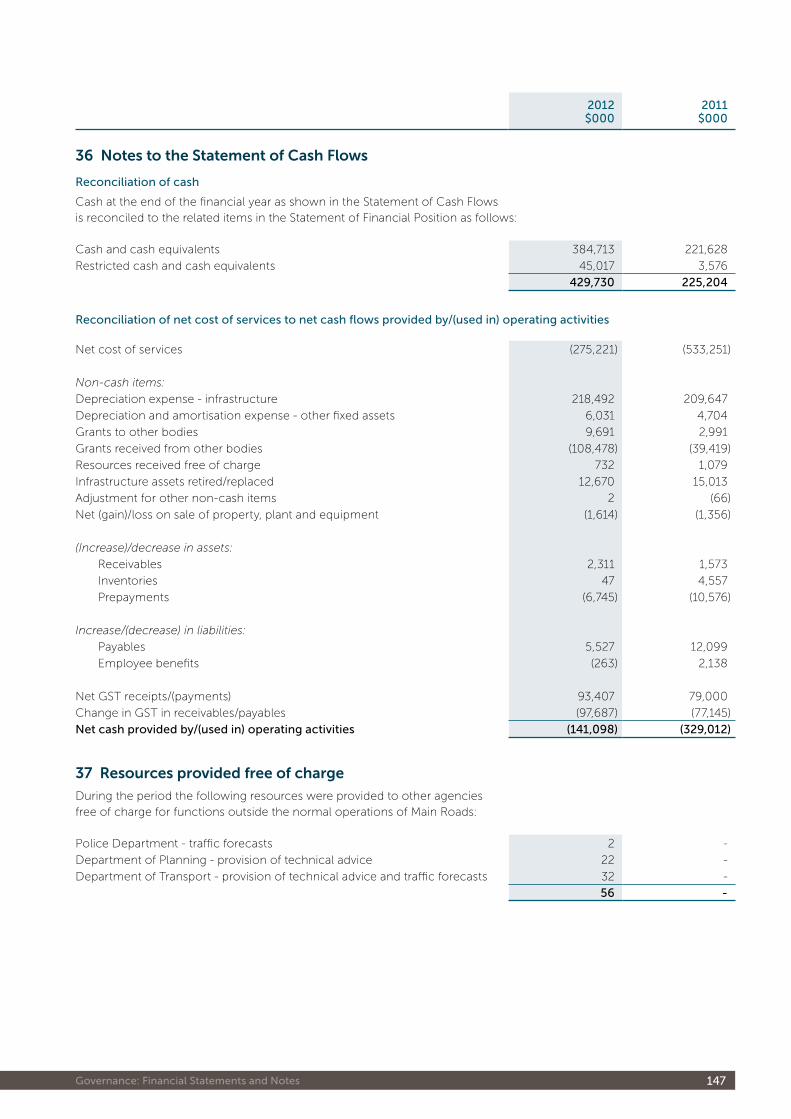
147 Governance: Financial Statements and Notes
36 notes to the Statement of cash Flows
Reconciliation of cash
Cash at the end of the financial year as shown in the Statement of Cash Flows is reconciled to the related items in the Statement of Financial Position as follows:
Cash and cash equivalents 384,713 221,628
Restricted cash and cash equivalents 45,017 3,576
429,730 225,204
Reconciliation of net cost of services to net cash flows provided by/(used in) operating activities
Net cost of services (275,221) (533,251)
Non-cash items:
Depreciation expense - infrastructure 218,492 209,647
Depreciation and amortisation expense - other fixed assets 6,031 4,704
Grants to other bodies 9,691 2,991
Grants received from other bodies (108,478) (39,419)
Resources received free of charge 732 1,079
Infrastructure assets retired/replaced 12,670 15,013
Adjustment for other non-cash items 2 (66)
Net (gain)/loss on sale of property, plant and equipment (1,614) (1,356)
(Increase)/decrease in assets:
Receivables 2,311 1,573
Inventories 47 4,557
Prepayments (6,745) (10,576)
Increase/(decrease) in liabilities:
Payables 5,527 12,099
Employee benefits (263) 2,138
Net GST receipts/(payments) 93,407 79,000
Change in GST in receivables/payables (97,687) (77,145)
Net cash provided by/(used in) operating activities (141,098) (329,012)
37 resources provided free of charge
During the period the following resources were provided to other agencies free of charge for functions outside the normal operations of Main Roads:
Police Department - traffic forecasts 2 -
Department of Planning - provision of technical advice 22 -
Department of Transport - provision of technical advice and traffic forecasts 32 -
56 -
2012$000
2011$000
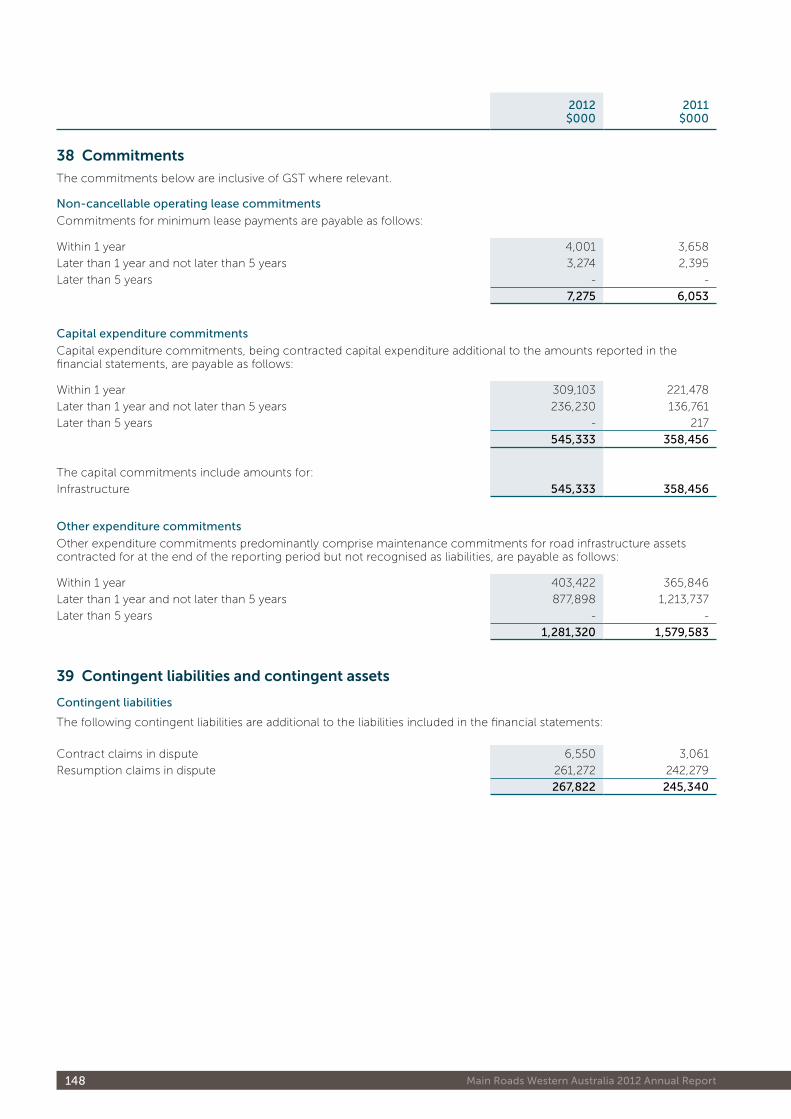
148 Main Roads Western Australia 2012 Annual Report
38 commitments
The commitments below are inclusive of GST where relevant�
Non-cancellable operating lease commitments
Commitments for minimum lease payments are payable as follows:
Within 1 year 4,001 3,658
Later than 1 year and not later than 5 years 3,274 2,395
Later than 5 years - -
7,275 6,053
Capital expenditure commitments
Capital expenditure commitments, being contracted capital expenditure additional to the amounts reported in the financial statements, are payable as follows:
Within 1 year 309,103 221,478
Later than 1 year and not later than 5 years 236,230 136,761
Later than 5 years - 217
545,333 358,456
The capital commitments include amounts for:
Infrastructure 545,333 358,456
Other expenditure commitments
Other expenditure commitments predominantly comprise maintenance commitments for road infrastructure assets contracted for at the end of the reporting period but not recognised as liabilities, are payable as follows:
Within 1 year 403,422 365,846
Later than 1 year and not later than 5 years 877,898 1,213,737
Later than 5 years - -
1,281,320 1,579,583
39 contingent liabilities and contingent assets
Contingent liabilities
The following contingent liabilities are additional to the liabilities included in the financial statements:
Contract claims in dispute 6,550 3,061
Resumption claims in dispute 261,272 242,279
267,822 245,340
2012$000
2011$000
149 Governance: Financial Statements and Notes
Contract claims in dispute
Claims have been submitted by contractors in relation to services provided under roadwork contracts� The contingent liability is the difference between the amount of the claim and the liability estimated by Main Roads based on legal advice�
Resumption claims in dispute
Claims have been lodged by owners of property acquired for road construction purposes� The contingent liability is the difference between the owner’s claim and the estimated settlement price determined by Main Roads in accordance with an independent valuation�
Contaminated sites
Under the Contaminated Sites Act 2003, Main Roads is required to report known and suspected contaminated sites to the Department of Environment and Conservation (DEC)� In accordance with the Act, DEC classifies these sites on the basis of the risk to human health, the environment and environmental values� Where sites are classified as contaminated – remediation required or possibly contaminated – investigation required, Main Roads may have a liability in respect of investigation or remediation expenses�
During the year, Main Roads reported eleven suspected contaminated sites to DEC� Three were classified as possibly contaminated - investigation required, four were classified as contaminated - remediation required and four were classified as remediated for restricted use� Main Roads is unable to assess the likely outcome of the classification process, and accordingly, it is not practicable to estimate the potential financial effect or to identify the uncertainties relating to the amount or timing of any outflows� Whilst there is no possibility of reimbursement of any future expenses that may be incurred in the remediation of these sites, Main Roads may apply for funding from the Contaminated Sites Management Account to undertake further investigative work or to meet remediation costs that may be required�
Contingent assets
The following contingent assets are additional to the assets included in the financial statements:
Contracts in dispute 1,400 21,938
Damages claim in progress - 2,417
1,400 24,355
Contracts in dispute (dispute resolution in progress)
The amount shown relates to claims against various contractors for deficient works, which are currently proceeding through dispute resolution processes� The potential financial effect of the success of the claims cannot be reliably measured at this time�
Damages claim in progress
The damages claim in progress relates to damage to Main Roads infrastructure by a third party� The potential financial effect of the success of the claim cannot be reliably measured at this time�
40 events occurring after the end of the reporting period
There were no events occurring after the end of the reporting period that have any financial effect on the results reported on these financial statements�
2012$000
2011$000
150 Main Roads Western Australia 2012 Annual Report
41 explanatory statements
Significant variations between estimates and actual results for 2012 and between the actual results for 2011 and 2012 are shown below� Significant variations are considered to be those greater than 10% and $5 million�
Significant variances between estimated and actual result for 2012
2012Estimate
$000
2012Actual$000
Variation$000
expensesGrants and subsidies 202,520 177,311 25,209
Infrastructure assets retired/replaced 19,704 12,670 7,034
incomeCommonwealth grants and contributions 354,965 441,161 (86,196)
Natural disaster funds 30,936 41,361 (10,425)
Grants from other bodies 47,900 108,478 (60,578)
Grants and subsidies
The transfer of roads to local government occurred earlier than anticipated� In particular Geraldton-Mt Magnet Road the section between North West Coast Highway and the Airport was transferred to the City of Greater Geraldton�
Infrastructure assets retired/replaced
The variation is due to lower than expected retirements of road assets being replaced, mainly due to a slower than anticipated capital works program�
Commonwealth grants and contributions
The variance relates to revenue received for Great Northern Hwy (Port Hedland Realignment) Project that was approved during the year�
Grants from other bodies
The transfer of roads to Main Roads occurred earlier than anticipated� In particular the Ravensthorpe-Hopetoun Road was transferred from the Shire of Ravensthorpe ahead of schedule�
Natural disaster funds
State and Local Road Infrastructure was greatly affected during 2010/11 resulting in more revenue being collected via the Western Australia Natural Disaster Relief and Recovery Arrangements�
151 Governance: Financial Statements and Notes
Significant variances between actual result for 2012 and 2011
2012$000
2011$000
Variation$000
expensesSupplies and services 454,751 377,580 77,171
Grants and subsidies 177,311 140,469 36,842
incomeRegulatory fines 57,887 18,682 39,205
Commonwealth grants and contributions 441,161 196,666 244,495
Contributions to roadworks 18,499 12,091 6,408
Grants from other bodies 108,478 39,419 69,059
Other revenue 29,592 7,526 22,066
Supplies and services
An increased Capital Works Program resulted in higher expenditure� Major Projects on Great Eastern Highway, Dampier Highway and Kwinana Freeway were all under construction�
Grants and subsidies
Increased expenditure by Local Government combined with the transfer of Lancelin Road to the Shire of Gingin resulted in the increase on last year�
Regulatory fines
In 2011 Main Roads received 1/3 of Speed and Red Light Camera Revenue, this was increased to 2/3 in 2012 resulting in a substantial increase in revenue�
Commonwealth grants and contributions
The variance relates to revenue received for Great Northern Hwy (Port Hedland Realignment) that was approved during the year�
Contributions to roadworks
The increase relates to an agreement reached in 2011/12 with Chevron Australia Pty Ltd resulting in revenue being received for improvements to Onslow Road for the Wheatstone Project�
Grants from other bodies
The transfer of roads to Main Roads occurred earlier than anticipated� In particular the Ravensthorpe-Hopetoun Road was transferred from the Shire of Ravensthorpe ahead of schedule�
Other revenue
The increase in revenue is a result of the settlement of the Contractual Disputes associated with the Pavement Failures on Kwinana Freeway Interchanges & Extension; Roe Highway Stages 4/5; Roe Highway Stage 6; Tonkin Highway and Great Eastern Highway Sawyers Valley to The Lake�
152 Main Roads Western Australia 2012 Annual Report
42 Financial instruments
(a) Financial risk management objectives and policies
Financial instruments held by Main Roads are cash and cash equivalents, restricted cash and cash equivalents, loans and receivables, payables, and WATC borrowings� Main Roads has limited exposure to financial risks� Main Roads’ overall risk management program focuses on managing the risks identified below�
Credit risk
Credit risk arises when there is the possibility of Main Roads’ receivables defaulting on their contractual obligations resulting in financial loss to Main Roads�
The maximum exposure to credit risk at the end of the reporting period in relation to each class of recognised financial assets is the gross carrying amount of those assets inclusive of any allowance for impairment as shown in the table at note 42(c) ‘Financial instrument disclosures’ and note 23 ‘Receivables’�
Credit risk associated with Main Roads’ financial assets is minimal because the main receivable is the amounts receivable for services (holding account)� For receivables other than government, Main Roads trades only with recognised, creditworthy third parties� Main Roads has policies in place to ensure that sales of products and services are made to customers with an appropriate credit history� In addition, receivable balances are monitored on an ongoing basis with the result that Main Roads’ exposure to bad debts is minimal� At the end of the reporting period there were no significant concentrations of credit risk�
Liquidity risk
Liquidity risk arises when Main Roads is unable to meet its financial obligations as they fall due�
Main Roads is exposed to liquidity risk through its trading in the normal course of business�
Main Roads has appropriate procedures to manage cash flows including drawdowns of appropriations by monitoring forecast cash flows to ensure that sufficient funds are available to meet its commitments�
Market risk
Market risk is the risk that changes in market prices such as foreign exchange rates and interest rates will affect Main Roads’ income or the value of its holdings of financial instruments� Main Roads does not trade in foreign currency and is not materially exposed to other price risks� Main Roads’ exposure to market risk for changes in interest rates relates primarily to the long-term debt obligations�
All borrowings are due to the Western Australian Treasury Corporation (WATC) and are repayable at fixed rates with varying maturities� Other than as detailed in the interest rate sensitivity analysis table at note 42(c), Main Roads is not exposed to interest rate risk because the majority of cash and cash equivalents and restricted cash are non-interest bearing and it has no borrowings other than the WATC borrowings�
(b) Categories of financial instruments
The carrying amounts of each of the following categories of financial assets and financial liabilities at the end of the reporting period are:
Financial assetsCash and cash equivalents 384,713 221,628
Restricted cash and cash equivalents 45,017 3,576
Loans and receivables (a) 1,301,355 1,200,640
Financial liabilitiesFinancial liabilities measured at amortised cost 226,221 205,580
(a) The amount of loans and receivables excludes GST recoverable from the ATO (statutory receivable).
2012$000
2011$000
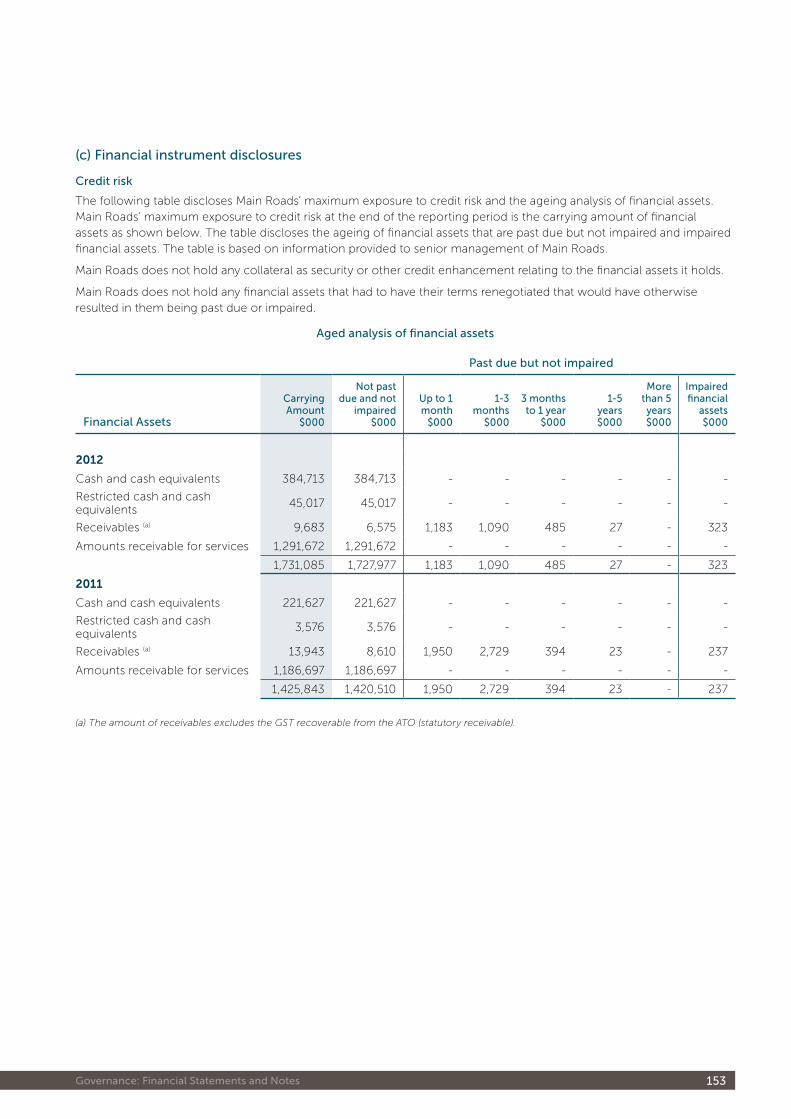
153 Governance: Financial Statements and Notes
(c) Financial instrument disclosures
Credit risk
The following table discloses Main Roads’ maximum exposure to credit risk and the ageing analysis of financial assets� Main Roads’ maximum exposure to credit risk at the end of the reporting period is the carrying amount of financial assets as shown below� The table discloses the ageing of financial assets that are past due but not impaired and impaired financial assets� The table is based on information provided to senior management of Main Roads�
Main Roads does not hold any collateral as security or other credit enhancement relating to the financial assets it holds�
Main Roads does not hold any financial assets that had to have their terms renegotiated that would have otherwise resulted in them being past due or impaired�
Aged analysis of financial assets
Past due but not impaired
Financial Assets
Carrying Amount
$000
Not past due and not
impaired$000
Up to 1 month
$000
1-3 months
$000
3 months to 1 year
$000
1-5 years$000
More than 5 years$000
Impaired financial
assets$000
2012
Cash and cash equivalents 384,713 384,713 - - - - - -
Restricted cash and cash equivalents
45,017 45,017 - - - - - -
Receivables (a) 9,683 6,575 1,183 1,090 485 27 - 323
Amounts receivable for services 1,291,672 1,291,672 - - - - - -
1,731,085 1,727,977 1,183 1,090 485 27 - 323
2011
Cash and cash equivalents 221,627 221,627 - - - - - -
Restricted cash and cash equivalents
3,576 3,576 - - - - - -
Receivables (a) 13,943 8,610 1,950 2,729 394 23 - 237
Amounts receivable for services 1,186,697 1,186,697 - - - - - -
1,425,843 1,420,510 1,950 2,729 394 23 - 237
(a) The amount of receivables excludes the GST recoverable from the ATO (statutory receivable).
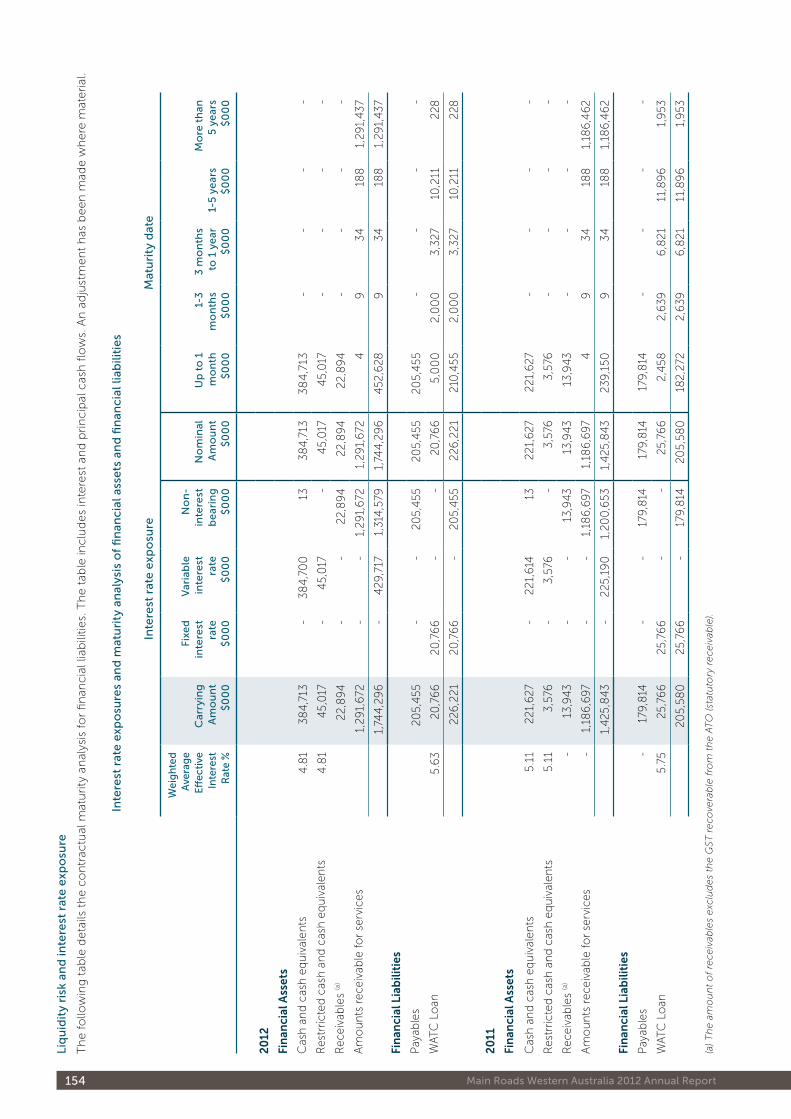
154 Main Roads Western Australia 2012 Annual Report
Liq
uid
ity
risk
an
d in
tere
st r
ate
exp
osu
re
Th
e f
ollo
win
g t
able
deta
ils t
he c
on
trac
tual
mat
uri
ty a
nal
ysis
fo
r fin
ancia
l lia
bili
tie
s� T
he t
able
inclu
de
s in
tere
st a
nd
pri
ncip
al c
ash
flo
ws�
An
ad
just
me
nt
has
be
en
mad
e w
he
re m
ate
rial
�
Inte
rest
rat
e e
xpo
sure
s an
d m
atu
rity
an
alys
is o
f fi
nan
cial
ass
ets
an
d fi
nan
cial
liab
iliti
es
Inte
rest
rat
e e
xpo
sure
Mat
uri
ty d
ate
Wei
gh
ted
A
vera
ge
Effec
tive
In
tere
st
Rat
e %
Car
ryin
g
Am
ou
nt
$0
00
Fixe
d
inte
rest
ra
te$
00
0
Var
iab
le
inte
rest
ra
te$
00
0
No
n-
inte
rest
b
ear
ing
$0
00
No
min
al
Am
ou
nt
$0
00
Up
to
1
mo
nth
$0
00
1-3
m
on
ths
$0
00
3
mo
nth
s to
1 y
ear
$0
00
1-5
ye
ars
$0
00
Mo
re t
han
5
ye
ars
$0
00
2012
Fin
anci
al a
sset
s
Cas
h a
nd
cas
h e
qu
ival
ents
4�8
1 3
84
,713
-
3
84
,70
0
13
38
4,7
13
38
4,7
13
-
-
-
-
Res
trri
cted
cas
h a
nd
cas
h e
qu
ival
ents
4�8
1 4
5,0
17
-
45,
017
-
4
5,0
17
45,
017
-
-
-
-
Rec
eiva
ble
s (a
) 2
2,8
94
-
-
2
2,8
94
2
2,8
94
2
2,8
94
-
-
-
-
Am
ou
nts
rec
eiva
ble
fo
r se
rvic
es1,
291,
672
-
-
1
,29
1,6
72
1,2
91,
672
4
9
3
4
18
8
1,2
91,
437
1,74
4,2
96
-
4
29,7
17
1,3
14,5
79
1,7
44
,29
6
452
,628
9
3
4
18
8
1,2
91,
437
Fin
anci
al l
iab
iliti
es
Pay
able
s 2
05,
455
-
-
2
05,
455
2
05,
455
2
05,
455
-
-
-
-
WAT
C L
oan
5 �6
3 2
0,7
66
2
0,7
66
-
-
2
0,7
66
5
,00
0
2,0
00
3
,327
1
0,2
11
228
226
,221
2
0,7
66
-
2
05,
455
2
26,2
21
210
,455
2
,00
0
3,3
27
10
,211
2
28
2011
Fin
anci
al a
sset
s
Cas
h a
nd
cas
h e
qu
ival
ents
5�11
221
,627
-
2
21,6
14
13
221
,627
2
21,6
27
-
-
-
-
Res
trri
cted
cas
h a
nd
cas
h e
qu
ival
ents
5�11
3,5
76
-
3,5
76
-
3,5
76
3,5
76
-
-
-
-
Rec
eiva
ble
s (a
)-
13,
943
-
-
1
3,9
43
13,
943
1
3,9
43
-
-
-
-
Am
ou
nts
rec
eiva
ble
fo
r se
rvic
es-
1,1
86
,697
-
-
1
,18
6,6
97
1,1
86
,697
4
9
3
4
18
8
1,1
86
,46
2
1,4
25,8
43
-
225
,19
0
1,20
0,6
53
1,4
25,8
43
239
,150
9
3
4
18
8
1,1
86
,46
2
Fin
anci
al l
iab
iliti
es
Pay
able
s-
179
,814
-
-
1
79,8
14
179
,814
1
79,8
14
-
-
-
-
WAT
C L
oan
5 �75
25,
766
2
5,76
6
-
-
25,
766
2
,458
2
,639
6
,821
1
1,8
96
1
,953
20
5,58
0
25,
766
-
1
79,8
14
20
5,58
0
18
2,27
2 2
,639
6
,821
1
1,8
96
1
,953
(a) T
he a
mo
un
t o
f re
ceiv
able
s e
xclu
des
the G
ST
re
cove
rab
le f
rom
th
e A
TO
(st
atu
tory
re
ceiv
able
).
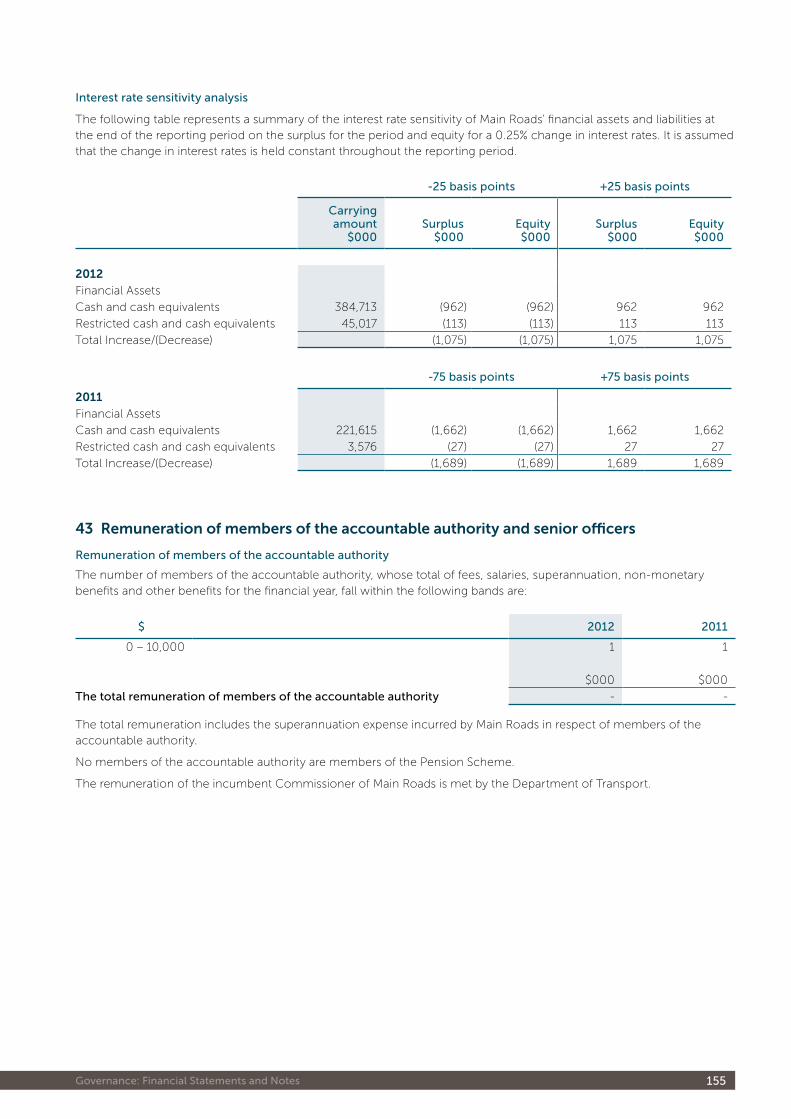
155 Governance: Financial Statements and Notes
Interest rate sensitivity analysis
The following table represents a summary of the interest rate sensitivity of Main Roads' financial assets and liabilities at the end of the reporting period on the surplus for the period and equity for a 0�25% change in interest rates� It is assumed that the change in interest rates is held constant throughout the reporting period�
-25 basis points +25 basis points
Carrying amount
$000Surplus
$000Equity$000
Surplus$000
Equity$000
2012Financial Assets
Cash and cash equivalents 384,713 (962) (962) 962 962
Restricted cash and cash equivalents 45,017 (113) (113) 113 113
Total Increase/(Decrease) (1,075) (1,075) 1,075 1,075
-75 basis points +75 basis points
2011Financial Assets
Cash and cash equivalents 221,615 (1,662) (1,662) 1,662 1,662
Restricted cash and cash equivalents 3,576 (27) (27) 27 27
Total Increase/(Decrease) (1,689) (1,689) 1,689 1,689
43 remuneration of members of the accountable authority and senior officers
Remuneration of members of the accountable authority
The number of members of the accountable authority, whose total of fees, salaries, superannuation, non-monetary benefits and other benefits for the financial year, fall within the following bands are:
$ 2012 2011
0 – 10,000 1 1
$000 $000
The total remuneration of members of the accountable authority - -
The total remuneration includes the superannuation expense incurred by Main Roads in respect of members of the accountable authority�
No members of the accountable authority are members of the Pension Scheme�
The remuneration of the incumbent Commissioner of Main Roads is met by the Department of Transport�
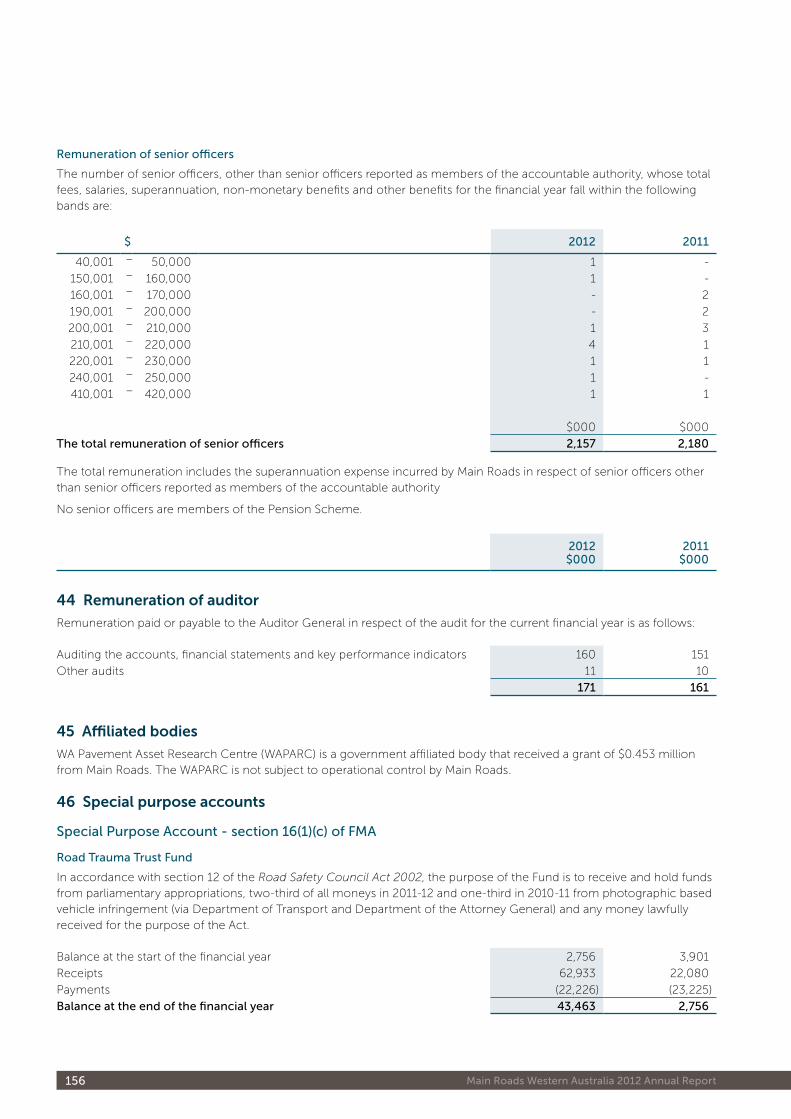
156 Main Roads Western Australia 2012 Annual Report
Remuneration of senior officers
The number of senior officers, other than senior officers reported as members of the accountable authority, whose total fees, salaries, superannuation, non-monetary benefits and other benefits for the financial year fall within the following bands are:
$ 2012 2011
40,001 – 50,000 1 -
150,001 – 160,000 1 -
160,001 – 170,000 - 2
190,001 – 200,000 - 2
200,001 – 210,000 1 3
210,001 – 220,000 4 1
220,001 – 230,000 1 1
240,001 – 250,000 1 -
410,001 – 420,000 1 1
$000 $000
The total remuneration of senior officers 2,157 2,180
The total remuneration includes the superannuation expense incurred by Main Roads in respect of senior officers other than senior officers reported as members of the accountable authority
No senior officers are members of the Pension Scheme�
2012$000
2011$000
44 remuneration of auditor
Remuneration paid or payable to the Auditor General in respect of the audit for the current financial year is as follows:
Auditing the accounts, financial statements and key performance indicators 160 151
Other audits 11 10
171 161
45 affiliated bodies
WA Pavement Asset Research Centre (WAPARC) is a government affiliated body that received a grant of $0�453 million from Main Roads� The WAPARC is not subject to operational control by Main Roads�
46 Special purpose accounts
Special Purpose Account - section 16(1)(c) of FMA
Road Trauma Trust Fund
In accordance with section 12 of the Road Safety Council Act 2002, the purpose of the Fund is to receive and hold funds from parliamentary appropriations, two-third of all moneys in 2011-12 and one-third in 2010-11 from photographic based vehicle infringement (via Department of Transport and Department of the Attorney General) and any money lawfully received for the purpose of the Act�
Balance at the start of the financial year 2,756 3,901
Receipts 62,933 22,080
Payments (22,226) (23,225)
Balance at the end of the financial year 43,463 2,756
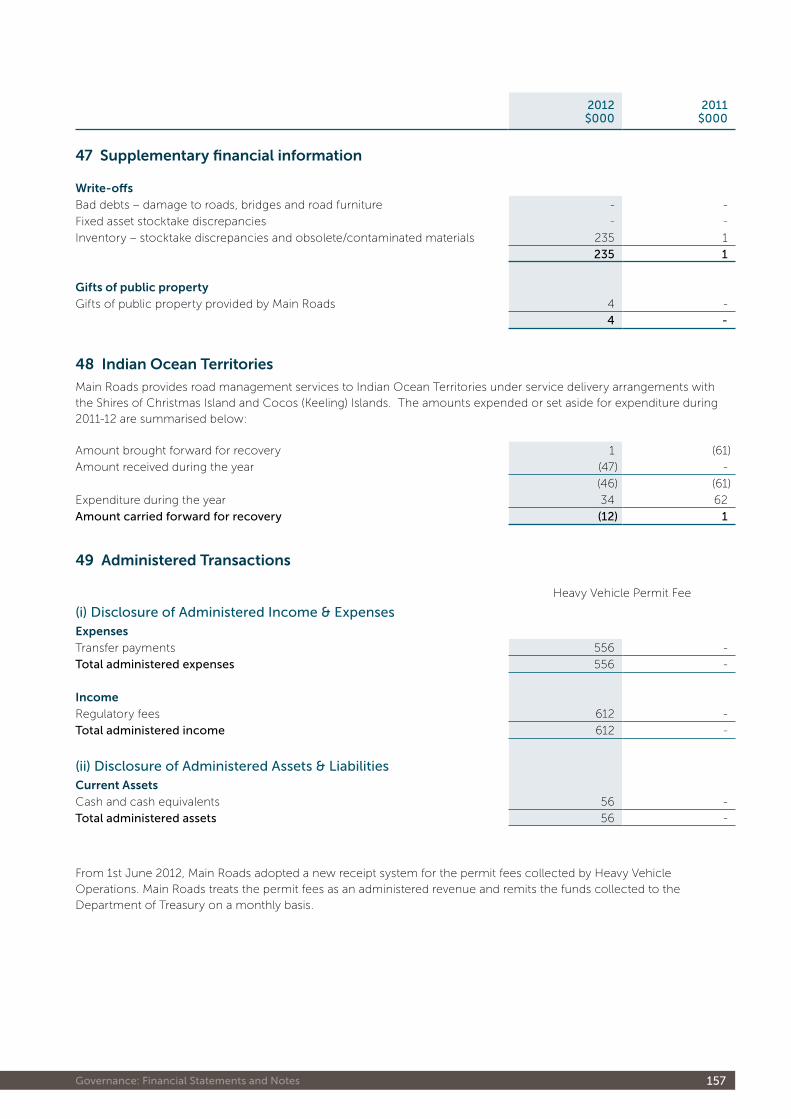
157 Governance: Financial Statements and Notes
47 Supplementary financial information
write-offsBad debts – damage to roads, bridges and road furniture - -
Fixed asset stocktake discrepancies - -
Inventory – stocktake discrepancies and obsolete/contaminated materials 235 1
235 1
gifts of public propertyGifts of public property provided by Main Roads 4 -
4 -
48 indian ocean territories
Main Roads provides road management services to Indian Ocean Territories under service delivery arrangements with the Shires of Christmas Island and Cocos (Keeling) Islands� The amounts expended or set aside for expenditure during 2011-12 are summarised below:
Amount brought forward for recovery 1 (61)
Amount received during the year (47) -
(46) (61)
Expenditure during the year 34 62
Amount carried forward for recovery (12) 1
49 administered transactions
Heavy Vehicle Permit Fee
(i) Disclosure of Administered Income & ExpensesexpensesTransfer payments 556 -
Total administered expenses 556 -
incomeRegulatory fees 612 -
Total administered income 612 -
(ii) Disclosure of Administered Assets & Liabilitiescurrent assetsCash and cash equivalents 56 -
Total administered assets 56 -
From 1st June 2012, Main Roads adopted a new receipt system for the permit fees collected by Heavy Vehicle Operations� Main Roads treats the permit fees as an administered revenue and remits the funds collected to the Department of Treasury on a monthly basis�
2012$000
2011$000
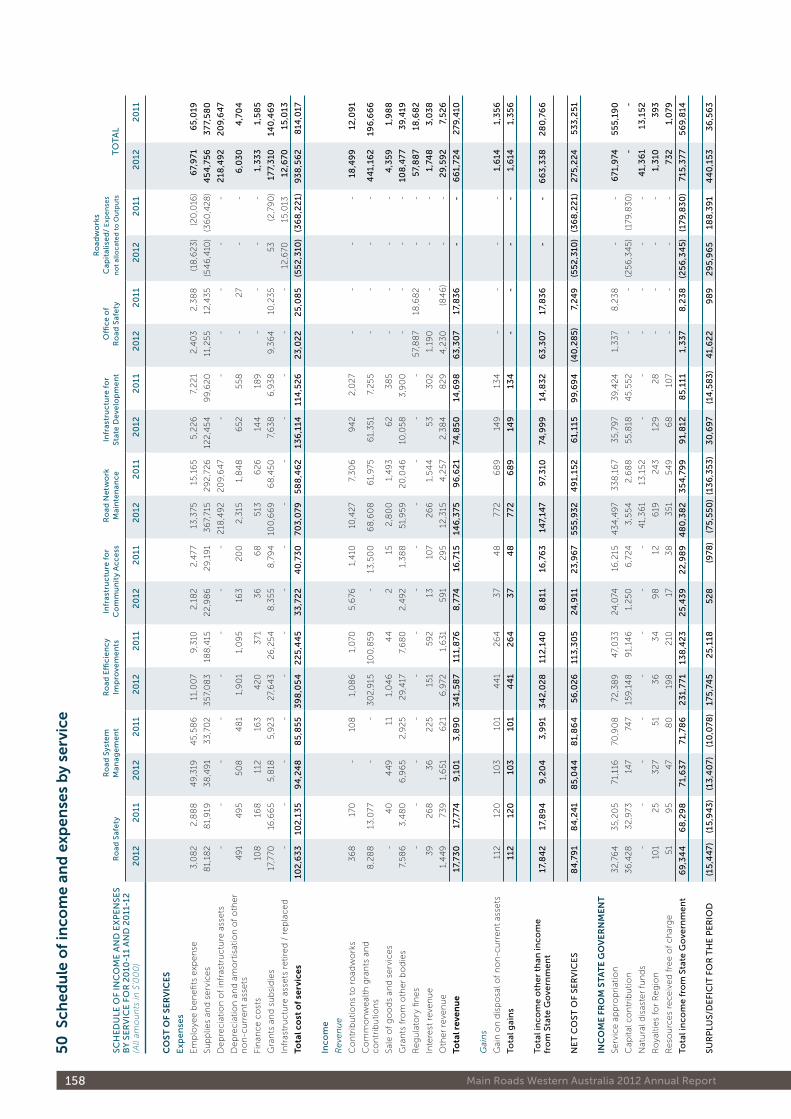
158 Main Roads Western Australia 2012 Annual Report
SC
HE
DU
LE O
F IN
CO
ME
AN
D E
XP
EN
SE
S B
Y S
ER
VIC
E F
OR
20
10-1
1 A
ND
20
11-1
2
(All
amo
un
ts in
$'0
00
)
Ro
ad
Saf
ety
Ro
ad
Sys
tem
M
ana
ge
me
nt
Ro
ad
Effi
cie
nc
y Im
pro
vem
en
tsIn
fras
tru
ctu
re f
or
Co
mm
un
ity
Ac
ce
ssR
oa
d N
etw
ork
M
ain
ten
anc
eIn
fras
tru
ctu
re f
or
Sta
te D
eve
lop
me
nt
Offi
ce
of
R
oa
d S
afe
ty
Ro
ad
wo
rks
Cap
ita
lise
d/
Exp
en
ses
no
t a
llo
cat
ed
to
Ou
tpu
ts T
OT
AL
20
122
011
20
122
011
20
122
011
20
122
011
20
122
011
20
122
011
20
122
011
20
122
011
20
122
011
co
St
oF
Se
rv
ice
S
Exp
en
ses
Em
plo
yee b
en
efit
s e
xpe
nse
3,0
82
2,8
88
49
,319
45
,58
611
,00
79
,310
2,1
82
2,4
77
13,3
7515
,16
55
,22
67,
22
12
,40
32
,38
8(1
8,6
23
)(2
0,0
16)
67,
971
65
,019
Su
pp
lies
and
se
rvic
es
81,
182
81,
919
38
,49
13
3,7
02
35
7,0
83
188
,415
22
,98
62
9,1
91
36
7,71
52
92
,72
612
2,4
54
99
,62
011
,25
512
,43
5(5
46
,410
)(3
60
,42
8)
45
4,7
56
37
7,5
80
De
pre
cia
tio
n o
f in
fras
tru
ctu
re a
sse
ts -
-
-
-
-
-
-
-
2
18,4
92
20
9,6
47
-
-
-
-
-
-
218
,49
22
09
,64
7
De
pre
cia
tio
n a
nd
am
ort
isat
ion
of
oth
er
n
on
-cu
rre
nt
asse
ts4
91
49
55
08
48
11,
90
11,
09
516
32
00
2,3
151,
84
86
52
55
8 -
2
7 -
-
6
,03
04
,70
4
Fin
ance c
ost
s10
816
811
216
34
20
371
36
68
513
62
614
418
9 -
-
-
-
1,
33
31,
58
5
Gra
nts
an
d s
ub
sid
ies
17,7
7016
,66
55
,818
5,9
23
27,
64
32
6,2
54
8,3
55
8,7
94
100
,66
96
8,4
50
7,6
38
6,9
38
9,3
64
10,2
35
53
(2,7
90
)17
7,3
1014
0,4
69
Infr
astr
uc
ture
ass
ets
re
tire
d /
re
pla
ce
d -
-
-
-
-
-
-
-
-
-
-
-
-
-
12
,670
15,0
1312
,670
15,0
13
tota
l co
st o
f se
rvic
es
102
,63
310
2,1
35
94
,24
88
5,8
55
39
8,0
54
22
5,4
45
33
,72
24
0,7
30
703
,079
58
8,4
62
136
,114
114
,52
62
3,0
22
25
,08
5(5
52
,310
)(3
68
,22
1)9
38
,56
28
14,0
17
Inc
om
e
Re
ven
ue
Co
ntr
ibu
tio
ns
to r
oad
wo
rks
36
817
0 -
10
81,
08
61,
070
5,6
761,
410
10,4
27
7,3
06
94
22
,02
7 -
-
-
-
18
,49
912
,09
1
Co
mm
on
we
alth
gra
nts
an
d
co
ntr
ibu
tio
ns
8,2
88
13,0
77
-
-
30
2,9
1510
0,8
59
-
13,5
00
68
,60
86
1,9
756
1,3
51
7,2
55
-
-
-
-
44
1,16
219
6,6
66
Sal
e o
f g
oo
ds
and
se
rvic
es
-
40
44
911
1,0
46
44
215
2,8
00
1,4
93
62
38
5 -
-
-
-
4
,35
91,
98
8
Gra
nts
fro
m o
the
r b
od
ies
7,5
86
3,4
80
6,9
65
2,9
25
29
,417
7,6
80
2,4
92
1,3
88
51,
959
20
,04
610
,05
83
,90
0 -
-
-
-
10
8,4
77
39
,419
Re
gu
lato
ry fi
ne
s -
-
-
-
-
-
-
-
-
-
-
-
5
7,8
87
18,6
82
-
-
57,
88
718
,68
2
Inte
rest
re
ven
ue
39
26
83
62
25
151
59
213
107
26
61,
54
45
33
02
1,19
0 -
-
-
1,
748
3,0
38
Oth
er
reve
nu
e1,
44
973
91,
651
62
16
,972
1,6
31
59
12
95
12,3
154
,25
72
,38
48
29
4,2
30
(84
6)
-
-
29
,59
27,
52
6
tota
l re
ven
ue
17,7
30
17,7
749
,10
13
,89
03
41,
58
711
1,8
768
,774
16,7
1514
6,3
759
6,6
21
74,8
50
14,6
98
63
,30
717
,83
6 -
-
6
61,
72
42
79,4
10
Gai
ns
Gai
n o
n d
isp
osa
l of
no
n-c
urr
en
t as
sets
112
120
103
101
44
12
64
37
48
772
68
914
913
4 -
-
-
-
1,
614
1,3
56
Tota
l gai
ns
112
120
103
101
44
12
64
37
48
77
26
89
149
134
-
-
-
-
1,6
141,
35
6
Tota
l in
co
me
oth
er
than
inc
om
e
fro
m S
tate
Go
vern
me
nt
17,8
42
17,8
94
9,2
04
3,9
91
34
2,0
28
112
,14
08
,811
16,7
63
1 47,
147
97,
310
74,9
99
14,8
32
63
,30
717
,83
6 -
-
6
63
,33
82
80
,76
6
NE
T C
OS
T O
F S
ER
VIC
ES
84
,79
18
4,2
41
85
,04
48
1,8
64
56
,02
611
3,3
05
24
,911
23
,96
75
55
,93
24
91,
152
61,
115
99
,69
4(4
0,2
85
)7,
24
9(5
52
,310
)(3
68
,22
1)2
75,2
24
53
3,2
51
inc
om
e F
ro
m S
ta
te
go
ve
rn
me
nt
Se
rvic
e a
pp
rop
riat
ion
32
,76
43
5,2
05
71,1
1670
,90
872
,38
94
7,0
33
24,0
7416
,215
43
4,4
97
33
8,1
67
35
,79
73
9,4
241,
33
78
,23
8 -
-
6
71,9
745
55
,19
0
Cap
ital
co
ntr
ibu
tio
n3
6,4
28
32
,973
147
747
159
,14
89
1,14
61,
25
06
,724
3,5
54
2,6
88
55
,818
45
,55
2 -
-
(2
56
,34
5)
(179
,83
0)
-
-
Nat
ura
l dis
aste
r fu
nd
s -
-
-
-
-
-
-
-
4
1,3
61
13,1
52
-
-
-
-
-
-
41,
36
113
,15
2
Ro
yalt
ies
for
Re
gio
n10
12
53
27
51
36
34
98
126
1924
312
92
8 -
-
-
-
1,
310
39
3
Re
sou
rce
s re
ce
ive
d f
ree o
f c
har
ge
51
95
47
80
198
210
173
83
51
54
96
810
7 -
-
-
-
7
32
1,0
79
Tota
l in
co
me
fro
m S
tate
Go
vern
me
nt
69
,34
46
8,2
98
71,6
37
71,7
86
23
1,7
7113
8,4
23
25
,43
92
2,9
89
48
0,3
82
35
4,7
99
91,
812
85
,111
1,3
37
8,2
38
(25
6,3
45
)(1
79,8
30
)71
5,3
77
56
9,8
14
SU
RP
LUS/
DE
FIC
IT F
OR
TH
E P
ER
IOD
(15
,44
7)
(15
,94
3)
(13
,40
7)
(10
,078
)17
5,7
45
25
,118
52
8(9
78)
(75
,55
0)
(13
6,3
53
)3
0,6
97
(14
,58
3)
41,
62
29
89
29
5,9
65
188
,39
14
40
,15
33
6,5
63
50
Sch
ed
ule
of
inco
me
and
exp
ense
s b
y se
rvic
e
159 Appendices
Appendices
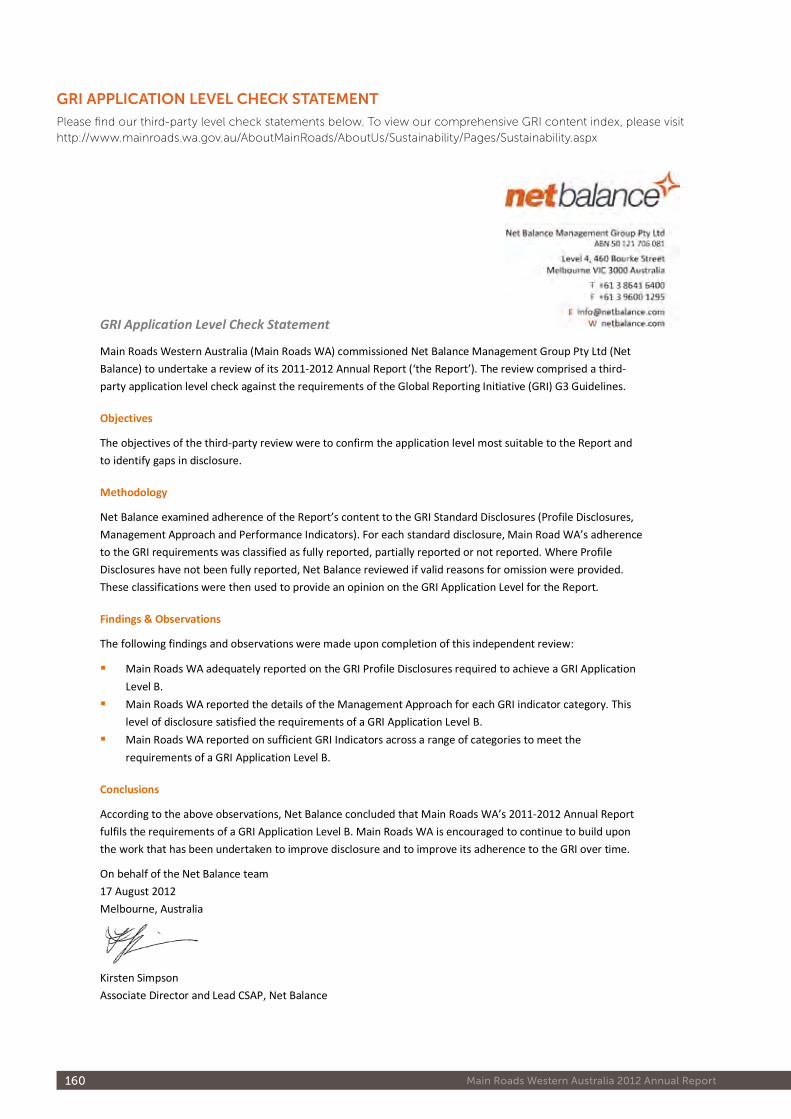
160 Main Roads Western Australia 2012 Annual Report
GRI Application Level Check Statement
Main Roads Western Australia (Main Roads WA) commissioned Net Balance Management Group Pty Ltd (Net
Balance) to undertake a review of its 2011-2012 Annual Report (‘the Report’). The review comprised a third-
party application level check against the requirements of the Global Reporting Initiative (GRI) G3 Guidelines.
Objectives
The objectives of the third-party review were to confirm the application level most suitable to the Report and
to identify gaps in disclosure.
Methodology
Net Balance examined adherence of the Report’s content to the GRI Standard Disclosures (Profile Disclosures,
Management Approach and Performance Indicators). For each standard disclosure, Main Road WA’s adherence
to the GRI requirements was classified as fully reported, partially reported or not reported. Where Profile
Disclosures have not been fully reported, Net Balance reviewed if valid reasons for omission were provided.
These classifications were then used to provide an opinion on the GRI Application Level for the Report.
Findings & Observations
The following findings and observations were made upon completion of this independent review:
Main Roads WA adequately reported on the GRI Profile Disclosures required to achieve a GRI Application
Level B.
Main Roads WA reported the details of the Management Approach for each GRI indicator category. This
level of disclosure satisfied the requirements of a GRI Application Level B.
Main Roads WA reported on sufficient GRI Indicators across a range of categories to meet the
requirements of a GRI Application Level B.
Conclusions
According to the above observations, Net Balance concluded that Main Roads WA’s 2011-2012 Annual Report
fulfils the requirements of a GRI Application Level B. Main Roads WA is encouraged to continue to build upon
the work that has been undertaken to improve disclosure and to improve its adherence to the GRI over time.
On behalf of the Net Balance team
17 August 2012
Melbourne, Australia
Kirsten Simpson
Associate Director and Lead CSAP, Net Balance
GRI ApplIcAtIon level check StAtement
Please find our third-party level check statements below. To view our comprehensive GRI content index, please visit http://www.mainroads.wa.gov.au/AboutMainRoads/AboutUs/Sustainability/Pages/Sustainability.aspx
161 Appendices
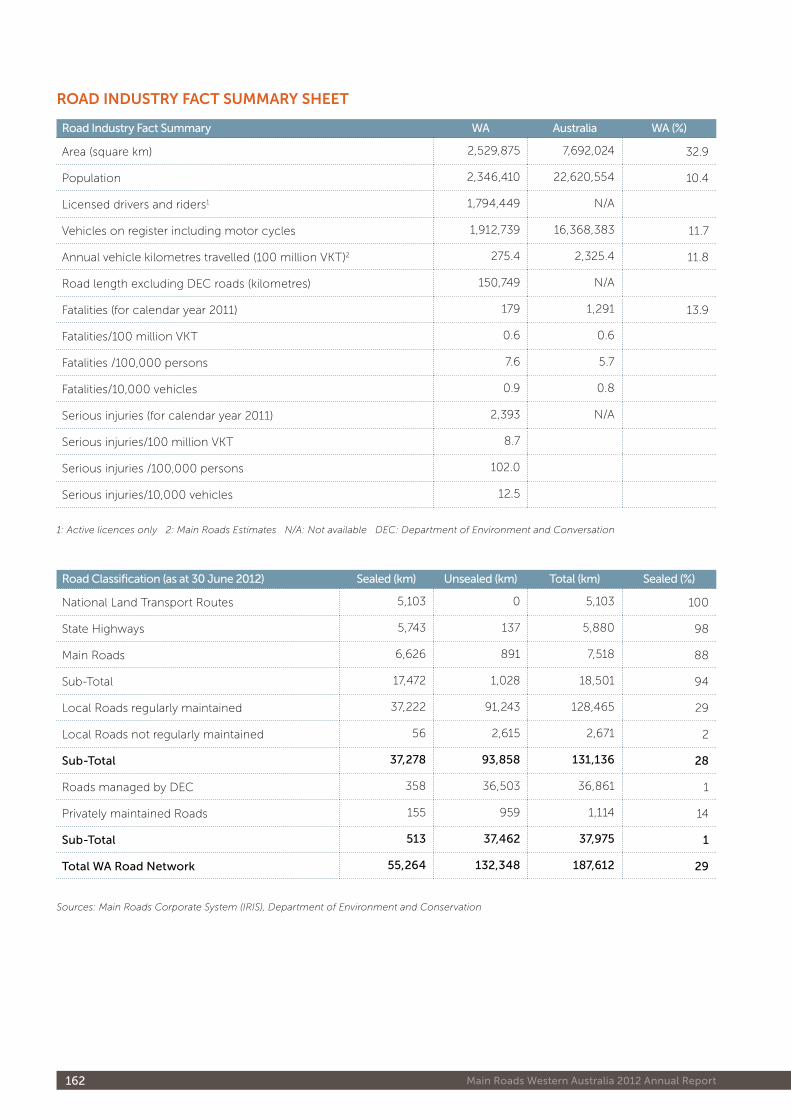
162 Main Roads Western Australia 2012 Annual Report
RoAd InduStRy FAct SummARy Sheet
Road Industry Fact Summary WA Australia WA (%)
Area (square km) 2,529,875 7,692,024 32.9
Population 2,346,410 22,620,554 10.4
Licensed drivers and riders1 1,794,449 N/A
Vehicles on register including motor cycles 1,912,739 16,368,383 11.7
Annual vehicle kilometres travelled (100 million VKT)2 275.4 2,325.4 11.8
Road length excluding DEC roads (kilometres) 150,749 N/A
Fatalities (for calendar year 2011) 179 1,291 13.9
Fatalities/100 million VKT 0.6 0.6
Fatalities /100,000 persons 7.6 5.7
Fatalities/10,000 vehicles 0.9 0.8
Serious injuries (for calendar year 2011) 2,393 N/A
Serious injuries/100 million VKT 8.7
Serious injuries /100,000 persons 102.0
Serious injuries/10,000 vehicles 12.5
1: Active licences only 2: Main Roads Estimates N/A: Not available DEC: Department of Environment and Conversation
Road Classification (as at 30 June 2012) Sealed (km) Unsealed (km) Total (km) Sealed (%)
National Land Transport Routes 5,103 0 5,103 100
State Highways 5,743 137 5,880 98
Main Roads 6,626 891 7,518 88
Sub-Total 17,472 1,028 18,501 94
Local Roads regularly maintained 37,222 91,243 128,465 29
Local Roads not regularly maintained 56 2,615 2,671 2
Sub-Total 37,278 93,858 131,136 28
Roads managed by DEC 358 36,503 36,861 1
Privately maintained Roads 155 959 1,114 14
Sub-Total 513 37,462 37,975 1
Total WA Road Network 55,264 132,348 187,612 29
Sources: Main Roads Corporate System (IRIS), Department of Environment and Conservation
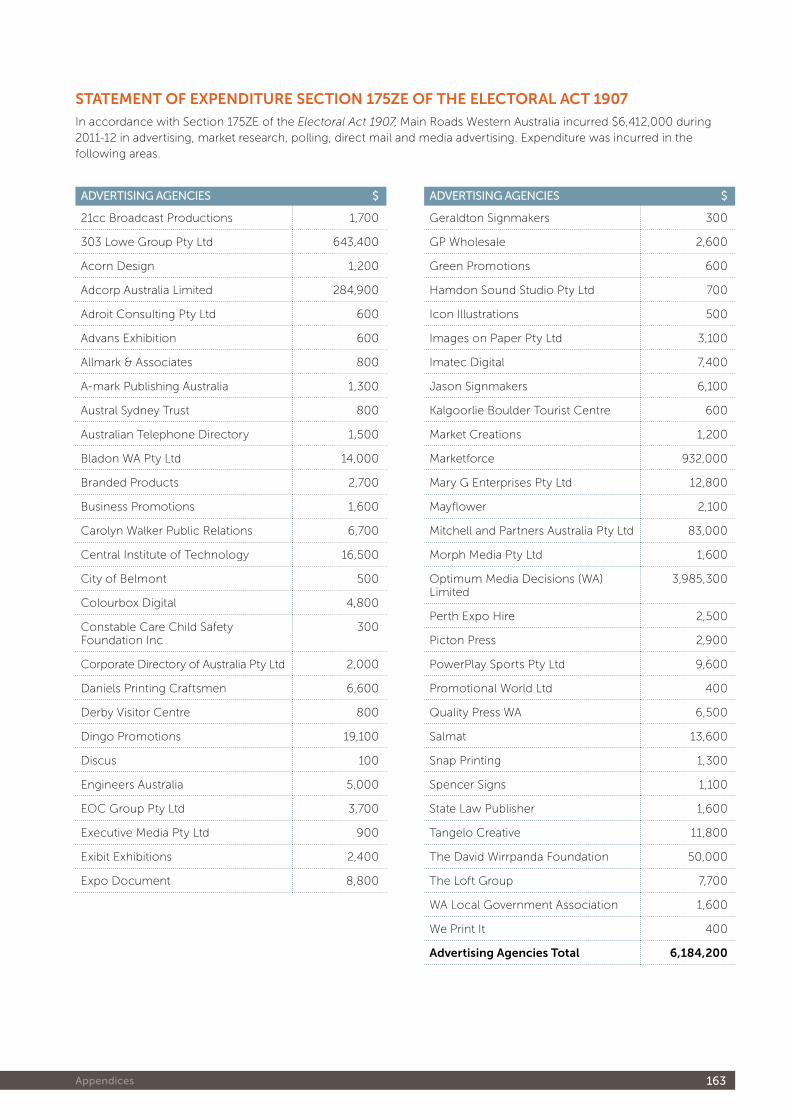
163 Appendices
StAtement oF expendItuRe SectIon 175Ze oF the electoRAl Act 1907
In accordance with Section 175ZE of the Electoral Act 1907, Main Roads Western Australia incurred $6,412,000 during 2011-12 in advertising, market research, polling, direct mail and media advertising. Expenditure was incurred in the following areas.
ADVERTISING AGENCIES $
21cc Broadcast Productions 1,700
303 Lowe Group Pty Ltd 643,400
Acorn Design 1,200
Adcorp Australia Limited 284,900
Adroit Consulting Pty Ltd 600
Advans Exhibition 600
Allmark & Associates 800
A-mark Publishing Australia 1,300
Austral Sydney Trust 800
Australian Telephone Directory 1,500
Bladon WA Pty Ltd 14,000
Branded Products 2,700
Business Promotions 1,600
Carolyn Walker Public Relations 6,700
Central Institute of Technology 16,500
City of Belmont 500
Colourbox Digital 4,800
Constable Care Child Safety Foundation Inc
300
Corporate Directory of Australia Pty Ltd 2,000
Daniels Printing Craftsmen 6,600
Derby Visitor Centre 800
Dingo Promotions 19,100
Discus 100
Engineers Australia 5,000
EOC Group Pty Ltd 3,700
Executive Media Pty Ltd 900
Exibit Exhibitions 2,400
Expo Document 8,800
ADVERTISING AGENCIES $
Geraldton Signmakers 300
GP Wholesale 2,600
Green Promotions 600
Hamdon Sound Studio Pty Ltd 700
Icon Illustrations 500
Images on Paper Pty Ltd 3,100
Imatec Digital 7,400
Jason Signmakers 6,100
Kalgoorlie Boulder Tourist Centre 600
Market Creations 1,200
Marketforce 932,000
Mary G Enterprises Pty Ltd 12,800
Mayflower 2,100
Mitchell and Partners Australia Pty Ltd 83,000
Morph Media Pty Ltd 1,600
Optimum Media Decisions (WA) Limited
3,985,300
Perth Expo Hire 2,500
Picton Press 2,900
PowerPlay Sports Pty Ltd 9,600
Promotional World Ltd 400
Quality Press WA 6,500
Salmat 13,600
Snap Printing 1,300
Spencer Signs 1,100
State Law Publisher 1,600
Tangelo Creative 11,800
The David Wirrpanda Foundation 50,000
The Loft Group 7,700
WA Local Government Association 1,600
We Print It 400
Advertising Agencies total 6,184,200
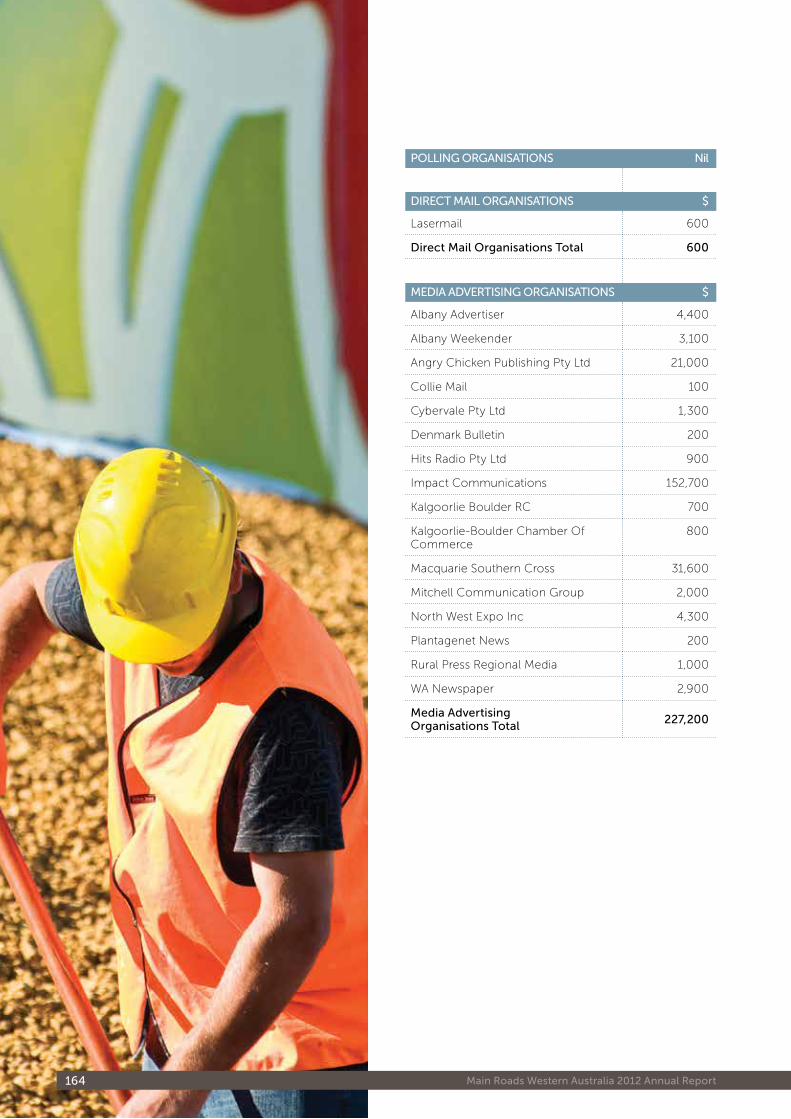
164 Main Roads Western Australia 2012 Annual Report
POLLING ORGANISATIONS Nil
DIRECT MAIL ORGANISATIONS $
Lasermail 600
Direct Mail Organisations Total 600
MEDIA ADVERTISING ORGANISATIONS $
Albany Advertiser 4,400
Albany Weekender 3,100
Angry Chicken Publishing Pty Ltd 21,000
Collie Mail 100
Cybervale Pty Ltd 1,300
Denmark Bulletin 200
Hits Radio Pty Ltd 900
Impact Communications 152,700
Kalgoorlie Boulder RC 700
Kalgoorlie-Boulder Chamber Of Commerce
800
Macquarie Southern Cross 31,600
Mitchell Communication Group 2,000
North West Expo Inc 4,300
Plantagenet News 200
Rural Press Regional Media 1,000
WA Newspaper 2,900
Media Advertising Organisations Total
227,200
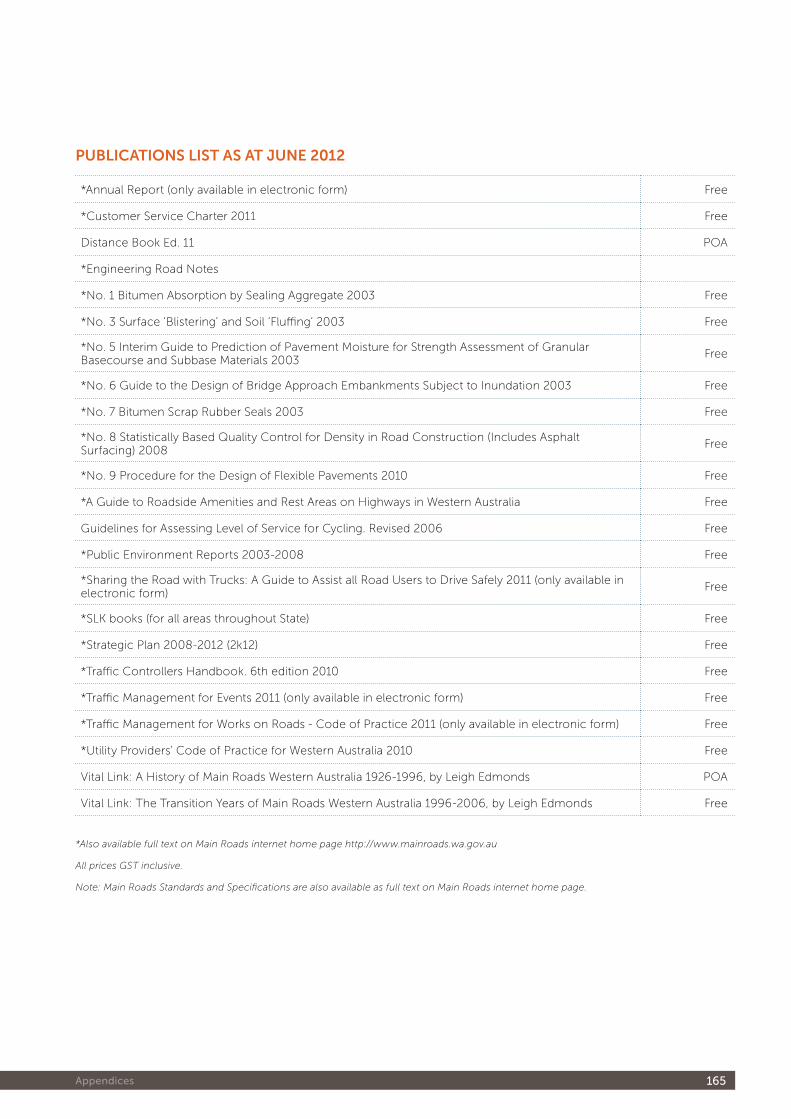
165 Appendices
publIcAtIonS lISt AS At June 2012
*Annual Report (only available in electronic form) Free
*Customer Service Charter 2011 Free
Distance Book Ed. 11 POA
*Engineering Road Notes
*No. 1 Bitumen Absorption by Sealing Aggregate 2003 Free
*No. 3 Surface ‘Blistering’ and Soil ‘Fluffing’ 2003 Free
*No. 5 Interim Guide to Prediction of Pavement Moisture for Strength Assessment of Granular Basecourse and Subbase Materials 2003
Free
*No. 6 Guide to the Design of Bridge Approach Embankments Subject to Inundation 2003 Free
*No. 7 Bitumen Scrap Rubber Seals 2003 Free
*No. 8 Statistically Based Quality Control for Density in Road Construction (Includes Asphalt Surfacing) 2008
Free
*No. 9 Procedure for the Design of Flexible Pavements 2010 Free
*A Guide to Roadside Amenities and Rest Areas on Highways in Western Australia Free
Guidelines for Assessing Level of Service for Cycling. Revised 2006 Free
*Public Environment Reports 2003-2008 Free
*Sharing the Road with Trucks: A Guide to Assist all Road Users to Drive Safely 2011 (only available in electronic form)
Free
*SLK books (for all areas throughout State) Free
*Strategic Plan 2008-2012 (2k12) Free
*Traffic Controllers Handbook. 6th edition 2010 Free
*Traffic Management for Events 2011 (only available in electronic form) Free
*Traffic Management for Works on Roads - Code of Practice 2011 (only available in electronic form) Free
*Utility Providers’ Code of Practice for Western Australia 2010 Free
Vital Link: A History of Main Roads Western Australia 1926-1996, by Leigh Edmonds POA
Vital Link: The Transition Years of Main Roads Western Australia 1996-2006, by Leigh Edmonds Free
*Also available full text on Main Roads internet home page http://www.mainroads.wa.gov.au
All prices GST inclusive.
Note: Main Roads Standards and Specifications are also available as full text on Main Roads internet home page.
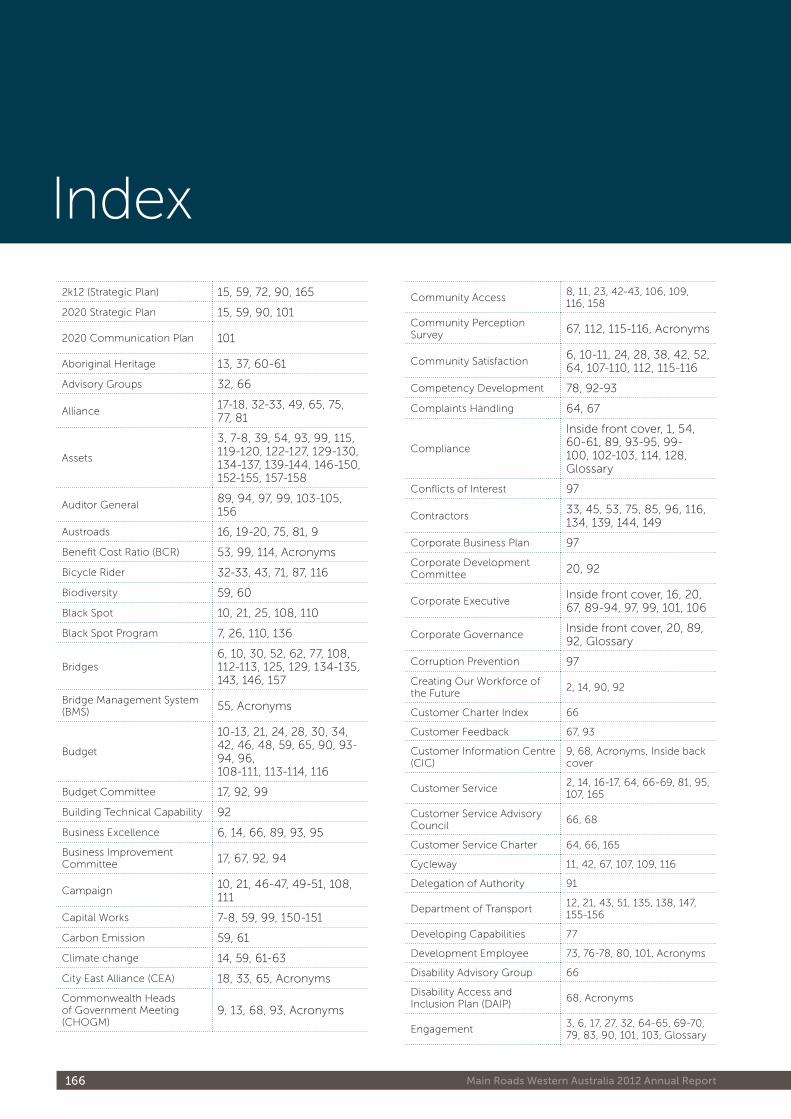
166 Main Roads Western Australia 2012 Annual Report
2k12 (Strategic Plan) 15, 59, 72, 90, 165
2020 Strategic Plan 15, 59, 90, 101
2020 Communication Plan 101
Aboriginal Heritage 13, 37, 60-61
Advisory Groups 32, 66
Alliance17-18, 32-33, 49, 65, 75, 77, 81
Assets
3, 7-8, 39, 54, 93, 99, 115, 119-120, 122-127, 129-130, 134-137, 139-144, 146-150, 152-155, 157-158
Auditor General89, 94, 97, 99, 103-105, 156
Austroads 16, 19-20, 75, 81, 9
Benefit Cost Ratio (BCR) 53, 99, 114, Acronyms
Bicycle Rider 32-33, 43, 71, 87, 116
Biodiversity 59, 60
Black Spot 10, 21, 25, 108, 110
Black Spot Program 7, 26, 110, 136
Bridges6, 10, 30, 52, 62, 77, 108, 112-113, 125, 129, 134-135, 143, 146, 157
Bridge Management System (BMS) 55, Acronyms
Budget
10-13, 21, 24, 28, 30, 34, 42, 46, 48, 59, 65, 90, 93-94, 96, 108-111, 113-114, 116
Budget Committee 17, 92, 99
Building Technical Capability 92
Business Excellence 6, 14, 66, 89, 93, 95
Business Improvement Committee 17, 67, 92, 94
Campaign10, 21, 46-47, 49-51, 108, 111
Capital Works 7-8, 59, 99, 150-151
Carbon Emission 59, 61
Climate change 14, 59, 61-63
City East Alliance (CEA) 18, 33, 65, Acronyms
Commonwealth Heads of Government Meeting (CHOGM)
9, 13, 68, 93, Acronyms
Community Access8, 11, 23, 42-43, 106, 109, 116, 158
Community Perception Survey 67, 112, 115-116, Acronyms
Community Satisfaction6, 10-11, 24, 28, 38, 42, 52, 64, 107-110, 112, 115-116
Competency Development 78, 92-93
Complaints Handling 64, 67
Compliance
Inside front cover, 1, 54, 60-61, 89, 93-95, 99-100, 102-103, 114, 128, Glossary
Conflicts of Interest 97
Contractors33, 45, 53, 75, 85, 96, 116, 134, 139, 144, 149
Corporate Business Plan 97
Corporate Development Committee 20, 92
Corporate ExecutiveInside front cover, 16, 20, 67, 89-94, 97, 99, 101, 106
Corporate GovernanceInside front cover, 20, 89, 92, Glossary
Corruption Prevention 97
Creating Our Workforce of the Future
2, 14, 90, 92
Customer Charter Index 66
Customer Feedback 67, 93
Customer Information Centre (CIC)
9, 68, Acronyms, Inside back cover
Customer Service2, 14, 16-17, 64, 66-69, 81, 95, 107, 165
Customer Service Advisory Council
66, 68
Customer Service Charter 64, 66, 165
Cycleway 11, 42, 67, 107, 109, 116
Delegation of Authority 91
Department of Transport12, 21, 43, 51, 135, 138, 147, 155-156
Developing Capabilities 77
Development Employee 73, 76-78, 80, 101, Acronyms
Disability Advisory Group 66
Disability Access and Inclusion Plan (DAIP)
68, Acronyms
Engagement3, 6, 17, 27, 32, 64-65, 69-70, 79, 83, 90, 101, 103, Glossary
Index
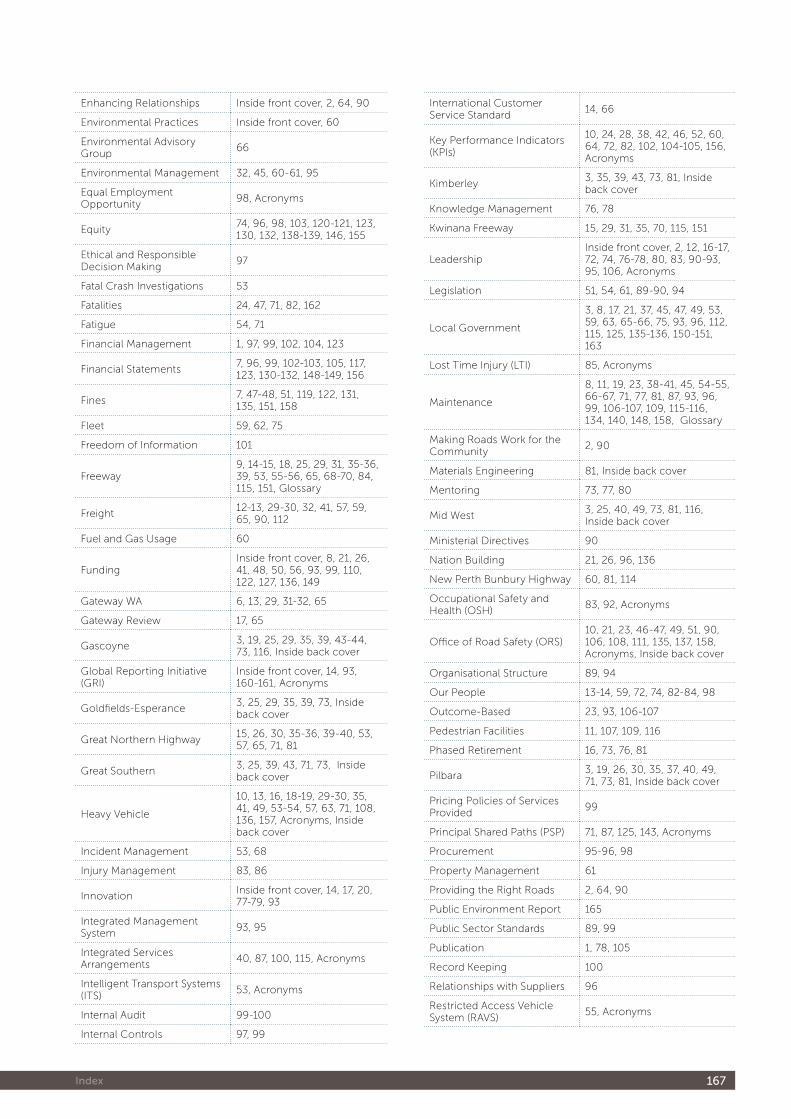
167 Index
Enhancing Relationships Inside front cover, 2, 64, 90
Environmental Practices Inside front cover, 60
Environmental Advisory Group
66
Environmental Management 32, 45, 60-61, 95
Equal Employment Opportunity
98, Acronyms
Equity74, 96, 98, 103, 120-121, 123, 130, 132, 138-139, 146, 155
Ethical and Responsible Decision Making
97
Fatal Crash Investigations 53
Fatalities 24, 47, 71, 82, 162
Fatigue 54, 71
Financial Management 1, 97, 99, 102, 104, 123
Financial Statements7, 96, 99, 102-103, 105, 117, 123, 130-132, 148-149, 156
Fines7, 47-48, 51, 119, 122, 131, 135, 151, 158
Fleet 59, 62, 75
Freedom of Information 101
Freeway9, 14-15, 18, 25, 29, 31, 35-36, 39, 53, 55-56, 65, 68-70, 84, 115, 151, Glossary
Freight12-13, 29-30, 32, 41, 57, 59, 65, 90, 112
Fuel and Gas Usage 60
FundingInside front cover, 8, 21, 26, 41, 48, 50, 56, 93, 99, 110, 122, 127, 136, 149
Gateway WA 6, 13, 29, 31-32, 65
Gateway Review 17, 65
Gascoyne3, 19, 25, 29, 35, 39, 43-44, 73, 116, Inside back cover
Global Reporting Initiative (GRI)
Inside front cover, 14, 93, 160-161, Acronyms
Goldfields-Esperance3, 25, 29, 35, 39, 73, Inside back cover
Great Northern Highway15, 26, 30, 35-36, 39-40, 53, 57, 65, 71, 81
Great Southern3, 25, 39, 43, 71, 73, Inside back cover
Heavy Vehicle
10, 13, 16, 18-19, 29-30, 35, 41, 49, 53-54, 57, 63, 71, 108, 136, 157, Acronyms, Inside back cover
Incident Management 53, 68
Injury Management 83, 86
InnovationInside front cover, 14, 17, 20, 77-79, 93
Integrated Management System
93, 95
Integrated Services Arrangements
40, 87, 100, 115, Acronyms
Intelligent Transport Systems (ITS)
53, Acronyms
Internal Audit 99-100
Internal Controls 97, 99
International Customer Service Standard
14, 66
Key Performance Indicators (KPIs)
10, 24, 28, 38, 42, 46, 52, 60, 64, 72, 82, 102, 104-105, 156, Acronyms
Kimberley3, 35, 39, 43, 73, 81, Inside back cover
Knowledge Management 76, 78
Kwinana Freeway 15, 29, 31, 35, 70, 115, 151
LeadershipInside front cover, 2, 12, 16-17, 72, 74, 76-78, 80, 83, 90-93, 95, 106, Acronyms
Legislation 51, 54, 61, 89-90, 94
Local Government
3, 8, 17, 21, 37, 45, 47, 49, 53, 59, 63, 65-66, 75, 93, 96, 112, 115, 125, 135-136, 150-151, 163
Lost Time Injury (LTI) 85, Acronyms
Maintenance
8, 11, 19, 23, 38-41, 45, 54-55, 66-67, 71, 77, 81, 87, 93, 96, 99, 106-107, 109, 115-116, 134, 140, 148, 158, Glossary
Making Roads Work for the Community
2, 90
Materials Engineering 81, Inside back cover
Mentoring 73, 77, 80
Mid West 3, 25, 40, 49, 73, 81, 116, Inside back cover
Ministerial Directives 90
Nation Building 21, 26, 96, 136
New Perth Bunbury Highway 60, 81, 114
Occupational Safety and Health (OSH)
83, 92, Acronyms
Office of Road Safety (ORS)10, 21, 23, 46-47, 49, 51, 90, 106, 108, 111, 135, 137, 158, Acronyms, Inside back cover
Organisational Structure 89, 94
Our People 13-14, 59, 72, 74, 82-84, 98
Outcome-Based 23, 93, 106-107
Pedestrian Facilities 11, 107, 109, 116
Phased Retirement 16, 73, 76, 81
Pilbara3, 19, 26, 30, 35, 37, 40, 49, 71, 73, 81, Inside back cover
Pricing Policies of Services Provided
99
Principal Shared Paths (PSP) 71, 87, 125, 143, Acronyms
Procurement 95-96, 98
Property Management 61
Providing the Right Roads 2, 64, 90
Public Environment Report 165
Public Sector Standards 89, 99
Publication 1, 78, 105
Record Keeping 100
Relationships with Suppliers 96
Restricted Access Vehicle System (RAVS)
55, Acronyms
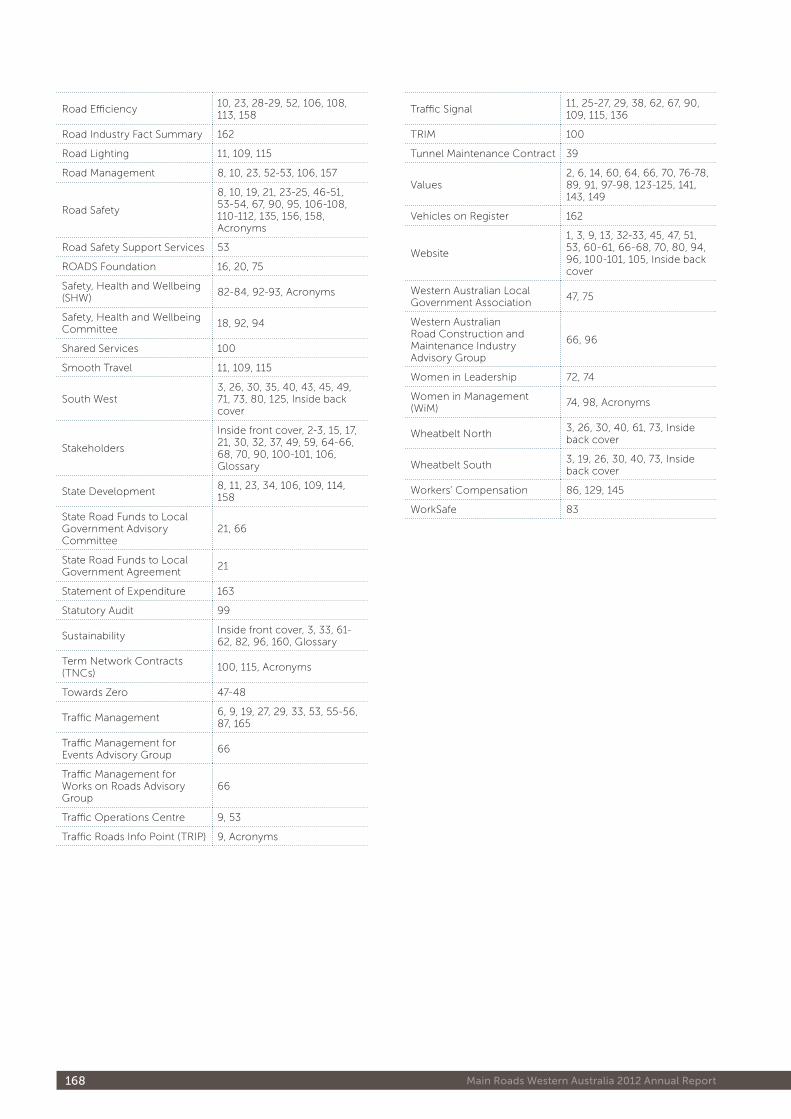
168 Main Roads Western Australia 2012 Annual Report
Road Efficiency10, 23, 28-29, 52, 106, 108, 113, 158
Road Industry Fact Summary 162
Road Lighting 11, 109, 115
Road Management 8, 10, 23, 52-53, 106, 157
Road Safety
8, 10, 19, 21, 23-25, 46-51, 53-54, 67, 90, 95, 106-108, 110-112, 135, 156, 158, Acronyms
Road Safety Support Services 53
ROADS Foundation 16, 20, 75
Safety, Health and Wellbeing (SHW)
82-84, 92-93, Acronyms
Safety, Health and Wellbeing Committee
18, 92, 94
Shared Services 100
Smooth Travel 11, 109, 115
South West3, 26, 30, 35, 40, 43, 45, 49, 71, 73, 80, 125, Inside back cover
Stakeholders
Inside front cover, 2-3, 15, 17, 21, 30, 32, 37, 49, 59, 64-66, 68, 70, 90, 100-101, 106, Glossary
State Development8, 11, 23, 34, 106, 109, 114, 158
State Road Funds to Local Government Advisory Committee
21, 66
State Road Funds to Local Government Agreement
21
Statement of Expenditure 163
Statutory Audit 99
SustainabilityInside front cover, 3, 33, 61-62, 82, 96, 160, Glossary
Term Network Contracts (TNCs)
100, 115, Acronyms
Towards Zero 47-48
Traffic Management6, 9, 19, 27, 29, 33, 53, 55-56, 87, 165
Traffic Management for Events Advisory Group
66
Traffic Management for Works on Roads Advisory Group
66
Traffic Operations Centre 9, 53
Traffic Roads Info Point (TRIP) 9, Acronyms
Traffic Signal11, 25-27, 29, 38, 62, 67, 90, 109, 115, 136
TRIM 100
Tunnel Maintenance Contract 39
Values2, 6, 14, 60, 64, 66, 70, 76-78, 89, 91, 97-98, 123-125, 141, 143, 149
Vehicles on Register 162
Website
1, 3, 9, 13, 32-33, 45, 47, 51, 53, 60-61, 66-68, 70, 80, 94, 96, 100-101, 105, Inside back cover
Western Australian Local Government Association
47, 75
Western Australian Road Construction and Maintenance Industry Advisory Group
66, 96
Women in Leadership 72, 74
Women in Management (WiM)
74, 98, Acronyms
Wheatbelt North3, 26, 30, 40, 61, 73, Inside back cover
Wheatbelt South3, 19, 26, 30, 40, 73, Inside back cover
Workers’ Compensation 86, 129, 145
WorkSafe 83
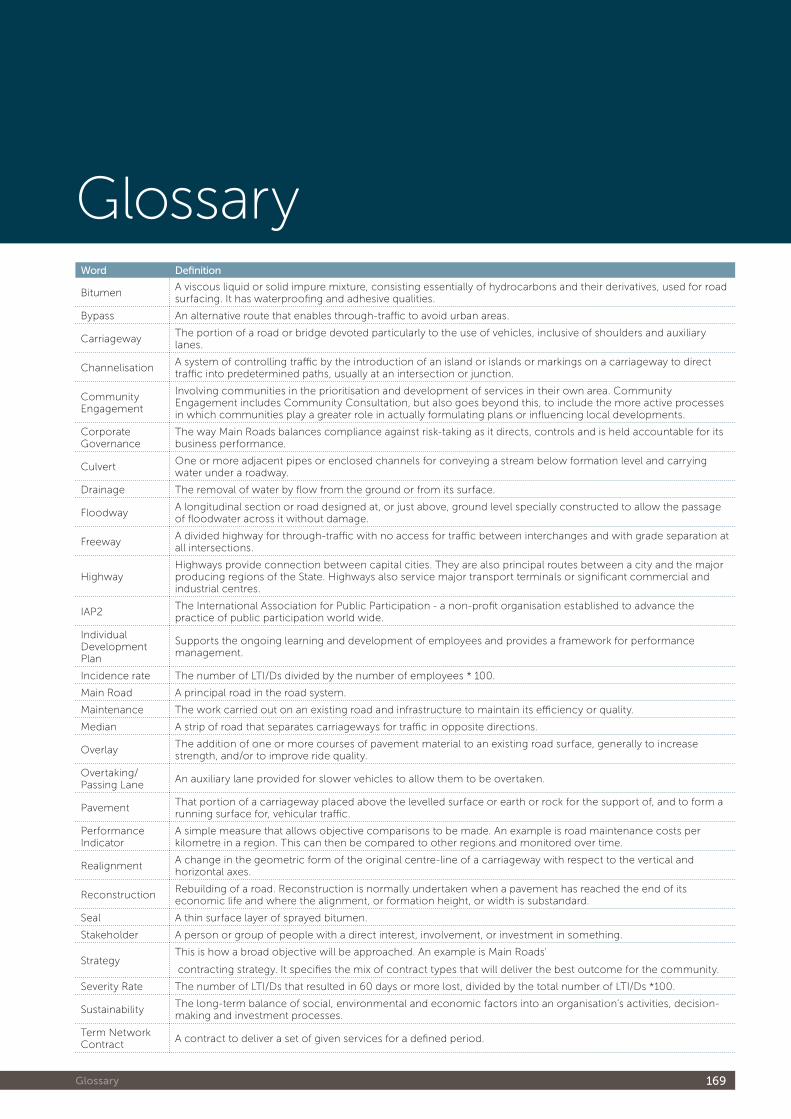
169 Glossary
Word Definition
BitumenA viscous liquid or solid impure mixture, consisting essentially of hydrocarbons and their derivatives, used for road surfacing. It has waterproofing and adhesive qualities.
Bypass An alternative route that enables through-traffic to avoid urban areas.
CarriagewayThe portion of a road or bridge devoted particularly to the use of vehicles, inclusive of shoulders and auxiliary lanes.
ChannelisationA system of controlling traffic by the introduction of an island or islands or markings on a carriageway to direct traffic into predetermined paths, usually at an intersection or junction.
Community Engagement
Involving communities in the prioritisation and development of services in their own area. Community Engagement includes Community Consultation, but also goes beyond this, to include the more active processes in which communities play a greater role in actually formulating plans or influencing local developments.
Corporate Governance
The way Main Roads balances compliance against risk-taking as it directs, controls and is held accountable for its business performance.
CulvertOne or more adjacent pipes or enclosed channels for conveying a stream below formation level and carrying water under a roadway.
Drainage The removal of water by flow from the ground or from its surface.
FloodwayA longitudinal section or road designed at, or just above, ground level specially constructed to allow the passage of floodwater across it without damage.
FreewayA divided highway for through-traffic with no access for traffic between interchanges and with grade separation at all intersections.
HighwayHighways provide connection between capital cities. They are also principal routes between a city and the major producing regions of the State. Highways also service major transport terminals or significant commercial and industrial centres.
IAP2The International Association for Public Participation - a non-profit organisation established to advance the practice of public participation world wide.
Individual Development Plan
Supports the ongoing learning and development of employees and provides a framework for performance management.
Incidence rate The number of LTI/Ds divided by the number of employees * 100.
Main Road A principal road in the road system.
Maintenance The work carried out on an existing road and infrastructure to maintain its efficiency or quality.
Median A strip of road that separates carriageways for traffic in opposite directions.
OverlayThe addition of one or more courses of pavement material to an existing road surface, generally to increase strength, and/or to improve ride quality.
Overtaking/Passing Lane
An auxiliary lane provided for slower vehicles to allow them to be overtaken.
PavementThat portion of a carriageway placed above the levelled surface or earth or rock for the support of, and to form a running surface for, vehicular traffic.
Performance Indicator
A simple measure that allows objective comparisons to be made. An example is road maintenance costs per kilometre in a region. This can then be compared to other regions and monitored over time.
RealignmentA change in the geometric form of the original centre-line of a carriageway with respect to the vertical and horizontal axes.
ReconstructionRebuilding of a road. Reconstruction is normally undertaken when a pavement has reached the end of its economic life and where the alignment, or formation height, or width is substandard.
Seal A thin surface layer of sprayed bitumen.
Stakeholder A person or group of people with a direct interest, involvement, or investment in something.
StrategyThis is how a broad objective will be approached. An example is Main Roads’
contracting strategy. It specifies the mix of contract types that will deliver the best outcome for the community.
Severity Rate The number of LTI/Ds that resulted in 60 days or more lost, divided by the total number of LTI/Ds *100.
SustainabilityThe long-term balance of social, environmental and economic factors into an organisation’s activities, decision-making and investment processes.
Term Network Contract
A contract to deliver a set of given services for a defined period.
Glossary
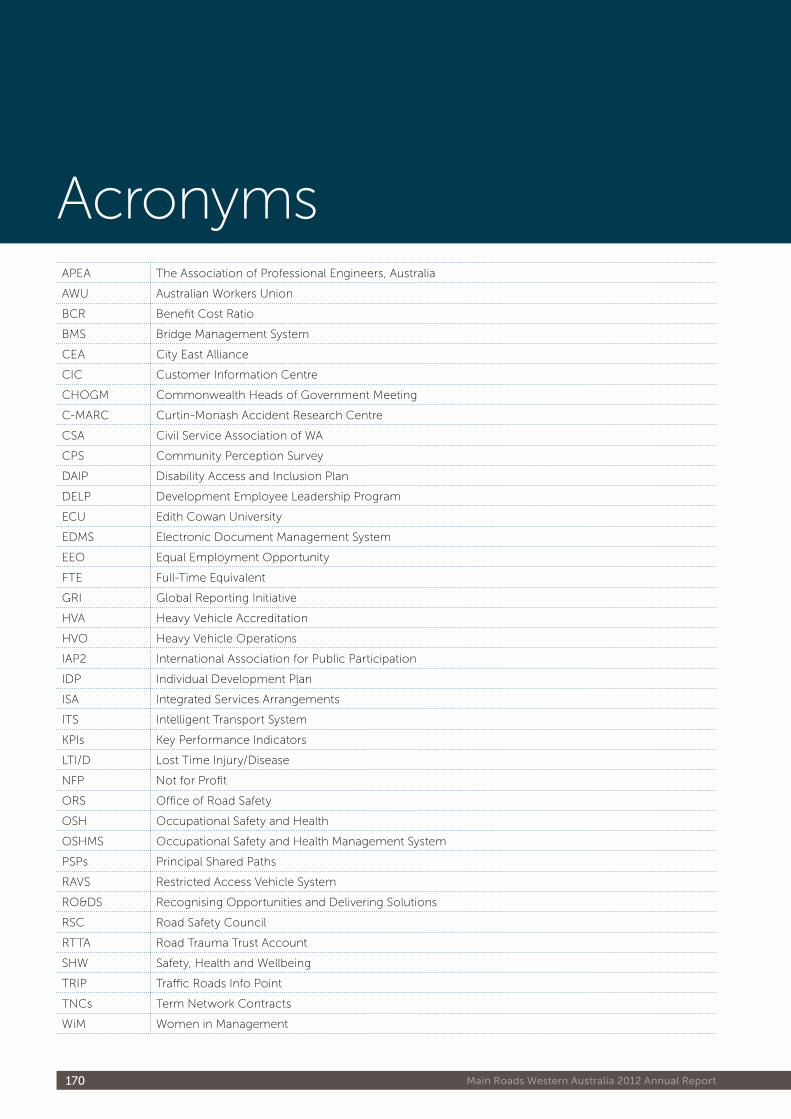
170 Main Roads Western Australia 2012 Annual Report
APEA The Association of Professional Engineers, Australia
AWU Australian Workers Union
BCR Benefit Cost Ratio
BMS Bridge Management System
CEA City East Alliance
CIC Customer Information Centre
CHOGM Commonwealth Heads of Government Meeting
C-MARC Curtin-Monash Accident Research Centre
CSA Civil Service Association of WA
CPS Community Perception Survey
DAIP Disability Access and Inclusion Plan
DELP Development Employee Leadership Program
ECU Edith Cowan University
EDMS Electronic Document Management System
EEO Equal Employment Opportunity
FTE Full-Time Equivalent
GRI Global Reporting Initiative
HVA Heavy Vehicle Accreditation
HVO Heavy Vehicle Operations
IAP2 International Association for Public Participation
IDP Individual Development Plan
ISA Integrated Services Arrangements
ITS Intelligent Transport System
KPIs Key Performance Indicators
LTI/D Lost Time Injury/Disease
NFP Not for Profit
ORS Office of Road Safety
OSH Occupational Safety and Health
OSHMS Occupational Safety and Health Management System
PSPs Principal Shared Paths
RAVS Restricted Access Vehicle System
RO&DS Recognising Opportunities and Delivering Solutions
RSC Road Safety Council
RTTA Road Trauma Trust Account
SHW Safety, Health and Wellbeing
TRIP Traffic Roads Info Point
TNCs Term Network Contracts
WiM Women in Management
Acronyms
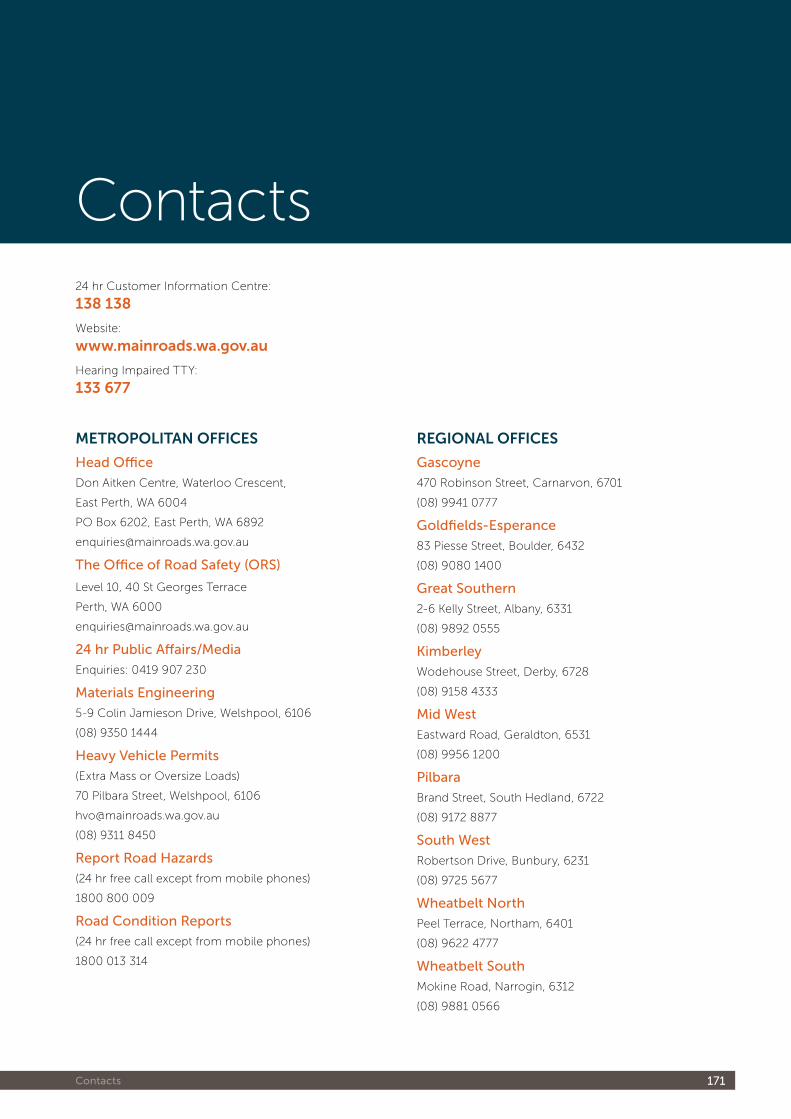
171 Contacts
Metropolitan offices
Head Office
Don Aitken Centre, Waterloo Crescent,
East Perth, WA 6004
PO Box 6202, East Perth, WA 6892
The Office of Road Safety (ORS)
Level 10, 40 St Georges Terrace
Perth, WA 6000
24 hr Public Affairs/Media
Enquiries: 0419 907 230
Materials Engineering
5-9 Colin Jamieson Drive, Welshpool, 6106
(08) 9350 1444
Heavy Vehicle Permits
(Extra Mass or Oversize Loads)
70 Pilbara Street, Welshpool, 6106
(08) 9311 8450
Report Road Hazards
(24 hr free call except from mobile phones)
1800 800 009
Road Condition Reports
(24 hr free call except from mobile phones)
1800 013 314
regional offices
Gascoyne
470 Robinson Street, Carnarvon, 6701
(08) 9941 0777
Goldfields-Esperance
83 Piesse Street, Boulder, 6432
(08) 9080 1400
Great Southern
2-6 Kelly Street, Albany, 6331
(08) 9892 0555
Kimberley
Wodehouse Street, Derby, 6728
(08) 9158 4333
Mid West
Eastward Road, Geraldton, 6531
(08) 9956 1200
Pilbara
Brand Street, South Hedland, 6722
(08) 9172 8877
South West
Robertson Drive, Bunbury, 6231
(08) 9725 5677
Wheatbelt North
Peel Terrace, Northam, 6401
(08) 9622 4777
Wheatbelt South
Mokine Road, Narrogin, 6312
(08) 9881 0566
Contacts24 hr Customer Information Centre:
138 138
Website:
www.mainroads.wa.gov.au
Hearing Impaired TTY:
133 677
#6408 jaz.com.au
www.mainroads.wa.gov.auDon Aitken Centre, Waterloo Crescent,
East Perth, WA 6004
PO Box 6202, East Perth, WA 6892
24 hr Customer Information Centre:
138 138
Hearing Impaired TTY:
133 677
#6
40
8 ja
z.co
m.a
u