data summary of municipal solid waste management
TRANSCRIPT

October 1992 • NREL/fP-431-49880
Data Summary of Municipal Solid Waste Management Alternatives
Volume VII: Appendix E-Material Recovery/Material Recycling Technologies
SRI International Menlo Park, California
National Renewable Energy Laboratory 1617 Cole Boulevard Golden, Colorado 80401-3393 Operated by Midwest Research Institute for the U.S. Department of Energy Under Contract No. DE-AC02-83CH10093

NOTICE
This. report was prepared as an account of work sponsored by an agency o( the United States government. Neither the United States government nor any agency thereof, nor any of their employees, makes any warranty, express or implied, or assumes any legal liability or responsibility for the accuracy, completeness, or usefulness of any information, apparatus, product, or process disclosed, or represents that its use would not infringe privately owned rights. Reference herein to any specific commercial product, process, or service by trade name, trademark, manufacturer, or otherwise does not necessarily constitute or imply its endorsement, recommendation, or favoring by the United States government or any agency thereof. The views and opinions of authors expressed herein do not necessarily state or reflect those of the United States government or any agency thereof.
Printed in the United States of America Available from:
National Technical Information Service U.S. Department of Commerce
5285 Port Royal Road Springfield, VA 22161
Price: Microfiche A01 Printed Copy A04
Codes are used for pricing all publications. The code is determined by the number of pages in the publication. Information pertaining to the pricing codes can be found in the current issue of the following publications which are generally available in most libraries: Energy Researc/1 Abstracts (ERA); Government Reports Announcements and Index ( GRA and I); Scientific and Technical Abstract Reports (STAR); and publication NTIS-PR-360 available from NTIS at the above address.

NREL(fP-431-49880 • UC Category 249 • DE92016433
Data Summary Waste Managem
Volume VII: Appe Recovery /Material Technologies
Municipal Solid t Alternatives
E-Material cling
SRI International Menlo Park, California
NREL Technical Monitors: Bimleshwar Gupta Philip Shepherd
National Renewable Energy Laboratory (formerly the Solar Energy Research Institute) 1617 Cole Boulevard Golden, Colorado 80401-3393 A Division of Midwest Research Institute Operated for the U.S. Department of Energy under Contract No. DE-AC02-83CH10093
Prepared under subcontract no: RF-1-1103
October 1992

Report Organization
This report, Data Summary of Municipal Solid Waste Management Alternatives, comprises 12 separately bound volumes. Volume I contains the report text. Volume II contains supporting exhibits. Volumes Ill through X are appendices, each addressing a specific MSW management technology. Volumes XI and XII contain project bibliographies. The document control page at the back of this volume contains contacts for obtaining copies of the other volumes.
Volume
I
II
III
IV
v
VI
VII
VIII
IX
X
XI
XII
Contents
Report Text
Exhibits
Appendix A Mass Bum Technologies
Appendix B RDF Technologies
Appendix C Fluidized-Bed Combustion
Appendix D Pyrolysis and Gasification ofMSW
Appendix E Material Recovery/Material Recycling Technologies
Appendix F Landfills
Appendix G Com posting
Appendix H Anaerobic Digestion of MSW
Alphabetically Indexed Bibliography
Numerically Indexed Bibliography
Document Number
TP-431-4988A
TP-431-4988B
TP-431-4988C
TP-431-4988D
TP-431-4988E
TP-431-4988F
TP-431-49880
TP-431-4988H
TP-431-49881
TP-431-4988J
TP-431-4988K
TP-431-4988L

TABLE OF CONTENTS
Sect jon .E.aQi E. 1 INTRODUCTION/OVERVIEW E-1 E.1 .1 Complexity of Recycling Decision Making E-3 E . 1 .2 Current Status of Recycling in the U.S. E-6
E.2 TECHNOLOGY DESCRIPTION E-9 E .2 .1 Generation of Recyclables E-9 E.2.2 Collection of Recyclables E-1 1 E.2.2 . 1 Curbside Collection E-1 1 E.2.2.2 Drop-Off Centers E-17 E .2 .2 .3 Buy-Back Centers E-20 E.2.2.4 Collection Vehicles E-20
E.2.3 Material Recovery Facilities E-21 E.2.3 . 1 MRF Vendors E-21 E.2.3.2 Low Technology MRFs E-21 E.2.3.3 High Technology MRFs E-28 E.2.3.4 MRF Processing Highly Separated Materials E-30 E.2.3.5 Mixed Waste MRFs E-31 E.2 .3 .6 Small-Scale MRFs E-34
E.2.4 Products E-35 E.2.4. 1 Sample Product Specifications E-35 E.2.4.2 Paper Recovery E-40 E.2.4.3 Ferrous Metal Recovery E-40 E.2.4.4 Aluminum Recovery E-41 E.2.4.5 Glass Recovery E-42 E.2.4.6 Plastics Recovery E-43 E.2.4. 7 Recovery of Other Materials E-44
E.3 ECONOMIC PERFORMANCE E-44 E.3 . 1 Facility Costs E-45 E.3.2 Collection Costs E-52
E.4 POTENTIAL ENVIRONMENTAL IMPACTS E-54
E.5 ENERGY PRODUCTION REQUIREMENTS E-55
E.6 INTEGRATION WITH OTHER TECHNOLOGIES E-56
E.? RESEARCH NEEDS E-57
REFERENCES E-58
wTe CORPORATION

E-1 E-2 E-3 E-4 E-5 E-6 E-7 E-8 E-9 E-1 0 E-1 1 E-1 2 E-1 3 E-1 4 E-1 5 E-1 6 E-1 7 E-18 E-19 E-20 E-21
E-1 E-2 E-3
LIST OF TABLES
States· Recycling Goals How U.S. Waste is Managed Materials Recovered in the U.S., 1 988 Curbside Recycling Programs by State Comparative Data, Curbside Recycling Programs Comparison of Curbside Recycling Options Comparison of New Jersey Curbside Collection Programs Average Characteristics of New Jersey Collection Programs ·
Drop-Off Programs -- General Characteristics ·
Drop-Off Programs -- Amounts of Materials Recycled Drop-Off Programs -- Site and Collection Characteristics Existing and Planned MRFs, 1989 Data MRF Owners/Operators/Designers MRF Products Capital Costs and Bond Issues Detailed Cost Data Adjusted Capital Costs by Design Capacity Adjusted Capital Costs by Degree of Mechanization Operating Costs Comparison of Collection Alternatives Environmental Benefits Derived from Substituting Recycled Materials for Virgin Resources
LIST OF ILLUSTRATIONS
Options for Recovering Source-Separated Recyclables Process Plan -- Johnston, Rhode Island MRF Floor Plan for Proposed Gaston County, North Carolina, Mixed Waste MRF
wTe CORPORATION
E-2 E-7 E-7 E-8 E-15 E-1 6 E-16 E-1 6 E-1 9 E-19 E-19 E-22 E-25 E-36 E-46 E-47 E-50 E-50 E-51 E-53
E-55
E-1 0 E-29 E-33
,.·.-';
APPENDIX E
MATERIAL RECOVERY/RECYCLING TECHNOLOGIES
E.1 INTRODUCTION/OVERVIEW
In its 1989 report, The Solid Waste Dilemma: An Agenda for Action (295), the U.S. EPA advocated the
·concept of integrated solid waste management, setting forth a hierarchy of solutions to the burgeoning
solid waste disposal crisis in the nation, namely: 1) source reduction and reuse; 2) materials recycling
and composting; 3) waste combustion with energy recovery; and 4) landfill disposal.
At that time, the U.S. EPA also proposed a national source reduction and recycling goal of 25 percent by
1992. While a national goal was never established through regulatory action, by 1990, 28 states and the
District of Columbia had mandated ambitious recycling and waste management programs (776). The
recycling goals established by these states are outlined in Table E-1 . In addition to the ultimate goals
listed in the table, many states have set interim goals as well. As noted, only a few states have separate
targets for source reduction or composting.
The enthusiasm for and commitment to recycling is based on several intuitive benefits (295, 772, 774):
o Conservation of landfill capacity
o Conservation of non-renewable natural resources and energy sources
o Minimization of the perceived potential environmental impacts of MSW combustion and
landfilling
o Minimization of disposal costs, both directly and through material resale credits
In this discussion, "recycling" refers to materials recovered from the waste stream. It excludes ,,�rap
·materials that are recovered and reused during industrial manufacturing processes and "prompt
industrial scrap," i.e., scrap generated in a production process that can be returned to the basic
production facility for reuse (e.g., scrap ferrous and nonferrous metals) (723).
Materials recycling is an integral part of several solid waste management options. For example, in the
preparation of refuse-derived fuel (RDF), described in Appendix B, ferrous metals are typically removed
from the waste stream both before and after shredding. Similarly, composting facilities, covered in
Appendix G, often include processes for recovering inert recyclable materials such as ferrous and
wTe CORPORATION E-1

nonferrous metals, glass, plastics, and paper. While these two technologies have as their primary
objectives the production of RDF and compost, respectively, the demonstrated recovery of recyclables
emphasizes the inherent compatibility of recycling with these MSW management strategies.
wTe CORPORATION
TABLE E·1 . STATES' RECYCLING GOALS (776)
================================================================ California SO% by 2000 Connecticut 25% by 1991 Delaware 30 by 1994 ( 1) Dist. of Columbia 45% by 1994 Florida 30% by 1994 Georgia 25% by 1996 (2) Illinois 25% by 2000 (3) Indiana 50% by 2001 Iowa 50% by 2000 Louisiana 25% by 1992 Maine 50% by 1994 Maryland 20% by 1994 (4) Massachusetts S6X by 2000 (S) Michigan sox by 200S Mimesota 2SX by 1993 Mississippi 2SX by 1996 Missouri 3S% by 2000 New H�hire 40X by 2000 New Jersey 2SX by 1992 New Mexico sox by 2000 New York sox by 1997 (6) North Carolina 2SX by 1993 Ohio 2SX by 1994 Pennsylvania 25X by 1997 Rhode Island maximum possible (7) Vermont 40X by 2000 Virginia 2SX by 1995 Washington sox by 1995 West Virginia 30X by 2000
(1) The goal combines a 10 percent recycling target with a 20 percent composting target.
(2) 25 percent of 1992 per capita waste generation.
(3) This goal only applies to countries with populations greater than 100,000.
(4) Twenty percent recyc l i ng is the optimum goal • Countries with populations under 150,000 must recycle at least 5X of their waste.
(5) The goal calls for a 46 percent recycling rate and a 10X reduction in 1990 per capita waste generation rate by 2000.
(6) The goal combines a 10 percent source reduction target and a_40X recycling target.
(7) Municipalities must achieve a least 15X recycling by 1993.
================================================================
E·2
Facilities that have as their primary function the processing and marketing of recyclables, received as
either commingled or source separated, are typically referred to as materials recovery facilities (MRFs).
M RFs can be operated in conjunction with drop-off centers, where community residents voluntarily
deposit recyclables, and/or buy-back centers, where the public receives payment for pre-sorted,
pre-separated materials (769).
The designation "MRF" has also been extended to encompass the recovery of recyclables from mixed
municipal solid waste (723). In order to avoid confusion in terminology, a mixed waste MRF is defined
here as a materials recovery facility whose primary function is to separate marketable recyclables from
mixed municipal solid waste. This definition of a MRF excludes recycling as a part of RDF production
and composting, but Includes front-end processing systems for mass burn plants. These MRFs or
front-end processing systems (as they are more commonly called) serve not only to recover recyclables,
but also to minimize the introduction of glass or aluminum that can foul the combustor, and household
batteries that can lead to air emissions problems.
This appendix discusses several technology options with regard to separating recyclables at the source
of generation, the methods available for collecting and transporting these materials to a MRF, the market
requirements for post-consumer recycied materials, and the process unit operations. Mixed waste
MRFs associated with mass bum plants are also presented.
E.1.1 Complexity of Recycling Decision-Making
Materials recycling alternatives involve a variety of technologies, each having technical, economic, and
institutional impacts. Any recycling application involves decisions on technologies for:
o Collection
o Materials separation and processing
o Repackaging
o Resale
o Reprocessing ahd reuse as a consumer or industrial product
o Disposal of rejects from separation, processing and reprocessing
These decisions are highly influenced by such factors as waste quantities and composition, and
secondary (i.e., resale) market availability, as well as a variety of subtle institutional factors. Of the
non-technical factors, the level of citizen and industry participation, along with existing administrati�e
structures and traditions, are key determinants in the selection, initial success, and progress of a
recycling program. (774)
wTe CORPORATION E-3

A variety of factors must be considered in the conceptual design of a recycling program and its MRF
(723, 295, 773):
o Quantity and composition of the waste stream in the service area. MSW feedstock
characteristics affect the economic and technical feasibility of materials recovery
strategies and technologies including equipment selection and facility sizing. For
example, if bottle bill legislation exists, the quantity of aluminum beverage containers
that will end up in a MRF will be much less than if no such legislation were in effect.
o ryoes and guantttjes of materjals targeted for recovery. These factors determine the
extent of generator participation and the processing steps required at a MRF. Modest
program objectives possibly can be accomplishect by a combination of selective
targeting of recyclables and less capital intensive processing. Depending on the waste
composition and other factors, an ambitious program may require more pervasive
involvement of waste generators and higher degrees of processing to maximize
materials separation and recovery.
o Oualtty of recyclable materials reaujred by end-users. Higher degrees of recovered
material quality, especially from the standpoint of contamination, may dictate generator
set-out protocols, collection methods; and processing alternatives. The absolute
quantity of recyclable materials processed for resale also may affect marketability.
Large producers can seek volume uses and collaborate more on quality specifications;
small recyclers typically I'Tl,l.� confonn to the market nonns.
o Degree of generator jnvo!yement desjred and participation attainable. Determining the
expected deliveries to the MRF, regardless of the fonn (source separated or mixed
waste) is essential to the sizing of the collection fleet and the MRF. In addition, the
reliability of material flows affect the processing efficiency, market commitments, and
financing arrangements. Deliveries to a MRF processing source-separated materials
are a function of the waste generation rate, generator participation, and generator
separation efficiency (if applicable) .
wTe CORPORATION E-4
o Degree of technical rjsk to be assumed. More ambitious recycling goals can be met
through various approaches to collection and processing. Selection of more
capital-intensive, automated approaches must balance the promise of higher recovery
rates, enhanced material quality, and unit cost against the risks of system reliability and
technological obsolescence.
o Degree of rnadsetjng rjsk to be assumed. Decision-making on program design assumes
that the targeted recyclable materials can be reused in some beneficial manner, thereby
avoiding their disposal and optimizing their resale value. Failure to accomplish these
objectives results in incurring disposal costs and/or costly materials processing. For
example, a decision to commingle paper with glass in collection or processing might
sufficiently contaminate the paper so as to adversely affect its marketability. Or, for
example, an investment in plastic granulator equipment might reduce transportation
costs, but might reduce the value to certain end-users who would be unable to ascertain
the level of contaminants in the material.
o Collection alternatives available. Unlike most other solid waste management
ahernatives, materials recycling can.greatly affect waste collection methods and costs.
In general, greater source separation requires different approaches to collection that
directly affect productivity and costs. It is essential that the incremental costs and
potential environmental impacts of these different collection technologies be considered
in program analysis. Also, certain collection-related limitations must be considered,
including population density issues, traffic congestion, noise, safety, fleet maintenance
needs, and parking needs.
o Compatjbi!tty with other components of the local solid waste management sy§lem.
While the U .S. EPA hierarchy (295) favors recycling· over combustion and landfilling, it
also contemplates that all four waste management options complement one another to
safely and efficiently manage MSW. Recycling "is .DQ1 meant to be rigidly applied when
local unique waste and demographic characteristics make source reduction and
recycling infeasible" (295).
o OVerall program cost. The overall cost of alternative programs must be assessed; this
includes collection, processing, resale, and public education.
wTe CORPORATION E·5

o Public educatjon strategjes. The implementation of a recycling program requires an
initial program to educate all involved parties on acceptable practices and the need to
implement them. It is likely that the education program will need to be continued to
sustain or to improve recycling performance. As a companion to education, new
ordinances and compliance policies must be implemented.
E.1 .2 Current Status of Recycling In the U.S.
An estimated 1 3 percent of the MSW generated in the United States was recovered from the national
waste stream for recycling in 1 988 (774) . This number represents contributions from commercial,
industrial, and household sources, spanning materials recovery/recycling facilities and curbside
collection programs as well as bottle redemption, drop-off, and buy-back centers. Recycling in this
context refers to the materials recovered from the waste stream as opposed to the lessor amount
actually made into new products. Table E-2 indicates how the entire solid waste stream has been, and
will likely continue to be managed for the period 1 980-2000 (77 4, 776).
Table E-3 itemizes materials recovered from MSW in 1 988 and the percentage that each recovered
waste fraction represents of that generated (774) . Of the approximate 1 80 million tons of materials
recycled, almost one-fifth is paper and paperboard products. This quantity represents about 26 percent
of paper products generated as waste. Although representing smaller absolute fractions of the overall
waste stream by weight, glass and metals are materials prominently recycled with 1 2 and 1 5 percent of
virgin· material recovered, respectively. Based on projections for recycling by respective industries
manufacturing the major commodity components of MSW, the goal of 25 percent recycling by the
mid-1990s may be achievable (777) .
For the residentially-generated component of MSW, one significant trend is the emergence of greater
mandatory or voluntary source separation of recyclable materials. These so-called "curbside programs"
require the participation of residents to separate recyclable materials into one or more fractions for
collection. Bjocycle magazine reported (778) that, in 1 989, 1 ,042 curbside programs existed in 35 states
(Table E-4) . There has been considerable growth since that time with the implementation of ambitious
programs in New York, Florida, California, Ohio, and other states.
wTe CORPORATION E-6

TABLE E-2. HOW U.S. WASTE IS MANAGED (776)
=========================================================================================== 1980 1986 1988 1995 2000
tons (1) X tons (1) X tons (1) X tons (1) X tons (1) X � ------------------------------------------------------------------------------------------
Recycling (2) 14.5 10 18.3 11 23.5 13 48.3 24 54.4 lolaste·to·Energy 2.7 2 9.6 6 24.5 14 45.0 23 55.0 Incineration (3) 11 .0 7 3.0 2 1.0 2 0.5 0.3 0.1 Landt ill 121.4 81 136.5 82 130.5 73 106.0 53 106.5
149.6 100 167.4 100 179.5 100 199.8 100
(1) All tons in millions of TPY. (2) Recycling used in this context refers to materials recovered from the waste
stream as opposed to the lesser amount made into new products. (3) Incineration without energy recovery.
216
25 26
< 01 49
100
===========================================================================================
TABLE E-3. MATERIALS RECOVERED IN THE U.S., 1988 (774)
=====================�==================================
Paper and Paperboard Glass Metals Plastics Rubber and Leather Textiles Wood Food Waste Yard Waste Other
Total
Amount Generated
(1)
71.8 12.5 15.3 14.4
4.6 3.9 6.5
13.2 31.6
5.8 -----
179.6
( 1) In millions of tons.
Amount Recovered
(1)
18.4 1.5 2.2 0.2 0.1
0 0 0
0.5 0.7
-----
23.6
% of Material
Generated
25.6 12.0 14.4
1.4 2.2 o.o o.o o.o 1.6
12.1
13.1
========================================================
wTe CORPORATION E-7

TABLE E-4. CURBSIDE RECYCLING PROGRAMS (n8)
Guroside Rec-;c!ing Programs: Population Multi- Single
Stat! Number Selved Matenal Item Mandatory Votuntaq
AI. 3 N/A 2 0 3 AJ( 0 A1. 1 'IUA 1 0 0 1
AR 2 10,000 2 0 0 2
CA 62 3,300.000 62 0 0 62 co 2 N/A 2 0 0 2
CT 24 N/A 18 6 12 12
DE 0 DC 0 Fl a N/A 7 0 8 GA UNK N/A HI 0 10 0 IL 25+ N/A 25+ a 25+
IN 9 N/A 9 a 0 9 lA 1 15,000 1 0 0 1
KS 0 � 0 LA 3 100,000 3 0 a 3 ME 2 25,000 2 a 1 1
MD 5 N/A 5 0 0 5
MA 7 N/A 4 3 N/A N/A Ml 5+ N/A N/A N/A 0 5+
MN 93 N/A 87 6 6 87 MS 0 MO 8 N/A 7 . 0 8
MT 0
NE 2 N/A N/A N/A 0 2
'IN 0 NH 2 30,000 2 0 0 2
NJ 439 N/A 439 0 439 0 NM 0 "" UNK NC 3 15,000 2 a 3 NO 0 OH 13 175.000 11 2 0 13
OK·· 1 1 1
OR 106 2.600.000 106 0 0 106
PA 141 1.300.000 75" NJA 55 86 iU 8 300,000 8 0 8 0
sc 2 N/A 2 0 a 2
so I) TN . Q TX 2 100.000+ 2 a a 2
UT Q vr· 1 10,000+ 1 a 0 1
'/A 4 N/A 3 1 1 3 WA 4 500.000+ 4 0 0 4 wv 2 N/A 2 a a 2
'M 50+ N/A � 13+ 7 43 WY 0 TOi'� 1042 8.480.000 932 35 529 504 •F'rognrn$ 'Nflll !111ft rx more tT7il!liaJs.
wTe CORPORA TJON E-8
E.2 TECHNOLOGY DESCRIPTION
Figure E-1 depicts several technology options for the separation and collection of recyclables that feed a
MRF. The characteristics of the MRF feed stream are directly related to the processes utilized in the
MRF. For exa!Tl>le, highly separated materials (streams A, B, and C) will require minimal processing.
The following sectiOns discuss the complete source separation, collectiOn, and processing components
of a materials recovery program. Case studies are provided to illustrate the recycling optiOns, as
appropriate.
E.2.1 Generation of Becyclables
Recyclables can be either source separated by residents and commercial businesses or they can be
mixed with the non-recyclable MSW. Source separation refers to the segregatiOn of recyclable
components from the non-recyclable portion of MSW through the use of one or more plastic bins or
bags. (Plastic containers are waterproof unlike paper bags and corrugated boxes.) The specific
materials to be recycled and the degree of source separation required are defined by the recycling
program. Materials are selected based on the availability and reliability of markets.
The separation method selected will have a direct influence on the effectiveness of the recycling
program. Generally speaking, the less residents have to do to comply with the recycling program
requirements, the more likely they are to participate (265). In addition to the degree of material
separation, the degree of household preparation of the materials affects both the perceived
inconvenience of participation and the market value of the recyclables (264). The rinsing of all
containers, removal of metal caps from glass containers, and the removal of labels from metal cans all
positively affect the market value of the products. Such requirements may also make recycling too
inconvenient for certain residents, perhaps resulting in a significant decrease in participation. Thus, the
trade-offs between participation and market value must be considered.
A public attitude survey conducted in New York's Oneida and Herkimer counties found that the perceived
inconvenience of recycling increases with the number of separation and preparation steps requested
(339). The survey also confirmed that most residents were unwilling to make more than two separations
from their mixed waste. Research has shown that the participation rate doubles when recycling
containers are provided to residents, but the participation rate does not necessarily increase with the
number of individual containers provided (334).
wTe CORPORA TJON E·9

� � 0 0 :lJ "0 0 :lJ ,.. ::t 0 z
rp .... 0
SOURCE SEPARATED RECYCLABLES
I I
SELF D I SPOSAL CURBSIDE COLLECTION
I I ! J
SORTED DROP-OFF CENTER BUY BACK CENTER
I COMMI NGLED
HOUSEHOLD CURBS IDE
I I MARKETABLE RECYCLABLE$ BROKERS OR SEPARATE COLLECT I ON CO-COLLECTED END-USERS C ( B I NS) (BAGS) Tn UDI:
8
I : . . . . . . . . . . . .. ..TEL. _j _ RECOVERY/RECYCL ING
.___---------------<• FACI L I TY BAGGED RECYCLABLES-
RESIDUE TO LAND F I L L
MARKETABLE RECYCLABLES TO BROKERS OR END-USERS
Figure E-1. Options for Recovering S ource-S eparated Recylables
MSIJ
MSIJ TO D I SPOSAL

Obviously, the most convenient source separation recycling scheme from the residents' perspective is
where all the recyclables are mixed (commingled) in one container for pick up at the source (curbside),
leaving any further material separation up to either the collection crew or to a MRF. A commingled
recyclable requirement is generally believed to maximize public participation (265).
An alternative to source separation is to leave the recyclables intermixed with the MSW and remove
them, for example, in a front end process prior to a mass bum system. This option requires a substantial
amount of processing at the MRF to recover the recyclables. The generator participation rate is not a
concern with this method, since the sole responsibility for material recovery is on the mixed waste MRF
itself.
E.2.2 Collection of Recyclables
Recyclables can be either delivered to a drop-off center or buy-back center, or collected from the point of
generation, at curbside. Again, the method used will influence the effectiveness of the recycling
program.
E.2.2.1 Curbside Collection
Collection can accommodate many degrees of source-separated materials. When the generator
separates recyclables into discrete product-specific containers at curbside, collection crews can simply
load each material into its own compartment on a specially designed collection vehicle. In programs
where the generator commingles all recyclables into one bin with newspapers separately bagged, the
collection crew typically sorts the recyclables at curbside. Alternatively, the commingled recyclables can
be transported to a MRF where separation will take place.
Combinations of these approaches also are possible. For example, residential waste generators could
be required to separate glass generically, and the collection crew would sort glass-into its clear, green,
and brown fractions.
The specific type of curbside· collection program selected will be a function of the community's
demographics, the availability and reliability of processing facilities, the type of collection vehicles used,
and community values (258) . If the materials are to be directly marketed instead of being processed in a
MRF, they must be either separated into individual components by the generators or by the collection
crew. If the materials are to be processed in a MRF, the complexity of the MRF (i.e., its capability for
material separation) will determine whether the incoming materials can be commingled.
wTe CORPORATION E-1 1

The day and frequency of collection also can affect the participation rate and the total tonnage recycled.
Weekly, bi-monthly, and monthly collection frequencies may be valid choices. The most convenient
arrangement is for recyclables to be collected on the same day as the mixed MSW. Bi-weekly collection
may be less costly than weekly collection, but it can reduce program participation due to confusion and a
loss of the perceived "mandatory impact", since the mixed trash would most likely be picked up whether
or not the household participated in the recycling program (325). The collection frequency will also
influence the size of the collection container required.
The use of dedicated recycling containers has the following advantages (334):
o They make sorting and storing recyclables in the home convenient and their presence is
a constant reminder of the need to recycle.
o The presence of containers at curbside on collection day raises awareness of recycling,
and may create a "peer pressure" that encourages non-participants to recycle.
o Dedicated recycling containers are easily distinguishable contributing to the efficiency of
the collection process. The efficiency of collection can also be increased if residents put
out full containers.
o Constructed of plastic, they can resist the degradation that befalls paper containers
which can result in scattering of recyclables and increased collection time.
An alternative to the conventional curbside collection bin method is known as the "blue bag" co-collection
system. Under this method, recyclables are placed in a specially colored plastic bag (typically blue) and
placed at the curb with the remainder of the trash. The bags are collected in the same vehicle that hauls
the trash, eliminating the need for separate collection by specialized vehicles. The bags are separated
from the mixed waste at the receiving facility, and transported to a MRF. This option is effective only if the MRF is located in close proximity to the disposal site to minimize transportation costs.
The advantages listed tor the use of recycling containers also apply to special plastic bags. Storage in
the home may not, however, be as convenient with bags as with a rigid container.
wTe CORPORATION E-12

The advantages of curbside collection include:
o Low capital and operating costs for processing if materials are highly sorted
o Negligible technical risk
o Typically high quality of recycled materials if materials are highly sorted
o Higher participation by generators than drop-off centers due to the convenience of
curbside collection
o Flexibility in responding to changes in waste composition or participation rates
o Flexibility in changing targeted recyclable materials
The disadvantages of curbside collection include:
o Collection capital and O&M costs are high, expressed on a per collection stop and per
ton basis. Operating costs for curbside sorting by collection crews are higher than for
collection of intensive source separated materials
o Participation rates for source separation may be low due to the beha-.:ioral change
required by waste generators
o Practical limitations on the number of compartments on vehicles (along with sorting
participation and collection costs) restrict the degree of separation possible at the
curbside, thereby requiring further processing at the MRF
o To standardize set-outs, communities or private collection companies normally provide
each household with one bin for each separation required. This adds to the program
costs. In addition, there is limited experience on the long term durability of recycling bins
or on vandalism and theft rates
wTe CORPORATION E-1 3

No comprehensive survey data are available on the number and performance of curbside sorting
programs in the United States. However, Snow (327) conducted an in-depth survey of 24 sample
programs in 1 989; data are summarized in Table E-5. The study indicates a variety of materials,
separation approaches, collection techniques, and public/private contracting arrangements. It appears I
that waste reduction of 1 0 to 1 2 percent is attainable (327).
Powell (669) has reported that as of early 1 991 about 2,000 U .S. communities collect recyclables from
residences, and that the majority of these programs require the separation of paper, bottles, and cans.
The trend, however, appears to be toward the commingling of recyclables in one bin at the curb followed
by separation at a MRF.
E.2.2.1 .1 New Jersey programs. A study was conducted in 1990 on 1 2 New Jersey recycling
programs in communities whose populations ranged from 5,000 to 300,000 residents. The survey
results are presented in Tables E-6 and E-7 (669).
The results show that the average overall cost of a program using the commingled collection scheme
was 41 percent higher than that of a program using complete material separation due to the high costs of
the requisite MRF. The recovery for commingled collection programs was 1 5 percent higher than that for
complete separation systems, probably due to lower participation because of the increased set out
requirements. Conversely, the material revenues from complete separation programs were higher than
those from commingled programs, a fact attributed to less glass contamination. Additional survey results
are presented in Table E-8. These results are average values for both program types.
E.2.2.1 .2 San Jose. California. As part of a comprehensive waste reduction program, the City of
San Jose, California, has conducted an intensive curbside recycling program since 1 986. As of April,
1 989, recyclables were collected from more than 70 percent of the city's 1 80,000 households, diverting
more than 1 0 percent of the residential refuse from the landfill (334). Residential generators set out
three separate stackable bins, one containing bi-metal and aluminum cans, one containing mixed glass
containers, and one containing newspapers. A private hauler collects the materials in a dedicated,
three-bin vehicle for transport to a MRF.
San Jose reports that approximately 57 percent of households served by the program actually participate
(291 ) , although no data has been reported on estimates of material capture rates for the participating
households. The City of San Jose estimates that the program recycles about 22,000 tons per year.
wTe CORPORATION E·14

!�����-barunutun. AI
bu;onlt: Coulll)'. NY
buCMa (.;ounly. PA
Ut��CIIUit:S County. OA
Hamou•g. NY
LouomuacJow. MA Mock1onbu1g Cnly, NC
Mt�IIO loromo. ONT
Monlclau NJ
Nowpon. AI
011onddga Counly, NY
Orlando. fl
Pialllfl du Sii&c, WI
Aoanokt:. VA
Sl Cloua. MN Sara&.ola. Fl
Sauk County. WI
St�allh:�. WA
5uunyvalt:. CA
Uppur Arlington OH Wdt-.c� 8atr(: PA WOOObur� NJ
Somt:l�til Courll)' NJ
l--lt.•l•f.i=>lt..siJ NY
m I ..... en
s,,.., u,, ..... ,
1&72
1987
1989
1985
1981
1994 1987
1988
1971
·1988
1988
1987
1982
1987
1983 1988
1979
1988
1982
1988
1981
1986
1987
TABLE E-5. COMPARATIVE DATA, CURBSIDE RECYCLING PROGRAMS (327)
PopuiMIIon HouHholda Volunlary Or l>•• vocl Manc1411ory?
I} .10U b.oOO
37.200 13,500
115.000 26.500
25,000 10.000
11.500 3.350
15.971 5,672 40,000 • 9.166
800,000 250.000
38,600
24.200
151,654
2.290
pilol aroa
43,000
12.000
500.000
1 1 4.000
36.000 50.500 10.353
220.000
55000
14,500
9,700
38,114
1,100
1.000
10.107
3.000
147.000: elogible: 94 101: &81\!IC<O 28,000
12.000 13.500
4.200
80,000
14.500
manaa1ory
volunlary
manaaiOry
volunlary
manda!Ory
man<laiOry YOiunlaty
volunlary
manclaiQry
mandalory
Yolunlary, will be
man<laiOry
Yolunlary
manclalory
Yolunlary
mencla!Ory volun1ary
vall&i
Volumary
volumary
voluntary mancscuor� mandator�
manoarory
volunuu�
',/;; Freq. Of Conta1nera
; �
Coll'l Reluae Coll'l? Reluoe Cull'l Prov1�od Type
monlhly
weekly
Weel\ly
weekly.N monlhly. can&' bonJes weel<ly
weekly weekly
weel<ly
biweekly
weekly
weekly
weekly
weekly
weekly
monlhly weekly
weekly
112 Wkly; 112111lhly
�ekly wt�ekly weokly weekly
bl·weekly
weekJy
yes
yes & no
yes
yes
yes
yes yes
yos
no
yes
ye•
yes
no
yes
no yes
vanes
vanes
yes
yes no no
varte6
yes
ORC8/W8ttk
OOC81Wttek
l\ltiCBIWHk
once1we8k
OOC81¥1Hk
onceJweok lw1C8/W8ek
hviCeiWIIok
hvic81WIIok
IWiceiWIHik
onceiWeok
IWiceJwllok
onc8/WII8k
onceiWellll
onceiWHI< hv1C81Welll\
OOC8JW8111\
O_rleal\¥8ak
oncetwsek
once/weak OOC81WVEtek oncetwlll&k
V8118'
IWK:81W'.IUtlk
in luture 12 gal blue
ye• 5 gal black
y.. 6 gal green &red
y�S JptiOI 5 gal .1rea onlyJ
no r11a
no r11a yes 10 gal
red yes 1.5 c1
no
yel
yea
yes
yea
yes.
no yes
y�s
yes
yus
no no no
no
v••
rl/a
10 gal blue
10 gal blue
12 gal "'""
33gal clear baga 3·10 gal: bl,gm & or r11a 14 gal red clear bags 11260 or90 gal; 112 3-nins burlap bags
r11a nla r11a
rva
10 gal blue
Program OperiltOr Vehicle
munrcrpot craws
mumc•pal crews & wtrttlusd haular cootracl wtretuss haulttr
conuacr w11etuse haulttr
mun�e�paJ crews
pnvale conlfact mun1C1paJ crews
mumcipat crews
Fora f-350 "'' cJiviOers !tUCk & 1talltU
racyc11ng truck
relustt !rucks &. recycling trucks
truck & trarler
reluse uuck racyc11ng uuck
reluse lluek & recy�1ng lruck
�?���------��������. kt:pt supardltl
commu1glarJ
kept saparala
kttpt sttparate
cans & bonles m1xad; papar & all kept s¶tu kept sa par are colllm1119htd
comm•nglacJ Dy rasulttnt & sot1ed lfuck-s•Oe
mun rt�c cu
lllUil. rt:�C.l.:lr
mun ldC ctt
nonprom ra..: tlf
mun. rttc. cu.
m11Jdlf8CI mun .. rae cu
pflvata rtte. ctr.
munu;,pal ctews step van & tra11er cans & bonlas pnvara I &C. ctr & mun. rec. err
conrracl wtretusa hauler
conlfact wuatu&e hauler: pnvaaa contract: & mun. crews muntCipaJ ctews
muOOpal crews
municipal craws pnvala conltaCI vanes varies
contract with refuse haulers
muniCrpal craws
muniCipal crews munu;,pal aews rnunte1pa1 crews
muruc1pal crews
muru.;rpc;U ClfiWI
.. racycling ltuck.
borough !ruCk
renovated truck
racycllng lruck noocomJ)at.11ng stde loader vanes
retusa lluck & recycling uuck
recycling truck
ralusatruck recycling uuck relusa truck & racycJ1ng truCk recycling uuck & step van r4feychoy trUCk
CDfllffiiOQhtd: OEtW!i kapc sa par ara botllas & caos comm•nglad papSr soJittcJ truck·slda kttpl Sdpataht
kdpl separale
kapt separaae
kepi sapa. ale rva
kept separate & comnungled 112 kttpl separate; t t2 CORiffilllgled
al . un & pla:itrc COIIUIIIOglad; th8 rest kttpl �aparata kttpl sttparate kttpt sapdrdta kept sepa1a1a
comm.nglad
COilUfli091e<l & so• lc:u.J truek::.lde
muniCipal "MAF"
pnvata rae. err & mun. rae. ctr
pnvate rae. cu.
pr1vate rec. ctr.
pnvate rae. cu. pnvate JtiC. cu.
nonptoht rae. cu
puvaltt rue. ctr.
mun. rae. ctr.
pnvau� rec. Clr. pnvata rae Clr. p.waut rttc. Clr.
mun. rae. cu
pr1Vt�ta rec. ctr
�!_ruse E���sal
Pnce S.,.um
)0(15)
12(111
:;1(111
10(111
66(1SI
19(Wldl 18(111
50(111 65(1S)
11(111
28(1sl
151111 18(1$) 25(111
16(111
50( ISI 14(111
62(1sJ 321111
30(111
60(1SI 60(111
12611SI
6611•1
01stance Milia
11
20
J9
16 8
J5
5
8
JO
2 27

TABLE E-6. COMPARISON OF CURBSIDE RECYCLING OPTIONS (669)
Commingled Complete Separation
Household Less storage space needed More storage space needed Fewer containers to set out More container to set out
At the curb Fewer containers to dump and More containers to dump and return to curb return to curb
Quantity More weight per container Less weight per container
In Transit . Better truck utilization can serve Poorer truck utilization, shorter longer route before unloading route before needing to unload
Unloading Less time needed More time needed
Processing More costly Less costly
Residue More residue ( 15 to 30 percent) Less residue (5 to 1 0 percent)
TABLE E-7. COMPARISON OF NEW JERSEY CURBSIDE COLLECTION PROGRAMS (669)
Qammicol�d Qampl�l� S�garaliQD Average cost of collection and processing $1 29/ton $91 /ton
Collection cost savings $1 0-$15/ton $0
Processing plant for complete separation $0 $63/ton
Average recovery, lb/capita/year 1 71 1 48
TABLE E-8. AVERAGE CHARACTERISTICS OF NEW JERSEY COLLECTION PROGRAMS (669)
Hauler operated programs Municipality operated programs Collection efficiency Unloading trips per day Average household cost Average households serviced per day Average households per stop Collection time at curb Travel between stops Unloading Round trip transit time Set up for unloading Unloading
wTe CORPORATION
4
8
1 25-500 lblcapita/yr 1 .5 $23/yr 330 1 .2 59 seconds/stop 45 seconds
1 5 minutes 9 minutes/trip 1 5 minutes/trip
E-16

E.2.2.2 prop-off Centers
Drop-off centers are centralized locations where a specified class of waste generators, typically
residential generators, may voluntarily bring certain recyclable materials. Generators are not
compensated for materials deposited at a drop-off center. A drop-off center can be as simple as several
small capacity containers that temporarily store the materials for regular pickup and transportation to
market or a central consolidation facility or it can consist of the central consolidation facility itself.
Because programs of this nature are voluntary, participation is often poor. However, participation can
be enhanced by public education, economic incentives (e.g. , incorporating a buy-back feature), and
ordinances that increase the difficulty to otherwise dispose of recyclable materials. Both buy-back
centers and drop-off centers seldom capture as much as 1 0 percent of the waste stream (547} .
Prosser (185) recently projected a 20 percent recycling rate for glass containers in the United Kingdom
based on collection at voluntary drop-off centers. It was noted that this recycling rate can only be
achieved by increasing the density of drop-off sites to 1 per 2,000 households or greater. Also, in 1990,
the EPA noted that in the U.S., approximately 20 percent of glass was recycled based on an recycling
sources, not just drop-off sites (n7).
The physical layout of a drop-off center varies by location, the volume and number of recyclable
materials processed, and level of supervision. A conventional drop-off center would be centrally-located
within a service area and provide bins or compartmentalized containers for waste generators to deposit
recyclable materials. To ensure material quality and public safety as wen as to prevent scavenging,
many drop-off centers have controlled access, limited hours of operation, and are monitored by
attendants. Once a sufficient quantity of a material has been collected, it can be shipped to end-users or
intermediaries in the container in which it was collected or, more often, transferred to a larger container.
Correct sizing and type of containers are key design features to address, along with traffic access and
security.
The smalleSt drop-off center might be a neighborhood "kiosk-like" or igloo container, unattended and
conveniently located to maximize its use. These containers typically are satellite operations for a
centralized facility where further consolidation and repackaging would occur to achieve maximum
quantities for resale. However convenient these unattended containers, they are vulnerable to
contamination, odors, vectors, and vandalism, aside from adding additional transportation and handling
costs. The successful development and implementation of drop-off programs is highly dependent on
other program factors and local conditions.
wTe CORPORATION E·17

Advantages of drop-off centers include:
o Low capital and operating costs
o No technical risk
o No mandatory change in waste generator behavior
o Flexibility in responding to changes in waste composition or participation rates
o Flexibility in changing targeted recyclable materials
Disadvantages of drop-off centers include:
o Lower participation rates due to the voluntary nature of the program and the
inconvenience associated with sorting and transporting materials to a remote location
o Low quantities of materials collected thereby limiting marketing with respect to price and
prospective users
o Low quality of materials, especially when center is unattended
A limited survey conducted by Biocycle in 1 988 . (779) is reproduced as Tables E-9, E-10 , and E-1 1 ,
illustrating the scope and performance of setected drop-off programs nationwide. Convenient siting,
more efficient equipment, public education, and economic incentive programs are cited as key elements
in successful programs (779).
E.2.2.2.1 Wellesley. Massachusens. A long�tanding, successful operation is in Wellesley,
Massachusetts, a community of 27,000 located southwest of Boston. This town has capitalized on the
logistical patterns of residents by establishing a drop-off center at the town's transfer station, the sole
location for residents to dispose of MSW (no municipal collection is provided). Residents are able to
recycle old newspaper (ONP), old corrugated cardboard (OCC) , mixed paper, three CQiors of glass,
aluminum cans, ferrous bimetal cans, high density polyethylene (HDPE) containers, waste motor oil,
tires, batteries (automotive and household) , scrap metals, wood, yard wastes, books, clothing, and bulky
wastes at an attended center comprised of assorted bins and roll-off containers. In 1 989, approximately
19 percent of wastes were recycled and thus diverted from the adjacent transfer station (291 ) .
wTe CORPORATION E-18

TABLE E·9. DROP.OFF PROGRAMS - GENERAL CHARACTERISTICS (779)
Population Se:rved II of
Location !Estimated) Sites
Champaign Co., I L 171,000 15
Columbia Co., PA 50,000 17 Cook & Lake Co., IL 270,000 18 Delaware Co., PA 500,000 50 Durham Co., NC 120,000 10 Fairfax Co. , VA 75,000 8 Kent/Ottawa Co., MI 650,000 30
Santa Monica, CA 70,000 66 Snohomish Co., WA N/A 15 Wayne Co., NY 30,000 4
Pop. Se:rved/ Site
3,000-20,000
3,000 (Ave) N/A
10,000 (Ave) 10,000-15,000
N!A NIA
Up to 2.000 1000-2000
N!A
Jfat�.als Collected
N, G, .-\, T, r
HDPE . OCC. :VIO N, G, A. T. OCC N. G . . -\., T Glass only N, G. A N, G, A. BI-M N, G . . -\., T HDPE . OCC N, G, A, T N, G. A N, T, OCC
Participaticm Rate
18%
25-30% Nl.-\. 25%
8%
10%
4%
28% N/A N/A
Key: N-�ewsprint A-Aluminum Bl·M-Bi-Metal Cans G-Glass T-Tin & Bi-Metal Cans OCC -Corregated Cardboard MO-Motor Oil
TABLE E·10. DROP.OFF PROGRAMS - AMOUNTS OF MATERIALS RECYCLED (n9) ANNUAL TON.VAGE
All News Glass .-\luminum Tin Others Materi.al8
Location (Tons) Tons % Tons % Tons % Tons % Tons % Champaign$Co., IL 1000 750 75 160 16 5 .5 15 1.5 70 7
(OCC) Columbia Co., PA 469 271 58 88 19 6 1 19 4 85 18
Cook & Lake Co., IL 7140 5800 81 1200 17 75 1 t35 1
Delaware Co., PA 1800 1800 100
Durham Co., NC 1200 900 75 300 25 Fairfax Co., VA 1000 721 72 271 27 Kent:JOttawa Co., MI 3200 2225 70 669 20 158 5 157 5 Santa Monica, CA 1398 1032 74 .360 25.5
Snohomish Co .. WA 233 67 29 159 68 7 3 TABLE E-1 1 . DROP.OFF PROGRAMS - SITE AND COLLECTION CHARACTERISTICS (n9)
Storage Type Capacity/ Collectitm Crew Collection
Location Container Site Equipment Size Frequency
Champaign Co. Compartment 15 cy-40 cy Multi-li:fti1ugger 1 1/wk-1/mo
container/ truck & van
lugger & barrel Columbia Co. Shelters 7 cy Van 2 2·3/wk-1/wk
Cook & Lake Co. Compartment N/A Multi-lift NIA N/A
container Delaware Co. Dome· 6.6 cy Tractor & 2 1-2/wk
trailer Durham Co. Shelters Up to 21 cy Flatbed/forklift 2 1/wk
Fairfax Co. Roll-off 120 cy Tractor & 1 1/wk-ma.'<:.
trailer Kent & Ottawa Co. Roll-off, bins & NIA Straight 2 3/wk-1/wk
barrels truck/van
Santa Monica Bins 6 cy (at least) Truck & trailer z 2/wk (at least) Snohomish Co. Dome 16 cy Truck & trailer 1 1/10-14 days Wayne Co. Bins 12-24 cy Packer 1 1/2 wks.
wTe CORPORATION E·19

E.2.2.2.2 Concord. New HamPshire. A municipally-sponsored outdoors drop-off center has
been in operation at the Concord, New Hafll)shire landfill since 1989. Opened by an attendant twice
weekly, residents of this 35,200 person city can deliver ONP, OCC, aluminum, three colors of glass, and
ferrous containers. The City provides weekly collection of residential wastes to its residents as well. In
the first full year of operaticns ( 1990}, this center processed 547 tons of materials, representing about 2
percent of the overall residential and commercial waste generated annually, or 4 percent of the
residentially generated MSW. A pilot curbside recycling program was initiated in 1991 for approximately
one-fifth of the City's households without any material impact on the quantity of materials received at the
drop-off center (780} .
E.2.2.3 Buy-Back Centers
Buy-back centers are similar to drop-off centers, with the exception that the generators are paid for the
materials left at the center. However, the quantity of materials recycled does not necessarily increase if compensation is provided. A study was conducted in Washington State in which four methods of
recycling were tested: weekly curbside collection, monthly curbside collection, drop-off center, and
buy-back center (764}. The study found that the buy-back centers had the lowest participation rate and
accordingly collected the least amount of materials of the four collection methods used. Because they
are selectively purchased from customers, the quality of buy-back center materials is generally very high.
The materials do not require further processing other than consolidation for shipping, and therefore are
usually shipped directly to market and not to a MRF.
E.2.2.4 Collection Vehicles
Recyclables can be collected by conventional waste collection vehicles, standard commercial trucks, or
specialized recycling vehicles. Conventional waste collection vehicles usually require fitting with trailers
or racks for transporting commingled materials. For reasons of productivity, the number of separate
compartments on a specialized recycling vehicle is usually limited to a maximum of five or six. In order
to avoid damaging the recyclables, these truck bodies typically do not compact the materials. The
specialized vehicles usually have a low profile body for ease in filling the compartments. The degree of
sorting that can be accomplished at curbside is somewhat limited. If glass is a target material, then a
product with greater quality and quantity can be recovered if it is sorted into three discrete colors at
curbside. separation of glass into its three colors would mean that all other containers (e.g., .ferrous,
aluminum, and mixed plastic) and paper (e.g., newspaper, corrugated, and magazines) would occupy
the remaining two compartments in a conventional five-compartment truck. Table E-1 1 includes the type
of vehicle used in ten sample collection programs.
wTe CORPORATION E-20
E.2.3 Material BecoveJ:Y Facilities
The term "material recovery facility" (MRF) includes a broad range of process designs and technologies
ranging from simple, predominantly manual sorting and repackaging facilities ("low tech") to complex,
highly mechanized processes that separate, beneficiate, and repackage a wide range of recyclable
components of MSW ("high tech") ( 181 , 316 , 339, n4) . In addition to the level of technology used,
MRFs can also be classified by the degree of separation and preparation incorporated, which is
determined by the characteristics of the materials received and the product purity required by the market.
The level of technology used is primarily a function of the required facility throughput. At low throughput
rates in the range of 2 to 3 tons per hour, a simple low tech process is sufficient (339). At higher
throughput rates, a high tech process is more appropriate. Table E-1 2 lists all existing and planned
MRFs throughout the U.S. as of 1 989 by status and degree of mechanization (386) .
E.2.3.1 MBF Vendors
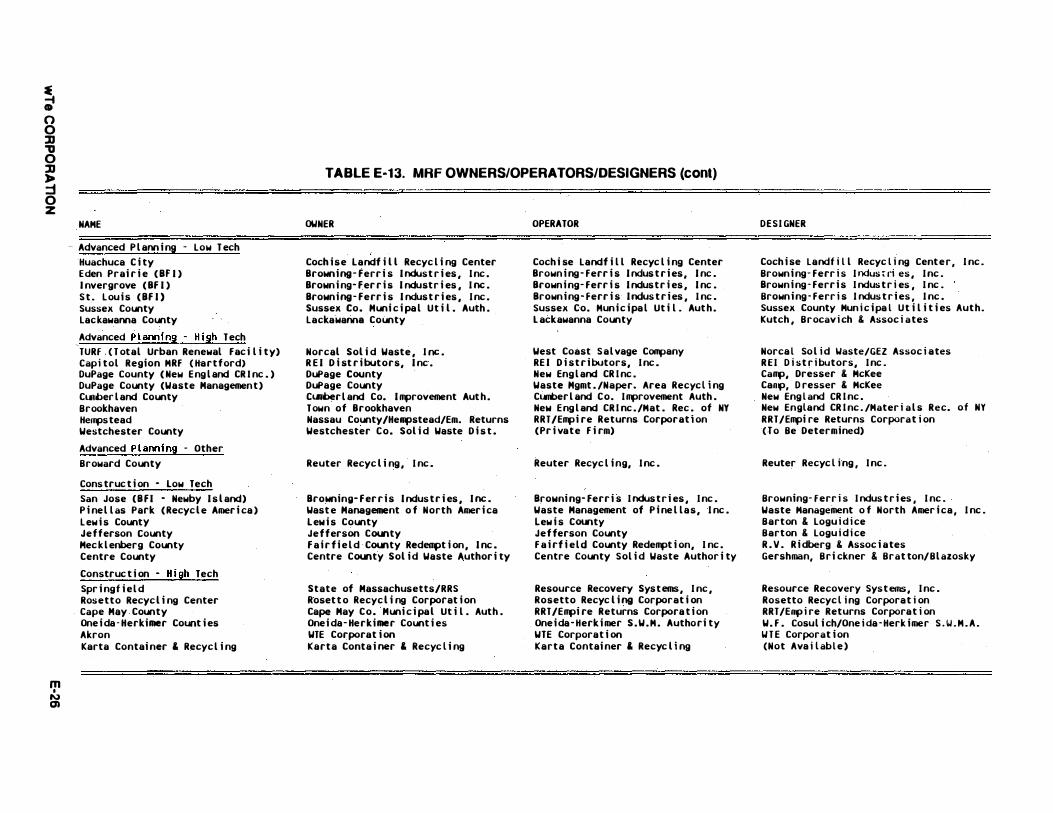
Table E-1 3 identifies the owners, operators, and designers of the MRFs in operation, construction,
shakedown, advanced planning, and concept stage. Over 50 percent of the owners are private, and
approximately 80 percent of the operators are private. Private owners and operators are typically the
MRF system vendor, as indicated in the table. As shown in the table, 34 of the 62 MRFs (55 percent)
use the technology of only seven vendors. The remaining 28 MREs all have unique vendors. Waste
Management of North America, Inc. , with one facility in construction and thirteen in operation, has the
most facilities by far. Second is Browning-Ferris, Inc with a total of five facilities, followed by
RAT/Empire Returns, Resource Recovery Systems, Inc., and New England CAine, all with four. REI
Distributors and Reuter Recycling, Inc. round out the top seven with two facilities each.
E.2.3.2 Low Technology MRFs . � ....... .
Low technology MREs use primarily manual labor to separate the feed stream into its individual
components. Such a system usually consists of a series of belt conveyors from which recyclables are
manually removed. Mechanical processing is usually limited to magnetic separation for ferrous removal
and volume reduction equipment such as a baler, glass crushers, and an aluminum flattener/blower.
wTe CORPORATION E·21

a: -4 • 0 0 ::D "'U 0 ::D ,.. ::j 0 z
m •
1\) 1\)
TABLE E·12. EXISTING AND PLANNED MRFs, 1989 DATA (386)
NAME
Operat i onal - low Tech Phoeni x San Mateo County ( B f l - Recyc l ery) East Bay D i sposal (Durham Rd. ) Waste Management of Santa C l ara Enp i re Waste Management Garden C i ty D i sposal Meyer Brothers Scavenger Servi ce Waste Management of McHenry County Buf falo Grove/Whee l i ng D i sposal Waste Management ( B l a i ne) Dakota County Ramsey County (Super Cycl e MRF ) At l ant i c County Somerset County Susquehanna County York County (Recyc l e Amer i ca ) York Waste D i sposal Seatt l e (Recyc l e Amer i ca ) WMI Recyc l i ng o f W i scons i n
Operat i onal · H iih Tech Mar i n Recyc l ing & R . R . Center Groton (SECRRRA) Camden County Monmouth County Recyc l i ng Corp. D i st r i butors Recyc l i ng Monmouth County West Paterson (WPAR ) New York C i ty (East Har l em) Syracuse Westbury Bri stol (Otter Recyc l i ng ) Bucks County Satel l i te Faci l i ty Ph i l adelph i a Transfer & Recyc l i ng Johnston MRF Seatt l e ( Rabanco)
Operati onal · Other Eden Pra i r i e (Reuter)
Tenporarl Shutdown - low Tech P i ne l l as County (Bf l ) D i xon Recyc lers MRF Nat i onal Tenple Recyc l i ng Center
Temporary Shutdown · H i gh Tech I s l i p (New Fac i l i ty)
YEAR
89 89 89 86 78 88 89 88 88 88 89 86 88 87 87 89 89 88 89
81 82 86 87 85 89 87 88 89 88 88 89 89 89 88
86
83 80 88
80
DES I GN RESIDUE C I TY STATE TPD TPD
Phoeni x AZ 1 0 0 . 30 Be lmont CA 75 2 . 30 fremont CA 55 5 . 50 San Jose CA 70 2 . 00 Santa Rosa CA 80 0 . 00 Bensenv i l le l l 2 0 . 1 0 Ch i cago R i dge l l 1 1 0 .60 McHenry County l l 4 0 . 1 0 Whee l i ng l l 21 0 . 00 B l a i ne MN 25 0 . 00 Burnsv i l le MN 40 0 . 60 S t . Paul MN 43 0 . 40 A t l ant i c C i ty NJ 37 0 . 90 B r i dgewater NJ 1 25 5 . 00 Susquehanna County PA 5 0 . 1 0 York PA 30 2 . 40 York PA 2 0 . 00 Seat t l e WA 1 1 0 1 . 1 0 Hi l waukee WI 21 0.60
San Rafael CA 1 00 1 0 . 00 Mys t i c CT 23 7 . 1 0 Camden NJ 70 1 3 . 00 long Branch NJ 43 4 . 30 Newark NJ 250 5 . 00 Ocean Townsh i p N J 25 0 . 60 West Paterson NJ 70 5 .60 New York NY 55 1 1 . 70 Syracuse NY 400 20 . 00 Westbury NY 75 0 . 80 B r i stol PA 45 3 .60 Bucks County PA 45 0 . 50 Ph i l ade l ph i a PA 35 2 . 80 Johnston R l 1 30 1 3 . 00 Seat t le WA 85 4 .30
Eden Pra i r i e HN 470 56.40
P i ne l l as Park Fl 325 1 0 . 00 Lebanon County PA 80 8 . 00 Ph i ladelph i a PA 40 3 . 00
l s l i p NY 300 9 . 00
co-HI NGLE SOURCE
X SEP X
100 . 00 0 . 00 40.00 60 . 00 26 . 00 74 . 00 30 . 00 70 . 00 1 5 . 00 85 . 00 35 . 00 65 . 00 20 . 00 80 . 00
6 . 00 94 . 00 5 . 00 95 . 00 5 . 00 95 . 00 2 . 00 98. 00 7 . 00 93 . 00
30 . 00 70 . 00 30 . 00 . 70 . 00 53 . 00 47.00 1 5 . 00 85 . 00 48 . 00 5 2 . 00 33 . 00 67. 00 33 . 00 67. 00
60 . 00 40 . 00 1 00 . 00 0 . 00 1 00.00 0 . 00 1 00 . 00 0 . 00 1 00 . 00 0 . 00 1 00 . 00 0 . 00 1 00 . 00 0 . 00
73 . 00 27.00 40 . 00 60 . 00
1 00 . 00 0 . 00 1 00 . 00 0 . 00
23.00 77 . 00 60 . 00 4 0 . 00 42 . 00 58 . 00 40 . 00 60 . 00
100 . 00 0 . 00
20 . 00 80 . 00 60 . 00 4 0 . 00 50.00 50 . 00
85 . 00 1 5 . 00

� ;;} 0 0 lJ "0 0 lJ ,.. ::t 0 z
m I N w
TABLE E-12. EXISTING AND PLANNED MRFs. 1989 DATA (cont)
DES I GN RESI DUE NAME YEAR C I TY STATE TPD TPO
Advanced P l annin� - low Tech Huachuca C i ty Huachuca C i ty AZ 42 3 . 00 Eden P ra i r i e (BF I ) Eden Pra i r i e HN 1 50 38. 00 l nvergrove (BF I ) l nvergrove Heights HN 150 38 .00 s t . Louis <BF I ) S t . lou i s MO 1 50 0 . 00 Sussex County lafayette Townsh i p N J 140 1 4 . 00 lackawanna County Lackawanna County PA 125 1 0 . 00
Advanced P l ann i ni - H igh Tech TURF ( Total Urban Renewal Fac i l i ty) San Franc i sco CA 150 1 5 . 00 Capi tol Reg i on MRF ( Hartford) Manchester CT 200 2 . 50 DuPage County (New Eng l and CR i nc . ) Carol Stream l l 1 50 1 4 . 00 OuPage County (Waste Management) S.C. DuPage County l l 150 1 4 . 00 Cumber l and County Deer f i eld Townsh i p NJ 80 8. 00 Brookhaven Brookhaven NY 120 1 2 . 00 Heq>stead Heq>stead NY 1 00 5 . 00 Westchester County Yonkers (proposed) NY 200 1 5 . 00
Advanced P l ann i n� · Other Broward County Pentlroke P i nes Fl 660 132 . 00
Construct i on - Low Tech San Jose (BFI - Newby I sland) Mi lpi tas CA 200 50 .00 P i nel las Park (Recyc l e Ameri ca ) P i nel las Park Fl 1 75 0 . 00 lew i s County Lowvi l le NY 50 0 . 00 Jef ferson County Pamel i a NY 1 00 1 .00 Mecklenberg CountY . Charlotte NC 1 20 5 . 00 Centre County Centre County PA 60 0 . 00
Construct i on - H iih Tech Spr i ngf i el d Spr i ng f i e ld MA 240 24 . 00 Rosetta Recycl i ng Center Dover Townsh i p NJ 250 1 7 .50 Cape May County Woodbi ne (Borough of ) NJ 225 1 4 . 90 One i da- Herkimer Count i es Ut i ca NY 200 20 .00 Akron Akron OH 1 0 0 . 00 Karta Conta i ner & Recyc l ing Peeksk i l l NY 145 0 . 00
co-H I NGLE SOURCE
X SEP X
64 . 00 36 . 00 1 0 . 00 90 . 00 1 0 . 00 90 . 00
0 . 00 0 . 00 1 5 . 00 85 . 00 40 . 00 60 . 00
5 0 . 00 50 . 00 50.00 50.00 30 . 00 70 . 00 30 . 00 70 . 00 62 . 00 38 . 00 25 . 00 75 . 00 5 5 . 00 45 . 00 50 . 00 50 . 00
1 00 . 00 0 . 00
30 .00 70 . 00 1 0 . 00 90 . 00 32 . 00 68.00
5 .00 95 .00 1 5 . 00 85 . 00 1 2 . 00 88 . 00
40 . 00 60 . 00 50 .00 50 .00 55.00 45 . 00 37.00 63 . 00 50 . 00 50.00 85 .00 1 5 . 00


� ;;} 0 0 ::0 "0 � ,.. :::t 0 z
m I N "'
NAME
Operat i onal • low Tech Phoen i x San Mateo County ( B F I · Recyc l ery) East Bay D i sposal (Durham Rd. ) �aste Management of Santa C l ara Enpi re �aste Management Garden C i ty D i sposal Meyer Brothers Scavenger Servi ce �aste Management of McHenry County Buf f a l o Grove/Wheel i ng D i sposal waste Management ( B l a i ne ) Dakota Col.llty Ramsey County ( Super Cyc l e HRF )
'
A t l ant i c COI.Ilty ·
Somerset COI.Ilty susquehanna County York COI.Ilty (Recyc l e Amer i ca) York �aste D i sposal Seat t l e (Recyc l e Amer i ca ) �I Recyc l i ng of W i scons i n
Operat i onal • H igh Tech Mar i n Recyc l i ng & R . R . Center Groton ( SECRRRA) Camden COI.Ilty Monmouth COI.Ilty Recyc l i ng Corp. D i s t r i butors Recyc l i ng Monmouth County �est Paterson (WPAR ) New York C i ty (East Har l em) Syracuse Westbury B r i stol (Otter Recyc l i ng) Bucks County Satel l i te Fac i l i ty Phi l adel ph i a T ransfer & Recyc l i ng Johnston MRF Seat t l e (Rabanco)
Operat i onal · Other Eden Pra i r i e ( Reuter)
Temporary Shutdown - Low Tech P i ne l l as Col.llty ( BF I ) D i xon Recyc l ers MRF Nat i onal T�1p l e Recyc l i ng Center
T enporary Shutdown - H igh Tech I s l i p (New Fac i l i ty)
TABLE E-13. MRF OWNERS/OPERATORS/DESIGNERS (386)
OUNER
S t . V i ncent DePaul Soc i ety Browni ng- Ferr i s I ndust r i es , I nc . oakland Scavenger/�aste Management �aste Management of North Ameri ca �aste Management of North Amer i ca �aste Management of North Ameri ca Waste Management of North America �aste Management of North Amer i ca Waste Management of North Amer i ca �aste Management of North Amer i ca Dakota County/RMR Ramsey County At l ant i c COI.Ilty Ut i l i t i es Author i ty Somerset COI.Ilty Susquehanna County Waste Management of North Ameri ca York �aste D i sposa l , I nc . Waste Management o f North Ameri ca �aste Hgmt. Recyc l i ng of W i sconsi n
Mar i n Recyc l i ng & R . R . Assoc i a t i on SE CT Reg i ona l R . R . Agency/Groton Camden County ( equ i pment ) Monmouth Recyc l i ng Corporat i on RE I D i stri butors , I nc . Monmouth Proces s i ng �PAR C i ty of New York RRT/Emp i re Returns Corpora t i on OHN I Recyc l ing of Westbury, I nc . Otter Recyc l i ng Bucks County Waste Management of North Ameri ca R l Sol i d Waste Management Corp. Rabanco, Ltd.
Reuter Recyc l i ng , I nc .
Brown i ng- Ferr i s I ndus t r i es , I nc . . D i xon Recyc l ers
Nat i onal Temple Non-Prof i t Corp.
Town of l s l i p
OPERATOR
S t . V i ncent DePaul Soc i ety Brown i ng- Ferr i s I ndustri es , I nc . Waste Management/Oak l and Scavenger Waste Management of Santa C l ara Waste Management of North Amer i ca Waste Management of North Amer i ca Heyer Brothers Scavenger Serv i ce Waste Management of McHenry County Buf f a l o Grove/Wheel i ng D i sposal �aste Management of North Amer i ca Recyc l e M i nnesota ' s Resources (RMR ) SUper Cyc l e A t l ant i c County Ut i l i t i es Author i ty Somerset County Susquehanna County Waste Management of North Ame r i ca York �aste D i sposa l , I nc . Waste Management of North Amer i ca �aste Mgmt . Recyc l i ng of Wi scons i n
Mar i n Recyc l i ng & R .R . Assoc i a t i on Resource Recovery Systems, I nc . Resource Recovery Systems, I nc . Monmouth Recyc l i ng Corporat i on RE I D i st r i butors , I nc . Monmouth P rocess i ng WPAR Resource Recovery Systems, I nc . RRT/Empi re Returns Corporat i on OHN I Recyc l ing of westbury, I nc . Otter Recyc l i ng RRT/Empi re Return� Corporat i on Waste Management of North Amer i ca New Eng l and CR i nc . Rabanco, L td .
Reuter Recyc l i ng, I nc .
Brown i ng- Ferr i s I ndustr i es , I nc . D i xon Recyc l ers Nat i ona l Temp l e Non-Prof i t Corp.
Town of l s l i p
D E S I GNER
(Not Ava i l ab l e ) Brown i ng- Ferr i s I ndustr i es , I nc . �aste Management/Oa k l and Scavenger �aste Management of North Ame r i ca , I nc . Waste Management o f North Amer i c a , I nc . Waste Management o f North An�r i ca , I nc . �aste Management of North An�r i ca , I nc . �aste Managen�nt o f North An�r i ca , I nc . �aste Manag�nent o f North Amer i ca , I nc . �aste Management o f North An�r i ca , I nc . R I S/Dakota County Ramsey County/Super Cyc l e A t l ant i c County ( Not Ava i l able) Susquehanna County �aste Management of North Amer i ca , I nc . York �aste D i sposa l , I nc . Waste Management o f North Amer i ca , I nc . Waste Management o f North Ameri ca, I nc .
Mar i n Recyc l i ng & Res . Recovery Center Resource Recovery Systems, I nc . JCA Eng i neer i ng Count Company R E I D i st r i butors , I nc . Monmouth Process i ng WPAR Resource Recovery Systems/New York C i ty RRT Des i gn & Construc t i on Corporat i on OMN I Recyc l i ng of �estbury, I nc . Otter Recyc l i ng RRT/Empire Returns Corporat i on Waste Management o f North Amer i ca, I nc . James C . Anderson Assoc i ates Rabanco Recyc l i ng Company
Reuter Recyc l i ng/Buh l er-M i ag , I nc .
Brown i ng- ferr i s I ndustr i es , I nc . D i xon Recyc lers Advent Des ign
OMN I Technical Servi ces/Town of I s l i p
� 0 0 :II ., 0 :II ,. ::t 0 z
m I N CJ)
NAME
- Advanced P l ann i ng - Low T ech Huachuca C i ty Eden Prai r i e ( Bf l ) l nvergrove ( BF I ) S t . Lou i s ( BF I ) Sussex County Lackawanna County
Advanced P l ann i ng - H igh Tech �
TURF ( T otal Urban Renewal Fac i l i ty) Capi tol Region MRF ( Hartford> DuPage County ( New Eng l and CR i nc . ) DuPage County (Waste Managemen t ) C1..111ber l and County Brookhaven Hempstead Westchester County
Advanced P l ann i n9 - Other Broward County
Cons truc t i on • Low Tech San Jose C B F I • Newby I s l and) P i ne l l as Park ( Recyc l e Amer i ca ) Lew i s County Jefferson county Mec k l enberg County Centre County
Construc t i on - H i gh Tech Spr i ngf i el d Rosetto Recyc l i ng Center Cape May County One i da - Herkimer Count i es Akron Karta Contai ner & Recyc l i ng
TABLE E·13. MRF OWNERS/OPERATORS/DESIGNERS (cont)
OWNER
Coch ise Landf i l l Recyc l i ng Center Browning- Ferr i s I ndust r i es , I nc . Brown i ng- Fer r i s I ndustr i es , I nc . Browning- Ferr i s I ndust r i es , I nc . Sussex Co. Muni c i pa l Ut i l . Auth . Lackawanna County
Norcal Sol i d Waste , I nc . R E I D i st r i butors, I nc . DuPage County DuPage County Cumber l and Co. I mprovement Aut h . Town of Brookhaven Nassau County/Hempstead/Em. Returns Westchester Co. Sol i d Waste D i s t .
Reuter Recyc l i ng , I nc .
Browning- Fer r i s I ndus tr i es , I nc . Wast e Management o f North Amer i ca Lew i s County Jefferson County F a i r f i e l d · County Redempt i on, I nc . Centre County Sol i d Waste Author i ty
State of Massachusetts/RRS Roset t o Recyc l i ng Corporat i on Cape May Co. Muni c i pa l Ut i l . Auth . Onei da- Herkimer Count i es WTE Corporat i on Karta Conta i ner & Recyc l i ng
OPERATOR
Coch i se Landf i l l Recyc l i ng Center Brown i ng - Ferr i s I ndus t r i es, I nc . Brown i ng- Ferr i s I ndustr i es , I nc . Brown i ng - ferr i s I ndus t r i es , I nc . Sussex Co. Mun i c ipa l Ut i l . Aut h . l ackawanna County
West Coast S a l vage Company RE I D i st r i butors, I nc . New Eng l and CR i nc . Waste Mgmt . /Naper. Area Recyc l i ng Cumber l and Co. I mprovement Auth . New Eng l and CR i nc . /Mat . Rec . of NY RRT/Empi re Returns Corporat i on (Pr i vate F i rm)
Reuter Recyc l i ng, I nc .
Browni ng- ferr i s I ndus t r i es , I nc . Waste Management of P i ne l las, I nc . lew i s County Jefferson County F a i rf i e l d County Redempt i on, I nc . Centre County Sol i d Waste Author i ty
Resource Recovery Systems, I nc , Rosetto Recyc l i ng Corporat i on RRT/Empi re Returns Corpora t i on One i da - Herk i mer S . W . M . Authori ty WTE Corporat i on Karta Contai ner & Recyc l i ng
DESI GNER
Coch i se Landf i l l Recyc l i ng Cente r , I nc . Brown i ng- Ferr i s I ndus t ri es , I nc . Brown i ng - Ferr i s I ndus t r i es , I nc . Brown i ng - Ferr i s I ndus t r i es , I nc . Sussex County Mun i c i pa l Ut i l i t i es Auth. Kutch , Brocav i ch & Assoc i ates
Norca l So l i d Waste/GEZ Assoc i ates R E I D i st r i butors, I nc . Camp, Dresser & McKee Canp, D resser & McKee New Eng l and CR i nc . New England CR i nc . /Mater i a l s Rec. of NY RRT/Empi re Returns Corporat i on (To Be Determined)
Reuter Recyc l i ng , I nc .
Browning- Ferr i s I ndus t r i es , I nc . Waste Management o f North Amer i ca , I nc . Barton & Logu i d i ce Barton & Logu i d i ce R . V . R i dberg & Assoc i ates Gershman, B r i ckner & Brat ton/Bl azosky
Resource Recovery Systems, I nc . Rosetto Recyc l i ng Corporat i on RRT/Enp i re Returns Corporat i on W. F . Cosul i ch/One i da - Herk imer S . W . M . A . IJ T E Corporat i on (Not Ava i l ab l e )

� n 0 ]J 'tJ 0 ]J ,. :::t 0 z
m • N ......
NAME
Conceptual P l ann i ng -C i ty of los Angeles ( 1 ) C i ty of Los Ange l es ( 2 ) C i ty o f los Angel es ( 3 ) C i ty o f Los Angel es ( 4 ) C i ty of Los Angel es ( 5 ) L .A . County San i tat i on D i st r i c t s Ventura Reg i on San i tat i on D i st r i ct Housaton i c Res . Recovery Autho r i ty MRF/T ransfer Stat i on/Compost i ng Montgomery County ( Shady Grove Rd. ) P r i nce George' s Co. , Muni c i pa l i t i es Southwest Sol i d Wast e Mgt . D i st r i c t Ocean County Mercer County Warren County West F i nger Lakes Cor t l and County oswego County Ontar i o County Monroe County Berks County Monroe County Quonset Point Pul ask i County
Conceptual P l ann i ng - Low Tech P r i nce George' s County Hennep i n county Orange Col.Wlty Madi son County K i ng of Pruss i a Knoxv i l l e P i erce Col.Wlty
Conceptual P l anni ng - H i gh Tech Greater B r i dgeport Reg i on Palm Beach County ( North ) SEHASS (MR F ) Oak l and County G l oucester County Dutchess county New York C i ty ( Staten I s land)
TABLE E-13. MRF OWNERS/OPERATORS/DESIGNERS (c ont)
OWNER
( P r i vate F i rm) (Pr i vate F i rm) ( P r i vate F i rm) ( Pr i vate F i rm) < P r i vate F i rm) L .A . County San i tat i on D i st r i cts Ventura Reg i on San i tat i on D i st r i c t ( To B e Determined) I ntergovernmental S . W . D i sp. Assn. Montgomery County Maryland Envi ronmental Servi ce ( To Be Determi ned) Ocean County Mercer Co. I mprovement Author i ty ( T o Be Determined) Sol i d Waste Management Author i ty Cor t l and County (Oswego Co. , P'r i vate F i rm or ARC) Onta r i o County Monroe Col.Wlty ( Berks County or P r i vate F i rm) Monroe county Genera l Authori ty R l Sol i d Waste Management Corp. ( To Be Determined)
( To Be Determined) Hennepi n County Orange County . Assoc i at i on for Retarded C i t i zens O ' Hara San i tat i on Company, I nc . Browni ng- Ferr i s I ndustr i es, I nc . ( To B e Determi ned - Prefer County)
( Pr i vate F i rm) Palm Beach County S . W . Author i ty Mater i a l s Recovery/Recyc l i ng Corp. Oakl and County G l oucester County Dutchess Co. Res . Recovery Agency C i ty of New Yrok
OPERATOR
( P r i vate F i rm) ( Pr i vate F i rm) ( Pr i vate F i rm) ( P r i vate F i rm) ( Pr i vate F i rm) L .A . County Sani tat i on D i st r i cts ( T o Be Determi ned) ( To Be Determi ned) ( P r i vate F i rm) ( P r i vate F i rm) Maryland Envi ronmental Servi ce ( Pr i vate F i rm - To Be Determi ned) ( P r i vate F i rm> ( P r i vate F i rm) ( To Be Determi ned) ( P r i vate F i rm) ( Cor t l and County or P r i vate F i rm) (Oswego Co. , P r i vate F i rm or ARC) ( Pr i vate F i rm) ( P r i vate F i rm) ( Pr i vate F i rm) ( Pr i vate F i rm) ( P r i vate F i rm) ( Pr i vate F i rm)
( P r i vate F i rm) ( Pr i vate F i rm)
,Orange County Assoc i a t i on for Retarded C i t i zens O ' Hara San i tat i on Company, I nc . Brown i ng - Fer r i s Indust r i es, I nc . ( To B e Determined)
( P r i vate F i rm) ( Pr i vate F i rm) Energy ANSWERS Corporat i on ( P r i vate F i rm - To Be Determi ned) ( P r i vate F i rm) ( Pr i vate F i rm) ( Pr i vate F i rm)
DES I GNER
( To Be Determi ned) ( To Be Determi ned) ( To Be Determi ned) ( To Be Determi ned) ( T o Be Determi ned) ( To Be Determi ned) ( To Be Determi ned) ( To Be Determi ned) ( To Be Determi ned) ( To Be Determi ned) Maryland Envi ro�nenta l Service ( To Be Determi ned) ( T o Be Determ i ned) ( To Be Deter·mi ned) ( To Be Determi ned) ( T o Be Determi ned) ( To Be Determi ned) ( To Be Determi ned) ( To Be Determi ned) ( To Be Determi ned) J .A . Hayden Assoc i ates ( procurement ) ( To Be Determi ned) ( To Be Determi ned) ( T o Be Determi ned)
( To Be Determi ned) ( T o Be Determi ned) Wehran Env i rotech Barton & Logu i d i ce/ARC ( To Be Determined) Brown i ng- Ferr i s I ndus t r i es , I nc . ( To B e Determi ned)
( To Be Determi ned) ( T o Be Determi ned) Smi th & Mahoney ( probably) ( To Be Determi ned) ( To Be Determi ned) ( To Be Determi ned) ( To Be Determi ned)

E.2.3.3 High Technology MBFs
M RFs employing a highly mechanized process line have been developed for processing large quantities
of recyclables from commingled feed streams. Several vendors such as New England CAine, Waste
Management, Inc, and Resource Recovery Systems (RRS) offer automated MRFs that minimize the
manual labor required . New England CAine is the exclusive North American licensee for the technology
developed by Maschinenfabrik Bezner of Germany. Twenty MRFs using the Bezner process are in
operation throughout Europe (332) . . Waste Management, Inc.'s automated M RF uses the Swedish
BRINI system.
E.2.3.3.1 Johnston. Rhode Island. The Johnston, Rhode Island MRF, owned by the Rhode
Island Solid Waste Management Corporation (RISWMC), was designed and is operated by New England
CAine (CAine). As an example of an automated MRF, the process is shown in Figure E-2. This facility
was designed to process 130 tons per day of commingled recyclables received in co-collected, separate
fractions of mixed paper (ON P and OCC) and mixed containers (ferrous, HOPE, PET, three colors of
glass, and aluminum).
As of 1 990, the facility throughput was increased to approximately 200 TPO by operating a second shift.
Mixed paper is removed from the tip floor and manually sorted on conveyors prior to baling into its
constituent fractions. Commingled containers are loaded onto a computer-regulated conveyor that
senses the quantity of materials fed per lineal foot in order to maintain a steady feedrate. Ascending to
elevated separation stations, material is initially visually inspected for gross contaminants and hazardous
materials, which are removed manually. After magnetic belts separate ferrous materials, the remaining
fraction cascades downwards on the conveyor and through a series of suspended metal bars that,
relying on the weight, particle size, and aerodynamic differences of aluminum and plastic containers
separates them from glass. Also, due to gravity, glass continues down the line with other containers
diverted to either side. Glass is screened, with the overs manually sorted by color and the unders
remaining as mixed cullet. Clear glass overs are negatively sorted and visually inspected to assure high
quality of this most valuable glass color. Containers on the diverted line pass through an eddy current
separator to remove aluminum, and plastics are manually sorted by resin type.
Materials are prepared for market as follows. Ferrous is shredded in a flail mill (which also removes and
separates the aluminum tops of bi-metal cans) and is containerized in loose form. Aluminum is shipped
similarly after passing through a can flattener. Glass is crushed and boxed or shipped loose in truckload
quantities. PET is perforated and baled, while HOPE is shredded and shipped in gaylord-style boxes.
Papers are baled.
wTe CORPORATION E·28

The RISWMC facility has experienced a high on-line per1onnance. Residue, primarily mixed glass cullet
from the screen unders, is estimated to be 1 0 percent of the daily throughput. Operating management
envisions expansion of interior storage and tipping floor room to i�rove maneuverability and material
climatic protection in this 40,000 square foot building.
r - - -. - - - - - - - - - - -,
I I I I I I I I
I
TIPPING FLOOR
MIXED RECVCLABLES PROCESS UNE
L - - --- -
PAPER RECVCLASLES PROCESS UNE
1-, I I I I I I.. - - - - - - .-o:=:::::l 1 r - - - - - - '-1 -'
Figura E-2. Johnston, Rhode Island MRF Process Plan
wTe CORPORATION E·29
E.2.3.4 MBE processing Highly Separated Materials
lnfeed materials from drop-off centers, buy-back centers, and curbside collection programs requiring
complete separation generally do not require extensive processing to prepare them for markets. MRFs
processing such materials may act more like consolidation facilities. Drop-off center materials may
require steps to ensure product quality control since contamination may have been introduced at either
the source or the center. Buy-back center material generally does not end up at a MRF unless the
buy-back center is part of the MBF.
Collection vehicles deliver materials to the centralized processing location, where separated materials
are consolidated in larger containers or otherwise packaged for resale and shipment. Depending on the
quantity and type of material collected, it may be desirable to invest in special repackaging equipment
such as paper and plastic balers or glass crushers. In the event that certain truck compartments contain
commingled materials requiring separation (e.g., mixed containers or mixed paper) , further sorting can
be done either manually or, if quantities warrant, manually with mechanical assistance. For example,
sorting of mixed containers might warrant channeling of materials onto a conveyor for magnetic
separation of ferrous metals and then manual picking of aluminum and plastics (mixed or by HOPE and
PET fractions) . For small volumes, an existing drop-off center might serve as the centralized processing
center.
E.2.3.4.1 Delaware Recycling Centers. In late 1 990, the Delaware Solid Waste Authority
(DSWA) contracted tor the establishment, operation, and maintenance of a statewide system of drop-off
centers and the marketing of the products (nO). The DSWA had an initial goal of 50 operating centers
by the end of 1 991 and 1 00 centers by the end of 1 992. However, because of active citizen
participation, 80 centers were established and in operation by the end of June 1 991 (904). An additional
1 0 satellite sites continue in operation for the collection of clear, green, and amber glass.
The drop-off centers, located within a S-mile radius of most homes, use color-coded igloos for the
collection of separated recyclable materials such as glass, ferrous metal cans, nonferrous metal cans,
plastics, newspapers, used motor oil, and batteries. Browning-Ferris Industries collects and markets the
materials received at the centers. A centrally located facility for storing, sorting, and shipping the
materials provides the necesary consolidation systems tor effective marketing of recyclables as well as
product enhancement to remove contaminants.
wTe CORPORATION E-30

E.2.3.4.2 San Jose. Ga!lfornla. San Jose's three-bin collection trucks are unloaded successively
at the processing facility where a computerized scale enables the vendor, Waste Management, Inc.
(WMI) to record tonnage information by load and by waste fraction. Newspaper is baled for shipment.
Glass is hand-sorted by color and contaminants are removed on a conveyor prior to containerization for
shipment. Instead of densification in a glass crusher, WMI relies on natural handling procedures to
density glass from its original 300 pounds per cubic yard to about 1 000 pounds per cubic yard. Metal
containers are separated into ferrous and aluminum fractions by passes under a series of magnets on a
conveyor. · Approximately 20 percent of bimetal cans are rejected because labels have not been
removed (723) . The MRF also recovers HOPE and PET plastics. Total residue amounts are reported as
2 tons per day, or about 3 percent of the design capacity (386) .
E.2.3.5 Mixed Waste MBFs
As discussed in Section 1 .1 , the inclusion of mixed waste MRFs in this report reflects their primary
function - to remove recyclables from the mixed municipal solid waste (MMSW) stream. In fact, such
front-end processing systems have several functions, including:
o Recovery, for subsequent resale, of marketable recyclable materials from the MMSW
stream
o Segregation of materials from the waste stream that are unprocessible by the
waste-to-energy (W-T-E) facility or have a low heating value (e.g. , yard wastes,
oversized bulky wastes)
o Delivery of non-recoverable, combustible materials to the W-T-E facility
In the following sections, examples of both a labor-intensive MRF (766) and a mechanized MRF (767)
are presented. In addition to a brief process description, included also is a list of the materials recovered
and pertinent operating and performance parameters. Since the current design and operating plans for
these two projects have not been reported in the �pen literature, the information pres.ented is derived
from the respective Request for Proposals.
wTe CORPORATION E-31

E.2.3.5.1 Gaston Coumy Mixed Waste MAE (766). The mixed waste MRF planned for Gaston
County is a front-end processing (FEP) system for a previously contracted waste-to-energy facil ity; both
facilities are currently on hold. The MRF features a relatively low technology, labor-intensive process
that relies heavily on manual inspection and picking of recyclable products from conveyors. 11 is
supplemented by two-stage screening for size classification and magnetic· separation of ferrous metals.
Designed to process up to 50 TPH of mixed municipal solid waste (MMSW) , the Gaston FEP not only
can recover recyclables from MMSW but is also capable of separating them from commingled "batch"
loads of recyclables should a recyclables collection program be established at a future date. Materials to
be recovered include: ferrous metals and aluminum; HOPE, PET and mixed film plastics; amber, green
and flint glass; and corrugated, newsprint and fine paper. Recovery of household batteries is a design
option.
The proposed process as depicted in Figure E-3 shows the FEP and W-T-E (with by-pass) sharing a
common tip floor where MMSW is received and initial segregation of OBW takes place. After loading
onto the inClined infeed conveyor, the MMSW reports to final OBW segregation and bag opening
stations, where MMSW is liberated and the bags removed. A disc screen then mechanically separates
MMSW to a +1- 5 inch size. The oversized material, consisting of corrugated, newsprint, and fine (office)
paper is manually separated in that order. Ferrous metals are then magnetically separated, film plastic
is picked and the remainder (i.e . , nonrecoverable, combustible residual) is conveyed to the W-T-E plant,
or diverted from the conveyor to the tipping floor for use as future W-T -E feedstock.
Undersized material from the primary disc screen proceeds to three glass picking stations where
manually-removed green, amber and flint glass report to individual storage bins, followed by crushing
and screening prior to loadout. Ferrous metals are magnetically separated from the primary undersized
material; the unders then report to a secondary screen with +1- 2 inches separation. The secondary
unders are conveyed to the common refuse loadout conveyor; secondary overs report to aluminum
picking stations, followed by manual separation of PET, HOPE and LOPE.
The unit processes described above are amenable to handling both MMSW and commingled
recyclables, and closely resemble those used to produce co�st or RDF, albeit without the size
reduction (shred) step. As such, additional information on the energy and environmental considerations
for these unit process operations can be found in Appendices B and G.
wTe CORPORATION E-32

� 0 0 lJ "0 0 � :j 0 z
� �
t
AWMitfUM
lOAO·OUI
GASTON MRF 3500 TPW
MtX£0 OVfk$ lOAD·OUJ
Mt.U'
oor
FIITJii ... l ; -CIUSU£1
OPJI()NAl r - -.
IIAllEKY : : I I " a SCRflHU
t . ce= .. t t t n r=��K)"
PICKING : : ' - �
PLASTICS J'ICKINU SIAJION AHO SJ�
ft.AIJOIIM a OONVIYOI
:iiiiHii. ;uJfil!I""
1
MRf iUO CONI/tYOR
<iN EN
AMIIfl
fUtoiT
Al
IIAG OPENING PLAlfORM
TIPPING FLOOR
COMIUSTOII: f(EIJ PIT ANI> (Of\IVtYOII:
IIAlEII.OAOtNGPIJ ,._ ...... , .._. ---.
I i : : . :1 IIAlfl IJ � ; : l ' I
611.\HUlAIOil D REfUSE COHVIYOil
10 COMIIUSlOl r - - - - - - -Sfrot.IO fl.OOI
1 - I VIEWING IIOON .--,;-r
L SOUM:f SlP-..Al£0 MAUNAL D.oroff ACCf)S OOOil
Figure E-3. Floor Plan for Proposed Gaston County, North Carolina, Mixed Waste MRF
!

i. E.2.3.5.2 Monmouth eoumy Mixed Waste MBE (767) . In the advanced stages of planning and
preliminary design, the Monmouth County MRF, or FEP, which will be co-located with a mass bum
W-T -E facility, is designed to process 1 700 TPO of MMSW, separating out recyclables and
noncombustibles. This is a highly mechanized front-end processing design utilizing trommels and
multiple product separations in three parallel processing lines, supplemented by manual picking. The
following recyclables are intended to be recovered: corrugated boxboard, ferrous metals, aluminum
cans, film plastic, HOPE, PET and household batteries.
The MRF is to be located in a 60,000 square foot building adjacent to the tipping floor where front-end
loaders will initially screen out unacceptable or nonprocessible waste and corrugated prior to loading the
infeed conveyors which transport the MMSW to the MRF. Additional corrugated is removed at the first
picking station in the MRF and conveyed to a baler. Waste not removed at the corrugated picking station
will be size separated by a trommel equipped with bag-breaking bars to liberate bagged MSW.
Ferrous metals will be removed with a suspended magnet from the trommel undersized material,
followed by manual removal of aluminum and magnetic (head pulley) separation of ferrous metal cans
inadvertently picked with the aluminum. The aluminum is then flattened and blown to a loadout area.
The ferrous metals separated by the suspended magnet are sent to loadout after reporting . to the
household battery picking station.
Oversized materials, consisting of PET, HOPE and film plastics are picked in that order and conveyed to
dedicated balers for subsequent loadout. Ferrous metals will be removed by suspended belt magnets
and corroined with the undersized ferrous stream to loadout, while the remaining oversized material
combines with unrecovered undersized material and conveyed to the refuse pit.
The Monmouth County FEP is unique in that it is the first mixed waste MRF dedicated to recyclables
separation from mixed waste in a comrrunity that already collects selected recyclables curbside.
E.2.3.6 Small-Scale MBEs
Small-scale MRFs and mobile MRFs are two recent developments. Count Recycling Systems offers a
"McMRF" system with a capacity of up to 20 tons per 8 hour shift (769). The system requires a volume
only 70 feet by 40 feet by 1 6.5 feet high. The system uses variable speed conveyors, air classification,
and a variable speed screen to supplement hand picking.
wTe CORPORATION E·34

New England CAine offers a mobile 20 ton-per-shift MRF built by the Ptarmigan Equipment Corporation
(769) . The Ptarmigan system is highway-towable at 8 feet wide by 48 feet long and 22,000 pounds. It can accomodate six or eight picking stations. Approximately 40 of these systems are in operation
throughout the country.
E.2.4 ProdUCtS
Table E-1 4 presents data on materials which are being recovered or are planned to be recovered at
operating and planned U .S. MRFs (386) . These materials and the percentages of the facilities reported
to recover them are: tin cans - 97 percent, clear glass - 97 percent, brown . glass - 94 percent, green
glass - 94 percent, aluminum - 93 percent, bi-metal cans - 91 percent, newspaper - 89 percent, HOPE -
82 percent, PET - 79 percent, cardboard - 66 percent, ferrous scrap - 30 percent, computer paper - 29 percent, mixed paper - 9 percent, and other materials - 9 percent.
Successful MRFs are highly responsive to location-specific needs and especially to the requirements of
the markets (1 64) . Recognizing the lack of design standardization and the material-specific, end-use
specifications, the following description of recovery techniques is presented on a material-specific basis.
E.2.4.1 sample ProdUct Sgec!f!Cat!ons
The following are sample product specifications taken from a MRF Request for Proposals (765). They
are conskfered to be typical of that required by end users.
E.2.4.1 .1 Newsprint. Newsprint shall be separated from all non-paper products and baled so as
to be suitable for overseas export. The density of the bales shall be approximately 25 pounds per Cubic
foot, yielding an average weight of 1 , 1 00 pounds per bale. Non-newsprint cOntamination is limited to a
maximum of 2 percent "out throws paper" and "prohibitive material" as defined by the Paper Stock
Institute of America (PS-86), "Special News" No. 7. The newsprint bale should consist of baled, sorted,
fresh, dry newspaper, not sunburned and free from paper other than news, containing not more than the
percentage of rotogravure and colored sections normally contained in newspaper delivered to the
household.
wTe CORPORATION E·35

m I
�
NAME
O�era t i onal - low Tech Phoeni x San Mateo County ( B f l - Recyc l ery) East Bay D i sposal (Durham Rd. ) lolaste Management of Santa C l ara Empi re Waste Management Garden C i ty D i sposal Meyer Brothers Scavenger Servi ce lolaste Management of McHenry County Buffalo Grove/lolheel i ng D i sposal lolaste Management ( B l aine) Dakota County Ran�ey County ( Super Cyc l e MRF ) A t l ant i c County Somerset County Susquehanna County York County (Recyc l e Ame r i ca ) York lolaste D i sposal Sea t t l e (Recyc l e Amer i ca) I.IHI Recyc l i ng of loli scons i n
Operat i onal - H igh Tech Mar i n Recyc l i ng & R . R . Center Groton ( SECRRRA ) Camden County Monmouth County Recyc l i ng Corp. D i st r i butors Recyc l i ng Morn10uth County West Paterson (loiPAR) New York C i ty ( E ast Harl em) Syracuse lolestbury B r i stol (Otter Recyc l i ng) Bucks County Satel l i te Fac i l i ty Ph i l adel ph i a T ransfer & Recyc l i ng Johnston MRF Seat t l e ( Rabanco)
Operat i onal - Other Eden Pra i r i e ( Reuter)
Temporar� Shutdown - low Tech P i nel l as County (Bf l ) D i xon Recyc lers MRF Nat i onal Tenple Recyc l i ng Center
Teu'Eorar� Shutdown - lt i gh Tech l • l i p (New Fac i l i ty)
DES I GN M I XED TPO PAPER
1 0 75 55 70 80
2 1 1
4 2 1 25 40 43 37
125 5
30 y 2
1 10 y 21
100 23 70 43
250 25 70 55
400 75 45 45 35
130 85 y
470
325 80 40
300 y
TABLE E-14. MRF PRODUCTS (386) ------------- ----
NEI.IS COHPTR CARD - M I XED CLEAR BROI.IN PAPER PAPER BOARD GLASS GLASS GLASS
y y y y
y y y y
y y y y y y y y y y y y
y y
y y y
y y y
y y y y y y y y y y y y y y y y y y
y y y y
y y y y y y y y
y y y y y y y y y y y
y y y y y y y y y
y y y y
y y y y y
y y y y y y y y
y y y y y
y y y y y y
y y y y y y y y
y
y y y y
y y y y y y y
y y y y y
GREEN SCRAP B l - OT HER GLASS ALUM F E METAl PE T HOPE HAT ' l T I N
y y y y y y y y
Y. y y y y y y
y y y y y y
y y y y y
y y y y y
y y y y y y y y y y y y y y y y y
y y y y y y y y y y y y y y y y y y y y y y
y y y y y y y y y y y y y y y y y y y y y y y y y y y y
y y y y y y y y y y y y y y y y
y y y y y y y y y
y y y y y y y y y y y y y y y y y y y y y y y y y y y y y y y y y y y y y
y y y y y y y y y y y y y y y y y y y y y
y y y y y y
y y y y y y y y y y y y y y y y y
y y y y y

m . (,) ......
NAME
Advanced P l ann i nj - Low Tech Huachuca C i t y Eden Pra i r i e ( BF I ) l nveryrove ( Bf l ) S t . L ou i s ( Bf l ) Sussex County Lacka.wanna County
Advanced P l ann i n!! - H i !!h Tech TURF ( To t a l Urban Renewa l Fac i l i t y) Cap i t o l Reg i on MRF ( Hart ford) OuPage County (New Eng l and CR i nc . ) OuPage County (IJaste Management ) C1.1uber l and County B rookhaven Hemps t ead IJes tches ter County
Advanced P l ann i n!! - Other Broward County
Cons t ruc t i on - Low Tech San Jose ( B F I - Newby I s l and) P i nel l as Park ( Recyc l e America) L ew i s County Jef ferson County Mec k l enberg County Centre County
Const ruc t i on - H ijh Tech Spr i ng f i e l d Rosetta Recyc l i ng Center Cape May County One i da - Herk in�r Count i es Akron Karta Conta i ner & Recyc l ing
DES I GN M I XED TPD PAPER
42 150 150 150 140 125 y
1 50 200 150 y 150 y
80 120 1 00 200
660
200 1 75
50 1 00 120
60
240 y
250 225 200
10 145
TABLE E-14. MRF PRODUCTS (cont)
NEIJS COMPTR CARD- M I XED CLEAR BROWN PAPER PAPER BOARD GLASS GLASS GLASS
y y y y y
y y y y y y y y y y
y y y y y
y y y y y
y y y y
y y y y y
y y y y
y y y y y y y y
y y y
y y y y
y y y
y y y y
y
y y y y y y y y y y y y y y y y y y y ' y y y y y y y y y y
y y y y y y y y y y
y y y y y y y y y y y y y y y y y y
GREEN SCRAP B l · O T HER GLASS ALUM FE ME TAL PE T HOPE MAT ' l l i N
--·
y y y y y y y
y y y y y y y y y y y y y y y y y y y y y y y y y y y y y y y y
y y y y y y y y y y y y y y y y y y y y y y y y y y y y y y y y y y y y
y y y y y
y y y y y y
y y y y y y y y y y y y y y y y y y y y y y y y y y y y y y y y y y
y y y y y y y y y y y y y y y y y y y y y y y y y y y y y y y y y y

TABlE E-1 4. MRF PRODUCTS (coni)
DE S I GN M I XED NEWS COMPTR CARD - M I XED CLEAR BROWN NAME TPD PAPER PAPER PAPER BOARD GLASS GLASS GLASS
Conce�tua l P l ann i n� -C i t y of Los Ange l es ( 1 ) 1 00 y y y y
C i t y of los Ange l es ( 2 ) 100 y y y y
C i t y of los Ange l es ( 3 ) 1 00 y y y y
C i t y of los Angeles ( 4 ) 1 00 y y y y
C i t y of l os Angeles ( 5 ) 100 y y y y
L . A . County San i ta t i on D i s t r i ct s 600 y y y y y
Ventura Reg i on San i t a t i on D i s t r i c t 500 y y y
Housaton i c Res . Recovery Author i ty 180 y y y y y
MR F / T r ans fer Stat l on/CO!IflOs t i ng 385 y y y y y
Montg�•� ry County ( Shady Grove Rd . ) 250 y y y
P r i nc e George ' s co. , Mun i c i pa l i t i es 20 y y y
Sout hwes t Sol i d waste Mg t . D i s t r i c t 80 y y y y y
Ocean County 225 y y y y ·
Mercer County 180 y y y
Warren County 80 y y y y
West f i nger lakes 75 y y y y
Cor t l and Coun t y 50 y y y y
Oswego County 1 00 y y y y
Ont a r i o County 20 y y y
Monroe County 280 y y y y
Be1·ks County 150 y y y
Monroe County 80 y y y
Quonset Point 160 y y y y y
Pul ask i County 140 y y y y
Conce�tua l P l anni� - low Tech P r i nce George ' s County 200 y y y y
Hennepi n County 200 y y y y y
Orange County 65 y y y y y
Madi son County 65 y y y y y
K i ng of Pruss i a 1 70 y y y y y
Knoxv i l l e 90 y y y y
P i erce Count y 70 y y y y y
Conce�tual P l ann i ng - H i gh Tech Greater Br i dgepor t Reg i on 275 y y y y y P a l m Beach County (North) 250 y y y y SEMASS (MR f ) 1 00 y y y y Oiil d and County 200 y y y y y
G l ouc ester County 150 y y y y
Dut chess County 75 y y y
N"" York C i t y ( S taten I s l and) 200 y y y y y
--x·
m I
�
GREEN SCRAP B l -GLASS ALUM f t Mt:l A l
y y y y y y y y y y y y y y y y y y y y y y y y y y y y y y y y y y y y y y
y y y
y y y y y y y y y y y y
y y y y y
y y
y y y y y
y y y y
y y y
y y y
y y y
y y y
y y y
y y y
y y y
y y y
y y y
y y y y
y y y
y y y
y y y
y y y y y
y y y
y y y
P E T lil>PE
y y
y y
y y
y y y y y y
y y
y y
y y y
y y
y y y y y y y y
y y y
y
y
y y
y y y y
y y
y y
y y
y y y y y y y y y y
y y y y y y y y
y y y y
----
O T H E R MAT ' L
y
y
y
y
- � - - - --
T I N
y
y
y
y
y
y
y
y
y
y y y y y
y
y
y
y
y
y
y
y
y
y

E.2.4.1 .2 Glass Cullet. The glass product shall be separated from non-container type glass
material with the exception of paper labels. The glass shall be segregated by color (amber, flint, and
green) prior to crushing. The cullet size shall be greater than 0.25 inch in diameter and less than 2.0
inches in diameter. Flint cullet shall contain not more than 5 percent other glass colors by weight, amber
cullet shall contain not more than 5 percent other glass colors by weight, and green cullet shall contain
not more than 5 percent other glass colors by weight. No stones, ceramics, or non-container glass shall
be contained in the outbound product. Non-glass contaminants shall not exceed 1 percent of the total
product weight.
E.2.4.1 .3 Alymlnym. Aluminum used beverage containers (UBCs) shall be separated from all
non-aluminum and other aluminum material and baled. All non-aluminum contamination, including
moisture shall be less than 1 .5 percent of total product weight. Minimum bale density shall be 20 pounds
per cubic toot. The other aluminum should be separated into cast and foils tractions and shipped loose
in palletized gaylords (as a minimum) .
E.2 .4.1 .4 Do Plated Steel Cans. Tin plated steel cans shall be separated from all other material
and shredded. The cans, initially up to 1 gallon in size, shall be shredded to a maxirTl.Jm dimension of 2
inches and a minimum density of 65 pounds per cubic foot. Non-tin plated steel can contamination
(including toil, food, aluminum, labels and plastic) shall be less than 2 percent of total product weight.
E.2.4.1 .5 PET Plastic. PET plastic shall be separated from all non-plastic material and further
sorted from high-density polyethylene prior to perforation and baling. All PET beverage bottles shall be
perforated and baled to a minimum density of 20 pounds per cubic foot. Contamination of all non-PET
beverage bottle material shall be less than 3 percent by weight of total product weight.
E.2.4.1 .6 HoPE Plastic. HOPE plastic translucent "milk jug-type" containers shall be separated
from all non-plastic material and further sorted from other plastic prior to baling. Colored HOPE content
shall not exceed 1 0 percent by weight. Non-HOPE and non-plastic contamination shall not exceed 1 .0
percent by weight.
E.2.4.1 .7 Mixed Rigid Plastic. Mixed rigid plastic containers shall be sep�rated from all
non-plastic material and from PET and translucent HOPE prior to perforatio� and baling. Contamination
of all non-plastic material shall be less than 3 percent by total product weight.
wTe CORPORATION E·39
E.2.4.2 Paper Recovery
Old newspaper (ONP) , old corrugated cardboard (OCC) , high grade office paper, mixed paper, and
specialty cellulosic materials can be recycled for a variety of uses. To make use of recycled paper,
manufacturers usually must employ specialized equipment to re-pulp, remove ink and other
contaminants, screen, and otherwise refine fibre for mixing with virgin feedstock (301 , 782) . Certain high
grade office papers can be remixed directly and therefore command a higher secondary market price
than commodity-grade ONP and OCC. Specifications for grades of waste paper are well-developed with
guidelines for numerous grades of used paper stock. These specifications focus on percentages of
"prohibitive materials" and "outthrows" for any contaminants that render the recyclable paper unusable in
reprocessing. Depending on the reprocessor's needs, paper is sold baled or loose.
To prevent contamination from glass, moisture, and beverage and food residue, source separation of
paper is the preferred alternative. Even in source separation of commingled recyclables, paper is best
recycled if separated from the remaining fraction. A MRF processing capability affords a program the
opportunity to collect more than one grade of paper in its paper fraction. Incoming mixed papers would
typically be isolated on the MRF tipping floor and pushed onto a box conveyor for manual picking by
paper grade. Paper grades then would be baled or containerized (e.g. , truckload, container, shrinkwrap)
for shipment.
Typical problems encountered in mixed paper separation include cross-contamination or moisture in the
material from exposure to precipitation at the curbside. Separation of paper grades from totally
commingled recycling streams conceptually is less effective due to the risk of residue contamination. If necessary from a collection standpoint, manual sorting on a conveyor is the preferred method (301 ).
E.2.4.3 Ferrous Metal Recovery
Recovered ferrous metals can be resold to detinning facilities or directly to steel mills for their smelting
operations. Detinners are sensitive to contaminants that can impede processing (e.g. , aluminum) or
exacerbate effluent problems (e.g . , labels in sludge) (782) . Steel mills are constrained by their basic
manufacturing process, metallurgical requirements of end products, and emission and effluent problems.
Oxygen furnace mills can usually use up to 30 percent scrap material, but electric arc furnace mills can
use up to 1 00 percent scrap materials (782) .
wTe CORPORATION E·40

Bi-metal cans are the primary source of post-consumer ferrous metal. These materials can be recovered
relatively easily from commingled recyclables by stationery or belt magnets. The recovered product can
be baled, shredded, or nuggetized in commercially available devices. According to the Steel Can
Recycling Institute (782) , the ferrous product must be free of all non-metallic, non-ferrous materials other
than paper labels. As a result of declining domestic steel production and the availability of other ferrous
scrap sources, the post-consumer recovery of ferrous has lagged (301 ) . For example, the San Jose,
California project has reported problems with the market acceptance of even label-contaminated ferrous
(723) .
E.2.4.4 Aluminum Recovery
Aluminum, primarily recovered in the form of used beverage containers (UBCs) , can be resold directly to
aluminum processors who reprocess it as container flat-rolled stock. Depending on specific alloy
specifications, post consumer aluminum can be re-used in amounts up to 1 00 percent of finished product
with substantial energy savings and conservation of the mineral bauxite (782, 336). The recovered
aluminum product is preferred by processors to be densified in bales or biscuits (i.e., nuggets) of specific ' •
size and to be free of excess moisture and contaminants (782) . Although aluminum only comprises a
small fraction of MSW, recovery is highly desirable. Aluminum is easy to recover from commingled
recyclables and its high resale value helps to subsidize the recycling of other materials (301 ) .
The most common methods of separating aluminum from other recyclables is manual picking from a � ;.
'
conveyor belt or use of an eddy current separator. Air classification also can be used, depending on :�, "'-.
whether the feed stream also contains plastics, which have comparable aerodynamic characteristics to
aluminum beverage containers. Small pieces of broken glass can also carry over with the aluminum
materials in an air classifier. Other methods for aluminum separation include electrostatic separation
and several wet processes Gigging, water elutrlation, and heavy media separation) (301 ) .
Repackaging of recovered aluminum for resale involves the flattening of cans in a press or by rollers
positioned above a conveyor. Flattened cans can then be baled or compressed into biscuits, or blown
into trailers for loose shipment. All of the packing equipment is commercially available as standard
items.
wTe CORPORATION E-41

E.2.4.5 Glass Recovery
Recovered glass beverage and food containers can be resold to glass container manufacturers for
substitution of up to 1 00 percent for virgin materials or to building material manufacturers for inclusion in
road surfacing, glass wool insulation , . or aggregate-based products. Substitution of recycled glass
enables container manufacturers to operate at lower furnace temperatures and improve emission
characteristics. Container manufacturers will accept recycled material in whole container, irregularly
broken, or crushed form. Two critical specifications have a direct affect on recycling practices:
o Glass must be sorted by color (i.e., flint, green, and brown) to control the cosmetic
appearance of end products, and
o Recycled glass must be free of all contaminants, including paper, plastics, metals,
textiles, and rocks (782) .
As glass containers break during the trip from the point of consumer discard through collection and
centralized processing, colors can become mixed and chards of glass can collect the residue of other
materials. Vestiges of metallic tops and paper labels can also remain if not removed by the generator or
the centralized processing system. Chards of glass also become imbeded in other recyclables with
which they come in contact, thereby reducing the marketability of the other material. Glass-impregnated
papers, for example, damage rollers and other processing equipment in the manufacture of recycled
papers.
If glass is to be separated from mixed waste without subsequent color separation, trommeling,
screening, air classification, or combinations thereof are used (181 , 316) . Froth flotation also has been
demonstrated (301 ). These techniques simultaneously break and densify the mixed glass cullet, thereby
possibly avoiding the necessity for a discrete densification step. Certain proprietary processes have
been developed and are used commercially ( 1 64, 783) to beneficiate glass prior to shipment , by
removing excessive contaminants through trommeling and wet processes.
By contrast, most processes to recover glass by color avoid breakage to facilitate visual recovery.
Manual picking of glass colors from a conveyor is the most common method of recovery, although optical
scanning and certain proprietary processes have been demonstrated (301 ) . Densification of the
recovered product can occur naturally by handling or use of a glass crusher, which is a
commercially-available device.
wTe CORPORATION E-42

As more post-consumer glass has become available from MRFs, contaifler manufacturers have become
considerably more selective of materials available for sale. More than a phenomenon of increased
supply exceeding demand, this has been in response to excessive contamination in post-consumer glass
products (784). Glass recycling can significantly contribute to machinery downtime in a MRF, as the
abrasive quality of the material causes accelerated wear of conveyor systems and glass crushers.
E.2.4.6 Plastics Recovery
All plastics represent only about 7 percent of all MSW by weight (n4) . Plastic containers and packaging
(those applications found in the MRF stream) represent about 3 percent of all MSW by weight (n4).
The variety of resins and colors often makes it difficult for the generator, curbside collection crew, MRF
workers, or MRF mechanical devices to distinguish one type from another. Although of likely resale
value. the quantities of certain plastics in the waste stream have precluded recycling at any reasonable
net cost. Consequently, plastics recycling technology has been slow to develop (301 ) .
Primarily because of their high volume and relative ease of identification, containers made from high
density polyethylene (HOPE) and polyethylene terephthalate (PET) are the most commonly recycled
plastics. Comprised largely of milk containers and soft drink base cups, HOPE can be sold as-is or
granulated. The primary source of PET is two-liter soda bottles that can be granulated and shipped
loose, shredded and baled, or baled whole. Recycled PET containers can be used in the manufacture of
a variety ontems such as fiberfill cushioning, geotextile membranes, or industrial strapping. PET can be
processed, mixed with virgin resin, and re-extruded. Several intermediate plastic processors serve as
value-added reprocessors to recycle post consumer PET in proprietary processes (involving air
classification, froth flotation, electrostatic separation, washing, and extrusion) for such re-use
applications.
Because of classification difficulty, plastics typically are best separated by primary resin type through
manual sorting on a conveyor belt prior to shredding and baling or granulation and packing in gaylord .
containers for s�ipment to market. In addition to manual sorting, plastics also can be separated from
other materials by air classification or vibration screening. · Use of any mechanically-assisted separation
depends largely on the design approach to glass recycling, its breakage and cross-contamination.
wTe CORPORATION E-43

E.2.4.7 Recovery of Other Materials
Other materials that are subjected to more intensive, centralized mixed-waste processing include wood
and yard wastes, construction and demolition wastes (C&D) , tires, and waste oil. Each of these
materials can be source separated and collected in a variety of dedicated vehicles or self:<lelivered to a
processing location. Except for waste oil, these materials are processed through large scale grinders,
shredders, hammennills, or flail mills for size reduction. Certain grades of waste oil can be co-fired in
heating systems or are processed first in specialized filtration systems to remove particulate matter and
excess moisture.
End markets for these orphan waste streams are very localized and without any general specifications
for size, density, composition, or packaging. In general, markets and applications consist of:
o Wood: Compost, decorative landscaping chips, biomass fuel
o C&D: Building material aggregate, landfil l cover
o Tires: Boiler fuel supplement, road surfacing bulking material, supplement to virgin tire
rubber
o Waste oil: Fuel supplement, asphalt additive, road dust surpressant
E.3 ECONOMIC PERFORMANCE
A wide range of process and program costs for recycling technologies have been reported (785, 1 48,
386) that reveal inconsistencies and little or no emerging pattern of costs (785) . This phenomenon can
be attributed to a variety of factors:
o Early programs and facilities have had a convoluted history (785) that make expended
costs different than replication costs
o Private vendors have been unwilling to provide proprietary information (785)
o Programs vary widely in target materials, collection methods, and levels of processing
(785)
wTe CORPORATION E-44

o Documentation of costs is poor and/or reporting is inconsistent (e.g. , exclusion of
collection costs, shared overhead, residue disposal charges, material resale credits)
Several emerging databases are available ( 148, 386) but data collection is inconsistent and the facility
classifications are broad, making comparative analysis by program or technology type difficult.
E.3.1 Facility Costs
Table E-1 5 (386) provides original and adjusted (to 1 989 cost levels) capital costs for 28 existing and 45 planned (circa 1 989) MRF facilities that process recyclable materials from a variety of curbside programs
(including intensive curbside and commingled source separation). Planned facilities reflect a higher cost
per ton likely attributable to the inclusion of a greater number of higher technology, larger scale plants in
the sample. Special note should be made of the range and standard deviation of the facilities polled for
this survey, which highlights the variations and inconsistencies in the available database (386) . Table
E-1 6 provides the detailed data supporting the summary statistics presented above.
For the same facility population above, Table E-1 7 presents plant capital cost ranges as a function of
design capacity. Planned facilities average 1 62 tons per day compared to 89 tons per day for existing
facilities (386) . The effect on capital cost ranges on the degree of mechanization is illustrated in Table
E-1 8. iThe number of facilities is approximately evenly split between high and low technology types, with
a greater concentration of high technology MRFs in the Northeast.
The same survey (386) was only able to collect O&M cost data from fourteen existing and nine planned
facilities as shown in Table E-19. In this limited sample, the costs per ton for planned facilities is lower
than existing facilities, likely reflecting economies of scale from larger facilities (386)
The capital cost for the small scale McMRF offered by Count Recycling Systems is $99,500. The mobile
Ptarmigan system's capital cost is approximately $75,000 (769).
wTe CORPORATION E-45

TABLE E·15. CAPITAL COSTS AND BONO ISSUES* {386)
Standard Sample Mean Sum Deviation Minimum Maximum N
ORIGINAL CAPITAL COSTS
All Facilities $4,684,260 $341 ,951,000 7,050,131 $11 ,000 $48,000,000 73
Planned $6,166,667 $2i7 ,500,000 8,099,193 $300,000 $48,000,000 45 Existing $2,301,821 $64,451,000 4,012,160 $11,000 $20,000,000 28
ADTUSTED CAPITA L COSTS (1989 OOLLARS)
All Facilities S4,n7,158 $345,082,536 . 7,109,979 $11,000 $48,000,000 73
Planned $6,169,185 $2i7,613,333 8,098,522 $300,000 $48,0CO,OOO 45 Existing $2,409,614 $67,469,203 4,346,0S1 $11 ,000 $22,0C6,672 28
ADDffiONAL OR RETROm COSTS
Existing $3,CX)1,667 $18,010,000 3,636,990 $120,000 $9,500,000 6
BOND fSSUES
All Facilities $13,888,889 $125,000,000 28,762,669 $200,000 $90,000,000 9
Planned $18,983,333 $113,900,000 34;987,965 $200,000 $90,000,000 6 Existing $3,700,000 $11,100,000 3,897,435 $400;000 $8,000,000 3
RATIO OF ADTL"STED CAPITAL COSTS: DESIGN CAPACin' (TONS PER DAY)
All Facilities $33,223 29,716 $1,100 $200,000 73
Planned $37,4i7 31,920 $6,000 $200,000 45 Existing $26,387 24,814 $1,100 $79,981 28
• No information was available form 19 planned and 12 existing MRFs with regard to original capital costs. Only minimal information was available on retrofit costs and the size of bond issues and these data have been presented for illustrative purposes only.
wTe CORPORATION E-46

:11: -t CD 0 0 :D "V 0 :D � :::1 0 z
m • ""' ......
NAME
O�rat i onal - Low Tech Phoen i x San Mateo County ( B f l - Recyc l ery) East Bay D i sposal (Durham Rd. ) Waste Management of Santa C l ara Empi re Waste Management Garden C i ty D i sposal Heyer Brothers Scavenger Service Waste Management .of McHenry County Buf f a l o Grove/Wheel i ng D i sposal Waste Management ( B l a i ne ) Dakota County Ramsey County ( Super Cyc l e MRF ) At l ant i c County Somerset County Susquehanna County York County (Recyc l e An�r i ca ) York Waste D i sposal Seat t l e (Recyc l e �r i ca ) WMI Recyc l ing o f W i scons i n
operat i ona l - H i ah Tech Mar i n Recyc l i ng & R . R . Center Groton (SECRRRA) Camden County Monmouth County Recyc l i ng Corp. D i st r ibutors Recyc l ing Monmouth County West Paterson (WPAR ) New York C i ty ( East Harlem) Syracuse Westbury B r i stol (Otter Recyc l i ng ) Bucks County Satel l i te f ac i l i ty Ph i l adelph i a Transfer & Recyc l i ng Johnston MRF Sea t t l e ( Rabanco)
O�rat i onal - Other ' Eden Prai r i e (Reuter)
Temporarl Shutdown - Low Tech P i nel las County ( Bf l ) D i xon Recyc l ers HRF Nat i onal Temple Recyc l i ng Center
Temporarl Shutdown - H i gh Tech I s l i p (New Fac i l i ty)
DESI GN TPO
1 0 75 55 70 80
2 1 1 4
21 25 40 43 37
125 5
30 2
1 10 21
100 23 70 43
250 25 70 55
400 75 45 45 35
130 85
470
325 80 40
300
TABLE E-16. DETAILED COST DATA (386) - --
OR I G I NAL 1989 ADDEO o&H COST O&H COST CAP I TAL ADJUSTED CAP I TAL PER TON PER TON
COSTS . YEAR COST COST YEAR U/OEBT S YEAR NO DEBT S YEAR
1 1 000 89 1 1 000 49
375000 89 375000
1 00000 89 1 00000 55 89 250000 88 257083 27
23 450000 82 540326 60 89 230000 89 230000 46
1 000000 87 1 051401 4900000 90 1 30 40000 87 42056
1500000 89 1500000 150000 89 1 50000 500000 88 5 14167 30 89
9500000 86 290000 87 8 5
700000 86 7531 72 69 1500000 87 1 5 77102 21
900000 87 946261 120000 88 1 23400 23 89
1 100000 88 1 131 167 3600000 88 3702000 61 3500000 88 3599167
400000 88 4 1 1 333 3500000 88 3599167 67
120000 89 7 400000 89 400000
4 150000 89 4150000 2200000 90 29 6000000 88 61 70000
20000000 85 22006672
875000 83 980562 1 000000 89 7
1 700000 88 1 748167
8400000 89 8400000 27
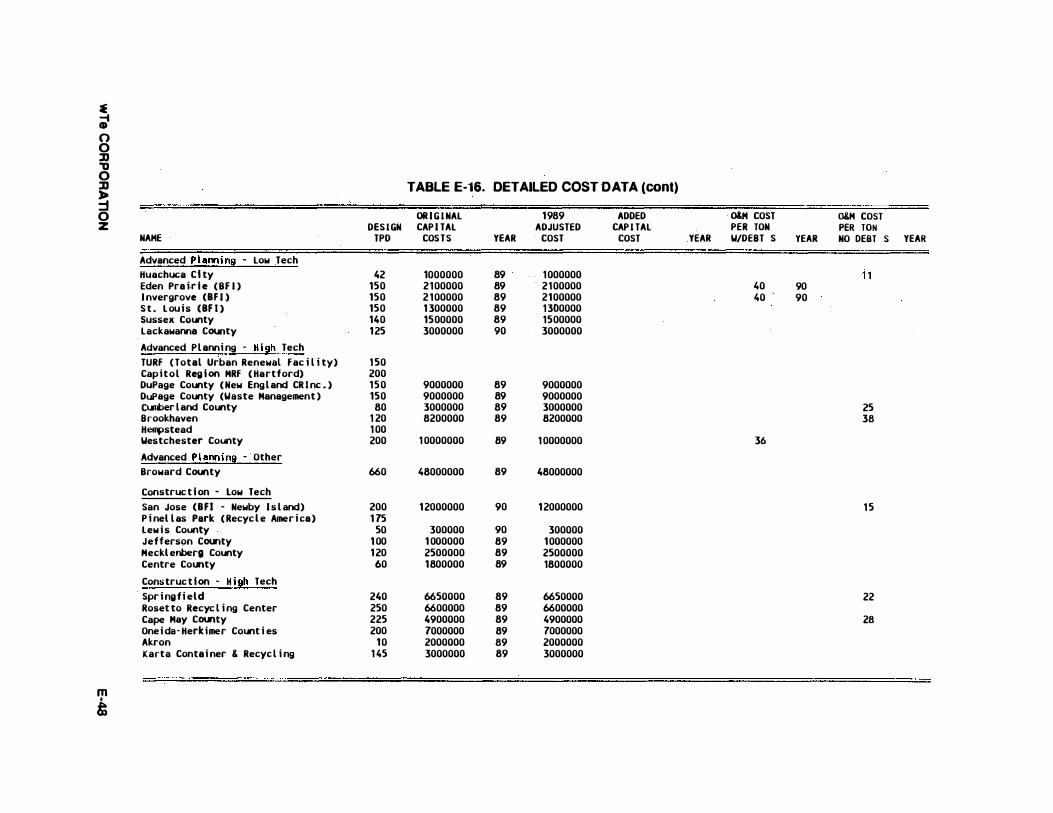
a: -i CD 0 0 ]] "0 0 ]] TABLE E-16. DETAILED COST DATA (cont) ,. :j 0 OR I G I NAl 1989 ADDED o&M COST o&H COST z DES I GN CAP I TAl ADJUSTED CAP I TAl PER TON PER TON
NAME TPD COSTS YEAR COST COST YEAR W/DEBT S YEAR NO DEBT S YEAR
Advanced P l ann i n� - low Tech Huachuca C l ty 42 1000000 89 1000000 1 1 Eden Pra i r i e ( Bf l ) 150 2100000 89 . 2100000 40 90 l nvergrove (Bf I ) 150 2 100000 89 2100000 40 90 S t . L ou i s (Bf l ) 150 1 300000 89 1300000 sussex County 140 1500000 89 1500000 lackawanna County 1 25 3000000 90 3000000
Advanced P l anni ng - H i�h Tech TURF ( Total Urban Renewal Fac i l i ty) 1 50 Cap i t o l Reg i on MRF ( Hartford) 200 DuPage County ( New Eng l and CR i nc . ) 150 9000000 89 9000000 DuPage County (Waste Management ) 150 9000000 89 9000000 Cumber land County 80 3000000 89 3000000 25 Brookhaven 1 20 8200000 89 8200000 38 H�stead 1 00 Westchester County 200 1 0000000 89 1 0000000 36
Advanced P l anni n� - Other Broward County 660 48000000 89 48000000
Construc t i on - low Tech San Jose (Bfl - Newby I s l and) 200 1 2000000 90 1 2000000 1 5 P i nel l as Park ( Recyc l e Amer i ca) 1 75 Lew i s County 50 300000 90 300000 Jefferson County 1 00 1 000000 89 1 000000 Meckl enberg County 1 20 2500000 89 2500000 Centre County 60 1800000 89 1800000
Construc t i on - H i �h Tech Spr i ng f i eld 240 6650000 89 6650000 22 Roset to Recyc l i ng Center 250 6600000 89 6600000 Cape May County 225 4900000 89 4900000 28 Onei da- Herkimer Count i es 200 7000000 89 7000000 Akron 1 0 2000000 89 2000000 Karta Contai ner & Recyc l i ng 1 45 3000000 89 3000000
m I
&

� CD 0 TABLE E-16. DETAILED COST DATA (cont) � "U OR I G INAl 1989 ADDED o&M COST o&M COST 0 lJ DES I GN CAP I TAL ADJUSTED CAPI TAL PER TON PER TON )o NAME TPD COSTS YEAR COST COST YEAR IUDEBT S YEAR NO DEBT S YEAR :j 0 Conce�tual P l annin� ·
z C i ty of Los Angeles ( 1 ) 1 00 C i ty of Los Angel es ( 2 ) 100 C i ty of Los Angeles ( 3 ) 1 00 C i ty of Los Angel es (4) 1 00 C i ty of Los Angel es ( 5 ) 1 00 L .A . County Sani tat i on D i s t r i cts 600 9000000 91 9000000 1 1 Ventura Region San i tat i on D i st r i c t 500 30000000 91 30000000 Housatoni c Res . Recovery Author i ty 180 MRF/Transfer Stat i on/Compos t i ng 385 7500000 93 7500000 Montgomery County ( Shady Grove Rd. ) 250 nooooo 89 nooooo Pr i nce George ' s Co . , Mun i c ipa l i t i es 20 800000 89 800000 30 89 1 5 89 Southwest Sol id �aste Mgt . D i s t r i ct 80 Ocean County 225 6000000 89 6000000 Mercer County 1 80 llarren County 80 1 000000 91 1 000000 llest F i nger Lakes 75 4000000 88 4 1 1 3333 Cort l and County 50 Oswego County 1 00 Ontar i o County 20 1 000000 90 1 000000 Monroe County 280 1 0000000 91 1 0000000 Berks County 150 4500000 89 4500000 Monroe County 80 Quonset Point 160 8000000 89 8000000 Pulaski County 140 2000000 91 2000000
Conce�tual P l annin� - Low Tech P r i nce George ' s County 200 Hennepi n County 200 3600000 89 3600000 19 Orange County 65 4500000 90 4500000 Madi son County 65 1 000000 90 1 000000 3 1 K i ng o f Pruss i a 1 70 2000000 90 2000000 Knoxv i l l e 90 1 200000 90 1 200000 P i erce County 70 1 750000 91 1 750000
Conce�tua l P l ann i n� · H i �h Tech Greater B r i dgeport Reg i on 275 Palm Beach County (North) 250 7000000 89 7000000 SEMASS (MR F ) 100 5000000 91 5000000 Oakland County 200 1 1 000000 90 1 1 000000 G l oucester County 1 50 Outchess _ County 75 6000000 90 6000000
m New York C i ty ( Staten I s l and) 200 •
t

TABLE E-1 7. ADJUSTED CAPITAL COSTS BY DESIGN CAPACITY (386)
Adjusted D esign Ca:Qacitv (Tons Per Dav) Cap ital Costs All (1989 Dollars) 1 to 99 100 to 199 Over 200 Facilities
Less Than 54.5%� 1 0 .5% 9.5% 30. 1 % $1,000,000 (22)
$1,000,001 to 39.4 68.4 1 4.3 39.7 $5,000,000 (29)
More Than 6. 1 21 . 1 76.2 30. 1 $5,000,000 (22)
Total Percent 1 00.0 1 00.0 . 100 .0 100.0 (Total Number��) . (33) (19) (21 ) (73)
� Percentage of column .
�� No information was available from 31 MRFs with regard to adjusted capital costs.
TABLE E-1 8. ADJUSTED CAPITAL COSTS BY DEGREE OF MECHANIZATION (386)
Adjusted De�ee of Mechanization Cap ital Costs All (1989 Dollars) Low High"' · Facilities
Less Than 46.7%�· 1 6.7% 31 .7% $1,000,000 ( 19)
StOOO ,001 to 50.0 36.7 43.3 $5,000,000 (26)
More Than 3.3 46.7 25.0 $5,000,000 ( 15)
Total Percent 100.0 100. 0 1 00 .0 (Total Number••�) (30) (30) (60)
� Includes Reuter projects.
•• Percentage of column.
"'"'"' No information was available from 44 MRFs with regard to adjusted capital costs or degree of mechanization.
wTe CORPORATION E-50

TABLE E·19. OPERATING COSTS (386)
Standard S ample Mean Deviation Minimum Maximum N·
ANNUAL O&M COSTS GNCUJDING DEBT SERVICING) All Facilities• $1,261 ,625 1,458,152 $54,000 $5,000,000 1 0
Planned $2,017,600 1,787,587 $168,000 $5,000,000 5 Existing $505,650 399,690 $54,000 $858,000 :J
• No information was available from 59 planned and 35 existing i\fR.Fs with regard to O&M costs (including debt servicing).
ANNUAL O&M COSTS (EXCLUDING DEBT SERVICING)
All Facilities•• $774,800 765,246 $33,400
Planned $904,333 585,311 $84,000 Existing $691,529 872,416 $33,400
$3,000,000
$1,900,000 $3,000,000
23
9 1 4
*• N o information was available from 55 planned and 26 existing i\fR.Fs with regard to O&M costs (excluding debt servicing).
O&M COSTS PER TON PROCESSED (INCLUDWG DEBT SERVICING)
All Facilities $36.51 16.95 $8.15 $66.66 1 0
Planned $35.45 4.72 $30.00 $40.00 :J Existing $37.56 24.92 $8.15 $66.66 5
O&M COSTS PER TON PROCESSED (EXCLUDING DEBT SERVICING)
All Facilities $32.29 27.69 $5.43 $130.43 . 23
Planned $20.61 · 8.90 $11 .07 $38.46 9 Existing $39.80 33.06 $5.43 $130.43 14
RESIDUE DISPOSAL COSTS COOLLARS PER TON)
All Facilities $52.49 22.91 $11 .00 $114.50 39
Planned $50.50 21.73 $12.00 $75.00 1 4 Existing $53.60 23.91 $11.00 $114.50 25
*•• No information was available from 50 planned and 15 existing MRFs with regard to residue disposal fees.
wTe CORPORATION E·51

E.3.2 Collection Costs
Collection costs are difficult to generalize due to several location-specific factors that affect collection
productivity, including equipment capacities, distance between stops, set-out practices, waste quantities
(pounds and containers per stop) , distance to the MRF, worker productivity, climate, topography, and
traffic. Also, the dorumentation and reporting practices of public and private sector hauling operations
are inconsistent. As a result, little comparative information is available.
By way of illustration, however, Table E-20 summarizes the projected comparative collection costs (as of
1 990) for various program alternatives in a New York State suburban setting (i.e., lower Hudson Valley)
(786) . This analysis highlights the comparative collection costs of intensive and commingled source
separation scenarios . based on expected participation and separation efficiency rates for each
alternative. In this specific case, the operating cost per ton (including debt service) of a MRF to process
commingled recyclables compatible with collection alternative number four was estimated to be $68 per
ton. Therefore, the total program cost for the commingled curbside program of $1 1 3 per ton was only
slightly higher than collection costs alone for a comparable intensive curbside program of $99 per ton
(excluding processing).
Intuitively, collection costs for the curbside collection of recyclables are higher than for conventional
curbside waste collection. Most collection costs are a function of units served or, to a much lesser
extent, tons collected. The aforementioned curbside services require a dedicated vehicle of s�ial
design, and each truckload processes less tons per unit of time, due to the density of materials and
typically the inability to use compaction equipment. Consequently, dedicated collection effectively
doubles variable collection costs per stop (e.g., per single family household) . Due to the lower tons per
vehicle, operating and capital costs per ton increase as well, the amount depending on the density of
materials collected, the relative utilization of each vehicle compartment, and the distance from the route
to the MRF.
wTe CORPORATION E-52
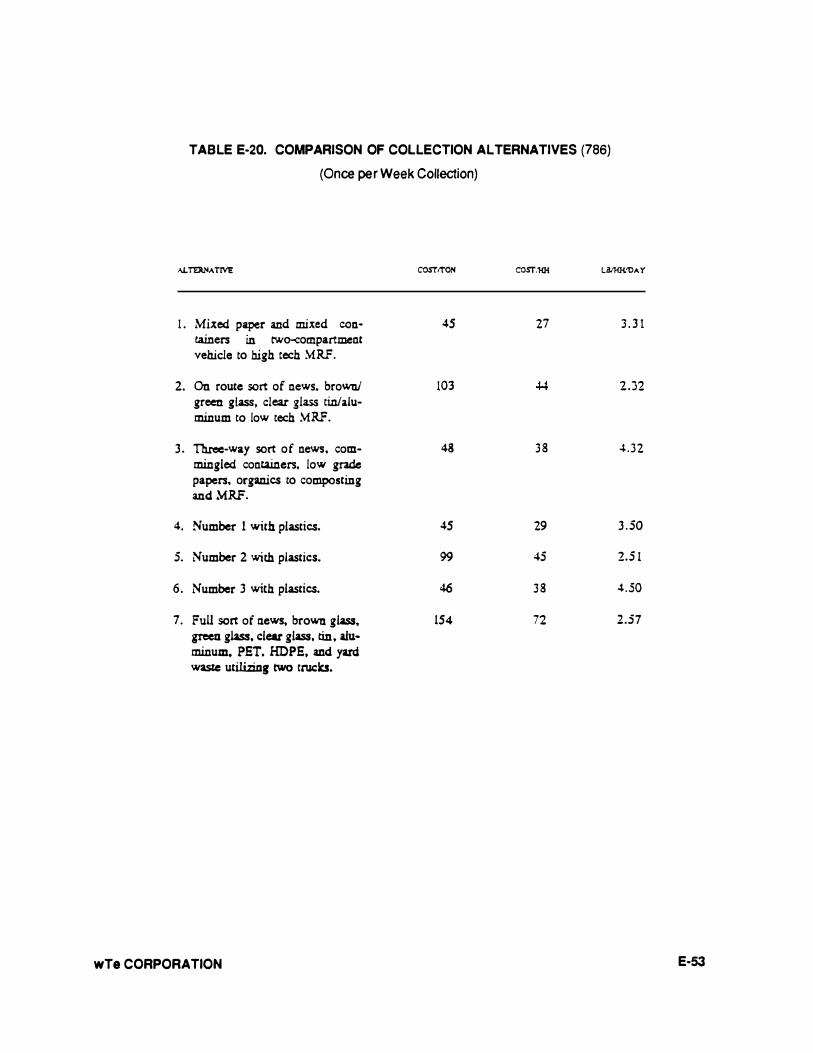
TABLE E-20. COMPARISON OF COLLECTION ALTERNATIVES (786) (Once per Week Collection)
AL�AT!VE COST/TON COST.'Hfl Li!IHH!OAY
! . Mixed paper and mixed con- 45 27 3 . 3 1 tainers in tw�ompartment vehicle to high tech �RF.
2. On route sort of news. brown/ 103 ., � ., - · .) -green glass, clear glass tinlalu-minum to low tech �RF.
3 . Three-way sort of news, com- 48 3 8 4.32 mingled containers, low grade papers, organics to composting and MRF.
4. Number 1 with plastics. 45 29 3 .50
5. Number 2 with plastics. 99 45 2.5 1
6. Number 3 with plastics. 46 3 8 4.50
7. Full sort of news, brown glass, !54 72 2.57 green glass, clear glass, tin, alu-minum, PET. HOPE, and yard waste utilizing two trucks.
wTe CORPORATION E-53
E.4 POTENTIAL ENVIRONMENTAL IMPACTS
Compared to other solid waste management aHernatives, recycling, including only the collection and
sortation of recyclables, is accepted by many as environmentally benign. There is, however, very limited
technical data to support this hypothesis or the environmental impacts that may be associated with
separating recylables directly from MSW or from the reform.Jiation of recyclables into new products. For
this reason, the U.S. EPA's Environmental Criteria Assessment Office has been studying the potential
hazards that may be associated with municipal solid waste recycling (905). ResuHs are expected to be
available in mid-1992. Also, the Solid Waste Association of North America, at the request of the U.S.
EPA as part of its MITE program, is also planning an evaluation of facilities which process (for the
purpose of recycling) materials from MSW. Environmental, process design, and cost data will be
evaluated for selected operating MRFs. ResuHs are expected to be available in 1 993 (906).
Groundwater resources are largely unaffected by recycling. MRFs for curbside separation programs
typically are constructed on a concrete pad that prevents seepage of any waste pollutants into the soils.
Moreover, these facilities typically handle pre-cleaned, dry, and solid components of the waste stream.
Facilities are usually new and therefore subject to state-of-the-art design and regulatory scrutiny with
respect to surface drainage and run-off. Potential groundwater impacts of mixed-waste MRFs would be
similar to the fuel preparation module of an RDF facility or front-end processing of a mixed waste
composting plant.
Atmospheric emissions from recycling programs are from two sources: collection operations and
processing facilities. Curbside recycling programs that employ dedicated vehicles increase vehicular
emissions to the atmosphere on a unit basis. Emission data on specially-designed recycling vehicles
was not identified in the literature search. Atmospheric emissions data from MRFs processing
commingled recyclables also is largely unavailable, except for limited data on a low technology facility in
Groton, Connecticut (787) , demonstrating low levels of particulate, VOC, and metals emissions.
Dust emissions likewise are minimal on route and in each MRF for curbside sorted materials.
Operations usually are conducted indoors where ventilation and localized dust surpression measures are
taken as required. Mixed waste MRFs experience greater opportunity for dust, but more sophisticated
ventilation and collecting devices are typically used, such as cyclones and fabric fitters.
Potential noise impacts are from two sources: collection vehicles and machinery. Collection vehicles are
equipped with conventional noise abatement devices. Machinery noise is surpressed by restriction of
operations to the interior of buildings.
wTe CORPORATION E·54

Potential vector impacts are minimal in front-end processing systems in general due to the enclosure of
processing operations, ventilation, and pest control. MRFs for curbside source separation programs also
process a cleaner fraction of the waste, which often is pre-washed by the waste generator of food and
other organic residues. The putrescible waste content of the commingled source-separated recyclable
stream entering a MRF can be virtually eliminated with a carefully-controlled collection program.
Odor emissions are controlled with similar design features for vehicles and machinery as are used to
control noise and dust. In addition, in mixed waste processing systems such as front-end systems, the
tipping floor areas can be designed to maintain a slightly negative pressure to control odors. Again, due
to the minimal putrescible waste content of commingled or source-separated recyclables entering a
MRF, odor is typically not a problem.
E.S ENERGY PRODUCTION REQUIREMENTS
Mixed waste processing facilities have energy requirements comparable to ROF fuel preparation plants,
but MRFs servicing curbside source separation programs require conceptually less energy to operate.
No information on energy requirements is readily available in the public literature.
One appeal of materials recycling is the reported energy savings available in reprocessing of recycled
materials and the avoidance of processing virgin raw materials (295, 723, 774, 271 ) . Table E-21
illustrates energy savings claimed (788, 271 ) for the substitution of recycled feedstock for virgin material
in basic manufacturing processes.
TABLE E·21 . ENVIRONMENTAL BENEFITS DERIVED FROM SUBSTITUTING
RECYCLED MATERIALS FOR VIRGIN RESOURCES
(modified from 271 )
(percentages)
Environmental Benefit Aluminum Steel Paper
Reduction of Energy Use 90-97 47-74 23-74
Reduction of Air Poilution 95 85 . 74
Reduction of Water Pollution 97 76 35
Reduction of Mining Wastes 97
Reduction of Water Use ..w 58
wTe CORPORATION
Glass
+---. .J-
:o
80
50
E-55

E.G INTEGRATION WITH OTHER TECHNOLOGIES
Materials recycling plays an integral role in the overall management of municipal solid wastes:
o Compostjng: Requires materials separation to remove impurities, reduce odor, and remove inorganics.
o Landfjlling: Landfilling benefits from recycling in the sense that the landfill life is
extended when materials are diverted. A MRF can be located at the landfill, reducing
residue disposal time and costs.
o MSW Combustion: Removal of low Btu materials such as metals and glass improves
the fuel quality, whereas removal of high Btu materials such as paper and pla�tic will
reduce the fuel yield. The higher heating value (HHV) of the fuel will be affected.
A study was conducted on the effects of recycling on Massachusetts' solid waste combustion capacity
projected to the year 2000 (792) . This study considered: 1 ) the cumulative effects of Massachusetts'
goals of 1 0 percent source reduction and 46 percent recycling by the year 2000; 2) a predicted change in
the percentage of plastics in the waste stream from 7.3 percent in 1 990 to 9.2 percent in 2000; and, 3 )
the diversion to landfill _ of non-combustible materials such as white goods, street sweepings, and
unrecycled metals and glass. The net result of these three factors is an estimated increase in the HHV
from 4,754 Btu per pound (without recycling) to 5,884 Btu per pound, a 24 percent increase.
Specifically, this increase can be attributed to the removal of low Btu yard waste, metals and glass, and
non-recyclable, non-combustibles; and an expected increase in the percentage of plastics in MSW in the
year 2000. Removal of high Btu paper and plastic in accordance with the recycling goals is expected to
have a much smaller affect on the HHV than that due to the removal of the low Btu materials.
Most of the combustion facilities in Massachusetts are limited on a heat input basis, and therefore the
quantity of fuel that can be burned is a function of its Btu content. Ariy increase in the energy content of
the fuel must be accompanied by a corresponding decrease in the feed rate. The Massachusetts study
estimated that for every Btu per pound added to the HHV, the processing capability decreases by
approximately 640 tons per year. Thus, Massachusetts will need to provide an additional disposal
capacity of 723,000 tons per year to meet the expected disposal requirements in the year 2000 if the
recycling goals are achieved.
wTe CORPORATION E·56

E.7 RESEARCH NEEDS
A relatively emerging technology and immature industry segment, materials recovery requires
substantially more research to assess per1ormance and develop improved applications. Primary areas
of focus are likely to include:
o Collection, classification, and analysis of design features, capital costs, operating costs,
and operating parameters of facilities. The focus should be on system costs, including
collection and processing
0
0
0
0
0
New materials processing techniques, especially for glass
New glass collection techniques
New uses and applications for recovered materials of all quality specifications, especially
low quality specifications
Environmental impact per1ormance of recycling systems, including collection and
processing ·
Life cycle costing analysis of recycling versus virgin material use in basic products
wTe CORPORATION E·57

APPEND IX E . MATERIAL RECOVERY/MATERIAL RECYCLING TECHNO LOG I ES REFERENC E S
1 4 8 G l enn , J . , " 1 9 9 0 B i oCyc l e S urvey : Fas t Pace fo r MR F D eve l opment , " B i oCyc l e , May 1 9 9 0 , p . 2 6 .
1 6 4 Egos i , N . G . and E . J . Rome o , " Me e t ing H i gh Exp e c ta t i ons Through MRF Des i gn , " S o l id Was te & Power , June 1 9 9 1 , p . 48 .
1 8 1 S avage , G . M . and L . F . D iaz , " Proc e s s ing o f S o l i d Was t e fo r Ma t e r i a l Recovery , " Proceedings o f ASME Nati onal Was te Proc e s s ing Conferenc e , Long Be ach , CA , J une 1 9 9 0 , pp . 4 1 7 - 4 2 6 .
1 8 5 Pro s s e r , H . J . , " Waste Recyc l ing in the 1 9 9 0 ' s , " I ns t i tute o f Was te Management S eminar on Manag ing Was tes in the 1 9 9 0 ' s , Brentwo o d , UK . Warren S p r ing Lab No . W9 1 00 7 , Feb ruary 1 9 9 1 .
2 5 8 McGrath , S . , " Comming l e d vs S eparation Pro gram Des i gn C r i t e r i a , " Proce edings o f S ix th Internat i onal Conference on S o l i d Was te Management and S e c ondary Mater i a l s , Phi l ade lphia , PA , Dec emb e r 1 9 9 0 .
2 6 4 G rove , C . , "Key Fac tors i n the Curb s ide Pro gram , " S e c t i on I V - P l ann ing the Pro gram . The B i oCyc l e Guide to Collec ting , Pro c e s s ing and Marke t ing Re cyc lab l e s , The JG Pres s , Inc . , Emmaus , PA , 1 9 9 0 .
2 6 5 Bul lock , D . and D . Burk , " Commingled Ve rsus Curb s ide S o r t , " S e c t i on IV P lanning the Program . The B ioCyc le Guide to C o l l e c t ing , Pro c e s s ing and Marke t ing Recyc lab l e s , The JG Pre s s , Inc . , Emmaus , PA , 1 9 9 0 .
2 7 1 Rob inson , W . D . , ed . , The S o l i d Was te Handbook , A Prac t i c a l Guide , J ohn W i l ey & S ons , I nc . , 1 9 8 6 .
2 9 1 U . S . Envi ronmental Protect ion Agency , Recyc l ing Works ! S tate and Lo c a l S o lut i ons to S o l id Was te Management Probl ems . EPA/5 3 0 - SW - 8 9 - 0 14 , J anuary 1 9 8 9 .
2 9 5 U . S . Environmental P r o t e c t ion Agency , The S o l id Was t e D i l emma : An Agenda for Ac t i on , EPA/5 3 0 - SW - 8 9 - 0 1 9 , Feb ruary 1 9 8 9 .
3 0 1 U . S . Environmental Pro t e c t ion Agency , Munic ipal Was te Combus t ion S tudy , Re cyc l ing o f S o l i d Was te , EPA/ 5 3 0 - SW - 8 7 - 021 i , June 1 9 8 7 .
3 1 6 S avage , G . M . , "Des i gn o f Materials Recovery Fac i l i t i e s (MR.Fs ) , " Pro c . , F i rs t U . S . Confe renc e on Muni c ipal S o l id Was te Management : S o lut ions for the 9 0 s , Vo l I . Washington , DC , U . S . EPA Office of S o l i d Was t e , J une 1 9 9 0 .
3 2 5 Marks , A . and M . Go ld , " Rhode I s l and Tackle s Curb s i de Recyc l ing , " Was te A l t e rnatives/Recyc l ing , pub l i shed by Nat i onal S o l i d Was t e s Management As s o c iat ion , June 1 9 8 8 , pp . 34 - 3 8 .
\vTe CORPORAT I ON E - 5 8

3 2 7 S now , D . , " Trends in C o l le c ting Recyc lab l e s , " Was te A l t e rnative s/Was te Reduc t i on and Recyc l ing , pub l i s hed by the Nat i onal S o l i d Was tes �anagement As s oc i ation , June 1 9 8 9 , pp . 5 8 - 6 5 .
3 3 2 Mar c e l l ino , M . , "MRF Automation Making S tride s into High - Tech , " Recyc l ing Today , July 1 9 8 9 , p . 3 8 .
3 34 " S ingle - Conta iner Sys tem Advantage s , " Was te Age , Ap r i l 1 9 8 9 , p-p . 1 2 9 - 1 3 2 .
3 3 6 B e rnhe i s e l , J . F . , " An Introduc t i o n to - Materials and Marke ts , " Was te Age , Ap r i l 1 9 8 8 , pp . 1 0 9 - 1 1 8 .
3 3 9 Gut tentag , R . and H . G . Arno ld , "What i s a MRF? " Was te Al terna t ive s/Was te Re duc t i on and Recyc l ing , pub l ished by the Nat i onal S o l i d Was t e s Management As s o c iat ion , June 1 9 8 9 , pp . 3 7 - 46 .
3 8 6 B e renyi , E . and R . Gould , 1 9 9 0 - 9 1 Materials Rec overy and Recycl ing Yearb o o k , D i rec tory & Guide . G overnmental Adv i s o ry As s o c iate s , Inc . , New Yo rk , NY , 1 9 9 0 .
5 4 7 Rankin , S . , " Recyc l ing P l a s t i c s i n Mun i c ipal S o l i d Was tes I : Myths and Real i t ie s , " J . Res ourc:e Management and Techno l o gy , Oc tob e r 1 9 8 9 , pp . 1 4 3 - 14 8 .
6 6 9 Powe l l , J . , " Keep ing i t S ep arate o r Comming l ing I t : The Lat e s t Numb ers , " Res ource Recyc l ing , March 1 9 9 1 , 3 p .
7 2 3 O f f i c e o f Techno logy As s e s sment , Congre s s o f the U . S . , " Fac ing Ame rica ' s Tras h : Wha t Next for Municipal S o l i d Was te ? , " Washing ton , D C , 1 9 8 8 .
7 6 4 D e shaye , J oyce , " S tudy Provide s Ins i ghts Into Recyc l ing , " Res ource Recyc l ing , Ap r i l 1 9 9 0 , 4 p .
7 6 5 Rhode I s land S o l id Was te Management Corp o rat ion , Reque s t fo r Propo sals for a Mat e r ials Recyc l ing Fac i l i ty to b e Located at Quons e t Po int/ D avisvi l l e Indus trial Park , No r th Kings town , Rhode I s land , 20 Oct 1 9 8 9 .
l
7 6 6 G a s ton County , NC , Reque s t For Prop o s als to Deve lop a Ma t e r i a l s Re covery Fac i l i ty To S e·rve Gas ton County , No r th Caro l ina , 2 2 S e p 1 9 8 9 .
7 6 7 Monmouth County , NJ , Reque s t for Prop o sals fo r a S o l i d Was te D i sp o sal and Res ourc e Rec overy Fac i l i ty , Monmouth County , New J e rsey , p r epared by HDR Engine e r ing , Inc . , J uly 1 9 8 9 .
7 6 9 Culvine r , P . , " McMRFs : Mob i l e Recycl ing , " Was te Age , May 1 9 9 1 , 3 p .
7 7 0 D e l aware S o l i d Was t e Autho r i ty , Reque s t for Prop o s al : Es tab l i shment , Op e ration , and Maintenanc e o f S ta tewide Recyc l in g Centers , S e ptemb er 1 9 9 0 .
·,.;T e CORPORATION E - 5 9

7 7 2 Keep Ame r i c a Beau t i ful , Inc . , Overview : S o l id Was te D i s p o s al Alternative s , Ap r i l 1 9 8 9 .
7 7 3 Che rtow , M . , Garbage So luti ons , A Pub l i c Offic ial ' s Guide to Recyc l ing and Alte rnat ive S o l i d Was te Management Techno l ogies , Uni t e d S ta t e s Co nference o f Mayors , Washington DC , 1 9 8 9 .
7 7 4 Frankl in As s o c iates , Charac teriz ation o f Municipal S o l i d Was te in the Uni t e d S tate s : 1 9 9 0 Up date , U . S . Envi ronmental Protection Agency EPA/5 3 0 - SW - 9 0 - 04 2 , Wash ington , DC , June 1 9 9 0 .
7 7 6 Nati onal S o l i d Was te s Management As s o c i ation , Recyc l ing in the S ta t e s , M i d - Year Update 1 9 9 0 , Washington , DC , 1 9 9 0 .
7 7 7 P o r t e r , J . W . , Mun i c ipal S o l id Was t e Recyc l ing : The B i g P i c ture , U . S . Conference o f Mayo rs Recyc l ing Conferenc e , 2 9 March 1 9 9 0 .
7 7 8 G l enn , J . and D . Riggle , "Where Does the Was te Go ? " B i oCyc l e , Ap r i l 1 9 8 9 , 6 p .
7 7 9 " New Age Drop - o ff Pro grams , " The BioCyc le Guide t o C o l l e c t ing , P r o c e s s ing and Marke t ing Recyc lab les , The JG Pre s s , Inc . , Emmaus , PA , 1 9 90 .
7 8 0 Pers ona l Communicat ion with M . Bob inski , DPW D irec t or , Conc o rd , NH , 1 9 9 1 .
7 8 2 Fine l l i , A . , " S e c ondary Mate r i a l s Marke t s : A P r imer , " S o l i d Was t e & Powe r , Augus t 1 9 9 0 , 5 p .
7 8 3 S al imando , J . , " Rhode I s land ' s S tate - o f - the -Ar t P lant , " Was t e Age , S ep temb e r 1 9 8 9 , 4 p .
7 8 5 " MRFs Move Ahead , " Th e B ioCyc l e Guide t o Collect ing , Pro c e s s ing and Marke t ing Recyc l ab l e s , The JG Press , Inc . , Emmaus , PA , 1 9 9 0 .
7 8 8 Thurne r , C . and D . Ashley , " D eve l op ing Recycl ing Marke t s and I ndus t r i e s , " Nat i onal Conference o f S tate Legis latur e s , Wash ing ton , DC , July 1 9 9 0 .
7 9 2 Neal , D . , " Ef fe c t o f Recyc l ing o n S o l id Was te Combus tion Cap ac i ty in Mas s achus e t t s , " New Engl and Envi ronmental Expo , Bo s ton , MA , 2 1 May 1 9 9 1 .
9 0 4 D e l aware S o l id Was t e Autho r i ty , Annual Report 19 9 1 .
9 0 5 Pers onal C ommunic a t i o n B e tween David V . Bubenick o f wTe and E l e tha - Brady Rob e r t s o f the Environmental C r i t e r i a Asse ssment O ff i c e , U . S . EPA , C inc inna t i , OH , 2 0 March 1 9 9 2 .
·.vTe CORPORATI ON E - 6 0

9 0 6 S o l i d Was te As s o c iat i on o f No rth Amer ica , Reque s t for Propo s a l s to Provide Consult ing S e rvices to Ana lyze and Evaluate Ma t e r i a l s P r o c e s s ing Fac i l i t i e s fo r Recyc l ing Op erati ons , prepared fo r the U . S . E PA MITE Prog ram , 17 March 1 9 9 2 .
wTe CORPORATION E - 6 1

Document Control Page 1 . NREL Report No .
NRELtrP-43 1 -4988G
4. Titl e and Subtitle
2. NTIS Accession No.
DE92016433
Data Summary of Municipal Solid Waste Management Alternatives. Volume VII: Appendix £-Material Recovery/Material Recycling Technologies
7. Author(s) S RI International
9. Performing Organization Name and Address
SRI International 333 Ravenswood Ave. Menlo Park, CA 94025-3493
1 2. Sponsoring Organization Name and Address
National Renewable Energy Laboratory 1 6 1 7 Cole Blvd. Golden, CO 80401
1 5 . Supplementary Notes NREL Technical Monitor: Bimleshwar Gupta and Philip Shepherd (303) 23 1 -1760
1 6 . Abstract (Umit: 200 words)
3. Recipient's Accession No.
5. Publication Date October 1992
6.
8. Performing Organization Rept. No.
1 0. Project/Task/Work Unit No. WM2 1 . 1d10
1 1 . Contract (C) or Grant (G) No.
(C) RF- 1 - 1 1003
(G)
1 3. Type of Report & Period Covered Subcontract Report
1 4.
The overall objective of the study in this report was to gather data on waste management technologies to allow comparison of various alternatives for managing municipal solid waste (MSW). The specific objectives of the study were to:
1 . Compile detailed data for existing waste management technologies on costs, environmental releases, energy requirements and production, and coproducts such as recycled materials and compost. 2. Identify missing information necessary to make energy, economic, and environmental comparisons of various MSW management technologies, and define needed research that could enhance the usefulness of the technology. 3. Develop a data base that can be used to identify the technology that best meets specific criteria defined by a user of the data base.
Volume I contains the report text. Volume II contains supporting exhibits. Volumes III through X are appendices, each addressing a specific MSW management technology. Volumes XI and XII contain project bibliographies.
1 7. Document Analysis a. Descriptors
municipal waste; waste to energy; resource recovery; recycling
b . Identifiers/Open-Ended Terms
c. UC Categories 249
1 8. Availability Statement National Technical Information Service U.S . Department of Commerce 5285 Port Royal Road Springfield, VA 22161
O rm !'10. WO�Il� �0-,jU·I H)
1 9. No. of Pages
67
20. Price
A04