collection of solid waste - marmara
TRANSCRIPT
3/19/2018
1
Chapter 9&12
Separation and
Processing of Solid Waste
The methods now used to recover source-separated waste
materials include curb side collection and homeowner
delivery of separated materials to drop-off and buy-back
centers.
The further separation and processing of wastes that have
been source-separated, as well as the separation of the
commingled wastes, usually occur at materials recovery
facilities (MRFs) or at large integrated materials recovery/
transfer facilities (MR/TF).
Recovery of Materials in MSW

3/19/2018
2
Materials recovery and transfer
Drop-off
Buy-backCurbside collection
Drop-off and Buy-back
Drop-off programs require residents or businesses to
separate recyclable materials at source and bring them to a
specified drop-off or collection center.
Buy-back refers to a drop-off program that provides a
monetary incentive to participate. Residents are paid for their
recyclables either directly or indirectly through a reduction in
monthly collection and disposal fees.

3/19/2018
3
Drop-off and Buy-back
Materials recovery and transfer
Paper
Glass
Metals
Plastics
Yard waste
CITY
Electricity
and/or
Heating
Materials
Recovery
Facility
Materials Recycling
Waste to
Energy Facility
MSW
MANAGEMENT
Curbside
Collection
Drop-off/Buy-back Centers
3/19/2018
4
Example 9.1 Home separation and delivery to
drop-off centers
A community of 1200 homes cannot pay for the initial and
operating costs of the recycling collection vehicles that were to
be used.
Instead, residents are to haul recycling containers to a drop-off
center operated by the community.
Calculate the number of cars from which recyclable materials
must be unloaded per hour at the recycling drop-off center.
Assume the center is open for eight hours per day, two days
per week, and that 40% of the residents will deliver recycling
containers.
Also assume that 75% of the participants will take their
separated materials to the drop-off center once per week and
that the remaining 25% of the participants will bring their
separated materials to the drop-off center once every 2 weeks.
Example 9.1 Home separation and delivery to
drop-off centers
Solution
Determine the average number of trips per week.
Trips/wk = [1200 homes * 0.40 * 0.75 * 1 trip/home.wk] +
[1200 homes * 0.40 * 0.25 * 0.5 trip/home.wk]
= 420 trips/wk
Determine the average number of cars per hour.
Cars/hr = 420 cars/wk / (2 day/wk * 8 hr/day)
= 27 cars/hr
Comment
Clearly, a small drop-off center cannot accommodate 27
cars/hr (equivalent to one car unloading every 2.2 minutes).
Also, it is unlikely that the cars would arrive at a uniform rate.
The most viable solution is to increase the number of hours
per week that the drop-off center will be open.

3/19/2018
5
Integrated Materials Recovery/Transfer Facilities
(MR/TFs) may include the functions of;
drop-off center for separated wastes
materials separation facility
facility for the composting and bioconversion of wastes
facility for the production of refuse-derived fuel
transfer and transport facility
Materials recovery and transfer
Separation of materials in MSW
Waste separation at source is usually accomplished by
manual means.
MRFs and MR/ TFs are used for;
Further processing of source-separated wastes obtained
from curbside collection programs and drop-off, pay-back
centers w/o processing facilities.
Separation and recovery of reusable and recyclable
materials from commingled MSW
Improvements in the quality of recovered waste materials

3/19/2018
6
Direct reuse
Raw materials for remanufacturing and reprocessing
Feedstock for the production of biological and chemical
conversion products
Fuel source for production of energy
Land reclamation
Uses for recovered materials(Table 9-2, pp.250)
Unit operations for separation and
processing (Table 9.3, pp.256)
Size Reduction
Screening
Density separation (air classification)
Magnetic separation
Densification (compaction)

3/19/2018
7
Size reduction
Collected waste materials are mechanically reduced in size
using shredders, glass crushers, wood grinders, etc.
Hammer Mill
ShredderCrushers
Screening
It is used to separate mixtures of materials of different sizes
into two or more size fractions by means of one or more
screening surfaces e.g. vibrating screens, rotary screens, disc
screens, etc.
Rotary Screen Disc Screen Vibrating Screen

3/19/2018
8
It is used to separate light materials
such as paper & plastics from
heavier materials such as ferrous
metals, based on weight differences
of materials in air stream.
Density separation (Air classification)
Light
fraction
Heavy fraction
Ferrous metals are separated from other waste materials by
utilizing their magnetic properties
Magnetic Separation
Waste materials
Ferrous metals
Non-ferous
materials

3/19/2018
9
It increases the density of waste materials so that they can
be stored and transported more efficiently and as a means of
preparing densified refuse-derived fuels (dRDF) (balers, can
crushers, etc.)
Densification (Compaction)
Cardboard balerCompacted waste materials
Densified RDF
Table 9.3
Shear shreader

3/19/2018
10
Separation of source separated MSW(Figure 9.21,pp.278)
Separation of commingled MSW (Figure 9.28, pp.284)

3/19/2018
11
Separation of commingled MSW(Figure 9.29, pp.286)
Highly mechanized system
When the recyclables arrive at the
MRF, they are dumped onto the
“tipping floor”.
Then they are pushed onto a
conveyor belt.
The conveyor belt takes the
recyclables to the “sort line” where
the materials are sorted by hand
and by machines.
Single-stream recycling

3/19/2018
12
At first, the workers separate the
paper and cardboard from the
other materials. They throw them
into the chutes.
Then, they check to make sure that
no glass, plastic, aluminum or steel
is mixed in with the paper.
Single-stream recycling
The baler compacts the loose
paper into huge rectangular bales.
Bales keep their shape because
they are tied with baling wire.
Bales are stacked together until
there is enough to fill a truck trailer.
When there are enough bales, they
are loaded and transported to a
processor, where new paper is
produced out of recycled paper.
Single-stream recycling
3/19/2018
13
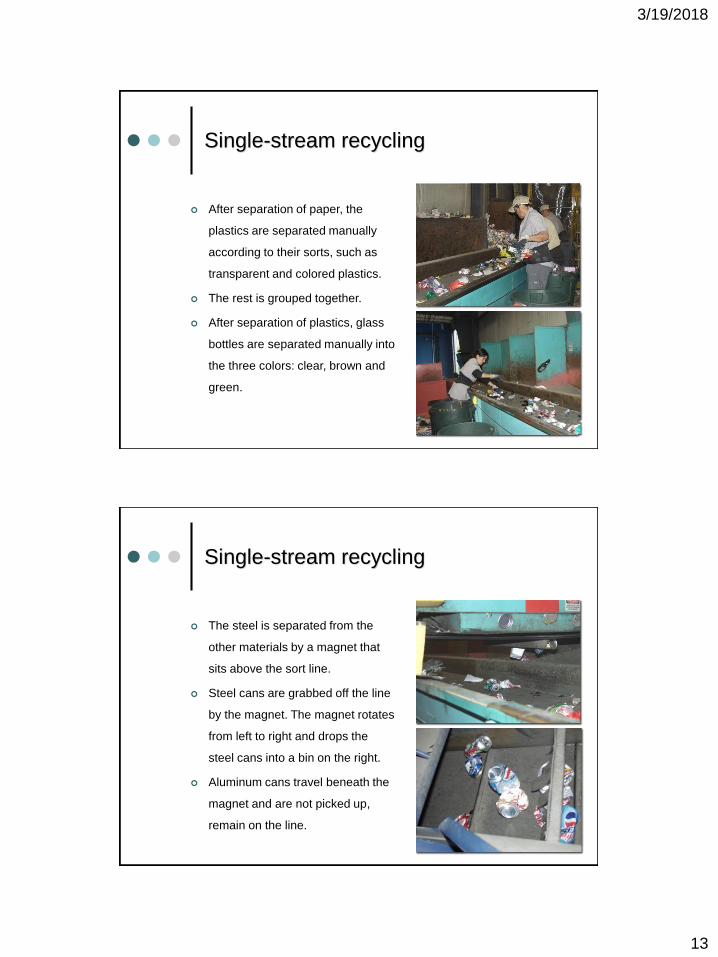
After separation of paper, the
plastics are separated manually
according to their sorts, such as
transparent and colored plastics.
The rest is grouped together.
After separation of plastics, glass
bottles are separated manually into
the three colors: clear, brown and
green.
Single-stream recycling
The steel is separated from the
other materials by a magnet that
sits above the sort line.
Steel cans are grabbed off the line
by the magnet. The magnet rotates
from left to right and drops the
steel cans into a bin on the right.
Aluminum cans travel beneath the
magnet and are not picked up,
remain on the line.
Single-stream recycling

3/19/2018
14
Bale of PETE plastic
Bale of steel cans
Bale of aluminum cans
Single-stream recycling
Video-1
https://www.youtube.com/watch?v=7
CFE5tD1CCI
Video-2
https://www.youtube.com/watch?v=J
da_9_30-WU
Waste transformation through
combustion
The most commonly used chemical transformation process is
combustion, which can be used to reduce the original volume of the
combustible fraction of MSW by 85 to 95%.
In addition, the recovery of energy in the form of heat is another
attractive feature of the combustion process.
Although combustion technology has advanced in the past two
decades, air pollution control is a major concern in implementation
Chapter 13 - Thermal Conversion Technologies

3/19/2018
15
Thermal conversion - Combustion
Combustion of MSW
Waste transformation through
anaerobic digestion/composting
With the exception of plastic, rubber and leather components,
the OFMSW is composed of proteins, lipids, carbohydrates,
cellulose, lignin and ash.
If these organic materials are subjected to anaerobic/aerobic
microbial decomposition, the end product is a humus material
known as compost.
When added to soil, compost lightens heavy soils, improve
texture of light soil and increase water retention capacity.
Chapter 14 - Biological Conversion Technologies

3/19/2018
16
Biological conversion - Composting
Biological conversion - Anaerobic Digestion

3/19/2018
17
Example 9.2 Determination of the stoichiometric
amount of air required for the combustion of an
organic solid waste.
Determine the amount of (kg and m3) of air required for the
complete combustion of one ton of an organic solid waste
Assume that the composition of the organic waste to be
combusted is given by C5H12. Assume the density of air is
1.2 kg / m3
Write a balanced stoichiometric equation for the oxidation of
the organic compound based on oxygen:
C5H12 + 8O2 → 5CO2 + 6H2O
Example 9-2 Determination of the stoichiometric
amount of air required for the combustion of an
organic solid waste.

3/19/2018
18
Example 9.2 Determination of the stoichiometric
amount of air required for the combustion of an
organic solid waste.
Example 9.3 Determination of volume reduction
and volume of residue after combustion.
Determine the quantity and
composition of the residue
from a combustor used for
MSWs with the average
composition given below.
Estimate the reduction in
waste volume if it is
assumed that the specific
weight of the residue is
600 kg/m3.
%
Inert
residue, %Component
Organic
Food wastes 9 5
Paper 34 6
Cardboard 6 5
Plastics 7 10
Textiles 2 6.5
Rubber 0.5 9.9
Leather 0.5 9.0
Yard wastes 18.5 4.5
Wood 2 1.5
Inorganic
Glass 8 98
Tin cans 6 98
Aluminum 0.5 96
Other metal 3 98
Dirt, ash, etc 3 68

3/19/2018
19
Example 9.3 Determination of volume reduction
and volume of residue after combustion.
Component
MSW,
kg
Moisture
content, %
Dry
weight, kg
Inert
Residue,
%
Inert
Residue,
kg
% distribution
in residue
Organic
Food wastes 90 70 27 5 1,4 0,6
Paper 340 6 319,6 6 19,2 8,6
Cardboard 60 5 57 5 2,9 1,3
Plastics 70 2 68,6 10 6,9 3,1
Textiles 20 10 18 6.5 1,2 0,5
Rubber 5 2 4,9 9.9 0,5 0,2
Leather 5 10 4,5 9.0 0,4 0,2
Yard wastes 185 60 74 4.5 3,3 1,5
Wood 20 20 16 1.5 0,2 0,1
Inorganic 0
Glass 80 2 78,4 98 76,8 34,7
Tin cans 60 3 58,2 98 57,0 25,7
Aluminum 5 2 4,9 96 4,7 2,1
Other metal 30 3 29,1 98 28,5 12,9
Dirt, ash, etc 30 8 27,6 68 18,8 8,5
Total 1000 221.7 100
Example 9.3 Determination of volume reduction
and volume of residue after combustion.

3/19/2018
20
Example 9.4 Estimate the change in the energy
content of MSW for various levels of recycling
Determine the energy
content of the typical
MSW given in Table 3-4
for the following levels of
recycling.
Also determine the
overall recycle
percentage, by weight,
represented by each
level of recycling.
Level of recycling, %
Component One Two Three
Organic
Food wastes 0 0 0
Paper 20 35 50
Cardboard 20 30 40
Plastics 20 30 40
Textiles 10 20 30
Rubber 10 20 30
Leather 10 20 30
Yard wastes 0 15 30
Wood 10 20 30
Inorganic
Glass 20 30 40
Tin cans 10 20 30
Aluminum 50 70 90
Other metal 10 20 30
Dirt, ash, etc 0 0 0
Example 9.4 Estimate the change in the energy
content of MSW for various levels of recycling
Solution:
Weight, kg (% by weight)Component No recycling Level 1 Level 2 Level 3Food wastes 9.0 (9.0) 9.0 (10.3) 9.0 (11.9) 9.0 (13.9)Paper 34.0 (34.0) 27.2 (31.1) 22.1 (29.1) 17.0 (26.3)Cardboard 6.0 (6.0) 4.8 (5.5) 4.2 (5.5) 3.6 (5.6)Plastics 7.0 (7.0) 5.6 (6.4) 4.9 (6.4) 4.2 (6.5)Textiles 2.0 (2.0) 1.8 (2.1) 1.6 (2.1) 1.4 (2.2)Rubber 0.5 (0.5) 0.5 (0.6) 0.4 (0.5) 0.4 (0.6)Leather 0.5 (0.5) 0.5 (0.6) 0.4 (0.5) 0.4 (0.6)Yard wastes 18.5 (18.5) 18.5 (21.1) 15.7 (20.7) 13.0 (20.1)Wood 2.0 (2.0) 1.8 (2.0) 1.6 (2.1) 1.4 (2.2)Glass 8.0 (8.0) 6.4 (7.3) 5.6 (7.4) 4.8 (7.4)Tin cans 6.0 (6.0) 5.4 (6.2) 4.8 (6.3) 4.2 (6.5)Aluminum 0.5 (0.5) 0.3 (0.3) 0.2 (0.3) 0.1 (0.2)Other metal 3.0 (3.0) 2.7 (3.1) 2.4 (3.2) 2.1 (3.3)Dirt,ash, etc. 3.0 (3.0) 3.0 (3.4) 3.0 (4.0) 3.0 (4.6)Total 100.0 (100.0) 87.5 (100.0) 75.9 (100.0) 64.6 (100.0)
Amount of wasterecyled, %
0.0 12.5 24.1 35.4

3/19/2018
21
Example 9.4 Estimate the change in the energy
content of MSW for various levels of recycling
Solution:
Total energy content, kJComponent Energy, kJ/kg No recycling Level 1 Level 2 Level 3Food wastes 4652 41868 41868 41868 41868Paper 16747 569398 455518 370109 284699Cardboard 16282 97692 78154 68384 58615Plastics 32564 227948 182358 159564 136769Textiles 17445 34890 31401 27912 24423Rubber 23260 11630 11630 9304 9304Leather 17445 8723 8723 6978 6978Yard wastes 6513 120491 120491 102254 84669Wood 18608 37216 33494 29773 26051Glass 140 1120 896 784 672Tin cans 698 4188 3769 3350 2932Aluminum 0 0 0 0 0Other metal 698 2094 1885 1675 1466Dirt,ash, etc. 6978 20934 20934 20934 20934Energy content, kJ/kg 11781.9 9911.2 8428.9 6993.8
kcal/kg 2816 2369 2015 1672
9 kg * 4652 kJ/kg = 41868 kJ 1178191 kJ / 100 kg = 11781.9 kJ/kg
(11781.9 kJ/kg ) / (4.184 kJ/kcal ) = 2816 kcal/kg