city research onlineopenaccess.city.ac.uk/14077/1/demenezeswoodandgelade2010jom.pdf · ... how do...
TRANSCRIPT
City, University of London Institutional Repository
Citation: de Menezes, L. M., Woods, S. A. and Gelade, G. (2010). The integration of human resource and operation management practices and its link with performance: A longitudinal latent class study. Journal of Operations Management, 28(6), pp. 411-418. doi: 10.1016/j.jom.2010.01.002
This is the accepted version of the paper.
This version of the publication may differ from the final published version.
Permanent repository link: http://openaccess.city.ac.uk/14077/
Link to published version: http://dx.doi.org/10.1016/j.jom.2010.01.002
Copyright and reuse: City Research Online aims to make research outputs of City, University of London available to a wider audience. Copyright and Moral Rights remain with the author(s) and/or copyright holders. URLs from City Research Online may be freely distributed and linked to.
City Research Online: http://openaccess.city.ac.uk/ [email protected]
City Research Online
The integration of human resource and operation management practices and
its link with performance: A longitudinal latent class study
Lilian M. de Menezes, Cass Business School, City University London
Stephen Wood, Institute of Work Psychology, University of Sheffield, Sheffield, UK
Garry Gelade, Cass Business School, City University London
January, 2010

2
Abstract
This paper reviews the literature on the association between lean production and performance.
From this, propositions on the integration and evolution of operation and human resource
management practices associated with the lean production concept are developed. Using 24
years of data on the use of seven core OM and HRM practices in British manufacturing firms,
the potential link between integration in the use of practices and productivity is tested. In each
year, three latent clusters are identified via ordered restricted latent class models; the cluster that
consistently makes a more integrated use of practices outperforms the others. Furthermore, the
longitudinal nature of the data permits modeling the growth curves of each practice in the
sample, recognizing any similarity in growth and investigating whether or not an early
integration in adoption of practices is associated with higher final productivity. The results show
that pioneers are more productive, thus suggesting that the head start in integrating core OM and
HRM practices associated with the lean production concept has paid off.
Keywords: operation and human resource management practices; lean production;
performance; latent classes, latent growth and multi-level models.

3
1. Introduction
Markets are increasingly more competitive and global, so quality standards and product or
service efficiency is crucial to the survival of any organization. In this context, the lean
production concept has been increasingly advocated beyond manufacturing (e.g. in services:
Abdi, Shavarini and Hoseini, 2006; Abernathy, Dunlop, Hammond, and Weil, 2000; Swank,
2003; in the public sector and healthcare: Kollberg, Dahlgaard and Brehmer, 2007). The spread
and interest that it has attracted are possibly due to claims of cost and waste reduction, superior
performance and competitive advantage that have been consistently made by academics and
practitioners alike (e.g. Chandler and McEvoy, 2000; Dennis, 2002; Hart and Schlesinger, 1991;
MacDuffie, 1995; Powell, 1995; Womack and Jones, 1994; Womack, Jones and Roos, 1990;
Wood, Stride, Wall and Clegg, 2004; Youndt, Snell, Dean and Lepak, 1996). Despite
controversies about the precise meaning of lean production (Li, Rao, Ragu-Nathan and Ragu-
Nathan, 2005; Shah and Ward, 2007), it has commonly been taken to involve techniques
concerned with production, work organization, quality management, logistics, supply chain,
customer satisfaction, efficient delivery and continuous improvement methods. In other words,
the adoption of lean production implies integration in the use of operation (OM) and human
resource management (HRM) practices.
The quality management literature, which can be traced back to 1949 when the Union of
Japanese Scientists and Engineers formed a committee to improve Japanese productivity
(Powell, 1995), also offers competing definitions for total quality management (TQM). Some
authors argue that it is a managerial philosophy (e.g. Martinez-Lorente, Dewhurst and Dale,
1998), whose principles imply an integration of operations and people management (Wickens,
1987). Yet Deming (2000) focused on an organizational system that promotes cooperation and
learning for facilitating process management, resulting in the constant improvement of
processes, products and services, as well as employee fulfillment and customer satisfaction. This
system, then, becomes critical to the survival of organizations (Anderson, Rungtusanatham and
4
Schroeder, 1994). Juran (1993) emphasized not only team and project work, participation and
recognition, but also highlighted the need to achieve the best return on investment. According to
him, the primary responsibility of management is to minimize the total cost of quality and to
decide when quality management efforts should be stopped. Deming also argued that the
improvement of the work process reduces cost because of less re-work, fewer mistakes or delays
and less waste in manpower and materials, but (in contrast to Juran) prescribed constant
improvements.
In this context, important questions for managers and scholars are: How do different
managerial practices impact on performance? Which practices have greater impact on
performance outcomes? Does the integration of operations management and human resource
management practices pay off? Are expectations of long-lasting gains fulfilled? For several
decades the link with performance has mainly been investigated by addressing the first two
questions. However, not only do results and measures vary within studies but the focus has
generally either been on individual practices or sets of practices that are presumed to result in
superior performance. For example, a common view is that HRM practices – for instance those
that empower or involve the employee – support specific OM practices; jointly they have a
higher, possibly nonlinear, effect on performance (Kufidu and Vouzas, 1998; Lawler, Mohrman
and Ledford, 1995; MacDuffie, 1995). Longitudinal studies remain rare and tend to rely either
on subjective assessments of practice implementation (Easton and Jarrel, 1998; Fullerton,
McWatters and Fawson, 2003) or on relatively short periods (e.g. Callen, Fader and Krinsky,
2000; Capelli and Neumark, 2001).
In this paper, we concentrate on the integration of HRM and OM practices and its
potential impact on performance, by reviewing the empirical literature and developing a set of
propositions, which we then test. In our analysis, we assume that there is a philosophy or culture
underlying the integration of OM and HRM practices, whose principles are not only concerned
with eliminating waste and adding value for customers but also entail the pursuit of continuous
5
improvements. The latter cannot be achieved without worker participation, such as quality at
source inspections that imply responsibility for checking one’s own work. Learning and
cooperation thus facilitates process management, and integration should continue to pay over
time; those organizations that adopt this managerial philosophy should outperform those that do
not.
We use secondary data of 448 British firms (Birdi, Clegg, Patterson, Robinson, Stride,
Wall and Wood, 2008) on seven management practices that are the most extensively employed
in British manufacturing (Wood et al., 2004), and company records for the period 1980–2003.
Of the seven management practices, the OM practices are total quality management (TQM),
just-in-time procedures (JIT), integrated computer-based technology (ICT, also known as
advanced manufacturing technology), and supply-chain partnering. The first three are central to
the lean manufacturing system and the last adds the customer–supplier relationships that are
necessary for the delivery of desired standards at a minimum cost. HRM practices included are
learning culture (or extensive training), empowerment and teamwork. The first two have
consistently been associated with quality management, as shown by the criteria of the 1992
Baldrige Award (George, 1992) and can be easily traced back to two of Deming’s 14 points
(Walton, 1986). Empowerment has been described as critical to successful JIT initiation and
implementation (Koufteros and Vonderembse, 1998), whereas teamwork is core both to high
involvement (Bailey, 1993; de Menezes and Wood, 2006) and quality managements (Wickens,
1987). Together, we would expect that these HRM practices will allow employees to enhance
their knowledge of the company, work more flexibly, and take more responsibility in quality
management and decision-making.
By focusing on the philosophy that underlies the co-existence (correlation in the use) of
different types of practices, we also address the measurement problem that has been identified in
the academic literature (e.g. Shah and Ward, 2007). This is done not in terms of what should be
included in the measure, but in terms of how it should be constructed. If the lean production
6
concept implies a managerial philosophy, culture or way of thinking, as advocated in the
literature (Womack and Jones, 1994), the co-existence of OM and HRM practices that are
traditionally associated with this concept should reflect this philosophy. Moreover, if this
philosophy is geared towards improving performance, the direct link between the philosophy
and performance should be investigated rather than the association between its elements and
performance. If practices co-exist, the longitudinal nature of our data also permits an assessment
of the overall evolution of practices and the association with performance. Our longitudinal
study thus investigates whether: (1) the integrated use of core OM and HRM lean practices is
associated with higher performance; (2) there are performance gains from being an early adopter
of such an integrated approach.
In the following sections, we review the empirical evidence on the link with performance
as well as the literature on the evolution of management practices, which set the background to
the propositions that are tested. We then describe the data, the methodology that we use and
report our results. Finally, we assess our contribution and conclude.
2. Background
Empirical studies of the link between a lean production philosophy and performance have
concentrated on assessing whether one or more of its elements are key, or whether combinations
of these lead to higher performance. In general, cross-sections were analyzed; definitions of
constructs as well as sample sizes vary considerably. Consequently, it is not only difficult to
compare studies, but, as observed by Shah and Ward (2003: 130), analyses of the performance
effects that focus on multiple components of lean production remain rare.
In the HRM literature, diverse sets of practices have been assumed to be part of a high
performance work system (Becker and Gehart, 1996; Huselid, 1995) and as such are linked with
performance. Fundamental practices like empowerment or work enrichment that we would
associate with the high involvement concept (Bailey, 1993) are often omitted in empirical

7
analyses. Results on the link with performance also reflect the diversity in measurement
constructs and dependent variables (Wall and Wood, 2005). The empirical evidence ranges from
positive association with all practices (Arthur, 1994), to lack of association and even a negative
correlation (Capelli and Neumark’s 2001 panel study showed no association, but one practice
was negatively related to both productivity and its change).
Overall, longitudinal studies are rare and the potential impact of integrating practices has
been generally neglected, though it is often argued that practices should be adopted in an
integrated fashion. We now review the empirical evidence from studies on quality management
and lean production, which justify our assessment of the current state of the literature and the
need for studies like ours.
2.1 The empirical evidence on the link between lean practices and performance
Initial reviews of the evidence reported a lack of association between practices and performance.
Powell (1995) offered several anecdotal examples where the costs of implementing a TQM
strategy outweighed its benefits. Reed, Lemak and Montgomery (1996) concluded that any
observed benefits were simply contingent on matching environmental conditions to firm
orientation. Samson and Terziovski (1999) argued that the lack of evidence was due to small
samples and measures that did not reflect the various dimensions of quality management. They
examined the relationship between TQM and quality, operational and business performance in
Australian and New Zealand manufacturing (n=1200), using multi-item measures that were
thoroughly constructed and validated. A positive link with performance was then observed, but
not all categories of TQM were strong predictors of performance. It appeared that gains from
quality management might be due to the interaction of practices, thus leading to subsequent
research where synergistic effects were found between distinct elements of lean (JIT, TQM,
HRM) on multi-item measures of manufacturing and employee performance (Challis, Samson
and Lawson, 2002).

8
Indeed, the search for promising combinations of practices has been a dominant subject
of empirical research (e.g. Bou and Beltran, 2005; Cua, McKone and Schroeder, 2001; Dow,
Samson and Ford, 1999; Flynn, Sakakibara and Schroeder; 1995; MacDuffie, 1995;
Narasimhan, Swink and Kim, 2004; Shah and Ward, 2003). Flynn et al. (1995) claimed that
TQM and JIT mutually support each other: TQM reduces process variance, which can simplify
the manufacturing process and closely match production and customer demand, while JIT
affects quality management by reducing lot sizes and thus decreasing potential waste and re-
work. Besides the combination of TQM and JIT, Flynn et al. argued that other practices (a
combination of OM and HRM that they named infrastructure) should interact with either of
them. Their sample of US manufacturing plants (n=42) within three industries (machinery,
transportation components and electronics) showed strong synergistic effects on quality, but
these were especially from combinations that also included HRM practices. The potential gain
from the interactions with HRM practices was also observed by MacDuffie (1995) in a seminal
study (n=62) that was part of a wider investigation on the human resource side of lean
production, using data from the MIT Future of the Auto Industry project. According to two
performance criteria – productivity (hours taken to build a vehicle adjusted by relevant factors,
e.g. size) and quality (defects/vehicle) – MacDuffie’s results showed significant synergies
between OM and HRM systems.
Positive interactions between supply-chain and total quality managements have also
attracted considerable interest (e.g. Carter and Narasimhan, 1996; Carter, Carter, Monczka,
Slaight and Swan, 2000; Mehra and Inman; 2004). The predominant view is that TQM expands
supply-chain management from cooperative relationships aimed at minimizing costs or trade-
offs, to a focus on achieving cumulative competitive capabilities that target the production of the
highest value product for customers. A minimum integration of OM practices is required to
achieve this effectiveness, and thus one would expect a significant correlation between the uses
of TQM, JIT and supply-chain practices. Flynn and Flynn (2005) tested for synergies between

9
the perceptions of how extensively TQM and supply-chain management were employed on a
sample of manufacturing plants from five industrialized countries (n=164). Their TQM measure
included JIT delivery and HRM practices and is thus broader than most studies. Overall, TQM
supported supply-chain management, though not all combinations of practices were positively
associated with all measures of performance (quality, volume flexibility, manufacturing cycle
time, on-time delivery).
With a few exceptions (e.g. Cua et al., 2001; Challis et al., 2002), most studies have
concentrated on just two elements of lean, though in some cases HRM practices might have
been included within TQM. Shah and Ward’s (2003) study is one of the most comprehensive,
since it focused on multiple elements in a large sample of US manufacturing plants (n=1,757)
from several industries. Plants were classified into four bundles of related processes and
procedures: JIT, TQM, HRM and TPM (Total Preventive Maintenance). After controlling for
industry, union presence, size and age of plant, the adoption of these bundles was positively
associated with operational performance, measured as the five-year change in six items (scrap
and re-work costs, manufacturing cycle time, first pass yield, labor productivity, unit
manufacturing cost and customer lead time). Shah and Ward then concluded that “a separate and
identifiable incremental effect can be attributed to the four major lean practices areas” (2003:
145–146), and that these findings provide “unambiguous evidence that the synergistic effects of
all lean practices are associated with better manufacturing performance”. Thus, all elements
should coexist, though they did not formally test for the four-way interaction (synergy) nor
modeled a secondary factor (integration).
To sum up, the literature supports synergies between the different practices and we
would expect OM and HRM practices to coexist, at least in the long run. It is reasonable, then,
to expect significant correlation between the different elements of lean production, and we
propose:
10
Proposition 1: OM and HRM practices that are associated with the lean production concept are
integrated.
Yet in the literature addressing the potential link with performance, the analysis of the
correlation structure has been limited to separate elements of lean. Potential synergies between
two or three elements tend to be analyzed, thus implying that elements may be perceived as
being independent. As an example, we refer to Bou and Beltran (2005: 71), who claimed that
“the influence of TQM on organizational results will be greater when its implementation is
supported by a high-commitment strategy”, and therefore HRM and TQM should have a
synergistic effect on performance. They tested this hypothesis via a structural equation model,
where TQM and high commitment management (HRM practices) are two independent latent
variables that positively interact on financial performance (Bou and Beltran, 2005: 81, figure 2).
They quoted Dwyer (2002: 536) by stating that “a model integrating quality and people
[practices] could have an impact on the bottom line of the organization”, but did not test for this
integration by assessing whether their two latent variables were correlated and loaded on a
single dimension. Moreover, by assuming that the correlation between TQM and the HRM-
centered commitment variable is negligible, they contradicted their observation that the
correlation could be significant, as an “analysis of the foundations of high-commitment
management shows clear parallelism with the quality climate proposed by TQM experts, since
both approaches [i.e. TQM and high-commitment management] emphasize employee
participation, commitment and trust within the organization” (Bou and Beltran, 2005: 75). In
short, despite acknowledging their expectation of integration between OM and HRM, the
authors followed the general trend in the literature and limited the investigation to synergistic
effects. Proposition 1 remains to be tested.
2.1.1 The potential link between the integration of lean practices and performance

11
The first stage in examining a link between the integrated use of practices and performance is an
assessment of integration. Few authors have actually modeled the correlation in the adoption of
different types of practices when developing their construct. Among those that did, not all
assumed that underlying the correlation between practices (or elements) was a management
philosophy. For example, Callen, Morel and Fader (2003) investigated the risk–profitability
trade-off of JIT manufacturing (lean) on a sample of 100 plants. Seventeen practices were
considered, of which only two can be broadly classified as HRM (quality circles and flexibility
of worker’s skills). Principal component analysis was used to develop an index of JIT
manufacturing, which is therefore a formative rather than a reflective construct (latent variable).
By choosing this statistical method, as described by Diamantopoulos and Siguaw (2006), the
authors assumed that the use of practices causes the construct being measured (JIT
manufacturing) and not that the coexistence of practices reflects an underlying managerial
approach. According to each plant’s score, the sample was then split: JIT manufacturing (lean),
non-JIT and the first group of plants were found to be more profitable, even after adjusting for
the operational risks relative to non-JIT manufacturing. Had similar results been found based on
a construct derived from factor analysis, we would have evidence of a link between integration
and performance.
Fullerton et al. (2003) examined the link between JIT (lean) manufacturing systems and
financial performance (profitability: return on assets, return on sales and cash flow margins) in
253 US manufacturing firms. They argued that the conflicting empirical evidence (see Kinney
and Wempe, 2002, who extended the work of Balakrishnan, Linsmeier and Venkatachalam,
1996, but in contrast to them found a negative link) suggested that the degree of implementation
affects the link and thus any measure should consider the extent of implementation. Hence,
based on the extent to which 10 practices were implemented, they found three factors: JIT
manufacturing, which underlies the adoption of OM and HRM practices, JIT quality and JIT
unique, both of which have underlying pairs of OM practices. Cross-sectional and longitudinal

12
links with financial performance were examined, with the respondents’ self-assessments as JIT
adopters being the basis of the longitudinal investigation. Only JIT manufacturing, which is the
factor that integrates HRM and OM, paid off and its level of implementation and maintenance
led to sustainable rewards.
Kaynak (2003) developed a structural equation model of potential effects of HRM and
TQM on perceived financial, market and operating performances relative to the competition,
which was tested on a sample of US manufacturing and service firms (n=42). In contrast to most
studies, the model (Kaynak, 2003: 414, Figure 1) shows some integration between OM and
HRM – for instance, management leadership is a latent variable that loads on HRM and quality
management practices. Results supported all paths in the model, and the author concluded that a
range of TQM practices had positive effects on firm performance and thus “practitioners as well
as researchers cannot simply pick and choose a few techniques to implement” (Kaynak, 2003:
427).
Nahm, Vonderembse and Koufteros (2003, 2004) examined the relationships between
organizational structure (number of layers in the hierarchy, level of horizontal integration, locus
of decision-making, nature of formalization and level of communication), culture, composite
measures of manufacturing practices (re-engineering setups, cellular manufacturing, quality
initiatives, preventive maintenance and pull production) and performance (sales, growth, return
on investment, market share gain and overall competition). In their structural equation models,
OM practices load on to a latent variable that is shown to mediate the link between performance
and both organizational structure (Nahm et al., 2003) and organizational culture (Nahm et al.,
2004). Overall, they demonstrated that managerial beliefs, locus of decision-making and level of
communication are associated with what they call time-based manufacturing practices (OM
latent variable), directly linked to performance. Although these elements may be expressed by
HRM practices, in their framework the authors have not explicitly examined the association
between OM and HRM practices.

13
The integration of TQM and HRM practices and its association with performance have
been explicitly investigated by de Menezes and Wood (2006) in a representative sample of
British workplaces (n=2191). According to their results, TQM and HRM practices loaded on a
single discrete factor, but JIT was a separate element. Their integrated HRM–TQM measure was
associated with subjective measures of workplace performance (labor productivity and its
change).
To sum up, the above studies suggest that the integration between OM and HRM
practices as prescribed by the lean production concept may be associated with performance and
we propose:
Proposition 2: The integration of OM and HRM practices associated with the lean production
concept is linked to performance.
Most studies did not set out to investigate this link and only one study was longitudinal. We
need evidence, especially from longitudinal studies because they enable the investigation of the
associations over time, of changes in the dependent variable (performance) as well as the
independent variables (e.g. practice use, integrated management approach or lean production)
and any effect of these changes in the relationships.
We now consider two longitudinal studies, namely Patterson, West and Wall (2004) and
Birdi et al. (2008), because they were based on the Institute of Work Psychology (University of
Sheffield) Modern Management Practices Survey Series, from which we draw our data.
Patterson et al. (2004) examined the individual and interactive effects of three OM practices
(TQM, JIT and advanced manufacturing technology – AMT) and two HRM practices (job
enrichment and skill enhancement) on labor productivity and profit. They found neither support
for synergies nor an association between JIT or TQM and performance; only the HRM practices
were associated with increases in both productivity and profits.
Birdi et al. (2008) extended the analysis to 22 years and seven practices: empowerment,
extensive training (learning culture) and teamwork, which are central to strategic HRM (Becker

14
and Huselid, 2006); TQM, JIT and AMT, which are the components of integrated
manufacturing (Dean and Snell, 1991; Snell and Dean, 1992); and supply-chain partnership that
complements the others. They examined the association with productivity, but the focus
remained on separate practices; only empowerment and extensive training were positively
associated with productivity, representing gains of at least 6%. Their conclusions on the link
between individual practices corroborated the earlier study (Patterson et al, 2004): OM practices
on their own and the combination of the four were not linked to performance. Yet there were
synergies: teamwork interacted with most practices; four of the six two-way interactions
between OM practices were positively linked to productivity, and supply-chain partnering
appeared to enhance the effect of all other OM practices. Moreover, they observed a high
proportion of positive two-way interactions between HRM and OM practices, which they
concluded to be a support for the lean production concept “that the effectiveness of operational
practices depends on human resource ones” (Birdi et al., 2008: 493).
We will revisit this second dataset and further explore its longitudinal nature. In
contrast to previous work, we will focus on the integration and the association in the evolution
of practices, based on which we may identify different stages of adoption and any link with
performance, as we discuss below.
2.2 The evolution of lean management practices and performance
To understand the evolution of OM and HRM practices, we refer to Powell (1995: 20–21) and
his use of the diffusion of innovation literature (Rogers, 1983). Diffusion of innovation refers to
the spread of concepts, technical information and actual practices within a social system. The
spread denotes a flow from a source to an adopter, typically by communication or influence (for
example, the adoption of lean practices by Japanese subsidiaries in the UK). Diffusion
trajectories as a function of time (growth curves) are such that at the beginning adoption takes

15
longer and growth is barely observed, then there is a period of growth, and finally there is a
plateau.
This pattern is observed and modeled in many areas, as described in Wejnert’s (2002)
review of diffusion processes. In management, the spreads of specific practices have rarely been
investigated. Bryson, Gomez, Kretschmer and Willman (2007) and Freitas (2008) use British
data from the Workplace Employment Relations Surveys and focus on workplace characteristics
that predict the diffusion of HRM practices. They argue that practices are governed by
considerations of costs and benefits that are similar to those involved in any innovation and thus
can be examined by diffusion models. The first study measured the diffusion or intensity of
HRM through an additive score, while the second focused on specific practices and their
implementation. Neither modeled the growth curve nor focused on performance, for both aimed
to identify factors that may predict diffusion. They found that industrial sector, size and age of
the establishment, set-up date and number of organizational affiliations are associated with
diffusion. Such results are consistent with the general view that innovations propagate more
rapidly among those that share similar visions, values and approaches. Consequently, firms can
be classified based on their stages of adopting a managerial philosophy and we propose:
Proposition 3: There is a pattern in the evolution of lean practices, so firms can be classified
according to their adoption stages.
Few studies have examined the link between the stages of adopting a managerial
philosophy and performance. Among this literature, Easton and Jarrell (1998) developed an
event history study on the impact of TQM between 1981 and 1991. Implementation was judged
according to the Baldrige Award criteria, in which case an advanced implementation would
combine OM and HRM practices (George, 1992). Each firm’s performance (accounting and
stock returns) was compared with a control benchmark that captured what performance would
have been without TQM. Independently of the performance measure, a positive link with TQM
was established and the observed improvement in performance was larger three to five years

16
after TQM implementation, which led the authors to support the view of a longer-term impact.
Yet expectations of sustainable effects might have been too optimistic. For example, Hendriks
and Singhal (2001) found no significant difference in performance between earlier and later
“effective” implementers (award winners) of TQM, and argued that the positive effects of TQM
could be diluted by other factors within the organization. Moreover, Fullerton et al. (2003: 400)
observed that greater degrees of implementation of JIT quality practices decreased profitability,
but JIT manufacturing that integrated OM and HRM showed sustainable profits. All in all, we
lack coherent evidence on any link between the evolution of management practices and firm
performance, possibly because of sampling variations, different constructs and measures, but
also due to distinct perspectives on long-term effects.
We may argue that expectations of long-term effects could discourage diffusion, because
only firms that have higher investment capacity would be willing to adopt an innovation and
wait for medium- or long-range returns. In which case, a higher performance would be
associated with early adoption. Furthermore, the diffusion process and its link with performance
can be highly influenced by learning effects, which may create asymmetries among firms and
affect the spread of adoption. In fact, when practices are viewed in bundles, learning can be
subject to considerable variance: some features are easily transferable, others may suffer great
resistance; therefore, investment can be perceived as too risky. Innovators would then be those
that have low transaction costs, are willing to take the risk, or have the capacity to invest in
continuous learning. Early adopters would then benefit from the sustainable learning and
continuous improvement that are commonly associated with the lean production concept. Hence
we propose:
Proposition 4: There is an association between stages of evolution and performance.
The longitudinal nature of the data that we analyze enables us to test our four
propositions and thus explore whether the integration of core lean HRM and OM practices in
British manufacturing may be linked to sustainable productivity.

17
3. The empirical study
3.1 The data
We use company-level data from the Institute of Work Psychology (University of Sheffield)
Modern Management Practices Survey Series. The dataset, as described by Birdi et al. (2008:
479–80), was constructed by matching the evidence from three surveys on the use of
management practices to yearly audited records of company data that include a measure of
performance. The surveys established the use of practices as well as when they were
implemented, and were based on interviews with either the company’s managing director or a
senior representative responsible for HRM or production.
During these interviews, a definition of working practices was given, which was
formulated from literature reviews, focus groups and pilot studies. Respondents were asked
whether and how extensively the practice was used across the company and, if so, the year it
was introduced. The descriptions of the practices that were common to all surveys in the series,
as relayed to the interviewees, are listed in table 1 of Birdi et al. (2008: 480) and are:
Empowerment: Passing considerable responsibility for operational management to
individuals or teams (rather than keeping all decision-making at the managerial level).
Integrated computer-based technology (ICT): Linking together computerized equipment to
enable enhanced integration (such as CADCAM, computer-integrated manufacturing and
flexible manufacturing systems).
Just-in-time production (JIT): Making products or providing services in direct response to
internal or external customer demands (rather than building in advance to maintain stock
levels).
Learning culture, which Birdi et al. (2008) relabeled “extensive training”: Providing a range
of development opportunities for all employees (rather than training people occasionally to
meet specific needs).

18
Supply-chain partnering: Developing strategic alliances and long-term relationships with
suppliers and customers (rather than negotiating on a short-term basis).
Team-based work: Placing employees into teams with their own responsibilities and giving
them the freedom to allocate work among team members (rather than having everyone work
as individuals).
Total quality management (TQM): Seeking continuous change to improve quality and
making all staff responsible for the quality of their work. (Such practices include Kaizen and
continuous improvement.)
In 1996, these practices were identified as the most popular in the lean management
practitioner literature and were estimated to be implemented in at least half of the UK’s
manufacturing companies (Waterson, Clegg, Bolden, Pepper, Warr and Wall, 1999), where their
combined used was pioneered in the early 1990s by Japanese transplants and firms directly
competing with or supplying them (Wood, 1996). Together with the HRM practices, they are
also included within elements that define total quality management as a philosophy (Dean and
Bowen, 1994). All seven practices appear in most accounts of lean production (e.g. Hopp and
Spearman, 2004; Parker, 2003; Shah and Ward, 2003; Womack et al., 1990) and have been
linked to descriptions of the Toyota Production System (e.g. Spear and Bowen, 1999). They
represent two (supplier-related and internally related) of the three underlying constructs
identified by Shah and Ward (2007) in their comprehensive investigation on what constitutes
lean production. Individually, TQM, JIT and ICT were core to integrated manufacturing
technology centers (Snell and Dean, 1992, 1994) or the Toyota Production System (Ohno, 1988)
and were considered in studies of JIT manufacturing (e.g. Fullerton et al., 2003, Koufteros and
Vonderembse, 1998). The data, however, does not cover the involvement of customers or TPM
(Total Preventive Maintenance – Cua et al., 2001; Shah and Ward, 2003, 2007), which was only
included in the 1996 survey where it was rarely used. Other HRM practices in the survey series
(appraisal, selection procedures and reward schemes) were absent in most years and their link
19
with employee involvement remains questionable (Beer, Spector, Lawrence, Mills and Walton,
1984; de Menezes and Wood, 2006).
Birdi et al. (2008) checked the consistency between the reported years of introductions
and the stated practice use in a sub-sample of over 200 companies for which they had additional
data. Very few inconsistencies in the reported year of introduction of practices were found
between surveys, in which case they opted for the most recent information. Their yearly data
was then constructed, by combining the practice usage information from the three surveys with
the information on when the practice had been introduced. The usage of each practice in each
year of the study was then recorded as a binary indicator (1 if a firm was using a practice that
year, otherwise 0). Only a small number of firms (1% of the total) had stopped using a practice
within the period studied. Company-related yearly data (productivity, size of workforce, value
of assets) were extracted from the annual audited accounts held at Companies House in London,
where checks were done and any anomalies were corrected prior to the creation of the dataset.
Productivity, the performance variable in the dataset, is our dependent variable, and was
measured as the logarithm of value-added derived profit and loss (operating profit, labor costs
and depreciation), adjusted for GDP inflation so that the measure is standardized to 2001 prices.
The focus on productivity as an index of performance is justified on grounds that “it should
more directly reflect the impact of implementing management practices” (Birdi et al., 2008:
481); it represents a direct link between human capital and organizational performance (Datta,
Guthrie and Wright, 2005) and is the key indicator of workforce performance (Delery and Shaw,
2001). Value-added is an important indicator of a company’s output because it evaluates a
company’s efficiency relative to its input (Birdi et al., 2008; Kato and Morishima, 2002).
When testing Proposition 2 and thus considering the (yearly) association between the
integrated use of practices and productivity, the models are controlled for: size of workforce (log
number of employees), value of assets (log fixed assets adjusted for inflation), and time
(accounting year). Finally, when examining the association between stages of adoption and

20
performance, we add initial productivity (value-added) to our controls, and measure time by the
number of years from the starting accounting year. These controls are consistent with the Cobb-
Douglas production function (Birdi et al., 2008: 481), as well as previous analysis of the
diffusion of management practices (Bryson et al., 2007).
Our models, which are described in the next section, aim to fit all possible combinations
of practice use in the data; if there were no missing observations, we could observe 128 (27)
types of responses. Hence, we need as much information on practice usage as possible (see de
Menezes, 1999, for the effect of sample sizes) and started with all 684 companies. However, the
exclusion of missing values practice-by-practice resulted in inconsistent models over the years,
so that we use the data from 448 companies that have complete information on all seven
practices in every year of our study period (1980–2003). A total of 157 companies had complete
information on all seven practices as well as productivity; the latter is unavailable for the first
two years in the dataset, so when addressing the association with performance we are limited to
this subset of 157 companies and the period from 1982 to 2003 (22 years). Yet this sample size
is comparatively larger than other studies of the link with performance in the manufacturing
industry that rely on data selected from far larger populations (e.g. Flynn et al., 1995; Kaynak,
2003; Powell, 1995). Our sample differs from Birdi et al. (2008), since they excluded the first
two years because these lacked information on productivity thus leading to a total of 308 firms,
but, depending on the practice or combination analyzed, their sample sizes vary from 122 to 284
firms.
3.2 Analysis procedure
Table 1 summarizes the steps, goals and methods that are involved in testing our four
propositions, which are detailed below.
Table 1 approximately here

21
3.2.1 Assessing integration of practice-use and its link with performance
To test Propositions 1 and 2, we need to examine the association in practice use in all years
studied and then analyze the link with performance. Our analysis differs from most of the
literature, since lean production has often been treated solely as a set of management practices
(e.g. Birdi et al., 2008; Li et al., 2005; Shah and Ward, 2007), which on their own or combined
may be associated with performance. In which case, if xi is a binary variable that indicates the
use of practice i (i=1 to n), the link with performance can be assessed by the following model:
Kknnnn CCxxePerformanc ...... 11110 , where the Cks (k=1 to K) are a
set of control variables. In addition, if two or more practices are assumed to have a synergistic
effect on performance, interactions or product-terms are added to the model. For example, when
considering two practices, the model becomes:
Kknn CCxxxxePerformanc ...1121322110 . The estimated coefficients
of the individual practices and their interaction term are then expected to be positive and to
demonstrate that the effect of the combination is greater than that of individual practices.
By contrast, when we view lean production as a philosophy, in line with Proposition 1,
practices co-exist due to this philosophy (latent variable) and can be measured by the common
factor underlying the correlation of individual practices or elements. Integration implies that a
common factor, which can be modeled as the latent variable that measures the philosophy, can
be estimated. Moreover, when testing Proposition 2, it is the link between this factor and
performance that should be examined, for example:
Kknn CCfactorePerformanc ...1110 , which in a longitudinal framework
may be written as:
tKtktnttntttCCfactorePerformanc ...1110 . (1)
Testing Proposition 1: Establishing evidence of integration and developing yearly
measures of the construct. We need to assess whether a factor underlies the association between
the seven practices in every year (t) of our data. If practices were used independently, we would
22
have no evidence of integration and Proposition 1 would be rejected. Hence, we first establish
that there is significant correlation in practice use, so that we can estimate for each firm the
value of this factor in the year. Since our practice data are binary variables, we use chi-square
tests. Having established association, our second step is to determine whether this association is
due to a common continuous factor. We therefore fit a logit-probit latent trait model that is
analogous to the traditional factor model but is specifically for binary variables, as proposed by
Bartholomew and Knott (1999: chapter 4) and used by de Menezes and Wood (2006) in their
analysis of management practices. For brevity, we report that these fits were poor and from now
on we consider models that assume the latent variable is categorical (discrete).
Latent class models were initially proposed by Lazarsfeld and Henry (1968) in order to
identify homogeneous groups of individuals based on the correlation structure between several
binary or categorical variables. Several variants of latent class models have been used in
sociology to identify types of attitude structures from survey responses, in marketing to unveil
consumer segments from demographic and preference variables and in management to identify
management styles (DeSarbo, Di Benedetto, Jedidi and Song, 2006; Lewis, 2005; McCutcheon,
1987; Rost and Langeheine, 1997a; Wood and de Menezes, 1998). The standard latent class
model assumes that binary indicator variables are associated because of discrete points (classes)
in the latent space. In the absence of these classes, the indicator variables are no longer
associated. Accordingly, we let πij be the probability of the ith practice being used by a firm in
category j, ηj be the prior probability that a randomly chosen firm is in class j or the size of a
class, and x=(x1,x2, ...,x7) represent the response of a firm to the use of these seven practices. As
we only observe x, inference must be based on the joint distribution, whose density for the K-
class model is given by:
f jj
K
i j
x i
i
p
i j
x i x i( ) ( )x
1 1
11 (2)
The posterior probability that a firm with response vector x is in class j is therefore:

23
h jf
j Kj
i
p
ij
xi
ijxi
( | )( )
( ), ,...x
x
1
111
(3)
By maximizing the log-likelihood function, parameters ( s and s ij j ) are estimated. Multiple
sets of random starting values are generally used to avoid local solutions. A firm is allocated to
the class that it has the highest posterior probability (3) of belonging to. Consequently, in a
latent class we have firms that do not necessarily make use of exactly the same subset of
practices, but have the same probability of adopting each practice and as such have a similar
approach to management.
A log-linear reformulation of this model, as shown by Rost and Langeheine (1997b),
whose parameters are not probabilities and as such not restricted to the interval [0,1] enables
restrictions to be applied to the parameters, the inclusion of predictors and more flexible
inference for categorical indicator variables (Heinen, 1996; Vermunt, 1999). This reformulation
has been adopted by Vermunt and Magidson (2005) in developing LatentGold 4.0, the software
that we use here, to classify cases into homogeneous groups that they call latent class clusters.
If a categorical latent variable is responsible for the association in practice use, we can fit
a latent class model to the data. LatentGold 4.0 is used to estimate the model parameters and
allocate firms into latent class clusters for each year in the dataset. Standard goodness-of-fit and
model selection statistics are then used to judge the number of latent class clusters that best fits
the data. Residual correlations are analyzed in order to detect any dependency between pairs of
practices (violation of the local independence assumption), which, if necessary, can then be
modeled. Since the probabilities of a firm adopting each practice are estimated, given that it is in
a cluster, we can also identify the characteristics of each cluster in terms of how firms are likely
to use practices.
As we describe in the next section, we fit up to five latent classes per year and the best
solutions imply either two- or three-classes; we opted for three. However, the yearly
classification varied and we then restricted the models so that the probability of a firm using a

24
practice changes monotonically as we move along the sequence of latent class clusters,
i.e.: 1 ijij . In short, we estimate models that are known in the statistical literature as
order-restricted latent classes (Goodman, 1974; Croon, 1990), which represent an intermediate
stage between the latent trait model where the latent space is a continuum, as in factor analysis,
and the standard latent class model described above. This procedure results in three ordered
homogeneous clusters of firms per year and a firm is allocated to the cluster that it has the
highest estimated probability of belonging to. In each cluster, the probabilities of a firm
adopting a practice i, where i=1 to 7, is the same, and as specified these do not decrease from
cluster 1 to 3.
Testing Proposition 2: Establishing the link between integration and performance. The
association between cluster membership and productivity is investigated via a two-level
hierarchical regression procedure, using Mixed Models with SPSS14. The first level is time (t)
and the second is the company (i). Cluster 2, the medium-usage cluster, is chosen as the
baseline, so that if there is a link, we would expect a positive coefficient for Cluster 3 and/or a
negative coefficient for Cluster 1. Our model is the following:
productivityit 0 sSizeit A Assetsit t t Cl1Cluster1it Cl 3Cluster3it eit (4)
where Cluster1it is 1 if firm i is low-usage at time t and 0 otherwise, Cluster3it is 1 if firm i is
high-usage at time t and 0 otherwise, and eit is the error term. Time (t) varies from 1 to 22 (1982
to 2003, since 1982 is the first year for which performance data is available). The correlation
structure of the first level residuals is identified and estimated from a baseline model that
excludes the cluster membership predictors. Improvement in model fit between our model, as
described in equation (4), and the baseline model is assessed by the change in -2 times the log-
likelihood, which is a likelihood ratio statistic that in our case is distributed as a chi-square with
two degrees of freedom (due to two additional parameters that our model has, relative to the
baseline model).

25
3.2.2 Assessing evolution and its link with performance
Testing Proposition 3: Establishing the evidence of evolution and classifying firms
according to the different stages. In order to establish the trajectory (evolution) of each practice,
we estimate latent growth cluster models (latent class growth analysis or LCGA: Andruff,
Carraro, Thompson, Gaudreau and Louvet, 2009; Jung and Wickrama, 2008; Muthén, 2001,
2004), using LatentGold 4.0 as described by Vermunt and Magidson (2005). These models are
increasingly being used in social sciences and psychology with the aim of capturing information
over time about inter-individual differences and intra-individual change (Nesselroade, 1991;
Wang, 2007). In contrast to conventional growth models that would assume firms come from a
single population and that a single growth trajectory can adequately approximate the entire
population, LCGA enables the identification of homogeneous clusters of firms that describe
similar growth trajectories of practice use.
We first examine the growth pattern of each practice separately, by using time (year) as a
predictor of usage in a latent class growth model. The aim is to find the best model (correct
number of latent classes) that describes the evolution of each practice. However, after
attempting to model the growth using the 24 points in time, the results did not converge to
unique solutions. Therefore, we divided the period 1980–2003 into five epochs of equal length
as follows: epoch 0=1980–1984, epoch 1=1985–1989, epoch 2=1990–1994, epoch 3=1995–
1999, epoch 4=2000–2003. If a practice was introduced at any time during an epoch, or was
already in use at the beginning of an epoch, the practice code for that epoch was set to 1.
Otherwise, the practice code for that epoch was 0.
We estimate latent class growth models for each individual practice: the dependent
variable is the practice-use indicator (xi=0 or 1) and the predictor is the epoch coded 0 to 4, as
defined above. Practice-use indicators are binary variables and thus binary logistic regression
models are estimated. For each practice, we fit up to five latent classes and choose the model
with the lowest Bayesian Information Criterion (BIC) that describes the growth or trajectory for

26
each practice. A mean growth curve is estimated for each class. We then use the identified
growth classes as inputs to a second latent class model, whose classification summarizes the
overall evolution of the seven practices. In short, this is a two-stage process that leads to a single
classification of firms (trajectory class) based on the diffusion of the seven practices over the 24
years.
Testing Proposition 4: Establishing the link between stages of adoption and
performance. Finally, we investigate whether the evolution is associated with firm performance,
by examining productivity in the last available accounting year as a function of trajectory class
that categorizes firms according to the identified stages of adopting (integrating) practices. A
General Linear Model is estimated using SPSS14, where the dependent variable is final
performance and the covariates are initial productivity, final company size, final fixed assets and
accounting period. The trajectory class is the categorical predictor. We also estimate an
alternative model, as a validity check, where the dependent variable is an average of
productivity in the last two years and the initial productivity is replaced by its average in the two
initial years.
4. Empirical Results
4.1 The link between integration and performance
4.1.2 Establishing the evidence of integration
Testing for association in practice use. Chi-square tests of the cross-tabulations of the
seven practices for the 24 years showed that independency was generally rejected (P-values <
0.05). We also observed that in 1980, 14% of firms reported using one or more OM practice and
only 9% reported using one or more HRM practice; by 2002 these figures had grown to 99%
and 98% respectively. In order to confirm that HRM practices were not being adopted
independently of OM practices, we created two binary indicator variables. For each year, the
first variable indicated whether a firm had adopted at least one OM practice, and the second

27
whether a firm had adopted at least one HRM practice. Cross-tabulation of these two variables
suggested that in every year prior to 2002, firms that had adopted at least one OM practice were
more likely to be using at least one HRM practice than firms that had not adopted any OM
practices. With the exception of 2002 and 2003, by which time almost all firms had adopted at
least one OM and one HRM practice, chi-square tests of independence with continuity
correction were strongly significant (P-values ≤ 0.002). There is no evidence that firms
emphasized a type of practice, or that two separate clusters representing HRM and OM practices
are likely to emerge from these data. In short, there is significant correlation in practice use over
the 24 years.
Estimating the underlying construct: Identifying yearly latent class clusters or
homogeneous groups of firms (1980–2003). As the data did not fit either a one- or two-factor
latent trait model, and failed the goodness-of-fit tests described by Bartholomew, Steele,
Moustaki and Galbraith (2002: 184–188), there is no evidence of a continuous common factor.
We therefore tested for a discrete common factor, as outlined in Table 1, and initially considered
up to five latent classes – K=2 to 5 in (2). However, some models resulted in multiple solutions,
indicating that either sample sizes were not sufficiently large to capture the detailed patterns that
stem from large models or that fewer homogeneous clusters are present in the data. Hence, we
estimated two- and three-latent class models (up to 23 parameters in a model) in each year, and
used model selection criteria to decide which best represented the data.
The log-likelihood-based model selection criteria (AIC, BIC, CAIC) suggested a three-
cluster (latent class) solution in some years and a two-cluster solution in others. This is
illustrated in the plot of the Akaike Information Criterion (AIC) that is shown in Figure 1: the
smaller the AIC statistic, the better is the model. It can be seen in the first decade of the period
that two- and three-latent cluster solutions fit the data equally well. From 1989, however, three-
cluster solutions fit better and, towards the end of the period, the quality of fit of the two- and
three-cluster solutions begins to converge again. It appears that the pattern of co-existence of

28
practices evolves in the period investigated. Yet the ordering of clusters oscillated between
years. In order to achieve consistency year to year, we use order-restricted models that, as
described in the previous section, constrain the probabilities of using a practice in each class so
that they do not decrease. Consequently, the latent variable that we estimate is ordinal.
~Figure 1~
Although the three-class solution might be worse than the two-class solution in a few
years, using a three-class model throughout is suitable to most years and simplifies tracking the
evolution of practice usage over time. We therefore concentrate on three-class models, which
are specified so that the first cluster makes the minimum use of practices and the third the
maximum use. All estimated models are identifiable (converge to unique solutions) and satisfy
the goodness-of-fit criteria, thus Proposition 1 is supported by the data.
Our results are summarized in Figures 2a to 2d, which show respectively for each year
the average number of practices used in each cluster, the cluster sizes (i.e. number of firms in
each cluster), the number of companies per cluster that use each practice (i.e. the diffusion of
each practice per cluster), and the (estimated) probability of usage of each practice per cluster.
~Figures 2a–2d~
As shown in Figure 2a, practice use increases significantly in every cluster during the
period studied. Firms in Cluster 3 appear to be the innovators, who are then followed by the
others. At the start of the study period, Cluster 3 firms had already adopted an average of about
four different practices, which increased to just above six at the end of the period, suggesting
that most firms in this cluster use all seven practices in the final year. As Figure 2b indicates,
Cluster 3 was initially quite small, but increased significantly in the 1990s so that at the end of
the study period it comprises more than 50% of the firms. The observed frequencies of adopting
each practice, as shown in Figure 2c, indicate that the typical growth curve that we associate
with diffusion processes is only completely observable for Cluster 3.
29
Firms in Cluster 1 are characterized by a consistently low use of practices, which only
increases by around the year 2000. This cluster comprises about 90% of the firms at the start of
the study period, but membership declined steadily. By contrast, Cluster 2, which contains firms
with an intermediate usage of practices (an average use of two practices until 1990), increased in
size up to 2000, and then decreased, such that by 2001 the data could be reasonably represented
by a high usage and a low usage group.
The observed frequencies of using a practice and the estimated probabilities of using a
practice vary significantly from cluster to cluster (see Figure 2c). Overall, JIT is used less and is
not used in Cluster 1; but in more recent years, the estimated likelihood of its use, according to
the latent class models, increased significantly in Clusters 2 and 3 (Figure 2d – probability of
usage is approximately 0.70).
Figure 2d shows the evolution of the estimated probability of using each practice if a
firm belongs to a cluster over the years. Clusters 2 and 3 are closer with regards to the estimated
probabilities of using OM practices, whereas Clusters 1 and 2 are closer with respect to their
likelihood of making use of empowerment in the early and late years. The relative gaps between
each cluster in the figures suggest that ICT and supply-chain partnering discriminate between
Clusters 1 and 2, whereas empowerment and teamwork discriminate between Clusters 2 and 3.
All figures indicate that firms in Cluster 3 adopt an integrated management approach and are
more likely to mirror those that have been described in the literature as early implementers. If
there were benefits from having such an approach, we would expect this group of firms to
outperform the others.
Testing Proposition 2: The link between cluster membership and performance (1982–
2003). The association between productivity, our performance measure, and yearly cluster
membership is examined by a linear mixed model with time defined as the first level, and
company as the second level. A baseline growth model (i.e. with time and the controls as fixed
effects) suggested a first-order autoregressive error covariance structure for the effect of time;

30
its fit statistics are: -2logLL=1775, BIC=1814, which show a significant improvement from a
null model that estimates the intercept (-2logLL=5195, BIC=5210). To this baseline model we
added the cluster membership predictors as fixed effects, so that we have the model that we
defined in equation (3). Results are summarized in Table 2. This model is not an improvement
in quality of fit (-2logLL=1779, BIC=1818) when compared to our baseline growth model, but
indicates that belonging to the high-usage cluster (Cluster 3) is positively associated with
performance (t=2.35, p=0.019), while belonging to the low-usage cluster is not (t=-0.44,
p=0.66). That is, a high-usage firm outperforms medium-usage firms, though there is no
difference between those within low- and medium-usage groups nor is cluster membership per
se a strong predictor of productivity.
The lack of difference in productivity within the two lower clusters tallies with our initial
finding that in more recent years a two-class model would best fit the data. In addition, given
our observations on the extent of practice use in each cluster, we might conclude that Cluster 3
is the only one making a fully integrated use of practices. Indeed, this is confirmed when we
consider the estimated probabilities of using each practice if a firm is in Cluster 3 that resulted
from the yearly models, as illustrated in Table 3. We observe that not only the estimated size of
Cluster 3 significantly increases in the period, but also that by the year 2003 all seven practices
are very likely to be adopted within this group of firms. All in all, those that made a more
integrated use of practices are also more likely to be high performers. These results may indicate
support for Propositions 3 and 4, which we now formally test by following the steps that were
described in Table 1.
~Tables 2 and 3~
4.2 Assessing the link between stages of adoption and performance
Testing for Proposition 3: Establishing the evidence of evolution and classifying firms
according to the different stages. We first estimated growth models for each practice separately.

31
For TQM, empowerment and ICT, the best latent class growth model is a three-class model, and
for JIT, learning culture, supply-chain partnership and teamwork it is a four-class model. The
latent class growth models are summarized in Table A1 (Appendix), where we report the
estimated regression coefficients, the quality of fit of the model and the size for each class per
practice. These describe the different growth curves per practice that were identified; a higher
coefficient for epoch indicates higher growth. For learning culture and supply-chain partnership,
the fourth class contained less than 1% of cases, so we also adopt three-class solutions for these
practices. For JIT and teamwork, four classes were identified whose sizes were greater than 5%;
we kept the 4-class solution, though we note that in both cases one of the growth classes
explains a very small proportion of the variance (low r-square). These results indicate that there
are three clearly identifiable stages in the evolution of these practices.
Identifying firms according to stages of evolution of an integrated approach. Our next
step was to classify the firms based on the growth models. The indicators for clustering were the
seven growth class membership variables that are categorical variables ranging from 1 to 4 in
the case of JIT and teamwork, or 1 to 3 for all other practices. In order to identify the number of
trajectory clusters across all practices, models with up to five latent classes were estimated.
Goodness-of-fit chi-square statistics were non-significant (p=1.00) for models with more than
three latent classes. Three clusters are sufficient to describe the whole data and companies can
be classified in three trajectory clusters that describe the evolution across the seven practices.
The classification error rate for this model is 7%, which is quite good and we have support for
Proposition 3.
Results are summarized in Table 4, which shows the size of each trajectory cluster and
the probabilities of belonging to each of the practice growth classes when a firm is within a
trajectory cluster. According to this table, the composition of each trajectory cluster in relation
to the growth classes of each practice can be inferred. For example, firms in the second
trajectory cluster are more likely to belong to Growth class 1 for empowerment (probability =

32
87% when Growth class is equal to 1 for empowerment), which corresponds to companies that
experienced the highest growth for empowerment since its regression coefficient for epoch in
Table A1 is equal to 6.85 and is the highest among the three growth classes. Similarly, it can be
seen that higher growth in JIT use (Growth Class 2) is also associated with a higher likelihood
of company being in the second trajectory cluster (probability = 0.63).
~Table 4~
Yet, in line with Proposition 3 and aiming to test Proposition 4, we focus on the
evolution across all practices. By plotting the observed practice use per trajectory cluster, as
shown in Figure 3, we have a clearer picture of the year-on-year evolution that enables the
identification of the three adoption stages.
~Figure 3~
Firms in Cluster 3 are early adopters who tend to make an integrated use of practices
early on, the smallest group (12.6% of the sample, as shown in Table 4). In this cluster,
however, the rate of further introduction of a practice is relatively slow; by midway through the
study period, adoption of the three HRM practices and JIT reaches a plateau, although adoption
of TQM, ICT and supply-chain partnering continues to rise. Firms in Cluster 2 start from a
lower base, but show rapid change over a relatively short period. These are firms that we will
call intermediate adopters, based on their initial status. In fact, by the end of the study period,
firms in this cluster have a higher estimated probability of using every practice than those in the
other two clusters. Cluster 1 firms also start from a low base, but are reluctant to get started, and
their adoption of practices only begins to rise in the middle of the study period. From this point,
however, adoption is fairly rapid, so that by the end of the period studied, the adoption rate in
this cluster is comparable to that in Cluster 3. We will refer to firms in Cluster 1 as late adopters.
Testing Proposition 4: Establishing the link between stages of adoption and
performance. We investigated a possible effect of the three trajectories on performance, by
examining productivity in the last available accounting year as a function of the trajectory class,
33
controlling for company size, fixed assets in the final accounting year, productivity in the initial
(first available) accounting year, and the number of years (accounting period) between the initial
and final accounting years. A general linear model with final productivity as the dependent
variable was estimated. Initial productivity, workforce size, final assets and accounting period
were entered as covariates, and the trajectory class was the categorical predictor.
~Table 5~
The results are shown in Table 5, where we observe a significant effect of trajectory
class on final performance, which is indicated by its partial eta-squared value (last column).
After accounting for the control variables, trajectory class membership explains 4.2% of the
remaining variation in final firm performance. Pairwise comparison tests showed that early
adopters significantly outperform both late and intermediate adopters (p<0.05) in the final
accounting year, but there is no significant difference between late and intermediate adopters. In
spite of the similarity in performance between late and intermediate adopters, we have an
indication that early adoption is beneficial to the firm.
These results were confirmed by a similar model where the initial productivity was
measured as the average of the first two available years, and similarly the final productivity was
the average of the last two years. Furthermore, hierarchical regressions, where a baseline model
had the covariates as controls and the second model had additional dummy variables that
indicated early and late adopters, also showed that early adopters were positively associated
with final (and average final) productivity. Given that intermediate adopters experienced rapid
growth and by the end of the period studied make a similar or even greater usage of the practices
than early adopters (as shown in Figure 3), this productivity differential supports Proposition 4.
Furthermore, it suggests first-movers’ advantage, which may reflect the continuous
improvement achieved through a longer period of integrating practices.
5. Discussion

34
Our review of the literature has shown that many studies have addressed the potential gains from
combining two or more elements of lean production, and that often such combinations entailed
both OM and HRM practices. We therefore expect a significant correlation in the use of
practices and thus a focus on separate elements may hide the potential outcomes from
integration. Indeed, the evidence from case studies on the successes of quality management and
lean production suggest that integrating OM and HRM practices is crucial (e.g. Scherrer-Rathje,
Boyle and Deflorin, 2009; Terziovski, Sohal and Samson, 1996). Yet few authors have
empirically addressed the integration of management practices and even fewer its link with
productivity.
In the present study, we observed that the use of the seven practices evolved in a similar
fashion and three homogeneous groups that described three levels of usage were identified for
each of the 24 years studied. The assumption that practices are only manifest of a latent
philosophy and that they would be independent in the absence of this philosophy was supported
by the data. The choice of practices is not driven by expectations on the performance of specific
combinations but by having an integrated system in place that reflects a managerial philosophy.
Hence, the focus switches from potential efficient bundles of practices to this unobserved
philosophy or management approach.
The implication for the practitioner is that there are no magical solutions or quick-fixes;
the philosophy needs to be in place. Indeed, this may not be surprising when we consider how
much academics and practitioners have written about Toyota. The challenge remains to fully
embrace the philosophy, be it quality management, integrated manufacturing, just-in-time
manufacturing or lean production. In fact, the need for integration between OM and HRM has
been acknowledged in descriptions of success as well as failures of quality management
strategies. Boudreau, Hopp, McClain and Thomas (2003) argued that in spite of a practical need
for integration because they are fundamentally related, the disciplines of HRM and OM tend to
be taught, researched and practiced separately, often drawing on distinct disciplinary

35
foundations. Consequently, more can be learned from addressing the interface, since OM and
HRM can explain and moderate the effect of each other, in which case integration is crucial for
competitive advantage.
Given that we had no evidence of a continuous latent variable that would measure the
underlying philosophy, latent class models enabled the identification of clusters and
significantly reduced the number of performance equations that were analyzed when compared
to previous studies on synergies, without the need for either arbitrary criteria or pre-specified
bundles. This type of model may also capture the non-linear association between practice and
performance that has often been mentioned. The analysis can be extended to ordinal or
continuous manifest variables, allowing for different levels of measurements and restrictions to
be added. If necessary, the assumption that the correlation between practices is only due to the
philosophy being measured can be relaxed. Hence, latent class models are powerful clustering
tools that can be used in future studies on large samples. In fact, if the pattern of low versus high
implementation that has been observed in the literature persists, such models may be more
robust than factor analysis when analyzing data that measure the extent of use. This is
particularly important when addressing the link with performance, as recent empirical work has
used structural equation models, which assume that the data are reasonably well distributed.
We observed that some firms moved between clusters so that in the final years only two
clusters might as well have been identified. Indeed, this pattern, which is observed after 2000, is
consistent with previous research where samples were generally split into two groups: basic–
advanced users, early–late implementers. In the present study, however, this pattern stems from
an integrated (correlated) use of practices and its evolution, and not from an arbitrary cutting-
point (e.g. use of 2/3 of practices at least 50% of times – Callen et al., 2003) or quality criterion
(e.g. award winners). It is possible that such a pattern might have resulted from focusing on the
set of the most widely used practices in a single industry sector, because similarities between
firms could have facilitated the spread of practices and thus favor a two-way classification: use,
36
no-use. Although the lower-usage cluster became smaller with time, some firms have lagged
behind the majority. In which case, they are either more resistant to innovations or lack the
investment capacity. Given our data, we are unable to identify factors that could explain this
perceived stagnation and we look forward to further work on different industries with a wider
set of practices and firm characteristics to clarify these findings.
Our results indicate that high usage and integration of OM and HRM practices are linked
with productivity. They support previous work on similar data (Birdi et al., 2008), which
concluded that expectations based on the lean production concept were supported by the data:
pairwise combinations of the OM and HRM practices tended to be positively associated with
productivity, while OM practices on their own were not; supply-chain partnering positively
interacted with the other OM practices; and teamwork interacted with most practices. In all,
Birdi and his colleagues concluded that adopting empowerment and extensive training was the
key to productivity. In our view, the implication that empowerment alone is best practice is
misleading, since a clear operational focus can be critical to its success. Nonetheless, they also
argued that “there is no practice that does not appear to have some effect when combined with
one or more practices” (Birdi et al., 2008: 496). We cannot directly compare the size of effects,
due to sampling variations in the models. There is no evidence, according to them, to suggest
that firms using any of the seven practices without an individual effect on productivity should
stop adopting them. Hence, they seem to have recommended that practices should be used as a
package, in spite of some having larger effects. In our results, as indicated by the gaps between
the curves of each cluster in Figure 2d, the estimated probabilities of adopting practices in
different clusters suggest that empowerment and teamwork may discriminate between medium-
and high-usage firms, whereas supply-chain partnership may discriminate at the bottom end. As
matter of fact, when we consider the higher-usage that we found to be the most productive
cluster, as illustrated in Table 3 in the last year studied (2003), all firms had introduced
37
empowerment and teamwork, while 15.6% had not introduced JIT and 4.6% had not introduced
supply-chain partnering.
We specifically examined whether there were sustainable effects by modeling the stages
of adoption. Based on the diffusion of each practice in the sample, we classified firms according
to when they adopted practices. The data unveiled three groups: early adopters, intermediate
adopters and late adopters. At the end of the period, intermediate adopters had not only caught
up with early adopters but were even making more use of practices, as we illustrate in table A2
where the actual use of practice by the different groups in different years is shown. In contrast
with 1990, when late and intermediate adopters rarely used the practices (median number of
practices used were respectively 0 and 1), in 2003 more practices were widespread in these
groups. Nevertheless, early adopters, a relatively small group (12.28% of the sample),
outperformed the others. This final result supports the initial claims that led to the spread of
quality management as a philosophy, which is that a cohesive management system and
continuous improvement can become sources of competitive advantage. It could be that some of
the early adopters in our sample were initially high performers, but since we controlled for
initial productivity and considered alternative models, we do have an indication of potential
first-mover’s advantage and long-lasting effects. It seems that benefits are sustainable over the
long term and thus we were unable to observe the productivity gains of the intermediate
adopters because their use of practices only caught up with early adopters near the end of the
period studied. This should be further investigated within the more encompassing concept of
lean production, and preferably beyond manufacturing. In which case, we would like to stress
the need for future longitudinal studies that include all elements of lean production, other factors
that may influence the learning experience, and the diffusion of management practices.
6. Conclusion

38
This is the first longitudinal study on the integration between OM and HRM practices and firm
performance in British manufacturing. It contrasts with previous work, which tended to
investigate potential effects of either individual practices or specific combinations, and focuses
on the association between practices and its link with productivity.
We argued that the integration of practices would reflect a managerial approach that
combines OM and HRM, as advocated in the quality management and lean production
literatures. Consequently, it is the integration of practices that would have the ability to achieve
multiple goals and result in superior firm performance. We used ordered restricted latent class
models to identify homogeneous clusters of firms and established a positive link with
performance. In addition, our analysis of the diffusion of each practice resulted in an alternative
classification that describes three stages of adoption, and we found that earlier integration is
indeed associated with performance. Overall, the benefits appear to be sustainable. An
integrated managerial philosophy is potentially a source of competitive advantage, highlighting
the importance of continuous improvement and learning that is often allied to the lean
production concept.
We lack information as to the extent of the use of practices and rely on single-item
measures, but generally our results are quite positive and give us insights into the potential
evolution of lean production in British manufacturing. Moreover, we rely on just one measure of
performance – productivity – though it may be more reliable than financial performance indices,
which are more likely to reflect several economic factors that cannot be controlled by any
individual company and thus lead to far more complex models. We regret not having access to
data on quality and lead-time, which in our view are key outcomes.
An additional limitation is the focus on core practices that are the most used in British
manufacturing and as such by the end of the study period are widespread in the sample. Yet our
results of a positive link between an integrated use of OM and HRM practices and performance
are consistent with more recent findings by academics and consultants based on a cross-section
39
of 730 manufacturing firms in France, Germany, the UK and the US (Bloom, Dorgan, Dowdy,
Rippin and Van Reenen, 2005). An index of 18 practices (OM and HRM) was positively
associated with productivity, return on capital employed, sales per employee, sales growth and
growth in market share. These findings should encourage future work on more detailed data that
would allow for multi-item measures of a wider range of practices and implementation.
In all, this research introduces a framework and statistical models that are not
traditionally used in empirical analysis of potential performance effects, but are fit to address the
integration of management practices in large samples. It gives evidence into the evolution of
core OM and HRM practices in British manufacturing and shows that integration, early adoption
and continuous improvement may be linked to organizational performance.
Acknowledgements
For giving access to the data, the authors are very grateful to Kamal Birdi, Chris Clegg,
Malcolm Patterson, Andrew Robinson and Toby Wall. The authors also thank for their
comments on previous versions, Canan Kocabasoglu-Hilmer, Mohan Sodhi, four anonymous
referees, and an anonymous associate editor.

40
References
Abdi, F., Shavarini, S., and Hoseini, S., 2006. Glean lean: how to use lean approach in services
industries?. Journal of Services Research 6, 191–206.
Abernathy, F., Dunlop, J., Hammond, J., and Weil, D., 2000. Control your inventory in a world
of lean retailing. Harvard Business Review, November/December, 169–176.
Anderson, J.C., Rungtusanatham, M., and Schroeder, R. 1994. A theory of quality management
underlying the Deming management method. Academy of Management Review 19 (3), 472–
509.
Andruff, H., Carraro, N., Thompson, A., Gaudreau, P., and Louvet, B., 2009. Latent class
growth modelling: a tutorial. Tutorials in Quantitative Methods for Psychology 5 (1), 11–24.
Arthur, J.B., 1994. Effects of human resource systems on manufacturing performance and
turnover. Academy of Management Journal 7, 670–687.
Bailey, T., 1993. Discretionary effort and the organization of work: Employee participation and
work reform since Hawthorne. Mimeo, Teachers College, Columbia University.
Balakrishnan, R., Linsmeier, T.J., and Venkatachalam, M., 1996. Financial benefits from JIT
adoption: Effects of costumer concentration and cost structure. The Accounting Review 71
(2), 183–205.
Bartholomew, D.J., and Knott, M.K., 1999. Latent Variable Models and Factor Analysis. 2nd
ed., Arnold, London.
Bartholomew, D.J., Steele, F., Moustaki, I., and Galbraith, J.I., 2002. The Analysis and
Interpretation of Multivariate Data for Social Scientists. Chapman & Hall/CRC, Boca Raton.
Becker, B.E., and Huselid, M.A., 2006. Strategic human resources management: Where do we
go from here?. Journal of Management 32 (6), 898–925.
Becker, G., and Gerhart, B., 1996. The impact of HRM on organizational performance: Progress
and prospects. Academy of Management Journal 39 (4), 779–801.

41
Beer, M., Spector, B., Lawrence, R., Mills, D., and Walton, R., 1984. Managing Human Assets.
The Free Press, New York.
Birdi, K., Clegg, C., Patterson, M., Robinson, A., Stride, C.B., Wall, T.D., and Wood, S.J.,
2008. The impact of human resource and operational management practices on company
productivity: A longitudinal study. Personnel Psychology 61, 467–501.
Bloom, N., Dorgan, S., Dowdy, J., Rippin, T., and Van Reenen, J., 2005. Management
practices: The impact on company performance. CentrePiece, summer issue, 2–6.
Bou, J.C., and Beltran, I., 2005. Total quality management, high-commitment human resource
strategy and firm performance: an empirical study. Total Quality Management 16 (1), 71–86.
Boudreau, J., Hopp, W., McClain, J.O., and Thomas, L.J., 2003. On the interface between
operations and human resources management. Manufacturing & Service Operations
Management 5 (3), 179–202.
Bryson, A., Gomez, R., Kretschmer, T., and Willman, P., 2007. The diffusion of workplace
voice and high-commitment human resource management practices in Britain, 1984–1998.
Industrial and Corporate Change 16 (3), 395–426.
Callen, J.L., Fader, C., and Krinsky, I., 2000. Just-in-time: A cross-sectional plant analysis.
International Journal of Production Economics 63 (3), 277–301.
Callen, J.L., Morel, M., and Fader, C., 2003. The profitability-risk tradeoff of just-in-time
manufacturing technologies. Managerial and Decision Economics 24, 393–402.
Capelli, P., and Neumark, D., 2001. Do 'high-performance' work practices improve
establishment-level outcomes?. Industrial Labor Relations Review 54 (4), 737–775.
Carter, J.R., and Narasimhan, R., 1996. Purchasing and supply chain management: future
directions and trends. International Journal of Purchasing and Materials Management 32 (1),
2–12.

42
Carter, P., Carter, J.R., Monczka, R.M., Slaight, T.H., and Swan, A.J., 2000. The future of
purchasing and supply: A ten year forecast. Journal of Supply Chain Management 36 (1), 14–
26.
Challis, D., Samson, D., and Lawson, B., 2002. Integrated manufacturing, employee and
business performance: Australian and New Zealand evidence. International Journal of
Production Research 40 (8), 1941–1964.
Chandler, G.N., and McEvoy, G.M., 2000. Human resource management, TQM, and firm
performance in small and medium enterprises. Entrepreneurship Theory and Practice 25 (1),
43–47.
Croon, M.A., 1990. Latent class analysis with ordered latent classes. British Journal of
Mathematical and Statistical Psychology 44, 315–331.
Cua, K.O., McKone, K.E., and Schroeder, R.G., 2001. Relationships between implementation
of TQM, JIT, and TPM and manufacturing performance. Journal of Operations Management
19 (2), 675–694.
Datta, D., Guthrie, J., and Wright, P., 2005. Human resource management and labor
productivity: Does industry matter?. Academy of Management Journal 48, 135–145.
Dean, J.W. Jr., and Bowen, D.E., 1994. Management theory and total quality: Improving
research and practice through theory development. Academy of Management Review 19 (3),
392–418.
Dean, J.W., and Snell, S.A., 1991. Integrated manufacturing and job design: Moderating effects
of organizational inertia. Academy of Management Journal 34 (4), 776–804.
Delery, J.E., and Shaw, J.D., 2001. The strategic management of people in work organizations:
Review, synthesis and extension. In: K.M. Rowland & G.R. Ferris (Eds.) Research in
Personnel and Human Resource Management, JAI Press, Greenwich CT, pp. 165–197.
Deming, W., 2000. Out of the Crisis: Quality, Productivity and Competitive Position.
Cambridge MA, The MIT Press.

43
Dennis, P., 2002. Lean Production Simplified. New York, Productivity Press.
DeSarbo, W.S., Di Benedetto, C.A., Jedidi, K., and Song, M., 2006. identifying sources of
heterogeneity for empirically deriving strategic types: A constrained finite-mixture
structural-equation methodology. Management Science 52 (6), 909–924.
Diamantopoulos, A., and Siguaw, J.A., 2006. Formative versus reflective indicators in
organizational measure development: A comparison and empirical illustration. British
Journal of Management 17 (4), 263–282.
Dow, D., Samson, D., and Ford, S., 1999. Exploding the myth: Do all quality management
practices contribute to superior quality performance?. Production and Operations
Management, 8 (1), 1–27.
Dwyer, G., 2002. Quality management initiatives and people management strategies.
International Journal of Quality and Reliability Management 19 (3), 524–539.
Easton, G.S., and Jarrell, S.L., 1998. The effects of total quality management on corporate
performance: An empirical investigation. Journal of Business 71 (2), 253–307.
Flynn, B.B., and Flynn, E.J., 2005. Synergies between supply chain management and quality
management: Emerging implications. International Journal of Production Research 43 (16),
3421–3436.
Flynn, B., Sakakibara, S., and Schroeder, R., 1995. Relationship between JIT and TQM:
Practices and performances. Academy of Management Journal 38 (5), 1325–1360.
Freitas, I.M.B., 2008. Sources of differences in the pattern of adoption of organizational and
managerial innovations from early to late 1990s in the UK. Research Policy 37 (1), 131–
148.
Fullerton, R.R., McWatters, C.S., and Fawson, C., 2003. An examination of the relationship
between JIT and financial performance. Journal of Operations Management 21 (4), 383–
404.
George, S., 1992. The Baldrige Quality System. Wiley, New York.

44
Goldstein, H., 2003. Multilevel Statistical Models. Third Edition. London, Edward Arnold.
Goodman, L.A., 1974. Simple models for the analysis of association in cross-classifications
having ordered categories. Journal of the American Statistical Association 74 (367), 537–
552.
Hart, C., and Schlesinger, L., 1991. Total quality management and the human resource
professional: Applying the Baldrige framework to human resources. Human Resource
Management 30 (4), 433–454.
Heinen, T., 1996. Latent class and discrete latent trait models: Similarities and differences. Sage
Publications, Thousand Oaks.
Hendriks, K.B, and Singhal, V.R., 2001. Firm characteristics, total quality management and
financial performance. Journal of Operations Management 19 (3), 269–285.
Hopp, W.J., and Spearman, M.L., 2004. To pull or not to pull: what is the question?
Manufacturing and Service Operations Management 6 (2), 133–148.
Huselid, M.A., 1995. The impact of human resource management practices on turnover,
productivity, and corporate financial performance. Academy of Management Journal 38 (3),
635–672.
Jung, T., and Wickrama, K.A.S., 2008. An introduction to latent class growth analysis and
growth mixture modeling. Social and Personality Psychology Compass 2 (1), 302–317.
Juran, J., 1993. Made in USA: A renaissance in quality. Harvard Business Review, July–
August, 42–50.
Kato, T., and Morishima, M., 2002. The productivity effects of participatory employment
practices: Evidence from new Japanese panel data. Industrial Relations 41 (4), 487–520.
Kaynak, H., 2003. The relationship between total quality management practices and their
effects on firm performance. Journal of Operations Management 21 (4), 405–435.
Kinney, M.R., and Wempe, W.F., 2002. Further evidence on the extent and origins of JIT’s
profitability effects. The Accounting Review 77 (1), 203–225.
45
Kollberg, B., Dahlgaard, J.J., and Brehmer, P., 2007. Measuring lean initiatives in health care
services: issues and findings. International Journal of Productivity & Performance
Management 56 (1), 7–24.
Koufteros, X.A., and Vonderembse, M.A., 1998. The impact of organizational structure on the
level of JIT attainment: Towards theory development. International Journal of Production
Research 36 (10), 2863–2878.
Kufidu, S., and Vouzas, F., 1998. Human resource aspects of quality management: Evidence
from MNEs operating in Greece. International Journal of Human Resource Management 9
(5), 818–830.
Lawler, E.E., Mohrman, S.A., and Ledford, G.E. Jr., 1995. Creating High Performance
Organizations. Jossey-Bass, San Francisco CA.
Lazarsfeld, P.F., and Henry, N.W., 1968. Latent Structure Analysis. Houghton-Mifflin, New
York.
Lewis, M., 2005. Research note: A dynamic programming approach to customer relationship
pricing. Management Science 51 (6), 986–994.
Li, S., Rao, S.S., Ragu-Nathan, T.S., and Ragu-Nathan, B., 2005. Development and validation
of a measurement instrument for studying supply management practices. Journal of
Operations Management 23 (6), 618–641.
MacDuffie, J.P., 1995. Human resource bundles and manufacturing performance:
Organizational logic and flexible production systems in the world auto industry. Industrial
and Labour Relations Review 48 (2), 197–221.
Martinez-Lorente, A., Dewhurst, F. and Dale, B., 1998. Total quality management: Origins and
evolution of the term. The TQM Magazine 10 (6), 378–386.
McCutcheon, A.C., 1987. Latent class analysis. Sage Publications, Beverly Hills.
Mehra, S., and Inman, A.R., 2004. Purchasing management and business competitiveness in the
coming decade. Production Planning and Control 15 (7), 710–718.

46
de Menezes, L.M., 1999. On fitting latent class models for binary data: The estimation of
standard errors. British Journal of Mathematical and Statistical Psychology 52 (2), 149–168.
de Menezes, L.M., and Wood, S., 2006. The reality of flexible work systems in Britain.
International Journal of Human Resource Management 17 (2), 106–138.
Muthén, B.O., 2001. Second-generation structural equation modeling with a combination of
categorical and continuous latent variables: New opportunities for latent class/latent growth
modeling. In: L.M.Collins & A. Sayer (Eds.), New Methods for the Analysis of Change,
American Psychological Association, Washington DC, pp. 291–322.
Muthén, B.O., 2004. Latent variable analysis: Growth mixture modelling and related techniques
for longitudinal data. In: D. Kaplan (Ed.), Handbook of Quantitative Methodology for the
Social Science, Sage Publications, Newbury Park CA, pp. 345–368.
Nahm, A., Vonderembse, M.A., and Koufteros, X., 2003. The impact of organizational structure
on time-based manufacturing and performance. Journal of Operations Management 21 (3),
281–306.
Nahm, A., Vonderembse, M.A., and Koufteros, X., 2004. The impact of organizational culture
on time-based manufacturing and performance. Decision Sciences 35 (4), 579–607.
Narasimhan, R., Swink, M., and Kim, S.W., 2004. Disentangling leanness and agility: An
empirical investigation. Journal of Operations Management 24 (5), 421–439.
Nesselroade, J.R., 1991. Interindividual differences in intraindividual change. In: L.A. Collins &
J.L. Horn (Eds.), Best Methods for the Analysis of Change, American Psychological
Association, Washington DC, pp. 92–106.
Ohno, T., 1988. Toyota Production System: Beyond Large Scale Production, Productivity Press,
Cambridge MA.
Parker, S., 2003. Longitudinal effects of lean production on employee outcomes and the
mediating role of work characteristics. Journal of Applied Psychology 88 (4), 620–634.

47
Patterson, M.G., West, M.A., and Wall, T.D., 2004. Integrated manufacturing, empowerment
and company performance. Journal of Organizational Behavior 25 (5), 641–665.
Powell, T.C., 1995. Total quality management as competitive advantage: A review and
empirical study. Strategic Management Journal 16 (1), 15–37.
Reed, R., Lemak, D.J., and Montgomery, J.C., 1996. Beyond process: TQM content and firm
performance. Academy of Management Review 21 (1), 173–202.
Rogers, E.M., 1983. Diffusion of Innovations. 3rd ed., Free Press, New York.
Rost, J., and Langeheine, R., 1997a. Applications of Latent Trait and Latent Class Models in the
Social Sciences. Waxmann, New York.
Rost, J., and Langeheine, R., 1997b. A guide through latent structure models for categorical
data. In: J. Rost & R. Langeheine (Eds.), Applications of Latent Trait and Latent Class
Models in the Social Sciences. Waxmann, New York.
Samson, D., and Terziovski, M., 1999. The relationship between total quality management
practices and operational performance. Journal of Operations Management 17 (5), 393–409.
Scherrer-Rathje, M., Boyle, T.A., Deflorin, P., 2009. Lean, take two! Reflections from the
second attempt at lean implementation. Business Horizons 52 (1), 79–88.
Shah, R., and Ward, P.T, 2003. Lean manufacturing: Context, practice bundles, and
performance. Journal of Operations Management 21 (2), 129–150.
Shah, R., and Ward, P.T., 2007. Defining and developing measures of lean production. Journal
of Operations Management 25 (4), 785–805.
Snell, S.A., and Dean, J.W., 1992. Integrated manufacturing and human resource management:
A human capital perspective. Academy of Management Journal 35 (3), 467–504.
Snell S.A., and Dean, J.W., 1994. Strategic compensation for integrated manufacturing: The
moderating effects of jobs and organizational inertia. Academy of Management Journal 37
(5), 1109–1140.

48
Spear, S., and Bowen, H.K., 1999. Decoding the DNA of the Toyota production system.
Harvard Business Review 77 (9), 97–106.
Swank, C., 2003. The lean service machine. Harvard Business Review 81 (10), 123–129.
Terziovski, M., Sohal, A., and Samson, D., 1996. Best practice implementation of total quality
management: Multiple cross-case analysis of manufacturing and service organizations.
Total Quality Management 7 (5), 459–482.
Vermunt, J.K., 1999. A general class of non-parametric models for ordinal categorical data. In:
M. Sobel & M. Becker (Eds.), Sociological Methodology 29, 187–224.
Vermunt, J.K., and Magidson, J., 2005. Technical Guide for LatentGold 4.0: Basic and
Advanced. Statistical Innovations Inc., Belmont MA.
Wall, T.D., and Wood, S.J., 2005. The romance of HRM and business performance, and the
case for big science. Human Relations 58 (4), 429–462.
Walton, M., 1986. The Deming Management Method. Pedigree, New York.
Wang, M., 2007. Profiling retirees in the retirement transition and adjustment process:
Examining the longitudinal change patterns of retirees’ psychological well-being.
Journal of Applied Psychology 92 (2), 455–474.
Waterson, P., Clegg, C.W., Bolden, R., Pepper, K., Warr, P.B., and Wall, T.D., 1999.
The use and effectiveness of modern manufacturing practices: A survey of UK
industry. International Journal of Production Research 37 (10), 2271–2292.
Wejnert, B., 2002. Integrating models of diffusion of innovations: A conceptual framework.
Annual Review of Sociology 28 (1), 297–326.
Wickens, P., 1987. The Road to Nissan: Flexibility, Quality, Teamwork. Macmillan,
Houndmills.
Womack, J., and Jones, D., 1994. From lean production to the lean enterprise. Harvard Business
Review 72 (1), 93–104.

49
Womack, J., Jones, D., and Roos, D., 1990. The Machine that Changed the World. Rawson,
New York.
Wood, S.J., 1996. How different are human resource practices in Japanese "transplants" in the
United Kingdom?. Industrial Relations 35 (4), 511–525.
Wood, S.J., and de Menezes, L.M., 1998. High commitment management in the UK: Evidence
from the Workplace Industrial Relations Survey, and Employers' Manpower and Skills
Practices Survey. Human Relations 51 (4), 485–515.
Wood, S.J., Stride, C.B., Wall, T.D., and Clegg, C.W., 2004. Revisiting the use and
effectiveness of modern management practices. Human Factors and Ergonomics in
Manufacturing 14 (4), 415–432.
Youndt, M.A., Snell, S.A., Dean, J.W., and Lepak, D.P., 1996. Human resource management,
manufacturing strategy, and firm performance. Academy of Management Journal 39 (4),
836–866.

1
Figure 1: Akaike Criterion – Latent Class Models
-200
-150
-100
-50
0
50
100
1980 1982 1984 1986 1988 1990 1992 1994 1996 1998 2000 2002
Year
Be
tter
fit<
---A
IC--
->W
ors
e fi
t
2-cluster model
3-cluster model

2
Figure 2a. Evolution of practice usage

3
Figure 2b: Evolution of cluster membership
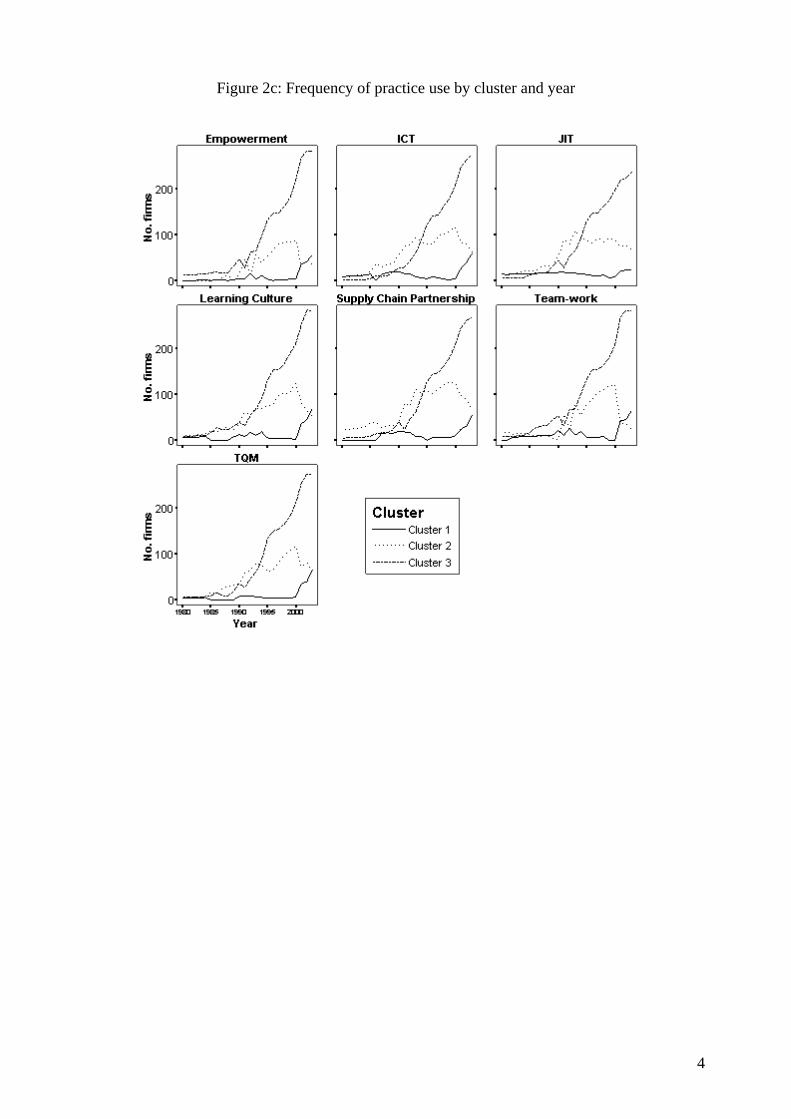
4
Figure 2c: Frequency of practice use by cluster and year

5
Figure 2d: Estimated probability of practice-use per Cluster
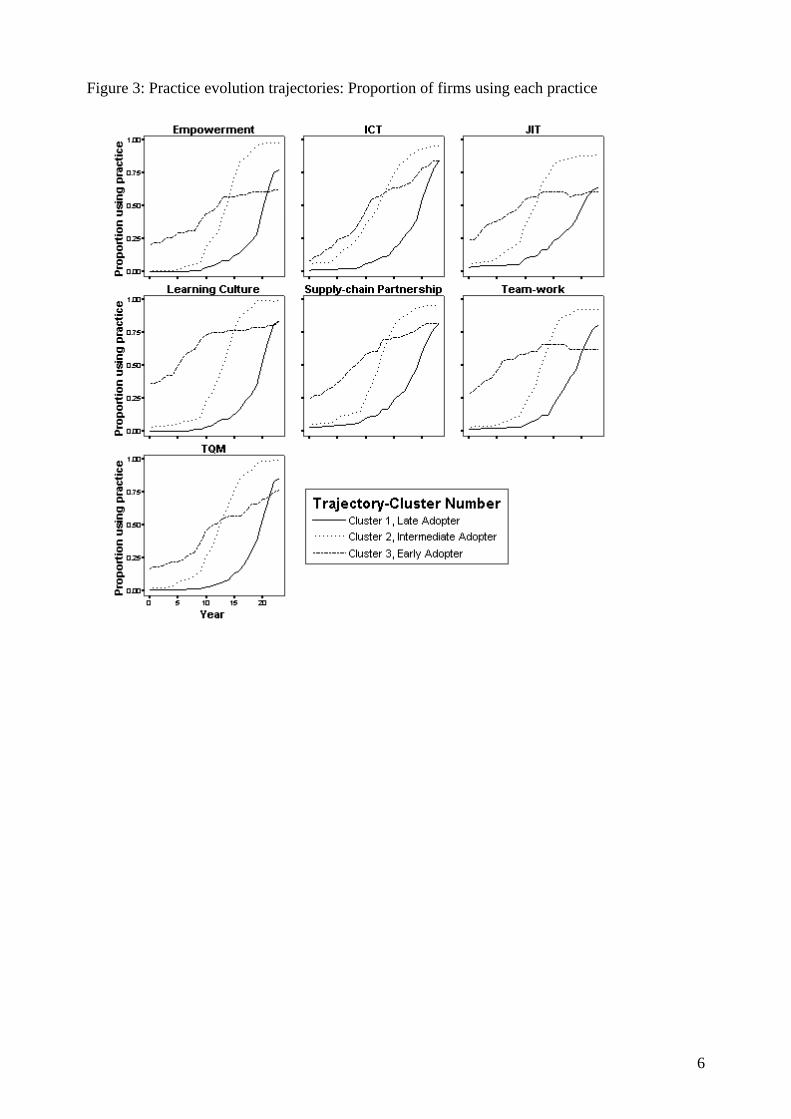
6
Figure 3: Practice evolution trajectories: Proportion of firms using each practice

Table 1: Methodological Summary Steps in Testing Propositions Goal Method Proposition 1 For each year of practice use data: 1. Test for association in practice use 2. Test for a common factor (latent variable that measures the integrated approach)
Establish evidence of integration and develop yearly measures Examine evidence for integration of OM and HRM practices Estimate the underlying construct (common factor) to be analyzed: Continuous Discrete (clusters of firms that similarly integrate practices)
Chi-square tests of independence Latent trait model (Bartholomew et al, 2002: 175–206)1 Latent class analysis (McCutcheon, 1987)2
Proposition 2 Test for a link between extent of integration and productivity
Establish link between integration and performance Continuous Estimate equation 1 if the common factor is continuous; Discrete Assess significance and identify the sign of the estimated coefficients for the common factor (cluster membership). In our case, a significant positive coefficient for the high usage cluster (or a significant negative coefficient for the low-usage cluster) indicates a positive link between combined practice use (integration) and productivity.
Linear two-level model (Goldstein, 2003) Level 1= firm, Level 2= time Dependent variable= productivity
Proposition 3 1. Estimate the evolution of each practice 2. Estimate the underlying evolution of all practices, using results from the previous stage as input
Establish evidence of evolution and classify firms according to their different stages Identify the evolutionary stages of each practice Identify stages of evolution of an integrated approach
Latent class growth analysis (Andruff et al, 2009)4 Latent class analysis
Proposition 4 Test for a link between stages of adoption and productivity
Establish a link between the identified stages and performance Estimate the linear model and assess the significance of the adoption stages
Linear model (GLM or OLS) Independent variable = evolution (trajectory class) Dependent variable = productivity
1 If the extent of practice use were available rather than binary indicators of practice use, standard factor analysis would be used. 2 If latent variable is ordinal, estimate an order-restricted model. 3 If latent variable is ordinal, estimate an order-restricted model. 4 Time (t=1 to 24) would have been the predictor of usage; we were unable to estimate the model and thus divided the 24 years in equal lengths (epochs) that we use as predictors.
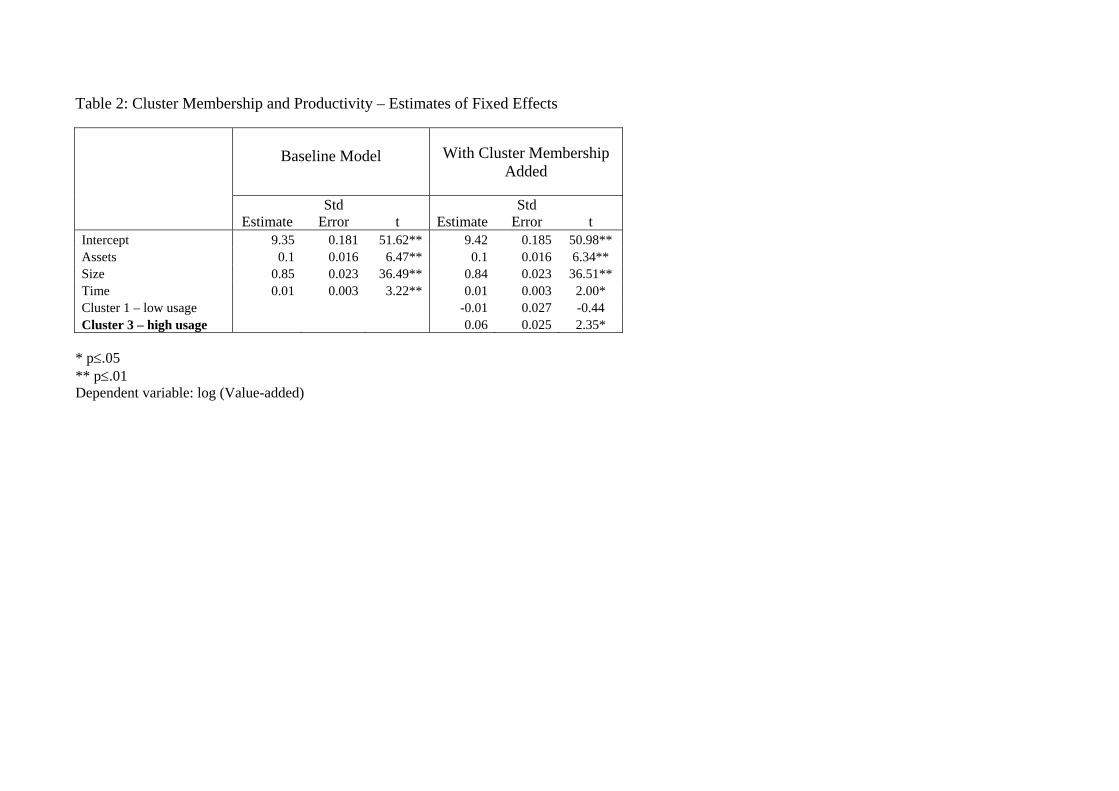
Table 2: Cluster Membership and Productivity – Estimates of Fixed Effects
Baseline Model
With Cluster Membership
Added
Estimate Std
Error t EstimateStd
Error t Intercept 9.35 0.181 51.62** 9.42 0.185 50.98** Assets 0.1 0.016 6.47** 0.1 0.016 6.34** Size 0.85 0.023 36.49** 0.84 0.023 36.51** Time 0.01 0.003 3.22** 0.01 0.003 2.00* Cluster 1 – low usage -0.01 0.027 -0.44 Cluster 3 – high usage 0.06 0.025 2.35*
* p≤.05 ** p≤.01 Dependent variable: log (Value-added)

Table 3: High-Usage Cluster 3 – Estimated Probabilities of Practice Use and Size Year
Practice 1980 1985 1990 1995 2000 2003Empowerment 0.84 0.70 0.71 0.95 0.98 1.00ICT 0.13 0.26 0.52 0.89 0.95 1.00JIT 0.42 0.50 0.70 0.94 0.90 0.84Learning Culture 0.67 0.74 0.62 0.94 0.96 0.99Supply-chain 0.39 0.42 0.62 0.93 0.96 0.95Teamwork 0.57 0.78 0.79 0.96 0.95 0.97TQM 0.46 0.35 0.54 0.96 0.97 0.98Size of Cluster 3 0.03 0.05 0.14 0.30 0.44 0.60

Table 4: Final Three-Class Solution based on the Evolution of Practice Use
Cluster (Trajectory)
Late adopter
Intermediate adopter
Early adopter
Cluster Size 46.8% 40.6% 12.6%
Management practice Growth class Probabilitya
Empowerment 1 0.29 0.87 0.25 2 0.69 0.06 0.40 3 0.01 0.07 0.36 ICT 1 0.36 0.64 0.39 2 0.61 0.08 0.25 3 0.03 0.28 0.36 JIT 1 0.61 0.10 0.37 2 0.12 0.63 0.25 3 0.23 0.20 0.02 4 0.04 0.07 0.36 Learning Culture 1 0.35 0.88 0.12 2 0.64 0.02 0.23 3 0.01 0.10 0.65 Supply-chain 1 0.42 0.79 0.26 2 0.53 0.06 0.22 3 0.05 0.15 0.52 Teamwork 1 0.70 0.38 0.01 2 0.11 0.55 0.26 3 0.17 0.03 0.36 4 0.02 0.04 0.37 TQM 1 0.37 0.82 0.31 2 0.62 0.04 0.33
3 0.02 0.15 0.36 a Probability of belonging to growth class conditional upon Cluster membership.

Table 5: Productivity and the Overall Evolution of Practice Use
Source Mean square F Partial Eta-square
(%) Corrected Model 41.3 181.8*** 87.9 Intercept 70.7 311.3*** 67.5 Initial Productivity 0.1 0.6 0.4 Value of assets 2.2 9.8** 6.1 Final size of workforce 45.9 202.0*** 57.4 Time (accounting year) 0.0 0.0 0.0 Trajectory class 0.8 3.3* 4.2 Error 0.2
Note: Dependent variable is log (Value-added) in the final accounting year. R-Sq=.88. *** p<.001 ** p≤.01 *p≤.05

Appendix - Table A1: Latent Class Growth Models
Estimated Regression Coefficients Practice Class
Intercept Epoch
R-square
Class Size
Empowerment 1 0.65 6.85 0.80 50.40% 2 0.43 3.68 0.51 40.60% 3 -1.08 1.63 0.40 9.00%
ICT 1 0.46 3.82 0.77 48.50% 2 0.13 5.89 0.64 34.50% 3 -0.59 4.88 0.59 17.00%
JIT 1 0.36 5.08 0.19 32.40% 2 0.30 6.48 0.82 30.40% 3 0.21 2.79 0.72 27.80% 4 -0.87 -2.52 0.06 9.40%
Learning Culture 1 0.52 6.96 0.80 48.80% 2 0.28 2.57 0.54 38.20% 3 -0.80 4.24 0.41 13.00%
Supply-chain 1 0.66 3.95 0.78 55.80% 2 0.03 5.56 0.53 29.60% 3 -0.68 4.39 0.39 14.60%
Teamwork 1 0.94 3.16 0.71 50.30% 2 0.38 6.43 0.86 28.50% 3 -0.35 1.42 0.01 13.80%
4 -0.97 -2.84 0.10 7.40% TQM 1 0.60 6.98 0.80 51.10%
2 0.30 3.02 0.57 37.60% 3 -0.90 4.46 0.58 11.30%

Table A2: Observed Percentage of Practice Use per Type of Adopter in Three Years of the Study
1980
1990
2003
Practice Late Intermediate Early Late Intermediate Early Late Intermediate Early Empowerment 0.00 2.72 20.00 2.87 18.48 43.64 77.03 97.28 69.09 ICT 0.48 4.89 7.27 5.74 35.87 45.45 84.21 95.65 87.27 JIT 2.87 5.98 23.64 9.57 35.33 54.55 63.64 88.04 65.45 Learning Culture 0.00 2.72 36.36 2.87 22.16 72.73 83.73 98.91 85.45 Supply-chain partnering 2.39 4.89 23.64 9.57 17.39 81.82 81.34 95.11 83.64 Teamwork 1.44 2.72 27.27 4.31 19.57 58.18 81.82 91.85 67.27 TQM 0.48 2.17 16.36 2.39 13.59 69.09 85.17 98.91 78.18 Mean No. of Practices 0.08 0.24 1.55 0.37 1.82 3.78 5.55 6.65 6 Median No. of Practices 0 0 1 0 1 4 6 7 6 Minimum No. of Practices 0 0 0 0 0 1 2 4 4 Maximum No. of Practices 2 3 6 4 7 7 7 7 7
Sample Size = 448; No. of Early Adopters = 55; No. of Intermediate Adopters = 184; No. of Late Adopters = 209.