malcolm baldrige national quality award application … · malcolm baldrige national quality award...
TRANSCRIPT

Malcolm Baldrige National Quality Award Application
2010
913 Gulf Breeze Parkway, Suite 6 • Gulf Breeze, FL 32561 • Office: 850-934-1099www.studergroup.com
Glossary of Terms and Abbreviations . . . . . . . . . . . . . . . . . . . . . . . . . . . . . . . . . . . . . . . . . . . . a – cP: Organizational Profile . . . . . . . . . . . . . . . . . . . . . . . . . . . . . . . . . . . . . . . . . . . . . . . . . . . . . . i – v Figure P .1-1 Evidence-Based LeadershipSM (EBL) Figure P .1-2 SG Healthcare Flywheel® Figure P .1-3 SG Mission, Vision and Values Figure P .1-4 SG Workforce Profile Figure P .1-5 SG Key Customer Groups and Requirements Figure P .2-1 Principal Success Factors Figure P .2-2 Key Strategic Advantages Figure P .2-3 Key Strategic Challenges Figure P .2-4 SG Performance Improvement System1: Leadership . . . . . . . . . . . . . . . . . . . . . . . . . . . . . . . . . . . . . . . . . . . . . . . . . . . . . . . . . . . . . . . 1 – 6 Figure 1 .1-1 Studer Group® Evidence-Based LeadershipSM System (EBL System) Figure 1 .1-2 Mechanisms to Deploy MVV Figure 1 .1-3 The SG Operational Flywheel Figure 1 .1-4 Key Communication & Engagement Methods Figure 1 .1-5 SG Performance Dashboard Figure 1 .2-1 SG Legal, Regulatory and Ethics Goals and Measures Figure 1 .2-2 Senior Leader Community Service2: Strategic Planning . . . . . . . . . . . . . . . . . . . . . . . . . . . . . . . . . . . . . . . . . . . . . . . . . . . . . . . . 6 – 12 Figure 2 .1-1 SG Strategic Planning Process Figure 2 .1-2 Strategic Plan Development Timeline Figure 2 .1-3 Inputs Used in the Strategic Planning Process Figure 2 .1-4 Key 3-Year Strategic Objectives & Annual Goals Figure 2 .2-1 SG Goal Cascade Process Figure 2 .2-2 Sample 90-Day Plan3: Customer Focus . . . . . . . . . . . . . . . . . . . . . . . . . . . . . . . . . . . . . . . . . . . . . . . . . . . . . . . . . 12 – 17 Figure 3 .1-1 SG Innovation Model Figure 3 .1-2 Support Mechanisms Figure 3 .1-3 SG Relationship Funnel Figure 3 .2-1 Customer Listening Methods Figure 3 .2-2 Complaint/Feedback Management Process4: Measurement, Analysis and Knowledge Management . . . . . . . . . . . . . . . . . . . . . . . . . . . 17 – 21 Figure 4 .1-1 SG Performance Review and Analysis Figure 4 .2-1 SG Find Knowledge Intranet Portal5: Workforce Focus . . . . . . . . . . . . . . . . . . . . . . . . . . . . . . . . . . . . . . . . . . . . . . . . . . . . . . . . 21 – 27 Figure 5 .1-1 Employee Listening Methods Figure 5 .1-2 Selecting and Retaining Talent System Figure 5 .1-3 Methods to Determine T&D Effectiveness Figure 5 .2-1 Goals and Measures Figure 5 .2-2 SG Key Benefits and Services6: Process Management . . . . . . . . . . . . . . . . . . . . . . . . . . . . . . . . . . . . . . . . . . . . . . . . . . . . .27 – 31 Figure 6 .1-1 SG Key Customer Processes Figure 6 .1-2 SG Business Operational and Support Processes Figure 6 .2-1 SG Work Process Design Figure 6 .2-2 Process Improvement Model7: Results . . . . . . . . . . . . . . . . . . . . . . . . . . . . . . . . . . . . . . . . . . . . . . . . . . . . . . . . . . . . . . . . 32 – 52
Table of Contents

Glossary of Terms and Abbreviations5 x 5: The 5 key process steps and up to 5 sub-steps used to design, document, manage, and analyze key work processes . Includes process requirements and measures
3 Question Exercise: Strategic planning tactic: top three strategic accomplishments; top three strategic shortfalls; three most important things learned since last session
ACCME: Accreditation Council for Continuing Medical Education
Account Leaders: Coach who has oversight and leadership responsibilities for a standalone hospital or large hospital system account
Admin: Administrative support staff; all employees excluding SG coaches and speakers
AHA: American Hospital Association
AIDETSM: Five fundamental steps to interacting with patients to anticipate and exceed expectations: Acknowledgement, Introduction, Duration, Explanation, Thank you
AMA: American Medical Association
AMCF: Association of Management Consulting Firms - represents diverse membership: large and small firms, traditional management consultants as well as providers of professional services, generalists and specialists, single-office firms along with multinational organizations; publish annual benchmark report on key operational metrics, highlighting performance and characteristics of top firms
AOS: Available onsite
ASTD: American Society for Training and Development
ASQ: American Society for Quality
AUPHA: Association of University Programs in Healthcare Administration
BD: Business Development
Big Rocks: Key strategic priorities
Bright Ideas: New ideas or innovations
Callidus Software Support: Leading software provider which also offers technical support and services for software solutions
CDI: Coach Development Institute; two day learning session focused on providing training and development to the coaching division
CEO: Chief Executive Officer
CFO: Chief Financial Officer
CNO: Chief Nursing Officer
CME: Continuing Medical Education
CMO: Chief Medical Officer
CMS: Centers for Medicaid and Medicare Services
Comparison #1: Training consulting firm which emphasizes practical principles and processes
Competitor #1: Provider of performance improvement services to the healthcare sector
Competitor #2: a performance improvement firm within the healthcare industry
Connect to Purpose: Relating a practice, idea or experience to the organizational MVV
CRM: Customer Relationship Manager software
Cross Departmental: Involving more than one department or division
Dashboard: Document used to capture, track, measure, and report key metrics and results
DCM: Discharge Call Manager™ - a software program that facilitates follow-up phone calls with discharged patients (Solution retired in 2010)
Debbie Connected: Monthly operational update and training session conducted by Senior Leader /Operations Leader Debbie Ritchie
Department: Operational area led by an administrative leader – Finance, Human Resources, IT, PRC
Division: Operational area led by a Senior Leader – Business Development, Coaching, Institutes, Marketing, Operations, Research & Development, Speaking, Solutions
DS: Deployment System (Tenrox)
E-Topaz: International company providing support to corporate travel management professionals
E-Hosting Index: Webpage that allows for comparisons with other uptimes of major US and UK web hosting services
EAS: Employee Attitude Survey
EBL: Evidence-Based LeadershipSM – Systematic process used to coach and educate healthcare organizations in aligning goals, aligning behaviors and aligning processes
ED: Emergency Department
EST: Environmental Stewardship Team
External Customer: Individuals and/or organizations outside SG who depend on SG for services or products
Find Knowledge: SG’s online repository for intellectual capital, standardized resources and best practices; housed within SG’s portal (an intranet)
GB: Gulf Breeze, Florida
Harbourtown: Office complex in Gulf Breeze, FL where corporate office is located
HardwiredSM: A fully deployed and integrated action or process to achieve consistent and sustained results; to deploy in a consistent manner
HCAHPS: Hospital Consumer Assessment of Healthcare Providers and Systems . Survey for public reporting of major areas of hospital performance to support consumer choice; the first national, standardized, publicly reported survey of patients’ perspectives of hospital care

Glossary of Terms and AbbreviationsHE: Hardwiring Excellence - Book by Quint Studer outlining the SG Healthcare Flywheel® and best practices for improved clinical outcomes currently in its fourth printing with approximately 450,000 copies sold
Healthcare Flywheel®: Teaching tool/diagram illustrating the power that Purpose, Passion, To-Do’s and Results has in creating momentum; developed to help organizations understand the journey in creating great places for employees to work, physicians to practice, and patients to receive care
HML: highmiddlelow® - Strategy for improved employee evaluation and development
HR: Human Resources
HR.com: Large online community of human resource professionals, articles and tools
Idea Express™: Software application allowing employees to electronically enter innovative ideas and SG to track and report implementation status
IHI: Institute for Healthcare Improvement
Initiative Champion: Designated employee to lead implementation of tactic or special initiative at partner organization related to their work with Studer Group
Institute: Training and development educational event
Intellectual Capital (IC): Knowledge assets to achieve business results . In addition to products, IC includes employee knowledge, evidence-based practices and results, processes, and innovations . Primary IC is hardwiring of EBL
Internal Customer: Individuals inside SG who depend on a co-worker to produce or deliver service or support
IP: Inpatient
Interdepartmental Survey (IDS): Internal customer satisfaction survey of support services
IT: Information Technology
Largest Partners, by Contract Size: 20% of partners representing 80% of revenue
Leader: Person responsible for a department, product or service line, TEAM or group of employees . Leaders may or may not have supervisory responsibilities
LEM: Leader Evaluation Manager™ - Web-based performance management software system
KPI: Key Performance Indicators source/library for best practices and measures among peers
LEAN: Process methodology to create more value for customers with fewer resources
LEP: Leader Evaluation Process - Standardized accountability process for setting and achieving organizational and leader goals under a 6 pillar framework . SG uses for goal setting and performance review
Linkage: Connection and validation between what is taught and applied post-training
LT: Long term
Manage Up: Positioning others in a positive light; form of communication to acknowledge, reward and recognize the positive contributions and/or attributes of others
MBNQA Quest: Malcolm Baldrige National Quality Award annual conference
MBS: Management by Strengths - program designed to help companies increase productivity, improve customer satisfaction and employee morale through an improved understanding of how to work more effectively together
Monthly Meeting Model: Monthly supervisory meeting using standardized agenda
Must Haves®: Specific actions and “to-do’s” based on the Nine Principles® to align goals, behaviors and processes, and to hardwire best practices in partner organizations
MVV: Mission, Vision and Values
N & B: Nuts & Bolts - Institute serving Emergency Department personnel
Nine Principles®: Studer Group Intellectual Capital that are the foundation for operational excellence
NQF: National Quality Forum
OFI: Opportunity for Improvement
Partner: Active contractual agreement/engagement with SG
PCM: Patient Call Manager™ – Software program to accelerate and improve clinical outcomes and perception of care, harvest recognition and improve patient compliance
PD: Process Design
Peer Interview: Screening for cultural fit by peers with similar responsibilities and close interface post-hire
PI: Process Improvement
Pillar: Foundation and framework upon which the organizational goals and evaluations are structured . SG 6 Pillars include: Service, People, Quality, Finance, Growth, and Community
Pinnacle III Corp: Company which offers financial consulting services, such as billing solutions
PI: Process improvement
PRC: Partner Relations Coordinator - SG employees whose main function is to serve SG partners by supporting coaches; PRCs handle logistical details, find and share intellectual capital, and provide other essential coach and partner support
Preceptor: Mentor and teacher for new SG coaches
RED - Rapid Enterprise Development™: Process to enable an agile and adaptive strategy given changing environment; to optimize three important dimensions of performance – strategy, people and execution – in a coordinated manner
Rounding for Outcomes: Communicating with employees, physicians and/or patients in such a way that there is a specific purpose to walk away with specific outcomes
SG: Studer Group

Glossary of Terms and AbbreviationsSG portal: Intranet portal used as repository for intellectual capital and internal information
SLG: Senior Leader Group; Studer Group senior leaders
SLS: Senior Leader Survey – Annual survey of senior leaders in partner organizations
Solutions: Software products, primarily DCM (retiring in 2010), LEM and PCM
SPG: Strategic Planning Group; internal participants in the strategic planning process
Sperduto & Associates: Firm of corporate psychologists and management consultants focused on helping organizations select, develop, understand, and organize human resources . Administrator of Annual EAS
SPI: Service Performance Insight – Firm specializing in business optimization and transformation for management consulting firms; conducts performance benchmarking on over 200 top firms
SPP: Strategic Planning Process
ST: Short term
Strategic Screening Matrix: Tool used to evaluate new product concepts against specific, weighted criteria related to strategic fit, customer needs, market attractiveness, feasibility and financial requirements
Stoplight Report: Monthly color coded communication tool of green (action taken), yellow (action pending), and red (no action taken) to report progress on departmental opportunities
Studerville Update: Monthly operational update of progress to goal reported by Pillar
Success Sharing: Profit share disbursement aligned to tenure
Supervisor: Person who has oversight of another worker or direct
report
Target Corp: National retail store largely recognized for its efforts in charitable giving
TEAM: Total Engagement and Measurable Success - group of SG employees working together
Tenrox: Deployment System; Web-based software for managing coach capacity (deployed days)
Tokens of Appreciation: Peer-to-peer recognition with leader approval using hand-written or electronic notes to acknowledge behavior in support of MVV and Standards
TYYO: Taking You and Your Organization to the Next Level; Institute focused on teaching EBL
VOC: Voice of the Customer
VPN: Virtual Private Network; an online private data network
WRIHC: What’s Right In HealthcareSM – Annual national peer-to-peer learning conference bringing healthcare organizations together to share ideas proven to make healthcare better
WWGO: Weekly What’s Going On – Weekly coach communication sent by the coach administrative leader
i
Preface: Organizational ProfileOrganizational DescriptionOrganizational EnvironmentP.1a(1) This application to the Baldrige National Quality Program is more than a technical response to criteria for excellence . It is a story about purpose and belief that the obligation of leadership is to lead in ways that maximize human potential . It is also a call-to-action for our company and the healthcare industry—that we can and will do better, in ways that help to ensure every patient, every time receives compassionate care from engaged, appreciated, knowledgeable professionals . This is the belief of Quint Studer and the highly empowered and industry-changing company he founded . It is a belief that has led to our innovative and successful approach to help the healthcare industry accelerate its pace of improvement, by rekindling the indefatigable passion that drew healthcare professionals into their roles, and focusing that passion on implementing and hardwiringSM tactics proven to make healthcare better .
Our quest to make healthcare better began in 1999 when Quint Studer found himself at a crossroads . As president of a successful hospital, he was increasingly in demand as a speaker and advisor to organizations nationwide seeking to duplicate the transformational results he and his team had achieved .
He decided to heed what he describes as a personal calling to make a bigger difference in healthcare . Because he had tested and honed the skills and tools that were effective during his tenure as an executive at several organizations, he believed that exceptional service and operational excellence could be hardwiredSM to bring about positive and sustainable results .
As a result, Quint formed Studer Group® (SG), a private, for-profit, healthcare consulting firm devoted to coaching and teaching evidence-based tools and tactics that organizations use to create and sustain cultures of service and operational excellence . Today, SG is nationally recognized as an industry leader that accelerates the results of healthcare organizations nationwide . Some examples of impact include:• SG has partnered to provide coaching and Solutions to more
than 700 partners and 4 Baldrige healthcare recipients . • SG delivers more than 450 annual speaking engagements,
reaching more than 100,000 participants . • Over the past five years, SG has hosted an average of 17
educational events, attended by over 25,000 individuals since 2006 .
• SG authors have published 18 titles, several of which are used as core textbooks for education in healthcare administration .
• The SG website draws more than 200,000 unique annual visits from more than 150 countries and counts more than 100,000 registered users (doubled over the past 2 years) .
• SG has experienced solid growth since its formation in 1999
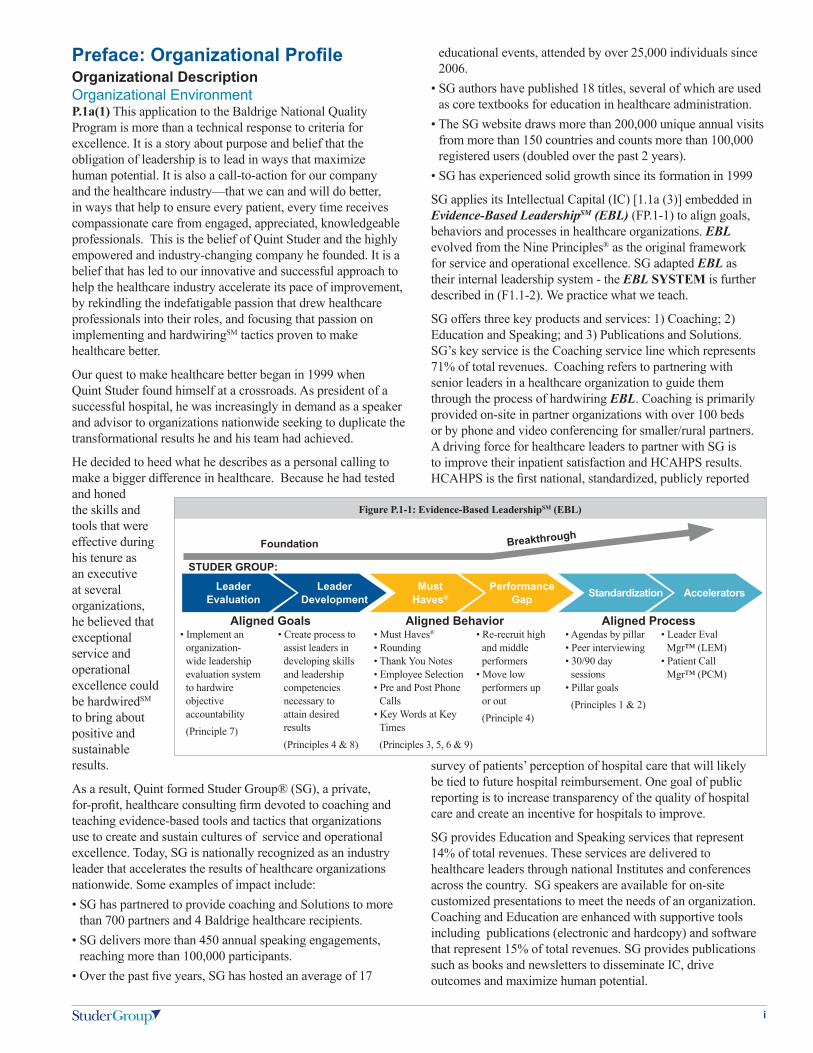
SG applies its Intellectual Capital (IC) [1 .1a (3)] embedded in Evidence-Based LeadershipSM (EBL) (FP .1-1) to align goals, behaviors and processes in healthcare organizations . EBL evolved from the Nine Principles® as the original framework for service and operational excellence . SG adapted EBL as their internal leadership system - the EBL SYSTEM is further described in (F1 .1-2) . We practice what we teach .
SG offers three key products and services: 1) Coaching; 2) Education and Speaking; and 3) Publications and Solutions . SG’s key service is the Coaching service line which represents 71% of total revenues . Coaching refers to partnering with senior leaders in a healthcare organization to guide them through the process of hardwiring EBL . Coaching is primarily provided on-site in partner organizations with over 100 beds or by phone and video conferencing for smaller/rural partners . A driving force for healthcare leaders to partner with SG is to improve their inpatient satisfaction and HCAHPS results . HCAHPS is the first national, standardized, publicly reported
survey of patients’ perception of hospital care that will likely be tied to future hospital reimbursement . One goal of public reporting is to increase transparency of the quality of hospital care and create an incentive for hospitals to improve .
SG provides Education and Speaking services that represent 14% of total revenues . These services are delivered to healthcare leaders through national Institutes and conferences across the country . SG speakers are available for on-site customized presentations to meet the needs of an organization . Coaching and Education are enhanced with supportive tools including publications (electronic and hardcopy) and software that represent 15% of total revenues . SG provides publications such as books and newsletters to disseminate IC, drive outcomes and maximize human potential .
• Implement an organization-wide leadership evaluation system to hardwire objective accountability
(Principle 7)
• Create process to assist leaders in developing skills and leadership competencies necessary to attain desired results
(Principles 4 & 8)
• Must Haves®
• Rounding• Thank You Notes• Employee Selection• Pre and Post Phone
Calls• Key Words at Key
Times (Principles 3, 5, 6 & 9)
• Re-recruit high and middle performers
• Move low performers up or out
(Principle 4)
• Agendas by pillar• Peer interviewing• 30/90 day
sessions• Pillar goals (Principles 1 & 2)
• Leader Eval Mgr™ (LEM)
• Patient Call Mgr™ (PCM)
Aligned Goals Aligned Behavior Aligned Process
Leader Evaluation
Leader Development
Must Haves®
Performance Gap Standardization Accelerators
Figure P.1-1: Evidence-Based LeadershipSM (EBL)
Foundation Breakthrough
STUDER GROUP:
ii
SG offers two key software Solutions . The innovative Leader Evaluation ManagerTM(LEM) software is used to automate the first component of EBL—SG’s proprietary Leader Evaluation Process (LEP) . LEM is the core alignment tool for partners . Patient Call ManagerTM (PCM), SG’s newest Solution, is used to create process efficiencies via the automation of key functions and aggregates reports, giving leaders information that is key to process management . Discharge Call MangerTM (DCM), a software tool to automate the discharge phone call process, was first introduced in 2006 and is being retired in 2010 .
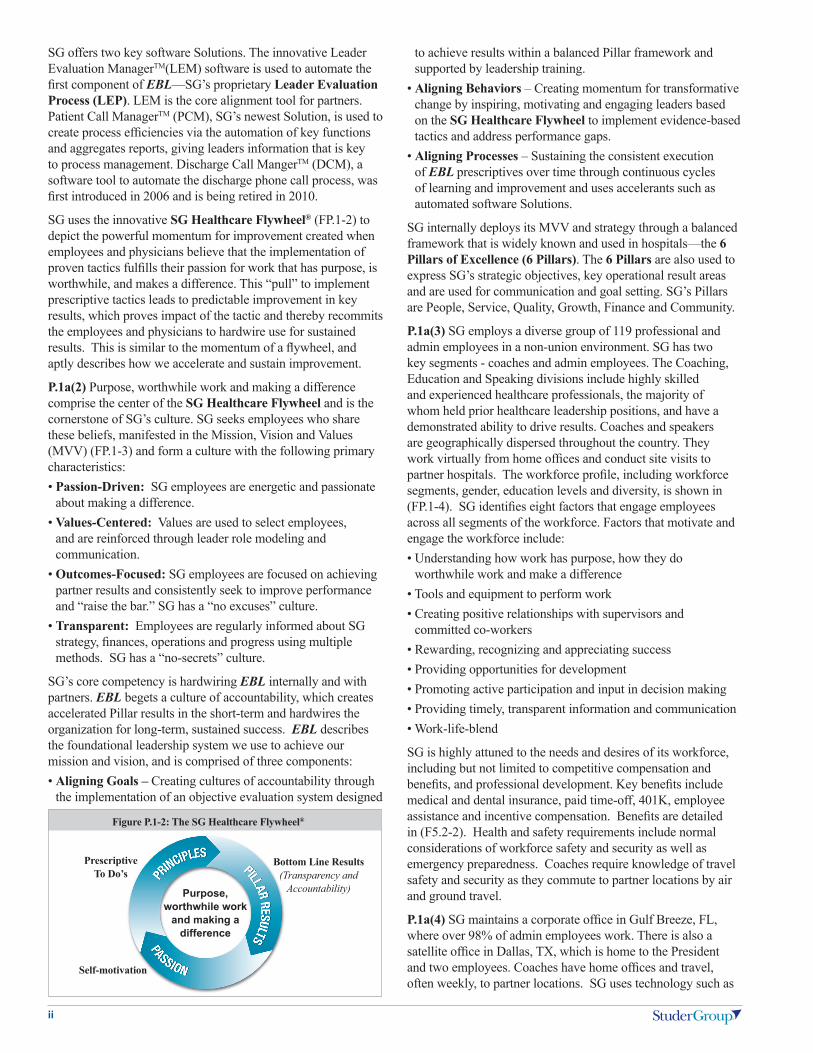
SG uses the innovative SG Healthcare Flywheel® (FP .1-2) to depict the powerful momentum for improvement created when employees and physicians believe that the implementation of proven tactics fulfills their passion for work that has purpose, is worthwhile, and makes a difference . This “pull” to implement prescriptive tactics leads to predictable improvement in key results, which proves impact of the tactic and thereby recommits the employees and physicians to hardwire use for sustained results . This is similar to the momentum of a flywheel, and aptly describes how we accelerate and sustain improvement .
P.1a(2) Purpose, worthwhile work and making a difference comprise the center of the SG Healthcare Flywheel and is the cornerstone of SG’s culture . SG seeks employees who share these beliefs, manifested in the Mission, Vision and Values (MVV) (FP .1-3) and form a culture with the following primary characteristics:• Passion-Driven: SG employees are energetic and passionate
about making a difference .• Values-Centered: Values are used to select employees,
and are reinforced through leader role modeling and communication .
• Outcomes-Focused: SG employees are focused on achieving partner results and consistently seek to improve performance and “raise the bar .” SG has a “no excuses” culture .
• Transparent: Employees are regularly informed about SG strategy, finances, operations and progress using multiple methods . SG has a “no-secrets” culture .
SG’s core competency is hardwiring EBL internally and with partners . EBL begets a culture of accountability, which creates accelerated Pillar results in the short-term and hardwires the organization for long-term, sustained success . EBL describes the foundational leadership system we use to achieve our mission and vision, and is comprised of three components:• Aligning Goals – Creating cultures of accountability through
the implementation of an objective evaluation system designed
to achieve results within a balanced Pillar framework and supported by leadership training .
• Aligning Behaviors – Creating momentum for transformative change by inspiring, motivating and engaging leaders based on the SG Healthcare Flywheel to implement evidence-based tactics and address performance gaps .
• Aligning Processes – Sustaining the consistent execution of EBL prescriptives over time through continuous cycles of learning and improvement and uses accelerants such as automated software Solutions .
SG internally deploys its MVV and strategy through a balanced framework that is widely known and used in hospitals—the 6 Pillars of Excellence (6 Pillars) . The 6 Pillars are also used to express SG’s strategic objectives, key operational result areas and are used for communication and goal setting . SG’s Pillars are People, Service, Quality, Growth, Finance and Community .
P.1a(3) SG employs a diverse group of 119 professional and admin employees in a non-union environment . SG has two key segments - coaches and admin employees . The Coaching, Education and Speaking divisions include highly skilled and experienced healthcare professionals, the majority of whom held prior healthcare leadership positions, and have a demonstrated ability to drive results . Coaches and speakers are geographically dispersed throughout the country . They work virtually from home offices and conduct site visits to partner hospitals . The workforce profile, including workforce segments, gender, education levels and diversity, is shown in (FP .1-4) . SG identifies eight factors that engage employees across all segments of the workforce . Factors that motivate and engage the workforce include: • Understanding how work has purpose, how they do
worthwhile work and make a difference• Tools and equipment to perform work• Creating positive relationships with supervisors and
committed co-workers• Rewarding, recognizing and appreciating success• Providing opportunities for development• Promoting active participation and input in decision making• Providing timely, transparent information and communication• Work-life-blend
SG is highly attuned to the needs and desires of its workforce, including but not limited to competitive compensation and benefits, and professional development . Key benefits include medical and dental insurance, paid time-off, 401K, employee assistance and incentive compensation . Benefits are detailed in (F5 .2-2) . Health and safety requirements include normal considerations of workforce safety and security as well as emergency preparedness . Coaches require knowledge of travel safety and security as they commute to partner locations by air and ground travel .
P.1a(4) SG maintains a corporate office in Gulf Breeze, FL, where over 98% of admin employees work . There is also a satellite office in Dallas, TX, which is home to the President and two employees . Coaches have home offices and travel, often weekly, to partner locations . SG uses technology such as
Figure P.1-2: The SG Healthcare Flywheel®
Purpose, worthwhile work
and making a difference
Prescriptive To Do’s
Self-motivation
Bottom Line Results(Transparency and
Accountability)

iii
cell phones, PDA’s and email to stay connected . All employees have computers and coaches have PDA’s and/or cell phones to provide timely access and connectivity . The SG website is content-rich for employees, partners and customers . The SG Portal is a key workforce communication tool given that 52% of SG employees are virtual . SG maintains servers at its FL location, while the public-access website and SG Solutions are housed at an external hosting company in Dallas, TX .
P.1a(5) As a Florida LLC consulting company, SG has regulatory requirements that include occupancy licenses, EEOC, OSHA ADA, HIPAA, the Accreditation Council for Continuing Medical Education (CME), the IRS, copyright laws and TSA requirements for travelers .
Organizational RelationshipsP.1b(1) SG is private company with no board of governors . SG is owned by two partners – the CEO, Quint Studer, and the President, BG Porter – majority and minority owners of the company, respectively . A commitment agreement between the owners describes the working relationship . The CEO is a thought leader, harvesting IC and serving as an author and speaker . The President reports to the CEO . His direct reports include senior leaders with clearly defined roles in a divisional, centralized structure
(see Organizational Chart) . Together, the President and Senior Leadership Group (SLG) have management responsibility for SG . Additionally, the Strategic Planning Group (SPG) is a formalized structure through which owners get input to short- and long-term SG strategic planning .
P.1b(2) SG’s key customer groups are shown in (FP .1-5) . SG describes partners as those healthcare organizations who have an active agreement (contract) for coaching . The key clients at partner organizations are the CEO and SLG which include the CNO, CFO, COO and Initiative Champion . SG has evidence to support that an organization will have difficulty achieving and sustaining improvements without the strong commitment of its senior leaders . In fact, SG only partners with organizations in which senior leaders are committed to the engagement through active participation in leadership development and accountability systems . To reinforce the intent, and in alignment with SG’s integrity and desire to exceed expectations, SG provides a money-back guarantee in all contracts that the partnership will produce results . SG serves its customers through delivery methods other than coaching . Customers are those who attend education events, schedule speakers and/or purchase Solutions or publications . Additionally, SG has two key market segments—hospitals with over 100 beds (which represent 94% of SG coaching revenue) and small, rural hospitals with under 100 beds that represent 4% of SG coaching revenue . SG refers to larger hospitals as EBL partners and smaller hospitals as rural partners . EBL and rural segments account for 60% of coaching revenue; 22% from renewals; 16% from new business and 2% from ED coaching .
Figure P.1-3: SG Mission, Vision and Values
Studer Group MissionTo make healthcare a better place for employees to work, physicians to practice medicine and patients to receive care . (We define mission success based on how our customers are evaluated by their customers – the ultimate measure of a healthcare organization is its patients’ perception of their care. This high bar inextricably aligns us with the long-term success of our partners.)
Studer Group VisionTo be the intellectual resource for healthcare professionals, combining passion with prescriptive actions and tools, to drive outcomes and maximize the human potential within each organization and healthcare as a whole .
Studer Group Core Values• Teamwork: Respectfully caring for each other and those we serve• Respect: Humility in our successes and grace in our challenges• Integrity: Honesty and integrity in all our interactions• Generosity: Being thankful for and sharing our opportunities and
blessings• Learning: Passionately pursuing making a difference in healthcare by
being a lifelong learner• Measurable Achievement: Achieving partner and Studer Group
outcomes using evidence-based practices, innovative technologies and other improvement methodologies
Standards of Behavior• Commitment to Co-Workers• Personal Conduct/Attitude• Appearance• Communication• Mentoring
• Professional/Personal Development
• Sense of Ownership• Commitment to Partners• Commitment to Community• Managing Up
Figure P.1-4: SG Workforce Profile
SG Staff ProfileSegments Admin staff 55%, coaches 45 %
Gender Female 77% , male 23%
Education Bachelor’s degree 41 .2%, Graduate degree 39 .5%, Associate degree 9 .3%, High school 9%
Ethnicity Caucasian 91%, African-American 7%, Other 2%
Employment Virtual staff 52%, 87% full-time, 13% part-time, Status 24 sub contractors Exempt 73% non-exempt 27%
Figure P.1-5: SG Key Customer Groups and Requirements
ProductCoaching
Education
Speaking
Solutions
Publications
Customer GroupPartners – CEO’s and key senior leaders
Customers that attend events
Customers who book speaking engagements
Customers and partners who use software
Customers and partners
Results• 7 .1-1 -14• 7 .2-4
• 7 .1-15 -18• 7 .2-8
• 7 .1-19• 7 .2 - 9
• 7 .1-20 -21• 7 .2-10
• 7 .3-15
Requirements• Effective tactics that drive patient
satisfaction results• Coach who provides value and is aligned
with priorities
• Learning objectives met• Value
• On time materials and quality• Courtesy and responsiveness when booking
• Applied Learning and quality of training• Value of Solutions
• Access to IC and quality of training

iv
P.1b(3) SG has two types of suppliers . Strategic suppliers (called partners in the eligibility form) provide key services in the areas of strategy facilitation, public relations and software support and development of Information Technology (IT) . SG uses an outside facilitator to help implement the innovative Rapid Enterprise Development™ (RED) planning methodology that helps firms respond more quickly to changes in the marketplace and build alignment and commitment at all levels . Suppliers provide non-strategic, commodity, support services, examples include: financial and legal service, products, supplies, and publishing suppliers . Technology suppliers assist SG in website development and IT hardware maintenance and storage . SG contracts with several key hotel suppliers to host events and conferences . Requirements include quality, cost and service including timeliness and responsiveness . SG communicates with suppliers directly in meetings, via email, by telephone and through contractual relationships .
Organizational SituationCompetitive EnvironmentP.2a(1) SG has helped over 700 healthcare organizations achieve and sustain service and operational outcomes through EBL using a breadth of products and services . This represents approximately 10% of total US healthcare organizations . Additionally, hundreds of organizations and thousands of individual leaders have been impacted by SG’s education, speaking and publishing resources . SG partners are located across the country with the majority located in the southeast and along the east coast . SG’s reputation in healthcare has been enhanced with the publication of Quint Studer’s first book, Hardwiring Excellence, a widely distributed industry bestseller now used as a text in several healthcare administration programs . SG is recognized for contributing to excellence through the development and often times free dissemination of IC and best practices, as well as through the hardwiring of EBL tactics .
SG competes in a fragmented market comprised of consulting firms and organizations that choose to “do it yourself” with internal staff . SG has no single competitor that has comparable offerings . SG is the largest and most respected company that healthcare leaders look to for assistance in improving their ultimate outcome measures of patient satisfaction . In the current economic crises, competition is fierce as hospitals are scrutinizing how to spend their limited budget dollars .
SG works with leading healthcare organizations, as reflected in the number of MBNQA recipients who are SG partners as well as the number that use SG tactics . SG’s reputation for success encourages organizations to collaborate with SG and result in innovative research, development of IC and creation of products and services that enable partners to achieve their requirements .
P.2a(2) The principal factors that determine the success of SG are shown in (FP .2-1) . It is crucial for SG to continue to provide EBL tools and tactics to our partner organizations in order to drive results . To fulfill its mission, SG must create and sustain relationships and engage customers and partners in order to differentiate SG from competitors and to maintain the positive reputation it enjoys today . The competitive situation, increasing consumer demands, and changing payer policies
are requiring healthcare organizations to discover and rapidly incorporate more effective methods for providing service and operational excellence into their organizations . SG’s robust Strategic Planning Process (SPP) includes early identification of external trends that impact our partners and customers, and helps SG to be agile in creating innovative solutions to address changing industry needs .
Changes in the competitive environment include the current economic crisis that began in 2008 and continues today . Many hospitals across the country are significantly impacted by declining volume and reimbursements, and are challenged to balance the needs of their stakeholders . The trend toward pay-for-performance and public reporting of clinical outcomes and patient perception of care data is creating a sense of urgency with healthcare leaders to improve results .
P.2a(3) SG compares its performance using a variety of data sources . Key sources include: Sperduto & Associates, employee satisfaction and engagement; Hay Group, salaries and benefits analysis; Association of Management Consulting Firms (AMCF), an international association of management consulting firms; previous Baldrige recipients, and the MBNQA Quest for Excellence Conference .
Information on competitors is obtained through two-way conversations with partners and employees, publicly available information and published financial reports of public companies . Other sources of comparative data come from patient satisfaction survey vendors used by SG partners .
Strategic ContextP.2b The key business, human resource, operational and sustainability strategic advantages and challenges are shown in (FP .2-2) (FP .2-3) .
Performance Improvement SystemP.2c The Baldrige Criteria for Performance Excellence are used as SG’s roadmap and framework for performance improvement . Through our systematic use and integration of the Baldrige Criteria, four feedback reports and two national site visits, SG has accelerated achievement of our MVV and those of our partners, as evidenced by our performance across Pillars (F7 .6-1) . It is this focus on performance improvement that drives our culture, relevance and sustainability . Feedback reports from the state and national level are used to prioritize improvements . A focus on evaluation, learning and innovation is embedded in the SG culture using processes in the SG Performance Improvement System (PI System) (FP .2-4) . SG uses a Performance Dashboard to review progress and
Figure P.2-1: Principal Success Factors
Principal Success FactorsPSF1 Ability to drive results through EBL
PSF2 Attract new coaching partnerships and retain relationships
PSF3 Insightful understanding of leadership challenges used to identify and innovate intellectual tools and tactics
PSF4 Flexible business model that allows agility for an efficiently run business
PSF5 Experience and expertise of coaches

v
determine opportunities for improvement (OFI) . Key organizational and department level process measures are systematically reviewed at cross-departmental, division and department meetings . As a result of Baldrige feedback, SG developed process maps, referred to as a 5x5, to standardize process steps, customer and internal process requirements and key performance measures . Standardized information and tools can be accessed on-site or remotely from the SG Portal by all SG employees . The portal serves as SG’s centralized repository for best practices, organizational knowledge and standardized resources .
SG’s results and those of our partners have stood the test of time, largely due to the strength of EBL and PI System . We respond to and proactively address the vagaries of the marketplace by continually refining our approaches so that our focus remains committed to our long-term view—accelerating and sustaining organizational results .
Figure P.2-2: Key Strategic Advantages
Key Strategic AdvantagesBusiness AdvantagesSA1 Relationships – Core group of SG loyalists and practitioners with proven (evidence-based) results
SA2 SG Intellectual Capital
Human Resource AdvantagesSA3 People – Depth of talent who share SG’s values with a solid core of passion, knowledge, and entrepreneurial enthusiasm
SA4 People – Education and experience of coaches– the majority of whom held healthcare leadership positions prior to SG
Operational AdvantagesSA5 C-Suite Perspective – Insightful understanding of hospital senior leadership challenges
SA6 SG Culture – Culture of action, alignment and accountability enables employees to be successful and achieve human potential
SA7 SG Operational Flywheel
Sustainability AdvantagesSA8 Name and Reputation – The SG name, reputation and track record for success is recognized in the healthcare industry
SA9 Proven Outcomes – Demonstrated by the improvement in organization results
Figure P.2-3: Key Strategic Challenges
Key Strategic ChallengesBusiness ChallengesSC1 Competition – Increased competition in industry competing for healthcare dollars
SC2 Shrinking Dollar Supply – Decline in healthcare reimbursement resulting in shrinking dollars available to hospitals
Human Resource ChallengesSC3 People – Retaining talent and skill set of coaches and delivering high quality/and consistency
Operational ChallengesSC4 Measurement – Aggregating and comparing partner results given the diverse number of approaches and vendors that partners use
SC5 Data systems – Aggregating customer and market knowledge
SC6 Flexing – Supporting infrastructure to maintain high quality and meet growth and contraction of business
Sustainability ChallengesSC7 Retention – Partnering to sustain relationships at various stages of their journey
Figure P.2-4: SG Performance Improvement System
Performance Improvement, Innovation and Learning6 Month EBL assessments
Operational Reviews
Senior Leader Group
Interdepartment surveys (IDS) and Employee Attitude Surveys (EAS)
Division and Department process reviews
Baldrige criteria Feedback reports, Baldrige recipients
Performance reviews
CDI/admin /PRC training
Strategic Planning Group
PI Model
SG Portal
SG TEAMS
Bright Ideas
Bi-annual fact-based review of EBL system
Understand EBL variation
SG Performance Dashboard
Indentify opportunities to learn, improve and innovate
Cross-departmental meetings review of 5x5 and process results
Organizational improvement and learning from high performing organizations
Systematic review of key processes (F .4 .1-1)
Quarterly training
3 Questions Exercise Identify product and service improvements and innovations SG Innovation Model
Process improvement and innovation
Find Knowledge feature
Diversity of thought and innovative approaches
Employee submission through Idea Express™

11
1. LeadershipSenior LeadershipVision, Values and Mission1.1a(1) Studer Group® (SG) leaders are passionate about purpose, worthwhile work and making a difference – within SG, with partner organizations and throughout the entire healthcare industry by hardwiringSM Evicence Based LeadershipSM (EBL), its core competency, to accelerate results . Senior leaders focus this passion into the company’s Mission, Vision and Values (MVV) - to make healthcare better . SG’s Evidence-Based Leadership System (EBL SYSTEM) (F1 .1-1) is used by the SLG to create alignment, action and accountability in order to fulfill the mission . EBL has been modified for internal use as a leadership system in order to practice what we teach .
SG leaders help to create a high bar for healthcare leaders and enable partners to outperform and exceed the rate of improvement as compared to organizations who do not partner with SG (F7 .1) . SG has become proficient in Coaching and Educating healthcare leaders to engage the passion of their employees using the SG Healthcare Flywheel® (F .P1-2), to apply prescriptive tactics and achieve results . And, as indicated throughout this application, including Category 7, SG has become proficient in managing a consulting practice .
SG’s MVV were originally set when the company was formed and are reviewed annually as part of the Strategic Planning Process (SPP) . In 2007, the SLG added “measurable achievement” to the Values to reflect SG’s commitment to achieving results and fact-based decisions . The SLG sets direction and creates clear and visible values and high expectations that guide SG’s activities and decisions . They deploy the MVV to partners, customers, employees and suppliers through the mechanisms in (F1 .1-2) . For example, the SG Healthcare Flywheel and the mission are included in internal and external presentations . SG’s MVV is deployed to partners through recognition processes such as “Fire Starter of
the Month” awards and annual “Hall of Fame” awards for making a difference in healthcare . Inspirational stories are emailed daily to leaders across the country . SG employees are recognized with “Pillar” Awards for exemplary performance and making a difference .
MVV are deployed to key suppliers during one-on-one meetings, via email and telephone, at strategic planning sessions and in contracts . A copy of the Standards of Behavior/Code of Conduct is provided to and discussed with key suppliers . Actions are monitored by audits, feedback, surveys, and two-way communications .
The Standards of Behavior (FP .1-3) are used to select and retain employees who share SG’s Values . Senior leaders strongly believe that the most influential factor for the success of high-performing organizations is the commitment of executive and senior leadership . At SG, senior leaders role model this belief through words and actions . They live the MVV by: 1) modeling the Standards of Behavior/Code of Conduct; 2) demonstrating honesty and Integrity
in all interactions; 3) complete transparency of financial and operational information; and 4) commitment to volunteerism and Generosity, and community involvement . Over the years, leaders lived the value of Integrity and risked substantial loss of revenue by forefiting potential agreements with those who require non-compete clauses; SG is committed to making healthcare better everywhere .
SG’s internal EBL SYSTEM is reviewed every six months using the 6 Month EBL Assessment tool . The review includes a formal assessment conducted by the SLG and a facilitator to identify gaps and opportunities to improve (OFI) . They use a quantitative tool to rate SG tactics to ensure they are well defined, deployed, hardwiredSM and improved . Based on the most recent review, the internal practice of Rounding (EBL tactic) was modified to reflect differing needs of coaches and admin . In early 2009, the process was formalized and scores
were tracked and trended to determine leader effectiveness .
1.1a(2) SG was founded on the belief of CEO Quint Studer that the potential goodness of people needs to be nurtured to their greatest
Figure 1.1-2: Mechanisms to Deploy MVV
SLG Deployment of MVVInterviews and Orientation •
Training Sessions •
“Weekly What’s Goin On” • •
“Debbie Connected” •
SG Daily Update •
Quint and BG videos* •
Institutes and Speaking • •
Expectations Meetings • •
Reward and Recognition •
Pillar Awards •
Code of Conduct/Standards • of Behavior
Strategy Meetings • •
Studerville Updates •
Website • • •
Business Development •
SG Portal •
Supplier Contracts •
Partner Awards •
*New in 2009Em
ploy
ees
Part
ner/
Cus
tom
ers
Supp
liers
• Set and deploy MVV• Standards of Behavior/Code of Conduct• SG Values• Strategic and operation pillar goals• Leader Evaluation Process• Goal Cascade• Communication and transparency• Incentive and Success Sharing
• Selecting and Retaining Talent – Select Talent – Traing and Develop – Manage Performance – Retain Talent• AIDET and Key Words
• 6 Pillars of Excellence• Ideas Management• Leader Evaluation Manager and SG
Performance Dashboard• SG Portal• SG TEAMS• PI Process• Learn and Improve – 6 month EBL
Assessment
Aligned Goals Aligned Behavior Aligned Process
1a. Objective Evaluation System
1b. Leader Development
2a. Must Haves®
2b. Performance
Gap
3a. Standardization
3b. Accelerators
Figure 1.1-1: Studer Group® Evidence-Based LeadershipSM System (EBL System)
2
human and social purpose . This is the underlying belief and enabler of the impact SG seeks to contribute, and it forms the ethical philosophy of both Quint Studer and President BG Porter that permeates the entire company . Integrity is a core value at SG, and senior leaders require Integrity, including legal and ethical behavior, from themselves and from every employee . Senior leaders promote an ethical environment through the deployment of defined Standards of Behavior/ Code of Conduct as well as other policies, such as appropriate use of the internet and submitting expenses for reimbursement . There is zero tolerance for unethical behavior . In 2008, the Code of Conduct was expanded to include additional business ethics standards . Employees are required to live the standards . SG leaders review the standards annually and all employees recommit to living them by re-signing on an annual basis .
Senior leaders conduct an annual Employee Attitude Survey (EAS) to determine employee perception of ethical behavior and their opinion regarding the ethical conduct of SG leaders (F7 .6-4) . Additionally, SG leaders use a tactic called Rounding for Outcomes which formalizes the process of employee listening . Rounding is one of the six Must Haves® tactics that SG uses internally and teaches in organizations across the country . During Rounding, division and department leaders give employees the opportunity to share ethical issues and concerns .
The SG culture is one of transparency where employees have access to all information, including full financial reports, strategic plans, access to view each other’s LEM goals, and opportunities to provide feedback on policies and processes .
Senior leaders schedule internal and external audits on financials, 401K, personnel and human resource processes, expense reports and payroll processes . Contracts with key suppliers are reviewed by outside firms to ensure compliance .
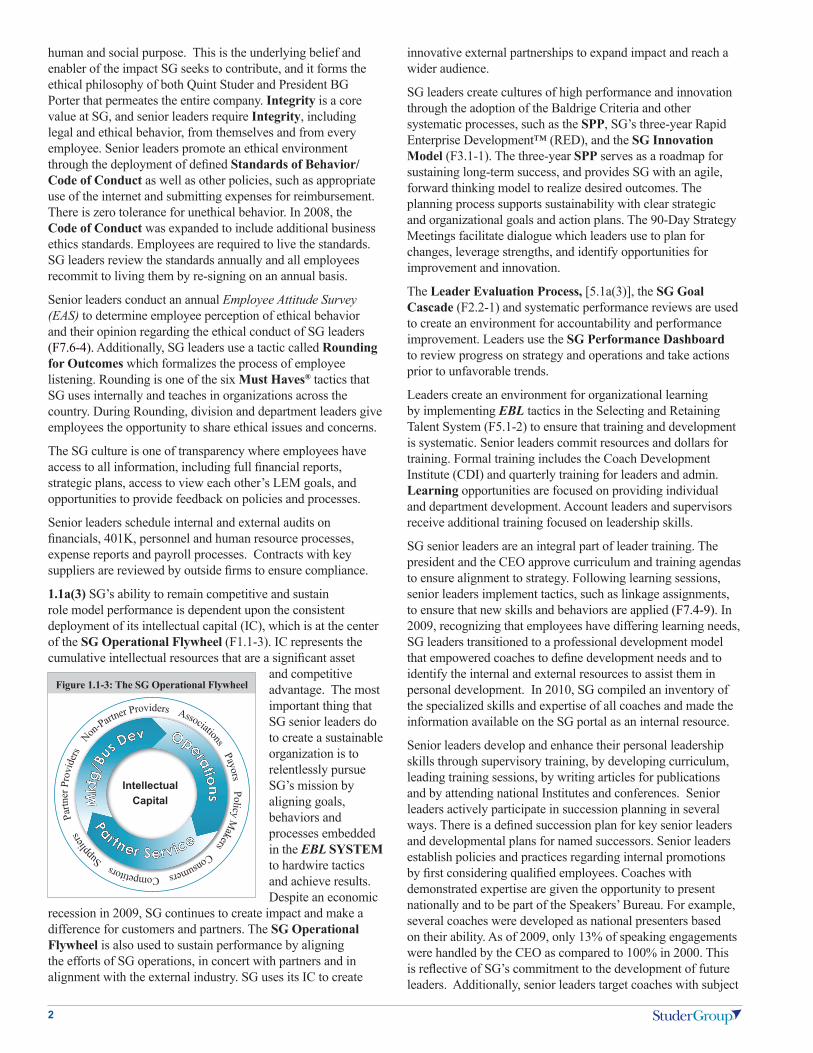
1.1a(3) SG’s ability to remain competitive and sustain role model performance is dependent upon the consistent deployment of its intellectual capital (IC), which is at the center of the SG Operational Flywheel (F1 .1-3) . IC represents the cumulative intellectual resources that are a significant asset
and competitive advantage . The most important thing that SG senior leaders do to create a sustainable organization is to relentlessly pursue SG’s mission by aligning goals, behaviors and processes embedded in the EBL SYSTEM to hardwire tactics and achieve results . Despite an economic
recession in 2009, SG continues to create impact and make a difference for customers and partners . The SG Operational Flywheel is also used to sustain performance by aligning the efforts of SG operations, in concert with partners and in alignment with the external industry . SG uses its IC to create
innovative external partnerships to expand impact and reach a wider audience .
SG leaders create cultures of high performance and innovation through the adoption of the Baldrige Criteria and other systematic processes, such as the SPP, SG’s three-year Rapid Enterprise Development™ (RED), and the SG Innovation Model (F3 .1-1) . The three-year SPP serves as a roadmap for sustaining long-term success, and provides SG with an agile, forward thinking model to realize desired outcomes . The planning process supports sustainability with clear strategic and organizational goals and action plans . The 90-Day Strategy Meetings facilitate dialogue which leaders use to plan for changes, leverage strengths, and identify opportunities for improvement and innovation .
The Leader Evaluation Process, [5 .1a(3)], the SG Goal Cascade (F2 .2-1) and systematic performance reviews are used to create an environment for accountability and performance improvement . Leaders use the SG Performance Dashboard to review progress on strategy and operations and take actions prior to unfavorable trends .
Leaders create an environment for organizational learning by implementing EBL tactics in the Selecting and Retaining Talent System (F5 .1-2) to ensure that training and development is systematic . Senior leaders commit resources and dollars for training . Formal training includes the Coach Development Institute (CDI) and quarterly training for leaders and admin . Learning opportunities are focused on providing individual and department development . Account leaders and supervisors receive additional training focused on leadership skills .
SG senior leaders are an integral part of leader training . The president and the CEO approve curriculum and training agendas to ensure alignment to strategy . Following learning sessions, senior leaders implement tactics, such as linkage assignments, to ensure that new skills and behaviors are applied (F7 .4-9) . In 2009, recognizing that employees have differing learning needs, SG leaders transitioned to a professional development model that empowered coaches to define development needs and to identify the internal and external resources to assist them in personal development . In 2010, SG compiled an inventory of the specialized skills and expertise of all coaches and made the information available on the SG portal as an internal resource .
Senior leaders develop and enhance their personal leadership skills through supervisory training, by developing curriculum, leading training sessions, by writing articles for publications and by attending national Institutes and conferences . Senior leaders actively participate in succession planning in several ways . There is a defined succession plan for key senior leaders and developmental plans for named successors . Senior leaders establish policies and practices regarding internal promotions by first considering qualified employees . Coaches with demonstrated expertise are given the opportunity to present nationally and to be part of the Speakers’ Bureau . For example, several coaches were developed as national presenters based on their ability . As of 2009, only 13% of speaking engagements were handled by the CEO as compared to 100% in 2000 . This is reflective of SG’s commitment to the development of future leaders . Additionally, senior leaders target coaches with subject
Figure 1.1-3: The SG Operational Flywheel
IntellectualCapital
Partn
er P
rovi
ders
N
on-Partn
er Providers Associations Payors Policy Makers Consumers Competitors
Suppli
ers

3
matter expertise and encourage and promote them as authors for articles, books and publications . Over 25 coaches wrote chapters in SG’s newest publication—“The Nurse Leader Handbook .”
SG senior leaders select a diverse group of employees to serve on the SPG . Membership is a developmental opportunity for individuals across the organization, as well as an effective approach to utilize the diverse experience and expertise of SG employees in the SPP .
Communication and Organizational Performance1.1b(1) Key to SG employee engagement is passion, worthwhile work and making a difference—the hub of the SG Healthcare Flywheel (FP .1-2) . Senior leaders use Communication and Engagement Methods (F1 .1-4) to inform and engage the workforce . With a large number of virtual employees, email is utilized routinely . Employees receive “Studerville Updates” for communication on organizational performance . “Weekly What’s Goin On” (WWGO) is sent by email by the coaching division leader to keep virtual coaches apprised of important information . Information can be accessed remotely 24/7 from the SG portal and since 2009, pretaped videos are used to keep employees up-to-date on the impact of the economy and changes in the external environment .
Admin employees participate in two-way communication such as department meetings and “Debbie Connected .” Also in 2009, many virtual employees began using a web camera for training sessions and meetings .
The Must Haves tactics are used to engage, empower and retain high-performing staff . Division and department leaders use hardwired processes such as Behavioral Based Interviewing, Peer Interviewing and 30/90 Day Meetings to involve and engage employees . Employees actively participate in the selection of all new employees through a process called Peer Interviewing . Peer interviewers receive training and make recommendations on whether or not to proceed with an offer based on their determination of a cultural fit .
New employees have scheduled 30/90 Day Meetings with their division or department leader . This hardwired communication fosters a positive work relationship and open dialogue between supervisor and employee . The employee is afforded the opportunity to Manage Up other employees (positioning them positively), contributing to a culture where employees actively look for what’s working well and model behavior .
Rounding for Outcomes is a tactic used to facilitate two-way communication between supervisor and employee . During Rounding, either in person or over the telephone, the leaders begin by asking “what is working well?” This gives leaders the opportunity to “harvest” recognition and to recognize other employees . Needs for tools and equipment are
also discussed . The leader takes appropriate action and then informs the employee about the result or why action cannot be taken . Progress on employee feedback is communicated using a Stoplight Report that signals the implementation status of employee feedback .
SG leaders develop and implement formal processes for reward and recognition, including handwritten Thank You Notes sent to employee homes, which is another Must Haves tactic used for recognition . Notes are given to align behaviors to goals and values, to reinforce desired results and to show appreciation for work . Leaders also distribute annual Flame Awards and quarterly Pillar Awards to recognize significant employee contributions . To recognize individual contributions, all employees, whether office-based or virtual, can participate in SG’s innovative online program called “Tokens of Appreciation .” Additional methods of reward and recognition are described in Category 5 .1 .
Communication methods are reviewed in three ways . Senior leaders use qualitative and quantitative information from the annual EAS to determine the effectiveness of Key Communication and Engagement Methods . Additionally, results of Rounding and Interdepartmental Surveys (IDS) are used to clarify employee preferences and feedback . Based on IDS results in 2010, leaders increased efforts to reduce the number of emails and modified the policy for rental cars .
The Must Haves tactics and communication methods are reviewed during the 6 Month EBL Assessment conducted by senior leaders . During the last review for example, it was determined that Rounding frequency for coaches will be scheduled quarterly to free up time on coach and speaker calendars to improve work-life-blend .
1.1b(2) In order to create a focus on action and accomplish organizational objectives, leaders use systematic processes embedded in the EBL SYSTEM such as the 6 Pillars, the SG Goal Cascade (F2 .2-1) and the SG Performance Dashboard (F1 .1-5) . The Pillar framework is used to create balance and alignment in the goal setting process . By setting goals in each area of strategic importance, SG creates value for partners, customers and employees . For example, goals in the Service
Pillar are used to create focus on delivering value to partners and customers and to determine the effectiveness of EBL in order to achieve mission and vision . Growth Pillar goals are set to expand SG impact and achieve success and sustainability . Employee engagement and satisfaction are tracked in the People Pillar to ensure SG attracts and retains a high performing workforce . The result is a culture of action, alignment and accountability that accelerates 6 Pillar results and hardwires organizational processes for long-term success and sustainability .
The SG Goal Cascade process is used to ensure alignment between organizational and individual goals . To track goals
Mechanisms FrequencyStuderville Updates
Senior Leader Meetings
Coach Quality Council
CDIs and admin training
Strategic Planning Group
Daily Update
Debbie “Connected”
“What’s Goin’ On?”
Industry Updates
Web Videos
* 2-way communication
Monthly
Monthly*
Monthly*
Quarterly*
30-Day Update Calls* 90-Day Strat Mtgs*
Daily
Monthly onsite*
Weekly email
Monthly email
As scheduled
Figure 1.1-4: Key Communication & Engagement Methods

4
and create a focus on individual accountability, SG uses an innovative software solution called the Leader Evaluation ManagerTM (LEM) . The robust features of the software, such as automated Annual Evaluations, Monthly Report Cards and 90-Day Plans, create a focus on action to accomplish objectives . Senior leaders use the SG Performance Dashboard to review key measures of strategy and operational performance and to identify action needed to achieve desired results . Systematic monthly reviews create a focus on performance improvement .
Governance and Societal ResponsibilitiesOrganizational Governance1.2a(1) As a privately-held company, governance rests with the owners - the CEO and president - with regular input from
the Strategic Planning Group (SPG) and outside advisors . Oversight for governance and management accountability transitioned from an Advisory Board that began in the 1990’s to the SPG in 2008 . This multi-disciplinary group of leaders is accountable for setting future direction in collaboration with the president and CEO . They develop action plans and are responsible for key product and service development . Senior leaders demonstrate accountability by maintaining a transparent culture in which information, decisions and actions are shared with the workforce through multiple channels of communication (F1 .1-4) .
SG reviews its financial data monthly with an outside financial advisor . Financial statements are posted on hallway and electronic Communication Boards so that the workforce can evaluate the company’s financial position and calculate the current level of Success Sharing based on performance .
SG also has an annual HR review by outside legal counsel who audits HR practices and compliance . Internal audits and scheduled reviews are conducted monthly by designated SG employees . Defined crosschecks are in place so the integrity of the system does not rest solely on one individual, which helps to ensure accountability . In 2008, SG formalized a written Code of Conduct to further guide employees in decision making .
1.2a(2) The CEO and president are evaluated based on the accomplishment of annual objective performance measures . Goals and weights are incorporated into an Annual Evaluation and tracked through the LEM . The CEO and president meet monthly to review progress on goals and to implement improvement plans that may include actions to address leadership effectiveness or operational issues .
As a key mechanism for governance, the SPG uses 90-Day Strategy Meetings to evaluate the performance of senior leaders through the “3 Questions Exercise” that includes: the three most important accomplishments; three most important ways SG fell short; and three most important things learned . The information is used to revise plans and improve processes and systems .
Senior leaders conduct a 6 Month EBL assessment to determine the effectiveness of the leadership system . Overall scores are used to measure effectiveness .
Legal and Ethical Behavior1.2b(1) Senior leaders anticipate and identify potential adverse impact of products and services through Customer Listening Methods (F3 .2-1), and external environment scans . As a business that provides consulting services, SG contributes positively to society through our mission-driven work to make healthcare better . The most significant potential adverse impact of SG products and services is if our work does not ultimately impact the mission of our partner hospitals and patient care, thereby increasing the cost of healthcare without concern to return value . To address this potential impact: 1) SG validates the effectiveness of new products and services before fully deploying; 2) SG reviews individual and aggregate performance of the organizations we serve and offers a service guarantee if dissatisfied; 3) SG recognizes that cost can be a challenge for small organizations and implemented the small/rural (rural) service line to improve access to services while reducing costs .
Figure 1.1-5: SG Performance Dashboard
Key Performance Measures FrequencyServicePartner IP % up (incentive comp threshold) MonthlyPartner patient satisfaction results across all service lines (coach LEM score) MonthlyPartner HCAHPS top box score on “Definitely Recommend Hospital?” QuarterlyPartner Employee Engagement AnnuallyPartner Physician Engagement AnnuallyQualitySenior Leader Survey (overall score) AnnuallyPartner Renewal Rate MonthlyEvents Evaluation Index (Institutes & Speaking) MonthlyFinancial Impact Index (3.00 = 100%) Bi-AnnuallySG 6 Month EBL Assessment Bi-AnnuallyMBNQA Scoring Band AnnuallyPeopleTotal Employee Turnover MonthlyEmployee Morale AnnuallyInterdepartmental Survey (IDS) (overall results) MonthlyMaintain Top 50 Places to Work designation AnnuallyGrowthTotal Revenue ($M) MonthlyRenewal Revenue ($M)* MonthlyNew Business Revenue ($M)* MonthlyGrowth in EBL partners (# total active contracts) MonthlyCoaching Agreement Revenue Converted from Non-Partner Speaking ($k) AnnuallyED Coaching Revenue ($k)* MonthlyGrowth in # ED Active Contracts MonthlyPatient Call Manager Revenue ($k)* MonthlyFinanceNet Income ($M) (incentive comp threshold) MonthlyTotal Operating Margin (%) MonthlyRevenue per Employee ($k) MonthlyRevenue per Coach ($k) Monthly% Overall Margin on EBL Accounts Monthly% Variance to Deployment Targets MonthlyCommunity Charitable Giving Contribution (includes $ and services) Monthly* Big Rock Strategic Priorities BOLD – Annual Goals

5
The rural segment reflects SG’s commitment to ensure that hospitals of all sizes have access to coaching services . This is accomplished through web based technology and virtual coaching and is priced accordingly . Despite an economic recession in 2009, SG continued to provide services to small hospitals and increased the number of rural hospitals served (F7 .3-12) .
1.2b(2) SG promotes and assures ethical behavior in all interactions by: 1) defined expectations in policies, procedures and standards; 2) mechanisms to encourage feedback from partners and employees; and 3) audits conducted on processes to ensure accuracy and integrity . A key policy of SG is for all employees to commit to the Standards of Behavior /Code of Conduct . Policies regarding ethical behavior are reviewed in orientation and training and SG leaders review infractions . Any breaches are handled according to defined policy, and the consequences are appropriately applied . SG uses the EAS to understand employee perception of the ethical behavior of the company and leaders . IDS and SLS include open-ended questions where concerns can be identified anonymously . Leaders empower all employees to report any adverse behavior and strive to create a non-punitive culture where blame isn’t assigned .
SG contracts include confidentiality clauses to promote ethical business conduct with partners and suppliers . As part of the new Patient Call ManagerTM (PCM) software, SG built the system to comply with HIPAA regulatory requirements and hired a consultant to ensure protection of confidential patient information .
SG legal, regulatory, risk and ethics goals and measures are listed in (F1 .2-1) . In-process measures are reviewed on a monthly basis and used to determine the effectiveness of policies and approaches to ethical and legal compliance .
Societal Responsibilities and Support of Key Communities1.2c(1) By creating value for partners and customers, SG creates societal impact by disseminating EBL tactics industry-wide . Senior leaders create innovative industry partnerships to promote and advance efforts for patient satisfaction, safety and quality . Three examples are: 1) SG collaborates with the Institute for Healthcare Improvement (IHI) and the National Quality Forum (NQF) to advance the efforts of safety and
quality across the nation . SG leaders disseminate EBL tactics to create impact and make a difference in healthcare . 2) SG and the Association of University Programs in Health Administration (AUPHA) collaborated to offer grants to educators to build teaching resources around SG books . 3) SG created the Studer Covenant Alliance—a partnership between Covenant Hospice and SG which focuses on implementing EBL in hospice organizations . Other social responsibility efforts include SG’s no-cost contribution of IC, products, tools, tactics and services to healthcare organizations, educational institutions, and other associations and organizations locally and around the country . SG senior leaders recognize that EBL tactics are applicable across business sectors and regularly invite local and non-healthcare leaders to attend TYYO at no cost of tuition . SG leaders and coaches provide coaching to local community organizations in order to make a difference by hardwiring the EBL tactics .
In order to better identify adverse environmental impacts, leaders expanded the role of the recycling team and charged them with defining a process whereby social and environmental responsibility could be systematically determined, goals set, and improvements made . This new team, called the Environmental Stewardship Team (EST), consists of admin employees, coach
representation andcommunity input . The EST uses feedback from employees and community leaders to identify and prioritize areas of potential impact using a scoring grid to identify significance of impact . The primary focus of the EST is to identify opportunities to positively impact the environment . The EST meets monthly to evaluate the program, to review progress on goals and to continually evaluate new ideas to improve and partner with the community . • Recycling: SG is committed to recycling as part of environmental stewardship . In 2008, SG employees partnered with Allied Waste to develop a recycling program . Paper, cardboard, cans and plastics are recycled . Employee compliance with recycling is measured monthly with “surprise” audits . Employees who consistently recycle over three months receive a casual dress day . In 2010, the EST expanded its focus and had approved by the Harbourtown (where SG corporate office resides) Board, a program where all other businesses in the complex would participate in recycling . Also in 2010, the EST offered free recycling to employees for rechargeable computer and cell phone batteries . The IT department
Figure 1.2-1: SG Legal, Regulatory and Ethics Goals and Measures
Criteria Goal MeasuresEthical Behavior
Regulatory
Trust in Leadership
Legal Financial
100%
90%ile
>90%ile
>90%ile>90%ile00000>90%ile
>90%ile
>90%ile
>90%ile
>90%ile
>90%ile
achieve0100%
0
Percent of employees who signed policy“Organization values diversity in the workplace”“SG is ethical in its treatment of EE’s”“My leader models ethical behavior”“Employees are treated fairly at SG .”# Corrective/disciplinary actionsEthical issues reported HIPPA violations* EEOC complaintsOSHA violations“My supervisor does what is right for employees”“This organization is dedicated to the satisfaction of its partners .”“SG is ethical in its treatment of partners”“I feel safe reporting ethics breaches to leader or HR”“I have confidence in the judgment of top management .”“Senior leader models ethical behavior”Top 50 Places to Work (v)# lawsuitsImprovements identified on audit/# implemented (v)*report audit errors (v)*
v – voluntary requirements *exceeds regulatory

6
collects and ships these items for recycling . Additionally, the EST surveys employees to measure personal “reduce and reuse” efforts .
• Carbon Footprint: The EST measured the impact of virtual coach training as compared to flying coaches to the corporate office and renting cars . A carbon footprint calculator showed a total of 14 .84 tons of CO2 saved . To reduce paper consumption, print material for training classes is now made available on the SG portal and SG Institutes and conferences went “green” by providing materials electronically .
1.2c(2) SG actively supports and strengthens key communities by leveraging the depth and breadth of talent in SG and actively contributing to the communities in which we live and work—consistent with SG’s MVV . Senior leaders and employees extend the values into the community and strive to create great places to live and work . SG’s commitment to community is evident in the support provided to many activities and organizations, including free coaching and training to community organizations, sponsorship (financial support and attendance) of many local events and organizations, and by employees who volunteer .
Targets for charitable giving are set on an annual basis and decisions about community support are made by senior leaders using an approach that aligns charitable giving with the Community Pillar goal and SG’s value of Generosity . The three key communities that SG supports include: 1) Pensacola Bay Area (Pensacola/Gulf Breeze, FL); 2) Communities and organizations in which SG employees and partners are located; and 3) Healthcare foundations and hospitals, and healthcare related activities and organizations .
SG’s visibility and charitable support, particularly within the community of its corporate office, is coordinated by an SG employee with a long-standing history of community service . Quint Studer has an unceasing passion for community service and has personally dedicated substantial time and financial resources to help improve the local community . As one example among many, Quint is the president of the local Autism Board and through his efforts opened the Sacred Heart Autism Center to provide much needed support and resource assistance to families dealing with autism . Quint is also active in downtown revitalization efforts and owns a minor league baseball team, the Pensacola Pelicans, which also supports the community in numerous ways .
Support of key communities is embraced by the organization and by employees in order to create the best places to live and work . SG encourages employees to volunteer by regularly highlighting opportunities to make a difference and then recognizing those efforts . SG also encourages giving back by offering a “casual day for a cause .” In exchange for casual dress, employees make a nominal donation in support of a charitable organization that they select . Departments and employee groups participate in volunteer efforts as well . For example, in 2007 the IT department adopted a local Boys’ and Girls’ Club . They contributed computers, financial support and time to create a computer lab and provide training and mentoring . As a result, they were recognized (internally and externally) for their efforts . In 2008, SG’s corporate office employees “adopted” a group
home of mentally disabled women . The residents were invited to luncheons and given small gifts . Senior leaders make a difference by role modeling through involvement in civic organizations, service on boards and fundraising (F1 .2-2) .
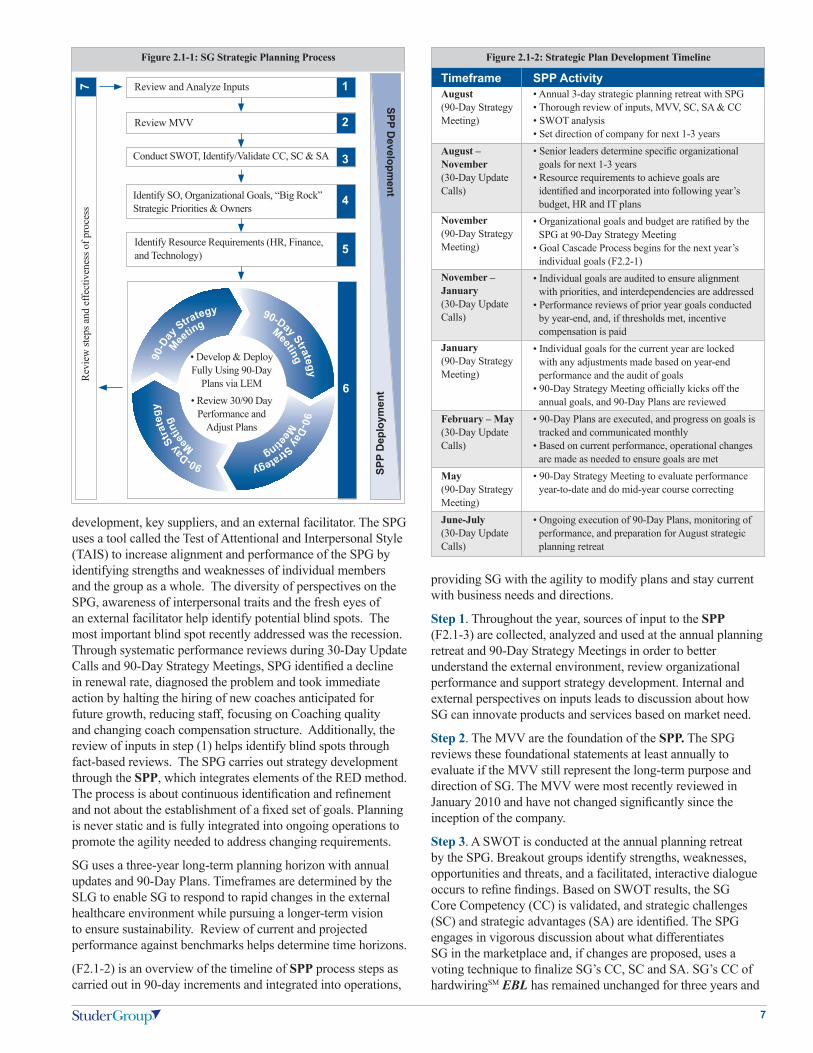
2. Strategic PlanningStrategy DevelopmentStrategy Development Process2.1a(1, 2) SG’s Strategic Planning Process (SPP) (F2 .1-1) is a continuous and dynamic process through which the organization’s direction and performance expectations are set in order to drive outcomes and to ensure SG’s long-term sustainability . The process has undergone improvements over the years that have increased the depth and breadth of strategic planning to further the organization’s mission and impact . In 2008, top management improved the effectiveness of the SPP by reviewing best practices of organizations moving from small- to medium-size businesses . SG identified an outside expert in growth-oriented strategic planning and adopted the Rapid Enterprise Development™ (RED) method . The RED method ensures a tight link between strategy, people and execution by focusing on the 20% of actions that drive 80% of the results for the most important strategic priorities . SG calls these strategic priorities “Big Rocks” to elevate their importance . These priorities are led by “Big Rock” owners, who are designated senior leaders responsible for developing and deploying the action plan for a “Big Rock .” These owners hold individual goals and 90-Day Plans related to the “Big Rocks .” The RED method includes systematic processes for developing strategy and monitoring performance, including 30-Day Update Calls and 90-Day Strategy Meetings . These processes create the agility needed to sustain outcomes .
A 30-person Strategic Planning Group (SPG) establishes the short- and long-term direction of the company . This multidisciplinary group leverages diverse strengths, insights and creativity in the planning process and creates ownership and buy-in across multiple levels of the organization . The SPG includes the CEO, president, senior leaders, account leaders, coaches, admin employees, operations leaders, business
Figure 1.2-2: Senior Leader Community Service
Quint Studer:Chairman Autism Pensacola Pensacola Revitalization ProjectPublic Hospital CoachBG Porter:St . Mark’s School of Texas Board Coach to JPS County Hospital Board Debbie Ritchie:Founding President IMPACT100, Board Member & Committee Chair
Autism Society of Pensacola BoardThe University of West Florida Foundation Board & Sub Committee Member
Multicultural Center Executive Development Board
Institute for Innovative Community Learning Board
Leadership PensacolaPensacola Young ProfessionalsHost of local TV Show – Pensacola a Proud Past a Better Tomorrow
Escambia County Foundation for Learning (Mentor)
Dan Collard: St . Henry’s Liturgy CommitteeSt . Henry’s Finance CommitteeCraig Deao:Coach for Naval Hospital PensacolaKey Presenter for Leadership PensacolaUniv Minn Alumni Assoc BODBrian Robinson: Getwell Network Advisor Institute for Interactive Patient Care National Quality Forum
7
development, key suppliers, and an external facilitator . The SPG uses a tool called the Test of Attentional and Interpersonal Style (TAIS) to increase alignment and performance of the SPG by identifying strengths and weaknesses of individual members and the group as a whole . The diversity of perspectives on the SPG, awareness of interpersonal traits and the fresh eyes of an external facilitator help identify potential blind spots . The most important blind spot recently addressed was the recession . Through systematic performance reviews during 30-Day Update Calls and 90-Day Strategy Meetings, SPG identified a decline in renewal rate, diagnosed the problem and took immediate action by halting the hiring of new coaches anticipated for future growth, reducing staff, focusing on Coaching quality and changing coach compensation structure . Additionally, the review of inputs in step (1) helps identify blind spots through fact-based reviews . The SPG carries out strategy development through the SPP, which integrates elements of the RED method . The process is about continuous identification and refinement and not about the establishment of a fixed set of goals . Planning is never static and is fully integrated into ongoing operations to promote the agility needed to address changing requirements .
SG uses a three-year long-term planning horizon with annual updates and 90-Day Plans . Timeframes are determined by the SLG to enable SG to respond to rapid changes in the external healthcare environment while pursuing a longer-term vision to ensure sustainability . Review of current and projected performance against benchmarks helps determine time horizons .
(F2 .1-2) is an overview of the timeline of SPP process steps as carried out in 90-day increments and integrated into operations,
providing SG with the agility to modify plans and stay current with business needs and directions .
Step 1 . Throughout the year, sources of input to the SPP (F2 .1-3) are collected, analyzed and used at the annual planning retreat and 90-Day Strategy Meetings in order to better understand the external environment, review organizational performance and support strategy development . Internal and external perspectives on inputs leads to discussion about how SG can innovate products and services based on market need .
Step 2 . The MVV are the foundation of the SPP. The SPG reviews these foundational statements at least annually to evaluate if the MVV still represent the long-term purpose and direction of SG . The MVV were most recently reviewed in January 2010 and have not changed significantly since the inception of the company .
Step 3 . A SWOT is conducted at the annual planning retreat by the SPG . Breakout groups identify strengths, weaknesses, opportunities and threats, and a facilitated, interactive dialogue occurs to refine findings . Based on SWOT results, the SG Core Competency (CC) is validated, and strategic challenges (SC) and strategic advantages (SA) are identified . The SPG engages in vigorous discussion about what differentiates SG in the marketplace and, if changes are proposed, uses a voting technique to finalize SG’s CC, SC and SA . SG’s CC of hardwiringSM EBL has remained unchanged for three years and
Figure 2.1-1: SG Strategic Planning Process
SPP Developm
ent
SPP
Dep
loym
ent
Revi
ew st
eps a
nd e
ffect
iven
ess o
f pro
cess
7 Review and Analyze Inputs 1
Review MVV 2
Conduct SWOT, Identify/Validate CC, SC & SA
Identify Resource Requirements (HR, Finance, and Technology)
Identify SO, Organizational Goals, “Big Rock” Strategic Priorities & Owners
4
3
5
6
90-D
ay
Strategy
Meeting
90-Day Strategy
Meeting90-Day Strategy
Meeting
90-Day S
trate
gy
Meetin
g
• Develop & Deploy Fully Using 90-Day
Plans via LEM• Review 30/90 Day
Performance and Adjust Plans
Figure 2.1-2: Strategic Plan Development Timeline
TimeframeAugust(90-Day Strategy Meeting)
August – November(30-Day Update Calls)
November(90-Day Strategy Meeting)
November – January(30-Day Update Calls)
January(90-Day Strategy Meeting)
February – May(30-Day Update Calls)
May(90-Day Strategy Meeting)June-July(30-Day Update Calls)
SPP Activity• Annual 3-day strategic planning retreat with SPG• Thorough review of inputs, MVV, SC, SA & CC• SWOT analysis • Set direction of company for next 1-3 years • Senior leaders determine specific organizational
goals for next 1-3 years• Resource requirements to achieve goals are
identified and incorporated into following year’s budget, HR and IT plans
• Organizational goals and budget are ratified by the SPG at 90-Day Strategy Meeting
• Goal Cascade Process begins for the next year’s individual goals (F2 .2-1)
• Individual goals are audited to ensure alignment with priorities, and interdependencies are addressed
• Performance reviews of prior year goals conducted by year-end, and, if thresholds met, incentive compensation is paid
• Individual goals for the current year are locked with any adjustments made based on year-end performance and the audit of goals
• 90-Day Strategy Meeting officially kicks off the annual goals, and 90-Day Plans are reviewed
• 90-Day Plans are executed, and progress on goals is tracked and communicated monthly
• Based on current performance, operational changes are made as needed to ensure goals are met
• 90-Day Strategy Meeting to evaluate performance year-to-date and do mid-year course correcting
• Ongoing execution of 90-Day Plans, monitoring of performance, and preparation for August strategic planning retreat

8
is aligned with the MVV . In 2010, an additional SC was added to reflect increased competition .
Step 4 . Understanding the CC, SC and SA, the SPG identifies three-year strategic objectives and annual organizational goals . The SPG also identifies 3-5 “Big Rock” strategic priorities that are mission critical to the business, and will differentiate SG in the marketplace and/or enable SG to expand its impact and fulfill its mission . For 2010, these priorities include increasing renewals with existing partners, growing and managing the efficiency of the new business pipeline, and launching and marketing the new Patient Call ManagerTM (PCM) software solution and ED Coaching product .
With these identified, the CEO, president and SLG refine and finalize organizational goals across the 6 Pillars through an iterative process based on prior year performance and input from the SPG . The 6 Pillars are key result areas that SG uses to set, balance, align and communicate goals throughout the organization . Goals include, but are not limited to, goals around the “Big Rock” strategic priorities .
Step 5 . “Big Rock” and goal owners identify resources needed to successfully deploy the strategy and execute the plan . The annual HR plan is updated to reflect the number and skill mix of personnel and training requirements . Upgrades for existing IT resources are identified, and budgets are developed . The SLG reviews how projected revenue aligns with expenses and profit margin . They provide input, and the final budget is approved by the CEO and the president . An example from the planning process in 2009 was identification of the resources needed to deliver the ED Coaching product . Existing coaches with ED expertise were identified, and additional training was provided to refine the skill set necessary to deliver the product .
Step 6 . SG uses 90-Day Strategy Meetings to review performance and adjust 90-Day Plans . This frequency creates the agility SG needs to align actions with internal operations and external market changes . The focus is on outcomes achieved and not just action steps taken or underway . 90-Day Plans are housed in and deployed through SG’s proprietary LEM software which can be accessed by all SG employees and key suppliers . Online access promotes accountability and transparency and streamlines communication . 30-Day Update Calls with the SLG and 90-Day Strategy Meetings with the SPG are processes used to track progress and manage performance through both historical and prospective review . The SG Performance Dashboard is a tool used monthly to track and trend key performance indicators including organizational and “Big Rock” goals and key processes . SG leaders use the Goal Cascade Process (F2 .2-1) to deploy organizational goals to leaders and staff across the organization . Each of the organizational goals has a goal owner among the SLG . As part of LEM, 90-Day Plans receive another level of review through monthly supervisory meetings using the Monthly Meeting Model .
Step 7 . A formal evaluation of the SPP and its effectiveness is conducted annually by the SLG . They review the process steps, timelines, planning timeframes, SPG membership (skill and number), as well as the continued use of an outside facilitator . In 2009, SPG identified an opportunity to tighten the link between strategy and operations by integrating 30-Day Update Calls into existing SLG calls . In 2010, seven SPG members were added and six reassigned . Additionally, the SPG reflects on the effectiveness of the SPP during the 90-Day Strategy Meetings using the “3 Questions Exercise” as defined in [1 .2a(2)] . Learnings from this exercise in 2009 helped SG focus more exclusively on its Coaching product service line . 90-Day Plans are revised based on these and other discussions at the meetings .
The SPG considers shifts in technology, customer preferences and regulatory environment as part of the inputs in step 1 and on an ongoing basis . Information on internal and external technology shifts is gathered through partner and customer feedback, industry trends and from publications and associations . Customer preferences are identified using feedback from the SLS and are analyzed to better understand partner requirements and needs for technology solutions . The Industry Relations Leader informs the SPG of pending external regulatory and reimbursement changes that will impact partners and customers as well as changes in the competitive landscape . The ability to execute the plan is described in step 5 . By linking strategic priorities and goals to resource allocations in budgets, closely monitoring performance and tying achievement to LEM and employee incentives, SG ensures the proper accountability is in place to make the plans a reality . SG ensures long-term organizational sustainability as described in [1 .1a(3)], and frequent reviews of the SG Performance Dashboard enable leaders to monitor key outcomes and processes and identify issues .
Strategic Objectives2.1b(1) SG’s Strategic Objectives (SO) in (F2 .1-4) are balanced across SG’s Pillars and are key to achieving the organization’s mission and expanding its impact .
Figure 2.1-3: Inputs Used in the Planning Process
InformationExternal Environment Industry Trends
Technology ShiftsCompetitive Environment
Customer and Market Focus
Human Resource Capability and Capacity
Source• Changes and trends in healthcare reimbursement • External environment scan (conferences, publications,
industry journals, industry groups)• Listening and learning posts• Economic conditions and trends• Regulatory changes• Information from industry groups and suppliers• Information on products from competitors• Information from customers, suppliers and employees• Public competitor information (website, annual reports)• Feedback from employees on competitors• Industry journals• Conferences• Senior Leader Survey analysis• VOC feedback • Root cause of lost customers• Customer requirements• Market opportunities• Complaint analysis • Employee Attitude Survey analysis• Training results• Compensation – salary and benefit overview• Interdepartmental service results• Rounding results• Peer Interview results• Analysis of turnover• Update on productivity of departments
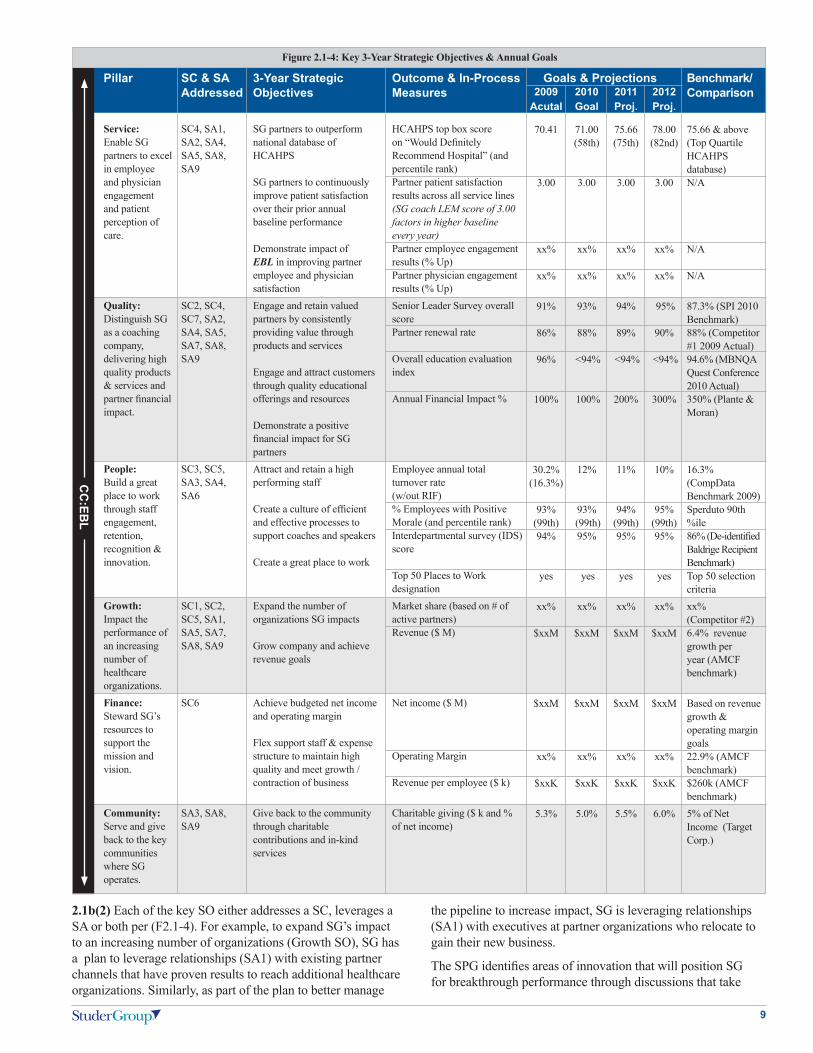
9
2.1b(2) Each of the key SO either addresses a SC, leverages a SA or both per (F2 .1-4) . For example, to expand SG’s impact to an increasing number of organizations (Growth SO), SG has a plan to leverage relationships (SA1) with existing partner channels that have proven results to reach additional healthcare organizations . Similarly, as part of the plan to better manage
the pipeline to increase impact, SG is leveraging relationships (SA1) with executives at partner organizations who relocate to gain their new business .
The SPG identifies areas of innovation that will position SG for breakthrough performance through discussions that take
Figure 2.1-4: Key 3-Year Strategic Objectives & Annual Goals
Pillar
Service:Enable SG partners to excel in employee and physician engagement and patient perception of care .
Quality:Distinguish SG as a coaching company, delivering high quality products & services and partner financial impact .
People:Build a great place to work through staff engagement, retention, recognition & innovation .
Growth:Impact the performance of an increasing number of healthcare organizations . Finance:Steward SG’s resources to support the mission and vision .
Community:Serve and give back to the key communities where SG operates .
SC & SA Addressed
SC4, SA1, SA2, SA4, SA5, SA8, SA9
SC2, SC4, SC7, SA2, SA4, SA5, SA7, SA8, SA9
SC3, SC5, SA3, SA4, SA6
SC1, SC2, SC5, SA1, SA5, SA7, SA8, SA9
SC6
SA3, SA8, SA9
3-Year Strategic Objectives
SG partners to outperform national database of HCAHPS
SG partners to continuously improve patient satisfaction over their prior annual baseline performance
Demonstrate impact of EBL in improving partner employee and physician satisfactionEngage and retain valued partners by consistently providing value through products and services
Engage and attract customers through quality educational offerings and resources
Demonstrate a positive financial impact for SG partners Attract and retain a high performing staff
Create a culture of efficient and effective processes to support coaches and speakers Create a great place to work
Expand the number of organizations SG impacts
Grow company and achieve revenue goals
Achieve budgeted net income and operating margin
Flex support staff & expense structure to maintain high quality and meet growth / contraction of business
Give back to the community through charitable contributions and in-kind services
Outcome & In-Process Measures
HCAHPS top box score on “Would Definitely Recommend Hospital” (and percentile rank) Partner patient satisfaction results across all service lines (SG coach LEM score of 3.00 factors in higher baseline every year)Partner employee engagement results (% Up)Partner physician engagement results (% Up) Senior Leader Survey overall scorePartner renewal rate
Overall education evaluation index
Annual Financial Impact %
Employee annual total turnover rate(w/out RIF)% Employees with Positive Morale (and percentile rank)Interdepartmental survey (IDS) score
Top 50 Places to Work designation Market share (based on # of active partners) Revenue ($ M)
Net income ($ M)
Operating Margin
Revenue per employee ($ k)
Charitable giving ($ k and % of net income)
Benchmark/ Comparison
75 .66 & above(Top Quartile HCAHPS database) N/A
N/A
N/A
87 .3% (SPI 2010 Benchmark)88% (Competitor #1 2009 Actual)94 .6% (MBNQA Quest Conference 2010 Actual)350% (Plante & Moran)
16 .3% (CompData Benchmark 2009)Sperduto 90th %ile86% (De-identified Baldrige Recipient Benchmark)Top 50 selection criteriaxx% (Competitor #2)6 .4% revenue growth per year (AMCF benchmark)
Based on revenue growth & operating margin goals22 .9% (AMCF benchmark) $260k (AMCF benchmark)5% of Net Income (Target Corp .)
Goals & Projections 2009
Acutal
70 .41
3 .00
xx%
xx%
91%
86%
96%
100%
30 .2%(16 .3%)
93%(99th)94%
yes
xx%
$xxM
$xxM
xx%
$xxK
5 .3%
2010 Goal
71 .00(58th)
3 .00
xx%
xx%
93%
88%
<94%
100%
12%
93% (99th)95%
yes
xx%
$xxM
$xxM
xx%
$xxK
5 .0%
2011 Proj.
75 .66(75th)
3 .00
xx%
xx%
94%
89%
<94%
200%
11%
94%(99th)95%
yes
xx%
$xxM
$xxM
xx%
$xxK
5 .5%
2012 Proj.
78 .00(82nd)
3 .00
xx%
xx%
95%
90%
<94%
300%
10%
95%(99th)95%
yes
xx%
$xxM
$xxM
xx%
$xxK
6 .0%
CC
:EBL

10
place during 30-Day Update Calls, 90-Day Strategy Meetings and the annual strategic planning retreat . The SPG uses the SG Innovation Model (F3 .1-1) to guide these discussions . After analysis of the information sources (F2 .1-3), the SPG conducts interactive table exercises, followed by group discussion to identify products and services that will attract and retain partners . For example, the SPG decided to develop an ED Coaching product . The goal was to drive the Service SO (moving patient perception of care results) and Quality SO (delivering financial impact and high quality Coaching product) while leveraging the ED expertise within our Coaching division (SA4) and the C-suite perspective (SA5) that ED excellence was a burning platform for hospital leaders across the country . This resulted from the challenge of the external environment and shrinking dollars (SC2) for hospitals .
ED product innovation arose from leveraging SG’s CC to address areas of regulatory disruption .
Information from partners and customers is used to develop and modify strategy by considering customer inputs, such as the SLS and other Customer Listening Methods (F3 .2-1) . For example, the new PCM was designed based on customer requirements and is currently being beta tested in partner organizations . 90-Day Strategy Meetings with monthly checkpoints create a focus on action and promote innovative ideas and approaches on a rapid timeframe . “Big Rock” and goal owners lead process and product innovations . For example, the “Big Rock” owner for partner renewals identified improvements to the renewal process, conducted training for account leaders and improved communication on the status of renewals . This process improvement (PI) ensured that renewal discussions begin eight months before the contract end date to better facilitate a positive outcome . SG sets goals in the 6 Pillars to ensure key result areas are considered and the plan is balanced to reflect the needs of partners, customers and SG .
SO are designed around and leverage the current CC of hardwiring EBL . All products and services are developed with the purpose of amplifying this competency and driving results with SG partners . In fact, SG made the strategic decision in 2009 to move away from further developing certain products, like software solutions and books . Hardwiring EBL is the core competency and competitive advantage for SG, and any future development of expertise or competencies will be within the framework of aligning goals, behaviors and processes, such as increased expertise around HCAHPS and ED .
Strategy DevelopmentAction Plan Development and Deployment2.2a(1) SG has three-year strategic objectives, annual goals and rolling 90-Day Plans with specified owners . 90-Day Plans
are housed within LEM as described in step 6 and cascaded and monitored through the Monthly Meeting Model . A portion of a sample 90-Day Plan is shown in (F2 .2-2) . There are 90-Day Plans for each SO and 90-Day Plans that coaches develop for each partner organization . 90-Day Plans are updated based on input received in the Monthly Meeting Model and modified based on the current environment . As a cycle of refinement based on best practices aligned to SG’s PSF4 of agility, we replaced long-term action plans with rolling 90-Day Plans while retaining short- and long-term goals .
The key planned changes include matching SG resources to market demand based on fluctuations in the economic environment . Opportunities to increase efficiency and productivity are a continuous area of focus . Adjustments are made to reflect changing reimbursement to hospitals and the changing requirements and financial impact on industry participants . For example, in alignment with the CMS initiative of public reporting of hospital outcomes (HCAHPS), SG developed tools and tactics to assist healthcare leaders in their improvement journey . SG
also aligned its internal performance measurement system accordingly .
2.2a(2) Once the strategic direction is set, SG leaders develop and deploy 90-Day Plans using systematic top-down, bottom-up alignment of organizational and individual goals using the SG Goal Cascade Process (F2 .2-1) and the performance measurement process described in [4 .1] . After annual organizational goals are finalized, senior leaders, supervisors, coaches and admin leaders set individual goals . Individual goals align with strategy to the department’s/individual’s area of responsibility, creating line-of-sight from individual contribution to organizational goals . Every employee understands the organizational goals, how their individual goals are in alignment with SG goals, and the key actions necessary for individual and organizational success . Communication and Engagement Methods (F1 .1- 4) are used to engage, inform and align all SG employees with plans .
Figure 2.2-1: SG Goal Cascade Process
Organizational Goals
Senior Leader Goals
Leader Goals Coach and Admin Goals
Set by SLG based on Strategic Plan
Goal progress reviewed monthly in Senior Leader Meeting and 90-Day Plans adjusted
90-Day Plans developed for each goal
Cross departmental goal reviews to ensure alignment across organization
Cross departmental goal reviews to ensure alignment across organizationGoal progress
reviewed monthly with the president and 90-Day Plans adjusted
90-Day Plans developed for each goal
90-Day Plans developed for each goal
Goal progress reviewed monthly with senior leaders and 90-Day Plans adjusted
Goal progress reviewed monthly with leaders and 90-Day Plans adjusted
Set in alignment with Organizational Goals
Leader Goals set in alignment with Senior Leader Goals
Coach & Admin Goals set in alignment with Leader Goals

11
Plans are deployed to suppliers in two ways: 1) Several key suppliers are members of the SPG and participate in decision making and strategy development and 2) receive information through two way discussions, organizational updates, training sessions and emails . They also have access to LEM .
Scheduled monthly and 90-day reviews of performance toward goals enable the SLG to determine if outcomes are sustained . If not sustained, they can take rapid action to correct the situation . Improvements, tools and techniques developed from the action plans are standardized and hardwiredSM into key processes .
2.2a(3, 5) We have combined our response of two criteria sections since HR is our most important and largest resource . Leaders responsible for the HR, IT and Finance plans serve on the SPG, and they consider financial and other resources required to accomplish all aspects of the strategic objectives, including mitigating potential risks . Development of the budget and other plans are integrated with the SPP timeline . If sufficient resources are not available, the SLG determines how to modify plans based on current and projected resource levels . Within LEM, goals and 90-Day Plans are given different priorities or “weights .” Those with the highest priority are ensured resources first . For example, coaching resources are high priority, and SG ensures these resources are available by using productivity measures with an automated tool called the Tenrox Deployment System (Tenrox) . This software is used to track productivity and project current and future needs for coaching resources . This information is used to make decisions about hiring additional employees or modifying the way current coaches are assigned to partners . Software enhancements were made to Tenrox in 2009 to better integrate with other operational systems .
The need for additional support services, such as PRCs, is a function of the number of coaches needed to meet business demand . Resources for other support services are determined based on business demand and growth . The SG Selecting and Retaining Talent System (F5 .1-2) ensures that the skills and competencies necessary to meet goals and SO are developed and refined . HR plans address potential impacts on people through the use of systems such as Tenrox and productivity measures (F7 .4-14 -15) that enable SG to project capacity and capability needs .
SG leaders manage risks associated with the plan by monitoring organizational performance on a monthly basis using in-process and outcome measures on the SG Performance Dashboard .
2.2a(4) SG operates in a dynamic environment in which new opportunities require quick response to meet the needs of new and existing partners . The key processes used to modify plans are the 30-Day Update Calls with the SLG and the 90-Day Strategy Meetings with the SPG . The discipline of the calls and meetings ensures that SG keeps the greatest attention on those things that matter most . The frequency of reviews enables SG to rapidly identify changes in the external environment and make adjustments to internal operations accordingly . In early 2009, the US financial and economic crisis accelerated the need for SG to re-scope revenue targets and reduce the overall expense structure built around anticipated revenue growth . This re-scoping was based on the slowdown of new contracts and renewals linked to external factors . Modifications included expense reduction strategies and a reduction in force . Communication methods such as email and video updates are used to share information with all employees as appropriate in order to modify and align their individual goals and plans .
Figure 2.2-2: Sample 90-Day Plan Name: Senior Leader
Leader: President
Department: Senior Leadership
Division: Senior Leadership
Year: 2010
Pillar Yearly Goal Increase the annual coaching revenue from converted speaking engagements by 30%, from a baseline of $xxxM in 2009 to $xxxM in 2010 .
90-Day GoalFirst Quarter GoalRecognize $xxx by March 31
Second Quarter GoalRecognize $yyy by June 30
Action StepsFirst Quarter Action Steps1 . Implement incentive for speakers to close coaching contracts by January 21 .2 . During the first week of each month, review assignments made to the BD team for speaking engagements and spot check for follow-up .3 . Have TYYO attendance from my two recent nonpartners engagement during Q1 .4 . Focus on conversion of my two nonpartner engagements during Q1 .
Second Quarter Action Steps1 . By May 1, direct and train BD team to document and follow-up in CRM for May leads, future leads dependent upon this change . Same for Institute-generated leads .2 . SG to fulfill 100% of nonpartner engagements with BD potential .3 . Encourage speakers to present at national conferences .
Manage UpLevel
1
1
1
1
Level1
1
1
ResultsFirst Quarter Results1 . Incentive was put in place on January 12th . No payouts yet . 2 . Reviewed 100% of March engagements; BD activity not performed as target; now priority for improvement in April resourced by Kat .3 . No TYYO attendance yet, but both organizations are scheduling .
Second Quarter ResultsGR
OW
TH

12
2.2a(6) The key performance measures for tracking progress are shown in the SG Performance Dashboard (F1 .1-5) . Progress on strategy and operations is reviewed monthly using the SG Performance Dashboard . The statuses of 90-Day Plans are reviewed monthly by the SLG on 30-Day Update Calls . Additionally, SG tracks achievement of organizational goals at all levels through objective measures in LEM . All leaders and coaches receive an overall score on their progress which aligns with their evaluation and compensation . SG communication methods to disseminate performance status are listed in (F1 .1-4) .
Performance Projection2.2b Performance projections are outlined in (F2 .1-4) along with how these projections compare with the performance of competitors and benchmarks as available . SG identifies short-term annual goals on the path to achieving longer term SO . The measures, goals and projections are determined based on SG past performance, SWOT analysis, internal capabilities and capacity to develop and release new products and services, healthcare industry trends and the projected needs of partners . For key measures, Category 7 provides more detailed historical performance, trending and comparative/competitive data . Because few of our competitors release their actual results or projected goals, competitor projections are speculative assumptions placed into scenarios for only those measures that have added value to SG . We do not let the absence of comparisons hinder our creativity and innovation in developing our own metrics to track performance . If gaps in performance exist against actual and projected short-term goals, then the SLG immediately evaluates the causes contributing to the gap, develops a plan to address it and designates an owner to lead corrective action . When a gap exists with respect to longer-term goals, the SLG modifies the goals of subsequent years to close the gap created in the current year .
3. Customer FocusCustomer EngagementProduct Offerings and Customer Support 3.1a(1) The success of Studer Group (SG) is inextricably aligned with and defined by the success of its partners and customers . The pathway to success is also shared by both SG and its partners and customers - hardwiringSM
EBL is both SG’s internal core competency and its core product offering . As primarily a coaching company, SG seeks long-term partnerships not short-term transactional interactions and seeks to create products and services that create value for customers . The
Senior Leadership Group (SLG) identifies product and service offerings to attract new customers, exceed the requirements of existing customers and expand relationships with current partners using the three dimensions in the SG Innovation Model (F3 .1-1) . 1) SG scans the external environment (Industry Thought Leadership) to anticipate changes in reimbursement and regulatory/external requirements that may impact partners/customers . 2) SG analyzes information derived from its Customer Listening Methods (F3 .2-1) to determine areas of customer need and opportunity . 3) SG determines if the opportunity aligns with its Core Competency of hardwiring EBL . The confluence of these three dimensions, indicates opportunities for innovation in products and services that have the potential to exceed customer requirements and build engagement . The product or service innovation is then screened using a Strategic Screening Matrix (AOS) to evaluate
likelihood of success against multiple dimensions such as market attractiveness, financial indicators and feasibility screens . The most attractive opportunities are developed and brought to market .
An example of how SG used the Innovation Model in 2009 was in the development of its newest product, the Patient Call ManagerTM (PCM), a software accelerant that automates the discharge call process . SG determined the need for this innovative software based on changes in the external environment that could unfavorably impact hospital partner reimbursement due to readmission rate, coupled with a
customer requirement to track multiple calls to patients, and SG’s ability to accelerate results using the tactic of discharge phone calls (a component within EBL) .
Another example of how SG used the Innovation Model was when we published in the American Journal of Nursing the largest ever study, demonstrating the impact of hourly nursing rounds on patients, which included a 50% reduction in patient falls, 14% decrease in pressure ulcers, 12-point improvement in patient satisfaction and 38% fewer requests for assistance in the inpatient setting (F7 .1-14) . SG supported the industry adoption of this evidence-based practice via publication and presentations, and supported implementation via Coaching, Education and Speaking . Through several cycles of innovation and improvement, subsequent materials have been developed, including supportative toolkits, webinars and follow-up research recently published in the Journal of Emergency Medicine showing that our adapation of this tactic in the emergency
Figure 3.1-1: SG Innovation Model
Innovation
VOC Engagement
Factors
Core Competency
(EBL)
Industry Thought
Leadership
Figure 3.1-2: Support Mechanisms
Direct ContactSG website AllBD and Expectations meetings Onsite coaching P,CCorrespondence All Printed materials AllMonthly CEO calls PEvaluations AllComplaints P,CConference Coordinator P,CPRCs P,CObtaining ServicesSG website P,CWeb registration P,C Speakers’ Bureau P,C SG research and publications AllObtain FeedbackDirect to coach/speaker/staff AllTelephone and email AllSLS AllSolutions support Help Desk P“Ask a SG expert” AllPartner 6 mo EBL Assessments PP=Partners C=Potential/former customers or customers of competitor S=Supplier

13
department setting produces results that are just as remarkable . As a result of this innovation, hourly rounding is now considered a standard practice in healthcare organizations across the country, and is helping to improve the patient care experience for organizations who partner with SG and those who have adopted the practice on their own .
The SLG systematically reviews opportunities for product and service development and innovation during the year-round SPP, allowing for continuous and proactive innovation as opportunities emerge . Product and service innovation results are shown in (F7 .5-1) .
3.1a(2) As a firm that teaches service excellence to its partners, SG also aspires to role model this practice to world-class standards . Therefore SG’s key customer support mechanism is people interacting with people . For example, there is no interactive voice response or automated messages for calling customers . Instead, SG employees are assigned during business hours to answer all calls directly, including a roster of back-up phone support in case the main greeter is unavailable . SG determines support mechanisms by analyzing information from Customer Listening Methods in (F3 .2-1), to better understand customer communication preferences and identify contact methods that meet and exceed requirements . Key means of customer support, including key communications Support Mechanisms, are outlined in (F3 .1-2) .
The primary mode of contact for partners is through coaches whether onsite, online or on CEO calls . Partners can access SG services 24/7, 365 via email and coach cell phone numbers given to key contact staff with each partner . For new partners, the Expectations Meeting is used to further define partner communication requirements .
The SG Speaker’s Bureau is the primary method for partners and customers to book an SG speaker . Healthcare leaders access education through SG Institutes held around the country . The conference coordinator, staff and leaders assist customers to access information, give feedback, or purchase products . SG’s education and information rich website is accessible to partners and customers . Customers could access publications online and at each Institute .
Mechanisms are continuously reviewed by the SLG to determine effectiveness of current approaches and learn about opportunities to improve . For example, in 2009, a listening session with CEO’s was incorporated into the monthly TYYO institutes to better enable customers and partners to access SG leadership, learn more about products and services and most importantly for SG to better understand their changing
requirements . In a cycle of improvement during 2010 there are now two of these sessions during the monthly TYYOs, one personally facilitated by SG’s CEO . This ensures that twice each month our key customer formally provides input directly to our CEO .
SG defines Standards of Behavior (FP .1-3) that specify and define customer contact requirements . For example, one of the standards is Commitment to Customer . The Standards of Behavior/Code of Conduct and other contact requirements are deployed to all employees, including virtual and
geographically dispersed staff through orientation, training, “Debbie Connected,” WWGO, and Standard-of-the-Month activities .
3.1a(3) The SPG analyzes information from Customer Listening Methods (F3 .2-1), to keep product offering and innovation approaches current with business needs and direction . SG’s Industry Relations Leader scans the
environment and harvests information to keep SG on the cutting edge of changes within and impacting the healthcare industry . SG leaders and employees read trade journals and attend national conferences to expand industry awareness, presence and build collaborative relationships . Additionally, leaders and employees are involved in professional organizations to learn and benchmark best practices This information is disseminated internally to SG through “Inside the Industry” emails, electronic updates and other Communication Methods (F 1 .1-4) and used as inputs into the SPP . As an example, SG partnered with Modern Healthcare (MH), the leading trade publication in the healthcare industry, to improve our annual national conference, What’s Right in HealthCareSM (WRIHC) . Previously, MH hosted a separate conference celebrating the best practices of their Best Places to Work (BPTW) award recipient organizations . SG sponsored this event in the past and provided faculty . In 2010, we invited MH to combine their BPTW conference with our WRIHC conference, which will now be held on adjacent days at the same venue, providing a greater value to our mutual attendees and further strengthening our mission component to help make healthcare a better place for employees to work .
Building a Customer Culture3.1b(1) SG creates with its partners an organizational culture that contributes to customer engagement as they seek to make healthcare a better place for employees to work, physicians to practice medicine and patients to receive care . In the same way, SG embraces these methods so that the SG culture is one of engagement of partners and customers . We practice what we teach . The EBL SYSTEM is used to create a culture that
Figure 3.1-3: SG Relationship Funnel
Breadth of Reach
Studer Group Website
Research and Publications
Tools/Toolkits/Webinars
Speaking
Institutes
Solutions and Coaching
Depth of Impact
Figure 3.2-1: Customer Listening Methods
Partners CustomersBusiness Development Meetings Website “Ask the Expert”Expectations Meeting Speaking Event EvaluationsCEO Calls and Onsite Meetings Institute Evaluation Scores and Comments6 month EBL Assessments CEO Lunches at InstitutesSLS Direct Conversations at InstitutesSolutions Support ComplaintsHot Surveys/Complaints Solutions SupportRequests for Coach Transition Product Feedback

14
contributes to customer engagement through aligned goals, behaviors and processes that are hardwiredSM throughout the organization .
SG uses two Must Haves® tactics called Employee Selection and Peer Interviewing to ensure a values match with new hires . The orientation process further aligns new employees with the culture by reviewing the MVV and Standards of Behaviors .
The SG Standards of Behavior/Code of Conduct clearly states expected behaviors . One of the standards is Commitment to Partners . The Standards Committee coordinates Standard-of-the-Month activities that are used to reinforce customer focused behaviors . Behaviors are also reinforced with emails, written Thank You Notes and other Reward and Recognition Methods described in [5 .1a-3] . As a result, employees maintain a sense of immediacy and understanding of partner engagement expectations and subsequently align behaviors .
Organizational goals related to customer outcomes are set and cascaded to employees using the SG Goal Cascade process, (F2 .2-1) . Leaders and employees are evaluated and compensated based on outcomes achieved . This is tracked using the Leader Evaluation Process (LEP) more fully described in [5 .1a(3)] . Leader and coach goals are tightly aligned with partner results contributing to a sense of purpose, worthwhile work and making a difference .
Training methods reinforce SG culture by beginning meetings with a review of the MVV, the SG Healthcare Flywheel®
(FP1-2), and “connect to purpose” stories . For example, coaches share letters or videos from partners that reinforce the difference we make every day in organizations across the country . Training curricula are built around enhancing skills and driving results for partners, developing and engaging employees, and further advancing the culture of alignment, action and accountability .
3.1b(2) SG leaders recognize the breadth of reach and depth of information in the Relationship Funnel (F3 .1-3) and use it to develop distinct approaches to Attract and Acquire new customers, two key customer value processes (F6 .1-1) . Healthcare leaders may be initially introduced to the organization through the SG website where they could download and implement tools at no cost, through word-of-mouth; through books and articles written by Quint Studer or other SG personnel; by educational offerings such as Institutes, speaking engagements or webinars . From any of these sources, the prospect is highly likely to become aware of SG’s passion for improving the healthcare industry and see evidence of their success . To attract new customers, CEO’s are afforded the opportunity to attend the TYYO Institute free of charge, where they learn about EBL and experience our role model service excellence firsthand . The SG Healthcare Flywheel is used to engage the passion of leaders, help them understand how their work has purpose, and how they can make a difference in the lives of others .
As customers understand how EBL could help them create a culture of excellence, they move through the Relationship Funnel by accessing information and advancing their relationship with SG . To manage relationships at Institutes, SG business development employees attend Institutes to meet with and engage partners and prospective partners . A customer who
attends an Institute may contact SG for a speaker engagement, request information about coaching, or show interest in a SG Solution . After a connection is made with a prospective partner, SG uses the Business Development (BD) Process in (F6 .1-1) to advance prospects to partners .
Coaches engage current partners through monthly CEO coaching calls, onsite visits, through books and publications, through 6 month EBL Assessments, and most of all by achieving results . The key method to increase partner engagement with SG is through an effective EBL coaching plan that drives results . The relationship with the coach is another key requirement . To recognize and engage partners who attend Institutes, the account Partner Relations Coordinator (PRC) and coach prepare a customized report prior to the presentation so that Institute speakers can publicly celebrate the partner’s success . Coaches are empowered and encouraged to distribute complimentary books to partners to increase engagement and provide an additional education . In 2010, all CEO’s across the country were sent a free copy of Quint Studer’s newest book, Straight A Leadership, with a follow-up offer to receive a free organizational assessment described therein .
The SG Renewal Process is a 5-step approach to retain partnerships through contract renewals . SG encourages the “partners for life” concept which means that a partner with longer tenure is in need of less onsite coaching but would have a continuing need to access IC and receive partner discounts to Institutes and publications . Customer engagement methods are reviewed continuously by senior leaders and formally as part of the SPP .
3.1b(3) SG uses methods as described in [3 .1 .a-3] to keep relationship building approaches current with evolving customer needs . Additionally, the SLG analyze SLS data to identify OFI . Partners are given the opportunity to make comments on products, services and individual coaches . The SLG uses this information to keep approaches current . For example, an improvement was realized through the SLS to further engage partner Chief Financial Officers (CFO), recognizing their key role in the organization . In 2009, CFOs were added to the SLS process and coaches were given a goal to identify a key partner metric and quantify the impact of key tactics being hardwired . The dollar impact became part of the coach evaluation in 2009 and continues for 2010 .
Voice of the CustomerCustomer Listening3.2a(1, 2) SG uses a variety of qualitative and quantitative methods to listen to partners and customers to obtain actionable information and feedback on products, services and support as shown in (F3 .2-1) . A key partner listening method is direct feedback from coaches and the SLS . An executive summary of the SLS is used with results segmented by: coach, length of time with SG, rural or large hospital size, and product type such as Solutions . Senior leaders analyze both scores and comments to understand satisfiers and dissatisfiers . The results figure prominently in coach’s-evaluations, who also use this information to modify the partner organization’s 90-day Plan .
Actionable feedback from customers at Institutes is obtained from evaluations . Feedback from the first day of an Institute
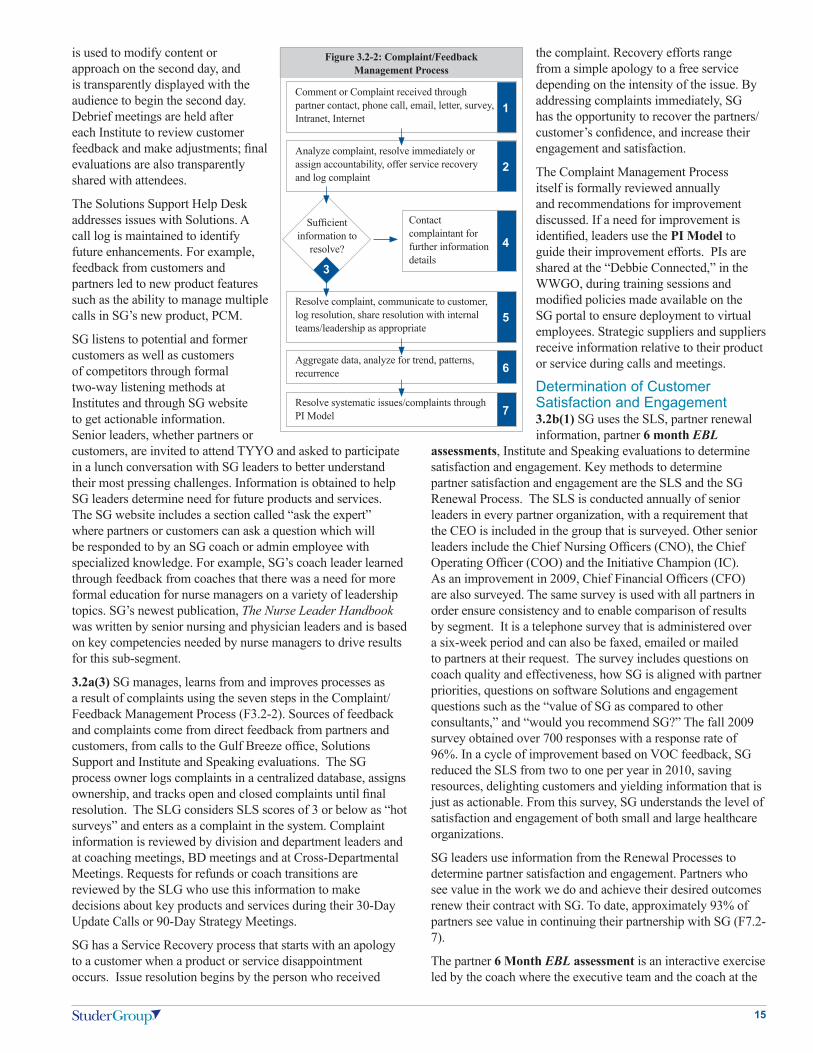
15
is used to modify content or approach on the second day, and is transparently displayed with the audience to begin the second day . Debrief meetings are held after each Institute to review customer feedback and make adjustments; final evaluations are also transparently shared with attendees .
The Solutions Support Help Desk addresses issues with Solutions . A call log is maintained to identify future enhancements . For example, feedback from customers and partners led to new product features such as the ability to manage multiple calls in SG’s new product, PCM .
SG listens to potential and former customers as well as customers of competitors through formal two-way listening methods at Institutes and through SG website to get actionable information . Senior leaders, whether partners or customers, are invited to attend TYYO and asked to participate in a lunch conversation with SG leaders to better understand their most pressing challenges . Information is obtained to help SG leaders determine need for future products and services . The SG website includes a section called “ask the expert” where partners or customers can ask a question which will be responded to by an SG coach or admin employee with specialized knowledge . For example, SG’s coach leader learned through feedback from coaches that there was a need for more formal education for nurse managers on a variety of leadership topics . SG’s newest publication, The Nurse Leader Handbook was written by senior nursing and physician leaders and is based on key competencies needed by nurse managers to drive results for this sub-segment .
3.2a(3) SG manages, learns from and improves processes as a result of complaints using the seven steps in the Complaint/ Feedback Management Process (F3 .2-2) . Sources of feedback and complaints come from direct feedback from partners and customers, from calls to the Gulf Breeze office, Solutions Support and Institute and Speaking evaluations . The SG process owner logs complaints in a centralized database, assigns ownership, and tracks open and closed complaints until final resolution . The SLG considers SLS scores of 3 or below as “hot surveys” and enters as a complaint in the system . Complaint information is reviewed by division and department leaders and at coaching meetings, BD meetings and at Cross-Departmental Meetings . Requests for refunds or coach transitions are reviewed by the SLG who use this information to make decisions about key products and services during their 30-Day Update Calls or 90-Day Strategy Meetings .
SG has a Service Recovery process that starts with an apology to a customer when a product or service disappointment occurs . Issue resolution begins by the person who received
the complaint . Recovery efforts range from a simple apology to a free service depending on the intensity of the issue . By addressing complaints immediately, SG has the opportunity to recover the partners/customer’s confidence, and increase their engagement and satisfaction .
The Complaint Management Process itself is formally reviewed annually and recommendations for improvement discussed . If a need for improvement is identified, leaders use the PI Model to guide their improvement efforts . PIs are shared at the “Debbie Connected,” in the WWGO, during training sessions and modified policies made available on the SG portal to ensure deployment to virtual employees . Strategic suppliers and suppliers receive information relative to their product or service during calls and meetings .
Determination of Customer Satisfaction and Engagement 3.2b(1) SG uses the SLS, partner renewal information, partner 6 month EBL
assessments, Institute and Speaking evaluations to determine satisfaction and engagement . Key methods to determine partner satisfaction and engagement are the SLS and the SG Renewal Process . The SLS is conducted annually of senior leaders in every partner organization, with a requirement that the CEO is included in the group that is surveyed . Other senior leaders include the Chief Nursing Officers (CNO), the Chief Operating Officer (COO) and the Initiative Champion (IC) . As an improvement in 2009, Chief Financial Officers (CFO) are also surveyed . The same survey is used with all partners in order ensure consistency and to enable comparison of results by segment . It is a telephone survey that is administered over a six-week period and can also be faxed, emailed or mailed to partners at their request . The survey includes questions on coach quality and effectiveness, how SG is aligned with partner priorities, questions on software Solutions and engagement questions such as the “value of SG as compared to other consultants,” and “would you recommend SG?” The fall 2009 survey obtained over 700 responses with a response rate of 96% . In a cycle of improvement based on VOC feedback, SG reduced the SLS from two to one per year in 2010, saving resources, delighting customers and yielding information that is just as actionable . From this survey, SG understands the level of satisfaction and engagement of both small and large healthcare organizations .
SG leaders use information from the Renewal Processes to determine partner satisfaction and engagement . Partners who see value in the work we do and achieve their desired outcomes renew their contract with SG . To date, approximately 93% of partners see value in continuing their partnership with SG (F7 .2-7) .
The partner 6 Month EBL assessment is an interactive exercise led by the coach where the executive team and the coach at the
Figure 3.2-2: Complaint/Feedback Management Process
Comment or Complaint received through partner contact, phone call, email, letter, survey, Intranet, Internet
Analyze complaint, resolve immediately or assign accountability, offer service recovery and log complaint
Resolve complaint, communicate to customer, log resolution, share resolution with internal teams/leadership as appropriate
Aggregate data, analyze for trend, patterns, recurrence
Resolve systematic issues/complaints through PI Model
Contact complaintant for further information details
1
2
5
6
7
4
Sufficient information to
resolve?
3

16
partner organization evaluate EBL progress using a quantitative tool followed by discussion . Information about partner satisfaction may be expressed during the assessment . Coaches are able to assess partner engagement through discussion and participation in action planning . Several improvements were made to the SLS process in the past two years . In 2008, the survey was administered through an online survey tool and aggregate results presented to partners . In 2009, feedback from the coaching division led to an improvement of a real-time discussion and leader self assessment exercise . This improved approach focuses more on discussion and actionable information than the scoring grid .
Customer satisfaction for Speaking and Education events are determined through event evaluations and comments . Loyalty is measured by “Would you recommend an SG speaker?” Satisfaction with SG Solutions is also determined by the SLS . Questions include overall value of Solutions and ratings of training and installation process . SG analyzes both scores and comments to determine satisfaction and engagement .
The SLG annually reviews and analyzes SLS detailed information . Positive comments from partners are shared in the “SG Daily Update” as a recognition improvement in 2009 . Survey questions are modified based on changing requirements or survey enhancements . In 2010, two questions were added to the SLS to quantify the impact of EBL on partner physician and employee engagement . In 2009, software upgrades were made based on feedback received from the SLS which further secure partner engagement with SG . Other methods to determine satisfaction and engagement are reviewed by division and department leaders responsible for events, solutions and publishing .
3.2b(2) SG obtains and uses information on customers’ satisfaction relative to their satisfaction with competitors through four methods: 1) direct conversations with partners and customers, 2) SLS information, 3) the SG BD Process and 4) information obtained on public websites and email . In 2008, two questions were added to the SLS to obtain information on partner satisfaction: “Would you recommend SG?” and what is the “value of SG compared to other consultants?” .
The marketing department scans websites and conference agendas of competitors and consulting organizations to obtain information . In 2010, SG coaches participated in a formalized market survey to harvest and aggregate their knowledge of the market, product use and competitive information .
3.2b(3) SG utilizes seven methods to determine partner dissatisfaction; the SLS, requests for coaching refunds, partner requested coach transitions, “hot” surveys, event evaluations, the SG Renewal Process and direct feedback from coaches . The SLS is a key method used to measure partner dissatisfaction with coaching, Solutions and the SG website . SG leaders analyze results by question, by coach and by organization to determine dissatisfaction . SG considers scores of 3 or less as an expression of partner dissatisfaction and refers to these as “hot” surveys . Customer dissatisfaction is also determined by the number of partners who invoke SG’s service guarantee (request for a refund), or who request a coach transition . Coaches who are onsite at partners and who lead CEO calls and 6 month
EBL assessments provide SG leaders with leading indications of partner dissatisfaction through direct conversations or emails .
When a contract is not renewed, or a potential new contract is lost, SG uses the information to better understand opportunities . From a lost renewal in 2009, leaders learned that whenever SG transfers coaches out of/into an account, there is the potential for dissatisfaction and loss of partnership . As a result, the coaching division leader developed a policy with specific actions to minimize transactions and handle them carefully when they must occur .
Customer dissatisfaction relative to SG Education and Speaking is determined through evaluation scores, comments and refunds requested . Dissatisfaction with publications is tracked through complaint manager (AOS) .
Methods to determine partner and customer dissatisfaction are reviewed by division leaders . Changes are approved by the SLG . For example, leaders modified the SLS process in 2010 so that comments made by partner senior leaders will remain anonymous . This change was made to encourage additional reporting of information to help SG further improve . Key learnings are shared throughout the organization through training, the SG portal and other communication methods .
Analysis and Use of Customer Data 3.2c(1) SG senior leaders and the SPG analyze customer, market and product offering information during the SPP in order to determine customers and markets to pursue . They use both internal information and results from environmental scans to better understand market need . This analysis resulted in SG’s decision to continue to focus efforts on coaching of healthcare leaders in both large and small organizations . SG’s BD strategy is to invite customers of competitors and former partners to an SG event in order to engage in their interest in SG . By understanding their needs and challenges, SG identifies services and products that align with their needs using the Innovation Model (F3 .1-1) . For example, during the 2009 SPP, senior leaders reviewed information relative to the challenges facing Emergency Departments . Coaches, partners and customers validated that as an area of opportunity . In 2010, a new ED Coaching service was brought to market based on understanding of need for future products . Additionally, the new PCM Solution is a product to address market need for strategies to reduce hospital readmissions . New Education, Speaking and Publications inform and attract customers based on a learning need, such as physician engagement guidance .
3.2c(2) SG leaders use Customer Listening Methods (F3 .2-1) such as the SLS, CEO calls, program evaluations, website feedback, individual discussions with healthcare leaders, speaking engagements, information from contracts won and lost, the SG BD process and external updates from Industry Relations leaders to identify and anticipate customer requirements and changing expectations . In order to meet the continued requirements of partners, new services are brought to market such as the Physician Coaching services . SG evaluates data against the differing needs and requirements across partners, customer groups, market segments and customer life cycles in order to tailor products and services to satisfy various needs . The information is evaluated by “Big Rock” owners and

17
used to develop and modify action plans for key products and services .
3.2c(3) SG leaders and “Big Rock” owners use the Relationship Funnel (F3 .1-3) to describe the breadth of reach and depth of impact of SG products and services to build a more customer-focused culture and identify opportunities for innovation . It is used to leverage existing products and services and identify opportunities for innovation and customer focus . A key point of contact is SG Institutes . Before each TYYO, a survey is conducted to better understand customer expectations to plan content and examples . After each TYYO, the CEO writes a follow-up email to conference participants and describes how objectives were met . A 30-day, no-cost access to SG partner-only website is provided to conference attendees . Healthcare leaders across the country receive emails on upcoming Institutes, and other products and services .
Recognizing partner needs to contain travel costs, SG developed a series of webinars for customers . Partners are able to access webinars at no cost . The on-demand feature is an innovation that reinforces a customer-focused culture . Topics for SG publications are based on analysis of customer data and used to create a customer-focused culture, to engage customers and introduce them to EBL .
3.2c(4) The SLG is responsible for keeping approaches to customer listening methods current . Information from internal and external sources include for example: industry trends; attending national conferences; creating partnerships with industry experts, and through accessing information from public and competitor websites . Additionally, SG benchmarks with Baldrige recipients as a valuable source of information . If a process needs to be changed to remain current and/or be improved, senior leaders appoint a PI team or individual leader to investigate the process and make recommendations . Information and recommendations for improvement are discussed at 90-Day Strategy Meetings and implemented using the PI Model .
4. Measurement, Analysis, and Knowledge Management Measurement, Analysis and Improvement of Organizational PerformancePerformance Measurement4.1a(1) Measurable Achievement is a core value of SG . The Senior Leader Group (SLG) drives what is measured and analyzed across the organization in order to execute strategy and accomplish desired results . Key performance indicators are set as part of the Strategic Planning Process (SPP) after the long- and short-term goals and action plans are determined .
Select: Annual goals are identified in each of the 6 Pillars to quantify the desired outcomes . The SLG collaborates to set achievable yet aggressive targets . “Big Rock” goals are those goals that reflect annual strategic priorities . For example, new product development on the Patient Call ManagerTM (PCM) is a 2010 strategic priority and thus a “Big Rock” goal . Measures are selected because they represent performance levels that result in improved customer, operational and financial success . In order to set goals, prior period performance and comparative
data are reviewed . SG uses the SMART goal template to ensure that goals are specific, measurable, aggressive, realistic and time-bound .
Collect: Methods to collect the information are determined and an assessment is made as to whether an existing, modified or new collection tool will be needed . For example, in order to collect and segment complaints by product and service, a centralized database needed to be purchased . To collect information on coach capacity, SG purchased software called Tenrox to manage information on coach deployment .
Align and Integrate: Strategic and organizational goals are integrated during the SG Goal Cascade Process . Key data and information from performance reviews is discussed at strategic planning meetings, division/department meetings, and monthly supervisory meetings to identify OFIs and to track progress to individual and organizaitonal performance and innovate as needed . Organizational performance measures are annually set (F1 .1-5) to reflect strategic priority status . Cascaded goals are weighted to reflect priority status . For example, the coaching division service goals are weighted at 35% to reflect coach impact on the Service Pillar . Individual leader and employee goals are then developed and aligned by Pillar using the SG Goal Cascade Process (F2 .2-1) . Individual goals can relate to strategy, operations, or process performance . LEM software is SG’s proprietary Solution that is used internally and with partners to create, automate and track goal progress . The software features an automated Annual Evaluation, a Monthly Report Card, and a 90-Day Plan . Goal ranges are set using a one-to-five scale and the automated software has a feature that calculates Pillar goal scores . An individual’s overall aggregate LEM score is used as the annual evaluation score .
4.1a(2) SG has no single competitor that has comparable offerings. As previously stated, SG’s main competitors are small, private firms, limiting the availability of direct competitor data and information . In order to make a difference in healthcare and achieve the mission SG continually seeks comparative data to: 1) validate the effectiveness of EBL, 2) compare our performance as a consulting business enterprise 3) set targets and 4) support decision making . The criteria used to select appropriate comparative data and internal measures include the 1) availability, 2) validity and reliability, 3) comparability to best practice, 4) identify department/service specific comparisons, and 5) cost of information . For example, SG recently purchased a benchmarking database to allow appropriate comparisons to consulting companies .
In order to fulfill SG’s mission and identify ways to innovate products and services, we benchmark with Baldrige recipients, identify subject matter experts, industry-known experts or organizations with validated best practices . For example, before identifying a model for strategic planning, SG president researched industry leading models and selected the Rapid Enterprise Development™ (RED) methodology developed by the well-known author of a book titled Breakthrough Improvement . Additionally, SG identifies opportunities for innovation by seeking best practices both within and outside of the healthcare industry, attending conferences, scanning the external environment and reviewing publicly available

18
information on competitors . For example, by attending industry conferences and reviewing public websites, SG learns about competitor prices for Institutes and Publications .
4.1a(3) SG keeps the performance management processes current with business needs and directions using internal feedback and improvement data from the robust nature of the SPP with 30-Day Update Calls and 90-Day Strategy Meetings, and monthly performanc reviews using standardized supervisory sessions . The frequency of scheduled performance reviews, such as monthly review of SG Performance Dashboard and adjustment to 90-Day Plans, promote agility to rapidly respond to unexpected organizational or external changes . For example, SG key measures of partner patient satisfaction are updated monthly and reported daily . Partner renewal information and updates on new partner agreements are regularly communicated through email every two weeks .
SG uses feedback from partners, customers and strategic suppliers to stay current with business needs and directions . All employees receive information about the external environment through the “Inside the Industry” updates in order to stay abreast of industry trends, changes in healthcare regulation, and changes in reimbursement or new programs to publicly reported data which could lead to modifications or improvements in the performance measurement system . For example, as CMS began publicly reporting data on the hospital patient experience, SG had access to comparative data and information on our performance .
Performance Analysis and Review4.1b SG senior leaders embrace fact-based decision making and schedule systematic performance reviews at 30-Day Update Calls, 90-Day Strategy Meetings, senior leader meetings, and division and department meetings to assess organizational success . Performance related to strategy and action plans is reviewed by the SLG on 30-Day Update Calls and by the SPG at 90-Day Strategy Meetings using key performance indicators on the SG Performance Dashboard and information from performance reviews in (F4 .1-1) . SG color codes information in a stoplight light color; Red: >10% below goal; Yellow: 10% or less below goal; Green: at or above goal . Internal and external changes that impact strategy are used to modify action plans and respond to changing organizational needs and external challenges . To analyze SG performance as compared to competitors, SG uses publicly
reported HCAHPS data to understand SG partner performance as compared to non-partners .
Leaders review the performance of their respective divisions and departments through standardized monthly supervisory meetings with their direct reports where individual performance results are reviewed using Monthly Report Cards (LEM score) .
The Coach Quality Council conducts monthly reviews of partner satisfaction results to determine how well-deployed the EBL tactics are and how effective the coaching plan has been . Operational reviews are performed for partners who are not moving results over baseline using a three-step review
Figure 4.1-1: SG Performance Review and Analysis
Analysis Performed • CMS HCAHPS data downloaded and sorted by partner/non-partner to compare
performance, statistical analysis to determine the degree of improvement and effectiveness of EBL . Information trended by top box and percentile rank which is internally developed . Results are segmented by: time with SG, geographic region, and bed size .
• Measurement sheet- Excel database pivot table, analysis of partner actual performance compared to rolling baseline . Scores tabulated by individual coach using rules of thumb .
• Operational reviews- partners not moving up undergo operational review of key results, compliance with key tactics, and 6 month EBL results .
• Event and Institute evaluation scores and comments . Review trends over time and Institutes Report Card . Correlate results to facility and content .
• SLS overall score aggregated by coach, by organization, by partner type(rural), top box determination . Sorted by product type – Coaching and Solutions, individual coach performance .
• Renewal Dashboards- Analysis of renewals segmented by coach, dollar amount, win/loss rate, top clients (80% of revenue) . Big Rock owner analyzes .
• Key work process steps analyzed and mapped on 5x5 . Process performance reviewed using histograms, Pareto charts, tables .
• Review of information from Rounding- Stoplight color-coded report to track status of employee suggestions .
• Analyze employee morale by department compared to prior year, other departments and 90th percentile of peer group .
• Analyze turnover by department, compared to prior period, and identify root causes that can be addressed .
• Analyze aggregate scores on IDS, segment scores by department .• Compensation and benefit analysis .
• Growth and revenue by product and service . Performance compared to budget and historical performance . Analyze actual revenue as compared to budget and historical performance .
• CRM In process measures including pipeline measures reviewed in BD meetings segmented by source and product line .
• Analysis of overall SG revenue and product lines compared to prior period, budget, strategic plan . Analyze revenue by employee and by coach .
• Analyze variance to deployment targets (actual to plan) .• Analyze proforma management actual to plan, by account, by account leader by
over and under deployed coaches and informally by skill set of coaches and by account .
• Analyze budgetary performance and expense management, net income and operating margin .
• Sum of monetary and in-kind contributions .
GroupSLG
Coach Quality Council
Division Review
SLG
Key Work Process Owners
Operations and Coaching Division
SLG
Division Leaders
Department Leaders
SLG
SER
VIC
EPE
OPL
EFI
NA
NC
EQ
UA
LITY
GR
OW
THC
OM
MU
NIT
Y

19
process . The BD division and the Marketing Department review in-process measures and action plans related to Attracting and Acquiring new customers using information from the Customer Relationship Manager software (CRM) .
SG compares current performance to benchmarks, prior period performance and historical performance to validate conclusions . An additional performance review was added in 2009 to provide in-process measures to track the status of new partner agreements and partner renewals . Progress reports are sent electronically every two weeks to recognize and inform SG staff .
Performance Improvement4.1c SG translates organizational review findings into priorities for improvement, innovation and learning using the systematic methods in the Process Improvement System (PI System) (FP .2-4) . The SLG assumes responsibility for translating findings into improvements and innovations by looking internally and externally for best practices and innovation opportunities .
Each 90-Day Strategy Meeting begins with a “3 Questions Exercise” that translates review findings into opportunities for improvement and innovation [1 .2a(2)] . Based on the “3 Questions Exercise” in 2008, SG decided to focus on coaching as our key product and align the organization accordingly . The SG Innovation Model is used to translate review findings from industry knowledge, Customer Listening Methods (F3 .2-1) and EBL into new products and services . Innovations that resulted from use of this model include: ED Coaching service line, invitations to all CEO’s across the country to attend a TYYO, free webinars to partners, the development of the Executive Coaching service line, a partnership between SG and Vanderbilt to develop a product for dealing with disruptive behaviors and most recently a radio show called “Talk Zone” where SG tactics are discussed by invited subject experts .
SG identifies process improvements and innovations using the PI Model (F6 .2-2) . Step 3 of the model includes an assessment of external benchmarking opportunities . Improvements that resulted from this process include automation of the payroll system and the complaint/feedback management process . Recommendations are discussed at the Cross-Departmental Meeting and vetted for senior leader approval .
A new process to identify industry best practices was initiated in 2010 in the coaching division . Each coach was asked to share a presentation on a best practice, during CDI .
Bright Ideas submitted by employees are another source of innovation . Ideas are reviewed for improvement and innovation potential . Innovative improvements that resulted from Idea Express™ are included the “SG Daily Update,” which is an electronic bulletin board where employee birthdays and anniversaries are recognized, tips for work-life-blend are given, travel tips and safety measures are communicated and quotes from the SLS are shared . The Daily Update replaced at least 5 separate emails that employees were receiving per day .
Performance improvement opportunities on operational and strategic measures on the SG Performance Dashboard are communicated by the president to all employees on a monthly basis through the “Studerville Updates .” Results of Operational
Reviews are deployed to partners through revised action plans . Key process measures are reviewed in department meetings and the Cross-Departmental Meeting where in-process measures are reviewed and processes improvements identified . Priorities and opportunities relative to supplier performance are deployed using appropriate communication methods .
Management of Information, Knowledge, and Information TechnologyData, Information, and Knowledge Management4.2a(1) SG’s Operations Leader, supported by key processes owned by the IT leader, ensures that key data and information are kept accurate, reliable, secure, confidential and accessible in as close to real-time as possible . To ensure accuracy of information SG upholds the section of our code of conduct related to accurate communication, and is supported by industry standard practices such as internal and external audits, leader reviews, and whenever possible automatic data entry and verification to ensure timeliness . Security and confidentiality are maintained first by upholding our code of conduct sections pertinent to protection of privacy and confidential information, and supported via login security and password protection, a secure database interface among internal databases for sharing data, secured/restrictive access to sensitive information and audit trails . Methods listed under [4 .2b(1)] ensure the reliability and integrity of information .
Standardized schedules are used for collection, distribution and use of handheld devices . Other methods include firewall security protection, spam filtering, secured wireless access, virus and other external protection, secured VPN access, restricted access for both server and applications and password protection at all levels ensure security and confidentiality . Information from annual and quarterly employee surveys is used to identify improvements to the process .
4.2a(2) Given the geographically dispersed locations of SG staff, rapid individual access to data and information is critical to the successful operation of SG and is a key factor in its commitment to a transparent culture . SG’s data and information is available to employees, sub-contractors, and key suppliers as appropriate on a 24/7 basis via network and internet services . Using VPN access, employees can share files and access resources such as policies, procedures, employee contacts, departmental-specific reference material, email and financial data . Employees can access intellectual capital (IC), internal communications and key SG databases, including coach deployment, partner contact and contract information, and Institute and conference attendee tracking via the SG portal . Travelers use an online expense reporting system .
IT recognized a need to provide centralized access to digital information to make the most current data and information readily available to end users . A PI Team comprised of representatives from IT and Research & Development undertook improvements using the PI Model . The SG portal was developed and serves as the central repository for knowledge assets, sharing new information, accessing best practices and sample tools . The IT leader receives feedback on information management through the IDS . The feedback has been positive both in terms of reduced time to find information and the accuracy of the search results .
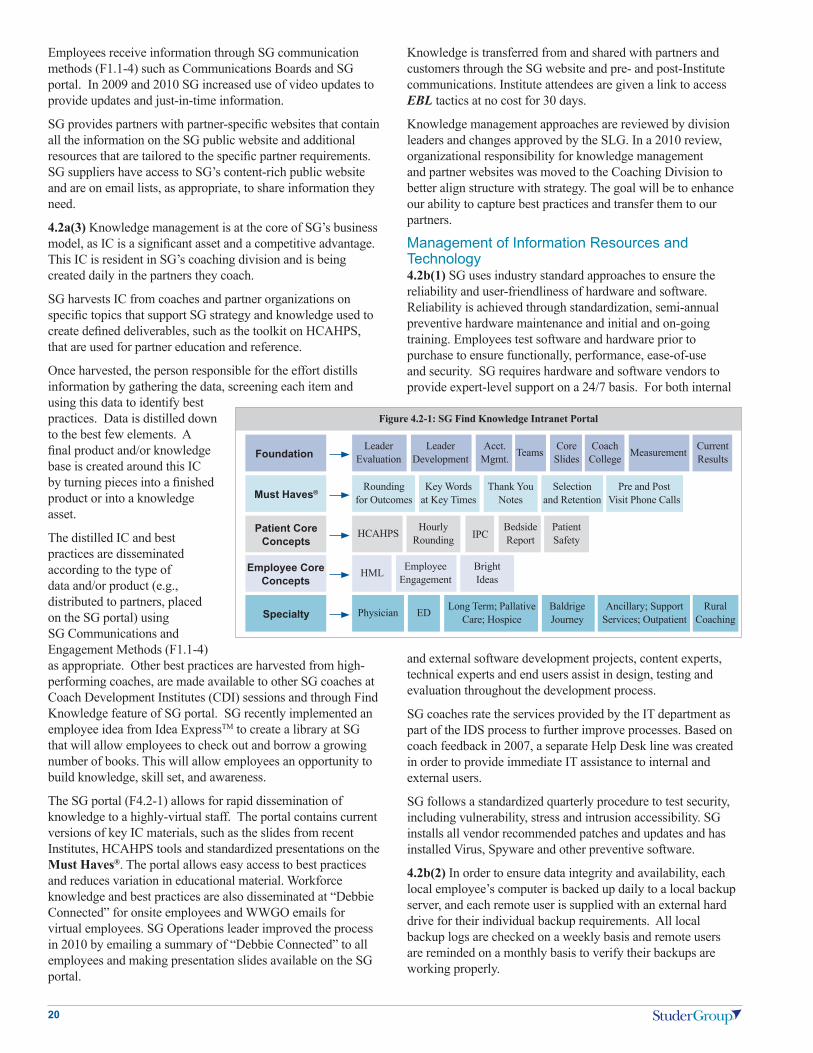
20
Employees receive information through SG communication methods (F1 .1-4) such as Communications Boards and SG portal . In 2009 and 2010 SG increased use of video updates to provide updates and just-in-time information .
SG provides partners with partner-specific websites that contain all the information on the SG public website and additional resources that are tailored to the specific partner requirements . SG suppliers have access to SG’s content-rich public website and are on email lists, as appropriate, to share information they need .
4.2a(3) Knowledge management is at the core of SG’s business model, as IC is a significant asset and a competitive advantage . This IC is resident in SG’s coaching division and is being created daily in the partners they coach .
SG harvests IC from coaches and partner organizations on specific topics that support SG strategy and knowledge used to create defined deliverables, such as the toolkit on HCAHPS, that are used for partner education and reference .
Once harvested, the person responsible for the effort distills information by gathering the data, screening each item and using this data to identify best practices . Data is distilled down to the best few elements . A final product and/or knowledge base is created around this IC by turning pieces into a finished product or into a knowledge asset .
The distilled IC and best practices are disseminated according to the type of data and/or product (e .g ., distributed to partners, placed on the SG portal) using SG Communications and Engagement Methods (F1 .1-4) as appropriate . Other best practices are harvested from high-performing coaches, are made available to other SG coaches at Coach Development Institutes (CDI) sessions and through Find Knowledge feature of SG portal . SG recently implemented an employee idea from Idea ExpressTM to create a library at SG that will allow employees to check out and borrow a growing number of books . This will allow employees an opportunity to build knowledge, skill set, and awareness .
The SG portal (F4 .2-1) allows for rapid dissemination of knowledge to a highly-virtual staff . The portal contains current versions of key IC materials, such as the slides from recent Institutes, HCAHPS tools and standardized presentations on the Must Haves® . The portal allows easy access to best practices and reduces variation in educational material . Workforce knowledge and best practices are also disseminated at “Debbie Connected” for onsite employees and WWGO emails for virtual employees . SG Operations leader improved the process in 2010 by emailing a summary of “Debbie Connected” to all employees and making presentation slides available on the SG portal .
Knowledge is transferred from and shared with partners and customers through the SG website and pre- and post-Institute communications . Institute attendees are given a link to access EBL tactics at no cost for 30 days .
Knowledge management approaches are reviewed by division leaders and changes approved by the SLG . In a 2010 review, organizational responsibility for knowledge management and partner websites was moved to the Coaching Division to better align structure with strategy . The goal will be to enhance our ability to capture best practices and transfer them to our partners .
Management of Information Resources and Technology4.2b(1) SG uses industry standard approaches to ensure the reliability and user-friendliness of hardware and software . Reliability is achieved through standardization, semi-annual preventive hardware maintenance and initial and on-going training . Employees test software and hardware prior to purchase to ensure functionally, performance, ease-of-use and security . SG requires hardware and software vendors to provide expert-level support on a 24/7 basis . For both internal
and external software development projects, content experts, technical experts and end users assist in design, testing and evaluation throughout the development process .
SG coaches rate the services provided by the IT department as part of the IDS process to further improve processes . Based on coach feedback in 2007, a separate Help Desk line was created in order to provide immediate IT assistance to internal and external users .
SG follows a standardized quarterly procedure to test security, including vulnerability, stress and intrusion accessibility . SG installs all vendor recommended patches and updates and has installed Virus, Spyware and other preventive software .
4.2b(2) In order to ensure data integrity and availability, each local employee’s computer is backed up daily to a local backup server, and each remote user is supplied with an external hard drive for their individual backup requirements . All local backup logs are checked on a weekly basis and remote users are reminded on a monthly basis to verify their backups are working properly .
Figure 4.2-1: SG Find Knowledge Intranet Portal
Foundation
Must Haves®
Specialty
Employee Core Concepts
Patient Core Concepts
Leader Evaluation
Rounding for Outcomes
Physician
HML
HCAHPS
Leader Development
Key Words at Key Times
ED
Employee Engagement
Hourly Rounding
Acct . Mgmt .
Thank You Notes
Long Term; Pallative Care; Hospice
Bright Ideas
IPC
MeasurementTeams Core Slides
Selection and Retention
Bedside Report
Coach College
Pre and Post Visit Phone Calls
Baldrige Journey
Ancillary; Support Services; Outpatient
Rural Coaching
Patient Safety
Current Results

21
Local area servers are backed up nightly to both a backup server and external tape backup system . The external backup tapes are backed up on a daily rotation with the newest one being taken offsite each night and returned the next day to be put back into the cycle . This process not only ensures SG has a reliable set of data offsite in case of a disaster to the building, but also provides a dual backup of the data, further ensuring data integrity in case a recovery is required .
SG’s public access website and SG’s web-hosted custom designed software are hosted at an offsite company in Dallas, TX . This organization is a leading hosting company that offers 24/7 server management, including immediate issue notification, secured access technologies, all data backup services and 24/7 system monitoring .
All internally developed Solutions and databases are web based, and the data reside on SG local servers or a hosted server in Dallas, TX . These databases are backed up nightly and can be restored within a two-hour period . If an employee’s computer has to be replaced, IT staff can reapply the links to the new computer, and access is restored .
IT has in place a set of disaster recovery plans and actions designed to facilitate the quick recovery of mission critical applications and hardware components including: access to duplicate hardware for all mission critical devices; vendor contact and support information; backup and restoration procedures; onsite and offsite locations, and specifications of required software components and configuration files; network diagram including system configurations and specifications . In addition to normal disaster recovery plans, a hurricane recovery plan is in place and includes a redundant local hosting site located farther inland so that SG can move and restore all critical mission operations within a four-hour time frame . Additionally, there is a redundant system available in the Dallas office that provides an alternative location for mission critical servers in case of long-term power outages .4.2b(3) SG uses the following approaches to keep data and information availability mechanisms current: 1) technology planning and systems and trend monitoring, 2) employee and partner feedback, including IDS results, 3) industry scans regarding information management and 4) technology and vendor-supplied system and software development upgrades and patches . Additionally, SG keeps data and information availability mechanisms current through cycles of refinement to the IT department . For example, SG uses a combination of outsource expertise and selected IT employees to keep current with partner and SG software demands .
5. Workforce FocusWorkforce EngagementWorkforce Enrichment5.1a(1) Workforce Engagement: SG is expert in the creation of enriched highly capable work cultures . Much of SG’s consulting practice is based on this expertise . Senior leaders use this same expertise and the many products, services and processes designed for partners and customers to ensure that the SG culture is distinctive . Embedded in the EBL SYSTEM (F1 .1-1) are systematic processes to select, engage, develop
and retain a highly engaged workforce . Senior leaders use both quantitative and qualitative methods (F5 .1-1), including the primary method of the annual EAS, to determine the key factors that affect workforce satisfaction and engagement . Satisfaction is determined by studying both aggregate and segmented data (by employee segment, full-time, part-time, tenure, gender, age, ethnicity) to understand the differences among different workforce segments . Additionally, SG determines key factors using survey items that are statistically determined to be predictive of employee engagement . Key factors for coaches and admin are further validated through systematic methods such as the employee rollout process, rounding on employees, Monthly Meeting Model as well as other listening methods (F5 .1-1), in order to understand segment specific requirements .
Scheduled monthly, quarterly or bi-annual interdepartmental survey scores and feedback are used by leaders to further validate key drivers of coach and speaker satisfaction and engagement . For example, a new key factor was identified during a 2009 training session . Coaches expressed the need to have flexibility to use rental cars of choice when they arrive late onsite or feel safety is ever in question .
5.1a(2) SG uses a six phase Selecting and Retaining Talent System (F5 .1-2) to foster a culture of open communication and employee engagement conducive to high performance . As part of the Retain and Re-recruit Talent phases, SG leaders use Communication and Engagement Methods (F1 .1-4),
Figure 5.1-1: Employee Listening Methods
Employee Attitude Survey EASEAS rollout and action planning Rounding on employeesInterdepartmental surveysPRC surveysNew employee orientation30/90 day meetingsMonthly Meeting ModelTraining evaluations
Re-recruit• EAS Action Plans
• Reward & Recognize
Measure, Learn & Improve
• 30/90/180 day feedback• EAS
• Turnover rateRetain Talent
• Rounding for outcomes• Transparent communication• Manage up
• Reward and Recognize• Merit and success
sharing
Manage Performance
• Goal setting• Monthly meeting model
• Monthly report cards• 90-day plans
• Annual Evaluation• HML
Train and Develop
• Orientation• Precept and mentor• Quarterly training
• Linkage grids• Development
Plans
Select Talent• Standards of behavior
• Behavioral based questions (MVV)• Peer Interviews
• Job specific assessment
MIS
SI
ON
VISION
VALUES
Purpose, worthwhile work and making a difference
Figure 5.1-2: Selecting and Retaining Talent System

22
Rounding for Outcomes and 30/90 Day Meetings to engage employees in two-way dialogue, to ensure they have accurate and up-to-date information about the company and to re-recruit high performing talent . Transparency is part of the culture, highlighted in the Standards of Behavior and evident in the amount of information SG makes available to employees . In 2010, SG began using a monthly Stoplight Report to communicate progress on employee feedback using a color coded communication tool of green (action taken), yellow (action pending), and red (no action taken) for specific requests . Other methods include access points such as online databases located on the SG portal, email and in-person communications, financial and strategy reports, and the most recent improvement—video updates to ensure that every employee and targeted key suppliers have accurate and real-time information about the company and its progress .
A culture of high-performing work is achieved by setting clear expectations expressed through the Standards of Behavior/Code of Conduct . Each standard is reinforced through “Standard-of-the-Month” communication and activities . Reward and Recognition Methods [5 .1a(3)] are designed to engage employees by reinforcing desired results and connecting staff to purpose, worthwhile work and making a difference .
SG’s value of integrity drives the commitment to a workplace where individual differences are recognized and respected; people are treated fairly; employees are valued and encouraged to maximize their full potential . SG believes it has a responsibility to promote an inclusive workplace that respects diversity in order to attract and retain talented individuals, to ensure personal and organizational success and to represent and serve the needs of each other and partners . This is accomplished through diversity of thought and representation of employee groups in Peer Interviewing, through education and participation in strategic planning . To further ensure thought diversity and to maximize performance and results, SG charters TEAMS (Total Engagement and Measurable Success) comprised of individuals with different skills, strengths and demographics and often from across departments with different roles . In 2008, SG dedicated a portion of staff development time and resources to diversity training . Additionally, questions on “inclusion” were added to the EAS in 2008 in order to monitor progress .
Cross-departmental training and education occurs through Coach Development Institutes (CDI), admin, and leader training sessions . All new employees complete a Management By Strengths (MBS) assessment in order to communicate and capitalize on each others’ strengths . In 2010, a new assessment for critical thinking skills was added for coaches .
5.1a(3) SG uses tactics in the Selecting and Retaining Talent System (F5 .1-2) to support high performing work and engagement . Workforce performance management begins with clear expectations for performance that includes Standards of Behavior/Code of Conduct and performance expectations . In addition to “what” is expected, employees are engaged to understand “why” and “how” they make a difference by using the SG Healthcare Flywheel® (FP .1-1) . Employee performance is aligned with strategy and organizational goals
driven by the Leader Evaluation Process (LEP) and managed through the LEM software . SG’s process and automated tool support high performance and workforce engagement by aligning individual goals with the organization’s strategic goals and establishing both under the 6 Pillars of: Service, Quality, Finance, Growth, People and Community .
SG is agile in its management of workforce performance . SG leaders use the Monthly Meeting Model, which is a scheduled supervisory meeting, to review progress on the employee’s Monthly Report Card and to modify actions on their 90-Day Plan, as appropriate . Employees receive individual feedback on their performance and opportunities for recognition, improvement and/or development are identified . Employees who excel at a skill are identified to assist with group training, presentations and/or individual mentoring . For example, in 2009, a list of coaches who were identified as subject matter experts was published for other coaches to contact for mentoring opportunities .
As part of managing performance, mid-year and year-end performance evaluations are conducted via 1 on 1 discussions between the supervisor and direct report . Discussions include: review of compensation using comparative data from an outside compensation specialist firm; review of organization and department accomplishments; actions taken to address feedback from the EAS; individual accomplishments and results as tracked in the LEM; and agreement on professional development opportunities/goals and specific action steps to achieve desired outcomes .
SG uses multiple methods of employee reward and recognition to recognize achievement and to reinforce desired results:
• Flame Award: Flame Award: A crystal flame statue signifying status as a “Fire Starter” is the highest award presented to individuals who have been role models throughout their tenure and who have attained outstanding results (F7 .4-8) .
• Pillar Award: A pillar statue signifying performance excellence and demonstration of SG values is presented quarterly, along with a monetary reward, to deserving employees (F7 .4-8) .
• Tokens of Appreciation: Note card and virtual Tokens of Appreciation are designed for peer-to-peer recognition . When employees go above and beyond their daily responsibilities their efforts are recognized with a “token” which they can collect and redeem for cash (F .7 .4-7) .
• Thank You notes: Writing personal and specific thank you notes that are mailed to the employee’s home is hardwiredSM into the SG culture and taught as one of the Must Haves® to partner organizations (AOS) .
• Managing Up: Leaders identify deserving individuals through the role model “Managing Up” process and communicate the difference they have made to co-workers or partners (AOS) .
• Gift cards, flowers, spot bonuses and other gifts: Gifts can be presented to teams and/or individuals to acknowledge success for a specific contribution or accomplishment (AOS) .
• Anniversaries and Birthdays: Employees are publicly

23
recognized via the “Daily Update” on anniversaries and birthdays . For birthdays, employees receive a $75 gift card . Also, $25 is sent to children of our employees (under the age of 18) (AOS) .
SG’s compensation practices include incentive compensation and Success Sharing which are linked to results – partner results, organizational outcomes, and individual performance and tenure . Every position in the company is eligible for incentive compensation . This alignment motivates employees to act as owners, promotes sharing in the company’s success and encourages operational success and teamwork since the incentive is based on both the entire organization meeting its goals and the employee achieving individual success as measured by their individual performance goals . Success Sharing is distributed if organizational goals are met . This results in 8% of the net profits being paid to employees based on tenure . SG’s approach is to reward financial stewardship company-wide . The 8% was determined through benchmarking Southwest Airlines, a much larger company with a renowned culture for employee recognition .
SG workforce performance management tactics are reviewed and improved by senior leaders on a formal basis during the annual goal setting process and as needed when opportunities are present . Additionally, senior leaders conduct the 6 Month EBL Assessment to evaluate and improve the effectiveness of EBL tactics to ensure best performance outcomes for employees and the organization .
The combination of hardwired approaches helps maintain a sense of immediacy and understanding that what employees accomplish on a daily basis is directly impacting their customer and business goals and performance, as well as driving improvement in partner organizations and at SG .
Workforce and Leader Development5.1b(1) Learning is a SG core value . The organization uses formalized approaches in the Train and Develop (F5 .1-2) phase of the Selecting and Retaining Talent System . Employee and leader development are driven by and align with the SPP when an assessment of organizational capability is conducted . For example, a 2009 “Big Rock” BD strategy was identified to improve the SG renewal process . In order to achieve the desired outcome and accomplish the action plan, account leaders received training on skills needed to manage the renewal process .
The primary training engine at SG is formalized quarterly training for leaders, coaches, and admin . The CDI is SG’s method to ensure systematic development of coaches so they are effective at hardwiringSM EBL tactics and achieving results . Sessions focus on knowledge transfer, skill building and critical thinking competencies required of coaches in order to achieve results with partner organizations . SG uses role plays, direct observation of skills and post-tests to ensure competency .
Admin employees receive role specific training . Training curriculum is built around enhancing skills needed to accomplish SG strategy, to develop and engage employees, and to further advance the culture of alignment, accountability and outcomes . Department specific training was a 2009 cycle
of improvement at the request of employees and leaders . The change in training delivery resulted in better utilization of time and more focused skill building opportunities .
Supervisory training focuses on developing essential leadership and business skills to better manage people, processes, partner engagements and BD opportunities in order to engage partners and leverage EBL, SG’s CC . For example, SG’s December and February Supervisory Training focused on maximizing productivity and assessing processes with pre-work and after-session linkage requirements to verify skills and consistency in deployment . Training was also provided to improve knowledge on legal and regulatory compliance .
All employees receive training in the PI Model (PI) to ensure that employees understand and are able to apply methods to improve and innovate processes . An innovative improvement was made, in 2009, to SG’s CDI training model that involved a modified approach . Instead of conducting CDI’s onsite in Gulf Breeze, a virtual model was implemented to better manage work-life blend and expenses . Virtual CDI’s were evaluated very favorably by coaches . Using the innovation of WebEx and webcam capabilities, coaches review content while maintaining a level of connectivity without the requirements of travel time and expense .
Review of the Standards of Behavior/Code of Conduct policy, which includes standards for ethical business behavior, is included in orientation . The policy is annually: 1) reviewed during the HR audit for legal compliance updates; 2) reviewed by all employees to ensure all remain knowledgeable of content and updates; and 3) codified by all employees with a signature to indicate commitment . Supervisors annually receive training from SG’s HR attorney and outside HIPAA expert on new or changing compliance requirements, such as HR statutory changes or amendments to the HIPAA security rule .
5.1b(2) Organizational learning and development needs are identified by leaders using the EAS, IDS, evaluation results, operational reviews, performance and competency evaluations and by results achieved . New coaches receive a baseline assessment of skills and learning needs and a plan to build skill and provide experience is developed . Assessing coach skills and partner needs was further refined in 2009 with the creation of the Coach Quality Council . On a monthly and quarterly basis, Quality Council members conduct reviews of partner results . Best practices and lessons learned are proactively identified and disseminated through the SG portal to standardize coach practice and improve quality .
Individual development opportunities are identified through the Monthly Meeting Model, performance reviews, Rounding for Outcomes, and coach development plans . Coaches use development plans to self-identify learning needs . Starting in 2010, a list of all coaches with specialty certifications and their areas of coaching expertise was made available on the SG portal for other coaches to call and learn from them . Multiple resources are available through the SG portal for self development, including a video library of specialized training on EBL tactics, standardized presentations, webinars and training videos .

24
Coach knowledge is also transferred through 1) precepting, which pairs seasoned coaches with new coaches; 2) the SG portal (Find Knowledge tab), which stores key IC and training materials and is accessible 24/7 for consistency of content; and 3) transition protocols, which allow key staff supporting coach and partner work to transition knowledge through collaborative expectations meetings with support staff, partners and coaches and to easily exchange key information and data through a manual and electronic format .
To reinforce new knowledge and skills on the job, new employees participate in the SG orientation process immediately after hire . The desired outcome of orientation is for employees to develop a strong understanding of SG MVV, Standards of Behavior and SG’s Core Competency EBL in order to understand organizational priorities and how their work links to SG’s mission . Coaches are provided mentoring opportunities through a systematic process of learning that begins with an assessment of current skills, followed by a plan to acquire new skills and training .
Employees participate in job specific orientation where they receive instruction and mentoring to ensure a smooth transition to their new role . All employees receive coaching through monthly supervisory meetings where progress is reviewed and OFIs identified . The annual employee performance review outlines development opportunities . Leaders identify the right resource to move individual skill and performance, also incorporating into their departmental training sessions as needed . In addition to internal training and mentoring, SG supports external educational opportunities by sponsoring employees to attend seminars, conferences, classes and online training .
When new policies or new technology are introduced, SG uses web-based technology, general training sessions and email to effectively convey information and educate staff . To ensure the retention of intellectual capital (IC) and to minimize the impact on employees and partners, leaders develop transition plans for departing employees . Harvesting information from departing employees includes an HR exit interview using standardized questions to capture wins and OFIs which are shared with senior leaders and used in future hiring and retention strategies .
5.1b(3) The effectiveness of the workforce learning and development system is determined through systematic methods using a three-tiered approach (F5 .1-3) . Tier One methods include analysis and evaluations . For example, based on comments from coaches, additional time with the CEO was included as a more formal component of training and launched as “Quint Days” as part of CDI . Tier Two methods include applied learning methods . For example, linkage grids are used as learning tools and delineate specific action to be taken . Employees complete an online survey to report the extent to which the learning was applied . Leaders use online completion
rates as well as status updates from employees to assess completion and effectiveness . Additionally, coach development plans are reviewed as part of the bi-annual performance review . The effectiveness of PRC training is evaluated through the IDS where coaches assess PRC effectiveness using a frequency scale for priority areas .
Tier Three effectiveness methods include assessment of the degree to which knowledge and skills taught impacted partner results . Each coach is formally evaluated on the degree to which they improved their partner’s results as reported in their individual LEM score . Admin staff and leaders use LEM scores as part of the effectiveness review . Other strategic outcomes used to evaluate effectiveness include partner renewal rates, HCAHPS performance and the overall achievement of goals . Additionally, SG uses targeted questions from the annual EAS to assess the degree to which employees are satisfied with investment in their development .
5.1b(4) SG manages career progression and succession of admin, coaches and leaders using several approaches including mentoring, opportunities for skill building, participation on TEAMS and internal promotions . Employees are mentored by leaders and opportunities for growth and development identified through annual performance reviews and when goals are set . High performing employees identified for advancement to leadership positions or given consideration for internal promotions receive training to further develop their skills and abilities to meet the demands of the role . Six of SG’s current senior leaders began as SG coaches . Employees have the opportunity to improve their skills through training, mentoring, precepting, and conference/seminar attendance and can transition that knowledge to additional roles and responsibilities within the organization . For example, as a development opportunity, employees are selected to coach or present to
community and business organizations and Lunch-and-Learn programs . Coaches with demonstrated expertise and speaking ability are given the opportunity to present to a national audience or to author books, articles and/or publications . Employees and leaders are invited to lead internal and external training presentations . Employees are also encouraged to serve on TEAMS, often in leadership roles, where they acquire new skills and apply learning to initiatives impacting co-workers or the entire organization .
SG succession planning for leaders is described in [1 .1-a (3)] . SG leaders continuously harvest opportunities to
develop coaches, national speakers and authors to ensure effective succession planning .
Assessment of Workforce Engagement5.1c(1) Workforce satisfaction and engagement is formally assessed through the annual EAS . The survey addresses mission, leadership, strategy, compensation, benefits and more . In all, 21 categories and 93 questions are measured . The confidential survey is taken online in support of SG’s high volume virtual
Figure 5.1-3: Methods to Determine T&D Effectiveness
Tier One
Tier Two
Tier Three
• Orientation ratings• CDI evaluations• Leader training evaluations• Admin training evaluations• PRC training evaluations• Skill/ competency
assessments• “3 Questions Exercise”• IDS• Development Plans• Accomplishment of strategic
goals, LEM• EAS results• Training hours per FTE

25
workforce . SG survey results were benchmarked against 85 organizations in 2009 and 484 organizations from 2006 to 2009 . Annual satisfaction results are presented along with 90th percentile comparisons . Statistically derived measures of satisfaction are computed based on items that are the best correlates of actual behavior . Engagement is formally assessed using the morale index which is expressed as the percent of employees with positive morale (F7 .4-2)—a composite of questions that SG’s outside vendor statistically determined to be drivers of engagement . Measures used to determine satisfaction and engagement are: overall satisfaction, % positive morale, turnover, “Would you recommend SG?” and other EAS questions (F7 .4-8) . Informal methods include Rounding for Outcomes, IDS, 30/90 Day Meetings and reward and recognition, such as Flame and Pillar awards .
SG leaders use segmented data to assess satisfaction and engagement of employee segments by coaching and admin comparing against the norm, all employees, and from the prior year’s survey . Based on this process, requirements are considered the same among all segments . Senior leaders study data for patterns and trends across and within factors and groups to draw conclusions and make improvements . For example, work-life blend was identified on the EAS as an opportunity for all employees and results were validated through the Action Planning Process . Following a department restructuring in 2009, leaders analyzed questions pertaining to the establishment of clear priorities, pace, and quality of work to monitor capacity requirements . In 2008 and 2010, the numbers of expected coach deployed days was reduced based on EAS results and employee feedback .
Satisfaction with support services provided by admin: PRCs and Speaker Support; Travel; IT (Solutions and Network); Finance (Reports and Billing); Measurement/Analyst; Solutions (LEM and PCM training); Websites; Find Knowledge (SG portal); Deployment and HR/Benefits - are measured with the IDS - an online tool to assess the satisfaction with key support departments and to evaluate process and people efficiency and effectiveness .
SG annually assesses the relevancy of the survey and recommends changes to align with current strategy . For example, in the 2008 EAS, questions were extended to cover diversity, inclusiveness and ethics, and questions to better understand employee perception of safety and effectiveness of work-life blend .
Subcontractors are also surveyed to understand key factors of their engagement and satisfaction . Based on Baldrige feedback, SG formalized the review process to include specific measures and fact based criteria to assess the survey tool . Senior leaders implement a plan for cascading EAS results to leaders and employees and conduct a formal and highly structured rollout process .
5.1c(2) SG’s focus on employee satisfaction and engagement drives bottom line results while at the same time contributing positively to SG’s culture . Results from assessment findings are also used as inputs to the SPP and training and development plans . After analyzing assessment results, leaders compare assessment findings with current results in order to identify
opportunities to improve training and development, operations, policies and procedures and to make modifications to work systems . For example, implementing virtual training positively impacted coaches’ schedules and also increased available hours for individual partners and contributed to sustained high performance in partner satisfaction .
Workforce EnvironmentWorkforce Capability and Capacity5.2a(1) SG leaders assess SG’s capacity and capability in support of the SPP and in alignment with the Growth and Finance Pillars in order to ensure adequate resources to support the business . During the SPP, a determination is made re: resource needs, skill mix and employee development and training needs and opportunities . In addition, senior leaders provide and receive from department leaders input on how best to prepare for and manage workforce requirements in order to meet SG’s annual business requirements . Planning for workforce, financial and partner needs requires on-going review which occurs monthly through the tracking and monitoring of key productivity metrics .
If new skills are required, leaders include as part of their quarterly training agendas . Whenever enhancements are made to technology or software, skill and competency needs are identified to ensure user proficiency . For example, as part of the new ED Coaching service line, it was determined that specialty ED coaches could benefit from training on the LEAN methodology since many of SG’s partners are adopting this approach . SG identified and sponsored external training opportunities resulting in real-time learning in alignment with strategic planning .
Deployment, a key indicator of the resources required to support the business demands, is assessed using Tenrox - SG’s innovative deployment system and software application that supports the assessment of capacity and determines which coaches are either over-deployed, under-deployed, or exceeding contracted days . Information from Tenrox is used to determine actual and projected need for coach and admin resources . In 2009, deployment was integrated with the financial system and SPP to further ensure that SG was proactively managing resource requirements to meet business demand . Admin requirements are based upon productivity measures; demand for other products and services and revenue growth goals and strategy . PRC workloads are reviewed by productivity measures, adjusted based on number of coach days supported and type of support needed .
In 3Q08 through 2Q09, SG felt the impact of the sudden economic downturn . By monitoring and forecasting key measures, SG projected a reduced demand for support services resulting in a need to rescope the business . Progress was immediately made by not filling vacant positions, through voluntary reductions and improved expense management, such as virtual training . Delayed demand ultimately resulted in a Reduction in Force (RIF) in the first quarters of 2009 . Impacted employees received severance pay (regardless of tenure), job placement services, and successful job replacement support as well as assistance from senior leaders with recommendations .
5.2a(2) SG uses systematic approaches in the Select Talent

26
phase to hire employees (F5 .1-2) which is a collaboration between HR, leaders and peers using aligned behaviors and processes . The process begins pre-hire at candidate screening through orientation . HR screens candidates for basic qualifications and then uses the Standards of Behavior to ensure cultural fit . Next, the leader interviews prospects using Behavior Based Questions . Innovative approaches, such as Peer Interviewing, are used to capitalize on diversity by involving staff in the hiring process . When matching coaches with partners, partners have input in the selection of a coach to ensure a cultural fit and to meet the diverse needs of their organization . To ensure capability and safety, job descriptions specify desired outcomes, duties and responsibilities, knowledge, skills and abilities, and physical requirements . All employees must sign to validate understanding .
In the Retaining Talent phase (F5 .1-2), Must Haves tactics, such as Rounding for Outcomes, are used to identify factors of engagement and for retention . This tactic is hardwired, just as coaches implement and hardwire it in partner organizations using standardized Rounding questions . Feedback is reviewed by leaders, wins and OFIs harvested and acted upon . Recruitment and retention methods are reviewed during the monthly HR departmental meetings and processes are refined as needed using the PI Model .
5.2a(3) One of the values of SG is “teamwork,” reflected in how SG organizes and manages company work . As a relatively flat organization, SG is divided into functional divisions and departments that have responsibility for different aspects of SG work requirements . This approach minimizes silos and offers best opportunities for diversity of thought and agility across the organization . As appropriate, employees work together in or across divisions and departments to contribute to the overall success of SG and its partners . SG deploys TEAMS to support initiatives like safety, standards, benefits/wellness, training, or environmental stewardship . In addition, SG uses the SLG, SPG, Coach Quality Council and Account Leaders, Cross-Departmental Leadership Team, Measurement Team, and Systems Integration Team to collectively gather and analyze input and drive strategic priorities .
SG organizes the workforce to accomplish strategic challenges and action plans and to capitalize on SG’s CC . In 2010, SG identified an opportunity to standardize and approve strategic action plans by using the automated and integrated software tool
(LEM) . Using the LEM also ensures alignment in that every SG employee has weighted goals that are aligned by Pillar and measured by the direct and/or indirect impact to organization and/or partner results . Leaders and employees whose work is project-driven also use 90-Day Plans to ensure goals and objectives are on track . Plans are reviewed during monthly supervisory meetings to verify progress and to prioritize actions .
5.2a(4) SG prepares the workforce for changing capacity and capability through its culture of transparency, frequent communication and through the use of measures that project capacity—all guided and informed through the SPP . SG shares all company results with employees, including monthly financial reports, the organization’s progress toward goals, partner results and BD activities . This open exchange of information creates ownership among employees and allows leaders and employees to be involved (either directly or indirectly) in decisions and actions . In addition to planned communication, the CEO, president and other senior leaders tape videos and/or webinars to keep employees informed, especially in this time of economic uncertainty .
SG actively manages demand for work and staffing needs using measures such as revenue per employee, deployment and productivity measures . Monitoring and forecasting capacity measures helped SG successfully manage workforce reductions due to external economic challenges . SG leaders minimized the impact by: (1) increasing the frequency of communication to build trust and opportunities; (2) providing training and development, targeting efficiency and effectiveness, to drive growth and results; (3) focusing on best practices; (4) engaging employees in expense reduction and increased revenue opportunities to ensure long-term sustainability of SG’s business, mission and people; (5) promoting peer-to-peer and other reward and recognition efforts; and (6) driving the submission of “bright ideas” to create a culture of ownership, and generate cost saving opportunities .
To address changing capability and to maximize transfer of knowledge, SG promotes advancement opportunities by posting positions internally before an external search is conducted . Other hardwired methods, such as precepting, mentoring, competency assessments and the 6 month EBL Assessments, ensure that SG is seizing opportunities for best workforce outcomes . Capacity and capability assessment methods are reviewed as part of the annual SPP . In 2010, expanded productivity measures were implemented and are AOS .
Workforce Climate5.2b(1) SG’s corporate business is conducted from a central office in Gulf Breeze, FL and a satellite office in Dallas, TX . A majority of SG’s key employees work from home offices and travel to meet business requirements . Regardless of work location, SG is committed to a healthy, safe and secure workplace . SG’s Safety TEAM promotes the safety and security of our workforce - in the office, at home and while traveling - by providing safety information and quarterly tips as well as identifying and addressing safety issues . Employees from different departments with diverse talent serve as members . The Safety TEAM meets quarterly to monitor progress and to identify OFIs .
Figure 5.2-1: Goals and Measures
Goals:Workforce Health: To promote the health and well being of SG workforce, reduce injury, and achieve work-life-blend
Safety & Security:To promote a safe and secure work environment in corporate offices, while traveling, and in home offices
Results in 7.4-16 tableWorker’s comp experienceEAP usageEAS “ Schedule permits balance between work and home”
EAS “Safe & secure work environment”Health & Safety educational activitiesFire /evacuation drillsAnnual first aid training/CPR/AED certification

27
In addition, an Emergency Preparedness Team (a sub-team of the Safety TEAM) annually reviews SG’s emergency preparedness plan with employees and oversees drill activity .
Actions taken to improve security include the installation of safety locks on exterior exit doors and a quarterly fire drill . Travel tips are provided in the “SG Daily Update .” In 2007, SG initiated “Team Well” to focus on the health of employees . During this time, targeted initiatives were offered, from bio-metric health measures for each employee to health tips in various communication methods, all to promote health awareness . To enhance the healthy eating habits of traveling employees, SG reimburses the purchase of high-protein/energy snacks . To further promote a healthy workforce, SG implemented a tobacco-free policy and offers a smoking cessation incentive . To maximize the incentive for tobacco users and minimize the financial impact to SG and non-tobacco users, higher health insurance premiums are required of employees who continue to use tobacco . This TEAM continues to meet at least bi-annually to review effectiveness of methods .
SG values and commits resources to understand the balance between work and personal responsibilities . SG provided education to all employees about energy management and work-life blend and provides flexibility in schedules and personal time-off in order to achieve that blend . Leaders added a question to the annual EAS to determine employee perception of work-life-blend .
The performance goals and measures for health, security and safety are shown in (F5 .2-1) . Environmental safety indicators such as fire drills and office security are used in office locations . Other indicators such as wellness and education apply to all SG employees regardless of location .
5.2b(2) SG is a culture-driven organization and its policies are a reflection of its values and are applied consistently throughout the organization . Key benefits and services are outlined in (F5 .2-2) . Benefits are reviewed annually by the Operations Leader and Benefits Administrator using input from the EAS, the Benefits/Wellness Team and through other listening mechanisms to ensure that the needs of the workforce are met and to maintain a competitive edge in the marketplace . The Benefits/Wellness
Team is made up of employees representing various divisions with input from senior leaders . They make recommendations to add or change benefits and those recommendations are considered by the president and CEO for final decision . SG engaged a global management consulting firm to perform a competitive Total Remuneration analysis for all positions . The vast majority of SG’s benefits rank above benchmark according to comparative data . In addition to a generous vacation policy, SG offers several benefits and services that align with work-life blend concerns to reflect the needs of a diverse workforce . SG reimburses travelers for expenses related to connectivity such as cell phone and internet access and equipment such as laptops and PDAs are provided . SG’s goal and current total compensation practice trends between the 50th and 75th percentile for the market and promotes the retention of talent .
6. Process ManagementWork SystemsWork System Design6.1a(1, 2) Work systems are designed to deliver EBL within SG and in healthcare organizations across the country . The SLG evaluates organizational capabilities and determines the inputs, processes and structures needed to: 1) deliver products and services that create value for customers and 2) promote effective and efficient business operations . Work systems are organized and designed by divisions and departments to facilitate work accomplishment . Senior leaders manage the coordination of divisions to ensure effective supervision and communication throughout the organization . The three internal work systems are identical to and therefore integrated into the delivery of SG’s three key products and services: 1) Coaching; 2) Education/ Speaking and 3) Publications/ Solutions . SG’s workforce is allocated into these three work systems .
SG innovates its work systems to continually meet and exceed customer requirements . Sources of innovation come from employees, performance reviews, Customer Listening Methods (F .3 .2-1) and the PI System methods (FP .2-4), such as SG TEAMS .
SG’s review process has resulted in several modifications to work systems . For example, as a relatively flat organization, internal work systems and structures facilitate rapid decision making and agility and enable SG to minimize non-revenue producing overhead . For example, in 2009 SG identified an opportunity to innovate its coach supervisory structure by increasing the span of control and coach empowerment to align with a professional practice model, while other leadership functions were centralized for efficiency and effectiveness .
The decision of whether work will be handled internally or externally is made by the SLG using three criteria: 1) the works’ relation to SG’s CC 2) SG’s capability and capacity to perform the work and 3) cost/benefit of outsourcing work . Leaders determine effectiveness of the work systems by assessing actual vs . expected outcomes using systematic reviews of performance . In 2007, an outside advisor was identified to facilitate the strategic planning process based on specialized skill and expertise needed to assist SG leaders in achieving desired outcomes . Additionally, in 2009 the decision was
Figure 5.2-2: SG Key Benefits and Services
Medical & Dental Insurance: SG pays 90% for employee; 50% for dependent (> benchmark) Life Insurance – 1x annual salary (< benchmark)Short & Long-Term Disability: SG pays 100% per employee(> benchmark) Employee Assistance Program: SG pays 100% 401K – quarterly enrollmentSuccess Sharing – tenure based Pillar & Flame Awards: Statue and $300 cash award Holiday celebrations: Monetary gifts and food
Paid Time Off (All Employees):Vacation 4 wks/year; Holidays- 6 days/year; Sick Leave 6 days/year (> benchmark)Voluntary Vacation Plan – proactive leave w/out pay prgmMaternity & Paternity Leave: SG pays 100%; 6-8 weeks & 1 week, respectivelyAdoption Assistance: $3k per adoption; $6k maximum Bereavement – 3 daysIncentive Comp and Spot Bonuses: Merit based Community Events & Activities: SG sponsored, including baseball home games

28
made to outsource software development from within the IT department based on special expertise needed to accomplish work . Another decision was made to hire - instead of outsource- a graphic designer based on the cost benefit analysis and a determination of need for internal expertise .
SG’s CC, hardwiring EBL is the enabling strategy and accelerating force that propels SG toward achieving its mission- to make healthcare a better place for employees to work, physicians to practice medicine and patients to receive care - and for managing company sustainability . The impact of results achieved by aligning goals, behaviors and processes in partner organizations and internally within SG is what differentiates SG from its competitors . SG’s long term
success and sustainability is dependent on our ability deliver EBL . In order to hardwire EBL within SG and in healthcare organizations across the country, SG designed three work systems, each of which have aligned key work processes to deliver the products and services that create value for customers as well as efficient and effective business operations . For example, in order to deliver effective coaching, SG uses Must Haves® tactics embedded in EBL to coach and educate healthcare leaders to align important behaviors that improve the patient experience and drive cultures of service and operational excellence . It is one of several processes embedded in EBL (F1 .1-1) that strengthens our core competency .
1. Marketing 2. Business Development
4. Manage Relationships
5. Create Loyalty
3. Deliver Value
Attract New Customers
Aquire New Customers
Support Customers
Retain Customers
Deliver Products
and Services
Figure 6.1-1: SG Key Customer Processes
Value Creation
Attracting Customers
Acquiring Customers
Delivering EBL Through Key Products and Services
Supporting Customers
Retaining Partners and Customers
Key Processes
MarketingAttracting non-partners to TYYO
Business Development Process:Lead, intake, assess and align, submit work plan, facilitate decision, transitionDelivering CoachingReviewing QualityManaging the Pro Forma
Delivering EducationProviding CME’s
Delivering Speaking
Distributing PublicationsDelivering Software Solutions
Solutions SupportManaging ComplaintsManaging Website
Retaining Partners
Requirements
EfficiencyTimeliness
TimelinessEfficiency
Effective EBL tactics that improve results
Coach who provides value
Coach aligned with partner priorities Institute value Learning objectives metSatisfactory hotel accommodationsOn-time materials High quality speakersCourtesy and responsivenessAccess to Publications
Value of SolutionsApplied learningTimely responseAccess to EBLSystem up time
Value
Key Measures
# relocated leads entered in CRM# high potential CEO’s entered as leads in CRM#CRM leads entered from each event% response time to qualified leads Sales cycle time at each stageNew EBL and ED coaching partnerships Conversation rate -education and speaking Win rateHCAHPS results% partners sat up: IP, employee and physician Partner results- coach LEM scores SLS overall value of coaching, aligned w prioritiesPartner EBL assessmentsDissatisfaction- hot surveys Partner requests for coach transitionsOperational reviewsInstitute growthInstitute value and objectives met
Materials delivered on time Quality of SG SpeakerSpeaking- courtesy and responsiveness Books in Circulation
SLS- overall value
Solutions Support – 1st call resolutionOpen Issues Website hitsUp timeRenewal rate Loyalty measures- coaching, speakingDollar value of renewalsProfitability of renewals Timeliness of renewalProbability of closed/won
I/O
IIIIIOIOOIO
OIIOIOI
IIOO
I
OIIOOOIIII
Results
AOSAOSAOSAOSAOS
7 .3-11AOSAOS
7 .1-1 - 77 .1-8, 11-12
7 .4-12
7 .2-2 - 37 .1-107 .2-127 .2-137 .5-37 .3-137 .2-8
7 .1-197 .1-197 .2-97 .3-15
7 .2-107 .1-20 - 21
7 .5-97 .2-14AOS
7 .5-107 .2-7
7 .2-5-6 & 9AOSAOSAOSAOS
Key Partners/ Customer Value Processes
I = In-Process; O = Outcomes; AOS = Available Onsite

29
Key Work Processes 6.1b(1) SG defines two categories of key work processes: 1) Key partner/customer value processes (F6 .1-1) are used to deliver value through high quality products and services to partners and customers that when effectively implemented by partners translate into mission achieved . Designing and delivering products and services that partners and customers want and need is directly relational to SG’s ability to deliver partner/customer value, long-term sustainability and profitability .
2) Operational, business and support processes have been identified to support daily operations and product delivery and must meet internal requirements to ensure efficient and effective operations (F6 .1-1) . For example, an operational process to effectively manage coach capacity contributes to profitability by providing in-process measures that assist SG leaders in managing and projecting resources .
3) Partner and customer value, as well as operational and support processes, contribute to SG’s success and sustainability . As SG exceeds partner and customer requirements through its customer value processes, partners and customers continue to do business with us through contract renewals, attendance at Institutes and purchase of products . When internal process requirements are met, SG realizes its fiduciary responsibility and financial return . Success in both contributes to organizational success and sustainability of SG .
6.1b(2) The SLG and division leaders determine key process requirements by analyzing information from the following listening methods: Information from Customer Listening Methods (F3 .2-1) and feedback from SG suppliers; information from employees through the IDS and EAS and new ideas submitted . Information is analyzed to better understand customer expectations, internal requirements and desired process outcomes .
A key method to determine customer value process requirements is the SLS . Leaders analyze quantitative data and comments to determine requirements of coaching and Solutions . Another key source of feedback on coaching are CEO lunches at Institutes and other meetings with partners and potential partners . Institute and speaker evaluations are used to determine requirements for Education and Speaking . Publications and software requirements are determined from the SLS and feedback at Institutes . Additionally, SG uses information learned at national conferences, from industry scans, from suppliers and from publications to project requirements of future customers . Supplier feedback is incorporated during face-to-face meetings . Process requirements are shown in (F6 .1-1) and (F6 .1-2) .
Emergency Readiness6.1c SG’s Emergency Preparedness Team leads the design and implementation of the Emergency Readiness Plan . The team consists of SG employees and external contacts, as needed . The emergency plan considers emergencies based on geographic
Figure 6.1-2: SG Business Operational and Support Processes
Key Processes
Generating Intellectual Capital
Managing Suppliers and Events
Managing Human Resources
Supporting Coaches and Speakers
Managing Finances
Managing Information and Technology
Sub Processes
Innovating and harvesting best practicesDeveloping product enhancementsManaging knowledgeManaging hotel suppliers
Selecting and hiring staffTraining and developing staffRewarding and recognizing staffRetaining staffManaging salaries and benefitsManaging productivity
Managing calendarsManaging travelManaging deployment
Revenue cycle managementExpense management
Managing the help deskHardware managementInventory management
Requirements
Access to standardized informationResources to improve results
QualityServiceCost
Positive work environmentInternal support and service Tools to perform workDevelopment opportunities Efficiency and effective PRC supportCompetitive salary and benefitsStaff recognitionHigh quality of supportCoach work-life-blendAccuracy of deployment system
Timeliness of expenses Fiscal management of travel cost to partner
Availability of system Reliability of equipmentData integrity
Key Measures
# new tools /product innovationCoach rating of portal – IDSIdeas Submitted
Hotel supplier performanceCosts incurred r/t blocked rooms
Turnover (overall and 90 day)Internal promotionsIDS resultsTokens of recognitionOrientation /training ratingLinkage grids and competencyAdmin staff productivity
Accuracy Tracking DeploymentTravel booked within guidelinesCost of travel Coach/speaker IDS Pro forma – actual vs . projectedAR over 90 daysExpense reports turnaround timeCost of travel
System UptimeHelpDesk 1st Call ResolutionAudits
I/O
OOI
IO
OOOIIII
IPIOIIIII
IOI
Results
7 .5-17 .4-57 .4-6
7 .5-13AOS
7 .4-47 .4-87 .4-57 .4-77 .4-107 .4-9AOS
7 .5-27 .5-57 .5-47 .4-57 .4-147 .3-67 .5-67 .5-4
7 .5-107 .5-8AOS
Business, Operational and Support Processes
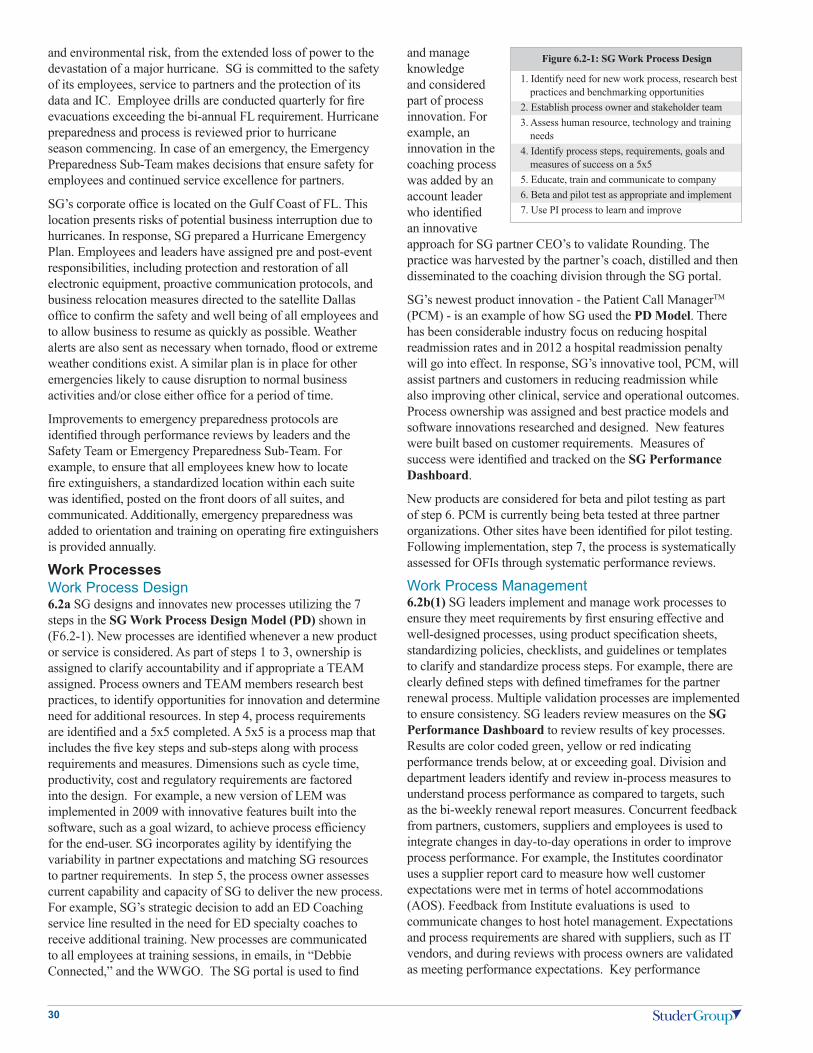
30
and environmental risk, from the extended loss of power to the devastation of a major hurricane . SG is committed to the safety of its employees, service to partners and the protection of its data and IC . Employee drills are conducted quarterly for fire evacuations exceeding the bi-annual FL requirement . Hurricane preparedness and process is reviewed prior to hurricane season commencing . In case of an emergency, the Emergency Preparedness Sub-Team makes decisions that ensure safety for employees and continued service excellence for partners .
SG’s corporate office is located on the Gulf Coast of FL . This location presents risks of potential business interruption due to hurricanes . In response, SG prepared a Hurricane Emergency Plan . Employees and leaders have assigned pre and post-event responsibilities, including protection and restoration of all electronic equipment, proactive communication protocols, and business relocation measures directed to the satellite Dallas office to confirm the safety and well being of all employees and to allow business to resume as quickly as possible . Weather alerts are also sent as necessary when tornado, flood or extreme weather conditions exist . A similar plan is in place for other emergencies likely to cause disruption to normal business activities and/or close either office for a period of time .
Improvements to emergency preparedness protocols are identified through performance reviews by leaders and the Safety Team or Emergency Preparedness Sub-Team . For example, to ensure that all employees knew how to locate fire extinguishers, a standardized location within each suite was identified, posted on the front doors of all suites, and communicated . Additionally, emergency preparedness was added to orientation and training on operating fire extinguishers is provided annually .
Work ProcessesWork Process Design6.2a SG designs and innovates new processes utilizing the 7 steps in the SG Work Process Design Model (PD) shown in (F6 .2-1) . New processes are identified whenever a new product or service is considered . As part of steps 1 to 3, ownership is assigned to clarify accountability and if appropriate a TEAM assigned . Process owners and TEAM members research best practices, to identify opportunities for innovation and determine need for additional resources . In step 4, process requirements are identified and a 5x5 completed . A 5x5 is a process map that includes the five key steps and sub-steps along with process requirements and measures . Dimensions such as cycle time, productivity, cost and regulatory requirements are factored into the design . For example, a new version of LEM was implemented in 2009 with innovative features built into the software, such as a goal wizard, to achieve process efficiency for the end-user . SG incorporates agility by identifying the variability in partner expectations and matching SG resources to partner requirements . In step 5, the process owner assesses current capability and capacity of SG to deliver the new process . For example, SG’s strategic decision to add an ED Coaching service line resulted in the need for ED specialty coaches to receive additional training . New processes are communicated to all employees at training sessions, in emails, in “Debbie Connected,” and the WWGO . The SG portal is used to find
and manage knowledge and considered part of process innovation . For example, an innovation in the coaching process was added by an account leader who identified an innovative approach for SG partner CEO’s to validate Rounding . The practice was harvested by the partner’s coach, distilled and then disseminated to the coaching division through the SG portal .
SG’s newest product innovation - the Patient Call ManagerTM (PCM) - is an example of how SG used the PD Model . There has been considerable industry focus on reducing hospital readmission rates and in 2012 a hospital readmission penalty will go into effect . In response, SG’s innovative tool, PCM, will assist partners and customers in reducing readmission while also improving other clinical, service and operational outcomes . Process ownership was assigned and best practice models and software innovations researched and designed . New features were built based on customer requirements . Measures of success were identified and tracked on the SG Performance Dashboard .
New products are considered for beta and pilot testing as part of step 6 . PCM is currently being beta tested at three partner organizations . Other sites have been identified for pilot testing . Following implementation, step 7, the process is systematically assessed for OFIs through systematic performance reviews .
Work Process Management6.2b(1) SG leaders implement and manage work processes to ensure they meet requirements by first ensuring effective and well-designed processes, using product specification sheets, standardizing policies, checklists, and guidelines or templates to clarify and standardize process steps . For example, there are clearly defined steps with defined timeframes for the partner renewal process . Multiple validation processes are implemented to ensure consistency . SG leaders review measures on the SG Performance Dashboard to review results of key processes . Results are color coded green, yellow or red indicating performance trends below, at or exceeding goal . Division and department leaders identify and review in-process measures to understand process performance as compared to targets, such as the bi-weekly renewal report measures . Concurrent feedback from partners, customers, suppliers and employees is used to integrate changes in day-to-day operations in order to improve process performance . For example, the Institutes coordinator uses a supplier report card to measure how well customer expectations were met in terms of hotel accommodations (AOS) . Feedback from Institute evaluations is used to communicate changes to host hotel management . Expectations and process requirements are shared with suppliers, such as IT vendors, and during reviews with process owners are validated as meeting performance expectations . Key performance
Figure 6.2-1: SG Work Process Design
1 . Identify need for new work process, research best practices and benchmarking opportunities
2 . Establish process owner and stakeholder team3 . Assess human resource, technology and training
needs4 . Identify process steps, requirements, goals and
measures of success on a 5x55 . Educate, train and communicate to company6 . Beta and pilot test as appropriate and implement7 . Use PI process to learn and improve

31
measures are detailed in (F6 .1-1) and (F6 .1-2) .
In order to sustain high performance, Communication Methods (F1 .1-4) and Recognition Methods [5 .1a(3)] are used to reinforce desired results . For example, when a coach renews a contract they are recognized via email acknowledging their success . On the “SG Daily Update,” in-process measures in the service Pillar are communicated daily .
6.2b(2) SG minimizes costs associated with defects, service errors, re-work and productivity losses in three ways: 1) through well defined processes using the PD Model; 2) validation mechanisms; and 3) defined performance reviews . Processes are analyzed prior to full deployment and piloted or beta tested internally and with partners to ensure performance according to specifications and to reduce impact of potential errors . Audits and validation practices are used to identify errors . For example, all expense reports undergo an audit before expenses are reimbursed . Technology Solutions are considered in order to prevent human errors and to improve efficiency . For example, an opportunity to automate and integrate coach deployment tracking was identified in 2008 and improvements and new software implemented in 2009 . The result was better workforce management and control of costs resulting from errors in pro forma management .
Rework is minimized by making standardized information available to coaches on the portal . For example, if a coach is teaching Rounding to a group of leaders in a partner organization, they can access standardized tools, forms and presentations from the Find Knowledge section of the SG portal . Making standardized information available, reduces variation in deployment to partners, ensures that the most updated information is used and reduces coach time to seek best practices .
Work Process Improvement6.2c Opportunities for improvement are identified during SG scheduled performance reviews when actual performance is below goal or an opportunity for innovation is identified . SG improves work processes using the four steps in the PI Model (F6 .2-2) . Step 1) Improvements are identified from scheduled performance reviews, from IDS, EAS, SLS and from new ideas . Step 2) When an improvement opportunity is identified, process owners gather the appropriate TEAM and use PI tools to better understand sources of process variation . They review the 5x5 process steps, customer requirements and internal requirements . Step 3) SG leaders drive innovation by empowering individuals
and TEAMS to seek out best practices and comparative data . In addition, innovation is embedded across departments through the Bright Ideas program, SG TEAMS, and at training and strategy sessions where discussion and interactive activities encourage innovative improvements . Steps in the 5x5’s are revised to reflect process improvements . Step 4) Improvements are implemented and monitored though scheduled performance reviews to determine if new actions result in desired outcomes . For example, in 2009, feedback from coaches on the expense management
process led to process innovation . Expenses are now scanned and submitted electronically instead of mail delivery . This saves time for coaches and finance staff and reduces expenses .
Process improvements and lessons learned are shared in the monthly “Debbie Connected,” WWGO updates, on the Daily Update and at division and department meetings . Knowledge is managed using the SG portal where employees can find, add or manage knowledge and best practices . The SG portal ensures that virtual employees have access to information to stay abreast of current processes and to perform work . The PI Model is reviewed at least annually by the SLG and as opportunities are identified .
Figure 6.2-2: Process Improvement Model
IntellectualCapital
1. Identify:• Identify performance variance and opportunities to improve and innovate existing processes
3. Treat:• Assess opportunities to benchmark best practice
• Identify process improvements• Revise 5x5 process steps
2. Diagnose:• Understand root causes of variation
• Apply PI tools as appropriate
• Review 5x5 process steps
4. Evaluate Effectiveness:• Review process measures
• Determine if improvement effective

Please note that this version of the application
includes results and narrative in Category 7 that have been updated
as of our site visit .

3232
7. Results7.1 Product OutcomesStuder Group® (SG) defines mission success based on how our customers are evaluated by their customers – the ultimate measure of a healthcare organization is its patients’ perception of their care . Achieving results are a key SG partner requirement . HCAHPS, or Hospital Consumer Assessment of Healthcare Providers and Systems, is a national standardized survey tool, which began public reporting in 2007, used to measure adult inpatient perception of the quality of care they receive at a given acute care hospital . SG uses data from HCAHPS to track and trend our partner’s performance on quality and satisfaction (patient experience), and to compare to the performance of organizations who do not work with SG . Each quarter, HCAHPS results are updated by CMS to reflect results for a rolling 12 month period and public reporting of this data lags by 9 months . There are 27 questions, including two global questions – “Would Definitely Recommend Hospital” and “Overall Rating of Hospital .” Public reporting and pay-for-performance methods focus on “Top Box” results -- the percentage of patients who responded in the most positive manner to each question, such as “definitely” on the recommend question or either “9” or “10” on the Overall Rating . SG uses the aggregate Top Box scores of “Would Definitely Recommend” as a key measure of mission achievement and EBL effectiveness .
(F7 .1-1) and (F7 .1-3) show the Top Box results of SG partners as compared to non-partners since the first period of public reporting . Results show that through hardwiringSM EBL, SG partners consistently outperform non-partners; and the longer an organization partners with SG, the better the results . Results are
consistent with national trend of larger hospitals often benefiting from a “halo” effect and generally scoring higher than rural hospitals (small hospitals with less than 100 beds) on the “would definitely recommend” question . Studer Group partners outpace nonpartners by an average of more than 20 percentile points .
(F7 .1-2) and (F7 .1-4) compare quarterly rate of change achieved by Studer Group partners on two HCAHPS questions . Studer Group EBL coaching tactics work as “change accelerators .” Studer Group partners’ rate of change consistently exceeds 2x the performance of nonpartners since the public reporting initiative was launched in 2007 . Projections for “Would Definitely Recommend” (SG strategic outcome) are in (F2 .1-4) .
(F7 .1-5) shows results for the HCAHPS “domains” or subscale questions that SG uses to determine the effectiveness of the individual EBL tactics – aligned goals, aligned behaviors (Must Haves®) and aligned processes . Must Have tactics include Rounding for Outcomes, Key Words at Key Times and Pre and Post Visit Calls . Top Box results represent the percent of patients who responded “Always” (as opposed to “Usually,” “Sometimes” or “Never”) on each domain question . Results are segmented by rural, EBL and length of time with SG . Results show how SG partners outperform non-partners in Top Box ratings for each question and for each period of reporting . Data represents the percent of patients that provided “top box” responses to HCAHPS questions concerning the quality of hospital care . Studer Group partners continue to improve each reporting period and outpace the performance of non-partners in all identified quality of care domains since the public reporting initiative was launched in 2007 .
Figure 7.1-1: SG Partner HCAHPS Results Top Box “Would Definitely Recommend”
Top
Box
: %
Defi
nite
ly R
ecom
men
d 78.076.074.072.070.068.066.064.0
SG EBL Since 2005
SG EBL Since 2006
SG EBL Since 2007
SG Rural
Non-Partner
Oct07-Sep08 Jan08-Dec08 Apr08-Mar09 Jul08-Jun09 Oct08-Sep09
Bet
ter
Figure 7.1-2: HCAHPS Quarterly Rate of Change for Percent Patients Who Would “Definitely Recommend” Hospital
3Q08-2Q09 to 4Q08-3Q09
2Q08-1Q09 to 3Q08-2Q09
1Q08-4Q08 to 2Q08-1Q09
4Q07-3Q08 to 1Q08-4Q08
3Q07-2Q08 to 4Q07-3Q08
0 0.2 0.4 0.6 0.8 1 1.2
Non-Partner Change ResultsSG Partner Change ResultsBetter
Change in Top Box Rating
Figure 7.1-3: SG Partner HCAHPS Results Top Box “Overall Rating of Hospital”
Top
Box
: Bes
t Hos
pita
l Pos
sibl
e %
9 a
nd 1
0 R
atin
gs
74.072.070.068.066.064.062.0
SG EBL Since 2005
SG EBL Since 2006
SG EBL Since 2007
SG Rural
Non-Partner
Bet
ter
Oct07-Sep08 Jan08-Dec08 Apr08-Mar09 Jul08-Jun09 Oct08-Sep09
Figure 7.1-4: HCAHPS Quarterly Rate of Change for Patients “Overall Hospital Rating”
0 0.2 0.4 0.6 0.8 1
Non-Partner Change ResultsSG Partner Change Results Better
Change in Top Box Rating
3Q08-2Q09 to 4Q08-3Q09
2Q08-1Q09 to 3Q08-2Q09
1Q08-4Q08 to 2Q08-1Q09
4Q07-3Q08 to 1Q08-4Q08
3Q07-2Q08 to 4Q07-3Q08

33
(F7 .1-6) is a unique, sophisticated SG designed result that demonstrates our impact on the performance of our partners . Data compares quarterly rate of change achieved by Studer Group partners in Top Box responses to HCAHPS questions concerning the patient’s perception of quality of hospital care as compared to non-partners . Studer Group partners consistently outpace the performance of non-partners across all HCAHPS domains . While SG partners have sustained a consistent advantage compared to nonpartners, it is important to note that SG partners continue to change in a positive direction on all 10 measures in the 3Q08-4Q08 period even though nonpartners saw performance decline on 6 of the 10 measures in this same time period .
While SG does not expect or guarantee that every partner will experience the same rate of change on a quarter to quarter basis, there is an expectation for a positive rate of change vs a negative rate of change . A SG rapid improvement action would
Figure 7.1-5: SG Partner HCAHPS Top Box: Questions Comparing SG Partners vs Non-PartnersTo
p B
ox %
“A
lway
s”
85
80
75
70
65
60
55
50
45
Oct
07-S
ep08
Jan0
8-D
ec08
Apr
08-M
ar09
Jul0
8-Ju
n09
Oct
08-S
ep09
Oct
07-S
ep08
Jan0
8-D
ec08
Apr
08-M
ar09
Jul0
8-Ju
n09
Oct
08-S
ep09
Oct
07-S
ep08
Jan0
8-D
ec08
Apr
08-M
ar09
Jul0
8-Ju
n09
Oct
08-S
ep09
Oct
07-S
ep08
Jan0
8-D
ec08
Apr
08-M
ar09
Jul0
8-Ju
n09
Oct
08-S
ep09
Oct
07-S
ep08
Jan0
8-D
ec08
Apr
08-M
ar09
Jul0
8-Ju
n09
Oct
08-S
ep09
Oct
07-S
ep08
Jan0
8-D
ec08
Apr
08-M
ar09
Jul0
8-Ju
n09
Oct
08-S
ep09
Oct
07-S
ep08
Jan0
8-D
ec08
Apr
08-M
ar09
Jul0
8-Ju
n09
Oct
08-S
ep09
Oct
07-S
ep08
Jan0
8-D
ec08
Apr
08-M
ar09
Jul0
8-Ju
n09
Oct
08-S
ep09
SG EBL SG Rural Non-Partners
Doctors Nurses Pain Quiet Help Room DischargeStaff Explained Meds
Bet
ter
Cha
nge
in T
op B
ox R
atin
g
.10
.9
.8
.7
.6
.5
.4
.3
.2
.1
0
-.1
-.2
3Q07
-4Q
074Q
07-1
Q08
1Q08
-2Q
082Q
08-3
Q08
3Q08
-4Q
08
3Q07
-4Q
074Q
07-1
Q08
1Q08
-2Q
082Q
08-3
Q08
3Q08
-4Q
08
3Q07
-4Q
074Q
07-1
Q08
1Q08
-2Q
082Q
08-3
Q08
3Q08
-4Q
08
3Q07
-4Q
074Q
07-1
Q08
1Q08
-2Q
082Q
08-3
Q08
3Q08
-4Q
08
3Q07
-4Q
074Q
07-1
Q08
1Q08
-2Q
082Q
08-3
Q08
3Q08
-4Q
08
3Q07
-4Q
074Q
07-1
Q08
1Q08
-2Q
082Q
08-3
Q08
3Q08
-4Q
08
3Q07
-4Q
074Q
07-1
Q08
1Q08
-2Q
082Q
08-3
Q08
3Q08
-4Q
08
3Q07
-4Q
074Q
07-1
Q08
1Q08
-2Q
082Q
08-3
Q08
3Q08
-4Q
08
3Q07
-4Q
074Q
07-1
Q08
1Q08
-2Q
082Q
08-3
Q08
3Q08
-4Q
08
3Q07
-4Q
074Q
07-1
Q08
1Q08
-2Q
082Q
08-3
Q08
3Q08
-4Q
08
SG Partners Non-Partners
Always quiet at night
Doctors always
communicated well
Nurses always
communicated well
Patient always received help
as soon as they wanted
Patients who gave a
rating of 9 or 10 (high)
Room was always clean
Staff always
explained medicines
before giving to
patients
Yes, patients were given info .
about what to do during their
recoveryYes,
patients would
definitely recommend
the hospitalPain was
always well controlled
Figure 7.1-6: HCAHPS Results: SG Partners vs Non-Partners Rate of Change
Bet
ter
Figure 7.1-7: HCAHPS Percentile Rank: SG Partners vs. Non-Partners “Overall Rating of Hospital”
40% 45% 50% 55% 60%
Non-Partner ResultsSG Rural Partner ResultsBetter
Percentile Rank
4Q08-3Q09
3Q08-2Q09
2Q08-1Q09
1Q08-4Q08
4Q07-3Q08

34
be implemented should a result ever reveal a negative rate of a change .
(F7 .1-7) shows the Top Box results of SG rural partners and how they have outperformed non-partners in each quarter since public reporting began on the overall rating of the hospital . This is an internal measure and given the variability in partner reporting methods, there is no benchmark available . Studer Group Rural partners consistently outperform non-partners by at least five (5) percentile points since the public reporting initiative was launched in 2007 .
At the beginning of an engagement with SG, partner baseline scores are calculated by averaging performance scores in the four quarters prior to the partnership . This average score then becomes the partner’s baseline result, which is compared to their quarterly results throughout the year . Each year, partner baselines are adjusted to reflect prior year performance . (F7 .1-8) shows the increasing percent of SG partners improving IP results through effective Coaching and Education of healthcare leaders to implement EBL tactics . Improvement in inpatient (IP) results is weighted at 15% of the coaching division’s performance evaluation and (along with meeting financial performance goals) opens the door to SG success sharing and incentive compensation . Data represents SG’s key outcome in determining effectiveness of EBL coaching in achieving our mission . SG is currently on track to meet the projected performance goal of 90% partners up in 2010 and 92% in 2011, with a long-term goal of 100% of partners trending up .
The IP service line is where SG has the greatest impact on the most patients . Given the variability in partner reporting methods, SG uses an internally developed measure to track and trend progress and consequently, this measure has no available benchmark .
(F7 .1-10) shows the average scores of SG partners’ semi-annual self-assessment of their effectiveness in implementing EBL tactics and is segmented to show scores by length of engagement with Studer Group . It represents five dimensions of EBL, which are scored by the partner with guided coach facilitation using a 0-100 percent scale . EBL self-assessment scores improve as length of engagement increases . This is an internal measure with no available benchmark .
(F7 .1-11) and (F7 .1-12) are measures of physician and employee satisfaction—“Best Place to Practice Medicine”
and “Best Place to Work .” SG defines mission success as the rating of our customer by their customer (patients) . As SG measures physician satisfaction, we lay the foundation for future value-based purchasing . Given the direct correlation between employee satisfaction and patient satisfaction, SG measures partner results (“All Partners” and “Largest Partners”) for employee satisfaction in the workplace . Results reflect the
Figure 7.1-8: SG Partner Inpatient Results: % Improving Over Baseline
Perc
ent o
f Par
tner
s
Up
from
Bas
elin
e
100%
90%
80%
70%
60% 2005 2006 2007 2008 2009 2010 Proj.
2011Proj.
2012Proj.
2013Proj.
SG EBL Up from Baseline SG Rural Up from Baseline
Bet
ter
2010 YTD
Figure 7.1-10: Coaching Effectiveness SG Partner 6 Month EBL Evaluation*
EBL
Self-
Ass
essm
ent b
y Pa
rtne
rs
Show
n by
Len
gth
of P
artn
ersh
ip 90%
80%
70%
60%
50%
40%
30%
20%
1-23 Months 24-35 Months 36-47 Months 48 Months or more
Bet
ter
Leaders
hip
Accountab
ility
Leaders
hip
Develo
pment
Must Hav
es
Standard
izatio
nHML
Figure 7.1-11: Physician Satisfaction “Best Place to Practice Medicine” *
Perc
ent o
f SG
Par
tner
s Im
prov
ing
Res
ults
Ove
r Bas
elin
e 80%
75%
70%
65%
60%2008 2009 2010
Proj.2011Proj.
2012Proj.
All Partners Largest Partners
Bet
ter
2010 YTD
Figure 7.1-12: Employee Satisfaction “Best Place to Work”
Perc
ent o
f SG
Par
tner
s Im
prov
ing
Res
ults
Ove
r Bas
elin
e 90%
85%
80%
75%
70%2008 2009 2010
Proj.2011Proj.
2012Proj.
All Partners Largest Partners
Bet
ter
2010 YTDSperduto & Associates Benchmark
Figure 7.1-13: Partner Financial Impact of EBL
2008 $xxxM
2009 $yyyM
2010 YTD $zzzM
Bet
ter
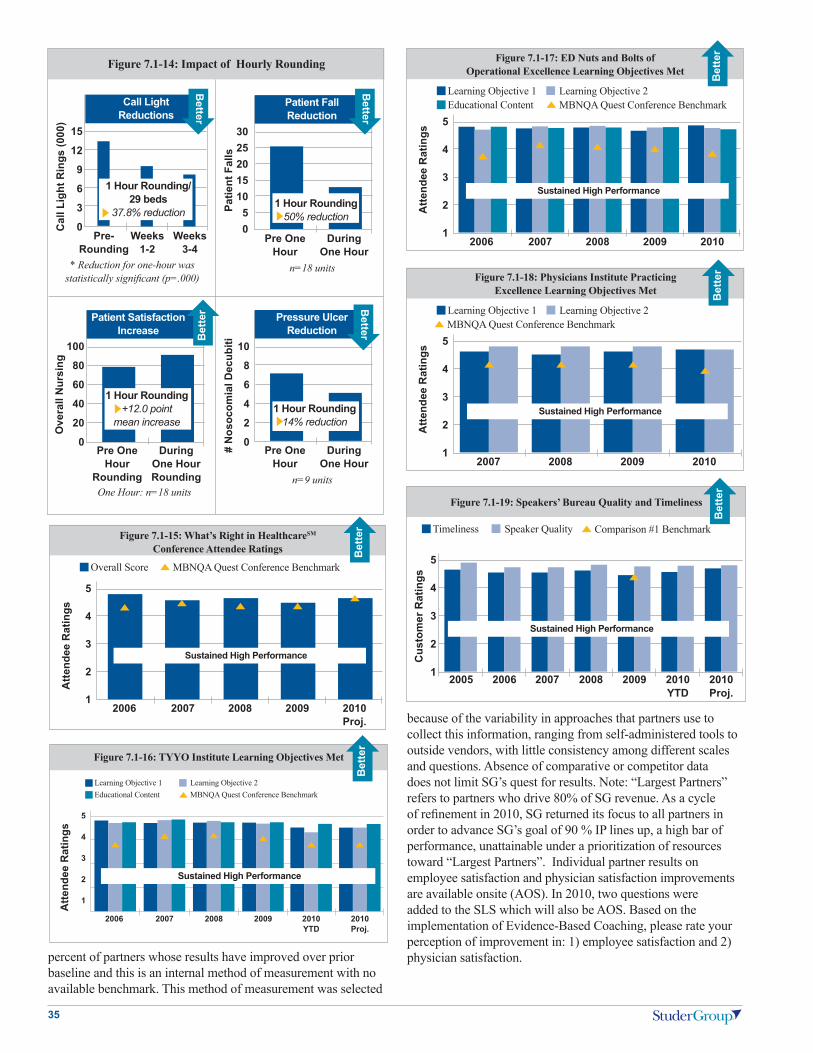
35
percent of partners whose results have improved over prior baseline and this is an internal method of measurement with no available benchmark . This method of measurement was selected
because of the variability in approaches that partners use to collect this information, ranging from self-administered tools to outside vendors, with little consistency among different scales and questions . Absence of comparative or competitor data does not limit SG’s quest for results . Note: “Largest Partners” refers to partners who drive 80% of SG revenue . As a cycle of refinement in 2010, SG returned its focus to all partners in order to advance SG’s goal of 90 % IP lines up, a high bar of performance, unattainable under a prioritization of resources toward “Largest Partners” . Individual partner results on employee satisfaction and physician satisfaction improvements are available onsite (AOS) . In 2010, two questions were added to the SLS which will also be AOS . Based on the implementation of Evidence-Based Coaching, please rate your perception of improvement in: 1) employee satisfaction and 2) physician satisfaction .
Figure 7.1-14: Impact of Hourly Rounding O
vera
ll N
ursi
ngC
all L
ight
Rin
gs (0
00)
# N
osoc
omia
l Dec
ubiti100
80
60
40
20
0
15
12
9
6
3
0
10
8
6
4
2
0Pre One
Hour Rounding
Pre-Rounding
Pre One Hour
During One Hour Rounding
Weeks 1-2
Weeks 3-4
During One Hour
One Hour: n=18 units
* Reduction for one-hour was statistically significant (p=.000)
n=9 units
1 Hour Rounding+12.0 point
mean increase
1 Hour Rounding/ 29 beds
37.8% reduction
1 Hour Rounding14% reduction
Patient Satisfaction Increase
Call Light Reductions
Pressure Ulcer Reduction
Patie
nt F
alls
3025201510
50
Pre One Hour
During One Hour
n=18 units
1 Hour Rounding50% reduction
Patient Fall Reduction
Bet
ter
Better
Better
Better
Figure 7.1-15: What’s Right in HealthcareSM Conference Attendee Ratings
Atte
ndee
Rat
ings
5
4
3
2
12006 2007 2008 2009 2010
Proj.
Overall Score
Bet
ter
MBNQA Quest Conference Benchmark
Sustained High Performance
Figure 7.1-16: TYYO Institute Learning Objectives Met
Atte
ndee
Rat
ings
5
4
3
2
1
2006 2007 2008 2009 2010 YTD
2010Proj.
Learning Objective 1Educational Content
Learning Objective 2MBNQA Quest Conference Benchmark
Bet
ter
Sustained High Performance
Figure 7.1-17: ED Nuts and Bolts of Operational Excellence Learning Objectives Met
Atte
ndee
Rat
ings
5
4
3
2
12006 2007 2008 2009 2010
Learning Objective 1Educational Content
Bet
ter
Learning Objective 2MBNQA Quest Conference Benchmark
Sustained High Performance
Figure 7.1-18: Physicians Institute Practicing Excellence Learning Objectives Met
Atte
ndee
Rat
ings
5
4
3
2
12007 2008 2009 2010
Learning Objective 1
Bet
ter
Learning Objective 2MBNQA Quest Conference Benchmark
Sustained High Performance
Figure 7.1-19: Speakers’ Bureau Quality and Timeliness
Cus
tom
er R
atin
gs
5
4
3
2
1 2005 2006 2007 2008 2009 2010 YTD
2010 Proj.
Timeliness
Bet
ter
Speaker Quality Comparison #1 Benchmark
Sustained High Performance

36
RESULT: In 2008, 12 out of 74 (16%) hospitals on Modern Healthcare’s Best Places to Work Top 100 list were SG partners, and 17 out of 65 (26%) in 2009.
An emerging partner requirement is evidence of financial impact based on partnership with SG . (F7 .1-13) shows a two-period trend of positive financial impact related to the implementation of EBL . Coaches’ goals are aligned to achieving partner financial impact via a 15% weighting in their annual evaluation (LEM) . This is consistent with SG’s commitment to be fiscally and socially responsible with healthcare dollars .
(F7 .1-14) (F7 .1-14) shows SG’s published results (AJN, 2006) from the impact of Hourly Rounding on quality, satisfaction and operations . Based on the statistically significant findings, SG’s Hourly Rounding innovation has become a core tactic to accelerate SG partner results .
Education is a SG key product . Demonstrated Education results from Institutes and SG’s national WRIHC conference are shown in (F7 .1-15-18) . On a post-conference evaluation, participants rate how well learning objectives were met using a 1-5 scale . The sustained high ratings reflect the ability of SG presenters to consistently engage the passion of attendees and to effectively teach EBL tactics .
(F7 .1-19) measures customer requirements relating to the quality and timeliness of materials when engaging a SG speaker . After each engagement, a six question survey using a 1-5 rating scale is sent to the customer for completion . These results represent over 1,400 speaking engagements with SG’s 21 experienced speakers who customize onsite presentations to meet individualized needs . Results show a consistently favorable trend exceeding the Comparison #1 presentation benchmark of 4 .5 .
(F7 .1-20) shows the overall ratings for SG Solution Leader Evaluation Manager™ (LEM) . The results represent ratings given by leaders in partner organizations on the quality of the training and the ability to use the system after training .
7.2 Customer-Focused OutcomesThe primary mechanism to measure partner satisfaction is the annual Senior Leader Survey (SLS) . Results are segmented by: EBL; rural; coach; organization; question; and length of partnership with SG . Additional detail is AOS . (F7 .2-1) shows the overall satisfaction of partner CEOs by two key
segments: EBL and rural . (F7 .2-2 - 7 .2-4) measure key partner requirements of coaching effectiveness which consists of
Figure 7.1-20: SG Partner Ratings of LEM Implementation
LEM
Tra
inin
g Pa
rtic
ipat
ion
O
vera
ll Ev
alua
tion
Scor
e 5
4
3
2
12007 2008 2009 2010
Actual2010Proj.
LEM Overall Training Evaluation
Bet
ter
ASQ BenchmarkFigure 7.2-1: SLS SG Partner CEO Satisfaction
by Key Partner Segments
Part
ner R
atin
g
5
4
3
2
12006 2007 2008 2009 2010 YTD
RuralEBL
Bet
ter
SPI Benchmark
Sustained High Performance
Figure 7.2-2: SLS Partner Ratings of Coaching Effectiveness by Leader Type
Part
ner R
atin
g
5
4
3
2
1CEO CNO COO IC VP
2007 2008 2009 2010 YTD
Bet
ter
SPI Benchmark for Customer Satisfaction (2009 & 2010)
Sustained High Performance
Figure 7.2-3: SLS Partner Ratings of Coaching Effectiveness by Segment
Part
ner R
atin
g
5
4
3
2
12006 2007 2008 2009 2010 YTD
EBL Rural
Bet
ter
SPI Benchmark
Sustained High Performance
Figure 7.2-4: SLS Partner Ratings of Coaching Effectiveness by Length of Partnership
Part
ner R
atin
g
5
4
3
2
10-11
Months12-23
Months24-35
Months36-47
Months48 or more
Months
SG Coach Score by Length of Partnership (measured Spring 2009)SG Coach Score by Length of Partnership (measured Fall 2009)SG Coach Score by Length of Partnership (measured 2010 YTD)
Bet
ter
Sustained High Performance

37
two questions: 1)“value of coaching” and 2)“coach aligned with priorities .” Effective Coaching, a results orientation and integration of the EBL tactics, contributes to sustained high satisfaction results since 2006 . SG benchmarks its results with Service Performance Insight (SPI), a customer satisfaction research and consulting organization dedicated to helping clients make quantum improvements .
SG results for partner engagement and loyalty are determined by SLS results on two questions: 1) “How does SG compare to other consultants” and 2) “Would you recommend SG” (F7 .2-5) . SLS Top Box ratings (% of 5’s on a 1-5 scale) are shown in (F7 .2-6) with benchmark data by Competitor #2 (redacted) .
Additionally, SG measures engagement by rates of contract renewals and compares its results to Competitor #1’s result . Continued high rates of renewal, even during economic recession, are shown in (F7 .2-7), reflecting improvements made to the renewal process to increase efficiency and effectiveness while continuing to provide value to partners . Following a period of strong growth in new business, SG increased focus on the renewal process . The increase in percentage of partners renewing contracts is a result of robust process measures, assigned leadership and accountability, and coach and AL training .
SG measures satisfaction and engagement with Education and Speaking through event and speaker evaluations using a 1-5 scale . (F7 .2-8) shows consistently high ratings of Institute value . (F7 .2-9) reflects sustained high results in SG’s over 450 annual
speaking engagements that reach over 100,000 participants .
SG also uses the SLS to determine satisfaction with Solutions . Results in (F7 .2-10) reflect SG partner ratings of overall value
Figure 7.2-7: SG Partner Renewal Rates
Part
ner R
enew
al R
ates 100%
90%
80%
70%
60%
50%2005 2006 2007 2008 2009 2010
Proj.2010YTD
2011Proj.
2012Proj.
2013Proj.
EBL Renewal Rate Rural Renewal Rate Competitor #1
Bet
ter
Figure 7.2-8: SG Institutes Overall Value
Cus
tom
er R
atin
g
5
4
3
2
12006 2007 2008 2009 2010
TYYO Physician’s Institute Nuts & Bolts
Bet
ter
MBNQA Quest Conference Benchmark 2010 YTD
Sustained High Performance
Figure 7.2-9: Customer Satisfaction Speakers’ Bureau
Cus
tom
er R
atin
g
5
4
3
2
12007 2008 2009 2010 YTD 2010 Proj.
Courtesy Responsiveness Recommend
Bet
ter
Comparison #1 Benchmark – Recommend
Sustained High Performance
Figure 7.2-10: SLS Overall Value of SG Solutions
Part
ner R
atin
g
5
4
3
2
1 LEM DCM Partner Websites
Spring 2008 Fall 2008 Spring 2009Fall 2009 2010 YTD
Bet
ter
Callidus Software Support Benchmark (2008)
Figure 7.2-5: SLS SG Partner Loyalty Measure Pa
rtne
r Rat
ing
5
4
3
2
1Spring 2008
Fall 2008 Spring 2009
Fall 2009 2010 YTD
How Does SG Compare Would Recommend SG
Bet
ter
SPI Best Benchmark
Sustained High Performance
Figure 7.2-6: SLS Partner Top Box Loyalty Ratings
Perc
ent o
f Par
tner
s
Rat
ing
SG 5
70%
65%
60%
55%
50%
45%
40%Spring 2007
Fall 2007
Spring 2008
Fall 2008
Spring 2009
Fall 2009
2010 YTD
Percent of 5’s
Bet
ter

38
of Solutions and partner websites . Since its inception in 2005, LEM has grown from having nine to more than 500 organizations using the software . Feedback and comments on Solutions ratings are used to make improvements, such as the most recent LEM upgrades which include a goal library and a goal wizard .
SG evaluates partner dissatisfaction via three measures: 1) SLS scores of “3” or less, which are considered “hot” surveys (F7 .2-12); 2) Partners who request a change in their coach (F7 .2-13); and 3) the number of service guarantees invoked by partners . The benchmark for partner dissatisfaction (hot surveys) is a Baldrige recipient . Each SG contract includes a money-back guarantee if partners are not satisfied with SG services .
RESULT: There have only been 6 EBL refunds during the life of SG (<1%).
Dissatisfaction with Education and Speaking is measured by refunds . Dissatisfaction with publications is tracked through the Complaint/Feedback Management System and is AOS . SG measures dissatisfaction with Solutions in two ways: 1) number of incidents reported (F7 .2-14) and 2) scores of 3 or less on the SLS (AOS) . (F7 .2-14) represents concerns, complaints and questions about the functionality of Solutions .
7.3 Financial and Market OutcomesSuccess in the Finance Pillar means the continued opportunity for SG to create impact, accelerate results and make a difference for employees, physicians and patients . (F7 .3-1) shows a favorable long-term trend in revenue . Revenue growth is a key financial measure for SG . SG has an average annual growth rate of 35% from 2000-2009 . Well-managed revenue growth is key to our long-term success and sustainabiltiy . Actual Total Revenue YTD $31,245,203 . The slight decline in 2009 represents challenges the company faced across all lines of business due to the economic downturn . SG’s steady growth in revenue, in conjunction with its low debt ratio speaks to the company’s long-term sustainability .
RESULT: as of May 7, 2010 the year-end 2010 targets for new business growth and renewals of partnerships had already both been exceeded.
Revenue for products and services are shown in (F7 .3-2 - 7 .3-4) . The 2009 decline in Institute revenue represents reduced attendance at Institutes due to travel restrictions and partner organization’s budgetary constraints during economic downturn; the 2009 increase in Speaking revenue represents the increased number of healthcare organizations bringing SG speakers onsite in lieu of travel . The shift in revenue from Institutes to Speaking is a reflection of a strategic proactive countermeasure to ramp up SG’s speaking division by bringing speakers onsite to healthcare providers . As of September 30, 2010, both Speaking and Institutes were ahead of budgeted revenues and projected to exceed annual budget at year-end .
SG’s measures of profitability and budget performance are shown in (F7 .3-5 - 7 .3-9) . Results reflect effective management
Figure 7.3-1: SG Revenue Growth
Rev
enue
in M
illio
ns
2001 2002 2003 2004 2005 2006 2007 2008 2009 2010Proj.
2011Proj.
2012Proj.
ActualAMCF Benchmark Standard of Growth 2010 YTD
Avg Annual Revenue Growth %
90%80%70%60%50%40%30%20%10%0% -10%
Revenue G
rowth %
Bet
ter
Figure 7.2-12: SLS Partner Dissatisfaction- Percent “Hot Surveys”
2005 2006 2007 2008 2009 2010 De-identified YTD Baldrige Recipient 0 .28% 1 .59% 0 .46% 0 .96% 0 .63% 0 .59% 1 .3%
Better
Figure 7.2-13: Partner Requested Coach Transitions*
Time frame Requests for Percent Transition 1Q09 4 1 .4% 2Q09 2 0 .7% 3Q09 4 1 .5% 4Q09 0 0 .0% 1Q10 1 0 .3% 2Q10 3 0 .9% 3Q10 0 0 .0%
Better
Figure 7.2-14: SG Solutions Support Reported Incidents
Num
ber o
f Inc
iden
ts
450
400
350
300
250
200Jan Feb4Q09
AvgMar Apr May Jun Jul Aug
Better
Figure 7.3-2: SG Coaching Revenue*
Coa
chin
g R
even
ue
in M
illio
ns
2006 2007 2008 2009 2010Proj.
2011Proj.
2012Proj.
EBL Rural
Bet
ter
2010 YTD

39
of SG business processes, such as revenue cycle, salary, and expense management .
(F7 .3-7) shows SG’s ability to align revenue (Finance Pillar) and employee growth (People Pillar) as the company scope changes . SG continues to align resources to match market demand ensuring both optimal service to partners and a profitable deployment of coaches and supporting employees . As a result of the slight decline in coaching revenue in late 2009, SG leaders re-scoped the number of coaches and admin employees needed to meet demand .
RESULT: Since founding the company in 1999, SG has exceeded annual budgeted revenue targets every year excluding the recessionary year of 2009.
The company has no material debt (under 10%) as shown in (F7 .3-9) . This measure is an outcome measure of financial control and efficiency, and demonstrates SG’s ability to fund its own growth rather than use external financing to fuel growth, product development and infrastructure expansion .
Results for marketplace performance are shown in (F7 .3-10 - 7 .3-16) . (F7 .3-10) shows SG market share using actual SG partners compared to potential partners, as identified by the American Hospital Association (AHA) database . A decline
spanning two consecutive periods was related to the economic recession as our partners were challenged by reductions in reimbursement and market uncertainty . In 2010, SG has more revenue with fewer contracts, a result of more business development success with Hospital Systems (counted as a single contract but representing multiple hospitals) . SG is trending to hit 2010 projections .
(F7 .3-11) shows SG continued growth in EBL and rural contracts and demonstrates the continued value that SG delivers as it hardwires EBL in partner organizations . SG had an average annual growth rate of 18% from 2006 to 2009 and performes better than the AMCF Benchmark .
(F7 .3-12) shows consistent growth in rural partnerships, which was achieved through service line focus and new leadership in the rural service line .
With economic challenges in the last 18-24 months, healthcare Education and travel budgets were reduced resulting in declines in Institute attendance (F7 .3-13) . New marketing and BD strategies, including complimentary invitations to non-parter CEOs, have been taken to encourage attendance . Attendance for SG’s annual conference WRIHC is consistently strong and anticipated to exceed target in 2010 .
(F7 .3-14) shows rapid growth in the number of annual speaking engagements, doubling over a two-year span . SG projects and plans for steady performance in future years with existing speaking nearing capacity .
Figure 7.3-5: SG Operating Margin
Net
Inco
me
2001 2002 2003 2004 2005 2006 2007 2008 2009 2010Proj.
2011Proj.
2012Proj.
Net Income BudgetAMCF Oper Margin % Benchmark
Margin
% M
arginB
ette
r
2010 Margin YTD %
Figure 7.3-6: SG Receivables and Days Sales Outstanding
Gro
ss R
ecei
vabl
es
in M
illio
ns
100
90
80
70
60
50
40
302006 2007 2008 2009 2010
Proj.
A/RB
etterD
ays Sales Outstanding
Accounts Receivable Network
DSO 2010 Accounts Receivable YTD
Figure 7.3-3: SG Education Division Revenue: Speaking and Institutes
Educ
atio
n D
ivis
ion
Rev
enue
in M
illio
ns
Institutes Speaking
2006 2007 2008 2009 2010 YTD2010 Proj . 2011 Proj . 2012 Proj .
Bet
ter
Figure 7.3-4: SG Solutions Revenue
Solu
tions
Rev
enue
in
Mill
ions
2006 2007 2008 2009 2010Proj.
2011Proj.
2012Proj.
2013Proj.
Books SoftwareVideos
Bet
ter
2010 YTD

40
(F .7 .3-15) shows that FSP currently has more than 600,000 books in circulation, including Hardwiring Excellence which is used as a core textbook for healthcare leaders . SG book sales follow an atypical industry trend with an average shelf-life of four to five years, as compared to an industry average of one to two years . According to industry data, a published book by a first time author is deemed a success if 7,500 books are sold . All SG books have consistently exceeded this number .
The number of new books published (11) in 2009 exceeded that of any prior year . In 3Q09 SG began strategically distributing books on a complimentary basis as a customer engagement strategy .
Figure 7.3-9: Debt to Equity Ratio
Deb
t: Eq
uity
Rat
io
0.6
0.5
0.4
0.3
0.2
0.1
02006 2007 2008 2009 2010 Proj.
Debt to Equity Ratio
Better
Research and Consulting Norm2010 YTD
Figure 7.3-10: SG Market Share
# of
Act
ive
Con
trac
ts
2006 2007 2008 2009 2010Proj.
2011Proj.
2012Proj.
# Total Active Contracts
Bet
ter
% M
arket Share
SG % Market Share2010 YTD Active Contracts
Figure 7.3-11: SG Active Contracts Segmented by EBL and Rurals
# of
Act
ive
Coa
chin
g C
ontr
acts
2006 2007 2008 2009 2010 YTD
2010 Proj.
2011 Proj.
2012 Proj.
EBL Rural Avg Annual Revenue Growth Rate % Bet
ter
Revenue G
rowth %
AMCF Benchmark
Figure 7.3-7: SG Total Revenue Per Employee – Sustained Efficiency
Tota
l Rev
enue
in M
illio
ns
160
140
120
100
80
60
40
20
01999 2000 2001 2002 2003 2004 2005 2006 2007 2008 2009 2010
Proj.
Revenue
# of Employees
Employees
5 9
Rev per employee:
1999 2000 2001 2002 2003 2004 2005 2006 2007 2008 2009 2010 Proj. $aaa $bbb $ccc $ddd $eee $fff $ggg $hhh $iii $jjj $kkk $lll
1840
4571
88104
132156
126132
2010 YTD Revenue
Figure 7.3-8: SG Expense as a Percent of Revenue
Rev
enue
in M
illio
ns
2006 2007 2008 2009 2010 Proj.
2011 Proj.
2012 Proj.
Revenue Expenses
Better
Expenses as a %
of Revenue
Competitor #1 BenchmarkExpense as a % of Revenue

41
SG’s website is a content-rich site that provides a platform for enabling partners, customers, and potential customers to access EBL tactics, research, blogs from topical experts, videos, webinars and inspirational industry-related books . (F7 .3-16) shows a favorable website registration growth trend over time .
7.4 Workforce-Focused OutcomesSG practices what it teaches in educating, engaging and developing its workforce using tactics in the Selecting and Retaining Talent System (F5 .1-2) and other EBL tactics that differentiate SG as a “Best Place to Work .” SG hires employees with a passion for purpose, for worthwhile work and for making a difference . In 2008 and 2009, SG was named a “Best Place to Work” by SHRM and the Great Place to Work Institute .
Figure 7.3-15: Publications Number of SG Books in Circulation
Boo
ks in
Circ
ulat
ion
(000
) 1,200
1,000
800
600
400
200
02004 2005 2006 2007 2008 2009 2010
Proj.2011Proj.
2012Proj.
Bet
ter
2010 YTD
Figure 7.3-16: SG Website Registered Users
# of
Reg
iste
red
Use
rs (0
00)
2101901701501301109070503010
2006 2007 2008 2009 2010Proj.
2011Proj.
2012Proj.
Bet
ter
All Registered Users Partners UsersDe-identified Baldrige Recipient Benchmark
All Registered Users - 2010 YTD Partners Users - 2010 YTD
Figure 7.4-1: EAS Overall Employee Satisfaction
Empl
oyee
Rat
ings
5
4
3
2
12006 2007 2008 2009
SG Overall Coach Admin Subcontractors
Bet
ter
Benchmark Sperduto DB 90th%ile
Figure 7.4-2: EAS Overall Employee Morale
Perc
ent E
mpl
oyee
s
with
Pos
itive
Mor
ale
100%
90%
80%
70%
60%
50%
40%
100%
90%
80%2006 2007 2008 2009
Overall Coaches AdminSG Percentile Rank – 99th
Bet
ter
Benchmark Sperduto DB
PercentileFigure 7.3-12: Growth in Rural Partnerships
Rural R
evenue ($)
2006 2007 2008 2009 2010 Proj.
2011 Proj.
2012 Proj.
Rural Revenue SG Rural Contracts Bet
ter
# of
Act
ive
Con
trac
ts
Figure 7.3-13: SG Institutes
Aver
age
Atte
ndan
ce
1600140012001000
800600400200
0TYYO Nuts &
BoltsPhysicians WRIHC Total
2006 2007 2008 2009 2010 YTDMBNQA Quest Conference
Bet
ter
Figure 7.3-14: Growth in Speaking Engagements
Num
ber o
f Spe
akin
g En
gage
men
ts 500
450
400
350
300
250
200
150
1002005 2006 2007 2008 2009 2010
Proj.2011Proj.
2012Proj.
Bet
ter
2010 YTD

42
(2010 recipients not yet announced) . SG measures employee satisfaction and engagement through the EAS . (F7 .4-1) shows overall employee satisfaction, which reflects sustained high performance at or above the 90th percentile in all periods .
(F7 .4-2) shows morale results, a key measure of engagement, as calculated by an outside vendor using 41 questions that correlate with engagement . While SG saw a decline in employee morale results in 2009, as compared to all other organizations in the database SG performed better . This is reflected in SG’s controlling hold on the 99th percentile rank . No other organization in the database performed better . SG attributes the 2009 decline to workforce challenges in conjunction with economic pressures .
(F7 .4-3) is an EAS engagement measure, which shows that SG has sustained high levels of employee engagement at or above the 90th percentile for the past four survey periods .
(F7 .4-4) shows SG employee turnover results is consistently well below benchmarks for overall and segmented metrics .
(F .7 .4-4) also shows SG turnover rates increased as a result of rescoping the workforce to match business demand in late 2008-early 2009 . New business contracts that were reduced or delayed necessitated a reduction in force who were hired in anticipation of business demand . SG extended a generous severence (regardless of tenure) and assisted with transitioning employees by successfully helping them find alternative employment . In 2010, SG results show favorable performance as compared to past years and benchmark . 90-day turnover continues to be at or near 0 for the last two years, which is reflective of the effectiveness of Selecting and Retaining Talent tactics (F5 .1-2) .
Within SG, work systems are fully deployed across all departments . When work systems are performing efficiently and effectively, both within and among departments, handoffs are smooth and results meet SG standards . One way that SG measures operational performance of work systems is by measuring the internal satisfaction among departments (F7 .4-5) on a 1-5 scale . This survey, known as the Interdepartmental Survey (IDS), allows coaches (internal customers) to rate the effectiveness and efficiency of support processes .
In order to fuel innovation and process improvement, employees are encouraged to submit new ideas . Ideas are reviewed by leaders and implemented ideas are communicated across the organization with reward and recognition provided . The increasing number of Bright Ideas (F7 .4-6) is an indicator of engagement and positive workforce climate and demonstrates ownership and employee desire to improve work systems and processes . SG’s consistently high results are above De-identified Baldrige Recipient Benchmark .
Figure 7.4-4: Employee Turnover
Turnover ‘06 ‘07 ‘08 ‘09 1/10- Benchmark 9/10 (2009) Overall 8 .65 10 .69 13 .58 16 .26%* 6 .50% 16 .3% HR .com (30 .89%) 90 Day 0 .00 4 .9 1 .9 0 0 Coach 0 .00 4 .58 6 .18 9 .0%* 2 .44% 24% AMCF (11 .39%) Admin 8 .65 6 .11 7 .41 6 .5%* 4 .06% 16 .3% HR .com (19 .50%) *Indicates Turnover Rate without RIF, ( ) represent turnover including RIF
Better
Figure 7.4-6: Idea Express – Ideas Submitted
Brig
ht Id
eas
Subm
itted 300
250
200
150
1002008 2009 2010 Proj.
Bright Idea Submissions De-identified Baldrige Recipient Benchmark
Bet
ter
Figure 7.4-7: Tokens of Appreciation Innovative Tool for Peer-to-Peer Recognition
Num
ber o
f Tok
ens
Aw
arde
d
95085075065055045035025015050
2007 2008 2009 2010 YTD 2010 Proj.
Bet
ter
Comparison #2
Figure 7.4-3: EAS Employee Engagement“Would you Recommend SG as a Good Place to Work?”
Empl
oyee
Rat
ings
5
4
3
2
12006 2007 2008 2009
SG Overall Coach Admin
Bet
ter
Benchmark Sperduto DB 90 Percentile
Figure 7.4-5: Interdepartmental Survey Employee Satisfaction with Support Services
Finance HR IT Travel
Bet
ter
De-identified Baldrige Recipient Benchmark
Empl
oyee
Rat
ings
5
4
3
2
12006 2007 2008 2009 2010

43
Tokens of Appreciation (F7 .4-7) are reflective of SG’s Value of Teamwork and aligns with SG’s key factor of employee engagement and appreciating success – Reward and Recognition . SG employees recognize colleagues with a “Token” as a sign of appreciation and recognition . Tokens may be redeemed for cash . SG innovated the paper token to an online tool and process which improved the ease of giving and receiving recognition across the organization, particularly for SG’s virtual team members .
Figure 7.4-8: Employee Engagement Measures
Measures ‘06 ‘07 ‘08 ‘09 Top 10%5 .0
4 .9
4 .9
4 .7
4 .8
4 .8
4 .9
4 .7
4 .7
4 .7
4 .4
8
4 .5
4 .7
4 .7
98%
4 .6
4 .5
4 .7
4 .7
4 .6
4 .5
4 .6
4 .7
2
23
3 .7
3 .4
4 .9
4 .9
4 .8
4 .5
4 .8
4 .8
N/A
4 .8
4 .8
4 .7
4 .3
13
4 .5
4 .7
4 .8
100%
4 .6
4 .5
4 .6
4 .6
4 .6
4 .5
4 .6
4 .6
4
34
3 .5
3 .4
4 .9
4 .9
4 .8
4 .6
4 .8
4 .7
4 .8
4 .7
4 .7
4 .6
4 .2
16
4 .5
4 .7
4 .8
98%
4 .6
4 .4
4 .5
4 .7
4 .5
4 .4
4 .5
4 .7
3
30
3 .9
3 .8
4 .9
4 .9
4 .8
4 .3
4 .7
4 .7
4 .8
4 .6
4 .6
4 .5
4 .1
5
4 .4
4 .6
4 .8
91%
4 .7
4 .4
4 .5
4 .5
4 .3
4 .3
4 .3
4 .6
0
53
3 .7
3 .4
4 .5
4 .9
4 .1
4 .2
4 .3
4 .2
4 .4
4 .4
4 .8
4 .1
3 .7
4 .1
4 .3
4 .5
40% req .
4 .0
4 .1
4 .3
4 .1
4 .1
3 .9
4 .0
4 .0
N/A
N/A
3 .9
3 .9
Available onsite
Engagement Factors
Understanding how work has purpose and making a difference
Tools and Equipment Positive relationship with supervisor and co-worker
Opportunities for development
Active participation and input into decision making
Timely and transparent information and communication
Reward and recognition and appreciating success
Work-Life-Blend
EAS-I know mission and goals
EAS-I am committed to mission and goals
EAS-Employees are committed to mission of SG
EAS-I have equipment, supplies and training to do job
EAS-SG employs people I like to work with
EAS-Colleagues have respect for my opinions and judgments
EAS-Colleagues are capable and willing to help when needed
EAS-My leader cares about me as a person
EAS-My leader would treat me fairly- even if I made a mistake
EAS-SG invests in my individual development
EAS-Adequate opportunities for advancement
# Internal promotions
EAS-My leader consults me on decisions that affect my job duties
EAS-My leader accepts my input with respect and appreciation
EAS-I am engaged in the action planning process
EAS-Survey Participation Rate (BM: 40% required for validity)
EAS-Kept informed on matters that affect the organization
EAS-Kept informed on matters that affect me
EAS-Clear picture of future direction
EAS-Receive feedback on my performance
EAS-Reward and recognition for things done well
EAS-Credit goes to those who deserve it
EAS-Dedication and effort are recognized and valued
EAS-Opportunities to use initiative and ingenuity
# Flame Awards
# Pillar Awards
Thank you note logs
EAS-My work schedule allows me to balance work and home demands effectively
EAS-(Coach) My work schedule allows me to balance work and home demands effectively
Updates 2010 YTD
# Internal Promotions 2
# Flame Awards 5
# Pillar Awards 15
New
# Mini-Pillar Awards 39
Figure 7.4-9: SG Training and Development Effectiveness: Employees who Applied Learning*
SG L
inka
ge G
rid
Com
plia
nce
100%
90%
80%
70%
60%
50%Coach Admin
Bet
ter
Target2006 2007 2008 2009 2010 Proj .

44
SG results for key factors that motivate and engage employees are shown in (F .7 .4-8) . Results are consistently above the 90th percentile norm, validating that SG practices what it teaches in providing a better place for employees to work .
Training and Development: SG results of its three-tiered training and development methods are shown in (F .7 .4-9-13) . Linkage grids are a level two method whereby employees are asked to demonstrate that they applied prescriptive learning goals from quarterly trainings . Linkage rate compliance is expected to be at 90% and is at or near goal for each period (F7 .4-9) .
SG’s employee orientation process is a tier one method of new
employee ratings of the on-boarding process . Orientation is designed to integrate new employees into the SG culture and to ensure that they have the skills and knowledge to be successful . SG attendees report high ratings for the on-boarding process (F7 .4-10), and as compared to De-identified Baldrige Recipient Benchmark . The HR leader uses orientation evaluations and comments in order to continually improve the training and development process . An addition to orientation in 2007 was the administration of an orientation quiz in order to validate learning in the orientation process, also noted in (F7 .4-10) .
(F7 .4-11) shows total training hours per employee for SG leaders, coaches and admin . The overall positive trend demonstrates SG’s commitment to the value of learning and aligns with the Baldrige Core Value of Organizational and Personal Learning . Admin training structure changed in 2009 to focus on role-and department-specific development, allowing greater efficiency with same effectiveness (see 7 .4-13) . SG surveys employees about their perception of training and development as this is a key factor of employee engagement . (F7 .4-8) shows the high results to the EAS questions: “The organization invests in my individual development” and “I have adequate opportunities for advancement .” Benchmark source is American Society for Training and Development (ASTD)’s 2009 Annual State of the Industry Report . The ASTD Best Benchmark consisted of 28 organizations in 2008 that were recognized by ASTD as demonstrating a “clear link between learning and performance across the enterprise .” Best Award winners adhered to the following criteria: evidence that learning has value in the culture, evidence of a link between learning and performance, evidence of innovative learning initiatives .
Figure 7.4-10: Overall Rating of the Orientation Process
Orie
ntat
ion
Rat
ing 5
4
3
2
1
100%
80%
60%
40%
20%
0%2005 2006 2007 2008 2009 2010YTD
Orientation Rating Orientation Quiz Score Bet
ter
Orientation Q
uiz Score
De-identified Baldrige Recipient Benchmark
Sustained High Performance
Figure 7.4-11: SG Training Hours per Employee
Hou
rs
1301201101009080706050403020
2006 2007 2008 2009 2010 Proj.
Leader Coaches Admin
Bet
ter
ASTD Best Benchmark
Figure 7.4-12: SG Coach Evaluation Results (LEM)
% o
f Coa
ches
Mee
ting
and
Exce
edin
g Ex
pect
atio
ns
100%90%80%70%60%50%40%30%20%10%0%
2006 2007 2008 2009 2010 Proj.
Far exceeds => 4 .8 Exceeds = 4 – 4 .79 Meets = 3 – 3 .99
Bet
ter
Scale changed from 4 to 3 “Meets Expectations”
Figure 7.4-13: Training and Development: PRC Competency Ratings*
PRC
Com
pete
ncy
Rat
ings
5
4
3
2
1 Calendaring Scheduling Travel
Bet
ter
2006 2007 2008 2009 2010
Sustained High Performance
Figure 7.4-14: Capacity Measure: Managing Coach Capacity to Contracted Deployment*
Dep
loye
d D
ays
5500
4500
3500
2500
1500
5002005 2006 2007 2008 2009 2010
Actual/ Proj.
Actual Deployed Days 2010 Projected Deployed DaysCoach Goal Days Goal = Match Actual
Days to Goal Days

45
The ultimate measure of training effectiveness is a SG three-tier measure-achieving results (F5 .1-3) . Coach evaluation scores are shown in (F7 .4-12) and reflect the percent of coaches achieving performance targets (LEM scores of 3 or above) . In 2008, SG raised the bar by shifting from a score of 4 (the measure of meeting performance expectations) to a 3 . In addition to aggregate scores, all coaches have individual development plans (AOS) .
(F7 .4-13) demonstrates the PRC (admin coach support) competency in three key competencies required by coaches . PRCs are evaluated bi-annually based on the key skills needed to successfully perform in their roles . An action plan is developed for any PRC whose competency rating falls below a “3” .
(F7 .4-14) and ( F7 .4-15) show measures of capacity and efficient resource usage for coaches and PRCs . A goal for coaches is to be 100% deployed, which is the equivalent of 120 days onsite . Additionally, the productivity deployment goal for PRCs is to support at least 26 deployed days per month . Productivity targets assist SG in minimizing workforce staffing challenges, including transitions . Productivity measures are used for other admin departments and are AOS . 2010 numbers outperform prior years and productivity target; reflects higher competency level and increased tenure of PRC team . SG leaders
monthly review productivity measures for appropriate staffing levels, taking into consideration performance and quality measures . Despite higher productivity (exceeding deployed days per PRC), admin turnover remains low (7 .4-4 reflects lowest YTD turnover rate since 2005) and performance high (7 .4-13 reflects competency evaluation at near 5 rating) . Productivity currently under review; 4Q adjustment to target anticipated .
SG demonstrates a commitment to health safety, climate and security of its employees through safety and disaster preparedness . Effectiveness of the emergency plan has been demonstrated by SG’s ability to withstand two severe hurricanes that directly impacted the Pensacola Bay Area (includes GB)with no impact on our service to partners and minimal business impact . (F7 .4-16) shows results on SG health, safety and security measures . High EAP usage is above benchmark as a result of SG’s continuous promotion of this health and wellness benefit to enhance employee well-being and is directly correlated to SG’s high employee engagement levels . SG had its highest number of staff in 2008, which was also an outlier year for W/C claims . Claims returned to 0 in 2009 and remain at 0 to date (2010) .
(F7 .4-17) shows employee satisfaction with benefits is above the 90th percentile . Sustained high results are related to strong benefits offering (at or above benchmark) and effective benefit management . Compensation and benefit analysis AOS .
(F7 .4-18) shows results for two questions that were added to the EAS in 2007 to measure SG’s climate and culture of inclusiveness . SG leaders provide training to educate employees on effective verbal and non-verbal communication approaches
Figure 7.4-17: EAS – Employee Satisfaction with Benefits
Empl
oyee
Rat
ings
5
4
3
2
12006 2007 2008 2009
SG Overall
Bet
ter
Benchmark Sperduto DB 90th%ile
Sustained High Performance
Figure 7.4-18: EAS Climate Culture of Diversity and Inclusion
Empl
oyee
Rat
ings
5
4
3
2
1SG values diversity Employees from different
backgrounds feel welcomed at SG
Bet
ter
2007 2008 20092009 Benchmark Sperduto 90th Percentile
Figure 7.4-15: Capacity Measure: PRC Productivity Measures
Aver
age
Dep
loye
d D
ays
Per P
RC 45
40
35
30
25
202007 2008 2009 2010 YTD
Bet
ter
Average Monthly Deployed Days per PRC Target
Figure 7.4-16: SG Results on Health, Safety and Security Measures
Measure ‘06 ‘07 ‘08 ‘09 ‘10 BenchmarkWorker’s compensation experienceSafety IncidentsEAS – SG Overall Score “Safe and secure work environment”EAS – Coach Score “Safe and secure work environment”Health & Safety Educational ActivitiesFire /evacuation drills% of employees who rollover sick daysEAP Usage
0 .81
0N/A
N/A
N/A
87 .1
N/A
0 .81
1N/A
N/A
N/A
67 .7
25%
0 .83
94 .70
4 .70
29
493 .8
28%
1 .06
0 4 .60
4 .70
64
491 .4
37%
N/A
0 N/A
N/A
69
2N/A
28 .6%
1 .00
N/A90th%tile= 4 .1
90th%tile=4 .1
N/A
N/AN/A
3-5%

46
to ensure that all employees are respected for their individual differences . Both questions are above the 90th percentile .
7.5 Process Effectiveness Outcomes(F7 .5-1) shows SG innovative products and services since the company was founded in 1999 and the resulting annualized revenue growth . As an innovative Industry Leader, SG has pioneered numerous focused research projects in order to
validate the effectiveness of its tools and tactics in improving healthcare . The research wing of Studer Group, the Alliance for Health Care Research, is focused on identifying and sharing best practices for the purpose of promoting service and operational excellence . Using data from Studer Group’s national learning lab, the Alliance for Health Care Research studies best practices to validate and quantify their impact and application at healthcare organizations nationwide . In addition to SG’s industry-changing Hourly Rounding research, SG has also focused research in the following areas: Organizational Change Processes in High Performing Organizations, Effective Meetings, and Discharge Phone Call Effectiveness in Improving Patient Care .
SG’s key measure for supporting coaches is accuracy of deployment tracking . Results in F7 .5-2 reflect accuracy of tracking deployment using SG’s prior deployment tracking system (Deployment Tracker) from 2007 to 2009 . Following a system and process review in 2008, SG transitioned to an improved software, Tenrox, in 2009 . Implementation was complete and fully deployed in 2010 . This new technology
Figure 7.5-2: Accuracy of Tracking Deployment (Tenrox)*
Perc
ent o
f Acc
urat
e A
nnua
l D
eplo
ymen
t Ent
ries
99.40%
99.35%
99.30%
99.25%
99.20%
99.15%
99.10%
99.05%2007 2008 2009
Figure 7.5-3: Percent of Partners Improving Inpatient Satisfaction Results 1 Quarter After Operational Review*
100%90%80%70%60%50%40%30% 20%10%
0%2Q08 3Q08 4Q08 1Q09 2Q09 3Q09 4Q09 1Q10
Perc
ent o
f Par
tner
s U
p
Bet
ter
Figure 7.5-4: SG Travel Process – Cost Per Flight
Cos
t Per
Flig
ht
$550$500$450$400$350$300$250$200
2007 2008 2009 2010 Proj.
Cost per flight
BetterE-Topaz Benchmark
2010 YTD
Bet
ter
Figure 7.5-1: Key Innovation Over Time Segmented By Revenue*
1999-2001 2002-2005 2006-2008 2009-2010
Ann
ualiz
ed R
even
ue
• Introduction of Nine Principles®
• Disruptive Behavior product• Executive & Physician Coaching
services• Straight A Leadership publication• Inspired Nurse publication
• Nurse Leader Handbook publication• Engaging Physicians publication• Excellence in the ED publication• On-demand videos and webinars• Department Rounding research• Leadership Skills of Early Careerists
research• Disruptive Behaviors research• Focused research• ED Coaching Services• Talk Zone Radio• Patient Call Manager™ (PCM)• Excellence with an Edge publication• The HCAHPS Handbook: Hardwire
Your Hospital for Pay-for-Performance Success publication
• First TYYO & Nuts & Bolts Institutes
• Introduction of Must Haves®
• Highmiddlelow® product• First Annual WRIHC• Hardwiring Excellence
publication• Hardwired Results
magazine• Must Haves® product
• Leader Evaluation Manager™ (LEM)
• Discharge Call Manager™ (DCM)
• AIDETSM product
• Practicing Excellence Book and Institute
• Hourly Rounding research & product
• Idea Express™• Rounding Manager™ (RM)• Staff Evaluation
Manager™ (SEM)
• Results that Last –book and audio version
• Selecting Talent product• Physician AIDETSM product• Individualized Patient Care
research• Hourly Rounding research• Work-Life-Blend research• ED Rounding research• Highmiddlelow® research• Nurse Manager Effectiveness
research

47
(Tenrox) allows for better tracking of data entry reporting errors; new measures as reported through Tenrox are not comparable to the above measures and are AOS . Improvements made to the deployment tracking process through implementation of Tenrox transition includes: systematic connections now made with SG’s finance system, the ability to post and lock time entries (allowing for better tracking of errors), and enhanced reporting capabilities .
SG measures the effectiveness of the coaching process using four results that comprise coach LEM evaluations: 1) Renewal rates (F7 .2-7); 2) HCAHPS and percent partners improving results (F7 .1-1 - F7 .1-9); 3) financial impact (F7 .1-13) and 4) SLS results (7 .2-1-6) . Individual results by coach are AOS . Partners who do not show expected progress undergo an
operational review by senior SG coaches to understand root causes of EBL variation and to identify revisions to partner action plans . (F7 .5-3) represents the percent of partners who showed improvement after an operational review . This data reflects 341 reviews conducted since 2007 when the process was formalized . This is an in-process measure indicating progress toward ultimate organizational measure of 90% of partners moving up over baseline performance . With sustained quarterly improvement in excess of 50% demonstrates effectiveness of operational review process (indicates results not due to chance) . This indicator measures the effectiveness of the operational review process, including “fresh eyes” assessment of partners who are not improving performance . Operational Reviews prompt changes in the coaching plan and advance SG’s organizational goal of percentage of partners moving up . The
Figure 7.5-8: SG Help Desk Percent Closed on First Response
Perc
ent o
f Inc
iden
ts
100%95%90%85%80%75%70%65%60%55%50%
Jan Feb Mar Apr May Jun Jul Aug Sept
Bet
ter
Percent Closed on First Response KPI Benchmark
Figure 7.5-9: IT Solutions (Software Products) Help Desk Percent Closed on First Response
Perc
ent o
f Inc
iden
ts
95%90%85%80%75%70%65%60%55%
Jan Feb Mar Apr May Jun Jul Aug Sept
Bet
ter
Percentage Closed by Front Line KPI Benchmark
Figure 7.5-10: IT Server Up Time
100%
99%
98%
97%
96%
95%
94%2004 2005 2006 2007 2008 2009 2010
Proj.
Server % Time Up E-Hosting Index Benchmark
Bet
ter
Perc
ent S
erve
r Up
Tim
e
2010 YTD
Figure 7.5-5: SG Travel Booked According to Guidelines*
Flig
hts
Boo
ked
Acc
ordi
ng
to G
uide
lines
80%70%60%50%40%30%20%10%
2007 2008 2009 2010 Proj.
Bet
ter
2010 YTD
Figure 7.5-6: SG Expense Management Process
Expe
nses
Rei
mbu
rsed
On-
Tim
e
100%
90%
80%
70%
60%
50%
40%
100%
90%
80%
70%
60%
50%
40%1Q082Q083Q084Q081Q092Q093Q094Q091Q10 2Q10
% Submitted On-Time % Invoiced On-Time% Reimbursed On-Time
Bet
ter
Expenses Submitted O
n-Time
Figure 7.5-7: SG Accounts Receivable Over 90 Days*
Gro
ss A
ccou
nts
Rec
eiva
bles
in
Mill
ions
18%
16%
14%
12%
10%
8%
6%
4%
2%1Q08 2Q08 3Q08 4Q08 1Q09 2Q09 3Q09 4Q09 1Q10 2Q10
Amount Over 90 Days Total AR % Over 90Pinnacle III Corp . Benchmark 16 .3% or Less
Better
% O
ver 90 Days

48
results show the percent of hospitals reporting results that were higher in the first quarter after Operational Review than at the time of the Operational Review . 1Q10 results are indicative of reviews accomplished in the first quarter and measured by 2Q data .
(F7 .5-4) results show expense reductions achieved by identifying the most cost effective travel options for SG travelers .
(F7 .5-5) shows results for the percent of travel booked according to SG’s policy of booking at least 14 days in advance (industry recommendation); travel not booked according to guidelines includes justifiable exceptions, e .g . last minute partner request, as well as non-justified exceptions, e .g . error by admin support (failure to timely book) .
(F7 .5-6) shows SG expense reporting results which include the percent of expenses: 1) submitted on-time; 2) reimbursed
on-time; and 3) invoiced on-time . The decline in expense reimbursement performance in 2008 was addressed by adding an additional resource and adopting new in-process measures which led to a steady trend of favorable performance . Additional actions taken to improve results are: frequent reporting of compliance using in-process measures; review of outliers; and training employees who have adverse patterns of non-compliance .
SG’s Accounts Receivable (AR) results are shown in (F7 .5-7) . The goal is to achieve 15% or below of total receivables in AR over 90 days . Analysis of long-term AR (% of AR over 90 days, the most risky receivables) identified an unfavorable trend . PI evaluation determined that best solution was increased staffing to manage accounts receivable . This process improvement led to a long-term AR decrease of approximately 66% and allows increased availability of cash for accomplishing SG growth strategies .
SG’s IT Help Desk (internal network and equipment support) and Solutions Support (software assistance) provide timely support to internal and external customers . (F7 .5-8) and (F7 .5-9) display the percent of SG internal and external issues resolved on first call . In order to classify an issue “closed” on first response, it must be responded to by the internal SG Help Desk within 4 business hours and resolved within first contact with no need to revisit the incident . To be classified as “closed” on first response, the service request to the IT Solutions Help Desk must be resolved by the first-line without assistance of second and/or third-line support . SG is consistently outperforming benchmark performance . IT system availability, server up time, of 99 .9962% as shown in (F7 .5-10) demonstrates effective IT systems management .
(F7 .5-11) shows a supplier report card for a key IT supplier . SG leaders us the evaluation to assist in vendor decision making and process improvement . No scores were reported in 2Q 2009 as SG was transitioning software development and support from one vendor to another .
(F7 .5-12) shows the SPG evaluations of SG’s Strategic supplier . SG is committed to quarterly review of the Strategic Planning Process (SPP) and strategic supplier effectiveness . At each strategy session, attendees rate effectiveness on a scale of 1-5 . Feedback is integrated into future planning of SPG meetings .
In 2006, SG initiated a hotel supplier report card to track key indicators of cost, service and quality of hotel suppliers . (F7 .5-13) shows the aggregate results for the past four years on a 1-5 scale (5= highest) . SG leaders use supplier measures to aid in decision making regarding which hotels to use for Institutes and events . A decline in supplier performance in 2009 led to changes in hotels used for Institutes and conferences . Detailed supplier report card information is AOS .
Figure 7.5-11: SG IT Supplier Report Card*
SSI 4 .0 3 .0 4 .0 3 .5 3 .0 n/a 4 .0 4 .0 4 .0 4 .0 4 .0 4 .0 4 .0 4 .0 4 .0 n/a 4 .0 4 .5 4 .5 4 .0 4 .0 4 .5 4 .0 4 .5 4 .5 n/a 4 .0 4 .0 4 .0 4 .0 4 .0 4 .0 4 .0 4 .0 4 .0 n/a 3 .0 4 .5 4 .5 3 .7 4 .0 4 .5 5 .0 4 .0 4 .5 n/a 4 .0 5 .0 5 .0 3 .3 4 .0 4 .0 4 .5 4 .0 4 .0 n/a 4 .0 5 .0 5 .0 4 .0
Support ResponseQuality of Support (issues resolved)Development completed on timeQuality of develop-ment (issue free)Quality of Partner interaction Overall value
1Q 2Q 3Q 4Q 1Q 2Q 3Q 4Q 1Q 2Q 08 08 08 08 09 09 09 09 10 10
Figure 7.5-12: Strategic Supplier Effectiveness: SPG Ratings*
September 2008
January 2009
May 2009
August 2009
November 2009
January 2010
May 2010
August 2010
4 .46
4 .82
4 .8
4 .87
4 .92
4 .61
4 .94
4 .76
Strategy Session Date
SPG Rating of Strategic Supplier Effectiveness
Bet
ter
Figure 7.5-13: SG Hotel Supplier Average Scores
Supp
lier A
vera
ge S
core
s 5
4
3
2
12006 2007 2008 2009 2010
Proj.
Supplier Average Scores
Bet
ter
2010 YTD

49
7.6 Leadership Outcomes(F7 .6-1) shows the results of SG’s “Big Rock” strategy accomplishments . Further detail may be found in (F2 .1-4) .
(F7 .6-2) SG practices what it teaches and uses the 6-Month EBL Assessment to determine the effectiveness of the EBL SYSTEM . Nine dimensions of EBL are scored using criteria in an ADLI format . Scores reflect the degree to which the tactic is hardwired and effective .
(F7 .6-3) shows SG’s Baldrige scoring bands since 2007 . SG adopted the Baldrige Criteria as its internal model for Performance Excellence in 2005 when the journey began with pursuing a state quality award, for which SG received recognition .
(F7 .6-4) shows SG’s governance, legal, ethical and societal measures; results on all EAS related questions are above the 90th percentile . SG has never lost a partner related to unethical business practice, breaches in confidentiality or unethical behavior . SG exceeds regulatory requirements in the areas of HIPAA compliance and ACCME credits . The effectiveness of the Environmental Stewardship Team (EST) is measured by recycling efforts which show increasing compliance from 84% in 2008 to nearly 98% in 2009 . According to a poll conducted by Harris Interactive, data shows that 49% of office workers recycle . SG trends better than this reported average with 97 .6% of the corporate office employees recycling (2009 audits) . SG expects to meet 99 .9% compliance for 2010 based on YTD data .
(F7 .6-5) shows results for SG’s charitable giving . SG exceeded its charitable giving goals in 2007 and 2008 . SG tracks monetary giving as well as in-kind donations and encourages employees to give of their time and talent in working with organizations within the key communities SG supports . In addition to intellectual capital, SG donates free of charge seats to Institutes, publications, and other products and services . In 2008, SG made a commitment to launch its education initiative
targeting training and development of education leaders across the country which required additional disbursement of start-up funds and resulted in a corresponding increase in charitable giving in 2008 .
SG’s Value of Generosity is shown through its charitable giving and SG’s commitment to excellence has earned recognition at the local, state and national levels, as shown in (F7 .6-6) . Additionally, SG employees and leaders have received
recognitions for their support of SG’s key communities . A sampling of select recognitions is provided in (F7 .6-7), which summarizes special acknowledgement bestowed upon senior leaders . (F7 .6-8) shows EAS results for trust in senior leaders which shows consistently high results .
At SG we practice what we teach . Just as we teach, we use the Healthcare Flywheel internally to accelerate and sustain improvement over time by engaging employees in the impassioned pursuit to hardwire prescriptive tactics proven to get results and reconnect each of us to our desire for purposeful, worthwhile work that makes a difference in the lives of others . Just as we teach, we use the Evidence-Based Leadership (EBL) system to align our goals, behaviors and processes to foster our culture of accountability, maximize our human potential, and sustain the consistent execution of evidence-based tactics .
As a result, our outcomes mirror those of the partners and customers we serve . For both SG and our partners, we define mission success through the voices of patients who entrust their care to the hundreds of thousands of individual leaders, physicians, and employees who read our publications, hear our speakers, use our Solutions and receive Coaching in our more than 700 partners . For both SG and our partners, we are resolute in our long-term commitment to accelerate and sustain organizational results so that patients receive better care, employees have a better place to work, and physicians have a better place to practice medicine .
Figure 7.6-1: Accomplishments of Organizational Strategy
% of Partner Inpatient Results UpSenior Leader Survey overall scoreEducation Evaluation Index (Institutes & Speaking)Total Employee Turnover EAS % of Employees with Positive MoraleTotal Revenue ($M) Net Income ($M) Charitable Giving ($k)
F7 .1-8F7 .2-196 .00%
F7 .4-4F7 .4-2
F7 .3-1F7 .3-5F7 .6-5
ServiceQuality
People
GrowthFinanceCommunity
Pillar Strategic Outcome
2009 Result
Figure 7.6-2: Effectiveness of Leadership System: 6-Month EBL Assessments*
SG S
emi-A
nnua
l EB
L Sc
ores
100
80
60
40
Mar 2009 Nov 2009 July 2010
Bet
ter
Figure 7.6-3: SG Baldrige Scoring Bands
SG B
aldr
ige
Scor
ing
Ban
ds 5
4
3
2
12007 2008 2009
Process Scoring Band Results Scoring Band
Bet
ter

50
Percent of employees who signed policy
EAS-Organization values diversity in the workplace
EAS-SG is ethical in its treatment of EE’s
EAS-My leader models ethical behavior
EAS-Employees are treated fairly at SG
HIPAA violations
OSHA violations
ADA
Non-compliance with ACCME
EAS-My supervisor does what is right for employees
EAS-This organization is dedicated to the satisfaction of its partners
EAS-SG is ethical in its treatment of partners
EAS-I feel safe reporting ethics breaches to leader or HR
EAS-I have confidence in the judgment of top management
EAS-SL models ethical behavior
# Corrective and disciplinary actions
EEOC complaints
Ethical issues reported by partners and suppliers
# lawsuits
% audit recommendations used
Expense report audit errors
% Studer Group Gulf Breeze Employees Recycling
N/A
N/A
N/A
N/A
4 .5
0
0
0
0
4 .6
5 .0
N/A
N/A
4 .6
N/A
1EAP
0
0
0
100%
N/A
N/A
N/A
N/A
N/A
N/A
4 .6
0
0
0
0
4 .7
4 .9
N/A
N/A
4 .7
N/A
1Exit
0
0
0
100%
N/A
N/A
100%
4 .4
4 .7
4 .8
4 .5
0
0
0
0
4 .7
4 .9
4 .8
N/A
4 .7
4 .7
2Exit
0
0
0
100%
N/A
84 .2%
100%
4 .6
4 .7
4 .8
4 .5
0
0
0
0
4 .6
4 .9
4 .8
4 .7
4 .6
4 .8
21-Exit1-EAP
0
0
0
100%
1 .18%
97 .6%
100%
N/A
N/A
N/A
N/A
0
0
0
0
N/A
N/A
N/A
N/A
N/A
N/A
0
0
0
0
100%
N/A
100%
Ethical Behavior
Regulatory
Stakeholder Trust
Ethical Breaches; Standards Violations
Legal
Financial
Recycling Tracking Compliance Trend
Criteria Indicators ‘06 ‘07 ‘08 ‘09 ‘10
Figure 7.6-4: SG Governance, Legal, Ethical, and Societal Measures

51
• Outstanding Partner in Education for 2009/2010 School Year• 5th Place Top Relay for Life Fundraising Team• Ranked #12 out of 50 Best Florida Companies to work for in Florida Trend
Magazine• Ranked #14 out of 25 Best Small Companies to Work for in America
• Certificate of Appreciation for support and passion for the community• Ranked #11 out of 25 Best Small Companies to Work for in America• Ranked #12 out of 50 Best Florida Companies to work for in Florida
Trend Magazine• Top 14 businesses providing most new consultants for 2008/2009 school
year • Business of the Month October 2009 • Positive IMPACT Expanding Business
• Top 25 Best Small Companies to Work for in America• Community Service Champion• Ranked #3 for Top 20 Companies for Working Families • Volunteer Recognition Award • Day of Caring Recognition • Volunteer of the Year• Business of the Year• Business of the Month-October 2007• Florida Sterling Quality Achievement • Employee Engagement Award • Pensacola’s Best Places to Work • Industry Appreciation Award• Covenant Heart of Hospice Award• Exceptional Employer Award• Results That Last named National #10 Bestseller• Bronze Merit Award• Outstanding Leadership Award • Community Service Recognition • Best Effort to Improve Pensacola - Maritime Park• Silver Spoon Award• Crystal Flame Award • President’s Award • National Healthcare Advocacy Award
• Escambia County School District• American Cancer Society• Florida Trend Magazine
• Great Place to Work Institute and Entrepreneur .com
• Pensacola Young Professionals• SHRM and Great Place to Work Institute• Florida Trend Magazine
• Junior Achievement
• Gulf Breeze Chamber of Commerce• Santa Rosa County Economic Development
Council • SHRM and Great Place to Work Institute• Families Count• Families Count• Hallmark Elementary• United Way• Boys and Girls Club• Gulf Breeze Chamber of Commerce• Gulf Breeze Chamber of Commerce• Florida Sterling Council • Sperduto & Associates• The Independent News• TEAM Santa Rosa• Covenant Hospice• Agency for Persons with Disabilities• Wall Street Journal • HFMA• Boys & Girls Club• Hands on Pensacola• The Independent News• Families Count• Mercy Health Partner • PRC
2010
2009
2008
2007
2006
2005
Year Recognition Awarded By
Figure 7.6-6: Studer Group Community Recognition
Figure 7.6-5: SG Charitable GivingA
nnua
l Cha
ritab
le G
ivin
g ($
) 8.00%7.00%6.00%5.00%4.00%3.00%2.00%1.00%0.00%
2007 2008 2009 2010YTD
2010 Proj.
Actual Monetary Donations In-Kind Donations% Net Income
Bet
ter
Target Benchmark (%Net Income)
% of N
et Income

52
• L .R . Jordan Distinguished Lecture, Health Services Administration • Whitewater Founders Day Award for Distinguished Alumni• John D . and Starr A . Blair Award in Health Organization Management• Distinguished Service Award, Graduate Program in Health Services Management
and Policy• Grover and Sandra Robinson Community Service Award• Top 100 Most Powerful in Healthcare Award, 2002 & 2008• Service to Mankind• PACE (Pensacola Area Commitment to Excellence) Award - Community Leader• Bronze Merit Award• Honorary Award for Outstanding Leadership• Crystal Flame Award• President’s Award• Faculty in Residence
• Reeves Silver Merit Award• Hall of Fame
• Lamplighter Spirit Award, Outstanding Alumni Service and Role Model Success• Volunteer / Consulting Services• Alumni Support
• Woman Business Leader of the Year• PACE (Pensacola Area Commitment to Excellence) Award - Community Leader• Best Community Leader• IMPACT 100, Pensacola Bay Area, Community Spirit Award (Founding
President, Women’s Philanthropic Organization)• Civic Leader of the Year• Women Business Leader of the Year• Service to Mankind• Conservation Award• Silver Spoon Community Leader Award• Peggy Pilcher Community Service Award
• Community Leader Rising Star• Elected Southeast Regional Director
• Fellow Status
• Elected Advisor
• University of Alabama at Birmingham• University of Wisconsin Whitewater• Center for Healthcare Innovation, Education & Research• Alumni Society, Ohio State University
• Rotary Clubs of Pensacola• Modern Healthcare• Sertoma• Pensacola Bay Area Chamber of Commerce• Healthcare Financial Management Association• Boys & Girls Club• Mercy Health Partner• PRC• George Washington University Department Health
Services Management Leadership• Healthcare Financial Management Association• Lyons Township HS
• Lamplighter School of Texas• JPS Tarrant County Hospital Board• St . Marks Alumni Association Board
• Pensacola Business Journal• Pensacola Bay Area Chamber of Commerce• Independent News• Pensacola Bay Area Chamber of Commerce
• Kiwanis Club of Pensacola• Business Women’s Network• Sertoma• The Nature Conservancy• Families Count• Escambia County Council of PTAs
• Independent News• University of Minnesota MHA Alumni Assoc
• American College of Healthcare Executives
• Institute for Interactive Patient Care
Quint StuderCEO
BG PorterPresident
Debbie RitchieCOO
Craig DeaoR&D Leader
Bob MurphySpeaker
Brian RobinsonIndustry Relations
Senior Leader Recognition OrganizationFigure 7.6-7: Studer Group Senior Leader Recognition
Figure 7.6-8: Trust in SG Senior Leaders
EAS
Rat
ing
5
4
3
2
1I think highly of Senior Leaders
Senior Leaders are sincere in
wanting to know how employees
feel
With current leaders I am
confident SG will do well
EAS 2007 EAS 2008 EAS 2009
Bet
ter
Benchmark Sperduto DB 90th%ile