business peace report - vision of humanity
TRANSCRIPT

BUSINESS & PEACE REPORT
PEACE: A GOOD PREDICTOR OF ECONOMIC SUCCESS
Quantifying Peace and its BenefitsThe Institute for Economics & Peace (IEP) is an independent, non-partisan, non-profit think tank dedicated to shifting the world’s focus to peace as a positive, achievable, and tangible measure of human well-being and progress.
IEP achieves its goals by developing new conceptual frameworks to define peacefulness; providing metrics for measuring peace; and uncovering the relationships between business, peace and prosperity as well as promoting a better understanding of the cultural, economic and political factors that create peace.
IEP is headquartered in Sydney, with offices in New York, The Hague, Mexico City and Brussels. It works with a wide range of partners internationally and collaborates with intergovernmental organisations on measuring and communicating the economic value of peace.
For more information visit www.economicsandpeace.org
Please cite this report as: Institute for Economics & Peace. Business & Peace 2019: Analysing peace as a precondition for a sound business environment, Sydney, September 2019. Available from: http://visionofhumanity.org/reports (accessed Date Month Year).
BUSINESS & PEACE REPORT | 1
Global Peace Index and Business 8Economic prosperity, peace and business 8Macroeconomic stability and investment 11Foreign direct investment and peace 12Peace and the Nature of Constraints to Investors 13
Positive Peace and Business 14Pillars of Positive Peace and Business performance 14Economic-wide effects of Positive Peace 17
Endnotes 20
Introduction 4
Executive summary 2
Contents

BUSINESS & PEACE REPORT | 2
Executive summary
This report analyses the relationship between the economic performance of a country and its levels of peace. The major finding of this report is that peace acts as a good predictor of a country’s future performance in a number of macroeconomic indicators. These insights can be used to better assess the expected investment potential of countries.
Rather than asking what businesses can do for peace, the study differentiates itself from other work by focusing on what peace can offer businesses. Institute for Economics & Peace (IEP) sees this as an important but missing step in business analysis. In order for businesses to be an actor in building peace, investors first need to see the benefits of peace to their investment decisions.
The results of this work show that economic performance can be predicted by understanding the movement in the same socio-economic factors that affect peacefulness. These conditions are known as Positive Peace. The countries that improved the most in Positive Peace between 2010 and 2016 also had substantially above average economic performance.
Five macroeconomic indicators were analysed through two different measures of peace: the Global Peace Index (GPI), which measures the absence of violence or fear of violence, and the Positive Peace Index (PPI), which measures the attitudes, institutions and structures that create and sustain peaceful societies. IEP’s research has found that measures of Positive Peace are a good indicator of future levels of peace and of macroeconomic performance.
Countries who currently have low levels of violence or fear of violence, as measured by the GPI, over the last six decades have averaged 3 times the gross domestic product (GDP) growth rates of countries ranked at the bottom of the GPI over the same period. Similarly, countries that perform well on the GPI have lower inflation rates, easier access to financing, and higher rates of foreign direct investment (FDI). However, defining peace solely by levels of violence does not provide a complete picture of the future prospects for peace and business. Changes in Positive Peace are a more accurate measure of future prospects.
Changes in Positive Peace are associated with changes in a number of macroeconomic indicators – GDP growth, FDI and credit ratings. Because it measures the background socio-economic conditions that creates the environment for both peace and business to flourish, changes in Positive Peace are lead indicators for future changes in both peace and the business environment. Between 2005 and 2016, countries that were improving in Positive Peace had on average 2 per cent per annum higher GDP growth rates than countries deteriorating in Positive Peace.
Economic performance and peace are often mutually reinforcing. That is, better economic performance assists in building peace and vice-versa. Together they can form a virtuous cycle. Similarly, a worsening performance in peace hinders economic growth, forming a vicious cycle. The economy and peace can therefore be thought of as a system that can move in either a beneficial or destructive direction. Identifying tipping points within this system, both positive and negative, is of obvious interest to business and the broader community.
Rather than focussing on nations with already strong business environments, where possible, this study centres on countries outside of the US and Europe. These countries generally have lower levels of peace and economic achievement and receive less global attention in the international investment community. However, such countries are of interest from a business perspective. Early investment in countries that have the potential to improve in peacefulness will see higher returns on the back of improvements in the aforementioned macroeconomic indicators. Further, the robustness of a business environment, measured by the number of businesses per 100,000 people, increases with peacefulness. This indicates opportunity, as the more businesses that exist, the more likely new businesses are to emerge.
Countries not currently ranked amongst the world’s most peaceful nations offer the best opportunities for investment. Studies by the World Bank suggest that returns on investment are up to 8 per cent higher in countries with lower levels peace.1 Additionally, with improvements in Positive Peace, some of which can come from increased investment, the frequency and adverse impacts of events such as violent demonstrations or political upheaval is reduced.
IEP’s analysis finds that all eight Pillars of Positive Peace are closely tied to the performance of private enterprise and the economy. For example, Free Flow of Information is not only critical for an informed populous but also helps market integration due to greater availability of information on prevailing prices. Free Flow of Information also helps in keeping tariff levels low, which is crucial for the efficient allocation of inputs available to the economy. Greater Acceptance of the Rights of Others increases the economic participation of marginalised groups, in turn increasing their purchasing power.
Analysis of the links between business and peace, through the lens of Positive Peace, offers the business community a new way of assessing the risk of investments and identifying the potentially large opportunities that exist in under-examined countries.
BUSINESS & PEACE REPORT | 3
Key Findings
g Over the last six decades, GDP growth has been three times higher in highly peaceful countries, as measured by the GPI, than in countries with low levels of peace.
g Over the last decade, countries with the highest improvements in their GPI score recorded GDP per capita growth seven times higher than those that deteriorated the most.
g On average, inflation is three times higher and ten times more volatile in countries ranked at the bottom of the Global Peace Index than countries at the top.
g Foreign direct investment inflows are more than two times higher in countries with higher levels of peace.
g A one per cent increase in Positive Peace was associated with a 0.9 per cent appreciation in the domestic currency for non-OECD countries between 2010 and 2016.
g Improvements in Positive Peace are associated with a 1.4 per cent per annum average appreciation in the domestic currency, while a deterioration in Positive Peace is associated with a 0.4 per cent average depreciation. IEP’s Positive Peace framework offers businesses a new tool to assess the risk of investments and identify the potentially large opportunities that exist in under-examined countries.
g Based on historical analysis, low peace countries that are making significant improvements in Positive Peace will be expected to have the strongest economic returns.
BUSINESS & PEACE REPORT | 4
Introduction
It is well-established that peace is good for business
performance and private sector-led economic development.
Violence resulting from armed conflict and crime imposes a
transaction cost on business. Peace is associated with improved
functionality of markets through increased competition and
better institutions.
The link between business and peace is an important topic. A
large body of work has focused on guidelines, such as the United
Nations (UN) Global Compact’s Ten Principles,2 promoting how
businesses can support peace. In this paper, IEP asks the converse
but equally important question: why is peace good for business?
In countries where peace is low, business may suffer. However,
such countries can simultaneously offer highly unsaturated
markets with large scope for economic expansion, if the correct
underlying social conditions are present. Post-violent economic
recovery can yield high rates of GDP growth.3 Despite this, funds
do not flow to destinations affected by armed conflict due to very
high levels of perceived risk. This paper offers findings aimed to
help businesses assess risk in a more efficient manner. A Sound
Business Environment (one of the eight Pillars of Positive Peace)
is associated with low levels of violence, and there is a virtuous
cycle between the two. At the same time, a Sound Business
Environment is an integral part of a peaceful society and one of
the eight pillars of IEP’s Positive Peace framework.
IEP research shows a close link between peace and economic
success. IEP’s measures of peace provide a framework for
business and investors to understand the level of risk and
potential opportunity in a country.
IEP has found that there are common underlying conditions
that foster improvements in both peace and economic
performance. This body of work is known as Positive Peace.
Changes in Positive Peace precede changes in macroeconomic
activity, both positive and negative, thereby providing an ideal
mechanism to identify countries with the strongest prospects
for economic growth and investment.
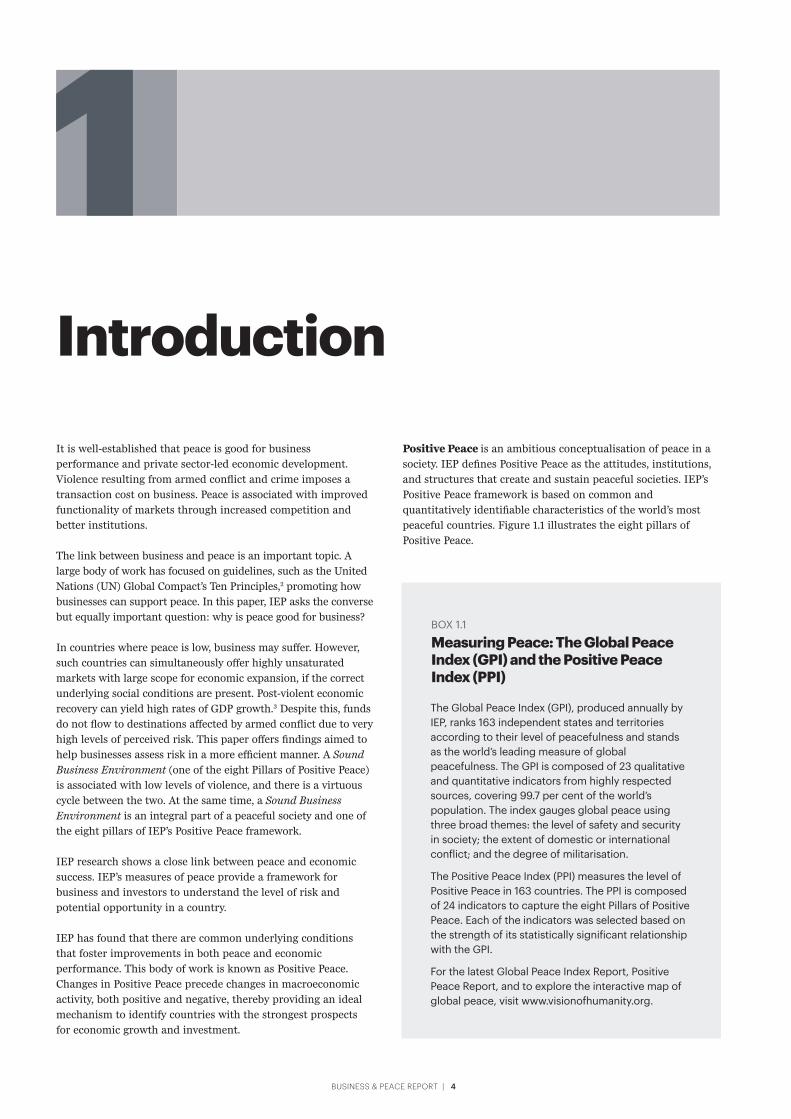
Positive Peace is an ambitious conceptualisation of peace in a
society. IEP defines Positive Peace as the attitudes, institutions,
and structures that create and sustain peaceful societies. IEP’s
Positive Peace framework is based on common and
quantitatively identifiable characteristics of the world’s most
peaceful countries. Figure 1.1 illustrates the eight pillars of
Positive Peace.
The Global Peace Index (GPI), produced annually by IEP, ranks 163 independent states and territories according to their level of peacefulness and stands as the world’s leading measure of global peacefulness. The GPI is composed of 23 qualitative and quantitative indicators from highly respected sources, covering 99.7 per cent of the world’s population. The index gauges global peace using three broad themes: the level of safety and security in society; the extent of domestic or international conflict; and the degree of militarisation.
The Positive Peace Index (PPI) measures the level of Positive Peace in 163 countries. The PPI is composed of 24 indicators to capture the eight Pillars of Positive Peace. Each of the indicators was selected based on the strength of its statistically significant relationship with the GPI.
For the latest Global Peace Index Report, Positive Peace Report, and to explore the interactive map of global peace, visit www.visionofhumanity.org.
BOX 1.1
Measuring Peace: The Global Peace Index (GPI) and the Positive Peace Index (PPI)

BUSINESS & PEACE REPORT | 5
As Positive Peace works systemically, changes within the system
cannot be explained by simple linear causality. This is not only
true for peace, but also for the business environment. A robust
business environment, as well as peace, springs from a
background set of conditions, articulated through the eight
Pillars of Positive Peace. For example, Free Flow of Information
is vital for the correct pricing of transactions and a well-
functioning media industry. Similarly, Acceptance of the Rights
of Others allow for greater participation of communities within
"There are common underlying conditions that foster improvements in both peace and economic performance."
a society. This inclusiveness improves peace and allows more
individuals to achieve their potential, which in turn supplies
more entrepreneurs for business.
What is important is the systemic nature of business and peace.
It is impossible to determine the influence of individual Pillars
on one another. Does a Well-functioning government lead to
Free Flow of Information and Low Levels of Corruption, or does
the media’s focus on corruption lead to a better functioning
Free Flowof Information
EquitableDistribution
of Resources
Well-FunctioningGovernment
Sound BusinessEnvironment
Low Levelsof Corruption
Acceptanceof the Rights
of OthersHigh Levels ofHuman Capital
Good Relationswith Neighbours
PEACE
FIGURE 1.1
The Pillars of Positive PeaceA visual representation of the factors comprising Positive Peace. All eight factors are highly interconnected and interact in varied and complex ways.
Source: IEP
BUSINESS & PEACE REPORT | 6
government? Well-Functioning Government, Free Flow of
Information and Low Levels of Corruption mutually influence
each other, as is true with all eight Pillars.
Sound Business Environment is one of the eight Pillars of
Positive Peace and refers to the conditions that enable
businesses to perform well and operate efficiently. A Sound
Business Environment represents one of the principal ways that
members of society routinely solve conflicts without violence.
Indicators that measure Sound Business Environment strongly
correlate with the level of peacefulness in a country.
A strong business environment has several systemic and positive
effects for Positive Peace through its impact on employment,
business density and level of competition, which can lower
corruption and improve governance. For instance, research
suggests that a lack of employment opportunities for youth is
associated with a higher risk of war in fragile contexts,4 but
increased availability of decent work inhibits citizens from
participating in violence. Such positive economic externalities
contribute to improving peace.
Entrepreneurship has long been identified as an engine of
economic growth. It is also an instrument of social
transformation in developing countries.5 This is evident in the
transformation produced by business innovation since the
industrial revolution. More specifically, the availability of
electricity, internet, mobile phones, personal computers and air
travel are recent phenomena in terms of human history.
However, not every global citizen has benefited from such
progress in living standards in the same way. This is particularly
true for less peaceful countries. For this group of countries to
achieve sustainable economic development and stability, private
enterprise has an important role to play.
Business in peaceful countries enjoys better-functioning formal
and informal institutions. Well-Functioning Government delivers
high-quality infrastructure and services, engenders trust and
participation, and upholds law and order. This context
incentivises citizens and businesses to participate in creating
and ensuring public order and safety due to the stake they have
in the peaceful order of their societies.
Therefore, for a country to have a highly effective business
sector, a minimal level of peace is an important condition. The
gain to the business environment from improvements in peace
is higher in the low and mid peace environment.
Section 3 of this report discusses the correlation between the
Pillars of Positive Peace and specific business indicators.
However, rather than implying causal links between peace and
business, IEP considers these to describe a system that can form
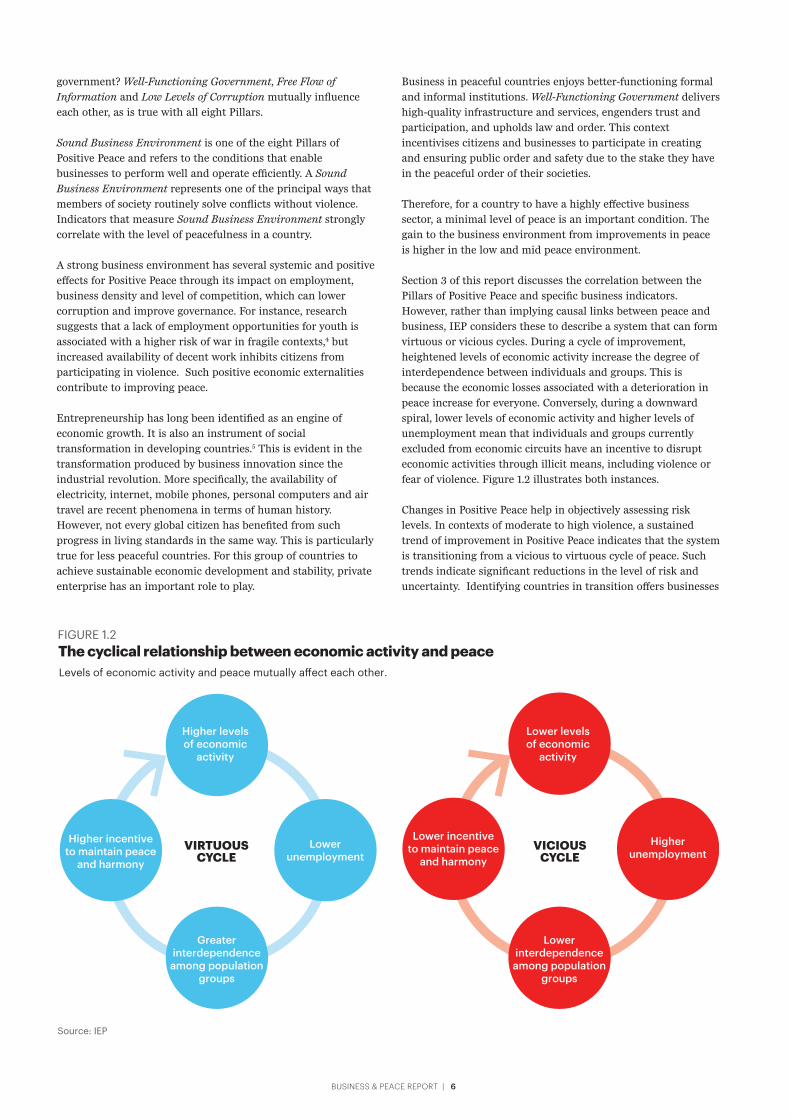
virtuous or vicious cycles. During a cycle of improvement,
heightened levels of economic activity increase the degree of
interdependence between individuals and groups. This is
because the economic losses associated with a deterioration in
peace increase for everyone. Conversely, during a downward
spiral, lower levels of economic activity and higher levels of
unemployment mean that individuals and groups currently
excluded from economic circuits have an incentive to disrupt
economic activities through illicit means, including violence or
fear of violence. Figure 1.2 illustrates both instances.
Changes in Positive Peace help in objectively assessing risk
levels. In contexts of moderate to high violence, a sustained
trend of improvement in Positive Peace indicates that the system
is transitioning from a vicious to virtuous cycle of peace. Such
trends indicate significant reductions in the level of risk and
uncertainty. Identifying countries in transition offers businesses
VICIOUSCYCLE
VIRTUOUSCYCLE
Source: IEP
FIGURE 1.2The cyclical relationship between economic activity and peace Levels of economic activity and peace mutually a�ect each other.
Higher levels of economic
activity
Greater interdependence
among population groups
Lower unemployment
Higher incentive to maintain peace
and harmony
Lower levels of economic
activity
Lower interdependence
among population groups
Higher unemployment
Lower incentive to maintain peace
and harmony
BUSINESS & PEACE REPORT | 7
and investors insights into markets with a strong potential for
superior returns on investment.
In the following sections of the paper, the link between business
and peace is explored in the context of two measures of peace,
the Global Peace Index (GPI) and the Positive Peace Index (PPI).
The GPI’s score is based on measures of the absence of violence
or fear of violence. However, looking at violence alone cannot
In the 2018 Global Peace Index Report, IEP finds a strong connection between future changes in peacefulness and past performance in Positive Peace.
The twenty countries that experienced the largest improvements in the GPI between 2013 and 2018 showed improvements in aspects of Positive Peace for the years prior. IEP also analysed the changes in Positive Peace for the 20 countries that experienced the largest deteriorations in the GPI since 2013. Fourteen out of these deteriorated in Acceptance of the Rights of Others and Low Levels of Corruption. Twelve worsened in Press Freedom. These results highlight the link between the attitudes, institutions and structures of a society and its subsequent peacefulness.
Improving peacefulness requires prior improvements across many Positive Peace indicators, a number of which are economic in nature. Escalations in violence, however, are preceded mainly by deteriorations of Positive Peace indicators that are political in nature. By taking a systems approach to understanding peace within a country, such findings assist in identifying countries that are approaching tipping points, either positive or negative, in their development.
Insights gained from IEP’s work offer a more complete assessment of the risks businesses face from deteriorations in peace in country. It also offers the ability to identify countries when opportunities are expected to improve as their peace strengthens.
BOX 1.2
Predicting Peace: How Positive Peace leads changes in the Global Peace Index
fully describe the true relationship between business and peace.
IEP’s Positive Peace framework, in analysing the attitudes,
institutions and structures that create and sustain peaceful
environments offers an opportunity to gauge the likely direction
things will take in the foreseeable future. This is explored in the
section on Positive Peace, which provides a glimpse into the
intimate link between business and the eight Pillars of Positive
Peace.
BUSINESS & PEACE REPORT | 8
Global Peace Index and Business
Economic prosperity, peace & businessThere has been sustained economic growth across the world
over the past seven decades. Expanded access to goods and
services has contributed to a longer life expectancy and better
quality of life. Higher global prosperity can be explained by
many factors, including higher productivity, itself driven by
technological innovation and a steady rise in human capital,
which in turn is driven by strong and stable institutions. Thus,
what one experiences is a virtuous cycle of ever-expanding
peace and prosperity. Unfortunately, this cycle of peace and
prosperity is not equally shared by societies.
The World Bank’s index of ‘Doing Business’ tracks 11 areas of
regulatory performance relevant for businesses across countries,
including starting a business, getting credit, paying taxes and
enforcing contracts.
Key Findings
g In the last six decades, per capita GDP growth has been three times higher in highly peaceful countries than in countries with low levels of peace.
g Over the last decade, countries with the largest improvements in peace recorded seven times higher GDP per capita growth than those that deteriorated the most.
g Interest rates are lower and more stable in countries with higher levels of peace.
g On average, inflation is three times higher and ten times more volatile in low peace countries than in high peace countries.
g Foreign direct investment inflows are more than two times higher in countries with higher levels of peace than in less peaceful countries.
Dividing countries into four groups by the level of their
peacefulness and comparing to their Ease of Doing Business
score, as shown in Figure 2.1, shows some interesting insights.
This shows that the gap between an individual country’s
performance and the best performing economies, also known as
the ‘distance to frontier’, decreases as peace improves. Thus,
good business performance is associated with a higher level of
peace. The widest gap occurs in conflict affected countries such
as Afghanistan, Syria and South Sudan. However, there are a
basket of mid-peace countries, such as Rwanda, Bhutan and
Georgia that have shown improvements in Positive Peace over
the past decade. With continuing improvements in Positive
Peace, these countries would be expected to close this gap in
coming years. It is these countries that offer potentially
attractive investment opportunities.
The mutually reinforcing relationship between business
performance and peacefulness is also demonstrated by the fact
that there is an identifiable differences in the historical

BUSINESS & PEACE REPORT | 9
performance of business environment indicators, such as GDP
growth, inflation, interest rate and inflow of Foreign Direct
Investment, as per levels of peace. High peace countries
generally have better average economic performance with lower
volatility compared to the average. Since 1960, the most peaceful
countries have, on average, seen their per capita GDP grow by
an annual rate of 2.8 per cent. Per person, GDP is now over
three times higher in 2016 than it was in 1960.
Less peaceful countries have experienced economic stagnation.
Their annual per capita GDP growth has, on average, grown by
just one per cent over the last six decades. Poor economic
performance has effectively made low peace countries more
vulnerable to political instability. Factors such as high levels of
poverty, unemployment and inflation have been shown to be
risk factors for political unrest.6
A common feature of low peace countries is a higher degree of
economic volatility. Short spurts of economic growth are often
followed by periods of stagnation and, in extreme cases,
prolonged economic contractions. Poor governing mechanisms
and political polarization can exacerbate economic shockwaves,
thereby prompting a cycle of instability.7 Prolonged
macroeconomic volatility is often a precursor to hyperinflation,
currency devaluation and indebtedness – all of which can create
further political and economic instability.
A descriptive analysis of the long-term economic performance
(since the 1960s) of countries at different levels of peacefulness
is presented. World Development Indicators (WDI) produced by
the World Bank are used for estimates of business environment
indicators. Country scores from the Global Peace Index (GPI)
produced by IEP are used to group countries by levels of
peacefulness. Overall, this section aims to illustrate the
association between peace and long-term economic
performance.
Per Capita GDP growth
Global per capita GDP has shown a sustained increase since
1960. However, at the country level, this trend is characterised
by a large degree of variation across nations. While a great
number of countries have significantly increased their per
person income, others have stagnated, while others have fallen
Source: International Finance Corporation, IEP
FIGURE 2.1Doing Business and peacefulness, 2017As peace improves, doing business also becomes easier. Some low and mid-peace countries o�er high-quality business environment.
WO
RLD
BA
NK
DO
ING
BU
SIN
ESS
'DIS
TAN
CE
TO F
RO
NTI
ER' S
CO
RE
GPI INTERNAL PEACE SCORE 2018 Less Peaceful More Peaceful
20
30
40
50
60
70
80
90
1.0 1.5 2.0 2.5 3.0 3.5 4.0 4.5
Very High PeaceHigh PeaceLow PeaceVery Low Peace
"Since 1960, the most peaceful countries have, on average, seen their per capita GDP grow by an annual rate of 2.8 per cent."
BUSINESS & PEACE REPORT | 10
backwards. Countries that have sustained higher levels of
prosperity have also achieved improvements in peace.
Empirical evidence suggests that returns on investment in
developing countries exceed those in developed economies.
A World Bank study states that the average rate of return in
fragile states is 14.5 per cent compared to 9.7 per cent for
low-income countries in general and 6.2 for all countries.8 Such
higher return reflects the risk premium that investors associate
with perceptions of higher political risk and weak institutions.
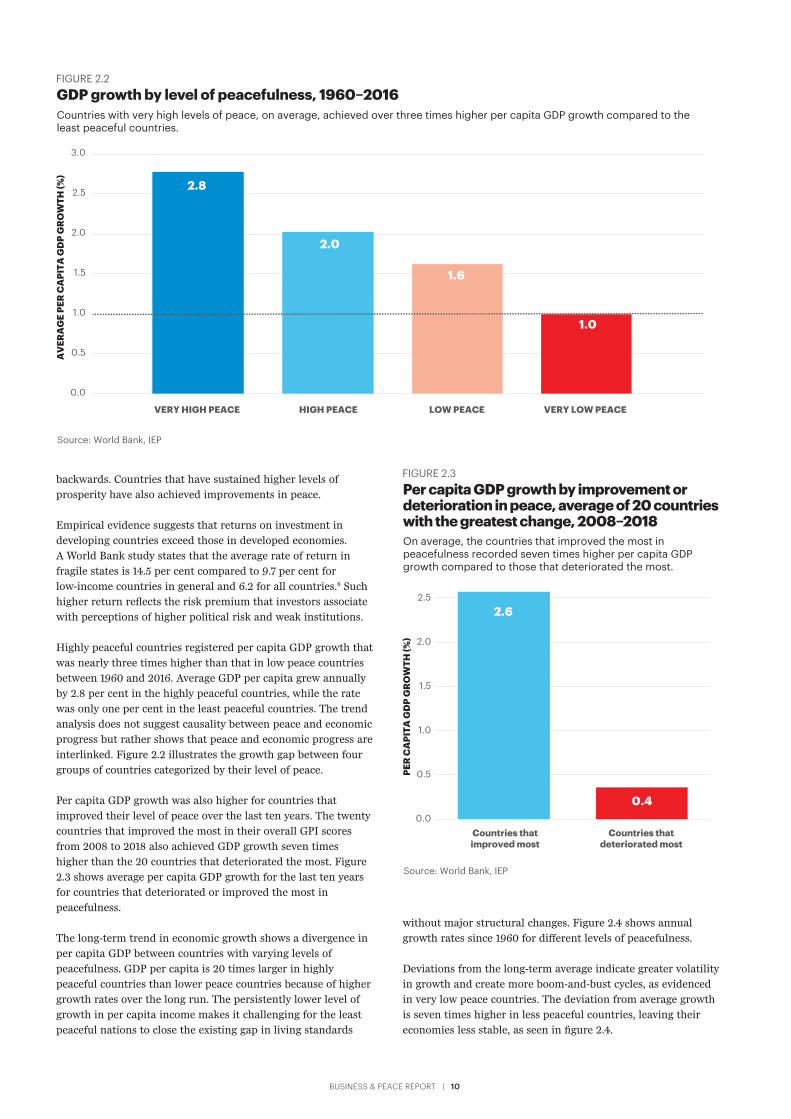
Highly peaceful countries registered per capita GDP growth that
was nearly three times higher than that in low peace countries
between 1960 and 2016. Average GDP per capita grew annually
by 2.8 per cent in the highly peaceful countries, while the rate
was only one per cent in the least peaceful countries. The trend
analysis does not suggest causality between peace and economic
progress but rather shows that peace and economic progress are
interlinked. Figure 2.2 illustrates the growth gap between four
groups of countries categorized by their level of peace.
Per capita GDP growth was also higher for countries that
improved their level of peace over the last ten years. The twenty
countries that improved the most in their overall GPI scores
from 2008 to 2018 also achieved GDP growth seven times
higher than the 20 countries that deteriorated the most. Figure
2.3 shows average per capita GDP growth for the last ten years
for countries that deteriorated or improved the most in
peacefulness.
The long-term trend in economic growth shows a divergence in
per capita GDP between countries with varying levels of
peacefulness. GDP per capita is 20 times larger in highly
peaceful countries than lower peace countries because of higher
growth rates over the long run. The persistently lower level of
growth in per capita income makes it challenging for the least
peaceful nations to close the existing gap in living standards
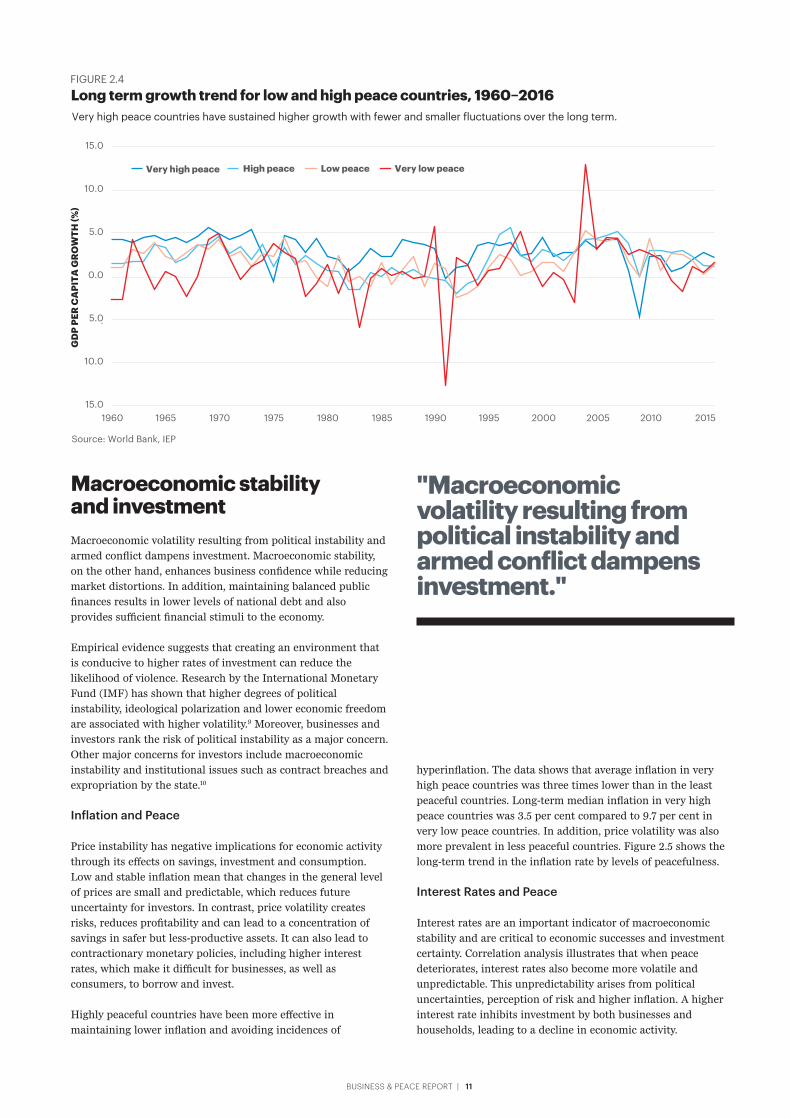
without major structural changes. Figure 2.4 shows annual
growth rates since 1960 for different levels of peacefulness.
Deviations from the long-term average indicate greater volatility
in growth and create more boom-and-bust cycles, as evidenced
in very low peace countries. The deviation from average growth
is seven times higher in less peaceful countries, leaving their
economies less stable, as seen in figure 2.4.
FIGURE 2.2GDP growth by level of peacefulness, 1960–2016 Countries with very high levels of peace, on average, achieved over three times higher per capita GDP growth compared to the least peaceful countries.
Source: World Bank, IEP
AV
ERA
GE
PER
CA
PITA
GD
P G
RO
WTH
(%)
0.0
0.5
1.0
1.5
2.0
2.5
3.0
2.8
VERY HIGH PEACE
2.0
HIGH PEACE
1.6
LOW PEACE
1.0
VERY LOW PEACE
FIGURE 2.3Per capita GDP growth by improvement or deterioration in peace, average of 20 countries with the greatest change, 2008–2018On average, the countries that improved the most in peacefulness recorded seven times higher per capita GDP growth compared to those that deteriorated the most.
Source: World Bank, IEP
PER
CA
PITA
GD
P G
RO
WTH
(%)
2.6
0.40.0
0.5
1.0
1.5
2.0
2.5
Countries thatimproved most
Countries thatdeteriorated most
BUSINESS & PEACE REPORT | 11
Macroeconomic stability and investment Macroeconomic volatility resulting from political instability and
armed conflict dampens investment. Macroeconomic stability,
on the other hand, enhances business confidence while reducing
market distortions. In addition, maintaining balanced public
finances results in lower levels of national debt and also
provides sufficient financial stimuli to the economy.
Empirical evidence suggests that creating an environment that
is conducive to higher rates of investment can reduce the
likelihood of violence. Research by the International Monetary
Fund (IMF) has shown that higher degrees of political
instability, ideological polarization and lower economic freedom
are associated with higher volatility.9 Moreover, businesses and
investors rank the risk of political instability as a major concern.
Other major concerns for investors include macroeconomic
instability and institutional issues such as contract breaches and
expropriation by the state.10
Inflation and Peace
Price instability has negative implications for economic activity
through its effects on savings, investment and consumption.
Low and stable inflation mean that changes in the general level
of prices are small and predictable, which reduces future
uncertainty for investors. In contrast, price volatility creates
risks, reduces profitability and can lead to a concentration of
savings in safer but less-productive assets. It can also lead to
contractionary monetary policies, including higher interest
rates, which make it difficult for businesses, as well as
consumers, to borrow and invest.
Highly peaceful countries have been more effective in
maintaining lower inflation and avoiding incidences of
FIGURE 2.4Long term growth trend for low and high peace countries, 1960–2016
GD
P PE
R C
API
TA G
RO
WTH
(%)
Source: World Bank, IEP
Very high peace countries have sustained higher growth with fewer and smaller fluctuations over the long term.
Very high peace High peace Low peace Very low peace
15.0
10.0
-5.0
0.0
5.0
10.0
15.0
1960 1965 1970 1975 1980 1985 1990 1995 2000 2005 2010 2015
"Macroeconomic volatility resulting from political instability and armed conflict dampens investment."
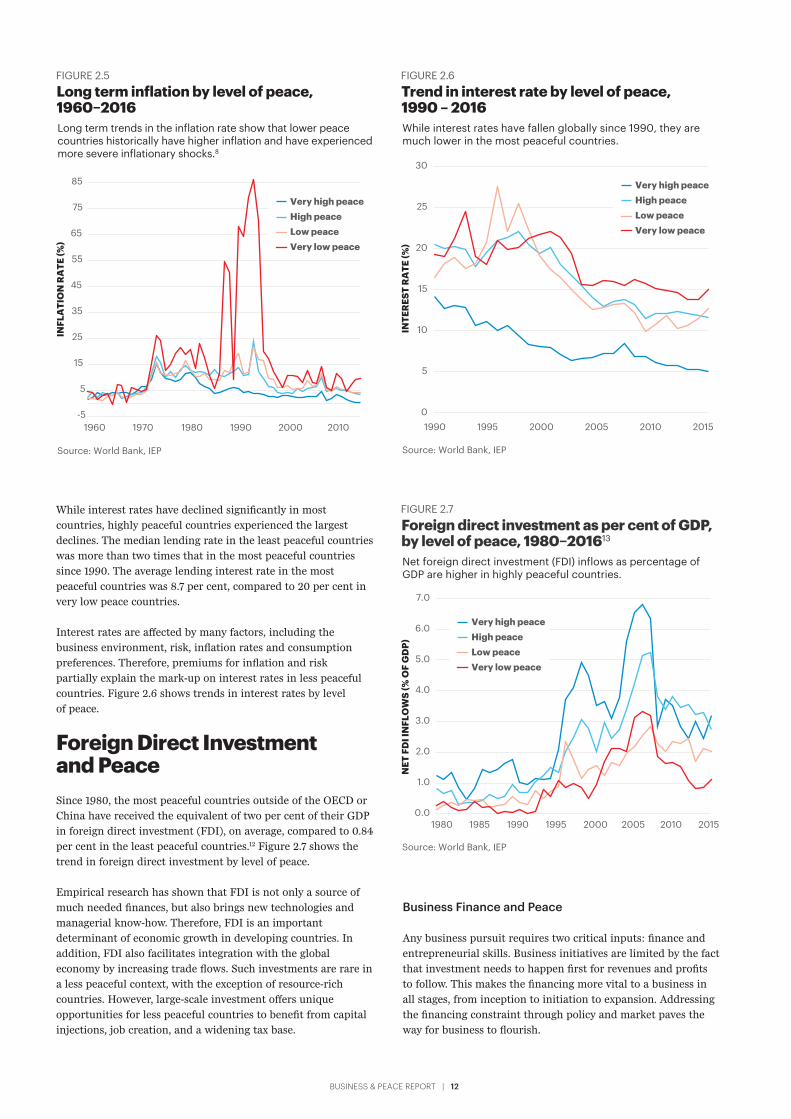
hyperinflation. The data shows that average inflation in very
high peace countries was three times lower than in the least
peaceful countries. Long-term median inflation in very high
peace countries was 3.5 per cent compared to 9.7 per cent in
very low peace countries. In addition, price volatility was also
more prevalent in less peaceful countries. Figure 2.5 shows the
long-term trend in the inflation rate by levels of peacefulness.
Interest Rates and Peace
Interest rates are an important indicator of macroeconomic
stability and are critical to economic successes and investment
certainty. Correlation analysis illustrates that when peace
deteriorates, interest rates also become more volatile and
unpredictable. This unpredictability arises from political
uncertainties, perception of risk and higher inflation. A higher
interest rate inhibits investment by both businesses and
households, leading to a decline in economic activity.
BUSINESS & PEACE REPORT | 12
While interest rates have declined significantly in most
countries, highly peaceful countries experienced the largest
declines. The median lending rate in the least peaceful countries
was more than two times that in the most peaceful countries
since 1990. The average lending interest rate in the most
peaceful countries was 8.7 per cent, compared to 20 per cent in
very low peace countries.
Interest rates are affected by many factors, including the
business environment, risk, inflation rates and consumption
preferences. Therefore, premiums for inflation and risk
partially explain the mark-up on interest rates in less peaceful
countries. Figure 2.6 shows trends in interest rates by level
of peace.
Foreign Direct Investment and PeaceSince 1980, the most peaceful countries outside of the OECD or
China have received the equivalent of two per cent of their GDP
in foreign direct investment (FDI), on average, compared to 0.84
per cent in the least peaceful countries.12 Figure 2.7 shows the
trend in foreign direct investment by level of peace.
Empirical research has shown that FDI is not only a source of
much needed finances, but also brings new technologies and
managerial know-how. Therefore, FDI is an important
determinant of economic growth in developing countries. In
addition, FDI also facilitates integration with the global
economy by increasing trade flows. Such investments are rare in
a less peaceful context, with the exception of resource-rich
countries. However, large-scale investment offers unique
opportunities for less peaceful countries to benefit from capital
injections, job creation, and a widening tax base.
Business Finance and Peace
Any business pursuit requires two critical inputs: finance and
entrepreneurial skills. Business initiatives are limited by the fact
that investment needs to happen first for revenues and profits
to follow. This makes the financing more vital to a business in
all stages, from inception to initiation to expansion. Addressing
the financing constraint through policy and market paves the
way for business to flourish.
FIGURE 2.6Trend in interest rate by level of peace, 1990 – 2016
INTE
RES
T R
ATE
(%)
Source: World Bank, IEP
While interest rates have fallen globally since 1990, they are much lower in the most peaceful countries.
0
5
10
15
20
25
30
1990 1995 2000 2005 2010 2015
Very high peaceHigh peaceLow peaceVery low peace
FIGURE 2.5Long term inflation by level of peace, 1960–2016
INFL
ATI
ON
RA
TE (%
)
Source: World Bank, IEP
Long term trends in the inflation rate show that lower peace countries historically have higher inflation and have experienced more severe inflationary shocks.8
-5
5
15
25
35
45
55
65
75
85
1960 1970 1980 1990 2000 2010
Very high peaceHigh peaceLow peaceVery low peace
FIGURE 2.7Foreign direct investment as per cent of GDP, by level of peace, 1980–201613
NET
FD
I IN
FLO
WS
(% O
F G
DP)
Source: World Bank, IEP
Net foreign direct investment (FDI) inflows as percentage of GDP are higher in highly peaceful countries.
0.0
1.0
2.0
3.0
4.0
5.0
6.0
7.0
1980 1985 1990 1995 2000 2005 2010 2015
Very high peaceHigh peaceLow peaceVery low peace
BUSINESS & PEACE REPORT | 13
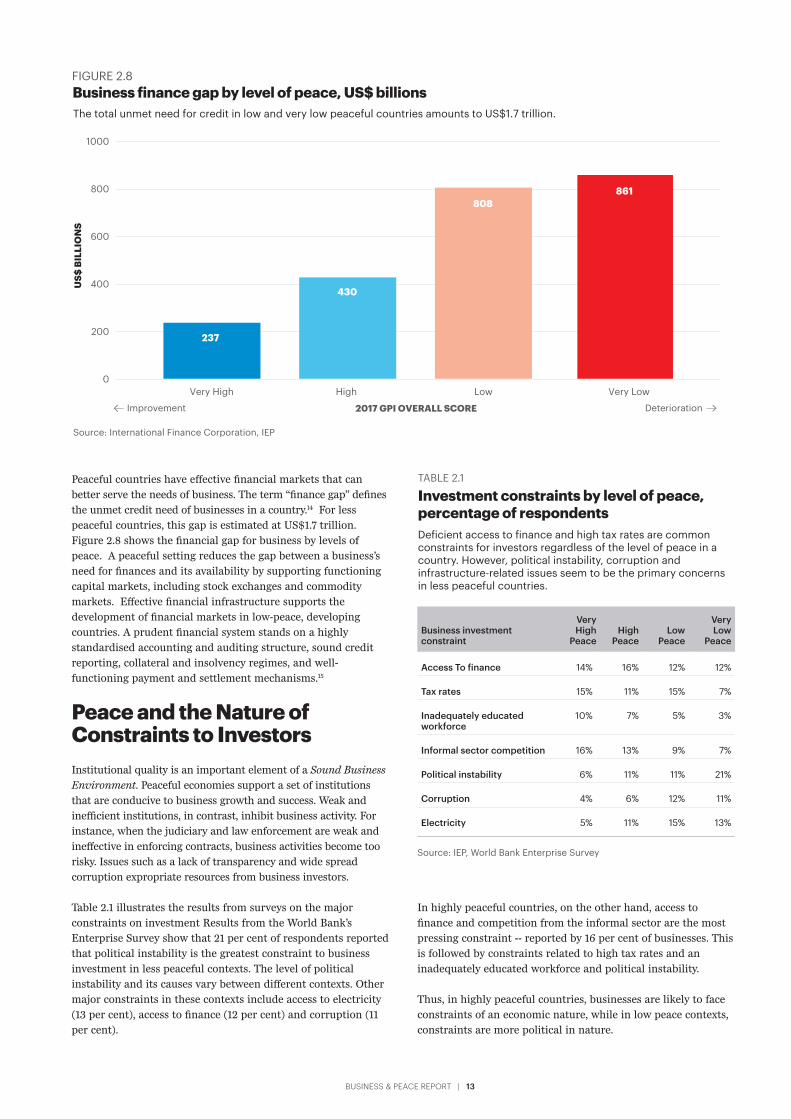
Peaceful countries have effective financial markets that can
better serve the needs of business. The term “finance gap” defines
the unmet credit need of businesses in a country.14 For less
peaceful countries, this gap is estimated at US$1.7 trillion.
Figure 2.8 shows the financial gap for business by levels of
peace. A peaceful setting reduces the gap between a business’s
need for finances and its availability by supporting functioning
capital markets, including stock exchanges and commodity
markets. Effective financial infrastructure supports the
development of financial markets in low-peace, developing
countries. A prudent financial system stands on a highly
standardised accounting and auditing structure, sound credit
reporting, collateral and insolvency regimes, and well-
functioning payment and settlement mechanisms.15
Peace and the Nature of Constraints to InvestorsInstitutional quality is an important element of a Sound Business
Environment. Peaceful economies support a set of institutions
that are conducive to business growth and success. Weak and
inefficient institutions, in contrast, inhibit business activity. For
instance, when the judiciary and law enforcement are weak and
ineffective in enforcing contracts, business activities become too
risky. Issues such as a lack of transparency and wide spread
corruption expropriate resources from business investors.
Table 2.1 illustrates the results from surveys on the major
constraints on investment Results from the World Bank’s
Enterprise Survey show that 21 per cent of respondents reported
that political instability is the greatest constraint to business
investment in less peaceful contexts. The level of political
instability and its causes vary between different contexts. Other
major constraints in these contexts include access to electricity
(13 per cent), access to finance (12 per cent) and corruption (11
per cent).
TABLE 2.1
Investment constraints by level of peace, percentage of respondentsDeficient access to finance and high tax rates are common constraints for investors regardless of the level of peace in a country. However, political instability, corruption and infrastructure-related issues seem to be the primary concerns in less peaceful countries.
Business investment constraint
Very High
PeaceHigh
PeaceLow
Peace
Very Low
Peace
Access To finance 14% 16% 12% 12%
Tax rates 15% 11% 15% 7%
Inadequately educated workforce
10% 7% 5% 3%
Informal sector competition 16% 13% 9% 7%
Political instability 6% 11% 11% 21%
Corruption 4% 6% 12% 11%
Electricity 5% 11% 15% 13%
Source: IEP, World Bank Enterprise Survey
In highly peaceful countries, on the other hand, access to
finance and competition from the informal sector are the most
pressing constraint -- reported by 16 per cent of businesses. This
is followed by constraints related to high tax rates and an
inadequately educated workforce and political instability.
Thus, in highly peaceful countries, businesses are likely to face
constraints of an economic nature, while in low peace contexts,
constraints are more political in nature.
2017 GPI OVERALL SCORE
Source: International Finance Corporation, IEP
FIGURE 2.8Business finance gap by level of peace, US$ billionsThe total unmet need for credit in low and very low peaceful countries amounts to US$1.7 trillion.
US$
BIL
LIO
NS
237
430
808861
0
200
400
600
800
1000
Very High High Low Very Low
DeteriorationImprovement

BUSINESS & PEACE REPORT | 14
Positive Peace & BusinessKey Findings
g Pillars of Positive Peace plays a specific role in the promotion of businesses and economic activity.
g There is a high correlation between the eight Pillars of Positive Peace and factors critical to business and economic activities.
g Positive Peace also contributes to the overall soundness of a country’s economic fundamentals, such as strength and stability of currencies and a better credit rating.
g Non-OECD countries that improve in Positive Peace had, on average, 1.45 percentage points higher annual GDP growth between 2005 and 2016 compared to those that deteriorated in Positive Peace.
g Non-OECD countries that deteriorated significantly in Positive Peace from 2010 to 2016 had an average fall in their credit rating of 4.8 points on a scale of 0 to 22.
g Improvements in Positive Peace are linked to stronger domestic currencies.
g A one per cent increase in Positive Peace is associated with a 0.9 per cent appreciation of the domestic currency among non-OECD countries.
g Improvements in Positive Peace are associated with an average currency appreciation of 1.4 per cent per annum, while a deterioration in Positive Peace is associated with an average depreciation of 0.4 per cent.
Pillars of Positive Peace and Business PerformanceBusiness activity is easier when Positive Peace improves.
Conversely, lower levels of Positive Peace introduce higher
transaction costs to undertake the same amount of economic
activity.
Another dividend of enhanced Positive Peace for businesses is
an increased propensity to spend. As Positive Peace increases,
the frequency and impact of uncertain events decline, thereby
motivating households and businesses to undertake big ticket
spending activities which they might have been postponing due
to uncertainties.
Although the current state of peace for a country can be measured
and known, it is not necessarily a predictor of future changes in
peace. This is especially true for countries in the middle two
quartiles of the Global Peace Index. Positive Peace acts as a lead
indicator of the future levels of a country’s peacefulness and its
economic performance. Improvements in Positive Peace bode well

BUSINESS & PEACE REPORT | 15
Peace and indicators of critical factors that determine business
performance. This highlights that while IEP’s Positive Peace
framework includes economic indicators in Sound Business
Environment, the remaining seven Pillars also correlate with
aspects of a strong economy.
These results indicate that improvements in Positive Peace are
associated with improved factors affecting business
performance, creating a virtuous cycle. This is because
improvements in Positive Peace:
for future peace and economic conditions, whereas deteriorations
bode poorly. Furthermore, IEP research has found that a deficit in
Positive Peace is an indicator of risk; countries whose GPI rank is
significantly higher than their PPI rank are more likely to suffer
major deteriorations in peace in the near future. IEP’s work in
predicting future major deteriorations in peace Positive Peace used
a basket of twenty countries with nearly a sixty per cent accuracy
rate in predicting future falls in peace.
Table 3.1 shows the correlations between the Pillars of Positive
TABLE 3.1
Positive Peace Pillars and the economic systemAll eight Pillars of Positive Peace play a significant role in facilitating and strengthening specific aspects of a Sound Business Environment.
POSITIVE PEACE PILLAREFFECT ON THE ECONOMY AS THE PILLAR IMPROVES
WORLD DEVELOPMENT INDICATOR METRIC
CORRELATION COEFFICIENT* WITH
THE PP PILLAR
Free Flow of Information Greater information Borrowers from commercial banks (per 1,000 adults) -0.44
Increased start-ups New business density (new registrations per 1,000 people ages 15-64) -0.49
Lower tariffs Tariff rate, applied, weighted mean, all products (%) 0.48
Cost savings Logistics Performance Index: Ease of arranging competitively priced shipments -0.53
Well-Functioning Government Improved contract enforcement Property rights and rule based governance -0.78
Low Levels of Corruption Lower tariffs Tariff rate, applied, weighted mean, all products (%) 0.57
Bureaucratic transparencyCountry Policy and Institutional Assessment (CPIA) transparency, accountability, and corruption in the public sector rating
-0.79
Better resource allocation International Development Association (IDA) resource allocation index -0.69
High Levels of Human Capital
Higher Productivity GDP per person employed (constant 2011 PPP) -0.75
Reduced talent search costs
Knowledge-based economy Research and development expenditure (% of GDP) 0.71
Sound Business Environment
Ease of navigating regulatory requirements of the government CPIA business regulatory environment rating -0.78
Logistics Performance Index: Efficiency of customs clearance process -0.85
Ease of access to finance Firms using banks to finance working capital (% of firms) -0.42
Equitable Distribution of Resources
Improved respect for private property rights and reduced property-related crime
Losses due to theft and vandalism (% of annual sales for affected firms) 0.44
Acceptance of the Rights of Others
Increased productive engagement of young women
% of female youth not in education, employment or training, female 0.47
Good Relations with Neighbours
Better performance in international related regulations
Volume of trades as share of GDP -0.39
Lower tarrifs 0.55
CPIA trade rating -0.43
Source: IEP, World Bank World Development Indicators
BUSINESS & PEACE REPORT | 16
• Enhances a country’s capacity to enforce contracts through third party (court of law) arbitration.
• Allows all groups in society to find employment or start their own businesses.
• Increases the efficiency of production process.
• Reduces the likelihood that businesses will face criminality or corruption.
The remainder of this section discusses the relationship of each
Pillar of Peace to business.
Sound Business Environment
Sound Business Environment captures the performance of the
economy and the ease with which businesses are able to
navigate the government’s regulatory requirements. IEP’s
composite metric for an all-around sound business environment
shows a strong correlation (r > |0.7|) with metrics of the
regulatory environment and efficient customs processes,
indicating that the same conditions that lead to peaceful
societies go hand in hand with factors that encourage trade.
Improvement in Sound Business Environment also enables a
larger number of firms to access the formal banking system to
meet their working capital requirements. The degree of
association between Sound Business Environment and the
percentage of firms using commercial banks to finance their
working capital requirement is relatively high (r =-0.42).
Free Flow of Information
Free Flow of Information plays a crucial role in fostering
healthy democracy and promoting trade and commerce.
Improvements in Free Flow of Information reduce information
bottlenecks, which improves price discovery and market activity.
Greater availability of information can lead to more market
integration, which reduces search costs in the economy.
Availability of information also helps in commercial
collaborations and innovations, thus helping businesses
improve their profitability and encouraging new entrants into
the business world.
Analysis shows that Free Flow of Information is highly
correlated with indicators of new entries into the business
world. The strength of correlation between the ‘Number of New
Business Registrations per 100,000’ and Free Flow of
Information is -0.49. Increased information also helps in
reducing friction in financial markets with the Number of
Borrowers and Free Flow of Information correlating at -0.44.
The analysis also indicates that improved Free Flow of
Information reduces the search cost for procurements, with the
Pillar strongly correlating with Ease of Arranging Competitively
Priced Shipment at -0.78.
A surprising element of the analysis is that countries with
higher levels of Free Flow of Information also have lower tariff
rates.16 The mechanisms for this is likely indirect. Greater
availability of information among the population about lower
commodity prices in foreign countries places pressure on the
domestic government to reduce the tariff levels so that price
differentials in foreign and domestic markets are minimal. For
example, a high differential between retail prices of petroleum
products in India and crude prices in the international market
due to high tariff levels and other taxes has become a debated
issue in Indian politics.17
Well-Functioning Government and Low Levels of Corruption
Similarly, effective third-party arbitration of bilateral contracts
is a major concern of businesses willing to invest in emerging
economies. This improves with higher scores for Well-
Functioning Government. This is intuitive given that a key
component of this Pillar is an effective and independent
judiciary. Respect for private property and effective courts is a
major contributor to confidence-building amongst potential
entrepreneurs. A high degree of association between Well
Functioning Government and Property Rights and Rule Based
Governance score (r = -0.78) demonstrates this point.
High levels of corruption in a country make local bureaucracy
less transparent, creating a serious bottleneck for domestic and
foreign investors. Often, foreign investors seeking to invest in
emerging countries face the challenge of dealing with officials
demanding bribes. Improvements in Low Levels of Corruption
are closely linked to amelioration of this problem. This is
demonstrated by a high degree of correlation between Low
Levels of Corruption and Bureaucratic transparency (r=-0.79).
IEP also found that effective tariff rates are strongly associated
with the Pillar of Low Levels of Corruption (r=0.57). Higher
levels of effective tariff rates in corrupt environments may occur
for many reasons. This hurts the long-term interest of the local
economy as disproportionate tariffs artificially distort
consumption choices and adversely affect production decisions.
Corruption subverts competition and favours selected firms,
particularly in the area of public procurement.18 This
inefficiency is substantiated by the high degree of association
between the Low Levels of Corruption Pillar and World Bank’s
Resource Allocation index (-0.69). Research has also found that
bribery decreases investment efficiency. The result is more
pronounced for small and medium-sized domestic firms.19
Research has found that increasing corruption uncertainty has a
negative impact on corporate investments.20
High Levels of Human Capital
A healthy and educated working population, captured by the High
Levels of Human Capital Pillar, is a key factor in successful
business operations. Productivity of workers in the economy,
measured by GDP per employed persons, correlates strongly with
the High Levels of Human Capital Pillar (r=-0.75). Greater access to
a highly capable workforce in the economy reduces cost and time,
while skilled individuals are less likely to emigrate if high quality
jobs are available. This is important for developing countries
because when highly-skilled individuals emigrate and less-skilled
workers immigrate, countries find it difficult to efficiently
capitalise on foreign aid and remittances.21 Additionally, High
levels of Human Capital also allows the potential for a knowledge-
based economy, a potent source of sustained growth.
Countries that rank high in High Levels of Human Capital tend
to have higher R&D expenditure as percentage of their GDP.
The degree of correlation between High Levels of Human
Capital and R&D expenditure expressed as a percentage of GDP
BUSINESS & PEACE REPORT | 17
is -0.75. Research also indicates that improved human capital
has a longer lasting positive effect on labour productivity than
improvements in physical capital.22
Equitable Distribution of Resources
Equitable Distribution of Resources improves respect for private
property rights by reducing property related crimes. The World
Development Report 2017 has highlighted the higher levels of
inequality are related to higher levels of crime, particularly
property related crime. IEP’s analysis shows that firms
operating in countries with lower levels of Equitable
Distribution of Resources tend to report higher levels of losses
due to theft and vandalism measured as a percentage of annual
sales (r=0.44). It is also well established in empirical studies
that countries with Equitable Distribution of Resources
generally have higher aggregate consumption demand.23 Thus
Equitable Distribution of Resources reduces losses from theft
and vandalism and boosts sales through higher demand as more
people move into the middle class.
Acceptance of the Rights of Others
Acceptance of the Rights of Others ensures greater workforce
participation, particularly from marginalised social groups,
which greatly enhances the available stock of human capital.
Importantly, this pillar brings diversity of ideas, which sustains
future growth of businesses. For example, the correlation of
Acceptance of the Rights of Others Pillar with Share of Youth Not
Engaged in Productive employment or Education is 0.47,
indicating that as countries deteriorate in this Pillar the number
of non-engaged youths increase.
Good Relations with Neighbours
Good Relations with Neighbours not only refers to the relations
between states but also other factors such as ethical or cultural
integration.
Countries that have Good Relations with Neighbours tend to
report higher levels of trade as a share of their GDP and have
lower tariff levels (r=-0.39). These countries also perform well in
trade policies as rated by the World Bank indicator ‘Trade
Rating,’ which assesses the effectiveness of countries’ policy
framework in fostering trade in goods and services (r=-0.43). On
the other hand, countries that score low in Good Relations with
Neighbours tend to have higher average tariff rates, which
inhibits trade (r=0.55).
Economy-wide effects of Positive PeaceAn increased propensity to spend and improvements in critical
institutions are important factors for business performance and
are the result of improvements in Positive Peace, which
permeates the economy. Further evidence of the link between
Positive Peace and the business environment can be seen in a
number of economic outcomes, such as wealth creation, credit
ratings and strengthening of the domestic currency. Such
relationships are explored in this section.
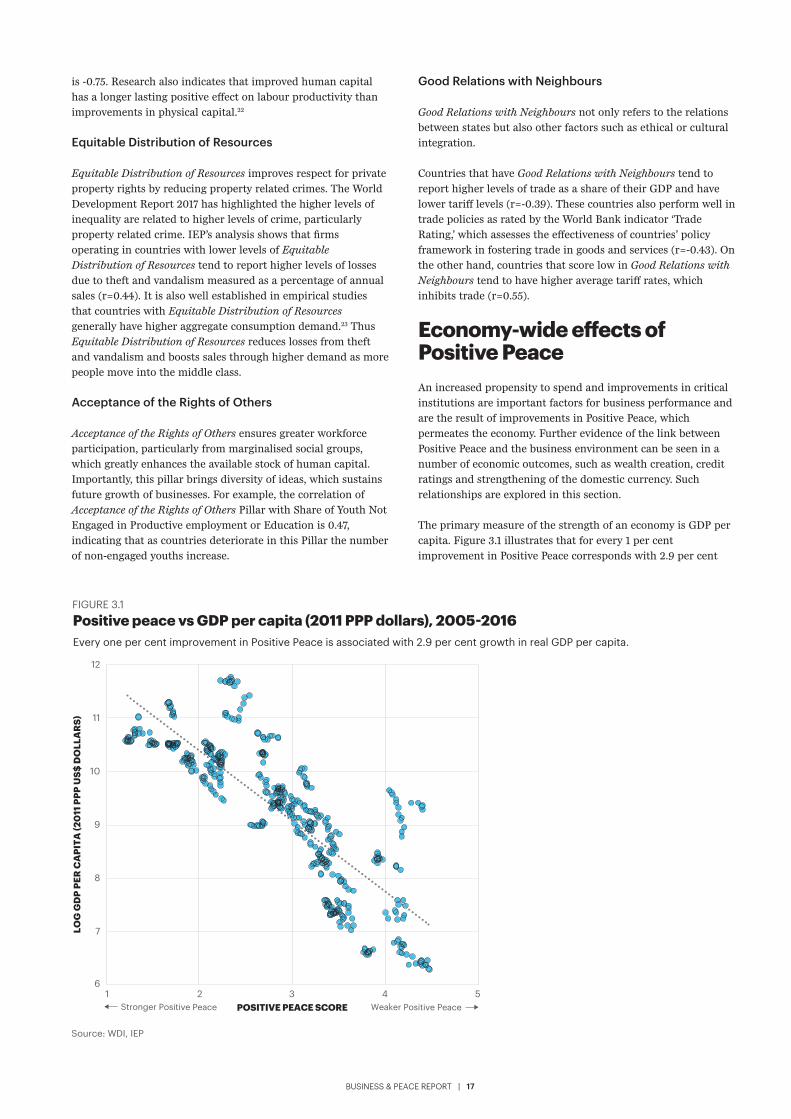
The primary measure of the strength of an economy is GDP per
capita. Figure 3.1 illustrates that for every 1 per cent
improvement in Positive Peace corresponds with 2.9 per cent
FIGURE 3.1Positive peace vs GDP per capita (2011 PPP dollars), 2005-2016Every one per cent improvement in Positive Peace is associated with 2.9 per cent growth in real GDP per capita.
Source: WDI, IEP
LOG
GD
P PE
R C
API
TA (2
011
PPP
US$
DO
LLA
RS)
POSITIVE PEACE SCORE Weaker Positive Peace Stronger Positive Peace
6
7
8
9
10
11
12
1 2 3 4 5
BUSINESS & PEACE REPORT | 18
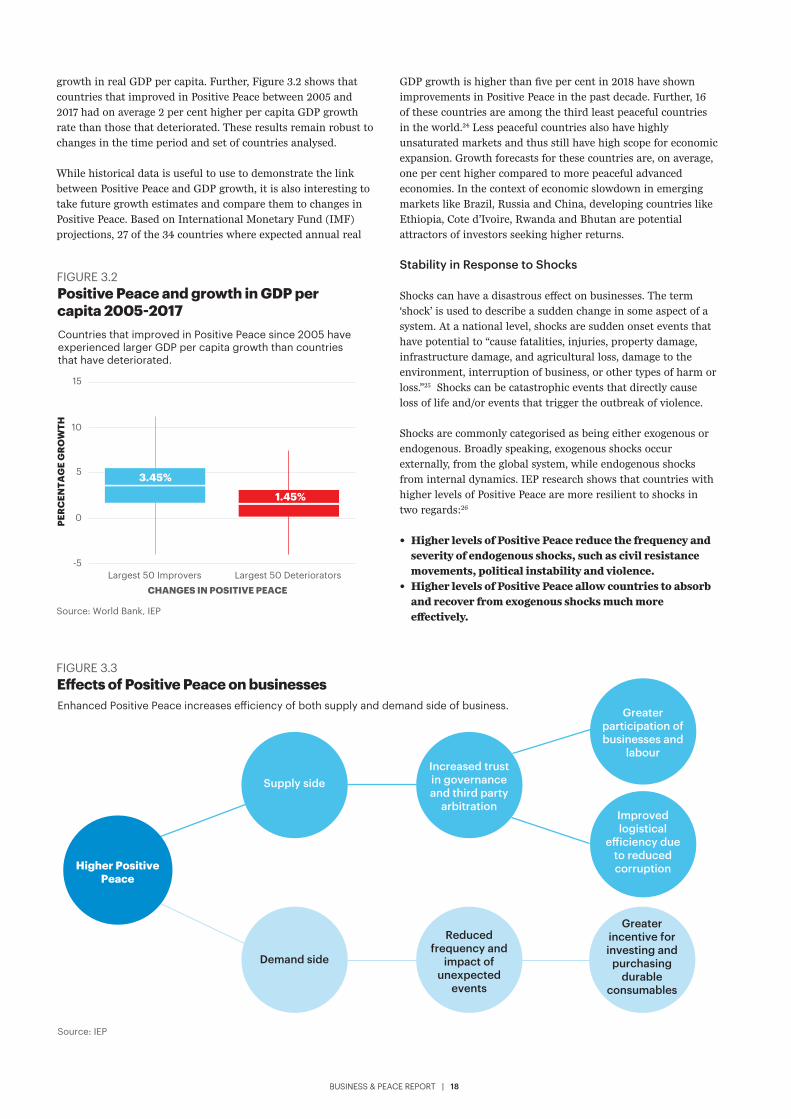
growth in real GDP per capita. Further, Figure 3.2 shows that
countries that improved in Positive Peace between 2005 and
2017 had on average 2 per cent higher per capita GDP growth
rate than those that deteriorated. These results remain robust to
changes in the time period and set of countries analysed.
While historical data is useful to use to demonstrate the link
between Positive Peace and GDP growth, it is also interesting to
take future growth estimates and compare them to changes in
Positive Peace. Based on International Monetary Fund (IMF)
projections, 27 of the 34 countries where expected annual real
GDP growth is higher than five per cent in 2018 have shown
improvements in Positive Peace in the past decade. Further, 16
of these countries are among the third least peaceful countries
in the world.24 Less peaceful countries also have highly
unsaturated markets and thus still have high scope for economic
expansion. Growth forecasts for these countries are, on average,
one per cent higher compared to more peaceful advanced
economies. In the context of economic slowdown in emerging
markets like Brazil, Russia and China, developing countries like
Ethiopia, Cote d’Ivoire, Rwanda and Bhutan are potential
attractors of investors seeking higher returns.
Stability in Response to Shocks
Shocks can have a disastrous effect on businesses. The term
‘shock’ is used to describe a sudden change in some aspect of a
system. At a national level, shocks are sudden onset events that
have potential to “cause fatalities, injuries, property damage,
infrastructure damage, and agricultural loss, damage to the
environment, interruption of business, or other types of harm or
loss.”25 Shocks can be catastrophic events that directly cause
loss of life and/or events that trigger the outbreak of violence.
Shocks are commonly categorised as being either exogenous or
endogenous. Broadly speaking, exogenous shocks occur
externally, from the global system, while endogenous shocks
from internal dynamics. IEP research shows that countries with
higher levels of Positive Peace are more resilient to shocks in
two regards:26
• Higher levels of Positive Peace reduce the frequency and severity of endogenous shocks, such as civil resistance movements, political instability and violence.
• Higher levels of Positive Peace allow countries to absorb and recover from exogenous shocks much more effectively.
CHANGES IN POSITIVE PEACE
Source: World Bank, IEP
FIGURE 3.2Positive Peace and growth in GDP per capita 2005-2017 Countries that improved in Positive Peace since 2005 have experienced larger GDP per capita growth than countries that have deteriorated.
PER
CEN
TAG
E G
RO
WTH
Largest 50 Improvers Largest 50 Deteriorators
3.45%
1.45%
-5
0
5
10
15
Source: IEP
FIGURE 3.3E�ects of Positive Peace on businessesEnhanced Positive Peace increases e�iciency of both supply and demand side of business.
Demand side
Supply side
Reduced frequency and
impact of unexpected
events
Greater incentive for investing and
purchasing durable
consumables
Increased trust in governance and third party
arbitration
Greater participation of businesses and
labour
Improved logistical
e�iciency due to reduced corruptionHigher Positive
Peace

BUSINESS & PEACE REPORT | 19
Thus, enhanced Positive Peace reduces both the probability and
impact of uncertain events that may restrict businesses and
consumers from spending or investing. This boosts spending by
both consumers and businesses. How increased Positive Peace
effects both supply and demand through such mechanisms is
depicted Figure 3.3.
Credit rating and business constraints
Sovereign credit ratings undescore the ability of a country to
mobilise fiscal resources and meet its financial commitments.
Countries that improve in Positive Peace either improve their
credit rating or maintain an already high grade (figure 3.4).
Standard and Poor’s (S&P) country credit ratings were used for
this analysis. Sovereign ratings by S&P reflect analysis of
institutional and governance effectiveness, economic structure
and growth prospects, external finances, and fiscal and
monetary flexibility.27 These ratings classify countries in 23
levels of performance in terms of the capacity and willingness of
a country to meet its financial commitments. Standard ratings
are expressed in alphabetical categories. For the purpose of the
analysis, IEP assigned numeric scores to S&P’s ratings, from
‘zero’ for the lowest score of ‘D’ to 22 for the best rating ‘AAA.’
Changes in credit rating scores for each country were examined
between 2010 and 2017 vis-à-vis their improvement or
deterioration in Positive Peace between 2010 and 2016.
Figure 3.4 highlights the changes in credit ratings for all
improvements and deteriorations in Positive Peace. Out of the
80 countries for which credit rating scores were available, 23
improved on Positive Peace and 21 deteriorated, while 36
remained stable. Interestingly, of the 23 countries that improved
in Positive Peace between 2010 and 2016, ten of them improved
in credit rating, nine remained at the same level and only four
were downgraded. Thus it can be said that 75 percent of
countries that improved in Positive Peace either retained or
improved their credit rating. For the 21 countries that
deteriorated in Positive Peace, 14 of them were downgraded in
credit rating, five remained at the same level and only two were
upgraded. However, countries that deteriorated tended to be
downgraded by around two credit rating levels on average.
Exchange rates and Positive Peace
Real Effective Exchange Rate (REER) is an index generally used
to indicate the real value of domestic currency vis-à-vis a bunch
of relevant foreign currencies at once. REER is expressed as a
weighted average of the exchange rates of the domestic currency
with a basket of major foreign currencies, adjusted for the effects
of inflation. The weights are determined on the basis of a relative
measure of the volume of trade with major trading partners.
A rising REER indicates a strengthening domestic currency, as
well as strong economic foundations in money supply, prices,
outputs, and interest rates. The European Central Bank has
found a strong connection between the strengthening of a
domestic currency and current and future improvements in the
economic fundamentals of the country.28
A country improving in Positive Peace is therefore a signal that
foreign businesses should start looking at exporting,
outsourcing and investing in opportunities in these countries.
These activities will lead to increased demand for the domestic
currency, causing it to appreciate.
IEP’s analysis finds that, on average, for every one per cent increase
in Positive Peace there is a 0.9 per cent strengthening of the
domestic currency. Improvement in Positive Peace is associated
with an average appreciation of the domestic currency by 1.4 per
cent per annum, while deterioration in Positive Peace is associated
with an average depreciation in domestic currency by 0.4 per cent.
Figure 3.5 illustrates that 75 per cent of countries that improved
in Positive Peace also appreciated in REER. For the countries that
deteriorated in Positive Peace, 50 per cent of the countries
depreciated in REER. These results were obtained after excluding
observations where year on year appreciation or depreciation
exceeded 50 per cent, which happened in two countries, that is,
Venezuela and the Democratic Republic of Congo.
FIGURE 3.4Change in credit rating by Positive Peace group, 2005 to 2016The majority of countries that deteriorated in Positive Peace also experienced a fall in their credit rating.
Source: S&P Global Ratings, IEP
CH
AN
GE
IN C
RED
IT R
AIN
G
POSITIVE PEACE GROUP
IMPROVED DETERIORATED
1st QuartileMedian
Number of countries = 23Median = 0Mean = 0.6
1st QuartileMedian
−5
0
3rd Quartile
Median
3rd Quartile
1st Quartile
Number of countries = 21Median = −1Mean = −1.9
FIGURE 3.5Year−on−year change in real e�ective exchange rates by Positive Peace group, non−OECD countries, 2005−2016Countries that improved in Positive Peace experienced higher rates of appreciation in the real value of their currency.
Source: WDI, IEP calculations
% C
UR
REN
CY
APP
REC
IATI
ON
1st QuartileMedian
3rd Quartile
Number of observations = 34Median = 1.9%Mean = 1.39%
1st Quartile
Median
3rd Quartile
Number of observations = 17Median = -0.2%Mean = -0.15%
-10
0
10
IMPROVED DETERIORATEDPOSITIVE PEACE GROUP

BUSINESS & PEACE REPORT | 20
SECTION 1
1 Multilateral Investment Guarantee Agency, World Investment and Political Risk 2011. Washington, D.C., World Bank Group, 2011.
2 United Nations Global Compact, "The Ten Principles of the UN Global Compact." in United Nations Global Compact, 2018, <https://www.unglobalcompact.org/what-is-gc/mission/principles> [accessed 29 August 2018].
3 J Dunne, Armed Conflict. Cape Town, South Africa, 2012.
4 H Urdal, "A Clash of Generations? Youth Bulges and Political Violence." in International Studies Quarterly, 50, 2006, 607-629.
5 H Roxas, V Lindsay, N Ashill, & A Vicorio, "An Institutional View of Local Entrepreneurial Climate.". in Asia-Pacific Social Science Review, 7, 2008, 1-31.
SECTION 2
6 M Farzanegan, "Can we predict political uprisings?" in The Conversation, 2017, <https://theconversation.com/can-we-predict-political-uprisings-71925> [accessed 29 August 2018].
7 D Acemoglu, S Johnson, J Robinson, & Y Thaicharoen, "Institutional causes, macroeconomic symptoms: volatility, crises and growth." in Journal of Monetary Economics, 50, 2003, 49-123.
8 Multilateral Investment Guarantee Agency. 2011. “MIGA Annual Report 2011 : Insuring Investments, Ensuring Opportunities.” Washington, DC: World Bank. © World Bank. https://openknowledge.worldbank.org/handle/10986/11851 License: CC BY 3.0 IGO.
9 B Pierpont, Violent Conflict and Foreign Direct Investment in Developing Economies: A Panel Data Analysis. Saint Paul, Minnesota, 2005.
10 A Aisen & F Veiga, "Political Instability and Inflation Volatility." in Public Choice, 135, 2008, 207-223.
11 Episodes of hyperinflation in the 1990s emerged in low peace countries like the Democratic Republic of the Congo, Iraq, Nigeria and Sudan.
12 OECD countries and China have been removed to reduce the bias that emerges due to the economic strength of these nations.
13 OECD countries and China are excluded.
14 G Teima, A Berthaud, M Bruhn, O De Castro, M Joshi, M Mirmulstein, & A Onate, Scaling-up SME access to financial services in the developing world. Washington, D.C., World Bank Group, 2010.
15 Teima et al. 2010.
16 T Beck, Financing Constraints of SMEs in Developing Countries: Evidence, Determinants and Solutions, in , Washington, D.C., World Bank Group, 2007.
SECTION 3
17 Tariffs are taxes levied on imported commodities. Tariff could be based on number of units imported (‘unit rate) or on monetary value of imported items expressed as certain percentage of value of the imported item (‘ad valorem rate). Application of tariff usually serve dual purpose in generating revenue for government and protecting domestic industries from foreign competition.
18 S Sundria & D Chakraborty, "Why India's fuel prices are sky-high when oil isn't", in Bloomberg, 2018, <https://bloomberg.com/news/articles/2018-04-29/why-india-s-fuel-prices-are-sky-high-when-oil-isn-t-quicktake> [accessed 29 August 2018].
19 Transparency International, The linkages between corruption and violation of competition laws. Berlin, Transparency International, 2016.
20 C O'Toole & F Tarp, "Corruption and the efficiency of capital investment in developing countries,” in Journal of International Development, vol. 26, 2014, 567-597.
21 J Hanousek, A Shamshur & J Tresl, "Corruption uncertainty and corporate practices", in Vox, , 2017, <https://voxeu.org/article/corruption-uncertainty-and-corporate-practices> [accessed 29 August 2018].
22 G Gelos, Investment efficiency, human capital and migration: a productivity analysis of the Jordanian economy, Washington, D.C., World Bank Group, 2010.
23 X Li, L Wang & B Wu, "Research on Efficiency of Physical Capital and Human Capital in China's Economic Growth", in Advanced Materials Research, vol. 468-471, 2012, 2970-2973.
24 V Almeida, "Rising Income Inequality and Aggregate Activity (Note)", in BSI Economics, 2016, <http://www.bsi-economics.org/628-income-inequality-activity> [accessed 29 August 2018].
25 International Monetary Fund, "Real GDP growth", in International Monetary Fund, , 2018, <http://www.imf.org/external/datamapper/NGDP_RPCH@WEO/OEMDC/ADVEC/WEOWORLD> [accessed 29 August 2018].
26 Coppola, D., ‘Introduction to International Disaster Management’, 2007, Oxford: Elsevier, p. 25.
27 Institute for Economics & Peace, Positive Peace Index 2017, Sydney, Australia, Institute for Economics & Peace, 2017.
28 Standard and Poor's, Sovereign Rating Methodology, New York City, Standard and Poor's, 2017.
29 C Engel & K West, Exchange rates and fundamentals, Frankfurt, Germany, European Central Bank, 2003.
End Notes
Our research analyses peace and its economic value.
We develop global and national indices, calculate the economic impact of violence, analyse country level risk and have developed Positive Peace which provides a roadmap to overcome
adversity and conflict, helping to build and sustain lasting peace.
Download our latest reports and research briefs for free at:visionofhumanity.org/reports

IEP is an independent, non-partisan, non-profit think tank dedicated to shifting the world’s focus to peace as a positive, achievable, and tangible measure of human well-being and progress.
IEP is headquartered in Sydney, with offices in New York, The Hague, Mexico City, and Brussels. It works with a wide range of partners internationally and collaborates with intergovernmental organisations on measuring and communicating the economic value of peace.
The Institute for Economics & Peace is a registered charitable research institute in Australia as a Deductible Gift Recipient. IEP USA is a 501(c)(3) tax exempt organization.
FOR MORE INFORMATION [email protected] EXPLORE OUR WORK WWW.ECONOMICSANDPEACE.ORG AND WWW.VISIONOFHUMANITY.ORG
IEP REPORT 60
GlobalPeaceIndex
@GlobPeaceIndex @IndicedePaz
9 780648 304838 >
ISBN 978-0-6483048-3-8
BP18-V02-DH-HS-20181003