annual results 2005 – mtu aero engines holding ag results 2005 – mtu aero engines holding ag...
TRANSCRIPT
Annual Results 2005 – MTU Aero Engines Holding AG
Conference Call with Investors and AnalystsMarch 23rd, 2006
- Prepared on the basis of IFRS (audited)
2
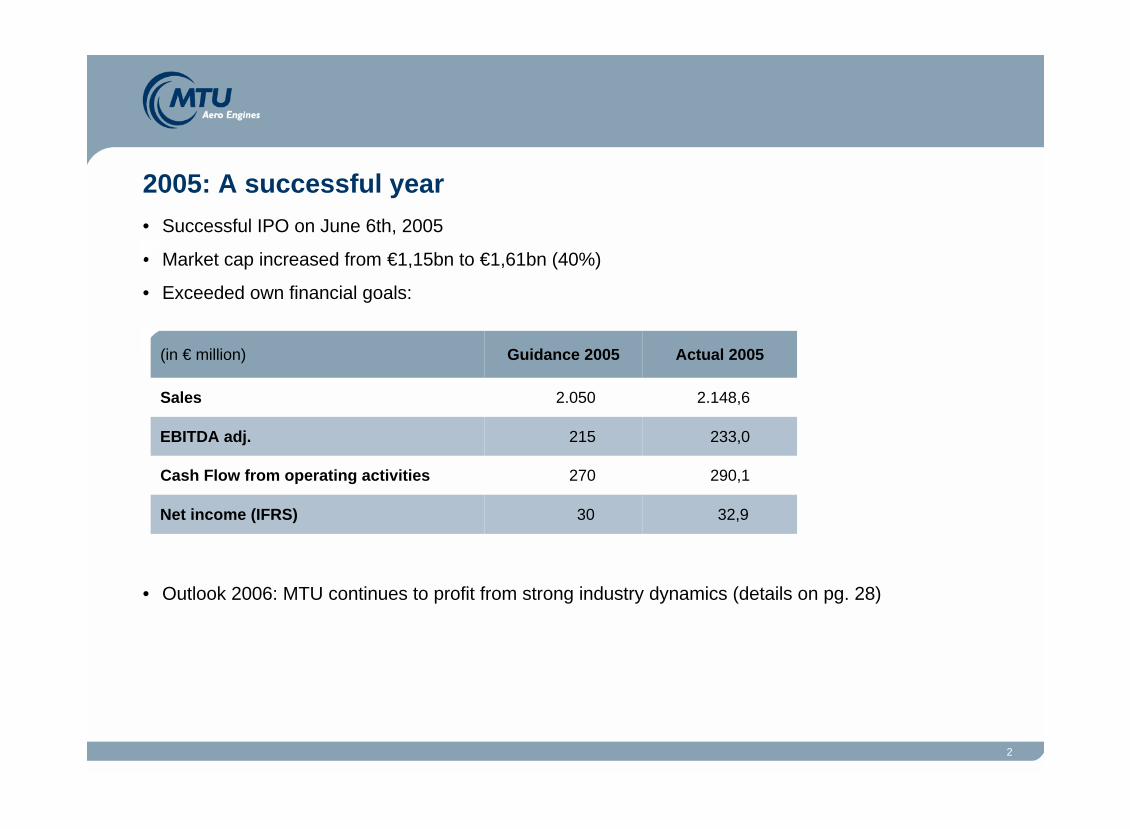
• Successful IPO on June 6th, 2005
• Market cap increased from €1,15bn to €1,61bn (40%)
• Exceeded own financial goals:
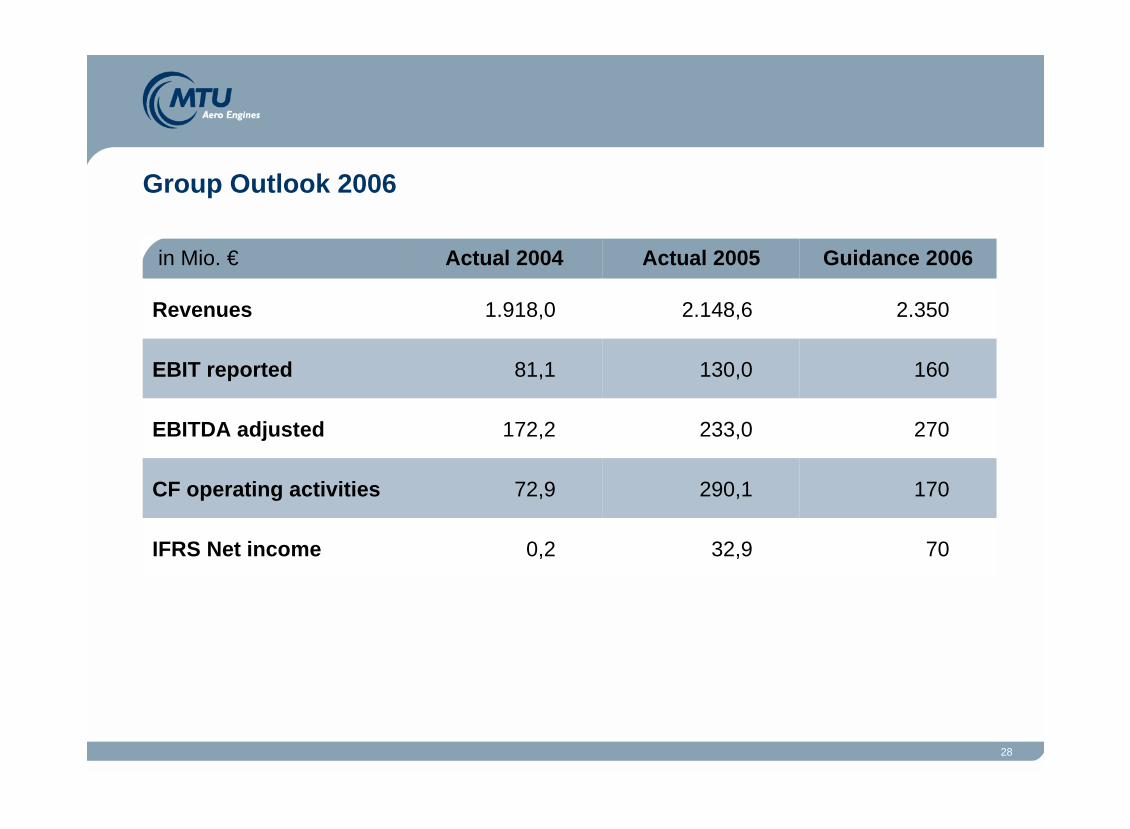
• Outlook 2006: MTU continues to profit from strong industry dynamics (details on pg. 28)
2005: A successful year
32,930Net income (IFRS)
290,1270Cash Flow from operating activities
233,0215EBITDA adj.
2.148,62.050Sales
Actual 2005Guidance 2005(in € million)
3
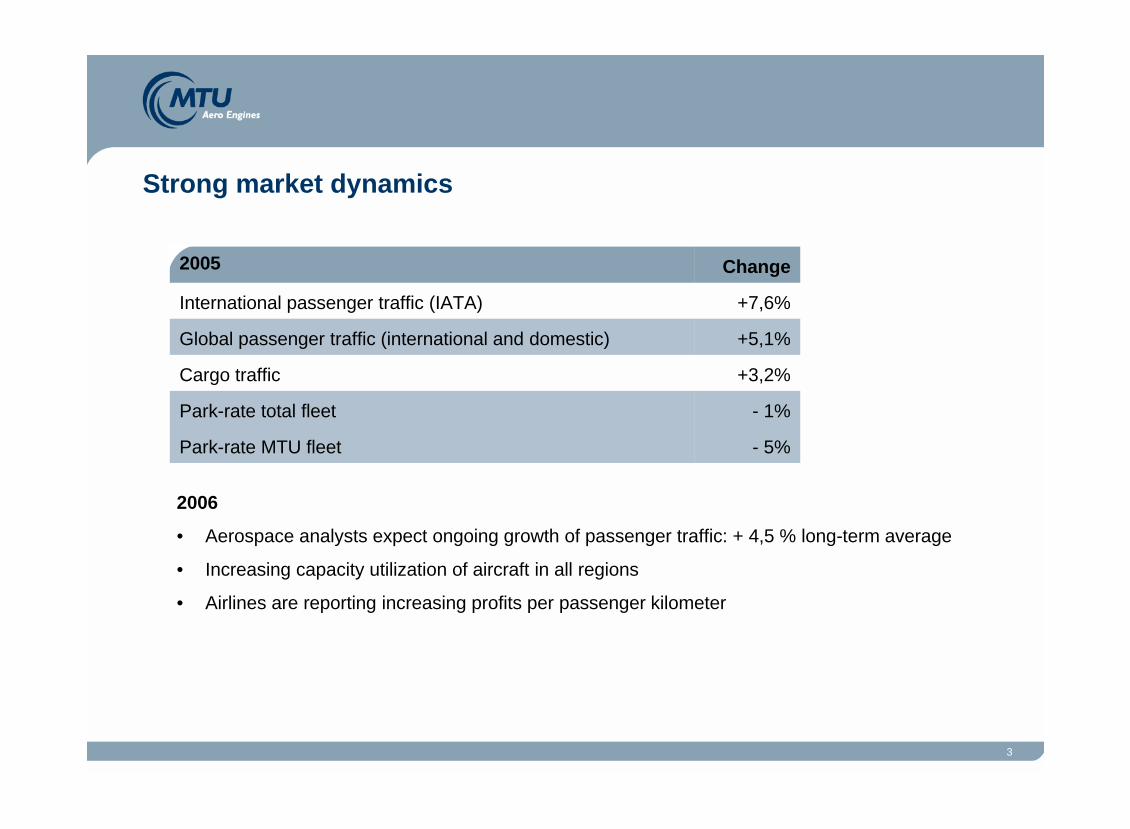
- 5%Park-rate MTU fleet
- 1%Park-rate total fleet
+3,2%Cargo traffic
+5,1%Global passenger traffic (international and domestic)
+7,6%International passenger traffic (IATA)
Change2005
Strong market dynamics
2006
• Aerospace analysts expect ongoing growth of passenger traffic: + 4,5 % long-term average
• Increasing capacity utilization of aircraft in all regions
• Airlines are reporting increasing profits per passenger kilometer
4
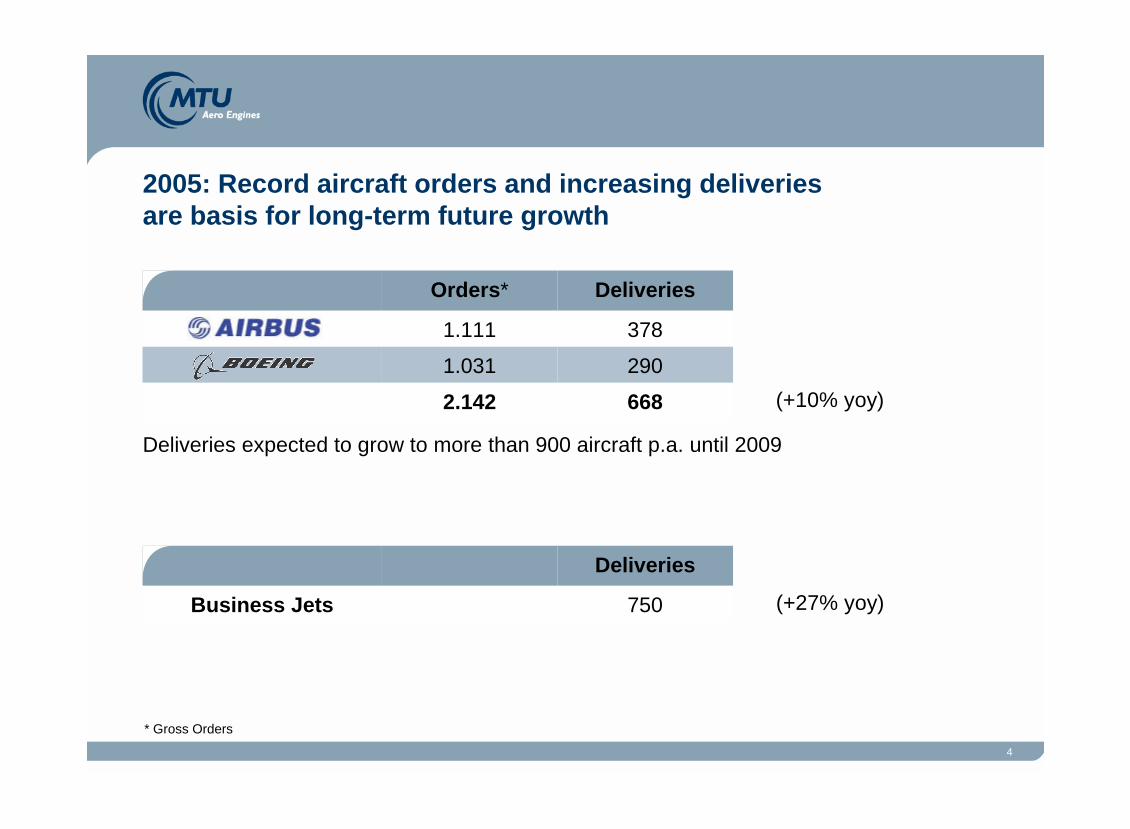
Deliveries expected to grow to more than 900 aircraft p.a. until 2009
6682.142
2901.031
3781.111
DeliveriesOrders*
750Business Jets
Deliveries
(+10% yoy)
(+27% yoy)
* Gross Orders
2005: Record aircraft orders and increasing deliveries are basis for long-term future growth

5
Total order backlog increased by 7,1 % - especially due to commercial business: order backlog
for commercial engines increased by 21,4% (orders for GP7000, V2500, LAN Chile launch
customer for the PW6000). Commercial MRO order backlog increased by 25% - total MRO
contract volume increased by 48% to € 2,9 bn (contracts with JetBlue, Shanghai Airlines etc).
Order
backlog
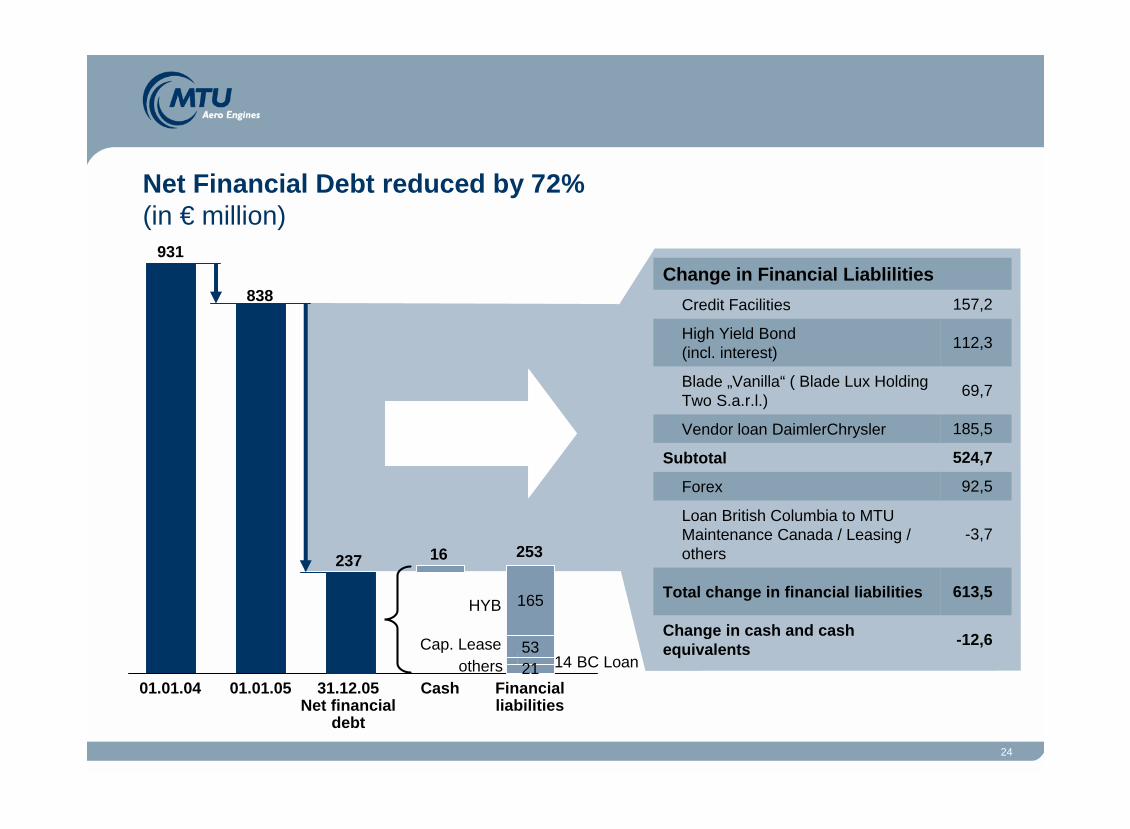
Very strong (+300%) CF from operating activities (€290,1 m) due to good operating results,
improvements in working capital and high prepayments from military customer (EJ200 Tranche
2 and Austria Export). Net financial debt reduced by 72% (total repayments in 2005 € 525 m).
Financial
results
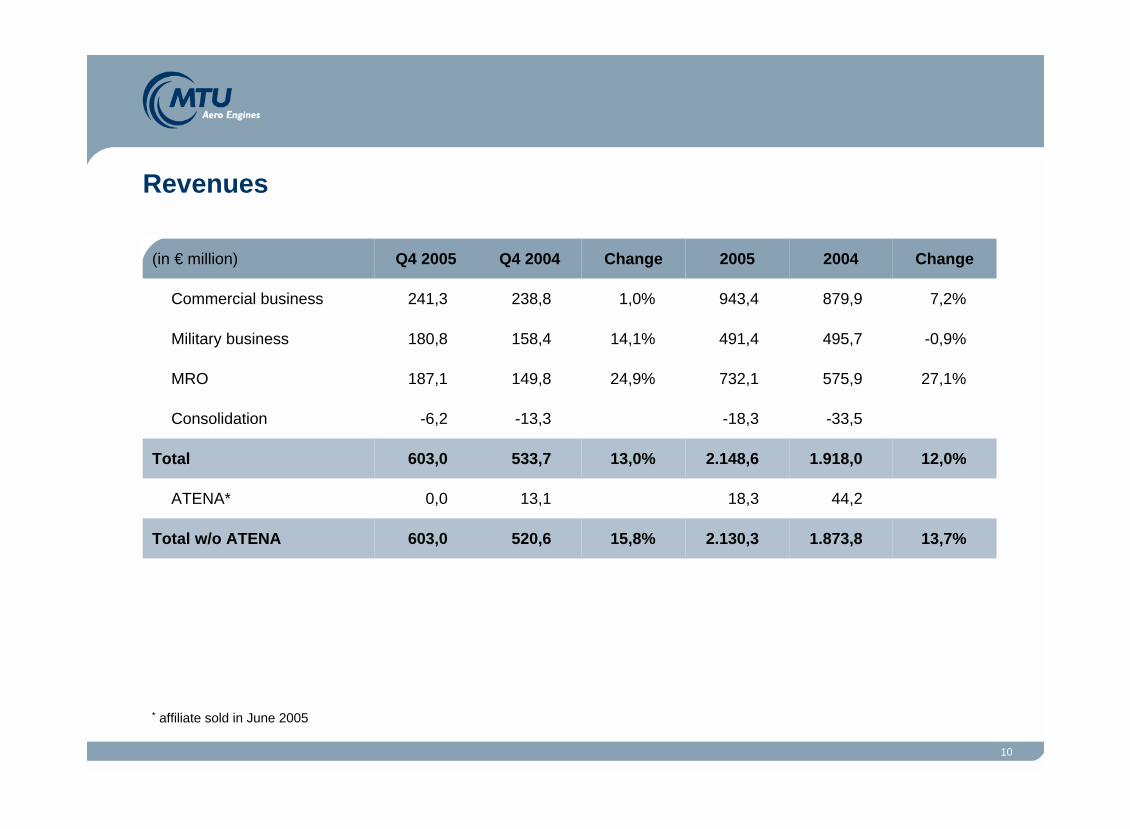
Increase in group revenues by 12 % to € 2.149 m especially driven by overproportional growth
(27%) in commercial MRO business. OEM-segment grew by 4,3% - with 7,2% growth in
commercial business (especially V2500) and with military business stable on level of 2004.
Revenues
IFRS net income increased to € 32,9 m in 2005 from € 0,2 m in 2004. Underlying Net Income
increased from € 13 m to € 51,4 m. Dividend proposal will be € 0,73 per share (according to
German GAAP and tax considerations).
Dividend
proposal
Group EBITDA increased by 35 % to € 233 m. MRO EBITDA grew by 69% reaching nearly 10%
margin. OEM EBITDA grew by 24% reaching over 11% margin. Negative gross margin effects
from increasing series sales compensated by lower R&D and lower SG&A.
EBITDA
adj.
Financial Highlights of Q4 2005 and per Dec. 2005

6
Average exchange rate
Y 2005 Y 20041,2441 1,2438
Q4 2005 Q4 20041,1897 1,2963
2003 2004 2005
Average exchange rate% of exposure
hedged
7 %
34 %
71 %
1,2434USD 50 m2008
1,2518USD 250 m2007
1,2618USD 430 m2006Hedging in place as of 13 March
2006
1,2796USD 305 m2005Hedges 2005
USD daily average exchange rate from 01/02/2003 to 02/17/2006
17.02.06 1,1863
30.12.05 1,1797
30.09.05 1,2042
30.06.05 1,2092 31.03.05
1,2964
02.01.031,0446
31.03.03 1,0895
30.06.031,1427
31.03.04 1,2224
30.06.04 1,2155 30.09.03
1,1652
30.09.04 1,2409
31.12.04 1,362131.12.03
1,2630
1,001,051,101,151,201,251,301,351,40
$ Exchange rate / Hedge portfolio
7
Table of Content
1. Order backlog
2. Revenues
3. Profit & Loss
4. EBITDA – Adjustments
5. Underlying Net Income and EPS
6. Cash Flow
7. Potential dividend capacity
8. Group outlook
Appendix – Segmental information

8
Order backlog
22,1%1.183,85.361,36.545,1Total Volume
48,3%943,01.953,02.896,0Contract Volume MRO
7,1%240,83.408,33.649,1Total
25,4%43,6171,7215,3MRO
-7,4%-127,31.717,31.590,0Military business
21,4%324,51.519,31.843,8Commercial business
ChangeChangeDec 31, 2004Dec 31, 2005(in € million)
Total Volume includes MRO long-term contracts
Definition Contract Volume MRO • All exclusive contracts • All non-exclusive contracts with expected orders within next 12 months• Remark: 2005 contract volume does not include MTU Zhuhai contracts (not consolidated in 05) à difference to previously mentioned contract volume of US$ 4,9 bn

9
Table of Content
1. Order backlog
2. Revenues
3. Profit & Loss
4. EBITDA – Adjustments
5. Underlying Net Income and EPS
6. Cash Flow
7. Potential dividend capacity
8. Group outlook
Appendix – Segmental information
10
Revenues
13,7%1.873,82.130,315,8%520,6603,0Total w/o ATENA
44,218,313,10,0ATENA*
12,0%1.918,02.148,613,0%533,7603,0Total
-33,5-18,3-13,3-6,2Consolidation
27,1%575,9732,124,9%149,8187,1MRO
-0,9%495,7491,414,1%158,4180,8Military business
7,2%879,9943,41,0%238,8241,3Commercial business
Change20042005ChangeQ4 2004Q4 2005(in € million)
* affiliate sold in June 2005
11
Table of Content
1. Order backlog
2. Revenues
3. Profit & Loss
4. EBITDA – Adjustments
5. Underlying Net Income and EPS
6. Cash Flow
7. Potential dividend capacity
8. Group outlook
Appendix – Segmental information

12
Profit & Loss
-1,82,2-0,40,3Share of income/loss of Joint Ventures accounted for using the equity method
25,3 %214,1268,319,9%65,878,9EBITDA reported
35,3 %172,2233,036,3%48,766,4EBITDA adjusted
0,232,914,613,5IFRS net income
-6,3-25,8-13,5-11,5Taxes
804,6 %6,558,7-11,0%28,125,0Profit before Tax (EBT)
-72,8-73,51,1-16,3Financial result
60,3 %81,1130,049,6%27,441,0EBIT reported
4,14,71,4-4,8Other operating income (expense)
-155,7-112,8-26,2-27,8SG&A
-57,7-45,7-19,7-24,9R & D company funded
15,1 %13,2 %13,5%16,3%Gross profit margin
-2,3%290,4283,837,0%71,998,5Gross profit
1.627,61.864,8461,8504,5Total cost of sales
12,0%1.918,02.148,613,0%533,7603,0Revenues
change20042005changeQ4 2004Q4 2005(in € million)
13
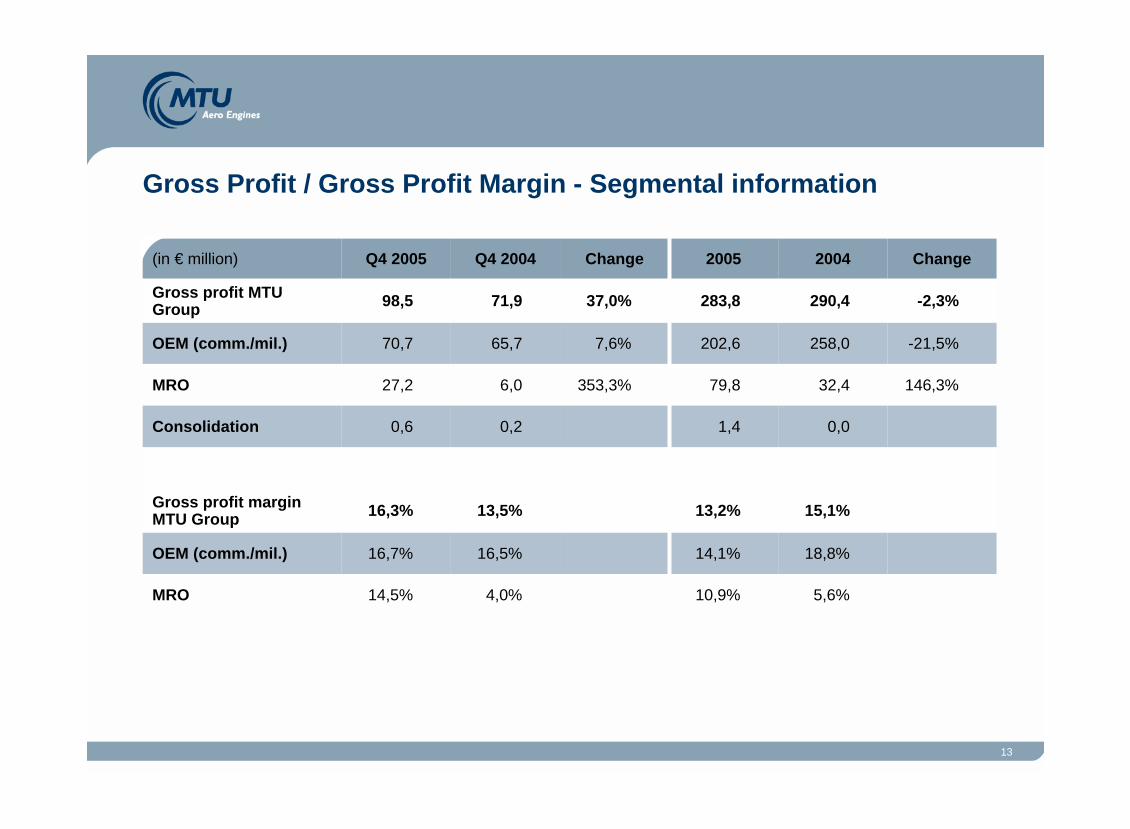
Gross Profit / Gross Profit Margin - Segmental information
5,6%10,9%4,0%14,5%MRO
18,8%14,1%16,5%16,7%OEM (comm./mil.)
15,1%13,2%13,5%16,3%Gross profit margin MTU Group
0,01,40,20,6Consolidation
146,3%32,479,8353,3%6,027,2MRO
-21,5%258,0202,67,6%65,770,7OEM (comm./mil.)
-2,3%290,4283,837,0%71,998,5Gross profit MTU Group
Change20042005ChangeQ4 2004Q4 2005(in € million)
14
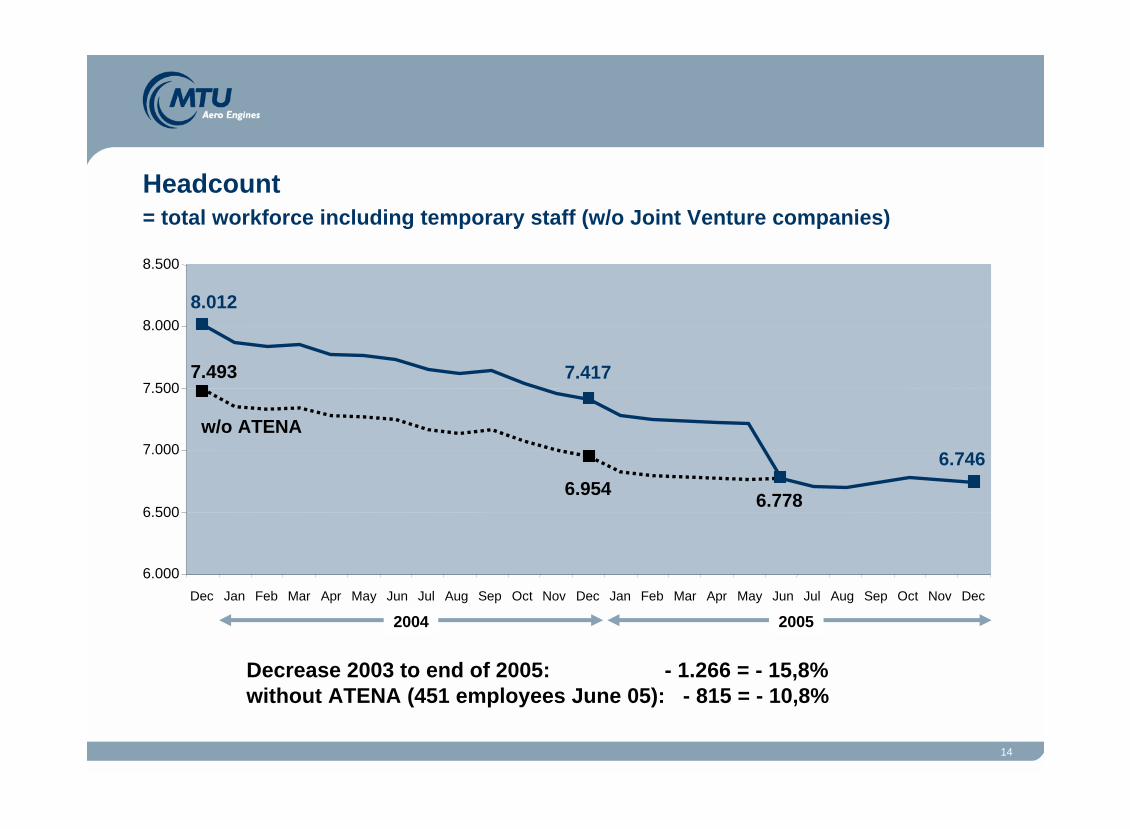
Decrease 2003 to end of 2005: - 1.266 = - 15,8% without ATENA (451 employees June 05): - 815 = - 10,8%
Headcount = total workforce including temporary staff (w/o Joint Venture companies)
w/o ATENA
6.746
7.417
8.012
7.493
6.9546.778
6.000
6.500
7.000
7.500
8.000
8.500
Dec Jan Feb Mar Apr May Jun Jul Aug Sep Oct Nov Dec Jan Feb Mar Apr May Jun Jul Aug Sep Oct Nov Dec
20052004

15
Research & Development
-98,2-38,1-24,5-13,3Consumption of R&D provision
-20,8 %57,745,726,4 %19,724,9R&D according to IFRS
76,988,129,223,8Customer funded R&D
-26,2 %232,8171,9-15,6%73,562,0Total R&D
155,9
2004
-13,8%
change
44,3
Q4 2004
38,2
Q4 2005
-46,3%83,8Company expensed R&D
change2005(in € million)
Higher R&D in Q4 2005 due to earlier R&D spendings for GP7000, which were originally planned for 2006
è higher R&D provision release in 2005
è R&D provisions for GP7000 in 2006 are confirm with the planned R&D spendings
High R&D spending in Q4/2005 especially for technological projects
16
Table of Content
1. Order backlog
2. Revenues
3. Profit & Loss
4. EBITDA – Adjustments
5. Underlying Net Income and EPS
6. Cash Flow
7. Potential dividend capacity
8. Group outlook
Appendix – Segmental information

17
EBITDA Adjustments – Group Level
35,3 %172,2233,036,4%48,766,4EBITDA adjusted
-41,9-35,3-17,1-12,5Total adjustments
22,63,6Direct Transaction costs
27,0Inventory write up (PPA)
-98,2-38,1-24,6-13,3R&D provision consumption
6,72,83,90,8Restructuring costs
25,3%214,1268,319,9%65,878,9EBITDA reported
133,0138,338,437,9Depreciation and amortization
60,3 %81,1130,049,6%27,441,0EBIT reported
change20042005changeQ4 2004Q4 2005(in € million)

18
EBITDA Adjustments – Segmental Level
68,9%42,772,1107,0%11,423,6EBITDA adjusted MRO
3,73,5Restructuring
7,1Inventory write up
126,0%31,972,1198,7%7,923,6EBITDA reported MRO
19,9Inventory write up
-98,2-38,1-24,6-13,3R&D cost, not expensed under IFRS
3,02,80,40,8Restructuring
22,63,6Direct Transaction Cost
131,3
184,0
2004
21,2%
0,3%
change
38,6
59,1
Q4 2004
46,8
59,3
Q4 2005
23,7%162,4EBITDA adjusted OEM
7,5%197,7EBITDA reported OEM
change2005OEM Segment
MRO Segment
19
Table of Content
1. Order backlog
2. Revenues
3. Profit & Loss
4. EBITDA – Adjustments
5. Underlying Net Income and EPS
6. Cash Flow
7. Potential dividend capacity
8. Group outlook
Appendix – Segmental information

20
Net Income and EPS underlying
0,93
51,4
-34,8
86,2
2,2
-0,5
-73,5
158,0
63,3
-38,1
2,8
-35,3
130,0
2005
22,6Direct Transaction costs
27,0Inventory write up (PPA)
6,7Restructuring costs
-15,8%-41,9MTU Adjustments
-98,2R&D provision consumption
0,24
13,0
-8,8
21,8
-1,8
-5,3
-72,8
101,7
62,5
81,1
2004
Reverse translation effects
295,4%underlying EPS
295,4%underlying Net Income
underlying Tax (40,4%)
295,4%underlying EBT
Gain/Loss JV equity method
Financial result
55,4%EBIT underlying
1,3%PPA Amortization
60,3%EBIT rep
change(in € million) Rationale of underlying net income:
• MTU adjustments, especially R&D expense
• Reverse of PPA amortization
• Reverse of translation effects included in financial results (mark to market of interest swaps, US$ cash revaluation, capital lease valuation)
• Tax rate for underlying EBT is equal to IFRS tax rate: 40.4%
According to our adjusted EBIT / EBITDA definition, we are proposing an underlying net income, which includes the same adjustments. Additionally we are adjusting for translation effects in the financial result.
21
Table of Content
1. Order backlog
2. Revenues
3. Profit & Loss
4. EBITDA – Adjustments
5. Underlying Net Income and EPS
6. Cash Flow
7. Potential dividend capacity
8. Group outlook
Appendix – Segmental information

22
Cash Flow - summary
-177,2-12,6-266,2-68,0Change in cash and cash equivalents
0,46,30,6-0,2Effect of exchange rate on cash and cash equivalents
-190,7-227,2-218,7-18,8Cash Flow from financing activities
+1.490,1%13,1208,3-48,1-49,0Free Cash Flow
36,8%-59,8-81,8-25,8-39,1Cash Flow from investing activities
+297,9%72,9290,1-22,2-9,9Cash Flow from operating activities
133,0138,338,437,9Depreciation and amortisation
-35,648,63,846,4Change in Provisions
-22,4157,9-111,1-11,3Change in Working Capital
-2,4-87,731,6-97,4Deferred taxes
0,1
0,2
2004change
0,5
14,6
Q4 2004
0,9
13,5
Q4 2005
0,1Gains/losses associated comp. /others
32,9Net income IFRS
change2005
23
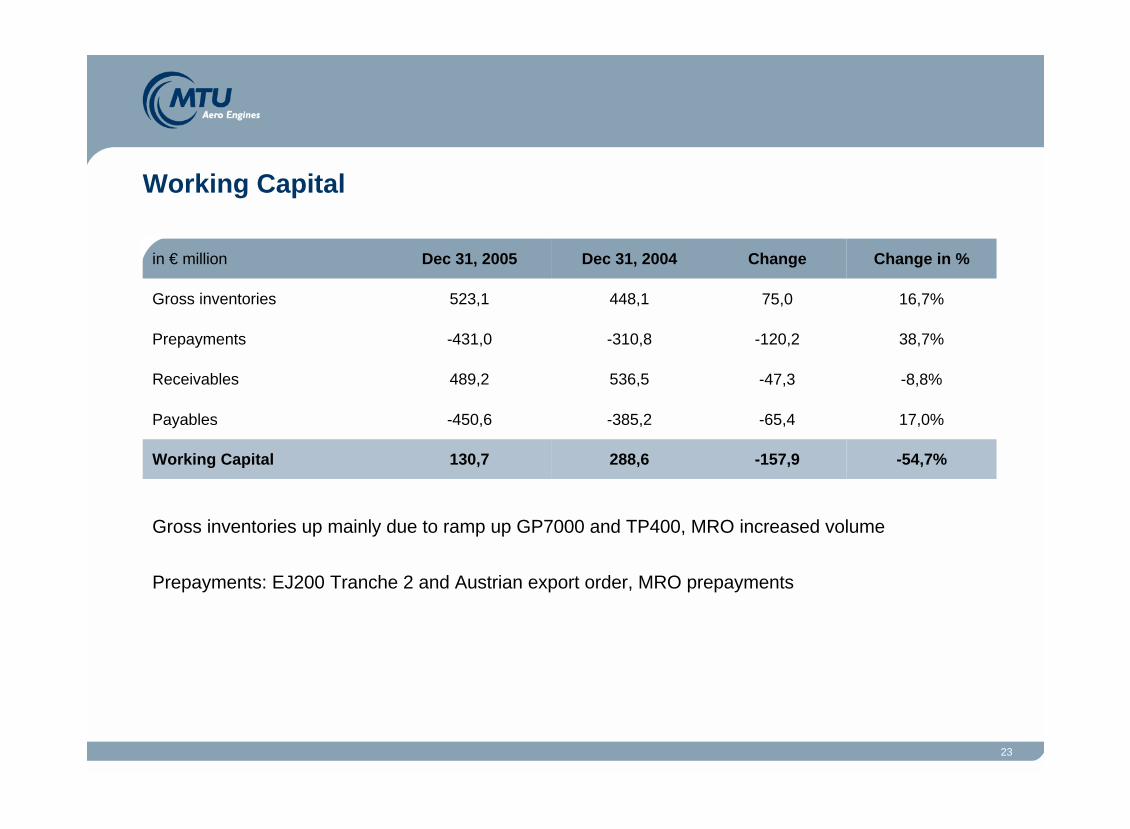
Working Capital
Gross inventories up mainly due to ramp up GP7000 and TP400, MRO increased volume
Prepayments: EJ200 Tranche 2 and Austrian export order, MRO prepayments
17,0%-65,4-385,2-450,6Payables
-54,7%-157,9288,6130,7Working Capital
-47,3
-120,2
75,0
Change
-8,8%536,5489,2Receivables
38,7%-310,8-431,0Prepayments
16,7%448,1523,1Gross inventories
Change in %Dec 31, 2004Dec 31, 2005in € million
24
Net Financial Debt reduced by 72%(in € million)
01.01.04 01.01.05 31.12.05Net financial
debt
Financial liabilities
Cash
838
931
-12,6Change in cash and cash equivalents
613,5Total change in financial liabilities
-3,7Loan British Columbia to MTU Maintenance Canada / Leasing / others
92,5Forex
524,7Subtotal
185,5Vendor loan DaimlerChrysler
69,7Blade „Vanilla“ ( Blade Lux Holding Two S.a.r.l.)
112,3High Yield Bond (incl. interest)
157,2Credit Facilities
Change in Financial Liablilities
253
53
165
others
237
BC Loan
16
HYB
Cap. Lease1421

25
Table of Content
1. Order backlog
2. Revenues
3. Profit & Loss
4. EBITDA – Adjustments
5. Underlying Net Income and EPS
6. Cash Flow
7. Potential dividend capacity
8. Group outlook
Appendix – Segmental information
26
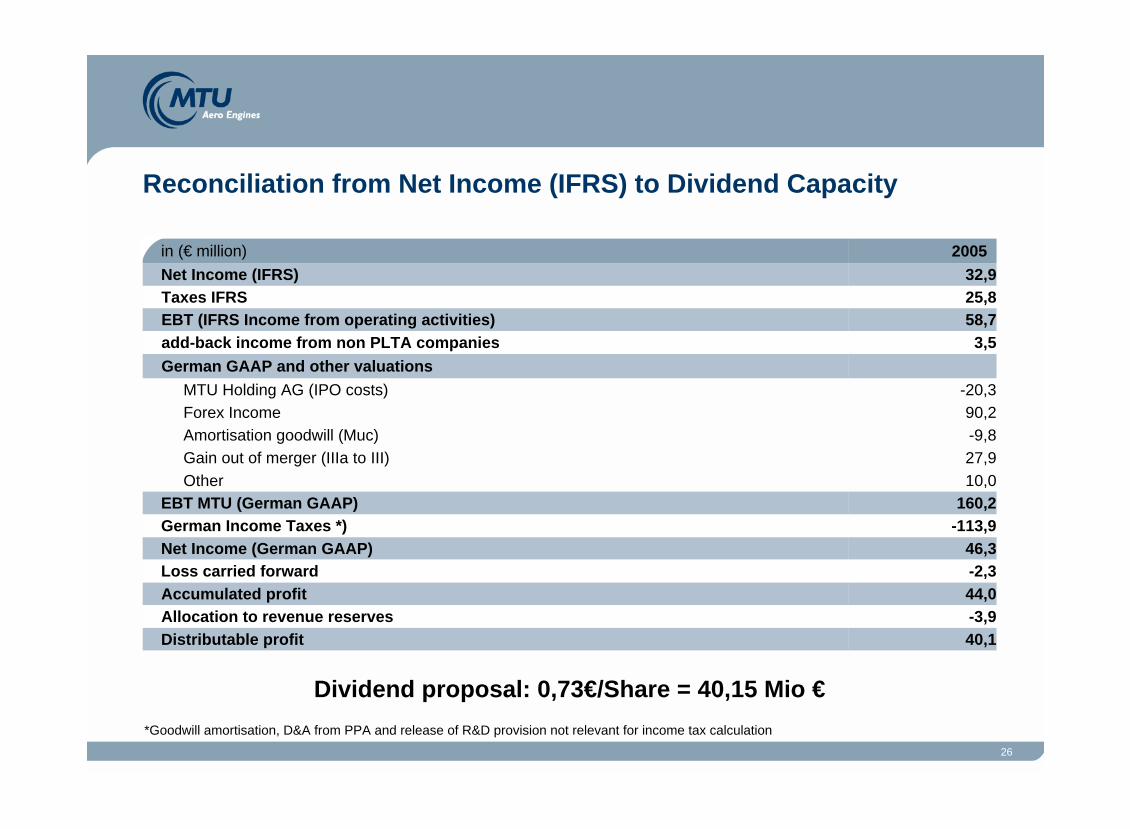
Reconciliation from Net Income (IFRS) to Dividend Capacity
44,0Accumulated profit
46,3Net Income (German GAAP)-2,3Loss carried forward
-3,9Allocation to revenue reserves
27,9Gain out of merger (IIIa to III)
-20,3MTU Holding AG (IPO costs)
-113,9German Income Taxes *)
90,2Forex Income-9,8Amortisation goodwill (Muc)
10,0Other160,2EBT MTU (German GAAP)
40,1Distributable profit
German GAAP and other valuations 3,5add-back income from non PLTA companies
25,8Taxes IFRS58,7EBT (IFRS Income from operating activities)
32,92005
Net Income (IFRS)in (€ million)
*Goodwill amortisation, D&A from PPA and release of R&D provision not relevant for income tax calculation
Dividend proposal: 0,73€/Share = 40,15 Mio €
27
Table of Content
1. Order backlog
2. Revenues
3. Profit & Loss
4. EBITDA – Adjustments
5. Underlying Net Income and EPS
6. Cash Flow
7. Potential dividend capacity
8. Group outlook
Appendix – Segmental information
28
Group Outlook 2006
7032,90,2IFRS Net income
270233,0172,2EBITDA adjusted
170290,172,9CF operating activities
81,1
1.918,0
Actual 2004
130,0
2.148,6
Actual 2005
160EBIT reported
2.350Revenues
Guidance 2006in Mio. €
29
Table of Content
1. Order backlog
2. Revenues
3. Profit & Loss
4. EBITDA – Adjustments
5. Underlying Net Income and EPS
6. Cash Flow
7. Potential dividend capacity
8. Group outlook
Appendix – Segmental information

30
Segmental information: Sales / Cost of sales
Appendix
-33,5-19,7-13,5-6,8Consolidation
543,5652,3143,8159,9MRO
1.117,61.232,2331,5351,4OEM (commercial / military)
14,6 %1.627,61.864,89,2 %461,8504,5Cost of Sales
7,2 %879,9943,41,0 %238,8241,3OEM Commercial
-0,9 %495,7491,414,1 %158,4180,8OEM Military
27,1 %575,9732,124,9 %149,8187,1MRO
-33,5-18,3-13,3-6,2Consolidation
1.918,0
2004
13,0 %
change
533,7
Q4 2004
603,0
Q4 2005
12,0 %2.148,6Sales
change2005

31
Segmental information: Gross Profit / EBIT reported
Appendix
-1,8-1,5-1,2-4,0Consolidation
-2,037,1-2,812,9MRO
84,994,431,432,1OEM (commercial / military)
60,3 %81,1130,049,6 %27,441,0EBIT reported
-21,5 %258,0202,67,6%65,770,7OEM (commercial / military)
146,3 %32,479,8353,3%6,027,2MRO
0,01,40,20,6Consolidation
290,4
2004
37,0 %
change
71,9
Q4 2004
98,5
Q4 2005
-2,3 %283,8Gross Profit
change2005
32
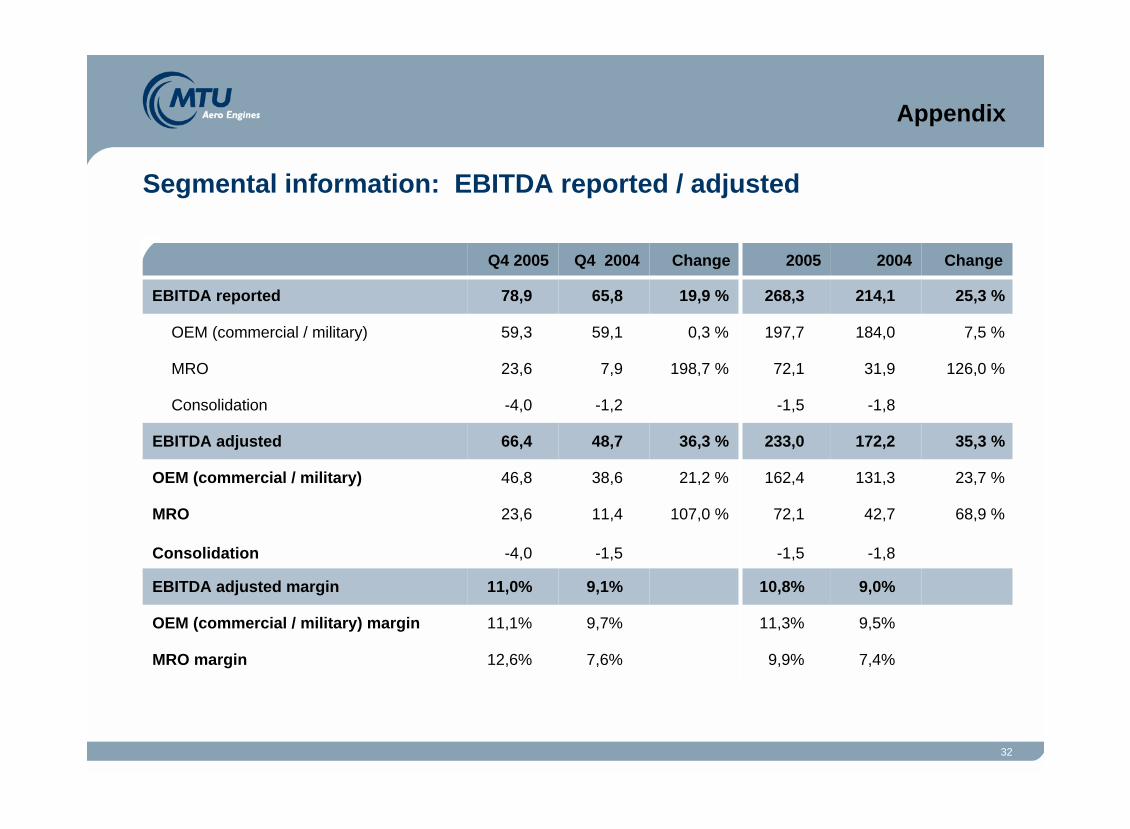
Segmental information: EBITDA reported / adjusted
Appendix
-1,8-1,5-1,5-4,0Consolidation
9,0%10,8%9,1%11,0%EBITDA adjusted margin
9,5%11,3%9,7%11,1%OEM (commercial / military) margin
7,4%9,9%7,6%12,6%MRO margin
68,9 %42,772,1107,0 %11,423,6MRO
23,7 %131,3162,421,2 %38,646,8OEM (commercial / military)
35,3 %172,2233,036,3 %48,766,4EBITDA adjusted
7,5 %184,0197,70,3 %59,159,3OEM (commercial / military)
126,0 %31,972,1198,7 %7,923,6MRO
-1,8-1,5-1,2-4,0Consolidation
214,1
2004
19,9 %
Change
65,8
Q4 2004
78,9
Q4 2005
25,3 %268,3EBITDA reported
Change2005

33
Segmental information
Appendix
99,1103,327,727,2OEM
33,935,010,710,7MRO
133,0
2004
38,4
Q4 2004
37,9
Q4 2005
138,3MTU total
2005Total depreciation / amortisation
49,851,212,212,1OEM
12,712,12,82,9MRO
62,5
2004
15,0
Q4 2004
15,0
Q4 2005
63,3MTU total
2005PPA depreciation / amortisation
49,352,115,515,1OEM
21,222,97,87,8MRO
70,5
2004
23,4
Q4 2004
22,9
Q4 2005
75,0MTU total
2005Depreciation / amortisation w/o PPA
34
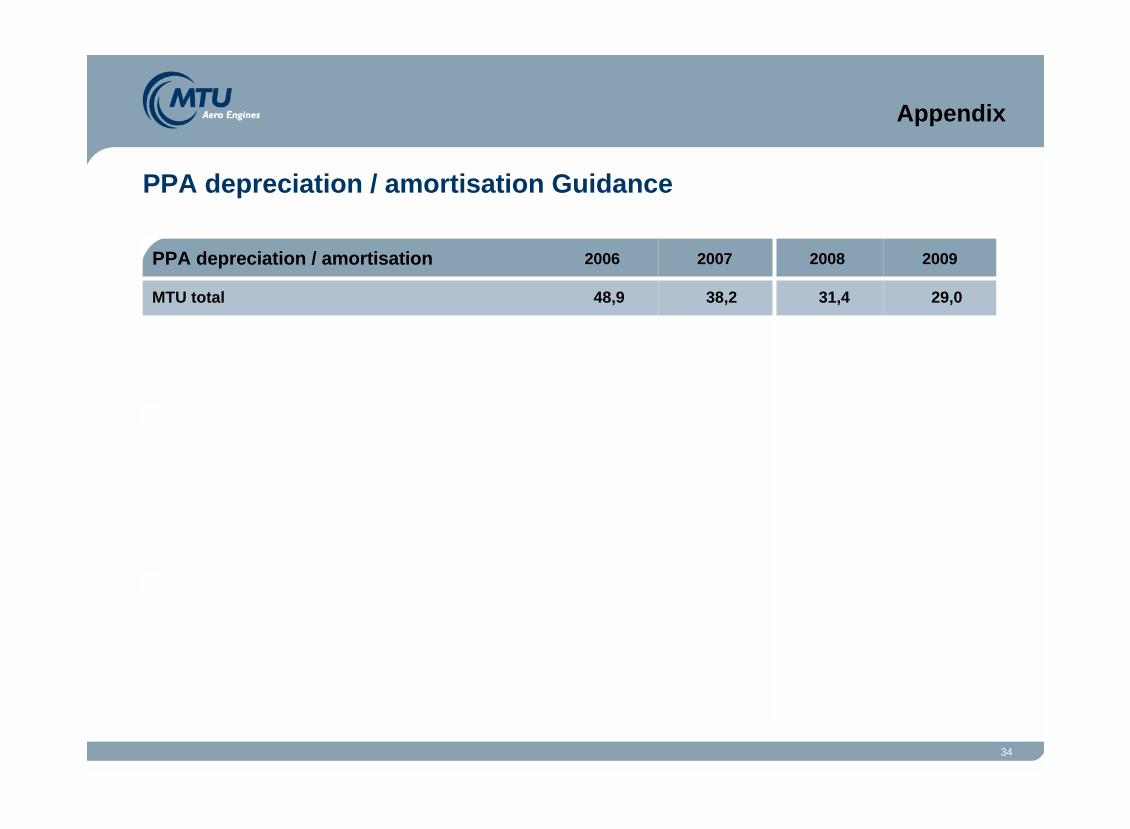
PPA depreciation / amortisation Guidance
Appendix
29,0
2009
38,2
2007
48,9
2006
31,4MTU total
2008PPA depreciation / amortisation
35
Cautionary Note Regarding Forward-Looking StatementsCertain of the statements contained herein may be statements of future expectations and other forward-looking statements that are
based on management’s current views and assumptions and involve known and unknown risks and uncertainties that could cause actual results, performance or events to differ materially from those expressed or implied in such statements. In addition to statements that are forward-looking by reason of context, the words “may,” “will,” “should,” “expect,” “plan,” “intend,” “anticipate,” “forecast,” “believe,” “estimate,” “predict,” “potential,” or “continue” and similar expressions identify forward-looking statements.
Actual results, performance or events may differ materially from those in such statements due to, without limitation, (i) competition from other companies in MTU’s industry and MTU’s ability to retain or increase its market share, (ii) MTU’s reliance on certain customers for its sales, (iii) risks related to MTU’s participation in consortia and risk and revenue sharing agreements for new aero engine programs, (iv) the impact of non-compete provisions included in certain of MTU’s contracts, (v) the impact of a decline in German or other European defense budgets or changes in funding priorities for military aircraft, (vi) risks associated with government funding, (vii) the impact of significant disruptions in MTU’s supply from key vendors, (viii) the continued success of MTU’s research and development initiatives, (ix) currency exchange rate fluctuations, (x) changes in tax legislation, (xi) the impact of any product liability claims, (xii) MTU’s ability to comply with regulations affecting its business and its ability to respond to changes in the regulatory environment, (xiii) the cyclicality of the airline industry and the current financial difficulties of commercial airlines, (xiv) risks associated with the significant ownership of our equity by affiliates of Kohlberg Kravis Roberts & Co., (xv) our substantial leverage and (xvi) general local and global economic conditions. Many of these factors may be more likely to occur, or more pronounced, as aresult of terrorist activities and their consequences.
The company assumes no obligation to update any forward-looking statement.
Any securities referred to herein have not been and will not be registered under the U.S. Securities Act of 1933, as amended (the “Securities Act”), and may not be offered or sold without registration thereunder or pursuant to an available exemption therefrom. Any public offering of securities of MTU Aero Engines to be made in the United States would have to be made by means of a prospectusthat would be obtainable from MTU Aero Engines and would contain detailed information about the issuer of the securities and itsmanagement, as well as financial statements.
Neither this document nor the information contained herein constitutes an offer to sell or the solicitation of an offer to buy any securities.
These materials do not constitute an offer of securities for sale in the United States; the securities may not be offered or sold in the United States absent registration or an exemption from registration.
No money, securities or other consideration is being solicited, and, if sent in response to the information contained herein, will not be accepted.