investor and analyst day 2008 mtu aero engines · investor and analyst day 2008 mtu aero engines...
TRANSCRIPT

Investor and Analyst Day 2008MTU Aero Engines
Munich 26 September 2008

26 September 2008 2
Agenda
Dr. Jörg HenneUpdate on Technology14:20 – 15:00
Guided tour through the aircraft exhibition
followed by a casual get together15:00 – 17:00
Reiner WinklerOverview of New Cost Efficiency Initiatives13:30 – 14:20
Dr. Stefan WeingartnerUpdate on Commercial MRO Business12:00 – 12:40
Egon W. BehleUpdate on Strategy, Commercial and Military Business11:00 – 12:00
Lunch with MTU Management
Event
12:40 – 13:30
SpeakerTime

Update on Strategy, Commercialand Military Business
Egon W. Behle, CEO

26 September 2008 4
Agenda
1. Overview Key Strengths
2. Market Situation
3. Strategy and Program Highlights
26 September 2008 5
MTU – Top Performance for the Worldwide Aviation Industry
• Leading technological position
• Strong partnership with all engine OEMs
• Largest independent MRO provider
• Excellent financial performance and robustness
26 September 2008 6
Agenda
1. Overview Key Strengths
2. Market Situation
3. Strategy and Program Highlights

26 September 2008 7
• July y/y international passenger trafficgrowth fell to 1.9% - the lowest in five years
• Cargo traffic in July fell by 1.9% y/y
• As a result, IATA revised passenger trafficoutlook for 2008 to 3.2% (was 3.9%) andfreight traffic growth projection to 1.8% (was3.9%)
• The initial outlook for 2009 shows only 2.8%growth in passenger traffic (was 4.5%)
• Oil price dropped close to $100/bbl afterpeak of $145/bbl in July
• Engines primarily affected by retirements:JT8D, CFM56-3, JT9D and RB211
Latest Traffic Data Shows Lower but Continued Growth in Demand– While There Has Been Some Relief in Oil Price
HighlightsPassenger Air Traffic Growth
Source: IATA, ATA, AEA and AAPA – July 2008
-30%
-20%
-10%
0%
10%
20%
30%
40%
Jan01
Jan02
Jan03
Jan04
Jan05
Jan06
Jan07
Jan08
IATA Global Int'al (excl. Domestic)Composite Index (Top 3 Regions Dom. + Int'al)9/11
Iraq Warand SARSIraq Warand SARS
9/11
Slowdown sinceDecember is confirmed

26 September 2008 8
Market drivers and outlook
Passenger 5.1% 5.4%Air Traffic
Jet Engine 3.6% 3.7%Fleet
Jet Engine 2.7% 4.2%Deliveries
CAGR
Source: Airline Monitor July 2008
0
100
200
300
400
500
600
700
800
1990 1995 2000 2005 2010 2015 2020 2025 2030
Inde
xed
1990
=10
0
08-3090-08
• Growth in passenger traffic and engine fleet are main drivers for MTU´s civil aftermarket business
• MTU´s series sales follow the overall engine delivery trend
Passenger TrafficJet Engine FleetJet Engine Deliveries
Long Term Outlook for Market Demand Remains Positive

26 September 2008 9
110 bn US$
210 bn US$
310 bn US$
Widebody Narrowbody Regional & Business Jet
Expected Deliveries and Sales 2008-2030: CAGR ~4%
57%27%16%% Engine Deliveries17%34%49%% Engine Sales
230+ seats 90-230 seats 20-90 seats
Sal
es
Source: Airline Monitor July 2008
Over the Next 20 Years the Commercial Aero Engine Market isExpected to Generate More Than $600bn Sales

26 September 2008 10
~ 60% of order backlog from growth regions~ 85% of order backlog from growth platforms
MTU´s Commercial OEM Order Book is Driven by Growth Platformsand Dynamic Regions
note: without PWC programs
Total 1,6 bn €Total 1,6 bn €
~ 15%Other
engineprograms
~ 85%GP7000V2500
~ 60%Middle East,
Asia,South America
~ 40%North America
EuropeRoW

26 September 2008 11
~ 55% of order backlog from growth regions~ 80% of order backlog from growth platforms
Total 7,2 bn US$Total 7,2 bn US$
~ 55%Asia/Pacific,
South America,Middle East
~45 %North
America,Europe
Vast Majority of Commercial MRO Contract Volume Derives fromFast Growing Engines and Regions
~ 80%V2500,
CF6-80C,CFM56-5/-7
~ 20%Other
engineprograms

26 September 2008 12
MTU Commercial OEM revenues2007 by engine typeMTU installed engine fleet by engine type
CF6-50/-80A2%
MTU Has Limited Exposure to Engines That Are Primarily Affectedby the Current Retirements (JT8D, CF6-50, 80A)
V250026%
JT8D-20016%
GP70000,03%
CF6-80E3%
CF6-80C27%
CF6-50/-80A11%
PW60000,2%
PW4000G3%
PW2000(incl. F117)
14%
Source: AirClaims Case 30.06.2008
~97%Other engine
programs
JT8D-2001%

26 September 2008 13
Agenda
1. Overview Key Strengths
2. Market Situation
3. Strategy and Program Highlights

26 September 2008 14
MTU Strategy Supports Profitable Growth
Five Strategic Pillars
1. Maintainleadership
in technology
3. Strengthencore businessby accessingrelated nichebusinesses
4. Evaluateacquisition
opportunities
5. Furtherimprove cost
competitiveness
2. Gain accessto fastest
growing newprograms
Global Footprint
Speed / Productivity
26 September 2008 15
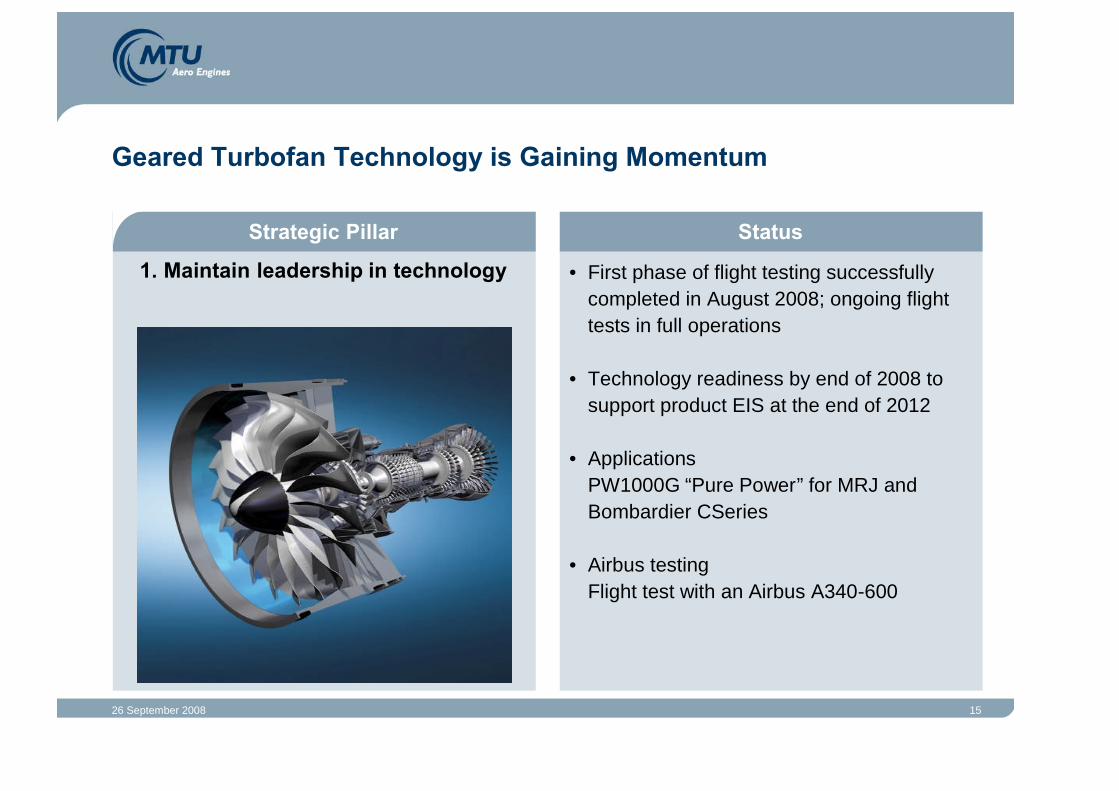
• First phase of flight testing successfullycompleted in August 2008; ongoing flighttests in full operations
• Technology readiness by end of 2008 tosupport product EIS at the end of 2012
• ApplicationsPW1000G “Pure Power” for MRJ andBombardier CSeries
• Airbus testingFlight test with an Airbus A340-600
Geared Turbofan Technology is Gaining Momentum
StatusStrategic Pillar
1. Maintain leadership in technology

26 September 2008 16
• 15% share in P&W PurePower FamilyPW810, PW1000G
Applications:
‒Cessna LCC (~5 bn€revenue potential)
‒MRJ (~5 bn€revenue potential)
‒Bombardier C Series under finalnegotiation (~6 bn€revenue potential)
• 13% share in GE LM6000 gas turbine
‒~ 1.2 bn€revenue potential
• 18% share in GE38 helicopter engine
‒Application: CH53-K US heavylifthelicopter
‒~ 2 bn revenue potential
‒Basis for potential European Application
In 2008 MTU Has Secured Shares in New Engine Programs withPotential Revenues of ~20 bn €
StatusStrategic Pillar
2. Gain access to fastest growingnew engine programs

26 September 2008 17
Ongoing Programs Provide Sustainable Basis for Profitable Growth
• EJ 200 Tranche 2 to be delivered up to 2012– Further significant export potential
• TP 400 flying testbed and first flight on A400M postponed– MTU has taken ~ 44 m €provision for potential penalties
Status main ongoing programs (comm. + mil. OEM)
• V2500 performing well– V2500Select received EASA 25 Certification– Sales market share in 2008 above 50% (roughly 500 engines)
• GP7000– Superb engine (Fuel, noise), affected by A/C push outs
• Business Jets– Close to 600 engine deliveries (PW300, PW500) expected in 08

26 September 2008 18
OEM:
• “Aero Solutions” complements RRSP -2008 expected revenues ~40 m €
• Project “More Electric Engine” examinescommercial applications for DECU/DECMU
MRO:
• MTU currently focused on Disassembly/Assembly/Test and related repairs
• Room for increased service offerings by:
– Engine lease
– 3rd party parts repair
– Accessory repair
StatusStrategic Pillar
3. Strengthen core business byaccessing related nichebusinesses
Further Potential Activity Fields Under Evaluation

26 September 2008 19
Motivation:
• Enhance position as Tier 1 supplier andreliable partner
• Leading role in European consolidation
• Access to growth markets / products
Criteria:
• Strict financial and strategic M&A criteria
StatusStrategic Pillar
4. Evaluate acquisition opportunities
Continuous Process of M&A Evaluation Follows Strict Strategicand Financial Criteria

26 September 2008 20
New cost cutting program:
• Challenge 2010
• Expected savings ~ 50 m €from2010/11 on
Existing cost cutting initiatives:
• Impact 06
• 50 m €savings (1/3 in 2007; 2/3 in 2008)
• Centers of Excellence/MTU Polska
• ~ 20 m €cost savings from 2011 on
StatusStrategic Pillar
5. Further improve costcompetitiveness
Cost Reduction Programs Ensure Competitiveness in ChallengingMacro Environment

Update on Commercial MRO
Dr. Stefan WeingartnerPresident and CEO Commercial Maintenance
26 September 2008 22
Agenda
1. Commercial MRO
2. Summary H108 Financials
3. Market Outlook & Strategy
4. Operations

26 September 2008 23
MTU Maintenance at a Glance
• Largest independent MRO provider in the world
• Attractive product portfolio
• Profitable and fast growing JV in China
• Great synergies within MTU-group
• Excellent and highly skilled workforce at all locations

26 September 2008 24
Commercial MRO – Overview
Status Quo
Major Initiatives
• Hanover: operational performance back on track
• New organisation at MTU Maintenance Hanover: strongly customer focused andfinancially driven
• New test cell in operation at MTU Maintenance Hanover
• 17% organic sales growth in US$
• High double digit sales growth at MTU Maintenance Zhuhai
• Cross-functional Masterplan in Hanover in execution
• Continuous improvement rolled out through entire organisation
• Operational introduction of newly developed MTUPlus Repair Solutions

26 September 2008 25
Agenda
1. Commercial MRO
2. Summary H108 Financials
3. Market Outlook & Strategy
4. Operations

26 September 2008 26
Summary H108 Financials – MRO Business
7,27,4Contract Volume MRO (in bn US$)
30.06.200831.12.2007
+ 2%
-55%
10.9%
5.8%
EBITDA OEM BusinessRevenues OEM Business EBITDA OEM BusinessRevenues OEM Business EBITDA OEM BusinessRevenues OEM Business EBITDA MRO BusinessRevenues MRO Business
m€ m€
505 513
0
200
400
600
H1 2007 H1 2008
55
30
0
20
40
60
80
100
H1 2007 H1 2008
0
5
10
15
EBITDA Margin
FX adjusted sales H1 2008: +17%
2009 ff.
8-10%

26 September 2008 27
Agenda
1. Commercial MRO
2. Summary H108 Financials
3. Market Outlook & Strategy
4. Operations

26 September 2008 28
• High oil and jet fuel prices
• Slow-down in air traffic growth due to oil price and weakening economy
• Above average MRO-growth in the Middle East, Asia and Latin-America
General Market
• Retirement of fuel-inefficient aircraft
• Ongoing consolidation in the airline industry
• Rising demand for MRO infrastructure in emerging markets (local content)
• Strong demand for core MTU-MRO-products (V2500, CFM56-5B/-7, CF34-8/-10) andMRO services
• Restrictive OEM policy with regard to granting MRO licenses
Market Trends
Commercial MRO – Market Trends

26 September 2008 29
Commercial Engine MRO Forecast
Forecast 2008-17 (in bn USD) MTU’s Response
Source: AeroStrategy published 2008; all commercial jet aircraft above 35 seats
• MTU continuously adds newengine programs to keep portfolioyoung
• Cooperation in repair and materialsolutions
• Focus on High-tech developmentand service solutions (eg. MTU’sTotal Engine Care)
• Low cost facilities
• Market access to new programsthrough airline JVs
• Think global, act local
0
5
10
15
20
25
2007 2008 2009 2010 2011 2012 2013 2014 2015 2016 2017
CAGR =
3.8%

26 September 2008 30
Capacity Reduction Announcements by Airlines (April – Sep 2008)
~ 20%V2500
PW2000CFM56-7CF6-80C
~ 80%other engine
programs
Affected Engine Types (Total 1500 units)
~ 75%North America
~ 25%RoW
Affected Market Areas
80% of the affected engines have no orlimited impact on MTU
75% of the announced fleet reductionsare from North American operators

26 September 2008 31
0,0 0,5 1,0 1,5 2,0 2,5 3,0
MarketShare
GE Engine Services
Rolls-Royce
Lufthansa Technik
MTU Maintenance*
Air France/KLM
American Airlines
SR Technics
Pratt & Whitney
Snecma Services
15%
9%
8%
7%
8%
4%
4%
3%
2%
5%Delta TechOps
Top 10 Engine MRO Providers 2007
1
2
3
4
5
6
7
8
9
10
Source: AeroStrategy 2007 Forecast Initiative, MTU actuals Note: Only JVs >50% are consolidated
2007 Estimated Engine MRO Revenue (US$ Bill.)
26 September 2008 32
Agenda
1. Commercial MRO
2. Summary H108 Financials
3. Market Outlook & Strategy
4. Operations

26 September 2008 33
MTU Maintenance Hanover: Achievements Over the Last 9 Months
OTD
0%
20%
40%
60%
80%
100%
Dec 07 Aug 0850
60
70
80
90
100
Dec 07 Aug 08
TAT• TAT decreased by 26%
Target TAT < 60 days
• OTD improved from 28% to 78%Target OTD >90%
• Inventory decreased by 7%
• 21 Kaizen Workshops successfullyconducted
• Headcount reduction by 65 employees
target
50%
60%
70%
80%
90%
100%
Dec 07 Aug 08
Inventory

26 September 2008 34
0
5
10
15
20
25
30
35
40
45
Jan Feb Mar Apr May Jun Jul Aug Sep Oct Nov Dec
Masterplan Hanover – Major Initiatives to Improve Performance
FC FC FC FC
Ramp up phase – SLUs large enginesObjective
Implementation
Status Quo
• Integrated production system
• Decrease Inventory
• Reduce TAT
• Increase flexibility
• Smooth introduction vs. radical changes
• Implementation with a dedicated project team(25 headcount and external support)
• New production system implemented
• Output stabilized on a good level
• Complexity has been reduced
• Kaizen established in entire organization

26 September 2008 35
Masterplan Hanover: Structure of Project
Inventory Cost of capital Competitiveness
Clean-upLegacy-Issues
BoostEfficiency
Win newContracts
ResolveRoot-causes
Processes Inventory Cost Turnover
• Planning• Production• Supply Chain
• Inventory• WIP / GDNI• Receivables
• Material• Personnel• SG&A
• Incoming Orders
TAT / OTD Working Capital EBITDA Turnover60 days / 90%
Integrated ProductionSystem
Project Goals for 2008

26 September 2008 36
Masterplan Hannover: Project Plan On Time and On Track
Apr May Jun Jul Aug Sep Oct Nov Dec
Implementation of new organisation
Clean-up legacy issues from switch to new system
Definition of new integrated production system
Implementation of new integrated production system
CIP workshops support entire process
Continuous Optimization
Mar
26 September 2008 37
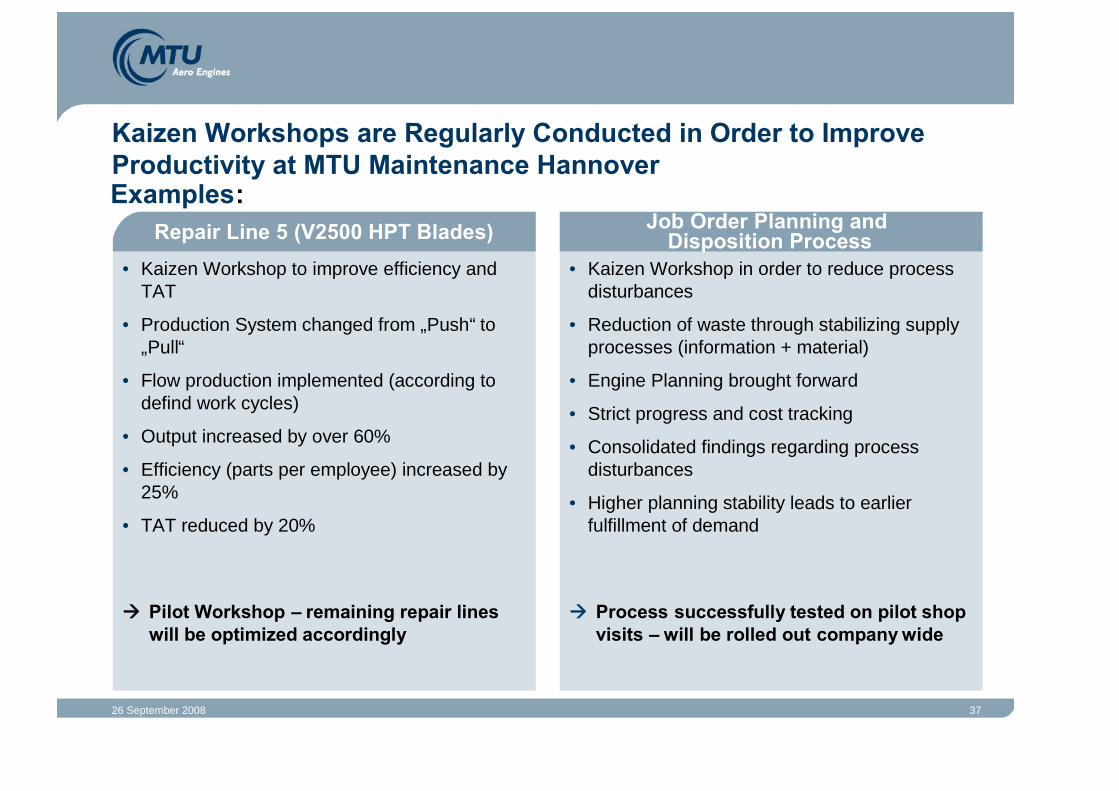
Repair Line 5 (V2500 HPT Blades)
• Kaizen Workshop to improve efficiency andTAT
• Production System changed from „Push“ to„Pull“
• Flow production implemented (according todefind work cycles)
• Output increased by over 60%
• Efficiency (parts per employee) increased by25%
• TAT reduced by 20%
Pilot Workshop – remaining repair lineswill be optimized accordingly
Job Order Planning andDisposition Process
• Kaizen Workshop in order to reduce processdisturbances
• Reduction of waste through stabilizing supplyprocesses (information + material)
• Engine Planning brought forward
• Strict progress and cost tracking
• Consolidated findings regarding processdisturbances
• Higher planning stability leads to earlierfulfillment of demand
Kaizen Workshops are Regularly Conducted in Order to ImproveProductivity at MTU Maintenance Hannover
Process successfully tested on pilot shopvisits – will be rolled out company wide
Examples:

26 September 2008 38
Commercial MRO – New Test Facility in Hannover
State of the art test facility Key facts
• Risk mitigation: >500 test runs/anno
• Permission to run both test cells at thesame time capacity increase
• Ready to test all new large engines CF6-80E1, GP7000, GE90
• State-of-the-art control room requiresonly two engineers (instead of 3)
• Cost reduction through less weekendwork
• Quick engine set-ups and removalsthrough automated engine recognition
• Max. Thrust: 150 k lbs• Base area: 1.800 m²• Length of the facility: ~ 100 m• Width of the testbed: ~ 15 m• Height of the exhaust: ~ 35 m• Investment: 24 m €• First engine run: Sept. 08

26 September 2008 39
Commercial MRO – Growth Development Zhuhai Facility
• No. 1 MRO facility in China with significantmarket shares (V2500 ~90%; CFM56-3~30%).
• Future growth is supported by increasingdemand for CFM56-7 MRO services in Asia.
• MRO capabilities cover approx. 80% ofnarrow-body engines operated within Chinaand South East Asia.
• > 500 engines successfully overhauled sincestart of operations in 2003.
• Base load secured due to partnership withlargest and fast growing airline ChinaSouthern Airlines.
• Large expanding customer base with focus onChina and Southeast Asia.
Introduction Key Facts
• Foundation: 2001
• Shareholder: MTU Aero Engines 50%;China Southern Airlines 50%
• Size: Land area 156.000 sqm;Shop area 17.000 sqm
• Investment: totalling US$ 170 m
• Products: V2500-A5; CFM56-3/-5B/-7

26 September 2008 40
Commerical MRO – Technology Developments Leading to ImprovedServices
Intelligent maintenance- and repair concepts are key tovalue optimized maintenance.
• MTUPlus workscopes and MTUPlus repair solutions
are effective, economic measures to address customerand environmental topics as:reduction of shop-visit-cost, fuel burn and emissions
• MTUPlus Engine Condition Monitoring
helps to optimize the usage of the engine fleet and willreduce total maintenance cost for the operator

26 September 2008 41
• CBN Tip Coating
‒Application: V2500 HPT Blades
‒USP: material cost reduction, shorter process time,higher oxydation resistance (EGT Margin improvement)
‒EASA approval received on Sept. 10, 2008
• Airfoil Replacement Projects
‒Application: CFM56-7 HPT and LPT Vanes
‒USP: material cost reduction
• Vane Full Repair Projects
‒Application: V2500 and CFM56-7
‒USP: improved component life, application MTUPlus
brazing and TBC coating
Commercial MRO - Highlights Repair Development H1 2008
Repair Development (High Tech)

26 September 2008 42
Conclusions
• Marginal impact on MTU by announced engine retirements
• Implementation of new production/MRO system
• Operational improvements implemented positive impact on bottom line
• Q3 trend confirms year end targets
• Sustainable basis for future profitable growth established

Overview of New Cost Efficiency Initiatives
Reiner Winkler, CFO

26 September 2008 44
1. HY 2008 and Guidance
2. Perspectives for 2009
3. Cost Initiatives and Projects: Existing Projects and New Initiatives
Agenda

26 September 2008 45
H1/2008: Revenue Growth 12% on US$ basis
1.261 1.256
H1 2007 H1 2008
MTU Group Revenues (m€) Segment Revenues (m€)
545 531
223 227
505 513
H1 2007 H1 2008
CommercialBusiness
MilitaryBusiness
MRO
- 0.4% * +2%*
+2%
- 3%**
*increase on US$ basis:12% *increase on US$ basis: 17%** increase on US$ basis: 12%

26 September 2008 46
H1/2008: EBITDA Improved by 8% on Group Level
181 195
15,5%14,4%
H1 2007 H1 2008Group margin
MTU Group EBITDA adj. (m€) Segment EBITDA adj. (m€)
+ 8%
126
167
55
30
16,4%
22,0%
10,9%
5,8%
H1 2007 H1 2008
OEM MRO OEM margin MRO margin
-46 %
+ 33 %

26 September 2008 47
Free Cash Flow Net Income / EPS
€m €/share
H1 2008: Net Income Grew by 80%
7782
0
10
20
30
40
50
60
70
80
90
100
H1 2007 H1 2008
-5%
4580
1,61
0,85
0
20
40
60
80
100
120
140
160
180
200
H1 2007 H1 20080,0
0,5
1,0
1,5
2,0
Net Income EPS
+79%

26 September 2008 48
FY 2008 Forecast Remains Unchanged
154 180
3,63,0
FY 2007 Outlook 2008
393 390
15,0%15,3%
FY 2007 Outlook 2008
132100
FY 2007 Outlook 2008
Free Cash Flow (m€) Net Income / EPS reported (m€)
Revenues (m€) EBITDA adj. (m€)
in €/share
2.576 2.600
FY 2007 Outlook 2008
stable
+ 17%
*increase on US$ basis: ~ 9 -10%
~
stable

26 September 2008 49
New Key Financial Figure: EBIT adj.
Main reasons for switching to EBIT adj. from 2009 onwards
1. Depreciation & amortization are part of operative costs, but not included in EBITDA.In order to extend the attention on the total operative cost base, MTU internallyswitched to EBIT adj. in 2008: EBIT adj. = EBIT reported + PPA
2. MTU is in line with 90% of the blue chips / mid caps which comment on EBIT
The mid-term target for EBIT adj. margin is 12-13%(corresponding to 14-15% EBITDA adj. margin)

26 September 2008 50
Reconciliation EBIT adj. / EBITDA adj. – MTU Group
390.0392.9EBITDA adjusted
75.080.3D&A w/o PPA
-15.0R&D capitalization
15.0%15.3%EBITDA adjusted margin
12.7%12.1%EBIT adjusted margin
14.7extraordinary write-off CF34 licence
312.6
14.7
54.6
243.3
2,575.9
2007
330.0EBIT adjusted
+/- other adjustments
50.0+ PPA depr./ amort.
280.0EBIT reported
2,600.0Sales
2008 G

26 September 2008 51
1. HY 2008 and Guidance
2. Perspectives for 2009
3. Cost Initiatives and Projects: Existing Projects and New Initiatives
Agenda
26 September 2008 52
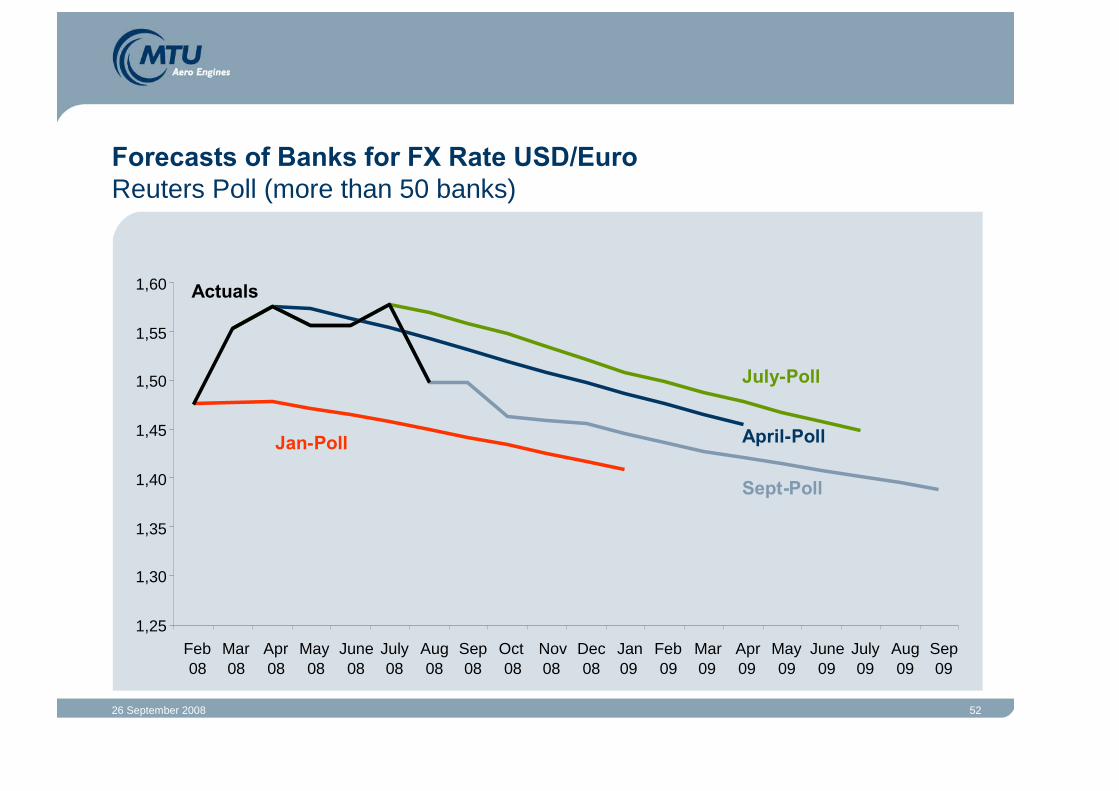
Forecasts of Banks for FX Rate USD/EuroReuters Poll (more than 50 banks)
Jan-Poll
Sept-Poll
Actuals
July-Poll
April-Poll
1,25
1,30
1,35
1,40
1,45
1,50
1,55
1,60
Feb08
Mar08
Apr08
May08
June08
July08
Aug08
Sep08
Oct08
Nov08
Dec08
Jan09
Feb09
Mar09
Apr09
May09
June09
July09
Aug09
Sep09

26 September 2008 53
ActualsSept-Poll maximum
Sept-Poll meanSept-Poll minimum
MTU- FX rate assumption 2009
MTU Assumes an Average USD-exchange in the Rangeof 1.50 for 2009
1,25
1,30
1,35
1,40
1,45
1,50
1,55
1,60
Feb08
Mar08
Apr08
May08
June08
July08
Aug08
Sep08
Oct08
Nov08
Dec08
Jan09
Feb09
Mar09
Apr09
May09
June09
July09
Aug09
Sep09

26 September 2008 54
2008 2009 2010
626(=72%)
520(=56%)
330(=33%)
Average hedge rate (US$/EUR)
1,37 1,43 1,44
Hedge book as of September 25 2008 (% of net exposure)
m US$
MTU Has Extended the Hedge Portfolio on a Favourable Basis

26 September 2008 55
Current Expectations: External Assumptions for Passenger Traffic
5,1%2,3%Worldwide
7,5%5,3%Asia
4,2%2,1%Europe
3,0%-1,3%USA
20102009
Sales expectations dependent on the financialsituation of the airlines
Source: Airline Monitor July 2008

26 September 2008 56
Current Expectations: MTU Assumptions for 2009
Commercial series: ramp up of GP7000, i.e. slightly higher sales inseries in total compared to 2008
Spare Parts: -5% / +5% compared to 2008
MRO: sales with a slight increase compared to 2008 and marginimprovement
Military business stable compared to 2008, i.e. no significant changesin the deliveries of series/spares EJ200 and RB199, TP400 same levelof R&D compared to 2008
R&D: Due to starting projects MRJ, C-Series, PW810 increasing R&D

26 September 2008 57
1. HY 2008 and Guidance
2. Perspectives for 2009
3. Cost Initiatives and Projects: Existing Projects and New Initiatives
Agenda
26 September 2008 58
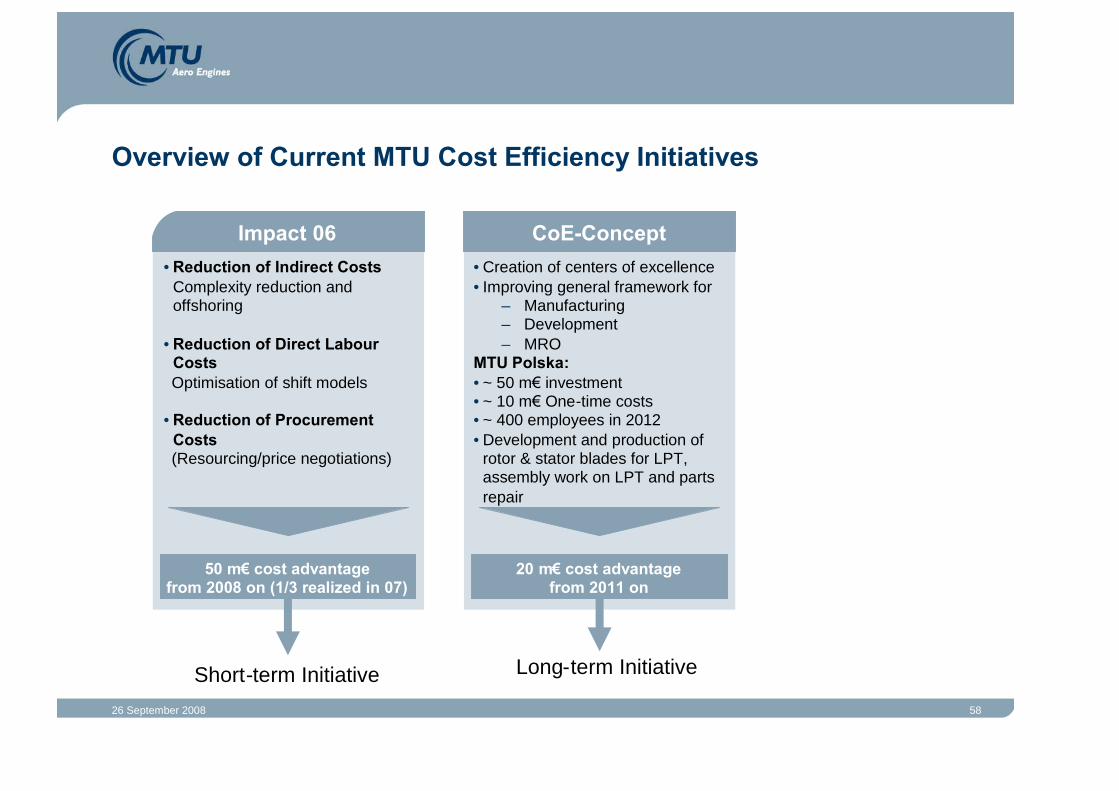
• Creation of centers of excellence• Improving general framework for
– Manufacturing– Development– MRO
MTU Polska:• ~ 50 m€investment• ~ 10 m€One-time costs• ~ 400 employees in 2012• Development and production of
rotor & stator blades for LPT,assembly work on LPT and partsrepair
• Reduction of Indirect CostsComplexity reduction andoffshoring
• Reduction of Direct LabourCostsOptimisation of shift models
• Reduction of ProcurementCosts(Resourcing/price negotiations)
Overview of Current MTU Cost Efficiency Initiatives
Impact 06 CoE-Concept
50 m€cost advantagefrom 2008 on (1/3 realized in 07)
Short-term Initiative Long-term Initiative
20 m€cost advantagefrom 2011 on

26 September 2008 59
Progress of MTU Polska
Friday, 01.08.08
Freitag, dem 12.09.08Friday, 22.09.08
• Ramp up of the production,start of production in Q2 2009

26 September 2008 60
• Creation of centers of excellence• Improving general framework for
– Manufacturing– Development– MRO
MTU Polska:• ~ 50 m€investment• ~ 10 m€One-time costs• ~ 400 employees in 2012• Development and production of
rotor & stator blades for LPT,assembly work on LPT and partsrepair
• Reduction of Indirect CostsComplexity reduction andoffshoring
• Reduction of Direct LabourCostsOptimisation of shift models
• Reduction of ProcurementCosts(Resourcing/price negotiations)
Introducing a New Cost Cutting Program “Challenge 2010”
Impact 06 CoE-Concept
50 m€cost advantagefrom 2008 on (1/3 realized in 07)
Short-term Initiative Long-term Initiatives
Challenge 2010• Reduction of Product Costs
• Optimization of productionprocesses and R&D
20 m€cost advantagefrom 2011 on
50 m€cost reductionfrom 2010/2011 on

26 September 2008 61
Challenge 2010
50m€savings from 2010/11
Optimization of production processes and R&D
Product Cost Reduction
Major initiatives:- Optimization of supply chain- Realization of best cost country supplies- Reevaluation designs for cost improvements- Optimization of existing production processes

26 September 2008 62
Actual Status Product Cost Reduction
4. Improve3. Analysis
2. Measure1. Define
Collection andstructuring of data(existing cost reductionprograms, existingideas)
Definition of the basis
Benchmarks
Identification of costdrivers
Comparison ofBenchmark-Data
Deduction of potentials
Deduction and evaluationof cost reduction ideas
firm establishment ofcost reduction measures
Commitments ofresponsibilities in therealization
Transfer to the line
Communication, Reporting, Documentation
Definition of scope(goals, organi-zation, time frame)
started
started
12/2008
started

26 September 2008 63
Actual Status Optimization Production Processes and R&D
4. Improve3. Analysis
2. Measure1. Define
Collection andstructuring of data(existing optimizationprograms, existingideas)
Definition of the basis
Benchmarks
Identification of costdrivers
Comparison ofBenchmark-Data
Deduction of potentials
Deduction and evaluationof optimization ideas
firm establishment ofoptimization measures
Commitments ofresponsibilities in therealization
Transfer to the line
Communication, Reporting, Documentation
Definition of scope(goals, organi-zation, time frame)
12/200912/2008

26 September 2008 64
Summary and Conclusion
H1 shows profitable growth of MTU
Despite downturn expectations, our guidance 2008 can be confirmed
2009: In contrast to some sharp downturn scenarios, MTU is slightlyoptimistic for the next year. We see risks and chances for 2009. Butdue to the volatility of the current market situation we cannot provide aspecific guidance yet.
MTU started the cost reduction program “Challenge 2010” with a totalvolume of 50m€to ensure competitiveness in a challenging macroenvironment

26 September 2008 65
Reconciliation EBIT adj. / EBITDA adj. – MTU Group
390.0194.5392.9318.2238.7EBITDA adjusted
75.037.780.380.577.0D&A w/o PPA
-15.0R&D capitalization
15.0%15.5%15.3%13.2%10.9%EBITDA adjusted margin
12.7%12.5%12.1%9.8%7.4%EBIT adjusted margin
6.32.4Impairment MTU-Canada/MTU AENA/TP400
14.7extraordinary write-off CF34 license
20.02.8Restructuring costs
-16.1-38.1R&D provision consumption
-10.5Property Sale
-10.8-21.3Provision program value
161.7
-54.2
84.7
131.2
2,182.7
2005
237.7
-11.1
65.0
183.8
2,416.2
2006
312.6
14.7
54.6
243.3
2,575.9
2007
156.8
24.4
132.4
1,256.1
H1 2008
330.0EBIT adjusted
+/- other adjustments
50.0+ PPA depr./ amort.
280.0EBIT reported
2,600.0Sales
2008 G
Appendix

26 September 2008 66
Reconciliation EBIT adj. / EBITDA adj. – OEM
166.8305.7217.7162.4EBITDA adjusted
26.254.753.652.1D&A w/o PPA
R&D capitalization
22.0%19.1%14.7%11.3%EBITDA adjusted margin
18.5%15.7%11.1%7.7%EBIT adjusted margin
5.7Impairment MTU AENA / TP400
20.02.8Restructuring costs
-16.1-38.1R&D provision consumption
-10.5Property Sale
-10.8-21.3Provision program value
110.3
-56.6
72.6
94.3
1434.8
2005
164.1
-11.7
56.8
119.0
1,483.1
2006
251.0
46.9
204.1
1,599.5
2007
140.6
21.9
118.7
758.1
H1 2008
EBIT adjusted
+/- other adjustments
+ PPA depr./ amort.
EBIT reported
Sales
Appendix

26 September 2008 67
Reconciliation EBIT adj. / EBITDA adj. – MRO
29.587.9103.477.8EBITDA adjusted
11.525.626.924.9D&A w/o PPA
R&D capitalization
5.8%8.7%10.8%10.1%EBITDA adjusted margin
3.5%6.2%8.0%6.9%EBIT adjusted margin
14.7Extraordinary write-off CF34 license
0.62.4Impairment MTU Canada
52.9
2.4
12.1
38.4
766.9
2005
76.5
0.6
8.2
67.7
954.7
2006
62.3
7.7
39.9
1,004.7
2007
18.0
2.5
15.5
513.0
H1 2008
EBIT adjusted
+/- other adjustments
+ PPA depr./ amort.
EBIT reported
Sales
Appendix

Update on Technology
Dr. Jörg Henne, SVP Engineering and Technology

26 September 2008 69Environmental andEconomic
Challenges
1. Environmental and Economic Challenges
2. The Geared Turbofan Concept
3. Geared Turbofan Technology Development & Demonstrator Program
4. MTU’s Long-term Technology Program Claire
Agenda
26 September 2008 70
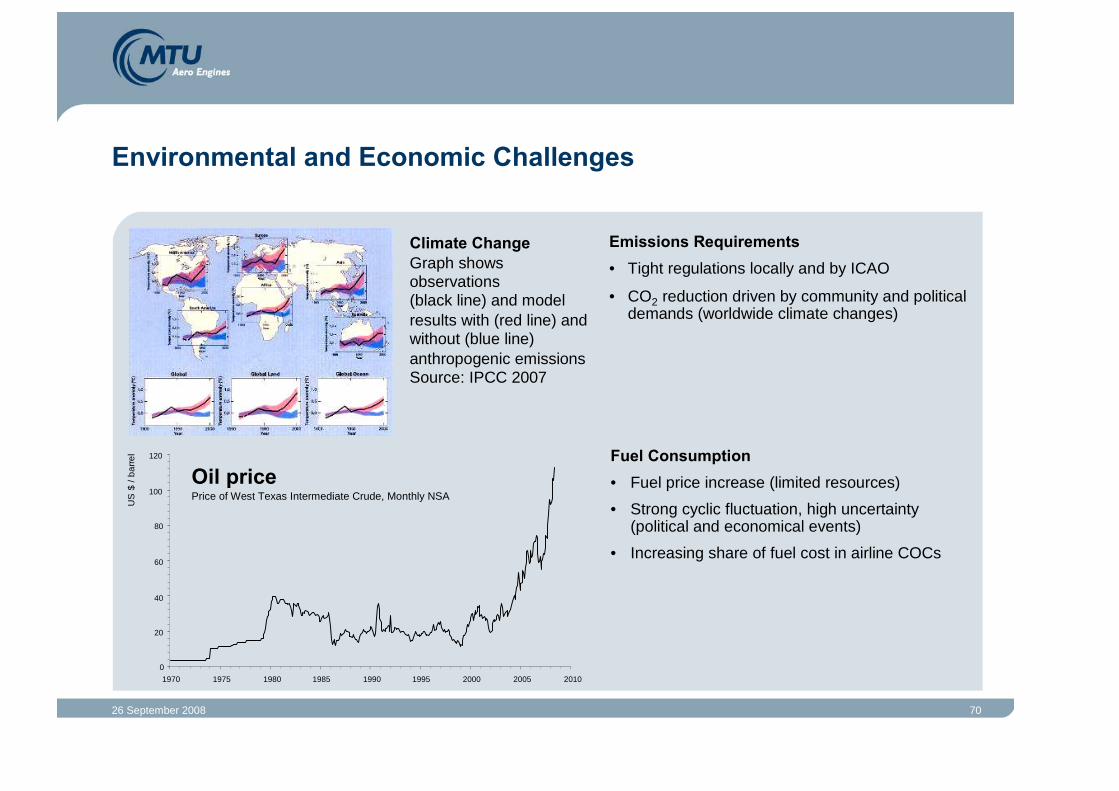
Emissions Requirements
• Tight regulations locally and by ICAO
• CO2 reduction driven by community and politicaldemands (worldwide climate changes)
Climate ChangeGraph showsobservations(black line) and modelresults with (red line) andwithout (blue line)anthropogenic emissionsSource: IPCC 2007
Fuel Consumption
• Fuel price increase (limited resources)
• Strong cyclic fluctuation, high uncertainty(political and economical events)
• Increasing share of fuel cost in airline COCs
Environmental and Economic Challenges
Oil pricePrice of West Texas Intermediate Crude, Monthly NSA
0
20
40
60
80
100
120
1970 1975 1980 1985 1990 1995 2000 2005 2010
US
$/b
arre
l

26 September 2008 71
• Tight regulations locally and by ICAO
• Noise is becoming an important economicfactor (fees, quota, flight ban)
Noise RequirementsGrowth in Airport Noise Restrictions
Expected long-term growth in world air traffic causes significant environmental andeconomic challenges.
Source: Boeing www.boeing.com/commercial/noise/restrictions.pdf
Restrictions:• Curfews• Noise Charges• Noise Level Limits• Operating Quotas
Environmental and Economic Challenges
0
100
200
300
400
500
1970 1980 1990 2000 2010
Num
ber
ofA
irpo
rts

26 September 2008 72
Agenda
1. Environmental and Economic Challenges
2. The Geared Turbofan Concept
3. Geared Turbofan Technology Development & Demonstrator Program
4. MTU’s Long-term Technology Program Claire

26 September 2008 73
Geared Turbofan Design Objectives
Source: P&W
• Fuel Burn is most critical objective due to impact on airlines’ operating costs and on the abilityto meet the tightening emission standards
• Community Noise is becoming an economic factor for airlines
• Reliability and Maintenance Cost will continue to be amongst the most important focus areasand can not be compromised
-60% rel ICAO 96-40% rel ICAO96Emissions
> - 20dB rel ICAO stg. 4-2 to -4 dB rel. ICAO stg. 4Noise
Zero Target (no IFSDs)BaseReliability
> -12%BaseFuel Burn
> - 30%BaseMaintenance Cost
-60% rel ICAO 96-40% rel ICAO96Emissions
> - 20dB rel ICAO stg. 4-2 to -4 dB rel. ICAO stg. 4Noise
Zero Target (no IFSDs)BaseReliability
> -12%BaseFuel Burn
> - 30%BaseMaintenance Cost
ObjectiveExisting EngineCriteria

26 September 2008 74
Geared Turbofan Engine Concept
High BypassLow Speed
Fan
Fan DriveGear System
High SpeedLow Pressure
Turbine
High SpeedLow PressureCompressor

26 September 2008 75
• Reduced stage and airfoil count due to high rotational speed
• Reduced weight and cost
• High efficiency due to low aerodynamic loading and high row velocity ratio
• Low noise due to high Blade Passing Frequency
The Geared Turbofan Heavily Benefits from the High Speed LPT
V2500 LPT
GTF LPT+ 60% speed• 3 stages vs 5• - 40% airfoil count• - 60 - 70% weight

26 September 2008 76
Today‘s Aircraft Geared Turbofan PoweredNext Generation Aircraft
72% Reduction in 75dB Single Event Noise Contour
Noise Simulation: Pratt & WhitneySEL Contour Source: Wyle Laboratories
Significantly Reduced Noise EmissionMunich International Airport (MUC)

26 September 2008 77
Geared Turbofan in Comparison with Alternative Concepts
The Geared Turbofan is the only concept which allows significant reduction in fuelburn and noise at the same time
Geared Turbofan• - 15 % fuel burn rel. to year 2000 engine• - 24 EPNdB noise emission rel. to year 2000 engine• Technology readiness 2008
Open Rotor• Potential SFC benefit in comparison to Geared Turbofan,
but not (fully) useable• High noise!• Significant installation and weight risks• Technology readiness 2020 or later

26 September 2008 78
Agenda
1. Environmental and Economic Challenges
2. The Geared Turbofan Concept
3. Geared Turbofan Technology Development & Demonstrator Program
4. MTU’s Long-term Technology Program Claire

26 September 2008 79
Gear System Test Facility (P&W) HPC Rig (MTU)
LPC Rig (P&W) LPT in the Clean Demo.(ATF Stuttgart)
Technology Development & Validation

26 September 2008 80
Geared Turbofan Demonstrator Program Milestones
• Ground and flight test to demonstrate performance, noise and engine installation• Technology Readiness by end of 2008 to support product EIS end of 2012
2007 2008
Build StartMay 2007
Ground TestNov. 2007
747 FTB 1st FlightJuly 2008
A340 1st Flight4Q 2008

26 September 2008 81
The Geared Turbofan Demonstrator Program Has Gained SignificantAttention from Airliners and Airframers
The GTF Demo Program met all targets; it has completed 250 hrs bench testingand achieved approximately 50 hrs flight testing.
„I think it‘s going to be a good engine (the P&W-GTFTM). We don‘t think the gearbox isgoing to be a problem. They‘ve done their homework to make sure it‘s going to work“says Mike Bair, VP Boeing Commercial Airplanes Business Strategy and Marketing(Aviation Week & Space Technology, September 1st, 2008)
26 September 2008 82
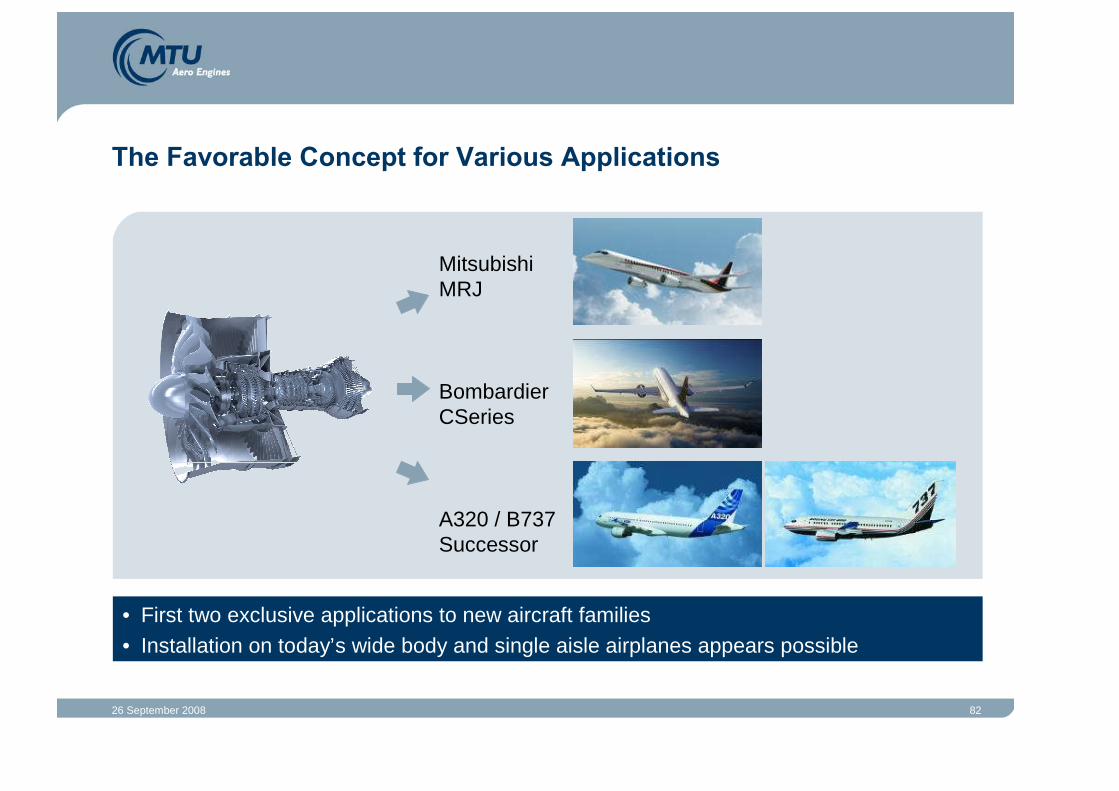
The Favorable Concept for Various Applications
• First two exclusive applications to new aircraft families• Installation on today’s wide body and single aisle airplanes appears possible
MitsubishiMRJ
BombardierCSeries
A320 / B737Successor
26 September 2008 83
Agenda
1. Environmental and Economic Challenges
2. The Geared Turbofan Concept
3. Geared Turbofan Technology Development & Demonstrator Program
4. MTU’s Long-term Technology Program Claire

26 September 2008 84
MTU Technology Program CLAIRECLean AIR Engine Technology Program
MTU is prepared to deliver technologies for further CO2 reduction
* Counter-Rotating IntegratedShrouded Propfan
** Intercooled recuperated
∆CO2%
2005 2010 2015 2020 from 2025 2030 from 2035
70
80
100
90
Base CLAIRE 1 CLAIRE 2 CLAIRE 3
up to30%
V2500 Geared Turbofan CRISP* IRA-Propfan**
upto
15%
up to20%
ACARE
TARGET

26 September 2008 85
Intercooled Recuperated Aero Engine
IPC
Fan
HPTHPC LPT
RecuperatorIntercooler
The Intercooled Recuperated Engine offers high thermal efficiency andlow NOx-emissions.
Advanced engine cycle
• Recuperator to exploit theheat of the exhaust gas
• Intercooler to reduce workneeded to compress air

26 September 2008 86
Summary
• Future engines need to reflect increasing environmental and economical challenges
• The Geared Turbofan offers huge benefits with respect to fuel consumption, noise,
and maintenance cost
• The Geared Turbofan has achieved technology readiness and has been
demonstrated in flight. The engine was selected by Bombardier and Mitsubishi
for their new families of aircrafts
• Open Rotor engine concepts incorporate significant technical risks. Entry into
service, if ever, would not occur before 2020
• MTU’s CLAIRE Technology Plan will provide further improvements

26 September 2008 87
Cautionary Note Regarding Forward-Looking Statements
Certain of the statements contained herein may be statements of future expectations and otherforwardlooking statements that are based on management’s current views and assumptions andinvolve known and unknown risks and uncertainties that could cause actual results, performance orevents to differ materially from those expressed or implied in such statements. Actual results,performance or events may differ materially from those in such statements due to, without limitation,competition from other companies in MTU Aero Engines’ industry and MTU Aero Engines’ ability toretain or increase its market share, the cyclicality of the airline industry, risks related to MTU AeroEngines’ participation in consortia and risk and revenue sharing agreements for new aero engineprograms, risks associated with the capital markets, currency exchange rate fluctuations, regulationsaffecting MTU Aero Engines’ business and MTU Aero Engines’ ability to respond to changes in theregulatory environment, and other factors. Many of these factors may be more likely to occur, or morepronounced, as a result of terrorist activities and their consequences.
MTU Aero Engines assumes no obligation to update any forward-looking statement.