aditya birla fashion & retail | buy - moneycontrol.com
TRANSCRIPT

JM Financial Institutional Securities Limited
JM Financial Research is also available on: Bloomberg - JMFR <GO>,
Thomson Publisher & Reuters S&P Capital IQ and FactSet
Please see Appendix I at the end of this report for Important Disclosures and Disclaimers and Research Analyst Certification.
“We do not want to let go the opportunity of having a very large business in the future” was
the key message delivered by ABFRL’s management in recent investor meetings. A lot of the
strategic initiatives in recent times were towards this end, e.g. the reduction in product prices
at Pantaloons’ stores in recent years was not to do with competition in the space but aimed
more at bringing affordability to a level that would allow the format to travel to 250+ towns
vs just the top-20 cities that it would otherwise have been confined to. We find the narrative
extremely compelling for the longer term, and management’s steadfast focus on cash-
generation and return-ratio (targeting 18-20% ROCE for Pantaloons in the next 3 years)
makes it all the more so. ABFRL remains one of our favoured consumer themes.
Pantaloons in its current format is a 1,000-store opportunity; Management targeting
10% margin in three years with ROCE of 18-20%: While management cites a few years’
delay in their profitability target for Pantaloons since the intrinsic profitability of the
format turned out to be much lower than envisaged, having now taken the effort to
carefully re-strategize the store format and the business over the last couple of years (e.g.
reducing store-size to a more optimum level, re-crafting of merchandise mix, improving
freshness of inventories at stores, costs re-structuring, etc), the company now sees a
much longer growth runway for the business going forward. Though Pantaloons did
resonate well as a brand with consumers even at the time when it was acquired (mid-
2012), the positioning of the brand and the stores were such that it would have remained
rather niche and confined to just the top-20 cities of the country. ABFRL’s management,
on the other hand, had their sights set on a much larger business given the wider appeal
of the Pantaloons brand. Key margin and ROCE drivers would be: upping own-brands
contribution to 75-80% over the next three years (vs 63% currently), better product-
management which would not only lower obsolescence but also ensure freshness of store
inventories, overall costs control and better leverage of common costs as the business
gains scale. Management is currently targeting 18-20% ROCE for Pantaloons business in
three years’ time, given that store-level margin is seen to be in the 20-30% range.
Madura business has stabilised well; ready for the next leg now: ABFRL’s traditional cash-
cow, viz Madura went through a soft patch in FY15/FY16 due, in part, to online retailers
taking away some share of consumers’ wallet on the back of steep discounting, etc. That
phase is, however, mostly done now and e-commerce players have now turned from
competitors to business-partners for brand-owners, having realised that they would need
the support of brand-owners to meet their topline ambitions. Online currently contributes
c.5% of ABFRL’s sales and is a relatively more profitable channel vs offline. For the near-
term, management expects core Madura to sustain the high single-digit LTL growth trend
and margin to progressively move up to a higher level of c.14% over the coming few
years (vs FY18’s 12%). Separately, the company is aggressively ramping up the innerwear
business and has interesting plans in place to tap adjacencies around that.
The Fast Fashion piece is still work-in-progress: One part of the company that is still in a
to-be-fixed mode is the Fast Fashion piece. Forever-21’s product-profile turned out to be
narrower than expected and while efforts are on to work more closely with F21 on
merchandise selections, etc, management has been working on re-strategizing the unit-
economics of the business to make it a more viable business for the medium-term.
Richard Liu [email protected] | Tel: (91 22) 66303064
Vicky Punjabi [email protected] | Tel: (91 22) 66303065
Recommendation and Price Target
Current Reco. BUY
Previous Reco. BUY
Current Price Target (12M) 225
Upside/(Downside) 17.2%
Previous Price Target 220
Change 2.3%
Key Data – ABFRL IN
Current Market Price INR192
Market cap (bn) INR145.6/US$2.0
Free Float 57%
Shares in issue (mn) 768.8
Diluted share (mn) 771.7
3-mon avg daily val (mn) INR322.5/US$4.4
52-week range 216/132
Sensex/Nifty 37,413/11,288
INR/US$ 72.7
Price Performance % 1M 6M 12M
Absolute 5.0 30.9 8.3
Relative* 6.3 16.5 -7.7
* To the BSE Sensex
Aditya Birla Fashion & Retail | BUY
12 September 2018 India | Consumer | Company Update
Management meeting notes: Scale, profitability, cashflow
Financial Summary (INR mn) FY17 FY18A FY19E FY20E FY21E
Net Sales 65,879 71,578 81,749 93,846 107,178
Sales growth (%) 9.9 8.7 14.2 14.8 14.2
EBITDA 4,375 4,943 6,273 8,010 9,898
EBITDA (%) 6.6 6.9 7.6 8.5 9.2
Adjusted net profit 535 1,438 1,677 2,767 4,295
EPS (INR) 0.7 1.9 2.2 3.6 5.6
EPS growth (%) NA NA 16.6 65.0 55.3
ROIC (%) 6.8% 7.4% 10.0% 12.5% 16.3%
ROE (%) 5.7% 14.0% 14.2% 19.8% 24.5%
PE (x) 276.5 103.0 88.4 53.6 34.5
Price/Book Value (x) 15.4 13.6 11.8 9.6 7.5
EV/EBITDA (x) 38.4 33.6 26.3 20.4 16.2
Dividend Yield 0.0% 0.0% 0.0% 0.0% 0.0%
Source: Company data, JM Financial. Note: Valuations as at 12/Sep/2018

Aditya Birla Fashion & Retail 12 September 2018
JM Financial Institutional Securities Limited Page 2
Favourable demographics to drive consumerism in India Exhibit 1.
Source: Company, JM Financial
Indian Apparel market estimated to cross USD100bn over next 5 years, which would provide a high growth opportunity for Exhibit 2.organised segment
Source: Company, JM Financial. Note: 1cr = 10mn
Indian market dynamics in 2025 Exhibit 3.
Source: Company, JM Financial

Aditya Birla Fashion & Retail 12 September 2018
JM Financial Institutional Securities Limited Page 3
ABFRL’s journey: presently focussing on portfolio diversification through investment in white spaces… Exhibit 4.
Source: Company, JM Financial. Note: 1cr = 10mn
…which should help address all apparel segments by FY25 Exhibit 5.
Source: Company, JM Financial. Note: 1cr = 10mn

Aditya Birla Fashion & Retail 12 September 2018
JM Financial Institutional Securities Limited Page 4
ABFRL has the most widespread distribution network amongst apparel companies… Exhibit 6.
Source: Company, JM Financial
…and a balanced portfolio of brands to help capitalise on opportunities across sub-segments Exhibit 7.
Source: Company, JM Financial
Some emerging trends in the apparels segment…. Exhibit 8.
Source: Company, JM Financial

Aditya Birla Fashion & Retail 12 September 2018
JM Financial Institutional Securities Limited Page 5
…and ABFRL’s strategy to capitalise on these trends…. Exhibit 9.
Source: Company, JM Financial
…and the e-commerce opportunity Exhibit 10.
Source: Company, JM Financial
Aditya Birla Fashion & Retail 12 September 2018
JM Financial Institutional Securities Limited Page 6
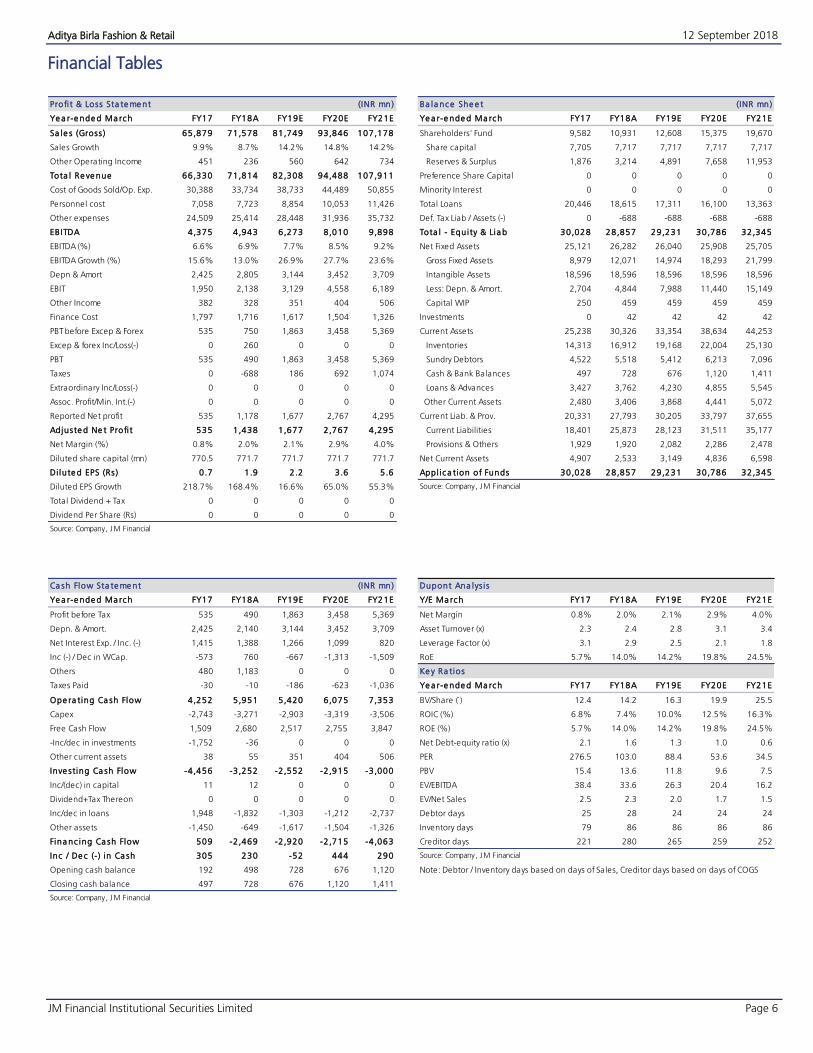
Financial Tables
Profi t & Loss Sta te me nt (INR mn) Ba la nce She e t (INR mn)
Ye a r-e nde d Ma rch FY17 FY18A FY19E FY20E FY21E Ye a r-e nde d Ma rch FY17 FY18A FY19E FY20E FY21E
Sa le s (Gross ) 65,879 71,578 81,749 93,846 107,178 Shareholders' Fund 9,582 10,931 12,608 15,375 19,670
Sales Growth 9.9% 8.7% 14.2% 14.8% 14.2% Share capital 7,705 7,717 7,717 7,717 7,717
Other Operating Income 451 236 560 642 734 Reserves & Surplus 1,876 3,214 4,891 7,658 11,953
Tota l Re ve nue 66,330 71,814 82,308 94,488 107,911 Preference Share Capital 0 0 0 0 0
Cost of Goods Sold/Op. Exp. 30,388 33,734 38,733 44,489 50,855 Minority Interest 0 0 0 0 0
Personnel cost 7,058 7,723 8,854 10,053 11,426 Total Loans 20,446 18,615 17,311 16,100 13,363
Other expenses 24,509 25,414 28,448 31,936 35,732 Def. Tax Liab / Assets (-) 0 -688 -688 -688 -688
EBITDA 4,375 4,943 6,273 8,010 9,898 Tota l - Equi ty & Lia b 30,028 28,857 29,231 30,786 32,345
EBITDA (%) 6.6% 6.9% 7.7% 8.5% 9.2% Net Fixed Assets 25,121 26,282 26,040 25,908 25,705
EBITDA Growth (%) 15.6% 13.0% 26.9% 27.7% 23.6% Gross Fixed Assets 8,979 12,071 14,974 18,293 21,799
Depn & Amort 2,425 2,805 3,144 3,452 3,709 Intangible Assets 18,596 18,596 18,596 18,596 18,596
EBIT 1,950 2,138 3,129 4,558 6,189 Less: Depn. & Amort. 2,704 4,844 7,988 11,440 15,149
Other Income 382 328 351 404 506 Capital WIP 250 459 459 459 459
Finance Cost 1,797 1,716 1,617 1,504 1,326 Investments 0 42 42 42 42
PBT before Excep & Forex 535 750 1,863 3,458 5,369 Current Assets 25,238 30,326 33,354 38,634 44,253
Excep & forex Inc/Loss(-) 0 260 0 0 0 Inventories 14,313 16,912 19,168 22,004 25,130
PBT 535 490 1,863 3,458 5,369 Sundry Debtors 4,522 5,518 5,412 6,213 7,096
Taxes 0 -688 186 692 1,074 Cash & Bank Balances 497 728 676 1,120 1,411
Extraordinary Inc/Loss(-) 0 0 0 0 0 Loans & Advances 3,427 3,762 4,230 4,855 5,545
Assoc. Profit/Min. Int.(-) 0 0 0 0 0 Other Current Assets 2,480 3,406 3,868 4,441 5,072
Reported Net profit 535 1,178 1,677 2,767 4,295 Current Liab. & Prov. 20,331 27,793 30,205 33,797 37,655
Adjuste d Ne t Profi t 535 1,438 1,677 2,767 4,295 Current Liabilities 18,401 25,873 28,123 31,511 35,177
Net Margin (%) 0.8% 2.0% 2.1% 2.9% 4.0% Provisions & Others 1,929 1,920 2,082 2,286 2,478
Diluted share capital (mn) 770.5 771.7 771.7 771.7 771.7 Net Current Assets 4,907 2,533 3,149 4,836 6,598
Di lute d EPS (Rs ) 0 .7 1.9 2.2 3.6 5.6 Appl ic a tion of Funds 30,028 28,857 29,231 30,786 32,345
Diluted EPS Growth 218.7% 168.4% 16.6% 65.0% 55.3% Source: Company, JM F inancial
Total Dividend + Tax 0 0 0 0 0
Dividend Per Share (Rs) 0 0 0 0 0
Source: Company, JM F inancial
Ca sh Flow Sta te me nt (INR mn) Dupont Ana lys i s
Ye a r-e nde d Ma rch FY17 FY18A FY19E FY20E FY21E Y/E Ma rch FY17 FY18A FY19E FY20E FY21E
Profit before Tax 535 490 1,863 3,458 5,369 Net Margin 0.8% 2.0% 2.1% 2.9% 4.0%
Depn. & Amort. 2,425 2,140 3,144 3,452 3,709 Asset Turnover (x) 2.3 2.4 2.8 3.1 3.4
Net Interest Exp. / Inc. (-) 1,415 1,388 1,266 1,099 820 Leverage Factor (x) 3.1 2.9 2.5 2.1 1.8
Inc (-) / Dec in WCap. -573 760 -667 -1,313 -1,509 RoE 5.7% 14.0% 14.2% 19.8% 24.5%
Others 480 1,183 0 0 0 Ke y Ra tios
Taxes Paid -30 -10 -186 -623 -1,036 Ye a r-e nde d Ma rch FY17 FY18A FY19E FY20E FY21E
Ope ra ting Ca sh Flow 4,252 5,951 5,420 6,075 7,353 BV/Share (`) 12.4 14.2 16.3 19.9 25.5
Capex -2,743 -3,271 -2,903 -3,319 -3,506 ROIC (%) 6.8% 7.4% 10.0% 12.5% 16.3%
Free Cash Flow 1,509 2,680 2,517 2,755 3,847 ROE (%) 5.7% 14.0% 14.2% 19.8% 24.5%
-Inc/dec in investments -1,752 -36 0 0 0 Net Debt-equity ratio (x) 2.1 1.6 1.3 1.0 0.6
Other current assets 38 55 351 404 506 PER 276.5 103.0 88.4 53.6 34.5
Inve sting Ca sh Flow -4,456 -3,252 -2,552 -2,915 -3,000 PBV 15.4 13.6 11.8 9.6 7.5
Inc/(dec) in capital 11 12 0 0 0 EV/EBITDA 38.4 33.6 26.3 20.4 16.2
Dividend+Tax Thereon 0 0 0 0 0 EV/Net Sales 2.5 2.3 2.0 1.7 1.5
Inc/dec in loans 1,948 -1,832 -1,303 -1,212 -2,737 Debtor days 25 28 24 24 24
Other assets -1,450 -649 -1,617 -1,504 -1,326 Inventory days 79 86 86 86 86
Fina nc ing Ca sh Flow 509 -2,469 -2,920 -2,715 -4,063 Creditor days 221 280 265 259 252
Inc / De c (-) in Ca sh 305 230 -52 444 290 Source: Company, JM F inancial
Opening cash balance 192 498 728 676 1,120 Note: Debtor / Inventory days based on days of Sales, Creditor days based on days of COGS
Closing cash balance 497 728 676 1,120 1,411
Source: Company, JM F inancial

Aditya Birla Fashion & Retail 12 September 2018
JM Financial Institutional Securities Limited Page 7
History of Earnings Estimate and Target Price
Date Recommendation Target Price % Chg.
1-Feb-16 Buy 270
13-Feb-16 Buy 270 0.0
25-May-16 Buy 225 -16.7
31-Aug-16 Buy 225 0.0
24-Nov-16 Buy 215 -4.4
3-Feb-17 Buy 215 0.0
13-May-17 Buy 215 0.0
27-Jul-17 Buy 215 0.0
28-Oct-17 Buy 210 -2.3
2-Feb-18 Buy 210 0.0
12-May-18 Buy 215 2.4
Recommendation History
BB
B B B B B B B B B
0
50
100
150
200
250
300
Jul-15 Dec-15 May-16 Oct-16 Mar-17 Aug-17 Jan-18 Jun-18
Aditya Birla Fashion & Retail
Target Price Aditya Birla Fashion & Retail

Aditya Birla Fashion & Retail 12 September 2018
JM Financial Institutional Securities Limited Page 8
APPENDIX I
JM Financial Inst itut ional Secur it ies Limited ( fo rmer l y known as JM F inanc ia l Secur i t i e s L im i ted)
Corporate Identity Number: U67100MH2017PLC296081
Member of BSE Ltd., National Stock Exchange of India Ltd. and Metropolitan Stock Exchange of India Ltd. SEBI Registration Nos.: Stock Broker - INZ000163434, Research Analyst – INH000000610
Registered Office: 7th Floor, Cnergy, Appasaheb Marathe Marg, Prabhadevi, Mumbai 400 025, India. Board: +9122 6630 3030 | Fax: +91 22 6630 3488 | Email: [email protected] | www.jmfl.com
Compliance Officer: Mr. Sunny Shah | Tel: +91 22 6630 3383 | Email: [email protected]
Definition of ratings
Rating Meaning
Buy Total expected returns of more than 15%. Total expected return includes dividend yields.
Hold Price expected to move in the range of 10% downside to 15% upside from the current market price.
Sell Price expected to move downwards by more than 10%
Research Analyst(s) Certification The Research Analyst(s), with respect to each issuer and its securities covered by them in this research report, certify that: All of the views expressed in this research report accurately reflect his or her or their personal views about all of the issuers and their securities; and No part of his or her or their compensation was, is, or will be directly or indirectly related to the specific recommendations or views expressed in this research report. Important Disclosures This research report has been prepared by JM Financial Institutional Securities Limited (JM Financial Institutional Securities) to provide information about the
company(ies) and sector(s), if any, covered in the report and may be distributed by it and/or its associates solely for the purpose of information of the select
recipient of this report. This report and/or any part thereof, may not be duplicated in any form and/or reproduced or redistributed without the prior written
consent of JM Financial Institutional Securities. This report has been prepared independent of the companies covered herein.
JM Financial Institutional Securities is registered with the Securities and Exchange Board of India (SEBI) as a Research Analyst and a Stock Broker having trading
memberships of the BSE Ltd. (BSE), National Stock Exchange of India Ltd. (NSE) and Metropolitan Stock Exchange of India Ltd. (MSEI). No material disciplinary
action has been taken by SEBI against JM Financial Institutional Securities in the past two financial years which may impact the investment decision making of the
investor.
JM Financial Institutional Securities renders stock broking services primarily to institutional investors and provides the research services to its institutional
clients/investors. JM Financial Institutional Securities and its associates are part of a multi-service, integrated investment banking, investment management,
brokerage and financing group. JM Financial Institutional Securities and/or its associates might have provided or may provide services in respect of managing
offerings of securities, corporate finance, investment banking, mergers & acquisitions, broking, financing or any other advisory services to the company(ies)
covered herein. JM Financial Institutional Securities and/or its associates might have received during the past twelve months or may receive compensation from the
company(ies) mentioned in this report for rendering any of the above services.
JM Financial Institutional Securities and/or its associates, their directors and employees may; (a) from time to time, have a long or short position in, and buy or sell
the securities of the company(ies) mentioned herein or (b) be engaged in any other transaction involving such securities and earn brokerage or other
compensation or act as a market maker in the financial instruments of the company(ies) covered under this report or (c) act as an advisor or lender/borrower to, or
may have any financial interest in, such company(ies) or (d) considering the nature of business/activities that JM Financial Institutional Securities is engaged in, it
may have potential conflict of interest at the time of publication of this report on the subject company(ies).
Neither JM Financial Institutional Securities nor its associates or the Research Analyst(s) named in this report or his/her relatives individually own one per cent or
more securities of the company(ies) covered under this report, at the relevant date as specified in the SEBI (Research Analysts) Regulations, 2014.
The Research Analyst(s) principally responsible for the preparation of this research report and members of their household are prohibited from buying or selling
debt or equity securities, including but not limited to any option, right, warrant, future, long or short position issued by company(ies) covered under this report.
The Research Analyst(s) principally responsible for the preparation of this research report or their relatives (as defined under SEBI (Research Analysts) Regulations,
2014); (a) do not have any financial interest in the company(ies) covered under this report or (b) did not receive any compensation from the company(ies) covered
under this report, or from any third party, in connection with this report or (c) do not have any other material conflict of interest at the time of publication of this
report. Research Analyst(s) are not serving as an officer, director or employee of the company(ies) covered under this report.
While reasonable care has been taken in the preparation of this report, it does not purport to be a complete description of the securities, markets or developments
referred to herein, and JM Financial Institutional Securities does not warrant its accuracy or completeness. JM Financial Institutional Securities may not be in any
way responsible for any loss or damage that may arise to any person from any inadvertent error in the information contained in this report. This report is provided
for information only and is not an investment advice and must not alone be taken as the basis for an investment decision.

Aditya Birla Fashion & Retail 12 September 2018
JM Financial Institutional Securities Limited Page 9
The investment discussed or views expressed or recommendations/opinions given herein may not be suitable for all investors. The user assumes the entire risk of any
use made of this information. The information contained herein may be changed without notice and JM Financial Institutional Securities reserves the right to make
modifications and alterations to this statement as they may deem fit from time to time.
This report is neither an offer nor solicitation of an offer to buy and/or sell any securities mentioned herein and/or not an official confirmation of any transaction.
This report is not directed or intended for distribution to, or use by any person or entity who is a citizen or resident of or located in any locality, state, country or
other jurisdiction, where such distribution, publication, availability or use would be contrary to law, regulation or which would subject JM Financial Institutional
Securities and/or its affiliated company(ies) to any registration or licensing requirement within such jurisdiction. The securities described herein may or may not be
eligible for sale in all jurisdictions or to a certain category of investors. Persons in whose possession this report may come, are required to inform themselves of and
to observe such restrictions.
Persons who receive this report from JM Financial Singapore Pte Ltd may contact Mr. Ruchir Jhunjhunwala ([email protected]) on +65 6422 1888 in
respect of any matters arising from, or in connection with, this report.
Additional disclosure only for U.S. persons: JM Financial Institutional Securities has entered into an agreement with JM Financial Securities, Inc. ("JM Financial
Securities"), a U.S. registered broker-dealer and member of the Financial Industry Regulatory Authority ("FINRA") in order to conduct certain business in the United
States in reliance on the exemption from U.S. broker-dealer registration provided by Rule 15a-6, promulgated under the U.S. Securities Exchange Act of 1934 (the
"Exchange Act"), as amended, and as interpreted by the staff of the U.S. Securities and Exchange Commission ("SEC") (together "Rule 15a-6").
This research report is distributed in the United States by JM Financial Securities in compliance with Rule 15a-6, and as a "third party research report" for purposes
of FINRA Rule 2241. In compliance with Rule 15a-6(a)(3) this research report is distributed only to "major U.S. institutional investors" as defined in Rule 15a-6 and is
not intended for use by any person or entity that is not a major U.S. institutional investor. If you have received a copy of this research report and are not a major
U.S. institutional investor, you are instructed not to read, rely on, or reproduce the contents hereof, and to destroy this research or return it to JM Financial
Institutional Securities or to JM Financial Securities.
This research report is a product of JM Financial Institutional Securities, which is the employer of the research analyst(s) solely responsible for its content. The
research analyst(s) preparing this research report is/are resident outside the United States and are not associated persons or employees of any U.S. registered broker-
dealer. Therefore, the analyst(s) are not subject to supervision by a U.S. broker-dealer, or otherwise required to satisfy the regulatory licensing requirements of FINRA
and may not be subject to the Rule 2241 restrictions on communications with a subject company, public appearances and trading securities held by a research
analyst account.
JM Financial Institutional Securities only accepts orders from major U.S. institutional investors. Pursuant to its agreement with JM Financial Institutional Securities, JM
Financial Securities effects the transactions for major U.S. institutional investors. Major U.S. institutional investors may place orders with JM Financial Institutional
Securities directly, or through JM Financial Securities, in the securities discussed in this research report.
Additional disclosure only for U.K. persons: Neither JM Financial Institutional Securities nor any of its affiliates is authorised in the United Kingdom (U.K.) by the
Financial Conduct Authority. As a result, this report is for distribution only to persons who (i) have professional experience in matters relating to investments falling
within Article 19(5) of the Financial Services and Markets Act 2000 (Financial Promotion) Order 2005 (as amended, the "Financial Promotion Order"), (ii) are persons
falling within Article 49(2)(a) to (d) ("high net worth companies, unincorporated associations etc.") of the Financial Promotion Order, (iii) are outside the United
Kingdom, or (iv) are persons to whom an invitation or inducement to engage in investment activity (within the meaning of section 21 of the Financial Services and
Markets Act 2000) in connection with the matters to which this report relates may otherwise lawfully be communicated or caused to be communicated (all such
persons together being referred to as "relevant persons"). This report is directed only at relevant persons and must not be acted on or relied on by persons who are
not relevant persons. Any investment or investment activity to which this report relates is available only to relevant persons and will be engaged in only with relevant
persons.
Additional disclosure only for Canadian persons: This report is not, and under no circumstances is to be construed as, an advertisement or a public offering of the
securities described herein in Canada or any province or territory thereof. Under no circumstances is this report to be construed as an offer to sell securities or as a
solicitation of an offer to buy securities in any jurisdiction of Canada. Any offer or sale of the securities described herein in Canada will be made only under an
exemption from the requirements to file a prospectus with the relevant Canadian securities regulators and only by a dealer properly registered under applicable
securities laws or, alternatively, pursuant to an exemption from the registration requirement in the relevant province or territory of Canada in which such offer or
sale is made. This report is not, and under no circumstances is it to be construed as, a prospectus or an offering memorandum. No securities commission or similar
regulatory authority in Canada has reviewed or in any way passed upon these materials, the information contained herein or the merits of the securities described
herein and any representation to the contrary is an offence. If you are located in Canada, this report has been made available to you based on your representation
that you are an “accredited investor” as such term is defined in National Instrument 45-106 Prospectus Exemptions and a “permitted client” as such term is
defined in National Instrument 31-103 Registration Requirements, Exemptions and Ongoing Registrant Obligations. Under no circumstances is the information
contained herein to be construed as investment advice in any province or territory of Canada nor should it be construed as being tailored to the needs of the
recipient. Canadian recipients are advised that JM Financial Securities, Inc., JM Financial Institutional Securities Limited, their affiliates and authorized agents are not
responsible for, nor do they accept, any liability whatsoever for any direct or consequential loss arising from any use of this research report or the information
contained herein.