activation of sodium, on · 2013-08-31 · activation cross-section data for the elements studied...
TRANSCRIPT
NASA TM X-1512
ACTIVATION OF SODIUM, LITHIUM, AND POTASSIUM IN COMPACT
FAST REACTORS AND ITS E F F E C T ON SHIELDING
By Leonard Soffer
L e w i s R e s e a r c h C e n t e r Cleve land , Ohio
NATIONAL AERONAUTICS AND SPACE ADMINISTRATION
For sale by the Clearinghouse for Federa l Scientific ond Technica l Information Springfield, V i rg in ia 22151 - CFSTl price $3.00
https://ntrs.nasa.gov/search.jsp?R=19680010886 2020-05-24T16:57:29+00:00Z

ACTIVATION OF SODIUM, LITHIUM, AND POTASSIUM IN COMPACT
FAST REACTORS AND ITS EFFECT ON SHIELDING
by Leonard Soffer
Lewis Research Center
SUMMARY
Neutron activation of sodium (Na), lithium (Li), and potassium (K) used as possible coolants in a "typical" compact fast reactor were analytically investigated. The natural elements, all individual isotopes, and one common eutectic (NaK 78) were examined.
Suitable energy dependent neutron fluxes were used in conjunction with activation c ros s sections to calculate saturated specific activities. Activation cross-section data f o r the elements studied were compiled and tabulated, and these data a r e judged to be adequate for engine e r ing calculations .
It was also assumed that 1 percent of all the bromine (Br), krypton (Kr), xenon (Xe), and iodine (I) fission products were released into the coolant. The unshielded dose ra tes f rom both the fission products and the activated coolant were then calculated.
Results show that when zero holdup time is assumed, the best coolants, on the basis of unshielded activation dose rate, a r e K40, K3', Li7, and natural Li. The worst are K and Na. Because of low natural abundance, K40 is impractical as a reactor coolant. Lithium dose rates are very sensitive to holdup time because of the short (0.8 sec) half- lives of the Li products. Holdup of even a few seconds greatly reduces the L i dose ra tes but not those for any other element. Lithium 7 held up for 8 seconds and gave the lowest activation dose rate of any coolant considered. The unshielded dose rate from the as- sumed fission product release was the highest of all. It was about two orders of magni-
7 tude greater than the zero-holdup Li rate, and about five o rde r s of magnitude greater than the dose ra te for L i held up for 8 seconds.
Gas evolution resulting from coolant irradiation was also investigated and found to 6 be negligible except for Li .
41
7
INTRODUCTION
Alkali metals such as sodium (Na), lithium (Li), and potassium (K) in liquid form

a r e often considered a s coolants for compact nuclear reactors intended for space power. Neutron activation occurs as the coolant circulates through the reactor. Subsequent transport of the radioactive coolant outside the reactor and adjacent biological shield may result in additional radiation exposure to personnel having access to unshielded loop com - ponents. The degree of activation clearly is a factor in selection of a reactor coolant for manned applications.
Activation of these materials in thermal spec trum reactors resul ts primarily from radiative capture. The c ross sections have bee, well known for a number of years . The different spectrum in a fast reactor greatly enk .nces the occurrence of other reactions as well, such as (n, p), (n, a), and (n, 2n). Un 1 relatively recently, neutron c ross sec- tions for these reactions had been scarce. Since fast reactors often employ moderating reflectors, some thermal radiative capture is to be expected as well, especially if the r e - flector is actively cooled. Usually the degree of activation var ies markedly in different isotopes of the same chemical element. Since isotope separation may sometimes be feasible, it is useful to examine the individual isotopes, as well as the naturally occur- ring elements.
The activations were calculated of Na, Li, and K used as coolants in compact fast reactors. A definitive calculation of actual activities or dose ra tes was not attempted. This calculation would require a detailed knowledge of the actual reactor, loop cycle t imes, and powerplant components layout. The emphasis in this study w a s to obtain a relative ranking of these coolants in t e r m s of activation and unshielded dose rates. Rough estimates of these quantities could be useful for preliminary studies o r screening purposes.
Actual reactor coolants may also contain small amounts of impurities with large ac- tivation cross sections. Quantitative knowledge of the impurity activation is essential in an actual application. This study assumed no impurities in the coolant, however, since the emphasis was to point out differences among the three alkali metals as the pr imary coolant constituents.
Since accurate and complete activation cross-section data a r e essential for an analy- sis of this kind, a l i terature survey and cross-section compilation were undertaken f i r s t . The results of such an effort indicated that, while gaps in cross-section data were pres- ent, fairly accurate and complete cross-section data were available for almost all reac- tions for each of the individual isotopes of Na, Li, and K to allow for a useful engineering assessment. The c ross sections that were compiled as a result of this undertaking a r e listed in appendix A.
transport code DTF (ref. 1) to obtain the magnitude of the neutron fluxes as a function of energy and spatial location throughout the reactor . A set of energy-dependent fluxes was obtained by performing a suitable spatial integration (see the section, Fas t Reactor Model
A typical fast reactor w a s then analyzed by using the one-dimensional neutron-
2

and Spatial Integration of Fluxes). These fluxes can be used to calculate specific activi- t i es and specific dose rates (see the section, Saturated Specific Activities and Specific Dose Rates).
Problems other than that of activation may be present. Release of fission products into the coolant by some method of fuel-element failure could add substantial amounts of radioactivity. A hypothetical release w a s assumed and dose rates were calculated (see the section, Dose Rates from Release of Fission Products into Coolant, and appendix B). In addition to reactions leading to activated products, use of the coolants considered herein also resul ts in evolution of gases in the coolant. This gas evolution was also cal- culated for each of the coolants considered.
I
METHOD OF CALCULATION
Activation in Reactor Coolant Loop
Circulating coolants for reactors are activated as they pass through the core, and they decay there and in the external loop. If N is’the number of radioactive atoms of some species formed in a unit volume of coolant as a result of the first pass through the core, then, as the unit volume exits from the reactor, N is given as
I
i where
C c ross section for reaction
cp average neutron flux
h decay constant of species
tl time spent in core, sec
Equation (1) has temporarily neglected the energy dependence of C. and the fact that cp is a function of both energy and spatial location in the core. During a second pass through the core, the number of new radioactive atoms formed is the same as that given by equation (l), while the number of atoms created in the first cycle decays by the factor
e , where t2 is the time required for the unit volume to travel the external loop. Thus, after two passes through the core, the total number of radioactive atoms present is
-X(t1+t2)
3

h
Since the bracketed quantity is a geometric se r ies , the total number of atoms after n passes is
-nh(t l+t2)
x - (t l+t 2) 1 - e
A s n approaches infinity, N approaches i t s saturated value and is given by
-At*
If the cycle time t l + t 2 is smal l compared with the half-life, the products X ( t l + t2) and A t l a re both small compared with 1. The exponentials can then be expanded and simplified, and equation (4) can be reduced to
Nsat = 3 - x t 1 + t 2
Thus, the saturated specific activity Asat becomes
ANsat = Cq ~
t l + t 2
When it is taken into consideration that 2 is energy dependent and q is spatial and energy dependent, this equation is written more correctly as
= (L) JZ(E)F(E)dE t l + t 2
(3)
(5)
where the simple product C q is replaced by an integration over all energies, and where
4

- q(E) are fluxes that have been suitably averaged spatially and a r e thus dependent only on energy.
version method employed. For the purposes of this study, a value of 0 .2 was assumed for the fraction of time spent by the coolant in the reactor.
The cycle time was assumed to be small compared with the half-life in the derivation of equations (5) and (6). This is t rue for all the activation products studied herein except lithium 8 (Li ) and helium 6 (He ), both of which a r e produced when lithium is activated. Both products have half-lives of 0.8 second.
It was not known what loop cycle t imes might be in an actual fast reactor. There- 8 6 fore, the saturated activities for Li and He were treated in the same manner as the
others, that is, by use of equations (5) and (6) instead of the rigorously correct equa- 8 tion (4). It should be kept in mind, nevertheless, that saturated activities for L i and
6 He are highly sensitive to loop cycle t imes since their half-lives are so short. This point is explained in the section, Saturated Specific Activities and Specific Dose Rates, where holdup time is discussed in connection with lithium.
The ratio t l /( t l + t2) might range from 0.10 to 0.25 depending somewhat on the con-
8 6
Fast-Reactor Model and Spatial Integrat ion of Fluxes
To obtain typical fas t - reactor neutron fluxes, a model fast reactor was chosen and neutron fluxes as a function of energy were computed over the entire reactor by the one- dimensional neutron transport code, DTF. The model w a s a cylindrical reactor fueled with mixtures of uranium dioxide (U02) and tungsten (W) in two radial zones. The inner- zone fuel consisted of 50-percent W and 50-percent U02 by volume, while the outer-zone fuel was 90-percent W and 10-percent U02 b y volume. The reactor, which employed a radial 3-inch- (7.62-cm-) thick Be reflector, was 20 percent void by volume. The transport code obtained the required dimensions to achieve a multiplication constant Keff of 1.05. A core diameter of 76 centimeters and a core height of 30 centimeters resulted. The relative radial power distribution obtained is shown in figure 1. This re- actor model is certainly not one that would be chosen by design. It has a length-diameter ratio of 0 . 4 and a poor power distribution in terms of flatness. However, for the purpose of providing a set of fast-reactor neutron fluxes for activation calculations, it is probably acceptable, since the uneven variation in power distribution was properly averaged.
For convenience, the reactor fluxes were scaled to a power level of 1 megawatt. Activation r a t e s per unit weight of coolant at other reactor powers will then scale accord- ingly. The power distribution rises just before the core-reflector interface. This power increase is caused by the peaking of the thermal flux near the core-reflector interface. This fact is illustrated in the plot of flux against radius for two energy groups (fig. 2).
5

Core I1
J 0 10 20 30
Radius, cm
eflectc
L 10
Figure L - Relative radial power generation.
1000~104
Group 1 03MeV or X. 48 pJ)-’
Core I 9 1 0 1 (50 percent uo2 - 50 percent - N- E
Group 16 (0.025 eV or 0.004 aJ)-
J 50
. ooo1 *mlL 0 10 20 Radius, cm 30
te- lector Be)
0 J 50
Figure 2. - Relative fast and thermal neutron fluxes as tunction of radius.
The first energy group (group 1) shows neutrons with an energy greater than 3 MeV (0.48 pJ), and the second group (group 16) shows neutrons at thermal energy (0.025 eV or 0.004 aJ). A s shown, the fast flux decreases monotonically from a high value at the center of the core to the reflector edge. The thermal flux, however, has a negligible value except close to the reflector where it r i s e s abruptly to large values, reaches a peak in the reflector, and then declines sharply near the outer boundary. Although the median fission energy for the reactor is between 0.100 and 0.400 MeV (0.016 and 0.064 pJ), the spectrum is fast throughout most of the core but is much more thermal in a relatively thin zone near the core-reflector interface. Thus, even in fast reactors, thermal neutron activation cannot be ignored unless heavy-metal, nonmoderating reflec- t o r s a r e employed. Such a case was not considered in this study.
Once the neutron fluxes as a function of energy for every spatial point in the core and reflector a r e known, these fluxes can be combined with the proper c ross sections to determine the production rates of the radioactive species per unit volume of coolant. Such a double integration over space and energy fo r each reaction of every isotope inves-
6
tigated would be tedious and fortunately is unnecessary. A spatial integration can be performed just once to yield a set of neutron fluxes as a function of energy that have been properly averaged over the entire reactor. In the spatial averaging, the flux at a given location is weighted by the volume element at that location. In addition, since activation of a coolant is of interest here, the weighting should also include the relative amount of coolant flow through the volume at that location. Since coolant flow is required to re- move heat generated from fissions, the coolant flow rate at a given point is proportional to the spatial power distribution. The equation for calculating spatially averaged fluxes suitable for reactor coolant activation is given as
- JP(r)cp(E, r)dv cp(E) = f P(r)dv
where
q(E, r) flux of neutrons at energy E at space point r
P(r) relative power distribution at space point r
0) spatially averaged flux of neutrons of energy E
V volume element of integration
-
In this investigation, the reflector was also assumed to require cooling because of gamma heating. Hence, the integration was carried out over the reflector as well, ex- cept that in the reflector a value of 5 percent of the total power in the core was substi- tuted for the function P(r) in equation (7) to account fo r gamma-heat deposition in the reflector. Spatial averaging w a s performed only in the radial direction since the axial variation was not expected to be large.
The spatially averaged fluxes, as a function of energy, scaled for a reactor power of 1 megawatt, are listed in table I. It is these spatially averaged fluxes (together with the c ros s sections for a given reaction) that give a t rue indication of how important fast neutron activations are in relation to thermal neutron activations. The highest flux oc- cu r s in the group from 0.100 to 0.400 MeV (0.016 to 0.064 pJ). The median fission en- ergy of the entire reactor a lso occurs in this group. Below 0.100 MeV (0.016 pJ), the fluxes decrease in magnitude as the energy is lowered, until at low energies the spatially weighted fluves are about four orders of magnitude below those of the highest magnitude. Since many reactions leading to activation have large c ros s sections a t low energies and the c ros s section often decreases monotonically as the energy increases, the total activa- tion is calculated from the integral
Total production rate = Jx(E)?jj(E)dE
7

TABLE I. - SPATIALLY AVERAGED FLUXES
[Reactor power, 1 M W . ]
Energy limits of groups
3. S. customary units
>3 MeV 1 . 4 to 3 MeV 0 . 9 to 1.4 MeV 0 . 4 to 0 . 9 MeV 0 . 1 to 0 . 4 MeV
17 to 100 keV
3 to 17 keV
100 to 550 eV 30 to 100 eV 10 to 30 eV 3 to 10 eV
0.55 to 3 keV
1 to 3 eV 0.4 to 1 eV 0. 1 to 0 . 4 eV
0.025 eV
SI units
>O. 48 pJ 0. 22 to 0.48 pJ 0. 14 to 0. 22 pJ
0.064 to 0. 14 pJ 0.016 to 0.064 pJ
2.72 to 16.0 fJ
0. 48 to 2.72 fJ 0.088 to 0.48 fJ
16 to 88 aJ 4 . 8 to 16 a J 1 . 6 to 4 . 8 a J
0 .48 to 1.6 aJ
0. 16 to 0.48 aJ 0.064 to 0.16 aJ 0.016 to 0.064 aJ
0.004 aJ
Average fluxes, ieutrons/(cm )(sec] 2
9. 13X1Ol1 1.91x10¹² 1 .61 4.70 5.70 2.20
2.02x10¹¹ 2.12x10¹⁰ 5 . 7 3 ~ 1 0 ' 2.80 1.49 1. 26
9. 45X108 5 .30 4.75 8.50
and it is not immediately obvious from table I that thermal reactions car primarily fast reactors.
be neglectec n
Saturated Specific Activities and Specific Dose Rates
When the spatially averaged fluxes shown in table I and the cross-section data for the isotopes of sodium, lithium, and potassium given in appendix A are used, the saturated activities per gram of pure isotope per megawatt of reactor operating power can be cal- culated by use of equation (6). The resul ts are shown in table II. From this table, the total saturated activities fo r various coolants operating in a reactor a t some power level P ( M W ) can be obtained.
How important these activities are to unshielded personnel nearby in t e r m s of ab- sorbed dose rate is not indicated in table II. Hence, the absorbed dose rate to a n un- shielded observer located 1 meter away f rom 1 gram of coolant irradiated in a reactor operating at 1 megawatt w a s calculated. The resul ts are summarized in table III.
From this table it can be seen that the lowest dose rate from activation is obtained with pure separated K40. However, the natural abundance of K40 is about 0.01 percent, and it has both a lighter and a heavier neighbor isotope adjacent to it. Hence, at least
8

TABLE II. - SATURATED SPECIFIC ACTIVITIES
24 Na Ne 23
22 Na F2O
E n g e t nuclide
15.0 h r 8 . 3 6 ~ 1 0 ~ 38 sec 4 . 1 5 ~ 1 0 ~ 2.58 y r 6. 22x104 11 sec 2. 81X107
23 Na
6 Li
~ i 7
K3
K40
K4
-
Product nuclide I Half-life I Saturated specific activity, dis/sec
(a)
He 1 0 . 8 sec I 1.39X10⁸ I 0.8 sec 4 . 0 ~ 1 0 ~ 6 He
Li8 10 .8 sec 1 4.59X1O6
260 y r
A r 260 yr 1.59X10
aper g of target material; per MW of reactor power.
TABLE III. - SATURATED SPECIFIC
DOSE RATES (UNSHIELDED)
Coolant
Na23, pure
Li 6 , pure
~ i 7 , pure
K3', pure
K40, pure
K41, pure Li, natural Li, natural K, natural NaK (78K) eutectic
(natural sodium)
hbbsorbed dose rate . mrem/hr
(4
4.77
b2. 05
'. 26
.155
'. 004
14.6 b. 394 '. 000394 1. 15 1.95
aAt distance of 1 m; per g of coolant;
bNo holdup time. 'Half of dose rate f rom unirradiated
dHoldup time, 8 sec.
per MW of reactor power.
40 but naturally radioactive K .
two isotope separation processes would be required, and the cost of separation would probably be prohibitive.
6 7 6 6 8 Activation of L i and Li produces mainly He in the former and both He and Li in 6 8 the latter. Both He and L i have half-lives of only 0 .8 second and decay by emission of
beta particles having maximum energies of 3 .5 MeV (0.56 pJ) and 13 MeV (2.08 pJ), re- spectively. X-rays (known as Bremsstrahlung) are produced when these betas are stopped in the walls of the containment vessel or piping. The X-rays have a continuous energy spectrum extending up to the maximum beta energy; however, their average en- ergy is approximately one-third of the maximum beta energy. In addition, when 3.5- MeV (0.56-pJ) and 13-MeV (2.08-pJ) betas a r e stopped in a relatively good mater ia l for production of X-rays, such as tantalum (Z = 73), on the average, 13 and 39 percent, r e - spectively, of their kinetic energy is converted to X-ray energy. The specific dose rates shown in table III f o r these nuclides are for zero holdup time between saturated activity and dosage. Except f o r locations in or immediately adjacent to the core, zero holdup time is unrealistic. Typical loop-cycle t imes a r e of the order of seconds, and while these t imes have a negligible effect on the dose rate from Na o r K isotopes, they pro- foundly affect the Li dose rates. A holdup of only 4 seconds, for example, whether from
9

normal loop cycling or deliberate holdup would reduce the lithium dose r a t e s shown in table 111 by a factor of 32. An 8-second holdup would result in lowering the values shown in the table by a factor of 1000. Holdup time, therefore, complicates any evaluation of Li activation relative to that of Na o r K.
rate is from the 1.83-hour argon 41 (Ar ), while the remainder is mainly from the 12.4-hour K42. In Na, the 15.0-hour Na24 activity dominates the dose rate. Of the natural materials, natural Li has the lowest dose rate, with a potential for even lower dose ra tes if loop-cycle holdup o r deliberate holdup is used.
The most undesirable isotopes are clearly K41 and Na. For K41, about half the dose 41
Dose Rates from Release of Fission Products into Coolant
If fission products a r e released to the reactor coolant, these products may also r e - sult in high dose rates. assuming a hypothetical fission product release.
1 percent of the Br, Kr, Xe, and I isotopes into the coolant. Another way of saying this
Under such circumstances, the dose r a t e s were calculated by
It was assumed that a saturated reactor operating at 1 megawatt of power releases
PRODUCTS AND COOLANT ACTIVATION
Radiation source
Na, pure
Li , pure
L i , pure
K3', pure
K40, pure
K41, pure Li, natural Li, natural K, natural NaK (78 K) eutectic Volatile fission
6
7
products, 1 percent
ibsorbed dose rate, rem/hr
(a)
TABLE IV. - DOSE RATES FROM FISSION
I
10
445
b188
b23
13.9
.315
1310 b36
'. 036 104 176
2200
aAt distance of 1 m; per MW of reactor
bNo holdup time. 'Holdup time, 8 sec.
power; 200 lb (90 kg) coolant assumed.
is that 1 percent of the fuel elements develop pinholes or minute cracks and all the vola- tile fission products (Br, Kr, Xe, and I) escape into the coolant. If the entire fission product inventory in the coolant can be re - garded as a point source, the dose rate to an unshielded observer 1 meter away is ap- proximately 2200 rem per hour (see appen- dix B for details).
Shown in table IV a r e the dose rates to an unshielded observer 1 meter away, caused by the activation of various coolants with 200 pounds (90 kg) of coolant assumed to be in the primary loop of a l-megawatt reactor.
While it is unrealistic to suppose that an observer could be subjected to the dose ra te from the entire coolant loop, the rela- tive values of these numbers should be valid f o r an observer in the vicinity of a major loop component. Thus, if the fission product

release model used herein is realistic, the selection of a coolant to minimize activation is of secondary importance. If the fission product release postulated herein is too severe, selection of a coolant becomes important. When appreciable holdup time be- tween the reactor and the loop (of the order of a few seconds) can be arranged without un- due shield weight penalty, pure Li offers the potential of yielding the lowest dose rates. When little o r no holdup is practical, pure K3’ may be superior.
Even when no fission products are present, personnel a r e likely to require some shielding from activated loop components no matter what coolant is used, with the excep- tion of L i that has been sufficiently held up for a number of seconds.
7
Na23, pure
Gas Product ion f rom I r rad ia t ion of Sodium, L i th ium, and Potassium Coolants
Ne2’ 2. 5X10⁻² Ne 22 5 . 7 ~ 1 0 ~ ~
In addition to radioactive nuclei, gases (stable and radioactive) are produced f rom coolant activation. In table V, the number of moles of gas evolved in a 1-year operation of a reactor at 1 megawatt using 200 pounds (90 kg) of coolant a r e listed. It can be seen from this table that gas evolution is probably unimportant for all of the coolants except Li when appreciable quantit- ’ of helium and tritium accumulate. 6
4 He H3 H2 H1
6 Li , pure
TAB, V. - GAS PRODUCTION RATES
6 .6 6 . 4 2.15X10⁻¹ 3. 8X10⁻³
rate , g-moles/yr
3 e 4 H3
7 Li , pure
H2
4. 6X10⁻² 4. 6X10⁻² 4. ~ X I O - ~
K3’, pure H1 3 . 55X10-2 He4 5 . 4 x 1 0 - ~ H2 4 . 7 ~ 1 0 - ~ Ar38 7. I X I O - ~
K41, pure He I 1 . 3 ~ 1 0 - ~
11

CONCLU S IONS
An investigation of the neutron activation of sodium (Na), lithium (Li), and potas- sium (K) used as possible coolants in a typical fast reactor has resulted in the following conclusions:
1. Existing neutron activation cross-section data of the individual isotopes of Na, Li, and K a r e adequate for a useful engineering assessment of the problem.
2. On the bas i s of dose rate to an unshielded observer and when zero holdup time is assumed, the best coolants of those considered a r e K40, K3', Li , and natural Li. The worst coolants are K41 and Na.
3. Because of low natural abundance and the need for two isotopic separation pro- cesses, K40 is impractical as a useful reactor coolant.
4. Lithium is relatively difficult to ra te on activation because of the effect of holdup between the reactor exit and the external loop. Because of the short half-lives (0.8 sec) of the Li products, holdup t imes of even a few seconds strongly affect L i dose rates . Lithium 7 held up for 8 seconds gives the lowest dose rates to an unshielded observer of any of the coolants considered. The dose rates of the other coolants are not affected by holdup.
loop components for all of the coolants considered except Li that has been held up for periods of the order of several seconds o r more.
6. If the fission product release rate into the coolant assumed herein is realist ic, coolant selection to minimize activation is of secondary importance. A fission product re lease rate at least two orders of magnitude smaller than that assumed would be re- quired before coolant activation exerted a major influence on personnel dose rate .
7. Gas evolution as the result of irradiation of isotopes of Na, Li, and K is small except for Li (and possibly natural Li).
8. Use of a fast-reactor model different from the one chosen should not a l te r the major conclusions reached herein, although some numerical changes would be expected.
7
5. Some shielding will be needed to protect personnel in the vicinity of the various
6
Lewis Research Center, National Aeronautics and Space Administration,
Cleveland, Ohio, August 30, 1967, 120-27-06-07-22.
12

APPENDIX A
Y
Y
Y
Y
P
NEUTRON REACTIONS, PRODUCTS, AND CROSS SECTIONS FOR ISOTOPES OF
. 44 .0704
1.65 .264
1.28 .205
1.63 .261
5 . 4 .864
SODIUM, LITHIUM, AND POTASSIUM
Natural abundance)
percent
7.42
92.58
The basic nuclear data used in this report to calculate activations and dose rates a r e tabulated herein. The important reactions and products formed are listed in tables VI, VII, and VI11 for the isotopes of sodium, lithium, and potassium, respectively. The c ross sections are similarly given in tables IX, X, and XI. The references from which the data were obtained are also listed.
TABLE VI. - NEUTRON REACTIONS O F SODIUM AND PRODUCTS FORMED
Reaction
n, Y
n, n'd
n, P
n, ff
n, 2n
n, Y
n, n't
1 Target I Natural I nuclide I abundance,
percent
100
React ion Jroduct 'ormed
Half-life
24 Na
Na24
Ne23 23 Ne
Na22
F20
F20
15.0 h r
15.0 h r
38 sec
38 sec
2.58 y r
11 sec
11 sec
radiation
1.37
Y 1 2.75
0.219
.440
TABLE VII. - NEUTRON REACTIONS OF LITHIUM AND PRODUCTS FORMED
Target nuclide
Li6
~i~
Producl formed
~i~
He
He6
H3
He4
Li8
H3 6 He
Li6 6 He 4 He
Half-life
~
Stable
Stab le
0.8 sec
1 2 . 2 y r
Stable ~
0.8 sec
12.2 y r
0 . 8 sec
Stable
0.8 sec
Stable
Type of ]Energy of radiation
I ------ ---
P .018
P 3 . 5
--- I ------ P I 3 . 5
13

TABLE VIII. - NEUTRON REACTIONS O F POTASSIUM AND PRODUCTS FORMED
'arget uc lide
K3
K40
K4
Natural bundance, percent
93.1
0.0118
6.88
Jroduct 'ormed
K40
K40
Ar3'
K3
~1~~
Ar38
Ar38
K4
Ar4'
K3
c137
Ar3'
Ar3'
K42
Ar41
K40
K40
~1~~
~1~~
c140
c 140
c138
~1~~
40 A r
Half-life
9
9 .3x10 y r
.3x10 y r
260 y r
7 . 7 min 5 3x10 y r
Stable
Stable ~~
Stable
Stab le
Stab le
Stable
260 y r
260 y r
12.4 h r
1 .83 h r
.3x10 y r
.. 3x10 y r
37.3 min
37.3 min
Stab le
1 . 4 min
1.4 min
37.3 min
37.3 min
9
9
Type of 'adiation emitted
h e r g y of radiation
MeV
1 . 3 2
1.46
.57
2 .2
. 7 1
- - - - ----
1.52
1 . 3
1.32
1.46
1 .6
2 . 2
- - - -
1 . 5
2.75
1 . 6
2 . 2
PJ
3.211
.2337
.0912
.352
.1207
------ ------
- - - - - - ------ ------ ------
0.0912
.0912
0.2431
.208
. 2 1 1
.2337
,256
.352
- - - - - -
.240
. 440
.256
.352

TABLE M. - NEUTRON CROSS SECTIONS FOR ACTIVATION OR
GAS-FORMING REACTIONS O F SODIUM
PJ
(a) 0.0032 to 0.16
0.432 ,640
>. 16
<O. 704 0.736 t o 0.992
.992 t o 1.280 1.280 t o 2.40
<2.00 2.16 to 2.88
<O. 96 0.96 to 2.40
Reaction
Na 23 ( n , ~ ) N a ~ ~
Na23(n, p)Ne23
Na 23 (n, 2n)Na22
23 20 Na (n, cu)F
c r o s s section, b
(or cm2)
0.53 . O O l
<. 00023 <. 00012 b. 0005
0 4 .0196 4 .030 4 .050 4
0 4 .030
0 4 .050 4
Energy range I Average 1 R e f e r q c e l
MeV
(a) 0.02 to 1
2.7 4.0
>l. 0
<4.4 4.6 t o 6 .2 6 . 2 t o 8 . 0 8 .0 t o 15
a 2 . 5 13.5 t o 18
<6 6 to 15
aThermal a t 0.025 eV (0.004 aJ). Cross section var ies inversely with
bAverage. neutron velocity to 300 eV (48.0 aJ ) .
15
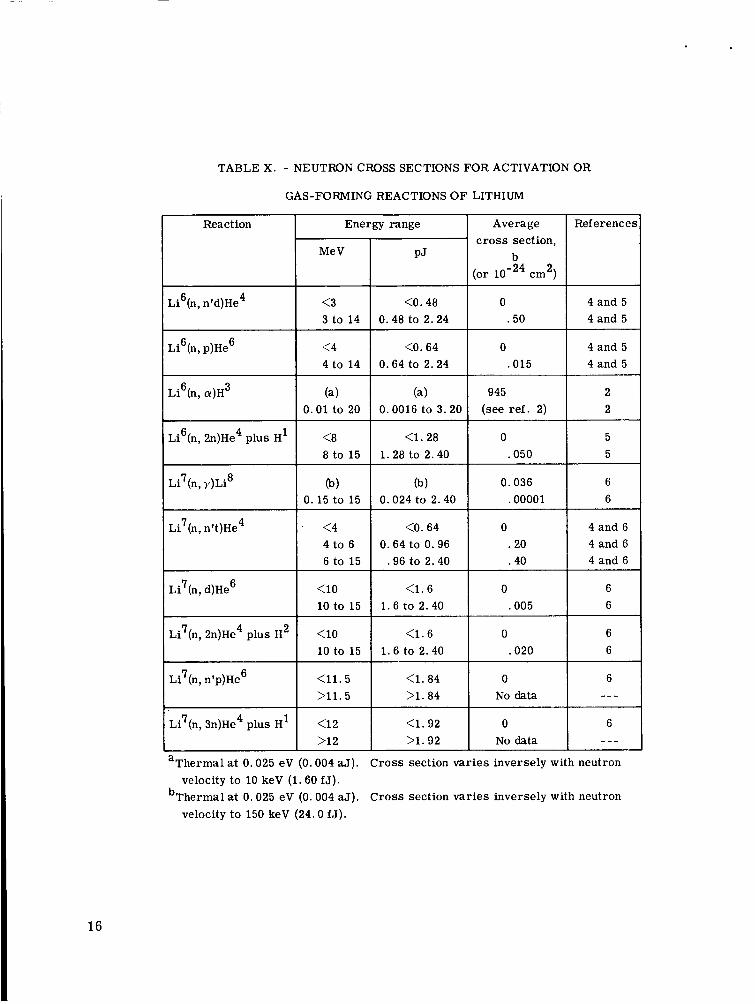
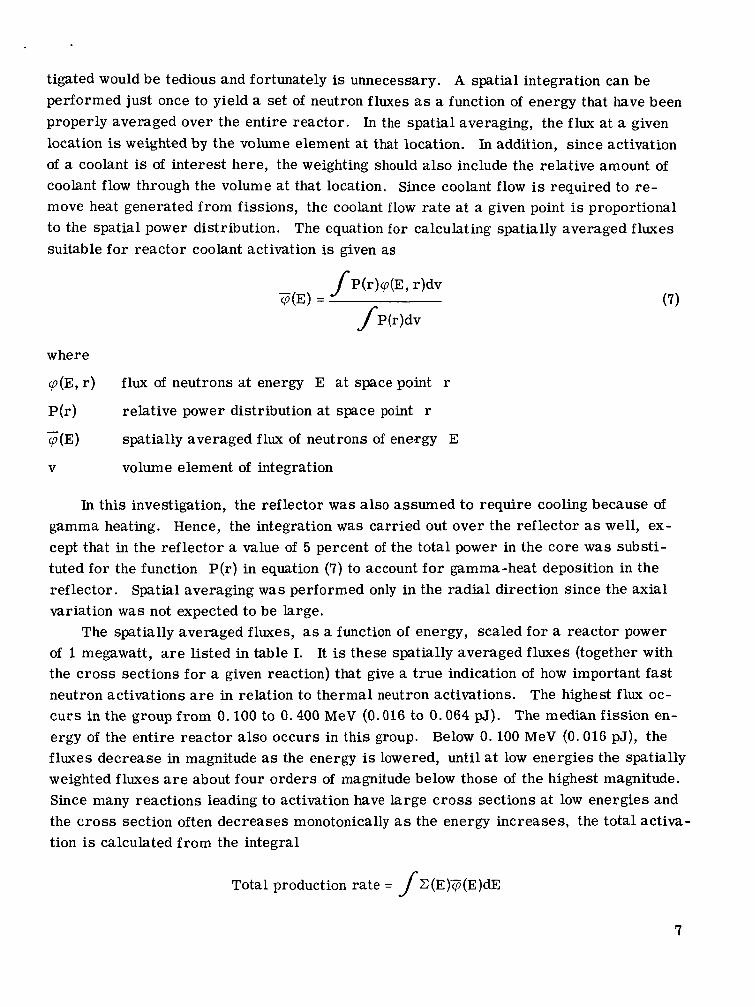
TABLE X. - NEUTFON CROSS SECTIONS FOR ACTIVATION OR
GAS-FORMING REACTIONS OF LITHIUM
0 .50
0 .015
945 (see ref . 2)
Reaction
4 and 5 4 and 5
4 and 5 4 and 5
2 2
6 4 Li (n,n'd)He
0 .20 . 40
0 .005
0 .020
0 No data
0 No data
6 6 Li (n,p)He
4 and 6 4 and 6 4 and 6
6 6
6 6
6 -_ -
6 - - -
6 3 L i (n, a ) H
6 Li (n,n'p)He I 7
6 4 1 Li (n, 2n)He plus H
a 1 . 5 >11.5
7 8 L i (n,y)Li
7 4 Li (n, n't)He
Li7(n, d)He 6
7 4 2 Li (n, 2n)He plus H
PJ
<O. 48 0.48 to 2.24
MeV
<3 3 to 14
<4 4 to 14
(a) 0.01 to 20
<8 8 to 15
(b) 0.15 to 15
' <4 4 to 6 6 to 15
<10 10 to 15
<10 I I 10 to 15
<O. 64 0.64 to 2.24
(a) 0.0016 to 3.20
<l. 28 1. 28 to 2.40
(b) 0.024 to 2.40
<O. 64 0.64 to 0.96
.96 to 2.40
<l. 6 1 .6 to 2.40
<l. 6 1.6 to 2.40
<l. 84 >l. 84
<l. 92 >l. 92
c r o s s section,
(or cm2) j
0 .050
I : 0.036 .00001
/Li7(n, 3n)He4 plus H1 I ;i: velocity to 10 keV (1.60 f J ) .
bThermal at 0.025 eV (0.004 aJ). Cross section var ies inversely with neutron velocity to 150 keV (24.0 fJ).
16

TABLE XI. - NEUTRON CROSS SECTIONS FOR ACTIVATION OR
GAS-FORMING REACTIONS OF POTASSIUM
~~
0 .02 . 1 3 .15
0 .07 .04
0 .05 .15
Energy range
4 and 7 4 and 7 4 and 7 4 and 7
7 7 7
7 7 7
MeV
0 to 1.( 1 to 3 3 to 8 8 to 14
<14 >14
1 .3 ,022
b<. 020
‘. 075 0
(No other data)
0 ‘. 030 (No other data)
0 <. 00013
(No other data)
0 <. 0025
(No other data)
<2 2 to 4 4 to 6 6 to 15
<6 6 to 8 8 to 15
<I 7 to 10
10 to 15
3 4 4
4 4
4 4
4 4
4 4
(a 1 0.020
,024
<l. 75 14. 5
<o. 1 14.5
<8 14 .5
12.9 14 .5
~~
PJ
0 to 0.16 .16 to 0 .48
1. 28 to 2. 24
<2.24 >2. 24
. 4 8 to 1. 28
~~
<O. 32 0.32 to 0.64
. 6 9 to 0.96
.96 to 2.40
<O. 96 0.96 to 1. 28 1.28 to 2. 40
a . 1 2 1 .12 to 1 .60 1 .60 to 2.40
(a I 0.0032
.00384
<O. 280 2.320
<O. 016 2.320
< l . 28 2.32
<2.063 2.320
cross section,
(or 10-Z4 b I cm2)
4 and 7 4 and 7 4 and 7 4 and 7
,007
No data I NO data I ---
No data I ---
aThermal at 0.025 eV (0.004 aJ). bSee fig. 3 (data from ref. 7). Cross-section value assumed to be
‘See fig. 4 (data f rom ref . 7). Cross-section value assumed t o be
dSee fig. 4 (data from ref . 7). Cross-section value assumed to be
0.667 t imes (n,y) c r o s s section for natural K.
0 .25 t imes (n, p) c r o s s section for natural K.
0.28 t imes (n, a) c r o s s section for natural K.
17

--2ooox10-27
1400 5 -200 !g-
= 1wo - - - N
.- -
c
- -
E .; .004=
z .NZ- .N17
v)
L
- - - .ooo4- I I
10-8 10-7 10-6 10-5 10-4 10-3 10-2 10-1 100 101 Energy, MeV
10-19 10-18 10-17 10-16 10-15 10-14 10-13 10-12 10-11 Energy, J
Figure 3. - Potassium capture cross sections as function of energy.
Neutron energy, MeV
I I I I I 0 3 6 9 12 15
Neutron energy, J
Figure 4. - Potassium (n, a) and (n, p) cross sections.
18

APPENDIX B
DOSE RATES FROM RELEASE OF FISSION PRODUCTS INTO COOLANT
Data on the volatile fission products (Br, Kr, Xe, and I) were obtained from refer- ence 8. In table XI1 are listed those nuclides that a r e gamma emitters, have appreciable yields, and emit photons of 0 .1 MeV (0.016 pJ) or greater, and, thus, have an apprecia- ble effect on human dose rates.
TABLE XU. - GAMMA-EMITTING VOLATILE FISSION PRODUCTS
Fission yield,
per cent percent
1 . 0 1 . 9 . 9
30 min
Br87 1 56 sec 2.7
Kr85m I 4.36 h r 1 .5 0 . 3 . 15
0.048 20 .024 I 80
2.5 2.0
3 . 7 1 Kr88 2.77 h r I
,
2.0 1 . 5 1 . 0 . 16
0 . 4 50 Kr8’ I 3 . 1 8 m i n 2.7 2 .5
2.9 0 . 5 8.05 days
2 .4 h r
52.5 min
4.7 0.7
6 . 5 0 . 5 0.08 I 100
6 .7 1 . 0 0.16 I 100
6.68 h r 5k-L 5 . 9 1 . 5 =-k- 0.016 6 . 5 0 .1
Xe135m I 15.6 min 1 .8 0 .5 0.08 I 100
6 . 2 0 . 2 0.032 I 100 Xe135 I 9 .13 h r
19
The activity from any one of the volatile fission products is given by
Average energy
MeV PJ
0 . 2 0 .032 . 5 . 0 8
1.0 .16 1 . 5 .24 2 . 0 . 3 2 2. 5 . 4 0 5 . 4 . 86
where
Source strength
MeV/sec J/sec
6. 70X1012 1 .07 3 . 7 3 ~ 1 0 ~ ~ 5 . 9 8 2 .53 4 .05 3 . 0 1 4 . 8 1 2.55 4 . 0 8 1 . 4 0 2 .24 2 . 5 5 4 . 0 8
A activity, dis/sec
P reactor power, W
y
h decay constant, sec-'
7 reactor operating time
t decay time
fractional yield of fission product of interest
Separation distance, m
1 2 5
10 20 50
100
If infinite reactor operating t ime (7 = w), no shut down (t = 0), a reactor power of 1 megawatt (P = 10 ), and a release of 100 percent of the volatile fission products from 1 percent of the fuel elements a r e assumed, A = 3.lXlO per second (or 3. lX1014 y dis/sec) for each of the nuclides in question. The source strengths of the fission products can then be calculated and grouped, for convenience, by energy as shown in table XIII.
sorbed dose rate to an unshielded obser te r can be calculated and is tabulated for various
6 10 6 x10 X10-2 y disintegrations
If it is assumed that all the fission products are collected in a point source, the ab-
Dose ra te , r em/h r
2200 550
88 22
5 . 5 . 8 8 . 2 2
distances in table XIV.
TABLE XIII. - GAMMA SOURCE STRENGTHS FOR
VOLATILE FISSION PRODUCTS IN COOLANT
20
TABLE XIV. - UNSHIELDED DOSE RATE
FROM VOLATILE FISSION PRODUCTS
[Saturated reactor at 1 M W ; 1 percent release of vo~a t i~es . ]

REFERENCES
1. Lathrop, K. D. : DTF-IV - A Fortran-IV Program for Solving the Multigroup Trans- port Equation with Anisotropic Scattering. Rep. No. LA-3373, Los Alamos Scien- tific Lab., July 1965.
2. Hughes, Donald J. ; and Schwartz, Robert B. : Neutron Cross Sections. Rep. No. BNL-325, second ed . , Brookhaven National Lab., July 1958.
3. Hughes, D. J. ; Magurno, B. A. ; and Brussel, M. K . : Neutron Cross Sections. Rep. No. BNL-325, second ed . , suppl. 1, Brookhaven National Lab., Jan. 1960.
4. Stehn, John R. ; Goldberg, Murrey D. ; Magurno, Benjamin A. ; and Wiener-Chasman, Renate: Neutron Cross Sections. Volume I. Z = 1 to 20. Rep. No. BNL-325, sec- ond ed . , suppl. 2, vol. I, Brookhaven National Lab., May 1964.
5. Pendlebury, E. D. : Neutron Cross Sections of Li-6 in the Energy Range 0.001 ev- 15 MeV. Rep. No. AWRE-0-60/64, United Kingdom Atomic Energy Authority, July 1964.
6. Pendlebury, E. D. : Neutron Cross Section of Li-7 in the Energy Range 0.001 ev- 15 MeV. Rep. No. AWRE-0-61/64, United Kingdom Atomic Energy Authority, July 1964.
7. Trall i , N.; Kalos, M . H . ; Longano, A. J.; Ray, J. H.; Sullivan, R. P.; Troubetzkoy, E. S. ; and Trupin, B. H. : Neutron Cross Sections for Titanium, Potassium, Magnesium, Nitrogen, Aluminum, Silicon, Sodium, Oxygen, and Manga- nese. Rep. No. UNC-5002, United Nuclear Corp., Jan. 1962.
8. Blomeke, J. 0. ; and Todd, Mary F. : Uranium-235 Fission-Product Production as a Function of Thermal Neutron Flux, Irradiation Time, and Decay Time. I. Atomic Concentrations and Gross Totals. Rep. No. ORNL-2127, pt. 1, vol. 1, Oak Ridge Nat . Lab., Aug. 1957.
NASA-Langley, 1968 - 22 E-3715 2 1

“The aeronaufirai rmd space mtivities of the tbited Stdes shail be candwrted so UJ to costrib& . . . to the expansion of human Rnowl- edge uf phenornend in the atmosphere and Jpace. The AdffrinfJfraijon shall provide for the widert pracficable md appraphte d h w i n a t i m of infflmtioa concerning its activirier and fhe resdts tbereof.”
-NhTlONhL AfRONAUnCS AND SPhCa ACT OF 195%
NASA SCIENTIFIC AND TECHNICAL PUBLICATIONS
TECHNICAL REPORTS Scientiiic and technic& information considered important, compleze, and a fastiog conrributiop to exisring .knowle#ge.
TECHNICAL NOTES: information Iess broad in scope but nevertheless of h p o m n c e as a conttibutim to existing knowledge.
TECHNICAL MEMQWDUMS: Idormatian receiving limited distribu- tion hecause of p W a r y data, security classification, or other reasans.
RBPOIil’fS. Scientific and terhnicai information geaerated tract or grant and considered an important contribution to
ormation derived from or of value to NASA
P A C E A D M I N I S t R AT I