tabulate, chart, map, download: pre-tabulated health indicators
TRANSCRIPT
Tabulate, chart, map, download:
Pre-tabulated health indicators

Objectives
• By the end of today’s workshop, you should:
– Understand the website’s general benefits and limitations
– Know how to navigate to and through the Health Indicators Warehouse website
– Be able to locate indicators of interest
– Be able to download indicator data
Background of Health Indicators Warehouse
Definition: HEALTH INDICATOR
• A measurable characteristic that describes:
– the health of a population (e.g., life expectancy, mortality, disease incidence or prevalence, or other health states);
– determinants of health (e.g., health behaviors, health risk factors, physical environments, and socioeconomic environments);
– health care access, cost, quality, and use.
Definition: HEALTH INDICATOR
• Depending on the measure, a health indicator may be defined for a specific population, place, political jurisdiction, or geographic area.
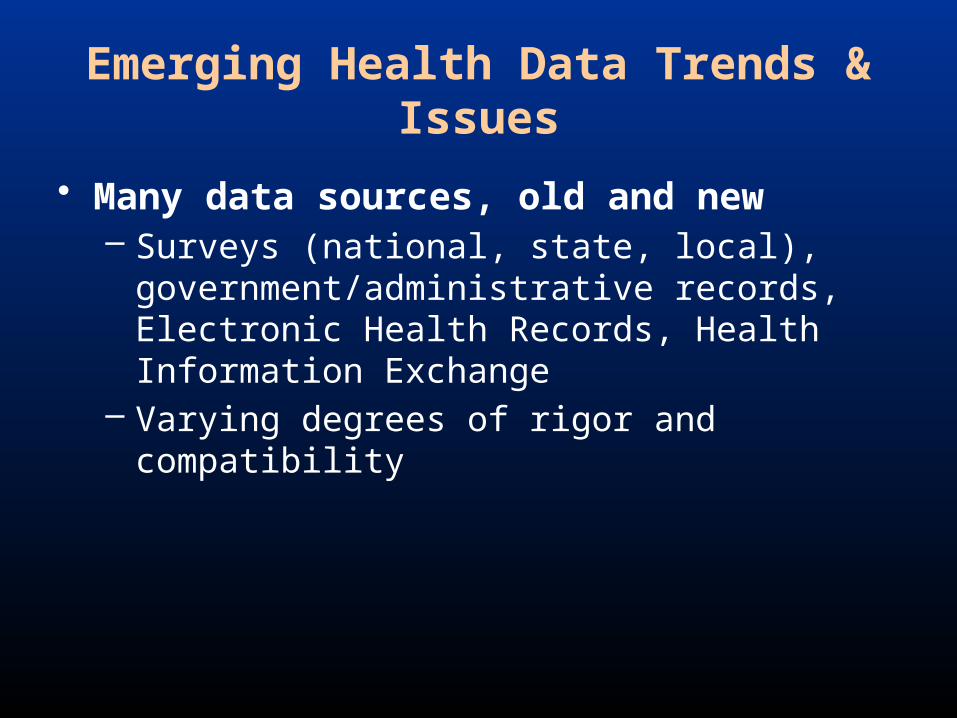
Emerging Health Data Trends & Issues
• Many data sources, old and new– Surveys (national, state, local),
government/administrative records, Electronic Health Records, Health Information Exchange
– Varying degrees of rigor and compatibility
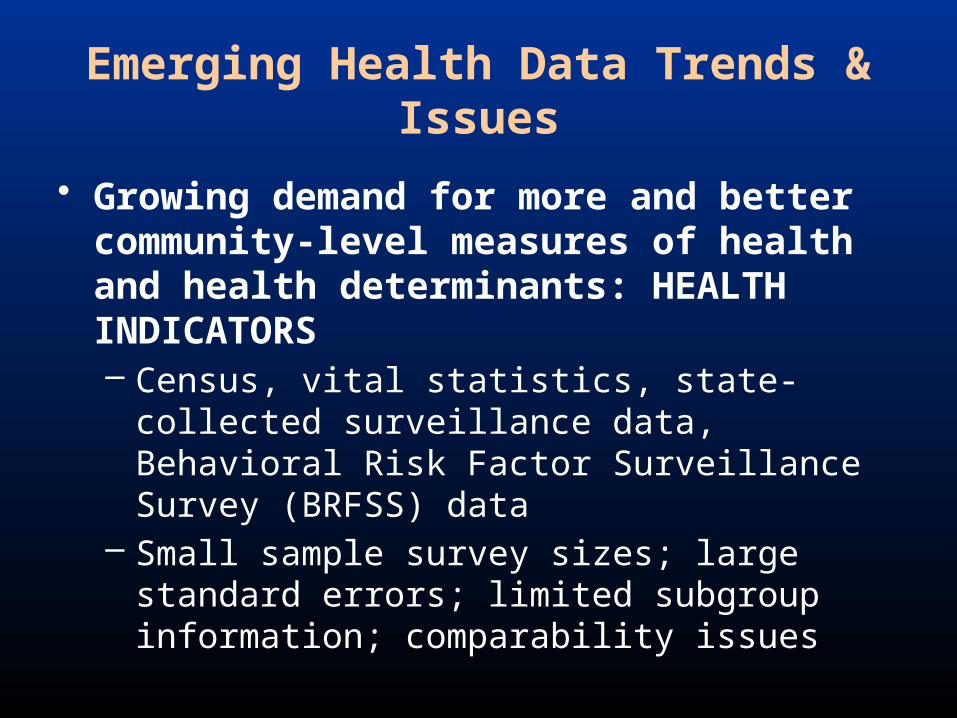
Emerging Health Data Trends & Issues
• Growing demand for more and better community-level measures of health and health determinants: HEALTH INDICATORS– Census, vital statistics, state-collected
surveillance data, Behavioral Risk Factor Surveillance Survey (BRFSS) data
– Small sample survey sizes; large standard errors; limited subgroup information; comparability issues
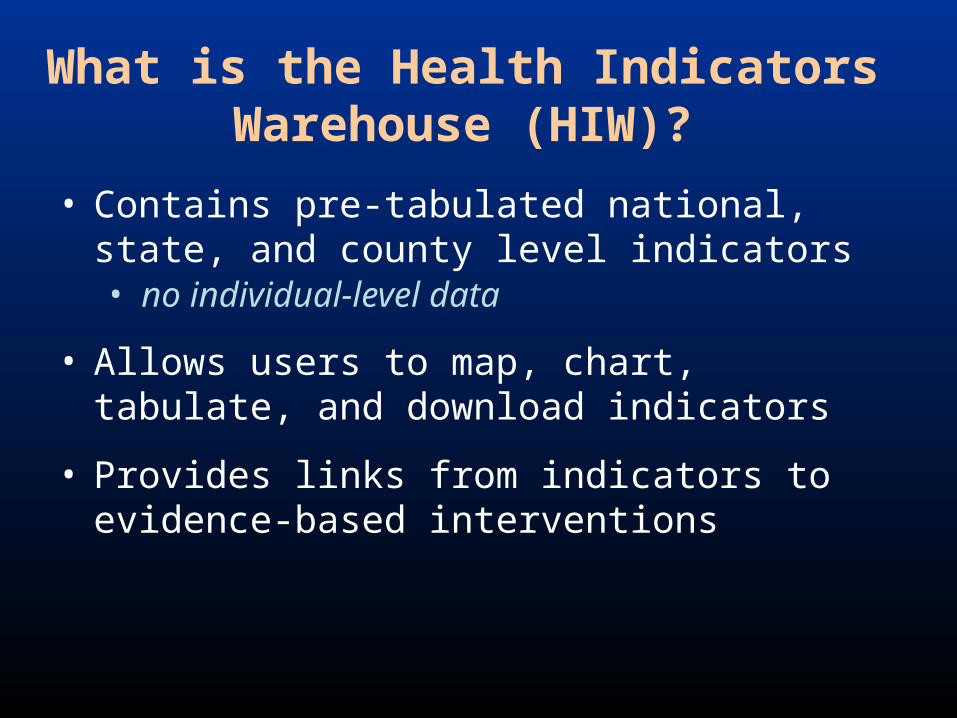
What is the Health Indicators Warehouse (HIW)?
• Contains pre-tabulated national, state, and county level indicators • no individual-level data
• Allows users to map, chart, tabulate, and download indicators
• Provides links from indicators to evidence-based interventions
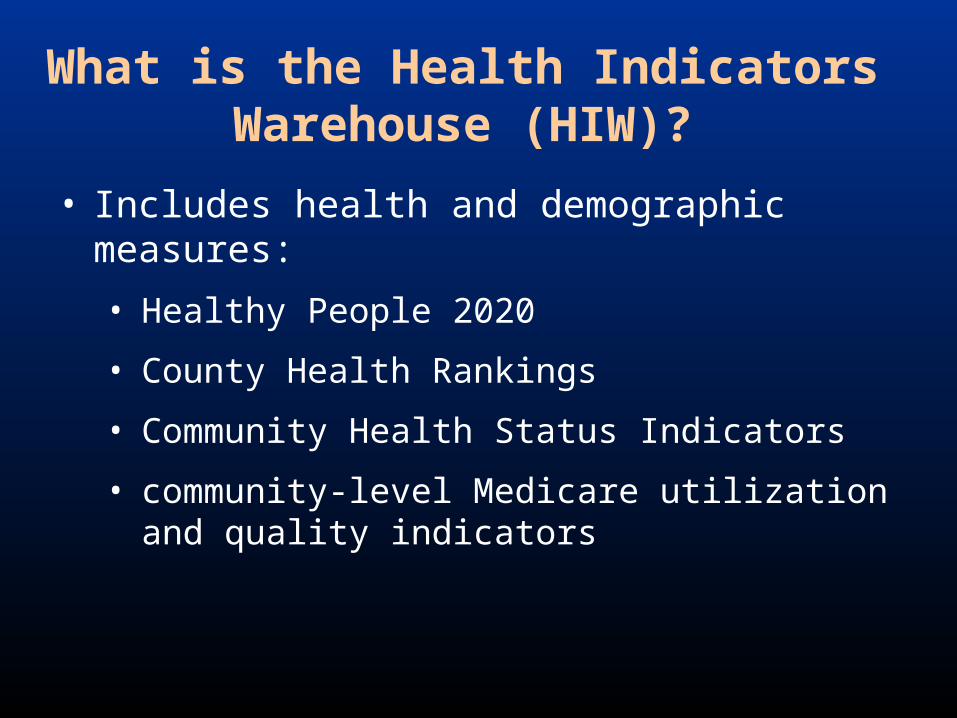
What is the Health Indicators Warehouse (HIW)?
• Includes health and demographic measures:
• Healthy People 2020
• County Health Rankings
• Community Health Status Indicators
• community-level Medicare utilization and quality indicators

Benefits of the HIW
• Provides metadata, with descriptions of methodology and data sources, allowing for better understanding of strengths and weaknesses of indicators
• Links to original data sources
• Facilitates harmonization across data sources and methodologies
• Allows users to examine, select and download indicator both data and metadata, either through the interface (in Excel or CSV) or through web services
Data sources
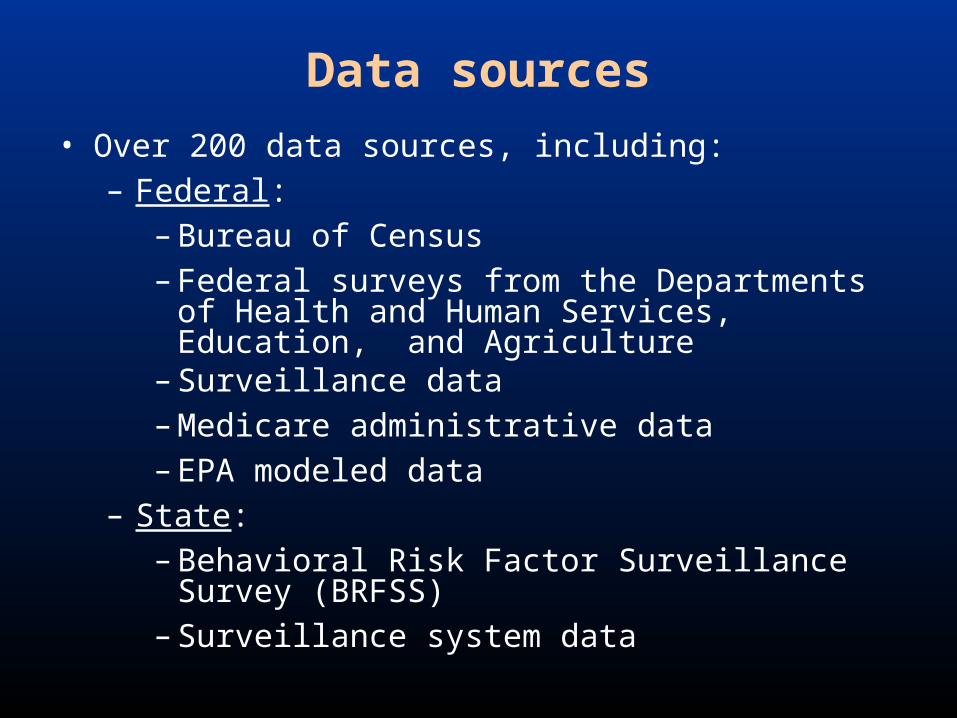
• Over 200 data sources, including:– Federal:
– Bureau of Census– Federal surveys from the Departments of Health
and Human Services, Education, and Agriculture– Surveillance data– Medicare administrative data– EPA modeled data
– State: – Behavioral Risk Factor Surveillance Survey
(BRFSS)– Surveillance system data
Data sources
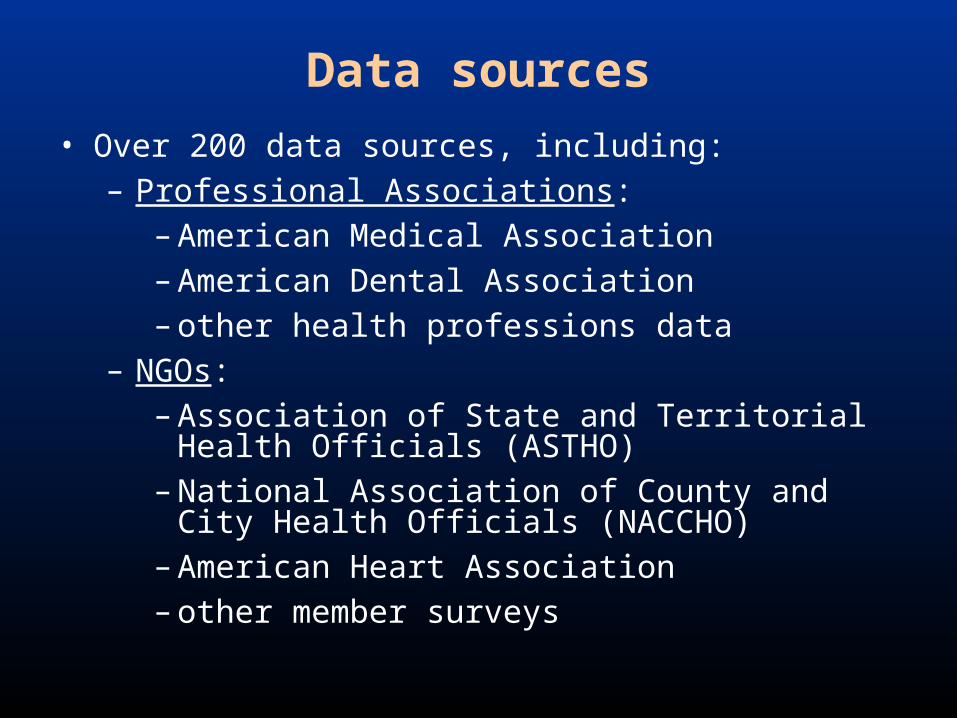
• Over 200 data sources, including:– Professional Associations:
– American Medical Association– American Dental Association – other health professions data
– NGOs: – Association of State and Territorial Health Officials
(ASTHO)– National Association of County and City Health
Officials (NACCHO)– American Heart Association– other member surveys
Current version of the HIW
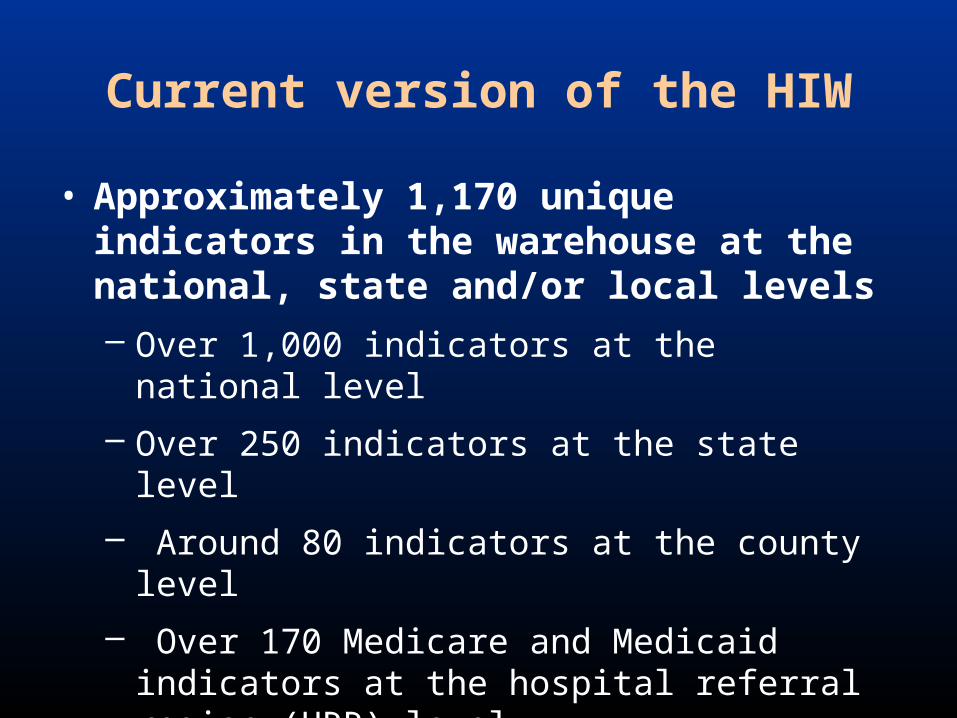
• Approximately 1,170 unique indicators in the warehouse at the national, state and/or local levels
– Over 1,000 indicators at the national level
– Over 250 indicators at the state level
– Around 80 indicators at the county level
– Over 170 Medicare and Medicaid indicators at the hospital referral region (HRR) level
Features of the Health Indicators Warehouse
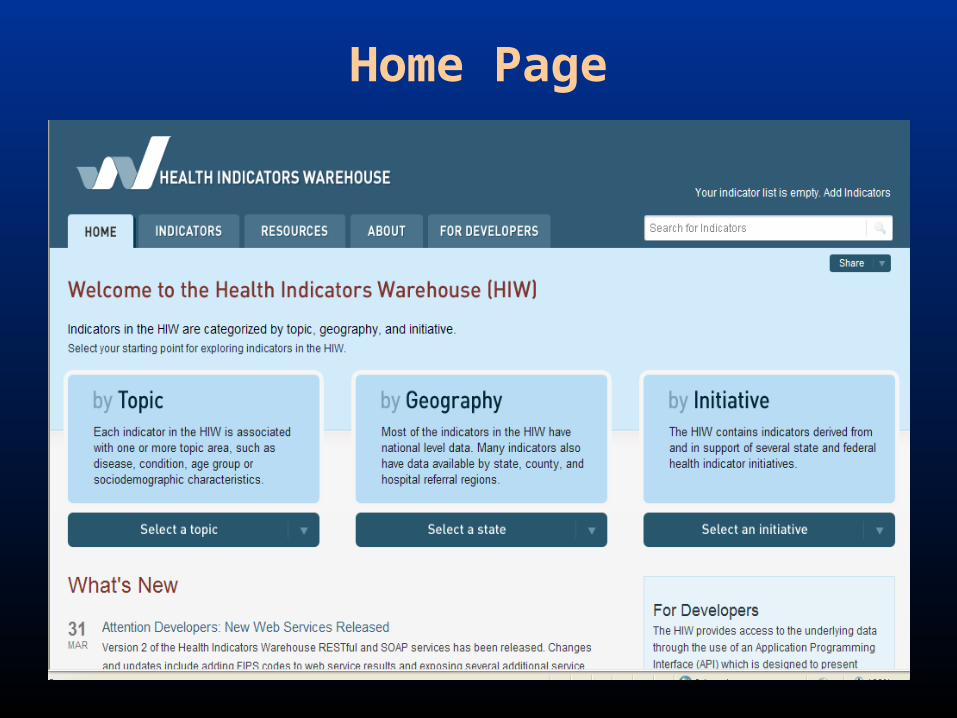
Home Page

Metadata: Descriptive Overview
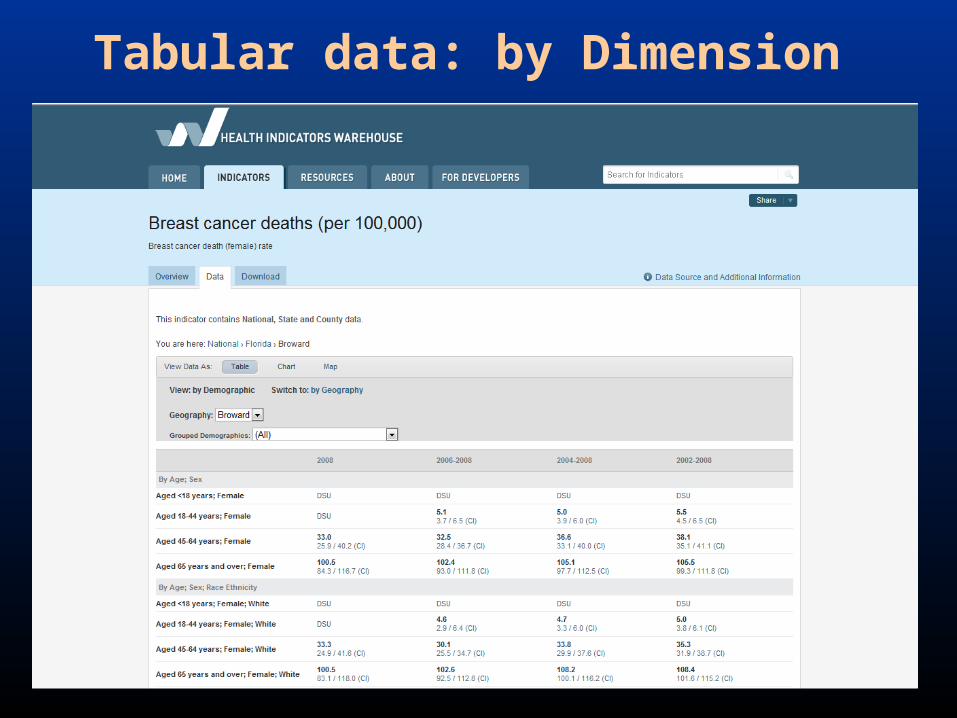
Tabular data: by Dimension
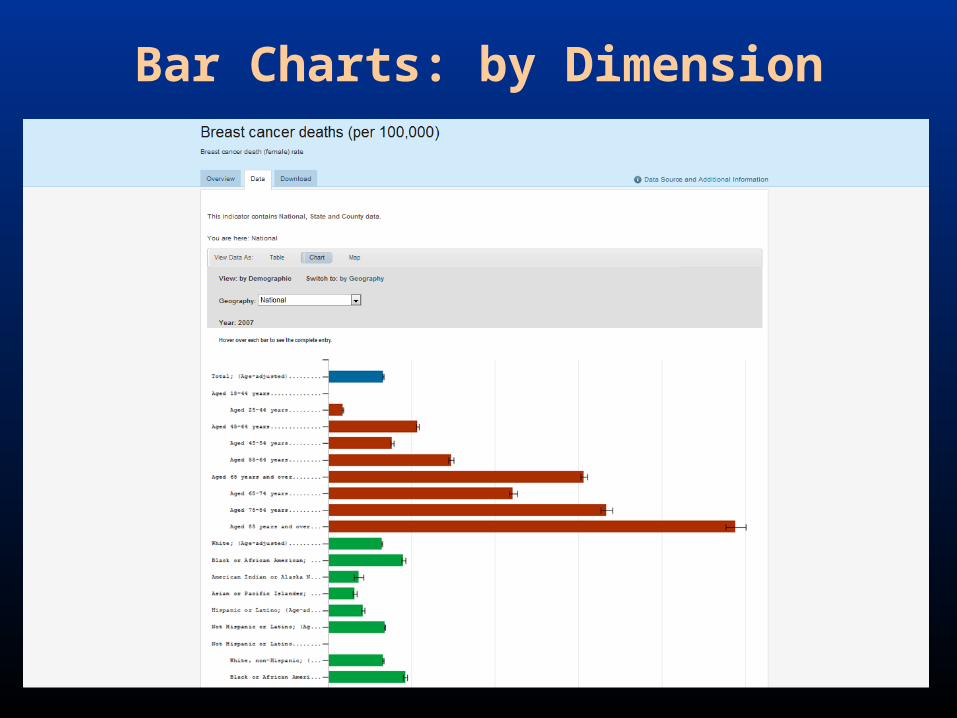
Bar Charts: by Dimension
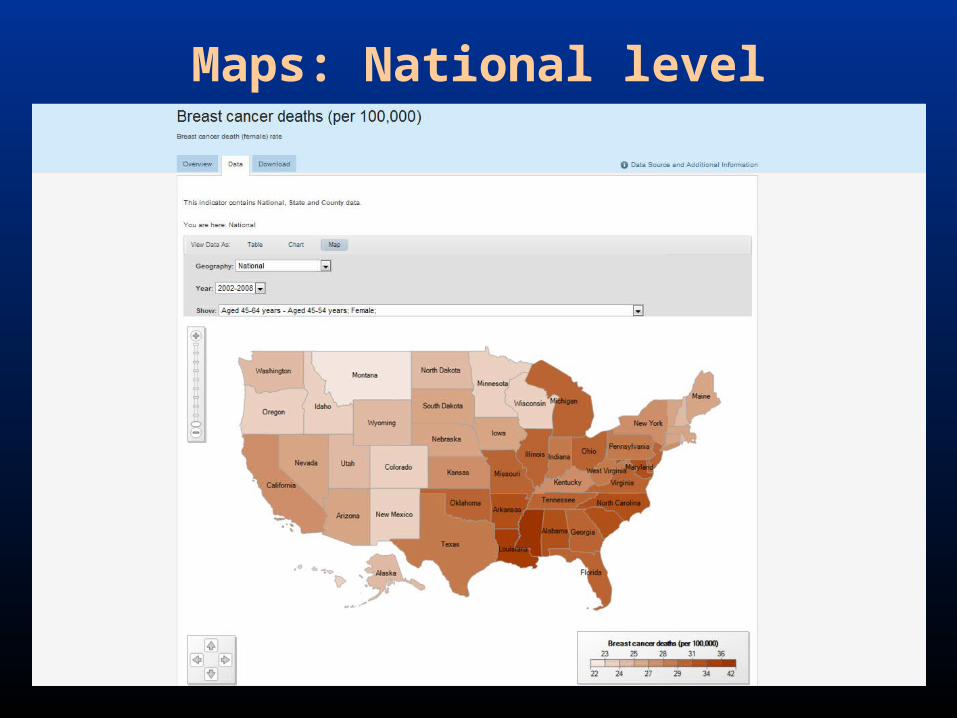
Maps: National level
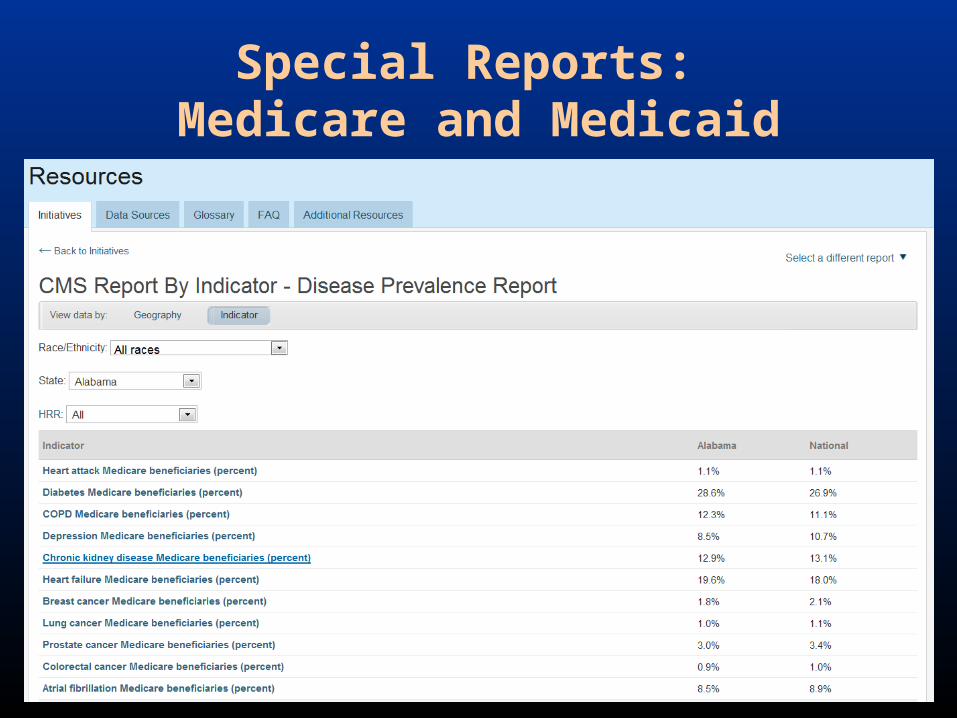
Special Reports: Medicare and Medicaid
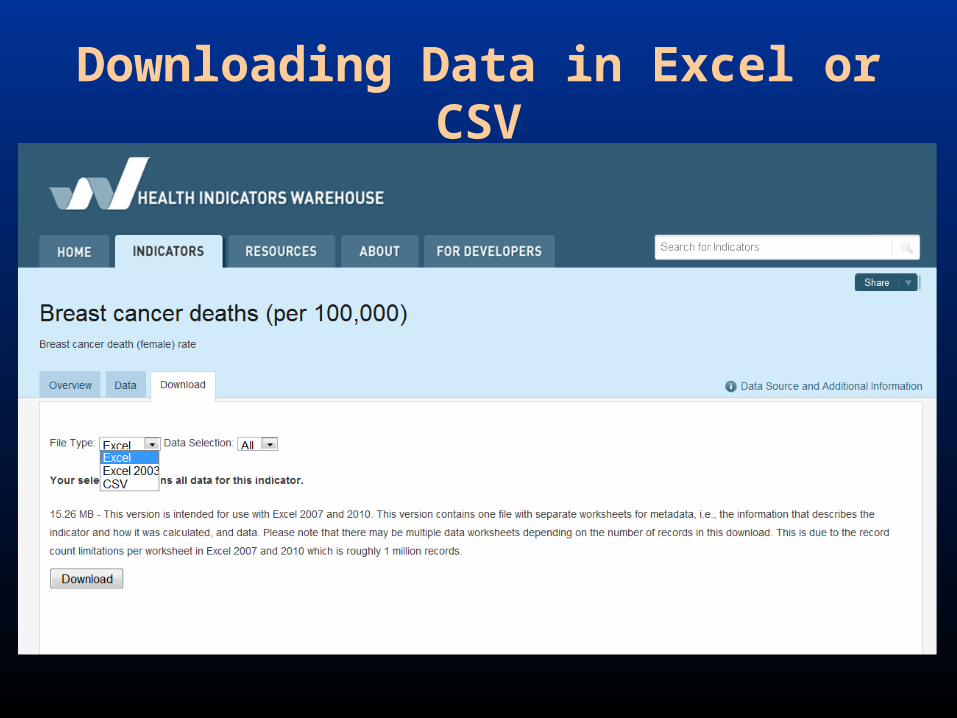
Downloading Data in Excel or CSV
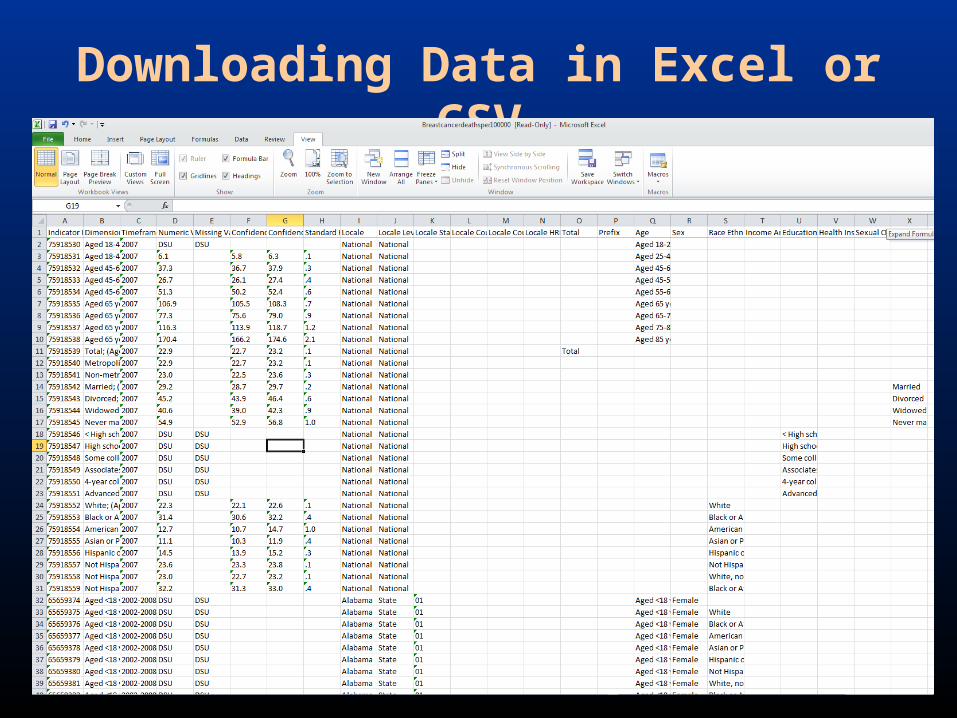
Downloading Data in Excel or CSV
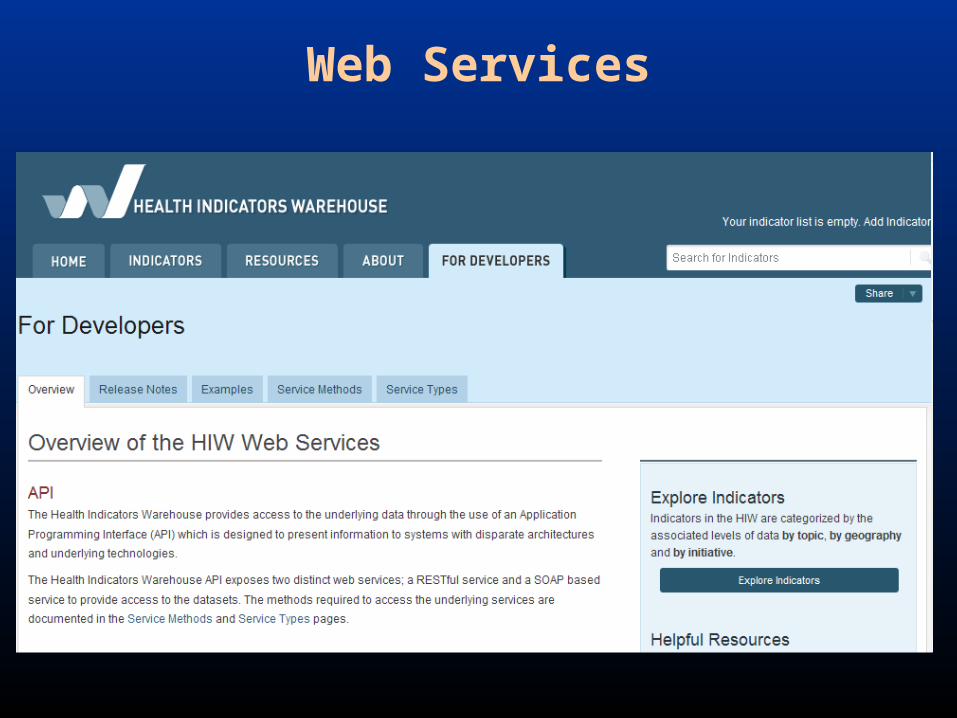
Web Services
Some considerations
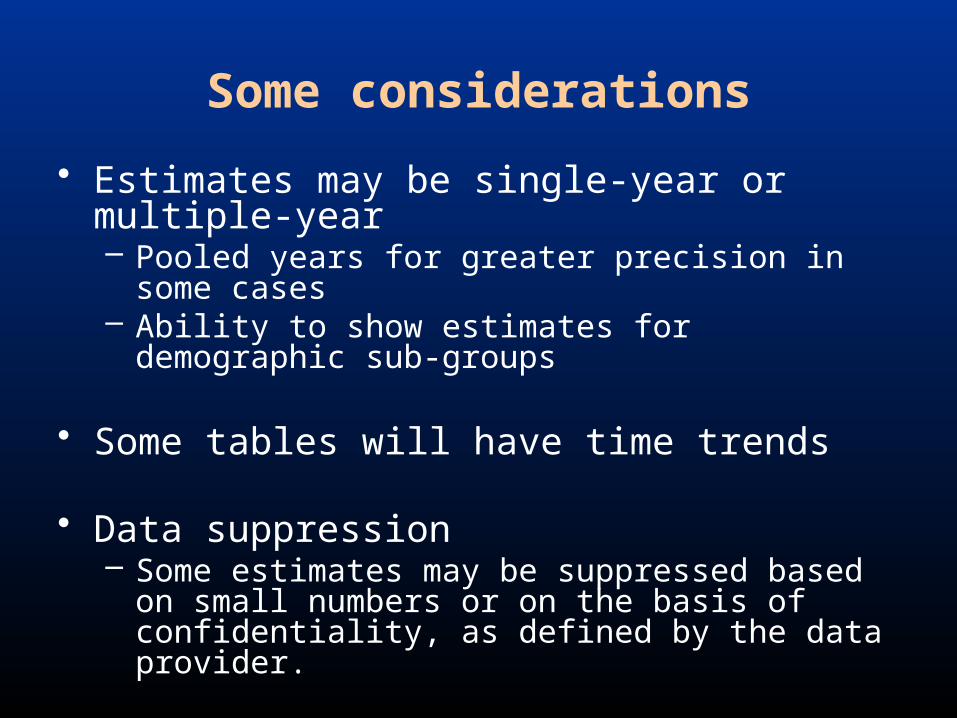
• Estimates may be single-year or multiple-year– Pooled years for greater precision in some cases – Ability to show estimates for demographic sub-groups
• Some tables will have time trends
• Data suppression– Some estimates may be suppressed based on small
numbers or on the basis of confidentiality, as defined by the data provider.
Live Demonstration of the Health Indicators Warehouse
http://www.healthindicators.gov
How to …
• Find an indicator• Interpret metadata• Show indicator data in a table
– View data by different geographies– Select various demographic dimensions
• Create charts• Create maps• Download data• Additional Resources
How to …
• Find an indicator• Interpret metadata• Show indicator data in a table
– View data by different geographies– Select various demographic dimensions
• Create charts• Create maps• Download data• Additional Resources

How to …
• Find an indicator• Interpret metadata• Show indicator data in a table
– View data by different geographies– Select various demographic dimensions
• Create charts• Create maps• Download data• Additional Resources

How to …
• Find an indicator• Interpret metadata• Show indicator data in a table
– View data by different geographies– Select various demographic dimensions
• Create charts• Create maps• Download data• Additional Resources
How to …
• Find an indicator• Interpret metadata• Show indicator data in a table
– View data by different geographies– Select various demographic dimensions
• Create charts• Create maps• Download data• Additional Resources
How to …
• Find an indicator• Interpret metadata• Show indicator data in a table
– View data by different geographies– Select various demographic dimensions
• Create charts• Create maps• Download data• Additional Resources
How to …
• Find an indicator• Interpret metadata• Show indicator data in a table
– View data by different geographies– Select various demographic dimensions
• Create charts• Create maps• Download data• Additional Resources
How to …
• Find an indicator• Interpret metadata• Show indicator data in a table
– View data by different geographies– Select various demographic dimensions
• Create charts• Create maps• Download data• Additional Resources
How to …
• Find an indicator• Interpret metadata• Show indicator data in a table
– View data by different geographies– Select various demographic dimensions
• Create charts• Create maps• Download data• Additional Resources
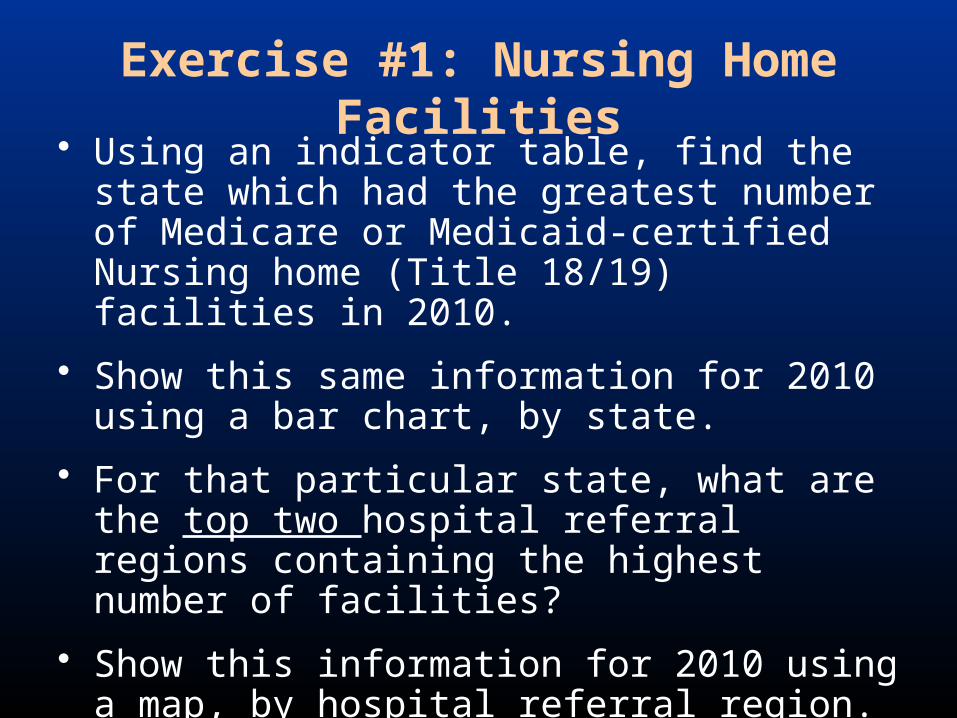
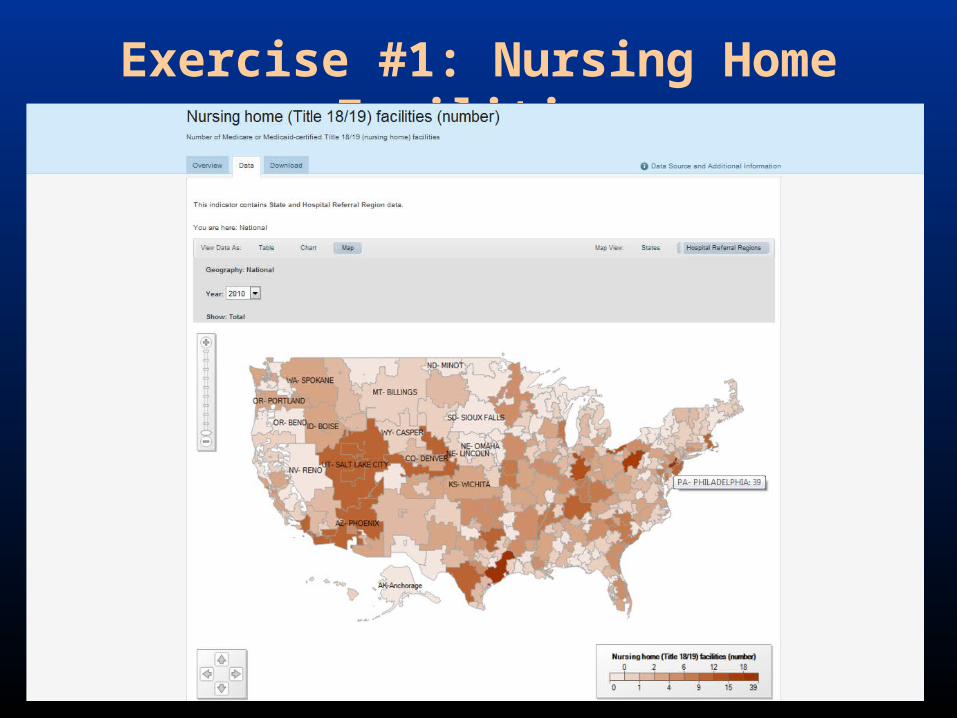
Exercise #1: Nursing Home Facilities
• Using an indicator table, find the state which had the greatest number of Medicare or Medicaid-certified Nursing home (Title 18/19) facilities in 2010.
• Show this same information for 2010 using a bar chart, by state.
• For that particular state, what are the top two hospital referral regions containing the highest number of facilities?
• Show this information for 2010 using a map, by hospital referral region.

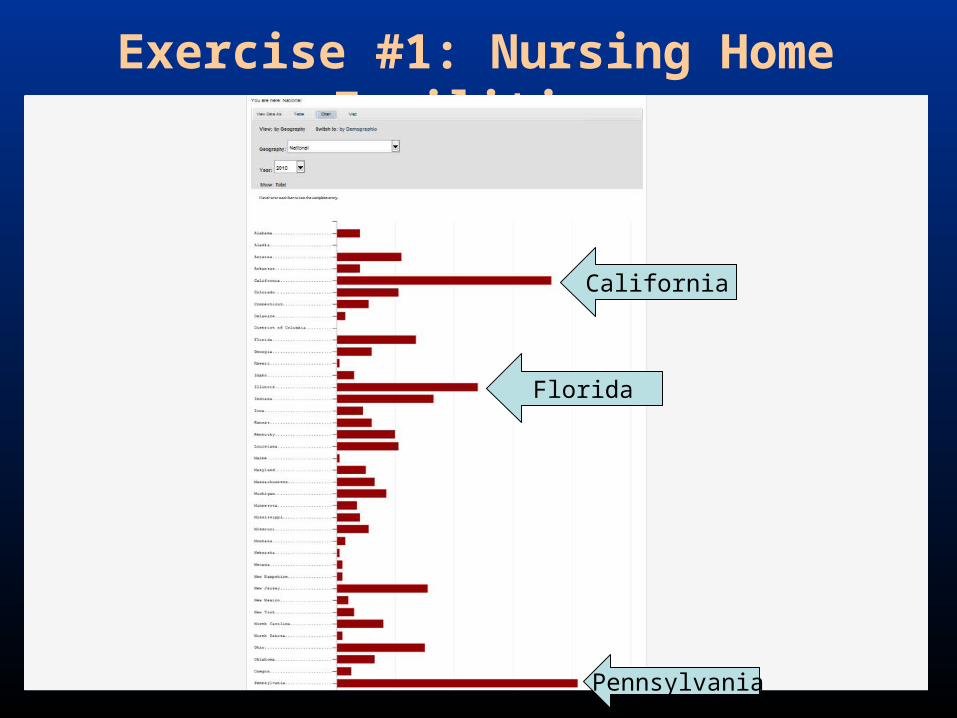
Exercise #1: Nursing Home Facilities
Exercise #1: Nursing Home Facilities
California
Florida
Pennsylvania
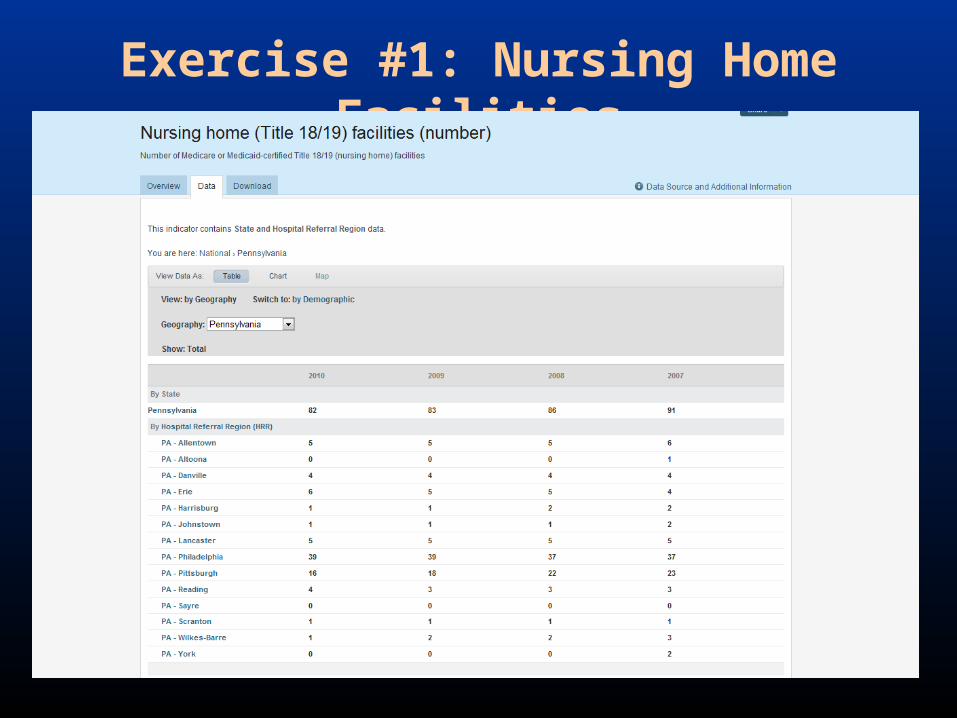
Exercise #1: Nursing Home Facilities
Exercise #1: Nursing Home Facilities
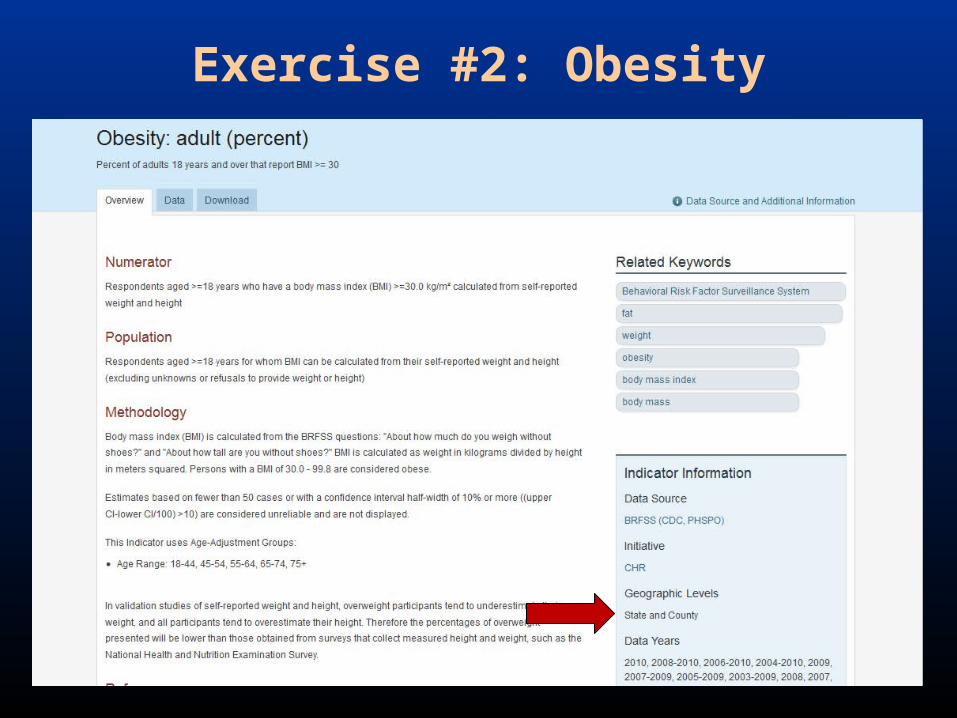
Exercise #2: Obesity
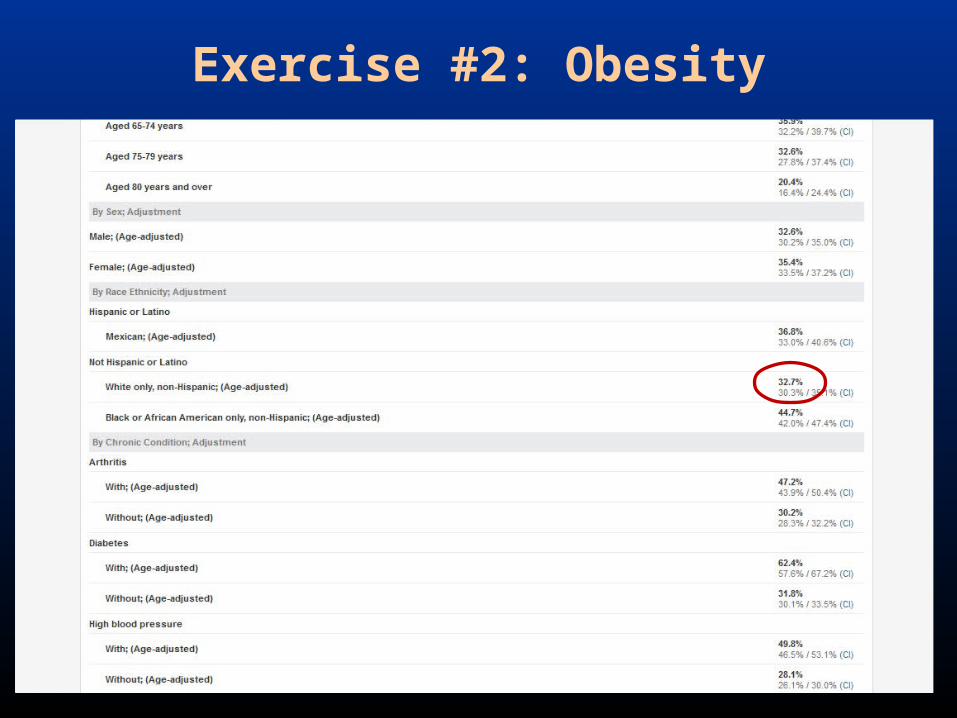
• What is the proportion of non-Hispanic whites in the US who are obese?
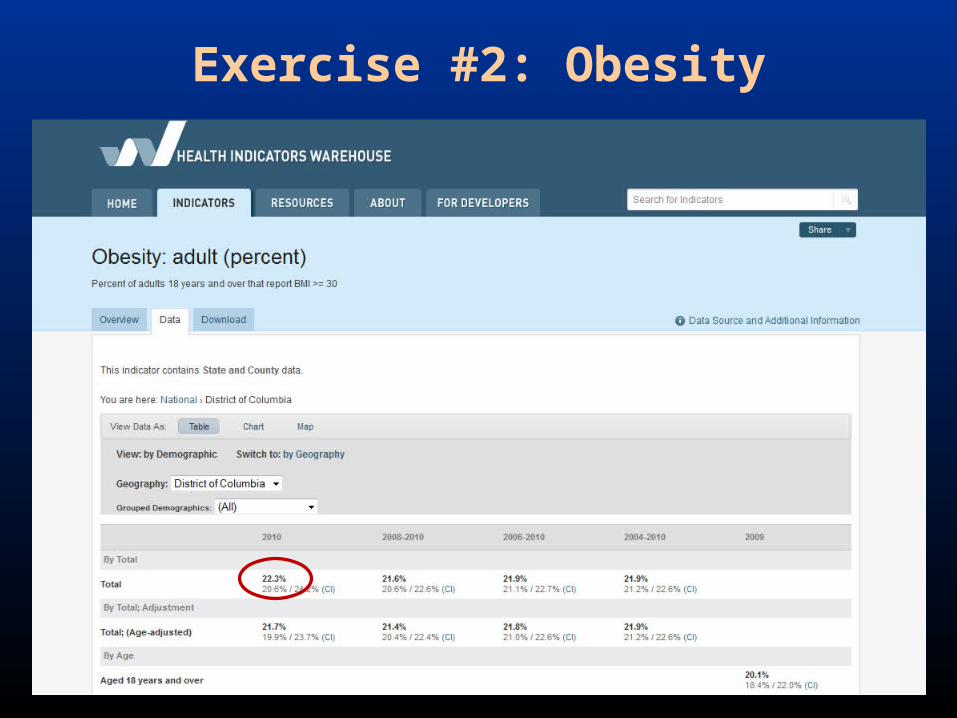
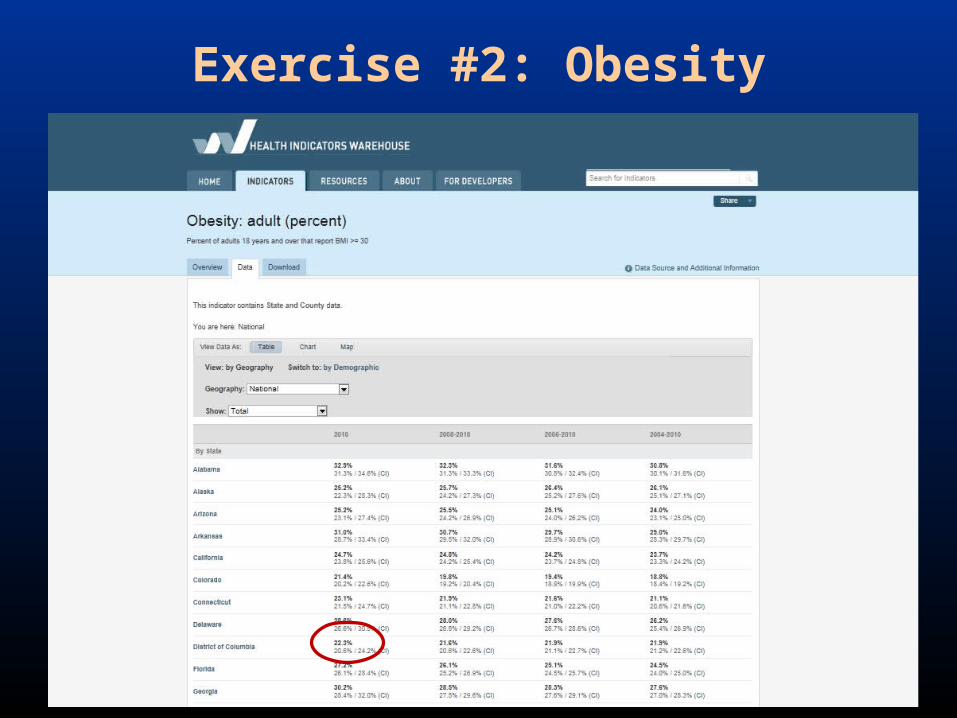
• What was the proportion of persons in Washington DC that were obese in 2010?
• HINT: you can look up “adult obesity” as a keyword
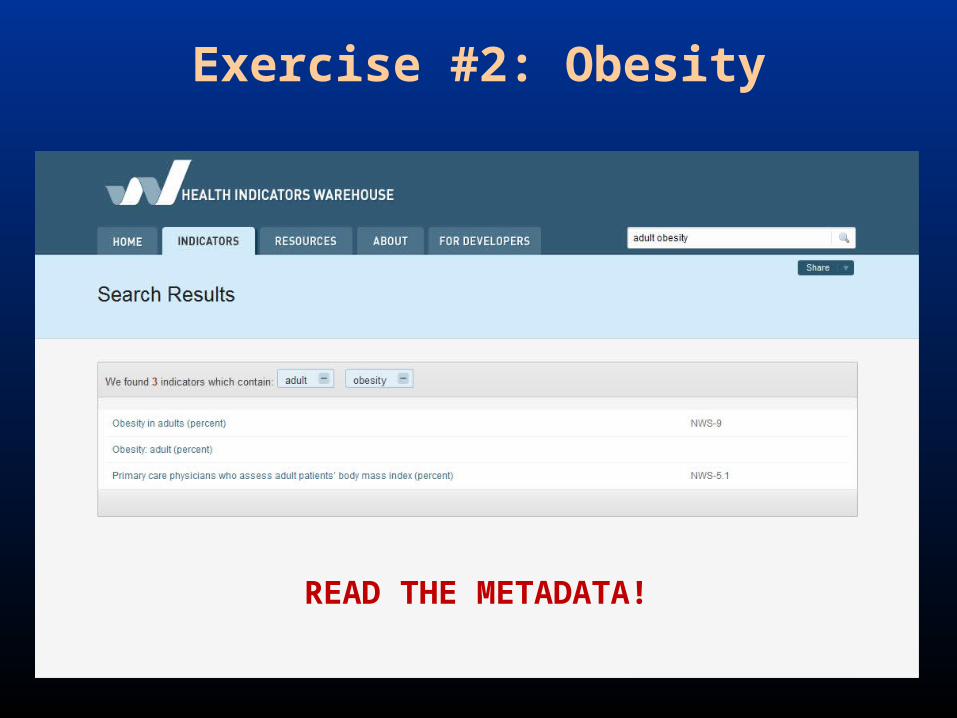
Exercise #2: Obesity
READ THE METADATA!

Exercise #2: Obesity
Exercise #2: Obesity
Exercise #2: Obesity
Exercise #2: Obesity
Exercise #2: Obesity

Help / Contact Us
To receive technical support with the Health Indicators Warehouse:
e-mail: [email protected]