a global leader in used equipment sales · pdf filea global leader in used equipment sales ......
TRANSCRIPT

1
A global leader in used equipment salesInvestor overview presentation
September 2016

2
Forward looking statements and non-GAAP measuresCaution Regarding Forward-Looking Statements
This presentation contains forward-looking statements and forward-looking information within the meaning of applicable U.S. and Canadian securities legislation (collectively, “forward-looking statements”), including, in particular, statements regarding the terms and potential benefits of the proposed transaction between Ritchie Bros. and IronPlanet, the terms and conditions of the proposed transaction, the expected timetable for completing the proposed transaction, benefits and synergies of the proposed transaction, future opportunities for the combined businesses of Ritchie Bros. and IronPlanet, future financial and operational results and any other statements regarding events or developments that Ritchie Bros. believes or anticipates will or may occur in the future. Forward-looking statements are statements that are not historical facts and are generally, although not always, identified by words such as “expect”, “plan, “anticipate”, “project”, “target”, “potential”, “schedule”, “forecast”, “budget”, “estimate”, “intend” or “believe” and similar expressions or their negative connotations, or statements that events or conditions “will”, “would”, “may”, “could”, “should” or “might” occur. All such forward-looking statements are based on the opinions and estimates of management as of the date such statements are made. Forward-looking statements necessarily involve assumptions, risks and uncertainties, certain of which are beyond Ritchie Bros.’s control, including risks and uncertainties related to: general economic conditions and conditions affecting the industries in which Ritchie Bros., IronPlanet and Caterpillar operate; obtaining regulatory approvals in connection with the proposed transaction; each of Ritchie Bros.’ andIronPlanet's ability to satisfy the merger agreement conditions and consummate the transaction on the anticipated timetable, or at all; Ritchie Bros.’ ability to successfully integrate IronPlanet's operations and employees with Ritchie Bros.’ existing business; the ability to realize anticipated growth, synergies and cost savings in the proposed transaction; the maintenance of important business relationships; the effects of the IronPlanet transaction on relationships with employees, customers, other business partners or governmental entities; transaction costs; deterioration of or instability in the economy, the markets we serve or the financial markets generally; as well as the risks and uncertainties set forth in Ritchie Bros.’ Annual Report on Form 10-K for the year ended December 31, 2015, which is available on the SEC, SEDAR, and Ritchie Bros.’ website. The foregoing list is not exhaustive of the factors that may affect Ritchie Bros.’ forward-looking statements. There can be no assurance that forward-looking statements will prove to be accurate, and actual results may differ materially from those expressed in, or implied by, these forward-looking statements. Forward-looking statements are made as of the date of this presentation and Ritchie Bros. does not undertake any obligation to update the information contained herein unless required by applicable securities legislation. For the reasons set forth above, you should not place undue reliance on forward-looking statements.
This presentation contains certain non-GAAP financial measures. For a discussion of non-GAAP measures and the most directly comparable GAAP financial measures, see the Appendix to this presentation as well as our earnings release and our Form 10-Q interim report, which are available at: investor.ritchiebros.com. These non-GAAP financial measures are not measures of financial performance in accordance with GAAP and may exclude items that are significant in understand and assessing our financial condition and results. Therefore, these measures should not be considered in isolation or as alternatives to measures of profitability, liquidity or other performance under GAAP. These measures may not be comparable to similarly-titled measures used by other companies.
This presentation also includes certain forward-looking non-GAAP financial measures. We are unable to present a quantitative reconciliation of this forward-looking non-GAAP financial information because management cannot reliably predict all of the necessary components of such measures. Accordingly, investors are cautioned not to place undue reliance on this information.
All figures are in US dollars, unless otherwise noted.

3
Ritchie Bros. overview
The trusted source for buying and selling industrial equipment• Global leader for industrial auctions; unreserved process
» No minimum bid/reserved price. No buy-backs. » Ensures the sale of goods on the day of the auction at global market price
• Cater to the needs of heavy equipment owners» Customers are from the construction, trucking, agricultural & resource sectors
• 345 auctions; $4.25 billion in Gross Auction Proceeds during 2015» Enormous growth opportunity, with a highly fragmented market
• Provide multichannel sales solutions to expand the breadth of services available to equipment sellers:» EquipmentOne launched in 2013» Mascus (equipment sales listing service) acquired in 2016
Strong financial performance • $515.9 million of revenue during fiscal 2015• $121.1 million of adjusted net income¹ during fiscal 2015
Publicly listed on the NYSE and TSX (as RBA)• Market cap of approx. US$3.8 billion
RBA Auction - Circa 1958
RBA Auction - Now
Ritchie Bros. has a strong heritage –selling used equipment since 1958
¹ Net Income attributable to stockholders

4
32%
50%
10%7%
Canada
United States
Europe
Other
Global reach
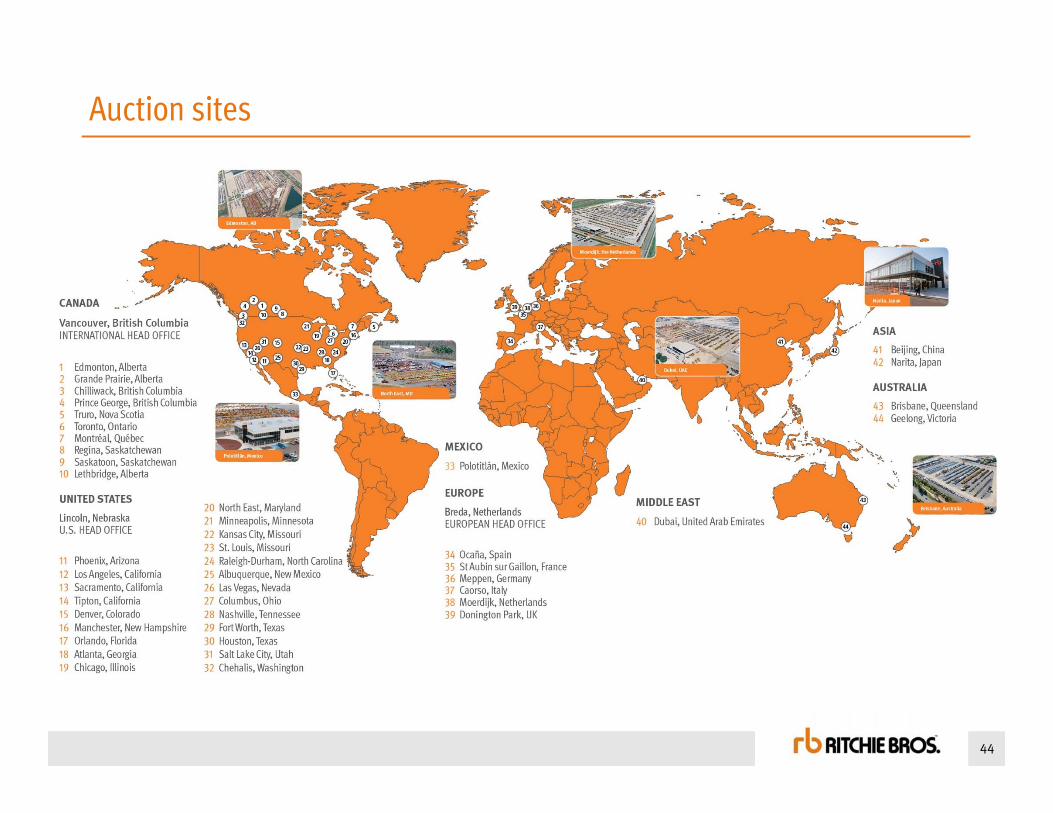
44 auction sites in 14 countries worldwide• More than half of auction purchases are made by bidders from outside
the region of the auction
• Allows RBA to effectively transfer equipment between regions experiencing different economic cycles
• Consignors benefit from global market pricing for their equipment, generated by international demand
• Buyers benefit from a global supply, with an ability to purchase and ship equipment from weak economic regions to areas with stronger growth
32%
47%
12%9%
CanadaUnited StatesEuropeOther
2015 Regional breakdown of revenue(Revenue breakdown - % of 2015 total)
Ritchie Bros.’ online bidding allows customers from around the world to bid on equipment at any of our auctions.
• Real-time information from live auctions available online to registered bidders
$481 Mil
2014 Revenue breakdown - % of 2014 total
$516 Mil
US comprised a greater proportion of revenue in 2015 relative to 2014.

5
Global equipment market size is $360 billion
Ritchie Bros. is a global leader in used equipment sales, with $4.2 billion of equipment sold in 2014However, this represents only 1.2% of a highly fragmented global used equipment exchange market
The US market alone represents over $50 billion, 7x Canada – a key market for growth
Mining
Oil & Gas
Transportation
Agriculture
Construction
Source: Internal estimates; based on historical OEM unit sales, estimates of fleet turnover, and average selling prices at RB auctions. Allocation by geography based on sector GDP.
Mining
Oil & Gas
Transportation
Agriculture
Construction

6
0
100,000
200,000
300,000
400,000
500,000
600,000
2005
2006
2007
2008
2009
2010
2011
2012
2013
2014
2015
Registrants
Lots
0
20,000
40,000
60,000
80,000
100,000
120,000
140,000
2005
2006
2007
2008
2009
2010
2011
2012
2013
2014
2015
Consignors
Buyers
Growing seller and buyer base
5.0% CAGR in consignments over last 10 years
6.4% CAGR in buyers over last 10 years
8.2% CAGR in registrants over last 10 years
5.2% CAGR in Lots over last 10 years
Consignments & buyer base (Metrics are for industrial auctions only)
Auction registrants & lots(Metrics are for industrial auctions only)

7
Growth of Gross Auction Proceeds (GAP)
US$4.25 billion of GAP produced during fiscal 2015
GAP:The aggregate dollar amount transacted through Ritchie Bros. Auctioneers and EquipmentOne
Includes transactions of AssetNation and EquipmentOne online marketplaces in 2012 - 2015
Gross Auction Proceeds (US$ millions)
4,245
$-
$500
$1,000
$1,500
$2,000
$2,500
$3,000
$3,500
$4,000
$4,500
1980
1981
1982
1983
1984
1985
1986
1987
1988
1989
1990
1991
1992
1993
1994
1995
1996
1997
1998
1999
2000
2001
2002
2003
2004
2005
2006
2007
2008
2009
2010
2011
2012
2013
2014
2015

8
Four external influences on GAP
The pricing environment• A strong pricing environment will enhance market values of equipment sold at auctions• Stable or increasing pricing environment provides consignors with more confidence to sell
equipment through unreserved auctions
The mix of categories of assets sold • RBA sells a wide variety of industrial and agricultural equipment and other products. There is
no consistency to the mix of assets sold, as it varies at each auction held due to regional, seasonal and cyclical factors.
• The proportion of higher-valued items sold at each auction relative to smaller goods impacts the auction proceeds generated
The mix of equipment age• Newer equipment generally has a higher market value compared to older machinery
The number of Lots consigned• Each sale generates proceeds. Increasing the number of Lots sold can bolster gross auction
proceeds
12
34

9
Unreserved auction revenue model
Four main revenue streams support Ritchie Bros.’ unreserved auction business:
Unreserved Auction
Straight Commission
Guaranteed Proceeds (underwritten transaction)
Inventory (underwritten transaction)
Consignors contract to sell their equipment through one of Ritchie Bros. unreserved auctions. A pre-determined percentage of the selling price is provided to RBA as commission.
Consignors are guaranteed to receive a pre-determined amount for their equipment, regardless of the final selling price at the auction. A stepped commission fee is negotiated, accounting for the additional risk being assumed by RBA. (Also known as an ‘at risk’ transaction)
On rare occasions, Ritchie Bros. may choose to purchase equipment outright, obtaining title of the piece to sell at an upcoming auction.
TRANSACTION TYPE REVENUE
Straight Commission fee (% of auction proceeds)
Stepped commission fee (x% of guaranteed proceeds; x+y% for proceeds above guaranteed amount)
Gains on sale
Sellers (Consignors)
Buyers Admin Fees & Value-added Services (VAS) Admin fees and fees from value-added service activities
RBA provides many services to assist with the purchase of equipment, including financing , inspection services, painting etc.
Revenue from other business lines supplement our revenue: EquipmentOne buyer and seller fees; Xcira revenue; Mascus revenue

10
54%
46%
0%
10%
20%
30%
40%
50%
60%
70%
Q1 2012 Q 2 Q 3 Q 4 Q1 2013 Q 2 Q 3 Q 4 Q1 2014 Q 2 Q 3 Q 4 Q1 2015 Q 2 Q 3 Q 4 Q1 2016 Q2
Online
Onsite
Q2 2016: First time more than half of GAP sold online
Online purchases comprised 51% of GAP in Q2 2016, the first time more than half of GAP was generated by online buyers.• Online transactions growing due to changing customer preferences, greater participation from non-
local bidders, the introduction of the Ritchie Bros. app, and growth of E1 • Sold approx. $650 million of assets through online transactions (incl. E1) during Q2 2016, an increase
of 11% from Q2 2015 • 54% of buyers during Q2 2016 participated in our auctions online
*Industrial auction data
Percent of buyers: # of buyers, on site or online
54% of total # of buyers were online(51% of total GAP was sold online)

11
Investing in our digital capabilities
Public launch of Ritchie Bros. App has been highly successful• Officially launched in App stores July 11, 2016• Early reviews in App stores are all 5-stars, demonstrating strong user endorsement• Including the beta testing period in Q1 and Q2 (prior to public launch), the app has
accumulated:• 68 successful winning bids• US$1.35 million of GAP
• Increased promotion of the App (and smartphone enabled bidding) will occur in coming months
Creation of Enterprise Sales Solution direct user portals for key EquipmentOne accounts launched earlier this year• Flexible, end-to-end solution that allows companies to better control asset management • Product includes data integrations, automated process workflows, remarketing solutions,
public and private (e.g. dealer to dealer networks, internal corporate redeployment sites) disposition channels, and detailed reporting capabilities.
• New customers include one of the world’s largest transportation OEM’s and a leading energy companies; interest in the product is aggressively growing

12
Growing our breadth of services through acquisitions
Since November 2015 we have deployed $90 million of capital to grow our sales channels and bolster our core business
Additional $758.5 committed to acquire IronPlanet
• During Q3 2016 (to date) we acquired the remaining 49% stake of Ritchie Bros. Financial Services, a minority investment in Machinio, and the purchase of Petrowsky Auctioneers
• On August 29, 2016 we announced the acquisition of IronPlanet for US$758.5 million (to close before or during H1 2017)
• Continue to evaluate M&A opportunities
Q4 2015 Q1 2016 Q3 2016 (to date)
(75% stake)
(Minority interest)
Recent M&A Activity:
(Announced; to close before or during H1 2017)

13
Multichannel solutions:
• Offers sellers more control over the sales price, time and purchaser; opens up opportunities for RBA to bid on RFPs
• During 2015, EquipmentOne contributed approx. $120 million of GTV (Gross Transaction Value) to GAP; up 13% from 2014
• Operates primarily in the United States; expanded into Canada in Q1 2016
• Website traffic up 11% in 2015, compared to 2014 (average monthly user)
Commercially launched in 2013
Customers of EquipmentOne value having control over the process and price, more than the guarantee of sale. They prefer a negotiated price, over global market value.
The launch of EquipmentOne provided customers with another sales solution – an online equipment marketplace
The seller journey: sellers choose methods based upon needed degree of controlOur vision is to position appropriate solutions at each point of seller journey and connect them
High
Cont
rol t
o Se
ller
LowEffort for Seller
Control over:PriceTime
LocationBuyer
Low
High
Uncertain CertainSome Certainty of Sale
Result: Transacting anyhow, anytime, anywhere
14
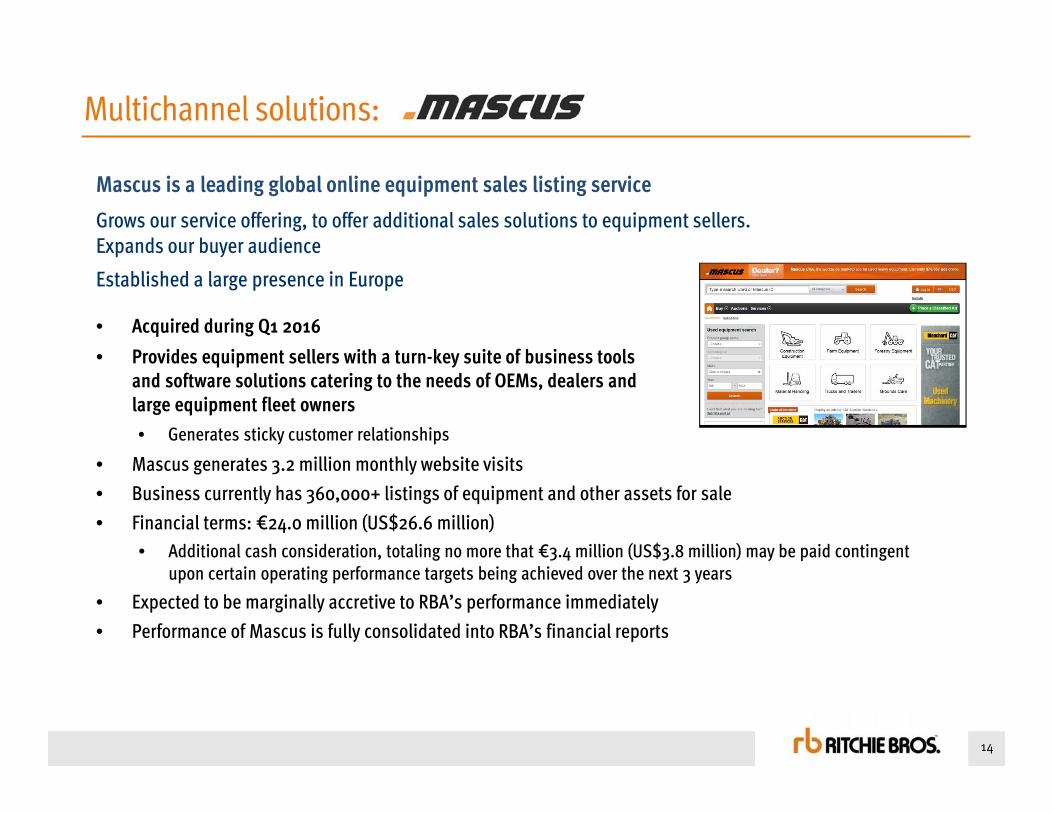
Multichannel solutions:
• Acquired during Q1 2016• Provides equipment sellers with a turn-key suite of business tools
and software solutions catering to the needs of OEMs, dealers and large equipment fleet owners• Generates sticky customer relationships
• Mascus generates 3.2 million monthly website visits• Business currently has 360,000+ listings of equipment and other assets for sale• Financial terms: €24.0 million (US$26.6 million)
• Additional cash consideration, totaling no more that €3.4 million (US$3.8 million) may be paid contingent upon certain operating performance targets being achieved over the next 3 years
• Expected to be marginally accretive to RBA’s performance immediately• Performance of Mascus is fully consolidated into RBA’s financial reports
Mascus is a leading global online equipment sales listing serviceGrows our service offering, to offer additional sales solutions to equipment sellers.Expands our buyer audience
Established a large presence in Europe

15
Strategic roadmap

16
PRIORITY DISCUSSION
1. Grow dividends with earnings Highly valued return of cash to shareholders
2. Hold fully-diluted shares flat Offset dilution from management stock options through share buybacks
3. Acquisitions Accelerate top-line growth and leverage the model
4. Share buy-backs Growth initiatives are a higher priority at this time
5. Pay down debt Only if better economic returns are not available
Capital allocation priorities
Consistently make use of cash on our balance sheet to facilitate underwritten transactions;The strength of our balance sheet is a competitive advantage.
(1) Priorities for cash utilization after operating CAPEX needs have been met.

17
0.10
50 0.11
25
0.11
25
0.11
25
0.11
25
0.12
25
0.12
25
0.12
25
0.12
25 0.13
00
0.13
00
0.13
00
0.13
00
0.14
00
0.14
00
0.14
00
0.14
00
0.16
00
0.16
00
0.16
00
0.16
00
0.17
00
0.1000
0.1100
0.1200
0.1300
0.1400
0.1500
0.1600
0.1700
0.1800
Q1/1
1
Q2/1
1
Q3/1
1
Q4/1
1
Q1/1
2
Q2/1
2
Q3/1
2
Q4/1
2
Q1/1
3
Q2/1
3
Q3/1
3
Q4/1
3
Q1/1
4
Q2/1
4
Q3/1
4
Q4/1
4
Q1/1
5
Q2/1
5
Q3/1
5
Q4/1
5
Q1/1
6
Q2/1
6
6.3% increase in quarterly cash dividend
Growing our dividend alongside earnings; announced a 1 cent increase to quarterly cash dividend on August 8, 2016Committed to 55-60% dividend payout, based on earnings trailing 12 months
Dividends declared ($US cash dividends)
7.1% increase
8.9% increase
6.1% increase
7.7% increase
6.3% increase
14.0% increase
18
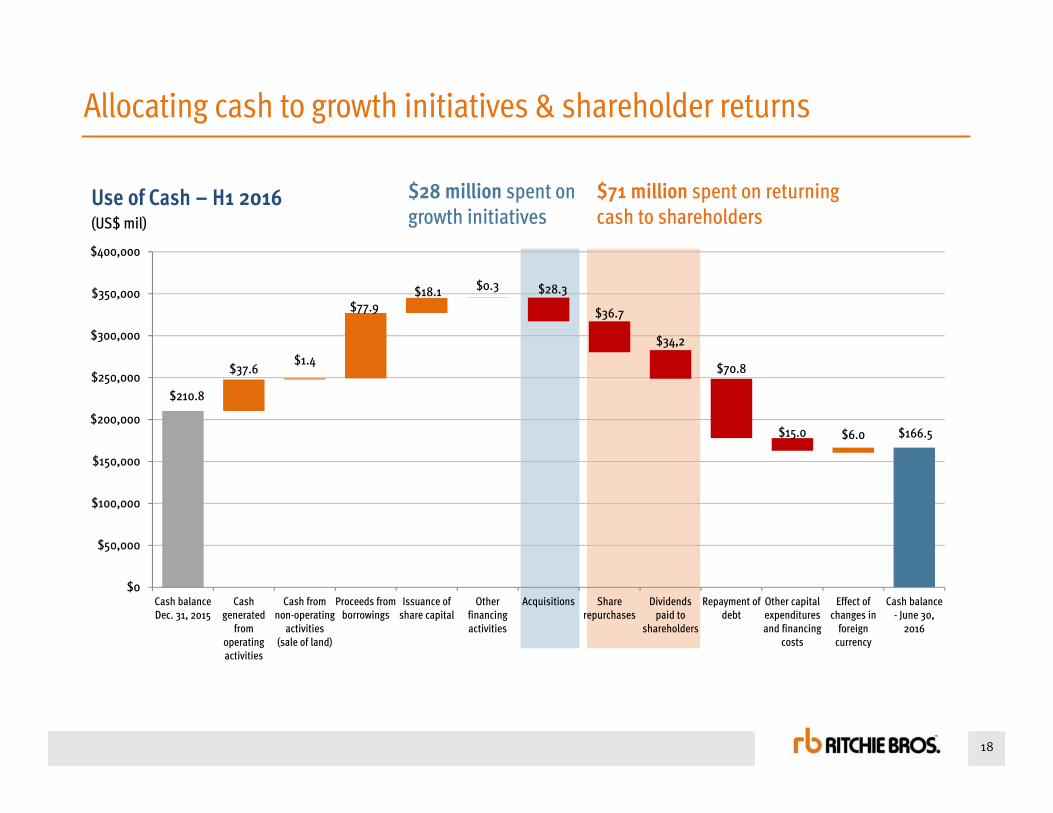
Allocating cash to growth initiatives & shareholder returns
Use of Cash – H1 2016(US$ mil)
$71 million spent on returning cash to shareholders
$28 million spent on growth initiatives
$210.8
$166.5
$37.6$1.4
$77.9$18.1 $0.3 $28.3
$36.7
$34,2
$70.8
$15.0 $6.0
$0
$50,000
$100,000
$150,000
$200,000
$250,000
$300,000
$350,000
$400,000
Cash balanceDec. 31, 2015
Cashgenerated
fromoperatingactivities
Cash fromnon-operating
activities(sale of land)
Proceeds fromborrowings
Issuance ofshare capital
Otherfinancingactivities
Acquisitions Sharerepurchases
Dividendspaid to
shareholders
Repayment ofdebt
Other capitalexpendituresand financing
costs
Effect ofchanges in
foreigncurrency
Cash balance- June 30,
2016
Acquisition of IronPlanet
19
On August 29, 2016, Ritchie Bros. announced it will acquire IronPlanet
20
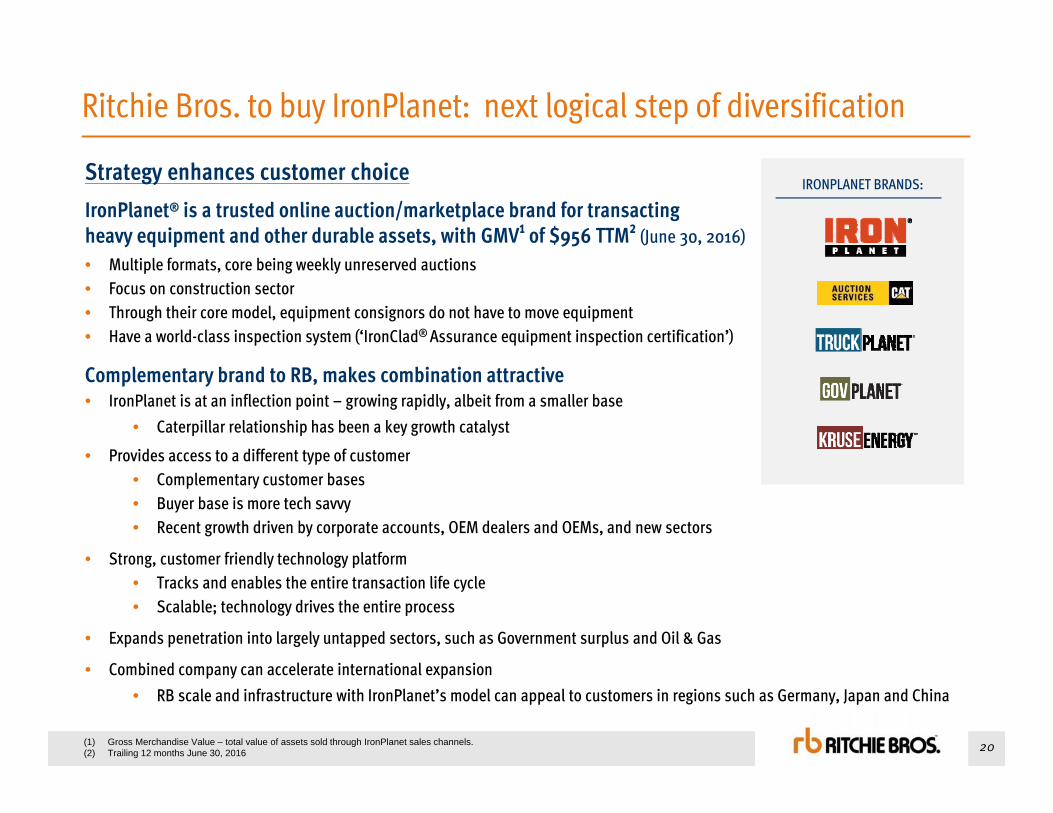
Strategy enhances customer choiceIronPlanet® is a trusted online auction/marketplace brand for transacting heavy equipment and other durable assets, with GMV¹ of $956 TTM² (June 30, 2016)• Multiple formats, core being weekly unreserved auctions• Focus on construction sector• Through their core model, equipment consignors do not have to move equipment• Have a world-class inspection system (‘IronClad® Assurance equipment inspection certification’)
Complementary brand to RB, makes combination attractive• IronPlanet is at an inflection point – growing rapidly, albeit from a smaller base
• Caterpillar relationship has been a key growth catalyst
• Provides access to a different type of customer• Complementary customer bases • Buyer base is more tech savvy • Recent growth driven by corporate accounts, OEM dealers and OEMs, and new sectors
• Strong, customer friendly technology platform• Tracks and enables the entire transaction life cycle• Scalable; technology drives the entire process
• Expands penetration into largely untapped sectors, such as Government surplus and Oil & Gas
• Combined company can accelerate international expansion• RB scale and infrastructure with IronPlanet’s model can appeal to customers in regions such as Germany, Japan and China
Ritchie Bros. to buy IronPlanet: next logical step of diversification
(1) Gross Merchandise Value – total value of assets sold through IronPlanet sales channels.(2) Trailing 12 months June 30, 2016
IRONPLANET BRANDS:

21
Summary of transaction terms
CONSIDERATION• ~US$758.5 million cash transaction¹ • 13.0X multiple of 2017E EBITDA²
EXPECTED FINANCIAL BENEFITS
• The transaction is expected to be earnings accretive within the first year ³• Annual cost synergies of ~$20 million, expected to be achieved by 2018• NPV of tax synergies of ~$100 million• Similar operating leverage model as Ritchie Bros.• Similar cash flow characteristics to Ritchie Bros.
GROWTHIMPLICATIONS
• RB’s revenue growth target4 revised upward to high single to low teens (% growth) post transaction• RB’s EPS growth target4 revised upward to low teens to high teens (% growth)
FINANCING
• Fully committed financing in place• Expect to replace committed facility with mix of pre-payable debt and long-term debt• Utilizes strength of Ritchie Bros. balance sheet• After final financing in place, expect <3.0x net to adjusted EBITDA ratio on closing
(with a target of returning to 2.5x)
CLOSING• Expect closing during or before H1 2017• Transaction is subject to customary closing conditions, including regulatory clearances
Ritchie Bros. has entered into an agreement to acquire 100% of IronPlanet
(1) Consists of US$740 million in cash plus approximately $18.5 million assumption of unvested equity interests, subject to standard closing adjustments(2) Inclusive of $100 million NPV of tax synergies and $20 million in run-rate cost synergies. Based on current tax environment(3) Transaction is expected to be accretive to earnings within the first year, excluding acquisition related costs(4) Growth implications is part of our new evergreen model post transaction; does not represent annual guidance
Provided to help with modeling an average annual basis over a 5 to 7 year period

22
$49
$72
$-
$20
$40
$60
$80
H1 2015 H1 2016
$395
$567
$- $100 $200 $300 $400 $500 $600 $700
H1 2015 H1 2016
IronPlanet brings exciting new opportunities to Ritchie Bros.
About IronPlanet
IronPlanet is the leading online marketplace for used heavy equipment.
US$787 million of GMV¹ (GAP) in 2015• 25.2% CAGR from 2013 – 2015• Most growth occurred in the last year• Strong growth trajectory
Strong collaborative relationship with Caterpillar and equipment dealerships in the Caterpillar network
Holds the U.S. Department of Defense rolling stock surplus contract (DLA contract)
490+ employees worldwide• Majority are based in the United States• ~10% are based in countries other than US
Private company • Current owners include Caterpillar Inc., Caterpillar
dealers, Volvo, venture cap (Kleiner Perkins and AccelPartners) and IP executives & employees
$502 $524
$787
$-
$100
$200
$300 $400
$500
$600
$700
$800
$900
2013 2014 2015
$58$65
$103
$-
$20
$40
$60
$80
$100
$120
2013 2014 2015
GROSS MERCHANDISE VALUE (GMV)(US$ millions)
REVENUE(US$ millions)
Strong growth in 2015 and H1 2016, generated by strategy to focus on major accounts, Caterpillar dealers and government contracts
50% growth 58% growth
44% growth 47% growth
(1) GAP/GMV represents the total proceeds from all items sold at auctions and online marketplaces. It is a measure of operational performance and not a measure of financial performance, liquidity, or revenue. It is not presented in our consolidated financial statements.

23
IP has built a platform for growth based on different value propositionsPR
ODUC
TS
FeaturedMarketplace
• Scheduled public online unreserved auctions held weekly
One-OwnerMarketplace
• Similar to “Featured Marketplace” but targets single-owner, single-event sales
DailyMarketplace
• Equipment pieces listed for sale, with a reserve price, on the website for a defined period of time
PrivateMarketplace
• Available for large industrial, rental companies and OEM equipment sellers who want to offer equipment assets to a select group of potential buyers
SERV
ICES Sellers • Includes equipment pricing & market evaluation, listing
services, inspection services, and funds settlement
Buyers • Offers detailed inspection reports to prospective buyers
SUMMARY OF IRONPLANET OFFERINGS:
IRONPLANET HISTORY
1999:Founded as Federal Sales Corp.
2013:Acquired Asset Appraisal Services (AAS), an inspection, appraisal and online auction services company
November 2014:Acquired Kruse Energy and Equipment Auctioneers, a leader in oilfield equipment auctions
April 2015:Merged with Cat Auction Services, an alliance of Caterpillar and independent Cat dealers
2016:Agrees to be acquired by Ritchie Bros.
More frequent auctions meet the needs of urgent sales. Improves the flow of business
VALUE PROPOSITION & OPPORTUNITY:
White labeled sales solutions to promote the brand and reputation of the selling customer
Reserve model meeting the needs of equipment sellers with minimum pricing restrictions
Private labeled sales solution to meet the ongoing needs of a single seller to a defined group of buyers. (Ensures preferred access to the sale to a pre-approved customer base, such as dealers within a brand family)
Full service sales offering that provides the seller with the option of keeping equipment where it is
IronClad guarantees and detailed inspection reports provide comfort to online buyers who have not inspected the equipment
Multiple formats provide customers with options that meet their specific needs/wantsCustomers that use multiple formats tend to consign more
July 2014:Awarded contract for U.S. Department of Defense rolling stock surplus contract

24
Combining RB and IronPlanet is transformative for our business
Offers a superior customer experience
a) Multiple sales channels for used equipment sellers and buyersb) More diversified, multichannel, multi-format live and digital sales ecosystemc) Equipment buyers and sellers will be able to transact and list when, where and how they want
Accelerates Growth
a) Expedites RB’s stated growth strategies: important gateways for growth in new sectors, regions and customer segments
b) Significantly enhances financial performance, with immediate positive impact to GAP, revenue & earningsc) Logical next step in our transformation – at the right time with a complementary brand
Strengthens relationships with OEMs and Dealers
a) New strategic alliance with Caterpillar is transformational for our business b) As a combined business independent Cat dealers will benefit from industry-leading data intelligence and
global marketing efforts, alongside established auction and online marketplace sales supportc) IronPlanet leadership has developed deep relationships with independent Cat dealers
Builds on the power of our existing
global platform
a) IronPlanet sales formats will benefit from RB’s established global footprint, scale, marketing prowess and brand awareness to drive incremental growth
b) Complementary cultures and talented leadership teams that will continue to drive innovationc) Equally committed to delivering value to our customers
Enhances digital and technology
capabilities
a) Significantly diversifies and expands RB online capabilitiesb) Combined data will drive greater transaction volume and build deeper relationships with OEMs and customersc) EquipmentOne and IronPlanet technology platforms are complementary
1
2
3
4
5
Compelling strategic rationale

25
Live on site and live simulcastonline auctions
Event-based sales of used
construction and heavy equipment
Online sales of used construction and used trucks
and trailers
Online reserve auction and marketplace
Online sales of government
surplus rolling stock
Event-based sales of used oil
and gas equipment
Online advertising
listing service and B2B portals
Confidential, negotiated sales
Providing unprecedented choice to used equipment sellers & buyers
Together, we will offer customers the widest range of sales solutions and selling formats:
Live auction(with online simulcast)
Online-Only Auction
Event-Based Auction
Reserve Price options Buy Now options Single Seller
optionsPrivate-Label
optionsListing service
✓ ✓ ✓ ✓ ✓ ✓ ✓ ✓
A MULTITUDE OF SALES CHANNEL OPTIONS, MEETING MORE CUSTOMER NEEDS:
OUR FULL-SERVICE OFFERING WILL CATER TO SPECIFIC NEEDS OF EQUIPMENT CONSIGNORS, WITH DIFFERING NEEDS:
26
RB AuctionsEquipmentOneIronPlanet
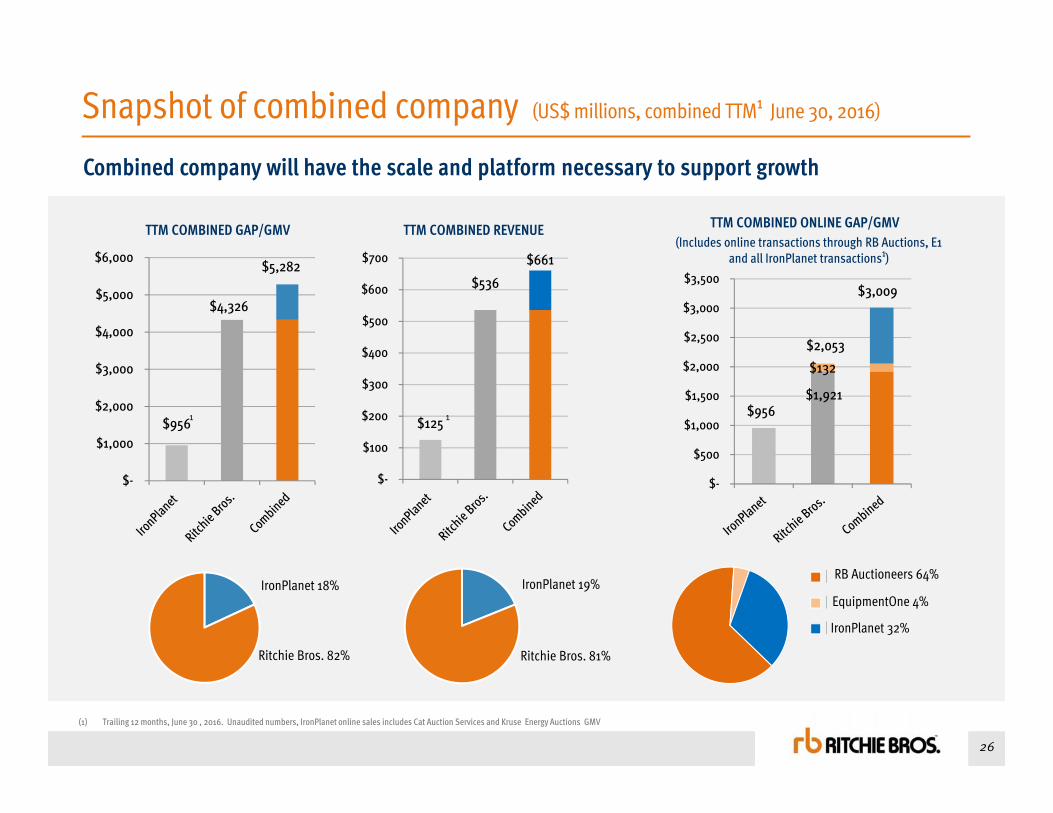
Snapshot of combined company (US$ millions, combined TTM¹ June 30, 2016)
Combined company will have the scale and platform necessary to support growth
TTM COMBINED GAP/GMV(Includes online transactions through RB Auctions, E1
and all IronPlanet transactions¹)
TTM COMBINED REVENUE
IronPlanet 18% IronPlanet 19%
Ritchie Bros. 82% Ritchie Bros. 81%
(1) Trailing 12 months, June 30 , 2016. Unaudited numbers, IronPlanet online sales includes Cat Auction Services and Kruse Energy Auctions GMV
$956
$4,326
$5,282
$-
$1,000
$2,000
$3,000
$4,000
$5,000
$6,000
$125
$536
$661
$-
$100
$200
$300
$400
$500
$600
$700
IronPlanet 32%
EquipmentOne 4%
RB Auctioneers 64%
$956$1,921
$3,009
$132
$-
$500
$1,000
$1,500
$2,000
$2,500
$3,000
$3,500
$2,053
TTM COMBINED ONLINE GAP/GMV
¹ ¹
27
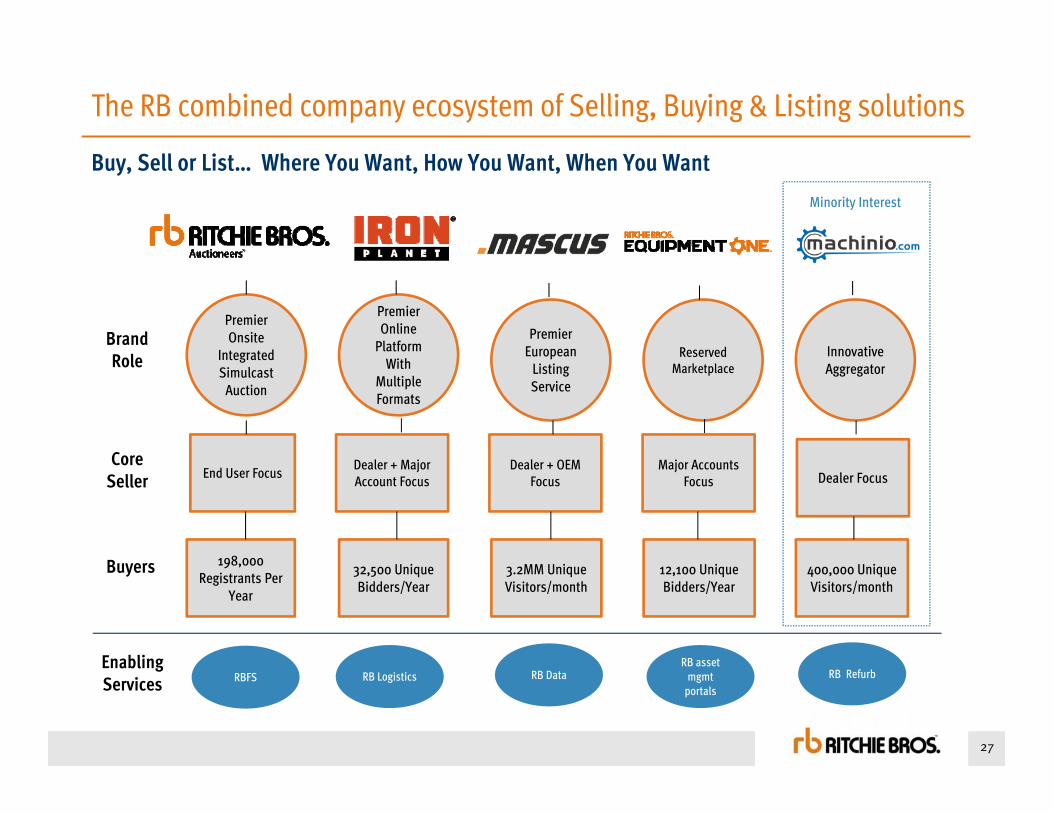
The RB combined company ecosystem of Selling, Buying & Listing solutions
Buy, Sell or List… Where You Want, How You Want, When You Want
Premier Onsite
Integrated Simulcast
Auction
Premier Online
Platform With
Multiple Formats
Premier European
Listing Service
Reserved Marketplace
Innovative Aggregator
End User Focus Dealer + Major Account Focus
Dealer + OEM Focus
Major Accounts Focus Dealer Focus
198,000 Registrants Per
Year
32,500 Unique Bidders/Year
3.2MM Unique Visitors/month
12,100 Unique Bidders/Year
400,000 Unique Visitors/month
Brand Role
Core Seller
Buyers
RBFS RB DataRB asset
mgmtportals
Enabling Services
Minority Interest
RB Logistics RB Refurb

28
0.9 0.90.6 0.6 0.6 0.5 0.6 0.7 0.6
3.02.5
0.00.51.01.52.02.53.03.5
FINANCING PLAN AND PRO FORMA CAPITALIZATIONFinancing plan and pro forma capitalization
• RB has secured a financing commitment sufficient to fund the acquisition until permanent capital structure can be put in place
• Permanent structure will consist of short-term and long-term components
» We will work with our existing creditors to evaluate our alternatives for our final, permanent capital structure
• We estimate that $850 million of debt will be outstanding on the closing date of the transaction
» The transaction implies net leverage multiple of 3.0x and the potential for rapid de-levering with abundant free cash flows (evergreen target for net debt to adjusted EBITDA remains at 2.5x)
• Effectively uses the balance sheet while allowing for continued financial flexibility
• Additional cash flows for combined company can be allocated towards:
» de-levering, » investing in organic growth opportunities, » returning cash to shareholders via dividends, and/or» potential bolt-on acquisitions
Sizeable opportunity to deploy under-levered balance sheet to support growthNET-DEBT TO ADJUSTED EBITDA (Historical and projected RB, TTM periods)
Target ratio of <2.5x by 2018
$153
$164
$158
$119
$112
$119
$110
$125
$145
$125
Appr
ox. $
850+
0100200300400500600700800900
1000
Long term debt
Short term debt
DEBT HELD & PROJECTED (US$ millions)

29
Alliance with Caterpillar Inc.
Alliance with Caterpillar will be transformative for our business; Provides RB with a strong foundation to be a trusted partner with the Cat dealer network… building on a strong foundation built by IronPlanet
• Initial 5-year agreement term with Caterpillar Inc. and its wholly owned subsidiaries; focus on long-term evergreen relationship
• Ritchie Bros. becomes their preferred global partner for auction and online marketplace sales services for used equipment upon IP transaction closing
• Caterpillar Inc. and its dealers will be supported through our industry leading data intelligence, sales information and global marketing efforts
• Cat Auction Services will continue to be the brand for auctions on Cat dealer sites
STRATEGIC ALLIANCE
2014 2015
CAT FAMILY VOLUME AT IRONPLANET¹( % of total IronPlanet GMV)
(1) Source: estimates provided by IronPlanet. Gross Merchandise Value: total value of assets sold through IronPlanet channels, comparable to Ritchie Bros. Gross Auction Proceeds

30
PERFORMANCE METRICSBefore transaction:
Avg. Annual Growth Targets
GAP Growth (%) High Single Digit to Low Double Digits
Revenue Growth (%)1 Mid Single Digit to High Single Digit
Operating expense Growth (%) Will grow slower than revenues
Operating Income Margin 50 bps+
EPS Growth2 (%) High Single Digit to Low Double Digits
Capex Intensity3 <10%
OFCF4 % of Net Income >100%
ROIC5 Increase 50 bps+
Dividend Payout Ratio 55% to 60%
Net Debt / Adjusted EBITDA <2.5x
1 Includes Tuck in and Bolt on Acquisitions.2 Variances may occur in certain years based on tax rate that is influenced by geographic revenue mix. 3 Net Capital Spending as % of Revenue.
RB’s updated evergreen financial model (post transaction)
4 Operating Free Cash Flow.5 Return on Invested Capital.
Transaction is expected to bolster growth New Evergreen Model (post transaction)(Average annual expectation over a 5 to 7 year period)
KEY SHAREHOLDER VALUE DRIVERS
Growth targets
GAP & Revenue growth (%) High single digit to low teens
EPS growth (%) Low teens to high teens
OFCF as a % of net income > 100%
Dividend Payout ratio 55%-60%
DRIVERS OF EPS GROWTH- Operating expenses growing slower than revenue- Cost synergies- Tax efficiencies
OTHER KEY METRICS Targets
Net debt to EBITDA <2.5 x
Capex Intensity <8.5%
EBITDA margins of 40%+ by 2018
ROIC returning to current levels by 2020 (15.1%: Q2 2016 TTM)

31
MERGERS AND ACQUISITIONSTuck-Ins and Bolt-Ons
Scale Enhancers & Needle MoversAccretive in Relatively Short Time Frame
GEOGRAPHIESDrive Depth vs Breadth
Focus on the US as #1 priority, grow Middle East and AustraliaOptimize Canada & Europe, turnaround LATAM
Position China for long term
SECTORSLeverage Construction
Grow Agriculture and TransportationPursue Oil & Gas opportunistically
SERVICESScale RBFS, achieve super majority
Pilot logistics
SEGMENTSAccelerate Strategic Accounts
Pilot Private Treaty as a New Vehicle forHighvalue, Specialized Deals
UNDERWRITTEN CONTRACTSUtilize Aggressively, Minimize Volatility
SALES PRODUCTIVITYTerritory Management & Coverage Based on Market Potential
Consistent Go to Market ProcessesImprove Selection, Onboarding & Training of New Hires
Consistently Utilize Sales ToolsReduce TM Turnover
PROCESS & SYSTEMSModernize Legacy Systems
Focus on Customer Relationship Management (CRM)Enable Scaling Business & Leverage Multichannel
Focus on revenue driving Apps
ORG STRUCTURE AND SELLING,GENERAL & ADMINISTRATIVE EXPENSE
Regional Org Structure with Profit & Loss (P&L) Statement and Balance Sheet Accountability
Target SG&A Growth Lower than Revenue Growth
PERFORMANCE METRICSP&L Statement and Balance Sheet Scoreboard
Operational MetricsAccountability at All levels
INCENTIVE COMPENSATIONTie to P&L Statement and Balance Measures
but simplify
CASH FLOWAlign Organization & Incentive
Target OFCF Equal to Net Income
ORGANIC CAPITAL SPENDSTarget Net Capital Spend <10% Revenue
Control Spending on New SitesFocus on IT Systems & Site Maintenance
CAPITAL STRUCTUREReturn Cash Via Ongoing Dividends
Address Option Dilution through Share RepurchaseInvest in Growth-Driven M&A
EXISTING SITE RETURNSHigh, Medium and Low Site Return League Table
Initiatives to Improve Medium and Low Site ReturnsDispose of Excess Assets
GrowRevenue & Earning
1
DriveEfficiencies & Effectiveness
2
OptimizeBalance Sheet
3
IronPlanet transaction meets many stated growth strategies
IronPlanet transaction meets this stated strategic criteria
CHANNELSScale EquipmentOneDrive Multichannel
RITCHIE BROS. LONG-TERM STRATEGY

32
The Ritchie Bros. family of brands
Ritchie Bros. will offer five main sales channels to equipment ownersBusiness units are supported through Ritchie Bros. ownership of Xcira (online auction technology provider) and Ritchie Bros. Financial Services (financial solutions partner for equipment buyers).
75% ownership
100% ownership
Integrated technology platform
Financial intermediary capitalizing on captive customer base to provide an alternative source of capital
Integrated onsite/online auction network¹
Online marketplace
Online listing service
Brokerage channel for highly specialized assets ¹ Includes Petrowsky Auctioneers
and Kruse Energy Auctions:
Online marketplace and online auction
Financial performance
For six and three months ended June 30, 2016, and full year 2015.
33

34
Reported - % Growth Constant Currency - % GrowthVersus Q2 2015 Versus Q2 2015
GAP 1% 3%
Revenue 2% 4%
Operating Income (15)% (13)%
Diluted EPS (12)% n/a
Operating Free Cash Flow (12 month rolling)
(63)% n/a
RONA excl. term loan reclass(12 month rolling)
260 bps n/a
ROIC(12 month rolling)
60 bpsn/a
Q2 2016 financial highlights
Revenue grew modestly on a tough comp versus prior year; maintained strong revenue rate• Costs of Services and SG&A increased disproportionately on account of new businesses, headcount investment in
strategic initiatives, and increased auction volumes; • Cash flow declined due to timing issues, but company remains a strong cash generator
attributable to stockholders

35
Reported - % Growth Constant Currency - % GrowthVersus H1 2015 Versus H1 2015
GAP 4% 6%
Revenue 7% 10%
Operating Income (3)% (2)%
Diluted EPS 2% n/a
Operating Free Cash Flow (12 month rolling)
(63)% n/a
RONA excl. term loan reclass(12 month rolling)
260 bps n/a
ROIC(12 month rolling)
60 bpsn/a
H1 2016 financial highlights
While Q1 generated solid results, first half results for 2016 were proportionately impacted by larger Q2 Foreign exchange continues to have an impact on quarterly comparators
attributable to stockholders

36
Very strong results in 2015
Performance during 2015 demonstrates our commitment to execution, our strategy is gaining traction, and our agility in leveraging market opportunities
Foreign exchange remains a headwind2015 Reported - % Growth 2015 Organic - % Growth
Versus 2014 Versus 2014
GAP 1% 8%
Revenue 7% 16%
Adjusted Operating Income 20% 46%
Diluted Adjusted EPS 22% n/a
Operating Free Cash Flow (12 month rolling)
28% n/a
RONA (12 month rolling)
1100 bps n/a
RONA excluding effects of term loan reclassification
910 bps n/a
attributable to stockholders

37
Income statement scorecard – Q2 2016
3 months trailing ($US Millions except for EPS, %)
June 30, 2016 June 30, 2015 Better / (Worse)
GAP $1,275.7 $1,262.2 1%
Revenues $158.8 $155.5 2%
Revenue Rate 12.45% 12.32% 13 bps
Operating Income $53.6 $62.8 (15)%
Operating Income Margin 33.8% 40.4% (660) bps
EBITDA $64.7 $74.7 (13)%
Diluted EPS $0.37 $0.42 (12)%
Q2 2016 Income statement scorecard
GAP and Revenue Rate increased modestly; Op income and EPS impacted by lower margins than in Q2 2015
attributable to stockholders

38
Balance sheet scorecard – Q2 2016
12 months trailing ($US Millions except for percent figures)
June 30, 2016 June 30, 2015 Better / (Worse)
Operating Free Cash Flow $81.6 $218.1 (63)%
Working Capital Intensity -19.8% -23.9% (410) bps
Capex Intensity 3.6% 3.2% (40) bps
ROIC (Return on Invested Capital) 15.1% 14.5% 60 bps
RONA (Return on Net Assets) 25.4% 25.3% 10 bps
RONA excluding term loan reclassification 25.4% 22.8% 260 bps
Debt / Adjusted EBITDA 0.6x 0.6x no change
Q2 2016 Balance sheet scorecard

39
Income statement scorecard – 2015
12 months trailing ($US Millions except for EPS, %)
Dec. 31, 2015 Dec. 31, 2014 Better / (Worse)
GAP $4,247.6 $4,212.6 1%
Revenues $515.9 $481.1 7%
Revenue Rate 12.14% 11.42% 72 bps
Adjusted Operating Income $166.5 $138.2 20%
Adjusted Operating Income Margin 32.3% 28.7% 360 bps
Diluted EPS $1.27 $0.85 50%
Diluted Adjusted EPS $1.13 $0.93 22%
Full year 2015 Income statement scorecard
Increased Diluted EPS by 50% versus last year – through GAP growth, revenue rate improvement, expense control, excess land sales and tax planning strategies
attributable to stockholders
attributable to stockholders

40
Balance sheet scorecard – 2015
12 months trailing ($US Millions except for percent figures)
Dec. 31, 2015 Dec. 31, 2014 Better / (Worse)
Operating free cash flow $182.2 $141.8 28%
Working Capital Intensity -3.2% -2.3% 90 bps
Capex Intensity 2.8% 6.2% 340 bps
ROIC (Return on Invested Capital) 15.1% 12.0% 310 bps
RONA (Return on Net Assets) 25.7% 14.7% 1100 bps
RONA excluding term loan reclassification 23.8% 14.7% 910 bps
Debt / Adjusted EBITDA 0.5x 0.6x 0.1x
2015 Balance sheet scorecard

41
Focused on generating long-term shareholder value through continued earnings and dividend growth.
A global leader in industrial auctions• Substantial growth opportunity• Focused on growth in the US and in key sectors
Diversifying services to meet broader customer needs• Sales solutions: Ritchie Bros. Auctioneers, EquipmentOne, Mascus• Complementary services: Ritchie Bros. Financial Services, Logistical Services• Supportive business unit: Xcira (online auction technology solutions)
Focused on basics of: • EPS growth • Return on Net Assets• EBITDA margin• Operating free cash flow
Summary
Moerdijk, Netherlands auction
Learn more about Ritchie Bros. auctions through our online videos:
www.youtube.com/ritchiebros

AppendicesAge of equipment sold trendsGlobal auction site network
42
43
11.5%
9.6%
4.2%
3.6%
8.7%
10.9%
8.6%
13.1%
12.1%
11.0%
5.0%
4.8%
8.7%
10.6%
11.2%
12.1%
12.2%
10.3%
5.0%
4.6%
9.7%
0% 10% 20% 30% 40% 50% 60% 70% 80% 90% 100%
New
1 Yr Old
2 Yrs Old
3 Yrs Old
4 Yrs Old
5 Yrs Old
6 Yrs Old
7 Yrs Old
8 Yrs Old
9 Yrs Old
10 Yrs Old
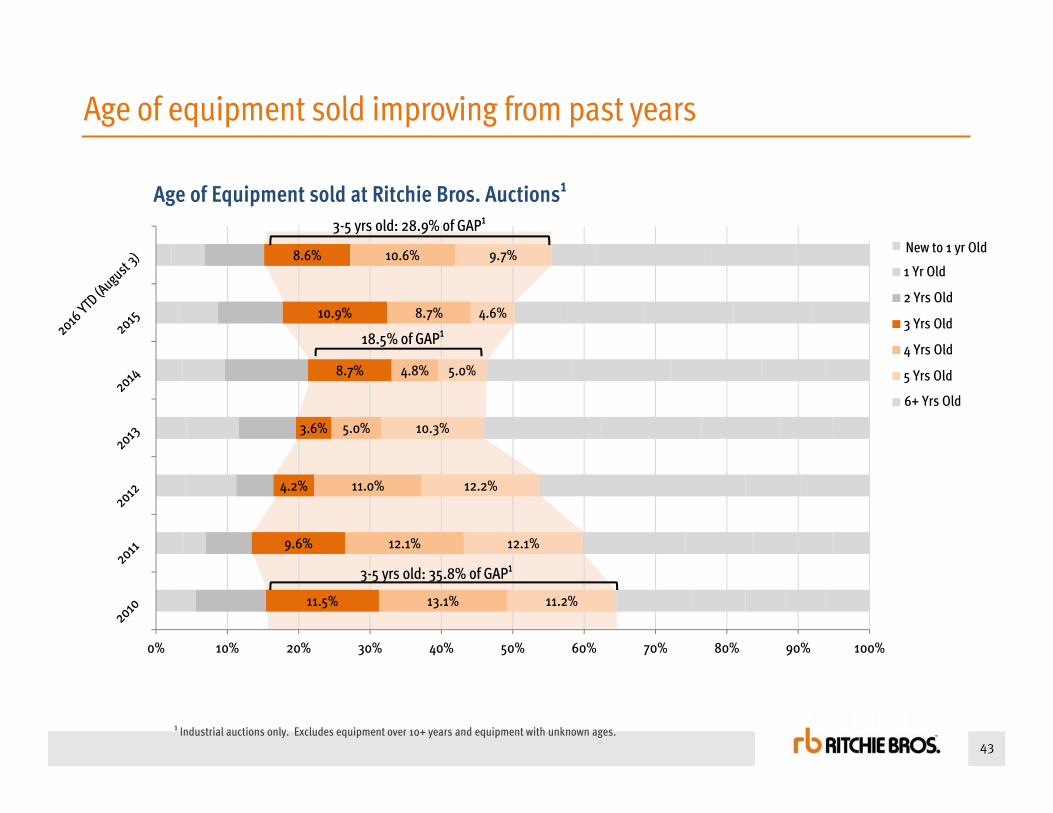
18.5% of GAP¹
3-5 yrs old: 35.8% of GAP¹
¹ Industrial auctions only. Excludes equipment over 10+ years and equipment with unknown ages.
Age of equipment sold improving from past years
Age of Equipment sold at Ritchie Bros. Auctions¹ 3-5 yrs old: 28.9% of GAP¹
6+ Yrs Old
New to 1 yr Old
44
Auction sites

US GAAP Reconciliation of Non-GAAP measures
Non- GAAP Measures
The following tables reconcile non-GAAP measures referred to in this presentation to the most directly comparable GAAP measure reflected in the Company’s financial statements
45

46
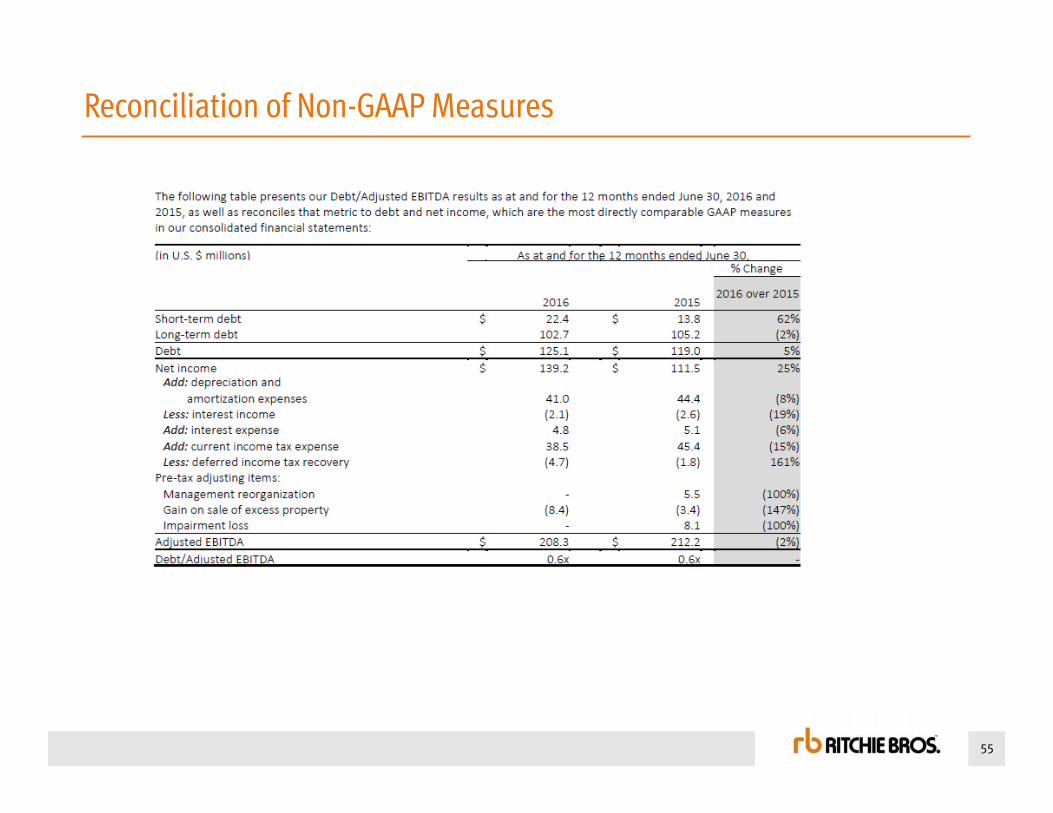
Reconciliation of Ritchie Bros. non-GAAP measuresDebt/Adjusted EBITDAOur balance sheet scorecard includes the performance metric, Debt/Adjusted EBITDA, which is a non-GAAP financial measure. We believe that comparing Debt/Adjusted EBIDTA on a 12-month rolling basis for different financial periods provides useful information about the performance of our operations, and in particular, it is an indicator of the amount of time it would take for us to settle both our short and long-term debt. We do not consider this to be a measure of our liquidity, which is our ability to settle only short-term obligations, but rather a measure of how well we fund liquidity. Measures of liquidity are discussed further below under “liquidity and capital resources”.
We calculate Debt/Adjusted EBITDA by dividing debt by EBITDA excluding the effects of pre-tax adjusting items.
The following table presents our Debt/Adjusted EBITDA results as at and for the years ended December 31, 2015, 2014, and 2013, as well as reconciles that metric to debt and net income, which are the most directly comparable GAAP measures in our consolidated financial statements:

47
Reconciliation of Ritchie Bros. non-GAAP measures
Earnings Before Interest, Taxes, Depreciation and Amortization (“EBITDA”) and EBITDA MarginEBITDA and EBITDA Margin are non-GAAP financial measures that we believe provide useful information about the growth or decline of our net income when compared between different financial periods. EBITDA is also an element of the performance criteria for certain PSUs we granted to our employees and officers in 2013 and 2014. EBITDA is calculated by adding back depreciation and amortization expenses, interest expense, and current income tax expense, and subtracting interest income and deferred income tax recovery from net income. EBITDA Margin presents EBITDA as a multiple of revenues.
The following table presents our EBITDA and EBITDA Margin results for the years ended December 31, 2015, 2014, and 2013, as well as reconciles those metrics to net income and revenues, which are the most directly comparable GAAP measures in our consolidated income statements:

4848
Reconciliation of Non-GAAP Measures
49
Reconciliation of Non-GAAP Measures

50
Reconciliation of Non-GAAP Measures

51
Reconciliation of Non-GAAP Measures

52
Reconciliation of Non-GAAP Measures

53
Reconciliation of Non-GAAP Measures

54
Reconciliation of Non-GAAP Measures
55
Reconciliation of Non-GAAP Measures