2016 deep dive 1 - nctm.org
TRANSCRIPT

7/18/2016
1
Introduction to Statistical Reasoning and Exploring Data Variability
Kyndall BrownExecutive Director
California Mathematics [email protected]
Deep Dive 1
Why Study Statistics?
• Guidelines for Assessment and Instruction in Statistics Education (GAISE)
“Our lives are governed by numbers. Every high school graduate should be able to use sound statistical reasoning to intelligently cope with the requirements of citizenship, employment, and family and to be prepared for a healthy, happy, and productive life.”

7/18/2016
2
Overview of Unit
• Purpose: To introduce Statistics as a methodological discipline that exists to offer other fields of study a method for dealing with data
GAISE Framework
• Statistical problem‐solving is an investigative process that involves four components:– I Formulate Questions– II Collect Data– III Analyze Data– IV Interpret Results

7/18/2016
3
GAISE Framework
• The Framework uses three developmental levels that are based upon development in statistical literacy, not age.
GAISE FrameworkDevelopmental Level A
• Children need to develop data sense‐ an understanding that data are more than just numbers
• Opportunities should be provided for students to generate questions about a context and determine what data might be collected to answer these questions

7/18/2016
4
GAISE FrameworkDevelopmental Level A
• Students should learn how to use statistical tools to analyze data and make inferences in answering the posed questions
•Students should develop basic ideas of probability
GAISE FrameworkDevelopmental Level B
•Students become more aware of the statistical question distinction‐a question with an answer based on data that may vary• Students should make decisions about what variables to measure and how to measure them in order to address the questions posed

7/18/2016
5
GAISE FrameworkDevelopmental Level B
• When selecting a sample, students should develop a basic understanding of the role probability plays in random selection• Students investigates problems with more emphasis placed on possible associations among two or more variables and understand how a more sophisticated collection of graphical, tabular, and numerical summaries is used to address these questions• Students recognize ways in which statistics is used or misused
GAISE FrameworkDevelopmental Level C
•Statistical studies at this level require students to draw on basic concepts from earlier work, extend the concepts to cover a wider scope of investigatory issues, and develop a deeper understanding of inferential reasoning and its connection to probability• Students develop additional strategies for producing, interpreting, and analyzing data to help answer questions of interest

7/18/2016
6
GAISE FrameworkDevelopmental Level C
•Students should be able to:‐ formulate questions that can be answered
with data‐devise a reasonable plan for collecting
appropriate data through observation, sampling, or experimentation
‐Draw conclusions an use data to support these conclusions, and
understand the role random variation plays in the inference process
Overview of Unit
In 6th grade the focus of this unit is the idea variability, in addition students will expand their
understanding of the statistical reasoning process.

7/18/2016
7
Overview of Unit
In 7th grade the focus of this unit is building student understanding of probability on a relative frequency view of the subject, one involving repeated observations of random
outcomes of a given event.
Overview of Unit
In 8th grade the focus of this unit is on building statistical models to explore the relationship
between two variables.
7/18/2016
8
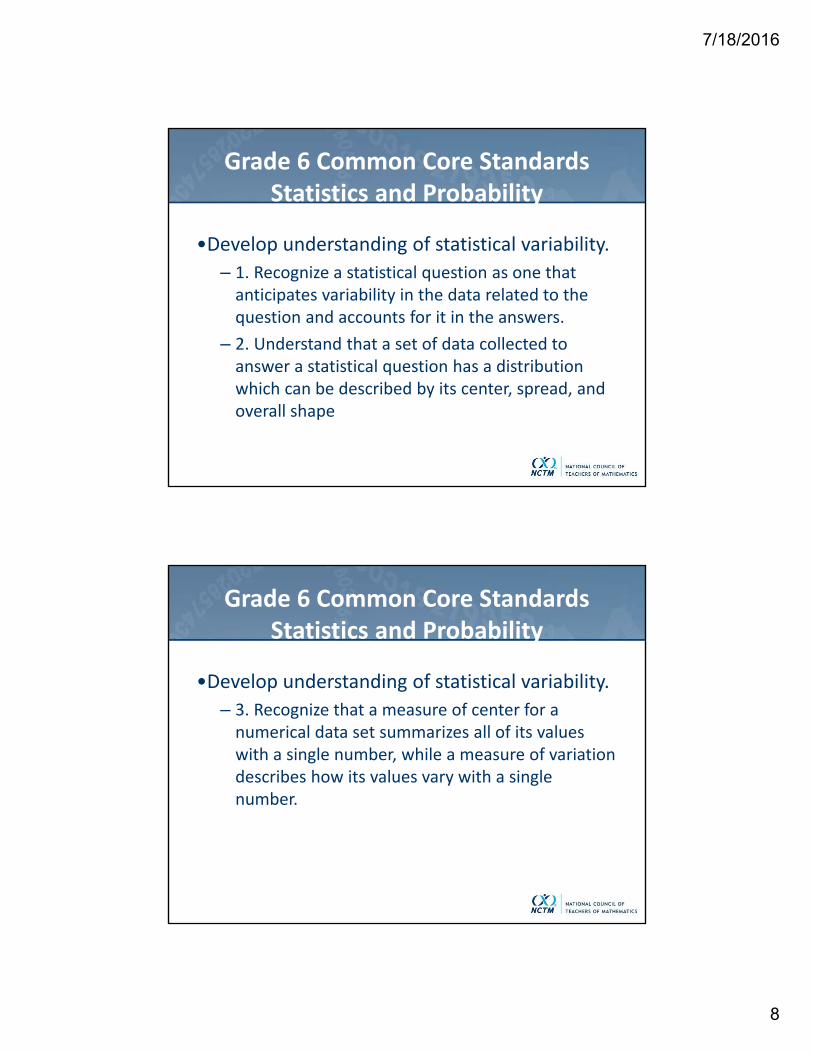
Grade 6 Common Core StandardsStatistics and Probability
•Develop understanding of statistical variability.– 1. Recognize a statistical question as one that anticipates variability in the data related to the question and accounts for it in the answers.
– 2. Understand that a set of data collected to answer a statistical question has a distribution which can be described by its center, spread, and overall shape
Grade 6 Common Core StandardsStatistics and Probability
•Develop understanding of statistical variability.– 3. Recognize that a measure of center for a numerical data set summarizes all of its values with a single number, while a measure of variation describes how its values vary with a single number.

7/18/2016
9
Grade 6 Common Core StandardsStatistics and Probability
•Summarize and describe distributions.– 4. Display numerical data in plots on a number line, including dot plots, histograms, and box plots
Grade 6 Common Core StandardsStatistics and Probability
•Summarize and describe distributions.• 5. Summarize numerical data sets in relation to their context,
such as by: ‐Reporting the number of observations. ‐Describing the nature of the attribute under
investigation, including how it was measured and its units of measurement.
‐Giving quantitative measures of center (median and/or mean) and variability (interquartile range and/or mean
absolute deviation), as well as describing any overall pattern and any striking deviations from the overall pattern with reference to the context in which the data were gathered.
‐Relating the choice of measures of center and variability.

7/18/2016
10
Measurement
• The cubit is an ancient unit of length based on the length of the forearm from the elbow to the tip of the middle finger. Cubits of various lengths were employed in many parts of the world in antiquity, during the Middle Ages and as recently as Early Modern Times. The term is still used in hedge laying, the length of the forearm being frequently used to determine the interval between stakes placed within the hedge.

7/18/2016
11
Cubit Rod
Royal Cubit
• The earliest attested standard measure is from the Ancient Egypt and was called the royal cubit (meh niswt).
• On the Palermo stone, the flood level of the Nile river during the reign of the Pharaoh Djer is given as measuring 6 cubits and 1 palm.
• Use of the royal cubit is also known from Old Kingdom architecture, from at least as early as the construction of the Step Pyramid of Djoser in around 2,700 B.C.

7/18/2016
12
Cubit Construction
• A cubit rod two from the tomb of Maya, the treasurer of Tutankhamun, in Saqqara is pictured below.
• Another rod was found in the tomb of Kha in Thebes.• Fourteen such rods, including one double cubit rod, were described and compared by Lepsius in 1865.– These cubits range from 523 to 529 mm (20.6 to 20.8 in) in length, and are
– divided into seven palms; each palm is divided into four fingers.
The Bible
• The Bible tells us that the length of Noah’s Ark was 300 cubits, its width 50 cubits, and its height 30 cubits.
• Ancient people groups assigned different lengths to the term “cubit” (Hebrew word the ,([ammah]אמהprimary unit of measure in the Old Testament.

7/18/2016
13
When Noah came off the Ark, only one cubit measurement existed—the one he had used to construct the Ark. Unfortunately, the exact length of this cubit is unknown. After the nations were divided, years later at the Tower of Babel, different cultures adopted different cubits.
Statistical Question
• The formulation of a statistics question requires an understanding of the difference between a question that anticipates a deterministic answer and a question that anticipates an answer based on data that vary.– The question, “How tall am I?” will be answered with a single height. It is not a statistics question.
– The question “How tall are adult men in the USA?” would not be a statistics question if all these men were exactly the same height! The fact that there are differing heights, however, implies that we anticipate an answer based on measurements of height that vary. This is a statistics question.

7/18/2016
14
Cubits
1. Formulate questions:– How do the lengths of cubits of everyone in our classroom compare?
– Are girls’ cubits different from boys?
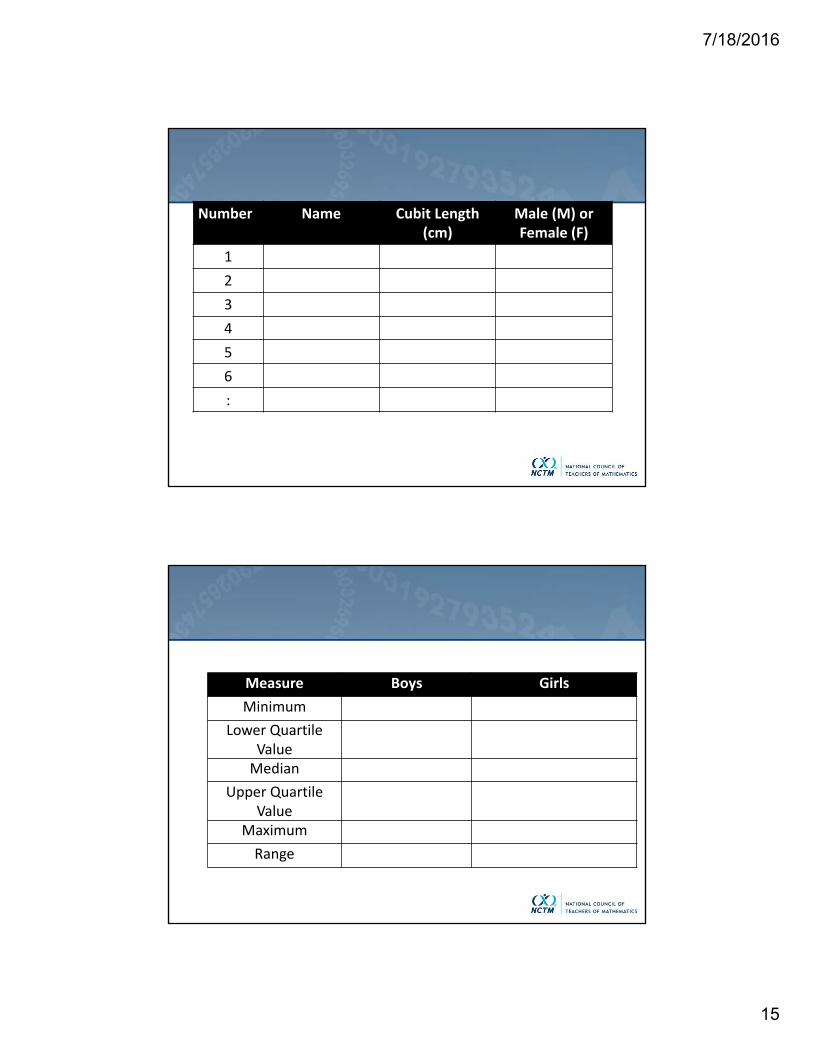
2. Collect Data:– In pairs, measure each other’s cubit in centimeters. Let’s all use our dominant arm for this. Why?
– Once you have measured each other’s cubits make note of the measurement and add it to the data chart.
7/18/2016
15
Number Name Cubit Length (cm)
Male (M) or Female (F)
123456:
Measure Boys GirlsMinimum
Lower Quartile ValueMedian
Upper Quartile Value
MaximumRange
7/18/2016
16
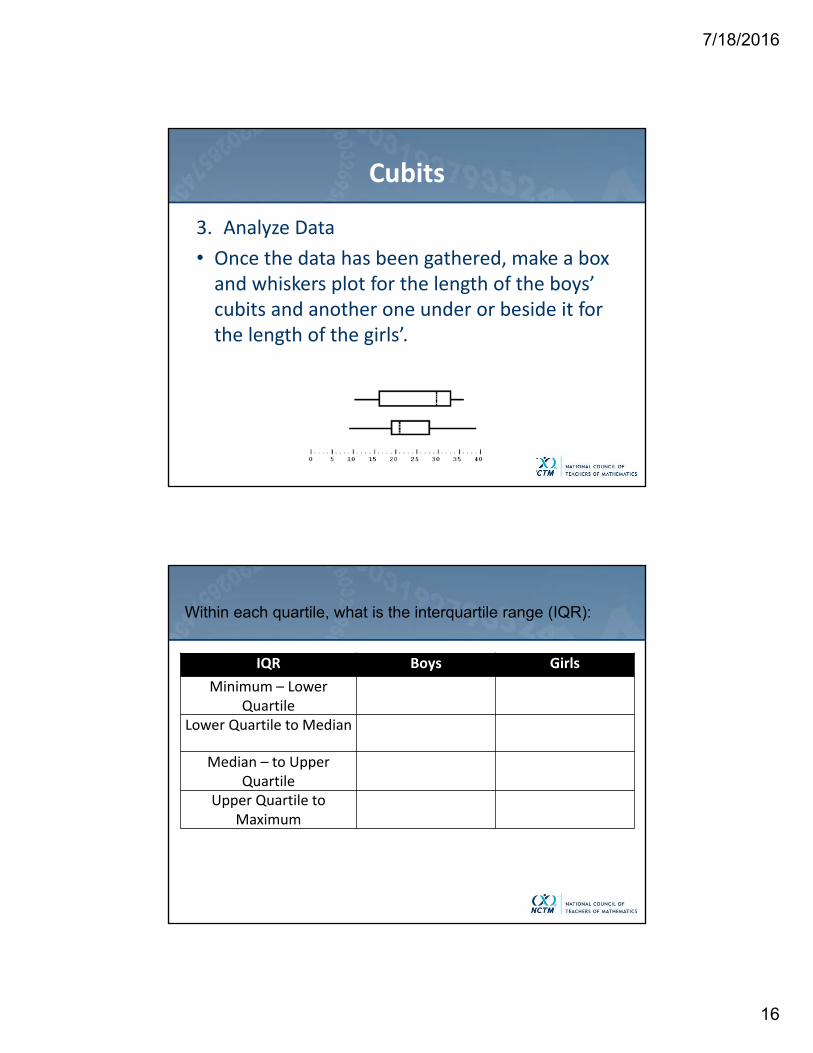
Cubits
3. Analyze Data• Once the data has been gathered, make a box and whiskers plot for the length of the boys’ cubits and another one under or beside it for the length of the girls’.
Within each quartile, what is the interquartile range (IQR):
IQR Boys GirlsMinimum – Lower
QuartileLower Quartile to Median
Median – to Upper Quartile
Upper Quartile to Maximum

7/18/2016
17
Questions
1. Is there a significant difference between the cubits of boys and those of girls? How do you know this?
2. Are the measurements for girls or boys occurring in one quartile more so than in others?
3. Are there any outliers in your data? What makes this an outlier?
DisclaimerThe National Council of Teachers of Mathematics is a public voice of mathematics education, providing vision, leadership, and professional development to support teachers in ensuring equitable mathematics learning of the highest quality for all students. NCTM’s Institutes, an official professional development offering of the National Council of Teachers of Mathematics, supports the improvement of pre-K-6 mathematics education by serving as a resource for teachers so as to provide more and better mathematics for all students. It is a forum for the exchange of mathematics ideas, activities, and pedagogical strategies, and for sharing and interpreting research. The Institutes presented by the Council present a variety of viewpoints. The views expressed or implied in the Institutes, unless otherwise noted, should not be interpreted as official positions of the Council.
34

7/18/2016
18
35