2013 whats happening in digital-- including nyc
TRANSCRIPT
What’s Happening in Digital…Including NYC
November 13, 2013
2
I. Setting the Stage
II. Key Digital Sector Trends
III. Digital NY
IV. Quick Gridley Commercial
Agenda
© 2013 Gridley & Company LLC

I. Setting the Stage
4
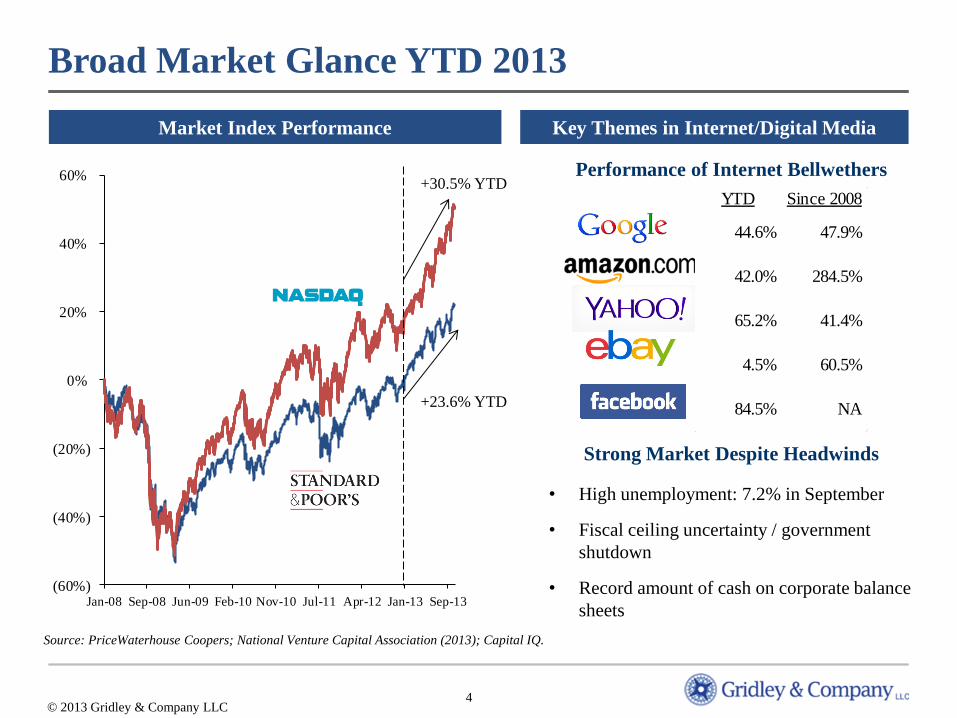
Broad Market Glance YTD 2013
(60%)
(40%)
(20%)
0%
20%
40%
60%
Jan-08 Sep-08 Jun-09 Feb-10 Nov-10 Jul-11 Apr-12 Jan-13 Sep-13
Source: PriceWaterhouse Coopers; National Venture Capital Association (2013); Capital IQ.
Key Themes in Internet/Digital Media Market Index Performance
© 2013 Gridley & Company LLC
+30.5% YTD
+23.6% YTD
Performance of Internet Bellwethers
YTD Since 2008
44.6% 47.9%
42.0% 284.5%
65.2% 41.4%
4.5% 60.5%
84.5% NA
Strong Market Despite Headwinds
• High unemployment: 7.2% in September
• Fiscal ceiling uncertainty / government
shutdown
• Record amount of cash on corporate balance
sheets
5
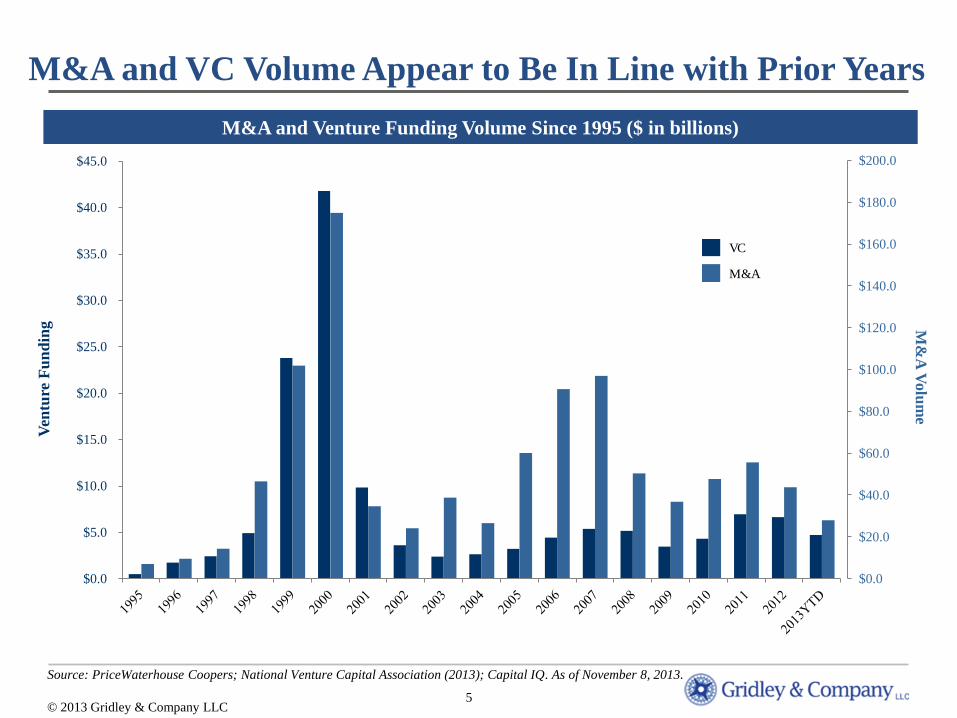
Source: PriceWaterhouse Coopers; National Venture Capital Association (2013); Capital IQ. As of November 8, 2013.
Ven
ture
Fu
nd
ing
M
&A
Volu
me
VC
M&A
M&A and Venture Funding Volume Since 1995 ($ in billions)
M&A and VC Volume Appear to Be In Line with Prior Years
© 2013 Gridley & Company LLC
$0.0
$20.0
$40.0
$60.0
$80.0
$100.0
$120.0
$140.0
$160.0
$180.0
$200.0
$0.0
$5.0
$10.0
$15.0
$20.0
$25.0
$30.0
$35.0
$40.0
$45.0
6
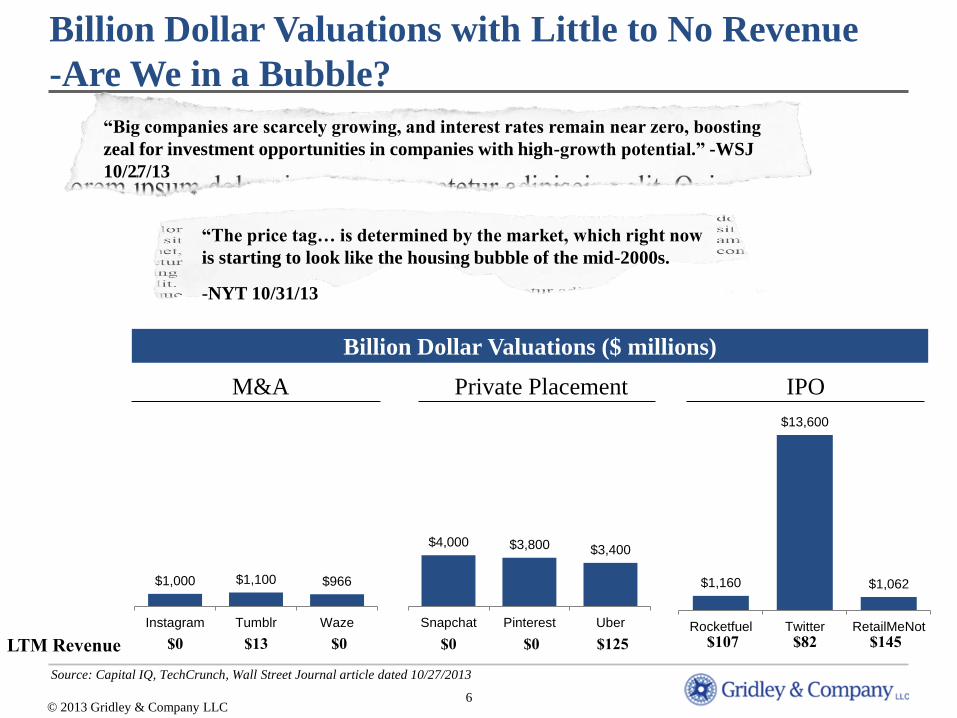
Billion Dollar Valuations with Little to No Revenue
-Are We in a Bubble?
“Big companies are scarcely growing, and interest rates remain near zero, boosting
zeal for investment opportunities in companies with high-growth potential.” -WSJ
10/27/13
“The price tag… is determined by the market, which right now
is starting to look like the housing bubble of the mid-2000s.
-NYT 10/31/13
LTM Revenue $0 $13 $0 $107 $82 $145 $0 $0 $125
$1,000 $1,100 $966
Instagram Tumblr Waze
$4,000 $3,800 $3,400
Snapchat Pinterest Uber
$1,160
$13,600
$1,062
Rocketfuel Twitter RetailMeNot
Billion Dollar Valuations ($ millions)
M&A Private Placement IPO
Source: Capital IQ, TechCrunch, Wall Street Journal article dated 10/27/2013
© 2013 Gridley & Company LLC
7
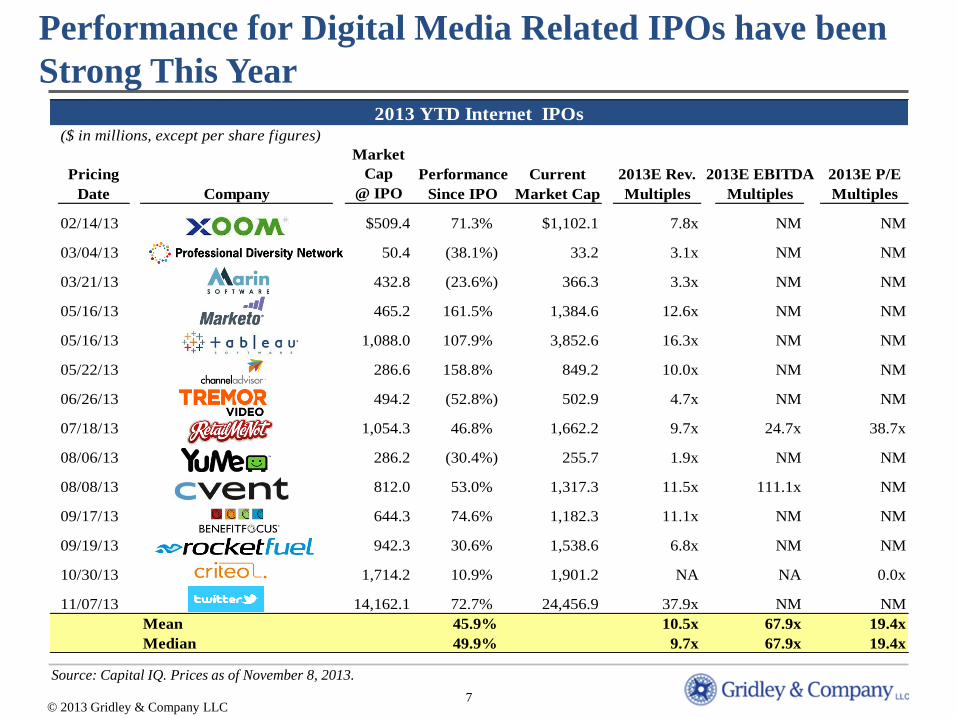
2013 YTD Internet IPOs($ in millions, except per share figures)
Pricing
Market
Cap Performance Current 2013E Rev. 2013E EBITDA 2013E P/E
Date Company @ IPO Since IPO Market Cap Multiples Multiples Multiples
02/14/13 Xoom Corporation $509.4 71.3% $1,102.1 7.8x NM NM
03/04/13 Professional Diversity Network LLC50.4 (38.1%) 33.2 3.1x NM NM
03/21/13 Marin Software Incorporated 432.8 (23.6%) 366.3 3.3x NM NM
05/16/13 Marketo, Inc. 465.2 161.5% 1,384.6 12.6x NM NM
05/16/13 Tableau Software, Inc. 1,088.0 107.9% 3,852.6 16.3x NM NM
05/22/13 ChannelAdvisor Corporation 286.6 158.8% 849.2 10.0x NM NM
06/26/13 Tremor Video, Inc. 494.2 (52.8%) 502.9 4.7x NM NM
07/18/13 RetailMeNot, Inc. 1,054.3 46.8% 1,662.2 9.7x 24.7x 38.7x
08/06/13 YuMe, Inc. 286.2 (30.4%) 255.7 1.9x NM NM
08/08/13 Cvent, Inc. 812.0 53.0% 1,317.3 11.5x 111.1x NM
09/17/13 Benefitfocus, Inc. 644.3 74.6% 1,182.3 11.1x NM NM
09/19/13 Rocket Fuel Inc. 942.3 30.6% 1,538.6 6.8x NM NM
10/30/13 Criteo SA 1,714.2 10.9% 1,901.2 NA NA 0.0x
11/07/13 Twitter, Inc. 14,162.1 72.7% 24,456.9 37.9x NM NM
Mean 45.9% 10.5x 67.9x 19.4x
Median 49.9% 9.7x 67.9x 19.4x
Performance for Digital Media Related IPOs have been
Strong This Year
© 2013 Gridley & Company LLC
Source: Capital IQ. Prices as of November 8, 2013.
8
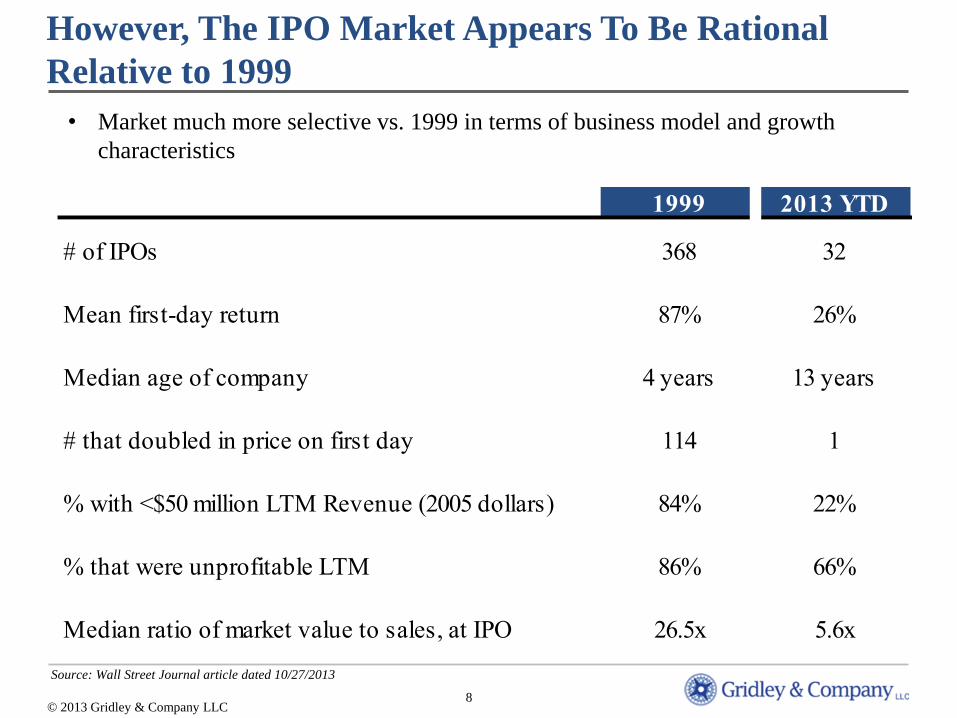
However, The IPO Market Appears To Be Rational
Relative to 1999
1999 2013 YTD
# of IPOs 368 32
Mean first-day return 87% 26%
Median age of company 4 years 13 years
# that doubled in price on first day 114 1
% with <$50 million LTM Revenue (2005 dollars) 84% 22%
% that were unprofitable LTM 86% 66%
Median ratio of market value to sales, at IPO 26.5x 5.6x
© 2013 Gridley & Company LLC
• Market much more selective vs. 1999 in terms of business model and growth
characteristics
Source: Wall Street Journal article dated 10/27/2013
9
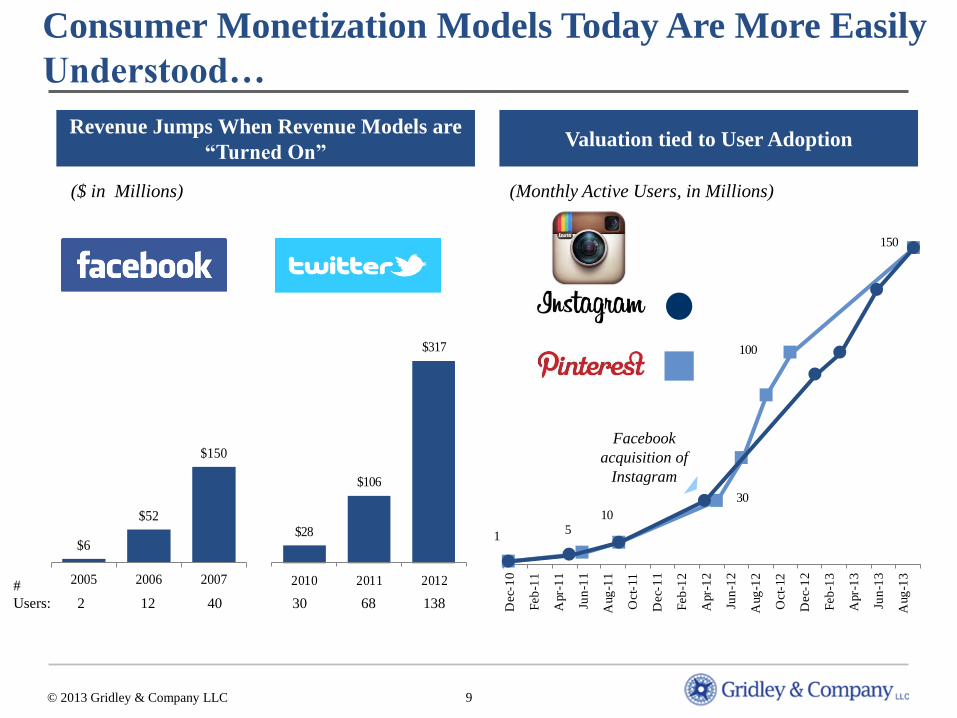
Consumer Monetization Models Today Are More Easily
Understood…
Revenue Jumps When Revenue Models are
“Turned On” Valuation tied to User Adoption
($ in Millions) (Monthly Active Users, in Millions)
© 2013 Gridley & Company LLC
15
10
30
100
150
Dec-
10
Feb
-11
Apr-
11
Jun
-11
Aug
-11
Oct-
11
Dec-
11
Feb
-12
Apr-
12
Jun
-12
Aug
-12
Oct-
12
Dec-
12
Feb
-13
Apr-
13
Jun
-13
Aug
-13
$28
$106
$317
2010 2011 2012
$6
$52
$150
2005 2006 2007
acquisition of
#
Users: 2 12 40 138 30 68
10
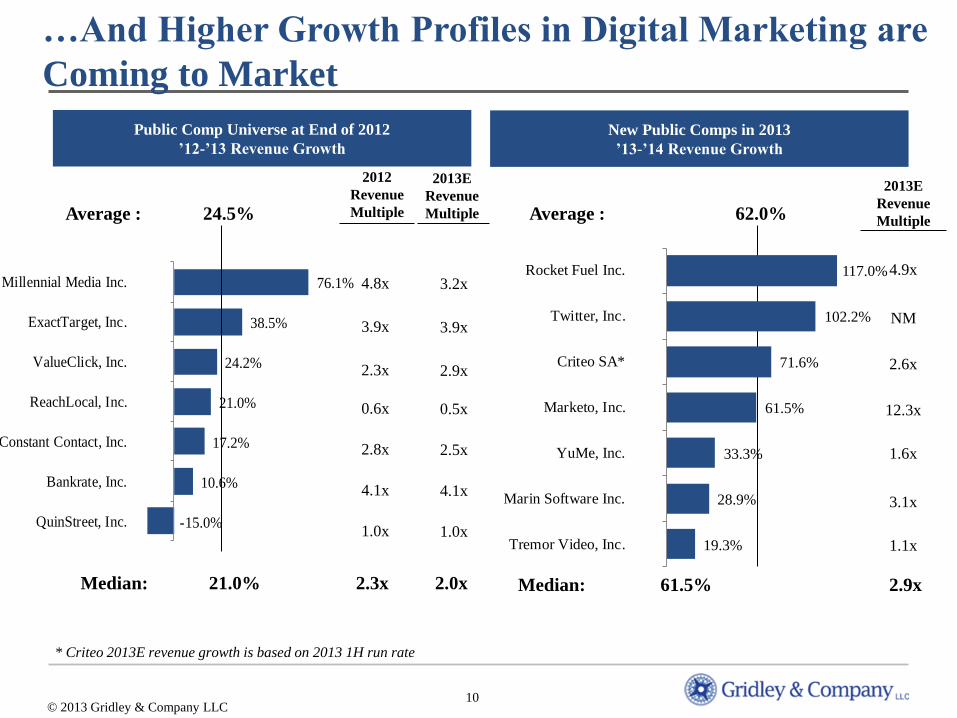
-15.0%
10.6%
17.2%
21.0%
24.2%
38.5%
76.1%
QuinStreet, Inc.
Bankrate, Inc.
Constant Contact, Inc.
ReachLocal, Inc.
ValueClick, Inc.
ExactTarget, Inc.
Millennial Media Inc.
…And Higher Growth Profiles in Digital Marketing are
Coming to Market
Average : 24.5% Average : 62.0%
* Criteo 2013E revenue growth is based on 2013 1H run rate
Public Comp Universe at End of 2012
’12-’13 Revenue Growth
New Public Comps in 2013
’13-’14 Revenue Growth
© 2013 Gridley & Company LLC
2012
Revenue
Multiple
2013E
Revenue
Multiple
4.8x
3.9x
2.3x
0.6x
2.8x
4.1x
1.0x
4.9x
NM
2.6x
12.3x
1.6x
3.1x
1.1x
Median: 21.0% 2.3x 2.0x Median: 61.5% 2.9x
3.2x
3.9x
2.9x
0.5x
2.5x
4.1x
1.0x
2013E
Revenue
Multiple
19.3%
28.9%
33.3%
61.5%
71.6%
102.2%
117.0%
Tremor Video, Inc.
Marin Software Inc.
YuMe, Inc.
Marketo, Inc.
Criteo SA*
Twitter, Inc.
Rocket Fuel Inc.
11
Key Themes in Strategic M&A and Funding Market
• Consolidation still quiet in fragmented sectors such as Adtech
‒ Complicated cap structures with multiple layers of institutional capital
‒ Investors with different time horizons and priorities on same deals
‒ Lots of strategics holding on to cash
• M&A as a recruiting tool is here to stay – didn’t exist five years ago
‒ Yahoo, Google, Twitter, Facebook all compete with hiring talent
‒ Still primarily a B2C concept, few examples of enterprise software
companies employing this tactic
‒ From banker’s perspective, no company is too small
• VC/PE investors reluctant to triage their portfolios, believe all will be home runs
© 2013 Gridley & Company LLC
12
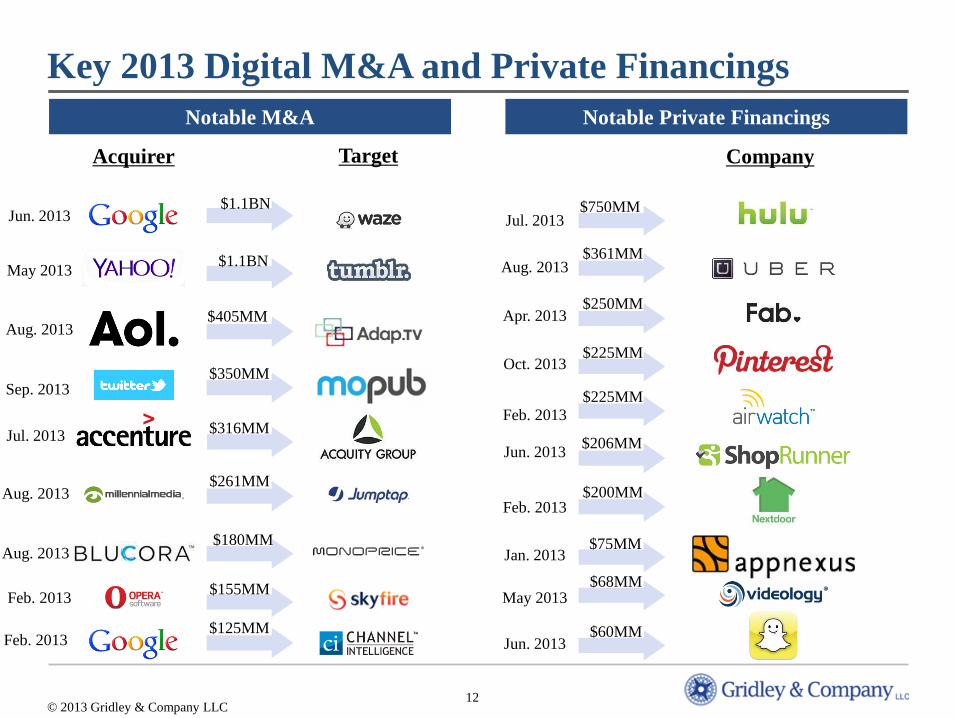
Notable M&A
$405MM
$350MM
$261MM
$75MM
Notable Private Financings
Acquirer Target Company
© 2013 Gridley & Company LLC
Aug. 2013
Sep. 2013
Aug. 2013
Key 2013 Digital M&A and Private Financings
$1.1BN Jun. 2013
$225MM
$361MM Aug. 2013
Feb. 2013
$1.1BN May 2013
$68MM
$750MM Jul. 2013
May 2013
$200MM
$60MM
$225MM Oct. 2013
Feb. 2013
Jun. 2013
$316MM Jul. 2013
$125MM Feb. 2013
$250MM
$206MM
Apr. 2013
Jun. 2013
$155MM Feb. 2013
$180MM Aug. 2013 Jan. 2013
13
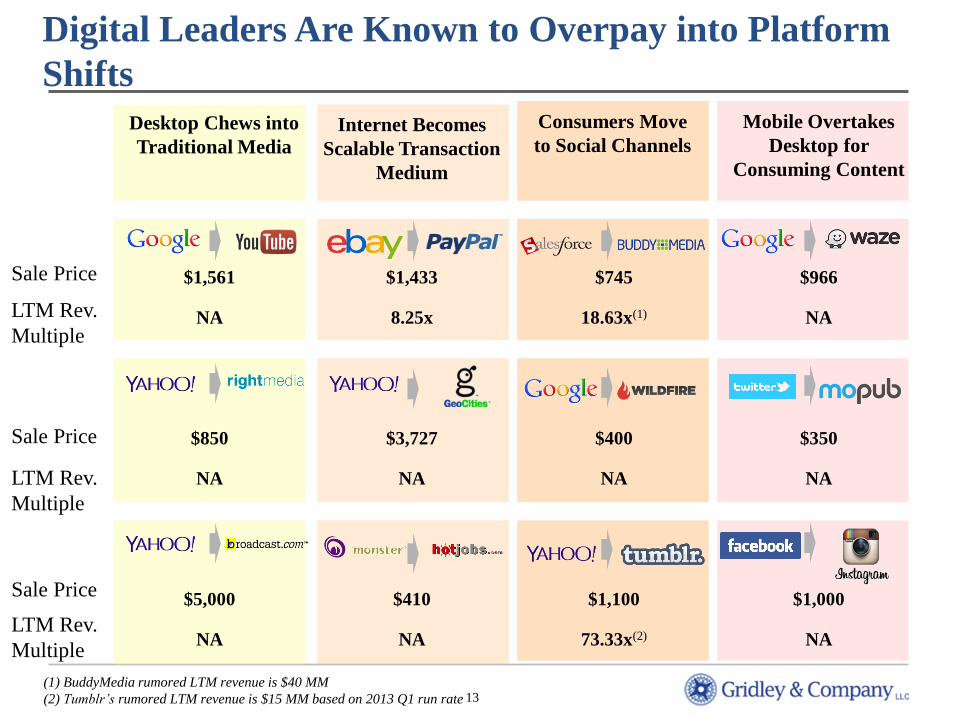
Digital Leaders Are Known to Overpay into Platform
Shifts
$1,561
NA
$850
NA
$5,000
NA
$745
18.63x(1)
$400
NA
$1,100
73.33x(2)
$966
NA
$350
NA
$1,000
NA
Desktop Chews into
Traditional Media
Consumers Move
to Social Channels
Mobile Overtakes
Desktop for
Consuming Content
Internet Becomes
Scalable Transaction
Medium
$1,433
8.25x
$3,727
NA
$410
NA
(1) BuddyMedia rumored LTM revenue is $40 MM
(2) Tumblr’s rumored LTM revenue is $15 MM based on 2013 Q1 run rate
Sale Price
LTM Rev.
Multiple
Sale Price
LTM Rev.
Multiple
Sale Price
LTM Rev.
Multiple
14
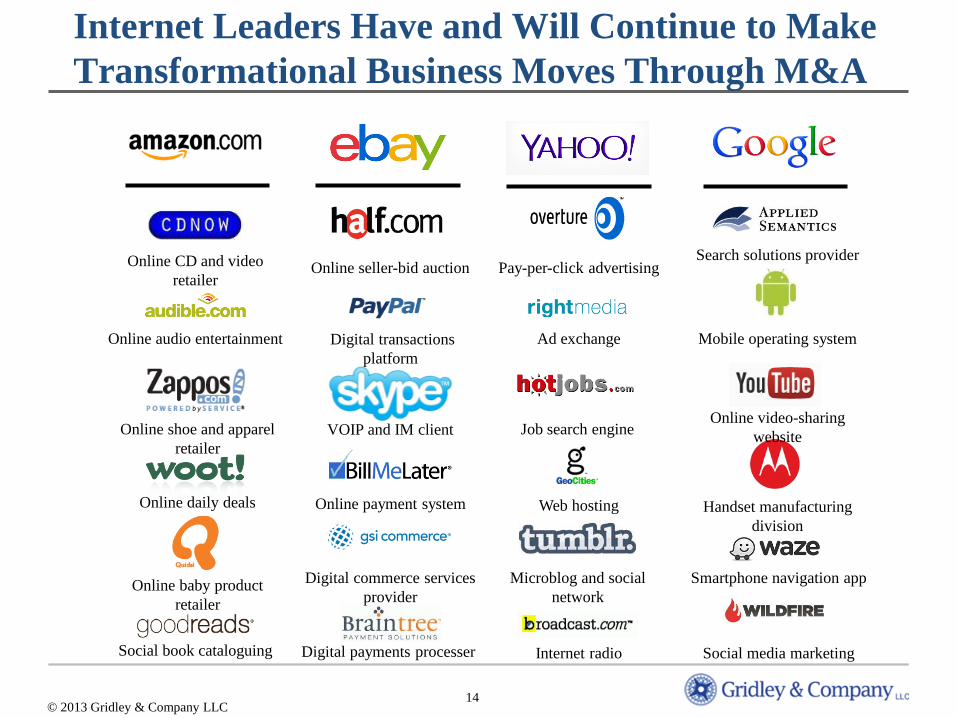
Internet Leaders Have and Will Continue to Make
Transformational Business Moves Through M&A
Online shoe and apparel
retailer
Online audio entertainment
Online CD and video
retailer
Online daily deals
Online baby product
retailer
Social book cataloguing
Online seller-bid auction
Digital transactions
platform
VOIP and IM client
Online payment system
Digital commerce services
provider
Digital payments processer
Pay-per-click advertising
Ad exchange
Job search engine
Web hosting
Microblog and social
network
Internet radio
Search solutions provider
Mobile operating system
Online video-sharing
website
Handset manufacturing
division
Smartphone navigation app
Social media marketing
© 2013 Gridley & Company LLC
15
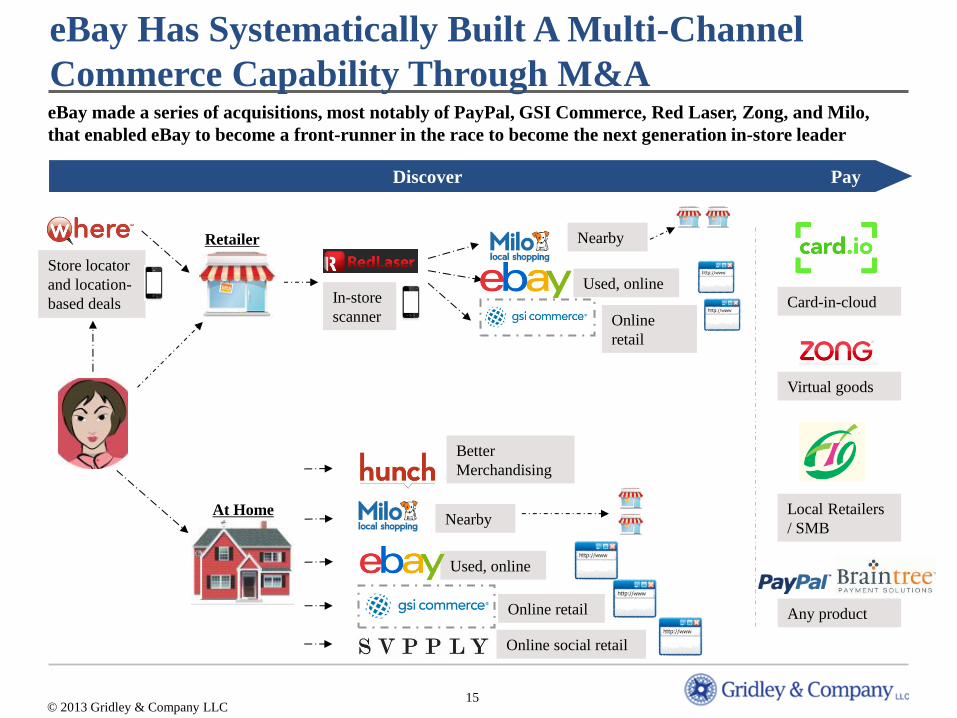
eBay Has Systematically Built A Multi-Channel
Commerce Capability Through M&A
Discover Pay
In-store
scanner
Nearby
Used, online
Online
retail
Nearby
Used, online
Online retail
Virtual goods
Local Retailers
/ SMB
Any product
Store locator
and location-
based deals
Retailer
At Home
eBay made a series of acquisitions, most notably of PayPal, GSI Commerce, Red Laser, Zong, and Milo,
that enabled eBay to become a front-runner in the race to become the next generation in-store leader
Better
Merchandising
Card-in-cloud
Online social retail
© 2013 Gridley & Company LLC
16
Legend
0%
20%
40%
60%
80%
100%
120%
140%
0.0x 5.0x 10.0x 15.0x 20.0x 25.0x
Adtech
Enterprise
Consumer Internet
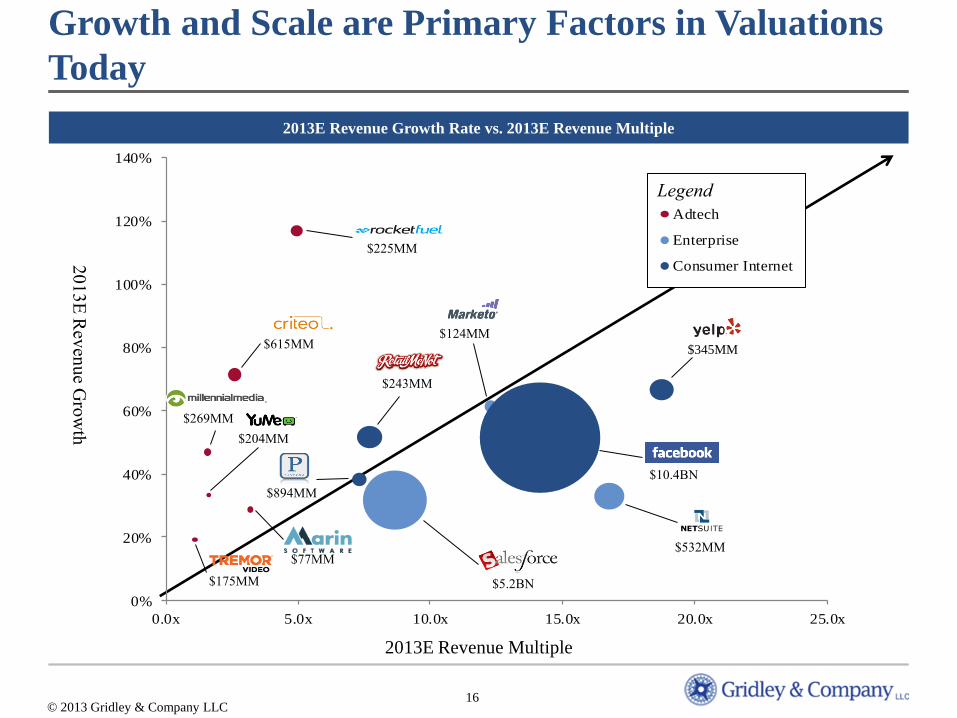
Growth and Scale are Primary Factors in Valuations
Today
2013E Revenue Growth Rate vs. 2013E Revenue Multiple
20
13
E R
even
ue G
row
th
2013E Revenue Multiple
$269MM
$615MM
$225MM
$77MM
$175MM
$204MM
$10.4BN
$345MM
$243MM
$894MM
$5.2BN
$532MM
$124MM
© 2013 Gridley & Company LLC

II. Key Digital Sector Trends
18
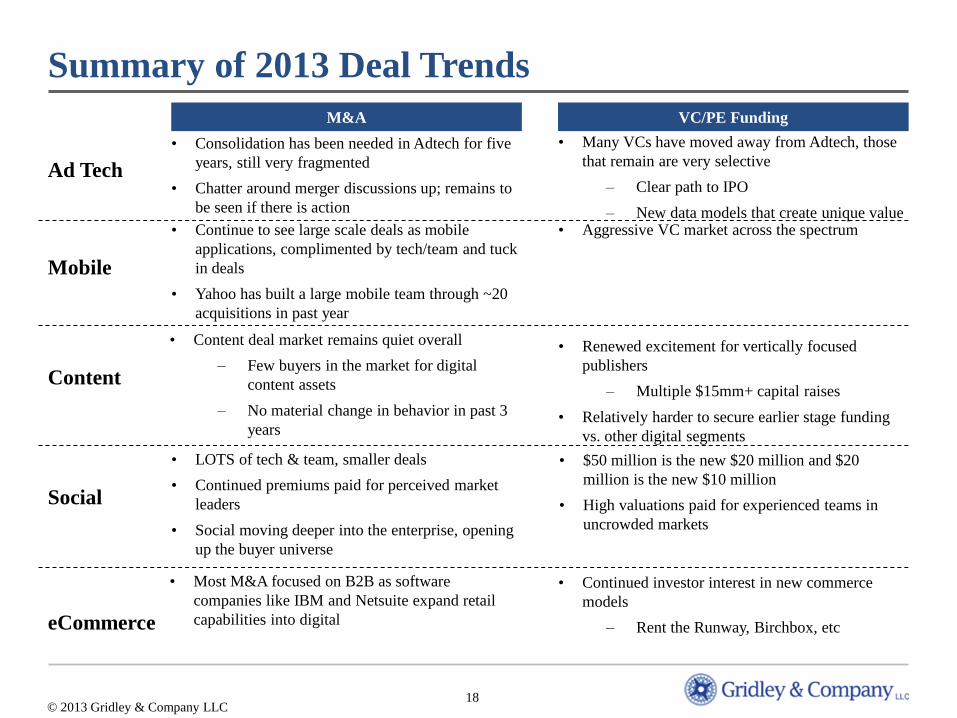
Summary of 2013 Deal Trends
M&A VC/PE Funding
Mobile
eCommerce
Ad Tech
Content
Social
© 2013 Gridley & Company LLC
• Consolidation has been needed in Adtech for five
years, still very fragmented
• Chatter around merger discussions up; remains to
be seen if there is action
• Many VCs have moved away from Adtech, those
that remain are very selective
‒ Clear path to IPO
‒ New data models that create unique value • Aggressive VC market across the spectrum
• Continue to see large scale deals as mobile
applications, complimented by tech/team and tuck
in deals
• Yahoo has built a large mobile team through ~20
acquisitions in past year
• Content deal market remains quiet overall
‒ Few buyers in the market for digital
content assets
‒ No material change in behavior in past 3
years
• Renewed excitement for vertically focused
publishers
‒ Multiple $15mm+ capital raises
• Relatively harder to secure earlier stage funding
vs. other digital segments
• LOTS of tech & team, smaller deals
• Continued premiums paid for perceived market
leaders
• Social moving deeper into the enterprise, opening
up the buyer universe
• $50 million is the new $20 million and $20
million is the new $10 million
• High valuations paid for experienced teams in
uncrowded markets
• Most M&A focused on B2B as software
companies like IBM and Netsuite expand retail
capabilities into digital
• Continued investor interest in new commerce
models
‒ Rent the Runway, Birchbox, etc

19
Sector
© 2013 Gridley & Company LLC
AdTech
Mobile
Content
Social
eCommerce
20
Key Trends in Adtech
• Recent IPOs have brought new life into the Adtech community
‒ Creating urgency to get scale
‒ Establishing clarity around value for high growth advertising stories
• Noise level on Privacy/Cookie debate up; although still very exploratory in
terms of going forward models
• Category leaders getting funding, but otherwise hard market for new capital
‒ Understanding and executing on data is actually very hard!
• Convergence of marketing and advertising technologies not leading to
considerable strategic activity yet
© 2013 Gridley & Company LLC
21
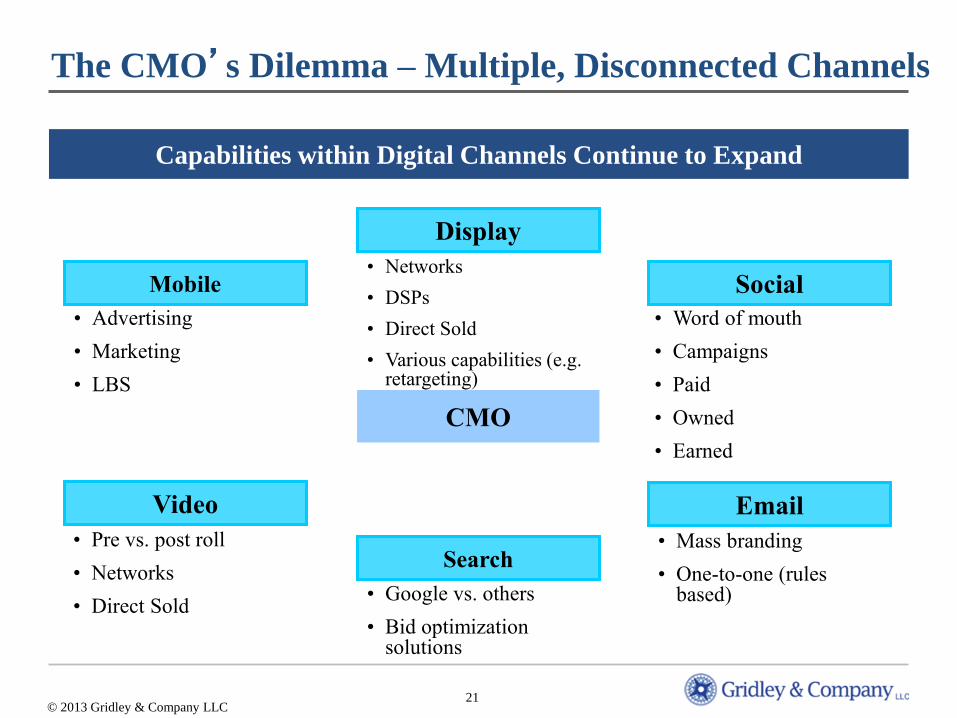
The CMO’s Dilemma – Multiple, Disconnected Channels
Mobile
CMO
• Advertising
• Marketing
• LBS
Display
• Networks
• DSPs
• Direct Sold
• Various capabilities (e.g. retargeting)
Social
• Word of mouth
• Campaigns
• Paid
• Owned
• Earned
• Mass branding
• One-to-one (rules based)
Search
• Google vs. others
• Bid optimization solutions
Video
• Pre vs. post roll
• Networks
• Direct Sold
Capabilities within Digital Channels Continue to Expand
© 2013 Gridley & Company LLC
22
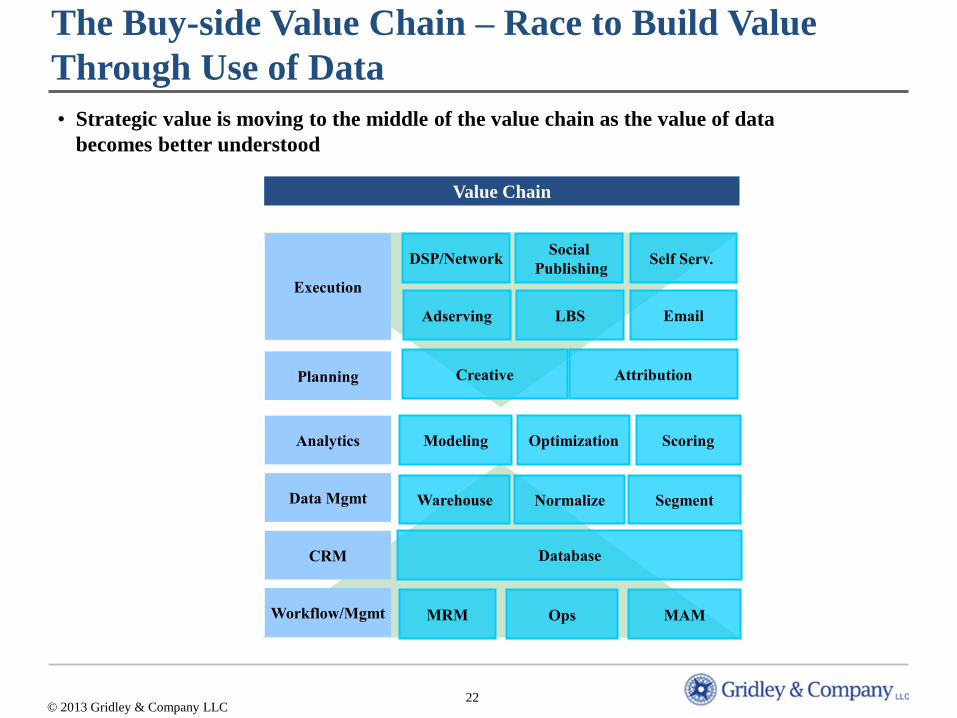
The Buy-side Value Chain – Race to Build Value
Through Use of Data
Execution
Workflow/Mgmt
Value Chain
Planning
Analytics
Data Mgmt
CRM
DSP/Network Social
Publishing Self Serv.
Adserving
Creative Attribution
Modeling Optimization
Warehouse
MRM Ops MAM
Database
Scoring
Normalize Segment
LBS Email
• Strategic value is moving to the middle of the value chain as the value of data
becomes better understood
© 2013 Gridley & Company LLC
23
Sector
© 2013 Gridley & Company LLC
AdTech
Mobile
Content
Social
eCommerce
24
0.0
0.5
1.0
1.5
2.0
2.5
3.0
2009 2010 2011 2012E 2013E 2014E 2015E
Glo
ba
l In
sta
lled
Ba
se (B
illi
on
s)
Desktops+NotebooksSmartphones+Tablets
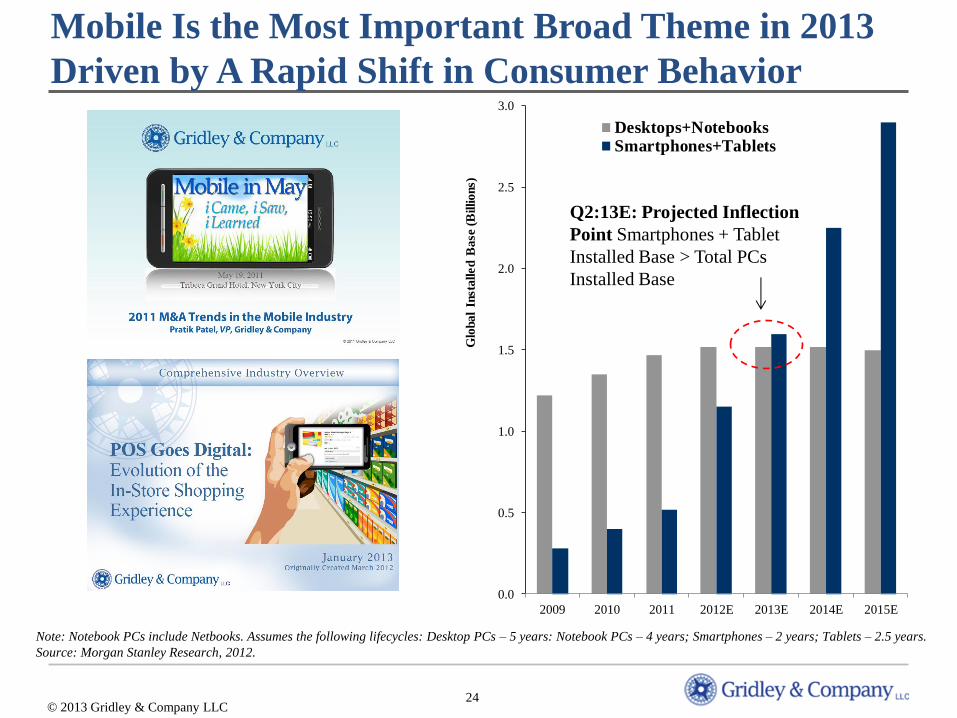
Mobile Is the Most Important Broad Theme in 2013
Driven by A Rapid Shift in Consumer Behavior
Note: Notebook PCs include Netbooks. Assumes the following lifecycles: Desktop PCs – 5 years: Notebook PCs – 4 years; Smartphones – 2 years; Tablets – 2.5 years.
Source: Morgan Stanley Research, 2012.
Q2:13E: Projected Inflection
Point Smartphones + Tablet
Installed Base > Total PCs
Installed Base
© 2013 Gridley & Company LLC
25
Key Trends in Mobile
• 2013 is the year of mobile from many perspectives
‒ Positive mobile consumption trends, quickly overtaking
desktop
‒ Internet bellwethers have executed multiple large scale M&A
deals
‒ Scaled consumer adoption of vertical specific application such
as Uber and Waze
• Facebook and Twitter are educating the broader market on value of
mobile marketing
• Mobile driving much of the innovation in the payments sector today
‒ Exciting opportunity in the convergence between marketing
and payments
© 2013 Gridley & Company LLC
26
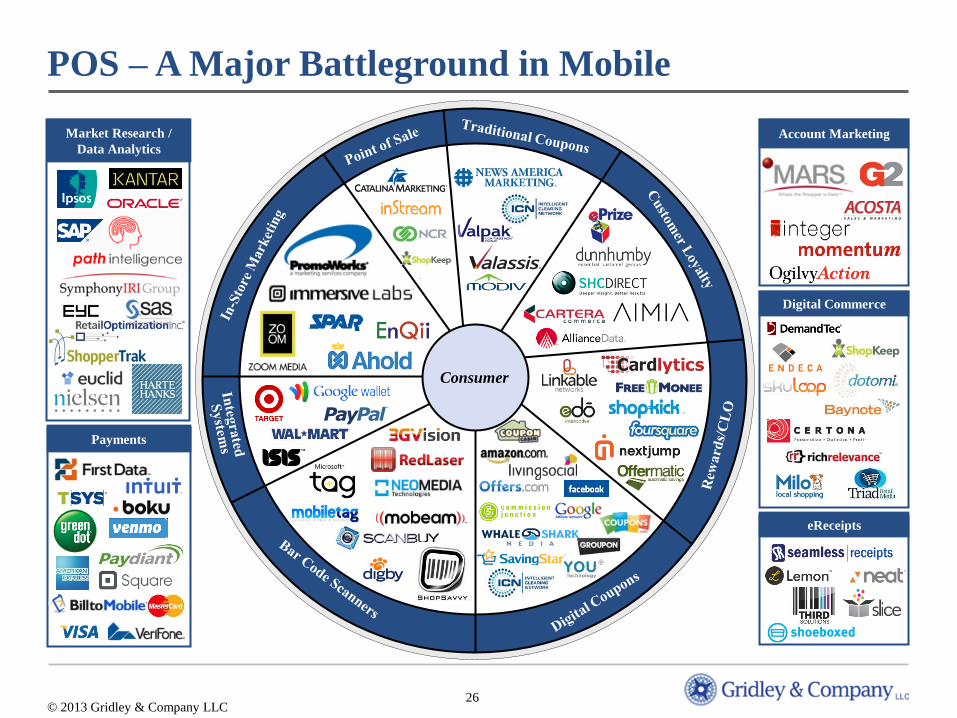
POS – A Major Battleground in Mobile
Market Research /
Data Analytics
Digital Commerce
Account Marketing
Payments
eReceipts
Consumer
© 2013 Gridley & Company LLC
27
$1.0$1.5
$2.2$2.9
$3.6$4.1
$0.7
$1.2
$2.1
$3.1
$4.5
$5.8
2011 2012 2013 2014 2015 2016
National Local
$8.1
$6.0
$4.3
$2.7
$9.9
$1.7
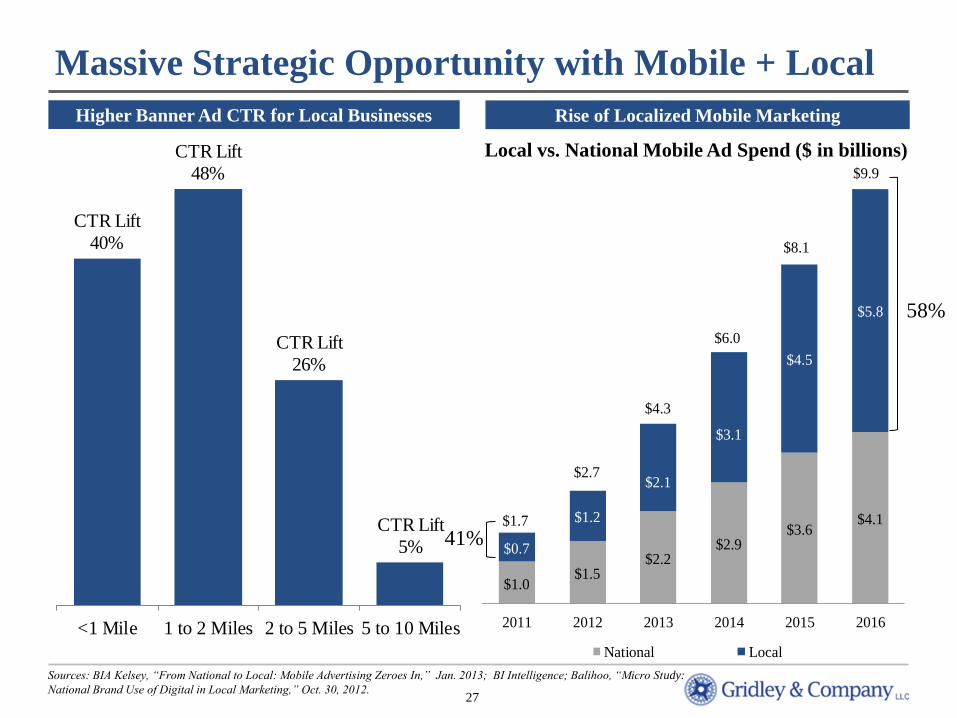
Massive Strategic Opportunity with Mobile + Local
Rise of Localized Mobile Marketing
Sources: BIA Kelsey, “From National to Local: Mobile Advertising Zeroes In,” Jan. 2013; BI Intelligence; Balihoo, “Micro Study:
National Brand Use of Digital in Local Marketing,” Oct. 30, 2012.
41%
58%
Local vs. National Mobile Ad Spend ($ in billions)
Higher Banner Ad CTR for Local Businesses
CTR Lift
40%
CTR Lift
48%
CTR Lift
26%
CTR Lift
5%
<1 Mile 1 to 2 Miles 2 to 5 Miles 5 to 10 Miles
28
Sector
© 2013 Gridley & Company LLC
AdTech
Mobile
Content
Social
eCommerce
29
© 2013 Gridley & Company LLC
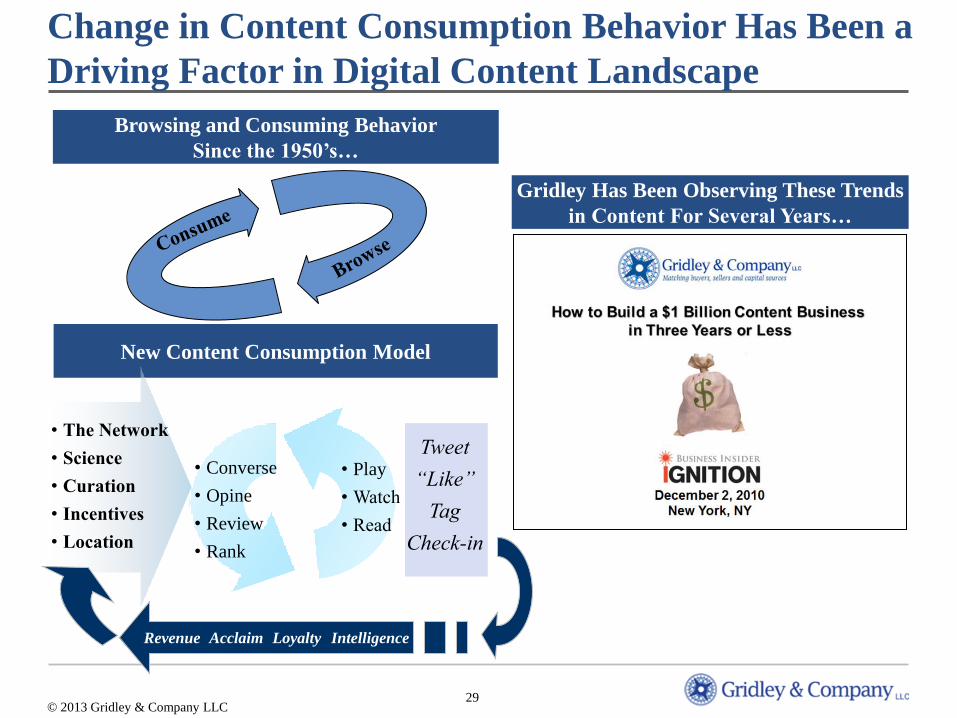
Change in Content Consumption Behavior Has Been a
Driving Factor in Digital Content Landscape
Browsing and Consuming Behavior
Since the 1950’s…
New Content Consumption Model
• The Network
• Science
• Curation
• Incentives
• Location
Tweet
“Like”
Tag
Check-in
• Play
• Watch
• Read
• Converse
• Opine
• Review
• Rank
Revenue Acclaim Loyalty Intelligence
Gridley Has Been Observing These Trends
in Content For Several Years…
30
Key Trends in Content
• Healthy valuations in content enablement (e.g. Wordpress) and big
vertical niche properties (e.g. Houzz)
• Ongoing pressure from traditional ad models has forced some innovation
in consumer acquisition/retention, revenue models,
integration/coordination across channels
‒ Deeper integration into social channels
‒ New advertising formats such as native advertising
‒ Better mobile consumption experiences
‒ More integrated use of user generated content
• Most traditional media companies still on the sidelines from an M&A
perspective
• Few good public comparable market for digital content businesses
© 2013 Gridley & Company LLC
31
Sector
© 2013 Gridley & Company LLC
AdTech
Mobile
Content
Social
eCommerce
32
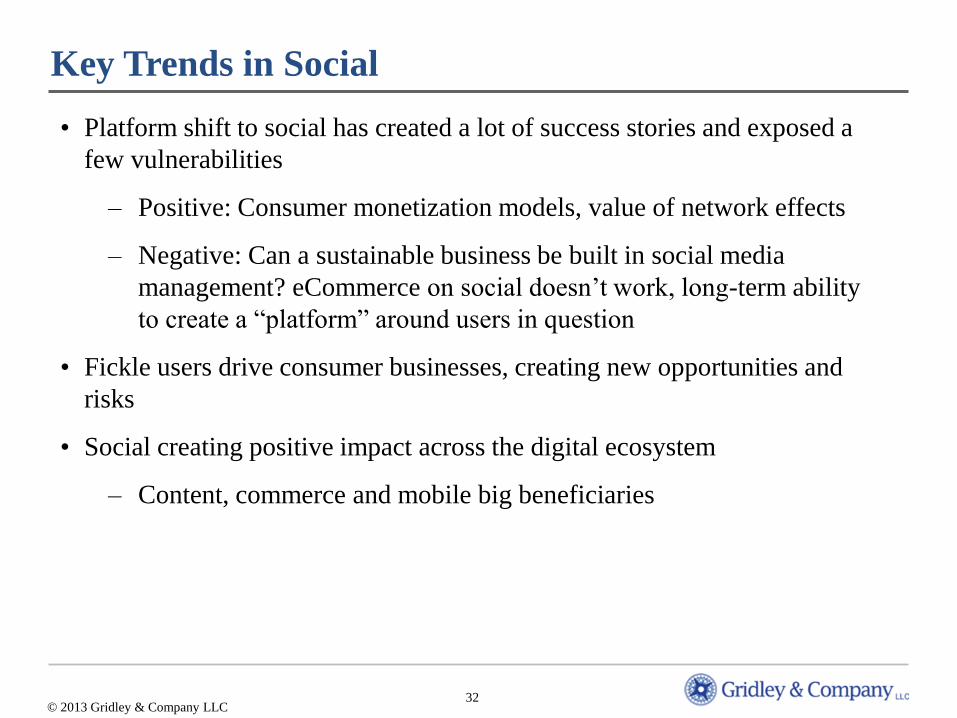
Key Trends in Social
• Platform shift to social has created a lot of success stories and exposed a
few vulnerabilities
‒ Positive: Consumer monetization models, value of network effects
‒ Negative: Can a sustainable business be built in social media
management? eCommerce on social doesn’t work, long-term ability
to create a “platform” around users in question
• Fickle users drive consumer businesses, creating new opportunities and
risks
• Social creating positive impact across the digital ecosystem
‒ Content, commerce and mobile big beneficiaries
© 2013 Gridley & Company LLC
33
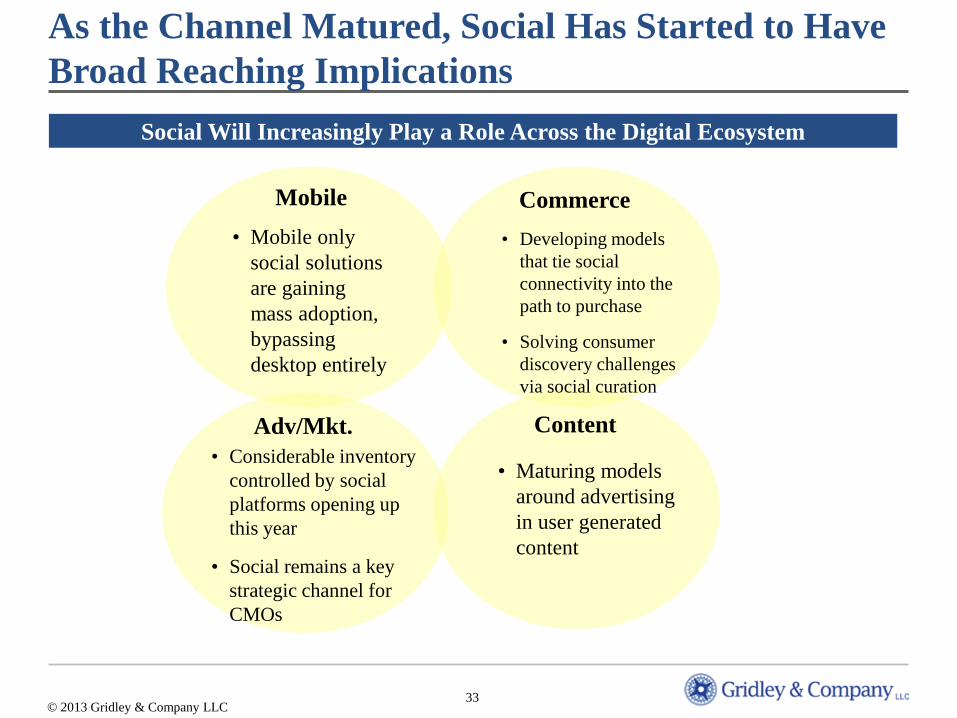
As the Channel Matured, Social Has Started to Have
Broad Reaching Implications
Social Will Increasingly Play a Role Across the Digital Ecosystem
Commerce
Adv/Mkt. Content
Mobile
• Mobile only
social solutions
are gaining
mass adoption,
bypassing
desktop entirely
• Considerable inventory
controlled by social
platforms opening up
this year
• Social remains a key
strategic channel for
CMOs
• Developing models
that tie social
connectivity into the
path to purchase
• Solving consumer
discovery challenges
via social curation
• Maturing models
around advertising
in user generated
content
© 2013 Gridley & Company LLC
34
Sector
© 2013 Gridley & Company LLC
AdTech
Mobile
Content
Social
eCommerce
35
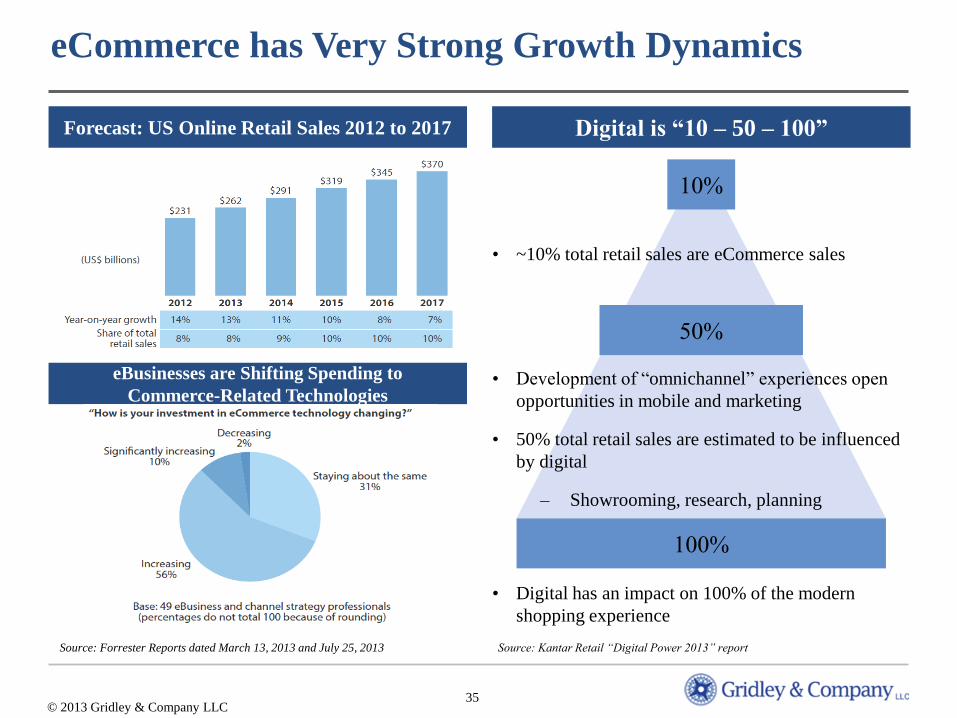
eCommerce has Very Strong Growth Dynamics
Source: Forrester Reports dated March 13, 2013 and July 25, 2013
© 2013 Gridley & Company LLC
Forecast: US Online Retail Sales 2012 to 2017
eBusinesses are Shifting Spending to
Commerce-Related Technologies
Digital is “10 – 50 – 100”
10%
50%
100%
Source: Kantar Retail “Digital Power 2013” report
• ~10% total retail sales are eCommerce sales
• Development of “omnichannel” experiences open
opportunities in mobile and marketing
• 50% total retail sales are estimated to be influenced
by digital
‒ Showrooming, research, planning
• Digital has an impact on 100% of the modern
shopping experience
36
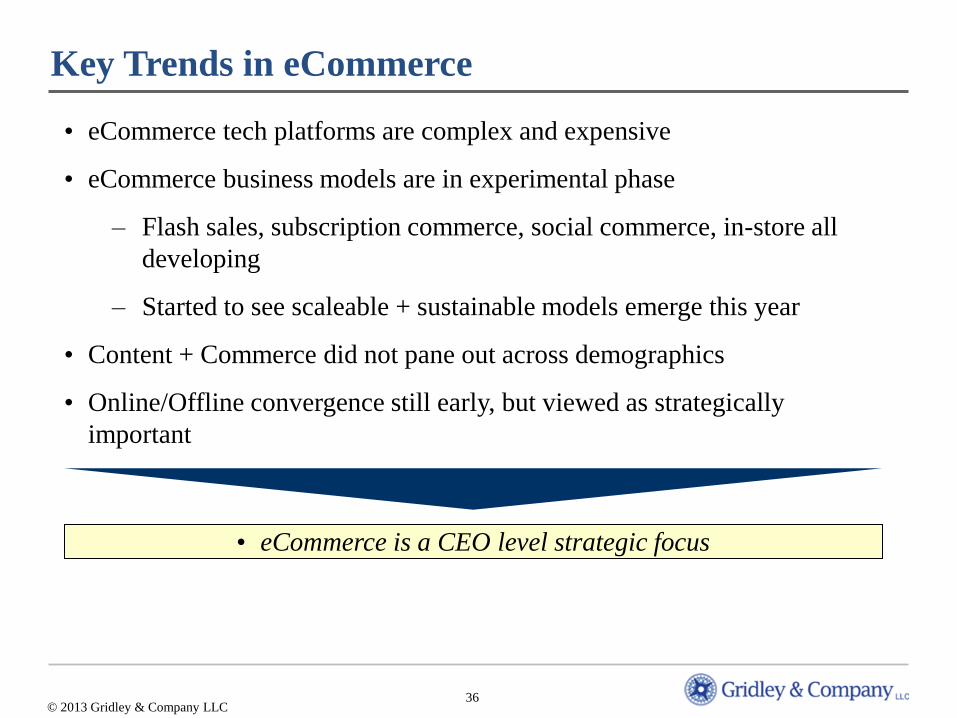
Key Trends in eCommerce
• eCommerce tech platforms are complex and expensive
• eCommerce business models are in experimental phase
‒ Flash sales, subscription commerce, social commerce, in-store all
developing
‒ Started to see scaleable + sustainable models emerge this year
• Content + Commerce did not pane out across demographics
• Online/Offline convergence still early, but viewed as strategically
important
© 2013 Gridley & Company LLC
• eCommerce is a CEO level strategic focus
III. Digital New York
38
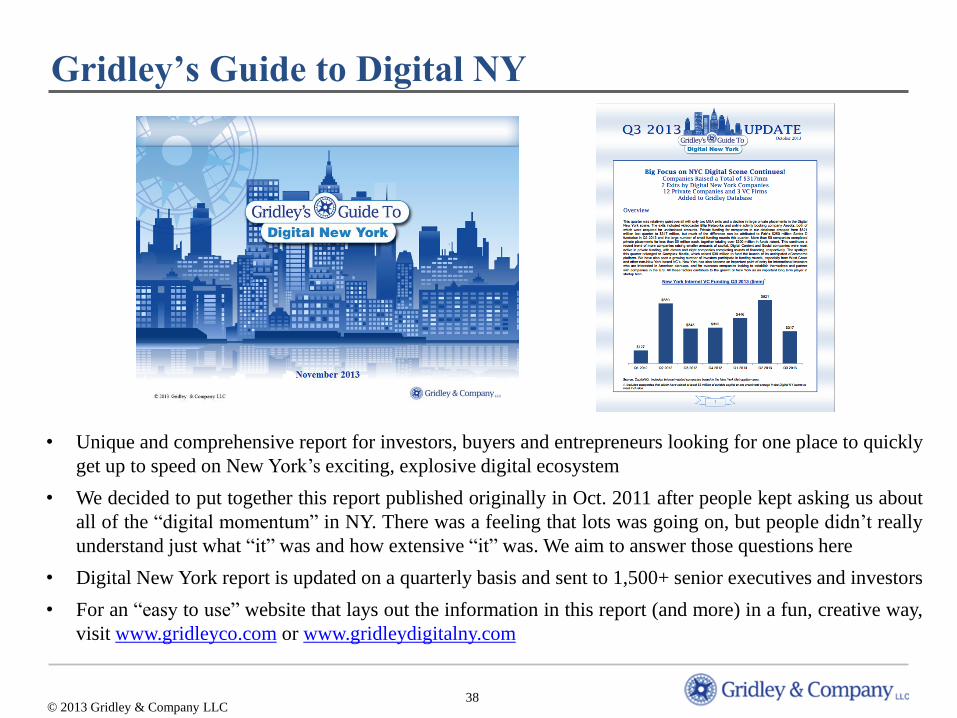
Gridley’s Guide to Digital NY
• Unique and comprehensive report for investors, buyers and entrepreneurs looking for one place to quickly
get up to speed on New York’s exciting, explosive digital ecosystem
• We decided to put together this report published originally in Oct. 2011 after people kept asking us about
all of the “digital momentum” in NY. There was a feeling that lots was going on, but people didn’t really
understand just what “it” was and how extensive “it” was. We aim to answer those questions here
• Digital New York report is updated on a quarterly basis and sent to 1,500+ senior executives and investors
• For an “easy to use” website that lays out the information in this report (and more) in a fun, creative way,
visit www.gridleyco.com or www.gridleydigitalny.com
© 2013 Gridley & Company LLC
39
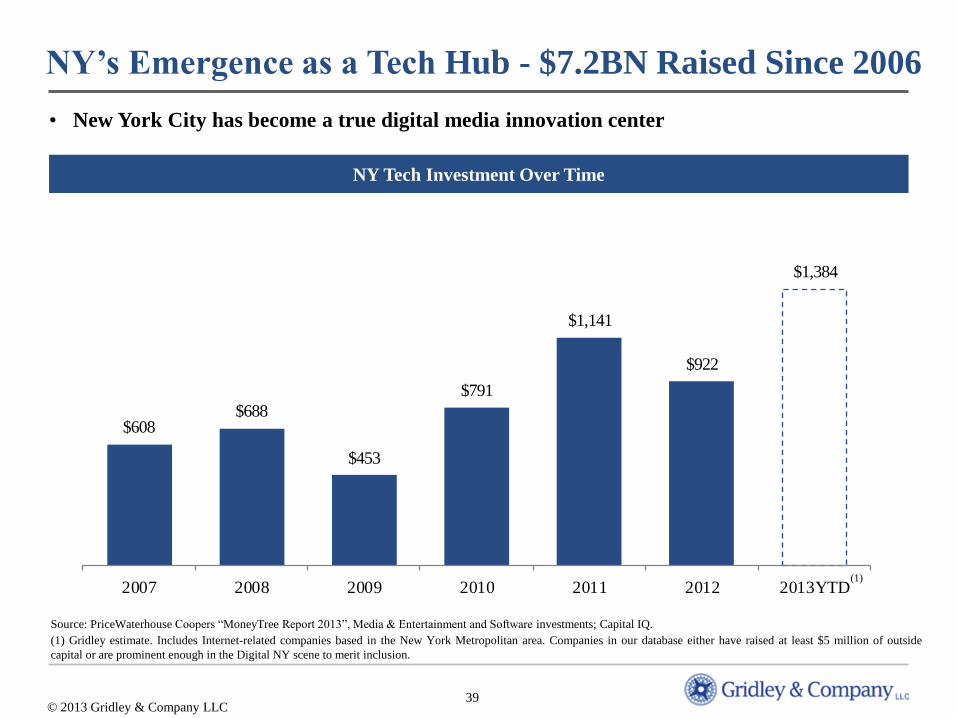
NY’s Emergence as a Tech Hub - $7.2BN Raised Since 2006
• New York City has become a true digital media innovation center
NY Tech Investment Over Time
Source: PriceWaterhouse Coopers “MoneyTree Report 2013”, Media & Entertainment and Software investments; Capital IQ.
(1) Gridley estimate. Includes Internet-related companies based in the New York Metropolitan area. Companies in our database either have raised at least $5 million of outside
capital or are prominent enough in the Digital NY scene to merit inclusion.
$608$688
$453
$791
$1,141
$922
$1,384
2007 2008 2009 2010 2011 2012 2013YTD(1)
© 2013 Gridley & Company LLC
40
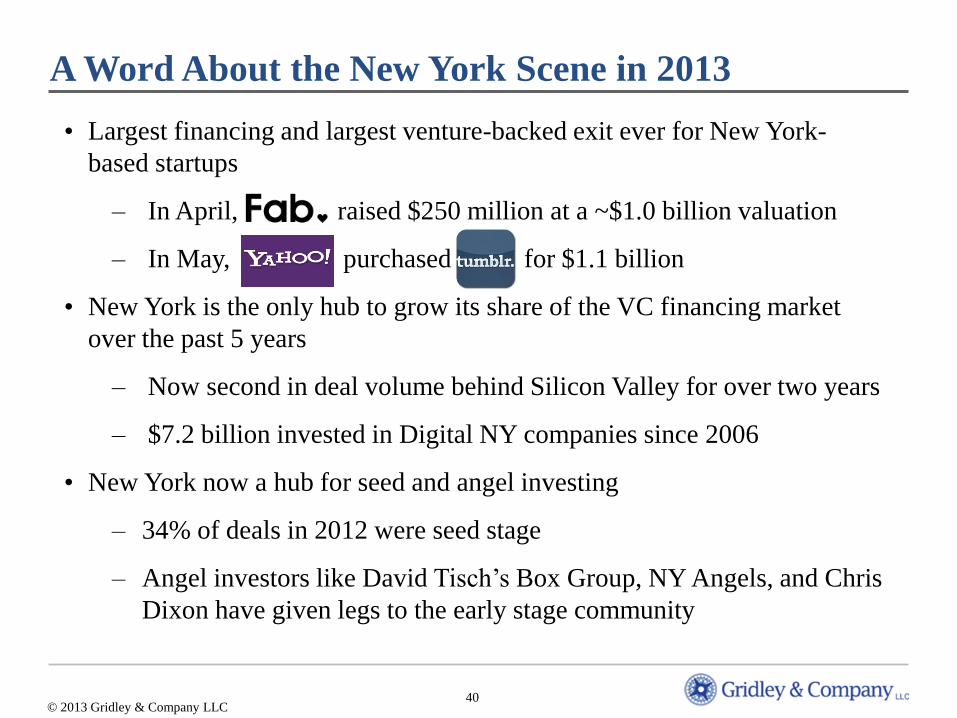
A Word About the New York Scene in 2013
• Largest financing and largest venture-backed exit ever for New York-
based startups
‒ In April, raised $250 million at a ~$1.0 billion valuation
‒ In May, purchased for $1.1 billion
• New York is the only hub to grow its share of the VC financing market
over the past 5 years
‒ Now second in deal volume behind Silicon Valley for over two years
‒ $7.2 billion invested in Digital NY companies since 2006
• New York now a hub for seed and angel investing
‒ 34% of deals in 2012 were seed stage
‒ Angel investors like David Tisch’s Box Group, NY Angels, and Chris
Dixon have given legs to the early stage community
© 2013 Gridley & Company LLC
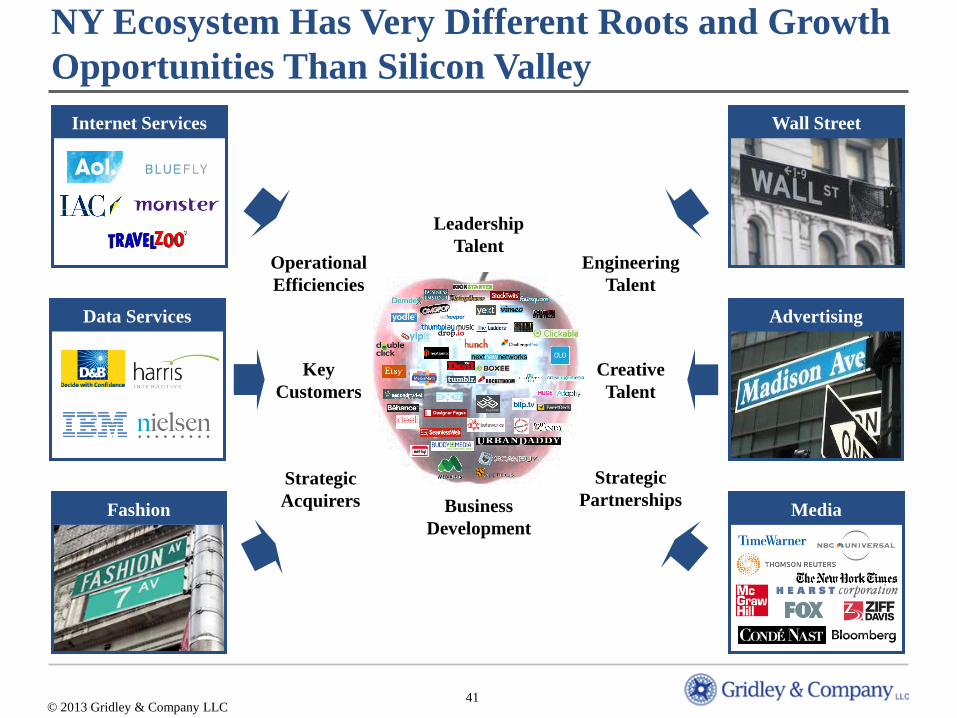
41
NY Ecosystem Has Very Different Roots and Growth
Opportunities Than Silicon Valley
Operational
Efficiencies
Leadership
Talent Engineering
Talent
Creative
Talent
Strategic
Partnerships
Strategic
Acquirers
Key
Customers
Internet Services
Advertising Data Services
Wall Street
Business
Development Media Fashion
© 2013 Gridley & Company LLC
42
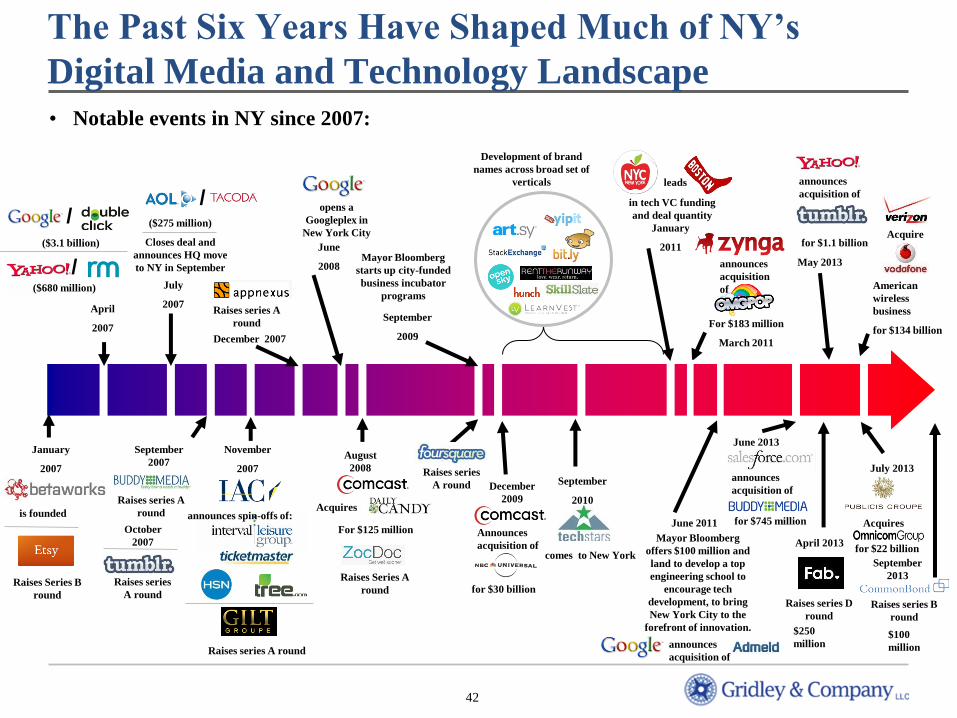
The Past Six Years Have Shaped Much of NY’s
Digital Media and Technology Landscape
• Notable events in NY since 2007:
June 2011
January
2007
/
April
2007
September
2010
November
2007
June
2008
September
2009
January
2011
is founded announces spin-offs of:
opens a
Googleplex in
New York City
Mayor Bloomberg
starts up city-funded
business incubator
programs
comes to New York
leads
in tech VC funding
and deal quantity
Mayor Bloomberg
offers $100 million and
land to develop a top
engineering school to
encourage tech
development, to bring
New York City to the
forefront of innovation.
($3.1 billion)
($680 million) July
2007
/
/ ($275 million)
Closes deal and
announces HQ move
to NY in September
Raises Series B
round
Raises series A round
Acquires
For $125 million
August
2008 Raises series
A round
Raises series A
round
September
2007
October
2007
Raises series
A round
Development of brand
names across broad set of
verticals
Raises Series A
round
December 2007
Raises series A
round
announces
acquisition of December
2009
Announces
acquisition of
for $30 billion
announces
acquisition of
June 2013
For $183 million
March 2011
announces
acquisition
of
for $745 million
May 2013
announces
acquisition of
for $1.1 billion
Raises series D
round
$250
million
April 2013
July 2013
Acquires
for $22 billion
Acquire
s
American
wireless
business
for $134 billion
Raises series B
round
$100
million
September
2013
43
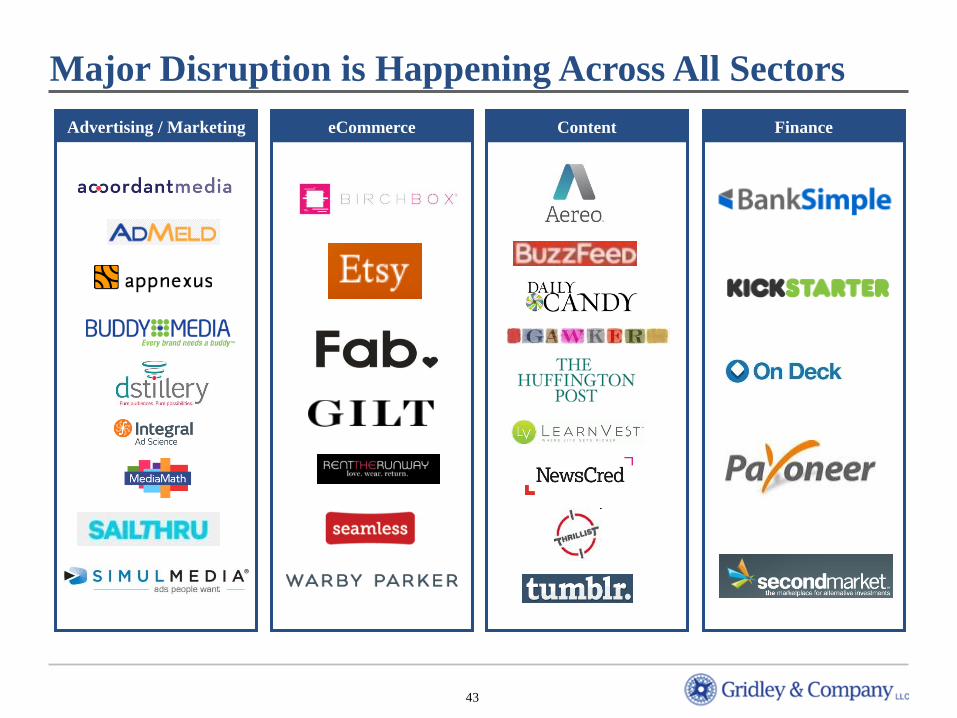
Major Disruption is Happening Across All Sectors
Advertising / Marketing eCommerce Content Finance
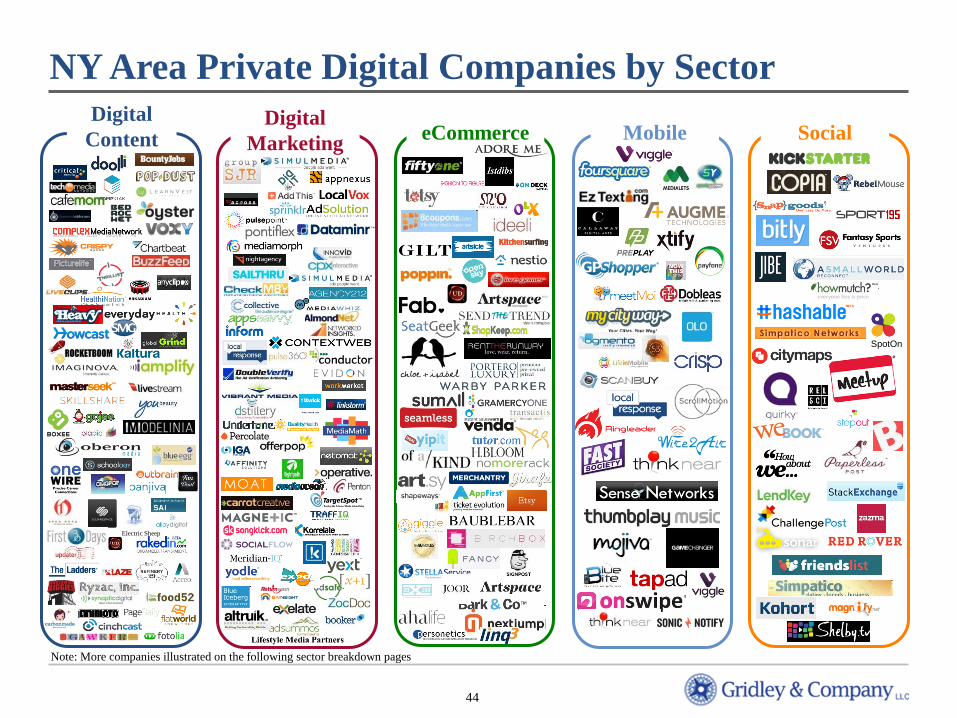
44
Note: More companies illustrated on the following sector breakdown pages
NY Area Private Digital Companies by Sector
Social
SpotOn
eCommerce Mobile Digital
Marketing
Digital
Content
Electric Sheep
45
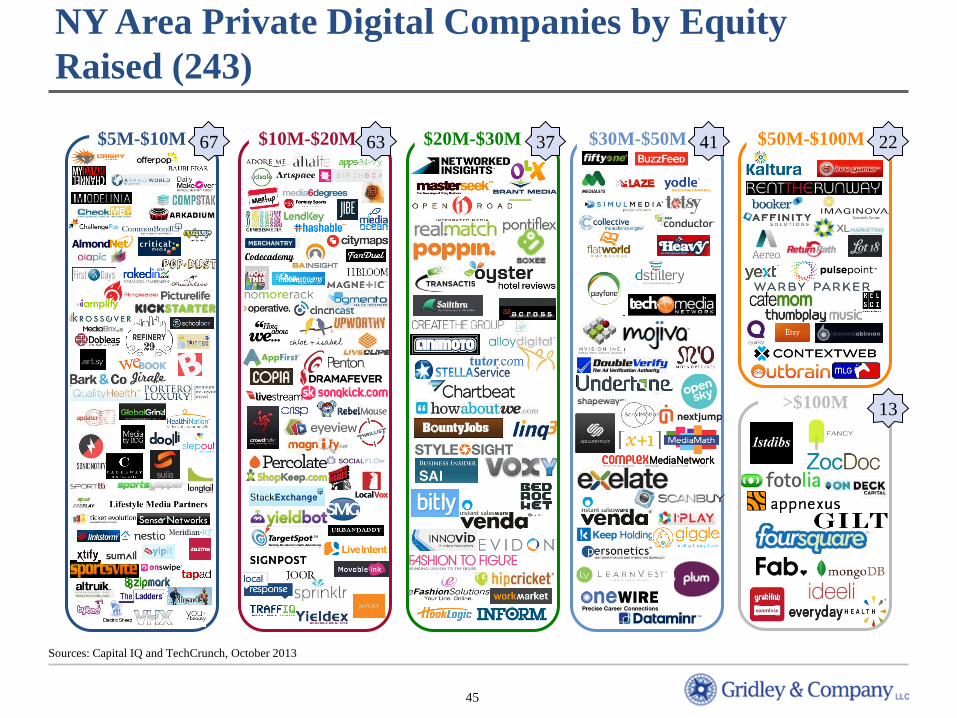
NY Area Private Digital Companies by Equity
Raised (243)
Sources: Capital IQ and TechCrunch, October 2013
>$100M
$30-$50 $30-$50
13
$50-$100 $50M-$100M 22 $20M-$30M $10M-$20M $30M-$50M 41 63 37 $5M-$10M 67
46
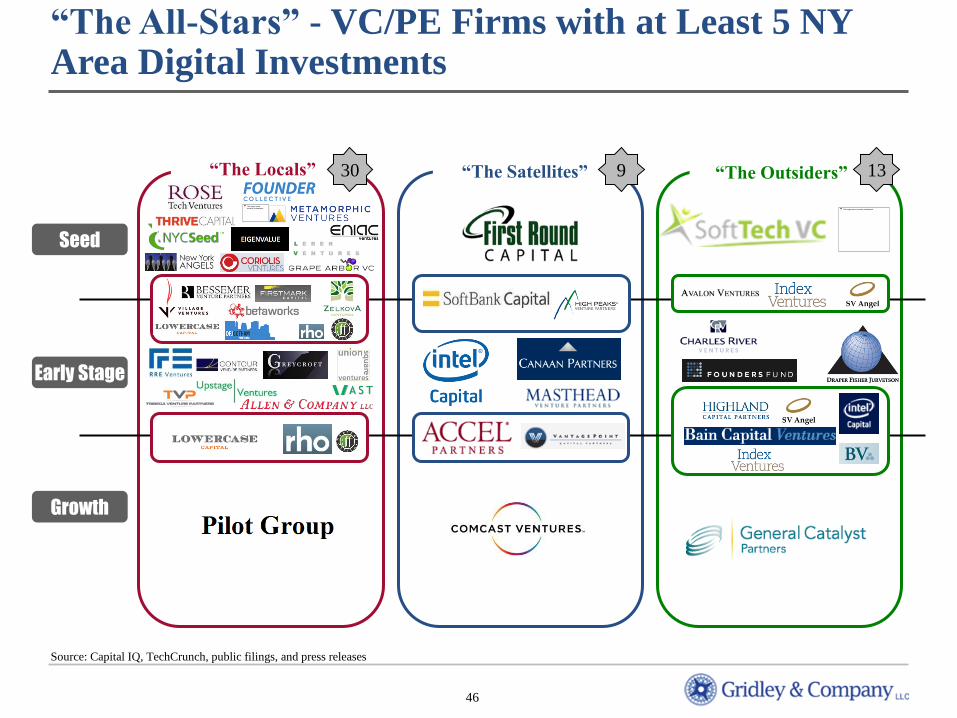
“The All-Stars” - VC/PE Firms with at Least 5 NY Area Digital Investments
Source: Capital IQ, TechCrunch, public filings, and press releases
“The Locals” “The Satellites” “The Outsiders”
Seed
Early Stage
Growth
13 9 30
47
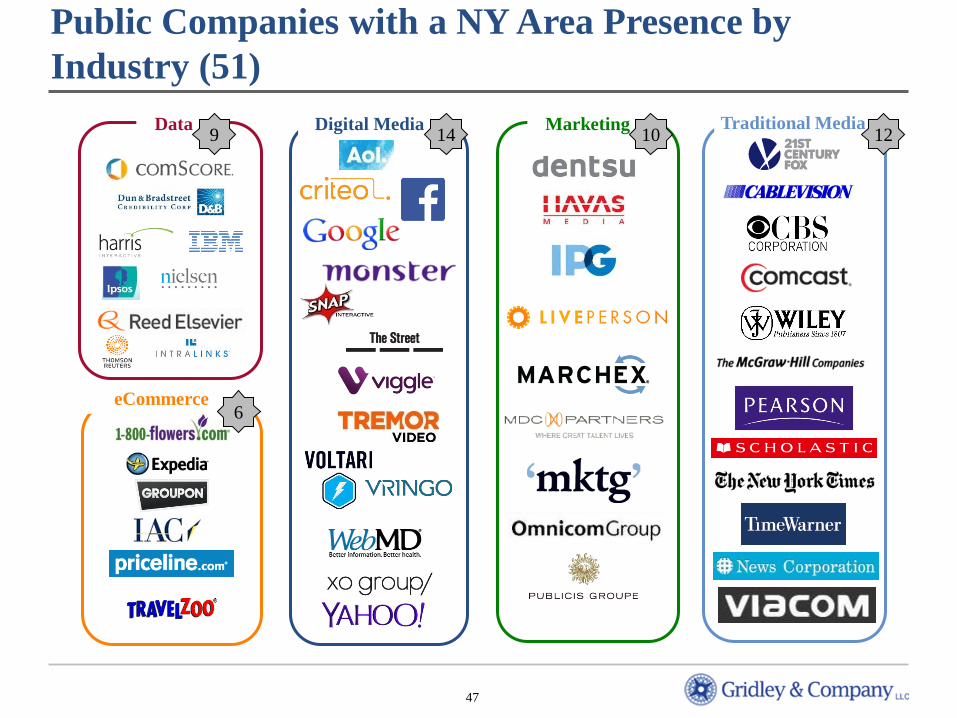
Public Companies with a NY Area Presence by
Industry (51)
Data Traditional Media Marketing
eCommerce
Digital Media 9 14
6
10 12
48
Notable Fundraises IPOs
Company
© 2013 Gridley & Company LLC
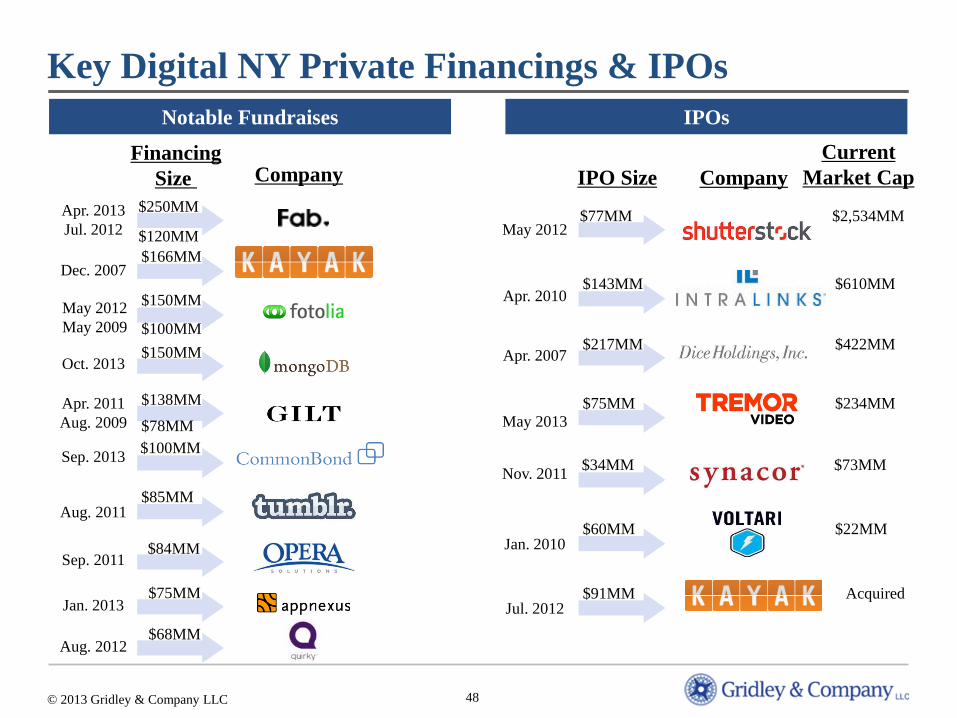
Key Digital NY Private Financings & IPOs
$75MM
May 2013
$77MM May 2012
$60MM
$217MM Apr. 2007
Jan. 2010
$143MM
$34MM
Apr. 2010
Nov. 2011
$84MM
Company
$166MM Dec. 2007
$75MM
$250MM Apr. 2013
Jul. 2012
Jan. 2013
$85MM
$150MM Oct. 2013
Aug. 2011
$150MM
$100MM
May 2012
May 2009
Sep. 2013
Sep. 2011
$138MM Apr. 2011
Aug. 2009
$120MM
$78MM
$100MM
$68MM Aug. 2012
Financing
Size IPO Size
Current
Market Cap
$234MM
$2,534MM
$22MM
$422MM
$610MM
$73MM
$91MM Jul. 2012
Acquired
49
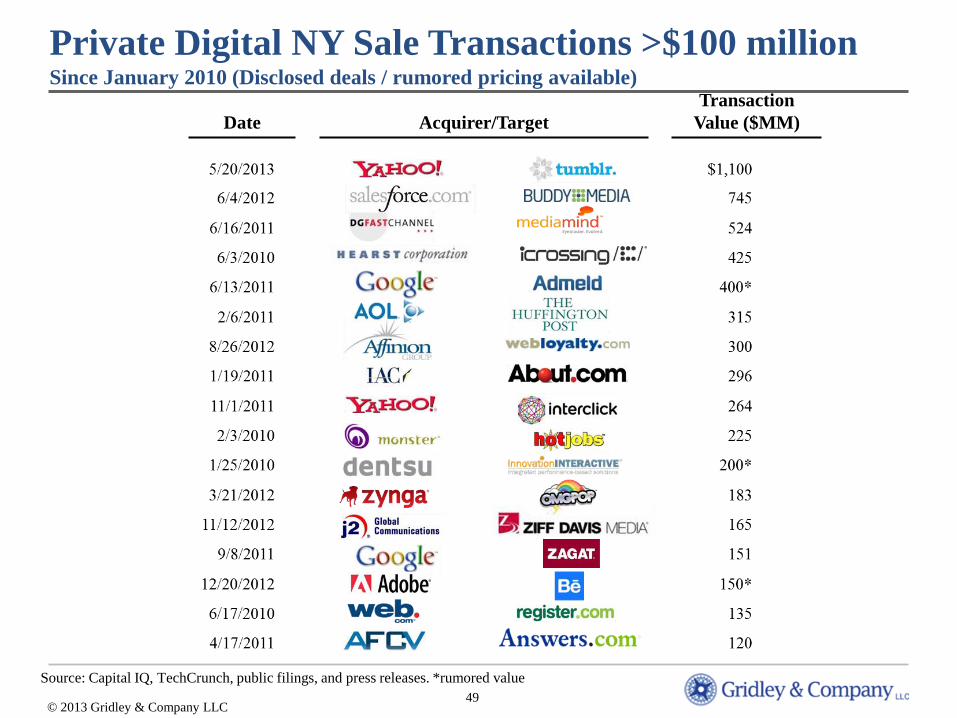
Private Digital NY Sale Transactions >$100 million Since January 2010 (Disclosed deals / rumored pricing available)
Source: Capital IQ, TechCrunch, public filings, and press releases. *rumored value
Date Acquirer/Target
Transaction
Value ($MM)
© 2013 Gridley & Company LLC
V. Quick Gridley Commercial
51
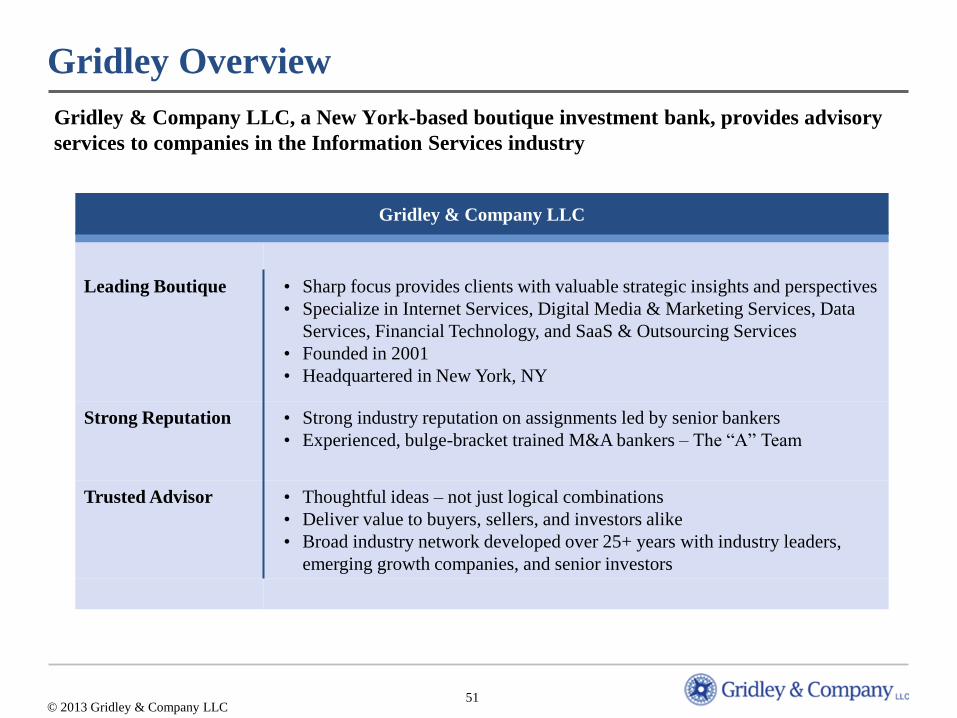
Gridley Overview
Gridley & Company LLC, a New York-based boutique investment bank, provides advisory
services to companies in the Information Services industry
Leading Boutique • Sharp focus provides clients with valuable strategic insights and perspectives
• Specialize in Internet Services, Digital Media & Marketing Services, Data
Services, Financial Technology, and SaaS & Outsourcing Services
• Founded in 2001
• Headquartered in New York, NY
Strong Reputation • Strong industry reputation on assignments led by senior bankers
• Experienced, bulge-bracket trained M&A bankers – The “A” Team
Trusted Advisor • Thoughtful ideas – not just logical combinations
• Deliver value to buyers, sellers, and investors alike
• Broad industry network developed over 25+ years with industry leaders,
emerging growth companies, and senior investors
Gridley & Company LLC
© 2013 Gridley & Company LLC
52
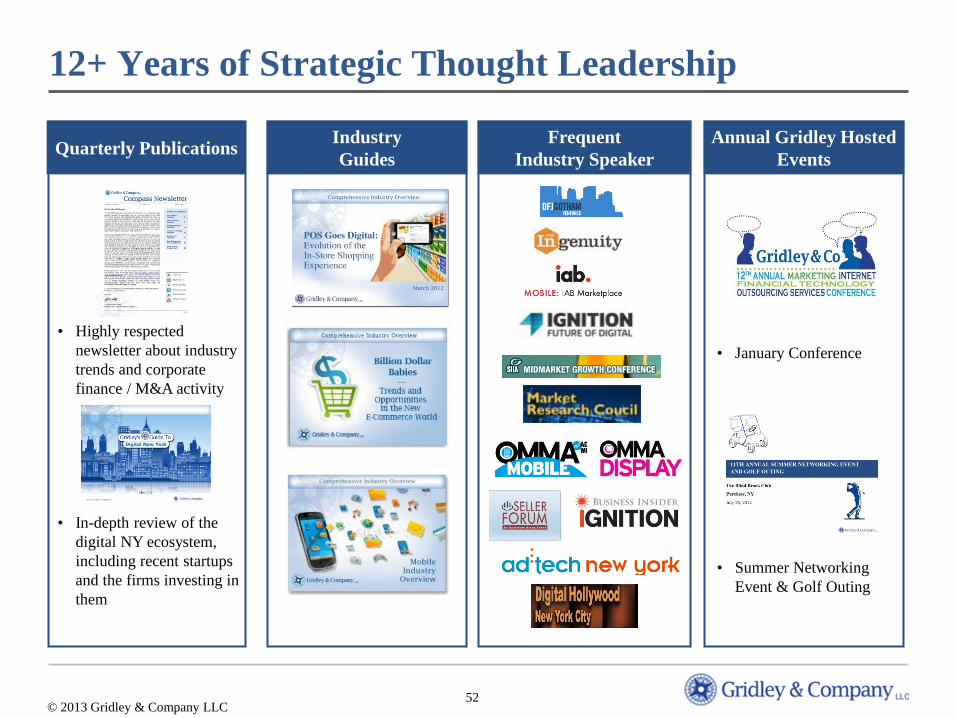
12+ Years of Strategic Thought Leadership
• January Conference
• Summer Networking
Event & Golf Outing
Quarterly Publications
Industry
Guides
Frequent
Industry Speaker
Annual Gridley Hosted
Events
• Highly respected
newsletter about industry
trends and corporate
finance / M&A activity
• In-depth review of the
digital NY ecosystem,
including recent startups
and the firms investing in
them
© 2013 Gridley & Company LLC
53
Host of Leading Annual Industry Conference for
13 years
• Bellwether event focused on our targeted industries
• Approximately 500 senior-level executives from over 300 companies
• Differentiated audience and participants vs. other conferences
• Highly personalized with Gridley arranged “1-on-1”s for clients, presenters, sponsors
• Presentations by approximately 40 private companies and industry panels addressing
timely topics
© 2013 Gridley & Company LLC
January 14, 2014
The Westin New York Grand
Central
(Invitation Only)
54
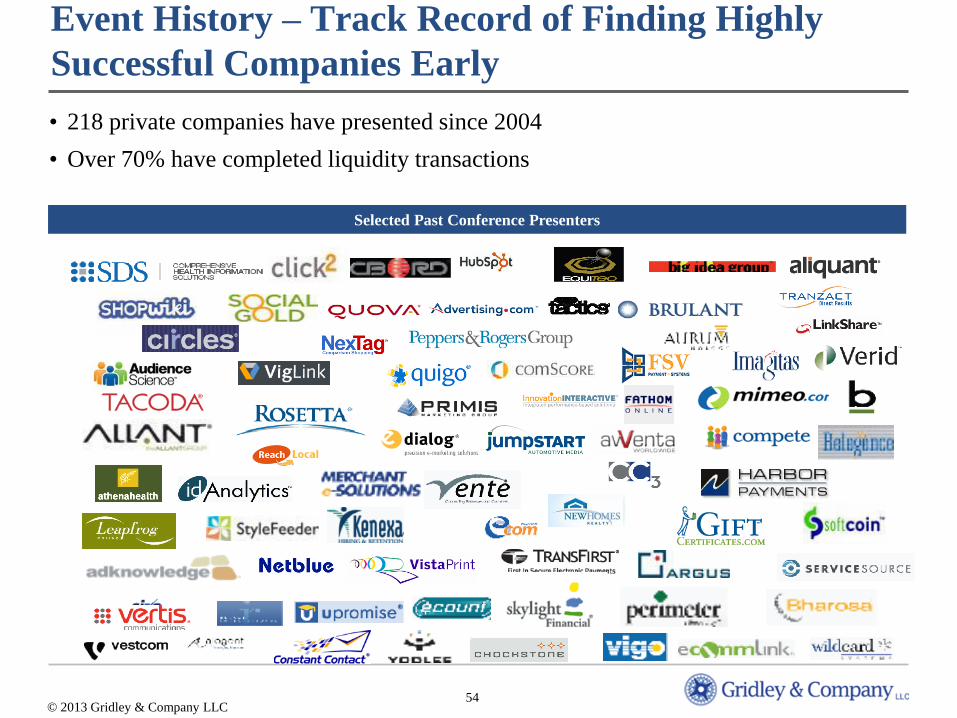
Event History – Track Record of Finding Highly
Successful Companies Early
• 218 private companies have presented since 2004
• Over 70% have completed liquidity transactions
Selected Past Conference Presenters
© 2013 Gridley & Company LLC
55
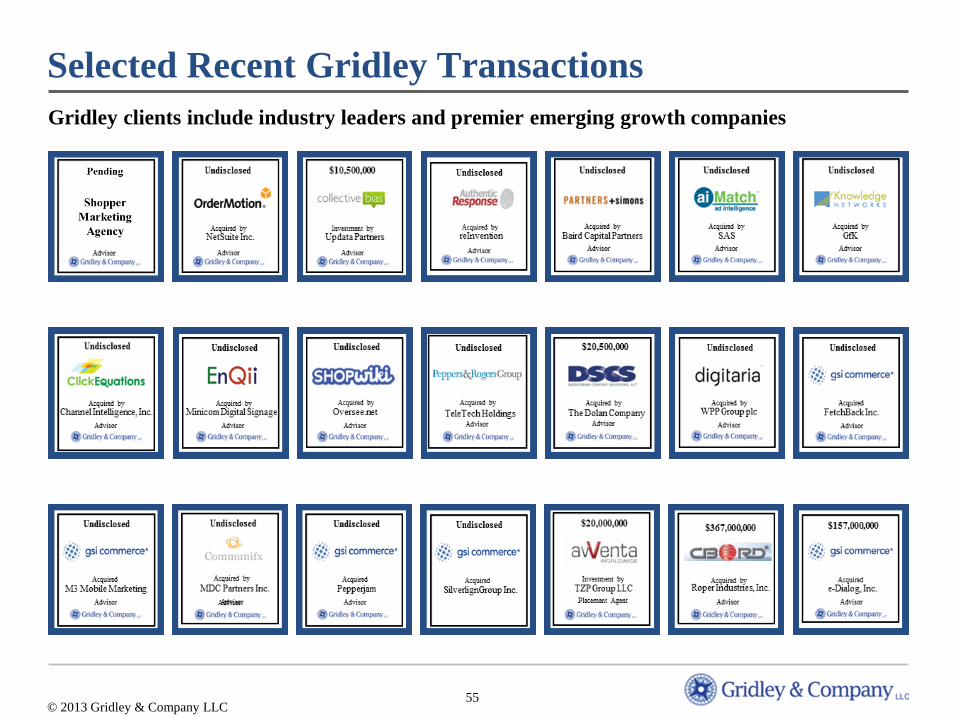
Selected Recent Gridley Transactions
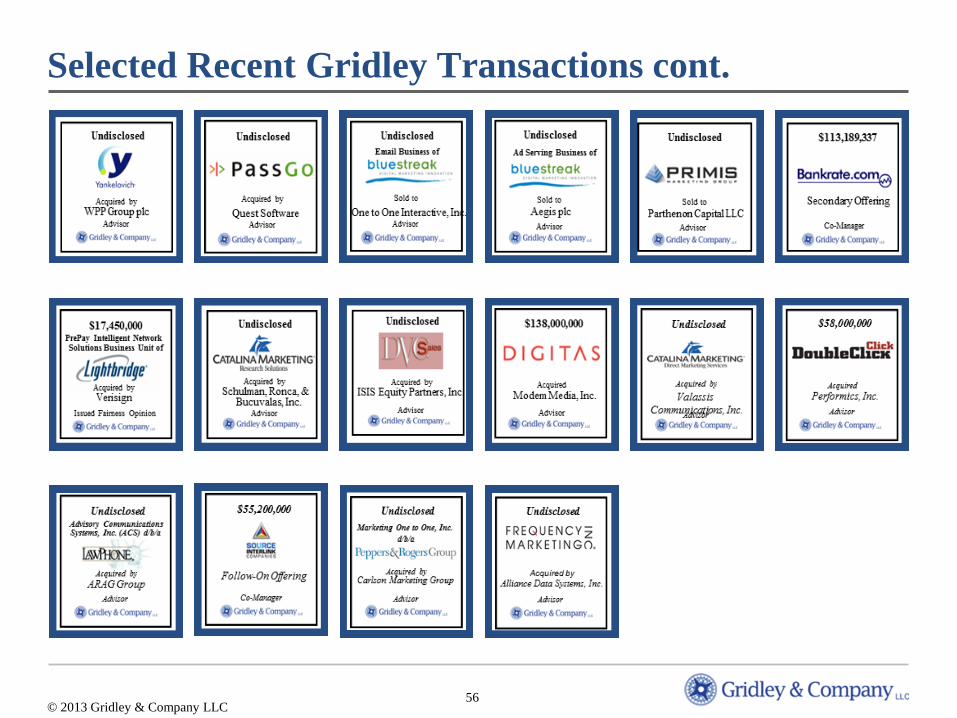
Gridley clients include industry leaders and premier emerging growth companies
© 2013 Gridley & Company LLC
56
Selected Recent Gridley Transactions cont.
© 2013 Gridley & Company LLC
Gridley & Company LLC
10 East 53rd Street, 24th Floor
New York, NY 10022
212.400.9720 tel
212.400.9717 fax
Twitter: @gridleyco
www.gridleyco.com
QUESTIONS?
Linda Gridley
President & CEO
212-400-9710
Pratik Patel
Managing Director
212-400-9712