141 tableau 55. rayonne et fibres textiles artificielles...
TRANSCRIPT

141
Tableau 55. RAYONNE ET FIBRES TEXTILES ARTIFICIELLES. - Table 55. RAYON AND STAPLE FIBRE.Production en tonnes metriques. - Production in' metric tons.
Note. - Ce tableau se refere i la production a) des fils de rayonne Note. - This table covers the production of (a) rayon (artificial(soie artificielle) proprement dits, non compris les ( fibres silk) yarn properly so called, excluding other artificial fibres andtextiles artificielles ) (fibranne), les files de dechets de rayonne, les yarns, such as staple fibre ", rayon waste yarn, artificialcrins artificiels, les lames, etc., et b) de la fibranne, ou fibres horsehair and straw, etc., and (b) "staple fibre" which is producedtextiles artificielles, produites a l'aide des m8mes matieres que la from the same materials as rayon, but instead of being made insoie artificielle, mais divisees en courts brins de fa;on a pouvoir continuous filaments is cut into short staples so as to be suitableatre filees sur les machines employees pour le coton et la laine. for spinning on cotton and worsted machinery.
Certaines estimations qui figurent au tableau, notamment a Some of the estimates given in the table, particularly thosepartir de 1940, sont tres incertaines et fortement arrondies. since 1940, are rather conjectural and rounded off.
Le tableau ne comprend pas la production de la laine artificielle The production of artificial wool obtained from milk (" lanital ",tir&e du lait -— lanital ,, etc. - (en Italie, 1941: 7.000 tonnes). etc.) is not included in the table (in Italy, 1941 : 7,000 tons).
a) Rayonne (soie artificielle). (a) Rayon (Artificial Silk).
PAYs 1934 1935 1936 1937 1938 1939 1940 * 1941 *1942 '1943 COUNTRY
AMARIQUEDUNORD* 99 279 122 822 132 117 153 399 123 074 155 502 185 844 213 516 225 770 234 805 NORTH AMERICA.*Canada* . ... . 4 785 5 995 6 180 7 485 6 215 6 438 8 908 8 850 8 370 7 505 Ganada. *Etats-Unis . . . 94494 116827 125937 145914 116859 149064 176936 204666 217400 227300 United States.
AM9RIQUE DU SUD . 1 198 1 589 2 440 4 136 5 965 9 375 8 288 11 450 11 300 ... SOUTH AMERICA.Argentine * . . - - 205 840 1 225 2 300 2 700 3 459 3 783 ... Argentine. *Br6sil. ..... I 198 1 589 2 235 3 296 4 740 7 075 5 588 *8 000 *7 500 ... Brazil.
AsIE (Japon) . .. 70 432 101 749 125 314 152 395 95 496 108 569 102 000 . 135 000 . ASIA (Japan).
U.R.S.S.. ... . 5430 *6 000 *6 200 *7 000 7? 250 *7 700 8 000 9 000 . . U.S.S.R.
EUROPE (s.URSS.) * 175 590 195 110 199 260 228 600 219 150 240 000* 220 000* . . . EUROPE (ex.USSR)*Allemagne . . 39 011 44 806 45 424 57193 6 800 6 80 000 00 000 Germany.Autriche. . . . 878 850 850 1 000 Austria.*Belgique* .. 5 875 6 225 6 450 7 500 5 100 5 900 6 746 5805 ... Belgium. *Espagne*. . .. 2526 3396 3 037 1 316 537 1 399 3'400 ... ... 5500 Spain. *France* . . . . 25 950 28 000 27 000 30 100 28 000 25 500 12 600 30 000 30 000 s45 000 France.*Grece . . .. 89 90 125 187 267 318 340 . . . Greece.Hongrie * . .. 50 50 50 50 50 50 ... . . . Hungary. *Italie . . . . . 38 905 38 880 39 011 48 331 45 996 53 610 52 754 ... 60000 . Italy.Norv6ge * ... - 76 141 168 . . . Norway.*Pays-Bas* . . 9 950 9 400 9 500 10 750 9 000 10400 5400 7200 12000 ... Netherlands.*Pologne .... 4 373 5 380 5 317 6 544 6 213 *5 000 . . . . Poland.Portugal . . .. - 98 134 181 175 125 151 207 343 Portugal.Roumanie . 27 295 598 842 1 210 ... 1 150 ... ... Roumania.Royaume-Uni . 40 315 50 948 52 985 54 294 48 285 54 450 45000 . 40000 Unit. Kingdom.Su6de * . . . . 466 588 737 794 803 933 889 977 1 273 ... Sweden. *Suisse * . .... 4 620 3 687 5 000 5 500 5 500 5 311 6 000 7 000 7 500 t 7 100 Switzerland.*Tchecoslovaquie* 2 581 2 785 3 377 4 242 2 430 1 277 . . . . Czechoslovakia*.
TOTAL *. ... . 351 930 427 270 465 330 545 500 450 950 $21 000 525 000 590 000 656 000 ... TOTAL.*
Prix en francs-or par kg: Price in gold frs. per kg:NEW YORK,15Of/moy. 4.02 3.87 3.99 4.18 3.51 3.51 3.58 3.62 3.71 3.71 Av. EWYORK, 150Qualit6 A [XlI. 3.87 3.87 4.05 4.25 3.44 3.58 3.58 3.71 3.71 3.71 XIIA grade.
b) Fibres textiles artificielles (fibranne). (b) Staple Fibre.
AMtRIQUE: Et.-Unis* 998 2 086 5 580 9 185 13 544 23 300 36 786 55 351 69 535 73 492 AMERICA: U.S.A. *Asm: Japon*. . . 2 140 6 180 20797 83795 170 100 140389 136000 . 180000 . ASIA: Japan.*EUROPE. EUROPE.
Allemagne. ... 7 169 17 199 42 903 99 434 150 000 200 000 250 000 . 400 000 . Germany.Belgique 300 700 2 300 .... 3 200 ... ... Belgium.France* . . . 1 995 2 268 2 995 5 125 4 900 7 030 9 000 21 000 27 500 545 000 France. *Italie. . . . . . 9804 30 700 49 943 70 922 75 682 86 567 113 330 ... 150 000 ... Italy.Portugal . . . - - - - - - - 119 ... Portugal.Royaume-Uni * 1110 4230 11 865 14 845 14 395 27 215 22 700 20 000 . Unit. Kingdom.*Su6de...... -— 220 536 937 1 061 1 253 3 924 7 150 ... Sweden.Suisse. .....- 2 000 2 000 8200 10 600 Switzerland.Autres pays 3* . 302 553 1 100 1550 4 350 4 600 . . . . Othercountries.*
TOTAL* . 23 520 63 220 135 400 285 700 434 600 492 500 575 000 670 000 920 000 ... TOTAL.*
* Estimation ou chiffre provisoire. - 1 Royaume-Uni: y compris * Estimate or provisional figure. - 1 U. K.: including artificialles lames.-- 2 Tch&coslovaquie, 1939: a Slovaquie P. - s Grece, straw. - " Czechoslov., 1939: " Slovakia ". - ' Greece, Norway,Norvege, Pays-Bas, Pologne et Tchecoslovaquie (1939: * Slova- the Netherlands. Poland and Czechoslov. (1939: " Slovakia "). -quie ). - 4 Allemagne, 1942: Allemagne, Pologne et Tchecoslo- 4 Germany, 1942: Germany, Poland and Czechoslov. - s France,vaquie.- - France, 1943: rayonne et fibranne, evaluation. 1943: conjectural estimates for total of rayon and staple fibre.
* 1944, Rayonne - Rayon : Etats-Unis : *253 000; Suisse : 7 100. Fibres textiles - Staple Fibre: U.S.A.: *75 000 ;Switzerland: 1 1 300.

- 142 -
Tableau 56. PATE DE BOIS (chimique et mecanique).Table 56. WOOD PULP (Chemical and Mechanical).
Production en milliers de tonnes m6triques. - Production in metric tons (000's).
Note. - Les donnees du tableau, exprimees en poids sec, comrn- Note. - The data in the table, which are expressed in termsprennent aussi dans quelques cas la pate de sparte et la pate de of dry weight, include in some cases also pulp produced frompaille. La pate de bois chimique (cellulose de bois) est obtenue esparto and straw. Chemical wood pulp (wood cellulose) may bepar des procedes dits de soude, de sulfate (Kraft) ou de bisulfite ; prepared by the soda, sulphate (Kraft) or sulphite processes, whichces proced's 6liminent en m8me temps les incrustants (matires also free the cellulose fibres from adhering impurities knowndtrangcres adherentes aux fibres cellulosiques). La pate de bois as incrustants. Mechanical (or groundwood) pulp, obtainedmecanique, obtenue en rapant du bois mouill', est d'une qualit' by grinding the wood wet, is of an inferior grade, the incrustantsinferieure, car les incrustants n'en sont pas elimines. not being eliminated.
PAYS 1934 1935 1936 1937 1938 1939 1940 1941 1942 * 1943 COUNTRY
AMgiR. DU NORD': Total 7 601 8 271 9 482 10 948 8 952 *10 375 *13 250 *14 875 *15 100 *13 750 NORTH AMER." : Total.Chimique . . . . . 4 oi8 4 466 5 187 6 148 5 247 *6 3-25 *8 300 *9 525 *9 950 *9 000 Chemical.Mkcanique . . . . . 3 583 3 805 4 295 4 800 3 706 *4 050 *4 950 *5 350 *5 150 *4 750 Mechanical.
Canada: Total . .. 3 298 3510 4029 4665 3 328 3 780 4800 5 190 5086 4783 Canada:Total.Chimique ...... 1 126 1 184 1 322 1 594 1 041 1 243 1 744 1 969 2 085 2 031 Chemical.Mkcanique ... .. 2 172 2 326 2 707 3 071 2 287 2 537 3 056 3 221 3 001 2 752 Mechanical.
Etats-Unis1
: Total . 4 025 4 465 5 166 5 963 5 382 6 344 "8 128 9 414 9 716 *8 658 United States' :Total.Chimique . . . . . . 2 847 3 235 3 821 4 502 4 173 5 033 6 488 7 507 7 807 6 891 Chemical.M6canique . . . . . 1 178 1 230 1 345 1 461 1 209 1 311 1 640 1 907 1 909 1 767 Mechanical.
Terre-Neuve : Total * 278 296 287 320 242 ... ... ... ... ... Newfoundland: Tot.*Chimique * ..... 45 47 44 52 37 ... ... ... .. ... Chemical*.
AMI.RIQUE CENTRALE CARIBBEAN(Mexique): Total * . 30 30 5 5 5 ... ... ... ... ... (Mexico): Total. *
Chimiqne* . . . . . 0 0 - - - ... ... ... ... ... Chemical*.Mcanique* ..... 20 20 5 5 5 ... ... ... .. ... ... Mechanical*.
AM"IRIQUE DU SUD S. AMERICA(Argentine): Total . . . . 16 23 * 31 36 * 42 ... (Argentine): Total.
Chimique...... . 6 · 12 *I 5 21 *25 29 "32 ... Chemical.Mcanique .... . . . . *I 2 *6 7 * Io ... Mechanical.
AsIE (Japon et poss.) : AsIA (Japan and poss.):Total ....... 716 749 772 *837 2 9432 1 057 . . . . Total.
Chimique....... 408 421 431 475 591 648 . . . Chemical.M'canique ..... 308 328 341 362 352 409 . . . Mechanical.
U.R.S.S. : Total . . . 525 591 701 740 ... ... . . . U.S.S.R. : Total.Chimique...... 239 271 321 340 .. .... Chemical.M6canique ...... 286 320 380 400 ... ... . . . . Mechanical.
EUROPE (sans EUROPE (excl.I'U.R.S.S.) : Total. 9 276 9 727 10 545 11 700 *10 800 . . U.S.S.R.) : Total.
Chimique. . . . . . 5 897 6 243 6 885 7 63I *7 00 . . . . . Chemical.Micanique ..... 3 379 3 484 3 660 '4 069 *3 800 . . . . . Mechanical.
Allemagne : Total. 2 011 2 153 2 367 2 564 2 544 . . . . . Germany: Total.Chimique ...... 1 167 1 241 1 356 1 430 1 413 . . . . . Chemical.M6canique. .... 844 912 1 011 1 134 1 131 . . . Mechanical.
Autriche : Total . 319 335 336 414 383 . . . . . Austria : Total.Chimique...... 239 254 254 304 276 . . .. . Chemical.M6canique ..... 80 81 82 110 107 . . . . . Mechanical.
Estonie : Total. .. 86 86 85 86 91 112 ... Estonia : Total.Chimique . .... 71 71 70 73 79 102 . . . Chemical.M6canique ..... 15 15 15 13 12 10 . . . . Mechanical.
Finlande : Total . 1 568 1 728 1 976 2 191 2 110 1 614 657 1 673 662 ... Finland : Total.Chimique . . . . . 1 023 1 137 1 329 1 475 1 471 a 1 002 a 533 8 590 502 ... Chemical.MWcanique ..... 545 591 647 716 639 a 612 3 124 a 88 160 ... Mechanical.
France : Total* . 280 310 342 355 342 . . . . France : Total*.Chimique* ..... 80 90 100 105 122 . . . . Chemical*.M6canique* ..... 200 220 242 250 220 . . . Mechanical*.
Italie : Total .. .. 113 132 139 184 186 . . . . . Italy : Total.Chimique ...... 8 12 24 37 41 . . . . . Chemical.M~canique ..... 105 120 115 147 145 . . . Mechanical.
Lettonie : Total. .. 32 26 33 36 41 32 .. Latvia : Total.
Lithuanie: Tot. (Chim.)* 56 54 59 66 54 ... . Lithuania: Tot.(Chem.)*
Norv6ge : Total. .. 982 860 992 1 097 907 965 *660 . . . Norway : Total.Chimique ...... 444 462 505 552 462 495 ... Chemical.M6canique... . 538 398 487 545 445 470 ... . . . Mechanical.
Pays-Bas 4: Total. 1. 01 105 106 121 105 108 . . . . Netherlands : Total.Chimique ...... 36 42 42 50 42 47 . . Chemical.M6canique . 65 63 464 4 71 4 63 61 . . . Mechanical.
Pologne : Total. . 123 124 152 174 187 . . . . . Poland : Total.Chimique ..... . 72 73 86 93 109 . . . . Chemical.M6canique ..... 51 51 66 81 78 . . . . Mechanical.
- 143 -
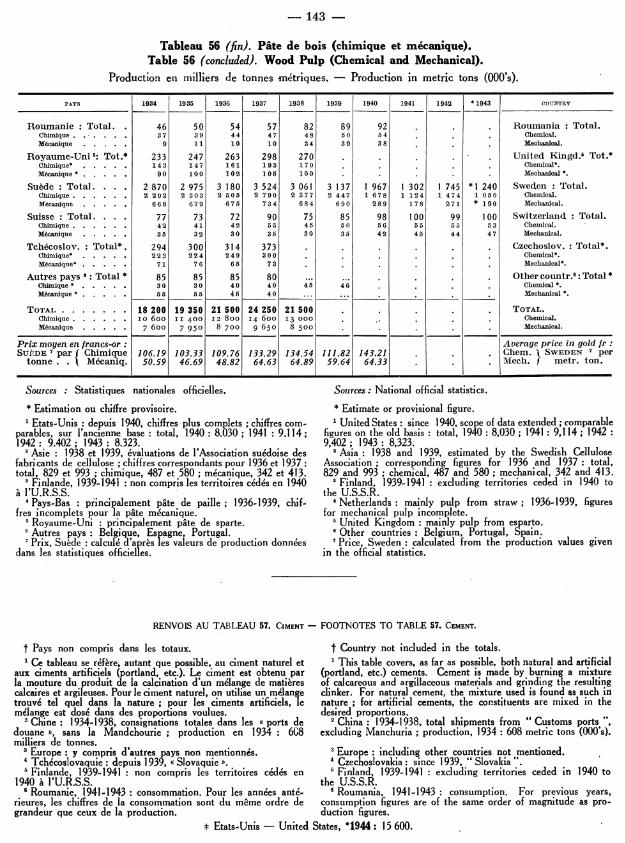
Tableau 56 (fin). Pate de bois (chimique et mecanique).Table 56 (concluded). Wood Pulp (Chemical and Mechanical).
Production en milliers de tonnes mdtriques. - Production in metric tons (000's).
PAYS 1934 1935 1936 1937 1938 1939 1940 1941 1942 *1943 COUNTRY
Roumanie : Total. . 46 50 54 57 82 89 92 . . Roumania : Total.Chimique . ..... 37 39 44 47 48 50 54 Chemical.M&canique ..... 9 11 10 10 34 39 38 . Mechanical.
Royaume-Uni S: Tot.* 233 247 263 298 270 . . . United Kingd. s Tot.*Chimique* ..... 143 147 161 193 170 . . Chemical*.M6canique *. . ... . 90 100 102 106 100 . . . . . Mechanical*.
Su6de : Total. ... 2 870 2 975 3 180 3 524 3 061 3 137 1 967 1 302 1 745 *1 240 Sweden : Total.Chimique . . . . . . 2 202 2 303 2 505 2 790 2 377 2 447 1 678 1 124 1 474 1 050 Chemical.MWcanique ..... 668 672 675 734 684 690 289 178 271 * 190 Mechanical.
Suisse : Total. ... . 77 73 72 90 75 85 98 100 99 100 Switzerland : Total.Chimique ...... 42 41 42 55 45 50 56 55 55 53 Chemical.M6canique ..... 35 32 30 35 30 35 42 45 44 47 Mechanical.
Tch6coslov. : Total*. 294 300 314 373 . . . . Czechoslov.: Total*.Chimique* ..... 223 224 249 300 . .. . Chemical*.M6canique*..... 71 76 65 73 . . . . . Mechanical*.
Autres pays 6: Total * 85 85 85 80 ... ... . Other countr.s
: Total *Chimique * ..... 30 30 40 40 45 46 .. Chemical *.M6canique* ..... 55 55 45 40 ... ... . . . . Mechanical*.
TOTAL ....... 18 200 19 350 21 500 24 250 21 500 . . TOTAL.Chimique . . . . . . o 6oo II 400 12 800 14 600 13 000 ooo . . Chemical.MOcanique . . . . . 7 600 7 950 8 700 9 650 8 500 . . . Mechanical.
Prix moyen en francs-or: Average price in gold r :SUEDE 7 par CGhimique 106.19 103.33 109.76 133.29 134.54 111.82 143.21 . . Chem. SWEDEN 7 per
tonne. . Mecaniq. 50.59 46.69 48.82 64.63 64.89 59.64 64.33 . . . Mech. metr. ton.
Sources : Statistiques nationales officielles. Sources: National official statistics.
* Estimation ou chiffre provisoire. * Estimate or provisional figure.
t Etats-Unis : depuis 1940, chiffres plus complets; chiffres com- 1 United States : since 1940, scope of data extended ; comparableparables, sur l'ancienne base : total, 1940: 8.030; 1941: 9.114; figures on the old basis : total, 1940: 8,030; 1941: 9,114; 1942:1942 : 9.402 ; 1943 : 8.323. 9,402 ; 1943 : 8,323.
'Asie : 1938 et 1939, evaluations de l'Association suedoise des 2 Asia : 1938 and 1939, estimated by the Swedish Cellulosefabricants de cellulose ;chiffres correspondants pour 1936 et 1937: Association; corresponding figures for 1936 and 1937: total,total, 829 et 993 ; chimique, 487 et 580; mecanique, 342 et 413. 829 and 993; chemical, 487 and 580; mechanical, 342 and 413.
3Finlande, 1939-1941 : non compris les territoires cedes en 1940 'Finland, 1939-1941 : excluding territories ceded in 1940 toa I'U.R.S.S. the U.S.S.R.
4Pays-Bas : principalement pate de paille; 1936-1939, chif- 'Netherlands : mainly pulp from straw; 1936-1939, figuresfres incomplets pour la pate mecanique. for mechanical pulp incomplete.
Royaume-Uni : principalement pate de sparte. 5 United Kingdom: mainly pulp from esparto.6 Autres pays: Belgique, Espagne, Portugal. ' Other countries: Belgium, Portugal, Spain.' Prix, Suede : calculd d'apres les valeurs de production donnees ' Price, Sweden: calculated from the production values given
dans les statistiques officielles. in the official statistics.
RENVOIS AU TABLEAU 57. CIMENT - FOOTNOTES TO TABLE 57. CEMENT.
f Pays non compris dans les totaux. t Country not included in the totals.1 Ce tableau se refere, autant que possible, au ciment naturel et 1 This table covers, as far as possible, both natural and artificial
aux ciments artificiels (portland, etc.). Le ciment est obtenu par (portland, etc.) cements. Cement is made by burning a mixturela mouture du produit de la calcination d'un mdlange de matieres of calcareous and argillaceous materials and grinding the resultingcalcaires et argileuses. Pour le ciment naturel, on utilise un melange clinker. For natural cement, the mixture used is found as such introuv6 tel quel dans la nature; pour les ciments artificiels, le nature; for artificial cements, the constituents are mixed in themelange est dose dans des proportions voulues. desired proportions.
Chine: 1934-1938, consignations totales dans les a ports de China : 1934-1938, total shipments from "Customs ports ",douane ,, sans la Mandchourie ; production en 1934 : 608 excluding Manchuria; production, 1934: 608 metric tons (000's).milliers de tonnes.
a Europe: y compris d'autres pays non mentionnes. 3 Europe : including other countries not mentioned.4 Tchecoslovaquie: depuis 1939, c Slovaquie . 4 Czechoslovakia: since 1939. " Slovakia ".
Finlande, 1939-1941 : non compris les territoires ced6s en Finland, 1939-1941 : excluding territories ceded in 1940 to1940 a I'U.R.S.S. the U.S.S.R.
6 Roumanie, 1941-1943: consommation. Pour les annees ante- " Roumania, 1941-1943 : consumption. For previous years,rieures, les chiffres de la consommation sont du meme ordre de consumption figures are of the same order of magnitude as pro-grandeur que ceux de la production. duction figures.
* Etats-Unis - United States, *1944: 15 600.

- 144 -
Tableau 57. CIMENT. - Table 57. CEMENT.Production en milliers de tonnes metriques. 1 - Production in metric tons (0's omitted). 1
PAYS 1934 1935 1936 1937 1938 1939 1940 1941 *1942 *1943 COUNTRY
AFRIQUE . .... 070 1 220 1 350 1 490 1 630 *1 700 *1 600 *1 700 * 1750 *1 650 AFRICA.Alg6rie ..... 96 65 67 65 90 . . Algeria.Congo beige... 11 4 21 26 25 35 43 64 Belgian Congo.Egypte . . . . . 297 379 335 330 376 372 357 420 381 323 -Egypt.Maroc (franqais) . 185 189 162 156 165 Morocco (Fr.).Mozambique . 12 13 12 15 24 28 28 27 25 31 Mozambique.Tunisie ..... 34 40 49 56 69 Tunis.Union Sud-Afr. . a) 436 a) 527 702 840 878 949 858 878 948 915 U. of S. Africa.
AM1.RIQUE DU NORD 13 927 13 814 20 307 21 113 19 161 22 120 23 775 29 733 32 868 24 060 N. AMERICA.Canada . . .. 553 554 784 975 882 908 *1 200 1 346 1 371 *1 159 Canada.Etats-Unis . . . 13 374 13 260 19 523 20 138 18 279 21 212 22 575 28 387 31 497 t22 901 United States.
AMEIRIQUE CENTRALE 266 248 286 345 374 465 551 617 704 766 CARIBBEAN.
Cuba T . . . . ( (.) () (.) (.) () (.) (.65) (170) Cuba. tMexique. 266 248 286 345 374 410 485 538 589 586 Mexico.Nicaragua..... -. - -- - 1 13 Nicaragua.Puerto-Rico . .. —- - - - 55 66 79 114 167 Puerto Rico.
AMARIQUE DU SUD . *1360 1 650 *1 920 *2 340 *2 620 2 690 2 790 2985 2 865 *2 800 SOUTH AMERICA.Argentine . . . . 567 722 834 1 035 1 161 1 128 1 082 1 169 1 077 957 Argentine.Bolivie ..... 5 7 11 11 19 23 24 24 23 23 Bolivia.Br6sil .... . . . 324 366 485 571 618 698 745 768 753 746 Brazil.Chili ...... 203 285 248 313 364 341 385 360 365 375 Chile.Colombie .. 72 77 104 123 142 161 188 211 208 226 Colombia.Equateur ... . . 14 . . . 15 17 17 20 28 Ecuador.Perou .... 46 60 75 83 101 120 125 168 188 209 Peru.Uruguay . . . 106 100 111 148 158 163 138 152 109 ... Uruguay.Venezuela.. .. 30 22 38 45 40 38 87 115 122 112 Venezuela.
AsIE ....... 6 720 *7 380 *7 440 *8 450 *8 000 *8 000 . . . ASIA.
Chine 2 . .
229 203 187 250 24 2 540 650 . . . China. 2
Inde (brit.) . . 767 892 977 1 142 . . . . India.Indes n6erland. . 113 * 140 *136 . . *170 . Neth. Indies.Indochine frang. . 115 107 149 235 266 306 278 270 ... ... Fr. Indo-China.Japon et colonies. 5 125 5 565 5 456 6 034 5 519 5 074 *4 250 . . . Japan & Col.Palestine . .. .. 143 187 154 161 98 112 149 115 ... ... Palestine.Philippines . . . 96 111 1 33 150 167 ... ... .. ... .. ... ... Philippines.Syrie et Liban . 78 130 190 250 251 .. . . Syria& Lebanon.Thailande .. . . 51 49 b) 62 b) 77 b) 92 b) 17 c) 100 ... ... ... Thailand.
U.R.S.S. ..... 3 533 4 465 5 845 *5 400 *5 700 *5 200 *5 300 . . . U.S.S.R.
EUROPE * 3 .... 31 300 34 560 *37 890 *40 910 *45 500 . . . . . EUROPE.*
Allemagne etSarre 6 625 8 807 11 689 12 605 15600 Germany& Saar.Autriche . ... 315 371 369 429 650 1 . Austria.Belgique . . . 1 900 2 200 2 350 2 975 2 911 2 552 . . . . Belgium.Bulgarie .. 130 124 122 154 194 . . . Bulgaria.Danemark . . . 770 757 792 676 640 696 441 Denmark.Espagne ... . 1 362 1 463 *761 *553 *592 *1 194 1 558 1 640 1 646 *1 750 Spain.Estonie ..... 34 40 50 69 79 77 . . Estonia.Finlande .. . 241 284 351 409 500 s 563 5 301 s 307 179 ... Finland.France . 4 872 4 371 4 638 4 285 4 121 . France.Grce. ... 248 273 277 290 308 343 190 63 30 . Greece.Hongrie .... 225 280 315 392 395 Hungary.Irlande. . .. I 110 261 272 294 202 252 Ireland.Italie ..... 4 092 4 196 3 859 4 258 4 587 . . . . . Italy.Lettonie. . 70 72 100 118 155 165 . . . Latvia.Norv6ge .... 249 263 301 320 332 390 . . . . Norway.Pays-Bas . . 394 360 401 441 456 541 . . . Netherlands.Pologne . . .. 721 843 1 052 1 289 1 719 Poland.Portugal .... 185 214 245. 254 268 297 273 272 244 247 Portugal.Roumanie. 314 382 376 , 464 532 531 400 6 368 6 357 6 493 Roumania.Royaume-Uni . 5 674 6 054 6 700 7 300 7 900 UnitedKingdom.Su6de. . . . .. 583 740 795 876 993 1 185 701 645 824 935 Sweden.Tch6coslovaquie*. . 980 1 050 1 350 4 276 4 214 4 300 4 320 4350 Czechoslovakia.*Turquie . . . . 180 193 193 226 287 284 267 277 178 176 Turkey.Yougoslavie . .. 682 785 643 619 712 663 ... . . . Yugoslavia.
OCIANIE .... . 515 683 810 908 1 086 1 117 1 097 1 093 1 122 ... OCEANIA.
Australie a). . . 417 559 656 732 866 882 879 874 904 742 Australia a),Nouv.-Z6lande b). 98 124 154 176 220 235 218 219 218 ... New Zealand b).
TOTAL* ...... 58700 64000 75 900 81 000 84 000 .. .I -. TOTAL.*
SOURCES: Statistiques nationales officielles. - National official statistics. U. S. Bureau of Mines : Minerals Year-Book.a)-b) 12 mois finissant: a) 30.VI; b) 31.111 de l'annee suivante. a)-b) 12 months ending : a) 30.VI; b) 31.III of following year.
c) IV-XII. * Estimation. c) IV-XII. * Estimate.(Pour les renvois, voir la page prdcddente.) (For footnotes, see preceding page.)

- 145 -
Tableau 58. CAOUTCHOUC. - Table 58. RUBBER.Expeditions en milliers de tonnes metriques. - Shipments in metric tons (000's omitted).
Note. - Les statistiques de ce tableau se rapportent aux expe- Note. - The statistics given in this table relate to shipmentsditions de caoutchouc brut, qui donnent une idee assez exacte de of crude rubber, which afford a fairly reliable measure ofla production. On a tenu compte des impuretes contenues dans le production. Allowance has been made for moisture in wet rubbercaoutchouc frais et dans le latex. Les chiffres se referent au ( caout- and latex. The figures cover both " plantation rubber " (i.e.,chouc de plantation )) (c.-a-d. au caoutchouc recolte sur des do- rubber produced on estates and native small-holdings in Asia) andmaines et sur de petites proprietes indigenes en Asie) et au "wild rubber " (i.e., rubber from African and South-American
caoutchouc sauvage)) (c.-A-d. au caoutchouc produit dans les pays countries); they exclude reclaimed rubber. World productionde l'Afrique et de 1'Amerique du Sud). Ils ne comprennent pas le of reclaimed rubber is not known ; in the United States, thiscaoutchouc reginere dont la production mondiale n'est pas connue; output amounted in 1934 to 109,500, in 1940 to 213,000 andaux Etats-Unis, cette production s'est elevde en 1934 a 109.500 in 1941 (I-X) to 232,000 metric tons.tonnes, en 1940 a 213.000, en 1941 (I-X) A 232.000 tonnes.
La production de caoutchouc synthetique en 1939 a 6te Production of synthetic rubber in 1939 was roughly estimated6valude a 50.000 tonnes en U.R.S.S., A 20.000 tonnes en Alle- at 50,000 tons in the U.S.S.R., at 20,000 tons in Germany; in themagne ; aux Etats-Unis a 3.000 tonnes en 1939, a 8.600 en 1941, United States at 3,000 tons in 1939, at 8,600 tons in 1941, at 22,000a 22.000 en 1942, a 238.000 en 1943 et a 775.000 en 1944; au in 1942, at 238,000 in 1943 and at 775,000 in 1944; in Canada,Canada, IX.1943 a fin 1944: env. 38.000 tonnes (pas de produc- IX.1943 to the end of 1944: about 38,000 metric tons (no pro-tion avant IX.1943). duction prior to IX.1943).
PAYS 1934 1935 1936 1937 1938 1939 1940 * 1941 *i942 *'1943 COUNTRY
AFRIQUE ........ 4 6 9 12 12 16 17 19 . . AFRICA.Congo beige ...... - I 1 1 1 . . 2 8 Belgian Congo.Lib6ria ........ - * * 2 * 2 3 6 7 a) 8 . Liberia.Nigeria et Cameroun br. 2 2 2 3 3 3 3 2 7 ... Nigeria & Br. Cameroons.Autres pays ...... 2 2 4 6 5 6 6 7 a) 66 . . Other countries.
AMIRIQUE CENT. (Mexique) - 1 3 3 3 4 4 . CARIBBEAN (Mexico).
AMEiR. DU SUD I(Br6sil, etc.) 9 12 15 17 16 16 18 22 26 30 SOUTH AMER.J (Brazil, etc.)
AsE .......... 1 020 867 845 1 125 879 983 1 370 1 500 . . ASIA.Born6o sept. et Sarawak. 29 29 30 40 28 36 54 a) 49 N. Borneo and Sarawak.Ceylan. ..... ... 80 55 50 72 52 61 90 92 116 *125 Ceylon.Inde (brit.) ...... 13 14 15 10 9. 9 12 7 . India.
Birmanie () (5) (6) 7 7 7 10 a)8 . Burma.Indes n6erlandaises .2 385 287 315 439 303 379 545 660 . . Netherlands Indies.2
Indochine fr .. 20 29 41 44 60 66 65 62 577 "75 French Indo-China.Malaisie brit. 3 . . . . 475 424 359 477 378 383 549 559 . British Malaya.3
Thailande ...... 18 29 35 36 42 42 45 a) 40 . . Thailand.4
OC]ANIE et Philippines * . I 2 2 2 2 2 2 2 . . OCEANIA and Philippines.*
TOTAL. ......... 1 034 888 872 1159 912 1 020 1411 1550 . . TOTAL.
LONDRES: Prix en francs-or par kg: - Prices in gold francs per kg: LONDON:Standard quality moy. 0.89 0.83 1.09 1.32 1.00 1.14 1.41 1.54 1.56 2.02 Av. Standard quality
ribbed smoked XII 0.88 0.88 1.35 1.04 1.06 1.36 1.40 1.56 1.56 2.04 XII ribbed smokedsheet.., sheet.NEW-YORK: NEW YORK:
Ribbed smoked moy. .' 0.88 0.83 1.11 1.30 0.99 1.18 1.34 1.51 b)1.52 152 Av. Ribbed smokedsheet. . . . X i. . 0.88 0.90 1.35 1.01 1.08 1.34 1.39 1.63 1.52 1.52 XII sheet.
PRINCIPALES SOURCES - MAIN SOURCES : Comite international de controle du caoutchouc, Londres. - International Rubber Regu-lation Committee, London ; 1941 : en partie - in part The World's Rubber Position. Informations officielles - Official infor-mation.
a) I-X; b) II-XI'.* Estimation. * Estimate.
Amerique du Sud: caoutchouc provenant de la vallde de l'Ama- 1 South America : rubber obtained from the Amazon Valley,zone, plus une estimation des expdditions provenant des autres plus an estimated allowance for other parts of South and Centralparties de l'Amirique Caentrale et du Sud ( I 'exclusion du caout- America (excl. guayule rubber).chouc guayule).
I Indes neerlandaises: y compris le contenu en caoutchouc du 2 Netherlands Indies : including the rubber content of the latexlatex exporte. exported.Malaisie britannique :y compris Brundi; les expeditions com- 8 British Malaya : including Brunei; shipments include theprennent le contenu en caoutchouc du latex exporte. rubber content of the latex exported.Thailande: iusqu'en juin 1935, importations en Malaisie, en 4 Thailand: imports into Malaya from Thailand up to June 1935;
provenance de la Thailande; depuis, exportations de la Thailande. thereafter, exports from Thailand.s Indochine fr., 1942, 1943 : production (chiffre comparable, ' Fr. Indo-China, 1942, 1943 :production (corresponding figure,1941: 74). 1941: 74).
Y compris le Congo belge. 1 Including Belgian Congo.
10

- 146 -
Tableau 59. PHOSPHATES NATURELS. - Table 59. NATURAL PHOSPHATES.Production en milliers de tonnes m6triques. - Production in metric tons (000's omitted).
Note. - Dans la majorite des cas, les statistiques se r ferent Note. - In the majority of cases, the statistics refer to crude& des minerais bruts avec une teneur en phosphate variable. Cette mineral with a variable phosphate content. This content is gener-teneur est exprimee generalement en phosphate tricalcique ally expressed in terms of tricalcium phosphate (PO4)2 Ca, but(P0 4)2 Ca8, mais parfois en acide phosphorique (P206). (Pour sometimes in terms of phosphoric acid (P2Os). (To obtain the equi-obtenir l'equivalent en phosphate tricalcique d'un pourcentage valent, in terms of tricalcium phosphate, of a percentage expressedexprime en PO', on le multiplie par 2,1849.) in terms of P205, the latter should be multiplied by 2.1849.)
La teneur approximative des minerals en phosphate trical- The approximate content of the mineral in terms of tricalciumcique figure dans la premiere colonne du tableau. phosphate is shown in the first column of the table.
Les phosphates bruts sont utilises principalement pour la fabri- The crude phosphates are used chiefly for the manufacturecation de superphosphates (voir Annuaire 1938/39, tableau 101) of superphosphate (see Year-Book, 1938/39, Table 101), and inet, a un degre moindre, comme engrais. a lesser degree as fertilisers.
PAYS (p4)
2Ca 1934 1935 1936 1937 1938 1939 1940 1941 1942 *1943 COUNTRY
AFRIQUE .... 3 956 3 740 3914 4 424 4 592 4 690 . . AFRICA.
Alg6rie ... .. 58-66 532 604 531 631 584 577 405 Algeria.Egypte .. . . 59-70 438 474 531 517 458 548 183 112 328 316 Egypt.Madagascar .. 68-73 8 6 5 4 6 (E) 7 Madagascar.Maroc francas. 75-77 1 200 1152 1335 1 477 1488 1 703 732 512 729 816 French Morocco.Seychelles (E.) 12 10 24 10 22 24 15 ... Seychelles (E.)Tunisie ..... 58-70 1 766 1 494 1 488 1 785 2 034 1 '828 . (E) 720 . . Tunis.
AMRIQUE . . . .. 3046 3301 3596 4432 4021 4 117 4 139 5 113 ... ... AMERICA.
Etats-Unis . . . 68-77 2 945 3 210 3 518 4 330 3 922 4 052 4 133 5 001 4 896 5 453 United States.Curacao (E.) . . 85-86 101 91 78 102 99 65 6 112 ... Curacao. (E.)
ASIE (sans U.R.S.S.) 192 253 297 335 . . . . . AsiA(excl. U.S.S.R.).
lie Christmas (E.) 78-86 130 150 164 165 162 178 242 . . . Christmas Is. (E)Indes n6erland. 55-66 5 12 11 26 33 19 34 . . . Netherl. Indies.Indochine .. 44 - 9 22 42 46 25 . . . ndo-Cha.Japon ..... 75-82 57 91 113 122 . . Japan.
U.R.S.S.1* . . . ± 40 1763 2376 3001 3014 *3203 ... . U.S.S.R..
dont: apatites . . 60 1 16 1 33 2002 2 121 2 303 of which: apatites.phosphorites .I 627 843 999 893 * 900 phosphorite.'
EUROPE (sans U. R. S. S.) 120 110 115 *150 ... EUROPE (exl. U.S.S, BR.)
Belgique . .. 30 14 16 16 ... Belgium.Espagne * . . . 63-65 19 20 20 11 23 10 16 14 15 ... Spain.*Estonie . . .. 43-44 11 12 11 10 13 ... . . . . Estonia.France . . . .. 35-65 67 50 55 104 93 . . . . France.Pologne . . . . 44 8 12 13 5 ... . . Poland.
OCtANIE ... .. 820 960 1 185 1 390 *1 380 *1 550 *1 550 . . CEANIA.
Australie . . . 9 14 ... Australia.Etabliss. francais* 84-85 82 136 147 187 113 (E) 161 (E) 173 . . French Settlem.*Ile Nauru (E.) . 85-88 426 489 556 700 855 955 , .267 Nauru Island. (E)Ile Ocean (E.) . 78-90 215 232 410 405 304 325) . . . Ocean Island. (E)lie Palaos. .. .. 87 98 94 (E) 70 (E) 94 (E) 1 04 . . . . . Palau Island.Nv.-Cal6donie (E.) 75-76 2 9 2 - 5 . . . . New Caledonia.(E)Nouv.-Z6lande . . . . .. . 9 New Zealand.
TOTAL ...... 9 900 10 700 12 100 *13 700 *13 800 . . . . . TOTAL.
Prix en francs-or calcules pour 100 kg de P205: Prices in gold francs calculated per 100 kg of PO2 s:
FLORIDE, FLORIDA,land-pebble, I moyenne 3.07 3.21 1.80 1.79 1.79 1.84 1.84 1.88 b)2.10 1.94 Av. land-pebble,68%. . .1. XII 3.16 2.16 1.79 1.79 1.79 1.84 1.84 1.94 1.94 1.94 XII.f 68%.
SOURCES: Statistiques nationales (Annuaires, informations directes). - National statistics (Year-Books, direct information).U. S. Bureau of Mines.
* Estimation. (E.) Exportations. a) Douze mois finissant le 30.VI; * Estimate. (E.) Exports. a) Twelve months ending 30.VI;b) I-12.X. b) 1-12.X.
U.R.S.S.: les chiffres relatifs aux phosphorites sont tres incer- 1 U.S.S.R. : figures relating to phosphorites are uncertain;tains ; la teneur des phosphorites est tres basse. the content of phosphorites is very low.
2 Indochine : la production de phosphate moulu et apatite s'est 2 Indo-China : the production of ground phosphate and apatiteilevee a : 1939, 36.000 tonnes ; 1940, 22.000 ; 1941, 71.000. amounted to : 1939, 36,000 metric tons; 1940, 22,000; 1941, 71,000.

147
Tableau 60. PITROLE BRUT ET HUILE DE SCHISTE. - Table 60. CRUDE PETROLEUM AND SHALE OIL.a) Petrole brut. En milliers de tonnes mktriques. - (a) Crude Petroleum. In metric tons (000's omitted).
PAYS 1934 1935 1936 1937 1938 1939 1940 *1941 *1942 *1943 COUNTERY
AFRIQUE * ....... 222 182 183 173 229 671 934 1 227 1 187 1 290 AFRICA. *
Egypte ....... 221 182 183 171 226 666 929 1 221 I 182 1 285 Egypt.Maroc francais .... I - - 2 3 5 5 6 5 5 French Morocco.
AMIRIQUE DU NORD .. .123 109 135 094 149 056 173 437 165 166 171 890 183 739 190 730 188 692 204 733 NORTH AMERICA.Canada . . ..... 178 182 188 367 864 972 1 082 1 265 1 333 1 299 Canada.Etats-Unis . . . . . . 122 931 134 912 148 868 173 070 164 302 170 918 182 657 189 465 187 359 t203 434 United States.
AMARIQUE CENTRALE. . 7 359 7 784 8 125 9 339 8 372 9 257 9 565 9 552 8 315 8 445 CARIBBEAN.
Mexique ....... 5 826 6 142 6262 7 159 5 877 6547 6722 6569 5 315 5 345 Mexico.Trinit6 (ile) ..... 1533 1 642 1 863 2 180 2 495 2 710 2 843 2 983 3 000 3 100 Trinidad.
AMIRIQUE DU SUD . . . 26 945 28 977 30 351 35 417 35 889 38 738 36 007 41 875 28 613 33 730 SOUTH AMERICA.Argentine ...... I 1998 2 012 2 178 2238 2391 2 655 2 940 3 167 3 391 t.3 550 Argentine.Bolivie. ....... 20 21 13 16 18 28 37 30 40 43 Bolivia.Colombieo ...... 2417 2452 2 614 2 831 3010 3425 3669 3 537 1 521 1 921 Colombia".Equateur. ...... 236 249 277 289 302 305 310 205 300 305 Ecuador.P6rou ........ 2 162 2253 2324 2309 2 097 1 792 1 608 1 583 1 811 1 948 Peru.Venezuela ...... 20 112 21 990 22 945 27 734 28 071 30 533 27 443 33 353 21 550 25 963 Venezuela.
ASIE (sans I'U.R.S.S.) . 16 948 19 817 21 794 25 470 26 575 26 395 23 994 20 645 . . ASIA (excl. U.S.S.R.).Arabie Saoudienne . - 2 8 67 536 727 801 Sa'udi Arabia.Bahrein, Iles ..... 39 173 636 1 065 1 139 1 036 '965 927 1 700 1 750O Bahrein Islands.Borneo britannique .. 660 707 685 789 910 940 932 897 ... ... British Borneo.Inde (britannique) 1 293 1 296 1 345 304 350 321 311 314 ... 350 India.
Birmanie . . (1 023) (i 009) (1 067) 1 103 1 061 1 087 1 068 1 069 . . Burma.Indes n6erlandaises 6 055 6 082 6 438 7 262 7 398 7 949 7 939 6 885 . Netherlands Indies.Irak. ........ 1 031 3 682 4 011 4 255 4363 3817 2 375 1374 2636 3 324 Iraq.Iran......... 7658 7608 8330 10330 10931 10329 *9 300 8000 9900 10300 Iran.Japon et Formose . . 212 269 347 * 354 * 356 * 380 377 378 . . Japan & Formosa.
U.R.S.S . . . . . . ... 24 218 25 240 27 385 27 821 *28 859 *30 300 *30 260 34 000 31 700 35 600 U.S.S.R.
EUROPE (sans I'U.R.S.S.). 9 443 9 449 9 819 8 328 7 980 7 872 . . . 9 050 EUROPE (ex. U.S.S.R.).Albanie ....... * 2 12 48 88 117 125 . . . 200 Albania.Allemagne ...... 318 427 445 451 552 * 647 . . . 900 Germany.Autriche. ...... 4 7 7 33 63 * 110 . 500 750 1 375 Austria.France. ....... 78 76 70 71 72 * 70 . . 75 France.Hongrie ....... . - I -— - 2 43 * 144 *262 550 . 750 Hungary.Italie ........ 20 16 16 14 13 *12 . . . 8 Italy.Pologne ....... 529 515 511 501 507 * 523 . . . 350 Poland.Roumanie ...... 8 466 8 376 8 703 7 150 6 594 6 225 5 810 5 577 5 665 5 266 Roumania.Tchhcoslovaquie . . . 26 20 19 18 19 2 16 2 24 2 29 2 31 228 Czechoslovakia.
TOTAL3
. . . . . . . . 208 244 226 543 246 743 279 985 273 071 285 123 293 000 305 000 285 000 312 000 TOTAL.8
Prix en francs-or par tonne mdtrique: - Prices in gold francs per metric ton:Kansas-Oklahoma (moy. 21.30 21.09 23.30 25.97 25.07 21.54 21.54 23.74 24.91 24.91 Av.\Kansas-Oklahomaauxpuits. 330-33,9
°XII 21.09 21.09 23.34 26.04 21.54 21.54 21.54 24.91 24.91 24.91 XXIlat wells, 330-33.90
b) Huile de schiste. - (b) Shale Oil.Huile brute obtenue par distillation des schistes bitumineux et dont Crude oil which results from the distillation of oil shale and
on extrait des produits semblables a ceux provenant du raffinage which yields products similar to those obtained from crudedu petrole brut. L'U.R.S.S. produit egalement de l'huile de schiste. petroleum. Shale oil is also produced in the U.S.S.R.
AsIE: Mandchourie . . . 109 60 . . *120 ... .. . .. . .. Manchuria.ASIA : Manchuria.
EUROPE .. .. 179 179 197 253 288 . . . . EUROPE.
Espagne . ...... 3 3 4 6 6 5 5 3 2 ... Spain.Estonie . ...... 47 47 63 111 140 182 174 . . Estonia.'France .. ...... 7 7 6 8 9 . . . . France.Italie . ....... 1 2 3 2 2 . . . Italy.Royaume-Uni* .... 121 120 121 126 131 . .. United Kingdom.*
TOTAL ........ 288 239 . . * 407 . . . . TOTAL.
SOURCES: Statistiques nationales officielles. - National official statistics. U.S. Bureau of Mines. Imperial Institute (London). WorldPetroleum (New York). Petroleum Press Service (London).
* Estimation ou chiffre provisoire. * Estimate or provisional figure.Colombie: y compris une faible quantite de gazoline naturelle. 1 Colombia: including a small quantity of natural gasoline.
2 Tchecoslovaquie: depuis 1939, , Slovaquie ,. Czechoslovakia: since 1939, "Slovakia".3Y compris la production estimee du Royaume-Uni (1943: Including estimated production of the United Kingdom (1943:
env. 100.000 tonnes; 300.000 tonnes depuis le debut de la guerre). about 100,000 tons ; 300,000 tons since the outbreak of war).
t 1944, Etats-Unis-U.S.A.: 226 700; Argentine: 3 470.

148
Tableau 61. PRODUITS DIRIVES DU PITROLE. - Table 61. PETROLEUM PRODUCTS.Production en milliers de tonnes metriques. - Production in metric tons (000's omitted).
Note. - Ce tableau donne la production de la gazoline natu- Note. - This table shows the production of natural (casing.relle et des derivs liquides obtenus, principalement, par la distilla- head) gasoline and of liquid petroleum products, obtained mainlytion directe du petrole brut et de l'huile de schiste (voir tableau by the direct distillation of crude petroleum and shale oil60), et par le a cracking )) (distillation A haute temperature et sous (see Table 60), and by the cracking (distillation at high tempe-pression) de l'huile a gaz (gas oil) ou du mazout (fuel oil). rature and pressure) of gas oil or fuel oil C' cracking stock ").
La gazoline naturelle est une essence legere obtenue par le trai- Natural gasoline is a light spirit extracted from the natural gastement des gaz naturels (voir tableau 62); on la melange gen&rale- associated with crude petroleum (see Table 62) and is principallyment A l'essence pour moteurs. I1 se peut qu'a I'exception des used for blending with motor spirit; in the case of some countriesEtats-Unis, les chiffres relatifs a la gazoline naturelle fassent en (other than the United States), there may possibly be partialpartie double emploi avec ceux ayant trait h l'essence pour moteurs. duplication with the figures given for motor spirit.
Les produits raffines figurent au tableau dans l'ordre de leur distil- The refined petroleum products are arranged in the table inlation. Les diverses essences (higeres, moyennes, lourdes, d'aviation, their order of distillation. The various spirits (light, medium,etc.), utillsees presque exclusivement comme carburants, figurent heavy, aviation, etc.) employed almost entirely as motor fuelsous a Essence) ; le ((white spirit)) ou ( solvent naphtha)) (produit are grouped under " Motor spirit " (petrol, gasoline) ; whiteremplacant l'essence de t&rebenthine et utilise comme solvant), le spirit or solvent naphtha (turpentine substitute, used as a solvent),petrole lampant ou kerosene, le p6trole pour tracteurs, etc., ont 6te kerosene (paraffin oil), tractor spirit, etc.,' are grouped underreunis sous a Petrole lampant a, car ce produit est de beaucoup le " Kerosene ", which is by far the most important of these products;plus important du groupe; l'huile A gaz (gas oil) ou huile solaire, gas (Solar) oil, Diesel oil and fuel oil (distillate or residual) arel'huile pour moteurs Diesel (Diesel oil) ainsi que les huiles lourdes grouped under " Heavy oils ". The lubricating oils are obtaineddistillees ou residuelles telles que mazout (fuel oil) etc., figurent by special processes from fuel oil. The solid petroleum productssous a Huiles. lourdes a. Les huiles de graissage s'obtiennent par excluded from the table are principally greases, paraffin wax,traitement special des huiles lourdes (fuel oil). Les produits solides petroleum jelly, asphalt, coke, etc.derivds du petrole sont exclus du tableau (graisses, paraffines, vase-line, bitumes, cokes de petrole, etc.).
Les statistiques originales sont souvent exprimees en mesures The original statistics are frequently expressed in measuresde capacit6. Bien que la densite des differents produits raffines of capacity. Although there are several grades of each product,varie selon la qualite, on a, pour la conversion en tonnes metriques, of varying density, the following rough average specific gravitiespris pour base de calcul les poids specifiques moyens suivants : have been adopted for purposes of conversion to metric tons:gazoline naturelle 0,680 ; essences pour moteurs 0,735 ; essences pour natural gasoline 0.680 ; motor spirit 0.735 ; aviation spirit 0.745;aviation 0,745; white spirit 0,790; petrole lampant 0,810; gas oil white spirit 0.790 ; kerosene 0.810 ; gas oil 0.860 ; Diesel oil 0.870;0,860; Diesel oil 0,870 ; mazout 0,930; huiles de graissage 0,900. fuel oil 0.930; lubricating oils 0.900.
Le tableau ne comprend pas la production de l'essence synthe- The production of synthetic motor spirit (synthetic gasoline)tique. En 1938, cette production s'est 6levee a pres de 150.000 is not included in the table. In 1938, this production amountedtonnes dans le Royaume-Uni, et a &te evaluee a 14.000 tonnes en to nearly 150,000 tons in the United Kingdom, and has been roughlyFrance et h 1.500-2.000 tonnes en Belgique ; en Allemagne, la pro- estimated at 14,000 tons in France and 1,500-2,000 tons in Belgium;duction a ete d'environ 950.000 tonnes en 1937; au printemps in Germany, production was about 950,000 tons in 1937; in the1941, la capacite de production des usines allemandes a 6te evaluee spring of 1941, the production capacity of German plants hada environ 5.000.000 de tonnes par an. been estimated at about 5,000,000 tons yearly.
Le benzol et l'alcool industriel sont employes, dans une certaine Benzol and industrial alcohol, either pure or mixed with motormesure, comme carburants, soit A l'etat pur, soit m6langes h spirit, are employed to some extent as motor fuel (see Year-BookI'essence pour moteurs (voir r'Annuaire 1939/40, tableaux 59 et 37). 1939/40, Tables 59 and 37).
PAYfs 1934 1935 1936 1937 1938 1939 1940 1941 *1942 * 1943 COUNTRY
AFRIQUE. AFRICA.
Egypte: Egypt:Essence .. .... 78 75 84 86 95 105 130 157 164 170 Motor spirit.P6trole lampant. .. 27 26 29 19 18 52 71 61 58 61 Kerosene.Huiles lourdes . . . 130 151 145 133 168 389 604 812 631 661 Heavy oils.
Iles Canaries: Canary Islands:Essence * . . . 80 80 60 75 114 ... Motor spirit.*Petrole lampant *. . 16 16 16 25 23 1525 1355 1408 127 ... Kerosene.*Huiles lourdes *. .. 265 265 175 135 200 ... Heavy oils.*
AMtRIQUE DU NORD. NORTH AMERICA.
Canada: Canada:Essence . ..... I 543 1 716 1 897 2 153 2 185 2 474 2 606 2 867 2 504 2 903 Motor spirit.P6trole lampant. .. 273 296 262 317 291 321 303 379 424 447 Kerosene.Huiles lourdes ·. . 1 895* 2 000* 2 100 2 181 2 183 2 345 2 394 3 367 3 465 3 586 Heavy oils.Huiles de graissage . 80 79 84 98 93 102 123 156 161 168 Lubricating oils.
SOURCES : Statistiques nationales officielles. - National official statistics. Imperial Institute (London). U.S. Bureau of Mines.
* Estimation ou chiffre provisoire. (E.) Exportations. * Estimate or provisional figure. (E.) Exports.Iles Canaries : depuis 1939, vente de tous les produits derives Canary Islands : since 1939, sales of all petroleum products.
du p6trole.

149 -
Tableau 61 (suite). Produits derives du petrole. - Table 61 (continued). Petroleum Products.Production en milliers de tonnes metriques. - Production in metric tons (000's omitted).
_______PAYS ¶1934 1935 1936 1937 1938 1939 1940 1941 * 1942 * 1943 COtNMY
AMIt. DU N. (suite). N. AMERICA (contd).Etats-Unis: United States .Gazoline naturelle. 3952 4252 4624 5317 5551 5584 6022 8062 8230 8 230 Natural gasoline.
Essence . . . . . . 45432 49878 55040 60725 60306 65079 65188 72837 61980 62079 Motor spirit.P6trole lampant. . 6935 7 188 7222 8410 8317 8824 9515 9348 8 689 * 9 307 Kerosene.Hulles lourdes . . . 48 528 52 123 59 794 66 201 64355 67 352 71 820 76 489 79 964 90 624 Heavy oils.Hules de graissage 3 774 3 985 4 425 5 054 4 411 5 013 5 261 5 658 5 527 5 535 Lubricating oils.
AM1RIQUE CENTRALE. CARIBBEAN.Barbade: Barbados:
Essence- I ... ... ... ... Motor spirit.P6trole lampant . - I ... ... ... ... Kerosene.Huiles lourdes . .. 3 4 3 3 3 ... ... ... ... ... Heavy oils.
Cuba: Cuba Gazoline naturelle. 3 . 2 6 7 11 14 17 15 1 1 Natural gasoline.Essence ...... 36 45 44 53 55 50 50 58 23 ... Motor spirit.Ptrole lampant... 15 18 22 21 22 19 19 23 9 ... Kerosene.Huiles lourdes'1. .. 10 13 16 21 24 26 26 40 16 ... Heavy oils.'Huiles de graissage 2 2 2 2 1 2 2 2 1 Lubricating oils.
Curacao (E.): Curaao (E.):Essence ...... 2 471 2 432 3 036 2 858 3 466 . . . . Motor spirit.P6trole lampant. .. 193 383 440 287 613 . . Kerosene.Huiles lourdes . . 10719 12300 13417 16431 17836 . . . . . Heavy oils.Huiles de graissage . 153 183 188 330 346 . . . . Lubricating oils.
Mexique: Mexico:Gazoline naturelle . 32 49 36 34 40 73 75 59 ... ... Natural gasoline.Essence . .. ..19.. 010 995 1123 1410 1871 1777 1452 1673 ... Motor spirit.Patrole lampant. . . 255 246 185 219 262 280 291 321 ... Kerosene.Huiles lourdes . .. 3430 3097 3410 3575 3178 3270 3277 3555 ... ... Heavy oils.Huiles de graissage . 71 92 82 74 53 36 50 26 ... ... Lubricating oils.
Trinit6 et Tobag (E.): Trinid. & Tobago (E.):Essence. .... . 305 321 347 350 451 . . . . Motor spirit.Petrole lampant . 9 16 19 16 14 . . . . . Kerosene.Huileslourdes . . 1007 1158 1309 1533 1741 . · . . Heavy oils.
AMtRIQUE DU SUD. SOUTH AMERICA.Argentine: Argentine :
Gazoline naturelle. 22 21 21 .21 16 14 13 12 ... Natural gasolineEssence .... 602. 706 723 816 883 998 942 986 963 ... Motor spirit.P6trole lampant. . 122 144 165 208 233 273 267 276 247 ... Kerosene.Huiles lourdes . . 1264 1306 1292 1447 1576 1483 1713 192 1905 ... Heavy oils.Huiles de gralssage 30 46 45 51 56 74 64 67 81 ... Lubricating oils.
Bolivie: Bolivia:Essence ...... 8 9 6 8 8 12 15 14 14 13 Motor spirit.P6trole lampant. . . -I 1 2 2 2 Kerosene.Huiles lourdes . . . 12 12 8 8 8 16 21 15 11 9 Heavy oils.
Brsil : Brazil:Essence ... ..... 20 19 17 11 5 Motor spirit.Pdtrole lampant. . - - . . 10 9 9 6 4 Kerosene.Huileslourdes . . . 17 16 12 10 9 Heavy oils.Huiles de graissage . I. . . i I Lubricating.oils.
Colombie: Colombia:Gazoline naturelle. 42 39 29 26 30 31 27 28 11 15 Natural gasoline.Essence ...... 47 52 81 92 101 108 121 128 117 117 Motor spirit.P6trole lampant. . 12 11 15 17 17 23 23 27 20 *25 Kerosene.Huiles lourdes . . . 145 147 220 261 310 313 309 337 342 ... Heavy oils.Huiles de graissage 3 4 4 4 3 4 5 11 4 4 Lubricating oils.
Equateur: Ecuador:Gazoline naturelle. . . . . 4 4 4 4 3 4 4 Natural gasoline.Essence ...... 6 9 11 13 18 13 16 17 19 21 Motor spirit.Patrole lampant. 3 .. 6 5 4 5 5 5 6 8 Kerosene.Huiles lourdes . .. 19 26 26 26 31 37 52 61 68 81 Heavy oils.
Prou: Peru :Gazoline naturelle.. 113 140 158 125 116 114 103 98 106 1101 Natural gasoline-Essence . . . . . . 316 259 271 277 274 ... 315 359 529 499 Motor spirit.P6trole lampant. .. 77 161 136 119 132 ... 92 67 69 97 Kerosene.Huiles lourdes . . . 371 368 372 365 392 ... 407 654 1258 1336 Heavy oils.Huiles de graissage 6 5 5 4 ... 6 6 6 9 Lubricating oils.
Cuba, huiles lourdes: non comp. le mazout(1936: 17.700t.). Cuba, heavy oils: excluding fuel oil (1936 : 17,700 m. t.).* 1944, Etats-Unis - U.S.A. (chiffres correspondants - corresponding figures): 9512; 76 603; 10089 100930; 5 882.

- 150
Tableau 61 (suite). Produits derives du petrole. - Tableau 61 (continued). Petroleum Products.Production en milliers de tonnes metriques. - Production in metric tons (000's omitted).
PAYs 1934 1935 1936 1937 1938 1939 1940 1941 1942 *1943 COUNTRY
AMRIQUE DU S. (suite.) S. AMERICA (contd).
Uruguay: Uruguay:Essence —. . . . . .49 92 92 93 89 63 46 Motor spirit.
P6trole lampant . ' — 19 42 46 45 42 35 22 Kerosene.
Huiles lourdes . . . - - - 23 51 78 97 128 82 78 Heavy oils.
Venezuela: Venezuela:
Essence . . . 107 104 101 107 130 195 258 316 ... •.. Motor spirit.Petrole lampant.. 4 3 2 5 10 25 29 51 .. .... Kerosene.
Huiles lourdes . . . 987 1 030 1 108 960 1 196 1 557 3 152 3 665 .. ... Heavy oils.
ASIE (sans I'U.R.S.S.). ASIA (exel. U.S.S.R.).
Bahrein, lies : Bahrein Islands:
Essence ...... 35 89 302 ... ... ... ... Motor spirit.
P6trole lampant. .. - 18 29 136 ... ... ... . ... Kerosene.
Huiles lourdes . . . 102 305 475 ... ... ... ... Heavy oils.
Born6o brit.: British Borneo:
Essence ...... 88 66 58 66 101 (E.)121 (E.)118 . . . Motor spirit.
Petrole lampant... 17 36 31 46 67 (E.) 56 (E.) 51 . . Kerosene.
Huiles lourdes . . . 555 607 590 679 (E.)752(E.)*715 E.) 759- . . Heavy oils.
Inde brit. 1 : India I:
Gazoline naturelle.. 29 30 28 1 2 1 . . Natural gasoline.
Essence a) .. .. 271 306 312 53 66 70 . .. Motor spirit. a)
P6trole lampant a) 625 600 633 135 139 104 . .. Kerosene. a)
Huiles lourdes I. .. 46 25 23 8 34 ... Heavy oils.'
Huiles de graissage 40 51 66 8 ... ... . . Lubricating oils.
Inde br. : Birmanie : India: Burma:Gazoline naturelle.. (27) (29) (27) 33 33 35 . . . Natural gasoline.
Essence ...... (204) (240) (242) 210 196 210 . . . Motor spirit.
P6trole lampant . . (509) (484) (444) 540 542 560 . . . . Kerosene.
Huiles lourdes . . . (36) (21) (24) 24 30 26 Heavy oils.
Huiles de graissage . (20) (28) (27) 30 27 33 . .. Lubricating oils.
Indes n6erlandaises: Netherlands Indies:Gazoline naturelle. 197 186 163 172 161 161 165 . . . Natural gasoline.
Essence ...... 1 325 1 565 1 698 1 974 2 092 2 355 2 113 . . Motor spirit.
P6trole lampant. .. 834 853 1 052 1 165 989 1 089 1 009 . . . Kerosene.Huiles lourdes .. . 1984 2 072 2217 2 707 2 793 2 902 2 854 . . Heavy oils.
Huiles de graissage 26 23 23 33 25 29 34 . . . Lubricating oils.
Irak: Iraq:Essence ...... 13 13 16 21 22 23 26 46 67 91 Motor spirit.Petrole lampant.. 16 16 17 20 20 23 24 28 38 38 Kerosene.Huiles lourdes . . . 57 59 59 73 114 80 94 102 201 209 Heavy oils.
Iran (E.) : Iran : (E.) Essence .... b)1 779b) 1 478b) 1 926b) 1 858 2 058 1 883 1158 815 ... a) 640 Motor spirit.P6trole lampant. .. b) 449 b) 463b) 511 b) 563 610 534 687 357 ... a) 816 Kerosene.
Hufles lourdes . .. b) 4 196b)3 411 b)5 159b) 6541 6033 5499 5693 3896 ... a)6 161 Heavy oils.
Japon: Japan:Essence ...... 358 416 .. . . . Motor spirit.
P6trole lampant. . '62 83 . . . . . . Kerosene.Huiles lourdes . . . 357 405 . . . . . . Heavy oils.Huiles de graissage . 198 243 . . . . . Lubricating oils.
U.R.S.S. U.S.S.R.
Essence..2 7....43. Motor spirit.W te spirit . . . . 3:0: 3069 4212 . * 6000 White spirit.
P6trole lampant. .. 4 462 4 910 5 410 . * 6 350 . . . . Kerosene.
Huiles lourdes . . . 9264 9200*10 000 . . *12 250 . . . . Heavy oils.
Huiles de graissage . 1372 1 345* 1 500 . . * 2 000 . . . Lubricating oils.
a)-b) Douze mois finissant - Twelve months ending: a) 21.III; b) 21.VI de l'annee suivante - of following year.
'Inde: a partir de 1937, non compris la Birmanie. Huiles ' India: as from 1937, not including Burma. Heavy oils:
lourdes : donnees incompletes, mazout (fuel oil) seulement. incomplete data, fuel oil only.2 Iran : y compris les reexportations. ' Iran : includes re-exports.
Japon, 1935 ; chiffres correspondants pour Formose ; 6, 2, 6, 4. 3 Japan, 1935 : corresponding figures for Formosa 6, 2, 6, 4.

- 151
Tableau 61 (fin). Produits d6rives du petrole. - Table 61 (concluded). Petroleum Products.Production en milliers de tonnes metriques. - Production in metric tons (000's omitted).
PAYS 1934 1935 1936 1937 1938 1939 1940 1941 *1942 *1943 COUNTRY
EUROPE (sans U.R.S.S.). EUROPE (excl. U.S.S.R.).
Allemagne 1: Germany: 1Essence ...... 371 577 878 '(1 260) (1 350) . . . . Motor spirit.P6trole lampant. 29 52 56 77 . . . Kerosene.Huiles lourdes ... 232 367 432 464 773 Heavy oils.Huiles de graissage . 171 207 270 342 ... Lubricating oils.
Autriche: Austria:Essence ...... 80 77 80 59 . . . . . Motor spirit.P6trole lampant. . 36 36 38 21 . . . . . Kerosene.Huiles lourdes ... 18 10 7 5 . . . . . Heavy oils.
Belgique: Belgium:Essence ...... . 60 71 71 76 60 . . Motor spirit.P6trole lampant. .. . 14 20 15 19 16 . . Kerosene.Huiles lourdes . .. . 102 175 173 170 1191 . . . Heavy oils.
Bulgarie: Bulgaria:Essence ...... - 3 4 6 6 . . . Motor spirit.Petrole lampant.. . - 2 7 8 9 . . . . Kerosene.Huiles lourdes .. . - 9 i 11 14 . .. . Heavy oils.
Estonie : Essence . . . 6 6 8 14 15 . . . . Estonia: Motor spirit.France: , France:
Essence ...... 1 572 1 944 2 084 2 218 2 394 . . . . . Motor spirit.Petrole lampant. . 196 203 253 264 271 . . . . Kerosene.Huiles lourdes . .. 2 004 2 319 2 737 2 461 2 777 . . . . . Heavy oils.Huiles de graissage . 230 272 222 256 231 . . . . Lubricating oils.
Italie: Italy:Essence ...... 126 103 130 289 422 518 . . Motor spirit.P6trole lampant. .. 38 50 41 124 154 144 . . . Kerosene.Huiles lourdes ... 113 127 149 451 707 2 . . Heavy oils.Huiles de graissage . 24 29 28 71 96 94 . . Lubricating oils.
Lettonie: Latvia:Essence . 1 1 1 1.... I . . Motor spirit.P6trole lampant. .. 2 1 I 1 . - .. Kerosene.Huiles lourdes ... 2 2 1 1 2 . . . Heavy oils.Huiles de graissage . 2 2 1 1 4 . . . . Lubricating oils.
Pologne: Poland:Gazoline naturelle. . 41 39 40 41 43 . . . . Natural gasoline.Essence ...... 85 86 88 91 100 . . . . Motor spirit.Pitrole lampant. .. 172 147 146 144 132 . . . . . Kerosene.Huiles lourdes . . . 82 97 98 102 90 · . ·· . Heavy oils.Huiles de graissage . 86 72 53 46 48 . . . . Lubricating oils.
Roumanie: Roumania:Gazoline naturelle. . 192 219 282 306 276 250 240 . . . Natural gasoline.Essence ...... 1771 1 853 1 922 1 589 1 529 1 567 1 408 . . . Motor spirit.P6trole lampant. . 1 349 1 367 1 290 1113 1 083 968 871 . . . Kerosene.Huiles lourdes . .. 4685 4 690 4 603 3780 3 397 3 150 2 704 . . . Heavy oils.Huiles de graissage . 75 82 63 49 65 63 ... Lubricating oils.
Royaume-Uni: United Kingdom:Essence .. . 565 514 478 471 393 . . . . Motor spirit.Petrole lampant. . 127 124 137 144 97 . . . . Kerosene.Huiles lourdes . . . 773 881 969 1 023 1 149 . .. . Heavy oils.Huiles de graissage 101 105 109 135 148 . . . . Lubricating oils.
Su6de: Sweden:Essence ...... 12 10 12 13 15 25 25 . . . Motor spirit.P6trole lampant. . 2 2 1 2 2 4 3 . · . Kerosene.Huiles lourdes . . . 23 34 54 31 25 24 12 . · . Heavy oils.
Tch6coslovaquie: Czechoslovakia:Essence ...... 131 136 151 . . . . . . Motor spirit.Petrole lampant. .. 67 69 73 . . . . . Kerosene.Huiles lourdes . .. 32 30 30 . . . . . . Heavy oils.Huiles de graissage 27 25 24 . . . . . . Lubricating oils.
Yougoslavie: Yugoslavia:Essence * . .... . 26 26 26 ...... . . . . Motor spirit.*
Allemagne : y compris des produits derives du charbon; 1 Germany: including some products obtained from coal;essence : depuis 1937, y compris l'essence etrangere melangee motor spirit: since 1937, including foreign spirit mixed witha la production indigene. domestic production.
2 Italie, 1939 : huile a gaz et huile Diesel, 273 milliers de tonnes; 1 Italy, 1939: gas oil and Diesel oil, 273 thousand metric tons;chiffre correspondant pour 1938: 261. corresponding figure for 1938: 261.

- 152 -
Tableau 62. GAZ NATUREL. - Table 62. NATURAL GAS.Consommation en millions-de mO. - Consumption in cubic metres (000,00 0's omitted).
Note. - Les donnees repr6sentent la quantit6 de gaz effectivement Note. - This table refers to natural gas actually collected andcaptie et utilisee pour l6clairage et le chauffage ou pour etre trans- utilised as lighting and fuel or for transformation into gaso-form&e en essence, etc. Le tableau ne comprend pas plusieurs pays line or other products. The table does not include countries forpour lesquels il n'existe pas de relevs ou dont la production est faible. which statistics are not available or where production is unimportant.
PAYS 1934 1935 1936 1937 1938 1939 1.940 1941 1942 *1943 COUNTRY
AMtRIQUE. AAMERICA.Argentine . . . 732 618 534 505 491 519 536 593 676 ... Argentine.Canada. ... 656 705 796 917 947 996 1 168 1 232 1 294 1 246 Canada.Etats-Unis . . . 50 143 54 274 61 388 68 179' 65 005 70 137 75 332 79 649 86 468 96 697 United States.Mexique . . . . 347 118 . . . . . Mexico.Venezuela' . . . 584 617 642 668 810 ... ... ......... Venezuela.
ASIE. ASIA.Born6o brit.. .. 22 13 27 80 90 114 . . . Brit. Borneo.Indes n6erland. 1 . 840 849 812 884 951 979 1 014 . . . Netherl. Indies.'Japon ... ... 47 41 41 . . . . Japan.
U.R.S.S. .... 1. 080 1 205 1 441 *2 000 *2 600 *2 900 . . . . U.S.S.R.'
EUROPE. EUROPE.
Allemagne . . . . 14 22 21 ... . . . . Germany.Antriche . . .. 15 —- - ... . . . . . Austria.Hongrie. 2 3 3 4 8 13 . . . . Hungary.Italie ...... 15 12 13 15 17 20 27 . Italy.Pologne ..... 469 485 483 531 581 . . . Poland.Roumanie. . . . 1 814 1 812 2 130 2007 1 860 1 702 1 775 Roumania.
dont: gaz m6thane . 171 185 205 247 301 349 ' 335 348 453 588 of which: methane gas.
* Venezuela, Indes neerlandaises, U.R.S.S.: les donnees origi- 1 Venezuela, Netherlands Indies, U.S.S.R.: the original datanales exprim6es en tonnes ont ete converties au taux approximatif expressed in metric tons were converted at the approximate rate ofde 775 m3 pour une tonne metrique. I long ton = 35,000 cubic feet (= 775 cubic metres per 1 metric ton).
Tableau 63. LIGNITE. - Table 63. LIGNITE.Production en milliers de tonnes metriques. - Production in metric tons (000's omitted).
Note. - Ce tableau se reffre au lignite et au , charbon brun a; Note. - This table covers lignite and brown coal, which mayleur 6quivalence en houille peut 8tre exprim6e au moyen des be expressed in terms of coal by means of the following conversiontaux de conversion suivants: Allemagne et Pologne 2: 9, Autriche rates :Austria 3: 5, Czecho-Slovakia 10: 17, Germany and Poland3: 5, Espagne et Grece 1: 2, Italie 1: 4, Tcheco-Slovaquie 10: 17 2: 9, Italy 1: 4, Spain and Greece 1: 2, and I : 3 for the otheret I : 3 pour les autres pays. Voir aussi renvoi ' au tableau 64. countries. See also footnote x to Table 64.
PAYS 1934 1935 1936 1937 1938 1939 1940 1941 1942 *1943 COUNTRY
AMARIQUE (Canada) 2 916 3 241 3 508 3 352 3 153 3 095 3 298 3 662 4 096 t 4 597 AMERICA (Canada).
ASIE (Japon). . . 125 109 109 . . . . . . . ASIA (Japan).
EUROPE' . .. 170 530 181 200 196 990 224 950 232 060 . . . . . EUROPE. Allemagne . . 137 274 147 072 161 397 184 709 2194 959 . . . . Germany.Autriche. . . 2 851 2 971 2 897 3 242 *3 500 . Austria.Bulgarie ... 1 568 1 572 1 576 1 732 1 942 2 134 2 549 *4 300 4700 . Bulgaria.Danemark* . . - - 226 1 100 1 800 2 600 Denmark.*Espagne . . . 299 321 199 208 166 194 569 793 1 106 1 112 Spain.*France ... 1 025 907 943 1 019 1 058 . . . France.Gr6ce ..... 104 93 106 131 108 141 250 . . Greece.Hongrie .... 6 199 6718 7105 8055 8306 9518 10306 312600 . . Hungary.Italie
4A . . 409 545 769 1 059 1 322 . Italy
4A.
B--. .. (356) (469) (608) (752) (873) (*1 058) (* 2 400) (.) (.) (.) , Bt.Pays-Bas .. . 92 86 89 143 171 197 . . . . Netherlands.Pologne . ... 26 18 14 18 10 Poland.Portugal. . .. 15 20 21 23 19 35 64 84 108 106 Portugal.Roumanie . . . 1 624 1 667 1 672 1 880 2 097 2179 2 385 2 197 3 2 616 a)
31 232 Roumania.
Tch6coslovaquie 15 071 15 114 16 070 18 042 12 973 778 805 5816 s 813 58 3 2 Czechoslovakia.Turquie . . . . 53 73 95 116 146 161 225 267 394 ... Turkey.Yougoslavie . . 3 925 4 028 4 035 4 574 5 287 5 622 6 888 . . . Yugoslavia.
dont: Croatie » . . . 2 073 2 360 2 500 3 178 2 531 2 34 6 ... of which: "Croatia".
OCPANIE. .... 3 908 3 568 4 396 4 777 4 998 5 028 5 743 6 122 6 542 ... OCEANIA.Australie . . 2 660 2 257 3 094 3 448 3 734 3 709 4 349 4 639 5 013 ... Australia.Nouv.-Z6lande . 1 248 1 311 1 302 1 329 1 264 1 319 1 394 1 483 1 529 1 675 New Zealand.
TOTAL. . . . . . 177 480 188 120 205 000 *233 200 *240 500, . .. ' TOTAL.
t Donnees non comprises dans les totaux. a) I-VI. t Data not included in the totals. a) I-VI.Europe: sans l'Albanie (1939 : 7.000 t.). ' Europe: exclusive of Albania (1939: 7,000 t.).Allemagne, 1938: non compris les territoires sudetes. 2 Germany, 1938: excluding Sudetenland.
8 Hongrie, 1941; Roumanie, 1942, 1943 : y compris la houille. 3 Hungary, 1941 ; Roumania, 1942, 1943 : including coal.4 Italie, A : lignite selon la classification utilisee jusqu'en 1938 ; 4 Italy, A: lignite according to the classification in use until 1938;
B : non compris une certaine espece de lignite (voir tableau 64). B : excluding a certain kind of lignite. (See Table 64.)s Tchecoslovaquie : depuis 1939, a Slovaquie Czechoslovakia : since 1939, " Slovakia
t Canada, 1944: 4113.

- 153 -
Tableau 64. HOUILLE. - Table 64. COAL.Production en milliers de tonnes metriques. - Production in metric tons (000's omitted).
Note. - Ce tableau comprend l'anthracite, mais, sauf indi. Note. - This table covers anthracite and bituminous coal, butcation contraire, il exclut le lignite. excludes lignite and brown coal, except where otherwise stated.
PAYS 1934 1935 1936 1937 1938 1939 1940 1941 * 1942 * 1943 COUNTRIMS
AFRIQUE. .. .. 13 189 14 640 15 921 17 065 17 884 * 18 500 * 19 200 * 20 600 * 22 500 . AFRICA.Alg6rie . . .. 34 38 7 14 13 .50 . . Algeria.Congo beige . 5 11 14 36 42 27 23 30 43 69 Belgian Congo.Maroc fran;ais . 36 52 49 107 123 115 143 140 118 102 French Morocco.Mozambique.. 12 8 8 19 10 19 20 17 7 14 Mozambique.Nigeria 264 262 296 369 368 311 313 ..... Nigeria.Rhod6sie duSud 643 695 705 1 029 1 044 1118 * 1170 * 540 *1640 . Southern Rhod.Un. Sud-Afric. . 12 195 13 574 14 842 15 491 16 284 16 890 17 493 18 500 20 300 20 500 Un. of S. Africa.
AMPRIQUE NORD . 387 488 394 487 458 156 462 237 367 830 416 056 477 351 530 436 596 357 600 925 NORTH AMERICA.Canada . . .. 9613 9358 10308 11 014 9815 11 141 12639 12872 13018 *11539 Canada.Etats-Unis 1
. . 377875 385 129 447848 451 223 358015 404915 464712 517564 583339 +589386 United States.'
Mexique .... 631 990 1 072 912 893 628 548 856 . . Mexico.
AMIRIQUE DU SUD* 2 820 3 194 3 014 3 198 3 363 3 357 3 913 3 992 4 644 * 5 000 S. AMERICA.*Br6sil . . . . 719 826 649 763 907 1 047 1 336 1 408 1 757 2 030 Brazil.Chili i . . 1 808 1 900 1 875 1 988 2044 1850 1938 2060 2 151 2 275 Chile.
1
Colombie. . 252 378 393 341 331 349 521 403 578 Colombia. s
P6rou . . . . 35 85 90 99 75 108 113 117 150 187 Peru.Venezuela . . 6 5 7 7 6 3 5 4 8 11 Venezuela.
ASIE (s. I'U.R.S.S.) 97 158 102 655 109 040 * 118 600 ... * 130 000 . . . ASIA (ex. U.S.S.R.).Chine sans Mandch.. 20 897 21 613 22 250 22 469 .. 17 800 .. . China: excl. Manch.
»Mandchourie 10 543 11 474 12 020 14 420 * 15 000 * 19000 * 21 000 . . . Manchuria.Coree . . 1 689 1999 2 282 2 348 Korea.Etats Mal. f6d 327 '398 529 639 486 448 * 794 . Fed. Mal. States.Formose. . 1 521 1 597 1 744 ... . Formosa.lnde: Prov. br 20 569 21 353 20 916 22 695 25 684 25 044 26 496 . . . India: Brit. prov.
Et. ind. 1 842 2 033 2 058 2 743 3 114 . Ind. States.Indes n6erl.1 . 1 033 1 111 147 1 373 1 457 1 781 2009 1990 . Netherl. Indies.'Indochine . . 1 592 1 775 2 186 2 308 2335 2615 2 500 2 329 * 200 ... Indo-China.Japon. . . 35 925 37 762 41 803 45 258 1 * 53 000 8 52 481 ,* 55 000 . . Japan.Philippines. . 23 24 30 26 41 54 59 . . Philippines.Sakhaline . . 1 197 1 516 2 075 2 536 . . . . . . Sakhalin.
U.R.S.S. . . . . 93 940 109 000 123 679 122 579 132 888 145 900 164 600* 171 000 . . U.S.S.R.1
EUROPE (s. URSS) 498 386 505 908 528 143 579 443* 571 157 . . .. EUROPE (excI. U.S.S.R.)Allemagne . 124 857 1 86 179 Germany.Sarre . . 11 318f^ 1 0 158 283 184 513 186 179 c261Saar.
Autriche .. 251 261 244 230 * 226 ' ' Austria.Belgique. . . 26 389 26 506 27 867 29 859 29 585 29 844 25 539 26 722 25 055 *23 743 Belgium.Bulgarie. 79 104 102 121 146 219 Bulgaria.Espagne * . 5 932 6 946 3 272 2 085 5 649 6-606 8862 8763 9 257 9 591 Spain. *France . 47 632 46 213 45 228 44 346 46 504 4 50 216 . ' 43 200 43 807 * 42 456 France.Hongrie. 756 823 827 917 1 042 1 107 1 207 b) 666 . Hungary.Irlande . 113 115 127 128 120 120 118 155 167 186 Ireland.Italie A 374 443 806 964 960 Italy A.
1B t · . (427) (522) (967) (1272) (1 480) (*2 025) (*2160) () (.) B.1tNorv6ge: Spitzerg. 533 709 784 766 627 625 400 . . . Norway: Spitzberg.
Pays-Bas . .. 12341 11 878 12 803 14 321 13 488 12 861 . . . Netherlands.Pologne . . 29 233 28 545 29 747 36 218 38 104 . Poland.Portugal. 203 211 217 259 308 299 369 435 498 403 Portugal.Roumanie . . 228 278 293 303 299 286 261 232 Roumania.Royaume-Uni 224 268 225 815 232 114 244 267 230 636 235 050 227 898 209 656 208 230 *202 112 UnitedKingdom.Su6de . . . . 415 424 456 460 431 444 498 557 582 ... Sweden.Tch6coslovaquie 10 789 10 894 12 233 16 951 13 814 Czechoslovakia.Turquie ... 2 288 2 340 2 299 2 307 2589 2696 3019 3020 2510 3 165 Turkey.Yougoslavie 387 400 441 428 450 446 421 . . Yugoslavia.
OCAANIE. . . 10 349 11 901 12 426 13 254 12 862 14 813 13 077 15 640 16 337 15 548 OCEANIA.Australie . . . 9504 11 063 11553 12 268 11868 13 752 11914 14 441 15 143 14 391 Australia.Nlle-Z61ande . 845 838 873 986 994 1 061 1 163 1 199 1 194 1 157 New Zealand.
TOTAL * ... .1 104 0001 142 800 1 251 500 1 317 300 1 232 000 . . . . . TOTAL. *
Prix en francs-or pour I tonne mdtrique: - Price in gold francs per I metric ton:(p oyenMoy. 12.34 12.12 12.77 13.90 15.33 13.84 AvR'x fo..U nX (aver. price(rexp moyb.)XII 12.18 12.43 12.64 14.79 14.48 a) 13.75 ... Xllipcd4exp. f.o.b.)4 1. ofexp. f.o.b)
* Estimation ou chiffre provisoire. - Estimate or provisional figure. a) VIII. b) I-VI. c) IV.1943-III11.1944.Etats-Unis, Chili, Mandchourie, Indes neerl., U.R.S.S., 1 U.S.A., Chile, Manchuria, Neth. Indies, U.S.S.R., Italy B:
Italie B: y compris une certaine quantit6 de lignite (en millions including some lignite (in millions of tons : U.S.A., 1939: 2.8;de tonnes: E.-U., 1939: 2,8; U.R.S.S., 1940: 15,9). U.S.S.R., 1940: 15.9).
Colombie : houille transport6e par chemin de fer. 2 Colombia : coal transported by rail.Japon 1938-1940: y compris Coree et Formose. Japan, 1938-1940: including Korea and Formosa.France : depus 1939, y compris le lignite ; depuis 1941, non France : since 1939, including lignite; since 1941, not includ-
compris l'Alsace.Lorraine. ing Alsace-Lorraine.sAllemagne, 1943/1944: y compris toute la Haute Silesie 5Germany, 1943/1944: including all Upper Silesia (102 000 000
(102 000 000 tonnes). tons).* 1944, Canada : 11 341 ; Etats-Unis-- U.S.A. : * 620 000 ; Belgique-Belgium : 13 505 ; Roy.-Uni- Un. Kingdom : 197 231.

154 -
Tableau 65. PYRITES. - Table 65. PYRITES.
Note. - La partie a) de ce tableau se ref're aux pyrites de fer Note. - Part (a) of this table covers iron pyrites (FeS2) and(FeS2) et aux pyrites cuivreuses (c.-aid. renfermant des chalco- cupreous pyrites (i. e. containing some chalcopyrite, CuFeS2), aspyrites, FeCuS2) ainsi qu'aux pyrites et concentres de pyrites obte- well as pyrites and pyrites concentrates obtained as a by-productnus comme sous-produits dans le traitement des minerals de cui- from copper, lead and zinc ore operations. The theoreticalvre, de plomb et de zinc. Le contenu theorique exprime en percentage contents are: for iron pyrites, iron 46.6 %, sulphurpour cent est : pour les pyrites de fer, 46,6 % de fer, 53,4 % de 53.4 % ; for chalcopyrite, copper 34.6 %, iron 30.4 %, sulphursoufre; pour les chalcopyrites, 34,6 % de cuivre, 30,4 % de fer 35 %. In practice, however, pyrites are not found pure. Partet 35,0 % de soufre. Toutefois les pyrites ne se trouvent pas l'dtat (b) shows the actual sulphur content of the pyrites mined (com-pur. La partie b) indique le contenu effectif en soufre des pyrites mercially, sulphur is the most important constituent). In someextraites (au point de vue commercial, c'est le soufre qui est le cases, where precise data on the sulphur content are not available,constituant le plus important). Dans certains cas, on a utilise fixed percentages, corresponding roughly to the average sulphurpour le calcul du contenu en soufre, faute de donnees precises, content, were utilised - e.g., Cyprus, 50 %: Japan, 45 %;des pourcentages fixes, correspondant approximativement au conte- Roumania (total of iron and copper pyrites), 35 % ; Spain, 40%.nu moyen. Par ex. Chypre, 50 %; Japon,; 45 %; Roumanie(total de pyrites de fer et de cuivre), 35 %; Espagne, 40 %.
Les pyrites sont employees principalement pour la fabricationde l'acide sulfurique. On les emploie egalement pour l'extraction Pyrites are mainly used in the manufacture of sulphuric acid;du soufre pur. D'autre part, les pyrites grillees provenant des usines also, to a small extent, for the production of pure sulphur. Further,d'acide sulfurique sont utilisees comme minerai de fer. (Pour roasted pyrites from sulphuric-acid plants are employed as anl'acide sulfurique, voir Annuaire, 1940/41, tableau 65.) iron ore. (For Sulphuric Acid, see Year-Book, 1940/41, Table 65.)
a) Production de pyrites en milliers de tonnes metriques.(a) Production of Pyrites in metric tons (000's omitted).
PAYS 1934 1935 1936 1937 1938 1939 1940 1941 1942 * 1943 COUNTRY
AFRIQUE ....... 43 50 64 88 106 105 . . . AFRICA.
Alg6rie. ...... 15 13 20 39 48 48 40 . . . Algeria.Rhod6sie du Sud . . 12 12 19 20 27 27 . . . . Southern Rhodesia.Union Sud-Africaine. 16 25 25 29 31 30 37 . . Union of S. Africa.
AMAgRIQUE ...... . . . . 449 548 671 702 605 735 753 931 1 076 1 073 AMERICA.Canada....... 10 26 115 108 40 207 116 275 344 258 Canada.Etats-Unis ... .. 439 522 556 594 565 528 637 656 732 815 United States.
AsIE (sans l'U.R.S.S.) 1 333 1 758 2 363 . . . . AsiA (excl. U.S.S.R.).'Chypre. ...... 203 363 534 809 776 (E.)404 257 ... ... Cyprus.Cor6e....... 40 56 78 78 . . . Korea.Japon ....... 1 090 1 339 1 751 . . . Japan.
U.R.S.S. t ... .. (525) (619) (.) (.) (978) (.) (.) (.) (.) (.) U.S.S.R.t
EUROPE (sans U.R.S.S.) 5 070 5 300 5 200 6 165 * 7 045 . . EUROPE (excl. U.S.S.R.).Allemagne ..... 226 277 285 424 415 . . Germany.Espagne* .... 2093 2 185 1 740 2277 2727 1 548 962 575 627 881 Spain. *Finlande...... 274 352 370 351 352 399 494 ... .. ... Finland.France. ...... 162 152 147 146 148 . . France.Grace . . ..... 151 132 208 207 245 217 ... Greece.Italic .... .. . 812 833 865 915 930 978 . . . Italy.Norv6ge ...... 961 894 1 032 1 048 1 028 1 025 . . . Norway.Pologne ...... I 11 16 38 82 92 . . Poland.Portugal . . . . . . 219 210 243 350 718 673 438 218 135 68 Portugal.Roumanie
2... .. 20 34 37 35 31 32 19 14 ... 20 Roumania. 2
Royaume-Uni. . . 2 4 5 5 4 . . United Kingdom.Su6de ....... 101 107 134 173 186 192 194 . Sweden.Tchecoslovaquie. .. 18 20 19 18 . I 10 8 14 ll '11 9I ; Czechoslovakia.Yougoslavie. ... .. 23 84 80 134 150 127 *135 . . Yugoslavia,
OCtANIE (Australie) .. 12 26 34 41 51 55 38 41 35 *45 OCEANIA (Australia).
TOTAL (sans l'U.R.S.S.) 6 900 7 700 *8 350 *9 800 *10 500 . . . . . TOTAL (excl. U.S.S.R.).
SOURCES : Statistiques nationales officielles. - National official statistics. Imperial Institute (London). U. S. Bureau of Mines.
* Estimation ou chiffre provisoire. (E.) Exportations. t Chiffres * Estimate or provisional figure. (E.) Exports. t Figuresnon compris dans les totaux. not included in the totals.
Asie : non compris la production de la Chine, evaluee i 49.000 1 Asia : excluding output in China, estimated at 49,000 tons intonnes en 1932 et 8 43.000 tonnes en 1934. 1932 and at 43,000 tons in 1934.
' Roumanie : pyrites de fer et de cuivre. 2 Roumania : total of iron and copper pyrites.3 Tchecoslovaquie : depuis 1939, a Slovaquie D. 3 Czechoslovakia: since 1939, " Slovakia

- 155 -
Tableau 65 (fin). Pyrites. - Table 65 (concluded). Pyrites.b) Contenu en soufre en milliers de tonnes metriques. (b) Sulphur Content in metric tons (000's omitted).
PAYS 1934 1 ].936 1 1937 1938 1939 1940 1941 1942 *1943 COUNTRY
AFRIQUE ....... 19 22 28 38 46 *45 . . AFRICA.
Alg6rie ..... . 7 6 9 17 21 *21 *18 . . . Algeria.Rhod6sie du Sud . . 5 5 8 8 11 * 11 . . . . Southern Rhodesia.Union Sud-Africaine. 7 11 11 13 14 13 16 . Un. of South Africa.
AMPRIQUE ...... 175 219 277 '291 243 327 323 410 478 459 AMERICA.Canada. ...... 5 13 57 55 20 104 57 135 166 126 Canada.Etats-Unis ..... 170 206 220 236 223 223 266 275 312 333 United States.
AsIE * ........ 590 780 1 060 . . . . . ASIA.*Chypre. ...... 101 182 267 404 388 (E.) 202 129 ... ... ... Cyprus.Japon * ...... 490 600 790 . . . . . Japan.*
EUROPE * . ...... 2120 2190 2 200 2 580* 2 970 . . . . . EUROPE.*Allemagne . . . '97 118 122 180 * 175 . . . . Germany.Espagne * ..... 840 870 700 910 1 090 620 390 230 250 350 Spain.*Finlande ...... 70 92 91 87 87 101 123 ... .. ... Finland.France....... 70 69 66 66 67 . . France.Gr6ce ....... 73 64 101 100 120 99 ... . . . Greece.Italie ....... 374 367 404 427 437 *457 . .. Italy.Norv6ge ...... 425 406 467 463 458 457 . . . Norway.Pologne ...... 5 7 17 36 41 Poland.Portugal ...... 103 100 115 158 *320 309 192 61 ... Portugal.Roumanie * .. ... 7 12 13 12 II11 11 7 5 ... 7 Roumania.*Su6de ... .... 40 43 57 75 84 87 *88 Sweden.Tch6coslovaquie. .. 8 8 8 8 . 4 '6 15 15 14 Czechoslovakia.Yougoslavie . .... 10 38 37 62 69 58 *62 . . . Yugoslavia.
TOTAL * ....... 2 900 3 200 3 550 4 250 4 500 . . . I -. TOTAL.*
* Evaluations. 1 Tchecoslovaquie: depuis 1939, , Slovaquie ". * Rough estimates. 1Czechoslovakia : since 1939, "Slovakia"
Tableau 66. SOUFRE. - Table 66. SULPHUR.Production en milliers de tonnes metriques. -- Production in metric tons (000's omitted).
Note. - Ce tableau se reifre, autant que possible, a la production Note. - This table refers, as far as possible, to the productiondu soufre par les mines. (I1 ne comprend pas le soufre contenu dans of sulphur by the mines (it does not cover sulphur contained in,les pyrites ou extrait de celles-ci; voir tableau 65 b).) or recovered from, pyrites ; see Table 65(b)).
Ces statistiques ne sont toutefois pas entieretnent homogenes, These statistics are, however, not entirely homogeneous, sincevu qu'elles se rapportent soit au minerai de soufre, soit a son con- they refer either to sulphur ore or its content or to the industrialtenu, soit A la production industrielle du soufre raffine. production of refined sulphur.
PAYS 1934 1935 1936 1937 1938 1939 1940 1941 1942 *1943 COUNTRY
AMPIRIQUE DU NORD NORTH AMERICA.
(Etats-Unis) I. .... 1 444 1 659 2 049 2 786 2 432 2 125 2776 3190 3516 2580 (United States).1
AMtRIQUE DU SUD 27 24 27 25 23 34 40 27 30 51 SOUTH AMERICA.
Argentine ..... - - - - - - - 2 18 Argentina.Bolivie (E.) .. . 6 4 1 2 2 2 4 2 4 7 Bolivia. (E.)Chili . ..... . 21 20 26 23 21 32 36 25 24 26 Chile.
ASIE *........ 151 180 210 160 . . .. ASIA.*Chine4 . . . ... . . China.Indes n6erlandaises . 12 10 I1 13 16 17 17 . . . Netherlands Indies.Japon . ...... 135 165 198 141 . . . . . Japan.
EUROPE ....... 380 350 360 380 410 * 385 . . . . EUROPE.
Espagne3A.t . . . (55) (45) (13) (8) (8) (32) (30) (53) (33) (...) Spain." A.tB . ... II 9 3 2 2 6 6 11 7 .... B.
Italie ....... 366 331 349 364 397 * 376 . .. Italy.Roumanie ..... 3 6 6 11 8 8 Roumania.Turquie ...... - 2 3 3 4 3 2 3 3 3 Turkey.
TOTAL *....... 2000 2200 2650 3350 3100 2950 . . 4400 . TOTAL.*
NEW-YORK: Prix en francs-or par tonne mtrique : — Prices in gold francs per metric ton: NEW YORK:
soufre brut moy. 58 55 54 54 53 49 49 49 49 49 Av. raw sulphurf. o. b. mines XII 55 55 54 54 49 49 49 49 49 49 XII f.o.b. mines.
CATANIA: moy. 96 95 88 69 70 62 . . . . Av. } CATANIA:jaune, sup. XII 96 95 65 71 70 62 . . . . XII. yellow sup.
SOURCES : Statistiques nationales officielles. - National official statistics. Imperial Institute. U.S. Bureau of Mines.* Estimation ou chiffre provisoire. (E.) Exportation. * Estimate or provisional figure. (E.) Exports.t Serie non comprise dans les totaux. t Series not included in the totals.
Etats-Unis: soufre brut. United States: crude sulphur.2 Japon: soufre raffin'. s Espagne : A. Minerai de sou- 2 Japan : refined sulphur. 8 Spain : A. Sulphur ore
fre. B. Contenu en soufre du minerai de soufre extrait. B. Sulphur content of sulphur ore mined.

156 -
Tableau 67. MINERAI DE MANGANESE (Contenu en metal).Table 67. MANGANESE ORE (Metal Content).
Production estim&e en milliers de tonnes m6triques. - Estimated production in metric tons (000's omitted).Note. - Ce tableau se refere au contenu en manganese (Mn) Note. - This table refers to the manganese (Mn) content of
des minerais de manganese extraits, dont le principal est la pyrolusite manganese ores mined, the most important of which is pyrolusite(Mn0 2). Sauf avis contraire, les donnees figurant dans le tableau (MnO2). Unless otherwise stated, the data given in the table coverne concernent que le contenu des minerals riches renfermant 30 % only the content of high-grade ore containing 30 % or more ofet plus de manganese. Dans beaucoup de cas, les chiffres donnes manganese. In many cases, the figures are only of an approximateont un caractere tres approximatif. nature.
PAYS 1934 1935 1936 1937 1938 1939 1940 1941 *1942 * 1943 COUNTRY
AFRIQUE ....... 219.3 297.6 394.2 658.2 483.3 426.3 *504 *417 . AFRICA.Congo beige . . .. - - - 15.5 3.7 4.4 10 13 7 9 Belgian Congo.C6te de l'Or (E.) . 181.0 212.0 219.0 280.0 172.0 179.0 254 228 ... Gold Coast. (E.)Egypte . ..... 0.5 25.5 39.1 53.9 44.4 34.8 18.8 0.6 2.4 2.1 Egypt.Maroc espagnol. - - - 0.3 0.1 - ... . .. Spanish Morocco.Maroc frangais . . . 4.3 10.7 14.2 39.0 24.0 32.2 45.5 22.4 19.1 21.1 French Morocco.Rhod6sie du Nord. 0.6 1.4 0.8 0.7 0.5 *0.6 Northern Rhodesia.Union Sud-Africaine. 32.9 48.0 121.1 268.8 238.6 175.3 174.5 151.6 102.2 49.7 jn. of South Africa,
AMtRIQUE DU NORD.. 11.6 11.8 14.9 20.2 11.6 12.7 18.4 40.3 *90 *95 NORTH AMERICA.Canada * ... .. -- 0. - - -- 0.2 0.1 - 0.2 - Canada.*Etats-Unis . . . 11.6 11.8 14.8 20.2 11.6 12.5 18.3 40.3 *90 *95 United States.
AMAIRIQUE CENTRALE*. 33.7 25.7 20.7 58.5 63.0 52.5 65.3 118.2 70 100 CARIBBEAN.*Cuba'. ...... 31.9 22.6 17.7 57.3 62.5 52.5 65.2 117.8 . . Cuba.'Mexique* . .0.9 1.4 1.5 - - 0.1 0.4 .Mexico.*Puerto-Rico (E.) 0.9 1.7 1.5 1.2 0.5 - - - - ... Puerto Rico. (E.)
AMItRIQUE DU SUD*.. 5.1 21.2 76.5i 125.0 146.9 121.5 150.0 212.5 173 178 SOUTH AMERICA.*Argentine. ... . . 0.2 0.2 0.2 0.3 0.2 0.2 0.3 0.6 0.6 ... Argentine.Br6sil * . . . . . . 3.0 19.0 74.0 119.0 137.0 116.0 140.0 202.0 E. 140 E. 125 Brazil.*Chili . . . . . 1.9 2.0 2.3 5.7 9.7 5.3 9.7 9.9 32.1 52.0 Chile.
ASIE (sans l'U.R.S.S.) * 248.7 378.1 475.1 610.0 . . . . ASIA (excl. U.S.S.R.).*Chine ...... 1.2 * 0.5 (E.)*i 1.0 (E.)23.5 (E.) 0.6 (E.)- (E.)- China.Etats Mal. non f6drWs 4.5 6.6 8.6 7.7 7.5 7.4 (E.) 2.7 Unfeder.Malay States.2
Inde (brit.)* . .. 206.0 326.0 414.0 534.0 492.0 430.0 . 490 ... ... India.*Indes n6erlandaises 6.1 6.4 4.6 6. 1 5.0 6.4 6.1 . Netherlands Indies.Inde portugaise * . 1.9 1.8 1.2 1.8 4.7 4.1 3.3 ... ... Portuguese India.*Indochine frangaise 2. - 0.6 1.6 2.4 1.1 1.7 0.3 0.5 ... French Indo-China.'Japon*. 29.0 36.0 34.0 . . . Japan.*Philippines* (.) 0.2 0.1 2.7 1 9.2 0.) .1 8.) 29.0 . . . Philippines.*
U.R.S.S. * ...... 800 1 050 1 350 1 250 1 050 ... *1300 *1 300 . . U.S.S.R.*
EUROPE(sans U.R.S.S.)*3 154.4 213.0 253.5 302.7 . . . . . . EUROPE(excl.U.S.S.R.)*3Allemagne ..... 133.8 171.5 191.2 208.7 . . . . Germany.
3
Autriche 3 . .
... 9.4 16.9 23.1 41.8 . . . . . . Austria.3
Bulgarie ..... . - -— 1.1 4.5 1.3 *0.4 Bulgaria.Espagne* . . . 1.2 1.2 0.5 0.1 0.4 1.4 1.8 3.0 6.4 7.8 Spain.*Gr6ce ..... 0.6 0.2 0.6 3.2 * 3.2 *5.0 ... . . . Greece.Hongrie ...... 2.2 11.3 10.1 8.9 15.7 Hungary.Italie ....... 2.5 3.3 8.9 12.0 * 15.0 Italy.Portugal .0.1 0.1.... 0. 0.2 804 0.3 0.8 1.5 2.6 ... Portugal.Roumanie . . . . . 3.9 7.1 12.2 18.3 21.7 14.9 12.7 ... *9.7 13.7 Roumania.Suede . . . . . . . 2.5 2.7 2.3 2.1 2.2 1.8 *1.5 . . . Sweden.Turquie ...... - 7.5 1.2 0.1 1.0 0.2 0.2 0.5 1.3 1.1 Turkey.Yougoslavie . . .. 0.4 0.3 1.0 1.6 1.4 2.0 3.8 . . . Yugoslavia.
dont Croatie . . . .. * 1.2 1.2 * 1.2 *1.7 of which "Croatia".
OCItANIE (Australie) * . 0.1 - 0.6 0.3 0.1 *6.0 *6.5 *5.0 ... OCEANIA (Australia).*
TOTAL * ....... 1473 1997 2 585 3025 . . . TOTAL.*
SOURCES :Statistiques nationales officielles. - National official statistics. U.S. Bureau of Mines. Imperial Institute.* Estimation ou chiffre provisoire. - (E.) Exportations. * Estimate or provisional figure. - (E.) Exports.1 Cuba: importations, aux Etats-Unis, qui absorbent la total'ti 1 Cuba: imports into the United States, which country takes all
des exportations de manganese en provenance de Cuba. Cuba's exports of manganese.2 Etats Malais non federes, Indochine fr.: y. compris le contenu 2 Unfederated Malay States, Fr. Indo-China: including content
des minerals titrant moins de 30% de manganese. of ores averaging less than 30% of manganese.Allemagne, Autriche : total du contenu en manganese de tous Germany, Austria : total manganese content of all manganiferous
les minerals manganiferes extraits; la production de minerais ore mined; output of high-grade manganese ore is smallriches en manganese est peu importante.

- 157
Tableau 68. MINERAI DE FER (Contenu en metal). - Table 68. IRON ORE (Metal Content).Production estimee en milliers de tonnes metriques. - Estimated production in metric tons (000's omitted).
Note. - Ce tableau se rapporte au contenu en fer - souvent Note. - This table refers to the iron content - sometimes verytres approximatif - des minerais de fer extraits. y compris les mine- roughly estimated - of iron ores mined, including manganiferousrais mangan6siferes, mais non compris les pyrites (tableau 65). Les iron ores but not including pyrites (Table 65). The principaprincipaux minerais de fer sont I'hematite (Fe20 3 ), la magnetite iron ores are hematite (Fe203), magnetite (FesO3), limonite(Fe3O4), la limonite (Fe203H 20) et la siderite (FeCO3 ). (Fe2OsH.O) and siderite (FeCOs).
PA S 1934 1935 1936 1937 1938 1939 1940 1941 *1942 -1943 COUNTRY
AFRIQU ....... I 790 2 320 2 600 * 3 360 3 860 * 3 600 . . . AFRICA.Alg6rie. ...... 703 907 1 010 *1300 1 655 *1 600 *900 . . Algeria.Congo belge * .... 4 4 - 7 1 5 3 7 5 12 Belgian Congo.*Maroc espagnol* (E.) 520 715 640 870 820 630 240 340 335 470 SpanishMorocco.*(E.)Maroc frangais . . . - - - * 35 128 210 38 2 2 5 French Morocco.Sierra-Leone (E.) . . 133 251 328 367 499 . . Sierra Leone. (E.)Sud-Ouest Africain *. - - - 7 10 ... ... ... ... S.W. Africa.*Tunisie. .. . 281 254 387 480 424 *420 ... Tunis.Union Sud-Africaine. 144 192 235 295 320 312 396 *500 440 440 Union of S. Africa.
AMIRIQUE DU NORD. . 12 867 16 100 25 771 38 143 15 322 27 613 39 297 49 000 *56 000 *53 500 NORTH AMERICA.Canada* . .. - - - - 50 150 190 200 230 Canada.*Etats-Unis: Total * 12 600 15 750 25 300 37 290 14 435 26 690 38 350 48 300 ... ... United States :Total.*
Minerai de fer. .... 12 584 15 608 26 078 36 991 14 322 26 428 37 919' 47 819 54 767 t52 547 Iron ore.'Terre-Neuve .... 267 350 471 853 887 873 797 510 450 280 Newfoundland.
AMfIRIQUE CENTRALE . 113 163 282 314 169 249 161 164 . . CARIBBEAN.Cuba........ 45 (E.)102 (E.)203 (E.)224 (E.) 70 (E.)138 '91 92 2- 6 Cuba.Mexique ...... 68 61 79 90 99 III 70 72 . . Mexico.
AMItRIQUE DU SUD. .. . . 1 590 1 470 1 542 1 600 430 470 SOUTH AMERICA.*Brdsil . .. . . . . 640 485 480 *500 *430 *470 Brazil.Chili ....... 584 517 815 916 950 985 1062 1 010 - -- Chile.
ASIE (sans I'U.R.S.S.) . 3 740 *4 550 *5 400 . . . ASIA (excl. U.S.S.R.).Chine: sans Mandch.* 560 (E.) 540 (E.) 530 (E.) 240 (E.) 30 (E.) 40 225 China: ex. Manch.*
a Mandchourie*. 590 770 1 000 . ... .. . Manchuria.*Cor6e ....... 320 346 * 350 . . . . . . . Korea.Etats Malais non f6d. 742 914 1 077 1 077 1 030 1 275 *1 200 . .. Unfeder. Malay St.Inde (brit.)...... 1 250 1 534 1 666 1 870 1 790 1 994 . . . India.
, Birmanie . . . (16) (15) (17) 17 12 .. ,, Burma.Indochine fr... -. I 1 5 16 72 71 17 28 ... ... Fr. Indo-China.Japon ....... 270 * 320 * 470 . Japan.Philippines* .. (E.) 3 (E.) 130 310 400 500 650 700 . . . Philippines. *
U.R.S.S.* ...... 10 890 13 400 14 000 14 000 13 500 ... 14 000 15 500 . . U.S.S.R.*EUROPE (sans U.R.S.S.) 21 770 24 230 28 140 *34 100 *32000 . EUROPE (ex. U.S.S.R).
Allemagne . . 1 372 I 849 2 259 2 759 *3 100 . . . . . Germany.Autriche . ..... 163 269 364 672 *900 Austria.Belgique ...... 42 59 69 96 65 60 *28 *45 *40 Belgium.Bulgarie ...... 2 4 10 11 13 Bulgaria.Espagne* . . . 986 1300 1 000 600 1200 1 100 1000 800 750 750 Spain.*France. ...... 10 450 9 832 10186 11520 10203 *10100 . . France.Gr6ce ....... 71 99 134 145 165 *150 . . . Greece.Hongrie ...... 25 65 100 100 2 130 2 220 230 . . Hungary.Italic ... 252 286 435 515 510 490 . . Italy.Luxembourg . . . 1174 1 269 1 476 2 240 1 507 ... Luxemburg.Norvge ...... 368 497 599 718 972 930 Norway.Pologne ...... 78 105 149 248 270 Poland.Portugal ...... I - 4 3 1 - ... Portugal.Roumanie ..... 40 46 53 63 68 69 72 Roumania.Royaume-Uni. . .. 3 227 3321 3 872 4333 3615 4 420 5 400 5 780 5 960 5 640 United Kingdom.Su6de ....... 3250 4 859 6 853 9 136 8 411 8 360 '*6 800 Sweden.Suisse ....... 4 2 - 40 55 60 60 . . . Switzerland.Tch6coslovaquie.. . 181 247 359 * 600 a *220 3 *250 3 *280 3 320 3310 310 Czechoslovakia.Turquie * .-.. - - 50 155 85 40 12 60 Turkey. *Yougoslavie. ... 90 118 226 310 300 330 300 Yugoslavia
dont· Croatie. * . .. . . 290 310 280 230 ' 2 ... ... of which "Croatia ". *
OCAANIE. .. . 848 1 262 1 267 1255 1 529 *1 774 1 640 ... ... OCEANIA.Australie . . . . . 847 1 257 1 267 1 255 1 509 *1 730 1 550 *1 500 *1430 Australia.Nouvelle-Cal6donie . - 19 43 90 ... ... ... New Caledonia.Nouvelle-Zelande .. 1 5 - I I I I 1 2 New Zealand.
TOTAL * . . ..... 52 500 62 700 78 500 98 500 74 000 88 000 ·· . . TOTAL.*
* Estimation ou chiffre provisoire. - (E.) Exportation. * Estimate or provisional figure. - (E.) Exports.1 Etats-Unis, mineral de fer : chiffres officiels relatifs au contenu 1 United States, iron ore: official figures for iron content of
en fer du minerai renfermant moins de 5% de manganese. ore containing less than 5% of manganese.Hongrie : a Territoire de Trianon ), 1938: 104; 1939: 100. Hungary: "Trianon Territory ", 1938: 104; 1939: 100.Tchecoslovaquie : depuis 1938, , Slovaquie , (1937: * 250). s Czechoslovakia : since 1938," Slovakia" (1937 : *250).
t 1944, Etats-Unis - U.S.A. : 49 110.

158
Tableau 69. FONTE ET FERRO-ALLIAGES. - Table 69. PiIG-IRON AND FERRO-ALLOYS.Production en milliers de tonnes metriques. - Production in metric tons (000's omitted).
Note. - Ce tableau se refere autant que possible a la production Note. - This table covers as far as possible the total productiontotale de fonte et de ferro-alliages (spiegel, ferro-manganese, ferro- of pig-iron and ferro-alloys (spiegeleisen, ferro-manganese, ferro-silicium, ferro-tungstene, ferro-vanadium, ferro-chrome, ferro-molyb- silicon, ferro-tungsten, ferro-vanadium, ferro-chrome, ferro-dene, etc.). Plus de 80 % de la production totale est employe pour la molybdenum, etc.). Over 80 % of the total output is utilisedfabrication de l'acier; le reste est transform6 en produits de fonderie, for steel-making, the rest being converted into foundry products,en pieces de forge, en fers finis (profiles, etc.) et en fer puddle. Les forgings, finished iron (shapes, etc.) and wrought (puddled) iron.totaux ne comprennent pas le Chili (1943: * 14 milliers de tonnes) Totals do not include Chile (1943: * 14,000 metric tons) andet la Turquie (1943: * 55 milliers de tonnes). Turkey (1943: * 55,000 metric tons).
PAYS 1934 1935 1936 1937 1938 1939 1940 1941 1942 * 1943 COUNTBRY
AFRIQUE AFRICA(Union (Union of
Sud-Africaine) 130 173 202 276 294 300 304 315 365 487 South Africa),
AMtRIQUE DU NORD 16 840 22 383 32 294 38 720 20 242 33 211 44 322 52 997 57 232 58 718 NORTH AMERICA.
Canada . . . . . 442 667 767 997 774 845 1 323 1 572 1 981 +1 774 Canada.Etats-Unis . . . . 16398 21 716 31 527 37723 19468 32366 42 999 51 425 55 251 456 944 United States.
AMtRIQUE CENTRALE CARIBBEAN
(Mexique) . ... . 66 64 88 90 105 95 92 85 127 4193 (Mexico).
AMJIRIQUE DU SUD SOUTH AMERICA(Br6sil)...... 59 64 78 98 122 160 186 209 214 249 (Brazil).
ASIE (sans I'U.R.S.S.) 3 956 *4 450 *4 650 *5 350 . . . . . . AsA (excl. U.S.S.R.).Chine : sans la China: excluding
Mandchourie. 156 . . 107 . Manchuria.Mandchourie. 476 608 647 762 .. * 736 * 1380 . . Manchuria.
Core ...... 211 211 217 168 Korea.Inde (brit.) . . . 1 341 1 490 1 568 1 655 1 596 1 785 2015 * 2 100 *2 000 * 2000 India.Japon ...... 1 772 1 965 2 072 '*2 635 . . . . Japan.
U.R.S.S. ...... 10 428 12 489 14 395 14 487 14 600 15 240 14 950 . . . U.S.S.R.
EUROPE (s. I'U.R.S.S.) 30 962 33 816 39 099 44 353 40 816 . . . . . EUROPE (ex. U.S.S.R.).
Allemagne . . . 8717) Germany.Sarre .... . 1 826 12 846 15 302 15 960 18595 . . . . . Sar.
Autriche ..... 133 193 248 388 Austria.Belgique .... . 2 953 3 030 3 161 3 804 2 426 3-059 1 790 1 422 1 269 +1 631 Belgium.Espagne ..... 372 349 235 141 443 482 585 541 545 596 Spain.Finlande ..... 8 11 13 24 36 34 2 26 " 22 29 ... Finland.France . . . . . . 6 142 5 790 6 230 7 927 6073 *7 441 . . . 410 France.Hongrie .. ... 140 186 306 358 335 409 427 . . . Hungary.Italie. ...... 582 704 816 874 930 1 101 . . . . Italy.Luxembourg . . . 2 000 1 872 1 987 2 512 1 551 1 778 . . Luxemburg.Norv6ge ..... 127 131 167 181 174 191 . . Norway.Pays-Bas a) . .. 262 256 290 299 276 272 . . . Netherlands a).Pologne . . . 382 394 586 720 968 Poland.Roumanie . .... 62 82 97 127 133 119 122 ... 160 175 Roumania.Royaume-Uni ... 6 065 6 527 7 845 8 629 6 870 8 108 8 337 7 511 7 726 7 302 United Kingdom.Su6de ...... 1 558 613 632 693 714 691 787 749 771 t* 820 Sweden.Tch6coslovaquie .. 600 811 1 140 1 675 1 234 3 39 3 40 42 ... ... Czechoslovakia.Yougoslavie. ... 33 21 44 41 58 61 84 . . Yugoslavia.
dont ·Croatie ... . .5 5 566 80 51 ... ... of which "Croatia ".
OClANIE . . . . . . 496 715 796 928 982 1 160 1 267 1 561 ... ... OCEANIA.
Australie b). . . . 495' 710 796 928 982 1 160 1 267 1 561 1 633 1 462 Australia b).Nouvelle-Z6lande . 1 5 - - ... ... New Zealand.
TOTAL ....... 62 940 *74 150 * 91 600 *104 300 * 82 550 *102 000 . . . . TOTAL.
* Estimation ou chiffre provisoire. * Estimate or provisional figure.a) Douze mois finissant le 31.III de l'ann&e suivante. a) Twelve months ending 31.111 of following year.b) Douze mois finissant le 30.VI. b) Twelve months ending 30.VI.1 Allemagne, 1938 : non compris les territoires sudetes. 1 Germany, 1938: excluding Sudetenland.
Finlande, 1939-1941 : non compris les territoires cedes en 2 Finland, 1939-1941 : excluding territories ceded in 1940 to1940 a I'U.R.S.S. the U.S.S.R.
3Tchecoslovaquie, 1939-1941 : ,Slovaquie,. Czechoslovakia, 1939-1941 : "Slovakia".4Mexique, 1943 : y compris acier. 4Mexico, 1943 : including steel.
France, 1943 : non compris 1'Alsace-Lorraine (chiffre corres- 5 France, 1943 : not including Alsace-Lorraine (correspondingpondant pour 1938: 3.780). figure for 1938: 3,780).
* 1944, Canada : 1 845 ; Etats-Unis - U.S.A. : * 57 200 ; Belgique - Belgium ; 713 ; Suede - Sweden : * 870.

- 159 -
Tableau 70. ACIER (Lingots et moulages).Table 70. STEEL (Ingots and Castings).
Production en milliers de tonnes metriques. - Production in metric tons (000*s omitted).
Note. - Ce tableau se r6fere autant que possible A la production Note. - This table covers as far as possible the total productiontotale d'acier brut - lingots ou moulages de premiere fusion - of crude steel, ingots and direct castings, whether obtained fromprovenant de la fonte ou de la ferraille. On a partout exclu le pig-iron or scrap. It excludes throughout wrought, or puddled,fer puddle qui, dans certaines statistiques nationales, est assimile iron, which in some national statistics is grouped with crude steel.A l'acier brut.
PAYS 1934 1935 1936 1937 1938 1939 1940 1941 1942 '1943 COUNTRY
AFRIQUE AFRICA
(Union Sud-Afric.). 11 188 248 284 300 314 . . . (Union of S. Africa).
AMI~RIQUE DU NORD. 27 243 35 597 49 668 52 805 29 979 49 304 62 810 77 610 80 868 83 316 NORTH AMERICA.
Canada .. ... 770 957 1 134 1 425 1 174 1 407 2 045 2 460 2 821 *2 725 Canada.Etats-Unis . .. . 26 473 34 640 48 534 51 380 28 805 47 897 60 76575 150 78 047 +80591 United States.
AM3zRIQUE CENTRALE CARIBBEAN
(Mexique) .... 119 129 13'6 . 74 77 95 95 95 5 193 (Mexico).
AMtRIQUE DU SUD SOUTH AMERICA
(Br6sil). . . .. 62 64 74 76 92 114 141 155 160 184 (Brazil).
AsIE ASIA(sans I'U.R.S.S.).. 4 764 *5 860 *6 580 *7 200 . . . . (excl. U.S.S.R.).
Chine sans Mandch. 50 .. . .. China: excl. Manch.Mandchourie. 137 344 427 . . . * 530 . . Manchuria.
Cor6e....... 60 97 87 . . . . Korea.Inde (brit.) . ... 810 876 880 910 952 1 035 *1 200*1 350 '1 500 *1 600 India.Japon ... 3 844 4 703 5223 15 811 . . . . . Japan.
U.R.S.S . . . . . 9 693 12 600 16 244 17 730 18 000 18 796 19 100 *21 000 . U.S.S.R.
EUROPE EUROPE(sans I'U.R.S.S.).. 39 734 44 278 50 017 55 749 52 000 . . . . (excl. U.S.S.R.).
Allemagne . . I .11696 Germany.Sarre. . 1944 16 144 18 756 19 356 223 208 . . . . . Saar.
Autriche . . . 313 369 424 6571 Austria.Belgique ... .. 2 944 3 023 3 168 3 863 2 279 3 104 1 894 1 624 1 380 *1 670 Belgium.Espagne . .. .. 647 595 373 167 574 584 695 574 601 654 Spain.Finlande . .. 38 45 42 48 77 377 3 77 3 * 60 * 80 ... Finland.France ..... 6 155 6 255 6686 7 893 6 137 *7 882 . . . 2340 France.Hongrie ..... 315 446 553 665 648 733 751 . . . Hungary.Italie. . ..... 1832 2 212 2 026 2 099 2 307 4 2 321 . . . Italy.Lettonie ..... 2 2 3 3 3 3 . . . Latvia.Luxembourg . . 1 932 1 837 1 981 2 510 1 437 1 829 1315 . . . Luxemburg.Pologne. . .. 856 946 1 149 1 467 1 542 . Poland.Roumanie ... . 175 213 220 239 276 268 261 ... * 295 350 Roumania.Royaume-Uni . . 8992 10 017 11 974 13 192 10 565 13 433 13 183 12 510 12 969 13 240 United Kingdom.Suede ...... 862 896 977 1 106 972 1 152 1 145 1 156 1 234 ... Sweden.Tchlcoslovaquie · 940 1 178 1560 2 315 1 761 . . . . . Czechoslovakia.Yougoslavie . .. 91 100 125 169 220 ... .... Yugoslavia.
OCAANIE OCEANIA(Australie) a) . . . 527 708 834 1 097 1 210 1 224 1 345 1 712 1 806 1 735 (Australia). a)
TOTAL ....... 82 150 *99 420 *123 800 135 100 * 109 000* 136 000 . . . TOTAL.
SOURCES: Statistiques nationales officielles. - National official statistics. Imperial Institute (London). U.S. Bureau of Mines.
* Estimation ou chiffre provisoire. a) 12 mois finissant le 30.VI. * Estimate or provisional figure. a) 12 months ending 30.VI.L Japon, 1937 : y compris la Coree. 1 Japan 1937: including Korea.' Allemagne, 1938 : non compris les territoires sudktes. 2 Germany, 1938 : excluding Sudetenland.3Finlande, 1939, 1940, 1941 : non compris les territoires cedes 3Finland, 1939, 1940, 1941 : excluding territories ceded in
en 1940 h l'U.R.S.S. 1940 to the U.S.S.R.4 Italie, 1939 : y compris le fer puddle ; chiffre correspondant 4 Italy, 1939: including puddled iron; corresponding figure
pour 1938 : 2.377. for 1938: 2,377.5 Mexique, 1943 : y compris fonte. Mexico, 1943: including pig-iron.GFrance, 1943 : non compris l'Alsace-Lorraine (chiffre corres- 6 France, 1943 : not including Alsace-Lorraine (corresponding
pondant pour 1938 : 4.090). figure for 1938 : 4,090).+ 1944, Canada : 2 745 ; Etats-Unis - U.S.A. : 81 262 ; Belgique - Belgium : 631.

160 -
Tableau 71. MINERAI DE CUIVRE (Contenu en metal). - Table 71. COPPER ORE (Metal Content).Production en milliers de tonnes metriques. - Production in metric tons (000's omitted).
Note. - Ce tableau se refere au contenu en cuivre (Cu) des mi- Note. - This table refers to the copper (Cu) content of coppernerais de cuivre extraits (y compris les minerais mixtes). Les chal- ores (including mixed ores) mined. Chalcopyrites (CuFeSs) andcopyrites (FeCuS 2) et la cuprite (Cu20) sont parmi les principaux cuprite (CugO) are among the principal copper ores.minerais de cuivre.
Les donnees du tableau representent, soit le contenu en cuivre The figures given in the table are based either on the analysisd'apr&s l'analyse des minerals, soit la quantite de cuivre effective- of the ores or else on the amount of copper actually recoveredment obtenue des minerals. from the ores.
PAYS 1934 1935 1936 1937 1938 1939 1940 1941 * 1942 *1943 COUNTRY
AFRIQUE ...... 278.2 289.9 280.3 424.0* 400.0 ... . . .. AFRICA.Afrique-Equat. fr... - —- . . . . . French Equat. Africa.Alg6rie ... . 0.1 - 0.2 0.4 ... 0.4 Algeria.Congo belge 1 . . . . 110.1 107.8 97.5 150.6 123.9 122.6 *150 162 166 157 Belgian Congo.1Rhod6sie du Nord. . 160.1 171.4 173.5 249.8 254.9 ... . . . . Northern Rhodesia.Sud-Ouest Africain a) - - - 11.8 8.9 8.7 ... ...... . South West Africa. a)Union Sud-Africaine 7.9 10.7 9.1 11.4 11.3 10.4 13.6 . . . Union of S. Africa.
AMtRIQUE DU NORD. . 385.2 538.3 753.8 1 012.71 773.2 947.2 1103.4 1 167.7 1 259.3 1 256.2 NORTH AMERICA.Canada . ..... 165.5 190.1 1 1.0 240.4 259.1 276.2 297.4 291.8 273.8 *260.9 Canada.Etats-Unis ... . 215.4 345.2 557.5 763.8 506.0 660.7 796.6 869.2 979.8 t989.6 United States.Terre-Neuve . . . . 4.3 3.0 5.3 8.5 8.1 10.3 9.4 6.7 5.7 5.7 Newfoundland.
AM]RIQUE CENTRALE . 50.2 45.1 41.3 58.6 55.3 54.7 48.1 58.5 ...... CARIBBEAN.Cuba. ....... 5.8 5.7 11.6 12.5 13.4 10.3 10.5 9.8 *13 *7 Cuba.Mexique ....... 44.4 39.4 29.7 46.1 41.9 44.4 37.6 48.7 . . Mexico.
AM]RIQUE DU SUD . 286.2 298.7 292.8 452.7 391.9 380.7 415.1 516.3 529.8 541.8 SOUTH AMERICA.Bolivie (E.) . . . 1.8 1.9 3.2 3.7 2.9 4.1 6.7 7.3 6.4 6.0 Bolivia. (E.)Chili. ....... '256.7 267.1 256.2 413.3 351.5 341.0 363.0 468.7 484.4 497.2 Chile.Equateur. .. . - - - - - - 1.4 3.5 3.7 5.2 Ecuador.Perou ....... 27.7 29.7 33.4 35.7 37.5 35.6 44.0 36.8 35.3 33.4 Peru.
ASIE (sans I'U.R.S.S.)* 91.1 101.0 109.7 125.0 130.0 . . . . . ASIA (excl. U.S.S.R.).*Chypre. .... . * 4.1 12.4 16.6 27.5 29.8 24.4 ... ... ... Cyprus.Cor6e .1.4 2.2 3.6 . . . . . . . Korea.Formose ... . * 5.0 * 4.0 * 4.0 . Formosa.Inde (brit.) * . . 13.6 13.1 11.7 7.2 5.6 . . . . . India.*
S Birmanie . (5.3) (4.3) (4.1) 3.8 3.6 *3.4 . . . . Burma.*Japon. ... 67.0 69.3 *73.8 *75.9 *77.0. *77.0 *72.6 . . . Japan.Philippines . ... - - - 2.0 3.5 7.5 9.3 *99 . . Philippines.
U.R.S.S . ....... 44.1 63.2 83.0 92.5 * 98.0 *107.0 . . . U.S.S.R.
EUROPE (sans U.R.S.S.)* 146.0 144.0 143.0 150.0 158.0 155.0 . . .EUROPE (ex. U.S.S.R.).*Allemagne .... . 28.0 29.6 29.4 30.4*30.0 * 30 * 8 Germany.Autriche...0.1 O.1 * Austria.Espagne* ..... 33 30 26 28 30 20 10 ... ... ... Spain.*Finlande . .... 10.6 14.4 13.9 14.3 14.1 2 15.0 2 17.2 ... .. ... Finland.Italie ....... 0.4 0.4 0.6 1.1 * 1.0 . . . Italy.Norvoge ..... . 21.1 20.5 22.6 20.7 21.6 20.4 . . . Norway.Sude ....... 5.1 6.4 8.1 7.2 9.3 9.6 *10.5 . . . Sweden.Tch6coslovaquie. ., 0.2 0.2 0.3 0.7 . . . . . Czechoslovakia.Turquie a. . .-.. . - - - 0.6 2.2 6.7 8.7 10.5 8.3 9.7 Turkey. 3
Yougoslavie . . 46.0 41.0 41.0 45.0 47.0 48.0 47.0 . . . Yugoslavia.Autres pays4.... 1.0 1.3 1.1 1.8 * 2.0 ... . . Other countries.'
OctANIE (Australie) . 12.2 17.3 18.9 19.4 19.8 *21.5 *20.5 *22.0 *22.0 ... OCEANIA (Australia).
TOTAL * .1......1293 1497 1723 2335 2026 2200 . . . . TOTAL.*
SOURCES: Statistiques nationales officielles. - National official statistics. Imperial Institute (London). U.S. Bureau of Mines.American Bureau of Metal Statistics (New York).
* Estimation ou chiffre provisoire. (E.) Exportation. * Estimate or provisional figure. (E.) Exports.a) Douze mois finissant le 31.11I de l'annie suivante. a) Twelve months ending 31.111 of the following year.1 Congo: production de fonderie. 1 Congo: smelter production.2 Finlande, 1939, -1940: sans les territoires cedes en 1940. 2 Finland, 1939, 1940: excluding territories ceded in 1940.3 Turquie : production de fonderie. Production de minerai brut: 3 Turkey : smelter production. Crude ore production : 1937, 21.2
1937, 21,2 milliers de tonnes ; 1938, 51,6 ; 1939, 74,1 ; 1940, 54,4; thousand metric tons; 1938, 51.6; 1939, 74.1; 1940, 54.4;1941, 31. 1941, 31.
4Autres pays : Bulgarie, France, Grece, Hongrie, Portugal, 4 Other countries: Bulgaria, France, Greece, Hungary, Portugal,Roumanie et Royaume-Uni. Roumania and United Kingdom.
* 1944, Canada : 248.5 ; Etats-Unis- U.S.A.: 881.8.

- 161
Tableau 72, CUIVRE. - Table 72. COPPER.Production de fonderie (en milliers de tonnes metriques). - Smelter Production in metric tons (000's omitted).
Note. - Ce tableau se re6fre au cuivre neuf. La production mon- Note. - This table refers to primary copper only. World produc.diale du cuivre recup&re du vieux metal n'est pas connue ; quelques tion of secondary copper (i.e., derived from scrap) is not known;series y relatives figurent cependant au tableau a titre d'indication. several series are, however, shown in the table as an indication.
PAYS 1934 1935 1936 1937 1938 1939 1940 1941 *1942 * 1943 COUTJBRY
AFRIQUE ...... 258.5 265.2 252.1 373.2 351.2 348.0 *395 . . . AFRICA.
Congo beige. . . . 110.1 107.8 97.5 150.6 123.9 122.6 *150 162 166 157 Belgian Congo.Rhoddsie du Nord. 140.1 145.8 144.6 211.5 216.4 215.1 *231.3 . . . Northern Rhodesia.Union Sud-Africaine 8.3 11.6 10.0 11.1 10.9 10.3 13.6 18.6 21.4 22.8 Union of S. Africa.
AM9RIQUE DU NORD. 403.0 554.1 766.01I 030.3 786.5 927.7 1 178.7 1 269.8 1 356.1 1 336.9 NORTH AMERICA.Canada . .... 151.8 175.5 173.4 210.0 215.7 229.4 256.3 254.5 244.6 233.0 Canada.Etats-Unis . . .. 251.2 378.6 592.6 820.3 570.8 698.3 922.4 1 015.3 1111.5+1103.9 United States.
r6cup&r6t. (342.4) (407.2) (439.6) (482.7) (326.4) (453.8) (482.7) (659.0) (841.6) (985.2) , secondary.f
AM]RIQUE CENTRALE CARIBBEAN(Mexique). ... 43.7 38.2 27.8 43.7 40.6 41.2 33.3 41.7 46 39 (Mexico).
AMRIQUE DU SUD . 274.4 288.4 277.3 430.6 373.2 360.5 381.1 484.3 507.2 516.7 SOUTH AMERICA.Chili ...... . 247.0 259.2 244.7 396.4 337.5 326.4 347.4 456.0 477.7 +488.5 Chile.P6rou ...... 27.4 29.2 32.6 34.2 35.7 34.1 33.7 28.3 29.5 28.2 Peru.
AsIE (sansl'U.R.S.S.)* 77.6 83 92 102 116 120 130 . .. AsIA (excl. U.S.S.R.)*Chine . .... 0.5 . . . 0.2 . . . China.Cor6e....... . 4 2.2 3.6 5.1 . . . . . Korea.Formose . .. . 2.3 2.4 2.2 2.6 . . . . . . Formosa.Inde (brit.) .. . 6.4 7.0 7.3 6.9 5.4 6.8 6.9 . . . India.Japon ...... 67.0 70.9 78.0 87.6 *102.0 *104.0 *115.0 . . . Japan.
U.R.S.S ....... I 44.1 63.2 *83.0 92.5 83.7 *107.0 . . U.S.S.R.recup6rt . . (.) (.) () (.) (19.6) (.) (.) () () () » secondary. t
EUROPE (sans l'.R.S.S.) * 200 220 207 245 250. 235 . - . . EUROPE (excl. U.S.S.R.)*Allemagne . . .. 53.3 57.8 61.4 65.4 Germany.Autriche . .. .. 0.6 1.3 1.8 2.1 Austria.Belgique. .. 1.0 81.7 58.8 90.3 81.5 65.9 28.7 15.8 17.0 ... Belgium.'Espagnes: noir et blister a) 10.0 10.2 8.6 6.1 5.4 4.3 7.6 9.3 Spain a
3: black and blister
6lectrolytiquet a) (7.2) (1.6) (0.4) (.) (.) (4.3) (4.0) (4.6) (7.3) (10.4) eletrolytic t.Finlande .... - - 6.6 10.6 12.0 413.5 410.9 48.8 13.3 ... Finland.France ...... 1.3 0.6 1.1 1.0 1.8 . . . . . France.Italie. .... . 0.5 0.4 0.4 1.5 3.0 2.6 . . . . Italy.
rcOuprt . . (0.2) (8.0) (16.0) (0.3) (0.4) (.) (.) (.) (.) (.) econdy.Norvge ..... 8.0 8.4 8.4 8.3 10.5 10.5 *7.3 . . Norway.Roumanie . . . 0.2 0.2 0.4 0.6 0.6 0.7 0.9 0.1 . . Roumania.Royaume-Uni* . 11.4 12.6 9.4 7.5 7.2 *4.0 *4.5 . . United Kingdom.*Su6de. . .
. .. 7.9 8.4 9.5 9.1 10.7 11.1 12.5 *18.0 . . Sweden. 2
. r6cuprt. . . · (0.3) (0.4) (0.7) (1.0) (0.6) (0.8) (0.4) (...) () () secondary.t
Tch6coslovaquies . 0.6 0.9 1.1 2.0 ... "1.0 62.3 62.3 ... ... Czechoslovakia. "Turquie. . .. .. -— -— 0.6 2.2 6.7 8.7 10.5 8.3 9.7 Turkey.Yougoslavie.. 44.4 39.0 39.4 39.4 42.0 41.7 43.0 . .. Yugoslavia.
OCAANIE (Australie) 2. 8.1 11.3 13.5 17.7 17.4 c) 22.9 c) 23.3 c) 35.8 c) 29.5 c) 29.9 OCEANIA (Australia). 2
TOTAL ........ 1 310 *1 525 *1'720 *2 335 *2020 *2 165 . . . . TOTAL.
Prix en francs-or pour I tonne mtlrique: - Price in gold francs per I metric ton:NEW-YORK. Moy. 574 586 642 894 678 740 762 796 795 795 Av. { NEW YORK61ectrolytique XII 596 613 731 677 749 828 796 795 795 795 XII. electrolytic.LONDRES . . I Moy. 515 530 645 900 678 661 . . . Av. { LONDON61ectrolytique I XII 470 591 755 672 700 b)620 . . XII. electrolytic.
* Estimation ou chiffre provisoire. t Chiffres non comp. dans * Estimate or provisional figure. t Figures not included in theles totaux. a) 1933. b) 1-16.XII. c) Douze mois finissant le 30.VI. totals. a) 1933. b) 1-16.XII. c) Twelve months ending 30.VI.
Chine, 1938 : exportations de lingots et plaques. China, 1938: exports of ingots and slabs.Belgique : cuivre noir; Suede, Australie : cuivre raffine. 2 Belgium : black copper; Sweden, Australia: refined copper.
3Espagne jusqu'en 1939, blister seulement. Une' partie du 3 Spain : up to 1939, blister only. Since part of the electro-cuivre electrolytique provient du cuivre noir et blister; il ne faut lytic copper is made out of black and blister copper, the twodonc pas additionner les deux rubriques. headings should not be added.
Finlande, 1939, 1940, 1941 : non compris les territoires cedes. 4Finland, 1939, 1940, 1941 : excluding ceded territories.Roumanie, 1941 : non compris la Transylvanie du Nord. "Roumania, 1941: excluding Northern Transylvania.
6 Tchcoslov.: cuivre 6lectrolytique, raffine et noir ; non comp. Czechoslovakia : electrolytic, refined and black copper, excl.cuivre precipite. Depuis 1939, ,Slovaquie ,; cuivre electrolytique. precipitate of copper. Since 1939, "Slovakia"; electrolytic copper.
* 1944, Etats-Unis - U.S.A. : * 975 ; Chili - Chile: * 490.
11

- 162 -
Tableau 73. MINERAI DE PLOMB (Contenu en metal). - Table 73. LEAD ORE (Metal Content).Production en milliers de tonnes mitriques. - Production in metric tons (000's omitted).
Note. - Ce tableau se refere au contenu en plomb (Pb) des mine- Note. - This table refers to the lead (Pb) content of lead oresrais de plomb extraits (y compris les minerals mixtes). La gal~ne (including mixed ores) mined. Galena (PbS) is the principal lead ore.(PbS) est le principal mineral de plomb. Les donnees du tableau The figures given in the table are based either on the analysisrepresentent soit le contenu en plomb d'apres l'analyse des minerais, of the ores or else on the amount of lead actually recovered fromsoit la quantite de plomb effectivement obtenue des minerais. the ores.
PAYS 1934 1935 1936 1937 1938 1939 1940 1941 * 1942 - * 1943 COUNTRY
AFRIQUE ....... 12.7 28.0 53.3 69.8 *70.5 . . . AFRICA.
Alg6rie. ...... 0.2 0.3 2.1 5.1 5.4 *4.0 *2.6 . . Algeria.Congo beige . . . - - - 4.8 4.6 5.9 7.8 . . . Belgian Congo.Maroc (fr.) ..... 0.1 0.1 7.6 16.1 20.3 25.3 22.1 10.0 6.5 7.0 French Morocco.Nigeria . ...... 0.4 0.7 0.8 0.6 0.3 ... .. .. ... ... Nigeria.Rhod6sie du Nord .. 6.0 7.2 4.0 3.0 2.8 . . . . Northern Rhodesia.Sud-Ouest Africain a) - - - 10.3 18.0 15.0 ... . . . South West Africa. a)Tunisie. . ... . 5.2 5.6 10.3 12.3 18.1 17.0 . . . . Tunis.Union Sud-Africaine. 0.1 - - 0.1 0.1 0.1 0.2 .. Union of South Africa,
AMJIRIQUE DU NORD . 456.5 489.8 543.5 637.8 557.2 579.3 658.6 657.4 707.9 642.5 NORTH AMERICA.Canada. ...... 157.1 153.8 '173.8 186.9 190.0 176.3 214.0 208.7 232.3 :201.4 Canada.Etats-Unis .... . 261.6 300.4 338.3 421.7 335.4 375.6 414.9 418.6 450.2 +411.2 United States.Terre-Neuve . ... 37.8 35.6 31.4 29.2 31.8 27.4 29.7 30.1 25.4 29.9 Newfoundland.
AM3RIQUE CENTRALE CARIBBEAN.
(Mexique) . . . . . 166.5 184.2 215.7 218.1 282.4 219.5 196.3 155.3 . . (Mexico).
AMtRIQUE DU SUD . . 23.4 41.3 51.7 75.9 95.8 88.9 92.0 89.8 83.7 ... SOUTH AMERICA.Argentine . .... 2.8 2.5 6.8 15.0 23.7 28.3 29.9 24.1 26.3 ... Argentine.Bolivie (E.) . ... 11.4 10.2 14.5 18.3 13.2 14.1 11.7 15.7 12.5 11.4 Bolivia. (E.)Chili. .. .... . 0.1 0.1 0.2 0.6 0.9 0.2 - - - ... Chile.P6rou ....... 9.1 28.5 30.2 42.0 58.0 46.3 50.4 50.0 44.9 47.8 Peru.
AsIE (sans l'U.R.S.S.) * 103 104 108 113 115 . . . . ASIA (excl. U.S.S.R.).*Birmanie ...... 90.2 90.8 92.4 92.7 89.0 . . . . . Burma.Chine * ...... 4.0 4.1 4.1 . . 3.4 . . . . China.*Cor6e ....... 1.8 1.7 2.7 5.9 *10.0 *10.0 . . . Korea.Japon ....... 7.0 7.4 8.9 10.2 *12.0 *12.0 . . . . Japan.
U.R,S.S. * ...... 27.2 36.6 50.8 55.0 69.0 75.0 *100 . · . U.S.S.R.*
EUROPE (sans U.R.S.S.)* 312 297 283 295 318 . . . . . EUROPE (ex. U.S.S.R.)*Allemagne . . .n 58.9 60.7 68.6 78.9 ( Germany.Autriche . ..... 5.3 5.6 5.9 8.7 Austria.Bulgarie * .... 0.5 0.5 0.1 0.2 0.3 ... . . . . Bulgaria.*Espagne ... .. . 63.1 66.2 *42 *27 *32 *28 *40 30 30 35 Spain.Finlande ...... 0.6 0.6 0.4 0.4 0.2 '0.1 10.2 ... ... ... Finland.France... .... . 0.9 3.3 3.2 4.6 4.2 . . . . . France.Gr/ce ....... 10.5 2.2 6.1 8.5 5.6 *3.1 ... . . . Greece.Italic ....... 19.1 24.8 *31 *36 *42 *46 . . . Italy.Norv6ge. .. .... 0.5 0.3 0.4 0.4 0.1 - . . . . Norway.Pologne ...... 5.9 4.3 4.1 6.2 5.3 . . . . . Poland.Portugal . .... . - - - 1.3 - - - Portugal.Roumanie2. . ... 4.3 5.0 6.1 7.4 6.4 5.7 . . . . Roumania.2Royaume-Uni. . 54.7 41.9 31.0 26.8 30.2 . . . United Kingdom.Sude ....... 8.2 8.9 9.7 9.3 8.6 8.7 . . . Sweden.Tch6coslovaquie. .. 3.5 3.8 3.9 3.9 * 4.0 . . . . . Czechoslovakia.Turquie . .. . . . 5.6 3.9 4.7 4.8 4.9 6.4 ... ... ... ... Turkey.Yougoslavie . ... 70.2 65.0 66.0 71.0 77.7 69.0 68.8 . . . Yugoslavia.
OCIIANIE (Australie). . 233.5 225.4 227.3 250.0 278.8 252.4 . . . . OCEANIA (Australia).
TOTAL * ....... 1 340 1 391 1508 1 698 1 786 . . . . . TOTAL.*
SOURCES: Statistiques nationales officielles. - National official statistics. U. S. Bureau of Mines. Imperial Institute (London).American Bureau of Metal Statistics (New York).
* Estimation ou chiffre provisoire. (E.) Exportation. * Estimate or provisional figure. (E.) Exports.a) Douze mois finissant le 31.III de l'annee suivante. a) Twelve months ending 31.III of the following year.1 Finlande, 1939, 1940: non compris les territoires cedes en ' Finland, 1939, 1940: excluding territories ceded in 1940
1940 a I'U.R.S.S. to the U.S.S.R.'Roumanie: production de fonderie. 2 Roumania : smelter production.
* 1944, Canada : 136.6 ; Etats-Unis - U.S.A. : 372.0.

- 163 -
Tableau 74. PLOMB. - Table 74. LEAD.
Production de fonderie (en milliers de tonnes mitriques). - Smelter Production in metric tons (000's omitted).
Note. - Ce tableau se refere au plomb neuf. La production mon- Note. - This table refers to primary lead. World productiondiale du plomb recupere du vieux metal n'est pas connue; quel- of secondary lead (i.e., derived from scrap) is not known; a fewques series figurent cependant au tableau a titre d'indication. series are, however, given in the table as an indication.
PAYS 1934 1935 1936 1937 1938 1939 1940 1941 * 1942 *1943 CONTTBY
AFRIQUE ...... 27.5 25.6 21.8 26.8 27.4 27.9 . . . . AFRICA.Rhod6sie du Nord 0.2 0.2 0.3 0.6 0.3 0.2 . . Northern Rhodesia.Sud-Ouest Afr. a) - - - 1.4 3.2 4.3 0.7 . . S. West Africa. a)Tunisie . .. ... 27.3 25.4 21.5 24.8 23.9 23.4 . . . Tunis.
AMOIRIQUE DU NORD . 424.9 443.0 527.0 605.1 529.9 612.0 683.4 725.4 735.4 611.8 NORTH AMERICA.Canada . .. ... 142.6 148.6 164.9 181.2 181.8 172.9 199.7 207.4 221.2 t203.7 Canada.Etats-Unis'. . .. 282.3 294.4 362.1 423.9 348.1 439. 1 483.7 518.0 514.2 +408.1 United States.
r6cupr6 t . (189.1) (245.3) (238.5) (249.6) (204.0) (219.1) (236.2) (360.5) (293.0) (309.6) » secondary.t
AM1RIQUE CENTRALE(Mexique) .... . 162.2 174.1 203.1 201.2 212.3 169.1 172.3 127.8 · . CARIBBEAN (Mexico).
AMARIQUE DU SUD 7.0 10.6 19.4 28.2 39.2 34.7 44.4 51.2 58.7 65.2 SOUTH AMERICA.Argentine . ... 5.0 4.1 10,5 9.1 10.7 14.0 12.9 18.0 20.8 ... Argentine.P~rou ...... 2.0 6.5 8.9 19.1 28.5 20.7 31.5 33.2 37.9 43.2 Peru.
AsIE (sans 1'U.R.S.S.) 83.5 82.3 87.5 * 97.0* 105.4* 103.0 . . . AsIA (excl. U.S.S.R.).Birmanie . . .. 73.0 73.2 74.3 78.9 81.4 78.6 ' . . . . Burma.Chine ...... 1.7 - 1.6 *2.0 *2.0 2.0 . . . China.Cor6e..... ... 1.8 1.7 2.7 5.9 * 10.0 * 10.0 . . . . Korea.Japon ...... 7.0 7.4 8.9 10.2 * 12.0 * 12.0 . .. Japan.
U.R.S.S. ...... 27.2 36.8 50.8 55.0 * 69.0 * 75.0 . . . . U.S.S.R.
EUROPE (s. 'U.R.S.S.) 386.8 391.9 361.6 425.5* 450.1* 455.0 . . . EUROPE (ex.U.S.S.R.).Allemagne . . . 122.4 128.8 144.4 166.4\ , Germany.Autriche ..... 5.6 8.0 8.7 10.8 185.2 Austria.Belgique . .. 66.7 67.0 65. 1 84.8 88.0 96.2 30.8 8.9 16.2 ... Belgium. 2Espagne *. . . .. 72.1 71.4 41.1 31.3 31.8 26.0 46.0 43.0 38.5 34.1 Spain.*France ...... 31.1 14.6 15.1 38.2 42.2 . . .. France.Groce ...... 8.9 6.4 4.4 9.2 9.0 ... ... . . . Greece.Hongrie. -- 0.1 0.1 0. ... . . . Hungary.Italie ....... 41.9 36.2 36.8 39.5 44.0 38.8 . . . Italy.
r6cnp 6r6t. . (5.9) (8.1) (6.4) (7.2) (6.7) (.) ( .) (.) ( ( ) secondary.t
Norv6ge 0.3 0.6 0.2 0.2 0.3 0.3 . . . Norway.Pologne . ..... 10.4 18.8 15.0 17.6 18.6 . . . . . Poland.Portugal . .... 0.I - -- - 0.8 0.6 0.7 0.6 0.6 Portugal.Roumanie . ... 4.3 5.0 6.1 7.4 6.4 5.7 . . . Roumania.Royaume-Uni. . . 9.1 22.4 13.8 10.3 10.0 . . . . United Kingdom.Tch6coslovaquie .. 4.1 4.8 4.8 5.1 * 5.0 3 0.5 3 0.6 a 0.6 ... ... Czechoslovakia.Turquie .-.... — 0.3 0.3 0.6 0.9 * 0.4 ... 0.7 ... ... Turkey.Yougoslavie. .. . 9.8 7.6 5.8 4.0 8.6 10.7 32.9 . . . Yugoslavia.
OcJIANIE (Australie) 4. 199.2 221.4 196.1 232.2 226.1c) 236.8 )254.0]c)242. 5c)259. 1 c) 222.8 OCEANIA (Australia). 4
TOTAL ....... 1 318 1 386 1 467 *1670 *1 660 *1 715 . . . . TOTAL.
Prix enfrancs-or pour Price in gold francs1 tonne mdtrique : per 1 metric ton:NEW-YORXK moy. 263 276 319 407 320 341 349 391 437 439 Av. NE) YORK.
XII 245 305 375 329 327 371 371 395 439 439 XII.)LONDRES.. mpLOmb moy. 170 212 265 349 227 207 . . . Av. LONDONimplom . XII 156 251 380 241 215 b)207 XII for eL import' ' lead.
SOURCES: Statistiques nationales officielles. - National official statistics. Imperial Institute (London). American Bureau of MetalStatistics (New York). U.S. Bureau of Mines.
* Estimation ou chiffre provisoire. t Serie non comprise dans * Estimate or provisional figure. t Series not included in theIes totaux. totals.
a) Douze mois finissant le 31.111 de l'annee suivante. a) Twelve months ending 31.111 of the following year.b) 1-16.XII. c) Douze mois finissant le 30.VI. b) 1-16.XII. c) Twelve months ending 30.VI.1Etats-Unis: plomb raffine, non compris plomb antimonial. United States: refined primary lead, excluding antimonial lead.2 Belgique : Plombs marchands ». a Belgium : merchantable lead.
Tchecoslovaquie, 1939-1941 : « Slovaquie . Czechoslovakia, 1939-1941 :" Slovakia"4 Australie: y compris le contenu en plomb des lingots de * Australia : including the lead content of base bullion
plomb argentifer e-et aurifere exportes. exported.: 1944, Canada : 130.4; Etats-Unis - U.S.A.: * 400.

- 164 -
Tableau 75. MINERAI DE ZINC (Contenu en metal). - Table 75. ZINC ORE (Metal Content).
Production en milliers de tonnes m6triques. - Production in metric tons (000's omitted).
Note. - Ce tableau se refere au contenu en zinc (Zn) des minerais Note. - This table refers to the zinc (Zn) content of zinc oresde zinc extraits (y compris les minerals mixtes). La blende (ZnS) (including mixed ores) mined. Blende (ZnS) and calamine (ZnCOs)et la calamine (COSZn) sont les principaux minerais de zinc. Les are the principal zinc ores. The figures given in the table aredonnees du tableau representent soit le contenu en zinc d'apres based either on the analysis of the ores or else on the amountI'analyse des minerals, soit la quantite de zinc effectivement obtenue of zinc actually recovered from the ores.des minerals.
PAYS 1934 1935 1936 1937 1938 1939 1940 1941 *1942 * 1943 COUNTRY
AFRIQUE . . . ... . 22.6 30.5 32.0 44.5 26.3 28.5 . . . . AFRICA.
Afrique-Equat. franc. - - - 0.9 1.4 . . . French Eq. Africa.Alg6rie ...... 2.7 3.2 2.7 10.4 4.6 *2.8 *2.2 . . . Algeria.Congo beige . . .. 0.4 3.1 4.0 6.4 11.1 15.1 8.7 11.2 Belgian Congo.Maroc francais . . - - 1.2 9.7 3.2 2.7 2.3 0.7 0.7 0.5 French Morocco.Rhod6sie du Nord . 19.9 27.3 26.6 19.1 12.7 15.0 . . . Northern Rhodesia.Tunisie. ....... I — - 1.1 1.3 0.4 0.4 . . . . Tunis.
AMnRIQUE DU NORD . 621.6 687.5 737.7 800.4 708.6 768.6 860.3 975.2 1 010.9 1 012.4 NORTH AMERICA.Canada. ...... 135.4 145.4 151.1 168.0 17 3.0 179.0 192.3 232.4 263.2 *277.0 Canada.Etats-Unis ... .. 398.0 469.8 522.2 56'8.2 468.7 529.6 603.3 679.6 696.7 t675.1 United States.Terre-Neuve ... . . 88.2 72.3 64.4 64.2 66.9 60.0 64.7 63.2 51.0 60.3 Newfoundland.
AMIRIQUE CENTRALE CARIBBEAN
(Mexique) .... . 125.2 135.9 150.2 154.6 172.2 134.2 115.0 155.0 . 207 (Mexico).
AMtRIQUE DU SUD . 15.2 18.0 27.8 36.1 40.6 49.0 66.9 65.3 65.0 ... SOUTH AMERICA.Argentine . . . . - - 3.0 6.3 15.3 20.0 37.0 36.4 29.7 ... Argentine.Bolivie (E.) . . . . 9.6 8.3 13.6 11.5 10.7 7.8 12.2 6.1 10.9 21.1 Bolivia. (E.)P6rou . ...... 5.6 9.7 11.2 18.3 14,6 21.2 17.7 22.8 24.4 31.3 Peru.
AsIE (sans l'U.R.S.S.) * 85.9 88.1 90.0 88.5 84.0 . . . . . ASIA (excl. U.S.S.R.).*Birmanie . .. . 55.7 59.1 62.3 59.5 55.8 45.0 . . . . Burma.Chine * ...... 5.2 4.0 4.5 4.0 1.0 . . . . . China.*Indochine francaise . 5.0 5.0 5.2 5.0 5.2 5.9 6.9 *7.6 ... .... French Indo-China.Japon * ...-... 20.0 20.0 18.0 20.0 22.0 . . . . Japan.*
U.R.S.S. * ...... 27.2 45.7 66.0 70.0 80.0 90.0 95.0 . . . U.S.S.R.*
EUROPE (sans U.R.S.S.)* 378.9 407.1 443.7 477.3 540.0 . . . . . EuROPE(excl.U.S.S.R.).*Allemagne ... . . 131.7 140.9 156.5 165.6 )n20 i Germany.Autriche ... 2.6 2.6 3.2 3.0 2 .. ' Austria.Belgique * ..... 1.0 0.5 2.0 3.0 3.0 ... Belgium.*Espagne * . . . 31.7 33.3 37.0 21.0 31.0 33.0 31.0 30.0 28.0 29-0 Spain.*Finlande . ... I . 1.7 1.6 1.4 1.3 0.6 '5.1 17.0 ... ... ... Finland.France....... — - - -- 0.9 0.1 . . . . . France.Grace ... .. . 5.9 1.0 4.6 10.9 7.8 *5.3 ... . . Greece.Italie ....... 46.1 62.2 69.7 *80.0 *90 *103 . . . . Italy.Norvige ...... 7.3 6.7 7.7 8.8 7.7 5.8 . . . . Norway.Pologne ...... 55.0 53.0 55.0 72.0 *70.0 . . . . . Poland.Roumanie. I .. 3.6 4.1 4.2 6.3 4.0 3.7 . . . Roumania. Royaume-Uni. . . 0.5 1.2 4.3 7.7 11.7 . . . United Kingdom.Su6de ....... 29.1 31.7 34.3 36.0 34.6 34.0 *29.0 . . . Sweden.Tch6coslovaquie.. 1.0 1.6 1.4 2.0 . . . . Czechoslovakia.Turquie ...... 7.9 5.7 9.6 10.0 9.6 7.5 ... ... ... Turkey.Yougoslavie . . . . 53.8 61.0 52.8 48.8 41.7 ... ... Yugoslavia.
OCAANIE (Australie) . 139.0 150.9 175.2 206.7 223.3 233.7 ... 300.2 320.9 ... OCEANIA (Australia).
TOTAL *..... 416 1 564 1 723 1 878 1 875 . . . . . TOTAL.*
SOURCES: Statistiques nationales officielles. - National official statistics. U.S. Bureau of Mines. Imperial Institute (London)American Bureau of Metal Statistics (New York).
* Estimation ou chiffre provisoire. (E.) Exportation. * Estimate or provisional figure. (E.) Exports.Finlande, 1939, 1940 : non compris les territoires cedes en 1 Finland, 1939, 1940: excluding territories ceded in 1940 to
1940 a rU. R. S. S. the U.S.S.R.2 Roumanie: production de fonderie. 2 Roumania: smelter production.
* 1944, Canada : 254.5; Etats-Unis - U.S.A.: 649.4.
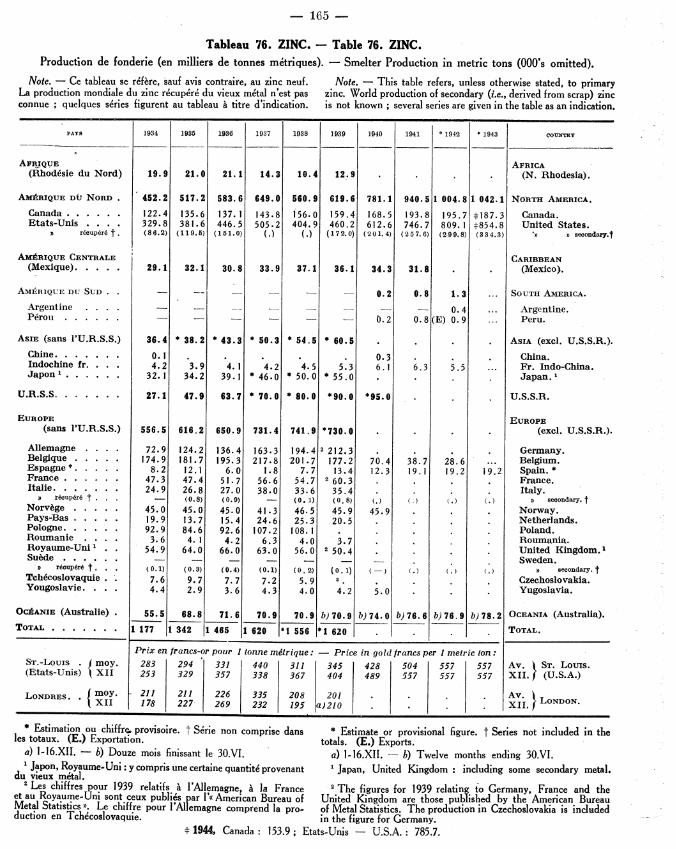
- 165 -
Tableau 76. ZINC. - Table 76. ZINC.Production de fonderie (en milliers de tonnes metriques). - Smelter Production in metric tons (000's omitted).
Note. - Ce tableau se refere, sauf avis contraire, au zinc neuf. Note. - This table refers, unless otherwise stated, to primaryLa production mondiale du zinc recupere du vieux m6tal n'est pas zinc. World production of secondary (i.e., derived from scrap) zincconnue; quelques series figurent au tableau a titre d'indication. is not known; several series are given in the table as an indication.
PAYS 1934 1935 1936 1937 1938 1939 1940 1941 * 1942 * 1943 OOUNTBY
AFRIQUE AFRICA(Rhod6sie du Nord) 19.9 21.0 21.1 14.3 10.4 12.9 . . . (N. Rhodesia).
AMItRIQUE Dti NORD. 452.2 517.2 583.6 649.0 560.9 619.6 781.1 940.51 004.81 042.1 NORTH AMERICA.
Canada. . . 122.4 135.6 137.1 143.8 156.0 159.4 168.5 193.8 195.7 *187.3 Canada.Etats-Unis . . .. 329.8 381.6 446.5 505.2 404.9 460.2 612.6 746.7 809.1 [854.8 United States.
r1cupr jt. (86.2) (119.6) (111.0) (.) (.) (172.0) (201.4) (257.6) (299.8) (334.3) •» secondary.t
AMItRIQUE CENTRALE CARIBBEAN(Mexique). .. 29.1 32.1 30.8 33.9 37.1 36.1 34.3 31.8 . . (Mexico).
AMEIRIQUE DU SUD . -- 0.2 0.8 1.3 ... SOUTH AMERICA.
.Argentine .... - -- -— — 0.4 ... Argentine.Perou . 0.2 0.8(E) 0.9 ... Peru.
AsIE (sans l'U.R.S.S.) 36.4 * 38.2 * 43.3 * 50.3 * 54.5 * 60.5 . . . . ASIA (excl. U.S.S.R.).
Chine. .... . .0 1 0.3 . . . China.Indochine fr. 4.2 3.9 4.1 4.2 4.5 5.3 6.1 6.3 5.5 ... Fr.Indo-China.Japon . . . . . . 32.1 34.2 39.1 *46.0 *50.0 *55.0 . . . . Japan."
U.R.S.S. .2..... 7.1 47.9 63. * 70.0 *80.0 *900 *95.0 . . . U.S.S.R.
EUROPE EUROPE(sans 'U.R.S.S.) 556.5 616.2 650.9 731.4 741.9 *730.0 . . . . (excl. U.S.S.R.).
Allemagne . . .. 72.9 124.2 136.4 163.3 194.4[2 212.3 . . . Germany.Belgique ..... 174.9 181.7 195.3 217.8 201.7 177.2 70.4 38.7 28.6 ... Belgium.Espagne*. . . . . 8.2 12.1 6.0 1.8 7.7 13.4 12.3 19.1 19.2 19.2 Spain.*France. . .. .. 47.3 47.4 51.7 56.6 54.7 260.3 . . . France.Italie. . .... 24.9 26.8 27. 0 38.0 33.6 35.4 . . . . Italy.
6cupr6 t. - (0.8) (0.9) - (0.1) (0.8) (.) ( (.) () secondary. t
Norvge .... 45.0 45.0 45.0 41.3 46.5 45.9 45.9 Norway.Pays-Bas . .. .. 19.9 13.7 15.4 24.6 25.3 20.5 . .Netherlands.Pologne. . .. .. 92.9 84.6 92.6 107.2 108.1 . . . . . Poland.Roumanie . . . 3.6 4.1 4.2 6.3 4.0 3.7 Roumania.Royaume-Uni .. 54.9 64.0 66.0 63.0 56.0 250.4 . . United Kingdom.1Sulde . - - - - - Sweden.
rtcnpur6 t. . . (0.1) (0.3) (0.4) (0.1) (0.2) (0.1) () ( ( ) secondary. tTchdcoslovaquie . 7.6 9. 7 7. 7 7.2 5.9 . . Czechoslovakia.Yougoslavie. 4.4 2.9 3.6 4.3 4.0 4.2 5.0 . . . Yugoslavia.
OC]ANIE (Australie) 55.5 68.8 71.6 70.9 70.9 b)70.9 b)74.0 b)76.6 b)76.9 b)78.2 OCEANIA (Australia).
TOTAL ....... 1177 1342 1465 1620 *1556 *1620 . . . . TOTAL.
Prix en francs-or pour I tonne mdtrique: - Price in gold francs per I metric ton:ST.-LouI . moy. 283 294 331 440 311 345 428 504 557 557 Av. ST. Louis.
les totaux. (E.) Exportation. totals. (E.) Exports.a) 1-16.XII. - b) Douze mois finissant le 30.VI. a) 1-16.XII. - b) Twelve months ending 30.VI.
Japon, Royaume-Uni :y compris une certaine quantite provenant Japan, United Kingdom: including some secondary metal.du vieux metal.
2 Les chiffres pour 1939 relatifs a 1'Allemagne, a la France The figures for 1939 relating to Germany, France and theet au Royaume-Uni sont ceux publics par l's American Bureau of United Kingdom are those published by the American BureauMetal Statistics o Le chiffre pour i'Allemagne comprend la pro- of Metal Statistics. The production in Czechoslovakia is includedduction en Tchefcoslovaquie. in the figure for Germany.
* 1944, Canada: 153.9; Etats-Unis - U.S.A.: 785.7.
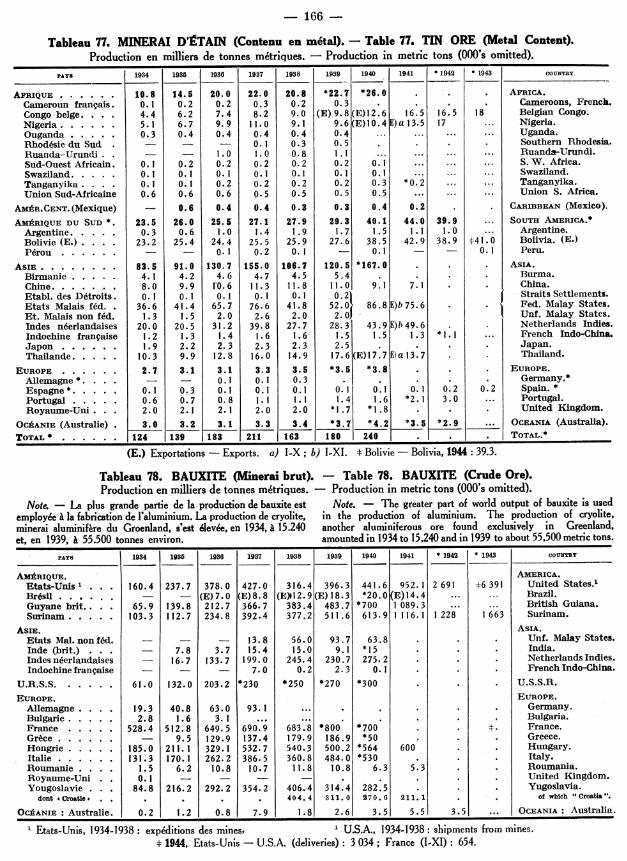
- 166 -
Tableau 77. MINERAI D'ETAIN (Contenu en metal). - Table 77. TIN ORE (Metal Content).Production en milliers de tonnes m6triques. - Production in metric tons (000's omitted).
PAYS 1934 1935 1936 1937 1938 1939 1940 1941 * 1942 * 1943 COUNTRY
AFRIQUE ...... 10.8 14.5 20.0 22.0 20.8 *22.7 *26.0 . . . AFRICA.
Cameroun frangais. 0.1 0.2 0.2 0.3 0.2 0.3 . . . . Cameroons, French.Congo beige. . . 4.4 6.2 7.4 8.2 9.0 (E)9.8(E)12.6 16.5 16.5 18 Belgian Congo.Nigeria . . . 5.1 6.7 9.9 11.0 9.1 9.6(E)10.4E) a 13.5 17 ... Nigeria.Ouganda . . . . . 0.3 0.4 0.4 0.4 0.4 0.4 ... ... ... ... Uganda.Rhod6sie du Sud . - - 0.1 0.3 0.5 . . . . Southern Rhodesia.Ruanda-Urundi.. - - 1.0 1.0 0.8 1.1 ... ... ... Ruanda-Urundi.Sud-Ouest Africain. 0.1 0.2 0.2 0.2 0.2 0.2 0.1 ... ... ... S.W. Africa.Swaziland. .... 0.1 0.1 0. 1 0.1 I 0.1 0.1 0.1 ... ... ... Swaziland.Tanganyika. . 0.1 0.1 0.2 0.2 0.2 0.2 0.3 *0.2 ... ... Tanganyika.Union Sud-Africaine 0.6 0.6 0.6 0.5 0.5 0.5 0.5 ... ... ... Union S. Africa.
AsmlR.CENT. (Mexique) - 0.6 0.4 0.4 0.3 0.3 0.4 0.2 . . CARIBBEAN (Mexico).
AMARIQUE DU SUD*. 23.5 26.0 25.5 27.1 27.9 29.3 40.1 44.0 39.9 ... SOUTH AMERICA.*
Argentine. 0.3 0.6 1.0 1.4 1.9 1.7 1.5 1.1 1.0 ... Argentine.Bolivie (E.) . . . 23.2 25.4 24.4 25.5 25.9 27.6 38.5 42.9 38.9 t41.0 Bolivia. (E.)PWrou.-..- .. - I I 0.1 0.2 0.1 - 0.1 - - 0.1 Peru.
ASIE. ........ 83.5 91.0 130.7 155.0 106.7 120.5 *167.0 . . . ASIA.
Birmanie ..... 4.1 4.2 4.6 4.7 4.5 5.4 . . . . Burma.
Chine ...... 8.0 9.9 1'0.6 11.3 11.8 11.0 9.1 7.1 . . China.Etabl. des nDtroits. 0.1 0.1 .1 .1 0.1 0.2 Straits Settlements.Etats Malais f6d.. 36.6 41.4 65.7 76.6 41.8 52.0- 86.8 E)h 75.6 . . Fed. Malay States.Et. Malais non f6d. 1.3 1.5 2.0 2.6 2.0 2.0) ' Unf. Malay States.Indes n6erlandaises 20.0 20.5 31.2 39.8 27.7 28.3 43.9 E)b 49.6 . . Netherlands Indies.Indochine franeaise 1.2 1.3 1.4 1.6 1.6 1.5 1.5 1.3 *1.1 I ... French Indo-China.Japon .1.9 2.2 2.3 2.3 2.3 2.5 . . . Japan.
Thailande . .... 10.3 9.9 12.8 16.0 14.9 17.6(E)17.7E)a 13.7 . Thailand.
EUROPE ...... 2.7 3.1 3.1 3.3 3.5 *3.5 *3.8 . . . EUROPE.
Allemagne * ...- - 0.1 0.1 0 .3 . . Germany.*
Espagne*. . .. 0.1 0.3 0.1 0.1 0.1 0.1 0.1 0. 1 0.2 0.2 Spain. *Portugal . . . . . 0.6 0.7 0.8 1.1 1.1 1.4 1.6 *2.1 3.0 ... Portugal.Royaume-Uni. . . 2.0 '2.1 2.1 2.0 2.0 *1.7 *1.8 . . . United Kingdom.
OCIANIE (Australie) . 3.0 3.2 3.1 3.3 3.4 *3.7 *4.2 *3.5 *2.9 ... OCEANIA (Australia).
TOTAL* . . . . . . 124 139 183 211 163 180 240 . . . TOTAL.*
(E.) Exportations - Exports. a) I-X; b) I-XI. * Bolivie - Bolivia, 1944 : 39.3.
Tableau 78. BAUXITE (Minerai brut). - Table 78. BAUXITE (Crude Ore).Production en milliers de tonnes metriques. - Production in metric tons (000's omitted).
Note. - La plus grande partie de la production de bauxite est Note. - The greater part of world output of bauxite is usedemployee & la fabrication de l'aluminium. La production de cryolite, in the production of aluminium. The production of cryolite,minerai aluminif~re du Groenland, s'est leve, en 1934, A 15.240 another aluminiferous ore found exclusively in Greenland,et, en 1939, A 55.500 tonnes environ. amounted in 1934 to 15,240 and in 1939 to about 55,500 metric tons.
PAYS 1934 1935 1936 1937 1938 1939 1940 1941 * 1942 * 1943 COUNTRY
AMBRIQUE. AMERICA.
Etats-Unis' . . . 160.4 237.7 378.0 427.0 316.4 396.3 441.6 952.1 2691 6 391 United States.'Br6sll ...... - - (E)7.0 (E)8.8 (E)X12.9(E)18.3 *20.0(E)14.4 ... ... Brazil.Guyane brit.. . 65.9 139.8 212.7 366.7 383.4 483.7 *700 1 089.3 ... ... British Guiana.Surinam . ... 103.3 112.7 234.8 392.4 377.2 511.6 613.9 1116.1 1 228 1663 Surinam.
AsIE. ASIA.Etats Mal. nonfed. - - - 13.8 56.0 93.7 63.8 . . . Unf. Malay States.Inde (brit.) . . . 7.8 3.7 15.4 15.0 9.1 *15 . . . India.Indes n6erlandaises - 16.7 133.7 .199.0 245.4 230.7 275.2 . . . Netherlands Indies.Indochine frangaise - - - 7.0 0.2 2.3 0.1 . . . French Indo-China.
U.R.S.S . .. . 61.0 132.0 203.2 *230 *250 *270 *300 . . . U.S.S.R.
EUROPE. EUROPE.Allemagne . . 19.3 40.8 63.0 93.1 ... . . . ' Germany.Bulgarie. .... 2.8 1.6 3. 1 ... .. Bulgaria.
France ... .. 528.4 512.8 649.5 690.9 683.8 *800 *700 . . . France.Grace . ..... . 9.5 129.9 137.4 179.9 186.9 *50 . . . Greece.Hongrie ..... 185.0 211.1 329.1 532.7 540.3 500.2 *564 600 . . Hungary.Italie . ..... 131.3 170.1 262.2 386.5 360.8 484.0 *530 . . . Italy.Roumanie . .. . 1.5 6.2 10.8 10.7 11.8 10.8 6.3 5.3 . . Roumania.Royaume-Uni . 0.1 i — - - . . ' . ' United Kingdom.
Yougoslavie .. . 84.8 216.2 292.2 354.2 406.4 314.4 282.5 . . Yugoslavia.dont «Croatie .. . . . . 404.4 311.0 270.06 211.1 . . of which "Croatia".
OCIANIE : Australie. 0.2 1.2 0.8 7.9 1.8 2.6 3.5 5.5 3.5 ... OCEANIA: Australia.
1 Etats-Unis, 1934-1938: expeditions des mines, 1 U.S.A., 1934-1938: shipments from mines.* 1944, Etats-Unis - U.S.A. (deliveries) : 3 034 ; France (I-XI) : 654.
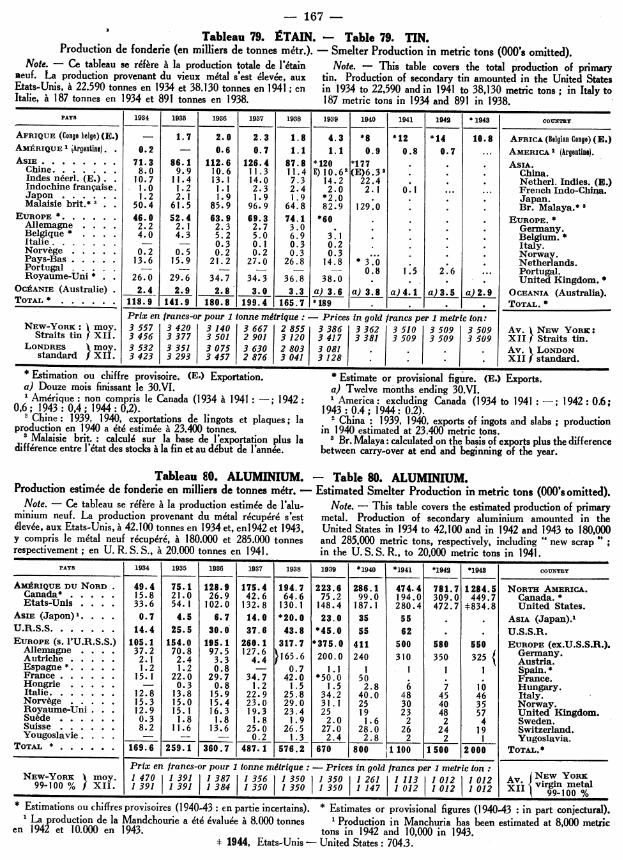
- 167 -
Tableau 79. SiTAIN. - Table 79. TIN.Production de fonderie (en milliers de tonnes metr.). - Smelter Production in metric tons (000's omitted).
Note. - Ce tableau se refkre A la production totale de l'tain Note. - This table covers the total production of primaryneuf. La production provenant du vieux metal s'est 6lev&e, aux tin. Production of secondary tin amounted in the United StatesEtats-Unis, A 22.590 tonnes en 1934 et 38.130 tonnes en 1941 ; en in 1934 to 22,590 and in 1941 to 38,130 metric tons; in Italy toItalie, A 187 tonnes en 1934 et 891 tonnes en 1938. 187 metric tons in 1934 and 891 in 1938.
PAYs 1934 1935 1936 1937 1938 1939 1940 1941 1942 * 1943 COUNTRY
AFRIQUE (Congo belge) (E.) - 1.7 2. 0 2.3 1.8 4.3 *8 *12 *14 10.8 AFRICA (Belgian Congo) (E.)AMIRIQUE' Argentine).. 0.2 - 0.6 0.7 1.1 1.1 0.9 0.8 0. 7 ... AMERICA' (Argentine).ASIE ....... 71.3 86.1 112.6 126.4 87.8 *120 *177 . . ASIA.Chine ...... 8.0 9.9 10.6 11.3 11.4 E)10.62(E)6.3 g
. . . China.Indes n6erl. (E.). 10.7 11.4 13.1 14.0 7.3 14.2 22.4 . . . Netherl. Indies. (E.)Indochine frangaise. 1.0 1.2 1.1 2.3 2.4 2.0 2.1 0.1 ... ... French Indo-China.Japon ...... 1.2 2.1 1.9 1.9 1.9 *2.0 Japan.Malaisie brit.* 3 . 50.4 61.5 85.9 96.9 64.8 82.9 129.0 . . . Br. Malaya.*
EUROPE *. ..... 46.0 52.4 63.9 69.3 74.1 *60 . EUROPE. *Allemagne .... 2.2 2.1 2.3 2.7 3.0 . . . Germany.Belgique* . . 4.0 4.3 5.2 5.0 6.9 3.1 Belgium. *Italie ...... - 0.3 0.1 0.3 0.2 Italy.Norv6ge . . 2. 2 0. 5 0.2 0.2 0.3 0.3 . . Norway.Pays-Bas . . . . 13.6 15.9 21.2 27.0 26.8 14.8 3.0 Netherlands.Portugal 1.5 2.6 ... Portugal.Royaume-Uni 26.0 29.6 34.7 34.3 368 38.0 . United Kingdom.*
OCAIANIE (Australie) . 2.4 2.9 2.8 3.0 3.3 a) 3.6 a) 3.8 a)4.1 a)3.5 a)2.9 OCEANIA (Australia).TOTAL* 1.... 118. 9 141.9 180.8 199.4 165.7 '.189 . TOTAL. *
Prix en francs-or pour 1 tonne mdtrique : - Prices in gold francs per I metric ton:NEW-YOR : moy. 3557 3420 3140 3667 2855 3386 3362 3510 3509 3509 Av. \ NEW YORK :
Straits tin f XII. 3 456 3 377 3 501 2 901 3 120 3 417 3 381 3 509 3 509 3 509 XII / Straits tin.LONDRES moy. 3 532 3 351 3 075 3630 2 803 3 081 .. Av. LONDON
standard XII. 3 423 3 293 3 457 2 876 3041 3128 . XII standard.
* Estimation ou chiffre provisoire. (E.) Exportation. * Estimate or provisional figure. (E.) Exports.a) Douze mois finissant le 30.VI. a) Twelve months ending 30.VI.1 Amerique : non compris le Canada (1934 a 1941: -; 1942: 1 America: excluding Canada (1934 to 1941: -; 1942: 0.6;
0,6; 1943: 0,4; 1944: 0,2). 1943: 0.4; 1944: 0.2).2 Chine: 1939, 1940, exportations de lingots et plaques; la 2 China : 1939, 1940, exports of ingots and slabs ; production
production en 1940 a etc estimee a 23.400 tonnes. in 1940 estimated at 23,400 metric tons.3 Malaisie brit.: calcule sur la base de l'exportation plus la 3 Br. Malaya: calculated on the basis of exports plus the difference
difference entre l'etat des stocks B la fin et au debut de I'ann~e. between carry-over at end and beginning of the year.
Tableau 80. ALUMINIUM. - Table 80. ALUMINIUM.Production estimee de fonderie en milliers de tonnes metr. - Estimated Smelter Production in metric tons (000's omitted).
Note. - Ce tableau se refere A la production estimee de l'alu- Note. - This table covers the estimated production of primaryminium neuf. La production provenant du metal recupere s'est metal. Production of secondary aluminium amounted in the6levee, aux Etats-Unis, a 42.100 tonnes en 1934 et, en1942 et 1943, United States in 1934 to 42,100 and in 1942 and 1943 to 180,000y compris le metal neuf recupere, a 180.000 et 285.000 tonnes and 285,000 metric tons, respectively, including " new scrap"respectivement; en U. R. S. S., a 20.000 tonnes en 1941. in the U. S. S. R., to 20,000 metric tons in 1941.
PAYS 1934 1935 1936 1937 1938 1939 *1940 *1941 *1942 *1943 COUNTRY
AMIIRIQUE DU NORD. 49.4 75.1 128.9 17-5.4 194.7 223.6 286.1 474.4 781.7 1284.5 NORTH AMERICA.Canada* . . .. 15.8 21.0 26.9 42.6 64.6 75.2 99.0 194.0 309.0 449.7 Canada.*Etats-Unis . . . 33.6 54.1 102.0 132.8 130.1 148.4 187.1 280.4 472.7 t834.8 United States.
AsIE (Japon)1. . . 0.7 4.5 6.7 14.0 *20.0 23.0 35 55 . . ASIA (Japan).'
U.R.S.S ....... 14.4 25.5 30.0 37.6 43.8 *45.0 55 62 . . U.S.S.R.EUROPE (s. l'U.R.S.S.) 105.1 154.0 195.1 260.1 317.7 *375.0 411 500 580 550 EUROPE (ex.U.S.S.R.).
Allemagne . ... 37.2 70.8 97.5 127 6 325 Germany.Autriche. . 2.1 2.4 3.3 4.4 165.6 200.0 240 310 350 325 Austria.Espagne* .. . 1.2 1.2 0.8 - 0.7 1.1 1 1 I 1 Spain.*France . . .. 15.1 22.0 29.7 34.7 42.0 *50.0 50 France.Hongrie ... - 0.3 0.8 1.2 1.5 1.5 2.8 6 7 10 Hungary.Italie ...... 12.8 13.8 15.9 22.9 25.8 34.2 40.0 48 45 46 Italy.Norv6ge ..... 15.3 15.0 15.4 23.0 29.0 31.1 25 30 40 35 Norway.Royaume-Uni . 12.9 15.1 16.3 19.3 23.4 25 19 23 48 57 United Kingdom.Su6de ...... 0.3 1.8 1.8 1.8 1.9 2.0 1.6 2 2 4 Sweden.Suisse . . . 8.2 11.6 13.6 25.0 26.5 27.0 28.0 26 24 19 Switzerland.Yougoslavie . . . 0.2 1.3 2.4 2.8 2 2 1 Yugoslavia.
TOTAL * ...... 169.6 259.1 360.7 487.1 576.2 670 800 1100 1500 2000 TOTAL.*
Prix en francs-or pour I tonne mdtrique -: Prices in gold francs per 1 metric ton :NEW-YORK moy. 1 470 1 391 1 387 1 356 1 350 1 1 350 1 261 1 113 1 012 1 012 Av.v NEW Yoar
99-100/ XII. 1 391 1 391 1384 1350 1 350 1 350 1147 1012 1012 1012 XII metal0 I 99-100 %
* Estimations ou chiffres provisoires (1940-43: en partie incertains). * Estimates or provisional figures (1940-43 : in part conjectural).1 La production de la Mandchourie a 6te evaluee A 8.000 tonnes 1 Production in Manchuria has been estimated at 8,000 metricen 1942 et 10.000 en 1943. tons In 1942 and 10,000 in 1943.
* 1944, Etats-Unis - United States: 704.3.

- 168 -
Tableau 81. MINERAI DE CHROME (Contenu en Cr'OS ; production en milliers de'tonnes).
Table 81. CHROME ORE (Cr2aO Content; Production in metric tons, 000's).Note. - Ce tableau donne des evaluations du contenu en oxyde Note. - This table reters to the estimated chromic oxide
de chrome (Cr203) des minerais de chrome extraits. Le principal (Cr2Os) content of chrome ores mined. The principal chromeminerai de chrome est le chromite (FeO, Cr20 3). Dans beaucoup ore is chromite (FeO, Cr003). In many cases, the figures arede cas, les donnees du tableau ont un caractere approximatif. only of an approximate nature.
PAYS 1934 1935 1936 1937 1938 1939 1940 1941 1942 1943 COUNTRY
AFRIQUE ....... 62.4 91.7 166.8 210.8 170.8 145.4 . . . AFRICA.Rhodesie du Sud . . 35.4 51.9 89.8 135.0 91.1 68.0 . . Southern Rhodesia.Sierra Leone . - - - 0.3 0.2 4.8 ... . . . Sierra Leone.Union Sud-Africaine. 27.0 39.8 77.0 75.5 79.5 72.6 73.3 94.3 120.0 44.7 Un. of South Africa.
AMPRIQUE DU NORD. . 0.2 0.7 0.3 2.5 0.4 1.7 1.3 6.6 48.5 74.5 NORTH AMERICA.
Canada* ........ - 0.5 0.2 1.5 - - 0.1 1.0 4.5 +12.0 Canada.*Etats-Unis ..... 0.2 0.2 0.1 1.0 0.4 1.7 1.2 5.6 44.0 +62.5 United States.
AM]RIQUE CENTRALE . 16.6 15.8 23.2 30.7 13.2 22.4 17.3 56.8 *49.2 *101.2 CARIBBEAN.
Cuba ....... 16.2 15.8 23.2 30.7 13.0 22.1 17.3 56.7 *49.0 *101.0 Cuba.1
Guat6mala ...... 1 0.4 - - - 0.2 0.3 - 0.1 0.2 0.2 Guatemala.AMtR. SUD: Br6sil(E)* - - 1.7 0.4 0.4 1.5 1.8 1.8 ... ... S. AMERICA: Brazil(E)*
ASIE......... 22.4 35.7 42.2 *80 *60 . . . . . AsIA.
Chypre . . . . . . 0.5 0.6 0.3 0.8 2.8 . 2.4 ... ... ... Cyprus.Inde (brit.) . . . . 11.0 20.0 25.0 31.0 22.0 *25 . . . India.Japon ........ 10.9 14.5 15.4 Japan.Philippines* . .. . - E.)0.6 1.5 34.5 18.3 56.0 80.0 1 112.1 Philippines.*
U.R.S.S.* ...... 50.0 75.0 90.0 90.0 . . *96 *125 . . U.S.S.R.*
EUROPE ....... 95.2 112.0 116.8 145.4 *149.0 *148 *150 . . . EUROPE.
Bulgarie ...... 1 0.1 0.9 0.7 1.6 . . . . Bulgaria.Grace ....... 12.2 11.8 18.0 19.9 *16 *22 ... . . . Greece.Norv6ge ...... - - 0. i 0.2 0.2 . . . . Norway.Royaume-Uni. . - - - 0.1 0.1 . . United Kingdom.Turquie (E) *. . . 60 75 80 96 104 96 91 75 *60 50 Turkey (E). *Yougoslavie . . .. 23.0 25.1 18.7 28.4 28 *28 *45 . . . Yugoslavia.
dont Croattie .... . . . . *21 ... *30 *25 ... of which "Croatia".
OCAANIE ....... 26.6 27.9 22.6 *24.2 27.1 *26.1 28.1 ... ... ... OCEANIA.
Australie* ..... 0.8 0.3 0.2 0.2 0.4 0.1 0.1 0.2 0.2 ... Australia.*Nouvelle-Cal6donie. 25.8 27.6 22.4 *24.0 26.7 *26.0 28.0 ... ... ... New Caledonia.
TOTAL ....... 273 359 464 *584 *520 *560 . . . *720 TOTAL.
* Estimation ou chiffre provisoire. - (E.) Exportation. * Estimate or provisional figure. - (E.) Exports.
1 Cuba, 1934-1941; Guatemala, 1934; Philippines, 1941 : import. 1 Cuba, 1934-1941 ; Guatemala, 1934; Philippines, 1941:aux Etats-Unis. Cuba, 1942-1943 : exportations aux Etats-Unis. imports into U.S. A. Cuba, 1942-1943: exports to U.S. A.
t 1944, Canada: 11.3; Etats-Unis- U.S.A.: 15.5.
Tableau 82. MINERAI DE NICKEL (Contenu en mdtal). - Table 82. NICKEL ORE (Metal Content).Production en milliers de tonnes metriques. - Production in metric tons (000's omitted).
Note. - Les chiffres reprdsentent le contenu en nickel des Note. - The figures refer to the nickel content of nickel oresminerals de nickel extraits. La production mondiale du nickel mined. World output of secondary nickel (i.e., derived fromprovenant du vieux m6tal n'est pas connue; aux Etats-Unis, la scrap) is not known; in the United States, output amounted inproduction en 1934 s'est 6levee A 1.680 et en 1943 a 6.275 tonnes. 1934 to 1,680 and in 1943 to 6,275 metric tons.
PAYS 1934 1936 1936 1937 1938 1939 1940 1941 *1942 * 1943 COUNTRY
AFRIQUE ....... - 0.2 -0.1 0.3 0.3 ... AFRICA.Maroc frangais . . . - 0.2 0.1 0.3 0.2 . . . French Morocco.Rhod6sie du Sud .. - - - 0.1 *05 . . . Southern Rhodesia.Union Sud-Africaine. - - - - - 0.4 0.4 . Union of S. Africa.
AMPRIQUE ...... 58.5 62.9 77.6 102.3 96.3 103.0 *112 *130 *131 *132 AMERICA.Canada. 58.4 62.8 77.0 102.0 95.5 102.6 111.4 128.0 129.41130.6 Canada.Etats-Unis . 0.1 0.1 0.1 0.2 0.4 0.4 0.5 0.6 0.5 United States.'Br6sil ....... - - 0.5 0.1 0.4 - ... ... ... ... Brazil.
AsIE ........ 1.2 1.5 1.3 1.2 1.6 1.7 . AsIA.Birmanie . 1.2 1.5 1.3 1.2 1.0 0.9 . . . Burma. Indes N6erlandaises*. - - - 0.6 0.8 2.2 . . . Netherlands Indies.*
U.R.S.S. ....... 0.9 1.8 *2.0 *2.0 *2. 5 ... *8.7 *15.0 . . U.S.S.R.EUROPE .. 2.4 2.6 3.3 2.8 3.0 . . . . . EUROPE.
Allemagne ..... 0.3 0.7 0.9 0.6 . . . . . Germany.Gr6ce . ..... 1.1 1.1 1.3 1.0 1.2 1.3 ... . Greece. Norvege ...... 1.3 1.2 1.3 0.9 1.2 1.1 . . . Norway.
OC]ANIE (N. Calddonie) 8.6 8.2 4.9 11.6 12.9 10.6 9.7 ._... ... ... OCEANIA (N.Caledonia).TOTAL ........ 71.6 77.2 * 89.2 *120.2 *116.6 I*122 *140 .. . TOTAL.
Prix en francs-or pour 1 tonne mdtrique: - Price in gold francs per 1 metric ton:NEw-YORK \moy. 2362 2362 2362 \ 2362 { 2362 2 362 2362 2 362 2 362 2 362 Av. NEW YORK
lingots XII . 2362\ 2362 2362\ 2362\ 2362 2362 2 2362 2362 \ 2362\ 2362 XII ingots.(Pour renvois, voir la page ci-contre. - For footnotes, see opposite page.)

- 169 -
Tableau 83. MINERAI DE TUNGSTINE (Contenu en trioxyde de tungst~ne W0 3).
Table 83. TUNGSTEN ORE (Tungsten Trioxide Content W03).Production estimee en tonnes m6triques. - Estimated production in metric tons.
Note. - Le terme general ( mineral de tungstene a comprend les Note. - Tungsten ore is a general term covering scheeliteminerais de scheelite (WO4 Ca), de ferberite (WO 4Fe), de hubnerite (CaWO4), ferberite (FeW04), hubnerite (MnW0 4) and wolfram(WO 4Mn) et de wolfram (WO 4Fe, WO4Mn). Les concentres a (FeWO4, MnWO4) ores. Concentrates containing 60-65 % WOs are60-65 % de W0 3 constituent le produit marchand. Le tungstene the usual commercial product. Tungsten is also produced inest produit egalement en U.R.S.S. (1928, 34 tonnes). the U.S.S.R. (34 metric tons in 1928).
Le tungstene est employe surtout dans l'industrie siderurgique, Tungsten is used chiefly in ferrous metallurgy; also, to a smallmais aussi dans les industries chimique et electrotechnique. extent, in the chemical and electrical industries.
PAYs 1934 1935 1936 1937 1938 1939 1940 1941 * 1942 * 1943 COUNTRY
AFRIQUE ....... 83 60 113 224 381 * 500 *350 *500 . . AFRICA.
Congo beige .... . . . 46 39 74 189 280 Belgian Congo.Egypte* . ... .- -.- 5 40 60 --- 100 ... Egypt.*Maroc francais . · . . French Morocco.Nigeria .. ..... 3 9 4 5 31 142 77 ... ... ... Nigeria.Ouganda ... .. - - - 1 1 II ... ... ... ... Uganda.Rhod6sie du Sud .. 70 16 62 163 197 162 15 0 . . Southern Rhodesia.Sud-Ouest Africain . 10 26 28 24 30 30 14 a) 50 ... ... S. W. Africa.Tanganyika .... . 3 1 1 2 - ... ... ... Tanganyika.Union Sud-Africaine. - 6 18 25 76 59 61 a) 29 . . Union of S. Africa.
AMIERIQUE DU NORD. . 1 115 1 304 1 422 1 905 1 657 2 335 2 899 3 593 5 227 6'916 NORTH AMERICA.Canada .. . . .. *2 4 19 147 t *420 Canada.Etats-Unis ..... 1115 1 304 1 422 1 905 1 657 2 333 2 895 3 574 5 080 t6 496 United States.
AMIR. CENT. (Mexique) 48 33 34 20 46 71 67 59 . . CARIBBEAN (Mexico).
AMIRIQUE DU SUD .. 776 1 231 1 559 1 726 2 362 2 920 3 540 3 903 *4 880 ... SOUTH AMERICA.Argentine . .. 238 376 457 528 738 810 843 1 071 1 280 ... Argentine.Bolivie (E.) . . . 530 817 1 044 1 081 1 518 2 002 2 510 2 613 3 363 4 141 Bolivia. (E.)Bresil (E.) ..... - -- - 4 1 4 5 16 ... ... Brazil. (E.)Chili ...... — 4 3 11 3 - - 1 - ... Chile.P6rou ....... 8 34 55 102 102 104 180 202 222 433 Peru.
AsIE (sans l'U.R.S.S.) . 7 643 9 077 10 273 * 16600 * 14 000 . . . . . ASIA (exel. U.S.S.R.).Chine . . . . . . . 3 783 (E.) 4 430(E.) 4 582 E.) 10737(E.) 8 033 (E.) 6 948 * 7 500 ' 9 000 10 000 ... China.Cor6e ....... 240 569 1 110 1 250 . . . . . . Korea.Etats Malais f6d6rls. 1 122 1 004 1i 000 631 483 (E.) 148 (E.) 65 . . . Fed. Malay States.Etats Mal. non f6d.. 52 181 186 160 190 207 (E.) 256 . . Unf. Malay States.Inde (brit.) . .. 2 199 2 534 3 006 8 6 ... . . . India.
Birmanie . .. . (2 199) (2 634) (3 006) 3 301 3 529 *4 400 *5 400 . . Burma.Indes n6erlandaises . 2 I 1 - * 1 ... . . Netherlands Indies.Indochine . ... 182 250 302 389 330 304 234 200 135 ... Indo-China.Japon ....... 42 58 36 . .. . . . . . Japan.Thailande ..... 21 50 50 59 151 227 236 . . . Thailand.
EUROPE (sans U.R.S.S.) 559 1 000 *1 180 *1 570 *2 110 *2 900 . . . . EUROPE (ex. U.S.S.R.).Espagne*2 ..... 30 126 148 163 140 239 255 270 983 2 625 Spain.*2France....... -. 10 . .- . France.Italic ....... - 1 4 2 3 * 1 . . . Italy.Norv6ge ...... - -— 2 11 19 . . . Norway.Portugal . .. . 396 697 862 1 243 1 687 2 370 2 641 3 3997 2 931 ... Portugal.Royaume-Uni. ... · 133 153 132 84 154 . . . . United Kingdom.Su~de ...... — — 37 76 108 120 *145 . . Sweden.
OCAANIE ....... 239 319 246 504 703 632 700 698 468 ... OCEANIA.Australie .... 214 294 228 488 673 605 651 654 424 ... Australia.Nouvelle-Zelande . . 25 25 18 16 30 27 49 44 44 73 New Zealand.
TOTAL* ..... . . 10 463 13 020 14 850 22 550 21 300 23 000 26 000 30 000 32 000 36 000 TOTAL.*
* Estimation ou chiffre provisoire. (E.) Exportation. a) I-VI. * Estimate or provisional figure. (E.) Exports. a) I-VI.x Chine, 1941 et 1942 : evaluations assez incertaines. Chine, 1941 and 1942 : rather conjectural estimates.
Espagne: « mines inspectees, seulement. La production 2 Spain: "inspected mines " only. Illicit production wouldclandestine semble avoir ett particulierement forte jusqu'en 1941 seem to have been on a specially large scale up to 1941 and theet encore au debut de 1942 et avoir decline depuis cette date a beginning of 1942 and to have then declined as a result of a consi-la suite d'un relevement considerable des prix officiels. On estime derable increase in official prices. It is estimated that, at thequ'au debut de 1942 la production totale 6tait quatre ou cinq fois beginning of 1942, total production was four or five times asplus forte que la production enregistree. great as recorded production.
3Portugal, 1941 : chiffre incomplet. 3Portugal, 1941 : incomplete figure.1944, Canada: * 17; Etats-Unis - U.S.A.: 5 700.
RENVOIS AU TABLEAU 82. MINERAI DE NICKEL. - FOOTNOTES TO TABLE 82. NICKEL ORE.
' Etats-Unis : nickel obtenu dans le raffinage du cuivre. 1 United States : nickel obtained in the refining of copper.2 Birmanie : metal contenu dans les mattes obtenues comme 2 Burma: metal content of nickel speiss obtained as a by-product
sous-produits de la fonte des minerais. in smelting operations.3 Grece : contenu en nickel-cobalt. 3 Greece: nickel-cobalt content.
1944, Canada: 124.8.

170
Tableau 84. CADMIUM (Cd). - Table 84. CADMIUM (Cd).Production en tonnes metriques. - Production in metric tons.
Note. --—Ce tableau se reftre au cadmium (metal pur ou metal Note. - This table refers to cadmium (either as metallic cadmiumcontenu dans les sels de cadmium) effectivement obtenu des or in cadmium compounds) actually produced from the residuesresidus (cadmies, prdcipites, etc.) des usines de zinc 6lectroly. (flue dust, precipitates, etc.) from electrolytic zinc plants andtique et de lithopone, ainsi que des usines de cuivre et de plomb. lithopone plants, also from copper and lead plants. In additionOutre les pays indiques dans le tableau, le Japon et le Perou (1943: to the countries given in the table, cadmium is also produced4.000 tonnes) produisent egalement du cadmium. La production in Japan and in Peru (1943: 4,000 metric tons). The productionindiqu&e officiellement pour le Sud-Ouest Africain (1934, 64; reported officially for South West Africa (1934, 64; 1939, 1971939, 197 tonnes) et pour le Mexique (1941, 908 tonnes) a ete exclue metric tons) and for Mexico (1941, 908 metric tons) has beencar elle se rdfere au contenu estime en cadmium des cadmies, etc., excluded, as it relates to the estimated cadmium content of flueexportees en vue de l'extraction du cadmium a l'etranger. dust, etc., exported for extraction of cadmium abroad.
PAYS 1934 1935 1936 1937 1938 1939 1940 1941 1942 * 1943 COUNTRY
AFRIQUE (Congo beige). -- - - - - 3 27 23 AFRICA (Belgian Congo).
AMJgRIQUE DU NORD. . *1 500 *1 900 2 151 2 463 2 265 2 599 3 298 3 849 ... NORTH AMERICA.Canada. ..... . 133 263 356 338 317 426 412 568 521 *357 Canada.Etats-Unis ... . .. 1 795 2 125 1 948 2 173 2 886 3 281 . . United States.
U.R.S.S .. . .... 3 12 115 ... ... . . .... U.S.S.R.
EUROPE (sans U.R.S.S.) 529 751 996 *1 261 *1 487 . . . . . EUROPE (excl. U.S.S.R.).Allemagne .. . .. 14 165 302 355 432 . . . Germany.Belgique ...... 226 210 289 * 270 * 180 E.)531 . . Belgium.France. ...... — - 121 84 99 116 . . . France.Italie. ....... 8 16 55 91 182 146 . . . Italy.Norv6ge ...... 137 118 102 154 208 138 . . . Norway.Pologne ...... 144 121 141 168 * 244 .. . Poland.Royaume-Uni. ... - - 23 124 125 . . . . United Kingdom.
OctaNIE (Australie) .. 175 222 252 211 199 177 178 195 166 ... OCEANIA (Australia).
TOTAL ......... .*2 200 *2 900 3 514 *4 050 *4 050 . . . . . TOTAL.
* Estimation ou chiffre provisoire. (E.) Exportation. * Estimate or provisional figure. (E.) Exports.,1944, Canada: 249.
Tableau 85. MINERAI D'ANTIMOINE (Contenu en metal). - Table 85. ANTIMONY ORE (Metal Content).Production en tonnes m6triques. - Production in metric tons.
Note. - Ce tableau se refere exclusivement au contenu en Note. - This table covers only the antimony (Sb) content ofantimoine (Sb) des minerals extraits, dont le plus important est la ores mined, of which stibnite (Sba Ss) is the most important.stibine (Sb2 S8). La production mondiale de l'antimoine provenant World output of secondary antimony (i.e., obtained from scrap)du vieux metal n'est pas connue; aux Etats-Unis, la production is not known; the United States output amounted in 1934 tos'est elevee en 1934 A 6.850 tonnes et en 1943 a 14.050 tonnes. 6,850 and in 1943 to 14,050 metric tons.
PAYS 1934 1935 1936 1937 1938 1939 1940 1941 *1942 *1943 COUNTRY
AFRIQUE *..... 1 071 2 266 319 1 418 1 146 1 337 1 600 . . . AFRICA. *Alg6rie ..... . 717 2 020 121 1 087 778 * 750 * 820 . Algeria.Maroc espagnol(E.) 321 17 16 208 104 60 73 *93 *144 *166 Span. Morocco. (E.)Maroc francais . . 33 224 80 44 174 457 464 192 255 430 French Morocco.Rhod6sie du Sud . - - 85 79 78 63 . . . Southern Rhodesia.Union Sud-Africaine - 5 17 - 12 7 158 . . . Union of S. Africa.
AKIO-RIQUE DU NORD 367 507 685 1 148 601 913 1 625 2 546 ... ... NORTH AMERICA.Canada. ...-. I - - - 11 556 1177 1445 1 379 '5'05 Canada.Etats-Unis . . . 367 507 685 1 148 590 357 448 1 101 ... ... United States.
AMI.RIQUE CENTRALE CARIBBEAN(Mexique) . ... 2 668 4 570 7 303 10 639 8 034 7 873 12267 11131 . . (Mexico).
AM.RIQUE DU SUD . 2 155 4 013 7 809 8 624 10 325 *11 027 12 763 16 569 *19 142 *20 400 SOUTH AMERICA.Argentine . .... . - - - 10 215 *120 114 128 *45 Argentine.Bolivie (E.). . . . 2055 3 670 6 565 7 127 9437 10060 11 753 14872 17643 17 973 Bolivia. (E.)P6rou (E.) . ... . 100 343 1 244 1 487 673 847 896 1 569 1 454 2 379 Peru. (E.)
ASIE * ....... 15 480 18 408 17 584 15 400 8 500 6 850 5 800 . ·· ASIA.*Birmanie * . . . - 10 40 30 90 * 100 . . . . Burma.*Born6o brit. ... - 16 30 5 - 17 51 . . . Brit. Borneo.Chine. .15 444 *18 300 *17 300 *15 200 *8 100 E.)6 497 .)5 493 ... ..... China.Core e....... 2 17 10 . . . . . . Korea.Indochine francaise - 20 47 6 104 24 i 1 ... ... French Indo-China.Japon .... 3. 36 60 150 . . ., . . . Japan.

- 171
Tableau 85 (fin). Mineral d'antimoine (Contenu en mr tal.) - Table 85 (conc.). Antimony Ore (Metal Content).Production en tonnes m6triques. - Production in metric tons.
PAYS 1934 1935 1936 1937 1938 1939 1940 1941 *1942 *1943 COUNTRY
EUROPE *. ..... I 1912 3 248 4 380 4 817 6 700 7 800 . . . . EUROPE.*
Autriche ..... . -- - 125 252 *180 . . . . Austria.France...... 265 -. -. . . . France.Gr6ce....... 91 36 199 - - 1 ... . . Greece.Italie. .. . 361 461 493 610 925 *1 000 . Italy.Portugal .... . ---- 25 86 164 189 269 50 135 ... Portugal.Tch6coslovaquie . . I 160 2 429 1 036 1 246 . 1 000 ' 1 200 1 1 900 3 400 ... Czechoslovakia.Turquie . . . 35 122 562 643 580 660 372 63 ... ... Turkey.Yougoslavie* . . . - 200 1 940 1 980 3 670 4 500 5 800 . . Yugoslavia.*
OCtANIE (Australie) . 9 20 152 576 *585 *350 *265 *400 *800 ... OCEANIA (Australia).
TOTAL * ...... 23 662 33 032 38 232 42 625 35 900 36 200 . . . . TOTAL.*
* Estimation ou chiffre provisoire. (E.) Exportation. * Estimate or provisional figure. (E.) Exports.Tchecoslovaquie : depuis 1939, ( Slovaquie ,. 1 Czechoslovakia : since 1939, " Slovakia
* 1944, Canada: 879.
Tableau 86. MERCURE. - Table 86. QUICKSILVER.Production en tonnes metriques. - Production in metric tons.
Note. - Les donnees se rdf&rent au mercure (Hg) effectivement Note. - The data refer to quicksilver (Hg) actually producedextrait des minerals, dont le plus important est le cinabre (Hg S). from ores, of which cinnabar (Hg S) is the most important.
PAYS 1934 1935 1936 1937 1938 1939 1940 1941 *1942 * 1943 COUNTRY
AFRIQUE ....... — - 1 6 5 16 . . . . . AFRICA.
Alg6rie....... -- -- 4 5 7 8 27 . . . Algeria.Tunisie ....... 1 2 1 9 . . Tunis.Union Sud-Africaine. - - - - - 2 . 19 31 Union of S. Africa.
AMIRIQUE DU NORD 532 604 571 569 620 642 1 372 1 792 2 223 2 557 NORTH AMERICA.Canada ....... - -. - 70 243 470 *767 Canada.Etats-Unis ..... 532 604 571 569 620 642 1 302 1 549 1 753 *1 790 United States.
AMARIQUE CENTRALE CARIBBEAN(Mexique) ..... . 158 216 183 170 294 254 402 798 . . (Mexico).
AMtRIQUE DU SUD 4 SOUTH AMERICA.4
(Bolivie) (E.) . . . 21 9 8 1 --- . -1.- -- (Bolivia). (E.)
ASIE (sans I'U.R.S.S.) . 124 66 118 *93 * 28 . . . . . ASIA (excl. U.S.S.R.).Chine . ...... 117 61 103 73 8 2 1118 *155 *236 ... China.1
Cor6e ....... - - - . . . . . Korea.Japon ....... 7 5 15 *20 *20 . . . . Japan.
U.R.S.S. ....... 268 ... ... ... ... . . . . U.S.S.R.
EUROPE (sans U.R.S.S.) 2 1 564 2 272 2 544 3 752 3 850 *3 660 . . . . EUROPE (excl.U.S.S.R.).2
Autriche .... 5 . . . . . . Austria.Espagne ...... 1096 1229 *979 *1 326 1 427 1 238 1 800 2 981 2492 ... Spain.Italie. ....... 441 972 1 473 2 308 2 301 2 315 . . . . Italy.Tch6coslovaquie. .. 26 69 65 95 100 393 89 80 ... ... Czechoslovakia.Turquie ...... 1 2 27 18 20 14 17 8 ...... Turkey.
OCIIANIE ....... '2 1 3 1 - - 1 4 ... ... OCEANIA.
Australie....... . 1 3 - - 1 I ... ... Australia.Nouvelle-ZWlande .. 2 - - I I - 3 5 3 New Zealand.
TOTAL ........ 2 669 *3 465 *3 700 *5 000 *5 100 *4 600 . . . . TOTAL.
SOURCES (85, 86): Statistiques nationales officielles. - National official statistics. Imperial Institute. U. S. Bureau of Mines.* Estimation ou chiffre provisoire. (E.) Exportation. * Estimate or provisional figure. (E.) Exports.
Chine, 1934-1939: consignations totales dans les s ports de 1 China, 1934-1939: total shipments from " Customs ports ",douaneo, y compris le trafic interne. 1940: evaluation de la pro- including internal trade. 1940: estimated production in the wholeduction dans toute la Chine. 1941, 1942 : evaluations incertaines. country. 1941, 1942 : rather conjectural estimates.
2 Europe : non compris l'Allemagne (1935: 4; 1936: 38) et la 2 Europe : excluding Germany (1935: 4; 1936: 38) and Rou-Roumanie (production de mineral : 1937: 19; 1938 : 5; 1939: 5). mania (ore production: 1937 : 19; 1938 : 5; 1939: 5).
3Tchecoslovaquie: depuis 1939, o Slovaquie ,. Czechoslovakia: since 1939, Slovakia4 Amerique du Sud: du mercure est produit a present egale- 4 South America: there is at present an output of quicksilver
ment au Chili et au Perou (1943: 11). also in- Chile and in Peru (1943: 11).* 1944, Canada: 334; Etats-Unis - United States: 1 286.

172
Tableau 87. MINERAI DE VANADIUM (Contenu en metal). - Table 87. VANADIUM ORE (Metal Content)Production en tonnes metriques. - Production in metric tons.
Note. - Ce tableau indique le contenu en vanadium (V) Note. - This table shows the pure vanadium (V) content of vana.des minerals de vanadium extraits, principalement vanadinite dium ores mined, mainly vanadinite [(PbCI) Pb 4 (VO4)3 ] and carno-((PbCI) Pb4 (VO4) 3) et carnotite (KO0, 2UO2, V20, 3H 20). tite (K20, 2UO2, V20s, 3H1 O).
Certaines donnees exprimees en pentoxyde de vanadium ont 6te Some of the basic data expressed in terms of vanadium pentoxideconverties de maniere a se ref&rer au contenu en m6tal ( 1 unite de were converted so as to refer to metal content (1 unit of VOs,V20O contient 56,52 % de V). contains 56.52 % of V).
PAYS 1934 1935 1936 1937 1938 1939 1940 1941 * 1942 *1943 COUNTRY
AFRIQUE ....... 38 343 752 825 932 899 . . . . AFRICA.
Rhod6sie du Nord. 3 173 204 233 374 384 . . Northern Rhodesia.Sud-Ouest Africain* . 35 170 548 592 558 515 428 269 ... ... South West Africa.*
AMItRIQUE DU NORD NORTH AMERICA(Etats-Unis) 1 ... . . 63 493 732 900 981 1 086 2 014 t2 534 (United States).'
AMARIQUE CENTRALE CARIBBEAN(Mexique) ..... - - - 38 180 148 57 1 . . (Mexico).
AMPRIQUE DU SUD 2 SOUTH AMERICA2
(P6rou) ....... 75 68 .163 588 833 1102 1 160 1 000 1 024 889 (Peru).
TOTAL . .. .. . 978 1 944 2 677 3 049 *3 100 *2 900 ...... TOTAL.
* Estimation ou chiffre provisoire. * Estimate or provisional figure.Etats-Unis : expeditions des mines. ' United States : shipments from mines.
2 Amr&ique du Sud : non compris l'Argentine, dont la production 2 South America: not including Argentine, the output of whichs'est elevee, en 1941, a 6 tonnes. amounted, in 1941, to 6 metric tons.
t 1944, Etats-Unis - United States: 1 500.
Tableau 88. MINERAI DE MOLYBD.NE (Contenu en metal).Production en tonnes mdtriques. Table 88. MOLYBDENUM ORE (Metal Content). Production in metric tons.
Note. - Ce tableau indique le contenu en molybdene (Mo) Note. - This table shows the pure molybdenum (Mo) contentdes minerals de molybdene extraits. La molybdenite ou bisulfure of molybdenum ores mined. Molybdenite or molybdenumde molybdene (MoS 2) est le principal minerai ;de petites quantites sulphide (MoSa) is the principal ore; small quantities of wulfenitede wulfenite (MoO4Pb) sont aussi extraites. (MoO 4 Pb) are also mined.
Le molybdene est surtout employe en sid&rurgie, et, dans une Molybdenum is used chiefly in ferrous metallurgy; also, to afaible proportion, dans les industries chimique et 6lectrotechnique. small extent, in the chemical and electrical industries.
PAYS 1934 1935 1936 1937 1938 1939 1940 1941 * 1942 * 1943 COUNTRY
AFRIQUE AFRICA
(Maroc fran<ais)* . . 82 120 110 167 110 84 57 29 6 8 -(French Morocco).*
AMERIQUE DU NORD. 4 247 5 222 7 795 13 348 15 106 13 756 15 569 18 264 25 871 28 122 NORTH AMERICA.Canada*....... - - - *4 *3 *1 *5 47 43 *150 Canada.*Etats-Unis . . . . . 4247 5222 7795 13344 15 103 13755 15564 18217 25 828 27 972 United States.
AMEIRIQUE CENTRALE CARIBBEAN
(Mexique) .. . . . 466 686 534 629 483 523 309 521 . . (Mexico).
AMERIQUE DU SUD . 5 6 10 50 92 145 443 376 1 289 ... SOUTH AMERICA.Chili ........ - - - - - 30 267 229 1095 ... Chile.P6rou*(E.) ... . 5 6 10 50 92 115 176 147 194 99 Peru. *(E.)
ASIE (sans I'U.R.S.S.) 53 *54 *41 . . . . . . . ASIA (exc. U.S.S.R.).Chine ... .. . . . . . . . . China.Cor6e*.52 53 40 . . . .0 .· . Korea.*
EUROPE (saex. U.S.S.R.).'Italie .-.... — -—. 9 - - *I . .. Italy.Norvsge ..... 146 388 421 344 462 423 . Norway.Turquie ...... - - - 26 41 ... ... .... ... Turkey.
OCPIANIE (Australie)* 2 5 10 36 30 36 18 22 7 ... OCEANIA (Australia).*
TOTAL. . . . . . . . 5001 *6481 *8930 *14 650*16350*15 100*16900*19 700 . . TOTAL.
SOURCES (87, 88): Statistiques nationales officielles. - National official statistics. Imperial Institute. U. S. Bureau of Mines.* Estimation ou chiffre provisoire. - (E.) Exportation. * Estimate or provisional figure. - (E.) Exports.1Europe: non compris la Roumanie, dont le minerai de 1 Europe : excluding Roumania, where bismuth-molybdenum
bismuth-molybdene (Bi-Mo) est pauvre en molybdene. (Bi-Mo) ore is poor in molybdenum
+1944, Etats-Unis - United States: 18000.
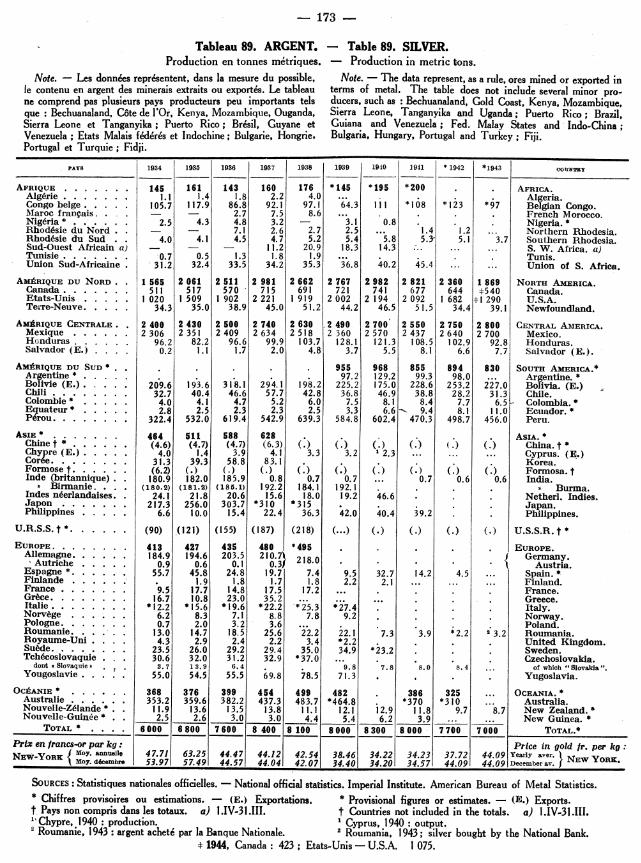
- 173 -
Tableau 89. ARGENT. - Table 89. SILVER.Production en tonnes metriques. - Production in metric tons.
Note. - Les donnees representent, dans la mesure du possible, Note. - The data represent, as a rule, ores mined or exported inle contenu en argent des minerals extraits ou exportes. Le tableau terms of metal. The table does not include several minor pro-ne comprend pas plusieurs pays producteurs peu importants tels ducers, such as: Bechuanaland, Gold Coast, Kenya, Mozambique,que : Bechuanaland, C6te de l'Or, Kenya, Mozambique, Ouganda, Sierra Leone, Tanganyika and Uganda; Puerto Rico; Brazil,Sierra Leone et Tanganyika; Puerto Rico; Bresil, Guyane et Guiana and Venezuela; Fed. Malay States and Indo-China;Venezuela; Etats Malais fd&r6s et Indochine; Bulgarie, Hongrie, Bulgaria, Hungary, Portugal and Turkey; Fiji.Portugal et Turquie; Fidji.
PAYS 1934 1935 1936 1937 1938 1939 1940 ]941 1942 1943
AFRIQUE ....... 145 161 143 160 176 *145 *195 *200 . . AFRICA.Alg6rie ....... 1.1 1.4 1.8 2.2 4.0 ... Algeria.Congo belge. .. 105.7 117.9 86.8 92.1 97.1 64.3 III *108 *123 *97 Belgian Congo.Maroc frangais. - - 2.7 7.5 8.6 ... French Morocco.Nig6ria* ... 2.5 4.3 4.8 3.2 - 3.1 0.8 . . Nigeria. *Rhod6sie du Nord . - 7.1 2.6 2.7 2.5 ... 1.4 1.2 ... Northern Rhodesia.Rhod6sie du Sud 4.0 4.1 4.5 4.7 5.2 5.4 5.8 5.3- 5.1 3.7 Southern Rhodesia.Sud-Ouest Africain a) - - - 11.2 20.9 18.3 14.3 .. W. Africa. a)Tunisie.. 0.7 0.5 1.3 1.8 1.9 . . Tunis.Union Sud-Africaine . 31.2 32.4 33.5 34.2 35.3 36.8 40.2 45.4 ... ... Union of S. Africa.
AMtRIQUE DU NORD .. 1 565 2 061 2 511 2 981 2 662 2 767 2 982 2 821 2 360 1 869 NORTH AMERICA.Canada ...... 511 517 570 715 691 721 741 677 644 *540 Canada.Etats-Unis ..... 1 020 1 509 1 902 2 221 1 919 2 002 2 194 2 092 1 682 I1 290 U.S.A.Terre-Neuve . .. 34.3 35.0 38.9 45.0 51.2 44.2 46.5 51.5 34.4 39.1 Newfoundland.
AMARIQUE CENTRALE .. 2 400 2 430 2 500 2 740 2 630 2 490 2 700 2 550 2 750 2 800 CENTRAL AMERICA.Mexique ...... 2 306 2 351 2 409 2 634 2 518 2 360 2 570 2 437 2 640 2 700 Mexico.Honduras ..... 96.2 82.2 96.6 99.9 103.7 128.1 121.3 108.5 102.9 92.8 Honduras.Salvador (E.) . . .. 0.2 1.1 1.7 2.0 4.8 3.7 5.5 8.1 6.6 7.7 Salvador (E.).
AMIRIQUE DU SUD * . . .. . 955 968 855 894 830 SOUTH AMERICA.*Argentine * . . . . 97.2 129.2 99.3 98.0 ... Argentine. *Bolivie (E.):. . . 209.6 193.6 318.1 294.1 198.2 225.2 175.0 228.6 253.2 227.0 Bolivia. (E.)Chili ........ 32.7 40.4 46.6 57.7 42.8 36.8 46.9 38.8 28.2 31.3 Chile.Colombie* . . . . . 4.0 4.1 4.7 5.2 6.0 7.5 8.1 8.4 7.7 6.5 Colombia.*Equateur* . . . . 2.8 2.5 2.3 2.3 2.5 3.3 6.6- 9.4 8.1 11.0 Ecuador.*P6rou ....... 322.4 532.0 619.4 542.9 639.3 584.8 602.4 470.3 498.7 456.0 Peru.
ASIE* . . 464 511 588 628 . ASIA.*Chine t . . (4.6) (4.7) (4.7) (6.3) (.) (.) (.) (.) (.) (.) China. t*Chypre (E.) . . . 4.0 1.4 3.9 4.1 3.3 3.2 1 2.3 ... ... Cyprus. (E.)Cor6e. .... . 31.3 39.3 58.8 83.1 . Korea.Formose t ... (6.2) (.) (.) (.) (.) (.) ( (.) (.) (.) Formosa. tInde (britannique) . 180.9 182.0 185.9 0.8 0.7 0.7 ... 0.7 0.6 0.6 India.
" Birmanie. (180.2) (181.2) (185.1) 192.2 184.1 192.1 . . . . Burma.Indes n6erlandaises. 24.1 21.8 20.6 15.6 18.0 19.2 46.6 . . . Netherl. Indies.Japon .217.3 256.0 303.7 *310 *315 . . Japan.Philippines 6.6 10.0 15.4 22.4 36.3 42.0 40.4 39.2 Philippines.
U.R.S.S.t*. ..... (90) (121) (155) (187) (218) (...) (.) (.) (.) (.) U.S.S.R.t *EUROPE . .... . 413 427 435 480 *495 . . . . EUROPE.
Allemagne . . . 184.9 194.6 203.5 210.7 218.0 Germany.'Autriche .. .. 0.9 0.6 0.1 0.3 1. Austria.
Espagne *. . ... 55.7 45.8 24.8 19.7 7.4 9.5 32.7 14.2 4.5 ... Spain. *Finlande . .. . . 1.9 1.8 1.7 1.8 2.2 2.1 ... ... ... Finland.France ....... 9.5 17.7 14.8 17.5 17.2 ... France.Gr6ce . ...... 16.7 10.8 23.0 35.2 ... ... ... Greece.Italie . ...... '12.2 '15.6 *19.6 *22.2 *25.3 *27.4 . . . . Italy.Norv6ge ...... 6.2 8.3 7.1 8.8 7.8 9.2 . . Norway.Pologne. 0.7 2.0 3.2 3.6 ... . . . . . Poland.Roumanie. .. 13.0 14.7 18.5 25.6 22.2 22.1 7.3 3.9 *2.2 2 3.2 Roumania.Royaume-Uni . 4.3 2.9 2.4 2.2 3.4 *2.2 United Kingdom.Su6de........ 23.5 26.0 29.2 29.4 35.0 34.9 *23.2 . . . Sweden.Tch6coslovaquie . 30.6 32.0 31.2 32.9 *37.0 ... . . . . Czechoslovakia.
dont ( 8lovaquie ,. 3.7 13.9 6.4 9.8 7.8 8.0 8.4 of which "Slovakia".Yougoslavie . 55.0 54.5 55.5 69.8 78.5 71.3 . . . . Yugoslavia.
OCANIE * . . . . . 368 376 399 454 499 482 . 386 325 ... OCEANIA. *Australie .. . 353.2 359.6 382.2 437.3 483.7 *464.8 *370 *310 ... Australia.Nouvelle-ZVlande* . 11.9 13.6 13.5 13.8 11.1 12.1 12.9 11.8 9.7 8.7 New Zealand. *Nouvelle-Guinee * . . 2.5 2.6 3.0 3.0 4.4 5.4 6.2 3.9 ... ... New Guinea. *
TOTAL* . ... . 6000 6800 7 600 8 400 8 100 8 000 8300 8 000 77 7000 7 TOTAL.*
Prix en francs-or par kg : Price in gold fr. per kg:NEW-YORK (J oy. a'nnoele 47.71 63.25 44.47 44.12 42.54 38.46 34.22 34.23 37.72 44.09 Yearly aver. NE
N\RX Moy. dhcembre 53.97 57.49 44.57 44.04 42.07 34.40 34.20 34.57 44.09 44.09 Decemberav. NW YORK.
SOURCES: Statistiques nationales officielles. - National official statistics. Imperial Institute. American Bureau of Metal Statistics.* Chiffres provisoires ou estimations. - (E.) Exportations,. * Provisional figures or estimates. - (E.) Exports.t Pays non compris dans les totaux. a) 1.IV-31.111. t Countries not included in the totals. a) 1.IV-31 .III.1'Chypre, 1940 : production. ' Cyprus, 1940 : output.2 Roumanie, 1943: argent achete par la Banque Nationale. 2 Roumania, 1943; silver bought by the National Bank.
t 1944, Canada : 423 ; Etats-Unis - U.S.A. 1 075.

- 174 -
Tableau 90. OR. - Table 90. GOLD.Production en kilogrammes. - Production in kilogrammes.
Note generale. - Les chiffres representent dans la mesure du General Note. - The data represent, whenever possible, the finepossible le contenu en or fin du mineral extrait ou exporte. Pour gold content of ore mined or exported. For a certain numberun certain nombre de pays, les donn&es representent, toutefois, of countries, however, the data represent crude gold or smelterl'or brut ou la production de fonderie. Dans certains cas, les production. In some cases, the original data do not contain anydonn&es originales n'indiquent pas la nature des chiffres reference as to the nature of those statistics.
Les totaux se trouvent affectes par l'omission de la Chine, par The totals are affected by the exclusion of China and by the un-le caractere incertain des donnees relatives l'Amr&ique du Sud, certain character of the statistics relating to South America andet notamment par l'incertitude des chiffres concernant I'U.R.S.S. more especially to the U.S.S.R.
En outre, le tableau ne comprend pas l'Ethiopie, la Bolivie et la Furthermore, the table does not include Ethiopia, Bolivia andThailande, dont la production est evaluee a quelques centaines de Thailand, the production of which is estimated at several hundredkg par an, ainsi que certains pays producteurs peu importants, tels kg annually, as well as some unimportant producers such as Hun-que la Hongrie, la Norvege, le Rovaume-Uni, etc. gary, Norway, the United Kingdom, etc.
Deux totaux mondiaux ont ite ins&res dans le tableau : l'un Two world totals are shown in the table: one excluding thenon compris I'U.R.S.S. et l'autre y compris des estimations tres U.S.S.R. and the other including rough average estimates for theapproximatives pour I'U.R.S.S., basees sur des donnees moyennes. U.S.S.R.
PAYS 1935 1936 1937 1938 1939 1940 1941 1942 *1943 *1944 COUNTRY
AFRIQUE. * 391 900 415 700 434 600 454 200 482 000 525 000 535 000 520 000 460 000 440 000 AFRICA. *
Afr.-Equat. fr. 1* 870 748 (E.) 660 1 202 ... ... ... .. ..... ... Fr. Eq. Africa. *Afr.-Occ. fr. I(E.) 3 901 3 559 3 992 3 954 4 300 4 200 ... ... Fr. West Afr.'(E.).Bechuanaland. . 355 521 547 594 536 560 451 480 ... ... Bechuanaland.Cameroun (mand. fr.) 80 309 * 400 *440 ... Cameroons(Fr.mand.)Congo beige . 11 521 12 108 13 053 14 1601 16 000' 17 0060 17 500 *16 000 *13 500 ... Belgian Congo.Cbte de l'Or . 11 161 13 317 17 393 20 993 24 331 27 558 27 530 24 400 17 600 16 200 Gold Coast.Egypte .. 2 9 38 67 121 228 89 55 14 ... Egypt.Erythr6e .. 134 78 131 ... ... ...... Eritrea.*Kenya . . 716 1 196 1 704 2 193 2 395 2 403 2 200 ... ... ... Kenya.Lib6ria (E.) 30 49 76 59 203 300 634 ... ... ... Liberia (E.).Madagascar* . 481 473 417 428 435 360 .... Madagascar. *Maroc fr.. . 36 50 101 275 240 130 29 1 90 ... Fr. Morocco.Mozambique 236 264 345 299 344 358 281 203 202 ... Mozambique.Nig6ria . . 1 212 1 038 823 771 802 797 ... ... Nigeria.Ouganda(E.) . 176 412 527 638 532 407 338 343 ... Uganda (E.).Rhod6sie du Sud. 22 590 24 791 25 014 25 321 24 746 25 707 24 586 23 640 20 425 18 436 Rhodesia, South.
S Nord 51 138 132 35 144 172 *106 *93 ... .. D North.Ruanda-Urundi 308 350 402 560 851 ... Ruanda-Urundi.Sierra Leone . . 957 1 181 I 111 933 1 047 1 016 ... ... Sierra Leone.Soudan. . ... 266 238 230 276 234 205 ... ... ... Sudan.Sud-Ouest Afric.. 100 126 87 56 50 42 9 7 .. ... S.W. Africa.Swaziland. . . . 10 9 75 39 31 34 ... ... Swaziland.Tanganyika. . . 1 623 2 167 2 342 2 546 3 910 4 470 4 400 4 000 3 400 ... Tanganyika.Union Sud-Afr. . 335 110 352 596 364 986 3.78 262 398 794 436 623 447 466 439 191 398 125 381 865 Unionof S.Africa.
AMARIQUE DU N. 203 249 234 733 256 157 280 449 304 434 317 347 314 682 258 600 156 570 *121 000 NORTH AMERICA.
Canada. . . .. 102 172 116 577 127 396 146 968 158 453 165 195 166 254 150 582 113 568 89 748 Canada.Etats-Unis . . . 100 681 117 655 128 056 132 731 145 349 151 474 147 769 107528 42 419 30 863 United States.Terre-Neuve . . 396 501 705 750 632 678 659 490 583 ... Newfoundland.
AMP.RIQUE CENT. 2* 25 423 27 750 30 630 33 830 31 700 36 400 35 800 36 800 34 500 ... CARIBBEAN." *
Mexique . . . . 21 223 23 451 26 326 28 734 26 178 27 468 24 882 24 800 23 300 ... Mexico.Honduras. . . . 413 472 752 681 691 721 704 848 628 ... Honduras.Nicaragua*. . . 504 718 754 1 378 3 116 5 112 6 514 7 502 6 879 ... Nicaragua.*Salvador (E.) . . 585 1 420 2 569 920 759 1 996 1 288 1 273 1 166 ... Salvador (E.)
AMJRIQUE DU S. * 39 900 40 300 44 000 49 000 54 600 58 400 55 400 49 000 43 000 ... SOUTH AMERICA. *
Argentine * . . 354 304 260 210 305 320 653 ... .... Argentine.*Br6sila . ... 8 162 6 947 6335 6739 7856 8 221 7321 7 125 4951 ... Brazil. 8
dont mines 3 592 3 925 4 425 4 615 4 467 4 607 4 483 5 468 4 599 .. of which mines.
Chili .. .... 8 272 7 739 8 482 9 145 10 247 10 433 8 206 5 827 5 404 5 300 Chile.Colombie . . .. 10233 12 115 13 755 16 196 17 730 19 655 20 404 18 557 17 589 18 350 Colombia.Equateur · . . 3 140 2 180 2 200 2 190 2 750 3 630 3 350 3 190 3 440 ... Ecuador.'
dont mines . .. 1 917 1 780 1 530 1 370 1 603 2 240 2 676 2 764 3 290 ... of which mines.
Guyane brit.i. . 948 1 003 1 120 1 197 1 197 1 112 1 000 910 ... ... Guiana, Brit.'s franc. (E.) 1 474 1 416 1 417 1 264 1 170 1 200 1 100 ... ... French.(E.)
P~rou ..... 3451 4740 6387 8097 8316 8 748 8 870 8013 6209 6500 Peru.Surinam . . 353 443 397 440 461 495 391 245 180 ... Surinam.'Venezuela .. 3 496 3 421 3 624 3 576 4 560 4 565 4 055 3 607 2 570 ... Venezuela. *
ASIE* (sans U.R.S.S.)S 66 500 79 700 89 800 104 300 110 000 . . . . . ASIA * (excl. U.S.S.R.).
Chine :Mandch. (.) (.) (4 700) (.) (.) (.) () (.) (.) (.) China: Manchur.tChypre (E.). . 214 653 736 910 510 * 424 ... ... ... Cyprus(E.).Cor6e *. . . 16 796 20 217 26 438 32 659* 33 550 . . . . . Korea. *Etats Malais f6d. 926 1 175 1 052 1 251 1 253 1 110 . . . Fed.Malay States.
· non f6d. 25 24 16 18 27 15 . . . Unfed. ,Formose * . .. 2650 3 300 * 3800 * 4500 Formosa.*Inde (brit.) . . 10 191 10 369 10 287 9995 * 9 800 9 000 8 893 8 096 7 846 5800 India.
Birmanie (46) (45) ( 31) 38 38 . . I Burma..Indesneerl.. . 2122 2 230 1 730 2 378 2 525 2 801 ... Netherl. Indies.

175
Tableau 90 (fin). Or. - Table, 90 (concluded). Gold.Production en kilogrammes. - Production in kilogrammes.
PAYS 1935 1936 1937 1938 1939 1940 1941 1942 *1.943 *1944 COUNTRY
ASIE (suite) ASIA (continued)Indochine. . ... 281 312 321 ... ...... ... Indo-China.
dont mines . . . 66 204 182 151 119 135; 72 .. ... .. of which mines.Japon ..... 18 321 22 235 22 500* 23 600* 26 000 Japan.Philippines. . . 14 053 18 577 22 300 28 095 32 352 34 185 36 100 Philippines.Sarawak* . . . 888 727 598 576 537 382 ... ... ... ... Sarawak.*
U.R.S.S. t * . . 120-148000) (151-187 000) ((I0-108 000) . . . . . . . U.S.S.R. t s *
EUROPE(sansU.R.S.S.). 16 750 16400 *17 400 *18 800 *18 000 . . . . EUROPE (xc. U.S.S.R.)Allemagne . . 185 236 250 269 . Germany.Bulgarie . . - -— 2 6 134 273 173 Bulgaria.Espagne*. . . 242 133 88 203 932 453 ... ... ... Spain.*Finlande . . . 144 153 125 141 135 159 . . . . Finland.France . . 2 849 2 665 2 066 2 711 . . . France.Italie. .. . 121 237 * 208 * 385 *418 . . Italy.Portugal . . . 102 136 192 185 304 . 35 ... ... Portugal.Roumanie . . 4671 4 977 5 465 4 912 4 667 3 814 3 187 *2 700 ... ... Roumania.Sude .5 616 4 925 6 010 7 282 6 723 6158 . Sweden.Tchcoslovaquie . 446 343 297 * 300 ' 292 282 6 250 6" 350 .... Czechoslovakia.Yougoslavie. 2 445 2 640 2 724 -2 436 2 224 ... ... . . . Yugoslavia.
OCANIE. * 39 820 49 910 56 320 65 300 68 820 70 500 64 500 . . OCEANIA.*
Australie .. .. 28 319 36 826 42 958 49 518 51 187 51 134 46 553 35 887 23 367 20200 Australia.Fidji . 209 527 775 2 873 3 400 3 500 3 700 3 100 Fiji Islands.Nouv.-Zande 5 034 5 012 5 131 4 631 5 450 5 655 5 319 5055 4 542 4 600 New Zealand. *Nlle-Guin6e * . 5723 6 873 6 754 7 353 7 664 9 169 7 800 NewGuinea.*Papoua. 533 674 705 928 1 123 ... ... ... ... ... Papua.
TOTAL San5 U.R.S.S. * 783 300 864 500 928 900 1005 900 107000 1000 000 1 120 000 1000 000' 800 000 *750 000 TOTAL, excl. U.S.S.R.*7
TOTAL ESTIMP ESTIMATED TOTAL,avec 1'U.R.S.S. s 903 000 1 016 000 1 073 000 1148 000 1 200 000 1 260 000 incl. U.S.S.R.'
Prix d'une once Price of one finefine: ounce:
enshillings Moy. 142/1 140/3 140/9 142/7 154/5 168/0 16810 16810 168/0 16810 Av. in shillingset pence XII 14111 141/8 139/9 148/10 168/0 168/0 168/0 168/0 168/0 168/0 XII and pence
en $ Moy. 35.00 35-00 35.00 35.00 35.00 35.00 35.00 35.00 35.00 35.00 Av. in $·XII 35.00 35.00 35.00 35.00 35.00 35.00 35.00 35.00 35.00 35.00 XIIi
Prix d'un kilo- Price of one kggramme fin: fine:en,sh, penceXII 226115 10 22711515 224114/I1 239/6/5 270/1/4 270/114 270/1/4 270/1/4 270/1/4 27011/4 XII in £ s. d.en $ XII 1125.27 1 125.27 1 125.27 1 125.27 1125.27 1 125.27 1 125.27 1 125.27 1 125.27 1125.27 XII in $en fr. suisses XII 3 442 4 870 4 860 4 939 4 887 4 871 4 961 4 970 4 970 4 970 XII in Swiss francs
SOURCES : Statistiques nationales officielles. - National official statistics. U. S. Bureau of Mines. Samuel Montagu & Co.Annual Bullion Review.
* Estimation ou chiffre provisoire. (E.) Exportations. * Estimate or provisional figure. (E.) Exports.t Chiffres non compris dans les totaux. t Figures not included in the totals.
Africue-Equatoriale frangaise, Afrique-Occidentale frangaise, 1 French Equatorial Africa, French West Africa, BritishGuyane britannique, Surinam: en partie ou en totalite, or brut. Guiana, Surinam: at least in part crude gold.
2 Amdrique Centrale : estimations donnees dans les Rapports 2 Central America: estimates given in the reports of the Directordu Directeur de la Monnaie E.-U.A., basees sur les importations of the Mint, U.S.A., based on U.S.A. imports of ore and bullionaux Etats-Unis de mineral et de m6tal en provenance de tous from all countries of Central America.les pays d'Amri que Centrale.
3 Bresil, Equateur : or des alluvions achete aux particuliers " Brazil, Ecuador: total of placers' gold purchased by the Cen.par la Banque Centrale et or extrait des mines, tral Bank and of gold mined.4 Asie : non compris la Chine, dont la production est estimde 4 Asia: not including China, the production of which is estimated
A plusieurs milliers de kg par an. at several thousand kg per annum.U.R.S.S. : la publication de chiffres officiels absolus a dtd 5 U.S.S.R. : the publication of official absolute figures was
interrompue en 1927. Vu le caractere contradictoire des diverses interrupted in 1927. Owing to rather wide divergencies in theinformations parues (principalement des chiffres relatifs), il n'est scattered data published (mainly relative figures), it is not possiblepas possible d'6tablir avec certitude une sdrie continue pour toute la to construct any accurate continuous series for the whole periodperiode prise en consideration. Les chiffres inseres au tableau under review. The figures in the table indicate a lower and aindiquent une serie inferieure et une serie superieure, etablies sur higher series computed as a result of a new scrutiny of thela base d'un nouvel examen des informations parues. available information.
Tchecoslovaquie: depuis 1939, i Slovaquie ,. 6 Czechoslovakia: since 1939, "Slovakia".7 Total mondial : depuis 1940, chiffres tres incertains. 7 World total : as from 1940, figures conjectural.

- 176 -
Tableau 91. NOMBRES-INDICES DE LA PRODUCTION INDUSTRIELLE.Table 91. INDEX NUMBERS OF INDUSTRIAL PRODUCTION. Base: 1929 1 I00.
Voir note generale a la page 185- See general note on page 185.
a. Indices generaux. - General Indices. b. Biens d'investissement (I.) - Biens de consom. cour. (L)P^riode ___________a. Inie generaux. — General Indices.__________________________ b. Investment Goods (I.) - Goods currently consumed (C.)Period Etats- Dane- Ftats-Unis Bulgarie Daneisark Suede
Chili Mexique U.R.S.S. Bulgarie Finlande Hongrie Irlande Sude U.S.A. Bulgaria Denmark SaedenC~~ ~~~~~~~~~~~~r ... Blanada Unienmark SeeChile Mexico U.S.S.R. Bulgaria nmark Finland Hungary Ireland Sweden
U.S.A. Denark I. C. L C. I. C. I. C.Moyenne 2 a
1929 . . . 100 100 100 100 100: 100 . 100 Idut 100 100 100 . . 100 100 100 1001930 . . . 85 83 101 . . . 108 d'export. 95 . 102 74 .90 . •. 111 107 99 i 1021931 ... 71 68 78 . i 1
0 0Export. 87 . 96 51 85 93 104 89 100
1932. . . 58 53 87 168 135 . 91 ind 82 . 89 31 75 . . 70 109 79 991933 . . . 60 63' 96 . 178; 154 . 105 1934-36 88 . 91 41 85 . . 83 122 84 1061934 . . . 73 68 105 96 1934/35 118 =100 99 . 110 49 87 1934/35194/35 101 128 109 1201935 . . . 81 79 120 106 260: . 100 125 96 107 . 123 63 i 97 =100- 100 112 135 123 1281936 . . . 90 94 124 112 3341 a)148 130 107 118 143 135 82 108 a150 :a136 117 141 133 1371937 . . . 100 103 132 124 372: 292 143 136 117 130 146 151 92 114 133 144 127 143 153 : 1471938 .. 90 81 137 123 4131 313 155 136 105 127 142 152 59 i 102 137 157 127 143 147 1421939 . . . 99 99 136 120 482: 344 164 146 93 '154 149 165 83 117 153 166 140 151 158 1481940 . . . '128 114 151 120 535: . 183 118 37 ' 163 149 152 105 124 152 187 106 127 163 1321941 . . . 77 147 156 125 194 113 39 *166 138 148 152 153 140 201 104 118 165 1161942 . . . '228 181 155 132 . 187 118 43 . 113 ... 211 i 170 156 191 118 115 173 1211943 . . . 273 217 154 ... . c)163 *119 48 . 116 ... 273 189 c156 c164 *119 *118 177 1151944. . . 267 *214 dl45 ... ... *267 :*184 : ... 117
dII I b) '• : I b) b A i 1939 VI .- 98 94 135 122 . 183 146 90 '138 . 156 75 114 202 181 135 155 158 146
IX . 101 105 132 124 . . 216 146 80 161 . 155 90 120 193 219 138 153 158 150XII. 108 113 151 116 . 152 144 38 172'. 160 103 127 98 159 136 151 165 159
1940 III . 111 104 137 115 144 136 22 *163 . 158 89 1 17 108 149 125 i 145 167 156VI . 125 112 156 119 . 173 115 39 *162 . 134 102 124 191 171 101 i 124 161 i 123IX . 141 117 151 125 . 235 III 43 *157 . 131 114 125 191 241 104 118 161 118XII. 144 127 153 119 . . 188 114 37 *169 . 134 126 135 121 196 107 122 164 121
1941 III . 153 138 155 120 . 149 106 49 *167 . 131 139 143 87 157 94 115 163 118VI . 175 149 162 122 . . 194 115 37 *159 . 129 154 155 167 197 116 116 164 114VII. 176 151 162 219 114 25 125 158 155 173 225 117 114 163 109VIII. 183 152 155 131 . : . 226 118 31 *161 . 125 158 157 187 231 120 116 165 110IX . 197 154 166 i 260 118 36 128 161 157 186 269 122 115 166 IIIX . 199 156 162 ) .'•. 284 114 34 129 166 159 208 293 120 109 166 113XI . 202 158 153 126 . . 228 110 33 *176 . 130 167 i 162 176 234 117 107 168 i 116XII. 208 160 160 . . 209 109 31 133 170 161 145 217 116 104 169 119
1942 I.. 217 165 152 121 108 38 130 178 163 80 126 108 109 167 116II. 216 166 150 135 . . 143 108 36 • 133 183 165 105 148 104 109 170 118III . 218 169 151 1 1 60 105 37' i 133 189 :165 124 165 99 109 168 119IV . 221 172 155 142 108 38 134 195 166 138 143 106 i 109 169 119V. . 217 174 153 133 176 113 37 . . 134 200 165 171 176 113 III 169 120VI. 222 175 1591 209 114 43 1 136 206 163 231 206 116 111 173 122VII 229 179 160 221 III 46 138 211 166 220 221 115 108 175 122VIII 233 185 162 3 12 29 210 1614 49 138 220 170 20 21 121 109 173 123IX 235 189 158 231 116 471 138 227 173 183 237 122 112 174 124X .239 195 157 233 116 48 138 236 177 153 243 121 112 176 1124XI . 239 200 155 130 212 118 43 1. 117 .139 242 181 1124 222 122 114 177 123XII. 251 203 154 1 185 119 43 139 248 1682 145 1 90 121 1 16 180 123
1943I . 255 206 143 120 119 481 138 255 184 99 122 119 119 179 119
II 268 211 137.138 12 122I
~~~II. .~2685 211 137 1*^~138 1 45 120 49 139 261 187 131 147 118 18 181 120III.26 269 14 148 1 163 121 50 ' ' 138 266: 187 130 168 120 1 1 179 119IV 274 215 150 . 1. 46 120 54 1 139, 270 188 153 145 124 118 179 119V. 268 217 149 *133 171 121 52 138 272 189 194 168 125 119 178 116VI 267 215 160 192 119 40 136 271 190 161 196 118 120 176 114VII 270 218 161 *202 116 42 135 273 190 *223 :*199 116 118 172 112VIII. 277 220 164 *141 . :. . 115 45 . 133 277 191 110 118 169 110IX . 281 222 1631 115 48 134 279 192 117 114 173 110X. . 283 225 154 . . 118 50 111 135 283 192 120 114 176 113XI 2583 225 157 . 1. 119 49 . 116 136 285 194 124 114 178 114XII. 282 219 1581 119 46 ' 136 277 187 124 114 179 115
1944 I . . 275 221 136 119 471 135 280 189 1 119 116 179 111II. . 280' 222 144 1 121 48 . 119 136 278 1190 119 122 181 113III . 283 219 156 123 51 136 276 188 120 122 180 116IV . 270 217 15 .553 136 273 185 177 118V. . 272 215 158 5 . 1 135 272 182 174 116VI. 267 214 160 1 . 40 136 268 182 176 116VII. 262 209 159 . 31 134 263 177 1 73 113VIII. 264 211 1 . 33 1 1133 264 181 170 1 114IX . 260 209 165 1" .i . . 321 1 134 259 181 115X. . 260 211 165 138 261 182 121XI. 255 211 172 . . . . 40 . 186 1 2 123XII. 256 211 141 260 1 186 . ; . 25
a) VII-XII. - b) Moyenne trimestrielle - Quarterly average. - c) INVII. d) I-XI.1 Canada: depuis 11/940, base 1935-1939 -100; moyenne cor- 1 Canada: since 1/1940, basis 1935-1939 1 00 corresponding
respondante pour 1939 : 105. - U.R.S.S. indice calcul6 par average for 1939: 105. - 2 U.S.S.R. : as calculated by the Institutl'institut fur Konjunkturforschung (Berlin). Suede : chiffres fir Konjunkturforschung (Berlin). - 3 Sweden : yearly figures,annuels, Kommerskollegium; chiffres mensuels, Industriforbund. - Kommerskollegium; monthly figures, Industriforbund. Hungary:4 Hongrie : des 1939, y compr. a production dans territ. rattachs. as from 1939, including production in the incorporated territories.

- 177 -
Tableau 92. NOMBRES-INDICES DE LA PRODUCTION INDUSTRIELLE.Table 92. INDEX NUMBERS OF INDUSTRIAL PRODUCTION.
Voir Note generale aux tableaux 91 et 92 a la page 185. See General Note on Tables 91 and 92 on page 185.Signes employes dans les tableaux 91 et 92. Signs used in Tables 91 and 92.
Variations saisonnieres: I dlimindes; Apartiellement dliminees. I Adjusted for seasonal variation. A Partly adjusted.& Serie calculie par le Service d''tudes economiques de la S. d. N. & Series calculated by the Economic Intelligence Service ol theL.o.N.* Chiffres provisoires ou partiellement estimes. * Figures provisional or partly estimated.
CANADA (Dominion Bureau of Statistics).
Indus- Denres Pneus, Chus- B ET AIER F ET CIE Energie Bti-Rasf* INDICE . * Ltood W PAPER IRON AND STB,+Base GENRAL Mines tries alim. Tabac etc. sures Textiles WOOD A PAPER IRON AND STEEL iectr. ment Basis
1926 JuE Mining Manu- Food. Tobacco Tyres, ootw T apler lanche Total Auto- Electric Build- 1926INDEX , Footwear Total p Total !mobiles power ingfactures stuffs etc. Newspr. Planks mobiles power ing _______
Poids 100 11.1 67.5 23.5 2.7 2.9 2.7 2.0 15.7 1 7.6 5.7 12.4 \ 3.3 5.6 15.8 Weights
1934. .. 94 134 93 88 129 82 93 . 100 138 64 60 57 175 36 19341935 . .. 104 149 101 87 141 75 109 . 105 147 62 87 ' 85 193 49 19351936 . 114 163 114 104 146 75 110 124 169 82 96 79 211 46 19361937 . . . 127 190 123 104 173 87 116 138 139 194 i 86 113 97 231 58 19371938 . 115 195 107 100 178 76 109 III 105 139 78 91 80 218 52 19381939 . 126 215 119 110 183 83 129 129 122 153 ' 98 97 78 238 51 19391940 . .. 153 238 147 126 199 82 a)128 198 146 182 114 155 132 252 88 1940
PRODUITS D'ORIOINE V¥OLLTALE PRODUITS D'ORIOINE ANIMALE BOlS ET PAPIER
Base INDICE Indus- CROP PRODUCTS ANIMAL PRODUCTS WOOD AND PAPER Fer et Energie Bti Basis1935- GENERAL Mines tries I Chaus- : Textiles Papier acier 6lectr.19359 1 in 100 ent 19395
jMj,, GENERAL Manu- M~inot. Cauthouc bactage Textiles iro and Electric
1940 . 128 138 124 . 113 05 1 115 . 62 131-11e 3 1_57 115 16_2 11940Total Minot. ;8 Caouthouc Taa1 103 . 100 1939
1941 . 177 215 175 b)140i 143 104 138 b)172 145: b)172 156 135 114 272 128 178 19411942 228 219 243 136 146 c) 9 165 152 145 149 162 131 106 455 142 119 19421943 . 273 242 294 147 172 . 181 151 149 165 154 123 99 592 155 89 19431944 267 226 293 163 a)168 186 166 a)148 a)201 135 121 100 582 154 a)113 1944
I 1941 156 160 151 115 105 146 143 138 131 109 223 117 241 11941I . 156 156 153 . 1532100 132 . 125 141 131 112 228 116 220 II
III . . 153 156 157 133 101 151 117 i 149 134 115 232 116 135 IIIIV . 161 150 164 153 104 131 . 130 158 132 i 109 241 126 1076 IVV. 16 . 3 155 165 170 104 117 133 160 127 106 249 129 178 VVI . 175 180 169 190 97 109 138 162 128 107 259 123 289 VIVII. . 176 225 176 181 105 118 153 161 137 114 274 131 130 VIIVIII 183 258 179 145 99 135 126 155 138 114 284 126 144 VIIIIX 197 284 191 137 120 121 153 151 130 164 170 149 122 299 136 165 IXX 199 300 192 138 98 119 159 139 150 181 166 141 119 310 137 144 XXI . 202 291 200 136 99 107 148 196 196 172 163 133 114 328 138 128 XIXII. . 208 261 207 149:: 158 87 160 203 206 170 151 141 124 339 139 185 XII
I 1942 217 259 223 149 152 27 i174 160 178 154 152 138 130 395 143 119 11942II . . 216 248 226 147 1652 16 180 191 143 142 151 148 128 396 138 98 IIIII 218 234 226 141 164 11 174 145 130 156 160 148 123 352 142 145 IIIIV . · 221 227 231 139 181 7 159 198 128 152 164 138 108 399 144 143 IVV. . 217 211 233 124 119 3 135 152 123 142 163 133 94 423 146 96 VVI . . 222 196 236 118i 120 8 128 116 134 148 159 131 95 442 147 157 VIVII . 229 213 246 119 136 3 133 117 133 154 164 129 94 472 146 119 VIIVIII 233 217 249 126 143 I 141 127 115 131 167 121 98 490 143 114 VIIIIX. . 235 226 253 131 127 4 156 133 119 134 168 116; 105 510 140 128 IXX 1 239 196 263 143 114 1 88 136 144 148 169 127 102 517 139 98 XXI . 1 239 192 263 144 118 200 170 194: 162 162 117 i 96 514 137 107 XIXII. . 251 210 276 1461 207 208 183 201 1 169 162 ! 25 101 542 140 102 XII
I 1943 255 224 279 168 192 10 201 1341 180 119 151 1061 98 561 143 95 11943II . 268 218 291 171 207 222 164 145 142 149 121 102 577 142 141 IIIII. . 269 245 294 1467 1 99 226 145 135 155 154 124 103 589 147 91 IIIIV . . 274 248 297 156 190 i i 201 164 131 160 155 116! 89 601 153 84 IVV . . 268 255 287 139 169 158 163 130 155 165 119 95 572 161 91 VVI . . 267 245 286 128 167 . 126 144 136 163 160 132 101 571 162 74 VIVII. . 270 253 285 126 167-i . 124 136 148 167 157 127 102 574 167 70 VIIVIII . 277 254 291 132 148 . 151 131 119 160 157 127 101 588 164 85 VIIIIX . . 281 243 299 134 147 . 162 126 120 165 156 127 103 615 161 78 IXX .. 283 240 304 144' 130 179 123 143 164 151 114 9 7 624 151 83 XXI . . 283 232 307 149i 1301 . 1 203 168i 197 i 203 150 126 98 619 149 70 XIXII. . 282 245 308 155 218 218 2111 204 221 147 1632 103 609 154 108 XII
I 1944 275 250 309 172 200 228 1 72 184 211 143 114; 102 606 156 70 I11944II 280 256 305 176 218 . 224 172 155 233 138 125 110 600 154 114 IIIII. . 283 263 301 183 205 228 160 144 23 6 151 125 105 588 155 202 IIIIV . . 270 248 291 151 180 1 . 42 194 129 208 143 115 92 574 153 140 IVV. . . 272 239 297 153 158 1 535 151 136 213 139 119 98 603 165 109 VVI . . 267 226 292 151 169 150 18 1 142 1 99 135 121 97 590 160 112 VIVII. · 262 225 288 1 47 149 132 1 49 130 187 131 113; 95 583 155 99 VIIVIII . 264 215 292 156 158 179 125 125 176 130 122 102 593 156 92 VIIIIX . 260 206 285 160 144 185 143 126 167 121 116 100 574 153 104 IXX. . . 260 209 286 162 126 . 189 129; 149; 169 133 129! 97 573 152 113 XXI . . 255 192 285 167 138 200 201 212 214 134 125 98 558 149 93 XIXII. · 256 189 284 174 220 244 128 126 101 547 145 ... XII
a)-c) Moyenne - Average a) I-XI; b) IX-XII c) I-IX.
12

- 178 -
Tableau 92 (suite). Nombres-indices de la production industrielle (par groupes d'industries).
!TATS-UNIS' - UNITED STATES' (Federal Reserve Board). Base - Basis : 1935-1939.
Charbon: Mtie ferreux etc.TOTAL bitu- Pptrole et cier achi- uto- Navires on- moie
M~taux~ No Iron I Avions Non- I Stone,Total m Petro- Total Durable: nery Total mobiles Shipbldg: forim-mineux : Metals durable and Steel Aircraft ferrous glass,
: nuileum oo toreBit. Coal metals etc.
Poids 100.0 15.201 3.44 8.70 2.19 84.80 37.93 146.87 11.00 10.81 5.92 4.79 0.53 0.25 2.81 4.39 3.00
1929 . . . 110 107 135 86 134 110 132 93 133 130 134 98 . 136 146 1101930 . . . 91 93 118 77 101 90 98 84 97 100 91: 103 . 106 105 961931 ... 75 80 1 96 73 67 74 67 79 61 66 62 73 83 76 771932.. 58 67 78 67 35 57 41 70 32 43 38 58 32 52 51 511933 ... 69 76 84 77 50 68 54 79 54 50 48 46 35 60 63 541934 .. 75 80 90 78 58 74 65 81 61 69 69 58 42 62 64 641935 . 87 86 94 85 73 87 i 83 90 81 83 93 104 i 68 48 80 85 771936 . .. 103 99 110 94 102 104 108 100 114 105 110 114 97 76 104 105 1031937 . .. 113 112 112 109 127 113 122 106 123 126 123 121 111 105 122 113 1141938 . . 89 97 88 104 89 87 78 95 68 82 72 67 98 97 80 90 921939 . .. 109 106 99 108 113 109 109 109 114 104 1031 94 127 175 113 106 1141940 . . . 125 117 116 116 134 126i 139 115 147 136 145 118 195 429 139 116 1241941 . . 162 125 129 : 120 149 168 1 201 142 186 221 245 152 518 I 103 191 134 1621942 . . . 199 129 145 118 148 212 279 ; 158 199 340 464 155 . 214 134 1681943 . . . 239 132 i 147 128 126 258 360 176 208 443 735 .222 267 129 1731944 . . *235 *140 156 i 143 i*113 *252 *353 *171 206 *439 *719 1 231 *259 *125 *164
1940 III 114 118 \ 110 120 133 113 118 109 107 123 128 I111i 158 304 126 112 119VI . 123 119 i 118 i 116i 134 124 134 115 152 130 135 113 173 \ 382 126 111 119IX . 129 117 121 114 127 132 151 116 169 143 160 125 228 523 147 122 126XII. 140 119 117 114 147 144 1 166 126 174 166 179 131 ! 275 660 168 129 136
1941 I . 143 120 119 114 148 147 1 172 127 180 171 193 142 297 715 173 130 143II. . 147 119 116 113 148 152 i 178 131 179 181 207 ! 153 325 777 179 128 148III 152 126 150 112 148 156 - 184 133 185 191 213 152 358 809 183 128 151IV . 149 96 22 113 149 159 186 ! 137 182 201 204 134 i 379 i 865 188 132 155V. 160 121 127 114 151 167 i 198 142 184 215 237 165 411 932 196 133 162VI 164 127 : 133 • 120 ? 151 170 203 144 185 224 253 1 175 465 992 194 135 168VII 166 126 130 119 151 173 ! 208 ! 144 186 228 267 183 517 i 1 072 198 139 168VIII. 167 128 138 i 119 148 174 209 146 185 237 257 153 568 1i 202 195 142 171IX 169 132 146 124i 145 176 212 146 187 242 261 146 617 1 311 198 138 170X. 172 134 146 127 146 179 219' 148 192 248 286 ! 161 703 1 417 192 137 170XI 174 133 145 128 147 182 220 151 192 248 293 158 723 1 487 197 135 169XII. 176 133 i 144 i 129 i 152 184 225 150 191 263 298 138 \ 847 1 1 662 200 136 169
1942 I . 181 133 - 144 129 i 146 189 235 152 192 277 330 1 143 i197 136 169II. 183 1 33 1 41 127 ' 150 192 241 i 153 194 291 339 127 . 199 138 169III . 186 126 140 115 154 196 250 - 153 200 305 357 128 204 135 170IV 189 125 150 109 153 200 257 154 199 313 380 130 205 134 170V. 191 126 ! 147 111 i 156 203 264 153 200 322 412 139 200 135 170VI 193 127 144 113 158 205 272 i 152 197 333 440 147 i 206 135 169VII. 197 126 141i 112i 155 210 278 I 154 196 340 471 153 205 136 162VIII. 204 130 140 121 152 217 290 158 197 356 506 165 i 216 134 163IX 208 131 150 120 145 222 299 161 199 365 539 172 223 130 163X. 215 129 145 121 140 230 311 165 207 380 567 177i 230 133 167XI 220 130 1541 121 133 236 319 168 204 392 600 185 239 132 170XII. 223 127 143 121 133 240 328 169 200 407 630 191 . : . 242 130 173
1943 I . . 227 125 ! 145 i 118 I 130 245 i 337 171 204 417 653 i 198 . . 255 123 180II. 232 131 i 157 i 121 ' 131 250 i 344 ! 174 207 426 673 i 203 1 . . 257 127 178III 235 133 161 122 131 253 351 174 210 436 692 204 260 129 175IV 237 131 151 124 130 256 356 175 209 441 717 206 259 130 175V. 239 129 143 125 129 258 359 176 208 443 729 211 264 133 175VI 237 117 103 124 128 258 ; 358 177 201 441 743 215 262 128 175VII 240 134 i 155 I 128 1 128 259 ' 360 i 177 204 440 754 i 220 ! . i 256 128 173VIII. 242 135 153 131 123 261 i 365 178 210 445 762 232 . 264 130 173IX 244 138 155 136 124 263 368 i 179 214 451 764 239 277 129 168X. 247 136 144 137 123 266 374 179 215 458 780 247 286 128 171XI 247 133 131 139 124 268 376 180 210 463 786 248 289 136 168XII 241 137 156 1 136 1 124 260 1 365 174 200 453 763 240 277 137 169
1944 I . . 243 139 i 161 137 124 262 i 369 176 208 461 754 '244 285 133 168II. . 244 142 162 i 139 i 127 262 367 i 177 212 458 746 238 285 131 168III · 241 139 155 138 126 259 364 175 214 452 734 233 287 129 167IV . 239 140 155 I 139 i 122 256 i 361 i 172 213 445 730 : 232 292 126 165V. . 236 143 159 142 120 253 356 169 210 437 726 226 279 124 161VI . 235 142 158 143 120 251 354 169 204 442 716 228 i 263 127 168VII. 230 139 151 142 117 246 347 165 202 435 704 223 244 124 165VIII. 232 142 154 146 114 248 348 168 203 434 707 229 i 245 127 162IX . 230 143 151 149 113 246 : 342 168 202 427 695 226 238 120 15.9X.. 232 143 152 148 i 111 248: 344 ' 169 206 428 703 229 233 120 161XI . 232 143 155 i 148 112 249 341 173 201 422 698 228 : 234 122 160XII. 232 137 138 146 111 249 343 173 198 431 708 233 229 122 163
a Au cours de la guerre, certains des indices ont perdu une 1 During the war, some of the individual indices have lost muchpartie de leur signification anterieure, a la suite des changements of their previous meaning because of the shifts that have occurredsurvenus dans la production. II en est particulierement ainsi pour in production. This applies more particularly to the group " auto-le groupe ( automobiles)), car plus de la moiti6 de la production de ce mobiles ", since more than half of the output of this group consistsgroupe consiste actuellement en avions, canons et autres articles. at present of aircraft, guns and other products.
2 Poids, de 1935 A 1938: 4,31. 3 Chantiers prives. 2 Weight, from 1935 to 1938: 4.31. " Private yards.
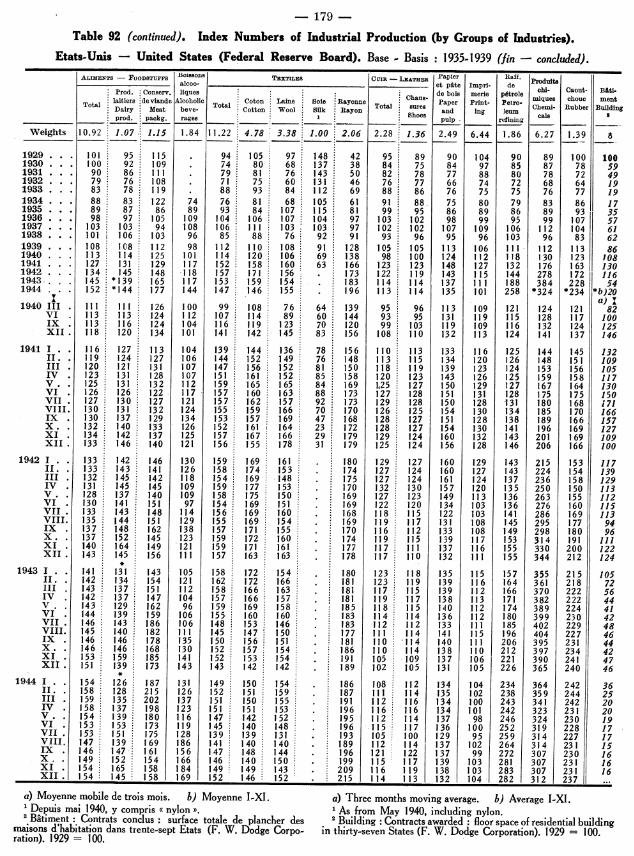
- 179 -
Table 92 (continued). Index Numbers of Industrial Production (by Groups of Industries).
Etats-Unis - United States (Federal Reserve Board). Base - Basis : 1935-1939 (fin - concluded).
ALIMENTS - FOODSTUFFS BOissOns TEXTILES C IR - LEATHER Papier Raff. rdalcoo- —i_________ et pate Imprl- de tt
:Prod. Conserv. liques: -: debos merie patrole chi- Caout- BAti-: Chaus- de bois merie p~trolemiques chouc mentlaitiers ideviande Alcoholic Coton Laine Sole Rayonne T Paper Print- Petro- hem Tota ToMeatlhe Total lures ndem lugberBeidin" : Dairy : Meat beve- Cotton Wool Silk Rayon h o and ing leum '__
p___________________ prod. pacg. rages __________________: i pulp. refining
Weights 10.92 1.07 1.15 1.84 11.22 4.78 3.38 1.00 2.06 2.28 1.36 2.49 6.44 1.86 6.27 1.39 $
1929 . 101 95 115 . 94 105 97 148 42 95 89 90 104 90 89 100 1001930 . . 100 92 109 74 80 68 137 38 84 75 84 97 85 87 78 591931 .. . 90 86 II . 79 9 81 76 143 50 82 78 77 88 80 78 72 491932 . .. 79 76 108 . 71 75 60 131 46 76 77 66 74 72 68 64 191933 . .. 83 78 119 88 93 84 112 69 88 86 76 75 75 76 77 191934 . .. 88 83- 122 74 76 81 68 105 61 91 88 75 80 79 83 86 171935 . . . 89 87 86 89 93 84 107 115 81 99 95 86 89 86 89 93 351936 . .. 98 97 105 109 104 106 107 104 97 103 102 98 99 95 99 107 571937 . . . 103 103 94 108 106 11iI 103 103 97 102 102 107 109 106 112 104 611938 . . . 101 106 103 96 85 88 76 92 91 93 96 95 96 103 96 83 621939 . . 108 108 112 98 112 110 108 91 128 105 105 113 106 III 112 113 861940. . . 113 114 125 101 114 120 106 69 138 98 100 124 112 118 130 123 1081941 . . . 127 131 129 117 152 158 160 63 166 123 123 148 127 132 176 163 1301942... 134 145 148 118 157 171 156:. 173 122 119 143 115 144 278 172 1161943 .. 145 139 165 117 153 159 154 . 183 114 114 137 111 188 384 228 541944 . . . 152 *144 177 144 147 146 155 . 196 113 114 135 101 258 *324 *234 *b)20
I : i : a) I1940 III 11i I1I 126 100 99 108 76 64 139 95 96 113 109 121 124 121 82
VI 113 113 124 112 107 114 89 60 144 93 95 131 119 115 128 117 100IX . 113 116 124 104 116 119 123 70 120 99 103 119 109 116 132 124 125XII 118 120 134 101 141 142 145 83 156 108 110 132 113 124 141 137 146
1941 I . 116 i 127 113 104 139 144 136 78 156 110 113 133 116 125 144 145 132II. 119 124 127 106 144 152 149 76 148 113 115 134 120 126 148 151 109III 120 121 131 107 147 156 152 81 150 118 119 139 123 124 153 156 105IV 123 131 128 107 151 161 152 85 158 120 123 143 126 125 159 158 117V. 125 131 132 112 159 165 165 84 169 125 127 150 129 127 167 164 130VI 126 126 122 117 157 : 160 163 88 173 127 128 151 131 128 175 175 150VII 127 130 127 121 157 162 157 92 173 129 128 150 128 131 180 168 171VIII 130 131 132 124 155 159 166 70 170 126 125 154 130 134 185 170 166IX 130 137 129 134 153 157 169 47 168 128 127 151 128 138 189 166 157X. 132 140 133 126 152 161 164 23 172 128 127 154 130 141 196 169 127XI . 134 142 137 125 157 167 166 29 179 129 124 160 132 143 201 169 109XII 133 146 140 121 156 155 178 31 179 125 124 156 128 146 206 166 100
1942 1 - 133 142 146 130 159 169 161 1 . 180 129 127 160 129 143 215 153 117II. 133 143 141 126 158 174 153 . 174 127 124 160 127 143 224 154 139III 132 145 142 118 154 169 148 175 127 124 161 124 137 236 158 129IV 131 145 145 109 159 177 153 . 170 132 130 157 120 135 250 150 113V. 128 137 140 109 158 175 150 . : 169 127 123 149 113 136 263 155 112VI 130 141 151 97 154 169 151 . 169 122 120 134 103 136 276 160 115VII 133 143 148 114 156 169 160 . 168 118 115 122 103 141 286 169 113VIII 135 144 151 129 155 169 154 . i 169 119 1 117 131 108 145 295 177 94IX 137 148 162 138 157 171 155 170 116 112 133 108 149 298 180 96X. 137 152 145 123 159 172 160 174 119 115 139 117 153 314 191 111XI 140 164 149 121 159 171 161 177 117 III 137 116 155 330 200 122XII 143 145 156 111 157 163 163 178 117 1 110 132 II 155 344 212 124
1943 I .. 141 131 143 105 158 172 154 180 123 118 135 115 157 355 215 105II. 142 134 154 121 162 172 166 . 181 123 119 139 116 164 361 218 72III . 143 137 151 112 158 166 163 . 181 117 115 139 112 166 370 222 56IV . 142 137 147 104 157 166 157 181 119 117 138 113 171 382 222 44V. . 143 129 162 96 159 169 158 . 185 118 115 140 112 174 389 224 41VI . 144 139 159 106 155 160 160 . 183 114 114 136 112 180 399 230 42VII. 146 143 186 106 148 153 ; 146 . 1 183 112 112 133 11 185 402 229 48VIII. 145 140 182 Ill 145 147 150 . 177 111 114 141 115 196 404 227 46IX . 146 146 178 135 150 156 151 181 110 '114 140 111 206 395 231 44X. . 146 146 168 130 152 157 154 . 186 110 114 138 110 212 397 234 42XI. 153 159 185 141 152 153 154 . 191 105 109 137 106 221 390 241 47XII 151 139 173 143 143 142 142 1 . 189 102 105 131 105 226 365 240 46
1944 I 154 126 187 131 149 150 154 1 . 186 108 112 134 104 234 364 242 36II. 158 128 215 126 152 151 159 . 187 Il 1 114 135 102 238 359 244 25III 159 135 202 137 151 150 155 . 191 112 116 134 100 243 341 242 20IV 158 137 198 123 151 151 153 . 196 116 116 134 101 242 323 231 20V. 154 139 180 116 147 142 152 . 195 112 114 137 98 246 324 230 19VI 153 153 173 119 145 140 148 . 196 115 117 136 100 252 319 228 17VII 153 151 175 128 139 139 131 . 193 105 100 129 95 259 314 227 17VIII. 147 139 169 186 141 140 1 40 189 112 114 137 102 264 314 231 15IX - 146 147 161 156 147 148 144 196 121 : 122 137 99 272 307 230 16X . -149 152 154 166 146 140 150 199 115 117 139 103 281 307 231 16XI . 154 165 158 184 149 149 143 209 116 119 138 103 283 307 231 16XII. 154 145 158 169 152 146 152 215 114 113 132 104 282 312 237
a) Moyenne mobile de trols mois. b) Moyenne I-XI. a) Three months moving average. b) Average I-XI.'Depuis mai 1940, y compris ( nylon ). o As from May 1940, including nylon.
Btiment : Contrats conclus: surface totale de plancher des 2 Building :Contracts awarded: floor space of residential buildingmaisons d'habitation dans trente-sept Etats (F. W. Dodge Corpo- in thirty-seven States (F. W. Dodge Corporation). 1929 = 100ration). 1929 = 100.

180 -
Tableau 92 (suite). Nombres-indices de la production industrielle (par groupes d'industries).
CHILI - CHILE (Direcciobn General de Estadistica). Base - Basis : 1927-1929.
IsDiCE Indas- Filte d Chaus- Lumidre, Textiles^6 Ittm.2Carton Sce Bre Tbc fre Mns Build. ]-
GENERAL tries Verre Ciment Drap laine sores Papler Paper Scre Bire Tabac forceINDEX Mann- Glass Cement Cloth Woollen Foot- Paper oards Sugar Beer Tobacco Light, i Base - Basis
_ factures _______ ______ yarn wear ________ _______ _______ ________ power _______ 1933/36 1938
1929 . . . 117 117 140 122 109 124 III 120 142 137 116 107 110 117 . 9291930 . . . 118 117 137 136 110 154 105 142 173 137 123 103 121 83 . 80 19301931 91 87 69 86 75 228 57 114 67 117 81 78 114 57 35 19311932 9 02 99 80 95 105 354 63 210 109 107 82 99 114 31 . 45 19321933 .. . 112 109 112 117 143 315 59 244 142 131 88 99 126 38 . 59 1933
1934 . . . 123 119 96 171 176 329 70 246 123 131 100 104 143 62 . 106 19341935 . . . 140 137 130 240 245 369 69 281 130 145 130 108 157 71 94 113 19351936 . . . 145 141 122 208 261 282 66 291 107 157 139 113 169 72 106 97 19361937 . . . 153 147 124 264 238 254 64 308 112 164 158 124 190 100 122 113 19371938 . . . 160 153 127 306 208 289 65 402 139 177 139 123 201 88 117 100 1938
1939 . . . 158 151 82 287 203 230 73 388 143 170 154 113 204 87 120 127 19391940 . . . 176 167 132 323 247 265 84 486 138 174 175 122 227 95 134 125 19401941 182 171 176 303 278 270 78 524 142 166 164 133 246 109 140 135 19411942 . . 181 169 179 307 288 280 69 485 138 198 143 122 256 105 143 115 19421943 . . . 179 163 158 315 283 296 73 470 100 158 148 127 278 *103 152 133 19431944 . . . 185 168 168 305 322 302 85 431 109 174 147 118 290 *102 168 ... 1944
1941 I 163 156 113 329 209 183 53 478 187 159 208 124 211 93 116 157 1.41II. 170 164 187 318 263 261- 73 494 175 128 198 139 211 103 128 123 IIIII 180 173 161 322 271 345 81 511 175 187 175 125 223 104 135 184 IIIIV 189 180 215 295 288 269 82 547 110 196 166 130 241 110 154 125 IVV. 180 168 182 284 264 299 88 538 104 169 132 125 252 110 140 III VVI 188 175 154 282 272 286 80 555 132 198 146 131 270 III 139 88 VIVII 189 174 164 313 281 310 82 536 117 176 138 129 279 100 144 150 VIIVIII. 180 163 204 228 272 252 78 480 79 163 153 124 286 III 135 100 ViIIIX 194 184 210 304 300 273 82 499 149 192 178 141 255 120 153 104 IXX. 189 180 168 334 301 281 83 536 139 182 141 140 245 112 144 190 XXI 179 168 197 354 303 247 76 543 177 127 165 134 240 118 146 128 XIXII 186 178 156 270 307 235 74 573 165 189 163 134 233 118 144 159 XII
1942 1. 178 170 158 374 245 177 53 526 167 206 169 125 221 109 119 132 I.42II. 175 168 163 329 307 280 65 437 157 199 178 107 222 105 134 132 IIIII 176 165 147 337 306 253 75 484 129 178 162 104 238 97 137 134 IIIIV 181 169 186 305 296 289 80 537 141 197 124 119 249 109 144 65 IVV. 178 165 172 285 307 326 75 486 159 201 100 114 263 112 153 81 VVI 185 169 155 263 288 292 73 548 129 212 III 122 285 III 141 70 VIVII 186 168 166 278 285 351 74 412 143 221 84 132 296 96 142 122 VIIVIII. 188 172 218 307 293 327 72 470 125 199 134 131 287 108 153 136 VIllIX 184 171 209 315 263 249 75 440 129 191 153 131 266 107 144 130 IXX. 183 171 192 301 308 311 72 501 108 185 146 124 255 102 156 113 XXI 181 170 201 302 283 249 57 490 135 194 158 127 245 101 148 136 XIXII 180 170 177 285 274 258 55 483 132 188 195 125 242 106 147 129 XII
1943 1 . 167 156 137 339 241 268 30 445 72 150 201 131 229 107 127 118 1.43II. 160 148 140 323 283 223 60 453 103 113 160 115 235 100 135 121 IIIII 173 159 107 350 278 303 69 466 78 161 124 122 254 103 143 108 IIIIV 175 160 160 307 289 251 78 473 112 141 115 136 267 106 159 98 IVV. 173 156 153 221 298 315 75 471 143 147 113 137 279 105 152 97 VVI 186 166 180 327 291 337 76 470 76 172 113 126 308 105 150 149 VIVII 188 167 160 323 309 298 81 429 76 187 107 119 320 96 165 153 VIIVIII. 191 166 165 311 295 347 81 418 96 181 139 117 341 100 154 134 VIllIX 190 170 179 306 291 287 82 527 114 160 166 123 316 101 157 136 IXX . 179 165 186 335 276 280 83 503 87 155 168 120 269 105 163 193 XXI . 183 171 176 295 278 281 84 504 93 180 177 128 260 102 156 164 XIXII. 185 172 164 346 257 356 85 481 109 142 199 148 260 106 161 127 XII
1944I. . 159 144 171 296 196 215 53 408 125 103 179 143 245 *96 126 189 1.44II. . 168 156 156 333 325 287 75 293 99 178 152 102 242 90 155 112 IIIII . 182 170 127 294 329 291 89 419 134 212 137 112 260 88 161 145 IIIIV . 180 164 125 310 325 343 81 474 130 178 143 109 277 110 175 104 IVV. . 184 163 180 288 322 317 87 409 75 176 123 III 313 109 165 212 VVI . 186 164 170 309 316 318 89 481 103 170 91 III 325 105 173 127 VIVII 186 162 185 294 342 345 85 421 43 161 94 109 328 101 172 170 VIIVIII 192 169 168 280 345 332 90 422 44 172 138 116 332 102 177 ... VIIIIX 192 176 205 329 326 293 96 457 77 166 167 117 295 103 184 ... IXX 193 176 192 251 334 294 95 476 194 173 170 131 298 107 173 ... XXI 200 185 181 323 333 306 92 460 158 207 177 128 291 105 177 ... XIXII 195 181 159 350 344 288 90 452 129 191 194 123 280 113 180 ... XII
'L'indice general ne comprend ni les mines, ni le batiment, 'The general index does not cover mining, nor building, norni certaines branches de 1'industrie textile comprises dans l'indice certain branches of the textile industry included in the specialspecial pour les textiles. index shown for textiles.
2Batiment : surface des bStiments pour lesquels des autori- 2Building: area of buildings for which permits have beensations de construire ont ete accordees ; avant 1938, huit com- granted ; before 1938, eight municipalities; 1938-39, ten; 1940-munes ; 1938-39, dix 1940-44, douze a treize. 44, twelve to thirteen.

181 -
Table 92 (continued). Index Numbers of Industrial Production (by Groups of Industries).
MEXIQUE - MEXICO (Banco de Mexico). Base - Basis : 1929.
MIRES ET MATAUX PATROLE PRODUCTION MANUFACTURIAREMINING AND METALS PETROLEUM MANUFACTURING INDUSTRIES
____INDI)_ICE -_ _____ -________-___ _______________________________ -BicElectri-
GENERAL Or, Autres Raffi- aBire, C6INDEX ent x Brut neries tabac Antres Eletri
ot Gold, Other Crude Refi- oir, Beer Others eityilver metals neries : tobacco
Poido 100 37.6 15.4 22.2 10.2 14.1 29.4 12.2 4.4 7.8 5.0 8.7 Weights
1934 96 68 74 63 85 145 106 116 95 98 106 112 19341935 ..... 106 71 76 67 89 144 134 144 158 121 108 126 19351936 . .... 112 74 79 70 92 154 141 157 162 139 87 137 19361937.....124 84 86 81 105 178 147 153 149 163 109 151 19371938.. ... 123 85 85 85 86 189 145 144 142 170 108 153 19381939.. ... 120 77 81 74 96 181 144 127 136 192 121 151 19391940 . ... 120 75 87 67 99 162 154 136 122 210 137 154 19401941. .... 125 76 81 73 96 177 164 150 126 214 153 154 19411942. .... 132 87 86 87 78 172 180 163 122 247 169 160 19421943.. . ... 87 83 91 79 186 ... ... ... ... ... 167 1943
1940 I-III .. 115 76 82 71 90 151 144 127 113 195 133 158 1940 I-IIIIV-VI.. 119 71 87 59 92 161 161 136 128 239 127 154 IV-VIVII-IX . 125 86 100 77 105 162 157 144 124 204 144 151 VII-IXX-XII.. 119 67 77 61 107 175 153 137 121 203 143 154 X-XII
1941 I-III . 120 81 96 70 87 163 152 137 129 195 140 153 1941 I-IIV-VI. . 122 71 79 66 101 173 161 139 126 220 150 151 IV-VIVII-IX . 131 82: 85 81 89 184 176: 175 129 220 154 155 VII-IXX-XII . 126 71 67 73 109 187 166 149 120 219 165 158 X-XII
1942 I-III . . 135 91 91 91 104 195 166 151 119 220 162 161 1942 I-IIIIV-VI. . 133 88 76 96 81 175 180 161 125 248 168 160 IV-VIVII-IX . 129 78 88 71 67 158 192 175 126 263 178 159 VII-IXX-XII . 130 90 91 90 59 162 182 164 120 256 169 162 X-XII
1943 I-III . . *138 1 109 97 79 181 *179 : 152 I 98 266 i 181 169 1943 I-I 1IV-VI.. *133 77 64 85 66 183 *191 160 98 299 :179 167 IV-VIVII-IX . *141 88 79 95 86 183 201 ... ... 2 ... 165 VII-IXX-XII . 83 78 86 90 199 ...... ... 169 X-XII
INDE - INDIA (Capital). Base- Basis: 1935.
Houille Co Jute Fonte Papier Houille Cotn Jute e Fonte apierCoal Cotton . . Steel Pig-iron Paper Cosl Cto man_. Ste Pig-iron raper
Poids 7 9 6 5 8 3 Weights 7 9 6 5 8 3
1932 ..... 87 . a) 89 a) 67 a) 58.a) 84 1942 . . . . . 118 161 124 165 144 1791933 ...... 86 . 92 80 73 91 II. .113 158 127 165 145 1891934 ...... 96 . 93 92 91 94 III ... . 110 150 135 147 134 1851935 .. .. 100 100 100 100 100 100 I . 113 143 136 119 105 1341936 ...... 98 ' 120 101 106 102 V..... 115 148 114 199 179 1521937 .. .. 106 108 128 106 13 106 VI.. . 118 164 116 156 142 1501938.121 120 126 112 107 123 VII . 115 168 117 154 140 1611939 . .11. 118 119 119 121 139 VII . 11 138 114 170 144 150•«43 l\1f\ 170 " i If * !i 3 i 17 8 V . .. .1940 .. 125 119 1123 1* 37 37 178 IX. 122 137 \ 123 111 107 1591940 ...... 125 119 123*137 1 78 v- UR \^\ \(\ n 841 1591941 . . 118 146 115 155 142 13. . . 118 1416 108 84 84 1591942 .11 151 * 121 * 149 *134 *161 XI. 11 138 121 154 142 155* 15XII . . . . 110 172 116 161 147 1571943 ..... . 10 * 1 101 * 147 *134 *151 ....
1940 I IQ . . . . 119 119 1 4 148 11943 I. 105 1682 11 74 151 1611940 .. . . 119 7 51 134 148 1 63II 11 163 118 165 144 153
II.. . . 123 9 14 136 150 162 III. . 118 175 139 84 84 156III. . 118 6 155 152 142 160 IV. 10 177 152 161 147 158IV.... 11 17 146 138 18 0 16V . . 108 174 120 156 142 154V.... 118 1241 1 149 123 16 VII. . 115 182 127 163 147 155
I . ... 13 121 12 1142 123 185 VII .... 110 174 86 155 142 162VII . . 131 12 1 128 144 120 187 VIII .. 107 173 50 -149 138 152VIII . . .. 12 1'25 '119 1241 132 191 IX.107 170 68/ 112 109 157IX .... 1 127 95 120 *140 18 X .. 109 157 83 17 146 140
. ... 131 127 95 117 *139 193 XI. 115 166 102 199 179 140XII. ... 132 12 87 1 * 1 2 13 XII . . . 110 162 79 84 84 129XII .... 129 137 95 137 1* 138 193 X II.... O * 9
IQ^I T IOQ ix8 O An i* IO 1944 1I.... 115 158 101 112 109 1421941 . . . 1128 140 94 130 140 189 . . 118 156 104 175 151 141
II .... . 14 1 37 116 167 150 173 III .... 11 159 10425 165 144 146III. . 113 142 95 149 142 194 IV. . . 11 14 121 15 13 142IV....* ii 139 129 161 142 206 V .. .. 113 153 113 112 115 148V ..... * 108 140 117 151 147 212 VI . .. . 11 162 114 98 109 146VI . ... .. * 110 140 114 157 140 187 VII . . . 8 58 9 135 9 129 160VII . . . . * 120 150 * 112 147 138 * 199 VIII . . . 107 16 104 112 109 159VIII. . . . * 118 149 * 104 161 134 *195 IX ' .1 ... ... ... 155IX . ... . * . 127 154 * 116 161 145 *193 - ', ' ' ' ' —X.. .. * 122 150 *121 149 141 *198XI.... i. 120 155 * 130 167 146 * 196 a) Moyenne- Average IV-XII.XII . . . . 123 158 * 137 156 142 * 180

- 182
Tableau 92 (suite). Nombres-indices de la production industrielle (par groupes d'industries).BULGARIE - BULGARIA (Direction generale de la statistique). Base -Basis : 1934-1935.
Biens BIENS DB CONSOMMATION Ciment, Alimen-tINICE d'invee- CONSUMERS' r ~GOODS Mines, verre, Ind. tation,I Elec-
tissement _____________________ carribres M6taux etc. chimique tabac,etc. Textiles Bo Peaux Papier tricit6 Btiment
INDx Invest- Alimnents Mines, Metals Cemnent, Chemi- Food, Wood Hides Paper Electri- Building.xqent Total '.Food- te quarries glass, cals tobacco, city 1
Othergoods : stuffs etc. etc.Polds 100 11.2 88.8 12.0 76.8 19.6 4.5 6.0 3.6 22.5 28.6 0.7 1.2 2.6 10.7 $ Weights
1937 . . . 143 133 144 184 138 109 133 141 148 185 134 89 150 136 147 100 19371938 . . . 155 137 157 180 154 128 134 146 176 195 142 111 147 137 171 112 19381939 . . . 164 153 166 : 200 i 160 136 136 173 133 194 157 110 192 143 194 127 19391940 . . . 183 152 187 249 i 177 163 111 189 199 240 153 127 157 156 214 133 19401941 . . . 194 140 201 270 i 190 170 135 154 176 292 146 96 146 208 221 88 19411942 . . . 187 156 191 209 188 214 154 166 146 264 106 136 123 231 232 96 1942
1941 I . . 139 89 146 165 142 169 88 99 154 117 125 68 109 121 220 5 1.41II. . 141 77 149 ! 153 : 148 171 112 55 184 103 136 77 150 182 216 37 IIIII . 149 87 157 ! 198 i 151 154 130 62 169 129 154 62 159 179 217 58 IIIIV . 118 72 124 152 120 114 100 57 152 105 119 56 118 173 173 80 IVV. . 159 114 165 186 161 150 110 126 200 165 151 58 163 231 198 93 VVI . 194 167 197 178 - 200 156 154 191 195 288 156 84 150 173 203 95 VIVII . 219 173 225 164i 235 172 150 198 187 377 154 130 131 215 219 138 VIIVIII. 226 187 231 180 239 175 125 244 192 392 152 141 126 207 231 153 VIIIIX . 260 186 269 ' 433 i 244 185 138 230 180 522 164 153 127 203 235 160 IXX. . 284 208 293 \ 668 i 235 191 184 249 149 606 161 103 152 242 249 112 XXI. 228 176 234 400 208 194 159 205 163 386 143 108 169 302 244 57 XIXII. 209 145 217 359 1'95 214 172 135 187 308 133 111 200 270 252 67 XII
1942 I . . 121 80 126 176 1 119 154 100 73 91 128 74 48 94 210 208 46 1.42II. . 143 105 148 i 141 i 149 188 149 74 129. 117 119 112 117 208 211 15 IIIII . 160 124 165 i 174 i 163 211 130 120 122 131 132 131 153 236 236 48 IIIIV . 142 138 143 i 158 : 140 163 163 121 112 122 118 157 132 210 207 101 IVV. . 176 171 176 145 181 177 187 168 154 219 115 124 143 298 228 144 VVI . 209 231 206 i 151 i 215 192 184 287 186 314 118 122 164 244 238 197 VIVII . 221 220 221 i 131 ! 235 217 192 247 208 367 102 196 119 239 247 179 VIIVIII. 210 201 211 ! 154 i 220 240 138 267 174 325 90 113 101 245 255 155 VIIIIX . 231 183 237 i 335 i 222 283 163 206 111 394 106 216 100 189 235 90 IXX. . 233 153 243 421 215 261 151 168 119 467 88 96 98 166 226 111 XXI . 212 124 222 i 347 : 203 219 127 127 180 387 100 116 108 219 238 28 XIXII. 185 145 190 179i 192 264 162 131 172 192 109 195 143 302 252 35 XII
1943 I . 120 99 122 92 127 197 128 85 100 85 62 77 96 183 218 1 7 1.43II. 145 131 147 i 99 154 231 226 76 128 88 106 83 131 194 219 18 IIIII . 163 130 168 114 176 257 114 140 153 100 128 172 169 230 240 36 IIIIV . 146 153 145 - 80 \ 156 213 164 146 126 80 112 154 131 238 231 38 IVV. . 171 194 168 88 i 181 234 133 242 178 140 101 183 144 342 247 75 VVI. 192 161 196 106 210 228 106 209 163 243 109 124 126 350 250 66 VIVII* 202 223 199 91 i 216 225 139 301 116 263 I111 141 159 277 264 67 VII*
1 Btiment: autorisations de construire pour logements et bati- Building : building permits for residential, industrial andments industriels ou commerciaux dans toutes les villes (cubage). commercial buildings in all towns (cubic space).
FINLANDE - FINLAND (Nordiska Foreningsbanken). Base - Basis : 1934-1936.INDUSTRIES D'EXPORTATION INDUSTRIES D'EXPORTATIONxPoRTIO InDusTRrEs BAtinient BltimentEXPoORTING INDUSTRIES Building EXPORTING INDUSTRIES Building
Papier, Bois sci6 Papier, Bois sci6 eTotal Paper, Sawn Helsinki Total Paper, Sawn elsinki
cellulose timber I cellulose timberPoids 100 50.2 42.9 & Poids 100 50.2 42.9 $
1935 . . . 96 98 94 1100 1942 VII . 46 46 46 151936 . . . 107 112 100 94 VIII . 49 44 561937 . . 117 123 108 147 IX.. 47 41 55 491938 .. . 105 120 85 177 X .. 48 39 58 681939 . . . 93 106 68 138 XI. 43 42 41 141940 ... . 37 38: 33 174 XII 43 41 40 2481941 . ... 39 40 36 601942 . 43 42 40 63 19431I 48 55 39 391943 . .. 48 47 45 27 II . 49 55 41 14
I I I III. . 50 56 43 101941 . . 43 47 35 223 IV.. 54 49 58 20
II.. 45 46 40 89 V.. 52 53 45 50III.. 49 48 49 60 VI.. 40 36 38 -IV.. 50 46 53 32 VII . 42 36 42 96V . · 51 56 45 62 VIII . 45 35 52 -VI. . 37 40 35 108 IX.. 48 39 52 30VII.. 25 25 21 12 X. 50 41 56 62VIII . 31 29 32 - XI. 49 46 47 8IX.. 36 37 34 — XII . 46 48 36 -X . 34 36 30 64XI. . 33 37 27 23 19441 . 47 50 38XII. 31 33 27 42 II.. 48 52 37
:III. . 51 54 4319421 . . 38 42 31 93 IV.. 53 49 57
II.. 36 37 33 35 V .. 51 53 45III. . 37 37 34 12 VI.. 40 39 35IV. . 38 39 34 44 VII . 31 28 31V .. 37 37 34 11 VIII . 33 28 37VI.. 43 44 37 170 IX . . 32 23 41 ...
Cubage achev6 ; 1935 = 100. 1 Cubic space completed; 1935 = 100.

- 183
Table 92 (continued). Index Numbers of Industrial Production (by Groups of Industries).
HONGRIE2 -HUNGARY 2 (Magyar gazdasagkutato intezet). Base - Basis: 1929.
LNDUSTRIES - MANUFACTUBESBiens Eau,
de Bien Indus. Indu.- MaI t6- I I INDICE pro- de tni trie Aaux 'l- 61ecn- ent
GE- duct. nconom. Mines de cGE-nduct. MinsO~, ilourde chii do Paper ment tricit6 Build-RENAL Pro- Con- Mining Total e iu cons- :Textileos : Paper o Water, ulgoodsHeavy miq~ tructions Paper Food , Wter ingINDEX ducers' sunders' i C- ftruaction: stuffs gas, h
g goods oods dustries:: nmicals Build electric.:_________________ ______ _______ ____________ mater. '•.''
Poids 100 32.7 67.3 77.1 19.1 8.4 3.0 15.7 0.8 25.6- 10.2 3.9
1929 . . 100 100 100 100 100 100 100 100 100 100 100 100 1001930 . 95 84 100 88 95 85 91 75 110 133 97 107 701931 . 87 73 95 84 87 70 ! 89 70 103 152 90 105 681932 . 82 58 94 80 80 52 92 50 105 156 87 102 661933 . . 88 56 104 78 89 51 89 44 135 148 94 106 561934 .. 99 68 115 83 100 i 66 100 45 164 183 92 118 64 Le groupe Aliments comprend1935 . . 107 80 120 90 108 79 113 60 162 212 96 131 56 l'eau, incluse egalement dans la1936 . . 118 96 129 96 1 iZO 98 121 62 179 253 100 142 79 colonne suiante relative aux ser-
:i1IonI suivan elative aux ser.1937 . . 130 110 139 107 132 i116 133 i70 i193 237 106 155 771938 . 127 116 132 118 126i 123i 141 72 161 239 103 163 63 vices publics. La ponderation des1939. . 154 136 163 138 156 151 173 80 216 311 118 193 49 aliments seuls est de 22,7.1940*. . 163 151 168 153 161 i 168 172 83 218 348 122 215 65 2 19 ~~~1941*. ~ ~ mel . 16 15 6 D...es 1939, y comprislaproduc-1941*..- 166 165 166 .. :. ..
tlon dans les territoires rattaches.19392
I-IIT.. .145 120 157 132 146 141 152 39 202 258 120 197 28IV-VI . 138 131 141 122 139 143 141 85 200 298 94 184 45 The group Foodstuffs includeVII-IX 160 144 169 141 166 153 212 109 223 347 122 179 54X-XII. 172 148 184 156 174 168 185i 86 240 342 138 210 68 water, which is likewise included
1940 in the next column referring toI-III - 163 139 175 150 163 170 174 36 234 321 126 228 28 public utilities. The weighting ofIV-VI*. 162 157 165 157 161 172 154 113 229 334 113 219 49 foodstuffs only is 22.7.VII-IX* 157 155 158 159 156 166 190 93 201 345 108 195 73 A 2o AX-XII* 169 154 176 147 165 : 163 163 91 208 391 143 220 108 As from 1939, including pro-
duction in the incorporated terri-1941 :
tories.1-III 167 150 175 165 162 163 1881 63 203 394 131 246 50 treIVVI*. 159 164 157 164 154 164 104 1761 121 . 57VII-IX* 161 173 154 17 154 165 128 : 173 116 . 82X-XII* 176 175 1 77 . : .. .:.1 . . .
IRLANDE - IRELAND (Deiartment of Industry and Commerce). Base - Basis: 1936.
Equipe- Biensdeno d ment c d M6taux, Lin, V te- Produits
nd.. pou. cn oIn machi- BriqueI I . I Fils et coton .ments, l ai t i er s
Fine, produc- II' mat ion I . lnqe i s, J. Xt , tion conom- coura ne, etc. verre, Papier, I ' Itisaus de jute, sous- Chaus- marga- pain,
Total mation I Metals, cinent Bols etc. ente, r
laine tole vte- sures riue etc. Biare TabacProdu Con- Curre engi- Bricks, Timber Paper, Woollen LinenDairy Flor, Brewing Tobacco
ds ' ' neering, glass, etc. Printing, and cotton, Clothing, wear products bread,. capital eP et. ceent etc. worsted jute, hosiery marga- etc.a goods $ canvas $ rine $
___________ _____b) )_______________________________
1936 . . . 100 100 100 100 100 100 100 100 100 100 100 100 100 100 100 100 1001937 . . . 102 105 III 101 108 I111I 92 129 102 98 107 104 94 93 100 94 1051938 . . . 99 112 106 97 112 161 97 146 101 85 110 106 90 93 102 77 1071939 . . . 104 119 108 102 116 196 95 181 100 123 139 115 100 89 107 76 1131940 . . . 104 103 83 106 101 208 69 170 89 151 150 116 97 83 104 73 1111941 . . . 96 78 64 103 81 176 52 154 73 127 106 113 99 84 84 83 1051942 .. . 79 61 48 84 63 129 47 99 57 119 57 93 89 78 79 68 981943*. . 80 63 48 84 64 150 50 100 57 130 54 76 85 76 87 67 1081942
VII-IX. 81 . . . 55 121 43 104 71 110 57 84 83 135 79 76 98X-XII . 82 . 63 139 41 112 69 125 41 81 87 63 90 75 104
1943I-III. . 78 . . . 60 176 37 110 70 125 51 74 89 11 87 62 106IV-VI . 83 . . . 68 152 38 128 73 126 46 71 91 105 90 73 108VII-IX. 80 . 54 155 39 114 72 139 44 64 78 133 89 73 110X-XII . 81 . . . 59 166 35 116 74 149 69 70 88 52 93 57 110
1944I-III. 83 . . . 57 134 37 108 74 154 60 68 91 12 101 66 110IV-VI . 84 . . . 58 132 39 113 73 148 49 67 90 103 102 66 109VII-IX. 85 . . 59 107 38 101 74 142 53 60 83 125 99 83 108
a) Industries produisant des biens d'investissement et du mate- a) Producers' equipment and materials for capital goods. -riel destine a la production. - b) Biens de consommation durables b) Consumers' permanent equipment (consumers' capital goods).et 6quipement pour la production de biens de consommation. - c) Goods currently consumed.c) Biens de consommation courante.

- 184 -
Tableau 92 (fin). Nombres-indices de la production industrielle (par groupes d'industries).
SUEDE - SWEDEN
Kommerskollegium. Base - Basis : 1935. Sveriges Industriforbund. Base - Basis: 1935.
MINEBAIB, ]fiTAUX INDICES DB CONSOMMALTIO
Biens Blens de Ind. Autresa Txpor. FCAach CONsUMPTION INDICES Btj.d'invee- consom- d'expor- indus- ORES, KETALS, gOINEEaINE G de bois et acier1501CR OR~s, METALS, SNOSNEERINo GEE- Wooed o 5 Papier zeet.
tissement mation tation ties Fer Machines RAL Engi- Aliment. ptte Textiles Autres Buildnvest Conu- Export Otaier mee Eng'- 1 a) a neering Food Pulp, Clothing Other i
INDEX ment mere' indus- indus. Total et c ^ a seernt e'indus- indus- Total Iron and: neering papergoods goods tries tries steel i
Poids 100 6 9 18 11 16 10 13 8Poids 100 43.0 37.5 16.5 3.0 39.1
1934. 91 116 91 81 98 96 99 91 811929 . 81 76 709 98 76 78 70'' • 78 1935. 100 100 100 100 100 100 100 100 100
1936. 108 98 107 113 104 107 108 107 112
1931 . 78 73 83 80 7 4 72 66 781931 II78 73 83 80 74 72 ''- 66' 78 193 120 112 122 131 109 118 112 116 1041932 . 72 64 83 68 73 60 A62 63 '1938. 117 92 112 131 114 103 107 117 136
11939. 124 93 124 139 120 105 115 126 133.1933 . 1 74 64 84 76 78 62 i 67i 631934. 89 83 1940. 113 78 130 146 116 70 125 116 19
1934 . 89 83 94 92 87 82 I88 80 91935 . 100 100 100 100 100 100 100 100 1941. 104 70 131 149 107 50 110 109 3311942. 108 64 139 157 103 66 101 117 901936 . 1i09 110 106 III 1077I I 109 1943. 109 64 140 162 103 50 102 117 931937 . 122 125 115 128 123 129 125 127 41938 . 123 131 119 113 125 133 115 140 1944. 109 ... 138 164 105 47 102 126 145
A
1939 . 134 143 129 119 141 144 132 150 19411940. 123 131 127 89 136 137 i 109 i 152 I. 106 75 132 146 111 57 114 1101941 . 120 136 120 72 147 141 i 110 I 160 II . 106 75 135 147 108 57 113 110 22
:'__ ____ __ III. 105 73 130 147 106 55 110 I111IV . 105 73 129 149 109 51 116 IIIV . 104 72 126 148 107 47 114 109 51VI. 103 71 126 150 106 43 114 108VII. 100 68 127 149 108 42 104 104
—PAPE, YPMPR Cum, CAOUTCHOUo, ETC. VIII 100 68 129 150 106 42 105 107 31Terr, Bols PAPER, PRINT. LEATHER, RURER, BTC. IX . 102 68 131 151 106 44 103 110
WarrClreo- X . 103 66 134 150 105. 48 104 111Earth,Wood P ~te Chas.Caout- XI. 104 66 135 152 102 54 106 ill 29
ah industry Total de boeis Total Foot- chouc XII 104 66 135 152 102 54 106 111 29stones Pulp wear RubberXII 106 65 138 152 105 60 107 III
Pulp wear Rubber1942
Poids 5.4 7.3 15.2 . 3.5 i i Wgts I. . 104 64 137 150 105 65 89 110II .I 106 64 140 152 103 67 95 112 76III. 106 63 135 152 102 67 96 113
1929. 97 89 79 78 77 87 66 1929 III. 10 6 13 15 10 6 111930 . 101 88 78 76 79 104 46 1930 IV 107 62 136 154 101 66 100 1141931' 86 82 77 70 81 95 67 1-931 V . 107 62 134 155 101 66 101 114 110
VI 109 63 138 158 101 67 104 1171932 . 75 74 74 65 78 85 74 1932 VI. 109 63 138 158 101 67 104 117VII. 10 64 141 158 102 68 104 1161933 . 70 74 84 : 84 83 89 82 1933 VII 110 6 14 158 104 1169VIII 110 63 140 157 104 67 104 119 78
1934 . 86 93 93 94 93 91 102 1934 IX. 110 63 138 159 105 67 104 1191935. 100 100 100 100 100 100 100 1935 X . 110 64 139 161 103 65 107 1211936. 110 109 107 109 105 99 114 1936 XI. Ill 66 140 163 103 64 106 122 961937 . 120 121 118 122 116 106 125 1937 XII 111 67 145 164 103 62 106 1221938. 127 119 107 106 117 113 118 1938 19431939 . 134 127 117 110 138 127 146 1939 I. . 67 143 163 102 58 101 1221940. 90 102 90 71 159 136 165 1940 II 1 111 66 148 163 103 55 108 122 841941 94 96 81 47 138 104 132 1941 III. 110 66 144 162 103 52 108 121
IV. 111 65 145 163 105 51 109 119V . 110 64 141 163 104 51 104 117 115VI . 109 63 138 163 104 50 99 116)VII. 108 63 138 157 103 49 98 113VIII 106 64 133 154 101 46 97 113 87
AulITATION —— Ind IX. 107 65 138 158 101 46 98 1121FoonsT TEXT cIhim X . 108 65 136 163 102 47 102 115
ique XI. 109 63 139 165 102 49 102 118 88t Tabac Coton Lanoe Autres hem- XII 109 62 140 166 102 47 101 121Tobacco Cotton Wool : Other cals 1944·als 1944
7 W I. 108 62 140 165 101 40 99 123_Pds1__ ___1_' 10.7 ______________ 4 _ Wgts .11 109 60 146 165 102 41 104 123 148
III. 109 59 143 166 102 45 107 1241929 87 85 70 69 80 74 84 1929 IV. 109 59 142 162 102 49 107 1241930 91 91 76 73 82 76 86 1930 V . 108 59 137 161 101 49 104 123 1421931 94 94 69 65 73 61 80 1931 VI. 109 60 137 163 103 47 102 1241932 93 98 75 80 81 70 74 1932 VII. 107 61 133 161 106 43 97 1221933. 90 91 78 78 85 75 79 1933 VIII 106 62 130 158 108 41 96 125 123
IX. 107 ... 132 160 109 43 97 1261934. 95 94 96 100 102 97 87 1934 X . 110 ... 131 166 107 51 103 1291935 . 100 100 100 100 100 100 100 1935 XI. 112 ... 137 168 106 56 104 131 1661936 . 105 100 110 109 110 101 106 1936 XII 113 143 167 107 58 104 1321937 . 113 107 117 112 111 111i 119 1937 11938. 122 110 115 113 90 105 124 1938 . .-. . . . .
1939 . 130 113 127 118 102 114 142 19391940 . 128 121 129 114 122 124 1940 a) Moyenne mobile de 12mois. a) 12 months moving average.1941 ! 121 111 117 112 105 82 123 1941 1 Bitiment : indice base sur le nombre de pieces des malsons
d'habitation pour lesquelles des permis de construire ont etcdelivres, dans onze grandes villes.
Industries mecaniques et eectriques. — Including electro- I Building : index based on the number of rooms in dwellingstechnical industry. for which building permits were delivered, in eleven large towns.

185 -
Table 92 (concluded). Index Numbers of Industrial Production (by Groups of Industries).
AUSTRALIE - AUSTRALIA NOUVELLE-ZgLANDE - NEW ZEALAND
Commonwealth Bureau of Census and Statistics. Census and Statistics Office.Base - Basis : 1929. Base - Basis : 1938.
Chaos- Boia Annee finissant le Produits Ga,Anne finissant le 0VI. Drap Tan- sures sci6 Tabac 31.III de l'annie Total latiers de "Semi-
Cloth neries Foot- Sawn Tobacco suivante. Factory viande, etc prim Industary iesYear ending 30.VI. Gas, pmanuf.
5
Year endingwear timber Year ending 31.III11 Industries Dairy and industries"a electricity 2w e $ of following year meat prod.
1
1929 ... 100 100 100 100 100 1o929. . . 74 75 73 95 701930 ........ 95 100 97 95 100 1930 . ... 69 78 76 77 641931 ........ 104 97 90 56 86 1931 . . .. 60 82 74 49 551932 ........ 150 114 98 46 86 1932. . .. 63 92 74 46 571933 .. .. .... 185 128 104 59 88 1933. . ... 65 93 74 54 59
1934 ........ 199 147 114 74 89 1934. ... . 74 96 77 64 691935 ........ 175 132 118 100 89 1935 ... . 81 98 82 79 761936 . ....... 196 135 125 112 96 1936 . ... 92 103 87 88 911937 .. ...... 186 122 130 128 101 1937. . .. 97 101 93 94 961938 ..-..... 177 145 131 145 106 1938 . . . 100 100 100 100 100
1939 ........ 190 119 127 138 107 1939. . . . 110 110 110 103 1111940 ......... 220 138 135 145 ill 1940 . .. 114 120 119 104 1141941 ........ 242 140 138 157 113 1941 . . . 116 122 124 103 1161942 ........ 254 150 151 172 121 1942 . . ., 119 124 130 ll 119
'Nouvelle-Zelande : transformation et preparation pour le 1 New Zealand : preparation of farm products for the marketmarche de produits de ferme et d'elevage (viandes congelees et (meat freezing and preserving, butter and cheese making, fertiliseren conserve, production de beurre, de fromage, d'engrais, etc.). making, etc.).
2( Utilisation de produits naturels)) : bols de scierie, conserves 2 "Utilisation of natural resources" : sawmilling, fish-curing,de poisson, briques, tuiles, beton, etc. bricks, tiles, concrete, etc.
3 Toutes les autres industries (y compris minoteries, ateliers 3 All other industries (including grain-milling, engineering).mdcaniques, etc.).
NOTE GN9RALE SUR LES NOMBRES-INDICES NATIONAUX DE LA PRODUCTION INDUSTRIELLEGENERAL NOTE ON NATIONAL INDICES OF INDUSTRIAL PRODUCTION (91-92).
Les indices nationaux de la production presentent d'importantes National production indices vary widely in scope and in methodsdiffdrences tant dans leur portee que dans les mathodes d'elabo- of compilation, a fact which should be borne in mind when makingration. Certains de ces indices comprennent la presque totalite de comparisons from country to country. Some cover almost thel'industrie nationale; d'autres sont limites A certaines branches entire range of national industry ; others are limited to importantimportantes considedres comme reprdsentatives. Enfin, tandis que branches considered representative. While most indices are chieflyla plupart ont pour base les chiffres reels de la production - quan- based on actual data of production, whether expressed in measurestit's effectives ou valeurs corrigees par des indices de prix - pour of physical quantity or in values corrected for price changes, somecertains indices, on utilise largement, et parfois meme presque make extensive, and a few almost exclusive, use of indirect measuresexclusivement, des mesures indirectes de l'activite, telles que les of activity, such as hours worked, consumption of raw materials,heures de travail, la consommation des matieres premieres, etc. etc.
Un tableau synoptique, public a la page 163 de l'Annuaire A synoptic table published in the 1939/40 issue of the Year-1939/40, donnait une idee sommaire de la portee et de la methode Book, page 163, afforded a summary illustration of the scope andde calcul des indices generaux pour les differents pays. method of computation of the various indices.
Les nombres-indices des biens d'investissement et des biens de The indices for investment goods and consumption goods (Tableconsommation (tableau 91) ainsi que la classification par branches 91) and the classification by individual branches (Table 92) are givende production (tableau 92) sont reproduits tels qu'ils sont calcules as computed - according to varying criteria - by the different- selon des criteres differents - par les diverses autorites. authorities.
Signes employes dans les tableaux 91 et 92. Signs used in Tables 91 and 92.Variations saisonnieres : I eliminees ; partiellement iliminees. I Adjusted for seasonal variation. A Partly adjusted.A Sdrie calculee par le Service d'e'tudes economiques de la S. d. N. 6 Series calculated by the Economic Intelligence Service of the L.o.N.* Chiffres provisoires ou partiellement estim's. * Figures provisional or partly estimated.