why has ipo underpricing changed over time?tloughra/whynew.pdf · financial management • autumn...
TRANSCRIPT

Financial Management • Autumn 2004 • pages 5 - 37
Why Has IPO Underpricing Changed Over Time?
Tim Loughran and Jay Ritter*
In the 1980s, the average first-day return on initial public offerings (IPOs) was 7%. The average first-day return doubled to almost 15% during 1990-1998, before jumping to 65% during the internet bubble years of 1999-2000 and then reverting to 12% during 2001-2003. We attribute much of the higher underpricing during the bubble period to a changing issuer objective function. We argue that in the later periods there was less focus on maximizing IPO proceeds due to an increased emphasis on research coverage. Furthermore, allocations of hot IPOs to the personal brokerage accounts of issuing firm executives created an incentive to seek rather than avoid underwriters with a reputation for severe underpricing.
What explains the severe underpricing of initial public offerings in 1999-2000, when the average first-day return of 65% exceeded any level previously seen before? In this article, we address this and the related question of why IPO underpricing doubled from 7% during 1980-1989 to almost 15% during 1990-1998 before reverting to 12% during the post-bubble period of 2001- 2003. Our goal is to explain low-frequency movements in underpricing (or first-day returns) that occur less often than hot and cold issue markets.
We examine three hypotheses for the change in underpricing: 1) the changing risk composition hypothesis, 2) the realignment of incentives hypothesis, and 3) a new hypothesis, the changing issuer objective function hypothesis. The changing issuer objective function hypothesis has two components, the spinning hypothesis and the analyst lust hypothesis.
The changing risk composition hypothesis, introduced by Ritter (1984), assumes that riskier IPOs will be underpriced by more than less-risky IPOs. This prediction follows from models where underpricing arises as an equilibrium condition to induce investors to participate in the IPO market. If the proportion of IPOs that represent risky stocks increases, there should be greater average underpricing. Risk can reflect either technological or valuation uncertainty. Although there have been some changes in the characteristics of firms going public, these changes are found to be too minor to explain much of the variation in underpricing over time if there is a stationary risk-return relation.
The realignment of incentives and the changing issuer objective function hypotheses both
We thank Hsuan-Chi Chen, Harry DeAngelo, Craig Dunbar, Todd Houge, Josh Lerner, Lemma Senbet and James Seward (the Editors), Toshio Serita, Ivo Welch, Ayako Yasuda, and Donghang Zhang; seminar participants at the 2002 Chicago NBER behavioral finance meetings, the 2002 Tokyo PACAP/APFA/FMA meetings, the 2003 AFA meetings, Boston College, Cornell, Gothenburg, Indiana, Michigan State, Penn State, Stanford, the Stockholm School of Economics, Vanderbilt, NYU, SMU, TCU, and the Universities of Alabama, California (Berkeley), Colorado, Houston, Illinois, Iowa, Notre Dame, and Pennsylvania, and several anonymous referees; and especially Alexander Ljungqvist for useful comments. Chris Barry, Laura Field, Paul Gompers, Josh Lerner, Alexander Ljungqvist, Scott Smart, Li-Anne Woo, and Chad Zutter generously provided IPO data. Bruce Foerster assisted us in ranking underwriters. Underwriter ranks are available online at http://bear.cba.ufl.edu/ritter/rank.htm. Donghang Zhang supplied useful research assistance.
*Tim Loughran is a Professor of Finance at the University of Notre Dame. Jay Ritter is the Cordell Professor of Finance at the University of Florida.
Financial Management • Autumn 2004 6
posit changes over time in the willingness of issuing firms to accept underpricing. Both hypotheses assume that underwriters benefit from rent-seeking behavior that occurs when there is excessive underpricing.
The realignment of incentives hypothesis, introduced by Ljungqvist and Wilhelm (2003), argues that the managers of issuing firms acquiesced in leaving money on the table during the 1999-2000 bubble period. (Money on the table is the change between the offer price and the first closing market price, multiplied by the number of shares sold.) The hypothesized reasons for the increased acquiescence are reduced chief executive officer (CEO) ownership, fewer IPOs containing secondary shares, increased ownership fragmentation, and an increased frequency and size of “friends and family” share allocations. These changes made issuing firm decision-makers less motivated to bargain for a higher offer price.
The realignment of incentives hypothesis is similar to the changing risk composition hypothesis in that it is changes in the characteristics of ownership, rather than any nonstationarities in the pricing relations, that are associated with changes in average underpricing. It differs from the changing risk composition hypothesis, however, in that underpricing is not determined solely by the investor demand side of the market.
In our empirical work, we find little support for the realignment of incentives hypothesis as an explanation for substantial changes in underpricing. We find no relation between the inclusion of secondary shares in an IPO and underpricing. And although CEO fractional ownership was lower during the internet bubble period, the CEO dollar ownership (the market value of the CEO’s holdings) was substantially higher, resulting in increased incentives to avoid underpricing. Furthermore, it is possible that changes in the characteristics of ownership may be partly a response to higher underpricing as well as a cause. Ljungqvist and Wilhelm (2003) do not provide an explanation for why these changes occurred.
The changing issuer objective function hypothesis argues that, holding constant the level of managerial ownership and other characteristics, issuing firms became more willing to accept underpricing. We hypothesize that, during our sample period, there are two reasons for why issuers became more willing to leave money on the table. The first reason is an increased emphasis on analyst coverage. As issuers placed more importance on hiring a lead underwriter with a highly ranked analyst to cover the firm, they became less concerned about avoiding underwriters with a reputation for excessive underpricing. We call this desire to hire an underwriter with an influential but bullish analyst the analyst lust hypothesis. This results in each issuer facing a local oligopoly of underwriters, no matter how many competing underwriters there are in total, because there are typically only five Institutional Investor all-star analysts covering any industry. As Hoberg (2003) shows, the more market power that underwriters have, the more underpricing there will be in equilibrium.
The second reason for a greater willingness to leave money on the table by issuers is the co-opting of decision-makers through side payments. Beginning in the 1990s, underwriters set up personal brokerage accounts for venture capitalists and the executives of issuing firms in order to allocate hot IPOs to them. By the end of the decade, this practice, known as spinning, had become commonplace. The purpose of these side payments is to influence the issuer’s choice of lead underwriter. These payments create an incentive to seek, rather than avoid, underwriters with a reputation for severe underpricing. We call this the spinning hypothesis. In the post-bubble period, increased regulatory scrutiny reduced spinning dramatically. This is one of several explanations why underpricing dropped back to an average of 12%. The reduction in spinning removed the incentive for issuers to choose investment bankers who underprice. Investment bankers responded by underpricing less in the post- bubble period.

Loughran & Ritter • Why Has IPO Underpricing Changed Over Time? 7
The contributions of our research are three-fold. First, we develop the changing issuer objective function hypothesis for the increased underpricing of IPOs during the 1990s and the bubble periods. Second, we document many patterns regarding the evolution of the US IPO market during the last two decades. Much of the data has been or will be posted on a website for other researchers to use. Many, although not all, of these patterns have been previously documented, especially for the first two subperiods. Third, we formally test the ability of the changing risk composition, realignment of incentives, and changing issuer objective function hypotheses to explain the changes in underpricing from 1980-1989 (“the 1980s”) to 1990-1998 (“the 1990s”), 1999-2000 (“the internet bubble”), and 2001-2003 (“the post-bubble period”).
Much of the increased underpricing in the bubble period is consistent with the predictions of the changing issuer objective function hypothesis. In multiple regression tests, the changing risk composition and the realignment of incentives hypotheses have little success at explaining the increase in first-day returns from the 1980s to the 1990s, to the bubble period, or to the post-bubble period. The regression results show that only part of the increase in the bubble period is attributable to the increased fraction of tech and internet stocks going public. Consistent with the changing issuer objective function hypothesis, underpricing became much more severe when there was a top-tier lead underwriter in the latter time periods. These conclusions are not substantially altered after controlling for the endogeneity of underwriter choice.
The rest of this article is as follows. In Section I, we present our changing issuer objective function hypothesis. In Section II, we describe our data. In Section III, we report year-by- year mean and median first-day returns and valuations. In Section IV, we report average first- day returns for various univariate sorts. In Section V, we report multiple regression results with first-day returns as the dependent variable. Section VI discusses alternative explanations for the high underpricing of IPOs during the internet bubble period. Section VII presents our conclusions. Four appendices provide detailed descriptions of our data on founding dates, post-issue shares outstanding, underwriter rankings, and internet IPO identification.
I. Causes of a Changing Issuer Objective Function
Most models of IPO underpricing are based on asymmetric information. There are two agency explanations of underpricing in the IPO literature. Baron (1982) presents a model of underpricing where issuers delegate the pricing decision to underwriters. Investment bankers find it less costly to market an IPO that is underpriced. Loughran and Ritter (2002) instead emphasize the quid pro quos that underwriters receive from buy-side clients in return for allocating underpriced IPOs to them. The managers of issuing firms care less about underpricing if they are simultaneously receiving good news about their personal wealth increasing. This argument, however, does not explain why issuers hire underwriters who will ex post exploit issuers’ psychology. Neither does the realignment of incentives hypothesis.
One can view issuers as seeking to maximize a weighted average of IPO proceeds, the proceeds from future sales (both insider sales and follow-on offerings), and side payments from underwriters to the people who will choose the lead underwriter:
α1IPO Proceeds + α
2Proceeds from Future Sales + (1 - α
1 - α
2)Side Payments (1)

Financial Management • Autumn 2004 8
The changing issuer objective function hypothesis states that issuers choosing an underwriter in some periods put less weight on IPO proceeds and more weight on the proceeds from future sales and side payments.
In Equation (1), IPO proceeds are a function of the choice of underwriter and underwriting contract (auction or bookbuilding) at the start of the process and, several months later, the bargaining at the pricing meeting for IPOs when bookbuilding is used. Loughran and Ritter (2002) provide a prospect theory analysis of the bargaining at the pricing meeting. The Ljungqvist and Wilhelm (2003) realignment of incentives hypothesis can also be viewed as a theory of the bargaining at the pricing meeting. Neither of these theories, though, explains why an issuing firm would choose an underwriter that would, at the pricing meeting, propose an offer price that leaves more money on the table than necessary. In contrast, the changing issuer objective function hypothesis does provide a theory for the choice of underwriter at the start of the process. Before discussing the analyst lust and spinning hypotheses in more detail, we explain why underwriters want to underprice.
A. Why Underwriters Want to Underprice IPOs
Underwriters, as intermediaries, advise the issuer on pricing the issue, both at the time of issuing a preliminary prospectus that includes a file price range, and at the pricing meeting when the final offer price is set. If underwriters receive compensation from both the issuer (the gross spread) and investors, they have an incentive to recommend a lower offer price than if the compensation was merely the gross spread.
Bookbuilding is the mechanism used to price and allocate IPOs for 99.9% of our sample, with auctions used for the other 0.1%. In the case of bookbuilding, underwriters can decide to whom to allocate shares if there is excess demand. Benveniste and Wilhelm (1997) and Sherman and Titman (2002) emphasize that underwriter discretion can be used to the benefit of issuing firms. Underwriters can reduce the average amount of underpricing, thereby increasing the expected proceeds to issuers, by favoring regular investors who provide information about their demand that is useful in pricing an IPO. Shares can be allocated to those who are likely to be buy-and-hold investors, minimizing any costs associated with price support.
Underwriter discretion can completely eliminate the winner’s curse problem if underwriters allocate shares in hot issues only to those investors who are willing to buy other IPOs. As Ritter and Welch (2002) note, if underwriters used their discretion to bundle IPOs, problems caused by asymmetric information could be nearly eliminated. The resulting average level of underpricing should then be no more than several percent. Thus, given the use of bookbuilding, the joint hypothesis that issuers desire to maximize their proceeds and that underwriters act in the best interests of issuers can be rejected whenever average underpricing exceeds several percent.
Although underwriter discretion in allocating IPOs can be desirable for issuing firms, it can also be disadvantageous if conflict of interest problems are not controlled. Underwriters acknowledge that in the late 1990s IPOs were allocated to investors largely on the basis of past and future commission business on other trades. In 1998-2000, for example, Robertson Stephens allocated IPOs to institutional clients almost exclusively on the basis of the amount of commission business generated during the prior 18 months, according to its January 9, 2003 settlement with the NASD and SEC. Credit Suisse First Boston (CSFB) received commission business equal to as much as 65% of the profits that some investors received

Loughran & Ritter • Why Has IPO Underpricing Changed Over Time? 9
from certain hot IPOs, such as the December 1999 IPO of VA Linux.1 The VA Linux IPO was priced at $30 per share, with a 7% gross spread equal to $2.10 per share. For an investor who was allocated shares at $30, and who then sold at the closing market price of $239.25, the capital gains would have amounted to $209.25 per share. If the investor then traded shares to generate commissions of one-half of this profit, the total underwriter compensation per share was $2.10 plus $104.625, or $106.725.
The receipt of commissions by underwriting firms in return for hot IPO allocations violates NASD Rule 2110 on “Free Riding and Withholding.” Because the underwriter has an economic interest (a share of the profits) in the IPO after it has been allocated, there is not a “full distribution” of the security. This is economically equivalent to withholding shares and selling them at a price higher than the offer price, in violation of Rule 2110. But if the NASD (a self-regulatory organization) did not enforce its rules, underwriters might find it optimal to violate the rules. Evidence consistent with commission business affecting IPO allocations is contained in Reuter (2004).
The willingness of buy-side clients to generate commissions by sending trades to integrated securities firms depends on the amount of money left on the table in IPOs. Underwriters have an incentive to underprice IPOs if they receive commission business in return for leaving money on the table. But the incentive to underprice presumably would have been as great in the 1980s as during the internet bubble period, unless there was a “supply” shift in the willingness of firms to hire underwriters with a history of underpricing. We argue that such a shift did indeed occur, resulting in increased underpricing.
B. The Analyst Lust Explanation of Underpricing
We hypothesize that issuing firms have increasingly chosen their lead underwriter largely on the basis of expected analyst coverage. Providing research coverage is expensive for investment bankers; the largest brokerage firms each spent close to $1 billion per year on equity research during the bubble (Rynecki, 2002). These costs are covered partly by charging issuers of securities explicit (gross spread) and implicit (underpricing) fees. The more that issuing firms see analyst coverage as important, the more they are willing to pay these costs.
There are several reasons for our opinion that analyst lust was more important during the 1990s and bubble period than in the 1980s. First, the investment bankers and venture capitalists we have talked to are unanimous in their agreement. Supporting this, in the early 1970s Morgan Stanley had “no research business to speak of,” even though it was a major IPO underwriter (Schack, 2002). As we will show, the number of managing underwriters in
1See the January 22, 2002 SEC litigation release 17327 and news release (available on the SEC website at http://www.sec.gov), and the NASD Regulation news release (available at http://www.nasdr.com). The NASD Regulation news release states that “For example, after a CSFB customer obtained an allocation of 13,500 shares in the VA Linux IPO, the customer sold two million shares of Compaq and paid CSFB $.50 a share—or $1 million—as a purported brokerage commission. The customer immediately repurchased the shares through other firms at normal commission rates of $.06 per share at a loss of $1.2 million on the Compaq sale and repurchase because of the $1 million paid to CSFB. On that same day, however, the customer sold the VA Linux IPO shares, making a one-day profit of $3.3 million.” According to paragraphs 48 and 49 of the SEC complaint, for the July 20, 1999 IPO of Gadzoox, which CSFB lead managed, “at least 261,025 shares were allocated to customers that were willing to funnel a portion of their IPO profits to CSFB.” CSFB distributed approximately 3.4 million of the 4.025 million offer, which went from an offer price of $21 to a closing price of $74.8125, up 256%. The following day, July 21, 1999, CSFB was the lead manager on MP3, which was priced at $28 and closed at $63.3125, up 126%. “CSFB distributed 7.2 million of the 10.35 million MP3 shares offered through underwriters. Of the 7.2 million MP3 shares distributed by CSFB, at least 520,170 shares were allocated to customers that were willing to funnel a portion of their trading profits to CSFB.”

Financial Management • Autumn 2004 10
IPO syndicates has increased over time. Investment bankers note that co-managers are included in a syndicate almost exclusively to provide research coverage. Indeed, by 2000 co- managers were generally not even invited to participate in road shows and the pricing meeting at which the final offer price is determined.
Second, as valuations have increased, changes in growth rates perceived in the financial markets represent more dollars. Firm value can be decomposed into the value of existing assets in place plus the net present value of growth opportunities. As the value of growth opportunities increases relative to the value of assets in place, issuing firms come to place more importance on analyst coverage. In 1982, for example, when the market price-earnings (PE) ratio was about 8, the difference in valuation for a firm with forecasted growth of 10% versus 15% might translate into a difference in PEs of 8 versus 12. In 1999, when the market PE was about 25, the difference in valuation for forecasted growth of 10% versus 15% might translate into a difference in PEs of 25 versus 40. For a firm with $1.00 in earnings per share, in 1982 the difference in values would have been $4 per share, but in 1999 it would be $15.
A final reason for the increased importance of analyst coverage in the bubble period is the greater visibility of analyst recommendations because of the internet and cable television stations such as CNBC. Consistent with this statement, Busse and Green (2002, Table 5) report that trading volume for Nasdaq stocks during June through October 2000 increased by an average of 300,000 shares in the four minutes after an analyst mentioned a stock favorably on CNBC’s Midday Call segment.
The analyst lust hypothesis does not necessarily assume any conflict of interest between managers and other pre-issue shareholders. If favorable analyst coverage results in a higher market price, all pre-issue shareholders benefit.
There is ample supporting evidence for this analyst lust hypothesis. Dunbar (2000) presents evidence that underwriters in 1984-1994 subsequently increased their IPO market share if they had an analyst who was highly ranked in the Institutional Investor (II) annual survey. Clarke, Dunbar, and Kahle (2003, Table 2) report that investment banks gaining an II all-star analyst subsequently boosted their market share of IPOs in the analyst’s industry; the changes were greater in 1995-1999 than in 1988-1994. The Krigman, Shaw, and Womack (2001) survey of issuing firms finds that one of the most important reasons to switch underwriters in a seasoned offering is to seek additional and influential analyst coverage from the new banker. Ljungqvist, Marston, and Wilhelm (2003) analyze the determinants of lead underwriter choice for debt and follow-on equity offerings conducted during December 1993 through June 2002. They report that the presence of an II all-star analyst in the issuing firm’s industry increases the probability of that underwriter being chosen as the lead, holding constant that bank’s fraction of the issuer’s equity deals during the prior five years.
Hong and Kubik (2003) report that analysts making optimistic forecasts are more likely to move to a higher-status brokerage firm if they change jobs. Furthermore, analysts whose employer underwrites stocks that they cover are more likely to be forced out, the less optimistic their forecasts are. Hong and Kubik report that these biases became even stronger in the 1999-2000 period. Discussions with executives of firms going public in 2001-2003 suggest that analyst coverage is still an important determinant of underwriter choice, in spite of the Global Settlement restrictions on analyst participation in IPOs.
Cliff and Denis (2004) test the analyst lust hypothesis using a sample of 1,050 US firms conducting IPOs during 1993-2000 that subsequently conducted at least one follow-on equity offering during 1993-2001. They find that issuers are less likely to switch underwriters for their first SEO if there had been greater underpricing, and if the IPO underwriter’s analyst covered the stock one year after the IPO. In their Table 6 regression with an analyst coverage

Loughran & Ritter • Why Has IPO Underpricing Changed Over Time? 11
instrument, they report that having an all-star analyst in the industry of the issuing firm at the time of the IPO is associated with first-day returns that are 16.3% higher. Furthermore, their subperiod results show higher incremental underpricing associated with hiring an underwriter with an II all-star covering the firm in the bubble period than earlier.
The evidence in all these studies is consistent with the analyst lust hypothesis, and those that report subperiod results find that the effects were stronger in the late 1990s when valuations were highest, just as we predict.
C. The Spinning Explanation of Underpricing
In 1999-2000, the average amount of money left on the table of $85 million per IPO adds up to $68 billion (in dollars of 2003 purchasing power), which seems way too high to be justified as equilibrium compensation for purchasing analyst coverage. This raises two questions. First, if issuing firms wanted to purchase analyst coverage, why did they pay for it by leaving money on the table, rather than paying a higher gross spread? Second, why did they leave so much money on the table?
Our answers are as follows. First, money on the table is state-contingent compensation; the deals leaving a lot of money on the table were the deals where the managers of issuing firms found themselves facing a substantial increase in their personal wealth (Loughran and Ritter, 2002). Second, with bookbuilding, underwriters have discretion over the allocation of hot IPOs. Some shares went to “friends and family” of the issuing firm, as Ljungqvist and Wilhelm (2003) show. But some shares also went to the executives of issuing firms and their venture capitalists through personal brokerage accounts (Siconolfi, 1997).
In this article, we introduce a new agency explanation for IPO underpricing, the spinning hypothesis, which is based on a conflict of interest between decision-makers and other pre-IPO shareholders. It posits that decision-makers are willing to hire underwriters with a history of underpricing because the decision-makers receive side payments.2 The decision-makers are the individuals who choose the managing underwriters, especially the lead underwriter, for an IPO. These decision-makers are the general partners of the lead venture capital firm (if a firm is financed with venture capital money) and the top managers of the issuing firm. The other pre-issue shareholders are the limited partners of venture capital firms and other minority shareholders.
Elkind and Gimein (2001) describe the “Friend of Frank” brokerage accounts set up for decision- makers by CSFB, where Frank Quattrone, head of technology investment banking, worked:
[I]n the 1990s firms also began offering shares to potential clients... by setting up brokerage accounts specifically for hot IPOs. Under these arrangements, VCs and entrepreneurs made a moderate deposit (perhaps $250,000) and signed over discretionary authority to the brokers whose firms were seeking their favor. Typically, IPO shares would be flipped for a quick— and riskless—windfall. “The stock would go into the hands of venture capitalists and the managements of companies that were going to go public next,” notes a Silicon Valley fund manager. “This was the closest thing to free money that there was. It may not be all that much different from a briefcase filled with unmarked tens and 20s.”...Indeed, two Silicon Valley CEOs, who asked that their names not be used, said that because several competing investment banks were offering them cheap IPO shares, they could not have been influenced
2On April 28, 2003, the “global settlement” between ten top investment banking firms and the NASD, NYSE, SEC, and the states, coordinated by New York Attorney General Eliot Spitzer, imposed a “no spinning” rule that prohibits officers and directors who are in a position to “greatly influence” investment banking decisions from receiving IPO allocations. Proposed NASD Rule 2712 addresses spinning and both clarifies and strengthens NASD Rule 2710.

Financial Management • Autumn 2004 12
when choosing between them.
The March 7, 2003 San Jose Mercury News lists, by name and company affiliation, 63 Silicon Valley executives who had “Friends of Frank” accounts at CSFB. The median executive received first-day capital gains of $538,000 from IPO allocations.3
Payments like this to individuals motivate the managers of an issuing firm to choose an underwriter with a reputation for leaving money on the table. This spinning theory of IPO underpricing explains why underwriters and issuing firm managers prefer to forego net proceeds by leaving money on the table, rather than pay a higher gross spread. Money on the table is the currency by which underwriters can influence other venture capitalists and issuing firm executives; gross spread revenue cannot be redistributed except in a more transparent manner.
If spinning is an important reason for underpricing in the bubble period, why wasn’t it important a decade earlier? In the 1980s, relatively little money was left on the table in IPOs because valuations were low and analyst coverage was not perceived to be as important as it became in the 1990s. As IPO underpricing increased over time, we hypothesize that the use of hot IPOs to reward decision-makers created an incentive for decision-makers to seek out underwriters known to leave money on the table, rather than to avoid such underwriters. Allocating these hot IPOs to the decision-makers of issuing companies and their friends (through friends and family accounts) allowed underwriters to underprice even more. In other words, underpricing fed on itself. In this regard, both our changing issuer objective function and Ljungqvist and Wilhelm’s (2003) realignment of incentives hypotheses are similar: Underpricing creates incentives for even more underpricing. What constrains underpricing from increasing without limit is that raising money is still a goal for an issuer.
II. Data
Our primary data source for IPOs over 1980-2003 is the Thomson Financial Securities Data (also known as Securities Data Co.) new issues database. We have made hundreds of corrections to this database, and we have collected missing information for thousands of observations from a number of sources, including prospectuses; Howard and Co.’s Going Public: The IPO Reporter for IPOs over 1980-1985; Dealogic for IPOs after 1990; and the SEC’s Electronic Data Gathering and Retrieval (EDGAR) system for IPOs after 1996 (final prospectuses are identified on EDGAR as document 424B at http://www.sec.gov).4
In all of our analysis, we exclude best efforts offers (typically very small offerings, these are not covered by Thomson Financial Securities Data); ADRs (American Depository Receipts, issued by foreign firms that list in at least one other market outside the US); closed-end funds; REITs (real estate investment trusts); banks and savings and loans (S&Ls); partnerships; and firms not covered by CRSP within six months of the offering. We also exclude IPOs with an offer price below $5.00 per share. What remains are almost all IPOs of
3Descriptions and evidence regarding spinning are presented in a number of additional sources. Smith (2002) describes the allocation of IPOs to top executives by Goldman Sachs. Smith, Grimes, Zuckerman, and Scannell (2002) describe the allocations to venture capitalists, and Sherburne (2002) lists the allocations to WorldCom officers and directors and to other telecom executives by Citigroup’s Salomon Smith Barney unit. 4While Thomson Financial’s database is missing some assets and sales data, and many founding dates, we find no evidence of any backfilling bias. That is, there is no evidence that subsequent “winners” are more comprehensively or accurately covered than other IPOs, so researchers using this database should not worry about introducing a survivorship bias.

Loughran & Ritter • Why Has IPO Underpricing Changed Over Time? 13
domestic operating companies that are large enough to be of interest to institutional investors. The sample size is 6,391 firms, although in some of the tables we are missing up to 6% of the sample because of incomplete information.
The main source of information on venture capital backing is Thomson Financial. Supplemental data on venture capital backing has been provided by Chris Barry, Paul Gompers, and Josh Lerner.
Information on the founding date of companies comes from a variety of sources, discussed in more detail in Appendix A. Laura Field, Alexander Ljungqvist, and Li-Anne Woo provided many of the founding dates. We are missing a reliable founding date for 120 firms.
The original file price range for IPOs over 1980-1982 is transcribed from Howard and Co.’s Going Public: The IPO Reporter. The file price range for IPOs from 1983 and later comes from Thomson Financial. We are missing the file price range for 11 firms in the early 1980s.
To calculate the market value of an IPO, we use the offer price multiplied by the post-issue number of shares outstanding. For firms with a single class of shares outstanding, the primary source of data on the post-issue number of shares is CRSP. For firms with more than one class of shares outstanding (dual-class firms), we use data from a variety of sources, as described in Appendix B.
Information on assets, sales, and earnings per share (EPS) in the year prior to going public comes mainly from Thomson Financial. When figures are available, we use sales and earnings per share for the most recent 12 months prior to going public. Otherwise, we use the most recent fiscal year numbers. Additional sources of information include Dealogic for post-1990 IPOs, Howard and Co.’s Going Public: The IPO Reporter for 1980-1985 IPOs, and EDGAR. If a firm has zero trailing sales, we assign a sales value of $0.01 million, since in our empirical work we use logarithms, and the logarithm of zero is undefined. If we are unsure whether sales are zero or are missing, we treat the value as missing. We are missing sales numbers for 85 firms and assets numbers for 223 firms.
We use Thomson Financial Securities Data as our source for information on lead underwriters and the number of managing underwriters for each IPO. For underwriter prestige rankings, we start with the Carter and Manaster (1990) and Carter, Dark, and Singh (1998) rankings, and then create rankings for 1992-2003 in the spirit of their methodology. Appendix C provides a detailed description of the procedures. The underwriter prestige rankings are on a 0 to 9 scale, and are based on the pecking order seen in “tombstone” advertisements. In our empirical work, if there is more than one lead underwriter, we use the rank of the bookrunner or the highest-ranking joint bookrunner.
Appendix D describes how we identify internet IPOs and lists the SIC codes that we use to categorize IPOs as a technology (tech) firm or not.
III. Time-Series of First-Day Returns and Valuations
Figure 1 plots the annual volume and average first-day return on IPOs over 1980-2003. Table I reports the means (Panel A) and medians (Panel B) of the first-day returns by year of issue and by subperiod. In all of our analysis, we split the sample into four subperiods: January 1980-December 1989 (“the 1980s”), January 1990-December 1998 (“the 1990s”), January 1999-December 2000 (“the internet bubble”), and January 2001-December 2003 (“the post-bubble period”).
In the 1980s, the average first-day return was slightly over 7%. The average first-day return increased to almost 15% in the 1990s, and then jumped to 65% during the internet

Financial Management • Autumn 2004 14
Figure 1. Number of IPOs (Bars) and Average First-Day Returns (Diamonds) by Cohort Year
IPOs with an offer price below $5.00 per share, unit offers, REITs, closed-end funds, banks and S&Ls, ADRs, partnerships, and IPOs not listed on CRSP within six months of the offer date are excluded. Data are from Thomson Financial Securities Data and other sources, with corrections by authors. The first-day return is defined as the percentage change from the offer price to the closing price. The data plotted are reported in Panel A of Table I.
0
100
200
300
400
500
600
700
800
1980
1982
1984
1986
1988
1990
1992
1994
1996
1998
2000
2002
Calendar Year
Num
ber
of I
PO
s
0
10
20
30
40
50
60
70
80
Ave
rage
Fir
st-D
ay R
etur
ns, %
bubble. In the post-bubble period, annual IPO volume dropped to 80 issues or fewer with a mean first-day return of approximately 12%.
Table I shows that from 1980 through 1994 the underpricing of IPOs was typically quite modest, as was the amount of money left on the table. In every year from 1995 through 2000, the average first-day return was higher than in any year between 1981 and 1994. Underpricing took a big jump in the bubble period, as did the amount of money left on the table. The number of managing underwriters increased steadily until 2003, with a rapid acceleration in the late 1990s. The conventional wisdom is that the growth in the number of managing underwriters is associated with greater emphasis on analyst coverage.
For IPOs in the 1980s, Panel B reports that the median valuation of $72 million using the offer price was less than twice the annual sales of $38 million. In the 1990s, the market-to- sales ratio increased to 2.7 (median valuation of $122 million relative to median sales of $46 million). During the internet bubble period, the median valuation using the offer price jumped to $387 million while the median sales fell to $15 million, for a market-to-sales ratio of 26. Using the valuation implied by the first closing market price, the market-to-sales ratio is even higher, at 38. This rapid escalation in market-to-sales ratios suggests that valuation uncertainty played a role in increased underpricing over time. In the post-bubble period, the market-to-sales ratio fell back to 2.4, approximately what it was in the 1990s.

Loughran & Ritter • Why Has IPO Underpricing Changed Over Time? 15
Table I. Number of IPOs, First Day Returns, Number of Managing Underwriters, Amount of Money Left on the Table, Valuation Levels, and Sales by Cohort Year IPOs with an offer price below $5.00 per share, unit offers, REITs, closed-end funds, banks and S&Ls, ADRs, and IPOs not listed on CRSP within six months of issuing are excluded. Data are from Thomson Financial Securities Data, with supplements from Dealogic and other sources, and corrections by authors. The first-day return is defined as the percentage change from the offer price to the closing price. The number of domestic managing underwriters includes both lead underwriters and co-managers. Money on the table is defined as the first-day price change (offer price to close) times the number of shares issued (global offering amount, excluding overallotment options). Both valuation calculations use the post-issue number of shares outstanding. Valuations are computed by multiplying either the offer price or the first closing market price by the post-issue shares outstanding. Sales are for the last 12 months prior to going public, as reported in the prospectus. The mean and median sales are computed for the 6,306 firms for which a sales number is available. All dollar values are in dollars of 2003 purchasing power adjusted using the Consumer Price Index.
Panel A. Means
Millions of 2003 Dollars Post-Issue Valuation
Year
Number of IPOs
First-Day Return
Number of Managing
Underwriters
Money on the Table
Offer Price
Market Price
Sales 1980 70 14.5% 1.4 $5.6 $145 $181 $77 1981 191 5.8% 1.3 $1.4 $102 $109 $55 1982 77 11.4% 1.4 $3.3 $111 $126 $41 1983 442 10.1% 1.5 $3.5 $151 $165 $92 1984 172 3.6% 1.5 $0.5 $89 $91 $84 1985 179 6.3% 1.5 $2.0 $188 $194 $202 1986 378 6.3% 1.5 $2.9 $182 $194 $171 1987 271 6.0% 1.8 $3.9 $219 $234 $248 1988 97 5.4% 1.7 $2.0 $306 $315 $300 1989 105 8.1% 1.6 $3.3 $229 $245 $241 1990 104 10.8% 1.9 $4.4 $206 $225 $365 1991 274 12.0% 2.0 $6.6 $211 $236 $237 1992 385 10.2% 2.0 $5.8 $217 $237 $222 1993 484 12.8% 2.1 $8.4 $269 $304 $263 1994 387 9.8% 2.0 $4.5 $179 $193 $204 1995 434 21.5% 2.3 $12.1 $268 $320 $211 1996 623 16.7% 2.4 $12.3 $330 $392 $160 1997 437 14.0% 2.5 $11.3 $287 $334 $181 1998 268 22.2% 2.9 $21.1 $540 $652 $332 1999 457 71.7% 3.4 $86.2 $890 $1,519 $368 2000 346 56.1% 3.7 $82.8 $963 $1,635 $270 2001 80 13.5% 4.4 $30.9 $2,084 $2,239 $2,130 2002 67 8.9% 4.7 $17.3 $1,147 $1,239 $1,137 2003 63 12.2% 4.0 $16.0 $575 $645 $380 1980-1989 1,982 7.3% 1.5 $2.8 $170 $181 $149 1990-1998 3,396 14.8% 2.3 $10.0 $281 $325 $222 1999-2000 803 65.0% 3.6 $84.7 $921 $1,569 $326 2001-2003 210 11.7% 4.4 $22.1 $1,332 $1,442 $1,289 Total 6,391 18.7% 2.3 $17.5 $361 $474 $248

Financial Management • Autumn 2004 16
Table I. Number of IPOs, First Day Returns, Number of Managing Underwriters, Amount of Money Left on the Table, Valuation Levels, and Sales by Cohort Year
(Continued)
Panel B. Medians
Millions of 2003 Dollars Post-Issue Valuation
Year
Number of IPOs
First-Day
Return
Number of Managing
Underwriters Money on the Table
Offer Price
Market Price
Sales 1980 70 8.0% 1 $0.8 $65 $77 $43 1981 191 0.0% 1 $0.0 $64 $65 $26 1982 77 3.7% 1 $0.4 $57 $64 $20 1983 442 2.6% 1 $0.5 $81 $86 $26 1984 172 0.0% 1 $0.0 $49 $51 $37 1985 179 2.5% 1 $0.6 $66 $66 $47 1986 378 1.3% 1 $0.2 $71 $75 $48 1987 271 1.4% 2 $0.4 $83 $84 $48 1988 97 2.5% 2 $0.5 $109 $117 $93 1989 105 4.3% 2 $1.2 $100 $113 $55 1990 104 5.4% 2 $1.5 $111 $121 $55 1991 274 7.5% 2 $2.5 $120 $135 $67 1992 385 4.2% 2 $1.1 $111 $120 $55 1993 484 6.3% 2 $1.9 $106 $117 $58 1994 387 4.5% 2 $1.2 $87 $93 $46 1995 434 13.3% 2 $4.5 $127 $150 $37 1996 623 10.0% 2 $3.6 $136 $156 $33 1997 437 9.4% 2 $3.3 $128 $143 $41 1998 268 9.0% 3 $3.4 $178 $213 $45 1999 457 37.5% 3 $29.8 $345 $529 $18 2000 346 27.4% 3 $23.3 $436 $607 $11 2001 80 10.0% 4 $10.3 $442 $465 $140 2002 67 8.0% 4 $8.6 $479 $506 $194 2003 63 9.8% 4 $10.3 $335 $369 $165 1980-1989 1,982 1.9% 1 $0.4 $72 $76 $38 1990-1998 3,396 7.8% 2 $2.4 $122 $134 $46 1999-2000 803 32.3% 3 $27.1 $387 $563 $15 2001-2003 210 8.8% 4 $9.7 $394 $459 $164 Total 6,391 6.3% 2 $1.7 $123 $136 $40
IV. Univariate Sorts
Can the changing characteristics of IPOs, a realignment of incentives, and changing issuer objectives explain the increase in underpricing over time? In this section, we first provide some evidence based on univariate sorts. Table II reports the mean first-day returns on IPOs after several simple sorts for four subperiods: the 1980s, the 1990s, the internet bubble, and the post-bubble period. One can see that some of the cross-sectional patterns in the 1980s reversed in the 1990s. In the 1990s, larger offers were underpriced more than smaller ones, and IPOs with a prestigious lead underwriter were underpriced

Loughran & Ritter • Why Has IPO Underpricing Changed Over Time? 17
Table II. Average First-day Returns on IPOs Categorized by Proceeds, Assets, Sales, Age, Industry, VC-backing, Share Overhang, and Underwriter Prestige
Unit offers, REITs, closed-end funds, banks and S&Ls, ADRs, IPOs with an offer price below $5.00, and IPOs not listed on CRSP within six months of the offer date are excluded. Data are from Thomson Financial Securities Data and other sources, with corrections by the authors. The sample size is 6,391 IPOs for 1980-2003. High-prestige underwriters are those with a Carter and Manaster (1990) ranking of 8 or higher on a 9-point scale. Rankings for 1985-1991 are based upon the Carter et al. (1998) rankings. Rankings for 1992-2003 are by the authors. Further descriptions of how age, industry, and underwriter prestige are defined are in the appendices. Firms are classified by proceeds on the basis of whether the global gross proceeds are higher or lower than the median issue size in the prior calendar year, with no adjustment for inflation. Firms with pre-issue assets of less than $40 million (2003 purchasing power) are classified as small. Firms with trailing 12 month sales of $40 million or less (2003 purchasing power) are classified as low sales firms. Share overhang is the ratio of retained shares to the public float. Low share overhang IPOs have an overhang ratio lower than 2.333 (representing a global offer size of 30% or more of the post-issue shares outstanding, if all of the shares in the IPO are issued by the firm). The file price range is missing for 11 firms. Sales is missing for 85 firms. Age is missing for 120 firms, and assets is missing for 223 firms.
1980-1989 1990-1998 1999-2000 2001-2003 Segmented by Return N Return N Return N Return N Proceeds Small 7.4% 880 12.1% 1,551 32.7% 232 12.4% 77 Large 7.3% 1,102 17.0% 1,845 78.1% 571 11.3% 133 Assets Small 9.0% 1,095 16.8% 1,519 71.0% 458 12.0% 50 Large 4.5% 717 13.1% 1,825 57.2% 344 11.6% 160 Sales Low 9.2% 1,003 18.3% 1,545 73.0% 560 12.5% 52 High 5.2% 944 11.7% 1,805 46.6% 240 11.5% 157 Age Young (0-7 years old) 9.0% 1,003 17.1% 1,640 75.2% 536 14.6% 72 Old (8 years and older) 5.8% 942 12.7% 1,681 45.2% 263 10.1% 134 Industry Tech and internet-related 10.2% 576 22.2% 1,081 80.6% 585 16.4% 60 Non-technology 6.2% 1,406 11.3% 2,315 23.1% 218 9.8% 150 Segmented by venture capital backing Non VC-backed 7.1% 1,437 13.8% 2,000 38.5% 316 9.4% 125 VC-backed 8.0% 545 16.1% 1,397 82.2% 487 15.0% 85 Segmented by source of shares offered Exclusively sold by firm 7.7% 868 13.8% 1,999 69.4% 681 11.7% 147 Including secondary shares 7.1% 1,114 16.1% 1,396 40.4% 122 11.7% 63 Segmented by share overhang Low 7.8% 885 11.8% 1,846 26.1% 134 7.2% 87 High 7.0% 1,097 18.3% 1,550 72.7% 669 14.8% 123 Segmented by underwriter prestige Low-prestige 9.1% 1,119 12.9% 1,302 35.1% 151 12.2% 45 High-prestige 5.1% 863 15.9% 2,094 71.9% 652 11.5% 165 Segmented by the offer price relative to the file price range Revised up 20.5% 246 32.0% 777 119.0% 362 24.3% 42 OP within range 7.8% 1,181 12.3% 1,750 26.8% 296 10.3% 116 Revised down 0.5% 544 4.3% 867 7.9% 145 4.5% 52 All 7.3% 1,982 14.8% 3,396 65.0% 803 11.7% 210

Financial Management • Autumn 2004 18
more than those without.5 In the 1990s and internet bubble years, IPOs had high returns when a relatively small fraction of the firm was sold in the IPO, as measured by the ratio of retained shares to issued shares, called share overhang by Bradley and Jordan (2002). But this pattern was not present in the 1980s. Several other patterns have increased in magnitude over time. Going across each row in Table II, underpricing uniformly increased until the post- bubble period.
In Table II, during the 1980s, tech stock IPOs had an average first-day return of 10.2%. This is the highest average first-day return of any category during the 1980s except for the set of IPOs whose offer price was revised upward from the file price maximum. If the changing characteristics of IPOs explained all the changes in underpricing across time, it would be hard to imagine that the average first-day return in the 1990s would have increased to much more than 10.2% if the first-day returns were drawn from a stationary distribution.
Barry (1989), Habib and Ljungqvist (2001), and Ljungqvist and Wilhelm (2003) argue that, because the dilution effect hurts selling shareholders more than if they retain their shares, there will be more severe underpricing of pure primary offerings than of IPOs with secondary shares. Table II reports that pure primary offerings were associated with greater underpricing during the internet bubble period, a pattern not present in any quantitatively important manner in the 1980s, 1990s, or the post-bubble period. We now look at some of the patterns in more detail.
A. Age
Figure 2 graphs the average first-day return in each subperiod after classifying firms by their age at the time of going public. In each subperiod, there is more underpricing of young firms than of old firms, although the relation is not strictly monotonic. Our results for the 1980s are consistent with those reported by Muscarella and Vetsuypens (1990).
Even more noteworthy is the increased underpricing, holding age constant, as one moves from the 1980s to the 1990s to the internet bubble period.6 Thus, Figure 2 shows that the increase in underpricing over time does not occur merely because younger firms are going public. Instead, the relation between age and first-day returns is nonstationary.
Figure 3 plots the 25th, 50th, and 75th percentiles of the age distribution for the IPOs in each cohort year over 1980-2003. Four patterns stand out. First, in the early 1990s, the proportion of young firms dropped. This decline is associated with an increase in the number of “reverse LBOs,” firms going public again after a leveraged buyout. Second, in 1999, more young firms went public. This increase is associated with the internet bubble. Third, after the bubble burst, few young firms went public. Fourth, there is no strong secular trend in the age distribution of firms going public. With only temporary aberrations, the median age has stayed remarkably constant at about 7 years. The median age of an issuing firm was 7 years in the 1980s and 8 years in the 1990s, before falling to 5 years during the internet bubble, and
5The difference in underpricing of 7.4% for small firms and 7.3% for large firms in the 1980s is lower than found in other studies because we screen out IPOs with an offer price below $5.00 per share. These low price IPOs had an average first-day return of 20.5%, and their inclusion would boost the average return on small IPOs during the 1980s to 8.8%. Low priced IPOs are historically subject to fraud and have been avoided by institutional investors. There has been a decrease in these issues over time partly due to tighter listing requirements on Nasdaq, and partly due to greater regulatory pressures on this part of the IPO market. 6The greater variation of average first-day returns during the internet bubble period is due to two features of the data. First, the internet bubble period has a smaller sample size, so each age group has fewer firms in it. Second, within each age group, the standard deviation of first-day returns is higher. The post-bubble period patterns are also affected by a very small sample size in most age categories.

Loughran & Ritter • Why Has IPO Underpricing Changed Over Time? 19
Figure 2. Average First-day Returns by Age of Firm at Time of IPO Average first-day returns on IPOs during 1980-1989 (N = 1,945), 1990-1998 (N = 3,321), 1999-2000 (N = 799), and 2001-2003 (N = 206) by age of firm at the time of its IPO. IPOs with trailing 12-month sales of over $200 million (2003 purchasing power) that are less than two years old are not included, for these are typically spinoffs or reverse LBOs or have the founding dates incorrectly listed as the date of reincorporation in Delaware. The age of the firm is defined as the calendar year of the IPO minus the calendar year of the founding.
0
10
20
30
40
50
60
70
80
90
100
0 1 2 3 4 5 6 7 8 9 10 11 12 13 15 17 20 30 40 50 60 70
AGE
Ave
rag
e F
irst
-Day
Ret
urn
%
1999-2000
1990-1998
1980-1989
2001-2003
then rising dramatically to 12 years during the post-bubble period.
B. CEO Ownership
The realignment of incentives hypothesis posits that issuing firm executives will not bargain as hard for a higher offer price if the CEO owns less of the firm. Ljungqvist and Wilhelm (2003) present regression evidence consistent with this prediction, using the percentage of shares owned by the CEO as the measure of ownership. It is not obvious, however, that CEO percentage ownership is as important as the market value of these shares if we want to measure the managerial benefits of a higher offer price. For a pure primary offering, the opportunity cost to a pre-issue shareholder of underpricing is the dollar value of money left on the table multiplied by the pre-issue fraction of the firm owned by that shareholder. Holding the amount of money left on the table from the sale of primary shares constant, the fractional ownership is the correct measure of the opportunity cost to a CEO. But as our Table I shows, the amount of money left on the table was not constant during

Financial Management • Autumn 2004 20
Figure 3. 25th, 50th, and 75th Percentiles of Firm Age at Time of Going Public by Year of IPO
Each year, companies going public are ranked by firm age. The 25th, 50th (median), and 75th percentiles of this age distribution are then plotted. For example, in 1980, 25% of IPOs were 2 years old or younger, 50% were 6 years old or younger, and 75% were 11 years old or younger. For each subperiod, the 25th, 50th, and 75th percentiles of the age distribution are 3, 7, and 16 years old (the 1980s); 4, 8, and 16 years old (the 1990s); 3, 5, and 9 years old (the internet bubble); and 6, 12, and 26 years old (the post-bubble period). The 25th, 50th, and 75th percentiles of the age distribution at the time of going public for the entire sample of 6,271 IPOs are 4, 7, and 15 years old.
0
5
10
15
20
25
30
35
40
1980
1981
1982
1983
1984
1985
1986
1987
1988
1989
1990
1991
1992
1993
1994
1995
1996
1997
1998
1999
2000
2001
2002
2003
Years
Ag
e
1996-2000. To be explicit, the dollar value of the opportunity cost of underpricing to a CEO, if the
offering is entirely primary, is:
(2)
where Nceo
is the number of shares owned by the CEO, No is the pre-issue number of shares
outstanding, Nn is the number of newly issued (primary) shares, P is the first closing market
price, and OP is the offer price per share. Ljungqvist and Wilhelm (2003) emphasize that the CEO ownership fraction N
ceo/N
o was lower during the bubble period than in previous years.
But it is also the case that Nn was much higher, while the distribution of nominal offer prices
did not change much. Table III tabulates the median pre-issue CEO percentage ownership reported by Ljungqvist
and Wilhelm (2003) for 1996-2000 and an estimate of the pre-issue number of shares owned

Loughran & Ritter • Why Has IPO Underpricing Changed Over Time? 21
Year
Number of IPOs
Median Pre-Issue Number of
CEO Shares
Median
Offer Price
Median CEO Pre-Issue
Dollar Value, Millions
Median Pre-Issue % CEO
Ownership
1996 623 723,591 $12.00 $8.68 m 10.4% 1997 437 880,401 $11.75 $10.34 m 12.8% 1998 268 1,188,677 $12.50 $14.86 m 11.8% 1999 457 1,394,336 $14.00 $19.52 m 8.0% 2000 346 1,554,172 $14.00 $21.76 m 5.3%
by the CEO for the median company going public in a year, computed as the product of the median CEO fractional ownership times the median pre-issue shares outstanding. We also report the median offer price in each year and an approximation of the median dollar value of shares owned by CEOs, valued at the offer price.7
Inspection of Table III shows that, while CEO percentage ownership decreased during 1996-2000, the number of shares owned more than doubled because of the number of shares outstanding quadrupled. This dramatic increase in pre-issue shares outstanding is attributable to the substantial increase in valuations along with a relatively constant offer price. Thus, the median CEO’s market value of equity rose, even though the fractional holdings fell. If one were to focus on the market value of the shares owned by the CEO when the firm went public, the realignment of incentives hypothesis predicts a decrease in underpricing during the bubble period due to the incentive effect. Wealth effects associated with the higher market value of the shares might dominate substitution effects, however, making predictions hazardous, as Ljungqvist and Wilhelm acknowledge. In any case, the substantial increase during 1996-2000 in CEO dollar holdings is in sharp contrast to the decline in CEO holdings when ownership is measured as a percentage of shares outstanding.
C. Prestigious Underwriters
In general, underwriters with a Carter and Manaster rank of 8.0 to 9.0 (on a scale of 0 to 9) are considered to be prestigious national underwriters. Those with a rank of 5.0 to 7.9 are considered to be quality regional or niche underwriters. Underwriters with a rank of 0 to 4.9
7Alexander Ljungqvist has computed the value of the median CEO’s pre-issue market value of equity, using the Ljungqvist and Wilhelm sample, which is virtually identical to ours for the 1996-2000 period. His numbers for the median market value each year show the same trend that we report in Table III, where we multiply the product of several medians. Ljungqvist’s pre-issue market value of equity for the median CEO increases from $6.76 million in 1996 to $20.64 million in 1999 before declining to $16.86 million in 2000, while our Table III medians increase from $8.68 million in 1996 to $21.76 million in 2000.
Table III. Pre-Issue CEO Ownership in Dollar Values and Percentage, 1996-2000
The median pre-issue number of CEO shares is computed as the product of the median pre-issue number of shares outstanding and the median pre-issue % CEO ownership. This should be viewed as an approxi-mation of the actual median pre-issue number of CEO shares. The median pre-issue % CEO ownership is from Ljungqvist and Wilhelm (2003, Table III). The median CEO pre-issue dollar value is computed as the product of the prior two columns, and is also an approximation of the actual median. Neither the median offer price nor the median market value (median pre-issue number of CEO shares times the median offer price) is adjusted for price level changes (inflation). Inflation averaged less than 3% per year during this period.

Financial Management • Autumn 2004 22
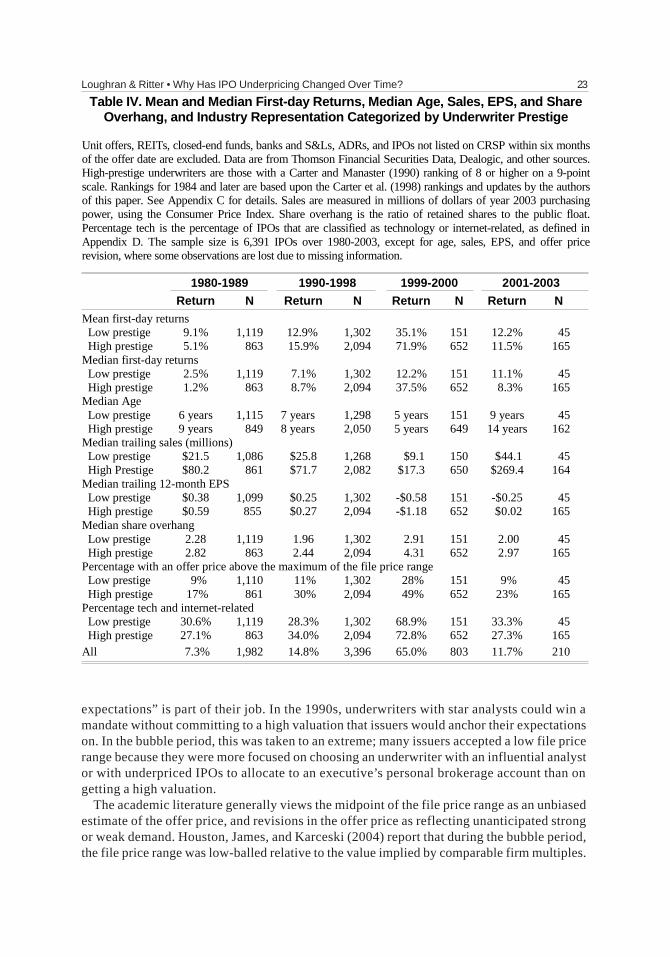
are generally associated with penny stocks; many with ranks of 3.0 or lower have been charged by the SEC with market manipulation. In Table IV, we categorize IPOs on the basis of lead underwriter prestige. Inspection of the sample sizes shows that prestigious lead underwriters increased their market share from under 50% in the 1980s to over 60% in the 1990s, and then to about 80% during the internet and post-bubble periods.8
Beatty and Welch (1996), Cooney, Singh, Carter, and Dark (2001), and others have documented that a negative relation between underwriter prestige and underpricing in the 1980s reversed itself in the 1990s, although the authors offer no explanation for the reversal. Our Table IV findings confirm this reversal. To rationalize the pattern of the 1980s that prestigious underwriters are associated with less underpricing, Carter and Manaster (1990) and Carter et al. (1998) argue that IPOs taken public by prestigious underwriters benefit from superior certification. Because of the greater reputation capital that is committed, investors do not demand as large a discount on these offers. The higher underpricing associated with prestigious underwriters in the 1990s and the internet bubble period is inconsistent with the joint hypothesis that underwriters are attempting to maximize issuer proceeds and that certification is an important determinant of the required amount of money left on the table. Instead, it is consistent with the changing issuer objective function hypothesis.
If issuers became more willing to hire underwriters with a history of underpricing after the 1980s, this could occur either because of a shift in which underwriters were hired, or a shift in the behavior of the underwriters. That is, underwriters, especially those with influential analysts and a willingness to allocate hot IPOs to the personal brokerage accounts of issuing firm decision-makers, could have changed their pricing policies in order to leave more money on the table. The evidence suggests that most of the shifts occurred via changes in the behavior of individual underwriters, rather than shifting market shares. For example, for IPOs with Goldman Sachs as the bookrunner, the average underpricing was 5.0% in the 1980s, 23.8% in the 1990s, 99.8% during the bubble, and 11.0% during the post-bubble period.
Table IV shows that over time, especially in the internet bubble period, prestigious underwriters relaxed their underwriting standards and took public an increasing number of very young and unprofitable companies. The median sales of firms taken public by prestigious underwriters dropped from $80 million in the 1980s to just $17 million during the internet bubble period.
Tables II and IV also report changes over time in the fraction of IPOs with upward revisions of the offer price relative to the file price range. Table II reports that, in the 1980s, it was twice as likely to see a downward revision as an upward revision, and in the bubble period, the proportion of upward revisions was much higher. This cannot be accounted for by differences in returns on the Nasdaq Composite in the three weeks prior to issuing. In the first three subperiods, the average three-week return immediately prior to issuing was about 1%, although in the post-bubble period it was only 0.54%.
Our analyst lust hypothesis can explain the changes over time that are documented in Table IV. In the 1980s, investment bankers competed for IPO underwriting mandates more on the basis of implied valuations and less on the basis of analyst coverage (because α
1 of
Equation (1) was higher in the 1980s). If an underwriter indicated it would price a firm higher than the competition, it was likely to be chosen. But in winning the mandate, the underwriter implicitly committed to a higher file price range, leaving less room to avoid a downward revision if market conditions weakened. Investment bankers tell us that managing “issuer
8Since in all subperiods the biggest deals are more commonly managed by prestigious underwriters, if market share is computed using gross proceeds rather than the number of IPOs, the market share of prestigious underwriters would be uniformly higher.
Loughran & Ritter • Why Has IPO Underpricing Changed Over Time? 23
Table IV. Mean and Median First-day Returns, Median Age, Sales, EPS, and Share Overhang, and Industry Representation Categorized by Underwriter Prestige
Unit offers, REITs, closed-end funds, banks and S&Ls, ADRs, and IPOs not listed on CRSP within six months of the offer date are excluded. Data are from Thomson Financial Securities Data, Dealogic, and other sources. High-prestige underwriters are those with a Carter and Manaster (1990) ranking of 8 or higher on a 9-point scale. Rankings for 1984 and later are based upon the Carter et al. (1998) rankings and updates by the authors of this paper. See Appendix C for details. Sales are measured in millions of dollars of year 2003 purchasing power, using the Consumer Price Index. Share overhang is the ratio of retained shares to the public float. Percentage tech is the percentage of IPOs that are classified as technology or internet-related, as defined in Appendix D. The sample size is 6,391 IPOs over 1980-2003, except for age, sales, EPS, and offer price revision, where some observations are lost due to missing information. 1980-1989 1990-1998 1999-2000 2001-2003
Return N Return N Return N Return N Mean first-day returns Low prestige 9.1% 1,119 12.9% 1,302 35.1% 151 12.2% 45 High prestige 5.1% 863 15.9% 2,094 71.9% 652 11.5% 165 Median first-day returns Low prestige 2.5% 1,119 7.1% 1,302 12.2% 151 11.1% 45 High prestige 1.2% 863 8.7% 2,094 37.5% 652 8.3% 165 Median Age Low prestige 6 years 1,115 7 years 1,298 5 years 151 9 years 45 High prestige 9 years 849 8 years 2,050 5 years 649 14 years 162 Median trailing sales (millions) Low prestige $21.5 1,086 $25.8 1,268 $9.1 150 $44.1 45 High Prestige $80.2 861 $71.7 2,082 $17.3 650 $269.4 164 Median trailing 12-month EPS Low prestige $0.38 1,099 $0.25 1,302 -$0.58 151 -$0.25 45 High prestige $0.59 855 $0.27 2,094 -$1.18 652 $0.02 165 Median share overhang Low prestige 2.28 1,119 1.96 1,302 2.91 151 2.00 45 High prestige 2.82 863 2.44 2,094 4.31 652 2.97 165 Percentage with an offer price above the maximum of the file price range Low prestige 9% 1,110 11% 1,302 28% 151 9% 45 High prestige 17% 861 30% 2,094 49% 652 23% 165 Percentage tech and internet-related Low prestige 30.6% 1,119 28.3% 1,302 68.9% 151 33.3% 45 High prestige 27.1% 863 34.0% 2,094 72.8% 652 27.3% 165 All 7.3% 1,982 14.8% 3,396 65.0% 803 11.7% 210
expectations” is part of their job. In the 1990s, underwriters with star analysts could win a mandate without committing to a high valuation that issuers would anchor their expectations on. In the bubble period, this was taken to an extreme; many issuers accepted a low file price range because they were more focused on choosing an underwriter with an influential analyst or with underpriced IPOs to allocate to an executive’s personal brokerage account than on getting a high valuation.
The academic literature generally views the midpoint of the file price range as an unbiased estimate of the offer price, and revisions in the offer price as reflecting unanticipated strong or weak demand. Houston, James, and Karceski (2004) report that during the bubble period, the file price range was low-balled relative to the value implied by comparable firm multiples.

Financial Management • Autumn 2004 24
During the internet bubble, Donaldson Lufkin Jenrette and Goldman Sachs, among others, low-balled the file price range on some IPOs in what DLJ refers to as a “walkup” strategy in its “pitchbook” for the August 2000 Viasource IPO.
In the early 1980s, many underwriters were thinly capitalized firms where risk-sharing was important. On a $50 million deal with a 7% gross spread, the underwriters shared $3.5 million in fees. The lead underwriter might get 20% of this, or $0.7 million. As underwriters grew larger, the lead manager was able to keep 60% of the fees, or $2.1 million. Furthermore, with more money left on the table, the lead underwriter could get quid pro quos that might be worth another $2.1 million. So it became a lot more lucrative to be the lead underwriter. To get this business, it was important to have an analyst who would be bullish. Issuers were willing to pay higher indirect fees due to both the analyst lust hypothesis and the spinning hypothesis. The time series evidence is consistent with this story, but what about cross- sectional implications?
V. Multiple Regression Results
One explanation for the cross-sectional pattern between age and first-day returns is that younger firms are riskier firms, and investors need to be compensated for this risk. The negative relationship between sales and first-day returns reported in Table II also can be interpreted as demonstrating a relation between the risk of an IPO and underpricing. The univariate sorts in Tables II and IV, however, are not independent. Tech firms are much more likely to be young firms, for instance. Thus, to examine marginal effects, we report multiple regression results with first-day return as the dependent variable. Our explanatory variables are chosen on the basis either of their association with first-day returns in our univariate sorts, or to test the changing risk composition, realignment of incentives, and changing issuer objective function hypotheses.
A. Ordinary Least Squares Regression Results
In the first and second rows of Table V, we use a total of 15 explanatory variables: a Carter- Manaster top-tier underwriter dummy (set equal to one if the lead underwriter has a rank of 8 or more, and zero otherwise), the logarithm of assets, a tech stock dummy, an internet stock dummy, the logarithm of (1 + age), share overhang (the ratio of retained shares to issued shares), a VC dummy, a pure primary offering dummy, the logarithm of sales, a dummy variable for IPOs in 1990-1998, a dummy variable for IPOs in 1999-2000, a dummy variable for IPOs in 2001-2003, and interaction terms between the Carter-Manaster top-tier underwriter dummy and the time period dummy variables. Both assets and sales are measured in millions of dollars of 2003 purchasing power. The regression is:
First-Day Returni = a
0 + a
1Top-Tier Underwriter Dummy
i + a
2ln(Assets)
i + a
3Tech Dummy
i
+ a4Internet Dummy
i +a
5ln(1 + Age)
i + a
6Overhang
i + a
7VC Dummy
i
+ a8Pure Primary Dummy
i + a
9ln(Sales)
i + a
10Top-Tier Dummy·Nineties Dummy
i
+ a11
Top-Tier Dummy·Bubble Dummyi + a
12 Top-Tier Dummy·Post Dummy
i
+ a13
Nineties Dummyi + a
14Bubble Dummy
i + a
15Post Dummy
i + e
i
The variables ln(assets), tech stock dummy, internet dummy, ln(1 + age), and ln(sales) measure changing risk composition. The pure primary dummy is a measure of the realignment of incentives,

Loughran & Ritter • Why Has IPO Underpricing Changed Over Time? 25
Pe
rio
d
Inte
r.
To
p-T
ier
Un
derw
rite
r
Du
mm
y
Ln
(As
se
ts)
Te
ch
Du
mm
y
Inte
rnet
Du
mm
y
Ln
(1 +
ag
e)
Sh
are
Ove
rha
ng
VC
Du
mm
y
Pu
re
Pri
mary
Du
mm
y
Ln
(Sale
s)
To
p-
Tie
r
Du
mm
y
·
Nin
eti
es
Du
mm
y
To
p-
Tie
r
Du
mm
y
·
Bu
bb
le
Du
mm
y
To
p-
Tie
r
Du
mm
y
·
Po
st
Du
mm
y
Nin
eti
es
Du
mm
y
Bu
bb
le
Du
mm
y
Po
st
Du
mm
yR
2
ad
j
(1)
All
2.33
(1
.57)
3.76
(3
.87)
-2.40
(-5
.21)
5.83
(4
.86)
34.43
(7
.09)
-1.28
(-3
.53)
3.67
(9.08
) 1.
92
(1.81
) -1
.17
(-1.57
) 0.
42
(1.12
) -
- -
8.86
(1
4.04)
33
.49
(11.0
4)
5.39
(3.60
) 0.2
79
(2)
All
5.45
(3
.68)
-2.50
(-2
.66)
-2.36
(-5
.13)
5.56
(4
.67)
34.88
(7
.22)
-1.18
(-3
.31)
3.54
(8.97
) 1.
78
(1.69
) -1
.60
(-2.17
) 0.
42
(1.13
) 5.0
5 (4
.60)
36.25
(6
.17)
5.29
(1.53
) 6.8
2 (7
.77)
6.66
(1
.28)
3.34
(1.07
) 0.2
90
(3)
1980
-198
9 12
.42
(8.80
) -1
.77
(-2.24
) -0
.75
(-2.00
) 2.
44
(2.62
) -4
.06
(-0.90
) -0
.89
(-2.46
) 0.1
6 (0
.79)
0.30
(0
.36)
-0.75
(-0
.98)
-0.25
(-0
.69)
- -
- -
-
0.037
(4)
1990
-199
8 15
.43
(11.3
9)
3.32
(3
.39)
-1.71
(-4
.65)
5.46
(5
.21)
31.29
(3
.47)
-1.31
(-3
.94)
2.76
(7.57
) -1
.90
(-1.83
) -3
.25
(-3.99
) 0.
05
(0.19
) -
- -
- -
0.1
30
(5)
1999
-200
0 -1
6.68
(-1.59
) 21
.22
(3.11
) -5
.89
(-2.98
) 16
.98
(2.84
) 25
.02
(3.72
) -0
.97
(-0.29
) 9.3
5 (6
.65)
21.48
(3
.42)
5.59
(1
.06)
2.38
(1
.32)
- -
- -
-
0.199
(6)
2001
-200
3 8.
41
(2.12
) -1
.29
(-0.46
) -0
.97
(-1.49
) 5.
26
(1.91
) -3
.25
(-0.57
) -1
.35
(-1.15
) 2.2
3 (4
.01)
4.00
(1
.65)
-2.41
(-1
.13)
1.09
(2
.42)
- -
- -
-
0.119
Tab
le V
. Reg
ress
ion
s o
f Per
cen
tag
e F
irst
-Day
Ret
urn
s o
n S
ever
al V
aria
ble
s an
d In
tera
ctio
n T
erm
s
The
sam
ple
in ro
w 1
incl
udes
5,9
90 U
S op
erat
ing
firm
IPO
s ove
r 198
0-20
03 w
here
the
offe
r pri
ce is
at l
east
$5.
00 a
nd c
ompl
ete
data
on
all o
f the
var
iabl
es is
ava
ilabl
e. T
he
subp
erio
ds h
ave,
resp
ectiv
ely,
1,7
52, 3
,235
, 797
, and
206
obs
erva
tions
. The
dep
ende
nt v
aria
ble
in a
ll re
gres
sion
s is
the
perc
enta
ge fi
rst-
day
retu
rn fr
om th
e of
fer p
rice
to
the
firs
t-da
y cl
osin
g pr
ice.
The
top-
tier u
nder
wri
ter d
umm
y ta
kes
a va
lue
of o
ne if
the
lead
und
erw
rite
r has
an
upda
ted
Car
ter a
nd M
anas
ter (
1990
) ran
k of
8 o
r mor
e, a
nd
zero
oth
erw
ise.
Ln(
asse
ts) i
s th
e na
tura
l log
arith
m o
f the
pre
-iss
ue b
ook
valu
e of
ass
ets,
exp
ress
ed in
mill
ions
of d
olla
rs o
f 200
3 pu
rcha
sing
pow
er u
sing
the
CPI
. The
tech
du
mm
y ta
kes
a va
lue
of o
ne (z
ero
othe
rwis
e) if
the
firm
is in
the
tech
nolo
gy b
usin
ess,
and
the
inte
rnet
dum
my
is s
imila
rly
defi
ned
(ind
ustr
ies
are
defi
ned
in A
ppen
dix
D).
Ln(
1 +
age)
is th
e na
tura
l log
of 1
plu
s th
e ye
ars
sinc
e th
e fi
rm’s
foun
ding
dat
e as
of t
he IP
O. S
hare
ove
rhan
g is
the
ratio
of r
etai
ned
shar
es to
the
publ
ic fl
oat (
the
num
ber
of s
hare
s is
sued
). T
he V
C d
umm
y ta
kes
a va
lue
of o
ne (z
ero
othe
rwis
e) if
the
IPO
is b
acke
d by
ven
ture
cap
ital.
The
pur
e pr
imar
y du
mm
y eq
uals
one
(zer
o ot
herw
ise)
if
the
offe
ring
is 1
00%
pri
mar
y (i
.e.,
no se
cond
ary
shar
es so
ld).
Ln(
sale
s) is
the
natu
ral l
og o
f the
trai
ling
annu
al fi
rm sa
les,
exp
ress
ed in
mill
ions
of d
olla
rs o
f 200
3 pu
rcha
sing
po
wer
. The
nin
etie
s dum
my
take
s a v
alue
of o
ne (z
ero
othe
rwis
e) if
the
IPO
occ
urre
d du
ring
199
0-19
98. T
he b
ubbl
e du
mm
y ta
kes a
val
ue o
f one
(zer
o ot
herw
ise)
if th
e IP
O
occu
rred
dur
ing
1999
-200
0. T
he p
ost d
umm
y ta
kes
a va
lue
of o
ne (
zero
oth
erw
ise)
if th
e IP
O o
ccur
red
duri
ng 2
001-
2003
. The
inte
ract
ion
term
s m
ultip
ly th
e to
p-tie
r un
derw
rite
r dum
my
by th
e tim
e pe
riod
dum
mie
s. T
he t-
stat
istic
s (i
n pa
rent
hese
s) a
re c
alcu
late
d us
ing
Whi
te’s
(198
0) h
eter
oske
dast
icity
-con
sist
ent m
etho
d.
Firs
t-D
ay R
etur
n i = a
0 +
a 1Top
-Tie
r U
nder
wri
ter
Dum
my i +
a2ln
(Ass
ets)
i + a
3Tec
h D
umm
y i + a
4Int
erne
t D
umm
y i +a 5ln
(1 +
age
) i +
a 6Ove
rhan
g i +
a7V
C D
umm
y i
+ a 8P
ure
Prim
ary
Dum
my i +
a9ln
(Sal
es) i +
a10
Top-
Tie
r D
umm
y·N
inet
ies
Dum
my i +
a11
Top-
Tie
r D
umm
y·B
ubbl
e D
umm
y i +
a 12To
p-T
ier
Dum
my·
Post
Dum
my i +
a 13
Nin
etie
s D
umm
y i + a
14B
ubbl
e D
umm
y i + a
15Po
st D
umm
y i + e
i

Financial Management • Autumn 2004 26
with a predicted positive coefficient. The changing issuer objective function hypothesis is tested by the change over time in the coefficients on the top-tier underwriter dummy. Our hypothesis is that, ceteris paribus, IPOs underwritten by top-tier underwriters were underpriced more in the 1990s and, especially, in the bubble period because of spinning and because they had more highly ranked analysts. We use a top-tier Carter-Manaster ranking as a proxy for all-star analyst presence and the ability and willingness to spin. It should be noted that the vast majority of Institutional Investor all-star analysts are employed by top-tier underwriters, which we define as investment bankers with a Carter-Manaster rank of 8 or higher.
Several variables capture the predictions of multiple hypotheses. For example, all three hypotheses are consistent with a positive coefficient on overhang, because the opportunity cost of underpricing is lower, the lower is the fraction of the firm sold (and thus the greater the overhang), and small proportionate offerings are associated with high valuations.
The slope coefficients in the row 1 regression are generally consistent with the univariate results reported earlier, although the lack of significance for the VC dummy and ln(sales) suggests that correlations between variables drive some of the univariate patterns. The negative coefficients on ln(assets) and ln(1 + age), and the positive coefficients on the tech and internet dummies, are consistent with the changing risk composition hypothesis, given that the bubble period saw a higher proportion of IPOs by young tech and internet firms than other periods. The negative and insignificant coefficient on the pure primary dummy is not consistent with the realignment of incentives hypothesis.
Recall that the average first-day return increased from 7.3% in the 1980s to 14.8% in the 1990s, 65.0% during the internet bubble, and 11.7% in the post-bubble period. We seek to explain these increases: 7.5 percentage points from the 1980s to the 1990s, 57.7 percentage points from the 1980s to the internet bubble, and 4.4 percentage points from the 1980s to the post-bubble period. In Table V, the row 1 coefficient on the nineties dummy of 8.86, or 8.86%, suggests that none of the increase in underpricing from the 1980s to the 1990s has been explained. The coefficient on the bubble dummy variable of 33.49 implies that only some of the 57.7% difference in underpricing between the 1980s and the internet bubble period is accounted for. And the coefficient of 5.39 on the post-bubble dummy variable suggests that the variables are not adequate to explain the difference in underpricing between the 1980s and the post-bubble period as well.
In row 2, we add three explanatory variables allowing a shift in the top-tier underwriter dummy coefficient over time. Specifically, we add three interaction terms by multiplying the top-tier underwriter dummy by the time period dummies. As the changing issuer objective function hypothesis would predict, all three of these interaction variables have positive coefficients in row 2, and the shifts in the 1990s and bubble periods are statistically significant. In row 2, the coefficient on the nineties dummy of 6.82 (6.8%) indicates that we are still unable to explain the unconditional difference in underpricing between the 1980s and 1990s of 7.5%. Most importantly, however, the coefficient on the bubble dummy falls to a statistically insignificant 6.66 (6.7%). Since the unconditional difference in underpricing between the 1980s and the bubble period is 57.7%, the row 2 regression is able to account for the vast majority of the extra underpricing associated with the bubble period. The same is true for the post-bubble dummy, where the coefficient of 3.34 (3.3%) is statistically indistinguishable from both zero and the unconditional difference in underpricing of 4.4%. Hence, the shift in the top-tier underwriter variable can explain all of the increase in first-day returns between the 1980s and the bubble and post-bubble time periods.
Thus, the coefficients on the time period dummies in row 1 suggest that neither the changing risk composition hypothesis nor the realignment of incentives hypothesis is able

Loughran & Ritter • Why Has IPO Underpricing Changed Over Time? 27
to explain much of the unconditional changes in underpricing over time. On the other hand, when we introduce variables suggested by the changing issuer objective function hypothesis in row 2, the bubble period dummy drops to a statistically insignificant 6.66%, although the inability to explain the higher underpricing in the 1990s remains.
Rows 3-6 present subperiod results. The top-tier underwriter dummy coefficient is reliably negative in the 1980s, positive in the 1990s, very positive in the bubble period, and insignificant in the post-bubble period. In the bubble period, the coefficient on the top-tier underwriter dummy is 21.22. This implies that IPOs with a top-tier lead underwriter had 21.2% higher first- day returns than IPOs with less prestigious bankers, after adjusting for other factors.
This increase in underpricing associated with prestigious underwriters in the 1990s and the bubble period is a test of the changing issuer objective function hypothesis. Also consistent with this hypothesis is the increasing market share of top-tier underwriters reported in Tables II and IV. As we have argued, issuer decision-makers were willing to pay for their services by leaving money on the table because of the side payments and the positive analyst coverage that they or their companies received.
Inspection of the subperiod results in rows 3-6 of Table V shows that the parameter estimates on all of the explanatory variables except ln(1 + age) have changed over time. This nonstationarity suggests that increased underpricing over time is not attributable entirely to an increase in the fraction of IPOs by riskier companies or a realignment of incentives, unless, for example, an omitted variable bias has different effects in different subperiods.
B. Instrumental Variable Regression Results
Habib and Ljungqvist (2001), Fernando, Gatchev, and Spindt (2004), and others argue that the prestige of the lead underwriter is endogenous in regressions with underpricing as the dependent variable. Habib and Ljungqvist (2001) deal with this by running two-stage least squares regressions for underpricing, where rather than using the Carter-Manaster underwriter prestige rank, they use the predicted rank from a first-stage OLS regression. In Table VI, we report underpricing regression results after controlling for the endogeneity of underwriter choice by using an instrument for the Carter-Manaster underwriter rank. Our qualitative conclusions are not substantially altered.
In Panel A of Table VI, the first-stage OLS regression for underwriter rank has as explanatory variables ln(assets), a tech dummy, an internet dummy, ln(1 + age), share overhang, a VC dummy, a pure primary dummy variable, ln(sales), and age/assets.9 In rows 1 and 2 of our Table V regressions, the pure primary dummy, the VC dummy, and ln(sales) were weakly related at best to first-day returns. In Panel A of Table VI, these three variables are strongly related to underwriter rank, except for the post-bubble subperiod, where a small sample size limits the statistical significance of all variables.
In Panel B of Table VI, we report regression results with underpricing as the dependent variable. In row 6, we report OLS regression coefficients. In row 7, we report regression coefficients from the second-stage regression using the predicted value of underwriter rank to construct the top-tier underwriter dummy instrument. That is, if the predicted Carter- Manaster rank is 8 or higher, the predicted value of the top-tier underwriter dummy is one, and zero otherwise.
Both rows 6 and 7 use the entire 24-year sample period, and a comparison of the two rows shows that controlling for the endogeneity of underwriter choice does not substantially alter the conclusions drawn from Table V. Both the 1990s and the post-bubble dummy variables 9For IPOs with an age-to-assets ratio higher than one, we set the ratio value at one.
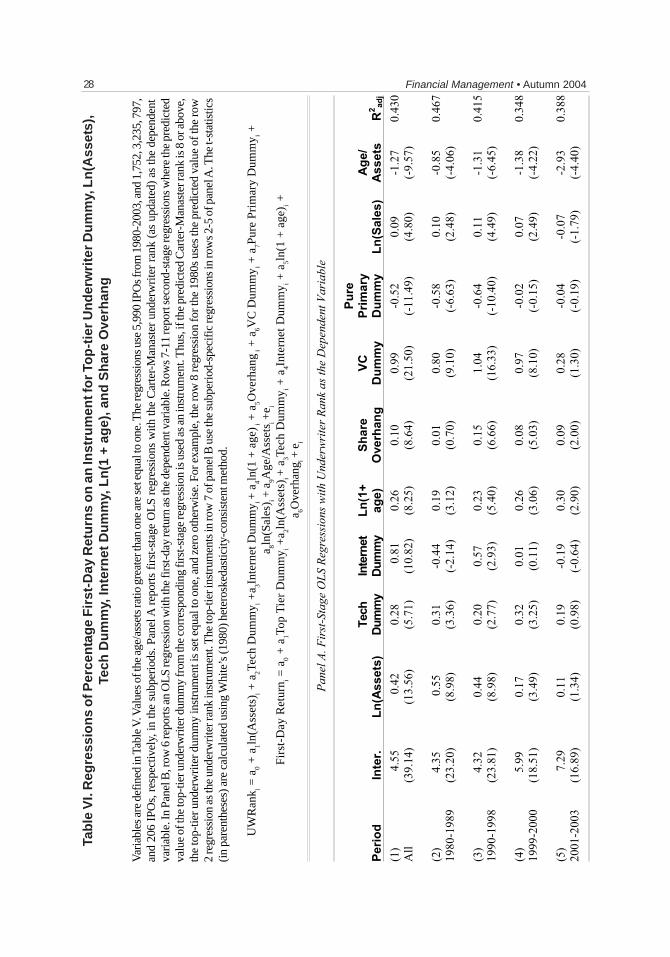
Financial Management • Autumn 2004 28 Ta
ble
VI.
Reg
ress
ion
s o
f Per
cen
tag
e F
irst
-Day
Ret
urn
s o
n a
n In
stru
men
t fo
r To
p-t
ier
Un
der
wri
ter
Du
mm
y, L
n(A
sset
s),
Tech
Du
mm
y, In
tern
et D
um
my,
Ln
(1 +
ag
e), a
nd
Sh
are
Ove
rhan
g
Var
iabl
es a
re d
efin
ed in
Tab
le V
. Val
ues o
f the
age
/ass
ets r
atio
gre
ater
than
one
are
set e
qual
to o
ne. T
he re
gres
sion
s use
5,9
90 IP
Os f
rom
198
0-20
03, a
nd 1
,752
, 3,2
35, 7
97,
and
206
IPO
s, r
espe
ctiv
ely,
in th
e su
bper
iods
. Pan
el A
rep
orts
fir
st-s
tage
OL
S re
gres
sion
s w
ith th
e C
arte
r-M
anas
ter
unde
rwri
ter
rank
(as
upd
ated
) as
the
depe
nden
t va
riab
le. I
n Pa
nel B
, row
6 re
port
s an
OL
S re
gres
sion
with
the
firs
t-da
y re
turn
as t
he d
epen
dent
var
iabl
e. R
ows 7
-11
repo
rt se
cond
-sta
ge re
gres
sion
s whe
re th
e pr
edic
ted
valu
e of
the
top-
tier u
nder
wri
ter d
umm
y fr
om th
e co
rres
pond
ing
firs
t-st
age
regr
essi
on is
use
d as
an
inst
rum
ent.
Thu
s, if
the
pred
icte
d C
arte
r-M
anas
ter r
ank
is 8
or a
bove
, th
e to
p-tie
r und
erw
rite
r dum
my
inst
rum
ent i
s se
t equ
al to
one
, and
zer
o ot
herw
ise.
For
exa
mpl
e, th
e ro
w 8
regr
essi
on fo
r the
198
0s u
ses
the
pred
icte
d va
lue
of th
e ro
w
2 re
gres
sion
as t
he u
nder
wri
ter r
ank
inst
rum
ent.
The
top-
tier i
nstr
umen
ts in
row
7 o
f pan
el B
use
the
subp
erio
d-sp
ecif
ic re
gres
sion
s in
row
s 2-5
of p
anel
A. T
he t-
stat
istic
s (i
n pa
rent
hese
s) a
re c
alcu
late
d us
ing
Whi
te’s
(198
0) h
eter
oske
dast
icity
-con
sist
ent m
etho
d.
UW
Ran
k i = a
0 + a
1ln(
Ass
ets)
i + a
2Tec
h D
umm
y i +a 3I
nter
net D
umm
y i + a
4ln(
1 +
age
) i +
a5O
verh
ang i
+ a
6VC
Dum
my i +
a7P
ure
Pri
mar
y D
umm
y i +
a 8ln(
Sal
es) i +
a9A
ge/A
sset
s i +e i
Fir
st-D
ay R
etur
n i = a
0 +
a1T
op T
ier
Dum
my i +
a 2ln(
Ass
ets)
i + a
3Tec
h D
umm
y i + a
4Int
erne
t D
umm
y i + a
5ln(
1 +
age
) i +
a 6Ove
rhan
g i + e
i
Panel
A.
Fir
st-
Sta
ge O
LS R
egressio
ns w
ith U
nderw
rit
er R
ank a
s t
he D
ependent
Varia
ble
Pe
rio
d
Inte
r.
Ln
(Ass
ets
)
Tech
Du
mm
y
Inte
rnet
Du
mm
y
Ln
(1+
ag
e)
Sh
are
Ove
rh
an
g
VC
Du
mm
y
Pu
re
Prim
ary
Du
mm
y
Ln
(Sa
les
)
Ag
e/
As
se
ts
R2
ad
j
(1)
All
4.
55
(39.
14)
0.4
2 (1
3.56
) 0.
28
(5.7
1)
0.8
1 (1
0.82
) 0.
26
(8.2
5)
0.10
(8
.64)
0.
99
(21.
50)
-0.5
2 (-
11.4
9)
0.09
(4
.80)
-1
.27
(-9.
57)
0.43
0
(2)
1980
-198
9
4.3
5 (2
3.20
) 0
.55
(8.9
8)
0.31
(3
.36)
-0
.44
(-2.
14)
0.19
(3
.12)
0.
01
(0.7
0)
0.80
(9
.10)
-0
.58
(-6.
63)
0.10
(2
.48)
-0
.85
(-4.
06)
0.46
7
(3)
1990
-199
8
4.3
2 (2
3.81
) 0.
44
(8.9
8)
0.20
(2
.77)
0.
57
(2.9
3)
0.23
(5
.40)
0.
15
(6.6
6)
1.04
(1
6.33
) -0
.64
(-10
.40)
0.
11
(4.4
9)
-1.3
1 (-
6.45
) 0.
415
(4)
1999
-200
0
5.9
9 (1
8.51
) 0.
17
(3.4
9)
0.32
(3
.25)
0.
01
(0.1
1)
0.26
(3
.06)
0.
08
(5.0
3)
0.97
(8
.10)
-0
.02
(-0.
15)
0.07
(2
.49)
-1
.38
(-4.
22)
0.34
8
(5)
2001
-200
3
7.29
(1
6.89
) 0.
11
(1.3
4)
0.19
(0
.98)
-0
.19
(-0.
64)
0.30
(2
.90)
0.
09
(2.0
0)
0.28
(1
.30)
-0
.04
(-0.
19)
-0.0
7 (-
1.79
) -2
.93
(-4.
40)
0.38
8

Loughran & Ritter • Why Has IPO Underpricing Changed Over Time? 29
Pa
nel
B.
Fir
st-
da
y R
etu
rn
as D
ep
en
den
t V
aria
ble
, w
ith S
eco
nd
-sta
ge R
eg
ressio
ns i
n R
ow
s 7
-11
Pe
rio
d
Inte
r.
To
p-T
ier
Un
derw
rite
r
Du
mm
y
Ln
(Ass
ets
)
Tech
Du
mm
y
Inte
rnet
Du
mm
y
Ln
(1
+ a
ge)
Sh
are
Ove
rha
ng
To
p-
Tie
r
Du
mm
y
·
Nin
eti
es
Du
mm
y
To
p-
Tie
r
Du
mm
y
·
Bu
bb
le
Du
mm
y
To
p-
Tie
r
Du
mm
y
·
Po
st
Du
mm
y
Nin
eti
es
Du
mm
y
Bu
bb
le
Du
mm
y
Po
st
Du
mm
y
R2
ad
j
(6)
All,
OLS
4.91
(3.56
) -1
.88
(-2.10
) -2
.04
(-6.95
) 6.1
8 (5
.61)
34.92
(7
.25)
-0.96
(-2
.76)
3.48
(8.89
) 5.1
0 (4
.67)
36.05
(6
.13)
4.53
(1.31
) 6.
48
(7.62
) 5.
99
(1.15
) 3.
33
(1.07
) 0.2
90
(7)
All
6.58
(4
.58)
1.04
(0
.89)
-2.68
(-8
.01)
5.63
(5
.07)
33.75
(6
.95)
-0.97
(-2
.80)
3.35
(8.95
) 3.8
9 (3
.41)
27.00
(4
.84)
9.99
(3.00
) 8.
52
(12.2
1)
18.51
(4
.87)
-0.11
(-0
.04)
0.290
(8)
1980
-198
9
12.54
(8
.89)
0.96
(1
.00)
-1.36
(-4
.19)
2.36
(2
.69)
-4.59
(-0
.98)
-0.90
(-2
.71)
0.12
(0.60
) -
- -
- -
0.0
36
(9)
1990
-199
8
14.16
(9
.67)
3.79
(3
.19)
-1.69
(-5
.48)
5.41
(5
.44)
31.17
(3
.38)
-1.22
(-3
.72)
2.57
(7.33
) -
- -
- -
0.1
25
(10)
19
99-2
000
14.93
(1
.66)
23.85
(3
.61)
-7.25
(-4
.30)
17.10
(2
.87)
24.36
(3
.57)
-1.00
(-0
.32)
9.47
(6.67
) -
- -
- -
0.1
88
(11)
20
01-2
003
7.20
(2
.09)
1.08
(0
.32)
-0.52
(-0
.83)
6.33
(2
.36)
-0.64
(-0
.12)
-0.48
(-0
.41)
2.01
(3.81
) -
- -
- -
- 0.0
98
Tab
le V
I. R
egre
ssio
ns
of P
erce
nta
ge
Fir
st-D
ay R
etu
rns
on
an
Inst
rum
ent f
or
Top
-tie
r U
nd
erw
rite
r D
um
my,
Ln
(Ass
ets)
, Te
ch D
um
my,
Inte
rnet
Du
mm
y, L
n(1
+ a
ge)
, an
d S
har
e O
verh
ang
(C
on
tin
ued
)

Financial Management • Autumn 2004 30
have approximately the same coefficient values in rows 6 and 7, but there is a difference between the rows in terms of the bubble dummy coefficient. Row 6 (OLS) reports an insignificant coefficient of 5.99 while the row 7 second-stage regression has a coefficient of 18.51. This is still much closer to zero than the 57.7% unconditional difference in underpricing, however.
Rows 8-11 report subperiod results for the instrumented regressions, which are analogous to the OLS regressions in rows 3-6 of Table V. Controlling for the endogeneity of underwriter choice has no impact on our qualitative conclusions, except that for the 1980s the coefficient on the top-tier underwriter dummy changes from negative to insignificantly positive.
VI. Alternative Explanations for the Underpricing of Internet Stocks
Many alternative explanations have been advanced for the severe underpricing of IPOs during the internet bubble.10 One view is that many issuers were more concerned with the market price at lockup expiration than with what the offer price was. Developing this idea, Aggarwal, Krigman, and Womack (2002) argue that severe underpricing generates “information momentum,” resulting in a higher market price at the end of the lockup period when insiders typically sell some of their shares. While this may be true, it is not clear that the benefits to the issuing firm exceed the opportunity cost associated with the increased dilution from underpricing the IPO. Nevertheless, we are comfortable with the notion that during the internet bubble issuers placed less weight on IPO proceeds and more weight on the proceeds from future insider sales and follow-on offerings than they did in prior periods. This, after all, is part of the analyst lust hypothesis.
During the internet bubble, there were widespread concerns about the valuation of internet stocks. One explanation for the severe underpricing of internet IPOs is that underwriters were unwilling to price these offerings at the level that the market was willing to pay out of concern about lawsuits and damage to reputation if and when the stocks eventually dropped in price. The argument is that unsophisticated day traders and others were bidding up the price to unjustified levels, and the underwriters were unwilling to price the IPOs at the market price determined by these “noise traders.”
In untabulated results, we do not find a negative relation between first-day returns and subsequent performance in either the 1980s or the 1990s, but we do find reversals during the internet bubble.11 For example, of the 19 IPOs with a first-day return of more than 300% during the internet bubble, the average buy-and-hold return from the first closing price until the end of December 2002 is –95.0%.12 Measured from the offer price, the average return through December 2002 (or the delisting date, if earlier) is –73.7% for these 19 IPOs, compared to –43.5% for the other bubble period IPOs. This evidence is consistent with the idea that 10DuCharme, Rajgopal, and Sefcik (2001), Schultz and Zaman (2001), and Ofek and Richardson (2003), among others, examine various hypotheses for the high underpricing of US internet stocks. Arosio, Giudici, and Paleari (2001) present evidence for the severe underpricing of European internet stocks. 11Logue, Rogalski, Seward, and Foster-Johnson (2002) for IPOs in 1988-1995 and Houge, Loughran, Suchanek, and Yan (2001) for IPOs in 1993-1996 find a slight negative relation between first-day returns and subsequent three-year stock performance. Lowry (2003) finds no relation for IPOs in 1973-1996, and Loughran and Ritter (2002) find no relation for IPOs in 1990-1998. 12The only one of these 19 IPOs that did not decline by more than 90% from the first-day close through December 2002 is Cobalt Networks, which was acquired in December 2000 after falling by 65.1%. Measured from the first closing price to 180 calendar days later, the average return was –46.8%. The bookrunners (with partial credit given for joint bookrunners) on these 19 IPOs were SG Cowen for 1, CSFB for 3, Deutsche Bank for 1.5, Donaldson Lufkin Jenrette for 0.5, Goldman Sachs for 1.5, Merrill Lynch for 2, Morgan Stanley for 8.5, and Robertson Stephens for 1.

Loughran & Ritter • Why Has IPO Underpricing Changed Over Time? 31
overoptimistic investor sentiment temporarily inflated the market prices on these IPOs. We are skeptical of this explanation for severe underpricing, however, for if underwriters
were concerned that the market prices on internet stocks were too high, presumably their analyst recommendations after the end of the quiet period would have been bearish. Bradley, Jordan, and Ritter (2003), Cliff and Denis (2004), and Houston, James, and Karceski (2004) find this is in fact not the case.
The poor subsequent performance of IPOs with high first-day returns in the bubble period is also consistent with a less innocuous explanation, however. As is typical in the academic IPO literature, we have taken the first closing market price as exogenous. Yet Smith and Pulliam (2002) state that:
[T]he Securities and Exchange Commission is examining whether some securities firms coerced investors who got hot IPO shares into placing orders for the same stocks at higher prices on the first day of trading, as a condition of getting the IPOs. That practice, known as “laddering,” contributed to the huge one-day run-ups in many IPOs during the tech-stock mania. The SEC’s laddering probe has focused on firms including Goldman Sachs Group Inc., Morgan Stanley, Robertson Stephens and J.P Morgan Chase.
On October 1, 2003, J.P. Morgan Chase settled with the SEC, paying a $25 million fine. Investors would be willing to buy these additional shares in the aftermarket if the sum of
the profits from the IPO allocation they received and the aftermarket purchases were positive (calculated using the weighted average purchase price). In many cases, the sales would occur on the day the quiet period ends, which is when the underwriters’ analysts typically initiate coverage, almost always with “buy” ratings. Thus, tainted analyst recommendations, which unsuspecting individual investors paid attention to, allow an exit at an inflated price.
Laddering would contribute to a negative correlation between first-day returns and long- run returns because the extra buying pressure on the first day from these purchase orders would create subsequent selling pressure when these shares were sold. Unless the market price is unaffected by buying and selling pressure, there will be price impacts. The evidence of stock price effects for analyst initiations at the end of the quiet period (Bradley et al., 2003 and Ofek and Richardson, 2003), and for selling pressure at the end of the lockup period (Bradley, Jordan, Roten, and Yi, 2001; Brav and Gompers, 2003; and Field and Hanka, 2001) suggests that such effects are present for IPOs.
VII. Conclusions
Why has underpricing changed over time? We explore three non-mutually exclusive explanations: changing risk composition, a realignment of incentives, and a changing issuer objective function.
A small part of the increase in underpricing can be attributed to the changing risk composition of the universe of firms going public. The physical riskiness of firms going public, as measured, for example, by age or assets, did not change very much between the 1980s and the 1990s, although the bubble period saw a high proportion of very young firms go public, and the post-bubble period saw a high proportion of older firms.
The realignment of incentives hypothesis argues that managerial incentives to reduce underpricing have decreased over time because of, among other reasons, reduced CEO ownership and a higher fraction of IPOs with no secondary shares. When we look at the
Financial Management • Autumn 2004 32
whole sample period, however, there are only weak cross-sectional relations between underpricing and both the fraction of the firm sold and a dummy variable for a pure primary offering. Furthermore, CEO ownership, as measured by the dollar value of holdings at the offer price, was twice as high during the bubble period as during the 1996-1998 period. This measure of CEO incentives suggests that underpricing should have decreased during the bubble period.
The changing issuer objective function hypothesis posits two reasons for why issuers became more complacent about underpricing in the 1990s and internet bubble period. First, the analyst lust hypothesis states that analyst coverage became a more important factor for issuers choosing a lead underwriter, due to higher valuations than in the 1980s. Since underwriters do not charge explicit fees for providing analyst coverage, issuers pay through the indirect cost of underpricing. Second, the spinning hypothesis argues that venture capitalists and the executives of issuing firms were co-opted through the allocation of hot IPOs to their personal brokerage accounts. This gave these decision-makers an incentive to choose a lead underwriter with a reputation for leaving money on the table in IPOs. Although the excessive dilution that results from underpricing their own IPO lowers their wealth, they gain on personal account when other hot IPOs are allocated to them. Since the profits from these other IPOs are imperfectly correlated with their undiversified paper wealth in their own company, the decision-makers are willing to accept excessive underpricing when their own firm goes public.
Multiple regressions with underpricing as the dependent variable yield evidence that supports the changing issuer objective function hypothesis. Specifically, top-tier underwriters are associated with more underpricing in the 1990s, and especially in the bubble period. This is the result in both OLS and two-stage procedures that control for the endogenous choice of the lead underwriter. This is consistent with issuers choosing top-tier underwriters who have both influential analysts and, until spinning was prohibited, many other hot IPOs to allocate to important decision-makers. Furthermore, there is strong corroborating evidence in recent academic studies examining the relation between Institutional Investor all-star analysts and both IPO underpricing and changes in underwriter market share, and in regulatory settlements regarding spinning. We know of no evidence that is inconsistent with the testable implications of the spinning and analyst lust hypotheses.
We also document patterns in the US IPO market. The universe of companies going public in the US has changed over time. For example, we document that there has been a pronounced shift towards technology stocks and firms with negative earnings. How firms are brought public has changed over time, too. The market share of the prestigious national underwriters has increased, and regional investment banking firms are increasingly shut out of lead underwriter positions.
The reasons that IPOs are underpriced vary, depending on the environment. In the 1980s, it is conceivable that the winner’s curse problem and dynamic information acquisition were the main explanations for underpricing that averaged 7% in the US. During the internet bubble, we think that these were not the main reasons for underpricing. Instead, analyst coverage and side payments to CEOs and venture capitalists became of significant importance.�
Appendix A. Founding Dates
The founding date is generally defined as the date of incorporation. We try to find the date of original incorporation, rather than a later date if the firm has reincorporated in Delaware or

Loughran & Ritter • Why Has IPO Underpricing Changed Over Time? 33
changed its name. Founding dates for 1980-1984 generally come from inspection of the prospectus. For 1985-1995, most of the founding dates were provided by Laura Field. For 1985- 1987, Moody’s is the main source of data. For 1988-1992, the prospectus is the main source. For 1993-1995, Disclosure and S&P Corporate Descriptions are the main sources. For 1993, some of the founding dates have come from Renaissance Capital. For 1996-2003, founding dates come from a variety of sources: Securities Data Co., Moody’s, Dun & Bradstreet’s Million Dollar Directory, and inspection of the prospectuses on Edgar, and were collected primarily by Laura Field (Field and Karpoff, 2002) and Li-Anne Woo. Some founding dates for 1999-2003 are from Thomson Financial’s The IPO Reporter, an industry newsletter. According to Laura Field, for 1988-1992, founding dates are earlier than the date of the most recent incorporation for 48% of the firms. An example of this is from the April 2000 prospectus of Krispy Kreme doughnuts. The firm going public was incorporated in 1999, but the predecessor corporation was incorporated in 1982. Elsewhere in the prospectus one finds the statement that their first doughnut shop was opened in 1937. We use 1937 as the founding date.
For 1996-2000, we have used some of the founding dates that Alexander Ljungqvist and William Wilhelm have tabulated for their paper (Ljungqvist and Wilhelm, 2003). They inspected prospectuses and made judgments on many spinoffs.
Firms with inflation-adjusted (2003 purchasing power) sales in the last 12 months prior to going public of $200 million or more and younger than 2 years are frequently “reverse LBOs” or divisional spinoffs. For spinoffs, the founding date of the division is used, when possible. This may be the founding date of the parent corporation. For example, Lucent Technologies (a 1996 IPO) is the former Bell Labs division of AT&T. Its founding date is given as the founding date of Bell Labs. In general, “roll-ups” are given a founding date corresponding to the founding date of the parent firm (frequently a year before the IPO).
Age is defined as the calendar year of offering minus the calendar year of founding. Thus, a 2-year old firm may be anywhere from 13 months old to 35 months old.
Because some years (1980-1984, 1988-1993, and 2000-2003) have founding dates that are primarily from the prospectus, rather than dates of incorporation from Moody’s, etc., some of the variation over time may be due to different data sources.
Appendix B. Post-Issue Shares Outstanding and Dual-class Shares
Of the 6,391 IPOs in our sample, 433 have multiple classes of shares outstanding after the IPO. Most of these are firms whose IPO is composed of Class A shares. Class B shares with superior voting rights are owned by pre-issue shareholders, and are not publicly traded. These firms present a problem for computing the market capitalization. CRSP reports shares outstanding only for share classes that are publicly traded on Nasdaq, the Amex, or the NYSE. Thus, using the CRSP-reported shares outstanding to compute the market capitalization captures only part of the market value. To take an extreme example, the United Parcel Services IPO of November 9, 1999 issued 109 million shares of Class A stock, but over 1 billion shares of Class B stock also existed. Using only the Class A shares outstanding would underestimate the market value by 91%. The December 9, 1998 IPO of Infinity Broadcasting is another example. 140 million Class A shares were issued. CRSP reports this as the number of shares outstanding. But there were also 700 million Class B shares outstanding, giving a market cap six times as high for all the shares. In all our calculations of market capitalization, we assume that non-traded shares have the same price per share as the publicly traded class.
Thomson Financial Securities Data has many errors in reporting the number of post-issue

Financial Management • Autumn 2004 34
shares outstanding, although the firm attempts to capture all classes. For single-class IPOs, CRSP is much more reliable. For dual-class IPOs, Thomson Financial is more reliable. Ljungqvist and Wilhelm (2003), in their analysis of IPOs from 1996-2000, also report substantial error rates in Thomson Financial’s data on, e.g., post-issue shares outstanding, EPS, venture capital backing, and founding dates.
If we use just the CRSP-reported shares outstanding, the median market cap figure that we calculate is 4% lower than the Table I, Panel B numbers reported. The mean market cap using CRSP data is 17% lower than the numbers reported in Table I, Panel A.
Scott Smart and Chad Zutter supplied us with a list of 258 dual-class IPOs for 1990-1998, along with the post-issue shares outstanding. CRSP does not identify all the IPOs that involve dual-class shares that Smart and Zutter (2003) identify. The post-issue shares outstanding number that Smart and Zutter have recorded is the same as the Thomson Financial number only a little over 50% of the time. For discrepancies where we could check the prospectus using EDGAR (beginning in 1996), we found that Smart and Zutter were correct over 90% of the time. For dual-class IPOs where we could not verify the number, we use the Smart and Zutter number as the first choice and the maximum of the Thomson Financial and the CRSP number as the second choice. We use Dealogic’s number if we cannot inspect the prospectus on EDGAR.
Appendix C. Underwriter Rank for IPOs over 1992-2003
For underwriter prestige rankings, we start with the Carter and Manaster (1990) and Carter et al. (1998) rankings. When a firm goes public, the underwriting section of the prospectus lists all the investment banking firms that are part of the underwriting syndicate, along with the number of shares that each underwrites. Lead underwriters are listed first, followed by co-managing underwriters, and then other syndicate members. More prestigious underwriters are listed first in the non-managing underwriting section, in brackets, with underwriters in higher brackets underwriting more shares. If an underwriter always appears in the highest bracket among non-managing underwriters, it is assigned the top ranking of 9 on a 0-9 scale.
For underwriters in the 1992-2003 period, we assign a ranking as follows. The May 1999 Goldman Sachs prospectus lists over 120 underwriters, with numerous brackets. Managing and co-managing underwriters are assigned a ranking of 9; other underwriters are given a ranking based on their bracket, with a few minor adjustments. Other underwriters not included in the Goldman Sachs prospectus are assigned a ranking of 1 or 2 if they were penny stock underwriters that had been subject to enforcement actions by the SEC during 1995-1999 (the information on enforcement actions was provided by the Chicago office of the SEC’s Division of Enforcement).
The numerical reputation ranking of remaining underwriters was determined by Bruce Foerster of South Beach Capital in Miami. Foerster has been an investment banker for close to 30 years, participating in the underwriting of 150 IPOs and hundreds of other transactions while a managing director at A.G. Becker Paribas, Paine Webber, Lehman Brothers, and South Beach Capital. He is also the editor of the Securities Industry Association’s Capital Markets Handbook (Foerster, 2004), and has an encyclopedic knowledge of the investment banking industry during the last few decades. For the handful of other underwriters that Bruce Foerster was not familiar with and that were not identified in our other procedures, we assign a rank based on the offer price of IPOs that they underwrote, with penny stock underwriters earning the lowest ranks.

Loughran & Ritter • Why Has IPO Underpricing Changed Over Time? 35
We made several alterations to the Carter and Manaster rankings for 1980-1984 and the Carter, Dark, and Singh rankings for 1985-1991. Carter, Dark, and Singh assign Hambrecht & Quist a 9.0, which we lower to 8.1. Carter and Manaster assign a rank of 2.0 to D.H. Blair in the 1980-1984 period, and Carter, Dark, and Singh assign it a rank of 8.0 to D.H. Blair during 1985- 1991. We assign a 4.1 to D.H. Blair for all years. A potential flaw in the Carter and Manaster methodology is that a penny stock underwriter that is never allowed into a syndicate of reputable underwriters might never be in a low bracket. Our judgment methodology avoids this problem. Note that we make very few changes in rankings.
All of the rankings we assign are integers followed by a 0.1 (1.1 up to 9.1). We attach a 0.1 to all our rankings so that other researchers can easily distinguish between our rankings and those from Carter and Manaster and Carter, Dark, and Singh, which never end with a 0.1. To use our rankings in empirical work, we recommend using “if then” commands to covert the x.1 rankings to x.0.
Appendix D. Internet and Technology Firms
To identify IPOs that are internet-related at the time of their offer, we merge the internet identifications of Thomson Financial Securities Data, Dealogic, and IPOMonitor.com. In 1998, Securities Data classified only 18 IPOs as internet stocks, omitting such firms as uBID, Ticketmaster Online/Citysearch, NetGravity, and Verio. IPOMonitor.com classified 27 IPOs from 1998 as internet stocks, but omitted Cdnow and Interactive Magic, among others. Since these sources generally did not backdate the identification of early internet companies, we assign a “1” value to America On-Line, Spyglass, and Netscape.
The classifications have some inherent arbitrariness. For example, Storage Area Network (SAN) companies and telecommunications companies are not internet stocks; nor are such IPOs as VA Linux and Perot Systems.
SDC identifies two IPOs from the 1980s as internet firms: IPC Communications, a manufacturer of telecommunications equipment, and McClatchey Newspapers, which offered on-line services.
Tech stocks are defined as those in SIC codes 3571, 3572, 3575, 3577, 3578 (computer hardware), 3661, 3663, 3669 (communications equipment), 3671, 3672, 3674, 3675, 3677, 3678, 3679 (electronics), 3812 (navigation equipment), 3823, 3825, 3826, 3827, 3829 (measuring and controlling devices), 3841, 3845 (medical instruments), 4812, 4813 (telephone equipment), 4899 (communications services), and 7371, 7372, 7373, 7374, 7375, 7378, and 7379 (software).
References
Aggarwal, R., L. Krigman, and K. Womack, 2002, “Strategic IPO Underpricing, Information Momentum, and Lockup Expiration Selling,” Journal of Financial Economics 66, 105-137.
Arosio, R., G. Giudici, and S. Paleari, 2001, “Why Do (or Did?) Internet-stock IPOs Leave So Much Money on the Table?” Politecnico di Milano (Italy) Working Paper.
Baron, D., 1982, “A Model of the Demand of Investment Banking Advising and Distribution Services for New Issues,” Journal of Finance 37, 955-976.
Barry, C., 1989, “Initial Public Offerings Underpricing: The Issuer’s View—A Comment,” Journal of Finance 44, 1099-1103.
Beatty, R.P., and I. Welch, 1996, “Issuer Expenses and Legal Liability in Initial Public Offerings,” Journal of Law and Economics 39, 545-602.

Financial Management • Autumn 2004 36
Benveniste, L.M., and W.J. Wilhelm, 1997, “Initial Public Offerings: Going by the Book,” Journal of Applied Corporate Finance 10, 98-108.
Bradley, D.J. and B. Jordan, 2002, “Partial Adjustment to Public Information and IPO Underpricing,” Journal of Financial and Quantitative Analysis 37, 595-616.
Bradley, D.J., B. Jordan, and J.R. Ritter, 2003, “The Quiet Period Goes Out with a Bang,” Journal of Finance 58, 1-36.
Bradley, D.J., B. Jordan, I.C. Roten, and H. C. Yi, 2001, “Venture Capital and IPO Lockup Expiration: An Empirical Analysis,” Journal of Financial Research 24, 465-494.
Brav, A. and P. Gompers, 2003, “The Role of Lock-ups in Initial Public Offerings,” Review of Financial Studies 16, 1-29.
Busse, J.A. and T.C. Green, 2002, “Market Efficiency in Real Time,” Journal of Financial Economics 65, 413-437.
Carter, R.B., F.H. Dark, and A.K. Singh, 1998, “Underwriter Reputation, Initial Returns, and the Long-run Performance of IPO Stocks,” Journal of Finance 53, 285-311.
Carter, R.B. and S. Manaster, 1990, “Initial Public Offerings and Underwriter Reputation,” Journal of Finance 45, 1045-1068.
Clarke, J.E., C. Dunbar, and K.M. Kahle, 2003, “All-star Analyst Turnover, Investment Bank Market Share, and the Performance of Initial Public Offerings,” Georgia Tech Working Paper.
Cliff, M. and D.J. Denis, 2004, “Do IPO Firms Purchase Analyst Coverage with Underpricing?” Journal of Finance (Forthcoming).
Cooney, J.W., A.K. Singh, R.B. Carter, and F.H. Dark, 2001, “IPO Initial Returns and Underwriter Reputation: Has the Inverse Relationship Flipped in the 1990s?” University of Kentucky, Case Western Reserve University, and Iowa State University Working Paper.
DuCharme, L.L., S. Rajgopal, and S.E. Sefcik, 2001, “Why Was Internet IPO Underpricing so Severe?” University of Washington Working Paper.
Dunbar, C.G., 2000, “Factors Affecting Investment Bank Initial Public Offering Market Share,” Journal of Financial Economics 55, 3-41.
Elkind, P. and M. Gimein, 2001, “The Trouble with Frank,” Fortune (September 3).
Fernando, C.S., V.A. Gatchev, and P.A. Spindt, 2004, “Wanna Dance? How Firms and Underwriters Choose Each Other,” Tulane University Working Paper.
Field, L.C. and G. Hanka, 2001, “The Expiration of IPO Share Lockups,” Journal of Finance 56, 471-500.
Field, L.C. and J. Karpoff, 2002, “Takeover Defenses of IPO Firms,” Journal of Finance 57, 1857-1889.
Foerster, B., 2004, Securities Industry Association’s Capital Markets Handbook, 5th Ed., Aspen, CO, Aspen Publishers.
Habib, M. and A. Ljungqvist, 2001, “Underpricing and Entrepreneurial Wealth Losses: Theory and Evidence,” Review of Financial Studies 14, 433-458.
Hoberg, G., 2003, “Strategic Underwriting in Initial Public Offerings,” Yale University Working Paper.
Hong, H. and J.D. Kubik, 2003, “Analyzing the Analysts: Career Concerns and Biased Earnings Forecasts,” Journal of Finance 58, 313-351.
Houge, T., T. Loughran, G. Suchanek, and X. Yan, 2001, “Divergence of Opinion, Uncertainty, and the Quality of Initial Public Offerings,” Financial Management 30, 5-23.
Houston, J., C. James, and J. Karceski, 2004, “What a Difference a Month Makes: Stock Analyst Valuations Following Initial Public Offerings,” University of Florida Working Paper.
Krigman, L., W. Shaw, and K. Womack, 2001, “Why Do Firms Switch Underwriters?” Journal of Financial Economics 60, 245-284.

Loughran & Ritter • Why Has IPO Underpricing Changed Over Time? 37
Ljungqvist, A.P., F. Marston, and W.J. Wilhelm, 2003, “Competing for Securities Underwriting Mandates: Banking Relationships and Analyst Recommendations,” NYU Working Paper.
Ljungqvist, A.P. and W.J. Wilhelm, 2003, “IPO Pricing in the Dot-com Bubble,” Journal of Finance 58, 723-752.
Logue, D.E., R.J. Rogalski, J.K. Seward, and L. Foster-Johnson, 2002, “What Is Special about the Roles of Underwriter Reputation and Market Activities in Initial Public Offerings?” Journal of Business 75, 213-243.
Loughran, T. and J.R. Ritter, 2002, “Why Don’t Issuers Get Upset About Leaving Money on the Table in IPOs?” Review of Financial Studies 15, 413-443.
Lowry, M., 2003, “Why Does IPO Volume Fluctuate So Much?” Journal of Financial Economics 67, 3-40.
Muscarella, C. and M. Vetsuypens, 1990, “Firm Age, Uncertainty, and IPO Underpricing: Some New Empirical Evidence,” SMU Working Paper.
NASD Regulation, 2002, “NASD Regulation Charges Credit Suisse First Boston with Siphoning Tens of Millions of Dollars of Customers’ Profits in Exchange for “Hot” IPO Shares,” news release available at http://www.nasdr.com/news (January 22).
Ofek, E. and M. Richardson, 2003, “Dotcom Mania: The Rise and Fall of Internet Stock Prices,” Journal of Finance 58, 1113-1138.
Reuter, J., 2004, “Are IPO Allocations for Sale? Evidence from the Mutual Fund Industry,” University of Oregon Working Paper.
Ritter, J.R., 1984, “The ‘Hot Issue’ Market of 1980,” Journal of Business 57, 215-240.
Ritter, J.R. and I. Welch, 2002, “A Review of IPO Activity, Pricing, and Allocations,” Journal of Finance 57, 1795-1828.
Rynecki, D., 2002, “Rebuild the Chinese Wall,” Fortune (June 24).
Schack, J., 2002, “Promises, Promises,” Institutional Investor (October), 39-45.
Schultz, P. and M. Zaman, 2001, “Do the Individuals Closest to Internet Firms Believe They Are Overvalued?” Journal of Financial Economics 59, 347-381.
Securities and Exchange Commission, 2002, “SEC Sues CSFB for IPO Violations; CSFB Will Pay $100 Million,” Litigation release 17327 available at http://www.sec.gov/litigation.
Sherburne, J.C., 2002, “Letter to the Honorable Michael G. Oxley,” available at http:// financialservices.house.gov/media/pdf/citiresp2_001.pdf.
Sherman, A.E. and S. Titman, 2002, “Building the IPO Order Book: Underpricing and Participation Limits with Costly Information,” Journal of Financial Economics 65, 3-29.
Siconolfi, M., 1997, “Underwriters Set Aside IPO Stock for Officials of Potential Customers,” Wall Street Journal (November 12), A1.
Smart, S. and C.J. Zutter, 2003, “Control as a Motivation for Underpricing: A Comparison of Dual- and Single-class IPOs,” Journal of Financial Economics 69, 85-110.
Smith, R., 2002, “Goldman Gave Hot IPO Shares to Top Executives of Its Clients,” Wall Street Journal (October 3), A1.
Smith, R., A. Grimes, G. Zuckerman, and K. Scannell, 2002, “Something Ventured and Something Gained?” Wall Street Journal (October 17), C1.
Smith, R. and S. Pulliam, 2002, “Two More Wall Street Firms Are Targeted in Trading Probe,” Wall Street Journal (April 25), A1.
White, H., 1980, “A Heteroskedasticity-consistent Covariance Matrix Estimator and a Direct Test for Heteroskedasticity,” Econometrica 48, 817-838.

Financial Management • Autumn 2004 38