who benefits from ipo underpricing? evidence form hybrid
TRANSCRIPT

WORKING PAPER SER IES
NO. 428 / JANUARY 2005
WHO BENEFITS FROMIPO UNDERPRICING?
EVIDENCE FORM HYBRID BOOKBUILDING OFFERINGS
by Vicente Pons-Sanz
ECB-CFS RESEARCH NETWORK ONCAPITAL MARKETS AND FINANCIALINTEGRATION IN EUROPE

In 2005 all ECB publications will feature
a motif taken from the
€50 banknote.
WORK ING PAPER S ER I E SNO. 428 / J ANUARY 2005
This paper can be downloaded without charge from http://www.ecb.int or from the Social Science Research Network
electronic library at http://ssrn.com/abstract_id=634023.
ECB-CFS RESEARCH NETWORK ONCAPITAL MARKETS AND FINANCIALINTEGRATION IN EUROPE
1 I would like to thank Arturo Bris, Roger Ibbotson, Matt Spiegel, Ivo Welch and seminar participants at the Yale School ofManagement for many helpful comments. I am grateful to Fundación Ramón Areces for financial support.All errors
are my sole responsibility. Comments most welcome.2 Yale School of Management, New Haven, CT 06520, United States; e-mail: [email protected]
WHO BENEFITS FROMIPO UNDERPRICING?
EVIDENCE FORM HYBRID
BOOKBUILDING OFFERINGS 1
by Vicente Pons-Sanz 2

© European Central Bank, 2005
AddressKaiserstrasse 2960311 Frankfurt am Main, Germany
Postal addressPostfach 16 03 1960066 Frankfurt am Main, Germany
Telephone+49 69 1344 0
Internethttp://www.ecb.int
Fax+49 69 1344 6000
Telex411 144 ecb d
All rights reserved.
Reproduction for educational and non-commercial purposes is permitted providedthat the source is acknowledged.
The views expressed in this paper do notnecessarily reflect those of the EuropeanCentral Bank.
The statement of purpose for the ECBWorking Paper Series is available from theECB website, http://www.ecb.int.
ISSN 1561-0810 (print)ISSN 1725-2806 (online)
ECB-CFS Research Network on “Capital Markets and Financial Integration in Europe”
This paper is part of the research conducted under the ECB-CFS Research Network on “Capital Markets and Financial Integration in Europe”. The Network aims at stimulating top-level and policy-relevant research, significantly contributing to the understanding of the current and future structure and integration of the financial system in Europe and its international linkages with the United States and Japan. After two years of work, the ECB Working Paper Series is issuing a selection of papers from the Network. This selection is covering the priority areas “European bond markets”, “European securities settlement systems”, “Bank competition and the geographical scope of banking activities”, “international portfolio choices and asset market linkages” and “start-up financing markets”. It also covers papers addressing the impact of the euro on financing structures and the cost of capital. The Network brings together researchers from academia and from policy institutions. It has been guided by a Steering Committee composed of Franklin Allen (University of Pennsylvania), Giancarlo Corsetti (European University Institute), Jean-Pierre Danthine (University of Lausanne), Vítor Gaspar (ECB), Philipp Hartmann (ECB), Jan Pieter Krahnen (Center for Financial Studies), Marco Pagano (University of Napoli “Federico II”) and Axel Weber (CFS). Mario Roberto Billi, Bernd Kaltenhäuser (both CFS), Simone Manganelli and Cyril Monnet (both ECB) supported the Steering Committee in its work. Jutta Heeg (CFS) and Sabine Wiedemann (ECB) provided administrative assistance in collaboration with staff of National Central Banks acting as hosts of Network events. Further information about the Network can be found at http://www.eu-financial-system.org. The joint ECB-CFS Research Network on "Capital Markets and Financial Integration in Europe" aims at promoting high quality research. The Network as such does not express any views, nor takes any positions. Therefore any opinions expressed in documents made available through the Network (including its web site) or during its workshops and conferences are the respective authors' own and do not necessarily reflect views of the ECB, the Eurosystem or CFS.

3ECB
Working Paper Series No. 428January 2005
CONTENT S
Abstract 4
Non-technical summary 5
1 Related literature 9
2 Sample description 12
2.1 Institutional characteristics of thespanish IPO and SEO markets 12
2.2 Data 15
3 Allocation to retail and institutional investors 16
3.1 Initial allocations 17
3.2 Final allocations 19
4 Information in the equity offerings market 21
4.1 The informational advantage ofinstitutional investors 21
4.2 The underwriter response toinvestors demand 23
4.3 Herding in the IPO and SEO market 23
5 Retail investors profits 24
5.1 The winner’s curse model of IPOunderpricing 24
5.2 Methodology and empirical results 26
6 Conclusion 34
References 35
Tables and figures 39
European Central Bank working paper series 60

Abstract
This paper uses a unique sample of 175 Spanish equity offerings from 1985 to 2002
to test who benefits from IPO underpricing and why. Institutions receive nearly 75%
of the profits in underpriced issues, while they have to bear only 56% of the losses
in overpriced offerings. Superior information regarding first day underpricing cannot
completely explain the institutional abnormal profits. Underwriters are better informed
about the companies they take public, and use that information to favor their long
term clients. The preferential treatment of institutional investors, however, does not
come at the expense of retail investors. Retail investors earn positive profits from
participating in the new issues market. The driving factor behind the relative retail
large allocation in overpriced issues when compared to underpriced offerings is not the
underwriter allocation bias in favor of institutional investors. Retail investors subscribe
more heavily to underpriced issues, consistent with individuals being partially informed.
JEL classification: G32, G24. Keywords: Initial Public Offerings, Allocations, Retail Investors, Winner's Curse.
4ECBWorking Paper Series No. 428January 2005

Non-technical summary
Initial public offerings are generally underpriced. While this puzzle has been extensively
documented, there is little evidence about who benefits from IPO underpricing and why. Do
institutions receive larger allocations than retail investors? Do institutions concentrate on the
most underpriced offerings because they are better informed than retail investors or because
underwriters use their superior knowledge to intentionally favour their long-term clients? If,
on the other hand, allocations to institutional investors are unrelated to first day returns, is it
because institutions lack superior ability or because allocations of coveted underpriced shares
carry the obligation of participating in cold, overpriced issues?
Recent scandals in the allocation of heavily underpriced offerings make the above questions
particularly revelevant. The Securities and Exchange Commission, the National Association
of Securities Dealers, and the Manhattan U.S. Attorney’s Office have found evidence that
competition for shares of hundreds of firms that went public since 1999 has been artificially
manipulated by the Wall Street investment banks that managed those stock offerings. The
lawsuits center on two sets of charges: the securities fraud of unfair IPO allocations; and
another set of antitrust charges alleging that several major Wall Street underwriters colluded
in determining the allocations. Investment banks demanded kickbacks in the form of higher
commissions or increased trading activity in exchange for coveted IPO shares. Banks fueled
the Internet bubble by pressuring some large investors who got IPO shares to buy more at
higher prices after the stock began trading (a practice known as ”laddering”). In either case,
these could be considered illegal ”tie -ins”, since securities laws prohibit quid-pro-quo
commission deals.
To analyze the beneficiaries of IPO underpricing, we need data on the allocation of new
issues to different investor groups. To differentiate whether any preferential treatment is due
to the informational advantage of certain investors or to the discriminatory actions of the
underwriter, we need data on investors demand. Understandably, due to the discretionary
nature of the US bookbuilding process, underwriters are unwilling to supply information
regarding IPO allocations. Given the data limitations on the allocation of U.S. offerings, we
attempt to answer the questions regarding who profits from equity offering underpricing and
the reason for this preferred status using data on the allocation of Spanish equity offerings.
The unique institutional framework of the Spanish new issues provide an unparalleled setting
to carry clear cut tests of the questions previously posed. The most important feature of the
Spanish IPO market for our purpose is that the distribution of the IPO between retail, local
5ECB
Working Paper Series No. 428January 2005

institutional investors and foreign institutions is stated in the offering prospectus, filed before
any investor is allowed to submit his formal application for IPO shares.
Using a sample of all 175 equity offerings, 137 IPOs and 38 secondary equity offerings, that
took place in Spain from 1985 to 2002, we document that institutions dominate initial equity
offerings allocations in Spanish issues, accounting for an average (median) of 64.74%
(58.5%) of the shares offered. The bias in favor of institutional investors is clear once we
weight initial allocations by the profit in participating in the equity offerings. While
institutional investors receive nearly 75% of the profits in underpriced issues, they have to
bear only 56% of the losses. Foreign institutions account for the whole institutional - retail
differential.
The preferential treatment of institutional investors is partially due to their informational
advantage and by the underwriter bias to favour its long term clients. All investors, however,
(retail, local institutions and foreign institutions) subscribe more heavily to underpriced than
to overpriced issues, and more to IPOs than to SEOs. This type of behavior is consistent with
institutional investors being informed about the future profitability of the issues. The results,
however, do not support the idea that retail investors behave as noise traders, subscribing
randomly to equity offerings.
One key issue, though, is whether the preferential treatment of institutions comes at the
expense of retail investors. We observe that, even though institutions capture the "lion’s
share" of the money left on the table, retail investors earn, on aggregate, positive profits. The
driving factor behind the relative large allocation in overpriced issues when compared to
underpriced offerings is not the underwriter allocation bias in favor of institutional investors.
Retail investors subscribe more heavily those issues that they believe are marketed at below
their expected value; for a fixed retail tranche size, retail behavior results in the allocation
pattern described.
6ECBWorking Paper Series No. 428January 2005

Initial public offerings are generally underpriced. While this puzzle has been extensively docu-
mented1, little do we know about who benefits from IPO underpricing and why. Do institutions
receive larger allocations than retail investors? Are institutional investors able to "skim the cream"
(i.e. avoid overpriced issues)? Do they impose a winner’s curse on retail investors? Is the "smart
money" really smart, that is, do institutions concentrate on the most underpriced offerings because
they are better informed than retail investors or because underwriters use their superior knowledge
to intentionally favour their long-term clients? If, on the other hand, allocations to institutional
investors are unrelated to first day returns, is it because institutions lack superior ability or because
allocations of coveted underpriced shares carry the obligation of participating in cold, overpriced
issues? How is information distributed among different investors in the new issues market? Do
cascades in IPO demand form? Do retail investors herd on the supposedly superior information of
institutions?
Recent scandals in the allocation of heavily underpriced offerings make the above questions
particularly revelevant. The Securities and Exchange Commission, the National Association of
Securities Dealers, and the Manhattan U.S. Attorney’s Office have found evidence that competition
for shares of hundreds of firms that went public since 1999 has been artificially manipulated by the
Wall Street investment banks that managed those stock offerings. The lawsuits center on two sets of
charges: the securities fraud of unfair IPO allocations; and another set of antitrust charges alleging
that several major Wall Street underwriters colluded in determining the allocations. Investment
banks demanded kickbacks in the form of higher commissions or increased trading activity in
exchange for coveted IPO shares. Banks fueled the Internet bubble by pressuring some large
investors who got IPO shares to buy more at higher prices after the stock began trading (a practice
known as ”laddering”). In either case, these could be considered illegal ”tie-ins”, since securities
laws prohibit quid-pro-quo commission deals.
To analyze the beneficiaries of IPO underpricing, we need data on the allocation of new issues
to different investor groups. To differentiate whether any preferential treatment is due to the
informational advantage of certain investors or to the discriminatory actions of the underwriter,
1 Ibbotson (1975), using data on US equity offerings, documents that the first day closing price of new equity issues
is on average higher than the price at which the new shares are offered. This finding holds for most time periods and
and countries analyzed [Loughran et al. (1994)].
7ECB
Working Paper Series No. 428January 2005

we need data on investors demand. Understandably, due to the discretionary nature of the US
bookbuilding process, underwriters are unwilling to supply information regarding IPO allocations.
Given the data limitations on the allocation of U.S. offerings, we attempt to answer the questions
regarding who profits from equity offering underpricing and the reason for this preferred status
using data on the allocation of Spanish equity offerings. The unique institutional framework of
the Spanish new issues provide an unparalleled setting to carry clear cut tests of the questions
previously posed. The most important feature of the Spanish IPO market for our purpose is that
the distribution of the IPO between retail, local institutional investors and foreign institutions is
stated in the offering prospectus, filed before any investor is allowed to submit his formal application
for IPO shares. Given that the underwriter assigns the issue before he can gauge the investors
demand, the Spanish IPO market is the ideal setting to test underpricing theories that rest on the
underwriter’s inferior information [Benveniste and Spindt (1989), Benveniste and Wilhelm (1990)]
and allocation bias [Biais et al. (2002)].
Using a sample of all 175 equity offerings, 137 IPOs and 38 secondary equity offerings, that took
place in Spain from 1985 to 2002, we document that institutions dominate initial equity offerings
allocations in Spanish issues, accounting for an average (median) of 64.74% (58.5%) of the shares
offered. The bias in favor of institutional investors is clear once we weight initial allocations by
the profit in participating in the equity offerings. While institutional investors receive nearly 75%
of the profits in underpriced issues, they have to bear only 56% of the losses. Foreign institutions
account for the whole institutional - retail differential.
The preferential treatment of institutional investors is partially due to their informational ad-
vantage and by the underwriter bias to favour its long term clients. All investors, however, (retail,
local institutions and foreign institutions) subscribe more heavily to underpriced than to overpriced
issues, and more to IPOs than to SEOs. This type of behavior is consistent with institutional in-
vestors being informed about the future profitability of the issues. The results, however, do not
support the idea that retail investors behave as noise traders, subscribing randomly to equity of-
ferings. Retail investors partially herd on the information contained in the demand of institutions.
The positive coefficient relationship between retail demand and underpricing is in part driven by the
fact that individual investors increase their demand when they observe that institutional demand
is high.
8ECBWorking Paper Series No. 428January 2005

One key issue, though, is whether the preferential treatment of institutions comes at the expense
of retail investors. We observe that, even though institutions capture the "lion’s share" of the money
left on the table, retail investors earn, on aggregate, positive profits. The driving factor behind
the relative large allocation in overpriced issues when compared to underpriced offerings is not
the underwriter allocation bias in favor of institutional investors. Retail investors subscribe more
heavily those issues that they believe are marketed at below their expected value; for a fixed retail
tranche size, retail behavior results in the allocation pattern described. Retail investors do not
seem to behave as the uninformed investors in Rock’s (1986) winner’s curse model.
The rest of this paper is organized as follows. Section I reviews the asymmetric information
based models of IPO underpricing, and shows how this paper contributes to the existing literature
on the topic. We discuss the similarities and differences between the institutional characteristics of
the Spanish and the more studied U.S. new issues markets in Section II. Section III describes our
data. Equity allocations are discussed in Section IV, where we document the excess allocation of
underpriced offerings to institutional investors. Section V shows that the preferential treatment of
institutions does not come at the expense of retail investors. Information in the new issues markets
is discussed in Section VI. Section VII summarizes the main results of the paper.
1 Related Literature.
A thorough review of the different models that attempt to explain the IPO underpricing puzzle is
beyond the scope of this paper.2 We will focus here on information asymmetry models, that is,
models that relate IPO underpricing to the allocation of the offering between differently informed
investors.3 Benveniste and Spindt (1989) show that investment banks use the declarations of in-
terest from their client investors to determine the price and allocation of new issues. Underpricing
is necessary to induce investors to reveal positive information. However, underwriters can reduce
2For this purpose, see the excellent analysis in Ibbotson and Ritter (1995), Jenkinson and Ljungqvist (2001), and
Ritter and Welch (2002).3A branch of the information asymmetry literature assumes that the issuing firm is better informed about its
present value and risk of its future cash flows than investors or the underwriter. The signalling models of Allen and
Faulaber (1989), Grinblatt and Hwang (1989), and Welch (1989) focus on the actions, such as the owners’ retention
rate and the level of underpricing, that the issuing firm can use to signal its quality. These models are not the focus
of this paper.
9ECB
Working Paper Series No. 428January 2005
underpricing by allocating shares repeatedly to a group of regular clients. Given that IPOs are
normally underpriced, participating in an allocation normally results in a positive profit. The in-
vestment bank can threaten investors that are unwilling to subscribe to badly received IPOs that
they will be withdrawn from future offerings. Benveniste and Wilhelm (1990) prove that invest-
ment banks can use a combination of price and allocation discrimination to maximize proceeds.
The authors analyze the impact that uniform-price restrictions and "evenhanded" allocations of
oversubscribed issues have on the cost of soliciting information from regular investors. Without
price discrimination, the underwriter is forced to underprice to all investors to place the issue,
when only informed investors need to be compensated. To reduce underpricing, the underwriter
can bundle IPO allocations with other investment-banking services supplied to regular investors.
Sherman (2000), on the other hand, argues that the investment bank’s ability to lower underpricing
requires favoring regular uninformed, rather than informed, investors. Given that the open offer
system limits the underwriter’s ability to discriminate between retail investors, the hybrid book
building-open offer IPO method should lead to higher underpricing than straight book building.
If issuing firms value pricing accuracy [Sherman and Titman (2002)], in the previous models
the underwriter acts in the best interest of the issuer. In both Benveniste and Spindt (1989) and
Benveniste and Wilhelm (1990), the preferential allocation of underpriced issues to institutional
investors is justified by their superior information. The underwriter, however, can also try to max-
imize his own utility, at the expense of the issuer. That is, the finding that institutions concentrate
on the most underpriced offerings is also consistent with underwriters using their superior knowledge
to favour their long-term clients. Biais et al. (2002) analyze the optimal (IPO) mechanism with
adverse selection, where institutional investors have private information about the market valuation
of the shares, the intermediary has private information about the demand, and the institutional
investors and intermediary collude.
If institutions are favored in the allocation of underpriced IPOs, whether it is because they
provide the underwriter with helpful information to price the issue or because of the underwriter bias
in favor of institutions, then why do individual investors subscribe to equity offerings? Rock (1986)
argues that uninformed investors abstain from participating in the new issues market unless the
issuing firm prices the shares at a discount. Uninformed investors are not allocated any underpriced
issues given the rationing imposed by informed demand, but receive all the overpriced offerings.
10ECBWorking Paper Series No. 428January 2005

The rich development of the allocation-based models of underpricing contrasts with the limited
number of papers that empirically test the predictions of these theoretical models. Not surprisingly,
given the underwriters’ reserve to provide allocation data to researchers, we are aware of only two
papers that analyze the allocation of initial public offerings in the United States. Hanley and
Wilhelm (1995) gather distribution data for a sample of 38 IPOs managed (or co-managed) by a
single underwriter during the period 1983-1988. The authors find that around 70% of shares in both
underpriced and overpriced issues are allocated to institutional investors. Insitutions are allocated a
large proportion of oversubscribed issues, however, they receive a similar share of issues in which pre-
offer interest is weak. The authors interpret this finding as evidence against Rock (1986) argument
that informed investors impose a winner’s curse on uninformed investors by demanding larger
allocations of hot offerings and smaller allocations of those issues identified as overpriced. In a more
recent study, Aggarwal et al. (2002) find that institutions dominate IPO allocations, accounting for
a median of about three-quarters of shares offered. Using a sample of 164 companies going public
between May 1997 and June 1998, the authors document that institutions earn greater profits on
their IPO investments than retail investors. Part of the institutional-retail differential can indeed be
attributed to favorable allocation patterns followed by underwriters. Book building cannot explain
completely the entire institutional-retail differential. Institutional allocation also contains private
information that predicts IPOs day one returns. Consistent with the Rock (1986) theory of IPO
underpricing, institutional investors seem to be able to avoid most overpriced offerings. In a similar
study, Ljunqvist and Wilhelm (2002) find that, for 1,032 IPOs in 37 countries and between 1990
and 2000, share allocations to institutional investors are virtually double those received by retail
investors.
This paper contributes to the existing literature on IPO allocations along three important lines.
First, Hanley andWilhelm’s (1995) result that institutions receive the same proportion of overpriced
and underpriced issues is consistent with institutional investors lacking superior information about
first day returns. This conclusion, however, implicitly assumes that it is costless form informed
investors to abstain from participating in less-attractive offerings. In the U.S., however, an investor’s
ability to skim the cream form the pool of IPOs is limited by the threat of being excluded from
future offerings [Benveniste and Spindt (1989)]. The finding that institutional investors concentrate
on the most undepriced offerings [Aggarwal et al. (2002), Ljunqvist and Wilhelm (2002)] has also
11ECB
Working Paper Series No. 428January 2005

two different interpretations. Institutions may be better informed about the offerings true value;
or underwriters may have superior information about the companies they take public, and use that
information to favor their long term institutional clients. The only way to determine the reasons
behind the preferential treatment of institutions is to analyze how information is distributed in
the new issues market. Superior information regarding first day underpricing cannot completely
explain institutional abnormal profits. Underwriters are better informed about the companies they
take public, and use that information to favor institutions.
Secondly, our analysis explains why retail investors participate in the new issues market. The
preferential treatment of institutional investors does not come at the expense of retail investors.
Retail investors earn positive profits from subscribing to new equity offerings. These positive profits
ensure that the retail tranche is normally oversubscribed. Benveniste and Spindt (1989) suggests,
investment banks reduce underpricing by threatening investors that are unwilling to subscribe to
badly received IPOs that they will be withdrawn from future offerings. Retail oversubscription
increases the credibility of the underwriters message. These results present new evidence regarding
the optimality of price discrimination in the new issues market [Benveniste and Wilhelm (1990),
Mello and Parson (1998), and Stoughton and Zechner (1998)]. Price discrimination in favour of
individual investors may be optimal since estimulates retail demand.
2 Sample Description.
2.1 Institutional Characteristics of the Spanish IPO and SEO Markets.
The Spanish IPO and SEO markets differ substantially from the extensively studied US equity
offerings market in the way shares are allocated, the information available during the bookbuilding
period regarding investors’ demand, and trading restrictions in the aftermarket. The institutional
features of the Spanish IPO market provide a unique framework to test asymmetric information
based models of IPO underpricing.
The way companies issue equity and the transparency of the going public process has dramati-
cally changed in the last decade. Prior to 1992, companies go public using three different methods:
listing, private placement and public offer. Right issues are the only mechanism for already listed
companies to raise new capital. In a listing, the company lists its existing shares; no new shares
12ECBWorking Paper Series No. 428January 2005

are issued. Listings are rare after 1992, with only 4 cases between 1992 and 2002. Private place-
ment issues are allocated at the discretion of the underwriter; the general public cannot apply
for shares. There is evidence in the prospectuses consulted, though, that private placements are
not only targeted to institutional investors, but few retail investors are also invited to apply for
shares. Simmilarly, many placements involve a large number of investors4. Public offerings can
be subscribed by both retail and institutional investors. Unlike private placements, any interested
investor can apply for the shares. Allocation to institutional investors is at the discretion of the
underwriter; shares are allocated to retail investors by the chronological ordering of their applica-
tions or pro rata. Unlike in the later hybrid offerings, there is normally no indication regarding
the relative size of the retail and institutional tranches in the early years of our sample. Auctions
are used to place new issues in Spain in only two cases. Both issues involve an auction tranche
and a private placement tranche. Regardless of the method used, all issues are offered at a fixed
price. The underwriter does not use the information contained in the investors demand to price
the shares; the issue price is set before the offering begins and is contained in the offer prospectus.
Published on March 27, 1992, Royal Decree 291/1992 about equity offerings brings a sharp
change in the way Spanish companies raise capital. The offering prospectus must contain much
more detailed information regarding the issuing company’s financials, underwriter and offer char-
acteristics. In particular, the offer period and trading date, the group of potential investors, and
the allocation method have to be perfectly defined. The greater transparency requirement resulted
in equity offerings being sold via hybrid book building, from 1992 onwards.5 Right issues continue
to be used, but listed companies also resort to new investors by selling new shares via secondary
equity offerings, also using the hybrid book building method.
Hybrid book building: In hybrid offerings, book building is used to set the price and to
allocate shares to institutional investors; a public offer tranche is reserved for local retail investors
who do not participate in the price-setting process [Sherman (2000, 2002)]. In the book building
tranche, the investment bank first decides which investors will be invited to evaluate and perhaps
4Although the number of investors that receive shares in early offerings is not normally available, one particular
placement is said to have been distributed among 2000 investors.5Sherman (2002) argues that the methods used for initial public offerings have changed dramatically for much of
the world in the last decade. In the 1980s, book building was rare outside North America, but it is now the standard
method in most countries.
13ECB
Working Paper Series No. 428January 2005

buy the issue. Investors then analyze the offering and provide the investment bank with preliminary
indications of their demand for the new shares. Finally, the investment bank prices the issue and
allocates shares to investors, generally allocating more shares to investors who indicate higher levels
of demand [Titman and Sherman (2001)]. The key characteristic of the book building method is
that the underwriter has total discretion in allocating shares, allowing allocations to be based on
a long term relationship between the underwriter and investors. This allows the underwriter to
"average" returns over time, requiring investors to participate in the current offering in order to
remain part of the group that will participate in future offerings. Retail investors normally pay the
price determined in the bookbuilding tranche, although in many offerings the retail price is lower
than the institutional price, to stimulate retail demand.
Initial allocations: The most important feature of the Spanish IPO market for our purpose is
that the distribution of the IPO between retail, local institutional investors and foreign institutions
is stated in the preliminary prospectus. The allocation is decided before any investor is allowed
to submit his formal application for IPO shares. Given that the underwriter assigns the issue
before he can gauge the investors demand, the Spanish IPO market is the ideal setting to test
whether underpricing is due to the underwriter’s inferior information [Benveniste and Spindt (1989),
Benveniste and Wilhelm (1990)] or to the underwriter bias in favor on institutional investors [Biais
et al. (2002)]. The preliminary prospectus normally contains claw back clauses. These clauses
establish that, depending on investors’ demand during the offer period, the underwriter can re-assign
a small percentage of shares from one tranche to another. Claw back clauses, though, normally
prevent the underwriter from reducing the retail tranche in favour of institutional investors when
the retail tranche is oversubscribed. Institutional demand thus cannot crowd out retail demand
in issues expected to be underpriced. Although the distribution of the offer between retail, local
and foreign institutions is decided before the offer begins, the distribution of the shares within the
institutional tranches is only decided after the underwriter collects investors’ demand and is at the
discretion of the underwriter.
Retail allocations: The main difference between the U.S. book building and the hybrid
book building method used in Spain lies in how shares are allocated to retail investors and the
restrictions placed on their trading behavior in the aftermarket. In the U.S., retail investors are
drawn mainly from the firm’s existing retail brokerage accounts. Once allocated to an individual
14ECBWorking Paper Series No. 428January 2005

broker, distribution of the IPO shares among retail investors is at the discretion of the broker,
although IPO shares are rarely allocated to new accounts [Hanley and Wilhelm (1995)]. Allocation
to retail investors normally depends on the customer’s account size and trading frequency. Even
investors able to get shares in an IPO will be penalized for selling those shares right after the stock
starts trading, a process called flipping. Most U.S. underwriters punish those who sell their IPO
shares in the first 30 or 60 days by restricting allocations in the future. Allocation to retail investors
in Spain is done pro rata, and is based only on order size. All retail investors that apply for a given
number of shares receive the same allocation, regardless of their past relationship with the issue’s
underwriter. Retail investors are similarly free to sell their shares immediately in the aftermarket,
without being penalized in future allocations.
Information: During the book building period, investors normally receive periodical informa-
tion regarding aggregate demand for different investor types. We are then able to test whether
there is herding in the demand for IPO shares and cascades appear [Welch(1992)]. More impor-
tant, we can test whether institutional investors are better informed than individuals. We are thus
able to discriminate between alternative explanations of the institutional abnormal profits. Finally,
information regarding allocation data to individual investors given their application size is publicly
available. It is then possible to test whether the assumed preferential treatment in the allocation
of underpriced shares to institutions imposes a winner’s curse on retail investors [Rock’s (1986)].
2.2 Data.
Our sample comprises all 175 equity offerings, 137 IPOs and 38 SEOs, that took place in Spain
from 1985 to 2002. We gather data on issue characteristics, such as the offer method, number of
shares offered, preliminary price range, proportion of the issuing firm sold, offer date, duration of
the offer period, underwriters, firm age, and existing shareholders from the offering prospectus.
We collect data on each issue final price and distribution from the Madrid Stock Exchange press
releases. First-day closing prices are from Datastream. We fill the small gaps in our data set using
the archive news service in Expansion, the leading Spanish economic newspaper, and Lexis/Nexis.
Data on IPO demand, oversubscription and pro-rata allocation among individual investors comes
from the filings of the issuing companies with the Comision Nacional del Mercado de Valores and
the Madrid Stock Exchchage press releases. Given that the focus of our paper is the allocation
15ECB
Working Paper Series No. 428January 2005

between retail and institutional investors of new shares, and as allocation decisions are influenced
by the common practice of the issuing company’s country of origin, rather than on the country
where shares are listed, we do not consider equity offerings by foreign companies listing in Spain
(8 cases). For the same reason, except in the preliminary analysis, we exclude the 28 listing in our
sample, since no new shares are offered. For 46 issues, the preliminary prospectus does not include
initial allocation data. The Spanish equity offering process is much more transparent from 1992.
We have allocation data for all the companies that went public after that date.
Table I presents summary statistics for our sample. The average company in our sample sells
637 million euros worth of shares (214 million median)6, which represents 30.91% (25% median) of
the existing company shares. The average market capitalization of the issuing company is 4.3 billion
euros (0.49 billion). Initial public offerings are larger and from bigger companies, but the original
owners sell a smaller fraction of the company (31.35% average, 29.53% median). For the sample as a
whole, average underpricing is 8.88% (0.81%). As expected, though, there are significant differences
in the underpricing of IPOs and SEOs. Underpricing is larger for IPOs (average 14.48%, median
4.34%) than for SEOs (average -0.17%, median 0.18%). Privatized companies are less underpriced
that private offerings, consistent with privatized companies being larger, more mature companies.
For our IPO sample, the initial returns are skewed to the right and have excess kurtosis; Jarque
and Bera (1980) normality test indicates that the null hypothesis about the normality of the initial
return distribution can be rejected at the 5% level of confidence. Issuing activity is not stable over
time but rather presents "cycles". Two periods, 1987-89 and 1997-200, comprise nearly 75% of
the offerings in our sample. These "hot markets" [Ritter (1984)] are characterized by high market
returns and above normal levels of underpricing.
3 Allocation to Retail and Institutional Investors.
We analyze the allocation of equity offerings among different investor types to identify which in-
vestors benefit the most from IPO and SEO underpricing. The unique characteristics of the Spanish
IPO allow us to study the initial allocations in the preliminary prospectus, before the underwriter
6All monetary variables in the paper are expressed in 2001 purchasing power euros. We use the January 26, 2003
exchange rate between the dollar and the euro of 0.9223 dollars per euro.
16ECBWorking Paper Series No. 428January 2005

is allowed to gauge investor demand. Using the final offering allocation, we test who benefits from
equity underpricing and how the underwriter uses the information contained in different investors’
demand to price and re-allocate the issue.
3.1 Initial Allocations.
We gather data on the distribution of equity offerings across three investor classes: retail investors,
Spanish institutional investors and foreign institutions. Detailed allocation data is available for
the 101 offerings for which we have allocation data. In Table II, we see that institutions dominate
initial equity offerings allocations in Spanish issues, accounting for an average of 64.74% (62.5%)
of the shares offered. Foreign institutions dominate initial institutional allocations. Allocation to
foreign institutional investors account for an average (median) of 60.89% (64.10%) of the shares
offered to institutional investors. Thirty four offers set aside a special tranche for employees of
the issuing company. In these offers, the average employee tranche represents an average of 4.62%
(3.88%) of the shares offered. Across offering types, we cannot reject that the IPO and SEO
mean allocation distributions are significantly different from each other. Retail, local and foreign
institutions receive an average 32.39% (33.45%), 33.10% (25.89%) and 41.04% (39.29%) of the shares
offered in IPOs, respectively. For SEOs, the proportion is 35.90% (40.29%), 20.88% (15.83%),
and 41.23% (37.42%). There is no difference either between offerings from private companies
and privatizations. Local investors (i.e. employees, retail investors and local institutions) receive
around 60% of the shares. Curiously, allocation to local investors is larger in offerings from private
companies than in privatizations, both for the overall, IPO and SEO sample.
Twenty-two issues in our sample are allocated to institutional investors exclusively. These issues,
though, are different from US private placements in that they are not allocated to a small group of
institutions. For those issues for which we have detailed institutional allocation data, offerings to
institutional investors are allocated on average to over 2000 institutions. In the offerings targeted
exclusively to institutional investors, foreign institutions receive 58.51% of all shares. If we exclude
these institutional offerings, the average (median) allocation to retail investors rises from 33.71%
(36.09%) to 43.10% (41.96%).
The large allocation of new issues that institutions receive does not necessarily imply that these
investors enjoy a preferred status. Larger allocations may not lead to abnormal profits if institutions
17ECB
Working Paper Series No. 428January 2005

receive a disproportionate amount of overpriced issues. Hanley and Wilhelm (1995), Ljungqvist
and Wilhelm (2001) and Aggarwal et al. (2002) all find that institutions are allocated the largest
fraction of the new shares. Hanley and Wilhelm (1995), on the other hand, find that institutions
are allocated a large proportion of oversubscribed issues; but they receive a similar share of issues
in which pre-offer interest is weak. Ljungqvist and Wilhelm (2001) and Aggarwal et al. (2002),
on the other hand, show that underwriters tend to allocate more shares to institutions in IPOs
priced at the upper end of the filing range, which are ex-ante expected to appreciate more in the
aftermarket. Conversely, institutional allocation is significantly lower in lower-end issues, less likely
to appreciate in the aftermarket. Table III relates the allocation among different different investor
types and initial underpricing. When looking at the fraction of shares allocated in underpriced
and overpriced issues, the initial allocation contained in the prospectus does not show an allocation
bias in favor of institutional investors. Institutions are allocated approximately two thirds of both
underpriced and overpriced issues. This pattern reflects the allocation in underpriced and overpriced
IPOs, where institutional allocations are 69.02% and 68.91%, respectively. Institutional allocation
in overpriced SEOs is significantly higher than for underpriced SEO (66.05% and 57.37%). This
last result, however, has to be interpreted with caution, given the small number of overpriced SEOs.
To study more rigorously the relationship between initial allocation and first day returns, we
estimate the following equation for the different investor types in our sample
Underpricingi = α+ β ∗ Init_Allocij + εij (1)
where Allocationij is the initial allocation to investor type j in issue i, j {retail, local institutional,foreign institutional}.Table IV confirms our previous results. Initial allocation is unrelated to firstday returns for different investor types and for different types of offerings. The coefficient on investor
allocation is insignificantly different from zero at the 0.1 level for all investor types, regardless of
whether we consider the whole sample, IPOs or SEOs.
From Tables III and IV, we cannot reject the hypothesis that there is no allocation bias in
initial allocations. This results is consistent with the underwriter being uninformed about first
day returns prior to gauging investors demand or, alternatively, the underwriter not using his
superior information to favour its long term clients. The analysis so far, though, fails to account
for the fact that offerings widely differ in size. The underwriter can favor institutional investors
by initially allocating them a larger fraction of underpriced shares in larger issues. To account for
18ECBWorking Paper Series No. 428January 2005

this possibility we focus on the relationship between initial allocations and money left on the table,
rather than underpricing. We calculate allocations weighted by the offering relative level of money
left on the table, assuming that the offer size does not change. That is, we compute
PW_Init_Allij = Init_Allocij ∗ (C Pr icei − Pr icei) ∗O Si zeiPi (C Pr icei − Pr icei) ∗O Si zei
(2)
where PW_Init_Allij is the profit weighted allocation to investor type j in offering i; C Pr icei is
the first day closing price; and O Si zei is the offer size (i.e. the number of shares offered times the
offer price). Panel A in Table V reports profit weighted allocations. The bias in favor of institutional
investors is clear once we weight initial allocations by the profit in participating in the equity
offerings. While institutional investors receive nearly 75% of the profits in underpriced issues, they
have to bear only 56% of the losses. Foreign institutions account for the whole institutional - retail
differential; allocation to Spanish institutions are independent of offering profits, at 20%. Retail
participation is significantly larger in SEOs than in IPOs. Underpricing in SEOs is significantly
smaller than in SEOs. SEOs, however, are significantly larger, mainly due to some very large
privatizations. The money left on the table, though, is larger in IPOs than in SEOs.
3.2 Final Allocations.
We look at the equity offerings final allocation in Table VI. Panel A shows that, consistent with
Ljungqvist and Wilhelm (2001) and Aggarwal et al. (2002) institutional investors concentrate on
the more underpriced issues. Institutional allocation is 70.71% (69.46%) in underpriced offerings
and 52.74% (53.04%) for overpriced issues. Among institutions,foreign institutional investors are
the main beneficiaries of equity offerings underpricing. Allocation to foreign institutions is 44.88%
(47.92%) of all shares. Panel B reports the change in the allocation from the initial allocation
contained in the preliminary prospectus to the actual, final allocation. Retail investor participation
in underpriced issues declines, while it increases in overpriced offerings. We estimate the following
following two regressions to confirm the relationship between final and change in allocation and
underpricing.
Underpricingi = α+ β1Fin_Allocij + ij (3)
Underpricingi = α+ β1Change_Allocij + ij (4)
19ECB
Working Paper Series No. 428January 2005

where Fin_Allocij is the final allocation of investor type j in issue i, j, and Change_Allocij =
Init_Allocij − Fin_Allocij .Tables VII and VIII report the OLS estimates of equations 3 (Table
VII) and 4 (Table VIII). Underpricing is positively related to institutional allocations for IPOs.
Simmilarly, the coefficient on the change in allocation is significantly positive at the ten percent
level for initial public offerings. Among institutions, foreign institutional investors allocation is
related to equity offering underpricing, although both types of investor benefit from the change in
allocation.
The results in Tables VII and VIII confirm that institutions, specially foreign institutional
investors, are the main beneficiaries of Spanish equity offerings underpricing. One key issue, though,
is whether the preferential treatment of institutions comes at the expense of retail investors. To
clarify this issue, we report in Table IX the final money left on the table for the 82 equity offerings
in our sample for which we have detailed final allocation data. We observe that, even though
institutions capture the "lion’s share" of the money left on the table, retail investors earn, on
aggregate, positive profits. In particular, retail investors earn significantly positive profits, casting
doubts on Rock (1986) prediction that retail investor break even on average. These results are
similar to that findings by Hanley and Wilhelm (1995) for U.S. offerings.
Panel B shows that actual profits are actually higher than the profits that investors would have
obtained if the offer had taken place as stated in the preliminary prospectus. This improvement
holds for all investor types. This last result is apparently in contradiction with the result in Table VI,
where we show that the change in allocation benefits institutions at the expense of retail investors.
The explanation lies in the expansion and contraction of offer size based on investors’ demand.
When investors demand is high, the underwriter can increase the offer size in two ways: increase
the number of shares offered, and exercise the green shoe option. When investors demand is low,
the underwriter can reduce the offer size. In Rock (1986) winner’s curse model, demand expansion
by institutional investors crows out retail demand. This mechanism does not entirely take place
in Spain. Offering prospectuses normally include claw back clauses that allow the underwriter
to modify the initial allocation tranches based on investors’ demand during the offering period.
These clauses, though, normally establish that the retail tranche cannot be reduced when it is
oversubscribed. In underpriced issues, underwriters normally exercise the green shoe option and
allocate the extra shares to institutions. Institutional investors account then for a larger fraction of
20ECBWorking Paper Series No. 428January 2005

the final allocation, even though retail profits are not cut. Retail investors get the same number of
shares, albeit of a larger offer; this results in a proportional decrease of the retail allocation. Retail
investors can also be allocated a portion of the extra shares. In overpriced offerings, underwriters
may reduce the offer size and in some cases re-allocate shares from institutions to retail investors, if
the retail tranche is oversubscribed. Demand expansion in underpriced offerings, and the fact that
equity offerings are normally underpriced, more than compensates demand expansion in overpriced
issues. Retail investors earn, on average, positive profits.
4 Information in the Equity Offerings Market.
The institutional characteristics of the Spanish equity offerings market, as well as the availability on
investors demand data, provide an unparalleled setting to test how information is distributed and
dissipates among market participants. In this section, we focus on three different issues. We first
analyze whether the preferential treatment of institutional investors is due to their informational
advantage or the preferential treatment by the underwriter. We start by analyzing whether a
subset of investors have superior information regarding first day returns. We then focus on the use
the underwriter makes of the information contained in investors’ demand. Finally, since data on
different investors’ demand are available during the book building process, we test whether there
is herding in the Spanish equity issues market.
4.1 The Informational Advantage of Institutional Investors.
In Table X, we see that the average (median) oversubscription is 13.01 (6.32). The oversubscription
series presents a high degree of cross-sectional variation. Oversubscription ranges from 108.72 times
to 0.67. Only two offers are under subscribed. Initial public offerings are much more oversubscribed
than SEOs for all investor groups. Underpriced issues are significantly more oversubscribed than
overpriced issues. Average (median) oversubscription is 22.26 (16.26) for underpriced IPOs and
6.66 (5) for SEOs; for overpriced issues, IPOs are 7.80 (6.15) times oversubscribed and SEOs 3.96
(2.52).
By investor groups, the retail tranche is more oversubscribed in median than the institutional
tranche (7.84 vs. 5.27 times); although there is not a significant difference on average (14.52 vs.14.43
21ECB
Working Paper Series No. 428January 2005

times). The difference between demand in underpriced and overpriced issues is larger for institutions
than for retail investors. Average institutional oversubscription in underpriced offerings is 17.66
(6.58); for overpriced issues it drops to 3.62 (3.40). Retail investors oversubscription rate, on the
other, is similar in underpriced offerings 17.71 (8.40), but is much higher than the institutional
oversubscription rate in overpriced issues 7.29 (5.36).
All investors, however, (retail, local institutions and foreign institutions) subscribe more heavily
to underpriced than to overpriced issues, and more to IPOs than to SEOs. This type of behavior
is consistent with institutional investors being informed about the future profitability of the issues.
The results, however, do not support the idea that retail investors behave as noise traders, sub-
scribing randomly to equity offerings. To confirm these hypotheses, we estimate for each investor
type:
Demandij = α+ β1Underpricingi + i (5)
where Demandij is the oversubscription in offering i for investor type j. The results in Table XI
confirm the positive relationship between investors’ demand and equity offering underpricing. For
all investor types, the coefficient on underpricing is significantly positive at the five percent level,
when we consider all offerings. This last result is driven by the initial public offerings sample.
In SEOs, the coefficient on underpricing remains significant for institutional investors, but it is
insignificantly different from zero for retail investors.
We turn now to the question of the relative information of different investor types. Are in-
stitutional investors better informed than individual? Do retail investors herd on the information
contained in the demand of institutions? If this is the case, the positive coefficient in equation 5
for individual investors may simply reflect that they invest when institutional demand is high. If
this is the case, since institutional investors seem to possess ability to predict first day returns,
herding by individuals would result in individuals appearing to be well informed as well. As a first
indication that retail demand is not simply a proxy for institutional demand, for the 57 offerings for
which we have detailed retail and institutional demand, the correlation between them is 0.43. To
compute the relative information of different investors, we calculate the percentage of times they
are "right" in their demand. To do so, we carry the following non-parametric test: we compute
the percentage of times the demand for each investor group is above its median demand for issues
whose underpricing is above the median level of underpricing; or its demand is below its median
22ECBWorking Paper Series No. 428January 2005

demand for issues whose underpricing is below the median level of underpricing. Table XII reports
the results for the various investor groups. We observe that overall institutional investors are better
informed about first day returns that individual investors. Among institutions, foreign institutions
exhibit superior performance than local institutional investors.
4.2 The Underwriter Response to Investors Demand.
In the traditional book building model, the underwriter initially sets a price range for the offering.
After it collects indications of interest from investors, it uses the information contained in investors
demand to set the offer price and distribute the offering. If the underwriter expects the offering to
be underpriced and the final price to be in the top half of the file price range, then there should
be a positive relationship between revisions in the offer price and the allocation of those investors
favored by the underwriter. To test whether this is the case, we estimate the following regression
using initial allocation data.
Updatei = α+ β1Demandij + εij (6)
where Updatei =Pricei−PlowiPhighi−Plowi , and Phigh and Plow are the upper and lower bounds of the
indicative price range in the preliminary prospectus. We can estimate the previous equation for the
45 offerings for which we have preliminary price range data. Note that for many SEOs there is no
price range filed. The offer price for SEOs is normally set as the average price few days before the
offer date. Out of the 45 offerings, 3 are priced below the range, 4 are price above the filed range
and 20 are priced at the upper indicative price range. Table XIII reports the estimates of equation
6. Underwriters use the information contained in the investors demand to set the final offer price.
There is an important difference, though, between institutional and retail demand. The coefficient
for institutional demand is significantly positive at the one percent level; the coefficient for retail
demand is insignificantly different from zero at the ten percent level.
4.3 Herding in the IPO and SEO Market.
In Welch (1992), potential investors can learn from the existing demand of other investors if shares
are sold sequentially. In this setting, cascades form when investors imitate the behavior of earlier
23ECB
Working Paper Series No. 428January 2005

investors, not using their own private information. This results in offerings being largely oversub-
scribed or under subscribed, with few cases in between. To test whether this is the case in our
sample, for each offer we calculate, for each investor group, the monetary value of its demand as
Mon_Demandij = Fractionij ∗ Si zei ∗ Pr icei ∗Demandij (7)
Figure I reports a histogram for overall, retail and institutional investors monetary demand. We
observe that, for both investor types, demand is extremely large or low, with few cases in between.
We confirm herding in the Spanish equity offerings market for both institutions and individuals.
While Figure I shows that individual investors do herd, it is more important to analyze the inter-
action between retail and institutional investors. Do individuals herd on the supposedly superior
information of institutions?. Retail unconditional demand may be high when institutional demand
is high, simply because institutions and individuals have common information. To analyze whether
one group of investors herds on the information of the other, we rank institutional demand and
calculate the average and median retail demand for each institutional demand quartile. We analyze
institutional demand conditional on retail demand in the same way. Table XIV shows that retail
and institutional demand move together, consistent will all investors sharing common information.
When we compare Panels A and B, we show that there is less variation in institutional demand
conditioned on retail demand than vice versa, consistent with individuals herding on institutional
investor’s demand.
Overall, this section shows that there is herding both among individuals and institutions in
the Spanish equity market. Analyzing the interaction between retail and institutional investors,
we observe both types share common information. Retail investors, though, seem to herd on the
information contained in institutional investors demand.
5 Retail Investors Profits.
5.1 The winner’s curse model of IPO underpricing.
In Rock’s (1986) winner’s curse model, IPO underpricing arises as a consequence of asymmetric
information and rationing. The value of the new shares offered is uncertain. A group of investors,
24ECBWorking Paper Series No. 428January 2005
the informed, have perfect knowledge about the realized value of the offering. All other investors,
including the issuing firm and the underwriter, are uninformed; they can only form an expectation
about the distribution of the issue’s value. In this setting, new shares cannot be priced at their
expected value. Informed investors crowd out the uninformed when the offering price is set below
its true value; similarly, the informed withdraw from the market when the issue is overpriced.
Uninformed investors are not allocated any underpriced issues given the rationing imposed by
informed demand, but receive all the overpriced offerings. The uninformed then abstain from
participating in the new issues market unless the issuing firm prices the shares at a discount.
Rock’s (1986) model yields several testable implications. Underpricing in the model is necessary
because informed demand expands in underpriced issues, crowding out retail investors. Individuals
are allocated only those offerings in which the underwriter does not collect positive indications
of interest. Secondly, while it seems appropriate to assume that institutional investors have an
informational advantage over retail investors, there is no reason a priori to assume that there is
asymmetry of information among institutional investors. If Rock’s model is correct, issues targeted
exclusively to institutional investors should not be underpriced.
The crucial test of the model involves observing the degree to which shares are rationed on the
offer date. The mere existence of rationing does not necessarily induce the uninformed to withdraw
from the market. Rationing is not sufficient to explain the discount. What is required is that
rationing occurs more often for overpriced shares than in underpriced IPOs. We feel, however, that
this test is inconclusive. If we abstain from the oversimplifying assumption that retail investors act
as simple noise traders, applying for shares randomly, the result that rationing occurs more often
for overpriced shares than in underpriced IPOs may occur naturally, with no need of an allocation
bias. This is the case when retail investors subscribe more heavily to those issues that they believe
that are being marketed at below their true price, resulting in larger oversubscription and smaller
allocation in underpriced issues for a given retail tranche size. Finally, Rock predicts that weighting
the returns by the probabilities of obtaining an allocation should leave the uninformed investor
earning the riskless rate.
In the next section, we then test these four predictions regarding the winner’s curse model
ability to explain Spanish equity offerings underpricing:
Hypothesis 1: In a setting where the fraction of shares allocated to each investor class is decided
25ECB
Working Paper Series No. 428January 2005

before bids are submitted, there should be no underpricing.
Hypothesis 2: IPOs targeted exclusively to institutional investors should not be underpriced.
Hypothesis 3: Rationing occurs more often for overpriced shares than in underpriced IPOs.
Hypothesis 4: Uninformed investors earn the riskless rate.
Rock’s model cannot be properly tested in the United States for two reasons. First, information
on the rationing process is not available. More important, in the United States allocation to retail
investors is at the discretion of the underwriter. It is impossible then to generate the return of
an uninformed investor that subscribes randomly to all offerings. Given these data restrictions,
researchers have tested Rock’s model in countries where retail allocations are unbiased, in the sense
that all investors that apply for the same number of shares receive the same allocation; and where
the allocation method is publicly disclosed. Koh and Walter (1989), Levis (1990), Keloharju (1993)
and Amihud et al. (2002) gather data from IPOs in Singapore, the United Kingdom, Finland
and Israel, respectively, to document that equally-weighted average initial returns are significantly
positive. Uninformed investors in these countries, however, could not have realized those returns
because of their disproportionately large purchases of overpriced shares. When individual returns
are weighted by the respective allocations, the average initial return falls to zero.
5.2 Methodology and Empirical Results
We proceed now to test the four hypothesis posed in Section 5.1. Given the evidence in Section
4 that equity offering allocations favor institutional investors, and Rock’s prediction that retail
investors earn zero profits, a logic question is why retail investors participate in the equity offerings
market. Tests of hypothesis three and four provide an answer to this question.
Hypothesis 1: In a setting where the fraction of shares allocated to each investor class is decided
before bids are submitted, there should be no underpricing.
We have seen in Section 3 that this prediction does not hold for our sample. In Spain, initial
allocation are included in the offering prospectus, filed before the underwriter collects indications
of interest from investors. Thus, institutional demand expansion cannot crowd out retail investors.
26ECBWorking Paper Series No. 428January 2005

Yet, as we have seen in Table I, Spanish equity offerings are on average underpriced by 8.72%.
Average (median) IPO underpricing is 14.39% (4.69%); only for SEOs underpricing is indifferent
from zero (-0.17% average, 0.17% median). These results are largely inconsistent with the winner’s
curse model prediction.
In many offerings, the prospectus includes claw back clauses that allow the underwriter to
modify the initial retail and institutional tranche size depending on investors demand during the
offer period. Underpricing for our equity offerings sample is only consistent with Rock winner’s
curse model if underwriters use the claw back provision to reduce retail allocations in heavily
oversubscribed issues, or decide to increase the retail tranche in poorly received offerings. This is
unlikely to be the case, though. Offering prospectuses normally include a clause that prevents the
underwriter to reduce the retail allocation when the retail tranche is oversubscribed. As we argued
in Section 4, the retail allocations are not decreased when the retail tranche is oversubscribed.
When comparing the final allocation with the allocation included in the offering prospectus, we
observe that retail investors are not harmed by the reallocation carried out by the underwriter.
Hypothesis 2: IPOs targeted exclusively to institutional investors should not be underpriced.
We do not find empirical support for Hypothesis 2 either. In Table II, we observe that IPOs
targeted to institutional investors are underpriced on average (median) by 9.39% (6.10%). This
result inconsistent with the winner’s curse model. While it is commonly accepted that institutional
investors have an informational advantage over individuals, it is more difficult to justify this in-
formation asymmetry within institutions. With no asymmetry of information, the winner’s curse
model predicts that there should be no underpricing. This result is consistent, however, with the
underwriter using the allocation of underpriced shares to induce institutional investors to reveal
positive information [Benveniste and Spindt (1989)]. Alternatively, the underwriter may use its
superior information regarding the issuing company to intentionally allocate underpriced shares to
its long term preferred clients.
Hypothesis 3: Rationing occurs more often for overpriced shares than in underpriced offerings.
To test Hypothesis 3 we gather retail allocation data for all equity offerings from 1993 onwards.
Prior to that year, even though offering prospectuses contain the size of the retail tranche, there
27ECB
Working Paper Series No. 428January 2005

is no reliable data on the pro rata allocation among individual investors, or shares were allocated
by chronological arrival. Of the 85 equity offerings that took place in Spain from 1993 to 2002,
24 were allocated to institutional investors exclusively, with no retail tranche. We also exclude
another 8 offerings for which, although they had a retail tranche, we do not have data on the pro
rata allocation among individual investors. Our working sample then contains 53 equity offerings,
30 IPOs and 23 SEOs for which data on retail allocations is publicly available.
Allocation of equity offerings among retail investors is done pro rata. All investors that apply
for the same number of shares receive the same allocation, regardless of their past relationship
with the underwriter. This allows us to simulate the return that an informed investor may obtain
from subscribing to equity offerings. We assume that the investor is uninformed in that he sub-
scribes to all offerings. For each offering, the prospectus establishes the minimum and maximum
retail application size. Applications are normally allowed to vary between 200,000 pesetas ($1303
approximately) and 10,000,000 pesetas ($65.163), although a minimum application size of 50.000
pesetas ($326) is not uncommon in early offerings. We observe these restrictions to make sure that
our uninformed strategy is perfectly implementable
To study the initial return that an uninformed investor could obtain, we assume that the
investor subscribes to all offerings. Retail investors are normally allocated a fixed number of shares,
regardless of application size, and a fixed fraction of their unsatisfied demand. This scheme results
in allocations that are a decreasing function of application size. We study allocation patterns for
applications between 50,000 and 10,000,000 pesetas in 50,000 ($326) increments. For each offer, we
define
Fractionij =Allocationi ∗ Pr icei + Perci ∗ [Si zej −Allocationi ∗ Pr icei]
Si zej(8)
where Fractionij is the fraction allocated in offer i to an investor that applies for j Spanish pesetas
worth of shares, where jε [50, 000; 10, 000, 000] ; that is, Fractionij is the ratio between the value
of the shares allocated to an investor in offer i and the size of his demand Si zej ; Sharesi is
the number of shares all investors get in offer i, regardless of their application size. Obviously,
if Si zej < Allocationi ∗ Pr icei, then the investor is allocated Si zej and Fractionij equals 1.
There are four issues that were so heavily oversubscribed that allocations were decided by lottery.
If all investors had received an allocation, the number of shares allocated would have been so
28ECBWorking Paper Series No. 428January 2005

small that transaction costs would have likely rendered any trading decision unprofitable. For
these issues, we multiply the final investor allocation by the probability of being chosen in the
lottery. Pr icei and Perci are the offer price and percentage allocated of unsatisfied demand,
App_ Si zej − Allocationi ∗ Pr icei.For each application size j, we compute the average allocationfraction for application size j across offerings as follows
FractionJ =
Pi Fractionij
NJ(9)
where NJ is the number of offerings for which Si zej is feasible.
Figures II, III and IV display the proportional allocations for each application size, ranging for
50,000 to 10,000,000 pesetas, for the whole sample (Figure II), IPOs (Figure III), and SEOs (Figure
IV). Curves A, U and O, represent the proportional allocation for the whole sample, underpriced
and overpriced offerings, respectively. Allocations are a decreasing function of order size. The
average allocation drops to 0.3072, 0.2063 and 0.1897 for an application size of one, five and ten
million pesetas, respectively ($6,516; $32,581 and $65.163). This same result holds for our IPO
and SEO sample in Panels B and C. Average allocation is 0.8993, 0.2459, 0.1438, 0.1241 for fifty
thousand, one, five and ten million peseta applications in the IPO sample; and 0.9591, 0.3871,
0.2878, 0.2754 for the SEO sample.
Consistent with prior studies [Amihud et al. (2002), Keloharju (1993), Koh and Walter (1989),
Levis (1990)], uninformed investors obtain large allocations in overpriced IPOs and small allocations
in underpriced offerings. For the smallest application size, 50.000 pesetas ($326), the average
allocation across all offerings is 0.9252; allocation in overpriced issues rises to 0.9381, whereas the
allocation in underpriced issues drops to 0.9186 and to 0.8098 for those issues that are underpriced
by more that 10%. Average allocation is 0.8732, 0.2240, 0.1202, 0.0973 for fifty thousand, one,
five and ten million pesetas in the IPO underpriced sample; and 0.9404, 0.3033, 0.2098, 0.1981
for overpriced IPOS. In the SEO sample, average allocations are 0.9868, 0.3187, 0.2284, 0.2172 for
underpriced offerings and 0.9055, 0.4482, 0.3216, 0.3058 for overpriced issues.
While these results are consistent with Rock’s model main assumption, the fact that retail
allocations are larger for underpriced than for overpriced offerings does not necessarily imply that
underwriters allocation decisions are biased against retail investors. If not completely uninformed,
retail investors will subscribe more heavily to those issues they believe are being marketed at
29ECB
Working Paper Series No. 428January 2005

below their true value. For a given retail tranche size, greater oversubscription of underpriced
offerings with respect to overpriced issues, results in allocations being inversely related to offering
initial returns, with no need of an allocation bias. We find support for this hypothesis in our
sample. Retail oversubscription in the two most underpriced IPOs in our sample, Terra and Adolfo
Dominguez (with a retail underpricing of 213.29% and 97.87%) was 90 and 182 times the size or
the retail tranche. Excluding these two offerings, average (median) retail oversubscription is 9.98
(7.14). Average oversubscription is 17.33 for underpriced offerings and 6.33 overpriced issues.
To study the relationship between underpricing and retail participation more rigorously, we
estimate the following two equations:
Demandir = α+ βUnderpricingi + i (10)
Re t_Numbi = α+ βUnderpricingi + i (11)
where Demandir is the oversubscription in the retail tranche (i.e. the ratio between retail investor’s
demand and the size of the retail tranche), and Re t_Numbi is the number of retail investors that
apply for shares in equity offering i. Panel A in Table XV reports equation 7 estimates. There
is a significantly positive relationship between underpricing and the level of retail demand. The
coefficient on underpricing is positive at the 1% level for our whole and IPO samples. Panel B
shows that results do not change when we use the number of retail investors that subscribe to each
offering, as an indication of retail demand.
Overall, we document that uninformed investors obtain larger allocations in overpriced issues
than in underpriced offerings. This result is consistent with Rock’s model main assumption. We
present evidence, however, that the driving factor behind the relative large allocation in overpriced
issues when compared to underpriced offerings is not the underwriter allocation bias in favor of
institutional investors. Retail investors subscribe more heavily those issues that they believe are
marketed at below their expected value; for a fixed retail tranche size, retail behavior results in the
allocation pattern described. Retail investors do not seem to behave as the uninformed investors
in Rock’s model. The crucial test of the winner’s curse theory will then be whether, as predicted
by the model, retail investors earn zero profits from participating in equity offerings.
Hypothesis 4: Uninformed investors earn the riskless rate.
30ECBWorking Paper Series No. 428January 2005

We have seen in Section 4 that out of the 101 offerings for which we have retail/institutional
allocation data, retail investors participate in 80 issues. Retail investors’ make aggregate abnormal
profits from participating in these offerings. These aggregate profits, although certainly large,
do not guarantee that an individual informed investor is able to obtain abnormal profits form
participating in all offerings. We know that retail investors subscribe more heavily to those issues
marketed at below their market value, and consequently allocations are larger in overpriced issues
than in underpriced offerings. To calculate the allocation-weighted return an uninformed investor
may obtain from subscribing to all issues, define
Pr ofitij = Fractionij ∗ Si zej ∗ Underpricingi (12)
Pr ofitJ =Xi
Fractionij ∗ Si zej ∗ Underpricingi (13)
where Pr ofitij is the monetary gain of an investor that applies for j Spanish pesetas worth of
shares in offer i, and Pr ofitJ is the aggregate return for an investor that applies for j Spanish
pesetas worth of shares in all equity offerings in which a Si zej application is permitted. Using
our monetary gain measure, we can devise two return measures: the return on application (ROA)
measures the ratio between the monetary gain an the application size; given that allocations are
normally a small, declining fraction of the application, the return on investment (ROI) measures
the ratio between the monetary gain and the amount actually invested.
ROAij =Pr ofitijSi zej
= Fractionij ∗ Underpricingi (14)
ROAJ =Xi
Fractionij ∗ UnderpricingiNJ
(15)
ROIij =Pr ofitij
Si zej ∗ Fractionij (16)
ROIJ =
Pi Si zej ∗ Fractionij ∗ UnderpricingiP
i Si zej ∗ Fractionij(17)
Since allocations are a monotonically declining function of applications, we expect returns on
application to be significantly lower than returns on investment. Whether the return on application
31ECB
Working Paper Series No. 428January 2005

or the return on investment is the appropriate return measure depends on the provision of funds
retail investors have to make when submitting their application. In Spain, retail investors do not
have to pay in full when submitting their applications. Soon after the book building period starts,
brokers have a rough estimate of how heavily subscribed the issue is going to be and, consequently,
of the allocation for each application size. Investors are normally required to have enough funds to
cover their expected allocation. Investors do not necessarily need to provide their broker with new
funds at the time of the application; mutual funds, stocks or bonds that an investor may have with
his broker account serve as collateral until final allocations are decided. Some investors, depending
on their trading relationship with their broker, do not need to provide funds at all, as long as they
sell their allocation in the first trading day. In this case, the investor’s account is credited (debited)
with his first day trading profit (loss).
Chowdhry and Shermann (1996) and Levis (1990) emphasize interest rate costs in the calculation
of investment returns. In Spain, the book building period starts on average (median) 16 (15) days
before shares start trading and lasts for 11 (10) days. The offer price and final pro rata retail
allocation are decided the day before shares start trading. Given the fund provision characteristics
of the Spanish offering market and the short time elapsed from application to actual trading,
interest rate costs in Spain are insignificant. We thus attempt to provide empirical support to or
refute Rock’s claim that retail investors earn zero profits from participating in equity offerings, and
abstain from interest rate cost considerations.
For the 53 offerings for which detailed pro rata retail allocation data are available, average
underpricing is 13.21%, 21.69% and 2.15% for the overall, IPO and SEO sample. We see on Table
XVI that the return on application, on the other hand, ranges from 9.21% to 0.77% for the overall
sample, from 14.67% to 1.21% for the IPO sample, and from 2.08% to 0.19% for the SEO sample.
Unconditional underpricing is significantly higher than allocation-weighted returns. The return
on application for the maximum application size is only larger than 1% for the IPO sample. We
think however, that it is inappropriate to conclude from these results that retail investors earn zero
abnormal profits from participating in equity offerings. First, as we have mentioned, the return
on investment is a superior measure of investor’s return. The return on investment is significantly
higher than the return on application In particular ROI rises to 4.06%, 9.78%, and 0.71% for the
overall, IPO and SEO sample. Furthermore, most offerings allow investors to submit more than
32ECBWorking Paper Series No. 428January 2005

one application. Individual investors are normally allowed to submit one application individually
and up to two more joint applications, providing the individual ten million pesetas limit is not
exceeded. Since allocations are a monotonically decreasing function of application size, a splitting
order strategy that consists of submitting three relatively small applications rather than a large one,
results in a higher allocation. We compute the returns for two such strategies: one that involves
three equal applications of 3.333.333 pesetas (Strategy A), and a second strategy that splits the
ten million application limit in a five million and two 2.5 million applications (Strategy B). The
return on investment for this last strategy is 4.57%, 9.79% and 0.85%, for the overall, IPO and
SEO sample. Even more compelling, the average individual profit from participating in all offerings
when Strategy B is used is 100,226, 157,934, 24,955 pesetas ($653, $1,029, $163) for the overall,
IPO and SEO sample. Retail investors earn positive abnormal profits from participating in equity
offerings.
Retail investors, though, can earn even higher profits if they condition on information publicly
available by the time the subscription period closes. Loughran and Ritter (2002) claim that under-
pricing is predictable based on lagged market returns because offer prices only adjust partially to
public information. Since the subscription period for retail investor opens on average 16 days before
the offer date, t, and lasts for about 11 days, we first assume that retail investors only subscribe
to those offerings for which the market return, as measured by the return for the Ibex-35 index, is
positive between t − 16 and t − 5. Secondly, we have observed in Section 4. that the underwriteruses its superior information to intentionally favor its long-term clients. We then assume that retail
investors only subscribe to those offerings for which the profit-weighted institutional size tranche
is larger than average (and that, of course, have a retail tranche). Finally, if we assume that insti-
tutional investors have an informational advantage of retail investors, we calculate the return from
participating in offerings for which institutional demand oversubscription is larger than average.
Table XVII shows the results for the conditional retail profits. Conditioning on publicly available
information, retail investors can increase their profits by about 16%.
33ECB
Working Paper Series No. 428January 2005
6 Conclusion.
In the Spanish IPO market, the distribution of the IPO between retail, local institutional investors
and foreign institutions is stated in the preliminary prospectus. The allocation is decided before
any investor is allowed to submit his formal application for IPO shares. Given that the underwriter
assigns the issue before he can gauge the investors demand, the Spanish IPO market is the ideal
setting to test underpricing theories that rest on the underwriter’s allocation bias.
Using a sample of all 175 equity offerings, 137 IPOs and 38 secondary equity offerings, that
took place in Spain from 1985 to 2002, we document that institutions receive nearly 75% of the
profits in underpriced issues, they have to bear only 56% of the losses. Foreign institutions account
for the whole institutional - retail differential; allocation to Spanish institutions are independent
of offering profits, at 20%. The preferential treatment of institutional investors is partially due to
their informational advantage and by the underwriter bias to favour its long term clients.
Even though institutions capture the "lion’s share" of the money left on the table, retail in-
vestors earn, on aggregate, positive profits. We simulate the return that an informed investor may
obtain from subscribing to equity offerings. Uninformed investors obtain large allocations in over-
priced IPOs and small allocations in underpriced offerings. The driving factor behind the relative
large allocation in overpriced issues when compared to underpriced offerings is not the underwriter
allocation bias in favor of institutional investors. Retail investors subscribe more heavily those
issues that they believe are marketed at below their expected value. The average individual profit
from participating in all offerings. Retail investors earn positive abnormal profits from participat-
ing in equity offerings. Retail investors, though, can earn even higher profits if they condition on
information publicly available by the time the subscription period closes.
34ECBWorking Paper Series No. 428January 2005

References
[1] Aggarwal, Reena, 2002, Allocation of initial public offerings and flipping activity, Journal of
Financial Economics, forthcoming.
[2] Aggarwal, Reena, N. Prabhala, and Manju Puri, 2002, Institutional allocation in initial public
offerings: Empirical evidence, Journal of Finance 57, forthcoming.
[3] Amihud, Yakov, Shmuel Hauser and Amir Kirsh. 2001 Allocations, adverse selection and
cascades in IPOs: Evidence from Israel, working paper.
[4] Baron, David P., 1982, A model of the demand for investment banking advising and distribu-
tion services for new issues, Journal of Finance 37, 955-976.
[5] Beatty, Randolph P. and Jay R. Ritter, 1986, Investment banking, reputation, and the under-
pricing of initial public offerings, Journal of Financial Economics 15, 213-232.
[6] Benveniste, Lawrence M., and Walid Y. Busaba, 1997, Bookbuilding vs. fixed price: An analy-
sis of competing strategies for marketing IPOs, Journal of Financial and Quantitative Analysis
32, 383-403.
[7] Benveniste, Lawrence M., Walid Y. Busaba and William J. Wilhelm, Jr., 1996, Price stabi-
lization as a bonding mechanism in new equity issues, Journal of Financial Economics 42,
223-256.
[8] Benveniste, Lawrence M. and Paul A. Spindt, 1989, How investment bankers determine the
offer price and allocation of new issues, Journal of Financial Economics 24, 343-362.
[9] Benveniste, Lawrence M. and William J. Wilhelm, 1990, A comparative analysis of IPO pro-
ceeds under alternative regulatory environments, Journal of Financial Economics 28, 173- 208.
[10] Benveniste, Lawrence M., Sina M. Erdal, and William J. Wilhelm, Jr., 1998, Who benefits from
secondary market price stabilization of IPOs, Journal of Banking and Finance 22, 741-767.
[11] Booth, James R. and Lena Chua, 1996, Ownership dispersion, costly information, and IPO
underpricing, Journal of Financial Economics 41, 291-310.
35ECB
Working Paper Series No. 428January 2005

[12] Brav, Alon and Paul A. Gompers, 1997, Myth or reality? The long-run underperformance
of initial public offerings: Evidence from venture and nonventure capital-backed companies,
Journal of Finance 52, 1791-1821.
[13] Brennan, Michael J. and J. Franks, 1997, Underpricing, ownership and control in initial public
offerings of equity securities in the UK, Journal of Financial Economics 45, 391-413.
[14] Carter, Richard B., Frederick H. Dark and Alan K. Singh, 1998, Underwriter reputation, initial
returns, and the long-run performance of IPO stocks, Journal of Finance 53, 285-311.
[15] Carter, Richard and Steven Manaster, 1990, Initial public offerings and underwriter reputation,
Journal of Finance 45, 1045-1067.
[16] Chemmanur, Thomas J., 1993, The pricing of initial public offers: A dynamic model with
information production, Journal of Finance 48, 285-304.
[17] Chemmanur, Thomas J. and Paolo Fulghieri, 1999, A theory of the going-public decision,
Review of Financial Studies 12, 249-279.
[18] Cornelli, Francesca, and David Goldreich, 2001, Bookbuilding and strategic allocation, Journal
of Finance, 2337-2369.
[19] Cornelli, Francesca, and David Goldreich, 2002, Bookbuilding: How informative is the order
book? Unpublished London Business School working paper.
[20] Derrien, Francois, and Kent L. Womack, 2002, Auctions vs. bookbuilding and the control of
underpricing in hot IPO markets, Review of Financial Studies, forthcoming.
[21] Ellis, Katrina, Roni Michaely, and Maureen O’Hara, 2000, When the underwriter is the market
maker: An examination of trading in the IPO aftermarket, Journal of Finance 55, 1039-1074.
[22] Habib, Michel, and Alexander Ljungqvist, 2001, Underpricing and entrepreneurial wealth losses
in IPOs: theory and evidence, Review of Financial Studies 14, 433-458.
[23] Hanley, Kathleen Weiss, 1993, The underpricing of initial public offerings and the partial
adjustment phenomenon, Journal of Financial Economics 34, 231-250.
36ECBWorking Paper Series No. 428January 2005

[24] Hanley, Kathleen Weiss and William J. Wilhelm, Jr., 1995, Evidence on the strategic allocation
of initial public offerings, Journal of Financial Economics 37, 239-257.
[25] Ibbotson, R. G., 1975, Price performance of common stock new issues, Journal of Financial
Economics 2, 235-272.
[26] Jenkinson, Tim and Alexander Ljungqvist, 2001, Going Public: The Theory and Evidence on
How Companies Raise Equity Finance (2nd edition), Oxford University Press.
[27] Keloharju, Matti, 1993, The winner’s curse, legal liability, and the long-run price performance
of initial public offerings in Finland, Journal of Financial Economics 34, 251-277.
[28] Kim, Moonchul and Jay R. Ritter, 1999, Valuing IPOs, Journal of Financial Economics 53,
409- 437.
[29] Koh, Francis and Terry Walter, 1989, A direct test of Rock’s model of the pricing of unseasoned
issues, Journal of Financial Economics 23, 251-272.
[30] Krigman, L., W. Shaw, and K. Womack, 1999, The persistence of IPO mispricing and the
predictive power of flipping, Journal of Finance 54, 1015-1044.
[31] Krigman, L., W. Shaw, and K. Womack, 2001, Why do firms switch underwriters? Journal of
Financial Economics 60, 245-284.
[32] La Porta, Rafael, Florencio Lopez-de-Silanes, Andrei Shleifer, and Robert W. Vishny, 1997,
Legal determinants of external finance, Journal of Finance 52, 1131-1150.
[33] Lee, Philip J., Stephen L. Taylor and Terry S. Walter, 1999, IPO underpricing explanations:
Implications from investor application and allocation schedules, Journal of Financial and Quan-
titative Analysis 34, 425-444.
[34] Ljungqvist, Alexander, and William Wilhelm, 2002a, IPO allocations: Discriminatory or dis-
cretionary?, Journal of Financial Economics, forthcoming.
[35] Ljungqvist, Alexander, and William Wilhelm, 2002b, IPO pricing in the dot-com bubble:
Complacency or incentives? unpublished NYU working paper.
37ECB
Working Paper Series No. 428January 2005

[36] Ljungqvist, Alexander, Vikram Nanda, and Raj Singh, 2001, Hot markets, investor sentiment,
and IPO pricing, unpublished NYU working paper.
[37] Loughran, Tim, and Jay R. Ritter, 2002, Why don’t issuers get upset about leaving money on
the table in IPOs? Review of Financial Studies 15, 413-443.
[38] Loughran, Tim, Jay R. Ritter and Kristian Rydqvist, 1994, Initial public offerings: Interna-
tional insights, Pacific-Basin Finance Journal 2, 165-199.
[39] Lowry, Michelle, 2002, Why does IPO volume fluctuate? Journal of Financial Economics,
forthcoming.
[40] Lowry, Michelle, and G. William Schwert, 2002, IPO market cycles: Bubbles or sequential
learning? Journal of Finance 57, forthcoming.
[41] Muscarella, Chris J. and Michael R. Vetsuypens, 1989, A simple test of Baron’s model of IPO
underpricing, Journal of Financial Economics 24, 125-136.
[42] Rock, Kevin, 1986, Why new issues are underpriced, Journal of Financial Economics 15, 187-
212.
[43] Sherman, Ann, 2000, IPOs and long-term relationships: An advantage of bookbuilding, Review
of Financial Studies 13, 697-714.
[44] Sherman, Ann, 2001, Global trends in IPO methods: Book building versus auctions, unpub-
lished University of Notre Dame working paper.
[45] Sherman, Ann, and Sheridan Titman, 2002, Building the IPO order book: Underpricing and
participation limits with costly information, Journal of Financial Economics, forthcoming.
[46] Teoh, Siew Hong, Ivo Welch and T. J. Wong, 1998, Earnings management and the long-run
market performance of initial public offerings, Journal of Finance 53, 1935-1974.
[47] Welch, Ivo, 1989, Seasoned offerings, imitation costs, and the underpricing of initial public
offerings, Journal of Finance 44, 421-450.
[48] Welch, Ivo, 1992, Sequential sales, learning, and cascades, Journal of Finance 47, 695-732.
38ECBWorking Paper Series No. 428January 2005

Sample IPOs SEOs
Issue Size 637,316,600 737,774,784 422,049,063(214,746,193) (214,284,772) (214,746,193)
Issue Size (inc. Green Shoe) 700,744,206 802,310,443 483,102,270(225,894,967) (223,767,539) (225,894,967)
Fraction Sold 30.91% 31.35% 30.04%(27.00%) (29.53%) (23.75%)
Market Capitalization 4,308,785,582 5,005,529,414 2,965,065,335(489,762,959) (624,995,183) (256,570,100)
Price 21.14 20.63 22.25(15.00) (15.67) (13.79)
Underpricing 8.88% 14.48% -0.17%(0.81%) (4.34%) (0.18%)
Money "Left on the Table" 24,119,959 45,734,118 -4,526,539(2,697,602) (3,079,307) (1,311,662)
Number 100 65 35
Table I: Summary StatisticsThis table reports summary statistics for 100 equity offerings in Spain from1985 to 2002. We report the average (median) issue size, both including andexcluding the green shoe option, the fraction of the company sold, the marketcapitalization of the issuing company, price, underpricing, and money left onthe table. All monetary variables are in euros.
39ECB
Working Paper Series No. 428January 2005

Panel A: All OfferingsN Employees Retail Local Inst Foreign Inst Total Inst Total Local
All All 101 1.56% 33.71% 25.32% 39.42% 64.74% 60.59%(0.00%) (36.09%) (21.00%) (37.50%) (62.50%) (62.50%)
Private 72 0.74% 33.98% 27.11% 38.18% 65.29% 61.09%(0.00%) (33.39%) (25.00%) (35.00%) (65.00%) (62.16%)
Public 29 3.58% 33.07% 20.86% 42.50% 63.35% 53.92%(1.94%) (38.13%) (15.00%) (39.29%) (55.00%) (54.00%)
IPO All 63 1.30% 32.39% 27.99% 38.33% 66.32% 61.69%(0.00%) (33.45%) (25.00%) (37.50%) (65.00%) (62.50%)
Private 54 0.99% 31.97% 29.15% 37.91% 67.06% 62.11%(0.00%) (33.32%) (26.69%) (37.68%) (65.83%) (62.32%)
Public 9 3.16% 34.94% 21.07% 40.83% 61.91% 59.17%(0.70%) (37.50%) (20.00%) (37.50%) (60.00%) (62.50%)
SEO All 38 1.98% 35.90% 20.88% 41.23% 61.73% 58.76%(0.00%) (40.29%) (15.83%) (37.42%) (54.50%) (62.58%)
Private 18 0.00% 39.99% 21.01% 39.00% 60.01% 61.00%(0.00%) (45.49%) (19.43%) (29.71%) (54.51%) (70.29%)
Public 20 3.77% 32.23% 20.76% 43.24% 64.00% 56.75%(2.97%) (39.35%) (10.83%) (41.00%) (54.50%) (59.00%)
Panel B: Offerings with a Retail TrancheN Employees Retail Local Inst Foreign Inst Total Inst Total Local
All 79 1.96% 43.10% 21.13% 33.82% 54.95% 66.19%(0.00%) (41.96%) (20.00%) (33.91%) (55.00%) (66.62%)
IPO 57 1.55% 40.02% 24.03% 34.41% 58.45% 65.60%(0.00%) (37.50%) (25.00%) (35.00%) (61.00%) (65.00%)
SEO 22 2.69% 48.73% 15.84% 32.74% 48.58% 67.26%(0.25%) (48.49%) (15.00%) (30.42%) (46.32%) (69.58%)
Panel C: Offerings with Institutional Tranche OnlyN Local Inst Foreign Inst
All 22 41.37% 58.51%(49.20%) (50.00%)
IPO 12 46.70% 53.08%(49.20%) (50.00%)
SEO 10 39.97% 60.03%(50.00%) (50.00%)
Table II: Unconditional Initial Allocation.This table reports the initial allocation for 101 equity offerings in Spain from 1985 to 2002. The initial allocationis the allocation specified in the prospectus filed with the Comisión Nacional del Mercado de Valores beforethe offer begins. We present the average (median) allocation for both IPOs and SEOs, and for offers byprivately owned companies, as wells as issues in which the government has a stake in the company. In PanelA, we consider all offerings. In Panel B, we report statistics only for those offerings that have a retail tranche.Finaly, in Panel C, we show the distribution between foreign and domestic institutions in those offeringstargeted exclusively to institutional investors. Data on initial allocations are from the offering prospectuses.Intuition: Institutional investors receive the largest fraction of the shares offered. Foreign institutions dominateinstitutional allocations.
40ECBWorking Paper Series No. 428January 2005

Num
ber
Empl
oyee
sR
etai
lLo
cal I
nst
Fore
ign
Inst
Tota
l Ins
tTo
tal L
ocal
All
821.
56%
33.7
1%25
.32%
39.4
2%64
.74%
60.5
9%(0
.00%
)(3
6.09
%)
(21.
00%
)(3
7.50
%)
(62.
50%
)(6
2.50
%)
Und
erpr
iced
552.
22%
33.4
2%24
.14%
40.2
2%64
.36%
59.7
8%(0
.00%
)(3
5.75
%)
(20.
00%
)(3
9.64
%)
(60.
71%
)(6
0.36
%)
Ove
rpric
ed22
0.95
%33
.17%
26.1
4%39
.74%
65.8
8%60
.00%
(0.0
0%)
(35.
90%
)(2
4.99
%)
(36.
25%
)(6
3.75
%)
(60.
26%
)IP
O63
1.30
%32
.39%
27.9
9%38
.33%
66.3
2%61
.69%
(0.0
0%)
(33.
45%
)(2
5.00
%)
(37.
50%
)(6
5.00
%)
(62.
50%
)U
nder
pric
ed34
1.67
%29
.32%
27.4
8%41
.54%
69.0
2%58
.46%
(0.0
0%)
(27.
50%
)(2
5.00
%)
(40.
00%
)(6
7.50
%)
(60.
00%
)O
verp
riced
101.
31%
29.7
8%28
.33%
40.5
8%68
.91%
59.4
2%(0
.32%
)(3
1.82
%)
(25.
00%
)(3
8.75
%)
(65.
83%
)(6
1.25
%)
SEO
381.
98%
35.9
0%20
.88%
41.2
3%61
.73%
58.7
6%(0
.00%
)(4
0.29
%)
(15.
83%
)(3
7.42
%)
(54.
50%
)(6
2.58
%)
Und
erpr
iced
243.
05%
39.5
7%19
.12%
38.2
5%57
.37%
61.7
4%(0
.71%
)(4
1.27
%)
(12.
08%
)(3
7.42
%)
(50.
31%
)(6
2.58
%)
Ove
rpric
ed6
0.94
%32
.90%
26.2
0%39
.73%
66.0
5%60
.27%
(0.1
6%)
(33.
06%
)(2
5.00
%)
(38.
12%
)(6
5.42
%)
(61.
88%
)
Tabl
e III
: Ini
tial A
lloca
tion
and
Und
erpr
icin
g.Th
ista
ble
repo
rtsth
ein
itial
allo
catio
nfo
r82
equi
tyof
ferin
gsin
Spai
nfro
m19
85to
2002
,con
ditio
nalo
nfir
stda
yre
turn
s.Th
ein
itial
allo
catio
nis
the
allo
catio
nsp
ecifi
edin
the
pros
pect
usfil
edw
ithth
eC
omis
ión
Nac
iona
ldel
Mer
cado
deVa
lore
sbe
fore
the
offe
rbe
gins
.W
epr
esen
tth
eav
erag
e(m
edia
n)al
loca
tion
for
both
IPO
san
dSE
Os,
and
for
offe
rsby
priv
atel
yow
ned
com
pani
es,
asw
ells
asis
sues
inw
hich
the
gove
rnm
enth
asa
stak
ein
the
com
pany
.Dat
aon
initi
alal
loca
tions
are
from
the
offe
ring
pros
pect
uses
. IPO
und
erpr
icin
g da
ta a
re fr
om th
e M
adrid
Sto
ck E
xcha
nge
and
Expa
nsió
n.In
tuiti
on:
Ther
eis
not
abi
asin
favo
urof
inst
itutio
nal
inve
stor
sw
hen
we
cond
ition
alin
itial
allo
catio
nsby
the
degr
eeof
unde
rpric
ing.
41ECB
Working Paper Series No. 428January 2005

Panel A: SampleRetail Local Inst Foreign Inst Total Inst Total Local
Intercept 0.1258 ** 0.0799 0.0194 0.0156 0.1994 **(0.0135) (0.1395) (0.7709) (0.8430) (0.0457)
Coefficient -0.1049 0.0389 0.1800 0.1163 -0.1800(0.3731) (0.8321) (0.2452) (0.3159) (0.2452)
F 0.80 0.05 1.37 1.02 1.37R-Squared 0.0103 0.0006 0.0175 0.0131 0.0175N 79 79 79 79 79
Panel B: Initial Public OfferingsRetail Local Inst Foreign Inst Total Inst Total Local
Intercept 0.1601 ** 0.1806 ** 0.0361 0.0954 0.3044 *(0.0348) (0.0482) (0.7577) (0.4927) (0.0729)
Coefficient -0.0536 -0.1310 0.2683 0.0711 -0.2683(0.7814) (0.6344) (0.3202) (0.7114) (0.3202)
F 0.08 0.23 1.01 0.14 1.01R-Squared 0.0017 0.0049 0.0210 0.0029 0.0210N 49 49 49 49 49
Panel C: Secondary Equity OfferingsRetail Local Inst Foreign Inst Total Inst Total Local
Intercept 0.0136 -0.0031 -0.0108 -0.0146 0.0204(0.2720) (0.7847) (0.3929) (0.3413) (0.3045)
Coefficient -0.0310 0.0201 0.0312 0.0274 -0.0312(0.2254) (0.6864) (0.2951) (0.2750) (0.2949)
F 1.54 0.17 1.14 1.24 1.14R-Squared 0.0520 0.0059 0.0391 0.0424 0.0391N 30 30 30 30 30
Table IV: Underpricing and Initial Allocations.This table reports the ordinary least squares estimates of the coefficients in a cross-sectionalregression of underpricing on initial allocations to different investor types in 79 equityofferings in Spain from 1985 to 2002. Initial allocation is the allocation specified in theprospectus filed with the Comisión Nacional del Mercado de Valores before the offer begins.
Intuition: Initial allocations are independent of underpricing, when allocations are not profit-weighted.*,**,*** imply significance at the 0.1, 0.05, 0.01 levels
iiji Alloc_InitngUnderprici ε+β+α=
42ECBWorking Paper Series No. 428January 2005

Pane
l A: M
oney
Lef
t on
the
Tabl
e W
eigh
ted
Allo
catio
nsN
umbe
rEm
ploy
ees
Ret
ail
Loca
l Ins
tFo
reig
n In
stTo
tal I
nst
Tota
l Loc
alAl
l81
1.71
%28
.24%
19.6
6%50
.39%
70.0
5%49
.61%
Und
erpr
iced
551.
95%
23.8
1%19
.46%
54.7
8%74
.24%
45.2
2%O
verp
riced
210.
93%
43.0
1%20
.32%
35.7
4%56
.06%
64.2
6%IP
O49
1.52
%26
.18%
19.8
3%52
.47%
72.3
0%47
.53%
Und
erpr
iced
361.
50%
26.5
5%20
.05%
51.9
0%71
.95%
48.1
0%O
verp
riced
100.
96%
35.1
7%25
.19%
38.6
8%63
.87%
61.3
2%SE
O32
1.64
%43
.95%
19.2
8%35
.13%
54.4
1%64
.87%
Und
erpr
iced
190.
93%
44.5
5%19
.36%
35.1
6%54
.52%
64.8
4%O
verp
riced
113.
84%
45.2
4%15
.73%
35.1
9%50
.92%
64.8
1%
Pane
l B: M
oney
Lef
t on
the
Tabl
eN
umbe
rEm
ploy
ees
Ret
ail
Loca
l Ins
tFo
reig
n In
stTo
tal I
nst
Tota
l Loc
alTo
tal
All
8146
9,27
25,
743,
451
4,69
3,95
413
,213
,285
17,9
07,2
3910
,906
,677
24,1
19,9
59(0
)(1
0,37
5)(3
60,6
07)
(670
,397
)(1
,107
,932
)(1
,427
,731
)(2
,697
,602
)U
nder
pric
ed55
800,
055
13,1
96,5
589,
187,
753
23,5
50,4
0132
,738
,153
23,1
84,3
6646
,734
,762
(0)
(1,7
03,8
69)
(1,2
44,7
26)
(1,8
03,0
36)
(2,9
04,6
62)
(2,9
81,7
58)
(4,9
99,7
42)
Ove
rpric
ed21
-251
,030
-11,
583,
988
-5,4
73,7
36-9
,626
,484
-15,
100,
220
-17,
308,
754
-26,
935,
239
(0)
(-1,7
61,8
80)
(-1,5
11,7
16)
(-2,4
42,9
64)
(-3,9
80,2
61)
(-4,1
00,1
95)
(-6,8
20,0
00)
IPO
4969
7,28
611
,971
,594
9,06
6,83
623
,998
,627
33,0
65,4
6321
,735
,716
45,7
34,1
18(0
)(2
07,9
16)
(820
,382
)(9
26,6
40)
(1,8
47,5
84)
(1,8
03,0
36)
(3,0
79,3
07)
Und
erpr
iced
3697
5,16
317
,248
,184
13,0
24,0
8633
,713
,479
46,7
37,5
6531
,247
,433
64,9
60,6
05(0
)(1
,136
,002
)(2
,150
,793
)(2
,268
,821
)(5
,827
,608
)(3
,956
,401
)(6
,769
,995
)O
verp
riced
10-9
3,88
3-3
,432
,653
-2,4
59,2
14-3
,775
,251
-6,2
34,4
65-5
,985
,750
-9,7
61,0
01(-2
1,52
4)(-2
,236
,744
)(-1
,511
,716
)(-2
,327
,382
)(-3
,904
,453
)(-4
,100
,195
)(-6
,543
,159
)SE
O32
-416
,712
-3,6
13,9
1026
8,80
1-7
64,7
18-4
95,9
16-3
,210
,318
-4,5
26,5
39(0
)(0
)(2
16,0
04)
(97,
820)
(479
,623
)(7
03,5
27)
(1,3
11,6
62)
Und
erpr
iced
1946
8,27
15,
519,
794
1,91
8,91
04,
294,
041
6,21
2,95
17,
906,
974
12,2
01,5
85(1
00,9
70)
(2,1
22,5
91)
(607
,884
)(1
,244
,726
)(2
,464
,150
)(2
,764
,656
)(4
,868
,198
)O
verp
riced
11-4
16,7
12-2
0,04
7,38
2-2
,532
,514
-9,6
41,6
13-1
2,17
4,12
7-2
2,99
6,60
9-3
2,63
8,22
2(0
)(-1
,487
,505
)(-1
,333
,600
)(-3
,872
,692
)(-4
,840
,865
)(-3
,308
,916
)(-6
,693
,797
)
Tabl
e V:
Initi
al A
lloca
tion
and
Mon
ey L
eft o
n th
e Ta
ble.
This
tabl
ere
ports
the
initi
alal
loca
tion
for
101
equi
tyof
ferin
gsin
Spai
nfro
m19
85to
2002
,con
ditio
nalo
nfir
stda
yre
turn
s.Th
ein
itial
allo
catio
nis
the
allo
catio
nsp
ecifi
edin
the
pros
pect
usfil
edw
ithth
eC
omis
ión
Nac
iona
ldel
Mer
cado
deVa
lore
sbe
fore
the
offe
rbe
gins
.W
epr
esen
tthe
aver
age
(med
ian)
allo
catio
nfo
rbot
hIP
Os
and
SEO
s,an
dfo
roffe
rsby
priv
atel
yow
ned
com
pani
es,a
sw
ells
asis
sues
inw
hich
the
gove
rnm
enth
asa
stak
ein
the
com
pany
.Dat
aon
initi
alal
loca
tions
are
from
the
offe
ring
pros
pect
uses
.IPO
unde
rpric
ing
data
are
from
the
Mad
rid S
tock
Exc
hang
e an
d Ex
pans
ión.
Intu
ition
: The
re is
not
a b
ias
in fa
vour
of i
nstit
utio
nal i
nves
tors
whe
n w
e co
nditi
onal
initi
al a
lloca
tions
by
the
degr
ee o
f und
erpr
icin
g.
43ECB
Working Paper Series No. 428January 2005
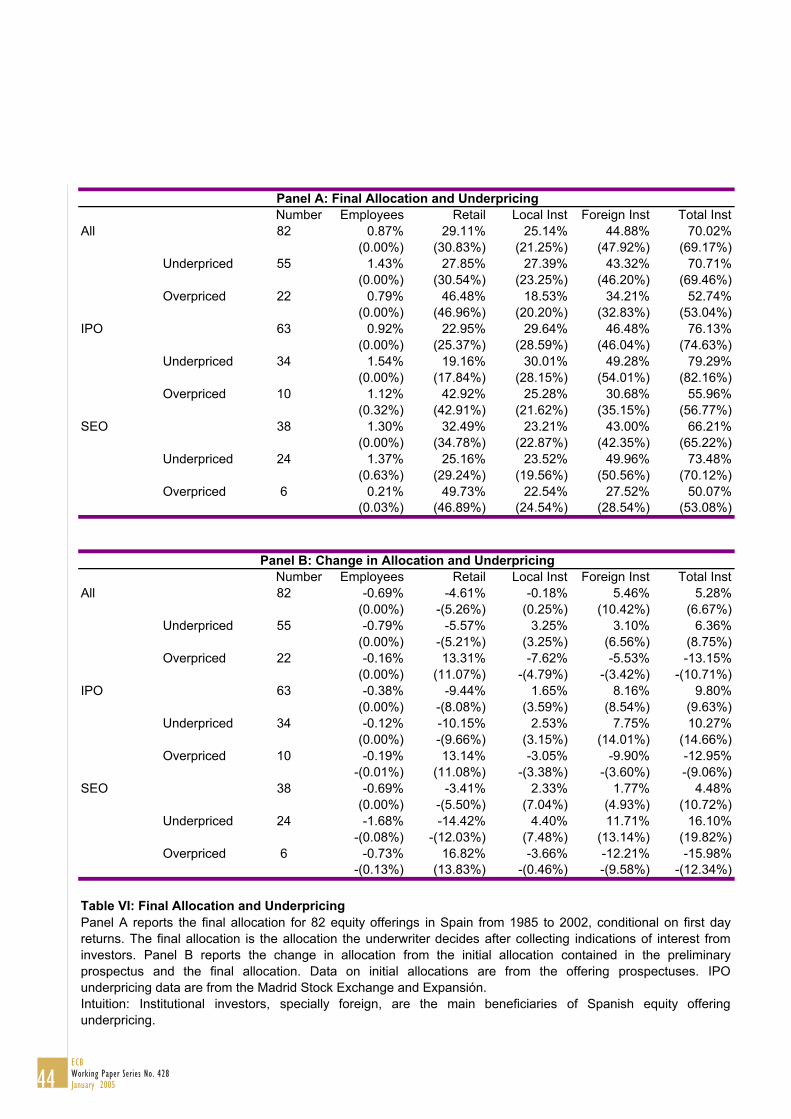
Panel A: Final Allocation and UnderpricingNumber Employees Retail Local Inst Foreign Inst Total Inst
All 82 0.87% 29.11% 25.14% 44.88% 70.02%(0.00%) (30.83%) (21.25%) (47.92%) (69.17%)
Underpriced 55 1.43% 27.85% 27.39% 43.32% 70.71%(0.00%) (30.54%) (23.25%) (46.20%) (69.46%)
Overpriced 22 0.79% 46.48% 18.53% 34.21% 52.74%(0.00%) (46.96%) (20.20%) (32.83%) (53.04%)
IPO 63 0.92% 22.95% 29.64% 46.48% 76.13%(0.00%) (25.37%) (28.59%) (46.04%) (74.63%)
Underpriced 34 1.54% 19.16% 30.01% 49.28% 79.29%(0.00%) (17.84%) (28.15%) (54.01%) (82.16%)
Overpriced 10 1.12% 42.92% 25.28% 30.68% 55.96%(0.32%) (42.91%) (21.62%) (35.15%) (56.77%)
SEO 38 1.30% 32.49% 23.21% 43.00% 66.21%(0.00%) (34.78%) (22.87%) (42.35%) (65.22%)
Underpriced 24 1.37% 25.16% 23.52% 49.96% 73.48%(0.63%) (29.24%) (19.56%) (50.56%) (70.12%)
Overpriced 6 0.21% 49.73% 22.54% 27.52% 50.07%(0.03%) (46.89%) (24.54%) (28.54%) (53.08%)
Panel B: Change in Allocation and UnderpricingNumber Employees Retail Local Inst Foreign Inst Total Inst
All 82 -0.69% -4.61% -0.18% 5.46% 5.28%(0.00%) -(5.26%) (0.25%) (10.42%) (6.67%)
Underpriced 55 -0.79% -5.57% 3.25% 3.10% 6.36%(0.00%) -(5.21%) (3.25%) (6.56%) (8.75%)
Overpriced 22 -0.16% 13.31% -7.62% -5.53% -13.15%(0.00%) (11.07%) -(4.79%) -(3.42%) -(10.71%)
IPO 63 -0.38% -9.44% 1.65% 8.16% 9.80%(0.00%) -(8.08%) (3.59%) (8.54%) (9.63%)
Underpriced 34 -0.12% -10.15% 2.53% 7.75% 10.27%(0.00%) -(9.66%) (3.15%) (14.01%) (14.66%)
Overpriced 10 -0.19% 13.14% -3.05% -9.90% -12.95%-(0.01%) (11.08%) -(3.38%) -(3.60%) -(9.06%)
SEO 38 -0.69% -3.41% 2.33% 1.77% 4.48%(0.00%) -(5.50%) (7.04%) (4.93%) (10.72%)
Underpriced 24 -1.68% -14.42% 4.40% 11.71% 16.10%-(0.08%) -(12.03%) (7.48%) (13.14%) (19.82%)
Overpriced 6 -0.73% 16.82% -3.66% -12.21% -15.98%-(0.13%) (13.83%) -(0.46%) -(9.58%) -(12.34%)
Table VI: Final Allocation and UnderpricingPanel A reports the final allocation for 82 equity offerings in Spain from 1985 to 2002, conditional on first dayreturns. The final allocation is the allocation the underwriter decides after collecting indications of interest frominvestors. Panel B reports the change in allocation from the initial allocation contained in the preliminaryprospectus and the final allocation. Data on initial allocations are from the offering prospectuses. IPOunderpricing data are from the Madrid Stock Exchange and Expansión.Intuition: Institutional investors, specially foreign, are the main beneficiaries of Spanish equity offeringunderpricing.
44ECBWorking Paper Series No. 428January 2005

Panel A: SampleRetail Local Inst Foreign Inst Total Inst
Intercept 0.3527 *** 0.0745 -0.0580 -0.2010 *(0.0010) (0.3344) (0.4834) (0.0939)
Coefficient -0.5436 ** 0.1767 0.5155 ** 0.5802 ***(0.0115) (0.5586) (0.0209) (0.0068)
F 6.89 0.35 5.70 8.00R-Squared 0.1233 0.0070 0.1042 0.1403N 51 51 51 51
Panel B: Initial Public OfferingsRetail Local Inst Foreign Inst Total Inst
Intercept 0.4749 *** 0.2179 -0.0559 -0.2788(0.0097) (0.1252) (0.7237) (0.3046)
Coefficient -0.7436 * -0.0795 0.6802 * 0.7710 *(0.0876) (0.8685) (0.0810) (0.0746)
F 3.14 0.03 3.29 3.44R-Squared 0.1042 0.0010 0.1085 0.1130N 29 29 29 29
Panel C: Secondary Equity OfferingsRetail Local Inst Foreign Inst Total Inst
Intercept 0.0402 * -0.0232 * -0.0123 -0.0394 *(0.0895) (0.0997) (0.4186) (0.0593)
Coefficient -0.0800 * 0.1249 * 0.0350 0.0844 *(0.0558) (0.0774) (0.4508) (0.0573)
F 4.12 3.47 0.59 4.07R-Squared 0.1710 0.1477 0.0287 0.1691N 22 22 22 22
Table VII: Underpricing and Final Allocations.This table reports the ordinary least squares estimates of the coefficients in across-sectional regression of underpricing on final allocations to differentinvestor types in 79 equity offerings in Spain from 1985 to 2002.
Intuition: Institutional investors, specially foreign, are the main beneficiaries ofSpanish equity offering underpricing.*,**,*** imply significance at the 0.1, 0.05, 0.01 levels
iiji Alloc_FinngUnderprici ε+β+α=
45ECB
Working Paper Series No. 428January 2005

SampleRetail Local Inst Foreign Inst Total Inst
Intercept 0.5729 * 0.5669 * 0.4875 ** 0.4823 **(0.0530) (0.0922) (0.0199) (0.0391)
Coefficient -0.0014 * 0.0024 * 0.0016 * 0.0002 *(0.9625) (0.0818) (0.0925) (0.0981)
R-Squared 0.0307 0.0804 0.0766 0.0201N 35 42 42 42
Table VIII: Allocation Update.This table reports the ordinary least squares estimates of the coefficients in across-sectional regression of the change in allocation on underpricing fordifferent investor types in 42 equity offerings in Spain from 1985 to 2002.
Intuition: Institutional investors, specially foreign, are the main beneficiaries ofSpanish equity offering underpricing.*,**,*** imply significance at the 0.1, 0.05, 0.01 levels
iijij DemandAlloc_Change ε+β+α=
46ECBWorking Paper Series No. 428January 2005

Pane
l A: A
ctua
l Mon
ey L
eft o
n th
e Ta
ble
Num
ber
Empl
oyee
sR
etai
lLo
cal I
nst
Fore
ign
Inst
Tota
l Ins
tTo
tal L
ocal
Tota
lAl
l81
478,
487
5,74
9,16
25,
625,
808
18,1
74,5
7523
,800
,383
11,8
53,4
5730
,028
,032
(0)
(10,
910)
(427
,175
)(9
06,6
10)
(1,3
46,1
75)
(428
,134
)(1
,382
,797
)U
nder
pric
ed55
819,
259
14,4
46,1
2311
,175
,827
33,7
26,8
6744
,902
,694
26,4
41,2
0960
,168
,076
(0)
(1,7
14,7
10)
(1,5
29,8
46)
(2,6
29,8
83)
(4,0
65,6
22)
(3,3
56,9
97)
(5,7
20,6
60)
Ove
rpric
ed21
-256
,616
-12,
376,
451
-4,6
11,7
35-9
,588
,879
-14,
200,
614
-17,
244,
801
-26,
833,
681
(0)
(-1,8
97,5
78)
(-1,2
15,8
62)
(-2,2
57,8
36)
(-3,5
82,2
44)
(-3,0
78,9
77)
(-5,5
35,8
01)
IPO
4971
0,23
312
,235
,159
11,3
35,5
4235
,463
,181
46,7
98,7
2424
,280
,935
59,7
44,1
16(0
)(2
08,4
37)
(952
,613
)(1
,262
,609
)(2
,269
,629
)(1
,199
,169
)(2
,223
,236
)U
nder
pric
ed36
1,01
8,86
018
,578
,296
16,9
83,9
0749
,590
,810
66,5
74,7
1736
,581
,062
86,1
71,8
72(0
)(1
,152
,928
)(2
,624
,953
)(3
,297
,418
)(5
,901
,822
)(3
,533
,103
)(6
,709
,072
)O
verp
riced
10-9
5,88
2-3
,623
,216
-1,9
14,3
05-3
,294
,608
-5,2
08,9
13-5
,633
,403
-8,9
28,0
11(-1
9,80
0)(-2
,418
,234
)(-1
,271
,964
)(-2
,168
,136
)(-3
,427
,943
)(-3
,720
,959
)(-5
,620
,252
)SE
O32
-434
,209
-3,7
81,9
9929
7,07
5-9
82,5
32-6
85,4
58-3
,919
,134
-4,9
01,6
66(0
)(0
)(2
54,6
81)
(130
,052
)(3
50,4
68)
(261
,177
)(3
81,1
97)
Und
erpr
iced
1948
2,06
25,
603,
879
2,30
0,52
36,
025,
715
8,32
6,23
88,
386,
464
14,4
12,1
79(9
4,29
2)(2
,216
,673
)(7
37,0
09)
(1,8
10,5
39)
(2,5
49,8
79)
(2,8
68,5
81)
(5,1
84,1
88)
Ove
rpric
ed11
-434
,254
-21,
584,
494
-2,2
32,0
40-9
,410
,048
-11,
642,
087
-24,
250,
788
-33,
660,
836
(0)
(-13,
583)
(-13,
501)
(-47,
426)
(-64,
213)
(-26,
355)
(-74,
418)
Pane
l B: M
oney
Lef
t on
the
Tabl
e, D
iffer
ence
with
Initi
al A
lloca
tion
Num
ber
Empl
oyee
sR
etai
lLo
cal I
nst
Fore
ign
Inst
Tota
l Ins
tTo
tal L
ocal
Tota
lAl
l81
9,21
45,
711
931,
855
4,96
1,29
05,
893,
145
946,
780
5,90
8,07
3(0
)(5
35)
(66,
567)
(236
,213
)(2
38,2
43)
-(999
,598
)-(1
,314
,805
)U
nder
pric
ed55
19,2
041,
249,
565
1,98
8,07
510
,176
,466
12,1
64,5
413,
256,
844
13,4
33,3
14(0
)(1
0,84
1)(2
85,1
20)
(826
,847
)(1
,160
,960
)(3
75,2
40)
(720
,918
)O
verp
riced
21-5
,586
-792
,463
862,
001
37,6
0589
9,60
663
,953
101,
558
(0)
(-135
,697
)(2
95,8
54)
(185
,128
)(3
98,0
17)
(1,0
21,2
18)
(1,2
84,2
00)
IPO
4912
,947
263,
566
2,26
8,70
611
,464
,554
13,7
33,2
602,
545,
219
14,0
09,9
98(0
)(5
21)
(132
,231
)(3
35,9
68)
(422
,045
)-(6
03,8
67)
-(856
,071
)U
nder
pric
ed36
43,6
971,
330,
112
3,95
9,82
015
,877
,331
19,8
37,1
515,
333,
629
21,2
11,2
67(0
)(1
6,92
6)(4
74,1
60)
(1,0
28,5
98)
(74,
214)
-(423
,298
)-(6
0,92
3)O
verp
riced
10-1
,999
-190
,563
544,
909
480,
642
1,02
5,55
135
2,34
783
2,99
0(1
,724
)(-1
81,4
91)
(239
,752
)(1
59,2
46)
(476
,510
)(3
79,2
36)
(922
,907
)SE
O32
-17,
497
-168
,089
28,2
73-2
17,8
15-1
89,5
41-7
08,8
16-3
75,1
27(0
)(0
)(3
8,67
7)(3
2,23
1)-(1
29,1
55)
-(442
,350
)-(9
30,4
65)
Und
erpr
iced
1913
,791
84,0
8538
1,61
31,
731,
673
2,11
3,28
747
9,49
02,
210,
594
-(6,6
78)
(94,
083)
(129
,125
)(5
65,8
12)
(85,
729)
(103
,926
)(3
15,9
90)
Ove
rpric
ed11
-17,
542
-1,5
37,1
1230
0,47
423
1,56
553
2,03
9-1
,254
,180
-1,0
22,6
14(0
)(-7
1,76
4)(2
36,7
98)
(351
,754
)(-1
54,1
27)
(532
,940
)(5
21,3
67)
Tabl
e IX
: Mon
ey L
eft o
n th
e Ta
ble.
Pane
lAre
ports
the
actu
alav
erag
e(m
edia
n)m
oney
left
onth
eta
ble
(ineu
ros)
for8
1eq
uity
offe
rings
inSp
ain
from
1985
to20
02,c
ondi
tiona
lon
first
day
retu
rns.
Pane
lBre
ports
the
chan
gein
mon
eyle
fton
the
tabl
efro
mth
ein
itial
allo
catio
nco
ntai
ned
inth
epr
elim
inar
ypr
ospe
ctus
and
the
final
allo
catio
n.D
ata
onin
itial
allo
catio
nsar
efro
mth
eof
ferin
gpr
ospe
ctus
es.I
POun
derp
ricin
gda
taar
efro
mth
eM
adrid
Stoc
kEx
chan
ge a
nd E
xpan
sión
.In
tuiti
on: I
nstit
utio
nal i
nves
tors
, spe
cial
ly fo
reig
n, a
re th
e m
ain
bene
ficia
ries
of S
pani
sh e
quity
offe
ring
unde
rpric
ing.
47ECB
Working Paper Series No. 428January 2005

Employ Retail Local Inst Foreign Inst Total Inst Total Local TotalAll 1.69 14.52 13.22 14.42 14.43 12.56 13.01
(1.40) (7.84) (5.00) (5.00) (5.27) (7.30) (6.30)Underprice 1.31 17.71 15.97 17.80 17.66 14.57 15.55
(0.75) (8.40) (5.70) (6.05) (6.58) (8.47) (8.37)Overpriced 2.22 7.29 3.94 3.20 3.62 5.83 4.75
(2.00) (5.36) (3.03) (3.55) (3.40) (4.54) (3.96)IPO 1.55 17.40 19.52 21.18 20.97 15.88 17.82
(1.00) (10.30) (9.09) (8.00) (8.00) (10.00) (9.72)Underprice 0.89 22.07 24.69 27.62 27.29 18.95 22.26
(0.74) (10.65) (10.00) (11.86) (12.40) (11.33) (16.26)Overpriced 2.50 8.45 8.18 6.47 7.06 9.27 7.80
(2.50) (10.50) (6.12) (4.05) (5.07) (8.30) (6.15)SEO 1.89 10.00 3.03 4.05 3.86 7.06 5.62
(1.90) (7.50) (2.70) (2.55) (2.70) (4.68) (4.40)Underprice 1.86 12.87 3.38 4.88 4.52 8.48 6.66
(1.90) (8.00) (2.80) (2.55) (2.60) (6.82) (5.00)Overpriced 1.94 5.91 2.54 2.28 2.54 4.76 3.96
(1.94) (4.47) (2.58) (1.49) (2.30) (3.56) (2.52)
Table X: Oversubscription.This table reports oversubscription data for 74 Spanish equity offerings from 1985 to 2002. We reportaverage (median) statistics by offering type (IPO and SEO) and level of underpricing. Underpricing dataare from the Madrid Stock Exchange and Expansión. Oversubscription data are from Expansion and theComisión Nacional del Mercado de Valores.Intuition: Equity offerings are normally oversubscribed. Institutional demand is more volatile than retaildemand.
48ECBWorking Paper Series No. 428January 2005

Panel A: SampleRetail Local Inst Foreign Inst Total Inst Total Local Total
Intercept 0.0057 0.0663 0.0202 0.0299 0.0169 -0.0287(0.8622) (0.0820) (0.5604) (0.4020) (0.6334) (0.3767)
Coefficient 0.0071 *** 0.0038 *** 0.0065 *** 0.0061 *** 0.0080 *** 0.0111 ***(<0.0001) (0.0047) (<0.0001) (<0.0001) (<0.0001) (<0.0001)
F 39.99 8.54 29.65 23.46 27.97 58.06R-Squared 0.4123 0.1115 0.3037 0.2565 0.2914 0.4606N 59 70 70 70 70 70
Panel B: Initial Public OfferingsRetail Local Inst Foreign Inst Total Inst Total Local Total
Intercept 0.0562 0.1150 0.0426 0.0580 0.0519 -0.0217(0.3268) (0.0858) (0.4896) (0.3612) (0.3791) (0.7007)
Coefficient 0.0081 *** 0.0032 * 0.0062 *** 0.0057 *** 0.0080 *** 0.0113 ***(<0.0001) (0.0773) (0.0005) (0.0021) (0.0003) (<0.0001)
F 26.23 3.29 14.22 10.81 15.64 31.35R-Squared 0.4355 0.0760 0.2622 0.2128 0.2810 0.4394N 36 42 42 42 42 42
Panel C: Secondary Equity OfferingsRetail Local Inst Foreign Inst Total Inst Total Local Total
Intercept 0.0155 0.0022 0.0125 0.0088 0.0152 0.0125(0.1140) (0.8206) (0.1019) (0.2860) (0.0550) (0.1345)
Coefficient 0.0008 0.0067 ** 0.0025 ** 0.0037 ** 0.0011 0.0018 *(0.2141) (0.0145) (0.0412) (0.0238) (0.1278) (0.0820)
F 1.64 6.87 4.62 5.77 2.47 3.27R-Squared 0.0725 0.2090 0.1508 0.1815 0.0869 0.1118N 23 28 28 28 28 28
Table XI: Underpricing and Investors Demand.This table reports the ordinary least squares estimates of the coefficients in a cross-sectionalregression of underpricing on investors demand for a sample of equity offerings in Spain from 1985to 2002. Intuition: There is a positive relationship between retail investors' demand and underpricing.*,**,*** imply significance at the 0.1, 0.05, 0.01 levels
iiri DemandngUnderprici ε+β+α=
49ECB
Working Paper Series No. 428January 2005

Panel A: All InvestorsRetail Local Inst Foreign Inst
All 55.93% 64.29% 68.57%IPO 44.44% 66.67% 73.81%SEO 73.91% 60.71% 60.71%
Panel B: Retail vs. InstitutionalBoth Retail Inst None
All 21 9 15 9IPO 12 2 11 7SEO 9 7 4 2
Panel C: Foreign vs. LocalBoth Local Foreign None
All 41 4 7 19IPO 25 3 6 8SEO 15 1 1 11
Table XII: Information about first day returns.This table analyzes the relative information among investor groups about first day returns. We assume aninvestor group makes the right demand decision in an offering when its demand for that offering is above (below)its median demand for all offerings if that particular offering is underpriced (overpriced). Panel A reports thepercentage of times each investor groups makes good demand decissions. In Panel B, we analyze the relativeinformation ability for retail and institutional investors. We classify if each offering depending on whether bothretail and institutions make appropriate demand decisions (Both), whether retail investors make the appropriatedecission and institutions do not (Retail), vice versa (Inst); or neither investor group makes the appropriatedecision (None). In Panel C, we repeat the previous analysis between local and foreign institutions.Oversubscription data are from Expansion and the Comisión Nacional del Mercado de Valores.Intuition: Institutions, particularly foreign institutional investors, are better informed about first day one returnsthat individuals.
50ECBWorking Paper Series No. 428January 2005

Retail Local Inst Foreign Inst Total Inst TotalIntercept 0.5369 *** 0.5188 *** 0.4540 *** 0.4656 *** 0.4299 ***
(<0.0001) (<0.0001) (<0.0001) (<0.0001) (<0.0001)Coefficient 0.0048 0.0054 ** 0.0079 *** 0.0076 *** 0.0113 ***
(0.1013) (0.0411) (0.0029) (0.0052) (0.0022)F 2.84 4.46 10.04 8.74 10.73R-Squared 0.0793 0.1002 0.2006 0.1793 0.2114N 35 42 42 42 42
Table XIII: Price Revision and Investors Demand.This table reports the ordinary least squares estimates of the coefficients in a cross-sectional regression of the revision in the offer price on the demand by different investor types in 42 equity offerings in Spain from 1985 to 2002.
Intuition: Underwriters use the information contained in the investors demand to set the final offer price. *,**,*** imply significance at the 0.1, 0.05, 0.01 levels
iiji DemandUpdate ε+β+α=
ii
iii PlowPhigh
PlowicePrUpdate
−−
=
51ECB
Working Paper Series No. 428January 2005

Panel A: Retail Demand Conditional on Institutional DemandAverage 230,904,710 2,857,454,668 7,999,007,180 7,880,086,465
(% increase) 1238% 280% 99%Median 172,766,824 1,124,976,000 2,867,136,527 5,113,125,000
(% increase) 651% 255% 178%
Panel B: Institutional Demand Conditional on Retail DemandAverage 169,218,303 1,925,496,747 7,510,016,037 14,142,134,061
(% increase) 1138% 390% 188%Median 66,562,309 858,238,469 4,825,676,426 5,191,433,726
(% increase) 1289% 562% 108%
Table XIV: Herding on other investors' demand.This table analyzes whether one group of investors herds on the information of the other. We rankinstitutional demand and calculate the average and median retail demand for each institutionaldemand quartile. We analyze institutional demand conditional on retail demand in the same way. Onbrackets, we report the percentage average and median increase from one quartile to the next. IPOunderpricing data are from the Madrid Stock Exchange and Expansión. Demand data are in euros. Intuition: Although retail and institutions share common information, retail investors herd oninstitutional investors' demand.
52ECBWorking Paper Series No. 428January 2005

Panel A: Retail Demand and UnderpricingAll IPO SEO
Intercept 0.05 ** 0.02 * 0.06 **(0.0317) (0.0887) (0.0471)
Demand 0.05 *** 0.06 *** 0.10(<0.0001) (<0.0001) (0.1380)
R-Square 0.4895 0.4966 0.0970Observations 59 36 23
Panel B: Retail Participation and UnderpricingAll IPO SEO
Intercept 0.0538 ** 0.0180 * 0.0613 **(0.0317) (0.0887) (0.0471)
Demand 0.0544 *** 0.0578 *** 0.1018(<0.0001) (<0.0001) (0.1380)
R-Square 0.4895 0.4966 0.0970Observations 59 36 23
Table XV: Underpricing and Retail Investors Demand.Panel A reports the ordinary least squares estimates of the coefficients in a cross-sectional regression ofunderpricing on retail investors demand for a sample of equity offerings in Spain from 1985 to 2002.Panel B uses, rather than oversubscription, the number of retail investors (in thousands) that subscribethe offering, as an indication of retail investors demand. Panel A: Panel B: Intuition: There is a positive relationship between retail investors' demand and underpricing.*,**,*** imply significance at the 0.1, 0.05, 0.01 levels
iiri DemandngUnderprici ε+β+α=
iiri Num_tRengUnderprici ε+β+α=
53ECB
Working Paper Series No. 428January 2005

Panel A: All OfferingsApplication Allocation Profit ROA ROI
50,000 0.9252 4,603 9.21% 9.95%200,000 0.7028 10,056 5.03% 7.15%500,000 0.4240 13,440 2.69% 6.34%
1,000,000 0.3072 17,052 1.71% 5.55%2,000,000 0.2488 24,276 1.21% 4.88%3,000,000 0.2280 31,339 1.04% 4.58%4,000,000 0.2145 37,918 0.95% 4.42%5,000,000 0.2063 44,449 0.89% 4.31%6,000,000 0.2008 50,979 0.85% 4.23%7,000,000 0.1968 57,510 0.82% 4.17%8,000,000 0.1939 64,041 0.80% 4.13%9,000,000 0.1916 70,571 0.78% 4.09%
10,000,000 0.1897 77,102 0.77% 4.06%Strategy A 0.2228 100,268 1.01% 4.52%Strategy B 0.2268 100,226 1.04% 4.57%
Panel B: IPOsApplication Allocation Profit ROA ROI
50,000 0.8993 7,336 14.67% 16.31%200,000 0.6521 15,723 7.86% 12.06%500,000 0.3572 21,002 4.20% 11.76%
1,000,000 0.2459 26,742 2.67% 10.87%2,000,000 0.1903 38,222 1.91% 10.04%3,000,000 0.1694 49,417 1.65% 9.72%4,000,000 0.1536 59,756 1.49% 9.73%5,000,000 0.1438 70,010 1.40% 9.74%6,000,000 0.1372 80,265 1.34% 9.75%7,000,000 0.1325 90,519 1.29% 9.76%8,000,000 0.1290 100,774 1.26% 9.77%9,000,000 0.1263 111,028 1.23% 9.77%
10,000,000 0.1241 121,282 1.21% 9.78%Strategy A 0.1634 158,072 1.59% 9.72%Strategy B 0.1674 157,934 1.64% 9.79%
Panel C: SEOsApplication Allocation Profit ROA ROI
50,000 0.9591 1,038 2.08% 2.16%200,000 0.7690 2,665 1.33% 1.73%500,000 0.5112 3,576 0.72% 1.40%
1,000,000 0.3871 4,413 0.44% 1.14%2,000,000 0.3250 6,087 0.30% 0.94%3,000,000 0.3043 7,760 0.26% 0.85%4,000,000 0.2940 9,434 0.24% 0.80%5,000,000 0.2878 11,108 0.22% 0.77%6,000,000 0.2837 12,781 0.21% 0.75%7,000,000 0.2807 14,455 0.21% 0.74%8,000,000 0.2785 16,128 0.20% 0.72%9,000,000 0.2768 17,802 0.20% 0.71%
10,000,000 0.2754 19,476 0.19% 0.71%Strategy A 0.3004 24,871 0.25% 0.83%Strategy B 0.3043 24,955 0.26% 0.85%
Table XVI: Retail Profits.This table reports the average allocation, profit per offering, return on allocation and return on investment fora sample of equity offerings in Spain from 1985 to 2002. Return on allocation and return on investment is theratio between the offering profit and the application size and investment, respectively. Data on initialallocations are from the offering prospectuses. IPO underpricing data are from the Madrid Stock Exchangeand Expansión.
54ECBWorking Paper Series No. 428January 2005

Panel A: Conditioning on Past Market ReturnsApplication Allocation Profit ROA ROI
50,000 0.8755 4,618 10.07% 11.29%200,000 0.6904 10,743 5.19% 7.17%500,000 0.3897 14,347 2.97% 6.83%
1,000,000 0.2765 20,017 2.00% 6.27%2,000,000 0.2444 26,492 1.38% 5.11%3,000,000 0.2279 37,159 1.18% 4.82%4,000,000 0.2015 45,271 1.03% 4.95%5,000,000 0.2005 44,831 0.89% 4.87%6,000,000 0.1976 56,305 0.90% 4.39%7,000,000 0.1921 66,624 0.94% 4.87%8,000,000 0.1774 76,655 0.89% 4.82%9,000,000 0.1760 80,396 0.85% 4.80%
10,000,000 0.1754 86,769 0.87% 4.52%Strategy A 0.2144 120,132 1.11% 5.34%Strategy B 0.2205 103,380 1.09% 4.64%
Panel B: Conditioning on Initial Institutional AllocationsApplication Allocation Profit ROA ROI
50,000 0.8696 8,266 14.68% 16.55%200,000 0.6105 18,509 8.05% 13.50%500,000 0.3226 21,482 4.61% 11.79%
1,000,000 0.2433 27,773 2.84% 12.36%2,000,000 0.1813 42,312 2.06% 11.66%3,000,000 0.1531 54,684 1.96% 10.30%4,000,000 0.1395 71,510 1.71% 10.26%5,000,000 0.1333 81,881 1.43% 11.21%6,000,000 0.1300 87,999 1.38% 11.23%7,000,000 0.1288 92,718 1.42% 10.76%8,000,000 0.1252 103,425 1.46% 11.50%9,000,000 0.1145 115,129 1.40% 10.82%
10,000,000 0.1118 132,770 1.46% 10.23%Strategy A 0.1534 184,662 1.70% 10.96%Strategy B 0.1533 184,228 1.94% 11.72%
Panel C: Conditioning on Institutional DemandApplication Allocation Profit ROA ROI
50,000 0.9136 1,242 2.48% 2.38%200,000 0.7051 3,059 1.42% 1.87%500,000 0.5065 4,031 0.72% 1.61%
1,000,000 0.3749 4,597 0.48% 1.35%2,000,000 0.3100 6,954 0.34% 1.02%3,000,000 0.2974 8,181 0.26% 1.00%4,000,000 0.2729 10,403 0.25% 0.89%5,000,000 0.2728 12,159 0.24% 0.83%6,000,000 0.2632 14,253 0.25% 0.88%7,000,000 0.2624 15,468 0.21% 0.77%8,000,000 0.2615 17,326 0.21% 0.77%9,000,000 0.2597 18,482 0.21% 0.74%
10,000,000 0.2579 21,396 0.23% 0.80%Strategy A 0.2997 29,441 0.29% 0.84%Strategy B 0.3025 25,394 0.28% 0.91%
Table XVII: Conditional Retail Profits.This table reports the conditional average allocation, profit per offering, return on allocation and return oninvestment for a sample of equity offerings in Spain from 1985 to 2002. We assumet that retail investorscondition their participation in equity offerings based on: past market returns (Panel A); profit weightedinstitutional allocations (Panel B); and institutional demand (Panel C).Return on allocation and return oninvestment is the ratio between the offering profit and the application size and investment, respectively. Dataon initial allocations are from the offering prospectuses. IPO underpricing data are from the Madrid StockExchange and Expansión.
55ECB
Working Paper Series No. 428January 2005

All Investors
05
1015202530
< 1 1 2 3 4 5 6 7 8 9 > 10Demand in Euros bn.
N. O
fferin
gs
Retail Investors
05
1015202530
< 1 1 2 3 4 5 6 7 8 9 > 10Demand in Euros bn.
N. O
fferin
gs
Institutional Investors
05
101520253035
< 1 1 2 3 4 5 6 7 8 9 > 10Demand in Euros bn.
N. O
fferin
gs
Figure I: Aggregate Monetary Demand.This figure shows the aggregate monetary demand for both retail and institutional investors. Data on initialallocations are from the offering prospectuses. IPO underpricing data are from the Madrid Stock Exchangeand Expansión.Intuition: There is herding, both among institutions and individual investors in the market for new issues.
56ECBWorking Paper Series No. 428January 2005

Sample
0.00
0.10
0.20
0.30
0.40
0.50
0.60
0.70
0.80
0.90
1.00
50 1,300 2,550 3,800 5,050 6,300 7,550 8,800
Demand
Allo
catio
n
O
A
U
Figure II: Pro-Rata Allocation to Retail Investors (All Offerings)This figure shows the pro rata allocation to retail investors in all offerings, for different applicationsizes. Allocation is the fraction between between the monetary allocation to an investor and hisapplication. We differentiate between the whole sample (A), underpriced (U) and overpriced (O)offerings. Underpricing data are from the Madrid Stock Exchange and Expansión. Allocation data arefrom Expansion and the Comisión Nacional del Mercado de Valores.Intuition: Allocations in overpriced issues are significantly larger than in underpriced offerings.
57ECB
Working Paper Series No. 428January 2005

Figure III: Pro-Rata Allocation to Retail Investors (IPOs).This figure shows the pro rata allocation to retail investors in initial public offerings, for differentapplication sizes. Allocation is the fraction between between the monetary allocation to an investorand his application. We differentiate between the whole sample (A), underpriced (U) and overpriced(O) offerings. Underpricing data are from the Madrid Stock Exchange and Expansión. Allocation dataare from Expansion and the Comisión Nacional del Mercado de Valores.Intuition: Allocations in overpriced issues are significantly larger than in underpriced offerings.
IPOs
0.00
0.10
0.20
0.30
0.40
0.50
0.60
0.70
0.80
0.90
1.00
50 1,300 2,550 3,800 5,050 6,300 7,550 8,800
Demand
Allo
catio
n
UA
O
58ECBWorking Paper Series No. 428January 2005

Figure IV: Pro-Rata Allocation to Retail Investors (SEOs).This figure shows the pro rata allocation to retail investors in secondary equity offerings, for differentapplication sizes. Allocation is the fraction between between the monetary allocation to an investorand his application. We differentiate between the whole sample (A), underpriced (U) and overpriced(O) offerings. Underpricing data are from the Madrid Stock Exchange and Expansión. Allocation dataare from Expansion and the Comisión Nacional del Mercado de Valores.Intuition: Allocations in overpriced issues are significantly larger than in underpriced offerings.
SEOs
0.00
0.20
0.40
0.60
0.80
1.00
1.20
50 1,300 2,550 3,800 5,050 6,300 7,550 8,800
Demand
Allo
catio
n
AU
O
59ECB
Working Paper Series No. 428January 2005

60ECBWorking Paper Series No. 428January 2005
European Central Bank working paper series
For a complete list of Working Papers published by the ECB, please visit the ECB’s website(http://www.ecb.int)
395 “Fiscal sustainability and public debt in an endogenous growth model”by J. Fernández-Huertas Moraga and J.-P. Vidal, October 2004.
396 “The short-term impact of government budgets on prices: evidence from macroeconomicmodels” by J. Henry, P. Hernández de Cos and S. Momigliano, October 2004.
397 “Determinants of euro term structure of credit spreads” by A. Van Landschoot, October 2004.
398 “Mergers and acquisitions and bank performance in Europe: the role of strategic similarities”by Y. Altunbas and D. Marqués Ibáñez, October 2004.
399 “Sporadic manipulation in money markets with central bank standing facilities”by C. Ewerhart, N. Cassola, S. Ejerskov and N. Valla, October 2004.
400 “Cross-country differences in monetary policy transmission” by R.-P. Berben, A. Locarno,J. Morgan and J. Valles, October 2004.
401 “Foreign direct investment and international business cycle comovement” by W. J. Jansenand A. C. J. Stokman, October 2004.
402 “Forecasting euro area inflation using dynamic factor measures of underlying inflation”by G. Camba-Méndez and G. Kapetanios, November 2004.
403 “Financial market integration and loan competition: when is entry deregulation sociallybeneficial?” by L. Kaas, November 2004.
404 “An analysis of systemic risk in alternative securities settlement architectures” by G. Iori,November 2004.
405 “A joint econometric model of macroeconomic and term structure dynamics” by P. Hördahl,O. Tristani and D. Vestin, November 2004.
406 “Labour market reform and the sustainability of exchange rate pegs” by O. Castrén, T. Takaloand G. Wood, November 2004.
407 “Banking consolidation and small business lending” by E. Takáts, November 2004.
408 “The great inflation, limited asset markets participation and aggregate demand: FED policy wasbetter than you think” by F. O. Bilbiie, November 2004.
409 “Currency mismatch, uncertainty and debt maturity structure” by M. Bussière, M. Fratzscherand W. Koeniger, November 2004.
410 “Do options-implied RND functions on G3 currencies move around the times of interventionson the JPY/USD exchange rate? by O. Castrén, November 2004.
411 “Fiscal discipline and the cost of public debt service: some estimates for OECD countries”by S. Ardagna, F. Caselli and T. Lane, November 2004.
412 “The real effects of money growth in dynamic general equilibrium” by L. Graham andD. J. Snower, November 2004.

61ECB
Working Paper Series No. 428January 2005
413 “An empirical analysis of price setting behaviour in the Netherlands in the period1998-2003 using micro data” by N. Jonker, C. Folkertsma and H. Blijenberg, November 2004.
414 “Inflation persistence in the European Union, the euro area, and the United States”by G. Gadzinski and F. Orlandi, November 2004.
415 “How persistent is disaggregate inflation? An analysis across EU15 countries andHICP sub-indices” by P. Lünnemann and T. Y. Mathä, November 2004.
416 “Price setting behaviour in Spain: stylised facts using consumer price micro data”by L. J. Álvarez and I. Hernando, November 2004.
417 “Staggered price contracts and inflation persistence: some general results”by K. Whelan, November 2004.
418 “Identifying the influences of nominal and real rigidities in aggregate price-setting behavior”by G. Coenen and A. T. Levin, November 2004.
419 “The design of fiscal rules and forms of governance in European Union countries”by M. Hallerberg, R. Strauch and J. von Hagen, December 2004.
420 “On prosperity and posterity: the need for fiscal discipline in a monetary union” by C. Detken,V. Gaspar and B. Winkler, December 2004.
421
422 “What determines fiscal balances? An empirical investigation in determinants of changes inOECD budget balances” by M. Tujula and G. Wolswijk, December 2004.
423 “Price setting in France: new evidence from survey data” by C. Loupias and R. Ricart,December 2004.
424by F. Breedon and P. Vitale, December 2004.
425January 2005.
and J. J. Puthenpurackal, January 2005.
427
428
“An empirical study of liquidity and information effects of order flow on exchange rates”
426 “Security fungibility and the cost of capital: evidence from global bonds” by D. P. Miller
“EU fiscal rules: issues and lessons from political economy” by L. Schuknecht, December 2004.
“Geographic versus industry diversification: constraints matter” by P. Ehling and S. B. Ramos,
“Interlinking securities settlement systems: a strategic commitment?” by K. Kauko, January 2005.
“Who benefits from IPO underpricing? Evidence form hybrid bookbuilding offerings”by V. Pons-Sanz, January 2005.
