bubble ipo underpricing: evidence from japancontent.csbs.utah.edu/~ehrbar/erc2002/pdf/p127.pdf · 1...
TRANSCRIPT
1
Bubble IPO Underpricing: Evidence from Japan
Berna Kirkulak∗
ABSTRACT This paper empirically examines the determinants of increase in the underpricing of Japanese initial public offerings (IPOs).I study the first-day return of Japanese IPOs during 1997-2001.Substantial underpricing varies year to year, across industries and Pre-IPO information of the firms. I find evidence of bubble IPO underpricing and more money left on the table especially during 1999-2000 in Japan. My finding is consistent with Loughran and Ritter (2001) who analyzed American IPO’s and figured out that there was also a bubble underpricing in U.S.A during 1999-2000. JEL classification: G32 Keywords: Initial Public Offering; Across Sector First-Day Return; Money Left on the Table
∗ The author is a Ph.D student of Economics Faculty of Hokkaido University in Japan and full time graduate research assistant at Business Faculty of Dokuz Eylul University in Turkey. E-mail: [email protected] and/or [email protected] Tel: + 81 90 8279-0492. I thank my supervisor Professor Yasuyuki Hamada for providing data from Nomura Securities. I also thank Hiromasa Nakamura for his excellent research assistance and helpful comments. I am grateful to Koichi Sato, Masahiro Tamura to provide me data from Tsubasa Securities. I gratefully acknowledge support of Professor Endo Kaeru from Otaru University of Commerce and thank anonymous referee.
2
1. Introduction Many researchers have been showing interest to initial public offerings (IPOs), the empirical literature on equity offerings focus on determinants of underpricing. Since Japan is the second largest economy, the recent characteristics of Japanese IPOs show similar and as well as different characteristics with IPOs namely in America and in Europe. This paper provides evidence of bubble underpricing by investigating the cross industries, pre-IPOs’ accounting information on several Japanese stock exchange markets. In the first part of this paper, I try to figure out the revisions in the offer range. Benveniste and Spindt (1989) explain that when investors reveal good information with high demand, the final offer price will exceed expected offer price. Hanley (1993) confirms that underpricing is positively related to revisions in the offer price from the filing of the preliminary prospectus to the offer date. I empirically show the close relation between the final offer price, offer range and expected offer price for Japanese IPOs from 1997 to 2001. Revisions in the offer range are also closely related with money left on the table which is calculated as the price change between the closing price on the first day and the offer price, multiplied by the number of shares sold. The number of shares sold includes all shares sold by both the company and by selling shareholders.1 Secondly, I analyze the relation between across industries and average first-day return.2 Examining Japanese IPOs makes us convince that during 1999 there is a bubble underpricing trend in technology–based, young companies’ IPOs. I also figure out the relation between age of IPO firms and the stock exchange market where they preferred to go public. Arguing the influence of introduction of two stock exchange markets; Mothers and Nasdaq Japan, helps us to understand the general characteristics of young, low-sales IPOs. Recent studies about Japanese IPOs are related with ownership structure. Cai & Loughran (1998), Kutsuna et al (2000) studied ownership structure and initial public offerings in Japan. Regarding the ownership they report a strong relation between ownership structure and operating performance of companies that go public. Conflict of interest has been discussed between managers and shareholders. Unlike the recent studies about Japanese IPO’s ownership structure, consistent with Loughran & Ritter (2001), the results in this paper considerably explore the relation between across industry of firms and underpricing. In addition to this, greater asymmetry information, partial adjustment phenomenon have strong explanatory powers to reveal the determinants of first-day returns.
1 In the literature there is a terminology phenomenon about newly offered shares and selling shareholders. In some cases newly offered shares are called primary offering and selling shares are called secondary offering. In this paper selling shareholders will be used for shares sold by shareholders. In contrast to shares offered by company selling shareholders’ gross proceed directly goes to shareholders. Besides, in the paper secondary offering, follow-on offering, seasoned equity offering (SEO) will be used interchangeable. 2 Underpricing and first-day return are used as synonyms in this paper.
3
2. Data I tried to apply some tests to understand the tremendous increase in underpricing in Japan using the sample of 689 IPOs issued from 1st January 1997, through 20th December 2001. There have been 702 IPOs by 20th December 2001(708 by 31st December 2001). My sample covers 98% of all IPOs in Japan. 12(19) IPOs are missing due to incomplete information. My sample excludes relistings and transfers from another stock market or market tier. I tried to use all sample considering the extreme hot issues based on across sectors and years3. In the total sample there are some extreme hot issues, showing outlier characteristics. For example; there are total 11 communication companies and 3 of them have extreme underpricing in the whole sample. I do believe that omitting these firms may cause bias. Because these 3 IPOs make up almost 30% (27.27%) for whole communication industry sample. Therefore I preferred not to use outlier treatment for these extreme underpricings. In addition to this phenomenon there is same case for service industry. The final sample consists of 689 IPOs, both pure primary share offerings and combination new shares and selling shareholders in which shareholders of the company sell some of their shares in the offering. Information about each IPO firm, including the number of the shares offered by the firm, the number of the shares offered by selling shareholders, the underwriters involved, accounting information of each firm prior to floatation have been obtained from Nomura Securities. Industry classification of each IPO firm is defined in Kaisha Shiki Ho (Japan Company Handbook) of several versions since 1997. The industry classification of each firm is matched with Nomura Securities’ data base. Its data base gives more detailed information of each IPO firm’s operation content. The industry classification of Kaisha Shiki Ho and the content of firm’s operation are sometimes different. For example; there is no special classification for internet-related, high tech product firms in Kaisha Shiki Ho. These firms are generally shown in service category or sometimes in others category. The firms, categorized as service and others in Kaisha Shiki Ho are generally internet related, PC & CD oriented technology firms. Offer price range information is provided from Tsubasa Securities. Offer range of each IPO includes minimum and maximum price ranges. Even for the auction IPOs, I was able to get offer price range. Then, I calculated expected offer price myself. I used the proxy of market value-weighted Jasdaq index. Underpricing studies are crucially sensitive to benchmark choice. In the sample of 689 firms, 61.39% of IPOs are realized in Jasdaq (OTC), 11.09% in TSE and 4.93% in Mothers, 10.74% in Nasdaq Japan and the rest 11.04% in regional stock exchange markets. Since the majority of my
3 Especially during 1999 initial first-day return of IPOs boomed and investors in Japan earned extreme profits in some sectors like communication, service, electronic products. Besides, underpricing in these industries is quite heterogeneous namely communication and service industries .Therefore my sample consists of all offerings during 1997-2001, including the outliers. Appendix gives details about the effect of extreme hot issue IPO returns for communication and service industries, showing outlier treatment.
4
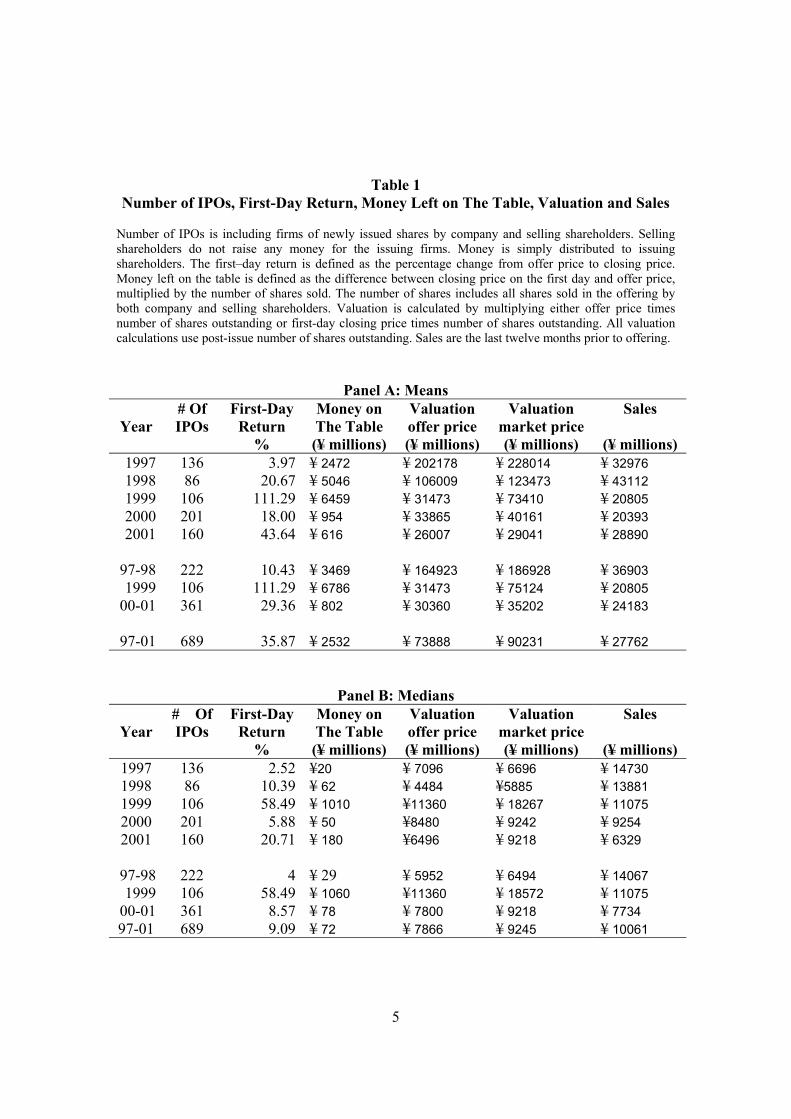
sample preferred going public in Jasdaq, value-weighted Jasdaq index is appropriate to indicate market movement. 3. Average First - Day Return and Money Left on The Table IPO literature has documented underpricing phenomenon. Loughran & Ritter (2000) recently came up with a discussion of leaving money on the table and reasons why issuers do not get upset about underpricing. Number of shares offered times the difference between closing price and offer price of share is referred to money left on the table. This amount is the wealth transfer from issuing company and its pre-issue shareholders to investors. The higher the closing price, the higher the money left on the table which investors enjoy too much. Money left on the table is closely related with underwriter. As far as underwriter plays the key role of pricing the stock in the pre-issue period determining offer price range becomes important. In Japan, in September in1997 book-building has been started using. Before 1997, auctions were used by many issuing companies. During the book keeping procedure, underwriter commits to distribute all shares issued as a result of the new issuance of stock. Therefore, much marketing effort of underwriter is needed. As far as underwriter has superior knowledge of the market conditions, underpricing of IPO will be desirable to market issues to investors, buy-side clients with less marketing effort and effects underwriter’s due diligence and distribution costs. Underpricing is an indirect cost to issuers they acquiesce. Many of researchers claim that underpricing is desirable for underwriter as well as for issuing companies. Ibbotson (1975), Ritter (1998) point out that IPOs are underpriced to leave a good taste in investors’ mouths’ so that future underwritings from the same issuer could be sold at attractive prices. Allen & Faulhaber (1989) suggest that large underpricings increase the likelihood of receiving publicity for issuing firm in which the IPO will be followed by a seasoned offering. On the other hand, if the shares were sold at the closing market price rather than the offer price, the proceeds of IPO will be higher by the amount equal to money left on the table. Unlike 1997-1998, average first-day return in Japan showed a great performance during 1999-2001. Part of the increase in the underpricing can be attributed to characteristics of companies such as low-sales firms. Table 1 shows there might be a relation between high average first-day returns and less sales figures of companies. On the contrary, the more underwriting results the more money left on the table and the higher valuations. Table 1 reports average first-day return, money left on the table, valuation and sales figures of IPOs. After 1998 average first-day return increased almost 5 times in 1999. It is the special case for 1999. Without outlier treatment the average first-day return of IPOs is 111% in 1999. After the outlier treatment it is reported 88% (Appendix). During 2000-2001 average first-day return of IPOs is not as high as it is in 1999. In recent IPOs, especially in 2001, the sales of companies are much higher than the IPOs in the previous years. As initial first-day return increases, the money left on table increases as well.
5
Table 1 Number of IPOs, First-Day Return, Money Left on The Table, Valuation and Sales
Number of IPOs is including firms of newly issued shares by company and selling shareholders. Selling shareholders do not raise any money for the issuing firms. Money is simply distributed to issuing shareholders. The first–day return is defined as the percentage change from offer price to closing price. Money left on the table is defined as the difference between closing price on the first day and offer price, multiplied by the number of shares sold. The number of shares includes all shares sold in the offering by both company and selling shareholders. Valuation is calculated by multiplying either offer price times number of shares outstanding or first-day closing price times number of shares outstanding. All valuation calculations use post-issue number of shares outstanding. Sales are the last twelve months prior to offering.
Panel A: Means
Year
# Of IPOs
First-Day Return
%
Money on The Table (¥ millions)
Valuation offer price (¥ millions)
Valuation market price (¥ millions)
Sales
(¥ millions) 1997 136 3.97 ¥ 2472 ¥ 202178 ¥ 228014 ¥ 32976 1998 86 20.67 ¥ 5046 ¥ 106009 ¥ 123473 ¥ 43112 1999 106 111.29 ¥ 6459 ¥ 31473 ¥ 73410 ¥ 20805 2000 201 18.00 ¥ 954 ¥ 33865 ¥ 40161 ¥ 20393 2001 160 43.64 ¥ 616 ¥ 26007 ¥ 29041 ¥ 28890
97-98 222 10.43 ¥ 3469 ¥ 164923 ¥ 186928 ¥ 36903 1999 106 111.29 ¥ 6786 ¥ 31473 ¥ 75124 ¥ 20805
00-01 361 29.36 ¥ 802 ¥ 30360 ¥ 35202 ¥ 24183
97-01 689 35.87 ¥ 2532 ¥ 73888 ¥ 90231 ¥ 27762
Panel B: Medians
Year
# Of IPOs
First-Day Return
%
Money on The Table (¥ millions)
Valuation offer price (¥ millions)
Valuation market price (¥ millions)
Sales
(¥ millions) 1997 136 2.52 ¥20 ¥ 7096 ¥ 6696 ¥ 14730 1998 86 10.39 ¥ 62 ¥ 4484 ¥5885 ¥ 13881 1999 106 58.49 ¥ 1010 ¥11360 ¥ 18267 ¥ 11075 2000 201 5.88 ¥ 50 ¥8480 ¥ 9242 ¥ 9254 2001 160 20.71 ¥ 180 ¥6496 ¥ 9218 ¥ 6329
97-98 222 4 ¥ 29 ¥ 5952 ¥ 6494 ¥ 14067 1999 106 58.49 ¥ 1060 ¥11360 ¥ 18572 ¥ 11075
00-01 361 8.57 ¥ 78 ¥ 7800 ¥ 9218 ¥ 7734 97-01 689 9.09 ¥ 72 ¥ 7866 ¥ 9245 ¥ 10061
6
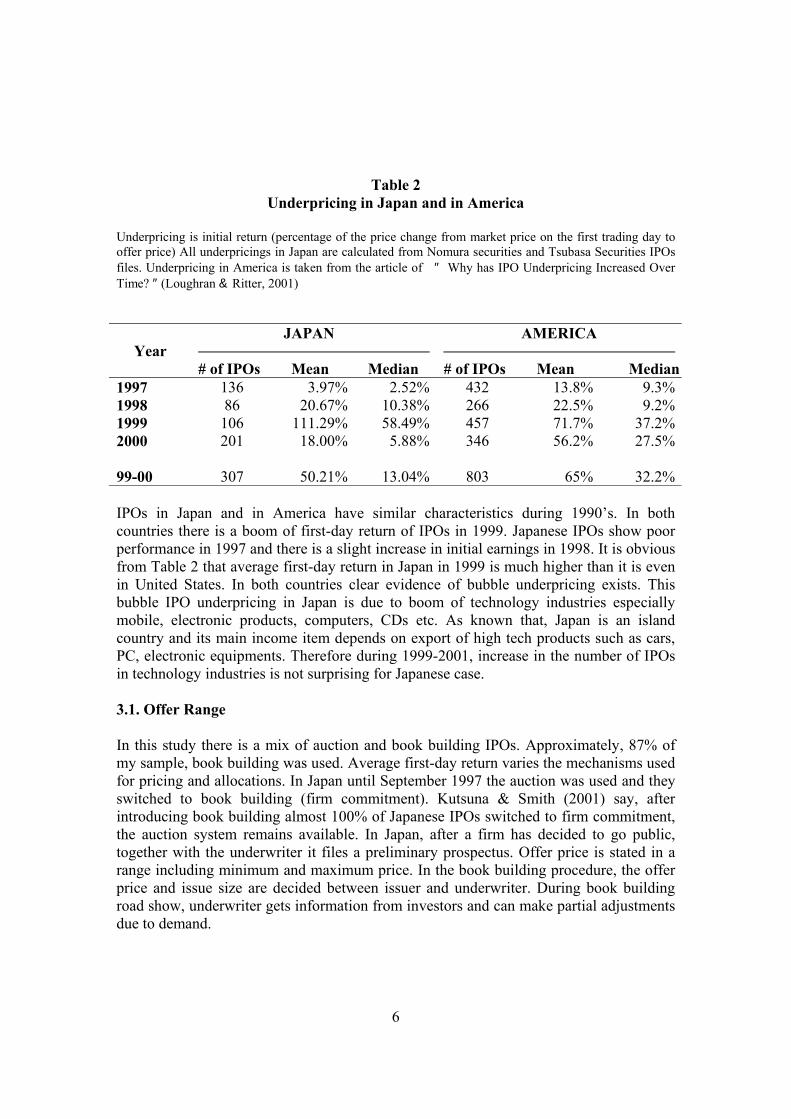
Table 2 Underpricing in Japan and in America
Underpricing is initial return (percentage of the price change from market price on the first trading day to offer price) All underpricings in Japan are calculated from Nomura securities and Tsubasa Securities IPOs files. Underpricing in America is taken from the article of ″ Why has IPO Underpricing Increased Over Time? ″ (Loughran & Ritter, 2001)
Year
JAPAN
# of IPOs Mean Median
AMERICA
# of IPOs Mean Median1997 136 3.97% 2.52% 432 13.8% 9.3%1998 86 20.67% 10.38% 266 22.5% 9.2%1999 106 111.29% 58.49% 457 71.7% 37.2%2000 201 18.00% 5.88% 346 56.2% 27.5% 99-00 307 50.21% 13.04% 803 65% 32.2% IPOs in Japan and in America have similar characteristics during 1990’s. In both countries there is a boom of first-day return of IPOs in 1999. Japanese IPOs show poor performance in 1997 and there is a slight increase in initial earnings in 1998. It is obvious from Table 2 that average first-day return in Japan in 1999 is much higher than it is even in United States. In both countries clear evidence of bubble underpricing exists. This bubble IPO underpricing in Japan is due to boom of technology industries especially mobile, electronic products, computers, CDs etc. As known that, Japan is an island country and its main income item depends on export of high tech products such as cars, PC, electronic equipments. Therefore during 1999-2001, increase in the number of IPOs in technology industries is not surprising for Japanese case. 3.1. Offer Range In this study there is a mix of auction and book building IPOs. Approximately, 87% of my sample, book building was used. Average first-day return varies the mechanisms used for pricing and allocations. In Japan until September 1997 the auction was used and they switched to book building (firm commitment). Kutsuna & Smith (2001) say, after introducing book building almost 100% of Japanese IPOs switched to firm commitment, the auction system remains available. In Japan, after a firm has decided to go public, together with the underwriter it files a preliminary prospectus. Offer price is stated in a range including minimum and maximum price. In the book building procedure, the offer price and issue size are decided between issuer and underwriter. During book building road show, underwriter gets information from investors and can make partial adjustments due to demand.
7
Both in auction and book building mechanisms it is available to get offer price range where minimum and maximum prices are set. In order to examine the relation and revisions in the offer price, I categorized the sample into 6 subgroups; 1) The final offer price (Poffer) that is equal or lower than the lowest price (Plowest) quoted in the preliminary prospectus Poffer ≤ Plowest 2) The final offer price within the offer range of the preliminary prospectus Plowest < Poffer < Phighest 3) The final offer price that is equal or higher than the highest price (Phighest) in the preliminary prospectus. Poffer ≥ Phighest 4) The final offer price that is lower than expected offer price. The expected offer price is defined as (Plowest + Phighest) / 2, Plowest is the lowest price in the offer range and Phighest is the highest price in the offer range Poffer < Pexpected
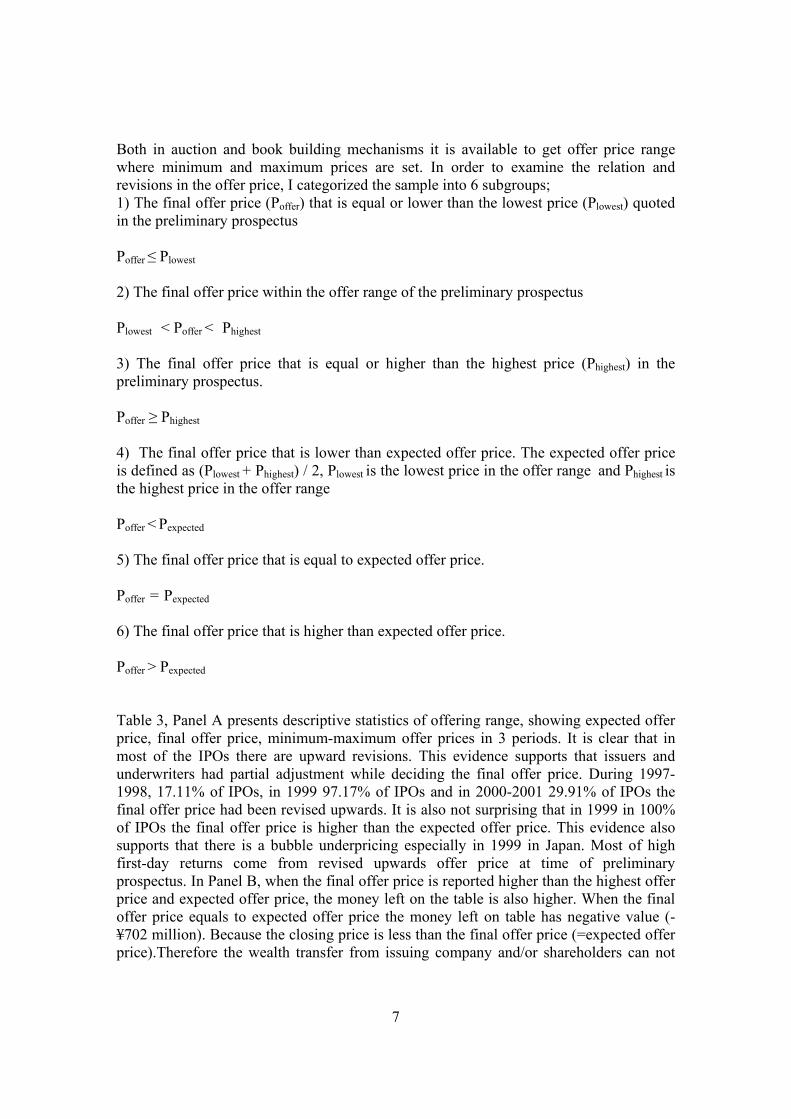
5) The final offer price that is equal to expected offer price. Poffer = Pexpected 6) The final offer price that is higher than expected offer price. Poffer > Pexpected Table 3, Panel A presents descriptive statistics of offering range, showing expected offer price, final offer price, minimum-maximum offer prices in 3 periods. It is clear that in most of the IPOs there are upward revisions. This evidence supports that issuers and underwriters had partial adjustment while deciding the final offer price. During 1997-1998, 17.11% of IPOs, in 1999 97.17% of IPOs and in 2000-2001 29.91% of IPOs the final offer price had been revised upwards. It is also not surprising that in 1999 in 100% of IPOs the final offer price is higher than the expected offer price. This evidence also supports that there is a bubble underpricing especially in 1999 in Japan. Most of high first-day returns come from revised upwards offer price at time of preliminary prospectus. In Panel B, when the final offer price is reported higher than the highest offer price and expected offer price, the money left on the table is also higher. When the final offer price equals to expected offer price the money left on table has negative value (-¥702 million). Because the closing price is less than the final offer price (=expected offer price).Therefore the wealth transfer from issuing company and/or shareholders can not
8
happen. The investors have loss due to low first closing price. Underwriters also do not enjoy this situation, may have troubles for marketing the next IPOs.
Table 3 Percent of IPOs in Offer Range
This table presents the percentage of IPOs that are subdivided into 6 categories in 3 periods as 1997-1998, 1999 and 2000-2001.The final offer price is Poffer and offer range is defined as the lowest, Plowest and highest, Phighest as quoted in the preliminary prospectus. The expected offer price is defined as (Plowest + Phighest ) / 2. Panel A: Price Revision of Offer Price 1997-1998
N=222
1999
N=106
2000-2001
N=361
1997-2001
N=689 Poffer ≤ Plowest 45.95% - 11.36% 20.76% Plowest < Poffer < Phighest 36.94% 2.83% 58.73% 28.00% Poffer ≥ Phighest 17.11% 97.17% 29.91% 51.24% Total 100% 100% 100% 100% Poffer < Pexpected 65.32% - 20.22% 31.64% Poffer = Pexpected 3.15% - 3.60% 2.90% Poffer > Pexpected 31.53% 100% 76.18% 65.46% Total 100% 100% 100% 100% Panel B: Price Revision of Offer Price
#IPOs Mean
(Median) First-Day Return
%
Mean (Median)
Gross Proceeds¥ million
Mean(Median) Money Left on
The Table ¥ million
Poffer ≤ Plowest 143 .3012 (1.33)
17476 (1041)
2206 (9.39)
Plowest < Poffer < Phighest 193 12.04 (5.88)
17767 (1243)
2025 (50)
Poffer ≥ Phighest 353 63.30 (27.78)
5665 (1500)
2941 (280)
Poffer < Pexpected 218 1.95
(2.20) 13569 (1091)
1541 (16)
Poffer = Pexpected 20 12.11 (11.01)
4091 (1103)
-702 (53.05)
Poffer > Pexpected 451 53.31 (18.42)
10837 (1500)
3154 (200)
9
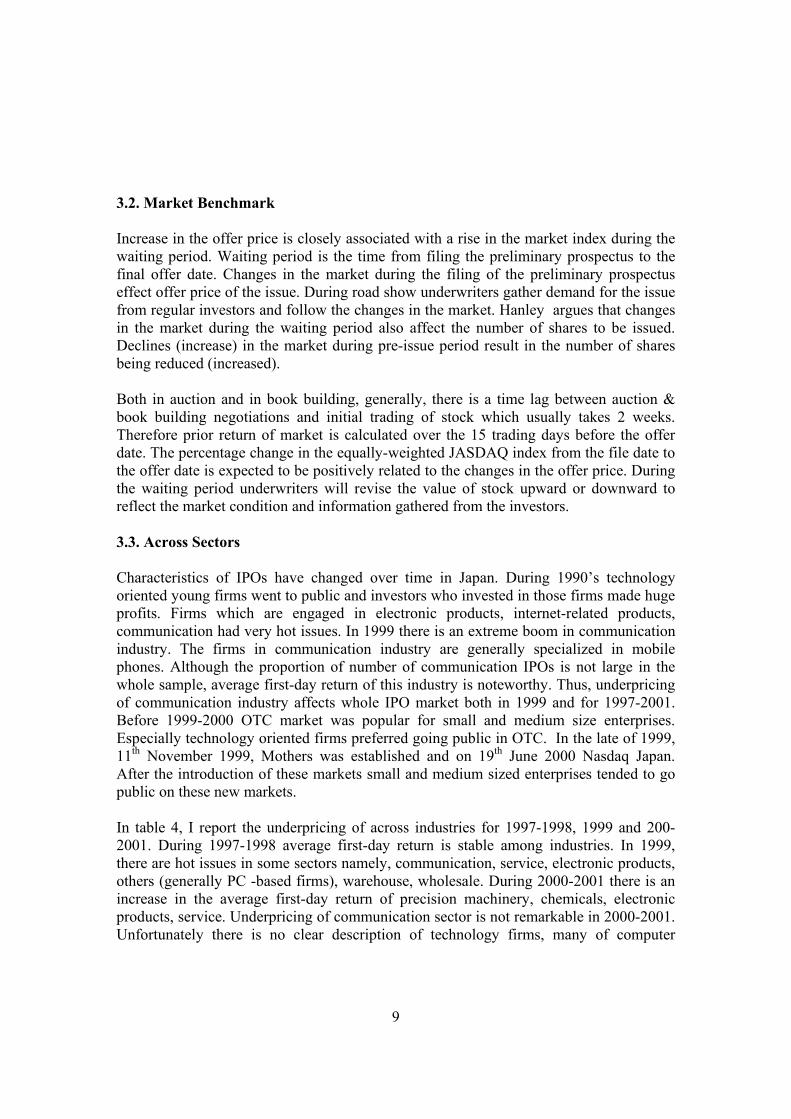
3.2. Market Benchmark Increase in the offer price is closely associated with a rise in the market index during the waiting period. Waiting period is the time from filing the preliminary prospectus to the final offer date. Changes in the market during the filing of the preliminary prospectus effect offer price of the issue. During road show underwriters gather demand for the issue from regular investors and follow the changes in the market. Hanley argues that changes in the market during the waiting period also affect the number of shares to be issued. Declines (increase) in the market during pre-issue period result in the number of shares being reduced (increased). Both in auction and in book building, generally, there is a time lag between auction & book building negotiations and initial trading of stock which usually takes 2 weeks. Therefore prior return of market is calculated over the 15 trading days before the offer date. The percentage change in the equally-weighted JASDAQ index from the file date to the offer date is expected to be positively related to the changes in the offer price. During the waiting period underwriters will revise the value of stock upward or downward to reflect the market condition and information gathered from the investors. 3.3. Across Sectors Characteristics of IPOs have changed over time in Japan. During 1990’s technology oriented young firms went to public and investors who invested in those firms made huge profits. Firms which are engaged in electronic products, internet-related products, communication had very hot issues. In 1999 there is an extreme boom in communication industry. The firms in communication industry are generally specialized in mobile phones. Although the proportion of number of communication IPOs is not large in the whole sample, average first-day return of this industry is noteworthy. Thus, underpricing of communication industry affects whole IPO market both in 1999 and for 1997-2001. Before 1999-2000 OTC market was popular for small and medium size enterprises. Especially technology oriented firms preferred going public in OTC. In the late of 1999, 11th November 1999, Mothers was established and on 19th June 2000 Nasdaq Japan. After the introduction of these markets small and medium sized enterprises tended to go public on these new markets. In table 4, I report the underpricing of across industries for 1997-1998, 1999 and 200-2001. During 1997-1998 average first-day return is stable among industries. In 1999, there are hot issues in some sectors namely, communication, service, electronic products, others (generally PC -based firms), warehouse, wholesale. During 2000-2001 there is an increase in the average first-day return of precision machinery, chemicals, electronic products, service. Underpricing of communication sector is not remarkable in 2000-2001. Unfortunately there is no clear description of technology firms, many of computer
10
companies (PC, CD etc) are categorized under service or others section in Kaisha Shiki Ho.
Figure 1 First-Day Returns By Across Sector
Figure 1 shows total of 689 IPO companies (listed in JASDAQ, Tokyo Exchange, Osaka Exchange, MOTHERS, NJG(Nasdaq Japan Growth), NJS(Nasdaq Japan Standart), Nagoya Exchange, Sapporo Exchange, Hiroshima Exchange, Fukoka Exchange ) by industry. Industry classification is based on Kaisha Shiki Ho ( Japan Company Handbook ) According to Kaisha Shiki Ho the total sample size includes 28 industry classification. Average first-day return during - period 1- 1997-1998(N=222), - period 2 - 1999(N=106), - period 3 - 2000-2001(N=361) 16 of these classification are chosen to graph show the difference of average first-day return % due to lack of number of IPOs based upon time intervals.
First-Day Returns by Across Sectors%
Distribution of IPOs by Industry
w holesale
w arehouse
vehicleservice
retailer
realestate
precision machinery
othersmetal products
machinery
foodfinancial institutio
electronic products
construction
communication
chemicals
Aver
age
Firs
t-Day
Ret
urn%
800
600
400
200
0
-200
PER
1
2
3
According to Figure 1, during 1997-1998 first-day return of IPOs is not volatile. There are not huge differences between across industries. In 1999, tremendous first-day return is observed in communication, electronic products, service, others, warehouse and wholesale industries. There is an overall increase in first-day returns of IPOs in this period. Unlike 1999, there is no extreme first–day return in communication industry between 2000-2001.First-day return of electronic products, service industries increased with declining speed. Surprisingly sharp increase in precision machinery industry is
11
realized during 2000-2001. IPOs of chemical, food, machinery industries look stable over 5 years.
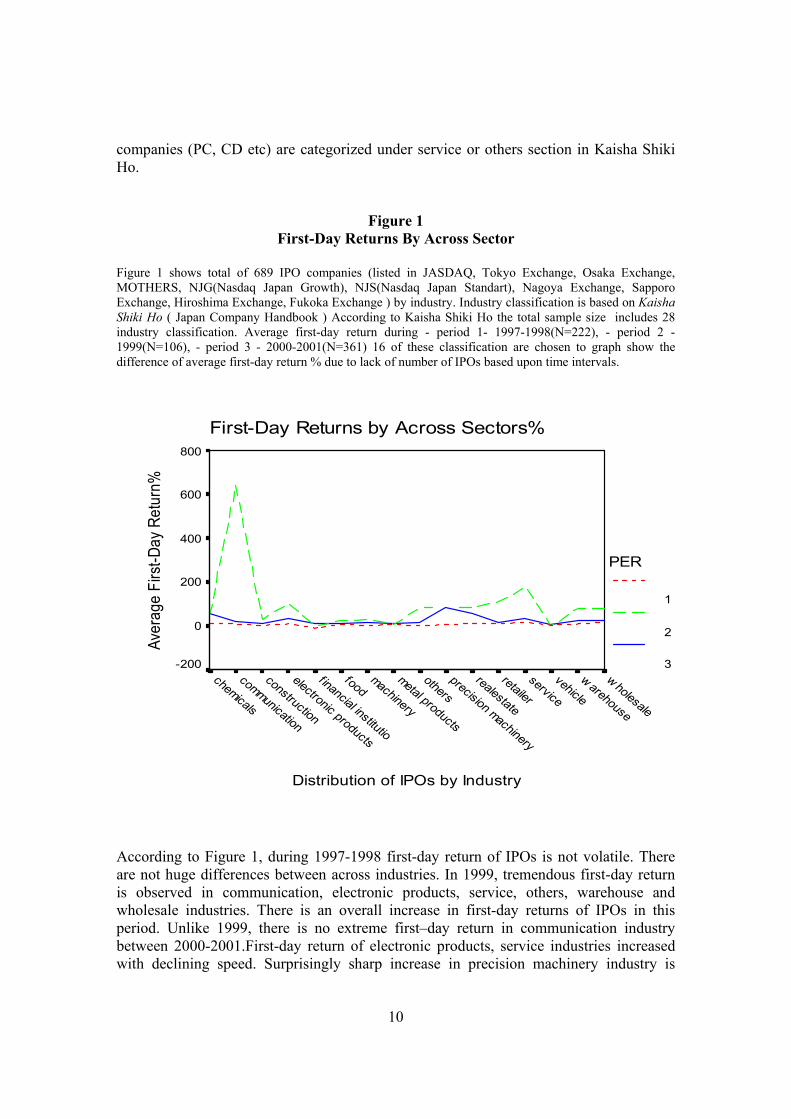
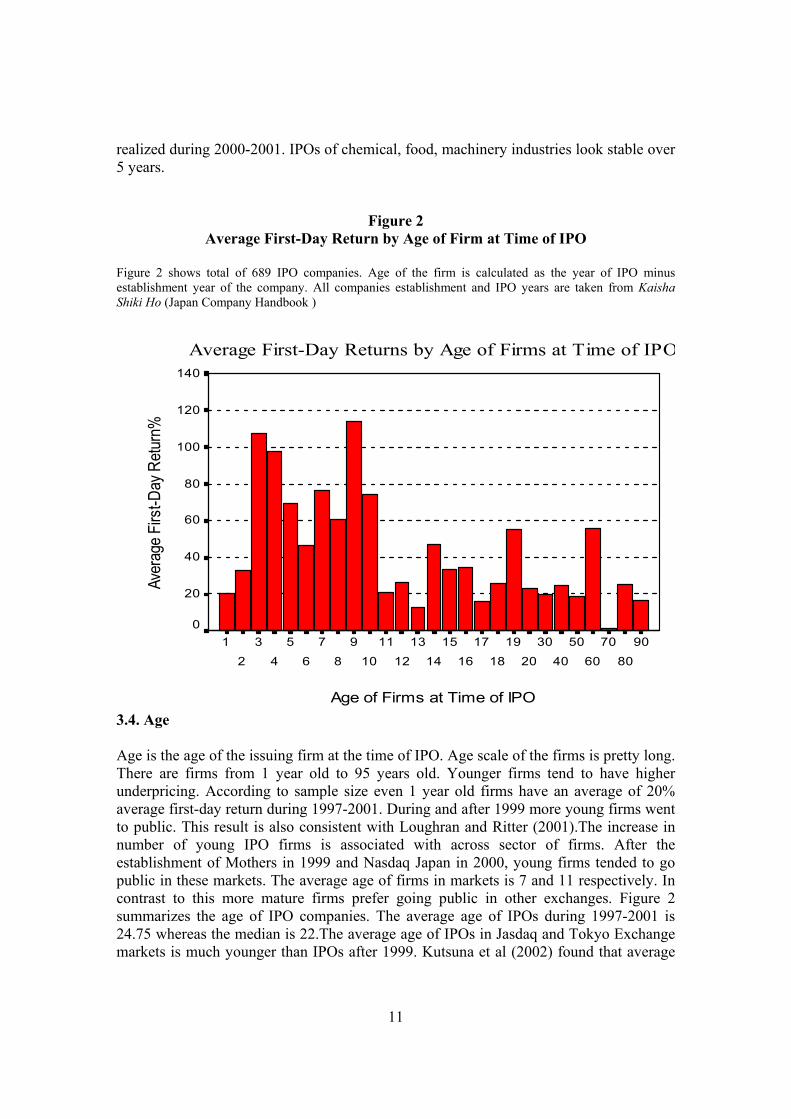
Figure 2 Average First-Day Return by Age of Firm at Time of IPO
Figure 2 shows total of 689 IPO companies. Age of the firm is calculated as the year of IPO minus establishment year of the company. All companies establishment and IPO years are taken from Kaisha Shiki Ho (Japan Company Handbook )
Average First-Day Returns by Age of Firms at Time of IPO
Age of Firms at Time of IPO
9080
7060
5040
3020
1918
1716
1514
1312
1110
98
76
54
32
1
Aver
age
Firs
t-Day
Ret
urn%
140
120
100
80
60
40
20
0
3.4. Age Age is the age of the issuing firm at the time of IPO. Age scale of the firms is pretty long. There are firms from 1 year old to 95 years old. Younger firms tend to have higher underpricing. According to sample size even 1 year old firms have an average of 20% average first-day return during 1997-2001. During and after 1999 more young firms went to public. This result is also consistent with Loughran and Ritter (2001).The increase in number of young IPO firms is associated with across sector of firms. After the establishment of Mothers in 1999 and Nasdaq Japan in 2000, young firms tended to go public in these markets. The average age of firms in markets is 7 and 11 respectively. In contrast to this more mature firms prefer going public in other exchanges. Figure 2 summarizes the age of IPO companies. The average age of IPOs during 1997-2001 is 24.75 whereas the median is 22.The average age of IPOs in Jasdaq and Tokyo Exchange markets is much younger than IPOs after 1999. Kutsuna et al (2002) found that average
12
age of firms during 1995-1996 is 31 for Jasdaq and 39 for TSE firms whereas Hamao et al (2000) reported average age of firms going public in Jasdaq during 1989-1995 is 35 years old. My findings are 25.37 for Jasdaq and 34.09 for TSE firms during 1997-2001.
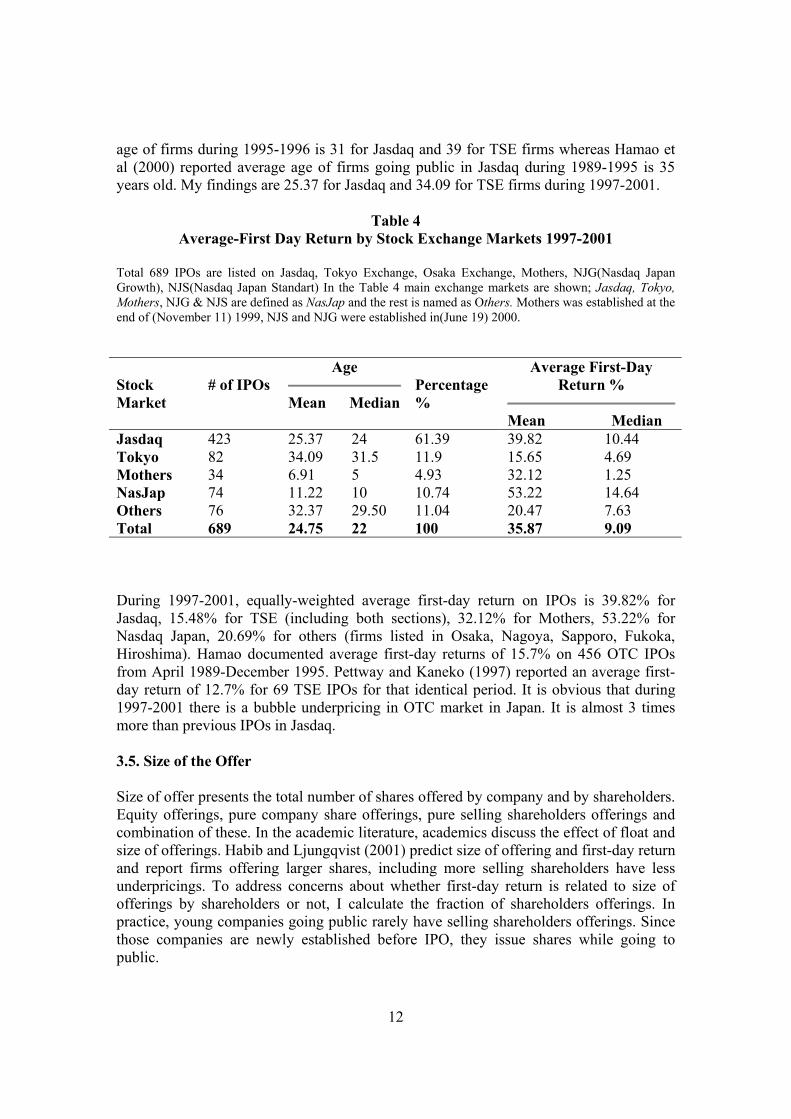
Table 4
Average-First Day Return by Stock Exchange Markets 1997-2001
Total 689 IPOs are listed on Jasdaq, Tokyo Exchange, Osaka Exchange, Mothers, NJG(Nasdaq Japan Growth), NJS(Nasdaq Japan Standart) In the Table 4 main exchange markets are shown; Jasdaq, Tokyo, Mothers, NJG & NJS are defined as NasJap and the rest is named as Others. Mothers was established at the end of (November 11) 1999, NJS and NJG were established in(June 19) 2000. Stock Market
# of IPOs
Age
Mean Median
Percentage %
Average First-Day Return %
Mean Median Jasdaq 423 25.37 24 61.39 39.82 10.44 Tokyo 82 34.09 31.5 11.9 15.65 4.69 Mothers 34 6.91 5 4.93 32.12 1.25 NasJap 74 11.22 10 10.74 53.22 14.64 Others 76 32.37 29.50 11.04 20.47 7.63 Total 689 24.75 22 100 35.87 9.09 During 1997-2001, equally-weighted average first-day return on IPOs is 39.82% for Jasdaq, 15.48% for TSE (including both sections), 32.12% for Mothers, 53.22% for Nasdaq Japan, 20.69% for others (firms listed in Osaka, Nagoya, Sapporo, Fukoka, Hiroshima). Hamao documented average first-day returns of 15.7% on 456 OTC IPOs from April 1989-December 1995. Pettway and Kaneko (1997) reported an average first-day return of 12.7% for 69 TSE IPOs for that identical period. It is obvious that during 1997-2001 there is a bubble underpricing in OTC market in Japan. It is almost 3 times more than previous IPOs in Jasdaq. 3.5. Size of the Offer Size of offer presents the total number of shares offered by company and by shareholders. Equity offerings, pure company share offerings, pure selling shareholders offerings and combination of these. In the academic literature, academics discuss the effect of float and size of offerings. Habib and Ljungqvist (2001) predict size of offering and first-day return and report firms offering larger shares, including more selling shareholders have less underpricings. To address concerns about whether first-day return is related to size of offerings by shareholders or not, I calculate the fraction of shareholders offerings. In practice, young companies going public rarely have selling shareholders offerings. Since those companies are newly established before IPO, they issue shares while going to public.
13
The willingness of selling shareholders depends on several conditions such as; trend in the market, revealed information by shareholders, convincing power of underwriters etc. IPO companies stand for high underpricing from several reasons; the winner’s curse, informational cascades, leaving good taste in investors’ mouth, marketing future probable SEOs. In other words, underpricing may not be as desirable as for shareholders while it is for issuing companies. Because the wealth transfer from shareholders to investors will not satisfy existing shareholders. Issuing companies stand for this wealth transfer for the future sake of company which is totally different from individual sake. Therefore, fraction of shareholders offering is usually small in general equity offerings. 4. General Characteristics of IPOs Previously discussed, recently established stock markets may have effect on IPO decision. In addition to stock market preference, consistent with American IPOs there is an upward trend of technology, IT IPOs in and after 1999. To test the characteristics of IPOs, I applied Mann-Whitney non-parametric test. U statistics measures the difference between the ranked observations in two samples and provides evidence on the difference between their population distributions. The observations from both groups are combined and ranked, with the average rank assigned in the case of ties. Mothers and Nasdaq Japan stock markets have been introduced in 1999, 2000 respectively. Their target companies more or less same with Jasdaq. Both of these recently established markets serve for young and low-sales, fast-growing firms. Among all exchange markets TSE IPOs offer more number of shares. Total number of shares offered by Jasdaq, Mothers and Nasdaq Japan IPOs are relatively low. I find in unreported my descriptive statistics, following TSE, the IPOs on regional markets also offer large number of shares. Panel A shows that Jasdaq, Tokyo Stock Exchange, Mothers and Nasdaq Japan companies are substantially different in terms of age, number of shares offered, sales, gross proceed, market capitalization, valuation. Especially, the firms which prefer going public on Mothers and Nasaq Japan stock exchanges are young, have low sales, offer less number of shares. In Panel B, I separated the firms which went to public between 1997-1998, 1999 and 2000-2001. My main interest is how the characteristics of IPOs in 1999-1998, 2000-2001 are different from the IPOs of 1999. The marginally significant coefficient of age, number of shares offered, valuation, market capitalization, sales, gross proceed suggest that IPOs in 1999 and other years have different characteristics from each other. The age of firms in 1997-1998 is 28, 27 in 1999 and 21 during 2000-2001. It is also reported in Table 1 mean of market capitalization during 1997-1998 is ¥ 186928 million, in 1999 it is ¥ 75124 million and during 2000-2001 capitalization is ¥ 35202 million. High market capitalization during 1997-1998 is due to high post-issue number of shares outstanding. Derived from Table 1, the mean sales figures of IPOs for 1997-1998, 1999 and 2000-20001 are; ¥ 36903 million, ¥ 20805 million and ¥ 24183million respectively.
14
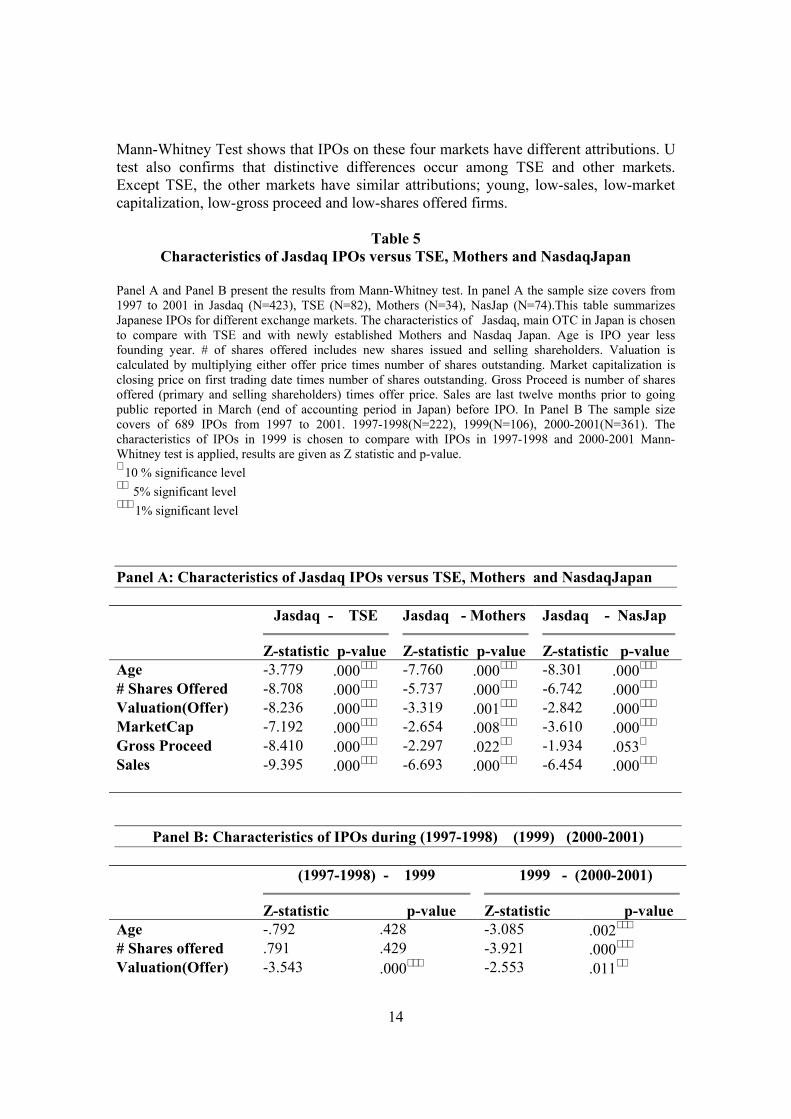
Mann-Whitney Test shows that IPOs on these four markets have different attributions. U test also confirms that distinctive differences occur among TSE and other markets. Except TSE, the other markets have similar attributions; young, low-sales, low-market capitalization, low-gross proceed and low-shares offered firms.
Table 5 Characteristics of Jasdaq IPOs versus TSE, Mothers and NasdaqJapan
Panel A and Panel B present the results from Mann-Whitney test. In panel A the sample size covers from 1997 to 2001 in Jasdaq (N=423), TSE (N=82), Mothers (N=34), NasJap (N=74).This table summarizes Japanese IPOs for different exchange markets. The characteristics of Jasdaq, main OTC in Japan is chosen to compare with TSE and with newly established Mothers and Nasdaq Japan. Age is IPO year less founding year. # of shares offered includes new shares issued and selling shareholders. Valuation is calculated by multiplying either offer price times number of shares outstanding. Market capitalization is closing price on first trading date times number of shares outstanding. Gross Proceed is number of shares offered (primary and selling shareholders) times offer price. Sales are last twelve months prior to going public reported in March (end of accounting period in Japan) before IPO. In Panel B The sample size covers of 689 IPOs from 1997 to 2001. 1997-1998(N=222), 1999(N=106), 2000-2001(N=361). The characteristics of IPOs in 1999 is chosen to compare with IPOs in 1997-1998 and 2000-2001 Mann-Whitney test is applied, results are given as Z statistic and p-value. ∗ 10 % significance level ∗∗ 5% significant level ∗∗∗ 1% significant level Panel A: Characteristics of Jasdaq IPOs versus TSE, Mothers and NasdaqJapan Jasdaq - TSE
Z-statistic p-value
Jasdaq - Mothers
Z-statistic p-value
Jasdaq - NasJap
Z-statistic p-value Age -3.779 .000∗∗∗ -7.760 .000∗∗∗ -8.301 .000∗∗∗ # Shares Offered -8.708 .000∗∗∗ -5.737 .000∗∗∗ -6.742 .000∗∗∗ Valuation(Offer) -8.236 .000∗∗∗ -3.319 .001∗∗∗ -2.842 .000∗∗∗ MarketCap -7.192 .000∗∗∗ -2.654 .008∗∗∗ -3.610 .000∗∗∗ Gross Proceed -8.410 .000∗∗∗ -2.297 .022∗∗ -1.934 .053∗ Sales -9.395 .000∗∗∗ -6.693 .000∗∗∗ -6.454 .000∗∗∗
Panel B: Characteristics of IPOs during (1997-1998) (1999) (2000-2001)
(1997-1998) - 1999
Z-statistic p-value
1999 - (2000-2001)
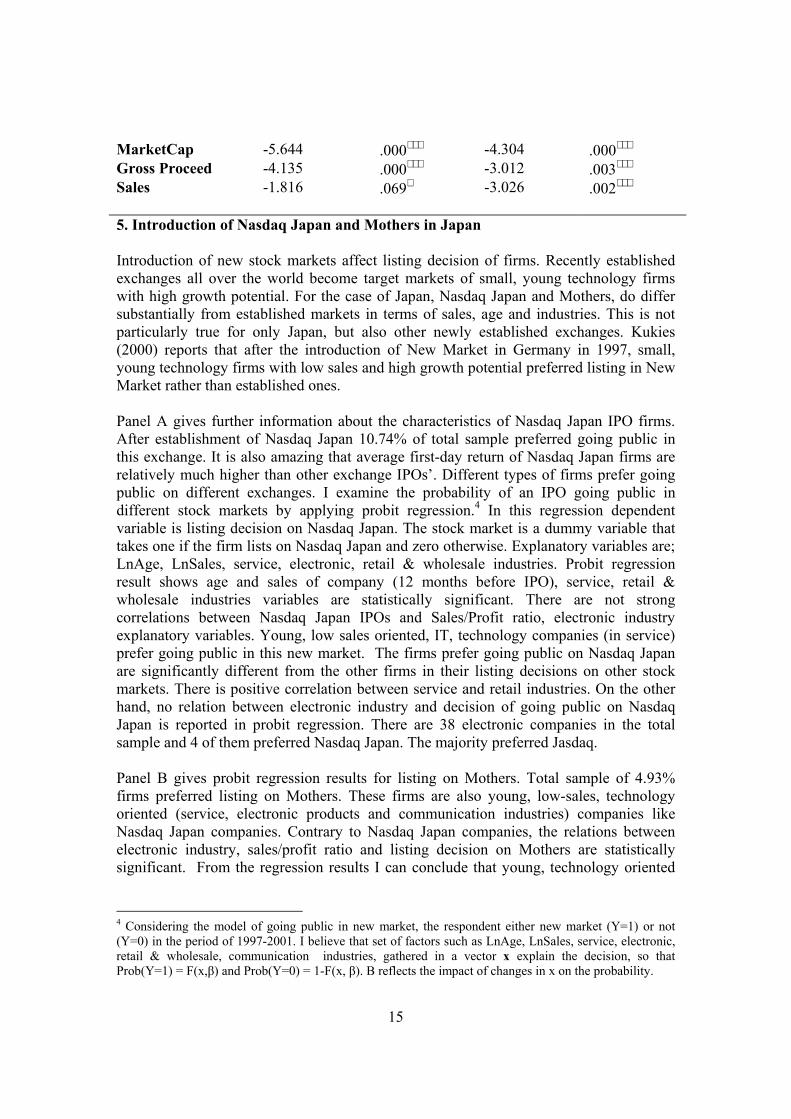
Z-statistic p-value Age -.792 .428 -3.085 .002∗∗∗ # Shares offered .791 .429 -3.921 .000∗∗∗ Valuation(Offer) -3.543 .000∗∗∗ -2.553 .011∗∗
15
MarketCap -5.644 .000∗∗∗ -4.304 .000∗∗∗ Gross Proceed -4.135 .000∗∗∗ -3.012 .003∗∗∗ Sales -1.816 .069∗ -3.026 .002∗∗∗ 5. Introduction of Nasdaq Japan and Mothers in Japan Introduction of new stock markets affect listing decision of firms. Recently established exchanges all over the world become target markets of small, young technology firms with high growth potential. For the case of Japan, Nasdaq Japan and Mothers, do differ substantially from established markets in terms of sales, age and industries. This is not particularly true for only Japan, but also other newly established exchanges. Kukies (2000) reports that after the introduction of New Market in Germany in 1997, small, young technology firms with low sales and high growth potential preferred listing in New Market rather than established ones. Panel A gives further information about the characteristics of Nasdaq Japan IPO firms. After establishment of Nasdaq Japan 10.74% of total sample preferred going public in this exchange. It is also amazing that average first-day return of Nasdaq Japan firms are relatively much higher than other exchange IPOs’. Different types of firms prefer going public on different exchanges. I examine the probability of an IPO going public in different stock markets by applying probit regression.4 In this regression dependent variable is listing decision on Nasdaq Japan. The stock market is a dummy variable that takes one if the firm lists on Nasdaq Japan and zero otherwise. Explanatory variables are; LnAge, LnSales, service, electronic, retail & wholesale industries. Probit regression result shows age and sales of company (12 months before IPO), service, retail & wholesale industries variables are statistically significant. There are not strong correlations between Nasdaq Japan IPOs and Sales/Profit ratio, electronic industry explanatory variables. Young, low sales oriented, IT, technology companies (in service) prefer going public in this new market. The firms prefer going public on Nasdaq Japan are significantly different from the other firms in their listing decisions on other stock markets. There is positive correlation between service and retail industries. On the other hand, no relation between electronic industry and decision of going public on Nasdaq Japan is reported in probit regression. There are 38 electronic companies in the total sample and 4 of them preferred Nasdaq Japan. The majority preferred Jasdaq. Panel B gives probit regression results for listing on Mothers. Total sample of 4.93% firms preferred listing on Mothers. These firms are also young, low-sales, technology oriented (service, electronic products and communication industries) companies like Nasdaq Japan companies. Contrary to Nasdaq Japan companies, the relations between electronic industry, sales/profit ratio and listing decision on Mothers are statistically significant. From the regression results I can conclude that young, technology oriented
4 Considering the model of going public in new market, the respondent either new market (Y=1) or not (Y=0) in the period of 1997-2001. I believe that set of factors such as LnAge, LnSales, service, electronic, retail & wholesale, communication industries, gathered in a vector x explain the decision, so that Prob(Y=1) = F(x,β) and Prob(Y=0) = 1-F(x, β). Β reflects the impact of changes in x on the probability.
16
especially service, electronic products and communication, low-sales firms prefer new stock markets to go public in Japan.
Table 6 Listing Decision in Nasdaq and Mothers Japan
Panel A and B present results from probit regression. The dependent variable is listing decision on Nasdaq Japan. The exchange is a dummy variable that takes one if the firm lists on Nasdaq Japan and zero otherwise. LnAge is the natural logarithm of the age of the company. LnSales is the natural logarithm of sales of firm in the year preceeding the IPO. In panel A, service, electronic, retail & wholesale are dummy variables that take 1 if the firm is in service, electronic products, retail and/or wholesale industries, respectively, and 0 otherwise. Sales/Profit ratio shows sales over ordinary profits 12 months prior to IPO. In panel B, only service, electronic, communication industries dummy variables are used. T-ratios are computed using White’s (1980) heteroskedascity-adjusted standard errors.Pseudo-R2 = 1-log L/log L0, where log L is the maximized value of log-likelihood function; log L0 is the log-likelihood computed with constant term. ∗ 10 % significance level ∗∗ 5% significant level ∗∗∗ 1% significant level
Panel A: Dependent Variable Nasdaq Japan
Independent Variables Coefficients T-ratio Std Error Constant 1.097193661∗ 1.94377 0.564468257 Ln (Age) -0.465109461∗∗∗ -4.95686 0.093831425 Ln(Sales) -0.172578855∗∗ -2.41500 0.071461363 Service 0.492591179∗∗∗ 2.62804 0.187436985 Electronic 0.351362910 1.09927 0.319633313 Retail&Wholesale 0.406678692∗∗ 1.99490 0.203858700 Sales/Profit 0.008066995 1.53690 0.005248868 Number of Firms=689 Pseudo-R2= 0.1528712
Panel B: Dependent Variable Mothers
Independent Variables Coefficients T-ratio Std Error Constant 1.434113081∗ 1.66062 0.863600263 Ln (Age) -0.372427249 ∗∗∗ -3.01867 0.123374677 Ln(Sales) -0.282863291∗∗∗ -2.65722 0.106450693 Service 0.522651273∗∗ 1.98550 0.263234745 Electronic 0.793423102∗∗ 2.29931 0.345070185 Communication 1.112696484∗∗ 2.38018 0.467484742
17
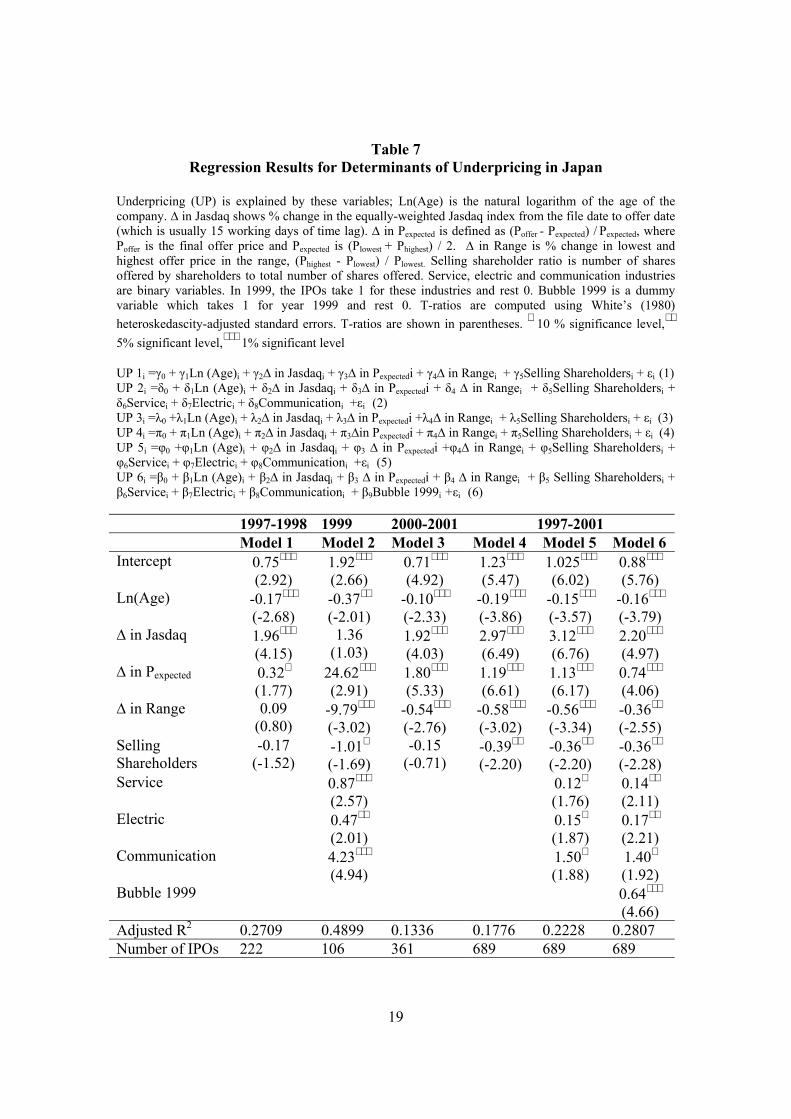
Sales/Profit -0.024462835∗∗∗ -3.27881 0.007460899 Number of Firms=689 Pseudo-R2= 0.1697345 6. Multiple Regression Multiple regression results show the determinants of bubble IPO in Japan. Different models are applied considering periods. In all models, I report the first-day return as dependent variable. The explanatory variables are chosen on the basis of their association with first-day return in univariate sorts. In Model 1, I use five independent variables are used to explore relationship; Ln(Age) is the natural logarithm of age of IPO company, ∆ in Jasdaq is % change in value-weighted Jasdaq index from file date to offer date, ∆ in Pexpected is defined as (Poffer - Pexpected) / Pexpected, where Poffer is the final offer price and Pexpected is (Plowest + Phighest) / 2. ∆ in Range is the percentage change in lowest and highest offer price in the range, (Phighest - Plowest) / Plowest. Selling shareholder ratio is number of shares offered by shareholders to total number of shares offered. Then I extend the model and used additional industry variables in Model 2. Service, electric and communication industries are binary variables that IPOs denote 1 for these industries and rest 0. In Model 6, additional bubble 1999 explanatory variable is used for IPOs which takes 1 for year 1999 and rest 0. The final multiple regression for 5 years is shown below. i = 689 t = 1997-2001
Model 6 First-Day Return it = β0 + β1 Ln(Age) it + β2 ∆ in Jasdaq it + β3 ∆ in Pexpected it + β4 ∆ in Range it + β5 Selling Shareholders it + β6 Service it + β7 Electric it + β8 Communication it + β9 Bubble 1999 it + ε it During 1997-1998, Ln(Age), ∆ in Jasdaq, ∆ in Pexpected explanatory variables are statistically significant while explaining first-day return. In 1999, there is a strong positive correlation between technology-based IPOs especially PC, electronics, communication industries, and first-day return. In 2000-2001, addition to explanatory power of Ln(Age), ∆ in Jasdaq, ∆ in Pexpected variables, first-day return is positively related to ∆ in Range. In all models there is a negative relationship between first-day return, age of IPO companies and ratio of selling shareholders. Young companies have higher first-day returns in all models. The less is the offering, the less is the dilution associated with first-day return. For all models, underpricing is positively related to Jasdaq market return and ∆ in Pexpected . Upward revisions in the offer price result high first-day return. A cross sectional ordinary least squares (OLS) shows that when final offer price exceeds expected offer price, first-day return is expected to be higher. On the other hand, uncertainty about the offer price and number of shares offered effect first-day returns. Underwriters who have doubts about offerings are likely to set wide offer ranges. The wider the offer range results the greater the uncertainty about offerings. High first-day return is inversely related to width of offer range. Width is quite small especially for

18
hot issues. Finally, considering five years general performance of IPOs in Japan bubble 1999 variable is statistically significant to explain the general behavior of going public in Japan from 1997 to 2001.
19
Table 7 Regression Results for Determinants of Underpricing in Japan
Underpricing (UP) is explained by these variables; Ln(Age) is the natural logarithm of the age of the company. ∆ in Jasdaq shows % change in the equally-weighted Jasdaq index from the file date to offer date (which is usually 15 working days of time lag). ∆ in Pexpected is defined as (Poffer - Pexpected) / Pexpected, where Poffer is the final offer price and Pexpected is (Plowest + Phighest) / 2. ∆ in Range is % change in lowest and highest offer price in the range, (Phighest - Plowest) / Plowest. Selling shareholder ratio is number of shares offered by shareholders to total number of shares offered. Service, electric and communication industries are binary variables. In 1999, the IPOs take 1 for these industries and rest 0. Bubble 1999 is a dummy variable which takes 1 for year 1999 and rest 0. T-ratios are computed using White’s (1980) heteroskedascity-adjusted standard errors. T-ratios are shown in parentheses. ∗ 10 % significance level,∗∗ 5% significant level,∗∗∗ 1% significant level UP 1i =γ0 + γ1Ln (Age)i + γ2∆ in Jasdaqi + γ3∆ in Pexpectedi + γ4∆ in Rangei + γ5Selling Shareholdersi + εi (1) UP 2i =δ0 + δ1Ln (Age)i + δ2∆ in Jasdaqi + δ3∆ in Pexpectedi + δ4 ∆ in Rangei + δ5Selling Shareholdersi + δ6Servicei + δ7Electrici + δ8Communicationi +εi (2) UP 3i =λ0 +λ1Ln (Age)i + λ2∆ in Jasdaqi + λ3∆ in Pexpectedi +λ4∆ in Rangei + λ5Selling Shareholdersi + εi (3) UP 4i =π0 + π1Ln (Age)i + π2∆ in Jasdaqi + π3∆in Pexpectedi + π4∆ in Rangei + π5Selling Shareholdersi + εi (4) UP 5i =φ0 +φ1Ln (Age)i + φ2∆ in Jasdaqi + φ3 ∆ in Pexpectedi +φ4∆ in Rangei + φ5Selling Shareholdersi + φ6Servicei + φ7Electrici + φ8Communicationi +εi (5) UP 6i =β0 + β1Ln (Age)i + β2∆ in Jasdaqi + β3 ∆ in Pexpectedi + β4 ∆ in Rangei + β5 Selling Shareholdersi + β6Servicei + β7Electrici + β8Communicationi + β9Bubble 1999i +εi (6)
1997-1998 1999 2000-2001 1997-2001 Model 1 Model 2 Model 3 Model 4 Model 5 Model 6 Intercept 0.75∗∗∗
(2.92) 1.92∗∗∗ (2.66)
0.71∗∗∗ (4.92)
1.23∗∗∗ (5.47)
1.025∗∗∗ (6.02)
0.88∗∗∗ (5.76)
Ln(Age) -0.17∗∗∗ (-2.68)
-0.37∗∗ (-2.01)
-0.10∗∗∗ (-2.33)
-0.19∗∗∗ (-3.86)
-0.15∗∗∗ (-3.57)
-0.16∗∗∗ (-3.79)
∆ in Jasdaq 1.96∗∗∗ (4.15)
1.36 (1.03)
1.92∗∗∗ (4.03)
2.97∗∗∗ (6.49)
3.12∗∗∗ (6.76)
2.20∗∗∗ (4.97)
∆ in Pexpected 0.32∗ (1.77)
24.62∗∗∗ (2.91)
1.80∗∗∗ (5.33)
1.19∗∗∗ (6.61)
1.13∗∗∗ (6.17)
0.74∗∗∗ (4.06)
∆ in Range 0.09 (0.80)
-9.79∗∗∗ (-3.02)
-0.54∗∗∗ (-2.76)
-0.58∗∗∗ (-3.02)
-0.56∗∗∗ (-3.34)
-0.36∗∗ (-2.55)
Selling Shareholders
-0.17 (-1.52)
-1.01∗ (-1.69)
-0.15 (-0.71)
-0.39∗∗ (-2.20)
-0.36∗∗ (-2.20)
-0.36∗∗ (-2.28)
Service 0.87∗∗∗ (2.57)
0.12∗ (1.76)
0.14∗∗ (2.11)
Electric 0.47∗∗ (2.01)
0.15∗ (1.87)
0.17∗∗ (2.21)
Communication 4.23∗∗∗ (4.94)
1.50∗ (1.88)
1.40∗ (1.92)
Bubble 1999 0.64∗∗∗ (4.66)
Adjusted R2 0.2709 0.4899 0.1336 0.1776 0.2228 0.2807 Number of IPOs 222 106 361 689 689 689
20
7. Conclusion In this paper, I explore the determinants of bubble underpricing in Japan. Using a sample of 689 firms from 1997 to 2001, excluding seasoned equity offerings, I show young, low-sales, technology oriented, IT companies had high-first day returns in Japan especially in 1999. The characteristics of high first-day return IPOs characteristics also differ from others. Japan, as IT exporter country and has good reputation in computers, communication, automobile sectors, it is not surprising that underpricing of Japanese IPOs is much higher than the ones in America. Besides, introduction of Mothers and Nasdaq Japan stock markets has great impact for young, fast growing firms to go public. Since this study covers all IPOs in Japan, the performance of going public on regional markets is poor. OTC market is still popular among young companies after the introduction of new markets. After 1999, underpricing was not so high. The sharp decrease is reported in 2000 and average initial return of IPOs in 2000 was lower even it was in 1998.Then it started to rise during 2001. Loughran & Ritter (2001) also report decline in the initial returns after 1999.One of the reasons of decline in the first-day return might be closely related to the general economic conditions. IPO has two important sides, one is the factors that affect the offer price and second is the factors that affect the closing price on the first trading date. The change from offer price to closing price gives us underpricing. Therefore, determining the factors that affect offer price plays key role to explain offer side of underpricing. My findings suggest that adjustment in the offer range has strong explanatory power to explain bubble underpricing in Japan. This paper confirms that, underpricing is positively related to revisions in the offer price from the filing prospectus to the offer date. The money left on table increases when the final offer price exceeds the highest offer price in the range and/ or expected offer price. Upward revision in the offer price is positively correlated with underpricing. Revisions in the offer range reflect the information learnt from the investors. The results for selling shareholders ratio confirm me that shareholders who sell a greater fraction of shares, induce less underpricing In this empirical study I report young companies going public rarely have selling shareholders offerings. Finally, I can conclude this paper that from 1997 to 2001 the evidence of bubble underpricing occurred in Japan. This bubble phenomenon can be explained by IPOs of young, fast growing companies in IT, communication industries. The introduction of Mothers and Nasdaq Japan stock exchange markets have also great impact for those young, fast growing firms to decide to go public. In addition to these, partial adjustment in the offer range helps us to understand the revisions while deciding the final offer price.
21
APPENDIX
Table 8 Extreme Hot Issues
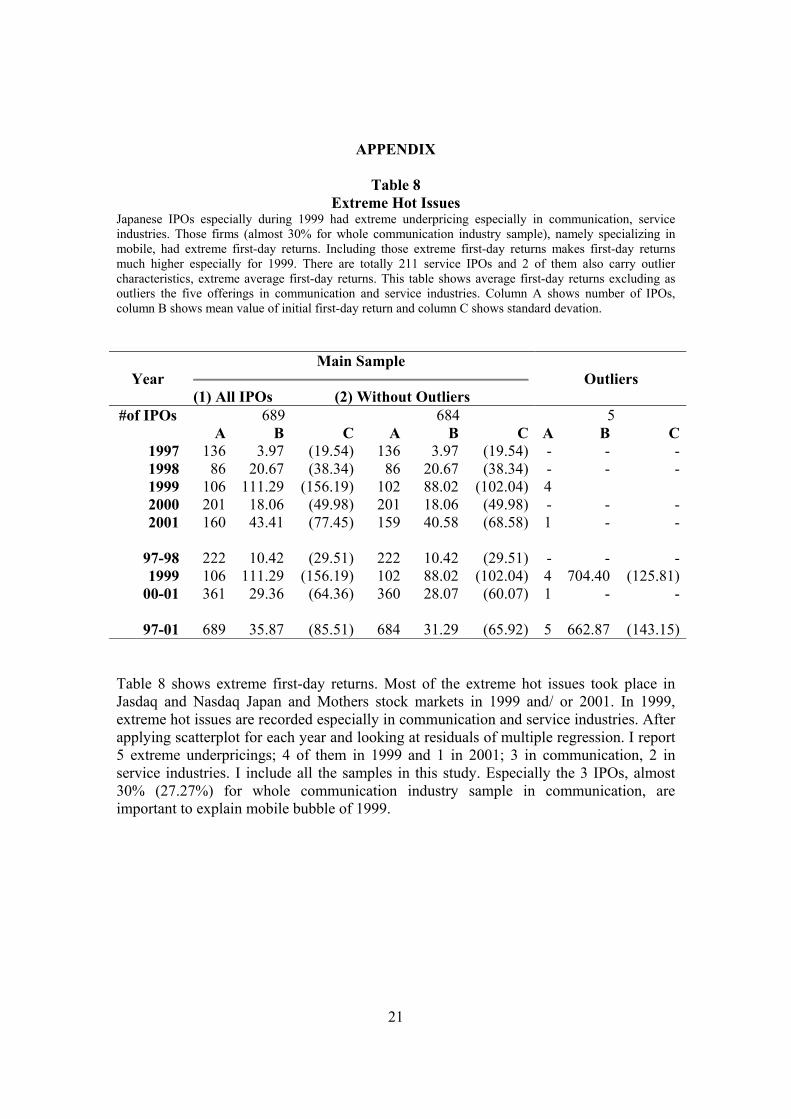
Japanese IPOs especially during 1999 had extreme underpricing especially in communication, service industries. Those firms (almost 30% for whole communication industry sample), namely specializing in mobile, had extreme first-day returns. Including those extreme first-day returns makes first-day returns much higher especially for 1999. There are totally 211 service IPOs and 2 of them also carry outlier characteristics, extreme average first-day returns. This table shows average first-day returns excluding as outliers the five offerings in communication and service industries. Column A shows number of IPOs, column B shows mean value of initial first-day return and column C shows standard devation.
Year
Main Sample
(1) All IPOs (2) Without Outliers
Outliers
#of IPOs 689 684 5 A B C A B C A B C
1997 136 3.97 (19.54) 136 3.97 (19.54) - - -1998 86 20.67 (38.34) 86 20.67 (38.34) - - -1999 106 111.29 (156.19) 102 88.02 (102.04) 4 2000 201 18.06 (49.98) 201 18.06 (49.98) - - -2001 160 43.41 (77.45) 159 40.58 (68.58) 1 - -
97-98 222 10.42 (29.51) 222 10.42 (29.51) - - -1999 106 111.29 (156.19) 102 88.02 (102.04) 4 704.40 (125.81)
00-01 361 29.36 (64.36) 360 28.07 (60.07) 1 - -
97-01 689 35.87 (85.51) 684 31.29 (65.92) 5 662.87 (143.15)
Table 8 shows extreme first-day returns. Most of the extreme hot issues took place in Jasdaq and Nasdaq Japan and Mothers stock markets in 1999 and/ or 2001. In 1999, extreme hot issues are recorded especially in communication and service industries. After applying scatterplot for each year and looking at residuals of multiple regression. I report 5 extreme underpricings; 4 of them in 1999 and 1 in 2001; 3 in communication, 2 in service industries. I include all the samples in this study. Especially the 3 IPOs, almost 30% (27.27%) for whole communication industry sample in communication, are important to explain mobile bubble of 1999.
22
References Allen, F., and Faulhaber R. G.,1989. Signaling by underpricing in the IPO market. Journal of Financial Economics 23, 303-323 Benveniste, L.M., and Spindt P.A.,1989. How investment bankers determine the offer price and allocation of new issues. Journal of financial Economics 24, 343-361 Cai, J., and Laughran, T., 1998. The performance of Japanese seasoned equity offerings, 1971-1992.Pacific-Basin Finance Journal 6, 395-425 Greene, W.H., 1997, Econometric Analysis (3rd ed.) Prentice-Hall, Englewood Cliffs, N.J. Habib, M., and Ljungqvist A., 2001. Underpricing and entrepreneurial wealth losses in IPOs: Theory and evidence. Review of Financial Studies 14, 433-458 Hamao, Y., Packer, F., and Ritter, R.J., 2000. Institutional affiliation and the role of venture capital’ Evidence from initial offerings in Japan. Pacific-Basin Finance Journal , Volume 8, Issue 5, 529-558 Hanley, W. K., 1993. The underpricing of initial public offerings and partial adjustment phenomenon. Journal of Financial Economics, 231-250 Ibbotson, R. G., 1975. Price performance of common stock issues. Journal of Financial Economics 2, 235-272 Kukies, J., 2000. The Effects of Introducing a New Stock exchange on the IPO process. ABN-AMRO International Conference on Initial Public Offerings, University of Amsterdam, Netherlands Kutsuna, K., Smith R., 2001. Why does book building drive out Auction Methods of IPO Issuance? Evidence and Implications from Japan, Claremont Colleges working paper Kutsuna, K., Okamura, H., and Cowling, M., 2002. Ownership structure pre- and post-IPOs and the operating performance of JASDAQ companies. Pacific-Basin Finance Journal 10, 163-181 Ljungqvist, P. A., 1997. Pricing initial public offerings’ further evidence from Germany. European Economic Review 41, 1309-1320 Loughran, T., and Ritter J., 2000. Why Don’t Issuers get upset about leaving money on the table in IPOs? Review of Financial Studies, Vol. 15, No. 2 (2002), pp. 413-443.
23
Loughran, T., and Ritter J., 2001. Why has IPO Underpricing Increased Over Time? Unpublished working paper Lutsuna, K., Cowling, M., and Westhead, P., 2000. The short-run performance of JASDAQ companies and venture capital involvement before and after IPO. Venture Capital: An International Journal of Entrepreneurial Finance 2, 1-25 Pettway, R., and Kaneko, T., 1997. A comparison of impacts of the partial auction system of Japanese IPOs versus the U.S. discretionary allocation system. Unpublished working paper, University of Missouri Ritte,R. J., 1998. Initial Public Offerings. Contemporary Finance Digest, Vol.2, No.1, 5-30 White, H., 1980. A heteroscedasticity-consistent covariance matrix and a direct test for heteroscedasticity. Econometrica 48, 721-746